As filed with the Securities and Exchange Commission on September 3, 2024
UNITED STATES
SECURITIES AND EXCHANGE COMMISSION
Washington, D.C. 20549
FORM N-CSR
CERTIFIED SHAREHOLDER REPORT OF REGISTERED
MANAGEMENT INVESTMENT COMPANIES
Investment Company Act file number: 811-04419
TRANSAMERICA SERIES TRUST
(Exact name of registrant as specified in charter)
1801 California St., Suite 5200, Denver, CO 80202
(Address of principal executive offices) (Zip code)
Dennis P. Gallagher, Esq., 1801 California St., Suite 5200, Denver, CO 80202
(Name and address of agent for service)
Registrant’s telephone number, including area code: 1-800-851-9777
Date of fiscal year end: December 31
Date of reporting period: June 30, 2024
| Item 1. |
Reports to Stockholders. |
Semi-Annual Shareholder Report
June 30, 2024
Transamerica 60/40 Allocation VP
Transamerica 60/40 Allocation VP seeks long-term capital appreciation and current income. This semi-annual shareholder report contains important information for the period of January 1, 2024 to June 30, 2024. You can find additional information about the Portfolio at transamerica.com/annuities/prospectus. You can also request this information by contacting us at 800-851-9777.
What were the Portfolio costs for the period?
Portfolio Overview Operating Expenses
(based on a hypothetical $10,000 investment)
Class Name |
Cost of a $10,000 investment |
Costs paid as a percentage of a $10,000 investment |
Service Class |
$23 |
0.44% |
This table does not reflect any charges that are, or may be, imposed under your variable life insurance policy or variable annuity contract. If such charges were reflected, expenses would be higher.
Total Net Assets |
$83,159,646 |
Number of Portfolio Holdings |
4 |
Portfolio Turnover Rate |
4% |
What did the Portfolio invest in?
Asset Allocation (Percentage of Net Assets)
U.S. Equity Funds |
45.3% |
U.S. Fixed Income Funds |
40.0 |
International Equity Funds |
14.8 |
Net Other Assets (Liabilities) |
(0.1) |
Top Holdings (Percentage of Net Assets)
Transamerica S&P 500 Index VP, Initial Class |
45.3% |
Transamerica Short-Term Bond, Class I2 |
20.1 |
Transamerica Core Bond, Class I2 |
19.9 |
Transamerica MSCI EAFE Index VP, Initial Class |
14.8 |
If you wish to view additional information about the Portfolio; including but not limited to full holdings, financial statements, proxy voting policies and other important documents, please see TST's most recent report on Form N-CSR available at transamerica.com/annuities/prospectus.
Transamerica 60/40 Allocation VP
Semi-Annual Shareholder Report
June 30, 2024
Transamerica Aegon Bond VP
Transamerica Aegon Bond VP seeks to provide high total return through a combination of current income and capital appreciation. This semi-annual shareholder report contains important information for the period of January 1, 2024 to June 30, 2024. You can find additional information about the Portfolio at transamerica.com/annuities/prospectus. You can also request this information by contacting us at 800-851-9777.
What were the Portfolio costs for the period?
Portfolio Overview Operating Expenses
(based on a hypothetical $10,000 investment)
Class Name |
Cost of a $10,000 investment |
Costs paid as a percentage of a $10,000 investment |
Initial Class |
$26 |
0.52% |
This table does not reflect any charges that are, or may be, imposed under your variable life insurance policy or variable annuity contract. If such charges were reflected, expenses would be higher.
Total Net Assets |
$2,303,593,675 |
Number of Portfolio Holdings |
501 |
Portfolio Turnover Rate |
36% |
What did the Portfolio invest in?
Top Asset Allocations (Percentage of Net Assets)
Corporate Debt Securities |
43.8% |
U.S. Government Obligations |
25.2 |
Asset-Backed Securities |
10.6 |
Mortgage-Backed Securities |
9.5 |
U.S. Government Agency Obligations |
9.0 |
Short-Term U.S. Government Obligations |
3.8 |
Repurchase Agreements |
2.7 |
Commercial Paper |
1.5 |
Net Other Assets (Liabilities) |
(6.1) |
Top Holdings (Percentage of Net Assets)
U.S. Treasury Bonds, 2.38%, 02/15/2042 |
2.5% |
Uniform Mortgage-Backed Security, TBA, 2.00%, 07/01/2054 |
2.4 |
U.S. Treasury Bills, 5.38%, 09/12/2024 |
2.0 |
Uniform Mortgage-Backed Security, TBA, 5.50%, 07/01/2054 |
1.7 |
U.S. Treasury Bonds, 3.50%, 02/15/2039 |
1.5 |
U.S. Treasury Bonds, 4.50%, 02/15/2044 |
1.4 |
U.S. Treasury Notes, 1.38%, 11/15/2031 |
1.4 |
U.S. Treasury Notes, 4.25%, 02/28/2031 |
1.3 |
U.S. Treasury Bonds, 3.88%, 05/15/2043 |
1.3 |
U.S. Treasury Notes, 4.13%, 11/15/2032 |
1.3 |
If you wish to view additional information about the Portfolio; including but not limited to full holdings, financial statements, proxy voting policies and other important documents, please see TST's most recent report on Form N-CSR available at transamerica.com/annuities/prospectus.
Transamerica Aegon Bond VP
Semi-Annual Shareholder Report
June 30, 2024
Transamerica Aegon Bond VP
Transamerica Aegon Bond VP seeks to provide high total return through a combination of current income and capital appreciation. This semi-annual shareholder report contains important information for the period of January 1, 2024 to June 30, 2024. You can find additional information about the Portfolio at transamerica.com/annuities/prospectus. You can also request this information by contacting us at 800-851-9777.
What were the Portfolio costs for the period?
Portfolio Overview Operating Expenses
(based on a hypothetical $10,000 investment)
Class Name |
Cost of a $10,000 investment |
Costs paid as a percentage of a $10,000 investment |
Service Class |
$38 |
0.77% |
This table does not reflect any charges that are, or may be, imposed under your variable life insurance policy or variable annuity contract. If such charges were reflected, expenses would be higher.
Total Net Assets |
$2,303,593,675 |
Number of Portfolio Holdings |
501 |
Portfolio Turnover Rate |
36% |
What did the Portfolio invest in?
Top Asset Allocations (Percentage of Net Assets)
Corporate Debt Securities |
43.8% |
U.S. Government Obligations |
25.2 |
Asset-Backed Securities |
10.6 |
Mortgage-Backed Securities |
9.5 |
U.S. Government Agency Obligations |
9.0 |
Short-Term U.S. Government Obligations |
3.8 |
Repurchase Agreements |
2.7 |
Commercial Paper |
1.5 |
Net Other Assets (Liabilities) |
(6.1) |
Top Holdings (Percentage of Net Assets)
U.S. Treasury Bonds, 2.38%, 02/15/2042 |
2.5% |
Uniform Mortgage-Backed Security, TBA, 2.00%, 07/01/2054 |
2.4 |
U.S. Treasury Bills, 5.38%, 09/12/2024 |
2.0 |
Uniform Mortgage-Backed Security, TBA, 5.50%, 07/01/2054 |
1.7 |
U.S. Treasury Bonds, 3.50%, 02/15/2039 |
1.5 |
U.S. Treasury Bonds, 4.50%, 02/15/2044 |
1.4 |
U.S. Treasury Notes, 1.38%, 11/15/2031 |
1.4 |
U.S. Treasury Notes, 4.25%, 02/28/2031 |
1.3 |
U.S. Treasury Bonds, 3.88%, 05/15/2043 |
1.3 |
U.S. Treasury Notes, 4.13%, 11/15/2032 |
1.3 |
If you wish to view additional information about the Portfolio; including but not limited to full holdings, financial statements, proxy voting policies and other important documents, please see TST's most recent report on Form N-CSR available at transamerica.com/annuities/prospectus.
Transamerica Aegon Bond VP
Semi-Annual Shareholder Report
June 30, 2024
Transamerica Aegon Core Bond VP
Transamerica Aegon Core Bond VP seeks to achieve maximum total return. This semi-annual shareholder report contains important information for the period of January 1, 2024 to June 30, 2024. You can find additional information about the Portfolio at transamerica.com/annuities/prospectus. You can also request this information by contacting us at 800-851-9777.
What were the Portfolio costs for the period?
Portfolio Overview Operating Expenses
(based on a hypothetical $10,000 investment)
Class Name |
Cost of a $10,000 investment |
Costs paid as a percentage of a $10,000 investment |
Initial Class |
$25 |
0.50% |
This table does not reflect any charges that are, or may be, imposed under your variable life insurance policy or variable annuity contract. If such charges were reflected, expenses would be higher.
Total Net Assets |
$376,813,111 |
Number of Portfolio Holdings |
646 |
Portfolio Turnover Rate |
40% |
What did the Portfolio invest in?
Top Asset Allocations (Percentage of Net Assets)
Corporate Debt Securities |
35.3% |
U.S. Government Agency Obligations |
27.1 |
U.S. Government Obligations |
24.3 |
Commercial Paper |
14.1 |
Mortgage-Backed Securities |
6.6 |
Asset-Backed Securities |
5.2 |
Short-Term U.S. Government Obligations |
3.5 |
Repurchase Agreements |
1.6 |
Net Other Assets (Liabilities) |
(17.7) |
Top Holdings (Percentage of Net Assets)
Uniform Mortgage-Backed Security, TBA, 3.00%, 07/01/2054 |
3.2% |
Uniform Mortgage-Backed Security, TBA, 2.50%, 07/01/2054 |
3.2 |
Uniform Mortgage-Backed Security, TBA, 3.50%, 07/01/2054 |
2.1 |
Uniform Mortgage-Backed Security, TBA, 5.50%, 07/01/2054 |
1.6 |
U.S. Treasury Notes, 1.63%, 02/15/2026 |
1.6 |
Uniform Mortgage-Backed Security, TBA, 4.50%, 07/01/2054 |
1.4 |
U.S. Treasury Notes, 1.63%, 05/15/2031 |
1.4 |
Uniform Mortgage-Backed Security, TBA, 4.00%, 07/01/2054 |
1.3 |
GTA Funding LLC, 5.46%, 08/19/2024 |
1.1 |
U.S. Treasury Bills, 5.37%, 09/19/2024 |
1.1 |
If you wish to view additional information about the Portfolio; including but not limited to full holdings, financial statements, proxy voting policies and other important documents, please see TST's most recent report on Form N-CSR available at transamerica.com/annuities/prospectus.
Transamerica Aegon Core Bond VP
Semi-Annual Shareholder Report
June 30, 2024
Transamerica Aegon Core Bond VP
Transamerica Aegon Core Bond VP seeks to achieve maximum total return. This semi-annual shareholder report contains important information for the period of January 1, 2024 to June 30, 2024. You can find additional information about the Portfolio at transamerica.com/annuities/prospectus. You can also request this information by contacting us at 800-851-9777.
What were the Portfolio costs for the period?
Portfolio Overview Operating Expenses
(based on a hypothetical $10,000 investment)
Class Name |
Cost of a $10,000 investment |
Costs paid as a percentage of a $10,000 investment |
Service Class |
$37 |
0.75% |
This table does not reflect any charges that are, or may be, imposed under your variable life insurance policy or variable annuity contract. If such charges were reflected, expenses would be higher.
Total Net Assets |
$376,813,111 |
Number of Portfolio Holdings |
646 |
Portfolio Turnover Rate |
40% |
What did the Portfolio invest in?
Top Asset Allocations (Percentage of Net Assets)
Corporate Debt Securities |
35.3% |
U.S. Government Agency Obligations |
27.1 |
U.S. Government Obligations |
24.3 |
Commercial Paper |
14.1 |
Mortgage-Backed Securities |
6.6 |
Asset-Backed Securities |
5.2 |
Short-Term U.S. Government Obligations |
3.5 |
Repurchase Agreements |
1.6 |
Net Other Assets (Liabilities) |
(17.7) |
Top Holdings (Percentage of Net Assets)
Uniform Mortgage-Backed Security, TBA, 3.00%, 07/01/2054 |
3.2% |
Uniform Mortgage-Backed Security, TBA, 2.50%, 07/01/2054 |
3.2 |
Uniform Mortgage-Backed Security, TBA, 3.50%, 07/01/2054 |
2.1 |
Uniform Mortgage-Backed Security, TBA, 5.50%, 07/01/2054 |
1.6 |
U.S. Treasury Notes, 1.63%, 02/15/2026 |
1.6 |
Uniform Mortgage-Backed Security, TBA, 4.50%, 07/01/2054 |
1.4 |
U.S. Treasury Notes, 1.63%, 05/15/2031 |
1.4 |
Uniform Mortgage-Backed Security, TBA, 4.00%, 07/01/2054 |
1.3 |
GTA Funding LLC, 5.46%, 08/19/2024 |
1.1 |
U.S. Treasury Bills, 5.37%, 09/19/2024 |
1.1 |
If you wish to view additional information about the Portfolio; including but not limited to full holdings, financial statements, proxy voting policies and other important documents, please see TST's most recent report on Form N-CSR available at transamerica.com/annuities/prospectus.
Transamerica Aegon Core Bond VP
Semi-Annual Shareholder Report
June 30, 2024
Transamerica Aegon High Yield Bond VP
Transamerica Aegon High Yield Bond VP seeks a high level of current income by investing in high-yield debt securities. This semi-annual shareholder report contains important information for the period of January 1, 2024 to June 30, 2024. You can find additional information about the Portfolio at transamerica.com/annuities/prospectus. You can also request this information by contacting us at 800-851-9777.
What were the Portfolio costs for the period?
Portfolio Overview Operating Expenses
(based on a hypothetical $10,000 investment)
Class Name |
Cost of a $10,000 investment |
Costs paid as a percentage of a $10,000 investment |
Initial Class |
$32 |
0.63% |
This table does not reflect any charges that are, or may be, imposed under your variable life insurance policy or variable annuity contract. If such charges were reflected, expenses would be higher.
Total Net Assets |
$252,760,395 |
Number of Portfolio Holdings |
459 |
Portfolio Turnover Rate |
17% |
What did the Portfolio invest in?
Top Asset Allocations (Percentage of Net Assets)
Corporate Debt Securities |
95.6% |
Other Investment Company |
5.9 |
Loan Assignments |
2.3 |
Repurchase Agreements |
1.1 |
Common Stocks |
0.1 |
Net Other Assets (Liabilities) |
(5.0) |
Top Holdings (Percentage of Net Assets)
VZ Secured Financing BV, 5.00%, 01/15/2032 |
0.9% |
ILFC E-Capital Trust I, 3-Month Term SOFR + 1.81%, 7.16%, 12/21/2065 |
0.7 |
CrownRock LP/CrownRock Finance, Inc., 5.63%, 10/15/2025 |
0.7 |
Constellium SE, 5.88%, 02/15/2026 |
0.7 |
Crown Americas LLC/Crown Americas Capital Corp. VI, 4.75%, 02/01/2026 |
0.7 |
Smyrna Ready Mix Concrete LLC, 8.88%, 11/15/2031 |
0.7 |
Herc Holdings, Inc., 5.50%, 07/15/2027 |
0.7 |
Station Casinos LLC, 4.50%, 02/15/2028 |
0.6 |
Novelis Corp., 4.75%, 01/30/2030 |
0.6 |
Allied Universal Holdco LLC, 7.88%, 02/15/2031 |
0.6 |
If you wish to view additional information about the Portfolio; including but not limited to full holdings, financial statements, proxy voting policies and other important documents, please see TST's most recent report on Form N-CSR available at transamerica.com/annuities/prospectus.
Transamerica Aegon High Yield Bond VP
Semi-Annual Shareholder Report
June 30, 2024
Transamerica Aegon High Yield Bond VP
Transamerica Aegon High Yield Bond VP seeks a high level of current income by investing in high-yield debt securities. This semi-annual shareholder report contains important information for the period of January 1, 2024 to June 30, 2024. You can find additional information about the Portfolio at transamerica.com/annuities/prospectus. You can also request this information by contacting us at 800-851-9777.
What were the Portfolio costs for the period?
Portfolio Overview Operating Expenses
(based on a hypothetical $10,000 investment)
Class Name |
Cost of a $10,000 investment |
Costs paid as a percentage of a $10,000 investment |
Service Class |
$44 |
0.88% |
This table does not reflect any charges that are, or may be, imposed under your variable life insurance policy or variable annuity contract. If such charges were reflected, expenses would be higher.
Total Net Assets |
$252,760,395 |
Number of Portfolio Holdings |
459 |
Portfolio Turnover Rate |
17% |
What did the Portfolio invest in?
Top Asset Allocations (Percentage of Net Assets)
Corporate Debt Securities |
95.6% |
Other Investment Company |
5.9 |
Loan Assignments |
2.3 |
Repurchase Agreements |
1.1 |
Common Stocks |
0.1 |
Net Other Assets (Liabilities) |
(5.0) |
Top Holdings (Percentage of Net Assets)
VZ Secured Financing BV, 5.00%, 01/15/2032 |
0.9% |
ILFC E-Capital Trust I, 3-Month Term SOFR + 1.81%, 7.16%, 12/21/2065 |
0.7 |
CrownRock LP/CrownRock Finance, Inc., 5.63%, 10/15/2025 |
0.7 |
Constellium SE, 5.88%, 02/15/2026 |
0.7 |
Crown Americas LLC/Crown Americas Capital Corp. VI, 4.75%, 02/01/2026 |
0.7 |
Smyrna Ready Mix Concrete LLC, 8.88%, 11/15/2031 |
0.7 |
Herc Holdings, Inc., 5.50%, 07/15/2027 |
0.7 |
Station Casinos LLC, 4.50%, 02/15/2028 |
0.6 |
Novelis Corp., 4.75%, 01/30/2030 |
0.6 |
Allied Universal Holdco LLC, 7.88%, 02/15/2031 |
0.6 |
If you wish to view additional information about the Portfolio; including but not limited to full holdings, financial statements, proxy voting policies and other important documents, please see TST's most recent report on Form N-CSR available at transamerica.com/annuities/prospectus.
Transamerica Aegon High Yield Bond VP
Semi-Annual Shareholder Report
June 30, 2024
Transamerica Aegon Sustainable Equity Income VP
Transamerica Aegon Sustainable Equity Income VP seeks total return gained from the combination of dividend yield, growth of dividends and capital appreciation. This semi-annual shareholder report contains important information for the period of January 1, 2024 to June 30, 2024. You can find additional information about the Portfolio at transamerica.com/annuities/prospectus. You can also request this information by contacting us at 800-851-9777.
What were the Portfolio costs for the period?
Portfolio Overview Operating Expenses
(based on a hypothetical $10,000 investment)
Class Name |
Cost of a $10,000 investment |
Costs paid as a percentage of a $10,000 investment |
Initial Class |
$37 |
0.72% |
This table does not reflect any charges that are, or may be, imposed under your variable life insurance policy or variable annuity contract. If such charges were reflected, expenses would be higher.
Total Net Assets |
$480,248,870 |
Number of Portfolio Holdings |
45 |
Portfolio Turnover Rate |
12% |
What did the Portfolio invest in?
Top Asset Allocations (Percentage of Net Assets)
Common Stocks |
99.5% |
Other Investment Company |
3.1 |
Repurchase Agreements |
0.4 |
Net Other Assets (Liabilities) |
(3.0) |
Top Holdings (Percentage of Net Assets)
Colgate-Palmolive Co. |
3.9% |
Merck & Co., Inc. |
3.8 |
Texas Instruments, Inc. |
3.7 |
Cisco Systems, Inc. |
3.5 |
MetLife, Inc. |
3.5 |
Republic Services, Inc. |
3.5 |
CME Group, Inc. |
3.4 |
Taiwan Semiconductor Manufacturing Co. Ltd., ADR |
3.3 |
Microsoft Corp. |
2.9 |
Gilead Sciences, Inc. |
2.8 |
If you wish to view additional information about the Portfolio; including but not limited to full holdings, financial statements, proxy voting policies and other important documents, please see TST's most recent report on Form N-CSR available at transamerica.com/annuities/prospectus.
Transamerica Aegon Sustainable Equity Income VP
Semi-Annual Shareholder Report
June 30, 2024
Transamerica Aegon Sustainable Equity Income VP
Transamerica Aegon Sustainable Equity Income VP seeks total return gained from the combination of dividend yield, growth of dividends and capital appreciation. This semi-annual shareholder report contains important information for the period of January 1, 2024 to June 30, 2024. You can find additional information about the Portfolio at transamerica.com/annuities/prospectus. You can also request this information by contacting us at 800-851-9777.
What were the Portfolio costs for the period?
Portfolio Overview Operating Expenses
(based on a hypothetical $10,000 investment)
Class Name |
Cost of a $10,000 investment |
Costs paid as a percentage of a $10,000 investment |
Service Class |
$50 |
0.97% |
This table does not reflect any charges that are, or may be, imposed under your variable life insurance policy or variable annuity contract. If such charges were reflected, expenses would be higher.
Total Net Assets |
$480,248,870 |
Number of Portfolio Holdings |
45 |
Portfolio Turnover Rate |
12% |
What did the Portfolio invest in?
Top Asset Allocations (Percentage of Net Assets)
Common Stocks |
99.5% |
Other Investment Company |
3.1 |
Repurchase Agreements |
0.4 |
Net Other Assets (Liabilities) |
(3.0) |
Top Holdings (Percentage of Net Assets)
Colgate-Palmolive Co. |
3.9% |
Merck & Co., Inc. |
3.8 |
Texas Instruments, Inc. |
3.7 |
Cisco Systems, Inc. |
3.5 |
MetLife, Inc. |
3.5 |
Republic Services, Inc. |
3.5 |
CME Group, Inc. |
3.4 |
Taiwan Semiconductor Manufacturing Co. Ltd., ADR |
3.3 |
Microsoft Corp. |
2.9 |
Gilead Sciences, Inc. |
2.8 |
If you wish to view additional information about the Portfolio; including but not limited to full holdings, financial statements, proxy voting policies and other important documents, please see TST's most recent report on Form N-CSR available at transamerica.com/annuities/prospectus.
Transamerica Aegon Sustainable Equity Income VP
Semi-Annual Shareholder Report
June 30, 2024
Transamerica Aegon U.S. Government Securities VP
Transamerica Aegon U.S. Government Securities VP seeks to provide as high a level of total return as is consistent with prudent investment strategies. This semi-annual shareholder report contains important information for the period of January 1, 2024 to June 30, 2024. You can find additional information about the Portfolio at transamerica.com/annuities/prospectus. You can also request this information by contacting us at 800-851-9777.
What were the Portfolio costs for the period?
Portfolio Overview Operating Expenses
(based on a hypothetical $10,000 investment)
Class Name |
Cost of a $10,000 investment |
Costs paid as a percentage of a $10,000 investment |
Initial Class |
$28 |
0.56% |
This table does not reflect any charges that are, or may be, imposed under your variable life insurance policy or variable annuity contract. If such charges were reflected, expenses would be higher.
Total Net Assets |
$262,952,487 |
Number of Portfolio Holdings |
86 |
Portfolio Turnover Rate |
24% |
What did the Portfolio invest in?
Top Asset Allocations (Percentage of Net Assets)
U.S. Government Obligations |
55.3% |
U.S. Government Agency Obligations |
36.0 |
Other Investment Company |
6.9 |
Repurchase Agreements |
6.8 |
Corporate Debt Securities |
5.4 |
Mortgage-Backed Securities |
1.8 |
Municipal Government Obligations |
0.1 |
Net Other Assets (Liabilities) |
(12.3) |
Top Holdings (Percentage of Net Assets)
Federal Home Loan Banks, 2.38%, 03/14/2025 |
9.3% |
U.S. Treasury Notes, 1.25%, 11/30/2026 |
7.7 |
Uniform Mortgage-Backed Security, 6.00%, 07/01/2054 |
4.1 |
Federal Farm Credit Banks Funding Corp., 2.04%, 09/24/2029 |
3.4 |
U.S. Treasury Notes, 1.88%, 02/28/2027 |
3.0 |
Federal National Mortgage Association, 0.88%, 08/05/2030 |
2.6 |
U.S. Treasury Notes, 4.63%, 05/31/2031 |
2.3 |
Tennessee Valley Authority, 2.88%, 02/01/2027 |
2.2 |
U.S. Treasury Bonds, 2.38%, 02/15/2042 |
2.1 |
U.S. Treasury Notes, 2.38%, 03/31/2029 |
2.1 |
If you wish to view additional information about the Portfolio; including but not limited to full holdings, financial statements, proxy voting policies and other important documents, please see TST's most recent report on Form N-CSR available at transamerica.com/annuities/prospectus.
Transamerica Aegon U.S. Government Securities VP
Semi-Annual Shareholder Report
June 30, 2024
Transamerica Aegon U.S. Government Securities VP
Transamerica Aegon U.S. Government Securities VP seeks to provide as high a level of total return as is consistent with prudent investment strategies. This semi-annual shareholder report contains important information for the period of January 1, 2024 to June 30, 2024. You can find additional information about the Portfolio at transamerica.com/annuities/prospectus. You can also request this information by contacting us at 800-851-9777.
What were the Portfolio costs for the period?
Portfolio Overview Operating Expenses
(based on a hypothetical $10,000 investment)
Class Name |
Cost of a $10,000 investment |
Costs paid as a percentage of a $10,000 investment |
Service Class |
$40 |
0.81% |
This table does not reflect any charges that are, or may be, imposed under your variable life insurance policy or variable annuity contract. If such charges were reflected, expenses would be higher.
Total Net Assets |
$262,952,487 |
Number of Portfolio Holdings |
86 |
Portfolio Turnover Rate |
24% |
What did the Portfolio invest in?
Top Asset Allocations (Percentage of Net Assets)
U.S. Government Obligations |
55.3% |
U.S. Government Agency Obligations |
36.0 |
Other Investment Company |
6.9 |
Repurchase Agreements |
6.8 |
Corporate Debt Securities |
5.4 |
Mortgage-Backed Securities |
1.8 |
Municipal Government Obligations |
0.1 |
Net Other Assets (Liabilities) |
(12.3) |
Top Holdings (Percentage of Net Assets)
Federal Home Loan Banks, 2.38%, 03/14/2025 |
9.3% |
U.S. Treasury Notes, 1.25%, 11/30/2026 |
7.7 |
Uniform Mortgage-Backed Security, 6.00%, 07/01/2054 |
4.1 |
Federal Farm Credit Banks Funding Corp., 2.04%, 09/24/2029 |
3.4 |
U.S. Treasury Notes, 1.88%, 02/28/2027 |
3.0 |
Federal National Mortgage Association, 0.88%, 08/05/2030 |
2.6 |
U.S. Treasury Notes, 4.63%, 05/31/2031 |
2.3 |
Tennessee Valley Authority, 2.88%, 02/01/2027 |
2.2 |
U.S. Treasury Bonds, 2.38%, 02/15/2042 |
2.1 |
U.S. Treasury Notes, 2.38%, 03/31/2029 |
2.1 |
If you wish to view additional information about the Portfolio; including but not limited to full holdings, financial statements, proxy voting policies and other important documents, please see TST's most recent report on Form N-CSR available at transamerica.com/annuities/prospectus.
Transamerica Aegon U.S. Government Securities VP
Semi-Annual Shareholder Report
June 30, 2024
Transamerica BlackRock Government Money Market VP
Transamerica BlackRock Government Money Market VP seeks as high a level of current income as is consistent with preservation of capital and liquidity. This semi-annual shareholder report contains important information for the period of January 1, 2024 to June 30, 2024. You can find additional information about the Portfolio at transamerica.com/annuities/prospectus. You can also request this information by contacting us at 800-851-9777.
What were the Portfolio costs for the period?
Portfolio Overview Operating Expenses
(based on a hypothetical $10,000 investment)
Class Name |
Cost of a $10,000 investment |
Costs paid as a percentage of a $10,000 investment |
Initial Class |
$15 |
0.29% |
This table does not reflect any charges that are, or may be, imposed under your variable life insurance policy or variable annuity contract. If such charges were reflected, expenses would be higher.
Total Net Assets |
$772,005,497 |
Number of Portfolio Holdings |
99 |
What did the Portfolio invest in?
Top Asset Allocations (Percentage of Net Assets)
Repurchase Agreements |
41.9% |
Short-Term U.S. Government Obligations |
32.1 |
Short-Term U.S. Government Agency Obligations |
12.9 |
U.S. Government Obligations |
7.9 |
U.S. Government Agency Obligations |
6.5 |
Net Other Assets (Liabilities) |
(1.3) |
Top Holdings (Percentage of Net Assets)
U.S. Treasury Bills, 5.39%, 07/09/2024 |
2.5% |
U.S. Treasury Floating Rate Notes, 5.43%, 07/31/2025 |
2.3 |
U.S. Treasury Bills, 5.17%, 07/18/2024 |
2.2 |
U.S. Treasury Floating Rate Notes, 5.51%, 01/31/2025 |
1.9 |
U.S. Treasury Bills, 5.22%, 07/25/2024 |
1.7 |
U.S. Treasury Bills, 5.37%, 12/05/2024 |
1.7 |
U.S. Treasury Bills, 5.38%, 10/31/2024 |
1.6 |
U.S. Treasury Bills, 5.25%, 07/05/2024 |
1.5 |
U.S. Treasury Bills, 5.38%, 11/29/2024 |
1.5 |
Federal Farm Credit Discount Notes, 5.31%, 01/17/2025 |
1.4 |
If you wish to view additional information about the Portfolio; including but not limited to full holdings, financial statements, proxy voting policies and other important documents, please see TST's most recent report on Form N-CSR available at transamerica.com/annuities/prospectus.
Transamerica BlackRock Government Money Market VP
Semi-Annual Shareholder Report
June 30, 2024
Transamerica BlackRock Government Money Market VP
Transamerica BlackRock Government Money Market VP seeks as high a level of current income as is consistent with preservation of capital and liquidity. This semi-annual shareholder report contains important information for the period of January 1, 2024 to June 30, 2024. You can find additional information about the Portfolio at transamerica.com/annuities/prospectus. You can also request this information by contacting us at 800-851-9777.
What were the Portfolio costs for the period?
Portfolio Overview Operating Expenses
(based on a hypothetical $10,000 investment)
Class Name |
Cost of a $10,000 investment |
Costs paid as a percentage of a $10,000 investment |
Service Class |
$27 |
0.54% |
This table does not reflect any charges that are, or may be, imposed under your variable life insurance policy or variable annuity contract. If such charges were reflected, expenses would be higher.
Total Net Assets |
$772,005,497 |
Number of Portfolio Holdings |
99 |
What did the Portfolio invest in?
Top Asset Allocations (Percentage of Net Assets)
Repurchase Agreements |
41.9% |
Short-Term U.S. Government Obligations |
32.1 |
Short-Term U.S. Government Agency Obligations |
12.9 |
U.S. Government Obligations |
7.9 |
U.S. Government Agency Obligations |
6.5 |
Net Other Assets (Liabilities) |
(1.3) |
Top Holdings (Percentage of Net Assets)
U.S. Treasury Bills, 5.39%, 07/09/2024 |
2.5% |
U.S. Treasury Floating Rate Notes, 5.43%, 07/31/2025 |
2.3 |
U.S. Treasury Bills, 5.17%, 07/18/2024 |
2.2 |
U.S. Treasury Floating Rate Notes, 5.51%, 01/31/2025 |
1.9 |
U.S. Treasury Bills, 5.22%, 07/25/2024 |
1.7 |
U.S. Treasury Bills, 5.37%, 12/05/2024 |
1.7 |
U.S. Treasury Bills, 5.38%, 10/31/2024 |
1.6 |
U.S. Treasury Bills, 5.25%, 07/05/2024 |
1.5 |
U.S. Treasury Bills, 5.38%, 11/29/2024 |
1.5 |
Federal Farm Credit Discount Notes, 5.31%, 01/17/2025 |
1.4 |
If you wish to view additional information about the Portfolio; including but not limited to full holdings, financial statements, proxy voting policies and other important documents, please see TST's most recent report on Form N-CSR available at transamerica.com/annuities/prospectus.
Transamerica BlackRock Government Money Market VP
Semi-Annual Shareholder Report
June 30, 2024
Transamerica BlackRock iShares Active Asset Allocation - Conservative VP
Transamerica BlackRock iShares Active Asset Allocation - Conservative VP seeks current income and preservation of capital. This semi-annual shareholder report contains important information for the period of January 1, 2024 to June 30, 2024. You can find additional information about the Portfolio at transamerica.com/annuities/prospectus. You can also request this information by contacting us at 800-851-9777.
What were the Portfolio costs for the period?
Portfolio Overview Operating Expenses
(based on a hypothetical $10,000 investment)
Class Name |
Cost of a $10,000 investment |
Costs paid as a percentage of a $10,000 investment |
Initial Class |
$25 |
0.50% |
This table does not reflect any charges that are, or may be, imposed under your variable life insurance policy or variable annuity contract. If such charges were reflected, expenses would be higher.
Total Net Assets |
$218,528,414 |
Number of Portfolio Holdings |
11 |
Portfolio Turnover Rate |
35% |
What did the Portfolio invest in?
Asset Allocation (Percentage of Net Assets)
U.S. Fixed Income Funds |
56.5% |
U.S. Equity Funds |
27.9 |
International Equity Funds |
13.3 |
Other Investment Company |
4.0 |
Repurchase Agreements |
2.0 |
Net Other Assets (Liabilities) |
(3.7) |
Top Holdings (Percentage of Net Assets)
iShares Core U.S. Aggregate Bond ETF |
35.4% |
iShares Core S&P 500 ETF |
24.0 |
iShares 7-10 Year Treasury Bond ETF |
9.7 |
iShares MSCI EAFE ETF |
8.5 |
iShares U.S. Treasury Bond ETF |
6.6 |
iShares iBoxx $ Investment Grade Corporate Bond ETF |
3.9 |
iShares Russell 2000 ETF |
3.9 |
iShares Core MSCI EAFE ETF |
3.7 |
iShares MSCI Eurozone ETF |
1.1 |
iShares Short Treasury Bond ETF |
0.9 |
If you wish to view additional information about the Portfolio; including but not limited to full holdings, financial statements, proxy voting policies and other important documents, please see TST's most recent report on Form N-CSR available at transamerica.com/annuities/prospectus.
Transamerica BlackRock iShares Active Asset Allocation - Conservative VP
Semi-Annual Shareholder Report
June 30, 2024
Transamerica BlackRock iShares Active Asset Allocation - Conservative VP
Transamerica BlackRock iShares Active Asset Allocation - Conservative VP seeks current income and preservation of capital. This semi-annual shareholder report contains important information for the period of January 1, 2024 to June 30, 2024. You can find additional information about the Portfolio at transamerica.com/annuities/prospectus. You can also request this information by contacting us at 800-851-9777.
What were the Portfolio costs for the period?
Portfolio Overview Operating Expenses
(based on a hypothetical $10,000 investment)
Class Name |
Cost of a $10,000 investment |
Costs paid as a percentage of a $10,000 investment |
Service Class |
$38 |
0.75% |
This table does not reflect any charges that are, or may be, imposed under your variable life insurance policy or variable annuity contract. If such charges were reflected, expenses would be higher.
Total Net Assets |
$218,528,414 |
Number of Portfolio Holdings |
11 |
Portfolio Turnover Rate |
35% |
What did the Portfolio invest in?
Asset Allocation (Percentage of Net Assets)
U.S. Fixed Income Funds |
56.5% |
U.S. Equity Funds |
27.9 |
International Equity Funds |
13.3 |
Other Investment Company |
4.0 |
Repurchase Agreements |
2.0 |
Net Other Assets (Liabilities) |
(3.7) |
Top Holdings (Percentage of Net Assets)
iShares Core U.S. Aggregate Bond ETF |
35.4% |
iShares Core S&P 500 ETF |
24.0 |
iShares 7-10 Year Treasury Bond ETF |
9.7 |
iShares MSCI EAFE ETF |
8.5 |
iShares U.S. Treasury Bond ETF |
6.6 |
iShares iBoxx $ Investment Grade Corporate Bond ETF |
3.9 |
iShares Russell 2000 ETF |
3.9 |
iShares Core MSCI EAFE ETF |
3.7 |
iShares MSCI Eurozone ETF |
1.1 |
iShares Short Treasury Bond ETF |
0.9 |
If you wish to view additional information about the Portfolio; including but not limited to full holdings, financial statements, proxy voting policies and other important documents, please see TST's most recent report on Form N-CSR available at transamerica.com/annuities/prospectus.
Transamerica BlackRock iShares Active Asset Allocation - Conservative VP
Semi-Annual Shareholder Report
June 30, 2024
Transamerica BlackRock iShares Active Asset Allocation - Moderate Growth VP
Transamerica BlackRock iShares Active Asset Allocation - Moderate Growth VP seeks capital appreciation with current income as a secondary objective. This semi-annual shareholder report contains important information for the period of January 1, 2024 to June 30, 2024. You can find additional information about the Portfolio at transamerica.com/annuities/prospectus. You can also request this information by contacting us at 800-851-9777.
What were the Portfolio costs for the period?
Portfolio Overview Operating Expenses
(based on a hypothetical $10,000 investment)
Class Name |
Cost of a $10,000 investment |
Costs paid as a percentage of a $10,000 investment |
Initial Class |
$25 |
0.49% |
This table does not reflect any charges that are, or may be, imposed under your variable life insurance policy or variable annuity contract. If such charges were reflected, expenses would be higher.
Total Net Assets |
$367,189,533 |
Number of Portfolio Holdings |
11 |
Portfolio Turnover Rate |
15% |
What did the Portfolio invest in?
Asset Allocation (Percentage of Net Assets)
U.S. Equity Funds |
53.6% |
International Equity Funds |
22.3 |
U.S. Fixed Income Funds |
21.5 |
Repurchase Agreements |
2.3 |
Other Investment Company |
1.6 |
Net Other Assets (Liabilities) |
(1.3) |
Top Holdings (Percentage of Net Assets)
iShares Core S&P 500 ETF |
46.8% |
iShares Core U.S. Aggregate Bond ETF |
15.4 |
iShares MSCI EAFE ETF |
13.8 |
iShares Core MSCI EAFE ETF |
7.5 |
iShares Russell 2000 ETF |
6.9 |
iShares U.S. Treasury Bond ETF |
2.6 |
iShares 7-10 Year Treasury Bond ETF |
1.6 |
iShares iBoxx $ Investment Grade Corporate Bond ETF |
1.6 |
iShares MSCI Eurozone ETF |
1.0 |
iShares Short Treasury Bond ETF |
0.2 |
If you wish to view additional information about the Portfolio; including but not limited to full holdings, financial statements, proxy voting policies and other important documents, please see TST's most recent report on Form N-CSR available at transamerica.com/annuities/prospectus.
Transamerica BlackRock iShares Active Asset Allocation - Moderate Growth VP
Semi-Annual Shareholder Report
June 30, 2024
Transamerica BlackRock iShares Active Asset Allocation - Moderate Growth VP
Transamerica BlackRock iShares Active Asset Allocation - Moderate Growth VP seeks capital appreciation with current income as a secondary objective. This semi-annual shareholder report contains important information for the period of January 1, 2024 to June 30, 2024. You can find additional information about the Portfolio at transamerica.com/annuities/prospectus. You can also request this information by contacting us at 800-851-9777.
What were the Portfolio costs for the period?
Portfolio Overview Operating Expenses
(based on a hypothetical $10,000 investment)
Class Name |
Cost of a $10,000 investment |
Costs paid as a percentage of a $10,000 investment |
Service Class |
$38 |
0.74% |
This table does not reflect any charges that are, or may be, imposed under your variable life insurance policy or variable annuity contract. If such charges were reflected, expenses would be higher.
Total Net Assets |
$367,189,533 |
Number of Portfolio Holdings |
11 |
Portfolio Turnover Rate |
15% |
What did the Portfolio invest in?
Asset Allocation (Percentage of Net Assets)
U.S. Equity Funds |
53.6% |
International Equity Funds |
22.3 |
U.S. Fixed Income Funds |
21.5 |
Repurchase Agreements |
2.3 |
Other Investment Company |
1.6 |
Net Other Assets (Liabilities) |
(1.3) |
Top Holdings (Percentage of Net Assets)
iShares Core S&P 500 ETF |
46.8% |
iShares Core U.S. Aggregate Bond ETF |
15.4 |
iShares MSCI EAFE ETF |
13.8 |
iShares Core MSCI EAFE ETF |
7.5 |
iShares Russell 2000 ETF |
6.9 |
iShares U.S. Treasury Bond ETF |
2.6 |
iShares 7-10 Year Treasury Bond ETF |
1.6 |
iShares iBoxx $ Investment Grade Corporate Bond ETF |
1.6 |
iShares MSCI Eurozone ETF |
1.0 |
iShares Short Treasury Bond ETF |
0.2 |
If you wish to view additional information about the Portfolio; including but not limited to full holdings, financial statements, proxy voting policies and other important documents, please see TST's most recent report on Form N-CSR available at transamerica.com/annuities/prospectus.
Transamerica BlackRock iShares Active Asset Allocation - Moderate Growth VP
Semi-Annual Shareholder Report
June 30, 2024
Transamerica BlackRock iShares Active Asset Allocation - Moderate VP
Transamerica BlackRock iShares Active Asset Allocation - Moderate VP seeks capital appreciation and current income. This semi-annual shareholder report contains important information for the period of January 1, 2024 to June 30, 2024. You can find additional information about the Portfolio at transamerica.com/annuities/prospectus. You can also request this information by contacting us at 800-851-9777.
What were the Portfolio costs for the period?
Portfolio Overview Operating Expenses
(based on a hypothetical $10,000 investment)
Class Name |
Cost of a $10,000 investment |
Costs paid as a percentage of a $10,000 investment |
Initial Class |
$24 |
0.47% |
This table does not reflect any charges that are, or may be, imposed under your variable life insurance policy or variable annuity contract. If such charges were reflected, expenses would be higher.
Total Net Assets |
$932,375,947 |
Number of Portfolio Holdings |
11 |
Portfolio Turnover Rate |
13% |
What did the Portfolio invest in?
Asset Allocation (Percentage of Net Assets)
U.S. Fixed Income Funds |
41.4% |
U.S. Equity Funds |
38.7 |
International Equity Funds |
17.4 |
Other Investment Company |
4.2 |
Repurchase Agreements |
2.2 |
Net Other Assets (Liabilities) |
(3.9) |
Top Holdings (Percentage of Net Assets)
iShares Core S&P 500 ETF |
33.7% |
iShares Core U.S. Aggregate Bond ETF |
26.6 |
iShares MSCI EAFE ETF |
12.0 |
iShares 7-10 Year Treasury Bond ETF |
6.9 |
iShares Russell 2000 ETF |
5.0 |
iShares U.S. Treasury Bond ETF |
4.7 |
iShares Core MSCI EAFE ETF |
4.4 |
iShares iBoxx $ Investment Grade Corporate Bond ETF |
2.8 |
iShares MSCI Eurozone ETF |
1.0 |
iShares Short Treasury Bond ETF |
0.4 |
If you wish to view additional information about the Portfolio; including but not limited to full holdings, financial statements, proxy voting policies and other important documents, please see TST's most recent report on Form N-CSR available at transamerica.com/annuities/prospectus.
Transamerica BlackRock iShares Active Asset Allocation - Moderate VP
Semi-Annual Shareholder Report
June 30, 2024
Transamerica BlackRock iShares Active Asset Allocation - Moderate VP
Transamerica BlackRock iShares Active Asset Allocation - Moderate VP seeks capital appreciation and current income. This semi-annual shareholder report contains important information for the period of January 1, 2024 to June 30, 2024. You can find additional information about the Portfolio at transamerica.com/annuities/prospectus. You can also request this information by contacting us at 800-851-9777.
What were the Portfolio costs for the period?
Portfolio Overview Operating Expenses
(based on a hypothetical $10,000 investment)
Class Name |
Cost of a $10,000 investment |
Costs paid as a percentage of a $10,000 investment |
Service Class |
$37 |
0.72% |
This table does not reflect any charges that are, or may be, imposed under your variable life insurance policy or variable annuity contract. If such charges were reflected, expenses would be higher.
Total Net Assets |
$932,375,947 |
Number of Portfolio Holdings |
11 |
Portfolio Turnover Rate |
13% |
What did the Portfolio invest in?
Asset Allocation (Percentage of Net Assets)
U.S. Fixed Income Funds |
41.4% |
U.S. Equity Funds |
38.7 |
International Equity Funds |
17.4 |
Other Investment Company |
4.2 |
Repurchase Agreements |
2.2 |
Net Other Assets (Liabilities) |
(3.9) |
Top Holdings (Percentage of Net Assets)
iShares Core S&P 500 ETF |
33.7% |
iShares Core U.S. Aggregate Bond ETF |
26.6 |
iShares MSCI EAFE ETF |
12.0 |
iShares 7-10 Year Treasury Bond ETF |
6.9 |
iShares Russell 2000 ETF |
5.0 |
iShares U.S. Treasury Bond ETF |
4.7 |
iShares Core MSCI EAFE ETF |
4.4 |
iShares iBoxx $ Investment Grade Corporate Bond ETF |
2.8 |
iShares MSCI Eurozone ETF |
1.0 |
iShares Short Treasury Bond ETF |
0.4 |
If you wish to view additional information about the Portfolio; including but not limited to full holdings, financial statements, proxy voting policies and other important documents, please see TST's most recent report on Form N-CSR available at transamerica.com/annuities/prospectus.
Transamerica BlackRock iShares Active Asset Allocation - Moderate VP
Semi-Annual Shareholder Report
June 30, 2024
Transamerica BlackRock iShares Dynamic Allocation - Balanced VP
Transamerica BlackRock iShares Dynamic Allocation - Balanced VP seeks capital appreciation and income. This semi-annual shareholder report contains important information for the period of January 1, 2024 to June 30, 2024. You can find additional information about the Portfolio at transamerica.com/annuities/prospectus. You can also request this information by contacting us at 800-851-9777.
What were the Portfolio costs for the period?
Portfolio Overview Operating Expenses
(based on a hypothetical $10,000 investment)
Class Name |
Cost of a $10,000 investment |
Costs paid as a percentage of a $10,000 investment |
Service Class |
$37 |
0.73% |
This table does not reflect any charges that are, or may be, imposed under your variable life insurance policy or variable annuity contract. If such charges were reflected, expenses would be higher.
Total Net Assets |
$713,585,430 |
Number of Portfolio Holdings |
9 |
Portfolio Turnover Rate |
10% |
What did the Portfolio invest in?
Asset Allocation (Percentage of Net Assets)
U.S. Fixed Income Funds |
47.3% |
U.S. Equity Funds |
35.3 |
International Equity Funds |
14.8 |
Repurchase Agreements |
1.2 |
Other Investment Company |
0.2 |
Net Other Assets (Liabilities) |
1.2 |
Top Holdings (Percentage of Net Assets)
iShares Core S&P 500 ETF |
35.3% |
iShares Core U.S. Aggregate Bond ETF |
18.8 |
iShares 7-10 Year Treasury Bond ETF |
16.8 |
iShares MSCI EAFE ETF |
11.3 |
iShares Short Treasury Bond ETF |
6.2 |
iShares Core MSCI EAFE ETF |
3.5 |
iShares U.S. Treasury Bond ETF |
3.4 |
iShares iBoxx $ Investment Grade Corporate Bond ETF |
2.1 |
If you wish to view additional information about the Portfolio; including but not limited to full holdings, financial statements, proxy voting policies and other important documents, please see TST's most recent report on Form N-CSR available at transamerica.com/annuities/prospectus.
Transamerica BlackRock iShares Dynamic Allocation - Balanced VP
Semi-Annual Shareholder Report
June 30, 2024
Transamerica BlackRock iShares Dynamic Allocation - Moderate Growth VP
Transamerica BlackRock iShares Dynamic Allocation - Moderate Growth VP seeks capital appreciation and income. This semi-annual shareholder report contains important information for the period of January 1, 2024 to June 30, 2024. You can find additional information about the Portfolio at transamerica.com/annuities/prospectus. You can also request this information by contacting us at 800-851-9777.
What were the Portfolio costs for the period?
Portfolio Overview Operating Expenses
(based on a hypothetical $10,000 investment)
Class Name |
Cost of a $10,000 investment |
Costs paid as a percentage of a $10,000 investment |
Service Class |
$38 |
0.74% |
This table does not reflect any charges that are, or may be, imposed under your variable life insurance policy or variable annuity contract. If such charges were reflected, expenses would be higher.
Total Net Assets |
$335,528,473 |
Number of Portfolio Holdings |
9 |
Portfolio Turnover Rate |
9% |
What did the Portfolio invest in?
Asset Allocation (Percentage of Net Assets)
U.S. Equity Funds |
50.4% |
U.S. Fixed Income Funds |
27.2 |
International Equity Funds |
20.0 |
Repurchase Agreements |
2.2 |
Net Other Assets (Liabilities) |
0.2 |
Top Holdings (Percentage of Net Assets)
iShares Core S&P 500 ETF |
50.4% |
iShares Core MSCI EAFE ETF |
13.4 |
iShares Core U.S. Aggregate Bond ETF |
11.4 |
iShares 7-10 Year Treasury Bond ETF |
7.6 |
iShares MSCI EAFE ETF |
6.6 |
iShares Short Treasury Bond ETF |
5.0 |
iShares U.S. Treasury Bond ETF |
2.0 |
iShares iBoxx $ Investment Grade Corporate Bond ETF |
1.2 |
If you wish to view additional information about the Portfolio; including but not limited to full holdings, financial statements, proxy voting policies and other important documents, please see TST's most recent report on Form N-CSR available at transamerica.com/annuities/prospectus.
Transamerica BlackRock iShares Dynamic Allocation - Moderate Growth VP
Semi-Annual Shareholder Report
June 30, 2024
Transamerica BlackRock iShares Edge 100 VP
Transamerica BlackRock iShares Edge 100 VP seeks long-term capital appreciation. This semi-annual shareholder report contains important information for the period of January 1, 2024 to June 30, 2024. You can find additional information about the Portfolio at transamerica.com/annuities/prospectus. You can also request this information by contacting us at 800-851-9777.
What were the Portfolio costs for the period?
Portfolio Overview Operating Expenses
(based on a hypothetical $10,000 investment)
Class Name |
Cost of a $10,000 investment |
Costs paid as a percentage of a $10,000 investment |
Service Class |
$29 |
0.56% |
This table does not reflect any charges that are, or may be, imposed under your variable life insurance policy or variable annuity contract. If such charges were reflected, expenses would be higher.
Total Net Assets |
$71,540,513 |
Number of Portfolio Holdings |
8 |
Portfolio Turnover Rate |
7% |
What did the Portfolio invest in?
Asset Allocation (Percentage of Net Assets)
U.S. Equity Funds |
75.1% |
International Equity Funds |
24.8 |
Other Investment Company |
14.7 |
Repurchase Agreements |
0.2 |
Net Other Assets (Liabilities) |
(14.8) |
Top Holdings (Percentage of Net Assets)
iShares MSCI EAFE Min Vol Factor ETF |
19.3% |
iShares MSCI USA Momentum Factor ETF |
16.4 |
iShares MSCI USA Quality Factor ETF |
16.4 |
iShares MSCI USA Min Vol Factor ETF |
16.3 |
iShares MSCI USA Value Factor ETF |
16.2 |
iShares MSCI USA Size Factor ETF |
9.8 |
iShares MSCI Emerging Markets Min Vol Factor ETF |
5.5 |
If you wish to view additional information about the Portfolio; including but not limited to full holdings, financial statements, proxy voting policies and other important documents, please see TST's most recent report on Form N-CSR available at transamerica.com/annuities/prospectus.
Transamerica BlackRock iShares Edge 100 VP
Semi-Annual Shareholder Report
June 30, 2024
Transamerica BlackRock iShares Edge 40 VP
Transamerica BlackRock iShares Edge 40 VP seeks long-term capital appreciation and capital preservation. This semi-annual shareholder report contains important information for the period of January 1, 2024 to June 30, 2024. You can find additional information about the Portfolio at transamerica.com/annuities/prospectus. You can also request this information by contacting us at 800-851-9777.
What were the Portfolio costs for the period?
Portfolio Overview Operating Expenses
(based on a hypothetical $10,000 investment)
Class Name |
Cost of a $10,000 investment |
Costs paid as a percentage of a $10,000 investment |
Initial Class |
$16 |
0.31% |
This table does not reflect any charges that are, or may be, imposed under your variable life insurance policy or variable annuity contract. If such charges were reflected, expenses would be higher.
Total Net Assets |
$222,405,517 |
Number of Portfolio Holdings |
9 |
Portfolio Turnover Rate |
3% |
What did the Portfolio invest in?
Asset Allocation (Percentage of Net Assets)
U.S. Fixed Income Funds |
59.1% |
U.S. Equity Funds |
31.1 |
International Equity Funds |
9.9 |
Other Investment Company |
9.2 |
Net Other Assets (Liabilities) |
(9.3) |
Top Holdings (Percentage of Net Assets)
iShares Core U.S. Aggregate Bond ETF |
49.5% |
iShares Broad USD Investment Grade Corporate Bond ETF |
9.6 |
iShares MSCI EAFE Min Vol Factor ETF |
7.7 |
iShares MSCI USA Quality Factor ETF |
6.9 |
iShares MSCI USA Momentum Factor ETF |
6.8 |
iShares MSCI USA Min Vol Factor ETF |
6.7 |
iShares MSCI USA Value Factor ETF |
6.5 |
iShares MSCI USA Size Factor ETF |
4.1 |
iShares MSCI Emerging Markets Min Vol Factor ETF |
2.2 |
If you wish to view additional information about the Portfolio; including but not limited to full holdings, financial statements, proxy voting policies and other important documents, please see TST's most recent report on Form N-CSR available at transamerica.com/annuities/prospectus.
Transamerica BlackRock iShares Edge 40 VP
Semi-Annual Shareholder Report
June 30, 2024
Transamerica BlackRock iShares Edge 40 VP
Transamerica BlackRock iShares Edge 40 VP seeks long-term capital appreciation and capital preservation. This semi-annual shareholder report contains important information for the period of January 1, 2024 to June 30, 2024. You can find additional information about the Portfolio at transamerica.com/annuities/prospectus. You can also request this information by contacting us at 800-851-9777.
What were the Portfolio costs for the period?
Portfolio Overview Operating Expenses
(based on a hypothetical $10,000 investment)
Class Name |
Cost of a $10,000 investment |
Costs paid as a percentage of a $10,000 investment |
Service Class |
$28 |
0.56% |
This table does not reflect any charges that are, or may be, imposed under your variable life insurance policy or variable annuity contract. If such charges were reflected, expenses would be higher.
Total Net Assets |
$222,405,517 |
Number of Portfolio Holdings |
9 |
Portfolio Turnover Rate |
3% |
What did the Portfolio invest in?
Asset Allocation (Percentage of Net Assets)
U.S. Fixed Income Funds |
59.1% |
U.S. Equity Funds |
31.1 |
International Equity Funds |
9.9 |
Other Investment Company |
9.2 |
Net Other Assets (Liabilities) |
(9.3) |
Top Holdings (Percentage of Net Assets)
iShares Core U.S. Aggregate Bond ETF |
49.5% |
iShares Broad USD Investment Grade Corporate Bond ETF |
9.6 |
iShares MSCI EAFE Min Vol Factor ETF |
7.7 |
iShares MSCI USA Quality Factor ETF |
6.9 |
iShares MSCI USA Momentum Factor ETF |
6.8 |
iShares MSCI USA Min Vol Factor ETF |
6.7 |
iShares MSCI USA Value Factor ETF |
6.5 |
iShares MSCI USA Size Factor ETF |
4.1 |
iShares MSCI Emerging Markets Min Vol Factor ETF |
2.2 |
If you wish to view additional information about the Portfolio; including but not limited to full holdings, financial statements, proxy voting policies and other important documents, please see TST's most recent report on Form N-CSR available at transamerica.com/annuities/prospectus.
Transamerica BlackRock iShares Edge 40 VP
Semi-Annual Shareholder Report
June 30, 2024
Transamerica BlackRock iShares Edge 50 VP
Transamerica BlackRock iShares Edge 50 VP seeks long-term capital appreciation and capital preservation. This semi-annual shareholder report contains important information for the period of January 1, 2024 to June 30, 2024. You can find additional information about the Portfolio at transamerica.com/annuities/prospectus. You can also request this information by contacting us at 800-851-9777.
What were the Portfolio costs for the period?
Portfolio Overview Operating Expenses
(based on a hypothetical $10,000 investment)
Class Name |
Cost of a $10,000 investment |
Costs paid as a percentage of a $10,000 investment |
Service Class |
$27 |
0.53% |
This table does not reflect any charges that are, or may be, imposed under your variable life insurance policy or variable annuity contract. If such charges were reflected, expenses would be higher.
Total Net Assets |
$428,946,743 |
Number of Portfolio Holdings |
9 |
Portfolio Turnover Rate |
4% |
What did the Portfolio invest in?
Asset Allocation (Percentage of Net Assets)
U.S. Fixed Income Funds |
49.3% |
U.S. Equity Funds |
38.5 |
International Equity Funds |
12.1 |
Repurchase Agreements |
0.2 |
Net Other Assets (Liabilities) |
(0.1) |
Top Holdings (Percentage of Net Assets)
iShares Core U.S. Aggregate Bond ETF |
49.3% |
iShares MSCI EAFE Min Vol Factor ETF |
9.5 |
iShares MSCI USA Quality Factor ETF |
8.6 |
iShares MSCI USA Momentum Factor ETF |
8.5 |
iShares MSCI USA Min Vol Factor ETF |
8.4 |
iShares MSCI USA Value Factor ETF |
8.0 |
iShares MSCI USA Size Factor ETF |
5.0 |
iShares MSCI Emerging Markets Min Vol Factor ETF |
2.6 |
If you wish to view additional information about the Portfolio; including but not limited to full holdings, financial statements, proxy voting policies and other important documents, please see TST's most recent report on Form N-CSR available at transamerica.com/annuities/prospectus.
Transamerica BlackRock iShares Edge 50 VP
Semi-Annual Shareholder Report
June 30, 2024
Transamerica BlackRock iShares Edge 75 VP
Transamerica BlackRock iShares Edge 75 VP seeks long-term capital appreciation with capital preservation as a secondary objective. This semi-annual shareholder report contains important information for the period of January 1, 2024 to June 30, 2024. You can find additional information about the Portfolio at transamerica.com/annuities/prospectus. You can also request this information by contacting us at 800-851-9777.
What were the Portfolio costs for the period?
Portfolio Overview Operating Expenses
(based on a hypothetical $10,000 investment)
Class Name |
Cost of a $10,000 investment |
Costs paid as a percentage of a $10,000 investment |
Service Class |
$28 |
0.55% |
This table does not reflect any charges that are, or may be, imposed under your variable life insurance policy or variable annuity contract. If such charges were reflected, expenses would be higher.
Total Net Assets |
$150,213,773 |
Number of Portfolio Holdings |
8 |
Portfolio Turnover Rate |
5% |
What did the Portfolio invest in?
Asset Allocation (Percentage of Net Assets)
U.S. Equity Funds |
56.9% |
U.S. Fixed Income Funds |
24.8 |
International Equity Funds |
18.5 |
Other Investment Company |
3.9 |
Net Other Assets (Liabilities) |
(4.1) |
Top Holdings (Percentage of Net Assets)
iShares Core U.S. Aggregate Bond ETF |
24.8% |
iShares MSCI EAFE Min Vol Factor ETF |
14.5 |
iShares MSCI USA Min Vol Factor ETF |
12.5 |
iShares MSCI USA Momentum Factor ETF |
12.4 |
iShares MSCI USA Quality Factor ETF |
12.4 |
iShares MSCI USA Value Factor ETF |
12.2 |
iShares MSCI USA Size Factor ETF |
7.5 |
iShares MSCI Emerging Markets Min Vol Factor ETF |
4.0 |
If you wish to view additional information about the Portfolio; including but not limited to full holdings, financial statements, proxy voting policies and other important documents, please see TST's most recent report on Form N-CSR available at transamerica.com/annuities/prospectus.
Transamerica BlackRock iShares Edge 75 VP
Semi-Annual Shareholder Report
June 30, 2024
Transamerica BlackRock iShares Tactical - Balanced VP
Transamerica BlackRock iShares Tactical - Balanced VP seeks a combination of capital appreciation and income. This semi-annual shareholder report contains important information for the period of January 1, 2024 to June 30, 2024. You can find additional information about the Portfolio at transamerica.com/annuities/prospectus. You can also request this information by contacting us at 800-851-9777.
What were the Portfolio costs for the period?
Portfolio Overview Operating Expenses
(based on a hypothetical $10,000 investment)
Class Name |
Cost of a $10,000 investment |
Costs paid as a percentage of a $10,000 investment |
Initial Class |
$39 |
0.77% |
This table does not reflect any charges that are, or may be, imposed under your variable life insurance policy or variable annuity contract. If such charges were reflected, expenses would be higher.
Total Net Assets |
$349,668,327 |
Number of Portfolio Holdings |
12 |
Portfolio Turnover Rate |
138% |
What did the Portfolio invest in?
Top Asset Allocations (Percentage of Net Assets)
U.S. Fixed Income Funds |
45.4% |
U.S. Equity Funds |
37.9 |
International Equity Funds |
15.6 |
Other Investment Company |
4.5 |
Repurchase Agreements |
1.2 |
Net Other Assets (Liabilities) |
(4.6) |
Top Holdings (Percentage of Net Assets)
iShares Core S&P 500 ETF |
22.9% |
iShares Core U.S. Aggregate Bond ETF |
18.3 |
iShares Core S&P Total U.S. Stock Market ETF |
15.0 |
iShares Short Treasury Bond ETF |
14.2 |
iShares Broad USD Investment Grade Corporate Bond ETF |
9.9 |
iShares MSCI EAFE ETF |
5.7 |
iShares Core MSCI EAFE ETF |
4.5 |
iShares Broad USD High Yield Corporate Bond ETF |
3.0 |
iShares MSCI Emerging Markets ETF |
2.1 |
iShares Core MSCI Emerging Markets ETF |
2.1 |
If you wish to view additional information about the Portfolio; including but not limited to full holdings, financial statements, proxy voting policies and other important documents, please see TST's most recent report on Form N-CSR available at transamerica.com/annuities/prospectus.
Transamerica BlackRock iShares Tactical - Balanced VP
Semi-Annual Shareholder Report
June 30, 2024
Transamerica BlackRock iShares Tactical - Balanced VP
Transamerica BlackRock iShares Tactical - Balanced VP seeks a combination of capital appreciation and income. This semi-annual shareholder report contains important information for the period of January 1, 2024 to June 30, 2024. You can find additional information about the Portfolio at transamerica.com/annuities/prospectus. You can also request this information by contacting us at 800-851-9777.
What were the Portfolio costs for the period?
Portfolio Overview Operating Expenses
(based on a hypothetical $10,000 investment)
Class Name |
Cost of a $10,000 investment |
Costs paid as a percentage of a $10,000 investment |
Service Class |
$52 |
1.02% |
This table does not reflect any charges that are, or may be, imposed under your variable life insurance policy or variable annuity contract. If such charges were reflected, expenses would be higher.
Total Net Assets |
$349,668,327 |
Number of Portfolio Holdings |
12 |
Portfolio Turnover Rate |
138% |
What did the Portfolio invest in?
Top Asset Allocations (Percentage of Net Assets)
U.S. Fixed Income Funds |
45.4% |
U.S. Equity Funds |
37.9 |
International Equity Funds |
15.6 |
Other Investment Company |
4.5 |
Repurchase Agreements |
1.2 |
Net Other Assets (Liabilities) |
(4.6) |
Top Holdings (Percentage of Net Assets)
iShares Core S&P 500 ETF |
22.9% |
iShares Core U.S. Aggregate Bond ETF |
18.3 |
iShares Core S&P Total U.S. Stock Market ETF |
15.0 |
iShares Short Treasury Bond ETF |
14.2 |
iShares Broad USD Investment Grade Corporate Bond ETF |
9.9 |
iShares MSCI EAFE ETF |
5.7 |
iShares Core MSCI EAFE ETF |
4.5 |
iShares Broad USD High Yield Corporate Bond ETF |
3.0 |
iShares MSCI Emerging Markets ETF |
2.1 |
iShares Core MSCI Emerging Markets ETF |
2.1 |
If you wish to view additional information about the Portfolio; including but not limited to full holdings, financial statements, proxy voting policies and other important documents, please see TST's most recent report on Form N-CSR available at transamerica.com/annuities/prospectus.
Transamerica BlackRock iShares Tactical - Balanced VP
Semi-Annual Shareholder Report
June 30, 2024
Transamerica BlackRock iShares Tactical - Conservative VP
Transamerica BlackRock iShares Tactical - Conservative VP seeks a combination of capital appreciation and income. This semi-annual shareholder report contains important information for the period of January 1, 2024 to June 30, 2024. You can find additional information about the Portfolio at transamerica.com/annuities/prospectus. You can also request this information by contacting us at 800-851-9777.
What were the Portfolio costs for the period?
Portfolio Overview Operating Expenses
(based on a hypothetical $10,000 investment)
Class Name |
Cost of a $10,000 investment |
Costs paid as a percentage of a $10,000 investment |
Initial Class |
$41 |
0.81% |
This table does not reflect any charges that are, or may be, imposed under your variable life insurance policy or variable annuity contract. If such charges were reflected, expenses would be higher.
Total Net Assets |
$175,616,219 |
Number of Portfolio Holdings |
12 |
Portfolio Turnover Rate |
142% |
What did the Portfolio invest in?
Top Asset Allocations (Percentage of Net Assets)
U.S. Fixed Income Funds |
60.3% |
U.S. Equity Funds |
27.8 |
Other Investment Company |
19.9 |
International Equity Funds |
10.8 |
Repurchase Agreements |
1.2 |
Net Other Assets (Liabilities) |
(20.0) |
Top Holdings (Percentage of Net Assets)
iShares Core U.S. Aggregate Bond ETF |
31.3% |
iShares Core S&P 500 ETF |
17.1 |
iShares Short Treasury Bond ETF |
14.0 |
iShares Broad USD Investment Grade Corporate Bond ETF |
12.0 |
iShares Core S&P Total U.S. Stock Market ETF |
10.6 |
iShares MSCI EAFE ETF |
4.2 |
iShares Core MSCI EAFE ETF |
3.1 |
iShares Broad USD High Yield Corporate Bond ETF |
3.0 |
iShares Core MSCI Emerging Markets ETF |
1.4 |
iShares MSCI Emerging Markets ETF |
1.4 |
If you wish to view additional information about the Portfolio; including but not limited to full holdings, financial statements, proxy voting policies and other important documents, please see TST's most recent report on Form N-CSR available at transamerica.com/annuities/prospectus.
Transamerica BlackRock iShares Tactical - Conservative VP
Semi-Annual Shareholder Report
June 30, 2024
Transamerica BlackRock iShares Tactical - Conservative VP
Transamerica BlackRock iShares Tactical - Conservative VP seeks a combination of capital appreciation and income. This semi-annual shareholder report contains important information for the period of January 1, 2024 to June 30, 2024. You can find additional information about the Portfolio at transamerica.com/annuities/prospectus. You can also request this information by contacting us at 800-851-9777.
What were the Portfolio costs for the period?
Portfolio Overview Operating Expenses
(based on a hypothetical $10,000 investment)
Class Name |
Cost of a $10,000 investment |
Costs paid as a percentage of a $10,000 investment |
Service Class |
$53 |
1.06% |
This table does not reflect any charges that are, or may be, imposed under your variable life insurance policy or variable annuity contract. If such charges were reflected, expenses would be higher.
Total Net Assets |
$175,616,219 |
Number of Portfolio Holdings |
12 |
Portfolio Turnover Rate |
142% |
What did the Portfolio invest in?
Top Asset Allocations (Percentage of Net Assets)
U.S. Fixed Income Funds |
60.3% |
U.S. Equity Funds |
27.8 |
Other Investment Company |
19.9 |
International Equity Funds |
10.8 |
Repurchase Agreements |
1.2 |
Net Other Assets (Liabilities) |
(20.0) |
Top Holdings (Percentage of Net Assets)
iShares Core U.S. Aggregate Bond ETF |
31.3% |
iShares Core S&P 500 ETF |
17.1 |
iShares Short Treasury Bond ETF |
14.0 |
iShares Broad USD Investment Grade Corporate Bond ETF |
12.0 |
iShares Core S&P Total U.S. Stock Market ETF |
10.6 |
iShares MSCI EAFE ETF |
4.2 |
iShares Core MSCI EAFE ETF |
3.1 |
iShares Broad USD High Yield Corporate Bond ETF |
3.0 |
iShares Core MSCI Emerging Markets ETF |
1.4 |
iShares MSCI Emerging Markets ETF |
1.4 |
If you wish to view additional information about the Portfolio; including but not limited to full holdings, financial statements, proxy voting policies and other important documents, please see TST's most recent report on Form N-CSR available at transamerica.com/annuities/prospectus.
Transamerica BlackRock iShares Tactical - Conservative VP
Semi-Annual Shareholder Report
June 30, 2024
Transamerica BlackRock iShares Tactical - Growth VP
Transamerica BlackRock iShares Tactical - Growth VP seeks a combination of capital appreciation and income. This semi-annual shareholder report contains important information for the period of January 1, 2024 to June 30, 2024. You can find additional information about the Portfolio at transamerica.com/annuities/prospectus. You can also request this information by contacting us at 800-851-9777.
What were the Portfolio costs for the period?
Portfolio Overview Operating Expenses
(based on a hypothetical $10,000 investment)
Class Name |
Cost of a $10,000 investment |
Costs paid as a percentage of a $10,000 investment |
Initial Class |
$41 |
0.80% |
This table does not reflect any charges that are, or may be, imposed under your variable life insurance policy or variable annuity contract. If such charges were reflected, expenses would be higher.
Total Net Assets |
$254,885,096 |
Number of Portfolio Holdings |
12 |
Portfolio Turnover Rate |
126% |
What did the Portfolio invest in?
Top Asset Allocations (Percentage of Net Assets)
U.S. Equity Funds |
52.7% |
U.S. Fixed Income Funds |
25.7 |
International Equity Funds |
20.5 |
Other Investment Company |
7.4 |
Repurchase Agreements |
1.2 |
Net Other Assets (Liabilities) |
(7.5) |
Top Holdings (Percentage of Net Assets)
iShares Core S&P 500 ETF |
31.9% |
iShares Core S&P Total U.S. Stock Market ETF |
20.8 |
iShares Short Treasury Bond ETF |
14.2 |
iShares Broad USD Investment Grade Corporate Bond ETF |
7.9 |
iShares MSCI EAFE ETF |
7.3 |
iShares Core MSCI EAFE ETF |
6.2 |
iShares MSCI Emerging Markets ETF |
2.8 |
iShares Core MSCI Emerging Markets ETF |
2.8 |
iShares Broad USD High Yield Corporate Bond ETF |
2.0 |
iShares Core U.S. Aggregate Bond ETF |
1.6 |
If you wish to view additional information about the Portfolio; including but not limited to full holdings, financial statements, proxy voting policies and other important documents, please see TST's most recent report on Form N-CSR available at transamerica.com/annuities/prospectus.
Transamerica BlackRock iShares Tactical - Growth VP
Semi-Annual Shareholder Report
June 30, 2024
Transamerica BlackRock iShares Tactical - Growth VP
Transamerica BlackRock iShares Tactical - Growth VP seeks a combination of capital appreciation and income. This semi-annual shareholder report contains important information for the period of January 1, 2024 to June 30, 2024. You can find additional information about the Portfolio at transamerica.com/annuities/prospectus. You can also request this information by contacting us at 800-851-9777.
What were the Portfolio costs for the period?
Portfolio Overview Operating Expenses
(based on a hypothetical $10,000 investment)
Class Name |
Cost of a $10,000 investment |
Costs paid as a percentage of a $10,000 investment |
Service Class |
$54 |
1.05% |
This table does not reflect any charges that are, or may be, imposed under your variable life insurance policy or variable annuity contract. If such charges were reflected, expenses would be higher.
Total Net Assets |
$254,885,096 |
Number of Portfolio Holdings |
12 |
Portfolio Turnover Rate |
126% |
What did the Portfolio invest in?
Top Asset Allocations (Percentage of Net Assets)
U.S. Equity Funds |
52.7% |
U.S. Fixed Income Funds |
25.7 |
International Equity Funds |
20.5 |
Other Investment Company |
7.4 |
Repurchase Agreements |
1.2 |
Net Other Assets (Liabilities) |
(7.5) |
Top Holdings (Percentage of Net Assets)
iShares Core S&P 500 ETF |
31.9% |
iShares Core S&P Total U.S. Stock Market ETF |
20.8 |
iShares Short Treasury Bond ETF |
14.2 |
iShares Broad USD Investment Grade Corporate Bond ETF |
7.9 |
iShares MSCI EAFE ETF |
7.3 |
iShares Core MSCI EAFE ETF |
6.2 |
iShares MSCI Emerging Markets ETF |
2.8 |
iShares Core MSCI Emerging Markets ETF |
2.8 |
iShares Broad USD High Yield Corporate Bond ETF |
2.0 |
iShares Core U.S. Aggregate Bond ETF |
1.6 |
If you wish to view additional information about the Portfolio; including but not limited to full holdings, financial statements, proxy voting policies and other important documents, please see TST's most recent report on Form N-CSR available at transamerica.com/annuities/prospectus.
Transamerica BlackRock iShares Tactical - Growth VP
Semi-Annual Shareholder Report
June 30, 2024
Transamerica BlackRock Real Estate Securities VP
Transamerica BlackRock Real Estate Securities VP seeks to maximize total return. This semi-annual shareholder report contains important information for the period of January 1, 2024 to June 30, 2024. You can find additional information about the Portfolio at transamerica.com/annuities/prospectus. You can also request this information by contacting us at 800-851-9777.
What were the Portfolio costs for the period?
Portfolio Overview Operating Expenses
(based on a hypothetical $10,000 investment)
Class Name |
Cost of a $10,000 investment |
Costs paid as a percentage of a $10,000 investment |
Initial Class |
$44 |
0.90% |
This table does not reflect any charges that are, or may be, imposed under your variable life insurance policy or variable annuity contract. If such charges were reflected, expenses would be higher.
Total Net Assets |
$162,546,184 |
Number of Portfolio Holdings |
75 |
Portfolio Turnover Rate |
24% |
What did the Portfolio invest in?
Top Asset Allocations (Percentage of Net Assets)
Common Stocks |
98.2% |
Repurchase Agreements |
1.8 |
Other Investment Company |
0.0Footnote Reference* |
Net Other Assets (Liabilities) |
0.0Footnote Reference* |
| Footnote |
Description |
Footnote* |
Percentage rounds to less than 0.1% or (0.1)%. |
Top Holdings (Percentage of Net Assets)
Equinix, Inc., REIT |
5.9% |
Prologis, Inc., REIT |
4.6 |
Welltower, Inc., REIT |
4.6 |
AvalonBay Communities, Inc., REIT |
3.6 |
Extra Space Storage, Inc., REIT |
3.3 |
VICI Properties, Inc., REIT |
3.1 |
Mid-America Apartment Communities, Inc., REIT |
3.0 |
Mitsubishi Estate Co. Ltd. |
2.7 |
Agree Realty Corp., REIT |
2.5 |
Link. REIT |
2.3 |
If you wish to view additional information about the Portfolio; including but not limited to full holdings, financial statements, proxy voting policies and other important documents, please see TST's most recent report on Form N-CSR available at transamerica.com/annuities/prospectus.
Transamerica BlackRock Real Estate Securities VP
Semi-Annual Shareholder Report
June 30, 2024
Transamerica BlackRock Real Estate Securities VP
Transamerica BlackRock Real Estate Securities VP seeks to maximize total return. This semi-annual shareholder report contains important information for the period of January 1, 2024 to June 30, 2024. You can find additional information about the Portfolio at transamerica.com/annuities/prospectus. You can also request this information by contacting us at 800-851-9777.
What were the Portfolio costs for the period?
Portfolio Overview Operating Expenses
(based on a hypothetical $10,000 investment)
Class Name |
Cost of a $10,000 investment |
Costs paid as a percentage of a $10,000 investment |
Service Class |
$56 |
1.15% |
This table does not reflect any charges that are, or may be, imposed under your variable life insurance policy or variable annuity contract. If such charges were reflected, expenses would be higher.
Total Net Assets |
$162,546,184 |
Number of Portfolio Holdings |
75 |
Portfolio Turnover Rate |
24% |
What did the Portfolio invest in?
Top Asset Allocations (Percentage of Net Assets)
Common Stocks |
98.2% |
Repurchase Agreements |
1.8 |
Other Investment Company |
0.0Footnote Reference* |
Net Other Assets (Liabilities) |
0.0Footnote Reference* |
| Footnote |
Description |
Footnote* |
Percentage rounds to less than 0.1% or (0.1)%. |
Top Holdings (Percentage of Net Assets)
Equinix, Inc., REIT |
5.9% |
Prologis, Inc., REIT |
4.6 |
Welltower, Inc., REIT |
4.6 |
AvalonBay Communities, Inc., REIT |
3.6 |
Extra Space Storage, Inc., REIT |
3.3 |
VICI Properties, Inc., REIT |
3.1 |
Mid-America Apartment Communities, Inc., REIT |
3.0 |
Mitsubishi Estate Co. Ltd. |
2.7 |
Agree Realty Corp., REIT |
2.5 |
Link. REIT |
2.3 |
If you wish to view additional information about the Portfolio; including but not limited to full holdings, financial statements, proxy voting policies and other important documents, please see TST's most recent report on Form N-CSR available at transamerica.com/annuities/prospectus.
Transamerica BlackRock Real Estate Securities VP
Semi-Annual Shareholder Report
June 30, 2024
Transamerica BlackRock Tactical Allocation VP
Transamerica BlackRock Tactical Allocation VP seeks capital appreciation with current income as a secondary objective. This semi-annual shareholder report contains important information for the period of January 1, 2024 to June 30, 2024. You can find additional information about the Portfolio at transamerica.com/annuities/prospectus. You can also request this information by contacting us at 800-851-9777.
What were the Portfolio costs for the period?
Portfolio Overview Operating Expenses
(based on a hypothetical $10,000 investment)
Class Name |
Cost of a $10,000 investment |
Costs paid as a percentage of a $10,000 investment |
Initial Class |
$9 |
0.17% |
This table does not reflect any charges that are, or may be, imposed under your variable life insurance policy or variable annuity contract. If such charges were reflected, expenses would be higher.
Total Net Assets |
$894,499,589 |
Number of Portfolio Holdings |
16 |
Portfolio Turnover Rate |
38% |
What did the Portfolio invest in?
Top Asset Allocations (Percentage of Net Assets)
U.S. Equity Funds |
55.5% |
U.S. Fixed Income Funds |
27.2 |
International Equity Funds |
15.8 |
Repurchase Agreements |
0.3 |
Other Investment Company |
0.0Footnote Reference* |
International Alternative Funds |
0.0Footnote Reference* |
Net Other Assets (Liabilities) |
1.2 |
| Footnote |
Description |
Footnote* |
Percentage rounds to less than 0.1% or (0.1)%. |
Top Holdings (Percentage of Net Assets)
Transamerica JPMorgan Enhanced Index VP, Initial Class |
33.4% |
Transamerica Large Cap Value, Class I2 |
8.2 |
Transamerica WMC US Growth VP, Initial Class |
8.1 |
Transamerica Aegon Core Bond VP, Initial Class |
7.9 |
Transamerica Bond, Class I2 |
7.9 |
Transamerica International Focus VP, Initial Class |
7.2 |
Transamerica Short-Term Bond, Class I2 |
7.1 |
Transamerica TSW International Equity VP, Initial Class |
6.2 |
Vanguard Total Bond Market ETF |
4.3 |
Transamerica Morgan Stanley Capital Growth VP, Initial Class |
2.3 |
If you wish to view additional information about the Portfolio; including but not limited to full holdings, financial statements, proxy voting policies and other important documents, please see TST's most recent report on Form N-CSR available at transamerica.com/annuities/prospectus.
Transamerica BlackRock Tactical Allocation VP
Semi-Annual Shareholder Report
June 30, 2024
Transamerica BlackRock Tactical Allocation VP
Transamerica BlackRock Tactical Allocation VP seeks capital appreciation with current income as a secondary objective. This semi-annual shareholder report contains important information for the period of January 1, 2024 to June 30, 2024. You can find additional information about the Portfolio at transamerica.com/annuities/prospectus. You can also request this information by contacting us at 800-851-9777.
What were the Portfolio costs for the period?
Portfolio Overview Operating Expenses
(based on a hypothetical $10,000 investment)
Class Name |
Cost of a $10,000 investment |
Costs paid as a percentage of a $10,000 investment |
Service Class |
$22 |
0.42% |
This table does not reflect any charges that are, or may be, imposed under your variable life insurance policy or variable annuity contract. If such charges were reflected, expenses would be higher.
Total Net Assets |
$894,499,589 |
Number of Portfolio Holdings |
16 |
Portfolio Turnover Rate |
38% |
What did the Portfolio invest in?
Top Asset Allocations (Percentage of Net Assets)
U.S. Equity Funds |
55.5% |
U.S. Fixed Income Funds |
27.2 |
International Equity Funds |
15.8 |
Repurchase Agreements |
0.3 |
Other Investment Company |
0.0Footnote Reference* |
International Alternative Funds |
0.0Footnote Reference* |
Net Other Assets (Liabilities) |
1.2 |
| Footnote |
Description |
Footnote* |
Percentage rounds to less than 0.1% or (0.1)%. |
Top Holdings (Percentage of Net Assets)
Transamerica JPMorgan Enhanced Index VP, Initial Class |
33.4% |
Transamerica Large Cap Value, Class I2 |
8.2 |
Transamerica WMC US Growth VP, Initial Class |
8.1 |
Transamerica Aegon Core Bond VP, Initial Class |
7.9 |
Transamerica Bond, Class I2 |
7.9 |
Transamerica International Focus VP, Initial Class |
7.2 |
Transamerica Short-Term Bond, Class I2 |
7.1 |
Transamerica TSW International Equity VP, Initial Class |
6.2 |
Vanguard Total Bond Market ETF |
4.3 |
Transamerica Morgan Stanley Capital Growth VP, Initial Class |
2.3 |
If you wish to view additional information about the Portfolio; including but not limited to full holdings, financial statements, proxy voting policies and other important documents, please see TST's most recent report on Form N-CSR available at transamerica.com/annuities/prospectus.
Transamerica BlackRock Tactical Allocation VP
Semi-Annual Shareholder Report
June 30, 2024
Transamerica Goldman Sachs 70/30 Allocation VP
Transamerica Goldman Sachs 70/30 Allocation VP seeks long-term capital appreciation with current income as a secondary objective. This semi-annual shareholder report contains important information for the period of January 1, 2024 to June 30, 2024. You can find additional information about the Portfolio at transamerica.com/annuities/prospectus. You can also request this information by contacting us at 800-851-9777.
What were the Portfolio costs for the period?
Portfolio Overview Operating Expenses
(based on a hypothetical $10,000 investment)
Class Name |
Cost of a $10,000 investment |
Costs paid as a percentage of a $10,000 investment |
Service Class |
$27 |
0.52% |
This table does not reflect any charges that are, or may be, imposed under your variable life insurance policy or variable annuity contract. If such charges were reflected, expenses would be higher.
Total Net Assets |
$7,872,630 |
Number of Portfolio Holdings |
14 |
Portfolio Turnover Rate |
12% |
What did the Portfolio invest in?
Asset Allocation (Percentage of Net Assets)
U.S. Equity Funds |
49.5% |
U.S. Fixed Income Funds |
29.5 |
International Equity Funds |
20.7 |
Net Other Assets (Liabilities) |
0.3 |
Top Holdings (Percentage of Net Assets)
Transamerica WMC US Growth VP, Initial Class |
24.5% |
Transamerica Large Cap Value, Class I2 |
20.7 |
Transamerica Core Bond, Class I2 |
16.0 |
Transamerica International Stock, Class I2 |
8.8 |
Transamerica International Equity, Class I2 |
8.4 |
Transamerica Bond, Class I2 |
6.9 |
Transamerica Long Credit, Class I2 |
2.5 |
Transamerica Emerging Markets Opportunities, Class I2 |
2.4 |
Transamerica High Yield Bond, Class I2 |
2.1 |
Transamerica Aegon Sustainable Equity Income VP, Initial Class |
2.0 |
If you wish to view additional information about the Portfolio; including but not limited to full holdings, financial statements, proxy voting policies and other important documents, please see TST's most recent report on Form N-CSR available at transamerica.com/annuities/prospectus.
Transamerica Goldman Sachs 70/30 Allocation VP
Semi-Annual Shareholder Report
June 30, 2024
Transamerica Goldman Sachs Managed Risk - Balanced ETF VP
Transamerica Goldman Sachs Managed Risk - Balanced ETF VP seeks to balance capital appreciation and income. This semi-annual shareholder report contains important information for the period of January 1, 2024 to June 30, 2024. You can find additional information about the Portfolio at transamerica.com/annuities/prospectus. You can also request this information by contacting us at 800-851-9777.
What were the Portfolio costs for the period?
Portfolio Overview Operating Expenses
(based on a hypothetical $10,000 investment)
Class Name |
Cost of a $10,000 investment |
Costs paid as a percentage of a $10,000 investment |
Initial Class |
$17 |
0.33% |
This table does not reflect any charges that are, or may be, imposed under your variable life insurance policy or variable annuity contract. If such charges were reflected, expenses would be higher.
Total Net Assets |
$3,959,152,897 |
Number of Portfolio Holdings |
14 |
Portfolio Turnover Rate |
11% |
What did the Portfolio invest in?
Asset Allocation (Percentage of Net Assets)
U.S. Fixed Income Funds |
47.8% |
U.S. Equity Funds |
36.2 |
International Equity Funds |
15.6 |
Other Investment Company |
6.1 |
Repurchase Agreements |
0.4 |
Net Other Assets (Liabilities) |
(6.1) |
Top Holdings (Percentage of Net Assets)
Vanguard Total Bond Market ETF |
16.9% |
iShares Core U.S. Aggregate Bond ETF |
16.9 |
Vanguard S&P 500 ETF |
16.6 |
Vanguard Intermediate-Term Corporate Bond ETF |
14.0 |
iShares Core S&P 500 ETF |
11.4 |
SPDR S&P 500 ETF Trust |
5.2 |
iShares Core MSCI Emerging Markets ETF |
5.1 |
Vanguard FTSE Developed Markets ETF |
5.1 |
iShares Core MSCI EAFE ETF |
3.3 |
iShares Russell 2000 ETF |
1.7 |
If you wish to view additional information about the Portfolio; including but not limited to full holdings, financial statements, proxy voting policies and other important documents, please see TST's most recent report on Form N-CSR available at transamerica.com/annuities/prospectus.
Transamerica Goldman Sachs Managed Risk - Balanced ETF VP
Semi-Annual Shareholder Report
June 30, 2024
Transamerica Goldman Sachs Managed Risk - Balanced ETF VP
Transamerica Goldman Sachs Managed Risk - Balanced ETF VP seeks to balance capital appreciation and income. This semi-annual shareholder report contains important information for the period of January 1, 2024 to June 30, 2024. You can find additional information about the Portfolio at transamerica.com/annuities/prospectus. You can also request this information by contacting us at 800-851-9777.
What were the Portfolio costs for the period?
Portfolio Overview Operating Expenses
(based on a hypothetical $10,000 investment)
Class Name |
Cost of a $10,000 investment |
Costs paid as a percentage of a $10,000 investment |
Service Class |
$30 |
0.58% |
This table does not reflect any charges that are, or may be, imposed under your variable life insurance policy or variable annuity contract. If such charges were reflected, expenses would be higher.
Total Net Assets |
$3,959,152,897 |
Number of Portfolio Holdings |
14 |
Portfolio Turnover Rate |
11% |
What did the Portfolio invest in?
Asset Allocation (Percentage of Net Assets)
U.S. Fixed Income Funds |
47.8% |
U.S. Equity Funds |
36.2 |
International Equity Funds |
15.6 |
Other Investment Company |
6.1 |
Repurchase Agreements |
0.4 |
Net Other Assets (Liabilities) |
(6.1) |
Top Holdings (Percentage of Net Assets)
Vanguard Total Bond Market ETF |
16.9% |
iShares Core U.S. Aggregate Bond ETF |
16.9 |
Vanguard S&P 500 ETF |
16.6 |
Vanguard Intermediate-Term Corporate Bond ETF |
14.0 |
iShares Core S&P 500 ETF |
11.4 |
SPDR S&P 500 ETF Trust |
5.2 |
iShares Core MSCI Emerging Markets ETF |
5.1 |
Vanguard FTSE Developed Markets ETF |
5.1 |
iShares Core MSCI EAFE ETF |
3.3 |
iShares Russell 2000 ETF |
1.7 |
If you wish to view additional information about the Portfolio; including but not limited to full holdings, financial statements, proxy voting policies and other important documents, please see TST's most recent report on Form N-CSR available at transamerica.com/annuities/prospectus.
Transamerica Goldman Sachs Managed Risk - Balanced ETF VP
Semi-Annual Shareholder Report
June 30, 2024
Transamerica Goldman Sachs Managed Risk - Conservative ETF VP
Transamerica Goldman Sachs Managed Risk - Conservative ETF VP seeks current income and preservation of capital. This semi-annual shareholder report contains important information for the period of January 1, 2024 to June 30, 2024. You can find additional information about the Portfolio at transamerica.com/annuities/prospectus. You can also request this information by contacting us at 800-851-9777.
What were the Portfolio costs for the period?
Portfolio Overview Operating Expenses
(based on a hypothetical $10,000 investment)
Class Name |
Cost of a $10,000 investment |
Costs paid as a percentage of a $10,000 investment |
Initial Class |
$18 |
0.35% |
This table does not reflect any charges that are, or may be, imposed under your variable life insurance policy or variable annuity contract. If such charges were reflected, expenses would be higher.
Total Net Assets |
$435,896,791 |
Number of Portfolio Holdings |
15 |
Portfolio Turnover Rate |
7% |
What did the Portfolio invest in?
Asset Allocation (Percentage of Net Assets)
U.S. Fixed Income Funds |
63.4% |
U.S. Equity Funds |
26.5 |
International Equity Funds |
9.7 |
Other Investment Company |
9.0 |
Repurchase Agreements |
0.4 |
Net Other Assets (Liabilities) |
(9.0) |
Top Holdings (Percentage of Net Assets)
iShares Core U.S. Aggregate Bond ETF |
17.8% |
Schwab U.S. Aggregate Bond ETF |
17.7 |
Vanguard Total Bond Market ETF |
17.7 |
Vanguard Intermediate-Term Corporate Bond ETF |
10.3 |
Vanguard S&P 500 ETF |
8.3 |
SPDR S&P 500 ETF Trust |
8.1 |
iShares Core S&P 500 ETF |
8.0 |
iShares Core MSCI Emerging Markets ETF |
3.2 |
iShares Core MSCI EAFE ETF |
2.2 |
iShares MSCI EAFE ETF |
2.1 |
If you wish to view additional information about the Portfolio; including but not limited to full holdings, financial statements, proxy voting policies and other important documents, please see TST's most recent report on Form N-CSR available at transamerica.com/annuities/prospectus.
Transamerica Goldman Sachs Managed Risk - Conservative ETF VP
Semi-Annual Shareholder Report
June 30, 2024
Transamerica Goldman Sachs Managed Risk - Conservative ETF VP
Transamerica Goldman Sachs Managed Risk - Conservative ETF VP seeks current income and preservation of capital. This semi-annual shareholder report contains important information for the period of January 1, 2024 to June 30, 2024. You can find additional information about the Portfolio at transamerica.com/annuities/prospectus. You can also request this information by contacting us at 800-851-9777.
What were the Portfolio costs for the period?
Portfolio Overview Operating Expenses
(based on a hypothetical $10,000 investment)
Class Name |
Cost of a $10,000 investment |
Costs paid as a percentage of a $10,000 investment |
Service Class |
$30 |
0.60% |
This table does not reflect any charges that are, or may be, imposed under your variable life insurance policy or variable annuity contract. If such charges were reflected, expenses would be higher.
Total Net Assets |
$435,896,791 |
Number of Portfolio Holdings |
15 |
Portfolio Turnover Rate |
7% |
What did the Portfolio invest in?
Asset Allocation (Percentage of Net Assets)
U.S. Fixed Income Funds |
63.4% |
U.S. Equity Funds |
26.5 |
International Equity Funds |
9.7 |
Other Investment Company |
9.0 |
Repurchase Agreements |
0.4 |
Net Other Assets (Liabilities) |
(9.0) |
Top Holdings (Percentage of Net Assets)
iShares Core U.S. Aggregate Bond ETF |
17.8% |
Schwab U.S. Aggregate Bond ETF |
17.7 |
Vanguard Total Bond Market ETF |
17.7 |
Vanguard Intermediate-Term Corporate Bond ETF |
10.3 |
Vanguard S&P 500 ETF |
8.3 |
SPDR S&P 500 ETF Trust |
8.1 |
iShares Core S&P 500 ETF |
8.0 |
iShares Core MSCI Emerging Markets ETF |
3.2 |
iShares Core MSCI EAFE ETF |
2.2 |
iShares MSCI EAFE ETF |
2.1 |
If you wish to view additional information about the Portfolio; including but not limited to full holdings, financial statements, proxy voting policies and other important documents, please see TST's most recent report on Form N-CSR available at transamerica.com/annuities/prospectus.
Transamerica Goldman Sachs Managed Risk - Conservative ETF VP
Semi-Annual Shareholder Report
June 30, 2024
Transamerica Goldman Sachs Managed Risk - Growth ETF VP
Transamerica Goldman Sachs Managed Risk - Growth ETF VP seeks capital appreciation as a primary objective and income as a secondary objective. This semi-annual shareholder report contains important information for the period of January 1, 2024 to June 30, 2024. You can find additional information about the Portfolio at transamerica.com/annuities/prospectus. You can also request this information by contacting us at 800-851-9777.
What were the Portfolio costs for the period?
Portfolio Overview Operating Expenses
(based on a hypothetical $10,000 investment)
Class Name |
Cost of a $10,000 investment |
Costs paid as a percentage of a $10,000 investment |
Initial Class |
$17 |
0.33% |
This table does not reflect any charges that are, or may be, imposed under your variable life insurance policy or variable annuity contract. If such charges were reflected, expenses would be higher.
Total Net Assets |
$1,925,972,142 |
Number of Portfolio Holdings |
14 |
Portfolio Turnover Rate |
8% |
What did the Portfolio invest in?
Asset Allocation (Percentage of Net Assets)
U.S. Equity Funds |
54.5% |
International Equity Funds |
24.0 |
U.S. Fixed Income Funds |
21.1 |
Other Investment Company |
5.4 |
Repurchase Agreements |
0.4 |
Net Other Assets (Liabilities) |
(5.4) |
Top Holdings (Percentage of Net Assets)
Vanguard S&P 500 ETF |
19.5% |
iShares Core S&P 500 ETF |
18.0 |
SPDR S&P 500 ETF Trust |
10.8 |
Vanguard Total Bond Market ETF |
7.6 |
iShares Core U.S. Aggregate Bond ETF |
7.5 |
iShares Core MSCI Emerging Markets ETF |
7.0 |
Vanguard Intermediate-Term Corporate Bond ETF |
6.0 |
iShares MSCI EAFE ETF |
5.5 |
iShares Core MSCI EAFE ETF |
5.4 |
Vanguard FTSE Developed Markets ETF |
5.4 |
If you wish to view additional information about the Portfolio; including but not limited to full holdings, financial statements, proxy voting policies and other important documents, please see TST's most recent report on Form N-CSR available at transamerica.com/annuities/prospectus.
Transamerica Goldman Sachs Managed Risk - Growth ETF VP
Semi-Annual Shareholder Report
June 30, 2024
Transamerica Goldman Sachs Managed Risk - Growth ETF VP
Transamerica Goldman Sachs Managed Risk - Growth ETF VP seeks capital appreciation as a primary objective and income as a secondary objective. This semi-annual shareholder report contains important information for the period of January 1, 2024 to June 30, 2024. You can find additional information about the Portfolio at transamerica.com/annuities/prospectus. You can also request this information by contacting us at 800-851-9777.
What were the Portfolio costs for the period?
Portfolio Overview Operating Expenses
(based on a hypothetical $10,000 investment)
Class Name |
Cost of a $10,000 investment |
Costs paid as a percentage of a $10,000 investment |
Service Class |
$30 |
0.58% |
This table does not reflect any charges that are, or may be, imposed under your variable life insurance policy or variable annuity contract. If such charges were reflected, expenses would be higher.
Total Net Assets |
$1,925,972,142 |
Number of Portfolio Holdings |
14 |
Portfolio Turnover Rate |
8% |
What did the Portfolio invest in?
Asset Allocation (Percentage of Net Assets)
U.S. Equity Funds |
54.5% |
International Equity Funds |
24.0 |
U.S. Fixed Income Funds |
21.1 |
Other Investment Company |
5.4 |
Repurchase Agreements |
0.4 |
Net Other Assets (Liabilities) |
(5.4) |
Top Holdings (Percentage of Net Assets)
Vanguard S&P 500 ETF |
19.5% |
iShares Core S&P 500 ETF |
18.0 |
SPDR S&P 500 ETF Trust |
10.8 |
Vanguard Total Bond Market ETF |
7.6 |
iShares Core U.S. Aggregate Bond ETF |
7.5 |
iShares Core MSCI Emerging Markets ETF |
7.0 |
Vanguard Intermediate-Term Corporate Bond ETF |
6.0 |
iShares MSCI EAFE ETF |
5.5 |
iShares Core MSCI EAFE ETF |
5.4 |
Vanguard FTSE Developed Markets ETF |
5.4 |
If you wish to view additional information about the Portfolio; including but not limited to full holdings, financial statements, proxy voting policies and other important documents, please see TST's most recent report on Form N-CSR available at transamerica.com/annuities/prospectus.
Transamerica Goldman Sachs Managed Risk - Growth ETF VP
Semi-Annual Shareholder Report
June 30, 2024
Transamerica Great Lakes Advisors Large Cap Value VP
Transamerica Great Lakes Advisors Large Cap Value VP seeks long-term capital appreciation. This semi-annual shareholder report contains important information for the period of January 1, 2024 to June 30, 2024. You can find additional information about the Portfolio at transamerica.com/annuities/prospectus. You can also request this information by contacting us at 800-851-9777.
What were the Portfolio costs for the period?
Portfolio Overview Operating Expenses
(based on a hypothetical $10,000 investment)
Class Name |
Cost of a $10,000 investment |
Costs paid as a percentage of a $10,000 investment |
Service Class |
$49 |
0.94% |
This table does not reflect any charges that are, or may be, imposed under your variable life insurance policy or variable annuity contract. If such charges were reflected, expenses would be higher.
Total Net Assets |
$65,079,080 |
Number of Portfolio Holdings |
45 |
Portfolio Turnover Rate |
11% |
What did the Portfolio invest in?
Top Asset Allocations (Percentage of Net Assets)
Common Stocks |
97.1% |
Repurchase Agreements |
2.6 |
Net Other Assets (Liabilities) |
0.3 |
Top Holdings (Percentage of Net Assets)
JPMorgan Chase & Co. |
4.4% |
Exxon Mobil Corp. |
4.3 |
Wells Fargo & Co. |
3.4 |
Hartford Financial Services Group, Inc. |
2.9 |
UnitedHealth Group, Inc. |
2.8 |
Boston Scientific Corp. |
2.8 |
AbbVie, Inc. |
2.7 |
BlackRock, Inc. |
2.7 |
ConocoPhillips |
2.5 |
Parker-Hannifin Corp. |
2.5 |
If you wish to view additional information about the Portfolio; including but not limited to full holdings, financial statements, proxy voting policies and other important documents, please see TST's most recent report on Form N-CSR available at transamerica.com/annuities/prospectus.
Transamerica Great Lakes Advisors Large Cap Value VP
Semi-Annual Shareholder Report
June 30, 2024
Transamerica International Focus VP
Transamerica International Focus VP seeks long-term capital appreciation. This semi-annual shareholder report contains important information for the period of January 1, 2024 to June 30, 2024. You can find additional information about the Portfolio at transamerica.com/annuities/prospectus. You can also request this information by contacting us at 800-851-9777.
What were the Portfolio costs for the period?
Portfolio Overview Operating Expenses
(based on a hypothetical $10,000 investment)
Class Name |
Cost of a $10,000 investment |
Costs paid as a percentage of a $10,000 investment |
Initial Class |
$43 |
0.84% |
This table does not reflect any charges that are, or may be, imposed under your variable life insurance policy or variable annuity contract. If such charges were reflected, expenses would be higher.
Total Net Assets |
$369,705,178 |
Number of Portfolio Holdings |
47 |
Portfolio Turnover Rate |
37% |
What did the Portfolio invest in?
Top Asset Allocations (Percentage of Net Assets)
Common Stocks |
97.5% |
Repurchase Agreements |
1.5 |
Net Other Assets (Liabilities) |
1.0 |
Transamerica International Focus VP
Top Country Allocation (Percentage of Net Assets)
Japan |
21.2% |
United Kingdom |
13.6 |
France |
11.5 |
Ireland |
7.0 |
Netherlands |
6.5 |
Australia |
5.9 |
Denmark |
4.3 |
Germany |
3.2 |
China |
2.5 |
Sweden |
2.5 |
Top Holdings (Percentage of Net Assets)
Novo Nordisk AS, Class B |
4.2% |
ASML Holding NV |
4.0 |
ITOCHU Corp. |
2.8 |
Shell PLC |
2.8 |
Tokyo Electron Ltd. |
2.7 |
LVMH Moet Hennessy Louis Vuitton SE |
2.7 |
Sanofi SA |
2.6 |
TotalEnergies SE |
2.6 |
Wolters Kluwer NV |
2.5 |
Atlas Copco AB, Class A |
2.5 |
If you wish to view additional information about the Portfolio; including but not limited to full holdings, financial statements, proxy voting policies and other important documents, please see TST's most recent report on Form N-CSR available at transamerica.com/annuities/prospectus.
Transamerica International Focus VP
Semi-Annual Shareholder Report
June 30, 2024
Transamerica International Focus VP
Transamerica International Focus VP seeks long-term capital appreciation. This semi-annual shareholder report contains important information for the period of January 1, 2024 to June 30, 2024. You can find additional information about the Portfolio at transamerica.com/annuities/prospectus. You can also request this information by contacting us at 800-851-9777.
What were the Portfolio costs for the period?
Portfolio Overview Operating Expenses
(based on a hypothetical $10,000 investment)
Class Name |
Cost of a $10,000 investment |
Costs paid as a percentage of a $10,000 investment |
Service Class |
$56 |
1.09% |
This table does not reflect any charges that are, or may be, imposed under your variable life insurance policy or variable annuity contract. If such charges were reflected, expenses would be higher.
Total Net Assets |
$369,705,178 |
Number of Portfolio Holdings |
47 |
Portfolio Turnover Rate |
37% |
What did the Portfolio invest in?
Top Asset Allocations (Percentage of Net Assets)
Common Stocks |
97.5% |
Repurchase Agreements |
1.5 |
Net Other Assets (Liabilities) |
1.0 |
Transamerica International Focus VP
Top Country Allocation (Percentage of Net Assets)
Japan |
21.2% |
United Kingdom |
13.6 |
France |
11.5 |
Ireland |
7.0 |
Netherlands |
6.5 |
Australia |
5.9 |
Denmark |
4.3 |
Germany |
3.2 |
China |
2.5 |
Sweden |
2.5 |
Top Holdings (Percentage of Net Assets)
Novo Nordisk AS, Class B |
4.2% |
ASML Holding NV |
4.0 |
ITOCHU Corp. |
2.8 |
Shell PLC |
2.8 |
Tokyo Electron Ltd. |
2.7 |
LVMH Moet Hennessy Louis Vuitton SE |
2.7 |
Sanofi SA |
2.6 |
TotalEnergies SE |
2.6 |
Wolters Kluwer NV |
2.5 |
Atlas Copco AB, Class A |
2.5 |
If you wish to view additional information about the Portfolio; including but not limited to full holdings, financial statements, proxy voting policies and other important documents, please see TST's most recent report on Form N-CSR available at transamerica.com/annuities/prospectus.
Transamerica International Focus VP
Semi-Annual Shareholder Report
June 30, 2024
Transamerica Janus Balanced VP
Transamerica Janus Balanced VP seeks long-term capital growth, consistent with preservation of capital and balanced by current income. This semi-annual shareholder report contains important information for the period of January 1, 2024 to June 30, 2024. You can find additional information about the Portfolio at transamerica.com/annuities/prospectus. You can also request this information by contacting us at 800-851-9777.
What were the Portfolio costs for the period?
Portfolio Overview Operating Expenses
(based on a hypothetical $10,000 investment)
Class Name |
Cost of a $10,000 investment |
Costs paid as a percentage of a $10,000 investment |
Initial Class |
$38 |
0.73% |
This table does not reflect any charges that are, or may be, imposed under your variable life insurance policy or variable annuity contract. If such charges were reflected, expenses would be higher.
Total Net Assets |
$958,993,817 |
Number of Portfolio Holdings |
736 |
Portfolio Turnover Rate |
31% |
What did the Portfolio invest in?
Top Asset Allocations (Percentage of Net Assets)
Common Stocks |
60.1% |
Corporate Debt Securities |
13.4 |
U.S. Government Agency Obligations |
10.8 |
Mortgage-Backed Securities |
5.5 |
U.S. Government Obligations |
5.3 |
Asset-Backed Securities |
4.3 |
Other Investment Company |
2.6 |
Repurchase Agreements |
2.0 |
Net Other Assets (Liabilities) |
(4.0) |
Top Holdings (Percentage of Net Assets)
Microsoft Corp. |
5.9% |
NVIDIA Corp. |
5.1 |
Apple, Inc. |
3.2 |
Alphabet, Inc., Class C |
3.0 |
Amazon.com, Inc. |
2.4 |
U.S. Treasury Bonds, 4.63%, 05/15/2044 |
2.3 |
Meta Platforms, Inc., Class A |
2.1 |
Mastercard, Inc., Class A |
2.0 |
U.S. Treasury Bonds, 4.25%, 02/15/2054 |
2.0 |
UnitedHealth Group, Inc. |
1.6 |
If you wish to view additional information about the Portfolio; including but not limited to full holdings, financial statements, proxy voting policies and other important documents, please see TST's most recent report on Form N-CSR available at transamerica.com/annuities/prospectus.
Transamerica Janus Balanced VP
Semi-Annual Shareholder Report
June 30, 2024
Transamerica Janus Balanced VP
Transamerica Janus Balanced VP seeks long-term capital growth, consistent with preservation of capital and balanced by current income. This semi-annual shareholder report contains important information for the period of January 1, 2024 to June 30, 2024. You can find additional information about the Portfolio at transamerica.com/annuities/prospectus. You can also request this information by contacting us at 800-851-9777.
What were the Portfolio costs for the period?
Portfolio Overview Operating Expenses
(based on a hypothetical $10,000 investment)
Class Name |
Cost of a $10,000 investment |
Costs paid as a percentage of a $10,000 investment |
Service Class |
$51 |
0.98% |
This table does not reflect any charges that are, or may be, imposed under your variable life insurance policy or variable annuity contract. If such charges were reflected, expenses would be higher.
Total Net Assets |
$958,993,817 |
Number of Portfolio Holdings |
736 |
Portfolio Turnover Rate |
31% |
What did the Portfolio invest in?
Top Asset Allocations (Percentage of Net Assets)
Common Stocks |
60.1% |
Corporate Debt Securities |
13.4 |
U.S. Government Agency Obligations |
10.8 |
Mortgage-Backed Securities |
5.5 |
U.S. Government Obligations |
5.3 |
Asset-Backed Securities |
4.3 |
Other Investment Company |
2.6 |
Repurchase Agreements |
2.0 |
Net Other Assets (Liabilities) |
(4.0) |
Top Holdings (Percentage of Net Assets)
Microsoft Corp. |
5.9% |
NVIDIA Corp. |
5.1 |
Apple, Inc. |
3.2 |
Alphabet, Inc., Class C |
3.0 |
Amazon.com, Inc. |
2.4 |
U.S. Treasury Bonds, 4.63%, 05/15/2044 |
2.3 |
Meta Platforms, Inc., Class A |
2.1 |
Mastercard, Inc., Class A |
2.0 |
U.S. Treasury Bonds, 4.25%, 02/15/2054 |
2.0 |
UnitedHealth Group, Inc. |
1.6 |
If you wish to view additional information about the Portfolio; including but not limited to full holdings, financial statements, proxy voting policies and other important documents, please see TST's most recent report on Form N-CSR available at transamerica.com/annuities/prospectus.
Transamerica Janus Balanced VP
Semi-Annual Shareholder Report
June 30, 2024
Transamerica Janus Mid-Cap Growth VP
Transamerica Janus Mid-Cap Growth VP seeks long-term capital appreciation. This semi-annual shareholder report contains important information for the period of January 1, 2024 to June 30, 2024. You can find additional information about the Portfolio at transamerica.com/annuities/prospectus. You can also request this information by contacting us at 800-851-9777.
What were the Portfolio costs for the period?
Portfolio Overview Operating Expenses
(based on a hypothetical $10,000 investment)
Class Name |
Cost of a $10,000 investment |
Costs paid as a percentage of a $10,000 investment |
Initial Class |
$43 |
0.85% |
This table does not reflect any charges that are, or may be, imposed under your variable life insurance policy or variable annuity contract. If such charges were reflected, expenses would be higher.
Total Net Assets |
$880,810,030 |
Number of Portfolio Holdings |
79 |
Portfolio Turnover Rate |
6% |
What did the Portfolio invest in?
Top Asset Allocations (Percentage of Net Assets)
Common Stocks |
99.0% |
Other Investment Company |
2.6 |
Repurchase Agreements |
1.3 |
Warrants |
0.0Footnote Reference* |
Net Other Assets (Liabilities) |
(2.9) |
| Footnote |
Description |
Footnote* |
Percentage rounds to less than 0.1% or (0.1)%. |
Top Holdings (Percentage of Net Assets)
Constellation Software, Inc. |
5.1% |
GoDaddy, Inc., Class A |
4.0 |
Boston Scientific Corp. |
3.9 |
Intact Financial Corp. |
2.8 |
Teleflex, Inc. |
2.7 |
SS&C Technologies Holdings, Inc. |
2.6 |
NXP Semiconductors NV |
2.6 |
WEX, Inc. |
2.5 |
W.R. Berkley Corp. |
2.2 |
Revvity, Inc. |
2.2 |
If you wish to view additional information about the Portfolio; including but not limited to full holdings, financial statements, proxy voting policies and other important documents, please see TST's most recent report on Form N-CSR available at transamerica.com/annuities/prospectus.
Transamerica Janus Mid-Cap Growth VP
Semi-Annual Shareholder Report
June 30, 2024
Transamerica Janus Mid-Cap Growth VP
Transamerica Janus Mid-Cap Growth VP seeks long-term capital appreciation. This semi-annual shareholder report contains important information for the period of January 1, 2024 to June 30, 2024. You can find additional information about the Portfolio at transamerica.com/annuities/prospectus. You can also request this information by contacting us at 800-851-9777.
What were the Portfolio costs for the period?
Portfolio Overview Operating Expenses
(based on a hypothetical $10,000 investment)
Class Name |
Cost of a $10,000 investment |
Costs paid as a percentage of a $10,000 investment |
Service Class |
$56 |
1.10% |
This table does not reflect any charges that are, or may be, imposed under your variable life insurance policy or variable annuity contract. If such charges were reflected, expenses would be higher.
Total Net Assets |
$880,810,030 |
Number of Portfolio Holdings |
79 |
Portfolio Turnover Rate |
6% |
What did the Portfolio invest in?
Top Asset Allocations (Percentage of Net Assets)
Common Stocks |
99.0% |
Other Investment Company |
2.6 |
Repurchase Agreements |
1.3 |
Warrants |
0.0Footnote Reference* |
Net Other Assets (Liabilities) |
(2.9) |
| Footnote |
Description |
Footnote* |
Percentage rounds to less than 0.1% or (0.1)%. |
Top Holdings (Percentage of Net Assets)
Constellation Software, Inc. |
5.1% |
GoDaddy, Inc., Class A |
4.0 |
Boston Scientific Corp. |
3.9 |
Intact Financial Corp. |
2.8 |
Teleflex, Inc. |
2.7 |
SS&C Technologies Holdings, Inc. |
2.6 |
NXP Semiconductors NV |
2.6 |
WEX, Inc. |
2.5 |
W.R. Berkley Corp. |
2.2 |
Revvity, Inc. |
2.2 |
If you wish to view additional information about the Portfolio; including but not limited to full holdings, financial statements, proxy voting policies and other important documents, please see TST's most recent report on Form N-CSR available at transamerica.com/annuities/prospectus.
Transamerica Janus Mid-Cap Growth VP
Semi-Annual Shareholder Report
June 30, 2024
Transamerica JPMorgan Asset Allocation - Conservative VP
Transamerica JPMorgan Asset Allocation - Conservative VP seeks current income and preservation of capital. This semi-annual shareholder report contains important information for the period of January 1, 2024 to June 30, 2024. You can find additional information about the Portfolio at transamerica.com/annuities/prospectus. You can also request this information by contacting us at 800-851-9777.
What were the Portfolio costs for the period?
Portfolio Overview Operating Expenses
(based on a hypothetical $10,000 investment)
Class Name |
Cost of a $10,000 investment |
Costs paid as a percentage of a $10,000 investment |
Initial Class |
$8 |
0.16% |
This table does not reflect any charges that are, or may be, imposed under your variable life insurance policy or variable annuity contract. If such charges were reflected, expenses would be higher.
Total Net Assets |
$812,257,680 |
Number of Portfolio Holdings |
21 |
Portfolio Turnover Rate |
7% |
What did the Portfolio invest in?
Asset Allocation (Percentage of Net Assets)
U.S. Fixed Income Funds |
41.6% |
U.S. Equity Funds |
25.4 |
International Mixed Allocation Funds |
23.1 |
International Equity Funds |
6.7 |
U.S. Government Obligations |
1.4 |
International Alternative Fund |
1.1 |
Repurchase Agreements |
0.7 |
Net Other Assets (Liabilities) |
0.0Footnote Reference* |
| Footnote |
Description |
Footnote* |
Percentage rounds to less than 0.1% or (0.1)%. |
Top Holdings (Percentage of Net Assets)
Transamerica Core Bond, Class I2 |
27.2% |
Transamerica Aegon Bond VP, Initial Class |
23.1 |
Transamerica WMC US Growth VP, Initial Class |
14.5 |
Transamerica High Yield Bond, Class I2 |
8.1 |
Transamerica Large Cap Value, Class I2 |
6.2 |
Transamerica Long Credit, Class I2 |
5.3 |
Transamerica JPMorgan Enhanced Index VP, Initial Class |
4.3 |
Transamerica International Focus, Class I2 |
2.1 |
Transamerica International Small Cap Value, Class I2 |
1.8 |
Transamerica Emerging Markets Opportunities, Class I2 |
1.4 |
If you wish to view additional information about the Portfolio; including but not limited to full holdings, financial statements, proxy voting policies and other important documents, please see TST's most recent report on Form N-CSR available at transamerica.com/annuities/prospectus.
Transamerica JPMorgan Asset Allocation - Conservative VP
Semi-Annual Shareholder Report
June 30, 2024
Transamerica JPMorgan Asset Allocation - Conservative VP
Transamerica JPMorgan Asset Allocation - Conservative VP seeks current income and preservation of capital. This semi-annual shareholder report contains important information for the period of January 1, 2024 to June 30, 2024. You can find additional information about the Portfolio at transamerica.com/annuities/prospectus. You can also request this information by contacting us at 800-851-9777.
What were the Portfolio costs for the period?
Portfolio Overview Operating Expenses
(based on a hypothetical $10,000 investment)
Class Name |
Cost of a $10,000 investment |
Costs paid as a percentage of a $10,000 investment |
Service Class |
$21 |
0.41% |
This table does not reflect any charges that are, or may be, imposed under your variable life insurance policy or variable annuity contract. If such charges were reflected, expenses would be higher.
Total Net Assets |
$812,257,680 |
Number of Portfolio Holdings |
21 |
Portfolio Turnover Rate |
7% |
What did the Portfolio invest in?
Asset Allocation (Percentage of Net Assets)
U.S. Fixed Income Funds |
41.6% |
U.S. Equity Funds |
25.4 |
International Mixed Allocation Funds |
23.1 |
International Equity Funds |
6.7 |
U.S. Government Obligations |
1.4 |
International Alternative Fund |
1.1 |
Repurchase Agreements |
0.7 |
Net Other Assets (Liabilities) |
0.0Footnote Reference* |
| Footnote |
Description |
Footnote* |
Percentage rounds to less than 0.1% or (0.1)%. |
Top Holdings (Percentage of Net Assets)
Transamerica Core Bond, Class I2 |
27.2% |
Transamerica Aegon Bond VP, Initial Class |
23.1 |
Transamerica WMC US Growth VP, Initial Class |
14.5 |
Transamerica High Yield Bond, Class I2 |
8.1 |
Transamerica Large Cap Value, Class I2 |
6.2 |
Transamerica Long Credit, Class I2 |
5.3 |
Transamerica JPMorgan Enhanced Index VP, Initial Class |
4.3 |
Transamerica International Focus, Class I2 |
2.1 |
Transamerica International Small Cap Value, Class I2 |
1.8 |
Transamerica Emerging Markets Opportunities, Class I2 |
1.4 |
If you wish to view additional information about the Portfolio; including but not limited to full holdings, financial statements, proxy voting policies and other important documents, please see TST's most recent report on Form N-CSR available at transamerica.com/annuities/prospectus.
Transamerica JPMorgan Asset Allocation - Conservative VP
Semi-Annual Shareholder Report
June 30, 2024
Transamerica JPMorgan Asset Allocation - Growth VP
Transamerica JPMorgan Asset Allocation - Growth VP seeks long-term capital appreciation. This semi-annual shareholder report contains important information for the period of January 1, 2024 to June 30, 2024. You can find additional information about the Portfolio at transamerica.com/annuities/prospectus. You can also request this information by contacting us at 800-851-9777.
What were the Portfolio costs for the period?
Portfolio Overview Operating Expenses
(based on a hypothetical $10,000 investment)
Class Name |
Cost of a $10,000 investment |
Costs paid as a percentage of a $10,000 investment |
Initial Class |
$8 |
0.16% |
This table does not reflect any charges that are, or may be, imposed under your variable life insurance policy or variable annuity contract. If such charges were reflected, expenses would be higher.
Total Net Assets |
$1,048,365,633 |
Number of Portfolio Holdings |
17 |
Portfolio Turnover Rate |
12% |
What did the Portfolio invest in?
Asset Allocation (Percentage of Net Assets)
U.S. Equity Funds |
73.6% |
International Equity Funds |
15.1 |
U.S. Fixed Income Funds |
9.3 |
U.S. Government Obligations |
1.0 |
Repurchase Agreements |
0.8 |
Net Other Assets (Liabilities) |
0.2 |
Top Holdings (Percentage of Net Assets)
Transamerica JPMorgan Enhanced Index VP, Initial Class |
39.6% |
Transamerica WMC US Growth VP, Initial Class |
18.9 |
Transamerica Large Cap Value, Class I2 |
11.4 |
Transamerica Aegon High Yield Bond VP, Initial Class |
6.6 |
Transamerica International Focus, Class I2 |
4.8 |
Transamerica International Equity, Class I2 |
3.9 |
Transamerica International Small Cap Value, Class I2 |
3.4 |
Transamerica Emerging Markets Opportunities, Class I2 |
2.7 |
Transamerica Floating Rate, Class I2 |
2.7 |
Transamerica Mid Cap Growth, Class I2 |
1.2 |
If you wish to view additional information about the Portfolio; including but not limited to full holdings, financial statements, proxy voting policies and other important documents, please see TST's most recent report on Form N-CSR available at transamerica.com/annuities/prospectus.
Transamerica JPMorgan Asset Allocation - Growth VP
Semi-Annual Shareholder Report
June 30, 2024
Transamerica JPMorgan Asset Allocation - Growth VP
Transamerica JPMorgan Asset Allocation - Growth VP seeks long-term capital appreciation. This semi-annual shareholder report contains important information for the period of January 1, 2024 to June 30, 2024. You can find additional information about the Portfolio at transamerica.com/annuities/prospectus. You can also request this information by contacting us at 800-851-9777.
What were the Portfolio costs for the period?
Portfolio Overview Operating Expenses
(based on a hypothetical $10,000 investment)
Class Name |
Cost of a $10,000 investment |
Costs paid as a percentage of a $10,000 investment |
Service Class |
$22 |
0.41% |
This table does not reflect any charges that are, or may be, imposed under your variable life insurance policy or variable annuity contract. If such charges were reflected, expenses would be higher.
Total Net Assets |
$1,048,365,633 |
Number of Portfolio Holdings |
17 |
Portfolio Turnover Rate |
12% |
What did the Portfolio invest in?
Asset Allocation (Percentage of Net Assets)
U.S. Equity Funds |
73.6% |
International Equity Funds |
15.1 |
U.S. Fixed Income Funds |
9.3 |
U.S. Government Obligations |
1.0 |
Repurchase Agreements |
0.8 |
Net Other Assets (Liabilities) |
0.2 |
Top Holdings (Percentage of Net Assets)
Transamerica JPMorgan Enhanced Index VP, Initial Class |
39.6% |
Transamerica WMC US Growth VP, Initial Class |
18.9 |
Transamerica Large Cap Value, Class I2 |
11.4 |
Transamerica Aegon High Yield Bond VP, Initial Class |
6.6 |
Transamerica International Focus, Class I2 |
4.8 |
Transamerica International Equity, Class I2 |
3.9 |
Transamerica International Small Cap Value, Class I2 |
3.4 |
Transamerica Emerging Markets Opportunities, Class I2 |
2.7 |
Transamerica Floating Rate, Class I2 |
2.7 |
Transamerica Mid Cap Growth, Class I2 |
1.2 |
If you wish to view additional information about the Portfolio; including but not limited to full holdings, financial statements, proxy voting policies and other important documents, please see TST's most recent report on Form N-CSR available at transamerica.com/annuities/prospectus.
Transamerica JPMorgan Asset Allocation - Growth VP
Semi-Annual Shareholder Report
June 30, 2024
Transamerica JPMorgan Asset Allocation - Moderate Growth VP
Transamerica JPMorgan Asset Allocation - Moderate Growth VP seeks capital appreciation with current income as a secondary objective. This semi-annual shareholder report contains important information for the period of January 1, 2024 to June 30, 2024. You can find additional information about the Portfolio at transamerica.com/annuities/prospectus. You can also request this information by contacting us at 800-851-9777.
What were the Portfolio costs for the period?
Portfolio Overview Operating Expenses
(based on a hypothetical $10,000 investment)
Class Name |
Cost of a $10,000 investment |
Costs paid as a percentage of a $10,000 investment |
Initial Class |
$8 |
0.15% |
This table does not reflect any charges that are, or may be, imposed under your variable life insurance policy or variable annuity contract. If such charges were reflected, expenses would be higher.
Total Net Assets |
$3,440,778,843 |
Number of Portfolio Holdings |
22 |
Portfolio Turnover Rate |
10% |
What did the Portfolio invest in?
Asset Allocation (Percentage of Net Assets)
U.S. Equity Funds |
52.7% |
U.S. Fixed Income Funds |
16.1 |
International Mixed Allocation Funds |
14.7 |
International Equity Funds |
13.8 |
U.S. Government Obligations |
1.3 |
International Alternative Funds |
1.0 |
Repurchase Agreements |
0.3 |
Net Other Assets (Liabilities) |
0.1 |
Top Holdings (Percentage of Net Assets)
Transamerica JPMorgan Enhanced Index VP, Initial Class |
30.5% |
Transamerica Aegon Bond VP, Initial Class |
14.7 |
Transamerica WMC US Growth VP, Initial Class |
13.4 |
Transamerica High Yield Bond, Class I2 |
8.9 |
Transamerica Large Cap Value, Class I2 |
6.4 |
Transamerica Long Credit, Class I2 |
5.0 |
Transamerica International Focus, Class I2 |
3.8 |
Transamerica International Equity, Class I2 |
3.4 |
Transamerica International Small Cap Value, Class I2 |
3.2 |
Transamerica Emerging Markets Opportunities, Class I2 |
3.1 |
If you wish to view additional information about the Portfolio; including but not limited to full holdings, financial statements, proxy voting policies and other important documents, please see TST's most recent report on Form N-CSR available at transamerica.com/annuities/prospectus.
Transamerica JPMorgan Asset Allocation - Moderate Growth VP
Semi-Annual Shareholder Report
June 30, 2024
Transamerica JPMorgan Asset Allocation - Moderate Growth VP
Transamerica JPMorgan Asset Allocation - Moderate Growth VP seeks capital appreciation with current income as a secondary objective. This semi-annual shareholder report contains important information for the period of January 1, 2024 to June 30, 2024. You can find additional information about the Portfolio at transamerica.com/annuities/prospectus. You can also request this information by contacting us at 800-851-9777.
What were the Portfolio costs for the period?
Portfolio Overview Operating Expenses
(based on a hypothetical $10,000 investment)
Class Name |
Cost of a $10,000 investment |
Costs paid as a percentage of a $10,000 investment |
Service Class |
$21 |
0.40% |
This table does not reflect any charges that are, or may be, imposed under your variable life insurance policy or variable annuity contract. If such charges were reflected, expenses would be higher.
Total Net Assets |
$3,440,778,843 |
Number of Portfolio Holdings |
22 |
Portfolio Turnover Rate |
10% |
What did the Portfolio invest in?
Asset Allocation (Percentage of Net Assets)
U.S. Equity Funds |
52.7% |
U.S. Fixed Income Funds |
16.1 |
International Mixed Allocation Funds |
14.7 |
International Equity Funds |
13.8 |
U.S. Government Obligations |
1.3 |
International Alternative Funds |
1.0 |
Repurchase Agreements |
0.3 |
Net Other Assets (Liabilities) |
0.1 |
Top Holdings (Percentage of Net Assets)
Transamerica JPMorgan Enhanced Index VP, Initial Class |
30.5% |
Transamerica Aegon Bond VP, Initial Class |
14.7 |
Transamerica WMC US Growth VP, Initial Class |
13.4 |
Transamerica High Yield Bond, Class I2 |
8.9 |
Transamerica Large Cap Value, Class I2 |
6.4 |
Transamerica Long Credit, Class I2 |
5.0 |
Transamerica International Focus, Class I2 |
3.8 |
Transamerica International Equity, Class I2 |
3.4 |
Transamerica International Small Cap Value, Class I2 |
3.2 |
Transamerica Emerging Markets Opportunities, Class I2 |
3.1 |
If you wish to view additional information about the Portfolio; including but not limited to full holdings, financial statements, proxy voting policies and other important documents, please see TST's most recent report on Form N-CSR available at transamerica.com/annuities/prospectus.
Transamerica JPMorgan Asset Allocation - Moderate Growth VP
Semi-Annual Shareholder Report
June 30, 2024
Transamerica JPMorgan Asset Allocation - Moderate VP
Transamerica JPMorgan Asset Allocation - Moderate VP seeks capital appreciation and current income. This semi-annual shareholder report contains important information for the period of January 1, 2024 to June 30, 2024. You can find additional information about the Portfolio at transamerica.com/annuities/prospectus. You can also request this information by contacting us at 800-851-9777.
What were the Portfolio costs for the period?
Portfolio Overview Operating Expenses
(based on a hypothetical $10,000 investment)
Class Name |
Cost of a $10,000 investment |
Costs paid as a percentage of a $10,000 investment |
Initial Class |
$8 |
0.15% |
This table does not reflect any charges that are, or may be, imposed under your variable life insurance policy or variable annuity contract. If such charges were reflected, expenses would be higher.
Total Net Assets |
$5,048,098,916 |
Number of Portfolio Holdings |
22 |
Portfolio Turnover Rate |
9% |
What did the Portfolio invest in?
Asset Allocation (Percentage of Net Assets)
U.S. Equity Funds |
38.3% |
U.S. Fixed Income Funds |
30.5 |
International Mixed Allocation Funds |
18.4 |
International Equity Funds |
10.1 |
U.S. Government Obligations |
1.2 |
International Alternative Funds |
1.1 |
Repurchase Agreements |
0.4 |
Net Other Assets (Liabilities) |
0.0Footnote Reference* |
| Footnote |
Description |
Footnote* |
Percentage rounds to less than 0.1% or (0.1)%. |
Top Holdings (Percentage of Net Assets)
Transamerica Aegon Bond VP, Initial Class |
18.4% |
Transamerica JPMorgan Enhanced Index VP, Initial Class |
17.7 |
Transamerica Core Bond, Class I2 |
15.8 |
Transamerica WMC US Growth VP, Initial Class |
13.8 |
Transamerica High Yield Bond, Class I2 |
8.6 |
Transamerica Large Cap Value, Class I2 |
5.8 |
Transamerica Long Credit, Class I2 |
5.1 |
Transamerica International Focus, Class I2 |
2.8 |
Transamerica Emerging Markets Opportunities, Class I2 |
2.6 |
Transamerica International Small Cap Value, Class I2 |
2.4 |
If you wish to view additional information about the Portfolio; including but not limited to full holdings, financial statements, proxy voting policies and other important documents, please see TST's most recent report on Form N-CSR available at transamerica.com/annuities/prospectus.
Transamerica JPMorgan Asset Allocation - Moderate VP
Semi-Annual Shareholder Report
June 30, 2024
Transamerica JPMorgan Asset Allocation - Moderate VP
Transamerica JPMorgan Asset Allocation - Moderate VP seeks capital appreciation and current income. This semi-annual shareholder report contains important information for the period of January 1, 2024 to June 30, 2024. You can find additional information about the Portfolio at transamerica.com/annuities/prospectus. You can also request this information by contacting us at 800-851-9777.
What were the Portfolio costs for the period?
Portfolio Overview Operating Expenses
(based on a hypothetical $10,000 investment)
Class Name |
Cost of a $10,000 investment |
Costs paid as a percentage of a $10,000 investment |
Service Class |
$20 |
0.40% |
This table does not reflect any charges that are, or may be, imposed under your variable life insurance policy or variable annuity contract. If such charges were reflected, expenses would be higher.
Total Net Assets |
$5,048,098,916 |
Number of Portfolio Holdings |
22 |
Portfolio Turnover Rate |
9% |
What did the Portfolio invest in?
Asset Allocation (Percentage of Net Assets)
U.S. Equity Funds |
38.3% |
U.S. Fixed Income Funds |
30.5 |
International Mixed Allocation Funds |
18.4 |
International Equity Funds |
10.1 |
U.S. Government Obligations |
1.2 |
International Alternative Funds |
1.1 |
Repurchase Agreements |
0.4 |
Net Other Assets (Liabilities) |
0.0Footnote Reference* |
| Footnote |
Description |
Footnote* |
Percentage rounds to less than 0.1% or (0.1)%. |
Top Holdings (Percentage of Net Assets)
Transamerica Aegon Bond VP, Initial Class |
18.4% |
Transamerica JPMorgan Enhanced Index VP, Initial Class |
17.7 |
Transamerica Core Bond, Class I2 |
15.8 |
Transamerica WMC US Growth VP, Initial Class |
13.8 |
Transamerica High Yield Bond, Class I2 |
8.6 |
Transamerica Large Cap Value, Class I2 |
5.8 |
Transamerica Long Credit, Class I2 |
5.1 |
Transamerica International Focus, Class I2 |
2.8 |
Transamerica Emerging Markets Opportunities, Class I2 |
2.6 |
Transamerica International Small Cap Value, Class I2 |
2.4 |
If you wish to view additional information about the Portfolio; including but not limited to full holdings, financial statements, proxy voting policies and other important documents, please see TST's most recent report on Form N-CSR available at transamerica.com/annuities/prospectus.
Transamerica JPMorgan Asset Allocation - Moderate VP
Semi-Annual Shareholder Report
June 30, 2024
Transamerica JPMorgan Enhanced Index VP
Transamerica JPMorgan Enhanced Index VP seeks to earn a total return modestly in excess of the total return performance of the S&P 500® (including the reinvestment of dividends) while maintaining a volatility of return similar to the S&P 500®. This semi-annual shareholder report contains important information for the period of January 1, 2024 to June 30, 2024. You can find additional information about the Portfolio at transamerica.com/annuities/prospectus. You can also request this information by contacting us at 800-851-9777.
What were the Portfolio costs for the period?
Portfolio Overview Operating Expenses
(based on a hypothetical $10,000 investment)
Class Name |
Cost of a $10,000 investment |
Costs paid as a percentage of a $10,000 investment |
Initial Class |
$33 |
0.61% |
This table does not reflect any charges that are, or may be, imposed under your variable life insurance policy or variable annuity contract. If such charges were reflected, expenses would be higher.
Total Net Assets |
$3,265,047,473 |
Number of Portfolio Holdings |
162 |
Portfolio Turnover Rate |
20% |
What did the Portfolio invest in?
Top Asset Allocations (Percentage of Net Assets)
Common Stocks |
97.2% |
Repurchase Agreement |
2.0 |
Net Other Assets (Liabilities) |
0.8 |
Top Holdings (Percentage of Net Assets)
Microsoft Corp. |
7.8% |
NVIDIA Corp. |
6.9 |
Apple, Inc. |
6.7 |
Amazon.com, Inc. |
4.3 |
Meta Platforms, Inc., Class A |
2.7 |
Alphabet, Inc., Class A |
2.3 |
Alphabet, Inc., Class C |
1.7 |
Exxon Mobil Corp. |
1.7 |
UnitedHealth Group, Inc. |
1.5 |
Mastercard, Inc., Class A |
1.5 |
If you wish to view additional information about the Portfolio; including but not limited to full holdings, financial statements, proxy voting policies and other important documents, please see TST's most recent report on Form N-CSR available at transamerica.com/annuities/prospectus.
Transamerica JPMorgan Enhanced Index VP
Semi-Annual Shareholder Report
June 30, 2024
Transamerica JPMorgan Enhanced Index VP
Transamerica JPMorgan Enhanced Index VP seeks to earn a total return modestly in excess of the total return performance of the S&P 500® (including the reinvestment of dividends) while maintaining a volatility of return similar to the S&P 500®. This semi-annual shareholder report contains important information for the period of January 1, 2024 to June 30, 2024. You can find additional information about the Portfolio at transamerica.com/annuities/prospectus. You can also request this information by contacting us at 800-851-9777.
What were the Portfolio costs for the period?
Portfolio Overview Operating Expenses
(based on a hypothetical $10,000 investment)
Class Name |
Cost of a $10,000 investment |
Costs paid as a percentage of a $10,000 investment |
Service Class |
$46 |
0.86% |
This table does not reflect any charges that are, or may be, imposed under your variable life insurance policy or variable annuity contract. If such charges were reflected, expenses would be higher.
Total Net Assets |
$3,265,047,473 |
Number of Portfolio Holdings |
162 |
Portfolio Turnover Rate |
20% |
What did the Portfolio invest in?
Top Asset Allocations (Percentage of Net Assets)
Common Stocks |
97.2% |
Repurchase Agreement |
2.0 |
Net Other Assets (Liabilities) |
0.8 |
Top Holdings (Percentage of Net Assets)
Microsoft Corp. |
7.8% |
NVIDIA Corp. |
6.9 |
Apple, Inc. |
6.7 |
Amazon.com, Inc. |
4.3 |
Meta Platforms, Inc., Class A |
2.7 |
Alphabet, Inc., Class A |
2.3 |
Alphabet, Inc., Class C |
1.7 |
Exxon Mobil Corp. |
1.7 |
UnitedHealth Group, Inc. |
1.5 |
Mastercard, Inc., Class A |
1.5 |
If you wish to view additional information about the Portfolio; including but not limited to full holdings, financial statements, proxy voting policies and other important documents, please see TST's most recent report on Form N-CSR available at transamerica.com/annuities/prospectus.
Transamerica JPMorgan Enhanced Index VP
Semi-Annual Shareholder Report
June 30, 2024
Transamerica JPMorgan International Moderate Growth VP
Transamerica JPMorgan International Moderate Growth VP seeks capital appreciation with current income as a secondary objective. This semi-annual shareholder report contains important information for the period of January 1, 2024 to June 30, 2024. You can find additional information about the Portfolio at transamerica.com/annuities/prospectus. You can also request this information by contacting us at 800-851-9777.
What were the Portfolio costs for the period?
Portfolio Overview Operating Expenses
(based on a hypothetical $10,000 investment)
Class Name |
Cost of a $10,000 investment |
Costs paid as a percentage of a $10,000 investment |
Initial Class |
$9 |
0.17% |
This table does not reflect any charges that are, or may be, imposed under your variable life insurance policy or variable annuity contract. If such charges were reflected, expenses would be higher.
Total Net Assets |
$387,641,343 |
Number of Portfolio Holdings |
15 |
Portfolio Turnover Rate |
14% |
What did the Portfolio invest in?
Asset Allocation (Percentage of Net Assets)
International Equity Funds |
53.6% |
U.S. Fixed Income Funds |
16.9 |
International Mixed Allocation Funds |
14.1 |
U.S. Equity Funds |
11.5 |
U.S. Government Obligations |
2.1 |
International Alternative Funds |
1.1 |
Repurchase Agreements |
0.7 |
Net Other Assets (Liabilities) |
0.0Footnote Reference* |
| Footnote |
Description |
Footnote* |
Percentage rounds to less than 0.1% or (0.1)%. |
Top Holdings (Percentage of Net Assets)
Transamerica International Focus, Class I2 |
20.8% |
Transamerica International Equity, Class I2 |
18.4 |
Transamerica International Small Cap Value, Class I2 |
14.2 |
Transamerica Aegon Bond VP, Initial Class |
14.1 |
Transamerica WMC US Growth VP, Initial Class |
11.5 |
Transamerica High Yield Bond, Class I2 |
9.3 |
Transamerica Long Credit, Class I2 |
5.2 |
U.S. Treasury Notes, 4.13%, 01/31/2025 |
2.1 |
Transamerica Core Bond, Class I2 |
1.3 |
Transamerica Unconstrained Bond, Class I2 |
1.1 |
If you wish to view additional information about the Portfolio; including but not limited to full holdings, financial statements, proxy voting policies and other important documents, please see TST's most recent report on Form N-CSR available at transamerica.com/annuities/prospectus.
Transamerica JPMorgan International Moderate Growth VP
Semi-Annual Shareholder Report
June 30, 2024
Transamerica JPMorgan International Moderate Growth VP
Transamerica JPMorgan International Moderate Growth VP seeks capital appreciation with current income as a secondary objective. This semi-annual shareholder report contains important information for the period of January 1, 2024 to June 30, 2024. You can find additional information about the Portfolio at transamerica.com/annuities/prospectus. You can also request this information by contacting us at 800-851-9777.
What were the Portfolio costs for the period?
Portfolio Overview Operating Expenses
(based on a hypothetical $10,000 investment)
Class Name |
Cost of a $10,000 investment |
Costs paid as a percentage of a $10,000 investment |
Service Class |
$21 |
0.42% |
This table does not reflect any charges that are, or may be, imposed under your variable life insurance policy or variable annuity contract. If such charges were reflected, expenses would be higher.
Total Net Assets |
$387,641,343 |
Number of Portfolio Holdings |
15 |
Portfolio Turnover Rate |
14% |
What did the Portfolio invest in?
Asset Allocation (Percentage of Net Assets)
International Equity Funds |
53.6% |
U.S. Fixed Income Funds |
16.9 |
International Mixed Allocation Funds |
14.1 |
U.S. Equity Funds |
11.5 |
U.S. Government Obligations |
2.1 |
International Alternative Funds |
1.1 |
Repurchase Agreements |
0.7 |
Net Other Assets (Liabilities) |
0.0Footnote Reference* |
| Footnote |
Description |
Footnote* |
Percentage rounds to less than 0.1% or (0.1)%. |
Top Holdings (Percentage of Net Assets)
Transamerica International Focus, Class I2 |
20.8% |
Transamerica International Equity, Class I2 |
18.4 |
Transamerica International Small Cap Value, Class I2 |
14.2 |
Transamerica Aegon Bond VP, Initial Class |
14.1 |
Transamerica WMC US Growth VP, Initial Class |
11.5 |
Transamerica High Yield Bond, Class I2 |
9.3 |
Transamerica Long Credit, Class I2 |
5.2 |
U.S. Treasury Notes, 4.13%, 01/31/2025 |
2.1 |
Transamerica Core Bond, Class I2 |
1.3 |
Transamerica Unconstrained Bond, Class I2 |
1.1 |
If you wish to view additional information about the Portfolio; including but not limited to full holdings, financial statements, proxy voting policies and other important documents, please see TST's most recent report on Form N-CSR available at transamerica.com/annuities/prospectus.
Transamerica JPMorgan International Moderate Growth VP
Semi-Annual Shareholder Report
June 30, 2024
Transamerica JPMorgan Tactical Allocation VP
Transamerica JPMorgan Tactical Allocation VP seeks current income and preservation of capital. This semi-annual shareholder report contains important information for the period of January 1, 2024 to June 30, 2024. You can find additional information about the Portfolio at transamerica.com/annuities/prospectus. You can also request this information by contacting us at 800-851-9777.
What were the Portfolio costs for the period?
Portfolio Overview Operating Expenses
(based on a hypothetical $10,000 investment)
Class Name |
Cost of a $10,000 investment |
Costs paid as a percentage of a $10,000 investment |
Initial Class |
$39 |
0.78% |
This table does not reflect any charges that are, or may be, imposed under your variable life insurance policy or variable annuity contract. If such charges were reflected, expenses would be higher.
Total Net Assets |
$981,962,448 |
Number of Portfolio Holdings |
1,220 |
Portfolio Turnover Rate |
38% |
What did the Portfolio invest in?
Top Asset Allocations (Percentage of Net Assets)
Common Stocks |
30.2% |
U.S. Government Agency Obligations |
21.8 |
Corporate Debt Securities |
21.2 |
U.S. Government Obligations |
18.8 |
Investment Companies |
4.7 |
Repurchase Agreements |
2.0 |
Mortgage-Backed Securities |
0.5 |
Asset-Backed Securities |
0.3 |
Net Other Assets (Liabilities) |
0.5 |
Transamerica JPMorgan Tactical Allocation VP
Top Country Allocation (Percentage of Net Assets)
United States of America |
83.0% |
United Kingdom |
2.8 |
France |
2.2 |
Japan |
1.6 |
Switzerland |
0.9 |
Germany |
0.8 |
Netherlands |
0.8 |
Canada |
0.5 |
Taiwan |
0.5 |
Denmark |
0.5 |
Top Holdings (Percentage of Net Assets)
JPMorgan High Yield Fund, Class R6 |
4.7% |
U.S. Treasury Notes, 1.13%, 10/31/2026 |
3.7 |
U.S. Treasury Notes, 1.38%, 10/31/2028 |
3.1 |
U.S. Treasury Notes, 2.63%, 05/31/2027 |
2.6 |
Microsoft Corp. |
1.6 |
U.S. Treasury Notes, 4.63%, 04/30/2029 |
1.3 |
NVIDIA Corp. |
1.3 |
U.S. Treasury Notes, 4.88%, 04/30/2026 |
1.2 |
Amazon.com, Inc. |
1.1 |
U.S. Treasury Bonds, 4.50%, 02/15/2044 |
1.1 |
If you wish to view additional information about the Portfolio; including but not limited to full holdings, financial statements, proxy voting policies and other important documents, please see TST's most recent report on Form N-CSR available at transamerica.com/annuities/prospectus.
Transamerica JPMorgan Tactical Allocation VP
Semi-Annual Shareholder Report
June 30, 2024
Transamerica JPMorgan Tactical Allocation VP
Transamerica JPMorgan Tactical Allocation VP seeks current income and preservation of capital. This semi-annual shareholder report contains important information for the period of January 1, 2024 to June 30, 2024. You can find additional information about the Portfolio at transamerica.com/annuities/prospectus. You can also request this information by contacting us at 800-851-9777.
What were the Portfolio costs for the period?
Portfolio Overview Operating Expenses
(based on a hypothetical $10,000 investment)
Class Name |
Cost of a $10,000 investment |
Costs paid as a percentage of a $10,000 investment |
Service Class |
$52 |
1.03% |
This table does not reflect any charges that are, or may be, imposed under your variable life insurance policy or variable annuity contract. If such charges were reflected, expenses would be higher.
Total Net Assets |
$981,962,448 |
Number of Portfolio Holdings |
1,220 |
Portfolio Turnover Rate |
38% |
What did the Portfolio invest in?
Top Asset Allocations (Percentage of Net Assets)
Common Stocks |
30.2% |
U.S. Government Agency Obligations |
21.8 |
Corporate Debt Securities |
21.2 |
U.S. Government Obligations |
18.8 |
Investment Companies |
4.7 |
Repurchase Agreements |
2.0 |
Mortgage-Backed Securities |
0.5 |
Asset-Backed Securities |
0.3 |
Net Other Assets (Liabilities) |
0.5 |
Transamerica JPMorgan Tactical Allocation VP
Top Country Allocation (Percentage of Net Assets)
United States of America |
83.0% |
United Kingdom |
2.8 |
France |
2.2 |
Japan |
1.6 |
Switzerland |
0.9 |
Germany |
0.8 |
Netherlands |
0.8 |
Canada |
0.5 |
Taiwan |
0.5 |
Denmark |
0.5 |
Top Holdings (Percentage of Net Assets)
JPMorgan High Yield Fund, Class R6 |
4.7% |
U.S. Treasury Notes, 1.13%, 10/31/2026 |
3.7 |
U.S. Treasury Notes, 1.38%, 10/31/2028 |
3.1 |
U.S. Treasury Notes, 2.63%, 05/31/2027 |
2.6 |
Microsoft Corp. |
1.6 |
U.S. Treasury Notes, 4.63%, 04/30/2029 |
1.3 |
NVIDIA Corp. |
1.3 |
U.S. Treasury Notes, 4.88%, 04/30/2026 |
1.2 |
Amazon.com, Inc. |
1.1 |
U.S. Treasury Bonds, 4.50%, 02/15/2044 |
1.1 |
If you wish to view additional information about the Portfolio; including but not limited to full holdings, financial statements, proxy voting policies and other important documents, please see TST's most recent report on Form N-CSR available at transamerica.com/annuities/prospectus.
Transamerica JPMorgan Tactical Allocation VP
Semi-Annual Shareholder Report
June 30, 2024
Transamerica Madison Diversified Income VP
Transamerica Madison Diversified Income VP seeks high total return through the combination of income and capital appreciation. This semi-annual shareholder report contains important information for the period of January 1, 2024 to June 30, 2024. You can find additional information about the Portfolio at transamerica.com/annuities/prospectus. You can also request this information by contacting us at 800-851-9777.
What were the Portfolio costs for the period?
Portfolio Overview Operating Expenses
(based on a hypothetical $10,000 investment)
Class Name |
Cost of a $10,000 investment |
Costs paid as a percentage of a $10,000 investment |
Service Class |
$54 |
1.08% |
This table does not reflect any charges that are, or may be, imposed under your variable life insurance policy or variable annuity contract. If such charges were reflected, expenses would be higher.
Total Net Assets |
$119,549,974 |
Number of Portfolio Holdings |
331 |
Portfolio Turnover Rate |
12% |
What did the Portfolio invest in?
Top Asset Allocations (Percentage of Net Assets)
Common Stocks |
39.0% |
U.S. Government Agency Obligations |
23.2 |
Corporate Debt Securities |
18.2 |
U.S. Government Obligations |
12.7 |
Mortgage-Backed Securities |
3.0 |
Asset-Backed Securities |
2.7 |
Repurchase Agreements |
0.7 |
Other Investment Company |
0.2 |
Net Other Assets (Liabilities) |
0.3 |
Top Holdings (Percentage of Net Assets)
U.S. Treasury Notes, 2.63%, 02/15/2029 |
1.9% |
U.S. Treasury Notes, 2.88%, 05/15/2028 |
1.8 |
NextEra Energy, Inc. |
1.6 |
Morgan Stanley |
1.5 |
Automatic Data Processing, Inc. |
1.5 |
Honeywell International, Inc. |
1.5 |
Texas Instruments, Inc. |
1.5 |
Fastenal Co. |
1.5 |
Home Depot, Inc. |
1.4 |
Medtronic PLC |
1.4 |
If you wish to view additional information about the Portfolio; including but not limited to full holdings, financial statements, proxy voting policies and other important documents, please see TST's most recent report on Form N-CSR available at transamerica.com/annuities/prospectus.
Transamerica Madison Diversified Income VP
Semi-Annual Shareholder Report
June 30, 2024
Transamerica Market Participation Strategy VP
Transamerica Market Participation Strategy VP seeks capital appreciation. This semi-annual shareholder report contains important information for the period of January 1, 2024 to June 30, 2024. You can find additional information about the Portfolio at transamerica.com/annuities/prospectus. You can also request this information by contacting us at 800-851-9777.
What were the Portfolio costs for the period?
Portfolio Overview Operating Expenses
(based on a hypothetical $10,000 investment)
Class Name |
Cost of a $10,000 investment |
Costs paid as a percentage of a $10,000 investment |
Service Class |
$51 |
0.98% |
This table does not reflect any charges that are, or may be, imposed under your variable life insurance policy or variable annuity contract. If such charges were reflected, expenses would be higher.
Total Net Assets |
$322,830,244 |
Number of Portfolio Holdings |
12 |
Portfolio Turnover Rate |
10% |
What did the Portfolio invest in?
Top Asset Allocations (Percentage of Net Assets)
Short-Term U.S. Government Obligations |
24.5% |
U.S. Government Obligations |
22.9 |
U.S. Government Agency Obligations |
19.8 |
Other Investment Company |
9.5 |
Foreign Government Obligations |
9.1 |
Repurchase Agreements |
4.1 |
Net Other Assets (Liabilities) |
10.1 |
Top Holdings (Percentage of Net Assets)
U.S. Treasury Notes, 1.63%, 10/31/2026 |
17.9% |
U.S. Treasury Bills, 5.38%, 10/15/2024 |
13.7 |
U.S. Treasury Bills, 5.31%, 08/01/2024 |
10.8 |
Federal Home Loan Banks, 3.25%, 11/16/2028 |
8.6 |
Federal National Mortgage Association, 0.63%, 04/22/2025 |
7.5 |
U.S. Treasury Bonds, Principal Only STRIPS Zero Coupon, 02/15/2027 |
5.0 |
International Bank for Reconstruction & Development, 0.88%, 07/15/2026 |
4.9 |
Federal National Mortgage Association, 6.25%, 05/15/2029 |
2.2 |
Inter-American Development Bank, 4.00%, 01/12/2028 |
2.1 |
European Investment Bank, 3.88%, 03/15/2028 |
2.1 |
If you wish to view additional information about the Portfolio; including but not limited to full holdings, financial statements, proxy voting policies and other important documents, please see TST's most recent report on Form N-CSR available at transamerica.com/annuities/prospectus.
Transamerica Market Participation Strategy VP
Semi-Annual Shareholder Report
June 30, 2024
Transamerica Morgan Stanley Capital Growth VP
Transamerica Morgan Stanley Capital Growth VP seeks to maximize long-term growth. This semi-annual shareholder report contains important information for the period of January 1, 2024 to June 30, 2024. You can find additional information about the Portfolio at transamerica.com/annuities/prospectus. You can also request this information by contacting us at 800-851-9777.
What were the Portfolio costs for the period?
Portfolio Overview Operating Expenses
(based on a hypothetical $10,000 investment)
Class Name |
Cost of a $10,000 investment |
Costs paid as a percentage of a $10,000 investment |
Initial Class |
$38 |
0.76% |
This table does not reflect any charges that are, or may be, imposed under your variable life insurance policy or variable annuity contract. If such charges were reflected, expenses would be higher.
Total Net Assets |
$129,608,299 |
Number of Portfolio Holdings |
30 |
Portfolio Turnover Rate |
19% |
What did the Portfolio invest in?
Top Asset Allocations (Percentage of Net Assets)
Common Stocks |
93.6% |
Repurchase Agreements |
6.6 |
Other Investment Company |
3.7 |
Net Other Assets (Liabilities) |
(3.9) |
Top Holdings (Percentage of Net Assets)
Cloudflare, Inc., Class A |
8.0% |
Trade Desk, Inc., Class A |
7.9 |
DoorDash, Inc., Class A |
6.9 |
Shopify, Inc., Class A |
5.9 |
Tesla, Inc. |
5.6 |
ROBLOX Corp., Class A |
4.9 |
Snowflake, Inc., Class A |
4.8 |
Airbnb, Inc., Class A |
4.7 |
Affirm Holdings, Inc. |
4.7 |
Royalty Pharma PLC, Class A |
4.6 |
If you wish to view additional information about the Portfolio; including but not limited to full holdings, financial statements, proxy voting policies and other important documents, please see TST's most recent report on Form N-CSR available at transamerica.com/annuities/prospectus.
Transamerica Morgan Stanley Capital Growth VP
Semi-Annual Shareholder Report
June 30, 2024
Transamerica Morgan Stanley Global Allocation Managed Risk - Balanced VP
Transamerica Morgan Stanley Global Allocation Managed Risk - Balanced VP seeks to provide capital appreciation and income while seeking to managed volatility. This semi-annual shareholder report contains important information for the period of January 1, 2024 to June 30, 2024. You can find additional information about the Portfolio at transamerica.com/annuities/prospectus. You can also request this information by contacting us at 800-851-9777.
What were the Portfolio costs for the period?
Portfolio Overview Operating Expenses
(based on a hypothetical $10,000 investment)
Class Name |
Cost of a $10,000 investment |
Costs paid as a percentage of a $10,000 investment |
Service Class |
$24 |
0.47% |
This table does not reflect any charges that are, or may be, imposed under your variable life insurance policy or variable annuity contract. If such charges were reflected, expenses would be higher.
Total Net Assets |
$212,851,259 |
Number of Portfolio Holdings |
2 |
Portfolio Turnover Rate |
0% |
What did the Portfolio invest in?
Asset Allocation (Percentage of Net Assets)
International Mixed Allocation Funds |
97.7% |
Repurchase Agreements |
2.4 |
Net Other Assets (Liabilities) |
(0.1) |
Top Holdings (Percentage of Net Assets)
Transamerica Morgan Stanley Global Allocation VP, Initial Class |
97.7% |
If you wish to view additional information about the Portfolio; including but not limited to full holdings, financial statements, proxy voting policies and other important documents, please see TST's most recent report on Form N-CSR available at transamerica.com/annuities/prospectus.
Transamerica Morgan Stanley Global Allocation Managed Risk - Balanced VP
Semi-Annual Shareholder Report
June 30, 2024
Transamerica Morgan Stanley Global Allocation VP
Transamerica Morgan Stanley Global Allocation VP seeks high total return. This semi-annual shareholder report contains important information for the period of January 1, 2024 to June 30, 2024. You can find additional information about the Portfolio at transamerica.com/annuities/prospectus. You can also request this information by contacting us at 800-851-9777.
What were the Portfolio costs for the period?
Portfolio Overview Operating Expenses
(based on a hypothetical $10,000 investment)
Class Name |
Cost of a $10,000 investment |
Costs paid as a percentage of a $10,000 investment |
Initial Class |
$41 |
0.81% |
This table does not reflect any charges that are, or may be, imposed under your variable life insurance policy or variable annuity contract. If such charges were reflected, expenses would be higher.
Total Net Assets |
$998,461,565 |
Number of Portfolio Holdings |
1,499 |
Portfolio Turnover Rate |
31% |
What did the Portfolio invest in?
Top Asset Allocations (Percentage of Net Assets)
Common Stocks |
27.9% |
Foreign Government Obligations |
25.7 |
Repurchase Agreements |
18.5 |
Corporate Debt Securities |
11.0 |
U.S. Government Obligations |
7.4 |
U.S. Government Agency Obligations |
4.8 |
Mortgage-Backed Securities |
2.4 |
Short-Term U.S. Government Obligations |
1.4 |
Net Other Assets (Liabilities) |
0.9 |
Transamerica Morgan Stanley Global Allocation VP
Top Country Allocation (Percentage of Net Assets)
United States of America |
35.5% |
China |
6.8 |
France |
4.2 |
United Kingdom |
4.0 |
Canada |
3.7 |
Germany |
3.7 |
Republic Of South Africa |
3.0 |
Japan |
2.3 |
Spain |
2.1 |
Australia |
2.0 |
Top Holdings (Percentage of Net Assets)
China Government Bonds, 2.76%, 05/15/2032 |
2.3% |
Republic of South Africa Government Bonds, 8.88%, 02/28/2035 |
2.2 |
Brazil Notas do Tesouro Nacional, 10.00%, 01/01/2029 |
1.2 |
French Republic Government Bonds OAT, 0.00%, 11/25/2029 |
1.2 |
China Government Bonds, 3.27%, 11/19/2030 |
1.2 |
U.S. Treasury Inflation-Indexed Notes, 1.75%, 01/15/2034 |
1.1 |
U.S. Treasury Notes, 0.38%, 12/31/2025 |
1.0 |
Bundesrepublik Deutschland Bundesanleihe, 08/15/2031 |
1.0 |
NVIDIA Corp. |
1.0 |
Federal National Mortgage Association, 3.00%, 01/01/2053 |
1.0 |
If you wish to view additional information about the Portfolio; including but not limited to full holdings, financial statements, proxy voting policies and other important documents, please see TST's most recent report on Form N-CSR available at transamerica.com/annuities/prospectus.
Transamerica Morgan Stanley Global Allocation VP
Semi-Annual Shareholder Report
June 30, 2024
Transamerica Morgan Stanley Global Allocation VP
Transamerica Morgan Stanley Global Allocation VP seeks high total return. This semi-annual shareholder report contains important information for the period of January 1, 2024 to June 30, 2024. You can find additional information about the Portfolio at transamerica.com/annuities/prospectus. You can also request this information by contacting us at 800-851-9777.
What were the Portfolio costs for the period?
Portfolio Overview Operating Expenses
(based on a hypothetical $10,000 investment)
Class Name |
Cost of a $10,000 investment |
Costs paid as a percentage of a $10,000 investment |
Service Class |
$53 |
1.04% |
This table does not reflect any charges that are, or may be, imposed under your variable life insurance policy or variable annuity contract. If such charges were reflected, expenses would be higher.
Total Net Assets |
$998,461,565 |
Number of Portfolio Holdings |
1,499 |
Portfolio Turnover Rate |
31% |
What did the Portfolio invest in?
Top Asset Allocations (Percentage of Net Assets)
Common Stocks |
27.9% |
Foreign Government Obligations |
25.7 |
Repurchase Agreements |
18.5 |
Corporate Debt Securities |
11.0 |
U.S. Government Obligations |
7.4 |
U.S. Government Agency Obligations |
4.8 |
Mortgage-Backed Securities |
2.4 |
Short-Term U.S. Government Obligations |
1.4 |
Net Other Assets (Liabilities) |
0.9 |
Transamerica Morgan Stanley Global Allocation VP
Top Country Allocation (Percentage of Net Assets)
United States of America |
35.5% |
China |
6.8 |
France |
4.2 |
United Kingdom |
4.0 |
Canada |
3.7 |
Germany |
3.7 |
Republic Of South Africa |
3.0 |
Japan |
2.3 |
Spain |
2.1 |
Australia |
2.0 |
Top Holdings (Percentage of Net Assets)
China Government Bonds, 2.76%, 05/15/2032 |
2.3% |
Republic of South Africa Government Bonds, 8.88%, 02/28/2035 |
2.2 |
Brazil Notas do Tesouro Nacional, 10.00%, 01/01/2029 |
1.2 |
French Republic Government Bonds OAT, 0.00%, 11/25/2029 |
1.2 |
China Government Bonds, 3.27%, 11/19/2030 |
1.2 |
U.S. Treasury Inflation-Indexed Notes, 1.75%, 01/15/2034 |
1.1 |
U.S. Treasury Notes, 0.38%, 12/31/2025 |
1.0 |
Bundesrepublik Deutschland Bundesanleihe, 08/15/2031 |
1.0 |
NVIDIA Corp. |
1.0 |
Federal National Mortgage Association, 3.00%, 01/01/2053 |
1.0 |
If you wish to view additional information about the Portfolio; including but not limited to full holdings, financial statements, proxy voting policies and other important documents, please see TST's most recent report on Form N-CSR available at transamerica.com/annuities/prospectus.
Transamerica Morgan Stanley Global Allocation VP
Semi-Annual Shareholder Report
June 30, 2024
Transamerica MSCI EAFE Index VP
Transamerica MSCI EAFE Index VP seeks to track the investment results of an index composed of large- and mid-capitalization developed market equities, excluding the U.S. and Canada. This semi-annual shareholder report contains important information for the period of January 1, 2024 to June 30, 2024. You can find additional information about the Portfolio at transamerica.com/annuities/prospectus. You can also request this information by contacting us at 800-851-9777.
What were the Portfolio costs for the period?
Portfolio Overview Operating Expenses
(based on a hypothetical $10,000 investment)
Class Name |
Cost of a $10,000 investment |
Costs paid as a percentage of a $10,000 investment |
Initial Class |
$9 |
0.18% |
This table does not reflect any charges that are, or may be, imposed under your variable life insurance policy or variable annuity contract. If such charges were reflected, expenses would be higher.
Total Net Assets |
$88,640,231 |
Number of Portfolio Holdings |
746 |
Portfolio Turnover Rate |
1% |
What did the Portfolio invest in?
Top Asset Allocations (Percentage of Net Assets)
Common Stocks |
97.6% |
Repurchase Agreements |
1.2 |
Preferred Stocks |
0.4 |
Rights |
0.0Footnote Reference* |
Net Other Assets (Liabilities) |
0.8 |
| Footnote |
Description |
Footnote* |
Percentage rounds to less than 0.1% or (0.1)%. |
Transamerica MSCI EAFE Index VP
Top Country Allocation (Percentage of Net Assets)
Japan |
22.3% |
United Kingdom |
13.6 |
France |
10.7 |
Switzerland |
10.3 |
Germany |
8.4 |
Australia |
7.2 |
Netherlands |
5.5 |
Denmark |
3.9 |
Sweden |
3.2 |
Spain |
2.5 |
Top Holdings (Percentage of Net Assets)
Novo Nordisk AS, Class B |
2.8% |
ASML Holding NV |
2.5 |
Nestle SA |
1.6 |
AstraZeneca PLC |
1.4 |
Shell PLC |
1.4 |
Toyota Motor Corp. |
1.3 |
SAP SE |
1.3 |
Novartis AG |
1.3 |
LVMH Moet Hennessy Louis Vuitton SE |
1.3 |
Roche Holding AG |
1.2 |
If you wish to view additional information about the Portfolio; including but not limited to full holdings, financial statements, proxy voting policies and other important documents, please see TST's most recent report on Form N-CSR available at transamerica.com/annuities/prospectus.
Transamerica MSCI EAFE Index VP
Semi-Annual Shareholder Report
June 30, 2024
Transamerica MSCI EAFE Index VP
Transamerica MSCI EAFE Index VP seeks to track the investment results of an index composed of large- and mid-capitalization developed market equities, excluding the U.S. and Canada. This semi-annual shareholder report contains important information for the period of January 1, 2024 to June 30, 2024. You can find additional information about the Portfolio at transamerica.com/annuities/prospectus. You can also request this information by contacting us at 800-851-9777.
What were the Portfolio costs for the period?
Portfolio Overview Operating Expenses
(based on a hypothetical $10,000 investment)
Class Name |
Cost of a $10,000 investment |
Costs paid as a percentage of a $10,000 investment |
Service Class |
$22 |
0.43% |
This table does not reflect any charges that are, or may be, imposed under your variable life insurance policy or variable annuity contract. If such charges were reflected, expenses would be higher.
Total Net Assets |
$88,640,231 |
Number of Portfolio Holdings |
746 |
Portfolio Turnover Rate |
1% |
What did the Portfolio invest in?
Top Asset Allocations (Percentage of Net Assets)
Common Stocks |
97.6% |
Repurchase Agreements |
1.2 |
Preferred Stocks |
0.4 |
Rights |
0.0Footnote Reference* |
Net Other Assets (Liabilities) |
0.8 |
| Footnote |
Description |
Footnote* |
Percentage rounds to less than 0.1% or (0.1)%. |
Transamerica MSCI EAFE Index VP
Top Country Allocation (Percentage of Net Assets)
Japan |
22.3% |
United Kingdom |
13.6 |
France |
10.7 |
Switzerland |
10.3 |
Germany |
8.4 |
Australia |
7.2 |
Netherlands |
5.5 |
Denmark |
3.9 |
Sweden |
3.2 |
Spain |
2.5 |
Top Holdings (Percentage of Net Assets)
Novo Nordisk AS, Class B |
2.8% |
ASML Holding NV |
2.5 |
Nestle SA |
1.6 |
AstraZeneca PLC |
1.4 |
Shell PLC |
1.4 |
Toyota Motor Corp. |
1.3 |
SAP SE |
1.3 |
Novartis AG |
1.3 |
LVMH Moet Hennessy Louis Vuitton SE |
1.3 |
Roche Holding AG |
1.2 |
If you wish to view additional information about the Portfolio; including but not limited to full holdings, financial statements, proxy voting policies and other important documents, please see TST's most recent report on Form N-CSR available at transamerica.com/annuities/prospectus.
Transamerica MSCI EAFE Index VP
Semi-Annual Shareholder Report
June 30, 2024
Transamerica Multi-Managed Balanced VP
Transamerica Multi-Managed Balanced VP seeks to provide a high total investment return through investments in a broadly diversified portfolio of stocks, bonds and money market instruments. This semi-annual shareholder report contains important information for the period of January 1, 2024 to June 30, 2024. You can find additional information about the Portfolio at transamerica.com/annuities/prospectus. You can also request this information by contacting us at 800-851-9777.
What were the Portfolio costs for the period?
Portfolio Overview Operating Expenses
(based on a hypothetical $10,000 investment)
Class Name |
Cost of a $10,000 investment |
Costs paid as a percentage of a $10,000 investment |
Initial Class |
$33 |
0.63% |
This table does not reflect any charges that are, or may be, imposed under your variable life insurance policy or variable annuity contract. If such charges were reflected, expenses would be higher.
Total Net Assets |
$1,519,859,731 |
Number of Portfolio Holdings |
642 |
Portfolio Turnover Rate |
23% |
What did the Portfolio invest in?
Top Asset Allocations (Percentage of Net Assets)
Common Stocks |
60.6% |
Corporate Debt Securities |
13.9 |
U.S. Government Agency Obligations |
10.6 |
U.S. Government Obligations |
9.0 |
Commercial Paper |
7.6 |
Mortgage-Backed Securities |
2.5 |
Asset-Backed Securities |
2.2 |
Repurchase Agreements |
1.2 |
Net Other Assets (Liabilities) |
(7.6) |
Top Holdings (Percentage of Net Assets)
Microsoft Corp. |
4.8% |
NVIDIA Corp. |
4.3 |
Apple, Inc. |
4.2 |
Amazon.com, Inc. |
2.7 |
Meta Platforms, Inc., Class A |
1.7 |
Uniform Mortgage-Backed Security, TBA, 2.50%, 07/01/2054 |
1.5 |
Alphabet, Inc., Class A |
1.4 |
Uniform Mortgage-Backed Security, TBA, 3.00%, 07/01/2054 |
1.4 |
Uniform Mortgage-Backed Security, TBA, 3.50%, 07/01/2054 |
1.1 |
Alphabet, Inc., Class C |
1.1 |
If you wish to view additional information about the Portfolio; including but not limited to full holdings, financial statements, proxy voting policies and other important documents, please see TST's most recent report on Form N-CSR available at transamerica.com/annuities/prospectus.
Transamerica Multi-Managed Balanced VP
Semi-Annual Shareholder Report
June 30, 2024
Transamerica Multi-Managed Balanced VP
Transamerica Multi-Managed Balanced VP seeks to provide a high total investment return through investments in a broadly diversified portfolio of stocks, bonds and money market instruments. This semi-annual shareholder report contains important information for the period of January 1, 2024 to June 30, 2024. You can find additional information about the Portfolio at transamerica.com/annuities/prospectus. You can also request this information by contacting us at 800-851-9777.
What were the Portfolio costs for the period?
Portfolio Overview Operating Expenses
(based on a hypothetical $10,000 investment)
Class Name |
Cost of a $10,000 investment |
Costs paid as a percentage of a $10,000 investment |
Service Class |
$46 |
0.88% |
This table does not reflect any charges that are, or may be, imposed under your variable life insurance policy or variable annuity contract. If such charges were reflected, expenses would be higher.
Total Net Assets |
$1,519,859,731 |
Number of Portfolio Holdings |
642 |
Portfolio Turnover Rate |
23% |
What did the Portfolio invest in?
Top Asset Allocations (Percentage of Net Assets)
Common Stocks |
60.6% |
Corporate Debt Securities |
13.9 |
U.S. Government Agency Obligations |
10.6 |
U.S. Government Obligations |
9.0 |
Commercial Paper |
7.6 |
Mortgage-Backed Securities |
2.5 |
Asset-Backed Securities |
2.2 |
Repurchase Agreements |
1.2 |
Net Other Assets (Liabilities) |
(7.6) |
Top Holdings (Percentage of Net Assets)
Microsoft Corp. |
4.8% |
NVIDIA Corp. |
4.3 |
Apple, Inc. |
4.2 |
Amazon.com, Inc. |
2.7 |
Meta Platforms, Inc., Class A |
1.7 |
Uniform Mortgage-Backed Security, TBA, 2.50%, 07/01/2054 |
1.5 |
Alphabet, Inc., Class A |
1.4 |
Uniform Mortgage-Backed Security, TBA, 3.00%, 07/01/2054 |
1.4 |
Uniform Mortgage-Backed Security, TBA, 3.50%, 07/01/2054 |
1.1 |
Alphabet, Inc., Class C |
1.1 |
If you wish to view additional information about the Portfolio; including but not limited to full holdings, financial statements, proxy voting policies and other important documents, please see TST's most recent report on Form N-CSR available at transamerica.com/annuities/prospectus.
Transamerica Multi-Managed Balanced VP
Semi-Annual Shareholder Report
June 30, 2024
Transamerica PineBridge Inflation Opportunities VP
Transamerica PineBridge Inflation Opportunities VP seeks maximum real return, consistent with appreciation of capital. This semi-annual shareholder report contains important information for the period of January 1, 2024 to June 30, 2024. You can find additional information about the Portfolio at transamerica.com/annuities/prospectus. You can also request this information by contacting us at 800-851-9777.
What were the Portfolio costs for the period?
Portfolio Overview Operating Expenses
(based on a hypothetical $10,000 investment)
Class Name |
Cost of a $10,000 investment |
Costs paid as a percentage of a $10,000 investment |
Initial Class |
$26 |
0.53% |
This table does not reflect any charges that are, or may be, imposed under your variable life insurance policy or variable annuity contract. If such charges were reflected, expenses would be higher.
Total Net Assets |
$111,158,926 |
Number of Portfolio Holdings |
88 |
Portfolio Turnover Rate |
14% |
What did the Portfolio invest in?
Top Asset Allocations (Percentage of Net Assets)
U.S. Government Obligations |
51.1% |
Foreign Government Obligations |
27.8 |
Corporate Debt Securities |
19.4 |
Short-Term Investment Companies |
0.6 |
Asset-Backed Securities |
0.6 |
Other Investment Company |
0.1 |
Net Other Assets (Liabilities) |
0.4 |
Top Holdings (Percentage of Net Assets)
U.S. Treasury Inflation-Indexed Notes, 1.38%, 07/15/2033 |
4.6% |
Bank of America Corp., Fixed until 12/20/2027, CPI-YoY + 1.10%, 4.37%, 11/19/2024 |
4.4 |
U.S. Treasury Inflation-Protected Indexed Bonds, 1.50%, 02/15/2053 |
3.9 |
Japan Government CPI-Linked Bonds, 0.10%, 03/10/2026 |
3.5 |
Australia Government Bonds, 2.50%, 09/20/2030 |
3.4 |
U.S. Treasury Inflation-Protected Indexed Notes, 0.50%, 01/15/2028 |
3.2 |
U.K. Inflation-Linked Gilts, 0.13%, 03/22/2029 |
3.2 |
French Republic Government Bonds OAT, 0.70%, 07/25/2030 |
3.0 |
U.S. Treasury Inflation-Protected Indexed Bonds, 2.38%, 01/15/2027 |
2.9 |
New Zealand Government Inflation-Linked Bonds, 2.00%, 09/20/2025 |
2.9 |
If you wish to view additional information about the Portfolio; including but not limited to full holdings, financial statements, proxy voting policies and other important documents, please see TST's most recent report on Form N-CSR available at transamerica.com/annuities/prospectus.
Transamerica PineBridge Inflation Opportunities VP
Semi-Annual Shareholder Report
June 30, 2024
Transamerica PineBridge Inflation Opportunities VP
Transamerica PineBridge Inflation Opportunities VP seeks maximum real return, consistent with appreciation of capital. This semi-annual shareholder report contains important information for the period of January 1, 2024 to June 30, 2024. You can find additional information about the Portfolio at transamerica.com/annuities/prospectus. You can also request this information by contacting us at 800-851-9777.
What were the Portfolio costs for the period?
Portfolio Overview Operating Expenses
(based on a hypothetical $10,000 investment)
Class Name |
Cost of a $10,000 investment |
Costs paid as a percentage of a $10,000 investment |
Service Class |
$39 |
0.78% |
This table does not reflect any charges that are, or may be, imposed under your variable life insurance policy or variable annuity contract. If such charges were reflected, expenses would be higher.
Total Net Assets |
$111,158,926 |
Number of Portfolio Holdings |
88 |
Portfolio Turnover Rate |
14% |
What did the Portfolio invest in?
Top Asset Allocations (Percentage of Net Assets)
U.S. Government Obligations |
51.1% |
Foreign Government Obligations |
27.8 |
Corporate Debt Securities |
19.4 |
Short-Term Investment Companies |
0.6 |
Asset-Backed Securities |
0.6 |
Other Investment Company |
0.1 |
Net Other Assets (Liabilities) |
0.4 |
Top Holdings (Percentage of Net Assets)
U.S. Treasury Inflation-Indexed Notes, 1.38%, 07/15/2033 |
4.6% |
Bank of America Corp., Fixed until 12/20/2027, CPI-YoY + 1.10%, 4.37%, 11/19/2024 |
4.4 |
U.S. Treasury Inflation-Protected Indexed Bonds, 1.50%, 02/15/2053 |
3.9 |
Japan Government CPI-Linked Bonds, 0.10%, 03/10/2026 |
3.5 |
Australia Government Bonds, 2.50%, 09/20/2030 |
3.4 |
U.S. Treasury Inflation-Protected Indexed Notes, 0.50%, 01/15/2028 |
3.2 |
U.K. Inflation-Linked Gilts, 0.13%, 03/22/2029 |
3.2 |
French Republic Government Bonds OAT, 0.70%, 07/25/2030 |
3.0 |
U.S. Treasury Inflation-Protected Indexed Bonds, 2.38%, 01/15/2027 |
2.9 |
New Zealand Government Inflation-Linked Bonds, 2.00%, 09/20/2025 |
2.9 |
If you wish to view additional information about the Portfolio; including but not limited to full holdings, financial statements, proxy voting policies and other important documents, please see TST's most recent report on Form N-CSR available at transamerica.com/annuities/prospectus.
Transamerica PineBridge Inflation Opportunities VP
Semi-Annual Shareholder Report
June 30, 2024
Transamerica ProFund UltraBear VP
Transamerica ProFund UltraBear VP seeks daily investment results, before fees and expenses, that correspond to two times the inverse (-2x) of the daily performance of the S&P 500® Index. The Portfolio does not seek to achieve its stated objective over a period of time greater than a single day. This semi-annual shareholder report contains important information for the period of January 1, 2024 to June 30, 2024. You can find additional information about the Portfolio at transamerica.com/annuities/prospectus. You can also request this information by contacting us at 800-851-9777.
What were the Portfolio costs for the period?
Portfolio Overview Operating Expenses
(based on a hypothetical $10,000 investment)
Class Name |
Cost of a $10,000 investment |
Costs paid as a percentage of a $10,000 investment |
Service Class |
$55 |
1.23% |
This table does not reflect any charges that are, or may be, imposed under your variable life insurance policy or variable annuity contract. If such charges were reflected, expenses would be higher.
Total Net Assets |
$16,634,732 |
Number of Portfolio Holdings (Including Derivatives) |
6 |
Portfolio Turnover Rate |
0% |
What did the Portfolio invest in?
Top Asset Allocations (Percentage of Net Assets)
Short-Term Investment Companies |
72.0% |
Repurchase Agreements |
18.0 |
Net Other Assets (Liabilities) |
10.0 |
Top Holdings (Percentage of Net Assets)
Dreyfus Treasury & Agency Cash Management Institutional Shares, 5.19%, 12/31/2031 |
18.0% |
BlackRock Liquidity Funds: T-Fund, Institutional Shares, 5.19%, 12/31/2049 |
18.0 |
UBS Select Treasury Preferred Fund, 5.25%, 12/31/2049 |
18.0 |
State Street Institutional U.S. Government Money Market Fund, 5.25%, 12/31/2030 |
18.0 |
If you wish to view additional information about the Portfolio; including but not limited to full holdings, financial statements, proxy voting policies and other important documents, please see TST's most recent report on Form N-CSR available at transamerica.com/annuities/prospectus.
Transamerica ProFund UltraBear VP
Semi-Annual Shareholder Report
June 30, 2024
Transamerica S&P 500 Index VP
Transamerica S&P 500 Index VP seeks to provide investment results that, before expenses, correspond generally to the price and yield performance of the S&P 500® Index. This semi-annual shareholder report contains important information for the period of January 1, 2024 to June 30, 2024. You can find additional information about the Portfolio at transamerica.com/annuities/prospectus. You can also request this information by contacting us at 800-851-9777.
What were the Portfolio costs for the period?
Portfolio Overview Operating Expenses
(based on a hypothetical $10,000 investment)
Class Name |
Cost of a $10,000 investment |
Costs paid as a percentage of a $10,000 investment |
Initial Class |
$6 |
0.12% |
This table does not reflect any charges that are, or may be, imposed under your variable life insurance policy or variable annuity contract. If such charges were reflected, expenses would be higher.
Total Net Assets |
$921,535,000 |
Number of Portfolio Holdings |
504 |
Portfolio Turnover Rate |
1% |
What did the Portfolio invest in?
Top Asset Allocations (Percentage of Net Assets)
Common Stocks |
99.4% |
Repurchase Agreements |
0.5 |
Net Other Assets (Liabilities) |
0.1 |
Top Holdings (Percentage of Net Assets)
Microsoft Corp. |
7.2% |
NVIDIA Corp. |
6.6 |
Apple, Inc. |
6.6 |
Amazon.com, Inc. |
3.8 |
Meta Platforms, Inc., Class A |
2.4 |
Alphabet, Inc., Class A |
2.3 |
Alphabet, Inc., Class C |
1.9 |
Berkshire Hathaway, Inc., Class B |
1.6 |
Eli Lilly & Co. |
1.6 |
Broadcom, Inc. |
1.5 |
If you wish to view additional information about the Portfolio; including but not limited to full holdings, financial statements, proxy voting policies and other important documents, please see TST's most recent report on Form N-CSR available at transamerica.com/annuities/prospectus.
Transamerica S&P 500 Index VP
Semi-Annual Shareholder Report
June 30, 2024
Transamerica S&P 500 Index VP
Transamerica S&P 500 Index VP seeks to provide investment results that, before expenses, correspond generally to the price and yield performance of the S&P 500® Index. This semi-annual shareholder report contains important information for the period of January 1, 2024 to June 30, 2024. You can find additional information about the Portfolio at transamerica.com/annuities/prospectus. You can also request this information by contacting us at 800-851-9777.
What were the Portfolio costs for the period?
Portfolio Overview Operating Expenses
(based on a hypothetical $10,000 investment)
Class Name |
Cost of a $10,000 investment |
Costs paid as a percentage of a $10,000 investment |
Service Class |
$21 |
0.39% |
This table does not reflect any charges that are, or may be, imposed under your variable life insurance policy or variable annuity contract. If such charges were reflected, expenses would be higher.
Total Net Assets |
$921,535,000 |
Number of Portfolio Holdings |
504 |
Portfolio Turnover Rate |
1% |
What did the Portfolio invest in?
Top Asset Allocations (Percentage of Net Assets)
Common Stocks |
99.4% |
Repurchase Agreements |
0.5 |
Net Other Assets (Liabilities) |
0.1 |
Top Holdings (Percentage of Net Assets)
Microsoft Corp. |
7.2% |
NVIDIA Corp. |
6.6 |
Apple, Inc. |
6.6 |
Amazon.com, Inc. |
3.8 |
Meta Platforms, Inc., Class A |
2.4 |
Alphabet, Inc., Class A |
2.3 |
Alphabet, Inc., Class C |
1.9 |
Berkshire Hathaway, Inc., Class B |
1.6 |
Eli Lilly & Co. |
1.6 |
Broadcom, Inc. |
1.5 |
If you wish to view additional information about the Portfolio; including but not limited to full holdings, financial statements, proxy voting policies and other important documents, please see TST's most recent report on Form N-CSR available at transamerica.com/annuities/prospectus.
Transamerica S&P 500 Index VP
Semi-Annual Shareholder Report
June 30, 2024
Transamerica Small/Mid Cap Value VP
Transamerica Small/Mid Cap Value VP seeks to maximize total return. This semi-annual shareholder report contains important information for the period of January 1, 2024 to June 30, 2024. You can find additional information about the Portfolio at transamerica.com/annuities/prospectus. You can also request this information by contacting us at 800-851-9777.
What were the Portfolio costs for the period?
Portfolio Overview Operating Expenses
(based on a hypothetical $10,000 investment)
Class Name |
Cost of a $10,000 investment |
Costs paid as a percentage of a $10,000 investment |
Initial Class |
$41 |
0.82% |
This table does not reflect any charges that are, or may be, imposed under your variable life insurance policy or variable annuity contract. If such charges were reflected, expenses would be higher.
Total Net Assets |
$523,076,101 |
Number of Portfolio Holdings |
219 |
Portfolio Turnover Rate |
26% |
What did the Portfolio invest in?
Top Asset Allocations (Percentage of Net Assets)
Common Stocks |
96.7% |
Repurchase Agreements |
3.2 |
Other Investment Company |
0.4 |
Net Other Assets (Liabilities) |
(0.3) |
Top Holdings (Percentage of Net Assets)
First Citizens BancShares, Inc., Class A |
2.2% |
Dominion Energy, Inc. |
1.9 |
NiSource, Inc. |
1.6 |
Huntington Ingalls Industries, Inc. |
1.5 |
OGE Energy Corp. |
1.5 |
Evergy, Inc. |
1.5 |
Bio-Rad Laboratories, Inc., Class A |
1.4 |
Liberty Broadband Corp., Class C |
1.3 |
Kinder Morgan, Inc. |
1.2 |
Labcorp Holdings, Inc. |
1.2 |
If you wish to view additional information about the Portfolio; including but not limited to full holdings, financial statements, proxy voting policies and other important documents, please see TST's most recent report on Form N-CSR available at transamerica.com/annuities/prospectus.
Transamerica Small/Mid Cap Value VP
Semi-Annual Shareholder Report
June 30, 2024
Transamerica Small/Mid Cap Value VP
Transamerica Small/Mid Cap Value VP seeks to maximize total return. This semi-annual shareholder report contains important information for the period of January 1, 2024 to June 30, 2024. You can find additional information about the Portfolio at transamerica.com/annuities/prospectus. You can also request this information by contacting us at 800-851-9777.
What were the Portfolio costs for the period?
Portfolio Overview Operating Expenses
(based on a hypothetical $10,000 investment)
Class Name |
Cost of a $10,000 investment |
Costs paid as a percentage of a $10,000 investment |
Service Class |
$54 |
1.07% |
This table does not reflect any charges that are, or may be, imposed under your variable life insurance policy or variable annuity contract. If such charges were reflected, expenses would be higher.
Total Net Assets |
$523,076,101 |
Number of Portfolio Holdings |
219 |
Portfolio Turnover Rate |
26% |
What did the Portfolio invest in?
Top Asset Allocations (Percentage of Net Assets)
Common Stocks |
96.7% |
Repurchase Agreements |
3.2 |
Other Investment Company |
0.4 |
Net Other Assets (Liabilities) |
(0.3) |
Top Holdings (Percentage of Net Assets)
First Citizens BancShares, Inc., Class A |
2.2% |
Dominion Energy, Inc. |
1.9 |
NiSource, Inc. |
1.6 |
Huntington Ingalls Industries, Inc. |
1.5 |
OGE Energy Corp. |
1.5 |
Evergy, Inc. |
1.5 |
Bio-Rad Laboratories, Inc., Class A |
1.4 |
Liberty Broadband Corp., Class C |
1.3 |
Kinder Morgan, Inc. |
1.2 |
Labcorp Holdings, Inc. |
1.2 |
If you wish to view additional information about the Portfolio; including but not limited to full holdings, financial statements, proxy voting policies and other important documents, please see TST's most recent report on Form N-CSR available at transamerica.com/annuities/prospectus.
Transamerica Small/Mid Cap Value VP
Semi-Annual Shareholder Report
June 30, 2024
Transamerica T. Rowe Price Small Cap VP
Transamerica T. Rowe Price Small Cap VP seeks long-term growth of capital by investing primarily in common stocks of small growth companies. This semi-annual shareholder report contains important information for the period of January 1, 2024 to June 30, 2024. You can find additional information about the Portfolio at transamerica.com/annuities/prospectus. You can also request this information by contacting us at 800-851-9777.
What were the Portfolio costs for the period?
Portfolio Overview Operating Expenses
(based on a hypothetical $10,000 investment)
Class Name |
Cost of a $10,000 investment |
Costs paid as a percentage of a $10,000 investment |
Initial Class |
$43 |
0.83% |
This table does not reflect any charges that are, or may be, imposed under your variable life insurance policy or variable annuity contract. If such charges were reflected, expenses would be higher.
Total Net Assets |
$646,832,603 |
Number of Portfolio Holdings |
315 |
Portfolio Turnover Rate |
19% |
What did the Portfolio invest in?
Top Asset Allocations (Percentage of Net Assets)
Common Stocks |
99.3% |
Repurchase Agreements |
1.1 |
Other Investment Company |
0.5 |
Net Other Assets (Liabilities) |
(0.9) |
Top Holdings (Percentage of Net Assets)
Tenet Healthcare Corp. |
1.1% |
Weatherford International PLC |
1.1 |
Wingstop, Inc. |
1.1 |
Murphy USA, Inc. |
1.0 |
Curtiss-Wright Corp. |
1.0 |
FTAI Aviation Ltd. |
1.0 |
Insmed, Inc. |
1.0 |
Fabrinet |
1.0 |
Onto Innovation, Inc. |
0.9 |
Ensign Group, Inc. |
0.9 |
If you wish to view additional information about the Portfolio; including but not limited to full holdings, financial statements, proxy voting policies and other important documents, please see TST's most recent report on Form N-CSR available at transamerica.com/annuities/prospectus.
Transamerica T. Rowe Price Small Cap VP
Semi-Annual Shareholder Report
June 30, 2024
Transamerica T. Rowe Price Small Cap VP
Transamerica T. Rowe Price Small Cap VP seeks long-term growth of capital by investing primarily in common stocks of small growth companies. This semi-annual shareholder report contains important information for the period of January 1, 2024 to June 30, 2024. You can find additional information about the Portfolio at transamerica.com/annuities/prospectus. You can also request this information by contacting us at 800-851-9777.
What were the Portfolio costs for the period?
Portfolio Overview Operating Expenses
(based on a hypothetical $10,000 investment)
Class Name |
Cost of a $10,000 investment |
Costs paid as a percentage of a $10,000 investment |
Service Class |
$56 |
1.08% |
This table does not reflect any charges that are, or may be, imposed under your variable life insurance policy or variable annuity contract. If such charges were reflected, expenses would be higher.
Total Net Assets |
$646,832,603 |
Number of Portfolio Holdings |
315 |
Portfolio Turnover Rate |
19% |
What did the Portfolio invest in?
Top Asset Allocations (Percentage of Net Assets)
Common Stocks |
99.3% |
Repurchase Agreements |
1.1 |
Other Investment Company |
0.5 |
Net Other Assets (Liabilities) |
(0.9) |
Top Holdings (Percentage of Net Assets)
Tenet Healthcare Corp. |
1.1% |
Weatherford International PLC |
1.1 |
Wingstop, Inc. |
1.1 |
Murphy USA, Inc. |
1.0 |
Curtiss-Wright Corp. |
1.0 |
FTAI Aviation Ltd. |
1.0 |
Insmed, Inc. |
1.0 |
Fabrinet |
1.0 |
Onto Innovation, Inc. |
0.9 |
Ensign Group, Inc. |
0.9 |
If you wish to view additional information about the Portfolio; including but not limited to full holdings, financial statements, proxy voting policies and other important documents, please see TST's most recent report on Form N-CSR available at transamerica.com/annuities/prospectus.
Transamerica T. Rowe Price Small Cap VP
Semi-Annual Shareholder Report
June 30, 2024
Transamerica TSW International Equity VP
Transamerica TSW International Equity VP seeks maximum long-term total return, consistent with reasonable risk to principal, by investing in a diversified portfolio of common stocks of primarily non-U.S. issuers. This semi-annual shareholder report contains important information for the period of January 1, 2024 to June 30, 2024. You can find additional information about the Portfolio at transamerica.com/annuities/prospectus. You can also request this information by contacting us at 800-851-9777.
What were the Portfolio costs for the period?
Portfolio Overview Operating Expenses
(based on a hypothetical $10,000 investment)
Class Name |
Cost of a $10,000 investment |
Costs paid as a percentage of a $10,000 investment |
Initial Class |
$43 |
0.85% |
This table does not reflect any charges that are, or may be, imposed under your variable life insurance policy or variable annuity contract. If such charges were reflected, expenses would be higher.
Total Net Assets |
$188,689,054 |
Number of Portfolio Holdings |
109 |
Portfolio Turnover Rate |
6% |
What did the Portfolio invest in?
Top Asset Allocations (Percentage of Net Assets)
Common Stocks |
97.7% |
Repurchase Agreements |
1.2 |
Preferred Stocks |
0.7 |
Other Investment Company |
0.2 |
Net Other Assets (Liabilities) |
0.2 |
Transamerica TSW International Equity VP
Top Country Allocation (Percentage of Net Assets)
Japan |
19.3% |
United Kingdom |
19.0 |
Germany |
11.5 |
France |
10.5 |
Switzerland |
7.7 |
Ireland |
5.0 |
Netherlands |
4.2 |
Australia |
3.5 |
Belgium |
3.1 |
Sweden |
2.8 |
Top Holdings (Percentage of Net Assets)
SAP SE |
2.3% |
Roche Holding AG |
2.1 |
Sony Group Corp. |
2.1 |
Hitachi Ltd. |
1.9 |
Nestle SA |
1.8 |
Sumitomo Mitsui Financial Group, Inc. |
1.8 |
Anheuser-Busch InBev SA |
1.7 |
Unilever PLC |
1.7 |
Samsung Electronics Co. Ltd. |
1.6 |
BP PLC |
1.6 |
If you wish to view additional information about the Portfolio; including but not limited to full holdings, financial statements, proxy voting policies and other important documents, please see TST's most recent report on Form N-CSR available at transamerica.com/annuities/prospectus.
Transamerica TSW International Equity VP
Semi-Annual Shareholder Report
June 30, 2024
Transamerica TSW International Equity VP
Transamerica TSW International Equity VP seeks maximum long-term total return, consistent with reasonable risk to principal, by investing in a diversified portfolio of common stocks of primarily non-U.S. issuers. This semi-annual shareholder report contains important information for the period of January 1, 2024 to June 30, 2024. You can find additional information about the Portfolio at transamerica.com/annuities/prospectus. You can also request this information by contacting us at 800-851-9777.
What were the Portfolio costs for the period?
Portfolio Overview Operating Expenses
(based on a hypothetical $10,000 investment)
Class Name |
Cost of a $10,000 investment |
Costs paid as a percentage of a $10,000 investment |
Service Class |
$56 |
1.10% |
This table does not reflect any charges that are, or may be, imposed under your variable life insurance policy or variable annuity contract. If such charges were reflected, expenses would be higher.
Total Net Assets |
$188,689,054 |
Number of Portfolio Holdings |
109 |
Portfolio Turnover Rate |
6% |
What did the Portfolio invest in?
Top Asset Allocations (Percentage of Net Assets)
Common Stocks |
97.7% |
Repurchase Agreements |
1.2 |
Preferred Stocks |
0.7 |
Other Investment Company |
0.2 |
Net Other Assets (Liabilities) |
0.2 |
Transamerica TSW International Equity VP
Top Country Allocation (Percentage of Net Assets)
Japan |
19.3% |
United Kingdom |
19.0 |
Germany |
11.5 |
France |
10.5 |
Switzerland |
7.7 |
Ireland |
5.0 |
Netherlands |
4.2 |
Australia |
3.5 |
Belgium |
3.1 |
Sweden |
2.8 |
Top Holdings (Percentage of Net Assets)
SAP SE |
2.3% |
Roche Holding AG |
2.1 |
Sony Group Corp. |
2.1 |
Hitachi Ltd. |
1.9 |
Nestle SA |
1.8 |
Sumitomo Mitsui Financial Group, Inc. |
1.8 |
Anheuser-Busch InBev SA |
1.7 |
Unilever PLC |
1.7 |
Samsung Electronics Co. Ltd. |
1.6 |
BP PLC |
1.6 |
If you wish to view additional information about the Portfolio; including but not limited to full holdings, financial statements, proxy voting policies and other important documents, please see TST's most recent report on Form N-CSR available at transamerica.com/annuities/prospectus.
Transamerica TSW International Equity VP
Semi-Annual Shareholder Report
June 30, 2024
Transamerica TSW Mid Cap Value Opportunities VP
Transamerica TSW Mid Cap Value Opportunities VP seeks to provide investors with long-term capital growth. This semi-annual shareholder report contains important information for the period of January 1, 2024 to June 30, 2024. You can find additional information about the Portfolio at transamerica.com/annuities/prospectus. You can also request this information by contacting us at 800-851-9777.
What were the Portfolio costs for the period?
Portfolio Overview Operating Expenses
(based on a hypothetical $10,000 investment)
Class Name |
Cost of a $10,000 investment |
Costs paid as a percentage of a $10,000 investment |
Initial Class |
$43 |
0.86% |
This table does not reflect any charges that are, or may be, imposed under your variable life insurance policy or variable annuity contract. If such charges were reflected, expenses would be higher.
Total Net Assets |
$241,309,057 |
Number of Portfolio Holdings |
64 |
Portfolio Turnover Rate |
87% |
What did the Portfolio invest in?
Top Asset Allocations (Percentage of Net Assets)
Common Stocks |
97.1% |
Repurchase Agreements |
2.9 |
Other Investment Company |
0.2 |
Net Other Assets (Liabilities) |
(0.2) |
Top Holdings (Percentage of Net Assets)
Dominion Energy, Inc. |
3.3% |
Huntington Ingalls Industries, Inc. |
3.0 |
NiSource, Inc. |
2.7 |
Bio-Rad Laboratories, Inc., Class A |
2.6 |
OGE Energy Corp. |
2.5 |
Mosaic Co. |
2.2 |
Tyson Foods, Inc., Class A |
2.1 |
Kinder Morgan, Inc. |
2.1 |
Baxter International, Inc. |
2.1 |
Perrigo Co. PLC |
2.1 |
If you wish to view additional information about the Portfolio; including but not limited to full holdings, financial statements, proxy voting policies and other important documents, please see TST's most recent report on Form N-CSR available at transamerica.com/annuities/prospectus.
Transamerica TSW Mid Cap Value Opportunities VP
Semi-Annual Shareholder Report
June 30, 2024
Transamerica TSW Mid Cap Value Opportunities VP
Transamerica TSW Mid Cap Value Opportunities VP seeks to provide investors with long-term capital growth. This semi-annual shareholder report contains important information for the period of January 1, 2024 to June 30, 2024. You can find additional information about the Portfolio at transamerica.com/annuities/prospectus. You can also request this information by contacting us at 800-851-9777.
What were the Portfolio costs for the period?
Portfolio Overview Operating Expenses
(based on a hypothetical $10,000 investment)
Class Name |
Cost of a $10,000 investment |
Costs paid as a percentage of a $10,000 investment |
Service Class |
$56 |
1.11% |
This table does not reflect any charges that are, or may be, imposed under your variable life insurance policy or variable annuity contract. If such charges were reflected, expenses would be higher.
Total Net Assets |
$241,309,057 |
Number of Portfolio Holdings |
64 |
Portfolio Turnover Rate |
87% |
What did the Portfolio invest in?
Top Asset Allocations (Percentage of Net Assets)
Common Stocks |
97.1% |
Repurchase Agreements |
2.9 |
Other Investment Company |
0.2 |
Net Other Assets (Liabilities) |
(0.2) |
Top Holdings (Percentage of Net Assets)
Dominion Energy, Inc. |
3.3% |
Huntington Ingalls Industries, Inc. |
3.0 |
NiSource, Inc. |
2.7 |
Bio-Rad Laboratories, Inc., Class A |
2.6 |
OGE Energy Corp. |
2.5 |
Mosaic Co. |
2.2 |
Tyson Foods, Inc., Class A |
2.1 |
Kinder Morgan, Inc. |
2.1 |
Baxter International, Inc. |
2.1 |
Perrigo Co. PLC |
2.1 |
If you wish to view additional information about the Portfolio; including but not limited to full holdings, financial statements, proxy voting policies and other important documents, please see TST's most recent report on Form N-CSR available at transamerica.com/annuities/prospectus.
Transamerica TSW Mid Cap Value Opportunities VP
Semi-Annual Shareholder Report
June 30, 2024
Transamerica WMC US Growth VP
Transamerica WMC US Growth VP seeks to maximize long-term growth. This semi-annual shareholder report contains important information for the period of January 1, 2024 to June 30, 2024. You can find additional information about the Portfolio at transamerica.com/annuities/prospectus. You can also request this information by contacting us at 800-851-9777.
What were the Portfolio costs for the period?
Portfolio Overview Operating Expenses
(based on a hypothetical $10,000 investment)
Class Name |
Cost of a $10,000 investment |
Costs paid as a percentage of a $10,000 investment |
Initial Class |
$35 |
0.64% |
This table does not reflect any charges that are, or may be, imposed under your variable life insurance policy or variable annuity contract. If such charges were reflected, expenses would be higher.
Total Net Assets |
$5,932,419,155 |
Number of Portfolio Holdings |
68 |
Portfolio Turnover Rate |
26% |
What did the Portfolio invest in?
Top Asset Allocations (Percentage of Net Assets)
Common Stocks |
99.1% |
Repurchase Agreements |
0.8 |
Net Other Assets (Liabilities) |
0.1 |
Top Holdings (Percentage of Net Assets)
NVIDIA Corp. |
9.0% |
Microsoft Corp. |
8.0 |
Apple, Inc. |
7.9 |
Amazon.com, Inc. |
5.0 |
Alphabet, Inc., Class A |
4.9 |
Meta Platforms, Inc., Class A |
4.6 |
Broadcom, Inc. |
4.0 |
Eli Lilly & Co. |
3.9 |
Mastercard, Inc., Class A |
2.8 |
Netflix, Inc. |
2.3 |
If you wish to view additional information about the Portfolio; including but not limited to full holdings, financial statements, proxy voting policies and other important documents, please see TST's most recent report on Form N-CSR available at transamerica.com/annuities/prospectus.
Transamerica WMC US Growth VP
Semi-Annual Shareholder Report
June 30, 2024
Transamerica WMC US Growth VP
Transamerica WMC US Growth VP seeks to maximize long-term growth. This semi-annual shareholder report contains important information for the period of January 1, 2024 to June 30, 2024. You can find additional information about the Portfolio at transamerica.com/annuities/prospectus. You can also request this information by contacting us at 800-851-9777.
What were the Portfolio costs for the period?
Portfolio Overview Operating Expenses
(based on a hypothetical $10,000 investment)
Class Name |
Cost of a $10,000 investment |
Costs paid as a percentage of a $10,000 investment |
Service Class |
$48 |
0.89% |
This table does not reflect any charges that are, or may be, imposed under your variable life insurance policy or variable annuity contract. If such charges were reflected, expenses would be higher.
Total Net Assets |
$5,932,419,155 |
Number of Portfolio Holdings |
68 |
Portfolio Turnover Rate |
26% |
What did the Portfolio invest in?
Top Asset Allocations (Percentage of Net Assets)
Common Stocks |
99.1% |
Repurchase Agreements |
0.8 |
Net Other Assets (Liabilities) |
0.1 |
Top Holdings (Percentage of Net Assets)
NVIDIA Corp. |
9.0% |
Microsoft Corp. |
8.0 |
Apple, Inc. |
7.9 |
Amazon.com, Inc. |
5.0 |
Alphabet, Inc., Class A |
4.9 |
Meta Platforms, Inc., Class A |
4.6 |
Broadcom, Inc. |
4.0 |
Eli Lilly & Co. |
3.9 |
Mastercard, Inc., Class A |
2.8 |
Netflix, Inc. |
2.3 |
If you wish to view additional information about the Portfolio; including but not limited to full holdings, financial statements, proxy voting policies and other important documents, please see TST's most recent report on Form N-CSR available at transamerica.com/annuities/prospectus.
Transamerica WMC US Growth VP
Semi-Annual Shareholder Report
June 30, 2024
Transamerica American Funds Managed Risk VP
Transamerica American Funds Managed Risk VP seeks to provide total return (including income and capital gains) consistent with preservation of capital over the long-term while seeking to manage volatility and provide downside protection. This semi-annual shareholder report contains important information for the period of January 1, 2024 to June 30, 2024. You can find additional information about the Portfolio at transamerica.com/annuities/prospectus. You can also request this information by contacting us at 800-851-9777.
What were the Portfolio costs for the period?
Portfolio Overview Operating Expenses
(based on a hypothetical $10,000 investment)
Class Name |
Cost of a $10,000 investment |
Costs paid as a percentage of a $10,000 investment |
Service Class |
$42 |
0.81% |
This table does not reflect any charges that are, or may be, imposed under your variable life insurance policy or variable annuity contract. If such charges were reflected, expenses would be higher.
Total Net Assets |
$903,995,600 |
Number of Portfolio Holdings |
2 |
Portfolio Turnover Rate |
0% |
What did the Portfolio invest in?
Top Asset Allocations (Percentage of Net Assets)
Investment Companies |
97.3% |
Repurchase Agreements |
2.8 |
Net Other Assets (Liabilities) |
(0.1) |
Top Holdings (Percentage of Net Assets)
American Funds Insurance Series - Asset Allocation Fund |
97.3% |
If you wish to view additional information about the Portfolio; including but not limited to full holdings, financial statements, proxy voting policies and other important documents, please see TST's most recent report on Form N-CSR available at transamerica.com/annuities/prospectus.
Transamerica American Funds Managed Risk
VP
|
|
|
| SEMI-ANNUAL SHAREHOLDER REPORT American Funds Insurance Series® – Asset Allocation Fund |
|

|
Class 1 for the six months ended June 30, 2024
This semi-annual shareholder report contains important information about American Funds Insurance Series - Asset Allocation Fund for the period from January 1, 2024 to June 30, 2024. You can find additional information about the fund at capitalgroup.com/AFIS-literature-1. You can also request this information by contacting us at (800) 421-4225.
What were the fund costs for the last six months? (based on a hypothetical $10,000 investment)
|
|
|
|
|
|
|
|
| Share class |
|
Costs of a $10,000 investment |
|
Costs paid as a percentage of a $10,000 investment |
|
|
|
| Class 1 |
|
$16 |
|
0.30%* |
*Annualized
Key fund statistics
|
|
|
|
|
| Fund net assets (in millions) |
|
$ |
26,927 |
|
|
|
| Total number of portfolio holdings |
|
|
1,538 |
|
|
|
| Portfolio turnover rate including mortgage dollar roll transactions |
|
|
71% |
|
|
|
| Portfolio turnover rate excluding mortgage dollar roll transactions |
|
|
19% |
|
Portfolio holdings by asset type (percent of net assets)
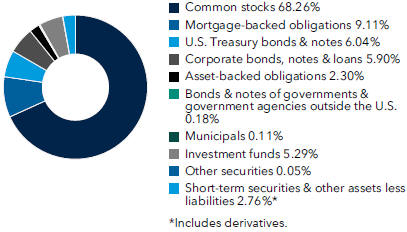
Availability of additional information
|
|
|

|
|
Scan the QR code to view additional information about the fund, including its prospectus, financial information, holdings and information on proxy voting. Or refer to the web address included at the beginning of this report. |
Important information
To reduce fund expenses, only one copy of most shareholder documents will be mailed to shareholders with multiple accounts at the same address (householding). If you would prefer that your documents not be householded, please contact Capital Group at (800) 421-4225, or contact your financial intermediary. Your instructions will typically be effective within 30 days of receipt by Capital Group or your financial intermediary.
Lit. No. INA1SRX-070-0824 © 2024 Capital Group. All rights reserved.
| (a) |
Not applicable for semi-annual reports. |
| Item 3. |
Audit Committee Financial Experts. |
| |
Not applicable for semi-annual reports. |
| Item 4. |
Principal Accountant Fees and Services. |
| |
Not applicable for semi-annual reports. |
| Item 5. |
Audit Committee of Listed Registrants. |
| |
Not applicable to the registrant. |
| (a) |
The Schedules of Investments are included within the Financial Statements filed under Item 7(a) of this Form. |
| Item 7. |
Financial Statements and Financial Highlights for Open-End Management Investment Companies. |
Transamerica Series Trust Semi-Annual Financial Statements
June 30, 2024
1801 California St., Suite 5200
Denver, CO 80202
Distributor: Transamerica Capital, Inc.
Customer Service: 1-800-851-9777
|
| The following pages contain the most recent semi-annual financial statements for the investment options in which you are invested. In compliance with Securities and Exchange Commission regulations, we present these reports on an annual and semi-annual basis with the hope that they will foster greater understanding of the investment options’ holdings, performance, financial data, accounting policies and other issues. This streamlined version provides information only on the investment options in which you are invested. |
|
| If you have any questions about these reports, please do not hesitate to contact your financial professional. As always, we thank you for your trust and the opportunity to serve you. |
Transamerica 60/40 Allocation VP
SCHEDULE OF INVESTMENTS
At June 30, 2024
(unaudited)
|
|
|
|
|
|
|
| |
|
Shares |
|
|
Value |
|
|
|
| INVESTMENT COMPANIES - 100.1% |
|
|
|
|
|
|
| International Equity Fund - 14.8% |
|
|
|
|
|
|
| Transamerica MSCI EAFE Index VP (A) |
|
|
926,191 |
|
|
$ 12,318,340 |
|
|
|
|
|
|
|
|
|
|
| U.S. Equity Fund - 45.3% |
|
|
|
|
|
|
| Transamerica S&P 500 Index VP (A) |
|
|
1,621,840 |
|
|
37,626,690 |
|
|
|
|
|
|
|
|
|
|
| U.S. Fixed Income Funds - 40.0% |
|
|
|
|
|
|
| Transamerica Core Bond (A) |
|
|
1,943,855 |
|
|
16,542,208 |
| Transamerica Short-Term Bond (A) |
|
|
1,718,203 |
|
|
16,718,114 |
|
|
|
|
|
|
|
|
|
|
|
|
|
|
|
|
33,260,322 |
|
|
|
|
|
|
|
|
|
|
| Total Investment Companies
(Cost $72,026,062) |
|
|
|
|
|
83,205,352 |
|
|
|
|
|
|
|
| Total Investments
(Cost $72,026,062) |
|
|
|
|
|
83,205,352 |
|
|
|
|
|
|
|
| Net Other Assets (Liabilities) - (0.1)% |
|
|
|
|
|
(45,706) |
|
|
|
|
|
|
|
|
|
|
| Net Assets - 100.0% |
|
|
|
|
|
$ 83,159,646 |
|
|
|
|
|
|
|
INVESTMENT VALUATION:
Valuation Inputs (B)
|
|
|
|
|
|
|
|
|
|
|
|
|
|
|
| |
|
Level 1 - Unadjusted Quoted Prices |
|
|
Level 2 - Other Significant Observable Inputs |
|
|
Level 3 - Significant Unobservable Inputs |
|
|
Value |
| |
|
|
|
|
|
| ASSETS |
|
|
|
|
|
|
|
|
|
|
|
|
|
|
| Investments |
|
|
|
|
|
|
|
|
|
|
|
|
|
|
| Investment Companies |
|
$ |
83,205,352 |
|
|
$ |
— |
|
|
$ |
— |
|
|
$ 83,205,352 |
|
|
|
|
|
|
|
|
|
|
|
|
|
|
|
|
|
|
|
|
| Total Investments |
|
$ |
83,205,352 |
|
|
$ |
— |
|
|
$ |
— |
|
|
$ 83,205,352 |
|
|
|
|
|
|
|
|
|
|
|
|
|
|
|
FOOTNOTES TO SCHEDULE OF INVESTMENTS:
| (A) |
Affiliated investment in the Class I2 shares of funds within Transamerica Funds and/or affiliated investment in the Initial Class shares of funds within Transamerica Series Trust. Affiliated interest income, dividends income, realized and unrealized gains (losses), if any, are broken out within the Statement of Operations. |
| (B) |
There were no transfers in or out of Level 3 during the period ended June 30, 2024. Please reference the Investment Valuation section of the Notes to Financial Statements for more information regarding investment valuation and pricing inputs. |
The Notes to Financial Statements are an integral part of this report.
|
|
|
|
|
| Transamerica Series Trust |
|
|
|
Semi-Annual Financial Statements 2024 |
|
|
Page 1 |
|
|
Transamerica 60/40 Allocation VP
STATEMENT OF ASSETS AND LIABILITIES
At June 30, 2024
(unaudited)
|
|
|
|
|
|
|
| Assets: |
|
|
|
|
| Affiliated investments, at value (cost $72,026,062) |
|
$ |
83,205,352 |
|
| Receivables and other assets: |
|
|
|
|
| Affiliated investments sold |
|
|
4,531 |
|
| Dividends from affiliated investments |
|
|
113,601 |
|
| Prepaid expenses |
|
|
365 |
|
| |
|
| Total assets |
|
|
83,323,849 |
|
|
|
| Liabilities: |
|
|
|
|
| Payables and other liabilities: |
|
|
|
|
| Affiliated investments purchased |
|
|
113,601 |
|
| Shares of beneficial interest redeemed |
|
|
2,989 |
|
| Due to custodian |
|
|
4,532 |
|
| Investment management fees |
|
|
7,610 |
|
| Distribution and service fees |
|
|
15,854 |
|
| Transfer agent costs |
|
|
31 |
|
| Trustee and CCO fees |
|
|
169 |
|
| Audit and tax fees |
|
|
11,656 |
|
| Custody fees |
|
|
343 |
|
| Legal fees |
|
|
666 |
|
| Printing and shareholder reports fees |
|
|
1,142 |
|
| Other accrued expenses |
|
|
5,610 |
|
|
|
| Total liabilities |
|
|
164,203 |
|
| |
|
| Net assets |
|
$ |
83,159,646 |
|
|
|
| Net assets consist of: |
|
|
|
|
| Capital stock ($0.01 par value) |
|
$ |
60,766 |
|
| Additional paid-in capital |
|
|
68,416,149 |
|
| Total distributable earnings (accumulated losses) |
|
|
14,682,731 |
|
| |
|
| Net assets |
|
$ |
83,159,646 |
|
|
|
| Shares outstanding |
|
|
6,076,570 |
|
| |
|
| Net asset value and offering price per share |
|
$ |
13.69 |
|
STATEMENT OF OPERATIONS
For the period ended June 30, 2024
(unaudited)
|
|
|
|
|
| Investment income: |
|
|
|
|
| Dividend income from affiliated investments |
|
$ |
693,426 |
|
| Interest income from unaffiliated investments |
|
|
204 |
|
|
|
| Total investment income |
|
|
693,630 |
|
|
|
| Expenses: |
|
|
|
|
| Investment management fees |
|
|
119,327 |
|
| Distribution and service fees |
|
|
99,439 |
|
| Transfer agent costs |
|
|
422 |
|
| Trustee and CCO fees |
|
|
1,809 |
|
| Audit and tax fees |
|
|
11,614 |
|
| Custody fees |
|
|
754 |
|
| Legal fees |
|
|
2,406 |
|
| Printing and shareholder reports fees |
|
|
1,907 |
|
| Other |
|
|
7,974 |
|
| |
|
| Total expenses before waiver and/or reimbursement and recapture |
|
|
245,652 |
|
| |
|
| Expenses waived and/or reimbursed |
|
|
(71,596 |
) |
|
|
| Net expenses |
|
|
174,056 |
|
| |
|
| Net investment income (loss) |
|
|
519,574 |
|
|
|
| Net realized gain (loss) on: |
|
|
|
|
| Affiliated investments |
|
|
1,220,653 |
|
|
|
| Net change in unrealized appreciation (depreciation) on: |
|
|
|
|
| Affiliated investments |
|
|
4,238,395 |
|
| |
|
| Net realized and change in unrealized gain (loss) |
|
|
5,459,048 |
|
| |
|
| Net increase (decrease) in net assets resulting from operations |
|
$ |
5,978,622 |
|
The Notes to Financial Statements are an integral part of this report.
|
|
|
|
|
| Transamerica Series Trust |
|
|
|
Semi-Annual Financial Statements 2024 |
|
|
Page 2 |
|
|
Transamerica 60/40 Allocation VP
STATEMENT OF CHANGES IN NET ASSETS
For the period and year ended:
|
|
|
|
|
|
|
|
|
|
|
|
| |
|
June 30, 2024 (unaudited) |
|
December 31, 2023 |
|
|
|
| From operations: |
|
|
|
|
|
|
|
|
| Net investment income (loss) |
|
|
$ 519,574 |
|
|
|
$ 1,187,617 |
|
| Net realized gain (loss) |
|
|
1,220,653 |
|
|
|
1,039,595 |
|
| Net change in unrealized appreciation (depreciation) |
|
|
4,238,395 |
|
|
|
6,589,482 |
|
|
|
|
| Net increase (decrease) in net assets resulting from operations |
|
|
5,978,622 |
|
|
|
8,816,694 |
|
|
|
|
| Dividends and/or distributions to shareholders: |
|
|
|
|
|
|
|
|
| Dividends and/or distributions to shareholders |
|
|
— |
|
|
|
(769,870 |
) |
| |
|
|
| Net increase (decrease) in net assets resulting from dividends and/or distributions to shareholders |
|
|
— |
|
|
|
(769,870 |
) |
|
|
|
| Capital share transactions: |
|
|
|
|
|
|
|
|
| Proceeds from shares sold |
|
|
3,654,249 |
|
|
|
26,726,501 |
|
| Dividends and/or distributions reinvested |
|
|
— |
|
|
|
769,870 |
|
| Cost of shares redeemed |
|
|
(4,716,311 |
) |
|
|
(5,783,996 |
) |
| |
|
|
| Net increase (decrease) in net assets resulting from capital share transactions |
|
|
(1,062,062 |
) |
|
|
21,712,375 |
|
|
|
|
| Net increase (decrease) in net assets |
|
|
4,916,560 |
|
|
|
29,759,199 |
|
|
|
|
| Net assets: |
|
|
|
|
|
|
|
|
| Beginning of period/year |
|
|
78,243,086 |
|
|
|
48,483,887 |
|
| End of period/year |
|
|
$83,159,646 |
|
|
|
$78,243,086 |
|
|
|
|
| Capital share transactions - shares: |
|
|
|
|
|
|
|
|
| Shares issued |
|
|
278,562 |
|
|
|
2,210,598 |
|
| Shares reinvested |
|
|
— |
|
|
|
63,731 |
|
| Shares redeemed |
|
|
(357,225 |
) |
|
|
(486,476 |
) |
| |
|
|
| Net increase (decrease) in shares outstanding |
|
|
(78,663 |
) |
|
|
1,787,853 |
|
FINANCIAL HIGHLIGHTS
|
|
|
|
|
|
|
|
|
|
|
|
|
|
|
|
|
|
|
|
|
|
|
|
|
|
|
| For a share outstanding during the period and years indicated: |
|
Service Class |
|
|
|
|
|
|
|
| |
|
June 30, 2024 (unaudited) |
|
December 31, 2023 |
|
December 31, 2022 |
|
December 31, 2021 |
|
December 31, 2020 |
|
December 31, 2019 |
|
|
|
|
|
|
|
| Net asset value, beginning of period/year |
|
|
$ 12.71 |
|
|
|
$ 11.10 |
|
|
|
$ 13.63 |
|
|
|
$ 12.46 |
|
|
|
$ 11.18 |
|
|
|
$ 9.35 |
|
| Investment operations: |
|
|
|
|
|
|
|
|
|
|
|
|
|
|
|
|
|
|
|
|
|
|
|
|
| Net investment income (loss)(A) |
|
|
0.08 |
|
|
|
0.24 |
|
|
|
0.18 |
|
|
|
0.14 |
|
|
|
0.15 |
|
|
|
0.12 |
|
| Net realized and unrealized gain (loss) |
|
|
0.90 |
|
|
|
1.52 |
|
|
|
(2.04 |
) |
|
|
1.51 |
|
|
|
1.24 |
|
|
|
1.74 |
|
| |
|
|
|
|
|
|
| Total investment operations |
|
|
0.98 |
|
|
|
1.76 |
|
|
|
(1.86 |
) |
|
|
1.65 |
|
|
|
1.39 |
|
|
|
1.86 |
|
| Dividends and/or distributions to shareholders: |
|
|
|
|
|
|
|
|
|
|
|
|
|
|
|
|
|
|
|
|
|
|
|
|
| Net investment income |
|
|
— |
|
|
|
(0.15 |
) |
|
|
(0.13 |
) |
|
|
(0.12 |
) |
|
|
(0.07 |
) |
|
|
(0.02 |
) |
| Net realized gains |
|
|
— |
|
|
|
— |
|
|
|
(0.54 |
) |
|
|
(0.36 |
) |
|
|
(0.04 |
) |
|
|
(0.01 |
) |
| |
|
|
|
|
|
|
| Total dividends and/or distributions to shareholders |
|
|
— |
|
|
|
(0.15 |
) |
|
|
(0.67 |
) |
|
|
(0.48 |
) |
|
|
(0.11 |
) |
|
|
(0.03 |
) |
|
|
|
|
|
|
|
| Net asset value, end of period/year |
|
|
$ 13.69 |
|
|
|
$ 12.71 |
|
|
|
$ 11.10 |
|
|
|
$ 13.63 |
|
|
|
$ 12.46 |
|
|
|
$ 11.18 |
|
| |
|
|
|
|
|
|
|
|
|
|
|
|
|
|
|
|
|
|
|
|
|
|
|
|
|
|
|
|
|
|
|
| Total return |
|
|
7.71 |
%(B) |
|
|
15.95 |
% |
|
|
(13.80 |
)% |
|
|
13.29 |
% |
|
|
12.47 |
% |
|
|
20.13 |
% |
|
|
|
|
|
|
|
| Ratio and supplemental data: |
|
|
|
|
|
|
|
|
|
|
|
|
|
|
|
|
|
|
|
|
|
|
|
|
| Net assets end of period/year (000’s) |
|
|
$ 83,160 |
|
|
|
$ 78,243 |
|
|
|
$ 48,484 |
|
|
|
$ 54,506 |
|
|
|
$ 43,254 |
|
|
|
$ 26,292 |
|
| Expenses to average net assets(C) |
|
|
|
|
|
|
|
|
|
|
|
|
|
|
|
|
|
|
|
|
|
|
|
|
| Excluding waiver and/or reimbursement and recapture |
|
|
0.62 |
%(D) |
|
|
0.64 |
% |
|
|
0.65 |
% |
|
|
0.63 |
% |
|
|
0.66 |
% |
|
|
0.71 |
% |
| Including waiver and/or reimbursement and recapture(E) |
|
|
0.44 |
%(D) |
|
|
0.46 |
% |
|
|
0.47 |
% |
|
|
0.45 |
% |
|
|
0.52 |
% |
|
|
0.63 |
% |
| Net investment income (loss) to average net assets |
|
|
1.31 |
%(D) |
|
|
2.02 |
% |
|
|
1.54 |
% |
|
|
1.05 |
% |
|
|
1.36 |
% |
|
|
1.12 |
% |
| Portfolio turnover rate |
|
|
4 |
%(B) |
|
|
9 |
% |
|
|
44 |
% |
|
|
28 |
% |
|
|
20 |
% |
|
|
14 |
% |
| (A) |
Calculated based on average number of shares outstanding. |
| (C) |
Does not include expenses of the underlying investments in which the Portfolio invests. |
| (E) |
TAM has contractually agreed to waive 0.18% of its management fee through May 1, 2025. These amounts are not subject to recapture by TAM. |
The Notes to Financial Statements are an integral part of this report.
|
|
|
|
|
| Transamerica Series Trust |
|
|
|
Semi-Annual Financial Statements 2024 |
|
|
Page 3 |
|
|
Transamerica 60/40 Allocation VP
NOTES TO FINANCIAL STATEMENTS
At June 30, 2024
(unaudited)
1. ORGANIZATION
Transamerica Series Trust (“TST”) is an open-end management investment company registered under the Investment Company Act of 1940, as amended (the “1940 Act”). TST applies investment company accounting and reporting guidance. TST serves as a funding vehicle for variable life insurance, variable annuity, and group annuity products. Transamerica 60/40 Allocation VP (the “Portfolio”) is a series of TST and is classified as diversified under the 1940 Act. The Portfolio currently offers one class of shares, Service Class.
The only shareholders of the Portfolio are affiliated insurance company separate accounts and/or affiliated asset allocation portfolios. Contract holders of the variable life and annuity contracts are not shareholders of the Portfolio. For ease of reference, shareholders and contract holders are collectively referred to in this report as “shareholders.”
This report must be accompanied or preceded by the Portfolio’s current prospectus, which contains additional information about the Portfolio, including risks, as well as investment objectives and strategies.
Transamerica Asset Management, Inc. (“TAM”) serves as investment manager for the Portfolio pursuant to an investment management agreement. TAM provides continuous and regular investment management services to the Portfolio. TAM supervises the Portfolio’s investments, conducts its investment program and provides supervisory, compliance and administrative services to the Portfolio.
TAM’s investment management services also include the provision of supervisory and administrative services to the Portfolio. These services include performing certain administrative services for the Portfolio and supervising and overseeing the administrative, clerical, recordkeeping and bookkeeping services provided to the Portfolio by State Street Bank and Trust Company (“State Street”), to whom TAM has outsourced the provision of certain sub-administration services. To the extent agreed upon by TAM and the Portfolio from time to time, TAM’s supervisory and administrative services include, but are not limited to: monitoring and verifying the custodian’s daily calculation of the Net Asset Values (“NAV”); shareholder relations functions; compliance services; valuation services; assisting in due diligence and in the oversight and monitoring of certain activities of sub-advisers and certain aspects of Portfolio investments; assisting with Portfolio combinations and liquidations; oversight of the preparation and filing, and review, of all returns and reports, in connection with federal, state and local taxes; oversight and review of regulatory reporting; supervising and coordinating the Portfolio’s custodian and dividend disbursing agent and monitoring their services to the Portfolio; assisting the Portfolio in preparing reports to shareholders; acting as liaison with the Portfolio’s independent public accountants and providing, upon request, analyses, fiscal year summaries and other audit related services; assisting in the preparation of agendas and supporting documents for and minutes of meetings of trustees and committees of trustees; assisting in the preparation of regular communications with the trustees; and providing personnel and office space, telephones and other office equipment as necessary in order for TAM to perform supervisory and administrative services to the Portfolio. The Portfolio pays certain fees and expenses to State Street for sub-administration services which are not administrative services covered by the management agreement with TAM or paid for through the management fees payable thereunder. For the period ended June 30, 2024, (i) the expenses paid to State Street for sub-administration services by the Portfolio are shown as a part of Other expenses within the Statement of Operations and (ii) the expenses payable to State Street for sub-administration services from the Portfolio are shown as part of Other accrued expenses within the Statement of Assets and Liabilities.
2. SIGNIFICANT ACCOUNTING POLICIES
In preparing the Portfolio’s financial statements in accordance with Generally Accepted Accounting Principles in the United States of America (“GAAP”), estimates or assumptions (which could differ from actual results) may be used that affect reported amounts and disclosures. The following is a summary of significant accounting policies followed by the Portfolio.
Security transactions and investment income: Security transactions are accounted for on the trade date. Security gains and losses are calculated on a first-in, first-out basis. Interest income, if any, is accrued as earned. Dividend income and capital gain distributions from underlying investments, if any, are recorded on the ex-dividend date. Income or short-term capital gain distributions received from underlying investments, if any, are recorded as Dividend income from investments within the Statement of Operations. Long-term capital gain distributions received from underlying investments, if any, are recorded as Net realized gain (loss) on Capital gain distributions received from investments within the Statement of Operations.
Distributions to shareholders: Distributions are recorded on the ex-dividend date and are determined in accordance with federal income tax regulations, which may differ from GAAP.
Cash overdraft: The Portfolio may have cash overdraft balances. A fee is incurred on these overdrafts, calculated by multiplying the overdraft by a rate based on the Federal Funds Rate.
|
|
|
|
|
| Transamerica Series Trust |
|
|
|
Semi-Annual Financial Statements 2024 |
|
|
Page 4 |
|
|
Transamerica 60/40 Allocation VP
NOTES TO FINANCIAL STATEMENTS (continued)
At June 30, 2024
(unaudited)
2. SIGNIFICANT ACCOUNTING POLICIES (continued)
Payables, if any, are reflected as Due to custodian within the Statement of Assets and Liabilities. Expenses, if any, from U.S. cash overdrafts are reflected in Custody fees within the Statement of Operations. Expenses, if any, from foreign cash overdrafts are reflected in Other expenses within the Statement of Operations.
Indemnification: In the normal course of business, the Portfolio enters into contracts that contain a variety of representations that provide general indemnifications. The Portfolio’s maximum exposure under these arrangements is unknown, as this would involve future claims that may be made against the Portfolio and/or its affiliates that have not yet occurred. However, based on experience, the Portfolio expects the risk of loss to be remote.
3. INVESTMENT VALUATION
TAM has been designated as the Portfolio’s valuation designee pursuant to Rule 2a-5 under the 1940 Act with responsibility for fair valuation subject to oversight by the Portfolio’s Board of Trustees. The net asset value of the Portfolio is computed as of the official close of the New York Stock Exchange (“NYSE”) each day the NYSE is open for business.
TAM utilizes various methods to measure the fair value of its investments on a recurring basis. GAAP establishes a hierarchy that prioritizes inputs to valuation methods. The inputs or methodology used for valuing securities are not necessarily an indication of the risk associated with investing in those securities. The three levels (“Levels”) of inputs of the fair value hierarchy are defined as follows:
Level 1—Unadjusted quoted prices in active markets for identical securities.
Level 2—Inputs, other than quoted prices included in Level 1, which are observable, either directly or indirectly. These inputs may include quoted prices for the identical instrument on an inactive market, prices for similar instruments, interest rates, prepayment speeds, credit risk, yield curves, default rates, and similar data.
Level 3—Unobservable inputs based on the best information available in the circumstances, to the extent observable inputs are not available, which may include TAM’s own assumptions used in determining the fair value of the Portfolio’s investments.
The inputs used to measure fair value may fall into different Levels of the fair value hierarchy. In such cases, for disclosure purposes, the Level in the fair value hierarchy that is assigned to the fair value measurement of a security is determined based on the lowest Level input that is significant to the fair value measurement in its entirety. Certain investments that are measured at fair value using NAV per share, or its equivalent, using the “practical expedient” have not been classified in the fair value Levels. The hierarchy classification of inputs used to value the Portfolio’s investments at June 30, 2024, is disclosed within the Investment Valuation section of the Schedule of Investments.
The availability of observable inputs can vary from security to security and is affected by a wide variety of factors, including, but not limited to, the type of security, whether the security is new and not yet established in the marketplace, the liquidity of markets, and other characteristics particular to the security. To the extent that valuation is based on models or inputs that are less observable or unobservable in the market, the determination of fair value requires more judgment. Accordingly, the degree of judgment exercised in determining fair value is generally greatest for instruments categorized in Level 3. Due to the inherent uncertainty of valuation, the determination of values may differ significantly from values that would have been realized had a ready market for investments existed, and the differences could be material.
Fair value measurements: Descriptions of the valuation techniques applied to the Portfolio’s significant categories of assets and liabilities measured at fair value on a recurring basis are as follows:
Investment companies: Certain investment companies are valued at the NAV as the practical expedient. These investment companies are not included within the fair value hierarchy. Certain other investment companies are valued at the actively traded NAV and no valuation adjustments are applied. These investment companies are categorized in Level 1 of the fair value hierarchy.
4. BORROWINGS AND OTHER FINANCING TRANSACTIONS
The Portfolio may engage in borrowing transactions as a means of raising cash to satisfy redemption requests, for other temporary or emergency purposes or, to the extent permitted by its investment policies, to raise additional cash to be invested in other securities or instruments. When the Portfolio invests borrowing proceeds in other securities, the Portfolio will bear the risk that the market value of the securities in which such proceeds are invested goes down and is insufficient to repay the borrowed proceeds. The Portfolio may borrow on a secured or on an unsecured basis. If the Portfolio enters into a secured borrowing arrangement, a portion of the Portfolio’s assets will be
|
|
|
|
|
| Transamerica Series Trust |
|
|
|
Semi-Annual Financial Statements 2024 |
|
|
Page 5 |
|
|
Transamerica 60/40 Allocation VP
NOTES TO FINANCIAL STATEMENTS (continued)
At June 30, 2024
(unaudited)
4. BORROWINGS AND OTHER FINANCING TRANSACTIONS (continued)
used as collateral. The 1940 Act requires the Portfolio to maintain asset coverage of at least 300% of the amount of its borrowings. Asset coverage means the ratio that the value of the Portfolio’s total assets, minus liabilities other than borrowings, bears to the aggregate amount of all borrowings. Although complying with this requirement has the effect of limiting the amount that the Portfolio may borrow, it does not otherwise mitigate the risks of entering into borrowing transactions.
Interfund lending: The Portfolio, along with other funds and portfolios advised by TAM, may participate in an interfund lending program pursuant to exemptive relief granted by the Securities and Exchange Commission on January 18, 2017. This program allows the Portfolio to lend to and borrow from other funds and portfolios advised by TAM. Interfund lending transactions are subject to the conditions of the exemptive relief which places limits on the amount of lending or borrowing a Portfolio may participate in under the program. Interest earned or paid on an interfund lending transaction will be based on the average of certain current market rates. For the period ended June 30, 2024, the Portfolio has not utilized the program.
5. RISK FACTORS
Investing in the Portfolio involves certain key risks related to the Portfolio’s trading activity. Please reference the Portfolio’s prospectus for a more complete discussion of the following risk(s), as well as other risks of investing in the Portfolio.
Market risk: The market prices of the Portfolio’s securities or other assets may go up or down, sometimes rapidly or unpredictably, due to factors such as economic events, inflation, changes in interest rates, governmental actions or interventions, actions taken by the U.S. Federal Reserve or foreign central banks, market disruptions caused by tariffs, trade disputes or other factors, political developments, armed conflicts, economic sanctions, cybersecurity events, investor sentiment, the global and domestic effects of widespread or local health, weather or climate events, and other factors that may or may not be related to the issuer of the security or other asset. If the market prices of the Portfolio’s securities and assets fall, the value of your investment in the Portfolio could go down.
Economies and financial markets throughout the world are increasingly interconnected. Events or circumstances in one or more countries or regions could be highly disruptive to, and have profound impacts on, global economies or markets. As a result, whether or not the Portfolio invests in securities of issuers located in or with significant exposure to the countries directly affected, the value and liquidity of the Portfolio’s investments may go down.
Asset allocation risk: The Portfolio’s investment performance is significantly impacted by the Portfolio’s asset allocation and reallocation from time to time. The value of your investment may decrease if the Investment Manager’s judgment about the attractiveness,value or market trends affecting a particular asset class, investment style, technique or strategy, underlying portfolio or other issuer is incorrect.
Underlying portfolios risk: Because the Portfolio invests its assets in various underlying portfolios, its ability to achieve its investment objective depends largely on the performance of the underlying portfolios in which it invests. Investing in underlying portfolios subjects the Portfolio to the risks of investing in the underlying securities or assets held by those underlying portfolios. Each of the underlying portfolios in which the Portfolio may invest has its own investment risks, and those risks can affect the value of the underlying portfolios’ shares and therefore the value of the Portfolio’s investments. There can be no assurance that the investment objective of any underlying portfolio will be achieved. To the extent that the Portfolio invests more of its assets in one underlying portfolio than in another, the Portfolio will have greater exposure to the risks of that underlying portfolio. In addition, the Portfolio will bear a pro rata portion of the operating expenses of the underlying portfolios in which it invests. The “List and Description of Underlying Portfolios” section of the Portfolio’s prospectus identifies certain risks of each underlying portfolio.
6. FEES AND OTHER AFFILIATED TRANSACTIONS
TST serves as a funding vehicle for certain affiliated asset allocation portfolios and certain affiliated separate accounts of Transamerica Life Insurance Company (“TLIC”) and Transamerica Financial Life Insurance Company.
TAM, the Portfolio’s investment manager, is directly owned by TLIC and AUSA Holding, LLC (“AUSA”), both of which are indirect, wholly owned subsidiaries of Aegon Ltd. TLIC is owned by Commonwealth General Corporation (“Commonwealth”). Commonwealth and AUSA are wholly owned by Transamerica Corporation (DE). Transamerica Corporation (DE) is wholly owned by Aegon International B.V., which is wholly owned by Aegon Ltd., a Bermuda exempted company with liability limited by shares (formerly, Aegon NV, a Netherlands corporation) and a publicly traded international insurance group.
Transamerica Fund Services, Inc. (“TFS”) is the Portfolio’s transfer agent. Transamerica Capital, Inc. (“TCI”) is the Portfolio’s distributor/principal underwriter. TAM, TFS and TCI are affiliates of Aegon Ltd.
|
|
|
|
|
| Transamerica Series Trust |
|
|
|
Semi-Annual Financial Statements 2024 |
|
|
Page 6 |
|
|
Transamerica 60/40 Allocation VP
NOTES TO FINANCIAL STATEMENTS (continued)
At June 30, 2024
(unaudited)
6. FEES AND OTHER AFFILIATED TRANSACTIONS (continued)
Certain officers and trustees of the Portfolio may also be officers and/or trustees of TAM, TFS and TCI. No interested trustee who is deemed an interested person due to current or former service with TAM or an affiliate of TAM receives compensation from the Portfolio. The Portfolio does pay non-interested persons (independent trustees), as disclosed in Trustee and CCO fees within the Statement of Operations.
Investment management fees: TAM serves as the Portfolio’s investment manager, performing administration as well as investment advisory services. TAM renders investment advisory, supervisory, and administration services under an investment management agreement and the Portfolio pays a single management fee, which is reflected in Investment management fees within the Statement of Operations.
The Portfolio pays a management fee to TAM based on daily average net assets at the following rates:
|
|
|
|
|
| Breakpoints |
|
Rate |
|
|
| First $1 billion |
|
|
0.30 |
% |
| Over $1 billion |
|
|
0.28 |
|
TAM has contractually agreed to waive 0.18% of the average daily net assets from its management fee through May 1, 2025.
TAM has contractually agreed to waive fees and/or reimburse Portfolio expenses to the extent that the total operating expenses excluding, as applicable, acquired fund fees and expenses, interest (including borrowing costs and overdraft charges), taxes, brokerage commissions, dividend and interest expenses on securities sold short, extraordinary expenses and other expenses not incurred in the ordinary course of the Portfolio’s business, exceed the following stated annual operating expense limits to the Portfolio’s daily average net assets. To the extent an expense limit changed during the period, the prior limit is also listed below. The expenses waived and/or reimbursed, if any, are included in Expenses waived and/or reimbursed within the Statement of Operations.
|
|
|
|
|
|
|
|
| Class |
|
Operating Expense Limit |
|
Operating Expense Limit Effective Through |
|
|
|
| Service Class |
|
0.63% |
|
May 1, 2025 |
TAM is permitted to recapture amounts contractually waived and/or reimbursed to a class during any of the 36 months from the date on which TAM waived fees and/or reimbursed expenses for the class. A class may recapture and reimburse TAM only if such amount does not cause, on any particular business day of the Portfolio, the class’s total annual operating expenses (after the recapture is taken into account) to exceed the Operating Expense Limits or any other lower limit then in effect. Amounts recaptured, if any, by TAM for the period ended June 30, 2024 are disclosed in Recapture of previously waived and/or reimbursed fees within the Statement of Operations.
TAM, on a voluntary basis and in addition to the contractual operating expense limits in effect, from time to time may waive and/or reimburse expenses of the Portfolio, or any classes thereof, to such level(s) as the Trust’s officers have determined or may reasonably determine from time to time. Any such voluntary waiver or expense reimbursement may be discontinued by TAM at any time. These amounts are not subject to recapture by TAM.
As of June 30, 2024, there are no amounts available for recapture by TAM.
Distribution and service fees: TST has a distribution plan (“Distribution Plan”) pursuant to Rule 12b-1 under the 1940 Act. Pursuant to the Distribution Plan, TST entered into a distribution agreement with TCI as the Portfolio’s distributor.
The Distribution Plan requires the Portfolio to pay distribution fees to TCI as compensation for various distribution activities, not as reimbursement for specific expenses. Under the Distribution Plan and distribution agreement, TCI, on behalf of the Portfolio, is authorized to pay various service providers, as direct payment for expenses incurred in connection with distribution of the Portfolio’s shares.
The fee on the Service Class shares is paid to the insurance companies for providing services and account maintenance for the policyholders who invest in the variable insurance products which invest in the Service Class shares. The distribution and service fees are included in Distribution and service fees within the Statement of Operations.
|
|
|
|
|
| Transamerica Series Trust |
|
|
|
Semi-Annual Financial Statements 2024 |
|
|
Page 7 |
|
|
Transamerica 60/40 Allocation VP
NOTES TO FINANCIAL STATEMENTS (continued)
At June 30, 2024
(unaudited)
6. FEES AND OTHER AFFILIATED TRANSACTIONS (continued)
The Portfolio is authorized under the Distribution Plan to pay fees to TCI based on daily average net assets up to an annual fee of 0.25% of Service Class shares.
Transfer agent costs: TFS provides transfer agency services under an intercompany agreement with TAM. TFS has outsourced the provision of certain sub-transfer agency services to SS&C Global Investor & Distribution Solutions, Inc. (“SS&C GIDS”). The Portfolio does not pay a separate transfer agent fee to TAM or TFS but does pay certain expenses to SS&C GIDS related to applicable sub-transfer agency services. For the period ended June 30, 2024, (i) the expenses paid to SS&C GIDS by the Portfolio are referred to as transfer agent costs and are included within the Statement of Operations and (ii) the expenses payable to SS&C GIDS by the Portfolio are referred to as transfer agent costs within the Statement of Assets and Liabilities.
Brokerage commissions: The Portfolio incurred no brokerage commissions on security transactions placed with affiliates of the investment manager or sub-adviser(s) for the period ended June 30, 2024.
7. PURCHASES AND SALES OF SECURITIES
For the period ended June 30, 2024, the cost of securities purchased and proceeds from securities sold (excluding short-term securities) are as follows:
|
|
|
| Purchases of Securities |
|
Sales of Securities |
|
|
| $ 3,276,763 |
|
$ 4,589,522 |
8. FEDERAL INCOME TAXES AND DISTRIBUTIONS TO SHAREHOLDERS
The Portfolio has not made any provision for federal income or excise taxes due to its policy to distribute all of its taxable income and capital gains to its shareholders and otherwise qualify as a regulated investment company under Subchapter M of the Internal Revenue Code. The Portfolio recognizes the tax benefits of uncertain tax positions only where the position is “more likely than not” to be sustained assuming examination by tax authorities. The Portfolio’s tax returns remain subject to examination by the Internal Revenue Service and state tax authorities three years from the date of filing for federal purposes and four years from the date of filing for state purposes. Management has evaluated the Portfolio’s tax provisions taken for all open tax years, and has concluded that no provision for income tax is required in the Portfolio’s financial statements. If applicable, the Portfolio recognizes interest accrued related to unrecognized tax benefits in relation to interest and penalties expense in Other within the Statement of Operations. The Portfolio identifies its major tax jurisdictions as U.S. Federal, the state of Colorado, and foreign jurisdictions where the Portfolio makes significant investments; however, the Portfolio is not aware of any tax positions for which it is reasonably possible that the total amounts of unrecognized tax benefits will change materially in the next twelve months. Distributions are determined in accordance with income tax regulations, which may differ from GAAP.
As of June 30, 2024, the approximate cost for U.S. federal income tax purposes, and the aggregate gross/net unrealized appreciation (depreciation) in the value of investments (including securities sold short and derivatives, if any) are as follows:
|
|
|
|
|
|
|
| Cost |
|
Gross Appreciation |
|
Gross (Depreciation) |
|
Net Appreciation (Depreciation) |
|
|
|
|
| $ 72,026,062 |
|
$ 11,740,228 |
|
$ (560,938) |
|
$ 11,179,290 |
Please see TST’s most recent report on Form N-CSR, available at: www.transamerica.com/annuities/prospectus, for additional information. For the most recently filed complete proxy voting records for the Trust please visit: https://www.transamerica.com/sites/default/files/files/e070d/TST%20N-PX%202021.pdf
|
|
|
|
|
| Transamerica Series Trust |
|
|
|
Semi-Annual Financial Statements 2024 |
|
|
Page 8 |
|
|
Transamerica 60/40 Allocation VP
MANAGEMENT AGREEMENT — CONTRACT RENEWAL
(unaudited)
At a meeting of the Board of Trustees of Transamerica Series Trust (the “Trustees” or the “Board”) held on June 12-13, 2024, the Board considered the renewal of the management agreement (the “Management Agreement”) between Transamerica Asset Management, Inc. (“TAM”) and Transamerica Series Trust, on behalf of Transamerica 60/40 Allocation VP (the “Portfolio”).
Following its review and consideration, the Board determined that the terms of the Management Agreement were reasonable and that the renewal of the Management Agreement was in the best interests of the Portfolio and the holders invested in the Portfolio. The Board, including the independent members of the Board (the “Independent Trustees”), unanimously approved the renewal of the Management Agreement through June 30, 2025.
Prior to reaching their decision, the Trustees requested and received from TAM certain information. They then reviewed such information as they deemed reasonably necessary to evaluate the Management Agreement, including information they had previously received from TAM as part of their regular oversight of the Portfolio, and knowledge they gained over time through meeting with TAM. Among other materials, the Trustees considered comparative fee, expense and performance information prepared by Broadridge Financial Solutions, Inc. (“Broadridge”), an independent provider of mutual fund performance information, as well as fee, expense and profitability information prepared by TAM. In addition, TAM provided the Board with additional supplemental comparative fee, expense and performance information. The Board also considered reductions to the Portfolio’s expense limit, if any, that took effect after the last renewal of the Management Agreement. In their review, the Trustees also sought to identify instances in which the Portfolio’s performance, fees, total expenses and/or profitability appeared to be outliers within its respective peer group or other comparative metrics and sought to understand the reasons for such comparative positions.
In their deliberations, the Independent Trustees met privately without representatives of TAM present and were represented throughout the process by their independent legal counsel. In considering the proposed continuation of the Management Agreement, the Trustees evaluated and weighed a number of considerations that they believed to be relevant in light of the legal advice furnished to them by counsel, including independent legal counsel, and made a decision in the exercise of their own business judgment. They based their decisions on the considerations discussed below, among others, although they did not identify any particular consideration or item of information that was controlling of their decisions, and each Trustee may have attributed different weights to the various factors.
Nature, Extent and Quality of the Services Provided
The Board considered the nature, extent and quality of the services provided by TAM to the Portfolio in the past and the services anticipated to be provided in the future. The Board also considered the investment approach for the Portfolio; the experience, capability and integrity of TAM’s senior management; the financial resources of TAM; TAM’s management oversight process; and TAM’s responsiveness to any questions by the Trustees.
The Board also considered the continuous and regular investment management and other services provided by TAM. The Board noted that the investment management and other services provided by TAM include the design, development and ongoing review and evaluation of the Portfolio and its investment strategy; ongoing portfolio trading oversight and analysis; risk management oversight and analysis; design, development, implementation and ongoing review and evaluation of a process for the valuation of Portfolio investments; design, development, implementation and ongoing review and evaluation of a compliance program for the Portfolio; design, development, implementation and ongoing review and evaluation of a process for the voting of proxies and exercise of rights to consent to corporate action for Portfolio investments; participation in Board meetings and oversight of preparation of materials for the Board, including materials for Board meetings and regular communications with the Board; oversight of preparation of the Portfolio’s prospectus, statement of additional information, shareholder reports and other disclosure materials and regulatory filings for the Portfolio; and ongoing cash management services for the Portfolio. The Board considered that TAM’s investment management services also include the provision of supervisory and administrative services to the Portfolio. The Board also noted that TAM, as part of the services it provides to all Transamerica mutual funds, including the Portfolio, oversees the services provided by the funds’ custodian, transfer agent, independent accountant and legal counsel and supervises the performance of the recordkeeping and holder service functions of the funds.
Investment Performance
In addition, the Board considered the short- and longer-term performance of the Portfolio in light of its investment objective, policies and strategies, including relative performance against (i) a peer universe of comparable mutual funds, as prepared by Broadridge, and (ii) the Portfolio’s benchmarks, in each case for various trailing periods ended December 31, 2023. Based on these considerations, the Board determined that TAM can provide investment and related services that are appropriate in scope and extent in light of the Portfolio’s investment objectives, policies and strategies and operations, the competitive landscape of the investment company business and investor needs. The Board’s conclusions as to the Portfolio’s performance are summarized below. For purposes of its review, the Board generally used the performance of Service Class Shares. In describing the Portfolio’s performance relative to its peer universe, the summary conclusions characterize performance for the relevant periods in relation to whether it was “above,” “below” or “in line with” the peer universe median and do so using quintile rankings prepared by Broadridge. For simplicity, performance is described as “above” the median if the Portfolio’s performance ranked anywhere in the first or second quintiles, as “below” the median if it ranked anywhere in the fourth or fifth quintiles, or “in line with” the median if it ranked anywhere in the third quintile (i.e., even if its precise return was somewhat above or somewhat below the precise median return).
|
|
|
|
|
| Transamerica Series Trust |
|
|
|
Semi-Annual Financial Statements 2024 |
|
|
Page 9 |
|
|
Transamerica 60/40 Allocation VP
MANAGEMENT AGREEMENT — CONTRACT RENEWAL (continued)
(unaudited)
When considering the Portfolio’s performance, the Trustees considered any representations made by TAM regarding the appropriateness of certain peer groups and benchmarks. They recognized that performance reflects a snapshot of a period as of a specific date, and that consideration of performance data for a different period could generate significantly different performance results. The Trustees also recognized that even longer-term performance can be negatively affected by performance over a short-term period when that short-term performance is significantly below the performance of the comparable benchmark or universe of peer funds.
The Board noted that the performance of Service Class Shares of the Portfolio was above the median for its peer universe for the past 1-, 3-, and 5-year periods. The Board also noted that the performance of Service Class Shares of the Portfolio was above the benchmark that TAM utilizes to measure performance of the Portfolio for the past 3-year period and below the benchmark for the past 1- and 5-year periods.
Management Fee and Total Expense Ratio
The Board considered the management fee and total expense ratio of the Portfolio, including information provided by Broadridge comparing the management fee and total expense ratio of the Portfolio to the management fees and total expense ratios of comparable investment companies in both a peer group and broader peer universe compiled by Broadridge. The Board’s conclusions as to the Portfolio’s management fee and total expense ratio are summarized below. For purposes of its review, the Board generally used the actual total expenses (i.e., expenses reflecting any waivers and/or reimbursements) of Service Class Shares. In describing the Portfolio’s management fee and total expense ratio relative to its peer group and peer universe, the summary conclusions characterize management fees and total expense ratios for the relevant periods in relation to whether they were “above,” “below” or “in line with” the peer group or peer universe median and do so using quintile rankings prepared by Broadridge. For simplicity, management fees and total expense ratios are described as “above” the median if the Portfolio’s management fee or total expense ratio ranked anywhere in the fourth or fifth quintiles, as “below” the median if it ranked anywhere in the first or second quintiles, or “in line with” the median if it ranked anywhere in the third quintile (i.e., even if its precise management fee or total expense ratio was somewhat above or somewhat below the precise median management fee or total expense ratio).
The Board noted that the Portfolio’s contractual management fee was above the medians for its peer group and peer universe and that the actual total expenses (i.e., expenses reflecting any waivers and/or reimbursements) of Service Class Shares of the Portfolio were below the medians for its peer group and peer universe. The Trustees also considered that TAM has entered into an expense limitation arrangement with the Portfolio, which may result in TAM waiving fees for the benefit of holders.
On the basis of these considerations, together with the other information it considered, the Board determined that the management fee to be received by TAM under the Management Agreement is reasonable in light of the services provided.
Cost of Services Provided and Level of Profitability
The Board reviewed information provided by TAM about the cost of providing and procuring fund management services, as well as the costs of the provision of administration, transfer agency and other services, to the Portfolio and to Transamerica Series Trust as a whole by TAM and its affiliates. The Board considered the profitability of TAM and its affiliates in providing these services for the Portfolio and Transamerica Series Trust as a whole. The Trustees recognized the competitiveness of the mutual fund industry and the importance of an investment adviser’s long-term profitability, including for maintaining company and management stability and accountability.
The Board also considered the allocation methodology used for calculating the profitability of TAM and its affiliates. The Board noted that the revenue and expense allocation methodology used by TAM to estimate its profitability with respect to its relationship with the Portfolio had been reviewed previously by an independent consultant. The Trustees considered that TAM reported that it had not made material changes to this methodology, and that the methodology had been applied consistently for the Portfolio.
Based on this information, the Board determined that the profitability of TAM and its affiliates from their relationships with the Portfolio was not excessive.
Economies of Scale
The Board considered economies of scale with respect to the management of the Portfolio, whether the Portfolio had appropriately benefited from any economies of scale and whether there was the potential for realization of any future economies of scale. The Board also considered the existence of economies of scale with respect to management of the Transamerica mutual funds overall and the extent to which the Portfolio benefited from any economies of scale. The Board recognized that, as the Portfolio’s assets increase, any economies of scale realized by TAM may not directly correlate with any economies of scale that might be realized by the Portfolio. The Board considered the Portfolio’s management fee schedule and the existence of breakpoints and also considered the extent to which TAM shared economies of scale, if any, with the Portfolio through undertakings to limit or reimburse Portfolio expenses and to invest in maintaining and developing its capabilities and services. The Trustees concluded that the Portfolio’s fee structure reflected an appropriate sharing of any efficiencies or economies of scale to date and noted that they will have the opportunity to periodically reexamine the appropriateness of the management fee payable to TAM in light of any economies of scale experienced in the future.
Benefits to TAM and/or its Affiliates from their Relationships with the Portfolio
|
|
|
|
|
| Transamerica Series Trust |
|
|
|
Semi-Annual Financial Statements 2024 |
|
|
Page 10 |
|
|
Transamerica 60/40 Allocation VP
MANAGEMENT AGREEMENT — CONTRACT RENEWAL (continued)
(unaudited)
The Board considered other benefits derived by TAM and/or its affiliates from their relationships with the Portfolio. The Board noted that TAM does not receive benefits from research obtained with commissions paid to broker-dealers for portfolio transactions (commonly referred to as “soft dollars”) as a result of its relationship with the Portfolio.
Other Considerations
The Board noted that TAM has made a substantial commitment to the recruitment and retention of high-quality personnel and maintains the financial, compliance and operational resources reasonably necessary to manage the Portfolio in a professional manner that is consistent with the best interests of the Portfolio and the holders. In this regard, the Board favorably considered the procedures and policies TAM has in place to enforce compliance with applicable laws and regulations. The Board also noted that TAM has made an entrepreneurial commitment and undertaken certain business risks with respect to the management and success of the Portfolio.
Conclusion
After consideration of the factors described above, as well as other factors, the Trustees, including the Independent Trustees, concluded that the renewal of the Management Agreement was in the best interests of the Portfolio and the holders and voted to approve the renewal of the Management Agreement.
|
|
|
|
|
| Transamerica Series Trust |
|
|
|
Semi-Annual Financial Statements 2024 |
|
|
Page 11 |
|
|
PROXY VOTING POLICIES AND PROCEDURES AND QUARTERLY PORTFOLIO HOLDINGS
(unaudited)
A description of Transamerica Series Trust’s (the “Trust”) proxy voting policies and procedures is available in the Statement of Additional Information of the Portfolios, available without charge upon request by calling 1-800-851-9777 (toll free) or on the Securities and Exchange Commission’s (“SEC”) website at http://www.sec.gov.
In addition, the Portfolio is required to file Form N-PX, with their complete proxy voting records for the most recent 12 months ended June 30th, no later than August 31st of each year. The Form is available without charge: (1) on the Transamerica Funds website at https://www.transamerica.com/sites/default/files/files/e070d/TST%20N-PX%202021.pdf; and (2) on the SEC’s website at http://www.sec.gov.
Each fiscal quarter, the Portfolios, except Transamerica BlackRock Government Money Market VP, will file with the SEC a complete schedule of its monthly portfolio holdings on Form N-PORT. The Portfolios’ holdings as of the end of the third month of every fiscal quarter, as reported on Form N-PORT, will be publicly available on the SEC’s website at http://www.sec.gov within 60 days of the end of the fiscal quarter.
On a monthly basis, Transamerica BlackRock Government Money Market VP will file with the SEC portfolio holdings information on Form N-MFP3. A complete schedule of portfolio holdings is also available at www.transamerica.com.
You may also visit the Trust’s website at www.transamerica.com/annuities/prospectus for this and other information about the Portfolios and the Trust.
Important Notice Regarding Delivery of Shareholder Documents
Every year we provide shareholders informative materials such as the Transamerica Series Trust Annual Report, the Transamerica Series Trust Prospectus, and other required documents that keep you informed regarding your Portfolios. To the extent provided by mail, Transamerica Series Trust will only send one piece per mailing address, a method that saves your Portfolios money by reducing mailing and printing costs. We will continue to do this unless you tell us not to. To elect to receive individual mailings, simply call a Transamerica Customer Service Representative toll free at 1-800-851-9777, 8 a.m. to 7 p.m. Eastern Time, Monday-Friday. Your request will take effect within 30 days.
|
|
|
|
|
| Transamerica Series Trust |
|
|
|
Semi-Annual Financial Statements 2024 |
|
|
Page 12 |
|
|
NOTICE OF PRIVACY POLICY
(unaudited)
Your privacy is very important to us. We want you to understand what information we collect and how we use it. We collect and use “nonpublic personal information” in connection with providing our customers with a broad range of financial products and services as effectively and conveniently as possible. We treat nonpublic personal information in accordance with our Privacy Policy.
What Information We Collect and From Whom We Collect It
We may collect nonpublic personal information about you from the following sources:
| • |
|
Information we receive from you on applications or other forms, such as your name, address, and account number; |
| • |
|
Information about your transactions with us, our affiliates, or others, such as your account balance and purchase/redemption history; and |
| • |
|
Information we receive from non-affiliated third parties, including consumer reporting agencies. |
What Information We Disclose and To Whom We Disclose It
We do not disclose any nonpublic personal information about current or former customers to anyone without their express consent, except as permitted by law. We may disclose the nonpublic personal information we collect, as described above, to persons or companies that perform services on our behalf and to other financial institutions with which we have joint marketing agreements. We will require these companies to protect the confidentiality of your nonpublic personal information and to use it only to perform the services for which we have hired them.
Our Security Procedures
We restrict access to your nonpublic personal information and only allow disclosures to persons and companies as permitted by law to assist in providing products or services to you. We maintain physical, electronic, and procedural safeguards to protect your nonpublic personal information and to safeguard the disposal of certain consumer information.
Contact Us
If you have any questions about our Privacy Policy, please call 1-800-851-9777 on any business day between 8 a.m. and 7 p.m. Eastern Time.
Note: This Privacy Policy applies only to customers that have a direct relationship with us or our affiliates. If you own shares of our portfolios in the name of a third party such as a bank or broker-dealer, its privacy policy may apply to you instead of ours.
|
|
|
|
|
| Transamerica Series Trust |
|
|
|
Semi-Annual Financial Statements 2024 |
|
|
Page 13 |
|
|
PO Box 219945
Kansas City, MO 64121-9945
|
|
|
| Distributor: |
|
Transamerica Capital, Inc. |
|
|
|
|
PO Box 219945 |
|
|
|
|
Kansas City, MO 64121-9945 |
|
|
|
|
Customer Service: 1-800-851-9777 |
Transamerica Series Trust Semi-Annual Financial Statements
June 30, 2024
1801 California St., Suite 5200
Denver, CO 80202
Distributor: Transamerica Capital, Inc.
Customer Service: 1-800-851-9777
|
| The following pages contain the most recent semi-annual financial statements for the investment options in which you are invested. In compliance with Securities and Exchange Commission regulations, we present these reports on an annual and semi-annual basis with the hope that they will foster greater understanding of the investment options’ holdings, performance, financial data, accounting policies and other issues. This streamlined version provides information only on the investment options in which you are invested. If you have any questions about these reports, please do not hesitate to contact your financial professional. As always, we thank you for your trust and the opportunity to serve you. |
Transamerica Aegon Bond VP
SCHEDULE OF INVESTMENTS
At June 30, 2024
(unaudited)
|
|
|
|
|
|
|
|
|
| |
|
Principal |
|
|
Value |
|
| |
|
|
| CORPORATE DEBT SECURITIES - 43.8% |
|
| Aerospace & Defense - 1.1% |
|
| BAE Systems PLC |
|
|
|
|
|
|
|
|
| 5.30%, 03/26/2034 (A) |
|
$ |
3,259,000 |
|
|
|
$ 3,235,724 |
|
| Boeing Co. |
|
|
|
|
|
|
|
|
| 5.93%, 05/01/2060 |
|
|
3,547,000 |
|
|
|
3,181,132 |
|
| 6.53%, 05/01/2034 (A) |
|
|
3,609,000 |
|
|
|
3,702,011 |
|
| 6.86%, 05/01/2054 (A) |
|
|
2,353,000 |
|
|
|
2,425,863 |
|
| Embraer Netherlands Finance BV |
|
|
|
|
|
|
|
|
| 7.00%, 07/28/2030 (A) |
|
|
2,524,000 |
|
|
|
2,633,153 |
|
| General Electric Co. |
|
|
|
|
|
|
|
|
| 4.50%, 03/11/2044 |
|
|
5,245,000 |
|
|
|
4,579,940 |
|
| HEICO Corp. |
|
|
|
|
|
|
|
|
| 5.35%, 08/01/2033 |
|
|
4,605,000 |
|
|
|
4,571,854 |
|
|
|
|
|
|
|
|
|
|
|
|
|
|
|
|
|
|
|
|
24,329,677 |
|
|
|
|
|
|
|
|
|
|
| Automobile Components - 0.2% |
|
| Aptiv PLC/Aptiv Corp. |
|
|
|
|
|
|
|
|
| 3.25%, 03/01/2032 |
|
|
2,346,000 |
|
|
|
2,037,629 |
|
| ZF North America Capital, Inc. |
|
|
|
|
|
|
|
|
| 6.88%, 04/23/2032 (A) |
|
|
2,374,000 |
|
|
|
2,454,200 |
|
|
|
|
|
|
|
|
|
|
|
|
|
|
|
|
|
|
|
|
4,491,829 |
|
|
|
|
|
|
|
|
|
|
| Automobiles - 1.1% |
|
| BMW US Capital LLC |
|
|
|
|
|
|
|
|
| 2.80%, 04/11/2026 (A) |
|
|
2,558,000 |
|
|
|
2,454,728 |
|
| Ford Motor Co. |
|
|
|
|
|
|
|
|
| 4.35%, 12/08/2026 |
|
|
1,570,000 |
|
|
|
1,524,102 |
|
| Ford Motor Credit Co. LLC |
|
|
|
|
|
|
|
|
| 3.38%, 11/13/2025 |
|
|
4,403,000 |
|
|
|
4,261,008 |
|
| 6.95%, 06/10/2026 |
|
|
3,402,000 |
|
|
|
3,467,347 |
|
| General Motors Co. |
|
|
|
|
|
|
|
|
| 6.25%, 10/02/2043 |
|
|
3,626,000 |
|
|
|
3,624,347 |
|
| Nissan Motor Acceptance Co. LLC |
|
|
|
|
|
|
|
|
| 7.05%, 09/15/2028 (A) |
|
|
4,765,000 |
|
|
|
4,961,879 |
|
| Stellantis Finance US, Inc. |
|
|
|
|
|
|
|
|
| 2.69%, 09/15/2031 (A) |
|
|
3,316,000 |
|
|
|
2,742,649 |
|
| Volkswagen Group of America Finance LLC |
|
|
|
|
|
|
|
|
| 1.63%, 11/24/2027 (A) |
|
|
2,869,000 |
|
|
|
2,543,003 |
|
|
|
|
|
|
|
|
|
|
|
|
|
|
|
|
|
|
|
|
25,579,063 |
|
|
|
|
|
|
|
|
|
|
| Banks - 7.3% |
|
| Banco Santander SA |
|
|
|
|
|
|
|
|
| Fixed until 03/14/2027, 5.55% (B), 03/14/2028 |
|
|
3,800,000 |
|
|
|
3,793,977 |
|
| Bank of America Corp. |
|
|
|
|
|
|
|
|
| Fixed until 03/11/2031, 2.65% (B), 03/11/2032 |
|
|
5,035,000 |
|
|
|
4,267,688 |
|
| Fixed until 01/23/2034, 5.47% (B), 01/23/2035 |
|
|
2,652,000 |
|
|
|
2,655,949 |
|
| Fixed until 09/15/2028, 5.82% (B), 09/15/2029 |
|
|
10,133,000 |
|
|
|
10,349,822 |
|
| Barclays PLC |
|
|
|
|
|
|
|
|
| Fixed until 03/12/2054, 6.04% (B), 03/12/2055 |
|
|
1,049,000 |
|
|
|
1,068,220 |
|
| Fixed until 11/02/2025, 7.33% (B), 11/02/2026 |
|
|
7,666,000 |
|
|
|
7,800,033 |
|
| Fixed until 12/15/2029 (C), 9.63% (B) |
|
|
5,702,000 |
|
|
|
6,183,403 |
|
|
|
|
|
|
|
|
|
|
| |
|
Principal |
|
|
Value |
|
| |
|
|
| CORPORATE DEBT SECURITIES (continued) |
|
| Banks (continued) |
|
| BBVA Bancomer SA |
|
|
|
|
|
|
|
|
| Fixed until 09/13/2029, 5.88% (B), 09/13/2034 (A) |
|
$ |
2,450,000 |
|
|
$ |
2,271,459 |
|
| Fixed until 06/29/2033, 8.45% (B), 06/29/2038 (A) |
|
|
6,000,000 |
|
|
|
6,181,434 |
|
| BNP Paribas SA |
|
|
|
|
|
|
|
|
| Fixed until 11/17/2027 (A)(C), 9.25% (B) |
|
|
7,821,000 |
|
|
|
8,292,700 |
|
| BPCE SA |
|
|
|
|
|
|
|
|
| 4.50%, 03/15/2025 (A) |
|
|
6,017,000 |
|
|
|
5,936,165 |
|
| Citigroup, Inc. |
|
|
|
|
|
|
|
|
| Fixed until 06/11/2034, 5.45% (B), 06/11/2035 |
|
|
2,850,000 |
|
|
|
2,833,870 |
|
| Fixed until 05/25/2033, 6.17% (B), 05/25/2034 |
|
|
4,446,000 |
|
|
|
4,527,671 |
|
| Goldman Sachs Group, Inc. |
|
|
|
|
|
|
|
|
| Fixed until 10/21/2031, 2.65% (B), 10/21/2032 |
|
|
6,732,000 |
|
|
|
5,606,887 |
|
| ING Groep NV |
|
|
|
|
|
|
|
|
| Fixed until 09/11/2033, 6.11% (B), 09/11/2034 |
|
|
3,476,000 |
|
|
|
3,590,160 |
|
| Intesa Sanpaolo SpA |
|
|
|
|
|
|
|
|
| Fixed until 11/21/2032, 8.25% (B), 11/21/2033 (A) |
|
|
11,077,000 |
|
|
|
12,237,349 |
|
| JPMorgan Chase & Co. |
|
|
|
|
|
|
|
|
| Fixed until 01/23/2029, 5.01% (B), 01/23/2030 |
|
|
11,055,000 |
|
|
|
10,976,954 |
|
| Fixed until 01/23/2034, 5.34% (B), 01/23/2035 |
|
|
4,503,000 |
|
|
|
4,485,440 |
|
| Fixed until 04/22/2034, 5.77% (B), 04/22/2035 |
|
|
1,895,000 |
|
|
|
1,948,281 |
|
| Lloyds Banking Group PLC |
|
|
|
|
|
|
|
|
| Fixed until 08/11/2032, 4.98% (B), 08/11/2033 |
|
|
2,824,000 |
|
|
|
2,703,509 |
|
| Fixed until 01/05/2034, 5.68% (B), 01/05/2035 |
|
|
4,697,000 |
|
|
|
4,687,083 |
|
| M&T Bank Corp. |
|
|
|
|
|
|
|
|
| Fixed until 03/13/2031, 6.08% (B), 03/13/2032 (D) |
|
|
2,312,000 |
|
|
|
2,306,536 |
|
| Morgan Stanley |
|
|
|
|
|
|
|
|
| Fixed until 01/16/2029, 5.17% (B), 01/16/2030 |
|
|
10,733,000 |
|
|
|
10,712,314 |
|
| Fixed until 01/18/2034, 5.47% (B), 01/18/2035 |
|
|
2,256,000 |
|
|
|
2,254,489 |
|
| Fixed until 04/19/2034, 5.83% (B), 04/19/2035 |
|
|
4,463,000 |
|
|
|
4,584,632 |
|
| PNC Financial Services Group, Inc. |
|
|
|
|
|
|
|
|
| Fixed until 01/22/2034, 5.68% (B), 01/22/2035 |
|
|
1,026,000 |
|
|
|
1,033,691 |
|
| Fixed until 08/18/2033, 5.94% (B), 08/18/2034 |
|
|
4,205,000 |
|
|
|
4,318,278 |
|
| Societe Generale SA |
|
|
|
|
|
|
|
|
| Fixed until 11/14/2028 (A)(C), 10.00% (B) |
|
|
5,471,000 |
|
|
|
5,679,987 |
|
The Notes to Financial Statements are an integral part of this report.
|
|
|
|
|
| Transamerica Series Trust |
|
|
|
Semi-Annual Financial Statements 2024 |
|
|
Page 1 |
|
|
Transamerica Aegon Bond VP
SCHEDULE OF INVESTMENTS (continued)
At June 30, 2024
(unaudited)
|
|
|
|
|
|
|
|
|
| |
|
Principal |
|
|
Value |
|
| |
|
|
| CORPORATE DEBT SECURITIES (continued) |
|
| Banks (continued) |
|
| Truist Financial Corp. |
|
|
|
|
|
|
|
|
| Fixed until 01/26/2033, 5.12% (B), 01/26/2034 |
|
$ |
3,911,000 |
|
|
|
$ 3,751,477 |
|
| Fixed until 01/24/2034, 5.71% (B), 01/24/2035 |
|
|
3,531,000 |
|
|
|
3,522,488 |
|
| Fixed until 06/08/2033, 5.87% (B), 06/08/2034 |
|
|
2,323,000 |
|
|
|
2,344,980 |
|
| Fixed until 10/30/2028, 7.16% (B), 10/30/2029 |
|
|
2,261,000 |
|
|
|
2,401,943 |
|
| UBS Group AG |
|
|
|
|
|
|
|
|
| Fixed until 11/15/2032, 9.02% (B), 11/15/2033 (A) |
|
|
1,823,000 |
|
|
|
2,202,299 |
|
| Fixed until 11/13/2028 (A)(C), 9.25% (B) |
|
|
5,160,000 |
|
|
|
5,551,850 |
|
| Wells Fargo & Co. |
|
|
|
|
|
|
|
|
| Fixed until 07/25/2033, 5.56% (B), 07/25/2034 |
|
|
5,746,000 |
|
|
|
5,753,764 |
|
|
|
|
|
|
|
|
|
|
|
|
|
|
|
|
|
|
|
|
168,816,782 |
|
|
|
|
|
|
|
|
|
|
| Beverages - 0.4% |
|
| Constellation Brands, Inc. |
|
|
|
|
|
|
|
|
| 3.15%, 08/01/2029 |
|
|
1,790,000 |
|
|
|
1,624,563 |
|
| 3.70%, 12/06/2026 |
|
|
1,806,000 |
|
|
|
1,744,738 |
|
| Primo Water Holdings, Inc. |
|
|
|
|
|
|
|
|
| 4.38%, 04/30/2029 (A) |
|
|
6,468,000 |
|
|
|
5,959,794 |
|
|
|
|
|
|
|
|
|
|
|
|
|
|
|
|
|
|
|
|
9,329,095 |
|
|
|
|
|
|
|
|
|
|
| Biotechnology - 0.5% |
|
| Amgen, Inc. |
|
|
|
|
|
|
|
|
| 2.80%, 08/15/2041 |
|
|
2,807,000 |
|
|
|
1,981,190 |
|
| 5.60%, 03/02/2043 |
|
|
2,459,000 |
|
|
|
2,432,390 |
|
| CSL Finance PLC |
|
|
|
|
|
|
|
|
| 4.63%, 04/27/2042 (A) |
|
|
4,421,000 |
|
|
|
3,965,965 |
|
| Royalty Pharma PLC |
|
|
|
|
|
|
|
|
| 2.20%, 09/02/2030 |
|
|
5,199,000 |
|
|
|
4,336,414 |
|
|
|
|
|
|
|
|
|
|
|
|
|
|
|
|
|
|
|
|
12,715,959 |
|
|
|
|
|
|
|
|
|
|
| Building Products - 0.4% |
|
| Builders FirstSource, Inc. |
|
|
|
|
|
|
|
|
| 5.00%, 03/01/2030 (A) |
|
|
1,802,000 |
|
|
|
1,704,890 |
|
| Lowe’s Cos., Inc. |
|
|
|
|
|
|
|
|
| 3.75%, 04/01/2032 |
|
|
5,053,000 |
|
|
|
4,595,612 |
|
| Mohawk Industries, Inc. |
|
|
|
|
|
|
|
|
| 5.85%, 09/18/2028 |
|
|
4,065,000 |
|
|
|
4,149,056 |
|
|
|
|
|
|
|
|
|
|
|
|
|
|
|
|
|
|
|
|
10,449,558 |
|
|
|
|
|
|
|
|
|
|
| Capital Markets - 0.6% |
|
| Charles Schwab Corp. |
|
|
|
|
|
|
|
|
| Fixed until 05/19/2033, 5.85% (B), 05/19/2034 |
|
|
6,674,000 |
|
|
|
6,818,112 |
|
| LPL Holdings, Inc. |
|
|
|
|
|
|
|
|
| 4.00%, 03/15/2029 (A) |
|
|
4,106,000 |
|
|
|
3,829,472 |
|
| 5.70%, 05/20/2027 |
|
|
2,367,000 |
|
|
|
2,376,742 |
|
|
|
|
|
|
|
|
|
|
|
|
|
|
|
|
|
|
|
|
13,024,326 |
|
|
|
|
|
|
|
|
|
|
| Chemicals - 0.5% |
|
| ASP Unifrax Holdings, Inc. |
|
|
|
|
|
|
|
|
| 5.25%, 09/30/2028 (A) |
|
|
964,000 |
|
|
|
527,790 |
|
|
|
|
|
|
|
|
|
|
| |
|
Principal |
|
|
Value |
|
| |
|
|
| CORPORATE DEBT SECURITIES (continued) |
|
| Chemicals (continued) |
|
| Celanese US Holdings LLC |
|
|
|
|
|
|
|
|
| 6.70%, 11/15/2033 |
|
$ |
3,156,000 |
|
|
|
$ 3,322,644 |
|
| Mosaic Co. |
|
|
|
|
|
|
|
|
| 4.05%, 11/15/2027 |
|
|
2,525,000 |
|
|
|
2,421,129 |
|
| Nutrien Ltd. |
|
|
|
|
|
|
|
|
| 4.20%, 04/01/2029 |
|
|
4,112,000 |
|
|
|
3,937,015 |
|
| OCP SA |
|
|
|
|
|
|
|
|
| 6.75%, 05/02/2034 (A) |
|
|
2,252,000 |
|
|
|
2,309,381 |
|
|
|
|
|
|
|
|
|
|
|
|
|
|
|
|
|
|
|
|
12,517,959 |
|
|
|
|
|
|
|
|
|
|
| Commercial Services & Supplies - 1.9% |
|
| ADT Security Corp. |
|
|
|
|
|
|
|
|
| 4.13%, 08/01/2029 (A) |
|
|
5,327,000 |
|
|
|
4,913,259 |
|
| Ambipar Lux SARL |
|
|
|
|
|
|
|
|
| 9.88%, 02/06/2031 (A)(D) |
|
|
4,583,000 |
|
|
|
4,444,349 |
|
| Ashtead Capital, Inc. |
|
|
|
|
|
|
|
|
| 5.55%, 05/30/2033 (A) |
|
|
1,773,000 |
|
|
|
1,730,753 |
|
| 5.80%, 04/15/2034 (A) |
|
|
1,234,000 |
|
|
|
1,226,920 |
|
| Element Fleet Management Corp. |
|
|
|
|
|
|
|
|
| 6.32%, 12/04/2028 (A) |
|
|
6,556,000 |
|
|
|
6,782,457 |
|
| GXO Logistics, Inc. |
|
|
|
|
|
|
|
|
| 2.65%, 07/15/2031 |
|
|
7,337,000 |
|
|
|
5,958,402 |
|
| 6.50%, 05/06/2034 |
|
|
2,732,000 |
|
|
|
2,779,392 |
|
| Quanta Services, Inc. |
|
|
|
|
|
|
|
|
| 2.90%, 10/01/2030 |
|
|
2,720,000 |
|
|
|
2,398,759 |
|
| Stericycle, Inc. |
|
|
|
|
|
|
|
|
| 3.88%, 01/15/2029 (A)(D) |
|
|
3,293,000 |
|
|
|
3,076,866 |
|
| Triton Container International Ltd./TAL International Container Corp. |
|
|
|
|
|
|
|
|
| 3.25%, 03/15/2032 |
|
|
8,998,000 |
|
|
|
7,420,017 |
|
| Veralto Corp. |
|
|
|
|
|
|
|
|
| 5.45%, 09/18/2033 (A) |
|
|
3,626,000 |
|
|
|
3,626,024 |
|
|
|
|
|
|
|
|
|
|
|
|
|
|
|
|
|
|
|
|
44,357,198 |
|
|
|
|
|
|
|
|
|
|
| Communications Equipment - 0.2% |
|
| CommScope, Inc. |
|
|
|
|
|
|
|
|
| 4.75%, 09/01/2029 (A) |
|
|
6,057,000 |
|
|
|
4,180,686 |
|
|
|
|
|
|
|
|
|
|
|
| Construction & Engineering - 0.5% |
|
| Ashton Woods USA LLC/Ashton Woods Finance Co. |
|
|
|
|
|
|
|
|
| 4.63%, 08/01/2029 - 04/01/2030 (A) |
|
|
2,867,000 |
|
|
|
2,576,744 |
|
| Century Communities, Inc. |
|
|
|
|
|
|
|
|
| 3.88%, 08/15/2029 (A) |
|
|
2,621,000 |
|
|
|
2,337,088 |
|
| 6.75%, 06/01/2027 |
|
|
2,100,000 |
|
|
|
2,111,254 |
|
| IHS Holding Ltd. |
|
|
|
|
|
|
|
|
| 5.63%, 11/29/2026 (A) |
|
|
2,572,000 |
|
|
|
2,435,817 |
|
| IHS Netherlands Holdco BV |
|
|
|
|
|
|
|
|
| 8.00%, 09/18/2027 (A)(D) |
|
|
2,253,000 |
|
|
|
2,182,150 |
|
|
|
|
|
|
|
|
|
|
|
|
|
|
|
|
|
|
|
|
11,643,053 |
|
|
|
|
|
|
|
|
|
|
| Construction Materials - 0.2% |
|
| CRH America Finance, Inc. |
|
|
|
|
|
|
|
|
| 3.40%, 05/09/2027 (A) |
|
|
4,733,000 |
|
|
|
4,519,618 |
|
| Holcim Finance US LLC |
|
|
|
|
|
|
|
|
| 4.75%, 09/22/2046 (A) |
|
|
1,100,000 |
|
|
|
955,179 |
|
|
|
|
|
|
|
|
|
|
|
|
|
|
|
|
|
|
|
|
5,474,797 |
|
|
|
|
|
|
|
|
|
|
The Notes to Financial Statements are an integral part of this report.
|
|
|
|
|
| Transamerica Series Trust |
|
|
|
Semi-Annual Financial Statements 2024 |
|
|
Page 2 |
|
|
Transamerica Aegon Bond VP
SCHEDULE OF INVESTMENTS (continued)
At June 30, 2024
(unaudited)
|
|
|
|
|
|
|
|
|
| |
|
Principal |
|
|
Value |
|
| |
|
|
| CORPORATE DEBT SECURITIES (continued) |
|
| Consumer Staples Distribution & Retail - 0.6% |
|
| 7-Eleven, Inc. |
|
|
|
|
|
|
|
|
| 1.80%, 02/10/2031 (A) |
|
$ |
6,750,000 |
|
|
$ |
5,415,572 |
|
| Albertsons Cos., Inc./Safeway, Inc./New Albertsons LP |
|
|
|
|
|
|
|
|
| 4.63%, 01/15/2027 (A) |
|
|
2,428,000 |
|
|
|
2,345,163 |
|
| InRetail Consumer |
|
|
|
|
|
|
|
|
| 3.25%, 03/22/2028 (A) |
|
|
3,319,000 |
|
|
|
2,997,481 |
|
| Sysco Corp. |
|
|
|
|
|
|
|
|
| 5.95%, 04/01/2030 |
|
|
3,019,000 |
|
|
|
3,143,976 |
|
|
|
|
|
|
|
|
|
|
|
|
|
|
|
|
|
|
|
|
13,902,192 |
|
|
|
|
|
|
|
|
|
|
| Containers & Packaging - 0.9% |
|
| Clydesdale Acquisition Holdings, Inc. |
|
|
|
|
|
|
|
|
| 6.63%, 04/15/2029 (A) |
|
|
3,807,000 |
|
|
|
3,741,629 |
|
| Mauser Packaging Solutions Holding Co. |
|
|
|
|
|
|
|
|
| 7.88%, 04/15/2027 (A) |
|
|
2,876,000 |
|
|
|
2,934,958 |
|
| Pactiv Evergreen Group Issuer, Inc./Pactiv Evergreen Group Issuer LLC |
|
|
|
|
|
|
|
|
| 4.00%, 10/15/2027 (A) |
|
|
7,824,000 |
|
|
|
7,330,114 |
|
| Sonoco Products Co. |
|
|
|
|
|
|
|
|
| 2.25%, 02/01/2027 |
|
|
2,888,000 |
|
|
|
2,677,011 |
|
| WRKCo, Inc. |
|
|
|
|
|
|
|
|
| 3.90%, 06/01/2028 |
|
|
3,913,000 |
|
|
|
3,724,978 |
|
|
|
|
|
|
|
|
|
|
|
|
|
|
|
|
|
|
|
|
20,408,690 |
|
|
|
|
|
|
|
|
|
|
| Distributors - 0.1% |
|
| LKQ Corp. |
|
|
|
|
|
|
|
|
| 6.25%, 06/15/2033 (D) |
|
|
2,416,000 |
|
|
|
2,481,474 |
|
|
|
|
|
|
|
|
|
|
|
| Diversified REITs - 1.3% |
|
| Broadstone Net Lease LLC |
|
|
|
|
|
|
|
|
| 2.60%, 09/15/2031 |
|
|
3,404,000 |
|
|
|
2,709,865 |
|
| GLP Capital LP/GLP Financing II, Inc. |
|
|
|
|
|
|
|
|
| 4.00%, 01/15/2030 |
|
|
3,493,000 |
|
|
|
3,200,930 |
|
| HAT Holdings I LLC/HAT Holdings II LLC |
|
|
|
|
|
|
|
|
| 3.38%, 06/15/2026 (A) |
|
|
3,656,000 |
|
|
|
3,449,485 |
|
| Safehold GL Holdings LLC |
|
|
|
|
|
|
|
|
| 6.10%, 04/01/2034 |
|
|
3,695,000 |
|
|
|
3,657,217 |
|
| SBA Tower Trust |
|
|
|
|
|
|
|
|
| 6.60%, 11/15/2052 (A) |
|
|
13,248,000 |
|
|
|
13,523,648 |
|
| WP Carey, Inc. |
|
|
|
|
|
|
|
|
| 5.38%, 06/30/2034 |
|
|
3,798,000 |
|
|
|
3,700,074 |
|
|
|
|
|
|
|
|
|
|
|
|
|
|
|
|
|
|
|
|
30,241,219 |
|
|
|
|
|
|
|
|
|
|
| Diversified Telecommunication Services - 0.4% |
|
| Verizon Communications, Inc. |
|
|
|
|
|
|
|
|
| 1.68%, 10/30/2030 |
|
|
2,873,000 |
|
|
|
2,336,584 |
|
| 1.75%, 01/20/2031 |
|
|
3,892,000 |
|
|
|
3,154,541 |
|
| 4.13%, 03/16/2027 |
|
|
2,842,000 |
|
|
|
2,771,474 |
|
|
|
|
|
|
|
|
|
|
|
|
|
|
|
|
|
|
|
|
8,262,599 |
|
|
|
|
|
|
|
|
|
|
| Electric Utilities - 1.0% |
|
| Black Hills Corp. |
|
|
|
|
|
|
|
|
| 3.15%, 01/15/2027 |
|
|
2,494,000 |
|
|
|
2,365,673 |
|
| Cleveland Electric Illuminating Co. |
|
|
|
|
|
|
|
|
| 3.50%, 04/01/2028 (A) |
|
|
5,935,000 |
|
|
|
5,554,102 |
|
| Duke Energy Corp. |
|
|
|
|
|
|
|
|
| 5.00%, 12/08/2027 |
|
|
1,687,000 |
|
|
|
1,678,744 |
|
|
|
|
|
|
|
|
|
|
| |
|
Principal |
|
|
Value |
|
| |
|
|
| CORPORATE DEBT SECURITIES (continued) |
|
| Electric Utilities (continued) |
|
| EDP Finance BV |
|
|
|
|
|
|
|
|
| 3.63%, 07/15/2024 (A) |
|
$ |
4,535,000 |
|
|
|
$ 4,530,560 |
|
| Investment Energy Resources Ltd. |
|
|
|
|
|
|
|
|
| 6.25%, 04/26/2029 (A) |
|
|
1,588,000 |
|
|
|
1,495,181 |
|
| JSW Hydro Energy Ltd. |
|
|
|
|
|
|
|
|
| 4.13%, 05/18/2031 (E) |
|
|
2,432,000 |
|
|
|
2,158,400 |
|
| Pacific Gas & Electric Co. |
|
|
|
|
|
|
|
|
| 2.50%, 02/01/2031 |
|
|
2,611,000 |
|
|
|
2,156,599 |
|
| 3.30%, 12/01/2027 |
|
|
400,000 |
|
|
|
372,921 |
|
| Vistra Operations Co. LLC |
|
|
|
|
|
|
|
|
| 6.88%, 04/15/2032 (A) |
|
|
2,365,000 |
|
|
|
2,400,856 |
|
|
|
|
|
|
|
|
|
|
|
|
|
|
|
|
|
|
|
|
22,713,036 |
|
|
|
|
|
|
|
|
|
|
| Electronic Equipment, Instruments & Components - 1.1% |
|
| Amphenol Corp. |
|
|
|
|
|
|
|
|
| 5.25%, 04/05/2034 |
|
|
4,620,000 |
|
|
|
4,615,192 |
|
| Arrow Electronics, Inc. |
|
|
|
|
|
|
|
|
| 2.95%, 02/15/2032 |
|
|
4,107,000 |
|
|
|
3,441,285 |
|
| 5.88%, 04/10/2034 |
|
|
2,950,000 |
|
|
|
2,926,125 |
|
| Keysight Technologies, Inc. |
|
|
|
|
|
|
|
|
| 4.60%, 04/06/2027 |
|
|
4,459,000 |
|
|
|
4,380,309 |
|
| Sensata Technologies, Inc. |
|
|
|
|
|
|
|
|
| 4.38%, 02/15/2030 (A) |
|
|
3,358,000 |
|
|
|
3,084,047 |
|
| Trimble, Inc. |
|
|
|
|
|
|
|
|
| 6.10%, 03/15/2033 |
|
|
5,703,000 |
|
|
|
5,915,846 |
|
|
|
|
|
|
|
|
|
|
|
|
|
|
|
|
|
|
|
|
24,362,804 |
|
|
|
|
|
|
|
|
|
|
| Energy Equipment & Services - 0.1% |
|
| Schlumberger Holdings Corp. |
|
|
|
|
|
|
|
|
| 3.90%, 05/17/2028 (A) |
|
|
2,313,000 |
|
|
|
2,209,610 |
|
|
|
|
|
|
|
|
|
|
|
| Financial Services - 1.5% |
|
| AerCap Ireland Capital DAC/AerCap Global Aviation Trust |
|
|
|
|
|
|
|
|
| 4.45%, 04/03/2026 |
|
|
2,421,000 |
|
|
|
2,376,290 |
|
| Aviation Capital Group LLC |
|
|
|
|
|
|
|
|
| 3.50%, 11/01/2027 (A) |
|
|
5,755,000 |
|
|
|
5,388,455 |
|
| 5.50%, 12/15/2024 (A) |
|
|
7,219,000 |
|
|
|
7,199,495 |
|
| Avolon Holdings Funding Ltd. |
|
|
|
|
|
|
|
|
| 5.50%, 01/15/2026 (A) |
|
|
7,337,000 |
|
|
|
7,278,546 |
|
| 5.75%, 11/15/2029 (A) |
|
|
6,926,000 |
|
|
|
6,882,753 |
|
| United Wholesale Mortgage LLC |
|
|
|
|
|
|
|
|
| 5.50%, 11/15/2025 (A) |
|
|
4,479,000 |
|
|
|
4,446,193 |
|
|
|
|
|
|
|
|
|
|
|
|
|
|
|
|
|
|
|
|
33,571,732 |
|
|
|
|
|
|
|
|
|
|
| Food Products - 0.8% |
|
| Bunge Ltd. Finance Corp. |
|
|
|
|
|
|
|
|
| 1.63%, 08/17/2025 |
|
|
2,709,000 |
|
|
|
2,591,032 |
|
| 2.75%, 05/14/2031 |
|
|
4,751,000 |
|
|
|
4,070,972 |
|
| Cargill, Inc. |
|
|
|
|
|
|
|
|
| 5.13%, 10/11/2032 (A) |
|
|
2,037,000 |
|
|
|
2,036,394 |
|
| J M Smucker Co. |
|
|
|
|
|
|
|
|
| 6.50%, 11/15/2043 |
|
|
2,332,000 |
|
|
|
2,462,950 |
|
| Viterra Finance BV |
|
|
|
|
|
|
|
|
| 4.90%, 04/21/2027 (A) |
|
|
6,685,000 |
|
|
|
6,581,445 |
|
|
|
|
|
|
|
|
|
|
|
|
|
|
|
|
|
|
|
|
17,742,793 |
|
|
|
|
|
|
|
|
|
|
The Notes to Financial Statements are an integral part of this report.
|
|
|
|
|
| Transamerica Series Trust |
|
|
|
Semi-Annual Financial Statements 2024 |
|
|
Page 3 |
|
|
Transamerica Aegon Bond VP
SCHEDULE OF INVESTMENTS (continued)
At June 30, 2024
(unaudited)
|
|
|
|
|
|
|
|
|
| |
|
Principal |
|
|
Value |
|
| |
|
|
| CORPORATE DEBT SECURITIES (continued) |
|
| Health Care Equipment & Supplies - 0.4% |
|
| Alcon Finance Corp. |
|
|
|
|
|
|
|
|
| 2.75%, 09/23/2026 (A) |
|
$ |
3,255,000 |
|
|
|
$ 3,079,026 |
|
| 5.75%, 12/06/2052 (A) |
|
|
892,000 |
|
|
|
906,644 |
|
| Medline Borrower LP |
|
|
|
|
|
|
|
|
| 3.88%, 04/01/2029 (A) |
|
|
1,821,000 |
|
|
|
1,676,804 |
|
| 5.25%, 10/01/2029 (A) |
|
|
1,459,000 |
|
|
|
1,392,404 |
|
| Stryker Corp. |
|
|
|
|
|
|
|
|
| 1.95%, 06/15/2030 |
|
|
3,078,000 |
|
|
|
2,593,389 |
|
|
|
|
|
|
|
|
|
|
|
|
|
|
|
|
|
|
|
|
9,648,267 |
|
|
|
|
|
|
|
|
|
|
| Health Care Providers & Services - 2.2% |
|
| Cardinal Health, Inc. |
|
|
|
|
|
|
|
|
| 5.45%, 02/15/2034 |
|
|
3,072,000 |
|
|
|
3,064,065 |
|
| Centene Corp. |
|
|
|
|
|
|
|
|
| 3.00%, 10/15/2030 |
|
|
1,559,000 |
|
|
|
1,332,929 |
|
| 3.38%, 02/15/2030 |
|
|
5,068,000 |
|
|
|
4,498,535 |
|
| 4.25%, 12/15/2027 |
|
|
1,394,000 |
|
|
|
1,331,495 |
|
| Charles River Laboratories International, Inc. |
|
|
|
|
|
|
|
|
| 4.00%, 03/15/2031 (A) |
|
|
2,308,000 |
|
|
|
2,058,312 |
|
| CHS/Community Health Systems, Inc. |
|
|
|
|
|
|
|
|
| 5.25%, 05/15/2030 (A) |
|
|
2,372,000 |
|
|
|
1,953,589 |
|
| Cigna Group |
|
|
|
|
|
|
|
|
| 2.40%, 03/15/2030 |
|
|
2,412,000 |
|
|
|
2,088,356 |
|
| 5.25%, 02/15/2034 |
|
|
5,574,000 |
|
|
|
5,507,656 |
|
| CVS Health Corp. |
|
|
|
|
|
|
|
|
| 5.25%, 01/30/2031 |
|
|
2,756,000 |
|
|
|
2,728,469 |
|
| 6.00%, 06/01/2044 |
|
|
3,710,000 |
|
|
|
3,649,307 |
|
| Elevance Health, Inc. |
|
|
|
|
|
|
|
|
| 2.25%, 05/15/2030 |
|
|
2,824,000 |
|
|
|
2,421,552 |
|
| 5.13%, 02/15/2053 |
|
|
4,390,000 |
|
|
|
4,058,274 |
|
| HCA, Inc. |
|
|
|
|
|
|
|
|
| 5.60%, 04/01/2034 |
|
|
3,896,000 |
|
|
|
3,880,037 |
|
| 6.00%, 04/01/2054 |
|
|
3,867,000 |
|
|
|
3,831,336 |
|
| Health Care Service Corp. A Mutual Legal Reserve Co. |
|
|
|
|
|
|
|
|
| 5.88%, 06/15/2054 (A) |
|
|
1,789,000 |
|
|
|
1,766,344 |
|
| Molina Healthcare, Inc. |
|
|
|
|
|
|
|
|
| 4.38%, 06/15/2028 (A) |
|
|
2,587,000 |
|
|
|
2,434,974 |
|
| Tenet Healthcare Corp. |
|
|
|
|
|
|
|
|
| 5.13%, 11/01/2027 |
|
|
1,190,000 |
|
|
|
1,164,597 |
|
| UnitedHealth Group, Inc. |
|
|
|
|
|
|
|
|
| 5.20%, 04/15/2063 |
|
|
3,894,000 |
|
|
|
3,626,116 |
|
|
|
|
|
|
|
|
|
|
|
|
|
|
|
|
|
|
|
|
51,395,943 |
|
|
|
|
|
|
|
|
|
|
| Health Care REITs - 0.1% |
|
| DOC DR LLC |
|
|
|
|
|
|
|
|
| 2.63%, 11/01/2031 |
|
|
2,789,000 |
|
|
|
2,313,006 |
|
|
|
|
|
|
|
|
|
|
|
| Health Care Technology - 0.1% |
|
| GE HealthCare Technologies, Inc. |
|
|
|
|
|
|
|
|
| 5.86%, 03/15/2030 |
|
|
1,946,000 |
|
|
|
2,001,201 |
|
|
|
|
|
|
|
|
|
|
|
| Hotel & Resort REITs - 0.1% |
|
| Host Hotels & Resorts LP |
|
|
|
|
|
|
|
|
| 5.70%, 07/01/2034 |
|
|
1,728,000 |
|
|
|
1,701,657 |
|
|
|
|
|
|
|
|
|
|
|
|
|
|
|
|
|
|
|
| |
|
Principal |
|
|
Value |
|
| |
|
|
| CORPORATE DEBT SECURITIES (continued) |
|
| Hotels, Restaurants & Leisure - 1.8% |
|
| Alsea SAB de CV |
|
|
|
|
|
|
|
|
| 7.75%, 12/14/2026 (E) |
|
$ |
2,500,000 |
|
|
|
$ 2,524,143 |
|
| Boyd Gaming Corp. |
|
|
|
|
|
|
|
|
| 4.75%, 12/01/2027 |
|
|
1,498,000 |
|
|
|
1,441,715 |
|
| Boyne USA, Inc. |
|
|
|
|
|
|
|
|
| 4.75%, 05/15/2029 (A) |
|
|
1,273,000 |
|
|
|
1,187,848 |
|
| Hilton Domestic Operating Co., Inc. |
|
|
|
|
|
|
|
|
| 3.75%, 05/01/2029 (A) |
|
|
4,439,000 |
|
|
|
4,070,041 |
|
| Hyatt Hotels Corp. |
|
|
|
|
|
|
|
|
| 1.80%, 10/01/2024 |
|
|
1,821,000 |
|
|
|
1,801,793 |
|
| 5.25%, 06/30/2029 |
|
|
3,673,000 |
|
|
|
3,645,246 |
|
| International Game Technology PLC |
|
|
|
|
|
|
|
|
| 6.50%, 02/15/2025 (A) |
|
|
2,190,000 |
|
|
|
2,191,194 |
|
| Light & Wonder International, Inc. |
|
|
|
|
|
|
|
|
| 7.00%, 05/15/2028 (A) |
|
|
1,439,000 |
|
|
|
1,446,962 |
|
| 7.25%, 11/15/2029 (A) |
|
|
1,730,000 |
|
|
|
1,767,150 |
|
| Marriott International, Inc. |
|
|
|
|
|
|
|
|
| 2.75%, 10/15/2033 |
|
|
3,179,000 |
|
|
|
2,572,890 |
|
| 5.75%, 05/01/2025 |
|
|
390,000 |
|
|
|
390,294 |
|
| MGM Resorts International |
|
|
|
|
|
|
|
|
| 4.75%, 10/15/2028 |
|
|
3,753,000 |
|
|
|
3,569,432 |
|
| NCL Corp. Ltd. |
|
|
|
|
|
|
|
|
| 5.88%, 03/15/2026 (A) |
|
|
3,086,000 |
|
|
|
3,051,192 |
|
| Royal Caribbean Cruises Ltd. |
|
|
|
|
|
|
|
|
| 5.50%, 04/01/2028 (A) |
|
|
2,253,000 |
|
|
|
2,223,909 |
|
| Viking Cruises Ltd. |
|
|
|
|
|
|
|
|
| 5.88%, 09/15/2027 (A) |
|
|
5,609,000 |
|
|
|
5,551,052 |
|
| Warnermedia Holdings, Inc. |
|
|
|
|
|
|
|
|
| 5.05%, 03/15/2042 |
|
|
3,809,000 |
|
|
|
3,109,300 |
|
|
|
|
|
|
|
|
|
|
|
|
|
|
|
|
|
|
|
|
40,544,161 |
|
|
|
|
|
|
|
|
|
|
| Independent Power & Renewable Electricity Producers - 0.3% |
|
| Calpine Corp. |
|
|
|
|
|
|
|
|
| 3.75%, 03/01/2031 (A) |
|
|
4,043,000 |
|
|
|
3,573,089 |
|
| NRG Energy, Inc. |
|
|
|
|
|
|
|
|
| 3.38%, 02/15/2029 (A) |
|
|
1,347,000 |
|
|
|
1,198,402 |
|
| 3.63%, 02/15/2031 (A) |
|
|
1,408,000 |
|
|
|
1,207,784 |
|
|
|
|
|
|
|
|
|
|
|
|
|
|
|
|
|
|
|
|
5,979,275 |
|
|
|
|
|
|
|
|
|
|
| Insurance - 2.2% |
|
| Allstate Corp. |
|
|
|
|
|
|
|
|
| 5.05%, 06/24/2029 |
|
|
7,510,000 |
|
|
|
7,480,762 |
|
| AXA SA |
|
|
|
|
|
|
|
|
| 8.60%, 12/15/2030 |
|
|
6,215,000 |
|
|
|
7,321,612 |
|
| Cloverie PLC for Zurich Insurance Co. Ltd. |
|
|
|
|
|
|
|
|
| Fixed until 06/24/2026, 5.63% (B), 06/24/2046 (E) |
|
|
7,053,000 |
|
|
|
6,974,112 |
|
| Constellation Insurance, Inc. |
|
|
|
|
|
|
|
|
| 6.80%, 01/24/2030 (A) |
|
|
8,992,000 |
|
|
|
8,795,663 |
|
| Equitable Holdings, Inc. |
|
|
|
|
|
|
|
|
| 5.59%, 01/11/2033 |
|
|
6,046,000 |
|
|
|
6,135,966 |
|
| Global Atlantic Finance Co. |
|
|
|
|
|
|
|
|
| 6.75%, 03/15/2054 (A) |
|
|
994,000 |
|
|
|
987,663 |
|
| 7.95%, 06/15/2033 (A) |
|
|
4,693,000 |
|
|
|
5,160,851 |
|
| Hanwha Life Insurance Co. Ltd. |
|
|
|
|
|
|
|
|
| Fixed until 02/04/2027, 3.38% (B), 02/04/2032 (A) |
|
|
4,600,000 |
|
|
|
4,309,696 |
|
The Notes to Financial Statements are an integral part of this report.
|
|
|
|
|
| Transamerica Series Trust |
|
|
|
Semi-Annual Financial Statements 2024 |
|
|
Page 4 |
|
|
Transamerica Aegon Bond VP
SCHEDULE OF INVESTMENTS (continued)
At June 30, 2024
(unaudited)
|
|
|
|
|
|
|
|
|
| |
|
Principal |
|
|
Value |
|
| |
|
|
| CORPORATE DEBT SECURITIES (continued) |
|
| Insurance (continued) |
|
| Muenchener Rueckversicherungs- Gesellschaft AG |
|
|
|
|
|
|
|
|
| Fixed until 11/23/2031, 5.88% (B), 05/23/2042 (A) |
|
$ |
2,600,000 |
|
|
|
$ 2,593,656 |
|
|
|
|
|
|
|
|
|
|
|
|
|
|
|
|
|
|
|
|
49,759,981 |
|
|
|
|
|
|
|
|
|
|
|
| Interactive Media & Services - 0.2% |
|
| Meta Platforms, Inc. |
|
|
|
|
|
|
|
|
| 4.80%, 05/15/2030 |
|
|
3,962,000 |
|
|
|
3,970,079 |
|
|
|
|
|
|
|
|
|
|
|
| Internet & Catalog Retail - 0.1% |
|
| Expedia Group, Inc. |
|
|
|
|
|
|
|
|
| 2.95%, 03/15/2031 |
|
|
1,013,000 |
|
|
|
877,314 |
|
| 3.80%, 02/15/2028 |
|
|
1,805,000 |
|
|
|
1,718,770 |
|
|
|
|
|
|
|
|
|
|
|
|
|
|
|
|
|
|
|
|
2,596,084 |
|
|
|
|
|
|
|
|
|
|
|
| IT Services - 0.1% |
|
| Gartner, Inc. |
|
|
|
|
|
|
|
|
| 4.50%, 07/01/2028 (A) |
|
|
3,323,000 |
|
|
|
3,202,670 |
|
|
|
|
|
|
|
|
|
|
|
| Machinery - 0.5% |
|
| CNH Industrial Capital LLC |
|
|
|
|
|
|
|
|
| 4.55%, 04/10/2028 |
|
|
3,538,000 |
|
|
|
3,462,011 |
|
| Huntington Ingalls Industries, Inc. |
|
|
|
|
|
|
|
|
| 2.04%, 08/16/2028 |
|
|
4,900,000 |
|
|
|
4,311,980 |
|
| Ingersoll Rand, Inc. |
|
|
|
|
|
|
|
|
| 5.45%, 06/15/2034 |
|
|
3,539,000 |
|
|
|
3,576,981 |
|
|
|
|
|
|
|
|
|
|
|
|
|
|
|
|
|
|
|
|
11,350,972 |
|
|
|
|
|
|
|
|
|
|
| Marine Transportation - 0.2% |
|
| MV24 Capital BV |
|
|
|
|
|
|
|
|
| 6.75%, 06/01/2034 (A) |
|
|
4,020,330 |
|
|
|
3,841,096 |
|
|
|
|
|
|
|
|
|
|
|
| Media - 1.0% |
|
| Charter Communications Operating LLC/Charter Communications Operating Capital |
|
|
|
|
|
|
|
|
| 5.13%, 07/01/2049 |
|
|
7,592,000 |
|
|
|
5,849,640 |
|
| Clear Channel Outdoor Holdings, Inc. |
|
|
|
|
|
|
|
|
| 7.50%, 06/01/2029 (A)(D) |
|
|
1,505,000 |
|
|
|
1,262,583 |
|
| Comcast Corp. |
|
|
|
|
|
|
|
|
| 4.15%, 10/15/2028 |
|
|
5,464,000 |
|
|
|
5,293,093 |
|
| CSC Holdings LLC |
|
|
|
|
|
|
|
|
| 4.50%, 11/15/2031 (A) |
|
|
2,712,000 |
|
|
|
1,749,505 |
|
| Paramount Global |
|
|
|
|
|
|
|
|
| 4.20%, 05/19/2032 |
|
|
2,146,000 |
|
|
|
1,756,168 |
|
| Virgin Media Secured Finance PLC |
|
|
|
|
|
|
|
|
| 4.50%, 08/15/2030 (A) |
|
|
2,620,000 |
|
|
|
2,221,252 |
|
| 5.50%, 05/15/2029 (A) |
|
|
6,126,000 |
|
|
|
5,601,037 |
|
|
|
|
|
|
|
|
|
|
|
|
|
|
|
|
|
|
|
|
23,733,278 |
|
|
|
|
|
|
|
|
|
|
| Metals & Mining - 0.4% |
|
| ArcelorMittal SA |
|
|
|
|
|
|
|
|
| 6.55%, 11/29/2027 |
|
|
4,981,000 |
|
|
|
5,136,601 |
|
| Glencore Funding LLC |
|
|
|
|
|
|
|
|
| 2.63%, 09/23/2031 (A) |
|
|
5,247,000 |
|
|
|
4,312,703 |
|
| Novelis Corp. |
|
|
|
|
|
|
|
|
| 3.25%, 11/15/2026 (A) |
|
|
915,000 |
|
|
|
860,897 |
|
|
|
|
|
|
|
|
|
|
|
|
|
|
|
|
|
|
|
|
10,310,201 |
|
|
|
|
|
|
|
|
|
|
|
|
|
|
|
|
|
|
|
| |
|
Principal |
|
|
Value |
|
| |
|
|
| CORPORATE DEBT SECURITIES (continued) |
|
| Mortgage Real Estate Investment Trusts - 0.4% |
|
| Ladder Capital Finance Holdings LLLP/Ladder Capital Finance Corp. |
|
|
|
|
|
|
|
|
| 4.25%, 02/01/2027 (A) |
|
$ |
9,156,000 |
|
|
|
$ 8,672,244 |
|
|
|
|
|
|
|
|
|
|
|
| Office REITs - 0.3% |
|
| COPT Defense Properties LP |
|
|
|
|
|
|
|
|
| 2.25%, 03/15/2026 |
|
|
2,812,000 |
|
|
|
2,654,797 |
|
| Highwoods Realty LP |
|
|
|
|
|
|
|
|
| 7.65%, 02/01/2034 |
|
|
1,762,000 |
|
|
|
1,894,774 |
|
| Kilroy Realty LP |
|
|
|
|
|
|
|
|
| 4.25%, 08/15/2029 |
|
|
1,884,000 |
|
|
|
1,708,525 |
|
|
|
|
|
|
|
|
|
|
|
|
|
|
|
|
|
|
|
|
6,258,096 |
|
|
|
|
|
|
|
|
|
|
| Oil, Gas & Consumable Fuels - 4.5% |
|
| Boardwalk Pipelines LP |
|
|
|
|
|
|
|
|
| 3.40%, 02/15/2031 |
|
|
5,193,000 |
|
|
|
4,551,669 |
|
| Cheniere Energy Partners LP |
|
|
|
|
|
|
|
|
| 4.00%, 03/01/2031 |
|
|
6,103,000 |
|
|
|
5,551,139 |
|
| 4.50%, 10/01/2029 |
|
|
2,926,000 |
|
|
|
2,787,518 |
|
| Chevron USA, Inc. |
|
|
|
|
|
|
|
|
| 3.25%, 10/15/2029 |
|
|
2,361,000 |
|
|
|
2,192,088 |
|
| Diamondback Energy, Inc. |
|
|
|
|
|
|
|
|
| 5.15%, 01/30/2030 |
|
|
4,488,000 |
|
|
|
4,467,189 |
|
| Ecopetrol SA |
|
|
|
|
|
|
|
|
| 8.38%, 01/19/2036 |
|
|
5,000,000 |
|
|
|
4,908,541 |
|
| Enbridge, Inc. |
|
|
|
|
|
|
|
|
| 5.63%, 04/05/2034 |
|
|
5,166,000 |
|
|
|
5,169,313 |
|
| Energy Transfer LP |
|
|
|
|
|
|
|
|
| 6.00%, 06/15/2048 |
|
|
6,128,000 |
|
|
|
5,937,964 |
|
| EnLink Midstream Partners LP |
|
|
|
|
|
|
|
|
| 5.05%, 04/01/2045 |
|
|
5,076,000 |
|
|
|
4,179,060 |
|
| EQM Midstream Partners LP |
|
|
|
|
|
|
|
|
| 6.38%, 04/01/2029 (A) |
|
|
1,324,000 |
|
|
|
1,337,354 |
|
| Exxon Mobil Corp. |
|
|
|
|
|
|
|
|
| 3.04%, 03/01/2026 |
|
|
3,243,000 |
|
|
|
3,136,389 |
|
| Hess Midstream Operations LP |
|
|
|
|
|
|
|
|
| 6.50%, 06/01/2029 (A) |
|
|
2,072,000 |
|
|
|
2,100,716 |
|
| NuStar Logistics LP |
|
|
|
|
|
|
|
|
| 5.63%, 04/28/2027 |
|
|
3,919,000 |
|
|
|
3,885,780 |
|
| 5.75%, 10/01/2025 |
|
|
1,162,000 |
|
|
|
1,154,730 |
|
| Occidental Petroleum Corp. |
|
|
|
|
|
|
|
|
| 5.55%, 03/15/2026 |
|
|
9,126,000 |
|
|
|
9,108,898 |
|
| ONEOK Partners LP |
|
|
|
|
|
|
|
|
| 4.90%, 03/15/2025 |
|
|
1,509,000 |
|
|
|
1,500,315 |
|
| ONEOK, Inc. |
|
|
|
|
|
|
|
|
| 6.10%, 11/15/2032 |
|
|
4,931,000 |
|
|
|
5,103,908 |
|
| Ovintiv, Inc. |
|
|
|
|
|
|
|
|
| 6.25%, 07/15/2033 |
|
|
3,486,000 |
|
|
|
3,600,041 |
|
| Petroleos Mexicanos |
|
|
|
|
|
|
|
|
| 6.50%, 01/23/2029 |
|
|
3,820,000 |
|
|
|
3,449,868 |
|
| 6.84%, 01/23/2030 |
|
|
3,043,000 |
|
|
|
2,678,731 |
|
| 6.88%, 10/16/2025 |
|
|
2,701,000 |
|
|
|
2,691,034 |
|
| 7.69%, 01/23/2050 |
|
|
1,538,000 |
|
|
|
1,111,324 |
|
| Plains All American Pipeline LP/PAA Finance Corp. |
|
|
|
|
|
|
|
|
| 3.55%, 12/15/2029 |
|
|
2,277,000 |
|
|
|
2,080,596 |
|
The Notes to Financial Statements are an integral part of this report.
|
|
|
|
|
| Transamerica Series Trust |
|
|
|
Semi-Annual Financial Statements 2024 |
|
|
Page 5 |
|
|
Transamerica Aegon Bond VP
SCHEDULE OF INVESTMENTS (continued)
At June 30, 2024
(unaudited)
|
|
|
|
|
|
|
|
|
| |
|
Principal |
|
|
Value |
|
| |
|
|
| CORPORATE DEBT SECURITIES (continued) |
|
| Oil, Gas & Consumable Fuels (continued) |
|
| Sabine Pass Liquefaction LLC |
|
|
|
|
|
|
|
|
| 5.90%, 09/15/2037 |
|
$ |
3,165,000 |
|
|
|
$ 3,244,521 |
|
| Southwestern Energy Co. |
|
|
|
|
|
|
|
|
| 5.38%, 03/15/2030 |
|
|
1,764,000 |
|
|
|
1,703,521 |
|
| Targa Resources Partners LP/Targa Resources Partners Finance Corp. |
|
|
|
|
|
|
|
|
| 4.00%, 01/15/2032 |
|
|
1,919,000 |
|
|
|
1,727,820 |
|
| Venture Global LNG, Inc. |
|
|
|
|
|
|
|
|
| 9.50%, 02/01/2029 (A) |
|
|
5,364,000 |
|
|
|
5,879,103 |
|
| Vital Energy, Inc. |
|
|
|
|
|
|
|
|
| 7.75%, 07/31/2029 (A) |
|
|
3,265,000 |
|
|
|
3,291,140 |
|
| Western Midstream Operating LP |
|
|
|
|
|
|
|
|
| 6.15%, 04/01/2033 |
|
|
3,610,000 |
|
|
|
3,702,633 |
|
| YPF SA |
|
|
|
|
|
|
|
|
| 9.50%, 01/17/2031 (A) |
|
|
1,338,000 |
|
|
|
1,359,333 |
|
|
|
|
|
|
|
|
|
|
|
|
|
|
|
|
|
|
|
|
103,592,236 |
|
|
|
|
|
|
|
|
|
|
| Passenger Airlines - 0.3% |
|
| American Airlines Pass-Through Trust |
|
|
|
|
|
|
|
|
| 3.15%, 08/15/2033 |
|
|
1,793,849 |
|
|
|
1,599,815 |
|
| Delta Air Lines, Inc./SkyMiles IP Ltd. |
|
|
|
|
|
|
|
|
| 4.75%, 10/20/2028 (A) |
|
|
4,436,000 |
|
|
|
4,322,179 |
|
|
|
|
|
|
|
|
|
|
|
|
|
|
|
|
|
|
|
|
5,921,994 |
|
|
|
|
|
|
|
|
|
|
| Personal Care Products - 0.2% |
|
| Kenvue, Inc. |
|
|
|
|
|
|
|
|
| 5.00%, 03/22/2030 |
|
|
4,807,000 |
|
|
|
4,825,950 |
|
|
|
|
|
|
|
|
|
|
|
| Pharmaceuticals - 0.9% |
|
| AbbVie, Inc. |
|
|
|
|
|
|
|
|
| 5.05%, 03/15/2034 |
|
|
3,455,000 |
|
|
|
3,452,085 |
|
| Bausch Health Cos., Inc. |
|
|
|
|
|
|
|
|
| 5.25%, 01/30/2030 (A) |
|
|
4,435,000 |
|
|
|
2,062,275 |
|
| Bayer US Finance II LLC |
|
|
|
|
|
|
|
|
| 4.38%, 12/15/2028 (A) |
|
|
2,232,000 |
|
|
|
2,120,988 |
|
| Bristol-Myers Squibb Co. |
|
|
|
|
|
|
|
|
| 5.65%, 02/22/2064 |
|
|
1,876,000 |
|
|
|
1,841,509 |
|
| Merck & Co., Inc. |
|
|
|
|
|
|
|
|
| 5.00%, 05/17/2053 |
|
|
4,634,000 |
|
|
|
4,381,224 |
|
| Organon & Co./Organon Foreign Debt Co- Issuer BV |
|
|
|
|
|
|
|
|
| 6.75%, 05/15/2034 (A) |
|
|
2,003,000 |
|
|
|
1,999,983 |
|
| Pfizer Investment Enterprises Pte. Ltd. |
|
|
|
|
|
|
|
|
| 5.11%, 05/19/2043 |
|
|
3,877,000 |
|
|
|
3,702,176 |
|
| Viatris, Inc. |
|
|
|
|
|
|
|
|
| 2.30%, 06/22/2027 |
|
|
1,582,000 |
|
|
|
1,444,622 |
|
|
|
|
|
|
|
|
|
|
|
|
|
|
|
|
|
|
|
|
21,004,862 |
|
|
|
|
|
|
|
|
|
|
| Professional Services - 0.2% |
|
| Equifax, Inc. |
|
|
|
|
|
|
|
|
| 2.60%, 12/01/2024 |
|
|
2,238,000 |
|
|
|
2,208,377 |
|
| 5.10%, 12/15/2027 |
|
|
3,106,000 |
|
|
|
3,093,912 |
|
|
|
|
|
|
|
|
|
|
|
|
|
|
|
|
|
|
|
|
5,302,289 |
|
|
|
|
|
|
|
|
|
|
| Residential REITs - 0.3% |
|
| American Homes 4 Rent LP |
|
|
|
|
|
|
|
|
| 5.50%, 02/01/2034 |
|
|
4,911,000 |
|
|
|
4,837,473 |
|
|
|
|
|
|
|
|
|
|
| |
|
Principal |
|
|
Value |
|
| |
|
|
| CORPORATE DEBT SECURITIES (continued) |
|
| Residential REITs (continued) |
|
| Invitation Homes Operating Partnership LP |
|
|
|
|
|
|
|
|
| 4.15%, 04/15/2032 (D) |
|
$ |
2,134,000 |
|
|
|
$ 1,950,273 |
|
|
|
|
|
|
|
|
|
|
|
|
|
|
|
|
|
|
|
|
6,787,746 |
|
|
|
|
|
|
|
|
|
|
| Semiconductors & Semiconductor Equipment - 1.3% |
|
| Advanced Micro Devices, Inc. |
|
|
|
|
|
|
|
|
| 3.92%, 06/01/2032 (D) |
|
|
4,408,000 |
|
|
|
4,097,258 |
|
| Broadcom, Inc. |
|
|
|
|
|
|
|
|
| 3.14%, 11/15/2035 (A) |
|
|
6,061,000 |
|
|
|
4,866,060 |
|
| Foundry JV Holdco LLC |
|
|
|
|
|
|
|
|
| 5.88%, 01/25/2034 (A) |
|
|
4,806,000 |
|
|
|
4,773,299 |
|
| 6.15%, 01/25/2032 (A) |
|
|
466,000 |
|
|
|
475,685 |
|
| KLA Corp. |
|
|
|
|
|
|
|
|
| 4.65%, 07/15/2032 |
|
|
3,528,000 |
|
|
|
3,450,315 |
|
| Microchip Technology, Inc. |
|
|
|
|
|
|
|
|
| 0.98%, 09/01/2024 |
|
|
3,240,000 |
|
|
|
3,212,593 |
|
| 5.05%, 03/15/2029 |
|
|
3,466,000 |
|
|
|
3,439,938 |
|
| Micron Technology, Inc. |
|
|
|
|
|
|
|
|
| 5.30%, 01/15/2031 |
|
|
4,998,000 |
|
|
|
4,991,656 |
|
| QUALCOMM, Inc. |
|
|
|
|
|
|
|
|
| 3.25%, 05/20/2050 |
|
|
1,902,000 |
|
|
|
1,349,980 |
|
|
|
|
|
|
|
|
|
|
|
|
|
|
|
|
|
|
|
|
30,656,784 |
|
|
|
|
|
|
|
|
|
|
| Software - 0.8% |
|
| Constellation Software, Inc. |
|
|
|
|
|
|
|
|
| 5.16%, 02/16/2029 (A) |
|
|
1,460,000 |
|
|
|
1,460,400 |
|
| Crowdstrike Holdings, Inc. |
|
|
|
|
|
|
|
|
| 3.00%, 02/15/2029 |
|
|
1,311,000 |
|
|
|
1,182,195 |
|
| Fiserv, Inc. |
|
|
|
|
|
|
|
|
| 5.45%, 03/02/2028 |
|
|
3,721,000 |
|
|
|
3,756,210 |
|
| Intuit, Inc. |
|
|
|
|
|
|
|
|
| 5.50%, 09/15/2053 |
|
|
1,697,000 |
|
|
|
1,714,832 |
|
| Oracle Corp. |
|
|
|
|
|
|
|
|
| 3.65%, 03/25/2041 |
|
|
2,255,000 |
|
|
|
1,731,997 |
|
| 6.90%, 11/09/2052 |
|
|
4,533,000 |
|
|
|
5,100,390 |
|
| Take-Two Interactive Software, Inc. |
|
|
|
|
|
|
|
|
| 3.55%, 04/14/2025 |
|
|
3,259,000 |
|
|
|
3,205,589 |
|
|
|
|
|
|
|
|
|
|
|
|
|
|
|
|
|
|
|
|
18,151,613 |
|
|
|
|
|
|
|
|
|
|
| Specialized REITs - 0.9% |
|
| Extra Space Storage LP |
|
|
|
|
|
|
|
|
| 5.90%, 01/15/2031 |
|
|
6,049,000 |
|
|
|
6,185,785 |
|
| Iron Mountain, Inc. |
|
|
|
|
|
|
|
|
| 5.25%, 03/15/2028 (A) |
|
|
5,956,000 |
|
|
|
5,763,349 |
|
| VICI Properties LP |
|
|
|
|
|
|
|
|
| 4.95%, 02/15/2030 |
|
|
6,119,000 |
|
|
|
5,904,896 |
|
| Weyerhaeuser Co. |
|
|
|
|
|
|
|
|
| 4.00%, 04/15/2030 |
|
|
4,288,000 |
|
|
|
4,005,167 |
|
|
|
|
|
|
|
|
|
|
|
|
|
|
|
|
|
|
|
|
21,859,197 |
|
|
|
|
|
|
|
|
|
|
| Technology Hardware, Storage & Peripherals - 0.3% |
|
| NCR Voyix Corp. |
|
|
|
|
|
|
|
|
| 5.00%, 10/01/2028 (A) |
|
|
1,582,000 |
|
|
|
1,493,554 |
|
| 5.13%, 04/15/2029 (A) |
|
|
2,386,000 |
|
|
|
2,248,070 |
|
| 5.25%, 10/01/2030 (A) |
|
|
2,379,000 |
|
|
|
2,174,570 |
|
|
|
|
|
|
|
|
|
|
|
|
|
|
|
|
|
|
|
|
5,916,194 |
|
|
|
|
|
|
|
|
|
|
The Notes to Financial Statements are an integral part of this report.
|
|
|
|
|
| Transamerica Series Trust |
|
|
|
Semi-Annual Financial Statements 2024 |
|
|
Page 6 |
|
|
Transamerica Aegon Bond VP
SCHEDULE OF INVESTMENTS (continued)
At June 30, 2024
(unaudited)
|
|
|
|
|
|
|
|
|
| |
|
Principal |
|
|
Value |
|
| |
|
|
| CORPORATE DEBT SECURITIES (continued) |
|
| Tobacco - 0.5% |
|
| BAT Capital Corp. |
|
|
|
|
|
|
|
|
| 6.00%, 02/20/2034 |
|
$ |
5,555,000 |
|
|
|
$ 5,631,272 |
|
| Philip Morris International, Inc. |
|
|
|
|
|
|
|
|
| 4.25%, 11/10/2044 |
|
|
4,200,000 |
|
|
|
3,412,085 |
|
| 5.25%, 02/13/2034 |
|
|
3,662,000 |
|
|
|
3,599,445 |
|
|
|
|
|
|
|
|
|
|
|
|
|
|
|
|
|
|
|
|
12,642,802 |
|
|
|
|
|
|
|
|
|
|
| Wireless Telecommunication Services - 0.5% |
|
| Axian Telecom |
|
|
|
|
|
|
|
|
| 7.38%, 02/16/2027 (A) |
|
|
728,000 |
|
|
|
715,268 |
|
| T-Mobile USA, Inc. |
|
|
|
|
|
|
|
|
| 3.50%, 04/15/2031 |
|
|
2,579,000 |
|
|
|
2,321,958 |
|
| 3.88%, 04/15/2030 |
|
|
1,890,000 |
|
|
|
1,767,942 |
|
| 5.15%, 04/15/2034 |
|
|
4,982,000 |
|
|
|
4,907,526 |
|
| Vmed O2 UK Financing I PLC |
|
|
|
|
|
|
|
|
| 4.75%, 07/15/2031 (A) |
|
|
2,825,000 |
|
|
|
2,382,686 |
|
|
|
|
|
|
|
|
|
|
|
|
|
|
|
|
|
|
|
|
12,095,380 |
|
|
|
|
|
|
|
|
|
|
| Total Corporate Debt Securities
(Cost $993,877,056) |
|
|
|
|
|
|
1,008,841,389 |
|
|
|
|
|
|
|
|
|
|
|
| U.S. GOVERNMENT OBLIGATIONS - 25.2% |
|
| U.S. Treasury - 23.6% |
|
| U.S. Treasury Bonds |
|
|
|
|
|
|
|
|
| 1.25%, 05/15/2050 |
|
|
35,958,200 |
|
|
|
17,953,817 |
|
| 2.00%, 02/15/2050 (F) |
|
|
21,937,000 |
|
|
|
13,413,276 |
|
| 2.25%, 05/15/2041 |
|
|
12,471,000 |
|
|
|
9,065,345 |
|
| 2.25%, 08/15/2046 (F) |
|
|
5,162,000 |
|
|
|
3,459,750 |
|
| 2.38%, 02/15/2042 |
|
|
77,443,300 |
|
|
|
56,639,489 |
|
| 2.75%, 08/15/2042 (F) |
|
|
35,479,000 |
|
|
|
27,413,071 |
|
| 2.88%, 05/15/2049 |
|
|
6,118,000 |
|
|
|
4,546,917 |
|
| 3.50%, 02/15/2039 |
|
|
37,159,000 |
|
|
|
33,557,770 |
|
| 3.63%, 05/15/2053 |
|
|
5,575,000 |
|
|
|
4,774,465 |
|
| 3.88%, 02/15/2043 - 05/15/2043 |
|
|
41,538,000 |
|
|
|
37,652,562 |
|
| 4.00%, 11/15/2052 |
|
|
5,449,000 |
|
|
|
4,994,136 |
|
| 4.13%, 08/15/2053 |
|
|
5,136,000 |
|
|
|
4,812,592 |
|
| 4.25%, 05/15/2039 (F) |
|
|
7,284,000 |
|
|
|
7,143,726 |
|
| 4.50%, 02/15/2044 |
|
|
33,221,000 |
|
|
|
32,733,067 |
|
| 4.63%, 05/15/2044 - 05/15/2054 |
|
|
11,335,000 |
|
|
|
11,436,517 |
|
| 4.75%, 11/15/2043 - 11/15/2053 |
|
|
5,720,000 |
|
|
|
5,880,191 |
|
| U.S. Treasury Bonds, Principal Only STRIPS |
|
|
|
|
|
|
|
|
| Zero Coupon, 08/15/2052 |
|
|
82,601,000 |
|
|
|
23,882,266 |
|
| U.S. Treasury Notes |
|
|
|
|
|
|
|
|
| 0.63%, 05/15/2030 |
|
|
12,203,000 |
|
|
|
9,873,943 |
|
| 1.25%, 08/15/2031 |
|
|
24,025,000 |
|
|
|
19,522,189 |
|
| 1.38%, 11/15/2031 |
|
|
38,352,000 |
|
|
|
31,238,902 |
|
| 1.88%, 02/15/2032 |
|
|
14,309,500 |
|
|
|
12,031,718 |
|
| 2.88%, 08/15/2028 - 05/15/2032 |
|
|
9,561,300 |
|
|
|
8,679,696 |
|
| 3.38%, 05/15/2033 |
|
|
11,034,300 |
|
|
|
10,246,382 |
|
| 3.50%, 02/15/2033 |
|
|
9,678,000 |
|
|
|
9,087,113 |
|
| 3.88%, 08/15/2033 |
|
|
7,672,000 |
|
|
|
7,395,988 |
|
| 4.00%, 01/31/2029 - 02/15/2034 |
|
|
7,290,000 |
|
|
|
7,125,980 |
|
| 4.13%, 03/31/2029 - 11/15/2032 |
|
|
56,270,900 |
|
|
|
55,505,346 |
|
| 4.25%, 02/28/2031 |
|
|
30,024,000 |
|
|
|
29,878,571 |
|
|
|
|
|
|
|
|
|
|
| |
|
Principal |
|
|
Value |
|
| |
|
|
| U.S. GOVERNMENT OBLIGATIONS (continued) |
|
| U.S. Treasury (continued) |
|
| U.S. Treasury Notes (continued) |
|
|
|
|
|
|
|
|
| 4.38%, 08/31/2028 - 05/15/2034 |
|
$ |
18,909,000 |
|
|
|
$ 18,951,032 |
|
| 4.50%, 03/31/2026 - 05/31/2029 |
|
|
24,834,000 |
|
|
|
24,995,238 |
|
|
|
|
|
|
|
|
|
|
|
|
|
|
|
|
|
|
|
|
543,891,055 |
|
|
|
|
|
|
|
|
|
|
| U.S. Treasury Inflation-Protected Securities - 1.6% |
|
| U.S. Treasury Inflation-Protected Indexed Bonds |
|
|
|
|
|
|
|
|
| 0.25%, 02/15/2050 |
|
|
36,347,252 |
|
|
|
22,374,474 |
|
| U.S. Treasury Inflation-Protected Indexed Notes |
|
|
|
|
|
|
|
|
| 0.13%, 07/15/2030 |
|
|
14,573,095 |
|
|
|
13,051,486 |
|
|
|
|
|
|
|
|
|
|
|
|
|
|
|
|
|
|
|
|
35,425,960 |
|
|
|
|
|
|
|
|
|
|
|
|
|
| Total U.S. Government Obligations
(Cost $603,829,146) |
|
|
|
|
|
|
579,317,015 |
|
|
|
|
|
|
|
|
|
|
|
| ASSET-BACKED SECURITIES - 10.6% |
|
| 321 Henderson Receivables VI LLC |
|
|
|
|
|
|
|
|
| Series 2010-1A, Class A, 5.56%, 07/15/2059 (A) |
|
|
2,087,424 |
|
|
|
2,077,722 |
|
| ACM Auto Trust |
|
|
|
|
|
|
|
|
| Series 2023-2A, Class A, 7.97%, 06/20/2030 (A) |
|
|
2,815,016 |
|
|
|
2,829,822 |
|
| Anchorage Capital CLO 25 Ltd. |
|
|
|
|
|
|
|
|
| Series 2022-25A, Class C, 3-Month Term SOFR + 2.35%, 7.67% (B), 04/20/2035 (A) |
|
|
1,000,000 |
|
|
|
999,763 |
|
| Apidos CLO XXXI Ltd. |
|
|
|
|
|
|
|
|
| Series 2019-31A, Class A1R, 3-Month Term SOFR + 1.36%, 6.69% (B), 04/15/2031 (A) |
|
|
7,000,000 |
|
|
|
7,000,000 |
|
| Aqua Finance Trust |
|
|
|
|
|
|
|
|
| Series 2021-A, Class A, 1.54%, 07/17/2046 (A) |
|
|
4,226,142 |
|
|
|
3,789,301 |
|
| Avis Budget Rental Car Funding AESOP LLC |
|
|
|
|
|
|
|
|
| Series 2023-7A, Class A, 5.90%, 08/21/2028 (A) |
|
|
5,355,000 |
|
|
|
5,417,236 |
|
| Series 2024-1A, Class A, 5.36%, 06/20/2030 (A) |
|
|
5,270,000 |
|
|
|
5,248,081 |
|
| Battalion CLO XXI Ltd. |
|
|
|
|
|
|
|
|
| Series 2021-21A, Class A, 3-Month Term SOFR + 1.44%, 6.77% (B), 07/15/2034 (A) |
|
|
3,000,000 |
|
|
|
3,003,285 |
|
| BXG Receivables Note Trust |
|
|
|
|
|
|
|
|
| Series 2023-A, Class A, 5.77%, 11/15/2038 (A) |
|
|
4,160,733 |
|
|
|
4,139,220 |
|
| CARS-DB4 LP |
|
|
|
|
|
|
|
|
| Series 2020-1A, Class A1, 2.69%, 02/15/2050 (A) |
|
|
4,430,133 |
|
|
|
4,335,352 |
|
| Series 2020-1A, Class A4, 3.19%, 02/15/2050 (A) |
|
|
1,230,990 |
|
|
|
1,202,647 |
|
| CARS-DB5 LP |
|
|
|
|
|
|
|
|
| Series 2021-1A, Class A1, 1.44%, 08/15/2051 (A) |
|
|
3,252,138 |
|
|
|
2,968,740 |
|
| Series 2021-1A, Class A3, 1.92%, 08/15/2051 (A) |
|
|
1,389,792 |
|
|
|
1,274,462 |
|
The Notes to Financial Statements are an integral part of this report.
|
|
|
|
|
| Transamerica Series Trust |
|
|
|
Semi-Annual Financial Statements 2024 |
|
|
Page 7 |
|
|
Transamerica Aegon Bond VP
SCHEDULE OF INVESTMENTS (continued)
At June 30, 2024
(unaudited)
|
|
|
|
|
|
|
|
|
| |
|
Principal |
|
|
Value |
|
| |
|
|
| ASSET-BACKED SECURITIES (continued) |
|
| CARS-DB7 LP |
|
|
|
|
|
|
|
|
| Series 2023-1A, Class A1, 5.75%, 09/15/2053 (A) |
|
$ |
7,760,000 |
|
|
$ |
7,679,481 |
|
| CIFC Funding Ltd. |
|
|
|
|
|
|
|
|
| Series 2017-4A, Class A1R, 3-Month Term SOFR + 1.21%, 6.53% (B), 10/24/2030 (A) |
|
|
3,422,392 |
|
|
|
3,427,053 |
|
| Citigroup Mortgage Loan Trust, Inc. |
|
|
|
|
|
|
|
|
| Series 2007-FS1, Class 1A1, 4.25% (B), 10/25/2037 (A) |
|
|
1,478,975 |
|
|
|
1,383,920 |
|
| DataBank Issuer LLC |
|
|
|
|
|
|
|
|
| Series 2021-1A, Class A2, 2.06%, 02/27/2051 (A) |
|
|
6,419,000 |
|
|
|
5,957,614 |
|
| Diamond Infrastructure Funding LLC |
|
|
|
|
|
|
|
|
| Series 2021-1A, Class A, 1.76%, 04/15/2049 (A) |
|
|
2,385,000 |
|
|
|
2,151,936 |
|
| Diamond Resorts Owner Trust |
|
|
|
|
|
|
|
|
| Series 2021-1A, Class B, 2.05%, 11/21/2033 (A) |
|
|
1,027,861 |
|
|
|
968,576 |
|
| Dryden 80 CLO Ltd. |
|
|
|
|
|
|
|
|
| Series 2019-80A, Class AR, 3-Month Term SOFR + 1.25%, 6.57% (B), 01/17/2033 (A) |
|
|
6,700,000 |
|
|
|
6,703,156 |
|
| First Investors Auto Owner Trust |
|
|
|
|
|
|
|
|
| Series 2021-2A, Class A, 0.48%, 03/15/2027 (A) |
|
|
276,969 |
|
|
|
275,354 |
|
| First National Master Note Trust |
|
|
|
|
|
|
|
|
| Series 2023-1, Class A, 5.13%, 04/15/2029 |
|
|
8,210,000 |
|
|
|
8,176,827 |
|
| GoodLeap Sustainable Home Solutions Trust |
|
|
|
|
|
|
|
|
| Series 2021-5CS, Class A, 2.31%, 10/20/2048 (A) |
|
|
5,013,373 |
|
|
|
3,998,890 |
|
| Series 2022-1GS, Class A, 2.70%, 01/20/2049 (A) |
|
|
593,130 |
|
|
|
488,693 |
|
| Series 2022-3CS, Class A, 4.95%, 07/20/2049 (A) |
|
|
585,303 |
|
|
|
544,476 |
|
| Hertz Vehicle Financing III LLC |
|
|
|
|
|
|
|
|
| Series 2022-1A, Class B, 2.19%, 06/25/2026 (A) |
|
|
4,450,000 |
|
|
|
4,298,477 |
|
| Series 2023-3A, Class A, 5.94%, 02/25/2028 (A) |
|
|
4,220,000 |
|
|
|
4,239,017 |
|
| Hilton Grand Vacations Trust |
|
|
|
|
|
|
|
|
| Series 2018-AA, Class B, 3.70%, 02/25/2032 (A) |
|
|
2,645,960 |
|
|
|
2,597,463 |
|
| Series 2023-1A, Class A, 5.72%, 01/25/2038 (A) |
|
|
3,020,702 |
|
|
|
3,044,169 |
|
| Series 2024-1B, Class B, 5.99%, 09/15/2039 (A) |
|
|
1,136,050 |
|
|
|
1,148,190 |
|
| Series 2024-1B, Class C, 6.62%, 09/15/2039 (A) |
|
|
1,145,517 |
|
|
|
1,158,084 |
|
| Series 2024-2A, Class A, 5.50%, 03/25/2038 (A) |
|
|
3,540,782 |
|
|
|
3,560,937 |
|
| Home Equity Asset Trust |
|
|
|
|
|
|
|
|
| Series 2004-4, Class M1, 1-Month Term SOFR + 0.89%, 6.24% (B), 10/25/2034 |
|
|
1,029,386 |
|
|
|
1,011,692 |
|
|
|
|
|
|
|
|
|
|
| |
|
Principal |
|
|
Value |
|
| |
|
|
| ASSET-BACKED SECURITIES (continued) |
|
| ICG US CLO Ltd. |
|
|
|
|
|
|
|
|
| Series 2014-1A, Class A1A2, 3-Month Term SOFR + 1.46%, 6.79% (B), 10/20/2034 (A) |
|
$ |
9,325,000 |
|
|
$ |
9,333,262 |
|
| Series 2021-1A, Class A1R, 3-Month Term SOFR + 1.27%, 0.00% (B), 04/17/2034 (A)(G) |
|
|
4,500,000 |
|
|
|
4,500,000 |
|
| LCM XV LP |
|
|
|
|
|
|
|
|
| Series 15A, Class AR2, 3-Month Term SOFR + 1.26%, 6.59% (B), 07/20/2030 (A) |
|
|
1,786,109 |
|
|
|
1,786,695 |
|
| LCM XXV Ltd. |
|
|
|
|
|
|
|
|
| Series 25A, Class AR, 3-Month Term SOFR + 1.10%, 6.42% (B), 07/20/2030 (A) |
|
|
1,790,686 |
|
|
|
1,791,025 |
|
| Mosaic Solar Loan Trust |
|
|
|
|
|
|
|
|
| Series 2023-2A, Class A, 5.36%, 09/22/2053 (A) |
|
|
7,428,262 |
|
|
|
7,246,343 |
|
| MVW LLC |
|
|
|
|
|
|
|
|
| Series 2020-1A, Class A, 1.74%, 10/20/2037 (A) |
|
|
1,105,871 |
|
|
|
1,041,911 |
|
| Series 2021-1WA, Class A, 1.14%, 01/22/2041 (A) |
|
|
834,659 |
|
|
|
778,999 |
|
| Series 2021-1WA, Class B, 1.44%, 01/22/2041 (A) |
|
|
3,932,204 |
|
|
|
3,657,231 |
|
| Series 2023-1A, Class A, 4.93%, 10/20/2040 (A) |
|
|
5,263,125 |
|
|
|
5,212,665 |
|
| Series 2024-1A, Class A, 5.32%, 02/20/2043 (A) |
|
|
1,464,479 |
|
|
|
1,461,735 |
|
| Series 2024-1A, Class C, 6.20%, 02/20/2043 (A) |
|
|
2,803,513 |
|
|
|
2,806,690 |
|
| OZLM XV Ltd. |
|
|
|
|
|
|
|
|
| Series 2016-15A, Class BRR, 3-Month Term SOFR + 2.35%, 7.41% (B), 04/20/2033 (A) |
|
|
3,900,000 |
|
|
|
3,903,705 |
|
| OZLM XXIV Ltd. |
|
|
|
|
|
|
|
|
| Series 2019-24A, Class A1AR, 3-Month Term SOFR + 1.42%, 6.75% (B), 07/20/2032 (A) |
|
|
5,000,000 |
|
|
|
5,003,505 |
|
| RASC Trust |
|
|
|
|
|
|
|
|
| Series 2005-KS11, Class M2, 1-Month Term SOFR + 0.74%, 6.09% (B), 12/25/2035 |
|
|
288,853 |
|
|
|
288,114 |
|
| Santander Drive Auto Receivables Trust |
|
|
|
|
|
|
|
|
| Series 2020-2, Class D, 2.22%, 09/15/2026 |
|
|
413,340 |
|
|
|
412,683 |
|
| Series 2021-1, Class D, 1.13%, 11/16/2026 |
|
|
5,976,376 |
|
|
|
5,881,052 |
|
| Series 2021-2, Class D, 1.35%, 07/15/2027 |
|
|
4,427,986 |
|
|
|
4,313,078 |
|
| Series 2021-4, Class C, 1.26%, 02/16/2027 |
|
|
4,601,135 |
|
|
|
4,560,750 |
|
The Notes to Financial Statements are an integral part of this report.
|
|
|
|
|
| Transamerica Series Trust |
|
|
|
Semi-Annual Financial Statements 2024 |
|
|
Page 8 |
|
|
Transamerica Aegon Bond VP
SCHEDULE OF INVESTMENTS (continued)
At June 30, 2024
(unaudited)
|
|
|
|
|
|
|
|
|
| |
|
Principal |
|
|
Value |
|
| |
|
|
| ASSET-BACKED SECURITIES (continued) |
|
| Sierra Timeshare Receivables Funding LLC |
|
|
|
|
|
|
|
|
| Series 2019-2A, Class A, 2.59%, 05/20/2036 (A) |
|
$ |
1,040,320 |
|
|
$ |
1,038,463 |
|
| Series 2020-2A, Class A, 1.33%, 07/20/2037 (A) |
|
|
3,361,811 |
|
|
|
3,248,220 |
|
| Series 2020-2A, Class B, 2.32%, 07/20/2037 (A) |
|
|
1,686,691 |
|
|
|
1,631,153 |
|
| Series 2021-1A, Class B, 1.34%, 11/20/2037 (A) |
|
|
2,004,040 |
|
|
|
1,905,064 |
|
| Series 2021-1A, Class C, 1.79%, 11/20/2037 (A) |
|
|
881,860 |
|
|
|
839,651 |
|
| Series 2023-1A, Class A, 5.20%, 01/20/2040 (A) |
|
|
5,272,195 |
|
|
|
5,225,496 |
|
| Series 2023-2A, Class A, 5.80%, 04/20/2040 (A) |
|
|
2,551,301 |
|
|
|
2,547,368 |
|
| Series 2023-3A, Class A, 6.10%, 09/20/2040 (A) |
|
|
5,629,783 |
|
|
|
5,692,626 |
|
| Series 2024-1A, Class A, 5.15%, 01/20/2043 (A) |
|
|
2,075,173 |
|
|
|
2,064,835 |
|
| Series 2024-1A, Class B, 5.35%, 01/20/2043 (A) |
|
|
1,699,199 |
|
|
|
1,690,994 |
|
| Series 2024-1A, Class C, 5.94%, 01/20/2043 (A) |
|
|
2,783,244 |
|
|
|
2,786,673 |
|
| Series 2024-1A, Class D, 8.02%, 01/20/2043 (A) |
|
|
989,407 |
|
|
|
995,441 |
|
| Sound Point CLO XVI Ltd. |
|
|
|
|
|
|
|
|
| Series 2017-2A, Class AR, 3-Month Term SOFR + 1.24%, 6.57% (B), 07/25/2030 (A) |
|
|
1,626,733 |
|
|
|
1,627,223 |
|
| Symphony CLO XIX Ltd. |
|
|
|
|
|
|
|
|
| Series 2018-19A, Class A, 3-Month Term SOFR + 1.22%, 6.55% (B), 04/16/2031 (A) |
|
|
4,251,316 |
|
|
|
4,252,153 |
|
| TCI-Symphony CLO Ltd. |
|
|
|
|
|
|
|
|
| Series 2016-1A, Class AR2, 3-Month Term SOFR + 1.28%, 6.61% (B), 10/13/2032 (A) |
|
|
4,334,599 |
|
|
|
4,337,559 |
|
| TCW CLO Ltd. |
|
|
|
|
|
|
|
|
| Series 2018-1A, Class A1R, 3-Month Term SOFR + 1.23%, 6.56% (B), 04/25/2031 (A) |
|
|
2,909,415 |
|
|
|
2,910,838 |
|
| Vantage Data Centers Issuer LLC |
|
|
|
|
|
|
|
|
| Series 2020-1A, Class A2, 1.65%, 09/15/2045 (A) |
|
|
9,170,000 |
|
|
|
8,684,689 |
|
| Venture 38 CLO Ltd. |
|
|
|
|
|
|
|
|
| Series 2019-38A, Class A1R, 3-Month Term SOFR + 1.42%, 6.75% (B), 07/30/2032 (A) |
|
|
4,900,000 |
|
|
|
4,902,019 |
|
| Venture 43 CLO Ltd. |
|
|
|
|
|
|
|
|
| Series 2021-43A, Class A1, 3-Month Term SOFR + 1.50%, 6.83% (B), 04/15/2034 (A) |
|
|
4,000,000 |
|
|
|
4,001,508 |
|
| Venture XXVII CLO Ltd. |
|
|
|
|
|
|
|
|
| Series 2017-27A, Class AR, 3-Month Term SOFR + 1.31%, 6.64% (B), 07/20/2030 (A) |
|
|
4,162,051 |
|
|
|
4,164,244 |
|
| Veridian Auto Receivables Trust |
|
|
|
|
|
|
|
|
| Series 2023-1A, Class A2, 5.97%, 08/17/2026 (A) |
|
|
1,816,497 |
|
|
|
1,817,232 |
|
|
|
|
|
|
|
|
|
|
| |
|
Principal |
|
|
Value |
|
| |
|
|
| ASSET-BACKED SECURITIES (continued) |
|
| Wellfleet CLO Ltd. |
|
|
|
|
|
|
|
|
| Series 2019-1A, Class BR, 3-Month Term SOFR + 2.61%, 7.94% (B), 07/20/2032 (A) |
|
$ |
3,000,000 |
|
|
|
$ 3,000,252 |
|
| Westlake Automobile Receivables Trust |
|
|
|
|
|
|
|
|
| Series 2022-3A, Class B, 5.99%, 12/15/2027 (A) |
|
|
4,095,000 |
|
|
|
4,097,749 |
|
|
|
|
|
|
|
|
|
|
|
|
| Total Asset-Backed Securities
(Cost $241,799,553) |
|
|
|
244,540,529 |
|
|
|
|
|
|
|
|
| MORTGAGE-BACKED SECURITIES - 9.5% |
|
| 1211 Avenue of the Americas Trust |
|
|
|
|
|
|
|
|
| Series 2015-1211, Class A1A1, 3.90%, 08/10/2035 (A) |
|
|
5,900,000 |
|
|
|
5,681,185 |
|
| 20 Times Square Trust |
|
|
|
|
|
|
|
|
| Series 2018-20TS, Class B, 3.20% (B), 05/15/2035 (A) |
|
|
5,148,000 |
|
|
|
4,462,293 |
|
| BAMLL Commercial Mortgage Securities Trust |
|
|
|
|
|
|
|
|
| Series 2019-BPR, Class ANM, 3.11%, 11/05/2032 (A) |
|
|
2,700,000 |
|
|
|
2,473,874 |
|
| Banc of America Funding Trust |
|
|
|
|
|
|
|
|
| Series 2005-D, Class A1, 5.56% (B), 05/25/2035 |
|
|
818,015 |
|
|
|
741,724 |
|
| BBCMS Mortgage Trust |
|
|
|
|
|
|
|
|
| Series 2018-TALL, Class D, 1-Month Term SOFR + 1.65%, 6.97% (B), 03/15/2037 (A) |
|
|
5,000,000 |
|
|
|
4,300,208 |
|
| BRAVO Residential Funding Trust |
|
|
|
|
|
|
|
|
| Series 2024-NQM3, Class A1, 6.19% (B), 03/25/2064 (A) |
|
|
3,964,198 |
|
|
|
3,973,982 |
|
| BX Commercial Mortgage Trust |
|
|
|
|
|
|
|
|
| Series 2020-VKNG, Class C, 1-Month Term SOFR + 1.51%, 6.84% (B), 10/15/2037 (A) |
|
|
1,624,000 |
|
|
|
1,607,760 |
|
| Citigroup Commercial Mortgage Trust |
|
|
|
|
|
|
|
|
| Series 2016-P5, Class AAB, 2.84%, 10/10/2049 |
|
|
2,650,447 |
|
|
|
2,591,117 |
|
| COLT Mortgage Loan Trust |
|
|
|
|
|
|
|
|
| Series 2024-2, Class A1, 6.13% (B), 04/25/2069 (A) |
|
|
3,906,075 |
|
|
|
3,907,158 |
|
| Series 2024-3, Class A1, 6.39% (B), 06/25/2069 (A) |
|
|
11,574,124 |
|
|
|
11,645,655 |
|
| COMM Mortgage Trust |
|
|
|
|
|
|
|
|
| Series 2016-787S, Class A, 3.55%, 02/10/2036 (A) |
|
|
5,000,000 |
|
|
|
4,723,914 |
|
| CSMC Trust |
|
|
|
|
|
|
|
|
| Series 2020-RPL4, Class A1, 2.00% (B), 01/25/2060 (A) |
|
|
10,544,312 |
|
|
|
9,196,146 |
|
| Series 2021-RPL3, Class A1, 2.00% (B), 01/25/2060 (A) |
|
|
5,262,357 |
|
|
|
4,529,729 |
|
| DOLP Trust |
|
|
|
|
|
|
|
|
| Series 2021-NYC, Class A, 2.96%, 05/10/2041 (A) |
|
|
5,300,000 |
|
|
|
4,416,069 |
|
| Fontainebleau Miami Beach Trust |
|
|
|
|
|
|
|
|
| Series 2019-FBLU, Class A, 3.14%, 12/10/2036 (A) |
|
|
5,000,000 |
|
|
|
4,928,545 |
|
The Notes to Financial Statements are an integral part of this report.
|
|
|
|
|
| Transamerica Series Trust |
|
|
|
Semi-Annual Financial Statements 2024 |
|
|
Page 9 |
|
|
Transamerica Aegon Bond VP
SCHEDULE OF INVESTMENTS (continued)
At June 30, 2024
(unaudited)
|
|
|
|
|
|
|
|
|
| |
|
Principal |
|
|
Value |
|
| |
|
|
| MORTGAGE-BACKED SECURITIES (continued) |
|
| Fontainebleau Miami Beach Trust (continued) |
|
|
|
|
|
|
|
|
| Series 2019-FBLU, Class C, 3.75%, 12/10/2036 (A) |
|
$ |
2,800,000 |
|
|
$ |
2,747,885 |
|
| Series 2019-FBLU, Class D, 4.10% (B), 12/10/2036 (A) |
|
|
1,500,000 |
|
|
|
1,462,764 |
|
| GCAT Trust |
|
|
|
|
|
|
|
|
| Series 2023-NQM1, Class A1, 6.01% (B), 01/25/2059 (A) |
|
|
6,405,239 |
|
|
|
6,391,692 |
|
| GS Mortgage Securities Trust |
|
|
|
|
|
|
|
|
| Series 2016-GS3, Class AAB, 2.78%, 10/10/2049 |
|
|
1,530,840 |
|
|
|
1,494,091 |
|
| HarborView Mortgage Loan Trust |
|
|
|
|
|
|
|
|
| Series 2006-7, Class 2A1A, 1-Month Term SOFR + 0.51%, 5.85% (B), 09/19/2046 |
|
|
107,116 |
|
|
|
91,366 |
|
| JPMorgan Chase Commercial Mortgage Securities Trust |
|
|
|
|
|
|
|
|
| Series 2020-ACE, Class A, 3.29%, 01/10/2037 (A) |
|
|
7,500,000 |
|
|
|
7,360,357 |
|
| MetLife Securitization Trust |
|
|
|
|
|
|
|
|
| Series 2017-1A, Class A, 3.00% (B), 04/25/2055 (A) |
|
|
1,400,344 |
|
|
|
1,309,289 |
|
| MFA Trust |
|
|
|
|
|
|
|
|
| Series 2021-RPL1, Class A1, 1.13% (B), 07/25/2060 (A) |
|
|
4,246,687 |
|
|
|
3,746,420 |
|
| Mill City Mortgage Loan Trust |
|
|
|
|
|
|
|
|
| Series 2019-1, Class A1, 3.25% (B), 10/25/2069 (A) |
|
|
796,339 |
|
|
|
762,984 |
|
| Morgan Stanley Bank of America Merrill Lynch Trust |
|
|
|
|
|
|
|
|
| Series 2015-C20, Class ASB, 3.07%, 02/15/2048 |
|
|
155,655 |
|
|
|
155,122 |
|
| Series 2015-C27, Class ASB, 3.56%, 12/15/2047 |
|
|
1,019,103 |
|
|
|
1,008,696 |
|
| New Residential Mortgage Loan Trust |
|
|
|
|
|
|
|
|
| Series 2016-4A, Class A1, 3.75% (B), 11/25/2056 (A) |
|
|
2,878,825 |
|
|
|
2,668,241 |
|
| Series 2018-RPL1, Class A1, 3.50% (B), 12/25/2057 (A) |
|
|
6,800,700 |
|
|
|
6,436,949 |
|
| Series 2019-2A, Class A1, 4.25% (B), 12/25/2057 (A) |
|
|
5,196,648 |
|
|
|
4,963,111 |
|
| Series 2019-4A, Class A1B, 3.50% (B), 12/25/2058 (A) |
|
|
6,199,950 |
|
|
|
5,675,991 |
|
| Series 2019-5A, Class A1B, 3.50% (B), 08/25/2059 (A) |
|
|
2,757,810 |
|
|
|
2,540,611 |
|
| Series 2019-6A, Class A1B, 3.50% (B), 09/25/2059 (A) |
|
|
2,294,945 |
|
|
|
2,128,270 |
|
| Series 2019-RPL2, Class A1, 3.25% (B), 02/25/2059 (A) |
|
|
3,812,065 |
|
|
|
3,610,323 |
|
| Series 2020-1A, Class A1B, 3.50% (B), 10/25/2059 (A) |
|
|
7,495,171 |
|
|
|
6,881,556 |
|
| OBX Trust |
|
|
|
|
|
|
|
|
| Series 2023-NQM4, Class A1, 6.11% (B), 03/25/2063 (A) |
|
|
2,909,957 |
|
|
|
2,910,122 |
|
| Series 2024-NQM4, Class A1, 6.07% (B), 01/25/2064 (A) |
|
|
4,851,063 |
|
|
|
4,843,373 |
|
| Series 2024-NQM5, Class A1, 5.99% (B), 12/01/2064 (A) |
|
|
1,900,376 |
|
|
|
1,899,390 |
|
| Series 2024-NQM6, Class A1, 6.45% (B), 02/25/2064 (A) |
|
|
4,793,656 |
|
|
|
4,828,704 |
|
|
|
|
|
|
|
|
|
|
| |
|
Principal |
|
|
Value |
|
| |
|
|
| MORTGAGE-BACKED SECURITIES (continued) |
|
| Reperforming Loan Trust REMICS |
|
|
|
|
|
|
|
|
| Series 2006-R1, Class AF1, 1-Month Term SOFR + 0.45%, 5.80% (B), 01/25/2036 (A) |
|
|
$ 954,978 |
|
|
|
$ 881,613 |
|
| Towd Point Mortgage Trust |
|
|
|
|
|
|
|
|
| Series 2017-4, Class A1, 2.75% (B), 06/25/2057 (A) |
|
|
4,400,663 |
|
|
|
4,204,465 |
|
| Series 2017-6, Class A1, 2.75% (B), 10/25/2057 (A) |
|
|
7,926,806 |
|
|
|
7,641,729 |
|
| Series 2018-2, Class A1, 3.25% (B), 03/25/2058 (A) |
|
|
184,088 |
|
|
|
178,642 |
|
| Series 2018-4, Class A1, 3.00% (B), 06/25/2058 (A) |
|
|
6,822,588 |
|
|
|
6,281,556 |
|
| Series 2019-1, Class A1, 3.75% (B), 03/25/2058 (A) |
|
|
9,012,916 |
|
|
|
8,580,780 |
|
| Series 2019-4, Class A1, 2.90% (B), 10/25/2059 (A) |
|
|
7,174,355 |
|
|
|
6,706,015 |
|
| Series 2020-4, Class A1, 1.75%, 10/25/2060 (A) |
|
|
12,279,311 |
|
|
|
10,870,379 |
|
| Series 2022-1, Class A1, 3.75% (B), 07/25/2062 (A) |
|
|
10,436,607 |
|
|
|
9,709,448 |
|
| Series 2022-4, Class A1, 3.75%, 09/25/2062 (A) |
|
|
9,621,951 |
|
|
|
8,978,281 |
|
| Series 2023-1, Class A1, 3.75%, 01/25/2063 (A) |
|
|
8,736,883 |
|
|
|
8,230,177 |
|
| WaMu Mortgage Pass-Through Certificates Trust |
|
|
|
|
|
|
|
|
| Series 2005-AR13, Class A1A1, 1-Month Term SOFR + 0.69%, 6.04% (B), 10/25/2045 |
|
|
564,804 |
|
|
|
541,313 |
|
|
|
|
|
|
|
|
|
|
|
|
|
| Total Mortgage-Backed Securities
(Cost $219,745,505) |
|
|
|
|
|
|
217,901,064 |
|
|
|
|
|
|
|
|
|
|
|
| U.S. GOVERNMENT AGENCY OBLIGATIONS - 9.0% |
|
| Federal Home Loan Mortgage Corp. |
|
|
|
|
|
|
|
|
| 3.00%, 04/01/2052 |
|
|
901,800 |
|
|
|
768,853 |
|
| 3.50%, 08/01/2049 |
|
|
581,880 |
|
|
|
522,571 |
|
| 5.50%, 04/01/2053 - 07/01/2053 (G) |
|
|
22,885,475 |
|
|
|
22,609,068 |
|
| 1-Year RFUCC Treasury + 1.35%, 5.63% (B), 09/01/2035 |
|
|
12,634 |
|
|
|
12,804 |
|
| 1-Year RFUCC Treasury + 1.87%, 6.12% (B), 09/01/2035 |
|
|
55,881 |
|
|
|
56,114 |
|
| Federal Home Loan Mortgage Corp. Multifamily Structured Pass-Through Certificates |
|
|
|
|
|
|
|
|
| 3.01%, 07/25/2025 |
|
|
2,052 |
|
|
|
2,003 |
|
| Federal National Mortgage Association |
|
|
|
|
|
|
|
|
| 3.00%, 08/01/2049 - 05/01/2052 |
|
|
1,897,637 |
|
|
|
1,620,267 |
|
| 4.00%, 10/01/2047 - 02/01/2048 |
|
|
1,472,585 |
|
|
|
1,377,344 |
|
| 4.50%, 08/01/2052 |
|
|
8,783,369 |
|
|
|
8,306,479 |
|
| 5.00%, 01/01/2025 - 02/01/2054 |
|
|
38,107,311 |
|
|
|
36,920,962 |
|
| 5.50%, 03/01/2053 |
|
|
9,995,468 |
|
|
|
9,878,346 |
|
| 1-Year RFUCC Treasury + 1.34%, 5.59% (B), 12/01/2034 |
|
|
642 |
|
|
|
639 |
|
| 1-Year CMT + 2.15%, 5.90% (B), 07/01/2032 |
|
|
1,916 |
|
|
|
1,932 |
|
| 1-Year CMT + 1.81%, 5.95% (B), 08/01/2035 |
|
|
4,153 |
|
|
|
4,179 |
|
| 6.00%, 06/01/2054 (G) |
|
|
11,394,662 |
|
|
|
11,453,985 |
|
The Notes to Financial Statements are an integral part of this report.
|
|
|
|
|
| Transamerica Series Trust |
|
|
|
Semi-Annual Financial Statements 2024 |
|
|
Page 10 |
|
|
Transamerica Aegon Bond VP
SCHEDULE OF INVESTMENTS (continued)
At June 30, 2024
(unaudited)
|
|
|
|
|
|
|
|
|
| |
|
Principal |
|
|
Value |
|
| |
|
|
| U.S. GOVERNMENT AGENCY OBLIGATIONS (continued) |
|
| Federal National Mortgage Association (continued) |
|
|
|
|
|
|
|
|
| 1-Year CMT + 2.18%, 6.30% (B), 10/01/2035 |
|
|
$ 1,025 |
|
|
|
$ 1,041 |
|
| 12-MTA + 1.20%, 6.31% (B), 06/01/2043 |
|
|
22,278 |
|
|
|
22,199 |
|
| 6-Month RFUCC Treasury + 1.75%, 6.50% (B), 05/01/2035 |
|
|
39,051 |
|
|
|
38,953 |
|
| 1-Year CMT + 2.22%, 6.52% (B), 01/01/2028 |
|
|
1,456 |
|
|
|
1,450 |
|
| 6-Month RFUCC Treasury + 1.61%, 7.36% (B), 08/01/2036 |
|
|
4,511 |
|
|
|
4,518 |
|
| Uniform Mortgage-Backed Security, TBA |
|
|
|
|
|
|
|
|
| 2.00%, 07/01/2054 (G) |
|
|
70,366,000 |
|
|
|
55,190,634 |
|
| 2.50%, 07/01/2054 (G) |
|
|
23,889,000 |
|
|
|
19,563,051 |
|
| 5.50%, 07/01/2054 (G) |
|
|
39,740,000 |
|
|
|
39,240,451 |
|
|
|
|
|
|
|
|
|
|
|
|
| Total U.S. Government Agency Obligations
(Cost $208,421,223) |
|
|
|
207,597,843 |
|
|
|
|
|
|
|
|
| FOREIGN GOVERNMENT OBLIGATIONS - 0.9% |
|
| Colombia - 0.1% |
|
| Colombia Government International Bonds |
|
|
|
|
|
|
|
|
| 3.13%, 04/15/2031 |
|
|
2,326,000 |
|
|
|
1,830,358 |
|
|
|
|
|
|
|
|
|
|
|
| Cote d’Ivoire - 0.1% |
|
| Ivory Coast Government International Bonds |
|
|
|
|
|
|
|
|
| 8.25%, 01/30/2037 (A) |
|
|
3,772,000 |
|
|
|
3,647,524 |
|
|
|
|
|
|
|
|
|
|
|
| Dominican Republic - 0.4% |
|
| Dominican Republic International Bonds |
|
|
|
|
|
|
|
|
| 4.88%, 09/23/2032 (A) |
|
|
1,489,000 |
|
|
|
1,332,105 |
|
| 5.50%, 01/27/2025 (E) |
|
|
2,640,000 |
|
|
|
2,633,454 |
|
| 6.60%, 06/01/2036 (A)(G) |
|
|
5,227,000 |
|
|
|
5,199,371 |
|
|
|
|
|
|
|
|
|
|
|
|
|
|
|
|
|
9,164,930 |
|
|
|
|
|
|
|
|
|
|
| Serbia - 0.2% |
|
| Serbia International Bonds |
|
|
|
|
|
|
|
|
| 6.00%, 06/12/2034 (A) |
|
|
3,791,000 |
|
|
|
3,732,410 |
|
|
|
|
|
|
|
|
|
|
|
| Uzbekistan - 0.1% |
|
| Republic of Uzbekistan International Bonds 3.90%, 10/19/2031 (A) |
|
|
2,745,000 |
|
|
|
2,229,333 |
|
|
|
|
|
|
|
|
|
|
|
|
|
| Total Foreign Government Obligations
(Cost $20,358,518) |
|
|
|
|
|
|
20,604,555 |
|
|
|
|
|
|
|
|
|
|
|
| LOAN ASSIGNMENT - 0.0% (H) |
|
| IT Services - 0.0% (H) |
|
| Rackspace Technology Global, Inc. 1st Lien Term Loan, 1-Month Term SOFR + 6.25%, 11.69% (B), 05/15/2028 |
|
|
1,067,408 |
|
|
|
1,075,859 |
|
|
|
|
|
|
|
|
|
|
|
|
|
| Total Loan Assignment
(Cost $1,026,017) |
|
|
|
|
|
|
1,075,859 |
|
|
|
|
|
|
|
|
|
|
|
|
|
|
|
|
|
|
|
| |
|
Principal |
|
|
Value |
|
| |
|
|
| COMMERCIAL PAPER - 1.5% |
|
| Financial Services - 1.5% |
|
| Britannia Funding Co. LLC |
|
|
|
|
|
|
|
|
| 5.50% (I), 09/06/2024 (A) |
|
|
$ 5,272,000 |
|
|
|
$ 5,216,370 |
|
| Glencove Funding LLC |
|
|
|
|
|
|
|
|
| 5.60% (I), 12/02/2024 (A) |
|
|
16,112,000 |
|
|
|
15,736,404 |
|
| Liberty Street Funding LLC |
|
|
|
|
|
|
|
|
| 5.59% (I), 11/01/2024 (A) |
|
|
13,500,000 |
|
|
|
13,246,740 |
|
|
|
|
|
|
|
|
|
|
|
|
|
| Total Commercial Paper
(Cost $34,204,471) |
|
|
|
|
|
|
34,199,514 |
|
|
|
|
|
|
|
|
|
|
|
| SHORT-TERM U.S. GOVERNMENT OBLIGATIONS - 3.8% |
|
| U.S. Treasury Bills |
|
|
|
|
|
|
|
|
| 5.31% (I), 08/01/2024 |
|
|
11,522,000 |
|
|
|
11,470,109 |
|
| 5.34% (I), 09/19/2024 |
|
|
24,171,000 |
|
|
|
23,890,993 |
|
| 5.38% (I), 09/12/2024 |
|
|
47,496,000 |
|
|
|
46,992,436 |
|
| 5.40% (I), 08/29/2024 |
|
|
4,984,000 |
|
|
|
4,941,056 |
|
|
|
|
|
|
|
|
|
|
|
|
| Total Short-Term U.S. Government Obligations
(Cost $87,266,631) |
|
|
|
87,294,594 |
|
|
|
|
|
|
|
|
|
|
| |
|
Shares |
|
|
Value |
|
| |
|
|
| OTHER INVESTMENT COMPANY - 0.2% |
|
| Securities Lending Collateral - 0.2% |
|
| State Street Navigator Securities Lending Trust - Government Money Market Portfolio, 5.28% (I) |
|
|
5,503,210 |
|
|
|
5,503,210 |
|
|
|
|
|
|
|
|
|
|
|
|
| Total Other Investment Company
(Cost $5,503,210) |
|
|
|
5,503,210 |
|
|
|
|
|
|
|
|
|
|
| |
|
Principal |
|
|
Value |
|
| |
|
|
| REPURCHASE AGREEMENT - 2.7% |
|
| Fixed Income Clearing Corp., 2.50% (I), dated 06/28/2024, to be repurchased at $61,714,543 on 07/01/2024. Collateralized by a U.S. Government Obligation, 4.50%, due 03/31/2026, and with a value of $62,935,904. |
|
$ |
61,701,689 |
|
|
|
61,701,689 |
|
|
|
|
|
|
|
|
|
|
|
|
| Total Repurchase Agreement
(Cost $61,701,689) |
|
|
|
61,701,689 |
|
|
|
|
|
|
|
| Total Investments
(Cost $2,477,733,019) |
|
|
|
2,468,577,261 |
|
|
|
|
|
|
|
| Net Other Assets (Liabilities) - (7.2)% |
|
|
|
(164,983,586) |
|
|
|
|
|
|
|
|
|
|
|
|
| Net Assets - 100.0% |
|
|
$ |
2,303,593,675 |
|
|
|
|
|
|
|
The Notes to Financial Statements are an integral part of this report.
|
|
|
|
|
| Transamerica Series Trust |
|
|
|
Semi-Annual Financial Statements 2024 |
|
|
Page 11 |
|
|
Transamerica Aegon Bond VP
SCHEDULE OF INVESTMENTS (continued)
At June 30, 2024
(unaudited)
INVESTMENT VALUATION:
Valuation Inputs (J)
|
|
|
|
|
|
|
|
|
|
|
|
|
|
|
|
|
| |
|
Level 1 - Unadjusted Quoted Prices |
|
|
Level 2 - Other Significant Observable Inputs |
|
|
Level 3 - Significant Unobservable Inputs |
|
|
Value |
|
| |
|
|
|
|
|
|
| ASSETS |
|
|
|
|
|
|
|
|
|
|
|
|
|
|
|
|
| Investments |
|
|
|
|
|
|
|
|
|
|
|
|
|
|
|
|
| Corporate Debt Securities |
|
$ |
— |
|
|
$ |
1,008,841,389 |
|
|
$ |
— |
|
|
$ |
1,008,841,389 |
|
| U.S. Government Obligations |
|
|
— |
|
|
|
579,317,015 |
|
|
|
— |
|
|
|
579,317,015 |
|
| Asset-Backed Securities |
|
|
— |
|
|
|
244,540,529 |
|
|
|
— |
|
|
|
244,540,529 |
|
| Mortgage-Backed Securities |
|
|
— |
|
|
|
217,901,064 |
|
|
|
— |
|
|
|
217,901,064 |
|
| U.S. Government Agency Obligations |
|
|
— |
|
|
|
207,597,843 |
|
|
|
— |
|
|
|
207,597,843 |
|
| Foreign Government Obligations |
|
|
— |
|
|
|
20,604,555 |
|
|
|
— |
|
|
|
20,604,555 |
|
| Loan Assignment |
|
|
— |
|
|
|
1,075,859 |
|
|
|
— |
|
|
|
1,075,859 |
|
| Commercial Paper |
|
|
— |
|
|
|
34,199,514 |
|
|
|
— |
|
|
|
34,199,514 |
|
| Short-Term U.S. Government Obligations |
|
|
— |
|
|
|
87,294,594 |
|
|
|
— |
|
|
|
87,294,594 |
|
| Other Investment Company |
|
|
5,503,210 |
|
|
|
— |
|
|
|
— |
|
|
|
5,503,210 |
|
| Repurchase Agreement |
|
|
— |
|
|
|
61,701,689 |
|
|
|
— |
|
|
|
61,701,689 |
|
|
|
|
|
|
|
|
|
|
|
|
|
|
|
|
|
|
| Total Investments |
|
$ |
5,503,210 |
|
|
$ |
2,463,074,051 |
|
|
$ |
— |
|
|
$ |
2,468,577,261 |
|
|
|
|
|
|
|
|
|
|
|
|
|
|
|
|
|
|
FOOTNOTES TO SCHEDULE OF INVESTMENTS:
| (A) |
Security is exempt from registration pursuant to Rule 144A of the Securities Act of 1933. Security may be resold as transactions exempt from registration, normally to qualified institutional buyers. At June 30, 2024, the total value of 144A securities is $868,265,815, representing 37.7% of the Portfolio’s net assets. |
| (B) |
Floating or variable rate security. The rate disclosed is as of June 30, 2024. For securities based on a published reference rate and spread, the reference rate and spread are indicated within the description. Variable rate securities with a floor or ceiling feature are disclosed at the inherent rate, where applicable. Certain variable rate securities are not based on a published reference rate and spread, but are determined by the issuer or agent and are based on current market conditions; these securities do not indicate a reference rate and spread in the description. |
| (C) |
Perpetual maturity. The date displayed is the next call date. |
| (D) |
All or a portion of the security is on loan. The total value of the securities on loan is $11,336,208, collateralized by cash collateral of $5,503,210 and non-cash collateral, such as U.S. government securities and irrevocable letters of credit, of $6,069,895. The amount on loan indicated may not correspond with the securities on loan identified because a security with pending sales are in the process of recall from the brokers. |
| (E) |
Security exempt from registration under Regulation S of the Securities Act of 1933, which exempts from registration securities offered and sold outside the United States. Security may not be offered or sold in the United States except pursuant to an exemption from, or in a transaction not subject to, the registration requirements of the Securities Act of 1933. At June 30, 2024, the total value of the Regulation S securities is $14,290,109, representing 0.6% of the Portfolio’s net assets. |
| (F) |
Security is subject to sale-buyback transactions. The average amount of sale-buybacks outstanding during the period ended June 30, 2024 was $0 at a weighted average interest rate of 0%. |
| (G) |
When-issued, delayed-delivery and/or forward commitment (including TBAs) security. Security to be settled and delivered after June 30, 2024. Security may display a coupon rate of 0.00%, as the rate is to be determined at time of settlement. |
| (H) |
Percentage rounds to less than 0.1% or (0.1)%. |
| (I) |
Rate disclosed reflects the yield at June 30, 2024. |
| (J) |
There were no transfers in or out of Level 3 during the period ended June 30, 2024. Please reference the Investment Valuation section of the Notes to Financial Statements for more information regarding investment valuation and pricing inputs. |
PORTFOLIO ABBREVIATION(S):
|
|
|
| CMT |
|
Constant Maturity Treasury |
| MTA |
|
Month Treasury Average |
| REIT |
|
Real Estate Investment Trust |
| RFUCC |
|
Refinitiv USD IBOR Consumer Cash Fallbacks |
| SOFR |
|
Secured Overnight Financing Rate |
| STRIPS |
|
Separate Trading of Registered Interest and Principal of Securities |
| TBA |
|
To Be Announced |
The Notes to Financial Statements are an integral part of this report.
|
|
|
|
|
| Transamerica Series Trust |
|
|
|
Semi-Annual Financial Statements 2024 |
|
|
Page 12 |
|
|
Transamerica Aegon Bond VP
|
|
|
| STATEMENT OF ASSETS AND LIABILITIES At June 30, 2024 (unaudited) |
|
STATEMENT OF OPERATIONS For the period ended June 30, 2024 (unaudited) |
|
|
|
|
|
| Assets: |
|
|
|
|
| Investments, at value (cost $2,416,031,330) (including securities loaned of $11,336,208) |
|
$ |
2,406,875,572 |
|
| Repurchase agreement, at value (cost $61,701,689) |
|
|
61,701,689 |
|
| Cash |
|
|
2,724 |
|
| Foreign currency, at value (cost $384) |
|
|
376 |
|
| Receivables and other assets: |
|
|
|
|
| Investments sold |
|
|
27,102,033 |
|
| Net income from securities lending |
|
|
5,894 |
|
| Shares of beneficial interest sold |
|
|
21,762 |
|
| Interest |
|
|
20,894,627 |
|
| Prepaid expenses |
|
|
11,136 |
|
|
|
| Total assets |
|
|
2,516,615,813 |
|
|
|
| Liabilities: |
|
|
|
|
| Cash collateral received upon return of: |
|
|
|
|
| Securities on loan |
|
|
5,503,210 |
|
| Cash collateral at broker for: |
|
|
|
|
| TBA commitments |
|
|
885,000 |
|
| Payables and other liabilities: |
|
|
|
|
| Investments purchased |
|
|
47,763,075 |
|
| When-issued, delayed-delivery, forward and TBA commitments purchased |
|
|
157,460,553 |
|
| Shares of beneficial interest redeemed |
|
|
203,626 |
|
| Investment management fees |
|
|
862,605 |
|
| Distribution and service fees |
|
|
90,439 |
|
| Transfer agent costs |
|
|
2,243 |
|
| Trustee and CCO fees |
|
|
7,819 |
|
| Audit and tax fees |
|
|
36,566 |
|
| Custody fees |
|
|
75,909 |
|
| Legal fees |
|
|
27,811 |
|
| Printing and shareholder reports fees |
|
|
63,028 |
|
| Other accrued expenses |
|
|
40,254 |
|
|
|
| Total liabilities |
|
|
213,022,138 |
|
|
|
| Net assets |
|
$ |
2,303,593,675 |
|
|
|
| Net assets consist of: |
|
|
|
|
| Capital stock ($0.01 par value) |
|
$ |
2,383,802 |
|
| Additional paid-in capital |
|
|
2,452,954,642 |
|
| Total distributable earnings (accumulated losses) |
|
|
(151,744,769 |
) |
|
|
| Net assets |
|
$ |
2,303,593,675 |
|
|
|
| Net assets by class: |
|
|
|
|
| Initial Class |
|
$ |
1,833,690,056 |
|
| Service Class |
|
|
469,903,619 |
|
|
|
| Shares outstanding: |
|
|
|
|
| Initial Class |
|
|
189,336,201 |
|
| Service Class |
|
|
49,044,045 |
|
|
|
| Net asset value and offering price per share: |
|
|
|
|
| Initial Class |
|
$ |
9.68 |
|
| Service Class |
|
|
9.58 |
|
|
|
|
|
|
| Investment income: |
|
|
|
|
| Interest income |
|
$ |
63,851,473 |
|
| Net income from securities lending |
|
|
66,282 |
|
| Total investment income |
|
|
63,917,755 |
|
|
|
| Expenses: |
|
|
|
|
| Investment management fees |
|
|
5,713,648 |
|
| Distribution and service fees: |
|
|
|
|
| Service Class |
|
|
590,530 |
|
| Transfer agent costs |
|
|
13,585 |
|
| Trustee and CCO fees |
|
|
55,687 |
|
| Audit and tax fees |
|
|
36,669 |
|
| Custody fees |
|
|
88,392 |
|
| Legal fees |
|
|
82,736 |
|
| Printing and shareholder reports fees |
|
|
60,264 |
|
| Other |
|
|
85,170 |
|
|
|
| Total expenses |
|
|
6,726,681 |
|
|
|
| Net investment income (loss) |
|
|
57,191,074 |
|
|
|
| Net realized gain (loss) on: |
|
|
|
|
| Investments |
|
|
(7,665,903 |
) |
| Foreign currency transactions |
|
|
(147 |
) |
|
|
| Net realized gain (loss) |
|
|
(7,666,050 |
) |
|
|
| Net change in unrealized appreciation (depreciation) on: |
|
|
|
|
| Investments |
|
|
(51,606,410 |
) |
| Translation of assets and liabilities denominated in foreign currencies |
|
|
111 |
|
|
|
| Net change in unrealized appreciation (depreciation) |
|
|
(51,606,299 |
) |
|
|
| Net realized and change in unrealized gain (loss) |
|
|
(59,272,349 |
) |
|
|
| Net increase (decrease) in net assets resulting from operations |
|
$ |
(2,081,275 |
) |
The Notes to Financial Statements are an integral part of this report.
|
|
|
|
|
| Transamerica Series Trust |
|
|
|
Semi-Annual Financial Statements 2024 |
|
|
Page 13 |
|
|
Transamerica Aegon Bond VP
STATEMENT OF CHANGES IN NET ASSETS
For the period and year ended:
|
|
|
|
|
|
|
|
|
| |
|
June 30, 2024 (unaudited) |
|
|
December 31, 2023 |
|
| From operations: |
|
|
|
|
|
|
|
|
| Net investment income (loss) |
|
$ |
57,191,074 |
|
|
|
$ 92,840,366 |
|
| Net realized gain (loss) |
|
|
(7,666,050 |
) |
|
|
(9,888,422 |
) |
| Net change in unrealized appreciation (depreciation) |
|
|
(51,606,299 |
) |
|
|
47,084,290 |
|
|
|
|
| Net increase (decrease) in net assets resulting from operations |
|
|
(2,081,275 |
) |
|
|
130,036,234 |
|
|
|
|
| Dividends and/or distributions to shareholders: |
|
|
|
|
|
|
|
|
| Initial Class |
|
|
— |
|
|
|
(14,721,993 |
) |
| Service Class |
|
|
— |
|
|
|
(3,240,146 |
) |
|
|
|
| Net increase (decrease) in net assets resulting from dividends and/or distributions to shareholders |
|
|
— |
|
|
|
(17,962,139 |
) |
|
|
|
| Capital share transactions: |
|
|
|
|
|
|
|
|
| Proceeds from shares sold: |
|
|
|
|
|
|
|
|
| Initial Class |
|
|
6,263,764 |
|
|
|
1,469,059,339 |
|
| Service Class |
|
|
3,838,099 |
|
|
|
4,945,369 |
|
| |
|
|
10,101,863 |
|
|
|
1,474,004,708 |
|
| Dividends and/or distributions reinvested: |
|
|
|
|
|
|
|
|
| Initial Class |
|
|
— |
|
|
|
14,721,993 |
|
| Service Class |
|
|
— |
|
|
|
3,240,146 |
|
| |
|
|
— |
|
|
|
17,962,139 |
|
| Cost of shares redeemed: |
|
|
|
|
|
|
|
|
| Initial Class |
|
|
(172,729,360 |
) |
|
|
(340,674,893 |
) |
| Service Class |
|
|
(33,872,244 |
) |
|
|
(75,408,414 |
) |
|
|
|
| |
|
|
(206,601,604 |
) |
|
|
(416,083,307 |
) |
|
|
|
| Net increase (decrease) in net assets resulting from capital share transactions |
|
|
(196,499,741 |
) |
|
|
1,075,883,540 |
|
|
|
|
| Net increase (decrease) in net assets |
|
|
(198,581,016 |
) |
|
|
1,187,957,635 |
|
|
|
|
| Net assets: |
|
|
|
|
|
|
|
|
| Beginning of period/year |
|
|
2,502,174,691 |
|
|
|
1,314,217,056 |
|
| End of period/year |
|
$ |
2,303,593,675 |
|
|
|
$ 2,502,174,691 |
|
|
|
|
| Capital share transactions - shares: |
|
|
|
|
|
|
|
|
| Shares issued: |
|
|
|
|
|
|
|
|
| Initial Class |
|
|
653,091 |
|
|
|
156,701,918 |
|
| Service Class |
|
|
403,896 |
|
|
|
530,972 |
|
| |
|
|
1,056,987 |
|
|
|
157,232,890 |
|
| Shares reinvested: |
|
|
|
|
|
|
|
|
| Initial Class |
|
|
— |
|
|
|
1,588,133 |
|
| Service Class |
|
|
— |
|
|
|
352,573 |
|
| |
|
|
— |
|
|
|
1,940,706 |
|
| Shares redeemed: |
|
|
|
|
|
|
|
|
| Initial Class |
|
|
(18,120,931 |
) |
|
|
(35,729,393 |
) |
| Service Class |
|
|
(3,571,430 |
) |
|
|
(8,161,549 |
) |
| |
|
|
(21,692,361 |
) |
|
|
(43,890,942 |
) |
| Net increase (decrease) in shares outstanding: |
|
|
|
|
|
|
|
|
| Initial Class |
|
|
(17,467,840 |
) |
|
|
122,560,658 |
|
| Service Class |
|
|
(3,167,534 |
) |
|
|
(7,278,004 |
) |
| |
|
|
(20,635,374 |
) |
|
|
115,282,654 |
|
The Notes to Financial Statements are an integral part of this report.
|
|
|
|
|
| Transamerica Series Trust |
|
|
|
Semi-Annual Financial Statements 2024 |
|
|
Page 14 |
|
|
Transamerica Aegon Bond VP
FINANCIAL HIGHLIGHTS
|
|
|
|
|
|
|
|
|
|
|
|
|
|
|
|
|
|
|
|
|
|
|
|
|
| For a share outstanding during the period and years indicated: |
|
Initial Class |
|
|
|
|
|
|
|
|
| |
|
June 30, 2024 (unaudited) |
|
|
December 31, 2023 |
|
|
December 31, 2022 |
|
|
December 31, 2021 |
|
|
December 31, 2020 |
|
|
December 31, 2019 |
|
|
|
|
|
|
|
|
| Net asset value, beginning of period/year |
|
$ |
9.68 |
|
|
$ |
9.18 |
|
|
$ |
11.08 |
|
|
$ |
12.08 |
|
|
$ |
11.77 |
|
|
$ |
11.12 |
|
|
|
|
|
|
|
|
| Investment operations: |
|
|
|
|
|
|
|
|
|
|
|
|
|
|
|
|
|
|
|
|
|
|
|
|
| Net investment income (loss)(A) |
|
|
0.23 |
|
|
|
0.43 |
|
|
|
0.28 |
|
|
|
0.23 |
|
|
|
0.27 |
|
|
|
0.31 |
|
| Net realized and unrealized gain (loss) |
|
|
(0.23 |
) |
|
|
0.16 |
|
|
|
(1.91 |
) |
|
|
(0.33 |
) |
|
|
0.61 |
|
|
|
0.63 |
|
| Total investment operations |
|
|
— |
|
|
|
0.59 |
|
|
|
(1.63 |
) |
|
|
(0.10 |
) |
|
|
0.88 |
|
|
|
0.94 |
|
|
|
|
|
|
|
|
| Dividends and/or distributions to shareholders: |
|
|
|
|
|
|
|
|
|
|
|
|
|
|
|
|
|
|
|
|
|
|
|
|
| Net investment income |
|
|
— |
|
|
|
(0.09 |
) |
|
|
(0.27 |
) |
|
|
(0.18 |
) |
|
|
(0.52 |
) |
|
|
(0.29 |
) |
| Net realized gains |
|
|
— |
|
|
|
— |
|
|
|
— |
|
|
|
(0.72 |
) |
|
|
(0.05 |
) |
|
|
— |
|
| Total dividends and/or distributions to shareholders |
|
|
— |
|
|
|
(0.09 |
) |
|
|
(0.27 |
) |
|
|
(0.90 |
) |
|
|
(0.57 |
) |
|
|
(0.29 |
) |
| Net asset value, end of period/year |
|
$ |
9.68 |
|
|
$ |
9.68 |
|
|
$ |
9.18 |
|
|
$ |
11.08 |
|
|
$ |
12.08 |
|
|
$ |
11.77 |
|
| |
|
|
|
|
|
|
|
|
|
|
|
|
|
|
|
|
|
|
| Total return |
|
|
0.00 |
%(B) |
|
|
6.45 |
% |
|
|
(14.84 |
)% |
|
|
(0.87 |
)% |
|
|
7.68 |
% |
|
|
8.41 |
% |
|
|
|
|
|
|
|
| Ratio and supplemental data: |
|
|
|
|
|
|
|
|
|
|
|
|
|
|
|
|
|
|
|
|
|
|
|
|
| Net assets end of period/year (000’s) |
|
$ |
1,833,690 |
|
|
$ |
2,001,616 |
|
|
$ |
773,454 |
|
|
$ |
1,153,539 |
|
|
$ |
1,372,817 |
|
|
$ |
1,805,918 |
|
| Expenses to average net assets |
|
|
0.52 |
%(C) |
|
|
0.53 |
% |
|
|
0.66 |
% |
|
|
0.67 |
% |
|
|
0.67 |
% |
|
|
0.67 |
% |
| Net investment income (loss) to average net assets |
|
|
4.92 |
%(C) |
|
|
4.67 |
% |
|
|
2.82 |
% |
|
|
1.96 |
% |
|
|
2.24 |
% |
|
|
2.63 |
% |
| Portfolio turnover rate |
|
|
36 |
%(B) |
|
|
76 |
% |
|
|
126 |
%(D) |
|
|
18 |
%(D) |
|
|
30 |
%(D) |
|
|
27 |
%(D) |
| (A) |
Calculated based on average number of shares outstanding. |
| (D) |
Excludes sale-buyback transactions. |
|
|
|
|
|
|
|
|
|
|
|
|
|
|
|
|
|
|
|
|
|
|
|
|
|
| For a share outstanding during the period and years indicated: |
|
Service Class |
|
|
|
|
|
|
|
|
| |
|
June 30, 2024 (unaudited) |
|
|
December 31, 2023 |
|
|
December 31, 2022 |
|
|
December 31, 2021 |
|
|
December 31, 2020 |
|
|
December 31, 2019 |
|
|
|
|
|
|
|
|
| Net asset value, beginning of period/year |
|
$ |
9.59 |
|
|
$ |
9.09 |
|
|
$ |
10.97 |
|
|
$ |
11.96 |
|
|
$ |
11.65 |
|
|
$ |
11.01 |
|
|
|
|
|
|
|
|
| Investment operations: |
|
|
|
|
|
|
|
|
|
|
|
|
|
|
|
|
|
|
|
|
|
|
|
|
| Net investment income (loss)(A) |
|
|
0.22 |
|
|
|
0.40 |
|
|
|
0.25 |
|
|
|
0.20 |
|
|
|
0.24 |
|
|
|
0.27 |
|
| Net realized and unrealized gain (loss) |
|
|
(0.23 |
) |
|
|
0.16 |
|
|
|
(1.89 |
) |
|
|
(0.32 |
) |
|
|
0.61 |
|
|
|
0.63 |
|
| Total investment operations |
|
|
(0.01 |
) |
|
|
0.56 |
|
|
|
(1.64 |
) |
|
|
(0.12 |
) |
|
|
0.85 |
|
|
|
0.90 |
|
|
|
|
|
|
|
|
| Dividends and/or distributions to shareholders: |
|
|
|
|
|
|
|
|
|
|
|
|
|
|
|
|
|
|
|
|
|
|
|
|
| Net investment income |
|
|
— |
|
|
|
(0.06 |
) |
|
|
(0.24 |
) |
|
|
(0.15 |
) |
|
|
(0.49 |
) |
|
|
(0.26 |
) |
| Net realized gains |
|
|
— |
|
|
|
— |
|
|
|
— |
|
|
|
(0.72 |
) |
|
|
(0.05 |
) |
|
|
— |
|
| Total dividends and/or distributions to shareholders |
|
|
— |
|
|
|
(0.06 |
) |
|
|
(0.24 |
) |
|
|
(0.87 |
) |
|
|
(0.54 |
) |
|
|
(0.26 |
) |
| Net asset value, end of period/year |
|
$ |
9.58 |
|
|
$ |
9.59 |
|
|
$ |
9.09 |
|
|
$ |
10.97 |
|
|
$ |
11.96 |
|
|
$ |
11.65 |
|
| |
|
|
|
|
|
|
|
|
|
|
|
|
|
|
|
|
|
|
| Total return |
|
|
(0.10 |
)%(B) |
|
|
6.18 |
% |
|
|
(15.08 |
)% |
|
|
(1.07 |
)% |
|
|
7.40 |
% |
|
|
8.22 |
% |
|
|
|
|
|
|
|
| Ratio and supplemental data: |
|
|
|
|
|
|
|
|
|
|
|
|
|
|
|
|
|
|
|
|
|
|
|
|
| Net assets end of period/year (000’s) |
|
$ |
469,904 |
|
|
$ |
500,559 |
|
|
$ |
540,763 |
|
|
$ |
748,830 |
|
|
$ |
813,000 |
|
|
$ |
811,186 |
|
| Expenses to average net assets |
|
|
0.77 |
%(C) |
|
|
0.78 |
% |
|
|
0.91 |
% |
|
|
0.92 |
% |
|
|
0.92 |
% |
|
|
0.92 |
% |
| Net investment income (loss) to average net assets |
|
|
4.67 |
%(C) |
|
|
4.38 |
% |
|
|
2.58 |
% |
|
|
1.72 |
% |
|
|
1.99 |
% |
|
|
2.38 |
% |
| Portfolio turnover rate |
|
|
36 |
%(B) |
|
|
76 |
% |
|
|
126 |
%(D) |
|
|
18 |
%(D) |
|
|
30 |
%(D) |
|
|
27 |
%(D) |
| (A) |
Calculated based on average number of shares outstanding. |
| (D) |
Excludes sale-buyback transactions. |
The Notes to Financial Statements are an integral part of this report.
|
|
|
|
|
| Transamerica Series Trust |
|
|
|
Semi-Annual Financial Statements 2024 |
|
|
Page 15 |
|
|
Transamerica Aegon Bond VP
NOTES TO FINANCIAL STATEMENTS
At June 30, 2024
(unaudited)
1. ORGANIZATION
Transamerica Series Trust (“TST”) is an open-end management investment company registered under the Investment Company Act of 1940, as amended (the “1940 Act”). TST applies investment company accounting and reporting guidance. TST serves as a funding vehicle for variable life insurance, variable annuity, and group annuity products. Transamerica Aegon Bond VP (the “Portfolio”) is a series of TST and is classified as diversified under the 1940 Act. The Portfolio currently offers two classes of shares, Initial Class and Service Class.
The only shareholders of the Portfolio are affiliated insurance company separate accounts and/or affiliated asset allocation portfolios. Contract holders of the variable life and annuity contracts are not shareholders of the Portfolio. For ease of reference, shareholders and contract holders are collectively referred to in this report as “shareholders.”
This report must be accompanied or preceded by the Portfolio’s current prospectus, which contains additional information about the Portfolio, including risks, as well as investment objectives and strategies.
Transamerica Asset Management, Inc. (“TAM”) serves as investment manager for the Portfolio pursuant to an investment management agreement. TAM provides continuous and regular investment management services to the Portfolio. TAM supervises the Portfolio’s investments, conducts its investment program and provides supervisory, compliance and administrative services to the Portfolio.
TAM currently acts as a “manager of managers” and has hired sub-advisers to furnish day-to-day investment advice and recommendations. TAM may, in the future, determine to provide all aspects of the day-to-day management of the Portfolio without the use of a sub-adviser. When acting as a manager of managers, TAM provides investment management services that include, without limitation, the design and development of the Portfolio and its investment strategies and the ongoing review and evaluation of those investment strategies including recommending changes in strategy where it believes appropriate or advisable; the selection of one or more sub-advisers for the Portfolio employing a combination of quantitative and qualitative screens, research, analysis and due diligence; negotiation of sub-advisory agreements and fees; oversight and monitoring of sub-advisers and recommending changes to sub-advisers where it believes appropriate or advisable; recommending portfolio combinations and liquidations where it believes appropriate or advisable; selection and oversight of transition managers, as needed; regular supervision of the Portfolio’s investments; regular review and evaluation of sub-adviser performance; daily monitoring of the sub-advisers’ buying and selling of securities for the Portfolio; regular review of holdings; ongoing trade oversight and analysis; regular monitoring to ensure adherence to investment process; regular calls and periodic on-site visits with sub-advisers; portfolio construction and asset allocation when using multiple sub-advisers for the Portfolio; risk management oversight and analysis; oversight of negotiation of investment documentation and agreements; design, development, implementation and regular monitoring of the valuation process; periodic due diligence reviews of pricing vendors and vendor methodology; design, development, implementation and regular monitoring of the compliance process; respond to regulatory inquiries and determine appropriate litigation strategy, as needed; review of proxies voted by sub-advisers; oversight of preparation and review of materials for meetings of the Portfolio’s Board of Trustees (the “Board”), participation in these meetings and preparation of regular communications with the Board; oversight of preparation and review of prospectuses, shareholder reports and other disclosure materials and regulatory filings for the Portfolio; oversight of other service providers to the Portfolio, such as the custodian, the transfer agent, the Portfolio’s independent accounting firm and legal counsel; supervision of the performance of recordkeeping and shareholder relations functions for the Portfolio; and oversight of cash management services. TAM uses a variety of quantitative and qualitative tools to carry out its investment management services. TAM, not the Portfolio, is responsible for paying the sub-adviser(s) for their services, and sub-advisory fees are TAM’s expense.
TAM’s investment management services also include the provision of supervisory and administrative services to the Portfolio. These services include performing certain administrative services for the Portfolio and supervising and overseeing the administrative, clerical, recordkeeping and bookkeeping services provided to the Portfolio by State Street Bank and Trust Company (“State Street”), to whom TAM has outsourced the provision of certain sub-administration services. To the extent agreed upon by TAM and the Portfolio from time to time, TAM’s supervisory and administrative services include, but are not limited to: monitoring and verifying the custodian’s daily calculation of the Net Asset Values (“NAV”); shareholder relations functions; compliance services; valuation services; assisting in due diligence and in the oversight and monitoring of certain activities of sub-advisers and certain aspects of Portfolio investments; assisting with Portfolio combinations and liquidations; oversight of the preparation and filing, and review, of all returns and reports, in connection with federal, state and local taxes; oversight and review of regulatory reporting; supervising and coordinating the Portfolio’s custodian and dividend disbursing agent and monitoring their services to the Portfolio; assisting the Portfolio in preparing reports to shareholders; acting as liaison with the Portfolio’s independent public accountants and providing, upon request, analyses, fiscal year summaries and other audit related services; assisting in the preparation of agendas and supporting documents for and minutes of meetings of trustees and committees of trustees; assisting in the preparation of regular communications with the trustees; and providing personnel and office space, telephones and other office equipment as necessary in order for TAM to perform supervisory and administrative services to the Portfolio. The Portfolio pays certain fees and expenses to State Street for sub-administration services which are not administrative services covered by the
|
|
|
|
|
| Transamerica Series Trust |
|
|
|
Semi-Annual Financial Statements 2024 |
|
|
Page 16 |
|
|
Transamerica Aegon Bond VP
NOTES TO FINANCIAL STATEMENTS (continued)
At June 30, 2024
(unaudited)
1. ORGANIZATION (continued)
management agreement with TAM or paid for through the management fees payable thereunder. For the period ended June 30, 2024, (i) the expenses paid to State Street for sub-administration services by the Portfolio are shown as a part of Other expenses within the Statement of Operations and (ii) the expenses payable to State Street for sub-administration services from the Portfolio are shown as part of Other accrued expenses within the Statement of Assets and Liabilities.
2. SIGNIFICANT ACCOUNTING POLICIES
In preparing the Portfolio’s financial statements in accordance with Generally Accepted Accounting Principles in the United States of America (“GAAP”), estimates or assumptions (which could differ from actual results) may be used that affect reported amounts and disclosures. The following is a summary of significant accounting policies followed by the Portfolio.
Foreign currency denominated investments: The accounting records of the Portfolio are maintained in U.S. dollars. Securities and other assets and liabilities denominated in foreign currencies are translated into U.S. dollars based on the closing exchange rate each day. The cost of foreign securities purchased and any realized gains or losses are translated at the prevailing exchange rates in effect on the date of the respective transaction. The Portfolio combines fluctuations from currency exchange rates and fluctuations in value when computing net realized and unrealized gains or losses from investments.
Net foreign currency gains and losses resulting from changes in exchange rates include, foreign currency fluctuations between trade date and settlement date of investment security transactions, gains and losses on forward foreign currency contracts, and the difference between the receivable amounts of interest and dividends recorded in the accounting records in U.S. dollars and the amounts actually received.
Foreign currency denominated assets may involve risks not typically associated with domestic transactions. These risks include revaluation of currencies, adverse fluctuations in foreign currency values, and possible adverse political, social, and economic developments, including those particular to a specific industry, country or region.
Security transactions and investment income: Security transactions are accounted for on the trade date. Security gains and losses are calculated on a first-in, first-out basis. Dividend income, if any, is recorded on the ex-dividend date or, in the case of foreign securities, as soon as the Portfolio is informed of the ex-dividend dates, net of foreign taxes. Non-cash dividends, if any, are recorded on the ex-dividend date at fair value. Interest income, if any, is recorded on the accrual basis from settlement date, net of foreign taxes. Fixed income premiums and discounts are amortized and/or accreted over the lives of the respective securities.
Multiple class operations, income, and expenses: Income, non-class specific expenses, and realized and unrealized gains and losses are allocated to each class daily based upon net assets. Each class bears its own specific expenses in addition to the allocated non-class specific expenses.
Distributions to shareholders: Distributions are recorded on the ex-dividend date and are determined in accordance with federal income tax regulations, which may differ from GAAP.
Commission recapture: The sub-adviser(s), to the extent consistent with the best execution and usual commission rate policies and practices, may elect to place security transactions of the Portfolio with broker/dealers with which TST has established a commission recapture program. A commission recapture program is any arrangement under which a broker/dealer applies a portion of the commissions received by such broker/dealer on the security transactions to the Portfolio. In no event will commissions, paid by the Portfolio, be used to pay expenses that would otherwise be borne by any other Portfolios within TST, or by any other party.
There were no commissions recaptured during the period ended June 30, 2024 by the Portfolio.
Indemnification: In the normal course of business, the Portfolio enters into contracts that contain a variety of representations that provide general indemnifications. The Portfolio’s maximum exposure under these arrangements is unknown, as this would involve future claims that may be made against the Portfolio and/or its affiliates that have not yet occurred. However, based on experience, the Portfolio expects the risk of loss to be remote.
|
|
|
|
|
| Transamerica Series Trust |
|
|
|
Semi-Annual Financial Statements 2024 |
|
|
Page 17 |
|
|
Transamerica Aegon Bond VP
NOTES TO FINANCIAL STATEMENTS (continued)
At June 30, 2024
(unaudited)
3. INVESTMENT VALUATION
TAM has been designated as the Portfolio’s valuation designee pursuant to Rule 2a-5 under the 1940 Act with responsibility for fair valuation subject to oversight by the Portfolio’s Board of Trustees. The net asset value of the Portfolio is computed as of the official close of the New York Stock Exchange (“NYSE”) each day the NYSE is open for business.
TAM utilizes various methods to measure the fair value of its investments on a recurring basis. GAAP establishes a hierarchy that prioritizes inputs to valuation methods. The inputs or methodology used for valuing securities are not necessarily an indication of the risk associated with investing in those securities. The three levels (“Levels”) of inputs of the fair value hierarchy are defined as follows:
Level 1—Unadjusted quoted prices in active markets for identical securities.
Level 2—Inputs, other than quoted prices included in Level 1, which are observable, either directly or indirectly. These inputs may include quoted prices for the identical instrument on an inactive market, prices for similar instruments, interest rates, prepayment speeds, credit risk, yield curves, default rates, and similar data.
Level 3—Unobservable inputs based on the best information available in the circumstances, to the extent observable inputs are not available, which may include TAM’s own assumptions used in determining the fair value of the Portfolio’s investments.
The inputs used to measure fair value may fall into different Levels of the fair value hierarchy. In such cases, for disclosure purposes, the Level in the fair value hierarchy that is assigned to the fair value measurement of a security is determined based on the lowest Level input that is significant to the fair value measurement in its entirety. Certain investments that are measured at fair value using NAV per share, or its equivalent, using the “practical expedient” have not been classified in the fair value Levels. The hierarchy classification of inputs used to value the Portfolio’s investments at June 30, 2024, is disclosed within the Investment Valuation section of the Schedule of Investments.
The availability of observable inputs can vary from security to security and is affected by a wide variety of factors, including, but not limited to, the type of security, whether the security is new and not yet established in the marketplace, the liquidity of markets, and other characteristics particular to the security. To the extent that valuation is based on models or inputs that are less observable or unobservable in the market, the determination of fair value requires more judgment. Accordingly, the degree of judgment exercised in determining fair value is generally greatest for instruments categorized in Level 3. Due to the inherent uncertainty of valuation, the determination of values may differ significantly from values that would have been realized had a ready market for investments existed, and the differences could be material.
Fair value measurements: Descriptions of the valuation techniques applied to the Portfolio’s significant categories of assets and liabilities measured at fair value on a recurring basis are as follows:
Asset-backed securities: The fair value of asset-backed securities is estimated based on models that consider the estimated cash flows of each tranche of the entity, establish a benchmark yield, and develop an estimated tranche specific spread to the benchmark yield based on the unique attributes of the tranche. To the extent the inputs are observable and timely, the values would generally be categorized in Level 2 of the fair value hierarchy; otherwise they would be categorized in Level 3.
Commercial paper: Commercial paper is valued using amortized cost, which approximates fair value. The values are generally categorized in Level 2 of the fair value hierarchy, or Level 3 if inputs are unobservable.
Corporate debt securities: The fair value of corporate debt securities is estimated using various techniques, which consider recently executed transactions in securities of the issuer or comparable issuers, market price quotations (where observable), bond spreads, fundamental data relating to the issuer, and credit default swap spreads adjusted for any basis difference between cash and derivative instruments. While most corporate debt securities are categorized in Level 2 of the fair value hierarchy, in instances where lower relative weight is placed on transaction prices, quotations, or similar observable inputs, they are categorized in Level 3.
Foreign government obligations: Foreign government obligations are normally valued using a model that incorporates market observable data such as reported sales of similar securities, broker quotes, yields, bids, offers, and reference data. Certain securities are valued by principally using dealer quotations. Foreign government obligations generally are categorized in Level 2 of the fair value hierarchy, or Level 3 if inputs are unobservable.
|
|
|
|
|
| Transamerica Series Trust |
|
|
|
Semi-Annual Financial Statements 2024 |
|
|
Page 18 |
|
|
Transamerica Aegon Bond VP
NOTES TO FINANCIAL STATEMENTS (continued)
At June 30, 2024
(unaudited)
3. INVESTMENT VALUATION (continued)
Loan assignments: Loan assignments are normally valued using an income approach, which projects future cash flows and converts those future cash flows to a present value using a discount rate. The resulting present value reflects the likely fair value of the loan. To the extent the inputs are observable and timely, the values would generally be categorized in Level 2 of the fair value hierarchy; otherwise are categorized in Level 3.
Mortgage-backed securities: The fair value of mortgage-backed securities is estimated based on models that consider issuer type, coupon, cash flows, mortgage prepayment projection tables and adjustable rate mortgage evaluations that incorporate index data, periodic life caps and the next coupon reset date. To the extent the inputs are observable and timely, the values would generally be categorized in Level 2 of the fair value hierarchy; otherwise they are categorized in Level 3.
U.S. government agency obligations: U.S. government agency obligations are comprised of two main categories consisting of agency issued debt and mortgage pass-throughs. Generally, agency issued debt securities are valued in a manner similar to U.S. government obligations. Mortgage pass-throughs include to be announced (“TBA”) securities and mortgage pass-through certificates. Generally, TBA securities and mortgage pass-throughs are valued using dealer quotations. Depending on market activity levels and whether quotations or other observable data are used, these securities are typically categorized in Level 2 of the fair value hierarchy; otherwise they would be categorized in Level 3.
U.S. government obligations: U.S. government obligations are normally valued using a model that incorporates market observable data such as reported sales of similar securities, broker quotes, yields, bids, offers, and reference data. Certain securities are valued by principally using dealer quotations. U.S. government obligations generally are categorized in Level 2 of the fair value hierarchy, or Level 3 if inputs are unobservable.
Short-term notes: The Portfolio normally values short-term government and U.S. government agency securities using a model that incorporates market observable data such as reported sales of similar securities, broker quotes, yields, bids, offers and reference data. Certain securities are valued by principally using dealer quotations. Short-term government and U.S. government agency securities generally are categorized in Level 2 of the fair value hierarchy, or Level 3 if inputs are unobservable.
Securities lending collateral: Securities lending collateral is invested in a money market fund which is valued at the actively traded NAV and no valuation adjustments are applied. Securities lending collateral is categorized in Level 1 of the fair value hierarchy.
Repurchase agreements: Repurchase agreements are valued at cost, which approximates fair value. To the extent the inputs are observable and timely, the values are generally categorized in Level 2 of the fair value hierarchy.
4. SECURITIES AND OTHER INVESTMENTS
Loan participations and assignments: The Portfolio may invest in direct debt instruments which are interests in amounts owed to lenders or lending syndicates by corporate, governmental, or other borrowers, either in the form of participations at the time the loan is originated (“Participations”) or buying an interest in the loan in the secondary market from a financial institution or institutional investor (“Assignments”). Participations and Assignments in commercial loans may be secured or unsecured. These investments may include standby financing commitments, including revolving credit facilities that obligate the Portfolio to supply additional cash to the borrowers on demand. Loan Participations and Assignments involve risks of insolvency of the lending banks or other financial intermediaries. As such, the Portfolio assumes the credit risks associated with the corporate borrowers and may assume the credit risks associated with the interposed banks or other financial intermediaries.
The Portfolio, based on its ability to invest in Loan Participations and Assignments, may be contractually obligated to receive approval from the agent banks and/or borrowers prior to the sale of these investments. The Portfolio that participates in such syndications, or that can buy a portion of the loans, become part lenders. Loans are often administered by agent banks acting as agents for all holders.
The agent banks administer the terms of the loans, as specified in the loan agreements. In addition, the agent banks are normally responsible for the collection of principal and interest payments from the corporate borrowers and the apportionment of these payments to the credit of all institutions that are parties to the loan agreements. Unless the Portfolio has direct recourse against the corporate borrowers under the terms of the loans or other indebtedness, the Portfolio may have to rely on the agent banks or other financial intermediaries to apply appropriate credit remedies against corporate borrowers.
|
|
|
|
|
| Transamerica Series Trust |
|
|
|
Semi-Annual Financial Statements 2024 |
|
|
Page 19 |
|
|
Transamerica Aegon Bond VP
NOTES TO FINANCIAL STATEMENTS (continued)
At June 30, 2024
(unaudited)
4. SECURITIES AND OTHER INVESTMENTS (continued)
The Portfolio held no unfunded loan participations at June 30, 2024. Open funded loan participations and assignments at June 30, 2024, if any, are included within the Schedule of Investments.
Real estate investment trusts (“REITs”): REITs are pooled investment vehicles which invest primarily in income producing real estate, or real estate related loans or interests. Distributions received by REITs are classified at management’s estimate of the dividend income, return of capital and capital gains. Estimates are based on information available at year-end, which includes the previous fiscal year’s classification. The actual amounts of dividend income, return of capital, and capital gains are only determined by each REIT after the fiscal year end and may differ from the estimated amounts. Upon notification from the REITs, some of the distributions received may be re-classified and recorded as a return of capital or capital gains. There are certain additional risks involved in investing in REITs. These include, but are not limited to, economic conditions, changes in zoning laws, real estate values, property taxes, and interest rates.
REITs held at June 30, 2024, if any, are identified within the Schedule of Investments.
Treasury inflation-protected securities (“TIPS”): The Portfolio may invest in TIPS, which are fixed income securities whose principal value is periodically adjusted according to the rate of inflation/deflation. If the index measuring inflation/deflation rises or falls, the principal value of TIPS will be adjusted upward or downward, and consequently the interest payable on these securities (calculated with respect to a larger or smaller principal amount) will be increased or reduced, respectively. Repayment of the original bond principal upon maturity (as adjusted for inflation) is guaranteed in the case of U.S. Treasury inflation-indexed bonds and notes. For bonds and notes that do not provide a similar guarantee, the adjusted principal value of the bond repaid at maturity may be less than the original principal.
TIPS held at June 30, 2024, if any, are included within the Schedule of Investments. The adjustments, if any, to principal due to inflation/deflation are reflected as increases/decreases to Interest income within the Statement of Operations, with a corresponding adjustment to Investments, at cost within the Statement of Assets and Liabilities.
When-issued, delayed-delivery, forward, and to be announced (“TBA”) commitment transactions: The Portfolio may purchase or sell securities on a when-issued, delayed-delivery, forward and TBA commitment basis. When-issued and forward commitment transactions are made conditionally because a security, although authorized, has not yet been issued in the market. Settlement of such transactions normally occurs within a month or more after the purchase or sale commitment is made. The Portfolio engages in when-issued and forward commitment transactions to obtain an advantageous price and yield at the time of the transaction. The Portfolio engages in when-issued and forward commitment transactions for the purpose of acquiring securities, but may enter into a separate agreement to sell the securities before the settlement date. Since the value of securities purchased may fluctuate prior to settlement, the Portfolio may be required to pay more at settlement than the security is worth. In addition, the Portfolio is not entitled to any of the interest earned prior to settlement.
Delayed-delivery transactions involve a commitment by the Portfolio to purchase or sell securities for a predetermined price or yield, with payment and delivery taking place beyond the customary settlement period. When delayed-delivery transactions are outstanding, the Portfolio will segregate with its custodian either cash, U.S. government securities, or other liquid assets at least equal to the value or purchase commitments until payment is made. When purchasing a security on a delayed-delivery basis, the Portfolio assumes the rights and risks of ownership of the security, including the risk of price and yield fluctuations. These transactions also involve a risk to the Portfolio if the other party to the transaction defaults on its obligation to make payment or delivery, and the Portfolio is delayed or prevented from completing the transaction. The Portfolio may dispose of or renegotiate a delayed-delivery transaction after it is entered into, which may result in a realized gain or loss. When the Portfolio sells a security on a delayed-delivery basis, the Portfolio does not participate in future gains and losses on the security.
TBA commitments are entered into to purchase or sell securities for a fixed price at a future date, typically not to exceed 45 days. TBAs are considered securities in themselves, and involve a risk of loss if the value of the security to be purchased declines, or the value of the security sold increases, prior to settlement date, in addition to the risk of decline in the value of a Portfolio’s other assets. Unsettled TBA commitments are valued at the current value of the underlying securities. TBA collateral requirements are typically calculated by netting the mark-to-market amount for each transaction and comparing that amount to the value of the collateral currently pledged by a Portfolio and the counterparty. Cash collateral that has been pledged to cover the obligations of a Portfolio and cash collateral received from the counterparty, if any, is reported separately in the Statement of Assets and Liabilities as Cash collateral pledged at broker for TBA commitments or Cash collateral at broker for TBA commitments, respectively. Non-cash collateral pledged by a Portfolio, if any, is disclosed within the Schedule of Investments. Typically, a Portfolio is permitted to sell, re-pledge or use the collateral it receives; however, the counterparty is not permitted. To the extent amounts due to a Portfolio are not fully collateralized, contractually or otherwise, a Portfolio bears the risk of loss from counterparty non-performance.
|
|
|
|
|
| Transamerica Series Trust |
|
|
|
Semi-Annual Financial Statements 2024 |
|
|
Page 20 |
|
|
Transamerica Aegon Bond VP
NOTES TO FINANCIAL STATEMENTS (continued)
At June 30, 2024
(unaudited)
4. SECURITIES AND OTHER INVESTMENTS (continued)
When-issued, delayed-delivery, forward and TBA commitment transactions held at June 30, 2024, if any, are identified within the Schedule of Investments. Open trades, if any, are reflected as When-issued, delayed-delivery, forward and TBA commitments purchased or sold within the Statement of Assets and Liabilities.
5. BORROWINGS AND OTHER FINANCING TRANSACTIONS
The Portfolio may engage in borrowing transactions as a means of raising cash to satisfy redemption requests, for other temporary or emergency purposes or, to the extent permitted by its investment policies, to raise additional cash to be invested in other securities or instruments. When the Portfolio invests borrowing proceeds in other securities, the Portfolio will bear the risk that the market value of the securities in which such proceeds are invested goes down and is insufficient to repay the borrowed proceeds. The Portfolio may borrow on a secured or on an unsecured basis. If the Portfolio enters into a secured borrowing arrangement, a portion of the Portfolio’s assets will be used as collateral. The 1940 Act requires the Portfolio to maintain asset coverage of at least 300% of the amount of its borrowings. Asset coverage means the ratio that the value of the Portfolio’s total assets, minus liabilities other than borrowings, bears to the aggregate amount of all borrowings. Although complying with this requirement has the effect of limiting the amount that the Portfolio may borrow, it does not otherwise mitigate the risks of entering into borrowing transactions.
Interfund lending: The Portfolio, along with other funds and portfolios advised by TAM, may participate in an interfund lending program pursuant to exemptive relief granted by the Securities and Exchange Commission on January 18, 2017. This program allows the Portfolio to lend to and borrow from other funds and portfolios advised by TAM. Interfund lending transactions are subject to the conditions of the exemptive relief which places limits on the amount of lending or borrowing a Portfolio may participate in under the program. Interest earned or paid on an interfund lending transaction will be based on the average of certain current market rates. For the period ended June 30, 2024, the Portfolio has not utilized the program.
Repurchase agreements: In a repurchase agreement, the Portfolio purchases a security and simultaneously commits to resell that security to the seller at an agreed-upon price on an agreed-upon date. Securities purchased subject to a repurchase agreement are held at the Portfolio’s custodian, or designated sub-custodian related to tri-party repurchase agreements, and, pursuant to the terms of the repurchase agreement, must be collateralized by securities with an aggregate market value greater than or equal to 100% of the resale price. The Portfolio will bear the risk of value fluctuations until the securities can be sold and may encounter delays and incur costs in liquidating the securities. In the event of bankruptcy or insolvency of the seller, delays and costs may be incurred.
Repurchase agreements are subject to netting agreements, which are agreements between the Portfolio and its counterparties that provide for the net settlement of all transactions and collateral with the Portfolio, through a single payment, in the event of default or termination. Amounts presented within the Schedule of Investments, and as part of Repurchase agreements, at value within the Statement of Assets and Liabilities are shown on a gross basis. The value of the related collateral for each repurchase agreement, as reflected within the Schedule of Investments, exceeds the value of each repurchase agreement at June 30, 2024.
Repurchase agreements at June 30, 2024, if any, are included within the Schedule of Investments and Statement of Assets and Liabilities.
Sale-buyback: The Portfolio may enter into sale-buyback financing transactions. The Portfolio accounts for sale-buyback financing transactions as borrowing transactions and realize gains and losses on these transactions at the end of the roll period. Sale-buyback financing transactions involve sales by the Portfolio of securities and simultaneously contracts to repurchase the same or substantially similar securities at an agreed upon price and date.
The Portfolio forgoes principal and interest paid during the roll period on the securities sold in a sale-buyback financing transaction. The Portfolio is compensated by the difference between the current sales price and the price for the future purchase (often referred to as the “price drop”), as well as by any interest earned on the proceeds of the securities sold. Sale-buyback financing transactions may be renewed with a new sale and a repurchase price and a cash settlement made at each renewal without physical delivery of the securities subject to the contract. Sale-buyback financing transactions expose the Portfolio to risks such as, the buyer under the agreement may file for bankruptcy, become insolvent, or otherwise default on its obligations to the Portfolio, the market value of the securities the Portfolio is obligated to repurchase under the agreement may decline below the repurchase price. The Portfolio’s obligations under a sale-buyback typically would be offset by liquid assets equal in value to the amount of the Portfolio’s forward commitment to repurchase the subject security. Sale-buyback financing transactions accounted for as borrowing transactions are excluded from the Portfolio’s portfolio turnover rates. The Portfolio recognizes price drop fee income on a straight line basis over the period of the roll. For the period ended June 30, 2024, the Portfolio earned price drop fee income of $0. The price drop fee income is included in Interest income within the Statement of Operations.
|
|
|
|
|
| Transamerica Series Trust |
|
|
|
Semi-Annual Financial Statements 2024 |
|
|
Page 21 |
|
|
Transamerica Aegon Bond VP
NOTES TO FINANCIAL STATEMENTS (continued)
At June 30, 2024
(unaudited)
5. BORROWINGS AND OTHER FINANCING TRANSACTIONS (continued)
The outstanding payable for securities to be repurchased, if any, is included in Payable for sale-buyback financing transactions within the Statement of Assets and Liabilities. The interest expense is included within Interest income on the Statement of Operations. In periods of increased demand of the security, the Portfolio may receive a fee for use of the security by the counterparty, which may result in interest income to the Portfolio, and is included in Interest income on the Statement of Operations.
Open sale-buyback financing transactions at June 30, 2024, if any, are identified within the Schedule of Investments and Statement of Assets and Liabilities.
Securities lending: The Portfolio may lend securities to qualified financial institutions, brokers and dealers. State Street serves as securities lending agent to the Portfolio pursuant to a Securities Lending Agreement. Loans of securities are terminable at any time and the borrower, after notice, is required to return borrowed securities within the standard time period for settlement of securities transactions. The lending of securities exposes the Portfolio to risks such as: the borrowers may fail to return the loaned securities or may not be able to provide additional collateral, the Portfolio may experience delays in recovery of the loaned securities or delays in access to collateral, or the Portfolio may experience losses related to the investment collateral. To minimize certain risks, loan counterparties pledge cash, securities issued or guaranteed by the U.S. Government and irrevocable letters of credit issued by banks as collateral. The initial collateral received by the Portfolio is required to have a value of at least 102% of the current value of the loaned securities traded on U.S. exchanges, and a value of at least 105% for all other securities. Typically the lending agent is not permitted to sell, re-pledge or use cash and non-cash collateral it receives. The lending agent has agreed to indemnify the Portfolio in the case of default of any securities borrower.
The Portfolio receives compensation for lending securities from interest or dividends earned on the cash, U.S. Government securities and irrevocable letters of credit held as collateral, less associated fees and expenses. Such income is reflected in Net income from securities lending within the Statement of Operations. Cash collateral received is invested in the State Street Navigator Securities Lending Trust — Government Money Market Portfolio.
The value of loaned securities and related cash and non-cash collateral outstanding at June 30, 2024, if any, are shown on a gross basis within the Schedule of Investments.
The following table reflects a breakdown of transactions accounted for as secured borrowings, the gross obligation by the type, and the remaining contractual maturity of those transactions as of June 30, 2024.
|
|
|
|
|
|
|
|
|
|
|
| |
|
Remaining Contractual Maturity of the Agreements |
| |
|
Overnight and Continuous |
|
Less Than 30 Days |
|
Between 30 & 90 Days |
|
Greater Than 90 Days |
|
Total |
| |
| Securities Lending Transactions Corporate Debt Securities |
|
$ 5,503,210 |
|
$ — |
|
$ — |
|
$ — |
|
$ 5,503,210 |
| |
| Total Borrowings |
|
$ 5,503,210 |
|
$ — |
|
$ — |
|
$ — |
|
$ 5,503,210 |
| |
6. RISK FACTORS
Investing in the Portfolio involves certain key risks related to the Portfolio’s trading activity. Please reference the Portfolio’s prospectus for a more complete discussion of the following risk(s), as well as other risks of investing in the Portfolio.
Market risk: The market prices of the Portfolio’s securities or other assets may go up or down, sometimes rapidly or unpredictably, due to factors such as economic events, inflation, changes in interest rates, governmental actions or interventions, actions taken by the U.S. Federal Reserve or foreign central banks, market disruptions caused by tariffs, trade disputes or other factors, political developments, armed conflicts, economic sanctions, cybersecurity events, investor sentiment, the global and domestic effects of widespread or local health, weather or climate events, and other factors that may or may not be related to the issuer of the security or other asset. If the market prices of the Portfolio’s securities and assets fall, the value of your investment in the Portfolio could go down.
Economies and financial markets throughout the world are increasingly interconnected. Events or circumstances in one or more countries or regions could be highly disruptive to, and have profound impacts on, global economies or markets. As a result, whether or not the Portfolio invests in securities of issuers located in or with significant exposure to the countries directly affected, the value and liquidity of the Portfolio’s investments may go down.
|
|
|
|
|
| Transamerica Series Trust |
|
|
|
Semi-Annual Financial Statements 2024 |
|
|
Page 22 |
|
|
Transamerica Aegon Bond VP
NOTES TO FINANCIAL STATEMENTS (continued)
At June 30, 2024
(unaudited)
6. RISK FACTORS (continued)
Credit risk: If an issuer or other obligor (such as a party providing insurance or other credit enhancement) of a security held by the Portfolio or a counterparty to a financial contract with the Portfolio is unable or unwilling to meet its financial obligations, or is downgraded or perceived to be less creditworthy (whether by market participants, ratings agencies, pricing services or otherwise), or if the value of any underlying assets declines, the value of your investment will typically decline. A decline may be rapid and/or significant, particularly in certain market environments. In addition, the Portfolio may incur costs and may be hindered or delayed in enforcing its rights against an issuer, obligor or counterparty.
Fixed-income securities risk: Risks of fixed-income securities include credit risk, interest rate risk, counterparty risk, prepayment risk, extension risk, valuation risk, and liquidity risk. The value of fixed-income securities may go up or down, sometimes rapidly and unpredictably, due to general market conditions, such as real or perceived adverse economic or political conditions, tariffs and trade disruptions, inflation, changes in interest rates, lack of liquidity in the bond markets or adverse investor sentiment. In addition, the value of a fixed-income security may decline if the issuer or other obligor of the security fails to pay principal and/or interest, otherwise defaults or has its credit rating downgraded or is perceived to be less creditworthy, or the credit quality or value of any underlying assets declines. If the value of fixed-income securities owned by the Portfolio falls, the value of your investment will go down. The Portfolio may lose its entire investment in the fixed-income securities of an issuer.
Real estate investment trusts (“REITs”) risk: Investing in real estate investment trusts (“REITs”) involves unique risks. When the Portfolio invests in REITs, it is subject to risks generally associated with investing in real estate. A REIT’s performance depends on the types and locations of the properties it owns, how well it manages those properties and cash flow. REITs may have limited financial resources, may trade less frequently and in limited volume, may engage in dilutive offerings, and may be subject to more abrupt or erratic price movements than the overall securities markets. In addition to its own expenses, the Portfolio will indirectly bear its proportionate share of any management and other expenses paid by REITs in which it invests. U.S. REITs are subject to a number of highly technical tax-related rules and requirements; and a U.S. REIT’s failure to qualify for the favorable U.S. federal income tax treatment generally available to U.S. REITs could result in corporate-level taxation, significantly reducing the return on an investment to the Portfolio.
7. FEES AND OTHER AFFILIATED TRANSACTIONS
TST serves as a funding vehicle for certain affiliated asset allocation portfolios and certain affiliated separate accounts of Transamerica Life Insurance Company (“TLIC”) and Transamerica Financial Life Insurance Company.
TAM, the Portfolio’s investment manager, is directly owned by TLIC and AUSA Holding, LLC (“AUSA”), both of which are indirect, wholly owned subsidiaries of Aegon Ltd. TLIC is owned by Commonwealth General Corporation (“Commonwealth”). Commonwealth and AUSA are wholly owned by Transamerica Corporation (DE). Transamerica Corporation (DE) is wholly owned by Aegon International B.V., which is wholly owned by Aegon Ltd., a Bermuda exempted company with liability limited by shares (formerly, Aegon NV, a Netherlands corporation) and a publicly traded international insurance group.
TAM has entered into a sub-advisory agreement with Aegon USA Investment Management, LLC (“AUIM”), an affiliate of TAM. AUIM provides day-to-day portfolio management services to the Portfolio, subject to the supervision of TAM. TAM is responsible for compensating the sub-adviser for its services.
Transamerica Fund Services, Inc. (“TFS”) is the Portfolio’s transfer agent. Transamerica Capital, Inc. (“TCI”) is the Portfolio’s distributor/principal underwriter. TAM, AUIM, TFS and TCI are affiliates of Aegon Ltd.
Certain officers and trustees of the Portfolio may also be officers and/or trustees of TAM, AUIM, TFS and TCI. No interested trustee who is deemed an interested person due to current or former service with TAM or an affiliate of TAM receives compensation from the Portfolio. The Portfolio does pay non-interested persons (independent trustees), as disclosed in Trustee and CCO fees within the Statement of Operations.
Investment management fees: TAM serves as the Portfolio’s investment manager, performing administration as well as investment advisory services. TAM renders investment advisory, supervisory, and administration services under an investment management agreement and the Portfolio pays a single management fee, which is reflected in Investment management fees within the Statement of Operations.
|
|
|
|
|
| Transamerica Series Trust |
|
|
|
Semi-Annual Financial Statements 2024 |
|
|
Page 23 |
|
|
Transamerica Aegon Bond VP
NOTES TO FINANCIAL STATEMENTS (continued)
At June 30, 2024
(unaudited)
7. FEES AND OTHER AFFILIATED TRANSACTIONS (continued)
The Portfolio pays a management fee to TAM based on daily average net assets at the following rates:
|
|
|
|
|
| Breakpoints |
|
Rate |
| |
|
| First $500 million |
|
|
0.510 |
% |
| Over $500 million up to $1 billion |
|
|
0.490 |
|
| Over $1 billion up to $1.5 billion |
|
|
0.480 |
|
| Over $1.5 billion |
|
|
0.475 |
|
TAM has contractually agreed to waive fees and/or reimburse Portfolio expenses to the extent that the total operating expenses excluding, as applicable, acquired fund fees and expenses, interest (including borrowing costs and overdraft charges), taxes, brokerage commissions, dividend and interest expenses on securities sold short, extraordinary expenses and other expenses not incurred in the ordinary course of the Portfolio’s business, exceed the following stated annual operating expense limits to the Portfolio’s daily average net assets. To the extent an expense limit changed during the period, the prior limit is also listed below. The expenses waived and/or reimbursed, if any, are included in Expenses waived and/or reimbursed within the Statement of Operations.
|
|
|
|
|
| Class |
|
Operating Expense Limit |
|
Operating Expense Limit Effective Through |
| |
| Effective May 1, 2024 |
|
|
|
|
| Initial Class |
|
0.58% |
|
May 1, 2025 |
| Service Class |
|
0.83 |
|
May 1, 2025 |
| Prior to May 1,2024 |
|
|
|
|
| Initial Class |
|
0.66 |
|
|
| Service Class |
|
0.87 |
|
|
TAM is permitted to recapture amounts contractually waived and/or reimbursed to a class during any of the 36 months from the date on which TAM waived fees and/or reimbursed expenses for the class. A class may recapture and reimburse TAM only if such amount does not cause, on any particular business day of the Portfolio, the class’s total annual operating expenses (after the recapture is taken into account) to exceed the Operating Expense Limits or any other lower limit then in effect. Amounts recaptured, if any, by TAM for the period ended June 30, 2024 are disclosed in Recapture of previously waived and/or reimbursed fees within the Statement of Operations.
TAM, on a voluntary basis and in addition to the contractual operating expense limits in effect, from time to time may waive and/or reimburse expenses of the Portfolio, or any classes thereof, to such level(s) as the Trust’s officers have determined or may reasonably determine from time to time. Any such voluntary waiver or expense reimbursement may be discontinued by TAM at any time. These amounts are not subject to recapture by TAM.
As of June 30, 2024, there are no amounts available for recapture by TAM.
Distribution and service fees: TST has a distribution plan (“Distribution Plan”) pursuant to Rule 12b-1 under the 1940 Act. Pursuant to the Distribution Plan, TST entered into a distribution agreement with TCI as the Portfolio’s distributor.
The Distribution Plan requires the Portfolio to pay distribution fees to TCI as compensation for various distribution activities, not as reimbursement for specific expenses. Under the Distribution Plan and distribution agreement, TCI, on behalf of the Portfolio, is authorized to pay various service providers, as direct payment for expenses incurred in connection with distribution of the Portfolio’s shares.
The fee on the Service Class shares is paid to the insurance companies for providing services and account maintenance for the policyholders who invest in the variable insurance products which invest in the Service Class shares. TCI has determined that it will not seek payment for the distribution expenses incurred by the Portfolio with respect to the Initial Class shares before May 1, 2025. Prior to TCI seeking distribution expenses on Initial Class shares, policy and contract owners will be notified in advance. The Portfolio will pay fees relating to Service Class shares. The distribution and service fees are included in Distribution and service fees within the Statement of Operations.
|
|
|
|
|
| Transamerica Series Trust |
|
|
|
Semi-Annual Financial Statements 2024 |
|
|
Page 24 |
|
|
Transamerica Aegon Bond VP
NOTES TO FINANCIAL STATEMENTS (continued)
At June 30, 2024
(unaudited)
7. FEES AND OTHER AFFILIATED TRANSACTIONS (continued)
The Portfolio is authorized under the Distribution Plan to pay fees to TCI based on daily average net assets of each applicable class up to the following annual rates:
|
|
|
|
|
| Class |
|
Rate |
| Initial Class |
|
|
0.15 |
% |
| Service Class |
|
|
0.25 |
|
Transfer agent costs: TFS provides transfer agency services under an intercompany agreement with TAM. TFS has outsourced the provision of certain sub-transfer agency services to SS&C Global Investor & Distribution Solutions, Inc. (“SS&C GIDS”). The Portfolio does not pay a separate transfer agent fee to TAM or TFS but does pay certain expenses to SS&C GIDS related to applicable sub-transfer agency services. For the period ended June 30, 2024, (i) the expenses paid to SS&C GIDS by the Portfolio are referred to as transfer agent costs and are included within the Statement of Operations and (ii) the expenses payable to SS&C GIDS by the Portfolio are referred to as transfer agent costs within the Statement of Assets and Liabilities.
Brokerage commissions: The Portfolio incurred no brokerage commissions on security transactions placed with affiliates of the investment manager or sub-adviser(s) for the period ended June 30, 2024.
8. PURCHASES AND SALES OF SECURITIES
For the period ended June 30, 2024, the cost of securities purchased and proceeds from securities sold (excluding short-term securities) are as follows:
|
|
|
|
|
|
|
| Purchases of Securities |
|
Sales/Maturities of Securities |
|
|
|
|
| Long-Term |
|
U.S. Government |
|
Long-Term |
|
U.S. Government |
| |
| $ 366,816,297 |
|
$ 435,208,679 |
|
$ 360,183,606 |
|
$ 568,226,169 |
9. FEDERAL INCOME TAXES AND DISTRIBUTIONS TO SHAREHOLDERS
The Portfolio has not made any provision for federal income or excise taxes due to its policy to distribute all of its taxable income and capital gains to its shareholders and otherwise qualify as a regulated investment company under Subchapter M of the Internal Revenue Code. The Portfolio recognizes the tax benefits of uncertain tax positions only where the position is “more likely than not” to be sustained assuming examination by tax authorities. The Portfolio’s tax returns remain subject to examination by the Internal Revenue Service and state tax authorities three years from the date of filing for federal purposes and four years from the date of filing for state purposes. Management has evaluated the Portfolio’s tax provisions taken for all open tax years, and has concluded that no provision for income tax is required in the Portfolio’s financial statements. If applicable, the Portfolio recognizes interest accrued related to unrecognized tax benefits in relation to interest and penalties expense in Other within the Statement of Operations. The Portfolio identifies its major tax jurisdictions as U.S. Federal, the state of Colorado, and foreign jurisdictions where the Portfolio makes significant investments; however, the Portfolio is not aware of any tax positions for which it is reasonably possible that the total amounts of unrecognized tax benefits will change materially in the next twelve months. Distributions are determined in accordance with income tax regulations, which may differ from GAAP.
As of June 30, 2024, the approximate cost for U.S. federal income tax purposes, and the aggregate gross/net unrealized appreciation (depreciation) in the value of investments (including securities sold short and derivatives, if any) are as follows:
|
|
|
|
|
|
|
| Cost |
|
Gross Appreciation |
|
Gross (Depreciation) |
|
Net Appreciation (Depreciation) |
| $ 2,477,733,019 |
|
$ 28,648,790 |
|
$ (37,804,548) |
|
$ (9,155,758) |
Please see TST’s most recent report on Form N-CSR, available at: www.transamerica.com/annuities/prospectus, for additional information. For the most recently filed complete proxy voting records for the Trust please visit: https://www.transamerica.com/sites/default/files/files/e070d/TST%20N-PX%202021.pdf
|
|
|
|
|
| Transamerica Series Trust |
|
|
|
Semi-Annual Financial Statements 2024 |
|
|
Page 25 |
|
|
Transamerica Aegon Bond VP
MANAGEMENT AND SUB-ADVISORY AGREEMENT — CONTRACT RENEWAL
(unaudited)
At a meeting of the Board of Trustees of Transamerica Series Trust (the “Trustees” or the “Board”) held on June 12-13, 2024, the Board considered the renewal of the management agreement (the “Management Agreement”) between Transamerica Asset Management, Inc. (“TAM”) and Transamerica Series Trust, on behalf of Transamerica Aegon Bond VP (the “Portfolio”). The Board also considered the renewal of the investment sub-advisory agreement (the “Sub-Advisory Agreement” and together with the Management Agreement, the “Agreements”) for the Portfolio between TAM and Aegon USA Investment Management, LLC (the “Sub-Adviser”).
Following its review and consideration, the Board determined that the terms of the Management Agreement and Sub-Advisory Agreement were reasonable and that the renewal of each of the Agreements was in the best interests of the Portfolio and the holders invested in the Portfolio. The Board, including the independent members of the Board (the “Independent Trustees”), unanimously approved the renewal of each of the Agreements through June 30, 2025.
Prior to reaching their decision, the Trustees requested and received from TAM and the Sub-Adviser certain information. They then reviewed such information as they deemed reasonably necessary to evaluate the Agreements, including information they had previously received from TAM and the Sub-Adviser as part of their regular oversight of the Portfolio, and knowledge they gained over time through meeting with TAM and the Sub-Adviser. Among other materials, the Trustees considered comparative fee, expense and performance information prepared by Broadridge Financial Solutions, Inc. (“Broadridge”), an independent provider of mutual fund performance information, as well as fee, expense and profitability information prepared by TAM. To the extent applicable, the Trustees considered information about fees and performance of comparable funds and/or accounts managed by the Sub-Adviser. The Board also considered reductions to the Portfolio’s expense limits, if any, that took effect after the last renewal of the Agreements. In their review, the Trustees also sought to identify instances in which the Portfolio’s performance, fees, total expenses and/or profitability appeared to be outliers within its respective peer group or other comparative metrics and sought to understand the reasons for such comparative positions.
In their deliberations, the Independent Trustees met privately without representatives of TAM or the Sub-Adviser present and were represented throughout the process by their independent legal counsel. In considering the proposed continuation of each of the Agreements, the Trustees evaluated and weighed a number of considerations that they believed to be relevant in light of the legal advice furnished to them by counsel, including independent legal counsel, and made a decision in the exercise of their own business judgment. They based their decisions on the considerations discussed below, among others, although they did not identify any particular consideration or item of information that was controlling of their decisions, and each Trustee may have attributed different weights to the various factors.
Nature, Extent and Quality of the Services Provided
The Board considered the nature, extent and quality of the services provided by TAM and the Sub-Adviser to the Portfolio in the past and the services anticipated to be provided in the future. The Board also considered the investment approach for the Portfolio; the experience, capability and integrity of TAM’s senior management; the financial resources of TAM; TAM’s management oversight process; TAM’s and the Sub-Adviser’s responsiveness to any questions by the Trustees; and the professional qualifications and compensation program of the portfolio management team of the Sub-Adviser. The Trustees noted that they receive, on a quarterly basis, an execution analysis from Capital Institutional Services, Inc. (CAPIS), an independent provider of trade analyses, for the Sub-Adviser and a comparison of trading results against a peer universe of managers.
The Board also considered the continuous and regular investment management and other services provided by TAM, when acting as a manager of managers, for the portion of the management fee it retains from the Portfolio after payment of the sub-advisory fees. The Board noted that the investment management and other services provided by TAM include the design, development and ongoing review and evaluation of the Portfolio and its investment strategy; the selection, oversight and monitoring of one or more investment sub-advisers to perform certain duties with respect to the Portfolio; ongoing portfolio trading oversight and analysis; risk management oversight and analysis; design, development, implementation and ongoing review and evaluation of a process for the valuation of Portfolio investments; design, development, implementation and ongoing review and evaluation of a compliance program for the Portfolio; design, development, implementation and ongoing review and evaluation of a process for the voting of proxies and exercise of rights to consent to corporate action for Portfolio investments; participation in Board meetings and oversight of preparation of materials for the Board, including materials for Board meetings and regular communications with the Board; oversight of preparation of the Portfolio’s prospectus, statement of additional information, shareholder reports and other disclosure materials and regulatory filings for the Portfolio; and ongoing cash management services for the Portfolio. The Board considered that TAM’s investment management services also include the provision of supervisory and administrative services to the Portfolio. The Board also noted that TAM, as part of the services it provides to all Transamerica mutual funds, including the Portfolio, oversees the services provided by the funds’ custodian, transfer agent, independent accountant and legal counsel and supervises the performance of the recordkeeping and holder service functions of the funds.
Investment Performance
In addition, the Board considered the short- and longer-term performance of the Portfolio in light of its investment objective, policies and strategies, including relative performance against (i) a peer universe of comparable mutual funds, as prepared by Broadridge, and (ii) the Portfolio’s benchmark, in each case for various trailing periods ended December 31, 2023. Based on these considerations, the Board determined that TAM and the Sub-Adviser can provide investment and related services that are appropriate in scope and extent in light of the Portfolio’s investment objectives, policies and strategies and operations, the competitive landscape of the investment company
|
|
|
|
|
| Transamerica Series Trust |
|
|
|
Semi-Annual Financial Statements 2024 |
|
|
Page 26 |
|
|
Transamerica Aegon Bond VP
MANAGEMENT AND SUB-ADVISORY AGREEMENT — CONTRACT RENEWAL (continued)
(unaudited)
business and investor needs. The Board’s conclusions as to the Portfolio’s performance are summarized below. For purposes of its review, the Board generally used the performance of Service Class Shares. In describing the Portfolio’s performance relative to its peer universe, the summary conclusions characterize performance for the relevant periods in relation to whether it was “above,” “below” or “in line with” the peer universe median and do so using quintile rankings prepared by Broadridge. For simplicity, performance is described as “above” the median if the Portfolio’s performance ranked anywhere in the first or second quintiles, as “below” the median if it ranked anywhere in the fourth or fifth quintiles, or “in line with” the median if it ranked anywhere in the third quintile (i.e., even if its precise return was somewhat above or somewhat below the precise median return).
When considering the Portfolio’s performance, the Trustees considered any representations made by TAM regarding the appropriateness of certain peer groups and benchmarks. They recognized that performance reflects a snapshot of a period as of a specific date, and that consideration of performance data for a different period could generate significantly different performance results. The Trustees also recognized that even longer-term performance can be negatively affected by performance over a short-term period when that short-term performance is significantly below the performance of the comparable benchmark or universe of peer funds.
The Board noted that the performance of Service Class Shares of the Portfolio was in line with the median for its peer universe for the past 1-year period and below the median for the past 3-, 5- and 10-year periods. The Board also noted that the performance of Service Class Shares of the Portfolio was above the benchmark that TAM utilizes to measure performance of the Portfolio for the past 1-year period and below the benchmark for the past 3-, 5- and 10-year periods. The Board noted that the Sub-Adviser had commenced sub-advising the Portfolio on November 1, 2022 pursuant to its current investment strategies. The Trustees also noted recent changes in the legal and compliance team at the Sub-Adviser.
Management Fee and Sub-Advisory Fees and Total Expense Ratio
The Board considered the management fee and total expense ratio of the Portfolio, including information provided by Broadridge comparing the management fee and total expense ratio of the Portfolio to the management fees and total expense ratios of comparable investment companies in both a peer group and broader peer universe compiled by Broadridge. The Board’s conclusions as to the Portfolio’s management fee and total expense ratio are summarized below. For purposes of its review, the Board generally used the actual total expenses (i.e., expenses reflecting any waivers and/or reimbursements) of Service Class Shares. In describing the Portfolio’s management fee and total expense ratio relative to its peer group and peer universe, the summary conclusions characterize management fees and total expense ratios for the relevant periods in relation to whether they were “above,” “below” or “in line with” the peer group or peer universe median and do so using quintile rankings prepared by Broadridge. For simplicity, management fees and total expense ratios are described as “above” the median if the Portfolio’s management fee or total expense ratio ranked anywhere in the fourth or fifth quintiles, as “below” the median if it ranked anywhere in the first or second quintiles, or “in line with” the median if it ranked anywhere in the third quintile (i.e., even if its precise management fee or total expense ratio was somewhat above or somewhat below the precise median management fee or total expense ratio).
The Board also considered the fees charged by the Sub-Adviser for sub-advisory services, as well as the portion of the Portfolio’s management fee retained by TAM following payment of the sub-advisory fee and how the portion of the contractual management fee retained by TAM at a specified asset level compared to the portions retained by other investment advisers managing mutual funds with similar investment strategies as calculated by an independent provider of information.
The Board noted that the Portfolio’s contractual management fee was above the median for its peer group and in line with the median for its peer universe and that the actual total expenses (i.e., expenses reflecting any waivers and/or reimbursements) of Service Class Shares of the Portfolio were above the median for its peer group and in line with the median for its peer universe. The Trustees also considered that TAM has entered into an expense limitation arrangement with the Portfolio, which may result in TAM waiving fees for the benefit of holders.
On the basis of these considerations, together with the other information it considered, the Board determined that the management and sub-advisory fees to be received by TAM and the Sub-Adviser under the Management Agreement and Sub-Advisory Agreement are reasonable in light of the services provided.
Cost of Services Provided and Level of Profitability
The Board reviewed information provided by TAM about the cost of providing and procuring fund management services, as well as the costs of the provision of administration, transfer agency and other services, to the Portfolio and to Transamerica Series Trust as a whole by TAM and its affiliates. The Board considered the profitability of TAM and its affiliates in providing these services for the Portfolio and Transamerica Series Trust as a whole. The Trustees recognized the competitiveness of the mutual fund industry and the importance of an investment adviser’s long-term profitability, including for maintaining company and management stability and accountability.
The Board also considered the allocation methodology used for calculating the profitability of TAM and its affiliates. The Board noted that the revenue and expense allocation methodology used by TAM to estimate its profitability with respect to its relationship with the Portfolio had been reviewed previously by an independent consultant. The Trustees considered that TAM reported that it had not made material changes to this methodology, and that the methodology had been applied consistently for the Portfolio.
|
|
|
|
|
| Transamerica Series Trust |
|
|
|
Semi-Annual Financial Statements 2024 |
|
|
Page 27 |
|
|
Transamerica Aegon Bond VP
MANAGEMENT AND SUB-ADVISORY AGREEMENT — CONTRACT RENEWAL (continued)
(unaudited)
With respect to the Sub-Adviser, the Board noted that information about the Sub-Adviser’s revenues and expenses was incorporated into the profitability analysis for TAM and its affiliates with respect to the Portfolio. As a result, the Board focused on profitability information for TAM and its affiliates and the Sub-Adviser in the aggregate.
Based on this information, the Board determined that the profitability of TAM and its affiliates from their relationships with the Portfolio was not excessive.
Economies of Scale
The Board considered economies of scale with respect to the management of the Portfolio, whether the Portfolio had appropriately benefited from any economies of scale and whether there was the potential for realization of any future economies of scale. The Board also considered the existence of economies of scale with respect to management of the Transamerica mutual funds overall and the extent to which the Portfolio benefited from any economies of scale. The Board recognized that, as the Portfolio’s assets increase, any economies of scale realized by TAM or the Sub-Adviser may not directly correlate with each other or with any economies of scale that might be realized by the Portfolio. The Board considered the Portfolio’s management fee schedule and the existence of breakpoints and also considered the extent to which TAM shared economies of scale, if any, with the Portfolio through undertakings to limit or reimburse Portfolio expenses and to invest in maintaining and developing its capabilities and services. The Board also considered the Sub-Adviser’s sub-advisory fee schedule and the existence of breakpoints, if any, and how such breakpoints relate to any breakpoints in the Portfolio’s management fee schedule. The Board considered that the Sub-Adviser’s sub-advisory fees would be based on the combined assets of multiple funds. The Trustees concluded that the Portfolio’s fee structure reflected an appropriate sharing of any efficiencies or economies of scale to date and noted that they will have the opportunity to periodically reexamine the appropriateness of the management fee payable to TAM and the fee paid to the Sub-Adviser in light of any economies of scale experienced in the future.
Benefits to TAM, its Affiliates and/or the Sub-Adviser from their Relationships with the Portfolio
The Board considered other benefits derived by TAM, its affiliates, and/or the Sub-Adviser from their relationships with the Portfolio. The Board noted that TAM does not receive benefits from research obtained with commissions paid to broker-dealers for portfolio transactions (commonly referred to as “soft dollars”) as a result of its relationship with the Portfolio.
Other Considerations
The Board noted that TAM has made a substantial commitment to the recruitment and retention of high-quality personnel and maintains the financial, compliance and operational resources reasonably necessary to manage the Portfolio in a professional manner that is consistent with the best interests of the Portfolio and the holders. In this regard, the Board favorably considered the procedures and policies TAM has in place to enforce compliance with applicable laws and regulations and oversee the portfolio management activities of the Sub-Adviser. The Board also noted that TAM has made an entrepreneurial commitment and undertaken certain business risks with respect to the management and success of the Portfolio.
Conclusion
After consideration of the factors described above, as well as other factors, the Trustees, including the Independent Trustees, concluded that the renewal of the Management Agreement and the Sub-Advisory Agreement was in the best interests of the Portfolio and the holders and voted to approve the renewal of the Agreements.
|
|
|
|
|
| Transamerica Series Trust |
|
|
|
Semi-Annual Financial Statements 2024 |
|
|
Page 28 |
|
|
PROXY VOTING POLICIES AND PROCEDURES AND QUARTERLY PORTFOLIO HOLDINGS
(unaudited)
A description of Transamerica Series Trust’s (the “Trust”) proxy voting policies and procedures is available in the Statement of Additional Information of the Portfolios, available without charge upon request by calling 1-800-851-9777 (toll free) or on the Securities and Exchange Commission’s (“SEC”) website at http://www.sec.gov.
In addition, the Portfolio is required to file Form N-PX, with their complete proxy voting records for the most recent 12 months ended June 30th, no later than August 31st of each year. The Form is available without charge: (1) on the Transamerica Funds website at https://www.transamerica.com/sites/default/files/files/e070d/TST%20N-PX%202021.pdf; and (2) on the SEC’s website at http://www.sec.gov.
Each fiscal quarter, the Portfolios, except Transamerica BlackRock Government Money Market VP, will file with the SEC a complete schedule of its monthly portfolio holdings on Form N-PORT. The Portfolios’ holdings as of the end of the third month of every fiscal quarter, as reported on Form N-PORT, will be publicly available on the SEC’s website at http://www.sec.gov within 60 days of the end of the fiscal quarter.
On a monthly basis, Transamerica BlackRock Government Money Market VP will file with the SEC portfolio holdings information on Form N-MFP3. A complete schedule of portfolio holdings is also available at www.transamerica.com.
You may also visit the Trust’s website at www.transamerica.com/annuities/prospectus for this and other information about the Portfolios and the Trust.
Important Notice Regarding Delivery of Shareholder Documents
Every year we provide shareholders informative materials such as the Transamerica Series Trust Annual Report, the Transamerica Series Trust Prospectus, and other required documents that keep you informed regarding your Portfolios. To the extent provided by mail, Transamerica Series Trust will only send one piece per mailing address, a method that saves your Portfolios money by reducing mailing and printing costs. We will continue to do this unless you tell us not to. To elect to receive individual mailings, simply call a Transamerica Customer Service Representative toll free at 1-800-851-9777, 8 a.m. to 7 p.m. Eastern Time, Monday-Friday. Your request will take effect within 30 days.
|
|
|
|
|
| Transamerica Series Trust |
|
|
|
Semi-Annual Financial Statements 2024 |
|
|
Page 29 |
|
|
NOTICE OF PRIVACY POLICY
(unaudited)
Your privacy is very important to us. We want you to understand what information we collect and how we use it. We collect and use “nonpublic personal information” in connection with providing our customers with a broad range of financial products and services as effectively and conveniently as possible. We treat nonpublic personal information in accordance with our Privacy Policy.
What Information We Collect and From Whom We Collect It
We may collect nonpublic personal information about you from the following sources:
| • |
|
Information we receive from you on applications or other forms, such as your name, address, and account number; |
| • |
|
Information about your transactions with us, our affiliates, or others, such as your account balance and purchase/redemption history; and |
| • |
|
Information we receive from non-affiliated third parties, including consumer reporting agencies. |
What Information We Disclose and To Whom We Disclose It
We do not disclose any nonpublic personal information about current or former customers to anyone without their express consent, except as permitted by law. We may disclose the nonpublic personal information we collect, as described above, to persons or companies that perform services on our behalf and to other financial institutions with which we have joint marketing agreements. We will require these companies to protect the confidentiality of your nonpublic personal information and to use it only to perform the services for which we have hired them.
Our Security Procedures
We restrict access to your nonpublic personal information and only allow disclosures to persons and companies as permitted by law to assist in providing products or services to you. We maintain physical, electronic, and procedural safeguards to protect your nonpublic personal information and to safeguard the disposal of certain consumer information.
Contact Us
If you have any questions about our Privacy Policy, please call 1-800-851-9777 on any business day between 8 a.m. and 7 p.m. Eastern Time.
Note: This Privacy Policy applies only to customers that have a direct relationship with us or our affiliates. If you own shares of our portfolios in the name of a third party such as a bank or broker-dealer, its privacy policy may apply to you instead of ours.
|
|
|
|
|
| Transamerica Series Trust |
|
|
|
Semi-Annual Financial Statements 2024 |
|
|
Page 30 |
|
|
PO Box 219945
Kansas City, MO 64121-9945
|
|
|
| Distributor: |
|
Transamerica Capital, Inc. PO Box 219945 Kansas City, MO 64121-9945 Customer Service: 1-800-851-9777 |
Transamerica Series Trust Semi-Annual Financial Statements
June 30, 2024
1801 California St., Suite 5200
Denver, CO 80202
Distributor: Transamerica Capital, Inc.
Customer Service: 1-800-851-9777
|
| The following pages contain the most recent semi-annual financial statements for the investment options in which you are invested. In compliance with Securities and Exchange Commission regulations, we present these reports on an annual and semi-annual basis with the hope that they will foster greater understanding of the investment options’ holdings, performance, financial data, accounting policies and other issues. This streamlined version provides information only on the investment options in which you are invested. |
|
| If you have any questions about these reports, please do not hesitate to contact your financial professional. As always, we thank you for your trust and the opportunity to serve you. |
Transamerica Aegon Core Bond VP
SCHEDULE OF INVESTMENTS
At June 30, 2024
(unaudited)
|
|
|
|
|
|
|
|
|
| |
|
Principal |
|
|
Value |
|
| |
|
|
| CORPORATE DEBT SECURITIES - 35.3% |
|
| Aerospace & Defense - 1.0% |
|
| BAE Systems PLC |
|
|
|
|
|
|
|
|
| 5.30%, 03/26/2034 (A) |
|
|
$ 539,000 |
|
|
|
$ 535,150 |
|
| Boeing Co. |
|
|
|
|
|
|
|
|
| 6.53%, 05/01/2034 (A) |
|
|
1,119,000 |
|
|
|
1,147,839 |
|
| 6.86%, 05/01/2054 (A) |
|
|
381,000 |
|
|
|
392,798 |
|
| General Electric Co. |
|
|
|
|
|
|
|
|
| 4.50%, 03/11/2044 |
|
|
1,175,000 |
|
|
|
1,026,011 |
|
| HEICO Corp. |
|
|
|
|
|
|
|
|
| 5.35%, 08/01/2033 |
|
|
791,000 |
|
|
|
785,307 |
|
|
|
|
|
|
|
|
|
|
|
|
|
|
|
|
|
|
|
|
3,887,105 |
|
|
|
|
|
|
|
|
|
|
| Automobile Components - 0.2% |
|
| Aptiv PLC/Aptiv Corp. |
|
|
|
|
|
|
|
|
| 3.25%, 03/01/2032 |
|
|
489,000 |
|
|
|
424,723 |
|
| ZF North America Capital, Inc. |
|
|
|
|
|
|
|
|
| 6.88%, 04/23/2032 (A) |
|
|
406,000 |
|
|
|
419,716 |
|
|
|
|
|
|
|
|
|
|
|
|
|
|
|
|
|
|
|
|
844,439 |
|
|
|
|
|
|
|
|
|
|
| Automobiles - 1.3% |
|
| BMW US Capital LLC |
|
|
|
|
|
|
|
|
| 2.80%, 04/11/2026 (A) |
|
|
703,000 |
|
|
|
674,618 |
|
| Ford Motor Credit Co. LLC |
|
|
|
|
|
|
|
|
| 3.38%, 11/13/2025 |
|
|
868,000 |
|
|
|
840,008 |
|
| 6.95%, 03/06/2026 |
|
|
600,000 |
|
|
|
609,663 |
|
| General Motors Co. |
|
|
|
|
|
|
|
|
| 6.25%, 10/02/2043 |
|
|
209,000 |
|
|
|
208,905 |
|
| General Motors Financial Co., Inc. |
|
|
|
|
|
|
|
|
| 5.00%, 04/09/2027 |
|
|
668,000 |
|
|
|
661,269 |
|
| Nissan Motor Acceptance Co. LLC |
|
|
|
|
|
|
|
|
| 7.05%, 09/15/2028 (A) |
|
|
819,000 |
|
|
|
852,839 |
|
| Stellantis Finance US, Inc. |
|
|
|
|
|
|
|
|
| 2.69%, 09/15/2031 (A) |
|
|
559,000 |
|
|
|
462,347 |
|
| Volkswagen Group of America Finance LLC |
|
|
|
|
|
|
|
|
| 1.63%, 11/24/2027 (A) |
|
|
650,000 |
|
|
|
576,142 |
|
|
|
|
|
|
|
|
|
|
|
|
|
|
|
|
|
|
|
|
4,885,791 |
|
|
|
|
|
|
|
|
|
|
| Banks - 6.2% |
|
| Banco Santander SA |
|
|
|
|
|
|
|
|
| Fixed until 03/14/2027, 5.55% (B), 03/14/2028 |
|
|
600,000 |
|
|
|
599,049 |
|
| Bank of America Corp. |
|
|
|
|
|
|
|
|
| Fixed until 01/23/2034, 5.47% (B), 01/23/2035 |
|
|
474,000 |
|
|
|
474,706 |
|
| Fixed until 09/15/2028, 5.82% (B), 09/15/2029 |
|
|
2,536,000 |
|
|
|
2,590,264 |
|
| Barclays PLC |
|
|
|
|
|
|
|
|
| Fixed until 03/12/2054, 6.04% (B), 03/12/2055 |
|
|
200,000 |
|
|
|
203,664 |
|
| Fixed until 11/02/2025, 7.33% (B), 11/02/2026 |
|
|
867,000 |
|
|
|
882,159 |
|
| Citigroup, Inc. |
|
|
|
|
|
|
|
|
| Fixed until 06/11/2034, 5.45% (B), 06/11/2035 |
|
|
388,000 |
|
|
|
385,804 |
|
| Fixed until 05/25/2033, 6.17% (B), 05/25/2034 |
|
|
737,000 |
|
|
|
750,538 |
|
|
|
|
|
|
|
|
|
|
| |
|
Principal |
|
|
Value |
|
| |
|
|
| CORPORATE DEBT SECURITIES (continued) |
|
| Banks (continued) |
|
| Deutsche Bank AG |
|
|
|
|
|
|
|
|
| Fixed until 11/26/2024, 3.96% (B), 11/26/2025 |
|
|
$ 440,000 |
|
|
|
$ 436,213 |
|
| Goldman Sachs Group, Inc. |
|
|
|
|
|
|
|
|
| Fixed until 10/21/2031, 2.65% (B), 10/21/2032 |
|
|
1,056,000 |
|
|
|
879,512 |
|
| ING Groep NV |
|
|
|
|
|
|
|
|
| Fixed until 09/11/2033, 6.11% (B), 09/11/2034 |
|
|
581,000 |
|
|
|
600,081 |
|
| Intesa Sanpaolo SpA |
|
|
|
|
|
|
|
|
| Fixed until 11/21/2032, 8.25% (B), 11/21/2033 (A) |
|
|
1,348,000 |
|
|
|
1,489,207 |
|
| JPMorgan Chase & Co. |
|
|
|
|
|
|
|
|
| Fixed until 04/22/2026, 1.58% (B), 04/22/2027 |
|
|
1,126,000 |
|
|
|
1,050,810 |
|
| Fixed until 01/23/2029, 5.01% (B), 01/23/2030 |
|
|
2,137,000 |
|
|
|
2,121,913 |
|
| Fixed until 01/23/2034, 5.34% (B), 01/23/2035 |
|
|
475,000 |
|
|
|
473,148 |
|
| Fixed until 04/22/2034, 5.77% (B), 04/22/2035 |
|
|
352,000 |
|
|
|
361,897 |
|
| Lloyds Banking Group PLC |
|
|
|
|
|
|
|
|
| Fixed until 08/11/2032, 4.98% (B), 08/11/2033 |
|
|
431,000 |
|
|
|
412,611 |
|
| Fixed until 01/05/2034, 5.68% (B), 01/05/2035 |
|
|
707,000 |
|
|
|
705,507 |
|
| M&T Bank Corp. |
|
|
|
|
|
|
|
|
| Fixed until 03/13/2031, 6.08% (B), 03/13/2032 (C) |
|
|
378,000 |
|
|
|
377,107 |
|
| Morgan Stanley |
|
|
|
|
|
|
|
|
| Fixed until 01/16/2029, 5.17% (B), 01/16/2030 |
|
|
1,890,000 |
|
|
|
1,886,357 |
|
| Fixed until 01/18/2034, 5.47% (B), 01/18/2035 |
|
|
356,000 |
|
|
|
355,762 |
|
| Fixed until 04/19/2034, 5.83% (B), 04/19/2035 |
|
|
733,000 |
|
|
|
752,977 |
|
| PNC Financial Services Group, Inc. |
|
|
|
|
|
|
|
|
| Fixed until 01/22/2034, 5.68% (B), 01/22/2035 |
|
|
133,000 |
|
|
|
133,997 |
|
| Fixed until 08/18/2033, 5.94% (B), 08/18/2034 |
|
|
750,000 |
|
|
|
770,204 |
|
| Truist Financial Corp. |
|
|
|
|
|
|
|
|
| Fixed until 01/26/2033, 5.12% (B), 01/26/2034 |
|
|
672,000 |
|
|
|
644,590 |
|
| Fixed until 01/24/2034, 5.71% (B), 01/24/2035 |
|
|
514,000 |
|
|
|
512,761 |
|
| Fixed until 06/08/2033, 5.87% (B), 06/08/2034 |
|
|
401,000 |
|
|
|
404,794 |
|
| Fixed until 10/30/2028, 7.16% (B), 10/30/2029 |
|
|
367,000 |
|
|
|
389,878 |
|
| UBS Group AG |
|
|
|
|
|
|
|
|
| Fixed until 09/11/2024, 2.59% (B), 09/11/2025 (A) |
|
|
703,000 |
|
|
|
698,336 |
|
| Fixed until 08/12/2032, 6.54% (B), 08/12/2033 (A) |
|
|
789,000 |
|
|
|
829,920 |
|
| Wells Fargo & Co. |
|
|
|
|
|
|
|
|
| Fixed until 07/25/2033, 5.56% (B), 07/25/2034 |
|
|
1,063,000 |
|
|
|
1,064,436 |
|
|
|
|
|
|
|
|
|
|
|
|
|
|
|
|
|
|
|
|
23,238,202 |
|
|
|
|
|
|
|
|
|
|
The Notes to Financial Statements are an integral part of this report.
|
|
|
|
|
| Transamerica Series Trust |
|
|
|
Semi-Annual Financial Statements 2024 |
|
|
Page 1 |
|
|
Transamerica Aegon Core Bond VP
SCHEDULE OF INVESTMENTS (continued)
At June 30, 2024
(unaudited)
|
|
|
|
|
|
|
|
|
| |
|
Principal |
|
|
Value |
|
| |
|
|
| CORPORATE DEBT SECURITIES (continued) |
|
| Beverages - 0.4% |
|
| Anheuser-Busch InBev Worldwide, Inc. |
|
|
|
|
|
|
|
|
| 4.44%, 10/06/2048 |
|
|
$ 751,000 |
|
|
|
$ 645,964 |
|
| Constellation Brands, Inc. |
|
|
|
|
|
|
|
|
| 3.15%, 08/01/2029 |
|
|
371,000 |
|
|
|
336,711 |
|
| 3.70%, 12/06/2026 |
|
|
177,000 |
|
|
|
170,996 |
|
| Diageo Capital PLC |
|
|
|
|
|
|
|
|
| 5.50%, 01/24/2033 |
|
|
445,000 |
|
|
|
458,337 |
|
|
|
|
|
|
|
|
|
|
|
|
|
|
|
|
|
|
|
|
1,612,008 |
|
|
|
|
|
|
|
|
|
|
| Biotechnology - 0.5% |
|
| Amgen, Inc. |
|
|
|
|
|
|
|
|
| 2.80%, 08/15/2041 |
|
|
455,000 |
|
|
|
321,141 |
|
| 5.60%, 03/02/2043 |
|
|
434,000 |
|
|
|
429,304 |
|
| CSL Finance PLC |
|
|
|
|
|
|
|
|
| 4.63%, 04/27/2042 (A) |
|
|
450,000 |
|
|
|
403,683 |
|
| Gilead Sciences, Inc. |
|
|
|
|
|
|
|
|
| 4.15%, 03/01/2047 |
|
|
183,000 |
|
|
|
149,295 |
|
| Royalty Pharma PLC |
|
|
|
|
|
|
|
|
| 2.20%, 09/02/2030 |
|
|
595,000 |
|
|
|
496,281 |
|
|
|
|
|
|
|
|
|
|
|
|
|
|
|
|
|
|
|
|
1,799,704 |
|
|
|
|
|
|
|
|
|
|
| Building Products - 0.3% |
|
| Lowe’s Cos., Inc. |
|
|
|
|
|
|
|
|
| 3.75%, 04/01/2032 |
|
|
1,008,000 |
|
|
|
916,758 |
|
| Mohawk Industries, Inc. |
|
|
|
|
|
|
|
|
| 5.85%, 09/18/2028 |
|
|
412,000 |
|
|
|
420,519 |
|
|
|
|
|
|
|
|
|
|
|
|
|
|
|
|
|
|
|
|
1,337,277 |
|
|
|
|
|
|
|
|
|
|
| Capital Markets - 0.5% |
|
| Charles Schwab Corp. |
|
|
|
|
|
|
|
|
| Fixed until 05/19/2033, 5.85% (B), 05/19/2034 |
|
|
1,308,000 |
|
|
|
1,336,244 |
|
| LPL Holdings, Inc. |
|
|
|
|
|
|
|
|
| 5.70%, 05/20/2027 |
|
|
389,000 |
|
|
|
390,601 |
|
|
|
|
|
|
|
|
|
|
|
|
|
|
|
|
|
|
|
|
1,726,845 |
|
|
|
|
|
|
|
|
|
|
| Chemicals - 0.4% |
|
| Celanese US Holdings LLC |
|
|
|
|
|
|
|
|
| 6.70%, 11/15/2033 |
|
|
540,000 |
|
|
|
568,513 |
|
| Nutrien Ltd. |
|
|
|
|
|
|
|
|
| 4.90%, 03/27/2028 |
|
|
462,000 |
|
|
|
456,788 |
|
| OCP SA |
|
|
|
|
|
|
|
|
| 6.75%, 05/02/2034 (A) |
|
|
367,000 |
|
|
|
376,351 |
|
|
|
|
|
|
|
|
|
|
|
|
|
|
|
|
|
|
|
|
1,401,652 |
|
|
|
|
|
|
|
|
|
|
| Commercial Services & Supplies - 1.7% |
|
| ADT Security Corp. |
|
|
|
|
|
|
|
|
| 4.13%, 08/01/2029 (A) |
|
|
712,000 |
|
|
|
656,700 |
|
| Ashtead Capital, Inc. |
|
|
|
|
|
|
|
|
| 5.55%, 05/30/2033 (A) |
|
|
334,000 |
|
|
|
326,042 |
|
| 5.80%, 04/15/2034 (A) |
|
|
230,000 |
|
|
|
228,681 |
|
| Element Fleet Management Corp. |
|
|
|
|
|
|
|
|
| 6.32%, 12/04/2028 (A) |
|
|
1,141,000 |
|
|
|
1,180,412 |
|
| GXO Logistics, Inc. |
|
|
|
|
|
|
|
|
| 2.65%, 07/15/2031 |
|
|
1,578,000 |
|
|
|
1,281,499 |
|
| 6.50%, 05/06/2034 |
|
|
442,000 |
|
|
|
449,667 |
|
| Quanta Services, Inc. |
|
|
|
|
|
|
|
|
| 2.90%, 10/01/2030 |
|
|
853,000 |
|
|
|
752,258 |
|
|
|
|
|
|
|
|
|
|
| |
|
Principal |
|
|
Value |
|
| |
|
|
| CORPORATE DEBT SECURITIES (continued) |
|
| Commercial Services & Supplies (continued) |
|
| Triton Container International Ltd. |
|
|
|
|
|
|
|
|
| 3.15%, 06/15/2031 (A) |
|
|
$ 478,000 |
|
|
|
$ 398,437 |
|
| Triton Container International Ltd./TAL International Container Corp. |
|
|
|
|
|
|
|
|
| 3.25%, 03/15/2032 |
|
|
732,000 |
|
|
|
603,629 |
|
| Veralto Corp. |
|
|
|
|
|
|
|
|
| 5.45%, 09/18/2033 (A) |
|
|
487,000 |
|
|
|
487,003 |
|
|
|
|
|
|
|
|
|
|
|
|
|
|
|
|
|
|
|
|
6,364,328 |
|
|
|
|
|
|
|
|
|
|
| Construction Materials - 0.0% (D) |
|
| Holcim Finance US LLC |
|
|
|
|
|
|
|
|
| 4.75%, 09/22/2046 (A) |
|
|
220,000 |
|
|
|
191,036 |
|
|
|
|
|
|
|
|
|
|
|
| Consumer Staples Distribution & Retail - 0.4% |
|
| 7-Eleven, Inc. |
|
|
|
|
|
|
|
|
| 1.80%, 02/10/2031 (A) |
|
|
872,000 |
|
|
|
699,612 |
|
| Sysco Corp. |
|
|
|
|
|
|
|
|
| 3.30%, 07/15/2026 |
|
|
793,000 |
|
|
|
762,631 |
|
|
|
|
|
|
|
|
|
|
|
|
|
|
|
|
|
|
|
|
1,462,243 |
|
|
|
|
|
|
|
|
|
|
| Containers & Packaging - 0.1% |
|
| Sonoco Products Co. |
|
|
|
|
|
|
|
|
| 2.25%, 02/01/2027 |
|
|
593,000 |
|
|
|
549,677 |
|
|
|
|
|
|
|
|
|
|
|
| Distributors - 0.1% |
|
| LKQ Corp. |
|
|
|
|
|
|
|
|
| 6.25%, 06/15/2033 |
|
|
430,000 |
|
|
|
441,653 |
|
|
|
|
|
|
|
|
|
|
|
| Diversified REITs - 1.4% |
|
| Broadstone Net Lease LLC |
|
|
|
|
|
|
|
|
| 2.60%, 09/15/2031 |
|
|
1,003,000 |
|
|
|
798,471 |
|
| Safehold GL Holdings LLC |
|
|
|
|
|
|
|
|
| 6.10%, 04/01/2034 |
|
|
590,000 |
|
|
|
583,967 |
|
| SBA Tower Trust |
|
|
|
|
|
|
|
|
| 6.60%, 11/15/2052 (A) |
|
|
3,165,000 |
|
|
|
3,230,853 |
|
| WP Carey, Inc. |
|
|
|
|
|
|
|
|
| 5.38%, 06/30/2034 |
|
|
622,000 |
|
|
|
605,963 |
|
|
|
|
|
|
|
|
|
|
|
|
|
|
|
|
|
|
|
|
5,219,254 |
|
|
|
|
|
|
|
|
|
|
|
| Diversified Telecommunication Services - 0.4% |
|
| Verizon Communications, Inc. |
|
|
|
|
|
|
|
|
| 1.68%, 10/30/2030 |
|
|
851,000 |
|
|
|
692,110 |
|
| 2.99%, 10/30/2056 |
|
|
1,459,000 |
|
|
|
899,213 |
|
|
|
|
|
|
|
|
|
|
|
|
|
|
|
|
|
|
|
|
1,591,323 |
|
|
|
|
|
|
|
|
|
|
|
| Electric Utilities - 1.1% |
|
| Cleveland Electric Illuminating Co. |
|
|
|
|
|
|
|
|
| 5.95%, 12/15/2036 |
|
|
65,000 |
|
|
|
66,024 |
|
| CMS Energy Corp. |
|
|
|
|
|
|
|
|
| 2.95%, 02/15/2027 |
|
|
93,000 |
|
|
|
87,083 |
|
| 4.88%, 03/01/2044 |
|
|
117,000 |
|
|
|
106,160 |
|
| DTE Electric Co. |
|
|
|
|
|
|
|
|
| 4.30%, 07/01/2044 |
|
|
1,187,000 |
|
|
|
1,011,969 |
|
| Duke Energy Corp. |
|
|
|
|
|
|
|
|
| 3.75%, 09/01/2046 |
|
|
1,162,000 |
|
|
|
849,524 |
|
| Duke Energy Progress LLC |
|
|
|
|
|
|
|
|
| 3.60%, 09/15/2047 |
|
|
805,000 |
|
|
|
583,839 |
|
The Notes to Financial Statements are an integral part of this report.
|
|
|
|
|
| Transamerica Series Trust |
|
|
|
Semi-Annual Financial Statements 2024 |
|
|
Page 2 |
|
|
Transamerica Aegon Core Bond VP
SCHEDULE OF INVESTMENTS (continued)
At June 30, 2024
(unaudited)
|
|
|
|
|
|
|
|
|
| |
|
Principal |
|
|
Value |
|
| |
|
|
| CORPORATE DEBT SECURITIES (continued) |
|
| Electric Utilities (continued) |
|
| Oncor Electric Delivery Co. LLC |
|
|
|
|
|
|
|
|
| 5.30%, 06/01/2042 |
|
$ |
44,000 |
|
|
|
$ 42,552 |
|
| Pacific Gas & Electric Co. |
|
|
|
|
|
|
|
|
| 3.75%, 08/15/2042 |
|
|
80,000 |
|
|
|
57,739 |
|
| Public Service Co. of Oklahoma |
|
|
|
|
|
|
|
|
| 6.63%, 11/15/2037 |
|
|
142,000 |
|
|
|
152,604 |
|
| Public Service Electric & Gas Co. |
|
|
|
|
|
|
|
|
| 3.00%, 05/15/2025 |
|
|
794,000 |
|
|
|
778,155 |
|
| Vistra Operations Co. LLC |
|
|
|
|
|
|
|
|
| 6.88%, 04/15/2032 (A) |
|
|
408,000 |
|
|
|
414,186 |
|
|
|
|
|
|
|
|
|
|
|
|
|
|
|
|
|
|
|
|
4,149,835 |
|
|
|
|
|
|
|
|
|
|
|
| Electronic Equipment, Instruments & Components - 0.9% |
|
| Amphenol Corp. |
|
|
|
|
|
|
|
|
| 5.25%, 04/05/2034 |
|
|
753,000 |
|
|
|
752,216 |
|
| Arrow Electronics, Inc. |
|
|
|
|
|
|
|
|
| 2.95%, 02/15/2032 |
|
|
786,000 |
|
|
|
658,595 |
|
| 5.88%, 04/10/2034 |
|
|
383,000 |
|
|
|
379,900 |
|
| Keysight Technologies, Inc. |
|
|
|
|
|
|
|
|
| 4.60%, 04/06/2027 |
|
|
652,000 |
|
|
|
640,494 |
|
| Sensata Technologies, Inc. |
|
|
|
|
|
|
|
|
| 4.38%, 02/15/2030 (A) |
|
|
471,000 |
|
|
|
432,575 |
|
| Trimble, Inc. |
|
|
|
|
|
|
|
|
| 6.10%, 03/15/2033 |
|
|
647,000 |
|
|
|
671,147 |
|
|
|
|
|
|
|
|
|
|
|
|
|
|
|
|
|
|
|
|
3,534,927 |
|
|
|
|
|
|
|
|
|
|
| Energy Equipment & Services - 0.2% |
|
| Schlumberger Holdings Corp. |
|
|
|
|
|
|
|
|
| 3.90%, 05/17/2028 (A) |
|
|
673,000 |
|
|
|
642,917 |
|
|
|
|
|
|
|
|
|
|
|
| Financial Services - 1.1% |
|
| AerCap Ireland Capital DAC/AerCap Global Aviation Trust |
|
|
|
|
|
|
|
|
| 4.45%, 04/03/2026 |
|
|
867,000 |
|
|
|
850,989 |
|
| Aviation Capital Group LLC |
|
|
|
|
|
|
|
|
| 1.95%, 01/30/2026 (A) |
|
|
411,000 |
|
|
|
386,729 |
|
| 5.50%, 12/15/2024 (A) |
|
|
1,381,000 |
|
|
|
1,377,269 |
|
| Avolon Holdings Funding Ltd. |
|
|
|
|
|
|
|
|
| 5.50%, 01/15/2026 (A) |
|
|
434,000 |
|
|
|
430,542 |
|
| 5.75%, 11/15/2029 (A) |
|
|
1,144,000 |
|
|
|
1,136,856 |
|
|
|
|
|
|
|
|
|
|
|
|
|
|
|
|
|
|
|
|
4,182,385 |
|
|
|
|
|
|
|
|
|
|
| Food Products - 0.6% |
|
| Bunge Ltd. Finance Corp. |
|
|
|
|
|
|
|
|
| 2.75%, 05/14/2031 |
|
|
792,000 |
|
|
|
678,638 |
|
| Cargill, Inc. |
|
|
|
|
|
|
|
|
| 5.13%, 10/11/2032 (A) |
|
|
461,000 |
|
|
|
460,863 |
|
| J M Smucker Co. |
|
|
|
|
|
|
|
|
| 6.50%, 11/15/2043 |
|
|
381,000 |
|
|
|
402,394 |
|
| Viterra Finance BV |
|
|
|
|
|
|
|
|
| 4.90%, 04/21/2027 (A) |
|
|
634,000 |
|
|
|
624,179 |
|
|
|
|
|
|
|
|
|
|
|
|
|
|
|
|
|
|
|
|
2,166,074 |
|
|
|
|
|
|
|
|
|
|
|
|
|
|
|
|
|
|
|
| |
|
Principal |
|
|
Value |
|
| |
|
|
| CORPORATE DEBT SECURITIES (continued) |
|
| Health Care Equipment & Supplies - 0.3% |
|
| Alcon Finance Corp. |
|
|
|
|
|
|
|
|
| 2.75%, 09/23/2026 (A) |
|
$ |
694,000 |
|
|
|
$ 656,481 |
|
| 5.75%, 12/06/2052 (A) |
|
|
324,000 |
|
|
|
329,319 |
|
|
|
|
|
|
|
|
|
|
|
|
|
|
|
|
|
|
|
|
985,800 |
|
|
|
|
|
|
|
|
|
|
|
| Health Care Providers & Services - 1.9% |
|
| Cardinal Health, Inc. |
|
|
|
|
|
|
|
|
| 5.45%, 02/15/2034 |
|
|
467,000 |
|
|
|
465,794 |
|
| Centene Corp. |
|
|
|
|
|
|
|
|
| 3.00%, 10/15/2030 |
|
|
669,000 |
|
|
|
571,988 |
|
| 3.38%, 02/15/2030 |
|
|
540,000 |
|
|
|
479,323 |
|
| Cigna Group |
|
|
|
|
|
|
|
|
| 2.40%, 03/15/2030 |
|
|
686,000 |
|
|
|
593,952 |
|
| 5.25%, 02/15/2034 |
|
|
877,000 |
|
|
|
866,562 |
|
| CVS Health Corp. |
|
|
|
|
|
|
|
|
| 5.25%, 01/30/2031 |
|
|
317,000 |
|
|
|
313,833 |
|
| 6.00%, 06/01/2044 |
|
|
693,000 |
|
|
|
681,663 |
|
| Elevance Health, Inc. |
|
|
|
|
|
|
|
|
| 2.25%, 05/15/2030 |
|
|
563,000 |
|
|
|
482,767 |
|
| 5.13%, 02/15/2053 |
|
|
446,000 |
|
|
|
412,298 |
|
| HCA, Inc. |
|
|
|
|
|
|
|
|
| 5.60%, 04/01/2034 |
|
|
593,000 |
|
|
|
590,570 |
|
| 6.00%, 04/01/2054 |
|
|
590,000 |
|
|
|
584,559 |
|
| Health Care Service Corp. A Mutual Legal Reserve Co. |
|
|
|
|
|
|
|
|
| 5.88%, 06/15/2054 (A) |
|
|
292,000 |
|
|
|
288,302 |
|
| Molina Healthcare, Inc. |
|
|
|
|
|
|
|
|
| 4.38%, 06/15/2028 (A) |
|
|
350,000 |
|
|
|
329,432 |
|
| UnitedHealth Group, Inc. |
|
|
|
|
|
|
|
|
| 5.20%, 04/15/2063 |
|
|
692,000 |
|
|
|
644,395 |
|
|
|
|
|
|
|
|
|
|
|
|
|
|
|
|
|
|
|
|
7,305,438 |
|
|
|
|
|
|
|
|
|
|
| Health Care REITs - 0.2% |
|
| DOC DR LLC |
|
|
|
|
|
|
|
|
| 2.63%, 11/01/2031 |
|
|
997,000 |
|
|
|
826,844 |
|
|
|
|
|
|
|
|
|
|
|
| Health Care Technology - 0.1% |
|
| GE HealthCare Technologies, Inc. |
|
|
|
|
|
|
|
|
| 5.86%, 03/15/2030 |
|
|
331,000 |
|
|
|
340,389 |
|
|
|
|
|
|
|
|
|
|
|
| Hotel & Resort REITs - 0.1% |
|
| Host Hotels & Resorts LP |
|
|
|
|
|
|
|
|
| 5.70%, 07/01/2034 |
|
|
286,000 |
|
|
|
281,640 |
|
|
|
|
|
|
|
|
|
|
|
| Hotels, Restaurants & Leisure - 0.5% |
|
| Hyatt Hotels Corp. |
|
|
|
|
|
|
|
|
| 1.80%, 10/01/2024 |
|
|
378,000 |
|
|
|
374,013 |
|
| 5.25%, 06/30/2029 |
|
|
599,000 |
|
|
|
594,474 |
|
| Warnermedia Holdings, Inc. |
|
|
|
|
|
|
|
|
| 5.05%, 03/15/2042 |
|
|
1,142,000 |
|
|
|
932,219 |
|
|
|
|
|
|
|
|
|
|
|
|
|
|
|
|
|
|
|
|
1,900,706 |
|
|
|
|
|
|
|
|
|
|
| Insurance - 1.6% |
|
| Allstate Corp. |
|
|
|
|
|
|
|
|
| 5.05%, 06/24/2029 |
|
|
1,232,000 |
|
|
|
1,227,203 |
|
| Constellation Insurance, Inc. |
|
|
|
|
|
|
|
|
| 6.80%, 01/24/2030 (A) |
|
|
1,614,000 |
|
|
|
1,578,759 |
|
The Notes to Financial Statements are an integral part of this report.
|
|
|
|
|
| Transamerica Series Trust |
|
|
|
Semi-Annual Financial Statements 2024 |
|
|
Page 3 |
|
|
Transamerica Aegon Core Bond VP
SCHEDULE OF INVESTMENTS (continued)
At June 30, 2024
(unaudited)
|
|
|
|
|
|
|
|
|
| |
|
Principal |
|
|
Value |
|
| |
|
|
| CORPORATE DEBT SECURITIES (continued) |
|
| Insurance (continued) |
|
| Equitable Holdings, Inc. |
|
|
|
|
|
|
|
|
| 5.59%, 01/11/2033 |
|
$ |
847,000 |
|
|
|
$ 859,604 |
|
| Global Atlantic Finance Co. |
|
|
|
|
|
|
|
|
| 6.75%, 03/15/2054 (A) |
|
|
159,000 |
|
|
|
157,986 |
|
| 7.95%, 06/15/2033 (A) |
|
|
723,000 |
|
|
|
795,077 |
|
| Muenchener Rueckversicherungs-Gesellschaft AG |
|
|
|
|
|
|
|
|
| Fixed until 11/23/2031, 5.88% (B), 05/23/2042 (A) |
|
|
600,000 |
|
|
|
598,536 |
|
| Prudential Financial, Inc. |
|
|
|
|
|
|
|
|
| Fixed until 07/01/2030, 3.70% (B), 10/01/2050 |
|
|
916,000 |
|
|
|
796,588 |
|
|
|
|
|
|
|
|
|
|
|
|
|
|
|
|
|
|
|
|
6,013,753 |
|
|
|
|
|
|
|
|
|
|
| Interactive Media & Services - 0.2% |
|
| Meta Platforms, Inc. |
|
|
|
|
|
|
|
|
| 4.80%, 05/15/2030 |
|
|
703,000 |
|
|
|
704,434 |
|
|
|
|
|
|
|
|
|
|
|
| Internet & Catalog Retail - 0.0% (D) |
|
| Expedia Group, Inc. |
|
|
|
|
|
|
|
|
| 2.95%, 03/15/2031 |
|
|
57,000 |
|
|
|
49,365 |
|
|
|
|
|
|
|
|
|
|
|
| Machinery - 0.6% |
|
| CNH Industrial Capital LLC |
|
|
|
|
|
|
|
|
| 4.55%, 04/10/2028 |
|
|
645,000 |
|
|
|
631,147 |
|
| Huntington Ingalls Industries, Inc. |
|
|
|
|
|
|
|
|
| 2.04%, 08/16/2028 |
|
|
1,168,000 |
|
|
|
1,027,835 |
|
| Ingersoll Rand, Inc. |
|
|
|
|
|
|
|
|
| 5.45%, 06/15/2034 |
|
|
584,000 |
|
|
|
590,268 |
|
|
|
|
|
|
|
|
|
|
|
|
|
|
|
|
|
|
|
|
2,249,250 |
|
|
|
|
|
|
|
|
|
|
| Media - 0.4% |
|
| Charter Communications Operating LLC/Charter Communications Operating Capital |
|
|
|
|
|
|
|
|
| 4.80%, 03/01/2050 |
|
|
659,000 |
|
|
|
485,768 |
|
| Comcast Corp. |
|
|
|
|
|
|
|
|
| 2.94%, 11/01/2056 |
|
|
378,000 |
|
|
|
229,406 |
|
| NBCUniversal Media LLC |
|
|
|
|
|
|
|
|
| 4.45%, 01/15/2043 |
|
|
461,000 |
|
|
|
399,230 |
|
| Paramount Global |
|
|
|
|
|
|
|
|
| 4.20%, 05/19/2032 |
|
|
393,000 |
|
|
|
321,609 |
|
|
|
|
|
|
|
|
|
|
|
|
|
|
|
|
|
|
|
|
1,436,013 |
|
|
|
|
|
|
|
|
|
|
| Metals & Mining - 0.7% |
|
| Anglo American Capital PLC |
|
|
|
|
|
|
|
|
| 4.50%, 03/15/2028 (A) |
|
|
972,000 |
|
|
|
942,815 |
|
| ArcelorMittal SA |
|
|
|
|
|
|
|
|
| 6.55%, 11/29/2027 |
|
|
950,000 |
|
|
|
979,677 |
|
| Glencore Funding LLC |
|
|
|
|
|
|
|
|
| 2.63%, 09/23/2031 (A) |
|
|
791,000 |
|
|
|
650,152 |
|
|
|
|
|
|
|
|
|
|
|
|
|
|
|
|
|
|
|
|
2,572,644 |
|
|
|
|
|
|
|
|
|
|
| Office REITs - 0.3% |
|
| COPT Defense Properties LP |
|
|
|
|
|
|
|
|
| 2.00%, 01/15/2029 |
|
|
454,000 |
|
|
|
385,177 |
|
| Highwoods Realty LP |
|
|
|
|
|
|
|
|
| 7.65%, 02/01/2034 |
|
|
281,000 |
|
|
|
302,174 |
|
|
|
|
|
|
|
|
|
|
| |
|
Principal |
|
|
Value |
|
| |
|
|
| CORPORATE DEBT SECURITIES (continued) |
|
| Office REITs (continued) |
|
| Kilroy Realty LP |
|
|
|
|
|
|
|
|
| 4.25%, 08/15/2029 |
|
$ |
308,000 |
|
|
|
$ 279,313 |
|
|
|
|
|
|
|
|
|
|
|
|
|
|
|
|
|
|
|
|
966,664 |
|
|
|
|
|
|
|
|
|
|
| Oil, Gas & Consumable Fuels - 3.2% |
|
| Boardwalk Pipelines LP |
|
|
|
|
|
|
|
|
| 3.40%, 02/15/2031 |
|
|
411,000 |
|
|
|
360,242 |
|
| Chevron USA, Inc. |
|
|
|
|
|
|
|
|
| 3.25%, 10/15/2029 |
|
|
582,000 |
|
|
|
540,362 |
|
| Diamondback Energy, Inc. |
|
|
|
|
|
|
|
|
| 5.40%, 04/18/2034 |
|
|
1,008,000 |
|
|
|
999,194 |
|
| Enbridge, Inc. |
|
|
|
|
|
|
|
|
| 5.63%, 04/05/2034 |
|
|
839,000 |
|
|
|
839,538 |
|
| Energy Transfer LP |
|
|
|
|
|
|
|
|
| 5.15%, 02/01/2043 |
|
|
468,000 |
|
|
|
411,067 |
|
| 5.55%, 02/15/2028 |
|
|
408,000 |
|
|
|
411,318 |
|
| 5.95%, 10/01/2043 |
|
|
433,000 |
|
|
|
420,922 |
|
| Enterprise Products Operating LLC |
|
|
|
|
|
|
|
|
| 4.25%, 02/15/2048 |
|
|
1,446,000 |
|
|
|
1,188,007 |
|
| EQM Midstream Partners LP |
|
|
|
|
|
|
|
|
| 6.38%, 04/01/2029 (A) |
|
|
245,000 |
|
|
|
247,471 |
|
| Hess Midstream Operations LP |
|
|
|
|
|
|
|
|
| 6.50%, 06/01/2029 (A) |
|
|
316,000 |
|
|
|
320,379 |
|
| Occidental Petroleum Corp. |
|
|
|
|
|
|
|
|
| 5.55%, 03/15/2026 |
|
|
983,000 |
|
|
|
981,158 |
|
| ONEOK, Inc. |
|
|
|
|
|
|
|
|
| 6.10%, 11/15/2032 |
|
|
941,000 |
|
|
|
973,997 |
|
| Ovintiv, Inc. |
|
|
|
|
|
|
|
|
| 6.25%, 07/15/2033 |
|
|
624,000 |
|
|
|
644,414 |
|
| Petroleos Mexicanos |
|
|
|
|
|
|
|
|
| 6.84%, 01/23/2030 |
|
|
1,306,000 |
|
|
|
1,149,663 |
|
| 7.69%, 01/23/2050 |
|
|
290,000 |
|
|
|
209,547 |
|
| Plains All American Pipeline LP/PAA Finance Corp. |
|
|
|
|
|
|
|
|
| 3.55%, 12/15/2029 |
|
|
668,000 |
|
|
|
610,381 |
|
| Sabine Pass Liquefaction LLC |
|
|
|
|
|
|
|
|
| 4.20%, 03/15/2028 |
|
|
393,000 |
|
|
|
379,382 |
|
| Shell International Finance BV |
|
|
|
|
|
|
|
|
| 2.50%, 09/12/2026 |
|
|
413,000 |
|
|
|
390,927 |
|
| 3.75%, 09/12/2046 |
|
|
548,000 |
|
|
|
425,479 |
|
| Western Midstream Operating LP |
|
|
|
|
|
|
|
|
| 6.15%, 04/01/2033 |
|
|
640,000 |
|
|
|
656,422 |
|
| Williams Cos., Inc. |
|
|
|
|
|
|
|
|
| 5.40%, 03/04/2044 |
|
|
76,000 |
|
|
|
71,876 |
|
|
|
|
|
|
|
|
|
|
|
|
|
|
|
|
|
|
|
|
12,231,746 |
|
|
|
|
|
|
|
|
|
|
| Passenger Airlines - 0.1% |
|
| American Airlines Pass-Through Trust |
|
|
|
|
|
|
|
|
| 3.20%, 12/15/2029 |
|
|
346,864 |
|
|
|
321,389 |
|
|
|
|
|
|
|
|
|
|
|
| Personal Care Products - 0.4% |
|
| Haleon US Capital LLC |
|
|
|
|
|
|
|
|
| 3.38%, 03/24/2027 |
|
|
450,000 |
|
|
|
429,422 |
|
| Kenvue, Inc. |
|
|
|
|
|
|
|
|
| 5.00%, 03/22/2030 |
|
|
1,035,000 |
|
|
|
1,039,080 |
|
|
|
|
|
|
|
|
|
|
|
|
|
|
|
|
|
|
|
|
1,468,502 |
|
|
|
|
|
|
|
|
|
|
The Notes to Financial Statements are an integral part of this report.
|
|
|
|
|
| Transamerica Series Trust |
|
|
|
Semi-Annual Financial Statements 2024 |
|
|
Page 4 |
|
|
Transamerica Aegon Core Bond VP
SCHEDULE OF INVESTMENTS (continued)
At June 30, 2024
(unaudited)
|
|
|
|
|
|
|
|
|
| |
|
Principal |
|
|
Value |
|
| |
|
|
| CORPORATE DEBT SECURITIES (continued) |
|
| Pharmaceuticals - 0.9% |
|
| AbbVie, Inc. |
|
|
|
|
|
|
|
|
| 5.05%, 03/15/2034 |
|
$ |
741,000 |
|
|
|
$ 740,375 |
|
| Bayer US Finance II LLC |
|
|
|
|
|
|
|
|
| 4.38%, 12/15/2028 (A) |
|
|
575,000 |
|
|
|
546,401 |
|
| Bristol-Myers Squibb Co. |
|
|
|
|
|
|
|
|
| 5.65%, 02/22/2064 |
|
|
285,000 |
|
|
|
279,760 |
|
| Merck & Co., Inc. |
|
|
|
|
|
|
|
|
| 5.00%, 05/17/2053 |
|
|
824,000 |
|
|
|
779,052 |
|
| Pfizer Investment Enterprises Pte. Ltd. |
|
|
|
|
|
|
|
|
| 5.11%, 05/19/2043 |
|
|
692,000 |
|
|
|
660,796 |
|
| Viatris, Inc. |
|
|
|
|
|
|
|
|
| 2.30%, 06/22/2027 |
|
|
398,000 |
|
|
|
363,439 |
|
|
|
|
|
|
|
|
|
|
|
|
|
|
|
|
|
|
|
|
3,369,823 |
|
|
|
|
|
|
|
|
|
|
| Professional Services - 0.3% |
|
| Equifax, Inc. |
|
|
|
|
|
|
|
|
| 2.60%, 12/01/2024 |
|
|
681,000 |
|
|
|
671,986 |
|
| 5.10%, 12/15/2027 |
|
|
371,000 |
|
|
|
369,556 |
|
|
|
|
|
|
|
|
|
|
|
|
|
|
|
|
|
|
|
|
1,041,542 |
|
|
|
|
|
|
|
|
|
|
| Residential REITs - 0.4% |
|
| American Homes 4 Rent LP |
|
|
|
|
|
|
|
|
| 5.50%, 02/01/2034 |
|
|
775,000 |
|
|
|
763,397 |
|
| Invitation Homes Operating Partnership LP |
|
|
|
|
|
|
|
|
| 4.15%, 04/15/2032 |
|
|
678,000 |
|
|
|
619,627 |
|
|
|
|
|
|
|
|
|
|
|
|
|
|
|
|
|
|
|
|
1,383,024 |
|
|
|
|
|
|
|
|
|
|
| Semiconductors & Semiconductor Equipment - 1.6% |
|
| Advanced Micro Devices, Inc. |
|
|
|
|
|
|
|
|
| 3.92%, 06/01/2032 |
|
|
998,000 |
|
|
|
927,646 |
|
| Broadcom, Inc. |
|
|
|
|
|
|
|
|
| 3.14%, 11/15/2035 (A) |
|
|
777,000 |
|
|
|
623,813 |
|
| Foundry JV Holdco LLC |
|
|
|
|
|
|
|
|
| 5.88%, 01/25/2034 (A) |
|
|
696,000 |
|
|
|
691,264 |
|
| KLA Corp. |
|
|
|
|
|
|
|
|
| 3.30%, 03/01/2050 |
|
|
739,000 |
|
|
|
522,905 |
|
| Microchip Technology, Inc. |
|
|
|
|
|
|
|
|
| 0.98%, 09/01/2024 |
|
|
628,000 |
|
|
|
622,688 |
|
| 5.05%, 03/15/2029 |
|
|
743,000 |
|
|
|
737,413 |
|
| Micron Technology, Inc. |
|
|
|
|
|
|
|
|
| 5.30%, 01/15/2031 |
|
|
788,000 |
|
|
|
787,000 |
|
| NXP BV/NXP Funding LLC/NXP USA, Inc. |
|
|
|
|
|
|
|
|
| 3.25%, 11/30/2051 |
|
|
400,000 |
|
|
|
264,516 |
|
| 3.40%, 05/01/2030 |
|
|
701,000 |
|
|
|
635,626 |
|
| QUALCOMM, Inc. |
|
|
|
|
|
|
|
|
| 3.25%, 05/20/2050 |
|
|
522,000 |
|
|
|
370,499 |
|
|
|
|
|
|
|
|
|
|
|
|
|
|
|
|
|
|
|
|
6,183,370 |
|
|
|
|
|
|
|
|
|
|
| Software - 0.9% |
|
| Constellation Software, Inc. |
|
|
|
|
|
|
|
|
| 5.16%, 02/16/2029 (A) |
|
|
228,000 |
|
|
|
228,063 |
|
| Fiserv, Inc. |
|
|
|
|
|
|
|
|
| 5.45%, 03/02/2028 |
|
|
659,000 |
|
|
|
665,236 |
|
| Intuit, Inc. |
|
|
|
|
|
|
|
|
| 5.50%, 09/15/2053 |
|
|
292,000 |
|
|
|
295,068 |
|
|
|
|
|
|
|
|
|
|
| |
|
Principal |
|
|
Value |
|
| |
|
|
| CORPORATE DEBT SECURITIES (continued) |
|
| Software (continued) |
|
| Oracle Corp. |
|
|
|
|
|
|
|
|
| 3.65%, 03/25/2041 |
|
$ |
525,000 |
|
|
|
$ 403,237 |
|
| 6.90%, 11/09/2052 |
|
|
678,000 |
|
|
|
762,864 |
|
| Take-Two Interactive Software, Inc. |
|
|
|
|
|
|
|
|
| 3.55%, 04/14/2025 |
|
|
1,072,000 |
|
|
|
1,054,431 |
|
|
|
|
|
|
|
|
|
|
|
|
|
|
|
|
|
|
|
|
3,408,899 |
|
|
|
|
|
|
|
|
|
|
| Specialized REITs - 0.7% |
|
| Extra Space Storage LP |
|
|
|
|
|
|
|
|
| 5.90%, 01/15/2031 |
|
|
969,000 |
|
|
|
990,912 |
|
| VICI Properties LP |
|
|
|
|
|
|
|
|
| 4.95%, 02/15/2030 |
|
|
764,000 |
|
|
|
737,268 |
|
| Weyerhaeuser Co. |
|
|
|
|
|
|
|
|
| 4.00%, 04/15/2030 |
|
|
817,000 |
|
|
|
763,111 |
|
|
|
|
|
|
|
|
|
|
|
|
|
|
|
|
|
|
|
|
2,491,291 |
|
|
|
|
|
|
|
|
|
|
| Tobacco - 0.6% |
|
| BAT Capital Corp. |
|
|
|
|
|
|
|
|
| 6.00%, 02/20/2034 |
|
|
923,000 |
|
|
|
935,673 |
|
| Philip Morris International, Inc. |
|
|
|
|
|
|
|
|
| 5.25%, 02/13/2034 |
|
|
570,000 |
|
|
|
560,263 |
|
| 5.63%, 11/17/2029 |
|
|
729,000 |
|
|
|
744,972 |
|
|
|
|
|
|
|
|
|
|
|
|
|
|
|
|
|
|
|
|
2,240,908 |
|
|
|
|
|
|
|
|
|
|
| Wireless Telecommunication Services - 0.5% |
|
| T-Mobile USA, Inc. |
|
|
|
|
|
|
|
|
| 3.50%, 04/15/2031 |
|
|
761,000 |
|
|
|
685,153 |
|
| 3.88%, 04/15/2030 |
|
|
481,000 |
|
|
|
449,937 |
|
| 5.15%, 04/15/2034 |
|
|
785,000 |
|
|
|
773,265 |
|
|
|
|
|
|
|
|
|
|
|
|
|
|
|
|
|
|
|
|
1,908,355 |
|
|
|
|
|
|
|
|
|
|
|
|
|
| Total Corporate Debt Securities
(Cost $132,099,788) |
|
|
|
|
|
|
132,910,464 |
|
|
|
|
|
|
|
|
|
|
|
| U.S. GOVERNMENT AGENCY OBLIGATIONS - 27.1% |
|
| Federal Home Loan Mortgage Corp. |
|
|
|
|
|
|
|
|
| 3.00%, 02/01/2052 |
|
|
848,074 |
|
|
|
723,063 |
|
| 3.50%, 06/01/2042 - 06/01/2043 |
|
|
451,977 |
|
|
|
413,390 |
|
| 4.00%, 06/01/2042 - 01/01/2046 |
|
|
818,170 |
|
|
|
767,640 |
|
| 4.50%, 06/01/2048 |
|
|
348,319 |
|
|
|
335,085 |
|
| 5.50%, 04/01/2053 - 07/01/2053 (E) |
|
|
2,557,724 |
|
|
|
2,526,815 |
|
| 1-Year RFUCC Treasury + 1.69%, 5.94% (B), 12/01/2036 |
|
|
2,091 |
|
|
|
2,100 |
|
| 1-Year RFUCC Treasury + 1.67%, 5.98% (B), 11/01/2036 |
|
|
13,582 |
|
|
|
13,614 |
|
| 6.00%, 12/01/2034 |
|
|
31,832 |
|
|
|
31,842 |
|
| 1-Year CMT + 2.25%, 6.36% (B), 02/01/2036 |
|
|
16,000 |
|
|
|
16,259 |
|
| 1-Year CMT + 2.25%, 6.38% (B), 01/01/2035 |
|
|
10,030 |
|
|
|
10,263 |
|
| 1-Year CMT + 2.36%, 6.48% (B), 10/01/2036 |
|
|
4,254 |
|
|
|
4,262 |
|
| 1-Year CMT + 2.37%, 6.56% (B), 09/01/2034 |
|
|
11,325 |
|
|
|
11,528 |
|
| 1-Year CMT + 2.25%, 7.13% (B), 05/01/2036 |
|
|
3,655 |
|
|
|
3,718 |
|
| 1-Year RFUCC Treasury + 1.95%, 7.26% (B), 06/01/2036 |
|
|
19,434 |
|
|
|
19,980 |
|
The Notes to Financial Statements are an integral part of this report.
|
|
|
|
|
| Transamerica Series Trust |
|
|
|
Semi-Annual Financial Statements 2024 |
|
|
Page 5 |
|
|
Transamerica Aegon Core Bond VP
SCHEDULE OF INVESTMENTS (continued)
At June 30, 2024
(unaudited)
|
|
|
|
|
|
|
|
|
| |
|
Principal |
|
|
Value |
|
| |
|
|
| U.S. GOVERNMENT AGENCY OBLIGATIONS (continued) |
|
| Federal Home Loan Mortgage Corp. (continued) |
|
|
|
|
|
|
|
|
| 6-Month RFUCC Treasury + 1.77%, 7.41% (B), 10/01/2036 |
|
|
$ 10,782 |
|
|
|
$ 10,962 |
|
| 6-Month RFUCC Treasury + 1.84%, 7.49% (B), 03/01/2037 |
|
|
4,041 |
|
|
|
4,105 |
|
| 6-Month RFUCC Treasury + 1.81%, 7.59% (B), 07/01/2036 |
|
|
13,682 |
|
|
|
13,946 |
|
| 6-Month RFUCC Treasury + 2.11%, 7.79% (B), 02/01/2037 |
|
|
11,329 |
|
|
|
11,453 |
|
| Federal Home Loan Mortgage Corp. Multifamily Structured Pass-Through Certificates |
|
|
|
|
|
|
|
|
| 3.01%, 07/25/2025 |
|
|
1,331,002 |
|
|
|
1,299,512 |
|
| 3.17%, 10/25/2024 |
|
|
1,136,012 |
|
|
|
1,126,955 |
|
| 3.30% (B), 11/25/2027 |
|
|
801,000 |
|
|
|
762,638 |
|
| Federal Home Loan Mortgage Corp. REMICS |
|
|
|
|
|
|
|
|
| (3.33) * 1-Month SOFR Average + 17.12%, 0.00% (B), 02/15/2040 |
|
|
24,478 |
|
|
|
23,066 |
|
| (2.00) * 1-Month SOFR Average + 13.06%, 2.39% (B), 07/15/2033 |
|
|
13,866 |
|
|
|
13,562 |
|
| (1.25) * 1-Month SOFR Average + 9.98%, 3.32% (B), 07/15/2032 |
|
|
12,348 |
|
|
|
11,993 |
|
| (1.83) * 1-Month SOFR Average + 14.55%, 4.77% (B), 09/15/2033 |
|
|
2,117 |
|
|
|
2,176 |
|
| 5.50%, 04/15/2033 - 05/15/2038 |
|
|
5,912 |
|
|
|
5,887 |
|
| (3.62) * 1-Month SOFR Average + 26.80%, 5.50% (B), 05/15/2041 |
|
|
19,988 |
|
|
|
18,772 |
|
| 1-Month SOFR Average + 0.46%, 5.80% (B), 06/15/2043 |
|
|
326,734 |
|
|
|
318,333 |
|
| 1-Month SOFR Average + 0.51%, 5.84% (B), 07/15/2037 |
|
|
46,499 |
|
|
|
45,739 |
|
| 1-Month SOFR Average + 0.51%, 5.85% (B), 10/15/2041 |
|
|
67,665 |
|
|
|
67,316 |
|
| 1-Month SOFR Average + 0.55%, 5.89% (B), 02/15/2037 |
|
|
2,734 |
|
|
|
2,687 |
|
| 6.00%, 11/15/2032 |
|
|
19,297 |
|
|
|
19,641 |
|
| 6.50%, 08/15/2031 - 07/15/2036 |
|
|
78,656 |
|
|
|
80,797 |
|
| 7.00%, 10/15/2030 - 05/15/2032 |
|
|
69,068 |
|
|
|
71,292 |
|
| 7.25%, 12/15/2030 |
|
|
8,793 |
|
|
|
9,082 |
|
| 7.50%, 08/15/2030 |
|
|
9,704 |
|
|
|
9,974 |
|
| 8.00%, 01/15/2030 |
|
|
40,161 |
|
|
|
41,756 |
|
| Federal Home Loan Mortgage Corp. REMICS, Interest Only STRIPS |
|
|
|
|
|
|
|
|
| 0.30% (B), 01/15/2040 |
|
|
24,141 |
|
|
|
1,565 |
|
| (1.00) * 1-Month SOFR Average + 5.89%, 0.55% (B), 11/15/2037 - 02/15/2039 |
|
|
37,838 |
|
|
|
2,677 |
|
| (1.00) * 1-Month SOFR Average + 6.09%, 0.75% (B), 06/15/2038 |
|
|
96,056 |
|
|
|
9,029 |
|
| (1.00) * 1-Month SOFR Average + 6.26%, 0.92% (B), 10/15/2037 |
|
|
174,398 |
|
|
|
15,955 |
|
| (1.00) * 1-Month SOFR Average + 6.31%, 0.97% (B), 11/15/2037 |
|
|
22,005 |
|
|
|
1,405 |
|
| (1.00) * 1-Month SOFR Average + 6.69%, 1.35% (B), 04/15/2038 |
|
|
16,737 |
|
|
|
1,540 |
|
|
|
|
|
|
|
|
|
|
| |
|
Principal |
|
|
Value |
|
| |
|
|
| U.S. GOVERNMENT AGENCY OBLIGATIONS (continued) |
|
| Federal Home Loan Mortgage Corp. REMICS, Interest Only STRIPS (continued) |
|
|
|
|
|
|
|
|
| (1.00) * 1-Month SOFR Average + 6.99%, 1.65% (B), 07/15/2036 |
|
|
$ 6,119 |
|
|
|
$ 627 |
|
| (1.00) * 1-Month SOFR Average + 7.89%, 2.55% (B), 03/15/2032 |
|
|
8,074 |
|
|
|
734 |
|
| Federal Home Loan Mortgage Corp. REMICS, Principal Only STRIPS |
|
|
|
|
|
|
|
|
| 12/15/2032 - 01/15/2040 |
|
|
61,016 |
|
|
|
50,794 |
|
| Federal Home Loan Mortgage Corp. Structured Pass-Through Certificates |
|
|
|
|
|
|
|
|
| 12-MTA + 1.20%, 6.35% (B), 10/25/2044 |
|
|
68,435 |
|
|
|
61,871 |
|
| 7.00%, 02/25/2043 |
|
|
27,125 |
|
|
|
28,127 |
|
| Federal Home Loan Mortgage Corp., Interest Only STRIPS |
|
|
|
|
|
|
|
|
| 5.00%, 09/15/2035 |
|
|
14,105 |
|
|
|
2,235 |
|
| Federal National Mortgage Association |
|
|
|
|
|
|
|
|
| 2.50%, 12/01/2051 - 07/01/2061 |
|
|
2,867,900 |
|
|
|
2,344,642 |
|
| 3.00%, 01/01/2043 - 07/01/2060 |
|
|
1,686,532 |
|
|
|
1,434,620 |
|
| 3.50%, 08/01/2032 - 03/01/2060 |
|
|
1,711,102 |
|
|
|
1,553,474 |
|
| 4.00%, 07/01/2042 - 08/01/2048 |
|
|
1,338,583 |
|
|
|
1,254,960 |
|
| 4.50%, 08/01/2052 |
|
|
2,470,034 |
|
|
|
2,335,925 |
|
| 5.00%, 03/01/2053 - 02/01/2054 |
|
|
9,571,690 |
|
|
|
9,273,461 |
|
| 5.50%, 03/01/2053 - 01/01/2058 |
|
|
3,659,408 |
|
|
|
3,651,252 |
|
| 1-Month SOFR Average + 0.37%, 5.71% (B), 11/25/2046 |
|
|
40,709 |
|
|
|
40,312 |
|
| 6.00%, 10/01/2033 |
|
|
4,585 |
|
|
|
4,559 |
|
| 6.00%, 06/01/2054 (E) |
|
|
1,868,514 |
|
|
|
1,878,242 |
|
| 1-Year RFUCC Treasury + 1.79%, 6.29% (B), 01/01/2038 |
|
|
623 |
|
|
|
622 |
|
| 6.50%, 01/01/2036 |
|
|
7,016 |
|
|
|
6,905 |
|
| 1-Year CMT + 2.22%, 6.52% (B), 01/01/2036 |
|
|
6,281 |
|
|
|
6,441 |
|
| 8.00%, 11/01/2037 |
|
|
3,160 |
|
|
|
3,242 |
|
| Federal National Mortgage Association REMICS |
|
|
|
|
|
|
|
|
| (2.50) * 1-Month SOFR Average + 13.46%, 0.15% (B), 07/25/2033 |
|
|
6,881 |
|
|
|
6,437 |
|
| (1.33) * 1-Month SOFR Average + 7.31%, 0.21% (B), 08/25/2033 |
|
|
22,202 |
|
|
|
19,949 |
|
| (1.88) * 1-Month SOFR Average + 11.06%, 1.03% (B), 07/25/2035 |
|
|
35,024 |
|
|
|
32,377 |
|
| (2.75) * 1-Month SOFR Average + 16.19%, 1.51% (B), 05/25/2034 |
|
|
4,046 |
|
|
|
3,953 |
|
| (4.00) * 1-Month SOFR Average + 23.54%, 2.20% (B), 05/25/2034 |
|
|
3,221 |
|
|
|
3,309 |
|
| (2.00) * 1-Month SOFR Average + 13.77%, 3.10% (B), 03/25/2038 |
|
|
3,135 |
|
|
|
2,818 |
|
| (1.67) * 1-Month SOFR Average + 12.31%, 3.42% (B), 09/25/2033 |
|
|
2,873 |
|
|
|
2,783 |
|
| (2.50) * 1-Month SOFR Average + 17.09%, 3.75% (B), 07/25/2035 |
|
|
23,178 |
|
|
|
23,057 |
|
The Notes to Financial Statements are an integral part of this report.
|
|
|
|
|
| Transamerica Series Trust |
|
|
|
Semi-Annual Financial Statements 2024 |
|
|
Page 6 |
|
|
Transamerica Aegon Core Bond VP
SCHEDULE OF INVESTMENTS (continued)
At June 30, 2024
(unaudited)
|
|
|
|
|
|
|
|
|
| |
|
Principal |
|
|
Value |
|
| |
|
|
| U.S. GOVERNMENT AGENCY OBLIGATIONS (continued) |
|
| Federal National Mortgage Association
REMICS (continued) |
|
|
|
|
|
|
|
|
| (4.00) * 1-Month SOFR Average + 25.74%, 4.40% (B), 10/25/2036 |
|
$ |
2,331 |
|
|
$ |
2,606 |
|
| (1.83) * 1-Month SOFR Average + 14.27%, 4.49% (B), 12/25/2032 |
|
|
1,830 |
|
|
|
1,874 |
|
| (2.75) * 1-Month SOFR Average + 19.21%, 4.54% (B), 04/25/2034 - 05/25/2034 |
|
|
30,522 |
|
|
|
32,476 |
|
| 1-Month SOFR Average + 0.36%, 4.54% (B), 06/27/2036 |
|
|
10,715 |
|
|
|
10,733 |
|
| (3.67) * 1-Month SOFR Average + 24.15%, 4.58% (B), 03/25/2036 |
|
|
7,938 |
|
|
|
9,124 |
|
| (2.00) * 1-Month SOFR Average + 15.27%, 4.61% (B), 11/25/2031 |
|
|
6,837 |
|
|
|
7,164 |
|
| (4.00) * 1-Month SOFR Average + 26.10%, 4.76% (B), 12/25/2036 |
|
|
1,688 |
|
|
|
1,843 |
|
| 5.35% (B), 10/25/2042 |
|
|
9,678 |
|
|
|
9,545 |
|
| 1-Month SOFR Average + 0.41%, 5.75% (B), 08/25/2041 |
|
|
15,240 |
|
|
|
15,179 |
|
| 1-Month SOFR Average + 0.46%, 5.80% (B), 04/25/2035 - 08/25/2036 |
|
|
24,850 |
|
|
|
24,563 |
|
| 6.00%, 08/25/2037 |
|
|
8,979 |
|
|
|
9,256 |
|
| 6.50%, 05/25/2044 |
|
|
24,091 |
|
|
|
24,226 |
|
| 7.00%, 03/25/2031 - 11/25/2031 |
|
|
45,647 |
|
|
|
46,812 |
|
| (3.25) * 1-Month SOFR Average + 24.82%, 7.48% (B), 02/25/2032 |
|
|
974 |
|
|
|
1,081 |
|
| (6.67) * 1-Month SOFR Average + 53.24%, 10.00% (B), 03/25/2032 |
|
|
881 |
|
|
|
925 |
|
| Federal National Mortgage Association REMICS, Interest Only STRIPS |
|
|
|
|
|
|
|
|
| (1.00) * 1-Month SOFR Average + 5.74%, 0.40% (B), 09/25/2038 |
|
|
51,663 |
|
|
|
2,992 |
|
| (1.00) * 1-Month SOFR Average + 5.80%, 0.46% (B), 02/25/2038 |
|
|
25,992 |
|
|
|
1,821 |
|
| 0.56% (B), 04/25/2041 |
|
|
15,525 |
|
|
|
688 |
|
| (1.00) * 1-Month SOFR Average + 5.99%, 0.65% (B), 06/25/2037 |
|
|
14,805 |
|
|
|
990 |
|
| (1.00) * 1-Month SOFR Average + 6.07%, 0.73% (B), 12/25/2039 |
|
|
3,981 |
|
|
|
259 |
|
| (1.00) * 1-Month SOFR Average + 6.09%, 0.75% (B), 03/25/2038 |
|
|
5,182 |
|
|
|
336 |
|
| 0.89% (B), 08/25/2042 |
|
|
133,165 |
|
|
|
4,215 |
|
| (1.00) * 1-Month SOFR Average + 6.31%, 0.97% (B), 04/25/2040 |
|
|
7,489 |
|
|
|
446 |
|
| (1.00) * 1-Month SOFR Average + 6.42%, 1.08% (B), 01/25/2041 |
|
|
109,773 |
|
|
|
13,575 |
|
| (1.00) * 1-Month SOFR Average + 6.43%, 1.09% (B), 09/25/2037 |
|
|
18,749 |
|
|
|
1,610 |
|
| (1.00) * 1-Month SOFR Average + 6.44%, 1.10% (B), 02/25/2039 |
|
|
9,837 |
|
|
|
810 |
|
| (1.00) * 1-Month SOFR Average + 6.47%, 1.13% (B), 06/25/2036 |
|
|
10,845 |
|
|
|
929 |
|
| (1.00) * 1-Month SOFR Average + 6.59%, 1.25% (B), 03/25/2036 |
|
|
214,438 |
|
|
|
18,320 |
|
|
|
|
|
|
|
|
|
|
| |
|
Principal |
|
|
Value |
|
| |
|
|
| U.S. GOVERNMENT AGENCY OBLIGATIONS (continued) |
|
| Federal National Mortgage Association REMICS, Interest Only STRIPS (continued) |
|
|
|
|
|
|
|
|
| 1.49% (B), 01/25/2038 |
|
$ |
10,714 |
|
|
$ |
529 |
|
| (1.00) * 1-Month SOFR Average + 7.04%, 1.70% (B), 07/25/2037 |
|
|
30,421 |
|
|
|
3,678 |
|
| 6.50%, 05/25/2033 |
|
|
7,758 |
|
|
|
1,221 |
|
| 7.00%, 06/25/2033 |
|
|
10,357 |
|
|
|
1,401 |
|
| Federal National Mortgage Association REMICS, Principal Only STRIPS |
|
|
|
|
|
|
|
|
| 12/25/2032 - 10/25/2043 |
|
|
359,887 |
|
|
|
280,806 |
|
| Federal National Mortgage Association, Interest Only STRIPS |
|
|
|
|
|
|
|
|
| 2.03% (B), 11/25/2033 |
|
|
3,248,803 |
|
|
|
240,433 |
|
| 2.06% (B), 07/25/2030 |
|
|
6,022,481 |
|
|
|
406,575 |
|
| Federal National Mortgage Association, Principal Only STRIPS |
|
|
|
|
|
|
|
|
| 08/25/2032 - 01/25/2033 |
|
|
13,300 |
|
|
|
11,769 |
|
| FREMF Mortgage Trust |
|
|
|
|
|
|
|
|
| 3.79% (B), 04/25/2028 (A) |
|
|
900,000 |
|
|
|
819,433 |
|
| Government National Mortgage Association REMICS |
|
|
|
|
|
|
|
|
| 1.65%, 01/20/2063 |
|
|
56 |
|
|
|
50 |
|
| (2.00) * 1-Month Term SOFR + 13.17%, 2.49% (B), 10/20/2037 |
|
|
8,572 |
|
|
|
8,204 |
|
| (4.91) * 1-Month Term SOFR + 28.90%, 2.69% (B), 09/20/2034 |
|
|
6,322 |
|
|
|
6,553 |
|
| (2.41) * 1-Month Term SOFR + 16.16%, 3.32% (B), 06/17/2035 |
|
|
3,535 |
|
|
|
3,584 |
|
| (3.00) * 1-Month Term SOFR + 19.86%, 3.85% (B), 09/20/2037 |
|
|
3,564 |
|
|
|
3,651 |
|
| (3.50) * 1-Month Term SOFR + 22.87%, 4.19% (B), 04/20/2037 |
|
|
11,957 |
|
|
|
12,718 |
|
| (2.75) * 1-Month Term SOFR + 19.35%, 4.69% (B), 04/16/2034 |
|
|
12,594 |
|
|
|
13,175 |
|
| (2.20) * 1-Month Term SOFR + 16.47%, 4.74% (B), 05/18/2034 |
|
|
63 |
|
|
|
63 |
|
| 1-Month Term SOFR + 0.56%, 5.50% (B), 03/20/2060 |
|
|
3,496 |
|
|
|
3,455 |
|
| 1-Month Term SOFR + 0.54%, 5.59% (B), 04/20/2060 - 08/20/2060 |
|
|
498 |
|
|
|
493 |
|
| 1-Month Term SOFR + 0.63%, 5.95% (B), 10/20/2062 |
|
|
29,298 |
|
|
|
29,268 |
|
| 1-Month Term SOFR + 0.66%, 5.99% (B), 07/20/2062 |
|
|
438 |
|
|
|
435 |
|
| 1-Month Term SOFR + 0.69%, 6.02% (B), 09/20/2062 |
|
|
880 |
|
|
|
876 |
|
| 1-Month Term SOFR + 0.81%, 6.14% (B), 05/20/2061 |
|
|
908 |
|
|
|
902 |
|
| Government National Mortgage Association REMICS, Interest Only STRIPS |
|
|
|
|
|
|
|
|
| (1.00) * 1-Month Term SOFR + 5.59%, 0.25% (B), 12/20/2038 |
|
|
16,265 |
|
|
|
744 |
|
| (1.00) * 1-Month Term SOFR + 5.72%, 0.38% (B), 02/20/2038 |
|
|
25,445 |
|
|
|
317 |
|
| (1.00) * 1-Month Term SOFR + 5.89%, 0.55% (B), 11/20/2037 |
|
|
23,823 |
|
|
|
363 |
|
| (1.00) * 1-Month Term SOFR + 5.97%, 0.63% (B), 06/20/2039 |
|
|
14,646 |
|
|
|
900 |
|
The Notes to Financial Statements are an integral part of this report.
|
|
|
|
|
| Transamerica Series Trust |
|
|
|
Semi-Annual Financial Statements 2024 |
|
|
Page 7 |
|
|
Transamerica Aegon Core Bond VP
SCHEDULE OF INVESTMENTS (continued)
At June 30, 2024
(unaudited)
|
|
|
|
|
|
|
|
|
| |
|
Principal |
|
|
Value |
|
| |
|
|
| U.S. GOVERNMENT AGENCY OBLIGATIONS (continued) |
|
| Government National Mortgage Association REMICS, Interest Only STRIPS (continued) |
|
|
|
|
|
|
|
|
| (1.00) * 1-Month Term SOFR + 5.99%, 0.65% (B), 10/20/2034 |
|
|
$ 28,918 |
|
|
|
$ 1,322 |
|
| (1.00) * 1-Month Term SOFR + 5.99%, 0.66% (B), 02/16/2039 |
|
|
7,727 |
|
|
|
2 |
|
| (1.00) * 1-Month Term SOFR + 6.09%, 0.75% (B), 03/20/2037 - 06/20/2038 |
|
|
54,581 |
|
|
|
2,053 |
|
| (1.00) * 1-Month Term SOFR + 6.16%, 0.82% (B), 04/20/2039 |
|
|
16,689 |
|
|
|
850 |
|
| (1.00) * 1-Month Term SOFR + 6.19%, 0.85% (B), 09/20/2035 - 03/20/2039 |
|
|
52,342 |
|
|
|
3,427 |
|
| (1.00) * 1-Month Term SOFR + 6.29%, 0.96% (B), 05/16/2038 |
|
|
47,815 |
|
|
|
2,568 |
|
| (1.00) * 1-Month Term SOFR + 6.36%, 1.03% (B), 06/16/2037 |
|
|
17,380 |
|
|
|
391 |
|
| (1.00) * 1-Month Term SOFR + 6.44%, 1.10% (B), 11/20/2037 - 12/20/2037 |
|
|
21,977 |
|
|
|
394 |
|
| (1.00) * 1-Month Term SOFR + 6.64%, 1.30% (B), 07/20/2037 |
|
|
41,999 |
|
|
|
1,790 |
|
| (1.00) * 1-Month Term SOFR + 6.70%, 1.37% (B), 04/16/2037 |
|
|
14,519 |
|
|
|
1,122 |
|
| 6.50%, 03/20/2039 |
|
|
11,451 |
|
|
|
1,306 |
|
| Government National Mortgage Association REMICS, Principal Only STRIPS |
|
|
|
|
|
|
|
|
| 06/16/2033 - 01/20/2038 |
|
|
27,116 |
|
|
|
23,586 |
|
| KGS-Alpha SBA COOF Trust, Interest Only STRIPS |
|
|
|
|
|
|
|
|
| 0.87% (B), 08/25/2038 (A) |
|
|
147,524 |
|
|
|
2,412 |
|
| 1.79% (B), 03/25/2039 (A) |
|
|
141,599 |
|
|
|
4,122 |
|
| 3.30% (B), 04/25/2040 (A) |
|
|
45,467 |
|
|
|
2,006 |
|
| Tennessee Valley Authority |
|
|
|
|
|
|
|
|
| 5.88%, 04/01/2036 |
|
|
1,459,000 |
|
|
|
1,608,422 |
|
| Uniform Mortgage-Backed Security, TBA |
|
|
|
|
|
|
|
|
| 2.00%, 07/01/2039 - 07/01/2054 (E) |
|
|
9,540,000 |
|
|
|
7,905,145 |
|
| 2.50%, 07/01/2039 - 07/01/2054 (E) |
|
|
18,414,000 |
|
|
|
15,385,548 |
|
| 3.00%, 07/01/2039 - 07/01/2054 (E) |
|
|
16,019,000 |
|
|
|
13,782,696 |
|
| 3.50%, 07/01/2039 - 07/01/2054 (E) |
|
|
10,731,000 |
|
|
|
9,622,509 |
|
| 4.00%, 07/01/2054 (E) |
|
|
5,410,000 |
|
|
|
4,958,519 |
|
| 4.50%, 07/01/2054 (E) |
|
|
5,722,000 |
|
|
|
5,403,311 |
|
| 5.50%, 07/01/2054 (E) |
|
|
6,040,000 |
|
|
|
5,964,075 |
|
| 6.00%, 07/01/2054 (E) |
|
|
2,565,000 |
|
|
|
2,574,657 |
|
| Vendee Mortgage Trust |
|
|
|
|
|
|
|
|
| 7.50%, 02/15/2027 |
|
|
43,741 |
|
|
|
44,245 |
|
|
|
|
|
|
|
|
|
|
|
|
| Total U.S. Government Agency Obligations
(Cost $105,024,557) |
|
|
|
102,303,574 |
|
|
|
|
|
|
|
|
| U.S. GOVERNMENT OBLIGATIONS - 24.3% |
|
| U.S. Treasury - 22.3% |
|
| U.S. Treasury Bonds |
|
|
|
|
|
|
|
|
| 1.25%, 05/15/2050 |
|
|
1,604,000 |
|
|
|
800,872 |
|
| 1.88%, 11/15/2051 |
|
|
2,107,800 |
|
|
|
1,232,404 |
|
| 2.00%, 02/15/2050 |
|
|
1,004,500 |
|
|
|
614,197 |
|
| 2.25%, 08/15/2046 - 02/15/2052 |
|
|
3,920,900 |
|
|
|
2,575,091 |
|
| 2.38%, 02/15/2042 - 05/15/2051 |
|
|
2,982,700 |
|
|
|
2,104,935 |
|
| 2.50%, 02/15/2045 - 05/15/2046 |
|
|
4,904,600 |
|
|
|
3,485,231 |
|
| 2.75%, 08/15/2042 - 11/15/2047 |
|
|
4,776,000 |
|
|
|
3,543,408 |
|
|
|
|
|
|
|
|
|
|
| |
|
Principal |
|
|
Value |
|
| |
|
|
| U.S. GOVERNMENT OBLIGATIONS (continued) |
|
| U.S. Treasury (continued) |
|
| U.S. Treasury Bonds (continued) |
|
|
|
|
|
|
|
|
| 2.88%, 08/15/2045 - 05/15/2049 |
|
|
$ 2,533,500 |
|
|
|
$ 1,908,942 |
|
| 3.00%, 05/15/2042 - 08/15/2052 |
|
|
4,408,600 |
|
|
|
3,407,785 |
|
| 3.13%, 02/15/2042 - 05/15/2048 |
|
|
1,754,300 |
|
|
|
1,425,218 |
|
| 3.50%, 02/15/2039 |
|
|
2,054,000 |
|
|
|
1,854,938 |
|
| 3.63%, 02/15/2044 - 05/15/2053 |
|
|
3,938,300 |
|
|
|
3,404,369 |
|
| 3.88%, 02/15/2043 |
|
|
872,000 |
|
|
|
791,476 |
|
| 4.00%, 11/15/2052 |
|
|
1,172,000 |
|
|
|
1,074,165 |
|
| 4.13%, 08/15/2053 |
|
|
628,000 |
|
|
|
588,456 |
|
| 4.25%, 05/15/2039 - 02/15/2054 |
|
|
1,162,000 |
|
|
|
1,120,805 |
|
| 4.63%, 05/15/2054 |
|
|
919,000 |
|
|
|
937,380 |
|
| 4.75%, 11/15/2043 - 11/15/2053 |
|
|
4,513,000 |
|
|
|
4,649,270 |
|
| 5.25%, 02/15/2029 |
|
|
736,800 |
|
|
|
766,013 |
|
| U.S. Treasury Notes |
|
|
|
|
|
|
|
|
| 0.25%, 08/31/2025 |
|
|
1,156,000 |
|
|
|
1,093,729 |
|
| 0.63%, 05/15/2030 - 08/15/2030 |
|
|
6,243,400 |
|
|
|
5,030,967 |
|
| 0.88%, 06/30/2026 |
|
|
1,176,000 |
|
|
|
1,090,924 |
|
| 1.00%, 12/15/2024 (C) |
|
|
1,882,000 |
|
|
|
1,845,757 |
|
| 1.13%, 10/31/2026 - 02/15/2031 |
|
|
6,792,000 |
|
|
|
5,847,182 |
|
| 1.38%, 11/15/2031 |
|
|
2,000,000 |
|
|
|
1,629,062 |
|
| 1.50%, 01/31/2027 - 02/15/2030 |
|
|
1,300,500 |
|
|
|
1,180,358 |
|
| 1.63%, 02/15/2026 - 05/15/2031 |
|
|
16,610,600 |
|
|
|
14,842,016 |
|
| 2.25%, 11/15/2025 - 11/15/2027 |
|
|
3,996,700 |
|
|
|
3,838,968 |
|
| 2.63%, 02/15/2029 |
|
|
529,000 |
|
|
|
490,647 |
|
| 2.88%, 05/15/2028 |
|
|
1,767,000 |
|
|
|
1,670,160 |
|
| 3.50%, 01/31/2028 |
|
|
1,279,000 |
|
|
|
1,239,081 |
|
| 3.63%, 05/31/2028 |
|
|
1,286,000 |
|
|
|
1,249,932 |
|
| 4.00%, 06/30/2028 |
|
|
720,000 |
|
|
|
709,369 |
|
| 4.13%, 09/30/2027 - 07/31/2028 |
|
|
2,429,300 |
|
|
|
2,404,025 |
|
| 4.38%, 08/31/2028 - 05/15/2034 |
|
|
1,487,000 |
|
|
|
1,488,219 |
|
| 4.63%, 06/30/2025 - 04/30/2029 |
|
|
1,938,000 |
|
|
|
1,941,471 |
|
|
|
|
|
|
|
|
|
|
|
|
|
|
|
|
|
|
|
|
83,876,822 |
|
|
|
|
|
|
|
|
|
|
| U.S. Treasury Inflation-Protected Securities - 2.0% |
|
| U.S. Treasury Inflation-Protected Indexed Bonds |
|
|
|
|
|
|
|
|
| 0.25%, 02/15/2050 |
|
|
2,151,301 |
|
|
|
1,324,288 |
|
| 1.75%, 01/15/2028 |
|
|
963,733 |
|
|
|
948,188 |
|
| 2.50%, 01/15/2029 |
|
|
3,607,157 |
|
|
|
3,671,386 |
|
| U.S. Treasury Inflation-Protected Indexed Notes |
|
|
|
|
|
|
|
|
| 0.13%, 07/15/2030 |
|
|
1,966,214 |
|
|
|
1,760,917 |
|
|
|
|
|
|
|
|
|
|
|
|
|
|
|
|
|
|
|
|
7,704,779 |
|
|
|
|
|
|
|
|
|
|
|
|
|
| Total U.S. Government Obligations
(Cost $95,182,461) |
|
|
|
|
|
|
91,581,601 |
|
|
|
|
|
|
|
|
|
|
|
| MORTGAGE-BACKED SECURITIES - 6.6% |
|
| Alternative Loan Trust |
|
|
|
|
|
|
|
|
| Series 2004-2CB, Class 1A9, 5.75%, 03/25/2034 |
|
|
75,848 |
|
|
|
75,255 |
|
| Series 2005-28CB, Class 1A4, 5.50%, 08/25/2035 |
|
|
64,209 |
|
|
|
53,691 |
|
| Series 2005-54CB, Class 1A11, 5.50%, 11/25/2035 |
|
|
18,040 |
|
|
|
13,625 |
|
The Notes to Financial Statements are an integral part of this report.
|
|
|
|
|
| Transamerica Series Trust |
|
|
|
Semi-Annual Financial Statements 2024 |
|
|
Page 8 |
|
|
Transamerica Aegon Core Bond VP
SCHEDULE OF INVESTMENTS (continued)
At June 30, 2024
(unaudited)
|
|
|
|
|
|
|
|
|
| |
|
Principal |
|
|
Value |
|
| |
|
|
| MORTGAGE-BACKED SECURITIES (continued) |
|
| Alternative Loan Trust, Interest Only STRIPS |
|
|
|
|
|
|
|
|
| Series 2005-20CB, Class 3A8, (1.00) * 1-Month Term SOFR + 4.64%, 0.00% (B), 07/25/2035 |
|
|
$ 122,219 |
|
|
|
$ 3,169 |
|
| Series 2005-22T1, Class A2, (1.00) * 1-Month Term SOFR + 4.96%, 0.00% (B), 06/25/2035 |
|
|
308,626 |
|
|
|
15,261 |
|
| BAMLL Commercial Mortgage Securities Trust |
|
|
|
|
|
|
|
|
| Series 2014-520M, Class C, 4.35% (B), 08/15/2046 (A) |
|
|
200,000 |
|
|
|
122,007 |
|
| Banc of America Funding Trust, Principal Only STRIPS |
|
|
|
|
|
|
|
|
| Series 2004-1, 03/25/2034 |
|
|
6,554 |
|
|
|
4,586 |
|
| Series 2005-7, Class 30, 11/25/2035 |
|
|
5,837 |
|
|
|
6,016 |
|
| Series 2005-8, Class 30, 01/25/2036 |
|
|
1,875 |
|
|
|
1,206 |
|
| Banc of America Mortgage Trust |
|
|
|
|
|
|
|
|
| Series 2003-J, Class 3A2, 4.81% (B), 11/25/2033 |
|
|
8,612 |
|
|
|
8,002 |
|
| BB-UBS Trust |
|
|
|
|
|
|
|
|
| Series 2012-SHOW, Class A, 3.43%, 11/05/2036 (A) |
|
|
550,000 |
|
|
|
537,055 |
|
| Bear Stearns ARM Trust |
|
|
|
|
|
|
|
|
| Series 2006-1, Class A1, 1-Year CMT + 2.25%, 7.66% (B), 02/25/2036 |
|
|
10,979 |
|
|
|
10,090 |
|
| BRAVO Residential Funding Trust |
|
|
|
|
|
|
|
|
| Series 2024-NQM2, Class A1, 6.29% (B), 02/25/2064 (A) |
|
|
603,974 |
|
|
|
605,890 |
|
| Series 2024-NQM3, Class A1, 6.19% (B), 03/25/2064 (A) |
|
|
245,988 |
|
|
|
246,595 |
|
| Chase Mortgage Finance Trust |
|
|
|
|
|
|
|
|
| Series 2007-A1, Class 1A3, 6.18% (B), 02/25/2037 |
|
|
12,760 |
|
|
|
12,368 |
|
| Series 2007-A2, Class 2A1, 5.78% (B), 06/25/2035 |
|
|
7,455 |
|
|
|
7,232 |
|
| CHL Mortgage Pass-Through Trust |
|
|
|
|
|
|
|
|
| Series 2004-3, Class A26, 5.50%, 04/25/2034 |
|
|
20,355 |
|
|
|
19,347 |
|
| Series 2004-3, Class A4, 5.75%, 04/25/2034 |
|
|
12,213 |
|
|
|
11,573 |
|
| Series 2004-7, Class 2A1, 5.59% (B), 06/25/2034 |
|
|
7,004 |
|
|
|
6,338 |
|
| Series 2004-8, Class 2A1, 4.50%, 06/25/2019 |
|
|
249 |
|
|
|
124 |
|
| Series 2004-HYB1, Class 2A, 5.43% (B), 05/20/2034 |
|
|
5,692 |
|
|
|
5,236 |
|
| Series 2005-22, Class 2A1, 4.69% (B), 11/25/2035 |
|
|
50,504 |
|
|
|
39,938 |
|
| Citigroup Mortgage Loan Trust, Inc. |
|
|
|
|
|
|
|
|
| Series 2003-1, Class 2A5, 5.25%, 10/25/2033 |
|
|
2,410 |
|
|
|
2,223 |
|
| COLT Mortgage Loan Trust |
|
|
|
|
|
|
|
|
| Series 2024-2, Class A1, 6.13% (B), 04/25/2069 (A) |
|
|
1,337,043 |
|
|
|
1,337,413 |
|
|
|
|
|
|
|
|
|
|
| |
|
Principal |
|
|
Value |
|
| |
|
|
| MORTGAGE-BACKED SECURITIES (continued) |
|
| COMM Mortgage Trust |
|
|
|
|
|
|
|
|
| Series 2015-3BP, Class A, 3.18%, 02/10/2035 (A) |
|
|
$ 1,665,000 |
|
|
|
$ 1,526,339 |
|
| Series 2015-CR25, Class A4, 3.76%, 08/10/2048 |
|
|
422,000 |
|
|
|
411,917 |
|
| Credit Suisse First Boston Mortgage Securities Corp. |
|
|
|
|
|
|
|
|
| Series 2003-21, Class 1A4, 5.25%, 09/25/2033 |
|
|
6,252 |
|
|
|
5,924 |
|
| Fontainebleau Miami Beach Trust |
|
|
|
|
|
|
|
|
| Series 2019-FBLU, Class C, 3.75%, 12/10/2036 (A) |
|
|
1,235,000 |
|
|
|
1,212,014 |
|
| GSMPS Mortgage Loan Trust |
|
|
|
|
|
|
|
|
| Series 2005-RP2, Class 1AF, 1-Month Term SOFR + 0.46%, 5.81% (B), 03/25/2035 (A) |
|
|
74,509 |
|
|
|
67,632 |
|
| Series 2005-RP3, Class 1AF, 1-Month Term SOFR + 0.46%, 5.81% (B), 09/25/2035 (A) |
|
|
51,337 |
|
|
|
43,120 |
|
| GSR Mortgage Loan Trust |
|
|
|
|
|
|
|
|
| Series 2004-6F, Class 2A4, 5.50%, 05/25/2034 |
|
|
11,066 |
|
|
|
10,663 |
|
| Series 2004-8F, Class 2A3, 6.00%, 09/25/2034 |
|
|
7,132 |
|
|
|
7,019 |
|
| Series 2005-7F, Class 3A9, 6.00%, 09/25/2035 |
|
|
16,315 |
|
|
|
15,525 |
|
| Series 2006-1F, Class 2A4, 6.00%, 02/25/2036 |
|
|
32,696 |
|
|
|
14,311 |
|
| Impac Secured Assets Trust |
|
|
|
|
|
|
|
|
| Series 2006-1, Class 2A1, 1-Month Term SOFR + 0.81%, 6.16% (B), 05/25/2036 |
|
|
10,049 |
|
|
|
8,776 |
|
| JPMorgan Mortgage Trust |
|
|
|
|
|
|
|
|
| Series 2006-A2, Class 5A3, 6.08% (B), 11/25/2033 |
|
|
3,393 |
|
|
|
3,248 |
|
| Ladder Capital Commercial Mortgage Trust |
|
|
|
|
|
|
|
|
| Series 2013-GCP, Class A2, 3.99%, 02/15/2036 (A) |
|
|
154,000 |
|
|
|
138,045 |
|
| Manhattan West Mortgage Trust |
|
|
|
|
|
|
|
|
| Series 2020-1MW, Class A, 2.13%, 09/10/2039 (A) |
|
|
600,000 |
|
|
|
533,517 |
|
| Series 2020-1MW, Class B, 2.41% (B), 09/10/2039 (A) |
|
|
826,000 |
|
|
|
730,742 |
|
| MASTR Adjustable Rate Mortgages Trust |
|
|
|
|
|
|
|
|
| Series 2004-13, Class 2A1, 6.41% (B), 04/21/2034 |
|
|
9,388 |
|
|
|
8,861 |
|
| Series 2004-13, Class 3A7, 5.99% (B), 11/21/2034 |
|
|
4,930 |
|
|
|
4,572 |
|
| Series 2004-3, Class 4A2, 4.58% (B), 04/25/2034 |
|
|
6,264 |
|
|
|
5,483 |
|
| MASTR Alternative Loan Trust |
|
|
|
|
|
|
|
|
| Series 2004-10, Class 1A1, 4.50%, 09/25/2019 |
|
|
271 |
|
|
|
259 |
|
| MASTR Resecuritization Trust, Principal Only STRIPS |
|
|
|
|
|
|
|
|
| Series 2005, Class 3, 05/28/2035 |
|
|
3,802 |
|
|
|
2,901 |
|
| Merrill Lynch Mortgage Investors Trust |
|
|
|
|
|
|
|
|
| Series 2003-E, Class A1, 1-Month Term SOFR + 0.73%, 6.08% (B), 10/25/2028 |
|
|
56,478 |
|
|
|
52,989 |
|
The Notes to Financial Statements are an integral part of this report.
|
|
|
|
|
| Transamerica Series Trust |
|
|
|
Semi-Annual Financial Statements 2024 |
|
|
Page 9 |
|
|
Transamerica Aegon Core Bond VP
SCHEDULE OF INVESTMENTS (continued)
At June 30, 2024
(unaudited)
|
|
|
|
|
|
|
|
|
| |
|
Principal |
|
|
Value |
|
| |
|
|
| MORTGAGE-BACKED SECURITIES (continued) |
|
| Merrill Lynch Mortgage Investors Trust (continued) |
|
|
|
|
|
|
|
|
| Series 2004-1, Class 2A1, 5.38% (B), 12/25/2034 |
|
|
$ 13,916 |
|
|
|
$ 12,820 |
|
| Series 2004-A, Class A1, 1-Month Term SOFR + 0.57%, 5.92% (B), 04/25/2029 |
|
|
38,970 |
|
|
|
35,733 |
|
| MetLife Securitization Trust |
|
|
|
|
|
|
|
|
| Series 2019-1A, Class A1A, 3.75% (B), 04/25/2058 (A) |
|
|
783,596 |
|
|
|
759,106 |
|
| MFA Trust |
|
|
|
|
|
|
|
|
| Series 2021-RPL1, Class A1, 1.13% (B), 07/25/2060 (A) |
|
|
698,760 |
|
|
|
616,444 |
|
| New Residential Mortgage Loan Trust |
|
|
|
|
|
|
|
|
| Series 2017-1A, Class A1, 4.00% (B), 02/25/2057 (A) |
|
|
87,211 |
|
|
|
82,716 |
|
| Series 2017-3A, Class A1, 4.00% (B), 04/25/2057 (A) |
|
|
329,626 |
|
|
|
309,743 |
|
| Series 2019-5A, Class A1B, 3.50% (B), 08/25/2059 (A) |
|
|
267,709 |
|
|
|
246,625 |
|
| Nomura Asset Acceptance Corp. Alternative Loan Trust |
|
|
|
|
|
|
|
|
| Series 2003-A1, Class A2, 6.00%, 05/25/2033 |
|
|
2,243 |
|
|
|
2,176 |
|
| Series 2003-A1, Class A5, 7.00%, 04/25/2033 |
|
|
9,871 |
|
|
|
9,601 |
|
| OBX Trust |
|
|
|
|
|
|
|
|
| Series 2023-NQM4, Class A1, 6.11% (B), 03/25/2063 (A) |
|
|
842,356 |
|
|
|
842,404 |
|
| Series 2024-NQM4, Class A1, 6.07% (B), 01/25/2064 (A) |
|
|
397,628 |
|
|
|
396,998 |
|
| Series 2024-NQM6, Class A1, 6.45% (B), 02/25/2064 (A) |
|
|
322,838 |
|
|
|
325,198 |
|
| PHH Alternative Mortgage Trust, Interest Only STRIPS |
|
|
|
|
|
|
|
|
| Series 2007-2, Class 2X, 6.00%, 05/25/2037 |
|
|
51,883 |
|
|
|
9,874 |
|
| RALI Trust |
|
|
|
|
|
|
|
|
| Series 2002-QS16, Class A3, (2.09) * 1-Month Term SOFR + 16.38%, 5.21% (B), 10/25/2017 |
|
|
12 |
|
|
|
1 |
|
| RBS Commercial Funding, Inc. Trust |
|
|
|
|
|
|
|
|
| Series 2013-SMV, Class A, 3.26%, 03/11/2031 (A) |
|
|
154,851 |
|
|
|
145,677 |
|
| Sequoia Mortgage Trust |
|
|
|
|
|
|
|
|
| Series 2003-1, Class 1A, 1-Month Term SOFR + 0.87%, 6.21% (B), 04/20/2033 |
|
|
27,813 |
|
|
|
26,024 |
|
| Series 2004-11, Class A1, 1-Month Term SOFR + 0.71%, 6.05% (B), 12/20/2034 |
|
|
22,145 |
|
|
|
19,533 |
|
| Series 2004-8, Class A1, 1-Month Term SOFR + 0.81%, 6.15% (B), 09/20/2034 |
|
|
73,345 |
|
|
|
63,677 |
|
| Series 2004-9, Class A1, 1-Month Term SOFR + 0.79%, 6.13% (B), 10/20/2034 |
|
|
41,094 |
|
|
|
36,640 |
|
| Structured Adjustable Rate Mortgage Loan Trust |
|
|
|
|
|
|
|
|
| Series 2004-1, Class 4A4, 7.28% (B), 02/25/2034 |
|
|
49,373 |
|
|
|
46,579 |
|
|
|
|
|
|
|
|
|
|
| |
|
Principal |
|
|
Value |
|
| |
|
|
| MORTGAGE-BACKED SECURITIES (continued) |
|
| Structured Asset Mortgage Investments II Trust |
|
|
|
|
|
|
|
|
| Series 2003-AR4, Class A1, 1-Month Term SOFR + 0.81%, 6.15% (B), 01/19/2034 |
|
|
$ 94,308 |
|
|
|
$ 87,674 |
|
| Series 2004-AR1, Class 1A1, 1-Month Term SOFR + 0.81%, 6.15% (B), 03/19/2034 |
|
|
69,865 |
|
|
|
63,731 |
|
| Series 2004-AR5, Class 1A1, 1-Month Term SOFR + 0.77%, 6.11% (B), 10/19/2034 |
|
|
10,794 |
|
|
|
9,949 |
|
| Series 2005-AR5, Class A3, 1-Month Term SOFR + 0.61%, 5.95% (B), 07/19/2035 |
|
|
42,904 |
|
|
|
39,878 |
|
| Thornburg Mortgage Securities Trust |
|
|
|
|
|
|
|
|
| Series 2004-4, Class 3A, 5.66% (B), 12/25/2044 |
|
|
23,172 |
|
|
|
21,490 |
|
| Towd Point Mortgage Trust |
|
|
|
|
|
|
|
|
| Series 2017-4, Class A1, 2.75% (B), 06/25/2057 (A) |
|
|
1,219,006 |
|
|
|
1,164,659 |
|
| Series 2017-6, Class A1, 2.75% (B), 10/25/2057 (A) |
|
|
652,162 |
|
|
|
628,708 |
|
| Series 2018-1, Class A1, 3.00% (B), 01/25/2058 (A) |
|
|
998,597 |
|
|
|
970,586 |
|
| Series 2018-4, Class A1, 3.00% (B), 06/25/2058 (A) |
|
|
1,625,458 |
|
|
|
1,496,559 |
|
| Series 2019-4, Class A1, 2.90% (B), 10/25/2059 (A) |
|
|
1,532,421 |
|
|
|
1,432,385 |
|
| Series 2020-4, Class A1, 1.75%, 10/25/2060 |
|
|
3,345,889 |
|
|
|
2,961,981 |
|
| Series 2021-R1, Class A1, 2.92% (B), 11/30/2060 (A) |
|
|
1,312,587 |
|
|
|
1,114,784 |
|
| Series 2022-1, Class A1, 3.75% (B), 07/25/2062 (A) |
|
|
644,245 |
|
|
|
599,358 |
|
| Series 2023-1, Class A1, 3.75%, 01/25/2063 (A) |
|
|
1,248,126 |
|
|
|
1,175,740 |
|
| UBS-BAMLL Trust |
|
|
|
|
|
|
|
|
| Series 2012-WRM, Class A, 3.66%, 06/10/2030 (A) |
|
|
7,320 |
|
|
|
6,870 |
|
| Wachovia Bank Commercial Mortgage Trust, Interest Only STRIPS |
|
|
|
|
|
|
|
|
| Series 2006-C24, Class XC, 0.00% (B), 03/15/2045 (A)(F) |
|
|
36,934 |
|
|
|
0 |
|
| WaMu Mortgage Pass-Through Certificates Trust |
|
|
|
|
|
|
|
|
| Series 2003-AR11, Class A6, 5.85% (B), 10/25/2033 |
|
|
24,200 |
|
|
|
22,262 |
|
| Series 2003-AR6, Class A1, 7.27% (B), 06/25/2033 |
|
|
6,169 |
|
|
|
5,906 |
|
| Series 2003-S3, Class 1A4, 5.50%, 06/25/2033 |
|
|
16,342 |
|
|
|
15,351 |
|
| Series 2003-S9, Class A8, 5.25%, 10/25/2033 |
|
|
13,906 |
|
|
|
13,068 |
|
| Series 2004-AR3, Class A2, 5.77% (B), 06/25/2034 |
|
|
3,707 |
|
|
|
3,316 |
|
| Washington Mutual Mortgage Pass-Through Certificates Trust |
|
|
|
|
|
|
|
|
| Series 2005-4, Class CB7, 5.50%, 06/25/2035 |
|
|
50,687 |
|
|
|
42,884 |
|
The Notes to Financial Statements are an integral part of this report.
|
|
|
|
|
| Transamerica Series Trust |
|
|
|
Semi-Annual Financial Statements 2024 |
|
|
Page 10 |
|
|
Transamerica Aegon Core Bond VP
SCHEDULE OF INVESTMENTS (continued)
At June 30, 2024
(unaudited)
|
|
|
|
|
|
|
|
|
| |
|
Principal |
|
|
Value |
|
| |
|
|
| MORTGAGE-BACKED SECURITIES (continued) |
|
| Washington Mutual Mortgage Pass- Through Certificates Trust, Interest Only STRIPS |
|
|
|
|
|
|
|
|
| Series 2005-2, Class 1A4, (1.00) * 1-Month Term SOFR + 4.94%, 0.00% (B), 04/25/2035 |
|
|
$ 170,515 |
|
|
|
$ 4,452 |
|
| Series 2005-3, Class CX, 5.50%, 05/25/2035 |
|
|
65,701 |
|
|
|
10,280 |
|
| Washington Mutual MSC Mortgage Pass- Through Certificates Trust, Principal Only STRIPS |
|
|
|
|
|
|
|
|
| Series 2003-MS7, Class P, 03/25/2033 |
|
|
109 |
|
|
|
83 |
|
| Wells Fargo Commercial Mortgage Trust |
|
|
|
|
|
|
|
|
| Series 2016-C35, Class A4, 2.93%, 07/15/2048 |
|
|
1,103,000 |
|
|
|
1,044,242 |
|
|
|
|
|
|
|
|
|
|
|
|
|
| Total Mortgage-Backed Securities
(Cost $25,363,456) |
|
|
|
|
|
|
24,871,862 |
|
|
|
|
|
|
|
|
|
|
|
| ASSET-BACKED SECURITIES - 5.2% |
|
| 321 Henderson Receivables VI LLC |
|
|
|
|
|
|
|
|
| Series 2010-1A, Class A, 5.56%, 07/15/2059 (A) |
|
|
612,110 |
|
|
|
609,265 |
|
| Accelerated LLC |
|
|
|
|
|
|
|
|
| Series 2021-1H, Class A, 1.35%, 10/20/2040 (A) |
|
|
89,420 |
|
|
|
82,006 |
|
| Series 2021-1H, Class B, 1.90%, 10/20/2040 (A) |
|
|
682,293 |
|
|
|
626,350 |
|
| Avis Budget Rental Car Funding AESOP LLC |
|
|
|
|
|
|
|
|
| Series 2023-7A, Class A, 5.90%, 08/21/2028 (A) |
|
|
1,080,000 |
|
|
|
1,092,552 |
|
| BXG Receivables Note Trust |
|
|
|
|
|
|
|
|
| Series 2023-A, Class A, 5.77%, 11/15/2038 (A) |
|
|
957,408 |
|
|
|
952,457 |
|
| Chase Funding Trust |
|
|
|
|
|
|
|
|
| Series 2003-6, Class 1A7, 4.87% (B), 11/25/2034 |
|
|
13,952 |
|
|
|
13,508 |
|
| CIFC Funding Ltd. |
|
|
|
|
|
|
|
|
| Series 2013-2A, Class A1L2, 3-Month Term SOFR + 1.26%, 6.59% (B), 10/18/2030 (A) |
|
|
824,427 |
|
|
|
824,710 |
|
| Diameter Capital CLO 1 Ltd. |
|
|
|
|
|
|
|
|
| Series 2021-1A, Class A1A, 3-Month Term SOFR + 1.50%, 6.83% (B), 07/15/2036 (A) |
|
|
1,500,000 |
|
|
|
1,502,672 |
|
| First National Master Note Trust |
|
|
|
|
|
|
|
|
| Series 2023-1, Class A, 5.13%, 04/15/2029 |
|
|
1,370,000 |
|
|
|
1,364,464 |
|
| Ford Credit Auto Owner Trust |
|
|
|
|
|
|
|
|
| Series 2018-1, Class B, 3.34%, 07/15/2031 (A) |
|
|
500,000 |
|
|
|
493,142 |
|
| GM Financial Consumer Automobile Receivables Trust |
|
|
|
|
|
|
|
|
| Series 2023-1, Class A2A, 5.19%, 03/16/2026 |
|
|
249,591 |
|
|
|
249,366 |
|
| Goodgreen Trust |
|
|
|
|
|
|
|
|
| Series 2017-1A, Class A, 3.74%, 10/15/2052 (A) |
|
|
70,438 |
|
|
|
63,597 |
|
|
|
|
|
|
|
|
|
|
| |
|
Principal |
|
|
Value |
|
| |
|
|
| ASSET-BACKED SECURITIES (continued) |
|
| GoodLeap Sustainable Home Solutions Trust |
|
|
|
|
|
|
|
|
| Series 2022-1GS, Class A, 2.70%, 01/20/2049 (A) |
|
|
$ 816,511 |
|
|
|
$ 672,742 |
|
| Series 2022-3CS, Class A, 4.95%, 07/20/2049 (A) |
|
|
174,197 |
|
|
|
162,046 |
|
| Hero Funding Trust |
|
|
|
|
|
|
|
|
| Series 2017-1A, Class A2, 4.46%, 09/20/2047 (A) |
|
|
186,147 |
|
|
|
168,999 |
|
| Series 2017-3A, Class A2, 3.95%, 09/20/2048 (A) |
|
|
207,748 |
|
|
|
183,751 |
|
| Hertz Vehicle Financing III LLC |
|
|
|
|
|
|
|
|
| Series 2023-3A, Class A, 5.94%, 02/25/2028 (A) |
|
|
955,000 |
|
|
|
959,304 |
|
| Hilton Grand Vacations Trust |
|
|
|
|
|
|
|
|
| Series 2024-1B, Class A, 5.75%, 09/15/2039 (A) |
|
|
449,686 |
|
|
|
454,291 |
|
| Series 2024-2A, Class A, 5.50%, 03/25/2038 (A) |
|
|
332,560 |
|
|
|
334,453 |
|
| HINNT LLC |
|
|
|
|
|
|
|
|
| Series 2024-A, Class A, 5.49%, 03/15/2043 (A) |
|
|
412,355 |
|
|
|
412,801 |
|
| Mosaic Solar Loan Trust |
|
|
|
|
|
|
|
|
| Series 2023-2A, Class A, 5.36%, 09/22/2053 (A) |
|
|
1,650,725 |
|
|
|
1,610,299 |
|
| MVW LLC |
|
|
|
|
|
|
|
|
| Series 2023-1A, Class A, 4.93%, 10/20/2040 (A) |
|
|
812,045 |
|
|
|
804,260 |
|
| Series 2024-1A, Class A, 5.32%, 02/20/2043 (A) |
|
|
760,275 |
|
|
|
758,850 |
|
| Palmer Square CLO Ltd. |
|
|
|
|
|
|
|
|
| Series 2015-2A, Class A1R2, 3-Month Term SOFR + 1.36%, 6.69% (B), 07/20/2030 (A) |
|
|
1,073,797 |
|
|
|
1,074,650 |
|
| Renew Financial |
|
|
|
|
|
|
|
|
| Series 2017-1A, Class A, 3.67%, 09/20/2052 (A) |
|
|
93,858 |
|
|
|
85,799 |
|
| Securitized Asset-Backed Receivables LLC Trust |
|
|
|
|
|
|
|
|
| Series 2006-CB1, Class AF2, 2.84% (B), 01/25/2036 |
|
|
12,887 |
|
|
|
10,355 |
|
| Sierra Timeshare Receivables Funding LLC |
|
|
|
|
|
|
|
|
| Series 2020-2A, Class A, 1.33%, 07/20/2037 (A) |
|
|
359,636 |
|
|
|
347,484 |
|
| Series 2023-1A, Class A, 5.20%, 01/20/2040 (A) |
|
|
982,076 |
|
|
|
973,377 |
|
| Series 2023-2A, Class A, 5.80%, 04/20/2040 (A) |
|
|
361,033 |
|
|
|
360,477 |
|
| Series 2023-3A, Class A, 6.10%, 09/20/2040 (A) |
|
|
427,016 |
|
|
|
431,783 |
|
| Series 2024-1A, Class A, 5.15%, 01/20/2043 (A) |
|
|
891,326 |
|
|
|
886,886 |
|
| Structured Receivables Finance LLC |
|
|
|
|
|
|
|
|
| Series 2010-A, Class A, 5.22%, 01/16/2046 (A) |
|
|
150,256 |
|
|
|
149,487 |
|
| TCW CLO Ltd. |
|
|
|
|
|
|
|
|
| Series 2018-1A, Class A1R, 3-Month Term SOFR + 1.23%, 6.56% (B), 04/25/2031 (A) |
|
|
407,318 |
|
|
|
407,517 |
|
The Notes to Financial Statements are an integral part of this report.
|
|
|
|
|
| Transamerica Series Trust |
|
|
|
Semi-Annual Financial Statements 2024 |
|
|
Page 11 |
|
|
Transamerica Aegon Core Bond VP
SCHEDULE OF INVESTMENTS (continued)
At June 30, 2024
(unaudited)
|
|
|
|
|
|
|
|
|
| |
|
Principal |
|
|
Value |
|
| |
|
|
| ASSET-BACKED SECURITIES (continued) |
|
| Veridian Auto Receivables Trust |
|
|
|
|
|
|
|
|
| Series 2023-1A, Class A2, 5.97%, 08/17/2026 (A) |
|
|
$ 461,019 |
|
|
|
$ 461,205 |
|
| VSE VOI Mortgage LLC |
|
|
|
|
|
|
|
|
| Series 2018-A, Class A, 3.56%, 02/20/2036 (A) |
|
|
47,637 |
|
|
|
47,312 |
|
|
|
|
|
|
|
|
|
|
|
|
| Total Asset-Backed Securities
(Cost $19,657,611) |
|
|
|
19,632,217 |
|
|
|
|
|
|
|
|
| FOREIGN GOVERNMENT OBLIGATIONS - 0.8% |
|
| Colombia - 0.1% |
|
| Colombia Government International Bonds |
|
|
|
|
|
|
|
|
| 3.13%, 04/15/2031 |
|
|
447,000 |
|
|
|
351,750 |
|
|
|
|
|
|
|
|
|
|
|
| Dominican Republic - 0.2% |
|
| Dominican Republic International Bonds |
|
|
|
|
|
|
|
|
| 6.60%, 06/01/2036 (A)(E) |
|
|
857,000 |
|
|
|
852,470 |
|
|
|
|
|
|
|
|
|
|
|
| Israel - 0.0% (D) |
|
| Israel Government AID Bonds |
|
|
|
|
|
|
|
|
| 5.50%, 09/18/2033 |
|
|
100,000 |
|
|
|
106,357 |
|
|
|
|
|
|
|
|
|
|
|
| Mexico - 0.3% |
|
| Mexico Government International Bonds |
|
|
|
|
|
|
|
|
| 3.75%, 01/11/2028 |
|
|
1,053,000 |
|
|
|
995,488 |
|
|
|
|
|
|
|
|
|
|
|
| Serbia - 0.2% |
|
| Serbia International Bonds |
|
|
|
|
|
|
|
|
| 6.00%, 06/12/2034 (A) |
|
|
617,000 |
|
|
|
607,464 |
|
|
|
|
|
|
|
|
|
|
|
|
|
| Total Foreign Government Obligations
(Cost $2,910,237) |
|
|
|
|
|
|
2,913,529 |
|
|
|
|
|
|
|
|
|
|
|
|
|
| |
|
Shares |
|
|
Value |
|
| |
|
|
| PREFERRED STOCK - 0.1% |
|
| Banks - 0.1% |
|
| Citigroup Capital XIII, 3-Month Term SOFR + 6.63%, 11.96% (B) |
|
|
10,475 |
|
|
|
306,603 |
|
|
|
|
|
|
|
|
|
|
|
|
|
| Total Preferred Stock
(Cost $303,760) |
|
|
|
|
|
|
306,603 |
|
|
|
|
|
|
|
|
|
|
|
|
|
| |
|
Principal |
|
|
Value |
|
| |
|
|
| COMMERCIAL PAPER - 14.1% |
|
| Banks - 4.4% |
|
| ABN AMRO Funding USA LLC |
|
|
|
|
|
|
|
|
| 5.52% (G), 10/15/2024 (A) |
|
$ |
4,200,000 |
|
|
|
4,131,145 |
|
| HSBC USA, Inc. |
|
|
|
|
|
|
|
|
| 5.59% (G), 11/21/2024 (A) |
|
|
4,200,000 |
|
|
|
4,106,941 |
|
| Macquarie Bank Ltd. |
|
|
|
|
|
|
|
|
| 5.61% (G), 10/28/2024 (A) |
|
|
4,200,000 |
|
|
|
4,121,850 |
|
| Nordea Bank Abp |
|
|
|
|
|
|
|
|
| 5.39% (G), 09/03/2024 (A) |
|
|
4,215,000 |
|
|
|
4,173,573 |
|
|
|
|
|
|
|
|
|
|
|
|
|
|
|
|
|
|
|
|
16,533,509 |
|
|
|
|
|
|
|
|
|
|
| Financial Services - 8.6% |
|
| Alinghi Funding Co. LLC |
|
|
|
|
|
|
|
|
| 5.56% (G), 12/10/2024 (A) |
|
|
4,200,000 |
|
|
|
4,097,205 |
|
|
|
|
|
|
|
|
|
|
| |
|
Principal |
|
|
Value |
|
| |
|
|
| COMMERCIAL PAPER (continued) |
|
| Financial Services (continued) |
|
| Atlantic Asset Securitization LLC |
|
|
|
|
|
|
|
|
| 5.56% (G), 11/06/2024 (A) |
|
|
$ 3,300,000 |
|
|
|
$ 3,235,445 |
|
| Barton Capital SA |
|
|
|
|
|
|
|
|
| 5.59% (G), 10/04/2024 (A) |
|
|
4,200,000 |
|
|
|
4,138,387 |
|
| Britannia Funding Co. LLC |
|
|
|
|
|
|
|
|
| 5.50% (G), 09/06/2024 (A) |
|
|
4,200,000 |
|
|
|
4,155,682 |
|
| Gotham Funding Corp. |
|
|
|
|
|
|
|
|
| 5.47% (G), 09/09/2024 (A) |
|
|
4,206,000 |
|
|
|
4,159,993 |
|
| GTA Funding LLC |
|
|
|
|
|
|
|
|
| 5.46% (G), 08/19/2024 (A) |
|
|
4,370,000 |
|
|
|
4,335,994 |
|
| LMA-Americas LLC |
|
|
|
|
|
|
|
|
| 5.55% (G), 12/12/2024 (A) |
|
|
4,200,000 |
|
|
|
4,096,287 |
|
| Sheffield Receivables Co. LLC |
|
|
|
|
|
|
|
|
| 5.48% (G), 09/03/2024 (A) |
|
|
4,215,000 |
|
|
|
4,172,579 |
|
|
|
|
|
|
|
|
|
|
|
|
|
|
|
|
|
|
|
|
32,391,572 |
|
|
|
|
|
|
|
|
|
|
| Health Care Providers & Services - 1.1% |
|
| Columbia Funding Co. LLC |
|
|
|
|
|
|
|
|
| 5.48% (G), 09/04/2024 (A) |
|
|
4,200,000 |
|
|
|
4,156,821 |
|
|
|
|
| Total Commercial Paper
(Cost $53,101,668) |
|
|
|
|
|
|
53,081,902 |
|
|
|
|
|
|
|
|
|
|
|
| SHORT-TERM U.S. GOVERNMENT OBLIGATIONS - 3.5% |
|
| U.S. Treasury Bills |
|
|
|
|
|
|
|
|
| 5.31% (G), 08/01/2024 |
|
|
2,613,000 |
|
|
|
2,601,232 |
|
| 5.34% (G), 09/19/2024 |
|
|
1,225,000 |
|
|
|
1,210,809 |
|
| 5.37% (G), 09/19/2024 |
|
|
4,298,000 |
|
|
|
4,248,210 |
|
| 5.38% (G), 09/12/2024 |
|
|
2,367,000 |
|
|
|
2,341,904 |
|
| 5.40% (G), 08/29/2024 |
|
|
2,919,000 |
|
|
|
2,893,849 |
|
|
|
|
|
|
|
|
|
|
|
|
| Total Short-Term U.S. Government Obligations
(Cost $13,292,238) |
|
|
|
13,296,004 |
|
|
|
|
|
|
|
|
|
|
| |
|
Shares |
|
|
Value |
|
| |
|
|
| OTHER INVESTMENT COMPANY - 1.1% |
|
| Securities Lending Collateral - 1.1% |
|
| State Street Navigator Securities Lending Trust - Government Money Market Portfolio, 5.28% (G) |
|
|
4,202,788 |
|
|
|
4,202,788 |
|
|
|
|
|
|
|
|
|
|
|
|
| Total Other Investment Company
(Cost $4,202,788) |
|
|
|
4,202,788 |
|
|
|
|
|
|
|
The Notes to Financial Statements are an integral part of this report.
|
|
|
|
|
| Transamerica Series Trust |
|
|
|
Semi-Annual Financial Statements 2024 |
|
|
Page 12 |
|
|
Transamerica Aegon Core Bond VP
SCHEDULE OF INVESTMENTS (continued)
At June 30, 2024
(unaudited)
|
|
|
|
|
|
|
|
|
| |
|
Principal |
|
|
Value |
|
| |
|
|
| REPURCHASE AGREEMENT - 1.6% |
|
| Fixed Income Clearing Corp.
, 2.50% (G), dated 06/28/2024, to be repurchased at $5,895,581 on 07/01/2024. Collateralized by a U.S. Government Obligation, 3.75%, due 04/15/2026, and with a value of $6,012,313. |
|
$ |
5,894,353 |
|
|
$ |
5,894,353 |
|
|
|
|
|
|
|
|
|
|
|
|
| Total Repurchase Agreement
(Cost $5,894,353) |
|
|
|
5,894,353 |
|
|
|
|
|
|
|
| Total Investments
(Cost $457,032,917) |
|
|
|
450,994,897 |
|
|
|
|
|
|
|
| Net Other Assets (Liabilities) - (19.7)% |
|
|
|
(74,181,786) |
|
|
|
|
|
|
|
|
|
|
|
|
| Net Assets - 100.0% |
|
|
$ |
376,813,111 |
|
|
|
|
|
|
|
INVESTMENT VALUATION:
Valuation Inputs (H)
|
|
|
|
|
|
|
|
|
|
|
|
|
|
|
|
|
| |
|
Level 1 - Unadjusted Quoted Prices |
|
|
Level 2 - Other Significant Observable Inputs |
|
|
Level 3 - Significant Unobservable Inputs |
|
|
Value |
|
| |
|
|
|
|
|
|
| ASSETS |
|
|
|
|
|
|
|
|
|
|
|
|
|
|
|
|
| Investments |
|
|
|
|
|
|
|
|
|
|
|
|
|
|
|
|
| Corporate Debt Securities |
|
$ |
— |
|
|
$ |
132,910,464 |
|
|
$ |
— |
|
|
$ |
132,910,464 |
|
| U.S. Government Agency Obligations |
|
|
— |
|
|
|
102,303,574 |
|
|
|
— |
|
|
|
102,303,574 |
|
| U.S. Government Obligations |
|
|
— |
|
|
|
91,581,601 |
|
|
|
— |
|
|
|
91,581,601 |
|
| Mortgage-Backed Securities |
|
|
— |
|
|
|
24,871,862 |
|
|
|
— |
|
|
|
24,871,862 |
|
| Asset-Backed Securities |
|
|
— |
|
|
|
19,632,217 |
|
|
|
— |
|
|
|
19,632,217 |
|
| Foreign Government Obligations |
|
|
— |
|
|
|
2,913,529 |
|
|
|
— |
|
|
|
2,913,529 |
|
| Preferred Stock |
|
|
306,603 |
|
|
|
— |
|
|
|
— |
|
|
|
306,603 |
|
| Commercial Paper |
|
|
— |
|
|
|
53,081,902 |
|
|
|
— |
|
|
|
53,081,902 |
|
| Short-Term U.S. Government Obligations |
|
|
— |
|
|
|
13,296,004 |
|
|
|
— |
|
|
|
13,296,004 |
|
| Other Investment Company |
|
|
4,202,788 |
|
|
|
— |
|
|
|
— |
|
|
|
4,202,788 |
|
| Repurchase Agreement |
|
|
— |
|
|
|
5,894,353 |
|
|
|
— |
|
|
|
5,894,353 |
|
|
|
|
|
|
|
|
|
|
|
|
|
|
|
|
|
|
| Total Investments |
|
$ |
4,509,391 |
|
|
$ |
446,485,506 |
|
|
$ |
— |
|
|
$ |
450,994,897 |
|
|
|
|
|
|
|
|
|
|
|
|
|
|
|
|
|
|
FOOTNOTES TO SCHEDULE OF INVESTMENTS:
| (A) |
Security is exempt from registration pursuant to Rule 144A of the Securities Act of 1933. Security may be resold as transactions exempt from registration, normally to qualified institutional buyers. At June 30, 2024, the total value of 144A securities is $126,892,232, representing 33.7% of the Portfolio’s net assets. |
| (B) |
Floating or variable rate security. The rate disclosed is as of June 30, 2024. For securities based on a published reference rate and spread, the reference rate and spread are indicated within the description. Variable rate securities with a floor or ceiling feature are disclosed at the inherent rate, where applicable. Certain variable rate securities are not based on a published reference rate and spread, but are determined by the issuer or agent and are based on current market conditions; these securities do not indicate a reference rate and spread in the description. |
| (C) |
All or a portion of the security is on loan. The total value of the securities on loan is $4,116,409, collateralized by cash collateral of $4,202,788. The amount on loan indicated may not correspond with the securities on loan identified because a security with pending sales are in the process of recall from the brokers. |
| (D) |
Percentage rounds to less than 0.1% or (0.1)%. |
| (E) |
When-issued, delayed-delivery and/or forward commitment (including TBAs) security. Security to be settled and delivered after June 30, 2024. Security may display a coupon rate of 0.00%, as the rate is to be determined at time of settlement. |
| (F) |
Rounds to less than $1 or $(1). |
| (G) |
Rate disclosed reflects the yield at June 30, 2024. |
| (H) |
There were no transfers in or out of Level 3 during the period ended June 30, 2024. Please reference the Investment Valuation section of the Notes to Financial Statements for more information regarding investment valuation and pricing inputs. |
The Notes to Financial Statements are an integral part of this report.
|
|
|
|
|
| Transamerica Series Trust |
|
|
|
Semi-Annual Financial Statements 2024 |
|
|
Page 13 |
|
|
Transamerica Aegon Core Bond VP
SCHEDULE OF INVESTMENTS (continued)
At June 30, 2024
(unaudited)
PORTFOLIO ABBREVIATION(S):
|
|
|
| CMT |
|
Constant Maturity Treasury |
| MTA |
|
Month Treasury Average |
| REIT |
|
Real Estate Investment Trust |
| RFUCC |
|
Refinitiv USD IBOR Consumer Cash Fallbacks |
| SOFR |
|
Secured Overnight Financing Rate |
| STRIPS |
|
Separate Trading of Registered Interest and Principal of Securities |
| TBA |
|
To Be Announced |
The Notes to Financial Statements are an integral part of this report.
|
|
|
|
|
| Transamerica Series Trust |
|
|
|
Semi-Annual Financial Statements 2024 |
|
|
Page 14 |
|
|
Transamerica Aegon Core Bond VP
|
|
|
| STATEMENT OF ASSETS AND LIABILITIES At June 30, 2024 (unaudited) |
|
STATEMENT OF OPERATIONS For the period ended June 30, 2024 (unaudited) |
|
|
|
|
|
| Assets: |
|
|
|
|
| Investments, at value (cost $451,138,564) (including securities loaned of $4,116,409) |
|
$ |
445,100,544 |
|
| Repurchase agreement, at value (cost $5,894,353) |
|
|
5,894,353 |
|
| Cash |
|
|
10,923 |
|
| Receivables and other assets: |
|
|
|
|
| Investments sold |
|
|
1,899,401 |
|
| Net income from securities lending |
|
|
385 |
|
| Shares of beneficial interest sold |
|
|
26,626 |
|
| Interest |
|
|
2,790,691 |
|
| Prepaid expenses |
|
|
2,012 |
|
|
|
| Total assets |
|
|
455,724,935 |
|
|
|
| Liabilities: |
|
|
|
|
| Cash collateral received upon return of: |
|
|
|
|
| Securities on loan |
|
|
4,202,788 |
|
| Cash collateral at broker for: |
|
|
|
|
| TBA commitments |
|
|
412,000 |
|
| Payables and other liabilities: |
|
|
|
|
| Investments purchased |
|
|
3,280,647 |
|
| When-issued, delayed-delivery, forward and TBA commitments purchased |
|
|
70,683,586 |
|
| Shares of beneficial interest redeemed |
|
|
49,488 |
|
| Investment management fees |
|
|
120,622 |
|
| Distribution and service fees |
|
|
48,971 |
|
| Transfer agent costs |
|
|
569 |
|
| Trustee and CCO fees |
|
|
1,630 |
|
| Audit and tax fees |
|
|
23,800 |
|
| Custody fees |
|
|
36,653 |
|
| Legal fees |
|
|
10,439 |
|
| Printing and shareholder reports fees |
|
|
30,029 |
|
| Other accrued expenses |
|
|
10,602 |
|
|
|
| Total liabilities |
|
|
78,911,824 |
|
|
|
| Net assets |
|
$ |
376,813,111 |
|
|
|
| Net assets consist of: |
|
|
|
|
| Capital stock ($0.01 par value) |
|
$ |
326,664 |
|
| Additional paid-in capital |
|
|
418,795,502 |
|
| Total distributable earnings (accumulated losses) |
|
|
(42,309,055 |
) |
|
|
| Net assets |
|
$ |
376,813,111 |
|
|
|
| Net assets by class: |
|
|
|
|
| Initial Class |
|
$ |
122,038,566 |
|
| Service Class |
|
|
254,774,545 |
|
|
|
| Shares outstanding: |
|
|
|
|
| Initial Class |
|
|
11,164,702 |
|
| Service Class |
|
|
21,501,662 |
|
|
|
| Net asset value and offering price per share: |
|
|
|
|
| Initial Class |
|
$ |
10.93 |
|
| Service Class |
|
|
11.85 |
|
|
|
|
|
|
| Investment income: |
|
|
|
|
| Dividend income |
|
$ |
31,303 |
|
| Interest income |
|
|
10,331,168 |
|
| Net income from securities lending |
|
|
5,638 |
|
| Total investment income |
|
|
10,368,109 |
|
|
|
| Expenses: |
|
|
|
|
| Investment management fees |
|
|
853,314 |
|
| Distribution and service fees: |
|
|
|
|
| Service Class |
|
|
317,793 |
|
| Transfer agent costs |
|
|
2,510 |
|
| Trustee and CCO fees |
|
|
9,669 |
|
| Audit and tax fees |
|
|
23,335 |
|
| Custody fees |
|
|
43,790 |
|
| Legal fees |
|
|
18,761 |
|
| Printing and shareholder reports fees |
|
|
37,717 |
|
| Other |
|
|
32,602 |
|
|
|
| Total expenses before waiver and/or reimbursement and recapture |
|
|
1,339,491 |
|
| Expenses waived and/or reimbursed: |
|
|
|
|
| Initial Class |
|
|
(205 |
) |
| Service Class |
|
|
(265 |
) |
| Recapture of previously waived and/or reimbursed fees: |
|
|
|
|
| Initial Class |
|
|
205 |
|
| Service Class |
|
|
265 |
|
|
|
| Net expenses |
|
|
1,339,491 |
|
|
|
| Net investment income (loss) |
|
|
9,028,618 |
|
|
|
| Net realized gain (loss) on: |
|
|
|
|
| Investments |
|
|
(3,890,119 |
) |
|
|
| Net change in unrealized appreciation (depreciation) on: |
|
|
|
|
| Investments |
|
|
(8,932,438 |
) |
|
|
| Net realized and change in unrealized gain (loss) |
|
|
(12,822,557 |
) |
|
|
| Net increase (decrease) in net assets resulting from operations |
|
$ |
(3,793,939 |
) |
The Notes to Financial Statements are an integral part of this report.
|
|
|
|
|
| Transamerica Series Trust |
|
|
|
Semi-Annual Financial Statements 2024 |
|
|
Page 15 |
|
|
Transamerica Aegon Core Bond VP
STATEMENT OF CHANGES IN NET ASSETS
For the period and year ended:
|
|
|
|
|
|
|
|
|
| |
|
June 30, 2024 (unaudited) |
|
December 31, 2023 |
|
|
|
| From operations: |
|
|
|
|
|
|
|
|
| Net investment income (loss) |
|
|
$ 9,028,618 |
|
|
|
$ 20,524,527 |
|
| Net realized gain (loss) |
|
|
(3,890,119 |
) |
|
|
(7,759,780 |
) |
| Net change in unrealized appreciation (depreciation) |
|
|
(8,932,438 |
) |
|
|
8,231,199 |
|
|
|
|
| Net increase (decrease) in net assets resulting from operations |
|
|
(3,793,939 |
) |
|
|
20,995,946 |
|
|
|
|
| Dividends and/or distributions to shareholders: |
|
|
|
|
|
|
|
|
|
|
|
| Initial Class |
|
|
— |
|
|
|
(5,670,149 |
) |
| Service Class |
|
|
— |
|
|
|
(5,917,700 |
) |
|
|
|
| Net increase (decrease) in net assets resulting from dividends and/or distributions to shareholders |
|
|
— |
|
|
|
(11,587,849 |
) |
|
|
|
| Capital share transactions: |
|
|
|
|
|
|
|
|
| Proceeds from shares sold: |
|
|
|
|
|
|
|
|
| Initial Class |
|
|
28,578,269 |
|
|
|
200,648,643 |
|
| Service Class |
|
|
5,296,278 |
|
|
|
10,288,142 |
|
| |
|
|
33,874,547 |
|
|
|
210,936,785 |
|
| Dividends and/or distributions reinvested: |
|
|
|
|
|
|
|
|
| Initial Class |
|
|
— |
|
|
|
5,670,149 |
|
| Service Class |
|
|
— |
|
|
|
5,917,700 |
|
| |
|
|
— |
|
|
|
11,587,849 |
|
| Cost of shares redeemed: |
|
|
|
|
|
|
|
|
| Initial Class |
|
|
(117,553,353 |
) |
|
|
(110,854,124 |
) |
| Service Class |
|
|
(14,267,470 |
) |
|
|
(36,182,547 |
) |
|
|
|
| |
|
|
(131,820,823 |
) |
|
|
(147,036,671 |
) |
|
|
|
| Net increase (decrease) in net assets resulting from capital share transactions |
|
|
(97,946,276 |
) |
|
|
75,487,963 |
|
|
|
|
| Net increase (decrease) in net assets |
|
|
(101,740,215 |
) |
|
|
84,896,060 |
|
|
|
|
| Net assets: |
|
|
|
|
|
|
|
|
|
|
|
| Beginning of period/year |
|
|
478,553,326 |
|
|
|
393,657,266 |
|
| End of period/year |
|
|
$ 376,813,111 |
|
|
|
$ 478,553,326 |
|
|
|
|
| Capital share transactions - shares: |
|
|
|
|
|
|
|
|
| Shares issued: |
|
|
|
|
|
|
|
|
| Initial Class |
|
|
2,645,786 |
|
|
|
18,219,620 |
|
| Service Class |
|
|
451,585 |
|
|
|
886,389 |
|
| |
|
|
3,097,371 |
|
|
|
19,106,009 |
|
| Shares reinvested: |
|
|
|
|
|
|
|
|
| Initial Class |
|
|
— |
|
|
|
539,500 |
|
| Service Class |
|
|
— |
|
|
|
518,187 |
|
| |
|
|
— |
|
|
|
1,057,687 |
|
| Shares redeemed: |
|
|
|
|
|
|
|
|
| Initial Class |
|
|
(10,953,511 |
) |
|
|
(10,329,732 |
) |
| Service Class |
|
|
(1,215,620 |
) |
|
|
(3,122,224 |
) |
| |
|
|
(12,169,131 |
) |
|
|
(13,451,956 |
) |
| Net increase (decrease) in shares outstanding: |
|
|
|
|
|
|
|
|
| Initial Class |
|
|
(8,307,725 |
) |
|
|
8,429,388 |
|
| Service Class |
|
|
(764,035 |
) |
|
|
(1,717,648 |
) |
|
|
|
| |
|
|
(9,071,760 |
) |
|
|
6,711,740 |
|
The Notes to Financial Statements are an integral part of this report.
|
|
|
|
|
| Transamerica Series Trust |
|
|
|
Semi-Annual Financial Statements 2024 |
|
|
Page 16 |
|
|
Transamerica Aegon Core Bond VP
FINANCIAL HIGHLIGHTS
|
|
|
|
|
|
|
|
|
|
|
|
|
|
|
|
|
|
|
|
|
|
|
|
|
| For a share outstanding during the period and years indicated: |
|
Initial Class |
|
|
|
|
|
|
|
|
| |
|
June 30, 2024 (unaudited) |
|
|
December 31, 2023 |
|
|
December 31, 2022 |
|
|
December 31, 2021 |
|
|
December 31, 2020 |
|
|
December 31, 2019 |
|
|
|
|
|
|
|
|
| Net asset value, beginning of period/year |
|
$ |
10.97 |
|
|
$ |
10.64 |
|
|
$ |
12.63 |
|
|
$ |
13.65 |
|
|
$ |
13.23 |
|
|
$ |
12.52 |
|
|
|
|
|
|
|
|
| Investment operations: |
|
|
|
|
|
|
|
|
|
|
|
|
|
|
|
|
|
|
|
|
|
|
|
|
| Net investment income (loss)(A) |
|
|
0.25 |
|
|
|
0.48 |
|
|
|
0.31 |
|
|
|
0.27 |
|
|
|
0.32 |
|
|
|
0.35 |
|
| Net realized and unrealized gain (loss) |
|
|
(0.29 |
) |
|
|
0.15 |
|
|
|
(1.91 |
) |
|
|
(0.40 |
) |
|
|
0.66 |
|
|
|
0.72 |
|
|
|
|
|
|
|
|
| Total investment operations |
|
|
(0.04 |
) |
|
|
0.63 |
|
|
|
(1.60 |
) |
|
|
(0.13 |
) |
|
|
0.98 |
|
|
|
1.07 |
|
|
|
|
|
|
|
|
| Dividends and/or distributions to shareholders: |
|
|
|
|
|
|
|
|
|
|
|
|
|
|
|
|
|
|
|
|
|
|
|
|
| Net investment income |
|
|
— |
|
|
|
(0.30 |
) |
|
|
(0.34 |
) |
|
|
(0.38 |
) |
|
|
(0.52 |
) |
|
|
(0.36 |
) |
| Net realized gains |
|
|
— |
|
|
|
— |
|
|
|
(0.05 |
) |
|
|
(0.51 |
) |
|
|
(0.04 |
) |
|
|
— |
|
|
|
|
|
|
|
|
| Total dividends and/or distributions to shareholders |
|
|
— |
|
|
|
(0.30 |
) |
|
|
(0.39 |
) |
|
|
(0.89 |
) |
|
|
(0.56 |
) |
|
|
(0.36 |
) |
|
|
|
|
|
|
|
| Net asset value, end of period/year |
|
$ |
10.93 |
|
|
$ |
10.97 |
|
|
$ |
10.64 |
|
|
$ |
12.63 |
|
|
$ |
13.65 |
|
|
$ |
13.23 |
|
| |
|
|
|
|
|
|
|
|
|
|
|
|
|
|
|
|
|
|
|
|
|
|
|
|
|
| Total return |
|
|
(0.36 |
)%(B) |
|
|
6.04 |
% |
|
|
(12.77 |
)% |
|
|
(1.03 |
)% |
|
|
7.46 |
% |
|
|
8.53 |
% |
|
|
|
|
|
|
|
| Ratio and supplemental data: |
|
|
|
|
|
|
|
|
|
|
|
|
|
|
|
|
|
|
|
|
|
|
|
|
| Net assets end of period/year (000’s) |
|
$ |
122,039 |
|
|
$ |
213,566 |
|
|
$ |
117,521 |
|
|
$ |
146,690 |
|
|
$ |
161,281 |
|
|
$ |
363,293 |
|
| Expenses to average net assets |
|
|
|
|
|
|
|
|
|
|
|
|
|
|
|
|
|
|
|
|
|
|
|
|
| Excluding waiver and/or reimbursement and recapture |
|
|
0.50 |
%(C) |
|
|
0.50 |
% |
|
|
0.50 |
% |
|
|
0.52 |
% |
|
|
0.52 |
% |
|
|
0.52 |
% |
| Including waiver and/or reimbursement and recapture |
|
|
0.50 |
%(C)(D) |
|
|
0.50 |
% |
|
|
0.50 |
% |
|
|
0.52 |
% |
|
|
0.52 |
% |
|
|
0.52 |
% |
| Net investment income (loss) to average net assets |
|
|
4.60 |
%(C) |
|
|
4.49 |
% |
|
|
2.70 |
% |
|
|
2.08 |
% |
|
|
2.37 |
% |
|
|
2.65 |
% |
| Portfolio turnover rate |
|
|
40 |
%(B) |
|
|
90 |
% |
|
|
116 |
% |
|
|
27 |
% |
|
|
30 |
% |
|
|
26 |
% |
| (A) |
Calculated based on average number of shares outstanding. |
| (D) |
Waiver and/or reimbursement rounds to less than 0.01%. |
|
|
|
|
|
|
|
|
|
|
|
|
|
|
|
|
|
|
|
|
|
|
|
|
|
| For a share outstanding during the period and years indicated: |
|
Service Class |
|
|
|
|
|
|
|
|
| |
|
June 30, 2024 (unaudited) |
|
|
December 31, 2023 |
|
|
December 31, 2022 |
|
|
December 31, 2021 |
|
|
December 31, 2020 |
|
|
December 31, 2019 |
|
|
|
|
|
|
|
|
| Net asset value, beginning of period/year |
|
$ |
11.90 |
|
|
$ |
11.51 |
|
|
$ |
13.62 |
|
|
$ |
14.65 |
|
|
$ |
14.17 |
|
|
$ |
13.39 |
|
|
|
|
|
|
|
|
| Investment operations: |
|
|
|
|
|
|
|
|
|
|
|
|
|
|
|
|
|
|
|
|
|
|
|
|
| Net investment income (loss)(A) |
|
|
0.25 |
|
|
|
0.49 |
|
|
|
0.30 |
|
|
|
0.26 |
|
|
|
0.31 |
|
|
|
0.33 |
|
| Net realized and unrealized gain (loss) |
|
|
(0.30 |
) |
|
|
0.16 |
|
|
|
(2.06 |
) |
|
|
(0.44 |
) |
|
|
0.70 |
|
|
|
0.78 |
|
|
|
|
|
|
|
|
| Total investment operations |
|
|
(0.05 |
) |
|
|
0.65 |
|
|
|
(1.76 |
) |
|
|
(0.18 |
) |
|
|
1.01 |
|
|
|
1.11 |
|
|
|
|
|
|
|
|
| Dividends and/or distributions to shareholders: |
|
|
|
|
|
|
|
|
|
|
|
|
|
|
|
|
|
|
|
|
|
|
|
|
| Net investment income |
|
|
— |
|
|
|
(0.26 |
) |
|
|
(0.30 |
) |
|
|
(0.34 |
) |
|
|
(0.49 |
) |
|
|
(0.33 |
) |
| Net realized gains |
|
|
— |
|
|
|
— |
|
|
|
(0.05 |
) |
|
|
(0.51 |
) |
|
|
(0.04 |
) |
|
|
— |
|
|
|
|
|
|
|
|
| Total dividends and/or distributions to shareholders |
|
|
— |
|
|
|
(0.26 |
) |
|
|
(0.35 |
) |
|
|
(0.85 |
) |
|
|
(0.53 |
) |
|
|
(0.33 |
) |
|
|
|
|
|
|
|
| Net asset value, end of period/year |
|
$ |
11.85 |
|
|
$ |
11.90 |
|
|
$ |
11.51 |
|
|
$ |
13.62 |
|
|
$ |
14.65 |
|
|
$ |
14.17 |
|
| |
|
|
|
|
|
|
|
|
|
|
|
|
|
|
|
|
|
|
|
|
|
|
|
|
|
| Total return |
|
|
(0.42 |
)%(B) |
|
|
5.78 |
% |
|
|
(12.99 |
)% |
|
|
(1.27 |
)% |
|
|
7.16 |
% |
|
|
8.25 |
% |
|
|
|
|
|
|
|
| Ratio and supplemental data: |
|
|
|
|
|
|
|
|
|
|
|
|
|
|
|
|
|
|
|
|
|
|
|
|
| Net assets end of period/year (000’s) |
|
$ |
254,774 |
|
|
$ |
264,987 |
|
|
$ |
276,136 |
|
|
$ |
360,914 |
|
|
$ |
376,623 |
|
|
$ |
320,594 |
|
| Expenses to average net assets |
|
|
|
|
|
|
|
|
|
|
|
|
|
|
|
|
|
|
|
|
|
|
|
|
| Excluding waiver and/or reimbursement and recapture |
|
|
0.75 |
%(C) |
|
|
0.75 |
% |
|
|
0.75 |
% |
|
|
0.77 |
% |
|
|
0.77 |
% |
|
|
0.77 |
% |
| Including waiver and/or reimbursement and recapture |
|
|
0.75 |
%(C)(D) |
|
|
0.75 |
% |
|
|
0.75 |
% |
|
|
0.77 |
% |
|
|
0.77 |
% |
|
|
0.77 |
% |
| Net investment income (loss) to average net assets |
|
|
4.35 |
%(C) |
|
|
4.25 |
% |
|
|
2.41 |
% |
|
|
1.83 |
% |
|
|
2.11 |
% |
|
|
2.40 |
% |
| Portfolio turnover rate |
|
|
40 |
%(B) |
|
|
90 |
% |
|
|
116 |
% |
|
|
27 |
% |
|
|
30 |
% |
|
|
26 |
% |
| (A) |
Calculated based on average number of shares outstanding. |
| (D) |
Waiver and/or reimbursement rounds to less than 0.01%. |
The Notes to Financial Statements are an integral part of this report.
|
|
|
|
|
| Transamerica Series Trust |
|
|
|
Semi-Annual Financial Statements 2024 |
|
|
Page 17 |
|
|
Transamerica Aegon Core Bond VP
NOTES TO FINANCIAL STATEMENTS
At June 30, 2024
(unaudited)
1. ORGANIZATION
Transamerica Series Trust (“TST”) is an open-end management investment company registered under the Investment Company Act of 1940, as amended (the “1940 Act”). TST applies investment company accounting and reporting guidance. TST serves as a funding vehicle for variable life insurance, variable annuity, and group annuity products. Transamerica Aegon Core Bond VP (the “Portfolio”) is a series of TST and is classified as diversified under the 1940 Act. The Portfolio currently offers two classes of shares, Initial Class and Service Class.
The only shareholders of the Portfolio are affiliated insurance company separate accounts and/or affiliated asset allocation portfolios. Contract holders of the variable life and annuity contracts are not shareholders of the Portfolio. For ease of reference, shareholders and contract holders are collectively referred to in this report as “shareholders.”
This report must be accompanied or preceded by the Portfolio’s current prospectus, which contains additional information about the Portfolio, including risks, as well as investment objectives and strategies.
Transamerica Asset Management, Inc. (“TAM”) serves as investment manager for the Portfolio pursuant to an investment management agreement. TAM provides continuous and regular investment management services to the Portfolio. TAM supervises the Portfolio’s investments, conducts its investment program and provides supervisory, compliance and administrative services to the Portfolio.
TAM currently acts as a “manager of managers” and has hired sub-advisers to furnish day-to-day investment advice and recommendations. TAM may, in the future, determine to provide all aspects of the day-to-day management of the Portfolio without the use of a sub-adviser. When acting as a manager of managers, TAM provides investment management services that include, without limitation, the design and development of the Portfolio and its investment strategies and the ongoing review and evaluation of those investment strategies including recommending changes in strategy where it believes appropriate or advisable; the selection of one or more sub-advisers for the Portfolio employing a combination of quantitative and qualitative screens, research, analysis and due diligence; negotiation of sub-advisory agreements and fees; oversight and monitoring of sub-advisers and recommending changes to sub-advisers where it believes appropriate or advisable; recommending portfolio combinations and liquidations where it believes appropriate or advisable; selection and oversight of transition managers, as needed; regular supervision of the Portfolio’s investments; regular review and evaluation of sub-adviser performance; daily monitoring of the sub-advisers’ buying and selling of securities for the Portfolio; regular review of holdings; ongoing trade oversight and analysis; regular monitoring to ensure adherence to investment process; regular calls and periodic on-site visits with sub-advisers; portfolio construction and asset allocation when using multiple sub-advisers for the Portfolio; risk management oversight and analysis; oversight of negotiation of investment documentation and agreements; design, development, implementation and regular monitoring of the valuation process; periodic due diligence reviews of pricing vendors and vendor methodology; design, development, implementation and regular monitoring of the compliance process; respond to regulatory inquiries and determine appropriate litigation strategy, as needed; review of proxies voted by sub-advisers; oversight of preparation and review of materials for meetings of the Portfolio’s Board of Trustees (the “Board”), participation in these meetings and preparation of regular communications with the Board; oversight of preparation and review of prospectuses, shareholder reports and other disclosure materials and regulatory filings for the Portfolio; oversight of other service providers to the Portfolio, such as the custodian, the transfer agent, the Portfolio’s independent accounting firm and legal counsel; supervision of the performance of recordkeeping and shareholder relations functions for the Portfolio; and oversight of cash management services. TAM uses a variety of quantitative and qualitative tools to carry out its investment management services. TAM, not the Portfolio, is responsible for paying the sub-adviser(s) for their services, and sub-advisory fees are TAM’s expense.
TAM’s investment management services also include the provision of supervisory and administrative services to the Portfolio. These services include performing certain administrative services for the Portfolio and supervising and overseeing the administrative, clerical, recordkeeping and bookkeeping services provided to the Portfolio by State Street Bank and Trust Company (“State Street”), to whom TAM has outsourced the provision of certain sub-administration services. To the extent agreed upon by TAM and the Portfolio from time to time, TAM’s supervisory and administrative services include, but are not limited to: monitoring and verifying the custodian’s daily calculation of the Net Asset Values (“NAV”); shareholder relations functions; compliance services; valuation services; assisting in due diligence and in the oversight and monitoring of certain activities of sub-advisers and certain aspects of Portfolio investments; assisting with Portfolio combinations and liquidations; oversight of the preparation and filing, and review, of all returns and reports, in connection with federal, state and local taxes; oversight and review of regulatory reporting; supervising and coordinating the Portfolio’s custodian and dividend disbursing agent and monitoring their services to the Portfolio; assisting the Portfolio in preparing reports to shareholders; acting as liaison with the Portfolio’s independent public accountants and providing, upon request, analyses, fiscal year summaries and other audit related services; assisting in the preparation of agendas and supporting documents for and minutes of meetings of trustees and committees of trustees; assisting in the preparation of regular communications with the trustees; and providing personnel and office space, telephones and other office equipment as necessary in order for TAM to perform supervisory and administrative services to the Portfolio. The Portfolio pays certain fees and expenses to State Street for sub-administration services which are not administrative services covered by the
|
|
|
|
|
| Transamerica Series Trust |
|
|
|
Semi-Annual Financial Statements 2024 |
|
|
Page 18 |
|
|
Transamerica Aegon Core Bond VP
NOTES TO FINANCIAL STATEMENTS (continued)
At June 30, 2024
(unaudited)
1. ORGANIZATION (continued)
management agreement with TAM or paid for through the management fees payable thereunder. For the period ended June 30, 2024, (i) the expenses paid to State Street for sub-administration services by the Portfolio are shown as a part of Other expenses within the Statement of Operations and (ii) the expenses payable to State Street for sub-administration services from the Portfolio are shown as part of Other accrued expenses within the Statement of Assets and Liabilities.
2. SIGNIFICANT ACCOUNTING POLICIES
In preparing the Portfolio’s financial statements in accordance with Generally Accepted Accounting Principles in the United States of America (“GAAP”), estimates or assumptions (which could differ from actual results) may be used that affect reported amounts and disclosures. The following is a summary of significant accounting policies followed by the Portfolio.
Security transactions and investment income: Security transactions are accounted for on the trade date. Security gains and losses are calculated on a first-in, first-out basis. Dividend income, if any, is recorded on the ex-dividend date or, in the case of foreign securities, as soon as the Portfolio is informed of the ex-dividend dates, net of foreign taxes. Non-cash dividends, if any, are recorded on the ex-dividend date at fair value. Interest income, if any, is recorded on the accrual basis from settlement date, net of foreign taxes. Fixed income premiums and discounts are amortized and/or accreted over the lives of the respective securities.
Multiple class operations, income, and expenses: Income, non-class specific expenses, and realized and unrealized gains and losses are allocated to each class daily based upon net assets. Each class bears its own specific expenses in addition to the allocated non-class specific expenses.
Distributions to shareholders: Distributions are recorded on the ex-dividend date and are determined in accordance with federal income tax regulations, which may differ from GAAP.
Commission recapture: The sub-adviser(s), to the extent consistent with the best execution and usual commission rate policies and practices, may elect to place security transactions of the Portfolio with broker/dealers with which TST has established a commission recapture program. A commission recapture program is any arrangement under which a broker/dealer applies a portion of the commissions received by such broker/dealer on the security transactions to the Portfolio. In no event will commissions, paid by the Portfolio, be used to pay expenses that would otherwise be borne by any other Portfolios within TST, or by any other party.
There were no commissions recaptured during the period ended June 30, 2024 by the Portfolio.
Indemnification: In the normal course of business, the Portfolio enters into contracts that contain a variety of representations that provide general indemnifications. The Portfolio’s maximum exposure under these arrangements is unknown, as this would involve future claims that may be made against the Portfolio and/or its affiliates that have not yet occurred. However, based on experience, the Portfolio expects the risk of loss to be remote.
3. INVESTMENT VALUATION
TAM has been designated as the Portfolio’s valuation designee pursuant to Rule 2a-5 under the 1940 Act with responsibility for fair valuation subject to oversight by the Portfolio’s Board of Trustees. The net asset value of the Portfolio is computed as of the official close of the New York Stock Exchange (“NYSE”) each day the NYSE is open for business.
TAM utilizes various methods to measure the fair value of its investments on a recurring basis. GAAP establishes a hierarchy that prioritizes inputs to valuation methods. The inputs or methodology used for valuing securities are not necessarily an indication of the risk associated with investing in those securities. The three levels (“Levels”) of inputs of the fair value hierarchy are defined as follows:
Level 1—Unadjusted quoted prices in active markets for identical securities.
Level 2—Inputs, other than quoted prices included in Level 1, which are observable, either directly or indirectly. These inputs may include quoted prices for the identical instrument on an inactive market, prices for similar instruments, interest rates, prepayment speeds, credit risk, yield curves, default rates, and similar data.
Level 3—Unobservable inputs based on the best information available in the circumstances, to the extent observable inputs are not available, which may include TAM’s own assumptions used in determining the fair value of the Portfolio’s investments.
|
|
|
|
|
| Transamerica Series Trust |
|
|
|
Semi-Annual Financial Statements 2024 |
|
|
Page 19 |
|
|
Transamerica Aegon Core Bond VP
NOTES TO FINANCIAL STATEMENTS (continued)
At June 30, 2024
(unaudited)
3. INVESTMENT VALUATION (continued)
The inputs used to measure fair value may fall into different Levels of the fair value hierarchy. In such cases, for disclosure purposes, the Level in the fair value hierarchy that is assigned to the fair value measurement of a security is determined based on the lowest Level input that is significant to the fair value measurement in its entirety. Certain investments that are measured at fair value using NAV per share, or its equivalent, using the “practical expedient” have not been classified in the fair value Levels. The hierarchy classification of inputs used to value the Portfolio’s investments at June 30, 2024, is disclosed within the Investment Valuation section of the Schedule of Investments.
The availability of observable inputs can vary from security to security and is affected by a wide variety of factors, including, but not limited to, the type of security, whether the security is new and not yet established in the marketplace, the liquidity of markets, and other characteristics particular to the security. To the extent that valuation is based on models or inputs that are less observable or unobservable in the market, the determination of fair value requires more judgment. Accordingly, the degree of judgment exercised in determining fair value is generally greatest for instruments categorized in Level 3. Due to the inherent uncertainty of valuation, the determination of values may differ significantly from values that would have been realized had a ready market for investments existed, and the differences could be material.
Fair value measurements: Descriptions of the valuation techniques applied to the Portfolio’s significant categories of assets and liabilities measured at fair value on a recurring basis are as follows:
Asset-backed securities: The fair value of asset-backed securities is estimated based on models that consider the estimated cash flows of each tranche of the entity, establish a benchmark yield, and develop an estimated tranche specific spread to the benchmark yield based on the unique attributes of the tranche. To the extent the inputs are observable and timely, the values would generally be categorized in Level 2 of the fair value hierarchy; otherwise they would be categorized in Level 3.
Commercial paper: Commercial paper is valued using amortized cost, which approximates fair value. The values are generally categorized in Level 2 of the fair value hierarchy, or Level 3 if inputs are unobservable.
Corporate debt securities: The fair value of corporate debt securities is estimated using various techniques, which consider recently executed transactions in securities of the issuer or comparable issuers, market price quotations (where observable), bond spreads, fundamental data relating to the issuer, and credit default swap spreads adjusted for any basis difference between cash and derivative instruments. While most corporate debt securities are categorized in Level 2 of the fair value hierarchy, in instances where lower relative weight is placed on transaction prices, quotations, or similar observable inputs, they are categorized in Level 3.
Equity securities: Securities are stated at the last reported sales price or closing price on the day of valuation taken from the primary exchange where the security is principally traded. To the extent these securities are actively traded and valuation adjustments are not applied, they are categorized in Level 1 of the fair value hierarchy. Equities traded on inactive markets or valued by reference to similar instruments are generally categorized in Level 2 or Level 3 if inputs are unobservable.
Foreign government obligations: Foreign government obligations are normally valued using a model that incorporates market observable data such as reported sales of similar securities, broker quotes, yields, bids, offers, and reference data. Certain securities are valued by principally using dealer quotations. Foreign government obligations generally are categorized in Level 2 of the fair value hierarchy, or Level 3 if inputs are unobservable.
Mortgage-backed securities: The fair value of mortgage-backed securities is estimated based on models that consider issuer type, coupon, cash flows, mortgage prepayment projection tables and adjustable rate mortgage evaluations that incorporate index data, periodic life caps and the next coupon reset date. To the extent the inputs are observable and timely, the values would generally be categorized in Level 2 of the fair value hierarchy; otherwise they are categorized in Level 3.
U.S. government agency obligations: U.S. government agency obligations are comprised of two main categories consisting of agency issued debt and mortgage pass-throughs. Generally, agency issued debt securities are valued in a manner similar to U.S. government obligations. Mortgage pass-throughs include to be announced (“TBA”) securities and mortgage pass-through certificates. Generally, TBA securities and mortgage pass-throughs are valued using dealer quotations. Depending on market activity levels and whether quotations or other observable data are used, these securities are typically categorized in Level 2 of the fair value hierarchy; otherwise they would be categorized in Level 3.
|
|
|
|
|
| Transamerica Series Trust |
|
|
|
Semi-Annual Financial Statements 2024 |
|
|
Page 20 |
|
|
Transamerica Aegon Core Bond VP
NOTES TO FINANCIAL STATEMENTS (continued)
At June 30, 2024
(unaudited)
3. INVESTMENT VALUATION (continued)
U.S. government obligations: U.S. government obligations are normally valued using a model that incorporates market observable data such as reported sales of similar securities, broker quotes, yields, bids, offers, and reference data. Certain securities are valued by principally using dealer quotations. U.S. government obligations generally are categorized in Level 2 of the fair value hierarchy, or Level 3 if inputs are unobservable.
Short-term notes: The Portfolio normally values short-term government and U.S. government agency securities using a model that incorporates market observable data such as reported sales of similar securities, broker quotes, yields, bids, offers and reference data. Certain securities are valued by principally using dealer quotations. Short-term government and U.S. government agency securities generally are categorized in Level 2 of the fair value hierarchy, or Level 3 if inputs are unobservable.
Securities lending collateral: Securities lending collateral is invested in a money market fund which is valued at the actively traded NAV and no valuation adjustments are applied. Securities lending collateral is categorized in Level 1 of the fair value hierarchy.
Repurchase agreements: Repurchase agreements are valued at cost, which approximates fair value. To the extent the inputs are observable and timely, the values are generally categorized in Level 2 of the fair value hierarchy.
4. SECURITIES AND OTHER INVESTMENTS
Real estate investment trusts (“REITs”): REITs are pooled investment vehicles which invest primarily in income producing real estate, or real estate related loans or interests. Distributions received by REITs are classified at management’s estimate of the dividend income, return of capital and capital gains. Estimates are based on information available at year-end, which includes the previous fiscal year’s classification. The actual amounts of dividend income, return of capital, and capital gains are only determined by each REIT after the fiscal year end and may differ from the estimated amounts. Upon notification from the REITs, some of the distributions received may be re-classified and recorded as a return of capital or capital gains. There are certain additional risks involved in investing in REITs. These include, but are not limited to, economic conditions, changes in zoning laws, real estate values, property taxes, and interest rates.
REITs held at June 30, 2024, if any, are identified within the Schedule of Investments.
Treasury inflation-protected securities (“TIPS”): The Portfolio may invest in TIPS, which are fixed income securities whose principal value is periodically adjusted according to the rate of inflation/deflation. If the index measuring inflation/deflation rises or falls, the principal value of TIPS will be adjusted upward or downward, and consequently the interest payable on these securities (calculated with respect to a larger or smaller principal amount) will be increased or reduced, respectively. Repayment of the original bond principal upon maturity (as adjusted for inflation) is guaranteed in the case of U.S. Treasury inflation-indexed bonds and notes. For bonds and notes that do not provide a similar guarantee, the adjusted principal value of the bond repaid at maturity may be less than the original principal.
TIPS held at June 30, 2024, if any, are included within the Schedule of Investments. The adjustments, if any, to principal due to inflation/deflation are reflected as increases/decreases to Interest income within the Statement of Operations, with a corresponding adjustment to Investments, at cost within the Statement of Assets and Liabilities.
When-issued, delayed-delivery, forward, and to be announced (“TBA”) commitment transactions: The Portfolio may purchase or sell securities on a when-issued, delayed-delivery, forward and TBA commitment basis. When-issued and forward commitment transactions are made conditionally because a security, although authorized, has not yet been issued in the market. Settlement of such transactions normally occurs within a month or more after the purchase or sale commitment is made. The Portfolio engages in when-issued and forward commitment transactions to obtain an advantageous price and yield at the time of the transaction. The Portfolio engages in when-issued and forward commitment transactions for the purpose of acquiring securities, but may enter into a separate agreement to sell the securities before the settlement date. Since the value of securities purchased may fluctuate prior to settlement, the Portfolio may be required to pay more at settlement than the security is worth. In addition, the Portfolio is not entitled to any of the interest earned prior to settlement.
Delayed-delivery transactions involve a commitment by the Portfolio to purchase or sell securities for a predetermined price or yield, with payment and delivery taking place beyond the customary settlement period. When delayed-delivery transactions are outstanding, the Portfolio will segregate with its custodian either cash, U.S. government securities, or other liquid assets at least equal to the value or purchase commitments until payment is made. When purchasing a security on a delayed-delivery basis, the Portfolio assumes the rights and risks of ownership of the security, including the risk of price and yield fluctuations. These transactions also involve a risk to the Portfolio if the other party to the transaction defaults on its obligation to make payment or delivery, and the Portfolio is delayed or prevented from
|
|
|
|
|
| Transamerica Series Trust |
|
|
|
Semi-Annual Financial Statements 2024 |
|
|
Page 21 |
|
|
Transamerica Aegon Core Bond VP
NOTES TO FINANCIAL STATEMENTS (continued)
At June 30, 2024
(unaudited)
4. SECURITIES AND OTHER INVESTMENTS (continued)
completing the transaction. The Portfolio may dispose of or renegotiate a delayed-delivery transaction after it is entered into, which may result in a realized gain or loss. When the Portfolio sells a security on a delayed-delivery basis, the Portfolio does not participate in future gains and losses on the security.
TBA commitments are entered into to purchase or sell securities for a fixed price at a future date, typically not to exceed 45 days. TBAs are considered securities in themselves, and involve a risk of loss if the value of the security to be purchased declines, or the value of the security sold increases, prior to settlement date, in addition to the risk of decline in the value of a Portfolio’s other assets. Unsettled TBA commitments are valued at the current value of the underlying securities. TBA collateral requirements are typically calculated by netting the mark-to-market amount for each transaction and comparing that amount to the value of the collateral currently pledged by a Portfolio and the counterparty. Cash collateral that has been pledged to cover the obligations of a Portfolio and cash collateral received from the counterparty, if any, is reported separately in the Statement of Assets and Liabilities as Cash collateral pledged at broker for TBA commitments or Cash collateral at broker for TBA commitments, respectively. Non-cash collateral pledged by a Portfolio, if any, is disclosed within the Schedule of Investments. Typically, a Portfolio is permitted to sell, re-pledge or use the collateral it receives; however, the counterparty is not permitted. To the extent amounts due to a Portfolio are not fully collateralized, contractually or otherwise, a Portfolio bears the risk of loss from counterparty non-performance.
When-issued, delayed-delivery, forward and TBA commitment transactions held at June 30, 2024, if any, are identified within the Schedule of Investments. Open trades, if any, are reflected as When-issued, delayed-delivery, forward and TBA commitments purchased or sold within the Statement of Assets and Liabilities.
5. BORROWINGS AND OTHER FINANCING TRANSACTIONS
The Portfolio may engage in borrowing transactions as a means of raising cash to satisfy redemption requests, for other temporary or emergency purposes or, to the extent permitted by its investment policies, to raise additional cash to be invested in other securities or instruments. When the Portfolio invests borrowing proceeds in other securities, the Portfolio will bear the risk that the market value of the securities in which such proceeds are invested goes down and is insufficient to repay the borrowed proceeds. The Portfolio may borrow on a secured or on an unsecured basis. If the Portfolio enters into a secured borrowing arrangement, a portion of the Portfolio’s assets will be used as collateral. The 1940 Act requires the Portfolio to maintain asset coverage of at least 300% of the amount of its borrowings. Asset coverage means the ratio that the value of the Portfolio’s total assets, minus liabilities other than borrowings, bears to the aggregate amount of all borrowings. Although complying with this requirement has the effect of limiting the amount that the Portfolio may borrow, it does not otherwise mitigate the risks of entering into borrowing transactions.
Interfund lending: The Portfolio, along with other funds and portfolios advised by TAM, may participate in an interfund lending program pursuant to exemptive relief granted by the Securities and Exchange Commission on January 18, 2017. This program allows the Portfolio to lend to and borrow from other funds and portfolios advised by TAM. Interfund lending transactions are subject to the conditions of the exemptive relief which places limits on the amount of lending or borrowing a Portfolio may participate in under the program. Interest earned or paid on an interfund lending transaction will be based on the average of certain current market rates. For the period ended June 30, 2024, the Portfolio has not utilized the program.
Repurchase agreements: In a repurchase agreement, the Portfolio purchases a security and simultaneously commits to resell that security to the seller at an agreed-upon price on an agreed-upon date. Securities purchased subject to a repurchase agreement are held at the Portfolio’s custodian, or designated sub-custodian related to tri-party repurchase agreements, and, pursuant to the terms of the repurchase agreement, must be collateralized by securities with an aggregate market value greater than or equal to 100% of the resale price. The Portfolio will bear the risk of value fluctuations until the securities can be sold and may encounter delays and incur costs in liquidating the securities. In the event of bankruptcy or insolvency of the seller, delays and costs may be incurred.
Repurchase agreements are subject to netting agreements, which are agreements between the Portfolio and its counterparties that provide for the net settlement of all transactions and collateral with the Portfolio, through a single payment, in the event of default or termination. Amounts presented within the Schedule of Investments, and as part of Repurchase agreements, at value within the Statement of Assets and Liabilities are shown on a gross basis. The value of the related collateral for each repurchase agreement, as reflected within the Schedule of Investments, exceeds the value of each repurchase agreement at June 30, 2024.
Repurchase agreements at June 30, 2024, if any, are included within the Schedule of Investments and Statement of Assets and Liabilities.
|
|
|
|
|
| Transamerica Series Trust |
|
|
|
Semi-Annual Financial Statements 2024 |
|
|
Page 22 |
|
|
Transamerica Aegon Core Bond VP
NOTES TO FINANCIAL STATEMENTS (continued)
At June 30, 2024
(unaudited)
5. BORROWINGS AND OTHER FINANCING TRANSACTIONS (continued)
Securities lending: The Portfolio may lend securities to qualified financial institutions, brokers and dealers. State Street serves as securities lending agent to the Portfolio pursuant to a Securities Lending Agreement. Loans of securities are terminable at any time and the borrower, after notice, is required to return borrowed securities within the standard time period for settlement of securities transactions. The lending of securities exposes the Portfolio to risks such as: the borrowers may fail to return the loaned securities or may not be able to provide additional collateral, the Portfolio may experience delays in recovery of the loaned securities or delays in access to collateral, or the Portfolio may experience losses related to the investment collateral. To minimize certain risks, loan counterparties pledge cash, securities issued or guaranteed by the U.S. Government and irrevocable letters of credit issued by banks as collateral. The initial collateral received by the Portfolio is required to have a value of at least 102% of the current value of the loaned securities traded on U.S. exchanges, and a value of at least 105% for all other securities. Typically the lending agent is not permitted to sell, re-pledge or use cash and non-cash collateral it receives. The lending agent has agreed to indemnify the Portfolio in the case of default of any securities borrower.
The Portfolio receives compensation for lending securities from interest or dividends earned on the cash, U.S. Government securities and irrevocable letters of credit held as collateral, less associated fees and expenses. Such income is reflected in Net income from securities lending within the Statement of Operations. Cash collateral received is invested in the State Street Navigator Securities Lending Trust — Government Money Market Portfolio.
The value of loaned securities and related cash and non-cash collateral outstanding at June 30, 2024, if any, are shown on a gross basis within the Schedule of Investments.
The following table reflects a breakdown of transactions accounted for as secured borrowings, the gross obligation by the type, and the remaining contractual maturity of those transactions as of June 30, 2024.
|
|
|
|
|
|
|
|
|
|
|
|
|
|
|
|
|
|
|
|
|
| |
|
Remaining Contractual Maturity of the Agreements |
|
| |
|
Overnight and Continuous |
|
|
Less Than 30 Days |
|
|
Between 30 & 90 Days |
|
|
Greater Than 90 Days |
|
|
Total |
|
| Securities Lending Transactions |
|
|
|
|
|
|
|
|
|
|
|
|
|
|
|
|
|
|
|
|
| Corporate Debt Securities |
|
$ |
381,564 |
|
|
$ |
— |
|
|
$ |
— |
|
|
$ |
— |
|
|
$ |
381,564 |
|
| U.S. Government Obligations |
|
|
3,821,224 |
|
|
|
— |
|
|
|
— |
|
|
|
— |
|
|
|
3,821,224 |
|
| Total Securities Lending Transactions |
|
$ |
4,202,788 |
|
|
$ |
— |
|
|
$ |
— |
|
|
$ |
— |
|
|
$ |
4,202,788 |
|
| Total Borrowings |
|
$ |
4,202,788 |
|
|
$ |
— |
|
|
$ |
— |
|
|
$ |
— |
|
|
$ |
4,202,788 |
|
| |
|
|
|
|
|
|
|
|
|
|
|
|
|
|
|
6. RISK FACTORS
Investing in the Portfolio involves certain key risks related to the Portfolio’s trading activity. Please reference the Portfolio’s prospectus for a more complete discussion of the following risk(s), as well as other risks of investing in the Portfolio.
Market risk: The market prices of the Portfolio’s securities or other assets may go up or down, sometimes rapidly or unpredictably, due to factors such as economic events, inflation, changes in interest rates, governmental actions or interventions, actions taken by the U.S. Federal Reserve or foreign central banks, market disruptions caused by tariffs, trade disputes or other factors, political developments, armed conflicts, economic sanctions, cybersecurity events, investor sentiment, the global and domestic effects of widespread or local health, weather or climate events, and other factors that may or may not be related to the issuer of the security or other asset. If the market prices of the Portfolio’s securities and assets fall, the value of your investment in the Portfolio could go down.
Economies and financial markets throughout the world are increasingly interconnected. Events or circumstances in one or more countries or regions could be highly disruptive to, and have profound impacts on, global economies or markets. As a result, whether or not the Portfolio invests in securities of issuers located in or with significant exposure to the countries directly affected, the value and liquidity of the Portfolio’s investments may go down.
Fixed-income securities risk: Risks of fixed-income securities include credit risk, interest rate risk, counterparty risk, prepayment risk, extension risk, valuation risk, and liquidity risk. The value of fixed-income securities may go up or down, sometimes rapidly and unpredictably, due to general market conditions, such as real or perceived adverse economic or political conditions, tariffs and trade disruptions, inflation, changes in interest rates, lack of liquidity in the bond markets or adverse investor sentiment. In addition, the value of a fixed-income security may decline if the issuer or other obligor of the security fails to pay principal and/or interest, otherwise defaults or
|
|
|
|
|
| Transamerica Series Trust |
|
|
|
Semi-Annual Financial Statements 2024 |
|
|
Page 23 |
|
|
Transamerica Aegon Core Bond VP
NOTES TO FINANCIAL STATEMENTS (continued)
At June 30, 2024
(unaudited)
6. RISK FACTORS (continued)
has its credit rating downgraded or is perceived to be less creditworthy, or the credit quality or value of any underlying assets declines. If the value of fixed-income securities owned by the Portfolio falls, the value of your investment will go down. The Portfolio may lose its entire investment in the fixed-income securities of an issuer.
Interest rate risk: The value of fixed-income securities generally goes down when interest rates rise. A rise in rates tends to have a greater impact on the prices of longer term or duration securities. Changes in interest rates also may affect the liquidity of the Portfolio’s investments. A general rise in interest rates may cause investors to sell fixed-income securities on a large scale, which could adversely affect the price and liquidity of fixed-income securities generally and could also result in increased redemptions from the Portfolio. Increased redemptions could cause the Portfolio to sell securities at inopportune times or depressed prices and result in further losses. The U.S. Federal Reserve has raised interest rates from historically low levels. Any additional interest rate increases in the future may cause the value of fixed-income securities to decrease.
7. FEES AND OTHER AFFILIATED TRANSACTIONS
TST serves as a funding vehicle for certain affiliated asset allocation portfolios and certain affiliated separate accounts of Transamerica Life Insurance Company (“TLIC”) and Transamerica Financial Life Insurance Company.
TAM, the Portfolio’s investment manager, is directly owned by TLIC and AUSA Holding, LLC (“AUSA”), both of which are indirect, wholly owned subsidiaries of Aegon Ltd. TLIC is owned by Commonwealth General Corporation (“Commonwealth”). Commonwealth and AUSA are wholly owned by Transamerica Corporation (DE). Transamerica Corporation (DE) is wholly owned by Aegon International B.V., which is wholly owned by Aegon Ltd., a Bermuda exempted company with liability limited by shares (formerly, Aegon NV, a Netherlands corporation) and a publicly traded international insurance group.
TAM has entered into a sub-advisory agreement with Aegon USA Investment Management, LLC (“AUIM”), an affiliate of TAM. AUIM provides day-to-day portfolio management services to the Portfolio, subject to the supervision of TAM. TAM is responsible for compensating the sub-adviser for its services.
Transamerica Fund Services, Inc. (“TFS”) is the Portfolio’s transfer agent. Transamerica Capital, Inc. (“TCI”) is the Portfolio’s distributor/principal underwriter. TAM, AUIM, TFS and TCI are affiliates of Aegon Ltd.
Certain officers and trustees of the Portfolio may also be officers and/or trustees of TAM, AUIM, TFS and TCI. No interested trustee who is deemed an interested person due to current or former service with TAM or an affiliate of TAM receives compensation from the Portfolio. The Portfolio does pay non-interested persons (independent trustees), as disclosed in Trustee and CCO fees within the Statement of Operations.
Investment management fees: TAM serves as the Portfolio’s investment manager, performing administration as well as investment advisory services. TAM renders investment advisory, supervisory, and administration services under an investment management agreement and the Portfolio pays a single management fee, which is reflected in Investment management fees within the Statement of Operations.
The Portfolio pays a management fee to TAM based on daily average net assets at the following rates:
|
|
|
|
|
| Breakpoints |
|
Rate |
|
| First $1 billion |
|
|
0.420 |
% |
| Over $1 billion up to $2 billion |
|
|
0.380 |
|
| Over $2 billion up to $3.5 billion |
|
|
0.365 |
|
| Over $3.5 billion up to $5 billion |
|
|
0.360 |
|
| Over $5 billion |
|
|
0.355 |
|
TAM has contractually agreed to waive fees and/or reimburse Portfolio expenses to the extent that the total operating expenses excluding, as applicable, acquired fund fees and expenses, interest (including borrowing costs and overdraft charges), taxes, brokerage commissions, dividend and interest expenses on securities sold short, extraordinary expenses and other expenses not incurred in the ordinary course of the Portfolio’s business, exceed the following stated annual operating expense limits to the Portfolio’s daily average net
|
|
|
|
|
| Transamerica Series Trust |
|
|
|
Semi-Annual Financial Statements 2024 |
|
|
Page 24 |
|
|
Transamerica Aegon Core Bond VP
NOTES TO FINANCIAL STATEMENTS (continued)
At June 30, 2024
(unaudited)
7. FEES AND OTHER AFFILIATED TRANSACTIONS (continued)
assets. To the extent an expense limit changed during the period, the prior limit is also listed below. The expenses waived and/or reimbursed, if any, are included in Expenses waived and/or reimbursed within the Statement of Operations.
|
|
|
|
|
|
|
|
|
| Class |
|
Operating Expense Limit |
|
|
Operating Expense Limit Effective Through |
|
| Effective May 1, 2024 |
|
|
|
|
|
|
|
|
| Initial Class |
|
|
0.54% |
|
|
|
May 1, 2025 |
|
| Service Class |
|
|
0.79 |
|
|
|
May 1, 2025 |
|
| Prior to May 1, 2024 |
|
|
|
|
|
|
|
|
| Service Class |
|
|
0.80 |
|
|
|
|
|
TAM is permitted to recapture amounts contractually waived and/or reimbursed to a class during any of the 36 months from the date on which TAM waived fees and/or reimbursed expenses for the class. A class may recapture and reimburse TAM only if such amount does not cause, on any particular business day of the Portfolio, the class’s total annual operating expenses (after the recapture is taken into account) to exceed the Operating Expense Limits or any other lower limit then in effect. Amounts recaptured, if any, by TAM for the period ended June 30, 2024 are disclosed in Recapture of previously waived and/or reimbursed fees within the Statement of Operations.
TAM, on a voluntary basis and in addition to the contractual operating expense limits in effect, from time to time may waive and/or reimburse expenses of the Portfolio, or any classes thereof, to such level(s) as the Trust’s officers have determined or may reasonably determine from time to time. Any such voluntary waiver or expense reimbursement may be discontinued by TAM at any time. These amounts are not subject to recapture by TAM.
As of June 30, 2024, there are no amounts available for recapture by TAM.
Distribution and service fees: TST has a distribution plan (“Distribution Plan”) pursuant to Rule 12b-1 under the 1940 Act. Pursuant to the Distribution Plan, TST entered into a distribution agreement with TCI as the Portfolio’s distributor.
The Distribution Plan requires the Portfolio to pay distribution fees to TCI as compensation for various distribution activities, not as reimbursement for specific expenses. Under the Distribution Plan and distribution agreement, TCI, on behalf of the Portfolio, is authorized to pay various service providers, as direct payment for expenses incurred in connection with distribution of the Portfolio’s shares.
The fee on the Service Class shares is paid to the insurance companies for providing services and account maintenance for the policyholders who invest in the variable insurance products which invest in the Service Class shares. TCI has determined that it will not seek payment for the distribution expenses incurred by the Portfolio with respect to the Initial Class shares before May 1, 2025. Prior to TCI seeking distribution expenses on Initial Class shares, policy and contract owners will be notified in advance. The Portfolio will pay fees relating to Service Class shares. The distribution and service fees are included in Distribution and service fees within the Statement of Operations.
The Portfolio is authorized under the Distribution Plan to pay fees to TCI based on daily average net assets of each applicable class up to the following annual rates:
|
|
|
|
|
| Class |
|
Rate |
|
| Initial Class |
|
|
0.15 |
% |
| Service Class |
|
|
0.25 |
|
Transfer agent costs: TFS provides transfer agency services under an intercompany agreement with TAM. TFS has outsourced the provision of certain sub-transfer agency services to SS&C Global Investor & Distribution Solutions, Inc. (“SS&C GIDS”). The Portfolio does not pay a separate transfer agent fee to TAM or TFS but does pay certain expenses to SS&C GIDS related to applicable sub-transfer agency services. For the period ended June 30, 2024, (i) the expenses paid to SS&C GIDS by the Portfolio are referred to as transfer agent costs and are included within the Statement of Operations and (ii) the expenses payable to SS&C GIDS by the Portfolio are referred to as transfer agent costs within the Statement of Assets and Liabilities.
|
|
|
|
|
| Transamerica Series Trust |
|
|
|
Semi-Annual Financial Statements 2024 |
|
|
Page 25 |
|
|
Transamerica Aegon Core Bond VP
NOTES TO FINANCIAL STATEMENTS (continued)
At June 30, 2024
(unaudited)
7. FEES AND OTHER AFFILIATED TRANSACTIONS (continued)
Brokerage commissions: The Portfolio incurred no brokerage commissions on security transactions placed with affiliates of the investment manager or sub-adviser(s) for the period ended June 30, 2024.
8. PURCHASES AND SALES OF SECURITIES
For the period ended June 30, 2024, the cost of securities purchased and proceeds from securities sold (excluding short-term securities) are as follows:
|
|
|
|
|
|
|
| Purchases of Securities |
|
Sales/Maturities of Securities |
| |
|
|
| Long-Term |
|
U.S. Government |
|
Long-Term |
|
U.S. Government |
| |
|
|
| $ 76,171,770 |
|
$ 54,231,065 |
|
$ 94,014,089 |
|
$ 106,729,200 |
9. FEDERAL INCOME TAXES AND DISTRIBUTIONS TO SHAREHOLDERS
The Portfolio has not made any provision for federal income or excise taxes due to its policy to distribute all of its taxable income and capital gains to its shareholders and otherwise qualify as a regulated investment company under Subchapter M of the Internal Revenue Code. The Portfolio recognizes the tax benefits of uncertain tax positions only where the position is “more likely than not” to be sustained assuming examination by tax authorities. The Portfolio’s tax returns remain subject to examination by the Internal Revenue Service and state tax authorities three years from the date of filing for federal purposes and four years from the date of filing for state purposes. Management has evaluated the Portfolio’s tax provisions taken for all open tax years, and has concluded that no provision for income tax is required in the Portfolio’s financial statements. If applicable, the Portfolio recognizes interest accrued related to unrecognized tax benefits in relation to interest and penalties expense in Other within the Statement of Operations. The Portfolio identifies its major tax jurisdictions as U.S. Federal, the state of Colorado, and foreign jurisdictions where the Portfolio makes significant investments; however, the Portfolio is not aware of any tax positions for which it is reasonably possible that the total amounts of unrecognized tax benefits will change materially in the next twelve months. Distributions are determined in accordance with income tax regulations, which may differ from GAAP.
As of June 30, 2024, the approximate cost for U.S. federal income tax purposes, and the aggregate gross/net unrealized appreciation (depreciation) in the value of investments (including securities sold short and derivatives, if any) are as follows:
|
|
|
|
|
|
|
| Cost |
|
Gross Appreciation |
|
Gross (Depreciation) |
|
Net Appreciation (Depreciation) |
| $ 457,032,917 |
|
$ 2,358,263 |
|
$ (8,396,283) |
|
$ (6,038,020) |
10. NEW ACCOUNTING PRONOUNCEMENT
In June 2022, the Financial Accounting Standards Board issued Accounting Standards Update No. 2022-03 (“ASU 2022-03”), “Fair Value Measurement of Equity Securities Subject to Contractual Sale Restrictions” (“Topic 820”). ASU 2022-03 clarifies the guidance in Topic 820, related to the measurement of the fair value of an equity security subject to contractual sale restrictions, where it eliminates the need to apply a discount to fair value of these securities, and introduces disclosure requirements related to such equity securities. The guidance is effective for fiscal years, and interim periods within those fiscal years, beginning after December 15, 2023, and allows for early adoption. Management is currently evaluating the implications, if any, of the additional requirements and their impact on the Portfolio’s financial statements.
Please see TST’s most recent report on Form N-CSR, available at: www.transamerica.com/annuities/prospectus, for additional information. For the most recently filed complete proxy voting records for the Trust please visit: https://www.transamerica.com/sites/default/files/files/e070d/TST%20N-PX%202021.pdf
|
|
|
|
|
| Transamerica Series Trust |
|
|
|
Semi-Annual Financial Statements 2024 |
|
|
Page 26 |
|
|
Transamerica Aegon Core Bond VP
MANAGEMENT AND SUB-ADVISORY AGREEMENT — CONTRACT RENEWAL
(unaudited)
At a meeting of the Board of Trustees of Transamerica Series Trust (the “Trustees” or the “Board”) held on June 12-13, 2024, the Board considered the renewal of the management agreement (the “Management Agreement”) between Transamerica Asset Management, Inc. (“TAM”) and Transamerica Series Trust, on behalf of Transamerica Aegon Core Bond VP (the “Portfolio”). The Board also considered the renewal of the investment sub-advisory agreement (the “Sub-Advisory Agreement” and together with the Management Agreement, the “Agreements”) for the Portfolio between TAM and Aegon USA Investment Management, LLC (the “Sub-Adviser”).
Following its review and consideration, the Board determined that the terms of the Management Agreement and Sub-Advisory Agreement were reasonable and that the renewal of each of the Agreements was in the best interests of the Portfolio and the holders invested in the Portfolio. The Board, including the independent members of the Board (the “Independent Trustees”), unanimously approved the renewal of each of the Agreements through June 30, 2025.
Prior to reaching their decision, the Trustees requested and received from TAM and the Sub-Adviser certain information. They then reviewed such information as they deemed reasonably necessary to evaluate the Agreements, including information they had previously received from TAM and the Sub-Adviser as part of their regular oversight of the Portfolio, and knowledge they gained over time through meeting with TAM and the Sub-Adviser. Among other materials, the Trustees considered comparative fee, expense and performance information prepared by Broadridge Financial Solutions, Inc. (“Broadridge”), an independent provider of mutual fund performance information, as well as fee, expense and profitability information prepared by TAM. In addition, TAM provided the Board with additional supplemental comparative performance information. To the extent applicable, the Trustees considered information about fees and performance of comparable funds and/or accounts managed by the Sub-Adviser. The Board also considered reductions to the Portfolio’s expense limits, if any, that took effect after the last renewal of the Agreements. In their review, the Trustees also sought to identify instances in which the Portfolio’s performance, fees, total expenses and/or profitability appeared to be outliers within its respective peer group or other comparative metrics and sought to understand the reasons for such comparative positions.
In their deliberations, the Independent Trustees met privately without representatives of TAM or the Sub-Adviser present and were represented throughout the process by their independent legal counsel. In considering the proposed continuation of each of the Agreements, the Trustees evaluated and weighed a number of considerations that they believed to be relevant in light of the legal advice furnished to them by counsel, including independent legal counsel, and made a decision in the exercise of their own business judgment. They based their decisions on the considerations discussed below, among others, although they did not identify any particular consideration or item of information that was controlling of their decisions, and each Trustee may have attributed different weights to the various factors.
Nature, Extent and Quality of the Services Provided
The Board considered the nature, extent and quality of the services provided by TAM and the Sub-Adviser to the Portfolio in the past and the services anticipated to be provided in the future. The Board also considered the investment approach for the Portfolio; the experience, capability and integrity of TAM’s senior management; the financial resources of TAM; TAM’s management oversight process; TAM’s and the Sub-Adviser’s responsiveness to any questions by the Trustees; and the professional qualifications and compensation program of the portfolio management team of the Sub-Adviser. The Trustees noted that they receive, on a quarterly basis, an execution analysis from Capital Institutional Services, Inc. (CAPIS), an independent provider of trade analyses, for the Sub-Adviser and a comparison of trading results against a peer universe of managers.
The Board also considered the continuous and regular investment management and other services provided by TAM, when acting as a manager of managers, for the portion of the management fee it retains from the Portfolio after payment of the sub-advisory fees. The Board noted that the investment management and other services provided by TAM include the design, development and ongoing review and evaluation of the Portfolio and its investment strategy; the selection, oversight and monitoring of one or more investment sub-advisers to perform certain duties with respect to the Portfolio; ongoing portfolio trading oversight and analysis; risk management oversight and analysis; design, development, implementation and ongoing review and evaluation of a process for the valuation of Portfolio investments; design, development, implementation and ongoing review and evaluation of a compliance program for the Portfolio; design, development, implementation and ongoing review and evaluation of a process for the voting of proxies and exercise of rights to consent to corporate action for Portfolio investments; participation in Board meetings and oversight of preparation of materials for the Board, including materials for Board meetings and regular communications with the Board; oversight of preparation of the Portfolio’s prospectus, statement of additional information, shareholder reports and other disclosure materials and regulatory filings for the Portfolio; and ongoing cash management services for the Portfolio. The Board considered that TAM’s investment management services also include the provision of supervisory and administrative services to the Portfolio. The Board also noted that TAM, as part of the services it provides to all Transamerica mutual funds, including the Portfolio, oversees the services provided by the funds’ custodian, transfer agent, independent accountant and legal counsel and supervises the performance of the recordkeeping and holder service functions of the funds.
Investment Performance
In addition, the Board considered the short- and longer-term performance of the Portfolio in light of its investment objective, policies and strategies, including relative performance against (i) a peer universe of comparable mutual funds, as prepared by Broadridge, and (ii) the Portfolio’s benchmark, in each case for various trailing periods ended December 31, 2023. Based on these considerations, the Board determined that TAM and the Sub-Adviser can provide investment and related services that are appropriate in scope and extent in light of
|
|
|
|
|
| Transamerica Series Trust |
|
|
|
Semi-Annual Financial Statements 2024 |
|
|
Page 27 |
|
|
Transamerica Aegon Core Bond VP
MANAGEMENT AND SUB-ADVISORY AGREEMENT — CONTRACT RENEWAL (continued)
(unaudited)
the Portfolio’s investment objectives, policies and strategies and operations, the competitive landscape of the investment company business and investor needs. The Board’s conclusions as to the Portfolio’s performance are summarized below. For purposes of its review, the Board generally used the performance of Service Class Shares. In describing the Portfolio’s performance relative to its peer universe, the summary conclusions characterize performance for the relevant periods in relation to whether it was “above,” “below” or “in line with” the peer universe median and do so using quintile rankings prepared by Broadridge. For simplicity, performance is described as “above” the median if the Portfolio’s performance ranked anywhere in the first or second quintiles, as “below” the median if it ranked anywhere in the fourth or fifth quintiles, or “in line with” the median if it ranked anywhere in the third quintile (i.e., even if its precise return was somewhat above or somewhat below the precise median return).
When considering the Portfolio’s performance, the Trustees considered any representations made by TAM regarding the appropriateness of certain peer groups and benchmarks. They recognized that performance reflects a snapshot of a period as of a specific date, and that consideration of performance data for a different period could generate significantly different performance results. The Trustees also recognized that even longer-term performance can be negatively affected by performance over a short-term period when that short-term performance is significantly below the performance of the comparable benchmark or universe of peer funds.
The Board noted that the performance of Service Class Shares of the Portfolio was above the median for its peer universe for the past 3-year period, in line with the median for the past 1- and 5-year periods and below the median for the past 10-year period. The Board also noted that the performance of Service Class Shares of the Portfolio was above the benchmark that TAM utilizes to measure performance of the Portfolio for the past 1- and 3-year periods and below the benchmark for the past 5- and 10-year periods. The Board noted that the Sub-Adviser had commenced sub-advising the Portfolio on November 1, 2022 pursuant to its current investment strategies. The Trustees also noted recent changes in the legal and compliance team at the Sub-Adviser.
Management Fee and Sub-Advisory Fees and Total Expense Ratio
The Board considered the management fee and total expense ratio of the Portfolio, including information provided by Broadridge comparing the management fee and total expense ratio of the Portfolio to the management fees and total expense ratios of comparable investment companies in both a peer group and broader peer universe compiled by Broadridge. The Board’s conclusions as to the Portfolio’s management fee and total expense ratio are summarized below. For purposes of its review, the Board generally used the actual total expenses (i.e., expenses reflecting any waivers and/or reimbursements) of Service Class Shares. In describing the Portfolio’s management fee and total expense ratio relative to its peer group and peer universe, the summary conclusions characterize management fees and total expense ratios for the relevant periods in relation to whether they were “above,” “below” or “in line with” the peer group or peer universe median and do so using quintile rankings prepared by Broadridge. For simplicity, management fees and total expense ratios are described as “above” the median if the Portfolio’s management fee or total expense ratio ranked anywhere in the fourth or fifth quintiles, as “below” the median if it ranked anywhere in the first or second quintiles, or “in line with” the median if it ranked anywhere in the third quintile (i.e., even if its precise management fee or total expense ratio was somewhat above or somewhat below the precise median management fee or total expense ratio).
The Board also considered the fees charged by the Sub-Adviser for sub-advisory services, as well as the portion of the Portfolio’s management fee retained by TAM following payment of the sub-advisory fee and how the portion of the contractual management fee retained by TAM at a specified asset level compared to the portions retained by other investment advisers managing mutual funds with similar investment strategies as calculated by an independent provider of information.
The Board noted that the Portfolio’s contractual management fee and the actual total expenses (i.e., expenses reflecting any waivers and/or reimbursements) of Service Class Shares of the Portfolio were below the medians for its peer group and peer universe. The Trustees also considered that TAM has entered into an expense limitation arrangement with the Portfolio, which may result in TAM waiving fees for the benefit of holders.
On the basis of these considerations, together with the other information it considered, the Board determined that the management and sub-advisory fees to be received by TAM and the Sub-Adviser under the Management Agreement and Sub-Advisory Agreement are reasonable in light of the services provided.
Cost of Services Provided and Level of Profitability
The Board reviewed information provided by TAM about the cost of providing and procuring fund management services, as well as the costs of the provision of administration, transfer agency and other services, to the Portfolio and to Transamerica Series Trust as a whole by TAM and its affiliates. The Board considered the profitability of TAM and its affiliates in providing these services for the Portfolio and Transamerica Series Trust as a whole. The Trustees recognized the competitiveness of the mutual fund industry and the importance of an investment adviser’s long-term profitability, including for maintaining company and management stability and accountability.
The Board also considered the allocation methodology used for calculating the profitability of TAM and its affiliates. The Board noted that the revenue and expense allocation methodology used by TAM to estimate its profitability with respect to its relationship with the Portfolio had been reviewed previously by an independent consultant. The Trustees considered that TAM reported that it had not made material changes to this methodology, and that the methodology had been applied consistently for the Portfolio.
|
|
|
|
|
| Transamerica Series Trust |
|
|
|
Semi-Annual Financial Statements 2024 |
|
|
Page 28 |
|
|
Transamerica Aegon Core Bond VP
MANAGEMENT AND SUB-ADVISORY AGREEMENT — CONTRACT RENEWAL (continued)
(unaudited)
With respect to the Sub-Adviser, the Board noted that information about the Sub-Adviser’s revenues and expenses was incorporated into the profitability analysis for TAM and its affiliates with respect to the Portfolio. As a result, the Board focused on profitability information for TAM and its affiliates and the Sub-Adviser in the aggregate.
Based on this information, the Board determined that the profitability of TAM and its affiliates from their relationships with the Portfolio was not excessive.
Economies of Scale
The Board considered economies of scale with respect to the management of the Portfolio, whether the Portfolio had appropriately benefited from any economies of scale and whether there was the potential for realization of any future economies of scale. The Board also considered the existence of economies of scale with respect to management of the Transamerica mutual funds overall and the extent to which the Portfolio benefited from any economies of scale. The Board recognized that, as the Portfolio’s assets increase, any economies of scale realized by TAM or the Sub-Adviser may not directly correlate with each other or with any economies of scale that might be realized by the Portfolio. The Board considered the Portfolio’s management fee schedule and the existence of breakpoints and also considered the extent to which TAM shared economies of scale, if any, with the Portfolio through undertakings to limit or reimburse Portfolio expenses and to invest in maintaining and developing its capabilities and services. The Board also considered the Sub-Adviser’s sub-advisory fee schedule and the existence of breakpoints, if any, and how such breakpoints relate to any breakpoints in the Portfolio’s management fee schedule. The Board considered that the Sub-Adviser’s sub-advisory fees would be based on the combined assets of multiple funds. The Trustees concluded that the Portfolio’s fee structure reflected an appropriate sharing of any efficiencies or economies of scale to date and noted that they will have the opportunity to periodically reexamine the appropriateness of the management fee payable to TAM and the fee paid to the Sub-Adviser in light of any economies of scale experienced in the future.
Benefits to TAM, its Affiliates and/or the Sub-Adviser from their Relationships with the Portfolio
The Board considered other benefits derived by TAM, its affiliates, and/or the Sub-Adviser from their relationships with the Portfolio. The Board noted that TAM does not receive benefits from research obtained with commissions paid to broker-dealers for portfolio transactions (commonly referred to as “soft dollars”) as a result of its relationship with the Portfolio.
Other Considerations
The Board noted that TAM has made a substantial commitment to the recruitment and retention of high-quality personnel and maintains the financial, compliance and operational resources reasonably necessary to manage the Portfolio in a professional manner that is consistent with the best interests of the Portfolio and the holders. In this regard, the Board favorably considered the procedures and policies TAM has in place to enforce compliance with applicable laws and regulations and oversee the portfolio management activities of the Sub-Adviser. The Board also noted that TAM has made an entrepreneurial commitment and undertaken certain business risks with respect to the management and success of the Portfolio.
Conclusion
After consideration of the factors described above, as well as other factors, the Trustees, including the Independent Trustees, concluded that the renewal of the Management Agreement and the Sub-Advisory Agreement was in the best interests of the Portfolio and the holders and voted to approve the renewal of the Agreements.
|
|
|
|
|
| Transamerica Series Trust |
|
|
|
Semi-Annual Financial Statements 2024 |
|
|
Page 29 |
|
|
Transamerica Aegon Core Bond VP
RESULTS OF SHAREHOLDER MEETING
(unaudited)
Rule 30e-1 under the Investment Company Act of 1940, as amended, titled “Reports to Stockholders of Management Companies,” requires regulated investment companies to report on all subject matters put to the vote of shareholders and to provide final results. Accordingly, the Board of Trustees of the Portfolio solicited a vote by the shareholders for the following item:
A special meeting of holders of Transamerica Aegon Core Bond VP was held on April 29, 2024. The results of Proposal 2 were as follows:
To approve the Portfolio’s use of the manager of managers exemptive order, which will allow TAM, the Portfolio’s investment manager, to enter into and materially amend sub-advisory agreements with respect to the Portfolio in the future without Holder approval, subject to prior approval by the Portfolio’s Board of Trustees.
|
|
|
| Proposal |
|
Number of Shares |
| |
| For |
|
35,245,024 |
| Against |
|
404,628 |
| Withheld |
|
458,764 |
|
|
|
|
|
| Transamerica Series Trust |
|
|
|
Semi-Annual Financial Statements 2024 |
|
|
Page 30 |
|
|
PROXY VOTING POLICIES AND PROCEDURES AND QUARTERLY PORTFOLIO HOLDINGS
(unaudited)
A description of Transamerica Series Trust’s (the “Trust”) proxy voting policies and procedures is available in the Statement of Additional Information of the Portfolios, available without charge upon request by calling 1-800-851-9777 (toll free) or on the Securities and Exchange Commission’s (“SEC”) website at http://www.sec.gov.
In addition, the Portfolio is required to file Form N-PX, with their complete proxy voting records for the most recent 12 months ended June 30th, no later than August 31st of each year. The Form is available without charge: (1) on the Transamerica Funds website at https://www.transamerica.com/sites/default/files/files/e070d/TST%20N-PX%202021.pdf; and (2) on the SEC’s website at http://www.sec.gov.
Each fiscal quarter, the Portfolios, except Transamerica BlackRock Government Money Market VP, will file with the SEC a complete schedule of its monthly portfolio holdings on Form N-PORT. The Portfolios’ holdings as of the end of the third month of every fiscal quarter, as reported on Form N-PORT, will be publicly available on the SEC’s website at http://www.sec.gov within 60 days of the end of the fiscal quarter.
On a monthly basis, Transamerica BlackRock Government Money Market VP will file with the SEC portfolio holdings information on Form N-MFP3. A complete schedule of portfolio holdings is also available at www.transamerica.com.
You may also visit the Trust’s website at www.transamerica.com/annuities/prospectus for this and other information about the Portfolios and the Trust.
Important Notice Regarding Delivery of Shareholder Documents
Every year we provide shareholders informative materials such as the Transamerica Series Trust Annual Report, the Transamerica Series Trust Prospectus, and other required documents that keep you informed regarding your Portfolios. To the extent provided by mail, Transamerica Series Trust will only send one piece per mailing address, a method that saves your Portfolios money by reducing mailing and printing costs. We will continue to do this unless you tell us not to. To elect to receive individual mailings, simply call a Transamerica Customer Service Representative toll free at 1-800-851-9777, 8 a.m. to 7 p.m. Eastern Time, Monday-Friday. Your request will take effect within 30 days.
|
|
|
|
|
| Transamerica Series Trust |
|
|
|
Semi-Annual Financial Statements 2024 |
|
|
Page 31 |
|
|
NOTICE OF PRIVACY POLICY
(unaudited)
Your privacy is very important to us. We want you to understand what information we collect and how we use it. We collect and use “nonpublic personal information” in connection with providing our customers with a broad range of financial products and services as effectively and conveniently as possible. We treat nonpublic personal information in accordance with our Privacy Policy.
What Information We Collect and From Whom We Collect It
We may collect nonpublic personal information about you from the following sources:
| • |
|
Information we receive from you on applications or other forms, such as your name, address, and account number; |
| • |
|
Information about your transactions with us, our affiliates, or others, such as your account balance and purchase/redemption history; and |
| • |
|
Information we receive from non-affiliated third parties, including consumer reporting agencies. |
What Information We Disclose and To Whom We Disclose It
We do not disclose any nonpublic personal information about current or former customers to anyone without their express consent, except as permitted by law. We may disclose the nonpublic personal information we collect, as described above, to persons or companies that perform services on our behalf and to other financial institutions with which we have joint marketing agreements. We will require these companies to protect the confidentiality of your nonpublic personal information and to use it only to perform the services for which we have hired them.
Our Security Procedures
We restrict access to your nonpublic personal information and only allow disclosures to persons and companies as permitted by law to assist in providing products or services to you. We maintain physical, electronic, and procedural safeguards to protect your nonpublic personal information and to safeguard the disposal of certain consumer information.
Contact Us
If you have any questions about our Privacy Policy, please call 1-800-851-9777 on any business day between 8 a.m. and 7 p.m. Eastern Time.
Note: This Privacy Policy applies only to customers that have a direct relationship with us or our affiliates. If you own shares of our portfolios in the name of a third party such as a bank or broker-dealer, its privacy policy may apply to you instead of ours.
|
|
|
|
|
| Transamerica Series Trust |
|
|
|
Semi-Annual Financial Statements 2024 |
|
|
Page 32 |
|
|
PO Box 219945
Kansas City, MO 64121-9945
|
|
|
| Distributor: |
|
Transamerica Capital, Inc. |
|
|
PO Box 219945 |
|
|
Kansas City, MO 64121-9945 |
|
|
|
|
Customer Service: 1-800-851-9777 |
Transamerica Series Trust Semi-Annual Financial Statements
June 30, 2024
1801 California St., Suite 5200
Denver, CO 80202
Distributor: Transamerica Capital, Inc.
Customer Service: 1-800-851-9777
|
| The following pages contain the most recent semi-annual financial statements for the investment options in which you are invested. In compliance with Securities and Exchange Commission regulations, we present these reports on an annual and semi-annual basis with the hope that they will foster greater understanding of the investment options’ holdings, performance, financial data, accounting policies and other issues. This streamlined version provides information only on the investment options in which you are invested. If you have any questions about these reports, please do not hesitate to contact your financial professional. As always, we thank you for your trust and the opportunity to serve you. |
Transamerica Aegon High Yield Bond VP
SCHEDULE OF INVESTMENTS
At June 30, 2024
(unaudited)
|
|
|
|
|
|
|
|
|
| |
|
Principal |
|
|
Value |
|
| |
|
|
| CORPORATE DEBT SECURITIES - 95.6% |
|
| Aerospace & Defense - 1.3% |
|
| TransDigm, Inc. |
|
| 4.88%, 05/01/2029 |
|
$ |
937,000 |
|
|
$ |
877,708 |
|
| 5.50%, 11/15/2027 |
|
|
754,000 |
|
|
|
740,465 |
|
| 6.38%, 03/01/2029 (A) |
|
|
383,000 |
|
|
|
384,930 |
|
| 6.88%, 12/15/2030 (A) |
|
|
385,000 |
|
|
|
393,048 |
|
| 7.13%, 12/01/2031 (A) |
|
|
85,000 |
|
|
|
87,559 |
|
| Triumph Group, Inc. |
|
| 9.00%, 03/15/2028 (A) |
|
|
731,000 |
|
|
|
765,508 |
|
|
|
|
|
|
|
|
|
|
|
|
|
|
|
|
|
|
|
|
3,249,218 |
|
|
|
|
|
|
|
|
|
|
| Automobile Components - 3.1% |
|
| Clarios Global LP
6.75%, 05/15/2025 (A) |
|
|
365,000 |
|
|
|
364,997 |
|
| Clarios Global LP/Clarios US Finance Co. |
|
| 6.25%, 05/15/2026 (A) |
|
|
462,000 |
|
|
|
461,517 |
|
| 6.75%, 05/15/2028 (A) |
|
|
419,000 |
|
|
|
424,013 |
|
| 8.50%, 05/15/2027 (A) |
|
|
846,000 |
|
|
|
850,577 |
|
| Dana Financing Luxembourg SARL
5.75%, 04/15/2025 (A) |
|
|
705,000 |
|
|
|
702,517 |
|
| Dana, Inc. |
|
| 4.25%, 09/01/2030 |
|
|
76,000 |
|
|
|
66,326 |
|
| 4.50%, 02/15/2032 |
|
|
889,000 |
|
|
|
763,645 |
|
| 5.63%, 06/15/2028 (B) |
|
|
218,000 |
|
|
|
211,469 |
|
| Goodyear Tire & Rubber Co. |
|
| 4.88%, 03/15/2027 (B) |
|
|
361,000 |
|
|
|
348,955 |
|
| 5.00%, 05/31/2026 |
|
|
512,000 |
|
|
|
503,330 |
|
| 5.00%, 07/15/2029 (B) |
|
|
434,000 |
|
|
|
404,060 |
|
| 9.50%, 05/31/2025 |
|
|
766,000 |
|
|
|
768,368 |
|
| ZF North America Capital, Inc. |
|
| 4.75%, 04/29/2025 (A) |
|
|
635,000 |
|
|
|
626,897 |
|
| 6.75%, 04/23/2030 (A) |
|
|
530,000 |
|
|
|
539,811 |
|
| 6.88%, 04/14/2028 (A) |
|
|
435,000 |
|
|
|
443,381 |
|
| 7.13%, 04/14/2030 (A) |
|
|
303,000 |
|
|
|
313,622 |
|
|
|
|
|
|
|
|
|
|
|
|
|
|
|
|
|
|
|
|
7,793,485 |
|
|
|
|
|
|
|
|
|
|
| Automobiles - 1.5% |
|
| Ford Motor Co.
6.10%, 08/19/2032 (B) |
|
|
140,000 |
|
|
|
140,051 |
|
| Ford Motor Credit Co. LLC |
|
|
|
|
|
|
|
|
| 2.70%, 08/10/2026 |
|
|
245,000 |
|
|
|
230,113 |
|
| 3.38%, 11/13/2025 |
|
|
627,000 |
|
|
|
606,780 |
|
| 4.00%, 11/13/2030 |
|
|
625,000 |
|
|
|
558,380 |
|
| 4.39%, 01/08/2026 |
|
|
676,000 |
|
|
|
661,524 |
|
| 6.95%, 03/06/2026 |
|
|
541,000 |
|
|
|
549,713 |
|
| 7.35%, 11/04/2027 - 03/06/2030 |
|
|
973,000 |
|
|
|
1,025,337 |
|
|
|
|
|
|
|
|
|
|
|
|
|
|
|
|
|
|
|
|
3,771,898 |
|
|
|
|
|
|
|
|
|
|
| Banks - 2.1% |
|
| Barclays PLC |
|
|
|
|
|
|
|
|
| Fixed until 11/02/2025, 7.33% (C), 11/02/2026 |
|
|
600,000 |
|
|
|
610,490 |
|
| Citigroup, Inc. |
|
|
|
|
|
|
|
|
| Fixed until 12/10/2025 (D), 4.00% (C) |
|
|
207,000 |
|
|
|
198,251 |
|
| Fixed until 09/12/2024 (D), 5.00% (B)(C) |
|
|
1,116,000 |
|
|
|
1,110,608 |
|
|
|
|
|
|
|
|
|
|
| |
|
Principal |
|
|
Value |
|
| |
|
|
| CORPORATE DEBT SECURITIES (continued) |
|
| Banks (continued) |
|
| Intesa Sanpaolo SpA |
|
| Fixed until 06/01/2031, 4.20% (C), 06/01/2032 (A) |
|
|
$972,000 |
|
|
|
$ 825,013 |
|
| 5.71%, 01/15/2026 (A) |
|
|
651,000 |
|
|
|
644,741 |
|
| 7.00%, 11/21/2025 (A) |
|
|
200,000 |
|
|
|
203,206 |
|
| Fixed until 11/21/2032, 8.25% (C), 11/21/2033 (A) |
|
|
411,000 |
|
|
|
454,054 |
|
| JPMorgan Chase & Co. |
|
|
|
|
|
|
|
|
| Fixed until 02/01/2025 (D), 4.60% (C) |
|
|
926,000 |
|
|
|
913,134 |
|
| Lloyds Banking Group PLC |
|
|
|
|
|
|
|
|
| Fixed until 08/15/2032, 7.95% (C), 11/15/2033 |
|
|
200,000 |
|
|
|
224,821 |
|
|
|
|
|
|
|
|
|
|
|
|
|
|
|
|
|
|
|
|
5,184,318 |
|
|
|
|
|
|
|
|
|
|
| Beverages - 0.5% |
|
| Primo Water Holdings, Inc. |
|
| 4.38%, 04/30/2029 (A) |
|
|
1,476,000 |
|
|
|
1,360,027 |
|
|
|
|
|
|
|
|
|
|
|
| Building Products - 2.1% |
|
| Boise Cascade Co. |
|
| 4.88%, 07/01/2030 (A) |
|
|
1,235,000 |
|
|
|
1,143,886 |
|
| Builders FirstSource, Inc. |
|
| 4.25%, 02/01/2032 (A) |
|
|
1,305,000 |
|
|
|
1,153,706 |
|
| 5.00%, 03/01/2030 (A) |
|
|
212,000 |
|
|
|
200,575 |
|
| 6.38%, 06/15/2032 (A) |
|
|
461,000 |
|
|
|
461,694 |
|
| Camelot Return Merger Sub, Inc. |
|
|
|
|
|
|
|
|
| 8.75%, 08/01/2028 (A) |
|
|
870,000 |
|
|
|
852,278 |
|
| Cornerstone Building Brands, Inc. |
|
|
|
|
|
|
|
|
| 6.13%, 01/15/2029 (A)(B) |
|
|
448,000 |
|
|
|
367,954 |
|
| EMRLD Borrower LP/Emerald Co-Issuer, Inc. |
|
|
|
|
|
|
|
|
| 6.63%, 12/15/2030 (A) |
|
|
881,000 |
|
|
|
888,959 |
|
| 6.75%, 07/15/2031 (A)(E) |
|
|
179,000 |
|
|
|
181,508 |
|
|
|
|
|
|
|
|
|
|
|
|
|
|
|
|
|
|
|
|
5,250,560 |
|
|
|
|
|
|
|
|
|
|
| Capital Markets - 0.4% |
|
|
|
|
|
|
|
|
| ION Trading Technologies SARL |
|
|
|
|
|
|
|
|
| 9.50%, 05/30/2029 (A) |
|
|
883,000 |
|
|
|
900,130 |
|
|
|
|
|
|
|
|
|
|
|
|
|
| Chemicals - 1.7% |
|
|
|
|
|
|
|
|
| ASP Unifrax Holdings, Inc. |
|
|
|
|
|
|
|
|
| 5.25%, 09/30/2028 (A) |
|
|
368,000 |
|
|
|
201,480 |
|
| Avient Corp. |
|
|
|
|
|
|
|
|
| 7.13%, 08/01/2030 (A) |
|
|
986,000 |
|
|
|
1,004,841 |
|
| Eagle Intermediate Global Holding BV/Eagle US Finance LLC |
|
|
|
|
|
|
|
|
| 7.50%, 05/01/2025 (A) |
|
|
536,000 |
|
|
|
302,437 |
|
| NOVA Chemicals Corp. |
|
|
|
|
|
|
|
|
| 5.25%, 06/01/2027 (A) |
|
|
1,127,000 |
|
|
|
1,077,702 |
|
| Olin Corp. |
|
|
|
|
|
|
|
|
| 5.00%, 02/01/2030 |
|
|
538,000 |
|
|
|
508,340 |
|
| 5.13%, 09/15/2027 |
|
|
427,000 |
|
|
|
414,168 |
|
| 5.63%, 08/01/2029 |
|
|
470,000 |
|
|
|
461,069 |
|
| Trinseo Materials Operating SCA/Trinseo Materials Finance, Inc. |
|
|
|
|
|
|
|
|
| 5.13%, 04/01/2029 (A) |
|
|
668,000 |
|
|
|
259,624 |
|
|
|
|
|
|
|
|
|
|
|
|
|
|
|
|
|
|
|
|
4,229,661 |
|
|
|
|
|
|
|
|
|
|
The Notes to Financial Statements are an integral part of this report.
|
|
|
|
|
| Transamerica Series Trust |
|
|
|
Semi-Annual Financial Statements 2024 |
|
|
Page 1 |
|
|
Transamerica Aegon High Yield Bond VP
SCHEDULE OF INVESTMENTS (continued)
At June 30, 2024
(unaudited)
|
|
|
|
|
|
|
|
|
| |
|
Principal |
|
|
Value |
|
| |
|
|
| CORPORATE DEBT SECURITIES (continued) |
|
| Commercial Services & Supplies - 4.6% |
|
| Allied Universal Holdco LLC |
|
|
|
|
|
|
|
|
| 7.88%, 02/15/2031 (A) |
|
|
$1,484,000 |
|
|
|
$ 1,488,002 |
|
| Avis Budget Car Rental LLC/Avis Budget Finance, Inc. |
|
|
|
|
|
|
|
|
| 5.75%, 07/15/2027 (A) |
|
|
738,000 |
|
|
|
715,800 |
|
| 8.00%, 02/15/2031 (A)(B) |
|
|
1,250,000 |
|
|
|
1,237,691 |
|
| Benteler International AG |
|
|
|
|
|
|
|
|
| 10.50%, 05/15/2028 (A) |
|
|
760,000 |
|
|
|
816,205 |
|
| Garda World Security Corp. |
|
|
|
|
|
|
|
|
| 6.00%, 06/01/2029 (A)(B) |
|
|
640,000 |
|
|
|
583,902 |
|
| 9.50%, 11/01/2027 (A) |
|
|
299,000 |
|
|
|
300,387 |
|
| GFL Environmental, Inc. |
|
|
|
|
|
|
|
|
| 6.75%, 01/15/2031 (A) |
|
|
355,000 |
|
|
|
362,146 |
|
| Herc Holdings, Inc. |
|
|
|
|
|
|
|
|
| 5.50%, 07/15/2027 (A) |
|
|
1,702,000 |
|
|
|
1,675,725 |
|
| 6.63%, 06/15/2029 (A) |
|
|
220,000 |
|
|
|
223,113 |
|
| Hertz Corp. |
|
|
|
|
|
|
|
|
| 4.63%, 12/01/2026 (A)(B) |
|
|
69,000 |
|
|
|
50,047 |
|
| 5.00%, 12/01/2029 (A)(B) |
|
|
1,376,000 |
|
|
|
843,810 |
|
| 12.63%, 07/15/2029 (A)(B) |
|
|
187,000 |
|
|
|
193,588 |
|
| Reworld Holding Corp. |
|
|
|
|
|
|
|
|
| 4.88%, 12/01/2029 (A) |
|
|
501,000 |
|
|
|
457,265 |
|
| 5.00%, 09/01/2030 |
|
|
458,000 |
|
|
|
414,057 |
|
| United Rentals North America, Inc. |
|
|
|
|
|
|
|
|
| 3.75%, 01/15/2032 |
|
|
395,000 |
|
|
|
343,796 |
|
| 4.00%, 07/15/2030 |
|
|
707,000 |
|
|
|
639,251 |
|
| 5.50%, 05/15/2027 |
|
|
77,000 |
|
|
|
76,419 |
|
| 6.00%, 12/15/2029 (A) |
|
|
802,000 |
|
|
|
805,749 |
|
| WW International, Inc. |
|
|
|
|
|
|
|
|
| 4.50%, 04/15/2029 (A) |
|
|
1,178,000 |
|
|
|
455,373 |
|
|
|
|
|
|
|
|
|
|
|
|
|
|
|
|
|
|
|
|
11,682,326 |
|
|
|
|
|
|
|
|
|
|
| Communications Equipment - 0.3% |
|
| CommScope, Inc. |
|
|
|
|
|
|
|
|
| 4.75%, 09/01/2029 (A) |
|
|
726,000 |
|
|
|
501,102 |
|
| 8.25%, 03/01/2027 (A) |
|
|
620,000 |
|
|
|
294,392 |
|
|
|
|
|
|
|
|
|
|
|
|
|
|
|
|
|
|
|
|
795,494 |
|
|
|
|
|
|
|
|
|
|
| Construction & Engineering - 1.9% |
|
| Ashton Woods USA LLC/Ashton Woods Finance Co. |
|
|
|
|
|
|
|
|
| 6.63%, 01/15/2028 (A) |
|
|
830,000 |
|
|
|
828,865 |
|
| Beazer Homes USA, Inc. |
|
|
|
|
|
|
|
|
| 7.25%, 10/15/2029 |
|
|
1,010,000 |
|
|
|
1,011,657 |
|
| 7.50%, 03/15/2031 (A) |
|
|
743,000 |
|
|
|
741,560 |
|
| Century Communities, Inc. |
|
|
|
|
|
|
|
|
| 6.75%, 06/01/2027 |
|
|
999,000 |
|
|
|
1,004,354 |
|
| KB Home |
|
|
|
|
|
|
|
|
| 7.25%, 07/15/2030 |
|
|
326,000 |
|
|
|
335,857 |
|
| Landsea Homes Corp. |
|
|
|
|
|
|
|
|
| 8.88%, 04/01/2029 (A) |
|
|
956,000 |
|
|
|
946,507 |
|
|
|
|
|
|
|
|
|
|
|
|
|
|
|
|
|
|
|
|
4,868,800 |
|
|
|
|
|
|
|
|
|
|
| Construction Materials - 1.2% |
|
|
|
|
|
|
|
|
| Smyrna Ready Mix Concrete LLC |
|
|
|
|
|
|
|
|
| 6.00%, 11/01/2028 (A) |
|
|
1,006,000 |
|
|
|
982,957 |
|
| 8.88%, 11/15/2031 (A) |
|
|
1,654,000 |
|
|
|
1,755,177 |
|
|
|
|
|
|
|
|
|
|
| |
|
Principal |
|
|
Value |
|
| |
|
|
| CORPORATE DEBT SECURITIES (continued) |
|
| Construction Materials (continued) |
|
| Summit Materials LLC/Summit Materials Finance Corp. |
|
|
|
|
|
|
|
|
| 7.25%, 01/15/2031 (A) |
|
|
$215,000 |
|
|
|
$ 222,671 |
|
|
|
|
|
|
|
|
|
|
|
|
|
|
|
|
|
|
|
|
2,960,805 |
|
|
|
|
|
|
|
|
|
|
| Consumer Staples Distribution & Retail - 1.0% |
|
| Albertsons Cos., Inc./Safeway, Inc./New Albertsons LP |
|
|
|
|
|
|
|
|
| 3.50%, 03/15/2029 (A) |
|
|
952,000 |
|
|
|
856,248 |
|
| 4.63%, 01/15/2027 (A) |
|
|
791,000 |
|
|
|
764,013 |
|
| 6.50%, 02/15/2028 (A) |
|
|
858,000 |
|
|
|
863,156 |
|
| 7.50%, 03/15/2026 (A) |
|
|
155,000 |
|
|
|
157,194 |
|
|
|
|
|
|
|
|
|
|
|
|
|
|
|
|
|
|
|
|
2,640,611 |
|
|
|
|
|
|
|
|
|
|
| Containers & Packaging - 6.1% |
|
|
|
|
|
|
|
|
| ARD Finance SA |
|
|
|
|
|
|
|
|
| PIK Rate 7.25%, Cash Rate 6.50%, 06/30/2027 (A)(F) |
|
|
472,000 |
|
|
|
116,867 |
|
| Ardagh Metal Packaging Finance USA LLC/Ardagh Metal Packaging Finance PLC |
|
|
|
|
|
|
|
|
| 6.00%, 06/15/2027 (A) |
|
|
275,000 |
|
|
|
270,220 |
|
| Ardagh Packaging Finance PLC/Ardagh Holdings USA, Inc. |
|
|
|
|
|
|
|
|
| 4.13%, 08/15/2026 (A)(B) |
|
|
594,000 |
|
|
|
515,572 |
|
| 5.25%, 08/15/2027 (A)(B) |
|
|
889,000 |
|
|
|
551,288 |
|
| Ball Corp. |
|
|
|
|
|
|
|
|
| 2.88%, 08/15/2030 |
|
|
1,547,000 |
|
|
|
1,314,355 |
|
| 6.00%, 06/15/2029 |
|
|
57,000 |
|
|
|
57,329 |
|
| 6.88%, 03/15/2028 |
|
|
709,000 |
|
|
|
726,997 |
|
| Cascades, Inc./Cascades USA, Inc. |
|
|
|
|
|
|
|
|
| 5.13%, 01/15/2026 (A) |
|
|
200,000 |
|
|
|
196,942 |
|
| 5.38%, 01/15/2028 (A)(B) |
|
|
904,000 |
|
|
|
870,335 |
|
| Clydesdale Acquisition Holdings, Inc. |
|
|
|
|
|
|
|
|
| 6.63%, 04/15/2029 (A) |
|
|
195,000 |
|
|
|
191,652 |
|
| Crown Americas LLC/Crown Americas Capital Corp. VI |
|
|
|
|
|
|
|
|
| 4.75%, 02/01/2026 |
|
|
1,788,000 |
|
|
|
1,757,416 |
|
| Graphic Packaging International LLC |
|
|
|
|
|
|
|
|
| 3.50%, 03/15/2028 - 03/01/2029 (A) |
|
|
1,087,000 |
|
|
|
994,686 |
|
| 3.75%, 02/01/2030 (A) |
|
|
404,000 |
|
|
|
360,657 |
|
| 4.13%, 08/15/2024 |
|
|
312,000 |
|
|
|
310,800 |
|
| 6.38%, 07/15/2032 (A) |
|
|
535,000 |
|
|
|
534,425 |
|
| Mauser Packaging Solutions Holding Co. |
|
|
|
|
|
|
|
|
| 7.88%, 04/15/2027 (A) |
|
|
466,000 |
|
|
|
475,553 |
|
| 9.25%, 04/15/2027 (A) |
|
|
148,000 |
|
|
|
148,090 |
|
| OI European Group BV |
|
|
|
|
|
|
|
|
| 4.75%, 02/15/2030 (A) |
|
|
353,000 |
|
|
|
322,703 |
|
| Owens-Brockway Glass Container, Inc. |
|
|
|
|
|
|
|
|
| 7.25%, 05/15/2031 (A) |
|
|
439,000 |
|
|
|
438,098 |
|
| 7.38%, 06/01/2032 (A) |
|
|
440,000 |
|
|
|
440,501 |
|
| Pactiv Evergreen Group Issuer LLC/Pactiv Evergreen Group Issuer, Inc. |
|
|
|
|
|
|
|
|
| 4.38%, 10/15/2028 (A) |
|
|
38,000 |
|
|
|
35,463 |
|
| Pactiv Evergreen Group Issuer, Inc./Pactiv Evergreen Group Issuer LLC |
|
|
|
|
|
|
|
|
| 4.00%, 10/15/2027 (A)(B) |
|
|
1,527,000 |
|
|
|
1,430,609 |
|
The Notes to Financial Statements are an integral part of this report.
|
|
|
|
|
| Transamerica Series Trust |
|
|
|
Semi-Annual Financial Statements 2024 |
|
|
Page 2 |
|
|
Transamerica Aegon High Yield Bond VP
SCHEDULE OF INVESTMENTS (continued)
At June 30, 2024
(unaudited)
|
|
|
|
|
|
|
|
|
| |
|
Principal |
|
|
Value |
|
| |
|
|
| CORPORATE DEBT SECURITIES (continued) |
|
| Containers & Packaging (continued) |
|
| Sealed Air Corp. |
|
|
|
|
|
|
|
|
| 6.50%, 07/15/2032 (A) |
|
|
$216,000 |
|
|
|
$ 215,050 |
|
| 6.88%, 07/15/2033 (A) |
|
|
887,000 |
|
|
|
913,473 |
|
| Sealed Air Corp./Sealed Air Corp. US |
|
|
|
|
|
|
|
|
| 6.13%, 02/01/2028 (A) |
|
|
364,000 |
|
|
|
363,170 |
|
| 7.25%, 02/15/2031 (A) |
|
|
553,000 |
|
|
|
569,904 |
|
| Trivium Packaging Finance BV |
|
|
|
|
|
|
|
|
| 5.50%, 08/15/2026 (A) |
|
|
1,049,000 |
|
|
|
1,027,937 |
|
| 8.50%, 08/15/2027 (A) |
|
|
345,000 |
|
|
|
342,427 |
|
|
|
|
|
|
|
|
|
|
|
|
|
|
|
|
|
|
|
|
15,492,519 |
|
|
|
|
|
|
|
|
|
|
| Diversified REITs - 0.8% |
|
|
|
|
|
|
|
|
| HAT Holdings I LLC/HAT Holdings II LLC |
|
|
|
|
|
|
|
|
| 3.38%, 06/15/2026 (A) |
|
|
1,044,000 |
|
|
|
985,028 |
|
| 6.00%, 04/15/2025 (A)(B) |
|
|
199,000 |
|
|
|
198,801 |
|
| 8.00%, 06/15/2027 (A) |
|
|
418,000 |
|
|
|
434,543 |
|
| Iron Mountain Information Management Services, Inc. |
|
|
|
|
|
|
|
|
| 5.00%, 07/15/2032 (A) |
|
|
505,000 |
|
|
|
461,711 |
|
|
|
|
|
|
|
|
|
|
|
|
|
|
|
|
|
|
|
|
2,080,083 |
|
|
|
|
|
|
|
|
|
|
| Diversified Telecommunication Services - 1.6% |
|
| Iliad Holding SASU |
|
|
|
|
|
|
|
|
| 6.50%, 10/15/2026 (A) |
|
|
222,000 |
|
|
|
221,007 |
|
| 7.00%, 10/15/2028 (A) |
|
|
534,000 |
|
|
|
529,505 |
|
| 8.50%, 04/15/2031 (A) |
|
|
728,000 |
|
|
|
737,118 |
|
| Level 3 Financing, Inc. |
|
|
|
|
|
|
|
|
| 3.63%, 01/15/2029 (A) |
|
|
418,000 |
|
|
|
125,967 |
|
| 3.75%, 07/15/2029 (A) |
|
|
1,290,000 |
|
|
|
399,900 |
|
| 4.25%, 07/01/2028 (A) |
|
|
1,047,000 |
|
|
|
394,478 |
|
| 10.50%, 05/15/2030 (A) |
|
|
1,090,000 |
|
|
|
1,079,454 |
|
| Telecom Italia Capital SA |
|
|
|
|
|
|
|
|
| 6.00%, 09/30/2034 (A) |
|
|
387,000 |
|
|
|
366,251 |
|
| 6.38%, 11/15/2033 (A) |
|
|
227,000 |
|
|
|
222,065 |
|
|
|
|
|
|
|
|
|
|
|
|
|
|
|
|
|
|
|
|
4,075,745 |
|
|
|
|
|
|
|
|
|
|
| Electric Utilities - 0.9% |
|
|
|
|
|
|
|
|
| Elwood Energy LLC |
|
|
|
|
|
|
|
|
| 8.16%, 07/05/2026 |
|
|
161,349 |
|
|
|
148,442 |
|
| Vistra Operations Co. LLC |
|
|
|
|
|
|
|
|
| 4.38%, 05/01/2029 (A) |
|
|
267,000 |
|
|
|
248,645 |
|
| 5.00%, 07/31/2027 (A) |
|
|
771,000 |
|
|
|
745,828 |
|
| 5.63%, 02/15/2027 (A) |
|
|
69,000 |
|
|
|
67,836 |
|
| 6.88%, 04/15/2032 (A) |
|
|
1,004,000 |
|
|
|
1,019,222 |
|
|
|
|
|
|
|
|
|
|
|
|
|
|
|
|
|
|
|
|
2,229,973 |
|
|
|
|
|
|
|
|
|
|
| Electrical Equipment - 0.8% |
|
|
|
|
|
|
|
|
| Energizer Holdings, Inc. |
|
|
|
|
|
|
|
|
| 4.38%, 03/31/2029 (A) |
|
|
502,000 |
|
|
|
454,127 |
|
| 6.50%, 12/31/2027 (A)(B) |
|
|
710,000 |
|
|
|
709,212 |
|
| WESCO Distribution, Inc. |
|
|
|
|
|
|
|
|
| 6.38%, 03/15/2029 (A) |
|
|
572,000 |
|
|
|
574,103 |
|
| 6.63%, 03/15/2032 (A) |
|
|
195,000 |
|
|
|
197,100 |
|
|
|
|
|
|
|
|
|
|
|
|
|
|
|
|
|
|
|
|
1,934,542 |
|
|
|
|
|
|
|
|
|
|
|
|
|
|
|
|
|
|
|
| |
|
Principal |
|
|
Value |
|
| |
|
|
| CORPORATE DEBT SECURITIES (continued) |
|
| Electronic Equipment, Instruments & Components - 1.2% |
|
| EquipmentShare.com, Inc. |
|
|
|
|
|
|
|
|
| 8.63%, 05/15/2032 (A) |
|
|
$290,000 |
|
|
|
$ 300,744 |
|
| 9.00%, 05/15/2028 (A) |
|
|
922,000 |
|
|
|
951,651 |
|
| GoTo Group, Inc. |
|
|
|
|
|
|
|
|
| 5.50%, 05/01/2028 (A) |
|
|
659,047 |
|
|
|
520,832 |
|
| Sensata Technologies BV |
|
|
|
|
|
|
|
|
| 4.00%, 04/15/2029 (A) |
|
|
412,000 |
|
|
|
378,277 |
|
| Sensata Technologies, Inc. |
|
|
|
|
|
|
|
|
| 3.75%, 02/15/2031 (A) |
|
|
66,000 |
|
|
|
57,467 |
|
| 4.38%, 02/15/2030 (A) |
|
|
301,000 |
|
|
|
276,444 |
|
| 6.63%, 07/15/2032 (A) |
|
|
428,000 |
|
|
|
431,055 |
|
|
|
|
|
|
|
|
|
|
|
|
|
|
|
|
|
|
|
|
2,916,470 |
|
|
|
|
|
|
|
|
|
|
| Energy Equipment & Services - 0.7% |
|
| Archrock Partners LP/Archrock Partners Finance Corp. |
|
|
|
|
|
|
|
|
| 6.25%, 04/01/2028 (A) |
|
|
788,000 |
|
|
|
780,377 |
|
| Sunnova Energy Corp. |
|
|
|
|
|
|
|
|
| 5.88%, 09/01/2026 (A)(B) |
|
|
592,000 |
|
|
|
460,280 |
|
| 11.75%, 10/01/2028 (A)(B) |
|
|
579,000 |
|
|
|
413,985 |
|
|
|
|
|
|
|
|
|
|
|
|
|
|
|
|
|
|
|
|
1,654,642 |
|
|
|
|
|
|
|
|
|
|
| Financial Services - 1.9% |
|
|
|
|
|
|
|
|
| ILFC E-Capital Trust I |
|
|
|
|
|
|
|
|
| 3-Month Term SOFR + 1.81%, 7.16% (C), 12/21/2065 (A) |
|
|
2,322,000 |
|
|
|
1,891,631 |
|
| ILFC E-Capital Trust II |
|
|
|
|
|
|
|
|
| 3-Month Term SOFR + 2.06%, 7.41% (C), 12/21/2065 (A) |
|
|
959,000 |
|
|
|
794,635 |
|
| Macquarie Airfinance Holdings Ltd. |
|
|
|
|
|
|
|
|
| 6.50%, 03/26/2031 (A) |
|
|
65,000 |
|
|
|
66,872 |
|
| 8.13%, 03/30/2029 (A) |
|
|
964,000 |
|
|
|
1,019,144 |
|
| PennyMac Financial Services, Inc. |
|
|
|
|
|
|
|
|
| 7.13%, 11/15/2030 (A) |
|
|
191,000 |
|
|
|
190,569 |
|
| United Wholesale Mortgage LLC |
|
|
|
|
|
|
|
|
| 5.50%, 04/15/2029 (A) |
|
|
291,000 |
|
|
|
276,444 |
|
| 5.75%, 06/15/2027 (A) |
|
|
466,000 |
|
|
|
454,936 |
|
|
|
|
|
|
|
|
|
|
|
|
|
|
|
|
|
|
|
|
4,694,231 |
|
|
|
|
|
|
|
|
|
|
| Food Products - 1.7% |
|
|
|
|
|
|
|
|
| Chobani LLC/Chobani Finance Corp., Inc. |
|
|
|
|
|
|
|
|
| 7.63%, 07/01/2029 (A) |
|
|
803,000 |
|
|
|
826,954 |
|
| Darling Ingredients, Inc. |
|
|
|
|
|
|
|
|
| 5.25%, 04/15/2027 (A) |
|
|
210,000 |
|
|
|
205,587 |
|
| 6.00%, 06/15/2030 (A) |
|
|
603,000 |
|
|
|
592,901 |
|
| Post Holdings, Inc. |
|
|
|
|
|
|
|
|
| 4.50%, 09/15/2031 (A) |
|
|
339,000 |
|
|
|
303,918 |
|
| 4.63%, 04/15/2030 (A) |
|
|
713,000 |
|
|
|
655,161 |
|
| 5.50%, 12/15/2029 (A) |
|
|
973,000 |
|
|
|
938,980 |
|
| 5.63%, 01/15/2028 (A) |
|
|
361,000 |
|
|
|
355,391 |
|
| 6.25%, 02/15/2032 (A) |
|
|
331,000 |
|
|
|
331,438 |
|
|
|
|
|
|
|
|
|
|
|
|
|
|
|
|
|
|
|
|
4,210,330 |
|
|
|
|
|
|
|
|
|
|
| Health Care Equipment & Supplies - 1.3% |
|
| Kedrion SpA |
|
|
|
|
|
|
|
|
| 6.50%, 09/01/2029 (A) |
|
|
776,000 |
|
|
|
709,555 |
|
| Medline Borrower LP |
|
|
|
|
|
|
|
|
| 3.88%, 04/01/2029 (A) |
|
|
1,076,000 |
|
|
|
990,797 |
|
The Notes to Financial Statements are an integral part of this report.
|
|
|
|
|
| Transamerica Series Trust |
|
|
|
Semi-Annual Financial Statements 2024 |
|
|
Page 3 |
|
|
Transamerica Aegon High Yield Bond VP
SCHEDULE OF INVESTMENTS (continued)
At June 30, 2024
(unaudited)
|
|
|
|
|
|
|
|
|
| |
|
Principal |
|
|
Value |
|
| |
|
|
| CORPORATE DEBT SECURITIES (continued) |
|
| Health Care Equipment & Supplies (continued) |
|
| Medline Borrower LP/Medline Co-Issuer, Inc. |
|
|
|
|
|
|
|
|
| 6.25%, 04/01/2029 (A) |
|
$ |
463,000 |
|
|
$ |
468,479 |
|
| Sotera Health Holdings LLC |
|
|
|
|
|
|
|
|
| 7.38%, 06/01/2031 (A) |
|
|
1,117,000 |
|
|
|
1,118,889 |
|
|
|
|
|
|
|
|
|
|
|
|
|
|
|
|
|
|
|
|
3,287,720 |
|
|
|
|
|
|
|
|
|
|
|
|
| Health Care Providers & Services - 4.7% |
|
|
|
|
|
| Acadia Healthcare Co., Inc. |
|
|
|
|
|
|
|
|
| 5.00%, 04/15/2029 (A) |
|
|
1,035,000 |
|
|
|
983,805 |
|
| AdaptHealth LLC |
|
|
|
|
|
|
|
|
| 4.63%, 08/01/2029 (A) |
|
|
66,000 |
|
|
|
57,184 |
|
| 5.13%, 03/01/2030 (A)(B) |
|
|
150,000 |
|
|
|
131,210 |
|
| 6.13%, 08/01/2028 (A) |
|
|
1,077,000 |
|
|
|
1,028,370 |
|
| CHS/Community Health Systems, Inc. |
|
|
|
|
|
|
|
|
| 5.25%, 05/15/2030 (A) |
|
|
853,000 |
|
|
|
702,534 |
|
| 5.63%, 03/15/2027 (A) |
|
|
319,000 |
|
|
|
297,076 |
|
| 6.88%, 04/15/2029 (A)(B) |
|
|
63,000 |
|
|
|
48,196 |
|
| 10.88%, 01/15/2032 (A) |
|
|
520,000 |
|
|
|
540,902 |
|
| Concentra Escrow Issuer Corp. |
|
|
|
|
|
|
|
|
| 6.88%, 07/15/2032 (A)(E) |
|
|
160,000 |
|
|
|
162,121 |
|
| DaVita, Inc. |
|
|
|
|
|
|
|
|
| 3.75%, 02/15/2031 (A) |
|
|
1,288,000 |
|
|
|
1,099,818 |
|
| 4.63%, 06/01/2030 (A) |
|
|
418,000 |
|
|
|
377,697 |
|
| Encompass Health Corp. |
|
|
|
|
|
|
|
|
| 4.50%, 02/01/2028 |
|
|
603,000 |
|
|
|
573,597 |
|
| 4.63%, 04/01/2031 |
|
|
60,000 |
|
|
|
55,070 |
|
| 4.75%, 02/01/2030 |
|
|
218,000 |
|
|
|
203,988 |
|
| 5.75%, 09/15/2025 |
|
|
1,004,000 |
|
|
|
1,000,823 |
|
| HCA, Inc. |
|
|
|
|
|
|
|
|
| 5.88%, 02/01/2029 |
|
|
182,000 |
|
|
|
185,386 |
|
| Heartland Dental LLC/Heartland Dental Finance Corp. |
|
|
|
|
|
|
|
|
| 10.50%, 04/30/2028 (A) |
|
|
601,000 |
|
|
|
637,937 |
|
| Molina Healthcare, Inc. |
|
|
|
|
|
|
|
|
| 4.38%, 06/15/2028 (A) |
|
|
922,000 |
|
|
|
867,818 |
|
| Tenet Healthcare Corp. |
|
|
|
|
|
|
|
|
| 4.25%, 06/01/2029 |
|
|
807,000 |
|
|
|
752,455 |
|
| 4.63%, 06/15/2028 |
|
|
28,000 |
|
|
|
26,714 |
|
| 5.13%, 11/01/2027 |
|
|
647,000 |
|
|
|
633,189 |
|
| 6.13%, 10/01/2028 (B) |
|
|
1,201,000 |
|
|
|
1,194,865 |
|
| 6.13%, 06/15/2030 |
|
|
451,000 |
|
|
|
447,843 |
|
|
|
|
|
|
|
|
|
|
|
|
|
|
|
|
|
|
|
|
12,008,598 |
|
|
|
|
|
|
|
|
|
|
|
|
|
| Health Care REITs - 0.2% |
|
|
|
|
|
|
|
|
| MPT Operating Partnership LP/MPT Finance Corp. |
|
|
|
|
|
|
|
|
| 3.50%, 03/15/2031 |
|
|
879,000 |
|
|
|
573,020 |
|
|
|
|
|
|
|
|
|
|
|
|
|
| Hotel & Resort REITs - 0.4% |
|
|
|
|
|
|
|
|
| Park Intermediate Holdings LLC/PK Domestic Property LLC/PK Finance Co-Issuer |
|
|
|
|
|
|
|
|
| 5.88%, 10/01/2028 (A) |
|
|
392,000 |
|
|
|
386,375 |
|
| 7.00%, 02/01/2030 (A) |
|
|
723,000 |
|
|
|
731,561 |
|
|
|
|
|
|
|
|
|
|
|
|
|
|
|
|
|
|
|
|
1,117,936 |
|
|
|
|
|
|
|
|
|
|
|
|
|
|
|
|
|
|
|
| |
|
Principal |
|
|
Value |
|
| |
|
|
| CORPORATE DEBT SECURITIES (continued) |
|
| Hotels, Restaurants & Leisure - 10.5% |
|
| 1011778 BC ULC/New Red Finance, Inc. |
|
|
|
|
|
|
|
|
| 3.88%, 01/15/2028 (A) |
|
$ |
242,000 |
|
|
$ |
226,606 |
|
| 4.00%, 10/15/2030 (A) |
|
|
636,000 |
|
|
|
559,264 |
|
| Boyne USA, Inc. |
|
|
|
|
|
|
|
|
| 4.75%, 05/15/2029 (A)(B) |
|
|
1,131,000 |
|
|
|
1,055,347 |
|
| Caesars Entertainment, Inc. |
|
|
|
|
|
|
|
|
| 4.63%, 10/15/2029 (A)(B) |
|
|
661,000 |
|
|
|
605,918 |
|
| 6.50%, 02/15/2032 (A) |
|
|
335,000 |
|
|
|
336,663 |
|
| 7.00%, 02/15/2030 (A) |
|
|
77,000 |
|
|
|
78,669 |
|
| Carnival Corp. |
|
|
|
|
|
|
|
|
| 6.00%, 05/01/2029 (A) |
|
|
1,423,000 |
|
|
|
1,406,123 |
|
| 7.00%, 08/15/2029 (A) |
|
|
109,000 |
|
|
|
112,991 |
|
| 7.63%, 03/01/2026 (A) |
|
|
192,000 |
|
|
|
193,906 |
|
| 10.50%, 06/01/2030 (A) |
|
|
412,000 |
|
|
|
447,546 |
|
| Carnival Holdings Bermuda Ltd. |
|
|
|
|
|
|
|
|
| 10.38%, 05/01/2028 (A) |
|
|
332,000 |
|
|
|
359,375 |
|
| Churchill Downs, Inc. |
|
|
|
|
|
|
|
|
| 5.75%, 04/01/2030 (A) |
|
|
912,000 |
|
|
|
885,875 |
|
| 6.75%, 05/01/2031 (A) |
|
|
441,000 |
|
|
|
443,507 |
|
| Hilton Domestic Operating Co., Inc. |
|
|
|
|
|
|
|
|
| 4.88%, 01/15/2030 |
|
|
622,000 |
|
|
|
595,505 |
|
| 5.38%, 05/01/2025 (A) |
|
|
37,000 |
|
|
|
36,883 |
|
| 5.75%, 05/01/2028 (A) |
|
|
69,000 |
|
|
|
68,658 |
|
| 5.88%, 04/01/2029 (A) |
|
|
81,000 |
|
|
|
81,122 |
|
| Hilton Grand Vacations Borrower Escrow LLC/Hilton Grand Vacations Borrower Escrow, Inc. |
|
|
|
|
|
|
|
|
| 4.88%, 07/01/2031 (A) |
|
|
944,000 |
|
|
|
835,781 |
|
| 5.00%, 06/01/2029 (A) |
|
|
453,000 |
|
|
|
422,428 |
|
| International Game Technology PLC |
|
|
|
|
|
|
|
|
| 4.13%, 04/15/2026 (A) |
|
|
227,000 |
|
|
|
220,900 |
|
| 5.25%, 01/15/2029 (A) |
|
|
217,000 |
|
|
|
210,009 |
|
| 6.25%, 01/15/2027 (A) |
|
|
214,000 |
|
|
|
214,691 |
|
| 6.50%, 02/15/2025 (A) |
|
|
434,000 |
|
|
|
434,236 |
|
| Light & Wonder International, Inc. |
|
|
|
|
|
|
|
|
| 7.00%, 05/15/2028 (A) |
|
|
731,000 |
|
|
|
735,045 |
|
| 7.50%, 09/01/2031 (A) |
|
|
928,000 |
|
|
|
958,651 |
|
| MGM Resorts International |
|
|
|
|
|
|
|
|
| 4.63%, 09/01/2026 |
|
|
341,000 |
|
|
|
332,691 |
|
| 4.75%, 10/15/2028 |
|
|
633,000 |
|
|
|
602,038 |
|
| 5.50%, 04/15/2027 (B) |
|
|
924,000 |
|
|
|
911,749 |
|
| 5.75%, 06/15/2025 |
|
|
649,000 |
|
|
|
646,830 |
|
| 6.50%, 04/15/2032 |
|
|
899,000 |
|
|
|
894,910 |
|
| NCL Corp. Ltd. |
|
|
|
|
|
|
|
|
| 5.88%, 03/15/2026 - 02/15/2027 (A) |
|
|
1,614,000 |
|
|
|
1,595,654 |
|
| 8.13%, 01/15/2029 (A) |
|
|
383,000 |
|
|
|
401,757 |
|
| Royal Caribbean Cruises Ltd. |
|
|
|
|
|
|
|
|
| 5.38%, 07/15/2027 (A) |
|
|
500,000 |
|
|
|
492,388 |
|
| 5.50%, 04/01/2028 (A) |
|
|
412,000 |
|
|
|
406,680 |
|
| 6.25%, 03/15/2032 (A) |
|
|
171,000 |
|
|
|
172,440 |
|
| 8.25%, 01/15/2029 (A) |
|
|
279,000 |
|
|
|
294,593 |
|
| Scientific Games Holdings LP/Scientific Games US FinCo, Inc. |
|
|
|
|
|
|
|
|
| 6.63%, 03/01/2030 (A) |
|
|
661,000 |
|
|
|
644,447 |
|
| Station Casinos LLC |
|
|
|
|
|
|
|
|
| 4.50%, 02/15/2028 (A) |
|
|
1,696,000 |
|
|
|
1,595,788 |
|
| 6.63%, 03/15/2032 (A) |
|
|
404,000 |
|
|
|
402,063 |
|
The Notes to Financial Statements are an integral part of this report.
|
|
|
|
|
| Transamerica Series Trust |
|
|
|
Semi-Annual Financial Statements 2024 |
|
|
Page 4 |
|
|
Transamerica Aegon High Yield Bond VP
SCHEDULE OF INVESTMENTS (continued)
At June 30, 2024
(unaudited)
|
|
|
|
|
|
|
|
|
| |
|
Principal |
|
|
Value |
|
| |
|
|
| CORPORATE DEBT SECURITIES (continued) |
|
| Hotels, Restaurants & Leisure (continued) |
|
| Travel & Leisure Co. |
|
|
|
|
|
|
|
|
| 4.50%, 12/01/2029 (A)(B) |
|
$ |
392,000 |
|
|
$ |
361,158 |
|
| 6.00%, 04/01/2027 |
|
|
926,000 |
|
|
|
924,099 |
|
| 6.60%, 10/01/2025 |
|
|
148,000 |
|
|
|
148,932 |
|
| Vail Resorts, Inc. |
|
|
|
|
|
|
|
|
| 6.50%, 05/15/2032 (A)(B) |
|
|
534,000 |
|
|
|
540,432 |
|
| Viking Cruises Ltd. |
|
|
|
|
|
|
|
|
| 5.88%, 09/15/2027 (A) |
|
|
1,374,000 |
|
|
|
1,359,805 |
|
| 7.00%, 02/15/2029 (A) |
|
|
710,000 |
|
|
|
714,128 |
|
| 9.13%, 07/15/2031 (A) |
|
|
251,000 |
|
|
|
271,941 |
|
| Wynn Resorts Finance LLC/Wynn Resorts Capital Corp. |
|
|
|
|
|
|
|
|
| 7.13%, 02/15/2031 (A) |
|
|
1,155,000 |
|
|
|
1,198,935 |
|
|
|
|
|
|
|
|
|
|
|
|
|
|
|
|
|
|
|
|
26,439,157 |
|
|
|
|
|
|
|
|
|
|
|
|
|
| Household Products - 0.3% |
|
|
|
|
|
|
|
|
| Central Garden & Pet Co. |
|
|
|
|
|
|
|
|
| 4.13%, 04/30/2031 (A) |
|
|
738,000 |
|
|
|
650,513 |
|
|
|
|
|
|
|
|
|
|
|
| Independent Power & Renewable Electricity Producers - 1.5% |
|
| Calpine Corp. |
|
|
|
|
|
|
|
|
| 3.75%, 03/01/2031 (A) |
|
|
581,000 |
|
|
|
513,471 |
|
| 4.50%, 02/15/2028 (A) |
|
|
753,000 |
|
|
|
715,422 |
|
| 5.00%, 02/01/2031 (A) |
|
|
140,000 |
|
|
|
130,672 |
|
| 5.13%, 03/15/2028 (A) |
|
|
472,000 |
|
|
|
453,988 |
|
| 5.25%, 06/01/2026 (A) |
|
|
700,000 |
|
|
|
692,300 |
|
| Clearway Energy Operating LLC |
|
|
|
|
|
|
|
|
| 3.75%, 02/15/2031 (A) |
|
|
360,000 |
|
|
|
314,167 |
|
| 4.75%, 03/15/2028 (A) |
|
|
583,000 |
|
|
|
557,000 |
|
| NRG Energy, Inc. |
|
|
|
|
|
|
|
|
| 3.38%, 02/15/2029 (A) |
|
|
193,000 |
|
|
|
171,709 |
|
| 3.63%, 02/15/2031 (A) |
|
|
62,000 |
|
|
|
53,184 |
|
| 3.88%, 02/15/2032 (A) |
|
|
31,000 |
|
|
|
26,625 |
|
| 5.75%, 01/15/2028 |
|
|
280,000 |
|
|
|
277,839 |
|
|
|
|
|
|
|
|
|
|
|
|
|
|
|
|
|
|
|
|
3,906,377 |
|
|
|
|
|
|
|
|
|
|
|
|
|
| Insurance - 2.6% |
|
|
|
|
|
|
|
|
| Constellation Insurance, Inc. |
|
|
|
|
|
|
|
|
| 6.80%, 01/24/2030 (A) |
|
|
1,361,000 |
|
|
|
1,331,283 |
|
| Global Atlantic Finance Co. |
|
|
|
|
|
|
|
|
| Fixed until 07/15/2026, 4.70% (C), 10/15/2051 (A) |
|
|
732,000 |
|
|
|
679,846 |
|
| 7.95%, 06/15/2033 (A) |
|
|
623,000 |
|
|
|
685,108 |
|
| Fixed Until 07/15/2029, 7.95% (C), 10/15/2054 (A) |
|
|
594,000 |
|
|
|
597,627 |
|
| Hartford Financial Services Group, Inc. |
|
|
|
|
|
|
|
|
| 3-Month Term SOFR + 2.39%, 7.71% (C), 02/12/2067 (A) |
|
|
1,028,000 |
|
|
|
914,984 |
|
| HUB International Ltd. |
|
|
|
|
|
|
|
|
| 7.25%, 06/15/2030 (A) |
|
|
370,000 |
|
|
|
379,236 |
|
| 7.38%, 01/31/2032 (A) |
|
|
210,000 |
|
|
|
212,936 |
|
| Lincoln National Corp. |
|
|
|
|
|
|
|
|
| 3-Month Term SOFR + 2.62%, 7.95% (C), 05/17/2066 |
|
|
1,057,000 |
|
|
|
860,290 |
|
| Panther Escrow Issuer LLC |
|
|
|
|
|
|
|
|
| 7.13%, 06/01/2031 (A) |
|
|
895,000 |
|
|
|
905,160 |
|
|
|
|
|
|
|
|
|
|
|
|
|
|
|
|
|
|
|
|
6,566,470 |
|
|
|
|
|
|
|
|
|
|
|
|
|
|
|
|
|
|
|
| |
|
Principal |
|
|
Value |
|
| |
|
|
| CORPORATE DEBT SECURITIES (continued) |
|
| Internet & Catalog Retail - 0.7% |
|
| Uber Technologies, Inc. |
|
|
|
|
|
|
|
|
| 6.25%, 01/15/2028 (A) |
|
$ |
59,000 |
|
|
$ |
59,079 |
|
| 7.50%, 09/15/2027 (A) |
|
|
883,000 |
|
|
|
900,291 |
|
| 8.00%, 11/01/2026 (A) |
|
|
907,000 |
|
|
|
914,716 |
|
|
|
|
|
|
|
|
|
|
|
|
|
|
|
|
|
|
|
|
1,874,086 |
|
|
|
|
|
|
|
|
|
|
|
|
|
| IT Services - 0.7% |
|
|
|
|
|
|
|
|
| Conduent Business Services LLC/Conduent State & Local Solutions, Inc. |
|
|
|
|
|
|
|
|
| 6.00%, 11/01/2029 (A) |
|
|
1,032,000 |
|
|
|
964,194 |
|
| Gartner, Inc. |
|
|
|
|
|
|
|
|
| 3.63%, 06/15/2029 (A) |
|
|
273,000 |
|
|
|
250,002 |
|
| 3.75%, 10/01/2030 (A) |
|
|
211,000 |
|
|
|
189,229 |
|
| 4.50%, 07/01/2028 (A) |
|
|
451,000 |
|
|
|
434,669 |
|
|
|
|
|
|
|
|
|
|
|
|
|
|
|
|
|
|
|
|
1,838,094 |
|
|
|
|
|
|
|
|
|
|
|
|
|
| Leisure Products - 0.4% |
|
|
|
|
|
|
|
|
| Amer Sports Co. |
|
|
|
|
|
|
|
|
| 6.75%, 02/16/2031 (A) |
|
|
984,000 |
|
|
|
981,410 |
|
|
|
|
|
|
|
|
|
|
|
|
|
| Machinery - 2.0% |
|
|
|
|
|
|
|
|
| Advanced Drainage Systems, Inc. |
|
|
|
|
|
|
|
|
| 5.00%, 09/30/2027 (A) |
|
|
217,000 |
|
|
|
212,197 |
|
| 6.38%, 06/15/2030 (A) |
|
|
238,000 |
|
|
|
238,958 |
|
| Chart Industries, Inc. |
|
|
|
|
|
|
|
|
| 7.50%, 01/01/2030 (A) |
|
|
1,247,000 |
|
|
|
1,288,848 |
|
| GrafTech Global Enterprises, Inc. |
|
|
|
|
|
|
|
|
| 9.88%, 12/15/2028 (A)(B) |
|
|
239,000 |
|
|
|
175,770 |
|
| Madison IAQ LLC |
|
|
|
|
|
|
|
|
| 5.88%, 06/30/2029 (A) |
|
|
985,000 |
|
|
|
916,250 |
|
| SPX Flow, Inc. |
|
|
|
|
|
|
|
|
| 8.75%, 04/01/2030 (A) |
|
|
1,274,000 |
|
|
|
1,308,116 |
|
| Wabash National Corp. |
|
|
|
|
|
|
|
|
| 4.50%, 10/15/2028 (A) |
|
|
974,000 |
|
|
|
876,446 |
|
|
|
|
|
|
|
|
|
|
|
|
|
|
|
|
|
|
|
|
5,016,585 |
|
|
|
|
|
|
|
|
|
|
|
|
|
| Media - 8.2% |
|
|
|
|
|
|
|
|
| CCO Holdings LLC/CCO Holdings Capital Corp. |
|
|
|
|
|
|
|
|
| 4.25%, 02/01/2031 - 01/15/2034 (A) |
|
|
846,000 |
|
|
|
655,895 |
|
| 4.50%, 08/15/2030 - 06/01/2033 (A) |
|
|
934,000 |
|
|
|
757,740 |
|
| 4.50%, 05/01/2032 |
|
|
698,000 |
|
|
|
563,819 |
|
| 4.75%, 03/01/2030 - 02/01/2032 (A) |
|
|
1,775,000 |
|
|
|
1,499,959 |
|
| 5.00%, 02/01/2028 (A) |
|
|
423,000 |
|
|
|
395,444 |
|
| 5.38%, 06/01/2029 (A) |
|
|
290,000 |
|
|
|
263,870 |
|
| 5.50%, 05/01/2026 (A) |
|
|
348,000 |
|
|
|
343,899 |
|
| Clear Channel Outdoor Holdings, Inc. |
|
|
|
|
|
|
|
|
| 7.50%, 06/01/2029 (A)(B) |
|
|
61,000 |
|
|
|
51,175 |
|
| 7.75%, 04/15/2028 (A)(B) |
|
|
244,000 |
|
|
|
213,573 |
|
| 9.00%, 09/15/2028 (A) |
|
|
699,000 |
|
|
|
731,861 |
|
The Notes to Financial Statements are an integral part of this report.
|
|
|
|
|
| Transamerica Series Trust |
|
|
|
Semi-Annual Financial Statements 2024 |
|
|
Page 5 |
|
|
Transamerica Aegon High Yield Bond VP
SCHEDULE OF INVESTMENTS (continued)
At June 30, 2024
(unaudited)
|
|
|
|
|
|
|
|
|
| |
|
Principal |
|
|
Value |
|
| |
|
|
| CORPORATE DEBT SECURITIES (continued) |
|
| Media (continued) |
|
| CSC Holdings LLC |
|
|
|
|
|
|
|
|
| 4.13%, 12/01/2030 (A) |
|
$ |
248,000 |
|
|
$ |
160,295 |
|
| 4.50%, 11/15/2031 (A) |
|
|
662,000 |
|
|
|
427,055 |
|
| 5.38%, 02/01/2028 (A) |
|
|
400,000 |
|
|
|
303,910 |
|
| 5.75%, 01/15/2030 (A) |
|
|
2,580,000 |
|
|
|
969,246 |
|
| 6.50%, 02/01/2029 (A)(B) |
|
|
460,000 |
|
|
|
335,689 |
|
| 7.50%, 04/01/2028 (A) |
|
|
500,000 |
|
|
|
265,358 |
|
| 11.75%, 01/31/2029 (A) |
|
|
200,000 |
|
|
|
170,497 |
|
| DISH DBS Corp. |
|
|
|
|
|
|
|
|
| 5.25%, 12/01/2026 (A) |
|
|
173,000 |
|
|
|
136,624 |
|
| 5.75%, 12/01/2028 (A) |
|
|
455,000 |
|
|
|
315,628 |
|
| 7.38%, 07/01/2028 |
|
|
360,000 |
|
|
|
153,101 |
|
| 7.75%, 07/01/2026 |
|
|
218,000 |
|
|
|
135,426 |
|
| DISH Network Corp. |
|
|
|
|
|
|
|
|
| 11.75%, 11/15/2027 (A) |
|
|
354,000 |
|
|
|
347,094 |
|
| Gray Television, Inc. |
|
|
|
|
|
|
|
|
| 4.75%, 10/15/2030 (A) |
|
|
662,000 |
|
|
|
397,332 |
|
| 5.38%, 11/15/2031 (A) |
|
|
1,156,000 |
|
|
|
655,669 |
|
| 7.00%, 05/15/2027 (A)(B) |
|
|
260,000 |
|
|
|
239,362 |
|
| iHeartCommunications, Inc. |
|
|
|
|
|
|
|
|
| 5.25%, 08/15/2027 (A) |
|
|
564,000 |
|
|
|
299,537 |
|
| 6.38%, 05/01/2026 (B) |
|
|
495,000 |
|
|
|
384,953 |
|
| 8.38%, 05/01/2027 |
|
|
1,147,386 |
|
|
|
422,579 |
|
| LCPR Senior Secured Financing DAC |
|
|
|
|
|
|
|
|
| 5.13%, 07/15/2029 (A)(B) |
|
|
1,506,000 |
|
|
|
1,248,814 |
|
| 6.75%, 10/15/2027 (A) |
|
|
816,000 |
|
|
|
764,307 |
|
| Sirius XM Radio, Inc. |
|
|
|
|
|
|
|
|
| 3.13%, 09/01/2026 (A) |
|
|
211,000 |
|
|
|
198,522 |
|
| 4.13%, 07/01/2030 (A) |
|
|
485,000 |
|
|
|
414,271 |
|
| 5.00%, 08/01/2027 (A) |
|
|
31,000 |
|
|
|
29,677 |
|
| 5.50%, 07/01/2029 (A) |
|
|
373,000 |
|
|
|
350,424 |
|
| TEGNA, Inc. |
|
|
|
|
|
|
|
|
| 4.63%, 03/15/2028 |
|
|
481,000 |
|
|
|
433,298 |
|
| 4.75%, 03/15/2026 (A) |
|
|
244,000 |
|
|
|
238,506 |
|
| Univision Communications, Inc. |
|
|
|
|
|
|
|
|
| 6.63%, 06/01/2027 (A) |
|
|
796,000 |
|
|
|
762,134 |
|
| 8.00%, 08/15/2028 (A) |
|
|
403,000 |
|
|
|
393,018 |
|
| 8.50%, 07/31/2031 (A) |
|
|
687,000 |
|
|
|
667,324 |
|
| Virgin Media Finance PLC |
|
|
|
|
|
|
|
|
| 5.00%, 07/15/2030 (A) |
|
|
647,000 |
|
|
|
533,251 |
|
| Virgin Media Secured Finance PLC |
|
|
|
|
|
|
|
|
| 5.50%, 05/15/2029 (A) |
|
|
1,139,000 |
|
|
|
1,041,394 |
|
| VZ Secured Financing BV |
|
|
|
|
|
|
|
|
| 5.00%, 01/15/2032 (A) |
|
|
2,548,000 |
|
|
|
2,173,001 |
|
|
|
|
|
|
|
|
|
|
|
|
|
|
|
|
|
|
|
|
20,844,531 |
|
|
|
|
|
|
|
|
|
|
|
|
|
| Metals & Mining - 4.8% |
|
|
|
|
|
|
|
|
| Big River Steel LLC/BRS Finance Corp. |
|
|
|
|
|
|
|
|
| 6.63%, 01/31/2029 (A) |
|
|
1,137,000 |
|
|
|
1,139,582 |
|
| Cleveland-Cliffs, Inc. |
|
|
|
|
|
|
|
|
| 7.00%, 03/15/2032 (A) |
|
|
900,000 |
|
|
|
889,432 |
|
| Constellium SE |
|
|
|
|
|
|
|
|
| 5.63%, 06/15/2028 (A) |
|
|
1,025,000 |
|
|
|
1,003,451 |
|
| 5.88%, 02/15/2026 (A) |
|
|
1,818,000 |
|
|
|
1,808,493 |
|
| Enviri Corp. |
|
|
|
|
|
|
|
|
| 5.75%, 07/31/2027 (A)(B) |
|
|
1,424,000 |
|
|
|
1,352,250 |
|
|
|
|
|
|
|
|
|
|
| |
|
Principal |
|
|
Value |
|
| |
|
|
| CORPORATE DEBT SECURITIES (continued) |
|
| Metals & Mining (continued) |
|
| FMG Resources August 2006 Pty. Ltd. |
|
|
|
|
|
|
|
|
| 5.88%, 04/15/2030 (A) |
|
$ |
718,000 |
|
|
$ |
701,502 |
|
| 6.13%, 04/15/2032 (A) |
|
|
698,000 |
|
|
|
689,962 |
|
| Mineral Resources Ltd. |
|
|
|
|
|
|
|
|
| 8.13%, 05/01/2027 (A) |
|
|
872,000 |
|
|
|
879,236 |
|
| 8.50%, 05/01/2030 (A) |
|
|
988,000 |
|
|
|
1,022,760 |
|
| 9.25%, 10/01/2028 (A) |
|
|
99,000 |
|
|
|
103,897 |
|
| New Gold, Inc. |
|
|
|
|
|
|
|
|
| 7.50%, 07/15/2027 (A) |
|
|
1,032,000 |
|
|
|
1,039,039 |
|
| Novelis Corp. |
|
|
|
|
|
|
|
|
| 3.25%, 11/15/2026 (A) |
|
|
70,000 |
|
|
|
65,861 |
|
| 3.88%, 08/15/2031 (A) |
|
|
71,000 |
|
|
|
61,495 |
|
| 4.75%, 01/30/2030 (A) |
|
|
1,620,000 |
|
|
|
1,502,807 |
|
|
|
|
|
|
|
|
|
|
|
|
|
|
|
|
|
|
|
|
12,259,767 |
|
|
|
|
|
|
|
|
|
|
|
| Mortgage Real Estate Investment Trusts - 0.5% |
|
| Ladder Capital Finance Holdings LLLP/Ladder Capital Finance Corp. |
|
|
|
|
|
|
|
|
| 4.25%, 02/01/2027 (A) |
|
|
364,000 |
|
|
|
344,768 |
|
| 5.25%, 10/01/2025 (A) |
|
|
632,000 |
|
|
|
626,561 |
|
| 7.00%, 07/15/2031 (A)(E) |
|
|
302,000 |
|
|
|
304,446 |
|
|
|
|
|
|
|
|
|
|
|
|
|
|
|
|
|
|
|
|
1,275,775 |
|
|
|
|
|
|
|
|
|
|
|
| Oil, Gas & Consumable Fuels - 11.2% |
|
| Antero Midstream Partners LP/Antero Midstream Finance Corp. |
|
|
|
|
|
|
|
|
| 5.38%, 06/15/2029 (A) |
|
|
690,000 |
|
|
|
668,929 |
|
| 6.63%, 02/01/2032 (A) |
|
|
393,000 |
|
|
|
396,527 |
|
| Chord Energy Corp. |
|
|
|
|
|
|
|
|
| 6.38%, 06/01/2026 (A) |
|
|
764,000 |
|
|
|
763,892 |
|
| Civitas Resources, Inc. |
|
|
|
|
|
|
|
|
| 5.00%, 10/15/2026 (A) |
|
|
424,000 |
|
|
|
412,669 |
|
| 8.63%, 11/01/2030 (A) |
|
|
28,000 |
|
|
|
30,047 |
|
| 8.75%, 07/01/2031 (A) |
|
|
940,000 |
|
|
|
1,006,758 |
|
| Comstock Resources, Inc. |
|
|
|
|
|
|
|
|
| 5.88%, 01/15/2030 (A) |
|
|
619,000 |
|
|
|
576,809 |
|
| CrownRock LP/CrownRock Finance, Inc. |
|
|
|
|
|
|
|
|
| 5.00%, 05/01/2029 (A) |
|
|
17,000 |
|
|
|
16,847 |
|
| 5.63%, 10/15/2025 (A) |
|
|
1,849,000 |
|
|
|
1,844,647 |
|
| DT Midstream, Inc. |
|
|
|
|
|
|
|
|
| 4.13%, 06/15/2029 (A) |
|
|
392,000 |
|
|
|
362,831 |
|
| 4.38%, 06/15/2031 (A) |
|
|
122,000 |
|
|
|
111,097 |
|
| EnLink Midstream LLC |
|
|
|
|
|
|
|
|
| 6.50%, 09/01/2030 (A) |
|
|
435,000 |
|
|
|
445,450 |
|
| EQM Midstream Partners LP |
|
|
|
|
|
|
|
|
| 6.00%, 07/01/2025 (A) |
|
|
59,000 |
|
|
|
59,004 |
|
| 6.38%, 04/01/2029 (A) |
|
|
769,000 |
|
|
|
776,756 |
|
| 6.50%, 07/01/2027 (A) |
|
|
366,000 |
|
|
|
369,875 |
|
| Genesis Energy LP/Genesis Energy Finance Corp. |
|
|
|
|
|
|
|
|
| 7.88%, 05/15/2032 |
|
|
154,000 |
|
|
|
155,359 |
|
| 8.25%, 01/15/2029 |
|
|
37,000 |
|
|
|
38,183 |
|
| 8.88%, 04/15/2030 |
|
|
407,000 |
|
|
|
428,168 |
|
| Harvest Midstream I LP |
|
|
|
|
|
|
|
|
| 7.50%, 05/15/2032 (A) |
|
|
889,000 |
|
|
|
903,098 |
|
The Notes to Financial Statements are an integral part of this report.
|
|
|
|
|
| Transamerica Series Trust |
|
|
|
Semi-Annual Financial Statements 2024 |
|
|
Page 6 |
|
|
Transamerica Aegon High Yield Bond VP
SCHEDULE OF INVESTMENTS (continued)
At June 30, 2024
(unaudited)
|
|
|
|
|
|
|
|
|
| |
|
Principal |
|
|
Value |
|
| |
|
|
| CORPORATE DEBT SECURITIES (continued) |
|
| Oil, Gas & Consumable Fuels (continued) |
|
| Hess Midstream Operations LP |
|
|
|
|
|
|
|
|
| 4.25%, 02/15/2030 (A) |
|
$ |
31,000 |
|
|
$ |
28,450 |
|
| 5.13%, 06/15/2028 (A) |
|
|
657,000 |
|
|
|
636,179 |
|
| 6.50%, 06/01/2029 (A) |
|
|
178,000 |
|
|
|
180,467 |
|
| HF Sinclair Corp. |
|
|
|
|
|
|
|
|
| 6.38%, 04/15/2027 (A) |
|
|
678,000 |
|
|
|
679,419 |
|
| Howard Midstream Energy Partners LLC |
|
|
|
|
|
|
|
|
| 7.38%, 07/15/2032 (A) |
|
|
98,000 |
|
|
|
99,756 |
|
| Ithaca Energy North Sea PLC |
|
|
|
|
|
|
|
|
| 9.00%, 07/15/2026 (A) |
|
|
875,000 |
|
|
|
886,175 |
|
| Kinder Morgan, Inc. |
|
|
|
|
|
|
|
|
| 7.75%, 01/15/2032 |
|
|
245,000 |
|
|
|
276,967 |
|
| 8.05%, 10/15/2030 |
|
|
134,000 |
|
|
|
150,971 |
|
| Matador Resources Co. |
|
|
|
|
|
|
|
|
| 6.50%, 04/15/2032 (A) |
|
|
184,000 |
|
|
|
184,089 |
|
| Moss Creek Resources Holdings, Inc. |
|
|
|
|
|
|
|
|
| 7.50%, 01/15/2026 (A) |
|
|
115,000 |
|
|
|
115,177 |
|
| 10.50%, 05/15/2027 (A) |
|
|
507,000 |
|
|
|
519,628 |
|
| NuStar Logistics LP |
|
|
|
|
|
|
|
|
| 5.63%, 04/28/2027 |
|
|
742,000 |
|
|
|
735,710 |
|
| 5.75%, 10/01/2025 |
|
|
115,000 |
|
|
|
114,281 |
|
| 6.00%, 06/01/2026 |
|
|
111,000 |
|
|
|
110,838 |
|
| Occidental Petroleum Corp. |
|
|
|
|
|
|
|
|
| 6.13%, 01/01/2031 |
|
|
79,000 |
|
|
|
80,825 |
|
| 6.45%, 09/15/2036 |
|
|
1,194,000 |
|
|
|
1,247,849 |
|
| 6.63%, 09/01/2030 |
|
|
899,000 |
|
|
|
942,800 |
|
| 7.15%, 05/15/2028 |
|
|
433,000 |
|
|
|
456,017 |
|
| Ovintiv, Inc. |
|
|
|
|
|
|
|
|
| 7.38%, 11/01/2031 |
|
|
276,000 |
|
|
|
301,194 |
|
| Parkland Corp. |
|
|
|
|
|
|
|
|
| 4.50%, 10/01/2029 (A) |
|
|
341,000 |
|
|
|
312,026 |
|
| 4.63%, 05/01/2030 (A) |
|
|
77,000 |
|
|
|
70,239 |
|
| 5.88%, 07/15/2027 (A) |
|
|
531,000 |
|
|
|
524,147 |
|
| PBF Holding Co. LLC/PBF Finance Corp. |
|
|
|
|
|
|
|
|
| 7.88%, 09/15/2030 (A) |
|
|
687,000 |
|
|
|
703,330 |
|
| Permian Resources Operating LLC |
|
|
|
|
|
|
|
|
| 7.00%, 01/15/2032 (A) |
|
|
979,000 |
|
|
|
1,005,697 |
|
| SM Energy Co. |
|
|
|
|
|
|
|
|
| 5.63%, 06/01/2025 (B) |
|
|
299,000 |
|
|
|
297,709 |
|
| 6.50%, 07/15/2028 |
|
|
77,000 |
|
|
|
76,345 |
|
| 6.63%, 01/15/2027 |
|
|
832,000 |
|
|
|
828,698 |
|
| 6.75%, 09/15/2026 |
|
|
222,000 |
|
|
|
222,070 |
|
| Southwestern Energy Co. |
|
|
|
|
|
|
|
|
| 4.75%, 02/01/2032 |
|
|
286,000 |
|
|
|
262,961 |
|
| 5.38%, 03/15/2030 |
|
|
540,000 |
|
|
|
521,486 |
|
| Summit Midstream Holdings LLC/Summit Midstream Finance Corp. |
|
|
|
|
|
|
|
|
| 10.00% (G), 10/15/2026 (A) |
|
|
340,000 |
|
|
|
349,561 |
|
| Summit Midstream Partners LP |
|
|
|
|
|
|
|
|
| Fixed until 05/01/2023 (D), 13.03% (C) |
|
|
672,000 |
|
|
|
833,280 |
|
| Targa Resources Partners LP/Targa Resources Partners Finance Corp. |
|
|
|
|
|
|
|
|
| 4.88%, 02/01/2031 |
|
|
145,000 |
|
|
|
138,339 |
|
| 5.00%, 01/15/2028 |
|
|
150,000 |
|
|
|
146,896 |
|
| 5.50%, 03/01/2030 |
|
|
716,000 |
|
|
|
711,912 |
|
| 6.50%, 07/15/2027 |
|
|
255,000 |
|
|
|
256,666 |
|
|
|
|
|
|
|
|
|
|
| |
|
Principal |
|
|
Value |
|
| |
|
|
| CORPORATE DEBT SECURITIES (continued) |
|
| Oil, Gas & Consumable Fuels (continued) |
|
| Venture Global LNG, Inc. |
|
|
|
|
|
|
|
|
| 9.50%, 02/01/2029 (A) |
|
$ |
959,000 |
|
|
$ |
1,051,092 |
|
| 9.88%, 02/01/2032 (A) |
|
|
1,090,000 |
|
|
|
1,185,061 |
|
| Vital Energy, Inc. |
|
|
|
|
|
|
|
|
| 9.75%, 10/15/2030 |
|
|
530,000 |
|
|
|
578,727 |
|
| Western Midstream Operating LP |
|
|
|
|
|
|
|
|
| 5.30%, 03/01/2048 |
|
|
1,122,000 |
|
|
|
970,043 |
|
| 5.45%, 04/01/2044 |
|
|
251,000 |
|
|
|
226,588 |
|
|
|
|
|
|
|
|
|
|
|
|
|
|
|
|
|
|
|
|
28,386,611 |
|
|
|
|
|
|
|
|
|
|
|
|
|
| Paper & Forest Products - 0.7% |
|
|
|
|
|
|
|
|
| Domtar Corp. |
|
|
|
|
|
|
|
|
| 6.75%, 10/01/2028 (A) |
|
|
970,000 |
|
|
|
865,064 |
|
| Glatfelter Corp. |
|
|
|
|
|
|
|
|
| 4.75%, 11/15/2029 (A)(B) |
|
|
1,171,000 |
|
|
|
967,978 |
|
|
|
|
|
|
|
|
|
|
|
|
|
|
|
|
|
|
|
|
1,833,042 |
|
|
|
|
|
|
|
|
|
|
|
|
|
| Personal Care Products - 0.3% |
|
|
|
|
|
|
|
|
| Coty, Inc. |
|
|
|
|
|
|
|
|
| 5.00%, 04/15/2026 (A) |
|
|
582,000 |
|
|
|
574,318 |
|
| Coty, Inc./HFC Prestige Products, Inc./HFC Prestige International US LLC |
|
|
|
|
|
|
|
|
| 6.63%, 07/15/2030 (A) |
|
|
243,000 |
|
|
|
246,626 |
|
|
|
|
|
|
|
|
|
|
|
|
|
|
|
|
|
|
|
|
820,944 |
|
|
|
|
|
|
|
|
|
|
|
|
|
| Pharmaceuticals - 1.2% |
|
|
|
|
|
|
|
|
| Bausch Health Americas, Inc. |
|
|
|
|
|
|
|
|
| 8.50%, 01/31/2027 (A) |
|
|
532,000 |
|
|
|
367,080 |
|
| Bausch Health Cos., Inc. |
|
|
|
|
|
|
|
|
| 5.00%, 01/30/2028 - 02/15/2029 (A) |
|
|
574,000 |
|
|
|
279,589 |
|
| 5.25%, 01/30/2030 - 02/15/2031 (A) |
|
|
619,000 |
|
|
|
287,835 |
|
| 7.00%, 01/15/2028 (A) |
|
|
161,000 |
|
|
|
86,940 |
|
| Grifols SA |
|
|
|
|
|
|
|
|
| 4.75%, 10/15/2028 (A)(B) |
|
|
613,000 |
|
|
|
528,853 |
|
| Organon & Co./Organon Foreign Debt Co-Issuer BV |
|
|
|
|
|
|
|
|
| 4.13%, 04/30/2028 (A) |
|
|
685,000 |
|
|
|
636,189 |
|
| 5.13%, 04/30/2031 (A) |
|
|
453,000 |
|
|
|
405,955 |
|
| 6.75%, 05/15/2034 (A) |
|
|
359,000 |
|
|
|
358,459 |
|
|
|
|
|
|
|
|
|
|
|
|
|
|
|
|
|
|
|
|
2,950,900 |
|
|
|
|
|
|
|
|
|
|
|
| Real Estate Management & Development - 0.4% |
|
| Cushman & Wakefield US Borrower LLC |
|
|
|
|
|
|
|
|
| 6.75%, 05/15/2028 (A)(B) |
|
|
510,000 |
|
|
|
506,284 |
|
| 8.88%, 09/01/2031 (A)(B) |
|
|
417,000 |
|
|
|
438,762 |
|
|
|
|
|
|
|
|
|
|
|
|
|
|
|
|
|
|
|
|
945,046 |
|
|
|
|
|
|
|
|
|
|
|
|
|
| Software - 1.8% |
|
|
|
|
|
|
|
|
| Central Parent LLC/CDK Global II LLC/CDK Financing Co., Inc. |
|
|
|
|
|
|
|
|
| 8.00%, 06/15/2029 (A) |
|
|
819,000 |
|
|
|
831,691 |
|
| Crowdstrike Holdings, Inc. |
|
|
|
|
|
|
|
|
| 3.00%, 02/15/2029 |
|
|
829,000 |
|
|
|
747,551 |
|
| Helios Software Holdings, Inc./ION Corporate Solutions Finance SARL |
|
|
|
|
|
|
|
|
| 4.63%, 05/01/2028 (A) |
|
|
555,000 |
|
|
|
495,717 |
|
| 8.75%, 05/01/2029 (A) |
|
|
770,000 |
|
|
|
784,024 |
|
The Notes to Financial Statements are an integral part of this report.
|
|
|
|
|
| Transamerica Series Trust |
|
|
|
Semi-Annual Financial Statements 2024 |
|
|
Page 7 |
|
|
Transamerica Aegon High Yield Bond VP
SCHEDULE OF INVESTMENTS (continued)
At June 30, 2024
(unaudited)
|
|
|
|
|
|
|
|
|
| |
|
Principal |
|
|
Value |
|
| |
|
|
| CORPORATE DEBT SECURITIES (continued) |
|
| Software (continued) |
|
| MSCI, Inc. |
|
|
|
|
|
|
|
|
| 3.63%, 09/01/2030 (A) |
|
|
$ 986,000 |
|
|
|
$ 885,228 |
|
| Rackspace Finance LLC |
|
|
|
|
|
|
|
|
| 3.50%, 05/15/2028 (A) |
|
|
426,685 |
|
|
|
183,475 |
|
| UKG, Inc. |
|
|
|
|
|
|
|
|
| 6.88%, 02/01/2031 (A) |
|
|
620,000 |
|
|
|
627,754 |
|
|
|
|
|
|
|
|
|
|
|
|
|
|
|
|
|
|
|
|
4,555,440 |
|
|
|
|
|
|
|
|
|
|
|
|
|
| Specialized REITs - 1.0% |
|
|
|
|
|
|
|
|
| Iron Mountain, Inc. |
|
|
|
|
|
|
|
|
| 4.50%, 02/15/2031 (A) |
|
|
183,000 |
|
|
|
165,196 |
|
| 5.25%, 03/15/2028 (A) |
|
|
994,000 |
|
|
|
961,848 |
|
| 7.00%, 02/15/2029 (A) |
|
|
346,000 |
|
|
|
352,111 |
|
| VICI Properties LP/VICI Note Co., Inc. |
|
|
|
|
|
|
|
|
| 3.88%, 02/15/2029 (A) |
|
|
319,000 |
|
|
|
295,068 |
|
| 4.63%, 06/15/2025 (A) |
|
|
182,000 |
|
|
|
179,670 |
|
| 5.75%, 02/01/2027 (A) |
|
|
480,000 |
|
|
|
480,104 |
|
|
|
|
|
|
|
|
|
|
|
|
|
|
|
|
|
|
|
|
2,433,997 |
|
|
|
|
|
|
|
|
|
|
|
|
|
| Specialty Retail - 0.7% |
|
|
|
|
|
|
|
|
| Bath & Body Works, Inc. |
|
|
|
|
|
|
|
|
| 6.63%, 10/01/2030 (A) |
|
|
236,000 |
|
|
|
236,720 |
|
| 6.75%, 07/01/2036 |
|
|
497,000 |
|
|
|
494,670 |
|
| 6.88%, 11/01/2035 |
|
|
395,000 |
|
|
|
398,347 |
|
| 7.50%, 06/15/2029 |
|
|
549,000 |
|
|
|
565,505 |
|
| 9.38%, 07/01/2025 (A) |
|
|
56,000 |
|
|
|
57,831 |
|
|
|
|
|
|
|
|
|
|
|
|
|
|
|
|
|
|
|
|
1,753,073 |
|
|
|
|
|
|
|
|
|
|
|
| Technology Hardware, Storage & Peripherals - 1.0% |
|
| NCR Voyix Corp. |
|
|
|
|
|
|
|
|
| 5.00%, 10/01/2028 (A) |
|
|
329,000 |
|
|
|
310,607 |
|
| 5.13%, 04/15/2029 (A) |
|
|
1,105,000 |
|
|
|
1,041,122 |
|
| 5.25%, 10/01/2030 (A) |
|
|
481,000 |
|
|
|
439,667 |
|
| Western Digital Corp. |
|
|
|
|
|
|
|
|
| 4.75%, 02/15/2026 |
|
|
774,000 |
|
|
|
757,788 |
|
|
|
|
|
|
|
|
|
|
|
|
|
|
|
|
|
|
|
|
2,549,184 |
|
|
|
|
|
|
|
|
|
|
|
| Wireless Telecommunication Services - 1.1% |
|
| Altice France SA |
|
|
|
|
|
|
|
|
| 8.13%, 02/01/2027 (A)(B) |
|
|
970,000 |
|
|
|
727,438 |
|
| Vmed O2 UK Financing I PLC |
|
|
|
|
|
|
|
|
| 4.25%, 01/31/2031 (A) |
|
|
585,000 |
|
|
|
485,824 |
|
| 4.75%, 07/15/2031 (A) |
|
|
1,029,000 |
|
|
|
867,888 |
|
| 7.75%, 04/15/2032 (A) |
|
|
776,000 |
|
|
|
756,899 |
|
|
|
|
|
|
|
|
|
|
|
|
|
|
|
|
|
|
|
|
2,838,049 |
|
|
|
|
|
|
|
|
|
|
|
|
|
| Total Corporate Debt Securities
(Cost $252,168,860) |
|
|
|
|
|
|
241,682,193 |
|
|
|
|
|
|
|
|
|
|
|
|
|
| LOAN ASSIGNMENTS - 2.3% |
|
|
|
|
|
|
|
|
| Automobile Components - 0.2% |
|
|
|
|
|
|
|
|
| Clarios Global LP
Term Loan B,
1-Month Term SOFR + 3.00%, 8.34% (C), 05/06/2030 |
|
|
434,910 |
|
|
|
435,725 |
|
|
|
|
|
|
|
|
|
|
|
|
|
|
|
|
|
|
|
| |
|
Principal |
|
|
Value |
|
| |
|
|
| LOAN ASSIGNMENTS (continued) |
|
| Commercial Services & Supplies - 0.3% |
|
| Garda World Security Corp.
Term Loan B,
3-Month Term SOFR + 4.25%, 9.59% (C), 02/01/2029 |
|
|
$ 892,728 |
|
|
|
$ 897,638 |
|
|
|
|
|
|
|
|
|
|
| Containers & Packaging - 0.4% |
|
|
|
|
|
|
|
|
| Anchor Glass Container Corp.
Term Loan,
3-Month Term SOFR + 5.00%, 10.59% (C), 12/07/2025 |
|
|
876,995 |
|
|
|
701,596 |
|
| Trident TPI Holdings, Inc.
Term Loan B6,
3-Month Term SOFR + 4.00%, 9.57% (C), 09/15/2028 |
|
|
402,241 |
|
|
|
402,681 |
|
|
|
|
|
|
|
|
|
|
|
|
|
|
|
|
|
|
|
|
1,104,277 |
|
|
|
|
|
|
|
|
|
|
|
|
|
| Hotels, Restaurants & Leisure - 0.3% |
|
|
|
|
|
|
|
|
| Caesars Entertainment, Inc.
Term Loan B1,
3-Month Term SOFR + 2.75%, 8.10% (C), 02/06/2031 |
|
|
773,063 |
|
|
|
772,235 |
|
|
|
|
|
|
|
|
|
|
|
|
|
| IT Services - 0.1% |
|
|
|
|
|
|
|
|
| Rackspace Technology Global, Inc.
1st Lien Term Loan,
1-Month Term SOFR + 6.25%, 11.69% (C), 05/15/2028 |
|
|
233,046 |
|
|
|
234,891 |
|
|
|
|
|
|
|
|
|
|
|
|
|
| Machinery - 0.3% |
|
|
|
|
|
|
|
|
| Madison IAQ LLC
Term Loan,
TBD, 06/21/2028 (E)(H) |
|
|
650,000 |
|
|
|
650,975 |
|
|
|
|
|
|
|
|
|
|
|
|
|
| Software - 0.7% |
|
|
|
|
|
|
|
|
| Central Parent, Inc.
Term Loan B,
3-Month Term SOFR + 3.25%, 8.58% (C), 07/06/2029 |
|
|
748,492 |
|
|
|
736,797 |
|
| UKG, Inc.
Term Loan B,
1-Month Term SOFR + 3.25%, 8.58% (C), 02/10/2031 |
|
|
1,020,000 |
|
|
|
1,023,188 |
|
|
|
|
|
|
|
|
|
|
|
|
|
|
|
|
|
|
|
|
1,759,985 |
|
|
|
|
|
|
|
|
|
|
|
|
|
| Total Loan Assignments
(Cost $5,925,719) |
|
|
|
|
|
|
5,855,726 |
|
|
|
|
|
|
|
|
|
|
|
|
|
| |
|
Shares |
|
|
Value |
|
| |
|
|
| COMMON STOCKS - 0.1% |
|
| Electric Utilities - 0.0% (I) |
|
|
|
|
|
|
|
|
| Homer City Generation LLC (J)(K)(L) |
|
|
39,132 |
|
|
|
391 |
|
|
|
|
|
|
|
|
|
|
|
|
|
| Oil, Gas & Consumable Fuels - 0.0% |
|
|
|
|
|
|
|
|
| Ultra Resources, Inc. (E)(J)(K)(L)(M) |
|
|
123 |
|
|
|
0 |
|
|
|
|
|
|
|
|
|
|
|
|
|
| Software - 0.1% |
|
|
|
|
|
|
|
|
| Avaya Holdings Corp. (J)(L) |
|
|
33,145 |
|
|
|
198,870 |
|
|
|
|
|
|
|
|
|
|
|
|
|
| Total Common Stocks
(Cost $2,523,065) |
|
|
|
|
|
|
199,261 |
|
|
|
|
|
|
|
|
|
|
The Notes to Financial Statements are an integral part of this report.
|
|
|
|
|
| Transamerica Series Trust |
|
|
|
Semi-Annual Financial Statements 2024 |
|
|
Page 8 |
|
|
Transamerica Aegon High Yield Bond VP
SCHEDULE OF INVESTMENTS (continued)
At June 30, 2024
(unaudited)
|
|
|
|
|
|
|
|
|
| |
|
Shares |
|
|
Value |
|
| |
|
|
| OTHER INVESTMENT COMPANY - 5.9% |
|
| Securities Lending Collateral - 5.9% |
|
|
|
|
|
|
|
|
| State Street Navigator Securities Lending Trust - Government Money Market Portfolio, 5.28% (N) |
|
|
14,845,118 |
|
|
$ |
14,845,118 |
|
|
|
|
|
|
|
|
|
|
|
|
| Total Other Investment Company
(Cost $14,845,118) |
|
|
|
14,845,118 |
|
|
|
|
|
|
|
|
|
|
|
|
|
| |
|
Principal |
|
|
Value |
|
| |
|
|
|
|
| REPURCHASE AGREEMENT - 1.1% |
|
|
|
|
|
|
|
|
| Fixed Income Clearing Corp.,
2.50% (N), dated 06/28/2024, to be repurchased at $2,690,575 on 07/01/2024. Collateralized by a U.S. Government Obligation, 4.50%, due 03/31/2026, and with a value of $2,743,933. |
|
$ |
2,690,014 |
|
|
|
2,690,014 |
|
|
|
|
|
|
|
|
|
|
|
|
| Total Repurchase Agreement
(Cost $2,690,014) |
|
|
|
2,690,014 |
|
|
|
|
|
|
|
|
|
|
| Total Investments
(Cost $278,152,776) |
|
|
|
265,272,312 |
|
|
|
|
|
|
|
|
|
|
| Net Other Assets (Liabilities) - (5.0)% |
|
|
|
(12,511,917) |
|
|
|
|
|
|
|
|
|
|
|
|
| Net Assets - 100.0% |
|
|
$ |
252,760,395 |
|
|
|
|
|
|
|
|
|
|
INVESTMENT VALUATION:
Valuation Inputs (O)
|
|
|
|
|
|
|
|
|
|
|
|
|
|
|
|
|
| |
|
Level 1 - Unadjusted Quoted Prices |
|
|
Level 2 - Other Significant Observable Inputs |
|
|
Level 3 - Significant Unobservable Inputs (P) |
|
|
Value |
|
|
|
|
|
|
| ASSETS |
|
|
|
|
|
|
|
|
|
|
|
|
|
|
|
|
| Investments |
|
|
|
|
|
|
|
|
|
|
|
|
|
|
|
|
| Corporate Debt Securities |
|
$ |
— |
|
|
$ |
241,682,193 |
|
|
$ |
— |
|
|
$ |
241,682,193 |
|
| Loan Assignments |
|
|
— |
|
|
|
5,855,726 |
|
|
|
— |
|
|
|
5,855,726 |
|
| Common Stocks |
|
|
— |
|
|
|
198,870 |
|
|
|
391 |
|
|
|
199,261 |
|
| Other Investment Company |
|
|
14,845,118 |
|
|
|
— |
|
|
|
— |
|
|
|
14,845,118 |
|
| Repurchase Agreement |
|
|
— |
|
|
|
2,690,014 |
|
|
|
— |
|
|
|
2,690,014 |
|
|
|
|
|
|
|
|
|
|
|
|
|
|
|
|
|
|
|
|
|
|
|
| Total Investments |
|
$ |
14,845,118 |
|
|
$ |
250,426,803 |
|
|
$ |
391 |
|
|
$ |
265,272,312 |
|
|
|
|
|
|
|
|
|
|
|
|
|
|
|
|
|
|
FOOTNOTES TO SCHEDULE OF INVESTMENTS:
| (A) |
Security is exempt from registration pursuant to Rule 144A of the Securities Act of 1933. Security may be resold as transactions exempt from registration, normally to qualified institutional buyers. At June 30, 2024, the total value of 144A securities is $192,634,606, representing 76.2% of the Portfolio’s net assets. |
| (B) |
All or a portion of the security is on loan. The total value of the securities on loan is $16,026,050, collateralized by cash collateral of $14,845,118 and non-cash collateral, such as U.S. government securities and irrevocable letters of credit, of $1,515,045. The amount on loan indicated may not correspond with the securities on loan identified because a security with pending sales are in the process of recall from the brokers. |
| (C) |
Floating or variable rate security. The rate disclosed is as of June 30, 2024. For securities based on a published reference rate and spread, the reference rate and spread are indicated within the description. Variable rate securities with a floor or ceiling feature are disclosed at the inherent rate, where applicable. Certain variable rate securities are not based on a published reference rate and spread, but are determined by the issuer or agent and are based on current market conditions; these securities do not indicate a reference rate and spread in the description. |
| (D) |
Perpetual maturity. The date displayed is the next call date. |
| (E) |
When-issued, delayed-delivery and/or forward commitment (including TBAs) security. Security to be settled and delivered after June 30, 2024. Security may display a coupon rate of 0.00%, as the rate is to be determined at time of settlement. |
| (F) |
Payment in-kind. Security pays interest or dividends in the form of additional bonds or preferred stock. If the security makes a cash payment in addition to in-kind, the cash rate is disclosed separately. |
| (G) |
Step bond. Coupon rate changes in increments to maturity. The rate disclosed is as of June 30, 2024; the maturity date disclosed is the ultimate maturity date. |
The Notes to Financial Statements are an integral part of this report.
|
|
|
|
|
| Transamerica Series Trust |
|
|
|
Semi-Annual Financial Statements 2024 |
|
|
Page 9 |
|
|
Transamerica Aegon High Yield Bond VP
SCHEDULE OF INVESTMENTS (continued)
At June 30, 2024
(unaudited)
FOOTNOTES TO SCHEDULE OF INVESTMENTS (continued):
| (H) |
All or a portion of the security represents an unsettled loan commitment at June 30, 2024 where the rate will be determined at time of settlement. |
| (I) |
Percentage rounds to less than 0.1% or (0.1)%. |
| (J) |
Non-income producing security. |
| (K) |
Security is Level 3 of the fair value hierarchy. |
| (L) |
Fair valued as determined in good faith in accordance with TAM’s procedures. At June 30, 2024, the total value of the securities is $199,261, representing 0.1% of the Portfolio’s net assets. |
| (M) |
Security deemed worthless. |
| (N) |
Rate disclosed reflects the yield at June 30, 2024. |
| (O) |
There were no transfers in or out of Level 3 during the period ended June 30, 2024. Please reference the Investment Valuation section of the Notes to Financial Statements for more information regarding investment valuation and pricing inputs. |
| (P) |
Level 3 securities were not considered significant to the Portfolio. |
PORTFOLIO ABBREVIATION(S):
|
|
|
| REIT |
|
Real Estate Investment Trust |
| SOFR |
|
Secured Overnight Financing Rate |
| TBD |
|
To Be Determined |
The Notes to Financial Statements are an integral part of this report.
|
|
|
|
|
| Transamerica Series Trust |
|
|
|
Semi-Annual Financial Statements 2024 |
|
|
Page 10 |
|
|
Transamerica Aegon High Yield Bond VP
STATEMENT OF ASSETS AND LIABILITIES
At June 30, 2024
(unaudited)
|
|
|
|
|
| Assets: |
|
|
|
|
| Investments, at value (cost $275,462,762) (including securities loaned of $16,026,050) |
|
$ |
262,582,298 |
|
| Repurchase agreement, at value (cost $2,690,014) |
|
|
2,690,014 |
|
| Cash |
|
|
142,524 |
|
| Receivables and other assets: |
|
|
|
|
| Net income from securities lending |
|
|
26,033 |
|
| Interest |
|
|
4,265,011 |
|
| Prepaid expenses |
|
|
1,142 |
|
|
|
| Total assets |
|
|
269,707,022 |
|
|
|
| Liabilities: |
|
|
|
|
| Cash collateral received upon return of: |
|
|
|
|
| Securities on loan |
|
|
14,845,118 |
|
| Payables and other liabilities: |
|
|
|
|
| Investments purchased |
|
|
395,105 |
|
| When-issued, delayed-delivery, forward and TBA commitments purchased |
|
|
1,294,334 |
|
| Shares of beneficial interest redeemed |
|
|
204,519 |
|
| Investment management fees |
|
|
107,201 |
|
| Distribution and service fees |
|
|
22,287 |
|
| Transfer agent costs |
|
|
254 |
|
| Trustee and CCO fees |
|
|
687 |
|
| Audit and tax fees |
|
|
19,752 |
|
| Custody fees |
|
|
28,323 |
|
| Legal fees |
|
|
3,026 |
|
| Printing and shareholder reports fees |
|
|
19,391 |
|
| Other accrued expenses |
|
|
6,630 |
|
|
|
| Total liabilities |
|
|
16,946,627 |
|
|
|
| Net assets |
|
$ |
252,760,395 |
|
|
|
| Net assets consist of: |
|
|
|
|
| Capital stock ($0.01 par value) |
|
$ |
359,413 |
|
| Additional paid-in capital |
|
|
271,939,693 |
|
|
|
| Total distributable earnings (accumulated losses) |
|
|
(19,538,711 |
) |
|
|
| Net assets |
|
$ |
252,760,395 |
|
|
|
| Net assets by class: |
|
|
|
|
| Initial Class |
|
$ |
136,428,528 |
|
| Service Class |
|
|
116,331,867 |
|
|
|
| Shares outstanding: |
|
|
|
|
| Initial Class |
|
|
19,582,669 |
|
| Service Class |
|
|
16,358,609 |
|
|
|
| Net asset value and offering price per share: |
|
|
|
|
| Initial Class |
|
$ |
6.97 |
|
| Service Class |
|
|
7.11 |
|
STATEMENT OF OPERATIONS
For the period ended June 30, 2024
(unaudited)
|
|
|
|
|
| Investment income: |
|
|
|
|
| Interest income |
|
$ |
8,678,785 |
|
| Net income from securities lending |
|
|
104,416 |
|
|
|
| Total investment income |
|
|
8,783,201 |
|
|
|
| Expenses: |
|
|
|
|
| Investment management fees |
|
|
693,022 |
|
| Distribution and service fees: |
|
|
|
|
| Service Class |
|
|
145,488 |
|
| Transfer agent costs |
|
|
1,439 |
|
| Trustee and CCO fees |
|
|
5,787 |
|
| Audit and tax fees |
|
|
19,575 |
|
| Custody fees |
|
|
27,548 |
|
| Legal fees |
|
|
8,483 |
|
| Printing and shareholder reports fees |
|
|
18,722 |
|
| Other |
|
|
9,648 |
|
|
|
| Total expenses |
|
|
929,712 |
|
|
|
| Net investment income (loss) |
|
|
7,853,489 |
|
|
|
| Net realized gain (loss) on: |
|
|
|
|
| Investments |
|
|
(2,546,789 |
) |
|
|
| Net change in unrealized appreciation (depreciation) on: |
|
|
|
|
| Investments |
|
|
(883,175 |
) |
|
|
| Net realized and change in unrealized gain (loss) |
|
|
(3,429,964 |
) |
|
|
| Net increase (decrease) in net assets resulting from operations |
|
$ |
4,423,525 |
|
The Notes to Financial Statements are an integral part of this report.
|
|
|
|
|
| Transamerica Series Trust |
|
|
|
Semi-Annual Financial Statements 2024 |
|
|
Page 11 |
|
|
Transamerica Aegon High Yield Bond VP
STATEMENT OF CHANGES IN NET ASSETS
For the period and year ended:
|
|
|
|
|
|
|
|
|
|
|
|
| |
|
June 30, 2024 (unaudited) |
|
December 31, 2023 |
|
|
|
| From operations: |
|
|
|
|
|
|
|
|
| Net investment income (loss) |
|
|
$ 7,853,489 |
|
|
|
$ 12,346,395 |
|
| Net realized gain (loss) |
|
|
(2,546,789 |
) |
|
|
(7,596,507 |
) |
| Net change in unrealized appreciation (depreciation) |
|
|
(883,175 |
) |
|
|
18,448,644 |
|
|
|
|
| Net increase (decrease) in net assets resulting from operations |
|
|
4,423,525 |
|
|
|
23,198,532 |
|
|
|
|
| Dividends and/or distributions to shareholders: |
|
|
|
|
|
|
|
|
| Initial Class |
|
|
— |
|
|
|
(5,978,036 |
) |
| Service Class |
|
|
— |
|
|
|
(4,956,039 |
) |
|
|
|
| Net increase (decrease) in net assets resulting from dividends and/or distributions to shareholders |
|
|
— |
|
|
|
(10,934,075 |
) |
|
|
|
| Capital share transactions: |
|
|
|
|
|
|
|
|
| Proceeds from shares sold: |
|
|
|
|
|
|
|
|
| Initial Class |
|
|
2,722,641 |
|
|
|
71,342,607 |
|
| Service Class |
|
|
3,034,771 |
|
|
|
5,867,254 |
|
|
|
|
| |
|
|
5,757,412 |
|
|
|
77,209,861 |
|
| Dividends and/or distributions reinvested: |
|
|
|
|
|
|
|
|
| Initial Class |
|
|
— |
|
|
|
5,978,036 |
|
| Service Class |
|
|
— |
|
|
|
4,956,039 |
|
|
|
|
| |
|
|
— |
|
|
|
10,934,075 |
|
| Cost of shares redeemed: |
|
|
|
|
|
|
|
|
| Initial Class |
|
|
(5,571,162 |
) |
|
|
(12,347,955 |
) |
| Service Class |
|
|
(9,915,071 |
) |
|
|
(16,223,227 |
) |
|
|
|
| |
|
|
(15,486,233 |
) |
|
|
(28,571,182 |
) |
|
|
|
| Net increase (decrease) in net assets resulting from capital share transactions |
|
|
(9,728,821 |
) |
|
|
59,572,754 |
|
|
|
|
| Net increase (decrease) in net assets |
|
|
(5,305,296 |
) |
|
|
71,837,211 |
|
|
|
|
| Net assets: |
|
|
|
|
|
|
|
|
| Beginning of period/year |
|
|
258,065,691 |
|
|
|
186,228,480 |
|
| End of period/year |
|
|
$252,760,395 |
|
|
|
$258,065,691 |
|
|
|
|
| Capital share transactions - shares: |
|
|
|
|
|
|
|
|
| Shares issued: |
|
|
|
|
|
|
|
|
| Initial Class |
|
|
397,264 |
|
|
|
10,584,220 |
|
| Service Class |
|
|
432,523 |
|
|
|
863,841 |
|
|
|
|
| |
|
|
829,787 |
|
|
|
11,448,061 |
|
| Shares reinvested: |
|
|
|
|
|
|
|
|
| Initial Class |
|
|
— |
|
|
|
922,537 |
|
| Service Class |
|
|
— |
|
|
|
747,517 |
|
|
|
|
| |
|
|
— |
|
|
|
1,670,054 |
|
| Shares redeemed: |
|
|
|
|
|
|
|
|
| Initial Class |
|
|
(812,914 |
) |
|
|
(1,864,833 |
) |
| Service Class |
|
|
(1,413,382 |
) |
|
|
(2,415,595 |
) |
|
|
|
| |
|
|
(2,226,296 |
) |
|
|
(4,280,428 |
) |
|
|
|
| Net increase (decrease) in shares outstanding: |
|
|
|
|
|
|
|
|
| Initial Class |
|
|
(415,650 |
) |
|
|
9,641,924 |
|
| Service Class |
|
|
(980,859 |
) |
|
|
(804,237 |
) |
|
|
|
| |
|
|
(1,396,509 |
) |
|
|
8,837,687 |
|
The Notes to Financial Statements are an integral part of this report.
|
|
|
|
|
| Transamerica Series Trust |
|
|
|
Semi-Annual Financial Statements 2024 |
|
|
Page 12 |
|
|
Transamerica Aegon High Yield Bond VP
FINANCIAL HIGHLIGHTS
|
|
|
|
|
|
|
|
|
|
|
|
|
|
|
|
|
|
|
|
|
|
|
|
|
|
|
| For a share outstanding during the period and years indicated: |
|
Initial Class |
|
|
|
|
|
|
|
| |
|
June 30, 2024 (unaudited) |
|
December 31, 2023 |
|
December 31, 2022 |
|
December 31, 2021 |
|
December 31, 2020 |
|
December 31, 2019 |
|
|
|
|
|
|
|
| Net asset value, beginning of period/year |
|
|
$ 6.84 |
|
|
|
$ 6.45 |
|
|
|
$ 7.72 |
|
|
|
$ 7.65 |
|
|
|
$ 7.78 |
|
|
|
$ 7.27 |
|
|
|
|
|
|
|
|
| Investment operations: |
|
|
|
|
|
|
|
|
|
|
|
|
|
|
|
|
|
|
|
|
|
|
|
|
| Net investment income (loss)(A) |
|
|
0.22 |
|
|
|
0.40 |
|
|
|
0.37 |
|
|
|
0.36 |
|
|
|
0.39 |
|
|
|
0.44 |
|
|
|
|
|
|
|
|
| Net realized and unrealized gain (loss) |
|
|
(0.09 |
) |
|
|
0.30 |
|
|
|
(1.22 |
) |
|
|
0.13 |
|
|
|
(0.04 |
) |
|
|
0.57 |
|
|
|
|
|
|
|
|
| Total investment operations |
|
|
0.13 |
|
|
|
0.70 |
|
|
|
(0.85 |
) |
|
|
0.49 |
|
|
|
0.35 |
|
|
|
1.01 |
|
|
|
|
|
|
|
|
| Dividends and/or distributions to shareholders: |
|
|
|
|
|
|
|
|
|
|
|
|
|
|
|
|
|
|
|
|
|
|
|
|
| Net investment income |
|
|
— |
|
|
|
(0.31 |
) |
|
|
(0.42 |
) |
|
|
(0.42 |
) |
|
|
(0.48 |
) |
|
|
(0.50 |
) |
|
|
|
|
|
|
|
| Net asset value, end of period/year |
|
|
$ 6.97 |
|
|
|
$ 6.84 |
|
|
|
$ 6.45 |
|
|
|
$ 7.72 |
|
|
|
$ 7.65 |
|
|
|
$ 7.78 |
|
| |
|
|
|
|
|
|
|
|
|
|
|
|
|
|
|
|
|
|
|
|
|
|
|
|
|
|
|
|
|
|
|
| Total return |
|
|
1.90 |
%(B) |
|
|
11.11 |
% |
|
|
(11.12 |
)% |
|
|
6.35 |
% |
|
|
5.04 |
% |
|
|
14.21 |
% |
|
|
|
|
|
|
|
| Ratio and supplemental data: |
|
|
|
|
|
|
|
|
|
|
|
|
|
|
|
|
|
|
|
|
|
|
|
|
| Net assets end of period/year (000’s) |
|
|
$ 136,428 |
|
|
|
$ 136,822 |
|
|
|
$ 66,793 |
|
|
|
$ 83,291 |
|
|
|
$ 96,601 |
|
|
|
$ 104,239 |
|
| Expenses to average net assets |
|
|
0.63 |
%(C) |
|
|
0.65 |
% |
|
|
0.62 |
% |
|
|
0.62 |
% |
|
|
0.63 |
% |
|
|
0.65 |
% |
| Net investment income (loss) to average net assets |
|
|
6.40 |
%(C) |
|
|
6.02 |
% |
|
|
5.35 |
% |
|
|
4.68 |
% |
|
|
5.34 |
% |
|
|
5.64 |
% |
| Portfolio turnover rate |
|
|
17 |
%(B) |
|
|
23 |
% |
|
|
16 |
% |
|
|
36 |
% |
|
|
40 |
% |
|
|
37 |
% |
| (A) |
Calculated based on average number of shares outstanding. |
|
|
|
|
|
|
|
|
|
|
|
|
|
|
|
|
|
|
|
|
|
|
|
|
|
|
|
| For a share outstanding during the period and years indicated: |
|
Service Class |
|
|
|
|
|
|
|
| |
|
June 30, 2024 (unaudited) |
|
December 31, 2023 |
|
December 31, 2022 |
|
December 31, 2021 |
|
December 31, 2020 |
|
December 31, 2019 |
|
|
|
|
|
|
|
| Net asset value, beginning of period/year |
|
|
$ 6.99 |
|
|
|
$ 6.58 |
|
|
|
$ 7.87 |
|
|
|
$ 7.78 |
|
|
|
$ 7.91 |
|
|
|
$ 7.38 |
|
|
|
|
|
|
|
|
| Investment operations: |
|
|
|
|
|
|
|
|
|
|
|
|
|
|
|
|
|
|
|
|
|
|
|
|
| Net investment income (loss)(A) |
|
|
0.21 |
|
|
|
0.39 |
|
|
|
0.36 |
|
|
|
0.35 |
|
|
|
0.38 |
|
|
|
0.42 |
|
|
|
|
|
|
|
|
| Net realized and unrealized gain (loss) |
|
|
(0.09 |
) |
|
|
0.31 |
|
|
|
(1.25 |
) |
|
|
0.14 |
|
|
|
(0.05 |
) |
|
|
0.59 |
|
|
|
|
|
|
|
|
| Total investment operations |
|
|
0.12 |
|
|
|
0.70 |
|
|
|
(0.89 |
) |
|
|
0.49 |
|
|
|
0.33 |
|
|
|
1.01 |
|
|
|
|
|
|
|
|
| Dividends and/or distributions to shareholders: |
|
|
|
|
|
|
|
|
|
|
|
|
|
|
|
|
|
|
|
|
|
|
|
|
| Net investment income |
|
|
— |
|
|
|
(0.29 |
) |
|
|
(0.40 |
) |
|
|
(0.40 |
) |
|
|
(0.46 |
) |
|
|
(0.48 |
) |
|
|
|
|
|
|
|
| Net asset value, end of period/year |
|
|
$ 7.11 |
|
|
|
$ 6.99 |
|
|
|
$ 6.58 |
|
|
|
$ 7.87 |
|
|
|
$ 7.78 |
|
|
|
$ 7.91 |
|
| |
|
|
|
|
|
|
|
|
|
|
|
|
|
|
|
|
|
|
|
|
|
|
|
|
|
|
|
|
|
|
|
| Total return |
|
|
1.72 |
%(B) |
|
|
10.87 |
% |
|
|
(11.45 |
)% |
|
|
6.25 |
% |
|
|
4.68 |
% |
|
|
13.97 |
% |
|
|
|
|
|
|
|
| Ratio and supplemental data: |
|
|
|
|
|
|
|
|
|
|
|
|
|
|
|
|
|
|
|
|
|
|
|
|
| Net assets end of period/year (000’s) |
|
|
$ 116,332 |
|
|
|
$ 121,244 |
|
|
|
$ 119,435 |
|
|
|
$ 160,658 |
|
|
|
$ 160,615 |
|
|
|
$ 166,739 |
|
| Expenses to average net assets |
|
|
0.88 |
%(C) |
|
|
0.90 |
% |
|
|
0.87 |
% |
|
|
0.87 |
% |
|
|
0.88 |
% |
|
|
0.90 |
% |
| Net investment income (loss) to average net assets |
|
|
6.14 |
%(C) |
|
|
5.74 |
% |
|
|
5.09 |
% |
|
|
4.42 |
% |
|
|
5.08 |
% |
|
|
5.39 |
% |
| Portfolio turnover rate |
|
|
17 |
%(B) |
|
|
23 |
% |
|
|
16 |
% |
|
|
36 |
% |
|
|
40 |
% |
|
|
37 |
% |
| (A) |
Calculated based on average number of shares outstanding. |
The Notes to Financial Statements are an integral part of this report.
|
|
|
|
|
| Transamerica Series Trust |
|
|
|
Semi-Annual Financial Statements 2024 |
|
|
Page 13 |
|
|
Transamerica Aegon High Yield Bond VP
NOTES TO FINANCIAL STATEMENTS
At June 30, 2024
(unaudited)
1. ORGANIZATION
Transamerica Series Trust (“TST”) is an open-end management investment company registered under the Investment Company Act of 1940, as amended (the “1940 Act”). TST applies investment company accounting and reporting guidance. TST serves as a funding vehicle for variable life insurance, variable annuity, and group annuity products. Transamerica Aegon High Yield Bond VP (the “Portfolio”) is a series of TST and is classified as diversified under the 1940 Act. The Portfolio currently offers two classes of shares, Initial Class and Service Class.
The only shareholders of the Portfolio are affiliated insurance company separate accounts and/or affiliated asset allocation portfolios. Contract holders of the variable life and annuity contracts are not shareholders of the Portfolio. For ease of reference, shareholders and contract holders are collectively referred to in this report as “shareholders.”
This report must be accompanied or preceded by the Portfolio’s current prospectus, which contains additional information about the Portfolio, including risks, as well as investment objectives and strategies.
Transamerica Asset Management, Inc. (“TAM”) serves as investment manager for the Portfolio pursuant to an investment management agreement. TAM provides continuous and regular investment management services to the Portfolio. TAM supervises the Portfolio’s investments, conducts its investment program and provides supervisory, compliance and administrative services to the Portfolio.
TAM currently acts as a “manager of managers” and has hired sub-advisers to furnish day-to-day investment advice and recommendations. TAM may, in the future, determine to provide all aspects of the day-to-day management of the Portfolio without the use of a sub-adviser. When acting as a manager of managers, TAM provides investment management services that include, without limitation, the design and development of the Portfolio and its investment strategies and the ongoing review and evaluation of those investment strategies including recommending changes in strategy where it believes appropriate or advisable; the selection of one or more sub-advisers for the Portfolio employing a combination of quantitative and qualitative screens, research, analysis and due diligence; negotiation of sub-advisory agreements and fees; oversight and monitoring of sub-advisers and recommending changes to sub-advisers where it believes appropriate or advisable; recommending portfolio combinations and liquidations where it believes appropriate or advisable; selection and oversight of transition managers, as needed; regular supervision of the Portfolio’s investments; regular review and evaluation of sub-adviser performance; daily monitoring of the sub-advisers’ buying and selling of securities for the Portfolio; regular review of holdings; ongoing trade oversight and analysis; regular monitoring to ensure adherence to investment process; regular calls and periodic on-site visits with sub-advisers; portfolio construction and asset allocation when using multiple sub-advisers for the Portfolio; risk management oversight and analysis; oversight of negotiation of investment documentation and agreements; design, development, implementation and regular monitoring of the valuation process; periodic due diligence reviews of pricing vendors and vendor methodology; design, development, implementation and regular monitoring of the compliance process; respond to regulatory inquiries and determine appropriate litigation strategy, as needed; review of proxies voted by sub-advisers; oversight of preparation and review of materials for meetings of the Portfolio’s Board of Trustees (the “Board”), participation in these meetings and preparation of regular communications with the Board; oversight of preparation and review of prospectuses, shareholder reports and other disclosure materials and regulatory filings for the Portfolio; oversight of other service providers to the Portfolio, such as the custodian, the transfer agent, the Portfolio’s independent accounting firm and legal counsel; supervision of the performance of recordkeeping and shareholder relations functions for the Portfolio; and oversight of cash management services. TAM uses a variety of quantitative and qualitative tools to carry out its investment management services. TAM, not the Portfolio, is responsible for paying the sub-adviser(s) for their services, and sub-advisory fees are TAM’s expense.
TAM’s investment management services also include the provision of supervisory and administrative services to the Portfolio. These services include performing certain administrative services for the Portfolio and supervising and overseeing the administrative, clerical, recordkeeping and bookkeeping services provided to the Portfolio by State Street Bank and Trust Company (“State Street”), to whom TAM has outsourced the provision of certain sub-administration services. To the extent agreed upon by TAM and the Portfolio from time to time, TAM’s supervisory and administrative services include, but are not limited to: monitoring and verifying the custodian’s daily calculation of the Net Asset Values (“NAV”); shareholder relations functions; compliance services; valuation services; assisting in due diligence and in the oversight and monitoring of certain activities of sub-advisers and certain aspects of Portfolio investments; assisting with Portfolio combinations and liquidations; oversight of the preparation and filing, and review, of all returns and reports, in connection with federal, state and local taxes; oversight and review of regulatory reporting; supervising and coordinating the Portfolio’s custodian and dividend disbursing agent and monitoring their services to the Portfolio; assisting the Portfolio in preparing reports to shareholders; acting as liaison with the Portfolio’s independent public accountants and providing, upon request, analyses, fiscal year summaries and other audit related services; assisting in the preparation of agendas and supporting documents for and minutes of meetings of trustees and committees of trustees; assisting in the preparation of regular communications with the trustees; and providing personnel and office space, telephones and other office equipment as necessary in order for TAM to perform supervisory and administrative services to the Portfolio. The Portfolio
|
|
|
|
|
| Transamerica Series Trust |
|
|
|
Semi-Annual Financial Statements 2024 |
|
|
Page 14 |
|
|
Transamerica Aegon High Yield Bond VP
NOTES TO FINANCIAL STATEMENTS (continued)
At June 30, 2024
(unaudited)
1. ORGANIZATION (continued)
pays certain fees and expenses to State Street for sub-administration services which are not administrative services covered by the management agreement with TAM or paid for through the management fees payable thereunder. For the period ended June 30, 2024, (i) the expenses paid to State Street for sub-administration services by the Portfolio are shown as a part of Other expenses within the Statement of Operations and (ii) the expenses payable to State Street for sub-administration services from the Portfolio are shown as part of Other accrued expenses within the Statement of Assets and Liabilities.
2. SIGNIFICANT ACCOUNTING POLICIES
In preparing the Portfolio’s financial statements in accordance with Generally Accepted Accounting Principles in the United States of America (“GAAP”), estimates or assumptions (which could differ from actual results) may be used that affect reported amounts and disclosures. The following is a summary of significant accounting policies followed by the Portfolio.
Foreign currency denominated investments: The accounting records of the Portfolio are maintained in U.S. dollars. Securities and other assets and liabilities denominated in foreign currencies are translated into U.S. dollars based on the closing exchange rate each day. The cost of foreign securities purchased and any realized gains or losses are translated at the prevailing exchange rates in effect on the date of the respective transaction. The Portfolio combines fluctuations from currency exchange rates and fluctuations in value when computing net realized and unrealized gains or losses from investments.
Net foreign currency gains and losses resulting from changes in exchange rates include, foreign currency fluctuations between trade date and settlement date of investment security transactions, gains and losses on forward foreign currency contracts, and the difference between the receivable amounts of interest and dividends recorded in the accounting records in U.S. dollars and the amounts actually received.
Foreign currency denominated assets may involve risks not typically associated with domestic transactions. These risks include revaluation of currencies, adverse fluctuations in foreign currency values, and possible adverse political, social, and economic developments, including those particular to a specific industry, country or region.
Security transactions and investment income: Security transactions are accounted for on the trade date. Security gains and losses are calculated on a first-in, first-out basis. Dividend income, if any, is recorded on the ex-dividend date or, in the case of foreign securities, as soon as the Portfolio is informed of the ex-dividend dates, net of foreign taxes. Non-cash dividends, if any, are recorded on the ex-dividend date at fair value. Interest income, if any, is recorded on the accrual basis from settlement date, net of foreign taxes. Fixed income premiums and discounts are amortized and/or accreted over the lives of the respective securities.
Multiple class operations, income, and expenses: Income, non-class specific expenses, and realized and unrealized gains and losses are allocated to each class daily based upon net assets. Each class bears its own specific expenses in addition to the allocated non-class specific expenses.
Distributions to shareholders: Distributions are recorded on the ex-dividend date and are determined in accordance with federal income tax regulations, which may differ from GAAP.
Foreign taxes: The Portfolio may be subject to taxes imposed by the countries in which it invests, with respect to its investments in issuers existing or operating in such countries. The Portfolio may also be subject to foreign taxes on income, gains on investments, or currency repatriation, a portion of which may be recoverable. The Portfolio accrues such taxes and recoveries as applicable when the related income or capital gains are earned or unrealized, and based upon the current interpretation of tax rules and regulations that exist in the markets in which the Portfolio invests. Some countries require governmental approval for the repatriation of investment income, capital, or the proceeds of sales earned by foreign investors. In addition, if there is deterioration in a country’s balance of payments or for other reasons, a country may impose temporary restrictions of foreign capital remittances abroad.
Commission recapture: The sub-adviser(s), to the extent consistent with the best execution and usual commission rate policies and practices, may elect to place security transactions of the Portfolio with broker/dealers with which TST has established a commission recapture program. A commission recapture program is any arrangement under which a broker/dealer applies a portion of the commissions received by such broker/dealer on the security transactions to the Portfolio. In no event will commissions, paid by the Portfolio, be used to pay expenses that would otherwise be borne by any other Portfolios within TST, or by any other party.
There were no commissions recaptured during the period ended June 30, 2024 by the Portfolio.
|
|
|
|
|
| Transamerica Series Trust |
|
|
|
Semi-Annual Financial Statements 2024 |
|
|
Page 15 |
|
|
Transamerica Aegon High Yield Bond VP
NOTES TO FINANCIAL STATEMENTS (continued)
At June 30, 2024
(unaudited)
2. SIGNIFICANT ACCOUNTING POLICIES (continued)
Indemnification: In the normal course of business, the Portfolio enters into contracts that contain a variety of representations that provide general indemnifications. The Portfolio’s maximum exposure under these arrangements is unknown, as this would involve future claims that may be made against the Portfolio and/or its affiliates that have not yet occurred. However, based on experience, the Portfolio expects the risk of loss to be remote.
3. INVESTMENT VALUATION
TAM has been designated as the Portfolio’s valuation designee pursuant to Rule 2a-5 under the 1940 Act with responsibility for fair valuation subject to oversight by the Portfolio’s Board of Trustees. The net asset value of the Portfolio is computed as of the official close of the New York Stock Exchange (“NYSE”) each day the NYSE is open for business.
TAM utilizes various methods to measure the fair value of its investments on a recurring basis. GAAP establishes a hierarchy that prioritizes inputs to valuation methods. The inputs or methodology used for valuing securities are not necessarily an indication of the risk associated with investing in those securities. The three levels (“Levels”) of inputs of the fair value hierarchy are defined as follows:
Level 1—Unadjusted quoted prices in active markets for identical securities.
Level 2—Inputs, other than quoted prices included in Level 1, which are observable, either directly or indirectly. These inputs may include quoted prices for the identical instrument on an inactive market, prices for similar instruments, interest rates, prepayment speeds, credit risk, yield curves, default rates, and similar data.
Level 3—Unobservable inputs based on the best information available in the circumstances, to the extent observable inputs are not available, which may include TAM’s own assumptions used in determining the fair value of the Portfolio’s investments.
The inputs used to measure fair value may fall into different Levels of the fair value hierarchy. In such cases, for disclosure purposes, the Level in the fair value hierarchy that is assigned to the fair value measurement of a security is determined based on the lowest Level input that is significant to the fair value measurement in its entirety. Certain investments that are measured at fair value using NAV per share, or its equivalent, using the “practical expedient” have not been classified in the fair value Levels. The hierarchy classification of inputs used to value the Portfolio’s investments at June 30, 2024, is disclosed within the Investment Valuation section of the Schedule of Investments.
The availability of observable inputs can vary from security to security and is affected by a wide variety of factors, including, but not limited to, the type of security, whether the security is new and not yet established in the marketplace, the liquidity of markets, and other characteristics particular to the security. To the extent that valuation is based on models or inputs that are less observable or unobservable in the market, the determination of fair value requires more judgment. Accordingly, the degree of judgment exercised in determining fair value is generally greatest for instruments categorized in Level 3. Due to the inherent uncertainty of valuation, the determination of values may differ significantly from values that would have been realized had a ready market for investments existed, and the differences could be material.
Fair value measurements: Descriptions of the valuation techniques applied to the Portfolio’s significant categories of assets and liabilities measured at fair value on a recurring basis are as follows:
Corporate debt securities: The fair value of corporate debt securities is estimated using various techniques, which consider recently executed transactions in securities of the issuer or comparable issuers, market price quotations (where observable), bond spreads, fundamental data relating to the issuer, and credit default swap spreads adjusted for any basis difference between cash and derivative instruments. While most corporate debt securities are categorized in Level 2 of the fair value hierarchy, in instances where lower relative weight is placed on transaction prices, quotations, or similar observable inputs, they are categorized in Level 3.
Equity securities: Securities are stated at the last reported sales price or closing price on the day of valuation taken from the primary exchange where the security is principally traded. To the extent these securities are actively traded and valuation adjustments are not applied, they are categorized in Level 1 of the fair value hierarchy. Equities traded on inactive markets or valued by reference to similar instruments are generally categorized in Level 2 or Level 3 if inputs are unobservable.
Foreign equity securities: Securities in which the primary trading market closes at the same time or after the NYSE, are valued based on quotations from the primary market in which they are traded and are categorized in Level 1. Because many foreign securities markets and exchanges close prior to the close of the NYSE, closing prices for foreign securities in those markets or on those exchanges do not reflect the events that occur after that close. Certain foreign securities may be fair valued using a pricing service that considers the correlation of
|
|
|
|
|
| Transamerica Series Trust |
|
|
|
Semi-Annual Financial Statements 2024 |
|
|
Page 16 |
|
|
Transamerica Aegon High Yield Bond VP
NOTES TO FINANCIAL STATEMENTS (continued)
At June 30, 2024
(unaudited)
3. INVESTMENT VALUATION (continued)
the trading patterns of the foreign security to the intraday trading in the U.S. markets for investments such as American Depositary Receipts, financial futures, or ETFs and the movement of certain indices of securities based on a statistical analysis of their historical relationship; such valuations generally are categorized in Level 2.
Loan assignments: Loan assignments are normally valued using an income approach, which projects future cash flows and converts those future cash flows to a present value using a discount rate. The resulting present value reflects the likely fair value of the loan. To the extent the inputs are observable and timely, the values would generally be categorized in Level 2 of the fair value hierarchy; otherwise are categorized in Level 3.
Securities lending collateral: Securities lending collateral is invested in a money market fund which is valued at the actively traded NAV and no valuation adjustments are applied. Securities lending collateral is categorized in Level 1 of the fair value hierarchy.
Repurchase agreements: Repurchase agreements are valued at cost, which approximates fair value. To the extent the inputs are observable and timely, the values are generally categorized in Level 2 of the fair value hierarchy.
4. SECURITIES AND OTHER INVESTMENTS
Loan participations and assignments: The Portfolio may invest in direct debt instruments which are interests in amounts owed to lenders or lending syndicates by corporate, governmental, or other borrowers, either in the form of participations at the time the loan is originated (“Participations”) or buying an interest in the loan in the secondary market from a financial institution or institutional investor (“Assignments”). Participations and Assignments in commercial loans may be secured or unsecured. These investments may include standby financing commitments, including revolving credit facilities that obligate the Portfolio to supply additional cash to the borrowers on demand. Loan Participations and Assignments involve risks of insolvency of the lending banks or other financial intermediaries. As such, the Portfolio assumes the credit risks associated with the corporate borrowers and may assume the credit risks associated with the interposed banks or other financial intermediaries.
The Portfolio, based on its ability to invest in Loan Participations and Assignments, may be contractually obligated to receive approval from the agent banks and/or borrowers prior to the sale of these investments. The Portfolio that participates in such syndications, or that can buy a portion of the loans, become part lenders. Loans are often administered by agent banks acting as agents for all holders.
The agent banks administer the terms of the loans, as specified in the loan agreements. In addition, the agent banks are normally responsible for the collection of principal and interest payments from the corporate borrowers and the apportionment of these payments to the credit of all institutions that are parties to the loan agreements. Unless the Portfolio has direct recourse against the corporate borrowers under the terms of the loans or other indebtedness, the Portfolio may have to rely on the agent banks or other financial intermediaries to apply appropriate credit remedies against corporate borrowers.
The Portfolio held no unfunded loan participations at June 30, 2024. Open funded loan participations and assignments at June 30, 2024, if any, are included within the Schedule of Investments.
Payment in-kind (“PIK”) securities: PIKs give the issuer the option of making interest payments in either cash or additional debt securities at each interest payment date. Those additional debt securities usually have the same terms, including maturity dates and interest rates, and associated risks as the original bonds. The daily market quotations of the original bonds may include the accrued interest (referred to as a “dirty price”) and require a pro-rata adjustment from Total distributable earnings (loss) to Interest within the Statement of Assets and Liabilities.
PIKs held at June 30, 2024, if any, are identified within the Schedule of Investments.
Real estate investment trusts (“REITs”): REITs are pooled investment vehicles which invest primarily in income producing real estate, or real estate related loans or interests. Distributions received by REITs are classified at management’s estimate of the dividend income, return of capital and capital gains. Estimates are based on information available at year-end, which includes the previous fiscal year’s classification. The actual amounts of dividend income, return of capital, and capital gains are only determined by each REIT after the fiscal year end and may differ from the estimated amounts. Upon notification from the REITs, some of the distributions received may be re-classified and recorded as a return of capital or capital gains. There are certain additional risks involved in investing in REITs. These include, but are not limited to, economic conditions, changes in zoning laws, real estate values, property taxes, and interest rates.
REITs held at June 30, 2024, if any, are identified within the Schedule of Investments.
|
|
|
|
|
| Transamerica Series Trust |
|
|
|
Semi-Annual Financial Statements 2024 |
|
|
Page 17 |
|
|
Transamerica Aegon High Yield Bond VP
NOTES TO FINANCIAL STATEMENTS (continued)
At June 30, 2024
(unaudited)
4. SECURITIES AND OTHER INVESTMENTS (continued)
When-issued, delayed-delivery, forward, and to be announced (“TBA”) commitment transactions: The Portfolio may purchase or sell securities on a when-issued, delayed-delivery, forward and TBA commitment basis. When-issued and forward commitment transactions are made conditionally because a security, although authorized, has not yet been issued in the market. Settlement of such transactions normally occurs within a month or more after the purchase or sale commitment is made. The Portfolio engages in when-issued and forward commitment transactions to obtain an advantageous price and yield at the time of the transaction. The Portfolio engages in when-issued and forward commitment transactions for the purpose of acquiring securities, but may enter into a separate agreement to sell the securities before the settlement date. Since the value of securities purchased may fluctuate prior to settlement, the Portfolio may be required to pay more at settlement than the security is worth. In addition, the Portfolio is not entitled to any of the interest earned prior to settlement.
Delayed-delivery transactions involve a commitment by the Portfolio to purchase or sell securities for a predetermined price or yield, with payment and delivery taking place beyond the customary settlement period. When delayed-delivery transactions are outstanding, the Portfolio will segregate with its custodian either cash, U.S. government securities, or other liquid assets at least equal to the value or purchase commitments until payment is made. When purchasing a security on a delayed-delivery basis, the Portfolio assumes the rights and risks of ownership of the security, including the risk of price and yield fluctuations. These transactions also involve a risk to the Portfolio if the other party to the transaction defaults on its obligation to make payment or delivery, and the Portfolio is delayed or prevented from completing the transaction. The Portfolio may dispose of or renegotiate a delayed-delivery transaction after it is entered into, which may result in a realized gain or loss. When the Portfolio sells a security on a delayed-delivery basis, the Portfolio does not participate in future gains and losses on the security.
TBA commitments are entered into to purchase or sell securities for a fixed price at a future date, typically not to exceed 45 days. TBAs are considered securities in themselves, and involve a risk of loss if the value of the security to be purchased declines, or the value of the security sold increases, prior to settlement date, in addition to the risk of decline in the value of a Portfolio’s other assets. Unsettled TBA commitments are valued at the current value of the underlying securities. TBA collateral requirements are typically calculated by netting the mark-to-market amount for each transaction and comparing that amount to the value of the collateral currently pledged by a Portfolio and the counterparty. Cash collateral that has been pledged to cover the obligations of a Portfolio and cash collateral received from the counterparty, if any, is reported separately in the Statement of Assets and Liabilities as Cash collateral pledged at broker for TBA commitments or Cash collateral at broker for TBA commitments, respectively. Non-cash collateral pledged by a Portfolio, if any, is disclosed within the Schedule of Investments. Typically, a Portfolio is permitted to sell, re-pledge or use the collateral it receives; however, the counterparty is not permitted. To the extent amounts due to a Portfolio are not fully collateralized, contractually or otherwise, a Portfolio bears the risk of loss from counterparty non-performance.
When-issued, delayed-delivery, forward and TBA commitment transactions held at June 30, 2024, if any, are identified within the Schedule of Investments. Open trades, if any, are reflected as When-issued, delayed-delivery, forward and TBA commitments purchased or sold within the Statement of Assets and Liabilities.
5. BORROWINGS AND OTHER FINANCING TRANSACTIONS
The Portfolio may engage in borrowing transactions as a means of raising cash to satisfy redemption requests, for other temporary or emergency purposes or, to the extent permitted by its investment policies, to raise additional cash to be invested in other securities or instruments. When the Portfolio invests borrowing proceeds in other securities, the Portfolio will bear the risk that the market value of the securities in which such proceeds are invested goes down and is insufficient to repay the borrowed proceeds. The Portfolio may borrow on a secured or on an unsecured basis. If the Portfolio enters into a secured borrowing arrangement, a portion of the Portfolio’s assets will be used as collateral. The 1940 Act requires the Portfolio to maintain asset coverage of at least 300% of the amount of its borrowings. Asset coverage means the ratio that the value of the Portfolio’s total assets, minus liabilities other than borrowings, bears to the aggregate amount of all borrowings. Although complying with this requirement has the effect of limiting the amount that the Portfolio may borrow, it does not otherwise mitigate the risks of entering into borrowing transactions.
Interfund lending: The Portfolio, along with other funds and portfolios advised by TAM, may participate in an interfund lending program pursuant to exemptive relief granted by the Securities and Exchange Commission on January 18, 2017. This program allows the Portfolio to lend to and borrow from other funds and portfolios advised by TAM. Interfund lending transactions are subject to the conditions of the exemptive relief which places limits on the amount of lending or borrowing a Portfolio may participate in under the program. Interest earned or paid on an interfund lending transaction will be based on the average of certain current market rates. For the period ended June 30, 2024, the Portfolio has not utilized the program.
|
|
|
|
|
| Transamerica Series Trust |
|
|
|
Semi-Annual Financial Statements 2024 |
|
|
Page 18 |
|
|
Transamerica Aegon High Yield Bond VP
NOTES TO FINANCIAL STATEMENTS (continued)
At June 30, 2024
(unaudited)
5. BORROWINGS AND OTHER FINANCING TRANSACTIONS (continued)
Repurchase agreements: In a repurchase agreement, the Portfolio purchases a security and simultaneously commits to resell that security to the seller at an agreed-upon price on an agreed-upon date. Securities purchased subject to a repurchase agreement are held at the Portfolio’s custodian, or designated sub-custodian related to tri-party repurchase agreements, and, pursuant to the terms of the repurchase agreement, must be collateralized by securities with an aggregate market value greater than or equal to 100% of the resale price. The Portfolio will bear the risk of value fluctuations until the securities can be sold and may encounter delays and incur costs in liquidating the securities. In the event of bankruptcy or insolvency of the seller, delays and costs may be incurred.
Repurchase agreements are subject to netting agreements, which are agreements between the Portfolio and its counterparties that provide for the net settlement of all transactions and collateral with the Portfolio, through a single payment, in the event of default or termination. Amounts presented within the Schedule of Investments, and as part of Repurchase agreements, at value within the Statement of Assets and Liabilities are shown on a gross basis. The value of the related collateral for each repurchase agreement, as reflected within the Schedule of Investments, exceeds the value of each repurchase agreement at June 30, 2024.
Repurchase agreements at June 30, 2024, if any, are included within the Schedule of Investments and Statement of Assets and Liabilities.
Securities lending: The Portfolio may lend securities to qualified financial institutions, brokers and dealers. State Street serves as securities lending agent to the Portfolio pursuant to a Securities Lending Agreement. Loans of securities are terminable at any time and the borrower, after notice, is required to return borrowed securities within the standard time period for settlement of securities transactions. The lending of securities exposes the Portfolio to risks such as: the borrowers may fail to return the loaned securities or may not be able to provide additional collateral, the Portfolio may experience delays in recovery of the loaned securities or delays in access to collateral, or the Portfolio may experience losses related to the investment collateral. To minimize certain risks, loan counterparties pledge cash, securities issued or guaranteed by the U.S. Government and irrevocable letters of credit issued by banks as collateral. The initial collateral received by the Portfolio is required to have a value of at least 102% of the current value of the loaned securities traded on U.S. exchanges, and a value of at least 105% for all other securities. Typically the lending agent is not permitted to sell, re-pledge or use cash and non-cash collateral it receives. The lending agent has agreed to indemnify the Portfolio in the case of default of any securities borrower.
The Portfolio receives compensation for lending securities from interest or dividends earned on the cash, U.S. Government securities and irrevocable letters of credit held as collateral, less associated fees and expenses. Such income is reflected in Net income from securities lending within the Statement of Operations. Cash collateral received is invested in the State Street Navigator Securities Lending Trust — Government Money Market Portfolio.
The value of loaned securities and related cash and non-cash collateral outstanding at June 30, 2024, if any, are shown on a gross basis within the Schedule of Investments.
The following table reflects a breakdown of transactions accounted for as secured borrowings, the gross obligation by the type, and the remaining contractual maturity of those transactions as of June 30, 2024.
|
|
|
|
|
|
|
|
|
|
|
|
|
|
|
|
|
|
|
|
|
| |
|
Remaining Contractual Maturity of the Agreements |
|
|
|
|
|
|
|
| |
|
Overnight and Continuous |
|
|
Less Than 30 Days |
|
|
Between 30 & 90 Days |
|
|
Greater Than 90 Days |
|
|
Total |
|
| |
|
|
|
|
|
|
|
| Securities Lending Transactions |
|
|
|
|
|
|
|
|
|
|
|
|
|
|
|
|
|
|
|
|
| Corporate Debt Securities |
|
$ |
14,845,118 |
|
|
|
$ — |
|
|
|
$ — |
|
|
|
$ — |
|
|
$ |
14,845,118 |
|
| |
|
|
|
|
|
|
|
| Total Borrowings |
|
$ |
14,845,118 |
|
|
|
$ — |
|
|
|
$ — |
|
|
|
$ — |
|
|
$ |
14,845,118 |
|
| |
|
6. RISK FACTORS
Investing in the Portfolio involves certain key risks related to the Portfolio’s trading activity. Please reference the Portfolio’s prospectus for a more complete discussion of the following risk(s), as well as other risks of investing in the Portfolio.
Market risk: The market prices of the Portfolio’s securities or other assets may go up or down, sometimes rapidly or unpredictably, due to factors such as economic events, inflation, changes in interest rates, governmental actions or interventions, actions taken by the U.S. Federal Reserve or foreign central banks, market disruptions caused by tariffs, trade disputes or other factors, political developments, armed conflicts, economic sanctions, cybersecurity events, investor sentiment, the global and domestic effects of widespread or local
|
|
|
|
|
| Transamerica Series Trust |
|
|
|
Semi-Annual Financial Statements 2024 |
|
|
Page 19 |
|
|
Transamerica Aegon High Yield Bond VP
NOTES TO FINANCIAL STATEMENTS (continued)
At June 30, 2024
(unaudited)
6. RISK FACTORS (continued)
health, weather or climate events, and other factors that may or may not be related to the issuer of the security or other asset. If the market prices of the Portfolio’s securities and assets fall, the value of your investment in the Portfolio could go down.
Economies and financial markets throughout the world are increasingly interconnected. Events or circumstances in one or more countries or regions could be highly disruptive to, and have profound impacts on, global economies or markets. As a result, whether or not the Portfolio invests in securities of issuers located in or with significant exposure to the countries directly affected, the value and liquidity of the Portfolio’s investments may go down.
Credit risk: If an issuer or other obligor (such as a party providing insurance or other credit enhancement) of a security held by the Portfolio or a counterparty to a financial contract with the Portfolio is unable or unwilling to meet its financial obligations, or is downgraded or perceived to be less creditworthy (whether by market participants, ratings agencies, pricing services or otherwise), or if the value of any underlying assets declines, the value of your investment will typically decline. A decline may be rapid and/or significant, particularly in certain market environments. In addition, the Portfolio may incur costs and may be hindered or delayed in enforcing its rights against an issuer, obligor or counterparty.
High-yield debt securities risk: High-yield debt securities, commonly referred to as “junk” bonds, are securities that are rated below “investment grade” or are of comparable quality. Changes in interest rates, the market’s perception of the issuers, the creditworthiness of the issuers and negative perceptions of the junk bond market generally may significantly affect the value of these bonds. Junk bonds are considered speculative, tend to be volatile, typically have a higher risk of default, tend to be less liquid and more difficult to value than higher grade securities, and may result in losses for the Portfolio.
Interest rate risk: The value of fixed-income securities generally goes down when interest rates rise. A rise in rates tends to have a greater impact on the prices of longer term or duration securities. Changes in interest rates also may affect the liquidity of the Portfolio’s investments. A general rise in interest rates may cause investors to sell fixed-income securities on a large scale, which could adversely affect the price and liquidity of fixed-income securities generally and could also result in increased redemptions from the Portfolio. Increased redemptions could cause the Portfolio to sell securities at inopportune times or depressed prices and result in further losses. The U.S. Federal Reserve has raised interest rates from historically low levels. Any additional interest rate increases in the future may cause the value of fixed-income securities to decrease.
Real estate investment trusts (“REITs”) risk: Investing in real estate investment trusts (“REITs”) involves unique risks. When the Portfolio invests in REITs, it is subject to risks generally associated with investing in real estate. A REIT’s performance depends on the types and locations of the properties it owns, how well it manages those properties and cash flow. REITs may have limited financial resources, may trade less frequently and in limited volume, may engage in dilutive offerings, and may be subject to more abrupt or erratic price movements than the overall securities markets. In addition to its own expenses, the Portfolio will indirectly bear its proportionate share of any management and other expenses paid by REITs in which it invests. U.S. REITs are subject to a number of highly technical tax-related rules and requirements; and a U.S. REIT’s failure to qualify for the favorable U.S. federal income tax treatment generally available to U.S. REITs could result in corporate-level taxation, significantly reducing the return on an investment to the Portfolio.
7. FEES AND OTHER AFFILIATED TRANSACTIONS
TST serves as a funding vehicle for certain affiliated asset allocation portfolios and certain affiliated separate accounts of Transamerica Life Insurance Company (“TLIC”) and Transamerica Financial Life Insurance Company.
TAM, the Portfolio’s investment manager, is directly owned by TLIC and AUSA Holding, LLC (“AUSA”), both of which are indirect, wholly owned subsidiaries of Aegon Ltd. TLIC is owned by Commonwealth General Corporation (“Commonwealth”). Commonwealth and AUSA are wholly owned by Transamerica Corporation (DE). Transamerica Corporation (DE) is wholly owned by Aegon International B.V., which is wholly owned by Aegon Ltd., a Bermuda exempted company with liability limited by shares (formerly, Aegon NV, a Netherlands corporation) and a publicly traded international insurance group.
TAM has entered into a sub-advisory agreement with Aegon USA Investment Management, LLC (“AUIM”), an affiliate of TAM. AUIM provides day-to-day portfolio management services to the Portfolio, subject to the supervision of TAM. TAM is responsible for compensating the sub-adviser for its services.
Transamerica Fund Services, Inc. (“TFS”) is the Portfolio’s transfer agent. Transamerica Capital, Inc. (“TCI”) is the Portfolio’s distributor/principal underwriter. TAM, AUIM, TFS and TCI are affiliates of Aegon Ltd.
|
|
|
|
|
| Transamerica Series Trust |
|
|
|
Semi-Annual Financial Statements 2024 |
|
|
Page 20 |
|
|
Transamerica Aegon High Yield Bond VP
NOTES TO FINANCIAL STATEMENTS (continued)
At June 30, 2024
(unaudited)
7. FEES AND OTHER AFFILIATED TRANSACTIONS (continued)
Certain officers and trustees of the Portfolio may also be officers and/or trustees of TAM, AUIM, TFS and TCI. No interested trustee who is deemed an interested person due to current or former service with TAM or an affiliate of TAM receives compensation from the Portfolio. The Portfolio does pay non-interested persons (independent trustees), as disclosed in Trustee and CCO fees within the Statement of Operations.
Investment management fees: TAM serves as the Portfolio’s investment manager, performing administration as well as investment advisory services. TAM renders investment advisory, supervisory, and administration services under an investment management agreement and the Portfolio pays a single management fee, which is reflected in Investment management fees within the Statement of Operations.
The Portfolio pays a management fee to TAM based on daily average net assets at the following rates:
|
|
|
|
|
| Breakpoints |
|
Rate |
| First $1.25 billion |
|
|
0.554 |
% |
| Over $1.25 billion up to $2 billion |
|
|
0.544 |
|
| Over $2 billion |
|
|
0.520 |
|
TAM has contractually agreed to waive fees and/or reimburse Portfolio expenses to the extent that the total operating expenses excluding, as applicable, acquired fund fees and expenses, interest (including borrowing costs and overdraft charges), taxes, brokerage commissions, dividend and interest expenses on securities sold short, extraordinary expenses and other expenses not incurred in the ordinary course of the Portfolio’s business, exceed the following stated annual operating expense limits to the Portfolio’s daily average net assets. To the extent an expense limit changed during the period, the prior limit is also listed below. The expenses waived and/or reimbursed, if any, are included in Expenses waived and/or reimbursed within the Statement of Operations.
|
|
|
|
|
| Class |
|
Operating Expense Limit |
|
Operating Expense Limit Effective Through |
| Initial Class |
|
0.70% |
|
May 1, 2025 |
| Service Class |
|
0.95 |
|
May 1, 2025 |
TAM is permitted to recapture amounts contractually waived and/or reimbursed to a class during any of the 36 months from the date on which TAM waived fees and/or reimbursed expenses for the class. A class may recapture and reimburse TAM only if such amount does not cause, on any particular business day of the Portfolio, the class’s total annual operating expenses (after the recapture is taken into account) to exceed the Operating Expense Limits or any other lower limit then in effect. Amounts recaptured, if any, by TAM for the period ended June 30, 2024 are disclosed in Recapture of previously waived and/or reimbursed fees within the Statement of Operations.
TAM, on a voluntary basis and in addition to the contractual operating expense limits in effect, from time to time may waive and/or reimburse expenses of the Portfolio, or any classes thereof, to such level(s) as the Trust’s officers have determined or may reasonably determine from time to time. Any such voluntary waiver or expense reimbursement may be discontinued by TAM at any time. These amounts are not subject to recapture by TAM.
As of June 30, 2024, there are no amounts available for recapture by TAM.
Distribution and service fees: TST has a distribution plan (“Distribution Plan”) pursuant to Rule 12b-1 under the 1940 Act. Pursuant to the Distribution Plan, TST entered into a distribution agreement with TCI as the Portfolio’s distributor.
The Distribution Plan requires the Portfolio to pay distribution fees to TCI as compensation for various distribution activities, not as reimbursement for specific expenses. Under the Distribution Plan and distribution agreement, TCI, on behalf of the Portfolio, is authorized to pay various service providers, as direct payment for expenses incurred in connection with distribution of the Portfolio’s shares.
The fee on the Service Class shares is paid to the insurance companies for providing services and account maintenance for the policyholders who invest in the variable insurance products which invest in the Service Class shares. TCI has determined that it will not seek payment for the distribution expenses incurred by the Portfolio with respect to the Initial Class shares before May 1, 2025. Prior to TCI
|
|
|
|
|
| Transamerica Series Trust |
|
|
|
Semi-Annual Financial Statements 2024 |
|
|
Page 21 |
|
|
Transamerica Aegon High Yield Bond VP
NOTES TO FINANCIAL STATEMENTS (continued)
At June 30, 2024
(unaudited)
7. FEES AND OTHER AFFILIATED TRANSACTIONS (continued)
seeking distribution expenses on Initial Class shares, policy and contract owners will be notified in advance. The Portfolio will pay fees relating to Service Class shares. The distribution and service fees are included in Distribution and service fees within the Statement of Operations.
The Portfolio is authorized under the Distribution Plan to pay fees to TCI based on daily average net assets of each applicable class up to the following annual rates:
|
|
|
|
|
| Class |
|
Rate |
| Initial Class |
|
|
0.15 |
% |
| Service Class |
|
|
0.25 |
|
Transfer agent costs: TFS provides transfer agency services under an intercompany agreement with TAM. TFS has outsourced the provision of certain sub-transfer agency services to SS&C Global Investor & Distribution Solutions, Inc. (“SS&C GIDS”). The Portfolio does not pay a separate transfer agent fee to TAM or TFS but does pay certain expenses to SS&C GIDS related to applicable sub-transfer agency services. For the period ended June 30, 2024, (i) the expenses paid to SS&C GIDS by the Portfolio are referred to as transfer agent costs and are included within the Statement of Operations and (ii) the expenses payable to SS&C GIDS by the Portfolio are referred to as transfer agent costs within the Statement of Assets and Liabilities.
Brokerage commissions: The Portfolio incurred no brokerage commissions on security transactions placed with affiliates of the investment manager or sub-adviser(s) for the period ended June 30, 2024.
8. PURCHASES AND SALES OF SECURITIES
For the period ended June 30, 2024, the cost of securities purchased and proceeds from securities sold (excluding short-term securities) are as follows:
|
|
|
|
|
|
|
| Purchases of Securities |
|
Sales/Maturities of Securities |
|
|
|
|
| Long-Term |
|
U.S. Government |
|
Long-Term |
|
U.S. Government |
| |
|
|
|
|
| $ 45,206,939 |
|
$ — |
|
$ 43,150,284 |
|
$ — |
9. FEDERAL INCOME TAXES AND DISTRIBUTIONS TO SHAREHOLDERS
The Portfolio has not made any provision for federal income or excise taxes due to its policy to distribute all of its taxable income and capital gains to its shareholders and otherwise qualify as a regulated investment company under Subchapter M of the Internal Revenue Code. The Portfolio recognizes the tax benefits of uncertain tax positions only where the position is “more likely than not” to be sustained assuming examination by tax authorities. The Portfolio’s tax returns remain subject to examination by the Internal Revenue Service and state tax authorities three years from the date of filing for federal purposes and four years from the date of filing for state purposes. Management has evaluated the Portfolio’s tax provisions taken for all open tax years, and has concluded that no provision for income tax is required in the Portfolio’s financial statements. If applicable, the Portfolio recognizes interest accrued related to unrecognized tax benefits in relation to interest and penalties expense in Other within the Statement of Operations. The Portfolio identifies its major tax jurisdictions as U.S. Federal, the state of Colorado, and foreign jurisdictions where the Portfolio makes significant investments; however, the Portfolio is not aware of any tax positions for which it is reasonably possible that the total amounts of unrecognized tax benefits will change materially in the next twelve months. Distributions are determined in accordance with income tax regulations, which may differ from GAAP.
As of June 30, 2024, the approximate cost for U.S. federal income tax purposes, and the aggregate gross/net unrealized appreciation (depreciation) in the value of investments (including securities sold short and derivatives, if any) are as follows:
|
|
|
|
|
|
|
| Cost |
|
Gross Appreciation |
|
Gross (Depreciation) |
|
Net Appreciation (Depreciation) |
|
|
|
|
| $ 278,152,776 |
|
$ 3,690,274 |
|
$ (16,570,738) |
|
$ (12,880,464) |
|
|
|
|
|
| Transamerica Series Trust |
|
|
|
Semi-Annual Financial Statements 2024 |
|
|
Page 22 |
|
|
Transamerica Aegon High Yield Bond VP
NOTES TO FINANCIAL STATEMENTS (continued)
At June 30, 2024
(unaudited)
10. NEW ACCOUNTING PRONOUNCEMENT
In June 2022, the Financial Accounting Standards Board issued Accounting Standards Update No. 2022-03 (“ASU 2022-03”), “Fair Value Measurement of Equity Securities Subject to Contractual Sale Restrictions” (“Topic 820”). ASU 2022-03 clarifies the guidance in Topic 820, related to the measurement of the fair value of an equity security subject to contractual sale restrictions, where it eliminates the need to apply a discount to fair value of these securities, and introduces disclosure requirements related to such equity securities. The guidance is effective for fiscal years, and interim periods within those fiscal years, beginning after December 15, 2023, and allows for early adoption. Management is currently evaluating the implications, if any, of the additional requirements and their impact on the Portfolio’s financial statements.
Please see TST’s most recent report on Form N-CSR, available at: www.transamerica.com/annuities/prospectus, for additional information. For the most recently filed complete proxy voting records for the Trust please visit: https://www.transamerica.com/sites/default/files/files/e070d/TST%20N-PX%202021.pdf
|
|
|
|
|
| Transamerica Series Trust |
|
|
|
Semi-Annual Financial Statements 2024 |
|
|
Page 23 |
|
|
Transamerica Aegon High Yield Bond VP
MANAGEMENT AND SUB-ADVISORY AGREEMENT — CONTRACT RENEWAL
(unaudited)
At a meeting of the Board of Trustees of Transamerica Series Trust (the “Trustees” or the “Board”) held on June 12-13, 2024, the Board considered the renewal of the management agreement (the “Management Agreement”) between Transamerica Asset Management, Inc. (“TAM”) and Transamerica Series Trust, on behalf of Transamerica Aegon High Yield Bond VP (the “Portfolio”). The Board also considered the renewal of the investment sub-advisory agreement (the “Sub-Advisory Agreement” and together with the Management Agreement, the “Agreements”) for the Portfolio between TAM and Aegon USA Investment Management, LLC (the “Sub-Adviser”).
Following its review and consideration, the Board determined that the terms of the Management Agreement and Sub-Advisory Agreement were reasonable and that the renewal of each of the Agreements was in the best interests of the Portfolio and the holders invested in the Portfolio. The Board, including the independent members of the Board (the “Independent Trustees”), unanimously approved the renewal of each of the Agreements through June 30, 2025.
Prior to reaching their decision, the Trustees requested and received from TAM and the Sub-Adviser certain information. They then reviewed such information as they deemed reasonably necessary to evaluate the Agreements, including information they had previously received from TAM and the Sub-Adviser as part of their regular oversight of the Portfolio, and knowledge they gained over time through meeting with TAM and the Sub-Adviser. Among other materials, the Trustees considered comparative fee, expense and performance information prepared by Broadridge Financial Solutions, Inc. (“Broadridge”), an independent provider of mutual fund performance information, as well as fee, expense and profitability information prepared by TAM. In addition, TAM provided the Board with additional supplemental comparative performance information. To the extent applicable, the Trustees considered information about fees and performance of comparable funds and/or accounts managed by the Sub-Adviser. The Board also considered reductions to the Portfolio’s expense limits, if any, that took effect after the last renewal of the Agreements. In their review, the Trustees also sought to identify instances in which the Portfolio’s performance, fees, total expenses and/or profitability appeared to be outliers within its respective peer group or other comparative metrics and sought to understand the reasons for such comparative positions.
In their deliberations, the Independent Trustees met privately without representatives of TAM or the Sub-Adviser present and were represented throughout the process by their independent legal counsel. In considering the proposed continuation of each of the Agreements, the Trustees evaluated and weighed a number of considerations that they believed to be relevant in light of the legal advice furnished to them by counsel, including independent legal counsel, and made a decision in the exercise of their own business judgment. They based their decisions on the considerations discussed below, among others, although they did not identify any particular consideration or item of information that was controlling of their decisions, and each Trustee may have attributed different weights to the various factors.
Nature, Extent and Quality of the Services Provided
The Board considered the nature, extent and quality of the services provided by TAM and the Sub-Adviser to the Portfolio in the past and the services anticipated to be provided in the future. The Board also considered the investment approach for the Portfolio; the experience, capability and integrity of TAM’s senior management; the financial resources of TAM; TAM’s management oversight process; TAM’s and the Sub-Adviser’s responsiveness to any questions by the Trustees; and the professional qualifications and compensation program of the portfolio management team of the Sub-Adviser. The Trustees noted that they receive, on a quarterly basis, an execution analysis from Capital Institutional Services, Inc. (CAPIS), an independent provider of trade analyses, for the Sub-Adviser and a comparison of trading results against a peer universe of managers.
The Board also considered the continuous and regular investment management and other services provided by TAM, when acting as a manager of managers, for the portion of the management fee it retains from the Portfolio after payment of the sub-advisory fees. The Board noted that the investment management and other services provided by TAM include the design, development and ongoing review and evaluation of the Portfolio and its investment strategy; the selection, oversight and monitoring of one or more investment sub-advisers to perform certain duties with respect to the Portfolio; ongoing portfolio trading oversight and analysis; risk management oversight and analysis; design, development, implementation and ongoing review and evaluation of a process for the valuation of Portfolio investments; design, development, implementation and ongoing review and evaluation of a compliance program for the Portfolio; design, development, implementation and ongoing review and evaluation of a process for the voting of proxies and exercise of rights to consent to corporate action for Portfolio investments; participation in Board meetings and oversight of preparation of materials for the Board, including materials for Board meetings and regular communications with the Board; oversight of preparation of the Portfolio’s prospectus, statement of additional information, shareholder reports and other disclosure materials and regulatory filings for the Portfolio; and ongoing cash management services for the Portfolio. The Board considered that TAM’s investment management services also include the provision of supervisory and administrative services to the Portfolio. The Board also noted that TAM, as part of the services it provides to all Transamerica mutual funds, including the Portfolio, oversees the services provided by the funds’ custodian, transfer agent, independent accountant and legal counsel and supervises the performance of the recordkeeping and holder service functions of the funds.
Investment Performance
In addition, the Board considered the short- and longer-term performance of the Portfolio in light of its investment objective, policies and strategies, including relative performance against (i) a peer universe of comparable mutual funds, as prepared by Broadridge, and (ii) the Portfolio’s benchmarks, in each case for various trailing periods ended December 31, 2023. Based on these considerations, the Board determined that TAM and the Sub-Adviser can provide investment and related services that are appropriate in scope and extent in light of
|
|
|
|
|
| Transamerica Series Trust |
|
|
|
Semi-Annual Financial Statements 2024 |
|
|
Page 24 |
|
|
Transamerica Aegon High Yield Bond VP
MANAGEMENT AND SUB-ADVISORY AGREEMENT — CONTRACT RENEWAL (continued)
(unaudited)
the Portfolio’s investment objectives, policies and strategies and operations, the competitive landscape of the investment company business and investor needs. The Board’s conclusions as to the Portfolio’s performance are summarized below. For purposes of its review, the Board generally used the performance of Service Class Shares. In describing the Portfolio’s performance relative to its peer universe, the summary conclusions characterize performance for the relevant periods in relation to whether it was “above,” “below” or “in line with” the peer universe median and do so using quintile rankings prepared by Broadridge. For simplicity, performance is described as “above” the median if the Portfolio’s performance ranked anywhere in the first or second quintiles, as “below” the median if it ranked anywhere in the fourth or fifth quintiles, or “in line with” the median if it ranked anywhere in the third quintile (i.e., even if its precise return was somewhat above or somewhat below the precise median return).
When considering the Portfolio’s performance, the Trustees considered any representations made by TAM regarding the appropriateness of certain peer groups and benchmarks. They recognized that performance reflects a snapshot of a period as of a specific date, and that consideration of performance data for a different period could generate significantly different performance results. The Trustees also recognized that even longer-term performance can be negatively affected by performance over a short-term period when that short-term performance is significantly below the performance of the comparable benchmark or universe of peer funds.
The Board noted that the performance of Service Class Shares of the Portfolio was in line with the median for its peer universe for the past 10-year period and below the median for the past 1-, 3- and 5-year periods. The Board also noted that the performance of Service Class Shares of the Portfolio was below the benchmark that TAM utilizes to measure performance of the Portfolio for the past 1-, 3-, 5- and 10-year periods. The Trustees discussed the reasons for the underperformance with TAM and TAM agreed to continue to closely monitor and report to the Board on the performance of the Portfolio. The Trustees also noted recent changes in the legal and compliance team at the Sub-Adviser.
Management Fee and Sub-Advisory Fees and Total Expense Ratio
The Board considered the management fee and total expense ratio of the Portfolio, including information provided by Broadridge comparing the management fee and total expense ratio of the Portfolio to the management fees and total expense ratios of comparable investment companies in both a peer group and broader peer universe compiled by Broadridge. The Board’s conclusions as to the Portfolio’s management fee and total expense ratio are summarized below. For purposes of its review, the Board generally used the actual total expenses (i.e., expenses reflecting any waivers and/or reimbursements) of Service Class Shares. In describing the Portfolio’s management fee and total expense ratio relative to its peer group and peer universe, the summary conclusions characterize management fees and total expense ratios for the relevant periods in relation to whether they were “above,” “below” or “in line with” the peer group or peer universe median and do so using quintile rankings prepared by Broadridge. For simplicity, management fees and total expense ratios are described as “above” the median if the Portfolio’s management fee or total expense ratio ranked anywhere in the fourth or fifth quintiles, as “below” the median if it ranked anywhere in the first or second quintiles, or “in line with” the median if it ranked anywhere in the third quintile (i.e., even if its precise management fee or total expense ratio was somewhat above or somewhat below the precise median management fee or total expense ratio).
The Board also considered the fees charged by the Sub-Adviser for sub-advisory services, as well as the portion of the Portfolio’s management fee retained by TAM following payment of the sub-advisory fee and how the portion of the contractual management fee retained by TAM at a specified asset level compared to the portions retained by other investment advisers managing mutual funds with similar investment strategies as calculated by an independent provider of information.
The Board noted that the Portfolio’s contractual management fee was below the medians for its peer group and peer universe and that the actual total expenses (i.e., expenses reflecting any waivers and/or reimbursements) of Service Class Shares of the Portfolio were below the median for its peer group and in line with the median for its peer universe. The Trustees also considered that TAM has entered into an expense limitation arrangement with the Portfolio, which may result in TAM waiving fees for the benefit of holders.
On the basis of these considerations, together with the other information it considered, the Board determined that the management and sub-advisory fees to be received by TAM and the Sub-Adviser under the Management Agreement and Sub-Advisory Agreement are reasonable in light of the services provided.
Cost of Services Provided and Level of Profitability
The Board reviewed information provided by TAM about the cost of providing and procuring fund management services, as well as the costs of the provision of administration, transfer agency and other services, to the Portfolio and to Transamerica Series Trust as a whole by TAM and its affiliates. The Board considered the profitability of TAM and its affiliates in providing these services for the Portfolio and Transamerica Series Trust as a whole. The Trustees recognized the competitiveness of the mutual fund industry and the importance of an investment adviser’s long-term profitability, including for maintaining company and management stability and accountability.
The Board also considered the allocation methodology used for calculating the profitability of TAM and its affiliates. The Board noted that the revenue and expense allocation methodology used by TAM to estimate its profitability with respect to its relationship with the Portfolio had been reviewed previously by an independent consultant. The Trustees considered that TAM reported that it had not made material changes to this methodology, and that the methodology had been applied consistently for the Portfolio.
|
|
|
|
|
| Transamerica Series Trust |
|
|
|
Semi-Annual Financial Statements 2024 |
|
|
Page 25 |
|
|
Transamerica Aegon High Yield Bond VP
MANAGEMENT AND SUB-ADVISORY AGREEMENT — CONTRACT RENEWAL (continued)
(unaudited)
With respect to the Sub-Adviser, the Board noted that information about the Sub-Adviser’s revenues and expenses was incorporated into the profitability analysis for TAM and its affiliates with respect to the Portfolio. As a result, the Board focused on profitability information for TAM and its affiliates and the Sub-Adviser in the aggregate.
Based on this information, the Board determined that the profitability of TAM and its affiliates from their relationships with the Portfolio was not excessive.
Economies of Scale
The Board considered economies of scale with respect to the management of the Portfolio, whether the Portfolio had appropriately benefited from any economies of scale and whether there was the potential for realization of any future economies of scale. The Board also considered the existence of economies of scale with respect to management of the Transamerica mutual funds overall and the extent to which the Portfolio benefited from any economies of scale. The Board recognized that, as the Portfolio’s assets increase, any economies of scale realized by TAM or the Sub-Adviser may not directly correlate with each other or with any economies of scale that might be realized by the Portfolio. The Board considered the Portfolio’s management fee schedule and the existence of breakpoints and also considered the extent to which TAM shared economies of scale, if any, with the Portfolio through undertakings to limit or reimburse Portfolio expenses and to invest in maintaining and developing its capabilities and services. The Board also considered the Sub-Adviser’s sub-advisory fee schedule and the existence of breakpoints, if any, and how such breakpoints relate to any breakpoints in the Portfolio’s management fee schedule. The Board considered that the Sub-Adviser’s sub-advisory fees would be based on the combined assets of multiple funds. The Trustees concluded that the Portfolio’s fee structure reflected an appropriate sharing of any efficiencies or economies of scale to date and noted that they will have the opportunity to periodically reexamine the appropriateness of the management fee payable to TAM and the fee paid to the Sub-Adviser in light of any economies of scale experienced in the future.
Benefits to TAM, its Affiliates and/or the Sub-Adviser from their Relationships with the Portfolio
The Board considered other benefits derived by TAM, its affiliates, and/or the Sub-Adviser from their relationships with the Portfolio. The Board noted that TAM does not receive benefits from research obtained with commissions paid to broker-dealers for portfolio transactions (commonly referred to as “soft dollars”) as a result of its relationship with the Portfolio.
Other Considerations
The Board noted that TAM has made a substantial commitment to the recruitment and retention of high-quality personnel and maintains the financial, compliance and operational resources reasonably necessary to manage the Portfolio in a professional manner that is consistent with the best interests of the Portfolio and the holders. In this regard, the Board favorably considered the procedures and policies TAM has in place to enforce compliance with applicable laws and regulations and oversee the portfolio management activities of the Sub-Adviser. The Board also noted that TAM has made an entrepreneurial commitment and undertaken certain business risks with respect to the management and success of the Portfolio.
Conclusion
After consideration of the factors described above, as well as other factors, the Trustees, including the Independent Trustees, concluded that the renewal of the Management Agreement and the Sub-Advisory Agreement was in the best interests of the Portfolio and the holders and voted to approve the renewal of the Agreements.
|
|
|
|
|
| Transamerica Series Trust |
|
|
|
Semi-Annual Financial Statements 2024 |
|
|
Page 26 |
|
|
PROXY VOTING POLICIES AND PROCEDURES AND QUARTERLY PORTFOLIO HOLDINGS
(unaudited)
A description of Transamerica Series Trust’s (the “Trust”) proxy voting policies and procedures is available in the Statement of Additional Information of the Portfolios, available without charge upon request by calling 1-800-851-9777 (toll free) or on the Securities and Exchange Commission’s (“SEC”) website at http://www.sec.gov.
In addition, the Portfolio is required to file Form N-PX, with their complete proxy voting records for the most recent 12 months ended June 30th, no later than August 31st of each year. The Form is available without charge: (1) on the Transamerica Funds website at https://www.transamerica.com/sites/default/files/files/e070d/TST%20N-PX%202021.pdf; and (2) on the SEC’s website at http://www.sec.gov.
Each fiscal quarter, the Portfolios, except Transamerica BlackRock Government Money Market VP, will file with the SEC a complete schedule of its monthly portfolio holdings on Form N-PORT. The Portfolios’ holdings as of the end of the third month of every fiscal quarter, as reported on Form N-PORT, will be publicly available on the SEC’s website at http://www.sec.gov within 60 days of the end of the fiscal quarter.
On a monthly basis, Transamerica BlackRock Government Money Market VP will file with the SEC portfolio holdings information on Form N-MFP3. A complete schedule of portfolio holdings is also available at www.transamerica.com.
You may also visit the Trust’s website at www.transamerica.com/annuities/prospectus for this and other information about the Portfolios and the Trust.
Important Notice Regarding Delivery of Shareholder Documents
Every year we provide shareholders informative materials such as the Transamerica Series Trust Annual Report, the Transamerica Series Trust Prospectus, and other required documents that keep you informed regarding your Portfolios. To the extent provided by mail, Transamerica Series Trust will only send one piece per mailing address, a method that saves your Portfolios money by reducing mailing and printing costs. We will continue to do this unless you tell us not to. To elect to receive individual mailings, simply call a Transamerica Customer Service Representative toll free at 1-800-851-9777, 8 a.m. to 7 p.m. Eastern Time, Monday-Friday. Your request will take effect within 30 days.
|
|
|
|
|
| Transamerica Series Trust |
|
|
|
Semi-Annual Financial Statements 2024 |
|
|
Page 27 |
|
|
NOTICE OF PRIVACY POLICY
(unaudited)
Your privacy is very important to us. We want you to understand what information we collect and how we use it. We collect and use “nonpublic personal information” in connection with providing our customers with a broad range of financial products and services as effectively and conveniently as possible. We treat nonpublic personal information in accordance with our Privacy Policy.
What Information We Collect and From Whom We Collect It
We may collect nonpublic personal information about you from the following sources:
| • |
|
Information we receive from you on applications or other forms, such as your name, address, and account number; |
| • |
|
Information about your transactions with us, our affiliates, or others, such as your account balance and purchase/redemption history; and |
| • |
|
Information we receive from non-affiliated third parties, including consumer reporting agencies. |
What Information We Disclose and To Whom We Disclose It
We do not disclose any nonpublic personal information about current or former customers to anyone without their express consent, except as permitted by law. We may disclose the nonpublic personal information we collect, as described above, to persons or companies that perform services on our behalf and to other financial institutions with which we have joint marketing agreements. We will require these companies to protect the confidentiality of your nonpublic personal information and to use it only to perform the services for which we have hired them.
Our Security Procedures
We restrict access to your nonpublic personal information and only allow disclosures to persons and companies as permitted by law to assist in providing products or services to you. We maintain physical, electronic, and procedural safeguards to protect your nonpublic personal information and to safeguard the disposal of certain consumer information.
Contact Us
If you have any questions about our Privacy Policy, please call 1-800-851-9777 on any business day between 8 a.m. and 7 p.m. Eastern Time.
Note: This Privacy Policy applies only to customers that have a direct relationship with us or our affiliates. If you own shares of our portfolios in the name of a third party such as a bank or broker-dealer, its privacy policy may apply to you instead of ours.
|
|
|
|
|
| Transamerica Series Trust |
|
|
|
Semi-Annual Financial Statements 2024 |
|
|
Page 28 |
|
|
PO Box 219945
Kansas City, MO 64121-9945
| Distributor: |
Transamerica Capital, Inc. |
| |
Kansas City, MO 64121-9945 |
| |
Customer Service: 1-800-851-9777 |
Transamerica Series Trust Semi-Annual Financial Statements
June 30, 2024
1801 California St., Suite 5200
Denver, CO 80202
Distributor: Transamerica Capital, Inc.
Customer Service: 1-800-851-9777
|
| The following pages contain the most recent semi-annual financial statements for the investment options in which you are invested. In compliance with Securities and Exchange Commission regulations, we present these reports on an annual and semi-annual basis with the hope that they will foster greater understanding of the investment options’ holdings, performance, financial data, accounting policies and other issues. This streamlined version provides information only on the investment options in which you are invested. |
|
| If you have any questions about these reports, please do not hesitate to contact your financial professional. As always, we thank you for your trust and the opportunity to serve you. |
Transamerica Aegon Sustainable Equity Income VP
SCHEDULE OF INVESTMENTS
At June 30, 2024
(unaudited)
|
|
|
|
|
|
|
|
|
| |
|
Shares |
|
|
Value |
|
| |
|
| |
|
|
|
|
|
|
|
|
|
| COMMON STOCKS - 99.5% |
|
|
|
|
|
|
|
|
| Banks - 4.3% |
|
| Citizens Financial Group, Inc. |
|
|
323,085 |
|
|
|
$ 11,640,753 |
|
| US Bancorp |
|
|
220,570 |
|
|
|
8,756,629 |
|
|
|
|
|
|
|
|
|
|
|
|
|
|
|
|
|
|
|
|
20,397,382 |
|
|
|
|
|
|
|
|
|
|
|
| Biotechnology - 2.8% |
|
| Gilead Sciences, Inc. |
|
|
196,318 |
|
|
|
13,469,378 |
|
|
|
|
|
|
|
|
|
|
|
| Capital Markets - 8.6% |
|
| CME Group, Inc. |
|
|
84,021 |
|
|
|
16,518,529 |
|
| Moody’s Corp. |
|
|
18,715 |
|
|
|
7,877,705 |
|
| State Street Corp. |
|
|
129,891 |
|
|
|
9,611,934 |
|
| Stifel Financial Corp. |
|
|
88,422 |
|
|
|
7,440,711 |
|
|
|
|
|
|
|
|
|
|
|
|
|
|
|
|
|
|
|
|
41,448,879 |
|
|
|
|
|
|
|
|
|
|
|
| Chemicals - 2.0% |
|
| Linde PLC |
|
|
21,886 |
|
|
|
9,603,796 |
|
|
|
|
|
|
|
|
|
|
|
| Commercial Services & Supplies - 3.5% |
|
| Republic Services, Inc. |
|
|
87,183 |
|
|
|
16,943,144 |
|
|
|
|
|
|
|
|
|
|
|
| Communications Equipment - 3.5% |
|
| Cisco Systems, Inc. |
|
|
357,746 |
|
|
|
16,996,512 |
|
|
|
|
|
|
|
|
|
|
|
| Consumer Staples Distribution & Retail - 1.3% |
|
| Costco Wholesale Corp. |
|
|
7,237 |
|
|
|
6,151,378 |
|
|
|
|
|
|
|
|
|
|
|
| Containers & Packaging - 2.4% |
|
| Packaging Corp. of America |
|
|
64,089 |
|
|
|
11,700,088 |
|
|
|
|
|
|
|
|
|
|
|
| Diversified Telecommunication Services - 1.2% |
|
| TELUS Corp. (A) |
|
|
363,199 |
|
|
|
5,498,833 |
|
|
|
|
|
|
|
|
|
|
|
| Electrical Equipment - 4.7% |
|
| Emerson Electric Co. |
|
|
95,400 |
|
|
|
10,509,264 |
|
| Schneider Electric SE, ADR (A) |
|
|
245,887 |
|
|
|
11,837,000 |
|
|
|
|
|
|
|
|
|
|
|
|
|
|
|
|
|
|
|
|
22,346,264 |
|
|
|
|
|
|
|
|
|
|
|
| Ground Transportation - 1.6% |
|
| Union Pacific Corp. |
|
|
33,864 |
|
|
|
7,662,069 |
|
|
|
|
|
|
|
|
|
|
|
| Health Care Equipment & Supplies - 2.1% |
|
| Medtronic PLC |
|
|
126,867 |
|
|
|
9,985,702 |
|
|
|
|
|
|
|
|
|
|
|
| Health Care Providers & Services - 4.9% |
|
| Elevance Health, Inc. |
|
|
23,796 |
|
|
|
12,894,100 |
|
| Quest Diagnostics, Inc. |
|
|
77,809 |
|
|
|
10,650,496 |
|
|
|
|
|
|
|
|
|
|
|
|
|
|
|
|
|
|
|
|
23,544,596 |
|
|
|
|
|
|
|
|
|
|
|
| Household Products - 6.1% |
|
| Colgate-Palmolive Co. |
|
|
195,222 |
|
|
|
18,944,343 |
|
| Kimberly-Clark Corp. |
|
|
76,135 |
|
|
|
10,521,857 |
|
|
|
|
|
|
|
|
|
|
|
|
|
|
|
|
|
|
|
|
29,466,200 |
|
|
|
|
|
|
|
|
|
|
|
| Independent Power & Renewable Electricity Producers - 1.6% |
|
| AES Corp. |
|
|
433,391 |
|
|
|
7,614,680 |
|
|
|
|
|
|
|
|
|
|
|
| Insurance - 6.8% |
|
| Cincinnati Financial Corp. |
|
|
83,031 |
|
|
|
9,805,961 |
|
| MetLife, Inc. |
|
|
241,957 |
|
|
|
16,982,962 |
|
| Progressive Corp. |
|
|
28,826 |
|
|
|
5,987,448 |
|
|
|
|
|
|
|
|
|
|
|
|
|
|
|
|
|
|
|
|
32,776,371 |
|
|
|
|
|
|
|
|
|
|
|
|
|
|
|
|
|
|
|
| |
|
Shares |
|
|
Value |
|
| |
|
| |
|
|
|
|
|
|
|
|
|
| COMMON STOCKS (continued) |
|
|
|
|
|
|
|
|
| Machinery - 4.0% |
|
| AGCO Corp. |
|
|
97,266 |
|
|
|
$ 9,520,396 |
|
| Xylem, Inc. |
|
|
71,985 |
|
|
|
9,763,326 |
|
|
|
|
|
|
|
|
|
|
|
|
|
|
|
|
|
|
|
|
19,283,722 |
|
|
|
|
|
|
|
|
|
|
|
| Media - 2.7% |
|
| Omnicom Group, Inc. |
|
|
145,085 |
|
|
|
13,014,124 |
|
|
|
|
|
|
|
|
|
|
|
| Metals & Mining - 1.8% |
|
| Steel Dynamics, Inc. |
|
|
67,767 |
|
|
|
8,775,826 |
|
|
|
|
|
|
|
|
|
|
|
| Pharmaceuticals - 5.5% |
|
| Bristol-Myers Squibb Co. |
|
|
186,971 |
|
|
|
7,764,906 |
|
| Merck & Co., Inc. |
|
|
148,933 |
|
|
|
18,437,905 |
|
|
|
|
|
|
|
|
|
|
|
|
|
|
|
|
|
|
|
|
26,202,811 |
|
|
|
|
|
|
|
|
|
|
|
| Professional Services - 4.2% |
|
| Automatic Data Processing, Inc. |
|
|
44,248 |
|
|
|
10,561,555 |
|
| RELX PLC, ADR |
|
|
203,108 |
|
|
|
9,318,595 |
|
|
|
|
|
|
|
|
|
|
|
|
|
|
|
|
|
|
|
|
19,880,150 |
|
|
|
|
|
|
|
|
|
|
|
| Semiconductors & Semiconductor Equipment - 9.2% |
|
| Broadcom, Inc. |
|
|
6,852 |
|
|
|
11,001,091 |
|
| Taiwan Semiconductor Manufacturing Co. Ltd., ADR |
|
|
90,402 |
|
|
|
15,712,772 |
|
| Texas Instruments, Inc. |
|
|
90,708 |
|
|
|
17,645,427 |
|
|
|
|
|
|
|
|
|
|
|
|
|
|
|
|
|
|
|
|
44,359,290 |
|
|
|
|
|
|
|
|
|
|
|
| Software - 2.9% |
|
| Microsoft Corp. |
|
|
31,241 |
|
|
|
13,963,165 |
|
|
|
|
|
|
|
|
|
|
|
| Specialized REITs - 4.1% |
|
| American Tower Corp. |
|
|
27,170 |
|
|
|
5,281,305 |
|
| Digital Realty Trust, Inc. |
|
|
41,342 |
|
|
|
6,286,051 |
|
| Weyerhaeuser Co. |
|
|
285,842 |
|
|
|
8,115,054 |
|
|
|
|
|
|
|
|
|
|
|
|
|
|
|
|
|
|
|
|
19,682,410 |
|
|
|
|
|
|
|
|
|
|
|
| Specialty Retail - 2.6% |
|
| Home Depot, Inc. |
|
|
36,821 |
|
|
|
12,675,261 |
|
|
|
|
|
|
|
|
|
|
|
| Trading Companies & Distributors - 3.9% |
|
| United Rentals, Inc. |
|
|
15,246 |
|
|
|
9,860,046 |
|
| WESCO International, Inc. |
|
|
54,610 |
|
|
|
8,656,777 |
|
|
|
|
|
|
|
|
|
|
|
|
|
|
|
|
|
|
|
|
18,516,823 |
|
|
|
|
|
|
|
|
|
|
|
| Water Utilities - 1.2% |
|
| Essential Utilities, Inc. |
|
|
152,141 |
|
|
|
5,679,423 |
|
|
|
|
|
|
|
|
|
|
|
|
|
| Total Common Stocks
(Cost $416,648,262) |
|
|
|
|
|
|
477,638,277 |
|
|
|
|
|
|
|
|
|
|
|
| OTHER INVESTMENT COMPANY - 3.1% |
|
| Securities Lending Collateral - 3.1% |
|
| State Street Navigator Securities Lending Trust - Government Money Market Portfolio, 5.28% (B) |
|
|
14,791,245 |
|
|
|
14,791,245 |
|
|
|
|
|
|
|
|
|
|
|
|
| Total Other Investment Company
(Cost $14,791,245) |
|
|
|
14,791,245 |
|
|
|
|
|
|
|
The Notes to Financial Statements are an integral part of this report.
|
|
|
|
|
| Transamerica Series Trust |
|
|
|
Semi-Annual Financial Statements 2024 |
|
|
Page 1 |
|
|
Transamerica Aegon Sustainable Equity Income VP
SCHEDULE OF INVESTMENTS (continued)
At June 30, 2024
(unaudited)
|
|
|
|
|
|
|
|
|
| |
|
Principal |
|
|
Value |
|
| |
|
|
| REPURCHASE AGREEMENT - 0.4% |
|
| Fixed Income Clearing Corp.,
2.50% (B), dated 06/28/2024, to be repurchased at $2,095,378 on 07/01/2024. Collateralized by a U.S. Government Obligation, 4.50%, due 03/31/2026, and with a value of $2,137,017. |
|
|
$ 2,094,942 |
|
|
|
$ 2,094,942 |
|
|
|
|
|
|
|
|
|
|
|
|
| Total Repurchase Agreement
(Cost $2,094,942) |
|
|
|
2,094,942 |
|
|
|
|
|
|
|
| Total Investments
(Cost $433,534,449) |
|
|
|
494,524,464 |
|
|
|
|
|
|
|
| Net Other Assets (Liabilities) - (3.0)% |
|
|
|
(14,275,594) |
|
|
|
|
|
|
|
|
|
|
|
|
| Net Assets - 100.0% |
|
|
|
$ 480,248,870 |
|
|
|
|
|
|
|
INVESTMENT VALUATION:
Valuation Inputs (C)
|
|
|
|
|
|
|
|
|
|
|
|
|
|
|
|
|
| |
|
Level 1 - Unadjusted Quoted Prices |
|
|
Level 2 - Other Significant Observable Inputs |
|
|
Level 3 - Significant Unobservable Inputs |
|
|
Value |
|
| |
|
|
|
|
|
|
| ASSETS |
|
|
|
|
|
|
|
|
|
|
|
|
|
|
|
|
| Investments |
|
|
|
|
|
|
|
|
|
|
|
|
|
|
|
|
| Common Stocks |
|
$ |
477,638,277 |
|
|
$ |
— |
|
|
$ |
— |
|
|
$ |
477,638,277 |
|
| Other Investment Company |
|
|
14,791,245 |
|
|
|
— |
|
|
|
— |
|
|
|
14,791,245 |
|
| Repurchase Agreement |
|
|
— |
|
|
|
2,094,942 |
|
|
|
— |
|
|
|
2,094,942 |
|
|
|
|
|
|
|
|
|
|
|
|
|
|
|
|
|
|
|
|
|
|
|
| Total Investments |
|
$ |
492,429,522 |
|
|
$ |
2,094,942 |
|
|
$ |
— |
|
|
$ |
494,524,464 |
|
|
|
|
|
|
|
|
|
|
|
|
|
|
|
|
|
|
FOOTNOTES TO SCHEDULE OF INVESTMENTS:
| (A) |
All or a portion of the security is on loan. The total value of the securities on loan is $16,048,047, collateralized by cash collateral of $14,791,245 and non-cash collateral, such as U.S. government securities and irrevocable letters of credit, of $1,630,755. The amount on loan indicated may not correspond with the securities on loan identified because a security with pending sales are in the process of recall from the brokers. |
| (B) |
Rate disclosed reflects the yield at June 30, 2024. |
| (C) |
There were no transfers in or out of Level 3 during the period ended June 30, 2024. Please reference the Investment Valuation section of the Notes to Financial Statements for more information regarding investment valuation and pricing inputs. |
PORTFOLIO ABBREVIATION(S):
|
|
|
| ADR |
|
American Depositary Receipt |
| REIT |
|
Real Estate Investment Trust |
The Notes to Financial Statements are an integral part of this report.
|
|
|
|
|
| Transamerica Series Trust |
|
|
|
Semi-Annual Financial Statements 2024 |
|
|
Page 2 |
|
|
Transamerica Aegon Sustainable Equity Income VP
STATEMENT OF ASSETS AND LIABILITIES
At June 30, 2024
(unaudited)
|
|
|
|
|
| Assets: |
|
|
|
|
| Investments, at value (cost $431,439,507) (including securities loaned of $16,048,047) |
|
$ |
492,429,522 |
|
| Repurchase agreement, at value (cost $2,094,942) |
|
|
2,094,942 |
|
| Receivables and other assets: |
|
|
|
|
| Net income from securities lending |
|
|
6,684 |
|
| Shares of beneficial interest sold |
|
|
49,702 |
|
| Dividends |
|
|
917,189 |
|
| Interest |
|
|
437 |
|
| Prepaid expenses |
|
|
1,802 |
|
|
|
| Total assets |
|
|
495,500,278 |
|
|
|
| Liabilities: |
|
|
|
|
| Cash collateral received upon return of: |
|
|
|
|
| Securities on loan |
|
|
14,791,245 |
|
| Payables and other liabilities: |
|
|
|
|
| Shares of beneficial interest redeemed |
|
|
80,209 |
|
| Investment management fees |
|
|
244,093 |
|
| Distribution and service fees |
|
|
31,791 |
|
| Transfer agent costs |
|
|
461 |
|
| Trustee and CCO fees |
|
|
1,309 |
|
| Audit and tax fees |
|
|
12,477 |
|
| Custody fees |
|
|
14,023 |
|
| Legal fees |
|
|
10,986 |
|
| Printing and shareholder reports fees |
|
|
54,387 |
|
| Other accrued expenses |
|
|
10,427 |
|
|
|
| Total liabilities |
|
|
15,251,408 |
|
|
|
| Net assets |
|
$ |
480,248,870 |
|
|
|
| Net assets consist of: |
|
|
|
|
| Capital stock ($0.01 par value) |
|
$ |
241,914 |
|
| Additional paid-in capital |
|
|
406,373,197 |
|
| Total distributable earnings (accumulated losses) |
|
|
73,633,759 |
|
|
|
| Net assets |
|
$ |
480,248,870 |
|
|
|
| Net assets by class: |
|
|
|
|
| Initial Class |
|
$ |
314,449,685 |
|
| Service Class |
|
|
165,799,185 |
|
|
|
| Shares outstanding: |
|
|
|
|
| Initial Class |
|
|
15,847,969 |
|
| Service Class |
|
|
8,343,420 |
|
|
|
| Net asset value and offering price per share: |
|
|
|
|
| Initial Class |
|
$ |
19.84 |
|
| Service Class |
|
|
19.87 |
|
STATEMENT OF OPERATIONS
For the period ended June 30, 2024
(unaudited)
|
|
|
|
|
| Investment income: |
|
|
|
|
| Dividend income |
|
$ |
5,866,487 |
|
| Interest income |
|
|
54,265 |
|
| Net income from securities lending |
|
|
23,203 |
|
| Withholding taxes on foreign income |
|
|
(82,323 |
) |
|
|
| Total investment income |
|
|
5,861,632 |
|
|
|
| Expenses: |
|
|
|
|
| Investment management fees |
|
|
1,573,390 |
|
| Distribution and service fees: |
|
|
|
|
| Service Class |
|
|
206,409 |
|
| Transfer agent costs |
|
|
2,685 |
|
| Trustee and CCO fees |
|
|
11,033 |
|
| Audit and tax fees |
|
|
11,988 |
|
| Custody fees |
|
|
14,235 |
|
| Legal fees |
|
|
19,679 |
|
| Printing and shareholder reports fees |
|
|
49,882 |
|
| Other |
|
|
18,377 |
|
|
|
| Total expenses |
|
|
1,907,678 |
|
|
|
| Net investment income (loss) |
|
|
3,953,954 |
|
|
|
| Net realized gain (loss) on: |
|
|
|
|
| Investments |
|
|
29,837,181 |
|
| Foreign currency transactions |
|
|
844 |
|
|
|
| Net realized gain (loss) |
|
|
29,838,025 |
|
|
|
| Net change in unrealized appreciation (depreciation) on: |
|
|
|
|
| Investments |
|
|
5,903,047 |
|
| Translation of assets and liabilities denominated in foreign currencies |
|
|
(1,549 |
) |
|
|
| Net change in unrealized appreciation (depreciation) |
|
|
5,901,498 |
|
|
|
| Net realized and change in unrealized gain (loss) |
|
|
35,739,523 |
|
|
|
| Net increase (decrease) in net assets resulting from operations |
|
$ |
39,693,477 |
|
The Notes to Financial Statements are an integral part of this report.
|
|
|
|
|
| Transamerica Series Trust |
|
|
|
Semi-Annual Financial Statements 2024 |
|
|
Page 3 |
|
|
Transamerica Aegon Sustainable Equity Income VP
STATEMENT OF CHANGES IN NET ASSETS
For the period and year ended:
|
|
|
|
|
|
|
|
|
|
|
|
| |
|
June 30, 2024 (unaudited) |
|
December 31, 2023 |
|
|
|
| From operations: |
|
|
|
|
|
|
|
|
| Net investment income (loss) |
|
|
$ 3,953,954 |
|
|
|
$ 9,922,977 |
|
| Net realized gain (loss) |
|
|
29,838,025 |
|
|
|
(17,087,931 |
) |
| Net change in unrealized appreciation (depreciation) |
|
|
5,901,498 |
|
|
|
31,786,196 |
|
|
|
|
| Net increase (decrease) in net assets resulting from operations |
|
|
39,693,477 |
|
|
|
24,621,242 |
|
|
|
|
| Dividends and/or distributions to shareholders: |
|
|
|
|
|
|
|
|
| Initial Class |
|
|
— |
|
|
|
(7,410,520 |
) |
| Service Class |
|
|
— |
|
|
|
(3,122,708 |
) |
|
|
|
| Net increase (decrease) in net assets resulting from dividends and/or distributions to shareholders |
|
|
— |
|
|
|
(10,533,228 |
) |
|
|
|
| Capital share transactions: |
|
|
|
|
|
|
|
|
| Proceeds from shares sold: |
|
|
|
|
|
|
|
|
| Initial Class |
|
|
2,844,693 |
|
|
|
15,433,206 |
|
| Service Class |
|
|
923,177 |
|
|
|
6,290,961 |
|
|
|
|
| |
|
|
3,767,870 |
|
|
|
21,724,167 |
|
| Dividends and/or distributions reinvested: |
|
|
|
|
|
|
|
|
| Initial Class |
|
|
— |
|
|
|
7,410,520 |
|
| Service Class |
|
|
— |
|
|
|
3,122,708 |
|
| |
|
|
— |
|
|
|
10,533,228 |
|
| Cost of shares redeemed: |
|
|
|
|
|
|
|
|
| Initial Class |
|
|
(19,545,268 |
) |
|
|
(91,006,584 |
) |
| Service Class |
|
|
(14,631,081 |
) |
|
|
(27,916,713 |
) |
|
|
|
| |
|
|
(34,176,349 |
) |
|
|
(118,923,297 |
) |
|
|
|
| Net increase (decrease) in net assets resulting from capital share transactions |
|
|
(30,408,479 |
) |
|
|
(86,665,902 |
) |
|
|
|
| Net increase (decrease) in net assets |
|
|
9,284,998 |
|
|
|
(72,577,888 |
) |
|
|
|
| Net assets: |
|
|
|
|
|
|
|
|
| Beginning of period/year |
|
|
470,963,872 |
|
|
|
543,541,760 |
|
| End of period/year |
|
|
$480,248,870 |
|
|
|
$ 470,963,872 |
|
|
|
|
| Capital share transactions - shares: |
|
|
|
|
|
|
|
|
| Shares issued: |
|
|
|
|
|
|
|
|
| Initial Class |
|
|
148,167 |
|
|
|
901,896 |
|
| Service Class |
|
|
47,686 |
|
|
|
360,127 |
|
|
|
|
| |
|
|
195,853 |
|
|
|
1,262,023 |
|
| Shares reinvested: |
|
|
|
|
|
|
|
|
| Initial Class |
|
|
— |
|
|
|
428,354 |
|
| Service Class |
|
|
— |
|
|
|
179,879 |
|
|
|
|
| |
|
|
— |
|
|
|
608,233 |
|
| Shares redeemed: |
|
|
|
|
|
|
|
|
| Initial Class |
|
|
(1,010,768 |
) |
|
|
(5,415,055 |
) |
| Service Class |
|
|
(755,662 |
) |
|
|
(1,608,996 |
) |
|
|
|
| |
|
|
(1,766,430 |
) |
|
|
(7,024,051 |
) |
| Net increase (decrease) in shares outstanding: |
|
|
|
|
|
|
|
|
| Initial Class |
|
|
(862,601 |
) |
|
|
(4,084,805 |
) |
| Service Class |
|
|
(707,976 |
) |
|
|
(1,068,990 |
) |
|
|
|
| |
|
|
(1,570,577 |
) |
|
|
(5,153,795 |
) |
The Notes to Financial Statements are an integral part of this report.
|
|
|
|
|
| Transamerica Series Trust |
|
|
|
Semi-Annual Financial Statements 2024 |
|
|
Page 4 |
|
|
Transamerica Aegon Sustainable Equity Income VP
FINANCIAL HIGHLIGHTS
|
|
|
|
|
|
|
|
|
|
|
|
|
|
|
|
|
|
|
|
|
|
|
|
|
|
|
|
|
|
|
| For a share outstanding during the period and years indicated: |
|
Initial Class |
|
|
|
|
|
|
|
| |
|
June 30, 2024 (unaudited) |
|
December 31, 2023 |
|
December 31, 2022 |
|
December 31, 2021 |
|
December 31, 2020 |
|
December 31, 2019 |
|
|
|
|
|
|
|
| Net asset value, beginning of period/year |
|
|
$ |
18.26 |
|
|
|
$ |
17.57 |
|
|
|
$ |
21.11 |
|
|
|
$ |
17.60 |
|
|
|
$ |
22.57 |
|
|
|
$ |
22.22 |
|
|
|
|
|
|
|
|
| Investment operations: |
|
|
|
|
|
|
|
|
|
|
|
|
|
|
|
|
|
|
|
|
|
|
|
|
|
|
|
|
|
|
| Net investment income (loss)(A) |
|
|
|
0.17 |
|
|
|
|
0.36 |
|
|
|
|
0.34 |
|
|
|
|
0.34 |
|
|
|
|
0.43 |
|
|
|
|
0.57 |
|
| Net realized and unrealized gain (loss) |
|
|
|
1.41 |
|
|
|
|
0.72 |
|
|
|
|
(2.80 |
) |
|
|
|
3.60 |
|
|
|
|
(2.48 |
) |
|
|
|
4.29 |
|
|
|
|
|
|
|
|
| Total investment operations |
|
|
|
1.58 |
|
|
|
|
1.08 |
|
|
|
|
(2.46 |
) |
|
|
|
3.94 |
|
|
|
|
(2.05 |
) |
|
|
|
4.86 |
|
|
|
|
|
|
|
|
| Dividends and/or distributions to shareholders: |
|
|
|
|
|
|
|
|
|
|
|
|
|
|
|
|
|
|
|
|
|
|
|
|
|
|
|
|
|
|
| Net investment income |
|
|
|
— |
|
|
|
|
(0.39 |
) |
|
|
|
(0.41 |
) |
|
|
|
(0.43 |
) |
|
|
|
(0.58 |
) |
|
|
|
(0.63 |
) |
| Net realized gains |
|
|
|
— |
|
|
|
|
— |
|
|
|
|
(0.67 |
) |
|
|
|
— |
|
|
|
|
(2.34 |
) |
|
|
|
(3.88 |
) |
| Total dividends and/or distributions to shareholders |
|
|
|
— |
|
|
|
|
(0.39 |
) |
|
|
|
(1.08 |
) |
|
|
|
(0.43 |
) |
|
|
|
(2.92 |
) |
|
|
|
(4.51 |
) |
|
|
|
|
|
|
|
| Net asset value, end of period/year |
|
|
$ |
19.84 |
|
|
|
$ |
18.26 |
|
|
|
$ |
17.57 |
|
|
|
$ |
21.11 |
|
|
|
$ |
17.60 |
|
|
|
$ |
22.57 |
|
| |
|
|
|
|
|
|
|
|
| Total return |
|
|
|
8.65 |
%(B) |
|
|
|
6.28 |
% |
|
|
|
(11.63 |
)% |
|
|
|
22.42 |
% |
|
|
|
(7.35 |
)% |
|
|
|
23.91 |
% |
|
|
|
|
|
|
|
| Ratio and supplemental data: |
|
|
|
|
|
|
|
|
|
|
|
|
|
|
|
|
|
|
|
|
|
|
|
|
|
|
|
|
|
|
| Net assets end of period/year (000’s) |
|
|
$ |
314,450 |
|
|
|
$ |
305,197 |
|
|
|
$ |
365,350 |
|
|
|
$ |
448,361 |
|
|
|
$ |
440,332 |
|
|
|
$ |
564,788 |
|
| Expenses to average net assets |
|
|
|
0.72 |
%(C) |
|
|
|
0.73 |
% |
|
|
|
0.69 |
% |
|
|
|
0.69 |
% |
|
|
|
0.74 |
% |
|
|
|
0.72 |
% |
| Net investment income (loss) to average net assets |
|
|
|
1.75 |
%(C) |
|
|
|
2.07 |
% |
|
|
|
1.86 |
% |
|
|
|
1.70 |
% |
|
|
|
2.40 |
% |
|
|
|
2.43 |
% |
| Portfolio turnover rate |
|
|
|
12 |
%(B) |
|
|
|
11 |
% |
|
|
|
22 |
% |
|
|
|
23 |
% |
|
|
|
135 |
% |
|
|
|
61 |
% |
| (A) |
Calculated based on average number of shares outstanding. |
|
|
|
|
|
|
|
|
|
|
|
|
|
|
|
|
|
|
|
|
|
|
|
|
|
|
|
|
|
|
|
| For a share outstanding during the period and years indicated: |
|
Service Class |
|
|
|
|
|
|
|
| |
|
June 30, 2024 (unaudited) |
|
December 31, 2023 |
|
December 31, 2022 |
|
December 31, 2021 |
|
December 31, 2020 |
|
December 31, 2019 |
|
|
|
|
|
|
|
| Net asset value, beginning of period/year |
|
|
$ |
18.31 |
|
|
|
$ |
17.61 |
|
|
|
$ |
21.14 |
|
|
|
$ |
17.63 |
|
|
|
$ |
22.59 |
|
|
|
$ |
22.23 |
|
|
|
|
|
|
|
|
| Investment operations: |
|
|
|
|
|
|
|
|
|
|
|
|
|
|
|
|
|
|
|
|
|
|
|
|
|
|
|
|
|
|
| Net investment income (loss)(A) |
|
|
|
0.14 |
|
|
|
|
0.32 |
|
|
|
|
0.30 |
|
|
|
|
0.29 |
|
|
|
|
0.38 |
|
|
|
|
0.51 |
|
| Net realized and unrealized gain (loss) |
|
|
|
1.42 |
|
|
|
|
0.72 |
|
|
|
|
(2.81 |
) |
|
|
|
3.60 |
|
|
|
|
(2.47 |
) |
|
|
|
4.29 |
|
|
|
|
|
|
|
|
| Total investment operations |
|
|
|
1.56 |
|
|
|
|
1.04 |
|
|
|
|
(2.51 |
) |
|
|
|
3.89 |
|
|
|
|
(2.09 |
) |
|
|
|
4.80 |
|
|
|
|
|
|
|
|
| Dividends and/or distributions to shareholders: |
|
|
|
|
|
|
|
|
|
|
|
|
|
|
|
|
|
|
|
|
|
|
|
|
|
|
|
|
|
|
| Net investment income |
|
|
|
— |
|
|
|
|
(0.34 |
) |
|
|
|
(0.35 |
) |
|
|
|
(0.38 |
) |
|
|
|
(0.53 |
) |
|
|
|
(0.56 |
) |
| Net realized gains |
|
|
|
— |
|
|
|
|
— |
|
|
|
|
(0.67 |
) |
|
|
|
— |
|
|
|
|
(2.34 |
) |
|
|
|
(3.88 |
) |
|
|
|
|
|
|
|
| Total dividends and/or distributions to shareholders |
|
|
|
— |
|
|
|
|
(0.34 |
) |
|
|
|
(1.02 |
) |
|
|
|
(0.38 |
) |
|
|
|
(2.87 |
) |
|
|
|
(4.44 |
) |
|
|
|
|
|
|
|
| Net asset value, end of period/year |
|
|
$ |
19.87 |
|
|
|
$ |
18.31 |
|
|
|
$ |
17.61 |
|
|
|
$ |
21.14 |
|
|
|
$ |
17.63 |
|
|
|
$ |
22.59 |
|
| |
|
|
|
|
|
|
|
|
| Total return |
|
|
|
8.52 |
%(B) |
|
|
|
6.00 |
% |
|
|
|
(11.84 |
)% |
|
|
|
22.12 |
% |
|
|
|
(7.59 |
)% |
|
|
|
23.57 |
% |
|
|
|
|
|
|
|
| Ratio and supplemental data: |
|
|
|
|
|
|
|
|
|
|
|
|
|
|
|
|
|
|
|
|
|
|
|
|
|
|
|
|
|
|
| Net assets end of period/year (000’s) |
|
|
$ |
165,799 |
|
|
|
$ |
165,767 |
|
|
|
$ |
178,192 |
|
|
|
$ |
235,078 |
|
|
|
$ |
225,731 |
|
|
|
$ |
255,061 |
|
| Expenses to average net assets |
|
|
|
0.97 |
%(C) |
|
|
|
0.98 |
% |
|
|
|
0.94 |
% |
|
|
|
0.94 |
% |
|
|
|
0.99 |
% |
|
|
|
0.97 |
% |
| Net investment income (loss) to average net assets |
|
|
|
1.50 |
%(C) |
|
|
|
1.83 |
% |
|
|
|
1.61 |
% |
|
|
|
1.45 |
% |
|
|
|
2.16 |
% |
|
|
|
2.17 |
% |
| Portfolio turnover rate |
|
|
|
12 |
%(B) |
|
|
|
11 |
% |
|
|
|
22 |
% |
|
|
|
23 |
% |
|
|
|
135 |
% |
|
|
|
61 |
% |
| (A) |
Calculated based on average number of shares outstanding. |
The Notes to Financial Statements are an integral part of this report.
|
|
|
|
|
| Transamerica Series Trust |
|
|
|
Semi-Annual Financial Statements 2024 |
|
|
Page 5 |
|
|
Transamerica Aegon Sustainable Equity Income VP
NOTES TO FINANCIAL STATEMENTS
At June 30, 2024
(unaudited)
1. ORGANIZATION
Transamerica Series Trust (“TST”) is an open-end management investment company registered under the Investment Company Act of 1940, as amended (the “1940 Act”). TST applies investment company accounting and reporting guidance. TST serves as a funding vehicle for variable life insurance, variable annuity, and group annuity products. Transamerica Aegon Sustainable Equity Income VP (the “Portfolio”) is a series of TST and is classified as diversified under the 1940 Act. The Portfolio currently offers two classes of shares, Initial Class and Service Class.
The only shareholders of the Portfolio are affiliated insurance company separate accounts and/or affiliated asset allocation portfolios. Contract holders of the variable life and annuity contracts are not shareholders of the Portfolio. For ease of reference, shareholders and contract holders are collectively referred to in this report as “shareholders.”
This report must be accompanied or preceded by the Portfolio’s current prospectus, which contains additional information about the Portfolio, including risks, as well as investment objectives and strategies.
Transamerica Asset Management, Inc. (“TAM”) serves as investment manager for the Portfolio pursuant to an investment management agreement. TAM provides continuous and regular investment management services to the Portfolio. TAM supervises the Portfolio’s investments, conducts its investment program and provides supervisory, compliance and administrative services to the Portfolio.
TAM currently acts as a “manager of managers” and has hired sub-advisers to furnish day-to-day investment advice and recommendations. TAM may, in the future, determine to provide all aspects of the day-to-day management of the Portfolio without the use of a sub-adviser. When acting as a manager of managers, TAM provides investment management services that include, without limitation, the design and development of the Portfolio and its investment strategies and the ongoing review and evaluation of those investment strategies including recommending changes in strategy where it believes appropriate or advisable; the selection of one or more sub-advisers for the Portfolio employing a combination of quantitative and qualitative screens, research, analysis and due diligence; negotiation of sub-advisory agreements and fees; oversight and monitoring of sub-advisers and recommending changes to sub-advisers where it believes appropriate or advisable; recommending portfolio combinations and liquidations where it believes appropriate or advisable; selection and oversight of transition managers, as needed; regular supervision of the Portfolio’s investments; regular review and evaluation of sub-adviser performance; daily monitoring of the sub-advisers’ buying and selling of securities for the Portfolio; regular review of holdings; ongoing trade oversight and analysis; regular monitoring to ensure adherence to investment process; regular calls and periodic on-site visits with sub-advisers; portfolio construction and asset allocation when using multiple sub-advisers for the Portfolio; risk management oversight and analysis; oversight of negotiation of investment documentation and agreements; design, development, implementation and regular monitoring of the valuation process; periodic due diligence reviews of pricing vendors and vendor methodology; design, development, implementation and regular monitoring of the compliance process; respond to regulatory inquiries and determine appropriate litigation strategy, as needed; review of proxies voted by sub-advisers; oversight of preparation and review of materials for meetings of the Portfolio’s Board of Trustees (the “Board”), participation in these meetings and preparation of regular communications with the Board; oversight of preparation and review of prospectuses, shareholder reports and other disclosure materials and regulatory filings for the Portfolio; oversight of other service providers to the Portfolio, such as the custodian, the transfer agent, the Portfolio’s independent accounting firm and legal counsel; supervision of the performance of recordkeeping and shareholder relations functions for the Portfolio; and oversight of cash management services. TAM uses a variety of quantitative and qualitative tools to carry out its investment management services. TAM, not the Portfolio, is responsible for paying the sub-adviser(s) for their services, and sub-advisory fees are TAM’s expense.
TAM’s investment management services also include the provision of supervisory and administrative services to the Portfolio. These services include performing certain administrative services for the Portfolio and supervising and overseeing the administrative, clerical, recordkeeping and bookkeeping services provided to the Portfolio by State Street Bank and Trust Company (“State Street”), to whom TAM has outsourced the provision of certain sub-administration services. To the extent agreed upon by TAM and the Portfolio from time to time, TAM’s supervisory and administrative services include, but are not limited to: monitoring and verifying the custodian’s daily calculation of the Net Asset Values (“NAV”); shareholder relations functions; compliance services; valuation services; assisting in due diligence and in the oversight and monitoring of certain activities of sub-advisers and certain aspects of Portfolio investments; assisting with Portfolio combinations and liquidations; oversight of the preparation and filing, and review, of all returns and reports, in connection with federal, state and local taxes; oversight and review of regulatory reporting; supervising and coordinating the Portfolio’s custodian and dividend disbursing agent and monitoring their services to the Portfolio; assisting the Portfolio in preparing reports to shareholders; acting as liaison with the Portfolio’s independent public accountants and providing, upon request, analyses, fiscal year summaries and other audit related services; assisting in the preparation of agendas and supporting documents for and minutes of meetings of trustees and committees of trustees; assisting in the preparation of regular communications with the trustees; and providing personnel and office space, telephones and other office equipment as necessary in order for TAM to perform supervisory and administrative services to the Portfolio. The Portfolio
|
|
|
|
|
| Transamerica Series Trust |
|
|
|
Semi-Annual Financial Statements 2024 |
|
|
Page 6 |
|
|
Transamerica Aegon Sustainable Equity Income VP
NOTES TO FINANCIAL STATEMENTS (continued)
At June 30, 2024
(unaudited)
1. ORGANIZATION (continued)
pays certain fees and expenses to State Street for sub-administration services which are not administrative services covered by the management agreement with TAM or paid for through the management fees payable thereunder. For the period ended June 30, 2024, (i) the expenses paid to State Street for sub-administration services by the Portfolio are shown as a part of Other expenses within the Statement of Operations and (ii) the expenses payable to State Street for sub-administration services from the Portfolio are shown as part of Other accrued expenses within the Statement of Assets and Liabilities.
2. SIGNIFICANT ACCOUNTING POLICIES
In preparing the Portfolio’s financial statements in accordance with Generally Accepted Accounting Principles in the United States of America (“GAAP”), estimates or assumptions (which could differ from actual results) may be used that affect reported amounts and disclosures. The following is a summary of significant accounting policies followed by the Portfolio.
Foreign currency denominated investments: The accounting records of the Portfolio are maintained in U.S. dollars. Securities and other assets and liabilities denominated in foreign currencies are translated into U.S. dollars based on the closing exchange rate each day. The cost of foreign securities purchased and any realized gains or losses are translated at the prevailing exchange rates in effect on the date of the respective transaction. The Portfolio combines fluctuations from currency exchange rates and fluctuations in value when computing net realized and unrealized gains or losses from investments.
Net foreign currency gains and losses resulting from changes in exchange rates include, foreign currency fluctuations between trade date and settlement date of investment security transactions, gains and losses on forward foreign currency contracts, and the difference between the receivable amounts of interest and dividends recorded in the accounting records in U.S. dollars and the amounts actually received.
Foreign currency denominated assets may involve risks not typically associated with domestic transactions. These risks include revaluation of currencies, adverse fluctuations in foreign currency values, and possible adverse political, social, and economic developments, including those particular to a specific industry, country or region.
Security transactions and investment income: Security transactions are accounted for on the trade date. Security gains and losses are calculated on a first-in, first-out basis. Dividend income, if any, is recorded on the ex-dividend date or, in the case of foreign securities, as soon as the Portfolio is informed of the ex-dividend dates, net of foreign taxes. Non-cash dividends, if any, are recorded on the ex-dividend date at fair value. Interest income, if any, is recorded on the accrual basis from settlement date, net of foreign taxes. Fixed income premiums and discounts are amortized and/or accreted over the lives of the respective securities.
Multiple class operations, income, and expenses: Income, non-class specific expenses, and realized and unrealized gains and losses are allocated to each class daily based upon net assets. Each class bears its own specific expenses in addition to the allocated non-class specific expenses.
Distributions to shareholders: Distributions are recorded on the ex-dividend date and are determined in accordance with federal income tax regulations, which may differ from GAAP.
Foreign taxes: The Portfolio may be subject to taxes imposed by the countries in which it invests, with respect to its investments in issuers existing or operating in such countries. The Portfolio may also be subject to foreign taxes on income, gains on investments, or currency repatriation, a portion of which may be recoverable. The Portfolio accrues such taxes and recoveries as applicable when the related income or capital gains are earned or unrealized, and based upon the current interpretation of tax rules and regulations that exist in the markets in which the Portfolio invests. Some countries require governmental approval for the repatriation of investment income, capital, or the proceeds of sales earned by foreign investors. In addition, if there is deterioration in a country’s balance of payments or for other reasons, a country may impose temporary restrictions of foreign capital remittances abroad.
Commission recapture: The sub-adviser(s), to the extent consistent with the best execution and usual commission rate policies and practices, may elect to place security transactions of the Portfolio with broker/dealers with which TST has established a commission recapture program. A commission recapture program is any arrangement under which a broker/dealer applies a portion of the commissions received by such broker/dealer on the security transactions to the Portfolio. In no event will commissions, paid by the Portfolio, be used to pay expenses that would otherwise be borne by any other Portfolios within TST, or by any other party.
There were no commissions recaptured during the period ended June 30, 2024 by the Portfolio.
|
|
|
|
|
| Transamerica Series Trust |
|
|
|
Semi-Annual Financial Statements 2024 |
|
|
Page 7 |
|
|
Transamerica Aegon Sustainable Equity Income VP
NOTES TO FINANCIAL STATEMENTS (continued)
At June 30, 2024
(unaudited)
2. SIGNIFICANT ACCOUNTING POLICIES (continued)
Indemnification: In the normal course of business, the Portfolio enters into contracts that contain a variety of representations that provide general indemnifications. The Portfolio’s maximum exposure under these arrangements is unknown, as this would involve future claims that may be made against the Portfolio and/or its affiliates that have not yet occurred. However, based on experience, the Portfolio expects the risk of loss to be remote.
3. INVESTMENT VALUATION
TAM has been designated as the Portfolio’s valuation designee pursuant to Rule 2a-5 under the 1940 Act with responsibility for fair valuation subject to oversight by the Portfolio’s Board of Trustees. The net asset value of the Portfolio is computed as of the official close of the New York Stock Exchange (“NYSE”) each day the NYSE is open for business.
TAM utilizes various methods to measure the fair value of its investments on a recurring basis. GAAP establishes a hierarchy that prioritizes inputs to valuation methods. The inputs or methodology used for valuing securities are not necessarily an indication of the risk associated with investing in those securities. The three levels (“Levels”) of inputs of the fair value hierarchy are defined as follows:
Level 1—Unadjusted quoted prices in active markets for identical securities.
Level 2—Inputs, other than quoted prices included in Level 1, which are observable, either directly or indirectly. These inputs may include quoted prices for the identical instrument on an inactive market, prices for similar instruments, interest rates, prepayment speeds, credit risk, yield curves, default rates, and similar data.
Level 3—Unobservable inputs based on the best information available in the circumstances, to the extent observable inputs are not available, which may include TAM’s own assumptions used in determining the fair value of the Portfolio’s investments.
The inputs used to measure fair value may fall into different Levels of the fair value hierarchy. In such cases, for disclosure purposes, the Level in the fair value hierarchy that is assigned to the fair value measurement of a security is determined based on the lowest Level input that is significant to the fair value measurement in its entirety. Certain investments that are measured at fair value using NAV per share, or its equivalent, using the “practical expedient” have not been classified in the fair value Levels. The hierarchy classification of inputs used to value the Portfolio’s investments at June 30, 2024, is disclosed within the Investment Valuation section of the Schedule of Investments.
The availability of observable inputs can vary from security to security and is affected by a wide variety of factors, including, but not limited to, the type of security, whether the security is new and not yet established in the marketplace, the liquidity of markets, and other characteristics particular to the security. To the extent that valuation is based on models or inputs that are less observable or unobservable in the market, the determination of fair value requires more judgment. Accordingly, the degree of judgment exercised in determining fair value is generally greatest for instruments categorized in Level 3. Due to the inherent uncertainty of valuation, the determination of values may differ significantly from values that would have been realized had a ready market for investments existed, and the differences could be material.
Fair value measurements: Descriptions of the valuation techniques applied to the Portfolio’s significant categories of assets and liabilities measured at fair value on a recurring basis are as follows:
Equity securities: Securities are stated at the last reported sales price or closing price on the day of valuation taken from the primary exchange where the security is principally traded. To the extent these securities are actively traded and valuation adjustments are not applied, they are categorized in Level 1 of the fair value hierarchy. Equities traded on inactive markets or valued by reference to similar instruments are generally categorized in Level 2 or Level 3 if inputs are unobservable.
Foreign equity securities: Securities in which the primary trading market closes at the same time or after the NYSE, are valued based on quotations from the primary market in which they are traded and are categorized in Level 1. Because many foreign securities markets and exchanges close prior to the close of the NYSE, closing prices for foreign securities in those markets or on those exchanges do not reflect the events that occur after that close. Certain foreign securities may be fair valued using a pricing service that considers the correlation of the trading patterns of the foreign security to the intraday trading in the U.S. markets for investments such as American Depositary Receipts, financial futures, or ETFs and the movement of certain indices of securities based on a statistical analysis of their historical relationship; such valuations generally are categorized in Level 2.
Securities lending collateral: Securities lending collateral is invested in a money market fund which is valued at the actively traded NAV and no valuation adjustments are applied. Securities lending collateral is categorized in Level 1 of the fair value hierarchy.
|
|
|
|
|
| Transamerica Series Trust |
|
|
|
Semi-Annual Financial Statements 2024 |
|
|
Page 8 |
|
|
Transamerica Aegon Sustainable Equity Income VP
NOTES TO FINANCIAL STATEMENTS (continued)
At June 30, 2024
(unaudited)
3. INVESTMENT VALUATION (continued)
Repurchase agreements: Repurchase agreements are valued at cost, which approximates fair value. To the extent the inputs are observable and timely, the values are generally categorized in Level 2 of the fair value hierarchy.
4. SECURITIES AND OTHER INVESTMENTS
Real estate investment trusts (“REITs”): REITs are pooled investment vehicles which invest primarily in income producing real estate, or real estate related loans or interests. Distributions received by REITs are classified at management’s estimate of the dividend income, return of capital and capital gains. Estimates are based on information available at year-end, which includes the previous fiscal year’s classification. The actual amounts of dividend income, return of capital, and capital gains are only determined by each REIT after the fiscal year end and may differ from the estimated amounts. Upon notification from the REITs, some of the distributions received may be re-classified and recorded as a return of capital or capital gains. There are certain additional risks involved in investing in REITs. These include, but are not limited to, economic conditions, changes in zoning laws, real estate values, property taxes, and interest rates.
REITs held at June 30, 2024, if any, are identified within the Schedule of Investments.
5. BORROWINGS AND OTHER FINANCING TRANSACTIONS
The Portfolio may engage in borrowing transactions as a means of raising cash to satisfy redemption requests, for other temporary or emergency purposes or, to the extent permitted by its investment policies, to raise additional cash to be invested in other securities or instruments. When the Portfolio invests borrowing proceeds in other securities, the Portfolio will bear the risk that the market value of the securities in which such proceeds are invested goes down and is insufficient to repay the borrowed proceeds. The Portfolio may borrow on a secured or on an unsecured basis. If the Portfolio enters into a secured borrowing arrangement, a portion of the Portfolio’s assets will be used as collateral. The 1940 Act requires the Portfolio to maintain asset coverage of at least 300% of the amount of its borrowings. Asset coverage means the ratio that the value of the Portfolio’s total assets, minus liabilities other than borrowings, bears to the aggregate amount of all borrowings. Although complying with this requirement has the effect of limiting the amount that the Portfolio may borrow, it does not otherwise mitigate the risks of entering into borrowing transactions.
Interfund lending: The Portfolio, along with other funds and portfolios advised by TAM, may participate in an interfund lending program pursuant to exemptive relief granted by the Securities and Exchange Commission on January 18, 2017. This program allows the Portfolio to lend to and borrow from other funds and portfolios advised by TAM. Interfund lending transactions are subject to the conditions of the exemptive relief which places limits on the amount of lending or borrowing a Portfolio may participate in under the program. Interest earned or paid on an interfund lending transaction will be based on the average of certain current market rates. For the period ended June 30, 2024, the Portfolio has not utilized the program.
Repurchase agreements: In a repurchase agreement, the Portfolio purchases a security and simultaneously commits to resell that security to the seller at an agreed-upon price on an agreed-upon date. Securities purchased subject to a repurchase agreement are held at the Portfolio’s custodian, or designated sub-custodian related to tri-party repurchase agreements, and, pursuant to the terms of the repurchase agreement, must be collateralized by securities with an aggregate market value greater than or equal to 100% of the resale price. The Portfolio will bear the risk of value fluctuations until the securities can be sold and may encounter delays and incur costs in liquidating the securities. In the event of bankruptcy or insolvency of the seller, delays and costs may be incurred.
Repurchase agreements are subject to netting agreements, which are agreements between the Portfolio and its counterparties that provide for the net settlement of all transactions and collateral with the Portfolio, through a single payment, in the event of default or termination. Amounts presented within the Schedule of Investments, and as part of Repurchase agreements, at value within the Statement of Assets and Liabilities are shown on a gross basis. The value of the related collateral for each repurchase agreement, as reflected within the Schedule of Investments, exceeds the value of each repurchase agreement at June 30, 2024.
Repurchase agreements at June 30, 2024, if any, are included within the Schedule of Investments and Statement of Assets and Liabilities.
Securities lending: The Portfolio may lend securities to qualified financial institutions, brokers and dealers. State Street serves as securities lending agent to the Portfolio pursuant to a Securities Lending Agreement. Loans of securities are terminable at any time and the borrower, after notice, is required to return borrowed securities within the standard time period for settlement of securities transactions. The lending of securities exposes the Portfolio to risks such as: the borrowers may fail to return the loaned securities or may not be able to provide additional collateral, the Portfolio may experience delays in recovery of the loaned securities or delays in access to collateral, or the Portfolio may experience losses related to the investment collateral. To minimize certain risks, loan counterparties pledge cash,
|
|
|
|
|
| Transamerica Series Trust |
|
|
|
Semi-Annual Financial Statements 2024 |
|
|
Page 9 |
|
|
Transamerica Aegon Sustainable Equity Income VP
NOTES TO FINANCIAL STATEMENTS (continued)
At June 30, 2024
(unaudited)
5. BORROWINGS AND OTHER FINANCING TRANSACTIONS (continued)
securities issued or guaranteed by the U.S. Government and irrevocable letters of credit issued by banks as collateral. The initial collateral received by the Portfolio is required to have a value of at least 102% of the current value of the loaned securities traded on U.S. exchanges, and a value of at least 105% for all other securities. Typically the lending agent is not permitted to sell, re-pledge or use cash and non-cash collateral it receives. The lending agent has agreed to indemnify the Portfolio in the case of default of any securities borrower.
The Portfolio receives compensation for lending securities from interest or dividends earned on the cash, U.S. Government securities and irrevocable letters of credit held as collateral, less associated fees and expenses. Such income is reflected in Net income from securities lending within the Statement of Operations. Cash collateral received is invested in the State Street Navigator Securities Lending Trust – Government Money Market Portfolio.
The value of loaned securities and related cash and non-cash collateral outstanding at June 30, 2024, if any, are shown on a gross basis within the Schedule of Investments.
The following table reflects a breakdown of transactions accounted for as secured borrowings, the gross obligation by the type, and the remaining contractual maturity of those transactions as of June 30, 2024.
|
|
|
|
|
|
|
|
|
|
|
|
|
|
|
|
|
|
|
|
|
| |
|
Remaining Contractual Maturity of the Agreements |
|
| |
|
Overnight and Continuous |
|
|
Less Than 30 Days |
|
|
Between 30 & 90 Days |
|
|
Greater Than 90 Days |
|
|
Total |
|
| |
|
| Securities Lending Transactions |
|
|
|
|
|
|
|
|
|
|
|
|
|
|
|
|
|
|
|
|
| Common Stocks |
|
$ |
14,791,245 |
|
|
$ |
— |
|
|
$ |
— |
|
|
$ |
— |
|
|
$ |
14,791,245 |
|
| |
|
| Total Borrowings |
|
$ |
14,791,245 |
|
|
$ |
— |
|
|
$ |
— |
|
|
$ |
— |
|
|
$ |
14,791,245 |
|
| |
|
6. RISK FACTORS
Investing in the Portfolio involves certain key risks related to the Portfolio’s trading activity. Please reference the Portfolio’s prospectus for a more complete discussion of the following risk(s), as well as other risks of investing in the Portfolio.
Market risk: The market prices of the Portfolio’s securities or other assets may go up or down, sometimes rapidly or unpredictably, due to factors such as economic events, inflation, changes in interest rates, governmental actions or interventions, actions taken by the U.S. Federal Reserve or foreign central banks, market disruptions caused by tariffs, trade disputes or other factors, political developments, armed conflicts, economic sanctions, cybersecurity events, investor sentiment, the global and domestic effects of widespread or local health, weather or climate events, and other factors that may or may not be related to the issuer of the security or other asset. If the market prices of the Portfolio’s securities and assets fall, the value of your investment in the Portfolio could go down.
Economies and financial markets throughout the world are increasingly interconnected. Events or circumstances in one or more countries or regions could be highly disruptive to, and have profound impacts on, global economies or markets. As a result, whether or not the Portfolio invests in securities of issuers located in or with significant exposure to the countries directly affected, the value and liquidity of the Portfolio’s investments may go down.
Dividend paying stock risk: There can be no assurance that the issuers of the stocks held by the Portfolio will pay dividends in the future or that, if dividends are paid, they will not decrease. The Portfolio’s emphasis on dividend paying stocks could cause the Portfolio’s share price and total return to fluctuate more than, or cause the Portfolio to underperform, similar Portfolios that invest without consideration of an issuer’s track record of paying dividends or ability to pay dividends in the future. Dividend-paying stocks tend to go through cycles of over- or under-performing the stock market in general.
Real estate investment trusts (“REITs”) risk: Investing in real estate investment trusts (“REITs”) involves unique risks. When the Portfolio invests in REITs, it is subject to risks generally associated with investing in real estate. A REIT’s performance depends on the types and locations of the properties it owns, how well it manages those properties and cash flow. REITs may have limited financial resources, may trade less frequently and in limited volume, may engage in dilutive offerings, and may be subject to more abrupt or erratic price movements than the overall securities markets. In addition to its own expenses, the Portfolio will indirectly bear its proportionate share of any management and other expenses paid by REITs in which it invests. U.S. REITs are subject to a number of highly technical
|
|
|
|
|
| Transamerica Series Trust |
|
|
|
Semi-Annual Financial Statements 2024 |
|
|
Page 10 |
|
|
Transamerica Aegon Sustainable Equity Income VP
NOTES TO FINANCIAL STATEMENTS (continued)
At June 30, 2024
(unaudited)
6. RISK FACTORS (continued)
tax-related rules and requirements; and a U.S. REIT’s failure to qualify for the favorable U.S. federal income tax treatment generally available to U.S. REITs could result in corporate-level taxation, significantly reducing the return on an investment to the Portfolio.
Sustainability investing risk: Applying sustainability criteria to the sub-adviser’s investment analysis for the Portfolio may impact the sub-adviser’s investment decisions as to securities of certain issuers and, therefore, the Portfolio may forgo some investment opportunities available to funds that do not apply sustainability investing principals or that apply different sustainability criteria. Applying sustainability criteria may impact the Portfolio’s exposure to risks associated with certain issuers, asset classes, industries and sectors, which may impact the Portfolio’s investment performance. The relevance and weightings of sustainability criteria to the sub-adviser’s investment process may vary significantly across issuers, asset classes, industries and sectors. Securities of companies meeting the sub-adviser’s sustainability criteria at the time of investment may shift into and out of favor depending on market and economic conditions, and a company’s sustainability practices, or the sub-adviser’s assessment of such practices, may change over time. The Portfolio’s performance may at times be better or worse than the performance of similar funds that do not utilize sustainability investing principals or that apply different sustainability criteria. “Sustainability” is not a uniformly defined characteristic and applying sustainability criteria involves subjective assessments. There may be significant differences in views in what constitutes positive or negative sustainability characteristics of a company. The sub-adviser’s sustainability assessment of a company may differ from that of other funds or investors. The Portfolio’s investments may include securities of issuers that derive revenue from non-sustainable activities. Sustainability ratings and assessments of issuers can vary across third party data providers, and sustainability data may be incomplete, delayed, inaccurate or unavailable, which could lead to an incorrect assessment of a company’s sustainability characteristics. Data inputs may include information self-reported by companies or from third party data providers. Regulation of sustainability investing in the U.S. and abroad is evolving. Regulatory change regarding the definition and/or use of sustainability criteria could have a material adverse effect on the Portfolio’s ability to invest in accordance with its sustainability strategy.
7. FEES AND OTHER AFFILIATED TRANSACTIONS
TST serves as a funding vehicle for certain affiliated asset allocation portfolios and certain affiliated separate accounts of Transamerica Life Insurance Company (“TLIC”) and Transamerica Financial Life Insurance Company.
TAM, the Portfolio’s investment manager, is directly owned by TLIC and AUSA Holding, LLC (“AUSA”), both of which are indirect, wholly owned subsidiaries of Aegon Ltd. TLIC is owned by Commonwealth General Corporation (“Commonwealth”). Commonwealth and AUSA are wholly owned by Transamerica Corporation (DE). Transamerica Corporation (DE) is wholly owned by Aegon International B.V., which is wholly owned by Aegon Ltd., a Bermuda exempted company with liability limited by shares (formerly, Aegon NV, a Netherlands corporation) and a publicly traded international insurance group.
With respect to the Portfolio TAM has entered into a sub-advisory agreement with Aegon Asset Management UK plc (“AAM UK”), a wholly-owned subsidiary of Aegon Ltd. AAM UK provides day-to-day portfolio management services to the Portfolio, subject to the supervision of TAM. TAM is responsible for compensating the sub-adviser for its services.
Transamerica Fund Services, Inc. (“TFS”) is the Portfolio’s transfer agent. Transamerica Capital, Inc. (“TCI”) is the Portfolio’s distributor/principal underwriter. TAM, AAM UK, TFS and TCI are affiliates of Aegon Ltd.
Certain officers and trustees of the Portfolio may also be officers and/or trustees of TAM, AAM UK, TFS and TCI. No interested trustee who is deemed an interested person due to current or former service with TAM or an affiliate of TAM receives compensation from the Portfolio. The Portfolio does pay non-interested persons (independent trustees), as disclosed in Trustee and CCO fees within the Statement of Operations.
Investment management fees: TAM serves as the Portfolio’s investment manager, performing administration as well as investment advisory services. TAM renders investment advisory, supervisory, and administration services under an investment management agreement and the Portfolio pays a single management fee, which is reflected in Investment management fees within the Statement of Operations.
|
|
|
|
|
| Transamerica Series Trust |
|
|
|
Semi-Annual Financial Statements 2024 |
|
|
Page 11 |
|
|
Transamerica Aegon Sustainable Equity Income VP
NOTES TO FINANCIAL STATEMENTS (continued)
At June 30, 2024
(unaudited)
7. FEES AND OTHER AFFILIATED TRANSACTIONS (continued)
The Portfolio pays a management fee to TAM based on daily average net assets at the following rates:
|
|
|
|
|
|
|
|
|
| Breakpoints |
|
Rate |
|
|
|
|
| First $500 million |
|
|
0.663 |
% |
|
|
|
|
| Over $500 million up to $1 billion |
|
|
0.580 |
|
|
|
|
|
| Over $1 billion up to $1.5 billion |
|
|
0.550 |
|
|
|
|
|
| Over $1.5 billion |
|
|
0.530 |
|
|
|
|
|
TAM has contractually agreed to waive fees and/or reimburse Portfolio expenses to the extent that the total operating expenses excluding, as applicable, acquired fund fees and expenses, interest (including borrowing costs and overdraft charges), taxes, brokerage commissions, dividend and interest expenses on securities sold short, extraordinary expenses and other expenses not incurred in the ordinary course of the Portfolio’s business, exceed the following stated annual operating expense limits to the Portfolio’s daily average net assets. To the extent an expense limit changed during the period, the prior limit is also listed below. The expenses waived and/or reimbursed, if any, are included in Expenses waived and/or reimbursed within the Statement of Operations.
|
|
|
|
|
|
|
|
| Class |
|
Operating Expense Limit |
|
Operating Expense Limit Effective Through |
| Initial Class |
|
0.73% |
|
May 1, 2025 |
| Service Class |
|
0.98 |
|
May 1, 2025 |
TAM is permitted to recapture amounts contractually waived and/or reimbursed to a class during any of the 36 months from the date on which TAM waived fees and/or reimbursed expenses for the class. A class may recapture and reimburse TAM only if such amount does not cause, on any particular business day of the Portfolio, the class’s total annual operating expenses (after the recapture is taken into account) to exceed the Operating Expense Limits or any other lower limit then in effect. Amounts recaptured, if any, by TAM for the period ended June 30, 2024 are disclosed in Recapture of previously waived and/or reimbursed fees within the Statement of Operations.
TAM, on a voluntary basis and in addition to the contractual operating expense limits in effect, from time to time may waive and/or reimburse expenses of the Portfolio, or any classes thereof, to such level(s) as the Trust’s officers have determined or may reasonably determine from time to time. Any such voluntary waiver or expense reimbursement may be discontinued by TAM at any time. These amounts are not subject to recapture by TAM.
As of June 30, 2024, there are no amounts available for recapture by TAM.
Distribution and service fees: TST has a distribution plan (“Distribution Plan”) pursuant to Rule 12b-1 under the 1940 Act. Pursuant to the Distribution Plan, TST entered into a distribution agreement with TCI as the Portfolio’s distributor.
The Distribution Plan requires the Portfolio to pay distribution fees to TCI as compensation for various distribution activities, not as reimbursement for specific expenses. Under the Distribution Plan and distribution agreement, TCI, on behalf of the Portfolio, is authorized to pay various service providers, as direct payment for expenses incurred in connection with distribution of the Portfolio’s shares.
The fee on the Service Class shares is paid to the insurance companies for providing services and account maintenance for the policyholders who invest in the variable insurance products which invest in the Service Class shares. TCI has determined that it will not seek payment for the distribution expenses incurred by the Portfolio with respect to the Initial Class shares before May 1, 2025. Prior to TCI seeking distribution expenses on Initial Class shares, policy and contract owners will be notified in advance. The Portfolio will pay fees relating to Service Class shares. The distribution and service fees are included in Distribution and service fees within the Statement of Operations.
|
|
|
|
|
| Transamerica Series Trust |
|
|
|
Semi-Annual Financial Statements 2024 |
|
|
Page 12 |
|
|
Transamerica Aegon Sustainable Equity Income VP
NOTES TO FINANCIAL STATEMENTS (continued)
At June 30, 2024
(unaudited)
7. FEES AND OTHER AFFILIATED TRANSACTIONS (continued)
The Portfolio is authorized under the Distribution Plan to pay fees to TCI based on daily average net assets of each applicable class up to the following annual rates:
|
|
|
|
|
|
|
|
|
| Class |
|
Rate |
|
|
|
|
| Initial Class |
|
|
0.15 |
% |
|
|
|
|
| Service Class |
|
|
0.25 |
|
|
|
|
|
Transfer agent costs: TFS provides transfer agency services under an intercompany agreement with TAM. TFS has outsourced the provision of certain sub-transfer agency services to SS&C Global Investor & Distribution Solutions, Inc. (“SS&C GIDS”). The Portfolio does not pay a separate transfer agent fee to TAM or TFS but does pay certain expenses to SS&C GIDS related to applicable sub-transfer agency services. For the period ended June 30, 2024, (i) the expenses paid to SS&C GIDS by the Portfolio are referred to as transfer agent costs and are included within the Statement of Operations and (ii) the expenses payable to SS&C GIDS by the Portfolio are referred to as transfer agent costs within the Statement of Assets and Liabilities.
Brokerage commissions: The Portfolio incurred no brokerage commissions on security transactions placed with affiliates of the investment manager or sub-adviser(s) for the period ended June 30, 2024.
8. PURCHASES AND SALES OF SECURITIES
For the period ended June 30, 2024, the cost of securities purchased and proceeds from securities sold (excluding short-term securities) are as follows:
|
|
|
|
|
|
|
| Purchases of Securities |
|
Sales/Maturities of Securities |
| Long-Term |
|
U.S. Government |
|
Long-Term |
|
U.S. Government |
| |
| $ 58,888,286 |
|
$ — |
|
$ 81,241,173 |
|
$ — |
9. FEDERAL INCOME TAXES AND DISTRIBUTIONS TO SHAREHOLDERS
The Portfolio has not made any provision for federal income or excise taxes due to its policy to distribute all of its taxable income and capital gains to its shareholders and otherwise qualify as a regulated investment company under Subchapter M of the Internal Revenue Code. The Portfolio recognizes the tax benefits of uncertain tax positions only where the position is “more likely than not” to be sustained assuming examination by tax authorities. The Portfolio’s tax returns remain subject to examination by the Internal Revenue Service and state tax authorities three years from the date of filing for federal purposes and four years from the date of filing for state purposes. Management has evaluated the Portfolio’s tax provisions taken for all open tax years, and has concluded that no provision for income tax is required in the Portfolio’s financial statements. If applicable, the Portfolio recognizes interest accrued related to unrecognized tax benefits in relation to interest and penalties expense in Other within the Statement of Operations. The Portfolio identifies its major tax jurisdictions as U.S. Federal, the state of Colorado, and foreign jurisdictions where the Portfolio makes significant investments; however, the Portfolio is not aware of any tax positions for which it is reasonably possible that the total amounts of unrecognized tax benefits will change materially in the next twelve months. Distributions are determined in accordance with income tax regulations, which may differ from GAAP.
As of June 30, 2024, the approximate cost for U.S. federal income tax purposes, and the aggregate gross/net unrealized appreciation (depreciation) in the value of investments (including securities sold short and derivatives, if any) are as follows:
|
|
|
|
|
|
|
| Cost |
|
Gross Appreciation |
|
Gross (Depreciation) |
|
Net Appreciation (Depreciation) |
|
|
|
|
| $ 433,534,449 |
|
$ 88,835,346 |
|
$ (27,845,331) |
|
$ 60,990,015 |
10. NEW ACCOUNTING PRONOUNCEMENT
In June 2022, the Financial Accounting Standards Board issued Accounting Standards Update No. 2022-03 (“ASU 2022-03”), “Fair Value Measurement of Equity Securities Subject to Contractual Sale Restrictions” (“Topic 820”). ASU 2022-03 clarifies the guidance in Topic 820, related to the measurement of the fair value of an equity security subject to contractual sale restrictions, where it eliminates the need to
|
|
|
|
|
| Transamerica Series Trust |
|
|
|
Semi-Annual Financial Statements 2024 |
|
|
Page 13 |
|
|
Transamerica Aegon Sustainable Equity Income VP
NOTES TO FINANCIAL STATEMENTS (continued)
At June 30, 2024
(unaudited)
10. NEW ACCOUNTING PRONOUNCEMENT (continued)
apply a discount to fair value of these securities, and introduces disclosure requirements related to such equity securities. The guidance is effective for fiscal years, and interim periods within those fiscal years, beginning after December 15, 2023, and allows for early adoption. Management is currently evaluating the implications, if any, of the additional requirements and their impact on the Portfolio’s financial statements.
Please see TST’s most recent report on Form N-CSR, available at: www.transamerica.com/annuities/prospectus, for additional information. For the most recently filed complete proxy voting records for the Trust please visit: https://www.transamerica.com/sites/default/files/files/e070d/TST%20N-PX%202021.pdf
|
|
|
|
|
| Transamerica Series Trust |
|
|
|
Semi-Annual Financial Statements 2024 |
|
|
Page 14 |
|
|
Transamerica Aegon Sustainable Equity Income VP
MANAGEMENT AND SUB-ADVISORY AGREEMENT — CONTRACT RENEWAL
(unaudited)
At a meeting of the Board of Trustees of Transamerica Series Trust (the “Trustees” or the “Board”) held on June 12-13, 2024, the Board considered the renewal of the management agreement (the “Management Agreement”) between Transamerica Asset Management, Inc. (“TAM”) and Transamerica Series Trust, on behalf of Transamerica Aegon Sustainable Equity Income VP (the “Portfolio”). The Board also considered the renewal of the investment sub-advisory agreement (the “Sub-Advisory Agreement” and together with the Management Agreement, the “Agreements”) for the Portfolio between TAM and Aegon Asset Management UK plc (the “Sub-Adviser”).
Following its review and consideration, the Board determined that the terms of the Management Agreement and Sub-Advisory Agreement were reasonable and that the renewal of each of the Agreements was in the best interests of the Portfolio and the holders invested in the Portfolio. The Board, including the independent members of the Board (the “Independent Trustees”), unanimously approved the renewal of each of the Agreements through June 30, 2025.
Prior to reaching their decision, the Trustees requested and received from TAM and the Sub-Adviser certain information. They then reviewed such information as they deemed reasonably necessary to evaluate the Agreements, including information they had previously received from TAM and the Sub-Adviser as part of their regular oversight of the Portfolio, and knowledge they gained over time through meeting with TAM and the Sub-Adviser. Among other materials, the Trustees considered comparative fee, expense and performance information prepared by Broadridge Financial Solutions, Inc. (“Broadridge”), an independent provider of mutual fund performance information, as well as fee, expense and profitability information prepared by TAM. In addition, TAM provided the Board with additional supplemental comparative performance information. To the extent applicable, the Trustees considered information about fees and performance of comparable funds and/or accounts managed by the Sub-Adviser. The Board also considered reductions to the Portfolio’s expense limits, if any, that took effect after the last renewal of the Agreements. In their review, the Trustees also sought to identify instances in which the Portfolio’s performance, fees, total expenses and/or profitability appeared to be outliers within its respective peer group or other comparative metrics and sought to understand the reasons for such comparative positions.
In their deliberations, the Independent Trustees met privately without representatives of TAM or the Sub-Adviser present and were represented throughout the process by their independent legal counsel. In considering the proposed continuation of each of the Agreements, the Trustees evaluated and weighed a number of considerations that they believed to be relevant in light of the legal advice furnished to them by counsel, including independent legal counsel, and made a decision in the exercise of their own business judgment. They based their decisions on the considerations discussed below, among others, although they did not identify any particular consideration or item of information that was controlling of their decisions, and each Trustee may have attributed different weights to the various factors.
Nature, Extent and Quality of the Services Provided
The Board considered the nature, extent and quality of the services provided by TAM and the Sub-Adviser to the Portfolio in the past and the services anticipated to be provided in the future. The Board also considered the investment approach for the Portfolio; the experience, capability and integrity of TAM’s senior management; the financial resources of TAM; TAM’s management oversight process; TAM’s and the Sub-Adviser’s responsiveness to any questions by the Trustees; and the professional qualifications and compensation program of the portfolio management team of the Sub-Adviser. The Trustees noted that they receive, on a quarterly basis, an execution analysis from Capital Institutional Services, Inc. (CAPIS), an independent provider of trade analyses, for the Sub-Adviser and a comparison of trading results against a peer universe of managers.
The Board also considered the continuous and regular investment management and other services provided by TAM, when acting as a manager of managers, for the portion of the management fee it retains from the Portfolio after payment of the sub-advisory fees. The Board noted that the investment management and other services provided by TAM include the design, development and ongoing review and evaluation of the Portfolio and its investment strategy; the selection, oversight and monitoring of one or more investment sub-advisers to perform certain duties with respect to the Portfolio; ongoing portfolio trading oversight and analysis; risk management oversight and analysis; design, development, implementation and ongoing review and evaluation of a process for the valuation of Portfolio investments; design, development, implementation and ongoing review and evaluation of a compliance program for the Portfolio; design, development, implementation and ongoing review and evaluation of a process for the voting of proxies and exercise of rights to consent to corporate action for Portfolio investments; participation in Board meetings and oversight of preparation of materials for the Board, including materials for Board meetings and regular communications with the Board; oversight of preparation of the Portfolio’s prospectus, statement of additional information, shareholder reports and other disclosure materials and regulatory filings for the Portfolio; and ongoing cash management services for the Portfolio. The Board considered that TAM’s investment management services also include the provision of supervisory and administrative services to the Portfolio. The Board also noted that TAM, as part of the services it provides to all Transamerica mutual funds, including the Portfolio, oversees the services provided by the funds’ custodian, transfer agent, independent accountant and legal counsel and supervises the performance of the recordkeeping and holder service functions of the funds.
Investment Performance
In addition, the Board considered the short- and longer-term performance of the Portfolio in light of its investment objective, policies and strategies, including relative performance against (i) a peer universe of comparable mutual funds, as prepared by Broadridge, and (ii) the Portfolio’s benchmarks, in each case for various trailing periods ended December 31, 2023. Based on these considerations, the Board determined that TAM and the Sub-Adviser can provide investment and related services that are appropriate in scope and extent in light of
|
|
|
|
|
| Transamerica Series Trust |
|
|
|
Semi-Annual Financial Statements 2024 |
|
|
Page 15 |
|
|
Transamerica Aegon Sustainable Equity Income VP
MANAGEMENT AND SUB-ADVISORY AGREEMENT — CONTRACT RENEWAL (continued)
(unaudited)
the Portfolio’s investment objectives, policies and strategies and operations, the competitive landscape of the investment company business and investor needs. The Board’s conclusions as to the Portfolio’s performance are summarized below. For purposes of its review, the Board generally used the performance of Service Class Shares. In describing the Portfolio’s performance relative to its peer universe, the summary conclusions characterize performance for the relevant periods in relation to whether it was “above,” “below” or “in line with” the peer universe median and do so using quintile rankings prepared by Broadridge. For simplicity, performance is described as “above” the median if the Portfolio’s performance ranked anywhere in the first or second quintiles, as “below” the median if it ranked anywhere in the fourth or fifth quintiles, or “in line with” the median if it ranked anywhere in the third quintile (i.e., even if its precise return was somewhat above or somewhat below the precise median return).
When considering the Portfolio’s performance, the Trustees considered any representations made by TAM regarding the appropriateness of certain peer groups and benchmarks. They recognized that performance reflects a snapshot of a period as of a specific date, and that consideration of performance data for a different period could generate significantly different performance results. The Trustees also recognized that even longer-term performance can be negatively affected by performance over a short-term period when that short-term performance is significantly below the performance of the comparable benchmark or universe of peer funds.
The Board noted that the performance of Service Class Shares of the Portfolio was below the median for its peer universe and below the benchmark that TAM utilizes to measure performance of the Portfolio, each for the past 1-, 3-, 5- and 10-year periods. The Board noted that the Sub-Adviser had commenced sub-advising the Portfolio on December 1, 2020 pursuant to its current investment strategies. The Trustees also noted recent changes in the legal and compliance team at the Sub-Adviser. The Trustees observed that the performance of the Portfolio had improved during the first quarter of 2024.
Management Fee and Sub-Advisory Fees and Total Expense Ratio
The Board considered the management fee and total expense ratio of the Portfolio, including information provided by Broadridge comparing the management fee and total expense ratio of the Portfolio to the management fees and total expense ratios of comparable investment companies in both a peer group and broader peer universe compiled by Broadridge. The Board’s conclusions as to the Portfolio’s management fee and total expense ratio are summarized below. For purposes of its review, the Board generally used the actual total expenses (i.e., expenses reflecting any waivers and/or reimbursements) of Service Class Shares. In describing the Portfolio’s management fee and total expense ratio relative to its peer group and peer universe, the summary conclusions characterize management fees and total expense ratios for the relevant periods in relation to whether they were “above,” “below” or “in line with” the peer group or peer universe median and do so using quintile rankings prepared by Broadridge. For simplicity, management fees and total expense ratios are described as “above” the median if the Portfolio’s management fee or total expense ratio ranked anywhere in the fourth or fifth quintiles, as “below” the median if it ranked anywhere in the first or second quintiles, or “in line with” the median if it ranked anywhere in the third quintile (i.e., even if its precise management fee or total expense ratio was somewhat above or somewhat below the precise median management fee or total expense ratio).
The Board also considered the fees charged by the Sub-Adviser for sub-advisory services, as well as the portion of the Portfolio’s management fee retained by TAM following payment of the sub-advisory fee and how the portion of the contractual management fee retained by TAM at a specified asset level compared to the portions retained by other investment advisers managing mutual funds with similar investment strategies as calculated by an independent provider of information.
The Board noted that the Portfolio’s contractual management fee was above the median for its peer group and in line with the median for its peer universe and that the actual total expenses (i.e., expenses reflecting any waivers and/or reimbursements) of Service Class Shares of the Portfolio were above the medians for its peer group and peer universe. The Trustees also considered that TAM has entered into an expense limitation arrangement with the Portfolio, which may result in TAM waiving fees for the benefit of holders.
On the basis of these considerations, together with the other information it considered, the Board determined that the management and sub-advisory fees to be received by TAM and the Sub-Adviser under the Management Agreement and Sub-Advisory Agreement are reasonable in light of the services provided.
Cost of Services Provided and Level of Profitability
The Board reviewed information provided by TAM about the cost of providing and procuring fund management services, as well as the costs of the provision of administration, transfer agency and other services, to the Portfolio and to Transamerica Series Trust as a whole by TAM and its affiliates. The Board considered the profitability of TAM and its affiliates in providing these services for the Portfolio and Transamerica Series Trust as a whole. The Trustees recognized the competitiveness of the mutual fund industry and the importance of an investment adviser’s long-term profitability, including for maintaining company and management stability and accountability.
The Board also considered the allocation methodology used for calculating the profitability of TAM and its affiliates. The Board noted that the revenue and expense allocation methodology used by TAM to estimate its profitability with respect to its relationship with the Portfolio had been reviewed previously by an independent consultant. The Trustees considered that TAM reported that it had not made material changes to this methodology, and that the methodology had been applied consistently for the Portfolio.
|
|
|
|
|
| Transamerica Series Trust |
|
|
|
Semi-Annual Financial Statements 2024 |
|
|
Page 16 |
|
|
Transamerica Aegon Sustainable Equity Income VP
MANAGEMENT AND SUB-ADVISORY AGREEMENT — CONTRACT RENEWAL (continued)
(unaudited)
With respect to the Sub-Adviser, the Board noted that information about the Sub-Adviser’s revenues and expenses was incorporated into the profitability analysis for TAM and its affiliates with respect to the Portfolio. As a result, the Board focused on profitability information for TAM and its affiliates and the Sub-Adviser in the aggregate.
Based on this information, the Board determined that the profitability of TAM and its affiliates from their relationships with the Portfolio was not excessive.
Economies of Scale
The Board considered economies of scale with respect to the management of the Portfolio, whether the Portfolio had appropriately benefited from any economies of scale and whether there was the potential for realization of any future economies of scale. The Board also considered the existence of economies of scale with respect to management of the Transamerica mutual funds overall and the extent to which the Portfolio benefited from any economies of scale. The Board recognized that, as the Portfolio’s assets increase, any economies of scale realized by TAM or the Sub-Adviser may not directly correlate with each other or with any economies of scale that might be realized by the Portfolio. The Board considered the Portfolio’s management fee schedule and the existence of breakpoints and also considered the extent to which TAM shared economies of scale, if any, with the Portfolio through undertakings to limit or reimburse Portfolio expenses and to invest in maintaining and developing its capabilities and services. The Board also considered the Sub-Adviser’s sub-advisory fee schedule and the existence of breakpoints, if any, and how such breakpoints relate to any breakpoints in the Portfolio’s management fee schedule. The Board considered that the Sub-Adviser’s sub-advisory fees would be based on the combined assets of multiple funds. The Trustees concluded that the Portfolio’s fee structure reflected an appropriate sharing of any efficiencies or economies of scale to date and noted that they will have the opportunity to periodically reexamine the appropriateness of the management fee payable to TAM and the fee paid to the Sub-Adviser in light of any economies of scale experienced in the future.
Benefits to TAM, its Affiliates and/or the Sub-Adviser from their Relationships with the Portfolio
The Board considered other benefits derived by TAM, its affiliates, and/or the Sub-Adviser from their relationships with the Portfolio. The Board noted that TAM does not receive benefits from research obtained with commissions paid to broker-dealers for portfolio transactions (commonly referred to as “soft dollars”) as a result of its relationship with the Portfolio.
Other Considerations
The Board noted that TAM has made a substantial commitment to the recruitment and retention of high-quality personnel and maintains the financial, compliance and operational resources reasonably necessary to manage the Portfolio in a professional manner that is consistent with the best interests of the Portfolio and the holders. In this regard, the Board favorably considered the procedures and policies TAM has in place to enforce compliance with applicable laws and regulations and oversee the portfolio management activities of the Sub-Adviser. The Board also noted that TAM has made an entrepreneurial commitment and undertaken certain business risks with respect to the management and success of the Portfolio.
Conclusion
After consideration of the factors described above, as well as other factors, the Trustees, including the Independent Trustees, concluded that the renewal of the Management Agreement and the Sub-Advisory Agreement was in the best interests of the Portfolio and the holders and voted to approve the renewal of the Agreements.
|
|
|
|
|
| Transamerica Series Trust |
|
|
|
Semi-Annual Financial Statements 2024 |
|
|
Page 17 |
|
|
Transamerica Aegon Sustainable Equity Income VP
RESULTS OF SHAREHOLDER MEETING
(unaudited)
Rule 30e-1 under the Investment Company Act of 1940, as amended, titled “Reports to Stockholders of Management Companies,” requires regulated investment companies to report on all subject matters put to the vote of shareholders and to provide final results. Accordingly, the Board of Trustees of the Portfolio solicited a vote by the shareholders for the following item:
A special meeting of holders of Transamerica Aegon Sustainable Equity Income VP was held on April 29, 2024. The results of Proposal 2 were as follows:
To approve the Portfolio’s use of the manager of managers exemptive order, which will allow TAM, the Portfolio’s investment manager, to enter into and materially amend sub-advisory agreements with respect to the Portfolio in the future without Holder approval, subject to prior approval by the Portfolio’s Board of Trustees.
|
|
|
| Proposal |
|
Number of Shares |
| |
| For |
|
22,651,362 |
| Against |
|
1,447,075 |
| Withheld |
|
1,036,908 |
|
|
|
|
|
| Transamerica Series Trust |
|
|
|
Semi-Annual Financial Statements 2024 |
|
|
Page 18 |
|
|
PROXY VOTING POLICIES AND PROCEDURES AND QUARTERLY PORTFOLIO HOLDINGS
(unaudited)
A description of Transamerica Series Trust’s (the “Trust”) proxy voting policies and procedures is available in the Statement of Additional Information of the Portfolios, available without charge upon request by calling 1-800-851-9777 (toll free) or on the Securities and Exchange Commission’s (“SEC”) website at http://www.sec.gov.
In addition, the Portfolio is required to file Form N-PX, with their complete proxy voting records for the most recent 12 months ended June 30th, no later than August 31st of each year. The Form is available without charge: (1) on the Transamerica Funds website at https://www.transamerica.com/sites/default/files/files/e070d/TST%20N-PX%202021.pdf; and (2) on the SEC’s website at http://www.sec.gov.
Each fiscal quarter, the Portfolios, except Transamerica BlackRock Government Money Market VP, will file with the SEC a complete schedule of its monthly portfolio holdings on Form N-PORT. The Portfolios’ holdings as of the end of the third month of every fiscal quarter, as reported on Form N-PORT, will be publicly available on the SEC’s website at http://www.sec.gov within 60 days of the end of the fiscal quarter.
On a monthly basis, Transamerica BlackRock Government Money Market VP will file with the SEC portfolio holdings information on Form N-MFP3. A complete schedule of portfolio holdings is also available at www.transamerica.com.
You may also visit the Trust’s website at www.transamerica.com/annuities/prospectus for this and other information about the Portfolios and the Trust.
Important Notice Regarding Delivery of Shareholder Documents
Every year we provide shareholders informative materials such as the Transamerica Series Trust Annual Report, the Transamerica Series Trust Prospectus, and other required documents that keep you informed regarding your Portfolios. To the extent provided by mail, Transamerica Series Trust will only send one piece per mailing address, a method that saves your Portfolios money by reducing mailing and printing costs. We will continue to do this unless you tell us not to. To elect to receive individual mailings, simply call a Transamerica Customer Service Representative toll free at 1-800-851-9777, 8 a.m. to 7 p.m. Eastern Time, Monday-Friday. Your request will take effect within 30 days.
|
|
|
|
|
| Transamerica Series Trust |
|
|
|
Semi-Annual Financial Statements 2024 |
|
|
Page 19 |
|
|
NOTICE OF PRIVACY POLICY
(unaudited)
Your privacy is very important to us. We want you to understand what information we collect and how we use it. We collect and use “nonpublic personal information” in connection with providing our customers with a broad range of financial products and services as effectively and conveniently as possible. We treat nonpublic personal information in accordance with our Privacy Policy.
What Information We Collect and From Whom We Collect It
We may collect nonpublic personal information about you from the following sources:
| • |
|
Information we receive from you on applications or other forms, such as your name, address, and account number; |
| • |
|
Information about your transactions with us, our affiliates, or others, such as your account balance and purchase/redemption history; and |
| • |
|
Information we receive from non-affiliated third parties, including consumer reporting agencies. |
What Information We Disclose and To Whom We Disclose It
We do not disclose any nonpublic personal information about current or former customers to anyone without their express consent, except as permitted by law. We may disclose the nonpublic personal information we collect, as described above, to persons or companies that perform services on our behalf and to other financial institutions with which we have joint marketing agreements. We will require these companies to protect the confidentiality of your nonpublic personal information and to use it only to perform the services for which we have hired them.
Our Security Procedures
We restrict access to your nonpublic personal information and only allow disclosures to persons and companies as permitted by law to assist in providing products or services to you. We maintain physical, electronic, and procedural safeguards to protect your nonpublic personal information and to safeguard the disposal of certain consumer information.
Contact Us
If you have any questions about our Privacy Policy, please call 1-800-851-9777 on any business day between 8 a.m. and 7 p.m. Eastern Time.
Note: This Privacy Policy applies only to customers that have a direct relationship with us or our affiliates. If you own shares of our portfolios in the name of a third party such as a bank or broker-dealer, its privacy policy may apply to you instead of ours.
|
|
|
|
|
| Transamerica Series Trust |
|
|
|
Semi-Annual Financial Statements 2024 |
|
|
Page 20 |
|
|
|
|
|
| PO Box 219945 |
| Kansas City, MO 64121-9945 |
|
|
| Distributor: |
|
Transamerica Capital, Inc. |
|
|
PO Box 219945 |
|
|
Kansas City, MO 64121-9945 |
|
|
|
|
Customer Service: 1-800-851-9777 |
Transamerica Series Trust Semi-Annual Financial Statements
June 30, 2024
1801 California St., Suite 5200
Denver, CO 80202
Distributor: Transamerica Capital, Inc.
Customer Service: 1-800-851-9777
|
| The following pages contain the most recent semi-annual financial statements for the investment options in which you are invested. In compliance with Securities and Exchange Commission regulations, we present these reports on an annual and semi-annual basis with the hope that they will foster greater understanding of the investment options’ holdings, performance, financial data, accounting policies and other issues. This streamlined version provides information only on the investment options in which you are invested. |
|
| If you have any questions about these reports, please do not hesitate to contact your financial professional. As always, we thank you for your trust and the opportunity to serve you. |
Transamerica Aegon U.S. Government Securities VP
SCHEDULE OF INVESTMENTS
At June 30, 2024
(unaudited)
|
|
|
|
|
|
|
|
|
| |
|
Principal |
|
|
Value |
|
| |
|
|
| U.S. GOVERNMENT OBLIGATIONS - 55.3% |
|
| U.S. Treasury - 53.8% |
|
| U.S. Treasury Bonds |
|
|
|
|
|
|
|
|
| 1.13%, 05/15/2040 |
|
|
$ 1,305,000 |
|
|
|
$ 806,806 |
|
| 1.88%, 02/15/2051 |
|
|
5,069,000 |
|
|
|
2,981,206 |
|
| 2.00%, 02/15/2050 |
|
|
4,264,000 |
|
|
|
2,607,203 |
|
| 2.25%, 02/15/2052 |
|
|
2,000,000 |
|
|
|
1,282,813 |
|
| 2.38%, 02/15/2042 |
|
|
7,500,000 |
|
|
|
5,485,254 |
|
| 2.50%, 02/15/2045 - 05/15/2046 |
|
|
1,517,000 |
|
|
|
1,082,227 |
|
| 2.88%, 05/15/2049 - 05/15/2052 |
|
|
3,981,000 |
|
|
|
2,947,676 |
|
| 3.00%, 05/15/2042 - 08/15/2052 |
|
|
6,434,000 |
|
|
|
5,009,523 |
|
| 3.38%, 08/15/2042 - 11/15/2048 |
|
|
1,263,000 |
|
|
|
1,055,528 |
|
| 3.63%, 08/15/2043 |
|
|
1,646,000 |
|
|
|
1,436,714 |
|
| 4.13%, 08/15/2053 |
|
|
2,897,000 |
|
|
|
2,714,580 |
|
| 4.38%, 11/15/2039 - 08/15/2043 |
|
|
2,329,000 |
|
|
|
2,269,201 |
|
| 4.50%, 02/15/2044 |
|
|
4,494,000 |
|
|
|
4,427,994 |
|
| 4.63%, 05/15/2054 |
|
|
463,000 |
|
|
|
472,260 |
|
| 4.75%, 11/15/2053 |
|
|
1,823,000 |
|
|
|
1,896,205 |
|
| U.S. Treasury Notes |
|
|
|
|
|
|
|
|
| 0.38%, 11/30/2025 |
|
|
5,000,000 |
|
|
|
4,690,625 |
|
| 0.63%, 12/31/2027 |
|
|
2,000,000 |
|
|
|
1,753,281 |
|
| 1.25%, 11/30/2026 |
|
|
21,884,000 |
|
|
|
20,212,780 |
|
| 1.75%, 01/31/2029 |
|
|
2,021,900 |
|
|
|
1,803,835 |
|
| 1.88%, 02/28/2027 - 02/15/2032 |
|
|
10,931,000 |
|
|
|
9,980,845 |
|
| 2.38%, 03/31/2029 |
|
|
5,982,000 |
|
|
|
5,475,633 |
|
| 2.50%, 03/31/2027 |
|
|
2,481,000 |
|
|
|
2,352,007 |
|
| 2.63%, 05/31/2027 |
|
|
5,000,000 |
|
|
|
4,742,578 |
|
| 2.88%, 05/15/2032 |
|
|
2,003,000 |
|
|
|
1,807,551 |
|
| 3.00%, 07/15/2025 |
|
|
1,387,000 |
|
|
|
1,357,933 |
|
| 3.13%, 08/31/2027 |
|
|
2,619,000 |
|
|
|
2,513,012 |
|
| 3.25%, 06/30/2027 - 06/30/2029 |
|
|
7,516,000 |
|
|
|
7,187,963 |
|
| 3.88%, 12/31/2027 |
|
|
3,716,000 |
|
|
|
3,646,035 |
|
| 4.00%, 02/15/2034 |
|
|
1,704,000 |
|
|
|
1,657,673 |
|
| 4.13%, 02/15/2027 - 11/15/2032 |
|
|
12,655,000 |
|
|
|
12,506,957 |
|
| 4.25%, 01/31/2026 - 03/15/2027 |
|
|
7,657,200 |
|
|
|
7,588,117 |
|
| 4.38%, 05/15/2034 |
|
|
984,000 |
|
|
|
986,460 |
|
| 4.50%, 03/31/2026 |
|
|
3,411,000 |
|
|
|
3,393,279 |
|
| 4.63%, 09/30/2028 - 05/31/2031 |
|
|
11,140,000 |
|
|
|
11,295,891 |
|
|
|
|
|
|
|
|
|
|
|
|
|
|
|
|
|
|
|
|
141,427,645 |
|
|
|
|
|
|
|
|
|
|
|
| U.S. Treasury Inflation-Protected Securities - 1.5% |
|
| U.S. Treasury Inflation-Protected Indexed Notes |
|
|
|
|
|
|
|
|
| 1.75%, 01/15/2034 |
|
|
3,969,451 |
|
|
|
3,860,409 |
|
|
|
|
|
|
|
|
|
|
|
|
|
|
|
|
|
|
|
|
3,860,409 |
|
|
|
|
|
|
|
|
|
|
|
|
|
| Total U.S. Government Obligations
(Cost $156,202,077) |
|
|
|
|
|
|
145,288,054 |
|
|
|
|
|
|
|
|
|
|
|
| U.S. GOVERNMENT AGENCY OBLIGATIONS - 36.0% |
|
| Federal Farm Credit Banks Funding Corp. |
|
|
|
|
|
|
|
|
| 2.04%, 09/24/2029 |
|
|
10,000,000 |
|
|
|
8,903,791 |
|
| Federal Home Loan Banks |
|
|
|
|
|
|
|
|
| 2.38%, 03/14/2025 |
|
|
25,000,000 |
|
|
|
24,497,215 |
|
| 4.75%, 12/10/2032 |
|
|
5,000,000 |
|
|
|
5,048,448 |
|
|
|
|
|
|
|
|
|
|
| |
|
Principal |
|
|
Value |
|
| |
|
|
| U.S. GOVERNMENT AGENCY OBLIGATIONS (continued) |
|
| Federal Home Loan Mortgage Corp. Multifamily Structured Pass-Through Certificates |
|
|
|
|
|
|
|
|
| 3.01%, 07/25/2025 |
|
|
$ 4,978,538 |
|
|
|
$ 4,860,755 |
|
| 3.19% (A), 09/25/2027 |
|
|
4,070,000 |
|
|
|
3,867,841 |
|
| Federal National Mortgage Association |
|
|
|
|
|
|
|
|
| 0.88%, 08/05/2030 (B) |
|
|
8,300,000 |
|
|
|
6,728,946 |
|
| 1.90%, 01/25/2036 |
|
|
5,000,000 |
|
|
|
3,670,688 |
|
| 2.63%, 09/06/2024 (B) |
|
|
4,000,000 |
|
|
|
3,978,824 |
|
| Government National Mortgage Association |
|
|
|
|
|
|
|
|
| 3.78% (A), 09/20/2061 |
|
|
149,616 |
|
|
|
148,758 |
|
| 4.25% (A), 06/20/2062 |
|
|
210,281 |
|
|
|
203,338 |
|
| 4.63% (A), 07/20/2061 |
|
|
8,440 |
|
|
|
8,095 |
|
| 4.70% (A), 10/20/2061 - 12/20/2061 |
|
|
11,423 |
|
|
|
10,972 |
|
| SLM Student Loan Trust |
|
|
|
|
|
|
|
|
| 3-Month SOFR Average + 0.43%, 5.78% (A), 01/25/2041 |
|
|
2,210,948 |
|
|
|
2,151,899 |
|
| Tennessee Valley Authority |
|
|
|
|
|
|
|
|
| 1.50%, 09/15/2031 (B) |
|
|
5,000,000 |
|
|
|
4,075,836 |
|
| 2.88%, 02/01/2027 (B) |
|
|
6,000,000 |
|
|
|
5,745,484 |
|
| 4.88%, 01/15/2048 (B) |
|
|
5,000,000 |
|
|
|
4,970,638 |
|
| Uniform Mortgage-Backed Security, TBA |
|
|
|
|
|
|
|
|
| 5.50%, 07/01/2054 (C) |
|
|
5,000,000 |
|
|
|
4,937,148 |
|
| 6.00%, 07/01/2054 (C) |
|
|
10,827,000 |
|
|
|
10,867,762 |
|
|
|
|
|
|
|
|
|
|
|
|
| Total U.S. Government Agency Obligations
(Cost $100,170,815) |
|
|
|
94,676,438 |
|
|
|
|
|
|
|
|
| CORPORATE DEBT SECURITIES - 5.4% |
|
| Aerospace & Defense - 0.2% |
|
| BAE Systems PLC |
|
|
|
|
|
|
|
|
| 5.30%, 03/26/2034 (D) |
|
|
679,000 |
|
|
|
674,151 |
|
|
|
|
|
|
|
|
|
|
|
| Banks - 1.0% |
|
| Bank of America Corp. |
|
|
|
|
|
|
|
|
| Fixed until 02/13/2030, 2.50% (A), 02/13/2031 |
|
|
1,500,000 |
|
|
|
1,297,293 |
|
| Morgan Stanley |
|
|
|
|
|
|
|
|
| Fixed until 01/22/2030, 2.70% (A), 01/22/2031 |
|
|
1,050,000 |
|
|
|
921,062 |
|
| Fixed until 01/18/2034, 5.47% (A), 01/18/2035 |
|
|
414,000 |
|
|
|
413,722 |
|
|
|
|
|
|
|
|
|
|
|
|
|
|
|
|
|
|
|
|
2,632,077 |
|
|
|
|
|
|
|
|
|
|
|
| Diversified Telecommunication Services - 0.4% |
|
| Verizon Communications, Inc. |
|
|
|
|
|
|
|
|
| 4.02%, 12/03/2029 |
|
|
1,000,000 |
|
|
|
946,187 |
|
|
|
|
|
|
|
|
|
|
|
| Electric Utilities - 0.3% |
|
| Consolidated Edison Co. of New York, Inc. |
|
|
|
|
|
|
|
|
| 3.35%, 04/01/2030 |
|
|
1,000,000 |
|
|
|
918,751 |
|
|
|
|
|
|
|
|
|
|
|
| Financial Services - 1.9% |
|
| Private Export Funding Corp. |
|
|
|
|
|
|
|
|
| 0.55%, 07/30/2024 (D) |
|
|
5,000,000 |
|
|
|
4,979,482 |
|
|
|
|
|
|
|
|
|
|
|
| Food Products - 0.2% |
|
| Cargill, Inc. |
|
|
|
|
|
|
|
|
| 5.13%, 10/11/2032 (D) |
|
|
511,000 |
|
|
|
510,848 |
|
|
|
|
|
|
|
|
|
|
The Notes to Financial Statements are an integral part of this report.
|
|
|
|
|
| Transamerica Series Trust |
|
|
|
Semi-Annual Financial Statements 2024 |
|
|
Page 1 |
|
|
Transamerica Aegon U.S. Government Securities VP
SCHEDULE OF INVESTMENTS (continued)
At June 30, 2024
(unaudited)
|
|
|
|
|
|
|
|
|
| |
|
Principal |
|
|
Value |
|
| |
|
|
| CORPORATE DEBT SECURITIES (continued) |
|
| Health Care Providers & Services - 0.7% |
|
| Cigna Group |
|
|
|
|
|
|
|
|
| 5.25%, 02/15/2034 |
|
|
$ 1,364,000 |
|
|
|
$ 1,347,765 |
|
| Health Care Service Corp. A Mutual Legal Reserve Co. |
|
|
|
|
|
|
|
|
| 5.45%, 06/15/2034 (D) |
|
|
601,000 |
|
|
|
595,283 |
|
|
|
|
|
|
|
|
|
|
|
|
|
|
|
|
|
|
|
|
1,943,048 |
|
|
|
|
|
|
|
|
|
|
|
| Pharmaceuticals - 0.5% |
|
| AbbVie, Inc. |
|
|
|
|
|
|
|
|
| 5.05%, 03/15/2034 |
|
|
1,250,000 |
|
|
|
1,248,945 |
|
|
|
|
|
|
|
|
|
|
|
| Semiconductors & Semiconductor Equipment - 0.2% |
|
| Foundry JV Holdco LLC |
|
|
|
|
|
|
|
|
| 6.15%, 01/25/2032 (D) |
|
|
450,000 |
|
|
|
459,352 |
|
|
|
|
|
|
|
|
|
|
|
|
|
| Total Corporate Debt Securities
(Cost $14,738,946) |
|
|
|
|
|
|
14,312,841 |
|
|
|
|
|
|
|
|
|
|
|
| MORTGAGE-BACKED SECURITIES - 1.8% |
|
| COMM Mortgage Trust |
|
|
|
|
|
|
|
|
| Series 2012-CR4, Class A3, 2.85%, 10/15/2045 |
|
|
84,389 |
|
|
|
77,388 |
|
| Eleven Madison Mortgage Trust |
|
|
|
|
|
|
|
|
| Series 2015-11MD, Class A, 3.67% (A), 09/10/2035 |
|
|
5,000,000 |
|
|
|
4,773,401 |
|
|
|
|
|
|
|
|
|
|
|
|
|
| Total Mortgage-Backed Securities
(Cost $5,169,215) |
|
|
|
|
|
|
4,850,789 |
|
|
|
|
|
|
|
|
|
|
|
| MUNICIPAL GOVERNMENT OBLIGATION - 0.1% |
|
| Vermont - 0.1% |
|
| Vermont Student Assistance Corp., Revenue Bonds, |
|
|
|
|
|
|
|
|
| Class A, 1-Month SOFR Average + 0.70%, |
|
|
|
|
|
|
|
|
| 6.15% (A), 07/28/2034 |
|
|
250,744 |
|
|
|
249,941 |
|
|
|
|
|
|
|
|
|
|
|
|
| Total Municipal Government Obligation
(Cost $250,744) |
|
|
|
249,941 |
|
|
|
|
|
|
|
|
|
|
|
|
|
|
|
|
|
|
|
| |
|
Shares |
|
|
Value |
|
| |
|
|
| OTHER INVESTMENT COMPANY - 6.9% |
|
| Securities Lending Collateral - 6.9% |
|
| State Street Navigator Securities Lending Trust - Government Money Market Portfolio, 5.28% (E) |
|
|
18,052,590 |
|
|
|
$ 18,052,590 |
|
|
|
|
|
|
|
|
|
|
|
|
| Total Other Investment Company
(Cost $18,052,590) |
|
|
|
18,052,590 |
|
|
|
|
|
|
|
|
|
|
| |
|
Principal |
|
|
Value |
|
| |
|
|
| REPURCHASE AGREEMENTS - 6.8% |
|
| Barclays Bank, PLC.,
5.30% (E), dated 06/28/2024, to be repurchased at $16,007,067 on 07/01/2024. Collateralized by U.S. Government Obligations, 0.00%, due 08/15/2039 - 05/15/2050, and with a total value of $16,320,000. |
|
|
$ 16,000,000 |
|
|
|
16,000,000 |
|
| Fixed Income Clearing Corp.,
2.50% (E), dated 06/28/2024, to be repurchased at $1,959,346 on 07/01/2024. Collateralized by a U.S. Government Obligation, 4.50%, due 03/31/2026, and with a value of $1,998,166. |
|
|
1,958,938 |
|
|
|
1,958,938 |
|
|
|
|
|
|
|
|
|
|
|
|
| Total Repurchase Agreements
(Cost $17,958,938) |
|
|
|
17,958,938 |
|
|
|
|
|
|
|
|
|
|
| Total Investments
(Cost $312,543,325) |
|
|
|
295,389,591 |
|
|
|
|
|
|
|
| Net Other Assets (Liabilities) - (12.3)% |
|
|
|
(32,437,104 |
) |
|
|
|
|
|
|
|
|
|
|
|
| Net Assets - 100.0% |
|
|
|
$ 262,952,487 |
|
|
|
|
|
|
|
FUTURES CONTRACTS:
|
|
|
|
|
|
|
|
|
|
|
|
|
|
|
|
|
|
|
|
|
|
|
|
|
|
|
|
|
|
|
| Long Futures Contracts |
|
|
|
|
|
|
|
|
|
|
|
|
|
|
|
|
|
|
|
|
|
| Description |
|
Number of Contracts |
|
|
Expiration Date |
|
|
Notional Amount |
|
|
|
|
|
Value |
|
|
|
|
Unrealized Appreciation |
|
Unrealized Depreciation |
| 2-Year U.S. Treasury Notes |
|
|
47 |
|
|
|
09/30/2024 |
|
|
|
$ 9,576,353 |
|
|
|
|
|
|
|
$ 9,598,281 |
|
|
|
|
|
$ 21,928 |
|
|
|
$— |
|
| 5-Year U.S. Treasury Notes |
|
|
165 |
|
|
|
09/30/2024 |
|
|
|
17,486,494 |
|
|
|
|
|
|
|
17,585,391 |
|
|
|
|
|
98,897 |
|
|
|
— |
|
| 10-Year U.S. Treasury Notes |
|
|
23 |
|
|
|
09/19/2024 |
|
|
|
2,510,648 |
|
|
|
|
|
|
|
2,529,641 |
|
|
|
|
|
18,993 |
|
|
|
— |
|
| 30-Year U.S. Treasury Bonds |
|
|
36 |
|
|
|
09/19/2024 |
|
|
|
4,213,212 |
|
|
|
|
|
|
|
4,259,250 |
|
|
|
|
|
46,038 |
|
|
|
— |
|
| U.S. Treasury Ultra Bonds |
|
|
45 |
|
|
|
09/19/2024 |
|
|
|
5,576,948 |
|
|
|
|
|
|
|
5,640,469 |
|
|
|
|
|
63,521 |
|
|
|
— |
|
|
|
|
|
|
|
|
|
|
|
|
|
|
|
|
|
|
|
|
|
|
|
|
|
|
|
|
| Total |
|
|
|
|
|
|
|
|
|
|
|
|
|
|
|
|
|
|
|
|
|
|
|
|
$ 249,377 |
|
|
|
$— |
|
|
|
|
|
|
|
|
|
|
|
|
|
|
|
|
|
|
|
|
|
|
|
|
|
|
|
|
|
|
|
|
|
|
|
|
|
|
|
|
|
|
|
|
|
|
|
|
|
|
|
|
|
|
|
|
|
|
|
| Short Futures Contracts |
|
|
|
|
|
|
|
|
|
|
|
|
|
|
|
|
|
|
|
|
|
| Description |
|
Number of Contracts |
|
|
Expiration Date |
|
|
Notional Amount |
|
|
|
|
|
Value |
|
|
|
|
Unrealized Appreciation |
|
Unrealized Depreciation |
| 10-Year U.S. Treasury Ultra Notes |
|
|
(36) |
|
|
|
09/19/2024 |
|
|
|
$ (4,052,166) |
|
|
|
|
|
|
|
$(4,087,125) |
|
|
|
|
|
$ — |
|
|
|
$ (34,959) |
|
|
|
|
|
|
|
|
|
|
|
|
|
|
|
|
|
|
|
|
|
|
|
|
|
|
|
|
| Total Futures Contracts |
|
|
|
|
|
|
|
|
|
|
|
|
|
|
|
|
|
|
|
|
|
|
|
|
$ 249,377 |
|
|
|
$ (34,959) |
|
|
|
|
|
|
|
|
|
|
|
|
|
|
|
|
|
|
|
|
|
|
|
|
|
|
|
|
The Notes to Financial Statements are an integral part of this report.
|
|
|
|
|
| Transamerica Series Trust |
|
|
|
Semi-Annual Financial Statements 2024 |
|
|
Page 2 |
|
|
Transamerica Aegon U.S. Government Securities VP
SCHEDULE OF INVESTMENTS (continued)
At June 30, 2024
(unaudited)
INVESTMENT VALUATION:
Valuation Inputs (F)
|
|
|
|
|
|
|
|
|
|
|
|
|
|
|
|
|
| |
|
Level 1 -
Unadjusted Quoted Prices |
|
|
Level 2 - Other Significant
Observable Inputs |
|
|
Level 3 - Significant
Unobservable Inputs |
|
|
Value |
|
| |
|
|
|
|
|
|
| ASSETS |
|
|
|
|
|
|
|
|
|
|
|
|
|
|
|
|
| Investments |
|
|
|
|
|
|
|
|
|
|
|
|
|
|
|
|
| U.S. Government Obligations |
|
$ |
— |
|
|
$ |
145,288,054 |
|
|
$ |
— |
|
|
$ |
145,288,054 |
|
| U.S. Government Agency Obligations |
|
|
— |
|
|
|
94,676,438 |
|
|
|
— |
|
|
|
94,676,438 |
|
| Corporate Debt Securities |
|
|
— |
|
|
|
14,312,841 |
|
|
|
— |
|
|
|
14,312,841 |
|
| Mortgage-Backed Securities |
|
|
— |
|
|
|
4,850,789 |
|
|
|
— |
|
|
|
4,850,789 |
|
| Municipal Government Obligation |
|
|
— |
|
|
|
249,941 |
|
|
|
— |
|
|
|
249,941 |
|
| Other Investment Company |
|
|
18,052,590 |
|
|
|
— |
|
|
|
— |
|
|
|
18,052,590 |
|
| Repurchase Agreements |
|
|
— |
|
|
|
17,958,938 |
|
|
|
— |
|
|
|
17,958,938 |
|
|
|
|
|
|
|
|
|
|
|
|
|
|
|
|
|
|
|
|
|
|
|
| Total Investments |
|
$ |
18,052,590 |
|
|
$ |
277,337,001 |
|
|
$ |
— |
|
|
$ |
295,389,591 |
|
|
|
|
|
|
|
|
|
|
|
|
|
|
|
|
|
|
|
|
|
|
|
| Other Financial Instruments |
|
|
|
|
|
|
|
|
|
|
|
|
|
|
|
|
| Futures Contracts (G) |
|
$ |
249,377 |
|
|
$ |
— |
|
|
$ |
— |
|
|
$ |
249,377 |
|
|
|
|
|
|
|
|
|
|
|
|
|
|
|
|
|
|
|
|
|
|
|
| Total Other Financial Instruments |
|
$ |
249,377 |
|
|
$ |
— |
|
|
$ |
— |
|
|
$ |
249,377 |
|
|
|
|
|
|
|
|
|
|
|
|
|
|
|
|
|
|
|
|
|
|
|
| LIABILITIES |
|
|
|
|
|
|
|
|
|
|
|
|
|
|
|
|
| Other Financial Instruments |
|
|
|
|
|
|
|
|
|
|
|
|
|
|
|
|
| Futures Contracts (G) |
|
$ |
(34,959 |
) |
|
$ |
— |
|
|
$ |
— |
|
|
$ |
(34,959 |
) |
|
|
|
|
|
|
|
|
|
|
|
|
|
|
|
|
|
|
|
|
|
|
| Total Other Financial Instruments |
|
$ |
(34,959 |
) |
|
$ |
— |
|
|
$ |
— |
|
|
$ |
(34,959 |
) |
|
|
|
|
|
|
|
|
|
|
|
|
|
|
|
|
|
FOOTNOTES TO SCHEDULE OF INVESTMENTS:
| (A) |
Floating or variable rate security. The rate disclosed is as of June 30, 2024. For securities based on a published reference rate and spread, the reference rate and spread are indicated within the description. Variable rate securities with a floor or ceiling feature are disclosed at the inherent rate, where applicable. Certain variable rate securities are not based on a published reference rate and spread, but are determined by the issuer or agent and are based on current market conditions; these securities do not indicate a reference rate and spread in the description. |
| (B) |
All or a portion of the security is on loan. The total value of the securities on loan is $17,694,976, collateralized by cash collateral of $18,052,590. The amount on loan indicated may not correspond with the securities on loan identified because a security with pending sales are in the process of recall from the brokers. |
| (C) |
When-issued, delayed-delivery and/or forward commitment (including TBAs) security. Security to be settled and delivered after June 30, 2024. Security may display a coupon rate of 0.00%, as the rate is to be determined at time of settlement. |
| (D) |
Security is exempt from registration pursuant to Rule 144A of the Securities Act of 1933. Security may be resold as transactions exempt from registration, normally to qualified institutional buyers. At June 30, 2024, the total value of 144A securities is $11,992,517, representing 4.6% of the Portfolio’s net assets. |
| (E) |
Rate disclosed reflects the yield at June 30, 2024. |
| (F) |
There were no transfers in or out of Level 3 during the period ended June 30, 2024. Please reference the Investment Valuation section of the Notes to Financial Statements for more information regarding investment valuation and pricing inputs. |
| (G) |
Derivative instruments are valued at unrealized appreciation (depreciation). |
PORTFOLIO ABBREVIATION(S):
|
|
|
| SOFR |
|
Secured Overnight Financing Rate |
| TBA |
|
To Be Announced |
The Notes to Financial Statements are an integral part of this report.
|
|
|
|
|
| Transamerica Series Trust |
|
|
|
Semi-Annual Financial Statements 2024 |
|
|
Page 3 |
|
|
Transamerica Aegon U.S. Government Securities VP
STATEMENT OF ASSETS AND LIABILITIES
At June 30, 2024
(unaudited)
|
|
|
|
|
| Assets: |
|
|
|
|
| Investments, at value (cost $294,584,387) (including securities loaned of $17,694,976) |
|
$ |
277,430,653 |
|
| Repurchase agreement, at value (cost $17,958,938) |
|
|
17,958,938 |
|
| Cash |
|
|
21,034 |
|
| Cash collateral pledged at broker for: |
|
|
|
|
| TBA commitments |
|
|
5,000 |
|
| Futures contracts |
|
|
632,060 |
|
| Receivables and other assets: |
|
|
|
|
| Net income from securities lending |
|
|
3,134 |
|
| Shares of beneficial interest sold |
|
|
198,601 |
|
| Interest |
|
|
2,047,013 |
|
| Prepaid expenses |
|
|
1,118 |
|
|
|
| Total assets |
|
|
298,297,551 |
|
|
|
| Liabilities: |
|
|
|
|
| Cash collateral received upon return of: |
|
|
|
|
| Securities on loan |
|
|
18,052,590 |
|
| Payables and other liabilities: |
|
|
|
|
| Investments purchased |
|
|
1,113,103 |
|
| When-issued, delayed-delivery, forward and TBA commitments purchased |
|
|
15,829,897 |
|
| Shares of beneficial interest redeemed |
|
|
20,088 |
|
| Investment management fees |
|
|
100,693 |
|
| Distribution and service fees |
|
|
40,186 |
|
| Transfer agent costs |
|
|
484 |
|
| Trustee and CCO fees |
|
|
1,188 |
|
| Audit and tax fees |
|
|
17,262 |
|
| Custody fees |
|
|
13,282 |
|
| Legal fees |
|
|
8,484 |
|
| Printing and shareholder reports fees |
|
|
20,417 |
|
| Other accrued expenses |
|
|
8,991 |
|
| Variation margin payable on futures contracts |
|
|
118,399 |
|
|
|
| Total liabilities |
|
|
35,345,064 |
|
|
|
| Net assets |
|
$ |
262,952,487 |
|
|
|
| Net assets consist of: |
|
|
|
|
| Capital stock ($0.01 par value) |
|
$ |
282,090 |
|
| Additional paid-in capital |
|
|
300,716,099 |
|
|
|
| Total distributable earnings (accumulated losses) |
|
|
(38,045,702 |
) |
|
|
| Net assets |
|
$ |
262,952,487 |
|
|
|
| Net assets by class: |
|
|
|
|
| Initial Class |
|
$ |
57,132,702 |
|
| Service Class |
|
|
205,819,785 |
|
|
|
| Shares outstanding: |
|
|
|
|
| Initial Class |
|
|
6,308,643 |
|
| Service Class |
|
|
21,900,344 |
|
|
|
| Net asset value and offering price per share: |
|
|
|
|
| Initial Class |
|
$ |
9.06 |
|
| Service Class |
|
|
9.40 |
|
STATEMENT OF OPERATIONS
For the period ended June 30, 2024
(unaudited)
|
|
|
|
|
| Investment income: |
|
|
|
|
| Interest income |
|
$ |
4,797,438 |
|
| Net income from securities lending |
|
|
19,760 |
|
|
|
| Total investment income |
|
|
4,817,198 |
|
|
|
| Expenses: |
|
|
|
|
| Investment management fees |
|
|
720,331 |
|
| Distribution and service fees: |
|
|
|
|
| Service Class |
|
|
277,192 |
|
| Transfer agent costs |
|
|
1,767 |
|
| Trustee and CCO fees |
|
|
6,823 |
|
| Audit and tax fees |
|
|
16,950 |
|
| Custody fees |
|
|
18,377 |
|
| Legal fees |
|
|
13,702 |
|
| Printing and shareholder reports fees |
|
|
19,814 |
|
| Other |
|
|
13,920 |
|
|
|
| Total expenses before waiver and/or reimbursement and recapture |
|
|
1,088,876 |
|
| Expenses waived and/or reimbursed: |
|
|
|
|
| Initial Class |
|
|
(5,589 |
) |
| Service Class |
|
|
(20,320 |
) |
|
|
| Net expenses |
|
|
1,062,967 |
|
|
|
| Net investment income (loss) |
|
|
3,754,231 |
|
|
|
| Net realized gain (loss) on: |
|
|
|
|
| Investments |
|
|
(7,103,067 |
) |
| Futures contracts |
|
|
(236,560 |
) |
|
|
| Net realized gain (loss) |
|
|
(7,339,627 |
) |
|
|
| Net change in unrealized appreciation (depreciation) on: |
|
|
|
|
| Investments |
|
|
2,384,774 |
|
| Futures contracts |
|
|
(1,345,681 |
) |
|
|
| Net change in unrealized appreciation (depreciation) |
|
|
1,039,093 |
|
|
|
| Net realized and change in unrealized gain (loss) |
|
|
(6,300,534 |
) |
|
|
| Net increase (decrease) in net assets resulting from operations |
|
$ |
(2,546,303 |
) |
The Notes to Financial Statements are an integral part of this report.
|
|
|
|
|
| Transamerica Series Trust |
|
|
|
Semi-Annual Financial Statements 2024 |
|
|
Page 4 |
|
|
Transamerica Aegon U.S. Government Securities VP
STATEMENT OF CHANGES IN NET ASSETS
For the period and year ended:
|
|
|
|
|
|
|
|
|
|
|
|
|
|
| |
|
June 30, 2024 (unaudited) |
|
December 31, 2023 |
|
|
|
| From operations: |
|
|
|
|
|
|
|
|
|
|
| Net investment income (loss) |
|
|
|
$ 3,754,231 |
|
|
|
|
$ 7,781,044 |
|
| Net realized gain (loss) |
|
|
|
(7,339,627 |
) |
|
|
|
(12,343,597 |
) |
| Net change in unrealized appreciation (depreciation) |
|
|
|
1,039,093 |
|
|
|
|
17,785,768 |
|
|
|
|
| Net increase (decrease) in net assets resulting from operations |
|
|
|
(2,546,303 |
) |
|
|
|
13,223,215 |
|
|
|
|
| Dividends and/or distributions to shareholders: |
|
|
|
|
|
|
|
|
|
|
| Initial Class |
|
|
|
— |
|
|
|
|
(1,096,750 |
) |
| Service Class |
|
|
|
— |
|
|
|
|
(3,999,036 |
) |
|
|
|
| Net increase (decrease) in net assets resulting from dividends and/or distributions to shareholders |
|
|
|
— |
|
|
|
|
(5,095,786 |
) |
|
|
|
| Capital share transactions: |
|
|
|
|
|
|
|
|
|
|
| Proceeds from shares sold: |
|
|
|
|
|
|
|
|
|
|
| Initial Class |
|
|
|
4,609,206 |
|
|
|
|
7,539,109 |
|
| Service Class |
|
|
|
7,128,651 |
|
|
|
|
50,283,001 |
|
|
|
|
| |
|
|
|
11,737,857 |
|
|
|
|
57,822,110 |
|
| Dividends and/or distributions reinvested: |
|
|
|
|
|
|
|
|
|
|
| Initial Class |
|
|
|
— |
|
|
|
|
1,096,750 |
|
| Service Class |
|
|
|
— |
|
|
|
|
3,999,036 |
|
| |
|
|
|
— |
|
|
|
|
5,095,786 |
|
| Cost of shares redeemed: |
|
|
|
|
|
|
|
|
|
|
| Initial Class |
|
|
|
(8,711,047 |
) |
|
|
|
(11,653,811 |
) |
| Service Class |
|
|
|
(48,219,204 |
) |
|
|
|
(126,033,847 |
) |
|
|
|
| |
|
|
|
(56,930,251 |
) |
|
|
|
(137,687,658 |
) |
|
|
|
| Net increase (decrease) in net assets resulting from capital share transactions |
|
|
|
(45,192,394 |
) |
|
|
|
(74,769,762 |
) |
|
|
|
| Net increase (decrease) in net assets |
|
|
|
(47,738,697 |
) |
|
|
|
(66,642,333 |
) |
|
|
|
| Net assets: |
|
|
|
|
|
|
|
|
|
|
| Beginning of period/year |
|
|
|
310,691,184 |
|
|
|
|
377,333,517 |
|
| End of period/year |
|
|
|
$262,952,487 |
|
|
|
|
$ 310,691,184 |
|
|
|
|
| Capital share transactions - shares: |
|
|
|
|
|
|
|
|
|
|
| Shares issued: |
|
|
|
|
|
|
|
|
|
|
| Initial Class |
|
|
|
513,787 |
|
|
|
|
838,816 |
|
| Service Class |
|
|
|
767,751 |
|
|
|
|
5,468,595 |
|
|
|
|
| |
|
|
|
1,281,538 |
|
|
|
|
6,307,411 |
|
| Shares reinvested: |
|
|
|
|
|
|
|
|
|
|
| Initial Class |
|
|
|
— |
|
|
|
|
124,631 |
|
| Service Class |
|
|
|
— |
|
|
|
|
437,053 |
|
|
|
|
| |
|
|
|
— |
|
|
|
|
561,684 |
|
| Shares redeemed: |
|
|
|
|
|
|
|
|
|
|
| Initial Class |
|
|
|
(974,722 |
) |
|
|
|
(1,294,713 |
) |
| Service Class |
|
|
|
(5,151,694 |
) |
|
|
|
(13,466,171 |
) |
|
|
|
| |
|
|
|
(6,126,416 |
) |
|
|
|
(14,760,884 |
) |
|
|
|
| Net increase (decrease) in shares outstanding: |
|
|
|
|
|
|
|
|
|
|
| Initial Class |
|
|
|
(460,935 |
) |
|
|
|
(331,266 |
) |
| Service Class |
|
|
|
(4,383,943 |
) |
|
|
|
(7,560,523 |
) |
|
|
|
| |
|
|
|
(4,844,878 |
) |
|
|
|
(7,891,789 |
) |
The Notes to Financial Statements are an integral part of this report.
|
|
|
|
|
| Transamerica Series Trust |
|
|
|
Semi-Annual Financial Statements 2024 |
|
|
Page 5 |
|
|
Transamerica Aegon U.S. Government Securities VP
FINANCIAL HIGHLIGHTS
|
|
|
|
|
|
|
|
|
|
|
|
|
|
|
|
|
|
|
|
|
|
|
|
|
|
|
|
|
|
|
| For a share outstanding during the period and years indicated: |
|
Initial Class |
|
|
|
|
|
|
|
| |
|
June 30, 2024 (unaudited) |
|
December 31, 2023 |
|
December 31, 2022 |
|
December 31, 2021 |
|
December 31, 2020 |
|
December 31, 2019 |
|
|
|
|
|
|
|
| Net asset value, beginning of period/year |
|
|
$ |
9.12 |
|
|
|
$ |
8.93 |
|
|
|
$ |
10.38 |
|
|
|
$ |
11.69 |
|
|
|
$ |
10.92 |
|
|
|
$ |
10.45 |
|
|
|
|
|
|
|
|
| Investment operations: |
|
|
|
|
|
|
|
|
|
|
|
|
|
|
|
|
|
|
|
|
|
|
|
|
|
|
|
|
|
|
| Net investment income (loss)(A) |
|
|
|
0.13 |
|
|
|
|
0.22 |
|
|
|
|
0.15 |
|
|
|
|
0.12 |
|
|
|
|
0.15 |
|
|
|
|
0.21 |
|
| Net realized and unrealized gain (loss) |
|
|
|
(0.19 |
) |
|
|
|
0.13 |
|
|
|
|
(1.50 |
) |
|
|
|
(0.39 |
) |
|
|
|
0.83 |
|
|
|
|
0.48 |
|
|
|
|
|
|
|
|
| Total investment operations |
|
|
|
(0.06 |
) |
|
|
|
0.35 |
|
|
|
|
(1.35 |
) |
|
|
|
(0.27 |
) |
|
|
|
0.98 |
|
|
|
|
0.69 |
|
|
|
|
|
|
|
|
| Dividends and/or distributions to shareholders: |
|
|
|
|
|
|
|
|
|
|
|
|
|
|
|
|
|
|
|
|
|
|
|
|
|
|
|
|
|
|
| Net investment income |
|
|
|
— |
|
|
|
|
(0.16 |
) |
|
|
|
(0.10 |
) |
|
|
|
(0.25 |
) |
|
|
|
(0.20 |
) |
|
|
|
(0.22 |
) |
| Net realized gains |
|
|
|
— |
|
|
|
|
— |
|
|
|
|
— |
|
|
|
|
(0.79 |
) |
|
|
|
(0.01 |
) |
|
|
|
— |
|
|
|
|
|
|
|
|
| Total dividends and/or distributions to shareholders |
|
|
|
— |
|
|
|
|
(0.16 |
) |
|
|
|
(0.10 |
) |
|
|
|
(1.04 |
) |
|
|
|
(0.21 |
) |
|
|
|
(0.22 |
) |
|
|
|
|
|
|
|
| Net asset value, end of period/year |
|
|
$ |
9.06 |
|
|
|
$ |
9.12 |
|
|
|
$ |
8.93 |
|
|
|
$ |
10.38 |
|
|
|
$ |
11.69 |
|
|
|
$ |
10.92 |
|
| |
|
|
|
|
|
|
|
|
| Total return |
|
|
|
(0.66 |
)%(B) |
|
|
|
4.00 |
% |
|
|
|
(13.03 |
)% |
|
|
|
(2.39 |
)% |
|
|
|
8.97 |
% |
|
|
|
6.60 |
% |
|
|
|
|
|
|
|
| Ratio and supplemental data: |
|
|
|
|
|
|
|
|
|
|
|
|
|
|
|
|
|
|
|
|
|
|
|
|
|
|
|
|
|
|
| Net assets end of period/year (000’s) |
|
|
$ |
57,133 |
|
|
|
$ |
61,715 |
|
|
|
$ |
63,432 |
|
|
|
$ |
81,905 |
|
|
|
$ |
105,166 |
|
|
|
$ |
80,042 |
|
| Expenses to average net assets |
|
|
|
|
|
|
|
|
|
|
|
|
|
|
|
|
|
|
|
|
|
|
|
|
|
|
|
|
|
|
| Excluding waiver and/or reimbursement and recapture |
|
|
|
0.58 |
%(C) |
|
|
|
0.61 |
% |
|
|
|
0.59 |
% |
|
|
|
0.60 |
% |
|
|
|
0.59 |
% |
|
|
|
0.61 |
% |
| Including waiver and/or reimbursement and recapture |
|
|
|
0.56 |
%(C) |
|
|
|
0.60 |
% |
|
|
|
0.59 |
% |
|
|
|
0.60 |
% |
|
|
|
0.59 |
% |
|
|
|
0.61 |
% |
| Net investment income (loss) to average net assets |
|
|
|
2.89 |
%(C) |
|
|
|
2.43 |
% |
|
|
|
1.56 |
% |
|
|
|
1.06 |
% |
|
|
|
1.32 |
% |
|
|
|
1.92 |
% |
| Portfolio turnover rate |
|
|
|
24 |
%(B) |
|
|
|
18 |
% |
|
|
|
9 |
% |
|
|
|
29 |
% |
|
|
|
128 |
% |
|
|
|
44 |
% |
| (A) |
Calculated based on average number of shares outstanding. |
|
|
|
|
|
|
|
|
|
|
|
|
|
|
|
|
|
|
|
|
|
|
|
|
|
|
|
|
|
|
|
| For a share outstanding during the period and years indicated: |
|
Service Class |
|
|
|
|
|
|
|
| |
|
June 30, 2024 (unaudited) |
|
December 31, 2023 |
|
December 31, 2022 |
|
December 31, 2021 |
|
December 31, 2020 |
|
December 31, 2019 |
|
|
|
|
|
|
|
| Net asset value, beginning of period/year |
|
|
$ |
9.47 |
|
|
|
$ |
9.27 |
|
|
|
$ |
10.78 |
|
|
|
$ |
12.07 |
|
|
|
$ |
11.28 |
|
|
|
$ |
10.79 |
|
|
|
|
|
|
|
|
| Investment operations: |
|
|
|
|
|
|
|
|
|
|
|
|
|
|
|
|
|
|
|
|
|
|
|
|
|
|
|
|
|
|
| Net investment income (loss)(A) |
|
|
|
0.12 |
|
|
|
|
0.20 |
|
|
|
|
0.13 |
|
|
|
|
0.09 |
|
|
|
|
0.13 |
|
|
|
|
0.19 |
|
| Net realized and unrealized gain (loss) |
|
|
|
(0.19 |
) |
|
|
|
0.14 |
|
|
|
|
(1.56 |
) |
|
|
|
(0.39 |
) |
|
|
|
0.84 |
|
|
|
|
0.50 |
|
|
|
|
|
|
|
|
| Total investment operations |
|
|
|
(0.07 |
) |
|
|
|
0.34 |
|
|
|
|
(1.43 |
) |
|
|
|
(0.30 |
) |
|
|
|
0.97 |
|
|
|
|
0.69 |
|
|
|
|
|
|
|
|
| Dividends and/or distributions to shareholders: |
|
|
|
|
|
|
|
|
|
|
|
|
|
|
|
|
|
|
|
|
|
|
|
|
|
|
|
|
|
|
| Net investment income |
|
|
|
— |
|
|
|
|
(0.14 |
) |
|
|
|
(0.08 |
) |
|
|
|
(0.20 |
) |
|
|
|
(0.17 |
) |
|
|
|
(0.20 |
) |
| Net realized gains |
|
|
|
— |
|
|
|
|
— |
|
|
|
|
— |
|
|
|
|
(0.79 |
) |
|
|
|
(0.01 |
) |
|
|
|
— |
|
|
|
|
|
|
|
|
| Total dividends and/or distributions to shareholders |
|
|
|
— |
|
|
|
|
(0.14 |
) |
|
|
|
(0.08 |
) |
|
|
|
(0.99 |
) |
|
|
|
(0.18 |
) |
|
|
|
(0.20 |
) |
|
|
|
|
|
|
|
| Net asset value, end of period/year |
|
|
$ |
9.40 |
|
|
|
$ |
9.47 |
|
|
|
$ |
9.27 |
|
|
|
$ |
10.78 |
|
|
|
$ |
12.07 |
|
|
|
$ |
11.28 |
|
| |
|
|
|
|
|
|
|
|
| Total return |
|
|
|
(0.74 |
)%(B) |
|
|
|
3.69 |
% |
|
|
|
(13.30 |
)% |
|
|
|
(2.53 |
)% |
|
|
|
8.66 |
% |
|
|
|
6.35 |
% |
|
|
|
|
|
|
|
| Ratio and supplemental data: |
|
|
|
|
|
|
|
|
|
|
|
|
|
|
|
|
|
|
|
|
|
|
|
|
|
|
|
|
|
|
| Net assets end of period/year (000’s) |
|
|
$ |
205,819 |
|
|
|
$ |
248,976 |
|
|
|
$ |
313,902 |
|
|
|
$ |
225,327 |
|
|
|
$ |
321,870 |
|
|
|
$ |
234,467 |
|
| Expenses to average net assets |
|
|
|
|
|
|
|
|
|
|
|
|
|
|
|
|
|
|
|
|
|
|
|
|
|
|
|
|
|
|
| Excluding waiver and/or reimbursement and recapture |
|
|
|
0.83 |
%(C) |
|
|
|
0.86 |
% |
|
|
|
0.84 |
% |
|
|
|
0.85 |
% |
|
|
|
0.84 |
% |
|
|
|
0.86 |
% |
| Including waiver and/or reimbursement and recapture |
|
|
|
0.81 |
%(C) |
|
|
|
0.85 |
% |
|
|
|
0.84 |
% |
|
|
|
0.85 |
% |
|
|
|
0.84 |
% |
|
|
|
0.86 |
% |
| Net investment income (loss) to average net assets |
|
|
|
2.63 |
%(C) |
|
|
|
2.18 |
% |
|
|
|
1.37 |
% |
|
|
|
0.81 |
% |
|
|
|
1.04 |
% |
|
|
|
1.67 |
% |
| Portfolio turnover rate |
|
|
|
24 |
%(B) |
|
|
|
18 |
% |
|
|
|
9 |
% |
|
|
|
29 |
% |
|
|
|
128 |
% |
|
|
|
44 |
% |
| (A) |
Calculated based on average number of shares outstanding. |
The Notes to Financial Statements are an integral part of this report.
|
|
|
|
|
| Transamerica Series Trust |
|
|
|
Semi-Annual Financial Statements 2024 |
|
|
Page 6 |
|
|
Transamerica Aegon U.S. Government Securities VP
NOTES TO FINANCIAL STATEMENTS
At June 30, 2024
(unaudited)
1. ORGANIZATION
Transamerica Series Trust (“TST”) is an open-end management investment company registered under the Investment Company Act of 1940, as amended (the “1940 Act”). TST applies investment company accounting and reporting guidance. TST serves as a funding vehicle for variable life insurance, variable annuity, and group annuity products. Transamerica Aegon U.S. Government Securities VP (the “Portfolio”) is a series of TST and is classified as diversified under the 1940 Act. The Portfolio currently offers two classes of shares, Initial Class and Service Class.
The only shareholders of the Portfolio are affiliated insurance company separate accounts and/or affiliated asset allocation portfolios. Contract holders of the variable life and annuity contracts are not shareholders of the Portfolio. For ease of reference, shareholders and contract holders are collectively referred to in this report as “shareholders.”
This report must be accompanied or preceded by the Portfolio’s current prospectus, which contains additional information about the Portfolio, including risks, as well as investment objectives and strategies.
Transamerica Asset Management, Inc. (“TAM”) serves as investment manager for the Portfolio pursuant to an investment management agreement. TAM provides continuous and regular investment management services to the Portfolio. TAM supervises the Portfolio’s investments, conducts its investment program and provides supervisory, compliance and administrative services to the Portfolio.
TAM currently acts as a “manager of managers” and has hired sub-advisers to furnish day-to-day investment advice and recommendations. TAM may, in the future, determine to provide all aspects of the day-to-day management of the Portfolio without the use of a sub-adviser. When acting as a manager of managers, TAM provides investment management services that include, without limitation, the design and development of the Portfolio and its investment strategies and the ongoing review and evaluation of those investment strategies including recommending changes in strategy where it believes appropriate or advisable; the selection of one or more sub-advisers for the Portfolio employing a combination of quantitative and qualitative screens, research, analysis and due diligence; negotiation of sub-advisory agreements and fees; oversight and monitoring of sub-advisers and recommending changes to sub-advisers where it believes appropriate or advisable; recommending portfolio combinations and liquidations where it believes appropriate or advisable; selection and oversight of transition managers, as needed; regular supervision of the Portfolio’s investments; regular review and evaluation of sub-adviser performance; daily monitoring of the sub-advisers’ buying and selling of securities for the Portfolio; regular review of holdings; ongoing trade oversight and analysis; regular monitoring to ensure adherence to investment process; regular calls and periodic on-site visits with sub-advisers; portfolio construction and asset allocation when using multiple sub-advisers for the Portfolio; risk management oversight and analysis; oversight of negotiation of investment documentation and agreements; design, development, implementation and regular monitoring of the valuation process; periodic due diligence reviews of pricing vendors and vendor methodology; design, development, implementation and regular monitoring of the compliance process; respond to regulatory inquiries and determine appropriate litigation strategy, as needed; review of proxies voted by sub-advisers; oversight of preparation and review of materials for meetings of the Portfolio’s Board of Trustees (the “Board”), participation in these meetings and preparation of regular communications with the Board; oversight of preparation and review of prospectuses, shareholder reports and other disclosure materials and regulatory filings for the Portfolio; oversight of other service providers to the Portfolio, such as the custodian, the transfer agent, the Portfolio’s independent accounting firm and legal counsel; supervision of the performance of recordkeeping and shareholder relations functions for the Portfolio; and oversight of cash management services. TAM uses a variety of quantitative and qualitative tools to carry out its investment management services. TAM, not the Portfolio, is responsible for paying the sub-adviser(s) for their services, and sub-advisory fees are TAM’s expense.
TAM’s investment management services also include the provision of supervisory and administrative services to the Portfolio. These services include performing certain administrative services for the Portfolio and supervising and overseeing the administrative, clerical, recordkeeping and bookkeeping services provided to the Portfolio by State Street Bank and Trust Company (“State Street”), to whom TAM has outsourced the provision of certain sub-administration services. To the extent agreed upon by TAM and the Portfolio from time to time, TAM’s supervisory and administrative services include, but are not limited to: monitoring and verifying the custodian’s daily calculation of the Net Asset Values (“NAV”); shareholder relations functions; compliance services; valuation services; assisting in due diligence and in the oversight and monitoring of certain activities of sub-advisers and certain aspects of Portfolio investments; assisting with Portfolio combinations and liquidations; oversight of the preparation and filing, and review, of all returns and reports, in connection with federal, state and local taxes; oversight and review of regulatory reporting; supervising and coordinating the Portfolio’s custodian and dividend disbursing agent and monitoring their services to the Portfolio; assisting the Portfolio in preparing reports to shareholders; acting as liaison with the Portfolio’s independent public accountants and providing, upon request, analyses, fiscal year summaries and other audit related services; assisting in the preparation of agendas and supporting documents for and minutes of meetings of trustees and committees of trustees; assisting in the preparation of regular communications with the trustees; and providing personnel and office space, telephones and other office equipment as necessary in order for TAM to perform supervisory and administrative services to the Portfolio. The Portfolio
|
|
|
|
|
| Transamerica Series Trust |
|
|
|
Semi-Annual Financial Statements 2024 |
|
|
Page 7 |
|
|
Transamerica Aegon U.S. Government Securities VP
NOTES TO FINANCIAL STATEMENTS (continued)
At June 30, 2024
(unaudited)
1. ORGANIZATION (continued)
pays certain fees and expenses to State Street for sub-administration services which are not administrative services covered by the management agreement with TAM or paid for through the management fees payable thereunder. For the period ended June 30, 2024, (i) the expenses paid to State Street for sub-administration services by the Portfolio are shown as a part of Other expenses within the Statement of Operations and (ii) the expenses payable to State Street for sub-administration services from the Portfolio are shown as part of Other accrued expenses within the Statement of Assets and Liabilities.
2. SIGNIFICANT ACCOUNTING POLICIES
In preparing the Portfolio’s financial statements in accordance with Generally Accepted Accounting Principles in the United States of America (“GAAP”), estimates or assumptions (which could differ from actual results) may be used that affect reported amounts and disclosures. The following is a summary of significant accounting policies followed by the Portfolio.
Security transactions and investment income: Security transactions are accounted for on the trade date. Security gains and losses are calculated on a first-in, first-out basis. Dividend income, if any, is recorded on the ex-dividend date or, in the case of foreign securities, as soon as the Portfolio is informed of the ex-dividend dates, net of foreign taxes. Non-cash dividends, if any, are recorded on the ex-dividend date at fair value. Interest income, if any, is recorded on the accrual basis from settlement date, net of foreign taxes. Fixed income premiums and discounts are amortized and/or accreted over the lives of the respective securities.
Multiple class operations, income, and expenses: Income, non-class specific expenses, and realized and unrealized gains and losses are allocated to each class daily based upon net assets. Each class bears its own specific expenses in addition to the allocated non-class specific expenses.
Distributions to shareholders: Distributions are recorded on the ex-dividend date and are determined in accordance with federal income tax regulations, which may differ from GAAP.
Commission recapture: The sub-adviser(s), to the extent consistent with the best execution and usual commission rate policies and practices, may elect to place security transactions of the Portfolio with broker/dealers with which TST has established a commission recapture program. A commission recapture program is any arrangement under which a broker/dealer applies a portion of the commissions received by such broker/dealer on the security transactions to the Portfolio. In no event will commissions, paid by the Portfolio, be used to pay expenses that would otherwise be borne by any other Portfolios within TST, or by any other party.
There were no commissions recaptured during the period ended June 30, 2024 by the Portfolio.
Indemnification: In the normal course of business, the Portfolio enters into contracts that contain a variety of representations that provide general indemnifications. The Portfolio’s maximum exposure under these arrangements is unknown, as this would involve future claims that may be made against the Portfolio and/or its affiliates that have not yet occurred. However, based on experience, the Portfolio expects the risk of loss to be remote.
3. INVESTMENT VALUATION
TAM has been designated as the Portfolio’s valuation designee pursuant to Rule 2a-5 under the 1940 Act with responsibility for fair valuation subject to oversight by the Portfolio’s Board of Trustees. The net asset value of the Portfolio is computed as of the official close of the New York Stock Exchange (“NYSE”) each day the NYSE is open for business.
TAM utilizes various methods to measure the fair value of its investments on a recurring basis. GAAP establishes a hierarchy that prioritizes inputs to valuation methods. The inputs or methodology used for valuing securities are not necessarily an indication of the risk associated with investing in those securities. The three levels (“Levels”) of inputs of the fair value hierarchy are defined as follows:
Level 1—Unadjusted quoted prices in active markets for identical securities.
Level 2—Inputs, other than quoted prices included in Level 1, which are observable, either directly or indirectly. These inputs may include quoted prices for the identical instrument on an inactive market, prices for similar instruments, interest rates, prepayment speeds, credit risk, yield curves, default rates, and similar data.
|
|
|
|
|
| Transamerica Series Trust |
|
|
|
Semi-Annual Financial Statements 2024 |
|
|
Page 8 |
|
|
Transamerica Aegon U.S. Government Securities VP
NOTES TO FINANCIAL STATEMENTS (continued)
At June 30, 2024
(unaudited)
3. INVESTMENT VALUATION (continued)
Level 3—Unobservable inputs based on the best information available in the circumstances, to the extent observable inputs are not available, which may include TAM’s own assumptions used in determining the fair value of the Portfolio’s investments and derivative instruments.
The inputs used to measure fair value may fall into different Levels of the fair value hierarchy. In such cases, for disclosure purposes, the Level in the fair value hierarchy that is assigned to the fair value measurement of a security is determined based on the lowest Level input that is significant to the fair value measurement in its entirety. Certain investments that are measured at fair value using NAV per share, or its equivalent, using the “practical expedient” have not been classified in the fair value Levels. The hierarchy classification of inputs used to value the Portfolio’s investments at June 30, 2024, is disclosed within the Investment Valuation section of the Schedule of Investments.
The availability of observable inputs can vary from security to security and is affected by a wide variety of factors, including, but not limited to, the type of security, whether the security is new and not yet established in the marketplace, the liquidity of markets, and other characteristics particular to the security. To the extent that valuation is based on models or inputs that are less observable or unobservable in the market, the determination of fair value requires more judgment. Accordingly, the degree of judgment exercised in determining fair value is generally greatest for instruments categorized in Level 3. Due to the inherent uncertainty of valuation, the determination of values may differ significantly from values that would have been realized had a ready market for investments existed, and the differences could be material.
Fair value measurements: Descriptions of the valuation techniques applied to the Portfolio’s significant categories of assets and liabilities measured at fair value on a recurring basis are as follows:
Asset-backed securities: The fair value of asset-backed securities is estimated based on models that consider the estimated cash flows of each tranche of the entity, establish a benchmark yield, and develop an estimated tranche specific spread to the benchmark yield based on the unique attributes of the tranche. To the extent the inputs are observable and timely, the values would generally be categorized in Level 2 of the fair value hierarchy; otherwise they would be categorized in Level 3.
Corporate debt securities: The fair value of corporate debt securities is estimated using various techniques, which consider recently executed transactions in securities of the issuer or comparable issuers, market price quotations (where observable), bond spreads, fundamental data relating to the issuer, and credit default swap spreads adjusted for any basis difference between cash and derivative instruments. While most corporate debt securities are categorized in Level 2 of the fair value hierarchy, in instances where lower relative weight is placed on transaction prices, quotations, or similar observable inputs, they are categorized in Level 3.
Mortgage-backed securities: The fair value of mortgage-backed securities is estimated based on models that consider issuer type, coupon, cash flows, mortgage prepayment projection tables and adjustable rate mortgage evaluations that incorporate index data, periodic life caps and the next coupon reset date. To the extent the inputs are observable and timely, the values would generally be categorized in Level 2 of the fair value hierarchy; otherwise they are categorized in Level 3.
Municipal government obligations: The fair value of municipal government obligations and variable rate notes is estimated based on models that consider, among other factors, information received from market makers and broker-dealers, current trades, bid-want lists, offerings, market movements, the liquidity of the bond, state of issuance, benchmark yield curves, and bond or note insurance. To the extent the inputs are observable and timely, the values would generally be categorized in Level 2 of the fair value hierarchy; otherwise they are categorized in Level 3.
U.S. government agency obligations: U.S. government agency obligations are comprised of two main categories consisting of agency issued debt and mortgage pass-throughs. Generally, agency issued debt securities are valued in a manner similar to U.S. government obligations. Mortgage pass-throughs include to be announced (“TBA”) securities and mortgage pass-through certificates. Generally, TBA securities and mortgage pass-throughs are valued using dealer quotations. Depending on market activity levels and whether quotations or other observable data are used, these securities are typically categorized in Level 2 of the fair value hierarchy; otherwise they would be categorized in Level 3.
U.S. government obligations: U.S. government obligations are normally valued using a model that incorporates market observable data such as reported sales of similar securities, broker quotes, yields, bids, offers, and reference data. Certain securities are valued by principally using dealer quotations. U.S. government obligations generally are categorized in Level 2 of the fair value hierarchy, or Level 3 if inputs are unobservable.
|
|
|
|
|
| Transamerica Series Trust |
|
|
|
Semi-Annual Financial Statements 2024 |
|
|
Page 9 |
|
|
Transamerica Aegon U.S. Government Securities VP
NOTES TO FINANCIAL STATEMENTS (continued)
At June 30, 2024
(unaudited)
3. INVESTMENT VALUATION (continued)
Securities lending collateral: Securities lending collateral is invested in a money market fund which is valued at the actively traded NAV and no valuation adjustments are applied. Securities lending collateral is categorized in Level 1 of the fair value hierarchy.
Repurchase agreements: Repurchase agreements are valued at cost, which approximates fair value. To the extent the inputs are observable and timely, the values are generally categorized in Level 2 of the fair value hierarchy.
Derivative instruments: Centrally cleared or listed derivatives that are actively traded are valued based on quoted prices from the exchange and are categorized in Level 1 of the fair value hierarchy. Over-the-counter (“OTC”) derivative contracts include forward, swap, swaption, and option contracts related to interest rates, foreign currencies, credit standing of reference entities, equity prices, or commodity prices. Depending on the product and the terms of the transaction, the fair value of the OTC derivative products are modeled taking into account the counterparties’ creditworthiness and using a series of techniques, including simulation models. Many pricing models do not entail material subjectivity because the methodologies employed do not necessitate significant judgments and the pricing inputs are observed from actively quoted markets, as is the case of interest rate swap and option contracts. The majority of OTC derivative products valued by the Portfolio using pricing models fall into this category and are categorized within Level 2 of the fair value hierarchy or Level 3 if inputs are unobservable.
4. SECURITIES AND OTHER INVESTMENTS
When-issued, delayed-delivery, forward, and to be announced (“TBA”) commitment transactions: The Portfolio may purchase or sell securities on a when-issued, delayed-delivery, forward and TBA commitment basis. When-issued and forward commitment transactions are made conditionally because a security, although authorized, has not yet been issued in the market. Settlement of such transactions normally occurs within a month or more after the purchase or sale commitment is made. The Portfolio engages in when-issued and forward commitment transactions to obtain an advantageous price and yield at the time of the transaction. The Portfolio engages in when-issued and forward commitment transactions for the purpose of acquiring securities, but may enter into a separate agreement to sell the securities before the settlement date. Since the value of securities purchased may fluctuate prior to settlement, the Portfolio may be required to pay more at settlement than the security is worth. In addition, the Portfolio is not entitled to any of the interest earned prior to settlement.
Delayed-delivery transactions involve a commitment by the Portfolio to purchase or sell securities for a predetermined price or yield, with payment and delivery taking place beyond the customary settlement period. When delayed-delivery transactions are outstanding, the Portfolio will segregate with its custodian either cash, U.S. government securities, or other liquid assets at least equal to the value or purchase commitments until payment is made. When purchasing a security on a delayed-delivery basis, the Portfolio assumes the rights and risks of ownership of the security, including the risk of price and yield fluctuations. These transactions also involve a risk to the Portfolio if the other party to the transaction defaults on its obligation to make payment or delivery, and the Portfolio is delayed or prevented from completing the transaction. The Portfolio may dispose of or renegotiate a delayed-delivery transaction after it is entered into, which may result in a realized gain or loss. When the Portfolio sells a security on a delayed-delivery basis, the Portfolio does not participate in future gains and losses on the security.
TBA commitments are entered into to purchase or sell securities for a fixed price at a future date, typically not to exceed 45 days. TBAs are considered securities in themselves, and involve a risk of loss if the value of the security to be purchased declines, or the value of the security sold increases, prior to settlement date, in addition to the risk of decline in the value of a Portfolio’s other assets. Unsettled TBA commitments are valued at the current value of the underlying securities. TBA collateral requirements are typically calculated by netting the mark-to-market amount for each transaction and comparing that amount to the value of the collateral currently pledged by a Portfolio and the counterparty. Cash collateral that has been pledged to cover the obligations of a Portfolio and cash collateral received from the counterparty, if any, is reported separately in the Statement of Assets and Liabilities as Cash collateral pledged at broker for TBA commitments or Cash collateral at broker for TBA commitments, respectively. Non-cash collateral pledged by a Portfolio, if any, is disclosed within the Schedule of Investments. Typically, a Portfolio is permitted to sell, re-pledge or use the collateral it receives; however, the counterparty is not permitted. To the extent amounts due to a Portfolio are not fully collateralized, contractually or otherwise, a Portfolio bears the risk of loss from counterparty non-performance.
When-issued, delayed-delivery, forward and TBA commitment transactions held at June 30, 2024, if any, are identified within the Schedule of Investments. Open trades, if any, are reflected as When-issued, delayed-delivery, forward and TBA commitments purchased or sold within the Statement of Assets and Liabilities.
|
|
|
|
|
| Transamerica Series Trust |
|
|
|
Semi-Annual Financial Statements 2024 |
|
|
Page 10 |
|
|
Transamerica Aegon U.S. Government Securities VP
NOTES TO FINANCIAL STATEMENTS (continued)
At June 30, 2024
(unaudited)
5. BORROWINGS AND OTHER FINANCING TRANSACTIONS
The Portfolio may engage in borrowing transactions as a means of raising cash to satisfy redemption requests, for other temporary or emergency purposes or, to the extent permitted by its investment policies, to raise additional cash to be invested in other securities or instruments. When the Portfolio invests borrowing proceeds in other securities, the Portfolio will bear the risk that the market value of the securities in which such proceeds are invested goes down and is insufficient to repay the borrowed proceeds. The Portfolio may borrow on a secured or on an unsecured basis. If the Portfolio enters into a secured borrowing arrangement, a portion of the Portfolio’s assets will be used as collateral. The 1940 Act requires the Portfolio to maintain asset coverage of at least 300% of the amount of its borrowings. Asset coverage means the ratio that the value of the Portfolio’s total assets, minus liabilities other than borrowings, bears to the aggregate amount of all borrowings. Although complying with this requirement has the effect of limiting the amount that the Portfolio may borrow, it does not otherwise mitigate the risks of entering into borrowing transactions.
Interfund lending: The Portfolio, along with other funds and portfolios advised by TAM, may participate in an interfund lending program pursuant to exemptive relief granted by the Securities and Exchange Commission on January 18, 2017. This program allows the Portfolio to lend to and borrow from other funds and portfolios advised by TAM. Interfund lending transactions are subject to the conditions of the exemptive relief which places limits on the amount of lending or borrowing a Portfolio may participate in under the program. Interest earned or paid on an interfund lending transaction will be based on the average of certain current market rates. For the period ended June 30, 2024, the Portfolio has not utilized the program.
Repurchase agreements: In a repurchase agreement, the Portfolio purchases a security and simultaneously commits to resell that security to the seller at an agreed-upon price on an agreed-upon date. Securities purchased subject to a repurchase agreement are held at the Portfolio’s custodian, or designated sub-custodian related to tri-party repurchase agreements, and, pursuant to the terms of the repurchase agreement, must be collateralized by securities with an aggregate market value greater than or equal to 100% of the resale price. The Portfolio will bear the risk of value fluctuations until the securities can be sold and may encounter delays and incur costs in liquidating the securities. In the event of bankruptcy or insolvency of the seller, delays and costs may be incurred.
Repurchase agreements are subject to netting agreements, which are agreements between the Portfolio and its counterparties that provide for the net settlement of all transactions and collateral with the Portfolio, through a single payment, in the event of default or termination. Amounts presented within the Schedule of Investments, and as part of Repurchase agreements, at value within the Statement of Assets and Liabilities are shown on a gross basis. The value of the related collateral for each repurchase agreement, as reflected within the Schedule of Investments, exceeds the value of each repurchase agreement at June 30, 2024.
Repurchase agreements at June 30, 2024, if any, are included within the Schedule of Investments and Statement of Assets and Liabilities.
Securities lending: The Portfolio may lend securities to qualified financial institutions, brokers and dealers. State Street serves as securities lending agent to the Portfolio pursuant to a Securities Lending Agreement. Loans of securities are terminable at any time and the borrower, after notice, is required to return borrowed securities within the standard time period for settlement of securities transactions. The lending of securities exposes the Portfolio to risks such as: the borrowers may fail to return the loaned securities or may not be able to provide additional collateral, the Portfolio may experience delays in recovery of the loaned securities or delays in access to collateral, or the Portfolio may experience losses related to the investment collateral. To minimize certain risks, loan counterparties pledge cash, securities issued or guaranteed by the U.S. Government and irrevocable letters of credit issued by banks as collateral. The initial collateral received by the Portfolio is required to have a value of at least 102% of the current value of the loaned securities traded on U.S. exchanges, and a value of at least 105% for all other securities. Typically the lending agent is not permitted to sell, re-pledge or use cash and non-cash collateral it receives. The lending agent has agreed to indemnify the Portfolio in the case of default of any securities borrower.
The Portfolio receives compensation for lending securities from interest or dividends earned on the cash, U.S. Government securities and irrevocable letters of credit held as collateral, less associated fees and expenses. Such income is reflected in Net income from securities lending within the Statement of Operations. Cash collateral received is invested in the State Street Navigator Securities Lending Trust — Government Money Market Portfolio.
The value of loaned securities and related cash and non-cash collateral outstanding at June 30, 2024, if any, are shown on a gross basis within the Schedule of Investments.
|
|
|
|
|
| Transamerica Series Trust |
|
|
|
Semi-Annual Financial Statements 2024 |
|
|
Page 11 |
|
|
Transamerica Aegon U.S. Government Securities VP
NOTES TO FINANCIAL STATEMENTS (continued)
At June 30, 2024
(unaudited)
5. BORROWINGS AND OTHER FINANCING TRANSACTIONS (continued)
The following table reflects a breakdown of transactions accounted for as secured borrowings, the gross obligation by the type, and the remaining contractual maturity of those transactions as of June 30, 2024.
|
|
|
|
|
|
|
|
|
|
|
|
|
|
|
|
|
|
|
|
|
| |
|
Remaining Contractual Maturity of the Agreements |
|
|
|
|
|
|
|
| |
|
Overnight and Continuous |
|
|
Less Than 30 Days |
|
|
Between 30 & 90 Days |
|
|
Greater Than 90 Days |
|
|
Total |
|
| |
|
|
|
|
|
|
|
| Securities Lending Transactions |
|
|
|
|
|
|
|
|
|
|
|
|
|
|
|
|
|
|
|
|
| U.S. Government Agency Obligations |
|
$ |
18,052,590 |
|
|
|
$ — |
|
|
|
$ — |
|
|
|
$ — |
|
|
$ |
18,052,590 |
|
| |
|
| Total Borrowings |
|
$ |
18,052,590 |
|
|
|
$ — |
|
|
|
$ — |
|
|
|
$ — |
|
|
$ |
18,052,590 |
|
| |
|
6. RISK EXPOSURES AND THE USE OF DERIVATIVE INSTRUMENTS
The Portfolio’s investment strategies allow the Portfolio to use various types of derivative contracts, including option contracts, swap agreements, futures contracts, and forward foreign currency contracts. Derivatives are investments whose value is primarily derived from underlying assets, indices or reference rates and may be transacted on an exchange or OTC.
Market Risk Factors: In pursuit of the Portfolio’s investment strategies, the Portfolio may seek to use derivatives to increase or decrease its exposure to certain market risks, including:
Interest rate risk: Interest rate risk relates to the fluctuations in the value of fixed income securities due to changes in the prevailing levels of market interest rates.
Foreign exchange rate risk: Foreign exchange rate risk relates to fluctuations in the value of an asset or liability due to changes in the currency exchange rates.
Equity risk: Equity risk relates to the change in value of equity securities as they relate to increases or decreases in the general market.
Credit risk: Credit risk relates to the ability of the issuer of a financial instrument to make further principal or interest payments on an obligation or commitment that it has to the Portfolio.
Commodity risk: Commodity risk relates to the change in value of commodities or commodity indices as they relate to increases or decreases in the commodities market. Commodities are physical assets that have tangible properties. Examples of these types of assets are crude oil, heating oil, metals, livestock, and agricultural products.
The Portfolio is also exposed to additional risks from investing in derivatives, such as liquidity and counterparty credit risk. Liquidity risk is the risk that the Portfolio will be unable to sell or close out the derivative in the open market in a timely manner. Counterparty credit risk is the risk that the counterparty will not be able to fulfill its obligations to the Portfolio. Investing in derivatives may also involve greater risks than investing directly in the underlying assets, such as losses in excess of any initial investment and collateral received. In addition, there may be the risk that the change in value of the derivative contract does not correspond to the change in value of the underlying instrument.
The Portfolio’s exposure to market risk factors and certain other associated risks are summarized by derivative type as follows:
Futures contracts: The Portfolio is subject to equity risk, credit risk, commodity risk, interest rate risk and foreign exchange rate risk in the normal course of pursuing its investment objective. The Portfolio uses futures contracts to gain exposure to, or hedge against, changes in the value of equities and commodities, interest rates, or foreign currencies. A futures contract represents a commitment for the future purchase or sale of an asset at a specified price on a specified date. Upon entering into such contracts, the Portfolio is required to deposit with the broker, either in cash or in securities, an initial margin in an amount equal to a certain percentage of the contract amount. Subsequent payments (variation margin) are paid or received by the Portfolio, depending on the daily fluctuations in the value of the contract, and are recorded for financial statement purposes as unrealized gains or losses by the Portfolio. Upon entering into such contracts, the Portfolio bears the risk of equity and commodity prices, interest rates, or exchange rates moving unexpectedly, in which case, the Portfolio may not achieve the anticipated benefits of the futures contracts and may realize losses. With futures, there is minimal counterparty credit risk to the Portfolio since futures are exchange-traded and the exchange’s clearinghouse, as counterparty to all exchange-traded futures, guarantees the futures against default. Futures contracts are generally entered into on a regulated futures exchange and cleared through a clearinghouse associated with the exchange.
|
|
|
|
|
| Transamerica Series Trust |
|
|
|
Semi-Annual Financial Statements 2024 |
|
|
Page 12 |
|
|
Transamerica Aegon U.S. Government Securities VP
NOTES TO FINANCIAL STATEMENTS (continued)
At June 30, 2024
(unaudited)
6. RISK EXPOSURES AND THE USE OF DERIVATIVE INSTRUMENTS (continued)
Open futures contracts at June 30, 2024 are listed within the Schedule of Investments. Variation margin, if applicable, is shown in Variation margin receivable or payable on futures contracts within the Statement of Assets and Liabilities.
The following is a summary of the location and the Portfolio’s fair values of derivative investments disclosed within the Statement of Assets and Liabilities, categorized by primary market risk exposure as of June 30, 2024.
|
|
|
|
|
|
|
|
|
|
|
|
|
|
|
|
|
|
|
|
|
|
|
|
|
| Asset Derivatives |
|
| |
|
|
|
|
|
|
|
|
| Location |
|
Interest Rate Contracts |
|
|
Foreign Exchange Contracts |
|
|
Equity Contracts |
|
|
Credit Contracts |
|
|
Commodity Contracts |
|
|
Total |
|
| |
|
|
|
|
|
|
|
|
| Futures contracts: |
|
|
|
|
|
|
|
|
|
|
|
|
|
|
|
|
|
|
|
|
|
|
|
|
| Total distributable earnings
(accumulated losses) (A)(B) |
|
$ |
249,377 |
|
|
|
$ — |
|
|
|
$ — |
|
|
|
$ — |
|
|
|
$ — |
|
|
$ |
249,377 |
|
| |
|
|
|
|
|
|
|
|
| Total |
|
$ |
249,377 |
|
|
|
$ — |
|
|
|
$ — |
|
|
|
$ — |
|
|
|
$ — |
|
|
$ |
249,377 |
|
| |
|
|
|
|
|
|
|
|
|
|
|
|
|
|
|
|
|
|
|
|
|
|
|
|
|
|
| Liability Derivatives |
|
| |
|
|
|
|
|
|
|
|
| Location |
|
Interest Rate Contracts |
|
|
Foreign Exchange Contracts |
|
|
Equity Contracts |
|
|
Credit Contracts |
|
|
Commodity Contracts |
|
|
Total |
|
| |
|
|
|
|
|
|
|
|
| Futures contracts: |
|
|
|
|
|
|
|
|
|
|
|
|
|
|
|
|
|
|
|
|
|
|
|
|
| Total distributable earnings
(accumulated losses) (A)(B) |
|
$ |
(34,959) |
|
|
|
$ — |
|
|
|
$ — |
|
|
|
$ — |
|
|
|
$ — |
|
|
$ |
(34,959) |
|
| |
|
|
|
|
|
|
|
|
| Total |
|
$ |
(34,959) |
|
|
|
$ — |
|
|
|
$ — |
|
|
|
$ — |
|
|
|
$ — |
|
|
$ |
(34,959) |
|
| |
|
| (A) |
May include exchange-traded derivatives which are not subject to a master netting arrangement, or another similar arrangement. |
| (B) |
Included within unrealized appreciation (depreciation) on futures contracts as reported in the Schedule of Investments. Only current day’s variation margin is reported within the Statement of Assets and Liabilities. |
The following is a summary of the location and the effect of derivative investments within the Statement of Operations, categorized by primary market risk exposure as of June 30, 2024.
|
|
|
|
|
|
|
|
|
|
|
|
|
|
|
|
|
| Realized Gain (Loss) on Derivative Instruments |
|
| |
|
|
|
|
|
|
|
|
| Location |
|
Interest Rate Contracts |
|
|
Foreign Exchange Contracts |
|
Equity Contracts |
|
Credit Contracts |
|
Commodity Contracts |
|
Total |
|
| |
|
|
|
|
|
|
|
|
| Futures contracts |
|
$ |
(236,560) |
|
|
$ — |
|
$ — |
|
$ — |
|
$ — |
|
$ |
(236,560) |
|
| |
|
|
|
|
|
|
|
|
| Total |
|
$ |
(236,560) |
|
|
$ — |
|
$ — |
|
$ — |
|
$ — |
|
$ |
(236,560) |
|
| |
|
|
|
|
|
|
|
|
|
|
|
|
|
|
|
|
|
|
| Net Change in Unrealized Appreciation (Depreciation) on Derivative Instruments |
|
| |
|
|
|
|
|
|
|
|
| Location |
|
Interest Rate Contracts |
|
|
Foreign Exchange Contracts |
|
Equity Contracts |
|
Credit Contracts |
|
Commodity Contracts |
|
Total |
|
| |
|
|
|
|
|
|
|
|
| Futures contracts |
|
$ |
(1,345,681) |
|
|
$ — |
|
$ — |
|
$ — |
|
$ — |
|
$ |
(1,345,681) |
|
| |
|
|
|
|
|
|
|
|
| Total |
|
$ |
(1,345,681) |
|
|
$ — |
|
$ — |
|
$ — |
|
$ — |
|
$ |
(1,345,681) |
|
| |
|
|
|
|
|
|
| Transamerica Series Trust |
|
|
|
Semi-Annual Financial Statements 2024 |
|
|
Page 13 |
|
|
Transamerica Aegon U.S. Government Securities VP
NOTES TO FINANCIAL STATEMENTS (continued)
At June 30, 2024
(unaudited)
6. RISK EXPOSURES AND THE USE OF DERIVATIVE INSTRUMENTS (continued)
The following is a summary of the ending monthly average volume on derivative activity during the period ended June 30, 2024.
|
|
|
|
|
| Futures contracts: |
|
|
|
|
| Average notional value of contracts — long |
|
$ |
48,350,580 |
|
| Average notional value of contracts — short |
|
|
(3,976,953 |
) |
Collateral requirements: Collateral or margin requirements are set by the broker or exchange clearing house for exchange-traded derivatives (futures contracts, exchange-traded options, and exchange-traded swap agreements) while collateral terms are contract specific for OTC derivatives (forward foreign currency exchange contracts, OTC options, and OTC swap agreements). For OTC derivatives, under standard derivatives agreements, the Portfolio may be required to pledge collateral on derivatives to a counterparty if the Portfolio is in a net liability position, and receive collateral if in a net positive position. For financial reporting purposes, cash collateral that has been pledged by the Portfolio to cover obligations, if any, is reported in Cash collateral at broker within the Statement of Assets and Liabilities. Cash collateral that has been received by the Portfolio from a counterparty, if any, is reported separately in Cash collateral pledged at custodian and/or broker within the Statement of Assets and Liabilities. Non-cash collateral pledged to the Portfolio, if any, is disclosed within the Schedule of Investments.
Generally, the amount of collateral due from or to a party must exceed a minimum transfer amount threshold before a transfer has been made. Typically a counterparty is not permitted to sell, re-pledge or use cash and non-cash collateral it receives. The Portfolio generally does not use non-cash collateral that it receives but may, absent default or certain other circumstances, be permitted to use cash collateral received. In such cases, interest may be paid pursuant to the collateral arrangement with the counterparty.
To the extent amounts due to the Portfolio from its counterparties are not fully collateralized, contractually or otherwise, the Portfolio bears the risk of loss from counterparty non-performance. Additionally, to the extent the Portfolio has delivered collateral to a counterparty, the Portfolio bears the risk of loss from a counterparty in the event the counterparty fails to return such collateral. Counterparties may immediately terminate derivatives contracts if the Portfolio fails to maintain sufficient asset coverage for its contracts or its net assets decline by stated percentages. Collateral may not be required for all derivative contracts.
7. RISK FACTORS
Investing in the Portfolio involves certain key risks related to the Portfolio’s trading activity. Please reference the Portfolio’s prospectus for a more complete discussion of the following risk(s), as well as other risks of investing in the Portfolio.
Market risk: The market prices of the Portfolio’s securities or other assets may go up or down, sometimes rapidly or unpredictably, due to factors such as economic events, inflation, changes in interest rates, governmental actions or interventions, actions taken by the U.S. Federal Reserve or foreign central banks, market disruptions caused by tariffs, trade disputes or other factors, political developments, armed conflicts, economic sanctions, cybersecurity events, investor sentiment, the global and domestic effects of widespread or local health, weather or climate events, and other factors that may or may not be related to the issuer of the security or other asset. If the market prices of the Portfolio’s securities and assets fall, the value of your investment in the Portfolio could go down.
Economies and financial markets throughout the world are increasingly interconnected. Events or circumstances in one or more countries or regions could be highly disruptive to, and have profound impacts on, global economies or markets. As a result, whether or not the Portfolio invests in securities of issuers located in or with significant exposure to the countries directly affected, the value and liquidity of the Portfolio’s investments may go down.
Interest rate risk: The value of fixed-income securities generally goes down when interest rates rise. A rise in rates tends to have a greater impact on the prices of longer term or duration securities. Changes in interest rates also may affect the liquidity of the Portfolio’s investments. A general rise in interest rates may cause investors to sell fixed-income securities on a large scale, which could adversely affect the price and liquidity of fixed-income securities generally and could also result in increased redemptions from the Portfolio. Increased redemptions could cause the Portfolio to sell securities at inopportune times or depressed prices and result in further losses. The U.S. Federal Reserve has raised interest rates from historically low levels. Any additional interest rate increases in the future may cause the value of fixed-income securities to decrease.
U.S. government securities risk: Securities backed by the Treasury or the full faith and credit of the U.S. government are guaranteed only as to the timely payment of interest and principal when held to maturity. Accordingly, the current market values for these securities will fluctuate with changes in interest rates and the financial condition or credit rating of the U.S. government. Not withstanding that these
|
|
|
|
|
| Transamerica Series Trust |
|
|
|
Semi-Annual Financial Statements 2024 |
|
|
Page 14 |
|
|
Transamerica Aegon U.S. Government Securities VP
NOTES TO FINANCIAL STATEMENTS (continued)
At June 30, 2024
(unaudited)
7. RISK FACTORS (continued)
securities are backed by the full faith and credit of the U.S. government, circumstances could arise that would prevent the payment of interest or principal. Securities issued by U.S. government-sponsored entities and federal agencies and instrumentalities that are not backed by the full faith and credit of the U.S. government are neither issued nor guaranteed by the U.S. government. U.S. government securities are subject to market risk, interest rate risk and credit risk.
8. FEES AND OTHER AFFILIATED TRANSACTIONS
TST serves as a funding vehicle for certain affiliated asset allocation portfolios and certain affiliated separate accounts of Transamerica Life Insurance Company (“TLIC”) and Transamerica Financial Life Insurance Company.
TAM, the Portfolio’s investment manager, is directly owned by TLIC and AUSA Holding, LLC (“AUSA”), both of which are indirect, wholly owned subsidiaries of Aegon Ltd. TLIC is owned by Commonwealth General Corporation (“Commonwealth”). Commonwealth and AUSA are wholly owned by Transamerica Corporation (DE). Transamerica Corporation (DE) is wholly owned by Aegon International B.V., which is wholly owned by Aegon Ltd., a Bermuda exempted company with liability limited by shares (formerly, Aegon NV, a Netherlands corporation) and a publicly traded international insurance group.
TAM has entered into a sub-advisory agreement with Aegon USA Investment Management, LLC (“AUIM”), an affiliate of TAM. AUIM provides day-to-day portfolio management services to the Portfolio, subject to the supervision of TAM. TAM is responsible for compensating the sub-adviser for its services.
Transamerica Fund Services, Inc. (“TFS”) is the Portfolio’s transfer agent. Transamerica Capital, Inc. (“TCI”) is the Portfolio’s distributor/principal underwriter. TAM, AUIM, TFS, and TCI are affiliates of Aegon Ltd.
Certain officers and trustees of the Portfolio may also be officers and/or trustees of TAM, AUIM, TFS and TCI. No interested trustee who is deemed an interested person due to current or former service with TAM or an affiliate of TAM receives compensation from the Portfolio. The Portfolio does pay non-interested persons (independent trustees), as disclosed in Trustee and CCO fees within the Statement of Operations.
Investment management fees: TAM serves as the Portfolio’s investment manager, performing administration as well as investment advisory services. TAM renders investment advisory, supervisory, and administration services under an investment management agreement and the Portfolio pays a single management fee, which is reflected in Investment management fees within the Statement of Operations.
The Portfolio pays a management fee to TAM based on daily average net assets at the following rates:
|
|
|
|
|
| Breakpoints |
|
Rate |
| First $250 million |
|
|
0.515 |
% |
| Over $250 million up to $500 million |
|
|
0.510 |
|
| Over $500 million up to $1 billion |
|
|
0.480 |
|
| Over $1 billion |
|
|
0.470 |
|
TAM has contractually agreed to waive fees and/or reimburse Portfolio expenses to the extent that the total operating expenses excluding, as applicable, acquired fund fees and expenses, interest (including borrowing costs and overdraft charges), taxes, brokerage commissions, dividend and interest expenses on securities sold short, extraordinary expenses and other expenses not incurred in the ordinary course of the Portfolio’s business, exceed the following stated annual operating expense limits to the Portfolio’s daily average net assets. To the extent an expense limit changed during the period, the prior limit is also listed below. The expenses waived and/or reimbursed, if any, are included in Expenses waived and/or reimbursed within the Statement of Operations.
|
|
|
|
|
| Class |
|
Operating Expense Limit |
|
Operating Expense Limit Effective Through |
| Initial Class |
|
0.56% |
|
May 1, 2025 |
| Service Class |
|
0.81 |
|
May 1, 2025 |
|
|
|
|
|
| Transamerica Series Trust |
|
|
|
Semi-Annual Financial Statements 2024 |
|
|
Page 15 |
|
|
Transamerica Aegon U.S. Government Securities VP
NOTES TO FINANCIAL STATEMENTS (continued)
At June 30, 2024
(unaudited)
8. FEES AND OTHER AFFILIATED TRANSACTIONS (continued)
TAM is permitted to recapture amounts contractually waived and/or reimbursed to a class during any of the 36 months from the date on which TAM waived fees and/or reimbursed expenses for the class. A class may recapture and reimburse TAM only if such amount does not cause, on any particular business day of the Portfolio, the class’s total annual operating expenses (after the recapture is taken into account) to exceed the Operating Expense Limits or any other lower limit then in effect. Amounts recaptured, if any, by TAM for the period ended June 30, 2024 are disclosed in Recapture of previously waived and/or reimbursed fees within the Statement of Operations.
TAM, on a voluntary basis and in addition to the contractual operating expense limits in effect, from time to time may waive and/or reimburse expenses of the Portfolio, or any classes thereof, to such level(s) as the Trust’s officers have determined or may reasonably determine from time to time. Any such voluntary waiver or expense reimbursement may be discontinued by TAM at any time. These amounts are not subject to recapture by TAM.
For the 36-month period ended June 30, 2024, the balances available for recapture by TAM for the Portfolio are as follows:
|
|
|
|
|
|
|
|
|
|
|
| |
|
Amounts Available |
|
|
|
|
|
|
|
|
| |
|
2021 |
|
2022 |
|
2023 |
|
2024 |
|
Total |
|
|
|
|
|
|
| Initial Class |
|
$ — |
|
$ — |
|
$ 4,025 |
|
$ 5,589 |
|
$ 9,614 |
| Service Class |
|
— |
|
— |
|
17,118 |
|
20,320 |
|
37,438 |
Distribution and service fees: TST has a distribution plan (“Distribution Plan”) pursuant to Rule 12b-1 under the 1940 Act. Pursuant to the Distribution Plan, TST entered into a distribution agreement with TCI as the Portfolio’s distributor.
The Distribution Plan requires the Portfolio to pay distribution fees to TCI as compensation for various distribution activities, not as reimbursement for specific expenses. Under the Distribution Plan and distribution agreement, TCI, on behalf of the Portfolio, is authorized to pay various service providers, as direct payment for expenses incurred in connection with distribution of the Portfolio’s shares.
The fee on the Service Class shares is paid to the insurance companies for providing services and account maintenance for the policyholders who invest in the variable insurance products which invest in the Service Class shares. TCI has determined that it will not seek payment for the distribution expenses incurred by the Portfolio with respect to the Initial Class shares before May 1, 2025. Prior to TCI seeking distribution expenses on Initial Class shares, policy and contract owners will be notified in advance. The Portfolio will pay fees relating to Service Class shares. The distribution and service fees are included in Distribution and service fees within the Statement of Operations.
The Portfolio is authorized under the Distribution Plan to pay fees to TCI based on daily average net assets of each applicable class up to the following annual rates:
|
|
|
|
|
| Class |
|
Rate |
|
|
| Initial Class |
|
|
0.15 |
% |
| Service Class |
|
|
0.25 |
|
Transfer agent costs: TFS provides transfer agency services under an intercompany agreement with TAM. TFS has outsourced the provision of certain sub-transfer agency services to SS&C Global Investor & Distribution Solutions, Inc. (“SS&C GIDS”). The Portfolio does not pay a separate transfer agent fee to TAM or TFS but does pay certain expenses to SS&C GIDS related to applicable sub-transfer agency services. For the period ended June 30, 2024, (i) the expenses paid to SS&C GIDS by the Portfolio are referred to as transfer agent costs and are included within the Statement of Operations and (ii) the expenses payable to SS&C GIDS by the Portfolio are referred to as transfer agent costs within the Statement of Assets and Liabilities.
Brokerage commissions: The Portfolio incurred no brokerage commissions on security transactions placed with affiliates of the investment manager or sub-adviser(s) for the period ended June 30, 2024.
|
|
|
|
|
| Transamerica Series Trust |
|
|
|
Semi-Annual Financial Statements 2024 |
|
|
Page 16 |
|
|
Transamerica Aegon U.S. Government Securities VP
NOTES TO FINANCIAL STATEMENTS (continued)
At June 30, 2024
(unaudited)
9. PURCHASES AND SALES OF SECURITIES
For the period ended June 30, 2024, the cost of securities purchased and proceeds from securities sold (excluding short-term securities) are as follows:
|
|
|
|
|
|
|
| Purchases of Securities |
|
Sales/Maturities of Securities |
|
|
|
|
| Long-Term |
|
U.S. Government |
|
Long-Term |
|
U.S. Government |
| |
|
|
|
|
| $ 4,746,825 |
|
$ 57,614,021 |
|
$ 4,719,064 |
|
$ 90,507,061 |
10. FEDERAL INCOME TAXES AND DISTRIBUTIONS TO SHAREHOLDERS
The Portfolio has not made any provision for federal income or excise taxes due to its policy to distribute all of its taxable income and capital gains to its shareholders and otherwise qualify as a regulated investment company under Subchapter M of the Internal Revenue Code. The Portfolio recognizes the tax benefits of uncertain tax positions only where the position is “more likely than not” to be sustained assuming examination by tax authorities. The Portfolio’s tax returns remain subject to examination by the Internal Revenue Service and state tax authorities three years from the date of filing for federal purposes and four years from the date of filing for state purposes. Management has evaluated the Portfolio’s tax provisions taken for all open tax years, and has concluded that no provision for income tax is required in the Portfolio’s financial statements. If applicable, the Portfolio recognizes interest accrued related to unrecognized tax benefits in relation to interest and penalties expense in Other within the Statement of Operations. The Portfolio identifies its major tax jurisdictions as U.S. Federal, the state of Colorado, and foreign jurisdictions where the Portfolio makes significant investments; however, the Portfolio is not aware of any tax positions for which it is reasonably possible that the total amounts of unrecognized tax benefits will change materially in the next twelve months. Distributions are determined in accordance with income tax regulations, which may differ from GAAP.
As of June 30, 2024, the approximate cost for U.S. federal income tax purposes, and the aggregate gross/net unrealized appreciation (depreciation) in the value of investments (including securities sold short and derivatives, if any) are as follows:
|
|
|
|
|
|
|
| Cost |
|
Gross Appreciation |
|
Gross (Depreciation) |
|
Net Appreciation (Depreciation) |
|
|
|
|
| $ 312,543,325 |
|
$ 881,234 |
|
$ (17,820,550) |
|
$ (16,939,316) |
Please see TST’s most recent report on Form N-CSR, available at: www.transamerica.com/annuities/prospectus, for additional information. For the most recently filed complete proxy voting records for the Trust please visit: https://www.transamerica.com/sites/default/files/files/e070d/TST%20N-PX%202021.pdf
|
|
|
|
|
| Transamerica Series Trust |
|
|
|
Semi-Annual Financial Statements 2024 |
|
|
Page 17 |
|
|
Transamerica Aegon U.S. Government Securities VP
MANAGEMENT AND SUB-ADVISORY AGREEMENT — CONTRACT RENEWAL
(unaudited)
At a meeting of the Board of Trustees of Transamerica Series Trust (the “Trustees” or the “Board”) held on June 12-13, 2024, the Board considered the renewal of the management agreement (the “Management Agreement”) between Transamerica Asset Management, Inc. (“TAM”) and Transamerica Series Trust, on behalf of Transamerica Aegon U.S. Government Securities VP (the “Portfolio”). The Board also considered the renewal of the investment sub-advisory agreement (the “Sub-Advisory Agreement” and together with the Management Agreement, the “Agreements”) for the Portfolio between TAM and Aegon USA Investment Management, LLC (the “Sub-Adviser”).
Following its review and consideration, the Board determined that the terms of the Management Agreement and Sub-Advisory Agreement were reasonable and that the renewal of each of the Agreements was in the best interests of the Portfolio and the holders invested in the Portfolio. The Board, including the independent members of the Board (the “Independent Trustees”), unanimously approved the renewal of each of the Agreements through June 30, 2025.
Prior to reaching their decision, the Trustees requested and received from TAM and the Sub-Adviser certain information. They then reviewed such information as they deemed reasonably necessary to evaluate the Agreements, including information they had previously received from TAM and the Sub-Adviser as part of their regular oversight of the Portfolio, and knowledge they gained over time through meeting with TAM and the Sub-Adviser. Among other materials, the Trustees considered comparative fee, expense and performance information prepared by Broadridge Financial Solutions, Inc. (“Broadridge”), an independent provider of mutual fund performance information, as well as fee, expense and profitability information prepared by TAM. In addition, TAM provided the Board with additional supplemental comparative performance information. To the extent applicable, the Trustees considered information about fees and performance of comparable funds and/or accounts managed by the Sub-Adviser. The Board also considered reductions to the Portfolio’s expense limits, if any, that took effect after the last renewal of the Agreements. In their review, the Trustees also sought to identify instances in which the Portfolio’s performance, fees, total expenses and/or profitability appeared to be outliers within its respective peer group or other comparative metrics and sought to understand the reasons for such comparative positions.
In their deliberations, the Independent Trustees met privately without representatives of TAM or the Sub-Adviser present and were represented throughout the process by their independent legal counsel. In considering the proposed continuation of each of the Agreements, the Trustees evaluated and weighed a number of considerations that they believed to be relevant in light of the legal advice furnished to them by counsel, including independent legal counsel, and made a decision in the exercise of their own business judgment. They based their decisions on the considerations discussed below, among others, although they did not identify any particular consideration or item of information that was controlling of their decisions, and each Trustee may have attributed different weights to the various factors.
Nature, Extent and Quality of the Services Provided
The Board considered the nature, extent and quality of the services provided by TAM and the Sub-Adviser to the Portfolio in the past and the services anticipated to be provided in the future. The Board also considered the investment approach for the Portfolio; the experience, capability and integrity of TAM’s senior management; the financial resources of TAM; TAM’s management oversight process; TAM’s and the Sub-Adviser’s responsiveness to any questions by the Trustees; and the professional qualifications and compensation program of the portfolio management team of the Sub-Adviser. The Trustees noted that they receive, on a quarterly basis, an execution analysis from Capital Institutional Services, Inc. (CAPIS), an independent provider of trade analyses, for the Sub-Adviser and a comparison of trading results against a peer universe of managers.
The Board also considered the continuous and regular investment management and other services provided by TAM, when acting as a manager of managers, for the portion of the management fee it retains from the Portfolio after payment of the sub-advisory fees. The Board noted that the investment management and other services provided by TAM include the design, development and ongoing review and evaluation of the Portfolio and its investment strategy; the selection, oversight and monitoring of one or more investment sub-advisers to perform certain duties with respect to the Portfolio; ongoing portfolio trading oversight and analysis; risk management oversight and analysis; design, development, implementation and ongoing review and evaluation of a process for the valuation of Portfolio investments; design, development, implementation and ongoing review and evaluation of a compliance program for the Portfolio; design, development, implementation and ongoing review and evaluation of a process for the voting of proxies and exercise of rights to consent to corporate action for Portfolio investments; participation in Board meetings and oversight of preparation of materials for the Board, including materials for Board meetings and regular communications with the Board; oversight of preparation of the Portfolio’s prospectus, statement of additional information, shareholder reports and other disclosure materials and regulatory filings for the Portfolio; and ongoing cash management services for the Portfolio. The Board considered that TAM’s investment management services also include the provision of supervisory and administrative services to the Portfolio. The Board also noted that TAM, as part of the services it provides to all Transamerica mutual funds, including the Portfolio, oversees the services provided by the funds’ custodian, transfer agent, independent accountant and legal counsel and supervises the performance of the recordkeeping and holder service functions of the funds.
Investment Performance
In addition, the Board considered the short- and longer-term performance of the Portfolio in light of its investment objective, policies and strategies, including relative performance against (i) a peer universe of comparable mutual funds, as prepared by Broadridge, and (ii) the Portfolio’s benchmarks, in each case for various trailing periods ended December 31, 2023. Based on these considerations, the Board determined that TAM and the Sub-Adviser can provide investment and related services that are appropriate in scope and extent in light of
|
|
|
|
|
| Transamerica Series Trust |
|
|
|
Semi-Annual Financial Statements 2024 |
|
|
Page 18 |
|
|
Transamerica Aegon U.S. Government Securities VP
MANAGEMENT AND SUB-ADVISORY AGREEMENT — CONTRACT RENEWAL (continued)
(unaudited)
the Portfolio’s investment objectives, policies and strategies and operations, the competitive landscape of the investment company business and investor needs. The Board’s conclusions as to the Portfolio’s performance are summarized below. For purposes of its review, the Board generally used the performance of Service Class Shares. In describing the Portfolio’s performance relative to its peer universe, the summary conclusions characterize performance for the relevant periods in relation to whether it was “above,” “below” or “in line with” the peer universe median and do so using quintile rankings prepared by Broadridge. For simplicity, performance is described as “above” the median if the Portfolio’s performance ranked anywhere in the first or second quintiles, as “below” the median if it ranked anywhere in the fourth or fifth quintiles, or “in line with” the median if it ranked anywhere in the third quintile (i.e., even if its precise return was somewhat above or somewhat below the precise median return).
When considering the Portfolio’s performance, the Trustees considered any representations made by TAM regarding the appropriateness of certain peer groups and benchmarks. They recognized that performance reflects a snapshot of a period as of a specific date, and that consideration of performance data for a different period could generate significantly different performance results. The Trustees also recognized that even longer-term performance can be negatively affected by performance over a short-term period when that short-term performance is significantly below the performance of the comparable benchmark or universe of peer funds.
The Board noted that the performance of Service Class Shares of the Portfolio was below the median for its peer universe and below the benchmark that TAM utilizes to measure performance of the Portfolio, each for the past 1-, 3-, 5- and 10-year periods. The Trustees also noted recent changes in the legal and compliance team at the Sub-Adviser.
Management Fee and Sub-Advisory Fees and Total Expense Ratio
The Board considered the management fee and total expense ratio of the Portfolio, including information provided by Broadridge comparing the management fee and total expense ratio of the Portfolio to the management fees and total expense ratios of comparable investment companies in both a peer group and broader peer universe compiled by Broadridge. The Board’s conclusions as to the Portfolio’s management fee and total expense ratio are summarized below. For purposes of its review, the Board generally used the actual total expenses (i.e., expenses reflecting any waivers and/or reimbursements) of Service Class Shares. In describing the Portfolio’s management fee and total expense ratio relative to its peer group and peer universe, the summary conclusions characterize management fees and total expense ratios for the relevant periods in relation to whether they were “above,” “below” or “in line with” the peer group or peer universe median and do so using quintile rankings prepared by Broadridge. For simplicity, management fees and total expense ratios are described as “above” the median if the Portfolio’s management fee or total expense ratio ranked anywhere in the fourth or fifth quintiles, as “below” the median if it ranked anywhere in the first or second quintiles, or “in line with” the median if it ranked anywhere in the third quintile (i.e., even if its precise management fee or total expense ratio was somewhat above or somewhat below the precise median management fee or total expense ratio).
The Board also considered the fees charged by the Sub-Adviser for sub-advisory services, as well as the portion of the Portfolio’s management fee retained by TAM following payment of the sub-advisory fee and how the portion of the contractual management fee retained by TAM at a specified asset level compared to the portions retained by other investment advisers managing mutual funds with similar investment strategies as calculated by an independent provider of information.
The Board noted that the Portfolio’s contractual management fee was below the median for its peer group and in line with the median for its peer universe and that the actual total expenses (i.e., expenses reflecting any waivers and/or reimbursements) of Service Class Shares of the Portfolio were above the medians for its peer group and peer universe. The Trustees also considered that TAM has entered into an expense limitation arrangement with the Portfolio, which may result in TAM waiving fees for the benefit of holders. The Trustees noted that they had previously approved a reduction to the Portfolio’s management fee schedule, which took effect on November 1, 2023 and was not fully reflected in the comparative data.
On the basis of these considerations, together with the other information it considered, the Board determined that the management and sub-advisory fees to be received by TAM and the Sub-Adviser under the Management Agreement and Sub-Advisory Agreement are reasonable in light of the services provided.
Cost of Services Provided and Level of Profitability
The Board reviewed information provided by TAM about the cost of providing and procuring fund management services, as well as the costs of the provision of administration, transfer agency and other services, to the Portfolio and to Transamerica Series Trust as a whole by TAM and its affiliates. The Board considered the profitability of TAM and its affiliates in providing these services for the Portfolio and Transamerica Series Trust as a whole. The Trustees recognized the competitiveness of the mutual fund industry and the importance of an investment adviser’s long-term profitability, including for maintaining company and management stability and accountability.
The Board also considered the allocation methodology used for calculating the profitability of TAM and its affiliates. The Board noted that the revenue and expense allocation methodology used by TAM to estimate its profitability with respect to its relationship with the Portfolio had been reviewed previously by an independent consultant. The Trustees considered that TAM reported that it had not made material changes to this methodology, and that the methodology had been applied consistently for the Portfolio.
|
|
|
|
|
| Transamerica Series Trust |
|
|
|
Semi-Annual Financial Statements 2024 |
|
|
Page 19 |
|
|
Transamerica Aegon U.S. Government Securities VP
MANAGEMENT AND SUB-ADVISORY AGREEMENT — CONTRACT RENEWAL (continued)
(unaudited)
With respect to the Sub-Adviser, the Board noted that information about the Sub-Adviser’s revenues and expenses was incorporated into the profitability analysis for TAM and its affiliates with respect to the Portfolio. As a result, the Board focused on profitability information for TAM and its affiliates and the Sub-Adviser in the aggregate.
Based on this information, the Board determined that the profitability of TAM and its affiliates from their relationships with the Portfolio was not excessive.
Economies of Scale
The Board considered economies of scale with respect to the management of the Portfolio, whether the Portfolio had appropriately benefited from any economies of scale and whether there was the potential for realization of any future economies of scale. The Board also considered the existence of economies of scale with respect to management of the Transamerica mutual funds overall and the extent to which the Portfolio benefited from any economies of scale. The Board recognized that, as the Portfolio’s assets increase, any economies of scale realized by TAM or the Sub-Adviser may not directly correlate with each other or with any economies of scale that might be realized by the Portfolio. The Board considered the Portfolio’s management fee schedule and the existence of breakpoints and also considered the extent to which TAM shared economies of scale, if any, with the Portfolio through undertakings to limit or reimburse Portfolio expenses and to invest in maintaining and developing its capabilities and services. The Board also considered the Sub-Adviser’s sub-advisory fee schedule and the existence of breakpoints, if any, and how such breakpoints relate to any breakpoints in the Portfolio’s management fee schedule. The Trustees concluded that the Portfolio’s fee structure reflected an appropriate sharing of any efficiencies or economies of scale to date and noted that they will have the opportunity to periodically reexamine the appropriateness of the management fee payable to TAM and the fee paid to the Sub-Adviser in light of any economies of scale experienced in the future.
Benefits to TAM, its Affiliates and/or the Sub-Adviser from their Relationships with the Portfolio
The Board considered other benefits derived by TAM, its affiliates, and/or the Sub-Adviser from their relationships with the Portfolio. The Board noted that TAM does not receive benefits from research obtained with commissions paid to broker-dealers for portfolio transactions (commonly referred to as “soft dollars”) as a result of its relationship with the Portfolio.
Other Considerations
The Board noted that TAM has made a substantial commitment to the recruitment and retention of high-quality personnel and maintains the financial, compliance and operational resources reasonably necessary to manage the Portfolio in a professional manner that is consistent with the best interests of the Portfolio and the holders. In this regard, the Board favorably considered the procedures and policies TAM has in place to enforce compliance with applicable laws and regulations and oversee the portfolio management activities of the Sub-Adviser. The Board also noted that TAM has made an entrepreneurial commitment and undertaken certain business risks with respect to the management and success of the Portfolio.
Conclusion
After consideration of the factors described above, as well as other factors, the Trustees, including the Independent Trustees, concluded that the renewal of the Management Agreement and the Sub-Advisory Agreement was in the best interests of the Portfolio and the holders and voted to approve the renewal of the Agreements.
|
|
|
|
|
| Transamerica Series Trust |
|
|
|
Semi-Annual Financial Statements 2024 |
|
|
Page 20 |
|
|
PROXY VOTING POLICIES AND PROCEDURES AND QUARTERLY PORTFOLIO HOLDINGS
(unaudited)
A description of Transamerica Series Trust’s (the “Trust”) proxy voting policies and procedures is available in the Statement of Additional Information of the Portfolios, available without charge upon request by calling 1-800-851-9777 (toll free) or on the Securities and Exchange Commission’s (“SEC”) website at http://www.sec.gov.
In addition, the Portfolio is required to file Form N-PX, with their complete proxy voting records for the most recent 12 months ended June 30th, no later than August 31st of each year. The Form is available without charge: (1) on the Transamerica Funds website at https://www.transamerica.com/sites/default/files/files/e070d/TST%20N-PX%202021.pdf; and (2) on the SEC’s website at http://www.sec.gov.
Each fiscal quarter, the Portfolios, except Transamerica BlackRock Government Money Market VP, will file with the SEC a complete schedule of its monthly portfolio holdings on Form N-PORT. The Portfolios’ holdings as of the end of the third month of every fiscal quarter, as reported on Form N-PORT, will be publicly available on the SEC’s website at http://www.sec.gov within 60 days of the end of the fiscal quarter.
On a monthly basis, Transamerica BlackRock Government Money Market VP will file with the SEC portfolio holdings information on Form N-MFP3. A complete schedule of portfolio holdings is also available at www.transamerica.com.
You may also visit the Trust’s website at www.transamerica.com/annuities/prospectus for this and other information about the Portfolios and the Trust.
Important Notice Regarding Delivery of Shareholder Documents
Every year we provide shareholders informative materials such as the Transamerica Series Trust Annual Report, the Transamerica Series Trust Prospectus, and other required documents that keep you informed regarding your Portfolios. To the extent provided by mail, Transamerica Series Trust will only send one piece per mailing address, a method that saves your Portfolios money by reducing mailing and printing costs. We will continue to do this unless you tell us not to. To elect to receive individual mailings, simply call a Transamerica Customer Service Representative toll free at 1-800-851-9777, 8 a.m. to 7 p.m. Eastern Time, Monday-Friday. Your request will take effect within 30 days.
|
|
|
|
|
| Transamerica Series Trust |
|
|
|
Semi-Annual Financial Statements 2024 |
|
|
Page 21 |
|
|
NOTICE OF PRIVACY POLICY
(unaudited)
Your privacy is very important to us. We want you to understand what information we collect and how we use it. We collect and use “nonpublic personal information” in connection with providing our customers with a broad range of financial products and services as effectively and conveniently as possible. We treat nonpublic personal information in accordance with our Privacy Policy.
What Information We Collect and From Whom We Collect It
We may collect nonpublic personal information about you from the following sources:
| • |
|
Information we receive from you on applications or other forms, such as your name, address, and account number; |
| • |
|
Information about your transactions with us, our affiliates, or others, such as your account balance and purchase/redemption history; and |
| • |
|
Information we receive from non-affiliated third parties, including consumer reporting agencies. |
What Information We Disclose and To Whom We Disclose It
We do not disclose any nonpublic personal information about current or former customers to anyone without their express consent, except as permitted by law. We may disclose the nonpublic personal information we collect, as described above, to persons or companies that perform services on our behalf and to other financial institutions with which we have joint marketing agreements. We will require these companies to protect the confidentiality of your nonpublic personal information and to use it only to perform the services for which we have hired them.
Our Security Procedures
We restrict access to your nonpublic personal information and only allow disclosures to persons and companies as permitted by law to assist in providing products or services to you. We maintain physical, electronic, and procedural safeguards to protect your nonpublic personal information and to safeguard the disposal of certain consumer information.
Contact Us
If you have any questions about our Privacy Policy, please call 1-800-851-9777 on any business day between 8 a.m. and 7 p.m. Eastern Time.
Note: This Privacy Policy applies only to customers that have a direct relationship with us or our affiliates. If you own shares of our portfolios in the name of a third party such as a bank or broker-dealer, its privacy policy may apply to you instead of ours.
|
|
|
|
|
| Transamerica Series Trust |
|
|
|
Semi-Annual Financial Statements 2024 |
|
|
Page 22 |
|
|
PO Box 219945
Kansas City, MO 64121-9945
|
|
|
| Distributor: |
|
Transamerica Capital, Inc. |
|
|
|
|
PO Box 219945 |
|
|
|
|
Kansas City, MO 64121-9945 |
|
|
|
|
Customer Service: 1-800-851-9777 |
Transamerica Series Trust Semi-Annual Financial Statements
June 30, 2024
1801 California St., Suite 5200
Denver, CO 80202
Distributor: Transamerica Capital, Inc.
Customer Service: 1-800-851-9777
The following pages contain the most recent semi-annual financial statements for the investment options in which you are invested. In compliance with Securities and Exchange Commission regulations, we present these reports on an annual and semi-annual basis with the hope that they will foster greater understanding of the investment options’ holdings, performance, financial data, accounting policies and other issues. This streamlined version provides information only on the investment options in which you are invested.
If you have any questions about these reports, please do not hesitate to contact your financial professional. As always, we thank you for your trust and the opportunity to serve you.
Transamerica American Funds Managed Risk VP
SCHEDULE OF INVESTMENTS
At June 30, 2024
(unaudited)
|
|
|
|
|
|
|
|
|
| |
|
Shares |
|
|
Value |
|
| |
|
|
|
|
| INVESTMENT COMPANY - 97.3% |
|
|
|
|
|
|
|
|
| U.S. Mixed Allocation Fund - 97.3% |
|
|
|
|
|
|
|
|
| American Funds Insurance Series - Asset Allocation Fund |
|
|
35,351,321 |
|
|
$ |
879,894,389 |
|
|
|
|
|
|
|
|
|
|
|
|
|
| Total Investment Company
(Cost $821,975,953) |
|
|
|
|
|
|
879,894,389 |
|
|
|
|
|
|
|
|
|
|
|
|
|
| |
|
Principal |
|
|
Value |
|
| |
|
|
|
|
| REPURCHASE AGREEMENT - 2.8% |
|
|
|
|
|
|
|
|
| Fixed Income Clearing Corp.,
2.50% (A), dated 06/28/2024, to be repurchased at $25,324,858 on 07/01/2024. Collateralized by a U.S. Government Obligation, 3.75%, due 04/15/2026, and with a value of $25,826,114. |
|
$ |
25,319,583 |
|
|
|
25,319,583 |
|
|
|
|
|
|
|
|
|
|
|
|
| Total Repurchase Agreement
(Cost $25,319,583) |
|
|
|
25,319,583 |
|
|
|
|
|
|
|
|
|
|
| Total Investments
(Cost $847,295,536) |
|
|
|
905,213,972 |
|
|
|
|
|
|
|
|
|
|
| Net Other Assets (Liabilities) - (0.1)% |
|
|
|
(1,218,372) |
|
|
|
|
|
|
|
|
|
|
|
|
| Net Assets - 100.0% |
|
|
$ |
903,995,600 |
|
|
|
|
|
|
|
|
|
|
INVESTMENT VALUATION:
Valuation Inputs (B)
|
|
|
|
|
|
|
|
|
|
|
|
|
|
|
|
|
| |
|
Level 1 - Unadjusted Quoted Prices |
|
|
Level 2 - Other Significant Observable Inputs |
|
|
Level 3 - Significant Unobservable Inputs |
|
|
Value |
|
| |
|
|
|
|
|
|
| ASSETS |
|
|
|
|
|
|
|
|
|
|
|
|
|
|
|
|
| Investments |
|
|
|
|
|
|
|
|
|
|
|
|
|
|
|
|
| Investment Company |
|
$ |
879,894,389 |
|
|
$ |
— |
|
|
$ |
— |
|
|
$ |
879,894,389 |
|
| Repurchase Agreement |
|
|
— |
|
|
|
25,319,583 |
|
|
|
— |
|
|
|
25,319,583 |
|
|
|
|
|
|
|
|
|
|
|
|
|
|
|
|
|
|
|
|
|
|
|
| Total Investments |
|
$ |
879,894,389 |
|
|
$ |
25,319,583 |
|
|
$ |
— |
|
|
$ |
905,213,972 |
|
|
|
|
|
|
|
|
|
|
|
|
|
|
|
|
|
|
FOOTNOTES TO SCHEDULE OF INVESTMENTS:
| (A) |
Rate disclosed reflects the yield at June 30, 2024. |
| (B) |
There were no transfers in or out of Level 3 during the period ended June 30, 2024. Please reference the Investment Valuation section of the Notes to Financial Statements for more information regarding investment valuation and pricing inputs. |
The Notes to Financial Statements are an integral part of this report.
|
|
|
|
|
| Transamerica Series Trust |
|
|
|
Semi-Annual Financial Statements 2024 |
|
|
Page 1 |
|
|
Transamerica American Funds Managed Risk VP
STATEMENT OF ASSETS AND LIABILITIES
At June 30, 2024
(unaudited)
|
|
|
|
|
| Assets: |
|
|
|
|
| Unaffiliated investments, at value (cost $821,975,953) |
|
$ |
879,894,389 |
|
| Repurchase agreement, at value (cost $25,319,583) |
|
|
25,319,583 |
|
| Receivables and other assets: |
|
|
|
|
| Interest |
|
|
5,275 |
|
| Prepaid expenses |
|
|
3,573 |
|
| Other assets |
|
|
101 |
|
|
|
| Total assets |
|
|
905,222,921 |
|
|
|
| Liabilities: |
|
|
|
|
| Payables and other liabilities: |
|
|
|
|
| Shares of beneficial interest redeemed |
|
|
380,179 |
|
| Investment management fees |
|
|
366,144 |
|
| Distribution and service fees |
|
|
172,710 |
|
| Transfer agent costs |
|
|
837 |
|
| Trustee and CCO fees |
|
|
2,385 |
|
| Audit and tax fees |
|
|
13,654 |
|
| Custody fees |
|
|
16,329 |
|
| Legal fees |
|
|
17,792 |
|
| Printing and shareholder reports fees |
|
|
241,563 |
|
| Other accrued expenses |
|
|
15,728 |
|
|
|
| Total liabilities |
|
|
1,227,321 |
|
|
|
| Net assets |
|
$ |
903,995,600 |
|
|
|
| Net assets consist of: |
|
|
|
|
| Capital stock ($0.01 par value) |
|
$ |
773,004 |
|
| Additional paid-in capital |
|
|
777,452,049 |
|
| Total distributable earnings (accumulated losses) |
|
|
125,770,547 |
|
|
|
| Net assets |
|
$ |
903,995,600 |
|
|
|
| Shares outstanding |
|
|
77,300,367 |
|
|
|
| Net asset value and offering price per share |
|
$ |
11.69 |
|
STATEMENT OF OPERATIONS
For the period ended June 30, 2024
(unaudited)
|
|
|
|
|
| Investment income: |
|
|
|
|
| Dividend income from unaffiliated investments |
|
$ |
4,376,293 |
|
| Interest income from unaffiliated investments |
|
|
279,426 |
|
| Total investment income |
|
|
4,655,719 |
|
|
|
| Expenses: |
|
|
|
|
| Investment management fees |
|
|
2,337,151 |
|
| Distribution and service fees |
|
|
1,102,430 |
|
| Transfer agent costs |
|
|
4,991 |
|
| Trustee and CCO fees |
|
|
20,489 |
|
| Audit and tax fees |
|
|
13,524 |
|
| Custody fees |
|
|
19,867 |
|
| Legal fees |
|
|
34,853 |
|
| Other |
|
|
24,170 |
|
|
|
| Total expenses |
|
|
3,557,475 |
|
|
|
| Net investment income (loss) |
|
|
1,098,244 |
|
|
|
| Net realized gain (loss) on: |
|
|
|
|
| Unaffiliated investments |
|
|
6,761,494 |
|
| Capital gain distributions received from unaffiliated investment companies |
|
|
37,288,595 |
|
| Futures contracts |
|
|
(1,044,428 |
) |
|
|
| Net realized gain (loss) |
|
|
43,005,661 |
|
|
|
| Net change in unrealized appreciation (depreciation) on: |
|
|
|
|
| Unaffiliated investments |
|
|
31,577,731 |
|
| Translation of assets and liabilities denominated in foreign currencies |
|
|
(2 |
) |
|
|
| Net change in unrealized appreciation (depreciation) |
|
|
31,577,729 |
|
|
|
| Net realized and change in unrealized gain (loss) |
|
|
74,583,390 |
|
|
|
| Net increase (decrease) in net assets resulting from operations |
|
$ |
75,681,634 |
|
The Notes to Financial Statements are an integral part of this report.
|
|
|
|
|
| Transamerica Series Trust |
|
|
|
Semi-Annual Financial Statements 2024 |
|
|
Page 2 |
|
|
Transamerica American Funds Managed Risk VP
STATEMENT OF CHANGES IN NET ASSETS
For the period and year ended:
|
|
|
|
|
|
|
|
|
|
|
|
|
| |
|
June 30, 2024 (unaudited) |
|
December 31, 2023 |
|
|
|
|
|
|
| From operations: |
|
|
|
|
|
|
|
|
|
|
|
|
| Net investment income (loss) |
|
|
$ |
1,098,244 |
|
|
|
$ |
14,084,336 |
|
|
|
| Net realized gain (loss) |
|
|
|
43,005,661 |
|
|
|
|
20,142,691 |
|
|
|
| Net change in unrealized appreciation (depreciation) |
|
|
|
31,577,729 |
|
|
|
|
51,721,690 |
|
|
|
|
|
|
|
| Net increase (decrease) in net assets resulting from operations |
|
|
|
75,681,634 |
|
|
|
|
85,948,717 |
|
|
|
|
|
|
|
| Dividends and/or distributions to shareholders: |
|
|
|
|
|
|
|
|
|
|
|
|
| Dividends and/or distributions to shareholders |
|
|
|
— |
|
|
|
|
(140,811,284 |
) |
|
|
|
|
|
|
| Net increase (decrease) in net assets resulting from dividends and/or distributions to shareholders |
|
|
|
— |
|
|
|
|
(140,811,284 |
) |
|
|
|
|
|
|
| Capital share transactions: |
|
|
|
|
|
|
|
|
|
|
|
|
| Proceeds from shares sold |
|
|
|
3,802,317 |
|
|
|
|
3,025,917 |
|
|
|
| Dividends and/or distributions reinvested |
|
|
|
— |
|
|
|
|
140,811,284 |
|
|
|
| Cost of shares redeemed |
|
|
|
(63,557,058 |
) |
|
|
|
(101,450,696 |
) |
|
|
|
|
|
|
| Net increase (decrease) in net assets resulting from capital share transactions |
|
|
|
(59,754,741 |
) |
|
|
|
42,386,505 |
|
|
|
|
|
|
|
| Net increase (decrease) in net assets |
|
|
|
15,926,893 |
|
|
|
|
(12,476,062 |
) |
|
|
|
|
|
|
| Net assets: |
|
|
|
|
|
|
|
|
|
|
|
|
| Beginning of period/year |
|
|
|
888,068,707 |
|
|
|
|
900,544,769 |
|
|
|
| End of period/year |
|
|
$ |
903,995,600 |
|
|
|
$ |
888,068,707 |
|
|
|
|
|
|
|
| Capital share transactions - shares: |
|
|
|
|
|
|
|
|
|
|
|
|
| Shares issued |
|
|
|
337,936 |
|
|
|
|
272,253 |
|
|
|
| Shares reinvested |
|
|
|
— |
|
|
|
|
13,764,544 |
|
|
|
| Shares redeemed |
|
|
|
(5,662,108 |
) |
|
|
|
(9,153,088 |
) |
|
|
|
|
|
|
| Net increase (decrease) in shares outstanding |
|
|
|
(5,324,172 |
) |
|
|
|
4,883,709 |
|
|
|
The Notes to Financial Statements are an integral part of this report.
|
|
|
|
|
| Transamerica Series Trust |
|
|
|
Semi-Annual Financial Statements 2024 |
|
|
Page 3 |
|
|
Transamerica American Funds Managed Risk VP
FINANCIAL HIGHLIGHTS
|
|
|
|
|
|
|
|
|
|
|
|
|
|
|
|
|
|
|
|
|
|
|
|
|
|
|
|
|
|
|
| For a share outstanding during the period and years indicated: |
|
Service Class |
|
|
|
|
|
|
|
| |
|
June 30, 2024 (unaudited) |
|
December 31, 2023 |
|
December 31, 2022 |
|
December 31, 2021 |
|
December 31, 2020 |
|
December 31, 2019 |
|
|
|
|
|
|
|
| Net asset value, beginning of period/year |
|
|
$ |
10.75 |
|
|
|
$ |
11.58 |
|
|
|
$ |
13.34 |
|
|
|
$ |
11.90 |
|
|
|
$ |
11.91 |
|
|
|
$ |
10.48 |
|
|
|
|
|
|
|
|
| Investment operations: |
|
|
|
|
|
|
|
|
|
|
|
|
|
|
|
|
|
|
|
|
|
|
|
|
|
|
|
|
|
|
| Net investment income (loss)(A) |
|
|
|
0.01 |
|
|
|
|
0.18 |
|
|
|
|
0.24 |
|
|
|
|
0.17 |
|
|
|
|
0.11 |
|
|
|
|
0.15 |
|
| Net realized and unrealized gain (loss) |
|
|
|
0.93 |
|
|
|
|
0.92 |
|
|
|
|
(1.77 |
) |
|
|
|
1.38 |
|
|
|
|
0.37 |
|
|
|
|
1.69 |
|
|
|
|
|
|
|
|
| Total investment operations |
|
|
|
0.94 |
|
|
|
|
1.10 |
|
|
|
|
(1.53 |
) |
|
|
|
1.55 |
|
|
|
|
0.48 |
|
|
|
|
1.84 |
|
|
|
|
|
|
|
|
| Dividends and/or distributions to shareholders: |
|
|
|
|
|
|
|
|
|
|
|
|
|
|
|
|
|
|
|
|
|
|
|
|
|
|
|
|
|
|
| Net investment income |
|
|
|
— |
|
|
|
|
(0.26 |
) |
|
|
|
(0.18 |
) |
|
|
|
(0.11 |
) |
|
|
|
(0.14 |
) |
|
|
|
(0.14 |
) |
| Net realized gains |
|
|
|
— |
|
|
|
|
(1.67 |
) |
|
|
|
(0.05 |
) |
|
|
|
— |
|
|
|
|
(0.35 |
) |
|
|
|
(0.27 |
) |
| Total dividends and/or distributions to shareholders |
|
|
|
— |
|
|
|
|
(1.93 |
) |
|
|
|
(0.23 |
) |
|
|
|
(0.11 |
) |
|
|
|
(0.49 |
) |
|
|
|
(0.41 |
) |
|
|
|
|
|
|
|
| Net asset value, end of period/year |
|
|
$ |
11.69 |
|
|
|
$ |
10.75 |
|
|
|
$ |
11.58 |
|
|
|
$ |
13.34 |
|
|
|
$ |
11.90 |
|
|
|
$ |
11.91 |
|
| |
|
|
|
|
|
|
|
|
| Total return |
|
|
|
8.74 |
%(B) |
|
|
|
10.39 |
% |
|
|
|
(11.42 |
)% |
|
|
|
13.08 |
% |
|
|
|
4.29 |
% |
|
|
|
17.81 |
% |
|
|
|
|
|
|
|
| Ratio and supplemental data: |
|
|
|
|
|
|
|
|
|
|
|
|
|
|
|
|
|
|
|
|
|
|
|
|
|
|
|
|
|
|
| Net assets end of period/year (000’s) |
|
|
$ |
903,996 |
|
|
|
$ |
888,069 |
|
|
|
$ |
900,545 |
|
|
|
$ |
1,106,790 |
|
|
|
$ |
1,061,238 |
|
|
|
$ |
1,015,698 |
|
| Expenses to average net assets(C) |
|
|
|
0.81 |
%(D) |
|
|
|
0.81 |
% |
|
|
|
0.81 |
% |
|
|
|
0.82 |
% |
|
|
|
0.84 |
% |
|
|
|
0.83 |
% |
| Net investment income (loss) to average net assets |
|
|
|
0.25 |
%(D) |
|
|
|
1.60 |
% |
|
|
|
1.99 |
% |
|
|
|
1.32 |
% |
|
|
|
0.96 |
% |
|
|
|
1.37 |
% |
| Portfolio turnover rate |
|
|
|
— |
%(B) |
|
|
|
— |
% |
|
|
|
— |
% |
|
|
|
— |
% |
|
|
|
9 |
% |
|
|
|
2 |
% |
| (A) |
Calculated based on average number of shares outstanding. |
| (C) |
Does not include expenses of the underlying investments in which the Portfolio invests. |
The Notes to Financial Statements are an integral part of this report.
|
|
|
|
|
| Transamerica Series Trust |
|
|
|
Semi-Annual Financial Statements 2024 |
|
|
Page 4 |
|
|
Transamerica American Funds Managed Risk VP
NOTES TO FINANCIAL STATEMENTS
At June 30, 2024
(unaudited)
1. ORGANIZATION
Transamerica Series Trust (“TST”) is an open-end management investment company registered under the Investment Company Act of 1940, as amended (the “1940 Act”). TST applies investment company accounting and reporting guidance. TST serves as a funding vehicle for variable life insurance, variable annuity, and group annuity products. Transamerica American Funds Managed Risk VP (the “Portfolio”) is a series of TST and is classified as non-diversified under the 1940 Act. The Portfolio currently offers one class of shares, Service Class.
The only shareholders of the Portfolio are affiliated insurance company separate accounts and/or affiliated asset allocation portfolios. Contract holders of the variable life and annuity contracts are not shareholders of the Portfolio. For ease of reference, shareholders and contract holders are collectively referred to in this report as “shareholders.”
This report must be accompanied or preceded by the Portfolio’s current prospectus, which contains additional information about the Portfolio, including risks, as well as investment objectives and strategies.
Transamerica Asset Management, Inc. (“TAM”) serves as investment manager for the Portfolio pursuant to an investment management agreement. TAM provides continuous and regular investment management services to the Portfolio. TAM supervises the Portfolio’s investments, conducts its investment program and provides supervisory, compliance and administrative services to the Portfolio.
TAM currently acts as a “manager of managers” and has hired sub-advisers to furnish day-to-day investment advice and recommendations. TAM may, in the future, determine to provide all aspects of the day-to-day management of the Portfolio without the use of a sub-adviser. When acting as a manager of managers, TAM provides investment management services that include, without limitation, the design and development of the Portfolio and its investment strategies and the ongoing review and evaluation of those investment strategies including recommending changes in strategy where it believes appropriate or advisable; the selection of one or more sub-advisers for the Portfolio employing a combination of quantitative and qualitative screens, research, analysis and due diligence; negotiation of sub-advisory agreements and fees; oversight and monitoring of sub-advisers and recommending changes to sub-advisers where it believes appropriate or advisable; recommending portfolio combinations and liquidations where it believes appropriate or advisable; selection and oversight of transition managers, as needed; regular supervision of the Portfolio’s investments; regular review and evaluation of sub-adviser performance; daily monitoring of the sub-advisers’ buying and selling of securities for the Portfolio; regular review of holdings; ongoing trade oversight and analysis; regular monitoring to ensure adherence to investment process; regular calls and periodic on-site visits with sub-advisers; portfolio construction and asset allocation when using multiple sub-advisers for the Portfolio; risk management oversight and analysis; oversight of negotiation of investment documentation and agreements; design, development, implementation and regular monitoring of the valuation process; periodic due diligence reviews of pricing vendors and vendor methodology; design, development, implementation and regular monitoring of the compliance process; respond to regulatory inquiries and determine appropriate litigation strategy, as needed; review of proxies voted by sub-advisers; oversight of preparation and review of materials for meetings of the Portfolio’s Board of Trustees (the “Board”), participation in these meetings and preparation of regular communications with the Board; oversight of preparation and review of prospectuses, shareholder reports and other disclosure materials and regulatory filings for the Portfolio; oversight of other service providers to the Portfolio, such as the custodian, the transfer agent, the Portfolio’s independent accounting firm and legal counsel; supervision of the performance of recordkeeping and shareholder relations functions for the Portfolio; and oversight of cash management services. TAM uses a variety of quantitative and qualitative tools to carry out its investment management services. TAM, not the Portfolio, is responsible for paying the sub-adviser(s) for their services, and sub-advisory fees are TAM’s expense.
TAM’s investment management services also include the provision of supervisory and administrative services to the Portfolio. These services include performing certain administrative services for the Portfolio and supervising and overseeing the administrative, clerical, recordkeeping and bookkeeping services provided to the Portfolio by State Street Bank and Trust Company (“State Street”), to whom TAM has outsourced the provision of certain sub-administration services. To the extent agreed upon by TAM and the Portfolio from time to time, TAM’s supervisory and administrative services include, but are not limited to: monitoring and verifying the custodian’s daily calculation of the Net Asset Values (“NAV”); shareholder relations functions; compliance services; valuation services; assisting in due diligence and in the oversight and monitoring of certain activities of sub-advisers and certain aspects of Portfolio investments; assisting with Portfolio combinations and liquidations; oversight of the preparation and filing, and review, of all returns and reports, in connection with federal, state and local taxes; oversight and review of regulatory reporting; supervising and coordinating the Portfolio’s custodian and dividend disbursing agent and monitoring their services to the Portfolio; assisting the Portfolio in preparing reports to shareholders; acting as liaison with the Portfolio’s independent public accountants and providing, upon request, analyses, fiscal year summaries and other audit related services; assisting in the preparation of agendas and supporting documents for and minutes of meetings of trustees and committees of trustees; assisting in the preparation of regular communications with the trustees; and providing personnel and office space, telephones and other office equipment as necessary in order for TAM to perform supervisory and administrative services to the Portfolio. The Portfolio pays certain fees and expenses to State Street for sub-administration services which are not administrative services covered by the
|
|
|
|
|
| Transamerica Series Trust |
|
|
|
Semi-Annual Financial Statements 2024 |
|
|
Page 5 |
|
|
Transamerica American Funds Managed Risk VP
NOTES TO FINANCIAL STATEMENTS (continued)
At June 30, 2024
(unaudited)
1. ORGANIZATION (continued)
management agreement with TAM or paid for through the management fees payable thereunder. For the period ended June 30, 2024, (i) the expenses paid to State Street for sub-administration services by the Portfolio are shown as a part of Other expenses within the Statement of Operations and (ii) the expenses payable to State Street for sub-administration services from the Portfolio are shown as part of Other accrued expenses within the Statement of Assets and Liabilities.
2. SIGNIFICANT ACCOUNTING POLICIES
In preparing the Portfolio’s financial statements in accordance with Generally Accepted Accounting Principles in the United States of America (“GAAP”), estimates or assumptions (which could differ from actual results) may be used that affect reported amounts and disclosures. The following is a summary of significant accounting policies followed by the Portfolio.
Security transactions and investment income: Security transactions are accounted for on the trade date. Security gains and losses are calculated on a first-in, first-out basis. Interest income, if any, is accrued as earned. Dividend income and capital gain distributions from underlying investments, if any, are recorded on the ex-dividend date. Income or short-term capital gain distributions received from underlying investments, if any, are recorded as Dividend income from investments within the Statement of Operations. Long-term capital gain distributions received from underlying investments, if any, are recorded as Net realized gain (loss) on Capital gain distributions received from investments within the Statement of Operations.
Distributions to shareholders: Distributions are recorded on the ex-dividend date and are determined in accordance with federal income tax regulations, which may differ from GAAP.
Commission recapture: The sub-adviser(s), to the extent consistent with the best execution and usual commission rate policies and practices, may elect to place security transactions of the Portfolio with broker/dealers with which TST has established a commission recapture program. A commission recapture program is any arrangement under which a broker/dealer applies a portion of the commissions received by such broker/dealer on the security transactions to the Portfolio. In no event will commissions, paid by the Portfolio, be used to pay expenses that would otherwise be borne by any other Portfolios within TST, or by any other party.
There were no commissions recaptured during the period ended June 30, 2024 by the Portfolio.
Indemnification: In the normal course of business, the Portfolio enters into contracts that contain a variety of representations that provide general indemnifications. The Portfolio’s maximum exposure under these arrangements is unknown, as this would involve future claims that may be made against the Portfolio and/or its affiliates that have not yet occurred. However, based on experience, the Portfolio expects the risk of loss to be remote.
3. INVESTMENT VALUATION
TAM has been designated as the Portfolio’s valuation designee pursuant to Rule 2a-5 under the 1940 Act with responsibility for fair valuation subject to oversight by the Portfolio’s Board of Trustees. The net asset value of the Portfolio is computed as of the official close of the New York Stock Exchange (“NYSE”) each day the NYSE is open for business.
TAM utilizes various methods to measure the fair value of its investments on a recurring basis. GAAP establishes a hierarchy that prioritizes inputs to valuation methods. The inputs or methodology used for valuing securities are not necessarily an indication of the risk associated with investing in those securities. The three levels (“Levels”) of inputs of the fair value hierarchy are defined as follows:
Level 1—Unadjusted quoted prices in active markets for identical securities.
Level 2—Inputs, other than quoted prices included in Level 1, which are observable, either directly or indirectly. These inputs may include quoted prices for the identical instrument on an inactive market, prices for similar instruments, interest rates, prepayment speeds, credit risk, yield curves, default rates, and similar data.
Level 3—Unobservable inputs based on the best information available in the circumstances, to the extent observable inputs are not available, which may include TAM’s own assumptions used in determining the fair value of the Portfolio’s investments.
The inputs used to measure fair value may fall into different Levels of the fair value hierarchy. In such cases, for disclosure purposes, the Level in the fair value hierarchy that is assigned to the fair value measurement of a security is determined based on the lowest Level input that is significant to the fair value measurement in its entirety. Certain investments that are measured at fair value using NAV per share, or
|
|
|
|
|
| Transamerica Series Trust |
|
|
|
Semi-Annual Financial Statements 2024 |
|
|
Page 6 |
|
|
Transamerica American Funds Managed Risk VP
NOTES TO FINANCIAL STATEMENTS (continued)
At June 30, 2024
(unaudited)
3. INVESTMENT VALUATION (continued)
its equivalent, using the “practical expedient” have not been classified in the fair value Levels. The hierarchy classification of inputs used to value the Portfolio’s investments at June 30, 2024, is disclosed within the Investment Valuation section of the Schedule of Investments.
The availability of observable inputs can vary from security to security and is affected by a wide variety of factors, including, but not limited to, the type of security, whether the security is new and not yet established in the marketplace, the liquidity of markets, and other characteristics particular to the security. To the extent that valuation is based on models or inputs that are less observable or unobservable in the market, the determination of fair value requires more judgment. Accordingly, the degree of judgment exercised in determining fair value is generally greatest for instruments categorized in Level 3. Due to the inherent uncertainty of valuation, the determination of values may differ significantly from values that would have been realized had a ready market for investments existed, and the differences could be material.
Fair value measurements: Descriptions of the valuation techniques applied to the Portfolio’s significant categories of assets and liabilities measured at fair value on a recurring basis are as follows:
Investment companies: Certain investment companies are valued at the NAV as the practical expedient. These investment companies are not included within the fair value hierarchy. Certain other investment companies are valued at the actively traded NAV and no valuation adjustments are applied. These investment companies are categorized in Level 1 of the fair value hierarchy.
Repurchase agreements: Repurchase agreements are valued at cost, which approximates fair value. To the extent the inputs are observable and timely, the values are generally categorized in Level 2 of the fair value hierarchy.
4. BORROWINGS AND OTHER FINANCING TRANSACTIONS
The Portfolio may engage in borrowing transactions as a means of raising cash to satisfy redemption requests, for other temporary or emergency purposes or, to the extent permitted by its investment policies, to raise additional cash to be invested in other securities or instruments. When the Portfolio invests borrowing proceeds in other securities, the Portfolio will bear the risk that the market value of the securities in which such proceeds are invested goes down and is insufficient to repay the borrowed proceeds. The Portfolio may borrow on a secured or on an unsecured basis. If the Portfolio enters into a secured borrowing arrangement, a portion of the Portfolio’s assets will be used as collateral. The 1940 Act requires the Portfolio to maintain asset coverage of at least 300% of the amount of its borrowings. Asset coverage means the ratio that the value of the Portfolio’s total assets, minus liabilities other than borrowings, bears to the aggregate amount of all borrowings. Although complying with this requirement has the effect of limiting the amount that the Portfolio may borrow, it does not otherwise mitigate the risks of entering into borrowing transactions.
Interfund lending: The Portfolio, along with other funds and portfolios advised by TAM, may participate in an interfund lending program pursuant to exemptive relief granted by the Securities and Exchange Commission on January 18, 2017. This program allows the Portfolio to lend to and borrow from other funds and portfolios advised by TAM. Interfund lending transactions are subject to the conditions of the exemptive relief which places limits on the amount of lending or borrowing a Portfolio may participate in under the program. Interest earned or paid on an interfund lending transaction will be based on the average of certain current market rates. For the period ended June 30, 2024, the Portfolio has not utilized the program.
Repurchase agreements: In a repurchase agreement, the Portfolio purchases a security and simultaneously commits to resell that security to the seller at an agreed-upon price on an agreed-upon date. Securities purchased subject to a repurchase agreement are held at the Portfolio’s custodian, or designated sub-custodian related to tri-party repurchase agreements, and, pursuant to the terms of the repurchase agreement, must be collateralized by securities with an aggregate market value greater than or equal to 100% of the resale price. The Portfolio will bear the risk of value fluctuations until the securities can be sold and may encounter delays and incur costs in liquidating the securities. In the event of bankruptcy or insolvency of the seller, delays and costs may be incurred.
Repurchase agreements are subject to netting agreements, which are agreements between the Portfolio and its counterparties that provide for the net settlement of all transactions and collateral with the Portfolio, through a single payment, in the event of default or termination. Amounts presented within the Schedule of Investments, and as part of Repurchase agreements, at value within the Statement of Assets and Liabilities are shown on a gross basis. The value of the related collateral for each repurchase agreement, as reflected within the Schedule of Investments, exceeds the value of each repurchase agreement at June 30, 2024.
Repurchase agreements at June 30, 2024, if any, are included within the Schedule of Investments and Statement of Assets and Liabilities.
|
|
|
|
|
| Transamerica Series Trust |
|
|
|
Semi-Annual Financial Statements 2024 |
|
|
Page 7 |
|
|
Transamerica American Funds Managed Risk VP
NOTES TO FINANCIAL STATEMENTS (continued)
At June 30, 2024
(unaudited)
5. RISK EXPOSURES AND THE USE OF DERIVATIVE INSTRUMENTS
The Portfolio’s investment strategies allow the Portfolio to use various types of derivative contracts, including option contracts, swap agreements, futures contracts, and forward foreign currency contracts. Derivatives are investments whose value is primarily derived from underlying assets, indices or reference rates and may be transacted on an exchange or OTC.
Market Risk Factors: In pursuit of the Portfolio’s investment strategies, the Portfolio may seek to use derivatives to increase or decrease its exposure to certain market risks, including:
Interest rate risk: Interest rate risk relates to the fluctuations in the value of fixed income securities due to changes in the prevailing levels of market interest rates.
Foreign exchange rate risk: Foreign exchange rate risk relates to fluctuations in the value of an asset or liability due to changes in the currency exchange rates.
Equity risk: Equity risk relates to the change in value of equity securities as they relate to increases or decreases in the general market.
Credit risk: Credit risk relates to the ability of the issuer of a financial instrument to make further principal or interest payments on an obligation or commitment that it has to the Portfolio.
Commodity risk: Commodity risk relates to the change in value of commodities or commodity indices as they relate to increases or decreases in the commodities market. Commodities are physical assets that have tangible properties. Examples of these types of assets are crude oil, heating oil, metals, livestock, and agricultural products.
The Portfolio is also exposed to additional risks from investing in derivatives, such as liquidity and counterparty credit risk. Liquidity risk is the risk that the Portfolio will be unable to sell or close out the derivative in the open market in a timely manner. Counterparty credit risk is the risk that the counterparty will not be able to fulfill its obligations to the Portfolio. Investing in derivatives may also involve greater risks than investing directly in the underlying assets, such as losses in excess of any initial investment and collateral received. In addition, there may be the risk that the change in value of the derivative contract does not correspond to the change in value of the underlying instrument.
The Portfolio’s exposure to market risk factors and certain other associated risks are summarized by derivative type as follows:
Futures contracts: The Portfolio is subject to equity risk, credit risk, commodity risk, interest rate risk and foreign exchange rate risk in the normal course of pursuing its investment objective. The Portfolio uses futures contracts to gain exposure to, or hedge against, changes in the value of equities and commodities, interest rates, or foreign currencies. A futures contract represents a commitment for the future purchase or sale of an asset at a specified price on a specified date. Upon entering into such contracts, the Portfolio is required to deposit with the broker, either in cash or in securities, an initial margin in an amount equal to a certain percentage of the contract amount. Subsequent payments (variation margin) are paid or received by the Portfolio, depending on the daily fluctuations in the value of the contract, and are recorded for financial statement purposes as unrealized gains or losses by the Portfolio. Upon entering into such contracts, the Portfolio bears the risk of equity and commodity prices, interest rates, or exchange rates moving unexpectedly, in which case, the Portfolio may not achieve the anticipated benefits of the futures contracts and may realize losses. With futures, there is minimal counterparty credit risk to the Portfolio since futures are exchange-traded and the exchange’s clearinghouse, as counterparty to all exchange-traded futures, guarantees the futures against default. Futures contracts are generally entered into on a regulated futures exchange and cleared through a clearinghouse associated with the exchange.
Open futures contracts at June 30, 2024 are listed within the Schedule of Investments. Variation margin, if applicable, is shown in Variation margin receivable or payable on futures contracts within the Statement of Assets and Liabilities.
|
|
|
|
|
| Transamerica Series Trust |
|
|
|
Semi-Annual Financial Statements 2024 |
|
|
Page 8 |
|
|
Transamerica American Funds Managed Risk VP
NOTES TO FINANCIAL STATEMENTS (continued)
At June 30, 2024
(unaudited)
5. RISK EXPOSURES AND THE USE OF DERIVATIVE INSTRUMENTS (continued)
The following is a summary of the location and the effect of derivative investments within the Statement of Operations, categorized by primary market risk exposure as of June 30, 2024.
|
|
|
|
|
|
|
|
|
|
|
|
|
| Realized Gain (Loss) on Derivative Instruments |
|
|
|
|
|
|
|
| Location |
|
Interest Rate Contracts |
|
Foreign Exchange Contracts |
|
Equity Contracts |
|
Credit Contracts |
|
Commodity Contracts |
|
Total |
| |
|
|
|
|
|
|
|
| Futures contracts |
|
$ — |
|
$ (2,380) |
|
$ (1,042,048) |
|
$ — |
|
$ — |
|
$ (1,044,428) |
| |
|
|
|
|
|
|
|
| Total |
|
$ — |
|
$ (2,380) |
|
$ (1,042,048) |
|
$ — |
|
$ — |
|
$ (1,044,428) |
| |
The following is a summary of the ending monthly average volume on derivative activity during the period ended June 30, 2024.
|
|
|
|
|
| Futures contracts: |
|
|
|
|
|
|
| Average notional value of contracts — short |
|
$ |
|
(70,986) |
Collateral requirements: Collateral or margin requirements are set by the broker or exchange clearing house for exchange-traded derivatives (futures contracts, exchange-traded options, and exchange-traded swap agreements) while collateral terms are contract specific for OTC derivatives (forward foreign currency exchange contracts, OTC options, and OTC swap agreements). For OTC derivatives, under standard derivatives agreements, the Portfolio may be required to pledge collateral on derivatives to a counterparty if the Portfolio is in a net liability position, and receive collateral if in a net positive position. For financial reporting purposes, cash collateral that has been pledged by the Portfolio to cover obligations, if any, is reported in Cash collateral at broker within the Statement of Assets and Liabilities. Cash collateral that has been received by the Portfolio from a counterparty, if any, is reported separately in Cash collateral pledged at custodian and/or broker within the Statement of Assets and Liabilities. Non-cash collateral pledged to the Portfolio, if any, is disclosed within the Schedule of Investments.
Generally, the amount of collateral due from or to a party must exceed a minimum transfer amount threshold before a transfer has been made. Typically a counterparty is not permitted to sell, re-pledge or use cash and non-cash collateral it receives. The Portfolio generally does not use non-cash collateral that it receives but may, absent default or certain other circumstances, be permitted to use cash collateral received. In such cases, interest may be paid pursuant to the collateral arrangement with the counterparty.
To the extent amounts due to the Portfolio from its counterparties are not fully collateralized, contractually or otherwise, the Portfolio bears the risk of loss from counterparty non-performance. Additionally, to the extent the Portfolio has delivered collateral to a counterparty, the Portfolio bears the risk of loss from a counterparty in the event the counterparty fails to return such collateral. Counterparties may immediately terminate derivatives contracts if the Portfolio fails to maintain sufficient asset coverage for its contracts or its net assets decline by stated percentages. Collateral may not be required for all derivative contracts.
6. RISK FACTORS
Investing in the Portfolio involves certain key risks related to the Portfolio’s trading activity. Please reference the Portfolio’s prospectus for a more complete discussion of the following risk(s), as well as other risks of investing in the Portfolio.
Market risk: The market prices of the Portfolio’s securities or other assets may go up or down, sometimes rapidly or unpredictably, due to factors such as economic events, inflation, changes in interest rates, governmental actions or interventions, actions taken by the U.S. Federal Reserve or foreign central banks, market disruptions caused by tariffs, trade disputes or other factors, political developments, armed conflicts, economic sanctions, cybersecurity events, investor sentiment, the global and domestic effects of widespread or local health, weather or climate events, and other factors that may or may not be related to the issuer of the security or other asset. If the market prices of the Portfolio’s securities and assets fall, the value of your investment in the Portfolio could go down.
Economies and financial markets throughout the world are increasingly interconnected. Events or circumstances in one or more countries or regions could be highly disruptive to, and have profound impacts on, global economies or markets. As a result, whether or not the Portfolio invests in securities of issuers located in or with significant exposure to the countries directly affected, the value and liquidity of the Portfolio’s investments may go down.
|
|
|
|
|
| Transamerica Series Trust |
|
|
|
Semi-Annual Financial Statements 2024 |
|
|
Page 9 |
|
|
Transamerica American Funds Managed Risk VP
NOTES TO FINANCIAL STATEMENTS (continued)
At June 30, 2024
(unaudited)
6. RISK FACTORS (continued)
Asset allocation risk: The Portfolio’s investment performance is significantly impacted by the Portfolio’s and Underlying Portfolio’s asset allocation and reallocation from time to time. These actions may be unsuccessful in maximizing return and/or avoiding investment losses.
Managed risk strategy risk: The Portfolio employs a managed risk strategy. The strategy attempts to stabilize the volatility of the Portfolio around a target volatility level and manage downside exposure during periods of significant market declines but may not work as intended. Because market conditions change, sometimes rapidly and unpredictably, the success of the strategy also will be subject to the sub-adviser’s ability to implement the strategy in a timely and efficient manner. The strategy may result in periods of underperformance and may fail to protect against market declines. The strategy may limit the Portfolio’s ability to participate in up markets, may cause the Portfolio to underperform its benchmark in up markets, may increase transaction costs at the Portfolio and/or underlying portfolio level and may result in substantial losses if it does not work as intended. For example, if the Portfolio has reduced its equity exposure to avoid losses in certain market conditions, and the market rises sharply and quickly, there may be a delay in increasing the Portfolio’s equity exposure, causing the Portfolio to forgo gains from the market rebound. Managing the Portfolio pursuant to the strategy may result in the Portfolio not achieving its stated asset mix goal due to unforeseen or unanticipated market conditions. The strategy also serves to reduce the risk to the Transamerica insurance companies that provide guaranteed benefits under certain variable contracts from equity market volatility and to facilitate their provision of those guaranteed benefits. The strategy also may have the effect of limiting the amount of guaranteed benefits. The Portfolio’s performance may be lower than similar portfolios that are not subject to a managed risk strategy.
Non-diversification risk: As a “non-diversified” Portfolio, the Portfolio may invest a larger percentage of its assets in a smaller number of issuers than a diversified fund. Investing in a smaller number of issuers will make the Portfolio more susceptible to the risks associated with investing in those issuers.
7. INVESTMENT CONCENTRATION
Throughout the period, the Portfolio can have investments that account for a significant percentage of the Portfolio’s total assets. As of June 30, 2024, the most recent financial statements are included within this report for the following investments:
|
|
|
| Investment |
|
Percentage of Total Assets |
|
|
| American Funds Insurance Series – Asset Allocation Fund |
|
97.20% |
8. FEES AND OTHER AFFILIATED TRANSACTIONS
TST serves as a funding vehicle for certain affiliated asset allocation portfolios and certain affiliated separate accounts of Transamerica Life Insurance Company (“TLIC”) and Transamerica Financial Life Insurance Company.
TAM, the Portfolio’s investment manager, is directly owned by TLIC and AUSA Holding, LLC (“AUSA”), both of which are indirect, wholly owned subsidiaries of Aegon Ltd. TLIC is owned by Commonwealth General Corporation (“Commonwealth”). Commonwealth and AUSA are wholly owned by Transamerica Corporation (DE). Transamerica Corporation (DE) is wholly owned by Aegon International B.V., which is wholly owned by Aegon Ltd., a Bermuda exempted company with liability limited by shares (formerly, Aegon NV, a Netherlands corporation) and a publicly traded international insurance group.
Transamerica Fund Services, Inc. (“TFS”) is the Portfolio’s transfer agent. Transamerica Capital, Inc. (“TCI”) is the Portfolio’s distributor/principal underwriter. TAM, TFS and TCI are affiliates of Aegon Ltd.
Certain officers and trustees of the Portfolio may also be officers and/or trustees of TAM, TFS and TCI. No interested trustee who is deemed an interested person due to current or former service with TAM or an affiliate of TAM receives compensation from the Portfolio. The Portfolio does pay non-interested persons (independent trustees), as disclosed in Trustee and CCO fees within the Statement of Operations.
Investment management fees: TAM serves as the Portfolio’s investment manager, performing administration as well as investment advisory services. TAM renders investment advisory, supervisory, and administration services under an investment management agreement and the Portfolio pays a single management fee, which is reflected in Investment management fees within the Statement of Operations.
|
|
|
|
|
| Transamerica Series Trust |
|
|
|
Semi-Annual Financial Statements 2024 |
|
|
Page 10 |
|
|
Transamerica American Funds Managed Risk VP
NOTES TO FINANCIAL STATEMENTS (continued)
At June 30, 2024
(unaudited)
8. FEES AND OTHER AFFILIATED TRANSACTIONS (continued)
The Portfolio pays a management fee to TAM based on daily average net assets at the following rates:
|
|
|
| Breakpoints |
|
Rate |
|
|
| First $2 billion |
|
0.53% |
| Over $2 billion up to $4 billion |
|
0.52 |
| Over $4 billion up to $6 billion |
|
0.50 |
| Over $6 billion up to $8 billion |
|
0.49 |
| Over $8 billion up to $10 billion |
|
0.48 |
| Over $10 billion |
|
0.46 |
TAM has contractually agreed to waive fees and/or reimburse Portfolio expenses to the extent that the total operating expenses excluding, as applicable, acquired fund fees and expenses, interest (including borrowing costs and overdraft charges), taxes, brokerage commissions, dividend and interest expenses on securities sold short, extraordinary expenses and other expenses not incurred in the ordinary course of the Portfolio’s business, exceed the following stated annual operating expense limits to the Portfolio’s daily average net assets. To the extent an expense limit changed during the period, the prior limit is also listed below. The expenses waived and/or reimbursed, if any, are included in Expenses waived and/or reimbursed within the Statement of Operations.
|
|
|
|
|
| Class |
|
Operating Expense Limit |
|
Operating Expense Limit Effective Through |
|
|
|
| Service Class |
|
0.85% |
|
May 1, 2025 |
TAM is permitted to recapture amounts contractually waived and/or reimbursed to a class during any of the 36 months from the date on which TAM waived fees and/or reimbursed expenses for the class. A class may recapture and reimburse TAM only if such amount does not cause, on any particular business day of the Portfolio, the class’s total annual operating expenses (after the recapture is taken into account) to exceed the Operating Expense Limits or any other lower limit then in effect. Amounts recaptured, if any, by TAM for the period ended June 30, 2024 are disclosed in Recapture of previously waived and/or reimbursed fees within the Statement of Operations.
TAM, on a voluntary basis and in addition to the contractual operating expense limits in effect, from time to time may waive and/or reimburse expenses of the Portfolio, or any classes thereof, to such level(s) as the Trust’s officers have determined or may reasonably determine from time to time. Any such voluntary waiver or expense reimbursement may be discontinued by TAM at any time. These amounts are not subject to recapture by TAM.
As of June 30, 2024, there are no amounts available for recapture by TAM.
Distribution and service fees: TST has a distribution plan (“Distribution Plan”) pursuant to Rule 12b-1 under the 1940 Act. Pursuant to the Distribution Plan, TST entered into a distribution agreement with TCI as the Portfolio’s distributor.
The Distribution Plan requires the Portfolio to pay distribution fees to TCI as compensation for various distribution activities, not as reimbursement for specific expenses. Under the Distribution Plan and distribution agreement, TCI, on behalf of the Portfolio, is authorized to pay various service providers, as direct payment for expenses incurred in connection with distribution of the Portfolio’s shares.
The fee on the Service Class shares is paid to the insurance companies for providing services and account maintenance for the policyholders who invest in the variable insurance products which invest in the Service Class shares. The distribution and service fees are included in Distribution and service fees within the Statement of Operations.
The Portfolio is authorized under the Distribution Plan to pay fees to TCI based on daily average net assets up to an annual fee of 0.25% of Service Class shares.
Transfer agent costs: TFS provides transfer agency services under an intercompany agreement with TAM. TFS has outsourced the provision of certain sub-transfer agency services to SS&C Global Investor & Distribution Solutions, Inc. (“SS&C GIDS”). The Portfolio does not pay a separate transfer agent fee to TAM or TFS but does pay certain expenses to SS&C GIDS related to applicable sub-transfer
|
|
|
|
|
| Transamerica Series Trust |
|
|
|
Semi-Annual Financial Statements 2024 |
|
|
Page 11 |
|
|
Transamerica American Funds Managed Risk VP
NOTES TO FINANCIAL STATEMENTS (continued)
At June 30, 2024
(unaudited)
8. FEES AND OTHER AFFILIATED TRANSACTIONS (continued)
agency services. For the period ended June 30, 2024, (i) the expenses paid to SS&C GIDS by the Portfolio are referred to as transfer agent costs and are included within the Statement of Operations and (ii) the expenses payable to SS&C GIDS by the Portfolio are referred to as transfer agent costs within the Statement of Assets and Liabilities.
Brokerage commissions: The Portfolio incurred no brokerage commissions on security transactions placed with affiliates of the investment manager or sub-adviser(s) for the period ended June 30, 2024.
9. PURCHASES AND SALES OF SECURITIES
For the period ended June 30, 2024, the cost of securities purchased and proceeds from securities sold (excluding short-term securities) are as follows:
|
|
|
| Purchases of Securities |
|
Sales of Securities |
|
|
| $ — |
|
$ 67,507,138 |
10. FEDERAL INCOME TAXES AND DISTRIBUTIONS TO SHAREHOLDERS
The Portfolio has not made any provision for federal income or excise taxes due to its policy to distribute all of its taxable income and capital gains to its shareholders and otherwise qualify as a regulated investment company under Subchapter M of the Internal Revenue Code. The Portfolio recognizes the tax benefits of uncertain tax positions only where the position is “more likely than not” to be sustained assuming examination by tax authorities. The Portfolio’s tax returns remain subject to examination by the Internal Revenue Service and state tax authorities three years from the date of filing for federal purposes and four years from the date of filing for state purposes. Management has evaluated the Portfolio’s tax provisions taken for all open tax years, and has concluded that no provision for income tax is required in the Portfolio’s financial statements. If applicable, the Portfolio recognizes interest accrued related to unrecognized tax benefits in relation to interest and penalties expense in Other within the Statement of Operations. The Portfolio identifies its major tax jurisdictions as U.S. Federal, the state of Colorado, and foreign jurisdictions where the Portfolio makes significant investments; however, the Portfolio is not aware of any tax positions for which it is reasonably possible that the total amounts of unrecognized tax benefits will change materially in the next twelve months. Distributions are determined in accordance with income tax regulations, which may differ from GAAP.
As of June 30, 2024, the approximate cost for U.S. federal income tax purposes, and the aggregate gross/net unrealized appreciation (depreciation) in the value of investments (including securities sold short and derivatives, if any) are as follows:
|
|
|
|
|
|
|
| Cost |
|
Gross Appreciation |
|
Gross (Depreciation) |
|
Net Appreciation (Depreciation) |
|
|
|
|
| $ 847,295,536 |
|
$ 57,918,436 |
|
$ — |
|
$ 57,918,436 |
Please see TST’s most recent report on Form N-CSR, available at: www.transamerica.com/annuities/prospectus, for additional information. For the most recently filed complete proxy voting records for the Trust please visit: https://www.transamerica.com/sites/default/files/files/e070d/TST%20N-PX%202021.pdf
|
|
|
|
|
| Transamerica Series Trust |
|
|
|
Semi-Annual Financial Statements 2024 |
|
|
Page 12 |
|
|
Transamerica American Funds Managed Risk VP
MANAGEMENT AND SUB-ADVISORY AGREEMENT — CONTRACT RENEWAL
(unaudited)
At a meeting of the Board of Trustees of Transamerica Series Trust (the “Trustees” or the “Board”) held on June 12-13, 2024, the Board considered the renewal of the management agreement (the “Management Agreement”) between Transamerica Asset Management, Inc. (“TAM”) and Transamerica Series Trust, on behalf of Transamerica American Funds Managed Risk VP (the “Portfolio”). The Board also considered the renewal of the investment sub-advisory agreement (the “Sub-Advisory Agreement” and together with the Management Agreement, the “Agreements”) for the Portfolio between TAM and Milliman Financial Risk Management LLC (the “Sub-Adviser”).
Following its review and consideration, the Board determined that the terms of the Management Agreement and Sub-Advisory Agreement were reasonable and that the renewal of each of the Agreements was in the best interests of the Portfolio and the holders invested in the Portfolio. The Board, including the independent members of the Board (the “Independent Trustees”), unanimously approved the renewal of each of the Agreements through June 30, 2025.
Prior to reaching their decision, the Trustees requested and received from TAM and the Sub-Adviser certain information. They then reviewed such information as they deemed reasonably necessary to evaluate the Agreements, including information they had previously received from TAM and the Sub-Adviser as part of their regular oversight of the Portfolio, and knowledge they gained over time through meeting with TAM and the Sub-Adviser. Among other materials, the Trustees considered comparative fee, expense and performance information prepared by Broadridge Financial Solutions, Inc. (“Broadridge”), an independent provider of mutual fund performance information, as well as fee, expense and profitability information prepared by TAM. In addition, TAM provided the Board with additional supplemental comparative fee, expense and performance information. To the extent applicable, the Trustees considered information about fees and performance of comparable funds and/or accounts managed by the Sub-Adviser. The Board also considered reductions to the Portfolio’s expense limit, if any, that took effect after the last renewal of the Agreements. In their review, the Trustees also sought to identify instances in which the Portfolio’s performance, fees, total expenses and/or profitability appeared to be outliers within its respective peer group or other comparative metrics and sought to understand the reasons for such comparative positions.
In their deliberations, the Independent Trustees met privately without representatives of TAM or the Sub-Adviser present and were represented throughout the process by their independent legal counsel. In considering the proposed continuation of each of the Agreements, the Trustees evaluated and weighed a number of considerations that they believed to be relevant in light of the legal advice furnished to them by counsel, including independent legal counsel, and made a decision in the exercise of their own business judgment. They based their decisions on the considerations discussed below, among others, although they did not identify any particular consideration or item of information that was controlling of their decisions, and each Trustee may have attributed different weights to the various factors.
Nature, Extent and Quality of the Services Provided
The Board considered the nature, extent and quality of the services provided by TAM and the Sub-Adviser to the Portfolio in the past and the services anticipated to be provided in the future. The Board also considered the investment approach for the Portfolio; the experience, capability and integrity of TAM’s senior management; the financial resources of TAM; TAM’s management oversight process; TAM’s and the Sub-Adviser’s responsiveness to any questions by the Trustees; and the professional qualifications and compensation program of the portfolio management team of the Sub-Adviser.
The Board also considered the continuous and regular investment management and other services provided by TAM, when acting as a manager of managers, for the portion of the management fee it retains from the Portfolio after payment of the sub-advisory fees. The Board noted that the investment management and other services provided by TAM include the design, development and ongoing review and evaluation of the Portfolio and its investment strategy; the selection, oversight and monitoring of one or more investment sub-advisers to perform certain duties with respect to the Portfolio; ongoing portfolio trading oversight and analysis; risk management oversight and analysis; design, development, implementation and ongoing review and evaluation of a process for the valuation of Portfolio investments; design, development, implementation and ongoing review and evaluation of a compliance program for the Portfolio; design, development, implementation and ongoing review and evaluation of a process for the voting of proxies and exercise of rights to consent to corporate action for Portfolio investments; participation in Board meetings and oversight of preparation of materials for the Board, including materials for Board meetings and regular communications with the Board; oversight of preparation of the Portfolio’s prospectus, statement of additional information, shareholder reports and other disclosure materials and regulatory filings for the Portfolio; and ongoing cash management services for the Portfolio. The Board considered that TAM’s investment management services also include the provision of supervisory and administrative services to the Portfolio. The Board also noted that TAM, as part of the services it provides to all Transamerica mutual funds, including the Portfolio, oversees the services provided by the funds’ custodian, transfer agent, independent accountant and legal counsel and supervises the performance of the recordkeeping and holder service functions of the funds.
Investment Performance
In addition, the Board considered the short- and longer-term performance of the Portfolio in light of its investment objective, policies and strategies, including relative performance against (i) a peer universe of comparable mutual funds, as prepared by Broadridge, and (ii) the Portfolio’s benchmarks, in each case for various trailing periods ended December 31, 2023. Based on these considerations, the Board determined that TAM and the Sub-Adviser can provide investment and related services that are appropriate in scope and extent in light of the Portfolio’s investment objectives, policies and strategies and operations, the competitive landscape of the investment company business and investor needs. The Board’s conclusions as to the Portfolio’s performance are summarized below. For purposes of its review,
|
|
|
|
|
| Transamerica Series Trust |
|
|
|
Semi-Annual Financial Statements 2024 |
|
|
Page 13 |
|
|
Transamerica American Funds Managed Risk VP
MANAGEMENT AND SUB-ADVISORY AGREEMENT — CONTRACT RENEWAL (continued)
(unaudited)
the Board generally used the performance of Service Class Shares. In describing the Portfolio’s performance relative to its peer universe, the summary conclusions characterize performance for the relevant periods in relation to whether it was “above,” “below” or “in line with” the peer universe median and do so using quintile rankings prepared by Broadridge. For simplicity, performance is described as “above” the median if the Portfolio’s performance ranked anywhere in the first or second quintiles, as “below” the median if it ranked anywhere in the fourth or fifth quintiles, or “in line with” the median if it ranked anywhere in the third quintile (i.e., even if its precise return was somewhat above or somewhat below the precise median return).
When considering the Portfolio’s performance, the Trustees considered any representations made by TAM regarding the appropriateness of certain peer groups and benchmarks. They recognized that performance reflects a snapshot of a period as of a specific date, and that consideration of performance data for a different period could generate significantly different performance results. The Trustees also recognized that even longer-term performance can be negatively affected by performance over a short-term period when that short-term performance is significantly below the performance of the comparable benchmark or universe of peer funds.
The Board noted that the performance of Service Class Shares of the Portfolio was above the median for its peer universe for the past 3-year period, in line with the median for the past 5-year period and below the median for the past 1-year period. The Board also noted that the performance of Service Class Shares of the Portfolio was below the benchmark that TAM utilizes to measure performance of the Portfolio for the past 1-, 3-, and 5-year periods. The Trustees observed that the performance of the Portfolio had improved during the first quarter of 2024.
Management Fee and Sub-Advisory Fees and Total Expense Ratio
The Board considered the management fee and total expense ratio of the Portfolio, including information provided by Broadridge comparing the management fee and total expense ratio of the Portfolio to the management fees and total expense ratios of comparable investment companies in both a peer group and broader peer universe compiled by Broadridge. The Board’s conclusions as to the Portfolio’s management fee and total expense ratio are summarized below. For purposes of its review, the Board generally used the actual total expenses (i.e., expenses reflecting any waivers and/or reimbursements) of Service Class Shares. In describing the Portfolio’s management fee and total expense ratio relative to its peer group and peer universe, the summary conclusions characterize management fees and total expense ratios for the relevant periods in relation to whether they were “above,” “below” or “in line with” the peer group or peer universe median and do so using quintile rankings prepared by Broadridge. For simplicity, management fees and total expense ratios are described as “above” the median if the Portfolio’s management fee or total expense ratio ranked anywhere in the fourth or fifth quintiles, as “below” the median if it ranked anywhere in the first or second quintiles, or “in line with” the median if it ranked anywhere in the third quintile (i.e., even if its precise management fee or total expense ratio was somewhat above or somewhat below the precise median management fee or total expense ratio).
The Board also considered the fees charged by the Sub-Adviser for sub-advisory services, as well as the portion of the Portfolio’s management fee retained by TAM following payment of the sub-advisory fee and how the portion of the contractual management fee retained by TAM at a specified asset level compared to the portions retained by other investment advisers managing mutual funds with similar investment strategies as calculated by an independent provider of information.
The Board noted that the Portfolio’s contractual management fee and the actual total expenses (i.e., expenses reflecting any waivers and/or reimbursements) of Service Class Shares of the Portfolio were above the medians for its peer group and peer universe. The Trustees also considered that TAM has entered into an expense limitation arrangement with the Portfolio, which may result in TAM waiving fees for the benefit of holders.
On the basis of these considerations, together with the other information it considered, the Board determined that the management and sub-advisory fees to be received by TAM and the Sub-Adviser under the Management Agreement and Sub-Advisory Agreement are reasonable in light of the services provided.
Cost of Services Provided and Level of Profitability
The Board reviewed information provided by TAM about the cost of providing and procuring fund management services, as well as the costs of the provision of administration, transfer agency and other services, to the Portfolio and to Transamerica Series Trust as a whole by TAM and its affiliates. The Board considered the profitability of TAM and its affiliates in providing these services for the Portfolio and Transamerica Series Trust as a whole. The Trustees recognized the competitiveness of the mutual fund industry and the importance of an investment adviser’s long-term profitability, including for maintaining company and management stability and accountability.
The Board also considered the allocation methodology used for calculating the profitability of TAM and its affiliates. The Board noted that the revenue and expense allocation methodology used by TAM to estimate its profitability with respect to its relationship with the Portfolio had been reviewed previously by an independent consultant. The Trustees considered that TAM reported that it had not made material changes to this methodology, and that the methodology had been applied consistently for the Portfolio.
|
|
|
|
|
| Transamerica Series Trust |
|
|
|
Semi-Annual Financial Statements 2024 |
|
|
Page 14 |
|
|
Transamerica American Funds Managed Risk VP
MANAGEMENT AND SUB-ADVISORY AGREEMENT — CONTRACT RENEWAL (continued)
(unaudited)
With respect to the Sub-Adviser, the Board noted that the sub-advisory fee is the product of arm’s-length negotiation between TAM and the Sub-Adviser, which is not affiliated with TAM, and is paid by TAM and not the Portfolio. As a result, the Board focused on the profitability of TAM and its affiliates with respect to the Portfolio.
Based on this information, the Board determined that the profitability of TAM and its affiliates from their relationships with the Portfolio was not excessive.
Economies of Scale
The Board considered economies of scale with respect to the management of the Portfolio, whether the Portfolio had appropriately benefited from any economies of scale and whether there was the potential for realization of any future economies of scale. The Board also considered the existence of economies of scale with respect to management of the Transamerica mutual funds overall and the extent to which the Portfolio benefited from any economies of scale. The Board recognized that, as the Portfolio’s assets increase, any economies of scale realized by TAM or the Sub-Adviser may not directly correlate with each other or with any economies of scale that might be realized by the Portfolio. The Board considered the Portfolio’s management fee schedule and the existence of breakpoints and also considered the extent to which TAM shared economies of scale, if any, with the Portfolio through undertakings to limit or reimburse Portfolio expenses and to invest in maintaining and developing its capabilities and services. The Board also considered the Sub-Adviser’s sub-advisory fee schedule and the existence of breakpoints, if any, and how such breakpoints relate to any breakpoints in the Portfolio’s management fee schedule. The Board considered that the Sub-Adviser’s sub-advisory fees would be based on the combined assets of multiple funds. The Trustees concluded that the Portfolio’s fee structure reflected an appropriate sharing of any efficiencies or economies of scale to date and noted that they will have the opportunity to periodically reexamine the appropriateness of the management fee payable to TAM and the fee paid to the Sub-Adviser in light of any economies of scale experienced in the future.
Benefits to TAM, its Affiliates and/or the Sub-Adviser from their Relationships with the Portfolio
The Board considered other benefits derived by TAM, its affiliates, and/or the Sub-Adviser from their relationships with the Portfolio. The Board noted that TAM does not receive benefits from research obtained with commissions paid to broker-dealers for portfolio transactions (commonly referred to as “soft dollars”) as a result of its relationship with the Portfolio.
Other Considerations
The Board noted that TAM has made a substantial commitment to the recruitment and retention of high-quality personnel and maintains the financial, compliance and operational resources reasonably necessary to manage the Portfolio in a professional manner that is consistent with the best interests of the Portfolio and the holders. In this regard, the Board favorably considered the procedures and policies TAM has in place to enforce compliance with applicable laws and regulations and oversee the portfolio management activities of the Sub-Adviser. The Board also noted that TAM has made an entrepreneurial commitment and undertaken certain business risks with respect to the management and success of the Portfolio.
Conclusion
After consideration of the factors described above, as well as other factors, the Trustees, including the Independent Trustees, concluded that the renewal of the Management Agreement and the Sub-Advisory Agreement was in the best interests of the Portfolio and the holders and voted to approve the renewal of the Agreements.
|
|
|
|
|
| Transamerica Series Trust |
|
|
|
Semi-Annual Financial Statements 2024 |
|
|
Page 15 |
|
|
PROXY VOTING POLICIES AND PROCEDURES AND QUARTERLY PORTFOLIO HOLDINGS
(unaudited)
A description of Transamerica Series Trust’s (the “Trust”) proxy voting policies and procedures is available in the Statement of Additional Information of the Portfolios, available without charge upon request by calling 1-800-851-9777 (toll free) or on the Securities and Exchange Commission’s (“SEC”) website at http://www.sec.gov.
In addition, the Portfolio is required to file Form N-PX, with their complete proxy voting records for the most recent 12 months ended June 30th, no later than August 31st of each year. The Form is available without charge: (1) on the Transamerica Funds website at https://www.transamerica.com/sites/default/files/files/e070d/TST%20N-PX%202021.pdf; and (2) on the SEC’s website at http://www.sec.gov.
Each fiscal quarter, the Portfolios, except Transamerica BlackRock Government Money Market VP, will file with the SEC a complete schedule of its monthly portfolio holdings on Form N-PORT. The Portfolios’ holdings as of the end of the third month of every fiscal quarter, as reported on Form N-PORT, will be publicly available on the SEC’s website at http://www.sec.gov within 60 days of the end of the fiscal quarter.
On a monthly basis, Transamerica BlackRock Government Money Market VP will file with the SEC portfolio holdings information on Form N-MFP3. A complete schedule of portfolio holdings is also available at www.transamerica.com.
You may also visit the Trust’s website at www.transamerica.com/annuities/prospectus for this and other information about the Portfolios and the Trust.
Important Notice Regarding Delivery of Shareholder Documents
Every year we provide shareholders informative materials such as the Transamerica Series Trust Annual Report, the Transamerica Series Trust Prospectus, and other required documents that keep you informed regarding your Portfolios. To the extent provided by mail, Transamerica Series Trust will only send one piece per mailing address, a method that saves your Portfolios money by reducing mailing and printing costs. We will continue to do this unless you tell us not to. To elect to receive individual mailings, simply call a Transamerica Customer Service Representative toll free at 1-800-851-9777, 8 a.m. to 7 p.m. Eastern Time, Monday-Friday. Your request will take effect within 30 days.
|
|
|
|
|
| Transamerica Series Trust |
|
|
|
Semi-Annual Financial Statements 2024 |
|
|
Page 16 |
|
|
NOTICE OF PRIVACY POLICY
(unaudited)
Your privacy is very important to us. We want you to understand what information we collect and how we use it. We collect and use “nonpublic personal information” in connection with providing our customers with a broad range of financial products and services as effectively and conveniently as possible. We treat nonpublic personal information in accordance with our Privacy Policy.
What Information We Collect and From Whom We Collect It
We may collect nonpublic personal information about you from the following sources:
| • |
|
Information we receive from you on applications or other forms, such as your name, address, and account number; |
| • |
|
Information about your transactions with us, our affiliates, or others, such as your account balance and purchase/redemption history; and |
| • |
|
Information we receive from non-affiliated third parties, including consumer reporting agencies. |
What Information We Disclose and To Whom We Disclose It
We do not disclose any nonpublic personal information about current or former customers to anyone without their express consent, except as permitted by law. We may disclose the nonpublic personal information we collect, as described above, to persons or companies that perform services on our behalf and to other financial institutions with which we have joint marketing agreements. We will require these companies to protect the confidentiality of your nonpublic personal information and to use it only to perform the services for which we have hired them.
Our Security Procedures
We restrict access to your nonpublic personal information and only allow disclosures to persons and companies as permitted by law to assist in providing products or services to you. We maintain physical, electronic, and procedural safeguards to protect your nonpublic personal information and to safeguard the disposal of certain consumer information.
Contact Us
If you have any questions about our Privacy Policy, please call 1-800-851-9777 on any business day between 8 a.m. and 7 p.m. Eastern Time.
Note: This Privacy Policy applies only to customers that have a direct relationship with us or our affiliates. If you own shares of our portfolios in the name of a third party such as a bank or broker-dealer, its privacy policy may apply to you instead of ours.
|
|
|
|
|
| Transamerica Series Trust |
|
|
|
Semi-Annual Financial Statements 2024 |
|
|
Page 17 |
|
|
PO Box 219945
Kansas City, MO 64121-9945
|
|
|
| Distributor: |
|
Transamerica Capital, Inc. |
|
|
|
|
PO Box 219945 |
|
|
|
|
Kansas City, MO 64121-9945 |
|
|
|
|
Customer Service: 1-800-851-9777 |
American Funds Insurance Series®
Financial Statements and Other Information N-CSR Items 7-11 for the six months ended June 30, 2024
Lit. No. INGEFP2-998-0824 © 2024 Capital Group. All rights reserved.
|
|
|
| Global Growth Fund |
|
|
| Investment portfolio June 30, 2024 |
|
unaudited |
|
|
|
|
|
|
|
|
|
|
|
|
|
|
|
| Common stocks 96.48% |
|
Shares |
|
|
|
|
|
Value (000) |
|
|
|
|
|
|
| Information technology 28.32% |
|
Microsoft Corp. |
|
|
1,087,801 |
|
|
|
|
|
|
$ |
486,193 |
|
|
|
Taiwan Semiconductor Manufacturing Co., Ltd. |
|
|
14,139,200 |
|
|
|
|
|
|
|
420,521 |
|
|
|
ASML Holding NV |
|
|
188,369 |
|
|
|
|
|
|
|
194,340 |
|
|
|
ASML Holding NV (ADR) |
|
|
174,387 |
|
|
|
|
|
|
|
178,351 |
|
|
|
NVIDIA Corp. |
|
|
2,575,150 |
|
|
|
|
|
|
|
318,134 |
|
|
|
Broadcom, Inc. |
|
|
92,907 |
|
|
|
|
|
|
|
149,165 |
|
|
|
Synopsys, Inc.1 |
|
|
181,103 |
|
|
|
|
|
|
|
107,767 |
|
|
|
Samsung Electronics Co., Ltd. |
|
|
1,309,808 |
|
|
|
|
|
|
|
76,972 |
|
|
|
Capgemini SE |
|
|
317,271 |
|
|
|
|
|
|
|
62,842 |
|
|
|
Apple, Inc. |
|
|
279,997 |
|
|
|
|
|
|
|
58,973 |
|
|
|
Arista Networks, Inc.1 |
|
|
159,456 |
|
|
|
|
|
|
|
55,886 |
|
|
|
Applied Materials, Inc. |
|
|
233,760 |
|
|
|
|
|
|
|
55,165 |
|
|
|
Shopify, Inc., Class A, subordinate voting shares1 |
|
|
608,475 |
|
|
|
|
|
|
|
40,190 |
|
|
|
Keyence Corp. |
|
|
82,700 |
|
|
|
|
|
|
|
36,485 |
|
|
|
NEC Corp. |
|
|
270,100 |
|
|
|
|
|
|
|
22,086 |
|
|
|
Micron Technology, Inc. |
|
|
165,629 |
|
|
|
|
|
|
|
21,785 |
|
|
|
SAP SE |
|
|
74,491 |
|
|
|
|
|
|
|
15,124 |
|
|
|
EPAM Systems, Inc.1 |
|
|
67,118 |
|
|
|
|
|
|
|
12,626 |
|
|
|
Disco Corp. |
|
|
18,600 |
|
|
|
|
|
|
|
7,127 |
|
|
|
NICE, Ltd. (ADR)1 |
|
|
37,217 |
|
|
|
|
|
|
|
6,400 |
|
|
|
International Business Machines Corp. |
|
|
34,130 |
|
|
|
|
|
|
|
5,903 |
|
|
|
|
|
|
|
|
|
|
|
|
|
|
|
|
|
|
|
|
|
|
|
|
|
|
|
|
|
2,332,035 |
|
|
|
|
|
|
|
|
|
|
|
|
|
|
|
|
|
|
|
|
|
|
|
|
|
|
|
|
|
|
|
| |
|
|
|
|
| Health care 15.42% |
|
Novo Nordisk AS, Class B |
|
|
2,064,144 |
|
|
|
|
|
|
|
294,876 |
|
|
|
Eli Lilly and Co. |
|
|
216,267 |
|
|
|
|
|
|
|
195,804 |
|
|
|
UnitedHealth Group, Inc. |
|
|
218,500 |
|
|
|
|
|
|
|
111,273 |
|
|
|
Vertex Pharmaceuticals, Inc.1 |
|
|
222,173 |
|
|
|
|
|
|
|
104,137 |
|
|
|
AstraZeneca PLC |
|
|
599,410 |
|
|
|
|
|
|
|
93,446 |
|
|
|
Thermo Fisher Scientific, Inc. |
|
|
160,880 |
|
|
|
|
|
|
|
88,967 |
|
|
|
Regeneron Pharmaceuticals, Inc.1 |
|
|
83,600 |
|
|
|
|
|
|
|
87,866 |
|
|
|
Pfizer, Inc. |
|
|
1,305,400 |
|
|
|
|
|
|
|
36,525 |
|
|
|
Cigna Group (The) |
|
|
104,417 |
|
|
|
|
|
|
|
34,517 |
|
|
|
Centene Corp.1 |
|
|
518,165 |
|
|
|
|
|
|
|
34,354 |
|
|
|
Sanofi |
|
|
310,200 |
|
|
|
|
|
|
|
29,817 |
|
|
|
Alnylam Pharmaceuticals, Inc.1 |
|
|
116,500 |
|
|
|
|
|
|
|
28,309 |
|
|
|
Siemens Healthineers AG |
|
|
345,670 |
|
|
|
|
|
|
|
19,912 |
|
|
|
EssilorLuxottica SA |
|
|
90,005 |
|
|
|
|
|
|
|
19,312 |
|
|
|
Zoetis, Inc., Class A |
|
|
90,200 |
|
|
|
|
|
|
|
15,637 |
|
|
|
Argenx SE (ADR)1 |
|
|
36,200 |
|
|
|
|
|
|
|
15,567 |
|
|
|
Bayer AG |
|
|
537,074 |
|
|
|
|
|
|
|
15,188 |
|
|
|
Illumina, Inc.1 |
|
|
142,868 |
|
|
|
|
|
|
|
14,913 |
|
|
|
Laboratorios Farmaceuticos Rovi, SA non-registered shares |
|
|
152,433 |
|
|
|
|
|
|
|
14,291 |
|
|
|
DexCom, Inc.1 |
|
|
121,000 |
|
|
|
|
|
|
|
13,719 |
|
|
|
Viatris, Inc. |
|
|
110,678 |
|
|
|
|
|
|
|
1,177 |
|
|
|
GRAIL, Inc.1 |
|
|
23,811 |
|
|
|
|
|
|
|
366 |
|
|
|
Euroapi SA1,2 |
|
|
5,869 |
|
|
|
|
|
|
|
16 |
|
|
|
|
|
|
|
|
|
|
|
|
|
|
|
|
|
|
|
|
|
|
|
|
|
|
|
|
|
1,269,989 |
|
|
|
|
|
|
|
|
|
|
|
|
|
|
|
|
|
|
|
|
|
|
|
|
|
|
|
|
|
|
|
| |
|
|
|
|
| Industrials 13.56% |
|
Safran SA |
|
|
844,273 |
|
|
|
|
|
|
|
177,623 |
|
|
|
Comfort Systems USA, Inc. |
|
|
278,016 |
|
|
|
|
|
|
|
84,550 |
|
|
|
Ingersoll-Rand, Inc. |
|
|
770,946 |
|
|
|
|
|
|
|
70,033 |
|
|
|
ASSA ABLOY AB, Class B |
|
|
2,462,100 |
|
|
|
|
|
|
|
69,776 |
|
|
|
TransDigm Group, Inc. |
|
|
50,071 |
|
|
|
|
|
|
|
63,971 |
|
|
|
Schneider Electric SE |
|
|
260,897 |
|
|
|
|
|
|
|
62,251 |
|
|
|
Caterpillar, Inc. |
|
|
185,000 |
|
|
|
|
|
|
|
61,624 |
|
|
|
Copart, Inc.1 |
|
|
1,011,807 |
|
|
|
|
|
|
|
54,800 |
|
|
|
Airbus SE, non-registered shares |
|
|
365,833 |
|
|
|
|
|
|
|
50,443 |
|
|
|
Ryanair Holdings PLC (ADR) |
|
|
401,837 |
|
|
|
|
|
|
|
46,790 |
|
|
|
ITOCHU Corp. |
|
|
684,560 |
|
|
|
|
|
|
|
33,590 |
|
|
|
Johnson Controls International PLC |
|
|
499,535 |
|
|
|
|
|
|
|
33,204 |
|
1 American Funds Insurance Series
Global Growth Fund (continued)
|
|
|
|
|
|
|
|
|
|
|
|
|
|
|
| Common stocks (continued) |
|
Shares |
|
|
|
|
|
Value (000) |
|
|
|
|
|
|
| Industrials (continued) |
|
GT Capital Holdings, Inc. |
|
|
2,635,611 |
|
|
|
|
|
|
$ |
27,832 |
|
|
|
Alliance Global Group, Inc. |
|
|
156,400,700 |
|
|
|
|
|
|
|
23,092 |
|
|
|
Daikin Industries, Ltd. |
|
|
151,500 |
|
|
|
|
|
|
|
20,929 |
|
|
|
Techtronic Industries Co., Ltd. |
|
|
1,679,500 |
|
|
|
|
|
|
|
19,178 |
|
|
|
Saab AB, Class B |
|
|
797,272 |
|
|
|
|
|
|
|
19,158 |
|
|
|
Brenntag SE |
|
|
280,312 |
|
|
|
|
|
|
|
18,889 |
|
|
|
ATS Corp.1 |
|
|
552,106 |
|
|
|
|
|
|
|
17,866 |
|
|
|
Boeing Co.1 |
|
|
91,400 |
|
|
|
|
|
|
|
16,636 |
|
|
|
General Electric Co. |
|
|
102,437 |
|
|
|
|
|
|
|
16,284 |
|
|
|
RS Group PLC |
|
|
1,745,907 |
|
|
|
|
|
|
|
15,438 |
|
|
|
Carrier Global Corp. |
|
|
242,000 |
|
|
|
|
|
|
|
15,265 |
|
|
|
DSV A/S |
|
|
97,734 |
|
|
|
|
|
|
|
14,956 |
|
|
|
Recruit Holdings Co., Ltd. |
|
|
277,600 |
|
|
|
|
|
|
|
14,940 |
|
|
|
Siemens AG |
|
|
76,677 |
|
|
|
|
|
|
|
14,261 |
|
|
|
Eaton Corp. PLC |
|
|
39,327 |
|
|
|
|
|
|
|
12,331 |
|
|
|
SMC Corp. |
|
|
22,500 |
|
|
|
|
|
|
|
10,743 |
|
|
|
TFI International, Inc. (CAD denominated) |
|
|
73,941 |
|
|
|
|
|
|
|
10,736 |
|
|
|
BayCurrent Consulting, Inc. |
|
|
502,900 |
|
|
|
|
|
|
|
10,135 |
|
|
|
NIBE Industrier AB, Class B2 |
|
|
2,142,588 |
|
|
|
|
|
|
|
9,032 |
|
|
|
|
|
|
|
|
|
|
|
|
|
|
|
|
|
|
|
|
|
|
|
|
|
|
|
|
|
1,116,356 |
|
|
|
|
|
|
|
|
|
|
|
|
|
|
|
|
|
|
|
|
|
|
|
|
|
|
|
|
|
|
|
| |
|
|
|
|
| Consumer discretionary 12.67% |
|
LVMH Moët Hennessy-Louis Vuitton SE |
|
|
221,302 |
|
|
|
|
|
|
|
169,949 |
|
|
|
Chipotle Mexican Grill, Inc.1 |
|
|
2,239,950 |
|
|
|
|
|
|
|
140,333 |
|
|
|
Amazon.com, Inc.1 |
|
|
532,410 |
|
|
|
|
|
|
|
102,888 |
|
|
|
Renault SA |
|
|
1,688,781 |
|
|
|
|
|
|
|
86,134 |
|
|
|
Prosus NV, Class N |
|
|
2,238,914 |
|
|
|
|
|
|
|
79,314 |
|
|
|
Booking Holdings, Inc. |
|
|
18,300 |
|
|
|
|
|
|
|
72,496 |
|
|
|
MGM China Holdings, Ltd. |
|
|
41,228,000 |
|
|
|
|
|
|
|
64,165 |
|
|
|
MercadoLibre, Inc.1 |
|
|
24,475 |
|
|
|
|
|
|
|
40,222 |
|
|
|
Evolution AB |
|
|
367,568 |
|
|
|
|
|
|
|
38,304 |
|
|
|
InterContinental Hotels Group PLC |
|
|
360,000 |
|
|
|
|
|
|
|
37,743 |
|
|
|
Trip.com Group, Ltd. (ADR)1 |
|
|
743,309 |
|
|
|
|
|
|
|
34,936 |
|
|
|
Moncler SpA |
|
|
449,770 |
|
|
|
|
|
|
|
27,544 |
|
|
|
lululemon athletica, Inc.1 |
|
|
82,202 |
|
|
|
|
|
|
|
24,554 |
|
|
|
LKQ Corp. |
|
|
582,953 |
|
|
|
|
|
|
|
24,245 |
|
|
|
Five Below, Inc.1 |
|
|
169,360 |
|
|
|
|
|
|
|
18,455 |
|
|
|
Wynn Macau, Ltd. |
|
|
21,430,000 |
|
|
|
|
|
|
|
17,586 |
|
|
|
Ferrari NV (EUR denominated) |
|
|
34,905 |
|
|
|
|
|
|
|
14,271 |
|
|
|
Industria de Diseño Textil, SA |
|
|
287,493 |
|
|
|
|
|
|
|
14,207 |
|
|
|
YUM! Brands, Inc. |
|
|
94,493 |
|
|
|
|
|
|
|
12,517 |
|
|
|
Home Depot, Inc. |
|
|
35,621 |
|
|
|
|
|
|
|
12,262 |
|
|
|
Global-E Online, Ltd.1 |
|
|
300,000 |
|
|
|
|
|
|
|
10,881 |
|
|
|
|
|
|
|
|
|
|
|
|
|
|
|
|
|
|
|
|
|
|
|
|
|
|
|
|
|
1,043,006 |
|
|
|
|
|
|
|
|
|
|
|
|
|
|
|
|
|
|
|
|
|
|
|
|
|
|
|
|
|
|
|
| |
|
|
|
|
| Financials 10.78% |
|
3i Group PLC |
|
|
2,293,500 |
|
|
|
|
|
|
|
88,446 |
|
|
|
Fiserv, Inc.1 |
|
|
573,419 |
|
|
|
|
|
|
|
85,462 |
|
|
|
AXA SA |
|
|
2,209,893 |
|
|
|
|
|
|
|
72,766 |
|
|
|
Aon PLC, Class A |
|
|
244,466 |
|
|
|
|
|
|
|
71,770 |
|
|
|
Visa, Inc., Class A |
|
|
259,088 |
|
|
|
|
|
|
|
68,003 |
|
|
|
Blackstone, Inc. |
|
|
366,835 |
|
|
|
|
|
|
|
45,414 |
|
|
|
Axis Bank, Ltd. |
|
|
2,813,670 |
|
|
|
|
|
|
|
42,634 |
|
|
|
Citigroup, Inc. |
|
|
617,255 |
|
|
|
|
|
|
|
39,171 |
|
|
|
Tradeweb Markets, Inc., Class A |
|
|
332,600 |
|
|
|
|
|
|
|
35,255 |
|
|
|
CVC Capital Partners PLC1 |
|
|
1,742,744 |
|
|
|
|
|
|
|
31,981 |
|
|
|
Prudential PLC |
|
|
3,390,552 |
|
|
|
|
|
|
|
30,759 |
|
|
|
Ameriprise Financial, Inc. |
|
|
67,606 |
|
|
|
|
|
|
|
28,881 |
|
|
|
Société Générale |
|
|
1,134,000 |
|
|
|
|
|
|
|
26,477 |
|
|
|
VZ Holding AG |
|
|
201,422 |
|
|
|
|
|
|
|
25,804 |
|
|
|
Banco Bilbao Vizcaya Argentaria, SA |
|
|
2,408,000 |
|
|
|
|
|
|
|
24,023 |
|
|
|
UBS Group AG |
|
|
794,665 |
|
|
|
|
|
|
|
23,261 |
|
American Funds Insurance Series 2
Global Growth Fund (continued)
|
|
|
|
|
|
|
|
|
|
|
|
|
|
|
| Common stocks (continued) |
|
Shares |
|
|
|
|
|
Value (000) |
|
|
|
|
|
|
| Financials (continued) |
|
Mastercard, Inc., Class A |
|
|
49,000 |
|
|
|
|
|
|
$ |
21,617 |
|
|
|
CME Group, Inc., Class A |
|
|
103,473 |
|
|
|
|
|
|
|
20,343 |
|
|
|
Japan Post Insurance Co., Ltd. |
|
|
985,600 |
|
|
|
|
|
|
|
19,186 |
|
|
|
JPMorgan Chase & Co. |
|
|
74,006 |
|
|
|
|
|
|
|
14,968 |
|
|
|
Eurobank Ergasias Services and Holdings SA |
|
|
6,819,248 |
|
|
|
|
|
|
|
14,765 |
|
|
|
Swissquote Group Holding, Ltd. |
|
|
43,329 |
|
|
|
|
|
|
|
13,615 |
|
|
|
HDFC Bank, Ltd. |
|
|
648,800 |
|
|
|
|
|
|
|
13,106 |
|
|
|
FinecoBank SpA |
|
|
635,542 |
|
|
|
|
|
|
|
9,471 |
|
|
|
XP, Inc., Class A |
|
|
474,027 |
|
|
|
|
|
|
|
8,338 |
|
|
|
AIA Group, Ltd. |
|
|
913,107 |
|
|
|
|
|
|
|
6,192 |
|
|
|
Jackson Financial, Inc., Class A |
|
|
44,327 |
|
|
|
|
|
|
|
3,292 |
|
|
|
GMO Payment Gateway, Inc. |
|
|
44,100 |
|
|
|
|
|
|
|
2,444 |
|
|
|
Moscow Exchange MICEX-RTS PJSC3 |
|
|
12,640,000 |
|
|
|
|
|
|
|
– |
4 |
|
|
|
|
|
|
|
|
|
|
|
|
|
|
|
|
|
|
|
|
|
|
|
|
|
|
|
|
887,444 |
|
|
|
|
|
|
|
|
|
|
|
|
|
|
|
|
|
|
|
|
|
|
|
|
|
|
|
|
|
|
|
| |
|
|
|
|
| Communication services 5.71% |
|
Alphabet, Inc., Class A |
|
|
1,299,939 |
|
|
|
|
|
|
|
236,784 |
|
|
|
Meta Platforms, Inc., Class A |
|
|
242,200 |
|
|
|
|
|
|
|
122,122 |
|
|
|
Publicis Groupe SA |
|
|
400,000 |
|
|
|
|
|
|
|
42,397 |
|
|
|
CTS Eventim AG & Co. KGaA |
|
|
224,500 |
|
|
|
|
|
|
|
18,738 |
|
|
|
Koninklijke KPN NV |
|
|
3,959,172 |
|
|
|
|
|
|
|
15,172 |
|
|
|
Bharti Airtel, Ltd. |
|
|
868,779 |
|
|
|
|
|
|
|
15,001 |
|
|
|
Tencent Holdings, Ltd. |
|
|
297,100 |
|
|
|
|
|
|
|
14,101 |
|
|
|
Nintendo Co., Ltd. |
|
|
111,300 |
|
|
|
|
|
|
|
5,947 |
|
|
|
|
|
|
|
|
|
|
|
|
|
|
|
|
|
|
|
|
|
|
|
|
|
|
|
|
|
470,262 |
|
|
|
|
|
|
|
|
|
|
|
|
|
|
|
|
|
|
|
|
|
|
|
|
|
|
|
|
|
|
|
| |
|
|
|
|
| Energy 3.98% |
|
Canadian Natural Resources, Ltd. (CAD denominated) |
|
|
3,110,600 |
|
|
|
|
|
|
|
110,800 |
|
|
|
Reliance Industries, Ltd. |
|
|
1,571,621 |
|
|
|
|
|
|
|
58,833 |
|
|
|
Schlumberger NV |
|
|
1,172,369 |
|
|
|
|
|
|
|
55,312 |
|
|
|
Chevron Corp. |
|
|
143,573 |
|
|
|
|
|
|
|
22,458 |
|
|
|
Exxon Mobil Corp. |
|
|
152,500 |
|
|
|
|
|
|
|
17,556 |
|
|
|
TotalEnergies SE |
|
|
218,273 |
|
|
|
|
|
|
|
14,548 |
|
|
|
EOG Resources, Inc. |
|
|
110,903 |
|
|
|
|
|
|
|
13,959 |
|
|
|
Galp Energia, SGPS, SA, Class B |
|
|
640,186 |
|
|
|
|
|
|
|
13,525 |
|
|
|
NAC Kazatomprom JSC (GDR) |
|
|
257,665 |
|
|
|
|
|
|
|
10,320 |
|
|
|
Cameco Corp. (CAD denominated) |
|
|
209,198 |
|
|
|
|
|
|
|
10,293 |
|
|
|
Gazprom PJSC1,3 |
|
|
8,346,000 |
|
|
|
|
|
|
|
– |
4 |
|
|
LUKOIL Oil Co. PJSC3 |
|
|
246,300 |
|
|
|
|
|
|
|
– |
4 |
|
|
|
|
|
|
|
|
|
|
|
|
|
|
|
|
|
|
|
|
|
|
|
|
|
|
|
|
327,604 |
|
|
|
|
|
|
|
|
|
|
|
|
|
|
|
|
|
|
|
|
|
|
|
|
|
|
|
|
|
|
|
| |
|
|
|
|
| Consumer staples 3.33% |
|
Monster Beverage Corp.1 |
|
|
852,204 |
|
|
|
|
|
|
|
42,568 |
|
|
|
Walgreens Boots Alliance, Inc. |
|
|
2,761,459 |
|
|
|
|
|
|
|
33,400 |
|
|
|
Costco Wholesale Corp. |
|
|
35,970 |
|
|
|
|
|
|
|
30,574 |
|
|
|
British American Tobacco PLC |
|
|
863,200 |
|
|
|
|
|
|
|
26,535 |
|
|
|
Carrefour SA, non-registered shares |
|
|
1,589,000 |
|
|
|
|
|
|
|
22,453 |
|
|
|
Pernod Ricard SA |
|
|
164,933 |
|
|
|
|
|
|
|
22,445 |
|
|
|
Dollar General Corp. |
|
|
155,180 |
|
|
|
|
|
|
|
20,520 |
|
|
|
Philip Morris International, Inc. |
|
|
167,000 |
|
|
|
|
|
|
|
16,922 |
|
|
|
Keurig Dr Pepper, Inc. |
|
|
501,530 |
|
|
|
|
|
|
|
16,751 |
|
|
|
Kweichow Moutai Co., Ltd., Class A |
|
|
74,500 |
|
|
|
|
|
|
|
15,025 |
|
|
|
Nestlé SA |
|
|
134,000 |
|
|
|
|
|
|
|
13,678 |
|
|
|
Dollar Tree Stores, Inc.1 |
|
|
123,184 |
|
|
|
|
|
|
|
13,152 |
|
|
|
|
|
|
|
|
|
|
|
|
|
|
|
|
|
|
|
|
|
|
|
|
|
|
|
|
|
274,023 |
|
|
|
|
|
|
|
|
|
|
|
|
|
|
|
|
3 American Funds Insurance Series
Global Growth Fund (continued)
|
|
|
|
|
|
|
|
|
|
|
|
|
|
|
| Common stocks (continued) |
|
Shares |
|
|
|
|
|
Value (000) |
|
|
|
|
|
|
| Materials 2.41% |
|
Linde PLC |
|
|
248,153 |
|
|
|
|
|
|
$ |
108,892 |
|
|
|
Amcor PLC (CDI) |
|
|
3,567,000 |
|
|
|
|
|
|
|
35,428 |
|
|
|
LyondellBasell Industries NV |
|
|
199,925 |
|
|
|
|
|
|
|
19,125 |
|
|
|
First Quantum Minerals, Ltd. |
|
|
1,128,850 |
|
|
|
|
|
|
|
14,828 |
|
|
|
DSM-Firmenich AG |
|
|
93,100 |
|
|
|
|
|
|
|
10,483 |
|
|
|
Fortescue, Ltd. |
|
|
659,105 |
|
|
|
|
|
|
|
9,416 |
|
|
|
|
|
|
|
|
|
|
|
|
|
|
|
|
|
|
|
|
|
|
|
|
|
|
|
|
|
198,172 |
|
|
|
|
|
|
|
|
|
|
|
|
|
|
|
|
|
|
|
|
|
|
|
|
|
|
|
|
|
|
|
| |
|
|
|
|
| Real estate 0.17% |
|
CBRE Group, Inc., Class A1 |
|
|
156,366 |
|
|
|
|
|
|
|
13,934 |
|
|
|
|
|
|
|
|
|
|
|
|
|
|
|
|
|
|
|
|
|
|
|
|
|
|
|
|
|
|
|
|
|
|
|
|
| |
|
|
|
|
| Utilities 0.13% |
|
FirstEnergy Corp. |
|
|
286,296 |
|
|
|
|
|
|
|
10,957 |
|
|
|
|
|
|
|
|
|
|
|
|
|
|
|
|
|
|
Total common stocks (cost: $4,863,595,000) |
|
|
|
|
|
|
|
|
|
|
7,943,782 |
|
|
|
|
|
|
|
|
|
|
|
|
|
|
|
|
|
|
|
|
| Preferred securities 0.22% |
|
|
|
|
|
|
|
|
|
|
|
|
|
|
| Information technology 0.22% |
|
Samsung Electronics Co., Ltd., nonvoting preferred shares |
|
|
406,300 |
|
|
|
|
|
|
|
18,658 |
|
|
|
|
|
|
|
|
|
|
|
|
|
|
|
|
|
|
Total preferred securities (cost: $10,959,000) |
|
|
|
|
|
|
|
|
|
|
18,658 |
|
|
|
|
|
|
|
|
|
|
|
|
|
|
|
|
|
|
|
|
|
|
|
|
|
|
|
|
|
|
|
|
|
|
|
| Short-term securities 3.64% |
|
|
|
|
|
|
|
|
|
|
|
|
|
| Money market investments 3.59% |
|
|
|
|
|
|
|
|
|
|
|
|
|
|
Capital Group Central Cash Fund 5.37%5,6 |
|
|
2,951,865 |
|
|
|
|
|
|
|
295,186 |
|
|
|
|
|
|
|
|
|
|
|
|
|
|
|
|
|
|
|
|
|
| |
|
|
|
|
|
|
|
|
|
|
|
|
|
|
| |
|
|
|
| Money market investments purchased with collateral from securities on loan 0.05% |
|
|
|
|
|
|
|
|
|
|
|
|
|
|
Invesco Short-Term Investments Trust – Government & Agency Portfolio,
Institutional Class 5.23%5,7 |
|
|
4,309,690 |
|
|
|
|
|
|
|
4,310 |
|
|
|
|
|
|
|
|
|
|
|
|
|
|
|
|
|
|
Total short-term securities (cost: $299,482,000) |
|
|
|
|
|
|
|
|
|
|
299,496 |
|
|
|
|
|
|
|
|
|
|
|
|
|
|
|
|
|
|
|
|
|
|
|
Total investment securities 100.34% (cost: $5,174,036,000) |
|
|
|
|
|
|
|
|
|
|
8,261,936 |
|
|
|
Other assets less liabilities (0.34)% |
|
|
|
|
|
|
|
|
|
|
(28,302 |
) |
|
|
|
|
|
|
|
|
|
|
|
|
|
|
|
|
|
|
|
|
|
|
Net assets 100.00% |
|
|
|
|
|
|
|
|
|
$ |
8,233,634 |
|
|
|
|
|
|
|
|
|
|
|
|
|
|
|
|
|
|
|
|
|
|
|
|
|
|
|
|
|
|
|
|
|
|
|
|
|
|
|
|
|
|
|
|
|
|
|
|
|
|
|
|
|
|
|
|
|
|
|
|
|
|
|
|
|
|
|
| Investments in affiliates6 |
|
|
|
|
|
|
|
|
|
|
|
|
|
|
|
|
|
|
|
|
|
|
|
|
|
|
|
|
| |
|
Value at 1/1/2024 (000) |
|
Additions (000) |
|
Reductions (000) |
|
Net
realized
gain (loss) (000) |
|
Net unrealized appreciation (depreciation) (000) |
|
Value at 6/30/2024
(000) |
|
Dividend
or interest
income (000) |
|
|
|
|
|
|
|
|
|
|
|
| Short-term securities 3.59% |
|
|
|
|
|
|
|
|
|
|
|
|
|
|
|
|
|
|
|
|
|
|
|
|
|
|
|
|
|
|
|
|
|
|
|
|
|
|
|
|
|
|
|
|
|
|
|
|
|
|
| Money market investments 3.59% |
|
|
|
|
|
|
|
|
|
|
|
|
|
|
|
|
|
|
|
|
|
|
|
|
|
|
|
|
|
|
|
|
|
|
|
|
|
|
|
|
|
|
|
|
|
|
|
|
|
|
| Capital Group Central Cash Fund 5.37%5 |
|
|
$ |
295,088 |
|
|
|
$ |
1,572,164 |
|
|
|
$ |
1,572,062 |
|
|
|
|
|
|
|
|
|
$ |
(31) |
|
|
|
|
|
|
|
|
$27 |
|
|
|
|
|
|
|
|
$ |
295,186 |
|
|
|
$ |
11,421 |
|
American Funds Insurance Series 4
Global Growth Fund (continued)
| 1 |
Security did not produce income during the last 12 months. |
| 2 |
All or a portion of this security was on loan. The total value of all such securities was $4,457,000, which represented .05% of the net assets of the fund. Refer to Note 5 for more information on securities lending. |
| 3 |
Value determined using significant unobservable inputs. |
| 4 |
Amount less than one thousand. |
| 5 |
Rate represents the seven-day yield at 6/30/2024. |
| 6 |
Part of the same “group of investment companies” as the fund as defined under the Investment Company Act of 1940, as amended. |
| 7 |
Security purchased with cash collateral from securities on loan. Refer to Note 5 for more information on securities lending. |
Key to abbreviation(s)
|
| ADR = American Depositary Receipts |
| CAD = Canadian dollars |
| CDI = CREST Depository Interest |
| EUR = Euros |
| GDR = Global Depositary Receipts |
Refer to the notes to financial statements.
5 American Funds Insurance Series
|
|
|
| Global Small Capitalization Fund |
|
|
| Investment portfolio June 30, 2024 |
|
unaudited |
|
|
|
|
|
|
|
|
|
|
|
|
|
|
|
| Common stocks 97.33% |
|
Shares |
|
|
|
|
|
Value
(000) |
|
|
|
|
|
|
| Industrials 26.37% |
|
Stericycle, Inc.1 |
|
|
1,061,241 |
|
|
|
|
|
|
$ |
61,690 |
|
|
|
International Container Terminal Services, Inc. |
|
|
9,163,480 |
|
|
|
|
|
|
|
54,732 |
|
|
|
CBIZ, Inc.1 |
|
|
708,466 |
|
|
|
|
|
|
|
52,497 |
|
|
|
Saia, Inc.1 |
|
|
68,952 |
|
|
|
|
|
|
|
32,703 |
|
|
|
Trelleborg AB, Class B |
|
|
741,923 |
|
|
|
|
|
|
|
28,744 |
|
|
|
Hensoldt AG |
|
|
730,761 |
|
|
|
|
|
|
|
26,866 |
|
|
|
Sulzer AG |
|
|
151,412 |
|
|
|
|
|
|
|
20,923 |
|
|
|
ICF International, Inc. |
|
|
140,898 |
|
|
|
|
|
|
|
20,918 |
|
|
|
Cleanaway Waste Management, Ltd. |
|
|
11,082,998 |
|
|
|
|
|
|
|
20,468 |
|
|
|
Visional, Inc.1,2 |
|
|
453,108 |
|
|
|
|
|
|
|
20,343 |
|
|
|
Diploma PLC |
|
|
377,968 |
|
|
|
|
|
|
|
19,721 |
|
|
|
MISUMI Group, Inc. |
|
|
1,143,106 |
|
|
|
|
|
|
|
19,551 |
|
|
|
AZEK Co., Inc. (The), Class A1 |
|
|
443,915 |
|
|
|
|
|
|
|
18,702 |
|
|
|
UL Solutions, Inc., Class A |
|
|
433,500 |
|
|
|
|
|
|
|
18,289 |
|
|
|
Wizz Air Holdings PLC1 |
|
|
582,688 |
|
|
|
|
|
|
|
16,479 |
|
|
|
Interpump Group SpA |
|
|
365,871 |
|
|
|
|
|
|
|
16,185 |
|
|
|
Instalco AB |
|
|
4,098,065 |
|
|
|
|
|
|
|
15,657 |
|
|
|
Qantas Airways, Ltd.1 |
|
|
3,657,608 |
|
|
|
|
|
|
|
14,232 |
|
|
|
VSE Corp. |
|
|
151,194 |
|
|
|
|
|
|
|
13,347 |
|
|
|
Cargotec OYJ, Class B, non-registered shares |
|
|
162,508 |
|
|
|
|
|
|
|
13,063 |
|
|
|
NORMA Group SE, non-registered shares |
|
|
640,303 |
|
|
|
|
|
|
|
11,844 |
|
|
|
Delhivery Ltd.1 |
|
|
2,384,307 |
|
|
|
|
|
|
|
11,386 |
|
|
|
Alaska Air Group, Inc.1 |
|
|
268,976 |
|
|
|
|
|
|
|
10,867 |
|
|
|
Comfort Systems USA, Inc. |
|
|
35,109 |
|
|
|
|
|
|
|
10,677 |
|
|
|
Godrej Industries, Ltd.1 |
|
|
1,032,000 |
|
|
|
|
|
|
|
10,537 |
|
|
|
First Advantage Corp. |
|
|
653,201 |
|
|
|
|
|
|
|
10,497 |
|
|
|
Inox Wind, Ltd. |
|
|
6,118,031 |
|
|
|
|
|
|
|
10,318 |
|
|
|
IMCD NV |
|
|
74,492 |
|
|
|
|
|
|
|
10,312 |
|
|
|
XPO, Inc.1 |
|
|
92,617 |
|
|
|
|
|
|
|
9,831 |
|
|
|
Nexans SA |
|
|
88,349 |
|
|
|
|
|
|
|
9,730 |
|
|
|
Carel Industries SpA |
|
|
524,806 |
|
|
|
|
|
|
|
9,723 |
|
|
|
LS Electric Co., Ltd. |
|
|
59,988 |
|
|
|
|
|
|
|
9,640 |
|
|
|
Fasadgruppen Group AB |
|
|
1,574,074 |
|
|
|
|
|
|
|
9,183 |
|
|
|
Dayforce, Inc.1 |
|
|
176,930 |
|
|
|
|
|
|
|
8,776 |
|
|
|
Engcon AB, Class B2 |
|
|
1,070,647 |
|
|
|
|
|
|
|
8,768 |
|
|
|
Rumo SA |
|
|
2,272,441 |
|
|
|
|
|
|
|
8,423 |
|
|
|
KEI Industries, Ltd. |
|
|
154,935 |
|
|
|
|
|
|
|
8,176 |
|
|
|
EuroGroup Laminations SpA2 |
|
|
1,841,164 |
|
|
|
|
|
|
|
8,037 |
|
|
|
Applied Industrial Technologies, Inc. |
|
|
40,766 |
|
|
|
|
|
|
|
7,909 |
|
|
|
Reliance Worldwide Corp., Ltd. |
|
|
2,633,607 |
|
|
|
|
|
|
|
7,891 |
|
|
|
Trex Co., Inc.1 |
|
|
102,977 |
|
|
|
|
|
|
|
7,633 |
|
|
|
GVS SpA1 |
|
|
1,021,101 |
|
|
|
|
|
|
|
7,172 |
|
|
|
TriNet Group, Inc. |
|
|
69,983 |
|
|
|
|
|
|
|
6,998 |
|
|
|
Beijer Ref AB, Class B |
|
|
445,805 |
|
|
|
|
|
|
|
6,903 |
|
|
|
Burckhardt Compression Holding AG |
|
|
9,963 |
|
|
|
|
|
|
|
6,525 |
|
|
|
Addtech AB, Class B |
|
|
245,222 |
|
|
|
|
|
|
|
6,114 |
|
|
|
TELUS International (Cda), Inc., subordinate voting shares1 |
|
|
1,038,769 |
|
|
|
|
|
|
|
6,004 |
|
|
|
SIS, Ltd.1 |
|
|
1,064,190 |
|
|
|
|
|
|
|
5,731 |
|
|
|
Daiseki Co., Ltd. |
|
|
233,700 |
|
|
|
|
|
|
|
5,441 |
|
|
|
ATS Corp.1 |
|
|
159,326 |
|
|
|
|
|
|
|
5,156 |
|
|
|
Embraer SA1 |
|
|
758,700 |
|
|
|
|
|
|
|
4,906 |
|
|
|
Alfen NV1 |
|
|
252,591 |
|
|
|
|
|
|
|
4,656 |
|
|
|
DL E&C Co., Ltd. |
|
|
177,600 |
|
|
|
|
|
|
|
4,159 |
|
|
|
Howden Joinery Group PLC |
|
|
367,287 |
|
|
|
|
|
|
|
4,058 |
|
|
|
ManpowerGroup, Inc. |
|
|
57,609 |
|
|
|
|
|
|
|
4,021 |
|
|
|
Loar Holdings, Inc.1,2 |
|
|
71,100 |
|
|
|
|
|
|
|
3,797 |
|
|
|
Controladora Vuela Compañía de Aviación, SAB de CV, Class A (ADR),
ordinary participation certificates1 |
|
|
525,900 |
|
|
|
|
|
|
|
3,345 |
|
|
|
Controladora Vuela Compañía de Aviación, SAB de CV, Class A,
ordinary participation certificates1,2 |
|
|
413,400 |
|
|
|
|
|
|
|
261 |
|
|
|
MonotaRO Co., Ltd.2 |
|
|
300,200 |
|
|
|
|
|
|
|
3,536 |
|
|
|
SPIE SA |
|
|
89,141 |
|
|
|
|
|
|
|
3,243 |
|
American Funds Insurance Series 6
Global Small Capitalization Fund (continued)
|
|
|
|
|
|
|
|
|
|
|
|
|
|
|
| Common stocks (continued) |
|
Shares |
|
|
|
|
|
Value
(000) |
|
|
|
|
|
|
| Industrials (continued) |
|
REV Group, Inc. |
|
|
91,177 |
|
|
|
|
|
|
$ |
2,269 |
|
|
|
Herc Holdings, Inc. |
|
|
15,514 |
|
|
|
|
|
|
|
2,068 |
|
|
|
IndiaMart InterMesh, Ltd. |
|
|
60,563 |
|
|
|
|
|
|
|
1,945 |
|
|
|
Boyd Group Services, Inc. |
|
|
7,695 |
|
|
|
|
|
|
|
1,445 |
|
|
|
McGrath RentCorp2 |
|
|
4,607 |
|
|
|
|
|
|
|
491 |
|
|
|
Ariston Holding NV2 |
|
|
105,809 |
|
|
|
|
|
|
|
436 |
|
|
|
|
|
|
|
|
|
|
|
|
|
|
|
|
|
|
|
|
|
|
|
|
|
|
|
|
|
805,948 |
|
|
|
|
|
|
|
|
|
|
|
|
|
|
|
|
|
|
|
|
|
|
|
|
|
|
|
|
|
|
|
| |
|
|
|
|
| Consumer discretionary 16.21% |
|
Skechers USA, Inc., Class A1 |
|
|
700,000 |
|
|
|
|
|
|
|
48,384 |
|
|
|
Melco Resorts & Entertainment, Ltd. (ADR)1 |
|
|
5,422,969 |
|
|
|
|
|
|
|
40,455 |
|
|
|
DraftKings, Inc., Class A1 |
|
|
1,000,000 |
|
|
|
|
|
|
|
38,170 |
|
|
|
CAVA Group, Inc.1 |
|
|
318,211 |
|
|
|
|
|
|
|
29,514 |
|
|
|
Light & Wonder, Inc.1 |
|
|
279,658 |
|
|
|
|
|
|
|
29,331 |
|
|
|
Lands’ End, Inc.1,3 |
|
|
2,100,000 |
|
|
|
|
|
|
|
28,539 |
|
|
|
Thor Industries, Inc. |
|
|
301,656 |
|
|
|
|
|
|
|
28,190 |
|
|
|
YETI Holdings, Inc.1 |
|
|
466,300 |
|
|
|
|
|
|
|
17,789 |
|
|
|
Evolution AB |
|
|
164,961 |
|
|
|
|
|
|
|
17,190 |
|
|
|
Ollies Bargain Outlet Holdings, Inc.1 |
|
|
167,768 |
|
|
|
|
|
|
|
16,470 |
|
|
|
Ermenegildo Zegna NV2 |
|
|
1,316,123 |
|
|
|
|
|
|
|
15,583 |
|
|
|
Inchcape PLC |
|
|
1,645,703 |
|
|
|
|
|
|
|
15,489 |
|
|
|
Wyndham Hotels & Resorts, Inc. |
|
|
200,796 |
|
|
|
|
|
|
|
14,859 |
|
|
|
Zalando SE, non-registered shares1 |
|
|
599,581 |
|
|
|
|
|
|
|
14,016 |
|
|
|
Entain PLC |
|
|
1,708,574 |
|
|
|
|
|
|
|
13,527 |
|
|
|
MRF, Ltd. |
|
|
6,769 |
|
|
|
|
|
|
|
10,491 |
|
|
|
Boot Barn Holdings, Inc.1 |
|
|
79,159 |
|
|
|
|
|
|
|
10,206 |
|
|
|
Tube Investments of India, Ltd. |
|
|
176,600 |
|
|
|
|
|
|
|
8,962 |
|
|
|
Five Below, Inc.1 |
|
|
81,296 |
|
|
|
|
|
|
|
8,859 |
|
|
|
TopBuild Corp.1 |
|
|
22,196 |
|
|
|
|
|
|
|
8,551 |
|
|
|
On Holding AG, Class A1 |
|
|
208,425 |
|
|
|
|
|
|
|
8,087 |
|
|
|
Chalet Hotels, Ltd.1 |
|
|
790,221 |
|
|
|
|
|
|
|
7,605 |
|
|
|
Shoei Co., Ltd. |
|
|
563,400 |
|
|
|
|
|
|
|
6,885 |
|
|
|
Steven Madden, Ltd. |
|
|
145,406 |
|
|
|
|
|
|
|
6,151 |
|
|
|
Arhaus, Inc., Class A |
|
|
343,575 |
|
|
|
|
|
|
|
5,820 |
|
|
|
Aditya Vision, Ltd. |
|
|
62,272 |
|
|
|
|
|
|
|
3,323 |
|
|
|
Aditya Vision, Ltd.4 |
|
|
38,441 |
|
|
|
|
|
|
|
2,052 |
|
|
|
Lottomatica Group SpA |
|
|
441,449 |
|
|
|
|
|
|
|
5,323 |
|
|
|
International Game Technology PLC |
|
|
252,200 |
|
|
|
|
|
|
|
5,160 |
|
|
|
tonies SE, Class A1 |
|
|
687,000 |
|
|
|
|
|
|
|
5,047 |
|
|
|
Camping World Holdings, Inc., Class A |
|
|
276,559 |
|
|
|
|
|
|
|
4,939 |
|
|
|
Haichang Ocean Park Holdings, Ltd.1,2 |
|
|
41,547,000 |
|
|
|
|
|
|
|
3,727 |
|
|
|
EIH, Ltd. |
|
|
724,032 |
|
|
|
|
|
|
|
3,697 |
|
|
|
Smartfit Escola de Ginástica e Dança SA |
|
|
909,317 |
|
|
|
|
|
|
|
3,514 |
|
|
|
Sanrio Co., Ltd. |
|
|
180,100 |
|
|
|
|
|
|
|
3,322 |
|
|
|
Elior Group SA1 |
|
|
1,153,174 |
|
|
|
|
|
|
|
3,246 |
|
|
|
First Watch Restaurant Group, Inc.1,2 |
|
|
105,725 |
|
|
|
|
|
|
|
1,856 |
|
|
|
Opmobility |
|
|
93,246 |
|
|
|
|
|
|
|
901 |
|
|
|
|
|
|
|
|
|
|
|
|
|
|
|
|
|
|
|
|
|
|
|
|
|
|
|
|
|
495,230 |
|
|
|
|
|
|
|
|
|
|
|
|
|
|
|
|
|
|
|
|
|
|
|
|
|
|
|
|
|
|
|
| |
|
|
|
|
| Information technology 15.63% |
|
PAR Technology Corp.1 |
|
|
846,492 |
|
|
|
|
|
|
|
39,861 |
|
|
|
PAR Technology Corp.1,5 |
|
|
325,484 |
|
|
|
|
|
|
|
15,327 |
|
|
|
Maruwa Co., Ltd. |
|
|
110,901 |
|
|
|
|
|
|
|
26,664 |
|
|
|
Insight Enterprises, Inc.1 |
|
|
118,240 |
|
|
|
|
|
|
|
23,454 |
|
|
|
GitLab, Inc., Class A1 |
|
|
464,256 |
|
|
|
|
|
|
|
23,083 |
|
|
|
MACOM Technology Solutions Holdings, Inc.1 |
|
|
190,000 |
|
|
|
|
|
|
|
21,179 |
|
|
|
Confluent, Inc., Class A1 |
|
|
647,799 |
|
|
|
|
|
|
|
19,129 |
|
|
|
Silicon Laboratories, Inc.1 |
|
|
161,697 |
|
|
|
|
|
|
|
17,888 |
|
|
|
Tokyo Seimitsu Co., Ltd. |
|
|
223,223 |
|
|
|
|
|
|
|
16,958 |
|
|
|
Credo Technology Group Holding, Ltd.1 |
|
|
520,402 |
|
|
|
|
|
|
|
16,622 |
|
|
|
Pegasystems, Inc. |
|
|
268,191 |
|
|
|
|
|
|
|
16,234 |
|
|
|
eMemory Technology, Inc. |
|
|
201,430 |
|
|
|
|
|
|
|
15,836 |
|
7 American Funds Insurance Series
Global Small Capitalization Fund (continued)
|
|
|
|
|
|
|
|
|
|
|
|
|
|
|
| Common stocks (continued) |
|
Shares |
|
|
|
|
|
Value
(000) |
|
|
|
|
|
|
| Information technology (continued) |
|
Nordic Semiconductor ASA1 |
|
|
1,136,540 |
|
|
|
|
|
|
$ |
15,152 |
|
|
|
Klaviyo, Inc., Class A1 |
|
|
566,791 |
|
|
|
|
|
|
|
14,107 |
|
|
|
Tanla Platforms, Ltd. |
|
|
1,220,333 |
|
|
|
|
|
|
|
13,734 |
|
|
|
Qorvo, Inc.1 |
|
|
104,345 |
|
|
|
|
|
|
|
12,108 |
|
|
|
SUMCO Corp.2 |
|
|
822,300 |
|
|
|
|
|
|
|
11,943 |
|
|
|
Topicus.com, Inc., subordinate voting shares |
|
|
139,094 |
|
|
|
|
|
|
|
11,896 |
|
|
|
Kokusai Electric Corp.2 |
|
|
401,100 |
|
|
|
|
|
|
|
11,822 |
|
|
|
Semtech Corp.1 |
|
|
383,121 |
|
|
|
|
|
|
|
11,448 |
|
|
|
INFICON Holding AG |
|
|
7,397 |
|
|
|
|
|
|
|
11,191 |
|
|
|
Wolfspeed, Inc.1 |
|
|
468,848 |
|
|
|
|
|
|
|
10,671 |
|
|
|
ALTEN SA, non-registered shares |
|
|
95,793 |
|
|
|
|
|
|
|
10,559 |
|
|
|
Softcat PLC |
|
|
370,983 |
|
|
|
|
|
|
|
8,526 |
|
|
|
MKS Instruments, Inc. |
|
|
56,170 |
|
|
|
|
|
|
|
7,335 |
|
|
|
King Slide Works Co., Ltd.1 |
|
|
190,000 |
|
|
|
|
|
|
|
7,182 |
|
|
|
Smartsheet, Inc., Class A1 |
|
|
149,320 |
|
|
|
|
|
|
|
6,582 |
|
|
|
HPSP Co., Ltd. |
|
|
215,585 |
|
|
|
|
|
|
|
6,163 |
|
|
|
MongoDB, Inc., Class A1 |
|
|
23,300 |
|
|
|
|
|
|
|
5,824 |
|
|
|
Riken Keiki Co., Ltd. |
|
|
204,800 |
|
|
|
|
|
|
|
5,395 |
|
|
|
Bentley Systems, Inc., Class B |
|
|
102,734 |
|
|
|
|
|
|
|
5,071 |
|
|
|
Alphawave IP Group PLC1 |
|
|
2,612,177 |
|
|
|
|
|
|
|
4,734 |
|
|
|
BE Semiconductor Industries NV |
|
|
28,225 |
|
|
|
|
|
|
|
4,716 |
|
|
|
Xiamen Faratronic Co., Ltd., Class A |
|
|
384,267 |
|
|
|
|
|
|
|
4,025 |
|
|
|
Keywords Studios PLC |
|
|
123,720 |
|
|
|
|
|
|
|
3,602 |
|
|
|
Aspen Technology, Inc.1 |
|
|
17,052 |
|
|
|
|
|
|
|
3,387 |
|
|
|
ASMPT, Ltd. |
|
|
240,000 |
|
|
|
|
|
|
|
3,345 |
|
|
|
Globant SA1 |
|
|
17,730 |
|
|
|
|
|
|
|
3,161 |
|
|
|
SentinelOne, Inc., Class A1 |
|
|
143,800 |
|
|
|
|
|
|
|
3,027 |
|
|
|
LEM Holding SA |
|
|
1,860 |
|
|
|
|
|
|
|
2,960 |
|
|
|
Unity Software, Inc.1 |
|
|
160,503 |
|
|
|
|
|
|
|
2,610 |
|
|
|
Silvaco Group, Inc.1,2 |
|
|
121,785 |
|
|
|
|
|
|
|
2,190 |
|
|
|
Yotpo, Ltd.1,5,6 |
|
|
678,736 |
|
|
|
|
|
|
|
964 |
|
|
|
|
|
|
|
|
|
|
|
|
|
|
|
|
|
|
|
|
|
|
|
|
|
|
|
|
|
477,665 |
|
|
|
|
|
|
|
|
|
|
|
|
|
|
|
|
|
|
|
|
|
|
|
|
|
|
|
|
|
|
|
| |
|
|
|
|
| Health care 14.74% |
|
Haemonetics Corp.1 |
|
|
833,183 |
|
|
|
|
|
|
|
68,930 |
|
|
|
Insulet Corp.1 |
|
|
207,210 |
|
|
|
|
|
|
|
41,815 |
|
|
|
Max Healthcare Institute, Ltd. |
|
|
2,758,703 |
|
|
|
|
|
|
|
31,021 |
|
|
|
Ensign Group, Inc. (The) |
|
|
223,488 |
|
|
|
|
|
|
|
27,643 |
|
|
|
Bachem Holding AG |
|
|
231,879 |
|
|
|
|
|
|
|
21,312 |
|
|
|
Structure Therapeutics, Inc. (ADR)1 |
|
|
507,303 |
|
|
|
|
|
|
|
19,922 |
|
|
|
Masimo Corp.1 |
|
|
145,613 |
|
|
|
|
|
|
|
18,338 |
|
|
|
iRhythm Technologies, Inc.1 |
|
|
163,088 |
|
|
|
|
|
|
|
17,555 |
|
|
|
Ambu AS, Class B, non-registered shares1 |
|
|
891,212 |
|
|
|
|
|
|
|
17,117 |
|
|
|
Vaxcyte, Inc.1 |
|
|
216,472 |
|
|
|
|
|
|
|
16,346 |
|
|
|
CONMED Corp. |
|
|
233,934 |
|
|
|
|
|
|
|
16,216 |
|
|
|
Denali Therapeutics, Inc.1 |
|
|
672,969 |
|
|
|
|
|
|
|
15,626 |
|
|
|
ICON PLC1 |
|
|
46,061 |
|
|
|
|
|
|
|
14,439 |
|
|
|
DiaSorin Italia SpA |
|
|
142,930 |
|
|
|
|
|
|
|
14,200 |
|
|
|
Glenmark Pharmaceuticals, Ltd. |
|
|
855,987 |
|
|
|
|
|
|
|
12,635 |
|
|
|
Hapvida Participações e Investimentos SA1 |
|
|
18,340,235 |
|
|
|
|
|
|
|
12,566 |
|
|
|
Aster DM Healthcare, Ltd. |
|
|
2,655,930 |
|
|
|
|
|
|
|
11,045 |
|
|
|
Integra LifeSciences Holdings Corp.1 |
|
|
359,697 |
|
|
|
|
|
|
|
10,481 |
|
|
|
Encompass Health Corp. |
|
|
117,866 |
|
|
|
|
|
|
|
10,112 |
|
|
|
IDEAYA Biosciences, Inc.1 |
|
|
285,721 |
|
|
|
|
|
|
|
10,032 |
|
|
|
Immunovant, Inc.1 |
|
|
195,870 |
|
|
|
|
|
|
|
5,171 |
|
|
|
BridgeBio Pharma, Inc.1,5 |
|
|
134,457 |
|
|
|
|
|
|
|
3,406 |
|
|
|
BridgeBio Pharma, Inc.1 |
|
|
68,966 |
|
|
|
|
|
|
|
1,747 |
|
|
|
LivaNova PLC1 |
|
|
93,282 |
|
|
|
|
|
|
|
5,114 |
|
|
|
Medmix AG |
|
|
299,727 |
|
|
|
|
|
|
|
4,521 |
|
|
|
Angelalign Technology, Inc.2 |
|
|
547,348 |
|
|
|
|
|
|
|
3,979 |
|
|
|
Integer Holdings Corp.1 |
|
|
33,364 |
|
|
|
|
|
|
|
3,863 |
|
|
|
Nordhealth AS, Class A1 |
|
|
1,228,343 |
|
|
|
|
|
|
|
3,626 |
|
American Funds Insurance Series 8
Global Small Capitalization Fund (continued)
|
|
|
|
|
|
|
|
|
|
|
|
|
|
|
| Common stocks (continued) |
|
Shares |
|
|
|
|
|
Value
(000) |
|
|
|
|
|
|
| Health care (continued) |
|
Establishment Labs Holdings, Inc.1 |
|
|
73,255 |
|
|
|
|
|
|
$ |
3,329 |
|
|
|
Ocumension Therapeutics1 |
|
|
3,095,983 |
|
|
|
|
|
|
|
2,715 |
|
|
|
Indegene, Ltd.1,4 |
|
|
221,331 |
|
|
|
|
|
|
|
1,476 |
|
|
|
Indegene, Ltd.1 |
|
|
69,104 |
|
|
|
|
|
|
|
461 |
|
|
|
Vimian Group AB (publ)1,2 |
|
|
578,147 |
|
|
|
|
|
|
|
1,878 |
|
|
|
WuXi XDC Cayman, Inc.1,2 |
|
|
759,000 |
|
|
|
|
|
|
|
1,682 |
|
|
|
|
|
|
|
|
|
|
|
|
|
|
|
|
|
|
|
|
|
|
|
|
|
|
|
|
|
450,319 |
|
|
|
|
|
|
|
|
|
|
|
|
|
|
|
|
|
|
|
|
|
|
|
|
|
|
|
|
|
|
|
| |
|
|
|
|
| Financials 9.66% |
|
Cholamandalam Investment and Finance Co., Ltd. |
|
|
2,252,839 |
|
|
|
|
|
|
|
38,269 |
|
|
|
HDFC Asset Management Co., Ltd. |
|
|
780,039 |
|
|
|
|
|
|
|
37,364 |
|
|
|
Eurobank Ergasias Services and Holdings SA |
|
|
11,977,160 |
|
|
|
|
|
|
|
25,933 |
|
|
|
Stifel Financial Corp. |
|
|
271,050 |
|
|
|
|
|
|
|
22,809 |
|
|
|
IIFL Finance, Ltd. |
|
|
3,669,495 |
|
|
|
|
|
|
|
22,598 |
|
|
|
Banco del Bajio, SA |
|
|
6,505,035 |
|
|
|
|
|
|
|
19,737 |
|
|
|
Janus Henderson Group PLC |
|
|
470,000 |
|
|
|
|
|
|
|
15,844 |
|
|
|
Five-Star Business Finance, Ltd.1 |
|
|
1,220,380 |
|
|
|
|
|
|
|
11,600 |
|
|
|
360 ONE WAM, Ltd. |
|
|
956,000 |
|
|
|
|
|
|
|
11,178 |
|
|
|
Vontobel Holding AG |
|
|
159,480 |
|
|
|
|
|
|
|
9,555 |
|
|
|
Aditya Birla Capital, Ltd.1 |
|
|
2,694,788 |
|
|
|
|
|
|
|
7,688 |
|
|
|
SiriusPoint, Ltd.1 |
|
|
550,000 |
|
|
|
|
|
|
|
6,710 |
|
|
|
Fukuoka Financial Group, Inc. |
|
|
250,000 |
|
|
|
|
|
|
|
6,709 |
|
|
|
Asia Commercial Joint Stock Bank |
|
|
6,666,205 |
|
|
|
|
|
|
|
6,669 |
|
|
|
Banc of California, Inc. |
|
|
494,940 |
|
|
|
|
|
|
|
6,325 |
|
|
|
Patria Investments, Ltd., Class A |
|
|
508,200 |
|
|
|
|
|
|
|
6,129 |
|
|
|
Glacier Bancorp, Inc. |
|
|
149,091 |
|
|
|
|
|
|
|
5,564 |
|
|
|
EFG International AG |
|
|
334,117 |
|
|
|
|
|
|
|
4,917 |
|
|
|
Lazard, Inc., Class A |
|
|
123,250 |
|
|
|
|
|
|
|
4,706 |
|
|
|
Hilltop Holdings, Inc. |
|
|
150,000 |
|
|
|
|
|
|
|
4,692 |
|
|
|
Bridgepoint Group PLC |
|
|
1,670,890 |
|
|
|
|
|
|
|
4,660 |
|
|
|
AvidXchange Holdings, Inc.1 |
|
|
365,286 |
|
|
|
|
|
|
|
4,405 |
|
|
|
Haci Ömer Sabanci Holding AS |
|
|
1,148,843 |
|
|
|
|
|
|
|
3,393 |
|
|
|
Remgro, Ltd. |
|
|
343,647 |
|
|
|
|
|
|
|
2,562 |
|
|
|
Discovery, Ltd. |
|
|
327,356 |
|
|
|
|
|
|
|
2,423 |
|
|
|
Capitec Bank Holdings, Ltd. |
|
|
15,161 |
|
|
|
|
|
|
|
2,190 |
|
|
|
JB Financial Group Co., Ltd. |
|
|
39,902 |
|
|
|
|
|
|
|
423 |
|
|
|
|
|
|
|
|
|
|
|
|
|
|
|
|
|
|
|
|
|
|
|
|
|
|
|
|
|
295,052 |
|
|
|
|
|
|
|
|
|
|
|
|
|
|
|
|
|
|
|
|
|
|
|
|
|
|
|
|
|
|
|
| |
|
|
|
|
| Communication services 4.42% |
|
Lions Gate Entertainment Corp., Class B1 |
|
|
4,462,841 |
|
|
|
|
|
|
|
38,247 |
|
|
|
Indosat Tbk PT |
|
|
38,357,467 |
|
|
|
|
|
|
|
25,024 |
|
|
|
JCDecaux SE1 |
|
|
976,059 |
|
|
|
|
|
|
|
19,110 |
|
|
|
Lionsgate Studios Corp.1 |
|
|
2,076,844 |
|
|
|
|
|
|
|
16,739 |
|
|
|
Nexstar Media Group, Inc. |
|
|
67,878 |
|
|
|
|
|
|
|
11,268 |
|
|
|
Rightmove PLC |
|
|
1,581,453 |
|
|
|
|
|
|
|
10,687 |
|
|
|
Future PLC |
|
|
725,708 |
|
|
|
|
|
|
|
9,645 |
|
|
|
Bharti Hexacom, Ltd.1 |
|
|
124,501 |
|
|
|
|
|
|
|
1,660 |
|
|
|
Bharti Hexacom, Ltd.1,4 |
|
|
92,729 |
|
|
|
|
|
|
|
1,237 |
|
|
|
IHS Holding, Ltd.1,2 |
|
|
493,000 |
|
|
|
|
|
|
|
1,578 |
|
|
|
|
|
|
|
|
|
|
|
|
|
|
|
|
|
|
|
|
|
|
|
|
|
|
|
|
|
135,195 |
|
|
|
|
|
|
|
|
|
|
|
|
|
|
|
|
|
|
|
|
|
|
|
|
|
|
|
|
|
|
|
| |
|
|
|
|
| Materials 3.97% |
|
Sumitomo Bakelite Co., Ltd. |
|
|
702,159 |
|
|
|
|
|
|
|
20,647 |
|
|
|
Nissan Chemical Corp. |
|
|
457,100 |
|
|
|
|
|
|
|
14,446 |
|
|
|
Materion Corp. |
|
|
128,316 |
|
|
|
|
|
|
|
13,875 |
|
|
|
Lundin Mining Corp. |
|
|
1,000,000 |
|
|
|
|
|
|
|
11,133 |
|
|
|
Huhtamäki OYJ |
|
|
250,000 |
|
|
|
|
|
|
|
10,022 |
|
|
|
Zeon Corp. |
|
|
1,100,000 |
|
|
|
|
|
|
|
9,151 |
|
|
|
Vidrala, SA, non-registered shares |
|
|
64,918 |
|
|
|
|
|
|
|
7,302 |
|
|
|
Arcadium Lithium PLC1 |
|
|
2,099,779 |
|
|
|
|
|
|
|
7,055 |
|
|
|
LANXESS AG |
|
|
282,599 |
|
|
|
|
|
|
|
6,939 |
|
|
|
Resonac Holdings Co., Ltd. |
|
|
242,900 |
|
|
|
|
|
|
|
5,358 |
|
9 American Funds Insurance Series
Global Small Capitalization Fund (continued)
|
|
|
|
|
|
|
|
|
|
|
|
|
|
|
| Common stocks (continued) |
|
Shares |
|
|
|
|
|
Value (000) |
|
|
|
|
|
|
| Materials (continued) |
|
Cabot Corp. |
|
|
48,229 |
|
|
|
|
|
|
$ |
4,432 |
|
|
|
Gujarat Fluorochemicals, Ltd. |
|
|
89,266 |
|
|
|
|
|
|
|
3,412 |
|
|
|
NV Bekaert SA |
|
|
53,808 |
|
|
|
|
|
|
|
2,252 |
|
|
|
Mayr-Melnhof Karton AG, non-registered shares |
|
|
17,479 |
|
|
|
|
|
|
|
2,098 |
|
|
|
Umicore SA |
|
|
127,835 |
|
|
|
|
|
|
|
1,918 |
|
|
|
Alcoa Corp. |
|
|
35,000 |
|
|
|
|
|
|
|
1,392 |
|
|
|
|
|
|
|
|
|
|
|
|
|
|
|
|
|
|
|
|
|
|
|
|
|
|
|
|
|
121,432 |
|
|
|
|
|
|
|
|
|
|
|
|
|
|
|
|
|
|
|
|
|
|
|
|
|
|
|
|
|
|
|
| |
|
|
|
|
| Real estate 2.62% |
|
Embassy Office Parks REIT |
|
|
6,652,704 |
|
|
|
|
|
|
|
28,284 |
|
|
|
Altus Group, Ltd.2 |
|
|
340,710 |
|
|
|
|
|
|
|
12,582 |
|
|
|
Macrotech Developers, Ltd. |
|
|
442,564 |
|
|
|
|
|
|
|
7,971 |
|
|
|
ESR-Logos REIT |
|
|
36,822,373 |
|
|
|
|
|
|
|
7,323 |
|
|
|
Fibra Uno Administración REIT, SA de CV |
|
|
5,679,172 |
|
|
|
|
|
|
|
6,978 |
|
|
|
Corp. Inmobiliaria Vesta, SAB de CV |
|
|
1,900,000 |
|
|
|
|
|
|
|
5,684 |
|
|
|
Mindspace Business Parks REIT |
|
|
1,250,000 |
|
|
|
|
|
|
|
4,991 |
|
|
|
Charter Hall Group REIT |
|
|
587,917 |
|
|
|
|
|
|
|
4,352 |
|
|
|
PotlatchDeltic Corp. REIT |
|
|
49,593 |
|
|
|
|
|
|
|
1,954 |
|
|
|
|
|
|
|
|
|
|
|
|
|
|
|
|
|
|
|
|
|
|
|
|
|
|
|
|
|
80,119 |
|
|
|
|
|
|
|
|
|
|
|
|
|
|
|
|
|
|
|
|
|
|
|
|
|
|
|
|
|
|
|
| |
|
|
|
|
| Energy 1.57% |
|
Diamond Offshore Drilling, Inc.1 |
|
|
1,142,513 |
|
|
|
|
|
|
|
17,698 |
|
|
|
Aegis Logistics, Ltd. |
|
|
1,041,407 |
|
|
|
|
|
|
|
10,858 |
|
|
|
Weatherford International1 |
|
|
55,696 |
|
|
|
|
|
|
|
6,820 |
|
|
|
Helmerich & Payne, Inc. |
|
|
167,387 |
|
|
|
|
|
|
|
6,049 |
|
|
|
Vista Energy, SAB de CV, Class A (ADR)1 |
|
|
132,280 |
|
|
|
|
|
|
|
6,016 |
|
|
|
United Tractors Tbk PT |
|
|
321,000 |
|
|
|
|
|
|
|
431 |
|
|
|
|
|
|
|
|
|
|
|
|
|
|
|
|
|
|
|
|
|
|
|
|
|
|
|
|
|
47,872 |
|
|
|
|
|
|
|
|
|
|
|
|
|
|
|
|
|
|
|
|
|
|
|
|
|
|
|
|
|
|
|
| |
|
|
|
|
| Utilities 1.40% |
|
Talen Energy Corp.1 |
|
|
92,500 |
|
|
|
|
|
|
|
10,269 |
|
|
|
ENN Energy Holdings, Ltd. |
|
|
1,205,597 |
|
|
|
|
|
|
|
9,927 |
|
|
|
ACEN Corp. |
|
|
101,171,292 |
|
|
|
|
|
|
|
8,633 |
|
|
|
SembCorp Industries, Ltd. |
|
|
1,536,800 |
|
|
|
|
|
|
|
5,434 |
|
|
|
Neoenergia SA |
|
|
1,393,872 |
|
|
|
|
|
|
|
4,630 |
|
|
|
Black Hills Corp. |
|
|
71,061 |
|
|
|
|
|
|
|
3,864 |
|
|
|
|
|
|
|
|
|
|
|
|
|
|
|
|
|
|
|
|
|
|
|
|
|
|
|
|
|
42,757 |
|
|
|
|
|
|
|
|
|
|
|
|
|
|
|
|
|
|
|
|
|
|
|
|
|
|
|
|
|
|
|
| |
|
|
|
|
| Consumer staples 0.74% |
|
Redcare Pharmacy NV, non-registered shares1 |
|
|
50,748 |
|
|
|
|
|
|
|
6,203 |
|
|
|
Kobe Bussan Co., Ltd. |
|
|
273,900 |
|
|
|
|
|
|
|
6,095 |
|
|
|
Universal Robina Corp. |
|
|
2,508,160 |
|
|
|
|
|
|
|
4,761 |
|
|
|
TreeHouse Foods, Inc.1 |
|
|
83,498 |
|
|
|
|
|
|
|
3,059 |
|
|
|
Bakkafrost P/F |
|
|
49,682 |
|
|
|
|
|
|
|
2,513 |
|
|
|
|
|
|
|
|
|
|
|
|
|
|
|
|
|
|
|
|
|
|
|
|
|
|
|
|
|
22,631 |
|
|
|
|
|
|
|
|
|
|
|
|
|
|
|
|
|
|
Total common stocks (cost: $2,290,967,000) |
|
|
|
|
|
|
|
|
|
|
2,974,220 |
|
|
|
|
|
|
|
|
|
|
|
|
|
|
|
|
|
|
|
|
|
|
|
|
|
|
|
|
|
|
|
|
|
|
|
|
| Preferred securities 0.61% |
|
|
|
|
|
|
|
|
|
|
|
|
|
|
| Information technology 0.55% |
|
SmartHR, Inc., Series D, preferred shares1,5,6 |
|
|
3,006 |
|
|
|
|
|
|
|
9,299 |
|
|
|
Yotpo, Ltd., Series F, preferred shares1,5,6 |
|
|
2,158,609 |
|
|
|
|
|
|
|
3,065 |
|
|
|
Yotpo, Ltd., Series B, preferred shares1,5,6 |
|
|
287,894 |
|
|
|
|
|
|
|
409 |
|
|
|
Yotpo, Ltd., Series C, preferred shares1,5,6 |
|
|
274,070 |
|
|
|
|
|
|
|
389 |
|
|
|
Yotpo, Ltd., Series A-1, preferred shares1,5,6 |
|
|
183,819 |
|
|
|
|
|
|
|
261 |
|
|
|
Yotpo, Ltd., Series A, preferred shares1,5,6 |
|
|
89,605 |
|
|
|
|
|
|
|
128 |
|
|
|
Yotpo, Ltd., Series C-1, preferred shares1,5,6 |
|
|
75,980 |
|
|
|
|
|
|
|
108 |
|
American Funds Insurance Series 10
Global Small Capitalization Fund (continued)
|
|
|
|
|
|
|
|
|
|
|
|
|
|
|
| Preferred securities (continued) |
|
Shares |
|
|
|
|
|
Value (000) |
|
|
|
|
|
|
| Information technology (continued) |
|
Yotpo, Ltd., Series D, preferred shares1,5,6 |
|
|
42,368 |
|
|
|
|
|
|
$ |
60 |
|
|
|
Yotpo, Ltd., Series B-1, preferred shares1,5,6 |
|
|
33,838 |
|
|
|
|
|
|
|
48 |
|
|
|
Outreach Corp., Series G, preferred shares1,5,6 |
|
|
154,354 |
|
|
|
|
|
|
|
2,913 |
|
|
|
|
|
|
|
|
|
|
|
|
|
|
|
|
|
|
|
|
|
|
|
|
|
|
|
|
|
16,680 |
|
|
|
|
|
|
|
|
|
|
|
|
|
|
|
|
|
|
|
|
|
|
|
|
|
|
|
|
|
|
|
| |
|
|
|
|
| Financials 0.06% |
|
Federal Home Loan Mortgage Corp., Series Z,
8.375% noncumulative preferred shares1 |
|
|
400,000 |
|
|
|
|
|
|
|
1,920 |
|
|
|
|
|
|
|
|
|
|
|
|
|
|
|
|
|
|
Total preferred securities (cost: $27,306,000) |
|
|
|
|
|
|
|
|
|
|
18,600 |
|
|
|
|
|
|
|
|
|
|
|
|
|
|
|
|
|
|
|
|
| Short-term securities 3.14% |
|
|
|
|
|
|
|
|
|
| |
|
|
|
| Money market investments 2.63% |
|
|
|
|
|
|
|
|
|
|
|
|
|
|
Capital Group Central Cash Fund 5.37%3,7 |
|
|
805,122 |
|
|
|
|
|
|
|
80,512 |
|
|
|
|
|
|
|
|
|
|
|
|
|
|
|
|
|
|
|
|
|
| |
|
|
|
|
|
|
|
|
|
|
|
| |
|
|
|
| Money market investments purchased with collateral from securities on loan 0.51% |
|
|
|
|
|
|
|
|
|
|
|
|
|
|
Invesco Short-Term Investments Trust - Government & Agency Portfolio,
Institutional Class 5.23%7,8 |
|
|
7,533,953 |
|
|
|
|
|
|
|
7,534 |
|
|
|
Capital Group Central Cash Fund 5.37%3,7,8 |
|
|
49,265 |
|
|
|
|
|
|
|
4,926 |
|
|
|
State Street Institutional U.S. Government Money Market Fund,
Institutional Class 5.22%7,8 |
|
|
3,041,946 |
|
|
|
|
|
|
|
3,042 |
|
|
|
|
|
|
|
|
|
|
|
|
|
|
|
|
|
|
|
|
|
|
|
|
|
|
|
|
|
15,502 |
|
|
|
|
|
|
|
|
|
|
|
|
|
|
|
|
|
|
Total short-term securities (cost: $96,015,000) |
|
|
|
|
|
|
|
|
|
|
96,014 |
|
|
|
|
|
|
|
|
|
|
|
|
|
|
|
|
|
|
|
|
|
|
|
Total investment securities 101.08% (cost: $2,414,288,000) |
|
|
|
|
|
|
|
|
|
|
3,088,834 |
|
|
|
Other assets less liabilities (1.08)% |
|
|
|
|
|
|
|
|
|
|
(33,084 |
) |
|
|
|
|
|
|
|
|
|
|
|
|
|
|
|
|
|
|
|
|
|
|
Net assets 100.00% |
|
|
|
|
|
|
|
|
|
$ |
3,055,750 |
|
|
|
|
|
|
|
|
|
|
|
|
|
|
|
|
|
|
|
|
|
|
|
|
|
|
|
|
|
|
|
|
|
|
|
|
|
|
|
|
|
|
|
|
|
|
|
|
|
|
|
|
|
|
|
|
|
| Investments in affiliates3 |
|
|
|
|
|
|
|
|
|
|
|
|
|
|
|
|
|
|
|
|
|
|
|
|
|
|
|
|
|
|
|
|
|
|
|
|
|
|
| |
|
Value at 1/1/2024 (000) |
|
|
Additions
(000) |
|
|
Reductions
(000) |
|
|
Net
realized
gain (loss) (000) |
|
|
Net unrealized
appreciation
(depreciation) (000) |
|
|
Value at
6/30/2024 (000) |
|
|
Dividend
or interest
income (000) |
|
|
|
|
|
|
|
|
|
|
|
|
| Common stocks 0.93% |
|
|
|
|
|
|
|
|
|
|
|
|
|
|
|
|
|
|
|
|
|
|
|
|
|
|
|
|
|
|
|
|
|
|
|
|
|
|
|
|
| Consumer discretionary 0.93% |
|
|
|
|
|
|
|
|
|
|
|
|
|
|
|
|
|
|
|
|
|
|
|
|
|
|
|
|
|
|
|
|
|
|
|
|
|
|
|
|
| Lands’ End, Inc.1 |
|
$ |
20,076 |
|
|
$ |
– |
|
|
$ |
– |
|
|
|
|
|
|
$ |
– |
|
|
|
|
|
|
$ |
8,463 |
|
|
$ |
28,539 |
|
|
|
|
|
|
$ |
– |
|
|
|
|
|
|
|
|
|
|
|
|
| Short-term securities 2.79% |
|
|
|
|
|
|
|
|
|
|
|
|
|
|
|
|
|
|
|
|
|
|
|
|
|
|
|
|
|
|
|
|
|
|
|
|
|
|
|
|
| Money market investments 2.63% |
|
|
|
|
|
|
|
|
|
|
|
|
|
|
|
|
|
|
|
|
|
|
|
|
|
|
|
|
|
|
|
|
|
|
|
|
|
|
|
|
| Capital Group Central Cash Fund 5.37%7 |
|
|
112,453 |
|
|
|
255,315 |
|
|
|
287,269 |
|
|
|
|
|
|
|
7 |
|
|
|
|
|
|
|
6 |
|
|
|
80,512 |
|
|
|
|
|
|
|
2,890 |
|
|
|
|
|
|
|
|
|
|
|
|
| Money market investments purchased with collateral from securities on loan 0.16% |
|
|
|
|
|
|
|
|
|
|
|
|
|
|
|
|
|
|
|
|
|
|
|
|
|
|
|
|
|
|
|
|
|
|
|
|
|
|
|
|
| Capital Group Central Cash Fund 5.37%7,8 |
|
|
4,926 |
|
|
|
|
|
|
|
|
|
|
|
|
|
|
|
|
|
|
|
|
|
|
|
|
|
|
|
4,926 |
|
|
|
|
|
|
|
– |
9 |
|
|
|
|
|
|
|
|
|
|
|
|
|
|
|
|
|
|
|
|
|
|
|
|
|
|
|
|
|
|
|
|
|
|
|
|
|
|
|
|
|
|
|
|
|
|
|
|
|
|
|
|
| Total short-term securities |
|
|
|
|
|
|
|
|
|
|
|
|
|
|
|
|
|
|
|
|
|
|
|
|
|
|
|
|
|
|
85,438 |
|
|
|
|
|
|
|
|
|
|
|
|
|
|
|
|
|
|
|
|
|
|
|
|
|
|
|
|
|
|
|
|
|
|
|
|
|
|
|
|
|
|
|
|
|
|
|
|
|
|
|
|
|
|
|
|
|
|
|
|
|
| Total 3.72% |
|
|
|
|
|
|
|
|
|
|
|
|
|
|
|
|
|
$ |
7 |
|
|
|
|
|
|
$ |
8,469 |
|
|
$ |
113,977 |
|
|
|
|
|
|
$ |
2,890 |
|
|
|
|
|
|
|
|
|
|
|
|
|
|
|
|
|
|
|
|
|
|
|
|
|
|
|
|
|
|
|
|
|
|
|
|
|
|
|
|
|
|
11 American Funds Insurance Series
Global Small Capitalization Fund (continued)
|
|
|
|
|
|
|
|
|
|
|
|
|
|
|
|
|
|
|
|
|
|
|
|
|
|
|
|
|
|
|
|
|
|
|
|
| Restricted securities5 |
|
|
|
|
|
|
|
|
|
|
|
|
|
|
|
|
|
|
|
| |
|
Acquisition date(s) |
|
Cost (000) |
|
Value (000) |
|
Percent of net assets |
|
|
|
|
|
|
|
|
| PAR Technology Corp.1 |
|
|
|
3/8/2024 |
|
|
|
|
|
|
|
|
$ |
12,580 |
|
|
|
|
|
|
|
|
$ |
15,327 |
|
|
|
|
|
|
|
|
|
.50 |
% |
|
|
|
|
|
|
|
|
| SmartHR, Inc., Series D, preferred shares1,6 |
|
|
|
5/28/2021 |
|
|
|
|
|
|
|
|
|
14,344 |
|
|
|
|
|
|
|
|
|
9,299 |
|
|
|
|
|
|
|
|
|
.30 |
|
|
|
|
|
|
|
|
|
| Yotpo, Ltd., Series F, preferred shares1,6 |
|
|
|
2/25/2021 |
|
|
|
|
|
|
|
|
|
4,748 |
|
|
|
|
|
|
|
|
|
3,065 |
|
|
|
|
|
|
|
|
|
.10 |
|
|
|
|
|
|
|
|
|
| Yotpo, Ltd.1,6 |
|
|
|
3/16/2021 |
|
|
|
|
|
|
|
|
|
1,418 |
|
|
|
|
|
|
|
|
|
964 |
|
|
|
|
|
|
|
|
|
.03 |
|
|
|
|
|
|
|
|
|
| Yotpo, Ltd., Series B, preferred shares1,6 |
|
|
|
3/16/2021 |
|
|
|
|
|
|
|
|
|
602 |
|
|
|
|
|
|
|
|
|
409 |
|
|
|
|
|
|
|
|
|
.01 |
|
|
|
|
|
|
|
|
|
| Yotpo, Ltd., Series C, preferred shares1,6 |
|
|
|
3/16/2021 |
|
|
|
|
|
|
|
|
|
573 |
|
|
|
|
|
|
|
|
|
389 |
|
|
|
|
|
|
|
|
|
.01 |
|
|
|
|
|
|
|
|
|
| Yotpo, Ltd., Series A-1, preferred shares1,6 |
|
|
|
3/16/2021 |
|
|
|
|
|
|
|
|
|
384 |
|
|
|
|
|
|
|
|
|
261 |
|
|
|
|
|
|
|
|
|
.01 |
|
|
|
|
|
|
|
|
|
| Yotpo, Ltd., Series A, preferred shares1,6 |
|
|
|
3/16/2021 |
|
|
|
|
|
|
|
|
|
187 |
|
|
|
|
|
|
|
|
|
128 |
|
|
|
|
|
|
|
|
|
.01 |
|
|
|
|
|
|
|
|
|
| Yotpo, Ltd., Series C-1, preferred shares1,6 |
|
|
|
3/16/2021 |
|
|
|
|
|
|
|
|
|
159 |
|
|
|
|
|
|
|
|
|
108 |
|
|
|
|
|
|
|
|
|
.01 |
|
|
|
|
|
|
|
|
|
| Yotpo, Ltd., Series D, preferred shares1,6 |
|
|
|
3/16/2021 |
|
|
|
|
|
|
|
|
|
88 |
|
|
|
|
|
|
|
|
|
60 |
|
|
|
|
|
|
|
|
|
.00 |
10 |
| |
|
|
|
|
|
|
|
| Yotpo, Ltd., Series B-1, preferred shares1,6 |
|
|
|
3/16/2021 |
|
|
|
|
|
|
|
|
|
71 |
|
|
|
|
|
|
|
|
|
48 |
|
|
|
|
|
|
|
|
|
.00 |
10 |
| |
|
|
|
|
|
|
|
| BridgeBio Pharma, Inc.1 |
|
|
|
9/25/2023 |
|
|
|
|
|
|
|
|
|
3,667 |
|
|
|
|
|
|
|
|
|
3,406 |
|
|
|
|
|
|
|
|
|
.11 |
|
|
|
|
|
|
|
|
|
| Outreach Corp., Series G, preferred shares1,6 |
|
|
|
5/27/2021 |
|
|
|
|
|
|
|
|
|
4,517 |
|
|
|
|
|
|
|
|
|
2,913 |
|
|
|
|
|
|
|
|
|
.10 |
|
|
|
|
|
|
|
|
|
|
|
|
|
|
|
|
|
|
|
|
|
|
|
|
|
|
|
|
|
|
|
|
|
|
|
|
|
|
|
|
|
|
|
|
|
| Total |
|
|
|
|
|
|
|
|
|
|
|
|
$ |
43,338 |
|
|
|
|
|
|
|
|
$ |
36,377 |
|
|
|
|
|
|
|
|
|
1.19 |
% |
|
|
|
|
|
|
|
|
|
|
|
|
|
|
|
|
|
|
|
|
|
|
|
|
|
|
|
|
|
|
|
|
|
|
|
|
|
|
|
|
|
|
|
|
| 1 |
Security did not produce income during the last 12 months. |
| 2 |
All or a portion of this security was on loan. The total value of all such securities was $41,131,000, which represented 1.35% of the net assets of the fund. Refer to Note 5 for more information on securities lending. |
| 3 |
Affiliate of the fund or part of the same “group of investment companies” as the fund, as defined under the Investment Company Act of 1940, as amended. |
| 4 |
Security is subject to a contractual sale restriction (lockup). The total value of all such securities was $4,765,000, which represented 0.15% of the net assets of the fund. The remaining lockup period is generally less than one year; and early lockup release provisions may be applicable based on certain set milestones or condition in accordance with legal documents. |
| 5 |
Restricted security, other than Rule 144A securities or commercial paper issued pursuant to Section 4(a)(2) of the Securities Act of 1933. The total value of all such restricted securities was $36,377,000, which represented 1.19% of the net assets of the fund. |
| 6 |
Value determined using significant unobservable inputs. |
| 7 |
Rate represents the seven-day yield at 6/30/2024. |
| 8 |
Security purchased with cash collateral from securities on loan. Refer to Note 5 for more information on securities lending. |
| 9 |
Dividend income is included with securities lending income in the fund’s statement of operations and is not shown in this table. |
| 10 |
Amount less than .01%. |
Key to abbreviation(s)
ADR = American Depositary Receipts
REIT = Real Estate Investment Trust
Refer to the notes to financial statements.
American Funds Insurance Series 12
|
|
|
| Growth Fund |
|
|
| Investment portfolio June 30, 2024 |
|
unaudited |
|
|
|
|
|
|
|
|
|
|
|
|
|
|
|
| Common stocks 97.67% |
|
Shares |
|
|
|
|
|
Value (000) |
|
|
|
|
|
|
| Information technology 23.92% |
|
Microsoft Corp. |
|
|
5,261,508 |
|
|
|
|
|
|
$ |
2,351,631 |
|
|
|
NVIDIA Corp. |
|
|
10,903,359 |
|
|
|
|
|
|
|
1,347,001 |
|
|
|
Broadcom, Inc. |
|
|
820,501 |
|
|
|
|
|
|
|
1,317,339 |
|
|
|
Apple, Inc. |
|
|
4,098,141 |
|
|
|
|
|
|
|
863,151 |
|
|
|
Salesforce, Inc. |
|
|
2,143,447 |
|
|
|
|
|
|
|
551,080 |
|
|
|
Shopify, Inc., Class A, subordinate voting shares1 |
|
|
7,195,403 |
|
|
|
|
|
|
|
475,256 |
|
|
|
Cloudflare, Inc., Class A1 |
|
|
5,111,309 |
|
|
|
|
|
|
|
423,370 |
|
|
|
Taiwan Semiconductor Manufacturing Co., Ltd. |
|
|
7,238,000 |
|
|
|
|
|
|
|
215,269 |
|
|
|
Taiwan Semiconductor Manufacturing Co., Ltd. (ADR) |
|
|
1,184,828 |
|
|
|
|
|
|
|
205,935 |
|
|
|
ASML Holding NV |
|
|
203,694 |
|
|
|
|
|
|
|
210,150 |
|
|
|
ASML Holding NV (ADR) |
|
|
181,768 |
|
|
|
|
|
|
|
185,900 |
|
|
|
MicroStrategy, Inc., Class A1,2 |
|
|
226,207 |
|
|
|
|
|
|
|
311,596 |
|
|
|
Applied Materials, Inc. |
|
|
1,258,469 |
|
|
|
|
|
|
|
296,986 |
|
|
|
Synopsys, Inc.1 |
|
|
459,300 |
|
|
|
|
|
|
|
273,311 |
|
|
|
Micron Technology, Inc. |
|
|
2,006,001 |
|
|
|
|
|
|
|
263,849 |
|
|
|
Constellation Software, Inc. |
|
|
63,212 |
|
|
|
|
|
|
|
182,138 |
|
|
|
Motorola Solutions, Inc. |
|
|
408,500 |
|
|
|
|
|
|
|
157,702 |
|
|
|
Adobe, Inc.1 |
|
|
264,824 |
|
|
|
|
|
|
|
147,120 |
|
|
|
Dell Technologies, Inc., Class C |
|
|
921,002 |
|
|
|
|
|
|
|
127,015 |
|
|
|
SAP SE |
|
|
477,361 |
|
|
|
|
|
|
|
96,921 |
|
|
|
ServiceNow, Inc.1 |
|
|
112,779 |
|
|
|
|
|
|
|
88,720 |
|
|
|
DocuSign, Inc.1 |
|
|
1,640,524 |
|
|
|
|
|
|
|
87,768 |
|
|
|
Wolfspeed, Inc.1 |
|
|
2,041,003 |
|
|
|
|
|
|
|
46,453 |
|
|
|
Unity Software, Inc.1 |
|
|
2,625,443 |
|
|
|
|
|
|
|
42,690 |
|
|
|
RingCentral, Inc., Class A1 |
|
|
1,465,500 |
|
|
|
|
|
|
|
41,327 |
|
|
|
ASM International NV |
|
|
52,525 |
|
|
|
|
|
|
|
40,008 |
|
|
|
Roper Technologies, Inc. |
|
|
61,350 |
|
|
|
|
|
|
|
34,581 |
|
|
|
MongoDB, Inc., Class A1 |
|
|
99,000 |
|
|
|
|
|
|
|
24,746 |
|
|
|
Fair Isaac Corp.1 |
|
|
13,994 |
|
|
|
|
|
|
|
20,832 |
|
|
|
Flex, Ltd.1 |
|
|
670,000 |
|
|
|
|
|
|
|
19,758 |
|
|
|
Atlassian Corp., Class A1 |
|
|
97,462 |
|
|
|
|
|
|
|
17,239 |
|
|
|
MKS Instruments, Inc. |
|
|
101,047 |
|
|
|
|
|
|
|
13,195 |
|
|
|
Stripe, Inc., Class B1,3,4 |
|
|
168,598 |
|
|
|
|
|
|
|
4,384 |
|
|
|
|
|
|
|
|
|
|
|
|
|
|
|
|
|
|
|
|
|
|
|
|
|
|
|
|
|
10,484,421 |
|
|
|
|
|
|
|
|
|
|
|
|
|
|
|
|
|
|
|
|
|
|
|
|
|
|
|
|
|
|
|
| |
|
|
|
|
| Communication services 19.84% |
|
Meta Platforms, Inc., Class A |
|
|
7,425,244 |
|
|
|
|
|
|
|
3,743,957 |
|
|
|
Netflix, Inc.1 |
|
|
3,022,121 |
|
|
|
|
|
|
|
2,039,569 |
|
|
|
Alphabet, Inc., Class C |
|
|
6,594,652 |
|
|
|
|
|
|
|
1,209,591 |
|
|
|
Alphabet, Inc., Class A |
|
|
4,309,284 |
|
|
|
|
|
|
|
784,936 |
|
|
|
Charter Communications, Inc., Class A1 |
|
|
1,020,153 |
|
|
|
|
|
|
|
304,985 |
|
|
|
Snap, Inc., Class A, nonvoting shares1 |
|
|
14,000,000 |
|
|
|
|
|
|
|
232,540 |
|
|
|
Frontier Communications Parent, Inc.1 |
|
|
4,298,912 |
|
|
|
|
|
|
|
112,546 |
|
|
|
Take-Two Interactive Software, Inc.1 |
|
|
492,195 |
|
|
|
|
|
|
|
76,531 |
|
|
|
Pinterest, Inc., Class A1 |
|
|
1,652,216 |
|
|
|
|
|
|
|
72,813 |
|
|
|
Comcast Corp., Class A |
|
|
1,343,725 |
|
|
|
|
|
|
|
52,620 |
|
|
|
T-Mobile US, Inc. |
|
|
265,000 |
|
|
|
|
|
|
|
46,688 |
|
|
|
Electronic Arts, Inc. |
|
|
133,146 |
|
|
|
|
|
|
|
18,551 |
|
|
|
|
|
|
|
|
|
|
|
|
|
|
|
|
|
|
|
|
|
|
|
|
|
|
|
|
|
8,695,327 |
|
|
|
|
|
|
|
|
|
|
|
|
|
|
|
|
|
|
|
|
|
|
|
|
|
|
|
|
|
|
|
| |
|
|
|
|
| Health care 14.97% |
|
Regeneron Pharmaceuticals, Inc.1 |
|
|
895,033 |
|
|
|
|
|
|
|
940,707 |
|
|
|
Intuitive Surgical, Inc.1 |
|
|
2,058,000 |
|
|
|
|
|
|
|
915,501 |
|
|
|
Eli Lilly and Co. |
|
|
755,720 |
|
|
|
|
|
|
|
684,214 |
|
|
|
Vertex Pharmaceuticals, Inc.1 |
|
|
1,384,508 |
|
|
|
|
|
|
|
648,947 |
|
|
|
UnitedHealth Group, Inc. |
|
|
1,232,278 |
|
|
|
|
|
|
|
627,550 |
|
|
|
Alnylam Pharmaceuticals, Inc.1 |
|
|
2,043,063 |
|
|
|
|
|
|
|
496,464 |
|
|
|
Thermo Fisher Scientific, Inc. |
|
|
411,071 |
|
|
|
|
|
|
|
227,322 |
|
|
|
Boston Scientific Corp.1 |
|
|
2,784,352 |
|
|
|
|
|
|
|
214,423 |
|
|
|
Novo Nordisk AS, Class B |
|
|
1,392,492 |
|
|
|
|
|
|
|
198,926 |
|
|
|
HCA Healthcare, Inc. |
|
|
535,904 |
|
|
|
|
|
|
|
172,175 |
|
|
|
Moderna, Inc.1 |
|
|
1,200,000 |
|
|
|
|
|
|
|
142,500 |
|
13 American Funds Insurance Series
Growth Fund (continued)
|
|
|
|
|
|
|
|
|
|
|
|
|
|
|
| Common stocks (continued) |
|
Shares |
|
|
|
|
|
Value (000) |
|
|
|
|
|
|
| Health care (continued) |
|
Centene Corp.1 |
|
|
2,042,755 |
|
|
|
|
|
|
$ |
135,435 |
|
|
|
QIAGEN NV1 |
|
|
2,651,780 |
|
|
|
|
|
|
|
108,962 |
|
|
|
Abbott Laboratories |
|
|
997,405 |
|
|
|
|
|
|
|
103,640 |
|
|
|
Danaher Corp. |
|
|
408,661 |
|
|
|
|
|
|
|
102,104 |
|
|
|
DexCom, Inc.1 |
|
|
850,000 |
|
|
|
|
|
|
|
96,373 |
|
|
|
Sarepta Therapeutics, Inc.1 |
|
|
548,342 |
|
|
|
|
|
|
|
86,638 |
|
|
|
Mettler-Toledo International, Inc.1 |
|
|
57,256 |
|
|
|
|
|
|
|
80,020 |
|
|
|
NovoCure, Ltd.1 |
|
|
3,865,163 |
|
|
|
|
|
|
|
66,210 |
|
|
|
Ascendis Pharma AS (ADR)1 |
|
|
444,896 |
|
|
|
|
|
|
|
60,675 |
|
|
|
AstraZeneca PLC |
|
|
343,952 |
|
|
|
|
|
|
|
53,621 |
|
|
|
Guardant Health, Inc.1 |
|
|
1,705,050 |
|
|
|
|
|
|
|
49,242 |
|
|
|
Molina Healthcare, Inc.1 |
|
|
159,150 |
|
|
|
|
|
|
|
47,315 |
|
|
|
Insmed, Inc.1 |
|
|
606,606 |
|
|
|
|
|
|
|
40,643 |
|
|
|
Bristol-Myers Squibb Co. |
|
|
944,357 |
|
|
|
|
|
|
|
39,219 |
|
|
|
Exact Sciences Corp.1 |
|
|
920,029 |
|
|
|
|
|
|
|
38,871 |
|
|
|
Align Technology, Inc.1 |
|
|
143,900 |
|
|
|
|
|
|
|
34,742 |
|
|
|
Verily Life Sciences, LLC1,3,4 |
|
|
300,178 |
|
|
|
|
|
|
|
31,351 |
|
|
|
Veeva Systems, Inc., Class A1 |
|
|
166,698 |
|
|
|
|
|
|
|
30,507 |
|
|
|
BioNTech SE (ADR)1 |
|
|
309,473 |
|
|
|
|
|
|
|
24,869 |
|
|
|
IQVIA Holdings, Inc.1 |
|
|
105,500 |
|
|
|
|
|
|
|
22,307 |
|
|
|
Amgen, Inc. |
|
|
55,569 |
|
|
|
|
|
|
|
17,363 |
|
|
|
CRISPR Therapeutics AG1 |
|
|
262,678 |
|
|
|
|
|
|
|
14,187 |
|
|
|
McKesson Corp. |
|
|
15,119 |
|
|
|
|
|
|
|
8,830 |
|
|
|
Biohaven, Ltd.1 |
|
|
65,550 |
|
|
|
|
|
|
|
2,275 |
|
|
|
|
|
|
|
|
|
|
|
|
|
|
|
|
|
|
|
|
|
|
|
|
|
|
|
|
|
6,564,128 |
|
|
|
|
|
|
|
|
|
|
|
|
|
|
|
|
|
|
|
|
|
|
|
|
|
|
|
|
|
|
|
| |
|
|
|
|
| Consumer discretionary 12.21% |
|
Tesla, Inc.1 |
|
|
7,656,300 |
|
|
|
|
|
|
|
1,515,029 |
|
|
|
Amazon.com, Inc.1 |
|
|
3,964,578 |
|
|
|
|
|
|
|
766,155 |
|
|
|
Royal Caribbean Cruises, Ltd.1 |
|
|
2,278,615 |
|
|
|
|
|
|
|
363,280 |
|
|
|
DoorDash, Inc., Class A1 |
|
|
3,000,000 |
|
|
|
|
|
|
|
326,340 |
|
|
|
Chipotle Mexican Grill, Inc.1 |
|
|
3,809,000 |
|
|
|
|
|
|
|
238,634 |
|
|
|
Airbnb, Inc., Class A1 |
|
|
1,480,898 |
|
|
|
|
|
|
|
224,548 |
|
|
|
Home Depot, Inc. |
|
|
565,000 |
|
|
|
|
|
|
|
194,496 |
|
|
|
Tractor Supply Co. |
|
|
665,000 |
|
|
|
|
|
|
|
179,550 |
|
|
|
Hermès International |
|
|
61,000 |
|
|
|
|
|
|
|
140,404 |
|
|
|
D.R. Horton, Inc. |
|
|
941,600 |
|
|
|
|
|
|
|
132,700 |
|
|
|
Booking Holdings, Inc. |
|
|
32,488 |
|
|
|
|
|
|
|
128,701 |
|
|
|
Amadeus IT Group SA, Class A, non-registered shares |
|
|
1,846,641 |
|
|
|
|
|
|
|
122,886 |
|
|
|
Norwegian Cruise Line Holdings, Ltd.1 |
|
|
6,094,950 |
|
|
|
|
|
|
|
114,524 |
|
|
|
Aramark |
|
|
3,218,114 |
|
|
|
|
|
|
|
109,480 |
|
|
|
Evolution AB |
|
|
1,012,589 |
|
|
|
|
|
|
|
105,521 |
|
|
|
NIKE, Inc., Class B |
|
|
1,347,886 |
|
|
|
|
|
|
|
101,590 |
|
|
|
O’Reilly Automotive, Inc.1 |
|
|
79,800 |
|
|
|
|
|
|
|
84,274 |
|
|
|
Floor & Decor Holdings, Inc., Class A1 |
|
|
792,300 |
|
|
|
|
|
|
|
78,762 |
|
|
|
YUM! Brands, Inc. |
|
|
451,544 |
|
|
|
|
|
|
|
59,811 |
|
|
|
Burlington Stores, Inc.1 |
|
|
181,389 |
|
|
|
|
|
|
|
43,533 |
|
|
|
Aptiv PLC1 |
|
|
584,134 |
|
|
|
|
|
|
|
41,135 |
|
|
|
Churchill Downs, Inc. |
|
|
208,489 |
|
|
|
|
|
|
|
29,105 |
|
|
|
Polaris, Inc. |
|
|
371,000 |
|
|
|
|
|
|
|
29,053 |
|
|
|
Flutter Entertainment PLC1 |
|
|
154,604 |
|
|
|
|
|
|
|
28,194 |
|
|
|
Five Below, Inc.1 |
|
|
252,000 |
|
|
|
|
|
|
|
27,460 |
|
|
|
Wayfair, Inc., Class A1 |
|
|
514,000 |
|
|
|
|
|
|
|
27,103 |
|
|
|
Helen of Troy, Ltd.1 |
|
|
269,597 |
|
|
|
|
|
|
|
25,002 |
|
|
|
TopBuild Corp.1 |
|
|
53,811 |
|
|
|
|
|
|
|
20,732 |
|
|
|
Salvatore Ferragamo SpA |
|
|
2,174,477 |
|
|
|
|
|
|
|
18,360 |
|
|
|
Hilton Worldwide Holdings, Inc. |
|
|
78,119 |
|
|
|
|
|
|
|
17,046 |
|
|
|
YETI Holdings, Inc.1 |
|
|
372,600 |
|
|
|
|
|
|
|
14,215 |
|
|
|
Caesars Entertainment, Inc.1 |
|
|
356,300 |
|
|
|
|
|
|
|
14,159 |
|
American Funds Insurance Series 14
Growth Fund (continued)
|
|
|
|
|
|
|
|
|
|
|
|
|
|
|
| Common stocks (continued) |
|
Shares |
|
|
|
|
|
Value (000) |
|
|
|
|
|
|
| Consumer discretionary (continued) |
|
Skyline Champion Corp.1 |
|
|
186,640 |
|
|
|
|
|
|
$ |
12,645 |
|
|
|
Service Corp. International |
|
|
155,236 |
|
|
|
|
|
|
|
11,042 |
|
|
|
DraftKings, Inc., Class A1 |
|
|
166,681 |
|
|
|
|
|
|
|
6,362 |
|
|
|
|
|
|
|
|
|
|
|
|
|
|
|
|
|
|
|
|
|
|
|
|
|
|
|
|
|
5,351,831 |
|
|
|
|
|
|
|
|
|
|
|
|
|
|
|
|
|
|
|
|
|
|
|
|
|
|
|
|
|
|
|
| |
|
|
|
|
| Industrials 10.92% |
|
TransDigm Group, Inc. |
|
|
733,363 |
|
|
|
|
|
|
|
936,952 |
|
|
|
General Electric Co. |
|
|
2,810,266 |
|
|
|
|
|
|
|
446,748 |
|
|
|
Uber Technologies, Inc.1 |
|
|
6,127,000 |
|
|
|
|
|
|
|
445,310 |
|
|
|
Carrier Global Corp. |
|
|
4,484,703 |
|
|
|
|
|
|
|
282,895 |
|
|
|
United Rentals, Inc. |
|
|
316,113 |
|
|
|
|
|
|
|
204,440 |
|
|
|
Ingersoll-Rand, Inc. |
|
|
2,141,709 |
|
|
|
|
|
|
|
194,553 |
|
|
|
Eaton Corp. PLC |
|
|
551,178 |
|
|
|
|
|
|
|
172,822 |
|
|
|
Ryanair Holdings PLC (ADR) |
|
|
1,466,022 |
|
|
|
|
|
|
|
170,704 |
|
|
|
Ryanair Holdings PLC |
|
|
96,554 |
|
|
|
|
|
|
|
1,685 |
|
|
|
Caterpillar, Inc. |
|
|
499,375 |
|
|
|
|
|
|
|
166,342 |
|
|
|
Jacobs Solutions, Inc. |
|
|
1,102,200 |
|
|
|
|
|
|
|
153,988 |
|
|
|
Equifax, Inc. |
|
|
616,955 |
|
|
|
|
|
|
|
149,587 |
|
|
|
Quanta Services, Inc. |
|
|
572,626 |
|
|
|
|
|
|
|
145,499 |
|
|
|
Boeing Co.1 |
|
|
609,759 |
|
|
|
|
|
|
|
110,982 |
|
|
|
MTU Aero Engines AG |
|
|
430,587 |
|
|
|
|
|
|
|
110,091 |
|
|
|
Airbus SE, non-registered shares |
|
|
770,328 |
|
|
|
|
|
|
|
106,217 |
|
|
|
United Airlines Holdings, Inc.1 |
|
|
1,924,540 |
|
|
|
|
|
|
|
93,648 |
|
|
|
Old Dominion Freight Line, Inc. |
|
|
490,000 |
|
|
|
|
|
|
|
86,534 |
|
|
|
Republic Services, Inc. |
|
|
437,004 |
|
|
|
|
|
|
|
84,927 |
|
|
|
Genpact, Ltd. |
|
|
2,636,874 |
|
|
|
|
|
|
|
84,881 |
|
|
|
FTAI Aviation, Ltd. |
|
|
820,915 |
|
|
|
|
|
|
|
84,743 |
|
|
|
Dayforce, Inc.1 |
|
|
1,586,142 |
|
|
|
|
|
|
|
78,673 |
|
|
|
Southwest Airlines Co. |
|
|
2,515,000 |
|
|
|
|
|
|
|
71,954 |
|
|
|
Core & Main, Inc., Class A1 |
|
|
1,293,294 |
|
|
|
|
|
|
|
63,294 |
|
|
|
ITT, Inc. |
|
|
343,000 |
|
|
|
|
|
|
|
44,309 |
|
|
|
Northrop Grumman Corp. |
|
|
94,803 |
|
|
|
|
|
|
|
41,329 |
|
|
|
HEICO Corp. |
|
|
179,400 |
|
|
|
|
|
|
|
40,116 |
|
|
|
TransUnion |
|
|
458,081 |
|
|
|
|
|
|
|
33,971 |
|
|
|
GE Vernova, Inc.1 |
|
|
192,016 |
|
|
|
|
|
|
|
32,933 |
|
|
|
Canadian Pacific Kansas City, Ltd. |
|
|
376,000 |
|
|
|
|
|
|
|
29,602 |
|
|
|
XPO, Inc.1 |
|
|
263,564 |
|
|
|
|
|
|
|
27,977 |
|
|
|
Dun & Bradstreet Holdings, Inc. |
|
|
2,339,500 |
|
|
|
|
|
|
|
21,664 |
|
|
|
FedEx Corp. |
|
|
68,327 |
|
|
|
|
|
|
|
20,487 |
|
|
|
Saia, Inc.1 |
|
|
37,514 |
|
|
|
|
|
|
|
17,793 |
|
|
|
Safran SA |
|
|
64,065 |
|
|
|
|
|
|
|
13,478 |
|
|
|
Paylocity Holding Corp.1 |
|
|
95,655 |
|
|
|
|
|
|
|
12,612 |
|
|
|
Willscot Mobile Mini Holdings Corp., Class A1 |
|
|
76,371 |
|
|
|
|
|
|
|
2,875 |
|
|
|
Einride AB1,3,4 |
|
|
78,648 |
|
|
|
|
|
|
|
2,674 |
|
|
|
|
|
|
|
|
|
|
|
|
|
|
|
|
|
|
|
|
|
|
|
|
|
|
|
|
|
4,789,289 |
|
|
|
|
|
|
|
|
|
|
|
|
|
|
|
|
|
|
|
|
|
|
|
|
|
|
|
|
|
|
|
| |
|
|
|
|
| Financials 6.96% |
|
Visa, Inc., Class A |
|
|
2,761,359 |
|
|
|
|
|
|
|
724,774 |
|
|
|
Bank of America Corp. |
|
|
7,760,600 |
|
|
|
|
|
|
|
308,639 |
|
|
|
KKR & Co., Inc. |
|
|
2,878,557 |
|
|
|
|
|
|
|
302,939 |
|
|
|
Fiserv, Inc.1 |
|
|
1,833,900 |
|
|
|
|
|
|
|
273,325 |
|
|
|
Mastercard, Inc., Class A |
|
|
614,033 |
|
|
|
|
|
|
|
270,887 |
|
|
|
Blackstone, Inc. |
|
|
1,315,765 |
|
|
|
|
|
|
|
162,892 |
|
|
|
Toast, Inc., Class A1 |
|
|
5,953,559 |
|
|
|
|
|
|
|
153,423 |
|
|
|
Apollo Asset Management, Inc. |
|
|
1,286,147 |
|
|
|
|
|
|
|
151,855 |
|
|
|
Marsh & McLennan Companies, Inc. |
|
|
403,461 |
|
|
|
|
|
|
|
85,017 |
|
|
|
Brookfield Corp., Class A |
|
|
1,763,605 |
|
|
|
|
|
|
|
73,260 |
|
|
|
Affirm Holdings, Inc., Class A1 |
|
|
1,999,051 |
|
|
|
|
|
|
|
60,391 |
|
|
|
Block, Inc., Class A1 |
|
|
920,219 |
|
|
|
|
|
|
|
59,345 |
|
|
|
Blue Owl Capital, Inc., Class A |
|
|
3,123,772 |
|
|
|
|
|
|
|
55,447 |
|
|
|
Truist Financial Corp. |
|
|
1,350,366 |
|
|
|
|
|
|
|
52,462 |
|
|
|
Ryan Specialty Holdings, Inc., Class A |
|
|
870,000 |
|
|
|
|
|
|
|
50,382 |
|
15 American Funds Insurance Series
Growth Fund (continued)
|
|
|
|
|
|
|
|
|
|
|
|
|
|
|
| Common stocks (continued) |
|
Shares |
|
|
|
|
|
Value (000) |
|
|
|
|
|
|
| Financials (continued) |
|
Progressive Corp. |
|
|
241,257 |
|
|
|
|
|
|
$ |
50,112 |
|
|
|
UBS Group AG |
|
|
1,535,000 |
|
|
|
|
|
|
|
44,932 |
|
|
|
Capital One Financial Corp. |
|
|
313,000 |
|
|
|
|
|
|
|
43,335 |
|
|
|
Ares Management Corp., Class A |
|
|
310,500 |
|
|
|
|
|
|
|
41,383 |
|
|
|
Intercontinental Exchange, Inc. |
|
|
188,000 |
|
|
|
|
|
|
|
25,735 |
|
|
|
MSCI, Inc. |
|
|
47,348 |
|
|
|
|
|
|
|
22,810 |
|
|
|
Aon PLC, Class A |
|
|
65,600 |
|
|
|
|
|
|
|
19,259 |
|
|
|
Arch Capital Group, Ltd.1 |
|
|
159,854 |
|
|
|
|
|
|
|
16,128 |
|
|
|
Discover Financial Services |
|
|
26,400 |
|
|
|
|
|
|
|
3,453 |
|
|
|
|
|
|
|
|
|
|
|
|
|
|
|
|
|
|
|
|
|
|
|
|
|
|
|
|
|
3,052,185 |
|
|
|
|
|
|
|
|
|
|
|
|
|
|
|
|
|
|
|
|
|
|
|
|
|
|
|
|
|
|
|
| |
|
|
|
|
| Energy 3.75% |
|
Halliburton Co. |
|
|
11,600,000 |
|
|
|
|
|
|
|
391,848 |
|
|
|
Schlumberger NV |
|
|
6,356,000 |
|
|
|
|
|
|
|
299,876 |
|
|
|
EOG Resources, Inc. |
|
|
1,969,064 |
|
|
|
|
|
|
|
247,846 |
|
|
|
Canadian Natural Resources, Ltd. (CAD denominated) |
|
|
6,443,281 |
|
|
|
|
|
|
|
229,510 |
|
|
|
Cenovus Energy, Inc. (CAD denominated) |
|
|
9,017,019 |
|
|
|
|
|
|
|
177,236 |
|
|
|
MEG Energy Corp.1 |
|
|
6,251,958 |
|
|
|
|
|
|
|
133,763 |
|
|
|
EQT Corp. |
|
|
1,676,328 |
|
|
|
|
|
|
|
61,991 |
|
|
|
Tourmaline Oil Corp. |
|
|
1,080,400 |
|
|
|
|
|
|
|
49,003 |
|
|
|
ConocoPhillips |
|
|
313,568 |
|
|
|
|
|
|
|
35,866 |
|
|
|
New Fortress Energy, Inc., Class A2 |
|
|
829,000 |
|
|
|
|
|
|
|
18,222 |
|
|
|
|
|
|
|
|
|
|
|
|
|
|
|
|
|
|
|
|
|
|
|
|
|
|
|
|
|
1,645,161 |
|
|
|
|
|
|
|
|
|
|
|
|
|
|
|
|
|
|
|
|
|
|
|
|
|
|
|
|
|
|
|
| |
|
|
|
|
| Consumer staples 2.65% |
|
Costco Wholesale Corp. |
|
|
287,855 |
|
|
|
|
|
|
|
244,674 |
|
|
|
Performance Food Group Co.1 |
|
|
3,559,500 |
|
|
|
|
|
|
|
235,318 |
|
|
|
Dollar General Corp. |
|
|
1,701,791 |
|
|
|
|
|
|
|
225,028 |
|
|
|
Target Corp. |
|
|
900,000 |
|
|
|
|
|
|
|
133,236 |
|
|
|
Dollar Tree Stores, Inc.1 |
|
|
1,048,471 |
|
|
|
|
|
|
|
111,945 |
|
|
|
Philip Morris International, Inc. |
|
|
711,723 |
|
|
|
|
|
|
|
72,119 |
|
|
|
Constellation Brands, Inc., Class A |
|
|
206,399 |
|
|
|
|
|
|
|
53,102 |
|
|
|
Monster Beverage Corp.1 |
|
|
866,500 |
|
|
|
|
|
|
|
43,282 |
|
|
|
Keurig Dr Pepper, Inc. |
|
|
903,000 |
|
|
|
|
|
|
|
30,160 |
|
|
|
Celsius Holdings, Inc.1 |
|
|
197,664 |
|
|
|
|
|
|
|
11,285 |
|
|
|
|
|
|
|
|
|
|
|
|
|
|
|
|
|
|
|
|
|
|
|
|
|
|
|
|
|
1,160,149 |
|
|
|
|
|
|
|
|
|
|
|
|
|
|
|
|
|
|
|
|
|
|
|
|
|
|
|
|
|
|
|
| |
|
|
|
|
| Materials 1.52% |
|
Wheaton Precious Metals Corp. |
|
|
2,252,500 |
|
|
|
|
|
|
|
118,076 |
|
|
|
ATI, Inc.1 |
|
|
2,086,140 |
|
|
|
|
|
|
|
115,677 |
|
|
|
Linde PLC |
|
|
261,960 |
|
|
|
|
|
|
|
114,951 |
|
|
|
Grupo México, SAB de CV, Series B |
|
|
19,156,155 |
|
|
|
|
|
|
|
103,042 |
|
|
|
Royal Gold, Inc. |
|
|
599,000 |
|
|
|
|
|
|
|
74,971 |
|
|
|
Franco-Nevada Corp. |
|
|
340,400 |
|
|
|
|
|
|
|
40,359 |
|
|
|
Albemarle Corp. |
|
|
372,000 |
|
|
|
|
|
|
|
35,533 |
|
|
|
Vulcan Materials Co. |
|
|
130,000 |
|
|
|
|
|
|
|
32,328 |
|
|
|
Glencore PLC |
|
|
5,275,000 |
|
|
|
|
|
|
|
30,077 |
|
|
|
|
|
|
|
|
|
|
|
|
|
|
|
|
|
|
|
|
|
|
|
|
|
|
|
|
|
665,014 |
|
|
|
|
|
|
|
|
|
|
|
|
|
|
|
|
|
|
|
|
|
|
|
|
|
|
|
|
|
|
|
| |
|
|
|
|
| Utilities 0.78% |
|
Constellation Energy Corp. |
|
|
989,351 |
|
|
|
|
|
|
|
198,137 |
|
|
|
PG&E Corp. |
|
|
8,221,738 |
|
|
|
|
|
|
|
143,552 |
|
|
|
|
|
|
|
|
|
|
|
|
|
|
|
|
|
|
|
|
|
|
|
|
|
|
|
|
|
341,689 |
|
|
|
|
|
|
|
|
|
|
|
|
|
|
|
|
|
|
|
|
|
|
|
|
|
|
|
|
|
|
|
| |
|
|
|
|
| Real estate 0.15% |
|
Zillow Group, Inc., Class C, nonvoting shares1 |
|
|
1,198,327 |
|
|
|
|
|
|
|
55,590 |
|
|
|
CoStar Group, Inc.1 |
|
|
143,416 |
|
|
|
|
|
|
|
10,633 |
|
|
|
|
|
|
|
|
|
|
|
|
|
|
|
|
|
|
|
|
|
|
|
|
|
|
|
|
|
66,223 |
|
|
|
|
|
|
|
|
|
|
|
|
|
|
|
|
|
|
Total common stocks (cost: $19,726,136,000) |
|
|
|
|
|
|
|
|
|
|
42,815,417 |
|
|
|
|
|
|
|
|
|
|
|
|
|
|
|
|
American Funds Insurance Series 16
Growth Fund (continued)
|
|
|
|
|
|
|
|
|
|
|
|
|
|
|
| Preferred securities 0.27% |
|
Shares |
|
|
|
|
|
Value (000) |
|
| Information technology 0.24% |
|
Stripe, Inc., Series I, 6.00% noncumulative preferred shares1,3,4 |
|
|
2,763,342 |
|
|
|
|
|
|
$ |
71,847 |
|
|
|
Stripe, Inc., Series H, 6.00% noncumulative preferred shares1,3,4 |
|
|
52,656 |
|
|
|
|
|
|
|
1,369 |
|
|
|
PsiQuantum Corp., Series D, preferred shares1,3,4 |
|
|
906,761 |
|
|
|
|
|
|
|
30,267 |
|
|
|
Tipalti Solutions, Ltd., Series F, preferred shares1,3,4 |
|
|
406,310 |
|
|
|
|
|
|
|
2,751 |
|
|
|
|
|
|
|
|
|
|
|
|
|
|
|
|
|
|
|
|
|
|
|
|
|
|
|
|
|
106,234 |
|
|
|
|
|
|
|
|
|
|
|
|
|
|
|
|
|
|
|
|
|
|
|
|
|
|
|
|
|
|
|
| |
|
|
|
|
| Industrials 0.03% |
|
ABL Space Systems Co., Series B2, 5.00% cumulative preferred shares1,3,4,5 |
|
|
153,713 |
|
|
|
|
|
|
|
5,027 |
|
|
|
ABL Space Systems Co., Series C1, 5.00% cumulative preferred shares1,3,4,5 |
|
|
42,272 |
|
|
|
|
|
|
|
1,382 |
|
|
|
Einride AB, Series C, preferred shares1,3,4 |
|
|
110,647 |
|
|
|
|
|
|
|
3,762 |
|
|
|
|
|
|
|
|
|
|
|
|
|
|
|
|
|
|
|
|
|
|
|
|
|
|
|
|
|
10,171 |
|
|
|
|
|
|
|
|
|
|
|
|
|
|
|
|
|
|
Total preferred securities (cost: $104,084,000) |
|
|
|
|
|
|
|
|
|
|
116,405 |
|
|
|
|
|
|
|
|
|
|
|
|
|
|
|
|
|
|
|
|
| Rights & warrants 0.00% |
|
|
|
|
|
|
|
|
|
| Information technology 0.00% |
|
Constellation Software, Inc., warrants, expire 3/31/20401,3 |
|
|
53,352 |
|
|
|
|
|
|
|
– |
6 |
|
|
|
|
|
|
|
|
|
|
|
|
|
|
|
|
|
|
|
|
|
|
|
|
|
|
|
|
|
|
| |
|
|
|
|
| Industrials 0.00% |
|
ABL Space Systems Co., Series C-1, warrants, expire 12/13/20301,3,4 |
|
|
31,704 |
|
|
|
|
|
|
|
– |
6 |
|
|
|
|
|
|
|
|
|
|
|
|
|
|
|
|
|
Total rights & warrants (cost: $0) |
|
|
|
|
|
|
|
|
|
|
– |
6 |
|
|
|
|
|
|
|
|
|
|
|
|
|
|
|
|
|
|
|
| Convertible stocks 0.01% |
|
|
|
|
|
|
|
|
|
|
|
|
|
|
| Materials 0.01% |
|
Albemarle Corp., Class A, cumulative convertible preferred depositary shares,
7.25% 3/1/2027 |
|
|
128,700 |
|
|
|
|
|
|
|
6,005 |
|
|
|
|
|
|
|
|
|
|
|
|
|
|
|
|
|
|
Total convertible stocks (cost: $6,435,000) |
|
|
|
|
|
|
|
|
|
|
6,005 |
|
|
|
|
|
|
|
|
|
|
|
|
|
|
|
|
|
|
|
|
| Short-term securities 2.23% |
|
|
|
|
|
|
|
|
|
|
| Money market investments 2.15% |
|
|
|
|
|
|
|
|
Capital Group Central Cash Fund 5.37%7,8 |
|
|
9,409,715 |
|
|
|
|
|
|
|
940,971 |
|
|
|
|
|
|
|
|
|
|
|
|
|
|
|
|
|
|
|
|
| |
|
|
|
|
|
|
|
|
|
|
|
|
| Money market investments purchased with collateral from securities on loan 0.08% |
|
|
|
|
|
|
|
|
|
|
|
Capital Group Central Cash Fund 5.37%7,8,9 |
|
|
240,324 |
|
|
|
|
|
|
|
24,032 |
|
|
|
Invesco Short-Term Investments Trust – Government & Agency Portfolio,
Institutional Class 5.23%7,9 |
|
|
8,092,847 |
|
|
|
|
|
|
|
8,093 |
|
|
|
State Street Institutional U.S. Government Money Market Fund,
Institutional Class 5.22%7,9 |
|
|
2,999,820 |
|
|
|
|
|
|
|
3,000 |
|
|
|
|
|
|
|
|
|
|
|
|
|
|
|
|
|
|
|
|
|
|
|
|
|
|
35,125 |
|
|
|
|
|
|
|
|
|
|
|
|
|
|
|
|
|
|
Total short-term securities (cost: $976,040,000) |
|
|
|
|
|
|
|
976,096 |
|
|
|
|
|
|
|
|
|
|
|
|
|
|
|
|
|
|
|
|
|
|
Total investment securities 100.18% (cost: $20,812,695,000) |
|
|
|
|
|
|
|
43,913,923 |
|
|
|
|
|
|
|
|
Other assets less liabilities (0.18)% |
|
|
|
|
|
|
|
|
|
|
(79,268 |
) |
|
|
|
|
|
|
|
|
|
|
|
|
|
|
|
|
|
|
|
|
|
|
Net assets 100.00% |
|
|
|
|
|
|
|
|
|
$ |
43,834,655 |
|
|
|
|
|
|
|
|
|
|
|
|
|
|
|
|
17 American Funds Insurance Series
Growth Fund (continued)
|
|
|
|
|
|
|
|
|
|
|
|
|
|
|
|
|
|
|
|
|
|
|
|
|
|
|
|
|
|
|
|
|
|
|
|
|
|
|
|
|
|
|
|
|
|
|
|
|
|
|
|
|
|
| Investments in affiliates8 |
|
|
|
|
|
|
|
|
|
|
|
|
|
|
|
|
|
|
|
|
|
|
|
|
|
|
|
|
|
|
|
|
|
|
|
|
|
|
| |
|
Value at 1/1/2024 (000) |
|
Additions
(000) |
|
|
Reductions
(000) |
|
|
Net realized gain (loss)
(000) |
|
|
Net unrealized appreciation (depreciation)
(000) |
|
|
Value at
6/30/2024
(000) |
|
|
Dividend or interest income (000) |
|
|
|
|
|
|
|
|
|
|
|
|
|
| Short-term securities 2.20% |
|
|
|
|
|
|
|
|
|
|
|
|
|
|
|
|
|
|
|
|
|
|
|
|
|
|
|
|
|
|
|
|
|
|
|
|
|
|
|
|
|
|
|
|
|
|
|
|
|
|
|
|
|
|
| Money market investments 2.15% |
|
|
|
|
|
|
|
|
|
|
|
|
|
|
|
|
|
|
|
|
|
|
|
|
|
|
|
|
|
|
|
|
|
|
|
|
|
|
|
|
|
|
| Capital Group Central Cash Fund 5.37%7 |
|
$588,273 |
|
$ |
2,478,043 |
|
|
$ |
2,125,362 |
|
|
|
|
|
|
$ |
(28 |
) |
|
|
|
|
|
$ |
45 |
|
|
|
|
|
|
$ |
940,971 |
|
|
|
|
|
|
$ |
27,383 |
|
|
|
|
|
|
|
|
|
|
|
|
|
| Money market investments purchased with collateral from securities on loan 0.05% |
|
|
|
|
|
|
|
|
|
|
|
|
|
|
|
|
|
|
|
|
|
|
|
|
|
|
|
|
|
|
|
|
|
|
|
|
|
|
|
|
|
|
| Capital Group Central Cash Fund 5.37%7,9 |
|
5,032 |
|
|
19,000 |
10 |
|
|
|
|
|
|
|
|
|
|
|
|
|
|
|
|
|
|
|
|
|
|
|
|
|
|
24,032 |
|
|
|
|
|
|
|
– |
11 |
|
|
|
|
|
|
|
|
|
|
|
|
|
|
|
|
|
|
|
|
|
|
|
|
|
|
|
|
|
|
|
|
|
|
|
|
|
|
|
|
|
|
|
|
|
|
|
|
|
|
|
|
|
|
|
| Total 2.20% |
|
|
|
|
|
|
|
|
|
|
|
|
|
|
|
$ |
(28 |
) |
|
|
|
|
|
$ |
45 |
|
|
|
|
|
|
$ |
965,003 |
|
|
|
|
|
|
$ |
27,383 |
|
|
|
|
|
|
|
|
|
|
|
|
|
|
|
|
|
|
|
|
|
|
|
|
|
|
|
|
|
|
|
|
|
|
|
|
|
|
|
|
|
|
|
|
|
|
|
|
|
|
|
|
|
|
|
|
|
|
|
|
|
|
|
|
|
|
|
|
|
|
|
|
|
| Restricted securities4 |
|
|
|
|
|
|
|
|
|
|
|
|
|
|
|
|
|
|
|
|
|
|
|
| |
|
Acquisition date(s) |
|
|
Cost (000) |
|
|
Value (000) |
|
|
Percent of net
assets |
|
|
|
|
|
|
|
|
|
| Stripe, Inc., Series I, 6.00% noncumulative preferred shares1,3 |
|
|
3/15/2023 |
|
|
|
|
|
|
$ |
55,638 |
|
|
|
|
|
|
$ |
71,847 |
|
|
|
|
|
|
|
.17 |
% |
|
|
|
|
|
|
|
|
| Stripe, Inc., Class B1,3 |
|
|
5/6/2021 |
|
|
|
|
|
|
|
6,766 |
|
|
|
|
|
|
|
4,384 |
|
|
|
|
|
|
|
.01 |
|
|
|
|
|
|
|
|
|
| Stripe, Inc., Series H, 6.00% noncumulative preferred shares1,3 |
|
|
3/15/2021 |
|
|
|
|
|
|
|
2,113 |
|
|
|
|
|
|
|
1,369 |
|
|
|
|
|
|
|
.00 |
12 |
|
|
|
|
|
|
|
|
| Verily Life Sciences, LLC1,3 |
|
|
12/21/2018 |
|
|
|
|
|
|
|
37,000 |
|
|
|
|
|
|
|
31,351 |
|
|
|
|
|
|
|
.07 |
|
|
|
|
|
|
|
|
|
| PsiQuantum Corp., Series D, preferred shares1,3 |
|
|
5/28/2021 |
|
|
|
|
|
|
|
23,781 |
|
|
|
|
|
|
|
30,267 |
|
|
|
|
|
|
|
.07 |
|
|
|
|
|
|
|
|
|
| Einride AB, Series C, preferred shares1,3 |
|
|
11/23/2022-2/21/2024 |
|
|
|
|
|
|
|
3,762 |
|
|
|
|
|
|
|
3,762 |
|
|
|
|
|
|
|
.01 |
|
|
|
|
|
|
|
|
|
| Einride AB1,3 |
|
|
2/1/2023 |
|
|
|
|
|
|
|
2,674 |
|
|
|
|
|
|
|
2,674 |
|
|
|
|
|
|
|
.00 |
12 |
|
|
|
|
|
|
|
|
| ABL Space Systems Co., Series B2, 5.00% cumulative preferred shares1,3,5 |
|
|
10/22/2021 |
|
|
|
|
|
|
|
10,452 |
|
|
|
|
|
|
|
5,027 |
|
|
|
|
|
|
|
.01 |
|
|
|
|
|
|
|
|
|
| ABL Space Systems Co., Series C1, 5.00% cumulative preferred shares1,3,5 |
|
|
12/14/2023 |
|
|
|
|
|
|
|
1,382 |
|
|
|
|
|
|
|
1,382 |
|
|
|
|
|
|
|
.00 |
12 |
|
|
|
|
|
|
|
|
| ABL Space Systems Co., Series C-1, warrants, expire 12/13/20301,3 |
|
|
12/14/2023 |
|
|
|
|
|
|
|
– |
6 |
|
|
|
|
|
|
– |
6 |
|
|
|
|
|
|
.00 |
12 |
|
|
|
|
|
|
|
|
| Tipalti Solutions, Ltd., Series F, preferred shares1,3 |
|
|
12/1/2021 |
|
|
|
|
|
|
|
6,956 |
|
|
|
|
|
|
|
2,751 |
|
|
|
|
|
|
|
.01 |
|
|
|
|
|
|
|
|
|
|
|
|
|
|
|
|
|
|
|
|
|
|
|
|
|
|
|
|
|
|
|
|
|
|
|
|
|
|
| Total |
|
|
|
|
|
|
|
|
|
$ |
150,524 |
|
|
|
|
|
|
$ |
154,814 |
|
|
|
|
|
|
|
.35 |
% |
|
|
|
|
|
|
|
|
|
|
|
|
|
|
|
|
|
|
|
|
|
|
|
|
|
|
|
|
|
| 1 |
Security did not produce income during the last 12 months. |
| 2 |
All or a portion of this security was on loan. The total value of all such securities was $38,162,000, which represented .09% of the net assets of the fund. Refer to Note 5 for more information on securities lending. |
| 3 |
Value determined using significant unobservable inputs. |
| 4 |
Restricted security, other than Rule 144A securities or commercial paper issued pursuant to Section 4(a)(2) of the Securities Act of 1933. The total value of all such restricted securities was $154,814,000, which represented .35% of the net assets of the fund. |
| 5 |
Payment in kind; the issuer has the option of paying additional securities in lieu of cash. Payment methods and rates are as of the most recent payment when available. |
| 6 |
Amount less than one thousand. |
| 7 |
Rate represents the seven-day yield at 6/30/2024. |
| 8 |
Part of the same “group of investment companies” as the fund as defined under the Investment Company Act of 1940, as amended. |
| 9 |
Security purchased with cash collateral from securities on loan. Refer to Note 5 for more information on securities lending. |
| 10 |
Represents net activity. Refer to Note 5 for more information on securities lending. |
| 11 |
Dividend income is included with securities lending income in the fund’s statement of operations and is not shown in this table. |
| 12 |
Amount less than .01%. |
Key to abbreviation(s)
ADR = American Depositary Receipts
CAD = Canadian dollars
Refer to the notes to financial statements.
American Funds Insurance Series 18
|
|
|
| International Fund |
|
|
| Investment portfolio June 30, 2024 |
|
unaudited |
|
|
|
|
|
|
|
|
|
|
|
|
|
|
|
| Common stocks 96.42% |
|
Shares |
|
|
|
|
|
Value (000) |
|
|
|
|
|
|
| Industrials 17.53% |
|
Recruit Holdings Co., Ltd. |
|
|
3,812,162 |
|
|
|
|
|
|
$ |
205,166 |
|
|
|
Airbus SE, non-registered shares |
|
|
1,387,973 |
|
|
|
|
|
|
|
191,382 |
|
|
|
Siemens AG |
|
|
569,990 |
|
|
|
|
|
|
|
106,012 |
|
|
|
Techtronic Industries Co., Ltd. |
|
|
7,983,000 |
|
|
|
|
|
|
|
91,156 |
|
|
|
Melrose Industries PLC |
|
|
12,204,660 |
|
|
|
|
|
|
|
85,233 |
|
|
|
Safran SA |
|
|
395,229 |
|
|
|
|
|
|
|
83,151 |
|
|
|
Diploma PLC |
|
|
1,289,802 |
|
|
|
|
|
|
|
67,299 |
|
|
|
MTU Aero Engines AG |
|
|
229,720 |
|
|
|
|
|
|
|
58,734 |
|
|
|
Ashtead Group PLC |
|
|
795,298 |
|
|
|
|
|
|
|
52,990 |
|
|
|
Rolls-Royce Holdings PLC1 |
|
|
8,817,090 |
|
|
|
|
|
|
|
50,966 |
|
|
|
Volvo AB, Class B |
|
|
1,865,267 |
|
|
|
|
|
|
|
47,851 |
|
|
|
Kingspan Group PLC |
|
|
496,546 |
|
|
|
|
|
|
|
42,070 |
|
|
|
International Container Terminal Services, Inc. |
|
|
6,806,450 |
|
|
|
|
|
|
|
40,654 |
|
|
|
Daikin Industries, Ltd. |
|
|
290,700 |
|
|
|
|
|
|
|
40,158 |
|
|
|
Schneider Electric SE |
|
|
94,008 |
|
|
|
|
|
|
|
22,431 |
|
|
|
Rumo SA |
|
|
5,353,005 |
|
|
|
|
|
|
|
19,841 |
|
|
|
Thales SA |
|
|
92,053 |
|
|
|
|
|
|
|
14,791 |
|
|
|
Shenzhen Inovance Technology Co., Ltd., Class A |
|
|
1,661,517 |
|
|
|
|
|
|
|
11,729 |
|
|
|
Grab Holdings, Ltd., Class A1 |
|
|
3,032,099 |
|
|
|
|
|
|
|
10,764 |
|
|
|
Deutsche Post AG |
|
|
253,300 |
|
|
|
|
|
|
|
10,249 |
|
|
|
NIBE Industrier AB, Class B |
|
|
1,820,442 |
|
|
|
|
|
|
|
7,674 |
|
|
|
Airports of Thailand PCL, foreign registered shares |
|
|
4,083,600 |
|
|
|
|
|
|
|
6,414 |
|
|
|
Larsen & Toubro, Ltd. |
|
|
121,773 |
|
|
|
|
|
|
|
5,159 |
|
|
|
|
|
|
|
|
|
|
|
|
|
|
|
|
|
|
|
|
|
|
|
|
|
|
|
|
|
1,271,874 |
|
|
|
|
|
|
|
|
|
|
|
|
|
|
|
|
|
|
|
|
|
|
|
|
|
|
|
|
|
|
|
| |
|
|
|
|
| Information technology 14.14% |
|
Taiwan Semiconductor Manufacturing Co., Ltd. |
|
|
6,339,000 |
|
|
|
|
|
|
|
188,531 |
|
|
|
SAP SE |
|
|
807,953 |
|
|
|
|
|
|
|
164,043 |
|
|
|
SK hynix, Inc. |
|
|
813,514 |
|
|
|
|
|
|
|
137,964 |
|
|
|
Shopify, Inc., Class A, subordinate voting shares1 |
|
|
2,005,603 |
|
|
|
|
|
|
|
132,470 |
|
|
|
Samsung Electronics Co., Ltd. |
|
|
1,568,557 |
|
|
|
|
|
|
|
92,178 |
|
|
|
ASML Holding NV |
|
|
66,028 |
|
|
|
|
|
|
|
68,121 |
|
|
|
Renesas Electronics Corp. |
|
|
1,975,500 |
|
|
|
|
|
|
|
37,299 |
|
|
|
NICE, Ltd. (ADR)1 |
|
|
200,311 |
|
|
|
|
|
|
|
34,448 |
|
|
|
Constellation Software, Inc. |
|
|
11,144 |
|
|
|
|
|
|
|
32,110 |
|
|
|
NXP Semiconductors NV |
|
|
96,785 |
|
|
|
|
|
|
|
26,044 |
|
|
|
Fujitsu, Ltd. |
|
|
1,430,200 |
|
|
|
|
|
|
|
22,471 |
|
|
|
Lasertec Corp. |
|
|
86,000 |
|
|
|
|
|
|
|
19,430 |
|
|
|
Tata Consultancy Services, Ltd. |
|
|
407,049 |
|
|
|
|
|
|
|
19,000 |
|
|
|
OBIC Co., Ltd. |
|
|
134,500 |
|
|
|
|
|
|
|
17,369 |
|
|
|
Keyence Corp. |
|
|
34,000 |
|
|
|
|
|
|
|
15,000 |
|
|
|
Disco Corp. |
|
|
19,400 |
|
|
|
|
|
|
|
7,434 |
|
|
|
NEC Corp. |
|
|
79,411 |
|
|
|
|
|
|
|
6,493 |
|
|
|
Canva, Inc.1,2,3 |
|
|
4,819 |
|
|
|
|
|
|
|
5,140 |
|
|
|
|
|
|
|
|
|
|
|
|
|
|
|
|
|
|
|
|
|
|
|
|
|
|
|
|
|
1,025,545 |
|
|
|
|
|
|
|
|
|
|
|
|
|
|
|
|
|
|
|
|
|
|
|
|
|
|
|
|
|
|
|
| |
|
|
|
|
| Health care 12.89% |
|
Novo Nordisk AS, Class B |
|
|
2,869,107 |
|
|
|
|
|
|
|
409,870 |
|
|
|
Daiichi Sankyo Co., Ltd. |
|
|
9,339,308 |
|
|
|
|
|
|
|
326,256 |
|
|
|
UCB SA |
|
|
340,362 |
|
|
|
|
|
|
|
50,441 |
|
|
|
Sanofi |
|
|
399,983 |
|
|
|
|
|
|
|
38,447 |
|
|
|
AstraZeneca PLC |
|
|
222,892 |
|
|
|
|
|
|
|
34,748 |
|
|
|
Eurofins Scientific SE, non-registered shares |
|
|
510,470 |
|
|
|
|
|
|
|
25,379 |
|
|
|
Grifols, SA, Class A, non-registered shares1 |
|
|
2,252,585 |
|
|
|
|
|
|
|
18,851 |
|
|
|
Insulet Corp.1 |
|
|
46,653 |
|
|
|
|
|
|
|
9,414 |
|
|
|
Ambu AS, Class B, non-registered shares1 |
|
|
480,488 |
|
|
|
|
|
|
|
9,229 |
|
|
|
bioMérieux SA |
|
|
79,847 |
|
|
|
|
|
|
|
7,554 |
|
|
|
WuXi AppTec Co., Ltd., Class H |
|
|
920,200 |
|
|
|
|
|
|
|
3,449 |
|
|
|
WuXi AppTec Co., Ltd., Class A |
|
|
288,960 |
|
|
|
|
|
|
|
1,558 |
|
|
|
|
|
|
|
|
|
|
|
|
|
|
|
|
|
|
|
|
|
|
|
|
|
|
|
|
|
935,196 |
|
|
|
|
|
|
|
|
|
|
|
|
|
|
|
|
19 American Funds Insurance Series
International Fund (continued)
|
|
|
|
|
|
|
|
|
|
|
|
|
|
|
| Common stocks (continued) |
|
Shares |
|
|
|
|
|
Value
(000) |
|
|
|
|
|
|
| Materials 12.07% |
|
Glencore PLC |
|
|
38,713,759 |
|
|
|
|
|
|
$ |
220,737 |
|
|
|
First Quantum Minerals, Ltd. |
|
|
14,456,903 |
|
|
|
|
|
|
|
189,898 |
|
|
|
Fortescue, Ltd. |
|
|
9,297,560 |
|
|
|
|
|
|
|
132,825 |
|
|
|
Ivanhoe Mines, Ltd., Class A1 |
|
|
4,152,270 |
|
|
|
|
|
|
|
53,571 |
|
|
|
Ivanhoe Mines, Ltd., Class A1,3 |
|
|
3,675,281 |
|
|
|
|
|
|
|
47,417 |
|
|
|
Shin-Etsu Chemical Co., Ltd. |
|
|
1,525,800 |
|
|
|
|
|
|
|
59,348 |
|
|
|
Rio Tinto PLC |
|
|
607,516 |
|
|
|
|
|
|
|
39,990 |
|
|
|
Anglo American PLC |
|
|
1,244,014 |
|
|
|
|
|
|
|
39,130 |
|
|
|
DSM-Firmenich AG |
|
|
241,889 |
|
|
|
|
|
|
|
27,238 |
|
|
|
Arkema SA |
|
|
189,600 |
|
|
|
|
|
|
|
16,393 |
|
|
|
Air Liquide SA |
|
|
67,630 |
|
|
|
|
|
|
|
11,643 |
|
|
|
Antofagasta PLC |
|
|
387,237 |
|
|
|
|
|
|
|
10,268 |
|
|
|
Grupo México, SAB de CV, Series B |
|
|
1,803,200 |
|
|
|
|
|
|
|
9,699 |
|
|
|
BASF SE |
|
|
193,532 |
|
|
|
|
|
|
|
9,352 |
|
|
|
Akzo Nobel NV |
|
|
127,802 |
|
|
|
|
|
|
|
7,771 |
|
|
|
|
|
|
|
|
|
|
|
|
|
|
|
|
|
|
|
|
|
|
|
|
|
|
|
|
|
875,280 |
|
|
|
|
|
|
|
|
|
|
|
|
|
|
|
|
|
|
|
|
|
|
|
|
|
|
|
|
|
|
|
| |
|
|
|
|
| Consumer discretionary 11.15% |
|
MercadoLibre, Inc.1 |
|
|
106,035 |
|
|
|
|
|
|
|
174,258 |
|
|
|
adidas AG |
|
|
481,188 |
|
|
|
|
|
|
|
114,842 |
|
|
|
Maruti Suzuki India, Ltd. |
|
|
447,149 |
|
|
|
|
|
|
|
64,324 |
|
|
|
LVMH Moët Hennessy-Louis Vuitton SE |
|
|
79,464 |
|
|
|
|
|
|
|
61,024 |
|
|
|
Flutter Entertainment PLC1 |
|
|
329,610 |
|
|
|
|
|
|
|
60,108 |
|
|
|
Evolution AB |
|
|
549,600 |
|
|
|
|
|
|
|
57,273 |
|
|
|
Ferrari NV (EUR denominated) |
|
|
131,030 |
|
|
|
|
|
|
|
53,573 |
|
|
|
Meituan, Class B1 |
|
|
2,607,700 |
|
|
|
|
|
|
|
36,946 |
|
|
|
Sony Group Corp. |
|
|
350,000 |
|
|
|
|
|
|
|
29,740 |
|
|
|
Compagnie Financière Richemont SA, Class A |
|
|
187,402 |
|
|
|
|
|
|
|
29,248 |
|
|
|
Kering SA |
|
|
77,668 |
|
|
|
|
|
|
|
28,235 |
|
|
|
NEXT PLC |
|
|
183,512 |
|
|
|
|
|
|
|
20,985 |
|
|
|
Entain PLC |
|
|
2,326,058 |
|
|
|
|
|
|
|
18,416 |
|
|
|
PUMA SE, non-registered shares |
|
|
276,959 |
|
|
|
|
|
|
|
12,729 |
|
|
|
Zalando SE, non-registered shares1 |
|
|
467,567 |
|
|
|
|
|
|
|
10,930 |
|
|
|
Sands China, Ltd.1 |
|
|
4,798,000 |
|
|
|
|
|
|
|
9,996 |
|
|
|
Fast Retailing Co., Ltd. |
|
|
33,500 |
|
|
|
|
|
|
|
8,499 |
|
|
|
Galaxy Entertainment Group, Ltd. |
|
|
1,820,000 |
|
|
|
|
|
|
|
8,477 |
|
|
|
Hermès International |
|
|
2,060 |
|
|
|
|
|
|
|
4,741 |
|
|
|
Coupang, Inc., Class A1 |
|
|
205,714 |
|
|
|
|
|
|
|
4,310 |
|
|
|
|
|
|
|
|
|
|
|
|
|
|
|
|
|
|
|
|
|
|
|
|
|
|
|
|
|
808,654 |
|
|
|
|
|
|
|
|
|
|
|
|
|
|
|
|
|
|
|
|
|
|
|
|
|
|
|
|
|
|
|
| |
|
|
|
|
| Financials 10.71% |
|
Nu Holdings Ltd., Class A1 |
|
|
14,180,495 |
|
|
|
|
|
|
|
182,787 |
|
|
|
Banco Bilbao Vizcaya Argentaria, SA |
|
|
10,041,451 |
|
|
|
|
|
|
|
100,177 |
|
|
|
Aegon, Ltd. |
|
|
10,831,321 |
|
|
|
|
|
|
|
66,872 |
|
|
|
ING Groep NV |
|
|
3,485,121 |
|
|
|
|
|
|
|
59,716 |
|
|
|
AIA Group, Ltd. |
|
|
8,508,476 |
|
|
|
|
|
|
|
57,696 |
|
|
|
NatWest Group PLC |
|
|
14,661,543 |
|
|
|
|
|
|
|
57,510 |
|
|
|
Kotak Mahindra Bank, Ltd. |
|
|
2,427,514 |
|
|
|
|
|
|
|
52,212 |
|
|
|
Axis Bank, Ltd. |
|
|
2,541,749 |
|
|
|
|
|
|
|
38,514 |
|
|
|
Bajaj Finserv, Ltd. |
|
|
1,272,550 |
|
|
|
|
|
|
|
24,212 |
|
|
|
HDFC Bank, Ltd. (ADR) |
|
|
207,750 |
|
|
|
|
|
|
|
13,364 |
|
|
|
HDFC Bank, Ltd. |
|
|
532,601 |
|
|
|
|
|
|
|
10,759 |
|
|
|
FinecoBank SpA |
|
|
1,183,344 |
|
|
|
|
|
|
|
17,634 |
|
|
|
3i Group PLC |
|
|
399,600 |
|
|
|
|
|
|
|
15,410 |
|
|
|
Jio Financial Services, Ltd.1 |
|
|
3,024,434 |
|
|
|
|
|
|
|
12,948 |
|
|
|
Bajaj Finance, Ltd. |
|
|
151,942 |
|
|
|
|
|
|
|
12,936 |
|
|
|
Bank Mandiri (Persero) Tbk PT |
|
|
27,858,000 |
|
|
|
|
|
|
|
10,403 |
|
|
|
Mizuho Financial Group, Inc. |
|
|
452,800 |
|
|
|
|
|
|
|
9,482 |
|
|
|
Bank Central Asia Tbk PT |
|
|
13,486,900 |
|
|
|
|
|
|
|
8,136 |
|
|
|
B3 SA - Brasil, Bolsa, Balcao |
|
|
4,413,000 |
|
|
|
|
|
|
|
8,084 |
|
American Funds Insurance Series 20
International Fund (continued)
|
|
|
|
|
|
|
|
|
|
|
|
|
|
|
| Common stocks (continued) |
|
Shares |
|
|
|
|
|
Value (000) |
|
|
|
|
|
|
| Financials (continued) |
|
KB Financial Group, Inc. |
|
|
135,354 |
|
|
|
|
|
|
$ |
7,675 |
|
|
|
ICICI Bank, Ltd. |
|
|
485,000 |
|
|
|
|
|
|
|
6,966 |
|
|
|
Futu Holdings, Ltd. (ADR)1 |
|
|
52,123 |
|
|
|
|
|
|
|
3,420 |
|
|
|
|
|
|
|
|
|
|
|
|
|
|
|
|
|
|
|
|
|
|
|
|
|
|
|
|
|
776,913 |
|
|
|
|
|
|
|
|
|
|
|
|
|
|
|
|
|
|
|
|
|
|
|
|
|
|
|
|
|
|
|
| |
|
|
|
|
| Energy 6.89% |
|
Reliance Industries, Ltd. |
|
|
7,089,341 |
|
|
|
|
|
|
|
265,388 |
|
|
|
Canadian Natural Resources, Ltd. (CAD denominated) |
|
|
2,882,289 |
|
|
|
|
|
|
|
102,667 |
|
|
|
Cenovus Energy, Inc. (CAD denominated) |
|
|
4,716,328 |
|
|
|
|
|
|
|
92,703 |
|
|
|
TotalEnergies SE |
|
|
315,209 |
|
|
|
|
|
|
|
21,008 |
|
|
|
Neste OYJ |
|
|
777,534 |
|
|
|
|
|
|
|
13,789 |
|
|
|
Shell PLC (GBP denominated) |
|
|
125,376 |
|
|
|
|
|
|
|
4,506 |
|
|
|
|
|
|
|
|
|
|
|
|
|
|
|
|
|
|
|
|
|
|
|
|
|
|
|
|
|
500,061 |
|
|
|
|
|
|
|
|
|
|
|
|
|
|
|
|
|
|
|
|
|
|
|
|
|
|
|
|
|
|
|
| |
|
|
|
|
| Communication services 5.05% |
|
Bharti Airtel, Ltd. |
|
|
8,901,433 |
|
|
|
|
|
|
|
153,703 |
|
|
|
Bharti Airtel, Ltd., interim shares |
|
|
271,584 |
|
|
|
|
|
|
|
3,387 |
|
|
|
Tencent Holdings, Ltd. |
|
|
1,786,123 |
|
|
|
|
|
|
|
84,771 |
|
|
|
Universal Music Group NV |
|
|
2,138,913 |
|
|
|
|
|
|
|
63,404 |
|
|
|
NetEase, Inc. |
|
|
1,659,900 |
|
|
|
|
|
|
|
31,691 |
|
|
|
Ubisoft Entertainment SA1 |
|
|
800,864 |
|
|
|
|
|
|
|
17,589 |
|
|
|
Singapore Telecommunications, Ltd. |
|
|
5,800,500 |
|
|
|
|
|
|
|
11,731 |
|
|
|
|
|
|
|
|
|
|
|
|
|
|
|
|
|
|
|
|
|
|
|
|
|
|
|
|
|
366,276 |
|
|
|
|
|
|
|
|
|
|
|
|
|
|
|
|
|
|
|
|
|
|
|
|
|
|
|
|
|
|
|
| |
|
|
|
|
| Consumer staples 4.15% |
|
JBS SA1 |
|
|
12,787,767 |
|
|
|
|
|
|
|
73,820 |
|
|
|
Danone SA |
|
|
871,867 |
|
|
|
|
|
|
|
53,210 |
|
|
|
Kweichow Moutai Co., Ltd., Class A |
|
|
216,732 |
|
|
|
|
|
|
|
43,711 |
|
|
|
Ajinomoto Co., Inc. |
|
|
1,100,100 |
|
|
|
|
|
|
|
38,722 |
|
|
|
Treasury Wine Estates, Ltd. |
|
|
3,801,466 |
|
|
|
|
|
|
|
31,518 |
|
|
|
Kobe Bussan Co., Ltd. |
|
|
965,600 |
|
|
|
|
|
|
|
21,487 |
|
|
|
Suntory Beverage & Food, Ltd.4 |
|
|
322,200 |
|
|
|
|
|
|
|
11,437 |
|
|
|
Avenue Supermarts, Ltd.1 |
|
|
186,878 |
|
|
|
|
|
|
|
10,569 |
|
|
|
Seven & i Holdings Co., Ltd. |
|
|
764,200 |
|
|
|
|
|
|
|
9,308 |
|
|
|
Barry Callebaut AG (Switzerland) |
|
|
4,464 |
|
|
|
|
|
|
|
7,275 |
|
|
|
|
|
|
|
|
|
|
|
|
|
|
|
|
|
|
|
|
|
|
|
|
|
|
|
|
|
301,057 |
|
|
|
|
|
|
|
|
|
|
|
|
|
|
|
|
|
|
|
|
|
|
|
|
|
|
|
|
|
|
|
| |
|
|
|
|
| Utilities 1.14% |
|
ENN Energy Holdings, Ltd. |
|
|
5,578,460 |
|
|
|
|
|
|
|
45,932 |
|
|
|
Engie SA |
|
|
1,099,626 |
|
|
|
|
|
|
|
15,662 |
|
|
|
E.ON SE |
|
|
1,023,903 |
|
|
|
|
|
|
|
13,419 |
|
|
|
SembCorp Industries, Ltd. |
|
|
2,195,700 |
|
|
|
|
|
|
|
7,763 |
|
|
|
|
|
|
|
|
|
|
|
|
|
|
|
|
|
|
|
|
|
|
|
|
|
|
|
|
|
82,776 |
|
|
|
|
|
|
|
|
|
|
|
|
|
|
|
|
|
|
|
|
|
|
|
|
|
|
|
|
|
|
|
| |
|
|
|
|
| Real estate 0.70% |
|
ESR Group, Ltd. |
|
|
21,411,800 |
|
|
|
|
|
|
|
28,087 |
|
|
|
Mitsui Fudosan Co., Ltd. |
|
|
1,467,900 |
|
|
|
|
|
|
|
13,502 |
|
|
|
Ayala Land, Inc. |
|
|
18,147,800 |
|
|
|
|
|
|
|
8,827 |
|
|
|
|
|
|
|
|
|
|
|
|
|
|
|
|
|
|
|
|
|
|
|
|
|
|
|
|
|
50,416 |
|
|
|
|
|
|
|
|
|
|
|
|
|
|
|
|
|
|
Total common stocks (cost: $4,941,324,000) |
|
|
|
|
|
|
|
|
|
|
6,994,048 |
|
|
|
|
|
|
|
|
|
|
|
|
|
|
|
|
|
|
|
|
| Preferred securities 0.36% |
|
|
|
|
|
|
|
|
|
| |
|
|
|
|
| Consumer discretionary 0.21% |
|
Dr. Ing. h.c. F. Porsche AG, nonvoting non-registered preferred shares |
|
|
199,755 |
|
|
|
|
|
|
|
14,851 |
|
|
|
|
|
|
|
|
|
|
|
|
|
|
|
|
|
|
|
|
|
|
|
|
|
|
|
|
|
|
|
| |
|
|
|
|
| Financials 0.10% |
|
Itaú Unibanco Holding SA, preferred nominative shares |
|
|
1,308,816 |
|
|
|
|
|
|
|
7,588 |
|
|
|
|
|
|
|
|
|
|
|
|
|
|
|
|
21 American Funds Insurance Series
International Fund (continued)
|
|
|
|
|
|
|
|
|
|
|
|
|
|
|
| Preferred securities (continued) |
|
Shares |
|
|
|
|
|
Value (000) |
|
|
|
|
|
|
| Health care 0.04% |
|
Grifols, SA, Class B, nonvoting non-registered preferred shares1 |
|
|
522,350 |
|
|
|
|
|
|
$ |
3,223 |
|
|
|
|
|
|
|
|
|
|
|
|
|
|
|
|
|
|
|
|
|
|
|
|
|
|
|
|
|
|
|
| |
|
|
|
|
| Information technology 0.01% |
|
Canva, Inc., Series A, noncumulative preferred shares1,2,3 |
|
|
422 |
|
|
|
|
|
|
|
450 |
|
|
|
Canva, Inc., Series A-3, noncumulative preferred shares1,2,3 |
|
|
18 |
|
|
|
|
|
|
|
19 |
|
|
|
Canva, Inc., Series A-4, noncumulative preferred shares1,2,3 |
|
|
1 |
|
|
|
|
|
|
|
1 |
|
|
|
|
|
|
|
|
|
|
|
|
|
|
|
|
|
|
|
|
|
|
|
|
|
|
|
|
|
470 |
|
|
|
|
|
|
|
|
|
|
|
|
|
|
|
|
|
|
Total preferred securities (cost: $35,361,000) |
|
|
|
|
|
|
|
|
|
|
26,132 |
|
|
|
|
|
|
|
|
|
|
|
|
|
|
|
|
|
|
|
|
| Rights & warrants 0.00% |
|
|
|
|
|
|
|
|
|
| |
|
|
|
|
| Information technology 0.00% |
|
Constellation Software, Inc., warrants, expire 3/31/20401,2 |
|
|
7,730 |
|
|
|
|
|
|
|
– |
5 |
|
|
|
|
|
|
|
|
|
|
|
|
|
|
|
|
|
Total rights & warrants (cost: $0) |
|
|
|
|
|
|
|
|
|
|
– |
5 |
|
|
|
|
|
|
|
|
|
|
|
|
|
|
|
|
|
|
|
| Short-term securities 3.51% |
|
|
|
|
|
|
|
|
|
|
| Money market investments 3.51% |
|
|
|
Capital Group Central Cash Fund 5.37%6,7 |
|
|
2,547,039 |
|
|
|
|
|
|
|
254,704 |
|
|
|
|
|
|
|
|
|
|
|
|
|
|
|
|
|
|
|
|
|
|
|
Total short-term securities (cost: $254,706,000) |
|
|
|
|
|
|
|
|
|
|
254,704 |
|
|
|
|
|
|
|
|
|
|
|
|
|
|
|
|
|
|
|
|
|
|
|
|
|
|
|
|
Total investment securities 100.29% (cost: $5,231,391,000) |
|
|
|
|
|
|
|
|
|
|
7,274,884 |
|
|
|
Other assets less liabilities (0.29)% |
|
|
|
|
|
|
|
|
|
|
(20,968 |
) |
|
|
|
|
|
|
|
|
|
|
|
|
|
|
|
|
|
|
|
|
|
|
|
|
|
|
|
Net assets 100.00% |
|
|
|
|
|
|
|
|
|
$ |
7,253,916 |
|
|
|
|
|
|
|
|
|
|
|
|
|
|
|
|
|
|
|
|
|
|
|
|
|
|
|
|
|
|
|
|
|
|
|
|
|
|
|
|
|
|
|
|
|
|
|
|
|
|
|
|
|
|
|
|
|
|
|
|
|
|
|
|
|
|
|
|
|
|
| Investments in affiliates7 |
|
|
|
|
|
|
|
|
|
|
|
|
|
|
|
|
|
|
|
|
|
|
|
|
|
|
|
|
|
|
|
|
|
|
|
|
|
|
| |
|
Value at 1/1/2024 (000) |
|
Additions
(000) |
|
|
Reductions
(000) |
|
|
Net
realized
gain (loss)
(000) |
|
|
Net unrealized appreciation (depreciation)
(000) |
|
|
Value at
6/30/2024
(000) |
|
|
Dividend or interest income (000) |
|
|
|
|
|
|
|
|
|
|
|
|
|
| Short-term securities 3.51% |
|
|
|
|
|
|
|
|
|
|
|
|
|
|
|
|
|
|
|
|
|
|
|
|
|
|
|
|
|
|
|
|
|
|
|
|
|
|
|
|
|
|
| Money market investments 3.51% |
|
|
|
|
|
|
|
|
|
|
|
|
|
|
|
|
|
|
|
|
|
|
|
|
|
|
|
|
|
|
|
|
|
|
|
|
|
|
|
|
|
|
| Capital Group Central Cash Fund 5.37%6 |
|
$202,026 |
|
$ |
962,313 |
|
|
$ |
909,613 |
|
|
|
|
|
|
|
$(19 |
) |
|
|
|
|
|
|
$(3 |
) |
|
|
|
|
|
$ |
254,704 |
|
|
|
|
|
|
$ |
6,516 |
|
|
|
|
|
|
|
|
|
|
|
|
|
|
|
|
|
|
|
|
|
|
|
|
|
|
|
|
|
|
| Restricted securities3 |
|
|
|
|
|
|
|
|
|
|
|
|
|
|
|
|
|
|
|
|
|
|
|
| |
|
Acquisition date(s) |
|
|
Cost (000) |
|
|
Value (000) |
|
|
Percent of net
assets |
|
|
|
|
|
|
|
|
|
| Ivanhoe Mines, Ltd., Class A1 |
|
|
12/18/2023 |
|
|
|
|
|
|
$ |
32,962 |
|
|
|
|
|
|
$ |
47,417 |
|
|
|
|
|
|
|
.65 |
% |
|
|
|
|
|
|
|
|
| Canva, Inc.1,2 |
|
|
8/26/2021-11/4/2021 |
|
|
|
|
|
|
|
8,215 |
|
|
|
|
|
|
|
5,140 |
|
|
|
|
|
|
|
.07 |
|
|
|
|
|
|
|
|
|
| Canva, Inc., Series A, noncumulative preferred shares1,2 |
|
|
11/4/2021 |
|
|
|
|
|
|
|
719 |
|
|
|
|
|
|
|
450 |
|
|
|
|
|
|
|
.01 |
|
|
|
|
|
|
|
|
|
| Canva, Inc., Series A-3, noncumulative preferred shares1,2 |
|
|
11/4/2021 |
|
|
|
|
|
|
|
31 |
|
|
|
|
|
|
|
19 |
|
|
|
|
|
|
|
.00 |
8 |
|
|
|
|
|
|
|
|
| Canva, Inc., Series A-4, noncumulative preferred shares1,2 |
|
|
11/4/2021 |
|
|
|
|
|
|
|
2 |
|
|
|
|
|
|
|
1 |
|
|
|
|
|
|
|
.00 |
8 |
|
|
|
|
|
|
|
|
|
|
|
|
|
|
|
|
|
|
|
|
|
|
|
|
|
|
|
|
|
|
|
|
|
|
|
|
|
| Total |
|
|
|
|
|
|
|
|
|
$ |
41,929 |
|
|
|
|
|
|
$ |
53,027 |
|
|
|
|
|
|
|
.73 |
% |
|
|
|
|
|
|
|
|
|
|
|
|
|
|
|
|
|
|
|
|
|
|
|
|
|
|
|
|
|
American Funds Insurance Series 22
International Fund (continued)
| 1 |
Security did not produce income during the last 12 months. |
| 2 |
Value determined using significant unobservable inputs. |
| 3 |
Restricted security, other than Rule 144A securities or commercial paper issued pursuant to Section 4(a)(2) of the Securities Act of 1933. The total value of all such restricted securities was $53,027,000, which represented .73% of the net assets of the fund. |
| 4 |
All or a portion of this security was on loan. The total value of all such securities was $9,093,000, which represented .13% of the net assets of the fund. Refer to Note 5 for more information on securities lending. |
| 5 |
Amount less than one thousand. |
| 6 |
Rate represents the seven-day yield at 6/30/2024. |
| 7 |
Part of the same “group of investment companies” as the fund as defined under the Investment Company Act of 1940, as amended. |
Key to abbreviation(s)
ADR = American Depositary Receipts
CAD = Canadian dollars
EUR = Euros
GBP = British pounds
Refer to the notes to financial statements.
23 American Funds Insurance Series
|
|
|
| New World Fund |
|
|
|
|
| Investment portfolio June 30, 2024 |
|
unaudited |
|
|
|
|
|
|
|
|
|
|
|
| Common stocks 91.00% |
|
Shares |
|
|
Value (000) |
|
| |
|
|
|
| Information technology 16.46% |
|
Taiwan Semiconductor Manufacturing Co., Ltd. |
|
|
4,555,269 |
|
|
$ |
135,480 |
|
|
|
Taiwan Semiconductor Manufacturing Co., Ltd. (ADR) |
|
|
9,625 |
|
|
|
1,673 |
|
|
|
Microsoft Corp. |
|
|
228,056 |
|
|
|
101,930 |
|
|
|
NVIDIA Corp. |
|
|
465,601 |
|
|
|
57,520 |
|
|
|
Broadcom, Inc. |
|
|
30,144 |
|
|
|
48,397 |
|
|
|
ASML Holding NV |
|
|
35,752 |
|
|
|
36,885 |
|
|
|
Samsung Electronics Co., Ltd. |
|
|
372,411 |
|
|
|
21,885 |
|
|
|
Synopsys, Inc.1 |
|
|
33,525 |
|
|
|
19,949 |
|
|
|
SK hynix, Inc. |
|
|
115,019 |
|
|
|
19,506 |
|
|
|
Keyence Corp. |
|
|
41,300 |
|
|
|
18,221 |
|
|
|
SAP SE |
|
|
81,541 |
|
|
|
16,556 |
|
|
|
SAP SE (ADR) |
|
|
5,124 |
|
|
|
1,033 |
|
|
|
Capgemini SE |
|
|
62,869 |
|
|
|
12,453 |
|
|
|
ASM International NV |
|
|
15,819 |
|
|
|
12,049 |
|
|
|
Tokyo Electron, Ltd. |
|
|
44,500 |
|
|
|
9,772 |
|
|
|
Apple, Inc. |
|
|
45,477 |
|
|
|
9,578 |
|
|
|
Coforge, Ltd. |
|
|
110,380 |
|
|
|
7,234 |
|
|
|
Disco Corp. |
|
|
16,100 |
|
|
|
6,169 |
|
|
|
MediaTek, Inc. |
|
|
139,000 |
|
|
|
5,942 |
|
|
|
Applied Materials, Inc. |
|
|
23,020 |
|
|
|
5,432 |
|
|
|
eMemory Technology, Inc. |
|
|
65,000 |
|
|
|
5,110 |
|
|
|
E Ink Holdings, Inc. |
|
|
597,000 |
|
|
|
4,656 |
|
|
|
TDK Corp. |
|
|
63,700 |
|
|
|
3,893 |
|
|
|
Tata Consultancy Services, Ltd. |
|
|
79,474 |
|
|
|
3,710 |
|
|
|
Globant SA1 |
|
|
18,965 |
|
|
|
3,381 |
|
|
|
EPAM Systems, Inc.1 |
|
|
16,583 |
|
|
|
3,119 |
|
|
|
Advantech Co., Ltd. |
|
|
269,000 |
|
|
|
3,060 |
|
|
|
Wolfspeed, Inc.1 |
|
|
120,200 |
|
|
|
2,736 |
|
|
|
Micron Technology, Inc. |
|
|
20,352 |
|
|
|
2,677 |
|
|
|
Oracle Corp. |
|
|
9,736 |
|
|
|
1,375 |
|
|
|
NICE, Ltd. (ADR)1 |
|
|
7,618 |
|
|
|
1,310 |
|
|
|
Intel Corp. |
|
|
41,006 |
|
|
|
1,270 |
|
|
|
Lasertec Corp. |
|
|
4,572 |
|
|
|
1,033 |
|
|
|
Hamamatsu Photonics KK |
|
|
35,400 |
|
|
|
955 |
|
|
|
Accenture PLC, Class A |
|
|
3,145 |
|
|
|
954 |
|
|
|
Canva, Inc.1,2,3 |
|
|
385 |
|
|
|
411 |
|
|
|
|
|
|
|
|
|
|
|
|
|
|
|
|
|
|
|
|
|
587,314 |
|
|
|
|
|
|
|
|
|
|
|
|
|
|
|
|
|
|
|
|
|
|
|
| |
|
|
|
| Financials 15.78% |
|
Nu Holdings Ltd., Class A1 |
|
|
3,094,881 |
|
|
|
39,893 |
|
|
|
Banco Bilbao Vizcaya Argentaria, SA |
|
|
3,402,208 |
|
|
|
33,941 |
|
|
|
AIA Group, Ltd. |
|
|
4,696,600 |
|
|
|
31,847 |
|
|
|
PB Fintech, Ltd.1 |
|
|
1,727,215 |
|
|
|
28,861 |
|
|
|
Capitec Bank Holdings, Ltd. |
|
|
182,361 |
|
|
|
26,341 |
|
|
|
Bank Central Asia Tbk PT |
|
|
40,916,923 |
|
|
|
24,684 |
|
|
|
Bank Mandiri (Persero) Tbk PT |
|
|
65,132,000 |
|
|
|
24,323 |
|
|
|
Mastercard, Inc., Class A |
|
|
53,392 |
|
|
|
23,554 |
|
|
|
HDFC Bank, Ltd. |
|
|
1,081,219 |
|
|
|
21,841 |
|
|
|
Kotak Mahindra Bank, Ltd. |
|
|
978,081 |
|
|
|
21,037 |
|
|
|
Ping An Insurance (Group) Company of China, Ltd., Class H |
|
|
3,843,044 |
|
|
|
17,475 |
|
|
|
Axis Bank, Ltd. |
|
|
1,112,512 |
|
|
|
16,857 |
|
|
|
Cholamandalam Investment and Finance Co., Ltd. |
|
|
941,517 |
|
|
|
15,994 |
|
|
|
XP, Inc., Class A |
|
|
872,035 |
|
|
|
15,339 |
|
|
|
Visa, Inc., Class A |
|
|
53,344 |
|
|
|
14,001 |
|
|
|
AU Small Finance Bank, Ltd. |
|
|
1,677,617 |
|
|
|
13,476 |
|
|
|
Eurobank Ergasias Services and Holdings SA |
|
|
5,452,369 |
|
|
|
11,805 |
|
|
|
Shriram Finance, Ltd. |
|
|
325,656 |
|
|
|
11,352 |
|
|
|
B3 SA - Brasil, Bolsa, Balcao |
|
|
5,866,855 |
|
|
|
10,747 |
|
|
|
ICICI Bank, Ltd. (ADR) |
|
|
178,177 |
|
|
|
5,133 |
|
|
|
ICICI Bank, Ltd. |
|
|
314,605 |
|
|
|
4,519 |
|
|
|
S&P Global, Inc. |
|
|
18,291 |
|
|
|
8,158 |
|
|
|
Discovery, Ltd. |
|
|
1,001,935 |
|
|
|
7,417 |
|
American Funds Insurance Series 24
New World Fund (continued)
|
|
|
|
|
|
|
|
|
|
|
| Common stocks (continued) |
|
Shares |
|
|
Value (000) |
|
|
|
|
|
| Financials (continued) |
|
Bank of the Philippine Islands |
|
|
3,590,328 |
|
|
$ |
7,295 |
|
|
|
Canara Bank |
|
|
5,058,160 |
|
|
|
7,230 |
|
|
|
Bajaj Finserv, Ltd. |
|
|
363,565 |
|
|
|
6,917 |
|
|
|
Power Finance Corp., Ltd.1 |
|
|
1,180,473 |
|
|
|
6,848 |
|
|
|
Grupo Financiero Banorte, SAB de CV, Series O |
|
|
877,970 |
|
|
|
6,841 |
|
|
|
National Bank of Greece SA1 |
|
|
790,899 |
|
|
|
6,596 |
|
|
|
Hong Kong Exchanges and Clearing, Ltd. |
|
|
205,400 |
|
|
|
6,544 |
|
|
|
Bajaj Finance, Ltd. |
|
|
65,590 |
|
|
|
5,584 |
|
|
|
Aon PLC, Class A |
|
|
18,358 |
|
|
|
5,390 |
|
|
|
Erste Group Bank AG |
|
|
112,765 |
|
|
|
5,341 |
|
|
|
Commercial International Bank - Egypt (CIB) SAE (GDR) |
|
|
2,383,296 |
|
|
|
3,547 |
|
|
|
Commercial International Bank - Egypt (CIB) SAE |
|
|
719,163 |
|
|
|
1,159 |
|
|
|
HSBC Holdings PLC (GBP denominated) |
|
|
515,437 |
|
|
|
4,461 |
|
|
|
REC, Ltd. |
|
|
654,212 |
|
|
|
4,115 |
|
|
|
Bank Rakyat Indonesia (Persero) Tbk PT |
|
|
13,813,800 |
|
|
|
3,854 |
|
|
|
Edenred SA |
|
|
88,127 |
|
|
|
3,718 |
|
|
|
Alpha Services and Holdings SA1 |
|
|
2,252,753 |
|
|
|
3,678 |
|
|
|
BDO Unibank, Inc. |
|
|
1,661,870 |
|
|
|
3,638 |
|
|
|
Bank of Baroda |
|
|
1,100,331 |
|
|
|
3,629 |
|
|
|
Kaspi.kz JSC (ADR) |
|
|
28,095 |
|
|
|
3,625 |
|
|
|
China Merchants Bank Co., Ltd., Class H |
|
|
766,500 |
|
|
|
3,481 |
|
|
|
DBS Group Holdings, Ltd. |
|
|
119,340 |
|
|
|
3,145 |
|
|
|
Brookfield Corp., Class A |
|
|
71,275 |
|
|
|
2,961 |
|
|
|
Moody’s Corp. |
|
|
7,024 |
|
|
|
2,957 |
|
|
|
Banco BTG Pactual SA, units |
|
|
503,543 |
|
|
|
2,784 |
|
|
|
Akbank TAS |
|
|
1,328,305 |
|
|
|
2,607 |
|
|
|
China Construction Bank Corp., Class H |
|
|
3,240,000 |
|
|
|
2,393 |
|
|
|
BNP Paribas SA |
|
|
36,217 |
|
|
|
2,321 |
|
|
|
Max Financial Services, Ltd.1 |
|
|
190,118 |
|
|
|
2,208 |
|
|
|
Jio Financial Services, Ltd.1 |
|
|
370,072 |
|
|
|
1,584 |
|
|
|
Bank of Ningbo Co., Ltd., Class A |
|
|
437,700 |
|
|
|
1,329 |
|
|
|
East Money Information Co., Ltd., Class A |
|
|
901,027 |
|
|
|
1,308 |
|
|
|
Haci Ömer Sabanci Holding AS |
|
|
412,704 |
|
|
|
1,219 |
|
|
|
Prudential PLC |
|
|
108,552 |
|
|
|
985 |
|
|
|
Emirates NBD Bank PJSC |
|
|
196,305 |
|
|
|
881 |
|
|
|
Société Générale |
|
|
31,778 |
|
|
|
742 |
|
|
|
TISCO Financial Group PCL, foreign registered shares |
|
|
281,800 |
|
|
|
733 |
|
|
|
China Pacific Insurance (Group) Co., Ltd., Class H |
|
|
255,200 |
|
|
|
622 |
|
|
|
Moscow Exchange MICEX-RTS PJSC2 |
|
|
438,203 |
|
|
|
– |
4 |
|
|
Sberbank of Russia PJSC2 |
|
|
2,662,164 |
|
|
|
– |
4 |
|
|
|
|
|
|
|
|
|
|
|
|
|
|
|
|
|
|
|
|
562,865 |
|
|
|
|
|
|
|
|
|
|
|
|
|
|
|
|
|
|
|
|
|
|
|
| |
|
|
|
| Industrials 10.95% |
|
Airbus SE, non-registered shares |
|
|
303,101 |
|
|
|
41,793 |
|
|
|
International Container Terminal Services, Inc. |
|
|
4,925,980 |
|
|
|
29,422 |
|
|
|
Safran SA |
|
|
133,021 |
|
|
|
27,986 |
|
|
|
Techtronic Industries Co., Ltd. |
|
|
1,517,000 |
|
|
|
17,322 |
|
|
|
Rumo SA |
|
|
4,258,067 |
|
|
|
15,783 |
|
|
|
Copa Holdings, SA, Class A |
|
|
164,342 |
|
|
|
15,642 |
|
|
|
Grupo Aeroportuario del Pacífico, SAB de CV, Class B |
|
|
869,119 |
|
|
|
13,595 |
|
|
|
Grupo Aeroportuario del Pacífico, SAB de CV, Class B (ADR) |
|
|
9,248 |
|
|
|
1,441 |
|
|
|
Rolls-Royce Holdings PLC1 |
|
|
2,365,175 |
|
|
|
13,672 |
|
|
|
Larsen & Toubro, Ltd. |
|
|
293,200 |
|
|
|
12,422 |
|
|
|
Shenzhen Inovance Technology Co., Ltd., Class A |
|
|
1,581,274 |
|
|
|
11,162 |
|
|
|
Daikin Industries, Ltd. |
|
|
76,600 |
|
|
|
10,582 |
|
|
|
Carrier Global Corp. |
|
|
162,961 |
|
|
|
10,280 |
|
|
|
TransDigm Group, Inc. |
|
|
7,771 |
|
|
|
9,928 |
|
|
|
Airports of Thailand PCL, foreign registered shares |
|
|
6,283,500 |
|
|
|
9,870 |
|
|
|
General Electric Co. |
|
|
61,193 |
|
|
|
9,728 |
|
|
|
Mitsui & Co., Ltd. |
|
|
383,200 |
|
|
|
8,741 |
|
|
|
BAE Systems PLC |
|
|
513,078 |
|
|
|
8,567 |
|
|
|
Contemporary Amperex Technology Co., Ltd., Class A |
|
|
329,425 |
|
|
|
8,138 |
|
25 American Funds Insurance Series
New World Fund (continued)
|
|
|
|
|
|
|
|
|
|
|
| Common stocks (continued) |
|
Shares |
|
|
Value (000) |
|
|
|
|
|
| Industrials (continued) |
|
Schneider Electric SE |
|
|
28,231 |
|
|
$ |
6,736 |
|
|
|
IMCD NV |
|
|
46,917 |
|
|
|
6,495 |
|
|
|
Wizz Air Holdings PLC1 |
|
|
214,193 |
|
|
|
6,058 |
|
|
|
Siemens AG |
|
|
31,592 |
|
|
|
5,876 |
|
|
|
ZTO Express (Cayman), Inc., Class A (ADR) |
|
|
278,207 |
|
|
|
5,773 |
|
|
|
Zhejiang Sanhua Intelligent Controls Co., Ltd., Class A |
|
|
2,194,123 |
|
|
|
5,768 |
|
|
|
Caterpillar, Inc. |
|
|
16,719 |
|
|
|
5,569 |
|
|
|
Boeing Co.1 |
|
|
27,229 |
|
|
|
4,956 |
|
|
|
Grab Holdings, Ltd., Class A1 |
|
|
1,368,510 |
|
|
|
4,858 |
|
|
|
Thales SA |
|
|
28,985 |
|
|
|
4,657 |
|
|
|
CCR SA, ordinary nominative shares |
|
|
2,180,359 |
|
|
|
4,540 |
|
|
|
SMC Corp. |
|
|
9,100 |
|
|
|
4,345 |
|
|
|
InPost SA1 |
|
|
239,071 |
|
|
|
4,195 |
|
|
|
DSV A/S |
|
|
27,186 |
|
|
|
4,160 |
|
|
|
Jiangsu Hengli Hydraulic Co., Ltd., Class A |
|
|
639,264 |
|
|
|
4,099 |
|
|
|
Interpump Group SpA |
|
|
84,813 |
|
|
|
3,752 |
|
|
|
Ayala Corp. |
|
|
371,770 |
|
|
|
3,686 |
|
|
|
Weichai Power Co., Ltd., Class H |
|
|
976,000 |
|
|
|
1,860 |
|
|
|
Weichai Power Co., Ltd., Class A |
|
|
780,400 |
|
|
|
1,745 |
|
|
|
MISUMI Group, Inc. |
|
|
174,600 |
|
|
|
2,986 |
|
|
|
Bureau Veritas SA |
|
|
102,855 |
|
|
|
2,839 |
|
|
|
Leonardo SpA |
|
|
115,560 |
|
|
|
2,694 |
|
|
|
GT Capital Holdings, Inc. |
|
|
218,150 |
|
|
|
2,304 |
|
|
|
Ingersoll-Rand, Inc. |
|
|
24,129 |
|
|
|
2,192 |
|
|
|
SM Investments Corp. |
|
|
154,590 |
|
|
|
2,186 |
|
|
|
Astra International Tbk PT |
|
|
7,835,919 |
|
|
|
2,129 |
|
|
|
Shanghai International Airport Co., Ltd., Class A1 |
|
|
396,500 |
|
|
|
1,760 |
|
|
|
Hitachi, Ltd. |
|
|
71,500 |
|
|
|
1,612 |
|
|
|
Epiroc AB, Class B |
|
|
72,448 |
|
|
|
1,322 |
|
|
|
Embraer SA1 |
|
|
146,300 |
|
|
|
946 |
|
|
|
Centre Testing International Group Co., Ltd. |
|
|
643,296 |
|
|
|
892 |
|
|
|
Legrand SA |
|
|
8,580 |
|
|
|
855 |
|
|
|
Haitian International Holdings, Ltd. |
|
|
197,146 |
|
|
|
562 |
|
|
|
Veralto Corp. |
|
|
– |
4 |
|
|
– |
4 |
|
|
|
|
|
|
|
|
|
|
|
|
|
|
|
|
|
|
|
|
390,481 |
|
|
|
|
|
|
|
|
|
|
|
|
|
|
|
|
|
|
|
|
|
|
|
| |
|
|
|
| Consumer discretionary 10.65% |
|
MercadoLibre, Inc.1 |
|
|
33,577 |
|
|
|
55,180 |
|
|
|
LVMH Moët Hennessy-Louis Vuitton SE |
|
|
48,128 |
|
|
|
36,960 |
|
|
|
Trip.com Group, Ltd. (ADR)1 |
|
|
609,981 |
|
|
|
28,669 |
|
|
|
Trip.com Group, Ltd.1 |
|
|
26,750 |
|
|
|
1,267 |
|
|
|
Midea Group Co., Ltd., Class A |
|
|
2,275,068 |
|
|
|
20,202 |
|
|
|
Eicher Motors, Ltd. |
|
|
312,279 |
|
|
|
17,455 |
|
|
|
Meituan, Class B1 |
|
|
1,209,700 |
|
|
|
17,139 |
|
|
|
Galaxy Entertainment Group, Ltd. |
|
|
3,295,000 |
|
|
|
15,348 |
|
|
|
adidas AG |
|
|
54,990 |
|
|
|
13,124 |
|
|
|
Compagnie Financière Richemont SA, Class A |
|
|
75,839 |
|
|
|
11,836 |
|
|
|
BYD Co., Ltd., Class A1 |
|
|
178,108 |
|
|
|
6,119 |
|
|
|
BYD Co., Ltd., Class H |
|
|
176,500 |
|
|
|
5,238 |
|
|
|
Jumbo SA |
|
|
364,761 |
|
|
|
10,466 |
|
|
|
Titan Co., Ltd. |
|
|
217,886 |
|
|
|
8,867 |
|
|
|
Maruti Suzuki India, Ltd. |
|
|
60,040 |
|
|
|
8,637 |
|
|
|
H World Group, Ltd. (ADR) |
|
|
251,137 |
|
|
|
8,368 |
|
|
|
H World Group, Ltd. |
|
|
47,700 |
|
|
|
159 |
|
|
|
YUM! Brands, Inc. |
|
|
60,957 |
|
|
|
8,074 |
|
|
|
Hilton Worldwide Holdings, Inc. |
|
|
35,293 |
|
|
|
7,701 |
|
|
|
Shenzhou International Group Holdings, Ltd. |
|
|
736,700 |
|
|
|
7,209 |
|
|
|
Evolution AB |
|
|
63,993 |
|
|
|
6,669 |
|
|
|
Ferrari NV (EUR denominated) |
|
|
15,419 |
|
|
|
6,304 |
|
|
|
Tesla, Inc.1 |
|
|
29,809 |
|
|
|
5,899 |
|
|
|
Hermès International |
|
|
2,386 |
|
|
|
5,492 |
|
|
|
Naspers, Ltd., Class N |
|
|
24,555 |
|
|
|
4,786 |
|
American Funds Insurance Series 26
New World Fund (continued)
|
|
|
|
|
|
|
|
|
|
|
| Common stocks (continued) |
|
Shares |
|
|
Value (000) |
|
|
|
|
|
| Consumer discretionary (continued) |
|
Sands China, Ltd.1 |
|
|
2,291,600 |
|
|
$ |
4,774 |
|
|
|
Industria de Diseño Textil, SA |
|
|
94,901 |
|
|
|
4,690 |
|
|
|
Alibaba Group Holding, Ltd. (ADR) |
|
|
40,360 |
|
|
|
2,906 |
|
|
|
Alibaba Group Holding, Ltd. |
|
|
168,672 |
|
|
|
1,516 |
|
|
|
TVS Motor Co., Ltd. |
|
|
152,648 |
|
|
|
4,315 |
|
|
|
Amadeus IT Group SA, Class A, non-registered shares |
|
|
61,547 |
|
|
|
4,096 |
|
|
|
Kering SA |
|
|
10,404 |
|
|
|
3,782 |
|
|
|
Mahindra & Mahindra, Ltd. |
|
|
109,980 |
|
|
|
3,767 |
|
|
|
Stellantis NV |
|
|
163,669 |
|
|
|
3,219 |
|
|
|
Li Ning Co., Ltd. |
|
|
1,266,655 |
|
|
|
2,679 |
|
|
|
Suzuki Motor Corp. |
|
|
227,300 |
|
|
|
2,631 |
|
|
|
China Tourism Group Duty Free Corp., Ltd., Class H5 |
|
|
394,952 |
|
|
|
2,414 |
|
|
|
Airbnb, Inc., Class A1 |
|
|
15,833 |
|
|
|
2,401 |
|
|
|
Tube Investments of India, Ltd. |
|
|
40,897 |
|
|
|
2,075 |
|
|
|
Aptiv PLC1 |
|
|
28,249 |
|
|
|
1,989 |
|
|
|
General Motors Co. |
|
|
42,308 |
|
|
|
1,966 |
|
|
|
Bharat Forge, Ltd. |
|
|
90,789 |
|
|
|
1,812 |
|
|
|
Melco Resorts & Entertainment, Ltd. (ADR)1 |
|
|
230,090 |
|
|
|
1,716 |
|
|
|
Booking Holdings, Inc. |
|
|
382 |
|
|
|
1,513 |
|
|
|
NIKE, Inc., Class B |
|
|
19,852 |
|
|
|
1,496 |
|
|
|
Renault SA |
|
|
28,126 |
|
|
|
1,434 |
|
|
|
Shangri-La Asia, Ltd. |
|
|
1,954,000 |
|
|
|
1,343 |
|
|
|
Magazine Luiza SA1 |
|
|
595,887 |
|
|
|
1,284 |
|
|
|
Inchcape PLC |
|
|
101,227 |
|
|
|
953 |
|
|
|
Zhongsheng Group Holdings, Ltd. |
|
|
518,500 |
|
|
|
757 |
|
|
|
Cyrela Brazil Realty SA, ordinary nominative shares |
|
|
201,625 |
|
|
|
680 |
|
|
|
Gree Electric Appliances, Inc. of Zhuhai, Class A |
|
|
116,846 |
|
|
|
631 |
|
|
|
|
|
|
|
|
|
|
|
|
|
|
|
|
|
|
|
|
|
380,007 |
|
|
|
|
|
|
|
|
|
|
|
|
|
|
|
|
|
|
|
|
|
|
|
| |
|
|
|
| Health care 10.18% |
|
Novo Nordisk AS, Class B |
|
|
580,598 |
|
|
|
82,942 |
|
|
|
Eli Lilly and Co. |
|
|
54,575 |
|
|
|
49,411 |
|
|
|
Max Healthcare Institute, Ltd. |
|
|
3,456,744 |
|
|
|
38,870 |
|
|
|
AstraZeneca PLC |
|
|
208,188 |
|
|
|
32,456 |
|
|
|
Thermo Fisher Scientific, Inc. |
|
|
49,309 |
|
|
|
27,268 |
|
|
|
Laurus Labs, Ltd. |
|
|
2,068,421 |
|
|
|
10,484 |
|
|
|
Abbott Laboratories |
|
|
97,925 |
|
|
|
10,175 |
|
|
|
BeiGene, Ltd. (ADR)1 |
|
|
67,796 |
|
|
|
9,672 |
|
|
|
BeiGene, Ltd.1 |
|
|
42,200 |
|
|
|
463 |
|
|
|
Innovent Biologics, Inc.1 |
|
|
2,028,873 |
|
|
|
9,568 |
|
|
|
Danaher Corp. |
|
|
36,009 |
|
|
|
8,997 |
|
|
|
Rede D’Or Sao Luiz SA |
|
|
1,813,576 |
|
|
|
8,824 |
|
|
|
Jiangsu Hengrui Medicine Co., Ltd., Class A1 |
|
|
1,656,888 |
|
|
|
8,767 |
|
|
|
Aspen Pharmacare Holdings, Ltd. |
|
|
545,396 |
|
|
|
6,995 |
|
|
|
EssilorLuxottica SA |
|
|
28,897 |
|
|
|
6,200 |
|
|
|
Hypera SA, ordinary nominative shares |
|
|
984,819 |
|
|
|
5,056 |
|
|
|
Revvity, Inc. |
|
|
47,284 |
|
|
|
4,958 |
|
|
|
Mankind Pharma, Ltd.1 |
|
|
165,835 |
|
|
|
4,212 |
|
|
|
Shenzhen Mindray Bio-Medical Electronics Co., Ltd., Class A |
|
|
102,500 |
|
|
|
4,109 |
|
|
|
WuXi AppTec Co., Ltd., Class H |
|
|
855,900 |
|
|
|
3,208 |
|
|
|
WuXi AppTec Co., Ltd., Class A |
|
|
161,019 |
|
|
|
868 |
|
|
|
Zoetis, Inc., Class A |
|
|
20,648 |
|
|
|
3,580 |
|
|
|
OdontoPrev SA |
|
|
1,457,766 |
|
|
|
2,962 |
|
|
|
Teva Pharmaceutical Industries, Ltd. (ADR)1 |
|
|
175,530 |
|
|
|
2,852 |
|
|
|
Zai Lab, Ltd. (ADR)1,5 |
|
|
156,069 |
|
|
|
2,705 |
|
|
|
Mettler-Toledo International, Inc.1 |
|
|
1,535 |
|
|
|
2,145 |
|
|
|
Siemens Healthineers AG |
|
|
37,235 |
|
|
|
2,145 |
|
|
|
Align Technology, Inc.1 |
|
|
8,344 |
|
|
|
2,015 |
|
|
|
Alcon, Inc. |
|
|
22,171 |
|
|
|
1,973 |
|
|
|
Legend Biotech Corp. (ADR)1 |
|
|
44,278 |
|
|
|
1,961 |
|
|
|
Illumina, Inc.1 |
|
|
14,693 |
|
|
|
1,534 |
|
|
|
Medtronic PLC |
|
|
15,457 |
|
|
|
1,217 |
|
27 American Funds Insurance Series
New World Fund (continued)
|
|
|
|
|
|
|
|
|
|
|
| Common stocks (continued) |
|
Shares |
|
|
Value (000) |
|
|
|
|
|
| Health care (continued) |
|
Asahi Intecc Co., Ltd. |
|
|
76,600 |
|
|
$ |
1,078 |
|
|
|
Straumann Holding AG |
|
|
8,668 |
|
|
|
1,067 |
|
|
|
Lupin, Ltd.1 |
|
|
49,541 |
|
|
|
963 |
|
|
|
Angelalign Technology, Inc. |
|
|
88,406 |
|
|
|
643 |
|
|
|
WuXi Biologics (Cayman), Inc.1 |
|
|
298,500 |
|
|
|
438 |
|
|
|
Shandong Pharmaceutical Glass Co., Ltd., Class A |
|
|
47,100 |
|
|
|
164 |
|
|
|
CanSino Biologics, Inc., Class H1,5 |
|
|
61,521 |
|
|
|
154 |
|
|
|
GRAIL, Inc.1 |
|
|
2,448 |
|
|
|
38 |
|
|
|
GE HealthCare Technologies, Inc. |
|
|
– |
4 |
|
|
– |
4 |
|
|
|
|
|
|
|
|
|
|
|
|
|
|
|
|
|
|
|
|
363,137 |
|
|
|
|
|
|
|
|
|
|
|
|
|
|
|
|
|
|
|
|
|
|
|
| |
|
|
|
| Communication services 8.75% |
|
Tencent Holdings, Ltd. |
|
|
1,621,251 |
|
|
|
76,946 |
|
|
|
Alphabet, Inc., Class A |
|
|
162,765 |
|
|
|
29,647 |
|
|
|
Alphabet, Inc., Class C |
|
|
146,286 |
|
|
|
26,832 |
|
|
|
Meta Platforms, Inc., Class A |
|
|
108,267 |
|
|
|
54,590 |
|
|
|
Bharti Airtel, Ltd. |
|
|
2,193,574 |
|
|
|
37,877 |
|
|
|
Bharti Airtel, Ltd., interim shares |
|
|
61,951 |
|
|
|
773 |
|
|
|
NetEase, Inc. |
|
|
1,057,400 |
|
|
|
20,188 |
|
|
|
NetEase, Inc. (ADR) |
|
|
23,644 |
|
|
|
2,260 |
|
|
|
MTN Group, Ltd. |
|
|
2,922,467 |
|
|
|
13,569 |
|
|
|
América Móvil, SAB de CV, Class B (ADR) |
|
|
538,156 |
|
|
|
9,149 |
|
|
|
Telefónica, SA, non-registered shares |
|
|
1,783,779 |
|
|
|
7,556 |
|
|
|
Netflix, Inc.1 |
|
|
10,302 |
|
|
|
6,953 |
|
|
|
Telkom Indonesia (Persero) Tbk PT, Class B |
|
|
35,586,000 |
|
|
|
6,753 |
|
|
|
Indus Towers, Ltd.1 |
|
|
955,570 |
|
|
|
4,302 |
|
|
|
Singapore Telecommunications, Ltd. |
|
|
1,876,100 |
|
|
|
3,794 |
|
|
|
Vodafone Group PLC |
|
|
3,990,134 |
|
|
|
3,515 |
|
|
|
Informa PLC |
|
|
186,372 |
|
|
|
2,018 |
|
|
|
Vodafone Idea, Ltd.1 |
|
|
8,957,264 |
|
|
|
1,910 |
|
|
|
JCDecaux SE1 |
|
|
75,052 |
|
|
|
1,469 |
|
|
|
TIM SA |
|
|
498,106 |
|
|
|
1,415 |
|
|
|
Saudi Telecom Co., non-registered shares |
|
|
44,520 |
|
|
|
445 |
|
|
|
|
|
|
|
|
|
|
|
|
|
|
|
|
|
|
|
|
|
311,961 |
|
|
|
|
|
|
|
|
|
|
|
|
|
|
|
|
|
|
|
|
|
|
|
| |
|
|
|
| Consumer staples 6.75% |
|
Kweichow Moutai Co., Ltd., Class A |
|
|
195,370 |
|
|
|
39,403 |
|
|
|
ITC, Ltd. |
|
|
4,563,649 |
|
|
|
23,157 |
|
|
|
Varun Beverages, Ltd. |
|
|
953,627 |
|
|
|
18,554 |
|
|
|
Nestlé SA |
|
|
142,447 |
|
|
|
14,541 |
|
|
|
Arca Continental, SAB de CV |
|
|
1,112,766 |
|
|
|
10,912 |
|
|
|
Bunge Global SA |
|
|
92,660 |
|
|
|
9,893 |
|
|
|
Monster Beverage Corp.1 |
|
|
192,453 |
|
|
|
9,613 |
|
|
|
JBS SA1 |
|
|
1,656,568 |
|
|
|
9,563 |
|
|
|
Constellation Brands, Inc., Class A |
|
|
32,921 |
|
|
|
8,470 |
|
|
|
Avenue Supermarts, Ltd.1 |
|
|
149,667 |
|
|
|
8,465 |
|
|
|
Ajinomoto Co., Inc. |
|
|
230,299 |
|
|
|
8,106 |
|
|
|
Carlsberg A/S, Class B |
|
|
63,645 |
|
|
|
7,617 |
|
|
|
Dino Polska SA, non-registered shares1 |
|
|
63,165 |
|
|
|
6,353 |
|
|
|
Kao Corp.5 |
|
|
151,100 |
|
|
|
6,139 |
|
|
|
KT&G Corp. |
|
|
90,585 |
|
|
|
5,792 |
|
|
|
Anheuser-Busch InBev SA/NV |
|
|
92,550 |
|
|
|
5,346 |
|
|
|
British American Tobacco PLC |
|
|
159,363 |
|
|
|
4,899 |
|
|
|
Budweiser Brewing Co., APAC, Ltd. |
|
|
4,133,100 |
|
|
|
4,866 |
|
|
|
Shoprite Holdings, Ltd. |
|
|
274,334 |
|
|
|
4,262 |
|
|
|
Pernod Ricard SA |
|
|
29,727 |
|
|
|
4,045 |
|
|
|
United Spirits, Ltd. |
|
|
255,890 |
|
|
|
3,919 |
|
|
|
Kimberly-Clark de México, SAB de CV, Class A, ordinary participation certificates |
|
|
2,027,176 |
|
|
|
3,507 |
|
|
|
Uni-Charm Corp. |
|
|
109,300 |
|
|
|
3,502 |
|
|
|
Tsingtao Brewery Co., Ltd., Class H |
|
|
475,634 |
|
|
|
3,169 |
|
|
|
Philip Morris International, Inc. |
|
|
29,107 |
|
|
|
2,949 |
|
|
|
L’Oréal SA, non-registered shares |
|
|
5,458 |
|
|
|
2,400 |
|
American Funds Insurance Series 28
New World Fund (continued)
|
|
|
|
|
|
|
|
|
|
|
| Common stocks (continued) |
|
Shares |
|
|
Value (000) |
|
|
|
|
|
| Consumer staples (continued) |
|
Dabur India, Ltd. |
|
|
309,986 |
|
|
$ |
2,234 |
|
|
|
WH Group, Ltd. |
|
|
2,961,000 |
|
|
|
1,948 |
|
|
|
Danone SA |
|
|
30,623 |
|
|
|
1,869 |
|
|
|
JD Health International, Inc.1 |
|
|
663,450 |
|
|
|
1,803 |
|
|
|
Barry Callebaut AG (Switzerland) |
|
|
660 |
|
|
|
1,076 |
|
|
|
Wuliangye Yibin Co., Ltd., Class A1 |
|
|
47,971 |
|
|
|
845 |
|
|
|
Mondelez International, Inc., Class A |
|
|
11,362 |
|
|
|
744 |
|
|
|
Reckitt Benckiser Group PLC |
|
|
11,580 |
|
|
|
625 |
|
|
|
|
|
|
|
|
|
|
|
|
|
|
|
|
|
|
|
|
|
240,586 |
|
|
|
|
|
|
|
|
|
|
|
|
|
|
|
|
|
|
|
|
|
|
|
| |
|
|
|
| Materials 6.36% |
|
First Quantum Minerals, Ltd. |
|
|
2,579,376 |
|
|
|
33,881 |
|
|
|
Freeport-McMoRan, Inc. |
|
|
685,576 |
|
|
|
33,319 |
|
|
|
Linde PLC |
|
|
46,332 |
|
|
|
20,331 |
|
|
|
Vale SA, ordinary nominative shares |
|
|
737,869 |
|
|
|
8,213 |
|
|
|
Vale SA (ADR), ordinary nominative shares |
|
|
559,941 |
|
|
|
6,254 |
|
|
|
APL Apollo Tubes, Ltd. |
|
|
621,870 |
|
|
|
11,545 |
|
|
|
Jindal Steel & Power, Ltd. |
|
|
774,403 |
|
|
|
9,655 |
|
|
|
Barrick Gold Corp. |
|
|
574,012 |
|
|
|
9,575 |
|
|
|
Glencore PLC |
|
|
1,562,596 |
|
|
|
8,910 |
|
|
|
Amcor PLC (CDI) |
|
|
845,294 |
|
|
|
8,395 |
|
|
|
Sika AG |
|
|
28,997 |
|
|
|
8,254 |
|
|
|
Grupo México, SAB de CV, Series B |
|
|
1,467,800 |
|
|
|
7,895 |
|
|
|
Albemarle Corp. |
|
|
62,894 |
|
|
|
6,008 |
|
|
|
Givaudan SA |
|
|
1,257 |
|
|
|
5,963 |
|
|
|
Shin-Etsu Chemical Co., Ltd. |
|
|
140,400 |
|
|
|
5,461 |
|
|
|
Southern Copper Corp. |
|
|
48,648 |
|
|
|
5,241 |
|
|
|
Asian Paints, Ltd. |
|
|
140,896 |
|
|
|
4,919 |
|
|
|
Tata Steel, Ltd. |
|
|
2,361,679 |
|
|
|
4,910 |
|
|
|
Nutrien, Ltd. (CAD denominated)5 |
|
|
70,551 |
|
|
|
3,592 |
|
|
|
Zijin Mining Group Co., Ltd., Class H |
|
|
1,526,000 |
|
|
|
3,194 |
|
|
|
Anhui Conch Cement Co., Ltd., Class H |
|
|
1,185,000 |
|
|
|
2,822 |
|
|
|
Gerdau SA (ADR) |
|
|
851,567 |
|
|
|
2,810 |
|
|
|
Loma Negra Compania Industrial Argentina SA (ADR)1 |
|
|
377,121 |
|
|
|
2,549 |
|
|
|
Shandong Sinocera Functional Material Co., Ltd., Class A |
|
|
799,500 |
|
|
|
1,964 |
|
|
|
Arkema SA |
|
|
22,359 |
|
|
|
1,933 |
|
|
|
Fresnillo PLC |
|
|
266,535 |
|
|
|
1,896 |
|
|
|
DSM-Firmenich AG |
|
|
14,805 |
|
|
|
1,667 |
|
|
|
BASF SE |
|
|
31,883 |
|
|
|
1,541 |
|
|
|
CEMEX, SAB de CV (ADR), ordinary participation certificates, units |
|
|
230,007 |
|
|
|
1,470 |
|
|
|
Akzo Nobel NV |
|
|
24,034 |
|
|
|
1,461 |
|
|
|
Antofagasta PLC |
|
|
45,109 |
|
|
|
1,196 |
|
|
|
OCI NV |
|
|
2,725 |
|
|
|
67 |
|
|
|
Alrosa PJSC2 |
|
|
1,123,215 |
|
|
|
– |
4 |
|
|
|
|
|
|
|
|
|
|
|
|
|
|
|
|
|
|
|
|
226,891 |
|
|
|
|
|
|
|
|
|
|
|
|
|
|
|
|
|
|
|
|
|
|
|
| |
|
|
|
| Energy 2.43% |
|
TotalEnergies SE |
|
|
395,528 |
|
|
|
26,362 |
|
|
|
Reliance Industries, Ltd. |
|
|
580,979 |
|
|
|
21,749 |
|
|
|
New Fortress Energy, Inc., Class A5 |
|
|
301,785 |
|
|
|
6,633 |
|
|
|
Exxon Mobil Corp. |
|
|
55,370 |
|
|
|
6,374 |
|
|
|
Schlumberger NV |
|
|
111,302 |
|
|
|
5,251 |
|
|
|
Cheniere Energy, Inc. |
|
|
29,614 |
|
|
|
5,178 |
|
|
|
Chevron Corp. |
|
|
32,824 |
|
|
|
5,134 |
|
|
|
Vista Energy, SAB de CV, Class A (ADR)1 |
|
|
64,664 |
|
|
|
2,941 |
|
|
|
Shell PLC (GBP denominated) |
|
|
59,216 |
|
|
|
2,128 |
|
|
|
Borr Drilling, Ltd. (NOK denominated) |
|
|
161,879 |
|
|
|
1,040 |
|
|
|
Borr Drilling, Ltd.1 |
|
|
156,383 |
|
|
|
1,009 |
|
|
|
Galp Energia, SGPS, SA, Class B |
|
|
82,092 |
|
|
|
1,734 |
|
|
|
INPEX Corp.5 |
|
|
42,400 |
|
|
|
626 |
|
|
|
Saudi Arabian Oil Co. |
|
|
54,835 |
|
|
|
405 |
|
29 American Funds Insurance Series
New World Fund (continued)
|
|
|
|
|
|
|
|
|
|
|
| Common stocks (continued) |
|
Shares |
|
|
Value (000) |
|
|
|
|
|
| Energy (continued) |
|
Petróleo Brasileiro SA (Petrobras) (ADR), ordinary nominative shares |
|
|
18,657 |
|
|
$ |
270 |
|
|
|
Gazprom PJSC1,2 |
|
|
945,858 |
|
|
|
– |
4 |
|
|
Rosneft Oil Co. PJSC2 |
|
|
588,661 |
|
|
|
– |
4 |
|
|
|
|
|
|
|
|
|
|
|
|
|
|
|
|
|
|
|
|
86,834 |
|
|
|
|
|
|
|
|
|
|
|
|
|
|
|
|
|
|
|
|
|
|
|
| |
|
|
|
| Real estate 1.74% |
|
Macrotech Developers, Ltd. |
|
|
2,136,509 |
|
|
|
38,480 |
|
|
|
China Resources Mixc Lifestyle Services, Ltd. |
|
|
1,720,200 |
|
|
|
5,697 |
|
|
|
Fibra Uno Administración REIT, SA de CV |
|
|
4,598,444 |
|
|
|
5,650 |
|
|
|
KE Holdings, Inc., Class A (ADR) |
|
|
339,115 |
|
|
|
4,799 |
|
|
|
CK Asset Holdings, Ltd. |
|
|
923,500 |
|
|
|
3,457 |
|
|
|
American Tower Corp. REIT |
|
|
9,397 |
|
|
|
1,827 |
|
|
|
ALLOS SA, ordinary nominative shares |
|
|
390,474 |
|
|
|
1,475 |
|
|
|
Longfor Group Holdings, Ltd. |
|
|
399,346 |
|
|
|
547 |
|
|
|
Ayala Land, Inc. |
|
|
87,800 |
|
|
|
43 |
|
|
|
|
|
|
|
|
|
|
|
|
|
|
|
|
|
|
|
|
|
61,975 |
|
|
|
|
|
|
|
|
|
|
|
|
|
|
|
|
|
|
|
|
|
|
|
| |
|
|
|
| Utilities 0.95% |
|
ENN Energy Holdings, Ltd. |
|
|
1,693,905 |
|
|
|
13,948 |
|
|
|
Equatorial Energia SA, ordinary nominative shares |
|
|
1,824,334 |
|
|
|
10,016 |
|
|
|
Equatorial Energia SA, subscription receipts1 |
|
|
28,068 |
|
|
|
156 |
|
|
|
Power Grid Corporation of India, Ltd. |
|
|
1,151,593 |
|
|
|
4,545 |
|
|
|
Engie SA |
|
|
277,981 |
|
|
|
3,959 |
|
|
|
AES Corp. |
|
|
79,278 |
|
|
|
1,393 |
|
|
|
|
|
|
|
|
|
|
|
|
|
|
|
|
|
|
|
|
|
34,017 |
|
|
|
|
|
|
|
|
|
|
|
|
|
|
|
|
|
|
Total common stocks (cost: $2,188,853,000) |
|
|
|
|
|
|
3,246,068 |
|
|
|
|
|
|
|
|
|
|
|
|
|
|
|
| Preferred securities 0.69% |
|
|
|
|
|
|
|
|
|
|
| Financials 0.27% |
|
Itaú Unibanco Holding SA (ADR), preferred nominative shares |
|
|
1,367,365 |
|
|
|
7,985 |
|
|
|
Itaú Unibanco Holding SA, preferred nominative shares |
|
|
301,179 |
|
|
|
1,746 |
|
|
|
|
|
|
|
|
|
|
|
|
|
|
|
|
|
|
|
|
|
9,731 |
|
|
|
|
|
|
|
|
|
|
|
|
|
|
|
|
|
|
|
|
|
|
|
| |
|
|
|
| Real estate 0.17% |
|
QuintoAndar, Ltd., Series E, preference shares1,2,3 |
|
|
32,657 |
|
|
|
4,780 |
|
|
|
QuintoAndar, Ltd., Series E-1, preference shares1,2,3 |
|
|
8,400 |
|
|
|
1,230 |
|
|
|
|
|
|
|
|
|
|
|
|
|
|
|
|
|
|
|
|
|
6,010 |
|
|
|
|
|
|
|
|
|
|
|
|
|
|
|
|
|
|
|
|
|
|
|
| |
|
|
|
| Consumer discretionary 0.15% |
|
Dr. Ing. h.c. F. Porsche AG, nonvoting non-registered preferred shares |
|
|
72,473 |
|
|
|
5,388 |
|
|
|
Getir BV, Series D, preferred shares1,2,3 |
|
|
7,768 |
|
|
|
– |
4 |
|
|
|
|
|
|
|
|
|
|
|
|
|
|
|
|
|
|
|
|
5,388 |
|
|
|
|
|
|
|
|
|
|
|
|
|
|
|
|
|
|
|
|
|
|
|
| |
|
|
|
| Information technology 0.10% |
|
Samsung Electronics Co., Ltd., nonvoting preferred shares |
|
|
78,747 |
|
|
|
3,616 |
|
|
|
Canva, Inc., Series A, noncumulative preferred shares1,2,3 |
|
|
34 |
|
|
|
37 |
|
|
|
Canva, Inc., Series A-3, noncumulative preferred shares1,2,3 |
|
|
1 |
|
|
|
1 |
|
|
|
|
|
|
|
|
|
|
|
|
|
|
|
|
|
|
|
|
|
3,654 |
|
|
|
|
|
|
|
|
|
|
|
|
|
|
|
|
|
|
Total preferred securities (cost: $30,556,000) |
|
|
|
|
|
|
24,783 |
|
|
|
|
|
|
|
|
|
|
|
|
|
|
|
| Rights & warrants 0.03% |
|
|
|
|
|
|
|
|
|
|
| Consumer discretionary 0.03% |
|
Midea Group Co., Ltd., warrants, expire 3/19/20251,6 |
|
|
128,407 |
|
|
|
1,140 |
|
|
|
|
|
|
|
|
|
|
|
|
|
|
Total rights & warrants (cost: $1,092,000) |
|
|
|
|
|
|
1,140 |
|
|
|
|
|
|
|
|
|
|
|
|
American Funds Insurance Series 30
New World Fund (continued)
|
|
|
|
|
|
|
|
|
|
|
| Convertible stocks 0.01% |
|
Shares |
|
|
Value (000) |
|
|
|
|
|
| Materials 0.01% |
|
Albemarle Corp., Class A, cumulative convertible preferred depositary shares,
7.25% 3/1/2027 |
|
|
5,700 |
|
|
$ |
266 |
|
|
|
|
|
|
|
|
|
|
|
|
|
|
Total convertible stocks (cost: $286,000) |
|
|
|
|
|
|
266 |
|
|
|
|
|
|
|
|
|
|
|
|
|
|
|
| Bonds, notes & other debt instruments 3.45% |
|
Principal amount (000) |
|
|
|
|
|
|
|
| Bonds & notes of governments & government agencies outside the U.S. 2.92% |
|
|
|
|
|
|
|
|
|
|
Abu Dhabi (Emirate of) 1.70% 3/2/20316 |
|
|
USD200 |
|
|
|
165 |
|
|
|
Angola (Republic of) 9.50% 11/12/2025 |
|
|
400 |
|
|
|
407 |
|
|
|
Angola (Republic of) 8.25% 5/9/2028 |
|
|
900 |
|
|
|
848 |
|
|
|
Angola (Republic of) 8.00% 11/26/20296 |
|
|
445 |
|
|
|
401 |
|
|
|
Angola (Republic of) 8.75% 4/14/20326 |
|
|
280 |
|
|
|
248 |
|
|
|
Argentine Republic 1.00% 7/9/2029 |
|
|
32 |
|
|
|
18 |
|
|
|
Argentine Republic 3.625% 7/9/2035 (4.125% on 7/9/2024)7 |
|
|
2,217 |
|
|
|
934 |
|
|
|
Argentine Republic 4.25% 1/9/2038 (5.00% on 7/9/2024)7 |
|
|
1,091 |
|
|
|
501 |
|
|
|
Argentine Republic 3.50% 7/9/2041 (4.875% on 7/9/2029)7 |
|
|
2,454 |
|
|
|
959 |
|
|
|
Brazil (Federative Republic of) 10.00% 1/1/2027 |
|
|
BRL12,699 |
|
|
|
2,186 |
|
|
|
Brazil (Federative Republic of) 6.00% 5/15/20278 |
|
|
27,282 |
|
|
|
4,826 |
|
|
|
Brazil (Federative Republic of) 10.00% 1/1/2031 |
|
|
4,628 |
|
|
|
748 |
|
|
|
Brazil (Federative Republic of) 6.00% 8/15/20328 |
|
|
4,941 |
|
|
|
859 |
|
|
|
Brazil (Federative Republic of) 10.00% 1/1/2033 |
|
|
27,237 |
|
|
|
4,326 |
|
|
|
Brazil (Federative Republic of) 6.00% 8/15/20508 |
|
|
5,525 |
|
|
|
932 |
|
|
|
Chile (Republic of) 5.30% 11/1/2037 |
|
|
CLP480,000 |
|
|
|
471 |
|
|
|
Chile (Republic of) 4.34% 3/7/2042 |
|
|
USD350 |
|
|
|
303 |
|
|
|
China (Peoples Republic of) 2.27% 5/25/2034 |
|
|
CNY6,100 |
|
|
|
844 |
|
|
|
China (Peoples Republic of) 2.57% 5/20/2054 |
|
|
4,000 |
|
|
|
567 |
|
|
|
China (People’s Republic of), Series INBK, 2.89% 11/18/2031 |
|
|
27,780 |
|
|
|
4,014 |
|
|
|
China (People’s Republic of), Series INBK, 3.72% 4/12/2051 |
|
|
25,030 |
|
|
|
4,263 |
|
|
|
China (People’s Republic of), Series INBK, 3.12% 10/25/2052 |
|
|
9,500 |
|
|
|
1,472 |
|
|
|
Colombia (Republic of) 3.25% 4/22/2032 |
|
|
USD700 |
|
|
|
538 |
|
|
|
Colombia (Republic of) 8.00% 11/14/2035 |
|
|
200 |
|
|
|
206 |
|
|
|
Colombia (Republic of) 5.20% 5/15/2049 |
|
|
755 |
|
|
|
534 |
|
|
|
Colombia (Republic of), Series B, 7.00% 3/26/2031 |
|
|
COP1,784,100 |
|
|
|
362 |
|
|
|
Colombia (Republic of), Series B, 13.25% 2/9/2033 |
|
|
1,734,800 |
|
|
|
476 |
|
|
|
Colombia (Republic of), Series UVR, 3.75% 2/25/20378 |
|
|
6,870 |
|
|
|
513 |
|
|
|
Colombia (Republic of), Series B, 9.25% 5/28/2042 |
|
|
4,013,400 |
|
|
|
807 |
|
|
|
Cote d’Ivoire (Republic of) 4.875% 1/30/2032 |
|
|
EUR150 |
|
|
|
135 |
|
|
|
Czech Republic 1.95% 7/30/2037 |
|
|
CZK17,900 |
|
|
|
593 |
|
|
|
Dominican Republic 8.625% 4/20/20276 |
|
|
USD575 |
|
|
|
596 |
|
|
|
Dominican Republic 5.50% 2/22/20296 |
|
|
275 |
|
|
|
266 |
|
|
|
Dominican Republic 11.375% 7/6/2029 |
|
|
DOP12,800 |
|
|
|
230 |
|
|
|
Dominican Republic 7.05% 2/3/20316 |
|
|
USD150 |
|
|
|
155 |
|
|
|
Dominican Republic 13.625% 2/3/2033 |
|
|
DOP9,000 |
|
|
|
180 |
|
|
|
Dominican Republic 5.875% 1/30/2060 |
|
|
USD1,725 |
|
|
|
1,468 |
|
|
|
Egypt (Arab Republic of) 6.375% 4/11/2031 |
|
|
EUR200 |
|
|
|
171 |
|
|
|
Egypt (Arab Republic of) 7.625% 5/29/2032 |
|
|
USD200 |
|
|
|
164 |
|
|
|
Egypt (Arab Republic of) 8.50% 1/31/2047 |
|
|
400 |
|
|
|
297 |
|
|
|
Egypt (Arab Republic of) 8.875% 5/29/2050 |
|
|
755 |
|
|
|
577 |
|
|
|
Egypt (Arab Republic of) 8.15% 11/20/20596 |
|
|
500 |
|
|
|
357 |
|
|
|
Ethiopia (Federal Democratic Republic of) 6.625% 12/11/20249 |
|
|
440 |
|
|
|
319 |
|
|
|
Gabonese Republic 7.00% 11/24/2031 |
|
|
950 |
|
|
|
717 |
|
|
|
Ghana (Republic of) 7.75% 4/7/20296,9 |
|
|
1,125 |
|
|
|
576 |
|
|
|
Ghana (Republic of) 8.125% 3/26/20329 |
|
|
1,280 |
|
|
|
660 |
|
|
|
Honduras (Republic of) 6.25% 1/19/2027 |
|
|
1,365 |
|
|
|
1,298 |
|
|
|
Honduras (Republic of) 5.625% 6/24/2030 |
|
|
283 |
|
|
|
242 |
|
|
|
Honduras (Republic of) 5.625% 6/24/20306 |
|
|
281 |
|
|
|
240 |
|
|
|
Hungary (Republic of) 6.25% 9/22/20326 |
|
|
330 |
|
|
|
341 |
|
|
|
Hungary (Republic of), Series A, 6.75% 10/22/2028 |
|
|
HUF160,000 |
|
|
|
435 |
|
|
|
India (Republic of) 7.32% 11/13/2030 |
|
|
INR39,150 |
|
|
|
476 |
|
|
|
India (Republic of) 6.54% 1/17/2032 |
|
|
81,680 |
|
|
|
952 |
|
31 American Funds Insurance Series
New World Fund (continued)
|
|
|
|
|
|
|
|
|
|
|
| Bonds, notes & other debt instruments (continued) |
|
Principal amount (000) |
|
|
Value (000) |
|
|
| Bonds & notes of governments & government agencies outside the U.S. (continued) |
|
|
|
India (Republic of) 7.18% 7/24/2037 |
|
|
INR44,040 |
|
|
$ |
535 |
|
|
|
Indonesia (Republic of) 6.625% 2/17/2037 |
|
|
USD300 |
|
|
|
335 |
|
|
|
Indonesia (Republic of), Series 95, 6.375% 8/15/2028 |
|
|
IDR23,910,000 |
|
|
|
1,438 |
|
|
|
Indonesia (Republic of), Series 82, 7.00% 9/15/2030 |
|
|
12,900,000 |
|
|
|
788 |
|
|
|
Indonesia (Republic of), Series 91, 6.375% 4/15/2032 |
|
|
5,666,000 |
|
|
|
333 |
|
|
|
Indonesia (Republic of), Series 96, 7.00% 2/15/2033 |
|
|
27,200,000 |
|
|
|
1,654 |
|
|
|
Indonesia (Republic of), Series 100, 6.625% 2/15/2034 |
|
|
38,157,000 |
|
|
|
2,262 |
|
|
|
Indonesia (Republic of), Series 80, 7.50% 6/15/2035 |
|
|
8,552,000 |
|
|
|
540 |
|
|
|
Indonesia (Republic of), Series 98, 7.125% 6/15/2038 |
|
|
34,690,000 |
|
|
|
2,123 |
|
|
|
Malaysia (Federation of), Series 0419, 3.828% 7/5/2034 |
|
|
MYR3,430 |
|
|
|
725 |
|
|
|
Malaysia (Federation of), Series 0418, 4.893% 6/8/2038 |
|
|
7,686 |
|
|
|
1,784 |
|
|
|
Malaysia (Federation of), Series 0519, 3.757% 5/22/2040 |
|
|
2,200 |
|
|
|
450 |
|
|
|
Malaysia (Federation of), Series 0519, 4.638% 11/15/2049 |
|
|
1,030 |
|
|
|
232 |
|
|
|
Malaysia (Federation of), Series 0120, 4.065% 6/15/2050 |
|
|
1,821 |
|
|
|
377 |
|
|
|
Malaysia (Federation of), Series 022, 5.357% 5/15/2052 |
|
|
989 |
|
|
|
247 |
|
|
|
MFB Magyar Fejlesztesi Bank Zartkoruen Mukodo Reszvenytarsasag 6.50% 6/29/2028 |
|
|
USD940 |
|
|
|
957 |
|
|
|
Mongolia (State of) 4.45% 7/7/2031 |
|
|
300 |
|
|
|
253 |
|
|
|
Morocco (Kingdom of) 5.95% 3/8/20286 |
|
|
255 |
|
|
|
256 |
|
|
|
Mozambique (Republic of) 9.00% 9/15/2031 |
|
|
1,300 |
|
|
|
1,079 |
|
|
|
Nigeria (Republic of) 7.625% 11/21/20256 |
|
|
358 |
|
|
|
359 |
|
|
|
Nigeria (Republic of) 7.625% 11/21/2025 |
|
|
342 |
|
|
|
343 |
|
|
|
Oman (Sultanate of) 6.75% 1/17/2048 |
|
|
285 |
|
|
|
291 |
|
|
|
Panama (Republic of) 3.75% 4/17/2026 |
|
|
100 |
|
|
|
94 |
|
|
|
Panama (Republic of) 4.50% 4/16/2050 |
|
|
200 |
|
|
|
135 |
|
|
|
Panama (Republic of) 6.853% 3/28/2054 |
|
|
590 |
|
|
|
542 |
|
|
|
Panama (Republic of) 7.875% 3/1/2057 |
|
|
1,400 |
|
|
|
1,461 |
|
|
|
Panama (Republic of) 4.50% 1/19/2063 |
|
|
200 |
|
|
|
128 |
|
|
|
Paraguay (Republic of) 4.95% 4/28/2031 |
|
|
320 |
|
|
|
307 |
|
|
|
Peru (Republic of) 3.00% 1/15/2034 |
|
|
225 |
|
|
|
183 |
|
|
|
Peru (Republic of) 6.55% 3/14/2037 |
|
|
360 |
|
|
|
386 |
|
|
|
Peru (Republic of) 2.78% 12/1/2060 |
|
|
100 |
|
|
|
56 |
|
|
|
PETRONAS Capital, Ltd. 4.55% 4/21/20506 |
|
|
400 |
|
|
|
347 |
|
|
|
Philippines (Republic of) 6.375% 10/23/2034 |
|
|
145 |
|
|
|
159 |
|
|
|
Philippines (Republic of) 3.95% 1/20/2040 |
|
|
500 |
|
|
|
425 |
|
|
|
Poland (Republic of) 5.75% 4/25/2029 |
|
|
PLN4,500 |
|
|
|
1,131 |
|
|
|
Poland (Republic of) 4.875% 10/4/2033 |
|
|
USD560 |
|
|
|
547 |
|
|
|
Poland (Republic of), Series 0726, 2.50% 7/25/2026 |
|
|
PLN7,680 |
|
|
|
1,813 |
|
|
|
Poland (Republic of), Series 1033, 6.00% 10/25/2033 |
|
|
9,440 |
|
|
|
2,403 |
|
|
|
Romania 2.00% 1/28/2032 |
|
|
EUR1,375 |
|
|
|
1,152 |
|
|
|
Romania 5.25% 5/30/2032 |
|
|
450 |
|
|
|
470 |
|
|
|
Romania 2.00% 4/14/2033 |
|
|
300 |
|
|
|
242 |
|
|
|
Romania 5.625% 5/30/2037 |
|
|
390 |
|
|
|
403 |
|
|
|
Romania 5.125% 6/15/20486 |
|
|
USD500 |
|
|
|
417 |
|
|
|
Saudi Arabia (Kingdom of) 5.00% 1/16/2034 |
|
|
710 |
|
|
|
698 |
|
|
|
Saudi Arabia (Kingdom of) 5.75% 1/16/2054 |
|
|
990 |
|
|
|
967 |
|
|
|
Senegal (Republic of) 4.75% 3/13/2028 |
|
|
EUR600 |
|
|
|
595 |
|
|
|
South Africa (Republic of) 11.625% 3/31/2053 |
|
|
ZAR9,182 |
|
|
|
490 |
|
|
|
South Africa (Republic of), Series R-213, 7.00% 2/28/2031 |
|
|
53,447 |
|
|
|
2,464 |
|
|
|
South Africa (Republic of), Series R-2032, 8.25% 3/31/2032 |
|
|
11,495 |
|
|
|
551 |
|
|
|
South Africa (Republic of), Series R-2035, 8.875% 2/28/2035 |
|
|
52,108 |
|
|
|
2,425 |
|
|
|
South Africa (Republic of), Series R-2040, 9.00% 1/31/2040 |
|
|
32,571 |
|
|
|
1,412 |
|
|
|
Thailand (Kingdom of) 2.875% 12/17/2028 |
|
|
THB15,532 |
|
|
|
431 |
|
|
|
Thailand (Kingdom of) 3.45% 6/17/2043 |
|
|
18,658 |
|
|
|
523 |
|
|
|
Turkey (Republic of) 12.60% 10/1/2025 |
|
|
TRY40,595 |
|
|
|
938 |
|
|
|
Turkey (Republic of) 9.875% 1/15/2028 |
|
|
USD200 |
|
|
|
220 |
|
|
|
Turkey (Republic of) 17.30% 7/19/2028 |
|
|
TRY67,970 |
|
|
|
1,561 |
|
|
|
Turkey (Republic of) 11.875% 1/15/2030 |
|
|
USD500 |
|
|
|
628 |
|
|
|
Turkey (Republic of) 4.875% 4/16/2043 |
|
|
655 |
|
|
|
465 |
|
|
|
Ukraine 7.75% 9/1/20299 |
|
|
1,728 |
|
|
|
540 |
|
|
|
United Mexican States 4.75% 3/8/2044 |
|
|
800 |
|
|
|
644 |
|
|
|
United Mexican States 3.75% 4/19/2071 |
|
|
200 |
|
|
|
121 |
|
American Funds Insurance Series 32
New World Fund (continued)
|
|
|
|
|
|
|
|
|
|
|
| Bonds, notes & other debt instruments (continued) |
|
Principal amount (000) |
|
|
Value (000) |
|
|
| Bonds & notes of governments & government agencies outside the U.S. (continued) |
|
|
|
United Mexican States, Series M, 7.50% 6/3/2027 |
|
|
MXN16,460 |
|
|
$ |
838 |
|
|
|
United Mexican States, Series M20, 8.50% 5/31/2029 |
|
|
34,418 |
|
|
|
1,772 |
|
|
|
United Mexican States, Series M, 7.75% 5/29/2031 |
|
|
73,381 |
|
|
|
3,578 |
|
|
|
United Mexican States, Series M, 7.50% 5/26/2033 |
|
|
38,770 |
|
|
|
1,825 |
|
|
|
United Mexican States, Series M, 7.75% 11/23/2034 |
|
|
38,324 |
|
|
|
1,804 |
|
|
|
United Mexican States, Series M30, 8.50% 11/18/2038 |
|
|
23,600 |
|
|
|
1,144 |
|
|
|
United Mexican States, Series M, 8.00% 7/31/2053 |
|
|
23,949 |
|
|
|
1,058 |
|
|
|
United Mexican States, Series S, 4.00% 10/29/20548 |
|
|
15,685 |
|
|
|
718 |
|
|
|
Venezuela (Bolivarian Republic of) 7.00% 12/1/20189 |
|
|
USD75 |
|
|
|
11 |
|
|
|
Venezuela (Bolivarian Republic of) 7.75% 10/13/20199 |
|
|
930 |
|
|
|
142 |
|
|
|
Venezuela (Bolivarian Republic of) 6.00% 12/9/20209 |
|
|
805 |
|
|
|
115 |
|
|
|
Venezuela (Bolivarian Republic of) 9.00% 5/7/20239 |
|
|
800 |
|
|
|
134 |
|
|
|
Venezuela (Bolivarian Republic of) 8.25% 10/13/20249 |
|
|
180 |
|
|
|
29 |
|
|
|
Venezuela (Bolivarian Republic of) 9.25% 5/7/20289 |
|
|
230 |
|
|
|
40 |
|
|
|
Venezuela (Bolivarian Republic of) 7.00% 3/31/20389 |
|
|
65 |
|
|
|
10 |
|
|
|
|
|
|
|
|
|
|
|
|
|
|
|
|
|
|
|
|
|
104,226 |
|
|
|
|
|
|
|
|
|
|
|
|
|
| Corporate bonds, notes & loans 0.53% |
|
|
|
|
|
| Energy 0.13% |
|
Oleoducto Central SA 4.00% 7/14/20276 |
|
|
255 |
|
|
|
237 |
|
|
|
Oleoducto Central SA 4.00% 7/14/2027 |
|
|
200 |
|
|
|
185 |
|
|
|
Petrobras Global Finance BV 6.85% 6/5/2115 |
|
|
59 |
|
|
|
52 |
|
|
|
Petroleos Mexicanos 7.19% 9/12/2024 |
|
|
MXN22,000 |
|
|
|
1,189 |
|
|
|
Petroleos Mexicanos 6.49% 1/23/2027 |
|
|
USD2,585 |
|
|
|
2,483 |
|
|
|
PTTEP Treasury Center Co., Ltd. 2.993% 1/15/2030 |
|
|
200 |
|
|
|
179 |
|
|
|
Sinopec Group Overseas Development (2018), Ltd. 3.10% 1/8/20516 |
|
|
630 |
|
|
|
446 |
|
|
|
|
|
|
|
|
|
|
|
|
|
|
|
|
|
|
|
|
|
4,771 |
|
|
|
|
|
|
|
|
|
|
|
|
|
|
|
|
|
|
|
|
|
|
|
| |
|
|
|
| Materials 0.10% |
|
Braskem Idesa SAPI 7.45% 11/15/2029 |
|
|
975 |
|
|
|
795 |
|
|
|
Braskem Idesa SAPI 7.45% 11/15/20296 |
|
|
300 |
|
|
|
244 |
|
|
|
Braskem Netherlands Finance BV 8.50% 1/12/2031 |
|
|
600 |
|
|
|
613 |
|
|
|
Braskem Netherlands Finance BV 8.50% 1/12/20316 |
|
|
355 |
|
|
|
363 |
|
|
|
CSN Resources SA 8.875% 12/5/20306 |
|
|
400 |
|
|
|
398 |
|
|
|
Sasol Financing USA, LLC 8.75% 5/3/20293 |
|
|
1,100 |
|
|
|
1,120 |
|
|
|
|
|
|
|
|
|
|
|
|
|
|
|
|
|
|
|
|
|
3,533 |
|
|
|
|
|
|
|
|
|
|
|
|
|
|
|
|
|
|
|
|
|
|
|
| |
|
|
|
| Financials 0.09% |
|
Bangkok Bank Public Co., Ltd. 3.733% 9/25/2034
(5-year UST Yield Curve Rate T Note Constant Maturity + 1.90% on 9/25/2029)7 |
|
|
800 |
|
|
|
709 |
|
|
|
|
|
|
|
BBVA Bancomer SA 8.45% 6/29/2038
(5-year UST Yield Curve Rate T Note Constant Maturity + 4.661% on 6/29/ 2033)6,7 |
|
|
340 |
|
|
|
351 |
|
|
|
CMB International Leasing Management, Ltd. 2.75% 8/12/2030 |
|
|
300 |
|
|
|
263 |
|
|
|
|
|
|
|
HDFC Bank, Ltd. 3.70% junior subordinated perpetual bonds
(5-Year UST Yield Curve Rate T Note Constant Maturity + 2.925% on 2/25/2027)6,7 |
|
|
600 |
|
|
|
558 |
|
|
|
HSBC Holdings PLC 7.399% 11/13/2034 (USD-SOFR + 3.02% on 11/13/2033)7 |
|
|
600 |
|
|
|
650 |
|
|
|
HSBC Holdings PLC 6.332% 3/9/2044 (USD-SOFR + 2.65% on 3/9/2043)7 |
|
|
600 |
|
|
|
628 |
|
|
|
|
|
|
|
|
|
|
|
|
|
|
|
|
|
|
|
|
|
3,159 |
|
|
|
|
|
|
|
|
|
|
|
|
|
|
|
|
|
|
|
|
|
|
|
| |
|
|
|
| Communication services 0.07% |
|
América Móvil, SAB de CV 10.125% 1/22/2029 |
|
|
MXN13,710 |
|
|
|
730 |
|
|
|
América Móvil, SAB de CV 9.50% 1/27/2031 |
|
|
24,000 |
|
|
|
1,226 |
|
|
|
Axiata SPV5 (Labuan), Ltd. 3.064% 8/19/2050 |
|
|
USD357 |
|
|
|
237 |
|
|
|
PLDT, Inc. 2.50% 1/23/2031 |
|
|
210 |
|
|
|
177 |
|
|
|
Tencent Holdings, Ltd. 3.24% 6/3/20506 |
|
|
380 |
|
|
|
249 |
|
|
|
|
|
|
|
|
|
|
|
|
|
|
|
|
|
|
|
|
|
2,619 |
|
|
|
|
|
|
|
|
|
|
|
|
33 American Funds Insurance Series
New World Fund (continued)
|
|
|
|
|
|
|
|
|
|
|
|
|
|
|
|
|
|
|
| Bonds, notes & other debt instruments (continued) |
|
|
Principal amount (000) |
|
|
|
|
|
Value (000) |
|
|
| Corporate bonds, notes & loans (continued) |
|
|
|
|
|
|
| Utilities 0.05% |
|
Aegea Finance SARL 9.00% 1/20/20316 |
|
|
|
USD275 |
|
|
|
|
|
|
$ |
286 |
|
|
|
AES Panama Generation Holdings, SRL 4.375% 5/31/20306 |
|
|
|
270 |
|
|
|
|
|
|
|
235 |
|
|
|
Empresas Publicas de Medellin ESP 4.25% 7/18/20296 |
|
|
|
412 |
|
|
|
|
|
|
|
356 |
|
|
|
Eskom Holdings SOC, Ltd. 8.45% 8/10/2028 |
|
|
|
490 |
|
|
|
|
|
|
|
494 |
|
|
|
Greenko Dutch BV 3.85% 3/29/20266 |
|
|
|
182 |
|
|
|
|
|
|
|
172 |
|
|
|
Greenko Dutch BV 3.85% 3/29/2026 |
|
|
|
182 |
|
|
|
|
|
|
|
172 |
|
|
|
|
|
|
|
|
|
|
|
|
|
|
|
|
|
|
|
|
|
|
|
|
|
|
|
|
|
|
|
1,715 |
|
|
|
|
|
|
|
|
|
|
|
|
|
|
|
|
|
|
|
|
|
|
|
|
|
|
|
|
|
|
|
|
|
| |
|
|
|
|
| Consumer discretionary 0.04% |
|
Alibaba Group Holding, Ltd. 3.15% 2/9/2051 |
|
|
|
410 |
|
|
|
|
|
|
|
263 |
|
|
|
Meituan 3.05% 10/28/20306 |
|
|
|
400 |
|
|
|
|
|
|
|
345 |
|
|
|
Melco Resorts Finance, Ltd. 7.625% 4/17/20326 |
|
|
|
345 |
|
|
|
|
|
|
|
342 |
|
|
|
MercadoLibre, Inc. 3.125% 1/14/2031 |
|
|
|
400 |
|
|
|
|
|
|
|
339 |
|
|
|
Sands China, Ltd. 4.375% 6/18/2030 |
|
|
|
220 |
|
|
|
|
|
|
|
203 |
|
|
|
|
|
|
|
|
|
|
|
|
|
|
|
|
|
|
|
|
|
|
|
|
|
|
|
|
|
|
|
1,492 |
|
|
|
|
|
|
|
|
|
|
|
|
|
|
|
|
|
|
|
|
|
|
|
|
|
|
|
|
|
|
|
|
|
| |
|
|
|
|
| Consumer staples 0.02% |
|
NBM US Holdings, Inc. 7.00% 5/14/20263 |
|
|
|
200 |
|
|
|
|
|
|
|
200 |
|
|
|
NBM US Holdings, Inc. 6.625% 8/6/20293 |
|
|
|
420 |
|
|
|
|
|
|
|
416 |
|
|
|
|
|
|
|
|
|
|
|
|
|
|
|
|
|
|
|
|
|
|
|
|
|
|
|
|
|
|
|
616 |
|
|
|
|
|
|
|
|
|
|
|
|
|
|
|
|
|
|
|
|
|
|
|
|
|
|
|
|
|
|
|
|
|
| |
|
|
|
|
| Industrials 0.02% |
|
IRB Infrastructure Developers, Ltd. 7.11% 3/11/20326 |
|
|
|
335 |
|
|
|
|
|
|
|
335 |
|
|
|
Mexico City Airport Trust 4.25% 10/31/2026 |
|
|
|
200 |
|
|
|
|
|
|
|
193 |
|
|
|
|
|
|
|
|
|
|
|
|
|
|
|
|
|
|
|
|
|
|
|
|
|
|
|
|
|
|
|
528 |
|
|
|
|
|
|
|
|
|
|
|
|
|
|
|
|
|
|
|
|
|
|
|
|
|
|
|
|
|
|
|
|
|
| |
|
|
|
|
| Health care 0.01% |
|
Rede D’Or Finance SARL 4.50% 1/22/2030 |
|
|
|
480 |
|
|
|
|
|
|
|
433 |
|
|
|
|
|
|
|
|
|
|
|
|
|
|
|
|
|
|
|
Total corporate bonds, notes & loans |
|
|
|
|
|
|
|
|
|
|
|
18,866 |
|
|
|
|
|
|
|
|
|
|
|
|
|
|
|
|
|
|
|
Total bonds, notes & other debt instruments (cost: $132,049,000) |
|
|
|
|
|
|
|
|
|
|
|
123,092 |
|
|
|
|
|
|
|
|
|
|
|
|
|
|
|
|
|
|
|
|
|
|
|
|
|
|
|
|
|
|
|
|
|
|
|
|
|
| Short-term securities 4.12% |
|
|
Shares |
|
|
|
|
|
|
|
|
| Money market investments 3.88% |
|
|
|
Capital Group Central Cash Fund 5.37%10,11 |
|
|
|
1,385,246 |
|
|
|
|
|
|
|
138,525 |
|
|
|
|
|
|
|
|
|
|
|
|
|
|
|
|
|
|
|
|
|
|
| |
|
|
|
|
|
|
|
|
|
|
|
|
|
|
|
|
| Money market investments purchased with collateral from securities on loan 0.19% |
|
|
|
|
|
|
|
|
Invesco Short-Term Investments Trust – Government & Agency Portfolio,
Institutional Class 5.23%10,12 |
|
|
|
6,722,363 |
|
|
|
|
|
|
|
6,722 |
|
|
|
|
|
|
|
|
State Street Institutional U.S. Government Money Market Fund,
Institutional Class 5.22%10,12 |
|
|
|
6,889 |
|
|
|
|
|
|
|
7 |
|
|
|
|
|
|
|
|
|
|
|
|
|
|
|
|
|
|
|
|
|
|
|
|
|
|
|
|
|
|
|
|
|
|
|
|
|
6,729 |
|
|
|
|
|
|
|
|
|
|
|
|
|
|
|
|
|
|
|
|
|
|
|
|
|
|
| |
|
|
|
Weighted average yield at acquisition |
|
|
Principal amount (000) |
|
|
|
|
|
|
|
|
| Bills & notes of governments & government agencies outside the U.S. 0.05% |
|
|
|
Egypt (Arab Republic of) 3/18/2025 |
|
|
20.180 |
% |
|
|
EGP48,550 |
|
|
|
|
|
|
|
856 |
|
|
|
Nigeria (Republic of) 2/11/2025 |
|
|
18.000 |
|
|
|
NGN85,333 |
|
|
|
|
|
|
|
49 |
|
|
|
Nigeria (Republic of) 2/20/2025 |
|
|
17.782 |
|
|
|
113,775 |
|
|
|
|
|
|
|
65 |
|
|
|
Nigeria (Republic of) 2/25/2025 |
|
|
18.036 |
|
|
|
346,521 |
|
|
|
|
|
|
|
199 |
|
American Funds Insurance Series 34
New World Fund (continued)
|
|
|
|
|
|
|
|
|
|
|
|
|
|
|
|
|
|
|
|
|
|
| Short-term securities (continued) |
|
Weighted
average yield
at acquisition |
|
Principal amount
(000) |
|
|
|
|
|
Value (000) |
|
|
| Bills & notes of governments & government agencies outside the U.S. (continued) |
|
|
|
Nigeria (Republic of) 3/6/2025 |
|
17.801% |
|
|
NGN389,048 |
|
|
|
|
|
|
$ |
221 |
|
|
|
Nigeria (Republic of) 3/13/2025 |
|
17.900 |
|
|
151,700 |
|
|
|
|
|
|
|
86 |
|
|
|
Nigeria (Republic of) 3/27/2025 |
|
18.586 |
|
|
221,188 |
|
|
|
|
|
|
|
124 |
|
|
|
|
|
|
|
|
|
|
|
|
|
|
|
|
|
|
|
|
|
|
|
|
|
|
|
|
|
|
|
1,600 |
|
|
|
|
|
|
|
|
|
|
|
|
|
|
|
|
|
|
|
|
Total short-term securities (cost: $146,928,000) |
|
|
|
|
|
|
|
|
|
|
146,854 |
|
|
|
|
|
|
|
|
|
|
|
|
|
|
|
|
|
|
|
|
|
|
|
|
|
Total investment securities 99.30% (cost: $2,499,764,000) |
|
|
|
|
|
|
|
|
|
|
3,542,203 |
|
|
|
Other assets less liabilities 0.70% |
|
|
|
|
|
|
|
|
|
|
25,094 |
|
|
|
|
|
|
|
|
|
|
|
|
|
|
|
|
|
|
|
|
|
|
|
|
|
Net assets 100.00% |
|
|
|
|
|
|
|
|
|
$ |
3,567,297 |
|
|
|
|
|
|
|
|
|
|
|
|
|
|
|
|
|
|
|
|
|
|
|
|
|
|
|
|
|
|
|
|
|
|
|
|
|
|
|
|
|
|
|
| Futures contracts |
|
|
|
|
|
|
|
| Contracts |
|
Type |
|
|
Number of contracts |
|
|
Expiration date |
|
|
Notional amount (000) |
|
|
Value and unrealized appreciation (depreciation) at 6/30/2024 (000) |
|
| 2 Year U.S. Treasury Note Futures |
|
|
Long |
|
|
|
115 |
|
|
|
10/3/2024 |
|
|
|
USD23,485 |
|
|
|
|
|
|
$ |
34 |
|
| 5 Year Euro-Bobl Futures |
|
|
Long |
|
|
|
17 |
|
|
|
9/10/2024 |
|
|
|
2,120 |
|
|
|
|
|
|
|
17 |
|
| 10 Year Euro-Bund Futures |
|
|
Short |
|
|
|
16 |
|
|
|
9/10/2024 |
|
|
|
(2,255 |
) |
|
|
|
|
|
|
(27 |
) |
| 10 Year Ultra U.S. Treasury Note Futures |
|
|
Short |
|
|
|
56 |
|
|
|
9/30/2024 |
|
|
|
(6,358 |
) |
|
|
|
|
|
|
(38 |
) |
| 20 Year U.S. Treasury Bond Futures |
|
|
Long |
|
|
|
4 |
|
|
|
9/30/2024 |
|
|
|
473 |
|
|
|
|
|
|
|
(6 |
) |
|
|
|
|
|
|
|
|
|
|
|
|
|
|
|
|
|
|
|
|
|
|
|
|
|
|
|
|
|
|
|
|
|
|
|
|
|
|
|
|
|
|
|
|
|
|
|
$ |
(20 |
) |
|
|
|
|
|
|
|
|
|
|
|
|
|
|
|
|
|
|
|
|
|
|
|
|
|
|
|
|
|
|
|
|
|
|
|
|
|
|
|
|
|
|
|
|
|
|
|
|
|
|
|
|
|
|
| Forward currency contracts |
|
|
|
|
|
|
|
|
|
| |
|
|
|
|
|
|
|
|
|
|
|
|
|
|
|
|
|
Unrealized |
|
| Contract amount |
|
|
|
|
|
|
|
appreciation (depreciation) |
|
| Currency purchased (000) |
|
|
|
|
|
Currency sold (000) |
|
|
Counterparty |
|
Settlement date |
|
|
at 6/30/2024 (000) |
|
|
|
|
|
|
|
|
|
|
| USD |
|
|
199 |
|
|
|
|
|
|
PLN |
|
|
800 |
|
|
Barclays Bank PLC |
|
|
7/1/2024 |
|
|
|
|
|
|
|
$ – |
4 |
| PLN |
|
|
800 |
|
|
|
|
|
|
USD |
|
|
202 |
|
|
Barclays Bank PLC |
|
|
7/1/2024 |
|
|
|
|
|
|
|
(4 |
) |
| USD |
|
|
1,058 |
|
|
|
|
|
|
CNH |
|
|
7,653 |
|
|
UBS AG |
|
|
7/9/2024 |
|
|
|
|
|
|
|
9 |
|
| CNH |
|
|
508 |
|
|
|
|
|
|
USD |
|
|
70 |
|
|
HSBC Bank |
|
|
7/9/2024 |
|
|
|
|
|
|
|
– |
4 |
| HUF |
|
|
21,785 |
|
|
|
|
|
|
USD |
|
|
59 |
|
|
BNP Paribas |
|
|
7/9/2024 |
|
|
|
|
|
|
|
– |
4 |
| HUF |
|
|
18,327 |
|
|
|
|
|
|
USD |
|
|
49 |
|
|
Morgan Stanley |
|
|
7/9/2024 |
|
|
|
|
|
|
|
– |
4 |
| HUF |
|
|
425,110 |
|
|
|
|
|
|
USD |
|
|
1,167 |
|
|
Standard Chartered Bank |
|
|
7/9/2024 |
|
|
|
|
|
|
|
(15 |
) |
| TRY |
|
|
21,350 |
|
|
|
|
|
|
USD |
|
|
637 |
|
|
Barclays Bank PLC |
|
|
7/10/2024 |
|
|
|
|
|
|
|
9 |
|
| USD |
|
|
120 |
|
|
|
|
|
|
EUR |
|
|
110 |
|
|
JPMorgan Chase |
|
|
7/10/2024 |
|
|
|
|
|
|
|
2 |
|
| USD |
|
|
483 |
|
|
|
|
|
|
EUR |
|
|
450 |
|
|
Barclays Bank PLC |
|
|
7/10/2024 |
|
|
|
|
|
|
|
1 |
|
| CZK |
|
|
1,350 |
|
|
|
|
|
|
USD |
|
|
58 |
|
|
Bank of America |
|
|
7/10/2024 |
|
|
|
|
|
|
|
– |
4 |
| PLN |
|
|
250 |
|
|
|
|
|
|
USD |
|
|
62 |
|
|
Goldman Sachs |
|
|
7/10/2024 |
|
|
|
|
|
|
|
– |
4 |
| USD |
|
|
70 |
|
|
|
|
|
|
TRY |
|
|
2,330 |
|
|
BNP Paribas |
|
|
7/10/2024 |
|
|
|
|
|
|
|
(1 |
) |
| PLN |
|
|
2,169 |
|
|
|
|
|
|
USD |
|
|
548 |
|
|
BNP Paribas |
|
|
7/10/2024 |
|
|
|
|
|
|
|
(10 |
) |
| USD |
|
|
918 |
|
|
|
|
|
|
ZAR |
|
|
17,141 |
|
|
Morgan Stanley |
|
|
7/10/2024 |
|
|
|
|
|
|
|
(23 |
) |
| CZK |
|
|
20,535 |
|
|
|
|
|
|
USD |
|
|
908 |
|
|
Standard Chartered Bank |
|
|
7/10/2024 |
|
|
|
|
|
|
|
(30 |
) |
| INR |
|
|
6,595 |
|
|
|
|
|
|
USD |
|
|
79 |
|
|
Bank of America |
|
|
7/11/2024 |
|
|
|
|
|
|
|
– |
4 |
| USD |
|
|
3,888 |
|
|
|
|
|
|
MYR |
|
|
18,240 |
|
|
JPMorgan Chase |
|
|
7/12/2024 |
|
|
|
|
|
|
|
20 |
|
| USD |
|
|
133 |
|
|
|
|
|
|
MYR |
|
|
625 |
|
|
Standard Chartered Bank |
|
|
7/12/2024 |
|
|
|
|
|
|
|
– |
4 |
| MYR |
|
|
843 |
|
|
|
|
|
|
USD |
|
|
179 |
|
|
JPMorgan Chase |
|
|
7/12/2024 |
|
|
|
|
|
|
|
– |
4 |
| MXN |
|
|
4,629 |
|
|
|
|
|
|
USD |
|
|
261 |
|
|
Morgan Stanley |
|
|
7/12/2024 |
|
|
|
|
|
|
|
(9 |
) |
| USD |
|
|
397 |
|
|
|
|
|
|
BRL |
|
|
2,100 |
|
|
Citibank |
|
|
7/15/2024 |
|
|
|
|
|
|
|
22 |
|
35 American Funds Insurance Series
New World Fund (continued)
|
|
|
|
|
|
|
|
|
|
|
|
|
|
|
|
|
|
|
|
|
|
|
|
|
|
|
|
|
| Forward currency contracts (continued) |
|
|
|
|
|
|
|
|
|
| |
|
|
|
|
|
|
|
|
|
|
|
|
|
|
|
|
|
Unrealized |
|
| Contract amount |
|
|
|
|
|
|
|
appreciation (depreciation) |
|
| Currency purchased (000) |
|
|
|
|
|
Currency sold (000) |
|
|
Counterparty |
|
Settlement date |
|
|
at 6/30/2024 (000) |
|
|
|
|
|
|
|
|
|
|
| IDR |
|
|
4,241,092 |
|
|
|
|
|
|
USD |
|
|
258 |
|
|
HSBC Bank |
|
|
7/15/2024 |
|
|
|
|
|
|
$ |
1 |
|
| MXN |
|
|
4,200 |
|
|
|
|
|
|
USD |
|
|
228 |
|
|
BNP Paribas |
|
|
7/17/2024 |
|
|
|
|
|
|
|
1 |
|
| MXN |
|
|
15,876 |
|
|
|
|
|
|
USD |
|
|
866 |
|
|
Goldman Sachs |
|
|
7/17/2024 |
|
|
|
|
|
|
|
(1 |
) |
| USD |
|
|
1,620 |
|
|
|
|
|
|
MXN |
|
|
30,285 |
|
|
Morgan Stanley |
|
|
7/17/2024 |
|
|
|
|
|
|
|
(31 |
) |
| EUR |
|
|
156 |
|
|
|
|
|
|
USD |
|
|
168 |
|
|
BNP Paribas |
|
|
7/22/2024 |
|
|
|
|
|
|
|
(1 |
) |
| USD |
|
|
839 |
|
|
|
|
|
|
EUR |
|
|
785 |
|
|
Barclays Bank PLC |
|
|
7/22/2024 |
|
|
|
|
|
|
|
(3 |
) |
| USD |
|
|
759 |
|
|
|
|
|
|
ZAR |
|
|
13,774 |
|
|
Goldman Sachs |
|
|
7/24/2024 |
|
|
|
|
|
|
|
3 |
|
| USD |
|
|
870 |
|
|
|
|
|
|
EUR |
|
|
810 |
|
|
Citibank |
|
|
7/24/2024 |
|
|
|
|
|
|
|
2 |
|
| USD |
|
|
89 |
|
|
|
|
|
|
ZAR |
|
|
1,605 |
|
|
Goldman Sachs |
|
|
7/24/2024 |
|
|
|
|
|
|
|
2 |
|
| USD |
|
|
165 |
|
|
|
|
|
|
ZAR |
|
|
2,995 |
|
|
Bank of New York Mellon |
|
|
7/24/2024 |
|
|
|
|
|
|
|
1 |
|
| CZK |
|
|
13,725 |
|
|
|
|
|
|
USD |
|
|
591 |
|
|
BNP Paribas |
|
|
7/24/2024 |
|
|
|
|
|
|
|
(4 |
) |
| USD |
|
|
858 |
|
|
|
|
|
|
TRY |
|
|
29,135 |
|
|
Barclays Bank PLC |
|
|
7/24/2024 |
|
|
|
|
|
|
|
(9 |
) |
| USD |
|
|
80 |
|
|
|
|
|
|
THB |
|
|
2,940 |
|
|
Citibank |
|
|
7/25/2024 |
|
|
|
|
|
|
|
– |
4 |
| USD |
|
|
943 |
|
|
|
|
|
|
EUR |
|
|
882 |
|
|
Morgan Stanley |
|
|
7/25/2024 |
|
|
|
|
|
|
|
(2 |
) |
| USD |
|
|
36 |
|
|
|
|
|
|
CLP |
|
|
33,408 |
|
|
Morgan Stanley |
|
|
7/30/2024 |
|
|
|
|
|
|
|
– |
4 |
| USD |
|
|
124 |
|
|
|
|
|
|
IDR |
|
|
2,028,485 |
|
|
Standard Chartered Bank |
|
|
7/30/2024 |
|
|
|
|
|
|
|
– |
4 |
| INR |
|
|
29,292 |
|
|
|
|
|
|
USD |
|
|
351 |
|
|
Standard Chartered Bank |
|
|
7/30/2024 |
|
|
|
|
|
|
|
– |
4 |
| USD |
|
|
70 |
|
|
|
|
|
|
INR |
|
|
5,840 |
|
|
Citibank |
|
|
7/30/2024 |
|
|
|
|
|
|
|
– |
4 |
| BRL |
|
|
5,020 |
|
|
|
|
|
|
USD |
|
|
910 |
|
|
Citibank |
|
|
7/30/2024 |
|
|
|
|
|
|
|
(15 |
) |
| BRL |
|
|
6,610 |
|
|
|
|
|
|
USD |
|
|
1,210 |
|
|
JPMorgan Chase |
|
|
7/30/2024 |
|
|
|
|
|
|
|
(32 |
) |
| PLN |
|
|
800 |
|
|
|
|
|
|
USD |
|
|
199 |
|
|
Barclays Bank PLC |
|
|
8/5/2024 |
|
|
|
|
|
|
|
– |
4 |
| USD |
|
|
192 |
|
|
|
|
|
|
MXN |
|
|
3,615 |
|
|
Barclays Bank PLC |
|
|
9/20/2024 |
|
|
|
|
|
|
|
(3 |
) |
| TRY |
|
|
20,295 |
|
|
|
|
|
|
USD |
|
|
516 |
|
|
Barclays Bank PLC |
|
|
9/23/2024 |
|
|
|
|
|
|
|
49 |
|
| USD |
|
|
579 |
|
|
|
|
|
|
MXN |
|
|
10,570 |
|
|
Citibank |
|
|
9/27/2024 |
|
|
|
|
|
|
|
9 |
|
| USD |
|
|
838 |
|
|
|
|
|
|
MXN |
|
|
15,605 |
|
|
Morgan Stanley |
|
|
9/27/2024 |
|
|
|
|
|
|
|
(2 |
) |
|
|
|
|
|
|
|
|
|
|
|
|
|
|
|
|
|
|
|
|
|
|
|
|
|
|
|
|
|
|
|
|
|
|
|
|
|
|
|
|
|
|
|
|
|
|
|
|
|
|
|
|
|
|
|
|
|
|
|
|
|
|
|
|
$ |
(64 |
) |
|
|
|
|
|
|
|
|
|
|
|
|
|
|
|
|
|
|
|
|
|
|
|
|
|
|
|
|
|
Swap contracts
Interest rate swaps
Centrally cleared interest rate swaps
|
|
|
|
|
|
|
|
|
|
|
|
|
|
|
|
|
|
|
|
|
|
|
|
|
|
|
|
|
|
|
|
|
|
|
|
|
|
|
|
|
|
|
|
|
|
|
| |
|
|
|
|
|
|
|
|
|
|
|
|
|
|
|
|
|
|
|
|
|
|
|
|
Upfront |
|
|
Unrealized |
|
| Receive |
|
|
|
|
|
Pay |
|
|
|
|
|
Notional |
|
|
Value at |
|
|
premium paid |
|
|
appreciation (depreciation) |
|
| |
|
Payment |
|
|
|
|
|
|
|
Payment |
|
|
Expiration |
|
|
amount |
|
|
6/30/2024 |
|
|
(received) |
|
|
at 6/30/2024 |
|
| Rate |
|
frequency |
|
|
|
|
|
Rate |
|
frequency |
|
|
date |
|
|
(000) |
|
|
(000) |
|
|
(000) |
|
|
(000) |
|
|
|
|
|
|
|
|
|
|
|
|
|
|
| 4.82% |
|
|
Annual |
|
|
|
|
|
|
6-month PLN-WIBOR |
|
|
Semi-annual |
|
|
|
1/29/2027 |
|
|
|
PLN2,560 |
|
|
|
|
|
|
$ |
(6 |
) |
|
|
|
|
|
$ |
– |
|
|
|
|
|
|
$ |
(6 |
) |
| 9.7175% |
|
|
28-day |
|
|
|
|
|
|
28-day MXN-TIIE |
|
|
28-day |
|
|
|
6/15/2029 |
|
|
|
MXN7,650 |
|
|
|
|
|
|
|
3 |
|
|
|
|
|
|
|
– |
|
|
|
|
|
|
|
3 |
|
| 9.5995% |
|
|
28-day |
|
|
|
|
|
|
28-day MXN-TIIE |
|
|
28-day |
|
|
|
6/21/2029 |
|
|
|
MXN20,349 |
|
|
|
|
|
|
|
3 |
|
|
|
|
|
|
|
– |
|
|
|
|
|
|
|
3 |
|
| SOFR |
|
|
Annual |
|
|
|
|
|
|
3.8835% |
|
|
Annual |
|
|
|
6/28/2034 |
|
|
|
USD334 |
|
|
|
|
|
|
|
1 |
|
|
|
|
|
|
|
– |
|
|
|
|
|
|
|
1 |
|
|
|
|
|
|
|
|
|
|
|
|
|
|
|
|
|
|
|
|
|
|
|
|
|
|
|
|
|
|
|
|
|
|
|
|
|
|
|
|
|
|
|
|
|
|
|
|
|
|
|
|
|
|
|
|
|
|
|
|
|
|
|
|
|
|
|
|
|
|
|
|
|
|
|
|
|
|
|
|
|
|
|
|
|
|
|
|
|
$ |
1 |
|
|
|
|
|
|
$ |
– |
|
|
|
|
|
|
$ |
1 |
|
|
|
|
|
|
|
|
|
|
|
|
|
|
|
|
|
|
|
|
|
|
|
|
|
|
|
|
|
|
|
|
|
|
|
|
|
|
|
|
|
|
|
|
|
|
|
|
Bilateral interest rate swaps
|
|
|
|
|
|
|
|
|
|
|
|
|
|
|
|
|
|
|
|
|
|
|
|
|
|
|
|
|
|
|
|
|
|
|
|
|
|
|
|
|
|
|
|
|
| |
|
|
|
|
|
|
|
|
|
|
|
|
|
|
|
|
|
|
|
|
|
|
|
|
|
Upfront |
|
|
Unrealized |
|
| Receive |
|
|
|
Pay |
|
|
|
|
|
|
|
|
Notional |
|
|
Value at |
|
|
premium paid |
|
|
appreciation (depreciation) |
|
| |
|
Payment |
|
|
|
|
|
Payment |
|
|
|
|
|
Expiration |
|
|
amount |
|
|
6/30/2024 |
|
|
(received) |
|
|
at 6/30/2024 |
|
| Rate |
|
frequency |
|
|
|
Rate |
|
frequency |
|
|
|
Counterparty |
|
date |
|
|
(000) |
|
|
(000) |
|
|
(000) |
|
|
(000) |
|
|
|
|
|
|
|
|
|
|
|
|
|
|
|
|
| 10.568657% |
|
At maturity |
|
|
|
BZDIOVER |
|
At maturity |
|
|
|
Barclays Bank PLC |
|
|
1/2/2025 |
|
|
|
BRL6,315 |
|
|
|
|
|
|
$ |
(9 |
) |
|
|
|
|
|
$ |
– |
|
|
|
|
|
|
$ |
(9 |
) |
| 11.5675% |
|
At maturity |
|
|
|
BZDIOVER |
|
At maturity |
|
|
|
Goldman Sachs |
|
|
1/4/2027 |
|
|
|
BRL6,045 |
|
|
|
|
|
|
|
(7 |
) |
|
|
|
|
|
|
– |
|
|
|
|
|
|
|
(7 |
) |
| 11.91% |
|
At maturity |
|
|
|
BZDIOVER |
|
At maturity |
|
|
|
Goldman Sachs |
|
|
1/2/2029 |
|
|
|
BRL3,508 |
|
|
|
|
|
|
|
(7 |
) |
|
|
|
|
|
|
– |
|
|
|
|
|
|
|
(7 |
) |
American Funds Insurance Series 36
New World Fund (continued)
Swap contracts (continued)
Interest rate swaps (continued)
Bilateral interest rate swaps (continued)
|
|
|
|
|
|
|
|
|
|
|
|
|
|
|
|
|
|
|
|
|
|
|
|
|
|
|
|
|
|
|
|
|
|
|
|
|
|
|
|
|
|
|
|
|
| |
|
|
|
|
|
|
|
|
|
|
|
|
|
|
|
|
|
|
|
|
|
|
|
|
|
Upfront |
|
|
Unrealized |
|
| Receive |
|
|
|
Pay |
|
|
|
|
|
|
|
|
Notional |
|
|
Value at |
|
|
premium paid |
|
|
appreciation (depreciation) |
|
| |
|
Payment |
|
|
|
|
|
Payment |
|
|
|
|
|
Expiration |
|
|
amount |
|
|
6/30/2024 |
|
|
(received) |
|
|
at 6/30/2024 |
|
| Rate |
|
frequency |
|
|
|
Rate |
|
frequency |
|
|
|
Counterparty |
|
date |
|
|
(000) |
|
|
(000) |
|
|
(000) |
|
|
(000) |
|
|
|
|
|
|
|
|
|
|
|
|
|
|
|
|
| 10.8091233% |
|
At maturity |
|
|
|
BZDIOVER |
|
At maturity |
|
|
|
Barclays Bank PLC |
|
|
1/2/2029 |
|
|
|
BRL4,534 |
|
|
|
|
|
|
$ |
(56 |
) |
|
|
|
|
|
$ |
– |
|
|
|
|
|
|
$ |
(56 |
) |
| 10.045% |
|
At maturity |
|
|
|
BZDIOVER |
|
At maturity |
|
|
|
Goldman Sachs |
|
|
1/2/2029 |
|
|
|
BRL5,311 |
|
|
|
|
|
|
|
(90 |
) |
|
|
|
|
|
|
– |
|
|
|
|
|
|
|
(90 |
) |
| 11.2144181% |
|
At maturity |
|
|
|
BZDIOVER |
|
At maturity |
|
|
|
Bank of America |
|
|
1/2/2031 |
|
|
|
BRL2,233 |
|
|
|
|
|
|
|
(28 |
) |
|
|
|
|
|
|
– |
|
|
|
|
|
|
|
(28 |
) |
|
|
|
|
|
|
|
|
|
|
|
|
|
|
|
|
|
|
|
|
|
|
|
|
|
|
|
|
|
|
|
|
|
|
|
|
|
|
|
|
|
|
|
|
|
|
|
|
|
|
|
|
|
|
|
|
|
|
|
|
|
|
|
|
|
|
|
|
|
|
|
|
|
|
|
|
|
|
|
|
|
|
|
|
|
|
$ |
(197 |
) |
|
|
|
|
|
$ |
– |
|
|
|
|
|
|
$ |
(197 |
) |
|
|
|
|
|
|
|
|
|
|
|
|
|
|
|
|
|
|
|
|
|
|
|
|
|
|
|
|
|
|
|
|
|
|
|
|
|
|
|
|
|
|
|
|
|
|
|
|
|
|
|
|
|
|
|
|
|
|
|
|
|
|
|
|
|
|
|
|
|
|
|
|
|
|
| Investments in affiliates11 |
|
|
|
|
|
|
|
|
|
|
|
|
|
|
|
|
|
|
|
|
|
|
|
|
|
|
|
|
|
| |
|
Value at 1/1/2024 (000) |
|
|
Additions (000) |
|
|
Reductions (000) |
|
|
Net realized gain (loss) (000) |
|
|
Net unrealized appreciation (depreciation) (000) |
|
|
Value at 6/30/2024 (000) |
|
|
Dividend or interest income (000) |
|
|
|
|
|
|
|
|
|
| Short-term securities 3.88% |
|
|
|
|
|
|
|
|
|
|
|
|
|
|
|
|
|
|
|
|
|
|
|
|
|
|
|
|
| Money market investments 3.88% |
|
|
|
|
|
|
|
|
|
|
|
|
|
|
|
|
|
|
|
|
|
|
|
|
|
|
|
|
| Capital Group Central Cash Fund 5.37%10 |
|
$ |
135,440 |
|
|
$ |
455,568 |
|
|
|
$452,493 |
|
|
|
$19 |
|
|
|
$(9 |
) |
|
|
$138,525 |
|
|
|
$4,142 |
|
|
|
|
|
|
|
|
|
|
|
|
|
|
|
|
|
|
|
|
|
|
|
|
|
|
|
|
|
|
|
|
|
|
|
|
|
| Restricted securities3 |
|
|
|
|
|
|
|
|
|
|
|
|
|
|
|
|
|
|
|
|
|
|
| |
|
Acquisition date(s) |
|
|
|
Cost (000) |
|
|
|
Value (000) |
|
|
|
Percent of net assets |
|
|
|
|
|
|
|
|
| QuintoAndar, Ltd., Series E, preference shares1,2 |
|
|
|
5/26/2021 |
|
|
|
|
|
|
|
|
$ |
5,258 |
|
|
|
|
|
|
|
|
$ |
4,780 |
|
|
|
|
|
|
|
|
|
.13 |
% |
|
|
|
|
|
|
|
|
| QuintoAndar, Ltd., Series E-1, preference shares1,2 |
|
|
|
12/20/2021 |
|
|
|
|
|
|
|
|
|
1,716 |
|
|
|
|
|
|
|
|
|
1,230 |
|
|
|
|
|
|
|
|
|
.04 |
|
|
|
|
|
|
|
|
|
| Sasol Financing USA, LLC 8.75% 5/3/2029 |
|
|
|
1/24/2024 |
|
|
|
|
|
|
|
|
|
1,113 |
|
|
|
|
|
|
|
|
|
1,120 |
|
|
|
|
|
|
|
|
|
.03 |
|
|
|
|
|
|
|
|
|
| NBM US Holdings, Inc. 6.625% 8/6/2029 |
|
|
|
7/8/2022 |
|
|
|
|
|
|
|
|
|
407 |
|
|
|
|
|
|
|
|
|
416 |
|
|
|
|
|
|
|
|
|
.01 |
|
|
|
|
|
|
|
|
|
| NBM US Holdings, Inc. 7.00% 5/14/2026 |
|
|
|
5/16/2023 |
|
|
|
|
|
|
|
|
|
194 |
|
|
|
|
|
|
|
|
|
200 |
|
|
|
|
|
|
|
|
|
.01 |
|
|
|
|
|
|
|
|
|
| Canva, Inc.1,2 |
|
|
|
8/26/2021-11/4/2021 |
|
|
|
|
|
|
|
|
|
656 |
|
|
|
|
|
|
|
|
|
411 |
|
|
|
|
|
|
|
|
|
.01 |
|
|
|
|
|
|
|
|
|
| Canva, Inc., Series A, noncumulative preferred shares1,2 |
|
|
|
11/4/2021 |
|
|
|
|
|
|
|
|
|
58 |
|
|
|
|
|
|
|
|
|
37 |
|
|
|
|
|
|
|
|
|
.00 |
13 |
| |
|
|
|
|
|
|
|
| Canva, Inc., Series A-3, noncumulative preferred shares1,2 |
|
|
|
11/4/2021 |
|
|
|
|
|
|
|
|
|
2 |
|
|
|
|
|
|
|
|
|
1 |
|
|
|
|
|
|
|
|
|
.00 |
13 |
| |
|
|
|
|
|
|
|
| Getir BV, Series D, preferred shares1,2 |
|
|
|
5/27/2021 |
|
|
|
|
|
|
|
|
|
3,500 |
|
|
|
|
|
|
|
|
|
– |
4 |
|
|
|
|
|
|
|
|
.00 |
13 |
|
|
|
|
|
|
|
|
|
|
|
|
|
|
|
|
|
|
|
|
|
|
|
|
|
|
|
|
|
|
|
|
|
|
|
|
|
|
|
|
|
|
|
|
| Total |
|
|
|
|
|
|
|
|
|
|
|
|
$ |
12,904 |
|
|
|
|
|
|
|
|
$ |
8,195 |
|
|
|
|
|
|
|
|
|
.23 |
% |
|
|
|
|
|
|
|
|
|
|
|
|
|
|
|
|
|
|
|
|
|
|
|
|
|
|
|
|
|
|
|
|
|
|
|
|
37 American Funds Insurance Series
New World Fund (continued)
| 1 |
Security did not produce income during the last 12 months. |
| 2 |
Value determined using significant unobservable inputs. |
| 3 |
Restricted security, other than Rule 144A securities or commercial paper issued pursuant to Section 4(a)(2) of the Securities Act of 1933. The total value of all such restricted securities was $8,195,000, which represented .23% of the net assets of the fund. |
| 4 |
Amount less than one thousand. |
| 5 |
All or a portion of this security was on loan. The total value of all such securities was $14,933,000, which represented .42% of the net assets of the fund. Refer to Note 5 for more information on securities lending. |
| 6 |
Acquired in a transaction exempt from registration under Rule 144A or, for commercial paper, Section 4(a)(2) of the Securities Act of 1933. May be resold in the U.S. in transactions exempt from registration, normally to qualified institutional buyers. The total value of all such securities was $10,781,000, which represented .30% of the net assets of the fund. |
| 7 |
Step bond; coupon rate may change at a later date. |
| 8 |
Index-linked bond whose principal amount moves with a government price index. |
| 9 |
Scheduled interest and/or principal payment was not received. |
| 10 |
Rate represents the seven-day yield at 6/30/2024. |
| 11 |
Part of the same “group of investment companies” as the fund as defined under the Investment Company Act of 1940, as amended. |
| 12 |
Security purchased with cash collateral from securities on loan. Refer to Note 5 for more information on securities lending. |
| 13 |
Amount less than .01%. |
Key to abbreviation(s)
|
|
|
| ADR = American Depositary Receipts |
|
IDR = Indonesian rupiah |
| BRL = Brazilian reais |
|
INR = Indian rupees |
| BZDIOVER = Overnight Brazilian Interbank Deposit Rate |
|
MXN = Mexican pesos |
| CAD = Canadian dollars |
|
MYR = Malaysian ringgits |
| CDI = CREST Depository Interest |
|
NGN = Nigerian naira |
| CLP = Chilean pesos |
|
NOK = Norwegian kroner |
| CNH = Chinese yuan renminbi |
|
PLN = Polish zloty |
| CNY = Chinese yuan |
|
REIT = Real Estate Investment Trust |
| COP = Colombian pesos |
|
SOFR = Secured Overnight Financing Rate |
| CZK = Czech korunas |
|
THB = Thai baht |
| DOP = Dominican pesos |
|
TIIE = Equilibrium Interbank Interest Rate |
| EGP = Egyptian pounds |
|
TRY = Turkish lira |
| EUR = Euros |
|
USD = U.S. dollars |
| GBP = British pounds |
|
WIBOR = Warsaw Interbank Offer Rate |
| GDR = Global Depositary Receipts |
|
ZAR = South African rand |
| HUF = Hungarian forints |
|
|
Refer to the notes to financial statements.
American Funds Insurance Series 38
|
|
|
| Washington Mutual Investors Fund |
|
|
| Investment portfolio June 30, 2024 |
|
unaudited |
|
|
|
|
|
|
|
|
|
|
|
|
|
|
|
|
|
|
|
| Common stocks 96.00% |
|
|
|
|
Shares |
|
|
|
|
|
Value (000) |
|
| Information technology 21.86% |
|
Broadcom, Inc. |
|
|
|
|
|
|
435,470 |
|
|
|
|
|
|
$ |
699,160 |
|
|
|
Microsoft Corp. |
|
|
|
|
|
|
1,538,699 |
|
|
|
|
|
|
|
687,722 |
|
|
|
Apple, Inc. |
|
|
|
|
|
|
1,123,388 |
|
|
|
|
|
|
|
236,608 |
|
|
|
ASML Holding NV (ADR) |
|
|
|
|
|
|
164,238 |
|
|
|
|
|
|
|
167,971 |
|
|
|
Applied Materials, Inc. |
|
|
|
|
|
|
399,451 |
|
|
|
|
|
|
|
94,267 |
|
|
|
SAP SE (ADR) |
|
|
|
|
|
|
462,757 |
|
|
|
|
|
|
|
93,343 |
|
|
|
Motorola Solutions, Inc. |
|
|
|
|
|
|
158,697 |
|
|
|
|
|
|
|
61,265 |
|
|
|
Oracle Corp. |
|
|
|
|
|
|
351,403 |
|
|
|
|
|
|
|
49,618 |
|
|
|
NVIDIA Corp. |
|
|
|
|
|
|
391,250 |
|
|
|
|
|
|
|
48,335 |
|
|
|
KLA Corp. |
|
|
|
|
|
|
53,955 |
|
|
|
|
|
|
|
44,486 |
|
|
|
Texas Instruments, Inc. |
|
|
|
|
|
|
202,747 |
|
|
|
|
|
|
|
39,440 |
|
|
|
Intel Corp. |
|
|
|
|
|
|
1,081,737 |
|
|
|
|
|
|
|
33,501 |
|
|
|
Synopsys, Inc.1 |
|
|
|
|
|
|
43,818 |
|
|
|
|
|
|
|
26,074 |
|
|
|
ASM International NV (ADR) |
|
|
|
|
|
|
28,085 |
|
|
|
|
|
|
|
21,460 |
|
|
|
Accenture PLC, Class A |
|
|
|
|
|
|
68,718 |
|
|
|
|
|
|
|
20,850 |
|
|
|
Salesforce, Inc. |
|
|
|
|
|
|
77,101 |
|
|
|
|
|
|
|
19,823 |
|
|
|
Cadence Design Systems, Inc.1 |
|
|
|
|
|
|
41,414 |
|
|
|
|
|
|
|
12,745 |
|
|
|
NetApp, Inc. |
|
|
|
|
|
|
95,194 |
|
|
|
|
|
|
|
12,261 |
|
|
|
Analog Devices, Inc. |
|
|
|
|
|
|
26,645 |
|
|
|
|
|
|
|
6,082 |
|
|
|
|
|
|
|
|
|
|
|
|
|
|
|
|
|
|
|
|
|
|
|
|
|
|
|
|
|
|
|
|
|
|
|
|
|
2,375,011 |
|
|
|
|
|
|
|
|
|
|
|
|
|
|
|
|
|
|
|
|
| |
|
|
|
|
|
|
|
|
|
|
|
|
|
|
|
|
|
|
| Health care 15.59% |
|
Eli Lilly and Co. |
|
|
|
|
|
|
367,975 |
|
|
|
|
|
|
|
333,157 |
|
|
|
UnitedHealth Group, Inc. |
|
|
|
|
|
|
635,126 |
|
|
|
|
|
|
|
323,444 |
|
|
|
AbbVie, Inc. |
|
|
|
|
|
|
939,446 |
|
|
|
|
|
|
|
161,134 |
|
|
|
AstraZeneca PLC (ADR) |
|
|
|
|
|
|
1,418,825 |
|
|
|
|
|
|
|
110,654 |
|
|
|
Abbott Laboratories |
|
|
|
|
|
|
853,882 |
|
|
|
|
|
|
|
88,727 |
|
|
|
CVS Health Corp. |
|
|
|
|
|
|
1,465,059 |
|
|
|
|
|
|
|
86,527 |
|
|
|
Gilead Sciences, Inc. |
|
|
|
|
|
|
1,259,365 |
|
|
|
|
|
|
|
86,405 |
|
|
|
Danaher Corp. |
|
|
|
|
|
|
296,600 |
|
|
|
|
|
|
|
74,106 |
|
|
|
Vertex Pharmaceuticals, Inc.1 |
|
|
|
|
|
|
156,991 |
|
|
|
|
|
|
|
73,585 |
|
|
|
Merck & Co., Inc. |
|
|
|
|
|
|
543,888 |
|
|
|
|
|
|
|
67,333 |
|
|
|
Elevance Health, Inc. |
|
|
|
|
|
|
101,066 |
|
|
|
|
|
|
|
54,764 |
|
|
|
Pfizer, Inc. |
|
|
|
|
|
|
1,884,841 |
|
|
|
|
|
|
|
52,738 |
|
|
|
Amgen, Inc. |
|
|
|
|
|
|
140,500 |
|
|
|
|
|
|
|
43,899 |
|
|
|
Novo Nordisk AS, Class B (ADR) |
|
|
|
|
|
|
237,042 |
|
|
|
|
|
|
|
33,835 |
|
|
|
Humana, Inc. |
|
|
|
|
|
|
83,622 |
|
|
|
|
|
|
|
31,245 |
|
|
|
Bristol-Myers Squibb Co. |
|
|
|
|
|
|
718,110 |
|
|
|
|
|
|
|
29,823 |
|
|
|
Johnson & Johnson |
|
|
|
|
|
|
128,490 |
|
|
|
|
|
|
|
18,780 |
|
|
|
Molina Healthcare, Inc.1 |
|
|
|
|
|
|
31,097 |
|
|
|
|
|
|
|
9,245 |
|
|
|
Zoetis, Inc., Class A |
|
|
|
|
|
|
49,598 |
|
|
|
|
|
|
|
8,598 |
|
|
|
Regeneron Pharmaceuticals, Inc.1 |
|
|
|
|
|
|
6,091 |
|
|
|
|
|
|
|
6,402 |
|
|
|
|
|
|
|
|
|
|
|
|
|
|
|
|
|
|
|
|
|
|
|
|
|
|
|
|
|
|
|
|
|
|
|
|
|
1,694,401 |
|
|
|
|
|
|
|
|
|
|
|
|
|
|
|
|
|
|
|
|
| |
|
|
|
|
|
|
|
|
|
|
|
|
|
|
|
|
|
|
| Financials 15.48% |
|
Marsh & McLennan Companies, Inc. |
|
|
|
|
|
|
1,172,805 |
|
|
|
|
|
|
|
247,133 |
|
|
|
JPMorgan Chase & Co. |
|
|
|
|
|
|
869,645 |
|
|
|
|
|
|
|
175,894 |
|
|
|
Visa, Inc., Class A |
|
|
|
|
|
|
433,679 |
|
|
|
|
|
|
|
113,828 |
|
|
|
BlackRock, Inc. |
|
|
|
|
|
|
135,304 |
|
|
|
|
|
|
|
106,528 |
|
|
|
Mastercard, Inc., Class A |
|
|
|
|
|
|
224,767 |
|
|
|
|
|
|
|
99,158 |
|
|
|
Chubb, Ltd. |
|
|
|
|
|
|
358,050 |
|
|
|
|
|
|
|
91,331 |
|
|
|
Blackstone, Inc. |
|
|
|
|
|
|
640,871 |
|
|
|
|
|
|
|
79,340 |
|
|
|
KKR & Co., Inc. |
|
|
|
|
|
|
748,264 |
|
|
|
|
|
|
|
78,747 |
|
|
|
Wells Fargo & Co. |
|
|
|
|
|
|
1,320,787 |
|
|
|
|
|
|
|
78,442 |
|
|
|
CME Group, Inc., Class A |
|
|
|
|
|
|
366,656 |
|
|
|
|
|
|
|
72,085 |
|
|
|
Discover Financial Services |
|
|
|
|
|
|
430,110 |
|
|
|
|
|
|
|
56,263 |
|
|
|
Arthur J. Gallagher & Co. |
|
|
|
|
|
|
210,691 |
|
|
|
|
|
|
|
54,634 |
|
|
|
Morgan Stanley |
|
|
|
|
|
|
527,975 |
|
|
|
|
|
|
|
51,314 |
|
|
|
Apollo Asset Management, Inc. |
|
|
|
|
|
|
421,124 |
|
|
|
|
|
|
|
49,722 |
|
|
|
Capital One Financial Corp. |
|
|
|
|
|
|
327,672 |
|
|
|
|
|
|
|
45,366 |
|
|
|
S&P Global, Inc. |
|
|
|
|
|
|
91,216 |
|
|
|
|
|
|
|
40,682 |
|
|
|
Aon PLC, Class A |
|
|
|
|
|
|
103,858 |
|
|
|
|
|
|
|
30,491 |
|
39 American Funds Insurance Series
Washington Mutual Investors Fund (continued)
|
|
|
|
|
|
|
|
|
|
|
|
|
|
|
|
|
|
|
| Common stocks (continued) |
|
|
|
|
Shares |
|
|
|
|
|
Value (000) |
|
| |
|
|
|
|
|
| Financials (continued) |
|
Bank of America Corp. |
|
|
|
|
|
|
728,984 |
|
|
|
|
|
|
$ |
28,992 |
|
|
|
Truist Financial Corp. |
|
|
|
|
|
|
681,651 |
|
|
|
|
|
|
|
26,482 |
|
|
|
Intercontinental Exchange, Inc. |
|
|
|
|
|
|
191,725 |
|
|
|
|
|
|
|
26,245 |
|
|
|
American Express Co. |
|
|
|
|
|
|
85,165 |
|
|
|
|
|
|
|
19,720 |
|
|
|
Brookfield Asset Management, Ltd., Class A |
|
|
|
|
|
|
493,148 |
|
|
|
|
|
|
|
18,764 |
|
|
|
Goldman Sachs Group, Inc. |
|
|
|
|
|
|
38,770 |
|
|
|
|
|
|
|
17,536 |
|
|
|
Fifth Third Bancorp |
|
|
|
|
|
|
457,601 |
|
|
|
|
|
|
|
16,698 |
|
|
|
Nasdaq, Inc. |
|
|
|
|
|
|
244,038 |
|
|
|
|
|
|
|
14,706 |
|
|
|
Canadian Imperial Bank of Commerce |
|
|
|
|
|
|
290,915 |
|
|
|
|
|
|
|
13,830 |
|
|
|
Carlyle Group, Inc. (The) |
|
|
|
|
|
|
287,865 |
|
|
|
|
|
|
|
11,558 |
|
|
|
PNC Financial Services Group, Inc. |
|
|
|
|
|
|
71,969 |
|
|
|
|
|
|
|
11,190 |
|
|
|
MSCI, Inc. |
|
|
|
|
|
|
10,656 |
|
|
|
|
|
|
|
5,134 |
|
|
|
|
|
|
|
|
|
|
|
|
|
|
|
|
|
|
|
|
|
|
|
|
|
|
|
|
|
|
|
|
|
|
|
|
|
1,681,813 |
|
|
|
|
|
|
|
|
|
|
|
|
|
|
|
|
|
|
|
|
| |
|
|
|
|
|
|
|
|
|
|
|
|
|
|
|
|
|
|
| |
|
|
|
|
|
| Industrials 10.73% |
|
RTX Corp. |
|
|
|
|
|
|
1,260,932 |
|
|
|
|
|
|
|
126,585 |
|
|
|
General Electric Co. |
|
|
|
|
|
|
777,220 |
|
|
|
|
|
|
|
123,555 |
|
|
|
Caterpillar, Inc. |
|
|
|
|
|
|
340,993 |
|
|
|
|
|
|
|
113,585 |
|
|
|
Northrop Grumman Corp. |
|
|
|
|
|
|
225,609 |
|
|
|
|
|
|
|
98,354 |
|
|
|
Union Pacific Corp. |
|
|
|
|
|
|
330,872 |
|
|
|
|
|
|
|
74,863 |
|
|
|
Paychex, Inc. |
|
|
|
|
|
|
519,589 |
|
|
|
|
|
|
|
61,602 |
|
|
|
L3Harris Technologies, Inc. |
|
|
|
|
|
|
243,427 |
|
|
|
|
|
|
|
54,669 |
|
|
|
CSX Corp. |
|
|
|
|
|
|
1,494,108 |
|
|
|
|
|
|
|
49,978 |
|
|
|
Equifax, Inc. |
|
|
|
|
|
|
170,599 |
|
|
|
|
|
|
|
41,363 |
|
|
|
ABB, Ltd. (ADR) |
|
|
|
|
|
|
675,987 |
|
|
|
|
|
|
|
37,659 |
|
|
|
Johnson Controls International PLC |
|
|
|
|
|
|
550,553 |
|
|
|
|
|
|
|
36,595 |
|
|
|
Boeing Co.1 |
|
|
|
|
|
|
197,303 |
|
|
|
|
|
|
|
35,911 |
|
|
|
Carrier Global Corp. |
|
|
|
|
|
|
526,468 |
|
|
|
|
|
|
|
33,210 |
|
|
|
Deere & Co. |
|
|
|
|
|
|
63,329 |
|
|
|
|
|
|
|
23,662 |
|
|
|
PACCAR, Inc. |
|
|
|
|
|
|
217,238 |
|
|
|
|
|
|
|
22,363 |
|
|
|
FedEx Corp. |
|
|
|
|
|
|
72,386 |
|
|
|
|
|
|
|
21,704 |
|
|
|
BAE Systems PLC (ADR) |
|
|
|
|
|
|
287,080 |
|
|
|
|
|
|
|
19,191 |
|
|
|
Ingersoll-Rand, Inc. |
|
|
|
|
|
|
198,747 |
|
|
|
|
|
|
|
18,054 |
|
|
|
Waste Connections, Inc. |
|
|
|
|
|
|
101,840 |
|
|
|
|
|
|
|
17,859 |
|
|
|
Southwest Airlines Co. |
|
|
|
|
|
|
602,398 |
|
|
|
|
|
|
|
17,235 |
|
|
|
3M Co. |
|
|
|
|
|
|
153,046 |
|
|
|
|
|
|
|
15,640 |
|
|
|
Delta Air Lines, Inc. |
|
|
|
|
|
|
321,899 |
|
|
|
|
|
|
|
15,271 |
|
|
|
TransUnion |
|
|
|
|
|
|
191,637 |
|
|
|
|
|
|
|
14,212 |
|
|
|
Veralto Corp. |
|
|
|
|
|
|
147,987 |
|
|
|
|
|
|
|
14,128 |
|
|
|
Republic Services, Inc. |
|
|
|
|
|
|
71,086 |
|
|
|
|
|
|
|
13,815 |
|
|
|
Waste Management, Inc. |
|
|
|
|
|
|
56,915 |
|
|
|
|
|
|
|
12,142 |
|
|
|
HEICO Corp. |
|
|
|
|
|
|
46,818 |
|
|
|
|
|
|
|
10,469 |
|
|
|
Honeywell International, Inc. |
|
|
|
|
|
|
46,268 |
|
|
|
|
|
|
|
9,880 |
|
|
|
Broadridge Financial Solutions, Inc. |
|
|
|
|
|
|
47,192 |
|
|
|
|
|
|
|
9,297 |
|
|
|
United Parcel Service, Inc., Class B |
|
|
|
|
|
|
66,914 |
|
|
|
|
|
|
|
9,157 |
|
|
|
Lockheed Martin Corp. |
|
|
|
|
|
|
18,718 |
|
|
|
|
|
|
|
8,743 |
|
|
|
Lennox International, Inc. |
|
|
|
|
|
|
8,982 |
|
|
|
|
|
|
|
4,805 |
|
|
|
|
|
|
|
|
|
|
|
|
|
|
|
|
|
|
|
|
|
|
|
|
|
|
|
|
|
|
|
|
|
|
|
|
|
1,165,556 |
|
|
|
|
|
|
|
|
|
|
|
|
|
|
|
|
|
|
|
|
| |
|
|
|
|
|
|
|
|
|
|
|
|
|
|
|
|
|
|
| |
|
|
|
|
|
| Consumer staples 7.87% |
|
Philip Morris International, Inc. |
|
|
|
|
|
|
1,984,592 |
|
|
|
|
|
|
|
201,099 |
|
|
|
Keurig Dr Pepper, Inc. |
|
|
|
|
|
|
3,298,857 |
|
|
|
|
|
|
|
110,182 |
|
|
|
Constellation Brands, Inc., Class A |
|
|
|
|
|
|
380,100 |
|
|
|
|
|
|
|
97,792 |
|
|
|
Altria Group, Inc. |
|
|
|
|
|
|
1,226,579 |
|
|
|
|
|
|
|
55,871 |
|
|
|
Procter & Gamble Co. |
|
|
|
|
|
|
290,365 |
|
|
|
|
|
|
|
47,887 |
|
|
|
Mondelez International, Inc., Class A |
|
|
|
|
|
|
697,782 |
|
|
|
|
|
|
|
45,663 |
|
|
|
Dollar General Corp. |
|
|
|
|
|
|
338,252 |
|
|
|
|
|
|
|
44,727 |
|
|
|
Target Corp. |
|
|
|
|
|
|
238,143 |
|
|
|
|
|
|
|
35,255 |
|
|
|
Kraft Heinz Co. (The) |
|
|
|
|
|
|
1,021,784 |
|
|
|
|
|
|
|
32,922 |
|
|
|
Costco Wholesale Corp. |
|
|
|
|
|
|
33,105 |
|
|
|
|
|
|
|
28,139 |
|
|
|
General Mills, Inc. |
|
|
|
|
|
|
362,380 |
|
|
|
|
|
|
|
22,924 |
|
|
|
Sysco Corp. |
|
|
|
|
|
|
308,324 |
|
|
|
|
|
|
|
22,011 |
|
American Funds Insurance Series 40
Washington Mutual Investors Fund (continued)
|
|
|
|
|
|
|
|
|
|
|
|
|
|
|
|
|
|
|
| Common stocks (continued) |
|
|
|
|
Shares |
|
|
|
|
|
Value (000) |
|
| |
|
|
|
|
|
| Consumer staples (continued) |
|
British American Tobacco PLC (ADR) |
|
|
|
|
|
|
701,402 |
|
|
|
|
|
|
$ |
21,694 |
|
|
|
Church & Dwight Co., Inc. |
|
|
|
|
|
|
189,242 |
|
|
|
|
|
|
|
19,620 |
|
|
|
Danone (ADR) |
|
|
|
|
|
|
1,594,470 |
|
|
|
|
|
|
|
19,548 |
|
|
|
Kimberly-Clark Corp. |
|
|
|
|
|
|
100,074 |
|
|
|
|
|
|
|
13,830 |
|
|
|
Nestlé SA (ADR) |
|
|
|
|
|
|
127,701 |
|
|
|
|
|
|
|
13,083 |
|
|
|
Bunge Global SA |
|
|
|
|
|
|
80,582 |
|
|
|
|
|
|
|
8,604 |
|
|
|
Kenvue, Inc. |
|
|
|
|
|
|
391,528 |
|
|
|
|
|
|
|
7,118 |
|
|
|
Reckitt Benckiser Group PLC (ADR) |
|
|
|
|
|
|
645,548 |
|
|
|
|
|
|
|
7,062 |
|
|
|
|
|
|
|
|
|
|
|
|
|
|
|
|
|
|
|
|
|
|
|
|
|
|
|
|
|
|
|
|
|
|
|
|
|
855,031 |
|
|
|
|
|
|
|
|
|
|
|
|
|
|
|
|
|
|
|
|
|
|
|
|
|
|
|
|
|
|
|
|
|
|
|
|
|
|
|
| |
|
|
|
|
|
| Consumer discretionary 6.34% |
|
Home Depot, Inc. |
|
|
|
|
|
|
382,694 |
|
|
|
|
|
|
|
131,738 |
|
|
|
YUM! Brands, Inc. |
|
|
|
|
|
|
928,961 |
|
|
|
|
|
|
|
123,050 |
|
|
|
Darden Restaurants, Inc. |
|
|
|
|
|
|
472,453 |
|
|
|
|
|
|
|
71,492 |
|
|
|
Royal Caribbean Cruises, Ltd.1 |
|
|
|
|
|
|
438,724 |
|
|
|
|
|
|
|
69,946 |
|
|
|
General Motors Co. |
|
|
|
|
|
|
1,156,695 |
|
|
|
|
|
|
|
53,740 |
|
|
|
TJX Companies, Inc. |
|
|
|
|
|
|
345,160 |
|
|
|
|
|
|
|
38,002 |
|
|
|
McDonald’s Corp. |
|
|
|
|
|
|
146,543 |
|
|
|
|
|
|
|
37,345 |
|
|
|
Tractor Supply Co. |
|
|
|
|
|
|
109,274 |
|
|
|
|
|
|
|
29,504 |
|
|
|
NIKE, Inc., Class B |
|
|
|
|
|
|
388,859 |
|
|
|
|
|
|
|
29,308 |
|
|
|
Marriott International, Inc., Class A |
|
|
|
|
|
|
97,630 |
|
|
|
|
|
|
|
23,604 |
|
|
|
Vail Resorts, Inc. |
|
|
|
|
|
|
110,037 |
|
|
|
|
|
|
|
19,821 |
|
|
|
D.R. Horton, Inc. |
|
|
|
|
|
|
117,911 |
|
|
|
|
|
|
|
16,617 |
|
|
|
Starbucks Corp. |
|
|
|
|
|
|
189,822 |
|
|
|
|
|
|
|
14,778 |
|
|
|
Lennar Corp., Class A |
|
|
|
|
|
|
62,894 |
|
|
|
|
|
|
|
9,426 |
|
|
|
Chipotle Mexican Grill, Inc.1 |
|
|
|
|
|
|
130,550 |
|
|
|
|
|
|
|
8,179 |
|
|
|
Amazon.com, Inc.1 |
|
|
|
|
|
|
33,975 |
|
|
|
|
|
|
|
6,566 |
|
|
|
Polaris, Inc. |
|
|
|
|
|
|
52,835 |
|
|
|
|
|
|
|
4,137 |
|
|
|
Advance Auto Parts, Inc. |
|
|
|
|
|
|
31,181 |
|
|
|
|
|
|
|
1,975 |
|
|
|
|
|
|
|
|
|
|
|
|
|
|
|
|
|
|
|
|
|
|
|
|
|
|
|
|
|
|
|
|
|
|
|
|
|
689,228 |
|
|
|
|
|
|
|
|
|
|
|
|
|
|
|
|
|
|
|
|
|
|
|
|
|
|
|
|
|
|
|
|
|
|
|
|
|
|
|
| |
|
|
|
|
|
| Communication services 5.27% |
|
Alphabet, Inc., Class C |
|
|
|
|
|
|
971,985 |
|
|
|
|
|
|
|
178,282 |
|
|
|
Alphabet, Inc., Class A |
|
|
|
|
|
|
417,657 |
|
|
|
|
|
|
|
76,076 |
|
|
|
Comcast Corp., Class A |
|
|
|
|
|
|
4,890,481 |
|
|
|
|
|
|
|
191,511 |
|
|
|
Meta Platforms, Inc., Class A |
|
|
|
|
|
|
141,343 |
|
|
|
|
|
|
|
71,268 |
|
|
|
Electronic Arts, Inc. |
|
|
|
|
|
|
123,936 |
|
|
|
|
|
|
|
17,268 |
|
|
|
Verizon Communications, Inc. |
|
|
|
|
|
|
407,342 |
|
|
|
|
|
|
|
16,799 |
|
|
|
Walt Disney Co. (The) |
|
|
|
|
|
|
157,832 |
|
|
|
|
|
|
|
15,671 |
|
|
|
Deutsche Telekom AG (ADR) |
|
|
|
|
|
|
236,620 |
|
|
|
|
|
|
|
5,960 |
|
|
|
|
|
|
|
|
|
|
|
|
|
|
|
|
|
|
|
|
|
|
|
|
|
|
|
|
|
|
|
|
|
|
|
|
|
572,835 |
|
|
|
|
|
|
|
|
|
|
|
|
|
|
|
|
|
|
|
|
|
|
|
|
|
|
|
|
|
|
|
|
|
|
|
|
|
|
|
| |
|
|
|
|
|
| Energy 4.87% |
|
Exxon Mobil Corp. |
|
|
|
|
|
|
1,169,736 |
|
|
|
|
|
|
|
134,660 |
|
|
|
EOG Resources, Inc. |
|
|
|
|
|
|
863,963 |
|
|
|
|
|
|
|
108,747 |
|
|
|
Canadian Natural Resources, Ltd. |
|
|
|
|
|
|
2,217,826 |
|
|
|
|
|
|
|
78,955 |
|
|
|
Chevron Corp. |
|
|
|
|
|
|
433,717 |
|
|
|
|
|
|
|
67,842 |
|
|
|
Halliburton Co. |
|
|
|
|
|
|
1,855,073 |
|
|
|
|
|
|
|
62,664 |
|
|
|
Schlumberger NV |
|
|
|
|
|
|
794,578 |
|
|
|
|
|
|
|
37,488 |
|
|
|
TC Energy Corp. |
|
|
|
|
|
|
538,275 |
|
|
|
|
|
|
|
20,401 |
|
|
|
ConocoPhillips |
|
|
|
|
|
|
122,350 |
|
|
|
|
|
|
|
13,994 |
|
|
|
HF Sinclair Corp. |
|
|
|
|
|
|
93,211 |
|
|
|
|
|
|
|
4,972 |
|
|
|
|
|
|
|
|
|
|
|
|
|
|
|
|
|
|
|
|
|
|
|
|
|
|
|
|
|
|
|
|
|
|
|
|
|
529,723 |
|
|
|
|
|
|
|
|
|
|
|
|
|
|
|
|
|
|
|
|
|
|
|
|
|
|
|
|
|
|
|
|
|
|
|
|
|
|
|
| |
|
|
|
|
|
| Utilities 3.27% |
|
Sempra |
|
|
|
|
|
|
1,149,215 |
|
|
|
|
|
|
|
87,409 |
|
|
|
Constellation Energy Corp. |
|
|
|
|
|
|
423,180 |
|
|
|
|
|
|
|
84,750 |
|
|
|
Southern Co. (The) |
|
|
|
|
|
|
921,284 |
|
|
|
|
|
|
|
71,464 |
|
|
|
FirstEnergy Corp. |
|
|
|
|
|
|
1,404,723 |
|
|
|
|
|
|
|
53,759 |
|
|
|
Public Service Enterprise Group, Inc. |
|
|
|
|
|
|
265,164 |
|
|
|
|
|
|
|
19,543 |
|
41 American Funds Insurance Series
Washington Mutual Investors Fund (continued)
|
|
|
|
|
|
|
|
|
|
|
|
|
|
|
|
|
|
|
| Common stocks (continued) |
|
|
|
|
Shares |
|
|
|
|
|
Value (000) |
|
| Utilities (continued) |
|
CenterPoint Energy, Inc. |
|
|
|
|
|
|
539,250 |
|
|
|
|
|
|
$ |
16,706 |
|
|
|
Entergy Corp. |
|
|
|
|
|
|
119,743 |
|
|
|
|
|
|
|
12,812 |
|
|
|
NextEra Energy, Inc. |
|
|
|
|
|
|
125,161 |
|
|
|
|
|
|
|
8,863 |
|
|
|
|
|
|
|
|
|
|
|
|
|
|
|
|
|
|
|
|
|
|
|
|
|
|
|
|
|
|
|
|
|
|
|
|
|
355,306 |
|
|
|
|
|
|
|
|
|
|
|
|
|
|
|
|
|
|
|
|
|
|
|
|
|
|
|
|
|
|
|
|
|
|
|
|
|
|
|
| |
|
|
|
|
|
| Materials 2.62% |
|
Linde PLC |
|
|
|
|
|
|
172,994 |
|
|
|
|
|
|
|
75,912 |
|
|
|
Celanese Corp. |
|
|
|
|
|
|
462,269 |
|
|
|
|
|
|
|
62,355 |
|
|
|
Corteva, Inc. |
|
|
|
|
|
|
712,123 |
|
|
|
|
|
|
|
38,412 |
|
|
|
Wheaton Precious Metals Corp. |
|
|
|
|
|
|
432,077 |
|
|
|
|
|
|
|
22,650 |
|
|
|
Nucor Corp. |
|
|
|
|
|
|
119,279 |
|
|
|
|
|
|
|
18,856 |
|
|
|
Rio Tinto PLC (ADR) |
|
|
|
|
|
|
271,564 |
|
|
|
|
|
|
|
17,904 |
|
|
|
LyondellBasell Industries NV |
|
|
|
|
|
|
155,020 |
|
|
|
|
|
|
|
14,829 |
|
|
|
Freeport-McMoRan, Inc. |
|
|
|
|
|
|
271,830 |
|
|
|
|
|
|
|
13,211 |
|
|
|
Mosaic Co. |
|
|
|
|
|
|
362,193 |
|
|
|
|
|
|
|
10,467 |
|
|
|
H.B. Fuller Co. |
|
|
|
|
|
|
90,381 |
|
|
|
|
|
|
|
6,956 |
|
|
|
Royal Gold, Inc. |
|
|
|
|
|
|
28,262 |
|
|
|
|
|
|
|
3,537 |
|
|
|
|
|
|
|
|
|
|
|
|
|
|
|
|
|
|
|
|
|
|
|
|
|
|
|
|
|
|
|
|
|
|
|
|
|
285,089 |
|
|
|
|
|
|
|
|
|
|
|
|
|
|
|
|
|
|
|
|
|
|
|
|
|
|
|
|
|
|
|
|
|
|
|
|
|
|
|
| |
|
|
|
|
|
| Real estate 2.10% |
|
Welltower, Inc. REIT |
|
|
|
|
|
|
848,714 |
|
|
|
|
|
|
|
88,479 |
|
|
|
Extra Space Storage, Inc. REIT |
|
|
|
|
|
|
416,185 |
|
|
|
|
|
|
|
64,679 |
|
|
|
Equinix, Inc. REIT |
|
|
|
|
|
|
42,576 |
|
|
|
|
|
|
|
32,213 |
|
|
|
American Tower Corp. REIT |
|
|
|
|
|
|
120,641 |
|
|
|
|
|
|
|
23,450 |
|
|
|
Prologis, Inc. REIT |
|
|
|
|
|
|
174,167 |
|
|
|
|
|
|
|
19,561 |
|
|
|
|
|
|
|
|
|
|
|
|
|
|
|
|
|
|
|
|
|
|
|
|
|
|
|
|
|
|
|
|
|
|
|
|
|
228,382 |
|
|
|
|
|
|
|
|
|
|
|
|
|
|
|
|
|
|
|
|
|
|
Total common stocks (cost: $6,949,928,000) |
|
|
|
|
|
|
|
|
|
|
|
|
|
|
10,432,375 |
|
|
|
|
|
|
|
|
|
|
|
|
|
|
|
|
|
|
|
|
|
|
|
|
|
|
|
|
|
|
|
|
|
|
|
|
|
|
|
|
| Convertible stocks 0.03% |
|
| |
|
|
|
|
|
| Financials 0.03% |
|
Apollo Global Management, Inc., Class A, cumulative convertible preferred shares, 6.75% 7/31/2026 |
|
|
|
|
|
|
54,000 |
|
|
|
|
|
|
|
3,543 |
|
|
|
|
|
|
|
|
|
|
|
|
|
|
|
|
|
|
|
|
|
|
Total convertible stocks (cost: $2,700,000) |
|
|
|
|
|
|
|
|
|
|
|
|
|
|
3,543 |
|
|
|
|
|
|
|
|
|
|
|
|
|
|
|
|
|
|
|
|
|
|
|
|
|
|
|
|
|
|
|
|
|
|
|
|
|
|
|
|
| Short-term securities 3.86% |
|
|
| Money market investments 3.86% |
|
|
|
Capital Group Central Cash Fund 5.37%2,3 |
|
|
|
|
|
|
4,192,299 |
|
|
|
|
|
|
|
419,230 |
|
|
|
|
|
|
|
|
|
|
|
|
|
|
|
|
|
|
|
|
|
|
Total short-term securities (cost: $419,195,000) |
|
|
|
|
|
|
|
|
|
|
|
|
|
|
419,230 |
|
|
|
|
|
|
|
|
|
|
|
|
|
|
|
|
|
|
|
|
|
|
|
|
|
|
|
|
Total investment securities 99.89% (cost: $7,371,823,000) |
|
|
|
|
|
|
|
|
|
|
|
|
|
|
10,855,148 |
|
|
|
Other assets less liabilities 0.11% |
|
|
|
|
|
|
|
|
|
|
|
|
|
|
12,216 |
|
|
|
|
|
|
|
|
|
|
|
|
|
|
|
|
|
|
|
|
|
|
|
|
|
|
|
|
Net assets 100.00% |
|
|
|
|
|
|
|
|
|
|
|
|
|
$ |
10,867,364 |
|
|
|
|
|
|
|
|
|
|
|
|
|
|
|
|
|
|
|
|
|
|
|
|
|
|
|
|
|
|
|
|
|
|
|
|
|
|
|
|
|
|
|
|
|
|
|
|
|
|
|
|
|
|
|
|
|
|
|
|
|
|
|
|
|
| Investments in affiliates3 |
|
|
|
|
|
|
|
|
|
|
|
|
|
|
|
|
|
|
|
|
|
|
|
|
|
|
|
|
|
|
|
|
|
| |
|
|
|
|
|
|
|
|
|
|
|
|
|
| |
|
Value at
1/1/2024
(000) |
|
|
Additions
(000) |
|
|
Reductions
(000) |
|
|
|
|
|
Net realized gain (loss) (000) |
|
|
|
|
|
Net
unrealized
appreciation
(depreciation) (000) |
|
|
|
|
|
Value at
6/30/2024
(000) |
|
|
|
|
|
Dividend
or interest
income (000) |
|
| |
|
|
|
|
|
|
|
|
|
|
|
|
|
| Short-term securities 3.86% |
|
|
|
|
|
|
|
|
|
|
|
|
|
|
|
|
|
|
|
|
|
|
|
|
|
|
|
|
|
|
|
|
|
|
|
|
|
|
|
|
|
|
|
|
| Money market investments 3.86% |
|
|
|
|
|
|
|
|
|
|
|
|
|
|
|
|
|
|
|
|
|
|
|
|
|
|
|
|
|
|
|
|
|
|
|
|
|
|
|
|
|
|
|
|
| Capital Group Central Cash Fund 5.37%2 |
|
$ |
329,850 |
|
|
$ |
819,532 |
|
|
$ |
730,158 |
|
|
|
|
|
|
|
$(5 |
) |
|
|
|
|
|
|
$11 |
|
|
|
|
|
|
$ |
419,230 |
|
|
|
|
|
|
|
$9,616 |
|
American Funds Insurance Series 42
Washington Mutual Investors Fund (continued)
|
|
|
|
|
|
|
|
|
|
|
|
|
|
|
|
|
|
|
|
|
|
|
|
|
|
|
|
|
|
|
|
|
|
|
|
|
|
|
|
|
|
|
|
|
| Investments in affiliates3 (continued) |
|
|
|
|
|
|
|
|
|
|
|
|
|
|
|
|
|
|
|
|
|
|
|
|
|
|
|
|
|
|
|
|
|
| |
|
|
|
|
|
|
|
|
| |
|
Value at
1/1/2024
(000) |
|
|
Additions
(000) |
|
|
Reductions
(000) |
|
|
Net
realized
gain (loss) (000) |
|
|
Net
unrealized
appreciation
(depreciation) (000) |
|
|
|
|
|
Value at
6/30/2024
(000) |
|
|
Dividend
or interest
income (000) |
|
| |
|
|
|
|
|
|
|
|
|
|
|
|
|
| Money market investments purchased with collateral from securities on loan 0.00% |
|
|
|
|
|
|
|
|
|
|
|
|
|
|
|
|
|
|
|
|
|
|
|
|
|
|
|
|
|
|
|
|
|
|
|
|
|
|
|
|
|
|
|
|
| Capital Group Central Cash Fund 5.37%2 |
|
$ |
629 |
|
|
$ |
|
|
|
$ |
629 |
4 |
|
|
|
|
|
$ |
|
|
|
|
|
|
|
$ |
|
|
|
|
|
|
|
$ |
– |
|
|
|
|
|
|
$ |
– |
5 |
|
|
|
|
|
|
|
|
|
|
|
|
|
|
|
|
|
|
|
|
|
|
|
|
|
|
|
|
|
|
|
|
|
|
|
|
|
|
|
|
|
|
|
|
|
|
|
|
|
|
|
|
|
|
|
|
|
| Total 3.86% |
|
|
|
|
|
|
|
|
|
|
|
|
|
|
|
|
|
$ |
(5 |
) |
|
|
|
|
|
$ |
11 |
|
|
|
|
|
|
$ |
419,230 |
|
|
|
|
|
|
$ |
9,616 |
|
|
|
|
|
|
|
|
|
|
|
|
|
|
|
|
|
|
|
|
|
|
|
|
|
|
|
|
|
|
|
|
|
|
|
|
|
|
|
|
|
|
|
|
|
|
| 1 |
Security did not produce income during the last 12 months. |
| 2 |
Rate represents the seven-day yield at 6/30/2024. |
| 3 |
Part of the same “group of investment companies” as the fund as defined under the Investment Company Act of 1940, as amended. |
| 4 |
Represents net activity. Refer to Note 5 for more information on securities lending. |
| 5 |
Dividend income is included with securities lending income in the fund’s statement of operations and is not shown in this table. |
Key to abbreviation(s)
ADR = American Depositary Receipts
REIT = Real Estate Investment Trust
Refer to the notes to financial statements.
43 American Funds Insurance Series
|
|
|
| Capital World Growth and Income Fund |
|
|
| Investment portfolio June 30, 2024 |
|
unaudited |
|
|
|
|
|
|
|
|
|
|
|
|
|
|
|
| Common stocks 96.16% |
|
Shares |
|
|
|
|
|
Value
(000) |
|
| |
|
|
|
|
| Information technology 22.51% |
|
Broadcom, Inc. |
|
|
50,340 |
|
|
|
|
|
|
$ |
80,822 |
|
|
|
Microsoft Corp. |
|
|
171,149 |
|
|
|
|
|
|
|
76,495 |
|
|
|
Taiwan Semiconductor Manufacturing Co., Ltd. |
|
|
2,168,772 |
|
|
|
|
|
|
|
64,502 |
|
|
|
Apple, Inc. |
|
|
177,479 |
|
|
|
|
|
|
|
37,381 |
|
|
|
ASML Holding NV |
|
|
26,498 |
|
|
|
|
|
|
|
27,338 |
|
|
|
ASML Holding NV (ADR) |
|
|
9,561 |
|
|
|
|
|
|
|
9,778 |
|
|
|
NVIDIA Corp. |
|
|
134,641 |
|
|
|
|
|
|
|
16,633 |
|
|
|
Tokyo Electron, Ltd. |
|
|
60,100 |
|
|
|
|
|
|
|
13,198 |
|
|
|
Capgemini SE |
|
|
53,910 |
|
|
|
|
|
|
|
10,678 |
|
|
|
Salesforce, Inc. |
|
|
35,935 |
|
|
|
|
|
|
|
9,239 |
|
|
|
Samsung Electronics Co., Ltd. |
|
|
139,329 |
|
|
|
|
|
|
|
8,188 |
|
|
|
Texas Instruments, Inc. |
|
|
39,595 |
|
|
|
|
|
|
|
7,702 |
|
|
|
Accenture PLC, Class A |
|
|
24,623 |
|
|
|
|
|
|
|
7,471 |
|
|
|
MediaTek, Inc. |
|
|
119,094 |
|
|
|
|
|
|
|
5,091 |
|
|
|
Applied Materials, Inc. |
|
|
19,589 |
|
|
|
|
|
|
|
4,623 |
|
|
|
Dell Technologies, Inc., Class C |
|
|
33,347 |
|
|
|
|
|
|
|
4,599 |
|
|
|
Oracle Corp. |
|
|
30,909 |
|
|
|
|
|
|
|
4,364 |
|
|
|
Micron Technology, Inc. |
|
|
32,523 |
|
|
|
|
|
|
|
4,278 |
|
|
|
Shopify, Inc., Class A, subordinate voting shares1 |
|
|
63,344 |
|
|
|
|
|
|
|
4,184 |
|
|
|
EPAM Systems, Inc.1 |
|
|
21,455 |
|
|
|
|
|
|
|
4,036 |
|
|
|
Seagate Technology Holdings PLC |
|
|
35,575 |
|
|
|
|
|
|
|
3,674 |
|
|
|
Intel Corp. |
|
|
114,111 |
|
|
|
|
|
|
|
3,534 |
|
|
|
Keyence Corp. |
|
|
7,800 |
|
|
|
|
|
|
|
3,441 |
|
|
|
Synopsys, Inc.1 |
|
|
5,182 |
|
|
|
|
|
|
|
3,084 |
|
|
|
Arista Networks, Inc.1 |
|
|
7,827 |
|
|
|
|
|
|
|
2,743 |
|
|
|
SAP SE |
|
|
11,663 |
|
|
|
|
|
|
|
2,368 |
|
|
|
GlobalWafers Co., Ltd. |
|
|
126,000 |
|
|
|
|
|
|
|
2,084 |
|
|
|
Constellation Software, Inc. |
|
|
613 |
|
|
|
|
|
|
|
1,766 |
|
|
|
Elastic NV, non-registered shares1 |
|
|
12,667 |
|
|
|
|
|
|
|
1,443 |
|
|
|
Advantech Co., Ltd. |
|
|
95,098 |
|
|
|
|
|
|
|
1,082 |
|
|
|
Fujitsu, Ltd. |
|
|
63,800 |
|
|
|
|
|
|
|
1,002 |
|
|
|
Delta Electronics, Inc. |
|
|
74,000 |
|
|
|
|
|
|
|
879 |
|
|
|
International Business Machines Corp. |
|
|
4,903 |
|
|
|
|
|
|
|
848 |
|
|
|
Disco Corp. |
|
|
2,100 |
|
|
|
|
|
|
|
805 |
|
|
|
Wolfspeed, Inc.1 |
|
|
12,732 |
|
|
|
|
|
|
|
290 |
|
|
|
|
|
|
|
|
|
|
|
|
|
|
|
|
|
|
|
|
|
|
|
|
|
|
|
|
|
429,643 |
|
|
|
|
|
|
|
|
|
|
|
|
|
|
|
|
|
|
|
|
|
|
|
|
|
|
|
|
|
|
|
| |
|
|
|
|
| Industrials 13.68% |
|
General Electric Co. |
|
|
173,170 |
|
|
|
|
|
|
|
27,529 |
|
|
|
Airbus SE, non-registered shares |
|
|
127,270 |
|
|
|
|
|
|
|
17,549 |
|
|
|
BAE Systems PLC |
|
|
834,872 |
|
|
|
|
|
|
|
13,940 |
|
|
|
Carrier Global Corp. |
|
|
216,587 |
|
|
|
|
|
|
|
13,662 |
|
|
|
Safran SA |
|
|
60,205 |
|
|
|
|
|
|
|
12,666 |
|
|
|
Siemens AG |
|
|
61,723 |
|
|
|
|
|
|
|
11,480 |
|
|
|
Mitsui & Co., Ltd. |
|
|
408,600 |
|
|
|
|
|
|
|
9,321 |
|
|
|
Mitsui & Co., Ltd. |
|
|
41,600 |
|
|
|
|
|
|
|
949 |
|
|
|
RTX Corp. |
|
|
101,266 |
|
|
|
|
|
|
|
10,166 |
|
|
|
Recruit Holdings Co., Ltd. |
|
|
182,750 |
|
|
|
|
|
|
|
9,835 |
|
|
|
TransDigm Group, Inc. |
|
|
7,556 |
|
|
|
|
|
|
|
9,654 |
|
|
|
Melrose Industries PLC |
|
|
1,375,832 |
|
|
|
|
|
|
|
9,608 |
|
|
|
Eaton Corp. PLC |
|
|
26,824 |
|
|
|
|
|
|
|
8,411 |
|
|
|
Leonardo SpA |
|
|
354,678 |
|
|
|
|
|
|
|
8,267 |
|
|
|
Deere & Co. |
|
|
19,834 |
|
|
|
|
|
|
|
7,411 |
|
|
|
Ryanair Holdings PLC (ADR) |
|
|
59,213 |
|
|
|
|
|
|
|
6,895 |
|
|
|
Boeing Co.1 |
|
|
37,750 |
|
|
|
|
|
|
|
6,871 |
|
|
|
Bureau Veritas SA |
|
|
232,210 |
|
|
|
|
|
|
|
6,409 |
|
|
|
Caterpillar, Inc. |
|
|
17,240 |
|
|
|
|
|
|
|
5,743 |
|
|
|
Techtronic Industries Co., Ltd. |
|
|
476,500 |
|
|
|
|
|
|
|
5,441 |
|
|
|
Compagnie de Saint-Gobain SA, non-registered shares |
|
|
67,985 |
|
|
|
|
|
|
|
5,265 |
|
|
|
Lockheed Martin Corp. |
|
|
10,779 |
|
|
|
|
|
|
|
5,035 |
|
|
|
L3Harris Technologies, Inc. |
|
|
15,314 |
|
|
|
|
|
|
|
3,439 |
|
|
|
RELX PLC |
|
|
71,705 |
|
|
|
|
|
|
|
3,287 |
|
American Funds Insurance Series 44
Capital World Growth and Income Fund (continued)
|
|
|
|
|
|
|
|
|
|
|
|
|
|
|
| Common stocks (continued) |
|
Shares |
|
|
|
|
|
Value
(000) |
|
| |
|
|
|
|
| Industrials (continued) |
|
Volvo AB, Class B |
|
|
126,472 |
|
|
|
|
|
|
$ |
3,244 |
|
|
|
Deutsche Post AG |
|
|
80,029 |
|
|
|
|
|
|
|
3,238 |
|
|
|
Rolls-Royce Holdings PLC1 |
|
|
552,955 |
|
|
|
|
|
|
|
3,196 |
|
|
|
Schneider Electric SE |
|
|
11,854 |
|
|
|
|
|
|
|
2,828 |
|
|
|
Daikin Industries, Ltd. |
|
|
19,800 |
|
|
|
|
|
|
|
2,735 |
|
|
|
International Consolidated Airlines Group SA (CDI)1 |
|
|
1,302,671 |
|
|
|
|
|
|
|
2,675 |
|
|
|
Dayforce, Inc.1 |
|
|
49,127 |
|
|
|
|
|
|
|
2,437 |
|
|
|
ITOCHU Corp. |
|
|
46,800 |
|
|
|
|
|
|
|
2,296 |
|
|
|
Weir Group PLC (The) |
|
|
86,187 |
|
|
|
|
|
|
|
2,150 |
|
|
|
Thales SA |
|
|
12,370 |
|
|
|
|
|
|
|
1,988 |
|
|
|
MTU Aero Engines AG |
|
|
7,528 |
|
|
|
|
|
|
|
1,925 |
|
|
|
United Rentals, Inc. |
|
|
2,973 |
|
|
|
|
|
|
|
1,923 |
|
|
|
Bunzl PLC |
|
|
44,896 |
|
|
|
|
|
|
|
1,703 |
|
|
|
CSX Corp. |
|
|
45,377 |
|
|
|
|
|
|
|
1,518 |
|
|
|
Rentokil Initial PLC |
|
|
222,930 |
|
|
|
|
|
|
|
1,300 |
|
|
|
GE Vernova, Inc.1 |
|
|
7,149 |
|
|
|
|
|
|
|
1,226 |
|
|
|
SMC Corp. |
|
|
2,500 |
|
|
|
|
|
|
|
1,194 |
|
|
|
Kingspan Group PLC |
|
|
12,412 |
|
|
|
|
|
|
|
1,052 |
|
|
|
SS&C Technologies Holdings, Inc. |
|
|
16,252 |
|
|
|
|
|
|
|
1,018 |
|
|
|
Grupo Aeroportuario del Sureste, SAB de CV, Class B |
|
|
26,165 |
|
|
|
|
|
|
|
788 |
|
|
|
SECOM Co., Ltd. |
|
|
10,900 |
|
|
|
|
|
|
|
646 |
|
|
|
Astra International Tbk PT |
|
|
2,146,900 |
|
|
|
|
|
|
|
583 |
|
|
|
Ingersoll-Rand, Inc. |
|
|
5,745 |
|
|
|
|
|
|
|
522 |
|
|
|
Brenntag SE |
|
|
1,098 |
|
|
|
|
|
|
|
74 |
|
|
|
|
|
|
|
|
|
|
|
|
|
|
|
|
|
|
|
|
|
|
|
|
|
|
|
|
|
261,092 |
|
|
|
|
|
|
|
|
|
|
|
|
|
|
|
|
|
|
|
|
|
|
|
|
|
|
|
|
|
|
|
| |
|
|
|
|
| Health care 13.21% |
|
Eli Lilly and Co. |
|
|
39,780 |
|
|
|
|
|
|
|
36,016 |
|
|
|
Novo Nordisk AS, Class B |
|
|
234,352 |
|
|
|
|
|
|
|
33,479 |
|
|
|
UnitedHealth Group, Inc. |
|
|
56,514 |
|
|
|
|
|
|
|
28,780 |
|
|
|
Abbott Laboratories |
|
|
203,136 |
|
|
|
|
|
|
|
21,108 |
|
|
|
Vertex Pharmaceuticals, Inc.1 |
|
|
44,260 |
|
|
|
|
|
|
|
20,746 |
|
|
|
AstraZeneca PLC |
|
|
96,049 |
|
|
|
|
|
|
|
14,974 |
|
|
|
Stryker Corp. |
|
|
31,998 |
|
|
|
|
|
|
|
10,887 |
|
|
|
Gilead Sciences, Inc. |
|
|
138,933 |
|
|
|
|
|
|
|
9,532 |
|
|
|
Daiichi Sankyo Co., Ltd. |
|
|
269,100 |
|
|
|
|
|
|
|
9,401 |
|
|
|
Sanofi |
|
|
89,875 |
|
|
|
|
|
|
|
8,639 |
|
|
|
Molina Healthcare, Inc.1 |
|
|
22,717 |
|
|
|
|
|
|
|
6,754 |
|
|
|
Takeda Pharmaceutical Co., Ltd. |
|
|
256,800 |
|
|
|
|
|
|
|
6,661 |
|
|
|
Novartis AG |
|
|
60,188 |
|
|
|
|
|
|
|
6,448 |
|
|
|
AbbVie, Inc. |
|
|
33,290 |
|
|
|
|
|
|
|
5,710 |
|
|
|
DexCom, Inc.1 |
|
|
40,592 |
|
|
|
|
|
|
|
4,602 |
|
|
|
GE HealthCare Technologies, Inc. |
|
|
57,427 |
|
|
|
|
|
|
|
4,475 |
|
|
|
Thermo Fisher Scientific, Inc. |
|
|
7,382 |
|
|
|
|
|
|
|
4,082 |
|
|
|
Medtronic PLC |
|
|
32,888 |
|
|
|
|
|
|
|
2,589 |
|
|
|
Catalent, Inc.1 |
|
|
45,413 |
|
|
|
|
|
|
|
2,554 |
|
|
|
EssilorLuxottica SA |
|
|
11,405 |
|
|
|
|
|
|
|
2,447 |
|
|
|
Zoetis, Inc., Class A |
|
|
12,305 |
|
|
|
|
|
|
|
2,133 |
|
|
|
Siemens Healthineers AG |
|
|
35,861 |
|
|
|
|
|
|
|
2,066 |
|
|
|
Coloplast AS, Class B |
|
|
12,236 |
|
|
|
|
|
|
|
1,469 |
|
|
|
Centene Corp.1 |
|
|
21,998 |
|
|
|
|
|
|
|
1,458 |
|
|
|
Insulet Corp.1 |
|
|
6,786 |
|
|
|
|
|
|
|
1,369 |
|
|
|
Lonza Group AG |
|
|
2,155 |
|
|
|
|
|
|
|
1,171 |
|
|
|
Eurofins Scientific SE, non-registered shares |
|
|
19,671 |
|
|
|
|
|
|
|
978 |
|
|
|
CVS Health Corp. |
|
|
9,959 |
|
|
|
|
|
|
|
588 |
|
|
|
Rede D’Or Sao Luiz SA |
|
|
101,720 |
|
|
|
|
|
|
|
495 |
|
|
|
agilon health, Inc.1 |
|
|
63,086 |
|
|
|
|
|
|
|
413 |
|
|
|
|
|
|
|
|
|
|
|
|
|
|
|
|
|
|
|
|
|
|
|
|
|
|
|
|
|
252,024 |
|
|
|
|
|
|
|
|
|
|
|
|
|
|
|
|
45 American Funds Insurance Series
Capital World Growth and Income Fund (continued)
|
|
|
|
|
|
|
|
|
|
|
|
|
|
|
| Common stocks (continued) |
|
Shares |
|
|
|
|
|
Value
(000) |
|
| |
|
|
|
|
| Financials 11.02% |
|
Zurich Insurance Group AG |
|
|
30,524 |
|
|
|
|
|
|
$ |
16,239 |
|
|
|
ING Groep NV |
|
|
744,643 |
|
|
|
|
|
|
|
12,759 |
|
|
|
Chubb, Ltd. |
|
|
43,365 |
|
|
|
|
|
|
|
11,062 |
|
|
|
JPMorgan Chase & Co. |
|
|
46,855 |
|
|
|
|
|
|
|
9,477 |
|
|
|
Mastercard, Inc., Class A |
|
|
20,655 |
|
|
|
|
|
|
|
9,112 |
|
|
|
Blackstone, Inc. |
|
|
73,130 |
|
|
|
|
|
|
|
9,054 |
|
|
|
Banco Bilbao Vizcaya Argentaria, SA |
|
|
818,024 |
|
|
|
|
|
|
|
8,161 |
|
|
|
HSBC Holdings PLC (GBP denominated) |
|
|
716,873 |
|
|
|
|
|
|
|
6,204 |
|
|
|
HSBC Holdings PLC (HKD denominated) |
|
|
138,400 |
|
|
|
|
|
|
|
1,212 |
|
|
|
AIA Group, Ltd. |
|
|
955,399 |
|
|
|
|
|
|
|
6,479 |
|
|
|
AXA SA |
|
|
179,365 |
|
|
|
|
|
|
|
5,906 |
|
|
|
Axis Bank, Ltd. |
|
|
379,876 |
|
|
|
|
|
|
|
5,756 |
|
|
|
Arthur J. Gallagher & Co. |
|
|
17,889 |
|
|
|
|
|
|
|
4,639 |
|
|
|
KKR & Co., Inc. |
|
|
43,223 |
|
|
|
|
|
|
|
4,549 |
|
|
|
B3 SA - Brasil, Bolsa, Balcao |
|
|
2,460,132 |
|
|
|
|
|
|
|
4,506 |
|
|
|
HDFC Life Insurance Co., Ltd. |
|
|
621,014 |
|
|
|
|
|
|
|
4,428 |
|
|
|
HDFC Bank, Ltd. |
|
|
178,714 |
|
|
|
|
|
|
|
3,610 |
|
|
|
HDFC Bank, Ltd. (ADR) |
|
|
8,872 |
|
|
|
|
|
|
|
571 |
|
|
|
Aon PLC, Class A |
|
|
13,554 |
|
|
|
|
|
|
|
3,979 |
|
|
|
Capital One Financial Corp. |
|
|
27,258 |
|
|
|
|
|
|
|
3,774 |
|
|
|
Ping An Insurance (Group) Company of China, Ltd., Class H |
|
|
781,000 |
|
|
|
|
|
|
|
3,551 |
|
|
|
Ping An Insurance (Group) Company of China, Ltd., Class A |
|
|
18,400 |
|
|
|
|
|
|
|
105 |
|
|
|
NatWest Group PLC |
|
|
930,361 |
|
|
|
|
|
|
|
3,649 |
|
|
|
Blue Owl Capital, Inc., Class A |
|
|
204,326 |
|
|
|
|
|
|
|
3,627 |
|
|
|
Fairfax Financial Holdings, Ltd., subordinate voting shares |
|
|
3,132 |
|
|
|
|
|
|
|
3,563 |
|
|
|
Postal Savings Bank of China Co., Ltd., Class H |
|
|
5,854,383 |
|
|
|
|
|
|
|
3,433 |
|
|
|
American Express Co. |
|
|
14,701 |
|
|
|
|
|
|
|
3,404 |
|
|
|
Apollo Asset Management, Inc. |
|
|
28,473 |
|
|
|
|
|
|
|
3,362 |
|
|
|
Discover Financial Services |
|
|
25,029 |
|
|
|
|
|
|
|
3,274 |
|
|
|
Kotak Mahindra Bank, Ltd. |
|
|
143,815 |
|
|
|
|
|
|
|
3,093 |
|
|
|
BNP Paribas SA |
|
|
44,512 |
|
|
|
|
|
|
|
2,852 |
|
|
|
Visa, Inc., Class A |
|
|
10,664 |
|
|
|
|
|
|
|
2,799 |
|
|
|
Wells Fargo & Co. |
|
|
45,216 |
|
|
|
|
|
|
|
2,685 |
|
|
|
Great-West Lifeco, Inc. |
|
|
91,872 |
|
|
|
|
|
|
|
2,680 |
|
|
|
Bank Rakyat Indonesia (Persero) Tbk PT |
|
|
8,751,700 |
|
|
|
|
|
|
|
2,442 |
|
|
|
Münchener Rückversicherungs-Gesellschaft AG |
|
|
4,875 |
|
|
|
|
|
|
|
2,438 |
|
|
|
Israel Discount Bank, Ltd., Class A |
|
|
454,371 |
|
|
|
|
|
|
|
2,266 |
|
|
|
Bank Central Asia Tbk PT |
|
|
3,681,200 |
|
|
|
|
|
|
|
2,221 |
|
|
|
FinecoBank SpA |
|
|
141,544 |
|
|
|
|
|
|
|
2,109 |
|
|
|
Macquarie Group, Ltd. |
|
|
15,393 |
|
|
|
|
|
|
|
2,100 |
|
|
|
KB Financial Group, Inc. |
|
|
33,776 |
|
|
|
|
|
|
|
1,915 |
|
|
|
American International Group, Inc. |
|
|
24,248 |
|
|
|
|
|
|
|
1,800 |
|
|
|
National Bank of Canada |
|
|
22,570 |
|
|
|
|
|
|
|
1,790 |
|
|
|
China Merchants Bank Co., Ltd., Class H |
|
|
234,403 |
|
|
|
|
|
|
|
1,065 |
|
|
|
China Merchants Bank Co., Ltd., Class A |
|
|
145,600 |
|
|
|
|
|
|
|
684 |
|
|
|
Erste Group Bank AG |
|
|
34,929 |
|
|
|
|
|
|
|
1,654 |
|
|
|
XP, Inc., Class A |
|
|
88,940 |
|
|
|
|
|
|
|
1,564 |
|
|
|
Bank Mandiri (Persero) Tbk PT |
|
|
3,925,900 |
|
|
|
|
|
|
|
1,466 |
|
|
|
Power Corporation of Canada, subordinate voting shares2 |
|
|
52,719 |
|
|
|
|
|
|
|
1,465 |
|
|
|
Marsh & McLennan Companies, Inc. |
|
|
6,884 |
|
|
|
|
|
|
|
1,451 |
|
|
|
CVC Capital Partners PLC1 |
|
|
67,541 |
|
|
|
|
|
|
|
1,239 |
|
|
|
MSCI, Inc. |
|
|
2,543 |
|
|
|
|
|
|
|
1,225 |
|
|
|
Danske Bank AS |
|
|
39,713 |
|
|
|
|
|
|
|
1,182 |
|
|
|
Citigroup, Inc. |
|
|
18,192 |
|
|
|
|
|
|
|
1,154 |
|
|
|
Aegon, Ltd. |
|
|
177,180 |
|
|
|
|
|
|
|
1,094 |
|
|
|
Brookfield Asset Management, Ltd., Class A (CAD denominated) |
|
|
26,298 |
|
|
|
|
|
|
|
1,001 |
|
|
|
Goldman Sachs Group, Inc. |
|
|
1,822 |
|
|
|
|
|
|
|
824 |
|
|
|
Bajaj Finance, Ltd. |
|
|
7,541 |
|
|
|
|
|
|
|
642 |
|
|
|
Sberbank of Russia PJSC3 |
|
|
3,196,952 |
|
|
|
|
|
|
|
– |
4 |
|
|
|
|
|
|
|
|
|
|
|
|
|
|
|
|
|
|
|
|
|
|
|
|
|
|
|
|
210,345 |
|
|
|
|
|
|
|
|
|
|
|
|
|
|
|
|
American Funds Insurance Series 46
Capital World Growth and Income Fund (continued)
|
|
|
|
|
|
|
|
|
|
|
|
|
|
|
| Common stocks (continued) |
|
Shares |
|
|
|
|
|
Value
(000) |
|
| |
|
|
|
|
| Consumer discretionary 9.19% |
|
Amazon.com, Inc.1 |
|
|
132,783 |
|
|
|
|
|
|
$ |
25,660 |
|
|
|
LVMH Moët Hennessy-Louis Vuitton SE |
|
|
24,232 |
|
|
|
|
|
|
|
18,609 |
|
|
|
Home Depot, Inc. |
|
|
48,564 |
|
|
|
|
|
|
|
16,718 |
|
|
|
Booking Holdings, Inc. |
|
|
2,531 |
|
|
|
|
|
|
|
10,027 |
|
|
|
Trip.com Group, Ltd. (ADR)1 |
|
|
206,249 |
|
|
|
|
|
|
|
9,694 |
|
|
|
Industria de Diseño Textil, SA |
|
|
189,252 |
|
|
|
|
|
|
|
9,352 |
|
|
|
Restaurant Brands International, Inc. |
|
|
69,860 |
|
|
|
|
|
|
|
4,916 |
|
|
|
Restaurant Brands International, Inc. (CAD denominated) |
|
|
38,571 |
|
|
|
|
|
|
|
2,718 |
|
|
|
Flutter Entertainment PLC1 |
|
|
41,108 |
|
|
|
|
|
|
|
7,496 |
|
|
|
Chipotle Mexican Grill, Inc.1 |
|
|
99,400 |
|
|
|
|
|
|
|
6,227 |
|
|
|
Marriott International, Inc., Class A |
|
|
25,570 |
|
|
|
|
|
|
|
6,182 |
|
|
|
Compagnie Financière Richemont SA, Class A |
|
|
38,574 |
|
|
|
|
|
|
|
6,020 |
|
|
|
NEXT PLC |
|
|
51,114 |
|
|
|
|
|
|
|
5,845 |
|
|
|
Hyundai Motor Co. |
|
|
23,980 |
|
|
|
|
|
|
|
5,114 |
|
|
|
YUM! Brands, Inc. |
|
|
31,906 |
|
|
|
|
|
|
|
4,226 |
|
|
|
McDonald’s Corp. |
|
|
16,292 |
|
|
|
|
|
|
|
4,152 |
|
|
|
Shimano, Inc.2 |
|
|
17,400 |
|
|
|
|
|
|
|
2,696 |
|
|
|
Evolution AB |
|
|
24,917 |
|
|
|
|
|
|
|
2,597 |
|
|
|
Stellantis NV |
|
|
127,173 |
|
|
|
|
|
|
|
2,503 |
|
|
|
MercadoLibre, Inc.1 |
|
|
1,521 |
|
|
|
|
|
|
|
2,500 |
|
|
|
Tesla, Inc.1 |
|
|
12,442 |
|
|
|
|
|
|
|
2,462 |
|
|
|
Royal Caribbean Cruises, Ltd.1 |
|
|
15,147 |
|
|
|
|
|
|
|
2,415 |
|
|
|
Kering SA |
|
|
5,944 |
|
|
|
|
|
|
|
2,161 |
|
|
|
Moncler SpA |
|
|
34,379 |
|
|
|
|
|
|
|
2,105 |
|
|
|
Pan Pacific International Holdings Corp. |
|
|
81,900 |
|
|
|
|
|
|
|
1,922 |
|
|
|
adidas AG |
|
|
7,091 |
|
|
|
|
|
|
|
1,692 |
|
|
|
InterContinental Hotels Group PLC |
|
|
15,358 |
|
|
|
|
|
|
|
1,610 |
|
|
|
Sands China, Ltd.1 |
|
|
764,400 |
|
|
|
|
|
|
|
1,593 |
|
|
|
General Motors Co. |
|
|
31,512 |
|
|
|
|
|
|
|
1,464 |
|
|
|
Aristocrat Leisure, Ltd. |
|
|
36,438 |
|
|
|
|
|
|
|
1,205 |
|
|
|
Las Vegas Sands Corp. |
|
|
21,493 |
|
|
|
|
|
|
|
951 |
|
|
|
Entain PLC |
|
|
103,633 |
|
|
|
|
|
|
|
820 |
|
|
|
Wynn Macau, Ltd. |
|
|
834,000 |
|
|
|
|
|
|
|
684 |
|
|
|
Ferrari NV (EUR denominated) |
|
|
1,301 |
|
|
|
|
|
|
|
532 |
|
|
|
Sony Group Corp. |
|
|
6,200 |
|
|
|
|
|
|
|
527 |
|
|
|
Dowlais Group PLC |
|
|
– |
4 |
|
|
|
|
|
|
– |
4 |
|
|
|
|
|
|
|
|
|
|
|
|
|
|
|
|
|
|
|
|
|
|
|
|
|
|
|
|
175,395 |
|
|
|
|
|
|
|
|
|
|
|
|
|
|
|
|
|
|
|
|
|
|
|
|
|
|
|
|
|
|
|
| |
|
|
|
|
| Communication services 6.68% |
|
Alphabet, Inc., Class C |
|
|
130,227 |
|
|
|
|
|
|
|
23,886 |
|
|
|
Alphabet, Inc., Class A |
|
|
72,880 |
|
|
|
|
|
|
|
13,275 |
|
|
|
Meta Platforms, Inc., Class A |
|
|
48,079 |
|
|
|
|
|
|
|
24,242 |
|
|
|
Publicis Groupe SA |
|
|
114,921 |
|
|
|
|
|
|
|
12,181 |
|
|
|
Netflix, Inc.1 |
|
|
15,278 |
|
|
|
|
|
|
|
10,311 |
|
|
|
NetEase, Inc. |
|
|
311,500 |
|
|
|
|
|
|
|
5,947 |
|
|
|
NetEase, Inc. (ADR) |
|
|
13,425 |
|
|
|
|
|
|
|
1,283 |
|
|
|
Universal Music Group NV |
|
|
210,590 |
|
|
|
|
|
|
|
6,243 |
|
|
|
Bharti Airtel, Ltd. |
|
|
345,588 |
|
|
|
|
|
|
|
5,967 |
|
|
|
Bharti Airtel, Ltd., interim shares |
|
|
13,994 |
|
|
|
|
|
|
|
175 |
|
|
|
Comcast Corp., Class A |
|
|
136,481 |
|
|
|
|
|
|
|
5,345 |
|
|
|
SoftBank Corp. |
|
|
329,385 |
|
|
|
|
|
|
|
4,030 |
|
|
|
Tencent Holdings, Ltd. |
|
|
78,300 |
|
|
|
|
|
|
|
3,716 |
|
|
|
Deutsche Telekom AG |
|
|
144,036 |
|
|
|
|
|
|
|
3,623 |
|
|
|
Singapore Telecommunications, Ltd. |
|
|
1,438,100 |
|
|
|
|
|
|
|
2,909 |
|
|
|
Take-Two Interactive Software, Inc.1 |
|
|
17,222 |
|
|
|
|
|
|
|
2,678 |
|
|
|
Omnicom Group, Inc. |
|
|
19,663 |
|
|
|
|
|
|
|
1,764 |
|
|
|
|
|
|
|
|
|
|
|
|
|
|
|
|
|
|
|
|
|
|
|
|
|
|
|
|
|
127,575 |
|
|
|
|
|
|
|
|
|
|
|
|
|
|
|
|
47 American Funds Insurance Series
Capital World Growth and Income Fund (continued)
|
|
|
|
|
|
|
|
|
|
|
|
|
|
|
| Common stocks (continued) |
|
Shares |
|
|
|
|
|
Value
(000) |
|
| |
|
|
|
|
| Consumer staples 6.18% |
|
Philip Morris International, Inc. |
|
|
300,926 |
|
|
|
|
|
|
$ |
30,493 |
|
|
|
Nestlé SA |
|
|
134,826 |
|
|
|
|
|
|
|
13,763 |
|
|
|
Imperial Brands PLC |
|
|
336,266 |
|
|
|
|
|
|
|
8,610 |
|
|
|
Kroger Co. |
|
|
157,324 |
|
|
|
|
|
|
|
7,855 |
|
|
|
Bunge Global SA |
|
|
51,036 |
|
|
|
|
|
|
|
5,449 |
|
|
|
Ajinomoto Co., Inc. |
|
|
153,000 |
|
|
|
|
|
|
|
5,385 |
|
|
|
British American Tobacco PLC |
|
|
140,809 |
|
|
|
|
|
|
|
4,329 |
|
|
|
Keurig Dr Pepper, Inc. |
|
|
127,136 |
|
|
|
|
|
|
|
4,246 |
|
|
|
Kweichow Moutai Co., Ltd., Class A |
|
|
19,600 |
|
|
|
|
|
|
|
3,953 |
|
|
|
Danone SA |
|
|
61,298 |
|
|
|
|
|
|
|
3,741 |
|
|
|
Constellation Brands, Inc., Class A |
|
|
13,364 |
|
|
|
|
|
|
|
3,438 |
|
|
|
JBS SA1 |
|
|
533,566 |
|
|
|
|
|
|
|
3,080 |
|
|
|
Sysco Corp. |
|
|
42,308 |
|
|
|
|
|
|
|
3,020 |
|
|
|
Ocado Group PLC1 |
|
|
817,690 |
|
|
|
|
|
|
|
2,990 |
|
|
|
Treasury Wine Estates, Ltd. |
|
|
343,961 |
|
|
|
|
|
|
|
2,852 |
|
|
|
Arca Continental, SAB de CV |
|
|
282,079 |
|
|
|
|
|
|
|
2,766 |
|
|
|
ITC, Ltd. |
|
|
541,438 |
|
|
|
|
|
|
|
2,747 |
|
|
|
Seven & i Holdings Co., Ltd. |
|
|
215,440 |
|
|
|
|
|
|
|
2,624 |
|
|
|
Suntory Beverage & Food, Ltd. |
|
|
56,700 |
|
|
|
|
|
|
|
2,013 |
|
|
|
Kao Corp.2 |
|
|
32,400 |
|
|
|
|
|
|
|
1,317 |
|
|
|
Costco Wholesale Corp. |
|
|
1,243 |
|
|
|
|
|
|
|
1,057 |
|
|
|
Mondelez International, Inc., Class A |
|
|
14,878 |
|
|
|
|
|
|
|
974 |
|
|
|
Dollar Tree Stores, Inc.1 |
|
|
5,329 |
|
|
|
|
|
|
|
569 |
|
|
|
Altria Group, Inc. |
|
|
11,175 |
|
|
|
|
|
|
|
509 |
|
|
|
Wilmar International, Ltd. |
|
|
35,100 |
|
|
|
|
|
|
|
80 |
|
|
|
|
|
|
|
|
|
|
|
|
|
|
|
|
|
|
|
|
|
|
|
|
|
|
|
|
|
117,860 |
|
|
|
|
|
|
|
|
|
|
|
|
|
|
|
|
|
|
|
|
|
|
|
|
|
|
|
|
|
|
|
| |
|
|
|
|
| Materials 6.05% |
|
Glencore PLC |
|
|
2,849,371 |
|
|
|
|
|
|
|
16,247 |
|
|
|
Freeport-McMoRan, Inc. |
|
|
327,305 |
|
|
|
|
|
|
|
15,907 |
|
|
|
Fortescue, Ltd. |
|
|
792,950 |
|
|
|
|
|
|
|
11,328 |
|
|
|
Air Products and Chemicals, Inc. |
|
|
43,571 |
|
|
|
|
|
|
|
11,243 |
|
|
|
Rio Tinto PLC |
|
|
155,591 |
|
|
|
|
|
|
|
10,242 |
|
|
|
Vale SA, ordinary nominative shares |
|
|
583,989 |
|
|
|
|
|
|
|
6,500 |
|
|
|
Vale SA (ADR), ordinary nominative shares |
|
|
151,651 |
|
|
|
|
|
|
|
1,694 |
|
|
|
Linde PLC |
|
|
11,518 |
|
|
|
|
|
|
|
5,054 |
|
|
|
First Quantum Minerals, Ltd. |
|
|
380,583 |
|
|
|
|
|
|
|
4,999 |
|
|
|
Anglo American PLC |
|
|
141,821 |
|
|
|
|
|
|
|
4,461 |
|
|
|
Ivanhoe Mines, Ltd., Class A1 |
|
|
303,878 |
|
|
|
|
|
|
|
3,921 |
|
|
|
BHP Group, Ltd. (CDI) |
|
|
104,402 |
|
|
|
|
|
|
|
2,990 |
|
|
|
Air Liquide SA |
|
|
10,153 |
|
|
|
|
|
|
|
1,748 |
|
|
|
Air Liquide SA, bonus shares |
|
|
7,036 |
|
|
|
|
|
|
|
1,211 |
|
|
|
Heidelberg Materials AG, non-registered shares |
|
|
28,282 |
|
|
|
|
|
|
|
2,931 |
|
|
|
Smurfit Kappa Group PLC |
|
|
65,438 |
|
|
|
|
|
|
|
2,909 |
|
|
|
Shin-Etsu Chemical Co., Ltd. |
|
|
58,100 |
|
|
|
|
|
|
|
2,260 |
|
|
|
Albemarle Corp. |
|
|
22,528 |
|
|
|
|
|
|
|
2,152 |
|
|
|
Barrick Gold Corp. (CAD denominated) |
|
|
109,694 |
|
|
|
|
|
|
|
1,830 |
|
|
|
Akzo Nobel NV |
|
|
21,947 |
|
|
|
|
|
|
|
1,334 |
|
|
|
Lundin Mining Corp. |
|
|
106,116 |
|
|
|
|
|
|
|
1,181 |
|
|
|
Southern Copper Corp. |
|
|
10,955 |
|
|
|
|
|
|
|
1,180 |
|
|
|
Antofagasta PLC |
|
|
39,354 |
|
|
|
|
|
|
|
1,044 |
|
|
|
Evonik Industries AG |
|
|
36,190 |
|
|
|
|
|
|
|
738 |
|
|
|
Grupo México, SAB de CV, Series B |
|
|
83,500 |
|
|
|
|
|
|
|
449 |
|
|
|
|
|
|
|
|
|
|
|
|
|
|
|
|
|
|
|
|
|
|
|
|
|
|
|
|
|
115,553 |
|
|
|
|
|
|
|
|
|
|
|
|
|
|
|
|
|
|
|
|
|
|
|
|
|
|
|
|
|
|
|
| |
|
|
|
|
| Energy 5.01% |
|
Canadian Natural Resources, Ltd. (CAD denominated) |
|
|
609,316 |
|
|
|
|
|
|
|
21,704 |
|
|
|
EOG Resources, Inc. |
|
|
99,862 |
|
|
|
|
|
|
|
12,570 |
|
|
|
TC Energy Corp. (CAD denominated)2 |
|
|
241,962 |
|
|
|
|
|
|
|
9,172 |
|
|
|
Cameco Corp. (CAD denominated) |
|
|
135,714 |
|
|
|
|
|
|
|
6,677 |
|
|
|
Cameco Corp. |
|
|
41,372 |
|
|
|
|
|
|
|
2,036 |
|
|
|
Tourmaline Oil Corp. |
|
|
132,146 |
|
|
|
|
|
|
|
5,994 |
|
American Funds Insurance Series 48
Capital World Growth and Income Fund (continued)
|
|
|
|
|
|
|
|
|
|
|
|
|
|
|
| Common stocks (continued) |
|
Shares |
|
|
|
|
|
Value (000) |
|
|
|
|
|
|
| Energy (continued) |
|
Shell PLC (GBP denominated) |
|
|
142,852 |
|
|
|
|
|
|
$ |
5,134 |
|
|
|
Cenovus Energy, Inc. (CAD denominated) |
|
|
210,158 |
|
|
|
|
|
|
|
4,131 |
|
|
|
Reliance Industries, Ltd. |
|
|
95,763 |
|
|
|
|
|
|
|
3,585 |
|
|
|
Exxon Mobil Corp. |
|
|
29,493 |
|
|
|
|
|
|
|
3,395 |
|
|
|
BP PLC |
|
|
546,050 |
|
|
|
|
|
|
|
3,290 |
|
|
|
TotalEnergies SE |
|
|
48,330 |
|
|
|
|
|
|
|
3,221 |
|
|
|
Suncor Energy, Inc. |
|
|
73,457 |
|
|
|
|
|
|
|
2,800 |
|
|
|
ConocoPhillips |
|
|
23,851 |
|
|
|
|
|
|
|
2,728 |
|
|
|
Baker Hughes Co., Class A |
|
|
68,847 |
|
|
|
|
|
|
|
2,421 |
|
|
|
Schlumberger NV |
|
|
45,084 |
|
|
|
|
|
|
|
2,127 |
|
|
|
Neste OYJ |
|
|
94,722 |
|
|
|
|
|
|
|
1,680 |
|
|
|
MEG Energy Corp.1 |
|
|
69,541 |
|
|
|
|
|
|
|
1,488 |
|
|
|
Aker BP ASA |
|
|
53,967 |
|
|
|
|
|
|
|
1,375 |
|
|
|
Gazprom PJSC1,3 |
|
|
2,248,304 |
|
|
|
|
|
|
|
– |
4 |
|
|
|
|
|
|
|
|
|
|
|
|
|
|
|
|
|
|
|
|
|
|
|
|
|
|
|
|
95,528 |
|
|
|
|
|
|
|
|
|
|
|
|
|
|
|
|
|
|
|
|
|
|
|
|
|
|
|
|
|
|
|
| |
|
|
|
|
| Utilities 2.00% |
|
Constellation Energy Corp. |
|
|
31,259 |
|
|
|
|
|
|
|
6,260 |
|
|
|
DTE Energy Co. |
|
|
47,424 |
|
|
|
|
|
|
|
5,265 |
|
|
|
E.ON SE |
|
|
372,508 |
|
|
|
|
|
|
|
4,882 |
|
|
|
Engie SA |
|
|
307,828 |
|
|
|
|
|
|
|
4,384 |
|
|
|
Iberdrola, SA, non-registered shares |
|
|
232,420 |
|
|
|
|
|
|
|
3,015 |
|
|
|
China Resources Gas Group, Ltd. |
|
|
830,832 |
|
|
|
|
|
|
|
2,912 |
|
|
|
Dominion Energy, Inc. |
|
|
44,838 |
|
|
|
|
|
|
|
2,197 |
|
|
|
Duke Energy Corp. |
|
|
19,966 |
|
|
|
|
|
|
|
2,001 |
|
|
|
FirstEnergy Corp. |
|
|
49,207 |
|
|
|
|
|
|
|
1,883 |
|
|
|
NextEra Energy, Inc. |
|
|
18,050 |
|
|
|
|
|
|
|
1,278 |
|
|
|
AES Corp. |
|
|
72,359 |
|
|
|
|
|
|
|
1,271 |
|
|
|
ENN Energy Holdings, Ltd. |
|
|
129,042 |
|
|
|
|
|
|
|
1,063 |
|
|
|
Public Service Enterprise Group, Inc. |
|
|
13,054 |
|
|
|
|
|
|
|
962 |
|
|
|
National Grid PLC |
|
|
80,274 |
|
|
|
|
|
|
|
895 |
|
|
|
|
|
|
|
|
|
|
|
|
|
|
|
|
|
|
|
|
|
|
|
|
|
|
|
|
|
38,268 |
|
|
|
|
|
|
|
|
|
|
|
|
|
|
|
|
|
|
|
|
|
|
|
|
|
|
|
|
|
|
|
| |
|
|
|
|
| Real estate 0.63% |
|
VICI Properties, Inc. REIT |
|
|
101,254 |
|
|
|
|
|
|
|
2,900 |
|
|
|
Extra Space Storage, Inc. REIT |
|
|
10,510 |
|
|
|
|
|
|
|
1,633 |
|
|
|
Iron Mountain, Inc. REIT |
|
|
16,890 |
|
|
|
|
|
|
|
1,514 |
|
|
|
American Tower Corp. REIT |
|
|
7,257 |
|
|
|
|
|
|
|
1,411 |
|
|
|
Prologis, Inc. REIT |
|
|
11,745 |
|
|
|
|
|
|
|
1,319 |
|
|
|
Mitsui Fudosan Co., Ltd. |
|
|
141,700 |
|
|
|
|
|
|
|
1,303 |
|
|
|
Longfor Group Holdings, Ltd. |
|
|
722,238 |
|
|
|
|
|
|
|
990 |
|
|
|
China Resources Mixc Lifestyle Services, Ltd. |
|
|
264,000 |
|
|
|
|
|
|
|
874 |
|
|
|
|
|
|
|
|
|
|
|
|
|
|
|
|
|
|
|
|
|
|
|
|
|
|
|
|
|
11,944 |
|
|
|
|
|
|
|
|
|
|
|
|
|
|
|
|
|
|
Total common stocks (cost: $1,174,470,000) |
|
|
|
|
|
|
|
|
|
|
1,835,227 |
|
|
|
|
|
|
|
|
|
|
|
|
|
|
|
|
|
|
|
|
|
|
|
|
|
|
|
|
|
|
|
|
| Preferred securities 0.07% |
|
|
|
|
|
|
| Consumer discretionary 0.05% |
|
Dr. Ing. h.c. F. Porsche AG, nonvoting non-registered preferred shares |
|
|
12,306 |
|
|
|
|
|
|
|
915 |
|
|
|
|
|
|
|
|
|
|
|
|
|
|
|
|
|
|
|
|
|
|
|
|
|
|
|
|
|
|
|
| |
|
|
|
|
| Health care 0.02% |
|
Grifols, SA, Class B, nonvoting non-registered preferred shares1 |
|
|
59,790 |
|
|
|
|
|
|
|
369 |
|
|
|
|
|
|
|
|
|
|
|
|
|
|
|
|
|
|
Total preferred securities (cost: $2,001,000) |
|
|
|
|
|
|
|
|
|
|
1,284 |
|
|
|
|
|
|
|
|
|
|
|
|
|
|
|
|
49 American Funds Insurance Series
Capital World Growth and Income Fund (continued)
|
|
|
|
|
|
|
|
|
|
|
|
|
|
|
| Convertible stocks 0.11% |
|
Shares |
|
|
|
|
|
Value (000) |
|
|
|
|
|
|
| Materials 0.11% |
|
Albemarle Corp., Class A, cumulative convertible preferred depositary shares,
7.25% 3/1/2027 |
|
|
47,000 |
|
|
|
|
|
|
$ |
2,193 |
|
|
|
|
|
|
|
|
|
|
|
|
|
|
|
|
|
|
Total convertible stocks (cost: $2,355,000) |
|
|
|
|
|
|
|
|
|
|
2,193 |
|
|
|
|
|
|
|
|
|
|
|
|
|
|
|
|
|
|
|
|
| Bonds, notes & other debt instruments 0.13% |
|
Principal amount
(000) |
|
|
|
|
|
|
|
|
| Corporate bonds, notes & loans 0.13% |
|
| |
|
|
|
|
| Health care 0.05% |
|
Teva Pharmaceutical Finance Netherlands III BV 3.15% 10/1/2026 |
|
|
USD1,100 |
|
|
|
|
|
|
|
1,033 |
|
|
|
|
|
|
|
|
|
|
|
|
|
|
|
|
|
|
|
|
|
|
|
|
|
|
|
|
|
|
|
| |
|
|
|
|
| Consumer discretionary 0.04% |
|
Royal Caribbean Cruises, Ltd. 5.50% 4/1/20285 |
|
|
390 |
|
|
|
|
|
|
|
385 |
|
|
|
Royal Caribbean Cruises, Ltd. 8.25% 1/15/20295 |
|
|
151 |
|
|
|
|
|
|
|
160 |
|
|
|
Royal Caribbean Cruises, Ltd. 9.25% 1/15/20295 |
|
|
125 |
|
|
|
|
|
|
|
133 |
|
|
|
|
|
|
|
|
|
|
|
|
|
|
|
|
|
|
|
|
|
|
|
|
|
|
|
|
|
678 |
|
|
|
|
|
|
|
|
|
|
|
|
|
|
|
|
|
|
|
|
|
|
|
|
|
|
|
|
|
|
|
| |
|
|
|
|
| Financials 0.03% |
|
Lloyds Banking Group PLC 3.369% 12/14/2046
(5-year UST Yield Curve Rate T Note Constant Maturity + 1.50% on 12/14/2041)6 |
|
|
709 |
|
|
|
|
|
|
|
494 |
|
|
|
|
|
|
|
|
|
|
|
|
|
|
|
|
|
|
|
|
|
|
|
|
|
|
|
|
|
|
|
| |
|
|
|
|
| Energy 0.01% |
|
TransCanada Pipelines, Ltd. 5.10% 3/15/2049 |
|
|
210 |
|
|
|
|
|
|
|
191 |
|
|
|
|
|
|
|
|
|
|
|
|
|
|
|
|
|
|
Total corporate bonds, notes & loans |
|
|
|
|
|
|
|
|
|
|
2,396 |
|
|
|
|
|
|
|
|
|
|
|
|
|
|
|
|
|
|
Total bonds, notes & other debt instruments (cost: $2,546,000) |
|
|
|
|
|
|
|
|
|
|
2,396 |
|
|
|
|
|
|
|
|
|
|
|
|
|
|
|
|
|
|
|
|
|
|
|
|
|
|
|
|
|
|
|
|
|
|
|
| Short-term securities 3.74% |
|
Shares |
|
|
|
|
|
|
|
|
|
|
|
| Money market investments 3.28% |
|
|
|
|
|
|
|
|
|
|
|
|
| |
|
|
|
|
|
|
Capital Group Central Cash Fund 5.37%7,8 |
|
|
626,746 |
|
|
|
|
|
|
|
62,675 |
|
|
|
|
|
|
|
|
|
|
|
|
|
|
|
|
|
|
|
|
|
| |
|
|
|
|
|
|
|
|
|
|
|
|
|
|
|
|
|
|
| Money market investments purchased with collateral from securities on loan 0.46% |
|
|
|
|
|
|
|
|
|
|
|
|
| |
|
|
|
|
|
|
Invesco Short-Term Investments Trust – Government & Agency Portfolio, Institutional Class 5.23%7,9 |
|
|
8,695,145 |
|
|
|
|
|
|
|
8,695 |
|
|
|
|
|
|
|
|
|
|
|
|
|
|
|
|
|
|
Total short-term securities (cost: $71,369,000) |
|
|
|
|
|
|
|
|
|
|
71,370 |
|
|
|
|
|
|
|
|
|
|
|
|
|
|
|
|
|
|
|
|
|
|
|
Total investment securities 100.21% (cost: $1,252,741,000) |
|
|
|
|
|
|
|
|
|
|
1,912,470 |
|
|
|
Other assets less liabilities (0.21)% |
|
|
|
|
|
|
|
|
|
|
(3,969 |
) |
|
|
|
|
|
|
|
|
|
|
|
|
|
|
|
|
|
|
|
|
|
|
Net assets 100.00% |
|
|
|
|
|
|
|
|
|
$ |
1,908,501 |
|
|
|
|
|
|
|
|
|
|
|
|
|
|
|
|
|
|
|
|
|
|
|
|
|
|
|
|
|
|
|
|
|
|
|
|
|
|
|
|
|
|
|
|
|
|
|
|
|
|
|
|
|
|
|
|
|
|
|
|
|
| Investments in affiliates8 |
|
| |
|
|
|
|
|
|
|
|
|
|
|
| |
|
Value at
1/1/2024
(000) |
|
|
Additions
(000) |
|
|
Reductions
(000) |
|
|
|
|
|
Net
realized
gain (loss)
(000) |
|
|
|
|
|
Net
unrealized
appreciation
(depreciation)
(000) |
|
|
|
|
|
Value at
6/30/2024
(000) |
|
|
|
|
|
Dividend
or interest
income
(000) |
|
|
|
|
|
|
|
|
|
|
|
|
|
| Short-term securities 3.28% |
|
|
|
|
|
|
|
|
|
|
|
|
|
|
|
|
|
|
|
|
|
|
|
|
|
|
|
|
|
|
|
|
|
|
|
|
|
|
|
|
|
|
|
|
| Money market investments 3.28% |
|
|
|
|
|
|
|
|
|
|
|
|
|
|
|
|
|
|
|
|
|
|
|
|
|
|
|
|
|
|
|
|
|
|
|
|
|
|
|
|
|
|
|
|
| Capital Group Central Cash Fund 5.37%7 |
|
|
$44,944 |
|
|
|
$134,258 |
|
|
|
$116,529 |
|
|
|
|
|
|
|
$(3 |
) |
|
|
|
|
|
|
$5 |
|
|
|
|
|
|
|
$62,675 |
|
|
|
|
|
|
|
$1,790 |
|
American Funds Insurance Series 50
Capital World Growth and Income Fund (continued)
| 1 |
Security did not produce income during the last 12 months. |
| 2 |
All or a portion of this security was on loan. The total value of all such securities was $10,543,000, which represented .55% of the net assets of the fund. Refer to Note 5 for more information on securities lending. |
| 3 |
Value determined using significant unobservable inputs. |
| 4 |
Amount less than one thousand. |
| 5 |
Acquired in a transaction exempt from registration under Rule 144A or, for commercial paper, Section 4(a)(2) of the Securities Act of 1933. May be resold in the U.S. in transactions exempt from registration, normally to qualified institutional buyers. The total value of all such securities was $678,000, which represented .04% of the net assets of the fund. |
| 6 |
Step bond; coupon rate may change at a later date. |
| 7 |
Rate represents the seven-day yield at 6/30/2024. |
| 8 |
Part of the same “group of investment companies“ as the fund as defined under the Investment Company Act of 1940, as amended. |
| 9 |
Security purchased with cash collateral from securities on loan. Refer to Note 5 for more information on securities lending. |
Key to abbreviation(s)
ADR = American Depositary Receipts
CAD = Canadian dollars
CDI = CREST Depository Interest
EUR = Euros
GBP = British pounds
HKD = Hong Kong dollars
REIT = Real Estate Investment Trust
USD = U.S. dollars
Refer to the notes to financial statements.
51 American Funds Insurance Series
|
|
|
|
|
|
|
|
|
|
|
|
|
|
|
|
|
|
|
| Growth-Income Fund |
|
|
|
|
|
|
|
| Investment portfolio June 30, 2024 |
|
|
|
|
|
|
|
unaudited |
|
|
|
|
|
|
| Common stocks 97.18% |
|
|
|
|
Shares |
|
|
|
|
|
Value (000) |
|
| Information technology 26.04% |
|
Microsoft Corp. |
|
|
|
|
|
|
6,573,221 |
|
|
|
|
|
|
$ |
2,937,901 |
|
|
|
Apple, Inc. |
|
|
|
|
|
|
8,830,338 |
|
|
|
|
|
|
|
1,859,846 |
|
|
|
Broadcom, Inc. |
|
|
|
|
|
|
890,046 |
|
|
|
|
|
|
|
1,428,996 |
|
|
|
NVIDIA Corp. |
|
|
|
|
|
|
7,861,138 |
|
|
|
|
|
|
|
971,165 |
|
|
|
Accenture PLC, Class A |
|
|
|
|
|
|
1,847,898 |
|
|
|
|
|
|
|
560,671 |
|
|
|
Texas Instruments, Inc. |
|
|
|
|
|
|
2,314,995 |
|
|
|
|
|
|
|
450,336 |
|
|
|
Salesforce, Inc. |
|
|
|
|
|
|
1,705,072 |
|
|
|
|
|
|
|
438,374 |
|
|
|
Intel Corp. |
|
|
|
|
|
|
10,290,199 |
|
|
|
|
|
|
|
318,687 |
|
|
|
Samsung Electronics Co., Ltd. |
|
|
|
|
|
|
4,599,072 |
|
|
|
|
|
|
|
270,268 |
|
|
|
Oracle Corp. |
|
|
|
|
|
|
1,294,478 |
|
|
|
|
|
|
|
182,780 |
|
|
|
Seagate Technology Holdings PLC |
|
|
|
|
|
|
1,588,555 |
|
|
|
|
|
|
|
164,050 |
|
|
|
Taiwan Semiconductor Manufacturing Co., Ltd. |
|
|
|
|
|
|
4,102,000 |
|
|
|
|
|
|
|
122,000 |
|
|
|
EPAM Systems, Inc.1 |
|
|
|
|
|
|
515,282 |
|
|
|
|
|
|
|
96,930 |
|
|
|
Cognizant Technology Solutions Corp., Class A |
|
|
|
|
|
|
1,376,004 |
|
|
|
|
|
|
|
93,568 |
|
|
|
Analog Devices, Inc. |
|
|
|
|
|
|
398,402 |
|
|
|
|
|
|
|
90,939 |
|
|
|
Palo Alto Networks, Inc.1 |
|
|
|
|
|
|
260,884 |
|
|
|
|
|
|
|
88,442 |
|
|
|
SK hynix, Inc. |
|
|
|
|
|
|
449,089 |
|
|
|
|
|
|
|
76,161 |
|
|
|
Applied Materials, Inc. |
|
|
|
|
|
|
300,000 |
|
|
|
|
|
|
|
70,797 |
|
|
|
ServiceNow, Inc.1 |
|
|
|
|
|
|
85,000 |
|
|
|
|
|
|
|
66,867 |
|
|
|
QUALCOMM, Inc. |
|
|
|
|
|
|
225,964 |
|
|
|
|
|
|
|
45,007 |
|
|
|
Arista Networks, Inc.1 |
|
|
|
|
|
|
125,000 |
|
|
|
|
|
|
|
43,810 |
|
|
|
Micron Technology, Inc. |
|
|
|
|
|
|
312,085 |
|
|
|
|
|
|
|
41,049 |
|
|
|
Adobe, Inc.1 |
|
|
|
|
|
|
43,879 |
|
|
|
|
|
|
|
24,377 |
|
|
|
|
|
|
|
|
|
|
|
|
|
|
|
|
|
|
|
|
|
|
|
|
|
|
|
|
|
|
|
|
|
|
|
|
|
10,443,021 |
|
|
|
|
|
|
|
|
|
|
|
|
|
|
|
|
|
|
|
|
|
|
|
|
|
|
|
|
|
|
|
|
|
|
|
|
|
|
|
| |
|
|
|
|
|
| Industrials 14.13% |
|
RTX Corp. |
|
|
|
|
|
|
8,103,024 |
|
|
|
|
|
|
|
813,463 |
|
|
|
General Electric Co. |
|
|
|
|
|
|
4,485,249 |
|
|
|
|
|
|
|
713,020 |
|
|
|
Boeing Co.1 |
|
|
|
|
|
|
2,877,649 |
|
|
|
|
|
|
|
523,761 |
|
|
|
Automatic Data Processing, Inc. |
|
|
|
|
|
|
1,695,401 |
|
|
|
|
|
|
|
404,675 |
|
|
|
Carrier Global Corp. |
|
|
|
|
|
|
5,347,121 |
|
|
|
|
|
|
|
337,296 |
|
|
|
General Dynamics Corp. |
|
|
|
|
|
|
1,160,968 |
|
|
|
|
|
|
|
336,843 |
|
|
|
GFL Environmental, Inc., subordinate voting shares |
|
|
|
|
|
|
7,977,235 |
|
|
|
|
|
|
|
310,554 |
|
|
|
TFI International, Inc. |
|
|
|
|
|
|
2,067,287 |
|
|
|
|
|
|
|
300,087 |
|
|
|
Airbus SE, non-registered shares |
|
|
|
|
|
|
1,921,964 |
|
|
|
|
|
|
|
265,011 |
|
|
|
Honeywell International, Inc. |
|
|
|
|
|
|
1,181,440 |
|
|
|
|
|
|
|
252,285 |
|
|
|
TransDigm Group, Inc. |
|
|
|
|
|
|
181,773 |
|
|
|
|
|
|
|
232,235 |
|
|
|
United Rentals, Inc. |
|
|
|
|
|
|
326,897 |
|
|
|
|
|
|
|
211,414 |
|
|
|
Ingersoll-Rand, Inc. |
|
|
|
|
|
|
2,103,958 |
|
|
|
|
|
|
|
191,124 |
|
|
|
Woodward, Inc. |
|
|
|
|
|
|
911,690 |
|
|
|
|
|
|
|
158,981 |
|
|
|
XPO, Inc.1 |
|
|
|
|
|
|
1,216,922 |
|
|
|
|
|
|
|
129,176 |
|
|
|
Paychex, Inc. |
|
|
|
|
|
|
1,059,135 |
|
|
|
|
|
|
|
125,571 |
|
|
|
L3Harris Technologies, Inc. |
|
|
|
|
|
|
381,989 |
|
|
|
|
|
|
|
85,787 |
|
|
|
APi Group Corp.1 |
|
|
|
|
|
|
1,599,578 |
|
|
|
|
|
|
|
60,192 |
|
|
|
CSX Corp. |
|
|
|
|
|
|
1,702,773 |
|
|
|
|
|
|
|
56,958 |
|
|
|
Union Pacific Corp. |
|
|
|
|
|
|
250,000 |
|
|
|
|
|
|
|
56,565 |
|
|
|
Delta Air Lines, Inc. |
|
|
|
|
|
|
900,000 |
|
|
|
|
|
|
|
42,696 |
|
|
|
TELUS International (Cda), Inc., subordinate voting shares1,2 |
|
|
|
|
|
|
5,158,625 |
|
|
|
|
|
|
|
29,817 |
|
|
|
GE Vernova, Inc.1 |
|
|
|
|
|
|
162,500 |
|
|
|
|
|
|
|
27,870 |
|
|
|
|
|
|
|
|
|
|
|
|
|
|
|
|
|
|
|
|
|
|
|
|
|
|
|
|
|
|
|
|
|
|
|
|
|
5,665,381 |
|
|
|
|
|
|
|
|
|
|
|
|
|
|
|
|
|
|
|
|
|
|
|
|
|
|
|
|
|
|
|
|
|
|
|
|
|
|
|
| |
|
|
|
|
|
| Health care 13.53% |
|
UnitedHealth Group, Inc. |
|
|
|
|
|
|
2,278,818 |
|
|
|
|
|
|
|
1,160,511 |
|
|
|
Eli Lilly and Co. |
|
|
|
|
|
|
763,290 |
|
|
|
|
|
|
|
691,068 |
|
|
|
AbbVie, Inc. |
|
|
|
|
|
|
3,366,224 |
|
|
|
|
|
|
|
577,375 |
|
|
|
Vertex Pharmaceuticals, Inc.1 |
|
|
|
|
|
|
797,380 |
|
|
|
|
|
|
|
373,748 |
|
|
|
Thermo Fisher Scientific, Inc. |
|
|
|
|
|
|
655,353 |
|
|
|
|
|
|
|
362,410 |
|
|
|
GE HealthCare Technologies, Inc. |
|
|
|
|
|
|
4,503,797 |
|
|
|
|
|
|
|
350,936 |
|
|
|
Abbott Laboratories |
|
|
|
|
|
|
2,886,063 |
|
|
|
|
|
|
|
299,891 |
|
|
|
Danaher Corp. |
|
|
|
|
|
|
896,225 |
|
|
|
|
|
|
|
223,922 |
|
|
|
Revvity, Inc. |
|
|
|
|
|
|
1,988,505 |
|
|
|
|
|
|
|
208,515 |
|
|
|
IQVIA Holdings, Inc.1 |
|
|
|
|
|
|
659,338 |
|
|
|
|
|
|
|
139,410 |
|
American Funds Insurance Series 52
Growth-Income Fund (continued)
|
|
|
|
|
|
|
|
|
|
|
|
|
|
|
|
|
|
|
| Common stocks (continued) |
|
|
|
|
Shares |
|
|
|
|
|
Value (000) |
|
| |
|
|
|
|
|
| Health care (continued) |
|
Sanofi |
|
|
|
|
|
|
1,245,837 |
|
|
|
|
|
|
$ |
119,751 |
|
|
|
Cencora, Inc. |
|
|
|
|
|
|
446,557 |
|
|
|
|
|
|
|
100,609 |
|
|
|
CVS Health Corp. |
|
|
|
|
|
|
1,696,989 |
|
|
|
|
|
|
|
100,224 |
|
|
|
Novo Nordisk AS, Class B |
|
|
|
|
|
|
663,888 |
|
|
|
|
|
|
|
94,840 |
|
|
|
Johnson & Johnson |
|
|
|
|
|
|
505,000 |
|
|
|
|
|
|
|
73,811 |
|
|
|
DexCom, Inc.1 |
|
|
|
|
|
|
647,230 |
|
|
|
|
|
|
|
73,383 |
|
|
|
Gilead Sciences, Inc. |
|
|
|
|
|
|
1,021,474 |
|
|
|
|
|
|
|
70,083 |
|
|
|
Takeda Pharmaceutical Co., Ltd. |
|
|
|
|
|
|
2,667,554 |
|
|
|
|
|
|
|
69,193 |
|
|
|
Regeneron Pharmaceuticals, Inc.1 |
|
|
|
|
|
|
58,996 |
|
|
|
|
|
|
|
62,007 |
|
|
|
Stryker Corp. |
|
|
|
|
|
|
170,434 |
|
|
|
|
|
|
|
57,990 |
|
|
|
Insulet Corp.1 |
|
|
|
|
|
|
239,321 |
|
|
|
|
|
|
|
48,295 |
|
|
|
Bristol-Myers Squibb Co. |
|
|
|
|
|
|
1,150,000 |
|
|
|
|
|
|
|
47,759 |
|
|
|
Amgen, Inc. |
|
|
|
|
|
|
151,000 |
|
|
|
|
|
|
|
47,180 |
|
|
|
Intuitive Surgical, Inc.1 |
|
|
|
|
|
|
87,269 |
|
|
|
|
|
|
|
38,822 |
|
|
|
Medtronic PLC |
|
|
|
|
|
|
462,434 |
|
|
|
|
|
|
|
36,398 |
|
|
|
|
|
|
|
|
|
|
|
|
|
|
|
|
|
|
|
|
|
|
|
|
|
|
|
|
|
|
|
|
|
|
|
|
|
5,428,131 |
|
|
|
|
|
|
|
|
|
|
|
|
|
|
|
|
|
|
|
|
|
|
|
|
|
|
|
|
|
|
|
|
|
|
|
|
|
|
|
| |
|
|
|
|
|
| Communication services 10.47% |
|
Meta Platforms, Inc., Class A |
|
|
|
|
|
|
3,777,491 |
|
|
|
|
|
|
|
1,904,687 |
|
|
|
Alphabet, Inc., Class C |
|
|
|
|
|
|
5,082,000 |
|
|
|
|
|
|
|
932,140 |
|
|
|
Alphabet, Inc., Class A |
|
|
|
|
|
|
5,032,544 |
|
|
|
|
|
|
|
916,678 |
|
|
|
Netflix, Inc.1 |
|
|
|
|
|
|
535,531 |
|
|
|
|
|
|
|
361,419 |
|
|
|
Comcast Corp., Class A |
|
|
|
|
|
|
2,098,931 |
|
|
|
|
|
|
|
82,194 |
|
|
|
|
|
|
|
|
|
|
|
|
|
|
|
|
|
|
|
|
|
|
|
|
|
|
|
|
|
|
|
|
|
|
|
|
|
4,197,118 |
|
|
|
|
|
|
|
|
|
|
|
|
|
|
|
|
|
|
|
|
|
|
|
|
|
|
|
|
|
|
|
|
|
|
|
|
|
|
|
| |
|
|
|
|
|
| Consumer discretionary 9.71% |
|
Amazon.com, Inc.1 |
|
|
|
|
|
|
8,582,508 |
|
|
|
|
|
|
|
1,658,570 |
|
|
|
Wyndham Hotels & Resorts, Inc.3 |
|
|
|
|
|
|
5,233,154 |
|
|
|
|
|
|
|
387,253 |
|
|
|
Restaurant Brands International, Inc. |
|
|
|
|
|
|
3,718,191 |
|
|
|
|
|
|
|
261,649 |
|
|
|
Royal Caribbean Cruises, Ltd.1 |
|
|
|
|
|
|
1,510,459 |
|
|
|
|
|
|
|
240,812 |
|
|
|
Tesla, Inc.1 |
|
|
|
|
|
|
1,104,141 |
|
|
|
|
|
|
|
218,487 |
|
|
|
Home Depot, Inc. |
|
|
|
|
|
|
582,781 |
|
|
|
|
|
|
|
200,617 |
|
|
|
InterContinental Hotels Group PLC |
|
|
|
|
|
|
1,396,700 |
|
|
|
|
|
|
|
146,434 |
|
|
|
Churchill Downs, Inc. |
|
|
|
|
|
|
939,327 |
|
|
|
|
|
|
|
131,130 |
|
|
|
Tapestry, Inc. |
|
|
|
|
|
|
2,982,230 |
|
|
|
|
|
|
|
127,610 |
|
|
|
Hasbro, Inc. |
|
|
|
|
|
|
1,788,473 |
|
|
|
|
|
|
|
104,626 |
|
|
|
Sony Group Corp. |
|
|
|
|
|
|
1,045,100 |
|
|
|
|
|
|
|
88,804 |
|
|
|
McDonald’s Corp. |
|
|
|
|
|
|
299,478 |
|
|
|
|
|
|
|
76,319 |
|
|
|
YUM! Brands, Inc. |
|
|
|
|
|
|
350,000 |
|
|
|
|
|
|
|
46,361 |
|
|
|
TJX Companies, Inc. |
|
|
|
|
|
|
328,670 |
|
|
|
|
|
|
|
36,187 |
|
|
|
LVMH Moët Hennessy-Louis Vuitton SE |
|
|
|
|
|
|
44,522 |
|
|
|
|
|
|
|
34,191 |
|
|
|
Hilton Worldwide Holdings, Inc. |
|
|
|
|
|
|
151,393 |
|
|
|
|
|
|
|
33,034 |
|
|
|
DoorDash, Inc., Class A1 |
|
|
|
|
|
|
266,642 |
|
|
|
|
|
|
|
29,005 |
|
|
|
Tractor Supply Co. |
|
|
|
|
|
|
99,068 |
|
|
|
|
|
|
|
26,748 |
|
|
|
Entain PLC |
|
|
|
|
|
|
3,054,537 |
|
|
|
|
|
|
|
24,183 |
|
|
|
General Motors Co. |
|
|
|
|
|
|
504,165 |
|
|
|
|
|
|
|
23,423 |
|
|
|
|
|
|
|
|
|
|
|
|
|
|
|
|
|
|
|
|
|
|
|
|
|
|
|
|
|
|
|
|
|
|
|
|
|
3,895,443 |
|
|
|
|
|
|
|
|
|
|
|
|
|
|
|
|
|
|
|
|
|
|
|
|
|
|
|
|
|
|
|
|
|
|
|
|
|
|
|
| |
|
|
|
|
|
| Financials 9.67% |
|
Mastercard, Inc., Class A |
|
|
|
|
|
|
1,208,007 |
|
|
|
|
|
|
|
532,924 |
|
|
|
JPMorgan Chase & Co. |
|
|
|
|
|
|
2,630,136 |
|
|
|
|
|
|
|
531,971 |
|
|
|
Fidelity National Information Services, Inc. |
|
|
|
|
|
|
6,795,448 |
|
|
|
|
|
|
|
512,105 |
|
|
|
S&P Global, Inc. |
|
|
|
|
|
|
706,397 |
|
|
|
|
|
|
|
315,053 |
|
|
|
BlackRock, Inc. |
|
|
|
|
|
|
356,179 |
|
|
|
|
|
|
|
280,427 |
|
|
|
Capital One Financial Corp. |
|
|
|
|
|
|
1,869,673 |
|
|
|
|
|
|
|
258,856 |
|
|
|
Berkshire Hathaway, Inc., Class B1 |
|
|
|
|
|
|
540,000 |
|
|
|
|
|
|
|
219,672 |
|
|
|
Marsh & McLennan Companies, Inc. |
|
|
|
|
|
|
878,016 |
|
|
|
|
|
|
|
185,016 |
|
|
|
Visa, Inc., Class A |
|
|
|
|
|
|
652,149 |
|
|
|
|
|
|
|
171,170 |
|
|
|
Power Corporation of Canada, subordinate voting shares2 |
|
|
|
|
|
|
4,060,000 |
|
|
|
|
|
|
|
112,833 |
|
|
|
Chubb, Ltd. |
|
|
|
|
|
|
435,647 |
|
|
|
|
|
|
|
111,125 |
|
|
|
B3 SA - Brasil, Bolsa, Balcao |
|
|
|
|
|
|
56,528,755 |
|
|
|
|
|
|
|
103,550 |
|
|
|
PNC Financial Services Group, Inc. |
|
|
|
|
|
|
520,903 |
|
|
|
|
|
|
|
80,990 |
|
53 American Funds Insurance Series
Growth-Income Fund (continued)
|
|
|
|
|
|
|
|
|
|
|
|
|
|
|
|
|
|
|
| Common stocks (continued) |
|
|
|
|
Shares |
|
|
|
|
|
Value (000) |
|
| |
|
|
|
|
|
| Financials (continued) |
|
First Citizens BancShares, Inc., Class A |
|
|
|
|
|
|
46,090 |
|
|
|
|
|
|
$ |
77,598 |
|
|
|
Wells Fargo & Co. |
|
|
|
|
|
|
1,300,000 |
|
|
|
|
|
|
|
77,207 |
|
|
|
Morgan Stanley |
|
|
|
|
|
|
750,000 |
|
|
|
|
|
|
|
72,892 |
|
|
|
Arthur J. Gallagher & Co. |
|
|
|
|
|
|
220,000 |
|
|
|
|
|
|
|
57,048 |
|
|
|
State Street Corp. |
|
|
|
|
|
|
760,000 |
|
|
|
|
|
|
|
56,240 |
|
|
|
American International Group, Inc. |
|
|
|
|
|
|
704,000 |
|
|
|
|
|
|
|
52,265 |
|
|
|
American Express Co. |
|
|
|
|
|
|
175,780 |
|
|
|
|
|
|
|
40,702 |
|
|
|
CME Group, Inc., Class A |
|
|
|
|
|
|
152,718 |
|
|
|
|
|
|
|
30,024 |
|
|
|
|
|
|
|
|
|
|
|
|
|
|
|
|
|
|
|
|
|
|
|
|
|
|
|
|
|
|
|
|
|
|
|
|
|
3,879,668 |
|
|
|
|
|
|
|
|
|
|
|
|
|
|
|
|
|
|
|
|
| |
|
|
|
|
|
|
|
|
|
|
|
|
|
|
|
|
|
|
| |
|
|
|
|
|
| Consumer staples 3.45% |
|
British American Tobacco PLC |
|
|
|
|
|
|
15,047,095 |
|
|
|
|
|
|
|
462,550 |
|
|
|
General Mills, Inc. |
|
|
|
|
|
|
2,690,394 |
|
|
|
|
|
|
|
170,194 |
|
|
|
Philip Morris International, Inc. |
|
|
|
|
|
|
1,608,349 |
|
|
|
|
|
|
|
162,974 |
|
|
|
Constellation Brands, Inc., Class A |
|
|
|
|
|
|
607,364 |
|
|
|
|
|
|
|
156,263 |
|
|
|
Mondelez International, Inc., Class A |
|
|
|
|
|
|
2,236,033 |
|
|
|
|
|
|
|
146,326 |
|
|
|
Church & Dwight Co., Inc. |
|
|
|
|
|
|
1,177,008 |
|
|
|
|
|
|
|
122,032 |
|
|
|
Imperial Brands PLC |
|
|
|
|
|
|
4,190,585 |
|
|
|
|
|
|
|
107,295 |
|
|
|
Keurig Dr Pepper, Inc. |
|
|
|
|
|
|
1,019,386 |
|
|
|
|
|
|
|
34,047 |
|
|
|
Kraft Heinz Co. (The) |
|
|
|
|
|
|
694,940 |
|
|
|
|
|
|
|
22,391 |
|
|
|
Monster Beverage Corp.1 |
|
|
|
|
|
|
17,894 |
|
|
|
|
|
|
|
894 |
|
|
|
|
|
|
|
|
|
|
|
|
|
|
|
|
|
|
|
|
|
|
|
|
|
|
|
|
|
|
|
|
|
|
|
|
|
1,384,966 |
|
|
|
|
|
|
|
|
|
|
|
|
|
|
|
|
|
|
|
|
| |
|
|
|
|
|
|
|
|
|
|
|
|
|
|
|
|
|
|
| |
|
|
|
|
|
| Energy 3.02% |
|
Baker Hughes Co., Class A |
|
|
|
|
|
|
9,934,219 |
|
|
|
|
|
|
|
349,386 |
|
|
|
Canadian Natural Resources, Ltd. (CAD denominated) |
|
|
|
|
|
|
8,858,000 |
|
|
|
|
|
|
|
315,522 |
|
|
|
Exxon Mobil Corp. |
|
|
|
|
|
|
1,841,478 |
|
|
|
|
|
|
|
211,991 |
|
|
|
EOG Resources, Inc. |
|
|
|
|
|
|
1,118,566 |
|
|
|
|
|
|
|
140,794 |
|
|
|
Chevron Corp. |
|
|
|
|
|
|
535,000 |
|
|
|
|
|
|
|
83,685 |
|
|
|
TC Energy Corp. |
|
|
|
|
|
|
1,629,755 |
|
|
|
|
|
|
|
61,768 |
|
|
|
ConocoPhillips |
|
|
|
|
|
|
434,738 |
|
|
|
|
|
|
|
49,725 |
|
|
|
|
|
|
|
|
|
|
|
|
|
|
|
|
|
|
|
|
|
|
|
|
|
|
|
|
|
|
|
|
|
|
|
|
|
1,212,871 |
|
|
|
|
|
|
|
|
|
|
|
|
|
|
|
|
|
|
|
|
| |
|
|
|
|
|
|
|
|
|
|
|
|
|
|
|
|
|
|
| |
|
|
|
|
|
| Materials 3.02% |
|
Air Products and Chemicals, Inc. |
|
|
|
|
|
|
1,615,736 |
|
|
|
|
|
|
|
416,941 |
|
|
|
Freeport-McMoRan, Inc. |
|
|
|
|
|
|
3,982,222 |
|
|
|
|
|
|
|
193,536 |
|
|
|
Linde PLC |
|
|
|
|
|
|
422,331 |
|
|
|
|
|
|
|
185,323 |
|
|
|
Celanese Corp. |
|
|
|
|
|
|
1,186,264 |
|
|
|
|
|
|
|
160,015 |
|
|
|
Eastman Chemical Co. |
|
|
|
|
|
|
1,613,268 |
|
|
|
|
|
|
|
158,052 |
|
|
|
LyondellBasell Industries NV |
|
|
|
|
|
|
579,974 |
|
|
|
|
|
|
|
55,480 |
|
|
|
Albemarle Corp. |
|
|
|
|
|
|
431,100 |
|
|
|
|
|
|
|
41,179 |
|
|
|
|
|
|
|
|
|
|
|
|
|
|
|
|
|
|
|
|
|
|
|
|
|
|
|
|
|
|
|
|
|
|
|
|
|
1,210,526 |
|
|
|
|
|
|
|
|
|
|
|
|
|
|
|
|
|
|
|
|
| |
|
|
|
|
|
|
|
|
|
|
|
|
|
|
|
|
|
|
| |
|
|
|
|
|
| Utilities 2.32% |
|
PG&E Corp. |
|
|
|
|
|
|
18,016,861 |
|
|
|
|
|
|
|
314,575 |
|
|
|
CenterPoint Energy, Inc. |
|
|
|
|
|
|
5,843,418 |
|
|
|
|
|
|
|
181,029 |
|
|
|
Edison International |
|
|
|
|
|
|
1,380,480 |
|
|
|
|
|
|
|
99,132 |
|
|
|
DTE Energy Co. |
|
|
|
|
|
|
866,518 |
|
|
|
|
|
|
|
96,192 |
|
|
|
Entergy Corp. |
|
|
|
|
|
|
838,520 |
|
|
|
|
|
|
|
89,722 |
|
|
|
Sempra |
|
|
|
|
|
|
800,000 |
|
|
|
|
|
|
|
60,848 |
|
|
|
Constellation Energy Corp. |
|
|
|
|
|
|
250,468 |
|
|
|
|
|
|
|
50,161 |
|
|
|
NextEra Energy, Inc. |
|
|
|
|
|
|
564,975 |
|
|
|
|
|
|
|
40,006 |
|
|
|
|
|
|
|
|
|
|
|
|
|
|
|
|
|
|
|
|
|
|
|
|
|
|
|
|
|
|
|
|
|
|
|
|
|
931,665 |
|
|
|
|
|
|
|
|
|
|
|
|
|
|
|
|
|
|
|
|
American Funds Insurance Series 54
Growth-Income Fund (continued)
|
|
|
|
|
|
|
|
|
|
|
|
|
|
|
|
|
|
|
| Common stocks (continued) |
|
|
|
|
Shares |
|
|
|
|
|
Value (000) |
|
| Real estate 1.82% |
|
VICI Properties, Inc. REIT |
|
|
|
|
|
|
9,162,577 |
|
|
|
|
|
|
$ |
262,416 |
|
|
|
Equinix, Inc. REIT |
|
|
|
|
|
|
338,856 |
|
|
|
|
|
|
|
256,379 |
|
|
|
American Tower Corp. REIT |
|
|
|
|
|
|
620,421 |
|
|
|
|
|
|
|
120,597 |
|
|
|
Welltower, Inc. REIT |
|
|
|
|
|
|
570,000 |
|
|
|
|
|
|
|
59,423 |
|
|
|
Prologis, Inc. REIT |
|
|
|
|
|
|
275,887 |
|
|
|
|
|
|
|
30,985 |
|
|
|
|
|
|
|
|
|
|
|
|
|
|
|
|
|
|
|
|
|
|
|
|
|
|
|
|
|
|
|
|
|
|
|
|
|
729,800 |
|
|
|
|
|
|
|
|
|
|
|
|
|
|
|
|
|
|
|
|
|
|
Total common stocks (cost: $23,669,490,000) |
|
|
|
|
|
|
|
|
|
|
|
|
|
|
38,978,590 |
|
|
|
|
|
|
|
|
|
|
|
|
|
|
|
|
|
|
|
|
|
|
|
|
|
| Bonds, notes & other debt instruments 0.01% |
|
|
|
|
Principal amount
(000) |
|
|
|
|
|
|
|
| |
|
|
|
|
| Corporate bonds, notes & loans 0.01% |
|
|
|
|
|
|
|
|
|
|
|
|
|
|
|
|
| Industrials 0.01% |
|
Boeing Co. 4.875% 5/1/2025 |
|
|
|
|
|
|
USD4,706 |
|
|
|
|
|
|
|
4,657 |
|
|
|
|
|
|
|
|
|
|
|
|
|
|
|
|
|
|
|
|
|
|
|
|
|
|
|
|
|
|
|
|
|
|
|
|
|
|
|
|
|
|
|
|
|
| |
|
|
|
|
|
| Consumer discretionary 0.00% |
|
General Motors Financial Co., Inc. 4.30% 7/13/2025 |
|
|
|
|
|
|
160 |
|
|
|
|
|
|
|
158 |
|
|
|
General Motors Financial Co., Inc. 5.25% 3/1/2026 |
|
|
|
|
|
|
827 |
|
|
|
|
|
|
|
823 |
|
|
|
|
|
|
|
|
|
|
|
|
|
|
|
|
|
|
|
|
|
|
|
|
|
|
|
|
|
|
|
|
|
|
|
|
|
981 |
|
|
|
|
|
|
|
|
|
|
|
|
|
|
|
|
|
|
|
|
|
|
Total corporate bonds, notes & loans |
|
|
|
|
|
|
|
|
|
|
|
|
|
|
5,638 |
|
|
|
|
|
|
|
|
|
|
|
|
|
|
|
|
|
|
|
|
|
|
Total bonds, notes & other debt instruments (cost: $5,645,000) |
|
|
|
|
|
|
|
|
|
|
|
|
|
|
5,638 |
|
|
|
|
|
|
|
|
|
|
|
|
|
|
|
|
|
|
|
|
|
|
|
|
|
| Short-term securities 2.80% |
|
|
|
|
Shares |
|
|
|
|
|
|
|
| |
|
|
|
|
| Money market investments 2.53% |
|
|
|
|
|
|
|
|
|
|
|
|
|
|
|
|
|
|
Capital Group Central Cash Fund 5.37%3,4 |
|
|
|
|
|
|
10,132,744 |
|
|
|
|
|
|
|
1,013,274 |
|
|
|
|
|
|
|
|
|
|
|
|
|
|
|
|
|
|
|
|
|
|
|
|
|
|
|
|
|
|
|
|
|
|
|
|
|
|
|
|
|
|
|
|
|
| |
|
|
|
|
| Money market investments purchased with collateral from securities on loan 0.27% |
|
|
|
|
|
|
|
|
|
|
|
|
|
|
|
|
|
|
|
|
|
|
|
|
Invesco Short-Term Investments Trust – Government & Agency Portfolio,
Institutional Class 5.23%4,5 |
|
|
|
|
|
|
61,453,772 |
|
|
|
|
|
|
|
61,454 |
|
|
|
State Street Institutional U.S. Government Money Market Fund,
Institutional Class 5.22%4,5 |
|
|
|
|
|
|
46,397,862 |
|
|
|
|
|
|
|
46,398 |
|
|
|
|
|
|
|
|
|
|
|
|
|
|
|
|
|
|
|
|
|
|
|
|
|
|
|
|
|
|
|
|
|
|
|
|
|
107,852 |
|
|
|
|
|
|
|
|
|
|
|
|
|
|
|
|
|
|
|
|
|
|
Total short-term securities (cost: $1,121,116,000) |
|
|
|
|
|
|
|
|
|
|
|
|
|
|
1,121,126 |
|
|
|
|
|
|
|
|
|
|
|
|
|
|
|
|
|
|
|
|
|
|
|
|
|
|
|
|
Total investment securities 99.99% (cost: $24,796,251,000) |
|
|
|
|
|
|
|
|
|
|
|
|
|
|
40,105,354 |
|
|
|
Other assets less liabilities 0.01% |
|
|
|
|
|
|
|
|
|
|
|
|
|
|
2,266 |
|
|
|
|
|
|
|
|
|
|
|
|
|
|
|
|
|
|
|
|
|
|
|
|
|
|
|
|
Net assets 100.00% |
|
|
|
|
|
|
|
|
|
|
|
|
|
$ |
40,107,620 |
|
|
|
|
|
|
|
|
|
|
|
|
|
|
|
|
|
|
|
|
55 American Funds Insurance Series
Growth-Income Fund (continued)
|
|
|
|
|
|
|
|
|
|
|
|
|
|
|
|
|
|
|
|
|
|
|
|
|
|
|
|
|
|
|
|
|
|
|
|
|
|
|
|
|
| Investments in affiliates3 |
|
| |
|
|
|
|
|
|
|
| |
|
Value at 1/1/2024 (000) |
|
|
Additions (000) |
|
|
Reductions (000) |
|
|
Net realized gain (loss) (000) |
|
|
Net unrealized appreciation (depreciation) (000) |
|
|
Value at 6/30/2024 (000) |
|
|
Dividend or interest income (000) |
|
|
|
|
|
|
|
|
|
|
|
|
|
| Common stocks 0.96% |
|
|
|
|
|
|
|
|
|
|
|
|
|
|
|
|
|
|
|
|
|
|
|
|
|
|
|
|
|
|
|
|
|
|
|
|
|
|
|
|
| Consumer discretionary 0.96% |
|
|
|
|
|
|
|
|
|
|
|
|
|
|
|
|
|
|
|
|
|
|
|
|
|
|
|
|
|
|
|
|
|
|
|
|
|
|
|
|
| Wyndham Hotels & Resorts, Inc. |
|
$ |
106,302 |
|
|
$ |
282,386 |
|
|
$ |
– |
|
|
|
|
$ |
– |
|
|
|
|
$ |
(1,435 |
) |
|
|
|
|
|
$ |
387,253 |
|
|
|
|
|
|
$ |
1,670 |
|
|
|
|
|
|
|
|
|
|
|
|
|
| Short-term securities 2.53% |
|
|
|
|
|
|
|
|
|
|
|
|
|
|
|
|
|
|
|
|
|
|
|
|
|
|
|
|
|
|
|
|
|
|
|
|
|
|
|
|
| Money market investments 2.53% |
|
|
|
|
|
|
|
|
|
|
|
|
|
|
|
|
|
|
|
|
|
|
|
|
|
|
|
|
|
|
|
|
|
|
|
|
|
|
|
|
| Capital Group Central Cash Fund 5.37%4 |
|
|
1,430,798 |
|
|
|
5,734,011 |
|
|
|
6,151,892 |
|
|
|
|
|
509 |
|
|
|
|
|
(152 |
) |
|
|
|
|
|
|
1,013,274 |
|
|
|
|
|
|
|
31,439 |
|
|
|
|
|
|
|
|
|
|
|
|
|
|
|
|
|
|
|
|
|
|
|
|
|
|
|
|
|
|
|
|
|
|
|
|
|
|
|
|
|
|
|
|
|
|
|
|
|
|
|
|
|
|
| Total 3.49% |
|
|
|
|
|
|
|
|
|
|
|
|
|
|
|
$ |
509 |
|
|
|
|
$ |
(1,587 |
) |
|
|
|
|
|
$ |
1,400,527 |
|
|
|
|
|
|
$ |
33,109 |
|
|
|
|
|
|
|
|
|
|
|
|
|
|
|
|
|
|
|
|
|
|
|
|
|
|
|
|
|
|
|
|
|
|
|
|
|
|
|
|
|
|
| 1 |
Security did not produce income during the last 12 months. |
| 2 |
All or a portion of this security was on loan. The total value of all such securities was $114,087,000, which represented .28% of the net assets of the fund. Refer to Note 5 for more information on securities lending. |
| 3 |
Affiliate of the fund or part of the same “group of investment companies“ as the fund, as defined under the Investment Company Act of 1940, as amended. |
| 4 |
Rate represents the seven-day yield at 6/30/2024. |
| 5 |
Security purchased with cash collateral from securities on loan. Refer to Note 5 for more information on securities lending. |
Key to abbreviation(s)
CAD = Canadian dollars
REIT = Real Estate Investment Trust
USD = U.S. dollars
Refer to the notes to financial statements.
American Funds Insurance Series 56
|
|
|
| International Growth and Income Fund |
| Investment portfolio June 30, 2024 |
|
unaudited |
|
|
|
|
|
|
|
|
|
|
|
|
|
|
|
|
|
|
|
| Common stocks 93.66% |
|
|
|
|
Shares |
|
|
|
|
|
Value
(000) |
|
| Financials 18.53% |
|
AXA SA |
|
|
|
|
|
|
138,710 |
|
|
|
|
|
|
$ |
4,567 |
|
|
|
Zurich Insurance Group AG |
|
|
|
|
|
|
6,511 |
|
|
|
|
|
|
|
3,464 |
|
|
|
Tokio Marine Holdings, Inc. |
|
|
|
|
|
|
77,000 |
|
|
|
|
|
|
|
2,890 |
|
|
|
Resona Holdings, Inc. |
|
|
|
|
|
|
382,200 |
|
|
|
|
|
|
|
2,538 |
|
|
|
HSBC Holdings PLC (GBP denominated) |
|
|
|
|
|
|
231,078 |
|
|
|
|
|
|
|
2,000 |
|
|
|
HSBC Holdings PLC (HKD denominated) |
|
|
|
|
|
|
55,200 |
|
|
|
|
|
|
|
483 |
|
|
|
KB Financial Group, Inc. |
|
|
|
|
|
|
41,786 |
|
|
|
|
|
|
|
2,369 |
|
|
|
UniCredit SpA |
|
|
|
|
|
|
60,402 |
|
|
|
|
|
|
|
2,251 |
|
|
|
Ping An Insurance (Group) Company of China, Ltd., Class H |
|
|
|
|
|
|
465,000 |
|
|
|
|
|
|
|
2,114 |
|
|
|
Edenred SA |
|
|
|
|
|
|
49,577 |
|
|
|
|
|
|
|
2,092 |
|
|
|
Hiscox, Ltd. |
|
|
|
|
|
|
143,056 |
|
|
|
|
|
|
|
2,078 |
|
|
|
Tryg A/S |
|
|
|
|
|
|
93,921 |
|
|
|
|
|
|
|
2,052 |
|
|
|
Banco Bilbao Vizcaya Argentaria, SA |
|
|
|
|
|
|
199,520 |
|
|
|
|
|
|
|
1,991 |
|
|
|
Société Générale |
|
|
|
|
|
|
79,587 |
|
|
|
|
|
|
|
1,858 |
|
|
|
Deutsche Bank AG |
|
|
|
|
|
|
114,032 |
|
|
|
|
|
|
|
1,819 |
|
|
|
Hana Financial Group, Inc. |
|
|
|
|
|
|
40,716 |
|
|
|
|
|
|
|
1,785 |
|
|
|
AIA Group, Ltd. |
|
|
|
|
|
|
258,800 |
|
|
|
|
|
|
|
1,755 |
|
|
|
Skandinaviska Enskilda Banken AB, Class A |
|
|
|
|
|
|
111,021 |
|
|
|
|
|
|
|
1,645 |
|
|
|
NatWest Group PLC |
|
|
|
|
|
|
395,137 |
|
|
|
|
|
|
|
1,550 |
|
|
|
Euronext NV |
|
|
|
|
|
|
16,511 |
|
|
|
|
|
|
|
1,524 |
|
|
|
CaixaBank, SA, non-registered shares |
|
|
|
|
|
|
217,373 |
|
|
|
|
|
|
|
1,150 |
|
|
|
HDFC Bank, Ltd. |
|
|
|
|
|
|
53,386 |
|
|
|
|
|
|
|
1,078 |
|
|
|
Grupo Financiero Banorte, SAB de CV, Series O |
|
|
|
|
|
|
137,554 |
|
|
|
|
|
|
|
1,072 |
|
|
|
Bank Hapoalim BM |
|
|
|
|
|
|
111,973 |
|
|
|
|
|
|
|
989 |
|
|
|
London Stock Exchange Group PLC |
|
|
|
|
|
|
7,674 |
|
|
|
|
|
|
|
910 |
|
|
|
DBS Group Holdings, Ltd. |
|
|
|
|
|
|
34,284 |
|
|
|
|
|
|
|
903 |
|
|
|
Royal Bank of Canada |
|
|
|
|
|
|
8,284 |
|
|
|
|
|
|
|
882 |
|
|
|
Aon PLC, Class A |
|
|
|
|
|
|
2,812 |
|
|
|
|
|
|
|
826 |
|
|
|
Kotak Mahindra Bank, Ltd. |
|
|
|
|
|
|
37,209 |
|
|
|
|
|
|
|
800 |
|
|
|
Prudential PLC |
|
|
|
|
|
|
87,009 |
|
|
|
|
|
|
|
789 |
|
|
|
DNB Bank ASA |
|
|
|
|
|
|
37,900 |
|
|
|
|
|
|
|
744 |
|
|
|
3i Group PLC |
|
|
|
|
|
|
16,295 |
|
|
|
|
|
|
|
628 |
|
|
|
CVC Capital Partners PLC1 |
|
|
|
|
|
|
34,088 |
|
|
|
|
|
|
|
626 |
|
|
|
Dai-ichi Life Holdings, Inc. |
|
|
|
|
|
|
20,400 |
|
|
|
|
|
|
|
548 |
|
|
|
Mediobanca SpA |
|
|
|
|
|
|
35,646 |
|
|
|
|
|
|
|
525 |
|
|
|
United Overseas Bank, Ltd. |
|
|
|
|
|
|
21,100 |
|
|
|
|
|
|
|
487 |
|
|
|
Mizuho Financial Group, Inc. |
|
|
|
|
|
|
22,900 |
|
|
|
|
|
|
|
480 |
|
|
|
ICICI Bank, Ltd. (ADR) |
|
|
|
|
|
|
16,655 |
|
|
|
|
|
|
|
480 |
|
|
|
Brookfield Corp., Class A (CAD denominated) |
|
|
|
|
|
|
11,454 |
|
|
|
|
|
|
|
476 |
|
|
|
XP, Inc., Class A |
|
|
|
|
|
|
26,563 |
|
|
|
|
|
|
|
467 |
|
|
|
Macquarie Group, Ltd. |
|
|
|
|
|
|
3,325 |
|
|
|
|
|
|
|
454 |
|
|
|
Canara Bank |
|
|
|
|
|
|
311,140 |
|
|
|
|
|
|
|
445 |
|
|
|
Intesa Sanpaolo SpA |
|
|
|
|
|
|
112,002 |
|
|
|
|
|
|
|
418 |
|
|
|
Hong Kong Exchanges and Clearing, Ltd. |
|
|
|
|
|
|
12,400 |
|
|
|
|
|
|
|
395 |
|
|
|
Discovery, Ltd. |
|
|
|
|
|
|
49,301 |
|
|
|
|
|
|
|
365 |
|
|
|
Bank Mandiri (Persero) Tbk PT |
|
|
|
|
|
|
862,900 |
|
|
|
|
|
|
|
322 |
|
|
|
Hang Seng Bank, Ltd. |
|
|
|
|
|
|
24,000 |
|
|
|
|
|
|
|
307 |
|
|
|
Banco Santander, SA |
|
|
|
|
|
|
52,177 |
|
|
|
|
|
|
|
242 |
|
|
|
Banca Generali SpA |
|
|
|
|
|
|
5,885 |
|
|
|
|
|
|
|
236 |
|
|
|
ABN AMRO Bank NV |
|
|
|
|
|
|
11,559 |
|
|
|
|
|
|
|
189 |
|
|
|
AU Small Finance Bank, Ltd. |
|
|
|
|
|
|
12,289 |
|
|
|
|
|
|
|
99 |
|
|
|
Moscow Exchange MICEX-RTS PJSC2 |
|
|
|
|
|
|
346,177 |
|
|
|
|
|
|
|
– |
3 |
|
|
Sberbank of Russia PJSC2 |
|
|
|
|
|
|
476,388 |
|
|
|
|
|
|
|
– |
3 |
|
|
|
|
|
|
|
|
|
|
|
|
|
|
|
|
|
|
|
|
|
|
|
|
|
|
|
|
|
|
|
|
|
|
|
|
61,157 |
|
|
|
|
|
|
|
|
|
|
|
|
|
|
|
|
|
|
|
|
| |
|
|
|
|
|
|
|
|
|
|
|
|
|
|
|
|
|
|
| Information technology 14.93% |
|
Taiwan Semiconductor Manufacturing Co., Ltd. |
|
|
|
|
|
|
448,000 |
|
|
|
|
|
|
|
13,324 |
|
|
|
ASML Holding NV |
|
|
|
|
|
|
8,235 |
|
|
|
|
|
|
|
8,496 |
|
|
|
MediaTek, Inc. |
|
|
|
|
|
|
149,000 |
|
|
|
|
|
|
|
6,370 |
|
|
|
Broadcom, Inc. |
|
|
|
|
|
|
2,985 |
|
|
|
|
|
|
|
4,793 |
|
|
|
Samsung Electronics Co., Ltd. |
|
|
|
|
|
|
59,498 |
|
|
|
|
|
|
|
3,496 |
|
|
|
SAP SE |
|
|
|
|
|
|
11,089 |
|
|
|
|
|
|
|
2,251 |
|
57 American Funds Insurance Series
International Growth and Income Fund (continued)
|
|
|
|
|
|
|
|
|
|
|
|
|
|
|
|
|
|
|
| Common stocks (continued) |
|
|
|
|
Shares |
|
|
|
|
|
Value (000) |
|
| Information technology (continued) |
|
Tokyo Electron, Ltd. |
|
|
|
|
|
|
9,000 |
|
|
|
|
|
|
$ |
1,976 |
|
|
|
Sage Group PLC (The) |
|
|
|
|
|
|
102,323 |
|
|
|
|
|
|
|
1,404 |
|
|
|
Capgemini SE |
|
|
|
|
|
|
6,700 |
|
|
|
|
|
|
|
1,327 |
|
|
|
Keyence Corp. |
|
|
|
|
|
|
2,600 |
|
|
|
|
|
|
|
1,147 |
|
|
|
ASM International NV |
|
|
|
|
|
|
1,504 |
|
|
|
|
|
|
|
1,146 |
|
|
|
E Ink Holdings, Inc. |
|
|
|
|
|
|
115,000 |
|
|
|
|
|
|
|
897 |
|
|
|
ASMPT, Ltd. |
|
|
|
|
|
|
42,000 |
|
|
|
|
|
|
|
585 |
|
|
|
Halma PLC |
|
|
|
|
|
|
15,200 |
|
|
|
|
|
|
|
518 |
|
|
|
Fujitsu, Ltd. |
|
|
|
|
|
|
31,900 |
|
|
|
|
|
|
|
501 |
|
|
|
NEC Corp. |
|
|
|
|
|
|
5,500 |
|
|
|
|
|
|
|
450 |
|
|
|
eMemory Technology, Inc. |
|
|
|
|
|
|
3,000 |
|
|
|
|
|
|
|
236 |
|
|
|
Tata Consultancy Services, Ltd. |
|
|
|
|
|
|
4,166 |
|
|
|
|
|
|
|
194 |
|
|
|
Nomura Research Institute, Ltd. |
|
|
|
|
|
|
5,300 |
|
|
|
|
|
|
|
150 |
|
|
|
|
|
|
|
|
|
|
|
|
|
|
|
|
|
|
|
|
|
|
|
|
|
|
|
|
|
|
|
|
|
|
|
|
|
49,261 |
|
|
|
|
|
|
|
|
|
|
|
|
|
|
|
|
|
|
|
|
| |
|
|
|
|
|
|
|
|
|
|
|
|
|
|
|
|
|
|
| Industrials 13.71% |
|
Airbus SE, non-registered shares |
|
|
|
|
|
|
40,597 |
|
|
|
|
|
|
|
5,598 |
|
|
|
BAE Systems PLC |
|
|
|
|
|
|
324,254 |
|
|
|
|
|
|
|
5,414 |
|
|
|
ABB, Ltd. |
|
|
|
|
|
|
55,843 |
|
|
|
|
|
|
|
3,091 |
|
|
|
Ryanair Holdings PLC (ADR) |
|
|
|
|
|
|
19,350 |
|
|
|
|
|
|
|
2,253 |
|
|
|
RELX PLC |
|
|
|
|
|
|
40,271 |
|
|
|
|
|
|
|
1,846 |
|
|
|
Rheinmetall AG, non-registered shares |
|
|
|
|
|
|
3,627 |
|
|
|
|
|
|
|
1,845 |
|
|
|
SMC Corp. |
|
|
|
|
|
|
3,100 |
|
|
|
|
|
|
|
1,480 |
|
|
|
Safran SA |
|
|
|
|
|
|
6,989 |
|
|
|
|
|
|
|
1,470 |
|
|
|
Mitsui & Co., Ltd. |
|
|
|
|
|
|
61,800 |
|
|
|
|
|
|
|
1,410 |
|
|
|
Thales SA |
|
|
|
|
|
|
8,242 |
|
|
|
|
|
|
|
1,324 |
|
|
|
TFI International, Inc. |
|
|
|
|
|
|
4,873 |
|
|
|
|
|
|
|
707 |
|
|
|
TFI International, Inc. (CAD denominated) |
|
|
|
|
|
|
3,952 |
|
|
|
|
|
|
|
574 |
|
|
|
Alliance Global Group, Inc. |
|
|
|
|
|
|
7,668,600 |
|
|
|
|
|
|
|
1,132 |
|
|
|
Diploma PLC |
|
|
|
|
|
|
20,936 |
|
|
|
|
|
|
|
1,092 |
|
|
|
Siemens AG |
|
|
|
|
|
|
5,713 |
|
|
|
|
|
|
|
1,063 |
|
|
|
CCR SA, ordinary nominative shares |
|
|
|
|
|
|
492,117 |
|
|
|
|
|
|
|
1,025 |
|
|
|
Copa Holdings, SA, Class A |
|
|
|
|
|
|
10,465 |
|
|
|
|
|
|
|
996 |
|
|
|
Epiroc AB, Class B |
|
|
|
|
|
|
31,801 |
|
|
|
|
|
|
|
580 |
|
|
|
Epiroc AB, Class A |
|
|
|
|
|
|
19,194 |
|
|
|
|
|
|
|
383 |
|
|
|
ITOCHU Corp. |
|
|
|
|
|
|
19,000 |
|
|
|
|
|
|
|
932 |
|
|
|
Pluxee NV1 |
|
|
|
|
|
|
33,005 |
|
|
|
|
|
|
|
926 |
|
|
|
Canadian National Railway Co. (CAD denominated) |
|
|
|
|
|
|
7,065 |
|
|
|
|
|
|
|
835 |
|
|
|
ASSA ABLOY AB, Class B |
|
|
|
|
|
|
29,355 |
|
|
|
|
|
|
|
832 |
|
|
|
Hitachi, Ltd. |
|
|
|
|
|
|
34,000 |
|
|
|
|
|
|
|
767 |
|
|
|
Caterpillar, Inc. |
|
|
|
|
|
|
2,189 |
|
|
|
|
|
|
|
729 |
|
|
|
Fluidra, SA, non-registered shares |
|
|
|
|
|
|
33,272 |
|
|
|
|
|
|
|
691 |
|
|
|
SITC International Holdings Co., Ltd. |
|
|
|
|
|
|
253,659 |
|
|
|
|
|
|
|
687 |
|
|
|
Volvo AB, Class B |
|
|
|
|
|
|
23,941 |
|
|
|
|
|
|
|
614 |
|
|
|
Bunzl PLC |
|
|
|
|
|
|
15,283 |
|
|
|
|
|
|
|
580 |
|
|
|
Grupo Aeroportuario del Pacífico, SAB de CV, Class B |
|
|
|
|
|
|
31,389 |
|
|
|
|
|
|
|
491 |
|
|
|
Komatsu, Ltd. |
|
|
|
|
|
|
14,200 |
|
|
|
|
|
|
|
413 |
|
|
|
Deutsche Post AG |
|
|
|
|
|
|
9,883 |
|
|
|
|
|
|
|
400 |
|
|
|
Techtronic Industries Co., Ltd. |
|
|
|
|
|
|
33,592 |
|
|
|
|
|
|
|
384 |
|
|
|
Contemporary Amperex Technology Co., Ltd., Class A |
|
|
|
|
|
|
14,400 |
|
|
|
|
|
|
|
356 |
|
|
|
Adecco Group AG |
|
|
|
|
|
|
10,196 |
|
|
|
|
|
|
|
339 |
|
|
|
Melrose Industries PLC |
|
|
|
|
|
|
45,326 |
|
|
|
|
|
|
|
317 |
|
|
|
Jiangsu Hengli Hydraulic Co., Ltd., Class A |
|
|
|
|
|
|
45,700 |
|
|
|
|
|
|
|
293 |
|
|
|
Daikin Industries, Ltd. |
|
|
|
|
|
|
1,900 |
|
|
|
|
|
|
|
263 |
|
|
|
Wizz Air Holdings PLC1 |
|
|
|
|
|
|
9,176 |
|
|
|
|
|
|
|
260 |
|
|
|
International Container Terminal Services, Inc. |
|
|
|
|
|
|
40,750 |
|
|
|
|
|
|
|
243 |
|
|
|
VAT Group AG |
|
|
|
|
|
|
324 |
|
|
|
|
|
|
|
182 |
|
|
|
Shenzhen Inovance Technology Co., Ltd., Class A |
|
|
|
|
|
|
22,400 |
|
|
|
|
|
|
|
158 |
|
American Funds Insurance Series 58
International Growth and Income Fund (continued)
|
|
|
|
|
|
|
|
|
|
|
|
|
|
|
|
|
|
|
| Common stocks (continued) |
|
|
|
|
Shares |
|
|
|
|
|
Value (000) |
|
| Industrials (continued) |
|
DSV A/S |
|
|
|
|
|
|
887 |
|
|
|
|
|
|
$ |
136 |
|
|
|
Aalberts NV, non-registered shares |
|
|
|
|
|
|
2,901 |
|
|
|
|
|
|
|
118 |
|
|
|
LIXIL Corp. |
|
|
|
|
|
|
700 |
|
|
|
|
|
|
|
7 |
|
|
|
|
|
|
|
|
|
|
|
|
|
|
|
|
|
|
|
|
|
|
|
|
|
|
|
|
|
|
|
|
|
|
|
|
|
45,236 |
|
|
|
|
|
|
|
|
|
|
|
|
|
|
|
|
|
|
|
|
| |
|
|
|
|
|
|
|
|
|
|
|
|
|
|
|
|
|
|
| Consumer discretionary 9.99% |
|
Renault SA |
|
|
|
|
|
|
73,265 |
|
|
|
|
|
|
|
3,737 |
|
|
|
Industria de Diseño Textil, SA |
|
|
|
|
|
|
73,940 |
|
|
|
|
|
|
|
3,654 |
|
|
|
LVMH Moët Hennessy-Louis Vuitton SE |
|
|
|
|
|
|
3,178 |
|
|
|
|
|
|
|
2,441 |
|
|
|
Trip.com Group, Ltd. (ADR)1 |
|
|
|
|
|
|
39,070 |
|
|
|
|
|
|
|
1,836 |
|
|
|
Trip.com Group, Ltd.1 |
|
|
|
|
|
|
9,750 |
|
|
|
|
|
|
|
462 |
|
|
|
Evolution AB |
|
|
|
|
|
|
19,770 |
|
|
|
|
|
|
|
2,060 |
|
|
|
InterContinental Hotels Group PLC |
|
|
|
|
|
|
18,156 |
|
|
|
|
|
|
|
1,904 |
|
|
|
MGM China Holdings, Ltd. |
|
|
|
|
|
|
1,128,400 |
|
|
|
|
|
|
|
1,756 |
|
|
|
Prosus NV, Class N |
|
|
|
|
|
|
40,579 |
|
|
|
|
|
|
|
1,437 |
|
|
|
Restaurant Brands International, Inc. (CAD denominated) |
|
|
|
|
|
|
19,418 |
|
|
|
|
|
|
|
1,368 |
|
|
|
Midea Group Co., Ltd., Class A |
|
|
|
|
|
|
153,300 |
|
|
|
|
|
|
|
1,361 |
|
|
|
Stellantis NV |
|
|
|
|
|
|
55,477 |
|
|
|
|
|
|
|
1,091 |
|
|
|
B&M European Value Retail SA |
|
|
|
|
|
|
191,615 |
|
|
|
|
|
|
|
1,060 |
|
|
|
Wynn Macau, Ltd. |
|
|
|
|
|
|
1,149,600 |
|
|
|
|
|
|
|
943 |
|
|
|
Suzuki Motor Corp. |
|
|
|
|
|
|
78,000 |
|
|
|
|
|
|
|
903 |
|
|
|
Hyundai Motor Co. |
|
|
|
|
|
|
4,112 |
|
|
|
|
|
|
|
877 |
|
|
|
H World Group, Ltd. (ADR) |
|
|
|
|
|
|
23,966 |
|
|
|
|
|
|
|
799 |
|
|
|
Bajaj Auto, Ltd. |
|
|
|
|
|
|
6,556 |
|
|
|
|
|
|
|
746 |
|
|
|
Galaxy Entertainment Group, Ltd. |
|
|
|
|
|
|
130,361 |
|
|
|
|
|
|
|
607 |
|
|
|
Paltac Corp. |
|
|
|
|
|
|
21,000 |
|
|
|
|
|
|
|
571 |
|
|
|
D’Ieteren Group |
|
|
|
|
|
|
2,554 |
|
|
|
|
|
|
|
540 |
|
|
|
Amadeus IT Group SA, Class A, non-registered shares |
|
|
|
|
|
|
6,960 |
|
|
|
|
|
|
|
463 |
|
|
|
Nitori Holdings Co., Ltd. |
|
|
|
|
|
|
4,300 |
|
|
|
|
|
|
|
455 |
|
|
|
Entain PLC |
|
|
|
|
|
|
46,518 |
|
|
|
|
|
|
|
368 |
|
|
|
Dixon Technologies (India), Ltd. |
|
|
|
|
|
|
2,332 |
|
|
|
|
|
|
|
333 |
|
|
|
Sands China, Ltd.1 |
|
|
|
|
|
|
117,572 |
|
|
|
|
|
|
|
245 |
|
|
|
China Tourism Group Duty Free Corp., Ltd., Class A |
|
|
|
|
|
|
18,300 |
|
|
|
|
|
|
|
157 |
|
|
|
China Tourism Group Duty Free Corp., Ltd., Class H4 |
|
|
|
|
|
|
14,300 |
|
|
|
|
|
|
|
87 |
|
|
|
Compagnie Financière Richemont SA, Class A |
|
|
|
|
|
|
1,499 |
|
|
|
|
|
|
|
234 |
|
|
|
Maruti Suzuki India, Ltd. |
|
|
|
|
|
|
1,334 |
|
|
|
|
|
|
|
192 |
|
|
|
Vedant Fashions, Ltd.1 |
|
|
|
|
|
|
13,629 |
|
|
|
|
|
|
|
171 |
|
|
|
Kering SA |
|
|
|
|
|
|
352 |
|
|
|
|
|
|
|
128 |
|
|
|
|
|
|
|
|
|
|
|
|
|
|
|
|
|
|
|
|
|
|
|
|
|
|
|
|
|
|
|
|
|
|
|
|
|
32,986 |
|
|
|
|
|
|
|
|
|
|
|
|
|
|
|
|
|
|
|
|
| |
|
|
|
|
|
|
|
|
|
|
|
|
|
|
|
|
|
|
| Health care 8.68% |
|
Novo Nordisk AS, Class B |
|
|
|
|
|
|
78,488 |
|
|
|
|
|
|
|
11,212 |
|
|
|
AstraZeneca PLC |
|
|
|
|
|
|
54,092 |
|
|
|
|
|
|
|
8,433 |
|
|
|
Sanofi |
|
|
|
|
|
|
35,982 |
|
|
|
|
|
|
|
3,459 |
|
|
|
EssilorLuxottica SA |
|
|
|
|
|
|
9,832 |
|
|
|
|
|
|
|
2,109 |
|
|
|
Bayer AG |
|
|
|
|
|
|
32,527 |
|
|
|
|
|
|
|
920 |
|
|
|
HOYA Corp. |
|
|
|
|
|
|
4,800 |
|
|
|
|
|
|
|
562 |
|
|
|
Grifols, SA, Class B (ADR)1 |
|
|
|
|
|
|
86,548 |
|
|
|
|
|
|
|
546 |
|
|
|
Genus PLC |
|
|
|
|
|
|
19,907 |
|
|
|
|
|
|
|
416 |
|
|
|
Siemens Healthineers AG |
|
|
|
|
|
|
6,899 |
|
|
|
|
|
|
|
397 |
|
|
|
Roche Holding AG, nonvoting non-registered shares |
|
|
|
|
|
|
671 |
|
|
|
|
|
|
|
186 |
|
|
|
BeiGene, Ltd. (ADR)1 |
|
|
|
|
|
|
1,113 |
|
|
|
|
|
|
|
159 |
|
|
|
Hypera SA, ordinary nominative shares |
|
|
|
|
|
|
27,159 |
|
|
|
|
|
|
|
139 |
|
|
|
Max Healthcare Institute, Ltd. |
|
|
|
|
|
|
9,259 |
|
|
|
|
|
|
|
104 |
|
|
|
Euroapi SA1,4 |
|
|
|
|
|
|
1,412 |
|
|
|
|
|
|
|
4 |
|
|
|
|
|
|
|
|
|
|
|
|
|
|
|
|
|
|
|
|
|
|
|
|
|
|
|
|
|
|
|
|
|
|
|
|
|
28,646 |
|
|
|
|
|
|
|
|
|
|
|
|
|
|
|
|
|
|
|
|
| |
|
|
|
|
|
|
|
|
|
|
|
|
|
|
|
|
|
|
| Consumer staples 8.23% |
|
British American Tobacco PLC |
|
|
|
|
|
|
122,877 |
|
|
|
|
|
|
|
3,777 |
|
|
|
Philip Morris International, Inc. |
|
|
|
|
|
|
32,074 |
|
|
|
|
|
|
|
3,250 |
|
|
|
Nestlé SA |
|
|
|
|
|
|
26,134 |
|
|
|
|
|
|
|
2,668 |
|
|
|
Carlsberg A/S, Class B |
|
|
|
|
|
|
18,766 |
|
|
|
|
|
|
|
2,246 |
|
59 American Funds Insurance Series
International Growth and Income Fund (continued)
|
|
|
|
|
|
|
|
|
|
|
|
|
|
|
|
|
|
|
| Common stocks (continued) |
|
|
|
|
Shares |
|
|
|
|
|
Value (000) |
|
| Consumer staples (continued) |
|
Imperial Brands PLC |
|
|
|
|
|
|
74,106 |
|
|
|
|
|
|
$ |
1,897 |
|
|
|
Arca Continental, SAB de CV |
|
|
|
|
|
|
171,771 |
|
|
|
|
|
|
|
1,684 |
|
|
|
KT&G Corp. |
|
|
|
|
|
|
22,515 |
|
|
|
|
|
|
|
1,440 |
|
|
|
Anheuser-Busch InBev SA/NV |
|
|
|
|
|
|
21,630 |
|
|
|
|
|
|
|
1,250 |
|
|
|
Tsingtao Brewery Co., Ltd., Class H |
|
|
|
|
|
|
179,738 |
|
|
|
|
|
|
|
1,198 |
|
|
|
Carrefour SA, non-registered shares |
|
|
|
|
|
|
78,343 |
|
|
|
|
|
|
|
1,107 |
|
|
|
Pernod Ricard SA |
|
|
|
|
|
|
8,078 |
|
|
|
|
|
|
|
1,099 |
|
|
|
ITC, Ltd. |
|
|
|
|
|
|
164,549 |
|
|
|
|
|
|
|
835 |
|
|
|
L’Oréal SA, non-registered shares |
|
|
|
|
|
|
1,830 |
|
|
|
|
|
|
|
805 |
|
|
|
Kweichow Moutai Co., Ltd., Class A |
|
|
|
|
|
|
3,690 |
|
|
|
|
|
|
|
744 |
|
|
|
Asahi Group Holdings, Ltd.4 |
|
|
|
|
|
|
20,300 |
|
|
|
|
|
|
|
717 |
|
|
|
Ocado Group PLC1 |
|
|
|
|
|
|
161,370 |
|
|
|
|
|
|
|
590 |
|
|
|
Kimberly-Clark de México, SAB de CV, Class A, ordinary participation certificates |
|
|
|
|
|
|
328,401 |
|
|
|
|
|
|
|
568 |
|
|
|
Danone SA |
|
|
|
|
|
|
7,212 |
|
|
|
|
|
|
|
440 |
|
|
|
Uni-Charm Corp. |
|
|
|
|
|
|
10,000 |
|
|
|
|
|
|
|
320 |
|
|
|
Yamazaki Baking Co., Ltd. |
|
|
|
|
|
|
14,400 |
|
|
|
|
|
|
|
296 |
|
|
|
United Spirits, Ltd. |
|
|
|
|
|
|
14,813 |
|
|
|
|
|
|
|
227 |
|
|
|
|
|
|
|
|
|
|
|
|
|
|
|
|
|
|
|
|
|
|
|
|
|
|
|
|
|
|
|
|
|
|
|
|
|
27,158 |
|
|
|
|
|
|
|
|
|
|
|
|
|
|
|
|
|
|
|
|
| |
|
|
|
|
|
|
|
|
|
|
|
|
|
|
|
|
|
|
| Communication services 6.68% |
|
Koninklijke KPN NV |
|
|
|
|
|
|
1,146,738 |
|
|
|
|
|
|
|
4,395 |
|
|
|
Publicis Groupe SA |
|
|
|
|
|
|
40,982 |
|
|
|
|
|
|
|
4,344 |
|
|
|
Tencent Holdings, Ltd. |
|
|
|
|
|
|
66,200 |
|
|
|
|
|
|
|
3,142 |
|
|
|
Telefónica, SA, non-registered shares |
|
|
|
|
|
|
387,885 |
|
|
|
|
|
|
|
1,643 |
|
|
|
América Móvil, SAB de CV, Class B (ADR) |
|
|
|
|
|
|
88,684 |
|
|
|
|
|
|
|
1,508 |
|
|
|
BT Group PLC |
|
|
|
|
|
|
648,421 |
|
|
|
|
|
|
|
1,151 |
|
|
|
Universal Music Group NV |
|
|
|
|
|
|
33,264 |
|
|
|
|
|
|
|
986 |
|
|
|
MTN Group, Ltd. |
|
|
|
|
|
|
183,621 |
|
|
|
|
|
|
|
852 |
|
|
|
KANZHUN, Ltd., Class A (ADR) |
|
|
|
|
|
|
39,661 |
|
|
|
|
|
|
|
746 |
|
|
|
HYBE Co., Ltd. |
|
|
|
|
|
|
4,081 |
|
|
|
|
|
|
|
601 |
|
|
|
Vodafone Group PLC |
|
|
|
|
|
|
622,480 |
|
|
|
|
|
|
|
548 |
|
|
|
Indus Towers, Ltd.1 |
|
|
|
|
|
|
107,317 |
|
|
|
|
|
|
|
483 |
|
|
|
Deutsche Telekom AG |
|
|
|
|
|
|
17,672 |
|
|
|
|
|
|
|
445 |
|
|
|
Nippon Television Holdings, Inc. |
|
|
|
|
|
|
30,000 |
|
|
|
|
|
|
|
434 |
|
|
|
Nintendo Co., Ltd. |
|
|
|
|
|
|
5,900 |
|
|
|
|
|
|
|
315 |
|
|
|
NetEase, Inc. |
|
|
|
|
|
|
14,000 |
|
|
|
|
|
|
|
267 |
|
|
|
Singapore Telecommunications, Ltd. |
|
|
|
|
|
|
93,300 |
|
|
|
|
|
|
|
189 |
|
|
|
|
|
|
|
|
|
|
|
|
|
|
|
|
|
|
|
|
|
|
|
|
|
|
|
|
|
|
|
|
|
|
|
|
|
22,049 |
|
|
|
|
|
|
|
|
|
|
|
|
|
|
|
|
|
|
|
|
| |
|
|
|
|
|
|
|
|
|
|
|
|
|
|
|
|
|
|
| Energy 4.73% |
|
TotalEnergies SE |
|
|
|
|
|
|
100,699 |
|
|
|
|
|
|
|
6,711 |
|
|
|
BP PLC |
|
|
|
|
|
|
343,327 |
|
|
|
|
|
|
|
2,069 |
|
|
|
Cameco Corp. (CAD denominated) |
|
|
|
|
|
|
36,331 |
|
|
|
|
|
|
|
1,787 |
|
|
|
Canadian Natural Resources, Ltd. (CAD denominated) |
|
|
|
|
|
|
49,128 |
|
|
|
|
|
|
|
1,750 |
|
|
|
TC Energy Corp. (CAD denominated) |
|
|
|
|
|
|
27,477 |
|
|
|
|
|
|
|
1,042 |
|
|
|
Gaztransport & Technigaz SA |
|
|
|
|
|
|
4,499 |
|
|
|
|
|
|
|
586 |
|
|
|
Schlumberger NV |
|
|
|
|
|
|
11,717 |
|
|
|
|
|
|
|
553 |
|
|
|
Aker BP ASA |
|
|
|
|
|
|
17,760 |
|
|
|
|
|
|
|
453 |
|
|
|
Tourmaline Oil Corp. |
|
|
|
|
|
|
7,638 |
|
|
|
|
|
|
|
346 |
|
|
|
Cenovus Energy, Inc. (CAD denominated) |
|
|
|
|
|
|
9,026 |
|
|
|
|
|
|
|
177 |
|
|
|
Cenovus Energy, Inc. |
|
|
|
|
|
|
7,706 |
|
|
|
|
|
|
|
152 |
|
|
|
Sovcomflot PAO2 |
|
|
|
|
|
|
356,717 |
|
|
|
|
|
|
|
– |
3 |
|
|
Gazprom PJSC1,2 |
|
|
|
|
|
|
671,150 |
|
|
|
|
|
|
|
– |
3 |
|
|
LUKOIL Oil Co. PJSC2 |
|
|
|
|
|
|
9,706 |
|
|
|
|
|
|
|
– |
3 |
|
|
|
|
|
|
|
|
|
|
|
|
|
|
|
|
|
|
|
|
|
|
|
|
|
|
|
|
|
|
|
|
|
|
|
|
15,626 |
|
|
|
|
|
|
|
|
|
|
|
|
|
|
|
|
|
|
|
|
| |
|
|
|
|
|
|
|
|
|
|
|
|
|
|
|
|
|
|
| Materials 4.69% |
|
Linde PLC |
|
|
|
|
|
|
4,258 |
|
|
|
|
|
|
|
1,868 |
|
|
|
Glencore PLC |
|
|
|
|
|
|
304,423 |
|
|
|
|
|
|
|
1,736 |
|
|
|
Vale SA, ordinary nominative shares |
|
|
|
|
|
|
87,487 |
|
|
|
|
|
|
|
974 |
|
|
|
Vale SA (ADR), ordinary nominative shares |
|
|
|
|
|
|
50,572 |
|
|
|
|
|
|
|
565 |
|
|
|
Newmont Corp. |
|
|
|
|
|
|
32,906 |
|
|
|
|
|
|
|
1,378 |
|
American Funds Insurance Series 60
International Growth and Income Fund (continued)
|
|
|
|
|
|
|
|
|
|
|
|
|
|
|
|
|
|
|
| Common stocks (continued) |
|
|
|
|
Shares |
|
|
|
|
|
Value (000) |
|
| Materials (continued) |
|
Rio Tinto PLC |
|
|
|
|
|
|
19,684 |
|
|
|
|
|
|
$ |
1,296 |
|
|
|
Barrick Gold Corp. |
|
|
|
|
|
|
57,997 |
|
|
|
|
|
|
|
967 |
|
|
|
Air Liquide SA |
|
|
|
|
|
|
5,188 |
|
|
|
|
|
|
|
893 |
|
|
|
Fortescue, Ltd. |
|
|
|
|
|
|
56,612 |
|
|
|
|
|
|
|
809 |
|
|
|
Nutrien, Ltd. (CAD denominated) |
|
|
|
|
|
|
15,631 |
|
|
|
|
|
|
|
796 |
|
|
|
Holcim, Ltd. |
|
|
|
|
|
|
8,452 |
|
|
|
|
|
|
|
750 |
|
|
|
Freeport-McMoRan, Inc. |
|
|
|
|
|
|
13,272 |
|
|
|
|
|
|
|
645 |
|
|
|
Grupo México, SAB de CV, Series B |
|
|
|
|
|
|
94,371 |
|
|
|
|
|
|
|
508 |
|
|
|
Sika AG |
|
|
|
|
|
|
1,728 |
|
|
|
|
|
|
|
492 |
|
|
|
First Quantum Minerals, Ltd. |
|
|
|
|
|
|
30,289 |
|
|
|
|
|
|
|
398 |
|
|
|
Givaudan SA |
|
|
|
|
|
|
72 |
|
|
|
|
|
|
|
341 |
|
|
|
Franco-Nevada Corp. |
|
|
|
|
|
|
2,845 |
|
|
|
|
|
|
|
337 |
|
|
|
Shin-Etsu Chemical Co., Ltd. |
|
|
|
|
|
|
8,500 |
|
|
|
|
|
|
|
330 |
|
|
|
Anhui Conch Cement Co., Ltd., Class H |
|
|
|
|
|
|
75,000 |
|
|
|
|
|
|
|
178 |
|
|
|
Fresnillo PLC |
|
|
|
|
|
|
23,302 |
|
|
|
|
|
|
|
166 |
|
|
|
Asahi Kasei Corp. |
|
|
|
|
|
|
10,100 |
|
|
|
|
|
|
|
65 |
|
|
|
Alrosa PJSC2 |
|
|
|
|
|
|
53,607 |
|
|
|
|
|
|
|
– |
3 |
|
|
|
|
|
|
|
|
|
|
|
|
|
|
|
|
|
|
|
|
|
|
|
|
|
|
|
|
|
|
|
|
|
|
|
|
15,492 |
|
|
|
|
|
|
|
|
|
|
|
|
|
|
|
|
|
|
|
|
| |
|
|
|
|
|
|
|
|
|
|
|
|
|
|
|
|
|
|
| Utilities 1.95% |
|
Engie SA |
|
|
|
|
|
|
156,038 |
|
|
|
|
|
|
|
2,223 |
|
|
|
SSE PLC |
|
|
|
|
|
|
54,244 |
|
|
|
|
|
|
|
1,223 |
|
|
|
Brookfield Infrastructure Partners, LP |
|
|
|
|
|
|
35,300 |
|
|
|
|
|
|
|
970 |
|
|
|
Iberdrola, SA, non-registered shares |
|
|
|
|
|
|
67,138 |
|
|
|
|
|
|
|
871 |
|
|
|
Veolia Environnement SA |
|
|
|
|
|
|
17,566 |
|
|
|
|
|
|
|
527 |
|
|
|
ENN Energy Holdings, Ltd. |
|
|
|
|
|
|
38,759 |
|
|
|
|
|
|
|
319 |
|
|
|
National Grid PLC |
|
|
|
|
|
|
25,946 |
|
|
|
|
|
|
|
289 |
|
|
|
|
|
|
|
|
|
|
|
|
|
|
|
|
|
|
|
|
|
|
|
|
|
|
|
|
|
|
|
|
|
|
|
|
|
6,422 |
|
|
|
|
|
|
|
|
|
|
|
|
|
|
|
|
|
|
|
|
| |
|
|
|
|
|
|
|
|
|
|
|
|
|
|
|
|
|
|
| Real estate 1.54% |
|
CK Asset Holdings, Ltd. |
|
|
|
|
|
|
393,500 |
|
|
|
|
|
|
|
1,473 |
|
|
|
Mitsubishi Estate Co., Ltd. |
|
|
|
|
|
|
65,100 |
|
|
|
|
|
|
|
1,026 |
|
|
|
Prologis Property Mexico, SA de CV, REIT |
|
|
|
|
|
|
257,827 |
|
|
|
|
|
|
|
842 |
|
|
|
Embassy Office Parks REIT |
|
|
|
|
|
|
154,717 |
|
|
|
|
|
|
|
658 |
|
|
|
Link REIT |
|
|
|
|
|
|
127,868 |
|
|
|
|
|
|
|
497 |
|
|
|
Longfor Group Holdings, Ltd. |
|
|
|
|
|
|
359,742 |
|
|
|
|
|
|
|
493 |
|
|
|
Macrotech Developers, Ltd. |
|
|
|
|
|
|
5,414 |
|
|
|
|
|
|
|
97 |
|
|
|
|
|
|
|
|
|
|
|
|
|
|
|
|
|
|
|
|
|
|
|
|
|
|
|
|
|
|
|
|
|
|
|
|
|
5,086 |
|
|
|
|
|
|
|
|
|
|
|
|
|
|
|
|
|
|
|
|
|
|
Total common stocks (cost: $250,671,000) |
|
|
|
|
|
|
|
|
|
|
|
|
|
|
309,119 |
|
|
|
|
|
|
|
|
|
|
|
|
|
|
|
|
|
|
|
|
|
|
|
|
|
| Preferred securities 0.13% |
|
|
|
|
|
|
|
|
|
|
|
|
| Materials 0.07% |
|
Gerdau SA, preferred nominative shares |
|
|
|
|
|
|
75,098 |
|
|
|
|
|
|
|
247 |
|
|
|
|
|
|
|
|
|
|
|
|
|
|
|
|
|
|
|
|
| |
|
|
|
|
|
|
|
|
|
|
|
|
|
|
|
|
|
|
| Information technology 0.06% |
|
Samsung Electronics Co., Ltd., nonvoting preferred shares |
|
|
|
|
|
|
4,070 |
|
|
|
|
|
|
|
187 |
|
|
|
|
|
|
|
|
|
|
|
|
|
|
|
|
|
|
|
|
|
|
Total preferred securities (cost: $503,000) |
|
|
|
|
|
|
|
|
|
|
|
|
|
|
434 |
|
|
|
|
|
|
|
|
|
|
|
|
|
|
|
|
|
|
|
|
61 American Funds Insurance Series
International Growth and Income Fund (continued)
|
|
|
|
|
|
|
|
|
|
|
|
|
|
|
|
|
|
|
| Short-term securities 5.91% |
|
|
|
|
Shares |
|
|
|
|
|
Value (000) |
|
|
|
|
|
|
| Money market investments 5.91% |
|
|
|
|
|
|
|
|
|
|
|
|
|
|
|
|
|
|
Capital Group Central Cash Fund 5.37%5,6 |
|
|
|
|
|
|
195,197 |
|
|
|
|
|
|
$ |
19,520 |
|
|
|
|
|
|
|
|
|
|
|
|
|
|
|
|
|
|
|
|
|
|
Total short-term securities (cost: $19,517,000) |
|
|
|
|
|
|
|
|
|
|
|
|
|
|
19,520 |
|
|
|
|
|
|
|
|
|
|
|
|
|
|
|
|
|
|
|
|
|
|
|
|
|
|
|
|
Total investment securities 99.70% (cost: $270,691,000) |
|
|
|
|
|
|
|
|
|
|
|
|
|
|
329,073 |
|
|
|
Other assets less liabilities 0.30% |
|
|
|
|
|
|
|
|
|
|
|
|
|
|
978 |
|
|
|
|
|
|
|
|
|
|
|
|
|
|
|
|
|
|
|
|
|
|
|
|
|
|
|
|
Net assets 100.00% |
|
|
|
|
|
|
|
|
|
|
|
|
|
$ |
330,051 |
|
|
|
|
|
|
|
|
|
|
|
|
|
|
|
|
|
|
|
|
|
|
|
|
|
|
|
|
|
|
|
|
|
|
|
|
|
|
|
|
|
|
|
|
|
|
|
|
|
|
|
|
|
|
|
|
|
|
|
|
|
|
|
|
|
| Investments in affiliates6 |
|
|
|
|
|
|
|
|
|
|
|
|
|
|
|
|
|
|
|
|
|
|
|
|
|
|
|
|
|
|
|
|
|
| |
|
|
|
|
|
|
|
| |
|
Value at 1/1/2024 (000) |
|
|
Additions (000) |
|
|
Reductions (000) |
|
|
Net realized gain (loss) (000) |
|
|
Net unrealized appreciation (depreciation) (000) |
|
|
Value at 6/30/2024 (000) |
|
|
Dividend or interest income (000) |
|
|
|
|
|
|
|
|
|
|
|
|
|
| Short-term securities 5.91% |
|
|
|
|
|
|
|
|
|
|
|
|
|
|
|
|
|
|
|
|
|
|
|
|
|
|
|
|
|
|
|
|
|
|
|
|
|
|
|
|
|
|
|
|
| Money market investments 5.91% |
|
|
|
|
|
|
|
|
|
|
|
|
|
|
|
|
|
|
|
|
|
|
|
|
|
|
|
|
|
|
|
|
|
|
|
|
|
|
|
|
|
|
|
|
| Capital Group Central Cash Fund 5.37%5 |
|
|
$10,070 |
|
|
|
$35,411 |
|
|
|
$25,962 |
|
|
|
|
|
|
|
$–
|
3 |
|
|
|
|
|
|
$1 |
|
|
|
|
|
|
|
$19,520 |
|
|
|
|
|
|
|
$385 |
|
| 1 |
Security did not produce income during the last 12 months. |
| 2 |
Value determined using significant unobservable inputs. |
| 3 |
Amount less than one thousand. |
| 4 |
All or a portion of this security was on loan. The total value of all such securities was $715,000, which represented .22% of the net assets of the fund. Refer to Note 5 for more information on securities lending. |
| 5 |
Rate represents the seven-day yield at 6/30/2024. |
| 6 |
Part of the same “group of investment companies“ as the fund as defined under the Investment Company Act of 1940, as amended. |
Key to abbreviation(s)
ADR = American Depositary Receipts
CAD = Canadian dollars
GBP = British pounds
HKD = Hong Kong dollars
REIT = Real Estate Investment Trust
Refer to the notes to financial statements.
American Funds Insurance Series 62
|
|
|
| Capital Income Builder |
|
|
|
|
| Investment portfolio June 30, 2024 |
|
unaudited |
|
|
|
|
|
|
|
|
|
|
|
| Common stocks 78.04% |
|
Shares |
|
|
Value (000) |
|
|
|
|
|
| Financials 12.98% |
|
JPMorgan Chase & Co. |
|
|
86,767 |
|
|
$ |
17,549 |
|
|
|
Zurich Insurance Group AG |
|
|
25,555 |
|
|
|
13,596 |
|
|
|
Morgan Stanley |
|
|
100,945 |
|
|
|
9,811 |
|
|
|
BlackRock, Inc. |
|
|
11,956 |
|
|
|
9,413 |
|
|
|
CME Group, Inc., Class A |
|
|
41,646 |
|
|
|
8,188 |
|
|
|
Münchener Rückversicherungs-Gesellschaft AG |
|
|
15,062 |
|
|
|
7,531 |
|
|
|
DBS Group Holdings, Ltd. |
|
|
274,816 |
|
|
|
7,242 |
|
|
|
ING Groep NV |
|
|
418,792 |
|
|
|
7,176 |
|
|
|
PNC Financial Services Group, Inc. |
|
|
34,083 |
|
|
|
5,299 |
|
|
|
Power Corporation of Canada, subordinate voting shares1 |
|
|
165,641 |
|
|
|
4,603 |
|
|
|
Intact Financial Corp. |
|
|
26,141 |
|
|
|
4,357 |
|
|
|
Kaspi.kz JSC (GDR)2 |
|
|
21,756 |
|
|
|
2,807 |
|
|
|
Kaspi.kz JSC (ADR) |
|
|
9,355 |
|
|
|
1,207 |
|
|
|
AIA Group, Ltd. |
|
|
523,553 |
|
|
|
3,550 |
|
|
|
Wells Fargo & Co. |
|
|
58,806 |
|
|
|
3,492 |
|
|
|
American International Group, Inc. |
|
|
46,102 |
|
|
|
3,423 |
|
|
|
B3 SA - Brasil, Bolsa, Balcao |
|
|
1,785,756 |
|
|
|
3,271 |
|
|
|
Citizens Financial Group, Inc. |
|
|
85,401 |
|
|
|
3,077 |
|
|
|
Apollo Asset Management, Inc. |
|
|
25,493 |
|
|
|
3,010 |
|
|
|
Truist Financial Corp. |
|
|
72,170 |
|
|
|
2,804 |
|
|
|
Hana Financial Group, Inc. |
|
|
62,338 |
|
|
|
2,733 |
|
|
|
Swedbank AB, Class A |
|
|
118,149 |
|
|
|
2,438 |
|
|
|
360 ONE WAM, Ltd. |
|
|
203,766 |
|
|
|
2,382 |
|
|
|
Great-West Lifeco, Inc. |
|
|
76,851 |
|
|
|
2,242 |
|
|
|
Blackstone, Inc. |
|
|
17,696 |
|
|
|
2,191 |
|
|
|
East West Bancorp, Inc. |
|
|
29,849 |
|
|
|
2,186 |
|
|
|
Bank Central Asia Tbk PT |
|
|
3,326,500 |
|
|
|
2,007 |
|
|
|
Toronto-Dominion Bank (The) (CAD denominated) |
|
|
36,395 |
|
|
|
2,001 |
|
|
|
Principal Financial Group, Inc. |
|
|
23,609 |
|
|
|
1,852 |
|
|
|
3i Group PLC |
|
|
41,828 |
|
|
|
1,613 |
|
|
|
NatWest Group PLC |
|
|
407,223 |
|
|
|
1,597 |
|
|
|
EFG International AG |
|
|
107,876 |
|
|
|
1,587 |
|
|
|
BNP Paribas SA |
|
|
24,071 |
|
|
|
1,542 |
|
|
|
Skandinaviska Enskilda Banken AB, Class A |
|
|
98,973 |
|
|
|
1,466 |
|
|
|
UniCredit SpA |
|
|
37,589 |
|
|
|
1,401 |
|
|
|
Banco Bilbao Vizcaya Argentaria, SA |
|
|
139,712 |
|
|
|
1,394 |
|
|
|
Webster Financial Corp. |
|
|
31,946 |
|
|
|
1,393 |
|
|
|
State Street Corp. |
|
|
18,578 |
|
|
|
1,375 |
|
|
|
TPG, Inc., Class A |
|
|
30,962 |
|
|
|
1,283 |
|
|
|
KBC Groep NV |
|
|
17,609 |
|
|
|
1,242 |
|
|
|
Western Union Co. |
|
|
93,040 |
|
|
|
1,137 |
|
|
|
National Bank of Canada |
|
|
13,863 |
|
|
|
1,100 |
|
|
|
Banco Santander, SA |
|
|
230,887 |
|
|
|
1,070 |
|
|
|
Bank Mandiri (Persero) Tbk PT |
|
|
2,858,800 |
|
|
|
1,068 |
|
|
|
Hong Kong Exchanges and Clearing, Ltd. |
|
|
33,200 |
|
|
|
1,058 |
|
|
|
Euronext NV |
|
|
10,922 |
|
|
|
1,008 |
|
|
|
United Overseas Bank, Ltd. |
|
|
37,700 |
|
|
|
871 |
|
|
|
DNB Bank ASA |
|
|
43,603 |
|
|
|
856 |
|
|
|
Patria Investments, Ltd., Class A |
|
|
63,717 |
|
|
|
768 |
|
|
|
China Pacific Insurance (Group) Co., Ltd., Class H |
|
|
277,950 |
|
|
|
678 |
|
|
|
Tokio Marine Holdings, Inc. |
|
|
17,500 |
|
|
|
657 |
|
|
|
Vontobel Holding AG |
|
|
10,823 |
|
|
|
648 |
|
|
|
Fukuoka Financial Group, Inc. |
|
|
19,200 |
|
|
|
515 |
|
|
|
Houlihan Lokey, Inc., Class A |
|
|
3,658 |
|
|
|
493 |
|
|
|
Bank of Montreal |
|
|
4,550 |
|
|
|
382 |
|
|
|
Resona Holdings, Inc. |
|
|
35,400 |
|
|
|
235 |
|
|
|
Deutsche Bank AG |
|
|
9,889 |
|
|
|
158 |
|
|
|
Moscow Exchange MICEX-RTS PJSC3 |
|
|
875,002 |
|
|
|
– |
4 |
|
|
Sberbank of Russia PJSC3 |
|
|
204,176 |
|
|
|
– |
4 |
|
|
|
|
|
|
|
|
|
|
|
|
|
|
|
|
|
|
|
|
170,033 |
|
|
|
|
|
|
|
|
|
|
|
|
63 American Funds Insurance Series
Capital Income Builder (continued)
|
|
|
|
|
|
|
|
|
|
|
| Common stocks (continued) |
|
Shares |
|
|
Value (000) |
|
|
|
|
|
| Information technology 11.61% |
|
Broadcom, Inc. |
|
|
35,027 |
|
|
$ |
56,237 |
|
|
|
Microsoft Corp. |
|
|
67,439 |
|
|
|
30,142 |
|
|
|
Taiwan Semiconductor Manufacturing Co., Ltd. |
|
|
659,800 |
|
|
|
19,623 |
|
|
|
Texas Instruments, Inc. |
|
|
53,452 |
|
|
|
10,398 |
|
|
|
KLA Corp. |
|
|
7,281 |
|
|
|
6,003 |
|
|
|
Seagate Technology Holdings PLC |
|
|
55,323 |
|
|
|
5,713 |
|
|
|
Samsung Electronics Co., Ltd. |
|
|
74,874 |
|
|
|
4,400 |
|
|
|
SAP SE |
|
|
18,492 |
|
|
|
3,755 |
|
|
|
Analog Devices, Inc. |
|
|
15,346 |
|
|
|
3,503 |
|
|
|
Accenture PLC, Class A |
|
|
10,703 |
|
|
|
3,247 |
|
|
|
TDK Corp. |
|
|
42,200 |
|
|
|
2,579 |
|
|
|
Tokyo Electron, Ltd. |
|
|
8,700 |
|
|
|
1,911 |
|
|
|
GlobalWafers Co., Ltd. |
|
|
92,938 |
|
|
|
1,537 |
|
|
|
HCL Technologies, Ltd. |
|
|
82,600 |
|
|
|
1,441 |
|
|
|
Intel Corp. |
|
|
29,886 |
|
|
|
926 |
|
|
|
Capgemini SE |
|
|
2,349 |
|
|
|
465 |
|
|
|
BE Semiconductor Industries NV |
|
|
1,523 |
|
|
|
254 |
|
|
|
|
|
|
|
|
|
|
|
|
|
|
|
|
|
|
|
|
|
152,134 |
|
|
|
|
|
|
|
|
|
|
|
|
|
|
|
|
|
|
|
|
|
|
|
| |
|
|
|
| Health care 9.86% |
|
AbbVie, Inc. |
|
|
172,276 |
|
|
|
29,549 |
|
|
|
Abbott Laboratories |
|
|
150,609 |
|
|
|
15,650 |
|
|
|
AstraZeneca PLC |
|
|
93,359 |
|
|
|
14,554 |
|
|
|
Amgen, Inc. |
|
|
43,722 |
|
|
|
13,661 |
|
|
|
Gilead Sciences, Inc. |
|
|
198,811 |
|
|
|
13,640 |
|
|
|
Sanofi |
|
|
82,690 |
|
|
|
7,948 |
|
|
|
Medtronic PLC |
|
|
76,952 |
|
|
|
6,057 |
|
|
|
Bristol-Myers Squibb Co. |
|
|
99,925 |
|
|
|
4,150 |
|
|
|
UnitedHealth Group, Inc. |
|
|
8,005 |
|
|
|
4,077 |
|
|
|
Merck & Co., Inc. |
|
|
29,723 |
|
|
|
3,680 |
|
|
|
Roche Holding AG, nonvoting non-registered shares |
|
|
12,267 |
|
|
|
3,404 |
|
|
|
CVS Health Corp. |
|
|
57,311 |
|
|
|
3,385 |
|
|
|
Novartis AG |
|
|
20,454 |
|
|
|
2,191 |
|
|
|
GSK PLC |
|
|
104,736 |
|
|
|
2,019 |
|
|
|
EssilorLuxottica SA |
|
|
8,529 |
|
|
|
1,830 |
|
|
|
Takeda Pharmaceutical Co., Ltd. |
|
|
60,125 |
|
|
|
1,559 |
|
|
|
EBOS Group, Ltd. |
|
|
65,279 |
|
|
|
1,281 |
|
|
|
Pfizer, Inc. |
|
|
18,765 |
|
|
|
525 |
|
|
|
|
|
|
|
|
|
|
|
|
|
|
|
|
|
|
|
|
|
129,160 |
|
|
|
|
|
|
|
|
|
|
|
|
|
|
|
|
|
|
|
|
|
|
|
| |
|
|
|
| Industrials 9.11% |
|
RTX Corp. |
|
|
236,467 |
|
|
|
23,739 |
|
|
|
Siemens AG |
|
|
44,233 |
|
|
|
8,227 |
|
|
|
BAE Systems PLC |
|
|
410,089 |
|
|
|
6,847 |
|
|
|
Union Pacific Corp. |
|
|
28,014 |
|
|
|
6,338 |
|
|
|
Volvo AB, Class B |
|
|
232,382 |
|
|
|
5,961 |
|
|
|
Deutsche Post AG |
|
|
133,097 |
|
|
|
5,385 |
|
|
|
FedEx Corp. |
|
|
17,608 |
|
|
|
5,280 |
|
|
|
Honeywell International, Inc. |
|
|
24,572 |
|
|
|
5,247 |
|
|
|
RELX PLC |
|
|
113,100 |
|
|
|
5,185 |
|
|
|
Mitsubishi Corp. |
|
|
237,481 |
|
|
|
4,671 |
|
|
|
Paychex, Inc. |
|
|
37,913 |
|
|
|
4,495 |
|
|
|
SGS SA |
|
|
44,778 |
|
|
|
3,984 |
|
|
|
Carrier Global Corp. |
|
|
62,055 |
|
|
|
3,914 |
|
|
|
Marubeni Corp. |
|
|
199,500 |
|
|
|
3,727 |
|
|
|
Singapore Technologies Engineering, Ltd. |
|
|
1,018,100 |
|
|
|
3,251 |
|
|
|
Broadridge Financial Solutions, Inc. |
|
|
15,016 |
|
|
|
2,958 |
|
|
|
Canadian National Railway Co. (CAD denominated) |
|
|
23,492 |
|
|
|
2,776 |
|
|
|
Automatic Data Processing, Inc. |
|
|
10,954 |
|
|
|
2,615 |
|
|
|
Trinity Industries, Inc. |
|
|
78,562 |
|
|
|
2,351 |
|
|
|
Trelleborg AB, Class B |
|
|
41,358 |
|
|
|
1,602 |
|
|
|
ITOCHU Corp. |
|
|
30,300 |
|
|
|
1,487 |
|
American Funds Insurance Series 64
Capital Income Builder (continued)
|
|
|
|
|
|
|
|
|
|
|
| Common stocks (continued) |
|
Shares |
|
|
Value (000) |
|
| Industrials (continued) |
|
Schneider Electric SE |
|
|
6,137 |
|
|
$ |
1,464 |
|
|
|
Bureau Veritas SA |
|
|
50,133 |
|
|
|
1,384 |
|
|
|
Compañia de Distribución Integral Logista Holdings, SA, non-registered shares |
|
|
47,027 |
|
|
|
1,328 |
|
|
|
Northrop Grumman Corp. |
|
|
2,555 |
|
|
|
1,114 |
|
|
|
Waste Management, Inc. |
|
|
4,833 |
|
|
|
1,031 |
|
|
|
General Dynamics Corp. |
|
|
2,797 |
|
|
|
812 |
|
|
|
Sulzer AG |
|
|
5,049 |
|
|
|
698 |
|
|
|
Illinois Tool Works, Inc. |
|
|
2,886 |
|
|
|
684 |
|
|
|
Airbus SE, non-registered shares |
|
|
3,930 |
|
|
|
542 |
|
|
|
Epiroc AB, Class B |
|
|
12,727 |
|
|
|
232 |
|
|
|
UL Solutions, Inc., Class A |
|
|
1,100 |
|
|
|
46 |
|
|
|
|
|
|
|
|
|
|
|
|
|
|
|
|
|
|
|
|
|
119,375 |
|
|
|
|
|
|
|
|
|
|
|
|
|
|
|
|
|
|
|
|
|
|
|
| |
|
|
|
| Consumer staples 8.72% |
|
Philip Morris International, Inc. |
|
|
307,980 |
|
|
|
31,208 |
|
|
|
British American Tobacco PLC |
|
|
361,768 |
|
|
|
11,121 |
|
|
|
British American Tobacco PLC (ADR) |
|
|
65,265 |
|
|
|
2,018 |
|
|
|
Mondelez International, Inc., Class A |
|
|
136,791 |
|
|
|
8,952 |
|
|
|
Nestlé SA |
|
|
73,098 |
|
|
|
7,462 |
|
|
|
Imperial Brands PLC |
|
|
231,107 |
|
|
|
5,917 |
|
|
|
General Mills, Inc. |
|
|
85,961 |
|
|
|
5,438 |
|
|
|
PepsiCo, Inc. |
|
|
29,747 |
|
|
|
4,906 |
|
|
|
Dollar General Corp. |
|
|
34,248 |
|
|
|
4,529 |
|
|
|
ITC, Ltd. |
|
|
817,623 |
|
|
|
4,149 |
|
|
|
Procter & Gamble Co. |
|
|
19,722 |
|
|
|
3,253 |
|
|
|
Altria Group, Inc. |
|
|
70,341 |
|
|
|
3,204 |
|
|
|
Carlsberg A/S, Class B |
|
|
23,465 |
|
|
|
2,808 |
|
|
|
Danone SA |
|
|
43,223 |
|
|
|
2,638 |
|
|
|
Kimberly-Clark Corp. |
|
|
18,542 |
|
|
|
2,562 |
|
|
|
Sysco Corp. |
|
|
29,707 |
|
|
|
2,121 |
|
|
|
Diageo PLC |
|
|
61,994 |
|
|
|
1,950 |
|
|
|
Asahi Group Holdings, Ltd.1 |
|
|
53,600 |
|
|
|
1,893 |
|
|
|
Seven & i Holdings Co., Ltd. |
|
|
122,700 |
|
|
|
1,494 |
|
|
|
Kao Corp.1 |
|
|
36,200 |
|
|
|
1,471 |
|
|
|
WH Group, Ltd. |
|
|
2,047,500 |
|
|
|
1,347 |
|
|
|
Molson Coors Beverage Co., Class B, restricted voting shares |
|
|
21,854 |
|
|
|
1,111 |
|
|
|
Anheuser-Busch InBev SA/NV |
|
|
14,423 |
|
|
|
833 |
|
|
|
Pernod Ricard SA |
|
|
6,104 |
|
|
|
831 |
|
|
|
Kenvue, Inc. |
|
|
29,864 |
|
|
|
543 |
|
|
|
Scandinavian Tobacco Group A/S |
|
|
24,914 |
|
|
|
352 |
|
|
|
Vector Group, Ltd. |
|
|
7,500 |
|
|
|
79 |
|
|
|
|
|
|
|
|
|
|
|
|
|
|
|
|
|
|
|
|
|
114,190 |
|
|
|
|
|
|
|
|
|
|
|
|
|
|
|
|
|
|
|
|
|
|
|
| |
|
|
|
| Energy 6.26% |
|
Canadian Natural Resources, Ltd. (CAD denominated) |
|
|
397,400 |
|
|
|
14,155 |
|
|
|
Exxon Mobil Corp. |
|
|
104,989 |
|
|
|
12,086 |
|
|
|
TC Energy Corp. (CAD denominated)1 |
|
|
286,565 |
|
|
|
10,863 |
|
|
|
Shell PLC (GBP denominated) |
|
|
270,995 |
|
|
|
9,739 |
|
|
|
Shell PLC (ADR) |
|
|
9,377 |
|
|
|
677 |
|
|
|
EOG Resources, Inc. |
|
|
69,270 |
|
|
|
8,719 |
|
|
|
BP PLC |
|
|
1,055,455 |
|
|
|
6,360 |
|
|
|
TotalEnergies SE |
|
|
77,762 |
|
|
|
5,183 |
|
|
|
ConocoPhillips |
|
|
34,075 |
|
|
|
3,897 |
|
|
|
Chevron Corp. |
|
|
19,728 |
|
|
|
3,086 |
|
|
|
Equitrans Midstream Corp. |
|
|
202,127 |
|
|
|
2,624 |
|
|
|
Cenovus Energy, Inc. |
|
|
64,079 |
|
|
|
1,260 |
|
|
|
Cenovus Energy, Inc. (CAD denominated) |
|
|
33,067 |
|
|
|
650 |
|
|
|
DT Midstream, Inc. |
|
|
15,549 |
|
|
|
1,104 |
|
65 American Funds Insurance Series
Capital Income Builder (continued)
|
|
|
|
|
|
|
|
|
|
|
| Common stocks (continued) |
|
Shares |
|
|
Value (000) |
|
| Energy (continued) |
|
Neste OYJ |
|
|
44,705 |
|
|
$ |
793 |
|
|
|
Schlumberger NV |
|
|
16,544 |
|
|
|
780 |
|
|
|
Gazprom PJSC3,5 |
|
|
880,428 |
|
|
|
– |
4 |
|
|
|
|
|
|
|
|
|
|
|
|
|
|
|
|
|
|
|
|
81,976 |
|
|
|
|
|
|
|
|
|
|
|
|
|
|
|
|
|
|
|
|
|
|
|
| |
|
|
|
| Utilities 6.08% |
|
SSE PLC |
|
|
345,541 |
|
|
|
7,794 |
|
|
|
Engie SA |
|
|
523,498 |
|
|
|
7,456 |
|
|
|
E.ON SE |
|
|
499,028 |
|
|
|
6,540 |
|
|
|
Dominion Energy, Inc. |
|
|
129,918 |
|
|
|
6,366 |
|
|
|
Iberdrola, SA, non-registered shares |
|
|
484,339 |
|
|
|
6,283 |
|
|
|
Edison International |
|
|
81,700 |
|
|
|
5,867 |
|
|
|
DTE Energy Co. |
|
|
52,323 |
|
|
|
5,808 |
|
|
|
Duke Energy Corp. |
|
|
51,699 |
|
|
|
5,182 |
|
|
|
Pinnacle West Capital Corp. |
|
|
58,175 |
|
|
|
4,443 |
|
|
|
Sempra |
|
|
56,345 |
|
|
|
4,286 |
|
|
|
Southern Co. (The) |
|
|
53,023 |
|
|
|
4,113 |
|
|
|
CenterPoint Energy, Inc. |
|
|
127,057 |
|
|
|
3,936 |
|
|
|
AES Corp. |
|
|
179,235 |
|
|
|
3,149 |
|
|
|
Entergy Corp. |
|
|
25,916 |
|
|
|
2,773 |
|
|
|
National Grid PLC |
|
|
242,338 |
|
|
|
2,702 |
|
|
|
SembCorp Industries, Ltd. |
|
|
254,500 |
|
|
|
900 |
|
|
|
ENN Energy Holdings, Ltd. |
|
|
99,100 |
|
|
|
816 |
|
|
|
Power Grid Corporation of India, Ltd. |
|
|
172,853 |
|
|
|
682 |
|
|
|
Power Assets Holdings, Ltd. |
|
|
117,500 |
|
|
|
633 |
|
|
|
|
|
|
|
|
|
|
|
|
|
|
|
|
|
|
|
|
|
79,729 |
|
|
|
|
|
|
|
|
|
|
|
|
|
|
|
|
|
|
|
|
|
|
|
| |
|
|
|
| Consumer discretionary 4.33% |
|
McDonald’s Corp. |
|
|
35,746 |
|
|
|
9,110 |
|
|
|
Home Depot, Inc. |
|
|
24,120 |
|
|
|
8,303 |
|
|
|
LVMH Moët Hennessy-Louis Vuitton SE |
|
|
8,203 |
|
|
|
6,299 |
|
|
|
YUM! Brands, Inc. |
|
|
29,699 |
|
|
|
3,934 |
|
|
|
Industria de Diseño Textil, SA |
|
|
68,847 |
|
|
|
3,402 |
|
|
|
Midea Group Co., Ltd., Class A |
|
|
378,475 |
|
|
|
3,361 |
|
|
|
Restaurant Brands International, Inc. |
|
|
40,800 |
|
|
|
2,871 |
|
|
|
Tractor Supply Co. |
|
|
9,884 |
|
|
|
2,669 |
|
|
|
Darden Restaurants, Inc. |
|
|
17,308 |
|
|
|
2,619 |
|
|
|
Stellantis NV |
|
|
129,220 |
|
|
|
2,541 |
|
|
|
Vail Resorts, Inc. |
|
|
11,999 |
|
|
|
2,161 |
|
|
|
NEXT PLC |
|
|
15,514 |
|
|
|
1,774 |
|
|
|
Galaxy Entertainment Group, Ltd. |
|
|
271,000 |
|
|
|
1,262 |
|
|
|
Kering SA |
|
|
3,432 |
|
|
|
1,248 |
|
|
|
Starbucks Corp. |
|
|
10,911 |
|
|
|
849 |
|
|
|
Bridgestone Corp.1 |
|
|
20,700 |
|
|
|
816 |
|
|
|
Compagnie Financière Richemont SA, Class A |
|
|
5,082 |
|
|
|
793 |
|
|
|
Hasbro, Inc. |
|
|
11,938 |
|
|
|
698 |
|
|
|
International Game Technology PLC |
|
|
22,715 |
|
|
|
465 |
|
|
|
Amadeus IT Group SA, Class A, non-registered shares |
|
|
6,772 |
|
|
|
451 |
|
|
|
OPAP SA |
|
|
26,284 |
|
|
|
412 |
|
|
|
Jumbo SA |
|
|
13,271 |
|
|
|
381 |
|
|
|
Inchcape PLC |
|
|
31,417 |
|
|
|
296 |
|
|
|
|
|
|
|
|
|
|
|
|
|
|
|
|
|
|
|
|
|
56,715 |
|
|
|
|
|
|
|
|
|
|
|
|
|
|
|
|
|
|
|
|
|
|
|
| |
|
|
|
| Real estate 4.02% |
|
VICI Properties, Inc. REIT |
|
|
624,137 |
|
|
|
17,875 |
|
|
|
Extra Space Storage, Inc. REIT |
|
|
34,866 |
|
|
|
5,419 |
|
|
|
Public Storage REIT |
|
|
12,858 |
|
|
|
3,699 |
|
|
|
Rexford Industrial Realty, Inc. REIT |
|
|
82,059 |
|
|
|
3,659 |
|
|
|
American Tower Corp. REIT |
|
|
15,959 |
|
|
|
3,102 |
|
|
|
Prologis, Inc. REIT |
|
|
26,182 |
|
|
|
2,940 |
|
|
|
Welltower, Inc. REIT |
|
|
27,117 |
|
|
|
2,827 |
|
|
|
Crown Castle, Inc. REIT |
|
|
22,999 |
|
|
|
2,247 |
|
American Funds Insurance Series 66
Capital Income Builder (continued)
|
|
|
|
|
|
|
|
|
|
|
| Common stocks (continued) |
|
Shares |
|
|
Value (000) |
|
| Real estate (continued) |
|
Link REIT |
|
|
465,248 |
|
|
$ |
1,807 |
|
|
|
CTP NV |
|
|
75,076 |
|
|
|
1,277 |
|
|
|
Equinix, Inc. REIT |
|
|
1,607 |
|
|
|
1,216 |
|
|
|
CK Asset Holdings, Ltd. |
|
|
297,000 |
|
|
|
1,112 |
|
|
|
Charter Hall Group REIT |
|
|
143,138 |
|
|
|
1,059 |
|
|
|
Digital Realty Trust, Inc. REIT |
|
|
6,342 |
|
|
|
964 |
|
|
|
Mindspace Business Parks REIT |
|
|
233,888 |
|
|
|
934 |
|
|
|
UDR, Inc. REIT |
|
|
17,780 |
|
|
|
732 |
|
|
|
POWERGRID Infrastructure Investment Trust REIT |
|
|
563,128 |
|
|
|
648 |
|
|
|
Embassy Office Parks REIT |
|
|
140,661 |
|
|
|
598 |
|
|
|
Longfor Group Holdings, Ltd.1 |
|
|
335,634 |
|
|
|
460 |
|
|
|
Kimco Realty Corp. REIT |
|
|
5,095 |
|
|
|
99 |
|
|
|
|
|
|
|
|
|
|
|
|
|
|
|
|
|
|
|
|
|
52,674 |
|
|
|
|
|
|
|
|
|
|
|
|
|
|
|
|
|
|
|
|
|
|
|
| |
|
|
|
| Communication services 2.78% |
|
Comcast Corp., Class A |
|
|
132,412 |
|
|
|
5,185 |
|
|
|
Verizon Communications, Inc. |
|
|
121,175 |
|
|
|
4,997 |
|
|
|
Koninklijke KPN NV |
|
|
1,078,485 |
|
|
|
4,133 |
|
|
|
Singapore Telecommunications, Ltd. |
|
|
1,937,600 |
|
|
|
3,919 |
|
|
|
Publicis Groupe SA |
|
|
28,814 |
|
|
|
3,054 |
|
|
|
América Móvil, SAB de CV, Class B (ADR) |
|
|
163,841 |
|
|
|
2,785 |
|
|
|
SoftBank Corp. |
|
|
215,200 |
|
|
|
2,633 |
|
|
|
Deutsche Telekom AG |
|
|
73,880 |
|
|
|
1,859 |
|
|
|
TELUS Corp. |
|
|
115,449 |
|
|
|
1,748 |
|
|
|
WPP PLC |
|
|
129,237 |
|
|
|
1,185 |
|
|
|
Warner Music Group Corp., Class A |
|
|
37,241 |
|
|
|
1,141 |
|
|
|
Omnicom Group, Inc. |
|
|
11,563 |
|
|
|
1,037 |
|
|
|
HKT Trust and HKT, Ltd., units |
|
|
908,240 |
|
|
|
1,019 |
|
|
|
T-Mobile US, Inc. |
|
|
4,185 |
|
|
|
737 |
|
|
|
Nippon Telegraph and Telephone Corp. |
|
|
594,700 |
|
|
|
562 |
|
|
|
Telkom Indonesia (Persero) Tbk PT, Class B |
|
|
2,242,000 |
|
|
|
426 |
|
|
|
|
|
|
|
|
|
|
|
|
|
|
|
|
|
|
|
|
|
36,420 |
|
|
|
|
|
|
|
|
|
|
|
|
|
|
|
|
|
|
|
|
|
|
|
| |
|
|
|
| Materials 2.29% |
|
Air Products and Chemicals, Inc. |
|
|
25,888 |
|
|
|
6,680 |
|
|
|
Rio Tinto PLC |
|
|
71,900 |
|
|
|
4,733 |
|
|
|
Linde PLC |
|
|
9,836 |
|
|
|
4,316 |
|
|
|
Smurfit Kappa Group PLC |
|
|
61,567 |
|
|
|
2,737 |
|
|
|
Vale SA (ADR), ordinary nominative shares |
|
|
184,297 |
|
|
|
2,059 |
|
|
|
BHP Group, Ltd. (CDI) |
|
|
68,808 |
|
|
|
1,971 |
|
|
|
Evonik Industries AG |
|
|
61,839 |
|
|
|
1,261 |
|
|
|
Eastman Chemical Co. |
|
|
12,625 |
|
|
|
1,237 |
|
|
|
Shin-Etsu Chemical Co., Ltd. |
|
|
24,762 |
|
|
|
963 |
|
|
|
WestRock Co. |
|
|
17,595 |
|
|
|
884 |
|
|
|
BASF SE |
|
|
17,655 |
|
|
|
853 |
|
|
|
Celanese Corp. |
|
|
5,602 |
|
|
|
756 |
|
|
|
UPM-Kymmene OYJ |
|
|
20,957 |
|
|
|
731 |
|
|
|
Antofagasta PLC |
|
|
15,107 |
|
|
|
401 |
|
|
|
Fortescue, Ltd. |
|
|
23,348 |
|
|
|
334 |
|
|
|
Asahi Kasei Corp. |
|
|
10,700 |
|
|
|
68 |
|
|
|
|
|
|
|
|
|
|
|
|
|
|
|
|
|
|
|
|
|
29,984 |
|
|
|
|
|
|
|
|
|
|
|
|
|
|
Total common stocks (cost: $800,768,000) |
|
|
|
|
|
|
1,022,390 |
|
|
|
|
|
|
|
|
|
|
|
|
|
|
|
| Convertible stocks 0.11% |
|
|
|
|
|
|
| Utilities 0.11% |
|
NextEra Energy, Inc., noncumulative convertible preferred units, 6.926% 9/1/20251 |
|
|
34,604 |
|
|
|
1,435 |
|
|
|
|
|
|
|
|
|
|
|
|
|
|
Total convertible stocks (cost: $1,501,000) |
|
|
|
|
|
|
1,435 |
|
|
|
|
|
|
|
|
|
|
|
|
67 American Funds Insurance Series
Capital Income Builder (continued)
|
|
|
|
|
|
|
|
|
|
|
|
|
| Bonds, notes & other debt instruments 15.82% |
|
Principal amount
(000) |
|
|
|
|
Value (000) |
|
| |
| Mortgage-backed obligations 7.94% |
|
| |
|
|
|
|
| Federal agency mortgage-backed obligations 6.95% |
|
Fannie Mae Pool #695412 5.00% 6/1/20336 |
|
|
USD– |
4 |
|
|
|
$ |
– |
4 |
|
|
Fannie Mae Pool #AD3566 5.00% 10/1/20356 |
|
|
1 |
|
|
|
|
|
1 |
|
|
|
Fannie Mae Pool #931768 5.00% 8/1/20396 |
|
|
1 |
|
|
|
|
|
1 |
|
|
|
Fannie Mae Pool #AC0794 5.00% 10/1/20396 |
|
|
5 |
|
|
|
|
|
5 |
|
|
|
Fannie Mae Pool #932606 5.00% 2/1/20406 |
|
|
2 |
|
|
|
|
|
2 |
|
|
|
Fannie Mae Pool #AE0311 3.50% 8/1/20406 |
|
|
7 |
|
|
|
|
|
7 |
|
|
|
Fannie Mae Pool #AE1248 5.00% 6/1/20416 |
|
|
8 |
|
|
|
|
|
8 |
|
|
|
Fannie Mae Pool #AJ1873 4.00% 10/1/20416 |
|
|
6 |
|
|
|
|
|
5 |
|
|
|
Fannie Mae Pool #AE1274 5.00% 10/1/20416 |
|
|
4 |
|
|
|
|
|
4 |
|
|
|
Fannie Mae Pool #AE1277 5.00% 11/1/20416 |
|
|
3 |
|
|
|
|
|
3 |
|
|
|
Fannie Mae Pool #AE1283 5.00% 12/1/20416 |
|
|
2 |
|
|
|
|
|
2 |
|
|
|
Fannie Mae Pool #AE1290 5.00% 2/1/20426 |
|
|
4 |
|
|
|
|
|
4 |
|
|
|
Fannie Mae Pool #AT0300 3.50% 3/1/20436 |
|
|
1 |
|
|
|
|
|
1 |
|
|
|
Fannie Mae Pool #AT3954 3.50% 4/1/20436 |
|
|
2 |
|
|
|
|
|
1 |
|
|
|
Fannie Mae Pool #AY1829 3.50% 12/1/20446 |
|
|
2 |
|
|
|
|
|
2 |
|
|
|
Fannie Mae Pool #BH3122 4.00% 6/1/20476 |
|
|
1 |
|
|
|
|
|
1 |
|
|
|
Fannie Mae Pool #BJ5015 4.00% 12/1/20476 |
|
|
29 |
|
|
|
|
|
27 |
|
|
|
Fannie Mae Pool #BK5232 4.00% 5/1/20486 |
|
|
17 |
|
|
|
|
|
16 |
|
|
|
Fannie Mae Pool #BK6840 4.00% 6/1/20486 |
|
|
24 |
|
|
|
|
|
22 |
|
|
|
Fannie Mae Pool #BK9743 4.00% 8/1/20486 |
|
|
6 |
|
|
|
|
|
6 |
|
|
|
Fannie Mae Pool #BK9761 4.50% 8/1/20486 |
|
|
4 |
|
|
|
|
|
4 |
|
|
|
Fannie Mae Pool #FM3280 3.50% 5/1/20496 |
|
|
32 |
|
|
|
|
|
29 |
|
|
|
Fannie Mae Pool #FS5372 3.50% 7/1/20496 |
|
|
177 |
|
|
|
|
|
160 |
|
|
|
Fannie Mae Pool #FS5313 3.50% 1/1/20506 |
|
|
2,032 |
|
|
|
|
|
1,829 |
|
|
|
Fannie Mae Pool #CA5540 3.00% 4/1/20506 |
|
|
2,859 |
|
|
|
|
|
2,472 |
|
|
|
Fannie Mae Pool #CA6309 3.00% 7/1/20506 |
|
|
332 |
|
|
|
|
|
290 |
|
|
|
Fannie Mae Pool #CA6349 3.00% 7/1/20506 |
|
|
125 |
|
|
|
|
|
108 |
|
|
|
Fannie Mae Pool #CA6740 3.00% 8/1/20506 |
|
|
85 |
|
|
|
|
|
74 |
|
|
|
Fannie Mae Pool #CA7048 3.00% 9/1/20506 |
|
|
46 |
|
|
|
|
|
39 |
|
|
|
Fannie Mae Pool #CA7052 3.00% 9/1/20506 |
|
|
14 |
|
|
|
|
|
12 |
|
|
|
Fannie Mae Pool #CA7381 3.00% 10/1/20506 |
|
|
140 |
|
|
|
|
|
121 |
|
|
|
Fannie Mae Pool #FM5166 3.00% 12/1/20506 |
|
|
89 |
|
|
|
|
|
77 |
|
|
|
Fannie Mae Pool #BR4104 2.00% 1/1/20516 |
|
|
47 |
|
|
|
|
|
37 |
|
|
|
Fannie Mae Pool #FM5509 3.00% 1/1/20516 |
|
|
135 |
|
|
|
|
|
117 |
|
|
|
Fannie Mae Pool #CB0191 3.00% 4/1/20516 |
|
|
173 |
|
|
|
|
|
149 |
|
|
|
Fannie Mae Pool #CB0193 3.00% 4/1/20516 |
|
|
21 |
|
|
|
|
|
18 |
|
|
|
Fannie Mae Pool #FM7909 3.00% 6/1/20516 |
|
|
16 |
|
|
|
|
|
14 |
|
|
|
Fannie Mae Pool #FM8477 3.00% 8/1/20516 |
|
|
120 |
|
|
|
|
|
104 |
|
|
|
Fannie Mae Pool #CB2787 3.50% 12/1/20516 |
|
|
21 |
|
|
|
|
|
19 |
|
|
|
Fannie Mae Pool #BV0790 3.50% 1/1/20526 |
|
|
87 |
|
|
|
|
|
77 |
|
|
|
Fannie Mae Pool #FS0647 3.00% 2/1/20526 |
|
|
888 |
|
|
|
|
|
770 |
|
|
|
Fannie Mae Pool #FS0752 3.00% 3/1/20526 |
|
|
506 |
|
|
|
|
|
434 |
|
|
|
Fannie Mae Pool #CB3179 3.50% 3/1/20526 |
|
|
305 |
|
|
|
|
|
272 |
|
|
|
Fannie Mae Pool #BV8976 5.00% 8/1/20526 |
|
|
58 |
|
|
|
|
|
56 |
|
|
|
Fannie Mae Pool #BW1289 5.50% 10/1/20526 |
|
|
122 |
|
|
|
|
|
121 |
|
|
|
Fannie Mae Pool #BW1243 5.50% 10/1/20526 |
|
|
109 |
|
|
|
|
|
108 |
|
|
|
Fannie Mae Pool #MA4842 5.50% 12/1/20526 |
|
|
165 |
|
|
|
|
|
162 |
|
|
|
Fannie Mae Pool #MA4919 5.50% 2/1/20536 |
|
|
106 |
|
|
|
|
|
104 |
|
|
|
Fannie Mae Pool #CB5986 5.00% 3/1/20536 |
|
|
95 |
|
|
|
|
|
92 |
|
|
|
Fannie Mae Pool #BX9827 5.00% 5/1/20536 |
|
|
3,377 |
|
|
|
|
|
3,266 |
|
|
|
Fannie Mae Pool #FS4563 5.00% 5/1/20536 |
|
|
63 |
|
|
|
|
|
61 |
|
|
|
Fannie Mae Pool #MA5010 5.50% 5/1/20536 |
|
|
284 |
|
|
|
|
|
281 |
|
|
|
Fannie Mae Pool #MA5011 6.00% 5/1/20536 |
|
|
1,627 |
|
|
|
|
|
1,634 |
|
|
|
Fannie Mae Pool #MA5039 5.50% 6/1/20536 |
|
|
347 |
|
|
|
|
|
343 |
|
|
|
Fannie Mae Pool #CB6485 6.00% 6/1/20536 |
|
|
428 |
|
|
|
|
|
432 |
|
|
|
Fannie Mae Pool #CB6486 6.00% 6/1/20536 |
|
|
263 |
|
|
|
|
|
265 |
|
|
|
Fannie Mae Pool #CB6465 6.00% 6/1/20536 |
|
|
194 |
|
|
|
|
|
195 |
|
|
|
Fannie Mae Pool #MA5089 4.00% 7/1/20536 |
|
|
285 |
|
|
|
|
|
261 |
|
|
|
Fannie Mae Pool #MA5071 5.00% 7/1/20536 |
|
|
133 |
|
|
|
|
|
128 |
|
|
|
Fannie Mae Pool #BU4112 5.00% 7/1/20536 |
|
|
95 |
|
|
|
|
|
92 |
|
|
|
Fannie Mae Pool #MA5072 5.50% 7/1/20536 |
|
|
1,158 |
|
|
|
|
|
1,143 |
|
American Funds Insurance Series 68
Capital Income Builder (continued)
|
|
|
|
|
|
|
|
|
|
|
|
|
| Bonds, notes & other debt instruments (continued) |
|
Principal amount
(000) |
|
|
|
|
Value (000) |
|
| |
| Mortgage-backed obligations (continued) |
|
| |
|
|
|
|
| Federal agency mortgage-backed obligations (continued) |
|
Fannie Mae Pool #MA5139 6.00% 9/1/20536 |
|
|
USD489 |
|
|
|
|
$ |
491 |
|
|
|
Fannie Mae Pool #MA5177 4.00% 10/1/20536 |
|
|
964 |
|
|
|
|
|
882 |
|
|
|
Fannie Mae Pool #MA5165 5.50% 10/1/20536 |
|
|
9 |
|
|
|
|
|
9 |
|
|
|
Fannie Mae Pool #MA5166 6.00% 10/1/20536 |
|
|
54 |
|
|
|
|
|
54 |
|
|
|
Fannie Mae Pool #MA5167 6.50% 10/1/20536 |
|
|
2,678 |
|
|
|
|
|
2,729 |
|
|
|
Fannie Mae Pool #MA5207 4.00% 11/1/20536 |
|
|
868 |
|
|
|
|
|
794 |
|
|
|
Fannie Mae Pool #MA5191 6.00% 11/1/20536 |
|
|
798 |
|
|
|
|
|
801 |
|
|
|
Fannie Mae Pool #CB8151 5.50% 3/1/20546 |
|
|
956 |
|
|
|
|
|
944 |
|
|
|
Fannie Mae Pool #CB8168 6.00% 3/1/20546 |
|
|
138 |
|
|
|
|
|
138 |
|
|
|
Fannie Mae Pool #CB8328 5.50% 4/1/20546 |
|
|
1,013 |
|
|
|
|
|
1,003 |
|
|
|
Fannie Mae Pool #FS8153 6.00% 6/1/20546 |
|
|
430 |
|
|
|
|
|
434 |
|
|
|
Fannie Mae Pool #BU4699 5.50% 7/1/20546 |
|
|
161 |
|
|
|
|
|
159 |
|
|
|
Fannie Mae Pool #BU4700 6.00% 7/1/20546 |
|
|
206 |
|
|
|
|
|
208 |
|
|
|
Fannie Mae Pool #MA5421 6.00% 7/1/20546 |
|
|
30 |
|
|
|
|
|
30 |
|
|
|
Fannie Mae Pool #BF0142 5.50% 8/1/20566 |
|
|
349 |
|
|
|
|
|
355 |
|
|
|
Fannie Mae Pool #BF0342 5.50% 1/1/20596 |
|
|
235 |
|
|
|
|
|
235 |
|
|
|
Fannie Mae Pool #BM6737 4.50% 11/1/20596 |
|
|
591 |
|
|
|
|
|
562 |
|
|
|
Fannie Mae Pool #BF0497 3.00% 7/1/20606 |
|
|
401 |
|
|
|
|
|
333 |
|
|
|
Freddie Mac Pool #SC0149 2.00% 3/1/20416 |
|
|
69 |
|
|
|
|
|
58 |
|
|
|
Freddie Mac Pool #RB0544 2.00% 6/1/20416 |
|
|
119 |
|
|
|
|
|
101 |
|
|
|
Freddie Mac Pool #Q15874 4.00% 2/1/20436 |
|
|
1 |
|
|
|
|
|
1 |
|
|
|
Freddie Mac Pool #G67711 4.00% 3/1/20486 |
|
|
201 |
|
|
|
|
|
188 |
|
|
|
Freddie Mac Pool #Q55971 4.00% 5/1/20486 |
|
|
16 |
|
|
|
|
|
15 |
|
|
|
Freddie Mac Pool #Q56175 4.00% 5/1/20486 |
|
|
14 |
|
|
|
|
|
13 |
|
|
|
Freddie Mac Pool #Q55970 4.00% 5/1/20486 |
|
|
7 |
|
|
|
|
|
7 |
|
|
|
Freddie Mac Pool #Q56599 4.00% 6/1/20486 |
|
|
24 |
|
|
|
|
|
22 |
|
|
|
Freddie Mac Pool #Q57242 4.50% 7/1/20486 |
|
|
10 |
|
|
|
|
|
10 |
|
|
|
Freddie Mac Pool #Q58411 4.50% 9/1/20486 |
|
|
45 |
|
|
|
|
|
43 |
|
|
|
Freddie Mac Pool #Q58436 4.50% 9/1/20486 |
|
|
23 |
|
|
|
|
|
23 |
|
|
|
Freddie Mac Pool #Q58378 4.50% 9/1/20486 |
|
|
15 |
|
|
|
|
|
15 |
|
|
|
Freddie Mac Pool #ZT1704 4.50% 1/1/20496 |
|
|
1,051 |
|
|
|
|
|
1,011 |
|
|
|
Freddie Mac Pool #RA3384 3.00% 8/1/20506 |
|
|
14 |
|
|
|
|
|
12 |
|
|
|
Freddie Mac Pool #RA3506 3.00% 9/1/20506 |
|
|
146 |
|
|
|
|
|
125 |
|
|
|
Freddie Mac Pool #RA5901 3.00% 9/1/20516 |
|
|
72 |
|
|
|
|
|
62 |
|
|
|
Freddie Mac Pool #RA6347 3.00% 11/1/20516 |
|
|
147 |
|
|
|
|
|
126 |
|
|
|
Freddie Mac Pool #SD8214 3.50% 5/1/20526 |
|
|
801 |
|
|
|
|
|
710 |
|
|
|
Freddie Mac Pool #QE4383 4.00% 6/1/20526 |
|
|
331 |
|
|
|
|
|
304 |
|
|
|
Freddie Mac Pool #RA7556 4.50% 6/1/20526 |
|
|
831 |
|
|
|
|
|
785 |
|
|
|
Freddie Mac Pool #SD8225 3.00% 7/1/20526 |
|
|
201 |
|
|
|
|
|
171 |
|
|
|
Freddie Mac Pool #SD8242 3.00% 9/1/20526 |
|
|
119 |
|
|
|
|
|
101 |
|
|
|
Freddie Mac Pool #SD1584 4.50% 9/1/20526 |
|
|
181 |
|
|
|
|
|
174 |
|
|
|
Freddie Mac Pool #QE9222 5.00% 9/1/20526 |
|
|
627 |
|
|
|
|
|
608 |
|
|
|
Freddie Mac Pool #QF0924 5.50% 9/1/20526 |
|
|
292 |
|
|
|
|
|
289 |
|
|
|
Freddie Mac Pool #SD2948 5.50% 11/1/20526 |
|
|
113 |
|
|
|
|
|
112 |
|
|
|
Freddie Mac Pool #SD2602 3.00% 12/1/20526 |
|
|
24 |
|
|
|
|
|
20 |
|
|
|
Freddie Mac Pool #SD4116 4.50% 12/1/20526 |
|
|
472 |
|
|
|
|
|
446 |
|
|
|
Freddie Mac Pool #SD2716 5.00% 4/1/20536 |
|
|
101 |
|
|
|
|
|
98 |
|
|
|
Freddie Mac Pool #SD8316 5.50% 4/1/20536 |
|
|
573 |
|
|
|
|
|
566 |
|
|
|
Freddie Mac Pool #SD8324 5.50% 5/1/20536 |
|
|
435 |
|
|
|
|
|
429 |
|
|
|
Freddie Mac Pool #SD8329 5.00% 6/1/20536 |
|
|
34 |
|
|
|
|
|
33 |
|
|
|
Freddie Mac Pool #SD8331 5.50% 6/1/20536 |
|
|
1,083 |
|
|
|
|
|
1,069 |
|
|
|
Freddie Mac Pool #SD3175 6.00% 6/1/20536 |
|
|
85 |
|
|
|
|
|
85 |
|
|
|
Freddie Mac Pool #RA9294 6.50% 6/1/20536 |
|
|
19 |
|
|
|
|
|
19 |
|
|
|
Freddie Mac Pool #RA9292 6.50% 6/1/20536 |
|
|
16 |
|
|
|
|
|
16 |
|
|
|
Freddie Mac Pool #RA9289 6.50% 6/1/20536 |
|
|
15 |
|
|
|
|
|
15 |
|
|
|
Freddie Mac Pool #RA9288 6.50% 6/1/20536 |
|
|
14 |
|
|
|
|
|
14 |
|
|
|
Freddie Mac Pool #RA9287 6.50% 6/1/20536 |
|
|
10 |
|
|
|
|
|
10 |
|
|
|
Freddie Mac Pool #RA9290 6.50% 6/1/20536 |
|
|
7 |
|
|
|
|
|
7 |
|
|
|
Freddie Mac Pool #RA9291 6.50% 6/1/20536 |
|
|
5 |
|
|
|
|
|
6 |
|
|
|
Freddie Mac Pool #RA9295 6.50% 6/1/20536 |
|
|
4 |
|
|
|
|
|
4 |
|
|
|
Freddie Mac Pool #SD8342 5.50% 7/1/20536 |
|
|
2,378 |
|
|
|
|
|
2,347 |
|
69 American Funds Insurance Series
Capital Income Builder (continued)
|
|
|
|
|
|
|
|
|
|
|
|
|
| Bonds, notes & other debt instruments (continued) |
|
Principal amount
(000) |
|
|
|
|
Value (000) |
|
| |
| Mortgage-backed obligations (continued) |
|
| |
|
|
|
|
| Federal agency mortgage-backed obligations (continued) |
|
Freddie Mac Pool #SD8362 5.50% 9/1/20536 |
|
|
USD19 |
|
|
|
|
$ |
19 |
|
|
|
Freddie Mac Pool #SD8367 5.50% 10/1/20536 |
|
|
237 |
|
|
|
|
|
234 |
|
|
|
Freddie Mac Pool #SD8369 6.50% 10/1/20536 |
|
|
1,596 |
|
|
|
|
|
1,626 |
|
|
|
Freddie Mac Pool #SD4977 5.00% 11/1/20536 |
|
|
913 |
|
|
|
|
|
882 |
|
|
|
Freddie Mac Pool #SD8372 5.50% 11/1/20536 |
|
|
86 |
|
|
|
|
|
85 |
|
|
|
Freddie Mac Pool #SD8408 5.50% 3/1/20546 |
|
|
973 |
|
|
|
|
|
960 |
|
|
|
Freddie Mac Pool #RJ1216 5.50% 4/1/20546 |
|
|
20 |
|
|
|
|
|
20 |
|
|
|
Freddie Mac Pool #RJ1215 5.50% 4/1/20546 |
|
|
10 |
|
|
|
|
|
10 |
|
|
|
Freddie Mac Pool #SD5303 6.00% 4/1/20546 |
|
|
486 |
|
|
|
|
|
490 |
|
|
|
Freddie Mac Pool #RJ1512 5.50% 5/1/20546 |
|
|
284 |
|
|
|
|
|
282 |
|
|
|
Freddie Mac Pool #RJ1768 5.50% 6/1/20546 |
|
|
25 |
|
|
|
|
|
25 |
|
|
|
Freddie Mac Pool #QI8872 5.50% 7/1/20546 |
|
|
78 |
|
|
|
|
|
77 |
|
|
|
Freddie Mac Pool #QI8874 6.00% 7/1/20546 |
|
|
82 |
|
|
|
|
|
83 |
|
|
|
Freddie Mac Pool #SD8447 6.00% 7/1/20546 |
|
|
30 |
|
|
|
|
|
30 |
|
|
|
Freddie Mac, Series K156, Class A2, Multi Family, 4.43% 2/25/20336,7 |
|
|
160 |
|
|
|
|
|
156 |
|
|
|
Freddie Mac Seasoned Credit Risk Transfer Trust, Series 2017-1, Class HA, 3.00% 1/25/20566,7 |
|
|
100 |
|
|
|
|
|
92 |
|
|
|
Freddie Mac Seasoned Credit Risk Transfer Trust, Series 2017-2, Class MA, 3.00% 8/25/20566 |
|
|
208 |
|
|
|
|
|
189 |
|
|
|
Freddie Mac Seasoned Credit Risk Transfer Trust, Series 2017-2, Class HA, 3.00% 8/25/20566,7 |
|
|
201 |
|
|
|
|
|
184 |
|
|
|
Freddie Mac Seasoned Credit Risk Transfer Trust, Series 2017-4, Class HT, 3.25% 6/25/20576,7 |
|
|
87 |
|
|
|
|
|
77 |
|
|
|
Freddie Mac Seasoned Credit Risk Transfer Trust, Series 2017-4, Class MT, 3.50% 6/25/20576 |
|
|
72 |
|
|
|
|
|
65 |
|
|
|
Freddie Mac Seasoned Credit Risk Transfer Trust, Series 2018-3, Class MA, 3.50% 8/25/20576 |
|
|
16 |
|
|
|
|
|
15 |
|
|
|
Freddie Mac Seasoned Credit Risk Transfer Trust, Series 2019-1, Class MT, 3.50% 7/25/20586 |
|
|
893 |
|
|
|
|
|
784 |
|
|
|
Freddie Mac Seasoned Credit Risk Transfer Trust, Series 2019-1, Class MA, 3.50% 7/25/20586 |
|
|
329 |
|
|
|
|
|
308 |
|
|
|
Freddie Mac Seasoned Credit Risk Transfer Trust, Series 2019-2, Class MA, 3.50% 8/25/20586 |
|
|
520 |
|
|
|
|
|
483 |
|
|
|
Freddie Mac Seasoned Credit Risk Transfer Trust, Series 2019-3, Class MA, 3.50% 10/25/20586 |
|
|
15 |
|
|
|
|
|
14 |
|
|
|
Freddie Mac Seasoned Credit Risk Transfer Trust, Series 2019-3, Class MT, 3.50% 10/25/20586 |
|
|
9 |
|
|
|
|
|
8 |
|
|
|
Freddie Mac Seasoned Loan Structured Transaction Trust, Series 2018-2, Class A1, 3.50% 11/25/20286 |
|
|
780 |
|
|
|
|
|
733 |
|
|
|
Freddie Mac Seasoned Loan Structured Transaction Trust, Series 2019-2, Class A1C, 2.75% 9/25/20296 |
|
|
1,115 |
|
|
|
|
|
1,024 |
|
|
|
Government National Mortgage Assn. 4.00% 7/1/20546,8 |
|
|
6 |
|
|
|
|
|
6 |
|
|
|
Government National Mortgage Assn. 5.50% 7/1/20546,8 |
|
|
610 |
|
|
|
|
|
605 |
|
|
|
Government National Mortgage Assn. Pool #MA5764 4.50% 2/20/20496 |
|
|
177 |
|
|
|
|
|
171 |
|
|
|
Government National Mortgage Assn. Pool #MA8267 4.00% 9/20/20526 |
|
|
3,071 |
|
|
|
|
|
2,839 |
|
|
|
Government National Mortgage Assn. Pool #MA8346 4.00% 10/20/20526 |
|
|
65 |
|
|
|
|
|
60 |
|
|
|
Government National Mortgage Assn. Pool #MA8723 4.00% 3/20/20536 |
|
|
231 |
|
|
|
|
|
213 |
|
|
|
Government National Mortgage Assn. Pool #MA8947 5.00% 6/20/20536 |
|
|
419 |
|
|
|
|
|
408 |
|
|
|
Government National Mortgage Assn. Pool #MA9016 5.00% 7/20/20536 |
|
|
1,121 |
|
|
|
|
|
1,092 |
|
|
|
Government National Mortgage Assn. Pool #694836 5.682% 9/20/20596 |
|
|
– |
4 |
|
|
|
|
– |
4 |
|
|
Government National Mortgage Assn. Pool #766525 4.70% 11/20/20626 |
|
|
– |
4 |
|
|
|
|
– |
4 |
|
|
Government National Mortgage Assn. Pool #725893 5.20% 9/20/20646 |
|
|
– |
4 |
|
|
|
|
– |
4 |
|
|
Uniform Mortgage-Backed Security 2.50% 7/1/20396,8 |
|
|
1,708 |
|
|
|
|
|
1,543 |
|
|
|
Uniform Mortgage-Backed Security 2.00% 7/1/20546,8 |
|
|
768 |
|
|
|
|
|
601 |
|
|
|
Uniform Mortgage-Backed Security 3.50% 7/1/20546,8 |
|
|
2,453 |
|
|
|
|
|
2,171 |
|
|
|
Uniform Mortgage-Backed Security 4.00% 7/1/20546,8 |
|
|
1,003 |
|
|
|
|
|
918 |
|
|
|
Uniform Mortgage-Backed Security 4.50% 7/1/20546,8 |
|
|
235 |
|
|
|
|
|
222 |
|
|
|
Uniform Mortgage-Backed Security 5.50% 7/1/20546,8 |
|
|
11,977 |
|
|
|
|
|
11,814 |
|
|
|
Uniform Mortgage-Backed Security 6.00% 7/1/20546,8 |
|
|
2,134 |
|
|
|
|
|
2,140 |
|
|
|
Uniform Mortgage-Backed Security 6.50% 7/1/20546,8 |
|
|
6,621 |
|
|
|
|
|
6,739 |
|
|
|
Uniform Mortgage-Backed Security 7.00% 7/1/20546,8 |
|
|
652 |
|
|
|
|
|
671 |
|
American Funds Insurance Series 70
Capital Income Builder (continued)
|
|
|
|
|
|
|
|
|
|
|
|
|
| Bonds, notes & other debt instruments (continued) |
|
Principal amount
(000) |
|
|
|
|
Value (000) |
|
| |
| Mortgage-backed obligations (continued) |
|
| |
|
|
|
|
| Federal agency mortgage-backed obligations (continued) |
|
Uniform Mortgage-Backed Security 3.00% 8/1/20546,8 |
|
|
USD988 |
|
|
|
|
$ |
841 |
|
|
|
Uniform Mortgage-Backed Security 4.50% 8/1/20546,8 |
|
|
1,720 |
|
|
|
|
|
1,622 |
|
|
|
Uniform Mortgage-Backed Security 6.00% 8/1/20546,8 |
|
|
6,177 |
|
|
|
|
|
6,192 |
|
|
|
Uniform Mortgage-Backed Security 6.50% 8/1/20546,8 |
|
|
222 |
|
|
|
|
|
226 |
|
|
|
Uniform Mortgage-Backed Security 7.00% 8/1/20546,8 |
|
|
4,332 |
|
|
|
|
|
4,453 |
|
|
|
|
|
|
|
|
|
|
|
|
|
|
|
|
|
|
|
|
|
|
|
|
|
91,021 |
|
|
|
|
|
|
|
|
|
|
|
|
|
|
|
|
|
|
|
|
|
|
|
|
|
|
|
| |
|
|
|
|
| Commercial mortgage-backed securities 0.56% |
|
Benchmark Mortgage Trust, Series 2024-V5, Class AM, 6.417% 1/10/20576 |
|
|
41 |
|
|
|
|
|
42 |
|
|
|
BOCA Commercial Mortgage Trust, Series 2022-BOCA, Class A,
(1-month USD CME Term SOFR + 1.77%) 7.098% 5/15/20392,6,7 |
|
|
110 |
|
|
|
|
|
110 |
|
|
|
BPR Trust, Series 2022-OANA, Class A,
(1-month USD CME Term SOFR + 1.898%) 7.227% 4/15/20372,6,7 |
|
|
329 |
|
|
|
|
|
330 |
|
|
|
BX Trust, Series 2022-CSMO, Class A,
(1-month USD CME Term SOFR + 2.115%) 7.444% 6/15/20272,6,7 |
|
|
332 |
|
|
|
|
|
333 |
|
|
|
BX Trust, Series 2024-KING, Class A,
(1-month USD CME Term SOFR + 1.541%) 6.87% 5/15/20342,6,7 |
|
|
107 |
|
|
|
|
|
107 |
|
|
|
BX Trust, Series 2021-VOLT, Class A,
(1-month USD CME Term SOFR + 0.814%) 6.143% 9/15/20362,6,7 |
|
|
648 |
|
|
|
|
|
640 |
|
|
|
BX Trust, Series 2021-ARIA, Class A,
(1-month USD CME Term SOFR + 1.014%) 6.342% 10/15/20362,6,7 |
|
|
266 |
|
|
|
|
|
263 |
|
|
|
BX Trust, Series 2021-ARIA, Class C,
(1-month USD CME Term SOFR + 1.76%) 7.089% 10/15/20362,6,7 |
|
|
100 |
|
|
|
|
|
98 |
|
|
|
BX Trust, Series 2022-IND, Class A,
(1-month USD CME Term SOFR + 1.491%) 6.82% 4/15/20372,6,7 |
|
|
123 |
|
|
|
|
|
123 |
|
|
|
BX Trust, Series 2021-SOAR, Class A,
(1-month USD CME Term SOFR + 0.784%) 6.113% 6/15/20382,6,7 |
|
|
152 |
|
|
|
|
|
151 |
|
|
|
BX Trust, Series 2021-SOAR, Class D,
(1-month USD CME Term SOFR + 1.514%) 6.843% 6/15/20382,6,7 |
|
|
88 |
|
|
|
|
|
87 |
|
|
|
BX Trust, Series 2021-ACNT, Class C,
(1-month USD CME Term SOFR + 1.614%) 6.943% 11/15/20382,6,7 |
|
|
94 |
|
|
|
|
|
93 |
|
|
|
BX Trust, Series 2022-PSB, Class A,
(1-month USD CME Term SOFR + 2.451%) 7.78% 8/15/20392,6,7 |
|
|
80 |
|
|
|
|
|
80 |
|
|
|
Citigroup Commercial Mortgage Trust, Series 2023-SMRT, Class A, 6.015% 10/12/20402,6,7 |
|
|
237 |
|
|
|
|
|
238 |
|
|
|
DATA 2023-CNTR Mortgage Trust, Series 2023-CNTR, Class A, 5.919% 8/12/20432,6,7 |
|
|
574 |
|
|
|
|
|
583 |
|
|
|
ELM Trust 2024, Series 2024-ELM, Class A15, 5.801% 6/10/20392,6,7 |
|
|
583 |
|
|
|
|
|
584 |
|
|
|
ELM Trust 2024, Series 2024-ELM, Class A10, 5.801% 6/10/20392,6,7 |
|
|
530 |
|
|
|
|
|
531 |
|
|
|
ELM Trust 2024, Series 2024-ELM, Class B10, 5.995% 6/10/20392,6,7 |
|
|
213 |
|
|
|
|
|
214 |
|
|
|
ELM Trust 2024, Series 2024-ELM, Class B15, 5.995% 6/10/20392,6,7 |
|
|
191 |
|
|
|
|
|
191 |
|
|
|
ELM Trust 2024, Series 2024-ELM, Class C15, 6.189% 6/10/20392,6,7 |
|
|
133 |
|
|
|
|
|
133 |
|
|
|
ELM Trust 2024, Series 2024-ELM, Class C10, 6.189% 6/10/20392,6,7 |
|
|
120 |
|
|
|
|
|
120 |
|
|
|
ELM Trust 2024, Series 2024-ELM, Class D10, 6.626% 6/10/20392,6,7 |
|
|
100 |
|
|
|
|
|
100 |
|
|
|
ELM Trust 2024, Series 2024-ELM, Class D15, 6.674% 6/10/20392,6,7 |
|
|
100 |
|
|
|
|
|
100 |
|
|
|
Extended Stay America Trust, Series 2021-ESH, Class A,
(1-month USD CME Term SOFR + 1.194%) 6.523% 7/15/20382,6,7 |
|
|
91 |
|
|
|
|
|
91 |
|
|
|
FIVE Mortgage Trust, Series 2023-V1, Class A3, 5.668% 2/10/20566 |
|
|
73 |
|
|
|
|
|
73 |
|
|
|
FS Commercial Trust, Series 2023-4SZN, Class A, 7.066% 11/10/20392,6 |
|
|
187 |
|
|
|
|
|
193 |
|
|
|
GS Mortgage Securities Trust, Series 2018-HULA, Class A,
(1-month USD CME Term SOFR + 1.223%) 6.363% 7/15/20252,6,7 |
|
|
210 |
|
|
|
|
|
209 |
|
|
|
GS Mortgage Securities Trust., Series 2024-70P, Class A, 5.487% 3/10/20412,6,7 |
|
|
592 |
|
|
|
|
|
580 |
|
|
|
Hawaii Hotel Trust, Series 2019-MAUI, Class A,
(1-month USD CME Term SOFR + 1.264%) 6.776% 5/17/20382,6,7 |
|
|
300 |
|
|
|
|
|
300 |
|
|
|
HTL Commercial Mortgage Trust, Series 2024-T53, Class A, 6.072% 5/10/20392,6,7 |
|
|
100 |
|
|
|
|
|
100 |
|
|
|
HTL Commercial Mortgage Trust, Series 2024-T53, Class B, 6.774% 5/10/20392,6,7 |
|
|
243 |
|
|
|
|
|
244 |
|
|
|
SREIT Trust, Series 2021-MFP, Class A,
(1-month USD CME Term SOFR + 0.845%) 6.174% 11/15/20382,6,7 |
|
|
345 |
|
|
|
|
|
342 |
|
|
|
|
|
|
|
|
|
|
|
|
|
|
|
|
|
|
|
|
|
|
|
|
|
7,383 |
|
|
|
|
|
|
|
|
|
|
|
|
|
|
71 American Funds Insurance Series
Capital Income Builder (continued)
|
|
|
|
|
|
|
|
|
|
|
|
|
| Bonds, notes & other debt instruments (continued) |
|
Principal amount
(000) |
|
|
|
|
Value (000) |
|
| |
| Mortgage-backed obligations (continued) |
|
| |
|
|
|
|
| Collateralized mortgage-backed obligations (privately originated) 0.43% |
|
Arroyo Mortgage Trust, Series 2021-1R, Class A1, 1.175% 10/25/20482,6,7 |
|
|
USD107 |
|
|
|
|
$ |
92 |
|
|
|
BINOM Securitization Trust, Series 2022-RPL1, Class A1, 3.00% 2/25/20612,6,7 |
|
|
68 |
|
|
|
|
|
61 |
|
|
|
BRAVO Residential Funding Trust, Series 2022-RPL1, Class A1, 2.75% 9/25/20612,6 |
|
|
80 |
|
|
|
|
|
71 |
|
|
|
CIM Trust, Series 2022-R2, Class A1, 3.75% 12/25/20612,6,7 |
|
|
157 |
|
|
|
|
|
146 |
|
|
|
Citigroup Mortgage Loan Trust, Series 2020-EXP1, Class A1A, 1.804% 5/25/20602,6,7 |
|
|
9 |
|
|
|
|
|
8 |
|
|
|
Connecticut Avenue Securities Trust, Series 2023-R01, Class 1M1,
(30-day Average USD-SOFR + 2.40%) 7.735% 12/25/20422,6,7 |
|
|
35 |
|
|
|
|
|
36 |
|
|
|
Connecticut Avenue Securities Trust, Series 2023-R05, Class 1M1,
(30-day Average USD-SOFR + 1.90%) 7.235% 6/25/20432,6,7 |
|
|
341 |
|
|
|
|
|
346 |
|
|
|
Connecticut Avenue Securities Trust, Series 2023-R06, Class 1M1,
(30-day Average USD-SOFR + 1.70%) 7.035% 7/25/20432,6,7 |
|
|
122 |
|
|
|
|
|
123 |
|
|
|
Connecticut Avenue Securities Trust, Series 2024-R04, Class 1M1,
(30-day Average USD-SOFR + 1.10%) 6.424% 5/25/20442,6,7 |
|
|
117 |
|
|
|
|
|
118 |
|
|
|
Finance of America Structured Securities Trust, Series 2019-JR3, Class A,
2.00% 9/25/20692,6 |
|
|
55 |
|
|
|
|
|
60 |
|
|
|
Finance of America Structured Securities Trust, Series 2019-JR4, Class A,
2.00% 11/25/20692,6 |
|
|
64 |
|
|
|
|
|
64 |
|
|
|
Freddie Mac Structured Agency Credit Risk Debt Notes, Series 2022-DNA3, Class M1A, (30-day Average USD-SOFR + 2.00%) 7.335% 4/25/20422,6,7 |
|
|
74 |
|
|
|
|
|
75 |
|
|
|
Freddie Mac Structured Agency Credit Risk Debt Notes, Series 2022-DNA4, Class M1A, (30-day Average USD-SOFR + 2.20%) 7.535% 5/25/20422,6,7 |
|
|
13 |
|
|
|
|
|
13 |
|
|
|
Freddie Mac Structured Agency Credit Risk Debt Notes, Series 2022-DNA6, Class M1A, (30-day Average USD-SOFR + 2.15%) 7.485% 9/25/20422,6,7 |
|
|
21 |
|
|
|
|
|
21 |
|
|
|
Freddie Mac Structured Agency Credit Risk Debt Notes, Series 2022-DNA6, Class M1B, (30-day Average USD-SOFR + 3.70%) 9.035% 9/25/20422,6,7 |
|
|
64 |
|
|
|
|
|
68 |
|
|
|
Freddie Mac Structured Agency Credit Risk Debt Notes, Series 2024-DNA2, Class M1, (30-day Average USD-SOFR + 1.20%) 6.535% 5/25/20442,6,7 |
|
|
276 |
|
|
|
|
|
277 |
|
|
|
Freddie Mac Structured Agency Credit Risk Debt Notes, Series 2020-DNA1, Class M2, (30-day Average USD-SOFR + 1.814%) 7.15% 1/25/20502,6,7 |
|
|
75 |
|
|
|
|
|
75 |
|
|
|
Freddie Mac Structured Agency Credit Risk Debt Notes, Series 2020-DNA2, Class M2, (30-day Average USD-SOFR + 1.964%) 7.30% 2/25/20502,6,7 |
|
|
268 |
|
|
|
|
|
271 |
|
|
|
Freddie Mac Structured Agency Credit Risk Debt Notes, Series 2020-DNA4, Class B1, (30-day Average USD-SOFR + 6.114%) 11.45% 8/25/20502,6,7 |
|
|
430 |
|
|
|
|
|
495 |
|
|
|
GCAT Trust, Series 2024-NQM2, Class A1, 6.085% 6/25/2059
(7.359% on 5/1/2028)2,6,9 |
|
|
141 |
|
|
|
|
|
141 |
|
|
|
Home Partners of America Trust, Series 2022-1, Class A, 3.93% 4/17/20392,6 |
|
|
125 |
|
|
|
|
|
120 |
|
|
|
Legacy Mortgage Asset Trust, Series 2022-GS1, Class A1, 4.00% 2/25/2061
(7.00% on 4/25/2025)2,6,9 |
|
|
160 |
|
|
|
|
|
156 |
|
|
|
Legacy Mortgage Asset Trust, Series 2021-GS2, Class A1, 4.75% 4/25/2061
(5.75% on 4/25/2025)2,6,9 |
|
|
65 |
|
|
|
|
|
63 |
|
|
|
Legacy Mortgage Asset Trust, Series 2021-GS5, Class A1, 2.25% 7/25/2067
(5.25% on 11/25/2024)2,6,9 |
|
|
109 |
|
|
|
|
|
106 |
|
|
|
Mello Warehouse Securitization Trust, Series 2021-3, Class A,
(3-month USD CME Term SOFR + 0.965%) 6.31% 11/25/20552,6,7 |
|
|
202 |
|
|
|
|
|
202 |
|
|
|
Morgan Stanley Residential Mortgage Loan Trust, Series 2024-NQM2, Class A1,
6.386% 5/25/2069 (7.386% on 5/1/2028)2,6,9 |
|
|
179 |
|
|
|
|
|
181 |
|
|
|
Onslow Bay Financial Mortgage Loan Trust, Series 2024-HYB1, Class A1,
3.564% 3/25/20532,6,7 |
|
|
182 |
|
|
|
|
|
177 |
|
|
|
Onslow Bay Financial, LLC, Series 2024-NQM7, Class A1, 6.243% 3/25/2064
(7.243% on 4/1/2028)2,6,9 |
|
|
236 |
|
|
|
|
|
237 |
|
|
|
Onslow Bay Financial, LLC, Series 2024-NQM8, Class A1, 6.233% 5/25/2064
(7.233% on 5/1/2028)2,6,9 |
|
|
510 |
|
|
|
|
|
513 |
|
|
|
Progress Residential Trust, Series 2022-SFR3, Class A, 3.20% 4/17/20392,6 |
|
|
98 |
|
|
|
|
|
93 |
|
|
|
Progress Residential Trust, Series 2024-SFR3, Class A, 3.00% 6/17/20412,6 |
|
|
309 |
|
|
|
|
|
278 |
|
|
|
Reverse Mortgage Investment Trust, Series 2021-HB1, Class A, 1.259% 11/25/20312,6,7 |
|
|
15 |
|
|
|
|
|
15 |
|
|
|
Towd Point Mortgage Trust, Series 2017-3, Class A1, 2.75% 7/25/20572,6,7 |
|
|
6 |
|
|
|
|
|
6 |
|
|
|
Towd Point Mortgage Trust, Series 2017-6, Class A1, 2.75% 10/25/20572,6,7 |
|
|
26 |
|
|
|
|
|
25 |
|
|
|
Towd Point Mortgage Trust, Series 2018-2, Class A1, 3.25% 3/25/20582,6,7 |
|
|
29 |
|
|
|
|
|
29 |
|
|
|
Towd Point Mortgage Trust, Series 2018-5, Class A1A, 3.25% 7/25/20582,6,7 |
|
|
16 |
|
|
|
|
|
15 |
|
|
|
Towd Point Mortgage Trust, Series 2020-4, Class A1, 1.75% 10/25/20602,6 |
|
|
382 |
|
|
|
|
|
339 |
|
American Funds Insurance Series 72
Capital Income Builder (continued)
|
|
|
|
|
|
|
|
|
|
|
|
|
| Bonds, notes & other debt instruments (continued) |
|
Principal amount
(000) |
|
|
|
|
Value (000) |
|
| |
| Mortgage-backed obligations (continued) |
|
| |
|
|
|
|
| Collateralized mortgage-backed obligations (privately originated) (continued) |
|
Treehouse Park Improvement Association No.1 9.75% 12/1/20332,3 |
|
|
USD100 |
|
|
|
|
$ |
98 |
|
|
|
Tricon Residential Trust, Series 2021-SFR1, Class A, 1.943% 7/17/20382,6 |
|
|
195 |
|
|
|
|
|
181 |
|
|
|
Tricon Residential Trust, Series 2024-SFR2, Class A, 4.75% 6/17/20402,6 |
|
|
167 |
|
|
|
|
|
163 |
|
|
|
Verus Securitization Trust, Series 2024-4, Class A1, 6.218% 6/25/2069
(7.218% on 5/1/2028)2,6,9 |
|
|
98 |
|
|
|
|
|
99 |
|
|
|
|
|
|
|
|
|
|
|
|
|
|
|
|
|
|
|
|
|
|
|
|
|
5,657 |
|
|
|
|
|
|
|
|
|
|
|
|
|
|
|
|
Total mortgage-backed obligations |
|
|
|
|
|
|
|
|
104,061 |
|
|
|
|
|
|
|
|
|
|
|
|
|
|
|
| U.S. Treasury bonds & notes 4.57% |
|
| |
|
|
|
|
| U.S. Treasury 4.57% |
|
U.S. Treasury 0.625% 10/15/2024 |
|
|
7,470 |
|
|
|
|
|
7,368 |
|
|
|
U.S. Treasury 2.125% 11/30/2024 |
|
|
1,860 |
|
|
|
|
|
1,836 |
|
|
|
U.S. Treasury 3.875% 3/31/2025 |
|
|
5,877 |
|
|
|
|
|
5,820 |
|
|
|
U.S. Treasury 4.625% 6/30/2025 |
|
|
4,793 |
|
|
|
|
|
4,770 |
|
|
|
U.S. Treasury 4.00% 2/15/2026 |
|
|
2,621 |
|
|
|
|
|
2,586 |
|
|
|
U.S. Treasury 0.75% 3/31/2026 |
|
|
1 |
|
|
|
|
|
1 |
|
|
|
U.S. Treasury 0.75% 5/31/2026 |
|
|
3,850 |
|
|
|
|
|
3,570 |
|
|
|
U.S. Treasury 1.875% 6/30/2026 |
|
|
4,855 |
|
|
|
|
|
4,595 |
|
|
|
U.S. Treasury 4.625% 6/30/2026 |
|
|
1,376 |
|
|
|
|
|
1,374 |
|
|
|
U.S. Treasury 1.125% 10/31/2026 |
|
|
995 |
|
|
|
|
|
918 |
|
|
|
U.S. Treasury 2.00% 11/15/202610 |
|
|
2,800 |
|
|
|
|
|
2,635 |
|
|
|
U.S. Treasury 4.625% 11/15/2026 |
|
|
1,200 |
|
|
|
|
|
1,199 |
|
|
|
U.S. Treasury 4.00% 1/15/2027 |
|
|
6,541 |
|
|
|
|
|
6,446 |
|
|
|
U.S. Treasury 0.50% 4/30/2027 |
|
|
2,375 |
|
|
|
|
|
2,123 |
|
|
|
U.S. Treasury 2.625% 5/31/2027 |
|
|
80 |
|
|
|
|
|
76 |
|
|
|
U.S. Treasury 4.00% 2/29/2028 |
|
|
745 |
|
|
|
|
|
734 |
|
|
|
U.S. Treasury 1.25% 3/31/2028 |
|
|
1,350 |
|
|
|
|
|
1,202 |
|
|
|
U.S. Treasury 3.625% 3/31/2028 |
|
|
4 |
|
|
|
|
|
3 |
|
|
|
U.S. Treasury 4.25% 6/30/2029 |
|
|
536 |
|
|
|
|
|
534 |
|
|
|
U.S. Treasury 4.00% 2/28/2030 |
|
|
1,659 |
|
|
|
|
|
1,629 |
|
|
|
U.S. Treasury 6.25% 5/15/2030 |
|
|
345 |
|
|
|
|
|
379 |
|
|
|
U.S. Treasury 4.25% 6/30/2031 |
|
|
1,773 |
|
|
|
|
|
1,767 |
|
|
|
U.S. Treasury 4.125% 11/15/2032 |
|
|
9 |
|
|
|
|
|
9 |
|
|
|
U.S. Treasury 4.375% 5/15/2034 |
|
|
260 |
|
|
|
|
|
260 |
|
|
|
U.S. Treasury 4.50% 8/15/2039 |
|
|
1,045 |
|
|
|
|
|
1,049 |
|
|
|
U.S. Treasury 4.75% 2/15/204110 |
|
|
1,730 |
|
|
|
|
|
1,777 |
|
|
|
U.S. Treasury 2.00% 11/15/2041 |
|
|
300 |
|
|
|
|
|
206 |
|
|
|
U.S. Treasury 4.625% 5/15/2044 |
|
|
1,099 |
|
|
|
|
|
1,097 |
|
|
|
U.S. Treasury 2.375% 5/15/2051 |
|
|
196 |
|
|
|
|
|
129 |
|
|
|
U.S. Treasury 4.00% 11/15/2052 |
|
|
152 |
|
|
|
|
|
139 |
|
|
|
U.S. Treasury 4.25% 2/15/205410 |
|
|
3,803 |
|
|
|
|
|
3,623 |
|
|
|
|
|
|
|
|
|
|
|
|
|
|
|
|
Total U.S. Treasury bonds & notes |
|
|
|
|
|
|
|
|
59,854 |
|
|
|
|
|
|
|
|
|
|
|
|
|
|
|
| Corporate bonds, notes & loans 2.39% |
|
| |
|
|
|
|
| Financials 0.41% |
|
American Express Co. 4.90% 2/13/2026 |
|
|
28 |
|
|
|
|
|
28 |
|
|
|
American International Group, Inc. 5.125% 3/27/2033 |
|
|
17 |
|
|
|
|
|
17 |
|
|
|
Aon Corp. 5.35% 2/28/2033 |
|
|
21 |
|
|
|
|
|
21 |
|
|
|
Bank of America Corp. 5.819% 9/15/2029 (USD-SOFR + 1.57% on 9/15/2028)9 |
|
|
31 |
|
|
|
|
|
32 |
|
|
|
Bank of America Corp. 1.898% 7/23/2031 (USD-SOFR + 1.53% on 7/23/2030)9 |
|
|
238 |
|
|
|
|
|
196 |
|
|
|
Bank of America Corp. 5.288% 4/25/2034 (USD-SOFR + 1.91% on 4/25/2033)9 |
|
|
118 |
|
|
|
|
|
117 |
|
|
|
Bank of America Corp. 5.468% 1/23/2035
(3-month USD CME Term SOFR + 1.65% on 1/23/2034)9 |
|
|
75 |
|
|
|
|
|
75 |
|
|
|
CaixaBank, SA 5.673% 3/15/2030 (USD-SOFR + 1.78% on 3/15/2029)2,9 |
|
|
400 |
|
|
|
|
|
398 |
|
|
|
CaixaBank, SA 6.037% 6/15/2035 (USD-SOFR + 2.26% on 9/15/2034)2,9 |
|
|
200 |
|
|
|
|
|
201 |
|
|
|
Capital One Financial Corp. 5.70% 2/1/2030 (USD-SOFR + 1.905% on 2/1/2029)9 |
|
|
43 |
|
|
|
|
|
43 |
|
|
|
Capital One Financial Corp. 6.377% 6/8/2034 (USD-SOFR + 2.86% on 6/8/2033)9 |
|
|
45 |
|
|
|
|
|
46 |
|
|
|
Capital One Financial Corp. 6.051% 2/1/2035 (USD-SOFR + 2.26% on 2/1/2034)9 |
|
|
95 |
|
|
|
|
|
96 |
|
|
|
Charles Schwab Corp. (The) 5.853% 5/19/2034 (USD-SOFR + 2.50% on 5/19/2033)9 |
|
|
15 |
|
|
|
|
|
15 |
|
|
|
Charles Schwab Corp. (The) 6.136% 8/24/2034 (USD-SOFR + 2.01% on 8/24/2033)9 |
|
|
40 |
|
|
|
|
|
42 |
|
73 American Funds Insurance Series
Capital Income Builder (continued)
|
|
|
|
|
|
|
|
|
|
|
|
|
| Bonds, notes & other debt instruments (continued) |
|
Principal amount
(000) |
|
|
|
|
Value (000) |
|
| |
| Corporate bonds, notes & loans (continued) |
|
| |
|
|
|
|
| Financials (continued) |
|
Chubb INA Holdings, LLC 5.00% 3/15/2034 |
|
|
USD35 |
|
|
|
|
$ |
35 |
|
|
|
Citigroup, Inc. 5.174% 2/13/2030 (USD-SOFR + 1.364% on 2/13/2029)9 |
|
|
85 |
|
|
|
|
|
85 |
|
|
|
Citigroup, Inc. 3.057% 1/25/2033 (USD-SOFR + 1.351% on 1/25/2032)9 |
|
|
35 |
|
|
|
|
|
30 |
|
|
|
Citigroup, Inc. 6.174% 5/25/2034 (USD-SOFR + 2.661% on 5/25/2033)9 |
|
|
50 |
|
|
|
|
|
51 |
|
|
|
Citizens Financial Group, Inc. 5.841% 1/23/2030
(USD-SOFR + 2.01% on 1/23/2029)9 |
|
|
120 |
|
|
|
|
|
120 |
|
|
|
Corebridge Financial, Inc. 3.85% 4/5/2029 |
|
|
180 |
|
|
|
|
|
169 |
|
|
|
Corebridge Financial, Inc. 3.90% 4/5/2032 |
|
|
32 |
|
|
|
|
|
29 |
|
|
|
Corebridge Financial, Inc. 4.35% 4/5/2042 |
|
|
7 |
|
|
|
|
|
6 |
|
|
|
Corebridge Financial, Inc. 4.40% 4/5/2052 |
|
|
31 |
|
|
|
|
|
24 |
|
|
|
Danske Bank AS 4.298% 4/1/2028
(1-year UST Yield Curve Rate T Note Constant Maturity + 1.75% on 4/1/2027)2,9 |
|
|
200 |
|
|
|
|
|
194 |
|
|
|
Deutsche Bank AG 6.72% 1/18/2029 (USD-SOFR + 3.18% on 1/18/2028)9 |
|
|
150 |
|
|
|
|
|
155 |
|
|
|
Deutsche Bank AG 6.819% 11/20/2029 (USD-SOFR + 2.51% on 11/20/2028)9 |
|
|
150 |
|
|
|
|
|
156 |
|
|
|
Fifth Third Bancorp 6.339% 7/27/2029 (USD-SOFR + 2.34% on 7/27/2028)9 |
|
|
5 |
|
|
|
|
|
5 |
|
|
|
Goldman Sachs Group, Inc. 5.727% 4/25/2030 (USD-SOFR + 1.265% on 4/25/2029)9 |
|
|
60 |
|
|
|
|
|
61 |
|
|
|
Goldman Sachs Group, Inc. 3.102% 2/24/2033 (USD-SOFR + 1.41% on 2/24/2032)9 |
|
|
111 |
|
|
|
|
|
95 |
|
|
|
Goldman Sachs Group, Inc. 5.851% 4/25/2035 (USD-SOFR + 1.552% on 4/25/2034)9 |
|
|
80 |
|
|
|
|
|
82 |
|
|
|
JPMorgan Chase & Co. 4.08% 4/26/2026 (USD-SOFR + 1.32% on 4/26/2025)9 |
|
|
78 |
|
|
|
|
|
77 |
|
|
|
JPMorgan Chase & Co. 5.04% 1/23/2028 (USD-SOFR + 1.19% on 1/23/2027)9 |
|
|
95 |
|
|
|
|
|
94 |
|
|
|
JPMorgan Chase & Co. 5.012% 1/23/2030 (USD-SOFR + 1.31% on 1/23/2029)9 |
|
|
64 |
|
|
|
|
|
63 |
|
|
|
JPMorgan Chase & Co. 5.581% 4/22/2030 (USD-SOFR + 1.16% on 4/22/2029)9 |
|
|
50 |
|
|
|
|
|
51 |
|
|
|
JPMorgan Chase & Co. 1.953% 2/4/2032 (USD-SOFR + 1.065% on 2/4/2031)9 |
|
|
259 |
|
|
|
|
|
211 |
|
|
|
JPMorgan Chase & Co. 2.963% 1/25/2033 (USD-SOFR + 1.26% on 1/25/2032)9 |
|
|
17 |
|
|
|
|
|
14 |
|
|
|
JPMorgan Chase & Co. 5.35% 6/1/2034 (USD-SOFR + 1.845% on 6/1/2033)9 |
|
|
55 |
|
|
|
|
|
55 |
|
|
|
JPMorgan Chase & Co. 5.336% 1/23/2035 (USD-SOFR + 1.62% on 1/23/2034)9 |
|
|
25 |
|
|
|
|
|
25 |
|
|
|
JPMorgan Chase & Co. 5.766% 4/22/2035 (USD-SOFR + 1.49% on 4/22/2034)9 |
|
|
75 |
|
|
|
|
|
77 |
|
|
|
Ladder Capital Finance Holdings LLLP 7.00% 7/15/20312 |
|
|
20 |
|
|
|
|
|
20 |
|
|
|
Mastercard, Inc. 4.875% 3/9/2028 |
|
|
31 |
|
|
|
|
|
31 |
|
|
|
Morgan Stanley 5.652% 4/13/2028 (USD-SOFR + 1.01% on 4/13/2027)7 |
|
|
25 |
|
|
|
|
|
25 |
|
|
|
Morgan Stanley 5.656% 4/18/2030 (USD-SOFR + 1.26% on 4/18/2029)9 |
|
|
140 |
|
|
|
|
|
142 |
|
|
|
Morgan Stanley 4.889% 7/20/2033 (USD-SOFR + 2.077% on 7/20/2032)9 |
|
|
20 |
|
|
|
|
|
19 |
|
|
|
Morgan Stanley 5.424% 7/21/2034 (USD-SOFR + 1.88% on 7/21/2033)9 |
|
|
35 |
|
|
|
|
|
35 |
|
|
|
Morgan Stanley 5.831% 4/19/2035 (USD-SOFR + 1.58% on 4/19/2034)9 |
|
|
100 |
|
|
|
|
|
103 |
|
|
|
Navient Corp. 5.00% 3/15/2027 |
|
|
150 |
|
|
|
|
|
143 |
|
|
|
New York Life Global Funding 3.00% 1/10/20282 |
|
|
150 |
|
|
|
|
|
140 |
|
|
|
PNC Financial Services Group, Inc. 5.812% 6/12/2026
(USD-SOFR + 1.322% on 6/12/2025)9 |
|
|
35 |
|
|
|
|
|
35 |
|
|
|
PNC Financial Services Group, Inc. 5.582% 6/12/2029
(USD-SOFR + 1.841% on 6/12/2028)9 |
|
|
50 |
|
|
|
|
|
51 |
|
|
|
PNC Financial Services Group, Inc. 6.875% 10/20/2034
(USD-SOFR + 2.284% on 10/20/2033)9 |
|
|
87 |
|
|
|
|
|
95 |
|
|
|
SVB Financial Group 4.70% junior subordinated perpetual bonds
(5-year UST Yield Curve Rate T Note Constant Maturity + 3.064% on 11/15/2031)9,11 |
|
|
38 |
|
|
|
|
|
– |
4 |
|
|
Truist Financial Corp. 5.435% 1/24/2030 (USD-SOFR + 1.62% on 1/24/2029)9 |
|
|
11 |
|
|
|
|
|
11 |
|
|
|
Truist Financial Corp. 5.867% 6/8/2034 (USD-SOFR + 2.361% on 6/8/2033)9 |
|
|
10 |
|
|
|
|
|
10 |
|
|
|
Truist Financial Corp. 5.711% 1/24/2035 (USD-SOFR + 1.922% on 1/24/2034)9 |
|
|
40 |
|
|
|
|
|
40 |
|
|
|
U.S. Bancorp 5.775% 6/12/2029 (USD-SOFR + 2.02% on 6/12/2028)9 |
|
|
70 |
|
|
|
|
|
71 |
|
|
|
U.S. Bancorp 5.384% 1/23/2030 (USD-SOFR + 1.56% on 1/23/2029)9 |
|
|
85 |
|
|
|
|
|
85 |
|
|
|
U.S. Bancorp 5.678% 1/23/2035 (USD-SOFR + 1.86% on 1/23/2034)9 |
|
|
120 |
|
|
|
|
|
120 |
|
|
|
UBS Group AG 5.617% 9/13/2030
(1-year USD-ICE SOFR Swap + 1.34% on 9/13/2029)2,9 |
|
|
200 |
|
|
|
|
|
201 |
|
|
|
UBS Group AG 4.194% 4/1/2031 (USD-SOFR + 3.73% on 4/1/2030)2,9 |
|
|
374 |
|
|
|
|
|
349 |
|
|
|
Wells Fargo & Co. 5.707% 4/22/2028 (USD-SOFR + 1.07% on 4/22/2027)9 |
|
|
50 |
|
|
|
|
|
50 |
|
|
|
Wells Fargo & Co. 4.808% 7/25/2028 (USD-SOFR + 1.98% on 7/25/2027)9 |
|
|
45 |
|
|
|
|
|
44 |
|
|
|
Wells Fargo & Co. 5.557% 7/25/2034 (USD-SOFR + 1.99% on 7/25/2033)9 |
|
|
84 |
|
|
|
|
|
84 |
|
|
|
Wells Fargo & Co. 6.491% 10/23/2034 (USD-SOFR + 2.06% on 10/23/2033)9 |
|
|
104 |
|
|
|
|
|
111 |
|
|
|
Willis North America, Inc. 5.90% 3/5/2054 |
|
|
35 |
|
|
|
|
|
34 |
|
|
|
|
|
|
|
|
|
|
|
|
|
|
|
|
|
|
|
|
|
|
|
|
|
5,340 |
|
|
|
|
|
|
|
|
|
|
|
|
|
|
American Funds Insurance Series 74
Capital Income Builder (continued)
|
|
|
|
|
|
|
|
|
|
|
|
|
| Bonds, notes & other debt instruments (continued) |
|
Principal amount
(000) |
|
|
|
|
Value (000) |
|
| |
| Corporate bonds, notes & loans (continued) |
|
| |
|
|
|
|
| Health care 0.40% |
|
AbbVie, Inc. 5.05% 3/15/2034 |
|
|
USD175 |
|
|
|
|
$ |
175 |
|
|
|
AbbVie, Inc. 5.35% 3/15/2044 |
|
|
25 |
|
|
|
|
|
25 |
|
|
|
AbbVie, Inc. 5.40% 3/15/2054 |
|
|
240 |
|
|
|
|
|
237 |
|
|
|
AbbVie, Inc. 5.50% 3/15/2064 |
|
|
25 |
|
|
|
|
|
25 |
|
|
|
Amgen, Inc. 5.507% 3/2/2026 |
|
|
30 |
|
|
|
|
|
30 |
|
|
|
Amgen, Inc. 5.15% 3/2/2028 |
|
|
55 |
|
|
|
|
|
55 |
|
|
|
Amgen, Inc. 4.05% 8/18/2029 |
|
|
100 |
|
|
|
|
|
96 |
|
|
|
Amgen, Inc. 5.25% 3/2/2030 |
|
|
124 |
|
|
|
|
|
125 |
|
|
|
Amgen, Inc. 4.20% 3/1/2033 |
|
|
133 |
|
|
|
|
|
123 |
|
|
|
Amgen, Inc. 5.25% 3/2/2033 |
|
|
71 |
|
|
|
|
|
71 |
|
|
|
Amgen, Inc. 5.60% 3/2/2043 |
|
|
105 |
|
|
|
|
|
103 |
|
|
|
Amgen, Inc. 4.20% 2/22/2052 |
|
|
19 |
|
|
|
|
|
15 |
|
|
|
Amgen, Inc. 4.875% 3/1/2053 |
|
|
25 |
|
|
|
|
|
22 |
|
|
|
Amgen, Inc. 5.65% 3/2/2053 |
|
|
37 |
|
|
|
|
|
36 |
|
|
|
Amgen, Inc. 5.75% 3/2/2063 |
|
|
85 |
|
|
|
|
|
83 |
|
|
|
AstraZeneca Finance, LLC 5.00% 2/26/2034 |
|
|
50 |
|
|
|
|
|
50 |
|
|
|
Baxter International, Inc. 3.132% 12/1/2051 |
|
|
25 |
|
|
|
|
|
16 |
|
|
|
Bristol-Myers Squibb Co. 4.90% 2/22/2029 |
|
|
95 |
|
|
|
|
|
95 |
|
|
|
Bristol-Myers Squibb Co. 5.10% 2/22/2031 |
|
|
260 |
|
|
|
|
|
261 |
|
|
|
Bristol-Myers Squibb Co. 5.20% 2/22/2034 |
|
|
295 |
|
|
|
|
|
294 |
|
|
|
Bristol-Myers Squibb Co. 5.50% 2/22/2044 |
|
|
25 |
|
|
|
|
|
25 |
|
|
|
Bristol-Myers Squibb Co. 5.55% 2/22/2054 |
|
|
325 |
|
|
|
|
|
321 |
|
|
|
Bristol-Myers Squibb Co. 5.65% 2/22/2064 |
|
|
100 |
|
|
|
|
|
98 |
|
|
|
Centene Corp. 4.625% 12/15/2029 |
|
|
530 |
|
|
|
|
|
502 |
|
|
|
Centene Corp. 3.375% 2/15/2030 |
|
|
179 |
|
|
|
|
|
159 |
|
|
|
Centene Corp. 2.625% 8/1/2031 |
|
|
40 |
|
|
|
|
|
33 |
|
|
|
CVS Health Corp. 5.125% 2/21/2030 |
|
|
50 |
|
|
|
|
|
49 |
|
|
|
CVS Health Corp. 5.25% 2/21/2033 |
|
|
23 |
|
|
|
|
|
22 |
|
|
|
CVS Health Corp. 5.70% 6/1/2034 |
|
|
97 |
|
|
|
|
|
97 |
|
|
|
CVS Health Corp. 6.00% 6/1/2044 |
|
|
50 |
|
|
|
|
|
49 |
|
|
|
CVS Health Corp. 5.625% 2/21/2053 |
|
|
55 |
|
|
|
|
|
51 |
|
|
|
CVS Health Corp. 6.05% 6/1/2054 |
|
|
50 |
|
|
|
|
|
49 |
|
|
|
Elevance Health, Inc. 4.75% 2/15/2033 |
|
|
16 |
|
|
|
|
|
15 |
|
|
|
Gilead Sciences, Inc. 1.65% 10/1/2030 |
|
|
8 |
|
|
|
|
|
7 |
|
|
|
HCA, Inc. 2.375% 7/15/2031 |
|
|
18 |
|
|
|
|
|
15 |
|
|
|
Humana, Inc. 3.70% 3/23/2029 |
|
|
12 |
|
|
|
|
|
11 |
|
|
|
Humana, Inc. 5.375% 4/15/2031 |
|
|
13 |
|
|
|
|
|
13 |
|
|
|
Medline Borrower, LP 6.25% 4/1/20292 |
|
|
380 |
|
|
|
|
|
385 |
|
|
|
Merck & Co., Inc. 1.70% 6/10/2027 |
|
|
118 |
|
|
|
|
|
108 |
|
|
|
Merck & Co., Inc. 3.40% 3/7/2029 |
|
|
110 |
|
|
|
|
|
104 |
|
|
|
Merck & Co., Inc. 4.50% 5/17/2033 |
|
|
35 |
|
|
|
|
|
34 |
|
|
|
Merck & Co., Inc. 4.90% 5/17/2044 |
|
|
35 |
|
|
|
|
|
33 |
|
|
|
Molina Healthcare, Inc. 3.875% 5/15/20322 |
|
|
40 |
|
|
|
|
|
35 |
|
|
|
Pfizer Investment Enterprises Pte., Ltd. 4.65% 5/19/2030 |
|
|
10 |
|
|
|
|
|
10 |
|
|
|
Pfizer Investment Enterprises Pte., Ltd. 4.75% 5/19/2033 |
|
|
23 |
|
|
|
|
|
22 |
|
|
|
Pfizer Investment Enterprises Pte., Ltd. 5.30% 5/19/2053 |
|
|
17 |
|
|
|
|
|
16 |
|
|
|
Shire Acquisitions Investments Ireland DAC 3.20% 9/23/2026 |
|
|
270 |
|
|
|
|
|
259 |
|
|
|
Teva Pharmaceutical Finance Netherlands III BV 3.15% 10/1/2026 |
|
|
650 |
|
|
|
|
|
611 |
|
|
|
Teva Pharmaceutical Finance Netherlands III BV 4.10% 10/1/2046 |
|
|
224 |
|
|
|
|
|
157 |
|
|
|
|
|
|
|
|
|
|
|
|
|
|
|
|
|
|
|
|
|
|
|
|
|
5,227 |
|
|
|
|
|
|
|
|
|
|
|
|
|
|
|
| |
|
| |
|
|
|
|
| Energy 0.34% |
|
Apache Corp. 4.25% 1/15/2030 |
|
|
385 |
|
|
|
|
|
359 |
|
|
|
BP Capital Markets America, Inc. 3.633% 4/6/2030 |
|
|
360 |
|
|
|
|
|
335 |
|
|
|
Cenovus Energy, Inc. 5.40% 6/15/2047 |
|
|
44 |
|
|
|
|
|
40 |
|
|
|
Columbia Pipelines Operating Co., LLC 5.927% 8/15/20302 |
|
|
9 |
|
|
|
|
|
9 |
|
|
|
ConocoPhillips Co. 5.30% 5/15/2053 |
|
|
25 |
|
|
|
|
|
24 |
|
|
|
Crescent Energy Finance, LLC 7.375% 1/15/20332 |
|
|
270 |
|
|
|
|
|
271 |
|
|
|
Diamondback Energy, Inc. 5.40% 4/18/2034 |
|
|
41 |
|
|
|
|
|
41 |
|
|
|
Enbridge, Inc. 6.70% 11/15/2053 |
|
|
12 |
|
|
|
|
|
13 |
|
75 American Funds Insurance Series
Capital Income Builder (continued)
|
|
|
|
|
|
|
|
|
|
|
|
|
| Bonds, notes & other debt instruments (continued) |
|
Principal amount
(000) |
|
|
|
|
Value (000) |
|
| |
| Corporate bonds, notes & loans (continued) |
|
| |
|
|
|
|
| Energy (continued) |
|
Energy Transfer, LP 6.10% 12/1/2028 |
|
|
USD41 |
|
|
|
|
$ |
42 |
|
|
|
Energy Transfer, LP 5.25% 7/1/2029 |
|
|
23 |
|
|
|
|
|
23 |
|
|
|
Energy Transfer, LP 6.40% 12/1/2030 |
|
|
34 |
|
|
|
|
|
36 |
|
|
|
Energy Transfer, LP 5.60% 9/1/2034 |
|
|
39 |
|
|
|
|
|
39 |
|
|
|
Energy Transfer, LP 6.05% 9/1/2054 |
|
|
22 |
|
|
|
|
|
22 |
|
|
|
Equinor ASA 2.375% 5/22/2030 |
|
|
365 |
|
|
|
|
|
319 |
|
|
|
Exxon Mobil Corp. 2.995% 8/16/2039 |
|
|
200 |
|
|
|
|
|
152 |
|
|
|
Exxon Mobil Corp. 3.452% 4/15/2051 |
|
|
25 |
|
|
|
|
|
18 |
|
|
|
Hess Midstream Operations, LP 6.50% 6/1/20292 |
|
|
530 |
|
|
|
|
|
538 |
|
|
|
Hilcorp Energy I, LP 6.875% 5/15/20342 |
|
|
400 |
|
|
|
|
|
396 |
|
|
|
Kinder Morgan, Inc. 5.20% 6/1/2033 |
|
|
7 |
|
|
|
|
|
7 |
|
|
|
Kinder Morgan, Inc. 5.40% 2/1/2034 |
|
|
63 |
|
|
|
|
|
62 |
|
|
|
Kinder Morgan, Inc. 5.45% 8/1/2052 |
|
|
11 |
|
|
|
|
|
10 |
|
|
|
MPLX, LP 4.95% 9/1/2032 |
|
|
20 |
|
|
|
|
|
19 |
|
|
|
New Fortress Energy, Inc. 6.50% 9/30/20262 |
|
|
80 |
|
|
|
|
|
74 |
|
|
|
ONEOK, Inc. 6.05% 9/1/2033 |
|
|
88 |
|
|
|
|
|
91 |
|
|
|
ONEOK, Inc. 7.15% 1/15/2051 |
|
|
97 |
|
|
|
|
|
107 |
|
|
|
ONEOK, Inc. 6.625% 9/1/2053 |
|
|
91 |
|
|
|
|
|
97 |
|
|
|
Petroleos Mexicanos 6.50% 1/23/2029 |
|
|
20 |
|
|
|
|
|
18 |
|
|
|
Petroleos Mexicanos 8.75% 6/2/2029 |
|
|
177 |
|
|
|
|
|
173 |
|
|
|
Shell International Finance BV 2.00% 11/7/2024 |
|
|
420 |
|
|
|
|
|
415 |
|
|
|
TransCanada Pipelines, Ltd. 5.10% 3/15/2049 |
|
|
150 |
|
|
|
|
|
136 |
|
|
|
Venture Global Calcasieu Pass, LLC 4.125% 8/15/20312 |
|
|
595 |
|
|
|
|
|
534 |
|
|
|
Williams Companies, Inc. 5.15% 3/15/2034 |
|
|
50 |
|
|
|
|
|
49 |
|
|
|
Williams Companies, Inc. 5.30% 8/15/2052 |
|
|
40 |
|
|
|
|
|
37 |
|
|
|
|
|
|
|
|
|
|
|
|
|
|
|
|
|
|
|
|
|
|
|
|
|
4,506 |
|
|
|
|
|
|
|
|
|
|
|
|
|
|
|
| |
|
| |
|
|
|
|
| Consumer discretionary 0.33% |
|
Advance Auto Parts, Inc. 3.90% 4/15/2030 |
|
|
18 |
|
|
|
|
|
16 |
|
|
|
Advance Auto Parts, Inc. 3.50% 3/15/2032 |
|
|
12 |
|
|
|
|
|
10 |
|
|
|
Bath & Body Works, Inc. 6.875% 11/1/2035 |
|
|
150 |
|
|
|
|
|
151 |
|
|
|
BMW US Capital, LLC 4.15% 4/9/20302 |
|
|
290 |
|
|
|
|
|
278 |
|
|
|
BMW US Capital, LLC 3.70% 4/1/20322 |
|
|
25 |
|
|
|
|
|
23 |
|
|
|
Carnival Corp. 6.00% 5/1/20292 |
|
|
830 |
|
|
|
|
|
820 |
|
|
|
Daimler Trucks Finance North America, LLC 1.625% 12/13/20242 |
|
|
175 |
|
|
|
|
|
172 |
|
|
|
Daimler Trucks Finance North America, LLC 5.15% 1/16/20262 |
|
|
150 |
|
|
|
|
|
149 |
|
|
|
Daimler Trucks Finance North America, LLC 5.125% 9/25/20272 |
|
|
150 |
|
|
|
|
|
149 |
|
|
|
Daimler Trucks Finance North America, LLC 2.50% 12/14/20312 |
|
|
150 |
|
|
|
|
|
124 |
|
|
|
Ford Motor Credit Co., LLC 2.30% 2/10/2025 |
|
|
200 |
|
|
|
|
|
196 |
|
|
|
Ford Motor Credit Co., LLC 5.125% 6/16/2025 |
|
|
695 |
|
|
|
|
|
690 |
|
|
|
Ford Motor Credit Co., LLC 2.70% 8/10/2026 |
|
|
306 |
|
|
|
|
|
288 |
|
|
|
Ford Motor Credit Co., LLC 4.95% 5/28/2027 |
|
|
604 |
|
|
|
|
|
590 |
|
|
|
Ford Motor Credit Co., LLC 6.798% 11/7/2028 |
|
|
200 |
|
|
|
|
|
207 |
|
|
|
Grand Canyon University 4.125% 10/1/2024 |
|
|
200 |
|
|
|
|
|
199 |
|
|
|
Hyundai Capital America 5.275% 6/24/20272 |
|
|
55 |
|
|
|
|
|
55 |
|
|
|
McDonald’s Corp. 3.60% 7/1/2030 |
|
|
12 |
|
|
|
|
|
11 |
|
|
|
McDonald’s Corp. 4.60% 9/9/2032 |
|
|
3 |
|
|
|
|
|
3 |
|
|
|
McDonald’s Corp. 4.95% 8/14/2033 |
|
|
3 |
|
|
|
|
|
3 |
|
|
|
McDonald’s Corp. 5.15% 9/9/2052 |
|
|
10 |
|
|
|
|
|
9 |
|
|
|
Toyota Motor Credit Corp. 5.40% 11/10/2025 |
|
|
228 |
|
|
|
|
|
229 |
|
|
|
|
|
|
|
|
|
|
|
|
|
|
|
|
|
|
|
|
|
|
|
|
|
4,372 |
|
|
|
|
|
|
|
|
|
|
|
|
|
|
|
| |
|
| |
|
|
|
|
| Utilities 0.19% |
|
AEP Transmission Co., LLC 3.80% 6/15/2049 |
|
|
45 |
|
|
|
|
|
33 |
|
|
|
Consumers Energy Co. 4.625% 5/15/2033 |
|
|
50 |
|
|
|
|
|
48 |
|
|
|
DTE Energy Co. 3.00% 3/1/2032 |
|
|
42 |
|
|
|
|
|
36 |
|
|
|
Duke Energy Florida, LLC 5.95% 11/15/2052 |
|
|
25 |
|
|
|
|
|
25 |
|
|
|
Edison International 4.125% 3/15/2028 |
|
|
132 |
|
|
|
|
|
126 |
|
|
|
Edison International 6.95% 11/15/2029 |
|
|
25 |
|
|
|
|
|
27 |
|
American Funds Insurance Series 76
Capital Income Builder (continued)
|
|
|
|
|
|
|
|
|
|
|
|
|
| Bonds, notes & other debt instruments (continued) |
|
Principal amount
(000) |
|
|
|
|
Value (000) |
|
| |
| Corporate bonds, notes & loans (continued) |
|
| |
|
|
|
|
| Utilities (continued) |
|
Electricité de France SA 9.125% junior subordinated perpetual bonds
(5-year UST Yield Curve Rate T Note Constant Maturity + 5.411% on 6/15/2033)2,9 |
|
|
USD200 |
|
|
|
|
$ |
218 |
|
|
|
Eversource Energy 5.50% 1/1/2034 |
|
|
25 |
|
|
|
|
|
25 |
|
|
|
FirstEnergy Corp. 2.65% 3/1/2030 |
|
|
393 |
|
|
|
|
|
342 |
|
|
|
FirstEnergy Corp. 2.25% 9/1/2030 |
|
|
107 |
|
|
|
|
|
90 |
|
|
|
Florida Power & Light Co. 5.05% 4/1/2028 |
|
|
70 |
|
|
|
|
|
70 |
|
|
|
Florida Power & Light Co. 5.10% 4/1/2033 |
|
|
35 |
|
|
|
|
|
35 |
|
|
|
NiSource, Inc. 5.40% 6/30/2033 |
|
|
25 |
|
|
|
|
|
25 |
|
|
|
Pacific Gas and Electric Co. 2.95% 3/1/2026 |
|
|
97 |
|
|
|
|
|
93 |
|
|
|
Pacific Gas and Electric Co. 3.75% 7/1/2028 |
|
|
105 |
|
|
|
|
|
99 |
|
|
|
Pacific Gas and Electric Co. 4.65% 8/1/2028 |
|
|
284 |
|
|
|
|
|
275 |
|
|
|
Pacific Gas and Electric Co. 6.10% 1/15/2029 |
|
|
35 |
|
|
|
|
|
36 |
|
|
|
Pacific Gas and Electric Co. 2.50% 2/1/2031 |
|
|
375 |
|
|
|
|
|
309 |
|
|
|
Pacific Gas and Electric Co. 6.40% 6/15/2033 |
|
|
50 |
|
|
|
|
|
52 |
|
|
|
Pacific Gas and Electric Co. 5.80% 5/15/2034 |
|
|
50 |
|
|
|
|
|
50 |
|
|
|
Pacific Gas and Electric Co. 4.95% 7/1/2050 |
|
|
62 |
|
|
|
|
|
51 |
|
|
|
PacifiCorp 5.30% 2/15/2031 |
|
|
35 |
|
|
|
|
|
35 |
|
|
|
PacifiCorp 5.50% 5/15/2054 |
|
|
95 |
|
|
|
|
|
88 |
|
|
|
PacifiCorp 5.80% 1/15/2055 |
|
|
25 |
|
|
|
|
|
24 |
|
|
|
Southern California Edison Co. 5.20% 6/1/2034 |
|
|
40 |
|
|
|
|
|
39 |
|
|
|
Southern California Edison Co. 3.60% 2/1/2045 |
|
|
206 |
|
|
|
|
|
151 |
|
|
|
Southern California Edison Co. 5.75% 4/15/2054 |
|
|
25 |
|
|
|
|
|
24 |
|
|
|
Union Electric Co. 3.90% 4/1/2052 |
|
|
25 |
|
|
|
|
|
19 |
|
|
|
WEC Energy Group, Inc. 5.15% 10/1/2027 |
|
|
25 |
|
|
|
|
|
25 |
|
|
|
|
|
|
|
|
|
|
|
|
|
|
|
|
|
|
|
|
|
|
|
|
|
2,470 |
|
|
|
|
|
|
|
|
|
|
|
|
|
|
|
| |
|
| |
|
|
|
|
| Real estate 0.18% |
|
American Tower Corp. 4.05% 3/15/2032 |
|
|
11 |
|
|
|
|
|
10 |
|
|
|
Boston Properties, LP 2.45% 10/1/2033 |
|
|
7 |
|
|
|
|
|
5 |
|
|
|
Boston Properties, LP 6.50% 1/15/2034 |
|
|
38 |
|
|
|
|
|
39 |
|
|
|
Crown Castle, Inc. 5.00% 1/11/2028 |
|
|
54 |
|
|
|
|
|
53 |
|
|
|
Equinix, Inc. 1.55% 3/15/2028 |
|
|
25 |
|
|
|
|
|
22 |
|
|
|
Equinix, Inc. 3.20% 11/18/2029 |
|
|
144 |
|
|
|
|
|
130 |
|
|
|
Iron Mountain, Inc. 4.50% 2/15/20312 |
|
|
530 |
|
|
|
|
|
479 |
|
|
|
Kennedy-Wilson, Inc. 5.00% 3/1/2031 |
|
|
550 |
|
|
|
|
|
450 |
|
|
|
MPT Operating Partnership, LP 5.00% 10/15/2027 |
|
|
475 |
|
|
|
|
|
393 |
|
|
|
Prologis, LP 5.00% 3/15/2034 |
|
|
40 |
|
|
|
|
|
39 |
|
|
|
Service Properties Trust 8.375% 6/15/2029 |
|
|
680 |
|
|
|
|
|
669 |
|
|
|
|
|
|
|
|
|
|
|
|
|
|
|
|
|
|
|
|
|
|
|
|
|
2,289 |
|
|
|
|
|
|
|
|
|
|
|
|
|
|
|
| |
|
| |
|
|
|
|
| Industrials 0.17% |
|
BAE Systems PLC 5.30% 3/26/20342 |
|
|
200 |
|
|
|
|
|
198 |
|
|
|
Boeing Co. 2.75% 2/1/2026 |
|
|
91 |
|
|
|
|
|
86 |
|
|
|
Boeing Co. 6.259% 5/1/20272 |
|
|
376 |
|
|
|
|
|
379 |
|
|
|
Boeing Co. 6.298% 5/1/20292 |
|
|
12 |
|
|
|
|
|
12 |
|
|
|
Boeing Co. 3.625% 2/1/2031 |
|
|
178 |
|
|
|
|
|
156 |
|
|
|
Boeing Co. 6.388% 5/1/20312 |
|
|
92 |
|
|
|
|
|
94 |
|
|
|
Boeing Co. 6.528% 5/1/20342 |
|
|
585 |
|
|
|
|
|
599 |
|
|
|
Boeing Co. 5.805% 5/1/2050 |
|
|
80 |
|
|
|
|
|
72 |
|
|
|
Boeing Co. 6.858% 5/1/20542 |
|
|
56 |
|
|
|
|
|
57 |
|
|
|
Canadian Pacific Railway Co. 3.10% 12/2/2051 |
|
|
102 |
|
|
|
|
|
68 |
|
|
|
Carrier Global Corp. 2.722% 2/15/2030 |
|
|
9 |
|
|
|
|
|
8 |
|
|
|
Carrier Global Corp. 2.70% 2/15/2031 |
|
|
9 |
|
|
|
|
|
8 |
|
|
|
Carrier Global Corp. 5.90% 3/15/2034 |
|
|
40 |
|
|
|
|
|
42 |
|
|
|
Carrier Global Corp. 3.577% 4/5/2050 |
|
|
8 |
|
|
|
|
|
6 |
|
|
|
Carrier Global Corp. 6.20% 3/15/2054 |
|
|
49 |
|
|
|
|
|
52 |
|
|
|
CSX Corp. 4.75% 11/15/2048 |
|
|
50 |
|
|
|
|
|
45 |
|
|
|
CSX Corp. 4.50% 11/15/2052 |
|
|
35 |
|
|
|
|
|
30 |
|
|
|
L3Harris Technologies, Inc. 5.40% 7/31/2033 |
|
|
15 |
|
|
|
|
|
15 |
|
77 American Funds Insurance Series
Capital Income Builder (continued)
|
|
|
|
|
|
|
|
|
|
|
|
|
| Bonds, notes & other debt instruments (continued) |
|
Principal amount
(000) |
|
|
|
|
Value (000) |
|
| |
| Corporate bonds, notes & loans (continued) |
|
| |
|
|
|
|
| Industrials (continued) |
|
L3Harris Technologies, Inc. 5.60% 7/31/2053 |
|
|
USD13 |
|
|
|
|
$ |
13 |
|
|
|
Lockheed Martin Corp. 5.10% 11/15/2027 |
|
|
19 |
|
|
|
|
|
19 |
|
|
|
Lockheed Martin Corp. 5.20% 2/15/2064 |
|
|
8 |
|
|
|
|
|
8 |
|
|
|
Moog, Inc. 4.25% 12/9/20272 |
|
|
55 |
|
|
|
|
|
52 |
|
|
|
Norfolk Southern Corp. 5.35% 8/1/2054 |
|
|
51 |
|
|
|
|
|
49 |
|
|
|
Northrop Grumman Corp. 4.95% 3/15/2053 |
|
|
21 |
|
|
|
|
|
19 |
|
|
|
Republic Services, Inc. 5.00% 4/1/2034 |
|
|
13 |
|
|
|
|
|
13 |
|
|
|
RTX Corp. 6.00% 3/15/2031 |
|
|
35 |
|
|
|
|
|
36 |
|
|
|
RTX Corp. 6.10% 3/15/2034 |
|
|
27 |
|
|
|
|
|
28 |
|
|
|
RTX Corp. 6.40% 3/15/2054 |
|
|
22 |
|
|
|
|
|
24 |
|
|
|
Union Pacific Corp. 2.80% 2/14/2032 |
|
|
17 |
|
|
|
|
|
15 |
|
|
|
Union Pacific Corp. 3.50% 2/14/2053 |
|
|
20 |
|
|
|
|
|
14 |
|
|
|
Waste Management, Inc. 4.625% 2/15/2030 |
|
|
60 |
|
|
|
|
|
59 |
|
|
|
|
|
|
|
|
|
|
|
|
|
|
|
|
|
|
|
|
|
|
|
|
|
2,276 |
|
|
|
|
|
|
|
|
|
|
|
|
|
|
|
| |
|
| |
|
|
|
|
| Communication services 0.12% |
|
América Móvil, SAB de CV 8.46% 12/18/2036 |
|
|
MXN1,300 |
|
|
|
|
|
60 |
|
|
|
AT&T, Inc. 3.50% 6/1/2041 |
|
|
USD75 |
|
|
|
|
|
57 |
|
|
|
CCO Holdings, LLC 4.75% 2/1/20322 |
|
|
25 |
|
|
|
|
|
21 |
|
|
|
CCO Holdings, LLC 4.25% 1/15/20342 |
|
|
175 |
|
|
|
|
|
133 |
|
|
|
Charter Communications Operating, LLC 6.10% 6/1/2029 |
|
|
41 |
|
|
|
|
|
41 |
|
|
|
Charter Communications Operating, LLC 3.70% 4/1/2051 |
|
|
25 |
|
|
|
|
|
15 |
|
|
|
SBA Tower Trust 1.631% 11/15/20262 |
|
|
253 |
|
|
|
|
|
230 |
|
|
|
T-Mobile USA, Inc. 3.875% 4/15/2030 |
|
|
625 |
|
|
|
|
|
585 |
|
|
|
T-Mobile USA, Inc. 2.55% 2/15/2031 |
|
|
203 |
|
|
|
|
|
172 |
|
|
|
T-Mobile USA, Inc. 6.00% 6/15/2054 |
|
|
69 |
|
|
|
|
|
71 |
|
|
|
Verizon Communications, Inc. 1.75% 1/20/2031 |
|
|
142 |
|
|
|
|
|
115 |
|
|
|
WarnerMedia Holdings, Inc. 5.05% 3/15/2042 |
|
|
47 |
|
|
|
|
|
38 |
|
|
|
WarnerMedia Holdings, Inc. 5.141% 3/15/2052 |
|
|
88 |
|
|
|
|
|
69 |
|
|
|
|
|
|
|
|
|
|
|
|
|
|
|
|
|
|
|
|
|
|
|
|
|
1,607 |
|
|
|
|
|
|
|
|
|
|
|
|
|
|
|
| |
|
| |
|
|
|
|
| Materials 0.11% |
|
BHP Billiton Finance (USA), Ltd. 4.875% 2/27/2026 |
|
|
35 |
|
|
|
|
|
35 |
|
|
|
BHP Billiton Finance (USA), Ltd. 4.75% 2/28/2028 |
|
|
35 |
|
|
|
|
|
35 |
|
|
|
BHP Billiton Finance (USA), Ltd. 4.90% 2/28/2033 |
|
|
16 |
|
|
|
|
|
16 |
|
|
|
BHP Billiton Finance (USA), Ltd. 5.25% 9/8/2033 |
|
|
7 |
|
|
|
|
|
7 |
|
|
|
BHP Billiton Finance (USA), Ltd. 5.50% 9/8/2053 |
|
|
15 |
|
|
|
|
|
15 |
|
|
|
Celanese US Holdings, LLC 6.35% 11/15/2028 |
|
|
36 |
|
|
|
|
|
37 |
|
|
|
Celanese US Holdings, LLC 6.55% 11/15/2030 |
|
|
27 |
|
|
|
|
|
28 |
|
|
|
Celanese US Holdings, LLC 6.379% 7/15/2032 |
|
|
10 |
|
|
|
|
|
10 |
|
|
|
Celanese US Holdings, LLC 6.70% 11/15/2033 |
|
|
23 |
|
|
|
|
|
24 |
|
|
|
Consolidated Energy Finance SA 5.625% 10/15/20282 |
|
|
750 |
|
|
|
|
|
638 |
|
|
|
Dow Chemical Co. (The) 5.15% 2/15/2034 |
|
|
34 |
|
|
|
|
|
33 |
|
|
|
Dow Chemical Co. (The) 5.55% 11/30/2048 |
|
|
15 |
|
|
|
|
|
14 |
|
|
|
Dow Chemical Co. (The) 3.60% 11/15/2050 |
|
|
75 |
|
|
|
|
|
52 |
|
|
|
Dow Chemical Co. (The) 6.90% 5/15/2053 |
|
|
6 |
|
|
|
|
|
7 |
|
|
|
Dow Chemical Co. (The) 5.60% 2/15/2054 |
|
|
53 |
|
|
|
|
|
51 |
|
|
|
Eastman Chemical Co. 5.625% 2/20/2034 |
|
|
35 |
|
|
|
|
|
35 |
|
|
|
International Flavors & Fragrances, Inc. 3.468% 12/1/20502 |
|
|
4 |
|
|
|
|
|
3 |
|
|
|
LYB International Finance III, LLC 3.625% 4/1/2051 |
|
|
102 |
|
|
|
|
|
70 |
|
|
|
NOVA Chemicals Corp. 8.50% 11/15/20282 |
|
|
10 |
|
|
|
|
|
11 |
|
|
|
NOVA Chemicals Corp. 4.25% 5/15/20292 |
|
|
325 |
|
|
|
|
|
287 |
|
|
|
|
|
|
|
|
|
|
|
|
|
|
|
|
|
|
|
|
|
|
|
|
|
1,408 |
|
|
|
|
|
|
|
|
|
|
|
|
|
|
|
| |
|
| |
|
|
|
|
| Consumer staples 0.09% |
|
7-Eleven, Inc. 1.30% 2/10/20282 |
|
|
14 |
|
|
|
|
|
12 |
|
|
|
BAT Capital Corp. 4.70% 4/2/2027 |
|
|
105 |
|
|
|
|
|
103 |
|
|
|
BAT Capital Corp. 6.343% 8/2/2030 |
|
|
9 |
|
|
|
|
|
9 |
|
|
|
BAT Capital Corp. 6.421% 8/2/2033 |
|
|
38 |
|
|
|
|
|
40 |
|
|
|
BAT Capital Corp. 7.079% 8/2/2043 |
|
|
31 |
|
|
|
|
|
33 |
|
American Funds Insurance Series 78
Capital Income Builder (continued)
|
|
|
|
|
|
|
|
|
|
|
|
|
| Bonds, notes & other debt instruments (continued) |
|
Principal amount
(000) |
|
|
|
|
Value (000) |
|
| |
| Corporate bonds, notes & loans (continued) |
|
| |
|
|
|
|
| Consumer staples (continued) |
|
BAT Capital Corp. 4.54% 8/15/2047 |
|
|
USD55 |
|
|
|
|
$ |
42 |
|
|
|
BAT Capital Corp. 4.758% 9/6/2049 |
|
|
121 |
|
|
|
|
|
95 |
|
|
|
BAT Capital Corp. 7.081% 8/2/2053 |
|
|
69 |
|
|
|
|
|
74 |
|
|
|
BAT International Finance PLC 4.448% 3/16/2028 |
|
|
150 |
|
|
|
|
|
145 |
|
|
|
Campbell Soup Co. 5.40% 3/21/2034 |
|
|
22 |
|
|
|
|
|
22 |
|
|
|
Constellation Brands, Inc. 5.00% 2/2/2026 |
|
|
50 |
|
|
|
|
|
50 |
|
|
|
H.J. Heinz Co. 4.875% 10/1/2049 |
|
|
235 |
|
|
|
|
|
205 |
|
|
|
J. M. Smucker Co. (The) 6.20% 11/15/2033 |
|
|
22 |
|
|
|
|
|
23 |
|
|
|
J. M. Smucker Co. (The) 6.50% 11/15/2043 |
|
|
6 |
|
|
|
|
|
6 |
|
|
|
J. M. Smucker Co. (The) 6.50% 11/15/2053 |
|
|
21 |
|
|
|
|
|
23 |
|
|
|
Philip Morris International, Inc. 5.125% 11/17/2027 |
|
|
43 |
|
|
|
|
|
43 |
|
|
|
Philip Morris International, Inc. 5.625% 11/17/2029 |
|
|
23 |
|
|
|
|
|
24 |
|
|
|
Philip Morris International, Inc. 5.125% 2/15/2030 |
|
|
56 |
|
|
|
|
|
56 |
|
|
|
Philip Morris International, Inc. 5.50% 9/7/2030 |
|
|
70 |
|
|
|
|
|
71 |
|
|
|
Philip Morris International, Inc. 5.75% 11/17/2032 |
|
|
16 |
|
|
|
|
|
16 |
|
|
|
Philip Morris International, Inc. 5.375% 2/15/2033 |
|
|
55 |
|
|
|
|
|
55 |
|
|
|
Philip Morris International, Inc. 5.625% 9/7/2033 |
|
|
30 |
|
|
|
|
|
30 |
|
|
|
|
|
|
|
|
|
|
|
|
|
|
|
|
|
|
|
|
|
|
|
|
|
1,177 |
|
|
|
|
|
|
|
|
|
|
|
|
|
|
|
| |
|
| |
|
|
|
|
| Information technology 0.05% |
|
Broadcom, Inc. 4.00% 4/15/20292 |
|
|
3 |
|
|
|
|
|
3 |
|
|
|
Broadcom, Inc. 4.15% 4/15/20322 |
|
|
11 |
|
|
|
|
|
10 |
|
|
|
Broadcom, Inc. 3.137% 11/15/20352 |
|
|
2 |
|
|
|
|
|
1 |
|
|
|
Cisco Systems, Inc. 4.95% 2/26/2031 |
|
|
11 |
|
|
|
|
|
11 |
|
|
|
Cisco Systems, Inc. 5.05% 2/26/2034 |
|
|
4 |
|
|
|
|
|
4 |
|
|
|
Cisco Systems, Inc. 5.30% 2/26/2054 |
|
|
8 |
|
|
|
|
|
8 |
|
|
|
Cisco Systems, Inc. 5.35% 2/26/2064 |
|
|
11 |
|
|
|
|
|
11 |
|
|
|
Intel Corp. 5.15% 2/21/2034 |
|
|
20 |
|
|
|
|
|
20 |
|
|
|
Intel Corp. 5.60% 2/21/2054 |
|
|
39 |
|
|
|
|
|
38 |
|
|
|
Lenovo Group, Ltd. 5.875% 4/24/2025 |
|
|
400 |
|
|
|
|
|
401 |
|
|
|
ServiceNow, Inc. 1.40% 9/1/2030 |
|
|
130 |
|
|
|
|
|
105 |
|
|
|
|
|
|
|
|
|
|
|
|
|
|
|
|
|
|
|
|
|
|
|
|
|
612 |
|
|
|
|
|
|
|
|
|
|
|
|
|
|
|
|
Total corporate bonds, notes & loans |
|
|
|
|
|
|
|
|
31,284 |
|
|
|
|
|
|
|
|
|
|
|
|
|
|
|
| Asset-backed obligations 0.84% |
|
| |
|
|
|
|
|
|
ACHV ABS Trust, Series 2023-3PL, Class B, 7.17% 8/19/20302,6 |
|
|
64 |
|
|
|
|
|
65 |
|
|
|
Affirm Asset Securitization Trust, Series 2022-X1, Class A, 1.75% 2/15/20272,6 |
|
|
4 |
|
|
|
|
|
4 |
|
|
|
Affirm Asset Securitization Trust, Series 2023-A, Class A, 6.61% 1/18/20282,6 |
|
|
100 |
|
|
|
|
|
100 |
|
|
|
Affirm, Inc., Series 2024-A, Class A, 5.61% 2/15/20292,6 |
|
|
215 |
|
|
|
|
|
214 |
|
|
|
American Express Credit Account Master Trust, Series 2022-3, Class A,
3.75% 8/16/20276 |
|
|
100 |
|
|
|
|
|
98 |
|
|
|
American Homes 4 Rent, Series 2015-SFR2, Class A, 3.732% 10/17/20522,6 |
|
|
85 |
|
|
|
|
|
83 |
|
|
|
American Homes 4 Rent, Series 2015-SFR2, Class B, 4.295% 10/17/20522,6 |
|
|
100 |
|
|
|
|
|
98 |
|
|
|
Auxilior Term Funding, LLC, Series 24-1A, Class A2, 5.84% 3/15/20272,6 |
|
|
477 |
|
|
|
|
|
477 |
|
|
|
Avis Budget Rental Car Funding (AESOP), LLC, Series 2020-2, Class A,
2.02% 2/20/20272,6 |
|
|
197 |
|
|
|
|
|
187 |
|
|
|
Avis Budget Rental Car Funding (AESOP), LLC, Series 2020-2A, Class B,
2.96% 2/20/20272,6 |
|
|
100 |
|
|
|
|
|
96 |
|
|
|
Avis Budget Rental Car Funding (AESOP), LLC, Series 2023-6, Class A,
5.81% 12/20/20292,6 |
|
|
339 |
|
|
|
|
|
344 |
|
|
|
Bankers Healthcare Group Securitization Trust, Series 2022-A, Class A,
1.71% 2/20/20352,6 |
|
|
19 |
|
|
|
|
|
19 |
|
|
|
CF Hippolyta, LLC, Series 2020-1, Class A1, 1.69% 7/15/20602,6 |
|
|
351 |
|
|
|
|
|
333 |
|
|
|
CF Hippolyta, LLC, Series 2020-1, Class A2, 1.99% 7/15/20602,6 |
|
|
87 |
|
|
|
|
|
76 |
|
|
|
CF Hippolyta, LLC, Series 2020-1, Class B1, 2.28% 7/15/20602,6 |
|
|
90 |
|
|
|
|
|
84 |
|
|
|
CF Hippolyta, LLC, Series 2020-1, Class B2, 2.60% 7/15/20602,6 |
|
|
90 |
|
|
|
|
|
75 |
|
|
|
CF Hippolyta, LLC, Series 2021-1, Class A1, 1.53% 3/15/20612,6 |
|
|
316 |
|
|
|
|
|
289 |
|
|
|
CF Hippolyta, LLC, Series 2022-1, Class A1, 5.97% 8/15/20622,6 |
|
|
489 |
|
|
|
|
|
482 |
|
|
|
CPS Auto Receivables Trust, Series 2023-A, Class A, 5.54% 3/16/20262,6 |
|
|
10 |
|
|
|
|
|
10 |
|
79 American Funds Insurance Series
Capital Income Builder (continued)
|
|
|
|
|
|
|
|
|
|
|
|
|
| Bonds, notes & other debt instruments (continued) |
|
Principal amount
(000) |
|
|
|
|
Value (000) |
|
| |
| Asset-backed obligations (continued) |
|
|
|
CPS Auto Receivables Trust, Series 2024-C, Class B, 5.68% 12/15/20282,6 |
|
|
USD497 |
|
|
|
|
$ |
497 |
|
|
|
DriveTime Auto Owner Trust, Series 2023-1, Class A, 5.48% 4/15/20272,6 |
|
|
20 |
|
|
|
|
|
20 |
|
|
|
Enterprise Fleet Financing, LLC, Series 2024-1, Class A2, 5.23% 3/20/20302,6 |
|
|
525 |
|
|
|
|
|
524 |
|
|
|
FirstKey Homes Trust, Series 2022-SFR2, Class A, 4.145% 5/17/20392,6 |
|
|
131 |
|
|
|
|
|
126 |
|
|
|
Ford Credit Auto Owner Trust, Series 2023-1, Class A, 4.85% 8/15/20352,6 |
|
|
176 |
|
|
|
|
|
175 |
|
|
|
Ford Credit Auto Owner Trust, Series 2023-2, Class A, 5.28% 2/15/20362,6 |
|
|
181 |
|
|
|
|
|
183 |
|
|
|
Ford Credit Floorplan Master Owner Trust, Series 2023-1, Class A1, 4.92% 5/15/20282,6 |
|
|
188 |
|
|
|
|
|
187 |
|
|
|
GCI Funding I, LLC, Series 2020-1, Class A, 2.82% 10/18/20452,6 |
|
|
395 |
|
|
|
|
|
360 |
|
|
|
GCI Funding I, LLC, Series 2021-1, Class A, 2.38% 6/18/20462,6 |
|
|
73 |
|
|
|
|
|
65 |
|
|
|
Global SC Finance V SRL, Series 2019-1A, Class B, 4.81% 9/17/20392,6 |
|
|
103 |
|
|
|
|
|
98 |
|
|
|
Global SC Finance V SRL, Series 2020-1A, Class A, 2.17% 10/17/20402,6 |
|
|
386 |
|
|
|
|
|
357 |
|
|
|
GM Financial Revolving Receivables Trust, Series 2023-1, Class A, 5.12% 4/11/20352,6 |
|
|
285 |
|
|
|
|
|
286 |
|
|
|
GM Financial Revolving Receivables Trust, Series 2022-1, Class A, 5.91% 10/11/20352,6 |
|
|
184 |
|
|
|
|
|
189 |
|
|
|
GM Financial Securitized Term Auto Receivables Trust, Series 2023-2, Class A3,
4.47% 2/16/20286 |
|
|
25 |
|
|
|
|
|
25 |
|
|
|
GM Financial Securitized Term Auto Receivables Trust, Series 2023-2, Class A4,
4.43% 10/16/20286 |
|
|
48 |
|
|
|
|
|
47 |
|
|
|
Hertz Vehicle Financing III, LLC, Series 2021-1A, Class A, 1.21% 12/26/20252,6 |
|
|
247 |
|
|
|
|
|
244 |
|
|
|
Hertz Vehicle Financing III, LLC, Series 2021-1A, Class B, 1.56% 12/26/20252,6 |
|
|
100 |
|
|
|
|
|
99 |
|
|
|
Hertz Vehicle Financing III, LLC, Series 2021-2A, Class A, 1.68% 12/27/20272,6 |
|
|
268 |
|
|
|
|
|
245 |
|
|
|
Hertz Vehicle Financing III, LLC, Series 2021-2A, Class B, 2.12% 12/27/20272,6 |
|
|
100 |
|
|
|
|
|
91 |
|
|
|
Hertz Vehicle Financing III, LLC, Series 2021-2A, Class C, 2.52% 12/27/20272,6 |
|
|
100 |
|
|
|
|
|
91 |
|
|
|
Hyundai Auto Receivables Trust, Series 2023-A, Class A3, 4.58% 4/15/20276 |
|
|
28 |
|
|
|
|
|
28 |
|
|
|
Hyundai Auto Receivables Trust, Series 2023-A, Class A4, 4.48% 7/17/20286 |
|
|
28 |
|
|
|
|
|
28 |
|
|
|
LAD Auto Receivables Trust, Series 2023-1, Class A2, 5.68% 10/15/20262,6 |
|
|
9 |
|
|
|
|
|
9 |
|
|
|
Merchants Fleet Funding, LLC, Series 2024-1, Class A, 5.82% 4/20/20372,6 |
|
|
190 |
|
|
|
|
|
190 |
|
|
|
Mission Lane Credit Card Master Trust, Series 2023-A, Class A, 7.23% 7/17/20282,6 |
|
|
70 |
|
|
|
|
|
70 |
|
|
|
Navient Student Loan Trust, Series 2021-A, Class A, 0.84% 5/15/20692,6 |
|
|
34 |
|
|
|
|
|
30 |
|
|
|
Navient Student Loan Trust, Series 2021-C, Class A, 1.06% 10/15/20692,6 |
|
|
59 |
|
|
|
|
|
52 |
|
|
|
Nelnet Student Loan Trust, Series 2021-A, Class APT1, 1.36% 4/20/20622,6 |
|
|
146 |
|
|
|
|
|
132 |
|
|
|
Nelnet Student Loan Trust, Series 2021-B, Class AFX, 1.42% 4/20/20622,6 |
|
|
292 |
|
|
|
|
|
267 |
|
|
|
Nelnet Student Loan Trust, Series 2021-C, Class AFL,
(1-month USD CME Term SOFR + 0.854%) 6.193% 4/20/20622,6,7 |
|
|
149 |
|
|
|
|
|
148 |
|
|
|
New Economy Assets Phase 1 Issuer, LLC, Series 2021-1, Class A1,
1.91% 10/20/20612,6 |
|
|
935 |
|
|
|
|
|
834 |
|
|
|
OnDeck Asset Securitization Trust, LLC, Series 2024-1, Class A, 6.27% 6/17/20312,6 |
|
|
100 |
|
|
|
|
|
101 |
|
|
|
Oportun Funding, LLC, Series 2021-B, Class A, 1.47% 5/8/20312,6 |
|
|
94 |
|
|
|
|
|
89 |
|
|
|
PEAC Solutions Receivables, LLC, Series 2024-1, Class A2, 5.79% 6/21/20272,6 |
|
|
273 |
|
|
|
|
|
274 |
|
|
|
PFS Financing Corp., Series 2022-D, Class A, 4.27% 8/16/20272,6 |
|
|
100 |
|
|
|
|
|
99 |
|
|
|
PFS Financing Corp., Series 2023-B, Class A, 5.27% 5/15/20282,6 |
|
|
175 |
|
|
|
|
|
175 |
|
|
|
Post Road Equipment Finance, Series 2024-1, Class A2, 5.59% 11/15/20292,6 |
|
|
156 |
|
|
|
|
|
156 |
|
|
|
SCF Equipment Leasing, LLC, Series 2024-1, Class A2, 5.88% 11/20/20292,6 |
|
|
100 |
|
|
|
|
|
100 |
|
|
|
SFS Auto Receivables Securitization Trust, Series 2023-1, Class A2A,
5.89% 3/22/20272,6 |
|
|
39 |
|
|
|
|
|
39 |
|
|
|
SMB Private Education Loan Trust, Series 2021-A, Class APT2, 1.07% 1/15/20532,6 |
|
|
52 |
|
|
|
|
|
46 |
|
|
|
Stonepeak Infrastructure Partners, Series 2021-1A, Class AA, 2.301% 2/28/20332,6 |
|
|
117 |
|
|
|
|
|
109 |
|
|
|
Toyota Auto Loan Extended Note Trust, Series 2021-1, Class A, 1.07% 2/27/20342,6,7 |
|
|
335 |
|
|
|
|
|
312 |
|
|
|
Toyota Auto Receivables Owner Trust, Series 2022-C, Class A2B,
(30-day Average USD-SOFR + 0.57%) 5.903% 8/15/20256,7 |
|
|
1 |
|
|
|
|
|
1 |
|
|
|
Verdant Receivables, LLC, Series 2024-1, Class A2, 5.68% 12/12/20312,6 |
|
|
100 |
|
|
|
|
|
100 |
|
|
|
Verizon Master Trust, Series 2022-7, Class A1A,
5.23% 11/22/2027 (5.98% on 11/20/2024)6,9 |
|
|
451 |
|
|
|
|
|
450 |
|
|
|
Westlake Automobile Receivables Trust, Series 2022-3, Class C, 5.49% 7/15/20262,6 |
|
|
53 |
|
|
|
|
|
53 |
|
|
|
Westlake Automobile Receivables Trust, Series 2022-3, Class B, 5.99% 12/15/20272,6 |
|
|
100 |
|
|
|
|
|
100 |
|
|
|
|
|
|
|
|
|
|
|
|
|
|
|
|
|
|
|
|
|
|
|
|
|
11,035 |
|
|
|
|
|
|
|
|
|
|
|
|
|
|
American Funds Insurance Series 80
Capital Income Builder (continued)
|
|
|
|
|
|
|
|
|
|
|
|
|
| Bonds, notes & other debt instruments (continued) |
|
Principal amount
(000) |
|
|
|
|
Value (000) |
|
| |
| Bonds & notes of governments & government agencies outside the U.S. 0.06% |
|
|
|
Peru (Republic of) 2.783% 1/23/2031 |
|
|
USD190 |
|
|
|
|
$ |
164 |
|
|
|
Portuguese Republic 5.125% 10/15/2024 |
|
|
18 |
|
|
|
|
|
18 |
|
|
|
Qatar (State of) 4.50% 4/23/2028 |
|
|
200 |
|
|
|
|
|
198 |
|
|
|
Saudi Arabia (Kingdom of) 3.625% 3/4/2028 |
|
|
200 |
|
|
|
|
|
190 |
|
|
|
United Mexican States 3.25% 4/16/2030 |
|
|
200 |
|
|
|
|
|
176 |
|
|
|
|
|
|
|
|
|
|
|
|
|
|
|
|
|
|
|
|
|
|
|
|
|
746 |
|
|
|
|
|
|
|
|
|
|
|
|
|
|
|
| Municipals 0.02% |
|
| |
|
|
|
|
| Illinois 0.01% |
|
G.O. Bonds, Pension Funding, Series 2003, 5.10% 6/1/2033 |
|
|
212 |
|
|
|
|
|
208 |
|
|
|
|
|
|
|
|
|
|
|
|
|
|
|
|
|
|
|
| |
|
|
|
|
|
|
|
|
|
|
|
|
| |
|
|
|
|
| Massachusetts 0.01% |
|
Educational Fncg. Auth., Education Loan Rev. Bonds, Series 2024-A, 6.352% 7/1/2049 |
|
|
135 |
|
|
|
|
|
136 |
|
|
|
|
|
|
|
|
|
|
|
|
|
|
|
|
Total municipals |
|
|
|
|
|
|
|
|
344 |
|
|
|
|
|
|
|
|
|
|
|
|
|
|
|
|
Total bonds, notes & other debt instruments (cost: $211,740,000) |
|
|
|
|
|
|
|
|
207,324 |
|
|
|
|
|
|
|
|
|
|
|
|
|
|
|
|
|
|
| Investment funds 2.30% |
|
Shares |
|
|
|
|
|
|
|
|
Capital Group Central Corporate Bond Fund12 |
|
|
3,645,090 |
|
|
|
|
|
30,145 |
|
|
|
|
|
|
|
|
|
|
|
|
|
|
|
|
Total Investment funds (cost: $33,746,000) |
|
|
|
|
|
|
|
|
30,145 |
|
|
|
|
|
|
|
|
|
|
|
|
|
|
|
|
|
|
| Short-term securities 7.27% |
|
|
|
|
|
|
|
|
| |
| Money market investments 6.14% |
|
|
|
Capital Group Central Cash Fund 5.37%12,13,14 |
|
|
804,193 |
|
|
|
|
|
80,419 |
|
|
|
|
|
|
|
|
|
|
|
|
|
|
| |
|
|
|
|
|
|
|
|
|
|
|
|
| |
|
|
|
| Money market investments purchased with collateral from securities on loan 1.13% |
|
|
|
|
|
|
|
|
|
|
|
|
Invesco Short-Term Investments Trust – Government & Agency Portfolio,
Institutional Class 5.23%13,14 |
|
|
10,117,335 |
|
|
|
|
|
10,118 |
|
|
|
State Street Institutional U.S. Government Money Market Fund,
Institutional Class 5.22%13,14 |
|
|
4,730,095 |
|
|
|
|
|
4,730 |
|
|
|
|
|
|
|
|
|
|
|
|
|
|
|
|
|
|
|
|
|
|
|
|
|
14,848 |
|
|
|
|
|
|
|
|
|
|
|
|
|
|
|
|
Total short-term securities (cost: $95,254,000) |
|
|
|
|
|
|
|
|
95,267 |
|
|
|
|
|
|
|
|
|
|
|
|
|
|
|
|
|
|
|
|
|
Total investment securities 103.54% (cost: $1,143,009,000) |
|
|
|
|
|
|
|
|
1,356,561 |
|
|
|
|
|
|
|
|
Other assets less liabilities (3.54)% |
|
|
|
|
|
|
|
|
(46,427 |
) |
|
|
|
|
|
|
|
|
|
|
|
|
|
|
|
|
|
|
|
|
Net assets 100.00% |
|
|
|
|
|
|
|
$ |
1,310,134 |
|
|
|
|
|
|
|
|
|
|
|
|
|
|
|
|
|
|
|
|
|
|
|
|
|
|
|
|
|
|
|
|
|
|
|
|
|
|
|
|
|
|
|
|
|
|
|
|
|
|
|
|
| Futures contracts |
|
|
|
|
|
|
|
|
|
|
|
| Contracts |
|
Type |
|
|
|
|
|
Number of
contracts |
|
|
|
|
|
Expiration
date |
|
|
|
|
|
Notional
amount
(000) |
|
|
|
|
|
Value and
unrealized
appreciation
(depreciation)
at 6/30/2024
(000) |
|
|
|
|
|
|
|
|
|
|
|
| 30 Day Federal Funds Futures |
|
|
Long |
|
|
|
|
|
|
|
113 |
|
|
|
|
|
|
|
9/3/2024 |
|
|
|
|
|
|
|
USD44,589 |
|
|
|
|
|
|
|
$ (3 |
) |
| 3 Month SOFR Futures |
|
|
Long |
|
|
|
|
|
|
|
28 |
|
|
|
|
|
|
|
3/19/2025 |
|
|
|
|
|
|
|
6,660 |
|
|
|
|
|
|
|
1 |
|
| 3 Month SOFR Futures |
|
|
Long |
|
|
|
|
|
|
|
73 |
|
|
|
|
|
|
|
9/17/2025 |
|
|
|
|
|
|
|
17,463 |
|
|
|
|
|
|
|
55 |
|
81 American Funds Insurance Series
Capital Income Builder (continued)
|
|
|
|
|
|
|
|
|
|
|
|
|
|
|
|
|
|
|
|
|
|
|
|
|
|
|
|
|
|
|
|
|
|
|
|
|
|
|
|
|
|
|
|
|
| Futures contracts (continued) |
|
|
|
|
|
|
|
|
|
|
|
|
|
|
|
|
|
|
|
|
|
|
|
|
|
|
|
|
|
|
|
|
|
|
|
|
|
|
|
|
|
|
|
| Contracts |
|
Type |
|
|
|
|
|
Number of
contracts |
|
|
|
|
|
Expiration
date |
|
|
|
|
|
Notional
amount
(000) |
|
|
Value and unrealized appreciation (depreciation) at 6/30/2024 (000) |
|
|
|
|
|
|
|
|
|
|
| 2 Year U.S. Treasury Note Futures |
|
|
Long |
|
|
|
|
|
|
|
237 |
|
|
|
|
|
|
|
10/3/2024 |
|
|
|
|
|
|
|
USD48,400 |
|
|
|
|
|
|
$106 |
| 5 Year U.S. Treasury Note Futures |
|
|
Long |
|
|
|
|
|
|
|
506 |
|
|
|
|
|
|
|
10/3/2024 |
|
|
|
|
|
|
|
53,929 |
|
|
|
|
|
|
277 |
| 10 Year U.S. Treasury Note Futures |
|
|
Long |
|
|
|
|
|
|
|
48 |
|
|
|
|
|
|
|
9/30/2024 |
|
|
|
|
|
|
|
5,279 |
|
|
|
|
|
|
51 |
| 10 Year Ultra U.S. Treasury Note Futures |
|
|
Short |
|
|
|
|
|
|
|
7 |
|
|
|
|
|
|
|
9/30/2024 |
|
|
|
|
|
|
|
(795 |
) |
|
|
|
|
|
1 |
| 20 Year U.S. Treasury Bond Futures |
|
|
Long |
|
|
|
|
|
|
|
8 |
|
|
|
|
|
|
|
9/30/2024 |
|
|
|
|
|
|
|
946 |
|
|
|
|
|
|
11 |
| 30 Year Ultra U.S. Treasury Bond Futures |
|
|
Long |
|
|
|
|
|
|
|
65 |
|
|
|
|
|
|
|
9/30/2024 |
|
|
|
|
|
|
|
8,147 |
|
|
|
|
|
|
75 |
|
|
|
|
|
|
|
|
|
|
|
|
|
|
|
|
|
|
|
|
|
|
|
|
|
|
|
|
|
|
|
|
|
|
|
|
|
|
|
|
|
|
|
|
|
|
|
|
|
|
|
|
|
|
|
|
|
|
|
|
|
|
|
|
|
|
|
|
|
|
|
|
|
|
|
|
|
|
|
$574 |
|
|
|
|
|
|
|
|
|
|
|
|
|
|
|
|
|
|
|
|
|
|
|
|
|
|
|
|
|
|
|
|
|
|
|
Swap contracts
Interest rate swaps
Centrally cleared interest rate swaps
|
|
|
|
|
|
|
|
|
|
|
|
|
|
|
|
|
|
|
|
|
|
|
|
|
|
|
|
|
|
|
|
|
|
|
|
|
|
|
|
|
|
|
|
|
|
|
| |
|
|
|
|
|
|
|
|
|
|
|
|
|
|
|
|
|
|
|
|
|
|
|
|
|
|
|
|
Upfront |
|
Unrealized |
| Receive |
|
|
|
|
|
Pay |
|
|
|
|
|
|
|
|
Notional |
|
|
Value at |
|
premium paid |
|
appreciation (depreciation) |
| |
|
Payment |
|
|
|
|
|
|
|
|
|
Payment |
|
|
|
|
|
Expiration |
|
|
amount |
|
|
6/30/2024 |
|
(received) |
|
at 6/30/2024 |
| Rate |
|
frequency |
|
|
|
|
|
Rate |
|
|
|
frequency |
|
|
|
|
|
date |
|
|
(000) |
|
|
(000) |
|
(000) |
|
(000) |
|
|
|
|
|
|
|
|
|
|
|
|
|
|
|
| SOFR |
|
|
Annual |
|
|
|
|
|
|
3.055% |
|
|
|
|
Annual |
|
|
|
|
|
|
|
4/6/2031 |
|
|
|
USD6,700 |
|
|
|
|
|
|
$362 |
|
|
|
|
|
$– |
|
|
|
|
|
$362 |
| SOFR |
|
|
Annual |
|
|
|
|
|
|
2.91% |
|
|
|
|
Annual |
|
|
|
|
|
|
|
9/18/2050 |
|
|
|
USD592 |
|
|
|
|
|
|
84 |
|
|
|
|
|
– |
|
|
|
|
|
84 |
|
|
|
|
|
|
|
|
|
|
|
|
|
|
|
|
|
|
|
|
|
|
|
|
|
|
|
|
|
|
|
|
|
|
|
|
|
|
|
|
|
|
|
|
|
|
|
|
|
|
|
|
|
|
|
|
|
|
|
|
|
|
|
|
|
|
|
|
|
|
|
|
|
|
|
|
|
|
|
|
|
|
|
|
|
|
|
|
|
|
|
|
|
|
|
|
$446 |
|
|
|
|
|
$– |
|
|
|
|
|
$446 |
|
|
|
|
|
|
|
|
|
|
|
|
|
|
|
|
|
|
|
|
|
|
|
|
|
|
|
|
|
|
|
|
|
|
|
|
|
|
|
|
|
|
|
|
|
|
|
|
|
|
|
|
|
|
|
|
|
|
|
|
|
|
|
|
|
|
|
|
|
|
|
|
|
|
|
|
|
|
|
|
|
|
|
|
|
|
|
|
|
|
|
|
|
|
| Credit default swaps |
|
|
| Centrally cleared credit default swaps on credit indices – sell protection |
|
Reference
index |
|
|
|
Financing
rate received |
|
|
|
|
Payment
frequency |
|
|
|
|
Expiration
date |
|
|
Notional amount15 (000) |
|
|
Value at 6/30/202416 (000) |
|
|
Upfront
premium
paid
(received)
(000) |
|
|
Unrealized
appreciation
(depreciation)
at 6/30/2024 (000) |
|
|
|
|
|
|
|
|
|
|
|
|
|
|
|
| CDX.NA.HY.42 |
|
|
|
5.00% |
|
|
|
|
|
Quarterly |
|
|
|
|
|
|
6/20/2029 |
|
|
|
USD170 |
|
|
|
|
|
|
|
$11 |
|
|
|
|
|
|
|
$9 |
|
|
|
|
|
|
|
$2 |
|
|
|
|
|
|
|
|
|
|
|
|
|
|
|
|
|
|
|
|
|
|
|
|
|
|
|
|
|
|
|
|
|
|
|
|
|
|
|
|
|
|
|
|
|
| Investments in affiliates12 |
|
|
|
|
|
|
|
|
|
| |
|
Value at
1/1/2024
(000) |
|
|
Additions
(000) |
|
|
Reductions
(000) |
|
|
Net realized gain (loss)
(000) |
|
|
Net
unrealized
appreciation (depreciation) (000) |
|
Value at 6/30/2024
(000) |
|
|
Dividend
or interest
income
(000) |
|
|
|
|
|
|
|
|
|
|
|
|
|
| Investment funds 2.30% |
|
|
|
|
|
|
|
|
|
|
|
|
|
|
|
|
|
|
|
|
|
|
|
|
|
|
|
|
|
|
|
|
|
|
|
|
|
|
|
|
|
|
| Capital Group Central Corporate Bond Fund |
|
$ |
34,970 |
|
|
$ |
676 |
|
|
$ |
4,712 |
|
|
|
|
|
|
$ |
(941 |
) |
|
|
|
|
|
$152 |
|
|
|
|
|
$ |
30,145 |
|
|
|
|
|
|
$ |
676 |
|
|
|
|
|
|
|
|
|
|
|
|
|
| Short-term securities 6.14% |
|
|
|
|
|
|
|
|
|
|
|
|
|
|
|
|
|
|
|
|
|
|
|
|
|
|
|
|
|
|
|
|
|
|
|
|
|
|
|
|
|
|
| Money market investments 6.14% |
|
|
|
|
|
|
|
|
|
|
|
|
|
|
|
|
|
|
|
|
|
|
|
|
|
|
|
|
|
|
|
|
|
|
|
|
|
|
|
|
|
|
| Capital Group Central Cash Fund 5.37%13,14 |
|
|
91,779 |
|
|
|
97,143 |
|
|
|
108,512 |
|
|
|
|
|
|
|
– |
|
|
|
|
|
|
9 |
|
|
|
|
|
|
80,419 |
|
|
|
|
|
|
|
2,376 |
|
|
|
|
|
|
|
|
|
|
|
|
|
| Money market investments purchased with collateral from securities on loan 0.00% |
|
|
|
|
|
|
|
|
|
|
|
|
|
|
|
|
|
|
|
|
|
|
|
|
|
|
|
|
|
|
|
|
|
|
|
|
|
|
|
|
|
|
| Capital Group Central Cash Fund 5.37%13 |
|
|
59 |
|
|
|
|
|
|
|
59 |
17 |
|
|
|
|
|
|
|
|
|
|
|
|
|
|
|
|
|
|
|
|
– |
|
|
|
|
|
|
|
– |
18 |
|
|
|
|
|
|
|
|
|
|
|
|
|
|
|
|
|
|
|
|
|
|
|
|
|
|
|
|
|
|
|
|
|
|
|
|
|
|
|
|
|
|
|
| Total short-term securities |
|
|
|
|
|
|
|
|
|
|
|
|
|
|
|
|
|
|
|
|
|
|
|
|
|
|
|
|
|
|
|
|
80,419 |
|
|
|
|
|
|
|
|
|
|
|
|
|
|
|
|
|
|
|
|
|
|
|
|
|
|
|
|
|
|
|
|
|
|
|
|
|
|
|
|
|
|
|
|
|
|
|
|
|
|
|
|
|
|
|
|
|
|
|
|
|
|
|
|
| Total 8.44% |
|
|
|
|
|
|
|
|
|
|
|
|
|
|
|
|
|
$ |
(941 |
) |
|
|
|
|
|
$161 |
|
|
|
|
|
$ |
110,564 |
|
|
|
|
|
|
$ |
3,052 |
|
|
|
|
|
|
|
|
|
|
|
|
|
|
|
|
|
|
|
|
|
|
|
|
|
|
|
|
|
|
|
|
|
|
|
|
|
|
|
|
|
|
|
|
American Funds Insurance Series 82
Capital Income Builder (continued)
| 1 |
All or a portion of this security was on loan. The total value of all such securities was $20,164,000, which represented 1.54% of the net assets of the fund. Refer to Note 5 for more information on securities lending. |
| 2 |
Acquired in a transaction exempt from registration under Rule 144A or, for commercial paper, Section 4(a)(2) of the Securities Act of 1933. May be resold in the U.S. in transactions exempt from registration, normally to qualified institutional buyers. The total value of all such securities was $35,042,000, which represented 2.67% of the net assets of the fund. |
| 3 |
Value determined using significant unobservable inputs. |
| 4 |
Amount less than one thousand. |
| 5 |
Security did not produce income during the last 12 months. |
| 6 |
Principal payments may be made periodically. Therefore, the effective maturity date may be earlier than the stated maturity date. |
| 7 |
Coupon rate may change periodically. Reference rate and spread are as of the most recent information available. Some coupon rates are determined by the issuer or agent based on current market conditions; therefore, the reference rate and spread are not available. |
| 8 |
Purchased on a TBA basis. |
| 9 |
Step bond; coupon rate may change at a later date. |
| 10 |
All or a portion of this security was pledged as collateral. The total value of pledged collateral was $1,858,000, which represented .14% of the net assets of the fund. |
| 11 |
Scheduled interest and/or principal payment was not received. |
| 12 |
Part of the same “group of investment companies“ as the fund as defined under the Investment Company Act of 1940, as amended. |
| 13 |
Rate represents the seven-day yield at 6/30/2024. |
| 14 |
Security purchased with cash collateral from securities on loan. Refer to Note 5 for more information on securities lending. |
| 15 |
The maximum potential amount the fund may pay as a protection seller should a credit event occur. |
| 16 |
The prices and resulting values for credit default swap indices serve as an indicator of the current status of the payment/performance risk. As the value of a sell protection credit default swap increases or decreases, when compared to the notional amount of the swap, the payment/performance risk may decrease or increase, respectively. |
| 17 |
Represents net activity. Refer to Note 5 for more information on securities lending. |
| 18 |
Dividend income is included with securities lending income in the fund’s statement of operations and is not shown in this table. |
83 American Funds Insurance Series
Capital Income Builder (continued)
Key to abbreviation(s)
ADR = American Depositary Receipts
Assn. = Association
Auth. = Authority
CAD = Canadian dollars
CDI = CREST Depository Interest
CME = CME Group
DAC = Designated Activity Company
Fncg. = Financing
G.O. = General Obligation
Refer to the notes to financial statements.
GBP = British pounds
GDR = Global Depositary Receipts
ICE = Intercontinental Exchange, Inc.
MXN = Mexican pesos
REIT = Real Estate Investment Trust
Rev. = Revenue
SOFR = Secured Overnight Financing Rate
TBA = To be announced
USD = U.S. dollars
American Funds Insurance Series 84
Asset Allocation Fund
|
|
|
|
|
|
|
|
|
|
|
|
|
|
|
|
|
|
|
| Investment portfolio June 30, 2024 |
|
|
|
|
|
|
|
|
|
|
|
|
|
|
unaudited |
|
|
|
|
|
|
| Common stocks 68.26% |
|
|
|
|
Shares |
|
|
|
|
|
Value (000) |
|
|
|
|
|
|
|
| Information technology 16.25% |
|
Broadcom, Inc. |
|
|
|
|
|
|
918,021 |
|
|
|
|
|
|
$ |
1,473,910 |
|
|
|
Microsoft Corp. |
|
|
|
|
|
|
2,319,173 |
|
|
|
|
|
|
|
1,036,554 |
|
|
|
Taiwan Semiconductor Manufacturing Co., Ltd. (ADR) |
|
|
|
|
|
|
3,668,838 |
|
|
|
|
|
|
|
637,681 |
|
|
|
Taiwan Semiconductor Manufacturing Co., Ltd. |
|
|
|
|
|
|
773,000 |
|
|
|
|
|
|
|
22,990 |
|
|
|
ASML Holding NV (ADR) |
|
|
|
|
|
|
374,711 |
|
|
|
|
|
|
|
383,228 |
|
|
|
Apple, Inc. |
|
|
|
|
|
|
1,226,378 |
|
|
|
|
|
|
|
258,300 |
|
|
|
Oracle Corp. |
|
|
|
|
|
|
928,989 |
|
|
|
|
|
|
|
131,173 |
|
|
|
NVIDIA Corp. |
|
|
|
|
|
|
948,770 |
|
|
|
|
|
|
|
117,211 |
|
|
|
Applied Materials, Inc. |
|
|
|
|
|
|
426,300 |
|
|
|
|
|
|
|
100,603 |
|
|
|
MicroStrategy, Inc., Class A1 |
|
|
|
|
|
|
43,100 |
|
|
|
|
|
|
|
59,369 |
|
|
|
Salesforce, Inc. |
|
|
|
|
|
|
225,203 |
|
|
|
|
|
|
|
57,900 |
|
|
|
Synopsys, Inc.1 |
|
|
|
|
|
|
90,490 |
|
|
|
|
|
|
|
53,847 |
|
|
|
Micron Technology, Inc. |
|
|
|
|
|
|
175,097 |
|
|
|
|
|
|
|
23,030 |
|
|
|
Diebold Nixdorf, Inc.1 |
|
|
|
|
|
|
532,940 |
|
|
|
|
|
|
|
20,508 |
|
|
|
|
|
|
|
|
|
|
|
|
|
|
|
|
|
|
|
|
|
|
|
|
|
|
|
|
|
|
|
|
|
|
|
|
|
4,376,304 |
|
|
|
|
|
|
|
|
|
|
|
|
|
|
|
|
|
|
|
|
| |
|
|
|
|
|
|
|
|
|
|
|
|
|
|
| |
|
|
|
|
|
| Health care 10.26% |
|
Eli Lilly and Co. |
|
|
|
|
|
|
653,499 |
|
|
|
|
|
|
|
591,665 |
|
|
|
UnitedHealth Group, Inc. |
|
|
|
|
|
|
968,599 |
|
|
|
|
|
|
|
493,269 |
|
|
|
Vertex Pharmaceuticals, Inc.1 |
|
|
|
|
|
|
1,029,586 |
|
|
|
|
|
|
|
482,588 |
|
|
|
Gilead Sciences, Inc. |
|
|
|
|
|
|
4,174,538 |
|
|
|
|
|
|
|
286,415 |
|
|
|
Thermo Fisher Scientific, Inc. |
|
|
|
|
|
|
300,000 |
|
|
|
|
|
|
|
165,900 |
|
|
|
Regeneron Pharmaceuticals, Inc.1 |
|
|
|
|
|
|
150,000 |
|
|
|
|
|
|
|
157,654 |
|
|
|
Novo Nordisk AS, Class B |
|
|
|
|
|
|
999,920 |
|
|
|
|
|
|
|
142,845 |
|
|
|
AstraZeneca PLC |
|
|
|
|
|
|
461,000 |
|
|
|
|
|
|
|
71,868 |
|
|
|
AbbVie, Inc. |
|
|
|
|
|
|
389,195 |
|
|
|
|
|
|
|
66,755 |
|
|
|
Alnylam Pharmaceuticals, Inc.1 |
|
|
|
|
|
|
205,917 |
|
|
|
|
|
|
|
50,038 |
|
|
|
Centene Corp.1 |
|
|
|
|
|
|
675,000 |
|
|
|
|
|
|
|
44,752 |
|
|
|
Cooper Companies, Inc. |
|
|
|
|
|
|
418,000 |
|
|
|
|
|
|
|
36,491 |
|
|
|
Merck & Co., Inc. |
|
|
|
|
|
|
280,560 |
|
|
|
|
|
|
|
34,733 |
|
|
|
CVS Health Corp. |
|
|
|
|
|
|
506,300 |
|
|
|
|
|
|
|
29,902 |
|
|
|
Danaher Corp. |
|
|
|
|
|
|
95,660 |
|
|
|
|
|
|
|
23,901 |
|
|
|
Illumina, Inc.1 |
|
|
|
|
|
|
194,900 |
|
|
|
|
|
|
|
20,344 |
|
|
|
Rotech Healthcare, Inc.1,2,3 |
|
|
|
|
|
|
184,138 |
|
|
|
|
|
|
|
18,138 |
|
|
|
Pfizer, Inc. |
|
|
|
|
|
|
459,554 |
|
|
|
|
|
|
|
12,858 |
|
|
|
Boston Scientific Corp.1 |
|
|
|
|
|
|
130,293 |
|
|
|
|
|
|
|
10,034 |
|
|
|
AbCellera Biologics, Inc.1,4 |
|
|
|
|
|
|
2,871,293 |
|
|
|
|
|
|
|
8,499 |
|
|
|
Zoetis, Inc., Class A |
|
|
|
|
|
|
42,300 |
|
|
|
|
|
|
|
7,333 |
|
|
|
Endo, Inc.1 |
|
|
|
|
|
|
101,957 |
|
|
|
|
|
|
|
2,868 |
|
|
|
Endo, Inc.1,5 |
|
|
|
|
|
|
38,158 |
|
|
|
|
|
|
|
1,073 |
|
|
|
Endo, Inc., 1L 7.50% Escrow1,2 |
|
|
|
|
|
|
9,648,000 |
|
|
|
|
|
|
|
– |
6 |
|
|
Catalent, Inc.1 |
|
|
|
|
|
|
40,200 |
|
|
|
|
|
|
|
2,260 |
|
|
|
|
|
|
|
|
|
|
|
|
|
|
|
|
|
|
|
|
|
|
|
|
|
|
|
|
|
|
|
|
|
|
|
|
|
2,762,183 |
|
|
|
|
|
|
|
|
|
|
|
|
|
|
|
|
|
|
|
|
| |
|
|
|
|
|
|
|
|
|
|
|
|
|
|
| |
|
|
|
|
|
| Financials 9.89% |
|
Apollo Asset Management, Inc. |
|
|
|
|
|
|
2,630,627 |
|
|
|
|
|
|
|
310,598 |
|
|
|
Aon PLC, Class A |
|
|
|
|
|
|
752,130 |
|
|
|
|
|
|
|
220,810 |
|
|
|
JPMorgan Chase & Co. |
|
|
|
|
|
|
979,000 |
|
|
|
|
|
|
|
198,012 |
|
|
|
Synchrony Financial |
|
|
|
|
|
|
3,600,000 |
|
|
|
|
|
|
|
169,884 |
|
|
|
Arthur J. Gallagher & Co. |
|
|
|
|
|
|
572,715 |
|
|
|
|
|
|
|
148,511 |
|
|
|
Mastercard, Inc., Class A |
|
|
|
|
|
|
317,897 |
|
|
|
|
|
|
|
140,243 |
|
|
|
Visa, Inc., Class A |
|
|
|
|
|
|
530,120 |
|
|
|
|
|
|
|
139,140 |
|
|
|
Ares Management Corp., Class A |
|
|
|
|
|
|
1,015,403 |
|
|
|
|
|
|
|
135,333 |
|
|
|
Blue Owl Capital, Inc., Class A |
|
|
|
|
|
|
7,085,161 |
|
|
|
|
|
|
|
125,762 |
|
|
|
Discover Financial Services |
|
|
|
|
|
|
922,710 |
|
|
|
|
|
|
|
120,700 |
|
|
|
Blackstone, Inc. |
|
|
|
|
|
|
785,000 |
|
|
|
|
|
|
|
97,183 |
|
|
|
Capital One Financial Corp. |
|
|
|
|
|
|
675,000 |
|
|
|
|
|
|
|
93,454 |
|
|
|
Fiserv, Inc.1 |
|
|
|
|
|
|
582,763 |
|
|
|
|
|
|
|
86,855 |
|
|
|
CME Group, Inc., Class A |
|
|
|
|
|
|
361,000 |
|
|
|
|
|
|
|
70,973 |
|
|
|
BlackRock, Inc. |
|
|
|
|
|
|
88,049 |
|
|
|
|
|
|
|
69,323 |
|
|
|
American Express Co. |
|
|
|
|
|
|
280,560 |
|
|
|
|
|
|
|
64,964 |
|
|
|
Bank of America Corp. |
|
|
|
|
|
|
1,580,000 |
|
|
|
|
|
|
|
62,837 |
|
85 American Funds Insurance Series
Asset Allocation Fund (continued)
|
|
|
|
|
|
|
|
|
|
|
|
|
|
|
|
|
|
|
| Common stocks (continued) |
|
|
Shares |
|
|
|
|
|
Value (000) |
|
| |
|
|
|
|
|
| Financials (continued) |
|
KKR & Co., Inc. |
|
|
|
|
|
|
595,732 |
|
|
|
|
|
|
$ |
62,695 |
|
|
|
Wells Fargo & Co. |
|
|
|
|
|
|
980,000 |
|
|
|
|
|
|
|
58,202 |
|
|
|
Nasdaq, Inc. |
|
|
|
|
|
|
962,300 |
|
|
|
|
|
|
|
57,988 |
|
|
|
Intercontinental Exchange, Inc. |
|
|
|
|
|
|
412,619 |
|
|
|
|
|
|
|
56,483 |
|
|
|
London Stock Exchange Group PLC |
|
|
|
|
|
|
460,314 |
|
|
|
|
|
|
|
54,564 |
|
|
|
Carlyle Group, Inc. (The) |
|
|
|
|
|
|
814,688 |
|
|
|
|
|
|
|
32,710 |
|
|
|
RenaissanceRe Holdings, Ltd. |
|
|
|
|
|
|
97,535 |
|
|
|
|
|
|
|
21,800 |
|
|
|
Brookfield Corp., Class A |
|
|
|
|
|
|
486,973 |
|
|
|
|
|
|
|
20,229 |
|
|
|
Fifth Third Bancorp |
|
|
|
|
|
|
432,000 |
|
|
|
|
|
|
|
15,764 |
|
|
|
Goldman Sachs Group, Inc. |
|
|
|
|
|
|
30,100 |
|
|
|
|
|
|
|
13,615 |
|
|
|
Chubb, Ltd. |
|
|
|
|
|
|
37,981 |
|
|
|
|
|
|
|
9,688 |
|
|
|
LPL Financial Holdings, Inc. |
|
|
|
|
|
|
17,807 |
|
|
|
|
|
|
|
4,973 |
|
|
|
Sberbank of Russia PJSC2 |
|
|
|
|
|
|
8,880,000 |
|
|
|
|
|
|
|
– |
6 |
|
|
|
|
|
|
|
|
|
|
|
|
|
|
|
|
|
|
|
|
|
|
|
|
|
|
|
|
|
|
|
|
|
|
|
|
2,663,293 |
|
|
|
|
|
|
|
|
|
|
|
|
|
|
|
|
|
|
|
|
| |
|
|
|
|
|
|
|
|
|
|
|
|
|
|
| |
|
|
|
|
|
| Communication services 6.70% |
|
Meta Platforms, Inc., Class A |
|
|
|
|
|
|
1,535,752 |
|
|
|
|
|
|
|
774,357 |
|
|
|
Alphabet, Inc., Class C |
|
|
|
|
|
|
3,149,339 |
|
|
|
|
|
|
|
577,652 |
|
|
|
Alphabet, Inc., Class A |
|
|
|
|
|
|
531,770 |
|
|
|
|
|
|
|
96,862 |
|
|
|
Comcast Corp., Class A |
|
|
|
|
|
|
5,491,873 |
|
|
|
|
|
|
|
215,062 |
|
|
|
Take-Two Interactive Software, Inc.1 |
|
|
|
|
|
|
550,000 |
|
|
|
|
|
|
|
85,519 |
|
|
|
Charter Communications, Inc., Class A1 |
|
|
|
|
|
|
184,000 |
|
|
|
|
|
|
|
55,009 |
|
|
|
|
|
|
|
|
|
|
|
|
|
|
|
|
|
|
|
|
|
|
|
|
|
|
|
|
|
|
|
|
|
|
|
|
|
1,804,461 |
|
|
|
|
|
|
|
|
|
|
|
|
|
|
|
|
|
|
|
|
| |
|
|
|
|
|
|
|
|
|
|
|
|
|
|
| |
|
|
|
|
|
| Consumer discretionary 6.62% |
|
Booking Holdings, Inc. |
|
|
|
|
|
|
107,243 |
|
|
|
|
|
|
|
424,843 |
|
|
|
Home Depot, Inc. |
|
|
|
|
|
|
815,243 |
|
|
|
|
|
|
|
280,639 |
|
|
|
Royal Caribbean Cruises, Ltd.1 |
|
|
|
|
|
|
1,259,400 |
|
|
|
|
|
|
|
200,786 |
|
|
|
General Motors Co. |
|
|
|
|
|
|
3,500,000 |
|
|
|
|
|
|
|
162,610 |
|
|
|
LVMH Moët Hennessy-Louis Vuitton SE |
|
|
|
|
|
|
202,300 |
|
|
|
|
|
|
|
155,357 |
|
|
|
Amazon.com, Inc.1 |
|
|
|
|
|
|
747,737 |
|
|
|
|
|
|
|
144,500 |
|
|
|
D.R. Horton, Inc. |
|
|
|
|
|
|
550,000 |
|
|
|
|
|
|
|
77,512 |
|
|
|
Darden Restaurants, Inc. |
|
|
|
|
|
|
448,084 |
|
|
|
|
|
|
|
67,804 |
|
|
|
Compagnie Financière Richemont SA, Class A |
|
|
|
|
|
|
391,173 |
|
|
|
|
|
|
|
61,050 |
|
|
|
YUM! Brands, Inc. |
|
|
|
|
|
|
368,381 |
|
|
|
|
|
|
|
48,796 |
|
|
|
Texas Roadhouse, Inc. |
|
|
|
|
|
|
263,872 |
|
|
|
|
|
|
|
45,310 |
|
|
|
Hilton Worldwide Holdings, Inc. |
|
|
|
|
|
|
139,547 |
|
|
|
|
|
|
|
30,449 |
|
|
|
Moncler SpA |
|
|
|
|
|
|
395,000 |
|
|
|
|
|
|
|
24,190 |
|
|
|
Restaurant Brands International, Inc. |
|
|
|
|
|
|
271,440 |
|
|
|
|
|
|
|
19,101 |
|
|
|
Advance Auto Parts, Inc. |
|
|
|
|
|
|
249,443 |
|
|
|
|
|
|
|
15,797 |
|
|
|
lululemon athletica, Inc.1 |
|
|
|
|
|
|
31,981 |
|
|
|
|
|
|
|
9,553 |
|
|
|
AutoZone, Inc.1 |
|
|
|
|
|
|
2,534 |
|
|
|
|
|
|
|
7,511 |
|
|
|
Five Below, Inc.1 |
|
|
|
|
|
|
43,676 |
|
|
|
|
|
|
|
4,759 |
|
|
|
Party City Holdco, Inc.1,2 |
|
|
|
|
|
|
68,158 |
|
|
|
|
|
|
|
1,187 |
|
|
|
Party City Holdco, Inc.1,2,5 |
|
|
|
|
|
|
681 |
|
|
|
|
|
|
|
12 |
|
|
|
|
|
|
|
|
|
|
|
|
|
|
|
|
|
|
|
|
|
|
|
|
|
|
|
|
|
|
|
|
|
|
|
|
|
1,781,766 |
|
|
|
|
|
|
|
|
|
|
|
|
|
|
|
|
|
|
|
|
| |
|
|
|
|
|
|
|
|
|
|
|
|
|
|
| |
|
|
|
|
|
| Industrials 6.32% |
|
L3Harris Technologies, Inc. |
|
|
|
|
|
|
1,031,041 |
|
|
|
|
|
|
|
231,551 |
|
|
|
Boeing Co.1 |
|
|
|
|
|
|
1,007,043 |
|
|
|
|
|
|
|
183,292 |
|
|
|
Deere & Co. |
|
|
|
|
|
|
392,399 |
|
|
|
|
|
|
|
146,612 |
|
|
|
Caterpillar, Inc. |
|
|
|
|
|
|
350,000 |
|
|
|
|
|
|
|
116,585 |
|
|
|
Ingersoll-Rand, Inc. |
|
|
|
|
|
|
1,127,311 |
|
|
|
|
|
|
|
102,405 |
|
|
|
TransDigm Group, Inc. |
|
|
|
|
|
|
74,424 |
|
|
|
|
|
|
|
95,085 |
|
|
|
General Electric Co. |
|
|
|
|
|
|
595,120 |
|
|
|
|
|
|
|
94,606 |
|
|
|
Airbus SE, non-registered shares |
|
|
|
|
|
|
651,130 |
|
|
|
|
|
|
|
89,781 |
|
|
|
Union Pacific Corp. |
|
|
|
|
|
|
335,667 |
|
|
|
|
|
|
|
75,948 |
|
|
|
Southwest Airlines Co. |
|
|
|
|
|
|
2,523,000 |
|
|
|
|
|
|
|
72,183 |
|
|
|
Republic Services, Inc. |
|
|
|
|
|
|
340,689 |
|
|
|
|
|
|
|
66,210 |
|
|
|
Safran SA |
|
|
|
|
|
|
312,100 |
|
|
|
|
|
|
|
65,661 |
|
|
|
Eaton Corp. PLC |
|
|
|
|
|
|
172,210 |
|
|
|
|
|
|
|
53,996 |
|
|
|
United Rentals, Inc. |
|
|
|
|
|
|
78,815 |
|
|
|
|
|
|
|
50,972 |
|
American Funds Insurance Series 86
Asset Allocation Fund (continued)
|
|
|
|
|
|
|
|
|
|
|
|
|
|
|
|
|
|
|
| Common stocks (continued) |
|
|
Shares |
|
|
|
|
|
Value (000) |
|
| |
|
|
|
|
|
| Industrials (continued) |
|
Copart, Inc.1 |
|
|
|
|
|
|
835,833 |
|
|
|
|
|
|
$ |
45,269 |
|
|
|
Lockheed Martin Corp. |
|
|
|
|
|
|
91,466 |
|
|
|
|
|
|
|
42,724 |
|
|
|
Quanta Services, Inc. |
|
|
|
|
|
|
152,260 |
|
|
|
|
|
|
|
38,688 |
|
|
|
Carrier Global Corp. |
|
|
|
|
|
|
587,000 |
|
|
|
|
|
|
|
37,028 |
|
|
|
Northrop Grumman Corp. |
|
|
|
|
|
|
80,000 |
|
|
|
|
|
|
|
34,876 |
|
|
|
GE Vernova, Inc.1 |
|
|
|
|
|
|
117,817 |
|
|
|
|
|
|
|
20,207 |
|
|
|
Johnson Controls International PLC |
|
|
|
|
|
|
278,300 |
|
|
|
|
|
|
|
18,499 |
|
|
|
CSX Corp. |
|
|
|
|
|
|
344,040 |
|
|
|
|
|
|
|
11,508 |
|
|
|
Regal Rexnord Corp. |
|
|
|
|
|
|
53,733 |
|
|
|
|
|
|
|
7,266 |
|
|
|
|
|
|
|
|
|
|
|
|
|
|
|
|
|
|
|
|
|
|
|
|
|
|
|
|
|
|
|
|
|
|
|
|
|
1,700,952 |
|
|
|
|
|
|
|
|
|
|
|
|
|
|
|
|
|
|
|
|
| |
|
|
|
|
|
|
|
|
|
|
|
|
|
|
| |
|
|
|
|
|
| Materials 4.21% |
|
Franco-Nevada Corp. |
|
|
|
|
|
|
1,597,498 |
|
|
|
|
|
|
|
189,404 |
|
|
|
Royal Gold, Inc. |
|
|
|
|
|
|
1,405,000 |
|
|
|
|
|
|
|
175,850 |
|
|
|
Wheaton Precious Metals Corp.4 |
|
|
|
|
|
|
3,349,100 |
|
|
|
|
|
|
|
175,560 |
|
|
|
Lundin Mining Corp. |
|
|
|
|
|
|
14,980,000 |
|
|
|
|
|
|
|
166,767 |
|
|
|
ATI, Inc.1 |
|
|
|
|
|
|
2,804,538 |
|
|
|
|
|
|
|
155,512 |
|
|
|
Nucor Corp. |
|
|
|
|
|
|
500,000 |
|
|
|
|
|
|
|
79,040 |
|
|
|
First Quantum Minerals, Ltd. |
|
|
|
|
|
|
5,805,000 |
|
|
|
|
|
|
|
76,251 |
|
|
|
Freeport-McMoRan, Inc. |
|
|
|
|
|
|
1,431,593 |
|
|
|
|
|
|
|
69,575 |
|
|
|
Linde PLC |
|
|
|
|
|
|
73,100 |
|
|
|
|
|
|
|
32,077 |
|
|
|
Air Products and Chemicals, Inc. |
|
|
|
|
|
|
45,664 |
|
|
|
|
|
|
|
11,783 |
|
|
|
Venator Materials PLC1,2 |
|
|
|
|
|
|
4,096 |
|
|
|
|
|
|
|
2,890 |
|
|
|
|
|
|
|
|
|
|
|
|
|
|
|
|
|
|
|
|
|
|
|
|
|
|
|
|
|
|
|
|
|
|
|
|
|
1,134,709 |
|
|
|
|
|
|
|
|
|
|
|
|
|
|
|
|
|
|
|
|
| |
|
|
|
|
|
|
|
|
|
|
|
|
|
|
| |
|
|
|
|
|
| Consumer staples 3.57% |
|
Philip Morris International, Inc. |
|
|
|
|
|
|
3,305,485 |
|
|
|
|
|
|
|
334,945 |
|
|
|
Constellation Brands, Inc., Class A |
|
|
|
|
|
|
669,157 |
|
|
|
|
|
|
|
172,161 |
|
|
|
Altria Group, Inc. |
|
|
|
|
|
|
2,239,790 |
|
|
|
|
|
|
|
102,022 |
|
|
|
Costco Wholesale Corp. |
|
|
|
|
|
|
89,700 |
|
|
|
|
|
|
|
76,244 |
|
|
|
Nestlé SA |
|
|
|
|
|
|
609,435 |
|
|
|
|
|
|
|
62,210 |
|
|
|
Monster Beverage Corp.1 |
|
|
|
|
|
|
702,217 |
|
|
|
|
|
|
|
35,076 |
|
|
|
British American Tobacco PLC |
|
|
|
|
|
|
1,080,000 |
|
|
|
|
|
|
|
33,199 |
|
|
|
Dollar Tree Stores, Inc.1 |
|
|
|
|
|
|
287,000 |
|
|
|
|
|
|
|
30,643 |
|
|
|
Keurig Dr Pepper, Inc. |
|
|
|
|
|
|
907,399 |
|
|
|
|
|
|
|
30,307 |
|
|
|
Mondelez International, Inc., Class A |
|
|
|
|
|
|
440,000 |
|
|
|
|
|
|
|
28,793 |
|
|
|
Bunge Global SA |
|
|
|
|
|
|
197,085 |
|
|
|
|
|
|
|
21,043 |
|
|
|
Procter & Gamble Co. |
|
|
|
|
|
|
105,500 |
|
|
|
|
|
|
|
17,399 |
|
|
|
Dollar General Corp. |
|
|
|
|
|
|
125,000 |
|
|
|
|
|
|
|
16,529 |
|
|
|
|
|
|
|
|
|
|
|
|
|
|
|
|
|
|
|
|
|
|
|
|
|
|
|
|
|
|
|
|
|
|
|
|
|
960,571 |
|
|
|
|
|
|
|
|
|
|
|
|
|
|
|
|
|
|
|
|
| |
|
|
|
|
|
|
|
|
|
|
|
|
|
|
| |
|
|
|
|
|
| Energy 3.21% |
|
Canadian Natural Resources, Ltd. (CAD denominated) |
|
|
|
|
|
|
13,470,800 |
|
|
|
|
|
|
|
479,830 |
|
|
|
ConocoPhillips |
|
|
|
|
|
|
824,000 |
|
|
|
|
|
|
|
94,249 |
|
|
|
Halliburton Co. |
|
|
|
|
|
|
2,534,613 |
|
|
|
|
|
|
|
85,619 |
|
|
|
Schlumberger NV |
|
|
|
|
|
|
1,326,757 |
|
|
|
|
|
|
|
62,596 |
|
|
|
Noble Corp. PLC, Class A |
|
|
|
|
|
|
657,505 |
|
|
|
|
|
|
|
29,358 |
|
|
|
Exxon Mobil Corp. |
|
|
|
|
|
|
233,835 |
|
|
|
|
|
|
|
26,919 |
|
|
|
Cenovus Energy, Inc. (CAD denominated) |
|
|
|
|
|
|
1,348,236 |
|
|
|
|
|
|
|
26,501 |
|
|
|
EOG Resources, Inc. |
|
|
|
|
|
|
174,000 |
|
|
|
|
|
|
|
21,901 |
|
|
|
TechnipFMC PLC4 |
|
|
|
|
|
|
715,711 |
|
|
|
|
|
|
|
18,716 |
|
|
|
New Fortress Energy, Inc., Class A4 |
|
|
|
|
|
|
408,780 |
|
|
|
|
|
|
|
8,985 |
|
|
|
TC Energy Corp. (CAD denominated)4 |
|
|
|
|
|
|
205,000 |
|
|
|
|
|
|
|
7,771 |
|
|
|
Altera Infrastructure, LP1,2 |
|
|
|
|
|
|
16,129 |
|
|
|
|
|
|
|
1,205 |
|
|
|
Constellation Oil Services Holding SA, Class B-11,2 |
|
|
|
|
|
|
480,336 |
|
|
|
|
|
|
|
77 |
|
|
|
Bighorn Permian Resources, LLC2 |
|
|
|
|
|
|
4,392 |
|
|
|
|
|
|
|
– |
6 |
|
|
|
|
|
|
|
|
|
|
|
|
|
|
|
|
|
|
|
|
|
|
|
|
|
|
|
|
|
|
|
|
|
|
|
|
863,727 |
|
|
|
|
|
|
|
|
|
|
|
|
|
|
|
|
|
|
|
|
87 American Funds Insurance Series
Asset Allocation Fund (continued)
|
|
|
|
|
|
|
|
|
|
|
|
|
|
|
|
|
|
|
| Common stocks (continued) |
|
|
Shares |
|
|
|
|
|
Value (000) |
|
|
|
|
|
|
|
| Real estate 1.07% |
|
Extra Space Storage, Inc. REIT |
|
|
|
|
|
|
811,931 |
|
|
|
|
|
|
$ |
126,182 |
|
|
|
VICI Properties, Inc. REIT |
|
|
|
|
|
|
4,209,324 |
|
|
|
|
|
|
|
120,555 |
|
|
|
Crown Castle, Inc. REIT |
|
|
|
|
|
|
435,600 |
|
|
|
|
|
|
|
42,558 |
|
|
|
|
|
|
|
|
|
|
|
|
|
|
|
|
|
|
|
|
|
|
|
|
|
|
|
|
|
|
|
|
|
|
|
|
|
289,295 |
|
|
|
|
|
|
|
|
|
|
|
|
|
|
|
|
|
|
|
|
| |
|
|
|
|
|
|
|
|
|
|
|
|
|
|
| |
|
|
|
|
|
| Utilities 0.16% |
|
Constellation Energy Corp. |
|
|
|
|
|
|
138,666 |
|
|
|
|
|
|
|
27,771 |
|
|
|
FirstEnergy Corp. |
|
|
|
|
|
|
400,000 |
|
|
|
|
|
|
|
15,308 |
|
|
|
|
|
|
|
|
|
|
|
|
|
|
|
|
|
|
|
|
|
|
|
|
|
|
|
|
|
|
|
|
|
|
|
|
|
43,079 |
|
|
|
|
|
|
|
|
|
|
|
|
|
|
|
|
|
|
|
|
|
|
Total common stocks (cost: $10,597,781,000) |
|
|
|
|
|
|
|
|
|
|
|
|
|
|
18,380,340 |
|
|
|
|
|
|
|
|
|
|
|
|
|
|
|
|
|
|
|
|
|
|
|
|
|
| Preferred securities 0.00% |
|
|
|
|
|
|
|
|
|
|
|
|
|
|
|
|
| |
|
|
|
|
|
| Industrials 0.00% |
|
ACR III LSC Holdings, LLC, Series B, preferred shares1,2,5 |
|
|
|
|
|
|
450 |
|
|
|
|
|
|
|
771 |
|
|
|
|
|
|
|
|
|
|
|
|
|
|
|
|
|
|
|
|
|
|
Total preferred securities (cost: $466,000) |
|
|
|
|
|
|
|
|
|
|
|
|
|
|
771 |
|
|
|
|
|
|
|
|
|
|
|
|
|
|
|
|
|
|
|
|
|
|
|
|
|
| Rights & warrants 0.00% |
|
|
|
|
|
|
|
|
|
|
|
|
|
|
|
|
| |
|
|
|
|
|
| Energy 0.00% |
|
Constellation Oil Services Holding SA, Class D, warrants, expire 6/10/20711,2 |
|
|
|
|
|
|
4 |
|
|
|
|
|
|
|
– |
6 |
|
|
|
|
|
|
|
|
|
|
|
|
|
|
|
|
|
|
|
|
|
Total rights & warrants (cost: $0) |
|
|
|
|
|
|
|
|
|
|
|
|
|
|
– |
6 |
|
|
|
|
|
|
|
|
|
|
|
|
|
|
|
|
|
|
|
|
|
|
|
|
| Convertible stocks 0.04% |
|
|
|
|
|
|
|
|
|
|
|
|
|
|
|
|
| |
|
|
|
|
|
| Health care 0.04% |
|
Carbon Health Technologies, Inc., Series D-2,
8.00% noncumulative convertible preferred shares2,3 |
|
|
|
|
|
|
4,955,500 |
|
|
|
|
|
|
|
11,596 |
|
|
|
|
|
|
|
|
|
|
|
|
|
|
|
|
|
|
|
|
|
|
Total convertible stocks (cost: $50,000,000) |
|
|
|
|
|
|
|
|
|
|
|
|
|
|
11,596 |
|
|
|
|
|
|
|
|
|
|
|
|
|
|
|
|
|
|
|
|
|
|
|
|
|
| Convertible bonds & notes 0.01% |
|
|
|
|
Principal amount
(000) |
|
|
|
|
|
|
|
|
|
|
|
|
|
| Communication services 0.01% |
|
DISH Network Corp., convertible notes, 3.375% 8/15/2026 |
|
|
|
|
|
|
USD4,000 |
|
|
|
|
|
|
|
2,501 |
|
|
|
|
|
|
|
|
|
|
|
|
|
|
|
|
|
|
|
|
|
|
Total convertible bonds & notes (cost: $2,707,000) |
|
|
|
|
|
|
|
|
|
|
|
|
|
|
2,501 |
|
|
|
|
|
|
|
|
|
|
|
|
|
|
|
|
|
|
|
|
|
|
|
|
|
|
|
|
|
|
|
|
|
|
|
|
|
|
|
|
|
|
|
|
|
|
|
|
|
|
|
|
|
|
|
|
|
|
|
|
|
|
|
| Bonds, notes & other debt instruments 23.64% |
|
|
|
|
|
|
|
|
|
|
|
|
|
|
|
|
|
|
|
|
| Mortgage-backed obligations 9.11% |
|
|
|
|
|
|
|
|
|
|
|
|
|
|
|
|
|
|
|
| Federal agency mortgage-backed obligations 8.42% |
|
Fannie Mae Pool #AD7072 4.00% 6/1/20257 |
|
|
|
|
|
|
– |
6 |
|
|
|
|
|
|
– |
6 |
|
|
Fannie Mae Pool #AE3069 4.00% 9/1/20257 |
|
|
|
|
|
|
– |
6 |
|
|
|
|
|
|
– |
6 |
|
|
Fannie Mae Pool #AH0829 4.00% 1/1/20267 |
|
|
|
|
|
|
– |
6 |
|
|
|
|
|
|
– |
6 |
|
|
Fannie Mae Pool #AH6431 4.00% 2/1/20267 |
|
|
|
|
|
|
79 |
|
|
|
|
|
|
|
77 |
|
|
|
Fannie Mae Pool #AH5618 4.00% 2/1/20267 |
|
|
|
|
|
|
– |
6 |
|
|
|
|
|
|
– |
6 |
|
|
Fannie Mae Pool #890329 4.00% 4/1/20267 |
|
|
|
|
|
|
9 |
|
|
|
|
|
|
|
9 |
|
|
|
Fannie Mae Pool #MA1109 4.00% 5/1/20277 |
|
|
|
|
|
|
1 |
|
|
|
|
|
|
|
1 |
|
|
|
Fannie Mae Pool #MA3653 3.00% 3/1/20297 |
|
|
|
|
|
|
9 |
|
|
|
|
|
|
|
8 |
|
|
|
Fannie Mae Pool #AL8347 4.00% 3/1/20297 |
|
|
|
|
|
|
49 |
|
|
|
|
|
|
|
49 |
|
|
|
Fannie Mae Pool #254767 5.50% 6/1/20337 |
|
|
|
|
|
|
160 |
|
|
|
|
|
|
|
160 |
|
|
|
Fannie Mae Pool #555956 5.50% 12/1/20337 |
|
|
|
|
|
|
102 |
|
|
|
|
|
|
|
102 |
|
|
|
Fannie Mae Pool #BN1085 4.00% 1/1/20347 |
|
|
|
|
|
|
296 |
|
|
|
|
|
|
|
287 |
|
|
|
Fannie Mae Pool #929185 5.50% 1/1/20367 |
|
|
|
|
|
|
318 |
|
|
|
|
|
|
|
319 |
|
|
|
Fannie Mae Pool #893641 6.00% 9/1/20367 |
|
|
|
|
|
|
542 |
|
|
|
|
|
|
|
555 |
|
|
|
Fannie Mae Pool #893688 6.00% 10/1/20367 |
|
|
|
|
|
|
138 |
|
|
|
|
|
|
|
141 |
|
|
|
Fannie Mae Pool #AS8554 3.00% 12/1/20367 |
|
|
|
|
|
|
5,069 |
|
|
|
|
|
|
|
4,673 |
|
|
|
Fannie Mae Pool #907239 6.00% 12/1/20367 |
|
|
|
|
|
|
22 |
|
|
|
|
|
|
|
22 |
|
|
|
Fannie Mae Pool #928031 6.00% 1/1/20377 |
|
|
|
|
|
|
48 |
|
|
|
|
|
|
|
49 |
|
American Funds Insurance Series 88
Asset Allocation Fund (continued)
|
|
|
|
|
|
|
|
|
|
|
|
|
|
|
|
|
| Bonds, notes & other debt instruments (continued) |
|
Principal amount
(000) |
|
|
|
|
|
Value (000) |
|
|
|
|
|
| Mortgage-backed obligations (continued) |
|
|
|
|
|
|
|
|
|
|
|
|
|
|
|
|
|
|
| Federal agency mortgage-backed obligations (continued) |
|
Fannie Mae Pool #888292 6.00% 3/1/20377 |
|
|
|
|
USD449 |
|
|
|
|
|
|
$ |
460 |
|
|
|
Fannie Mae Pool #AD0249 5.50% 4/1/20377 |
|
|
|
|
84 |
|
|
|
|
|
|
|
85 |
|
|
|
Fannie Mae Pool #190379 5.50% 5/1/20377 |
|
|
|
|
45 |
|
|
|
|
|
|
|
45 |
|
|
|
Fannie Mae Pool #924952 6.00% 8/1/20377 |
|
|
|
|
683 |
|
|
|
|
|
|
|
698 |
|
|
|
Fannie Mae Pool #888637 6.00% 9/1/20377 |
|
|
|
|
8 |
|
|
|
|
|
|
|
8 |
|
|
|
Fannie Mae Pool #995674 6.00% 5/1/20387 |
|
|
|
|
255 |
|
|
|
|
|
|
|
261 |
|
|
|
Fannie Mae Pool #AD0119 6.00% 7/1/20387 |
|
|
|
|
803 |
|
|
|
|
|
|
|
823 |
|
|
|
Fannie Mae Pool #995224 6.00% 9/1/20387 |
|
|
|
|
7 |
|
|
|
|
|
|
|
7 |
|
|
|
Fannie Mae Pool #AE0021 6.00% 10/1/20387 |
|
|
|
|
251 |
|
|
|
|
|
|
|
258 |
|
|
|
Fannie Mae Pool #AL7164 6.00% 10/1/20387 |
|
|
|
|
173 |
|
|
|
|
|
|
|
176 |
|
|
|
Fannie Mae Pool #889983 6.00% 10/1/20387 |
|
|
|
|
15 |
|
|
|
|
|
|
|
15 |
|
|
|
Fannie Mae Pool #AD0095 6.00% 11/1/20387 |
|
|
|
|
568 |
|
|
|
|
|
|
|
581 |
|
|
|
Fannie Mae Pool #AB0538 6.00% 11/1/20387 |
|
|
|
|
96 |
|
|
|
|
|
|
|
98 |
|
|
|
Fannie Mae Pool #995391 6.00% 11/1/20387 |
|
|
|
|
11 |
|
|
|
|
|
|
|
12 |
|
|
|
Fannie Mae Pool #AD0833 6.00% 1/1/20397 |
|
|
|
|
– |
6 |
|
|
|
|
|
|
– |
6 |
|
|
Fannie Mae Pool #AL0309 6.00% 1/1/20407 |
|
|
|
|
52 |
|
|
|
|
|
|
|
53 |
|
|
|
Fannie Mae Pool #AL0013 6.00% 4/1/20407 |
|
|
|
|
152 |
|
|
|
|
|
|
|
156 |
|
|
|
Fannie Mae Pool #AL7228 6.00% 4/1/20417 |
|
|
|
|
193 |
|
|
|
|
|
|
|
197 |
|
|
|
Fannie Mae Pool #AB4536 6.00% 6/1/20417 |
|
|
|
|
359 |
|
|
|
|
|
|
|
367 |
|
|
|
Fannie Mae Pool #MA4387 2.00% 7/1/20417 |
|
|
|
|
6,756 |
|
|
|
|
|
|
|
5,685 |
|
|
|
Fannie Mae Pool #MA4501 2.00% 12/1/20417 |
|
|
|
|
7,786 |
|
|
|
|
|
|
|
6,517 |
|
|
|
Fannie Mae Pool #FS0305 1.50% 1/1/20427 |
|
|
|
|
20,333 |
|
|
|
|
|
|
|
16,400 |
|
|
|
Fannie Mae Pool #MA4520 2.00% 1/1/20427 |
|
|
|
|
13,249 |
|
|
|
|
|
|
|
11,089 |
|
|
|
Fannie Mae Pool #AP2131 3.50% 8/1/20427 |
|
|
|
|
2,699 |
|
|
|
|
|
|
|
2,470 |
|
|
|
Fannie Mae Pool #AU8813 4.00% 11/1/20437 |
|
|
|
|
1,806 |
|
|
|
|
|
|
|
1,710 |
|
|
|
Fannie Mae Pool #AU9348 4.00% 11/1/20437 |
|
|
|
|
1,012 |
|
|
|
|
|
|
|
958 |
|
|
|
Fannie Mae Pool #AU9350 4.00% 11/1/20437 |
|
|
|
|
868 |
|
|
|
|
|
|
|
819 |
|
|
|
Fannie Mae Pool #AL8773 3.50% 2/1/20457 |
|
|
|
|
4,657 |
|
|
|
|
|
|
|
4,244 |
|
|
|
Fannie Mae Pool #FM9416 3.50% 7/1/20457 |
|
|
|
|
7,679 |
|
|
|
|
|
|
|
6,964 |
|
|
|
Fannie Mae Pool #AL8354 3.50% 10/1/20457 |
|
|
|
|
1,135 |
|
|
|
|
|
|
|
1,029 |
|
|
|
Fannie Mae Pool #AL8522 3.50% 5/1/20467 |
|
|
|
|
2,395 |
|
|
|
|
|
|
|
2,171 |
|
|
|
Fannie Mae Pool #BC7611 4.00% 5/1/20467 |
|
|
|
|
82 |
|
|
|
|
|
|
|
77 |
|
|
|
Fannie Mae Pool #AS8310 3.00% 11/1/20467 |
|
|
|
|
326 |
|
|
|
|
|
|
|
289 |
|
|
|
Fannie Mae Pool #BD9307 4.00% 11/1/20467 |
|
|
|
|
1,271 |
|
|
|
|
|
|
|
1,189 |
|
|
|
Fannie Mae Pool #BD9699 3.50% 12/1/20467 |
|
|
|
|
1,421 |
|
|
|
|
|
|
|
1,286 |
|
|
|
Fannie Mae Pool #BE1290 3.50% 2/1/20477 |
|
|
|
|
1,892 |
|
|
|
|
|
|
|
1,714 |
|
|
|
Fannie Mae Pool #BM1179 3.00% 4/1/20477 |
|
|
|
|
415 |
|
|
|
|
|
|
|
365 |
|
|
|
Fannie Mae Pool #256975 7.00% 10/1/20477 |
|
|
|
|
2 |
|
|
|
|
|
|
|
2 |
|
|
|
Fannie Mae Pool #CA0770 3.50% 11/1/20477 |
|
|
|
|
1,347 |
|
|
|
|
|
|
|
1,217 |
|
|
|
Fannie Mae Pool #257036 7.00% 11/1/20477 |
|
|
|
|
6 |
|
|
|
|
|
|
|
6 |
|
|
|
Fannie Mae Pool #MA3211 4.00% 12/1/20477 |
|
|
|
|
2,319 |
|
|
|
|
|
|
|
2,168 |
|
|
|
Fannie Mae Pool #MA3277 4.00% 2/1/20487 |
|
|
|
|
9 |
|
|
|
|
|
|
|
9 |
|
|
|
Fannie Mae Pool #BK5255 4.00% 5/1/20487 |
|
|
|
|
10 |
|
|
|
|
|
|
|
9 |
|
|
|
Fannie Mae Pool #FM3278 3.50% 11/1/20487 |
|
|
|
|
14,686 |
|
|
|
|
|
|
|
13,283 |
|
|
|
Fannie Mae Pool #FM3280 3.50% 5/1/20497 |
|
|
|
|
1,987 |
|
|
|
|
|
|
|
1,802 |
|
|
|
Fannie Mae Pool #CA4756 3.00% 12/1/20497 |
|
|
|
|
1,531 |
|
|
|
|
|
|
|
1,328 |
|
|
|
Fannie Mae Pool #CA5968 2.50% 6/1/20507 |
|
|
|
|
4,974 |
|
|
|
|
|
|
|
4,147 |
|
|
|
Fannie Mae Pool #CA6593 2.50% 8/1/20507 |
|
|
|
|
11,280 |
|
|
|
|
|
|
|
9,393 |
|
|
|
Fannie Mae Pool #CA7052 3.00% 9/1/20507 |
|
|
|
|
348 |
|
|
|
|
|
|
|
300 |
|
|
|
Fannie Mae Pool #CA7737 2.50% 11/1/20507 |
|
|
|
|
9,151 |
|
|
|
|
|
|
|
7,590 |
|
|
|
Fannie Mae Pool #CA7599 2.50% 11/1/20507 |
|
|
|
|
1,426 |
|
|
|
|
|
|
|
1,191 |
|
|
|
Fannie Mae Pool #FM4897 3.00% 11/1/20507 |
|
|
|
|
12,840 |
|
|
|
|
|
|
|
11,236 |
|
|
|
Fannie Mae Pool #MA4237 2.00% 1/1/20517 |
|
|
|
|
6,150 |
|
|
|
|
|
|
|
4,870 |
|
|
|
Fannie Mae Pool #CA8828 2.50% 2/1/20517 |
|
|
|
|
3,567 |
|
|
|
|
|
|
|
2,968 |
|
|
|
Fannie Mae Pool #CB0290 2.00% 4/1/20517 |
|
|
|
|
4,442 |
|
|
|
|
|
|
|
3,505 |
|
|
|
Fannie Mae Pool #CB0191 3.00% 4/1/20517 |
|
|
|
|
5,000 |
|
|
|
|
|
|
|
4,295 |
|
|
|
Fannie Mae Pool #CB0193 3.00% 4/1/20517 |
|
|
|
|
601 |
|
|
|
|
|
|
|
517 |
|
|
|
Fannie Mae Pool #FM7909 3.00% 6/1/20517 |
|
|
|
|
462 |
|
|
|
|
|
|
|
397 |
|
|
|
Fannie Mae Pool #MA4378 2.00% 7/1/20517 |
|
|
|
|
164 |
|
|
|
|
|
|
|
129 |
|
|
|
Fannie Mae Pool #FM8453 3.00% 8/1/20517 |
|
|
|
|
4,308 |
|
|
|
|
|
|
|
3,741 |
|
|
|
Fannie Mae Pool #CB1304 3.00% 8/1/20517 |
|
|
|
|
78 |
|
|
|
|
|
|
|
67 |
|
89 American Funds Insurance Series
Asset Allocation Fund (continued)
|
|
|
|
|
|
|
|
|
|
|
|
|
|
|
|
|
| Bonds, notes & other debt instruments (continued) |
|
Principal amount
(000) |
|
|
|
|
|
Value (000) |
|
|
|
|
|
| Mortgage-backed obligations (continued) |
|
|
|
|
|
|
|
|
|
|
|
|
|
|
|
|
|
|
| Federal agency mortgage-backed obligations (continued) |
|
Fannie Mae Pool #MA4465 2.00% 11/1/20517 |
|
|
|
|
USD9,007 |
|
|
|
|
|
|
$ |
7,073 |
|
|
|
Fannie Mae Pool #CB2078 3.00% 11/1/20517 |
|
|
|
|
8,781 |
|
|
|
|
|
|
|
7,533 |
|
|
|
Fannie Mae Pool #MA4492 2.00% 12/1/20517 |
|
|
|
|
2,597 |
|
|
|
|
|
|
|
2,038 |
|
|
|
Fannie Mae Pool #CB2286 2.50% 12/1/20517 |
|
|
|
|
15,565 |
|
|
|
|
|
|
|
12,897 |
|
|
|
Fannie Mae Pool #CB2375 2.50% 12/1/20517 |
|
|
|
|
7,243 |
|
|
|
|
|
|
|
6,008 |
|
|
|
Fannie Mae Pool #CB2319 2.50% 12/1/20517 |
|
|
|
|
177 |
|
|
|
|
|
|
|
147 |
|
|
|
Fannie Mae Pool #BT9483 2.50% 12/1/20517 |
|
|
|
|
85 |
|
|
|
|
|
|
|
71 |
|
|
|
Fannie Mae Pool #CB2372 2.50% 12/1/20517 |
|
|
|
|
84 |
|
|
|
|
|
|
|
70 |
|
|
|
Fannie Mae Pool #BT9510 2.50% 12/1/20517 |
|
|
|
|
84 |
|
|
|
|
|
|
|
70 |
|
|
|
Fannie Mae Pool #BQ7006 2.00% 1/1/20527 |
|
|
|
|
3,141 |
|
|
|
|
|
|
|
2,466 |
|
|
|
Fannie Mae Pool #FS0182 3.00% 1/1/20527 |
|
|
|
|
11,326 |
|
|
|
|
|
|
|
9,720 |
|
|
|
Fannie Mae Pool #BV3076 2.00% 2/1/20527 |
|
|
|
|
7,915 |
|
|
|
|
|
|
|
6,215 |
|
|
|
Fannie Mae Pool #MA4547 2.00% 2/1/20527 |
|
|
|
|
5,434 |
|
|
|
|
|
|
|
4,260 |
|
|
|
Fannie Mae Pool #BV3083 2.00% 2/1/20527 |
|
|
|
|
1,073 |
|
|
|
|
|
|
|
842 |
|
|
|
Fannie Mae Pool #FS0647 3.00% 2/1/20527 |
|
|
|
|
59,325 |
|
|
|
|
|
|
|
51,449 |
|
|
|
Fannie Mae Pool #BV3101 2.00% 3/1/20527 |
|
|
|
|
3,156 |
|
|
|
|
|
|
|
2,478 |
|
|
|
Fannie Mae Pool #FS1742 2.00% 3/1/20527 |
|
|
|
|
2,641 |
|
|
|
|
|
|
|
2,073 |
|
|
|
Fannie Mae Pool #MA4562 2.00% 3/1/20527 |
|
|
|
|
1,938 |
|
|
|
|
|
|
|
1,521 |
|
|
|
Fannie Mae Pool #BV4169 2.00% 3/1/20527 |
|
|
|
|
1,419 |
|
|
|
|
|
|
|
1,114 |
|
|
|
Fannie Mae Pool #BV4172 2.00% 3/1/20527 |
|
|
|
|
1,362 |
|
|
|
|
|
|
|
1,069 |
|
|
|
Fannie Mae Pool #MA4577 2.00% 4/1/20527 |
|
|
|
|
6,278 |
|
|
|
|
|
|
|
4,923 |
|
|
|
Fannie Mae Pool #FS1598 2.00% 4/1/20527 |
|
|
|
|
3,221 |
|
|
|
|
|
|
|
2,523 |
|
|
|
Fannie Mae Pool #FS7329 2.00% 6/1/20527 |
|
|
|
|
2,572 |
|
|
|
|
|
|
|
2,017 |
|
|
|
Fannie Mae Pool #BW2918 4.50% 6/1/20527 |
|
|
|
|
5,626 |
|
|
|
|
|
|
|
5,314 |
|
|
|
Fannie Mae Pool #FS6986 2.00% 7/1/20527 |
|
|
|
|
5,423 |
|
|
|
|
|
|
|
4,252 |
|
|
|
Fannie Mae Pool #BW1192 4.50% 9/1/20527 |
|
|
|
|
683 |
|
|
|
|
|
|
|
645 |
|
|
|
Fannie Mae Pool #CB4852 4.50% 10/1/20527 |
|
|
|
|
11,484 |
|
|
|
|
|
|
|
10,847 |
|
|
|
Fannie Mae Pool #BX0097 4.50% 10/1/20527 |
|
|
|
|
855 |
|
|
|
|
|
|
|
809 |
|
|
|
Fannie Mae Pool #FS5554 4.50% 11/1/20527 |
|
|
|
|
3,219 |
|
|
|
|
|
|
|
3,041 |
|
|
|
Fannie Mae Pool #MA4842 5.50% 12/1/20527 |
|
|
|
|
2,632 |
|
|
|
|
|
|
|
2,598 |
|
|
|
Fannie Mae Pool #MA4919 5.50% 2/1/20537 |
|
|
|
|
1,114 |
|
|
|
|
|
|
|
1,100 |
|
|
|
Fannie Mae Pool #FS4191 5.50% 3/1/20537 |
|
|
|
|
2,781 |
|
|
|
|
|
|
|
2,749 |
|
|
|
Fannie Mae Pool #MA5027 4.00% 5/1/20537 |
|
|
|
|
7,391 |
|
|
|
|
|
|
|
6,767 |
|
|
|
Fannie Mae Pool #FS4563 5.00% 5/1/20537 |
|
|
|
|
811 |
|
|
|
|
|
|
|
786 |
|
|
|
Fannie Mae Pool #MA5010 5.50% 5/1/20537 |
|
|
|
|
192 |
|
|
|
|
|
|
|
189 |
|
|
|
Fannie Mae Pool #MA5038 5.00% 6/1/20537 |
|
|
|
|
25,518 |
|
|
|
|
|
|
|
24,675 |
|
|
|
Fannie Mae Pool #MA5039 5.50% 6/1/20537 |
|
|
|
|
681 |
|
|
|
|
|
|
|
672 |
|
|
|
Fannie Mae Pool #CB6491 6.50% 6/1/20537 |
|
|
|
|
1,536 |
|
|
|
|
|
|
|
1,579 |
|
|
|
Fannie Mae Pool #CB6490 6.50% 6/1/20537 |
|
|
|
|
525 |
|
|
|
|
|
|
|
536 |
|
|
|
Fannie Mae Pool #CB6468 6.50% 6/1/20537 |
|
|
|
|
388 |
|
|
|
|
|
|
|
396 |
|
|
|
Fannie Mae Pool #FS7823 2.00% 7/1/20537 |
|
|
|
|
13,386 |
|
|
|
|
|
|
|
10,504 |
|
|
|
Fannie Mae Pool #MA5072 5.50% 7/1/20537 |
|
|
|
|
2,552 |
|
|
|
|
|
|
|
2,518 |
|
|
|
Fannie Mae Pool #MA5107 5.50% 8/1/20537 |
|
|
|
|
112 |
|
|
|
|
|
|
|
110 |
|
|
|
Fannie Mae Pool #MA5139 6.00% 9/1/20537 |
|
|
|
|
23,988 |
|
|
|
|
|
|
|
24,071 |
|
|
|
Fannie Mae Pool #MA5165 5.50% 10/1/20537 |
|
|
|
|
1,986 |
|
|
|
|
|
|
|
1,960 |
|
|
|
Fannie Mae Pool #MA5166 6.00% 10/1/20537 |
|
|
|
|
5,848 |
|
|
|
|
|
|
|
5,867 |
|
|
|
Fannie Mae Pool #BY1418 4.00% 11/1/20537 |
|
|
|
|
15,857 |
|
|
|
|
|
|
|
14,518 |
|
|
|
Fannie Mae Pool #MA5191 6.00% 11/1/20537 |
|
|
|
|
8,784 |
|
|
|
|
|
|
|
8,814 |
|
|
|
Fannie Mae Pool #BY1448 4.00% 12/1/20537 |
|
|
|
|
12,058 |
|
|
|
|
|
|
|
11,039 |
|
|
|
Fannie Mae Pool #FS6668 5.50% 12/1/20537 |
|
|
|
|
293 |
|
|
|
|
|
|
|
290 |
|
|
|
Fannie Mae Pool #FS6873 6.50% 1/1/20547 |
|
|
|
|
9,559 |
|
|
|
|
|
|
|
9,744 |
|
|
|
Fannie Mae Pool #BY1343 4.00% 2/1/20547 |
|
|
|
|
12,961 |
|
|
|
|
|
|
|
11,864 |
|
|
|
Fannie Mae Pool #FS6809 5.50% 2/1/20547 |
|
|
|
|
271 |
|
|
|
|
|
|
|
267 |
|
|
|
Fannie Mae Pool #CB7932 6.00% 2/1/20547 |
|
|
|
|
3,672 |
|
|
|
|
|
|
|
3,696 |
|
|
|
Fannie Mae Pool #CB7933 6.50% 2/1/20547 |
|
|
|
|
2,911 |
|
|
|
|
|
|
|
2,971 |
|
|
|
Fannie Mae Pool #MA5296 5.50% 3/1/20547 |
|
|
|
|
14,315 |
|
|
|
|
|
|
|
14,123 |
|
|
|
Fannie Mae Pool #CB8151 5.50% 3/1/20547 |
|
|
|
|
5,348 |
|
|
|
|
|
|
|
5,282 |
|
|
|
Fannie Mae Pool #CB8163 6.00% 3/1/20547 |
|
|
|
|
983 |
|
|
|
|
|
|
|
990 |
|
|
|
Fannie Mae Pool #CB8168 6.00% 3/1/20547 |
|
|
|
|
11 |
|
|
|
|
|
|
|
11 |
|
|
|
Fannie Mae Pool #MA5341 4.00% 4/1/20547 |
|
|
|
|
24,586 |
|
|
|
|
|
|
|
22,506 |
|
|
|
Fannie Mae Pool #CB8337 5.50% 4/1/20547 |
|
|
|
|
8,038 |
|
|
|
|
|
|
|
7,938 |
|
American Funds Insurance Series 90
Asset Allocation Fund (continued)
|
|
|
|
|
|
|
|
|
|
|
|
|
|
|
|
|
| Bonds, notes & other debt instruments (continued) |
|
Principal amount
(000) |
|
|
|
|
|
Value (000) |
|
|
|
|
|
| Mortgage-backed obligations (continued) |
|
|
|
|
|
|
|
|
|
|
|
|
|
|
|
|
|
|
| Federal agency mortgage-backed obligations (continued) |
|
Fannie Mae Pool #MA5378 4.00% 5/1/20547 |
|
|
|
|
USD4,436 |
|
|
|
|
|
|
$ |
4,061 |
|
|
|
Fannie Mae Pool #FS8153 6.00% 6/1/20547 |
|
|
|
|
1,240 |
|
|
|
|
|
|
|
1,251 |
|
|
|
Fannie Mae Pool #CB8755 6.00% 6/1/20547 |
|
|
|
|
1,084 |
|
|
|
|
|
|
|
1,092 |
|
|
|
Fannie Mae Pool #BU4699 5.50% 7/1/20547 |
|
|
|
|
1,576 |
|
|
|
|
|
|
|
1,559 |
|
|
|
Fannie Mae Pool #BU4700 6.00% 7/1/20547 |
|
|
|
|
563 |
|
|
|
|
|
|
|
567 |
|
|
|
Fannie Mae Pool #BM6736 4.50% 11/1/20597 |
|
|
|
|
10,197 |
|
|
|
|
|
|
|
9,704 |
|
|
|
Fannie Mae Pool #BF0497 3.00% 7/1/20607 |
|
|
|
|
3,614 |
|
|
|
|
|
|
|
3,007 |
|
|
|
Fannie Mae, Series 2002-W3, Class A5, 7.50% 11/25/20417 |
|
|
|
|
21 |
|
|
|
|
|
|
|
22 |
|
|
|
Fannie Mae, Series 2001-T10, Class A1, 7.00% 12/25/20417 |
|
|
|
|
65 |
|
|
|
|
|
|
|
65 |
|
|
|
Fannie Mae, Series 2006-43, Class JO, principal only, 0% 6/25/20367 |
|
|
|
|
31 |
|
|
|
|
|
|
|
26 |
|
|
|
Freddie Mac Pool #C91912 3.00% 2/1/20377 |
|
|
|
|
9,285 |
|
|
|
|
|
|
|
8,543 |
|
|
|
Freddie Mac Pool #G03978 5.00% 3/1/20387 |
|
|
|
|
371 |
|
|
|
|
|
|
|
367 |
|
|
|
Freddie Mac Pool #G04553 6.50% 9/1/20387 |
|
|
|
|
41 |
|
|
|
|
|
|
|
43 |
|
|
|
Freddie Mac Pool #G08347 4.50% 6/1/20397 |
|
|
|
|
56 |
|
|
|
|
|
|
|
55 |
|
|
|
Freddie Mac Pool #RB5071 2.00% 9/1/20407 |
|
|
|
|
22,289 |
|
|
|
|
|
|
|
18,840 |
|
|
|
Freddie Mac Pool #C03518 5.00% 9/1/20407 |
|
|
|
|
507 |
|
|
|
|
|
|
|
502 |
|
|
|
Freddie Mac Pool #Q05807 4.00% 1/1/20427 |
|
|
|
|
1,401 |
|
|
|
|
|
|
|
1,325 |
|
|
|
Freddie Mac Pool #Q23185 4.00% 11/1/20437 |
|
|
|
|
1,065 |
|
|
|
|
|
|
|
1,010 |
|
|
|
Freddie Mac Pool #Q23190 4.00% 11/1/20437 |
|
|
|
|
706 |
|
|
|
|
|
|
|
667 |
|
|
|
Freddie Mac Pool #760014 2.838% 8/1/20457,8 |
|
|
|
|
149 |
|
|
|
|
|
|
|
145 |
|
|
|
Freddie Mac Pool #Q37988 4.00% 12/1/20457 |
|
|
|
|
4,731 |
|
|
|
|
|
|
|
4,439 |
|
|
|
Freddie Mac Pool #G60344 4.00% 12/1/20457 |
|
|
|
|
4,215 |
|
|
|
|
|
|
|
3,955 |
|
|
|
Freddie Mac Pool #Z40130 3.00% 1/1/20467 |
|
|
|
|
3,760 |
|
|
|
|
|
|
|
3,323 |
|
|
|
Freddie Mac Pool #Q41090 4.50% 6/1/20467 |
|
|
|
|
196 |
|
|
|
|
|
|
|
190 |
|
|
|
Freddie Mac Pool #Q41909 4.50% 7/1/20467 |
|
|
|
|
200 |
|
|
|
|
|
|
|
193 |
|
|
|
Freddie Mac Pool #760015 2.67% 1/1/20477,8 |
|
|
|
|
384 |
|
|
|
|
|
|
|
363 |
|
|
|
Freddie Mac Pool #Q46021 3.50% 2/1/20477 |
|
|
|
|
1,097 |
|
|
|
|
|
|
|
995 |
|
|
|
Freddie Mac Pool #SI2002 4.00% 3/1/20487 |
|
|
|
|
2,021 |
|
|
|
|
|
|
|
1,883 |
|
|
|
Freddie Mac Pool #RA3384 3.00% 8/1/20507 |
|
|
|
|
367 |
|
|
|
|
|
|
|
316 |
|
|
|
Freddie Mac Pool #SD8106 2.00% 11/1/20507 |
|
|
|
|
30,169 |
|
|
|
|
|
|
|
23,754 |
|
|
|
Freddie Mac Pool #SD7528 2.00% 11/1/20507 |
|
|
|
|
15,946 |
|
|
|
|
|
|
|
12,734 |
|
|
|
Freddie Mac Pool #RA5288 2.00% 5/1/20517 |
|
|
|
|
27,893 |
|
|
|
|
|
|
|
22,159 |
|
|
|
Freddie Mac Pool #SD7544 3.00% 7/1/20517 |
|
|
|
|
369 |
|
|
|
|
|
|
|
320 |
|
|
|
Freddie Mac Pool #SD8160 2.00% 8/1/20517 |
|
|
|
|
847 |
|
|
|
|
|
|
|
666 |
|
|
|
Freddie Mac Pool #RA5782 2.50% 9/1/20517 |
|
|
|
|
9,191 |
|
|
|
|
|
|
|
7,637 |
|
|
|
Freddie Mac Pool #SD7545 2.50% 9/1/20517 |
|
|
|
|
6,264 |
|
|
|
|
|
|
|
5,224 |
|
|
|
Freddie Mac Pool #RA5971 3.00% 9/1/20517 |
|
|
|
|
6,078 |
|
|
|
|
|
|
|
5,247 |
|
|
|
Freddie Mac Pool #QC6456 3.00% 9/1/20517 |
|
|
|
|
667 |
|
|
|
|
|
|
|
569 |
|
|
|
Freddie Mac Pool #SD0734 3.00% 10/1/20517 |
|
|
|
|
163 |
|
|
|
|
|
|
|
141 |
|
|
|
Freddie Mac Pool #QD1841 2.00% 11/1/20517 |
|
|
|
|
4,022 |
|
|
|
|
|
|
|
3,156 |
|
|
|
Freddie Mac Pool #SD8182 2.00% 12/1/20517 |
|
|
|
|
1,730 |
|
|
|
|
|
|
|
1,356 |
|
|
|
Freddie Mac Pool #RA6483 2.50% 12/1/20517 |
|
|
|
|
6,184 |
|
|
|
|
|
|
|
5,130 |
|
|
|
Freddie Mac Pool #SD7552 2.50% 1/1/20527 |
|
|
|
|
2,162 |
|
|
|
|
|
|
|
1,797 |
|
|
|
Freddie Mac Pool #SD0813 3.00% 1/1/20527 |
|
|
|
|
308 |
|
|
|
|
|
|
|
266 |
|
|
|
Freddie Mac Pool #QD5748 2.00% 2/1/20527 |
|
|
|
|
909 |
|
|
|
|
|
|
|
714 |
|
|
|
Freddie Mac Pool #SD8193 2.00% 2/1/20527 |
|
|
|
|
881 |
|
|
|
|
|
|
|
690 |
|
|
|
Freddie Mac Pool #QD7089 3.50% 2/1/20527 |
|
|
|
|
939 |
|
|
|
|
|
|
|
838 |
|
|
|
Freddie Mac Pool #SD5343 2.00% 3/1/20527 |
|
|
|
|
4,474 |
|
|
|
|
|
|
|
3,509 |
|
|
|
Freddie Mac Pool #SD8199 2.00% 3/1/20527 |
|
|
|
|
3,102 |
|
|
|
|
|
|
|
2,432 |
|
|
|
Freddie Mac Pool #QD8408 2.00% 3/1/20527 |
|
|
|
|
1,182 |
|
|
|
|
|
|
|
927 |
|
|
|
Freddie Mac Pool #QD8103 2.00% 3/1/20527 |
|
|
|
|
893 |
|
|
|
|
|
|
|
700 |
|
|
|
Freddie Mac Pool #QD8820 2.00% 3/1/20527 |
|
|
|
|
268 |
|
|
|
|
|
|
|
210 |
|
|
|
Freddie Mac Pool #SD8204 2.00% 4/1/20527 |
|
|
|
|
3,138 |
|
|
|
|
|
|
|
2,462 |
|
|
|
Freddie Mac Pool #QE0312 2.00% 4/1/20527 |
|
|
|
|
1,127 |
|
|
|
|
|
|
|
884 |
|
|
|
Freddie Mac Pool #SD7554 2.50% 4/1/20527 |
|
|
|
|
83 |
|
|
|
|
|
|
|
69 |
|
|
|
Freddie Mac Pool #SD8214 3.50% 5/1/20527 |
|
|
|
|
50 |
|
|
|
|
|
|
|
44 |
|
|
|
Freddie Mac Pool #QE4383 4.00% 6/1/20527 |
|
|
|
|
2,276 |
|
|
|
|
|
|
|
2,089 |
|
|
|
Freddie Mac Pool #SD8225 3.00% 7/1/20527 |
|
|
|
|
12,205 |
|
|
|
|
|
|
|
10,398 |
|
|
|
Freddie Mac Pool #SD7556 3.00% 8/1/20527 |
|
|
|
|
1,274 |
|
|
|
|
|
|
|
1,098 |
|
|
|
Freddie Mac Pool #QE7976 4.50% 8/1/20527 |
|
|
|
|
41,461 |
|
|
|
|
|
|
|
39,161 |
|
|
|
Freddie Mac Pool #QE8579 4.50% 8/1/20527 |
|
|
|
|
188 |
|
|
|
|
|
|
|
177 |
|
91 American Funds Insurance Series
Asset Allocation Fund (continued)
|
|
|
|
|
|
|
|
|
|
|
|
|
|
|
|
|
| Bonds, notes & other debt instruments (continued) |
|
Principal amount
(000) |
|
|
|
|
|
Value (000) |
|
|
|
|
|
| Mortgage-backed obligations (continued) |
|
|
|
|
|
|
|
|
|
|
|
|
|
|
|
|
|
|
| Federal agency mortgage-backed obligations (continued) |
|
Freddie Mac Pool #QF0212 4.50% 9/1/20527 |
|
|
|
|
USD863 |
|
|
|
|
|
|
$ |
815 |
|
|
|
Freddie Mac Pool #QE9497 4.50% 9/1/20527 |
|
|
|
|
211 |
|
|
|
|
|
|
|
200 |
|
|
|
Freddie Mac Pool #SD1608 4.50% 9/1/20527 |
|
|
|
|
126 |
|
|
|
|
|
|
|
119 |
|
|
|
Freddie Mac Pool #RA7938 5.00% 9/1/20527 |
|
|
|
|
1,180 |
|
|
|
|
|
|
|
1,143 |
|
|
|
Freddie Mac Pool #QF1236 4.50% 10/1/20527 |
|
|
|
|
1,253 |
|
|
|
|
|
|
|
1,183 |
|
|
|
Freddie Mac Pool #SD2465 4.50% 10/1/20527 |
|
|
|
|
82 |
|
|
|
|
|
|
|
77 |
|
|
|
Freddie Mac Pool #SD8276 5.00% 12/1/20527 |
|
|
|
|
6,271 |
|
|
|
|
|
|
|
6,072 |
|
|
|
Freddie Mac Pool #SD8297 4.00% 2/1/20537 |
|
|
|
|
1,940 |
|
|
|
|
|
|
|
1,778 |
|
|
|
Freddie Mac Pool #SD8305 4.00% 3/1/20537 |
|
|
|
|
18,182 |
|
|
|
|
|
|
|
16,645 |
|
|
|
Freddie Mac Pool #SD2716 5.00% 4/1/20537 |
|
|
|
|
1,298 |
|
|
|
|
|
|
|
1,256 |
|
|
|
Freddie Mac Pool #RA8647 4.50% 5/1/20537 |
|
|
|
|
86 |
|
|
|
|
|
|
|
81 |
|
|
|
Freddie Mac Pool #SD8329 5.00% 6/1/20537 |
|
|
|
|
427 |
|
|
|
|
|
|
|
412 |
|
|
|
Freddie Mac Pool #SD8331 5.50% 6/1/20537 |
|
|
|
|
3,034 |
|
|
|
|
|
|
|
2,994 |
|
|
|
Freddie Mac Pool #RA9294 6.50% 6/1/20537 |
|
|
|
|
723 |
|
|
|
|
|
|
|
742 |
|
|
|
Freddie Mac Pool #RA9292 6.50% 6/1/20537 |
|
|
|
|
634 |
|
|
|
|
|
|
|
648 |
|
|
|
Freddie Mac Pool #RA9289 6.50% 6/1/20537 |
|
|
|
|
583 |
|
|
|
|
|
|
|
600 |
|
|
|
Freddie Mac Pool #RA9288 6.50% 6/1/20537 |
|
|
|
|
561 |
|
|
|
|
|
|
|
579 |
|
|
|
Freddie Mac Pool #RA9287 6.50% 6/1/20537 |
|
|
|
|
404 |
|
|
|
|
|
|
|
417 |
|
|
|
Freddie Mac Pool #RA9290 6.50% 6/1/20537 |
|
|
|
|
295 |
|
|
|
|
|
|
|
303 |
|
|
|
Freddie Mac Pool #RA9291 6.50% 6/1/20537 |
|
|
|
|
218 |
|
|
|
|
|
|
|
222 |
|
|
|
Freddie Mac Pool #RA9295 6.50% 6/1/20537 |
|
|
|
|
158 |
|
|
|
|
|
|
|
164 |
|
|
|
Freddie Mac Pool #SD8341 5.00% 7/1/20537 |
|
|
|
|
34 |
|
|
|
|
|
|
|
33 |
|
|
|
Freddie Mac Pool #SD8342 5.50% 7/1/20537 |
|
|
|
|
9,215 |
|
|
|
|
|
|
|
9,095 |
|
|
|
Freddie Mac Pool #QH1153 4.00% 9/1/20537 |
|
|
|
|
494 |
|
|
|
|
|
|
|
453 |
|
|
|
Freddie Mac Pool #SD8362 5.50% 9/1/20537 |
|
|
|
|
27,916 |
|
|
|
|
|
|
|
27,547 |
|
|
|
Freddie Mac Pool #SD4053 6.00% 10/1/20537 |
|
|
|
|
5,721 |
|
|
|
|
|
|
|
5,751 |
|
|
|
Freddie Mac Pool #SD4977 5.00% 11/1/20537 |
|
|
|
|
130,134 |
|
|
|
|
|
|
|
125,836 |
|
|
|
Freddie Mac Pool #SD8372 5.50% 11/1/20537 |
|
|
|
|
25,587 |
|
|
|
|
|
|
|
25,249 |
|
|
|
Freddie Mac Pool #SD8406 4.00% 1/1/20547 |
|
|
|
|
11,885 |
|
|
|
|
|
|
|
10,879 |
|
|
|
Freddie Mac Pool #SD8413 4.00% 2/1/20547 |
|
|
|
|
22,785 |
|
|
|
|
|
|
|
20,856 |
|
|
|
Freddie Mac Pool #SD8408 5.50% 3/1/20547 |
|
|
|
|
12,411 |
|
|
|
|
|
|
|
12,245 |
|
|
|
Freddie Mac Pool #RJ1216 5.50% 4/1/20547 |
|
|
|
|
1,722 |
|
|
|
|
|
|
|
1,704 |
|
|
|
Freddie Mac Pool #RJ1215 5.50% 4/1/20547 |
|
|
|
|
1,308 |
|
|
|
|
|
|
|
1,292 |
|
|
|
Freddie Mac Pool #SD8428 4.00% 5/1/20547 |
|
|
|
|
1,005 |
|
|
|
|
|
|
|
920 |
|
|
|
Freddie Mac Pool #RJ1417 5.50% 5/1/20547 |
|
|
|
|
16,539 |
|
|
|
|
|
|
|
16,370 |
|
|
|
Freddie Mac Pool #RJ1419 5.50% 5/1/20547 |
|
|
|
|
7,984 |
|
|
|
|
|
|
|
7,892 |
|
|
|
Freddie Mac Pool #RJ1448 5.50% 5/1/20547 |
|
|
|
|
3,077 |
|
|
|
|
|
|
|
3,045 |
|
|
|
Freddie Mac Pool #SD8435 4.00% 6/1/20547 |
|
|
|
|
690 |
|
|
|
|
|
|
|
632 |
|
|
|
Freddie Mac Pool #RJ1768 5.50% 6/1/20547 |
|
|
|
|
460 |
|
|
|
|
|
|
|
455 |
|
|
|
Freddie Mac Pool #RJ1785 6.00% 6/1/20547 |
|
|
|
|
1,810 |
|
|
|
|
|
|
|
1,821 |
|
|
|
Freddie Mac Pool #RJ1779 6.00% 6/1/20547 |
|
|
|
|
1,260 |
|
|
|
|
|
|
|
1,270 |
|
|
|
Freddie Mac Pool #QI8872 5.50% 7/1/20547 |
|
|
|
|
766 |
|
|
|
|
|
|
|
758 |
|
|
|
Freddie Mac Pool #QI8874 6.00% 7/1/20547 |
|
|
|
|
225 |
|
|
|
|
|
|
|
227 |
|
|
|
Freddie Mac, Series T041, Class 3A, 4.336% 7/25/20327,8 |
|
|
|
|
160 |
|
|
|
|
|
|
|
150 |
|
|
|
Freddie Mac, Series K755, Class A2, Multi Family, 5.203% 2/25/20317 |
|
|
|
|
11,374 |
|
|
|
|
|
|
|
11,629 |
|
|
|
Freddie Mac Seasoned Credit Risk Transfer Trust, Series 2017-1, Class HA,
3.00% 1/25/20567,8 |
|
|
|
|
2,296 |
|
|
|
|
|
|
|
2,105 |
|
|
|
Freddie Mac Seasoned Credit Risk Transfer Trust, Series 2017-3, Class HA,
3.25% 7/25/20567,8 |
|
|
|
|
983 |
|
|
|
|
|
|
|
907 |
|
|
|
Freddie Mac Seasoned Credit Risk Transfer Trust, Series 2017-2, Class MA,
3.00% 8/25/20567 |
|
|
|
|
4,513 |
|
|
|
|
|
|
|
4,117 |
|
|
|
Freddie Mac Seasoned Credit Risk Transfer Trust, Series 2017-2, Class HA,
3.00% 8/25/20567,8 |
|
|
|
|
4,378 |
|
|
|
|
|
|
|
4,010 |
|
|
|
Freddie Mac Seasoned Credit Risk Transfer Trust, Series 2017-4, Class HT,
3.25% 6/25/20577,8 |
|
|
|
|
820 |
|
|
|
|
|
|
|
728 |
|
|
|
Freddie Mac Seasoned Credit Risk Transfer Trust, Series 2017-4, Class MT,
3.50% 6/25/20577 |
|
|
|
|
681 |
|
|
|
|
|
|
|
609 |
|
|
|
Freddie Mac Seasoned Credit Risk Transfer Trust, Series 2018-3, Class MA,
3.50% 8/25/20577 |
|
|
|
|
1,456 |
|
|
|
|
|
|
|
1,372 |
|
|
|
Freddie Mac Seasoned Credit Risk Transfer Trust, Series 2018-2, Class MT,
3.50% 11/25/20577 |
|
|
|
|
1,749 |
|
|
|
|
|
|
|
1,540 |
|
American Funds Insurance Series 92
Asset Allocation Fund (continued)
|
|
|
|
|
|
|
|
|
|
|
|
|
|
|
|
|
|
|
| Bonds, notes & other debt instruments (continued) |
|
|
Principal amount
(000) |
|
|
|
|
|
Value (000) |
|
|
|
|
|
| Mortgage-backed obligations (continued) |
|
|
|
|
|
|
|
|
|
|
|
|
|
|
|
|
|
|
|
| Federal agency mortgage-backed obligations (continued) |
|
Freddie Mac Seasoned Credit Risk Transfer Trust, Series 2019-2, Class MA,
3.50% 8/25/20587 |
|
|
|
|
|
|
USD7,854 |
|
|
|
|
|
|
$ |
7,296 |
|
|
|
Freddie Mac Seasoned Credit Risk Transfer Trust, Series 2019-4, Class MA,
3.00% 2/25/20597 |
|
|
|
|
|
|
4,595 |
|
|
|
|
|
|
|
4,149 |
|
|
|
Freddie Mac Seasoned Loan Structured Transaction Trust, Series 2018-2, Class A1, 3.50% 11/25/20287 |
|
|
|
|
|
|
1,821 |
|
|
|
|
|
|
|
1,712 |
|
|
|
Freddie Mac Seasoned Loan Structured Transaction Trust, Series 2019-1, Class A1, 3.50% 5/25/20297 |
|
|
|
|
|
|
3,584 |
|
|
|
|
|
|
|
3,402 |
|
|
|
Freddie Mac Seasoned Loan Structured Transaction Trust, Series 2019-1, Class A2, 3.50% 5/25/20297 |
|
|
|
|
|
|
2,455 |
|
|
|
|
|
|
|
2,290 |
|
|
|
Freddie Mac Seasoned Loan Structured Transaction Trust, Series 2019-3, Class A1C, 2.75% 11/25/20297 |
|
|
|
|
|
|
2,254 |
|
|
|
|
|
|
|
2,082 |
|
|
|
Government National Mortgage Assn. 2.50% 7/1/20547,9 |
|
|
|
|
|
|
14,000 |
|
|
|
|
|
|
|
11,770 |
|
|
|
Government National Mortgage Assn. 3.00% 7/1/20547,9 |
|
|
|
|
|
|
32,663 |
|
|
|
|
|
|
|
28,462 |
|
|
|
Government National Mortgage Assn. 4.00% 7/1/20547,9 |
|
|
|
|
|
|
14,285 |
|
|
|
|
|
|
|
13,202 |
|
|
|
Government National Mortgage Assn. Pool #BD7245 4.00% 1/20/20487 |
|
|
|
|
|
|
421 |
|
|
|
|
|
|
|
392 |
|
|
|
Government National Mortgage Assn. Pool #MA5652 4.50% 12/20/20487 |
|
|
|
|
|
|
283 |
|
|
|
|
|
|
|
273 |
|
|
|
Government National Mortgage Assn. Pool #MA6602 4.50% 4/20/20507 |
|
|
|
|
|
|
168 |
|
|
|
|
|
|
|
162 |
|
|
|
Government National Mortgage Assn. Pool #MA6994 2.00% 11/20/20507 |
|
|
|
|
|
|
7,236 |
|
|
|
|
|
|
|
5,868 |
|
|
|
Government National Mortgage Assn. Pool #MA7051 2.00% 12/20/20507 |
|
|
|
|
|
|
72,466 |
|
|
|
|
|
|
|
58,755 |
|
|
|
Government National Mortgage Assn. Pool #MA7259 4.50% 3/20/20517 |
|
|
|
|
|
|
1,469 |
|
|
|
|
|
|
|
1,416 |
|
|
|
Government National Mortgage Assn. Pool #MA7316 4.50% 4/20/20517 |
|
|
|
|
|
|
406 |
|
|
|
|
|
|
|
391 |
|
|
|
Government National Mortgage Assn. Pool #MA7827 2.50% 1/20/20527 |
|
|
|
|
|
|
152 |
|
|
|
|
|
|
|
128 |
|
|
|
Government National Mortgage Assn. Pool #MA7881 2.50% 2/20/20527 |
|
|
|
|
|
|
13,059 |
|
|
|
|
|
|
|
10,983 |
|
|
|
Government National Mortgage Assn. Pool #MA8099 3.50% 6/20/20527 |
|
|
|
|
|
|
142 |
|
|
|
|
|
|
|
128 |
|
|
|
Government National Mortgage Assn. Pool #MA8197 2.50% 8/20/20527 |
|
|
|
|
|
|
924 |
|
|
|
|
|
|
|
777 |
|
|
|
Government National Mortgage Assn. Pool #MA8266 3.50% 9/20/20527 |
|
|
|
|
|
|
697 |
|
|
|
|
|
|
|
626 |
|
|
|
Government National Mortgage Assn. Pool #MA8346 4.00% 10/20/20527 |
|
|
|
|
|
|
1,585 |
|
|
|
|
|
|
|
1,466 |
|
|
|
Government National Mortgage Assn. Pool #MA8425 3.50% 11/20/20527 |
|
|
|
|
|
|
32,854 |
|
|
|
|
|
|
|
29,510 |
|
|
|
Government National Mortgage Assn. Pool #MA8485 2.50% 12/20/20527 |
|
|
|
|
|
|
2,386 |
|
|
|
|
|
|
|
2,008 |
|
|
|
Government National Mortgage Assn. Pool #MA8642 2.50% 2/20/20537 |
|
|
|
|
|
|
2,081 |
|
|
|
|
|
|
|
1,752 |
|
|
|
Government National Mortgage Assn. Pool #MA9015 4.50% 7/20/20537 |
|
|
|
|
|
|
3,153 |
|
|
|
|
|
|
|
2,999 |
|
|
|
Government National Mortgage Assn. Pool #MA9104 4.50% 8/20/20537 |
|
|
|
|
|
|
29,544 |
|
|
|
|
|
|
|
28,103 |
|
|
|
Government National Mortgage Assn., Series 2021-2, Class AH, 1.50% 6/16/20637 |
|
|
|
|
|
|
2,065 |
|
|
|
|
|
|
|
1,539 |
|
|
|
Uniform Mortgage-Backed Security 2.50% 7/1/20397,9 |
|
|
|
|
|
|
638 |
|
|
|
|
|
|
|
576 |
|
|
|
Uniform Mortgage-Backed Security 2.00% 7/1/20547,9 |
|
|
|
|
|
|
111,474 |
|
|
|
|
|
|
|
87,202 |
|
|
|
Uniform Mortgage-Backed Security 2.50% 7/1/20547,9 |
|
|
|
|
|
|
210,980 |
|
|
|
|
|
|
|
172,303 |
|
|
|
Uniform Mortgage-Backed Security 3.00% 7/1/20547,9 |
|
|
|
|
|
|
46,540 |
|
|
|
|
|
|
|
39,596 |
|
|
|
Uniform Mortgage-Backed Security 3.50% 7/1/20547,9 |
|
|
|
|
|
|
101,292 |
|
|
|
|
|
|
|
89,659 |
|
|
|
Uniform Mortgage-Backed Security 4.00% 7/1/20547,9 |
|
|
|
|
|
|
59,638 |
|
|
|
|
|
|
|
54,575 |
|
|
|
Uniform Mortgage-Backed Security 4.50% 7/1/20547,9 |
|
|
|
|
|
|
62,783 |
|
|
|
|
|
|
|
59,195 |
|
|
|
Uniform Mortgage-Backed Security 5.00% 7/1/20547,9 |
|
|
|
|
|
|
16,500 |
|
|
|
|
|
|
|
15,948 |
|
|
|
Uniform Mortgage-Backed Security 5.50% 7/1/20547,9 |
|
|
|
|
|
|
57,079 |
|
|
|
|
|
|
|
56,300 |
|
|
|
Uniform Mortgage-Backed Security 6.00% 7/1/20547,9 |
|
|
|
|
|
|
42,142 |
|
|
|
|
|
|
|
42,265 |
|
|
|
Uniform Mortgage-Backed Security 6.50% 7/1/20547,9 |
|
|
|
|
|
|
114,534 |
|
|
|
|
|
|
|
116,583 |
|
|
|
Uniform Mortgage-Backed Security 2.50% 8/1/20547,9 |
|
|
|
|
|
|
104,050 |
|
|
|
|
|
|
|
85,065 |
|
|
|
Uniform Mortgage-Backed Security 3.00% 8/1/20547,9 |
|
|
|
|
|
|
20,104 |
|
|
|
|
|
|
|
17,120 |
|
|
|
Uniform Mortgage-Backed Security 3.50% 8/1/20547,9 |
|
|
|
|
|
|
27,000 |
|
|
|
|
|
|
|
23,903 |
|
|
|
Uniform Mortgage-Backed Security 4.50% 8/1/20547,9 |
|
|
|
|
|
|
35,000 |
|
|
|
|
|
|
|
33,008 |
|
|
|
Uniform Mortgage-Backed Security 5.00% 8/1/20547,9 |
|
|
|
|
|
|
9,000 |
|
|
|
|
|
|
|
8,698 |
|
|
|
Uniform Mortgage-Backed Security 6.00% 8/1/20547,9 |
|
|
|
|
|
|
58,728 |
|
|
|
|
|
|
|
58,873 |
|
|
|
Uniform Mortgage-Backed Security 6.50% 8/1/20547,9 |
|
|
|
|
|
|
18,304 |
|
|
|
|
|
|
|
18,620 |
|
|
|
|
|
|
|
|
|
|
|
|
|
|
|
|
|
|
|
|
|
|
|
|
|
|
|
|
|
|
|
|
|
|
|
|
|
2,268,656 |
|
|
|
|
|
|
|
|
|
|
|
|
|
|
|
|
|
|
|
|
| |
|
|
|
|
|
|
|
|
|
|
|
|
|
|
|
|
|
|
|
|
|
|
|
|
| Commercial mortgage-backed securities 0.53% |
|
Bank Commercial Mortgage Trust, Series 2023-5YR4, Class A3, 6.50% 12/15/20567 |
|
|
|
|
|
|
5,368 |
|
|
|
|
|
|
|
5,573 |
|
|
|
Bank Commercial Mortgage Trust, Series 2023-5YR4, Class AS, 7.274% 12/15/20567,8 |
|
|
|
|
|
|
857 |
|
|
|
|
|
|
|
905 |
|
|
|
Bank Commercial Mortgage Trust, Series 2020-BN26, Class A4, 2.403% 3/15/20637 |
|
|
|
|
|
|
2,909 |
|
|
|
|
|
|
|
2,483 |
|
|
|
Benchmark Mortgage Trust, Series 2018-B2, Class A4, 3.615% 2/15/20517 |
|
|
|
|
|
|
1,000 |
|
|
|
|
|
|
|
943 |
|
|
|
Benchmark Mortgage Trust, Series 2020-B17, Class A5, 2.289% 3/15/20537 |
|
|
|
|
|
|
2,960 |
|
|
|
|
|
|
|
2,479 |
|
93 American Funds Insurance Series
Asset Allocation Fund (continued)
|
|
|
|
|
|
|
|
|
|
|
|
|
|
|
|
|
| Bonds, notes & other debt instruments (continued) |
|
Principal amount
(000) |
|
|
|
|
|
Value (000) |
|
|
|
|
|
| Mortgage-backed obligations (continued) |
|
|
|
|
|
|
|
|
|
|
|
|
|
|
|
|
|
|
| Commercial mortgage-backed securities (continued) |
|
BX Trust, Series 2024-CNYN, Class A,
(1-month USD CME Term SOFR + 1.442%) 6.771% 4/15/20295,7,8 |
|
|
|
|
USD6,164 |
|
|
|
|
|
|
$ |
6,177 |
|
|
|
BX Trust, Series 2021-SDMF, Class A,
(1-month USD CME Term SOFR + 0.703%) 6.032% 9/15/20345,7,8 |
|
|
|
|
5,711 |
|
|
|
|
|
|
|
5,633 |
|
|
|
BX Trust, Series 2021-VOLT, Class A,
(1-month USD CME Term SOFR + 0.814%) 6.143% 9/15/20365,7,8 |
|
|
|
|
4,505 |
|
|
|
|
|
|
|
4,452 |
|
|
|
BX Trust, Series 2021-ARIA, Class A,
(1-month USD CME Term SOFR + 1.014%) 6.342% 10/15/20365,7,8 |
|
|
|
|
7,968 |
|
|
|
|
|
|
|
7,875 |
|
|
|
BX Trust, Series 2021-ARIA, Class B,
(1-month USD CME Term SOFR + 1.411%) 6.74% 10/15/20365,7,8 |
|
|
|
|
5,968 |
|
|
|
|
|
|
|
5,889 |
|
|
|
BX Trust, Series 2021-SOAR, Class A,
(1-month USD CME Term SOFR + 0.784%) 6.113% 6/15/20385,7,8 |
|
|
|
|
6,609 |
|
|
|
|
|
|
|
6,539 |
|
|
|
BX Trust, Series 2021-SOAR, Class B,
(1-month USD CME Term SOFR + 0.984%) 6.313% 6/15/20385,7,8 |
|
|
|
|
1,193 |
|
|
|
|
|
|
|
1,179 |
|
|
|
BX Trust, Series 2021-SOAR, Class C,
(1-month USD CME Term SOFR + 1.214%) 6.543% 6/15/20385,7,8 |
|
|
|
|
1,078 |
|
|
|
|
|
|
|
1,064 |
|
|
|
BX Trust, Series 2021-ACNT, Class A,
(1-month USD CME Term SOFR + 0.964%) 6.293% 11/15/20385,7,8 |
|
|
|
|
4,955 |
|
|
|
|
|
|
|
4,901 |
|
|
|
BX Trust, Series 2022-AHP, Class A,
(1-month USD CME Term SOFR + 0.99%) 6.319% 2/15/20395,7,8 |
|
|
|
|
6,334 |
|
|
|
|
|
|
|
6,264 |
|
|
|
Citigroup Commercial Mortgage Trust, Series 2023-SMRT, Class A,
6.015% 10/12/20405,7,8 |
|
|
|
|
3,606 |
|
|
|
|
|
|
|
3,614 |
|
|
|
Citigroup Commercial Mortgage Trust, Series 2015-GC29, Class AAB,
2.984% 4/10/20487 |
|
|
|
|
42 |
|
|
|
|
|
|
|
42 |
|
|
|
Commercial Mortgage Trust, Series 2015-PC1, Class A5, 3.902% 7/10/20507 |
|
|
|
|
4,735 |
|
|
|
|
|
|
|
4,660 |
|
|
|
CSAIL Commercial Mortgage Trust, Series 2015-C4, Class ASB, 3.617% 11/15/20487 |
|
|
|
|
322 |
|
|
|
|
|
|
|
318 |
|
|
|
DC Commercial Mortgage Trust, Series 2023-DC, Class A, 6.314% 9/10/20405,7 |
|
|
|
|
3,677 |
|
|
|
|
|
|
|
3,774 |
|
|
|
Extended Stay America Trust, Series 2021-ESH, Class A,
(1-month USD CME Term SOFR + 1.194%) 6.523% 7/15/20385,7,8 |
|
|
|
|
1,429 |
|
|
|
|
|
|
|
1,424 |
|
|
|
Extended Stay America Trust, Series 2021-ESH, Class B,
(1-month USD CME Term SOFR + 1.494%) 6.823% 7/15/20385,7,8 |
|
|
|
|
1,304 |
|
|
|
|
|
|
|
1,300 |
|
|
|
Extended Stay America Trust, Series 2021-ESH, Class C,
(1-month USD CME Term SOFR + 1.814%) 7.143% 7/15/20385,7,8 |
|
|
|
|
1,363 |
|
|
|
|
|
|
|
1,361 |
|
|
|
Grace Mortgage Trust, Series 2020-GRCE, Class A, 2.347% 12/10/20405,7 |
|
|
|
|
3,795 |
|
|
|
|
|
|
|
3,104 |
|
|
|
Great Wolf Trust, Series 2024-WLF2, Class A,
(1-month USD CME Term SOFR + 1.691%) 7.02% 5/15/20415,7,8 |
|
|
|
|
9,264 |
|
|
|
|
|
|
|
9,275 |
|
|
|
GS Mortgage Securities Trust, Series 2023-SHIP, Class B, 5.101% 9/15/20385,7,8 |
|
|
|
|
1,355 |
|
|
|
|
|
|
|
1,321 |
|
|
|
GS Mortgage Securities Trust, Series 2020-GC47, Class A5, 2.377% 5/12/20537 |
|
|
|
|
2,489 |
|
|
|
|
|
|
|
2,119 |
|
|
|
JPMorgan Chase Commercial Mortgage Securities Trust, Series 2022-OPO, Class A, 3.024% 1/5/20395,7 |
|
|
|
|
1,698 |
|
|
|
|
|
|
|
1,519 |
|
|
|
JPMorgan Chase Commercial Mortgage Securities Trust, Series 2022-OPO, Class C, 3.377% 1/5/20395,7 |
|
|
|
|
578 |
|
|
|
|
|
|
|
484 |
|
|
|
JPMorgan Chase Commercial Mortgage Securities Trust, Series 2022-OPO, Class C, 3.565% 1/5/20395,7,8 |
|
|
|
|
100 |
|
|
|
|
|
|
|
81 |
|
|
|
LUXE Commercial Mortgage Trust, Series 2021-TRIP, Class B,
(1-month USD CME Term SOFR + 1.514%) 6.85% 10/15/20385,7,8 |
|
|
|
|
1,326 |
|
|
|
|
|
|
|
1,323 |
|
|
|
Manhattan West Mortgage Trust, Series 2020-1MW, Class A, 2.13% 9/10/20395,7 |
|
|
|
|
13,772 |
|
|
|
|
|
|
|
12,258 |
|
|
|
MHC Commercial Mortgage Trust, CMO, Series 2021-MHC, Class A,
(1-month USD CME Term SOFR + 0.915%) 6.244% 4/15/20385,7,8 |
|
|
|
|
3,314 |
|
|
|
|
|
|
|
3,289 |
|
|
|
Morgan Stanley Bank of America Merrill Lynch Trust, Series 2015-C27, Class ASB, 3.557% 12/15/20477 |
|
|
|
|
192 |
|
|
|
|
|
|
|
190 |
|
|
|
Morgan Stanley Bank of America Merrill Lynch Trust, Series 2015-C22, Class ASB, 3.04% 4/15/20487 |
|
|
|
|
107 |
|
|
|
|
|
|
|
107 |
|
|
|
SDR Commercial Mortgage Trust, Series 2024-DSNY, Class A,
(1-month USD CME Term SOFR + 1.392%) 6.72% 5/15/20395,7,8 |
|
|
|
|
4,424 |
|
|
|
|
|
|
|
4,409 |
|
|
|
SLG Office Trust, Series 2021-OVA, Class A, 2.585% 7/15/20415,7 |
|
|
|
|
2,194 |
|
|
|
|
|
|
|
1,794 |
|
American Funds Insurance Series 94
Asset Allocation Fund (continued)
|
|
|
|
|
|
|
|
|
|
|
|
|
|
|
|
|
| Bonds, notes & other debt instruments (continued) |
|
Principal amount
(000) |
|
|
|
|
|
Value (000) |
|
|
|
|
|
| Mortgage-backed obligations (continued) |
|
|
|
|
|
|
|
|
|
|
|
|
|
|
|
|
|
|
| Commercial mortgage-backed securities (continued) |
|
SREIT Trust, Series 2021-MFP, Class A,
(1-month USD CME Term SOFR + 0.845%) 6.174% 11/15/20385,7,8 |
|
|
|
|
USD4,601 |
|
|
|
|
|
|
$ |
4,561 |
|
|
|
StorageMart Commercial Mortgage Trust, Series 2022-MINI, Class A,
(1-month USD CME Term SOFR + 1.00%) 6.329% 1/15/20395,7,8 |
|
|
|
|
10,709 |
|
|
|
|
|
|
|
10,584 |
|
|
|
WMRK Commercial Mortgage Trust, Series 2022-WMRK, Class A,
(1-month USD CME Term SOFR + 2.789%) 8.118% 11/15/20275,7,8 |
|
|
|
|
6,379 |
|
|
|
|
|
|
|
6,402 |
|
|
|
|
|
|
|
|
|
|
|
|
|
|
|
|
|
|
|
|
|
|
|
|
|
|
|
|
|
|
|
|
|
141,669 |
|
|
|
|
|
|
|
|
|
|
|
|
|
|
|
|
|
|
| |
|
|
|
|
|
|
|
|
|
|
|
|
|
|
|
|
|
|
|
| Collateralized mortgage-backed obligations (privately originated) 0.16% |
|
Arroyo Mortgage Trust, Series 2021-1R, Class A1, 1.175% 10/25/20485,7,8 |
|
|
|
|
836 |
|
|
|
|
|
|
|
720 |
|
|
|
Cascade Funding Mortgage Trust, Series 2018-RM2, Class A, 4.00% 10/25/20685,7,8 |
|
|
|
|
740 |
|
|
|
|
|
|
|
734 |
|
|
|
Credit Suisse Mortgage Trust, Series 2020-NET, Class A, 2.257% 8/15/20375,7 |
|
|
|
|
3,693 |
|
|
|
|
|
|
|
3,495 |
|
|
|
CS First Boston Mortgage Securities Corp., Series 2004-5, Class IVA1,
6.00% 9/25/20347 |
|
|
|
|
133 |
|
|
|
|
|
|
|
127 |
|
|
|
Finance of America Structured Securities Trust, Series 2019-JR1, Class A,
2.00% 3/25/20695,7 |
|
|
|
|
1,897 |
|
|
|
|
|
|
|
2,078 |
|
|
|
Finance of America Structured Securities Trust, Series 2019-JR2, Class A1, 2.00% 6/25/20695,7 |
|
|
|
|
5,901 |
|
|
|
|
|
|
|
6,403 |
|
|
|
Freddie Mac Structured Agency Credit Risk Debt Notes, Series 2015-DNA1, Class M3, (30-day Average USD-SOFR + 3.414%) 8.75% 10/25/20277,8 |
|
|
|
|
56 |
|
|
|
|
|
|
|
56 |
|
|
|
Freddie Mac Structured Agency Credit Risk Debt Notes, Series 2022-DNA6, Class M1A, (30-day Average USD-SOFR + 2.15%) 7.485% 9/25/20425,7,8 |
|
|
|
|
612 |
|
|
|
|
|
|
|
620 |
|
|
|
Freddie Mac Structured Agency Credit Risk Debt Notes, Series 2024-DNA2, Class A1, (30-day Average USD-SOFR + 1.25%) 6.585% 5/25/20445,7,8 |
|
|
|
|
4,467 |
|
|
|
|
|
|
|
4,487 |
|
|
|
Home Partners of America Trust, Series 2021-2, Class A, 1.901% 12/17/20265,7 |
|
|
|
|
3,958 |
|
|
|
|
|
|
|
3,637 |
|
|
|
MASTR Alternative Loan Trust, Series 2004-2, Class 2A1, 6.00% 2/25/20347 |
|
|
|
|
261 |
|
|
|
|
|
|
|
251 |
|
|
|
Mello Warehouse Securitization Trust, Series 2021-3, Class A,
(3-month USD CME Term SOFR + 0.965%) 6.31% 11/25/20555,7,8 |
|
|
|
|
4,040 |
|
|
|
|
|
|
|
4,039 |
|
|
|
Morgan Stanley Residential Mortgage Loan Trust, Series 2024-NQM2, Class A1, 6.386% 5/25/2069 (7.386% on 5/1/2028)5,7,10 |
|
|
|
|
3,695 |
|
|
|
|
|
|
|
3,733 |
|
|
|
Onslow Bay Financial, LLC, Series 2022-NQM6, Class A1,
4.70% 7/25/2062 (5.70% on 6/1/2026)5,7,10 |
|
|
|
|
5,045 |
|
|
|
|
|
|
|
4,924 |
|
|
|
Progress Residential Trust, Series 2021-SFR6, Class A, 1.524% 7/17/20385,7 |
|
|
|
|
2,446 |
|
|
|
|
|
|
|
2,260 |
|
|
|
Towd Point Mortgage Trust, Series 2023-1, Class A1, 3.75% 1/25/20635,7 |
|
|
|
|
2,899 |
|
|
|
|
|
|
|
2,735 |
|
|
|
Verus Securitization Trust, Series 2023-5, Class A5,
6.476% 6/25/2068 (7.476% on 6/1/2027)5,7,10 |
|
|
|
|
2,875 |
|
|
|
|
|
|
|
2,882 |
|
|
|
|
|
|
|
|
|
|
|
|
|
|
|
|
|
|
|
|
|
|
|
|
|
|
|
|
|
|
|
|
|
43,181 |
|
|
|
|
|
|
|
|
|
|
|
|
|
|
|
|
|
|
|
|
Total mortgage-backed obligations |
|
|
|
|
|
|
|
|
|
|
|
|
2,453,506 |
|
|
|
|
|
|
|
|
|
|
|
|
|
|
|
|
|
|
| |
|
|
|
|
|
|
|
|
|
|
|
|
|
|
|
|
|
| U.S. Treasury bonds & notes 6.04% |
|
|
|
|
|
|
|
|
|
|
|
|
|
|
|
|
|
|
| U.S. Treasury 5.91% |
|
U.S. Treasury 4.25% 9/30/2024 |
|
|
|
|
880 |
|
|
|
|
|
|
|
878 |
|
|
|
U.S. Treasury 1.00% 12/15/2024 |
|
|
|
|
10,725 |
|
|
|
|
|
|
|
10,520 |
|
|
|
U.S. Treasury 3.875% 4/30/2025 |
|
|
|
|
4,250 |
|
|
|
|
|
|
|
4,204 |
|
|
|
U.S. Treasury 4.625% 6/30/2025 |
|
|
|
|
160,260 |
|
|
|
|
|
|
|
159,496 |
|
|
|
U.S. Treasury 4.75% 7/31/2025 |
|
|
|
|
71,532 |
|
|
|
|
|
|
|
71,283 |
|
|
|
U.S. Treasury 5.00% 10/31/2025 |
|
|
|
|
2,418 |
|
|
|
|
|
|
|
2,418 |
|
|
|
U.S. Treasury 4.875% 11/30/2025 |
|
|
|
|
12,250 |
|
|
|
|
|
|
|
12,237 |
|
|
|
U.S. Treasury 4.25% 1/31/2026 |
|
|
|
|
1,813 |
|
|
|
|
|
|
|
1,796 |
|
|
|
U.S. Treasury 0.50% 2/28/2026 |
|
|
|
|
42,515 |
|
|
|
|
|
|
|
39,590 |
|
|
|
U.S. Treasury 4.625% 2/28/2026 |
|
|
|
|
2,096 |
|
|
|
|
|
|
|
2,088 |
|
|
|
U.S. Treasury 3.625% 5/15/2026 |
|
|
|
|
1,195 |
|
|
|
|
|
|
|
1,171 |
|
|
|
U.S. Treasury 4.625% 6/30/2026 |
|
|
|
|
13,850 |
|
|
|
|
|
|
|
13,824 |
|
|
|
U.S. Treasury 0.75% 8/31/2026 |
|
|
|
|
52 |
|
|
|
|
|
|
|
48 |
|
|
|
U.S. Treasury 0.875% 9/30/2026 |
|
|
|
|
565 |
|
|
|
|
|
|
|
520 |
|
|
|
U.S. Treasury 1.125% 10/31/2026 |
|
|
|
|
471 |
|
|
|
|
|
|
|
435 |
|
|
|
U.S. Treasury 4.625% 11/15/2026 |
|
|
|
|
7,985 |
|
|
|
|
|
|
|
7,982 |
|
|
|
U.S. Treasury 4.00% 1/15/2027 |
|
|
|
|
8,825 |
|
|
|
|
|
|
|
8,697 |
|
|
|
U.S. Treasury 4.125% 2/15/2027 |
|
|
|
|
1,404 |
|
|
|
|
|
|
|
1,388 |
|
|
|
U.S. Treasury 1.125% 2/28/2027 |
|
|
|
|
762 |
|
|
|
|
|
|
|
697 |
|
95 American Funds Insurance Series
Asset Allocation Fund (continued)
|
|
|
|
|
|
|
|
|
|
|
|
|
|
|
|
|
|
|
| Bonds, notes & other debt instruments (continued) |
|
Principal amount (000) |
|
|
|
|
|
Value (000) |
|
|
|
|
|
|
| U.S. Treasury bonds & notes (continued) |
|
|
|
|
|
|
|
|
|
|
|
|
|
|
|
|
| |
|
|
|
|
|
| U.S. Treasury (continued) |
|
U.S. Treasury 2.375% 5/15/2027 |
|
|
|
|
|
|
USD880 |
|
|
|
|
|
|
$ |
829 |
|
|
|
U.S. Treasury 2.625% 5/31/2027 |
|
|
|
|
|
|
96,250 |
|
|
|
|
|
|
|
91,282 |
|
|
|
U.S. Treasury 4.625% 6/15/2027 |
|
|
|
|
|
|
924 |
|
|
|
|
|
|
|
927 |
|
|
|
U.S. Treasury 0.50% 6/30/2027 |
|
|
|
|
|
|
36,300 |
|
|
|
|
|
|
|
32,259 |
|
|
|
U.S. Treasury 4.125% 9/30/2027 |
|
|
|
|
|
|
90,000 |
|
|
|
|
|
|
|
88,998 |
|
|
|
U.S. Treasury 4.00% 2/29/2028 |
|
|
|
|
|
|
46,200 |
|
|
|
|
|
|
|
45,494 |
|
|
|
U.S. Treasury 3.625% 3/31/2028 |
|
|
|
|
|
|
10 |
|
|
|
|
|
|
|
10 |
|
|
|
U.S. Treasury 3.50% 4/30/2028 |
|
|
|
|
|
|
5,600 |
|
|
|
|
|
|
|
5,415 |
|
|
|
U.S. Treasury 1.25% 9/30/2028 |
|
|
|
|
|
|
3,142 |
|
|
|
|
|
|
|
2,761 |
|
|
|
U.S. Treasury 4.00% 1/31/2029 |
|
|
|
|
|
|
127,369 |
|
|
|
|
|
|
|
125,386 |
|
|
|
U.S. Treasury 2.875% 4/30/2029 |
|
|
|
|
|
|
50,000 |
|
|
|
|
|
|
|
46,759 |
|
|
|
U.S. Treasury 4.25% 6/30/2029 |
|
|
|
|
|
|
48,480 |
|
|
|
|
|
|
|
48,260 |
|
|
|
U.S. Treasury 1.50% 2/15/2030 |
|
|
|
|
|
|
16,651 |
|
|
|
|
|
|
|
14,291 |
|
|
|
U.S. Treasury 4.00% 2/28/2030 |
|
|
|
|
|
|
1,598 |
|
|
|
|
|
|
|
1,569 |
|
|
|
U.S. Treasury 0.625% 5/15/2030 |
|
|
|
|
|
|
20,225 |
|
|
|
|
|
|
|
16,344 |
|
|
|
U.S. Treasury 4.00% 7/31/2030 |
|
|
|
|
|
|
8,160 |
|
|
|
|
|
|
|
8,003 |
|
|
|
U.S. Treasury 4.875% 10/31/2030 |
|
|
|
|
|
|
50,765 |
|
|
|
|
|
|
|
52,199 |
|
|
|
U.S. Treasury 4.25% 6/30/2031 |
|
|
|
|
|
|
31,288 |
|
|
|
|
|
|
|
31,180 |
|
|
|
U.S. Treasury 2.875% 5/15/2032 |
|
|
|
|
|
|
50,000 |
|
|
|
|
|
|
|
45,041 |
|
|
|
U.S. Treasury 4.125% 11/15/2032 |
|
|
|
|
|
|
723 |
|
|
|
|
|
|
|
711 |
|
|
|
U.S. Treasury 3.50% 2/15/2033 |
|
|
|
|
|
|
29,540 |
|
|
|
|
|
|
|
27,682 |
|
|
|
U.S. Treasury 3.875% 8/15/2033 |
|
|
|
|
|
|
136,086 |
|
|
|
|
|
|
|
130,930 |
|
|
|
U.S. Treasury 4.375% 5/15/2034 |
|
|
|
|
|
|
46,050 |
|
|
|
|
|
|
|
46,068 |
|
|
|
U.S. Treasury 1.125% 5/15/204011 |
|
|
|
|
|
|
37,775 |
|
|
|
|
|
|
|
23,257 |
|
|
|
U.S. Treasury 1.375% 11/15/2040 |
|
|
|
|
|
|
17,695 |
|
|
|
|
|
|
|
11,171 |
|
|
|
U.S. Treasury 1.75% 8/15/2041 |
|
|
|
|
|
|
37,854 |
|
|
|
|
|
|
|
25,020 |
|
|
|
U.S. Treasury 2.00% 11/15/2041 |
|
|
|
|
|
|
1,181 |
|
|
|
|
|
|
|
812 |
|
|
|
U.S. Treasury 4.625% 5/15/2044 |
|
|
|
|
|
|
43,595 |
|
|
|
|
|
|
|
43,512 |
|
|
|
U.S. Treasury 2.50% 2/15/2046 |
|
|
|
|
|
|
3,755 |
|
|
|
|
|
|
|
2,647 |
|
|
|
U.S. Treasury 3.00% 5/15/2047 |
|
|
|
|
|
|
9,355 |
|
|
|
|
|
|
|
7,158 |
|
|
|
U.S. Treasury 3.00% 2/15/2048 |
|
|
|
|
|
|
336 |
|
|
|
|
|
|
|
256 |
|
|
|
U.S. Treasury 1.375% 8/15/205011 |
|
|
|
|
|
|
12,500 |
|
|
|
|
|
|
|
6,400 |
|
|
|
U.S. Treasury 2.25% 2/15/2052 |
|
|
|
|
|
|
72,025 |
|
|
|
|
|
|
|
45,906 |
|
|
|
U.S. Treasury 4.00% 11/15/2052 |
|
|
|
|
|
|
8,369 |
|
|
|
|
|
|
|
7,627 |
|
|
|
U.S. Treasury 3.625% 2/15/205311 |
|
|
|
|
|
|
125,000 |
|
|
|
|
|
|
|
106,394 |
|
|
|
U.S. Treasury 3.625% 5/15/2053 |
|
|
|
|
|
|
22,676 |
|
|
|
|
|
|
|
19,306 |
|
|
|
U.S. Treasury 4.25% 2/15/205411 |
|
|
|
|
|
|
95,597 |
|
|
|
|
|
|
|
91,068 |
|
|
|
|
|
|
|
|
|
|
|
|
|
|
|
|
|
|
|
|
|
|
|
|
|
|
|
|
|
|
|
|
|
|
|
|
|
1,592,204 |
|
|
|
|
|
|
|
|
|
|
|
|
|
|
|
|
|
|
|
|
| |
|
|
|
|
|
|
|
|
|
|
|
|
|
|
| |
|
|
|
|
|
| U.S. Treasury inflation-protected securities 0.13% |
|
U.S. Treasury Inflation-Protected Security 0.25% 1/15/202512 |
|
|
|
|
|
|
26,473 |
|
|
|
|
|
|
|
25,939 |
|
|
|
U.S. Treasury Inflation-Protected Security 0.375% 7/15/202512 |
|
|
|
|
|
|
4,891 |
|
|
|
|
|
|
|
4,770 |
|
|
|
U.S. Treasury Inflation-Protected Security 0.125% 10/15/202512 |
|
|
|
|
|
|
4,108 |
|
|
|
|
|
|
|
3,974 |
|
|
|
|
|
|
|
|
|
|
|
|
|
|
|
|
|
|
|
|
|
|
|
|
|
|
|
|
|
|
|
|
|
|
|
|
|
34,683 |
|
|
|
|
|
|
|
|
|
|
|
|
|
|
|
|
|
|
|
|
|
|
Total U.S. Treasury bonds & notes |
|
|
|
|
|
|
|
|
|
|
|
|
|
|
1,626,887 |
|
|
|
|
|
|
|
|
|
|
|
|
|
|
|
|
|
|
|
|
|
|
|
|
|
| Corporate bonds, notes & loans 5.90% |
|
|
|
|
|
|
|
|
|
|
|
|
|
|
|
|
| |
|
|
|
|
|
| Financials 1.47% |
|
AerCap Ireland Capital DAC 2.45% 10/29/2026 |
|
|
|
|
|
|
5,457 |
|
|
|
|
|
|
|
5,092 |
|
|
|
AG Issuer, LLC 6.25% 3/1/20285 |
|
|
|
|
|
|
4,470 |
|
|
|
|
|
|
|
4,377 |
|
|
|
AG TTMT Escrow Issuer, LLC 8.625% 9/30/20275 |
|
|
|
|
|
|
1,072 |
|
|
|
|
|
|
|
1,113 |
|
|
|
AIB Group PLC 7.583% 10/14/2026 (USD-SOFR + 3.456% on 10/14/2025)5,10 |
|
|
|
|
|
|
4,250 |
|
|
|
|
|
|
|
4,343 |
|
|
|
Alliant Holdings Intermediate, LLC 4.25% 10/15/20275 |
|
|
|
|
|
|
2,100 |
|
|
|
|
|
|
|
1,969 |
|
|
|
Alliant Holdings Intermediate, LLC 5.875% 11/1/20295 |
|
|
|
|
|
|
2,295 |
|
|
|
|
|
|
|
2,150 |
|
|
|
Ally Financial, Inc. 8.00% 11/1/2031 |
|
|
|
|
|
|
3,000 |
|
|
|
|
|
|
|
3,315 |
|
|
|
American Express Co. 6.338% 10/30/2026 (USD-SOFR + 1.33% on 10/30/2025)10 |
|
|
|
|
|
|
4,810 |
|
|
|
|
|
|
|
4,859 |
|
|
|
American Express Co. 6.489% 10/30/2031 (USD-SOFR + 1.94% on 10/30/2030)10 |
|
|
|
|
|
|
2,686 |
|
|
|
|
|
|
|
2,864 |
|
|
|
American International Group, Inc. 5.125% 3/27/2033 |
|
|
|
|
|
|
2,937 |
|
|
|
|
|
|
|
2,895 |
|
|
|
AmWINS Group, Inc. 4.875% 6/30/20295 |
|
|
|
|
|
|
1,348 |
|
|
|
|
|
|
|
1,256 |
|
|
|
Aretec Group, Inc. 7.50% 4/1/20295 |
|
|
|
|
|
|
1,250 |
|
|
|
|
|
|
|
1,206 |
|
American Funds Insurance Series 96
Asset Allocation Fund (continued)
|
|
|
|
|
|
|
|
|
|
|
|
|
|
|
|
|
| Bonds, notes & other debt instruments (continued) |
|
Principal amount (000) |
|
|
|
|
|
Value (000) |
|
|
|
|
|
|
| Corporate bonds, notes & loans (continued) |
|
|
|
|
|
|
|
|
|
|
|
|
|
|
| |
|
|
|
|
|
| Financials (continued) |
|
Banco Santander, SA 2.746% 5/28/2025 |
|
|
|
|
USD1,200 |
|
|
|
|
|
|
$ |
1,169 |
|
|
|
Banco Santander, SA 5.147% 8/18/2025 |
|
|
|
|
1,400 |
|
|
|
|
|
|
|
1,390 |
|
|
|
Bangkok Bank Public Co., Ltd. 3.733% 9/25/2034
(5-year UST Yield Curve Rate T Note Constant Maturity + 1.90% on 9/25/2029)10 |
|
|
|
|
2,428 |
|
|
|
|
|
|
|
2,153 |
|
|
|
Bank of America Corp. 5.08% 1/20/2027 (USD-SOFR + 1.29% on 1/20/2026)10 |
|
|
|
|
2,250 |
|
|
|
|
|
|
|
2,237 |
|
|
|
Bank of America Corp. 5.202% 4/25/2029 (USD-SOFR + 1.63% on 4/25/2028)10 |
|
|
|
|
2,098 |
|
|
|
|
|
|
|
2,095 |
|
|
|
Bank of America Corp. 1.922% 10/24/2031 (USD-SOFR + 1.37% on 10/24/2030)10 |
|
|
|
|
1,000 |
|
|
|
|
|
|
|
818 |
|
|
|
Bank of America Corp. 5.288% 4/25/2034 (USD-SOFR + 1.91% on 4/25/2033)10 |
|
|
|
|
4,535 |
|
|
|
|
|
|
|
4,490 |
|
|
|
Bank of America Corp. 5.468% 1/23/2035
(3-month USD CME Term SOFR + 1.65% on 1/23/2034)10 |
|
|
|
|
8,050 |
|
|
|
|
|
|
|
8,045 |
|
|
|
Bank of New York Mellon Corp. 4.975% 3/14/2030
(USD-SOFR + 1.085% on 3/14/2029)10 |
|
|
|
|
3,477 |
|
|
|
|
|
|
|
3,457 |
|
|
|
Berkshire Hathaway, Inc. 3.125% 3/15/2026 |
|
|
|
|
500 |
|
|
|
|
|
|
|
484 |
|
|
|
Block, Inc. 3.50% 6/1/2031 |
|
|
|
|
2,325 |
|
|
|
|
|
|
|
2,007 |
|
|
|
Blue Owl Capital Corp. 4.00% 3/30/2025 |
|
|
|
|
102 |
|
|
|
|
|
|
|
100 |
|
|
|
Blue Owl Capital Corp. 3.40% 7/15/2026 |
|
|
|
|
1,290 |
|
|
|
|
|
|
|
1,216 |
|
|
|
Blue Owl Capital Corp. II 4.625% 11/26/20245 |
|
|
|
|
512 |
|
|
|
|
|
|
|
509 |
|
|
|
Blue Owl Capital Corp. III 3.125% 4/13/2027 |
|
|
|
|
2,520 |
|
|
|
|
|
|
|
2,306 |
|
|
|
Blue Owl Credit Income Corp. 4.70% 2/8/2027 |
|
|
|
|
2,500 |
|
|
|
|
|
|
|
2,380 |
|
|
|
Blue Owl Credit Income Corp. 6.65% 3/15/2031 |
|
|
|
|
1,630 |
|
|
|
|
|
|
|
1,594 |
|
|
|
BNP Paribas SA 2.591% 1/20/2028 (USD-SOFR + 1.228% on 1/20/2027)5,10 |
|
|
|
|
3,062 |
|
|
|
|
|
|
|
2,847 |
|
|
|
BNP Paribas SA 2.159% 9/15/2029 (USD-SOFR + 1.218% on 9/15/2028)5,10 |
|
|
|
|
2,829 |
|
|
|
|
|
|
|
2,470 |
|
|
|
BNP Paribas SA 5.738% 2/20/2035 (USD-SOFR + 1.88% on 2/20/2034)5,10 |
|
|
|
|
281 |
|
|
|
|
|
|
|
280 |
|
|
|
Boost Newco Borrower, LLC 7.50% 1/15/20315 |
|
|
|
|
1,150 |
|
|
|
|
|
|
|
1,200 |
|
|
|
BPCE SA 5.15% 7/21/20245 |
|
|
|
|
3,710 |
|
|
|
|
|
|
|
3,707 |
|
|
|
BPCE SA 1.00% 1/20/20265 |
|
|
|
|
500 |
|
|
|
|
|
|
|
467 |
|
|
|
BPCE SA 5.748% 7/19/2033 (USD-SOFR + 2.865% on 7/19/2032)5,10 |
|
|
|
|
271 |
|
|
|
|
|
|
|
269 |
|
|
|
BPCE SA 5.936% 5/30/2035 (USD-SOFR + 1.85% on 5/30/2034)5,10 |
|
|
|
|
8,125 |
|
|
|
|
|
|
|
8,096 |
|
|
|
CaixaBank, SA 6.208% 1/18/2029 (USD-SOFR + 2.70% on 1/18/2028)5,10 |
|
|
|
|
1,450 |
|
|
|
|
|
|
|
1,474 |
|
|
|
CaixaBank, SA 5.673% 3/15/2030 (USD-SOFR + 1.78% on 3/15/2029)5,10 |
|
|
|
|
4,375 |
|
|
|
|
|
|
|
4,358 |
|
|
|
Capital One Financial Corp. 6.051% 2/1/2035 (USD-SOFR + 2.26% on 2/1/2034)10 |
|
|
|
|
4,609 |
|
|
|
|
|
|
|
4,638 |
|
|
|
Castlelake Aviation Finance DAC 5.00% 4/15/20275 |
|
|
|
|
3,370 |
|
|
|
|
|
|
|
3,263 |
|
|
|
Chubb INA Holdings, LLC 3.35% 5/3/2026 |
|
|
|
|
880 |
|
|
|
|
|
|
|
852 |
|
|
|
Chubb INA Holdings, LLC 5.00% 3/15/2034 |
|
|
|
|
4,223 |
|
|
|
|
|
|
|
4,183 |
|
|
|
Chubb INA Holdings, LLC 4.35% 11/3/2045 |
|
|
|
|
400 |
|
|
|
|
|
|
|
346 |
|
|
|
Citigroup, Inc. 5.61% 9/29/2026 (USD-SOFR + 1.546% on 12/29/2025)10 |
|
|
|
|
8,000 |
|
|
|
|
|
|
|
7,998 |
|
|
|
Citigroup, Inc. 5.174% 2/13/2030 (USD-SOFR + 1.364% on 2/13/2029)10 |
|
|
|
|
6,275 |
|
|
|
|
|
|
|
6,240 |
|
|
|
Citigroup, Inc. 2.976% 11/5/2030 (USD-SOFR + 1.422% on 11/5/2029)10 |
|
|
|
|
3,254 |
|
|
|
|
|
|
|
2,899 |
|
|
|
Citigroup, Inc. 6.174% 5/25/2034 (USD-SOFR + 2.661% on 5/25/2033)10 |
|
|
|
|
1,475 |
|
|
|
|
|
|
|
1,501 |
|
|
|
Citizens Financial Group, Inc. 6.645% 4/25/2035
(USD-SOFR + 2.325% on 4/25/2034)10 |
|
|
|
|
4,250 |
|
|
|
|
|
|
|
4,395 |
|
|
|
CME Group, Inc. 3.75% 6/15/2028 |
|
|
|
|
3,425 |
|
|
|
|
|
|
|
3,300 |
|
|
|
Coinbase Global, Inc. 3.375% 10/1/20285 |
|
|
|
|
4,875 |
|
|
|
|
|
|
|
4,184 |
|
|
|
Coinbase Global, Inc. 3.625% 10/1/20315 |
|
|
|
|
5,230 |
|
|
|
|
|
|
|
4,198 |
|
|
|
Compass Group Diversified Holdings, LLC 5.25% 4/15/20295 |
|
|
|
|
820 |
|
|
|
|
|
|
|
779 |
|
|
|
Compass Group Diversified Holdings, LLC 5.00% 1/15/20325 |
|
|
|
|
715 |
|
|
|
|
|
|
|
648 |
|
|
|
Cooperatieve Rabobank UA 4.375% 8/4/2025 |
|
|
|
|
4,500 |
|
|
|
|
|
|
|
4,431 |
|
|
|
Corebridge Financial, Inc. 3.50% 4/4/2025 |
|
|
|
|
642 |
|
|
|
|
|
|
|
631 |
|
|
|
Corebridge Financial, Inc. 3.65% 4/5/2027 |
|
|
|
|
914 |
|
|
|
|
|
|
|
875 |
|
|
|
Corebridge Financial, Inc. 3.85% 4/5/2029 |
|
|
|
|
621 |
|
|
|
|
|
|
|
582 |
|
|
|
Corebridge Financial, Inc. 3.90% 4/5/2032 |
|
|
|
|
351 |
|
|
|
|
|
|
|
314 |
|
|
|
Corebridge Financial, Inc. 4.35% 4/5/2042 |
|
|
|
|
203 |
|
|
|
|
|
|
|
167 |
|
|
|
Corebridge Financial, Inc. 4.40% 4/5/2052 |
|
|
|
|
489 |
|
|
|
|
|
|
|
385 |
|
|
|
Crédit Agricole SA 4.375% 3/17/20255 |
|
|
|
|
850 |
|
|
|
|
|
|
|
840 |
|
|
|
Deutsche Bank AG 2.552% 1/7/2028 (USD-SOFR + 1.318% on 1/7/2027)10 |
|
|
|
|
6,650 |
|
|
|
|
|
|
|
6,151 |
|
|
|
Deutsche Bank AG 5.706% 2/8/2028 (USD-SOFR + 1.594% on 2/8/2027)10 |
|
|
|
|
1,109 |
|
|
|
|
|
|
|
1,108 |
|
|
|
Deutsche Bank AG 6.72% 1/18/2029 (USD-SOFR + 3.18% on 1/18/2028)10 |
|
|
|
|
2,250 |
|
|
|
|
|
|
|
2,323 |
|
|
|
Deutsche Bank AG 6.819% 11/20/2029 (USD-SOFR + 2.51% on 11/20/2028)10 |
|
|
|
|
750 |
|
|
|
|
|
|
|
780 |
|
|
|
Deutsche Bank AG 3.547% 9/18/2031 (USD-SOFR + 3.043% on 9/18/2030)10 |
|
|
|
|
300 |
|
|
|
|
|
|
|
264 |
|
|
|
DNB Bank ASA 5.896% 10/9/2026 (USD-SOFR + 1.95% on 10/9/2025)5,10 |
|
|
|
|
7,750 |
|
|
|
|
|
|
|
7,775 |
|
|
|
Fidelity National Information Services, Inc. 3.10% 3/1/2041 |
|
|
|
|
302 |
|
|
|
|
|
|
|
217 |
|
97 American Funds Insurance Series
Asset Allocation Fund (continued)
|
|
|
|
|
|
|
|
|
|
|
|
|
|
|
|
|
| Bonds, notes & other debt instruments (continued) |
|
Principal amount (000) |
|
|
|
|
|
Value (000) |
|
|
|
|
|
|
| Corporate bonds, notes & loans (continued) |
|
|
|
|
|
|
|
|
|
|
|
|
|
|
| |
|
|
|
|
|
| Financials (continued) |
|
Fiserv, Inc. 3.50% 7/1/2029 |
|
|
|
|
USD471 |
|
|
|
|
|
|
$ |
436 |
|
|
|
Fiserv, Inc. 2.65% 6/1/2030 |
|
|
|
|
3,605 |
|
|
|
|
|
|
|
3,138 |
|
|
|
Goldman Sachs Group, Inc. 1.948% 10/21/2027
(USD-SOFR + 0.913% on 10/21/2026)10 |
|
|
|
|
2,198 |
|
|
|
|
|
|
|
2,030 |
|
|
|
Goldman Sachs Group, Inc. 2.64% 2/24/2028
(USD-SOFR + 1.114% on 2/24/2027)10 |
|
|
|
|
4,000 |
|
|
|
|
|
|
|
3,732 |
|
|
|
Goldman Sachs Group, Inc.
3.814% 4/23/2029 (3-month USD CME Term SOFR + 1.42% on 4/23/2028)10 |
|
|
|
|
390 |
|
|
|
|
|
|
|
370 |
|
|
|
Goldman Sachs Group, Inc. 2.615% 4/22/2032 (USD-SOFR + 1.281% on 4/22/2031)10 |
|
|
|
|
2,323 |
|
|
|
|
|
|
|
1,954 |
|
|
|
Goldman Sachs Group, Inc. 3.21% 4/22/2042 (USD-SOFR + 1.513% on 4/22/2041)10 |
|
|
|
|
2,000 |
|
|
|
|
|
|
|
1,480 |
|
|
|
Hightower Holding, LLC 6.75% 4/15/20295 |
|
|
|
|
870 |
|
|
|
|
|
|
|
815 |
|
|
|
HSBC Holdings PLC 2.633% 11/7/2025 (USD-SOFR + 1.402% on 11/7/2024)10 |
|
|
|
|
625 |
|
|
|
|
|
|
|
618 |
|
|
|
HSBC Holdings PLC 2.804% 5/24/2032 (USD-SOFR + 1.187% on 5/24/2031)10 |
|
|
|
|
1,436 |
|
|
|
|
|
|
|
1,202 |
|
|
|
HSBC Holdings PLC 2.871% 11/22/2032 (USD-SOFR + 1.41% on 11/22/2031)10 |
|
|
|
|
400 |
|
|
|
|
|
|
|
333 |
|
|
|
HSBC Holdings PLC 6.254% 3/9/2034 (USD-SOFR + 2.39% on 3/9/2033)10 |
|
|
|
|
770 |
|
|
|
|
|
|
|
802 |
|
|
|
HSBC Holdings PLC 5.719% 3/4/2035 (USD-SOFR + 1.78% on 3/4/2034)10 |
|
|
|
|
5,839 |
|
|
|
|
|
|
|
5,873 |
|
|
|
HSBC Holdings PLC 6.332% 3/9/2044 (USD-SOFR + 2.65% on 3/9/2043)10 |
|
|
|
|
537 |
|
|
|
|
|
|
|
562 |
|
|
|
Intercontinental Exchange, Inc. 5.25% 6/15/2031 |
|
|
|
|
2,254 |
|
|
|
|
|
|
|
2,270 |
|
|
|
Intesa Sanpaolo SpA 8.248% 11/21/2033
(1-year UST Yield Curve Rate T Note Constant Maturity + 4.40% on 11/21/ 2032)5,10 |
|
|
|
|
4,600 |
|
|
|
|
|
|
|
5,076 |
|
|
|
Intesa Sanpaolo SpA 7.778% 6/20/2054
(1-year UST Yield Curve Rate T Note Constant Maturity + 3.90% on 6/20/2053)5,10 |
|
|
|
|
3,621 |
|
|
|
|
|
|
|
3,786 |
|
|
|
JPMorgan Chase & Co. 1.04% 2/4/2027 (USD-SOFR + 0.695% on 2/4/2026)10 |
|
|
|
|
2,975 |
|
|
|
|
|
|
|
2,772 |
|
|
|
JPMorgan Chase & Co. 5.04% 1/23/2028 (USD-SOFR + 1.19% on 1/23/2027)10 |
|
|
|
|
1,066 |
|
|
|
|
|
|
|
1,060 |
|
|
|
JPMorgan Chase & Co. 4.323% 4/26/2028 (USD-SOFR + 1.56% on 4/26/2027)10 |
|
|
|
|
4,000 |
|
|
|
|
|
|
|
3,903 |
|
|
|
JPMorgan Chase & Co. 4.851% 7/25/2028 (USD-SOFR + 1.99% on 7/25/2027)10 |
|
|
|
|
3,740 |
|
|
|
|
|
|
|
3,703 |
|
|
|
JPMorgan Chase & Co. 6.087% 10/23/2029 (USD-SOFR + 1.57% on 10/23/2028)10 |
|
|
|
|
4,250 |
|
|
|
|
|
|
|
4,392 |
|
|
|
JPMorgan Chase & Co. 5.581% 4/22/2030 (USD-SOFR + 1.16% on 4/22/2029)10 |
|
|
|
|
4,750 |
|
|
|
|
|
|
|
4,826 |
|
|
|
JPMorgan Chase & Co. 5.35% 6/1/2034 (USD-SOFR + 1.845% on 6/1/2033)10 |
|
|
|
|
4,411 |
|
|
|
|
|
|
|
4,394 |
|
|
|
JPMorgan Chase & Co. 5.766% 4/22/2035 (USD-SOFR + 1.49% on 4/22/2034)10 |
|
|
|
|
4,250 |
|
|
|
|
|
|
|
4,362 |
|
|
|
Kasikornbank PCL (Hong Kong Branch) 3.343% 10/2/2031
(5-year UST Yield Curve Rate T Note Constant Maturity + 1.70% on 10/2/2026)10 |
|
|
|
|
1,222 |
|
|
|
|
|
|
|
1,141 |
|
|
|
Ladder Capital Finance Holdings LLLP 7.00% 7/15/20315 |
|
|
|
|
355 |
|
|
|
|
|
|
|
358 |
|
|
|
Lloyds Banking Group PLC 1.627% 5/11/2027
(1-year UST Yield Curve Rate T Note Constant Maturity + 0.85% on 5/11/2026)10 |
|
|
|
|
800 |
|
|
|
|
|
|
|
743 |
|
|
|
Lloyds Banking Group PLC 5.679% 1/5/2035
(1-year UST Yield Curve Rate T Note Constant Maturity + 1.75% on 1/5/2034)10 |
|
|
|
|
10,155 |
|
|
|
|
|
|
|
10,120 |
|
|
|
Marsh & McLennan Companies, Inc. 4.375% 3/15/2029 |
|
|
|
|
1,705 |
|
|
|
|
|
|
|
1,667 |
|
|
|
Marsh & McLennan Companies, Inc. 4.90% 3/15/2049 |
|
|
|
|
719 |
|
|
|
|
|
|
|
644 |
|
|
|
Marsh & McLennan Companies, Inc. 2.90% 12/15/2051 |
|
|
|
|
920 |
|
|
|
|
|
|
|
573 |
|
|
|
Mastercard, Inc. 4.85% 3/9/2033 |
|
|
|
|
4,258 |
|
|
|
|
|
|
|
4,241 |
|
|
|
Metropolitan Life Global Funding I 5.15% 3/28/20335 |
|
|
|
|
1,600 |
|
|
|
|
|
|
|
1,581 |
|
|
|
Morgan Stanley 4.679% 7/17/2026 (USD-SOFR + 1.669% on 7/17/2025)10 |
|
|
|
|
2,450 |
|
|
|
|
|
|
|
2,427 |
|
|
|
Morgan Stanley 3.125% 7/27/2026 |
|
|
|
|
325 |
|
|
|
|
|
|
|
311 |
|
|
|
Morgan Stanley 5.123% 2/1/2029 (USD-SOFR + 1.73% on 2/1/2028)10 |
|
|
|
|
425 |
|
|
|
|
|
|
|
423 |
|
|
|
Morgan Stanley 5.164% 4/20/2029 (USD-SOFR + 1.59% on 4/20/2028)10 |
|
|
|
|
4,458 |
|
|
|
|
|
|
|
4,445 |
|
|
|
Morgan Stanley 5.449% 7/20/2029 (USD-SOFR + 1.63% on 7/20/2028)10 |
|
|
|
|
4,150 |
|
|
|
|
|
|
|
4,176 |
|
|
|
Morgan Stanley 5.25% 4/21/2034 (USD-SOFR + 1.87% on 4/21/2033)10 |
|
|
|
|
2,500 |
|
|
|
|
|
|
|
2,462 |
|
|
|
Nasdaq, Inc. 5.35% 6/28/2028 |
|
|
|
|
1,926 |
|
|
|
|
|
|
|
1,944 |
|
|
|
Nasdaq, Inc. 5.55% 2/15/2034 |
|
|
|
|
4,870 |
|
|
|
|
|
|
|
4,879 |
|
|
|
Nationstar Mortgage Holdings, Inc. 7.125% 2/1/20325 |
|
|
|
|
1,630 |
|
|
|
|
|
|
|
1,641 |
|
|
|
Navient Corp. 6.75% 6/15/2026 |
|
|
|
|
300 |
|
|
|
|
|
|
|
302 |
|
|
|
Navient Corp. 5.50% 3/15/2029 |
|
|
|
|
10,330 |
|
|
|
|
|
|
|
9,441 |
|
|
|
Navient Corp. 11.50% 3/15/2031 |
|
|
|
|
4,860 |
|
|
|
|
|
|
|
5,358 |
|
|
|
New York Life Global Funding 2.35% 7/14/20265 |
|
|
|
|
590 |
|
|
|
|
|
|
|
559 |
|
|
|
New York Life Global Funding 4.55% 1/28/20335 |
|
|
|
|
1,263 |
|
|
|
|
|
|
|
1,202 |
|
|
|
Northwestern Mutual Global Funding 1.75% 1/11/20275 |
|
|
|
|
2,500 |
|
|
|
|
|
|
|
2,308 |
|
|
|
OneMain Finance Corp. 3.875% 9/15/2028 |
|
|
|
|
756 |
|
|
|
|
|
|
|
679 |
|
|
|
OneMain Finance Corp. 7.875% 3/15/2030 |
|
|
|
|
2,565 |
|
|
|
|
|
|
|
2,647 |
|
|
|
Osaic Holdings, Inc. 10.75% 8/1/20275 |
|
|
|
|
2,420 |
|
|
|
|
|
|
|
2,494 |
|
|
|
Owl Rock Capital Corp. 3.75% 7/22/2025 |
|
|
|
|
2,874 |
|
|
|
|
|
|
|
2,803 |
|
American Funds Insurance Series 98
Asset Allocation Fund (continued)
|
|
|
|
|
|
|
|
|
|
|
|
|
|
|
|
|
| Bonds, notes & other debt instruments (continued) |
|
Principal amount (000) |
|
|
|
|
|
Value (000) |
|
|
|
|
|
|
| Corporate bonds, notes & loans (continued) |
|
|
|
|
|
|
|
|
|
|
|
|
|
|
| |
|
|
|
|
|
| Financials (continued) |
|
Oxford Finance, LLC 6.375% 2/1/20275 |
|
|
|
|
USD1,125 |
|
|
|
|
|
|
$ |
1,085 |
|
|
|
PayPal Holdings, Inc. 2.65% 10/1/2026 |
|
|
|
|
662 |
|
|
|
|
|
|
|
627 |
|
|
|
PayPal Holdings, Inc. 2.30% 6/1/2030 |
|
|
|
|
616 |
|
|
|
|
|
|
|
531 |
|
|
|
Power Finance Corp., Ltd. 5.25% 8/10/2028 |
|
|
|
|
383 |
|
|
|
|
|
|
|
380 |
|
|
|
Power Finance Corp., Ltd. 6.15% 12/6/2028 |
|
|
|
|
350 |
|
|
|
|
|
|
|
359 |
|
|
|
Power Finance Corp., Ltd. 4.50% 6/18/2029 |
|
|
|
|
554 |
|
|
|
|
|
|
|
530 |
|
|
|
Power Finance Corp., Ltd. 3.95% 4/23/2030 |
|
|
|
|
1,213 |
|
|
|
|
|
|
|
1,117 |
|
|
|
Prudential Financial, Inc. 4.35% 2/25/2050 |
|
|
|
|
2,205 |
|
|
|
|
|
|
|
1,798 |
|
|
|
Prudential Financial, Inc. 3.70% 3/13/2051 |
|
|
|
|
755 |
|
|
|
|
|
|
|
548 |
|
|
|
Rocket Mortgage, LLC 2.875% 10/15/20265 |
|
|
|
|
2,110 |
|
|
|
|
|
|
|
1,972 |
|
|
|
Rocket Mortgage, LLC 3.625% 3/1/20295 |
|
|
|
|
1,505 |
|
|
|
|
|
|
|
1,366 |
|
|
|
Royal Bank of Canada 1.15% 6/10/2025 |
|
|
|
|
4,711 |
|
|
|
|
|
|
|
4,525 |
|
|
|
Starwood Property Trust, Inc. 4.375% 1/15/20275 |
|
|
|
|
3,580 |
|
|
|
|
|
|
|
3,393 |
|
|
|
Starwood Property Trust, Inc. 7.25% 4/1/20295 |
|
|
|
|
425 |
|
|
|
|
|
|
|
430 |
|
|
|
Swiss Re Finance (Luxembourg) SA 5.00% 4/2/2049
(5-year UST Yield Curve Rate T Note Constant Maturity + 3.582% on 4/2/2029)5,10 |
|
|
|
|
1,000 |
|
|
|
|
|
|
|
966 |
|
|
|
Toronto-Dominion Bank (The) 0.75% 9/11/2025 |
|
|
|
|
5,375 |
|
|
|
|
|
|
|
5,088 |
|
|
|
Toronto-Dominion Bank (The) 1.25% 9/10/2026 |
|
|
|
|
2,425 |
|
|
|
|
|
|
|
2,224 |
|
|
|
Toronto-Dominion Bank (The) 1.95% 1/12/2027 |
|
|
|
|
2,500 |
|
|
|
|
|
|
|
2,321 |
|
|
|
Travelers Companies, Inc. 4.00% 5/30/2047 |
|
|
|
|
860 |
|
|
|
|
|
|
|
693 |
|
|
|
Truist Financial Corp. 7.161% 10/30/2029 (USD-SOFR + 2.446% on 10/30/2028)10 |
|
|
|
|
1,677 |
|
|
|
|
|
|
|
1,781 |
|
|
|
Truist Insurance Holdings, LLC, Term Loan,
(1-month USD CME Term SOFR + 4.75%) 10.073% 3/8/20328,13 |
|
|
|
|
4,160 |
|
|
|
|
|
|
|
4,252 |
|
|
|
U.S. Bancorp 2.375% 7/22/2026 |
|
|
|
|
4,000 |
|
|
|
|
|
|
|
3,776 |
|
|
|
UBS Group AG 2.593% 9/11/2025 (USD-SOFR + 1.56% on 9/11/2024)5,10 |
|
|
|
|
1,568 |
|
|
|
|
|
|
|
1,558 |
|
|
|
UBS Group AG 4.125% 9/24/20255 |
|
|
|
|
2,750 |
|
|
|
|
|
|
|
2,698 |
|
|
|
UBS Group AG 2.193% 6/5/2026 (USD-SOFR + 2.044% on 6/5/2025)5,10 |
|
|
|
|
1,250 |
|
|
|
|
|
|
|
1,208 |
|
|
|
UBS Group AG 3.869% 1/12/2029 (3-month USD-LIBOR + 1.41% on 1/12/2028)5,10,14 |
|
|
|
|
800 |
|
|
|
|
|
|
|
755 |
|
|
|
UBS Group AG 5.428% 2/8/2030
(1-year UST Yield Curve Rate T Note Constant Maturity + 1.52% on 2/8/2029)5,10 |
|
|
|
|
3,575 |
|
|
|
|
|
|
|
3,569 |
|
|
|
UBS Group AG 5.699% 2/8/2035
(1-year UST Yield Curve Rate T Note Constant Maturity + 1.77% on 2/8/2034)5,10 |
|
|
|
|
3,075 |
|
|
|
|
|
|
|
3,073 |
|
|
|
UniCredit SpA 4.625% 4/12/20275 |
|
|
|
|
625 |
|
|
|
|
|
|
|
610 |
|
|
|
Wells Fargo & Co.
2.164% 2/11/2026 (3-month USD CME Term SOFR + 1.012% on 2/11/2025)10 |
|
|
|
|
8,000 |
|
|
|
|
|
|
|
7,828 |
|
|
|
Wells Fargo & Co. 5.707% 4/22/2028 (USD-SOFR + 1.07% on 4/22/2027)10 |
|
|
|
|
7,025 |
|
|
|
|
|
|
|
7,087 |
|
|
|
Wells Fargo & Co. 2.393% 6/2/2028 (USD-SOFR + 2.10% on 6/2/2027)10 |
|
|
|
|
400 |
|
|
|
|
|
|
|
369 |
|
|
|
Wells Fargo & Co. 6.303% 10/23/2029 (USD-SOFR + 1.79% on 10/23/2028)10 |
|
|
|
|
7,225 |
|
|
|
|
|
|
|
7,499 |
|
|
|
Wells Fargo & Co. 6.491% 10/23/2034 (USD-SOFR + 2.06% on 10/23/2033)10 |
|
|
|
|
3,750 |
|
|
|
|
|
|
|
3,999 |
|
|
|
Westpac Banking Corp. 2.894% 2/4/2030
(5-year UST Yield Curve Rate T Note Constant Maturity + 1.35% on 2/4/2025)10 |
|
|
|
|
3,000 |
|
|
|
|
|
|
|
2,942 |
|
|
|
Westpac Banking Corp. 2.668% 11/15/2035
(5-year UST Yield Curve Rate T Note Constant Maturity + 1.75% on 11/15/2030)10 |
|
|
|
|
3,325 |
|
|
|
|
|
|
|
2,749 |
|
|
|
Westpac Banking Corp. 2.963% 11/16/2040 |
|
|
|
|
1,500 |
|
|
|
|
|
|
|
1,052 |
|
|
|
|
|
|
|
|
|
|
|
|
|
|
|
|
|
|
|
|
|
|
|
|
|
|
|
|
|
|
|
|
|
395,540 |
|
|
|
|
|
|
|
|
|
|
|
|
|
|
|
|
|
|
| |
|
|
|
|
|
|
|
|
|
|
|
|
|
| |
|
|
|
|
|
| Health care 0.64% |
|
AdaptHealth, LLC 6.125% 8/1/20285 |
|
|
|
|
645 |
|
|
|
|
|
|
|
616 |
|
|
|
AdaptHealth, LLC 4.625% 8/1/20295 |
|
|
|
|
1,990 |
|
|
|
|
|
|
|
1,727 |
|
|
|
AdaptHealth, LLC 5.125% 3/1/20305 |
|
|
|
|
1,010 |
|
|
|
|
|
|
|
884 |
|
|
|
Amgen, Inc. 5.25% 3/2/2030 |
|
|
|
|
1,244 |
|
|
|
|
|
|
|
1,254 |
|
|
|
Amgen, Inc. 5.25% 3/2/2033 |
|
|
|
|
2,500 |
|
|
|
|
|
|
|
2,494 |
|
|
|
Amgen, Inc. 5.60% 3/2/2043 |
|
|
|
|
1,500 |
|
|
|
|
|
|
|
1,479 |
|
|
|
Amgen, Inc. 5.65% 3/2/2053 |
|
|
|
|
378 |
|
|
|
|
|
|
|
373 |
|
|
|
Amgen, Inc. 4.40% 2/22/2062 |
|
|
|
|
1,697 |
|
|
|
|
|
|
|
1,349 |
|
|
|
Amgen, Inc. 5.75% 3/2/2063 |
|
|
|
|
258 |
|
|
|
|
|
|
|
253 |
|
|
|
AstraZeneca Finance, LLC 1.75% 5/28/2028 |
|
|
|
|
1,871 |
|
|
|
|
|
|
|
1,660 |
|
|
|
AstraZeneca Finance, LLC 4.90% 2/26/2031 |
|
|
|
|
1,850 |
|
|
|
|
|
|
|
1,846 |
|
|
|
AstraZeneca Finance, LLC 2.25% 5/28/2031 |
|
|
|
|
742 |
|
|
|
|
|
|
|
627 |
|
|
|
AstraZeneca Finance, LLC 5.00% 2/26/2034 |
|
|
|
|
5,800 |
|
|
|
|
|
|
|
5,770 |
|
99 American Funds Insurance Series
Asset Allocation Fund (continued)
|
|
|
|
|
|
|
|
|
|
|
|
|
|
|
|
|
| Bonds, notes & other debt instruments (continued) |
|
Principal amount (000) |
|
|
|
|
|
Value (000) |
|
|
|
|
|
|
| Corporate bonds, notes & loans (continued) |
|
|
|
|
|
|
|
|
|
|
|
|
|
|
| |
|
|
|
|
|
| Health care (continued) |
|
AstraZeneca PLC 3.375% 11/16/2025 |
|
|
|
|
USD1,140 |
|
|
|
|
|
|
$ |
1,112 |
|
|
|
Bausch Health Companies, Inc. 5.50% 11/1/20255 |
|
|
|
|
6,275 |
|
|
|
|
|
|
|
5,851 |
|
|
|
Bausch Health Companies, Inc. 4.875% 6/1/20285 |
|
|
|
|
7,450 |
|
|
|
|
|
|
|
5,584 |
|
|
|
Bausch Health Companies, Inc., Term Loan,
(3-month USD CME Term SOFR + 5.25%) 10.694% 2/1/20278,13 |
|
|
|
|
987 |
|
|
|
|
|
|
|
902 |
|
|
|
Baxter International, Inc. 1.322% 11/29/2024 |
|
|
|
|
7,109 |
|
|
|
|
|
|
|
6,981 |
|
|
|
Baxter International, Inc. 1.915% 2/1/2027 |
|
|
|
|
4,739 |
|
|
|
|
|
|
|
4,345 |
|
|
|
Baxter International, Inc. 2.272% 12/1/2028 |
|
|
|
|
3,180 |
|
|
|
|
|
|
|
2,804 |
|
|
|
Bayer US Finance, LLC 6.125% 11/21/20265 |
|
|
|
|
6,047 |
|
|
|
|
|
|
|
6,113 |
|
|
|
Bayer US Finance, LLC 6.25% 1/21/20295 |
|
|
|
|
3,451 |
|
|
|
|
|
|
|
3,525 |
|
|
|
Becton, Dickinson and Co. 5.081% 6/7/2029 |
|
|
|
|
3,363 |
|
|
|
|
|
|
|
3,361 |
|
|
|
Bristol-Myers Squibb Co. 4.90% 2/22/2029 |
|
|
|
|
3,750 |
|
|
|
|
|
|
|
3,744 |
|
|
|
Bristol-Myers Squibb Co. 5.10% 2/22/2031 |
|
|
|
|
1,800 |
|
|
|
|
|
|
|
1,807 |
|
|
|
Bristol-Myers Squibb Co. 5.20% 2/22/2034 |
|
|
|
|
825 |
|
|
|
|
|
|
|
824 |
|
|
|
Bristol-Myers Squibb Co. 5.65% 2/22/2064 |
|
|
|
|
2,550 |
|
|
|
|
|
|
|
2,493 |
|
|
|
Centene Corp. 4.25% 12/15/2027 |
|
|
|
|
565 |
|
|
|
|
|
|
|
540 |
|
|
|
Centene Corp. 4.625% 12/15/2029 |
|
|
|
|
1,265 |
|
|
|
|
|
|
|
1,197 |
|
|
|
CHS / Community Health Systems, Inc. 5.625% 3/15/20275 |
|
|
|
|
2,750 |
|
|
|
|
|
|
|
2,563 |
|
|
|
CHS / Community Health Systems, Inc. 5.25% 5/15/20305 |
|
|
|
|
4,325 |
|
|
|
|
|
|
|
3,570 |
|
|
|
CVS Health Corp. 5.00% 1/30/2029 |
|
|
|
|
3,831 |
|
|
|
|
|
|
|
3,793 |
|
|
|
CVS Health Corp. 5.40% 6/1/2029 |
|
|
|
|
4,144 |
|
|
|
|
|
|
|
4,150 |
|
|
|
CVS Health Corp. 5.55% 6/1/2031 |
|
|
|
|
3,039 |
|
|
|
|
|
|
|
3,043 |
|
|
|
CVS Health Corp. 5.70% 6/1/2034 |
|
|
|
|
4,053 |
|
|
|
|
|
|
|
4,044 |
|
|
|
Elevance Health, Inc. 2.375% 1/15/2025 |
|
|
|
|
818 |
|
|
|
|
|
|
|
804 |
|
|
|
Elevance Health, Inc. 4.90% 2/8/2026 |
|
|
|
|
1,417 |
|
|
|
|
|
|
|
1,406 |
|
|
|
Elevance Health, Inc. 4.75% 2/15/2033 |
|
|
|
|
811 |
|
|
|
|
|
|
|
784 |
|
|
|
Elevance Health, Inc. 5.125% 2/15/2053 |
|
|
|
|
344 |
|
|
|
|
|
|
|
317 |
|
|
|
Endo Finance Holdings, Inc. 8.50% 4/15/20315 |
|
|
|
|
2,200 |
|
|
|
|
|
|
|
2,273 |
|
|
|
Endo International PLC, Term Loan B,
(3-month USD CME Term SOFR + 4.50%) 9.826% 4/23/20318,13 |
|
|
|
|
2,575 |
|
|
|
|
|
|
|
2,573 |
|
|
|
Gilead Sciences, Inc. 5.25% 10/15/2033 |
|
|
|
|
2,642 |
|
|
|
|
|
|
|
2,663 |
|
|
|
HCA, Inc. 3.375% 3/15/2029 |
|
|
|
|
804 |
|
|
|
|
|
|
|
739 |
|
|
|
HCA, Inc. 3.625% 3/15/2032 |
|
|
|
|
1,000 |
|
|
|
|
|
|
|
881 |
|
|
|
HCA, Inc. 4.375% 3/15/2042 |
|
|
|
|
1,500 |
|
|
|
|
|
|
|
1,234 |
|
|
|
HCA, Inc. 4.625% 3/15/2052 |
|
|
|
|
1,450 |
|
|
|
|
|
|
|
1,171 |
|
|
|
Humana, Inc. 5.375% 4/15/2031 |
|
|
|
|
3,194 |
|
|
|
|
|
|
|
3,178 |
|
|
|
Humana, Inc. 5.75% 4/15/2054 |
|
|
|
|
1,517 |
|
|
|
|
|
|
|
1,463 |
|
|
|
Jazz Securities DAC 4.375% 1/15/20295 |
|
|
|
|
1,975 |
|
|
|
|
|
|
|
1,835 |
|
|
|
Medtronic Global Holdings S.C.A. 4.25% 3/30/2028 |
|
|
|
|
2,213 |
|
|
|
|
|
|
|
2,163 |
|
|
|
Medtronic Global Holdings S.C.A. 4.50% 3/30/2033 |
|
|
|
|
4,000 |
|
|
|
|
|
|
|
3,847 |
|
|
|
Molina Healthcare, Inc. 3.875% 11/15/20305 |
|
|
|
|
2,899 |
|
|
|
|
|
|
|
2,579 |
|
|
|
Molina Healthcare, Inc. 3.875% 5/15/20325 |
|
|
|
|
3,855 |
|
|
|
|
|
|
|
3,344 |
|
|
|
Novant Health, Inc. 3.168% 11/1/2051 |
|
|
|
|
3,750 |
|
|
|
|
|
|
|
2,511 |
|
|
|
Novartis Capital Corp. 1.75% 2/14/2025 |
|
|
|
|
500 |
|
|
|
|
|
|
|
489 |
|
|
|
Novartis Capital Corp. 2.00% 2/14/2027 |
|
|
|
|
636 |
|
|
|
|
|
|
|
592 |
|
|
|
Owens & Minor, Inc. 4.50% 3/31/20295 |
|
|
|
|
5,065 |
|
|
|
|
|
|
|
4,373 |
|
|
|
Owens & Minor, Inc. 6.625% 4/1/20305 |
|
|
|
|
1,495 |
|
|
|
|
|
|
|
1,361 |
|
|
|
Radiology Partners, Inc. 3.50% PIK and 4.28% Cash 1/31/20295,15 |
|
|
|
|
3,199 |
|
|
|
|
|
|
|
3,003 |
|
|
|
Radiology Partners, Inc., Term Loan B,
(3-month USD CME Term SOFR + 5.00%)
1.50% PIK and 9.08% Cash 1/31/20298,13,15 |
|
|
|
|
3,351 |
|
|
|
|
|
|
|
3,188 |
|
|
|
Summa Health 3.511% 11/15/2051 |
|
|
|
|
1,655 |
|
|
|
|
|
|
|
1,208 |
|
|
|
Tenet Healthcare Corp. 4.25% 6/1/2029 |
|
|
|
|
1,560 |
|
|
|
|
|
|
|
1,454 |
|
|
|
Teva Pharmaceutical Finance Netherlands III BV 3.15% 10/1/2026 |
|
|
|
|
16,940 |
|
|
|
|
|
|
|
15,912 |
|
|
|
Teva Pharmaceutical Finance Netherlands III BV 5.125% 5/9/2029 |
|
|
|
|
11,995 |
|
|
|
|
|
|
|
11,549 |
|
|
|
Teva Pharmaceutical Finance Netherlands III BV 4.10% 10/1/2046 |
|
|
|
|
2,625 |
|
|
|
|
|
|
|
1,836 |
|
|
|
|
|
|
|
|
|
|
|
|
|
|
|
|
|
|
|
|
|
|
|
|
|
|
|
|
|
|
|
|
|
173,408 |
|
|
|
|
|
|
|
|
|
|
|
|
|
|
|
|
|
|
American Funds Insurance Series 100
Asset Allocation Fund (continued)
|
|
|
|
|
|
|
|
|
|
|
|
|
|
|
|
|
| Bonds, notes & other debt instruments (continued) |
|
Principal amount (000) |
|
|
|
|
|
Value (000) |
|
|
|
|
|
|
| Corporate bonds, notes & loans (continued) |
|
|
|
|
|
|
|
|
|
|
|
|
|
|
| |
|
|
|
|
|
| Communication services 0.63% |
|
AT&T, Inc. 3.50% 9/15/2053 |
|
|
|
|
USD5,140 |
|
|
|
|
|
|
$ |
3,492 |
|
|
|
CCO Holdings, LLC 4.75% 3/1/20305 |
|
|
|
|
2,658 |
|
|
|
|
|
|
|
2,304 |
|
|
|
CCO Holdings, LLC 4.50% 8/15/20305 |
|
|
|
|
3,500 |
|
|
|
|
|
|
|
2,966 |
|
|
|
CCO Holdings, LLC 4.25% 2/1/20315 |
|
|
|
|
4,286 |
|
|
|
|
|
|
|
3,503 |
|
|
|
CCO Holdings, LLC 4.75% 2/1/20325 |
|
|
|
|
2,150 |
|
|
|
|
|
|
|
1,762 |
|
|
|
CCO Holdings, LLC 4.50% 5/1/2032 |
|
|
|
|
6,268 |
|
|
|
|
|
|
|
5,053 |
|
|
|
CCO Holdings, LLC 4.50% 6/1/20335 |
|
|
|
|
157 |
|
|
|
|
|
|
|
124 |
|
|
|
CCO Holdings, LLC 4.25% 1/15/20345 |
|
|
|
|
116 |
|
|
|
|
|
|
|
88 |
|
|
|
Charter Communications Operating, LLC 4.908% 7/23/2025 |
|
|
|
|
116 |
|
|
|
|
|
|
|
115 |
|
|
|
Charter Communications Operating, LLC 5.25% 4/1/2053 |
|
|
|
|
3,750 |
|
|
|
|
|
|
|
2,945 |
|
|
|
Comcast Corp. 2.35% 1/15/2027 |
|
|
|
|
4,000 |
|
|
|
|
|
|
|
3,746 |
|
|
|
Comcast Corp. 4.80% 5/15/2033 |
|
|
|
|
2,416 |
|
|
|
|
|
|
|
2,353 |
|
|
|
Comcast Corp. 5.65% 6/1/2054 |
|
|
|
|
2,281 |
|
|
|
|
|
|
|
2,279 |
|
|
|
Connect Finco SARL 6.75% 10/1/20265 |
|
|
|
|
3,800 |
|
|
|
|
|
|
|
3,671 |
|
|
|
CSC Holdings, LLC, Term Loan B,
(3-month USD CME Term SOFR + 4.50%) 9.829% 1/18/20288,13 |
|
|
|
|
2,693 |
|
|
|
|
|
|
|
2,595 |
|
|
|
DIRECTV Financing, LLC 5.875% 8/15/20275 |
|
|
|
|
3,655 |
|
|
|
|
|
|
|
3,441 |
|
|
|
DIRECTV Financing, LLC 8.875% 2/1/20305 |
|
|
|
|
925 |
|
|
|
|
|
|
|
906 |
|
|
|
DISH DBS Corp. 5.875% 11/15/2024 |
|
|
|
|
7,055 |
|
|
|
|
|
|
|
6,705 |
|
|
|
DISH Network Corp. 11.75% 11/15/20275 |
|
|
|
|
5,000 |
|
|
|
|
|
|
|
4,907 |
|
|
|
Embarq Corp. 7.995% 6/1/2036 |
|
|
|
|
7,409 |
|
|
|
|
|
|
|
973 |
|
|
|
Frontier Communications Holdings, LLC 5.00% 5/1/20285 |
|
|
|
|
7,210 |
|
|
|
|
|
|
|
6,800 |
|
|
|
Frontier Communications Holdings, LLC 6.75% 5/1/20295 |
|
|
|
|
4,400 |
|
|
|
|
|
|
|
4,040 |
|
|
|
Frontier Communications Holdings, LLC 5.875% 11/1/2029 |
|
|
|
|
3,850 |
|
|
|
|
|
|
|
3,358 |
|
|
|
Frontier Communications Holdings, LLC 6.00% 1/15/20305 |
|
|
|
|
2,900 |
|
|
|
|
|
|
|
2,527 |
|
|
|
Frontier Communications Holdings, LLC 8.75% 5/15/20305 |
|
|
|
|
1,100 |
|
|
|
|
|
|
|
1,135 |
|
|
|
Frontier Communications Holdings, LLC 8.625% 3/15/20315 |
|
|
|
|
1,000 |
|
|
|
|
|
|
|
1,031 |
|
|
|
Gray Television, Inc. 7.00% 5/15/20275 |
|
|
|
|
1,969 |
|
|
|
|
|
|
|
1,815 |
|
|
|
Gray Television, Inc. 10.50% 7/15/20295 |
|
|
|
|
4,805 |
|
|
|
|
|
|
|
4,836 |
|
|
|
Gray Television, Inc. 4.75% 10/15/20305 |
|
|
|
|
1,850 |
|
|
|
|
|
|
|
1,112 |
|
|
|
Gray Television, Inc. 5.375% 11/15/20315 |
|
|
|
|
7,010 |
|
|
|
|
|
|
|
3,979 |
|
|
|
Intelsat Jackson Holdings SA 6.50% 3/15/20305 |
|
|
|
|
5,516 |
|
|
|
|
|
|
|
5,146 |
|
|
|
Ligado Networks, LLC 15.50% PIK 11/1/20235,15,16 |
|
|
|
|
5,838 |
|
|
|
|
|
|
|
861 |
|
|
|
Ligado Networks, LLC, Term Loan, 17.50% PIK 11/1/20232,13,15,16 |
|
|
|
|
571 |
|
|
|
|
|
|
|
542 |
|
|
|
Midas OpCo Holdings, LLC 5.625% 8/15/20295 |
|
|
|
|
3,205 |
|
|
|
|
|
|
|
2,963 |
|
|
|
Netflix, Inc. 5.875% 11/15/2028 |
|
|
|
|
1,313 |
|
|
|
|
|
|
|
1,353 |
|
|
|
Netflix, Inc. 5.375% 11/15/20295 |
|
|
|
|
20 |
|
|
|
|
|
|
|
20 |
|
|
|
Nexstar Media, Inc. 4.75% 11/1/20285 |
|
|
|
|
3,950 |
|
|
|
|
|
|
|
3,515 |
|
|
|
SBA Tower Trust 1.631% 11/15/20265 |
|
|
|
|
8,707 |
|
|
|
|
|
|
|
7,914 |
|
|
|
Scripps Escrow II, Inc. 3.875% 1/15/20295 |
|
|
|
|
2,325 |
|
|
|
|
|
|
|
1,622 |
|
|
|
Sirius XM Radio, Inc. 4.00% 7/15/20285 |
|
|
|
|
3,575 |
|
|
|
|
|
|
|
3,233 |
|
|
|
Sirius XM Radio, Inc. 4.125% 7/1/20305 |
|
|
|
|
2,272 |
|
|
|
|
|
|
|
1,942 |
|
|
|
Sirius XM Radio, Inc. 3.875% 9/1/20315 |
|
|
|
|
6,252 |
|
|
|
|
|
|
|
5,108 |
|
|
|
Take-Two Interactive Software, Inc. 4.00% 4/14/2032 |
|
|
|
|
2,438 |
|
|
|
|
|
|
|
2,219 |
|
|
|
Tencent Holdings, Ltd. 2.39% 6/3/2030 |
|
|
|
|
566 |
|
|
|
|
|
|
|
486 |
|
|
|
T-Mobile USA, Inc. 1.50% 2/15/2026 |
|
|
|
|
500 |
|
|
|
|
|
|
|
470 |
|
|
|
T-Mobile USA, Inc. 2.05% 2/15/2028 |
|
|
|
|
325 |
|
|
|
|
|
|
|
292 |
|
|
|
T-Mobile USA, Inc. 4.95% 3/15/2028 |
|
|
|
|
1,918 |
|
|
|
|
|
|
|
1,906 |
|
|
|
T-Mobile USA, Inc. 4.80% 7/15/2028 |
|
|
|
|
4,000 |
|
|
|
|
|
|
|
3,947 |
|
|
|
T-Mobile USA, Inc. 5.75% 1/15/2054 |
|
|
|
|
3,550 |
|
|
|
|
|
|
|
3,536 |
|
|
|
T-Mobile USA, Inc. 6.00% 6/15/2054 |
|
|
|
|
3,116 |
|
|
|
|
|
|
|
3,225 |
|
|
|
T-Mobile USA, Inc. 5.50% 1/15/2055 |
|
|
|
|
2,051 |
|
|
|
|
|
|
|
1,979 |
|
|
|
Univision Communications, Inc. 6.625% 6/1/20275 |
|
|
|
|
6,300 |
|
|
|
|
|
|
|
6,037 |
|
|
|
Univision Communications, Inc. 8.00% 8/15/20285 |
|
|
|
|
300 |
|
|
|
|
|
|
|
293 |
|
|
|
Univision Communications, Inc. 4.50% 5/1/20295 |
|
|
|
|
5,300 |
|
|
|
|
|
|
|
4,460 |
|
|
|
Univision Communications, Inc. 7.375% 6/30/20305 |
|
|
|
|
725 |
|
|
|
|
|
|
|
675 |
|
|
|
Verizon Communications, Inc. 2.55% 3/21/2031 |
|
|
|
|
410 |
|
|
|
|
|
|
|
348 |
|
|
|
Verizon Communications, Inc. 2.355% 3/15/2032 |
|
|
|
|
2,944 |
|
|
|
|
|
|
|
2,408 |
|
|
|
Verizon Communications, Inc. 5.05% 5/9/2033 |
|
|
|
|
1,946 |
|
|
|
|
|
|
|
1,919 |
|
|
|
Verizon Communications, Inc. 2.875% 11/20/2050 |
|
|
|
|
671 |
|
|
|
|
|
|
|
422 |
|
|
|
Verizon Communications, Inc. 5.50% 2/23/2054 |
|
|
|
|
272 |
|
|
|
|
|
|
|
266 |
|
101 American Funds Insurance Series
Asset Allocation Fund (continued)
|
|
|
|
|
|
|
|
|
|
|
|
|
|
|
|
|
| Bonds, notes & other debt instruments (continued) |
|
Principal amount (000) |
|
|
|
|
|
Value (000) |
|
|
|
|
|
|
| Corporate bonds, notes & loans (continued) |
|
|
|
|
|
|
|
|
|
|
|
|
|
|
| |
|
|
|
|
|
| Communication services (continued) |
|
Verizon Communications, Inc. 2.987% 10/30/2056 |
|
|
|
|
USD1,343 |
|
|
|
|
|
|
$ |
823 |
|
|
|
VMED O2 UK Financing I PLC 4.25% 1/31/20315 |
|
|
|
|
4,525 |
|
|
|
|
|
|
|
3,762 |
|
|
|
Vodafone Group PLC 4.25% 9/17/2050 |
|
|
|
|
4,350 |
|
|
|
|
|
|
|
3,398 |
|
|
|
WarnerMedia Holdings, Inc. 3.638% 3/15/2025 |
|
|
|
|
3,807 |
|
|
|
|
|
|
|
3,749 |
|
|
|
WarnerMedia Holdings, Inc. 3.755% 3/15/2027 |
|
|
|
|
1,018 |
|
|
|
|
|
|
|
967 |
|
|
|
WarnerMedia Holdings, Inc. 4.054% 3/15/2029 |
|
|
|
|
1,435 |
|
|
|
|
|
|
|
1,325 |
|
|
|
WarnerMedia Holdings, Inc. 5.141% 3/15/2052 |
|
|
|
|
1,500 |
|
|
|
|
|
|
|
1,169 |
|
|
|
|
|
|
|
|
|
|
|
|
|
|
|
|
|
|
|
|
|
|
|
|
|
|
|
|
|
|
|
|
|
168,861 |
|
|
|
|
|
|
|
|
|
|
|
|
|
|
|
|
|
|
| |
|
|
|
|
|
|
|
|
|
|
|
|
|
| |
|
|
|
|
|
| Energy 0.60% |
|
Antero Midstream Partners, LP 5.375% 6/15/20295 |
|
|
|
|
2,170 |
|
|
|
|
|
|
|
2,105 |
|
|
|
Antero Resources Corp. 7.625% 2/1/20295 |
|
|
|
|
955 |
|
|
|
|
|
|
|
984 |
|
|
|
Ascent Resources Utica Holdings, LLC 7.00% 11/1/20265 |
|
|
|
|
2,000 |
|
|
|
|
|
|
|
2,003 |
|
|
|
Ascent Resources Utica Holdings, LLC 5.875% 6/30/20295 |
|
|
|
|
1,270 |
|
|
|
|
|
|
|
1,242 |
|
|
|
Baytex Energy Corp. 8.50% 4/30/20305 |
|
|
|
|
225 |
|
|
|
|
|
|
|
235 |
|
|
|
Blue Racer Midstream, LLC 7.25% 7/15/20325 |
|
|
|
|
300 |
|
|
|
|
|
|
|
309 |
|
|
|
Borr IHC, Ltd. 10.00% 11/15/20285 |
|
|
|
|
3,335 |
|
|
|
|
|
|
|
3,495 |
|
|
|
BP Capital Markets America, Inc. 2.772% 11/10/2050 |
|
|
|
|
681 |
|
|
|
|
|
|
|
419 |
|
|
|
Canadian Natural Resources, Ltd. 2.05% 7/15/2025 |
|
|
|
|
961 |
|
|
|
|
|
|
|
926 |
|
|
|
Canadian Natural Resources, Ltd. 4.95% 6/1/2047 |
|
|
|
|
1,559 |
|
|
|
|
|
|
|
1,359 |
|
|
|
Chesapeake Energy Corp. 5.875% 2/1/20295 |
|
|
|
|
2,240 |
|
|
|
|
|
|
|
2,219 |
|
|
|
Chesapeake Energy Corp. 4.875% 4/15/203216 |
|
|
|
|
7,225 |
|
|
|
|
|
|
|
151 |
|
|
|
CITGO Petroleum Corp. 8.375% 1/15/20295 |
|
|
|
|
2,075 |
|
|
|
|
|
|
|
2,141 |
|
|
|
Civitas Resources, Inc. 5.00% 10/15/20265 |
|
|
|
|
480 |
|
|
|
|
|
|
|
468 |
|
|
|
Civitas Resources, Inc. 8.375% 7/1/20285 |
|
|
|
|
1,705 |
|
|
|
|
|
|
|
1,789 |
|
|
|
Civitas Resources, Inc. 8.625% 11/1/20305 |
|
|
|
|
525 |
|
|
|
|
|
|
|
563 |
|
|
|
Civitas Resources, Inc. 8.75% 7/1/20315 |
|
|
|
|
735 |
|
|
|
|
|
|
|
788 |
|
|
|
CNX Midstream Partners, LP 4.75% 4/15/20305 |
|
|
|
|
1,055 |
|
|
|
|
|
|
|
952 |
|
|
|
CNX Resources Corp. 6.00% 1/15/20295 |
|
|
|
|
2,675 |
|
|
|
|
|
|
|
2,620 |
|
|
|
CNX Resources Corp. 7.375% 1/15/20315 |
|
|
|
|
553 |
|
|
|
|
|
|
|
566 |
|
|
|
CNX Resources Corp. 7.25% 3/1/20325 |
|
|
|
|
505 |
|
|
|
|
|
|
|
515 |
|
|
|
Comstock Resources, Inc. 5.875% 1/15/20305 |
|
|
|
|
450 |
|
|
|
|
|
|
|
419 |
|
|
|
ConocoPhillips Co. 5.30% 5/15/2053 |
|
|
|
|
1,015 |
|
|
|
|
|
|
|
964 |
|
|
|
Constellation Oil Services Holding SA 13.50% 6/30/20252,5 |
|
|
|
|
852 |
|
|
|
|
|
|
|
852 |
|
|
|
Constellation Oil Services Holding SA 3.00% Cash 12/31/202615 |
|
|
|
|
445 |
|
|
|
|
|
|
|
367 |
|
|
|
Crescent Energy Finance, LLC 7.625% 4/1/20325 |
|
|
|
|
495 |
|
|
|
|
|
|
|
505 |
|
|
|
Diamond Foreign Asset Co. 8.50% 10/1/20305 |
|
|
|
|
575 |
|
|
|
|
|
|
|
604 |
|
|
|
Diamondback Energy, Inc. 6.25% 3/15/2053 |
|
|
|
|
500 |
|
|
|
|
|
|
|
515 |
|
|
|
Diamondback Energy, Inc. 5.75% 4/18/2054 |
|
|
|
|
2,149 |
|
|
|
|
|
|
|
2,085 |
|
|
|
Diamondback Energy, Inc. 5.90% 4/18/2064 |
|
|
|
|
2,160 |
|
|
|
|
|
|
|
2,087 |
|
|
|
Enbridge, Inc. 2.50% 1/15/2025 |
|
|
|
|
300 |
|
|
|
|
|
|
|
295 |
|
|
|
Enbridge, Inc. 3.70% 7/15/2027 |
|
|
|
|
62 |
|
|
|
|
|
|
|
59 |
|
|
|
Enbridge, Inc. 6.70% 11/15/2053 |
|
|
|
|
3,732 |
|
|
|
|
|
|
|
4,078 |
|
|
|
Encino Acquisition Partners Holdings, LLC 8.75% 5/1/20315 |
|
|
|
|
395 |
|
|
|
|
|
|
|
412 |
|
|
|
Energy Transfer, LP 4.75% 1/15/2026 |
|
|
|
|
2,494 |
|
|
|
|
|
|
|
2,465 |
|
|
|
Energy Transfer, LP 5.60% 9/1/2034 |
|
|
|
|
2,133 |
|
|
|
|
|
|
|
2,120 |
|
|
|
Energy Transfer, LP 6.05% 9/1/2054 |
|
|
|
|
1,182 |
|
|
|
|
|
|
|
1,166 |
|
|
|
Eni SpA 5.95% 5/15/20545 |
|
|
|
|
831 |
|
|
|
|
|
|
|
817 |
|
|
|
Enterprise Products Operating, LLC 5.05% 1/10/2026 |
|
|
|
|
3,519 |
|
|
|
|
|
|
|
3,511 |
|
|
|
Enterprise Products Operating, LLC 4.90% 5/15/2046 |
|
|
|
|
500 |
|
|
|
|
|
|
|
451 |
|
|
|
EQM Midstream Partners, LP 5.50% 7/15/2028 |
|
|
|
|
1,463 |
|
|
|
|
|
|
|
1,442 |
|
|
|
EQM Midstream Partners, LP 7.50% 6/1/20305 |
|
|
|
|
642 |
|
|
|
|
|
|
|
686 |
|
|
|
EQM Midstream Partners, LP 4.75% 1/15/20315 |
|
|
|
|
1,635 |
|
|
|
|
|
|
|
1,530 |
|
|
|
Equinor ASA 3.25% 11/10/2024 |
|
|
|
|
2,850 |
|
|
|
|
|
|
|
2,825 |
|
|
|
Equinor ASA 4.25% 11/23/2041 |
|
|
|
|
2,000 |
|
|
|
|
|
|
|
1,750 |
|
|
|
Exxon Mobil Corp. 2.019% 8/16/2024 |
|
|
|
|
643 |
|
|
|
|
|
|
|
640 |
|
|
|
Exxon Mobil Corp. 2.44% 8/16/2029 |
|
|
|
|
213 |
|
|
|
|
|
|
|
190 |
|
|
|
Genesis Energy, LP 8.00% 1/15/2027 |
|
|
|
|
4,612 |
|
|
|
|
|
|
|
4,720 |
|
|
|
Genesis Energy, LP 7.75% 2/1/2028 |
|
|
|
|
470 |
|
|
|
|
|
|
|
475 |
|
|
|
Genesis Energy, LP 8.25% 1/15/2029 |
|
|
|
|
720 |
|
|
|
|
|
|
|
744 |
|
American Funds Insurance Series 102
Asset Allocation Fund (continued)
|
|
|
|
|
|
|
|
|
|
|
|
|
|
|
|
|
| Bonds, notes & other debt instruments (continued) |
|
Principal amount (000) |
|
|
|
|
|
Value (000) |
|
|
|
|
|
|
| Corporate bonds, notes & loans (continued) |
|
|
|
|
|
|
|
|
|
|
|
|
|
|
| |
|
|
|
|
|
| Energy (continued) |
|
Genesis Energy, LP 8.875% 4/15/2030 |
|
|
|
|
USD934 |
|
|
|
|
|
|
$ |
983 |
|
|
|
Genesis Energy, LP 7.875% 5/15/2032 |
|
|
|
|
1,195 |
|
|
|
|
|
|
|
1,207 |
|
|
|
Global Partners, LP 8.25% 1/15/20325 |
|
|
|
|
310 |
|
|
|
|
|
|
|
319 |
|
|
|
Halliburton Co. 3.80% 11/15/2025 |
|
|
|
|
6 |
|
|
|
|
|
|
|
6 |
|
|
|
Harvest Midstream I, LP 7.50% 9/1/20285 |
|
|
|
|
850 |
|
|
|
|
|
|
|
864 |
|
|
|
Harvest Midstream I, LP 7.50% 5/15/20325 |
|
|
|
|
390 |
|
|
|
|
|
|
|
396 |
|
|
|
Hess Midstream Operations, LP 5.125% 6/15/20285 |
|
|
|
|
1,655 |
|
|
|
|
|
|
|
1,604 |
|
|
|
Hess Midstream Operations, LP 4.25% 2/15/20305 |
|
|
|
|
960 |
|
|
|
|
|
|
|
882 |
|
|
|
Hess Midstream Operations, LP 5.50% 10/15/20305 |
|
|
|
|
400 |
|
|
|
|
|
|
|
387 |
|
|
|
Hilcorp Energy I, LP 6.00% 4/15/20305 |
|
|
|
|
350 |
|
|
|
|
|
|
|
338 |
|
|
|
Hilcorp Energy I, LP 6.00% 2/1/20315 |
|
|
|
|
460 |
|
|
|
|
|
|
|
441 |
|
|
|
Hilcorp Energy I, LP 8.375% 11/1/20335 |
|
|
|
|
925 |
|
|
|
|
|
|
|
986 |
|
|
|
Jonah Energy, LLC 12.00% 11/5/20252 |
|
|
|
|
707 |
|
|
|
|
|
|
|
707 |
|
|
|
Kinder Morgan, Inc. 5.00% 2/1/2029 |
|
|
|
|
7,261 |
|
|
|
|
|
|
|
7,182 |
|
|
|
Kinder Morgan, Inc. 5.40% 2/1/2034 |
|
|
|
|
9,069 |
|
|
|
|
|
|
|
8,934 |
|
|
|
Kinder Morgan, Inc. 5.45% 8/1/2052 |
|
|
|
|
1,238 |
|
|
|
|
|
|
|
1,140 |
|
|
|
Kodiak Gas Services, LLC 7.25% 2/15/20295 |
|
|
|
|
220 |
|
|
|
|
|
|
|
226 |
|
|
|
Marathon Oil Corp. 4.40% 7/15/2027 |
|
|
|
|
1,005 |
|
|
|
|
|
|
|
983 |
|
|
|
Matador Resources Co. 6.50% 4/15/20325 |
|
|
|
|
1,325 |
|
|
|
|
|
|
|
1,326 |
|
|
|
MPLX, LP 4.125% 3/1/2027 |
|
|
|
|
500 |
|
|
|
|
|
|
|
486 |
|
|
|
MPLX, LP 2.65% 8/15/2030 |
|
|
|
|
4,273 |
|
|
|
|
|
|
|
3,684 |
|
|
|
MPLX, LP 4.50% 4/15/2038 |
|
|
|
|
750 |
|
|
|
|
|
|
|
654 |
|
|
|
MPLX, LP 4.70% 4/15/2048 |
|
|
|
|
1,101 |
|
|
|
|
|
|
|
907 |
|
|
|
Nabors Industries, Inc. 9.125% 1/31/20305 |
|
|
|
|
1,745 |
|
|
|
|
|
|
|
1,809 |
|
|
|
Nabors Industries, Ltd. 7.25% 1/15/20265 |
|
|
|
|
750 |
|
|
|
|
|
|
|
761 |
|
|
|
New Fortress Energy, Inc. 6.75% 9/15/20255 |
|
|
|
|
947 |
|
|
|
|
|
|
|
920 |
|
|
|
New Fortress Energy, Inc. 6.50% 9/30/20265 |
|
|
|
|
6,840 |
|
|
|
|
|
|
|
6,298 |
|
|
|
New Fortress Energy, Inc. 8.75% 3/15/20295 |
|
|
|
|
1,115 |
|
|
|
|
|
|
|
1,019 |
|
|
|
Noble Finance II, LLC 8.00% 4/15/20305 |
|
|
|
|
175 |
|
|
|
|
|
|
|
182 |
|
|
|
Northern Oil and Gas, Inc. 8.75% 6/15/20315 |
|
|
|
|
605 |
|
|
|
|
|
|
|
636 |
|
|
|
ONEOK, Inc. 5.55% 11/1/2026 |
|
|
|
|
989 |
|
|
|
|
|
|
|
993 |
|
|
|
ONEOK, Inc. 5.65% 11/1/2028 |
|
|
|
|
1,279 |
|
|
|
|
|
|
|
1,299 |
|
|
|
ONEOK, Inc. 5.80% 11/1/2030 |
|
|
|
|
384 |
|
|
|
|
|
|
|
393 |
|
|
|
ONEOK, Inc. 6.05% 9/1/2033 |
|
|
|
|
2,355 |
|
|
|
|
|
|
|
2,426 |
|
|
|
ONEOK, Inc. 6.625% 9/1/2053 |
|
|
|
|
2,250 |
|
|
|
|
|
|
|
2,403 |
|
|
|
Parkland Corp. 4.625% 5/1/20305 |
|
|
|
|
1,035 |
|
|
|
|
|
|
|
945 |
|
|
|
Permian Resources Operating, LLC 9.875% 7/15/20315 |
|
|
|
|
905 |
|
|
|
|
|
|
|
1,003 |
|
|
|
Permian Resources Operating, LLC 7.00% 1/15/20325 |
|
|
|
|
1,020 |
|
|
|
|
|
|
|
1,048 |
|
|
|
Petroleos Mexicanos 6.875% 10/16/2025 |
|
|
|
|
3,755 |
|
|
|
|
|
|
|
3,744 |
|
|
|
Plains All American Pipeline, LP 3.80% 9/15/2030 |
|
|
|
|
113 |
|
|
|
|
|
|
|
103 |
|
|
|
Range Resources Corp. 4.75% 2/15/20305 |
|
|
|
|
186 |
|
|
|
|
|
|
|
175 |
|
|
|
Rockies Express Pipeline, LLC 4.95% 7/15/20295 |
|
|
|
|
2,689 |
|
|
|
|
|
|
|
2,534 |
|
|
|
Southwestern Energy Co. 5.375% 3/15/2030 |
|
|
|
|
1,945 |
|
|
|
|
|
|
|
1,880 |
|
|
|
Southwestern Energy Co. 4.75% 2/1/2032 |
|
|
|
|
960 |
|
|
|
|
|
|
|
884 |
|
|
|
Sunoco, LP 7.00% 9/15/20285 |
|
|
|
|
1,675 |
|
|
|
|
|
|
|
1,718 |
|
|
|
Sunoco, LP 4.50% 5/15/2029 |
|
|
|
|
1,050 |
|
|
|
|
|
|
|
983 |
|
|
|
Sunoco, LP 4.50% 4/30/2030 |
|
|
|
|
1,255 |
|
|
|
|
|
|
|
1,162 |
|
|
|
Talos Production, Inc. 9.375% 2/1/20315 |
|
|
|
|
170 |
|
|
|
|
|
|
|
180 |
|
|
|
TotalEnergies Capital SA 5.15% 4/5/2034 |
|
|
|
|
3,003 |
|
|
|
|
|
|
|
3,005 |
|
|
|
TransCanada Pipelines, Ltd. 4.25% 5/15/2028 |
|
|
|
|
1,090 |
|
|
|
|
|
|
|
1,054 |
|
|
|
TransCanada Pipelines, Ltd. 4.10% 4/15/2030 |
|
|
|
|
598 |
|
|
|
|
|
|
|
564 |
|
|
|
Valero Energy Corp. 4.00% 4/1/2029 |
|
|
|
|
4,000 |
|
|
|
|
|
|
|
3,808 |
|
|
|
Venture Global Calcasieu Pass, LLC 3.875% 8/15/20295 |
|
|
|
|
1,030 |
|
|
|
|
|
|
|
939 |
|
|
|
Venture Global Calcasieu Pass, LLC 4.125% 8/15/20315 |
|
|
|
|
840 |
|
|
|
|
|
|
|
754 |
|
|
|
Venture Global LNG, Inc. 8.375% 6/1/20315 |
|
|
|
|
3,905 |
|
|
|
|
|
|
|
4,053 |
|
|
|
Weatherford International, Ltd. 8.625% 4/30/20305 |
|
|
|
|
8,825 |
|
|
|
|
|
|
|
9,152 |
|
|
|
Williams Companies, Inc. 3.50% 11/15/2030 |
|
|
|
|
1,094 |
|
|
|
|
|
|
|
992 |
|
|
|
Williams Companies, Inc. 5.15% 3/15/2034 |
|
|
|
|
2,202 |
|
|
|
|
|
|
|
2,149 |
|
|
|
|
|
|
|
|
|
|
|
|
|
|
|
|
|
|
|
|
|
|
|
|
|
|
|
|
|
|
|
|
|
161,233 |
|
|
|
|
|
|
|
|
|
|
|
|
|
|
|
|
|
|
103 American Funds Insurance Series
Asset Allocation Fund (continued)
|
|
|
|
|
|
|
|
|
|
|
|
|
|
|
|
|
| Bonds, notes & other debt instruments (continued) |
|
Principal amount (000) |
|
|
|
|
|
Value (000) |
|
|
|
|
|
|
| Corporate bonds, notes & loans (continued) |
|
|
|
|
|
|
|
|
|
|
|
|
|
|
| |
|
|
|
|
|
| Consumer discretionary 0.52% |
|
Advance Auto Parts, Inc. 3.90% 4/15/2030 |
|
|
|
|
USD813 |
|
|
|
|
|
|
$ |
735 |
|
|
|
Advance Auto Parts, Inc. 3.50% 3/15/2032 |
|
|
|
|
458 |
|
|
|
|
|
|
|
389 |
|
|
|
Alibaba Group Holding, Ltd. 2.125% 2/9/2031 |
|
|
|
|
501 |
|
|
|
|
|
|
|
414 |
|
|
|
Alibaba Group Holding, Ltd. 4.50% 11/28/2034 |
|
|
|
|
766 |
|
|
|
|
|
|
|
707 |
|
|
|
Alibaba Group Holding, Ltd. 4.00% 12/6/2037 |
|
|
|
|
200 |
|
|
|
|
|
|
|
170 |
|
|
|
Allwyn Entertainment Financing (UK) PLC 7.875% 4/30/20295 |
|
|
|
|
1,200 |
|
|
|
|
|
|
|
1,241 |
|
|
|
American Honda Finance Corp. 3.50% 2/15/2028 |
|
|
|
|
750 |
|
|
|
|
|
|
|
714 |
|
|
|
Asbury Automotive Group, Inc. 4.625% 11/15/20295 |
|
|
|
|
2,115 |
|
|
|
|
|
|
|
1,957 |
|
|
|
Carnival Corp. 5.75% 3/1/20275 |
|
|
|
|
1,850 |
|
|
|
|
|
|
|
1,829 |
|
|
|
Carnival Corp. 4.00% 8/1/20285 |
|
|
|
|
1,675 |
|
|
|
|
|
|
|
1,574 |
|
|
|
Carnival Corp. 6.00% 5/1/20295 |
|
|
|
|
775 |
|
|
|
|
|
|
|
766 |
|
|
|
Daimler Trucks Finance North America, LLC 5.15% 1/16/20265 |
|
|
|
|
1,783 |
|
|
|
|
|
|
|
1,774 |
|
|
|
Daimler Trucks Finance North America, LLC 3.65% 4/7/20275 |
|
|
|
|
450 |
|
|
|
|
|
|
|
431 |
|
|
|
Daimler Trucks Finance North America, LLC 5.125% 1/19/20285 |
|
|
|
|
604 |
|
|
|
|
|
|
|
603 |
|
|
|
Daimler Trucks Finance North America, LLC 2.375% 12/14/20285 |
|
|
|
|
1,350 |
|
|
|
|
|
|
|
1,203 |
|
|
|
Daimler Trucks Finance North America, LLC 5.125% 9/25/20295 |
|
|
|
|
3,661 |
|
|
|
|
|
|
|
3,635 |
|
|
|
Daimler Trucks Finance North America, LLC 5.375% 6/25/20345 |
|
|
|
|
1,070 |
|
|
|
|
|
|
|
1,058 |
|
|
|
Fertitta Entertainment, LLC 4.625% 1/15/20295 |
|
|
|
|
3,580 |
|
|
|
|
|
|
|
3,263 |
|
|
|
Ford Motor Co. 4.75% 1/15/2043 |
|
|
|
|
4,354 |
|
|
|
|
|
|
|
3,524 |
|
|
|
Ford Motor Co. 5.291% 12/8/2046 |
|
|
|
|
2,256 |
|
|
|
|
|
|
|
1,976 |
|
|
|
Ford Motor Credit Co., LLC 6.798% 11/7/2028 |
|
|
|
|
2,111 |
|
|
|
|
|
|
|
2,182 |
|
|
|
Ford Motor Credit Co., LLC 5.80% 3/8/2029 |
|
|
|
|
6,135 |
|
|
|
|
|
|
|
6,116 |
|
|
|
Ford Motor Credit Co., LLC 7.20% 6/10/2030 |
|
|
|
|
3,750 |
|
|
|
|
|
|
|
3,947 |
|
|
|
Ford Motor Credit Co., LLC 4.00% 11/13/2030 |
|
|
|
|
1,915 |
|
|
|
|
|
|
|
1,711 |
|
|
|
Ford Motor Credit Co., LLC 7.122% 11/7/2033 |
|
|
|
|
1,425 |
|
|
|
|
|
|
|
1,507 |
|
|
|
Gap, Inc. 3.625% 10/1/20295 |
|
|
|
|
486 |
|
|
|
|
|
|
|
421 |
|
|
|
Gap, Inc. 3.875% 10/1/20315 |
|
|
|
|
323 |
|
|
|
|
|
|
|
270 |
|
|
|
Hanesbrands, Inc. 4.875% 5/15/20265 |
|
|
|
|
2,700 |
|
|
|
|
|
|
|
2,643 |
|
|
|
Hanesbrands, Inc. 9.00% 2/15/20315 |
|
|
|
|
1,625 |
|
|
|
|
|
|
|
1,704 |
|
|
|
Hilton Domestic Operating Co., Inc. 4.00% 5/1/20315 |
|
|
|
|
1,885 |
|
|
|
|
|
|
|
1,689 |
|
|
|
Hilton Grand Vacations Borrower, LLC 5.00% 6/1/20295 |
|
|
|
|
3,580 |
|
|
|
|
|
|
|
3,341 |
|
|
|
Home Depot, Inc. 1.50% 9/15/2028 |
|
|
|
|
3,000 |
|
|
|
|
|
|
|
2,633 |
|
|
|
Home Depot, Inc. 3.90% 12/6/2028 |
|
|
|
|
825 |
|
|
|
|
|
|
|
797 |
|
|
|
Home Depot, Inc. 2.95% 6/15/2029 |
|
|
|
|
1,174 |
|
|
|
|
|
|
|
1,076 |
|
|
|
Home Depot, Inc. 1.875% 9/15/2031 |
|
|
|
|
3,000 |
|
|
|
|
|
|
|
2,443 |
|
|
|
Home Depot, Inc. 4.25% 4/1/2046 |
|
|
|
|
2,000 |
|
|
|
|
|
|
|
1,684 |
|
|
|
Home Depot, Inc. 4.50% 12/6/2048 |
|
|
|
|
428 |
|
|
|
|
|
|
|
371 |
|
|
|
Hyundai Capital America 1.50% 6/15/20265 |
|
|
|
|
850 |
|
|
|
|
|
|
|
788 |
|
|
|
Hyundai Capital America 5.45% 6/24/20265 |
|
|
|
|
4,358 |
|
|
|
|
|
|
|
4,353 |
|
|
|
Hyundai Capital America 5.275% 6/24/20275 |
|
|
|
|
10,500 |
|
|
|
|
|
|
|
10,457 |
|
|
|
Hyundai Capital America 2.375% 10/15/20275 |
|
|
|
|
2,579 |
|
|
|
|
|
|
|
2,353 |
|
|
|
Hyundai Capital America 2.10% 9/15/20285 |
|
|
|
|
3,075 |
|
|
|
|
|
|
|
2,703 |
|
|
|
Hyundai Capital America 5.40% 1/8/20315 |
|
|
|
|
1,106 |
|
|
|
|
|
|
|
1,099 |
|
|
|
International Game Technology PLC 5.25% 1/15/20295 |
|
|
|
|
2,445 |
|
|
|
|
|
|
|
2,367 |
|
|
|
KB Home 7.25% 7/15/2030 |
|
|
|
|
1,295 |
|
|
|
|
|
|
|
1,336 |
|
|
|
Kontoor Brands, Inc. 4.125% 11/15/20295 |
|
|
|
|
910 |
|
|
|
|
|
|
|
825 |
|
|
|
LCM Investments Holdings II, LLC 4.875% 5/1/20295 |
|
|
|
|
590 |
|
|
|
|
|
|
|
552 |
|
|
|
LCM Investments Holdings II, LLC 8.25% 8/1/20315 |
|
|
|
|
1,350 |
|
|
|
|
|
|
|
1,410 |
|
|
|
Light and Wonder International, Inc. 7.00% 5/15/20285 |
|
|
|
|
750 |
|
|
|
|
|
|
|
754 |
|
|
|
Light and Wonder International, Inc. 7.25% 11/15/20295 |
|
|
|
|
2,240 |
|
|
|
|
|
|
|
2,289 |
|
|
|
Lindblad Expeditions, LLC 6.75% 2/15/20275 |
|
|
|
|
775 |
|
|
|
|
|
|
|
766 |
|
|
|
Lithia Motors, Inc. 3.875% 6/1/20295 |
|
|
|
|
2,900 |
|
|
|
|
|
|
|
2,607 |
|
|
|
Lithia Motors, Inc. 4.375% 1/15/20315 |
|
|
|
|
1,025 |
|
|
|
|
|
|
|
914 |
|
|
|
Marriott International, Inc. 4.90% 4/15/2029 |
|
|
|
|
1,207 |
|
|
|
|
|
|
|
1,195 |
|
|
|
Marriott International, Inc. 2.75% 10/15/2033 |
|
|
|
|
2,500 |
|
|
|
|
|
|
|
2,019 |
|
|
|
Marriott Ownership Resorts, Inc. 4.50% 6/15/20295 |
|
|
|
|
620 |
|
|
|
|
|
|
|
570 |
|
|
|
McDonald’s Corp. 4.60% 9/9/2032 |
|
|
|
|
716 |
|
|
|
|
|
|
|
692 |
|
|
|
McDonald’s Corp. 4.95% 8/14/2033 |
|
|
|
|
559 |
|
|
|
|
|
|
|
551 |
|
|
|
Melco Resorts Finance, Ltd. 5.75% 7/21/20285 |
|
|
|
|
1,710 |
|
|
|
|
|
|
|
1,603 |
|
|
|
Mercedes-Benz Finance North America, LLC 5.375% 11/26/20255 |
|
|
|
|
1,500 |
|
|
|
|
|
|
|
1,502 |
|
|
|
NCL Corp., Ltd. 5.875% 2/15/20275 |
|
|
|
|
2,450 |
|
|
|
|
|
|
|
2,420 |
|
American Funds Insurance Series 104
Asset Allocation Fund (continued)
|
|
|
|
|
|
|
|
|
|
|
|
|
|
|
|
|
| Bonds, notes & other debt instruments (continued) |
|
Principal amount (000) |
|
|
|
|
|
Value (000) |
|
|
|
|
|
|
| Corporate bonds, notes & loans (continued) |
|
|
|
|
|
|
|
|
|
|
|
|
|
|
| |
|
|
|
|
|
| Consumer discretionary (continued) |
|
NCL Corp., Ltd. 7.75% 2/15/20295 |
|
|
|
|
USD1,375 |
|
|
|
|
|
|
$ |
1,431 |
|
|
|
Neiman Marcus Group, Ltd., LLC 7.125% 4/1/20265 |
|
|
|
|
1,345 |
|
|
|
|
|
|
|
1,330 |
|
|
|
Newell Brands Inc. 6.625% 9/15/2029 |
|
|
|
|
1,850 |
|
|
|
|
|
|
|
1,817 |
|
|
|
Party City Holdings, Inc. 12.00% PIK 1/11/20295,15 |
|
|
|
|
1,277 |
|
|
|
|
|
|
|
1,233 |
|
|
|
Penske Automotive Group, Inc. 3.75% 6/15/2029 |
|
|
|
|
1,375 |
|
|
|
|
|
|
|
1,243 |
|
|
|
RHP Hotel Properties, LP 4.50% 2/15/20295 |
|
|
|
|
1,300 |
|
|
|
|
|
|
|
1,220 |
|
|
|
Royal Caribbean Cruises, Ltd. 5.375% 7/15/20275 |
|
|
|
|
1,795 |
|
|
|
|
|
|
|
1,769 |
|
|
|
Sands China, Ltd. 2.30% 3/8/2027 |
|
|
|
|
2,075 |
|
|
|
|
|
|
|
1,892 |
|
|
|
Sonic Automotive, Inc. 4.625% 11/15/20295 |
|
|
|
|
3,035 |
|
|
|
|
|
|
|
2,743 |
|
|
|
Sonic Automotive, Inc. 4.875% 11/15/20315 |
|
|
|
|
1,325 |
|
|
|
|
|
|
|
1,168 |
|
|
|
Stellantis Finance US, Inc. 1.711% 1/29/20275 |
|
|
|
|
2,200 |
|
|
|
|
|
|
|
2,005 |
|
|
|
Stellantis Finance US, Inc. 5.625% 1/12/20285 |
|
|
|
|
2,500 |
|
|
|
|
|
|
|
2,533 |
|
|
|
Stellantis Finance US, Inc. 2.691% 9/15/20315 |
|
|
|
|
927 |
|
|
|
|
|
|
|
767 |
|
|
|
Stellantis Finance US, Inc. 6.375% 9/12/20325 |
|
|
|
|
635 |
|
|
|
|
|
|
|
664 |
|
|
|
Tempur Sealy International, Inc. 4.00% 4/15/20295 |
|
|
|
|
850 |
|
|
|
|
|
|
|
768 |
|
|
|
Toyota Motor Credit Corp. 0.80% 1/9/2026 |
|
|
|
|
429 |
|
|
|
|
|
|
|
402 |
|
|
|
Toyota Motor Credit Corp. 1.90% 1/13/2027 |
|
|
|
|
2,500 |
|
|
|
|
|
|
|
2,313 |
|
|
|
Travel + Leisure Co. 4.50% 12/1/20295 |
|
|
|
|
2,100 |
|
|
|
|
|
|
|
1,936 |
|
|
|
Volkswagen Group of America Finance, LLC 4.625% 11/13/20255 |
|
|
|
|
3,845 |
|
|
|
|
|
|
|
3,801 |
|
|
|
|
|
|
|
|
|
|
|
|
|
|
|
|
|
|
|
|
|
|
|
|
|
|
|
|
|
|
|
|
|
139,658 |
|
|
|
|
|
|
|
|
|
|
|
|
|
|
|
|
|
|
| |
|
|
|
|
|
|
|
|
|
|
|
|
|
| |
|
|
|
|
|
| Industrials 0.42% |
|
AAdvantage Loyalty IP, Ltd. 5.50% 4/20/20265 |
|
|
|
|
670 |
|
|
|
|
|
|
|
665 |
|
|
|
Allison Transmission, Inc. 3.75% 1/30/20315 |
|
|
|
|
3,445 |
|
|
|
|
|
|
|
3,024 |
|
|
|
Avis Budget Car Rental, LLC 5.75% 7/15/20275 |
|
|
|
|
1,025 |
|
|
|
|
|
|
|
986 |
|
|
|
Avis Budget Car Rental, LLC 4.75% 4/1/20285 |
|
|
|
|
35 |
|
|
|
|
|
|
|
32 |
|
|
|
Avis Budget Car Rental, LLC 5.375% 3/1/20295 |
|
|
|
|
2,450 |
|
|
|
|
|
|
|
2,244 |
|
|
|
Avis Budget Car Rental, LLC 8.00% 2/15/20315 |
|
|
|
|
1,665 |
|
|
|
|
|
|
|
1,651 |
|
|
|
BAE Systems PLC 5.125% 3/26/20295 |
|
|
|
|
3,403 |
|
|
|
|
|
|
|
3,389 |
|
|
|
BAE Systems PLC 5.25% 3/26/20315 |
|
|
|
|
2,663 |
|
|
|
|
|
|
|
2,657 |
|
|
|
BAE Systems PLC 5.30% 3/26/20345 |
|
|
|
|
2,772 |
|
|
|
|
|
|
|
2,748 |
|
|
|
BAE Systems PLC 5.50% 3/26/20545 |
|
|
|
|
599 |
|
|
|
|
|
|
|
586 |
|
|
|
Boeing Co. 4.875% 5/1/2025 |
|
|
|
|
946 |
|
|
|
|
|
|
|
936 |
|
|
|
Boeing Co. 3.10% 5/1/2026 |
|
|
|
|
251 |
|
|
|
|
|
|
|
238 |
|
|
|
Boeing Co. 3.25% 2/1/2028 |
|
|
|
|
2,000 |
|
|
|
|
|
|
|
1,832 |
|
|
|
Boeing Co. 5.15% 5/1/2030 |
|
|
|
|
945 |
|
|
|
|
|
|
|
908 |
|
|
|
Boeing Co. 3.625% 2/1/2031 |
|
|
|
|
178 |
|
|
|
|
|
|
|
156 |
|
|
|
Boeing Co. 6.388% 5/1/20315 |
|
|
|
|
227 |
|
|
|
|
|
|
|
231 |
|
|
|
Boeing Co. 3.60% 5/1/2034 |
|
|
|
|
2,500 |
|
|
|
|
|
|
|
2,012 |
|
|
|
Boeing Co. 6.528% 5/1/20345 |
|
|
|
|
4,274 |
|
|
|
|
|
|
|
4,378 |
|
|
|
Boeing Co. 5.805% 5/1/2050 |
|
|
|
|
3,380 |
|
|
|
|
|
|
|
3,048 |
|
|
|
Boeing Co. 6.858% 5/1/20545 |
|
|
|
|
520 |
|
|
|
|
|
|
|
534 |
|
|
|
Bombardier, Inc. 7.125% 6/15/20265 |
|
|
|
|
473 |
|
|
|
|
|
|
|
480 |
|
|
|
Bombardier, Inc. 7.875% 4/15/20275 |
|
|
|
|
1,021 |
|
|
|
|
|
|
|
1,024 |
|
|
|
Brink’s Co. (The) 6.50% 6/15/20295 |
|
|
|
|
485 |
|
|
|
|
|
|
|
491 |
|
|
|
Brink’s Co. (The) 4.625% 10/15/20275 |
|
|
|
|
2,385 |
|
|
|
|
|
|
|
2,290 |
|
|
|
Canadian Pacific Railway Co. 1.75% 12/2/2026 |
|
|
|
|
1,385 |
|
|
|
|
|
|
|
1,278 |
|
|
|
Canadian Pacific Railway Co. 3.10% 12/2/2051 |
|
|
|
|
829 |
|
|
|
|
|
|
|
551 |
|
|
|
Carrier Global Corp. 6.20% 3/15/2054 |
|
|
|
|
328 |
|
|
|
|
|
|
|
352 |
|
|
|
Chart Industries, Inc. 7.50% 1/1/20305 |
|
|
|
|
1,347 |
|
|
|
|
|
|
|
1,394 |
|
|
|
Clarivate Science Holdings Corp. 3.875% 7/1/20285 |
|
|
|
|
590 |
|
|
|
|
|
|
|
549 |
|
|
|
Clarivate Science Holdings Corp. 4.875% 7/1/20295 |
|
|
|
|
520 |
|
|
|
|
|
|
|
483 |
|
|
|
CoreLogic, Inc. 4.50% 5/1/20285 |
|
|
|
|
6,075 |
|
|
|
|
|
|
|
5,519 |
|
|
|
CSX Corp. 4.25% 3/15/2029 |
|
|
|
|
1,062 |
|
|
|
|
|
|
|
1,030 |
|
|
|
Herc Holdings, Inc. 6.625% 6/15/20295 |
|
|
|
|
660 |
|
|
|
|
|
|
|
670 |
|
|
|
Honeywell International, Inc. 2.30% 8/15/2024 |
|
|
|
|
2,640 |
|
|
|
|
|
|
|
2,629 |
|
|
|
Icahn Enterprises, LP 5.25% 5/15/2027 |
|
|
|
|
1,185 |
|
|
|
|
|
|
|
1,113 |
|
|
|
Icahn Enterprises, LP 4.375% 2/1/2029 |
|
|
|
|
1,525 |
|
|
|
|
|
|
|
1,306 |
|
|
|
L3Harris Technologies, Inc. 5.40% 7/31/2033 |
|
|
|
|
4,530 |
|
|
|
|
|
|
|
4,518 |
|
|
|
L3Harris Technologies, Inc. 5.60% 7/31/2053 |
|
|
|
|
3,945 |
|
|
|
|
|
|
|
3,916 |
|
105 American Funds Insurance Series
Asset Allocation Fund (continued)
|
|
|
|
|
|
|
|
|
|
|
|
|
|
|
|
|
| Bonds, notes & other debt instruments (continued) |
|
Principal amount (000) |
|
|
|
|
|
Value (000) |
|
| |
|
|
|
|
| Corporate bonds, notes & loans (continued) |
|
|
|
|
|
|
|
|
|
|
|
|
|
|
|
|
|
|
|
|
| Industrials (continued) |
|
Lockheed Martin Corp. 5.10% 11/15/2027 |
|
|
|
|
USD951 |
|
|
|
|
|
|
$ |
958 |
|
|
|
Lockheed Martin Corp. 4.45% 5/15/2028 |
|
|
|
|
2,906 |
|
|
|
|
|
|
|
2,863 |
|
|
|
Lockheed Martin Corp. 5.25% 1/15/2033 |
|
|
|
|
1,602 |
|
|
|
|
|
|
|
1,629 |
|
|
|
Lockheed Martin Corp. 4.75% 2/15/2034 |
|
|
|
|
4,337 |
|
|
|
|
|
|
|
4,225 |
|
|
|
Lockheed Martin Corp. 5.70% 11/15/2054 |
|
|
|
|
1,849 |
|
|
|
|
|
|
|
1,904 |
|
|
|
Masco Corp. 1.50% 2/15/2028 |
|
|
|
|
774 |
|
|
|
|
|
|
|
679 |
|
|
|
Masco Corp. 2.00% 2/15/2031 |
|
|
|
|
497 |
|
|
|
|
|
|
|
405 |
|
|
|
Masco Corp. 3.125% 2/15/2051 |
|
|
|
|
230 |
|
|
|
|
|
|
|
149 |
|
|
|
Norfolk Southern Corp. 4.45% 3/1/2033 |
|
|
|
|
654 |
|
|
|
|
|
|
|
617 |
|
|
|
Norfolk Southern Corp. 3.05% 5/15/2050 |
|
|
|
|
2,746 |
|
|
|
|
|
|
|
1,787 |
|
|
|
Norfolk Southern Corp. 5.35% 8/1/2054 |
|
|
|
|
4,136 |
|
|
|
|
|
|
|
3,947 |
|
|
|
Northrop Grumman Corp. 2.93% 1/15/2025 |
|
|
|
|
1,820 |
|
|
|
|
|
|
|
1,794 |
|
|
|
Northrop Grumman Corp. 3.25% 1/15/2028 |
|
|
|
|
3,495 |
|
|
|
|
|
|
|
3,293 |
|
|
|
Otis Worldwide Corp. 2.293% 4/5/2027 |
|
|
|
|
2,135 |
|
|
|
|
|
|
|
1,980 |
|
|
|
Reworld Holding Corp. 4.875% 12/1/20295 |
|
|
|
|
1,035 |
|
|
|
|
|
|
|
946 |
|
|
|
RTX Corp. 5.15% 2/27/2033 |
|
|
|
|
2,669 |
|
|
|
|
|
|
|
2,642 |
|
|
|
RTX Corp. 5.375% 2/27/2053 |
|
|
|
|
3,950 |
|
|
|
|
|
|
|
3,755 |
|
|
|
Spirit AeroSystems, Inc. 9.375% 11/30/20295 |
|
|
|
|
2,382 |
|
|
|
|
|
|
|
2,568 |
|
|
|
Spirit AeroSystems, Inc. 9.75% 11/15/20305 |
|
|
|
|
2,720 |
|
|
|
|
|
|
|
3,004 |
|
|
|
TransDigm, Inc. 5.50% 11/15/2027 |
|
|
|
|
2,200 |
|
|
|
|
|
|
|
2,162 |
|
|
|
TransDigm, Inc. 6.625% 3/1/20325 |
|
|
|
|
1,625 |
|
|
|
|
|
|
|
1,643 |
|
|
|
Triumph Group, Inc. 9.00% 3/15/20285 |
|
|
|
|
2,581 |
|
|
|
|
|
|
|
2,709 |
|
|
|
Union Pacific Corp. 2.40% 2/5/2030 |
|
|
|
|
2,414 |
|
|
|
|
|
|
|
2,114 |
|
|
|
Union Pacific Corp. 2.95% 3/10/2052 |
|
|
|
|
1,000 |
|
|
|
|
|
|
|
644 |
|
|
|
Union Pacific Corp. 3.839% 3/20/2060 |
|
|
|
|
546 |
|
|
|
|
|
|
|
402 |
|
|
|
Union Pacific Corp. 3.799% 4/6/2071 |
|
|
|
|
545 |
|
|
|
|
|
|
|
384 |
|
|
|
United Rentals (North America), Inc. 3.875% 2/15/2031 |
|
|
|
|
2,785 |
|
|
|
|
|
|
|
2,487 |
|
|
|
United Rentals (North America), Inc. 3.75% 1/15/2032 |
|
|
|
|
215 |
|
|
|
|
|
|
|
187 |
|
|
|
XPO, Inc. 7.125% 6/1/20315 |
|
|
|
|
800 |
|
|
|
|
|
|
|
818 |
|
|
|
|
|
|
|
|
|
|
|
|
|
|
|
|
|
|
|
|
|
|
|
|
|
|
|
|
|
|
|
|
|
114,543 |
|
|
|
|
|
|
|
|
|
|
|
|
|
|
|
|
|
|
|
|
|
|
|
|
|
|
|
|
|
|
|
|
|
|
|
| |
|
|
|
|
|
| Real estate 0.42% |
|
Alexandria Real Estate Equities, Inc. 3.80% 4/15/2026 |
|
|
|
|
315 |
|
|
|
|
|
|
|
306 |
|
|
|
Alexandria Real Estate Equities, Inc. 3.95% 1/15/2028 |
|
|
|
|
1,220 |
|
|
|
|
|
|
|
1,169 |
|
|
|
Alexandria Real Estate Equities, Inc. 2.75% 12/15/2029 |
|
|
|
|
1,940 |
|
|
|
|
|
|
|
1,706 |
|
|
|
Alexandria Real Estate Equities, Inc. 3.375% 8/15/2031 |
|
|
|
|
1,320 |
|
|
|
|
|
|
|
1,165 |
|
|
|
Alexandria Real Estate Equities, Inc. 1.875% 2/1/2033 |
|
|
|
|
4,095 |
|
|
|
|
|
|
|
3,082 |
|
|
|
Alexandria Real Estate Equities, Inc. 4.85% 4/15/2049 |
|
|
|
|
410 |
|
|
|
|
|
|
|
347 |
|
|
|
American Tower Corp. 1.45% 9/15/2026 |
|
|
|
|
2,369 |
|
|
|
|
|
|
|
2,175 |
|
|
|
American Tower Corp. 3.55% 7/15/2027 |
|
|
|
|
1,425 |
|
|
|
|
|
|
|
1,353 |
|
|
|
American Tower Corp. 3.60% 1/15/2028 |
|
|
|
|
1,000 |
|
|
|
|
|
|
|
944 |
|
|
|
American Tower Corp. 1.50% 1/31/2028 |
|
|
|
|
2,500 |
|
|
|
|
|
|
|
2,193 |
|
|
|
American Tower Corp. 2.30% 9/15/2031 |
|
|
|
|
1,500 |
|
|
|
|
|
|
|
1,224 |
|
|
|
American Tower Corp. 2.95% 1/15/2051 |
|
|
|
|
2,000 |
|
|
|
|
|
|
|
1,252 |
|
|
|
Anywhere Real Estate Group, LLC 5.75% 1/15/20295 |
|
|
|
|
3,040 |
|
|
|
|
|
|
|
1,874 |
|
|
|
Anywhere Real Estate Group, LLC 7.00% 4/15/20305 |
|
|
|
|
1,975 |
|
|
|
|
|
|
|
1,617 |
|
|
|
Boston Properties, LP 6.50% 1/15/2034 |
|
|
|
|
2,223 |
|
|
|
|
|
|
|
2,262 |
|
|
|
Equinix Europe 2 Financing Corp., LLC 5.50% 6/15/2034 |
|
|
|
|
3,235 |
|
|
|
|
|
|
|
3,231 |
|
|
|
Essex Portfolio, LP 3.50% 4/1/2025 |
|
|
|
|
6,825 |
|
|
|
|
|
|
|
6,711 |
|
|
|
Extra Space Storage, LP 2.35% 3/15/2032 |
|
|
|
|
1,385 |
|
|
|
|
|
|
|
1,104 |
|
|
|
GLP Capital, LP 3.35% 9/1/2024 |
|
|
|
|
1,263 |
|
|
|
|
|
|
|
1,259 |
|
|
|
Host Hotels & Resorts, LP 4.50% 2/1/2026 |
|
|
|
|
355 |
|
|
|
|
|
|
|
349 |
|
|
|
Howard Hughes Corp. (The) 5.375% 8/1/20285 |
|
|
|
|
1,450 |
|
|
|
|
|
|
|
1,380 |
|
|
|
Howard Hughes Corp. (The) 4.125% 2/1/20295 |
|
|
|
|
2,340 |
|
|
|
|
|
|
|
2,095 |
|
|
|
Howard Hughes Corp. (The) 4.375% 2/1/20315 |
|
|
|
|
3,520 |
|
|
|
|
|
|
|
3,034 |
|
|
|
Invitation Homes Operating Partnership, LP 2.00% 8/15/2031 |
|
|
|
|
2,401 |
|
|
|
|
|
|
|
1,907 |
|
|
|
Iron Mountain, Inc. 5.25% 7/15/20305 |
|
|
|
|
3,785 |
|
|
|
|
|
|
|
3,601 |
|
|
|
Iron Mountain, Inc. 4.50% 2/15/20315 |
|
|
|
|
2,650 |
|
|
|
|
|
|
|
2,394 |
|
|
|
Kennedy-Wilson, Inc. 4.75% 3/1/2029 |
|
|
|
|
4,045 |
|
|
|
|
|
|
|
3,464 |
|
|
|
Kennedy-Wilson, Inc. 4.75% 2/1/2030 |
|
|
|
|
2,520 |
|
|
|
|
|
|
|
2,094 |
|
American Funds Insurance Series 106
Asset Allocation Fund (continued)
|
|
|
|
|
|
|
|
|
|
|
|
|
|
|
|
|
| Bonds, notes & other debt instruments (continued) |
|
Principal amount (000) |
|
|
|
|
|
Value (000) |
|
| |
|
|
|
|
| Corporate bonds, notes & loans (continued) |
|
|
|
|
|
|
|
|
|
|
|
|
|
|
|
|
|
|
|
|
| Real estate (continued) |
|
Kennedy-Wilson, Inc. 5.00% 3/1/2031 |
|
|
|
|
USD2,260 |
|
|
|
|
|
|
$ |
1,850 |
|
|
|
Kilroy Realty, LP 6.25% 1/15/2036 |
|
|
|
|
1,468 |
|
|
|
|
|
|
|
1,395 |
|
|
|
Ladder Capital Finance Holdings LLP 4.25% 2/1/20275 |
|
|
|
|
3,842 |
|
|
|
|
|
|
|
3,643 |
|
|
|
Ladder Capital Finance Holdings LLP 4.75% 6/15/20295 |
|
|
|
|
2,295 |
|
|
|
|
|
|
|
2,122 |
|
|
|
MPT Operating Partnership, LP 5.25% 8/1/2026 |
|
|
|
|
130 |
|
|
|
|
|
|
|
118 |
|
|
|
MPT Operating Partnership, LP 5.00% 10/15/2027 |
|
|
|
|
7,152 |
|
|
|
|
|
|
|
5,913 |
|
|
|
MPT Operating Partnership, LP 4.625% 8/1/2029 |
|
|
|
|
130 |
|
|
|
|
|
|
|
95 |
|
|
|
Park Intermediate Holdings, LLC 4.875% 5/15/20295 |
|
|
|
|
2,280 |
|
|
|
|
|
|
|
2,140 |
|
|
|
Prologis, LP 4.875% 6/15/2028 |
|
|
|
|
2,357 |
|
|
|
|
|
|
|
2,346 |
|
|
|
Prologis, LP 4.75% 6/15/2033 |
|
|
|
|
4,359 |
|
|
|
|
|
|
|
4,205 |
|
|
|
Prologis, LP 5.125% 1/15/2034 |
|
|
|
|
2,000 |
|
|
|
|
|
|
|
1,977 |
|
|
|
Prologis, LP 5.00% 3/15/2034 |
|
|
|
|
4,095 |
|
|
|
|
|
|
|
4,007 |
|
|
|
Prologis, LP 5.25% 6/15/2053 |
|
|
|
|
1,365 |
|
|
|
|
|
|
|
1,289 |
|
|
|
Prologis, LP 5.25% 3/15/2054 |
|
|
|
|
615 |
|
|
|
|
|
|
|
582 |
|
|
|
Public Storage Operating Co. 1.85% 5/1/2028 |
|
|
|
|
2,490 |
|
|
|
|
|
|
|
2,216 |
|
|
|
Public Storage Operating Co. 1.95% 11/9/2028 |
|
|
|
|
2,027 |
|
|
|
|
|
|
|
1,787 |
|
|
|
Public Storage Operating Co. 2.30% 5/1/2031 |
|
|
|
|
719 |
|
|
|
|
|
|
|
605 |
|
|
|
RLJ Lodging Trust, LP 4.00% 9/15/20295 |
|
|
|
|
1,240 |
|
|
|
|
|
|
|
1,097 |
|
|
|
Scentre Group Trust 1 3.50% 2/12/20255 |
|
|
|
|
3,075 |
|
|
|
|
|
|
|
3,033 |
|
|
|
Scentre Group Trust 1 3.25% 10/28/20255 |
|
|
|
|
1,000 |
|
|
|
|
|
|
|
971 |
|
|
|
Scentre Group Trust 1 3.75% 3/23/20275 |
|
|
|
|
2,430 |
|
|
|
|
|
|
|
2,330 |
|
|
|
Service Properties Trust 5.25% 2/15/2026 |
|
|
|
|
510 |
|
|
|
|
|
|
|
494 |
|
|
|
Service Properties Trust 4.75% 10/1/2026 |
|
|
|
|
1,635 |
|
|
|
|
|
|
|
1,533 |
|
|
|
Service Properties Trust 4.95% 2/15/2027 |
|
|
|
|
1,540 |
|
|
|
|
|
|
|
1,401 |
|
|
|
Service Properties Trust 5.50% 12/15/2027 |
|
|
|
|
655 |
|
|
|
|
|
|
|
609 |
|
|
|
Service Properties Trust 3.95% 1/15/2028 |
|
|
|
|
1,270 |
|
|
|
|
|
|
|
1,065 |
|
|
|
Service Properties Trust 8.375% 6/15/2029 |
|
|
|
|
3,028 |
|
|
|
|
|
|
|
2,979 |
|
|
|
Service Properties Trust 4.95% 10/1/2029 |
|
|
|
|
270 |
|
|
|
|
|
|
|
205 |
|
|
|
Service Properties Trust 8.625% 11/15/20315 |
|
|
|
|
775 |
|
|
|
|
|
|
|
809 |
|
|
|
Service Properties Trust 8.875% 6/15/2032 |
|
|
|
|
2,078 |
|
|
|
|
|
|
|
1,940 |
|
|
|
Sun Communities Operating, LP 2.30% 11/1/2028 |
|
|
|
|
1,845 |
|
|
|
|
|
|
|
1,623 |
|
|
|
Sun Communities Operating, LP 2.70% 7/15/2031 |
|
|
|
|
876 |
|
|
|
|
|
|
|
724 |
|
|
|
UDR, Inc. 2.95% 9/1/2026 |
|
|
|
|
760 |
|
|
|
|
|
|
|
721 |
|
|
|
|
|
|
|
|
|
|
|
|
|
|
|
|
|
|
|
|
|
|
|
|
|
|
|
|
|
|
|
|
|
113,116 |
|
|
|
|
|
|
|
|
|
|
|
|
|
|
|
|
|
|
|
|
|
|
|
|
|
|
|
|
|
|
|
|
|
|
|
| |
|
|
|
|
|
| Information technology 0.41% |
|
Adobe, Inc. 1.90% 2/1/2025 |
|
|
|
|
366 |
|
|
|
|
|
|
|
358 |
|
|
|
Analog Devices, Inc. 5.05% 4/1/2034 |
|
|
|
|
1,281 |
|
|
|
|
|
|
|
1,276 |
|
|
|
Analog Devices, Inc. 5.30% 4/1/2054 |
|
|
|
|
1,762 |
|
|
|
|
|
|
|
1,721 |
|
|
|
Broadcom, Inc. 3.469% 4/15/20345 |
|
|
|
|
193 |
|
|
|
|
|
|
|
165 |
|
|
|
Cisco Systems, Inc. 4.85% 2/26/2029 |
|
|
|
|
1,388 |
|
|
|
|
|
|
|
1,388 |
|
|
|
Cisco Systems, Inc. 4.95% 2/26/2031 |
|
|
|
|
3,015 |
|
|
|
|
|
|
|
3,014 |
|
|
|
Cisco Systems, Inc. 5.05% 2/26/2034 |
|
|
|
|
112 |
|
|
|
|
|
|
|
112 |
|
|
|
Cisco Systems, Inc. 5.30% 2/26/2054 |
|
|
|
|
1,784 |
|
|
|
|
|
|
|
1,749 |
|
|
|
Cisco Systems, Inc. 5.35% 2/26/2064 |
|
|
|
|
1,812 |
|
|
|
|
|
|
|
1,765 |
|
|
|
Cloud Software Group, Inc. 6.50% 3/31/20295 |
|
|
|
|
2,000 |
|
|
|
|
|
|
|
1,922 |
|
|
|
Cloud Software Group, Inc. 9.00% 9/30/20295 |
|
|
|
|
750 |
|
|
|
|
|
|
|
728 |
|
|
|
Cloud Software Group, Inc. 8.25% 6/30/20325 |
|
|
|
|
2,975 |
|
|
|
|
|
|
|
3,034 |
|
|
|
Cloud Software Group, Inc., Term Loan,
(3-month USD CME Term SOFR + 4.00%) 9.335% 3/30/20298,13 |
|
|
|
|
5,175 |
|
|
|
|
|
|
|
5,177 |
|
|
|
CommScope Technologies, LLC 6.00% 6/15/20255 |
|
|
|
|
4,750 |
|
|
|
|
|
|
|
3,876 |
|
|
|
CommScope Technologies, LLC 5.00% 3/15/20275 |
|
|
|
|
4,553 |
|
|
|
|
|
|
|
1,892 |
|
|
|
CommScope, Inc. 6.00% 3/1/20265 |
|
|
|
|
5,865 |
|
|
|
|
|
|
|
5,154 |
|
|
|
CommScope, Inc. 8.25% 3/1/20275 |
|
|
|
|
967 |
|
|
|
|
|
|
|
460 |
|
|
|
CommScope, Inc. 7.125% 7/1/20285 |
|
|
|
|
908 |
|
|
|
|
|
|
|
377 |
|
|
|
CommScope, Inc., Term Loan B,
(3-month USD CME Term SOFR + 3.25%) 8.708% 4/6/20268,13 |
|
|
|
|
4,645 |
|
|
|
|
|
|
|
4,195 |
|
|
|
Diebold Nixdorf, Inc., Term Loan,
(3-month USD CME Term SOFR + 7.50%)
12.826% 8/11/20285,8,13 |
|
|
|
|
17,116 |
|
|
|
|
|
|
|
17,733 |
|
107 American Funds Insurance Series
Asset Allocation Fund (continued)
|
|
|
|
|
|
|
|
|
|
|
|
|
|
|
|
|
| Bonds, notes & other debt instruments (continued) |
|
Principal amount (000) |
|
|
|
|
|
Value (000) |
|
| |
|
|
|
|
| Corporate bonds, notes & loans (continued) |
|
|
|
|
|
|
|
|
|
|
|
|
|
|
|
|
|
|
|
|
| Information technology (continued) |
|
Finastra USA, Inc., Term Loan B,
(3-month USD CME Term SOFR + 7.25%) 12.459% 9/13/20293,8,13 |
|
|
|
|
USD2,640 |
|
|
|
|
|
|
$ |
2,654 |
|
|
|
Finastra USA, Inc., Term Loan,
(3-month USD CME Term SOFR + 7.25%) 12.581% 9/13/20293,8,13 |
|
|
|
|
29 |
|
|
|
|
|
|
|
29 |
|
|
|
Hughes Satellite Systems Corp. 5.25% 8/1/2026 |
|
|
|
|
12,971 |
|
|
|
|
|
|
|
10,054 |
|
|
|
Hughes Satellite Systems Corp. 6.625% 8/1/2026 |
|
|
|
|
8,528 |
|
|
|
|
|
|
|
3,974 |
|
|
|
Intel Corp. 5.20% 2/10/2033 |
|
|
|
|
2,625 |
|
|
|
|
|
|
|
2,622 |
|
|
|
Intuit, Inc. 0.95% 7/15/2025 |
|
|
|
|
1,530 |
|
|
|
|
|
|
|
1,463 |
|
|
|
Intuit, Inc. 1.35% 7/15/2027 |
|
|
|
|
1,395 |
|
|
|
|
|
|
|
1,258 |
|
|
|
ION Trading Technologies SARL 9.50% 5/30/20295 |
|
|
|
|
560 |
|
|
|
|
|
|
|
571 |
|
|
|
Microchip Technology, Inc. 5.05% 3/15/2029 |
|
|
|
|
4,750 |
|
|
|
|
|
|
|
4,713 |
|
|
|
Microsoft Corp. 2.921% 3/17/2052 |
|
|
|
|
4,814 |
|
|
|
|
|
|
|
3,271 |
|
|
|
NCR Atleos Corp. 9.50% 4/1/20295 |
|
|
|
|
5,144 |
|
|
|
|
|
|
|
5,564 |
|
|
|
NCR Voyix Corp. 5.125% 4/15/20295 |
|
|
|
|
1,650 |
|
|
|
|
|
|
|
1,555 |
|
|
|
Synaptics, Inc. 4.00% 6/15/20295 |
|
|
|
|
875 |
|
|
|
|
|
|
|
794 |
|
|
|
Texas Instruments, Inc. 4.60% 2/8/2029 |
|
|
|
|
2,480 |
|
|
|
|
|
|
|
2,467 |
|
|
|
Texas Instruments, Inc. 4.85% 2/8/2034 |
|
|
|
|
1,343 |
|
|
|
|
|
|
|
1,331 |
|
|
|
Unisys Corp. 6.875% 11/1/20275 |
|
|
|
|
725 |
|
|
|
|
|
|
|
637 |
|
|
|
Viasat, Inc. 5.625% 9/15/20255 |
|
|
|
|
1,525 |
|
|
|
|
|
|
|
1,481 |
|
|
|
Viasat, Inc. 5.625% 4/15/20275 |
|
|
|
|
2,475 |
|
|
|
|
|
|
|
2,217 |
|
|
|
Viasat, Inc. 6.50% 7/15/20285 |
|
|
|
|
1,275 |
|
|
|
|
|
|
|
967 |
|
|
|
Viasat, Inc. 7.50% 5/30/20315 |
|
|
|
|
6,147 |
|
|
|
|
|
|
|
4,091 |
|
|
|
Viavi Solutions, Inc. 3.75% 10/1/20295 |
|
|
|
|
725 |
|
|
|
|
|
|
|
613 |
|
|
|
Wolfspeed, Inc. 9.875% 6/23/2030 (10.875% on 6/23/2026)2,3,10 |
|
|
|
|
1,005 |
|
|
|
|
|
|
|
978 |
|
|
|
|
|
|
|
|
|
|
|
|
|
|
|
|
|
|
|
|
|
|
|
|
|
|
|
|
|
|
|
|
|
109,400 |
|
|
|
|
|
|
|
|
|
|
|
|
|
|
|
|
|
|
|
|
|
|
|
|
|
|
|
|
|
|
|
|
|
|
|
| |
|
|
|
|
|
| Materials 0.33% |
|
ATI, Inc. 4.875% 10/1/2029 |
|
|
|
|
710 |
|
|
|
|
|
|
|
665 |
|
|
|
ATI, Inc. 5.125% 10/1/2031 |
|
|
|
|
1,110 |
|
|
|
|
|
|
|
1,027 |
|
|
|
Avient Corp. 7.125% 8/1/20305 |
|
|
|
|
855 |
|
|
|
|
|
|
|
872 |
|
|
|
Ball Corp. 3.125% 9/15/2031 |
|
|
|
|
3,520 |
|
|
|
|
|
|
|
2,980 |
|
|
|
CAN-PACK Spolka Akcyjna 3.875% 11/15/20295 |
|
|
|
|
935 |
|
|
|
|
|
|
|
839 |
|
|
|
Celanese US Holdings, LLC 6.165% 7/15/2027 |
|
|
|
|
3,500 |
|
|
|
|
|
|
|
3,554 |
|
|
|
Celanese US Holdings, LLC 6.55% 11/15/2030 |
|
|
|
|
2,791 |
|
|
|
|
|
|
|
2,918 |
|
|
|
Celanese US Holdings, LLC 6.70% 11/15/2033 |
|
|
|
|
1,806 |
|
|
|
|
|
|
|
1,899 |
|
|
|
Cleveland-Cliffs, Inc. 5.875% 6/1/2027 |
|
|
|
|
5,425 |
|
|
|
|
|
|
|
5,392 |
|
|
|
Cleveland-Cliffs, Inc. 4.625% 3/1/20295 |
|
|
|
|
2,525 |
|
|
|
|
|
|
|
2,393 |
|
|
|
Cleveland-Cliffs, Inc. 6.75% 4/15/20305 |
|
|
|
|
2,275 |
|
|
|
|
|
|
|
2,254 |
|
|
|
Cleveland-Cliffs, Inc. 4.875% 3/1/20315 |
|
|
|
|
775 |
|
|
|
|
|
|
|
687 |
|
|
|
Cleveland-Cliffs, Inc. 7.00% 3/15/20325 |
|
|
|
|
1,570 |
|
|
|
|
|
|
|
1,554 |
|
|
|
Consolidated Energy Finance SA 12.00% 2/15/20315 |
|
|
|
|
1,630 |
|
|
|
|
|
|
|
1,683 |
|
|
|
CVR Partners, LP 6.125% 6/15/20285 |
|
|
|
|
925 |
|
|
|
|
|
|
|
890 |
|
|
|
Dow Chemical Co. (The) 4.80% 5/15/2049 |
|
|
|
|
485 |
|
|
|
|
|
|
|
414 |
|
|
|
Dow Chemical Co. (The) 3.60% 11/15/2050 |
|
|
|
|
1,180 |
|
|
|
|
|
|
|
823 |
|
|
|
First Quantum Minerals, Ltd. 6.875% 10/15/20275 |
|
|
|
|
7,545 |
|
|
|
|
|
|
|
7,379 |
|
|
|
First Quantum Minerals, Ltd. 9.375% 3/1/20295 |
|
|
|
|
5,370 |
|
|
|
|
|
|
|
5,618 |
|
|
|
FXI Holdings, Inc. 12.25% 11/15/20265 |
|
|
|
|
4,517 |
|
|
|
|
|
|
|
4,487 |
|
|
|
FXI Holdings, Inc. 12.25% 11/15/20265 |
|
|
|
|
2,181 |
|
|
|
|
|
|
|
2,171 |
|
|
|
INEOS Finance PLC 6.75% 5/15/20285 |
|
|
|
|
1,985 |
|
|
|
|
|
|
|
1,991 |
|
|
|
INEOS Finance PLC 7.50% 4/15/20295 |
|
|
|
|
805 |
|
|
|
|
|
|
|
814 |
|
|
|
International Flavors & Fragrances, Inc. 1.832% 10/15/20275 |
|
|
|
|
5,400 |
|
|
|
|
|
|
|
4,824 |
|
|
|
Kaiser Aluminum Corp. 4.625% 3/1/20285 |
|
|
|
|
2,495 |
|
|
|
|
|
|
|
2,337 |
|
|
|
Linde, Inc. 1.10% 8/10/2030 |
|
|
|
|
2,938 |
|
|
|
|
|
|
|
2,369 |
|
|
|
LSB Industries, Inc. 6.25% 10/15/20285 |
|
|
|
|
1,560 |
|
|
|
|
|
|
|
1,506 |
|
|
|
LYB International Finance III, LLC 2.25% 10/1/2030 |
|
|
|
|
1,198 |
|
|
|
|
|
|
|
1,013 |
|
|
|
LYB International Finance III, LLC 4.20% 5/1/2050 |
|
|
|
|
1,186 |
|
|
|
|
|
|
|
904 |
|
|
|
Methanex Corp. 5.125% 10/15/2027 |
|
|
|
|
6,305 |
|
|
|
|
|
|
|
6,086 |
|
|
|
Mineral Resources, Ltd. 9.25% 10/1/20285 |
|
|
|
|
945 |
|
|
|
|
|
|
|
993 |
|
|
|
Mineral Resources, Ltd. 8.50% 5/1/20305 |
|
|
|
|
1,525 |
|
|
|
|
|
|
|
1,581 |
|
|
|
Mosaic Co. 4.05% 11/15/2027 |
|
|
|
|
1,050 |
|
|
|
|
|
|
|
1,008 |
|
American Funds Insurance Series 108
Asset Allocation Fund (continued)
|
|
|
|
|
|
|
|
|
|
|
|
|
|
|
|
|
| Bonds, notes & other debt instruments (continued) |
|
Principal amount (000) |
|
|
|
|
|
Value (000) |
|
| |
|
|
|
|
| Corporate bonds, notes & loans (continued) |
|
|
|
|
|
|
|
|
|
|
|
|
|
|
| |
|
|
|
|
|
| Materials (continued) |
|
NOVA Chemicals Corp. 4.25% 5/15/20295 |
|
|
|
|
USD1,875 |
|
|
|
|
|
|
$ |
1,655 |
|
|
|
NOVA Chemicals Corp. 9.00% 2/15/20305 |
|
|
|
|
775 |
|
|
|
|
|
|
|
819 |
|
|
|
Novelis Corp. 3.875% 8/15/20315 |
|
|
|
|
1,115 |
|
|
|
|
|
|
|
966 |
|
|
|
SCIH Salt Holdings, Inc. 4.875% 5/1/20285 |
|
|
|
|
3,485 |
|
|
|
|
|
|
|
3,246 |
|
|
|
SCIH Salt Holdings, Inc. 6.625% 5/1/20295 |
|
|
|
|
1,230 |
|
|
|
|
|
|
|
1,158 |
|
|
|
Venator Material, LLC, Term Loan,
(3-month USD CME Term SOFR + 2.00%) 8.00% PIK and 7.31% Cash
1/16/20268,13,15 |
|
|
|
|
556 |
|
|
|
|
|
|
|
562 |
|
|
|
Venator Material, LLC, Term Loan,
(USD-SOFR + 10.00%) 8.00% PIK and 7.33% Cash 10/10/20288,13,15 |
|
|
|
|
1,169 |
|
|
|
|
|
|
|
1,164 |
|
|
|
Warrior Met Coal, Inc. 7.875% 12/1/20285 |
|
|
|
|
2,212 |
|
|
|
|
|
|
|
2,261 |
|
|
|
Westlake Corp. 4.375% 11/15/2047 |
|
|
|
|
500 |
|
|
|
|
|
|
|
406 |
|
|
|
|
|
|
|
|
|
|
|
|
|
|
|
|
|
|
|
|
|
|
|
|
|
|
|
|
|
|
|
|
|
88,162 |
|
|
|
|
|
|
|
|
|
|
|
|
|
|
|
|
|
|
|
|
|
|
|
|
|
|
|
|
|
|
|
|
|
|
|
| |
|
|
|
|
|
| Utilities 0.25% |
|
Ameren Corp. 2.50% 9/15/2024 |
|
|
|
|
969 |
|
|
|
|
|
|
|
962 |
|
|
|
Calpine Corp. 3.75% 3/1/20315 |
|
|
|
|
1,975 |
|
|
|
|
|
|
|
1,747 |
|
|
|
Commonwealth Edison Co. 4.35% 11/15/2045 |
|
|
|
|
1,085 |
|
|
|
|
|
|
|
915 |
|
|
|
Commonwealth Edison Co. 3.85% 3/15/2052 |
|
|
|
|
2,600 |
|
|
|
|
|
|
|
1,928 |
|
|
|
Duke Energy Indiana, LLC 3.25% 10/1/2049 |
|
|
|
|
850 |
|
|
|
|
|
|
|
570 |
|
|
|
Duke Energy Progress, LLC 3.70% 10/15/2046 |
|
|
|
|
457 |
|
|
|
|
|
|
|
341 |
|
|
|
Duke Energy Progress, LLC 2.50% 8/15/2050 |
|
|
|
|
202 |
|
|
|
|
|
|
|
116 |
|
|
|
Duke Energy Progress, LLC 2.90% 8/15/2051 |
|
|
|
|
91 |
|
|
|
|
|
|
|
56 |
|
|
|
EDP Finance BV 3.625% 7/15/20245 |
|
|
|
|
4,100 |
|
|
|
|
|
|
|
4,096 |
|
|
|
Electricité de France SA 6.25% 5/23/20335 |
|
|
|
|
1,075 |
|
|
|
|
|
|
|
1,113 |
|
|
|
Electricité de France SA 9.125% junior subordinated perpetual bonds
(5-year UST Yield Curve Rate T Note Constant Maturity + 5.411% on 6/15/ 2033)5,10 |
|
|
|
|
1,475 |
|
|
|
|
|
|
|
1,608 |
|
|
|
Emera US Finance, LP 3.55% 6/15/2026 |
|
|
|
|
320 |
|
|
|
|
|
|
|
307 |
|
|
|
Enel Américas SA 4.00% 10/25/2026 |
|
|
|
|
245 |
|
|
|
|
|
|
|
235 |
|
|
|
Entergy Corp. 2.80% 6/15/2030 |
|
|
|
|
2,302 |
|
|
|
|
|
|
|
2,012 |
|
|
|
FirstEnergy Transmission, LLC 2.866% 9/15/20285 |
|
|
|
|
675 |
|
|
|
|
|
|
|
617 |
|
|
|
MidAmerican Energy Co. 5.85% 9/15/2054 |
|
|
|
|
875 |
|
|
|
|
|
|
|
897 |
|
|
|
NextEra Energy Capital Holdings, Inc. 6.051% 3/1/2025 |
|
|
|
|
650 |
|
|
|
|
|
|
|
651 |
|
|
|
Oncor Electric Delivery Co., LLC 5.65% 11/15/2033 |
|
|
|
|
4,625 |
|
|
|
|
|
|
|
4,747 |
|
|
|
Pacific Gas and Electric Co. 2.10% 8/1/2027 |
|
|
|
|
125 |
|
|
|
|
|
|
|
113 |
|
|
|
Pacific Gas and Electric Co. 2.50% 2/1/2031 |
|
|
|
|
2,941 |
|
|
|
|
|
|
|
2,426 |
|
|
|
Pacific Gas and Electric Co. 6.95% 3/15/2034 |
|
|
|
|
2,425 |
|
|
|
|
|
|
|
2,613 |
|
|
|
Pacific Gas and Electric Co. 3.30% 8/1/2040 |
|
|
|
|
100 |
|
|
|
|
|
|
|
71 |
|
|
|
Pacific Gas and Electric Co. 3.50% 8/1/2050 |
|
|
|
|
1,250 |
|
|
|
|
|
|
|
817 |
|
|
|
PacifiCorp 5.30% 2/15/2031 |
|
|
|
|
3,953 |
|
|
|
|
|
|
|
3,942 |
|
|
|
PacifiCorp 5.45% 2/15/2034 |
|
|
|
|
3,450 |
|
|
|
|
|
|
|
3,409 |
|
|
|
PacifiCorp 4.125% 1/15/2049 |
|
|
|
|
3,500 |
|
|
|
|
|
|
|
2,675 |
|
|
|
PacifiCorp 5.35% 12/1/2053 |
|
|
|
|
419 |
|
|
|
|
|
|
|
381 |
|
|
|
PacifiCorp 5.80% 1/15/2055 |
|
|
|
|
2,075 |
|
|
|
|
|
|
|
2,011 |
|
|
|
PG&E Corp. 5.00% 7/1/2028 |
|
|
|
|
3,750 |
|
|
|
|
|
|
|
3,612 |
|
|
|
PG&E Corp. 5.25% 7/1/2030 |
|
|
|
|
3,400 |
|
|
|
|
|
|
|
3,250 |
|
|
|
Public Service Electric and Gas Co. 3.60% 12/1/2047 |
|
|
|
|
548 |
|
|
|
|
|
|
|
410 |
|
|
|
Public Service Electric and Gas Co. 3.15% 1/1/2050 |
|
|
|
|
2,451 |
|
|
|
|
|
|
|
1,681 |
|
|
|
Southern California Edison Co. 2.85% 8/1/2029 |
|
|
|
|
4,450 |
|
|
|
|
|
|
|
3,999 |
|
|
|
Southern California Edison Co. 5.45% 6/1/2031 |
|
|
|
|
2,500 |
|
|
|
|
|
|
|
2,519 |
|
|
|
Southern California Edison Co. 5.20% 6/1/2034 |
|
|
|
|
2,522 |
|
|
|
|
|
|
|
2,464 |
|
|
|
Southern California Edison Co. 5.75% 4/1/2035 |
|
|
|
|
675 |
|
|
|
|
|
|
|
689 |
|
|
|
Southern California Edison Co. 5.35% 7/15/2035 |
|
|
|
|
3,000 |
|
|
|
|
|
|
|
2,974 |
|
|
|
Southern California Edison Co. 4.00% 4/1/2047 |
|
|
|
|
264 |
|
|
|
|
|
|
|
202 |
|
|
|
Virginia Electric & Power 2.40% 3/30/2032 |
|
|
|
|
2,575 |
|
|
|
|
|
|
|
2,117 |
|
|
|
Xcel Energy, Inc. 2.60% 12/1/2029 |
|
|
|
|
1,131 |
|
|
|
|
|
|
|
987 |
|
|
|
|
|
|
|
|
|
|
|
|
|
|
|
|
|
|
|
|
|
|
|
|
|
|
|
|
|
|
|
|
|
66,280 |
|
|
|
|
|
|
|
|
|
|
|
|
|
|
|
|
|
|
109 American Funds Insurance Series
Asset Allocation Fund (continued)
|
|
|
|
|
|
|
|
|
|
|
|
|
|
|
|
|
| Bonds, notes & other debt instruments (continued) |
|
Principal amount (000) |
|
|
|
|
|
Value (000) |
|
| |
|
|
|
|
| Corporate bonds, notes & loans (continued) |
|
|
|
|
|
|
|
|
|
|
|
|
|
|
| |
|
|
|
|
|
| Consumer staples 0.21% |
|
7-Eleven, Inc. 0.95% 2/10/20265 |
|
|
|
|
USD825 |
|
|
|
|
|
|
$ |
769 |
|
|
|
7-Eleven, Inc. 1.30% 2/10/20285 |
|
|
|
|
2,500 |
|
|
|
|
|
|
|
2,179 |
|
|
|
Anheuser-Busch InBev Worldwide, Inc. 4.35% 6/1/2040 |
|
|
|
|
2,500 |
|
|
|
|
|
|
|
2,205 |
|
|
|
Anheuser-Busch InBev Worldwide, Inc. 4.60% 4/15/2048 |
|
|
|
|
290 |
|
|
|
|
|
|
|
257 |
|
|
|
BAT Capital Corp. 6.343% 8/2/2030 |
|
|
|
|
1,191 |
|
|
|
|
|
|
|
1,242 |
|
|
|
BAT Capital Corp. 6.421% 8/2/2033 |
|
|
|
|
1,290 |
|
|
|
|
|
|
|
1,349 |
|
|
|
BAT Capital Corp. 7.079% 8/2/2043 |
|
|
|
|
2,075 |
|
|
|
|
|
|
|
2,188 |
|
|
|
BAT Capital Corp. 4.54% 8/15/2047 |
|
|
|
|
627 |
|
|
|
|
|
|
|
483 |
|
|
|
Central Garden & Pet Co. 4.125% 4/30/20315 |
|
|
|
|
1,395 |
|
|
|
|
|
|
|
1,232 |
|
|
|
Coca-Cola Co. 1.00% 3/15/2028 |
|
|
|
|
940 |
|
|
|
|
|
|
|
825 |
|
|
|
Conagra Brands, Inc. 1.375% 11/1/2027 |
|
|
|
|
4,615 |
|
|
|
|
|
|
|
4,067 |
|
|
|
Constellation Brands, Inc. 3.60% 2/15/2028 |
|
|
|
|
625 |
|
|
|
|
|
|
|
593 |
|
|
|
Constellation Brands, Inc. 2.25% 8/1/2031 |
|
|
|
|
1,487 |
|
|
|
|
|
|
|
1,221 |
|
|
|
Coty, Inc. 4.75% 1/15/20295 |
|
|
|
|
1,680 |
|
|
|
|
|
|
|
1,598 |
|
|
|
J. M. Smucker Co. (The) 5.90% 11/15/2028 |
|
|
|
|
2,662 |
|
|
|
|
|
|
|
2,743 |
|
|
|
J. M. Smucker Co. (The) 6.20% 11/15/2033 |
|
|
|
|
1,734 |
|
|
|
|
|
|
|
1,822 |
|
|
|
J. M. Smucker Co. (The) 6.50% 11/15/2043 |
|
|
|
|
256 |
|
|
|
|
|
|
|
270 |
|
|
|
J. M. Smucker Co. (The) 6.50% 11/15/2053 |
|
|
|
|
899 |
|
|
|
|
|
|
|
967 |
|
|
|
Kronos Acquisition Holdings, Inc. 5.00% 12/31/20265 |
|
|
|
|
965 |
|
|
|
|
|
|
|
988 |
|
|
|
Lamb Weston Holdings, Inc. 4.125% 1/31/20305 |
|
|
|
|
2,210 |
|
|
|
|
|
|
|
2,008 |
|
|
|
PepsiCo, Inc. 3.625% 3/19/2050 |
|
|
|
|
633 |
|
|
|
|
|
|
|
482 |
|
|
|
Philip Morris International, Inc. 3.25% 11/10/2024 |
|
|
|
|
2,000 |
|
|
|
|
|
|
|
1,983 |
|
|
|
Philip Morris International, Inc. 5.125% 11/17/2027 |
|
|
|
|
3,073 |
|
|
|
|
|
|
|
3,074 |
|
|
|
Philip Morris International, Inc. 4.875% 2/15/2028 |
|
|
|
|
6,000 |
|
|
|
|
|
|
|
5,950 |
|
|
|
Philip Morris International, Inc. 5.625% 11/17/2029 |
|
|
|
|
1,482 |
|
|
|
|
|
|
|
1,514 |
|
|
|
Philip Morris International, Inc. 5.125% 2/15/2030 |
|
|
|
|
4,166 |
|
|
|
|
|
|
|
4,153 |
|
|
|
Philip Morris International, Inc. 5.125% 2/13/2031 |
|
|
|
|
2,275 |
|
|
|
|
|
|
|
2,252 |
|
|
|
Philip Morris International, Inc. 5.25% 2/13/2034 |
|
|
|
|
3,109 |
|
|
|
|
|
|
|
3,051 |
|
|
|
Post Holdings, Inc. 4.625% 4/15/20305 |
|
|
|
|
2,886 |
|
|
|
|
|
|
|
2,654 |
|
|
|
Post Holdings, Inc. 6.25% 2/15/20325 |
|
|
|
|
279 |
|
|
|
|
|
|
|
280 |
|
|
|
Prestige Brands, Inc. 3.75% 4/1/20315 |
|
|
|
|
1,115 |
|
|
|
|
|
|
|
971 |
|
|
|
Reynolds American, Inc. 5.85% 8/15/2045 |
|
|
|
|
2,030 |
|
|
|
|
|
|
|
1,874 |
|
|
|
Simmons Foods, Inc. 4.625% 3/1/20295 |
|
|
|
|
560 |
|
|
|
|
|
|
|
493 |
|
|
|
United Natural Foods, Inc. 6.75% 10/15/20285 |
|
|
|
|
500 |
|
|
|
|
|
|
|
452 |
|
|
|
|
|
|
|
|
|
|
|
|
|
|
|
|
|
|
|
|
|
|
|
|
|
|
|
|
|
|
|
|
|
58,189 |
|
|
|
|
|
|
|
|
|
|
|
|
|
|
|
|
|
|
|
|
Total corporate bonds, notes & loans |
|
|
|
|
|
|
|
|
|
|
|
|
1,588,390 |
|
|
|
|
|
|
|
|
|
|
|
|
|
|
|
|
|
|
|
|
|
|
|
| Asset-backed obligations 2.30% |
|
|
|
|
|
|
|
|
|
|
|
|
|
|
|
|
Affirm Asset Securitization Trust, Series 2021-Z2, Class A, 1.17% 11/16/20265,7 |
|
|
|
|
167 |
|
|
|
|
|
|
|
165 |
|
|
|
Affirm, Inc., Series 2024-A, Class A, 5.61% 2/15/20295,7 |
|
|
|
|
2,962 |
|
|
|
|
|
|
|
2,954 |
|
|
|
Affirm, Inc., Series 2024-X1, Class A, 6.27% 5/15/20295,7 |
|
|
|
|
2,788 |
|
|
|
|
|
|
|
2,791 |
|
|
|
American Express Credit Account Master Trust, Series 2022-3, Class A,
3.75% 8/16/20277 |
|
|
|
|
12,228 |
|
|
|
|
|
|
|
12,012 |
|
|
|
AmeriCredit Automobile Receivables Trust, Series 2023-1, Class A2A,
5.84% 10/19/20267 |
|
|
|
|
1,414 |
|
|
|
|
|
|
|
1,414 |
|
|
|
Avis Budget Rental Car Funding (AESOP), LLC, Series 2020-2, Class A,
2.02% 2/20/20275,7 |
|
|
|
|
20,244 |
|
|
|
|
|
|
|
19,232 |
|
|
|
Avis Budget Rental Car Funding (AESOP), LLC, Series 2020-2A, Class B,
2.96% 2/20/20275,7 |
|
|
|
|
138 |
|
|
|
|
|
|
|
132 |
|
|
|
Avis Budget Rental Car Funding (AESOP), LLC, Series 2021-1A, Class A,
1.38% 8/20/20275,7 |
|
|
|
|
11,617 |
|
|
|
|
|
|
|
10,736 |
|
|
|
Avis Budget Rental Car Funding (AESOP), LLC, Series 2023-5, Class A,
5.78% 4/20/20285,7 |
|
|
|
|
32,377 |
|
|
|
|
|
|
|
32,642 |
|
|
|
Avis Budget Rental Car Funding (AESOP), LLC, Series 2023-6, Class A,
5.81% 12/20/20295,7 |
|
|
|
|
5,535 |
|
|
|
|
|
|
|
5,618 |
|
|
|
Ballyrock, Ltd., CLO, Series 2019-2A, Class A1R,
(3-month USD CME Term SOFR + 1.40%) 6.714% 2/20/20365,7,8 |
|
|
|
|
7,810 |
|
|
|
|
|
|
|
7,822 |
|
|
|
Bank of America Credit Card Trust, Series 2022-A2, Class A2, 5.00% 4/17/20287 |
|
|
|
|
6,633 |
|
|
|
|
|
|
|
6,611 |
|
|
|
Bank of America Credit Card Trust, Series 2024-A1, Class A, 4.93% 5/15/20297 |
|
|
|
|
10,137 |
|
|
|
|
|
|
|
10,150 |
|
American Funds Insurance Series 110
Asset Allocation Fund (continued)
|
|
|
|
|
|
|
|
|
|
|
|
|
|
|
|
|
| Bonds, notes & other debt instruments (continued) |
|
Principal amount (000) |
|
|
|
|
|
Value (000) |
|
| |
|
|
|
|
| Asset-backed obligations (continued) |
|
|
|
|
|
|
|
|
|
|
|
|
|
|
|
|
Bankers Healthcare Group Securitization Trust, Series 2021-A, Class A,
1.42% 11/17/20335,7 |
|
|
|
|
USD282 |
|
|
|
|
|
|
$ |
270 |
|
|
|
BofA Auto Trust, Series 2024-1, Class A3, 5.35% 11/15/20285,7 |
|
|
|
|
2,756 |
|
|
|
|
|
|
|
2,766 |
|
|
|
CarMax Auto Owner Trust, Series 2024-2, Class A2A, 5.65% 5/17/20277 |
|
|
|
|
4,737 |
|
|
|
|
|
|
|
4,744 |
|
|
|
CarMax Select Receivables Trust, Series 2024-A, Class A2A, 5.78% 9/15/20277 |
|
|
|
|
1,259 |
|
|
|
|
|
|
|
1,259 |
|
|
|
Castlelake Aircraft Securitization Trust, Series 2021-1, Class A, 2.868% 5/11/20375,7 |
|
|
|
|
4,411 |
|
|
|
|
|
|
|
3,940 |
|
|
|
Castlelake Aircraft Securitization Trust, Series 2017-1R, Class A, 2.741% 8/15/20415,7 |
|
|
|
|
283 |
|
|
|
|
|
|
|
264 |
|
|
|
Cent CLO, Ltd., Series 2014-21A, Class AR,
(3-month USD CME Term SOFR + 1.231%) 6.556% 7/27/20305,7,8 |
|
|
|
|
1,461 |
|
|
|
|
|
|
|
1,462 |
|
|
|
CF Hippolyta, LLC, Series 2020-1, Class A1, 1.69% 7/15/20605,7 |
|
|
|
|
5,140 |
|
|
|
|
|
|
|
4,873 |
|
|
|
CF Hippolyta, LLC, Series 2020-1, Class A2, 1.99% 7/15/20605,7 |
|
|
|
|
1,716 |
|
|
|
|
|
|
|
1,493 |
|
|
|
CF Hippolyta, LLC, Series 2021-1, Class A1, 1.53% 3/15/20615,7 |
|
|
|
|
6,034 |
|
|
|
|
|
|
|
5,531 |
|
|
|
Chase Auto Owner Trust, Series 2024-2, Class A2, 5.66% 5/26/20275,7 |
|
|
|
|
5,525 |
|
|
|
|
|
|
|
5,528 |
|
|
|
Chase Auto Owner Trust, Series 2024-3, Class A2, 5.53% 9/27/20275,7 |
|
|
|
|
5,646 |
|
|
|
|
|
|
|
5,653 |
|
|
|
Chase Auto Owner Trust, Series 2024-3, Class A3, 5.22% 7/25/20295,7 |
|
|
|
|
4,751 |
|
|
|
|
|
|
|
4,752 |
|
|
|
Chase Issuance Trust, Series 2024-A1, Class A, 4.60% 1/16/20297 |
|
|
|
|
10,475 |
|
|
|
|
|
|
|
10,387 |
|
|
|
Chase Issuance Trust, Series 2024-A2, Class A, 4.63% 1/15/20317 |
|
|
|
|
3,278 |
|
|
|
|
|
|
|
3,259 |
|
|
|
Citibank Credit Card Issuance Trust, Series 2023-A1, Class A1, 5.23% 12/8/20277 |
|
|
|
|
4,553 |
|
|
|
|
|
|
|
4,551 |
|
|
|
CLI Funding VI, LLC, Series 2020-2A, Class A, 2.03% 9/15/20455,7 |
|
|
|
|
1,159 |
|
|
|
|
|
|
|
1,046 |
|
|
|
CLI Funding VI, LLC, Series 2020-1A, Class A, 2.08% 9/18/20455,7 |
|
|
|
|
4,344 |
|
|
|
|
|
|
|
3,917 |
|
|
|
CLI Funding VI, LLC, Series 2020-3A, Class A, 2.07% 10/18/20455,7 |
|
|
|
|
926 |
|
|
|
|
|
|
|
838 |
|
|
|
CLI Funding VIII, LLC, Series 2021-1A, Class A, 1.64% 2/18/20465,7 |
|
|
|
|
1,286 |
|
|
|
|
|
|
|
1,144 |
|
|
|
CNH Equipment Trust, Series 2024-B, Class A2A, 5.42% 10/15/20277 |
|
|
|
|
4,015 |
|
|
|
|
|
|
|
4,018 |
|
|
|
CPS Auto Trust, Series 2024-C, Class A, 5.88% 2/15/20285,7 |
|
|
|
|
2,347 |
|
|
|
|
|
|
|
2,350 |
|
|
|
Credit Acceptance Auto Loan Trust, Series 2023-3, Class A, 6.39% 8/15/20335,7 |
|
|
|
|
1,958 |
|
|
|
|
|
|
|
1,983 |
|
|
|
Daimler Trucks Retail Trust, Series 2024-1, Class A2, 5.60% 4/15/20267 |
|
|
|
|
4,594 |
|
|
|
|
|
|
|
4,595 |
|
|
|
Daimler Trucks Retail Trust, Series 2024-1, Class A3, 5.49% 12/15/20277 |
|
|
|
|
3,457 |
|
|
|
|
|
|
|
3,470 |
|
|
|
DriveTime Auto Owner Trust, Series 2022-3, Class A, 6.05% 10/15/20265,7 |
|
|
|
|
716 |
|
|
|
|
|
|
|
716 |
|
|
|
DriveTime Auto Owner Trust, Series 2023-2, Class A, 5.88% 4/15/20275,7 |
|
|
|
|
1,279 |
|
|
|
|
|
|
|
1,279 |
|
|
|
Dryden Senior Loan Fund, CLO, Series 2017-47A, Class A1R,
(3-month USD CME Term SOFR + 1.242%) 6.57% 4/15/20285,7,8 |
|
|
|
|
1,871 |
|
|
|
|
|
|
|
1,873 |
|
|
|
EDvestinU Private Education Loan, LLC, Series 2021-A, Class A, 1.80% 11/25/20455,7 |
|
|
|
|
273 |
|
|
|
|
|
|
|
244 |
|
|
|
Enterprise Fleet Financing, LLC, Series 2024-2, Class A2, 5.74% 12/20/20265,7 |
|
|
|
|
960 |
|
|
|
|
|
|
|
963 |
|
|
|
Enterprise Fleet Financing, LLC, Series 2022-1, Class A2, 3.03% 1/20/20285,7 |
|
|
|
|
2,073 |
|
|
|
|
|
|
|
2,053 |
|
|
|
Enterprise Fleet Financing, LLC, Series 2022-3, Class A2, 4.38% 7/20/20295,7 |
|
|
|
|
1,856 |
|
|
|
|
|
|
|
1,838 |
|
|
|
Enterprise Fleet Financing, LLC, Series 2022-4, Class A2, 5.76% 10/22/20295,7 |
|
|
|
|
3,404 |
|
|
|
|
|
|
|
3,407 |
|
|
|
First National Master Note Trust, Series 2024-1, Class A, 5.34% 5/15/20307 |
|
|
|
|
4,430 |
|
|
|
|
|
|
|
4,452 |
|
|
|
FirstKey Homes Trust, Series 2020-SFR2, Class A, 1.266% 10/19/20375,7 |
|
|
|
|
5,699 |
|
|
|
|
|
|
|
5,399 |
|
|
|
Flagship Credit Auto Trust, Series 2022-4, Class A2, 6.15% 9/15/20265,7 |
|
|
|
|
648 |
|
|
|
|
|
|
|
649 |
|
|
|
Ford Credit Auto Owner Trust, Series 2018-1, Class A, 3.19% 7/15/20315,7 |
|
|
|
|
9,605 |
|
|
|
|
|
|
|
9,477 |
|
|
|
Ford Credit Auto Owner Trust, Series 2020-1, Class A, 2.04% 8/15/20315,7 |
|
|
|
|
8,861 |
|
|
|
|
|
|
|
8,665 |
|
|
|
Ford Credit Auto Owner Trust, Series 2023-2, Class A, 5.28% 2/15/20365,7 |
|
|
|
|
6,693 |
|
|
|
|
|
|
|
6,751 |
|
|
|
Ford Credit Auto Owner Trust, Series 2024-1, Class A, 4.87% 8/15/20365,7,8 |
|
|
|
|
15,000 |
|
|
|
|
|
|
|
14,898 |
|
|
|
GCI Funding I, LLC, Series 2020-1, Class A, 2.82% 10/18/20455,7 |
|
|
|
|
535 |
|
|
|
|
|
|
|
487 |
|
|
|
GCI Funding I, LLC, Series 2020-1, Class B, 3.81% 10/18/20455,7 |
|
|
|
|
215 |
|
|
|
|
|
|
|
193 |
|
|
|
Global SC Finance V SRL, Series 2019-1A, Class B, 4.81% 9/17/20395,7 |
|
|
|
|
1,894 |
|
|
|
|
|
|
|
1,793 |
|
|
|
Global SC Finance V SRL, Series 2020-1A, Class A, 2.17% 10/17/20405,7 |
|
|
|
|
7,977 |
|
|
|
|
|
|
|
7,394 |
|
|
|
Global SC Finance VII SRL, Series 2020-2A, Class A, 2.26% 11/19/20405,7 |
|
|
|
|
10,020 |
|
|
|
|
|
|
|
9,290 |
|
|
|
Global SC Finance VII SRL, Series 2021-1A, Class A, 1.86% 4/17/20415,7 |
|
|
|
|
3,284 |
|
|
|
|
|
|
|
2,945 |
|
|
|
Global SC Finance VII SRL, Series 2021-2A, Class A, 1.95% 8/17/20415,7 |
|
|
|
|
4,871 |
|
|
|
|
|
|
|
4,399 |
|
|
|
Global SC Finance VII SRL, Series 2021-2A, Class B, 2.49% 8/17/20415,7 |
|
|
|
|
385 |
|
|
|
|
|
|
|
342 |
|
|
|
GM Financial Automobile Leasing Trust, Series 2023-3, Class A3, 5.38% 11/20/20267 |
|
|
|
|
1,774 |
|
|
|
|
|
|
|
1,773 |
|
|
|
GM Financial Revolving Receivables Trust, Series 2023-2, Class A, 5.77% 8/11/20365,7 |
|
|
|
|
9,657 |
|
|
|
|
|
|
|
9,927 |
|
|
|
GM Financial Securitized Term Auto Receivables Trust, Series 2024-1, Class A3,
4.85% 12/18/20287 |
|
|
|
|
2,372 |
|
|
|
|
|
|
|
2,359 |
|
|
|
Hertz Vehicle Financing III, LLC, Series 2021-A, Class B, 9.44% 6/25/20252,5,7 |
|
|
|
|
5,930 |
|
|
|
|
|
|
|
5,930 |
|
|
|
Hertz Vehicle Financing III, LLC, Series 2021-1A, Class A, 1.21% 12/26/20255,7 |
|
|
|
|
8,452 |
|
|
|
|
|
|
|
8,341 |
|
|
|
Hertz Vehicle Financing III, LLC, Series 2021-1A, Class B, 1.56% 12/26/20255,7 |
|
|
|
|
634 |
|
|
|
|
|
|
|
625 |
|
|
|
Hertz Vehicle Financing III, LLC, Series 2021-1A, Class C, 2.05% 12/26/20255,7 |
|
|
|
|
405 |
|
|
|
|
|
|
|
399 |
|
|
|
Hertz Vehicle Financing III, LLC, Series 2022-1A, Class A, 1.99% 6/25/20265,7 |
|
|
|
|
8,089 |
|
|
|
|
|
|
|
7,861 |
|
|
|
Hertz Vehicle Financing III, LLC, Series 2022-4A, Class A, 3.73% 9/25/20265,7 |
|
|
|
|
8,390 |
|
|
|
|
|
|
|
8,214 |
|
111 American Funds Insurance Series
Asset Allocation Fund (continued)
|
|
|
|
|
|
|
|
|
|
|
|
|
|
|
|
|
| Bonds, notes & other debt instruments (continued) |
|
Principal amount (000) |
|
|
|
|
|
Value (000) |
|
| |
|
|
|
|
| Asset-backed obligations (continued) |
|
|
|
|
|
|
|
|
|
|
|
|
|
|
|
|
Hertz Vehicle Financing III, LLC, Series 2021-2A, Class A, 1.68% 12/27/20275,7 |
|
|
|
|
USD5,565 |
|
|
|
|
|
|
$ |
5,085 |
|
|
|
Hertz Vehicle Financing III, LLC, Series 2021-2A, Class B, 2.12% 12/27/20275,7 |
|
|
|
|
685 |
|
|
|
|
|
|
|
625 |
|
|
|
Hertz Vehicle Financing III, LLC, Series 2021-2A, Class C, 2.52% 12/27/20275,7 |
|
|
|
|
429 |
|
|
|
|
|
|
|
390 |
|
|
|
Hertz Vehicle Financing III, LLC, Series 2022-2A, Class A, 2.33% 6/26/20285,7 |
|
|
|
|
4,900 |
|
|
|
|
|
|
|
4,500 |
|
|
|
Hertz Vehicle Financing III, LLC, Series 2022-5A, Class A, 3.89% 9/25/20285,7 |
|
|
|
|
4,960 |
|
|
|
|
|
|
|
4,711 |
|
|
|
Hertz Vehicle Financing III, LLC, Series 2023-4, Class A, 6.15% 3/25/20305,7 |
|
|
|
|
5,141 |
|
|
|
|
|
|
|
5,251 |
|
|
|
Honda Auto Receivables Owner Trust, Series 2023-1, Class A2, 5.22% 10/21/20257 |
|
|
|
|
417 |
|
|
|
|
|
|
|
417 |
|
|
|
Honda Auto Receivables Owner Trust, Series 2023-3, Class A2, 5.71% 3/18/20267 |
|
|
|
|
4,913 |
|
|
|
|
|
|
|
4,915 |
|
|
|
Honda Auto Receivables Owner Trust, Series 2023-1, Class A3, 5.04% 4/21/20277 |
|
|
|
|
1,141 |
|
|
|
|
|
|
|
1,137 |
|
|
|
Hyundai Auto Receivables Trust, Series 2024-A, Class A3, 4.99% 2/15/20297 |
|
|
|
|
3,557 |
|
|
|
|
|
|
|
3,546 |
|
|
|
John Deere Owner Trust, Series 2024-A, Class A3, 4.96% 11/15/20287 |
|
|
|
|
3,229 |
|
|
|
|
|
|
|
3,222 |
|
|
|
LAD Auto Receivables Trust, Series 2023-4, Class A3, 6.10% 12/15/20275,7 |
|
|
|
|
2,594 |
|
|
|
|
|
|
|
2,606 |
|
|
|
Madison Park Funding, Ltd., CLO, Series 2015-17A, Class AR2,
(3-month USD CME Term SOFR + 1.262%) 6.586% 7/21/20305,7,8 |
|
|
|
|
4,553 |
|
|
|
|
|
|
|
4,559 |
|
|
|
Mission Lane Credit Card Master Trust, Series 2023-A, Class A, 7.23% 7/17/20285,7 |
|
|
|
|
3,475 |
|
|
|
|
|
|
|
3,495 |
|
|
|
Navient Student Loan Trust, Series 2021-C, Class A, 1.06% 10/15/20695,7 |
|
|
|
|
3,854 |
|
|
|
|
|
|
|
3,398 |
|
|
|
Navient Student Loan Trust, Series 2021-G, Class A, 1.58% 4/15/20705,7 |
|
|
|
|
4,760 |
|
|
|
|
|
|
|
4,161 |
|
|
|
Navigator Aircraft ABS, Ltd., Series 2021-1, Class A, 2.771% 11/15/20465,7 |
|
|
|
|
5,599 |
|
|
|
|
|
|
|
5,042 |
|
|
|
Nelnet Student Loan Trust, Series 2021-C, Class AFX, 1.32% 4/20/20625,7 |
|
|
|
|
7,177 |
|
|
|
|
|
|
|
6,517 |
|
|
|
Nelnet Student Loan Trust, Series 2021-A, Class APT1, 1.36% 4/20/20625,7 |
|
|
|
|
4,079 |
|
|
|
|
|
|
|
3,698 |
|
|
|
Nelnet Student Loan Trust, Series 2021-B, Class AFX, 1.42% 4/20/20625,7 |
|
|
|
|
6,924 |
|
|
|
|
|
|
|
6,327 |
|
|
|
New Economy Assets Phase 1 Issuer, LLC, Series 2021-1, Class A1,
1.91% 10/20/20615,7 |
|
|
|
|
23,051 |
|
|
|
|
|
|
|
20,565 |
|
|
|
Newark BSL CLO 2, Ltd., Series 2017-1A, Class A1R,
(3-month USD CME Term SOFR + 1.232%) 6.555% 7/25/20305,7,8 |
|
|
|
|
1,393 |
|
|
|
|
|
|
|
1,394 |
|
|
|
OCP CLO, Ltd., Series 2018-15A, Class A1,
(3-month USD CME Term SOFR + 1.362%) 6.686% 7/20/20315,7,8 |
|
|
|
|
2,114 |
|
|
|
|
|
|
|
2,119 |
|
|
|
Palmer Square Loan Funding, CLO, Series 2021-1, Class A1,
(3-month USD CME Term SOFR + 1.162%) 6.486% 4/20/20295,7,8 |
|
|
|
|
87 |
|
|
|
|
|
|
|
87 |
|
|
|
Palmer Square Loan Funding, CLO, Series 2021-4A, Class A1,
(3-month USD CME Term SOFR + 1.062%) 6.39% 10/15/20295,7,8 |
|
|
|
|
4,624 |
|
|
|
|
|
|
|
4,628 |
|
|
|
Palmer Square Loan Funding, CLO, Series 2021-4A, Class A2,
(3-month USD CME Term SOFR + 1.662%) 6.99% 10/15/20295,7,8 |
|
|
|
|
5,378 |
|
|
|
|
|
|
|
5,379 |
|
|
|
PFS Financing Corp., Series 2023-B, Class A, 5.27% 5/15/20285,7 |
|
|
|
|
5,912 |
|
|
|
|
|
|
|
5,902 |
|
|
|
PG&E Wildfire Recovery Funding, LLC, Series 2022-A, Class A2, 4.263% 6/1/20367 |
|
|
|
|
2,725 |
|
|
|
|
|
|
|
2,547 |
|
|
|
PK ALIFT Loan Funding 3 LP, Series 2024-1, Class AF,
(1-month USD CME Term SOFR + 0%) 5.347% 9/15/20395,7,8 |
|
|
|
|
963 |
|
|
|
|
|
|
|
963 |
|
|
|
PK ALIFT Loan Funding 3, LP, Series 2024-1, Class A1, 6.264% 9/15/20395,7 |
|
|
|
|
962 |
|
|
|
|
|
|
|
965 |
|
|
|
Race Point CLO, Ltd., Series 2015-9A, Class A1A2,
(3-month USD CME Term SOFR + 1.202%) 6.53% 10/15/20305,7,8 |
|
|
|
|
3,076 |
|
|
|
|
|
|
|
3,077 |
|
|
|
Santander Drive Auto Receivables Trust, Series 2022-5, Class A3, 4.11% 8/17/20267 |
|
|
|
|
451 |
|
|
|
|
|
|
|
450 |
|
|
|
Santander Drive Auto Receivables Trust, Series 2024-1, Class A2, 5.71% 2/16/20277 |
|
|
|
|
2,755 |
|
|
|
|
|
|
|
2,756 |
|
|
|
Santander Drive Auto Receivables Trust, Series 2023-4, Class A2, 6.18% 2/16/20277 |
|
|
|
|
1,458 |
|
|
|
|
|
|
|
1,460 |
|
|
|
Santander Drive Auto Receivables Trust, Series 2024-2, Class A2, 5.80% 9/15/20277 |
|
|
|
|
8,250 |
|
|
|
|
|
|
|
8,252 |
|
|
|
Santander Drive Auto Receivables Trust, Series 2024-1, Class A3, 5.25% 4/17/20287 |
|
|
|
|
738 |
|
|
|
|
|
|
|
735 |
|
|
|
Santander Drive Auto Receivables Trust, Series 2024-2, Class A3, 5.63% 11/15/20287 |
|
|
|
|
5,474 |
|
|
|
|
|
|
|
5,496 |
|
|
|
Santander Drive Auto Receivables Trust, Series 2023-4, Class B, 5.77% 12/15/20287 |
|
|
|
|
5,062 |
|
|
|
|
|
|
|
5,101 |
|
|
|
SBNA Auto Lease Trust, Series 2024-A, Class A2, 5.45% 1/20/20265,7 |
|
|
|
|
3,601 |
|
|
|
|
|
|
|
3,598 |
|
|
|
SBNA Auto Lease Trust, Series 2024-A, Class A3, 5.39% 11/20/20265,7 |
|
|
|
|
4,498 |
|
|
|
|
|
|
|
4,492 |
|
|
|
SBNA Auto Lease Trust, Series 2024-B, Class A2, 5.67% 11/20/20265,7 |
|
|
|
|
974 |
|
|
|
|
|
|
|
975 |
|
|
|
SBNA Auto Lease Trust, Series 2024-B, Class A3, 5.56% 11/22/20275,7 |
|
|
|
|
1,412 |
|
|
|
|
|
|
|
1,416 |
|
|
|
SFS Auto Receivables Securitization Trust, Series 2023-1, Class A3,
5.47% 10/20/20285,7 |
|
|
|
|
3,573 |
|
|
|
|
|
|
|
3,580 |
|
|
|
SMB Private Education Loan Trust, Series 2021-A, Class A2A2,
(1-month USD CME Term SOFR + 0.844%) 6.173% 1/15/20535,7,8 |
|
|
|
|
4,678 |
|
|
|
|
|
|
|
4,653 |
|
|
|
SOLRR Aircraft Aviation Holding, Ltd., Series 2021-1, Class A, 2.636% 10/15/20465,7 |
|
|
|
|
3,070 |
|
|
|
|
|
|
|
2,749 |
|
|
|
SPRITE, Ltd., Series 2021-1, Class A, 3.75% 11/15/20465,7 |
|
|
|
|
3,369 |
|
|
|
|
|
|
|
3,157 |
|
|
|
Stellar Jay Ireland DAC, Series 2021-1, Class A, 3.967% 10/15/20415,7 |
|
|
|
|
3,811 |
|
|
|
|
|
|
|
3,520 |
|
|
|
Stonepeak Infrastructure Partners, Series 2021-1A, Class AA, 2.301% 2/28/20335,7 |
|
|
|
|
1,376 |
|
|
|
|
|
|
|
1,278 |
|
|
|
Stonepeak Infrastructure Partners, Series 2021-1A, Class A, 2.675% 2/28/20335,7 |
|
|
|
|
1,108 |
|
|
|
|
|
|
|
1,027 |
|
American Funds Insurance Series 112
Asset Allocation Fund (continued)
|
|
|
|
|
|
|
|
|
|
|
|
|
|
|
|
|
| Bonds, notes & other debt instruments (continued) |
|
Principal amount (000) |
|
|
|
|
|
Value (000) |
|
| |
|
|
|
|
| Asset-backed obligations (continued) |
|
|
|
|
|
|
|
|
|
|
|
|
|
|
|
|
Stratus Static CLO, Ltd., Series 2022-3, Class AR,
(3-month USD CME Term SOFR + 1.30%) 6.618% 10/20/20315,7,8 |
|
|
|
|
USD4,351 |
|
|
|
|
|
|
$ |
4,357 |
|
|
|
SuttonPark Structured Settlements, Series 2021-1, Class A, 1.95% 9/15/20755,7 |
|
|
|
|
2,005 |
|
|
|
|
|
|
|
1,896 |
|
|
|
Synchrony Card Issuance Trust, Series 2023-A, Class A, 5.54% 7/15/20297 |
|
|
|
|
3,169 |
|
|
|
|
|
|
|
3,192 |
|
|
|
TAL Advantage V, LLC, Series 2020-1A, Class A, 2.05% 9/20/20455,7 |
|
|
|
|
1,445 |
|
|
|
|
|
|
|
1,320 |
|
|
|
Textainer Marine Containers, Ltd., Series 2020-2A, Class A, 2.10% 9/20/20455,7 |
|
|
|
|
650 |
|
|
|
|
|
|
|
591 |
|
|
|
Textainer Marine Containers, Ltd., Series 2021-1, Class A, 1.68% 2/20/20465,7 |
|
|
|
|
794 |
|
|
|
|
|
|
|
704 |
|
|
|
Textainer Marine Containers, Ltd., Series 2021-2A, Class A, 2.23% 4/20/20465,7 |
|
|
|
|
2,292 |
|
|
|
|
|
|
|
2,054 |
|
|
|
T-Mobile US Trust, Series 2024-1, Class A, 5.05% 9/20/20295,7 |
|
|
|
|
6,229 |
|
|
|
|
|
|
|
6,222 |
|
|
|
Toyota Auto Loan Extended Note Trust, Series 2020-1, Class A, 1.35% 5/25/20335,7 |
|
|
|
|
8,337 |
|
|
|
|
|
|
|
8,028 |
|
|
|
Toyota Auto Loan Extended Note Trust, Series 2021-1, Class A, 1.07% 2/27/20345,7,8 |
|
|
|
|
7,257 |
|
|
|
|
|
|
|
6,769 |
|
|
|
Toyota Auto Receivables Owner Trust, Series 2023-C, Class A3, 5.16% 4/17/20287 |
|
|
|
|
5,253 |
|
|
|
|
|
|
|
5,241 |
|
|
|
Toyota Auto Receivables Owner Trust, Series 2023-C, Class A4, 5.01% 2/15/20297 |
|
|
|
|
2,033 |
|
|
|
|
|
|
|
2,028 |
|
|
|
Toyota Lease Owner Trust, Series 2023-A, Class A2, 5.30% 8/20/20255,7 |
|
|
|
|
1,370 |
|
|
|
|
|
|
|
1,369 |
|
|
|
Triton Container Finance VIII, LLC, Series 2020-1, Class A, 2.11% 9/20/20455,7 |
|
|
|
|
8,714 |
|
|
|
|
|
|
|
7,813 |
|
|
|
Triton Container Finance VIII, LLC, Series 2021-1, Class A, 1.86% 3/20/20465,7 |
|
|
|
|
1,550 |
|
|
|
|
|
|
|
1,365 |
|
|
|
Verdant Receivables, LLC, Series 2024-1, Class A2, 5.68% 12/12/20315,7 |
|
|
|
|
1,363 |
|
|
|
|
|
|
|
1,369 |
|
|
|
Verizon Master Trust, Series 2023-2, Class A, 4.89% 4/13/20287 |
|
|
|
|
8,460 |
|
|
|
|
|
|
|
8,422 |
|
|
|
Verizon Master Trust, Series 2024-1, Class A1A, 5.00% 12/20/20287 |
|
|
|
|
4,292 |
|
|
|
|
|
|
|
4,277 |
|
|
|
Verizon Master Trust, Series 2023-1, Class A,
4.49% 1/22/2029 (5.24% on 1/20/2026)7,10 |
|
|
|
|
7,481 |
|
|
|
|
|
|
|
7,394 |
|
|
|
Verizon Master Trust, Series 2024-3, Class A1A, 5.34% 4/22/20307 |
|
|
|
|
10,500 |
|
|
|
|
|
|
|
10,606 |
|
|
|
Verizon Master Trust, Series 2023-3, Class A, 4.73% 4/21/20315,7 |
|
|
|
|
8,981 |
|
|
|
|
|
|
|
8,901 |
|
|
|
Verizon Master Trust., Series 24-5, Class A, 5.832% 6/21/20325,7 |
|
|
|
|
1,042 |
|
|
|
|
|
|
|
1,042 |
|
|
|
Westlake Automobile Receivables Trust, Series 2023-1, Class A2A,
5.51% 6/15/20265,7 |
|
|
|
|
519 |
|
|
|
|
|
|
|
519 |
|
|
|
Westlake Automobile Receivables Trust, Series 2023-2, Class A2A, 5.87% 7/15/20265,7 |
|
|
|
|
1,572 |
|
|
|
|
|
|
|
1,572 |
|
|
|
Westlake Automobile Receivables Trust, Series 2023-2, Class A3, 5.80% 2/16/20275,7 |
|
|
|
|
3,504 |
|
|
|
|
|
|
|
3,508 |
|
|
|
Westlake Automobile Receivables Trust, Series 2023-1, Class A3,
5.21% 1/18/20285,7 |
|
|
|
|
794 |
|
|
|
|
|
|
|
791 |
|
|
|
Westlake Automobile Receivables Trust, Series 2023-3, Class B, 5.92% 9/15/20285,7 |
|
|
|
|
2,794 |
|
|
|
|
|
|
|
2,802 |
|
|
|
World Financial Network Credit Card Master Trust, Series 2023-A, Class A,
5.02% 3/15/20307 |
|
|
|
|
7,845 |
|
|
|
|
|
|
|
7,790 |
|
|
|
|
|
|
|
|
|
|
|
|
|
|
|
|
|
|
|
|
|
|
|
|
|
|
|
|
|
|
|
|
|
619,173 |
|
|
|
|
|
|
|
|
|
|
|
|
|
|
|
|
|
|
|
|
|
|
|
|
|
|
|
|
|
|
|
|
|
|
|
|
|
|
|
|
| Bonds & notes of governments & government agencies outside the U.S. 0.18% |
|
|
|
|
|
|
|
|
|
|
|
|
|
|
|
|
Chile (Republic of) 4.85% 1/22/2029 |
|
|
|
|
4,500 |
|
|
|
|
|
|
|
4,453 |
|
|
|
CPPIB Capital, Inc. 2.75% 11/2/20275 |
|
|
|
|
6,600 |
|
|
|
|
|
|
|
6,204 |
|
|
|
European Investment Bank 0.75% 10/26/2026 |
|
|
|
|
6,194 |
|
|
|
|
|
|
|
5,664 |
|
|
|
OMERS Finance Trust 3.50% 4/19/20325 |
|
|
|
|
4,315 |
|
|
|
|
|
|
|
3,941 |
|
|
|
OMERS Finance Trust 4.00% 4/19/20525 |
|
|
|
|
4,315 |
|
|
|
|
|
|
|
3,452 |
|
|
|
Panama (Republic of) 7.50% 3/1/2031 |
|
|
|
|
1,970 |
|
|
|
|
|
|
|
2,064 |
|
|
|
Panama (Republic of) 2.252% 9/29/2032 |
|
|
|
|
4,805 |
|
|
|
|
|
|
|
3,463 |
|
|
|
Panama (Republic of) 8.00% 3/1/2038 |
|
|
|
|
1,495 |
|
|
|
|
|
|
|
1,578 |
|
|
|
Panama (Republic of) 4.50% 1/19/2063 |
|
|
|
|
1,035 |
|
|
|
|
|
|
|
664 |
|
|
|
Peru (Republic of) 1.862% 12/1/2032 |
|
|
|
|
2,525 |
|
|
|
|
|
|
|
1,912 |
|
|
|
Peru (Republic of) 2.78% 12/1/2060 |
|
|
|
|
3,775 |
|
|
|
|
|
|
|
2,124 |
|
|
|
Qatar (State of) 4.00% 3/14/20295 |
|
|
|
|
745 |
|
|
|
|
|
|
|
722 |
|
|
|
Qatar (State of) 4.817% 3/14/20495 |
|
|
|
|
750 |
|
|
|
|
|
|
|
702 |
|
|
|
Swedish Export Credit Corp. 3.625% 9/3/2024 |
|
|
|
|
5,089 |
|
|
|
|
|
|
|
5,071 |
|
|
|
United Mexican States 2.659% 5/24/2031 |
|
|
|
|
2,703 |
|
|
|
|
|
|
|
2,225 |
|
|
|
United Mexican States 3.50% 2/12/2034 |
|
|
|
|
1,790 |
|
|
|
|
|
|
|
1,459 |
|
|
|
United Mexican States 3.771% 5/24/2061 |
|
|
|
|
1,528 |
|
|
|
|
|
|
|
940 |
|
|
|
|
|
|
|
|
|
|
|
|
|
|
|
|
|
|
|
|
|
|
|
|
|
|
|
|
|
|
|
|
|
46,638 |
|
|
|
|
|
|
|
|
|
|
|
|
|
|
|
|
|
|
113 American Funds Insurance Series
Asset Allocation Fund (continued)
|
|
|
|
|
|
|
|
|
|
|
|
|
|
|
|
|
|
|
| Bonds, notes & other debt instruments (continued) |
|
Principal amount (000) |
|
|
|
|
|
Value (000) |
|
| |
|
|
|
|
| Municipals 0.11% |
|
|
|
|
|
|
|
|
|
|
|
|
|
|
|
|
| |
|
|
|
|
|
| California 0.02% |
|
Golden State Tobacco Securitization Corp., Enhanced Tobacco Settlement
Asset-Backed Bonds, Series 2021-A-1, 2.158% 6/1/2026 |
|
|
|
|
|
|
USD1,200 |
|
|
|
|
|
|
$ |
1,128 |
|
|
|
Golden State Tobacco Securitization Corp., Enhanced Tobacco Settlement
Asset-Backed Bonds, Series 2021-A-1, 2.332% 6/1/2027 |
|
|
|
|
|
|
1,660 |
|
|
|
|
|
|
|
1,529 |
|
|
|
Golden State Tobacco Securitization Corp., Enhanced Tobacco Settlement
Asset-Backed Bonds, Series 2021-B, 2.746% 6/1/2034 |
|
|
|
|
|
|
495 |
|
|
|
|
|
|
|
414 |
|
|
|
Golden State Tobacco Securitization Corp., Enhanced Tobacco Settlement
Asset-Backed Bonds, Series 2021-B, 3.293% 6/1/2042 |
|
|
|
|
|
|
1,170 |
|
|
|
|
|
|
|
912 |
|
|
|
Golden State Tobacco Securitization Corp., Enhanced Tobacco Settlement
Asset-Backed Bonds, Series 2021-B, 3.00% 6/1/2046 |
|
|
|
|
|
|
1,975 |
|
|
|
|
|
|
|
1,803 |
|
|
|
|
|
|
|
|
|
|
|
|
|
|
|
|
|
|
|
|
|
|
|
|
|
|
|
|
|
|
|
|
|
|
|
|
|
5,786 |
|
|
|
|
|
|
|
|
|
|
|
|
|
|
|
|
|
|
|
|
|
|
|
|
|
|
|
|
|
|
|
|
|
|
|
|
|
|
|
| |
|
|
|
|
|
| Florida 0.03% |
|
Board of Administration Fin. Corp., Rev. Bonds, Series 2020-A, 1.705% 7/1/2027 |
|
|
|
|
|
|
5,335 |
|
|
|
|
|
|
|
4,844 |
|
|
|
Board of Administration Fin. Corp., Rev. Bonds, Series 2020-A, 2.154% 7/1/2030 |
|
|
|
|
|
|
5,365 |
|
|
|
|
|
|
|
4,550 |
|
|
|
|
|
|
|
|
|
|
|
|
|
|
|
|
|
|
|
|
|
|
|
|
|
|
|
|
|
|
|
|
|
|
|
|
|
9,394 |
|
|
|
|
|
|
|
|
|
|
|
|
|
|
|
|
|
|
|
|
|
|
|
|
|
|
|
|
|
|
|
|
|
|
|
|
|
|
|
| |
|
|
|
|
|
| Guam 0.00% |
|
A.B. Won Pat International Airport Auth., General Rev. Bonds, Series 2021-A, 3.839% 10/1/2036 |
|
|
|
|
|
|
240 |
|
|
|
|
|
|
|
203 |
|
|
|
A.B. Won Pat International Airport Auth., General Rev. Bonds, Series 2021-A, 4.46% 10/1/2043 |
|
|
|
|
|
|
315 |
|
|
|
|
|
|
|
258 |
|
|
|
|
|
|
|
|
|
|
|
|
|
|
|
|
|
|
|
|
|
|
|
|
|
|
|
|
|
|
|
|
|
|
|
|
|
461 |
|
|
|
|
|
|
|
|
|
|
|
|
|
|
|
|
|
|
|
|
|
|
|
|
|
|
|
|
|
|
|
|
|
|
|
|
|
|
|
| |
|
|
|
|
|
| Illinois 0.02% |
|
G.O. Bonds, Pension Funding, Series 2003, Assured Guaranty Municipal insured, 5.10% 6/1/2033 |
|
|
|
|
|
|
4,125 |
|
|
|
|
|
|
|
4,105 |
|
|
|
|
|
|
|
|
|
|
|
|
|
|
|
|
|
|
|
|
|
|
|
|
|
|
|
|
|
|
|
|
|
|
|
|
|
|
|
|
|
|
|
|
|
| |
|
|
|
|
|
| Minnesota 0.00% |
|
Housing Fin. Agcy., Residential Housing Fin. Bonds, Series 2014-A, 4.00% 7/1/2038 |
|
|
|
|
|
|
5 |
|
|
|
|
|
|
|
5 |
|
|
|
|
|
|
|
|
|
|
|
|
|
|
|
|
|
|
|
|
|
|
|
|
|
|
|
|
|
|
|
|
|
|
|
|
|
|
|
|
|
|
|
|
|
| |
|
|
|
|
|
| Ohio 0.02% |
|
Cleveland-Cuyahoga Port Auth., Federal Lease Rev. Bonds
(VA Cleveland Health Care Center Project), Series 2021, 4.425% 5/1/2031 |
|
|
|
|
|
|
5,020 |
|
|
|
|
|
|
|
4,408 |
|
|
|
|
|
|
|
|
|
|
|
|
|
|
|
|
|
|
|
|
|
|
|
|
|
|
|
|
|
|
|
|
|
|
|
|
|
|
|
|
|
|
|
|
|
| |
|
|
|
|
|
| Wisconsin 0.02% |
|
Public Fin. Auth., Federal Lease Rev. Bonds (Fort Sam Acquisition Fncg.), Series 2022, 4.95% 3/1/2034 |
|
|
|
|
|
|
5,805 |
|
|
|
|
|
|
|
5,515 |
|
|
|
|
|
|
|
|
|
|
|
|
|
|
|
|
|
|
|
|
|
|
Total municipals |
|
|
|
|
|
|
|
|
|
|
|
|
|
|
29,674 |
|
|
|
|
|
|
|
|
|
|
|
|
|
|
|
|
|
|
|
|
|
|
Total bonds, notes & other debt instruments (cost: $6,599,237,000) |
|
|
|
|
|
|
|
|
|
|
|
|
|
|
6,364,268 |
|
|
|
|
|
|
|
|
|
|
|
|
|
|
|
|
|
|
|
|
|
|
|
|
|
|
|
|
|
|
|
|
|
|
|
|
|
|
|
|
|
|
|
|
|
|
|
|
|
| Investment funds 5.29% |
|
Shares |
|
|
|
|
|
|
|
|
|
Capital Group Central Corporate Bond Fund17 |
|
|
|
|
|
|
172,076,034 |
|
|
|
|
|
|
|
1,423,069 |
|
|
|
|
|
|
|
|
|
|
|
|
|
|
|
|
|
|
|
|
|
|
Total Investment funds (cost: $1,622,158,000) |
|
|
|
|
|
|
|
|
|
|
|
|
|
|
1,423,069 |
|
|
|
|
|
|
|
|
|
|
|
|
|
|
|
|
|
|
|
|
|
|
|
|
|
|
|
|
|
|
|
|
|
|
|
|
|
|
|
|
|
|
|
|
|
| Short-term securities 6.61% |
|
|
|
|
|
|
|
|
|
|
|
|
| |
|
|
|
|
| Money market investments 6.55% |
|
|
|
|
|
|
|
|
|
|
|
|
|
|
|
|
|
|
Capital Group Central Cash Fund 5.37%17,18 |
|
|
|
|
|
|
17,628,972 |
|
|
|
|
|
|
|
1,762,897 |
|
|
|
|
|
|
|
|
|
|
|
|
|
|
|
|
|
|
|
|
American Funds Insurance Series 114
Asset Allocation Fund (continued)
|
|
|
|
|
|
|
|
|
|
|
|
|
|
|
|
|
| Short-term securities (continued) |
|
Shares |
|
|
|
|
|
Value (000) |
|
| |
|
|
|
|
| Money market investments purchased with collateral from securities on loan 0.06% |
|
|
|
|
|
|
|
|
|
|
|
|
|
|
|
|
Invesco Short-Term Investments Trust – Government & Agency Portfolio,
Institutional Class 5.23%18,19 |
|
|
|
|
7,476,299 |
|
|
|
|
|
|
$ |
7,476 |
|
|
|
Capital Group Central Cash Fund 5.37%17,18,19 |
|
|
|
|
70,379 |
|
|
|
|
|
|
|
7,038 |
|
|
|
State Street Institutional U.S. Government Money Market Fund,
Institutional Class 5.22%18,19 |
|
|
|
|
3,408,672 |
|
|
|
|
|
|
|
3,409 |
|
|
|
|
|
|
|
|
|
|
|
|
|
|
|
|
|
|
|
|
|
|
|
|
|
|
|
|
|
|
|
|
|
17,923 |
|
|
|
|
|
|
|
|
|
|
|
|
|
|
|
|
|
|
|
|
Total short-term securities (cost: $1,780,720,000) |
|
|
|
|
|
|
|
|
|
|
|
|
1,780,820 |
|
|
|
|
|
|
|
|
|
|
|
|
|
|
|
|
|
|
|
|
|
|
|
|
|
|
Total investment securities 103.85% (cost: $20,653,069,000) |
|
|
|
|
|
|
|
|
|
|
|
|
27,963,365 |
|
|
|
Other assets less liabilities (3.85)% |
|
|
|
|
|
|
|
|
|
|
|
|
(1,036,573 |
) |
|
|
|
|
|
|
|
|
|
|
|
|
|
|
|
|
|
|
|
|
|
|
|
|
|
Net assets 100.00% |
|
|
|
|
|
|
|
|
|
|
|
$ |
26,926,792 |
|
|
|
|
|
|
|
|
|
|
|
|
|
|
|
|
|
|
|
|
|
|
|
|
|
|
|
|
|
|
|
|
|
|
|
|
|
|
|
|
|
|
|
| Futures contracts |
|
|
|
|
|
|
|
|
|
|
|
|
|
|
|
|
|
|
|
|
|
|
|
|
| Contracts |
|
Type |
|
|
Number of
contracts |
|
|
Expiration
date |
|
|
Notional amount (000) |
|
|
Value and
unrealized
appreciation (depreciation)
at 6/30/2024 (000) |
|
|
|
|
|
|
|
|
| 2 Year U.S. Treasury Note Futures |
|
|
Long |
|
|
|
2,858 |
|
|
|
10/3/2024 |
|
|
|
USD583,657 |
|
|
|
|
|
|
$ |
1,496 |
|
| 5 Year U.S. Treasury Note Futures |
|
|
Long |
|
|
|
5,850 |
|
|
|
10/3/2024 |
|
|
|
623,482 |
|
|
|
|
|
|
|
3,982 |
|
| 10 Year U.S. Treasury Note Futures |
|
|
Long |
|
|
|
1,102 |
|
|
|
9/30/2024 |
|
|
|
121,203 |
|
|
|
|
|
|
|
1,288 |
|
| 10 Year Ultra U.S. Treasury Note Futures |
|
|
Short |
|
|
|
1,991 |
|
|
|
9/30/2024 |
|
|
|
(226,041 |
) |
|
|
|
|
|
|
(1,574 |
) |
| 20 Year U.S. Treasury Bond Futures |
|
|
Long |
|
|
|
661 |
|
|
|
9/30/2024 |
|
|
|
78,205 |
|
|
|
|
|
|
|
907 |
|
| 30 Year Ultra U.S. Treasury Bond Futures |
|
|
Short |
|
|
|
1,099 |
|
|
|
9/30/2024 |
|
|
|
(137,753 |
) |
|
|
|
|
|
|
(2,316 |
) |
|
|
|
|
|
|
|
|
|
|
|
|
|
|
|
|
|
|
|
|
|
|
|
|
|
|
|
|
|
|
|
|
|
|
|
|
|
|
|
|
|
|
|
|
|
|
|
|
|
|
|
|
|
|
$ |
3,783 |
|
|
|
|
|
|
|
|
|
|
|
|
|
|
|
|
|
|
|
|
|
|
|
|
|
|
|
|
|
| Swap contracts |
|
|
|
|
| Interest rate swaps |
|
|
|
|
| Centrally cleared interest rate swaps |
|
|
|
|
|
|
|
|
|
|
|
|
|
|
|
|
|
|
|
|
|
|
|
|
|
|
|
|
|
|
|
|
|
|
|
|
|
|
|
|
|
|
|
|
|
|
|
|
|
|
|
|
|
|
|
|
|
|
|
|
|
| Receive |
|
|
|
|
Pay |
|
|
|
|
|
|
|
Notional |
|
|
Value at |
|
|
|
|
|
Upfront premium paid |
|
|
Unrealized
appreciation
(depreciation) |
|
| Rate |
|
Payment
frequency |
|
|
|
|
Rate |
|
|
|
|
|
Payment
frequency |
|
|
|
Expiration
date |
|
|
|
|
|
amount
(000) |
|
|
6/30/2024 (000) |
|
|
|
|
|
(received)
(000) |
|
|
at 6/30/2024 (000) |
|
|
|
|
|
|
|
|
|
|
|
|
|
|
|
|
|
|
| 4.7325% |
|
Annual |
|
|
|
|
|
|
SOFR |
|
|
|
|
|
|
Annual |
|
|
|
|
5/7/2026 |
|
|
|
|
|
|
|
USD284,200 |
|
|
|
|
|
|
$ |
448 |
|
|
|
|
|
|
|
|
|
|
$ |
– |
|
|
|
|
|
|
$ |
448 |
|
| 4.7315% |
|
Annual |
|
|
|
|
|
|
SOFR |
|
|
|
|
|
|
Annual |
|
|
|
|
5/8/2026 |
|
|
|
|
|
|
|
USD146,300 |
|
|
|
|
|
|
|
232 |
|
|
|
|
|
|
|
|
|
|
|
– |
|
|
|
|
|
|
|
232 |
|
| 4.741% |
|
Annual |
|
|
|
|
|
|
SOFR |
|
|
|
|
|
|
Annual |
|
|
|
|
5/10/2026 |
|
|
|
|
|
|
|
USD394,133 |
|
|
|
|
|
|
|
717 |
|
|
|
|
|
|
|
|
|
|
|
– |
|
|
|
|
|
|
|
717 |
|
|
|
|
|
|
|
|
|
|
|
|
|
|
|
|
|
|
|
|
|
|
|
|
|
|
|
|
|
|
|
|
|
|
|
|
|
|
|
|
|
|
|
|
|
|
|
|
|
|
|
|
|
|
|
|
|
|
|
|
|
|
|
|
|
|
|
|
|
|
|
|
|
|
|
|
|
|
|
|
|
|
|
|
|
|
|
|
|
|
|
|
|
|
|
|
|
|
|
|
|
|
|
|
|
|
|
|
|
|
|
|
|
$ |
1,397 |
|
|
|
|
|
|
|
|
|
|
$ |
– |
|
|
|
|
|
|
$ |
1,397 |
|
|
|
|
|
|
|
|
|
|
|
|
|
|
|
|
|
|
|
|
|
|
|
|
|
|
|
|
|
|
|
|
|
|
|
|
|
|
|
|
|
|
|
|
|
|
|
|
|
|
|
|
|
|
|
|
|
|
|
|
115 American Funds Insurance Series
Asset Allocation Fund (continued)
|
|
|
| Swap contracts |
|
|
|
|
| Credit default swaps |
|
|
|
| Centrally cleared credit default swaps on credit indices – sell protection |
|
|
|
|
|
|
|
|
|
|
|
|
|
|
|
|
|
|
|
|
|
|
|
|
|
|
|
|
|
|
|
|
|
|
|
|
|
|
|
|
|
|
|
|
|
| Reference index |
|
Financing
rate received |
|
|
|
Payment
frequency |
|
|
|
|
Expiration
date |
|
|
|
|
|
|
|
Notional
amount(000) |
20 |
|
|
|
|
|
|
Value at
6/30/202421
(000) |
|
|
|
|
|
|
|
Upfront
premium paid (received) (000) |
|
|
|
|
|
|
|
Unrealized
appreciation
(depreciation)
at 6/30/2024
(000) |
|
| CDX.NA.IG.42 |
|
1.00% |
|
|
|
Quarterly |
|
|
|
|
6/20/2029 |
|
|
|
|
|
|
|
USD17,902 |
|
|
|
|
|
|
$ |
369 |
|
|
|
|
|
|
$ |
397 |
|
|
|
|
|
|
$ |
(28 |
) |
|
|
|
|
|
|
|
|
|
|
|
|
|
|
|
|
|
|
|
|
|
|
|
|
|
|
|
|
|
|
|
|
|
|
|
|
|
| Investments in affiliates17 |
|
|
|
|
|
|
|
|
|
|
|
|
|
|
|
|
|
|
|
|
|
|
|
|
|
|
|
|
|
|
|
|
|
|
|
| |
|
Value at 1/1/2024 (000) |
|
|
Additions (000) |
|
|
Reductions (000) |
|
|
Net realized
gain (loss) (000) |
|
|
Net unrealized
appreciation
(depreciation) (000) |
|
|
Value at
6/30/2024 (000) |
|
|
Dividend
or interest
income (000) |
|
|
|
|
|
|
|
|
|
|
|
| Investment funds 5.29% |
|
|
|
|
|
|
|
|
|
|
|
|
|
|
|
|
|
|
|
|
|
|
|
|
|
|
|
|
|
|
|
|
|
|
|
|
| Capital Group Central Corporate Bond Fund |
|
$ |
1,406,015 |
|
|
$ |
77,372 |
|
|
$ |
24,780 |
|
|
|
|
|
|
$ |
(3,560 |
) |
|
|
|
|
|
$ |
(31,978 |
) |
|
$ |
1,423,069 |
|
|
$ |
31,228 |
|
|
|
|
|
|
|
|
|
|
|
| Short-term securities 6.57% |
|
|
|
|
|
|
|
|
|
|
|
|
|
|
|
|
|
|
|
|
|
|
|
|
|
|
|
|
|
|
|
|
|
|
|
|
| Money market investments 6.55% |
|
|
|
|
|
|
|
|
|
|
|
|
|
|
|
|
|
|
|
|
|
|
|
|
|
|
|
|
|
|
|
|
|
|
|
|
| Capital Group Central Cash Fund 5.37%18 |
|
|
2,395,658 |
|
|
|
1,915,770 |
|
|
|
2,548,791 |
|
|
|
|
|
|
|
(56 |
) |
|
|
|
|
|
|
316 |
|
|
|
1,762,897 |
|
|
|
58,736 |
|
|
|
|
|
|
|
|
|
|
|
| Money market investments purchased with collateral from securities on loan 0.02% |
|
|
|
|
|
|
|
|
|
|
|
|
|
|
|
|
|
|
|
|
|
|
|
|
|
|
|
|
|
|
|
|
|
|
|
|
| Capital Group Central Cash Fund 5.37%18,19 |
|
|
1,991 |
|
|
|
5,047 |
22 |
|
|
|
|
|
|
|
|
|
|
|
|
|
|
|
|
|
|
|
|
|
|
7,038 |
|
|
|
– |
23 |
|
|
|
|
|
|
|
|
|
|
|
|
|
|
|
|
|
|
|
|
|
|
|
|
|
|
|
|
|
|
|
|
|
|
|
|
|
|
|
|
|
|
|
|
|
|
|
| Total short-term securities |
|
|
|
|
|
|
|
|
|
|
|
|
|
|
|
|
|
|
|
|
|
|
|
|
|
|
|
|
|
|
1,769,935 |
|
|
|
|
|
|
|
|
|
|
|
|
|
|
|
|
|
|
|
|
|
|
|
|
|
|
|
|
|
|
|
|
|
|
|
|
|
|
|
|
|
|
|
|
|
|
|
|
|
|
|
|
| Total 11.86% |
|
|
|
|
|
|
|
|
|
|
|
|
|
|
|
|
|
$ |
(3,616 |
) |
|
|
|
|
|
$ |
(31,662 |
) |
|
$ |
3,193,004 |
|
|
$ |
89,964 |
|
|
|
|
|
|
|
|
|
|
|
|
|
|
|
|
|
|
|
|
|
|
|
|
|
|
|
|
|
|
|
|
|
|
|
|
|
|
|
|
|
|
|
|
|
|
|
|
|
|
|
|
|
|
|
|
|
|
|
|
|
|
|
|
|
|
|
| Restricted securities3 |
|
|
|
|
|
|
|
|
|
|
|
|
|
|
|
|
|
|
|
|
|
|
|
|
|
|
|
|
| |
|
Acquisition date(s) |
|
|
|
|
|
Cost (000) |
|
|
|
|
|
Value (000) |
|
|
Percent of net assets |
|
|
|
|
|
|
|
|
|
| Rotech Healthcare, Inc.1,2 |
|
|
8/22/2014 |
|
|
|
|
|
|
$ |
6,949 |
|
|
|
|
|
|
$ |
18,138 |
|
|
|
|
|
|
|
.07 |
% |
|
|
|
|
|
|
|
|
| Carbon Health Technologies, Inc., Series D-2,
8.00% noncumulative convertible preferred shares2 |
|
|
7/9/2021 |
|
|
|
|
|
|
|
50,000 |
|
|
|
|
|
|
|
11,596 |
|
|
|
|
|
|
|
.04 |
|
|
|
|
|
|
|
|
|
| Finastra USA, Inc., Term Loan B,
(3-month USD CME Term SOFR + 7.25%)
12.459% 9/13/20294,5 |
|
|
9/13/2023 |
|
|
|
|
|
|
|
2,592 |
|
|
|
|
|
|
|
2,654 |
|
|
|
|
|
|
|
.01 |
|
|
|
|
|
|
|
|
|
| Finastra USA, Inc., Term Loan,
(3-month USD CME Term SOFR + 7.25%)
12.581% 9/13/20294,5 |
|
|
9/13/2023-6/13/2024 |
|
|
|
|
|
|
|
29 |
|
|
|
|
|
|
|
29 |
|
|
|
|
|
|
|
.00 |
6 |
|
|
|
|
|
|
|
|
| Wolfspeed, Inc. 9.875% 6/23/2030 (10.875% on 6/23/2026)2,10 |
|
|
6/23/2023 |
|
|
|
|
|
|
|
977 |
|
|
|
|
|
|
|
978 |
|
|
|
|
|
|
|
.00 |
24 |
|
|
|
|
|
|
|
|
|
|
|
|
|
|
|
|
|
|
|
|
|
|
|
|
|
|
|
|
|
|
|
|
|
|
|
|
|
| Total |
|
|
|
|
|
|
|
|
|
$ |
60,547 |
|
|
|
|
|
|
$ |
33,395 |
|
|
|
|
|
|
|
.12 |
% |
|
|
|
|
|
|
|
|
|
|
|
|
|
|
|
|
|
|
|
|
|
|
|
|
|
|
|
|
|
American Funds Insurance Series 116
Asset Allocation Fund (continued)
| 1 |
Security did not produce income during the last 12 months. |
| 2 |
Value determined using significant unobservable inputs. |
| 3 |
Restricted security, other than Rule 144A securities or commercial paper issued pursuant to Section 4(a)(2) of the Securities Act of 1933. The total value of all such restricted securities was $33,395,000, which represented .12% of the net assets of the fund. |
| 4 |
All or a portion of this security was on loan. The total value of all such securities was $19,113,000, which represented .07% of the net assets of the fund. Refer to Note 5 for more information on securities lending. |
| 5 |
Acquired in a transaction exempt from registration under Rule 144A or, for commercial paper, Section 4(a)(2) of the Securities Act of 1933. May be resold in the U.S. in transactions exempt from registration, normally to qualified institutional buyers. The total value of all such securities was $1,265,872,000, which represented 4.70% of the net assets of the fund. |
| 6 |
Amount less than one thousand. |
| 7 |
Principal payments may be made periodically. Therefore, the effective maturity date may be earlier than the stated maturity date. |
| 8 |
Coupon rate may change periodically. Reference rate and spread are as of the most recent information available. Some coupon rates are determined by the issuer or agent based on current market conditions; therefore, the reference rate and spread are not available. |
| 9 |
Purchased on a TBA basis. |
| 10 |
Step bond; coupon rate may change at a later date. |
| 11 |
All or a portion of this security was pledged as collateral. The total value of pledged collateral was $17,690,000, which represented .07% of the net assets of the fund. |
| 12 |
Index-linked bond whose principal amount moves with a government price index. |
| 13 |
Loan participations and assignments; may be subject to legal or contractual restrictions on resale. The total value of all such loans was $45,566,000, which represented .17% of the net assets of the fund. |
| 14 |
Securities referencing LIBOR are expected to transition to an alternative reference rate by the security’s next scheduled coupon reset date. |
| 15 |
Payment in kind; the issuer has the option of paying additional securities in lieu of cash. Payment methods and rates are as of the most recent payment when available. |
| 16 |
Scheduled interest and/or principal payment was not received. |
| 17 |
Part of the same “group of investment companies” as the fund as defined under the Investment Company Act of 1940, as amended. |
| 18 |
Rate represents the seven-day yield at 6/30/2024. |
| 19 |
Security purchased with cash collateral from securities on loan. Refer to Note 5 for more information on securities lending. |
| 20 |
The maximum potential amount the fund may pay as a protection seller should a credit event occur. |
| 21 |
The prices and resulting values for credit default swap indices serve as an indicator of the current status of the payment/performance risk. As the value of a sell protection credit default swap increases or decreases, when compared to the notional amount of the swap, the payment/performance risk may decrease or increase, respectively. |
| 22 |
Represents net activity. Refer to Note 5 for more information on securities lending. |
| 23 |
Dividend income is included with securities lending income in the fund’s statement of operations and is not shown in this table. |
| 24 |
Amount less than .01%. |
Key to abbreviation(s)
ADR = American Depositary Receipts
Agcy. = Agency
Assn. = Association
Auth. = Authority
CAD = Canadian dollars
CLO = Collateralized Loan Obligations
CME = CME Group
CMO = Collateralized Mortgage Obligations
DAC = Designated Activity Company
Fin. = Finance
Fncg. = Financing
G.O. = General Obligation
LIBOR = London Interbank Offered Rate
PIK = Payment In Kind
REIT = Real Estate Investment Trust
Rev. = Revenue
SOFR = Secured Overnight Financing Rate
TBA = To be announced
USD = U.S. dollars
Refer to the notes to financial statements.
117 American Funds Insurance Series
|
|
|
| American Funds Global Balanced Fund |
|
|
| Investment portfolio June 30, 2024 |
|
unaudited |
|
|
|
|
|
|
|
|
|
|
|
|
|
|
|
| Common stocks 64.24% |
|
Shares |
|
|
|
|
|
Value
(000) |
|
|
|
|
|
|
| Information technology 12.12% |
|
Microsoft Corp. |
|
|
28,427 |
|
|
|
|
|
|
$ |
12,706 |
|
|
|
Broadcom, Inc. |
|
|
7,302 |
|
|
|
|
|
|
|
11,724 |
|
|
|
Apple, Inc. |
|
|
26,030 |
|
|
|
|
|
|
|
5,483 |
|
|
|
Samsung Electronics Co., Ltd. |
|
|
66,608 |
|
|
|
|
|
|
|
3,914 |
|
|
|
Taiwan Semiconductor Manufacturing Co., Ltd. |
|
|
89,000 |
|
|
|
|
|
|
|
2,647 |
|
|
|
Accenture PLC, Class A |
|
|
8,352 |
|
|
|
|
|
|
|
2,534 |
|
|
|
Texas Instruments, Inc. |
|
|
11,952 |
|
|
|
|
|
|
|
2,325 |
|
|
|
ServiceNow, Inc.1 |
|
|
2,161 |
|
|
|
|
|
|
|
1,700 |
|
|
|
TDK Corp. |
|
|
19,000 |
|
|
|
|
|
|
|
1,161 |
|
|
|
GlobalWafers Co., Ltd. |
|
|
40,000 |
|
|
|
|
|
|
|
662 |
|
|
|
Intel Corp. |
|
|
18,607 |
|
|
|
|
|
|
|
576 |
|
|
|
SK hynix, Inc. |
|
|
3,393 |
|
|
|
|
|
|
|
575 |
|
|
|
Salesforce, Inc. |
|
|
2,160 |
|
|
|
|
|
|
|
555 |
|
|
|
NEC Corp. |
|
|
6,400 |
|
|
|
|
|
|
|
523 |
|
|
|
Seagate Technology Holdings PLC |
|
|
3,768 |
|
|
|
|
|
|
|
389 |
|
|
|
|
|
|
|
|
|
|
|
|
|
|
|
|
|
|
|
|
|
|
|
|
|
|
|
|
|
47,474 |
|
|
|
|
|
|
|
|
|
|
|
|
|
|
|
|
|
|
|
|
|
|
|
|
|
|
|
|
|
|
|
| |
|
|
|
|
| Health care 9.70% |
|
Sanofi |
|
|
52,883 |
|
|
|
|
|
|
|
5,083 |
|
|
|
Novo Nordisk AS, Class B |
|
|
32,415 |
|
|
|
|
|
|
|
4,631 |
|
|
|
Abbott Laboratories |
|
|
39,946 |
|
|
|
|
|
|
|
4,151 |
|
|
|
Gilead Sciences, Inc. |
|
|
43,345 |
|
|
|
|
|
|
|
2,974 |
|
|
|
AstraZeneca PLC |
|
|
15,774 |
|
|
|
|
|
|
|
2,459 |
|
|
|
UnitedHealth Group, Inc. |
|
|
4,388 |
|
|
|
|
|
|
|
2,235 |
|
|
|
Eli Lilly and Co. |
|
|
2,262 |
|
|
|
|
|
|
|
2,048 |
|
|
|
Vertex Pharmaceuticals, Inc.1 |
|
|
3,067 |
|
|
|
|
|
|
|
1,438 |
|
|
|
DexCom, Inc.1 |
|
|
12,646 |
|
|
|
|
|
|
|
1,434 |
|
|
|
Takeda Pharmaceutical Co., Ltd. |
|
|
52,600 |
|
|
|
|
|
|
|
1,364 |
|
|
|
Stryker Corp. |
|
|
3,698 |
|
|
|
|
|
|
|
1,258 |
|
|
|
Molina Healthcare, Inc.1 |
|
|
3,802 |
|
|
|
|
|
|
|
1,130 |
|
|
|
AbbVie, Inc. |
|
|
5,914 |
|
|
|
|
|
|
|
1,014 |
|
|
|
Medtronic PLC |
|
|
12,617 |
|
|
|
|
|
|
|
993 |
|
|
|
Novartis AG |
|
|
8,429 |
|
|
|
|
|
|
|
903 |
|
|
|
Thermo Fisher Scientific, Inc. |
|
|
1,632 |
|
|
|
|
|
|
|
903 |
|
|
|
Eurofins Scientific SE, non-registered shares |
|
|
18,109 |
|
|
|
|
|
|
|
900 |
|
|
|
GE HealthCare Technologies, Inc. |
|
|
10,463 |
|
|
|
|
|
|
|
815 |
|
|
|
GSK PLC |
|
|
31,883 |
|
|
|
|
|
|
|
615 |
|
|
|
Danaher Corp. |
|
|
2,261 |
|
|
|
|
|
|
|
565 |
|
|
|
BioMarin Pharmaceutical, Inc.1 |
|
|
6,215 |
|
|
|
|
|
|
|
512 |
|
|
|
Alnylam Pharmaceuticals, Inc.1 |
|
|
1,800 |
|
|
|
|
|
|
|
437 |
|
|
|
Shenzhen Mindray Bio-Medical Electronics Co., Ltd., Class A |
|
|
3,600 |
|
|
|
|
|
|
|
144 |
|
|
|
|
|
|
|
|
|
|
|
|
|
|
|
|
|
|
|
|
|
|
|
|
|
|
|
|
|
38,006 |
|
|
|
|
|
|
|
|
|
|
|
|
|
|
|
|
|
|
|
|
|
|
|
|
|
|
|
|
|
|
|
| |
|
|
|
|
| Industrials 8.13% |
|
RTX Corp. |
|
|
59,935 |
|
|
|
|
|
|
|
6,017 |
|
|
|
Carrier Global Corp. |
|
|
66,144 |
|
|
|
|
|
|
|
4,172 |
|
|
|
General Dynamics Corp. |
|
|
8,803 |
|
|
|
|
|
|
|
2,554 |
|
|
|
Safran SA |
|
|
11,352 |
|
|
|
|
|
|
|
2,388 |
|
|
|
BAE Systems PLC |
|
|
127,728 |
|
|
|
|
|
|
|
2,133 |
|
|
|
General Electric Co. |
|
|
10,592 |
|
|
|
|
|
|
|
1,684 |
|
|
|
Siemens AG |
|
|
8,055 |
|
|
|
|
|
|
|
1,498 |
|
|
|
Daikin Industries, Ltd. |
|
|
9,600 |
|
|
|
|
|
|
|
1,326 |
|
|
|
Honeywell International, Inc. |
|
|
6,018 |
|
|
|
|
|
|
|
1,285 |
|
|
|
CSX Corp. |
|
|
35,172 |
|
|
|
|
|
|
|
1,176 |
|
|
|
Thales SA |
|
|
7,136 |
|
|
|
|
|
|
|
1,147 |
|
|
|
Airbus SE, non-registered shares |
|
|
5,999 |
|
|
|
|
|
|
|
827 |
|
|
|
Melrose Industries PLC |
|
|
114,430 |
|
|
|
|
|
|
|
799 |
|
|
|
Volvo AB, Class B |
|
|
30,779 |
|
|
|
|
|
|
|
790 |
|
|
|
Boeing Co.1 |
|
|
3,659 |
|
|
|
|
|
|
|
666 |
|
|
|
Deutsche Post AG |
|
|
14,691 |
|
|
|
|
|
|
|
594 |
|
|
|
Rolls-Royce Holdings PLC1 |
|
|
93,431 |
|
|
|
|
|
|
|
540 |
|
|
|
United Rentals, Inc. |
|
|
795 |
|
|
|
|
|
|
|
514 |
|
American Funds Insurance Series 118
American Funds Global Balanced Fund (continued)
|
|
|
|
|
|
|
|
|
|
|
|
|
|
|
| Common stocks (continued) |
|
Shares |
|
|
|
|
|
Value
(000) |
|
|
|
|
|
|
| Industrials (continued) |
|
L3Harris Technologies, Inc. |
|
|
2,038 |
|
|
|
|
|
|
$ |
458 |
|
|
|
Grupo Aeroportuario del Pacífico, SAB de CV, Class B |
|
|
27,204 |
|
|
|
|
|
|
|
426 |
|
|
|
Waste Management, Inc. |
|
|
1,974 |
|
|
|
|
|
|
|
421 |
|
|
|
Caterpillar, Inc. |
|
|
1,194 |
|
|
|
|
|
|
|
398 |
|
|
|
Recruit Holdings Co., Ltd. |
|
|
500 |
|
|
|
|
|
|
|
27 |
|
|
|
GE Vernova, Inc.1 |
|
|
– |
2 |
|
|
|
|
|
|
– |
2 |
|
|
|
|
|
|
|
|
|
|
|
|
|
|
|
|
|
|
|
|
|
|
|
|
|
|
|
|
31,840 |
|
|
|
|
|
|
|
|
|
|
|
|
|
|
|
|
|
|
|
|
|
|
|
|
|
|
|
|
|
|
|
| |
|
|
|
|
| Financials 7.71% |
|
ING Groep NV |
|
|
267,263 |
|
|
|
|
|
|
|
4,579 |
|
|
|
B3 SA - Brasil, Bolsa, Balcao |
|
|
1,815,653 |
|
|
|
|
|
|
|
3,326 |
|
|
|
Banco Bilbao Vizcaya Argentaria, SA |
|
|
321,700 |
|
|
|
|
|
|
|
3,209 |
|
|
|
Münchener Rückversicherungs-Gesellschaft AG |
|
|
4,943 |
|
|
|
|
|
|
|
2,472 |
|
|
|
HDFC Bank, Ltd. (ADR) |
|
|
28,810 |
|
|
|
|
|
|
|
1,853 |
|
|
|
HDFC Bank, Ltd. |
|
|
24,510 |
|
|
|
|
|
|
|
495 |
|
|
|
AIA Group, Ltd. |
|
|
344,800 |
|
|
|
|
|
|
|
2,338 |
|
|
|
BlackRock, Inc. |
|
|
2,696 |
|
|
|
|
|
|
|
2,123 |
|
|
|
Chubb, Ltd. |
|
|
7,322 |
|
|
|
|
|
|
|
1,868 |
|
|
|
Zurich Insurance Group AG |
|
|
2,885 |
|
|
|
|
|
|
|
1,535 |
|
|
|
JPMorgan Chase & Co. |
|
|
4,919 |
|
|
|
|
|
|
|
995 |
|
|
|
BNP Paribas SA |
|
|
11,724 |
|
|
|
|
|
|
|
751 |
|
|
|
Aegon, Ltd. |
|
|
112,731 |
|
|
|
|
|
|
|
696 |
|
|
|
Capital One Financial Corp. |
|
|
4,869 |
|
|
|
|
|
|
|
674 |
|
|
|
Bank Central Asia Tbk PT |
|
|
1,011,700 |
|
|
|
|
|
|
|
610 |
|
|
|
3i Group PLC |
|
|
13,863 |
|
|
|
|
|
|
|
535 |
|
|
|
FinecoBank SpA |
|
|
35,668 |
|
|
|
|
|
|
|
532 |
|
|
|
Great-West Lifeco, Inc. |
|
|
17,796 |
|
|
|
|
|
|
|
519 |
|
|
|
Kotak Mahindra Bank, Ltd. |
|
|
19,234 |
|
|
|
|
|
|
|
414 |
|
|
|
Visa, Inc., Class A |
|
|
1,307 |
|
|
|
|
|
|
|
343 |
|
|
|
Ping An Insurance (Group) Company of China, Ltd., Class H |
|
|
59,000 |
|
|
|
|
|
|
|
268 |
|
|
|
Ping An Insurance (Group) Company of China, Ltd., Class A |
|
|
11,300 |
|
|
|
|
|
|
|
64 |
|
|
|
|
|
|
|
|
|
|
|
|
|
|
|
|
|
|
|
|
|
|
|
|
|
|
|
|
|
30,199 |
|
|
|
|
|
|
|
|
|
|
|
|
|
|
|
|
|
|
|
|
|
|
|
|
|
|
|
|
|
|
|
| |
|
|
|
|
| Consumer staples 5.65% |
|
Philip Morris International, Inc. |
|
|
38,604 |
|
|
|
|
|
|
|
3,912 |
|
|
|
ITC, Ltd. |
|
|
726,576 |
|
|
|
|
|
|
|
3,687 |
|
|
|
Imperial Brands PLC |
|
|
116,457 |
|
|
|
|
|
|
|
2,982 |
|
|
|
Ajinomoto Co., Inc. |
|
|
73,950 |
|
|
|
|
|
|
|
2,603 |
|
|
|
British American Tobacco PLC |
|
|
73,860 |
|
|
|
|
|
|
|
2,270 |
|
|
|
Suntory Beverage & Food, Ltd. |
|
|
44,300 |
|
|
|
|
|
|
|
1,573 |
|
|
|
Seven & i Holdings Co., Ltd. |
|
|
101,300 |
|
|
|
|
|
|
|
1,234 |
|
|
|
Barry Callebaut AG (Switzerland) |
|
|
755 |
|
|
|
|
|
|
|
1,230 |
|
|
|
Nestlé SA |
|
|
10,727 |
|
|
|
|
|
|
|
1,095 |
|
|
|
Kao Corp. |
|
|
21,800 |
|
|
|
|
|
|
|
886 |
|
|
|
Pernod Ricard SA |
|
|
5,072 |
|
|
|
|
|
|
|
690 |
|
|
|
|
|
|
|
|
|
|
|
|
|
|
|
|
|
|
|
|
|
|
|
|
|
|
|
|
|
22,162 |
|
|
|
|
|
|
|
|
|
|
|
|
|
|
|
|
|
|
|
|
|
|
|
|
|
|
|
|
|
|
|
| |
|
|
|
|
| Materials 4.93% |
|
Freeport-McMoRan, Inc. |
|
|
104,223 |
|
|
|
|
|
|
|
5,065 |
|
|
|
Air Products and Chemicals, Inc. |
|
|
13,578 |
|
|
|
|
|
|
|
3,504 |
|
|
|
Glencore PLC |
|
|
429,258 |
|
|
|
|
|
|
|
2,448 |
|
|
|
Linde PLC |
|
|
4,263 |
|
|
|
|
|
|
|
1,871 |
|
|
|
BHP Group, Ltd. (CDI) |
|
|
56,251 |
|
|
|
|
|
|
|
1,611 |
|
|
|
Smurfit Kappa Group PLC |
|
|
27,151 |
|
|
|
|
|
|
|
1,207 |
|
|
|
Fortescue, Ltd. |
|
|
68,831 |
|
|
|
|
|
|
|
983 |
|
|
|
Rio Tinto PLC |
|
|
12,568 |
|
|
|
|
|
|
|
827 |
|
|
|
Celanese Corp. |
|
|
5,091 |
|
|
|
|
|
|
|
687 |
|
|
|
Vale SA (ADR), ordinary nominative shares |
|
|
58,771 |
|
|
|
|
|
|
|
656 |
|
|
|
Air Liquide SA |
|
|
2,601 |
|
|
|
|
|
|
|
448 |
|
|
|
|
|
|
|
|
|
|
|
|
|
|
|
|
|
|
|
|
|
|
|
|
|
|
|
|
|
19,307 |
|
|
|
|
|
|
|
|
|
|
|
|
|
|
|
|
119 American Funds Insurance Series
American Funds Global Balanced Fund (continued)
|
|
|
|
|
|
|
|
|
|
|
|
|
|
|
| Common stocks (continued) |
|
Shares |
|
|
|
|
|
Value
(000) |
|
|
|
|
|
|
| Communication services 4.63% |
|
Meta Platforms, Inc., Class A |
|
|
13,614 |
|
|
|
|
|
|
$ |
6,864 |
|
|
|
Alphabet, Inc., Class A |
|
|
22,016 |
|
|
|
|
|
|
|
4,010 |
|
|
|
Alphabet, Inc., Class C |
|
|
7,461 |
|
|
|
|
|
|
|
1,369 |
|
|
|
Netflix, Inc.1 |
|
|
2,737 |
|
|
|
|
|
|
|
1,847 |
|
|
|
Singapore Telecommunications, Ltd. |
|
|
718,100 |
|
|
|
|
|
|
|
1,452 |
|
|
|
Omnicom Group, Inc. |
|
|
9,635 |
|
|
|
|
|
|
|
864 |
|
|
|
Comcast Corp., Class A |
|
|
19,062 |
|
|
|
|
|
|
|
747 |
|
|
|
TELUS Corp. |
|
|
47,553 |
|
|
|
|
|
|
|
720 |
|
|
|
Nintendo Co., Ltd. |
|
|
5,300 |
|
|
|
|
|
|
|
283 |
|
|
|
|
|
|
|
|
|
|
|
|
|
|
|
|
|
|
|
|
|
|
|
|
|
|
|
|
|
18,156 |
|
|
|
|
|
|
|
|
|
|
|
|
|
|
|
|
|
|
|
|
|
|
|
|
|
|
|
|
|
|
|
| |
|
|
|
|
| Consumer discretionary 4.03% |
|
Amazon.com, Inc.1 |
|
|
15,165 |
|
|
|
|
|
|
|
2,931 |
|
|
|
LVMH Moët Hennessy-Louis Vuitton SE |
|
|
2,627 |
|
|
|
|
|
|
|
2,017 |
|
|
|
Home Depot, Inc. |
|
|
5,834 |
|
|
|
|
|
|
|
2,008 |
|
|
|
Ferrari NV |
|
|
3,604 |
|
|
|
|
|
|
|
1,472 |
|
|
|
Ferrari NV (EUR denominated) |
|
|
1,214 |
|
|
|
|
|
|
|
496 |
|
|
|
Compagnie Financière Richemont SA, Class A |
|
|
9,433 |
|
|
|
|
|
|
|
1,472 |
|
|
|
Royal Caribbean Cruises, Ltd.1 |
|
|
7,852 |
|
|
|
|
|
|
|
1,252 |
|
|
|
InterContinental Hotels Group PLC |
|
|
11,356 |
|
|
|
|
|
|
|
1,191 |
|
|
|
McDonald’s Corp. |
|
|
3,512 |
|
|
|
|
|
|
|
895 |
|
|
|
Hasbro, Inc. |
|
|
11,777 |
|
|
|
|
|
|
|
689 |
|
|
|
Sony Group Corp. |
|
|
6,200 |
|
|
|
|
|
|
|
527 |
|
|
|
Restaurant Brands International, Inc. |
|
|
6,188 |
|
|
|
|
|
|
|
435 |
|
|
|
adidas AG |
|
|
1,646 |
|
|
|
|
|
|
|
393 |
|
|
|
|
|
|
|
|
|
|
|
|
|
|
|
|
|
|
|
|
|
|
|
|
|
|
|
|
|
15,778 |
|
|
|
|
|
|
|
|
|
|
|
|
|
|
|
|
|
|
|
|
|
|
|
|
|
|
|
|
|
|
|
| |
|
|
|
|
| Energy 3.09% |
|
Canadian Natural Resources, Ltd. (CAD denominated) |
|
|
173,623 |
|
|
|
|
|
|
|
6,185 |
|
|
|
Shell PLC (GBP denominated) |
|
|
49,225 |
|
|
|
|
|
|
|
1,769 |
|
|
|
TC Energy Corp. (CAD denominated) |
|
|
32,907 |
|
|
|
|
|
|
|
1,247 |
|
|
|
Chevron Corp. |
|
|
7,410 |
|
|
|
|
|
|
|
1,159 |
|
|
|
BP PLC |
|
|
169,713 |
|
|
|
|
|
|
|
1,023 |
|
|
|
Neste OYJ |
|
|
42,256 |
|
|
|
|
|
|
|
749 |
|
|
|
|
|
|
|
|
|
|
|
|
|
|
|
|
|
|
|
|
|
|
|
|
|
|
|
|
|
12,132 |
|
|
|
|
|
|
|
|
|
|
|
|
|
|
|
|
|
|
|
|
|
|
|
|
|
|
|
|
|
|
|
| |
|
|
|
|
| Utilities 3.04% |
|
DTE Energy Co. |
|
|
27,496 |
|
|
|
|
|
|
|
3,053 |
|
|
|
Constellation Energy Corp. |
|
|
13,593 |
|
|
|
|
|
|
|
2,722 |
|
|
|
E.ON SE |
|
|
187,940 |
|
|
|
|
|
|
|
2,463 |
|
|
|
Duke Energy Corp. |
|
|
15,430 |
|
|
|
|
|
|
|
1,547 |
|
|
|
SembCorp Industries, Ltd. |
|
|
272,700 |
|
|
|
|
|
|
|
964 |
|
|
|
Dominion Energy, Inc. |
|
|
12,884 |
|
|
|
|
|
|
|
631 |
|
|
|
ENN Energy Holdings, Ltd. |
|
|
64,100 |
|
|
|
|
|
|
|
528 |
|
|
|
Power Grid Corporation of India, Ltd. |
|
|
– |
2 |
|
|
|
|
|
|
– |
2 |
|
|
|
|
|
|
|
|
|
|
|
|
|
|
|
|
|
|
|
|
|
|
|
|
|
|
|
|
11,908 |
|
|
|
|
|
|
|
|
|
|
|
|
|
|
|
|
|
|
|
|
|
|
|
|
|
|
|
|
|
|
|
| |
|
|
|
|
| Real estate 1.21% |
|
CTP NV |
|
|
104,539 |
|
|
|
|
|
|
|
1,778 |
|
|
|
Equinix, Inc. REIT |
|
|
2,132 |
|
|
|
|
|
|
|
1,613 |
|
|
|
Embassy Office Parks REIT |
|
|
316,897 |
|
|
|
|
|
|
|
1,347 |
|
|
|
|
|
|
|
|
|
|
|
|
|
|
|
|
|
|
|
|
|
|
|
|
|
|
|
|
|
4,738 |
|
|
|
|
|
|
|
|
|
|
|
|
|
|
|
|
|
|
Total common stocks (cost: $192,436,000) |
|
|
|
|
|
|
|
|
|
|
251,700 |
|
|
|
|
|
|
|
|
|
|
|
|
|
|
|
|
|
|
|
|
|
|
|
|
|
|
|
|
|
|
|
|
|
|
|
|
| Preferred securities 0.08% |
|
|
|
|
|
|
|
|
|
|
|
|
|
|
| Consumer discretionary 0.08% |
|
Dr. Ing. h.c. F. Porsche AG, nonvoting non-registered preferred shares |
|
|
4,238 |
|
|
|
|
|
|
|
315 |
|
|
|
|
|
|
|
|
|
|
|
|
|
|
|
|
|
|
Total preferred securities (cost: $345,000) |
|
|
|
|
|
|
|
|
|
|
315 |
|
|
|
|
|
|
|
|
|
|
|
|
|
|
|
|
American Funds Insurance Series 120
American Funds Global Balanced Fund (continued)
|
|
|
|
|
|
|
|
|
|
|
|
|
|
|
| Convertible stocks 0.50% |
|
Shares |
|
|
|
|
|
Value
(000) |
|
|
|
|
|
|
| Utilities 0.50% |
|
NextEra Energy, Inc., noncumulative convertible preferred units, 6.926% 9/1/20253 |
|
|
47,600 |
|
|
|
|
|
|
$ |
1,975 |
|
|
|
|
|
|
|
|
|
|
|
|
|
|
|
|
|
|
Total convertible stocks (cost: $2,123,000) |
|
|
|
|
|
|
|
|
|
|
1,975 |
|
|
|
|
|
|
|
|
|
|
|
|
|
|
|
|
|
|
|
|
| Bonds, notes & other debt instruments 30.42% |
|
Principal amount (000) |
|
|
|
|
|
|
|
|
|
|
|
| Bonds & notes of governments & government agencies outside the U.S. 12.95% |
|
|
|
|
|
|
|
|
|
|
|
|
|
|
Agricultural Development Bank of China 3.75% 1/25/2029 |
|
|
CNY550 |
|
|
|
|
|
|
|
81 |
|
|
|
Asian Development Bank 1.125% 6/10/2025 |
|
|
GBP100 |
|
|
|
|
|
|
|
122 |
|
|
|
Asian Development Bank 6.20% 10/6/2026 |
|
|
INR1,990 |
|
|
|
|
|
|
|
24 |
|
|
|
Asian Development Bank 6.72% 2/8/2028 |
|
|
18,000 |
|
|
|
|
|
|
|
215 |
|
|
|
Australia (Commonwealth of), Series 157, 1.50% 6/21/2031 |
|
|
AUD115 |
|
|
|
|
|
|
|
64 |
|
|
|
Australia (Commonwealth of), Series 166, 3.00% 11/21/2033 |
|
|
725 |
|
|
|
|
|
|
|
436 |
|
|
|
Austria (Republic of) 0% 2/20/2031 |
|
|
EUR500 |
|
|
|
|
|
|
|
442 |
|
|
|
Austria (Republic of) 2.90% 2/20/2034 |
|
|
120 |
|
|
|
|
|
|
|
127 |
|
|
|
Belgium (Kingdom of), Series 97, 3.00% 6/22/2033 |
|
|
270 |
|
|
|
|
|
|
|
288 |
|
|
|
Brazil (Federative Republic of) 0% 1/1/2025 |
|
|
BRL2,300 |
|
|
|
|
|
|
|
391 |
|
|
|
Brazil (Federative Republic of) 10.00% 1/1/2025 |
|
|
900 |
|
|
|
|
|
|
|
160 |
|
|
|
Brazil (Federative Republic of) 0% 4/1/2025 |
|
|
6,700 |
|
|
|
|
|
|
|
1,107 |
|
|
|
Brazil (Federative Republic of) 10.00% 1/1/2029 |
|
|
2,230 |
|
|
|
|
|
|
|
371 |
|
|
|
Brazil (Federative Republic of) 10.00% 1/1/2031 |
|
|
1,529 |
|
|
|
|
|
|
|
247 |
|
|
|
Brazil (Federative Republic of) 6.00% 8/15/20404 |
|
|
215 |
|
|
|
|
|
|
|
37 |
|
|
|
Brazil (Federative Republic of) 6.00% 8/15/20504 |
|
|
1,551 |
|
|
|
|
|
|
|
262 |
|
|
|
Brazil (Federative Republic of) 6.00% 8/15/20604 |
|
|
215 |
|
|
|
|
|
|
|
36 |
|
|
|
Bulgaria (Republic of) 4.50% 1/27/2033 |
|
|
EUR120 |
|
|
|
|
|
|
|
134 |
|
|
|
Canada 3.00% 11/1/2024 |
|
|
CAD320 |
|
|
|
|
|
|
|
233 |
|
|
|
Canada 2.25% 6/1/2025 |
|
|
1,400 |
|
|
|
|
|
|
|
1,004 |
|
|
|
Canada 0.25% 3/1/2026 |
|
|
246 |
|
|
|
|
|
|
|
169 |
|
|
|
Canada 3.50% 3/1/2028 |
|
|
609 |
|
|
|
|
|
|
|
444 |
|
|
|
Chile (Republic of) 4.70% 9/1/2030 |
|
|
CLP55,000 |
|
|
|
|
|
|
|
55 |
|
|
|
China (People’s Republic of), Series INBK, 2.64% 1/15/2028 |
|
|
CNY8,160 |
|
|
|
|
|
|
|
1,150 |
|
|
|
China (People’s Republic of), Series INBK, 2.37% 1/15/2029 |
|
|
3,860 |
|
|
|
|
|
|
|
540 |
|
|
|
China (People’s Republic of), Series INBK, 2.62% 6/25/2030 |
|
|
1,970 |
|
|
|
|
|
|
|
279 |
|
|
|
China (People’s Republic of), Series INBK, 2.88% 2/25/2033 |
|
|
12,270 |
|
|
|
|
|
|
|
1,775 |
|
|
|
China (People’s Republic of), Series INBK, 3.81% 9/14/2050 |
|
|
3,860 |
|
|
|
|
|
|
|
665 |
|
|
|
China (People’s Republic of), Series INBK, 3.12% 10/25/2052 |
|
|
4,630 |
|
|
|
|
|
|
|
717 |
|
|
|
China (People’s Republic of), Series INBK, 3.00% 10/15/2053 |
|
|
820 |
|
|
|
|
|
|
|
126 |
|
|
|
China Development Bank Corp., Series 2008, 2.89% 6/22/2025 |
|
|
3,240 |
|
|
|
|
|
|
|
451 |
|
|
|
China Development Bank Corp., Series 2004, 3.43% 1/14/2027 |
|
|
1,060 |
|
|
|
|
|
|
|
151 |
|
|
|
China Development Bank Corp., Series 2009, 3.39% 7/10/2027 |
|
|
8,580 |
|
|
|
|
|
|
|
1,231 |
|
|
|
China Development Bank Corp., Series 1805, 4.88% 2/9/2028 |
|
|
2,040 |
|
|
|
|
|
|
|
309 |
|
|
|
Dominican Republic 5.50% 1/27/2025 |
|
|
USD286 |
|
|
|
|
|
|
|
286 |
|
|
|
Estonia (Republic of) 3.25% 1/17/2034 |
|
|
EUR160 |
|
|
|
|
|
|
|
167 |
|
|
|
European Bank for Reconstruction and Development 5.00% 1/15/2026 |
|
|
INR7,100 |
|
|
|
|
|
|
|
83 |
|
|
|
European Bank for Reconstruction and Development 5.25% 1/12/2027 |
|
|
10,100 |
|
|
|
|
|
|
|
116 |
|
|
|
European Bank for Reconstruction and Development 6.30% 10/26/2027 |
|
|
4,300 |
|
|
|
|
|
|
|
51 |
|
|
|
European Investment Bank 0.375% 9/15/2027 |
|
|
EUR110 |
|
|
|
|
|
|
|
109 |
|
|
|
European Investment Bank 0.25% 1/20/2032 |
|
|
860 |
|
|
|
|
|
|
|
756 |
|
|
|
European Union 0% 7/6/2026 |
|
|
100 |
|
|
|
|
|
|
|
101 |
|
|
|
European Union 0.25% 10/22/2026 |
|
|
50 |
|
|
|
|
|
|
|
50 |
|
|
|
European Union 2.875% 12/6/2027 |
|
|
50 |
|
|
|
|
|
|
|
53 |
|
|
|
French Republic O.A.T. 0.75% 2/25/2028 |
|
|
410 |
|
|
|
|
|
|
|
405 |
|
|
|
French Republic O.A.T. 0% 11/25/2030 |
|
|
1,320 |
|
|
|
|
|
|
|
1,167 |
|
|
|
French Republic O.A.T. 2.00% 11/25/2032 |
|
|
610 |
|
|
|
|
|
|
|
598 |
|
|
|
French Republic O.A.T. 3.25% 5/25/2045 |
|
|
160 |
|
|
|
|
|
|
|
162 |
|
|
|
Germany (Federal Republic of) 2.50% 3/13/2025 |
|
|
845 |
|
|
|
|
|
|
|
900 |
|
|
|
Germany (Federal Republic of) 0% 4/16/2027 |
|
|
950 |
|
|
|
|
|
|
|
947 |
|
|
|
Germany (Federal Republic of) 0% 2/15/2032 |
|
|
540 |
|
|
|
|
|
|
|
483 |
|
|
|
Germany (Federal Republic of) 1.70% 8/15/2032 |
|
|
674 |
|
|
|
|
|
|
|
684 |
|
|
|
Germany (Federal Republic of) 2.30% 2/15/2033 |
|
|
510 |
|
|
|
|
|
|
|
540 |
|
|
|
Germany (Federal Republic of) 1.00% 5/15/2038 |
|
|
280 |
|
|
|
|
|
|
|
243 |
|
121 American Funds Insurance Series
American Funds Global Balanced Fund (continued)
|
|
|
|
|
|
|
|
|
|
|
|
|
|
|
| Bonds, notes & other debt instruments (continued) |
|
Principal amount (000) |
|
|
|
|
|
Value (000) |
|
|
| Bonds & notes of governments & government agencies outside the U.S. (continued) |
|
|
|
Germany (Federal Republic of) 0% 8/15/2050 |
|
|
EUR380 |
|
|
|
|
|
|
$ |
206 |
|
|
|
Germany (Federal Republic of) 0% 8/15/2052 |
|
|
80 |
|
|
|
|
|
|
|
41 |
|
|
|
Greece (Hellenic Republic of) 3.375% 2/15/2025 |
|
|
5 |
|
|
|
|
|
|
|
5 |
|
|
|
Greece (Hellenic Republic of) 3.875% 6/15/2028 |
|
|
65 |
|
|
|
|
|
|
|
71 |
|
|
|
Greece (Hellenic Republic of) 1.50% 6/18/2030 |
|
|
90 |
|
|
|
|
|
|
|
87 |
|
|
|
Greece (Hellenic Republic of) 1.75% 6/18/2032 |
|
|
530 |
|
|
|
|
|
|
|
500 |
|
|
|
Indonesia (Republic of), Series 64, 6.125% 5/15/2028 |
|
|
IDR1,165,000 |
|
|
|
|
|
|
|
70 |
|
|
|
Indonesia (Republic of), Series 95, 6.375% 8/15/2028 |
|
|
1,767,000 |
|
|
|
|
|
|
|
106 |
|
|
|
Indonesia (Republic of), Series 71, 9.00% 3/15/2029 |
|
|
4,437,000 |
|
|
|
|
|
|
|
293 |
|
|
|
Indonesia (Republic of), Series 78, 8.25% 5/15/2029 |
|
|
3,301,000 |
|
|
|
|
|
|
|
212 |
|
|
|
Indonesia (Republic of), Series 87, 6.50% 2/15/2031 |
|
|
1,253,000 |
|
|
|
|
|
|
|
74 |
|
|
|
Indonesia (Republic of), Series 96, 7.00% 2/15/2033 |
|
|
4,446,000 |
|
|
|
|
|
|
|
270 |
|
|
|
Inter-American Development Bank 7.00% 1/25/2029 |
|
|
INR47,000 |
|
|
|
|
|
|
|
561 |
|
|
|
International Bank for Reconstruction and Development 6.75% 9/8/2027 |
|
|
15,800 |
|
|
|
|
|
|
|
188 |
|
|
|
International Bank for Reconstruction and Development 6.75% 7/13/2029 |
|
|
16,200 |
|
|
|
|
|
|
|
192 |
|
|
|
Ireland (Republic of) 2.60% 10/18/2034 |
|
|
EUR100 |
|
|
|
|
|
|
|
104 |
|
|
|
Ireland (Republic of) 3.00% 10/18/2043 |
|
|
150 |
|
|
|
|
|
|
|
156 |
|
|
|
Israel (State of) 1.30% 4/30/2032 |
|
|
ILS2,540 |
|
|
|
|
|
|
|
520 |
|
|
|
Israel (State of) 4.50% 1/17/2033 |
|
|
USD200 |
|
|
|
|
|
|
|
180 |
|
|
|
Israel (State of) 4.00% 3/30/2035 |
|
|
ILS940 |
|
|
|
|
|
|
|
230 |
|
|
|
Italy (Republic of) 1.35% 4/1/2030 |
|
|
EUR550 |
|
|
|
|
|
|
|
521 |
|
|
|
Italy (Republic of) 4.40% 5/1/2033 |
|
|
1,200 |
|
|
|
|
|
|
|
1,333 |
|
|
|
Italy (Republic of) 4.35% 11/1/2033 |
|
|
740 |
|
|
|
|
|
|
|
816 |
|
|
|
Italy (Republic of) 4.20% 3/1/2034 |
|
|
1,675 |
|
|
|
|
|
|
|
1,823 |
|
|
|
Italy (Republic of) 4.50% 10/1/2053 |
|
|
390 |
|
|
|
|
|
|
|
414 |
|
|
|
Japan, Series 19, 0.10% 9/10/20244 |
|
|
JPY32,760 |
|
|
|
|
|
|
|
205 |
|
|
|
Japan, Series 150, 0.005% 12/20/2026 |
|
|
84,950 |
|
|
|
|
|
|
|
523 |
|
|
|
Japan, Series 346, 0.10% 3/20/2027 |
|
|
134,150 |
|
|
|
|
|
|
|
828 |
|
|
|
Japan, Series 352, 0.10% 9/20/2028 |
|
|
61,950 |
|
|
|
|
|
|
|
379 |
|
|
|
Japan, Series 363, 0.10% 6/20/2031 |
|
|
7,500 |
|
|
|
|
|
|
|
45 |
|
|
|
Japan, Series 373, 0.60% 12/20/2033 |
|
|
55,750 |
|
|
|
|
|
|
|
334 |
|
|
|
Japan, Series 152, 1.20% 3/20/2035 |
|
|
205,250 |
|
|
|
|
|
|
|
1,281 |
|
|
|
Japan, Series 176, 0.50% 3/20/2041 |
|
|
109,950 |
|
|
|
|
|
|
|
569 |
|
|
|
Japan, Series 179, 0.50% 12/20/2041 |
|
|
50,500 |
|
|
|
|
|
|
|
257 |
|
|
|
Japan, Series 42, 1.70% 3/20/2044 |
|
|
50,150 |
|
|
|
|
|
|
|
305 |
|
|
|
Japan, Series 37, 0.60% 6/20/2050 |
|
|
26,950 |
|
|
|
|
|
|
|
118 |
|
|
|
Japan, Series 74, 1.00% 3/20/2052 |
|
|
84,000 |
|
|
|
|
|
|
|
400 |
|
|
|
Japan, Series 76, 1.40% 9/20/2052 |
|
|
47,500 |
|
|
|
|
|
|
|
250 |
|
|
|
Magyar Export-Import Bank 6.00% 5/16/2029 |
|
|
EUR100 |
|
|
|
|
|
|
|
113 |
|
|
|
Netherlands (Kingdom of the) 5.50% 1/15/2028 |
|
|
100 |
|
|
|
|
|
|
|
117 |
|
|
|
New South Wales Treasury Corp. 4.75% 2/20/2035 |
|
|
AUD400 |
|
|
|
|
|
|
|
259 |
|
|
|
New South Wales Treasury Corp. 4.25% 2/20/2036 |
|
|
670 |
|
|
|
|
|
|
|
409 |
|
|
|
Norway (Kingdom of) 1.75% 9/6/2029 |
|
|
NOK2,850 |
|
|
|
|
|
|
|
244 |
|
|
|
Norway (Kingdom of) 3.625% 4/13/2034 |
|
|
4,630 |
|
|
|
|
|
|
|
435 |
|
|
|
Nova Scotia (Province of) 3.15% 12/1/2051 |
|
|
CAD170 |
|
|
|
|
|
|
|
99 |
|
|
|
Panama (Republic of) 7.50% 3/1/2031 |
|
|
USD200 |
|
|
|
|
|
|
|
210 |
|
|
|
Panama (Republic of) 6.40% 2/14/2035 |
|
|
200 |
|
|
|
|
|
|
|
190 |
|
|
|
Panama (Republic of) 7.875% 3/1/2057 |
|
|
570 |
|
|
|
|
|
|
|
595 |
|
|
|
Philippines (Republic of) 0.25% 4/28/2025 |
|
|
EUR100 |
|
|
|
|
|
|
|
104 |
|
|
|
Philippines (Republic of) 1.648% 6/10/2031 |
|
|
USD200 |
|
|
|
|
|
|
|
159 |
|
|
|
Poland (Republic of), Series 1029, 2.75% 10/25/2029 |
|
|
PLN410 |
|
|
|
|
|
|
|
89 |
|
|
|
Portuguese Republic 0.475% 10/18/2030 |
|
|
EUR230 |
|
|
|
|
|
|
|
213 |
|
|
|
Portuguese Republic 3.50% 6/18/2038 |
|
|
230 |
|
|
|
|
|
|
|
247 |
|
|
|
Romania 2.125% 3/7/2028 |
|
|
130 |
|
|
|
|
|
|
|
129 |
|
|
|
South Africa (Republic of), Series R-214, 6.50% 2/28/2041 |
|
|
ZAR4,235 |
|
|
|
|
|
|
|
142 |
|
|
|
South Korea (Republic of), Series 2712, 2.375% 12/10/2027 |
|
|
KRW348,590 |
|
|
|
|
|
|
|
246 |
|
|
|
South Korea (Republic of), Series 3212, 4.25% 12/10/2032 |
|
|
1,831,500 |
|
|
|
|
|
|
|
1,428 |
|
|
|
Spain (Kingdom of) 0% 1/31/2027 |
|
|
EUR335 |
|
|
|
|
|
|
|
332 |
|
|
|
Spain (Kingdom of) 0.80% 7/30/2027 |
|
|
490 |
|
|
|
|
|
|
|
491 |
|
|
|
Spain (Kingdom of) 0.50% 10/31/2031 |
|
|
165 |
|
|
|
|
|
|
|
146 |
|
|
|
Spain (Kingdom of) 3.15% 4/30/2033 |
|
|
317 |
|
|
|
|
|
|
|
336 |
|
American Funds Insurance Series 122
American Funds Global Balanced Fund (continued)
|
|
|
|
|
|
|
|
|
|
|
|
|
|
|
| Bonds, notes & other debt instruments (continued) |
|
Principal amount (000) |
|
|
|
|
|
Value (000) |
|
|
| Bonds & notes of governments & government agencies outside the U.S. (continued) |
|
|
|
Spain (Kingdom of) 3.55% 10/31/2033 |
|
|
EUR370 |
|
|
|
|
|
|
$ |
403 |
|
|
|
Spain (Kingdom of) 3.25% 4/30/2034 |
|
|
120 |
|
|
|
|
|
|
|
127 |
|
|
|
Spain (Kingdom of) 3.45% 10/31/2034 |
|
|
240 |
|
|
|
|
|
|
|
258 |
|
|
|
Turkey (Republic of) 12.60% 10/1/2025 |
|
|
TRY13,340 |
|
|
|
|
|
|
|
308 |
|
|
|
Ukraine 6.876% 5/21/20315,6 |
|
|
USD250 |
|
|
|
|
|
|
|
72 |
|
|
|
Ukraine 6.876% 5/21/20315 |
|
|
200 |
|
|
|
|
|
|
|
57 |
|
|
|
United Kingdom 2.75% 9/7/2024 |
|
|
GBP50 |
|
|
|
|
|
|
|
63 |
|
|
|
United Kingdom 1.25% 7/22/2027 |
|
|
410 |
|
|
|
|
|
|
|
476 |
|
|
|
United Kingdom 0.375% 10/22/2030 |
|
|
490 |
|
|
|
|
|
|
|
496 |
|
|
|
United Kingdom 1.00% 1/31/2032 |
|
|
920 |
|
|
|
|
|
|
|
932 |
|
|
|
United Kingdom 4.25% 6/7/2032 |
|
|
785 |
|
|
|
|
|
|
|
1,006 |
|
|
|
United Kingdom 3.25% 1/22/2044 |
|
|
174 |
|
|
|
|
|
|
|
182 |
|
|
|
United Kingdom 1.25% 7/31/2051 |
|
|
413 |
|
|
|
|
|
|
|
252 |
|
|
|
United Kingdom 4.375% 7/31/2054 |
|
|
235 |
|
|
|
|
|
|
|
283 |
|
|
|
United Mexican States, Series M, 5.75% 3/5/2026 |
|
|
MXN10,710 |
|
|
|
|
|
|
|
541 |
|
|
|
United Mexican States, Series M, 7.75% 11/23/2034 |
|
|
13,804 |
|
|
|
|
|
|
|
650 |
|
|
|
United Mexican States, Series M, 8.00% 11/7/2047 |
|
|
5,120 |
|
|
|
|
|
|
|
229 |
|
|
|
United Mexican States, Series M, 8.00% 7/31/2053 |
|
|
28,580 |
|
|
|
|
|
|
|
1,262 |
|
|
|
United Mexican States, Series S, 4.00% 10/29/20544 |
|
|
4,128 |
|
|
|
|
|
|
|
189 |
|
|
|
|
|
|
|
|
|
|
|
|
|
|
|
|
|
|
|
|
|
|
|
|
|
|
|
|
|
50,730 |
|
|
|
|
|
|
|
|
|
|
|
|
|
|
|
|
|
| Mortgage-backed obligations 6.90% |
|
|
|
|
|
|
| Federal agency mortgage-backed obligations 6.03% |
|
Fannie Mae Pool #FS4191 5.50% 3/1/20537 |
|
|
USD290 |
|
|
|
|
|
|
|
287 |
|
|
|
|
|
|
|
|
Fannie Mae Pool #MA5191 6.00% 11/1/20537 |
|
|
527 |
|
|
|
|
|
|
|
528 |
|
|
|
|
|
|
|
|
Fannie Mae Pool #MA5274 7.00% 2/1/20547 |
|
|
1,072 |
|
|
|
|
|
|
|
1,103 |
|
|
|
|
|
|
|
|
Fannie Mae Pool #FS8131 5.50% 6/1/20547 |
|
|
100 |
|
|
|
|
|
|
|
99 |
|
|
|
Fannie Mae Pool #FS8153 6.00% 6/1/20547 |
|
|
190 |
|
|
|
|
|
|
|
192 |
|
|
|
Fannie Mae Pool #BU4700 6.00% 7/1/20547 |
|
|
118 |
|
|
|
|
|
|
|
119 |
|
|
|
Freddie Mac Pool #SD8276 5.00% 12/1/20527 |
|
|
461 |
|
|
|
|
|
|
|
447 |
|
|
|
Freddie Mac Pool #SD4977 5.00% 11/1/20537 |
|
|
1,609 |
|
|
|
|
|
|
|
1,556 |
|
|
|
Freddie Mac Pool #RJ1855 5.00% 6/1/20547 |
|
|
28 |
|
|
|
|
|
|
|
27 |
|
|
|
Freddie Mac Pool #RJ1768 5.50% 6/1/20547 |
|
|
45 |
|
|
|
|
|
|
|
45 |
|
|
|
Freddie Mac Pool #RJ1859 6.00% 6/1/20547 |
|
|
110 |
|
|
|
|
|
|
|
111 |
|
|
|
Freddie Mac Pool #RJ1779 6.00% 6/1/20547 |
|
|
90 |
|
|
|
|
|
|
|
91 |
|
|
|
Freddie Mac Pool #QI8874 6.00% 7/1/20547 |
|
|
47 |
|
|
|
|
|
|
|
47 |
|
|
|
Freddie Mac, Series K153, Class A2, Multi Family, 3.82% 1/25/20337 |
|
|
580 |
|
|
|
|
|
|
|
541 |
|
|
|
Government National Mortgage Assn. 6.50% 7/1/20547,8 |
|
|
1,175 |
|
|
|
|
|
|
|
1,192 |
|
|
|
Uniform Mortgage-Backed Security 2.00% 7/1/20547,8 |
|
|
50 |
|
|
|
|
|
|
|
39 |
|
|
|
Uniform Mortgage-Backed Security 4.50% 7/1/20547,8 |
|
|
1,095 |
|
|
|
|
|
|
|
1,032 |
|
|
|
Uniform Mortgage-Backed Security 5.00% 7/1/20547,8 |
|
|
3,223 |
|
|
|
|
|
|
|
3,115 |
|
|
|
Uniform Mortgage-Backed Security 5.50% 7/1/20547,8 |
|
|
4,083 |
|
|
|
|
|
|
|
4,028 |
|
|
|
Uniform Mortgage-Backed Security 6.00% 7/1/20547,8 |
|
|
3,426 |
|
|
|
|
|
|
|
3,436 |
|
|
|
Uniform Mortgage-Backed Security 6.50% 7/1/20547,8 |
|
|
580 |
|
|
|
|
|
|
|
590 |
|
|
|
Uniform Mortgage-Backed Security 7.00% 7/1/20547,8 |
|
|
7 |
|
|
|
|
|
|
|
7 |
|
|
|
Uniform Mortgage-Backed Security 6.00% 8/1/20547,8 |
|
|
2,837 |
|
|
|
|
|
|
|
2,844 |
|
|
|
Uniform Mortgage-Backed Security 6.50% 8/1/20547,8 |
|
|
2,073 |
|
|
|
|
|
|
|
2,109 |
|
|
|
Uniform Mortgage-Backed Security 7.00% 8/1/20547,8 |
|
|
46 |
|
|
|
|
|
|
|
47 |
|
|
|
|
|
|
|
|
|
|
|
|
|
|
|
|
|
|
|
|
|
|
|
|
|
|
|
|
|
23,632 |
|
|
|
|
|
|
|
|
|
|
|
|
|
|
|
|
| |
|
| |
|
|
|
|
| Collateralized mortgage-backed obligations (privately originated) 0.48% |
|
Connecticut Avenue Securities Trust, Series 2023-R04, Class 1M1,
(30-day Average USD-SOFR + 2.30%) 7.635% 5/25/20436,7,9 |
|
|
179 |
|
|
|
|
|
|
|
184 |
|
|
|
|
|
|
|
|
Connecticut Avenue Securities Trust, Series 2023-R05, Class 1M1,
(30-day Average USD-SOFR + 1.90%) 7.235% 6/25/20436,7,9 |
|
|
100 |
|
|
|
|
|
|
|
102 |
|
|
|
|
|
|
|
|
Connecticut Avenue Securities Trust, Series 2023-R06, Class 1M1,
(30-day Average USD-SOFR + 1.70%) 7.035% 7/25/20436,7,9 |
|
|
73 |
|
|
|
|
|
|
|
73 |
|
|
|
|
|
|
|
|
Connecticut Avenue Securities Trust, Series 2024-R01, Class 1M2,
(30-day Average USD-SOFR + 1.80%) 7.135% 1/25/20446,7,9 |
|
|
55 |
|
|
|
|
|
|
|
56 |
|
|
|
|
|
|
|
|
Connecticut Avenue Securities Trust, Series 2024-R04, Class 1M1,
(30-day Average USD-SOFR + 1.10%) 6.424% 5/25/20446,7,9 |
|
|
112 |
|
|
|
|
|
|
|
112 |
|
123 American Funds Insurance Series
American Funds Global Balanced Fund (continued)
|
|
|
|
|
|
|
|
|
|
|
|
|
|
|
| Bonds, notes & other debt instruments (continued) |
|
Principal amount (000) |
|
|
|
|
|
Value (000) |
|
|
| Mortgage-backed obligations (continued) |
|
| |
|
|
|
|
| Collateralized mortgage-backed obligations (privately originated) (continued) |
|
Connecticut Avenue Securities Trust, Series 2024-R04, Class 1M2,
(30-day Average USD-SOFR + 1.65%) 6.985% 5/25/20446,7,9 |
|
|
USD121 |
|
|
|
|
|
|
$ |
122 |
|
|
|
|
|
|
|
|
GCAT Trust, Series 2024-NQM2, Class A1,
6.085% 6/25/2059 (7.359% on 5/1/2028)6,7,10 |
|
|
329 |
|
|
|
|
|
|
|
330 |
|
|
|
|
|
|
|
|
New York Mortgage Trust, Series 2024-CP1, Class A1, 3.75% 2/25/20686,7,9 |
|
|
97 |
|
|
|
|
|
|
|
89 |
|
|
|
|
|
|
|
|
Onslow Bay Financial, LLC, Series 2024-NQM5, Class A1,
5.988% 3/25/2028 (6.988% on 3/1/2028)6,7,10 |
|
|
118 |
|
|
|
|
|
|
|
118 |
|
|
|
|
|
|
|
|
Onslow Bay Financial, LLC, Series 2024-NQM7, Class A1,
6.243% 3/25/2064 (7.243% on 4/1/2028)6,7,10 |
|
|
227 |
|
|
|
|
|
|
|
228 |
|
|
|
|
|
|
|
|
Verus Securitization Trust, Series 2024-4, Class A1,
6.218% 6/25/2069 (7.218% on 5/1/2028)6,7,10 |
|
|
301 |
|
|
|
|
|
|
|
303 |
|
|
|
|
|
|
|
|
Verus Securitization Trust, Series 24-4, Class A2,
6.572% 6/25/2069 (7.572% on 5/1/2028)6,7,10 |
|
|
151 |
|
|
|
|
|
|
|
152 |
|
|
|
|
|
|
|
|
|
|
|
|
|
|
|
|
|
|
|
|
|
|
|
|
|
|
|
|
|
1,869 |
|
|
|
|
|
|
|
|
|
|
|
|
|
|
|
|
|
|
|
|
|
|
|
|
|
|
|
|
|
|
|
| |
|
|
|
|
| Other mortgage-backed securities 0.24% |
|
Nykredit Realkredit AS, Series 01E, 1.50% 10/1/20377 |
|
|
DKK450 |
|
|
|
|
|
|
|
58 |
|
|
|
|
|
|
|
|
Nykredit Realkredit AS, Series 01E, 1.50% 10/1/20407 |
|
|
1,169 |
|
|
|
|
|
|
|
148 |
|
|
|
|
|
|
|
|
Nykredit Realkredit AS, Series 01E, 0.50% 10/1/20437 |
|
|
5,392 |
|
|
|
|
|
|
|
616 |
|
|
|
|
|
|
|
|
Nykredit Realkredit AS, Series 01E, 0.50% 10/1/20507 |
|
|
465 |
|
|
|
|
|
|
|
48 |
|
|
|
|
|
|
|
|
Nykredit Realkredit AS, Series CCE, 1.00% 10/1/20507 |
|
|
560 |
|
|
|
|
|
|
|
62 |
|
|
|
|
|
|
|
|
Realkredit Danmark AS 1.00% 10/1/20537 |
|
|
185 |
|
|
|
|
|
|
|
20 |
|
|
|
|
|
|
|
|
|
|
|
|
|
|
|
|
|
|
|
|
|
|
|
|
|
|
|
|
|
952 |
|
|
|
|
|
|
|
|
|
|
|
|
|
|
|
|
|
|
|
|
|
|
|
|
|
|
|
|
|
|
|
| |
|
|
|
|
| Commercial mortgage-backed securities 0.15% |
|
BX Trust, Series 2021-VOLT, Class A,
(1-month USD CME Term SOFR + 0.814%) 6.143% 9/15/20366,7,9 |
|
|
USD150 |
|
|
|
|
|
|
|
148 |
|
|
|
|
|
|
|
|
BX Trust, Series 2021-ARIA, Class A,
(1-month USD CME Term SOFR + 1.014%) 6.342% 10/15/20366,7,9 |
|
|
110 |
|
|
|
|
|
|
|
109 |
|
|
|
|
|
|
|
|
Citigroup Commercial Mortgage Trust, Series 2023-PRM3, Class A,
6.572% 7/10/20286,7,9 |
|
|
100 |
|
|
|
|
|
|
|
102 |
|
|
|
|
|
|
|
|
Citigroup Commercial Mortgage Trust, Series 2023-SMRT, Class A,
6.015% 10/12/20406,7,9 |
|
|
135 |
|
|
|
|
|
|
|
135 |
|
|
|
|
|
|
|
|
HTL Commercial Mortgage Trust, Series 2024-T53, Class A, 6.072% 5/10/20396,7,9 |
|
|
100 |
|
|
|
|
|
|
|
100 |
|
|
|
|
|
|
|
|
|
|
|
|
|
|
|
|
|
|
|
|
|
|
|
|
|
|
|
|
|
594 |
|
|
|
|
|
|
|
|
|
|
|
|
|
|
|
|
|
|
Total mortgage-backed obligations |
|
|
|
|
|
|
|
|
|
|
27,047 |
|
|
|
|
|
|
|
|
|
|
|
|
|
|
|
|
|
| Corporate bonds, notes & loans 5.83% |
|
| |
|
|
|
|
| Financials 1.52% |
|
AIA Group, Ltd. 0.88% 9/9/2033 (5-year EUR Mid-Swap + 1.10% on 9/9/2028)10 |
|
|
EUR330 |
|
|
|
|
|
|
|
306 |
|
|
|
|
|
|
|
|
AIB Group PLC 7.583% 10/14/2026 (USD-SOFR + 3.456% on 10/14/2025)6,10 |
|
|
USD200 |
|
|
|
|
|
|
|
204 |
|
|
|
|
|
|
|
|
Banco de Sabadell, SA 5.25% 2/7/2029
(1-year EUR Mid-Swap + 2.40% on 2/7/2028)10 |
|
|
EUR100 |
|
|
|
|
|
|
|
111 |
|
|
|
|
|
|
|
|
Bank of America Corp. 1.319% 6/19/2026 (USD-SOFR + 1.15% on 6/19/2025)10 |
|
|
USD500 |
|
|
|
|
|
|
|
479 |
|
|
|
|
|
|
|
|
Bank of America Corp. 5.202% 4/25/2029 (USD-SOFR + 1.63% on 4/25/2028)10 |
|
|
161 |
|
|
|
|
|
|
|
161 |
|
|
|
|
|
|
|
|
BBVA Bancomer SA 8.45% 6/29/2038
(5-year UST Yield Curve Rate T Note Constant Maturity + 4.661% on 6/29/2033)10 |
|
|
285 |
|
|
|
|
|
|
|
294 |
|
|
|
|
|
|
|
|
BPCE SA 4.50% 1/13/2033 |
|
|
EUR100 |
|
|
|
|
|
|
|
111 |
|
|
|
|
|
|
|
|
CaixaBank, SA 6.208% 1/18/2029 (USD-SOFR + 2.70% on 1/18/2028)6,10 |
|
|
USD200 |
|
|
|
|
|
|
|
203 |
|
|
|
|
|
|
|
|
Chubb INA Holdings, LLC 3.35% 5/3/2026 |
|
|
10 |
|
|
|
|
|
|
|
10 |
|
|
|
|
|
|
|
|
Chubb INA Holdings, LLC 4.35% 11/3/2045 |
|
|
20 |
|
|
|
|
|
|
|
17 |
|
|
|
|
|
|
|
|
Citigroup, Inc. 3.07% 2/24/2028 (USD-SOFR + 1.28% on 2/24/2027)10 |
|
|
110 |
|
|
|
|
|
|
|
104 |
|
|
|
|
|
|
|
|
Citigroup, Inc. 4.91% 5/24/2033 (USD-SOFR + 2.086% on 5/24/2032)10 |
|
|
29 |
|
|
|
|
|
|
|
28 |
|
|
|
|
|
|
|
|
Citizens Financial Group, Inc. 5.841% 1/23/2030
(USD-SOFR + 2.01% on 1/23/2029)10 |
|
|
140 |
|
|
|
|
|
|
|
140 |
|
|
|
|
|
|
|
|
Corebridge Financial, Inc. 3.90% 4/5/2032 |
|
|
59 |
|
|
|
|
|
|
|
53 |
|
|
|
|
|
|
|
|
Deutsche Bank AG 2.311% 11/16/2027 (USD-SOFR + 1.219% on 11/16/2026)10 |
|
|
160 |
|
|
|
|
|
|
|
148 |
|
|
|
|
|
|
|
|
Deutsche Bank AG 1.75% 11/19/2030
(3-month EUR-EURIBOR + 2.05% on 11/19/2029)10 |
|
|
EUR200 |
|
|
|
|
|
|
|
188 |
|
American Funds Insurance Series 124
American Funds Global Balanced Fund (continued)
|
|
|
|
|
|
|
|
|
|
|
|
|
|
|
| Bonds, notes & other debt instruments (continued) |
|
Principal amount (000) |
|
|
|
|
|
Value (000) |
|
|
| Corporate bonds, notes & loans (continued) |
|
| Financials (continued) |
|
Goldman Sachs Group, Inc. 4.017% 10/31/2038
(3-month USD CME Term SOFR + 1.635% on 10/31/2037)10 |
|
|
USD78 |
|
|
|
|
|
|
$ |
66 |
|
|
|
HSBC Holdings PLC 4.292% 9/12/2026
(3-month USD CME Term SOFR + 1.609% on 9/12/2025)10 |
|
|
200 |
|
|
|
|
|
|
|
197 |
|
|
|
HSBC Holdings PLC 7.39% 11/03/2028 (USD-SOFR + 7.39% on 11/3/2027)10 |
|
|
360 |
|
|
|
|
|
|
|
381 |
|
|
|
HSBC Holdings PLC 7.399% 11/13/2034 (USD-SOFR + 3.02% on 11/13/2033)10 |
|
|
290 |
|
|
|
|
|
|
|
314 |
|
|
|
ING Groep NV 5.25% 11/14/2033
(3-month EUR-EURIBOR + 2.15% on 11/14/2032)10 |
|
|
EUR100 |
|
|
|
|
|
|
|
117 |
|
|
|
JPMorgan Chase & Co. 4.493% 3/24/2031 (USD-SOFR + 3.79% on 3/24/2030)10 |
|
|
USD160 |
|
|
|
|
|
|
|
154 |
|
|
|
KfW 1.125% 7/4/2025 |
|
|
GBP95 |
|
|
|
|
|
|
|
116 |
|
|
|
Mastercard, Inc. 2.00% 11/18/2031 |
|
|
USD102 |
|
|
|
|
|
|
|
84 |
|
|
|
Morgan Stanley 0.985% 12/10/2026 (USD-SOFR + 0.72% on 12/10/2025)10 |
|
|
200 |
|
|
|
|
|
|
|
187 |
|
|
|
Morgan Stanley 1.593% 5/4/2027 (USD-SOFR + 0.879% on 5/4/2026)10 |
|
|
126 |
|
|
|
|
|
|
|
118 |
|
|
|
Morgan Stanley 2.699% 1/22/2031 (USD-SOFR + 1.143% on 1/22/2030)10 |
|
|
72 |
|
|
|
|
|
|
|
63 |
|
|
|
NatWest Group PLC 0.78% 2/26/2030
(3-month EUR-EURIBOR + 0.949% on 2/26/2029)10 |
|
|
EUR175 |
|
|
|
|
|
|
|
163 |
|
|
|
New York Life Insurance Co. 3.75% 5/15/20506 |
|
|
USD23 |
|
|
|
|
|
|
|
17 |
|
|
|
PNC Financial Services Group, Inc. 6.875% 10/20/2034
(USD-SOFR + 2.284% on 10/20/2033)10 |
|
|
65 |
|
|
|
|
|
|
|
71 |
|
|
|
PNC Financial Services Group, Inc. 5.676% 1/22/2035
(USD-SOFR + 1.902% on 1/22/2034)10 |
|
|
25 |
|
|
|
|
|
|
|
25 |
|
|
|
PT Bank Negara Indonesia (Persero) Tbk 5.28% 4/5/2029 |
|
|
280 |
|
|
|
|
|
|
|
278 |
|
|
|
Royal Bank of Canada 1.20% 4/27/2026 |
|
|
175 |
|
|
|
|
|
|
|
163 |
|
|
|
UBS Group AG 4.49% 8/5/2025
(1-year UST Yield Curve Rate T Note Constant Maturity + 1.60% on 8/5/2024)6,10 |
|
|
450 |
|
|
|
|
|
|
|
449 |
|
|
|
Wells Fargo & Co. 2.393% 6/2/2028 (USD-SOFR + 2.10% on 6/2/2027)10 |
|
|
400 |
|
|
|
|
|
|
|
368 |
|
|
|
Wells Fargo & Co. 4.611% 4/25/2053 (USD-SOFR + 2.13% on 4/25/2052)10 |
|
|
100 |
|
|
|
|
|
|
|
86 |
|
|
|
|
|
|
|
|
|
|
|
|
|
|
|
|
|
|
|
|
|
|
|
|
|
|
|
|
|
5,974 |
|
|
|
|
|
|
|
|
|
|
|
|
|
|
|
|
|
|
|
|
|
|
|
|
|
|
|
|
|
|
|
| |
|
|
|
|
| Energy 0.85% |
|
Ecopetrol SA 4.125% 1/16/2025 |
|
|
127 |
|
|
|
|
|
|
|
125 |
|
|
|
|
|
|
|
|
Ecopetrol SA 8.625% 1/19/2029 |
|
|
555 |
|
|
|
|
|
|
|
584 |
|
|
|
Ecopetrol SA 6.875% 4/29/2030 |
|
|
160 |
|
|
|
|
|
|
|
154 |
|
|
|
Halliburton Co. 3.80% 11/15/2025 |
|
|
2 |
|
|
|
|
|
|
|
2 |
|
|
|
Kinder Morgan, Inc. 4.30% 6/1/2025 |
|
|
165 |
|
|
|
|
|
|
|
163 |
|
|
|
ONEOK, Inc. 5.80% 11/1/2030 |
|
|
7 |
|
|
|
|
|
|
|
7 |
|
|
|
ONEOK, Inc. 6.05% 9/1/2033 |
|
|
53 |
|
|
|
|
|
|
|
55 |
|
|
|
Petrobras Global Finance BV 5.299% 1/27/2025 |
|
|
113 |
|
|
|
|
|
|
|
112 |
|
|
|
Petroleos Mexicanos 7.19% 9/12/2024 |
|
|
MXN6,179 |
|
|
|
|
|
|
|
334 |
|
|
|
Petroleos Mexicanos 4.25% 1/15/2025 |
|
|
USD296 |
|
|
|
|
|
|
|
292 |
|
|
|
Petroleos Mexicanos 6.875% 10/16/2025 |
|
|
63 |
|
|
|
|
|
|
|
63 |
|
|
|
Petroleos Mexicanos 6.875% 8/4/2026 |
|
|
211 |
|
|
|
|
|
|
|
207 |
|
|
|
Petroleos Mexicanos 6.49% 1/23/2027 |
|
|
1,068 |
|
|
|
|
|
|
|
1,026 |
|
|
|
Raizen Fuels Finance SA 6.45% 3/5/20346 |
|
|
200 |
|
|
|
|
|
|
|
203 |
|
|
|
|
|
|
|
|
|
|
|
|
|
|
|
|
|
|
|
|
|
|
|
|
|
|
|
|
|
3,327 |
|
|
|
|
|
|
|
|
|
|
|
|
|
|
|
|
|
|
|
|
|
|
|
|
|
|
|
|
|
|
|
| |
|
|
|
|
| Utilities 0.74% |
|
American Electric Power Co., Inc. 1.00% 11/1/2025 |
|
|
100 |
|
|
|
|
|
|
|
94 |
|
|
|
|
|
|
|
|
Cleveland Electric Illuminating Co. (The) 3.50% 4/1/20286 |
|
|
35 |
|
|
|
|
|
|
|
33 |
|
|
|
CMS Energy Corp. 3.00% 5/15/2026 |
|
|
180 |
|
|
|
|
|
|
|
172 |
|
|
|
Consumers Energy Co. 3.60% 8/15/2032 |
|
|
250 |
|
|
|
|
|
|
|
225 |
|
|
|
Duke Energy Progress, LLC 3.70% 9/1/2028 |
|
|
75 |
|
|
|
|
|
|
|
72 |
|
|
|
Enel Américas SA 4.00% 10/25/2026 |
|
|
35 |
|
|
|
|
|
|
|
34 |
|
|
|
Enel Finance International NV 1.875% 7/12/20286 |
|
|
200 |
|
|
|
|
|
|
|
176 |
|
|
|
Enfragen Energia Sur SA 5.375% 12/30/2030 |
|
|
200 |
|
|
|
|
|
|
|
167 |
|
|
|
Entergy Louisiana, LLC 4.75% 9/15/2052 |
|
|
100 |
|
|
|
|
|
|
|
87 |
|
|
|
Exelon Corp. 3.40% 4/15/2026 |
|
|
150 |
|
|
|
|
|
|
|
145 |
|
|
|
FirstEnergy Corp. 1.60% 1/15/2026 |
|
|
100 |
|
|
|
|
|
|
|
94 |
|
|
|
Interstate Power and Light Co. 2.30% 6/1/2030 |
|
|
50 |
|
|
|
|
|
|
|
43 |
|
|
|
NextEra Energy Operating Partners, LP 7.25% 1/15/20296 |
|
|
550 |
|
|
|
|
|
|
|
564 |
|
125 American Funds Insurance Series
American Funds Global Balanced Fund (continued)
|
|
|
|
|
|
|
|
|
|
|
|
|
|
|
| Bonds, notes & other debt instruments (continued) |
|
Principal amount (000) |
|
|
|
|
|
Value (000) |
|
|
| Corporate bonds, notes & loans (continued) |
|
|
|
|
|
|
| Utilities (continued) |
|
Niagara Mohawk Power Corp. 3.508% 10/1/20246 |
|
|
USD85 |
|
|
|
|
|
|
$ |
84 |
|
|
|
Pacific Gas and Electric Co. 3.15% 1/1/2026 |
|
|
100 |
|
|
|
|
|
|
|
96 |
|
|
|
Pacific Gas and Electric Co. 2.95% 3/1/2026 |
|
|
25 |
|
|
|
|
|
|
|
24 |
|
|
|
Pacific Gas and Electric Co. 2.10% 8/1/2027 |
|
|
100 |
|
|
|
|
|
|
|
90 |
|
|
|
Pacific Gas and Electric Co. 4.65% 8/1/2028 |
|
|
114 |
|
|
|
|
|
|
|
110 |
|
|
|
Pacific Gas and Electric Co. 4.55% 7/1/2030 |
|
|
31 |
|
|
|
|
|
|
|
29 |
|
|
|
Pacific Gas and Electric Co. 6.15% 1/15/2033 |
|
|
78 |
|
|
|
|
|
|
|
79 |
|
|
|
Pacific Gas and Electric Co. 3.50% 8/1/2050 |
|
|
137 |
|
|
|
|
|
|
|
90 |
|
|
|
Southern California Edison Co. 0.975% 8/1/2024 |
|
|
100 |
|
|
|
|
|
|
|
100 |
|
|
|
Xcel Energy, Inc. 3.35% 12/1/2026 |
|
|
316 |
|
|
|
|
|
|
|
302 |
|
|
|
|
|
|
|
|
|
|
|
|
|
|
|
|
|
|
|
|
|
|
|
|
|
|
|
|
|
2,910 |
|
|
|
|
|
|
|
|
|
|
|
|
|
|
|
|
|
|
|
|
|
|
|
|
|
|
|
|
|
|
|
| |
|
|
|
|
| Communication services 0.66% |
|
América Móvil, SAB de CV 10.125% 1/22/2029 |
|
|
MXN9,100 |
|
|
|
|
|
|
|
484 |
|
|
|
América Móvil, SAB de CV 9.50% 1/27/2031 |
|
|
12,420 |
|
|
|
|
|
|
|
635 |
|
|
|
AT&T, Inc. 2.75% 6/1/2031 |
|
|
USD165 |
|
|
|
|
|
|
|
141 |
|
|
|
AT&T, Inc. 2.55% 12/1/2033 |
|
|
64 |
|
|
|
|
|
|
|
51 |
|
|
|
AT&T, Inc. 4.30% 11/18/2034 |
|
|
EUR100 |
|
|
|
|
|
|
|
111 |
|
|
|
Comcast Corp. 0% 9/14/2026 |
|
|
100 |
|
|
|
|
|
|
|
99 |
|
|
|
Deutsche Telekom International Finance BV 9.25% 6/1/2032 |
|
|
USD45 |
|
|
|
|
|
|
|
56 |
|
|
|
Orange 9.00% 3/1/203110 |
|
|
65 |
|
|
|
|
|
|
|
78 |
|
|
|
Tencent Holdings, Ltd. 3.925% 1/19/2038 |
|
|
200 |
|
|
|
|
|
|
|
168 |
|
|
|
T-Mobile USA, Inc. 2.05% 2/15/2028 |
|
|
200 |
|
|
|
|
|
|
|
180 |
|
|
|
T-Mobile USA, Inc. 3.70% 5/8/2032 |
|
|
EUR100 |
|
|
|
|
|
|
|
107 |
|
|
|
T-Mobile USA, Inc. 5.15% 4/15/2034 |
|
|
USD115 |
|
|
|
|
|
|
|
113 |
|
|
|
Verizon Communications, Inc. 0.375% 3/22/2029 |
|
|
EUR140 |
|
|
|
|
|
|
|
130 |
|
|
|
Verizon Communications, Inc. 0.75% 3/22/2032 |
|
|
100 |
|
|
|
|
|
|
|
87 |
|
|
|
WarnerMedia Holdings, Inc. 5.05% 3/15/2042 |
|
|
USD168 |
|
|
|
|
|
|
|
137 |
|
|
|
|
|
|
|
|
|
|
|
|
|
|
|
|
|
|
|
|
|
|
|
|
|
|
|
|
|
2,577 |
|
|
|
|
|
|
|
|
|
|
|
|
|
|
|
|
|
|
|
|
|
|
|
|
|
|
|
|
|
|
|
| |
|
|
|
|
| Health care 0.53% |
|
AbbVie, Inc. 5.05% 3/15/2034 |
|
|
25 |
|
|
|
|
|
|
|
25 |
|
|
|
|
|
|
|
|
AbbVie, Inc. 5.35% 3/15/2044 |
|
|
25 |
|
|
|
|
|
|
|
25 |
|
|
|
AbbVie, Inc. 5.40% 3/15/2054 |
|
|
25 |
|
|
|
|
|
|
|
25 |
|
|
|
AbbVie, Inc. 5.50% 3/15/2064 |
|
|
25 |
|
|
|
|
|
|
|
25 |
|
|
|
Amgen, Inc. 1.90% 2/21/2025 |
|
|
40 |
|
|
|
|
|
|
|
39 |
|
|
|
Amgen, Inc. 2.20% 2/21/2027 |
|
|
30 |
|
|
|
|
|
|
|
28 |
|
|
|
Amgen, Inc. 4.20% 3/1/2033 |
|
|
280 |
|
|
|
|
|
|
|
259 |
|
|
|
Amgen, Inc. 5.65% 3/2/2053 |
|
|
151 |
|
|
|
|
|
|
|
149 |
|
|
|
AstraZeneca Finance, LLC 2.25% 5/28/2031 |
|
|
69 |
|
|
|
|
|
|
|
58 |
|
|
|
Becton, Dickinson and Co. 3.734% 12/15/2024 |
|
|
10 |
|
|
|
|
|
|
|
10 |
|
|
|
Becton, Dickinson and Co. 3.70% 6/6/2027 |
|
|
43 |
|
|
|
|
|
|
|
41 |
|
|
|
Becton, Dickinson and Co. 4.298% 8/22/2032 |
|
|
320 |
|
|
|
|
|
|
|
300 |
|
|
|
Bristol-Myers Squibb Co. 5.20% 2/22/2034 |
|
|
215 |
|
|
|
|
|
|
|
215 |
|
|
|
EMD Finance, LLC 3.25% 3/19/20256 |
|
|
250 |
|
|
|
|
|
|
|
246 |
|
|
|
Pfizer Investment Enterprises Pte., Ltd. 4.75% 5/19/2033 |
|
|
197 |
|
|
|
|
|
|
|
192 |
|
|
|
Pfizer Investment Enterprises Pte., Ltd. 5.30% 5/19/2053 |
|
|
21 |
|
|
|
|
|
|
|
20 |
|
|
|
Stryker Corp. 0.75% 3/1/2029 |
|
|
EUR210 |
|
|
|
|
|
|
|
199 |
|
|
|
Takeda Pharmaceutical Co., Ltd. 2.25% 11/21/2026 |
|
|
100 |
|
|
|
|
|
|
|
104 |
|
|
|
UnitedHealth Group, Inc. 4.00% 5/15/2029 |
|
|
USD135 |
|
|
|
|
|
|
|
130 |
|
|
|
|
|
|
|
|
|
|
|
|
|
|
|
|
|
|
|
|
|
|
|
|
|
|
|
|
|
2,090 |
|
|
|
|
|
|
|
|
|
|
|
|
|
|
|
|
|
|
|
|
|
|
|
|
|
|
|
|
|
|
|
| |
|
|
|
|
| Consumer discretionary 0.42% |
|
Amazon.com, Inc. 2.80% 8/22/2024 |
|
|
45 |
|
|
|
|
|
|
|
45 |
|
|
|
|
|
|
|
|
BMW US Capital, LLC 3.90% 4/9/20256 |
|
|
70 |
|
|
|
|
|
|
|
69 |
|
|
|
|
|
|
|
|
Daimler Trucks Finance North America, LLC 3.65% 4/7/20276 |
|
|
150 |
|
|
|
|
|
|
|
144 |
|
|
|
|
|
|
|
|
Daimler Trucks Finance North America, LLC 5.375% 1/18/20346 |
|
|
150 |
|
|
|
|
|
|
|
149 |
|
|
|
Hyundai Capital America 1.50% 6/15/20266 |
|
|
250 |
|
|
|
|
|
|
|
232 |
|
|
|
Hyundai Capital America 2.375% 10/15/20276 |
|
|
109 |
|
|
|
|
|
|
|
99 |
|
|
|
Royal Caribbean Cruises, Ltd. 5.50% 4/1/20286 |
|
|
185 |
|
|
|
|
|
|
|
183 |
|
American Funds Insurance Series 126
American Funds Global Balanced Fund (continued)
|
|
|
|
|
|
|
|
|
|
|
|
|
|
|
| Bonds, notes & other debt instruments (continued) |
|
Principal amount (000) |
|
|
|
|
|
Value (000) |
|
|
| Corporate bonds, notes & loans (continued) |
|
|
|
|
|
|
| Consumer discretionary (continued) |
|
Royal Caribbean Cruises, Ltd. 8.25% 1/15/20296 |
|
|
USD70 |
|
|
|
|
|
|
$ |
74 |
|
|
|
Royal Caribbean Cruises, Ltd. 9.25% 1/15/20296 |
|
|
59 |
|
|
|
|
|
|
|
63 |
|
|
|
Sands China, Ltd. 5.40% 8/8/2028 |
|
|
400 |
|
|
|
|
|
|
|
392 |
|
|
|
Stellantis Finance US, Inc. 2.691% 9/15/20316 |
|
|
200 |
|
|
|
|
|
|
|
165 |
|
|
|
Toyota Motor Credit Corp. 3.375% 4/1/2030 |
|
|
33 |
|
|
|
|
|
|
|
30 |
|
|
|
|
|
|
|
|
|
|
|
|
|
|
|
|
|
|
|
|
|
|
|
|
|
|
|
|
|
1,645 |
|
|
|
|
|
|
|
|
|
|
|
|
|
|
|
|
|
|
|
|
|
|
|
|
|
|
|
|
|
|
|
| |
|
|
|
|
| Industrials 0.28% |
|
Boeing Co. 6.528% 5/1/20346 |
|
|
270 |
|
|
|
|
|
|
|
277 |
|
|
|
Canadian Pacific Railway Co. 3.10% 12/2/2051 |
|
|
164 |
|
|
|
|
|
|
|
109 |
|
|
|
Carrier Global Corp. 2.242% 2/15/2025 |
|
|
6 |
|
|
|
|
|
|
|
6 |
|
|
|
Carrier Global Corp. 2.493% 2/15/2027 |
|
|
7 |
|
|
|
|
|
|
|
6 |
|
|
|
CSX Corp. 3.80% 4/15/2050 |
|
|
6 |
|
|
|
|
|
|
|
4 |
|
|
|
CSX Corp. 2.50% 5/15/2051 |
|
|
75 |
|
|
|
|
|
|
|
44 |
|
|
|
Lima Metro Line 2 Finance, Ltd. 5.875% 7/5/20346 |
|
|
86 |
|
|
|
|
|
|
|
85 |
|
|
|
MISC Capital Two (Labuan), Ltd. 3.75% 4/6/20276 |
|
|
200 |
|
|
|
|
|
|
|
191 |
|
|
|
RTX Corp. 4.125% 11/16/2028 |
|
|
170 |
|
|
|
|
|
|
|
164 |
|
|
|
Sats Treasury Pte., Ltd. 4.828% 1/23/2029 |
|
|
200 |
|
|
|
|
|
|
|
198 |
|
|
|
|
|
|
|
|
|
|
|
|
|
|
|
|
|
|
|
|
|
|
|
|
|
|
|
|
|
1,084 |
|
|
|
|
|
|
|
|
|
|
|
|
|
|
|
|
|
|
|
|
|
|
|
|
|
|
|
|
|
|
|
| |
|
|
|
|
| Materials 0.26% |
|
Braskem Netherlands Finance BV 8.50% 1/12/2031 |
|
|
600 |
|
|
|
|
|
|
|
613 |
|
|
|
Celanese US Holdings, LLC 6.379% 7/15/2032 |
|
|
50 |
|
|
|
|
|
|
|
51 |
|
|
|
First Quantum Minerals, Ltd. 9.375% 3/1/20296 |
|
|
250 |
|
|
|
|
|
|
|
262 |
|
|
|
Vale Overseas, Ltd. 3.75% 7/8/2030 |
|
|
94 |
|
|
|
|
|
|
|
85 |
|
|
|
|
|
|
|
|
|
|
|
|
|
|
|
|
|
|
|
|
|
|
|
|
|
|
|
|
|
1,011 |
|
|
|
|
|
|
|
|
|
|
|
|
|
|
|
|
|
|
|
|
|
|
|
|
|
|
|
|
|
|
|
| |
|
|
|
|
| Consumer staples 0.25% |
|
Altria Group, Inc. 2.20% 6/15/2027 |
|
|
EUR270 |
|
|
|
|
|
|
|
278 |
|
|
|
BAT Capital Corp. 3.215% 9/6/2026 |
|
|
USD62 |
|
|
|
|
|
|
|
59 |
|
|
|
BAT Capital Corp. 4.70% 4/2/2027 |
|
|
67 |
|
|
|
|
|
|
|
66 |
|
|
|
BAT Capital Corp. 3.557% 8/15/2027 |
|
|
105 |
|
|
|
|
|
|
|
100 |
|
|
|
BAT Capital Corp. 3.462% 9/6/2029 |
|
|
75 |
|
|
|
|
|
|
|
68 |
|
|
|
British American Tobacco PLC 3.00% subordinated perpetual bonds
(5-year EUR Mid-Swap + 3.372% on 12/27/2026)10 |
|
|
EUR300 |
|
|
|
|
|
|
|
304 |
|
|
|
Philip Morris International, Inc. 5.75% 11/17/2032 |
|
|
USD110 |
|
|
|
|
|
|
|
112 |
|
|
|
|
|
|
|
|
|
|
|
|
|
|
|
|
|
|
|
|
|
|
|
|
|
|
|
|
|
987 |
|
|
|
|
|
|
|
|
|
|
|
|
|
|
|
|
|
|
|
|
|
|
|
|
|
|
|
|
|
|
|
| |
|
|
|
|
| Information technology 0.21% |
|
Broadcom, Inc. 4.00% 4/15/20296 |
|
|
21 |
|
|
|
|
|
|
|
20 |
|
|
|
Broadcom, Inc. 4.15% 11/15/2030 |
|
|
70 |
|
|
|
|
|
|
|
66 |
|
|
|
Broadcom, Inc. 3.419% 4/15/20336 |
|
|
53 |
|
|
|
|
|
|
|
46 |
|
|
|
Broadcom, Inc. 3.137% 11/15/20356 |
|
|
15 |
|
|
|
|
|
|
|
12 |
|
|
|
Lenovo Group, Ltd. 5.875% 4/24/2025 |
|
|
269 |
|
|
|
|
|
|
|
269 |
|
|
|
Oracle Corp. 2.65% 7/15/2026 |
|
|
216 |
|
|
|
|
|
|
|
205 |
|
|
|
SK hynix, Inc. 1.50% 1/19/2026 |
|
|
200 |
|
|
|
|
|
|
|
188 |
|
|
|
|
|
|
|
|
|
|
|
|
|
|
|
|
|
|
|
|
|
|
|
|
|
|
|
|
|
806 |
|
|
|
|
|
|
|
|
|
|
|
|
|
|
|
|
|
|
|
|
|
|
|
|
|
|
|
|
|
|
|
| |
|
|
|
|
| Real estate 0.11% |
|
American Tower Corp. 0.875% 5/21/2029 |
|
|
EUR130 |
|
|
|
|
|
|
|
121 |
|
|
|
Equinix, Inc. 2.15% 7/15/2030 |
|
|
USD176 |
|
|
|
|
|
|
|
147 |
|
|
|
Essex Portfolio, LP 3.50% 4/1/2025 |
|
|
120 |
|
|
|
|
|
|
|
118 |
|
|
|
Essex Portfolio, LP 3.375% 4/15/2026 |
|
|
40 |
|
|
|
|
|
|
|
39 |
|
|
|
|
|
|
|
|
|
|
|
|
|
|
|
|
|
|
|
|
|
|
|
|
|
|
|
|
|
425 |
|
|
|
|
|
|
|
|
|
|
|
|
|
|
|
|
|
|
Total corporate bonds, notes & loans |
|
|
|
|
|
|
|
|
|
|
22,836 |
|
|
|
|
|
|
|
|
|
|
|
|
|
|
|
|
127 American Funds Insurance Series
American Funds Global Balanced Fund (continued)
|
|
|
|
|
|
|
|
|
|
|
|
|
|
|
| Bonds, notes & other debt instruments (continued) |
|
Principal amount (000) |
|
|
|
|
|
Value (000) |
|
|
| U.S. Treasury bonds & notes 4.34% |
|
|
|
|
|
|
| U.S. Treasury 3.90% |
|
U.S. Treasury 2.125% 11/30/2024 |
|
|
USD1,230 |
|
|
|
|
|
|
$ |
1,214 |
|
|
|
U.S. Treasury 1.75% 3/15/2025 |
|
|
98 |
|
|
|
|
|
|
|
96 |
|
|
|
U.S. Treasury 3.00% 7/15/2025 |
|
|
941 |
|
|
|
|
|
|
|
921 |
|
|
|
U.S. Treasury 3.125% 8/15/2025 |
|
|
18 |
|
|
|
|
|
|
|
18 |
|
|
|
U.S. Treasury 0.375% 11/30/2025 |
|
|
50 |
|
|
|
|
|
|
|
47 |
|
|
|
U.S. Treasury 3.75% 4/15/2026 |
|
|
76 |
|
|
|
|
|
|
|
75 |
|
|
|
U.S. Treasury 2.75% 4/30/2027 |
|
|
432 |
|
|
|
|
|
|
|
412 |
|
|
|
U.S. Treasury 2.75% 7/31/2027 |
|
|
46 |
|
|
|
|
|
|
|
44 |
|
|
|
U.S. Treasury 4.00% 6/30/2028 |
|
|
4,443 |
|
|
|
|
|
|
|
4,376 |
|
|
|
U.S. Treasury 4.375% 8/31/2028 |
|
|
115 |
|
|
|
|
|
|
|
115 |
|
|
|
U.S. Treasury 4.625% 9/30/2028 |
|
|
1,858 |
|
|
|
|
|
|
|
1,874 |
|
|
|
U.S. Treasury 4.375% 11/30/2028 |
|
|
119 |
|
|
|
|
|
|
|
119 |
|
|
|
U.S. Treasury 4.125% 3/31/2029 |
|
|
815 |
|
|
|
|
|
|
|
807 |
|
|
|
U.S. Treasury 1.375% 11/15/2031 |
|
|
772 |
|
|
|
|
|
|
|
627 |
|
|
|
U.S. Treasury 2.875% 5/15/2032 |
|
|
284 |
|
|
|
|
|
|
|
256 |
|
|
|
U.S. Treasury 4.375% 5/15/2034 |
|
|
1,080 |
|
|
|
|
|
|
|
1,080 |
|
|
|
U.S. Treasury 1.875% 2/15/204111 |
|
|
605 |
|
|
|
|
|
|
|
414 |
|
|
|
U.S. Treasury 2.25% 5/15/204111 |
|
|
1,115 |
|
|
|
|
|
|
|
807 |
|
|
|
U.S. Treasury 2.875% 11/15/2046 |
|
|
400 |
|
|
|
|
|
|
|
300 |
|
|
|
U.S. Treasury 1.25% 5/15/205011 |
|
|
630 |
|
|
|
|
|
|
|
312 |
|
|
|
U.S. Treasury 1.375% 8/15/2050 |
|
|
400 |
|
|
|
|
|
|
|
205 |
|
|
|
U.S. Treasury 2.375% 5/15/205111 |
|
|
510 |
|
|
|
|
|
|
|
336 |
|
|
|
U.S. Treasury 2.00% 8/15/205111 |
|
|
560 |
|
|
|
|
|
|
|
336 |
|
|
|
U.S. Treasury 4.00% 11/15/2052 |
|
|
270 |
|
|
|
|
|
|
|
246 |
|
|
|
U.S. Treasury 3.625% 2/15/2053 |
|
|
299 |
|
|
|
|
|
|
|
254 |
|
|
|
|
|
|
|
|
|
|
|
|
|
|
|
|
|
|
|
|
|
|
|
|
|
|
|
|
|
15,291 |
|
|
|
|
|
|
|
|
|
|
|
|
|
|
|
|
|
|
|
|
|
|
|
|
|
|
|
|
|
|
|
| |
|
|
|
|
| U.S. Treasury inflation-protected securities 0.44% |
|
U.S. Treasury Inflation-Protected Security 0.125% 10/15/20244 |
|
|
526 |
|
|
|
|
|
|
|
521 |
|
|
|
U.S. Treasury Inflation-Protected Security 0.375% 7/15/20274 |
|
|
342 |
|
|
|
|
|
|
|
324 |
|
|
|
U.S. Treasury Inflation-Protected Security 2.375% 10/15/20284 |
|
|
672 |
|
|
|
|
|
|
|
681 |
|
|
|
|
|
|
|
|
U.S. Treasury Inflation-Protected Security 1.00% 2/15/20494 |
|
|
261 |
|
|
|
|
|
|
|
199 |
|
|
|
|
|
|
|
|
|
|
|
|
|
|
|
|
|
|
|
|
|
|
|
|
|
|
|
|
|
1,725 |
|
|
|
|
|
|
|
|
|
|
|
|
|
|
|
|
|
|
Total U.S. Treasury bonds & notes |
|
|
|
|
|
|
|
|
|
|
17,016 |
|
|
|
|
|
|
|
|
|
|
|
|
|
|
|
|
|
| Asset-backed obligations 0.31% |
|
|
|
ACHV ABS Trust, Series 2023-4CP, Class B, 7.24% 11/25/20306,7 |
|
|
100 |
|
|
|
|
|
|
|
101 |
|
|
|
Affirm, Inc., Series 2023-X1, Class A, 7.11% 11/15/20286,7 |
|
|
47 |
|
|
|
|
|
|
|
47 |
|
|
|
Affirm, Inc., Series 2024-X1, Class A, 6.27% 5/15/20296,7 |
|
|
92 |
|
|
|
|
|
|
|
93 |
|
|
|
American Credit Acceptance Receivables Trust, Series 2022-3, Class C, 4.86% 10/13/20286,7 |
|
|
15 |
|
|
|
|
|
|
|
15 |
|
|
|
Avis Budget Rental Car Funding (AESOP), LLC, Series 2023-2, Class A, 5.20% 10/20/20276,7 |
|
|
125 |
|
|
|
|
|
|
|
124 |
|
|
|
Avis Budget Rental Car Funding (AESOP), LLC, Series 2023-6, Class A, 5.81% 12/20/20296,7 |
|
|
148 |
|
|
|
|
|
|
|
150 |
|
|
|
Mission Lane Credit Card Master Trust, Series 2024-A, Class A1, 6.20% 8/15/20296,7 |
|
|
113 |
|
|
|
|
|
|
|
113 |
|
|
|
Mission Lane Credit Card Master Trust, Series 2024-A, Class B, 6.59% 8/15/20296,7 |
|
|
100 |
|
|
|
|
|
|
|
100 |
|
|
|
OnDeck Asset Securitization Trust, LLC, Series 2024-1, Class A, 6.27% 6/17/20316,7 |
|
|
208 |
|
|
|
|
|
|
|
210 |
|
|
|
OnDeck Asset Securitization Trust, LLC, Series 2024-1, Class B, 7.15% 6/17/20316,7 |
|
|
100 |
|
|
|
|
|
|
|
101 |
|
|
|
Prestige Auto Receivables Trust, Series 2023-1, Class A2, 5.88% 3/16/20266,7 |
|
|
26 |
|
|
|
|
|
|
|
25 |
|
|
|
SMB Private Education Loan Trust, Series 2023-C, Class A1B,
(30-day Average USD-SOFR + 1.55%) 6.883% 11/15/20526,7,9 |
|
|
86 |
|
|
|
|
|
|
|
88 |
|
|
|
Toyota Auto Receivables Owner Trust, Series 2022-C, Class A2B,
(30-day Average USD-SOFR + 0.57%) 5.903% 8/15/20257,9 |
|
|
2 |
|
|
|
|
|
|
|
2 |
|
|
|
Westlake Automobile Receivables Trust, Series 2023-1, Class A2A, 5.51% 6/15/20266,7 |
|
|
31 |
|
|
|
|
|
|
|
30 |
|
|
|
Westlake Automobile Receivables Trust, Series 2023-1, Class A3, 5.21% 1/18/20286,7 |
|
|
19 |
|
|
|
|
|
|
|
19 |
|
|
|
|
|
|
|
|
|
|
|
|
|
|
|
|
|
|
|
|
|
|
|
|
|
|
|
|
|
1,218 |
|
|
|
|
|
|
|
|
|
|
|
|
|
|
|
|
American Funds Insurance Series 128
American Funds Global Balanced Fund (continued)
|
|
|
|
|
|
|
|
|
|
|
|
|
|
|
|
|
|
|
| Bonds, notes & other debt instruments (continued) |
|
|
Principal amount (000) |
|
|
|
|
|
Value (000) |
|
|
| Federal agency bonds & notes 0.05% |
|
|
|
Export-Import Bank of Thailand 5.354% 5/16/2029 |
|
|
|
USD200 |
|
|
|
|
|
|
$ |
201 |
|
|
|
|
|
|
|
|
|
|
|
|
|
|
|
|
|
|
| Municipals 0.04% |
|
|
|
|
|
|
| Ohio 0.02% |
|
Turnpike and Infrastructure Commission, Turnpike Rev. Ref. Bonds (Infrastructure Projects), Series 2020-A, 3.216% 2/15/2048 |
|
|
|
100 |
|
|
|
|
|
|
|
76 |
|
|
|
|
|
|
|
|
|
|
|
|
|
|
|
|
|
|
|
|
|
|
|
|
|
|
|
|
|
|
|
|
|
| |
|
|
|
|
| Texas 0.02% |
|
Grand Parkway Transportation Corp., Grand Parkway System Toll Rev. Ref. Bonds, Series 2020-B, 3.236% 10/1/2052 |
|
|
|
80 |
|
|
|
|
|
|
|
59 |
|
|
|
|
|
|
|
|
|
|
|
|
|
|
|
|
|
|
|
Total municipals |
|
|
|
|
|
|
|
|
|
|
|
135 |
|
|
|
|
|
|
|
|
|
|
|
|
|
|
|
|
|
|
|
Total bonds, notes & other debt instruments (cost: $125,986,000) |
|
|
|
|
|
|
|
|
|
|
|
119,183 |
|
|
|
|
|
|
|
|
|
|
|
|
|
|
|
|
|
|
|
|
|
| Investment funds 0.99% |
|
|
Shares |
|
|
|
|
|
|
|
|
|
Capital Group Central Corporate Bond Fund12 |
|
|
|
466,539 |
|
|
|
|
|
|
|
3,858 |
|
|
|
|
|
|
|
|
|
|
|
|
|
|
|
|
|
|
|
Total Investment funds (cost: $3,685,000) |
|
|
|
|
|
|
|
|
|
|
|
3,858 |
|
|
|
|
|
|
|
|
|
|
|
|
|
|
|
|
|
|
|
|
|
| Short-term securities 8.67% |
|
|
|
|
|
|
|
|
|
|
|
| Money market investments 8.20% |
|
|
|
Capital Group Central Cash Fund 5.37%12,13 |
|
|
|
321,365 |
|
|
|
|
|
|
|
32,137 |
|
|
|
|
|
|
|
|
|
|
|
|
|
|
|
|
|
|
|
|
|
|
|
|
|
|
| |
|
|
|
Weighted
average yield
at acquisition |
|
|
Principal amount
(000) |
|
|
|
|
|
|
|
|
|
|
|
|
| Bills & notes of governments & government agencies outside the U.S. 0.43% |
|
|
|
|
|
|
|
|
|
|
|
|
|
|
|
|
|
|
Egypt (Arab Republic of) 10/1/2024 |
|
|
22.855 |
% |
|
|
EGP2,850 |
|
|
|
|
|
|
|
56 |
|
|
|
Egypt (Arab Republic of) 11/12/2024 |
|
|
22.326 |
|
|
|
4,200 |
|
|
|
|
|
|
|
80 |
|
|
|
Egypt (Arab Republic of) 11/19/2024 |
|
|
22.238 |
|
|
|
6,500 |
|
|
|
|
|
|
|
123 |
|
|
|
Egypt (Arab Republic of) 3/11/2025 |
|
|
21.301 |
|
|
|
7,550 |
|
|
|
|
|
|
|
134 |
|
|
|
Egypt (Arab Republic of) 3/18/2025 |
|
|
21.138 |
|
|
|
34,700 |
|
|
|
|
|
|
|
612 |
|
|
|
Japan Treasury 7/22/2024 |
|
|
0.005 |
|
|
|
JPY110,650 |
|
|
|
|
|
|
|
688 |
|
|
|
|
|
|
|
|
|
|
|
|
|
|
|
|
|
|
|
|
|
|
|
|
|
|
|
|
|
|
|
|
|
|
|
|
|
1,693 |
|
|
|
|
|
|
|
|
|
|
|
|
|
|
|
|
|
|
|
|
|
|
|
|
| |
|
|
Shares |
|
|
|
|
|
|
|
|
| Money market investments purchased with collateral from securities on loan 0.04% |
|
|
|
State Street Institutional U.S. Government Money Market Fund, Institutional Class 5.22%13,14 |
|
|
|
|
|
|
109,997 |
|
|
|
|
|
|
|
110 |
|
|
|
Invesco Short-Term Investments Trust – Government & Agency Portfolio, Institutional Class 5.23%13,14 |
|
|
|
|
|
|
22,048 |
|
|
|
|
|
|
|
22 |
|
|
|
|
|
|
|
|
|
|
|
|
|
|
|
|
|
|
|
|
|
|
|
|
|
|
|
|
|
|
|
|
|
|
132 |
|
|
|
|
|
|
|
|
|
|
|
|
|
|
|
|
|
|
|
|
|
|
Total short-term securities (cost: $34,001,000) |
|
|
|
|
|
|
|
|
|
|
|
33,962 |
|
|
|
|
|
|
|
|
|
|
|
|
|
|
|
|
|
|
|
|
|
|
|
|
|
|
|
Total investment securities 104.90% (cost: $358,576,000) |
|
|
|
|
|
|
|
|
|
|
|
410,993 |
|
|
|
Other assets less liabilities (4.90)% |
|
|
|
|
|
|
|
|
|
|
|
(19,196 |
) |
|
|
|
|
|
|
|
|
|
|
|
|
|
|
|
|
|
|
|
|
|
|
|
|
|
|
Net assets 100.00% |
|
|
|
|
|
|
|
|
|
|
$ |
391,797 |
|
|
|
|
|
|
|
|
|
|
|
|
|
|
|
|
|
|
|
|
129 American Funds Insurance Series
American Funds Global Balanced Fund (continued)
|
|
|
|
|
|
|
|
|
|
|
|
|
|
|
|
|
|
|
|
|
|
|
|
|
| Futures contracts |
|
|
|
|
|
|
|
| Contracts |
|
Type |
|
|
Number of
contracts |
|
|
Expiration
date |
|
|
Notional
amount
(000) |
|
|
Value and
unrealized
appreciation
(depreciation)
at 6/30/2024
(000) |
|
| 2 Year Euro-Schatz Futures |
|
|
Long |
|
|
|
8 |
|
|
|
9/10/2024 |
|
|
|
USD906 |
|
|
|
|
|
|
$ |
4 |
|
| 2 Year U.S. Treasury Note Futures |
|
|
Long |
|
|
|
57 |
|
|
|
10/3/2024 |
|
|
|
11,640 |
|
|
|
|
|
|
|
7 |
|
| 5 Year Euro-Bobl Futures |
|
|
Long |
|
|
|
75 |
|
|
|
9/10/2024 |
|
|
|
9,353 |
|
|
|
|
|
|
|
68 |
|
| 5 Year U.S. Treasury Note Futures |
|
|
Long |
|
|
|
58 |
|
|
|
10/3/2024 |
|
|
|
6,181 |
|
|
|
|
|
|
|
35 |
|
| 10 Year French Government Bond Futures |
|
|
Short |
|
|
|
5 |
|
|
|
9/10/2024 |
|
|
|
(659 |
) |
|
|
|
|
|
|
10 |
|
| 10 Year Italy Government Bond Futures |
|
|
Short |
|
|
|
18 |
|
|
|
9/10/2024 |
|
|
|
(2,222 |
) |
|
|
|
|
|
|
27 |
|
| 10 Year Australian Treasury Bond Futures |
|
|
Short |
|
|
|
1 |
|
|
|
9/16/2024 |
|
|
|
(76 |
) |
|
|
|
|
|
|
– |
2 |
| 10 Year Japanese Government Bond Futures |
|
|
Short |
|
|
|
5 |
|
|
|
9/20/2024 |
|
|
|
(4,440 |
) |
|
|
|
|
|
|
11 |
|
| 10 Year Canadian Government Bond Futures |
|
|
Long |
|
|
|
18 |
|
|
|
9/27/2024 |
|
|
|
1,580 |
|
|
|
|
|
|
|
13 |
|
| 10 Year UK Gilt Futures |
|
|
Long |
|
|
|
25 |
|
|
|
9/30/2024 |
|
|
|
3,083 |
|
|
|
|
|
|
|
(27 |
) |
| 10 Year U.S. Treasury Note Futures |
|
|
Long |
|
|
|
21 |
|
|
|
9/30/2024 |
|
|
|
2,310 |
|
|
|
|
|
|
|
23 |
|
| 10 Year Ultra U.S. Treasury Note Futures |
|
|
Short |
|
|
|
11 |
|
|
|
9/30/2024 |
|
|
|
(1,249 |
) |
|
|
|
|
|
|
9 |
|
| 20 Year U.S. Treasury Bond Futures |
|
|
Long |
|
|
|
13 |
|
|
|
9/30/2024 |
|
|
|
1,538 |
|
|
|
|
|
|
|
18 |
|
| 30 Year Ultra U.S. Treasury Bond Futures |
|
|
Long |
|
|
|
4 |
|
|
|
9/30/2024 |
|
|
|
501 |
|
|
|
|
|
|
|
5 |
|
|
|
|
|
|
|
|
|
|
|
|
|
|
|
|
|
|
|
|
|
|
|
|
|
|
|
|
|
|
|
|
|
|
|
|
|
|
|
|
|
|
|
|
|
|
|
|
|
|
|
|
|
|
|
$ |
203 |
|
|
|
|
|
|
|
|
|
|
|
|
|
|
|
|
|
|
|
|
|
|
|
|
|
|
|
|
|
|
|
|
|
|
|
|
|
|
|
|
|
|
|
|
|
|
|
|
|
|
|
|
|
|
|
| Forward currency contracts |
|
|
|
|
|
|
|
|
|
| |
|
|
|
|
|
|
|
|
|
|
|
|
|
|
|
|
|
Unrealized |
|
| Contract amount |
|
|
|
|
|
|
|
appreciation (depreciation) |
|
Currency purchased
(000) |
|
|
|
|
|
Currency sold
(000) |
|
|
Counterparty |
|
Settlement
date |
|
|
at 6/30/2024 (000) |
|
|
|
|
|
|
|
|
|
|
| USD |
|
|
1,096 |
|
|
|
|
|
|
PLN |
|
|
4,490 |
|
|
Citibank |
|
|
7/3/2024 |
|
|
|
|
|
|
|
$ (19 |
) |
| PLN |
|
|
4,490 |
|
|
|
|
|
|
USD |
|
|
1,144 |
|
|
Bank of America |
|
|
7/3/2024 |
|
|
|
|
|
|
|
(28 |
) |
| AUD |
|
|
1,390 |
|
|
|
|
|
|
USD |
|
|
925 |
|
|
Bank of America |
|
|
7/9/2024 |
|
|
|
|
|
|
|
3 |
|
| USD |
|
|
107 |
|
|
|
|
|
|
JPY |
|
|
16,710 |
|
|
Citibank |
|
|
7/9/2024 |
|
|
|
|
|
|
|
3 |
|
| USD |
|
|
99 |
|
|
|
|
|
|
CNH |
|
|
720 |
|
|
Bank of America |
|
|
7/9/2024 |
|
|
|
|
|
|
|
– |
2 |
| CNH |
|
|
1,460 |
|
|
|
|
|
|
USD |
|
|
200 |
|
|
Standard Chartered Bank |
|
|
7/9/2024 |
|
|
|
|
|
|
|
– |
2 |
| THB |
|
|
12,750 |
|
|
|
|
|
|
USD |
|
|
349 |
|
|
Citibank |
|
|
7/9/2024 |
|
|
|
|
|
|
|
(2 |
) |
| CHF |
|
|
270 |
|
|
|
|
|
|
USD |
|
|
304 |
|
|
Bank of America |
|
|
7/9/2024 |
|
|
|
|
|
|
|
(3 |
) |
| CNH |
|
|
5,190 |
|
|
|
|
|
|
USD |
|
|
717 |
|
|
UBS AG |
|
|
7/9/2024 |
|
|
|
|
|
|
|
(6 |
) |
| JPY |
|
|
184,360 |
|
|
|
|
|
|
USD |
|
|
1,197 |
|
|
Morgan Stanley |
|
|
7/9/2024 |
|
|
|
|
|
|
|
(49 |
) |
| USD |
|
|
850 |
|
|
|
|
|
|
EUR |
|
|
790 |
|
|
Morgan Stanley |
|
|
7/10/2024 |
|
|
|
|
|
|
|
4 |
|
| CAD |
|
|
1,610 |
|
|
|
|
|
|
USD |
|
|
1,175 |
|
|
Morgan Stanley |
|
|
7/10/2024 |
|
|
|
|
|
|
|
2 |
|
| CAD |
|
|
90 |
|
|
|
|
|
|
USD |
|
|
66 |
|
|
HSBC Bank |
|
|
7/10/2024 |
|
|
|
|
|
|
|
– |
2 |
| EUR |
|
|
60 |
|
|
|
|
|
|
USD |
|
|
64 |
|
|
HSBC Bank |
|
|
7/10/2024 |
|
|
|
|
|
|
|
– |
2 |
| USD |
|
|
190 |
|
|
|
|
|
|
GBP |
|
|
150 |
|
|
BNP Paribas |
|
|
7/10/2024 |
|
|
|
|
|
|
|
– |
2 |
| PLN |
|
|
540 |
|
|
|
|
|
|
USD |
|
|
136 |
|
|
BNP Paribas |
|
|
7/10/2024 |
|
|
|
|
|
|
|
(2 |
) |
| EUR |
|
|
180 |
|
|
|
|
|
|
USD |
|
|
196 |
|
|
Bank of America |
|
|
7/10/2024 |
|
|
|
|
|
|
|
(3 |
) |
| EUR |
|
|
201 |
|
|
|
|
|
|
CAD |
|
|
300 |
|
|
UBS AG |
|
|
7/10/2024 |
|
|
|
|
|
|
|
(4 |
) |
| GBP |
|
|
530 |
|
|
|
|
|
|
USD |
|
|
677 |
|
|
Morgan Stanley |
|
|
7/10/2024 |
|
|
|
|
|
|
|
(7 |
) |
| EUR |
|
|
1,520 |
|
|
|
|
|
|
USD |
|
|
1,655 |
|
|
JPMorgan Chase |
|
|
7/10/2024 |
|
|
|
|
|
|
|
(27 |
) |
| USD |
|
|
90 |
|
|
|
|
|
|
JPY |
|
|
14,288 |
|
|
HSBC Bank |
|
|
7/11/2024 |
|
|
|
|
|
|
|
1 |
|
| USD |
|
|
247 |
|
|
|
|
|
|
AUD |
|
|
370 |
|
|
Morgan Stanley |
|
|
7/11/2024 |
|
|
|
|
|
|
|
– |
2 |
| USD |
|
|
247 |
|
|
|
|
|
|
AUD |
|
|
370 |
|
|
HSBC Bank |
|
|
7/11/2024 |
|
|
|
|
|
|
|
– |
2 |
| NZD |
|
|
280 |
|
|
|
|
|
|
USD |
|
|
173 |
|
|
Bank of America |
|
|
7/11/2024 |
|
|
|
|
|
|
|
(3 |
) |
| SEK |
|
|
3,570 |
|
|
|
|
|
|
USD |
|
|
341 |
|
|
Bank of America |
|
|
7/11/2024 |
|
|
|
|
|
|
|
(4 |
) |
| JPY |
|
|
284,629 |
|
|
|
|
|
|
USD |
|
|
1,834 |
|
|
UBS AG |
|
|
7/11/2024 |
|
|
|
|
|
|
|
(61 |
) |
| USD |
|
|
1,377 |
|
|
|
|
|
|
MXN |
|
|
24,383 |
|
|
Morgan Stanley |
|
|
7/12/2024 |
|
|
|
|
|
|
|
47 |
|
| USD |
|
|
303 |
|
|
|
|
|
|
MXN |
|
|
5,466 |
|
|
Goldman Sachs |
|
|
7/12/2024 |
|
|
|
|
|
|
|
5 |
|
| MYR |
|
|
800 |
|
|
|
|
|
|
USD |
|
|
171 |
|
|
Standard Chartered Bank |
|
|
7/12/2024 |
|
|
|
|
|
|
|
(1 |
) |
| USD |
|
|
133 |
|
|
|
|
|
|
BRL |
|
|
700 |
|
|
Morgan Stanley |
|
|
7/15/2024 |
|
|
|
|
|
|
|
8 |
|
American Funds Insurance Series 130
American Funds Global Balanced Fund (continued)
|
|
|
|
|
|
|
|
|
|
|
|
|
|
|
|
|
|
|
|
|
|
|
|
|
|
|
|
|
| Forward currency contracts (continued) |
|
|
|
|
|
|
|
|
|
| |
|
|
|
|
|
|
|
|
|
|
|
|
|
|
|
|
|
Unrealized |
|
| Contract amount |
|
|
|
|
|
|
|
appreciation (depreciation) |
|
| Currency purchased (000) |
|
|
|
|
|
Currency sold (000) |
|
|
Counterparty |
|
Settlement
date |
|
|
at 6/30/2024 (000) |
|
|
|
|
|
|
|
|
|
|
| USD |
|
|
49 |
|
|
|
|
|
|
KRW |
|
|
66,900 |
|
|
Barclays Bank PLC |
|
|
7/15/2024 |
|
|
|
|
|
|
$ |
1 |
|
| USD |
|
|
345 |
|
|
|
|
|
|
KRW |
|
|
474,750 |
|
|
Citibank |
|
|
7/15/2024 |
|
|
|
|
|
|
|
1 |
|
| USD |
|
|
811 |
|
|
|
|
|
|
ILS |
|
|
3,000 |
|
|
BNP Paribas |
|
|
7/17/2024 |
|
|
|
|
|
|
|
16 |
|
| HUF |
|
|
17,610 |
|
|
|
|
|
|
USD |
|
|
48 |
|
|
JPMorgan Chase |
|
|
7/17/2024 |
|
|
|
|
|
|
|
– |
2 |
| USD |
|
|
134 |
|
|
|
|
|
|
MXN |
|
|
2,470 |
|
|
BNP Paribas |
|
|
7/17/2024 |
|
|
|
|
|
|
|
(1 |
) |
| USD |
|
|
535 |
|
|
|
|
|
|
MXN |
|
|
10,001 |
|
|
Morgan Stanley |
|
|
7/17/2024 |
|
|
|
|
|
|
|
(10 |
) |
| SGD |
|
|
160 |
|
|
|
|
|
|
USD |
|
|
118 |
|
|
HSBC Bank |
|
|
7/18/2024 |
|
|
|
|
|
|
|
– |
2 |
| JPY |
|
|
35,000 |
|
|
|
|
|
|
USD |
|
|
220 |
|
|
Bank of America |
|
|
7/18/2024 |
|
|
|
|
|
|
|
(2 |
) |
| JPY |
|
|
227,460 |
|
|
|
|
|
|
USD |
|
|
1,454 |
|
|
Morgan Stanley |
|
|
7/18/2024 |
|
|
|
|
|
|
|
(35 |
) |
| AUD |
|
|
360 |
|
|
|
|
|
|
USD |
|
|
239 |
|
|
Standard Chartered Bank |
|
|
7/22/2024 |
|
|
|
|
|
|
|
2 |
|
| EUR |
|
|
1,040 |
|
|
|
|
|
|
USD |
|
|
1,113 |
|
|
Standard Chartered Bank |
|
|
7/22/2024 |
|
|
|
|
|
|
|
2 |
|
| EUR |
|
|
1,130 |
|
|
|
|
|
|
USD |
|
|
1,211 |
|
|
UBS AG |
|
|
7/22/2024 |
|
|
|
|
|
|
|
1 |
|
| USD |
|
|
170 |
|
|
|
|
|
|
AUD |
|
|
255 |
|
|
HSBC Bank |
|
|
7/22/2024 |
|
|
|
|
|
|
|
– |
2 |
| USD |
|
|
740 |
|
|
|
|
|
|
EUR |
|
|
690 |
|
|
Morgan Stanley |
|
|
7/22/2024 |
|
|
|
|
|
|
|
– |
2 |
| EUR |
|
|
1,320 |
|
|
|
|
|
|
USD |
|
|
1,426 |
|
|
BNP Paribas |
|
|
7/22/2024 |
|
|
|
|
|
|
|
(11 |
) |
| USD |
|
|
730 |
|
|
|
|
|
|
CNH |
|
|
5,310 |
|
|
Goldman Sachs |
|
|
7/24/2024 |
|
|
|
|
|
|
|
1 |
|
| CAD |
|
|
300 |
|
|
|
|
|
|
USD |
|
|
219 |
|
|
JPMorgan Chase |
|
|
7/24/2024 |
|
|
|
|
|
|
|
– |
2 |
| USD |
|
|
35 |
|
|
|
|
|
|
ZAR |
|
|
630 |
|
|
Bank of New York Mellon |
|
|
7/24/2024 |
|
|
|
|
|
|
|
– |
2 |
| CZK |
|
|
2,000 |
|
|
|
|
|
|
USD |
|
|
86 |
|
|
BNP Paribas |
|
|
7/24/2024 |
|
|
|
|
|
|
|
(1 |
) |
| ILS |
|
|
200 |
|
|
|
|
|
|
USD |
|
|
54 |
|
|
BNP Paribas |
|
|
7/24/2024 |
|
|
|
|
|
|
|
(1 |
) |
| USD |
|
|
682 |
|
|
|
|
|
|
NOK |
|
|
7,213 |
|
|
Morgan Stanley |
|
|
7/25/2024 |
|
|
|
|
|
|
|
6 |
|
| EUR |
|
|
375 |
|
|
|
|
|
|
USD |
|
|
401 |
|
|
Morgan Stanley |
|
|
7/25/2024 |
|
|
|
|
|
|
|
1 |
|
| EUR |
|
|
396 |
|
|
|
|
|
|
DKK |
|
|
2,950 |
|
|
HSBC Bank |
|
|
7/25/2024 |
|
|
|
|
|
|
|
– |
2 |
| DKK |
|
|
800 |
|
|
|
|
|
|
USD |
|
|
115 |
|
|
HSBC Bank |
|
|
7/25/2024 |
|
|
|
|
|
|
|
– |
2 |
| EUR |
|
|
210 |
|
|
|
|
|
|
USD |
|
|
226 |
|
|
JPMorgan Chase |
|
|
7/25/2024 |
|
|
|
|
|
|
|
– |
2 |
| USD |
|
|
1,897 |
|
|
|
|
|
|
BRL |
|
|
10,361 |
|
|
JPMorgan Chase |
|
|
7/30/2024 |
|
|
|
|
|
|
|
50 |
|
| USD |
|
|
90 |
|
|
|
|
|
|
BRL |
|
|
500 |
|
|
Goldman Sachs |
|
|
7/30/2024 |
|
|
|
|
|
|
|
1 |
|
| COP |
|
|
276,050 |
|
|
|
|
|
|
USD |
|
|
66 |
|
|
Morgan Stanley |
|
|
7/30/2024 |
|
|
|
|
|
|
|
– |
2 |
| IDR |
|
|
2,000,000 |
|
|
|
|
|
|
USD |
|
|
122 |
|
|
Standard Chartered Bank |
|
|
7/30/2024 |
|
|
|
|
|
|
|
– |
2 |
| USD |
|
|
169 |
|
|
|
|
|
|
IDR |
|
|
2,768,834 |
|
|
Standard Chartered Bank |
|
|
7/30/2024 |
|
|
|
|
|
|
|
– |
2 |
| USD |
|
|
293 |
|
|
|
|
|
|
INR |
|
|
24,479 |
|
|
JPMorgan Chase |
|
|
7/30/2024 |
|
|
|
|
|
|
|
– |
2 |
| USD |
|
|
572 |
|
|
|
|
|
|
INR |
|
|
47,780 |
|
|
UBS AG |
|
|
7/30/2024 |
|
|
|
|
|
|
|
(1 |
) |
| CLP |
|
|
333,610 |
|
|
|
|
|
|
USD |
|
|
357 |
|
|
Morgan Stanley |
|
|
7/30/2024 |
|
|
|
|
|
|
|
(3 |
) |
| USD |
|
|
205 |
|
|
|
|
|
|
MXN |
|
|
3,833 |
|
|
Morgan Stanley |
|
|
9/18/2024 |
|
|
|
|
|
|
|
(2 |
) |
| USD |
|
|
268 |
|
|
|
|
|
|
BRL |
|
|
1,390 |
|
|
Citibank |
|
|
4/1/2025 |
|
|
|
|
|
|
|
28 |
|
|
|
|
|
|
|
|
|
|
|
|
|
|
|
|
|
|
|
|
|
|
|
|
|
|
|
|
|
|
|
|
|
|
|
|
|
|
|
|
|
|
|
|
|
|
|
|
|
|
|
|
|
|
|
|
|
|
|
|
|
|
|
|
|
$ |
(103 |
) |
|
|
|
|
|
|
|
|
|
|
|
|
|
|
|
|
|
|
|
|
|
|
|
|
|
|
|
|
|
Swap contracts
Interest rate swaps
Centrally cleared interest rate swaps
|
|
|
|
|
|
|
|
|
|
|
|
|
|
|
|
|
|
|
|
|
|
|
|
|
|
|
|
|
|
|
|
|
|
|
|
|
|
|
|
|
| |
|
|
|
|
|
|
|
|
|
|
|
|
|
|
|
|
|
|
|
|
|
Upfront |
|
|
Unrealized |
|
| Receive |
|
|
|
Pay |
|
|
|
|
Notional |
|
|
Value at |
|
|
premium paid |
|
|
appreciation (depreciation) |
|
| |
|
Payment |
|
|
|
|
|
Payment |
|
Expiration |
|
|
amount |
|
|
6/30/2024 |
|
|
(received) |
|
|
at 6/30/2024 |
|
| Rate |
|
frequency |
|
|
|
Rate |
|
frequency |
|
date |
|
|
(000) |
|
|
(000) |
|
|
(000) |
|
|
(000) |
|
|
|
|
|
|
|
|
|
|
|
|
|
|
| 3.79165% |
|
Annual |
|
|
|
SOFR |
|
Annual |
|
|
1/13/2026 |
|
|
|
USD865 |
|
|
|
|
|
|
$ |
(13 |
) |
|
|
|
|
|
$ |
– |
|
|
|
|
|
|
$ |
(13 |
) |
| 6.64% |
|
28-day |
|
|
|
28-day MXN-TIIE |
|
28-day |
|
|
6/25/2026 |
|
|
|
MXN3,200 |
|
|
|
|
|
|
|
(11 |
) |
|
|
|
|
|
|
– |
|
|
|
|
|
|
|
(11 |
) |
| 4.254% |
|
Annual |
|
|
|
SONIA |
|
Annual |
|
|
5/9/2027 |
|
|
|
GBP70 |
|
|
|
|
|
|
|
– |
2 |
|
|
|
|
|
|
– |
|
|
|
|
|
|
|
– |
2 |
| 4.98038% |
|
Annual |
|
|
|
SONIA |
|
Annual |
|
|
6/21/2028 |
|
|
|
GBP1,715 |
|
|
|
|
|
|
|
68 |
|
|
|
|
|
|
|
– |
|
|
|
|
|
|
|
68 |
|
| 4.96048% |
|
Annual |
|
|
|
SONIA |
|
Annual |
|
|
6/21/2028 |
|
|
|
GBP850 |
|
|
|
|
|
|
|
33 |
|
|
|
|
|
|
|
– |
|
|
|
|
|
|
|
33 |
|
| 3.968% |
|
Annual |
|
|
|
SONIA |
|
Annual |
|
|
2/16/2029 |
|
|
|
GBP1,495 |
|
|
|
|
|
|
|
(5 |
) |
|
|
|
|
|
|
– |
|
|
|
|
|
|
|
(5 |
) |
| SOFR |
|
Annual |
|
|
|
3.29015% |
|
Annual |
|
|
1/13/2030 |
|
|
|
USD2,870 |
|
|
|
|
|
|
|
104 |
|
|
|
|
|
|
|
– |
|
|
|
|
|
|
|
104 |
|
131 American Funds Insurance Series
American Funds Global Balanced Fund (continued)
Swap contracts (continued)
Interest rate swaps (continued)
Centrally cleared interest rate swaps (continued)
|
|
|
|
|
|
|
|
|
|
|
|
|
|
|
|
|
|
|
|
|
|
|
|
|
|
|
|
|
|
|
|
|
|
|
|
|
|
|
|
|
| |
|
|
|
|
|
|
|
|
|
|
|
|
|
|
|
|
|
|
|
|
|
Upfront |
|
|
Unrealized |
|
| Receive |
|
|
|
Pay |
|
|
|
|
Notional |
|
|
Value at |
|
|
premium paid |
|
|
appreciation (depreciation) |
|
| |
|
Payment |
|
|
|
|
|
Payment |
|
Expiration |
|
|
amount |
|
|
6/30/2024 |
|
|
(received) |
|
|
at 6/30/2024 |
|
| Rate |
|
frequency |
|
|
|
Rate |
|
frequency |
|
date |
|
|
(000) |
|
|
(000) |
|
|
(000) |
|
|
(000) |
|
|
|
|
|
|
|
|
|
|
|
|
|
|
|
|
|
|
|
|
|
|
|
|
|
|
|
|
|
|
|
|
|
|
|
|
|
|
|
|
|
|
| SONIA |
|
Annual |
|
|
|
4.34948% |
|
Annual |
|
|
6/21/2033 |
|
|
|
GBP460 |
|
|
|
|
|
|
$ |
(21 |
) |
|
|
|
|
|
$ |
– |
|
|
|
|
|
|
$ |
(21 |
) |
| SONIA |
|
Annual |
|
|
|
4.36738% |
|
Annual |
|
|
6/21/2033 |
|
|
|
GBP930 |
|
|
|
|
|
|
|
(44 |
) |
|
|
|
|
|
|
– |
|
|
|
|
|
|
|
(44 |
) |
| SONIA |
|
Annual |
|
|
|
3.9322% |
|
Annual |
|
|
2/16/2054 |
|
|
|
GBP375 |
|
|
|
|
|
|
|
– |
2 |
|
|
|
|
|
|
– |
|
|
|
|
|
|
|
– |
2 |
|
|
|
|
|
|
|
|
|
|
|
|
|
|
|
|
|
|
|
|
|
|
|
|
|
|
|
|
|
|
|
|
|
|
|
|
|
|
|
|
|
|
|
|
|
|
|
|
|
|
|
|
|
|
|
|
|
|
|
|
|
|
|
|
|
|
|
|
|
|
|
|
|
|
|
|
$ |
111 |
|
|
|
|
|
|
$ |
– |
|
|
|
|
|
|
$ |
111 |
|
|
|
|
|
|
|
|
|
|
|
|
|
|
|
|
|
|
|
|
|
|
|
|
|
|
|
|
|
|
|
|
|
|
|
|
|
|
|
|
|
|
Bilateral interest rate swaps
|
|
|
|
|
|
|
|
|
|
|
|
|
|
|
|
|
|
|
|
|
|
|
|
|
|
|
|
|
|
|
|
|
|
|
|
|
|
|
|
|
| |
|
|
|
|
|
|
|
|
|
|
|
|
|
|
|
|
|
|
|
|
|
|
|
Upfront |
|
|
Unrealized |
|
| Receive |
|
|
|
Pay |
|
|
|
|
|
|
|
Notional |
|
Value at |
|
|
premium paid |
|
|
appreciation (depreciation) |
|
| |
|
Payment |
|
|
|
|
|
Payment |
|
|
|
|
|
Expiration |
|
amount |
|
6/30/2024 |
|
|
(received) |
|
|
at 6/30/2024 |
|
| Rate |
|
frequency |
|
|
|
Rate |
|
frequency |
|
|
|
Counterparty |
|
date |
|
(000) |
|
(000) |
|
|
(000) |
|
|
(000) |
|
|
|
|
|
|
|
|
|
|
|
|
|
|
|
|
| 10.045% |
|
At maturity |
|
|
|
BZDIOVER |
|
At maturity |
|
|
|
Goldman Sachs |
|
1/2/2029 |
|
BRL9,330 |
|
|
|
|
|
$ |
(157 |
) |
|
|
|
|
|
$ |
– |
|
|
|
|
|
|
$ |
(157 |
) |
Credit default swaps
Centrally cleared credit default swaps on credit indices – sell protection
|
|
|
|
|
|
|
|
|
|
|
|
|
|
|
|
|
|
|
|
|
|
|
|
|
|
|
|
|
|
|
|
|
|
|
|
|
|
|
|
|
|
|
|
|
|
|
| Reference index |
|
Financing
rate received |
|
|
|
Payment
frequency |
|
|
|
|
|
|
Expiration
date |
|
|
|
|
|
|
|
Notional
amount(000) |
15 |
|
|
|
|
|
|
Value at
6/30/2024(000) |
16 |
|
|
|
|
|
|
Upfront
premium
paid
(received)
(000) |
|
|
|
|
|
|
|
Unrealized
appreciation
(depreciation)
at 6/30/2024
(000) |
|
|
|
|
|
|
|
|
|
|
|
|
|
|
|
| CDX.NA.IG.42 |
|
1.00% |
|
|
|
Quarterly |
|
|
|
|
|
|
6/20/2029 |
|
|
|
|
|
|
|
USD11,764 |
|
|
|
|
|
|
|
$242 |
|
|
|
|
|
|
|
$261 |
|
|
|
|
|
|
|
$(19) |
|
American Funds Insurance Series 132
American Funds Global Balanced Fund (continued)
|
|
|
|
|
|
|
|
|
|
|
|
|
|
|
|
|
|
|
|
|
|
|
|
|
|
|
|
|
|
|
|
|
|
|
|
|
|
|
|
|
|
|
|
|
|
|
|
|
|
|
| Investments in affiliates12 |
|
|
|
|
|
|
|
|
|
|
|
|
|
|
|
|
|
|
|
|
|
|
|
|
|
|
|
|
| |
|
Value at 1/1/2024 (000) |
|
Additions (000) |
|
Reductions
(000) |
|
Net realized gain (loss) (000) |
|
Net unrealized appreciation (depreciation) (000) |
|
Value at 6/30/2024 (000) |
|
Dividend or interest income (000) |
|
|
|
|
|
|
|
|
|
|
|
| Investment funds 0.99% |
|
|
|
|
|
|
|
|
|
|
|
|
|
|
|
|
|
|
|
|
|
|
|
|
|
|
|
|
|
|
|
|
|
|
|
|
|
|
|
|
|
|
|
|
|
|
|
|
|
|
| Capital Group Central Corporate Bond Fund |
|
|
$ |
8,341 |
|
|
|
$ |
2,535 |
|
|
|
|
|
|
|
|
$ |
6,757 |
|
|
|
|
|
|
|
|
$ |
45 |
|
|
|
|
|
|
|
|
$ |
(306 |
) |
|
|
$ |
3,858 |
|
|
|
$ |
173 |
|
|
|
|
|
|
|
|
|
|
|
|
| Short-term securities 8.20% |
|
|
|
|
|
|
|
|
|
|
|
|
|
|
|
|
|
|
|
|
|
|
|
|
|
|
|
|
|
|
|
|
|
|
|
|
|
|
|
|
|
|
|
|
|
|
|
|
|
|
| Money market investments 8.20% |
|
|
|
|
|
|
|
|
|
|
|
|
|
|
|
|
|
|
|
|
|
|
|
|
|
|
|
|
|
|
|
|
|
|
|
|
|
|
|
|
|
|
|
|
|
|
|
|
|
|
| Capital Group Central Cash Fund 5.37%13 |
|
|
|
12,974 |
|
|
|
|
69,325 |
|
|
|
|
|
|
|
|
|
50,163 |
|
|
|
|
|
|
|
|
|
– |
2 |
|
|
|
|
|
|
|
|
1 |
|
|
|
|
32,137 |
|
|
|
|
843 |
|
|
|
|
|
|
|
|
|
|
|
|
|
|
|
|
|
|
|
|
|
|
|
|
|
|
|
|
|
|
|
|
|
|
|
|
|
|
|
|
|
|
|
|
|
|
|
|
|
|
|
|
|
|
|
|
|
|
|
|
|
|
|
| Total 9.19% |
|
|
|
|
|
|
|
|
|
|
|
|
|
|
|
|
|
|
|
|
|
|
|
|
|
|
|
$ |
45 |
|
|
|
|
|
|
|
|
$ |
(305 |
) |
|
|
$ |
35,995 |
|
|
|
$ |
1,016 |
|
|
|
|
|
|
|
|
|
|
|
|
|
|
|
|
|
|
|
|
|
|
|
|
|
|
|
|
|
|
|
|
|
|
|
|
|
|
|
|
|
|
|
|
|
|
|
|
|
|
|
|
| 1 |
Security did not produce income during the last 12 months. |
| 2 |
Amount less than one thousand. |
| 3 |
All or a portion of this security was on loan. The total value of all such securities was $143,000, which represented .04% of the net assets of the fund. Refer to Note 5 for more information on securities lending. |
| 4 |
Index-linked bond whose principal amount moves with a government price index. |
| 5 |
Scheduled interest and/or principal payment was not received. |
| 6 |
Acquired in a transaction exempt from registration under Rule 144A or, for commercial paper, Section 4(a)(2) of the Securities Act of 1933. May be resold in the U.S. in transactions exempt from registration, normally to qualified institutional buyers. The total value of all such securities was $8,001,000, which represented 2.04% of the net assets of the fund. |
| 7 |
Principal payments may be made periodically. Therefore, the effective maturity date may be earlier than the stated maturity date. |
| 8 |
Purchased on a TBA basis. |
| 9 |
Coupon rate may change periodically. Reference rate and spread are as of the most recent information available. Some coupon rates are determined by the issuer or agent based on current market conditions; therefore, the reference rate and spread are not available. |
| 10 |
Step bond; coupon rate may change at a later date. |
| 11 |
All or a portion of this security was pledged as collateral. The total value of pledged collateral was $907,000, which represented .23% of the net assets of the fund. |
| 12 |
Part of the same “group of investment companies” as the fund as defined under the Investment Company Act of 1940, as amended. |
| 13 |
Rate represents the seven-day yield at 6/30/2024. |
| 14 |
Security purchased with cash collateral from securities on loan. Refer to Note 5 for more information on securities lending. |
| 15 |
The maximum potential amount the fund may pay as a protection seller should a credit event occur. |
| 16 |
The prices and resulting values for credit default swap indices serve as an indicator of the current status of the payment/performance risk. As the value of a sell protection credit default swap increases or decreases, when compared to the notional amount of the swap, the payment/performance risk may decrease or increase, respectively. |
Key to abbreviation(s)
|
|
|
| ADR = American Depositary Receipts |
|
INR = Indian rupees |
| Assn. = Association |
|
JPY = Japanese yen |
| AUD = Australian dollars |
|
KRW = South Korean won |
| BRL = Brazilian reais |
|
MXN = Mexican pesos |
| BZDIOVER = Overnight Brazilian Interbank Deposit Rate |
|
MYR = Malaysian ringgits |
| CAD = Canadian dollars |
|
NOK = Norwegian kroner |
| CDI = CREST Depository Interest |
|
NZD = New Zealand dollars |
| CHF = Swiss francs |
|
PLN = Polish zloty |
| CLP = Chilean pesos |
|
Ref. = Refunding |
| CME = CME Group |
|
REIT = Real Estate Investment Trust |
| CNH = Chinese yuan renminbi |
|
Rev. = Revenue |
| CNY = Chinese yuan |
|
SEK = Swedish kronor |
| COP = Colombian pesos |
|
SGD = Singapore dollars |
| CZK = Czech korunas |
|
SOFR = Secured Overnight Financing Rate |
| DKK = Danish kroner |
|
SONIA = Sterling Overnight Interbank Average Rate |
| EGP = Egyptian pounds |
|
TBA = To be announced |
| EUR = Euros |
|
THB = Thai baht |
| EURIBOR = Euro Interbank Offered Rate |
|
TIIE = Equilibrium Interbank Interest Rate |
| GBP = British pounds |
|
TRY = Turkish lira |
| HUF = Hungarian forints |
|
USD = U.S. dollars |
| IDR = Indonesian rupiah |
|
ZAR = South African rand |
| ILS = Israeli shekels |
|
|
Refer to the notes to financial statements.
133 American Funds Insurance Series
|
|
|
| The Bond Fund of America |
|
|
|
|
| Investment portfolio June 30, 2024 |
|
unaudited |
|
|
|
|
|
|
|
|
|
|
|
|
|
|
|
| Bonds, notes & other debt instruments 97.11% |
|
Principal amount
(000) |
|
|
|
|
|
Value
(000) |
|
|
| Mortgage-backed obligations 41.39% |
|
|
|
|
|
|
| Federal agency mortgage-backed obligations 36.85% |
|
Fannie Mae Pool #AB1068 4.50% 5/1/20251 |
|
|
USD8 |
|
|
|
|
|
|
$ |
8 |
|
|
|
Fannie Mae Pool #256133 4.50% 1/1/20261 |
|
|
4 |
|
|
|
|
|
|
|
4 |
|
|
|
Fannie Mae Pool #AR3058 3.00% 1/1/20281 |
|
|
46 |
|
|
|
|
|
|
|
44 |
|
|
|
Fannie Mae Pool #AS8018 3.00% 9/1/20311 |
|
|
33 |
|
|
|
|
|
|
|
31 |
|
|
|
Fannie Mae Pool #BM4741 3.00% 4/1/20321 |
|
|
17 |
|
|
|
|
|
|
|
17 |
|
|
|
Fannie Mae Pool #913966 6.00% 2/1/20371 |
|
|
32 |
|
|
|
|
|
|
|
33 |
|
|
|
Fannie Mae Pool #945680 6.00% 9/1/20371 |
|
|
357 |
|
|
|
|
|
|
|
365 |
|
|
|
Fannie Mae Pool #924866 5.765% 10/1/20371,2 |
|
|
134 |
|
|
|
|
|
|
|
133 |
|
|
|
Fannie Mae Pool #988588 5.50% 8/1/20381 |
|
|
170 |
|
|
|
|
|
|
|
171 |
|
|
|
Fannie Mae Pool #889982 5.50% 11/1/20381 |
|
|
742 |
|
|
|
|
|
|
|
745 |
|
|
|
Fannie Mae Pool #AB1297 5.00% 8/1/20401 |
|
|
174 |
|
|
|
|
|
|
|
172 |
|
|
|
Fannie Mae Pool #AH8144 5.00% 4/1/20411 |
|
|
760 |
|
|
|
|
|
|
|
744 |
|
|
|
Fannie Mae Pool #AH9479 5.00% 4/1/20411 |
|
|
711 |
|
|
|
|
|
|
|
702 |
|
|
|
Fannie Mae Pool #FM7365 2.00% 5/1/20411 |
|
|
117,066 |
|
|
|
|
|
|
|
98,517 |
|
|
|
Fannie Mae Pool #AI1862 5.00% 5/1/20411 |
|
|
734 |
|
|
|
|
|
|
|
725 |
|
|
|
Fannie Mae Pool #AI3510 5.00% 6/1/20411 |
|
|
403 |
|
|
|
|
|
|
|
399 |
|
|
|
Fannie Mae Pool #AJ0704 5.00% 9/1/20411 |
|
|
343 |
|
|
|
|
|
|
|
340 |
|
|
|
Fannie Mae Pool #AJ5391 5.00% 11/1/20411 |
|
|
249 |
|
|
|
|
|
|
|
246 |
|
|
|
Fannie Mae Pool #MA4501 2.00% 12/1/20411 |
|
|
1,385 |
|
|
|
|
|
|
|
1,159 |
|
|
|
Fannie Mae Pool #MA4540 2.00% 2/1/20421 |
|
|
2,320 |
|
|
|
|
|
|
|
1,941 |
|
|
|
Fannie Mae Pool #AZ3904 4.00% 5/1/20451 |
|
|
40 |
|
|
|
|
|
|
|
37 |
|
|
|
Fannie Mae Pool #FM9416 3.50% 7/1/20451 |
|
|
1,785 |
|
|
|
|
|
|
|
1,619 |
|
|
|
Fannie Mae Pool #AL8522 3.50% 5/1/20461 |
|
|
765 |
|
|
|
|
|
|
|
693 |
|
|
|
Fannie Mae Pool #BD1968 4.00% 7/1/20461 |
|
|
760 |
|
|
|
|
|
|
|
710 |
|
|
|
Fannie Mae Pool #BD5477 4.00% 7/1/20461 |
|
|
128 |
|
|
|
|
|
|
|
120 |
|
|
|
Fannie Mae Pool #BM5148 4.00% 10/1/20461 |
|
|
4,848 |
|
|
|
|
|
|
|
4,529 |
|
|
|
Fannie Mae Pool #BE0592 4.00% 11/1/20461 |
|
|
302 |
|
|
|
|
|
|
|
277 |
|
|
|
Fannie Mae Pool #BE8885 4.00% 3/1/20471 |
|
|
789 |
|
|
|
|
|
|
|
737 |
|
|
|
Fannie Mae Pool #MA3058 4.00% 7/1/20471 |
|
|
36 |
|
|
|
|
|
|
|
34 |
|
|
|
Fannie Mae Pool #CA0770 3.50% 11/1/20471 |
|
|
4,156 |
|
|
|
|
|
|
|
3,755 |
|
|
|
Fannie Mae Pool #BJ1515 4.00% 11/1/20471 |
|
|
2,200 |
|
|
|
|
|
|
|
2,061 |
|
|
|
Fannie Mae Pool #CA0706 4.00% 11/1/20471 |
|
|
78 |
|
|
|
|
|
|
|
73 |
|
|
|
Fannie Mae Pool #BM4413 4.50% 12/1/20471 |
|
|
2,325 |
|
|
|
|
|
|
|
2,235 |
|
|
|
Fannie Mae Pool #CA1189 3.50% 2/1/20481 |
|
|
1,211 |
|
|
|
|
|
|
|
1,096 |
|
|
|
Fannie Mae Pool #BJ5749 4.00% 5/1/20481 |
|
|
14 |
|
|
|
|
|
|
|
13 |
|
|
|
Fannie Mae Pool #BF0293 3.00% 7/1/20481 |
|
|
5,894 |
|
|
|
|
|
|
|
5,139 |
|
|
|
Fannie Mae Pool #BF0318 3.50% 8/1/20481 |
|
|
4,530 |
|
|
|
|
|
|
|
4,105 |
|
|
|
Fannie Mae Pool #BM5349 4.00% 9/1/20481 |
|
|
19,903 |
|
|
|
|
|
|
|
18,650 |
|
|
|
Fannie Mae Pool #FM4891 3.50% 10/1/20481 |
|
|
18,207 |
|
|
|
|
|
|
|
16,489 |
|
|
|
Fannie Mae Pool #BM4676 4.00% 10/1/20481 |
|
|
11 |
|
|
|
|
|
|
|
10 |
|
|
|
Fannie Mae Pool #FM3280 3.50% 5/1/20491 |
|
|
463 |
|
|
|
|
|
|
|
420 |
|
|
|
Fannie Mae Pool #CA3807 3.00% 7/1/20491 |
|
|
1,240 |
|
|
|
|
|
|
|
1,079 |
|
|
|
Fannie Mae Pool #CA3806 3.00% 7/1/20491 |
|
|
812 |
|
|
|
|
|
|
|
710 |
|
|
|
Fannie Mae Pool #FS5372 3.50% 7/1/20491 |
|
|
2,386 |
|
|
|
|
|
|
|
2,161 |
|
|
|
Fannie Mae Pool #FM1262 4.00% 7/1/20491 |
|
|
19,812 |
|
|
|
|
|
|
|
18,382 |
|
|
|
Fannie Mae Pool #FM0007 3.50% 9/1/20491 |
|
|
13,461 |
|
|
|
|
|
|
|
12,072 |
|
|
|
Fannie Mae Pool #FM1589 3.50% 9/1/20491 |
|
|
3,668 |
|
|
|
|
|
|
|
3,290 |
|
|
|
Fannie Mae Pool #FM1954 3.50% 11/1/20491 |
|
|
5,819 |
|
|
|
|
|
|
|
5,219 |
|
|
|
Fannie Mae Pool #FS5313 3.50% 1/1/20501 |
|
|
27,415 |
|
|
|
|
|
|
|
24,681 |
|
|
|
Fannie Mae Pool #CA5968 2.50% 6/1/20501 |
|
|
5,417 |
|
|
|
|
|
|
|
4,516 |
|
|
|
Fannie Mae Pool #FM5507 3.00% 7/1/20501 |
|
|
16,098 |
|
|
|
|
|
|
|
14,029 |
|
|
|
Fannie Mae Pool #CA6309 3.00% 7/1/20501 |
|
|
5,890 |
|
|
|
|
|
|
|
5,146 |
|
|
|
Fannie Mae Pool #CA6349 3.00% 7/1/20501 |
|
|
1,835 |
|
|
|
|
|
|
|
1,580 |
|
|
|
Fannie Mae Pool #CA6740 3.00% 8/1/20501 |
|
|
1,064 |
|
|
|
|
|
|
|
922 |
|
|
|
Fannie Mae Pool #BQ1226 2.00% 9/1/20501 |
|
|
1,756 |
|
|
|
|
|
|
|
1,384 |
|
|
|
Fannie Mae Pool #BP6715 2.00% 9/1/20501 |
|
|
1 |
|
|
|
|
|
|
|
1 |
|
|
|
Fannie Mae Pool #FM4256 2.50% 9/1/20501 |
|
|
2,915 |
|
|
|
|
|
|
|
2,435 |
|
|
|
Fannie Mae Pool #CA7028 2.50% 9/1/20501 |
|
|
986 |
|
|
|
|
|
|
|
823 |
|
|
|
Fannie Mae Pool #CA7052 3.00% 9/1/20501 |
|
|
351 |
|
|
|
|
|
|
|
302 |
|
|
|
Fannie Mae Pool #CA7257 2.50% 10/1/20501 |
|
|
276 |
|
|
|
|
|
|
|
230 |
|
|
|
Fannie Mae Pool #CA7381 3.00% 10/1/20501 |
|
|
1,637 |
|
|
|
|
|
|
|
1,408 |
|
American Funds Insurance Series 134
The Bond Fund of America (continued)
|
|
|
|
|
|
|
|
|
|
|
|
|
|
|
| Bonds, notes & other debt instruments (continued) |
|
Principal amount
(000) |
|
|
|
|
|
Value
(000) |
|
|
|
|
|
| Mortgage-backed obligations (continued) |
|
|
|
|
|
|
|
|
|
|
|
|
|
|
|
|
|
| Federal agency mortgage-backed obligations (continued) |
|
Fannie Mae Pool #CA7599 2.50% 11/1/20501 |
|
|
USD6,621 |
|
|
|
|
|
|
$ |
5,529 |
|
|
|
Fannie Mae Pool #FM4897 3.00% 11/1/20501 |
|
|
16,703 |
|
|
|
|
|
|
|
14,616 |
|
|
|
Fannie Mae Pool #MA4208 2.00% 12/1/20501 |
|
|
1,117 |
|
|
|
|
|
|
|
882 |
|
|
|
Fannie Mae Pool #FM5166 3.00% 12/1/20501 |
|
|
1,113 |
|
|
|
|
|
|
|
958 |
|
|
|
Fannie Mae Pool #MA4237 2.00% 1/1/20511 |
|
|
7,012 |
|
|
|
|
|
|
|
5,552 |
|
|
|
Fannie Mae Pool #BR4104 2.00% 1/1/20511 |
|
|
5,495 |
|
|
|
|
|
|
|
4,339 |
|
|
|
Fannie Mae Pool #FM6113 2.50% 1/1/20511 |
|
|
23,230 |
|
|
|
|
|
|
|
19,138 |
|
|
|
Fannie Mae Pool #FM6293 3.00% 1/1/20511 |
|
|
69 |
|
|
|
|
|
|
|
60 |
|
|
|
Fannie Mae Pool #BR2666 2.00% 2/1/20511 |
|
|
420 |
|
|
|
|
|
|
|
335 |
|
|
|
Fannie Mae Pool #CA8828 2.50% 2/1/20511 |
|
|
5,593 |
|
|
|
|
|
|
|
4,653 |
|
|
|
Fannie Mae Pool #MA4305 2.00% 4/1/20511 |
|
|
30 |
|
|
|
|
|
|
|
24 |
|
|
|
Fannie Mae Pool #BR6309 2.50% 4/1/20511 |
|
|
4,329 |
|
|
|
|
|
|
|
3,558 |
|
|
|
Fannie Mae Pool #MA4306 2.50% 4/1/20511 |
|
|
2,653 |
|
|
|
|
|
|
|
2,184 |
|
|
|
Fannie Mae Pool #CB0191 3.00% 4/1/20511 |
|
|
3,348 |
|
|
|
|
|
|
|
2,876 |
|
|
|
Fannie Mae Pool #CB0193 3.00% 4/1/20511 |
|
|
403 |
|
|
|
|
|
|
|
346 |
|
|
|
Fannie Mae Pool #BR1035 2.00% 5/1/20511 |
|
|
18 |
|
|
|
|
|
|
|
14 |
|
|
|
Fannie Mae Pool #FM7803 2.00% 6/1/20511 |
|
|
550 |
|
|
|
|
|
|
|
439 |
|
|
|
Fannie Mae Pool #FM7909 3.00% 6/1/20511 |
|
|
308 |
|
|
|
|
|
|
|
265 |
|
|
|
Fannie Mae Pool #FM7510 3.00% 6/1/20511 |
|
|
217 |
|
|
|
|
|
|
|
187 |
|
|
|
Fannie Mae Pool #MA4378 2.00% 7/1/20511 |
|
|
82 |
|
|
|
|
|
|
|
65 |
|
|
|
Fannie Mae Pool #CB0988 2.50% 7/1/20511 |
|
|
9,390 |
|
|
|
|
|
|
|
7,765 |
|
|
|
Fannie Mae Pool #FM7900 2.50% 7/1/20511 |
|
|
477 |
|
|
|
|
|
|
|
397 |
|
|
|
Fannie Mae Pool #CB1304 3.00% 8/1/20511 |
|
|
1,476 |
|
|
|
|
|
|
|
1,275 |
|
|
|
Fannie Mae Pool #CB1527 2.50% 9/1/20511 |
|
|
1,145 |
|
|
|
|
|
|
|
946 |
|
|
|
Fannie Mae Pool #FS4628 3.00% 10/1/20511 |
|
|
3,426 |
|
|
|
|
|
|
|
2,946 |
|
|
|
Fannie Mae Pool #MA4465 2.00% 11/1/20511 |
|
|
4,718 |
|
|
|
|
|
|
|
3,705 |
|
|
|
Fannie Mae Pool #FS0965 2.00% 11/1/20511 |
|
|
140 |
|
|
|
|
|
|
|
111 |
|
|
|
Fannie Mae Pool #FM9810 3.00% 11/1/20511 |
|
|
1,024 |
|
|
|
|
|
|
|
882 |
|
|
|
Fannie Mae Pool #MA4492 2.00% 12/1/20511 |
|
|
866 |
|
|
|
|
|
|
|
679 |
|
|
|
Fannie Mae Pool #CB2787 3.50% 12/1/20511 |
|
|
24 |
|
|
|
|
|
|
|
22 |
|
|
|
Fannie Mae Pool #BQ7006 2.00% 1/1/20521 |
|
|
1,970 |
|
|
|
|
|
|
|
1,546 |
|
|
|
Fannie Mae Pool #FS0454 3.00% 1/1/20521 |
|
|
1,069 |
|
|
|
|
|
|
|
919 |
|
|
|
Fannie Mae Pool #BV3076 2.00% 2/1/20521 |
|
|
16,051 |
|
|
|
|
|
|
|
12,604 |
|
|
|
Fannie Mae Pool #MA4547 2.00% 2/1/20521 |
|
|
2,653 |
|
|
|
|
|
|
|
2,080 |
|
|
|
Fannie Mae Pool #BV3083 2.00% 2/1/20521 |
|
|
876 |
|
|
|
|
|
|
|
688 |
|
|
|
Fannie Mae Pool #FS0647 3.00% 2/1/20521 |
|
|
35,999 |
|
|
|
|
|
|
|
31,220 |
|
|
|
Fannie Mae Pool #BV3101 2.00% 3/1/20521 |
|
|
1,675 |
|
|
|
|
|
|
|
1,315 |
|
|
|
Fannie Mae Pool #MA4562 2.00% 3/1/20521 |
|
|
1,333 |
|
|
|
|
|
|
|
1,047 |
|
|
|
Fannie Mae Pool #FS1742 2.00% 3/1/20521 |
|
|
1,152 |
|
|
|
|
|
|
|
904 |
|
|
|
Fannie Mae Pool #BV4172 2.00% 3/1/20521 |
|
|
908 |
|
|
|
|
|
|
|
712 |
|
|
|
Fannie Mae Pool #FS1598 2.00% 4/1/20521 |
|
|
1,772 |
|
|
|
|
|
|
|
1,388 |
|
|
|
Fannie Mae Pool #MA4577 2.00% 4/1/20521 |
|
|
794 |
|
|
|
|
|
|
|
622 |
|
|
|
Fannie Mae Pool #FS1655 4.00% 4/1/20521 |
|
|
299 |
|
|
|
|
|
|
|
275 |
|
|
|
Fannie Mae Pool #BW1931 5.00% 6/1/20521 |
|
|
3,118 |
|
|
|
|
|
|
|
3,018 |
|
|
|
Fannie Mae Pool #BT8262 5.00% 6/1/20521 |
|
|
1,405 |
|
|
|
|
|
|
|
1,364 |
|
|
|
Fannie Mae Pool #BW0959 5.00% 7/1/20521 |
|
|
2,902 |
|
|
|
|
|
|
|
2,821 |
|
|
|
Fannie Mae Pool #BV8976 5.00% 8/1/20521 |
|
|
612 |
|
|
|
|
|
|
|
593 |
|
|
|
Fannie Mae Pool #BW1192 4.50% 9/1/20521 |
|
|
276 |
|
|
|
|
|
|
|
261 |
|
|
|
Fannie Mae Pool #BW8497 4.50% 9/1/20521 |
|
|
60 |
|
|
|
|
|
|
|
57 |
|
|
|
Fannie Mae Pool #CB4852 4.50% 10/1/20521 |
|
|
54,473 |
|
|
|
|
|
|
|
51,450 |
|
|
|
Fannie Mae Pool #BX0097 4.50% 10/1/20521 |
|
|
2,564 |
|
|
|
|
|
|
|
2,428 |
|
|
|
Fannie Mae Pool #BW1289 5.50% 10/1/20521 |
|
|
3,177 |
|
|
|
|
|
|
|
3,144 |
|
|
|
Fannie Mae Pool #BW1243 5.50% 10/1/20521 |
|
|
2,837 |
|
|
|
|
|
|
|
2,808 |
|
|
|
Fannie Mae Pool #MA4820 6.50% 10/1/20521 |
|
|
234 |
|
|
|
|
|
|
|
239 |
|
|
|
Fannie Mae Pool #BX1132 4.50% 11/1/20521 |
|
|
943 |
|
|
|
|
|
|
|
890 |
|
|
|
Fannie Mae Pool #BX5673 5.00% 12/1/20521 |
|
|
135 |
|
|
|
|
|
|
|
130 |
|
|
|
Fannie Mae Pool #MA4842 5.50% 12/1/20521 |
|
|
5,478 |
|
|
|
|
|
|
|
5,407 |
|
|
|
Fannie Mae Pool #CB5778 6.00% 12/1/20521 |
|
|
44 |
|
|
|
|
|
|
|
44 |
|
|
|
Fannie Mae Pool #BX5927 4.00% 1/1/20531 |
|
|
277 |
|
|
|
|
|
|
|
254 |
|
|
|
Fannie Mae Pool #FS6769 5.00% 1/1/20531 |
|
|
33,346 |
|
|
|
|
|
|
|
32,337 |
|
|
|
Fannie Mae Pool #MA4916 4.00% 2/1/20531 |
|
|
4,907 |
|
|
|
|
|
|
|
4,493 |
|
135 American Funds Insurance Series
The Bond Fund of America (continued)
|
|
|
|
|
|
|
|
|
|
|
|
|
|
|
|
|
| Bonds, notes & other debt instruments (continued) |
|
Principal amount
(000) |
|
|
|
|
|
Value (000) |
|
|
| Mortgage-backed obligations (continued) |
|
|
|
|
|
|
| Federal agency mortgage-backed obligations (continued) |
|
Fannie Mae Pool #MA4918 5.00% 2/1/20531 |
|
|
USD651 |
|
|
|
|
|
|
$ |
630 |
|
|
|
Fannie Mae Pool #MA4919 5.50% 2/1/20531 |
|
|
8,425 |
|
|
|
|
|
|
|
8,319 |
|
|
|
Fannie Mae Pool #BW5268 4.00% 3/1/20531 |
|
|
414 |
|
|
|
|
|
|
|
379 |
|
|
|
Fannie Mae Pool #CB5986 5.00% 3/1/20531 |
|
|
159 |
|
|
|
|
|
|
|
154 |
|
|
|
Fannie Mae Pool #BX7779 5.50% 3/1/20531 |
|
|
4,277 |
|
|
|
|
|
|
|
4,231 |
|
|
|
Fannie Mae Pool #FS4191 5.50% 3/1/20531 |
|
|
468 |
|
|
|
|
|
|
|
463 |
|
|
|
Fannie Mae Pool #BX7949 6.00% 3/1/20531 |
|
|
1,014 |
|
|
|
|
|
|
|
1,020 |
|
|
|
Fannie Mae Pool #MA4993 4.00% 4/1/20531 |
|
|
4,633 |
|
|
|
|
|
|
|
4,242 |
|
|
|
Fannie Mae Pool #MA4977 4.50% 4/1/20531 |
|
|
708 |
|
|
|
|
|
|
|
669 |
|
|
|
Fannie Mae Pool #BX9041 5.00% 4/1/20531 |
|
|
95 |
|
|
|
|
|
|
|
92 |
|
|
|
Fannie Mae Pool #BY0130 5.50% 4/1/20531 |
|
|
987 |
|
|
|
|
|
|
|
976 |
|
|
|
Fannie Mae Pool #CB6033 6.00% 4/1/20531 |
|
|
20,911 |
|
|
|
|
|
|
|
21,041 |
|
|
|
Fannie Mae Pool #MA5027 4.00% 5/1/20531 |
|
|
4,983 |
|
|
|
|
|
|
|
4,562 |
|
|
|
Fannie Mae Pool #CB6297 4.00% 5/1/20531 |
|
|
32 |
|
|
|
|
|
|
|
29 |
|
|
|
Fannie Mae Pool #BX9827 5.00% 5/1/20531 |
|
|
11,602 |
|
|
|
|
|
|
|
11,222 |
|
|
|
Fannie Mae Pool #FS4563 5.00% 5/1/20531 |
|
|
3,075 |
|
|
|
|
|
|
|
2,977 |
|
|
|
Fannie Mae Pool #MA5010 5.50% 5/1/20531 |
|
|
6,630 |
|
|
|
|
|
|
|
6,544 |
|
|
|
Fannie Mae Pool #BY1592 5.50% 5/1/20531 |
|
|
894 |
|
|
|
|
|
|
|
884 |
|
|
|
Fannie Mae Pool #MA5011 6.00% 5/1/20531 |
|
|
8,335 |
|
|
|
|
|
|
|
8,375 |
|
|
|
Fannie Mae Pool #MA5039 5.50% 6/1/20531 |
|
|
11,645 |
|
|
|
|
|
|
|
11,495 |
|
|
|
Fannie Mae Pool #FS5192 5.50% 6/1/20531 |
|
|
7,530 |
|
|
|
|
|
|
|
7,450 |
|
|
|
Fannie Mae Pool #BY3612 5.50% 6/1/20531 |
|
|
315 |
|
|
|
|
|
|
|
311 |
|
|
|
Fannie Mae Pool #CB6485 6.00% 6/1/20531 |
|
|
4,450 |
|
|
|
|
|
|
|
4,482 |
|
|
|
Fannie Mae Pool #CB6486 6.00% 6/1/20531 |
|
|
2,730 |
|
|
|
|
|
|
|
2,748 |
|
|
|
Fannie Mae Pool #CB6465 6.00% 6/1/20531 |
|
|
2,013 |
|
|
|
|
|
|
|
2,029 |
|
|
|
Fannie Mae Pool #FS7823 2.00% 7/1/20531 |
|
|
6,445 |
|
|
|
|
|
|
|
5,057 |
|
|
|
Fannie Mae Pool #BY4459 5.00% 7/1/20531 |
|
|
663 |
|
|
|
|
|
|
|
642 |
|
|
|
Fannie Mae Pool #BU4112 5.00% 7/1/20531 |
|
|
95 |
|
|
|
|
|
|
|
92 |
|
|
|
Fannie Mae Pool #MA5072 5.50% 7/1/20531 |
|
|
3,759 |
|
|
|
|
|
|
|
3,710 |
|
|
|
Fannie Mae Pool #CB6768 6.50% 7/1/20531 |
|
|
9,288 |
|
|
|
|
|
|
|
9,493 |
|
|
|
Fannie Mae Pool #MA5107 5.50% 8/1/20531 |
|
|
26,058 |
|
|
|
|
|
|
|
25,714 |
|
|
|
Fannie Mae Pool #FS6666 5.50% 8/1/20531 |
|
|
13,799 |
|
|
|
|
|
|
|
13,645 |
|
|
|
Fannie Mae Pool #MA5138 5.50% 9/1/20531 |
|
|
15,171 |
|
|
|
|
|
|
|
14,970 |
|
|
|
Fannie Mae Pool #CB7108 5.50% 9/1/20531 |
|
|
6,875 |
|
|
|
|
|
|
|
6,796 |
|
|
|
Fannie Mae Pool #MA5139 6.00% 9/1/20531 |
|
|
9,176 |
|
|
|
|
|
|
|
9,207 |
|
|
|
Fannie Mae Pool #FS5749 6.50% 9/1/20531 |
|
|
19,306 |
|
|
|
|
|
|
|
19,698 |
|
|
|
Fannie Mae Pool #MA5177 4.00% 10/1/20531 |
|
|
8,015 |
|
|
|
|
|
|
|
7,338 |
|
|
|
Fannie Mae Pool #CB7331 5.50% 10/1/20531 |
|
|
35,544 |
|
|
|
|
|
|
|
35,113 |
|
|
|
Fannie Mae Pool #CB7332 5.50% 10/1/20531 |
|
|
12,570 |
|
|
|
|
|
|
|
12,426 |
|
|
|
Fannie Mae Pool #MA5165 5.50% 10/1/20531 |
|
|
478 |
|
|
|
|
|
|
|
472 |
|
|
|
Fannie Mae Pool #CB7725 6.00% 10/1/20531 |
|
|
10,082 |
|
|
|
|
|
|
|
10,124 |
|
|
|
Fannie Mae Pool #MA5207 4.00% 11/1/20531 |
|
|
3,657 |
|
|
|
|
|
|
|
3,348 |
|
|
|
Fannie Mae Pool #FS7252 5.00% 11/1/20531,3 |
|
|
137,570 |
|
|
|
|
|
|
|
133,027 |
|
|
|
Fannie Mae Pool #MA5190 5.50% 11/1/20531 |
|
|
55,185 |
|
|
|
|
|
|
|
54,456 |
|
|
|
Fannie Mae Pool #FS7979 2.00% 12/1/20531 |
|
|
1,873 |
|
|
|
|
|
|
|
1,470 |
|
|
|
Fannie Mae Pool #MA5215 5.50% 12/1/20531 |
|
|
9,675 |
|
|
|
|
|
|
|
9,547 |
|
|
|
Fannie Mae Pool #FS6668 5.50% 12/1/20531 |
|
|
2,063 |
|
|
|
|
|
|
|
2,037 |
|
|
|
Fannie Mae Pool #FS6873 6.50% 1/1/20541 |
|
|
1,643 |
|
|
|
|
|
|
|
1,675 |
|
|
|
Fannie Mae Pool #FS6809 5.50% 2/1/20541 |
|
|
1,964 |
|
|
|
|
|
|
|
1,938 |
|
|
|
Fannie Mae Pool #MA5271 5.50% 2/1/20541 |
|
|
782 |
|
|
|
|
|
|
|
772 |
|
|
|
Fannie Mae Pool #FS7031 6.00% 2/1/20541 |
|
|
7,993 |
|
|
|
|
|
|
|
8,058 |
|
|
|
Fannie Mae Pool #FS7503 6.00% 2/1/20541 |
|
|
6,093 |
|
|
|
|
|
|
|
6,113 |
|
|
|
Fannie Mae Pool #BY8083 4.00% 3/1/20541 |
|
|
25 |
|
|
|
|
|
|
|
23 |
|
|
|
Fannie Mae Pool #MA5296 5.50% 3/1/20541 |
|
|
23,700 |
|
|
|
|
|
|
|
23,383 |
|
|
|
Fannie Mae Pool #CB8151 5.50% 3/1/20541 |
|
|
21,060 |
|
|
|
|
|
|
|
20,798 |
|
|
|
Fannie Mae Pool #FS7507 6.00% 3/1/20541 |
|
|
5,680 |
|
|
|
|
|
|
|
5,725 |
|
|
|
Fannie Mae Pool #CB8168 6.00% 3/1/20541 |
|
|
3,998 |
|
|
|
|
|
|
|
4,018 |
|
|
|
Fannie Mae Pool #MA5341 4.00% 4/1/20541 |
|
|
38 |
|
|
|
|
|
|
|
35 |
|
|
|
Fannie Mae Pool #MA5331 5.50% 4/1/20541 |
|
|
12,704 |
|
|
|
|
|
|
|
12,535 |
|
|
|
Fannie Mae Pool #CB8328 5.50% 4/1/20541 |
|
|
5,331 |
|
|
|
|
|
|
|
5,276 |
|
|
|
Fannie Mae Pool #DB1235 6.00% 4/1/20541 |
|
|
6,267 |
|
|
|
|
|
|
|
6,326 |
|
American Funds Insurance Series 136
The Bond Fund of America (continued)
|
|
|
|
|
|
|
|
|
|
|
|
|
|
|
|
|
| Bonds, notes & other debt instruments (continued) |
|
Principal amount
(000) |
|
|
|
|
|
Value (000) |
|
|
| Mortgage-backed obligations (continued) |
|
|
|
|
|
|
| Federal agency mortgage-backed obligations (continued) |
|
Fannie Mae Pool #DB5160 5.50% 5/1/20541 |
|
|
USD670 |
|
|
|
|
|
|
$ |
662 |
|
|
|
Fannie Mae Pool #MA5385 4.00% 6/1/20541 |
|
|
3,896 |
|
|
|
|
|
|
|
3,566 |
|
|
|
Fannie Mae Pool #FS8131 5.50% 6/1/20541 |
|
|
2,027 |
|
|
|
|
|
|
|
2,006 |
|
|
|
Fannie Mae Pool #FS8153 6.00% 6/1/20541 |
|
|
20,582 |
|
|
|
|
|
|
|
20,773 |
|
|
|
Fannie Mae Pool #CB8755 6.00% 6/1/20541 |
|
|
1,377 |
|
|
|
|
|
|
|
1,387 |
|
|
|
Fannie Mae Pool #MA5421 6.00% 7/1/20541 |
|
|
7,844 |
|
|
|
|
|
|
|
7,869 |
|
|
|
Fannie Mae Pool #BF0145 3.50% 3/1/20571 |
|
|
10,427 |
|
|
|
|
|
|
|
9,166 |
|
|
|
Fannie Mae Pool #BF0264 3.50% 5/1/20581 |
|
|
7,840 |
|
|
|
|
|
|
|
6,931 |
|
|
|
Fannie Mae Pool #BF0332 3.00% 1/1/20591 |
|
|
16,878 |
|
|
|
|
|
|
|
14,274 |
|
|
|
Fannie Mae Pool #BF0497 3.00% 7/1/20601 |
|
|
19,641 |
|
|
|
|
|
|
|
16,341 |
|
|
|
Fannie Mae Pool #BF0585 4.50% 12/1/20611 |
|
|
1,134 |
|
|
|
|
|
|
|
1,071 |
|
|
|
Fannie Mae, Series 2001-4, Class GA, 9.00% 4/17/20251,2 |
|
|
– |
4 |
|
|
|
|
|
|
– |
4 |
|
|
Fannie Mae, Series 2001-50, Class BA, 7.00% 10/25/20411 |
|
|
5 |
|
|
|
|
|
|
|
5 |
|
|
|
Fannie Mae, Series 2002-W3, Class A5, 7.50% 11/25/20411 |
|
|
15 |
|
|
|
|
|
|
|
16 |
|
|
|
Fannie Mae, Series 2002-W1, Class 2A, 4.596% 2/25/20421,2 |
|
|
17 |
|
|
|
|
|
|
|
17 |
|
|
|
Freddie Mac Pool #ZS8507 3.00% 11/1/20281 |
|
|
71 |
|
|
|
|
|
|
|
68 |
|
|
|
Freddie Mac Pool #ZK7590 3.00% 1/1/20291 |
|
|
1,422 |
|
|
|
|
|
|
|
1,372 |
|
|
|
Freddie Mac Pool #A15120 5.50% 10/1/20331 |
|
|
44 |
|
|
|
|
|
|
|
44 |
|
|
|
Freddie Mac Pool #QN1073 3.00% 12/1/20341 |
|
|
33 |
|
|
|
|
|
|
|
31 |
|
|
|
Freddie Mac Pool #G05196 5.50% 10/1/20381 |
|
|
42 |
|
|
|
|
|
|
|
42 |
|
|
|
Freddie Mac Pool #G05267 5.50% 12/1/20381 |
|
|
31 |
|
|
|
|
|
|
|
31 |
|
|
|
Freddie Mac Pool #G06020 5.50% 12/1/20391 |
|
|
59 |
|
|
|
|
|
|
|
60 |
|
|
|
Freddie Mac Pool #G05860 5.50% 2/1/20401 |
|
|
219 |
|
|
|
|
|
|
|
221 |
|
|
|
Freddie Mac Pool #RB5071 2.00% 9/1/20401 |
|
|
1,984 |
|
|
|
|
|
|
|
1,677 |
|
|
|
Freddie Mac Pool #A93948 4.50% 9/1/20401 |
|
|
143 |
|
|
|
|
|
|
|
139 |
|
|
|
Freddie Mac Pool #SC0149 2.00% 3/1/20411 |
|
|
5,946 |
|
|
|
|
|
|
|
5,025 |
|
|
|
Freddie Mac Pool #G06868 4.50% 4/1/20411 |
|
|
148 |
|
|
|
|
|
|
|
144 |
|
|
|
Freddie Mac Pool #RB0544 2.00% 6/1/20411 |
|
|
10,297 |
|
|
|
|
|
|
|
8,703 |
|
|
|
Freddie Mac Pool #G06841 5.50% 6/1/20411 |
|
|
343 |
|
|
|
|
|
|
|
344 |
|
|
|
Freddie Mac Pool #RB5138 2.00% 12/1/20411 |
|
|
2,327 |
|
|
|
|
|
|
|
1,947 |
|
|
|
Freddie Mac Pool #RB5145 2.00% 2/1/20421 |
|
|
2,288 |
|
|
|
|
|
|
|
1,913 |
|
|
|
Freddie Mac Pool #RB5148 2.00% 3/1/20421 |
|
|
4,913 |
|
|
|
|
|
|
|
4,107 |
|
|
|
Freddie Mac Pool #Z40130 3.00% 1/1/20461 |
|
|
17,548 |
|
|
|
|
|
|
|
15,506 |
|
|
|
Freddie Mac Pool #ZT2100 3.00% 4/1/20471 |
|
|
97 |
|
|
|
|
|
|
|
84 |
|
|
|
Freddie Mac Pool #SD0470 4.00% 11/1/20471 |
|
|
877 |
|
|
|
|
|
|
|
817 |
|
|
|
Freddie Mac Pool #G08789 4.00% 11/1/20471 |
|
|
539 |
|
|
|
|
|
|
|
505 |
|
|
|
Freddie Mac Pool #G61733 3.00% 12/1/20471 |
|
|
4,499 |
|
|
|
|
|
|
|
3,936 |
|
|
|
Freddie Mac Pool #G67709 3.50% 3/1/20481 |
|
|
11,566 |
|
|
|
|
|
|
|
10,479 |
|
|
|
Freddie Mac Pool #ZT2265 4.00% 8/1/20481 |
|
|
849 |
|
|
|
|
|
|
|
788 |
|
|
|
Freddie Mac Pool #G61628 3.50% 9/1/20481 |
|
|
273 |
|
|
|
|
|
|
|
247 |
|
|
|
Freddie Mac Pool #Q58494 4.00% 9/1/20481 |
|
|
1,009 |
|
|
|
|
|
|
|
943 |
|
|
|
Freddie Mac Pool #ZN4842 3.50% 4/1/20491 |
|
|
688 |
|
|
|
|
|
|
|
618 |
|
|
|
Freddie Mac Pool #RA1369 3.50% 9/1/20491 |
|
|
1,721 |
|
|
|
|
|
|
|
1,543 |
|
|
|
Freddie Mac Pool #SD7508 3.50% 10/1/20491 |
|
|
9,440 |
|
|
|
|
|
|
|
8,482 |
|
|
|
Freddie Mac Pool #QA4673 3.00% 11/1/20491 |
|
|
25,882 |
|
|
|
|
|
|
|
22,609 |
|
|
|
Freddie Mac Pool #QB1368 2.50% 7/1/20501 |
|
|
5,179 |
|
|
|
|
|
|
|
4,325 |
|
|
|
Freddie Mac Pool #RA3384 3.00% 8/1/20501 |
|
|
370 |
|
|
|
|
|
|
|
319 |
|
|
|
Freddie Mac Pool #RA3506 3.00% 9/1/20501 |
|
|
1,892 |
|
|
|
|
|
|
|
1,628 |
|
|
|
Freddie Mac Pool #SD7525 2.50% 10/1/20501 |
|
|
6,520 |
|
|
|
|
|
|
|
5,445 |
|
|
|
Freddie Mac Pool #QB8605 2.00% 2/1/20511 |
|
|
459 |
|
|
|
|
|
|
|
366 |
|
|
|
Freddie Mac Pool #SD8128 2.00% 2/1/20511 |
|
|
105 |
|
|
|
|
|
|
|
82 |
|
|
|
Freddie Mac Pool #SD8134 2.00% 3/1/20511 |
|
|
76,105 |
|
|
|
|
|
|
|
59,814 |
|
|
|
Freddie Mac Pool #RA5288 2.00% 5/1/20511 |
|
|
1,346 |
|
|
|
|
|
|
|
1,069 |
|
|
|
Freddie Mac Pool #RA5267 3.00% 5/1/20511 |
|
|
1,202 |
|
|
|
|
|
|
|
1,033 |
|
|
|
Freddie Mac Pool #QC2817 2.50% 6/1/20511 |
|
|
2,538 |
|
|
|
|
|
|
|
2,108 |
|
|
|
Freddie Mac Pool #SD7544 3.00% 7/1/20511 |
|
|
6,348 |
|
|
|
|
|
|
|
5,498 |
|
|
|
Freddie Mac Pool #SD8160 2.00% 8/1/20511 |
|
|
834 |
|
|
|
|
|
|
|
655 |
|
|
|
Freddie Mac Pool #RA5836 2.50% 9/1/20511 |
|
|
11,011 |
|
|
|
|
|
|
|
9,121 |
|
|
|
Freddie Mac Pool #RA5901 3.00% 9/1/20511 |
|
|
1,149 |
|
|
|
|
|
|
|
988 |
|
|
|
Freddie Mac Pool #SD2880 3.00% 10/1/20511 |
|
|
6,983 |
|
|
|
|
|
|
|
6,000 |
|
|
|
Freddie Mac Pool #SD0734 3.00% 10/1/20511 |
|
|
1,959 |
|
|
|
|
|
|
|
1,693 |
|
137 American Funds Insurance Series
The Bond Fund of America (continued)
|
|
|
|
|
|
|
|
|
|
|
|
|
|
|
|
|
| Bonds, notes & other debt instruments (continued) |
|
Principal amount
(000) |
|
|
|
|
|
Value (000) |
|
|
| Mortgage-backed obligations (continued) |
|
|
|
|
|
|
| Federal agency mortgage-backed obligations (continued) |
|
Freddie Mac Pool #QD1841 2.00% 11/1/20511 |
|
|
USD2,516 |
|
|
|
|
|
|
$ |
1,975 |
|
|
|
Freddie Mac Pool #SD1385 2.50% 11/1/20511 |
|
|
1,489 |
|
|
|
|
|
|
|
1,237 |
|
|
|
Freddie Mac Pool #RA6347 3.00% 11/1/20511 |
|
|
1,322 |
|
|
|
|
|
|
|
1,134 |
|
|
|
Freddie Mac Pool #SD8182 2.00% 12/1/20511 |
|
|
865 |
|
|
|
|
|
|
|
678 |
|
|
|
Freddie Mac Pool #QD3310 3.00% 12/1/20511 |
|
|
20 |
|
|
|
|
|
|
|
17 |
|
|
|
Freddie Mac Pool #SD0855 2.50% 1/1/20521 |
|
|
2,822 |
|
|
|
|
|
|
|
2,314 |
|
|
|
Freddie Mac Pool #SD0813 3.00% 1/1/20521 |
|
|
4,296 |
|
|
|
|
|
|
|
3,712 |
|
|
|
Freddie Mac Pool #SD8193 2.00% 2/1/20521 |
|
|
881 |
|
|
|
|
|
|
|
690 |
|
|
|
Freddie Mac Pool #QD7089 3.50% 2/1/20521 |
|
|
681 |
|
|
|
|
|
|
|
608 |
|
|
|
Freddie Mac Pool #SD5343 2.00% 3/1/20521 |
|
|
2,486 |
|
|
|
|
|
|
|
1,950 |
|
|
|
Freddie Mac Pool #SD8199 2.00% 3/1/20521 |
|
|
1,932 |
|
|
|
|
|
|
|
1,515 |
|
|
|
Freddie Mac Pool #QD8010 2.00% 3/1/20521 |
|
|
997 |
|
|
|
|
|
|
|
782 |
|
|
|
Freddie Mac Pool #QD8103 2.00% 3/1/20521 |
|
|
893 |
|
|
|
|
|
|
|
700 |
|
|
|
Freddie Mac Pool #QD8820 2.00% 3/1/20521 |
|
|
179 |
|
|
|
|
|
|
|
140 |
|
|
|
Freddie Mac Pool #SD8204 2.00% 4/1/20521 |
|
|
1,345 |
|
|
|
|
|
|
|
1,055 |
|
|
|
Freddie Mac Pool #SD8214 3.50% 5/1/20521 |
|
|
15,182 |
|
|
|
|
|
|
|
13,452 |
|
|
|
Freddie Mac Pool #QE4084 6.50% 6/1/20521 |
|
|
265 |
|
|
|
|
|
|
|
273 |
|
|
|
Freddie Mac Pool #SD8225 3.00% 7/1/20521 |
|
|
6,974 |
|
|
|
|
|
|
|
5,942 |
|
|
|
Freddie Mac Pool #QE5698 5.00% 7/1/20521 |
|
|
2,085 |
|
|
|
|
|
|
|
2,022 |
|
|
|
Freddie Mac Pool #SD7556 3.00% 8/1/20521 |
|
|
613 |
|
|
|
|
|
|
|
528 |
|
|
|
Freddie Mac Pool #QE8579 4.50% 8/1/20521 |
|
|
76 |
|
|
|
|
|
|
|
72 |
|
|
|
Freddie Mac Pool #SD8242 3.00% 9/1/20521 |
|
|
4,312 |
|
|
|
|
|
|
|
3,671 |
|
|
|
Freddie Mac Pool #QF0212 4.50% 9/1/20521 |
|
|
348 |
|
|
|
|
|
|
|
329 |
|
|
|
Freddie Mac Pool #QF1205 4.50% 9/1/20521 |
|
|
291 |
|
|
|
|
|
|
|
274 |
|
|
|
Freddie Mac Pool #QE9497 4.50% 9/1/20521 |
|
|
86 |
|
|
|
|
|
|
|
81 |
|
|
|
Freddie Mac Pool #SD1608 4.50% 9/1/20521 |
|
|
51 |
|
|
|
|
|
|
|
48 |
|
|
|
Freddie Mac Pool #SD2465 4.50% 10/1/20521 |
|
|
33 |
|
|
|
|
|
|
|
31 |
|
|
|
Freddie Mac Pool #RA8059 5.50% 10/1/20521 |
|
|
6,552 |
|
|
|
|
|
|
|
6,483 |
|
|
|
Freddie Mac Pool #SD1896 4.00% 11/1/20521 |
|
|
18,080 |
|
|
|
|
|
|
|
16,983 |
|
|
|
Freddie Mac Pool #SD1894 4.00% 11/1/20521 |
|
|
6,190 |
|
|
|
|
|
|
|
5,810 |
|
|
|
Freddie Mac Pool #SD8266 4.50% 11/1/20521 |
|
|
19,372 |
|
|
|
|
|
|
|
18,281 |
|
|
|
Freddie Mac Pool #QF2926 5.00% 11/1/20521 |
|
|
3,630 |
|
|
|
|
|
|
|
3,516 |
|
|
|
Freddie Mac Pool #QF2692 5.00% 11/1/20521 |
|
|
3,558 |
|
|
|
|
|
|
|
3,456 |
|
|
|
Freddie Mac Pool #SD2948 5.50% 11/1/20521 |
|
|
2,243 |
|
|
|
|
|
|
|
2,218 |
|
|
|
Freddie Mac Pool #QF2862 6.50% 11/1/20521 |
|
|
62 |
|
|
|
|
|
|
|
63 |
|
|
|
Freddie Mac Pool #SD8280 6.50% 11/1/20521 |
|
|
45 |
|
|
|
|
|
|
|
46 |
|
|
|
Freddie Mac Pool #SD2602 3.00% 12/1/20521 |
|
|
1,104 |
|
|
|
|
|
|
|
940 |
|
|
|
Freddie Mac Pool #SD2065 4.00% 12/1/20521 |
|
|
1,061 |
|
|
|
|
|
|
|
973 |
|
|
|
Freddie Mac Pool #RA8200 4.00% 12/1/20521 |
|
|
683 |
|
|
|
|
|
|
|
626 |
|
|
|
Freddie Mac Pool #QF5671 4.50% 12/1/20521 |
|
|
12,410 |
|
|
|
|
|
|
|
11,721 |
|
|
|
Freddie Mac Pool #SD8288 5.00% 1/1/20531 |
|
|
209 |
|
|
|
|
|
|
|
203 |
|
|
|
Freddie Mac Pool #RA8423 6.00% 1/1/20531 |
|
|
3,547 |
|
|
|
|
|
|
|
3,571 |
|
|
|
Freddie Mac Pool #SD8298 4.50% 2/1/20531 |
|
|
16,101 |
|
|
|
|
|
|
|
15,192 |
|
|
|
Freddie Mac Pool #SD2462 5.50% 2/1/20531 |
|
|
45,430 |
|
|
|
|
|
|
|
44,966 |
|
|
|
Freddie Mac Pool #RA8544 5.50% 2/1/20531 |
|
|
25,666 |
|
|
|
|
|
|
|
25,387 |
|
|
|
Freddie Mac Pool #QF7144 5.50% 2/1/20531 |
|
|
4,839 |
|
|
|
|
|
|
|
4,788 |
|
|
|
Freddie Mac Pool #QF8083 6.00% 2/1/20531 |
|
|
15,419 |
|
|
|
|
|
|
|
15,537 |
|
|
|
Freddie Mac Pool #QF9463 4.00% 3/1/20531 |
|
|
2,747 |
|
|
|
|
|
|
|
2,516 |
|
|
|
Freddie Mac Pool #SD2610 4.00% 3/1/20531 |
|
|
1,808 |
|
|
|
|
|
|
|
1,655 |
|
|
|
Freddie Mac Pool #SD8305 4.00% 3/1/20531 |
|
|
81 |
|
|
|
|
|
|
|
74 |
|
|
|
Freddie Mac Pool #SD8314 4.50% 4/1/20531 |
|
|
207 |
|
|
|
|
|
|
|
196 |
|
|
|
Freddie Mac Pool #SD2716 5.00% 4/1/20531 |
|
|
4,920 |
|
|
|
|
|
|
|
4,762 |
|
|
|
Freddie Mac Pool #QG1268 5.00% 4/1/20531 |
|
|
660 |
|
|
|
|
|
|
|
638 |
|
|
|
Freddie Mac Pool #SD8315 5.00% 4/1/20531 |
|
|
588 |
|
|
|
|
|
|
|
569 |
|
|
|
Freddie Mac Pool #SD8316 5.50% 4/1/20531 |
|
|
12,506 |
|
|
|
|
|
|
|
12,349 |
|
|
|
Freddie Mac Pool #QG1023 5.50% 4/1/20531 |
|
|
4,437 |
|
|
|
|
|
|
|
4,388 |
|
|
|
Freddie Mac Pool #QG2977 4.00% 5/1/20531 |
|
|
197 |
|
|
|
|
|
|
|
181 |
|
|
|
Freddie Mac Pool #RA8647 4.50% 5/1/20531 |
|
|
35 |
|
|
|
|
|
|
|
33 |
|
|
|
Freddie Mac Pool #SD8324 5.50% 5/1/20531 |
|
|
9,002 |
|
|
|
|
|
|
|
8,887 |
|
|
|
Freddie Mac Pool #QG3365 5.50% 5/1/20531 |
|
|
4,625 |
|
|
|
|
|
|
|
4,568 |
|
|
|
Freddie Mac Pool #SD3369 5.50% 5/1/20531 |
|
|
2,662 |
|
|
|
|
|
|
|
2,632 |
|
American Funds Insurance Series 138
The Bond Fund of America (continued)
|
|
|
|
|
|
|
|
|
|
|
|
|
|
|
|
|
| Bonds, notes & other debt instruments (continued) |
|
Principal amount
(000) |
|
|
|
|
|
Value (000) |
|
|
| Mortgage-backed obligations (continued) |
|
|
|
|
|
|
| Federal agency mortgage-backed obligations (continued) |
|
Freddie Mac Pool #SD2861 6.00% 5/1/20531 |
|
|
USD17,803 |
|
|
|
|
|
|
$ |
17,947 |
|
|
|
Freddie Mac Pool #QG5002 4.00% 6/1/20531 |
|
|
590 |
|
|
|
|
|
|
|
540 |
|
|
|
Freddie Mac Pool #SD8329 5.00% 6/1/20531 |
|
|
38,761 |
|
|
|
|
|
|
|
37,480 |
|
|
|
Freddie Mac Pool #SD8331 5.50% 6/1/20531 |
|
|
21,484 |
|
|
|
|
|
|
|
21,200 |
|
|
|
Freddie Mac Pool #SD3177 6.00% 6/1/20531 |
|
|
7,151 |
|
|
|
|
|
|
|
7,209 |
|
|
|
Freddie Mac Pool #SD3083 6.00% 6/1/20531 |
|
|
3,298 |
|
|
|
|
|
|
|
3,316 |
|
|
|
Freddie Mac Pool #RA9294 6.50% 6/1/20531 |
|
|
822 |
|
|
|
|
|
|
|
844 |
|
|
|
Freddie Mac Pool #RA9292 6.50% 6/1/20531 |
|
|
720 |
|
|
|
|
|
|
|
736 |
|
|
|
Freddie Mac Pool #RA9289 6.50% 6/1/20531 |
|
|
663 |
|
|
|
|
|
|
|
682 |
|
|
|
Freddie Mac Pool #RA9288 6.50% 6/1/20531 |
|
|
638 |
|
|
|
|
|
|
|
658 |
|
|
|
Freddie Mac Pool #RA9287 6.50% 6/1/20531 |
|
|
459 |
|
|
|
|
|
|
|
474 |
|
|
|
Freddie Mac Pool #RA9290 6.50% 6/1/20531 |
|
|
336 |
|
|
|
|
|
|
|
345 |
|
|
|
Freddie Mac Pool #RA9291 6.50% 6/1/20531 |
|
|
247 |
|
|
|
|
|
|
|
253 |
|
|
|
Freddie Mac Pool #RA9295 6.50% 6/1/20531 |
|
|
180 |
|
|
|
|
|
|
|
186 |
|
|
|
Freddie Mac Pool #QG7153 4.00% 7/1/20531 |
|
|
5,319 |
|
|
|
|
|
|
|
4,871 |
|
|
|
Freddie Mac Pool #QG6067 4.00% 7/1/20531 |
|
|
550 |
|
|
|
|
|
|
|
504 |
|
|
|
Freddie Mac Pool #QG7958 4.00% 7/1/20531 |
|
|
67 |
|
|
|
|
|
|
|
61 |
|
|
|
Freddie Mac Pool #SD8341 5.00% 7/1/20531 |
|
|
274 |
|
|
|
|
|
|
|
265 |
|
|
|
Freddie Mac Pool #SD8342 5.50% 7/1/20531 |
|
|
47,489 |
|
|
|
|
|
|
|
46,871 |
|
|
|
Freddie Mac Pool #SD3386 5.50% 7/1/20531 |
|
|
7,915 |
|
|
|
|
|
|
|
7,827 |
|
|
|
Freddie Mac Pool #QG7411 5.50% 7/1/20531 |
|
|
593 |
|
|
|
|
|
|
|
586 |
|
|
|
Freddie Mac Pool #RA9474 6.00% 7/1/20531 |
|
|
9,108 |
|
|
|
|
|
|
|
9,176 |
|
|
|
Freddie Mac Pool #SD3434 6.00% 7/1/20531 |
|
|
3,258 |
|
|
|
|
|
|
|
3,280 |
|
|
|
Freddie Mac Pool #QG8958 4.00% 8/1/20531 |
|
|
489 |
|
|
|
|
|
|
|
448 |
|
|
|
Freddie Mac Pool #QG9629 4.00% 8/1/20531 |
|
|
403 |
|
|
|
|
|
|
|
369 |
|
|
|
Freddie Mac Pool #SD4999 5.00% 8/1/20531 |
|
|
8,063 |
|
|
|
|
|
|
|
7,800 |
|
|
|
Freddie Mac Pool #QG9084 5.50% 8/1/20531 |
|
|
2,538 |
|
|
|
|
|
|
|
2,510 |
|
|
|
Freddie Mac Pool #QG9008 5.50% 8/1/20531 |
|
|
2,211 |
|
|
|
|
|
|
|
2,188 |
|
|
|
Freddie Mac Pool #QG9628 5.50% 8/1/20531 |
|
|
2,179 |
|
|
|
|
|
|
|
2,153 |
|
|
|
Freddie Mac Pool #QG9141 5.50% 8/1/20531 |
|
|
1,660 |
|
|
|
|
|
|
|
1,642 |
|
|
|
Freddie Mac Pool #SD3639 6.00% 8/1/20531 |
|
|
11,804 |
|
|
|
|
|
|
|
11,894 |
|
|
|
Freddie Mac Pool #SD8362 5.50% 9/1/20531 |
|
|
8,399 |
|
|
|
|
|
|
|
8,288 |
|
|
|
Freddie Mac Pool #QH0474 6.00% 9/1/20531 |
|
|
27,055 |
|
|
|
|
|
|
|
27,213 |
|
|
|
Freddie Mac Pool #QH1059 6.00% 9/1/20531 |
|
|
22,225 |
|
|
|
|
|
|
|
22,371 |
|
|
|
Freddie Mac Pool #QH1296 6.00% 9/1/20531 |
|
|
16,546 |
|
|
|
|
|
|
|
16,644 |
|
|
|
Freddie Mac Pool #QH0851 6.00% 9/1/20531 |
|
|
15,255 |
|
|
|
|
|
|
|
15,335 |
|
|
|
Freddie Mac Pool #RA9854 6.00% 9/1/20531 |
|
|
4,613 |
|
|
|
|
|
|
|
4,658 |
|
|
|
Freddie Mac Pool #SD3825 6.50% 9/1/20531 |
|
|
243,270 |
|
|
|
|
|
|
|
248,213 |
|
|
|
Freddie Mac Pool #SD8379 4.00% 10/1/20531 |
|
|
5,588 |
|
|
|
|
|
|
|
5,116 |
|
|
|
Freddie Mac Pool #SD4997 5.00% 10/1/20531 |
|
|
858 |
|
|
|
|
|
|
|
830 |
|
|
|
Freddie Mac Pool #SD8367 5.50% 10/1/20531 |
|
|
19,268 |
|
|
|
|
|
|
|
19,013 |
|
|
|
Freddie Mac Pool #SD8368 6.00% 10/1/20531 |
|
|
28,542 |
|
|
|
|
|
|
|
28,638 |
|
|
|
Freddie Mac Pool #SD8369 6.50% 10/1/20531 |
|
|
4,797 |
|
|
|
|
|
|
|
4,886 |
|
|
|
Freddie Mac Pool #SD4977 5.00% 11/1/20531 |
|
|
6,170 |
|
|
|
|
|
|
|
5,966 |
|
|
|
Freddie Mac Pool #SD4571 5.50% 11/1/20531 |
|
|
19,403 |
|
|
|
|
|
|
|
19,182 |
|
|
|
Freddie Mac Pool #SD8372 5.50% 11/1/20531 |
|
|
4,022 |
|
|
|
|
|
|
|
3,969 |
|
|
|
Freddie Mac Pool #SD8373 6.00% 11/1/20531 |
|
|
7,136 |
|
|
|
|
|
|
|
7,160 |
|
|
|
Freddie Mac Pool #QH5936 6.00% 12/1/20531 |
|
|
6,766 |
|
|
|
|
|
|
|
6,815 |
|
|
|
Freddie Mac Pool #RJ0440 6.00% 12/1/20531 |
|
|
6,068 |
|
|
|
|
|
|
|
6,109 |
|
|
|
Freddie Mac Pool #SD5500 2.00% 1/1/20541 |
|
|
1,991 |
|
|
|
|
|
|
|
1,562 |
|
|
|
Freddie Mac Pool #SD8406 4.00% 1/1/20541 |
|
|
2,631 |
|
|
|
|
|
|
|
2,408 |
|
|
|
Freddie Mac Pool #SD8395 5.50% 1/1/20541 |
|
|
5,263 |
|
|
|
|
|
|
|
5,193 |
|
|
|
Freddie Mac Pool #SD8396 6.00% 1/1/20541 |
|
|
12,815 |
|
|
|
|
|
|
|
12,858 |
|
|
|
Freddie Mac Pool #SD4975 6.00% 2/1/20541 |
|
|
18,425 |
|
|
|
|
|
|
|
18,510 |
|
|
|
Freddie Mac Pool #QI0006 6.00% 2/1/20541 |
|
|
5,342 |
|
|
|
|
|
|
|
5,365 |
|
|
|
Freddie Mac Pool #SD4897 6.00% 2/1/20541 |
|
|
4,321 |
|
|
|
|
|
|
|
4,350 |
|
|
|
Freddie Mac Pool #SD8402 6.00% 2/1/20541 |
|
|
3,985 |
|
|
|
|
|
|
|
3,998 |
|
|
|
Freddie Mac Pool #SD4966 6.50% 2/1/20541 |
|
|
5,925 |
|
|
|
|
|
|
|
6,058 |
|
|
|
Freddie Mac Pool #SD8408 5.50% 3/1/20541 |
|
|
7,691 |
|
|
|
|
|
|
|
7,588 |
|
|
|
Freddie Mac Pool #SD8420 5.50% 4/1/20541 |
|
|
26,381 |
|
|
|
|
|
|
|
26,028 |
|
|
|
Freddie Mac Pool #RJ1216 5.50% 4/1/20541 |
|
|
2,770 |
|
|
|
|
|
|
|
2,742 |
|
139 American Funds Insurance Series
The Bond Fund of America (continued)
|
|
|
|
|
|
|
|
|
|
|
|
|
|
|
|
|
| Bonds, notes & other debt instruments (continued) |
|
Principal amount
(000) |
|
|
|
|
|
Value (000) |
|
|
| Mortgage-backed obligations (continued) |
|
|
|
|
|
|
| Federal agency mortgage-backed obligations (continued) |
|
Freddie Mac Pool #RJ1215 5.50% 4/1/20541 |
|
|
USD2,095 |
|
|
|
|
|
|
$ |
2,068 |
|
|
|
Freddie Mac Pool #RJ1435 6.00% 4/1/20541 |
|
|
9,850 |
|
|
|
|
|
|
|
9,903 |
|
|
|
Freddie Mac Pool #SD5303 6.00% 4/1/20541 |
|
|
9,105 |
|
|
|
|
|
|
|
9,165 |
|
|
|
Freddie Mac Pool #QI2895 6.00% 4/1/20541 |
|
|
4,262 |
|
|
|
|
|
|
|
4,289 |
|
|
|
Freddie Mac Pool #RJ1346 6.00% 4/1/20541 |
|
|
2,468 |
|
|
|
|
|
|
|
2,486 |
|
|
|
Freddie Mac Pool #RJ1417 5.50% 5/1/20541 |
|
|
39,926 |
|
|
|
|
|
|
|
39,516 |
|
|
|
Freddie Mac Pool #RJ1512 5.50% 5/1/20541 |
|
|
4,951 |
|
|
|
|
|
|
|
4,907 |
|
|
|
Freddie Mac Pool #RJ1447 6.50% 5/1/20541 |
|
|
7,410 |
|
|
|
|
|
|
|
7,575 |
|
|
|
Freddie Mac Pool #SD8435 4.00% 6/1/20541 |
|
|
1,413 |
|
|
|
|
|
|
|
1,293 |
|
|
|
Freddie Mac Pool #RJ1857 5.50% 6/1/20541 |
|
|
2,876 |
|
|
|
|
|
|
|
2,845 |
|
|
|
Freddie Mac Pool #RJ1768 5.50% 6/1/20541 |
|
|
1,030 |
|
|
|
|
|
|
|
1,020 |
|
|
|
Freddie Mac Pool #RJ1859 6.00% 6/1/20541 |
|
|
27,740 |
|
|
|
|
|
|
|
27,946 |
|
|
|
Freddie Mac Pool #SD8447 6.00% 7/1/20541 |
|
|
7,240 |
|
|
|
|
|
|
|
7,263 |
|
|
|
Freddie Mac, Series 3061, Class PN, 5.50% 11/15/20351 |
|
|
44 |
|
|
|
|
|
|
|
45 |
|
|
|
Freddie Mac, Series 3318, Class JT, 5.50% 5/15/20371 |
|
|
108 |
|
|
|
|
|
|
|
111 |
|
|
|
Freddie Mac, Series K156, Class A2, Multi Family, 4.43% 2/25/20331,2 |
|
|
3,461 |
|
|
|
|
|
|
|
3,372 |
|
|
|
Freddie Mac, Series 3146, Class PO, principal only, 0% 4/15/20361 |
|
|
101 |
|
|
|
|
|
|
|
85 |
|
|
|
Freddie Mac, Series 3156, Class PO, principal only, 0% 5/15/20361 |
|
|
90 |
|
|
|
|
|
|
|
76 |
|
|
|
Freddie Mac Seasoned Credit Risk Transfer Trust, Series 2018-3, Class MA,
3.50% 8/25/20571 |
|
|
6,679 |
|
|
|
|
|
|
|
6,292 |
|
|
|
Freddie Mac Seasoned Credit Risk Transfer Trust, Series 2019-2, Class MA,
3.50% 8/25/20581 |
|
|
1,595 |
|
|
|
|
|
|
|
1,482 |
|
|
|
Freddie Mac Seasoned Loan Structured Transaction Trust, Series 2022-1, Class A1,
3.50% 5/25/20321 |
|
|
8,842 |
|
|
|
|
|
|
|
8,327 |
|
|
|
Government National Mortgage Assn. 3.00% 7/1/20541,5 |
|
|
411 |
|
|
|
|
|
|
|
358 |
|
|
|
Government National Mortgage Assn. 3.50% 7/1/20541,5 |
|
|
9,355 |
|
|
|
|
|
|
|
8,400 |
|
|
|
Government National Mortgage Assn. 4.00% 7/1/20541,5 |
|
|
4,000 |
|
|
|
|
|
|
|
3,697 |
|
|
|
Government National Mortgage Assn. 5.00% 7/1/20541,5 |
|
|
135 |
|
|
|
|
|
|
|
131 |
|
|
|
Government National Mortgage Assn. 5.50% 7/1/20541,5 |
|
|
55,605 |
|
|
|
|
|
|
|
55,174 |
|
|
|
Government National Mortgage Assn. Pool #MA5817 4.00% 3/20/20491 |
|
|
10,369 |
|
|
|
|
|
|
|
9,689 |
|
|
|
Government National Mortgage Assn. Pool #MA6042 5.00% 7/20/20491 |
|
|
28 |
|
|
|
|
|
|
|
28 |
|
|
|
Government National Mortgage Assn. Pool #MA6221 4.50% 10/20/20491 |
|
|
4,284 |
|
|
|
|
|
|
|
4,129 |
|
|
|
Government National Mortgage Assn. Pool #MA6600 3.50% 4/20/20501 |
|
|
9,594 |
|
|
|
|
|
|
|
8,690 |
|
|
|
Government National Mortgage Assn. Pool #MA6994 2.00% 11/20/20501 |
|
|
2,100 |
|
|
|
|
|
|
|
1,703 |
|
|
|
Government National Mortgage Assn. Pool #MA7051 2.00% 12/20/20501 |
|
|
3,647 |
|
|
|
|
|
|
|
2,957 |
|
|
|
Government National Mortgage Assn. Pool #785607 2.50% 8/20/20511 |
|
|
8,575 |
|
|
|
|
|
|
|
7,154 |
|
|
|
Government National Mortgage Assn. Pool #785575 2.50% 8/20/20511 |
|
|
3,140 |
|
|
|
|
|
|
|
2,603 |
|
|
|
Government National Mortgage Assn. Pool #785659 2.50% 10/20/20511 |
|
|
3,113 |
|
|
|
|
|
|
|
2,587 |
|
|
|
Government National Mortgage Assn. Pool #785813 2.50% 12/20/20511 |
|
|
4,805 |
|
|
|
|
|
|
|
3,991 |
|
|
|
Government National Mortgage Assn. Pool #MA7881 2.50% 2/20/20521 |
|
|
4,431 |
|
|
|
|
|
|
|
3,727 |
|
|
|
Government National Mortgage Assn. Pool #785998 2.50% 3/20/20521 |
|
|
3,655 |
|
|
|
|
|
|
|
3,042 |
|
|
|
Government National Mortgage Assn. Pool #MA8148 3.00% 7/20/20521 |
|
|
5,402 |
|
|
|
|
|
|
|
4,715 |
|
|
|
Government National Mortgage Assn. Pool #MA8266 3.50% 9/20/20521 |
|
|
23,629 |
|
|
|
|
|
|
|
21,224 |
|
|
|
Government National Mortgage Assn. Pool #MA8267 4.00% 9/20/20521 |
|
|
8,376 |
|
|
|
|
|
|
|
7,743 |
|
|
|
Government National Mortgage Assn. Pool #MA8346 4.00% 10/20/20521 |
|
|
3,690 |
|
|
|
|
|
|
|
3,412 |
|
|
|
Government National Mortgage Assn. Pool #MA8799 4.50% 4/20/20531 |
|
|
3,722 |
|
|
|
|
|
|
|
3,545 |
|
|
|
Government National Mortgage Assn. Pool #MA9015 4.50% 7/20/20531 |
|
|
12,935 |
|
|
|
|
|
|
|
12,304 |
|
|
|
Government National Mortgage Assn. Pool #MA9016 5.00% 7/20/20531 |
|
|
3,434 |
|
|
|
|
|
|
|
3,346 |
|
|
|
Government National Mortgage Assn. Pool #MA9104 4.50% 8/20/20531 |
|
|
8,264 |
|
|
|
|
|
|
|
7,861 |
|
|
|
Government National Mortgage Assn. Pool #MA9169 4.50% 9/20/20531 |
|
|
13,509 |
|
|
|
|
|
|
|
12,848 |
|
|
|
Government National Mortgage Assn., Series 2021-2, Class AH, 1.50% 6/16/20631 |
|
|
1,502 |
|
|
|
|
|
|
|
1,119 |
|
|
|
Uniform Mortgage-Backed Security 2.00% 7/1/20391,5 |
|
|
5,845 |
|
|
|
|
|
|
|
5,137 |
|
|
|
Uniform Mortgage-Backed Security 2.50% 7/1/20391,5 |
|
|
7,545 |
|
|
|
|
|
|
|
6,814 |
|
|
|
Uniform Mortgage-Backed Security 2.00% 7/1/20541,5 |
|
|
13,940 |
|
|
|
|
|
|
|
10,905 |
|
|
|
Uniform Mortgage-Backed Security 2.50% 7/1/20541,5 |
|
|
209,674 |
|
|
|
|
|
|
|
171,236 |
|
|
|
Uniform Mortgage-Backed Security 3.50% 7/1/20541,5 |
|
|
15,739 |
|
|
|
|
|
|
|
13,931 |
|
|
|
Uniform Mortgage-Backed Security 4.00% 7/1/20541,5 |
|
|
50,073 |
|
|
|
|
|
|
|
45,823 |
|
|
|
Uniform Mortgage-Backed Security 4.50% 7/1/20541,5 |
|
|
37,011 |
|
|
|
|
|
|
|
34,896 |
|
|
|
Uniform Mortgage-Backed Security 5.00% 7/1/20541,5 |
|
|
7,260 |
|
|
|
|
|
|
|
7,017 |
|
|
|
Uniform Mortgage-Backed Security 5.50% 7/1/20541,5 |
|
|
107,576 |
|
|
|
|
|
|
|
106,109 |
|
|
|
Uniform Mortgage-Backed Security 6.00% 7/1/20541,5 |
|
|
187,140 |
|
|
|
|
|
|
|
187,689 |
|
American Funds Insurance Series 140
The Bond Fund of America (continued)
|
|
|
|
|
|
|
|
|
|
|
|
|
|
|
|
|
| Bonds, notes & other debt instruments (continued) |
|
Principal amount
(000) |
|
|
|
|
|
Value (000) |
|
|
| Mortgage-backed obligations (continued) |
|
|
|
|
|
|
| Federal agency mortgage-backed obligations (continued) |
|
Uniform Mortgage-Backed Security 6.50% 7/1/20541,5 |
|
|
USD319,675 |
|
|
|
|
|
|
$ |
325,394 |
|
|
|
Uniform Mortgage-Backed Security 7.00% 7/1/20541,5 |
|
|
11,885 |
|
|
|
|
|
|
|
12,225 |
|
|
|
Uniform Mortgage-Backed Security 3.00% 8/1/20541,5 |
|
|
43,389 |
|
|
|
|
|
|
|
36,949 |
|
|
|
Uniform Mortgage-Backed Security 3.50% 8/1/20541,5 |
|
|
51,000 |
|
|
|
|
|
|
|
45,151 |
|
|
|
Uniform Mortgage-Backed Security 4.50% 8/1/20541,5 |
|
|
13,000 |
|
|
|
|
|
|
|
12,260 |
|
|
|
Uniform Mortgage-Backed Security 6.00% 8/1/20541,5 |
|
|
245,428 |
|
|
|
|
|
|
|
246,032 |
|
|
|
Uniform Mortgage-Backed Security 6.50% 8/1/20541,5 |
|
|
28,774 |
|
|
|
|
|
|
|
29,271 |
|
|
|
Uniform Mortgage-Backed Security 7.00% 8/1/20541,5 |
|
|
78,970 |
|
|
|
|
|
|
|
81,176 |
|
|
|
|
|
|
|
|
|
|
|
|
|
|
|
|
|
|
|
|
|
|
|
|
|
|
|
|
|
4,103,585 |
|
|
|
|
|
|
|
|
|
|
|
|
|
|
|
|
|
|
|
|
|
|
|
|
|
|
|
|
|
|
|
| |
|
|
|
|
| Collateralized mortgage-backed obligations (privately originated) 2.28% |
|
Arroyo Mortgage Trust, Series 2021-1R, Class A1, 1.175% 10/25/20481,2,6 |
|
|
2,174 |
|
|
|
|
|
|
|
1,872 |
|
|
|
Arroyo Mortgage Trust, Series 2020-1, Class A1A, 1.662% 3/25/20551,6 |
|
|
97 |
|
|
|
|
|
|
|
90 |
|
|
|
Arroyo Mortgage Trust, Series 2022-1, Class A1A, 2.495% 12/25/2056 (3.495% on 2/25/2026)1,6,7 |
|
|
4,897 |
|
|
|
|
|
|
|
4,565 |
|
|
|
BRAVO Residential Funding Trust, Series 2020-RPL2, Class A1, 2.00% 5/25/20591,2,6 |
|
|
727 |
|
|
|
|
|
|
|
662 |
|
|
|
BRAVO Residential Funding Trust, Series 2020-RPL1, Class A1, 2.50% 5/26/20591,2,6 |
|
|
379 |
|
|
|
|
|
|
|
364 |
|
|
|
BRAVO Residential Funding Trust, Series 2022-RPL1, Class A1, 2.75% 9/25/20611,6 |
|
|
4,319 |
|
|
|
|
|
|
|
3,857 |
|
|
|
Cascade Funding Mortgage Trust, Series 2023-HB12, Class A, 4.25% 4/25/20331,2,6 |
|
|
315 |
|
|
|
|
|
|
|
309 |
|
|
|
CIM Trust, Series 2022-R2, Class A1, 3.75% 12/25/20611,2,6 |
|
|
5,846 |
|
|
|
|
|
|
|
5,421 |
|
|
|
Citigroup Mortgage Loan Trust, Series 2020-EXP1, Class A1A, 1.804% 5/25/20601,2,6 |
|
|
169 |
|
|
|
|
|
|
|
153 |
|
|
|
COLT Mortgage Loan Trust, Series 2021-5, Class A1, 1.726% 11/26/20661,2,6 |
|
|
1,292 |
|
|
|
|
|
|
|
1,110 |
|
|
|
Connecticut Avenue Securities Trust, Series 2022-R06, Class 1M1,
(30-day Average USD-SOFR + 2.75%) 8.085% 5/25/20421,2,6 |
|
|
236 |
|
|
|
|
|
|
|
242 |
|
|
|
Connecticut Avenue Securities Trust, Series 2023-R01, Class 1M1,
(30-day Average USD-SOFR + 2.40%) 7.735% 12/25/20421,2,6 |
|
|
571 |
|
|
|
|
|
|
|
589 |
|
|
|
Connecticut Avenue Securities Trust, Series 2023-R04, Class 1M1,
(30-day Average USD-SOFR + 2.30%) 7.635% 5/25/20431,2,6 |
|
|
2,975 |
|
|
|
|
|
|
|
3,059 |
|
|
|
Connecticut Avenue Securities Trust, Series 2023-R05, Class 1M1,
(30-day Average USD-SOFR + 1.90%) 7.235% 6/25/20431,2,6 |
|
|
1,978 |
|
|
|
|
|
|
|
2,003 |
|
|
|
Connecticut Avenue Securities Trust, Series 2023-R06, Class 1M1,
(30-day Average USD-SOFR + 1.70%) 7.035% 7/25/20431,2,6 |
|
|
1,087 |
|
|
|
|
|
|
|
1,098 |
|
|
|
Connecticut Avenue Securities Trust, Series 2024-R01, Class 1M1,
(30-day Average USD-SOFR + 1.05%) 6.385% 1/25/20441,2,6 |
|
|
5,196 |
|
|
|
|
|
|
|
5,203 |
|
|
|
Connecticut Avenue Securities Trust, Series 2024-R01, Class 1M2,
(30-day Average USD-SOFR + 1.80%) 7.135% 1/25/20441,2,6 |
|
|
507 |
|
|
|
|
|
|
|
515 |
|
|
|
Connecticut Avenue Securities Trust, Series 2024-R02, Class 1M1,
(30-day Average USD-SOFR + 1.10%) 6.435% 2/25/20441,2,6 |
|
|
572 |
|
|
|
|
|
|
|
572 |
|
|
|
Connecticut Avenue Securities Trust, Series 2024-R02, Class 1M2,
(30-day Average USD-SOFR + 1.80%) 7.135% 2/25/20441,2,6 |
|
|
1,053 |
|
|
|
|
|
|
|
1,065 |
|
|
|
Connecticut Avenue Securities Trust, Series 2024-R04, Class 1M1,
(30-day Average USD-SOFR + 1.10%) 6.424% 5/25/20441,2,6 |
|
|
4,830 |
|
|
|
|
|
|
|
4,835 |
|
|
|
Credit Suisse Mortgage Trust, Series 2020-NET, Class A, 2.257% 8/15/20371,6 |
|
|
1,420 |
|
|
|
|
|
|
|
1,344 |
|
|
|
Finance of America Structured Securities Trust, Series 2019-JR1, Class A, 2.00% 3/25/20691,6 |
|
|
1,897 |
|
|
|
|
|
|
|
2,078 |
|
|
|
Finance of America Structured Securities Trust, Series 2019-JR2, Class A1, 2.00% 6/25/20691,6 |
|
|
2,459 |
|
|
|
|
|
|
|
2,668 |
|
|
|
Flagstar Mortgage Trust, Series 2021-8INV, Class A3, 2.50% 9/25/20511,2,6 |
|
|
1,835 |
|
|
|
|
|
|
|
1,462 |
|
|
|
Flagstar Mortgage Trust, Series 2021-11INV, Class A4, 2.50% 11/25/20511,2,6 |
|
|
2,015 |
|
|
|
|
|
|
|
1,603 |
|
|
|
Freddie Mac Structured Agency Credit Risk Debt Notes, Series 2022-DNA3,
Class M1A, (30-day Average USD-SOFR + 2.00%) 7.335% 4/25/20421,2,6 |
|
|
1,037 |
|
|
|
|
|
|
|
1,053 |
|
|
|
Freddie Mac Structured Agency Credit Risk Debt Notes, Series 2022-DNA4,
Class M1A, (30-day Average USD-SOFR + 2.20%) 7.535% 5/25/20421,2,6 |
|
|
50 |
|
|
|
|
|
|
|
51 |
|
|
|
Freddie Mac Structured Agency Credit Risk Debt Notes, Series 2022-DNA5,
Class M1A, (30-day Average USD-SOFR + 2.95%) 8.285% 6/25/20421,2,6 |
|
|
191 |
|
|
|
|
|
|
|
196 |
|
|
|
Freddie Mac Structured Agency Credit Risk Debt Notes, Series 2022-DNA6,
Class M1A, (30-day Average USD-SOFR + 2.15%) 7.485% 9/25/20421,2,6 |
|
|
375 |
|
|
|
|
|
|
|
380 |
|
|
|
Freddie Mac Structured Agency Credit Risk Debt Notes, Series 2022-DNA6,
Class M1B, (30-day Average USD-SOFR + 3.70%) 9.035% 9/25/20421,2,6 |
|
|
1,519 |
|
|
|
|
|
|
|
1,619 |
|
141 American Funds Insurance Series
The Bond Fund of America (continued)
|
|
|
|
|
|
|
|
|
|
|
|
|
|
|
| Bonds, notes & other debt instruments (continued) |
|
Principal amount
(000) |
|
|
|
|
|
Value (000) |
|
|
| Mortgage-backed obligations (continued) |
|
| Collateralized mortgage-backed obligations (privately originated) (continued) |
|
Freddie Mac Structured Agency Credit Risk Debt Notes, Series 2024-DNA1, Class M1,
(30-day Average USD-SOFR + 1.35%) 6.685% 2/25/20441,2,6 |
|
|
USD5,172 |
|
|
|
|
|
|
$ |
5,194 |
|
|
|
Freddie Mac Structured Agency Credit Risk Debt Notes, Series 2024-DNA2, Class M1,
(30-day Average USD-SOFR + 1.20%) 6.535% 5/25/20441,2,6 |
|
|
17,714 |
|
|
|
|
|
|
|
17,754 |
|
|
|
Freddie Mac Structured Agency Credit Risk Debt Notes, Series 2020-DNA2, Class M2,
(30-day Average USD-SOFR + 1.964%) 7.30% 2/25/20501,2,6 |
|
|
1,975 |
|
|
|
|
|
|
|
1,994 |
|
|
|
Freddie Mac Structured Agency Credit Risk Debt Notes, Series 2020-DNA4, Class B1,
(30-day Average USD-SOFR + 6.114%) 11.45% 8/25/20501,2,6 |
|
|
756 |
|
|
|
|
|
|
|
869 |
|
|
|
GCAT Trust, Series 2024-NQM2, Class A1,
6.085% 6/25/2059 (7.359% on 5/1/2028)1,6,7 |
|
|
6,435 |
|
|
|
|
|
|
|
6,446 |
|
|
|
GCAT Trust, Series 2021-NQM6, Class A1, 1.855% 8/25/20661,2,6 |
|
|
2,041 |
|
|
|
|
|
|
|
1,800 |
|
|
|
GS Mortgage-Backed Securities Trust, Series 2024-RPL2, Class A1,
3.75% 7/25/2061 (4.75% on 2/1/2028)1,6,7 |
|
|
2,256 |
|
|
|
|
|
|
|
2,138 |
|
|
|
Home Partners of America Trust, Series 2021-2, Class A, 1.901% 12/17/20261,6 |
|
|
4,947 |
|
|
|
|
|
|
|
4,546 |
|
|
|
Legacy Mortgage Asset Trust, Series 2022-GS1, Class A1,
4.00% 2/25/2061 (7.00% on 4/25/2025)1,6,7 |
|
|
2,823 |
|
|
|
|
|
|
|
2,759 |
|
|
|
Legacy Mortgage Asset Trust, Series 2021-GS2, Class A1,
4.75% 4/25/2061 (5.75% on 4/25/2025)1,6,7 |
|
|
709 |
|
|
|
|
|
|
|
696 |
|
|
|
Legacy Mortgage Asset Trust, Series 2021-GS5, Class A1,
2.25% 7/25/2067 (5.25% on 11/25/2024)1,6,7 |
|
|
2,185 |
|
|
|
|
|
|
|
2,129 |
|
|
|
Mello Warehouse Securitization Trust, Series 2021-3, Class A,
(3-month USD CME Term SOFR + 0.965%) 6.31% 11/25/20551,2,6 |
|
|
16,160 |
|
|
|
|
|
|
|
16,158 |
|
|
|
MFRA Trust, Series 2021-RPL1, Class A1, 1.131% 7/25/20601,2,6 |
|
|
2,419 |
|
|
|
|
|
|
|
2,139 |
|
|
|
Onslow Bay Financial Mortgage Loan Trust, Series 2024-HYB1, Class A1,
3.564% 3/25/20531,2,6 |
|
|
2,947 |
|
|
|
|
|
|
|
2,860 |
|
|
|
Onslow Bay Financial, LLC, Series 2024-NQM5, Class A1,
5.988% 3/25/2028 (6.988% on 3/1/2028)1,6,7 |
|
|
9,097 |
|
|
|
|
|
|
|
9,099 |
|
|
|
Onslow Bay Financial, LLC, Series 2024-HYB2, Class A1,
3.601% 4/25/20531,2,6 |
|
|
2,265 |
|
|
|
|
|
|
|
2,176 |
|
|
|
Onslow Bay Financial, LLC, Series 2024-NQM4, Class A1,
6.067% 1/25/2064 (7.067% on 2/1/2028)1,6,7 |
|
|
4,496 |
|
|
|
|
|
|
|
4,492 |
|
|
|
Onslow Bay Financial, LLC, Series 2024-NQM7, Class A1,
6.243% 3/25/2064 (7.243% on 4/1/2028)1,6,7 |
|
|
9,882 |
|
|
|
|
|
|
|
9,931 |
|
|
|
Onslow Bay Financial, LLC, Series 2024-NQM10, Class A1,
6.18% 5/25/2064 (7.18% on 6/1/2028)1,6,7 |
|
|
9,090 |
|
|
|
|
|
|
|
9,109 |
|
|
|
Onslow Bay Financial, LLC, Series 2024-NQM8, Class A1,
6.233% 5/25/2064 (7.233% on 5/1/2028)1,6,7 |
|
|
23,364 |
|
|
|
|
|
|
|
23,488 |
|
|
|
PRKCM Trust, Series 2021-AFC2, Class A1, 2.071% 11/25/20561,2,6 |
|
|
1,456 |
|
|
|
|
|
|
|
1,230 |
|
|
|
Progress Residential Trust, Series 2022-SFR3, Class A, 3.20% 4/17/20391,6 |
|
|
1,112 |
|
|
|
|
|
|
|
1,048 |
|
|
|
Progress Residential Trust, Series 2024-SFR1, Class A, 3.35% 2/17/20411,6 |
|
|
11,545 |
|
|
|
|
|
|
|
10,632 |
|
|
|
Progress Residential Trust, Series 2024-SFR2, Class A, 3.30% 4/17/20411,6 |
|
|
2,277 |
|
|
|
|
|
|
|
2,087 |
|
|
|
Progress Residential Trust, Series 2024-SFR2, Class B, 3.40% 4/17/20411,2,6 |
|
|
1,044 |
|
|
|
|
|
|
|
942 |
|
|
|
Progress Residential Trust, Series 2024-SFR3, Class A, 3.00% 6/17/20411,6 |
|
|
7,109 |
|
|
|
|
|
|
|
6,406 |
|
|
|
Reverse Mortgage Investment Trust, Series 2021-HB1, Class A,
1.259% 11/25/20311,2,6 |
|
|
770 |
|
|
|
|
|
|
|
756 |
|
|
|
Towd Point Mortgage Trust, Series 2020-4, Class A1, 1.75% 10/25/20601,6 |
|
|
8,680 |
|
|
|
|
|
|
|
7,700 |
|
|
|
Treehouse Park Improvement Association No.1 9.75% 12/1/20336,8 |
|
|
1,680 |
|
|
|
|
|
|
|
1,642 |
|
|
|
Tricon Residential Trust, Series 2021-SFR1, Class A, 1.943% 7/17/20381,6 |
|
|
5,027 |
|
|
|
|
|
|
|
4,669 |
|
|
|
Tricon Residential Trust, Series 2024-SFR2, Class A, 4.75% 6/17/20401,6 |
|
|
8,586 |
|
|
|
|
|
|
|
8,387 |
|
|
|
Tricon Residential Trust, Series 2023-SFR2, Class A, 5.00% 12/17/20401,6 |
|
|
1,817 |
|
|
|
|
|
|
|
1,792 |
|
|
|
Verus Securitization Trust, Series 2024-3, Class A1,
6.338% 4/25/2069 (7.338% on 4/1/2028)1,6,7 |
|
|
22,413 |
|
|
|
|
|
|
|
22,533 |
|
|
|
Verus Securitization Trust, Series 2024-4, Class A1,
6.218% 6/25/2069 (7.218% on 5/1/2028)1,6,7 |
|
|
8,382 |
|
|
|
|
|
|
|
8,419 |
|
|
|
|
|
|
|
|
|
|
|
|
|
|
|
|
|
|
|
|
|
|
|
|
|
|
|
|
|
254,058 |
|
|
|
|
|
|
|
|
|
|
|
|
|
|
|
|
American Funds Insurance Series 142
The Bond Fund of America (continued)
|
|
|
|
|
|
|
|
|
|
|
|
|
|
|
| Bonds, notes & other debt instruments (continued) |
|
Principal amount
(000) |
|
|
|
|
|
Value (000) |
|
|
| Mortgage-backed obligations (continued) |
|
| Commercial mortgage-backed securities 2.26% |
|
AMSR Trust, Series 2023-SFR2, Class A, 3.95% 6/17/20401,6 |
|
|
USD389 |
|
|
|
|
|
|
$ |
369 |
|
|
|
ARES Commercial Mortgage Trust., Series 24-IND, Class A,
(1-month USD CME Term SOFR + 1.69%) 7.012% 7/15/20411,2,6 |
|
|
1,251 |
|
|
|
|
|
|
|
1,251 |
|
|
|
Bank Commercial Mortgage Trust, Series 2019-BN16, Class A4,
4.005% 2/15/20521 |
|
|
770 |
|
|
|
|
|
|
|
725 |
|
|
|
Bank Commercial Mortgage Trust, Series 2019-BN17, Class A4,
3.714% 4/15/20521 |
|
|
100 |
|
|
|
|
|
|
|
93 |
|
|
|
Bank Commercial Mortgage Trust, Series 2023-5YR3, Class AS,
7.559% 9/15/20561,2 |
|
|
684 |
|
|
|
|
|
|
|
726 |
|
|
|
Bank Commercial Mortgage Trust, Series 2023-5YR4, Class AS,
7.274% 12/15/20561,2 |
|
|
500 |
|
|
|
|
|
|
|
528 |
|
|
|
Bank Commercial Mortgage Trust, Series 2018-BN10, Class A5,
3.688% 2/15/20611 |
|
|
205 |
|
|
|
|
|
|
|
194 |
|
|
|
Bank Commercial Mortgage Trust, Series 2018-BN10, Class A4,
3.428% 2/17/20611 |
|
|
126 |
|
|
|
|
|
|
|
119 |
|
|
|
Bank Commercial Mortgage Trust, Series 2018-BN12, Class A4,
4.255% 5/15/20611,2 |
|
|
2,444 |
|
|
|
|
|
|
|
2,346 |
|
|
|
Bank Commercial Mortgage Trust, Series 2019-BN19, Class A3,
3.183% 8/15/20611 |
|
|
1,018 |
|
|
|
|
|
|
|
895 |
|
|
|
Bank Commercial Mortgage Trust, Series 2020-BN26, Class A4,
2.403% 3/15/20631 |
|
|
295 |
|
|
|
|
|
|
|
252 |
|
|
|
Benchmark Mortgage Trust, Series 2018-B8, Class A5,
4.232% 1/15/20521 |
|
|
2,541 |
|
|
|
|
|
|
|
2,389 |
|
|
|
Benchmark Mortgage Trust, Series 2018-B7, Class A4,
4.51% 5/15/20531,2 |
|
|
781 |
|
|
|
|
|
|
|
750 |
|
|
|
Benchmark Mortgage Trust, Series 2024-V5, Class AM,
6.417% 1/10/20571 |
|
|
3,361 |
|
|
|
|
|
|
|
3,454 |
|
|
|
BOCA Commercial Mortgage Trust, Series 2022-BOCA, Class A,
(1-month USD CME Term SOFR + 1.77%) 7.098% 5/15/20391,2,6 |
|
|
8,575 |
|
|
|
|
|
|
|
8,577 |
|
|
|
BPR Trust, Series 2022-OANA, Class A,
(1-month USD CME Term SOFR + 1.898%) 7.227% 4/15/20371,2,6 |
|
|
3,822 |
|
|
|
|
|
|
|
3,828 |
|
|
|
BX Trust, Series 2022-CSMO, Class A,
(1-month USD CME Term SOFR + 2.115%) 7.444% 6/15/20271,2,6 |
|
|
8,476 |
|
|
|
|
|
|
|
8,507 |
|
|
|
BX Trust, Series 2024-KING, Class A,
(1-month USD CME Term SOFR + 1.541%) 6.87% 5/15/20341,2,6 |
|
|
2,212 |
|
|
|
|
|
|
|
2,217 |
|
|
|
BX Trust, Series 2021-VOLT, Class A,
(1-month USD CME Term SOFR + 0.814%) 6.143% 9/15/20361,2,6 |
|
|
14,727 |
|
|
|
|
|
|
|
14,554 |
|
|
|
BX Trust, Series 2021-VOLT, Class B,
(1-month USD CME Term SOFR + 1.064%) 6.393% 9/15/20361,2,6 |
|
|
570 |
|
|
|
|
|
|
|
562 |
|
|
|
BX Trust, Series 2021-ARIA, Class A,
(1-month USD CME Term SOFR + 1.014%) 6.342% 10/15/20361,2,6 |
|
|
5,292 |
|
|
|
|
|
|
|
5,230 |
|
|
|
BX Trust, Series 2021-ARIA, Class B,
(1-month USD CME Term SOFR + 1.411%) 6.74% 10/15/20361,2,6 |
|
|
995 |
|
|
|
|
|
|
|
982 |
|
|
|
BX Trust, Series 2021-ARIA, Class C,
(1-month USD CME Term SOFR + 1.76%) 7.089% 10/15/20361,2,6 |
|
|
996 |
|
|
|
|
|
|
|
980 |
|
|
|
BX Trust, Series 2021-RISE, Class A,
(1-month USD CME Term SOFR + 0.862%) 6.191% 11/15/20361,2,6 |
|
|
11,575 |
|
|
|
|
|
|
|
11,446 |
|
|
|
BX Trust, Series 2022-IND, Class A,
(1-month USD CME Term SOFR + 1.491%) 6.82% 4/15/20371,2,6 |
|
|
4,318 |
|
|
|
|
|
|
|
4,310 |
|
|
|
BX Trust, Series 2021-SOAR, Class A,
(1-month USD CME Term SOFR + 0.784%) 6.113% 6/15/20381,2,6 |
|
|
3,304 |
|
|
|
|
|
|
|
3,269 |
|
|
|
BX Trust, Series 2021-SOAR, Class B,
(1-month USD CME Term SOFR + 0.984%) 6.313% 6/15/20381,2,6 |
|
|
382 |
|
|
|
|
|
|
|
378 |
|
|
|
BX Trust, Series 2021-SOAR, Class C,
(1-month USD CME Term SOFR + 1.214%) 6.543% 6/15/20381,2,6 |
|
|
259 |
|
|
|
|
|
|
|
255 |
|
|
|
BX Trust, Series 2021-SOAR, Class D,
(1-month USD CME Term SOFR + 1.514%) 6.843% 6/15/20381,2,6 |
|
|
654 |
|
|
|
|
|
|
|
646 |
|
|
|
BX Trust, Series 2021-ACNT, Class A,
(1-month USD CME Term SOFR + 0.964%) 6.293% 11/15/20381,2,6 |
|
|
9,412 |
|
|
|
|
|
|
|
9,308 |
|
|
|
BX Trust, Series 2021-ACNT, Class B,
(1-month USD CME Term SOFR + 1.364%) 6.693% 11/15/20381,2,6 |
|
|
320 |
|
|
|
|
|
|
|
316 |
|
|
|
BX Trust, Series 2021-ACNT, Class C,
(1-month USD CME Term SOFR + 1.614%) 6.943% 11/15/20381,2,6 |
|
|
94 |
|
|
|
|
|
|
|
93 |
|
|
|
BX Trust, Series 2021-ACNT, Class D,
(1-month USD CME Term SOFR + 1.964%) 7.293% 11/15/20381,2,6 |
|
|
142 |
|
|
|
|
|
|
|
141 |
|
|
|
BX Trust, Series 2022-AHP, Class A,
(1-month USD CME Term SOFR + 0.99%) 6.319% 2/15/20391,2,6 |
|
|
8,600 |
|
|
|
|
|
|
|
8,505 |
|
|
|
BX Trust, Series 2022-GPA, Class A,
(1-month USD CME Term SOFR + 2.165%) 7.499% 10/15/20391,2,6 |
|
|
3,151 |
|
|
|
|
|
|
|
3,157 |
|
|
|
Citigroup Commercial Mortgage Trust, Series 2023-SMRT, Class A,
6.015% 10/12/20401,2,6 |
|
|
19,044 |
|
|
|
|
|
|
|
19,089 |
|
|
|
Citigroup Commercial Mortgage Trust, Series 2016-GC36, Class A5,
3.616% 2/10/20491 |
|
|
610 |
|
|
|
|
|
|
|
585 |
|
143 American Funds Insurance Series
The Bond Fund of America (continued)
|
|
|
|
|
|
|
|
|
|
|
|
|
|
|
| Bonds, notes & other debt instruments (continued) |
|
Principal amount
(000) |
|
|
|
|
|
Value (000) |
|
|
| Mortgage-backed obligations (continued) |
|
| Commercial mortgage-backed securities (continued) |
|
CSAIL Commercial Mortgage Trust, Series 2015-C2, Class A3, 3.231% 6/15/20571 |
|
|
USD1,137 |
|
|
|
|
|
|
$ |
1,124 |
|
|
|
DATA 2023-CNTR Mortgage Trust, Series 2023-CNTR, Class A,
5.919% 8/12/20431,2,6 |
|
|
8,924 |
|
|
|
|
|
|
|
9,065 |
|
|
|
DC Commercial Mortgage Trust, Series 2023-DC, Class A, 6.314% 9/10/20401,6 |
|
|
966 |
|
|
|
|
|
|
|
991 |
|
|
|
DC Commercial Mortgage Trust, Series 2023-DC, Class B, 6.804% 9/10/20401,6 |
|
|
1,121 |
|
|
|
|
|
|
|
1,147 |
|
|
|
DC Commercial Mortgage Trust, Series 2023-DC, Class C, 7.379% 9/10/20401,2,6 |
|
|
862 |
|
|
|
|
|
|
|
882 |
|
|
|
Deutsche Bank Commercial Mortgage Trust, Series 2016-C1, Class AM,
3.539% 5/10/20491 |
|
|
200 |
|
|
|
|
|
|
|
189 |
|
|
|
ELM Trust 2024, Series 2024-ELM, Class A15, 5.801% 6/10/20391,2,6 |
|
|
26,878 |
|
|
|
|
|
|
|
26,925 |
|
|
|
ELM Trust 2024, Series 2024-ELM, Class A10, 5.801% 6/10/20391,2,6 |
|
|
24,421 |
|
|
|
|
|
|
|
24,463 |
|
|
|
Extended Stay America Trust, Series 2021-ESH, Class A,
(1-month USD CME Term SOFR + 1.194%) 6.523% 7/15/20381,2,6 |
|
|
2,614 |
|
|
|
|
|
|
|
2,606 |
|
|
|
Extended Stay America Trust, Series 2021-ESH, Class B,
(1-month USD CME Term SOFR + 1.494%) 6.823% 7/15/20381,2,6 |
|
|
596 |
|
|
|
|
|
|
|
595 |
|
|
|
Extended Stay America Trust, Series 2021-ESH, Class C,
(1-month USD CME Term SOFR + 1.814%) 7.143% 7/15/20381,2,6 |
|
|
813 |
|
|
|
|
|
|
|
812 |
|
|
|
Extended Stay America Trust, Series 2021-ESH, Class D,
(1-month USD CME Term SOFR + 2.364%) 7.693% 7/15/20381,2,6 |
|
|
623 |
|
|
|
|
|
|
|
623 |
|
|
|
FIVE Mortgage Trust, Series 2023-V1, Class A3, 5.668% 2/10/20561 |
|
|
2,432 |
|
|
|
|
|
|
|
2,445 |
|
|
|
Fontainebleau Miami Beach Trust, CMO, Series 2019-FBLU, Class A,
3.144% 12/10/20361,6 |
|
|
449 |
|
|
|
|
|
|
|
443 |
|
|
|
FS Commercial Trust, Series 2023-4SZN, Class A, 7.066% 11/10/20391,6 |
|
|
1,212 |
|
|
|
|
|
|
|
1,252 |
|
|
|
Grace Mortgage Trust, Series 2020-GRCE, Class A, 2.347% 12/10/20401,6 |
|
|
1,897 |
|
|
|
|
|
|
|
1,551 |
|
|
|
GS Mortgage Securities Trust., Series 2024-70P, Class A, 5.487% 3/10/20411,2,6 |
|
|
10,443 |
|
|
|
|
|
|
|
10,227 |
|
|
|
GS Mortgage Securities Trust, Series 2017-GS7, Class A4, 3.43% 8/10/20501 |
|
|
400 |
|
|
|
|
|
|
|
373 |
|
|
|
GS Mortgage Securities Trust, Series 2019-GC38, Class A4, 3.968% 2/10/20521 |
|
|
100 |
|
|
|
|
|
|
|
94 |
|
|
|
GS Mortgage Securities Trust, Series 2020-GC47, Class A5, 2.377% 5/12/20531 |
|
|
1,536 |
|
|
|
|
|
|
|
1,307 |
|
|
|
HTL Commercial Mortgage Trust, Series 2024-T53, Class A, 6.072% 5/10/20391,2,6 |
|
|
1,478 |
|
|
|
|
|
|
|
1,477 |
|
|
|
JPMDB Commercial Mortgage Securities Trust, Series 2017-C5, Class A5,
3.694% 3/15/20501 |
|
|
640 |
|
|
|
|
|
|
|
604 |
|
|
|
JPMDB Commercial Mortgage Securities Trust, Series 2017-C7, Class A5,
3.409% 10/15/20501 |
|
|
240 |
|
|
|
|
|
|
|
224 |
|
|
|
JPMorgan Chase Commercial Mortgage Securities Trust, Series 2022-OPO, Class A,
3.024% 1/5/20391,6 |
|
|
6,854 |
|
|
|
|
|
|
|
6,132 |
|
|
|
JPMorgan Chase Commercial Mortgage Securities Trust, Series 2016-JP4, Class A4,
3.648% 12/15/20491,2 |
|
|
2,040 |
|
|
|
|
|
|
|
1,929 |
|
|
|
MHC Commercial Mortgage Trust, CMO, Series 2021-MHC, Class A,
(1-month USD CME Term SOFR + 0.915%) 6.244% 4/15/20381,2,6 |
|
|
129 |
|
|
|
|
|
|
|
128 |
|
|
|
Morgan Stanley Bank of America Merrill Lynch Trust, Series 2015-C22, Class A-4,
3.306% 4/15/20481 |
|
|
410 |
|
|
|
|
|
|
|
401 |
|
|
|
Morgan Stanley Bank of America Merrill Lynch Trust, Series 2016-C32, Class A-4,
3.72% 12/15/20491 |
|
|
245 |
|
|
|
|
|
|
|
235 |
|
|
|
Morgan Stanley Capital I Trust, Series 2015-UBS8, Class AS, 4.114% 12/15/20481 |
|
|
730 |
|
|
|
|
|
|
|
696 |
|
|
|
SDR Commercial Mortgage Trust, Series 2024-DSNY, Class A,
(1-month USD CME Term SOFR + 1.392%) 6.72% 5/15/20391,2,6 |
|
|
3,848 |
|
|
|
|
|
|
|
3,835 |
|
|
|
SLG Office Trust, Series 2021-OVA, Class A, 2.585% 7/15/20411,6 |
|
|
4,065 |
|
|
|
|
|
|
|
3,324 |
|
|
|
SREIT Trust, Series 2021-FLWR, Class A,
(1-month USD CME Term SOFR + 0.691%) 6.02% 7/15/20361,2,6 |
|
|
9,351 |
|
|
|
|
|
|
|
9,234 |
|
|
|
SREIT Trust, Series 2021-FLWR, Class B,
(1-month USD CME Term SOFR + 1.04%) 6.369% 7/15/20361,2,6 |
|
|
1,000 |
|
|
|
|
|
|
|
985 |
|
|
|
SREIT Trust, Series 2021-MFP, Class A,
(1-month USD CME Term SOFR + 0.845%) 6.174% 11/15/20381,2,6 |
|
|
8,362 |
|
|
|
|
|
|
|
8,289 |
|
|
|
SREIT Trust, Series 2021-MFP, Class B,
(1-month USD CME Term SOFR + 1.194%) 6.523% 11/15/20381,2,6 |
|
|
252 |
|
|
|
|
|
|
|
248 |
|
|
|
SREIT Trust, Series 2021-MFP, Class C,
(1-month USD CME Term SOFR + 1.443%) 6.772% 11/15/20381,2,6 |
|
|
135 |
|
|
|
|
|
|
|
133 |
|
|
|
Wells Fargo Commercial Mortgage Trust, Series 2015-SG1, Class A4,
3.789% 9/15/20481 |
|
|
2,373 |
|
|
|
|
|
|
|
2,318 |
|
American Funds Insurance Series 144
The Bond Fund of America (continued)
|
|
|
|
|
|
|
|
|
|
|
|
|
|
|
| Bonds, notes & other debt instruments (continued) |
|
Principal amount
(000) |
|
|
|
|
|
Value (000) |
|
|
| Mortgage-backed obligations (continued) |
|
| Commercial mortgage-backed securities (continued) |
|
Wells Fargo Commercial Mortgage Trust, Series 2016-C37, Class A5,
3.794% 12/15/20491 |
|
|
USD2,550 |
|
|
|
|
|
|
$ |
2,444 |
|
|
|
Wells Fargo Commercial Mortgage Trust, Series 2019-C54, Class A4,
3.146% 12/15/20521 |
|
|
1,019 |
|
|
|
|
|
|
|
911 |
|
|
|
Wells Fargo Commercial Mortgage Trust, Series 2017-RC1, Class A4,
3.631% 1/15/20601 |
|
|
205 |
|
|
|
|
|
|
|
196 |
|
|
|
|
|
|
|
|
|
|
|
|
|
|
|
|
|
|
|
|
|
|
|
|
|
|
|
|
|
251,883 |
|
|
|
|
|
|
|
|
|
|
|
|
|
|
|
|
|
|
Total mortgage-backed obligations |
|
|
|
|
|
|
|
|
|
|
4,609,526 |
|
|
|
|
|
|
|
|
|
|
|
|
|
|
|
|
|
| Corporate bonds, notes & loans 30.52% |
|
| Financials 9.69% |
|
AerCap Ireland Capital DAC 1.65% 10/29/2024 |
|
|
1,568 |
|
|
|
|
|
|
|
1,547 |
|
|
|
AerCap Ireland Capital DAC 6.50% 7/15/2025 |
|
|
1,798 |
|
|
|
|
|
|
|
1,812 |
|
|
|
AerCap Ireland Capital DAC 1.75% 1/30/2026 |
|
|
2,841 |
|
|
|
|
|
|
|
2,677 |
|
|
|
AerCap Ireland Capital DAC 2.45% 10/29/2026 |
|
|
10,289 |
|
|
|
|
|
|
|
9,601 |
|
|
|
AerCap Ireland Capital DAC 6.45% 4/15/2027 |
|
|
3,994 |
|
|
|
|
|
|
|
4,087 |
|
|
|
AIB Group PLC 6.608% 9/13/2029 (USD-SOFR + 2.33% on 9/13/2028)6,7 |
|
|
1,597 |
|
|
|
|
|
|
|
1,649 |
|
|
|
AIB Group PLC 5.871% 3/28/2035 (USD-SOFR + 1.91% on 3/28/2034)6,7 |
|
|
1,995 |
|
|
|
|
|
|
|
1,983 |
|
|
|
Ally Financial, Inc. 5.125% 9/30/2024 |
|
|
1,500 |
|
|
|
|
|
|
|
1,496 |
|
|
|
Ally Financial, Inc. 8.00% 11/1/2031 |
|
|
6,872 |
|
|
|
|
|
|
|
7,594 |
|
|
|
Alpha Bank SA 6.875% 6/27/2029
(1-year EUR-ICE Swap EURIBOR + 3.793% on 6/27/2028)7 |
|
|
EUR2,640 |
|
|
|
|
|
|
|
3,057 |
|
|
|
Alpha Bank SA 5.00% 5/12/2030
(1-year EUR-ICE Swap EURIBOR + 2.432% on 5/12/2029)7 |
|
|
3,025 |
|
|
|
|
|
|
|
3,252 |
|
|
|
American Express Co. 6.338% 10/30/2026 (USD-SOFR + 1.33% on 10/30/2025)7 |
|
|
USD604 |
|
|
|
|
|
|
|
610 |
|
|
|
American Express Co. 6.489% 10/30/2031 (USD-SOFR + 1.94% on 10/30/2030)7 |
|
|
359 |
|
|
|
|
|
|
|
383 |
|
|
|
American Express Co. 5.043% 5/1/2034 (USD-SOFR + 1.835% on 5/1/2033)7 |
|
|
4,565 |
|
|
|
|
|
|
|
4,466 |
|
|
|
American International Group, Inc. 5.125% 3/27/2033 |
|
|
2,749 |
|
|
|
|
|
|
|
2,709 |
|
|
|
Aon Corp. 5.35% 2/28/2033 |
|
|
1,083 |
|
|
|
|
|
|
|
1,076 |
|
|
|
Aon North America, Inc. 5.15% 3/1/2029 |
|
|
3,015 |
|
|
|
|
|
|
|
3,008 |
|
|
|
Aon North America, Inc. 5.30% 3/1/2031 |
|
|
1,005 |
|
|
|
|
|
|
|
1,003 |
|
|
|
Aon North America, Inc. 5.45% 3/1/2034 |
|
|
2,550 |
|
|
|
|
|
|
|
2,540 |
|
|
|
Aon North America, Inc. 5.75% 3/1/2054 |
|
|
1,163 |
|
|
|
|
|
|
|
1,138 |
|
|
|
Banco Santander, SA 5.147% 8/18/2025 |
|
|
4,000 |
|
|
|
|
|
|
|
3,970 |
|
|
|
Banco Santander, SA 1.722% 9/14/2027
(1-year UST Yield Curve Rate T Note Constant Maturity + 0.90% on 9/14/2026)7 |
|
|
1,400 |
|
|
|
|
|
|
|
1,284 |
|
|
|
Bank of America Corp. 1.53% 12/6/2025
(USD-SOFR + 0.65% on 12/6/2024)7 |
|
|
1,970 |
|
|
|
|
|
|
|
1,933 |
|
|
|
Bank of America Corp. 2.551% 2/4/2028 (USD-SOFR + 1.05% on 2/4/2027)7 |
|
|
4,295 |
|
|
|
|
|
|
|
4,010 |
|
|
|
Bank of America Corp. 4.376% 4/27/2028 (USD-SOFR + 1.58% on 4/27/2027)7 |
|
|
2,635 |
|
|
|
|
|
|
|
2,573 |
|
|
|
Bank of America Corp. 5.202% 4/25/2029 (USD-SOFR + 1.63% on 4/25/2028)7 |
|
|
4,758 |
|
|
|
|
|
|
|
4,752 |
|
|
|
Bank of America Corp. 2.087% 6/14/2029 (USD-SOFR + 1.06% on 6/14/2028)7 |
|
|
2,773 |
|
|
|
|
|
|
|
2,461 |
|
|
|
Bank of America Corp. 5.819% 9/15/2029 (USD-SOFR + 1.57% on 9/15/2028)7 |
|
|
4,291 |
|
|
|
|
|
|
|
4,382 |
|
|
|
Bank of America Corp. 2.592% 4/29/2031 (USD-SOFR + 2.15% on 4/29/2030)7 |
|
|
4,902 |
|
|
|
|
|
|
|
4,240 |
|
|
|
Bank of America Corp. 1.898% 7/23/2031 (USD-SOFR + 1.53% on 7/23/2030)7 |
|
|
257 |
|
|
|
|
|
|
|
212 |
|
|
|
Bank of America Corp. 1.922% 10/24/2031 (USD-SOFR + 1.37% on 10/24/2030)7 |
|
|
20,927 |
|
|
|
|
|
|
|
17,128 |
|
|
|
Bank of America Corp. 2.299% 7/21/2032 (USD-SOFR + 1.22% on 7/21/2031)7 |
|
|
36,155 |
|
|
|
|
|
|
|
29,609 |
|
|
|
Bank of Ireland Group PLC 6.253% 9/16/2026
(1-year UST Yield Curve Rate T Note Constant Maturity + 2.65% on 9/16/2025)6,7 |
|
|
4,850 |
|
|
|
|
|
|
|
4,876 |
|
|
|
Bank of New York Mellon Corp. 4.975% 3/14/2030
(USD-SOFR + 1.085% on 3/14/2029)7 |
|
|
1,858 |
|
|
|
|
|
|
|
1,847 |
|
|
|
Bank of New York Mellon Corp.
5.188% 3/14/2035 (USD-SOFR + 1.418% on 3/14/2034)7 |
|
|
2,378 |
|
|
|
|
|
|
|
2,348 |
|
|
|
Bank of Nova Scotia (The) 5.25% 6/12/2028 |
|
|
1,370 |
|
|
|
|
|
|
|
1,377 |
|
|
|
Banque Federative du Credit Mutuel 0.82% 10/16/2026 |
|
|
JPY300,000 |
|
|
|
|
|
|
|
1,864 |
|
|
|
Block, Inc. 2.75% 6/1/2026 |
|
|
USD1,975 |
|
|
|
|
|
|
|
1,867 |
|
|
|
Block, Inc. 3.50% 6/1/2031 |
|
|
825 |
|
|
|
|
|
|
|
712 |
|
|
|
BNP Paribas SA 2.591% 1/20/2028 (USD-SOFR + 1.228% on 1/20/2027)6,7 |
|
|
13,134 |
|
|
|
|
|
|
|
12,214 |
|
|
|
BNP Paribas SA 2.159% 9/15/2029 (USD-SOFR + 1.218% on 9/15/2028)6,7 |
|
|
3,594 |
|
|
|
|
|
|
|
3,138 |
|
|
|
BNP Paribas SA 5.497% 5/20/2030 (USD-SOFR + 1.59% on 5/20/2029)6,7 |
|
|
7,416 |
|
|
|
|
|
|
|
7,389 |
|
145 American Funds Insurance Series
The Bond Fund of America (continued)
|
|
|
|
|
|
|
|
|
|
|
|
|
|
|
| Bonds, notes & other debt instruments (continued) |
|
Principal amount
(000) |
|
|
|
|
|
Value (000) |
|
|
| Corporate bonds, notes & loans (continued) |
|
| Financials (continued) |
|
BPCE SA 5.15% 7/21/20246 |
|
|
USD5,481 |
|
|
|
|
|
|
$ |
5,476 |
|
|
|
BPCE SA 1.625% 1/14/20256 |
|
|
2,980 |
|
|
|
|
|
|
|
2,915 |
|
|
|
BPCE SA 1.652% 10/6/2026 (USD-SOFR + 1.52% on 10/6/2025)6,7 |
|
|
4,729 |
|
|
|
|
|
|
|
4,476 |
|
|
|
BPCE SA 0.895% 12/14/2026 |
|
|
JPY100,000 |
|
|
|
|
|
|
|
620 |
|
|
|
BPCE SA 5.975% 1/18/2027 (USD-SOFR + 2.10% on 1/18/2026)6,7 |
|
|
USD2,150 |
|
|
|
|
|
|
|
2,152 |
|
|
|
BPCE SA 6.714% 10/19/2029 (USD-SOFR + 2.27% on 10/19/2028)6,7 |
|
|
5,000 |
|
|
|
|
|
|
|
5,186 |
|
|
|
BPCE SA 5.748% 7/19/2033 (USD-SOFR + 2.865% on 7/19/2032)6,7 |
|
|
6,195 |
|
|
|
|
|
|
|
6,141 |
|
|
|
BPCE SA 5.936% 5/30/2035 (USD-SOFR + 1.85% on 5/30/2034)6,7 |
|
|
4,503 |
|
|
|
|
|
|
|
4,487 |
|
|
|
BPCE SA 5.716% 1/18/2030
(1-year UST Yield Curve Rate T Note Constant Maturity + 1.959% on 1/18/2029)6,7 |
|
|
1,285 |
|
|
|
|
|
|
|
1,283 |
|
|
|
CaixaBank, SA 6.684% 9/13/2027 (USD-SOFR + 2.08% on 9/13/2026)6,7 |
|
|
980 |
|
|
|
|
|
|
|
999 |
|
|
|
CaixaBank, SA 6.208% 1/18/2029 (USD-SOFR + 2.70% on 1/18/2028)6,7 |
|
|
1,952 |
|
|
|
|
|
|
|
1,984 |
|
|
|
CaixaBank, SA 5.673% 3/15/2030 (USD-SOFR + 1.78% on 3/15/2029)6,7 |
|
|
9,440 |
|
|
|
|
|
|
|
9,404 |
|
|
|
CaixaBank, SA 6.84% 9/13/2034 (USD-SOFR + 2.77% on 9/13/2033)6,7 |
|
|
1,900 |
|
|
|
|
|
|
|
2,008 |
|
|
|
CaixaBank, SA 6.037% 6/15/2035 (USD-SOFR + 2.26% on 9/15/2034)6,7 |
|
|
3,953 |
|
|
|
|
|
|
|
3,964 |
|
|
|
Canadian Imperial Bank of Commerce 5.237% 6/28/2027 |
|
|
2,650 |
|
|
|
|
|
|
|
2,647 |
|
|
|
Capital One Financial Corp. 4.985% 7/24/2026 (USD-SOFR + 2.16% on 7/24/2025)7 |
|
|
2,430 |
|
|
|
|
|
|
|
2,409 |
|
|
|
Capital One Financial Corp. 5.468% 2/1/2029 (USD-SOFR + 2.08% on 2/1/2028)7 |
|
|
515 |
|
|
|
|
|
|
|
513 |
|
|
|
Capital One Financial Corp. 5.70% 2/1/2030 (USD-SOFR + 1.905% on 2/1/2029)7 |
|
|
4,352 |
|
|
|
|
|
|
|
4,374 |
|
|
|
Capital One Financial Corp. 6.377% 6/8/2034 (USD-SOFR + 2.86% on 6/8/2033)7 |
|
|
1,204 |
|
|
|
|
|
|
|
1,236 |
|
|
|
Capital One Financial Corp. 6.051% 2/1/2035 (USD-SOFR + 2.26% on 2/1/2034)7 |
|
|
3,985 |
|
|
|
|
|
|
|
4,010 |
|
|
|
Charles Schwab Corp. (The) 5.643% 5/19/2029 (USD-SOFR + 2.21% on 5/19/2028)7 |
|
|
2,445 |
|
|
|
|
|
|
|
2,478 |
|
|
|
Charles Schwab Corp. (The)
6.196% 11/17/2029 (USD-SOFR + 1.878% on 11/17/2028)7 |
|
|
2,180 |
|
|
|
|
|
|
|
2,268 |
|
|
|
Charles Schwab Corp. (The) 5.853% 5/19/2034 (USD-SOFR + 2.50% on 5/19/2033)7 |
|
|
1,776 |
|
|
|
|
|
|
|
1,812 |
|
|
|
Charles Schwab Corp. (The) 6.136% 8/24/2034 (USD-SOFR + 2.01% on 8/24/2033)7 |
|
|
4,795 |
|
|
|
|
|
|
|
4,995 |
|
|
|
China Ping An Insurance Overseas (Holdings), Ltd. 2.85% 8/12/2031 |
|
|
526 |
|
|
|
|
|
|
|
438 |
|
|
|
Chubb INA Holdings, LLC 3.35% 5/3/2026 |
|
|
2,020 |
|
|
|
|
|
|
|
1,956 |
|
|
|
Chubb INA Holdings, LLC 5.00% 3/15/2034 |
|
|
2,875 |
|
|
|
|
|
|
|
2,848 |
|
|
|
Chubb INA Holdings, LLC 4.35% 11/3/2045 |
|
|
2,015 |
|
|
|
|
|
|
|
1,741 |
|
|
|
Citibank, NA 5.803% 9/29/2028 |
|
|
4,100 |
|
|
|
|
|
|
|
4,213 |
|
|
|
Citigroup, Inc. 4.60% 3/9/2026 |
|
|
1,800 |
|
|
|
|
|
|
|
1,772 |
|
|
|
Citigroup, Inc. 5.174% 2/13/2030 (USD-SOFR + 1.364% on 2/13/2029)7 |
|
|
10,629 |
|
|
|
|
|
|
|
10,569 |
|
|
|
Citigroup, Inc. 2.976% 11/5/2030 (USD-SOFR + 1.422% on 11/5/2029)7 |
|
|
2,714 |
|
|
|
|
|
|
|
2,418 |
|
|
|
Citigroup, Inc. 2.561% 5/1/2032 (USD-SOFR + 1.167% on 5/1/2031)7 |
|
|
42 |
|
|
|
|
|
|
|
35 |
|
|
|
Citigroup, Inc. 3.057% 1/25/2033 (USD-SOFR + 1.351% on 1/25/2032)7 |
|
|
990 |
|
|
|
|
|
|
|
841 |
|
|
|
Citigroup, Inc. 3.785% 3/17/2033 (USD-SOFR + 1.939% on 3/17/2032)7 |
|
|
3,090 |
|
|
|
|
|
|
|
2,754 |
|
|
|
Citigroup, Inc. 6.174% 5/25/2034 (USD-SOFR + 2.661% on 5/25/2033)7 |
|
|
140 |
|
|
|
|
|
|
|
142 |
|
|
|
Citizens Financial Group, Inc. 5.841% 1/23/2030
(USD-SOFR + 2.01% on 1/23/2029)7 |
|
|
11,170 |
|
|
|
|
|
|
|
11,137 |
|
|
|
Citizens Financial Group, Inc. 6.645% 4/25/2035
(USD-SOFR + 2.325% on 4/25/2034)7 |
|
|
1,733 |
|
|
|
|
|
|
|
1,792 |
|
|
|
Corebridge Financial, Inc. 3.65% 4/5/2027 |
|
|
3,913 |
|
|
|
|
|
|
|
3,746 |
|
|
|
Corebridge Financial, Inc. 3.85% 4/5/2029 |
|
|
3,534 |
|
|
|
|
|
|
|
3,314 |
|
|
|
Corebridge Financial, Inc. 3.90% 4/5/2032 |
|
|
3,964 |
|
|
|
|
|
|
|
3,550 |
|
|
|
Corebridge Financial, Inc. 4.35% 4/5/2042 |
|
|
361 |
|
|
|
|
|
|
|
298 |
|
|
|
Corebridge Financial, Inc. 4.40% 4/5/2052 |
|
|
415 |
|
|
|
|
|
|
|
327 |
|
|
|
Crédit Agricole SA 1.907% 6/16/2026 (USD-SOFR + 1.676% on 6/16/2025)6,7 |
|
|
4,450 |
|
|
|
|
|
|
|
4,284 |
|
|
|
Crédit Agricole SA 1.247% 1/26/2027 (USD-SOFR + 0.892% on 1/26/2026)6,7 |
|
|
2,450 |
|
|
|
|
|
|
|
2,285 |
|
|
|
Danske Bank AS 1.549% 9/10/2027
(1-year UST Yield Curve Rate T Note Constant Maturity + 0.73% on 9/10/2026)6,7 |
|
|
2,990 |
|
|
|
|
|
|
|
2,747 |
|
|
|
Danske Bank AS 4.298% 4/1/2028
(1-year UST Yield Curve Rate T Note Constant Maturity + 1.75% on 4/1/2027)6,7 |
|
|
2,975 |
|
|
|
|
|
|
|
2,881 |
|
|
|
Deutsche Bank AG 3.961% 11/26/2025 (USD-SOFR + 2.581% on 11/26/2024)7 |
|
|
3,673 |
|
|
|
|
|
|
|
3,642 |
|
|
|
Deutsche Bank AG 4.10% 1/13/2026 |
|
|
7,305 |
|
|
|
|
|
|
|
7,148 |
|
|
|
Deutsche Bank AG 4.10% 1/13/2026 |
|
|
857 |
|
|
|
|
|
|
|
842 |
|
|
|
Deutsche Bank AG 2.129% 11/24/2026 (USD-SOFR + 1.87% on 11/24/2025)7 |
|
|
27,047 |
|
|
|
|
|
|
|
25,676 |
|
|
|
Deutsche Bank AG 2.552% 1/7/2028 (USD-SOFR + 1.318% on 1/7/2027)7 |
|
|
17,595 |
|
|
|
|
|
|
|
16,275 |
|
|
|
Deutsche Bank AG 6.72% 1/18/2029 (USD-SOFR + 3.18% on 1/18/2028)7 |
|
|
8,853 |
|
|
|
|
|
|
|
9,140 |
|
|
|
Deutsche Bank AG 6.819% 11/20/2029 (USD-SOFR + 2.51% on 11/20/2028)7 |
|
|
4,775 |
|
|
|
|
|
|
|
4,968 |
|
American Funds Insurance Series 146
The Bond Fund of America (continued)
|
|
|
|
|
|
|
|
|
|
|
|
|
|
|
| Bonds, notes & other debt instruments (continued) |
|
Principal amount
(000) |
|
|
|
|
|
Value (000) |
|
|
| Corporate bonds, notes & loans (continued) |
|
| Financials (continued) |
|
Deutsche Bank AG 3.547% 9/18/2031 (USD-SOFR + 3.043% on 9/18/2030)7 |
|
|
USD4,550 |
|
|
|
|
|
|
$ |
4,007 |
|
|
|
Deutsche Bank AG 3.729% 1/14/2032 (USD-SOFR + 2.757% on 1/14/2031)7 |
|
|
3,235 |
|
|
|
|
|
|
|
2,729 |
|
|
|
DNB Bank ASA 1.535% 5/25/2027
(5-year UST Yield Curve Rate T Note Constant Maturity + 0.72% on 5/25/2026)6,7 |
|
|
1,200 |
|
|
|
|
|
|
|
1,113 |
|
|
|
Eurobank SA 2.00% 5/5/2027 (1-year EUR Mid-Swap + 2.398% on 5/5/2026)7 |
|
|
EUR1,845 |
|
|
|
|
|
|
|
1,906 |
|
|
|
Eurobank SA 2.25% 3/14/2028 (1-year EUR Mid-Swap + 2.634% on 3/14/2027)7 |
|
|
4,230 |
|
|
|
|
|
|
|
4,292 |
|
|
|
Eurobank SA 7.00% 1/26/2029 (1-year EUR Mid-Swap + 4.418% on 1/26/2028)7 |
|
|
3,855 |
|
|
|
|
|
|
|
4,491 |
|
|
|
Eurobank SA 5.875% 11/28/2029 (1-year EUR Mid-Swap + 2.83% on 11/28/2028)7 |
|
|
12,035 |
|
|
|
|
|
|
|
13,596 |
|
|
|
Eurobank SA 4.875% 4/30/2031 (5-year EUR Mid-Swap + 2.165% on 4/30/2030)7 |
|
|
100 |
|
|
|
|
|
|
|
108 |
|
|
|
Fifth Third Bancorp 6.339% 7/27/2029 (USD-SOFR + 2.34% on 7/27/2028)7 |
|
|
USD205 |
|
|
|
|
|
|
|
210 |
|
|
|
Fifth Third Bancorp 5.631% 1/29/2032 (USD-SOFR + 1.84% on 1/29/2031)7 |
|
|
8,660 |
|
|
|
|
|
|
|
8,588 |
|
|
|
Five Corners Funding Trust III 5.791% 2/15/20336 |
|
|
942 |
|
|
|
|
|
|
|
959 |
|
|
|
Goldman Sachs Group, Inc. 1.431% 3/9/2027 (USD-SOFR + 0.795% on 3/9/2026)7 |
|
|
3,030 |
|
|
|
|
|
|
|
2,828 |
|
|
|
Goldman Sachs Group, Inc. 1.542% 9/10/2027 (USD-SOFR + 0.818% on 9/10/2026)7 |
|
|
13,275 |
|
|
|
|
|
|
|
12,196 |
|
|
|
Goldman Sachs Group, Inc. 1.948% 10/21/2027
(USD-SOFR + 0.913% on 10/21/2026)7 |
|
|
12,997 |
|
|
|
|
|
|
|
12,005 |
|
|
|
Goldman Sachs Group, Inc. 2.64% 2/24/2028 (USD-SOFR + 1.114% on 2/24/2027)7 |
|
|
3,703 |
|
|
|
|
|
|
|
3,455 |
|
|
|
Goldman Sachs Group, Inc. 3.615% 3/15/2028 (USD-SOFR + 1.846% on 3/15/2027)7 |
|
|
5,534 |
|
|
|
|
|
|
|
5,293 |
|
|
|
Goldman Sachs Group, Inc. 4.482% 8/23/2028 (USD-SOFR + 1.725% on 8/23/2027)7 |
|
|
5,114 |
|
|
|
|
|
|
|
4,999 |
|
|
|
Goldman Sachs Group, Inc.
3.814% 4/23/2029 (3-month USD CME Term SOFR + 1.42% on 4/23/2028)7 |
|
|
7,324 |
|
|
|
|
|
|
|
6,951 |
|
|
|
Goldman Sachs Group, Inc. 6.484% 10/24/2029
(USD-SOFR + 1.77% on 10/24/2028)7 |
|
|
1,950 |
|
|
|
|
|
|
|
2,036 |
|
|
|
Goldman Sachs Group, Inc. 5.727% 4/25/2030 (USD-SOFR + 1.265% on 4/25/2029)7 |
|
|
28,930 |
|
|
|
|
|
|
|
29,450 |
|
|
|
Goldman Sachs Group, Inc. 3.102% 2/24/2033 (USD-SOFR + 1.41% on 2/24/2032)7 |
|
|
10,662 |
|
|
|
|
|
|
|
9,109 |
|
|
|
Goldman Sachs Group, Inc. 5.851% 4/25/2035 (USD-SOFR + 1.552% on 4/25/2034)7 |
|
|
9,975 |
|
|
|
|
|
|
|
10,222 |
|
|
|
Goldman Sachs Group, Inc. 2.908% 7/21/2042 (USD-SOFR + 1.40% on 7/21/2041)7 |
|
|
3,160 |
|
|
|
|
|
|
|
2,221 |
|
|
|
HSBC Holdings PLC 2.206% 8/17/2029 (USD-SOFR + 1.285% on 8/17/2028)7 |
|
|
14,232 |
|
|
|
|
|
|
|
12,514 |
|
|
|
HSBC Holdings PLC 2.804% 5/24/2032 (USD-SOFR + 1.187% on 5/24/2031)7 |
|
|
5,250 |
|
|
|
|
|
|
|
4,395 |
|
|
|
HSBC Holdings PLC 2.871% 11/22/2032 (USD-SOFR + 1.41% on 11/22/2031)7 |
|
|
4,463 |
|
|
|
|
|
|
|
3,713 |
|
|
|
HSBC Holdings PLC 5.719% 3/4/2035 (USD-SOFR + 1.78% on 3/4/2034)7 |
|
|
2,000 |
|
|
|
|
|
|
|
2,012 |
|
|
|
ING Groep NV 6.083% 9/11/2027 (USD-SOFR + 1.56% on 9/11/2026)7 |
|
|
1,680 |
|
|
|
|
|
|
|
1,699 |
|
|
|
ING Groep NV 6.114% 9/11/2034 (USD-SOFR + 1.85% on 9/11/2033)7 |
|
|
840 |
|
|
|
|
|
|
|
867 |
|
|
|
Intercontinental Exchange, Inc. 5.25% 6/15/2031 |
|
|
1,091 |
|
|
|
|
|
|
|
1,098 |
|
|
|
Intesa Sanpaolo SpA 3.25% 9/23/20246 |
|
|
770 |
|
|
|
|
|
|
|
765 |
|
|
|
Intesa Sanpaolo SpA 5.71% 1/15/20266 |
|
|
15,400 |
|
|
|
|
|
|
|
15,261 |
|
|
|
Intesa Sanpaolo SpA 3.875% 7/14/20276 |
|
|
6,250 |
|
|
|
|
|
|
|
5,921 |
|
|
|
Intesa Sanpaolo SpA 3.875% 1/12/20286 |
|
|
1,986 |
|
|
|
|
|
|
|
1,863 |
|
|
|
Intesa Sanpaolo SpA 7.778% 6/20/2054
(1-year UST Yield Curve Rate T Note Constant Maturity + 3.90% on 6/20/2053)6,7 |
|
|
5,100 |
|
|
|
|
|
|
|
5,333 |
|
|
|
Iron Mountain Information Management Services, Inc. 5.00% 7/15/20326 |
|
|
705 |
|
|
|
|
|
|
|
645 |
|
|
|
JPMorgan Chase & Co. 1.561% 12/10/2025 (USD-SOFR + 0.605% on 12/10/2024)7 |
|
|
2,435 |
|
|
|
|
|
|
|
2,390 |
|
|
|
JPMorgan Chase & Co. 4.08% 4/26/2026 (USD-SOFR + 1.32% on 4/26/2025)7 |
|
|
3,272 |
|
|
|
|
|
|
|
3,229 |
|
|
|
JPMorgan Chase & Co. 1.04% 2/4/2027 (USD-SOFR + 0.695% on 2/4/2026)7 |
|
|
323 |
|
|
|
|
|
|
|
301 |
|
|
|
JPMorgan Chase & Co. 6.07% 10/22/2027 (USD-SOFR + 1.33% on 10/22/2026)7 |
|
|
1,400 |
|
|
|
|
|
|
|
1,425 |
|
|
|
JPMorgan Chase & Co. 5.04% 1/23/2028 (USD-SOFR + 1.19% on 1/23/2027)7 |
|
|
20,786 |
|
|
|
|
|
|
|
20,677 |
|
|
|
JPMorgan Chase & Co. 2.947% 2/24/2028 (USD-SOFR + 1.17% on 2/24/2027)7 |
|
|
6,538 |
|
|
|
|
|
|
|
6,159 |
|
|
|
JPMorgan Chase & Co. 5.571% 4/22/2028 (USD-SOFR + 0.93% on 4/22/2027)7 |
|
|
3,355 |
|
|
|
|
|
|
|
3,383 |
|
|
|
JPMorgan Chase & Co. 4.203% 7/23/2029
(3-month USD CME Term SOFR + 1.522% on 7/23/2028)7 |
|
|
11,980 |
|
|
|
|
|
|
|
11,532 |
|
|
|
JPMorgan Chase & Co. 5.299% 7/24/2029 (USD-SOFR + 1.45% on 7/24/2028)7 |
|
|
2,240 |
|
|
|
|
|
|
|
2,248 |
|
|
|
JPMorgan Chase & Co. 5.012% 1/23/2030 (USD-SOFR + 1.31% on 1/23/2029)7 |
|
|
14,663 |
|
|
|
|
|
|
|
14,553 |
|
|
|
JPMorgan Chase & Co. 5.581% 4/22/2030 (USD-SOFR + 1.16% on 4/22/2029)7 |
|
|
6,480 |
|
|
|
|
|
|
|
6,584 |
|
|
|
JPMorgan Chase & Co. 1.953% 2/4/2032 (USD-SOFR + 1.065% on 2/4/2031)7 |
|
|
5,031 |
|
|
|
|
|
|
|
4,094 |
|
|
|
JPMorgan Chase & Co. 2.545% 11/8/2032 (USD-SOFR + 1.18% on 11/8/2031)7 |
|
|
5,313 |
|
|
|
|
|
|
|
4,426 |
|
|
|
JPMorgan Chase & Co. 2.963% 1/25/2033 (USD-SOFR + 1.26% on 1/25/2032)7 |
|
|
553 |
|
|
|
|
|
|
|
472 |
|
|
|
JPMorgan Chase & Co. 5.35% 6/1/2034 (USD-SOFR + 1.845% on 6/1/2033)7 |
|
|
1,874 |
|
|
|
|
|
|
|
1,867 |
|
|
|
JPMorgan Chase & Co. 6.254% 10/23/2034 (USD-SOFR + 1.81% on 10/23/2033)7 |
|
|
3,741 |
|
|
|
|
|
|
|
3,970 |
|
|
|
JPMorgan Chase & Co. 5.766% 4/22/2035 (USD-SOFR + 1.49% on 4/22/2034)7 |
|
|
2,100 |
|
|
|
|
|
|
|
2,155 |
|
|
|
Kasikornbank PCL (Hong Kong Branch) 3.343% 10/2/2031
(5-year UST Yield Curve Rate T Note Constant Maturity + 1.70% on 10/2/2026)7 |
|
|
2,415 |
|
|
|
|
|
|
|
2,255 |
|
147 American Funds Insurance Series
The Bond Fund of America (continued)
|
|
|
|
|
|
|
|
|
|
|
|
|
|
|
| Bonds, notes & other debt instruments (continued) |
|
Principal amount
(000) |
|
|
|
|
|
Value (000) |
|
|
| Corporate bonds, notes & loans (continued) |
|
| Financials (continued) |
|
KBC Groep NV 5.796% 1/19/2029
(1-year UST Yield Curve Rate T Note Constant Maturity + 2.10% on 1/19/2028)6,7 |
|
|
USD1,375 |
|
|
|
|
|
|
$ |
1,385 |
|
|
|
KBC Groep NV 6.324% 9/21/2034
(1-year UST Yield Curve Rate T Note Constant Maturity + 2.05% on 9/21/2033)6,7 |
|
|
5,875 |
|
|
|
|
|
|
|
6,103 |
|
|
|
Ladder Capital Finance Holdings LLLP 7.00% 7/15/20316 |
|
|
4,683 |
|
|
|
|
|
|
|
4,727 |
|
|
|
Lloyds Banking Group PLC 2.438% 2/5/2026
(1-year UST Yield Curve Rate T Note Constant Maturity + 1.00% on 2/5/2025)7 |
|
|
2,675 |
|
|
|
|
|
|
|
2,621 |
|
|
|
Lloyds Banking Group PLC 5.985% 8/7/2027
(1-year UST Yield Curve Rate T Note Constant Maturity + 1.48% on 8/7/2026)7 |
|
|
1,625 |
|
|
|
|
|
|
|
1,635 |
|
|
|
Lloyds Banking Group PLC 5.462% 1/5/2028
(1-year UST Yield Curve Rate T Note Constant Maturity + 1.375% on 1/5/2027)7 |
|
|
200 |
|
|
|
|
|
|
|
200 |
|
|
|
Lloyds Banking Group PLC 5.871% 3/6/2029
(1-year UST Yield Curve Rate T Note Constant Maturity + 1.70% on 3/6/2028)7 |
|
|
2,705 |
|
|
|
|
|
|
|
2,744 |
|
|
|
Lloyds Banking Group PLC 5.679% 1/5/2035
(1-year UST Yield Curve Rate T Note Constant Maturity + 1.75% on 1/5/2034)7 |
|
|
810 |
|
|
|
|
|
|
|
807 |
|
|
|
M&T Bank Corp. 7.413% 10/30/2029 (USD-SOFR + 2.80% on 10/30/2028)7 |
|
|
3,750 |
|
|
|
|
|
|
|
3,947 |
|
|
|
M&T Bank Corp. 5.053% 1/27/2034 (USD-SOFR + 1.85% on 1/27/2033)7 |
|
|
5,900 |
|
|
|
|
|
|
|
5,463 |
|
|
|
Marsh & McLennan Companies, Inc. 5.40% 9/15/2033 |
|
|
490 |
|
|
|
|
|
|
|
500 |
|
|
|
MetLife Capital Trust IV, junior subordinated,
7.875% 12/15/2067 (3-month USD-LIBOR + 3.96% on 12/1/2037)6,7,9 |
|
|
1,405 |
|
|
|
|
|
|
|
1,508 |
|
|
|
MetLife, Inc. 3.60% 11/13/2025 |
|
|
3,490 |
|
|
|
|
|
|
|
3,414 |
|
|
|
MetLife, Inc. 5.375% 7/15/2033 |
|
|
1,279 |
|
|
|
|
|
|
|
1,290 |
|
|
|
Metropolitan Life Global Funding I 5.40% 9/12/20286 |
|
|
840 |
|
|
|
|
|
|
|
854 |
|
|
|
Metropolitan Life Global Funding I 4.85% 1/8/20296 |
|
|
2,050 |
|
|
|
|
|
|
|
2,034 |
|
|
|
Metropolitan Life Global Funding I 5.15% 3/28/20336 |
|
|
619 |
|
|
|
|
|
|
|
612 |
|
|
|
Mitsubishi UFJ Financial Group, Inc. 0.962% 10/11/2025
(1-year UST Yield Curve Rate T Note Constant Maturity + 0.45% on 10/11/2024)7 |
|
|
2,960 |
|
|
|
|
|
|
|
2,919 |
|
|
|
Mitsubishi UFJ Financial Group, Inc. 1.538% 7/20/2027
(1-year UST Yield Curve Rate T Note Constant Maturity + 0.75% on 7/20/2026)7 |
|
|
6,200 |
|
|
|
|
|
|
|
5,739 |
|
|
|
Mitsubishi UFJ Financial Group, Inc. 1.64% 10/13/2027
(1-year UST Yield Curve Rate T Note Constant Maturity + 0.67% on 10/13/2026)7 |
|
|
2,225 |
|
|
|
|
|
|
|
2,049 |
|
|
|
Mitsubishi UFJ Financial Group, Inc. 5.422% 2/22/2029
(1-year UST Yield Curve Rate T Note Constant Maturity + 1.38% on 2/22/2028)7 |
|
|
1,430 |
|
|
|
|
|
|
|
1,439 |
|
|
|
Mitsubishi UFJ Financial Group, Inc. 5.133% 7/20/2033
(1-year UST Yield Curve Rate T Note Constant Maturity + 2.125% on 7/20/2032)7 |
|
|
763 |
|
|
|
|
|
|
|
752 |
|
|
|
Mizuho Financial Group, Inc. 1.554% 7/9/2027
(1-year UST Yield Curve Rate T Note Constant Maturity + 0.75% on 7/9/2026)7 |
|
|
1,367 |
|
|
|
|
|
|
|
1,266 |
|
|
|
Mizuho Financial Group, Inc. 5.778% 7/6/2029
(1-year UST Yield Curve Rate T Note Constant Maturity + 1.65% on 7/6/2028)7 |
|
|
1,701 |
|
|
|
|
|
|
|
1,724 |
|
|
|
Mizuho Financial Group, Inc. 5.376% 5/26/2030
(1-year UST Yield Curve Rate T Note Constant Maturity + 1.12% on 5/26/2029)7 |
|
|
2,020 |
|
|
|
|
|
|
|
2,019 |
|
|
|
Morgan Stanley 2.72% 7/22/2025 (USD-SOFR + 1.152% on 7/22/2024)7 |
|
|
2,300 |
|
|
|
|
|
|
|
2,296 |
|
|
|
Morgan Stanley 1.512% 7/20/2027 (USD-SOFR + 0.858% on 7/20/2026)7 |
|
|
13,336 |
|
|
|
|
|
|
|
12,331 |
|
|
|
Morgan Stanley 5.164% 4/20/2029 (USD-SOFR + 1.59% on 4/20/2028)7 |
|
|
21,869 |
|
|
|
|
|
|
|
21,803 |
|
|
|
Morgan Stanley 5.173% 1/16/2030 (USD-SOFR + 1.45% on 1/16/2029)7 |
|
|
4,600 |
|
|
|
|
|
|
|
4,590 |
|
|
|
Morgan Stanley 5.656% 4/18/2030 (USD-SOFR + 1.26% on 4/18/2029)7 |
|
|
22,087 |
|
|
|
|
|
|
|
22,466 |
|
|
|
Morgan Stanley 1.794% 2/13/2032 (USD-SOFR + 1.034% on 2/13/2031)7 |
|
|
3,031 |
|
|
|
|
|
|
|
2,434 |
|
|
|
Morgan Stanley 5.424% 7/21/2034 (USD-SOFR + 1.88% on 7/21/2033)7 |
|
|
11,313 |
|
|
|
|
|
|
|
11,260 |
|
|
|
Morgan Stanley 5.831% 4/19/2035 (USD-SOFR + 1.58% on 4/19/2034)7 |
|
|
19,472 |
|
|
|
|
|
|
|
19,968 |
|
|
|
Morgan Stanley Bank, N.A. 5.882% 10/30/2026 |
|
|
2,775 |
|
|
|
|
|
|
|
2,810 |
|
|
|
MSCI, Inc. 3.25% 8/15/20336 |
|
|
695 |
|
|
|
|
|
|
|
575 |
|
|
|
NatWest Group PLC 5.847% 3/2/2027
(1-year UST Yield Curve Rate T Note Constant Maturity + 1.35% on 3/2/2026)7 |
|
|
3,555 |
|
|
|
|
|
|
|
3,565 |
|
|
|
NatWest Group PLC 5.583% 3/1/2028
(1-year UST Yield Curve Rate T Note Constant Maturity + 1.10% on 3/1/2027)7 |
|
|
2,170 |
|
|
|
|
|
|
|
2,173 |
|
|
|
NatWest Group PLC 6.016% 3/2/2034
(1-year UST Yield Curve Rate T Note Constant Maturity + 2.10% on 3/2/2033)7 |
|
|
1,140 |
|
|
|
|
|
|
|
1,166 |
|
|
|
Navient Corp. 6.75% 6/25/2025 |
|
|
425 |
|
|
|
|
|
|
|
425 |
|
|
|
Northwestern Mutual Life Insurance Co. (The) 4.90% 6/12/20286 |
|
|
2,090 |
|
|
|
|
|
|
|
2,077 |
|
|
|
OneMain Finance Corp. 7.125% 3/15/2026 |
|
|
250 |
|
|
|
|
|
|
|
254 |
|
|
|
Piraeus Bank SA 7.25% 7/13/2028 (1-year EUR Mid-Swap + 3.692% on 7/13/2027)7 |
|
|
EUR355 |
|
|
|
|
|
|
|
407 |
|
American Funds Insurance Series 148
The Bond Fund of America (continued)
|
|
|
|
|
|
|
|
|
|
|
|
|
|
|
| Bonds, notes & other debt instruments (continued) |
|
Principal amount
(000) |
|
|
|
|
|
Value (000) |
|
|
| Corporate bonds, notes & loans (continued) |
|
| Financials (continued) |
|
Piraeus Bank SA 6.75% 12/5/2029 (1-year EUR Mid-Swap + 3.837% on 12/5/2028)7 |
|
|
EUR1,135 |
|
|
|
|
|
|
$ |
1,303 |
|
|
|
PNC Financial Services Group, Inc. 5.582% 6/12/2029
(USD-SOFR + 1.841% on 6/12/2028)7 |
|
|
USD4,594 |
|
|
|
|
|
|
|
4,646 |
|
|
|
PNC Financial Services Group, Inc. 6.875% 10/20/2034
(USD-SOFR + 2.284% on 10/20/2033)7 |
|
|
12,265 |
|
|
|
|
|
|
|
13,373 |
|
|
|
PNC Financial Services Group, Inc. 5.676% 1/22/2035
(USD-SOFR + 1.902% on 1/22/2034)7 |
|
|
635 |
|
|
|
|
|
|
|
639 |
|
|
|
Royal Bank of Canada 4.90% 1/12/2028 |
|
|
360 |
|
|
|
|
|
|
|
357 |
|
|
|
Royal Bank of Canada 4.95% 2/1/2029 |
|
|
1,360 |
|
|
|
|
|
|
|
1,354 |
|
|
|
Royal Bank of Canada 5.00% 2/1/2033 |
|
|
3,591 |
|
|
|
|
|
|
|
3,541 |
|
|
|
Santander Holdings USA, Inc. 6.499% 3/9/2029 (USD-SOFR + 2.356% on 3/9/2028)7 |
|
|
5,100 |
|
|
|
|
|
|
|
5,197 |
|
|
|
Santander Holdings USA, Inc. 6.174% 1/9/2030 (USD-SOFR + 2.50% on 1/9/2029)7 |
|
|
4,100 |
|
|
|
|
|
|
|
4,133 |
|
|
|
Standard Chartered PLC 5.905% 5/14/2035
(1-year UST Yield Curve Rate T Note Constant Maturity + 1.45% on 5/14/2034)6,7 |
|
|
546 |
|
|
|
|
|
|
|
542 |
|
|
|
State Street Corp. 4.164% 8/4/2033 (USD-SOFR + 1.726% on 8/4/2032)7 |
|
|
1,640 |
|
|
|
|
|
|
|
1,521 |
|
|
|
State Street Corp. 5.159% 5/18/2034 (USD-SOFR + 1.89% on 5/18/2033)7 |
|
|
6,337 |
|
|
|
|
|
|
|
6,265 |
|
|
|
Sumitomo Mitsui Financial Group, Inc. 5.88% 7/13/2026 |
|
|
1,429 |
|
|
|
|
|
|
|
1,442 |
|
|
|
Sumitomo Mitsui Financial Group, Inc. 2.174% 1/14/2027 |
|
|
1,100 |
|
|
|
|
|
|
|
1,020 |
|
|
|
Sumitomo Mitsui Financial Group, Inc. 5.80% 7/13/2028 |
|
|
1,045 |
|
|
|
|
|
|
|
1,068 |
|
|
|
Sumitomo Mitsui Financial Group, Inc. 5.766% 1/13/2033 |
|
|
373 |
|
|
|
|
|
|
|
383 |
|
|
|
Sumitomo Mitsui Trust Bank, Ltd. 5.55% 9/14/20286 |
|
|
1,400 |
|
|
|
|
|
|
|
1,428 |
|
|
|
SVB Financial Group 4.70% junior subordinated perpetual bonds
(5-year UST Yield Curve Rate T Note Constant Maturity +
3.064% on 11/15/2031)7,10 |
|
|
1,530 |
|
|
|
|
|
|
|
8 |
|
|
|
Swedbank AB 6.136% 9/12/20266 |
|
|
2,100 |
|
|
|
|
|
|
|
2,136 |
|
|
|
Synchrony Financial 2.875% 10/28/2031 |
|
|
3,385 |
|
|
|
|
|
|
|
2,716 |
|
|
|
Toronto-Dominion Bank (The) 5.523% 7/17/2028 |
|
|
1,855 |
|
|
|
|
|
|
|
1,879 |
|
|
|
Truist Financial Corp. 6.047% 6/8/2027 (USD-SOFR + 2.05% on 6/8/2026)7 |
|
|
1,370 |
|
|
|
|
|
|
|
1,380 |
|
|
|
Truist Financial Corp. 4.873% 1/26/2029 (USD-SOFR + 1.435% on 1/26/2028)7 |
|
|
2,605 |
|
|
|
|
|
|
|
2,556 |
|
|
|
Truist Financial Corp. 7.161% 10/30/2029 (USD-SOFR + 2.446% on 10/30/2028)7 |
|
|
2,396 |
|
|
|
|
|
|
|
2,545 |
|
|
|
Truist Financial Corp. 5.435% 1/24/2030 (USD-SOFR + 1.62% on 1/24/2029)7 |
|
|
1,741 |
|
|
|
|
|
|
|
1,737 |
|
|
|
Truist Financial Corp. 5.867% 6/8/2034 (USD-SOFR + 2.361% on 6/8/2033)7 |
|
|
1,586 |
|
|
|
|
|
|
|
1,599 |
|
|
|
Truist Financial Corp. 5.711% 1/24/2035 (USD-SOFR + 1.922% on 1/24/2034)7 |
|
|
2,440 |
|
|
|
|
|
|
|
2,430 |
|
|
|
U.S. Bancorp 4.653% 2/1/2029 (USD-SOFR + 1.23% on 2/1/2028)7 |
|
|
2,115 |
|
|
|
|
|
|
|
2,070 |
|
|
|
U.S. Bancorp 5.384% 1/23/2030 (USD-SOFR + 1.56% on 1/23/2029)7 |
|
|
7,300 |
|
|
|
|
|
|
|
7,321 |
|
|
|
U.S. Bancorp 4.839% 2/1/2034 (USD-SOFR + 1.60% on 2/1/2033)7 |
|
|
3,119 |
|
|
|
|
|
|
|
2,958 |
|
|
|
U.S. Bancorp 5.836% 6/12/2034 (USD-SOFR + 2.26% on 6/10/2033)7 |
|
|
1,712 |
|
|
|
|
|
|
|
1,737 |
|
|
|
U.S. Bancorp 5.678% 1/23/2035 (USD-SOFR + 1.86% on 1/23/2034)7 |
|
|
3,030 |
|
|
|
|
|
|
|
3,043 |
|
|
|
UBS AG 7.50% 2/15/2028 |
|
|
2,445 |
|
|
|
|
|
|
|
2,617 |
|
|
|
UBS Group AG 2.593% 9/11/2025 (USD-SOFR + 1.56% on 9/11/2024)6,7 |
|
|
850 |
|
|
|
|
|
|
|
844 |
|
|
|
UBS Group AG 2.193% 6/5/2026 (USD-SOFR + 2.044% on 6/5/2025)6,7 |
|
|
7,609 |
|
|
|
|
|
|
|
7,355 |
|
|
|
UBS Group AG 1.305% 2/2/2027 (USD-SOFR + 0.98% on 2/2/2026)6,7 |
|
|
11,200 |
|
|
|
|
|
|
|
10,451 |
|
|
|
UBS Group AG 1.494% 8/10/2027
(1-year UST Yield Curve Rate T Note Constant Maturity + 0.85% on 8/10/2026)6,7 |
|
|
6,623 |
|
|
|
|
|
|
|
6,078 |
|
|
|
UBS Group AG 5.428% 2/8/2030
(1-year UST Yield Curve Rate T Note Constant Maturity + 1.52% on 2/8/2029)6,7 |
|
|
17,490 |
|
|
|
|
|
|
|
17,459 |
|
|
|
UBS Group AG 5.617% 9/13/2030
(1-year USD-ICE SOFR Swap + 1.34% on 9/13/2029)6,7 |
|
|
14,459 |
|
|
|
|
|
|
|
14,525 |
|
|
|
UBS Group AG 4.194% 4/1/2031 (USD-SOFR + 3.73% on 4/1/2030)6,7 |
|
|
9,636 |
|
|
|
|
|
|
|
8,999 |
|
|
|
UBS Group AG 2.095% 2/11/2032
(1-year UST Yield Curve Rate T Note Constant Maturity + 1.00% on 2/11/2031)6,7 |
|
|
1,392 |
|
|
|
|
|
|
|
1,119 |
|
|
|
UBS Group AG 3.091% 5/14/2032 (USD-SOFR + 1.73% on 5/14/2031)6,7 |
|
|
7,869 |
|
|
|
|
|
|
|
6,715 |
|
|
|
UBS Group AG 2.746% 2/11/2033
(1-year UST Yield Curve Rate T Note Constant Maturity + 1.10% on 2/11/2032)6,7 |
|
|
4,038 |
|
|
|
|
|
|
|
3,301 |
|
|
|
UBS Group AG 6.537% 8/12/2033 (USD-SOFR + 3.92% on 8/12/2032)6,7 |
|
|
9,662 |
|
|
|
|
|
|
|
10,144 |
|
|
|
UBS Group AG 9.016% 11/15/2033 (USD-SOFR + 5.02% on 11/15/2032)6,7 |
|
|
5,000 |
|
|
|
|
|
|
|
6,030 |
|
|
|
UBS Group AG 5.699% 2/8/2035
(1-year UST Yield Curve Rate T Note Constant Maturity + 1.77% on 2/8/2034)6,7 |
|
|
1,250 |
|
|
|
|
|
|
|
1,249 |
|
|
|
UniCredit SpA 4.625% 4/12/20276 |
|
|
1,395 |
|
|
|
|
|
|
|
1,361 |
|
|
|
Vigorous Champion International, Ltd. 4.25% 5/28/2029 |
|
|
462 |
|
|
|
|
|
|
|
435 |
|
|
|
Wells Fargo & Co. 3.908% 4/25/2026 (USD-SOFR + 1.32% on 4/25/2025)7 |
|
|
3,524 |
|
|
|
|
|
|
|
3,472 |
|
149 American Funds Insurance Series
The Bond Fund of America (continued)
|
|
|
|
|
|
|
|
|
|
|
|
|
|
|
| Bonds, notes & other debt instruments (continued) |
|
Principal amount
(000) |
|
|
|
|
|
Value (000) |
|
|
| Corporate bonds, notes & loans (continued) |
|
| Financials (continued) |
|
Wells Fargo & Co. 3.526% 3/24/2028 (USD-SOFR + 1.51% on 3/24/2027)7 |
|
|
USD6,615 |
|
|
|
|
|
|
$ |
6,311 |
|
|
|
Wells Fargo & Co. 5.707% 4/22/2028 (USD-SOFR + 1.07% on 4/22/2027)7 |
|
|
5,650 |
|
|
|
|
|
|
|
5,700 |
|
|
|
Wells Fargo & Co. 2.393% 6/2/2028 (USD-SOFR + 2.10% on 6/2/2027)7 |
|
|
1,003 |
|
|
|
|
|
|
|
924 |
|
|
|
Wells Fargo & Co. 4.808% 7/25/2028 (USD-SOFR + 1.98% on 7/25/2027)7 |
|
|
13,490 |
|
|
|
|
|
|
|
13,307 |
|
|
|
Wells Fargo & Co. 5.574% 7/25/2029 (USD-SOFR + 1.74% on 7/25/2028)7 |
|
|
2,545 |
|
|
|
|
|
|
|
2,569 |
|
|
|
Wells Fargo & Co. 5.389% 4/24/2034 (USD-SOFR + 2.02% on 4/24/2033)7 |
|
|
10,406 |
|
|
|
|
|
|
|
10,291 |
|
|
|
Wells Fargo & Co. 5.557% 7/25/2034 (USD-SOFR + 1.99% on 7/25/2033)7 |
|
|
188 |
|
|
|
|
|
|
|
188 |
|
|
|
Wells Fargo & Co. 6.491% 10/23/2034 (USD-SOFR + 2.06% on 10/23/2033)7 |
|
|
4,062 |
|
|
|
|
|
|
|
4,332 |
|
|
|
Wells Fargo & Co. 5.499% 1/23/2035 (USD-SOFR + 1.78% on 1/23/2034)7 |
|
|
3,133 |
|
|
|
|
|
|
|
3,123 |
|
|
|
Wells Fargo & Co. 4.611% 4/25/2053 (USD-SOFR + 2.13% on 4/25/2052)7 |
|
|
5,719 |
|
|
|
|
|
|
|
4,891 |
|
|
|
Willis North America, Inc. 4.65% 6/15/2027 |
|
|
930 |
|
|
|
|
|
|
|
914 |
|
|
|
Willis North America, Inc. 5.90% 3/5/2054 |
|
|
270 |
|
|
|
|
|
|
|
262 |
|
|
|
|
|
|
|
|
|
|
|
|
|
|
|
|
|
|
|
|
|
|
|
|
|
|
|
|
|
1,079,704 |
|
|
|
|
|
|
|
|
|
|
|
|
|
|
|
|
| |
|
| Health care 4.79% |
|
AbbVie, Inc. 5.05% 3/15/2034 |
|
|
18,501 |
|
|
|
|
|
|
|
18,454 |
|
|
|
AbbVie, Inc. 5.35% 3/15/2044 |
|
|
800 |
|
|
|
|
|
|
|
791 |
|
|
|
AbbVie, Inc. 5.40% 3/15/2054 |
|
|
15,770 |
|
|
|
|
|
|
|
15,605 |
|
|
|
AbbVie, Inc. 5.50% 3/15/2064 |
|
|
550 |
|
|
|
|
|
|
|
543 |
|
|
|
Amgen, Inc. 5.507% 3/2/2026 |
|
|
725 |
|
|
|
|
|
|
|
725 |
|
|
|
Amgen, Inc. 5.15% 3/2/2028 |
|
|
5,326 |
|
|
|
|
|
|
|
5,326 |
|
|
|
Amgen, Inc. 4.05% 8/18/2029 |
|
|
7,429 |
|
|
|
|
|
|
|
7,108 |
|
|
|
Amgen, Inc. 2.45% 2/21/2030 |
|
|
5,131 |
|
|
|
|
|
|
|
4,476 |
|
|
|
Amgen, Inc. 5.25% 3/2/2030 |
|
|
2,854 |
|
|
|
|
|
|
|
2,876 |
|
|
|
Amgen, Inc. 4.20% 3/1/2033 |
|
|
8,502 |
|
|
|
|
|
|
|
7,881 |
|
|
|
Amgen, Inc. 5.25% 3/2/2033 |
|
|
20,793 |
|
|
|
|
|
|
|
20,743 |
|
|
|
Amgen, Inc. 4.875% 3/1/2053 |
|
|
3,360 |
|
|
|
|
|
|
|
2,961 |
|
|
|
Amgen, Inc. 4.40% 2/22/2062 |
|
|
196 |
|
|
|
|
|
|
|
156 |
|
|
|
AstraZeneca Finance, LLC 4.90% 2/26/2031 |
|
|
5,760 |
|
|
|
|
|
|
|
5,747 |
|
|
|
AstraZeneca Finance, LLC 5.00% 2/26/2034 |
|
|
6,925 |
|
|
|
|
|
|
|
6,889 |
|
|
|
Bausch Health Companies, Inc. 4.875% 6/1/20286 |
|
|
830 |
|
|
|
|
|
|
|
622 |
|
|
|
Baxter International, Inc. 2.539% 2/1/2032 |
|
|
3,906 |
|
|
|
|
|
|
|
3,205 |
|
|
|
Becton, Dickinson and Co. 4.874% 2/8/2029 |
|
|
5,000 |
|
|
|
|
|
|
|
4,963 |
|
|
|
Bristol-Myers Squibb Co. 4.90% 2/22/2029 |
|
|
2,625 |
|
|
|
|
|
|
|
2,620 |
|
|
|
Bristol-Myers Squibb Co. 5.10% 2/22/2031 |
|
|
3,990 |
|
|
|
|
|
|
|
4,006 |
|
|
|
Bristol-Myers Squibb Co. 5.20% 2/22/2034 |
|
|
18,021 |
|
|
|
|
|
|
|
17,991 |
|
|
|
Bristol-Myers Squibb Co. 5.50% 2/22/2044 |
|
|
425 |
|
|
|
|
|
|
|
421 |
|
|
|
Bristol-Myers Squibb Co. 2.55% 11/13/2050 |
|
|
2,113 |
|
|
|
|
|
|
|
1,238 |
|
|
|
Bristol-Myers Squibb Co. 3.70% 3/15/2052 |
|
|
2,197 |
|
|
|
|
|
|
|
1,611 |
|
|
|
Bristol-Myers Squibb Co. 6.25% 11/15/2053 |
|
|
1,740 |
|
|
|
|
|
|
|
1,870 |
|
|
|
Bristol-Myers Squibb Co. 5.55% 2/22/2054 |
|
|
12,840 |
|
|
|
|
|
|
|
12,668 |
|
|
|
Bristol-Myers Squibb Co. 5.65% 2/22/2064 |
|
|
5,205 |
|
|
|
|
|
|
|
5,089 |
|
|
|
Centene Corp. 4.25% 12/15/2027 |
|
|
14,860 |
|
|
|
|
|
|
|
14,200 |
|
|
|
Centene Corp. 2.45% 7/15/2028 |
|
|
12,410 |
|
|
|
|
|
|
|
11,028 |
|
|
|
Centene Corp. 4.625% 12/15/2029 |
|
|
14,945 |
|
|
|
|
|
|
|
14,146 |
|
|
|
Centene Corp. 3.375% 2/15/2030 |
|
|
15,718 |
|
|
|
|
|
|
|
13,963 |
|
|
|
Centene Corp. 2.50% 3/1/2031 |
|
|
9,750 |
|
|
|
|
|
|
|
8,009 |
|
|
|
Centene Corp. 2.625% 8/1/2031 |
|
|
4,400 |
|
|
|
|
|
|
|
3,618 |
|
|
|
Cigna Group (The) 5.125% 5/15/2031 |
|
|
2,095 |
|
|
|
|
|
|
|
2,081 |
|
|
|
Cigna Group (The) 5.25% 2/15/2034 |
|
|
3,745 |
|
|
|
|
|
|
|
3,695 |
|
|
|
CVS Health Corp. 5.125% 2/21/2030 |
|
|
1,720 |
|
|
|
|
|
|
|
1,702 |
|
|
|
CVS Health Corp. 5.25% 1/30/2031 |
|
|
960 |
|
|
|
|
|
|
|
950 |
|
|
|
CVS Health Corp. 5.55% 6/1/2031 |
|
|
3,707 |
|
|
|
|
|
|
|
3,711 |
|
|
|
CVS Health Corp. 5.25% 2/21/2033 |
|
|
2,122 |
|
|
|
|
|
|
|
2,073 |
|
|
|
CVS Health Corp. 5.70% 6/1/2034 |
|
|
7,706 |
|
|
|
|
|
|
|
7,688 |
|
|
|
CVS Health Corp. 5.625% 2/21/2053 |
|
|
40 |
|
|
|
|
|
|
|
37 |
|
|
|
CVS Health Corp. 5.875% 6/1/2053 |
|
|
4,897 |
|
|
|
|
|
|
|
4,696 |
|
|
|
CVS Health Corp. 6.05% 6/1/2054 |
|
|
1,995 |
|
|
|
|
|
|
|
1,958 |
|
|
|
CVS Health Corp. 6.00% 6/1/2063 |
|
|
1,344 |
|
|
|
|
|
|
|
1,288 |
|
|
|
Elevance Health, Inc. 2.375% 1/15/2025 |
|
|
1,534 |
|
|
|
|
|
|
|
1,508 |
|
American Funds Insurance Series 150
The Bond Fund of America (continued)
|
|
|
|
|
|
|
|
|
|
|
|
|
|
|
| Bonds, notes & other debt instruments (continued) |
|
Principal amount
(000) |
|
|
|
|
|
Value (000) |
|
|
| Corporate bonds, notes & loans (continued) |
|
| Health care (continued) |
|
Elevance Health, Inc. 4.10% 5/15/2032 |
|
|
USD6,161 |
|
|
|
|
|
|
$ |
5,719 |
|
|
|
Elevance Health, Inc. 4.75% 2/15/2033 |
|
|
887 |
|
|
|
|
|
|
|
857 |
|
|
|
Elevance Health, Inc. 4.55% 5/15/2052 |
|
|
271 |
|
|
|
|
|
|
|
227 |
|
|
|
Elevance Health, Inc. 5.125% 2/15/2053 |
|
|
784 |
|
|
|
|
|
|
|
722 |
|
|
|
GE HealthCare Technologies, Inc. 5.65% 11/15/2027 |
|
|
4,895 |
|
|
|
|
|
|
|
4,961 |
|
|
|
GE HealthCare Technologies, Inc. 5.857% 3/15/2030 |
|
|
207 |
|
|
|
|
|
|
|
213 |
|
|
|
GE HealthCare Technologies, Inc. 6.377% 11/22/2052 |
|
|
215 |
|
|
|
|
|
|
|
234 |
|
|
|
Gilead Sciences, Inc. 5.25% 10/15/2033 |
|
|
3,340 |
|
|
|
|
|
|
|
3,366 |
|
|
|
Gilead Sciences, Inc. 5.55% 10/15/2053 |
|
|
4,978 |
|
|
|
|
|
|
|
4,974 |
|
|
|
HCA, Inc. 5.20% 6/1/2028 |
|
|
4,165 |
|
|
|
|
|
|
|
4,150 |
|
|
|
HCA, Inc. 2.375% 7/15/2031 |
|
|
2,233 |
|
|
|
|
|
|
|
1,834 |
|
|
|
HCA, Inc. 3.625% 3/15/2032 |
|
|
2,400 |
|
|
|
|
|
|
|
2,115 |
|
|
|
HCA, Inc. 4.625% 3/15/2052 |
|
|
226 |
|
|
|
|
|
|
|
183 |
|
|
|
Humana, Inc. 5.375% 4/15/2031 |
|
|
2,078 |
|
|
|
|
|
|
|
2,068 |
|
|
|
Humana, Inc. 5.75% 4/15/2054 |
|
|
954 |
|
|
|
|
|
|
|
920 |
|
|
|
Johnson & Johnson 4.80% 6/1/2029 |
|
|
3,970 |
|
|
|
|
|
|
|
4,002 |
|
|
|
Johnson & Johnson 4.90% 6/1/2031 |
|
|
4,175 |
|
|
|
|
|
|
|
4,217 |
|
|
|
Johnson & Johnson 4.95% 6/1/2034 |
|
|
6,880 |
|
|
|
|
|
|
|
6,963 |
|
|
|
Johnson & Johnson 5.25% 6/1/2054 |
|
|
3,390 |
|
|
|
|
|
|
|
3,407 |
|
|
|
Laboratory Corp. of America Holdings 1.55% 6/1/2026 |
|
|
773 |
|
|
|
|
|
|
|
719 |
|
|
|
Laboratory Corp. of America Holdings 4.70% 2/1/2045 |
|
|
3,975 |
|
|
|
|
|
|
|
3,490 |
|
|
|
Medtronic Global Holdings S.C.A. 4.50% 3/30/2033 |
|
|
1,485 |
|
|
|
|
|
|
|
1,428 |
|
|
|
Merck & Co., Inc. 1.70% 6/10/2027 |
|
|
3,093 |
|
|
|
|
|
|
|
2,839 |
|
|
|
Pfizer Investment Enterprises Pte., Ltd. 4.45% 5/19/2028 |
|
|
1,375 |
|
|
|
|
|
|
|
1,351 |
|
|
|
Pfizer Investment Enterprises Pte., Ltd. 4.75% 5/19/2033 |
|
|
7,942 |
|
|
|
|
|
|
|
7,742 |
|
|
|
Pfizer Investment Enterprises Pte., Ltd. 5.30% 5/19/2053 |
|
|
5,622 |
|
|
|
|
|
|
|
5,426 |
|
|
|
Roche Holdings, Inc. 1.93% 12/13/20286 |
|
|
7,545 |
|
|
|
|
|
|
|
6,662 |
|
|
|
Roche Holdings, Inc. 2.076% 12/13/20316 |
|
|
9,309 |
|
|
|
|
|
|
|
7,603 |
|
|
|
Roche Holdings, Inc. 2.607% 12/13/20516 |
|
|
645 |
|
|
|
|
|
|
|
394 |
|
|
|
Shire Acquisitions Investments Ireland DAC 3.20% 9/23/2026 |
|
|
13,390 |
|
|
|
|
|
|
|
12,844 |
|
|
|
Teva Pharmaceutical Finance Netherlands III BV 7.125% 1/31/2025 |
|
|
45,000 |
|
|
|
|
|
|
|
45,153 |
|
|
|
Teva Pharmaceutical Finance Netherlands III BV 3.15% 10/1/2026 |
|
|
68,853 |
|
|
|
|
|
|
|
64,674 |
|
|
|
Teva Pharmaceutical Finance Netherlands III BV 6.75% 3/1/2028 |
|
|
26,824 |
|
|
|
|
|
|
|
27,483 |
|
|
|
Teva Pharmaceutical Finance Netherlands III BV 4.10% 10/1/2046 |
|
|
46,666 |
|
|
|
|
|
|
|
32,644 |
|
|
|
UnitedHealth Group, Inc. 3.75% 7/15/2025 |
|
|
5,410 |
|
|
|
|
|
|
|
5,331 |
|
|
|
UnitedHealth Group, Inc. 2.00% 5/15/2030 |
|
|
466 |
|
|
|
|
|
|
|
396 |
|
|
|
UnitedHealth Group, Inc. 4.20% 5/15/2032 |
|
|
1,654 |
|
|
|
|
|
|
|
1,557 |
|
|
|
UnitedHealth Group, Inc. 3.05% 5/15/2041 |
|
|
1,300 |
|
|
|
|
|
|
|
960 |
|
|
|
UnitedHealth Group, Inc. 4.25% 6/15/2048 |
|
|
960 |
|
|
|
|
|
|
|
794 |
|
|
|
UnitedHealth Group, Inc. 3.25% 5/15/2051 |
|
|
572 |
|
|
|
|
|
|
|
393 |
|
|
|
UnitedHealth Group, Inc. 4.95% 5/15/2062 |
|
|
69 |
|
|
|
|
|
|
|
61 |
|
|
|
|
|
|
|
|
|
|
|
|
|
|
|
|
|
|
|
|
|
|
|
|
|
|
|
|
|
534,012 |
|
|
|
|
|
|
|
|
|
|
|
|
|
|
|
|
| |
|
| Utilities 4.13% |
|
AEP Texas, Inc. 3.45% 5/15/2051 |
|
|
1,380 |
|
|
|
|
|
|
|
909 |
|
|
|
Alabama Power Co. 3.00% 3/15/2052 |
|
|
3,219 |
|
|
|
|
|
|
|
2,088 |
|
|
|
Alfa Desarrollo SpA 4.55% 9/27/20516 |
|
|
998 |
|
|
|
|
|
|
|
750 |
|
|
|
Baltimore Gas and Electric Co. 4.55% 6/1/2052 |
|
|
525 |
|
|
|
|
|
|
|
438 |
|
|
|
Berkshire Hathaway Energy Co. 4.50% 2/1/2045 |
|
|
5,895 |
|
|
|
|
|
|
|
5,165 |
|
|
|
Berkshire Hathaway Energy Co. 4.60% 5/1/2053 |
|
|
1,017 |
|
|
|
|
|
|
|
846 |
|
|
|
Cleveland Electric Illuminating Co. (The) 3.50% 4/1/20286 |
|
|
2,400 |
|
|
|
|
|
|
|
2,251 |
|
|
|
Comision Federal de Electricidad 4.688% 5/15/20296 |
|
|
3,655 |
|
|
|
|
|
|
|
3,425 |
|
|
|
Connecticut Light and Power Co. (The) 2.05% 7/1/2031 |
|
|
1,775 |
|
|
|
|
|
|
|
1,453 |
|
|
|
Consumers Energy Co. 4.625% 5/15/2033 |
|
|
3,500 |
|
|
|
|
|
|
|
3,353 |
|
|
|
Consumers Energy Co. 3.10% 8/15/2050 |
|
|
939 |
|
|
|
|
|
|
|
647 |
|
|
|
DTE Energy Co. 5.10% 3/1/2029 |
|
|
7,900 |
|
|
|
|
|
|
|
7,838 |
|
|
|
DTE Energy Co. 3.00% 3/1/2032 |
|
|
259 |
|
|
|
|
|
|
|
224 |
|
|
|
Duke Energy Carolinas, LLC 5.35% 1/15/2053 |
|
|
332 |
|
|
|
|
|
|
|
316 |
|
|
|
Duke Energy Florida, LLC 5.875% 11/15/2033 |
|
|
370 |
|
|
|
|
|
|
|
385 |
|
|
|
Duke Energy Florida, LLC 3.40% 10/1/2046 |
|
|
5,669 |
|
|
|
|
|
|
|
3,996 |
|
151 American Funds Insurance Series
The Bond Fund of America (continued)
|
|
|
|
|
|
|
|
|
|
|
|
|
|
|
| Bonds, notes & other debt instruments (continued) |
|
Principal amount
(000) |
|
|
|
|
|
Value (000) |
|
|
| Corporate bonds, notes & loans (continued) |
|
| Utilities (continued) |
|
Duke Energy Florida, LLC 3.00% 12/15/2051 |
|
|
USD293 |
|
|
|
|
|
|
$ |
184 |
|
|
|
Duke Energy Florida, LLC 5.95% 11/15/2052 |
|
|
575 |
|
|
|
|
|
|
|
586 |
|
|
|
Duke Energy Progress, LLC 3.70% 9/1/2028 |
|
|
3,750 |
|
|
|
|
|
|
|
3,577 |
|
|
|
Duke Energy Progress, LLC 2.00% 8/15/2031 |
|
|
1,775 |
|
|
|
|
|
|
|
1,451 |
|
|
|
Duke Energy Progress, LLC 2.50% 8/15/2050 |
|
|
644 |
|
|
|
|
|
|
|
371 |
|
|
|
Edison International 4.95% 4/15/2025 |
|
|
175 |
|
|
|
|
|
|
|
174 |
|
|
|
Edison International 5.75% 6/15/2027 |
|
|
3,181 |
|
|
|
|
|
|
|
3,210 |
|
|
|
Edison International 4.125% 3/15/2028 |
|
|
4,253 |
|
|
|
|
|
|
|
4,065 |
|
|
|
Edison International 5.25% 11/15/2028 |
|
|
50 |
|
|
|
|
|
|
|
50 |
|
|
|
Edison International 5.45% 6/15/2029 |
|
|
4,525 |
|
|
|
|
|
|
|
4,525 |
|
|
|
Edison International 6.95% 11/15/2029 |
|
|
2,425 |
|
|
|
|
|
|
|
2,580 |
|
|
|
Electricité de France SA 5.65% 4/22/20296 |
|
|
1,420 |
|
|
|
|
|
|
|
1,433 |
|
|
|
Electricité de France SA 2.625% junior subordinated perpetual bonds
(5-year EUR Mid-Swap + 2.86% on 6/1/2028)7 |
|
|
EUR2,800 |
|
|
|
|
|
|
|
2,711 |
|
|
|
Electricité de France SA 9.125% junior subordinated perpetual bonds
(5-year UST Yield Curve Rate T Note Constant Maturity +
5.411% on 6/15/2033)6,7 |
|
|
USD1,575 |
|
|
|
|
|
|
|
1,717 |
|
|
|
Emera US Finance, LP 2.639% 6/15/2031 |
|
|
4,400 |
|
|
|
|
|
|
|
3,634 |
|
|
|
ENN Clean Energy International Investment, Ltd. 3.375% 5/12/20266 |
|
|
1,310 |
|
|
|
|
|
|
|
1,249 |
|
|
|
Entergy Louisiana, LLC 4.20% 9/1/2048 |
|
|
6,325 |
|
|
|
|
|
|
|
5,005 |
|
|
|
Entergy Louisiana, LLC 4.75% 9/15/2052 |
|
|
395 |
|
|
|
|
|
|
|
341 |
|
|
|
Eversource Energy 5.00% 1/1/2027 |
|
|
3,415 |
|
|
|
|
|
|
|
3,389 |
|
|
|
Eversource Energy 5.50% 1/1/2034 |
|
|
2,700 |
|
|
|
|
|
|
|
2,650 |
|
|
|
FirstEnergy Corp. 1.60% 1/15/2026 |
|
|
20,066 |
|
|
|
|
|
|
|
18,902 |
|
|
|
FirstEnergy Corp. 2.65% 3/1/2030 |
|
|
10,149 |
|
|
|
|
|
|
|
8,829 |
|
|
|
FirstEnergy Corp. 2.25% 9/1/2030 |
|
|
12,602 |
|
|
|
|
|
|
|
10,562 |
|
|
|
FirstEnergy Corp., Series B, 4.15% 7/15/2027 |
|
|
12,178 |
|
|
|
|
|
|
|
11,694 |
|
|
|
Florida Power & Light Co. 5.05% 4/1/2028 |
|
|
1,511 |
|
|
|
|
|
|
|
1,517 |
|
|
|
Florida Power & Light Co. 4.40% 5/15/2028 |
|
|
1,655 |
|
|
|
|
|
|
|
1,626 |
|
|
|
Florida Power & Light Co. 2.45% 2/3/2032 |
|
|
1,844 |
|
|
|
|
|
|
|
1,537 |
|
|
|
Florida Power & Light Co. 5.10% 4/1/2033 |
|
|
7,431 |
|
|
|
|
|
|
|
7,400 |
|
|
|
Florida Power & Light Co. 4.80% 5/15/2033 |
|
|
1,085 |
|
|
|
|
|
|
|
1,056 |
|
|
|
Florida Power & Light Co. 5.30% 4/1/2053 |
|
|
1,255 |
|
|
|
|
|
|
|
1,211 |
|
|
|
Georgia Power Co. 4.65% 5/16/2028 |
|
|
1,050 |
|
|
|
|
|
|
|
1,034 |
|
|
|
Georgia Power Co. 4.95% 5/17/2033 |
|
|
1,845 |
|
|
|
|
|
|
|
1,800 |
|
|
|
Georgia Power Co. 5.25% 3/15/2034 |
|
|
3,200 |
|
|
|
|
|
|
|
3,191 |
|
|
|
Georgia Power Co. 3.70% 1/30/2050 |
|
|
190 |
|
|
|
|
|
|
|
140 |
|
|
|
Jersey Central Power & Light Co. 2.75% 3/1/20326 |
|
|
525 |
|
|
|
|
|
|
|
434 |
|
|
|
Mid-Atlantic Interstate Transmission, LLC 4.10% 5/15/20286 |
|
|
425 |
|
|
|
|
|
|
|
409 |
|
|
|
Monongahela Power Co. 3.55% 5/15/20276 |
|
|
1,700 |
|
|
|
|
|
|
|
1,621 |
|
|
|
NextEra Energy Capital Holdings, Inc. 5.25% 2/28/2053 |
|
|
1,440 |
|
|
|
|
|
|
|
1,341 |
|
|
|
NiSource, Inc. 5.40% 6/30/2033 |
|
|
650 |
|
|
|
|
|
|
|
644 |
|
|
|
Pacific Gas and Electric Co. 3.40% 8/15/2024 |
|
|
2,000 |
|
|
|
|
|
|
|
1,993 |
|
|
|
Pacific Gas and Electric Co. 3.15% 1/1/2026 |
|
|
27,543 |
|
|
|
|
|
|
|
26,542 |
|
|
|
Pacific Gas and Electric Co. 2.95% 3/1/2026 |
|
|
10,850 |
|
|
|
|
|
|
|
10,391 |
|
|
|
Pacific Gas and Electric Co. 3.30% 3/15/2027 |
|
|
2,393 |
|
|
|
|
|
|
|
2,268 |
|
|
|
Pacific Gas and Electric Co. 2.10% 8/1/2027 |
|
|
1,000 |
|
|
|
|
|
|
|
903 |
|
|
|
Pacific Gas and Electric Co. 3.30% 12/1/2027 |
|
|
7,997 |
|
|
|
|
|
|
|
7,459 |
|
|
|
Pacific Gas and Electric Co. 3.00% 6/15/2028 |
|
|
2,542 |
|
|
|
|
|
|
|
2,325 |
|
|
|
Pacific Gas and Electric Co. 3.75% 7/1/2028 |
|
|
13,760 |
|
|
|
|
|
|
|
12,926 |
|
|
|
Pacific Gas and Electric Co. 4.65% 8/1/2028 |
|
|
7,900 |
|
|
|
|
|
|
|
7,651 |
|
|
|
Pacific Gas and Electric Co. 6.10% 1/15/2029 |
|
|
3,165 |
|
|
|
|
|
|
|
3,241 |
|
|
|
Pacific Gas and Electric Co. 4.55% 7/1/2030 |
|
|
35,449 |
|
|
|
|
|
|
|
33,612 |
|
|
|
Pacific Gas and Electric Co. 2.50% 2/1/2031 |
|
|
21,597 |
|
|
|
|
|
|
|
17,814 |
|
|
|
Pacific Gas and Electric Co. 6.15% 1/15/2033 |
|
|
518 |
|
|
|
|
|
|
|
527 |
|
|
|
Pacific Gas and Electric Co. 6.40% 6/15/2033 |
|
|
12,331 |
|
|
|
|
|
|
|
12,745 |
|
|
|
Pacific Gas and Electric Co. 5.80% 5/15/2034 |
|
|
6,047 |
|
|
|
|
|
|
|
6,011 |
|
|
|
Pacific Gas and Electric Co. 3.30% 8/1/2040 |
|
|
9,898 |
|
|
|
|
|
|
|
7,057 |
|
|
|
Pacific Gas and Electric Co. 3.75% 8/15/2042 |
|
|
442 |
|
|
|
|
|
|
|
319 |
|
|
|
Pacific Gas and Electric Co. 4.95% 7/1/2050 |
|
|
1,627 |
|
|
|
|
|
|
|
1,346 |
|
|
|
Pacific Gas and Electric Co. 3.50% 8/1/2050 |
|
|
14,919 |
|
|
|
|
|
|
|
9,750 |
|
American Funds Insurance Series 152
The Bond Fund of America (continued)
|
|
|
|
|
|
|
|
|
|
|
|
|
|
|
| Bonds, notes & other debt instruments (continued) |
|
Principal amount
(000) |
|
|
|
|
|
Value (000) |
|
|
| Corporate bonds, notes & loans (continued) |
|
| Utilities (continued) |
|
PacifiCorp 5.10% 2/15/2029 |
|
|
USD7,150 |
|
|
|
|
|
|
$ |
7,148 |
|
|
|
PacifiCorp 5.30% 2/15/2031 |
|
|
1,915 |
|
|
|
|
|
|
|
1,910 |
|
|
|
PacifiCorp 5.45% 2/15/2034 |
|
|
8,920 |
|
|
|
|
|
|
|
8,815 |
|
|
|
PacifiCorp 3.30% 3/15/2051 |
|
|
325 |
|
|
|
|
|
|
|
210 |
|
|
|
PacifiCorp 2.90% 6/15/2052 |
|
|
586 |
|
|
|
|
|
|
|
346 |
|
|
|
PacifiCorp 5.35% 12/1/2053 |
|
|
1,748 |
|
|
|
|
|
|
|
1,587 |
|
|
|
PacifiCorp 5.50% 5/15/2054 |
|
|
8,738 |
|
|
|
|
|
|
|
8,124 |
|
|
|
PacifiCorp 5.80% 1/15/2055 |
|
|
7,735 |
|
|
|
|
|
|
|
7,496 |
|
|
|
Public Service Company of Colorado 5.35% 5/15/2034 |
|
|
4,000 |
|
|
|
|
|
|
|
3,968 |
|
|
|
Public Service Company of Colorado 2.70% 1/15/2051 |
|
|
2,472 |
|
|
|
|
|
|
|
1,462 |
|
|
|
Public Service Company of Colorado 5.75% 5/15/2054 |
|
|
1,975 |
|
|
|
|
|
|
|
1,952 |
|
|
|
Public Service Electric and Gas Co. 3.20% 5/15/2029 |
|
|
6,000 |
|
|
|
|
|
|
|
5,557 |
|
|
|
Public Service Electric and Gas Co. 5.20% 8/1/2033 |
|
|
1,200 |
|
|
|
|
|
|
|
1,203 |
|
|
|
Puget Energy, Inc. 3.65% 5/15/2025 |
|
|
300 |
|
|
|
|
|
|
|
294 |
|
|
|
Southern California Edison Co. 4.90% 6/1/2026 |
|
|
1,177 |
|
|
|
|
|
|
|
1,168 |
|
|
|
Southern California Edison Co. 4.70% 6/1/2027 |
|
|
404 |
|
|
|
|
|
|
|
399 |
|
|
|
Southern California Edison Co. 5.30% 3/1/2028 |
|
|
4,000 |
|
|
|
|
|
|
|
4,009 |
|
|
|
Southern California Edison Co. 4.20% 3/1/2029 |
|
|
8,211 |
|
|
|
|
|
|
|
7,863 |
|
|
|
Southern California Edison Co. 5.15% 6/1/2029 |
|
|
924 |
|
|
|
|
|
|
|
923 |
|
|
|
Southern California Edison Co. 2.85% 8/1/2029 |
|
|
6,945 |
|
|
|
|
|
|
|
6,241 |
|
|
|
Southern California Edison Co. 2.50% 6/1/2031 |
|
|
5,044 |
|
|
|
|
|
|
|
4,236 |
|
|
|
Southern California Edison Co. 5.45% 6/1/2031 |
|
|
3,350 |
|
|
|
|
|
|
|
3,375 |
|
|
|
Southern California Edison Co. 5.20% 6/1/2034 |
|
|
4,950 |
|
|
|
|
|
|
|
4,835 |
|
|
|
Southern California Edison Co. 5.75% 4/1/2035 |
|
|
4,549 |
|
|
|
|
|
|
|
4,640 |
|
|
|
Southern California Edison Co. 5.35% 7/15/2035 |
|
|
6,450 |
|
|
|
|
|
|
|
6,395 |
|
|
|
Southern California Edison Co. 5.625% 2/1/2036 |
|
|
7,051 |
|
|
|
|
|
|
|
7,046 |
|
|
|
Southern California Edison Co. 3.60% 2/1/2045 |
|
|
2,417 |
|
|
|
|
|
|
|
1,770 |
|
|
|
Southern California Edison Co. 3.65% 2/1/2050 |
|
|
14,600 |
|
|
|
|
|
|
|
10,389 |
|
|
|
Southern California Edison Co. 2.95% 2/1/2051 |
|
|
151 |
|
|
|
|
|
|
|
94 |
|
|
|
Southern California Edison Co. 3.65% 6/1/2051 |
|
|
354 |
|
|
|
|
|
|
|
250 |
|
|
|
Southern California Edison Co. 3.45% 2/1/2052 |
|
|
515 |
|
|
|
|
|
|
|
350 |
|
|
|
Southern California Edison Co. 5.75% 4/15/2054 |
|
|
575 |
|
|
|
|
|
|
|
563 |
|
|
|
Southwestern Electric Power Co. 1.65% 3/15/2026 |
|
|
3,550 |
|
|
|
|
|
|
|
3,341 |
|
|
|
Southwestern Electric Power Co. 3.25% 11/1/2051 |
|
|
2,075 |
|
|
|
|
|
|
|
1,311 |
|
|
|
Southwestern Public Service Co. 6.00% 6/1/2054 |
|
|
25 |
|
|
|
|
|
|
|
25 |
|
|
|
Virginia Electric & Power 2.40% 3/30/2032 |
|
|
2,575 |
|
|
|
|
|
|
|
2,117 |
|
|
|
WEC Energy Group, Inc. 5.60% 9/12/2026 |
|
|
400 |
|
|
|
|
|
|
|
402 |
|
|
|
Wisconsin Power and Light Co. 1.95% 9/16/2031 |
|
|
525 |
|
|
|
|
|
|
|
420 |
|
|
|
Wisconsin Power and Light Co. 3.65% 4/1/2050 |
|
|
1,075 |
|
|
|
|
|
|
|
771 |
|
|
|
Wisconsin Public Service Corp. 2.85% 12/1/2051 |
|
|
375 |
|
|
|
|
|
|
|
232 |
|
|
|
Xcel Energy, Inc. 3.30% 6/1/2025 |
|
|
5,650 |
|
|
|
|
|
|
|
5,526 |
|
|
|
Xcel Energy, Inc. 1.75% 3/15/2027 |
|
|
4,363 |
|
|
|
|
|
|
|
3,971 |
|
|
|
Xcel Energy, Inc. 2.60% 12/1/2029 |
|
|
1,725 |
|
|
|
|
|
|
|
1,506 |
|
|
|
Xcel Energy, Inc. 4.60% 6/1/2032 |
|
|
4,600 |
|
|
|
|
|
|
|
4,304 |
|
|
|
Xcel Energy, Inc. 5.50% 3/15/2034 |
|
|
4,230 |
|
|
|
|
|
|
|
4,169 |
|
|
|
|
|
|
|
|
|
|
|
|
|
|
|
|
|
|
|
|
|
|
|
|
|
|
|
|
|
459,527 |
|
|
|
|
|
|
|
|
|
|
|
|
|
|
|
|
| |
|
| Consumer discretionary 3.09% |
|
Allied Universal Holdco, LLC 4.625% 6/1/20286 |
|
|
335 |
|
|
|
|
|
|
|
306 |
|
|
|
Amazon.com, Inc. 1.65% 5/12/2028 |
|
|
3,860 |
|
|
|
|
|
|
|
3,440 |
|
|
|
Amazon.com, Inc. 3.45% 4/13/2029 |
|
|
600 |
|
|
|
|
|
|
|
569 |
|
|
|
Amazon.com, Inc. 3.25% 5/12/2061 |
|
|
4,100 |
|
|
|
|
|
|
|
2,736 |
|
|
|
Amazon.com, Inc. 4.10% 4/13/2062 |
|
|
470 |
|
|
|
|
|
|
|
376 |
|
|
|
Atlas LuxCo 4 SARL 4.625% 6/1/20286 |
|
|
255 |
|
|
|
|
|
|
|
233 |
|
|
|
Bath & Body Works, Inc. 6.875% 11/1/2035 |
|
|
740 |
|
|
|
|
|
|
|
747 |
|
|
|
BMW US Capital, LLC 3.45% 4/1/20276 |
|
|
1,075 |
|
|
|
|
|
|
|
1,031 |
|
|
|
BMW US Capital, LLC 3.70% 4/1/20326 |
|
|
1,350 |
|
|
|
|
|
|
|
1,223 |
|
|
|
Daimler Trucks Finance North America, LLC 1.625% 12/13/20246 |
|
|
4,950 |
|
|
|
|
|
|
|
4,863 |
|
|
|
Daimler Trucks Finance North America, LLC 5.00% 1/15/20276 |
|
|
794 |
|
|
|
|
|
|
|
788 |
|
|
|
Daimler Trucks Finance North America, LLC 3.65% 4/7/20276 |
|
|
3,567 |
|
|
|
|
|
|
|
3,416 |
|
153 American Funds Insurance Series
The Bond Fund of America (continued)
|
|
|
|
|
|
|
|
|
|
|
|
|
|
|
| Bonds, notes & other debt instruments (continued) |
|
Principal amount
(000) |
|
|
|
|
|
Value (000) |
|
|
| Corporate bonds, notes & loans (continued) |
|
| Consumer discretionary (continued) |
|
Daimler Trucks Finance North America, LLC 5.125% 9/25/20276 |
|
|
USD1,320 |
|
|
|
|
|
|
$ |
1,314 |
|
|
|
Daimler Trucks Finance North America, LLC 5.40% 9/20/20286 |
|
|
832 |
|
|
|
|
|
|
|
839 |
|
|
|
Daimler Trucks Finance North America, LLC 2.375% 12/14/20286 |
|
|
3,230 |
|
|
|
|
|
|
|
2,879 |
|
|
|
Daimler Trucks Finance North America, LLC 2.50% 12/14/20316 |
|
|
8,174 |
|
|
|
|
|
|
|
6,750 |
|
|
|
Daimler Trucks Finance North America, LLC 5.50% 9/20/20336 |
|
|
691 |
|
|
|
|
|
|
|
693 |
|
|
|
Daimler Trucks Finance North America, LLC 5.375% 1/18/20346 |
|
|
246 |
|
|
|
|
|
|
|
244 |
|
|
|
Ford Motor Co. 3.25% 2/12/2032 |
|
|
620 |
|
|
|
|
|
|
|
513 |
|
|
|
Ford Motor Credit Co., LLC 5.125% 6/16/2025 |
|
|
3,870 |
|
|
|
|
|
|
|
3,842 |
|
|
|
Ford Motor Credit Co., LLC 6.95% 3/6/2026 |
|
|
855 |
|
|
|
|
|
|
|
869 |
|
|
|
Ford Motor Credit Co., LLC 6.95% 6/10/2026 |
|
|
755 |
|
|
|
|
|
|
|
770 |
|
|
|
Ford Motor Credit Co., LLC 2.70% 8/10/2026 |
|
|
200 |
|
|
|
|
|
|
|
188 |
|
|
|
Ford Motor Credit Co., LLC 4.271% 1/9/2027 |
|
|
18,742 |
|
|
|
|
|
|
|
18,066 |
|
|
|
Ford Motor Credit Co., LLC 5.80% 3/5/2027 |
|
|
3,145 |
|
|
|
|
|
|
|
3,146 |
|
|
|
Ford Motor Credit Co., LLC 5.85% 5/17/2027 |
|
|
6,490 |
|
|
|
|
|
|
|
6,492 |
|
|
|
Ford Motor Credit Co., LLC 4.95% 5/28/2027 |
|
|
485 |
|
|
|
|
|
|
|
474 |
|
|
|
Ford Motor Credit Co., LLC 4.125% 8/17/2027 |
|
|
39,480 |
|
|
|
|
|
|
|
37,530 |
|
|
|
Ford Motor Credit Co., LLC 3.815% 11/2/2027 |
|
|
3,990 |
|
|
|
|
|
|
|
3,745 |
|
|
|
Ford Motor Credit Co., LLC 7.35% 11/4/2027 |
|
|
7,549 |
|
|
|
|
|
|
|
7,870 |
|
|
|
Ford Motor Credit Co., LLC 6.80% 5/12/2028 |
|
|
2,030 |
|
|
|
|
|
|
|
2,092 |
|
|
|
Ford Motor Credit Co., LLC 6.798% 11/7/2028 |
|
|
762 |
|
|
|
|
|
|
|
788 |
|
|
|
Ford Motor Credit Co., LLC 2.90% 2/10/2029 |
|
|
1,065 |
|
|
|
|
|
|
|
939 |
|
|
|
Ford Motor Credit Co., LLC 5.80% 3/8/2029 |
|
|
6,740 |
|
|
|
|
|
|
|
6,719 |
|
|
|
Ford Motor Credit Co., LLC 5.113% 5/3/2029 |
|
|
9,854 |
|
|
|
|
|
|
|
9,524 |
|
|
|
Ford Motor Credit Co., LLC 7.35% 3/6/2030 |
|
|
10,668 |
|
|
|
|
|
|
|
11,296 |
|
|
|
Ford Motor Credit Co., LLC 7.20% 6/10/2030 |
|
|
1,015 |
|
|
|
|
|
|
|
1,068 |
|
|
|
Ford Motor Credit Co., LLC 6.05% 3/5/2031 |
|
|
3,960 |
|
|
|
|
|
|
|
3,967 |
|
|
|
Ford Motor Credit Co., LLC 3.625% 6/17/2031 |
|
|
1,215 |
|
|
|
|
|
|
|
1,048 |
|
|
|
Ford Motor Credit Co., LLC 7.122% 11/7/2033 |
|
|
688 |
|
|
|
|
|
|
|
727 |
|
|
|
General Motors Co. 6.125% 10/1/2025 |
|
|
22,221 |
|
|
|
|
|
|
|
22,345 |
|
|
|
General Motors Co. 5.40% 4/1/2048 |
|
|
5,200 |
|
|
|
|
|
|
|
4,657 |
|
|
|
General Motors Financial Co., Inc. 4.35% 4/9/2025 |
|
|
11,358 |
|
|
|
|
|
|
|
11,238 |
|
|
|
General Motors Financial Co., Inc. 1.50% 6/10/2026 |
|
|
6,712 |
|
|
|
|
|
|
|
6,219 |
|
|
|
General Motors Financial Co., Inc. 2.35% 2/26/2027 |
|
|
9,771 |
|
|
|
|
|
|
|
9,044 |
|
|
|
Grand Canyon University 4.125% 10/1/2024 |
|
|
4,190 |
|
|
|
|
|
|
|
4,174 |
|
|
|
Hanesbrands, Inc. 9.00% 2/15/20316 |
|
|
528 |
|
|
|
|
|
|
|
554 |
|
|
|
Home Depot, Inc. 2.95% 6/15/2029 |
|
|
1,966 |
|
|
|
|
|
|
|
1,802 |
|
|
|
Home Depot, Inc. 4.75% 6/25/2029 |
|
|
1,849 |
|
|
|
|
|
|
|
1,839 |
|
|
|
Home Depot, Inc. 4.85% 6/25/2031 |
|
|
2,559 |
|
|
|
|
|
|
|
2,540 |
|
|
|
Home Depot, Inc. 4.95% 6/25/2034 |
|
|
4,749 |
|
|
|
|
|
|
|
4,701 |
|
|
|
Home Depot, Inc. 4.50% 12/6/2048 |
|
|
1,915 |
|
|
|
|
|
|
|
1,660 |
|
|
|
Home Depot, Inc. 5.30% 6/25/2054 |
|
|
2,234 |
|
|
|
|
|
|
|
2,183 |
|
|
|
Hyundai Capital America 1.00% 9/17/20246 |
|
|
605 |
|
|
|
|
|
|
|
599 |
|
|
|
Hyundai Capital America 2.65% 2/10/20256 |
|
|
11,383 |
|
|
|
|
|
|
|
11,171 |
|
|
|
Hyundai Capital America 1.80% 10/15/20256 |
|
|
13,274 |
|
|
|
|
|
|
|
12,651 |
|
|
|
Hyundai Capital America 6.25% 11/3/20256 |
|
|
825 |
|
|
|
|
|
|
|
832 |
|
|
|
Hyundai Capital America 1.30% 1/8/20266 |
|
|
6,000 |
|
|
|
|
|
|
|
5,633 |
|
|
|
Hyundai Capital America 5.50% 3/30/20266 |
|
|
705 |
|
|
|
|
|
|
|
705 |
|
|
|
Hyundai Capital America 1.50% 6/15/20266 |
|
|
7,475 |
|
|
|
|
|
|
|
6,930 |
|
|
|
Hyundai Capital America 1.65% 9/17/20266 |
|
|
7,275 |
|
|
|
|
|
|
|
6,702 |
|
|
|
Hyundai Capital America 3.00% 2/10/20276 |
|
|
9,000 |
|
|
|
|
|
|
|
8,494 |
|
|
|
Hyundai Capital America 5.275% 6/24/20276 |
|
|
1,650 |
|
|
|
|
|
|
|
1,643 |
|
|
|
Hyundai Capital America 2.375% 10/15/20276 |
|
|
7,543 |
|
|
|
|
|
|
|
6,882 |
|
|
|
Hyundai Capital America 5.60% 3/30/20286 |
|
|
1,385 |
|
|
|
|
|
|
|
1,395 |
|
|
|
Hyundai Capital America 5.30% 6/24/20296 |
|
|
1,523 |
|
|
|
|
|
|
|
1,515 |
|
|
|
Hyundai Capital America 5.40% 6/24/20316 |
|
|
3,365 |
|
|
|
|
|
|
|
3,338 |
|
|
|
Hyundai Capital Services, Inc. 1.25% 2/8/20266 |
|
|
3,695 |
|
|
|
|
|
|
|
3,451 |
|
|
|
Marriott International, Inc. 5.75% 5/1/2025 |
|
|
190 |
|
|
|
|
|
|
|
190 |
|
|
|
Marriott International, Inc. 5.00% 10/15/2027 |
|
|
4,470 |
|
|
|
|
|
|
|
4,460 |
|
|
|
Marriott International, Inc. 4.90% 4/15/2029 |
|
|
653 |
|
|
|
|
|
|
|
646 |
|
|
|
McDonald’s Corp. 5.00% 5/17/2029 |
|
|
2,184 |
|
|
|
|
|
|
|
2,182 |
|
|
|
McDonald’s Corp. 2.125% 3/1/2030 |
|
|
2,482 |
|
|
|
|
|
|
|
2,131 |
|
American Funds Insurance Series 154
The Bond Fund of America (continued)
|
|
|
|
|
|
|
|
|
|
|
|
|
|
|
| Bonds, notes & other debt instruments (continued) |
|
Principal amount
(000) |
|
|
|
|
|
Value (000) |
|
|
| Corporate bonds, notes & loans (continued) |
|
| Consumer discretionary (continued) |
|
McDonald’s Corp. 3.60% 7/1/2030 |
|
|
USD1,014 |
|
|
|
|
|
|
$ |
939 |
|
|
|
McDonald’s Corp. 5.20% 5/17/2034 |
|
|
2,786 |
|
|
|
|
|
|
|
2,798 |
|
|
|
McDonald’s Corp. 4.45% 3/1/2047 |
|
|
3,535 |
|
|
|
|
|
|
|
2,968 |
|
|
|
McDonald’s Corp. 3.625% 9/1/2049 |
|
|
2,938 |
|
|
|
|
|
|
|
2,131 |
|
|
|
McDonald’s Corp. 5.15% 9/9/2052 |
|
|
509 |
|
|
|
|
|
|
|
470 |
|
|
|
Nissan Motor Acceptance Co., LLC 2.75% 3/9/20286 |
|
|
3,167 |
|
|
|
|
|
|
|
2,825 |
|
|
|
Sands China, Ltd. 2.30% 3/8/2027 |
|
|
2,368 |
|
|
|
|
|
|
|
2,159 |
|
|
|
Stellantis Finance US, Inc. 5.625% 1/12/20286 |
|
|
825 |
|
|
|
|
|
|
|
836 |
|
|
|
Stellantis Finance US, Inc. 2.691% 9/15/20316 |
|
|
4,849 |
|
|
|
|
|
|
|
4,010 |
|
|
|
Stellantis Finance US, Inc. 6.375% 9/12/20326 |
|
|
2,669 |
|
|
|
|
|
|
|
2,792 |
|
|
|
Toyota Motor Credit Corp. 3.375% 4/1/2030 |
|
|
4,954 |
|
|
|
|
|
|
|
4,558 |
|
|
|
Toyota Motor Credit Corp. 4.55% 5/17/2030 |
|
|
1,625 |
|
|
|
|
|
|
|
1,589 |
|
|
|
Toyota Motor Credit Corp. 5.55% 11/20/2030 |
|
|
690 |
|
|
|
|
|
|
|
709 |
|
|
|
Travel + Leisure Co. 6.625% 7/31/20266 |
|
|
675 |
|
|
|
|
|
|
|
680 |
|
|
|
Volkswagen Group of America Finance, LLC 2.85% 9/26/20246 |
|
|
546 |
|
|
|
|
|
|
|
542 |
|
|
|
Volkswagen Group of America Finance, LLC 6.45% 11/16/20306 |
|
|
5,190 |
|
|
|
|
|
|
|
5,445 |
|
|
|
Wynn Resorts Finance, LLC 5.125% 10/1/20296 |
|
|
410 |
|
|
|
|
|
|
|
390 |
|
|
|
|
|
|
|
|
|
|
|
|
|
|
|
|
|
|
|
|
|
|
|
|
|
|
|
|
|
344,467 |
|
|
|
|
|
|
|
|
|
|
|
|
|
|
|
|
| |
|
| Energy 2.50% |
|
Antero Resources Corp. 5.375% 3/1/20306 |
|
|
280 |
|
|
|
|
|
|
|
271 |
|
|
|
Apache Corp. 4.625% 11/15/2025 |
|
|
645 |
|
|
|
|
|
|
|
637 |
|
|
|
Apache Corp. 4.25% 1/15/2030 |
|
|
2,465 |
|
|
|
|
|
|
|
2,302 |
|
|
|
Apache Corp. 5.10% 9/1/2040 |
|
|
1,664 |
|
|
|
|
|
|
|
1,421 |
|
|
|
Baker Hughes Holdings, LLC 2.061% 12/15/2026 |
|
|
1,136 |
|
|
|
|
|
|
|
1,055 |
|
|
|
BP Capital Markets America, Inc. 4.893% 9/11/2033 |
|
|
3,701 |
|
|
|
|
|
|
|
3,601 |
|
|
|
BP Capital Markets America, Inc. 3.001% 3/17/2052 |
|
|
710 |
|
|
|
|
|
|
|
456 |
|
|
|
Canadian Natural Resources, Ltd. 2.05% 7/15/2025 |
|
|
754 |
|
|
|
|
|
|
|
726 |
|
|
|
Cenovus Energy, Inc. 5.375% 7/15/2025 |
|
|
2,763 |
|
|
|
|
|
|
|
2,736 |
|
|
|
Cenovus Energy, Inc. 4.25% 4/15/2027 |
|
|
13,613 |
|
|
|
|
|
|
|
13,246 |
|
|
|
Cenovus Energy, Inc. 2.65% 1/15/2032 |
|
|
2,969 |
|
|
|
|
|
|
|
2,457 |
|
|
|
Cenovus Energy, Inc. 5.25% 6/15/2037 |
|
|
289 |
|
|
|
|
|
|
|
277 |
|
|
|
Cenovus Energy, Inc. 5.40% 6/15/2047 |
|
|
8,809 |
|
|
|
|
|
|
|
8,118 |
|
|
|
Cenovus Energy, Inc. 3.75% 2/15/2052 |
|
|
19 |
|
|
|
|
|
|
|
13 |
|
|
|
Cheniere Energy Partners, LP 3.25% 1/31/2032 |
|
|
937 |
|
|
|
|
|
|
|
800 |
|
|
|
Chevron Corp. 2.954% 5/16/2026 |
|
|
3,365 |
|
|
|
|
|
|
|
3,239 |
|
|
|
Chevron Corp. 3.078% 5/11/2050 |
|
|
692 |
|
|
|
|
|
|
|
473 |
|
|
|
Civitas Resources, Inc. 8.75% 7/1/20316 |
|
|
1,400 |
|
|
|
|
|
|
|
1,501 |
|
|
|
Columbia Pipelines Operating Co., LLC 5.927% 8/15/20306 |
|
|
268 |
|
|
|
|
|
|
|
274 |
|
|
|
ConocoPhillips Co. 3.80% 3/15/2052 |
|
|
15 |
|
|
|
|
|
|
|
11 |
|
|
|
ConocoPhillips Co. 5.30% 5/15/2053 |
|
|
6,279 |
|
|
|
|
|
|
|
5,965 |
|
|
|
ConocoPhillips Co. 5.55% 3/15/2054 |
|
|
1,708 |
|
|
|
|
|
|
|
1,682 |
|
|
|
Devon Energy Corp. 4.50% 1/15/2030 |
|
|
5,197 |
|
|
|
|
|
|
|
5,003 |
|
|
|
Diamondback Energy, Inc. 5.20% 4/18/2027 |
|
|
1,645 |
|
|
|
|
|
|
|
1,646 |
|
|
|
Diamondback Energy, Inc. 5.15% 1/30/2030 |
|
|
415 |
|
|
|
|
|
|
|
413 |
|
|
|
Diamondback Energy, Inc. 5.40% 4/18/2034 |
|
|
1,195 |
|
|
|
|
|
|
|
1,184 |
|
|
|
Diamondback Energy, Inc. 5.75% 4/18/2054 |
|
|
902 |
|
|
|
|
|
|
|
875 |
|
|
|
DT Midstream, Inc. 4.125% 6/15/20296 |
|
|
555 |
|
|
|
|
|
|
|
513 |
|
|
|
Ecopetrol SA 4.625% 11/2/2031 |
|
|
270 |
|
|
|
|
|
|
|
221 |
|
|
|
Ecopetrol SA 8.875% 1/13/2033 |
|
|
15,110 |
|
|
|
|
|
|
|
15,615 |
|
|
|
Enbridge, Inc. 6.20% 11/15/2030 |
|
|
1,650 |
|
|
|
|
|
|
|
1,733 |
|
|
|
Enbridge, Inc. 6.70% 11/15/2053 |
|
|
1,167 |
|
|
|
|
|
|
|
1,275 |
|
|
|
Energy Transfer, LP 5.25% 7/1/2029 |
|
|
979 |
|
|
|
|
|
|
|
974 |
|
|
|
Energy Transfer, LP 6.40% 12/1/2030 |
|
|
479 |
|
|
|
|
|
|
|
504 |
|
|
|
Energy Transfer, LP 5.60% 9/1/2034 |
|
|
2,168 |
|
|
|
|
|
|
|
2,155 |
|
|
|
Energy Transfer, LP 6.05% 9/1/2054 |
|
|
1,095 |
|
|
|
|
|
|
|
1,081 |
|
|
|
Eni SpA 5.50% 5/15/20346 |
|
|
359 |
|
|
|
|
|
|
|
356 |
|
|
|
Eni SpA 5.95% 5/15/20546 |
|
|
222 |
|
|
|
|
|
|
|
218 |
|
|
|
EQT Corp. 7.25% 2/1/20307 |
|
|
7,500 |
|
|
|
|
|
|
|
7,964 |
|
|
|
Equinor ASA 3.625% 9/10/2028 |
|
|
4,928 |
|
|
|
|
|
|
|
4,708 |
|
155 American Funds Insurance Series
The Bond Fund of America (continued)
|
|
|
|
|
|
|
|
|
|
|
|
|
|
|
| Bonds, notes & other debt instruments (continued) |
|
Principal amount
(000) |
|
|
|
|
|
Value (000) |
|
|
| Corporate bonds, notes & loans (continued) |
|
| Energy (continued) |
|
Equinor ASA 3.125% 4/6/2030 |
|
|
USD20,000 |
|
|
|
|
|
|
$ |
18,245 |
|
|
|
Equinor ASA 3.25% 11/18/2049 |
|
|
5,687 |
|
|
|
|
|
|
|
3,982 |
|
|
|
Exxon Mobil Corp. 3.043% 3/1/2026 |
|
|
4,625 |
|
|
|
|
|
|
|
4,476 |
|
|
|
Exxon Mobil Corp. 2.61% 10/15/2030 |
|
|
1,040 |
|
|
|
|
|
|
|
913 |
|
|
|
Kinder Morgan, Inc. 5.00% 2/1/2029 |
|
|
1,752 |
|
|
|
|
|
|
|
1,733 |
|
|
|
Kinder Morgan, Inc. 5.40% 2/1/2034 |
|
|
3,888 |
|
|
|
|
|
|
|
3,830 |
|
|
|
Occidental Petroleum Corp. 8.875% 7/15/2030 |
|
|
4,345 |
|
|
|
|
|
|
|
5,008 |
|
|
|
Occidental Petroleum Corp. 6.125% 1/1/2031 |
|
|
759 |
|
|
|
|
|
|
|
777 |
|
|
|
Occidental Petroleum Corp. 6.45% 9/15/2036 |
|
|
3,330 |
|
|
|
|
|
|
|
3,480 |
|
|
|
Odebrecht Drilling Services, LLC 7.50% 6/15/20306 |
|
|
6 |
|
|
|
|
|
|
|
6 |
|
|
|
Oleoducto Central SA 4.00% 7/14/20276 |
|
|
1,715 |
|
|
|
|
|
|
|
1,591 |
|
|
|
Oleoducto Central SA 4.00% 7/14/2027 |
|
|
350 |
|
|
|
|
|
|
|
325 |
|
|
|
ONEOK, Inc. 5.55% 11/1/2026 |
|
|
736 |
|
|
|
|
|
|
|
739 |
|
|
|
ONEOK, Inc. 5.65% 11/1/2028 |
|
|
467 |
|
|
|
|
|
|
|
474 |
|
|
|
ONEOK, Inc. 6.05% 9/1/2033 |
|
|
5,098 |
|
|
|
|
|
|
|
5,251 |
|
|
|
Petroleos Mexicanos 6.875% 10/16/2025 |
|
|
5,000 |
|
|
|
|
|
|
|
4,986 |
|
|
|
Petroleos Mexicanos 4.50% 1/23/2026 |
|
|
1,158 |
|
|
|
|
|
|
|
1,103 |
|
|
|
Petroleos Mexicanos 6.875% 8/4/2026 |
|
|
9,682 |
|
|
|
|
|
|
|
9,487 |
|
|
|
Petroleos Mexicanos 6.49% 1/23/2027 |
|
|
20,653 |
|
|
|
|
|
|
|
19,839 |
|
|
|
Petroleos Mexicanos 6.50% 3/13/2027 |
|
|
35,154 |
|
|
|
|
|
|
|
33,519 |
|
|
|
Petroleos Mexicanos 6.50% 1/23/2029 |
|
|
2,404 |
|
|
|
|
|
|
|
2,173 |
|
|
|
Petroleos Mexicanos 8.75% 6/2/2029 |
|
|
14,185 |
|
|
|
|
|
|
|
13,942 |
|
|
|
Petroleos Mexicanos 6.84% 1/23/2030 |
|
|
11,164 |
|
|
|
|
|
|
|
9,835 |
|
|
|
Petroleos Mexicanos 5.95% 1/28/2031 |
|
|
4,681 |
|
|
|
|
|
|
|
3,775 |
|
|
|
Petroleos Mexicanos 6.70% 2/16/2032 |
|
|
15,755 |
|
|
|
|
|
|
|
13,201 |
|
|
|
Shell International Finance BV 3.875% 11/13/2028 |
|
|
9,410 |
|
|
|
|
|
|
|
9,028 |
|
|
|
Shell International Finance BV 2.75% 4/6/2030 |
|
|
377 |
|
|
|
|
|
|
|
336 |
|
|
|
Southwestern Energy Co. 5.70% 1/23/20257 |
|
|
495 |
|
|
|
|
|
|
|
495 |
|
|
|
TotalEnergies Capital International SA 3.455% 2/19/2029 |
|
|
885 |
|
|
|
|
|
|
|
831 |
|
|
|
TransCanada Pipelines, Ltd. 4.10% 4/15/2030 |
|
|
1,578 |
|
|
|
|
|
|
|
1,490 |
|
|
|
Williams Companies, Inc. 4.90% 3/15/2029 |
|
|
2,735 |
|
|
|
|
|
|
|
2,699 |
|
|
|
Williams Companies, Inc. 5.15% 3/15/2034 |
|
|
3,711 |
|
|
|
|
|
|
|
3,622 |
|
|
|
|
|
|
|
|
|
|
|
|
|
|
|
|
|
|
|
|
|
|
|
|
|
|
|
|
|
278,890 |
|
|
|
|
|
|
|
|
|
|
|
|
|
|
|
|
| |
|
| Industrials 2.14% |
|
ADT Security Corp. 4.125% 8/1/20296 |
|
|
510 |
|
|
|
|
|
|
|
471 |
|
|
|
Air Lease Corp. 0.80% 8/18/2024 |
|
|
3,175 |
|
|
|
|
|
|
|
3,154 |
|
|
|
Air Lease Corp. 2.875% 1/15/2026 |
|
|
10,172 |
|
|
|
|
|
|
|
9,763 |
|
|
|
Air Lease Corp. 2.20% 1/15/2027 |
|
|
4,341 |
|
|
|
|
|
|
|
4,010 |
|
|
|
Air Lease Corp. 5.20% 7/15/2031 |
|
|
3,650 |
|
|
|
|
|
|
|
3,568 |
|
|
|
BAE Systems PLC 5.00% 3/26/20276 |
|
|
1,200 |
|
|
|
|
|
|
|
1,192 |
|
|
|
BAE Systems PLC 5.125% 3/26/20296 |
|
|
3,482 |
|
|
|
|
|
|
|
3,467 |
|
|
|
BAE Systems PLC 5.25% 3/26/20316 |
|
|
2,156 |
|
|
|
|
|
|
|
2,151 |
|
|
|
BAE Systems PLC 5.30% 3/26/20346 |
|
|
570 |
|
|
|
|
|
|
|
565 |
|
|
|
BNSF Funding Trust I, junior subordinated, 6.613% 12/15/2055
(3-month USD-LIBOR + 2.35% on 1/15/2026)7,9 |
|
|
1,680 |
|
|
|
|
|
|
|
1,687 |
|
|
|
Boeing Co. 4.875% 5/1/2025 |
|
|
21,607 |
|
|
|
|
|
|
|
21,382 |
|
|
|
Boeing Co. 2.75% 2/1/2026 |
|
|
11,211 |
|
|
|
|
|
|
|
10,659 |
|
|
|
Boeing Co. 2.196% 2/4/2026 |
|
|
9,781 |
|
|
|
|
|
|
|
9,197 |
|
|
|
Boeing Co. 2.70% 2/1/2027 |
|
|
6,473 |
|
|
|
|
|
|
|
5,969 |
|
|
|
Boeing Co. 5.04% 5/1/2027 |
|
|
13,539 |
|
|
|
|
|
|
|
13,245 |
|
|
|
Boeing Co. 6.259% 5/1/20276 |
|
|
4,214 |
|
|
|
|
|
|
|
4,244 |
|
|
|
Boeing Co. 3.25% 2/1/2028 |
|
|
11,810 |
|
|
|
|
|
|
|
10,819 |
|
|
|
Boeing Co. 3.25% 3/1/2028 |
|
|
1,925 |
|
|
|
|
|
|
|
1,756 |
|
|
|
Boeing Co. 6.298% 5/1/20296 |
|
|
1,507 |
|
|
|
|
|
|
|
1,529 |
|
|
|
Boeing Co. 5.15% 5/1/2030 |
|
|
25,342 |
|
|
|
|
|
|
|
24,343 |
|
|
|
Boeing Co. 3.625% 2/1/2031 |
|
|
751 |
|
|
|
|
|
|
|
658 |
|
|
|
Boeing Co. 6.388% 5/1/20316 |
|
|
5,632 |
|
|
|
|
|
|
|
5,736 |
|
|
|
Boeing Co. 6.528% 5/1/20346 |
|
|
1,381 |
|
|
|
|
|
|
|
1,415 |
|
|
|
Canadian National Railway Co. 5.85% 11/1/2033 |
|
|
465 |
|
|
|
|
|
|
|
492 |
|
American Funds Insurance Series 156
The Bond Fund of America (continued)
|
|
|
|
|
|
|
|
|
|
|
|
|
|
|
| Bonds, notes & other debt instruments (continued) |
|
Principal amount
(000) |
|
|
|
|
|
Value (000) |
|
|
| Corporate bonds, notes & loans (continued) |
|
| Industrials (continued) |
|
Canadian National Railway Co. 6.125% 11/1/2053 |
|
|
USD137 |
|
|
|
|
|
|
$ |
152 |
|
|
|
Canadian Pacific Railway Co. 1.75% 12/2/2026 |
|
|
1,066 |
|
|
|
|
|
|
|
984 |
|
|
|
Canadian Pacific Railway Co. 3.10% 12/2/2051 |
|
|
2,286 |
|
|
|
|
|
|
|
1,520 |
|
|
|
Carrier Global Corp. 2.722% 2/15/2030 |
|
|
292 |
|
|
|
|
|
|
|
258 |
|
|
|
Carrier Global Corp. 2.70% 2/15/2031 |
|
|
292 |
|
|
|
|
|
|
|
251 |
|
|
|
Carrier Global Corp. 5.90% 3/15/2034 |
|
|
1,345 |
|
|
|
|
|
|
|
1,404 |
|
|
|
Carrier Global Corp. 3.377% 4/5/2040 |
|
|
14,710 |
|
|
|
|
|
|
|
11,389 |
|
|
|
Carrier Global Corp. 3.577% 4/5/2050 |
|
|
138 |
|
|
|
|
|
|
|
100 |
|
|
|
Carrier Global Corp. 6.20% 3/15/2054 |
|
|
827 |
|
|
|
|
|
|
|
886 |
|
|
|
CK Hutchison International (23), Ltd. 4.75% 4/21/20286 |
|
|
1,260 |
|
|
|
|
|
|
|
1,244 |
|
|
|
CSX Corp. 4.10% 11/15/2032 |
|
|
1,886 |
|
|
|
|
|
|
|
1,762 |
|
|
|
CSX Corp. 5.20% 11/15/2033 |
|
|
1,333 |
|
|
|
|
|
|
|
1,337 |
|
|
|
CSX Corp. 4.50% 11/15/2052 |
|
|
4,470 |
|
|
|
|
|
|
|
3,825 |
|
|
|
Dun & Bradstreet Corp. (The) 5.00% 12/15/20296 |
|
|
978 |
|
|
|
|
|
|
|
909 |
|
|
|
General Dynamics Corp. 3.75% 5/15/2028 |
|
|
479 |
|
|
|
|
|
|
|
461 |
|
|
|
General Dynamics Corp. 3.625% 4/1/2030 |
|
|
387 |
|
|
|
|
|
|
|
363 |
|
|
|
Honeywell International, Inc. 4.875% 9/1/2029 |
|
|
270 |
|
|
|
|
|
|
|
270 |
|
|
|
Honeywell International, Inc. 4.95% 9/1/2031 |
|
|
270 |
|
|
|
|
|
|
|
270 |
|
|
|
Honeywell International, Inc. 5.00% 3/1/2035 |
|
|
400 |
|
|
|
|
|
|
|
397 |
|
|
|
Honeywell International, Inc. 5.25% 3/1/2054 |
|
|
400 |
|
|
|
|
|
|
|
388 |
|
|
|
Honeywell International, Inc. 5.35% 3/1/2064 |
|
|
400 |
|
|
|
|
|
|
|
389 |
|
|
|
Ingersoll-Rand, Inc. 5.197% 6/15/2027 |
|
|
665 |
|
|
|
|
|
|
|
667 |
|
|
|
Ingersoll-Rand, Inc. 5.40% 8/14/2028 |
|
|
801 |
|
|
|
|
|
|
|
809 |
|
|
|
Ingersoll-Rand, Inc. 5.176% 6/15/2029 |
|
|
1,463 |
|
|
|
|
|
|
|
1,463 |
|
|
|
Ingersoll-Rand, Inc. 5.314% 6/15/2031 |
|
|
176 |
|
|
|
|
|
|
|
177 |
|
|
|
Ingersoll-Rand, Inc. 5.70% 8/14/2033 |
|
|
946 |
|
|
|
|
|
|
|
968 |
|
|
|
Ingersoll-Rand, Inc. 5.45% 6/15/2034 |
|
|
1,176 |
|
|
|
|
|
|
|
1,187 |
|
|
|
Ingersoll-Rand, Inc. 5.70% 6/15/2054 |
|
|
400 |
|
|
|
|
|
|
|
403 |
|
|
|
L3Harris Technologies, Inc. 5.40% 7/31/2033 |
|
|
1,126 |
|
|
|
|
|
|
|
1,123 |
|
|
|
Lockheed Martin Corp. 4.50% 2/15/2029 |
|
|
1,174 |
|
|
|
|
|
|
|
1,156 |
|
|
|
Lockheed Martin Corp. 4.80% 8/15/2034 |
|
|
2,393 |
|
|
|
|
|
|
|
2,338 |
|
|
|
Lockheed Martin Corp. 5.20% 2/15/2064 |
|
|
600 |
|
|
|
|
|
|
|
568 |
|
|
|
MISC Capital Two (Labuan), Ltd. 3.75% 4/6/20276 |
|
|
2,690 |
|
|
|
|
|
|
|
2,572 |
|
|
|
Norfolk Southern Corp. 5.05% 8/1/2030 |
|
|
1,734 |
|
|
|
|
|
|
|
1,732 |
|
|
|
Norfolk Southern Corp. 5.35% 8/1/2054 |
|
|
1,458 |
|
|
|
|
|
|
|
1,392 |
|
|
|
Northrop Grumman Corp. 4.70% 3/15/2033 |
|
|
2,909 |
|
|
|
|
|
|
|
2,808 |
|
|
|
Northrop Grumman Corp. 4.95% 3/15/2053 |
|
|
1,124 |
|
|
|
|
|
|
|
1,012 |
|
|
|
Republic Services, Inc. 2.375% 3/15/2033 |
|
|
1,635 |
|
|
|
|
|
|
|
1,308 |
|
|
|
Republic Services, Inc. 5.00% 4/1/2034 |
|
|
15 |
|
|
|
|
|
|
|
15 |
|
|
|
RTX Corp. 5.75% 11/8/2026 |
|
|
550 |
|
|
|
|
|
|
|
556 |
|
|
|
RTX Corp. 3.125% 5/4/2027 |
|
|
4,551 |
|
|
|
|
|
|
|
4,315 |
|
|
|
RTX Corp. 4.125% 11/16/2028 |
|
|
4,974 |
|
|
|
|
|
|
|
4,790 |
|
|
|
RTX Corp. 5.75% 1/15/2029 |
|
|
410 |
|
|
|
|
|
|
|
421 |
|
|
|
RTX Corp. 6.00% 3/15/2031 |
|
|
550 |
|
|
|
|
|
|
|
573 |
|
|
|
RTX Corp. 2.375% 3/15/2032 |
|
|
451 |
|
|
|
|
|
|
|
370 |
|
|
|
RTX Corp. 6.10% 3/15/2034 |
|
|
401 |
|
|
|
|
|
|
|
422 |
|
|
|
RTX Corp. 2.82% 9/1/2051 |
|
|
665 |
|
|
|
|
|
|
|
405 |
|
|
|
RTX Corp. 3.03% 3/15/2052 |
|
|
1,190 |
|
|
|
|
|
|
|
759 |
|
|
|
RTX Corp. 6.40% 3/15/2054 |
|
|
1,006 |
|
|
|
|
|
|
|
1,098 |
|
|
|
Summit Digitel Infrastructure Pvt, Ltd. 2.875% 8/12/20316 |
|
|
2,550 |
|
|
|
|
|
|
|
2,115 |
|
|
|
Triton Container International, Ltd. 3.15% 6/15/20316 |
|
|
2,482 |
|
|
|
|
|
|
|
2,065 |
|
|
|
Union Pacific Corp. 2.15% 2/5/2027 |
|
|
2,213 |
|
|
|
|
|
|
|
2,063 |
|
|
|
Union Pacific Corp. 2.40% 2/5/2030 |
|
|
4,454 |
|
|
|
|
|
|
|
3,900 |
|
|
|
Union Pacific Corp. 2.375% 5/20/2031 |
|
|
2,298 |
|
|
|
|
|
|
|
1,952 |
|
|
|
Union Pacific Corp. 2.80% 2/14/2032 |
|
|
5,244 |
|
|
|
|
|
|
|
4,527 |
|
|
|
Union Pacific Corp. 3.25% 2/5/2050 |
|
|
7,000 |
|
|
|
|
|
|
|
4,892 |
|
|
|
Union Pacific Corp. 2.95% 3/10/2052 |
|
|
1,405 |
|
|
|
|
|
|
|
905 |
|
|
|
United Rentals (North America), Inc. 5.50% 5/15/2027 |
|
|
2,500 |
|
|
|
|
|
|
|
2,483 |
|
|
|
Veralto Corp. 5.50% 9/18/20266 |
|
|
350 |
|
|
|
|
|
|
|
350 |
|
|
|
Veralto Corp. 5.35% 9/18/20286 |
|
|
2,450 |
|
|
|
|
|
|
|
2,461 |
|
|
|
Veralto Corp. 5.45% 9/18/20336 |
|
|
1,680 |
|
|
|
|
|
|
|
1,678 |
|
157 American Funds Insurance Series
The Bond Fund of America (continued)
|
|
|
|
|
|
|
|
|
|
|
|
|
|
|
| Bonds, notes & other debt instruments (continued) |
|
Principal amount
(000) |
|
|
|
|
|
Value (000) |
|
|
| Corporate bonds, notes & loans (continued) |
|
| Industrials (continued) |
|
Waste Management, Inc. 1.50% 3/15/2031 |
|
|
USD419 |
|
|
|
|
|
|
$ |
336 |
|
|
|
Waste Management, Inc. 4.15% 4/15/2032 |
|
|
688 |
|
|
|
|
|
|
|
648 |
|
|
|
Waste Management, Inc. 4.875% 2/15/2034 |
|
|
2,830 |
|
|
|
|
|
|
|
2,775 |
|
|
|
|
|
|
|
|
|
|
|
|
|
|
|
|
|
|
|
|
|
|
|
|
|
|
|
|
|
238,588 |
|
|
|
|
|
|
|
|
|
|
|
|
|
|
|
|
| |
|
| Communication services 1.60% |
|
AT&T, Inc. 1.70% 3/25/2026 |
|
|
17,807 |
|
|
|
|
|
|
|
16,722 |
|
|
|
AT&T, Inc. 1.65% 2/1/2028 |
|
|
4,700 |
|
|
|
|
|
|
|
4,175 |
|
|
|
AT&T, Inc. 4.30% 2/15/2030 |
|
|
15,940 |
|
|
|
|
|
|
|
15,276 |
|
|
|
AT&T, Inc. 2.55% 12/1/2033 |
|
|
12,748 |
|
|
|
|
|
|
|
10,141 |
|
|
|
AT&T, Inc. 5.40% 2/15/2034 |
|
|
629 |
|
|
|
|
|
|
|
629 |
|
|
|
CCO Holdings, LLC 5.125% 5/1/20276 |
|
|
4,800 |
|
|
|
|
|
|
|
4,613 |
|
|
|
CCO Holdings, LLC 4.75% 2/1/20326 |
|
|
1,265 |
|
|
|
|
|
|
|
1,037 |
|
|
|
CCO Holdings, LLC 4.25% 1/15/20346 |
|
|
3,875 |
|
|
|
|
|
|
|
2,945 |
|
|
|
Charter Communications Operating, LLC 6.10% 6/1/2029 |
|
|
1,360 |
|
|
|
|
|
|
|
1,365 |
|
|
|
Charter Communications Operating, LLC 2.80% 4/1/2031 |
|
|
6,057 |
|
|
|
|
|
|
|
4,953 |
|
|
|
Charter Communications Operating, LLC 4.40% 4/1/2033 |
|
|
1,092 |
|
|
|
|
|
|
|
963 |
|
|
|
Charter Communications Operating, LLC 5.75% 4/1/2048 |
|
|
5,000 |
|
|
|
|
|
|
|
4,184 |
|
|
|
Charter Communications Operating, LLC 5.25% 4/1/2053 |
|
|
835 |
|
|
|
|
|
|
|
656 |
|
|
|
Comcast Corp. 3.15% 2/15/2028 |
|
|
7,200 |
|
|
|
|
|
|
|
6,765 |
|
|
|
Comcast Corp. 4.55% 1/15/2029 |
|
|
1,610 |
|
|
|
|
|
|
|
1,585 |
|
|
|
Comcast Corp. 4.80% 5/15/2033 |
|
|
1,841 |
|
|
|
|
|
|
|
1,793 |
|
|
|
Comcast Corp. 2.887% 11/1/2051 |
|
|
18 |
|
|
|
|
|
|
|
11 |
|
|
|
Comcast Corp. 5.35% 5/15/2053 |
|
|
3,455 |
|
|
|
|
|
|
|
3,314 |
|
|
|
Comcast Corp. 5.50% 5/15/2064 |
|
|
250 |
|
|
|
|
|
|
|
241 |
|
|
|
Lumen Technologies, Inc. 4.00% 2/15/20276 |
|
|
6,756 |
|
|
|
|
|
|
|
3,482 |
|
|
|
Netflix, Inc. 5.875% 11/15/2028 |
|
|
5,970 |
|
|
|
|
|
|
|
6,153 |
|
|
|
Netflix, Inc. 5.375% 11/15/20296 |
|
|
7,416 |
|
|
|
|
|
|
|
7,491 |
|
|
|
News Corp. 5.125% 2/15/20326 |
|
|
1,300 |
|
|
|
|
|
|
|
1,234 |
|
|
|
SBA Tower Trust 1.631% 11/15/20266 |
|
|
6,741 |
|
|
|
|
|
|
|
6,127 |
|
|
|
Sirius XM Radio, Inc. 4.00% 7/15/20286 |
|
|
675 |
|
|
|
|
|
|
|
610 |
|
|
|
Sprint, LLC 7.625% 2/15/2025 |
|
|
1,305 |
|
|
|
|
|
|
|
1,314 |
|
|
|
T-Mobile USA, Inc. 3.50% 4/15/2025 |
|
|
3,275 |
|
|
|
|
|
|
|
3,221 |
|
|
|
T-Mobile USA, Inc. 2.625% 4/15/2026 |
|
|
4,416 |
|
|
|
|
|
|
|
4,204 |
|
|
|
T-Mobile USA, Inc. 3.75% 4/15/2027 |
|
|
5,000 |
|
|
|
|
|
|
|
4,807 |
|
|
|
T-Mobile USA, Inc. 4.95% 3/15/2028 |
|
|
705 |
|
|
|
|
|
|
|
700 |
|
|
|
T-Mobile USA, Inc. 4.80% 7/15/2028 |
|
|
175 |
|
|
|
|
|
|
|
173 |
|
|
|
T-Mobile USA, Inc. 4.85% 1/15/2029 |
|
|
2,725 |
|
|
|
|
|
|
|
2,692 |
|
|
|
T-Mobile USA, Inc. 3.875% 4/15/2030 |
|
|
4,500 |
|
|
|
|
|
|
|
4,208 |
|
|
|
T-Mobile USA, Inc. 2.875% 2/15/2031 |
|
|
14,691 |
|
|
|
|
|
|
|
12,766 |
|
|
|
T-Mobile USA, Inc. 5.05% 7/15/2033 |
|
|
832 |
|
|
|
|
|
|
|
814 |
|
|
|
T-Mobile USA, Inc. 5.75% 1/15/2034 |
|
|
730 |
|
|
|
|
|
|
|
751 |
|
|
|
T-Mobile USA, Inc. 5.15% 4/15/2034 |
|
|
2,085 |
|
|
|
|
|
|
|
2,050 |
|
|
|
T-Mobile USA, Inc. 3.00% 2/15/2041 |
|
|
2,100 |
|
|
|
|
|
|
|
1,504 |
|
|
|
T-Mobile USA, Inc. 6.00% 6/15/2054 |
|
|
920 |
|
|
|
|
|
|
|
952 |
|
|
|
T-Mobile USA, Inc. 5.50% 1/15/2055 |
|
|
406 |
|
|
|
|
|
|
|
392 |
|
|
|
Verizon Communications, Inc. 4.329% 9/21/2028 |
|
|
1,539 |
|
|
|
|
|
|
|
1,497 |
|
|
|
Verizon Communications, Inc. 1.75% 1/20/2031 |
|
|
9,144 |
|
|
|
|
|
|
|
7,403 |
|
|
|
Verizon Communications, Inc. 2.55% 3/21/2031 |
|
|
5,047 |
|
|
|
|
|
|
|
4,289 |
|
|
|
Verizon Communications, Inc. 2.355% 3/15/2032 |
|
|
2,775 |
|
|
|
|
|
|
|
2,269 |
|
|
|
Verizon Communications, Inc. 3.40% 3/22/2041 |
|
|
1,085 |
|
|
|
|
|
|
|
830 |
|
|
|
Verizon Communications, Inc. 3.55% 3/22/2051 |
|
|
1,520 |
|
|
|
|
|
|
|
1,095 |
|
|
|
Verizon Communications, Inc. 3.875% 3/1/2052 |
|
|
3,155 |
|
|
|
|
|
|
|
2,395 |
|
|
|
Vodafone Group PLC 4.25% 9/17/2050 |
|
|
3,050 |
|
|
|
|
|
|
|
2,382 |
|
|
|
WarnerMedia Holdings, Inc. 3.638% 3/15/2025 |
|
|
3,056 |
|
|
|
|
|
|
|
3,009 |
|
|
|
WarnerMedia Holdings, Inc. 3.755% 3/15/2027 |
|
|
1,126 |
|
|
|
|
|
|
|
1,069 |
|
|
|
WarnerMedia Holdings, Inc. 4.279% 3/15/2032 |
|
|
112 |
|
|
|
|
|
|
|
98 |
|
American Funds Insurance Series 158
The Bond Fund of America (continued)
|
|
|
|
|
|
|
|
|
|
|
| Bonds, notes & other debt instruments (continued) |
|
Principal amount
(000) |
|
|
Value (000) |
|
|
| Corporate bonds, notes & loans (continued) |
|
|
|
|
|
| Communication services (continued) |
|
WarnerMedia Holdings, Inc. 5.05% 3/15/2042 |
|
|
USD719 |
|
|
$ |
585 |
|
|
|
WarnerMedia Holdings, Inc. 5.141% 3/15/2052 |
|
|
5,408 |
|
|
|
4,213 |
|
|
|
ZipRecruiter, Inc. 5.00% 1/15/20306 |
|
|
490 |
|
|
|
426 |
|
|
|
|
|
|
|
|
|
|
|
|
|
|
|
|
|
|
|
|
|
178,573 |
|
|
|
|
|
|
|
|
|
|
|
|
|
|
|
|
|
|
|
|
|
|
|
| |
|
|
|
| Consumer staples 1.29% |
|
7-Eleven, Inc. 1.80% 2/10/20316 |
|
|
2,923 |
|
|
|
2,342 |
|
|
|
7-Eleven, Inc. 2.80% 2/10/20516 |
|
|
5,000 |
|
|
|
2,983 |
|
|
|
Altria Group, Inc. 4.40% 2/14/2026 |
|
|
4,585 |
|
|
|
4,513 |
|
|
|
Anheuser-Busch InBev Worldwide, Inc. 4.75% 1/23/2029 |
|
|
6,635 |
|
|
|
6,600 |
|
|
|
Anheuser-Busch InBev Worldwide, Inc. 5.55% 1/23/2049 |
|
|
4,715 |
|
|
|
4,754 |
|
|
|
BAT Capital Corp. 3.557% 8/15/2027 |
|
|
9,271 |
|
|
|
8,809 |
|
|
|
BAT Capital Corp. 2.259% 3/25/2028 |
|
|
2,353 |
|
|
|
2,109 |
|
|
|
BAT Capital Corp. 6.343% 8/2/2030 |
|
|
2,210 |
|
|
|
2,305 |
|
|
|
BAT Capital Corp. 4.742% 3/16/2032 |
|
|
2,675 |
|
|
|
2,539 |
|
|
|
BAT Capital Corp. 6.421% 8/2/2033 |
|
|
4,665 |
|
|
|
4,880 |
|
|
|
BAT Capital Corp. 7.079% 8/2/2043 |
|
|
1,323 |
|
|
|
1,395 |
|
|
|
BAT Capital Corp. 4.758% 9/6/2049 |
|
|
15,972 |
|
|
|
12,590 |
|
|
|
BAT Capital Corp. 5.65% 3/16/2052 |
|
|
120 |
|
|
|
107 |
|
|
|
BAT International Finance PLC 3.95% 6/15/20256 |
|
|
16,879 |
|
|
|
16,606 |
|
|
|
BAT International Finance PLC 1.668% 3/25/2026 |
|
|
4,070 |
|
|
|
3,815 |
|
|
|
BAT International Finance PLC 4.448% 3/16/2028 |
|
|
2,925 |
|
|
|
2,833 |
|
|
|
Campbell Soup Co. 5.20% 3/21/2029 |
|
|
726 |
|
|
|
727 |
|
|
|
Campbell Soup Co. 5.40% 3/21/2034 |
|
|
534 |
|
|
|
531 |
|
|
|
Conagra Brands, Inc. 5.30% 11/1/2038 |
|
|
436 |
|
|
|
411 |
|
|
|
Constellation Brands, Inc. 3.50% 5/9/2027 |
|
|
7,500 |
|
|
|
7,163 |
|
|
|
Constellation Brands, Inc. 4.35% 5/9/2027 |
|
|
890 |
|
|
|
868 |
|
|
|
Constellation Brands, Inc. 2.25% 8/1/2031 |
|
|
1,487 |
|
|
|
1,221 |
|
|
|
Constellation Brands, Inc. 4.75% 5/9/2032 |
|
|
1,978 |
|
|
|
1,902 |
|
|
|
Constellation Brands, Inc. 4.90% 5/1/2033 |
|
|
2,807 |
|
|
|
2,712 |
|
|
|
H.J. Heinz Co. 4.875% 10/1/2049 |
|
|
2,725 |
|
|
|
2,378 |
|
|
|
Indofood CBP Sukses Makmur Tbk PT 3.398% 6/9/2031 |
|
|
3,110 |
|
|
|
2,714 |
|
|
|
Indofood CBP Sukses Makmur Tbk PT 4.745% 6/9/2051 |
|
|
685 |
|
|
|
569 |
|
|
|
J. M. Smucker Co. (The) 6.20% 11/15/2033 |
|
|
701 |
|
|
|
737 |
|
|
|
J. M. Smucker Co. (The) 6.50% 11/15/2053 |
|
|
310 |
|
|
|
333 |
|
|
|
JBS USA Holding Lux SARL 2.50% 1/15/2027 |
|
|
3,000 |
|
|
|
2,793 |
|
|
|
JBS USA Holding Lux SARL 3.00% 2/2/2029 |
|
|
2,092 |
|
|
|
1,868 |
|
|
|
PepsiCo, Inc. 1.95% 10/21/2031 |
|
|
4,763 |
|
|
|
3,914 |
|
|
|
Philip Morris International, Inc. 4.875% 2/13/2026 |
|
|
2,508 |
|
|
|
2,489 |
|
|
|
Philip Morris International, Inc. 5.25% 9/7/2028 |
|
|
2,800 |
|
|
|
2,824 |
|
|
|
Philip Morris International, Inc. 5.125% 2/15/2030 |
|
|
982 |
|
|
|
979 |
|
|
|
Philip Morris International, Inc. 5.50% 9/7/2030 |
|
|
4,565 |
|
|
|
4,628 |
|
|
|
Philip Morris International, Inc. 5.375% 2/15/2033 |
|
|
1,644 |
|
|
|
1,633 |
|
|
|
Philip Morris International, Inc. 4.875% 11/15/2043 |
|
|
4,407 |
|
|
|
3,890 |
|
|
|
Reynolds American, Inc. 4.45% 6/12/2025 |
|
|
14,570 |
|
|
|
14,403 |
|
|
|
Walmart, Inc. 4.10% 4/15/2033 |
|
|
1,479 |
|
|
|
1,410 |
|
|
|
Walmart, Inc. 4.50% 4/15/2053 |
|
|
1,277 |
|
|
|
1,131 |
|
|
|
|
|
|
|
|
|
|
|
|
|
|
|
|
|
|
|
|
|
143,408 |
|
|
|
|
|
|
|
|
|
|
|
|
|
|
|
|
|
|
|
|
|
|
|
| |
|
|
|
| Real estate 0.82% |
|
American Tower Corp. 3.65% 3/15/2027 |
|
|
1,375 |
|
|
|
1,317 |
|
|
|
Boston Properties, LP 2.90% 3/15/2030 |
|
|
955 |
|
|
|
811 |
|
|
|
Boston Properties, LP 3.25% 1/30/2031 |
|
|
463 |
|
|
|
392 |
|
|
|
Boston Properties, LP 2.55% 4/1/2032 |
|
|
1,674 |
|
|
|
1,306 |
|
|
|
Boston Properties, LP 2.45% 10/1/2033 |
|
|
1,335 |
|
|
|
990 |
|
|
|
Boston Properties, LP 6.50% 1/15/2034 |
|
|
10,849 |
|
|
|
11,042 |
|
|
|
COPT Defense Properties, LP 2.00% 1/15/2029 |
|
|
1,139 |
|
|
|
966 |
|
|
|
COPT Defense Properties, LP 2.75% 4/15/2031 |
|
|
1,547 |
|
|
|
1,280 |
|
|
|
COPT Defense Properties, LP 2.90% 12/1/2033 |
|
|
564 |
|
|
|
444 |
|
|
|
Corp. Inmobiliaria Vesta, SAB de CV 3.625% 5/13/20316 |
|
|
395 |
|
|
|
333 |
|
159 American Funds Insurance Series
The Bond Fund of America (continued)
|
|
|
|
|
|
|
|
|
|
|
| Bonds, notes & other debt instruments (continued) |
|
Principal amount
(000) |
|
|
Value (000) |
|
|
| Corporate bonds, notes & loans (continued) |
|
|
|
|
|
| Real estate (continued) |
|
Crown Castle, Inc. 5.00% 1/11/2028 |
|
|
USD4,874 |
|
|
$ |
4,817 |
|
|
|
Equinix Europe 2 Financing Corp., LLC 5.50% 6/15/2034 |
|
|
3,410 |
|
|
|
3,406 |
|
|
|
Equinix, Inc. 2.90% 11/18/2026 |
|
|
2,762 |
|
|
|
2,610 |
|
|
|
Equinix, Inc. 3.20% 11/18/2029 |
|
|
887 |
|
|
|
799 |
|
|
|
Equinix, Inc. 3.90% 4/15/2032 |
|
|
1,155 |
|
|
|
1,051 |
|
|
|
FibraSOMA 4.375% 7/22/20316 |
|
|
1,475 |
|
|
|
1,181 |
|
|
|
Howard Hughes Corp. (The) 5.375% 8/1/20286 |
|
|
1,755 |
|
|
|
1,670 |
|
|
|
Howard Hughes Corp. (The) 4.125% 2/1/20296 |
|
|
2,755 |
|
|
|
2,467 |
|
|
|
Howard Hughes Corp. (The) 4.375% 2/1/20316 |
|
|
3,135 |
|
|
|
2,702 |
|
|
|
Invitation Homes Operating Partnership, LP 2.30% 11/15/2028 |
|
|
767 |
|
|
|
680 |
|
|
|
Invitation Homes Operating Partnership, LP 2.00% 8/15/2031 |
|
|
1,333 |
|
|
|
1,059 |
|
|
|
Iron Mountain, Inc. 5.25% 3/15/20286 |
|
|
3,020 |
|
|
|
2,925 |
|
|
|
Iron Mountain, Inc. 5.25% 7/15/20306 |
|
|
675 |
|
|
|
642 |
|
|
|
Kilroy Realty, LP 6.25% 1/15/2036 |
|
|
1,994 |
|
|
|
1,894 |
|
|
|
Prologis, LP 4.875% 6/15/2028 |
|
|
1,040 |
|
|
|
1,035 |
|
|
|
Prologis, LP 4.75% 6/15/2033 |
|
|
1,409 |
|
|
|
1,359 |
|
|
|
Prologis, LP 5.125% 1/15/2034 |
|
|
6,175 |
|
|
|
6,105 |
|
|
|
Prologis, LP 5.00% 3/15/2034 |
|
|
360 |
|
|
|
352 |
|
|
|
Prologis, LP 5.25% 6/15/2053 |
|
|
117 |
|
|
|
110 |
|
|
|
Public Storage Operating Co. 2.30% 5/1/2031 |
|
|
2,920 |
|
|
|
2,457 |
|
|
|
Scentre Group Trust 1 3.50% 2/12/20256 |
|
|
4,015 |
|
|
|
3,960 |
|
|
|
Service Properties Trust 3.95% 1/15/2028 |
|
|
1,710 |
|
|
|
1,434 |
|
|
|
Service Properties Trust 8.625% 11/15/20316 |
|
|
3,040 |
|
|
|
3,171 |
|
|
|
VICI Properties, LP 4.375% 5/15/2025 |
|
|
670 |
|
|
|
662 |
|
|
|
VICI Properties, LP 4.75% 2/15/2028 |
|
|
6,844 |
|
|
|
6,690 |
|
|
|
VICI Properties, LP 4.95% 2/15/2030 |
|
|
5,515 |
|
|
|
5,325 |
|
|
|
VICI Properties, LP 5.125% 5/15/2032 |
|
|
11,766 |
|
|
|
11,218 |
|
|
|
VICI Properties, LP 5.625% 5/15/2052 |
|
|
388 |
|
|
|
350 |
|
|
|
|
|
|
|
|
|
|
|
|
|
|
|
|
|
|
|
|
|
91,012 |
|
|
|
|
|
|
|
|
|
|
|
|
|
|
|
|
|
|
|
|
|
|
|
| |
|
|
|
| Information technology 0.33% |
|
Analog Devices, Inc. 2.10% 10/1/2031 |
|
|
270 |
|
|
|
224 |
|
|
|
Analog Devices, Inc. 5.05% 4/1/2034 |
|
|
717 |
|
|
|
714 |
|
|
|
Analog Devices, Inc. 2.80% 10/1/2041 |
|
|
521 |
|
|
|
367 |
|
|
|
Broadcom Corp. 3.875% 1/15/2027 |
|
|
5,966 |
|
|
|
5,774 |
|
|
|
Broadcom, Inc. 4.00% 4/15/20296 |
|
|
609 |
|
|
|
580 |
|
|
|
Broadcom, Inc. 4.15% 4/15/20326 |
|
|
630 |
|
|
|
582 |
|
|
|
Broadcom, Inc. 3.469% 4/15/20346 |
|
|
11,652 |
|
|
|
9,937 |
|
|
|
Broadcom, Inc. 3.137% 11/15/20356 |
|
|
847 |
|
|
|
679 |
|
|
|
Broadcom, Inc. 4.926% 5/15/20376 |
|
|
2,879 |
|
|
|
2,709 |
|
|
|
Cisco Systems, Inc. 4.85% 2/26/2029 |
|
|
1,819 |
|
|
|
1,819 |
|
|
|
Cisco Systems, Inc. 4.95% 2/26/2031 |
|
|
991 |
|
|
|
991 |
|
|
|
Cisco Systems, Inc. 5.05% 2/26/2034 |
|
|
843 |
|
|
|
843 |
|
|
|
Cisco Systems, Inc. 5.30% 2/26/2054 |
|
|
784 |
|
|
|
768 |
|
|
|
Microchip Technology, Inc. 5.05% 3/15/2029 |
|
|
4,350 |
|
|
|
4,316 |
|
|
|
Oracle Corp. 1.65% 3/25/2026 |
|
|
4,867 |
|
|
|
4,564 |
|
|
|
ServiceNow, Inc. 1.40% 9/1/2030 |
|
|
1,760 |
|
|
|
1,430 |
|
|
|
|
|
|
|
|
|
|
|
|
|
|
|
|
|
|
|
|
|
36,297 |
|
|
|
|
|
|
|
|
|
|
|
|
|
|
|
|
|
|
|
|
|
|
|
| |
|
|
|
| Materials 0.13% |
|
Air Products and Chemicals, Inc. 2.70% 5/15/2040 |
|
|
2,911 |
|
|
|
2,078 |
|
|
|
BHP Billiton Finance (USA), Ltd. 5.25% 9/8/2033 |
|
|
138 |
|
|
|
138 |
|
|
|
Braskem Netherlands Finance BV 7.25% 2/13/20336 |
|
|
700 |
|
|
|
660 |
|
|
|
Celanese US Holdings, LLC 6.165% 7/15/2027 |
|
|
2,875 |
|
|
|
2,919 |
|
|
|
Celanese US Holdings, LLC 6.35% 11/15/2028 |
|
|
495 |
|
|
|
509 |
|
|
|
Celanese US Holdings, LLC 6.33% 7/15/2029 |
|
|
297 |
|
|
|
306 |
|
|
|
Celanese US Holdings, LLC 6.55% 11/15/2030 |
|
|
465 |
|
|
|
486 |
|
|
|
Celanese US Holdings, LLC 6.379% 7/15/2032 |
|
|
800 |
|
|
|
823 |
|
|
|
Celanese US Holdings, LLC 6.70% 11/15/2033 |
|
|
1,031 |
|
|
|
1,084 |
|
|
|
Dow Chemical Co. (The) 5.15% 2/15/2034 |
|
|
659 |
|
|
|
645 |
|
American Funds Insurance Series 160
The Bond Fund of America (continued)
|
|
|
|
|
|
|
|
|
|
|
| Bonds, notes & other debt instruments (continued) |
|
Principal amount
(000) |
|
|
Value (000) |
|
|
| Corporate bonds, notes & loans (continued) |
|
|
|
|
|
| Materials (continued) |
|
Dow Chemical Co. (The) 5.55% 11/30/2048 |
|
|
USD142 |
|
|
$ |
135 |
|
|
|
Dow Chemical Co. (The) 6.90% 5/15/2053 |
|
|
62 |
|
|
|
69 |
|
|
|
Dow Chemical Co. (The) 5.60% 2/15/2054 |
|
|
504 |
|
|
|
485 |
|
|
|
Eastman Chemical Co. 5.625% 2/20/2034 |
|
|
861 |
|
|
|
856 |
|
|
|
Methanex Corp. 5.125% 10/15/2027 |
|
|
510 |
|
|
|
492 |
|
|
|
NOVA Chemicals Corp. 8.50% 11/15/20286 |
|
|
205 |
|
|
|
218 |
|
|
|
NOVA Chemicals Corp. 4.25% 5/15/20296 |
|
|
425 |
|
|
|
375 |
|
|
|
OCI NV 6.70% 3/16/20336 |
|
|
1,150 |
|
|
|
1,136 |
|
|
|
POSCO 5.75% 1/17/20286 |
|
|
745 |
|
|
|
755 |
|
|
|
|
|
|
|
|
|
|
|
|
|
|
|
|
|
|
|
|
|
14,169 |
|
|
|
|
|
|
|
|
|
|
|
|
|
|
|
|
|
|
|
|
|
|
|
| |
|
|
|
| Municipals 0.01% |
|
Aeropuerto Internacional de Tocumen, SA 4.00% 8/11/20416 |
|
|
730 |
|
|
|
551 |
|
|
|
Aeropuerto Internacional de Tocumen, SA 5.125% 8/11/20616 |
|
|
565 |
|
|
|
417 |
|
|
|
|
|
|
|
|
|
|
|
|
|
|
|
|
|
|
|
|
|
968 |
|
|
|
|
|
|
|
|
|
|
|
|
|
|
Total corporate bonds, notes & loans |
|
|
|
|
|
|
3,399,615 |
|
|
|
|
|
|
|
|
|
|
|
|
|
| U.S. Treasury bonds & notes 17.41% |
|
|
|
|
|
| U.S. Treasury 16.38% |
|
|
|
|
|
|
|
|
|
|
|
|
U.S. Treasury 3.875% 3/31/2025 |
|
|
81,282 |
|
|
|
80,490 |
|
|
|
U.S. Treasury 4.625% 6/30/2025 |
|
|
67,785 |
|
|
|
67,462 |
|
|
|
U.S. Treasury 3.00% 7/15/2025 |
|
|
97,643 |
|
|
|
95,593 |
|
|
|
U.S. Treasury 5.00% 9/30/2025 |
|
|
1,090 |
|
|
|
1,090 |
|
|
|
U.S. Treasury 5.00% 10/31/2025 |
|
|
27,980 |
|
|
|
27,983 |
|
|
|
U.S. Treasury 2.25% 11/15/2025 |
|
|
6,785 |
|
|
|
6,543 |
|
|
|
U.S. Treasury 4.00% 12/15/2025 |
|
|
42,800 |
|
|
|
42,253 |
|
|
|
U.S. Treasury 4.25% 12/31/2025 |
|
|
4,994 |
|
|
|
4,946 |
|
|
|
U.S. Treasury 3.625% 5/15/2026 |
|
|
1,926 |
|
|
|
1,887 |
|
|
|
U.S. Treasury 4.125% 6/15/2026 |
|
|
205 |
|
|
|
203 |
|
|
|
U.S. Treasury 4.625% 6/30/2026 |
|
|
58,280 |
|
|
|
58,169 |
|
|
|
U.S. Treasury 4.375% 8/15/2026 |
|
|
265 |
|
|
|
263 |
|
|
|
U.S. Treasury 0.75% 8/31/2026 |
|
|
8,871 |
|
|
|
8,160 |
|
|
|
U.S. Treasury 4.625% 11/15/2026 |
|
|
3,589 |
|
|
|
3,587 |
|
|
|
U.S. Treasury 4.00% 1/15/2027 |
|
|
3,741 |
|
|
|
3,686 |
|
|
|
U.S. Treasury 1.875% 2/28/2027 |
|
|
4,000 |
|
|
|
3,732 |
|
|
|
U.S. Treasury 2.625% 5/31/2027 |
|
|
43,530 |
|
|
|
41,283 |
|
|
|
U.S. Treasury 4.625% 6/15/2027 |
|
|
42,298 |
|
|
|
42,416 |
|
|
|
U.S. Treasury 2.25% 11/15/2027 |
|
|
105,830 |
|
|
|
98,484 |
|
|
|
U.S. Treasury 6.125% 11/15/2027 |
|
|
24,000 |
|
|
|
25,266 |
|
|
|
U.S. Treasury 1.125% 2/29/2028 |
|
|
9,895 |
|
|
|
8,790 |
|
|
|
U.S. Treasury 4.00% 2/29/2028 |
|
|
4,750 |
|
|
|
4,677 |
|
|
|
U.S. Treasury 3.625% 3/31/2028 |
|
|
13 |
|
|
|
13 |
|
|
|
U.S. Treasury 1.00% 7/31/2028 |
|
|
5,630 |
|
|
|
4,917 |
|
|
|
U.S. Treasury 1.125% 8/31/2028 |
|
|
13,555 |
|
|
|
11,874 |
|
|
|
U.S. Treasury 5.25% 11/15/2028 |
|
|
5,700 |
|
|
|
5,900 |
|
|
|
U.S. Treasury 2.375% 5/15/2029 |
|
|
4,070 |
|
|
|
3,717 |
|
|
|
U.S. Treasury 4.25% 6/30/2029 |
|
|
294,478 |
|
|
|
293,144 |
|
|
|
U.S. Treasury 3.875% 12/31/2029 |
|
|
44,049 |
|
|
|
43,006 |
|
|
|
U.S. Treasury 4.00% 2/28/2030 |
|
|
38,255 |
|
|
|
37,565 |
|
|
|
U.S. Treasury 3.75% 5/31/2030 |
|
|
13,300 |
|
|
|
12,882 |
|
|
|
U.S. Treasury 4.125% 8/31/2030 |
|
|
11,215 |
|
|
|
11,072 |
|
|
|
U.S. Treasury 4.875% 10/31/2030 |
|
|
92,133 |
|
|
|
94,735 |
|
|
|
U.S. Treasury 1.625% 5/15/2031 |
|
|
1,630 |
|
|
|
1,368 |
|
|
|
U.S. Treasury 4.25% 6/30/2031 |
|
|
9,834 |
|
|
|
9,800 |
|
|
|
U.S. Treasury 4.125% 11/15/2032 |
|
|
114 |
|
|
|
112 |
|
|
|
U.S. Treasury 4.375% 5/15/2034 |
|
|
16,801 |
|
|
|
16,807 |
|
|
|
U.S. Treasury 4.25% 5/15/20393 |
|
|
109,335 |
|
|
|
106,881 |
|
|
|
U.S. Treasury 1.375% 11/15/2040 |
|
|
24,540 |
|
|
|
15,493 |
|
|
|
U.S. Treasury 1.875% 2/15/2041 |
|
|
24,272 |
|
|
|
16,592 |
|
|
|
U.S. Treasury 4.75% 2/15/2041 |
|
|
75,066 |
|
|
|
77,108 |
|
161 American Funds Insurance Series
The Bond Fund of America (continued)
|
|
|
|
|
|
|
|
|
|
|
| Bonds, notes & other debt instruments (continued) |
|
Principal amount
(000) |
|
|
Value (000) |
|
|
| U.S. Treasury bonds & notes (continued) |
|
|
|
|
|
| U.S. Treasury (continued) |
|
U.S. Treasury 2.00% 11/15/2041 |
|
|
USD57 |
|
|
$ |
39 |
|
|
|
U.S. Treasury 2.375% 2/15/2042 |
|
|
2,701 |
|
|
|
1,967 |
|
|
|
U.S. Treasury 3.25% 5/15/2042 |
|
|
10,848 |
|
|
|
9,021 |
|
|
|
U.S. Treasury 4.625% 5/15/2044 |
|
|
63,845 |
|
|
|
63,723 |
|
|
|
U.S. Treasury 3.00% 2/15/20493 |
|
|
114,305 |
|
|
|
86,618 |
|
|
|
U.S. Treasury 2.875% 5/15/2049 |
|
|
19,228 |
|
|
|
14,209 |
|
|
|
U.S. Treasury 2.875% 5/15/2052 |
|
|
990 |
|
|
|
726 |
|
|
|
U.S. Treasury 4.00% 11/15/2052 |
|
|
8,553 |
|
|
|
7,795 |
|
|
|
U.S. Treasury 4.125% 8/15/2053 |
|
|
6,390 |
|
|
|
5,954 |
|
|
|
U.S. Treasury 4.25% 2/15/20543 |
|
|
256,791 |
|
|
|
244,626 |
|
|
|
|
|
|
|
|
|
|
|
|
|
|
|
|
|
|
|
|
|
1,824,627 |
|
|
|
|
|
|
|
|
|
|
|
|
|
|
|
|
|
|
|
|
|
|
|
| |
|
|
|
| U.S. Treasury inflation-protected securities 1.03% |
|
U.S. Treasury Inflation-Protected Security 0.125% 7/15/202411 |
|
|
23,868 |
|
|
|
23,845 |
|
|
|
U.S. Treasury Inflation-Protected Security 0.25% 1/15/202511 |
|
|
2,983 |
|
|
|
2,923 |
|
|
|
U.S. Treasury Inflation-Protected Security 0.375% 7/15/202511 |
|
|
5,370 |
|
|
|
5,237 |
|
|
|
U.S. Treasury Inflation-Protected Security 0.125% 10/15/202611 |
|
|
5,908 |
|
|
|
5,625 |
|
|
|
U.S. Treasury Inflation-Protected Security 0.375% 7/15/202711 |
|
|
50,598 |
|
|
|
48,029 |
|
|
|
U.S. Treasury Inflation-Protected Security 0.50% 1/15/20283,11 |
|
|
4,131 |
|
|
|
3,894 |
|
|
|
U.S. Treasury Inflation-Protected Security 0.125% 2/15/205111 |
|
|
– |
4 |
|
|
– |
4 |
|
|
U.S. Treasury Inflation-Protected Security 0.125% 2/15/205211 |
|
|
191 |
|
|
|
108 |
|
|
|
U.S. Treasury Inflation-Protected Security 1.50% 2/15/205311 |
|
|
29,407 |
|
|
|
24,657 |
|
|
|
|
|
|
|
|
|
|
|
|
|
|
|
|
|
|
|
|
|
114,318 |
|
|
|
|
|
|
|
|
|
|
|
|
|
|
Total U.S. Treasury bonds & notes |
|
|
|
|
|
|
1,938,945 |
|
|
|
|
|
|
|
|
|
|
|
|
|
| Asset-backed obligations 5.15% |
|
|
|
ACHV ABS Trust, Series 2023-4CP, Class A, 6.81% 11/25/20301,6 |
|
|
62 |
|
|
|
62 |
|
|
|
ACHV ABS Trust, Series 2023-4CP, Class B, 7.24% 11/25/20301,6 |
|
|
347 |
|
|
|
349 |
|
|
|
Affirm Asset Securitization Trust, Series 2021-Z2, Class A,
1.17% 11/16/20261,6 |
|
|
107 |
|
|
|
105 |
|
|
|
Affirm Asset Securitization Trust, Series 2022-X1, Class A,
1.75% 2/15/20271,6 |
|
|
29 |
|
|
|
29 |
|
|
|
Affirm, Inc., Series 2023-X1, Class A, 7.11% 11/15/20281,6 |
|
|
1,299 |
|
|
|
1,304 |
|
|
|
Affirm, Inc., Series 2024, Class 1A, 5.61% 2/15/20291,6 |
|
|
11,785 |
|
|
|
11,748 |
|
|
|
Affirm, Inc., Series 2024-A, Class A, 5.61% 2/15/20291,6 |
|
|
3,485 |
|
|
|
3,476 |
|
|
|
Affirm, Inc., Series 2024-X1, Class A, 6.27% 5/15/20291,6 |
|
|
2,719 |
|
|
|
2,723 |
|
|
|
Ally Auto Receivables Trust, Series 2023-1, Class A3, 5.46% 5/15/20281 |
|
|
505 |
|
|
|
507 |
|
|
|
American Credit Acceptance Receivables Trust, Series 2023-2, Class A,
5.89% 10/13/20261,6 |
|
|
201 |
|
|
|
201 |
|
|
|
American Credit Acceptance Receivables Trust, Series 2023-4, Class B,
6.63% 2/14/20281,6 |
|
|
4,033 |
|
|
|
4,067 |
|
|
|
American Homes 4 Rent, Series 2015-SFR2, Class A, 3.732% 10/17/20521,6 |
|
|
2,691 |
|
|
|
2,627 |
|
|
|
American Homes 4 Rent, Series 2015-SFR2, Class B, 4.295% 10/17/20521,6 |
|
|
396 |
|
|
|
387 |
|
|
|
AmeriCredit Automobile Receivables Trust, Series 2023-1, Class A2A,
5.84% 10/19/20261 |
|
|
602 |
|
|
|
603 |
|
|
|
AmeriCredit Automobile Receivables Trust, Series 2021-2, Class B,
0.69% 1/19/20271 |
|
|
823 |
|
|
|
811 |
|
|
|
AmeriCredit Automobile Receivables Trust, Series 2021-2, Class C,
1.01% 1/19/20271 |
|
|
1,109 |
|
|
|
1,057 |
|
|
|
AmeriCredit Automobile Receivables Trust, Series 2021-2, Class D,
1.29% 6/18/20271 |
|
|
2,613 |
|
|
|
2,442 |
|
|
|
Avis Budget Rental Car Funding (AESOP), LLC, Series 2020-1A, Class A,
2.33% 8/20/20261,6 |
|
|
7,689 |
|
|
|
7,450 |
|
|
|
Avis Budget Rental Car Funding (AESOP), LLC, Series 2020-2, Class A,
2.02% 2/20/20271,6 |
|
|
2,427 |
|
|
|
2,306 |
|
|
|
Avis Budget Rental Car Funding (AESOP), LLC, Series 2020-2A, Class B, 2.96% 2/20/20271,6 |
|
|
623 |
|
|
|
596 |
|
|
|
Avis Budget Rental Car Funding (AESOP), LLC, Series 2020-2, Class C,
4.25% 2/20/20271,6 |
|
|
1,279 |
|
|
|
1,241 |
|
|
|
Avis Budget Rental Car Funding (AESOP), LLC, Series 2021-1A, Class A, 1.38% 8/20/20271,6 |
|
|
3,445 |
|
|
|
3,184 |
|
|
|
Avis Budget Rental Car Funding (AESOP), LLC, Series 2021-1A, Class B, 1.63% 8/20/20271,6 |
|
|
531 |
|
|
|
490 |
|
American Funds Insurance Series 162
The Bond Fund of America (continued)
|
|
|
|
|
|
|
|
|
|
|
| Bonds, notes & other debt instruments (continued) |
|
Principal amount
(000) |
|
|
Value (000) |
|
|
| Asset-backed obligations (continued) |
|
|
|
Avis Budget Rental Car Funding (AESOP), LLC, Series 2021-1A, Class C,
2.13% 8/20/20271,6 |
|
|
USD193 |
|
|
$ |
178 |
|
|
|
Avis Budget Rental Car Funding (AESOP), LLC, Series 2023-5, Class A,
5.78% 4/20/20281,6 |
|
|
6,724 |
|
|
|
6,779 |
|
|
|
Avis Budget Rental Car Funding (AESOP), LLC, Series 2023-6, Class A,
5.81% 12/20/20291,6 |
|
|
5,059 |
|
|
|
5,135 |
|
|
|
Avis Budget Rental Car Funding (AESOP), LLC, Series 2024-1, Class A,
5.36% 6/20/20301,6 |
|
|
4,665 |
|
|
|
4,654 |
|
|
|
Bankers Healthcare Group Securitization Trust, Series 2021-B, Class A,
0.90% 10/17/20341,6 |
|
|
50 |
|
|
|
50 |
|
|
|
Bankers Healthcare Group Securitization Trust, Series 2021-B, Class B,
1.67% 10/17/20341,6 |
|
|
269 |
|
|
|
252 |
|
|
|
Blackbird Capital II Aircraft Lease, Ltd. / Blackbird Capital II Aircraft Lease US, LLC,
Series 2021-1, Class A, 2.443% 7/15/20461,6 |
|
|
3,388 |
|
|
|
3,036 |
|
|
|
Blackbird Capital II Aircraft Lease, Ltd. / Blackbird Capital II Aircraft Lease US, LLC,
Series 2021-1, Class B, 3.446% 7/15/20461,6 |
|
|
390 |
|
|
|
348 |
|
|
|
BMW Vehicle Owner Trust, Series 2023-A, Class A3,
5.47% 2/25/20281 |
|
|
213 |
|
|
|
214 |
|
|
|
Bridgecrest Lending Auto Securitization Trust, Series 2023-1, Class A3,
6.51% 11/15/20271 |
|
|
881 |
|
|
|
886 |
|
|
|
Bridgecrest Lending Auto Securitization Trust, Series 2024-1, Class A3,
5.53% 1/18/20281 |
|
|
5,539 |
|
|
|
5,529 |
|
|
|
Bridgecrest Lending Auto Securitization Trust, Series 2023-1, Class B,
6.80% 8/15/20291 |
|
|
1,400 |
|
|
|
1,420 |
|
|
|
CarMax Auto Owner Trust, Series 2023-2, Class A2A, 5.50% 6/15/20261 |
|
|
330 |
|
|
|
330 |
|
|
|
CarMax Auto Owner Trust, Series 2021-1, Class C, 0.94% 12/15/20261 |
|
|
210 |
|
|
|
203 |
|
|
|
CarMax Auto Owner Trust, Series 2021-1, Class D, 1.28% 7/15/20271 |
|
|
206 |
|
|
|
199 |
|
|
|
Carvana Auto Receivables Trust, Series 2023-N3, Class A, 6.41% 9/10/20271,6 |
|
|
157 |
|
|
|
157 |
|
|
|
Carvana Auto Receivables Trust, Series 2023-P3, Class A3, 5.82% 8/10/20281,6 |
|
|
469 |
|
|
|
472 |
|
|
|
Carvana Auto Receivables Trust, Series 2021-N4, Class C, 1.72% 9/11/20281 |
|
|
105 |
|
|
|
99 |
|
|
|
Carvana Auto Receivables Trust, Series 2023-P3, Class A4, 5.71% 7/10/20291,6 |
|
|
172 |
|
|
|
174 |
|
|
|
Castlelake Aircraft Securitization Trust, Series 2021-1, Class A, 2.868% 5/11/20371,6 |
|
|
14,639 |
|
|
|
13,075 |
|
|
|
Castlelake Aircraft Securitization Trust, Series 2021-1, Class C, 3.464% 5/11/20371,6 |
|
|
5,697 |
|
|
|
4,953 |
|
|
|
Castlelake Aircraft Securitization Trust, Series 2021-1, Class C, 6.171% 5/11/20371,6 |
|
|
628 |
|
|
|
551 |
|
|
|
Castlelake Aircraft Securitization Trust, Series 2017-1R, Class A, 2.741% 8/15/20411,6 |
|
|
341 |
|
|
|
319 |
|
|
|
CF Hippolyta, LLC, Series 2020-1, Class A1, 1.69% 7/15/20601,6 |
|
|
18,497 |
|
|
|
17,537 |
|
|
|
CF Hippolyta, LLC, Series 2020-1, Class A2, 1.99% 7/15/20601,6 |
|
|
1,917 |
|
|
|
1,667 |
|
|
|
CF Hippolyta, LLC, Series 2020-1, Class B1, 2.28% 7/15/20601,6 |
|
|
3,362 |
|
|
|
3,144 |
|
|
|
CF Hippolyta, LLC, Series 2020-1, Class B2, 2.60% 7/15/20601,6 |
|
|
364 |
|
|
|
306 |
|
|
|
CF Hippolyta, LLC, Series 2021-1, Class A1, 1.53% 3/15/20611,6 |
|
|
5,994 |
|
|
|
5,495 |
|
|
|
CF Hippolyta, LLC, Series 2021-1, Class B1, 1.98% 3/15/20611,6 |
|
|
1,898 |
|
|
|
1,697 |
|
|
|
CF Hippolyta, LLC, Series 2022-1, Class A1, 5.97% 8/15/20621,6 |
|
|
14,984 |
|
|
|
14,774 |
|
|
|
CF Hippolyta, LLC, Series 2022-1, Class A2, 6.11% 8/15/20621,6 |
|
|
6,572 |
|
|
|
6,462 |
|
|
|
Chase Issuance Trust, Series 2024-A2, Class A, 4.63% 1/15/20311 |
|
|
8,429 |
|
|
|
8,381 |
|
|
|
Chesapeake Funding II, LLC, Series 2023-2, Class A1, 6.16% 10/15/20351,6 |
|
|
1,014 |
|
|
|
1,020 |
|
|
|
Citizens Auto Receivables Trust, Series 2023-2, Class A3, 5.83% 2/15/20281,6 |
|
|
1,635 |
|
|
|
1,646 |
|
|
|
Citizens Auto Receivables Trust, Series 2023-2, Class A4, 5.74% 10/15/20301,6 |
|
|
799 |
|
|
|
808 |
|
|
|
CLI Funding VI, LLC, Series 2020-2A, Class A, 2.03% 9/15/20451,6 |
|
|
1,842 |
|
|
|
1,663 |
|
|
|
CLI Funding VI, LLC, Series 2020-3A, Class A, 2.07% 10/18/20451,6 |
|
|
3,801 |
|
|
|
3,441 |
|
|
|
CLI Funding VIII, LLC, Series 2021-1A, Class A, 2.38% 2/18/20461,6 |
|
|
349 |
|
|
|
307 |
|
|
|
CPS Auto Receivables Trust, Series 2023-C, Class A, 6.13% 9/15/20261,6 |
|
|
260 |
|
|
|
261 |
|
|
|
CPS Auto Receivables Trust, Series 2021-A, Class D, 1.16% 12/15/20261,6 |
|
|
247 |
|
|
|
243 |
|
|
|
CPS Auto Receivables Trust, Series 2023-D, Class A, 6.40% 6/15/20271,6 |
|
|
1,176 |
|
|
|
1,179 |
|
|
|
CPS Auto Receivables Trust, Series 2023-B, Class A, 5.91% 8/16/20271,6 |
|
|
566 |
|
|
|
566 |
|
|
|
CPS Auto Receivables Trust, Series 2024-A, Class B, 5.65% 5/15/20281,6 |
|
|
1,237 |
|
|
|
1,235 |
|
|
|
CPS Auto Receivables Trust, Series 2022-B, Class B, 3.88% 8/15/20281,6 |
|
|
1,481 |
|
|
|
1,476 |
|
|
|
CPS Auto Receivables Trust, Series 2022-B, Class C, 4.33% 8/15/20281,6 |
|
|
2,797 |
|
|
|
2,765 |
|
|
|
Drive Auto Receivables Trust, Series 2021-1, Class D, 1.45% 1/16/20291 |
|
|
3,441 |
|
|
|
3,358 |
|
|
|
DriveTime Auto Owner Trust, Series 2021-1, Class C, 0.84% 10/15/20261,6 |
|
|
39 |
|
|
|
38 |
|
|
|
DriveTime Auto Owner Trust, Series 2021-1A, Class D, 1.16% 11/16/20261,6 |
|
|
449 |
|
|
|
438 |
|
|
|
DriveTime Auto Owner Trust, Series 2021-2A, Class C, 1.10% 2/16/20271,6 |
|
|
156 |
|
|
|
156 |
|
|
|
DriveTime Auto Owner Trust, Series 2021-2A, Class D, 1.50% 2/16/20271,6 |
|
|
832 |
|
|
|
810 |
|
163 American Funds Insurance Series
The Bond Fund of America (continued)
|
|
|
|
|
|
|
|
|
|
|
| Bonds, notes & other debt instruments (continued) |
|
Principal amount
(000) |
|
|
Value (000) |
|
|
| Asset-backed obligations (continued) |
|
|
|
DriveTime Auto Owner Trust, Series 2023-2, Class A, 5.88% 4/15/20271,6 |
|
|
USD224 |
|
|
$ |
224 |
|
|
|
DriveTime Auto Owner Trust, Series 2023-3, Class C, 6.40% 5/15/20291,6 |
|
|
819 |
|
|
|
826 |
|
|
|
DriveTime Auto Owner Trust, Series 2023-3, Class D, 7.12% 5/15/20291,6 |
|
|
846 |
|
|
|
866 |
|
|
|
EDvestinU Private Education Loan, LLC, Series 2021-A, Class A, 1.80% 11/25/20451,6 |
|
|
333 |
|
|
|
297 |
|
|
|
Enterprise Fleet Financing, LLC, Series 2022-3, Class A3, 4.29% 7/20/20291,6 |
|
|
897 |
|
|
|
880 |
|
|
|
Enterprise Fleet Financing, LLC, Series 2022-3, Class A2, 4.38% 7/20/20291,6 |
|
|
785 |
|
|
|
777 |
|
|
|
Enterprise Fleet Financing, LLC, Series 2024-1, Class A2, 5.23% 3/20/20301,6 |
|
|
14,087 |
|
|
|
14,052 |
|
|
|
Exeter Automobile Receivables Trust, Series 2020-1, Class D, 2.73% 12/15/20251,6 |
|
|
154 |
|
|
|
153 |
|
|
|
Exeter Automobile Receivables Trust, Series 2021-2, Class C, 0.98% 6/15/20261 |
|
|
24 |
|
|
|
24 |
|
|
|
Exeter Automobile Receivables Trust, Series 2020-3A, Class D, 1.73% 7/15/20261 |
|
|
120 |
|
|
|
120 |
|
|
|
Exeter Automobile Receivables Trust, Series 2023-3, Class A3, 6.04% 7/15/20261 |
|
|
94 |
|
|
|
94 |
|
|
|
Exeter Automobile Receivables Trust, Series 2022-2A, Class B, 3.65% 10/15/20261 |
|
|
457 |
|
|
|
456 |
|
|
|
Exeter Automobile Receivables Trust, Series 2022-4A, Class B, 4.57% 1/15/20271 |
|
|
212 |
|
|
|
212 |
|
|
|
Exeter Automobile Receivables Trust, Series 2023-5, Class A3, 6.32% 3/15/20271 |
|
|
1,709 |
|
|
|
1,715 |
|
|
|
Exeter Automobile Receivables Trust, Series 2021-2, Class D, 1.40% 4/15/20271 |
|
|
2,612 |
|
|
|
2,508 |
|
|
|
Exeter Automobile Receivables Trust, Series 2023-3, Class B, 6.11% 9/15/20271 |
|
|
232 |
|
|
|
232 |
|
|
|
Exeter Automobile Receivables Trust, Series 2023-5, Class B, 6.58% 4/17/20281 |
|
|
5,028 |
|
|
|
5,082 |
|
|
|
Exeter Automobile Receivables Trust, Series 2023-3, Class C, 6.21% 6/15/20281 |
|
|
418 |
|
|
|
420 |
|
|
|
Exeter Automobile Receivables Trust, Series 2022-2A, Class D, 4.56% 7/17/20281 |
|
|
271 |
|
|
|
265 |
|
|
|
Exeter Automobile Receivables Trust, Series 2023-3, Class D, 6.68% 4/16/20291 |
|
|
758 |
|
|
|
769 |
|
|
|
Exeter Automobile Receivables Trust, Series 2023-1, Class D, 6.69% 6/15/20291 |
|
|
462 |
|
|
|
467 |
|
|
|
Exeter Automobile Receivables Trust, Series 2023-3, Class E, 9.98% 1/15/20311,6 |
|
|
1,014 |
|
|
|
1,080 |
|
|
|
FirstKey Homes Trust, Series 2020-SFR2, Class A, 1.266% 10/19/20371,6 |
|
|
17,063 |
|
|
|
16,163 |
|
|
|
FirstKey Homes Trust, Series 2021-SFR3, Class A, 2.135% 12/17/20381,6 |
|
|
1,377 |
|
|
|
1,271 |
|
|
|
FirstKey Homes Trust, Series 2022-SFR2, Class A, 4.145% 5/17/20391,6 |
|
|
1,726 |
|
|
|
1,665 |
|
|
|
Flagship Credit Auto Trust, Series 2023-3, Class A3, 5.44% 4/17/20281,6 |
|
|
561 |
|
|
|
560 |
|
|
|
Flagship Credit Auto Trust, Series 2023-3, Class B, 5.64% 7/16/20291,6 |
|
|
312 |
|
|
|
312 |
|
|
|
Flagship Credit Auto Trust, Series 2023-3, Class C, 6.01% 7/16/20291,6 |
|
|
454 |
|
|
|
457 |
|
|
|
Flagship Credit Auto Trust, Series 2023-3, Class D, 6.58% 8/15/20291,6 |
|
|
307 |
|
|
|
310 |
|
|
|
Ford Credit Auto Owner Trust, Series 2023-A, Class A2A, 5.14% 3/15/20261 |
|
|
928 |
|
|
|
927 |
|
|
|
Ford Credit Auto Owner Trust, Series 2023-B, Class A3, 5.23% 5/15/20281 |
|
|
765 |
|
|
|
765 |
|
|
|
Ford Credit Auto Owner Trust, Series 2023-B, Class A4, 5.06% 2/15/20291 |
|
|
597 |
|
|
|
597 |
|
|
|
Ford Credit Auto Owner Trust, Series 2018-1, Class A, 3.19% 7/15/20311,6 |
|
|
30,070 |
|
|
|
29,669 |
|
|
|
Ford Credit Auto Owner Trust, Series 2020-1, Class A, 2.04% 8/15/20311,6 |
|
|
1,619 |
|
|
|
1,583 |
|
|
|
Ford Credit Auto Owner Trust, Series 2023-1, Class A, 4.85% 8/15/20351,6 |
|
|
4,218 |
|
|
|
4,188 |
|
|
|
Ford Credit Floorplan Master Owner Trust, Series 2023-1, Class A1, 4.92% 5/15/20281,6 |
|
|
5,833 |
|
|
|
5,799 |
|
|
|
GCI Funding I, LLC, Series 2020-1, Class A, 2.82% 10/18/20451,6 |
|
|
1,616 |
|
|
|
1,473 |
|
|
|
GCI Funding I, LLC, Series 2021-1, Class A, 2.38% 6/18/20461,6 |
|
|
1,221 |
|
|
|
1,085 |
|
|
|
GCI Funding I, LLC, Series 2021-1, Class B, 3.04% 6/18/20461,6 |
|
|
136 |
|
|
|
113 |
|
|
|
Global SC Finance VII SRL, Series 2020-2A, Class A, 2.26% 11/19/20401,6 |
|
|
2,240 |
|
|
|
2,077 |
|
|
|
Global SC Finance VII SRL, Series 2021-1A, Class A, 1.86% 4/17/20411,6 |
|
|
8,003 |
|
|
|
7,176 |
|
|
|
Global SC Finance VII SRL, Series 2021-2A, Class A, 1.95% 8/17/20411,6 |
|
|
2,227 |
|
|
|
2,011 |
|
|
|
Global SC Finance VII SRL, Series 2021-2A, Class B, 2.49% 8/17/20411,6 |
|
|
1,876 |
|
|
|
1,663 |
|
|
|
GLS Auto Receivables Trust, Series 2023-2, Class A2, 5.70% 1/15/20271,6 |
|
|
310 |
|
|
|
310 |
|
|
|
GLS Auto Receivables Trust, Series 2023-4, Class A3, 6.42% 6/15/20271,6 |
|
|
4,751 |
|
|
|
4,787 |
|
|
|
GLS Auto Receivables Trust, Series 2023-3, Class B, 5.89% 1/18/20281,6 |
|
|
1,175 |
|
|
|
1,174 |
|
|
|
GLS Auto Receivables Trust, Series 2023-3, Class C, 6.01% 5/15/20291,6 |
|
|
561 |
|
|
|
562 |
|
|
|
GLS Auto Receivables Trust, Series 2023-3, Class D, 6.44% 5/15/20291,6 |
|
|
507 |
|
|
|
512 |
|
|
|
GLS Auto Select Receivables Trust, Series 2024-2, Class A2, 5.58% 6/17/20301,6 |
|
|
2,257 |
|
|
|
2,259 |
|
|
|
GM Financial Automobile Leasing Trust, Series 2023-3, Class A3, 5.38% 11/20/20261 |
|
|
807 |
|
|
|
807 |
|
|
|
GM Financial Automobile Leasing Trust, Series 2023-3, Class A4, 5.44% 8/20/20271 |
|
|
101 |
|
|
|
101 |
|
|
|
GM Financial Consumer Automobile Receivables Trust, Series 2023-3, Class A3, 5.45% 6/16/20281 |
|
|
483 |
|
|
|
485 |
|
|
|
GM Financial Consumer Automobile Receivables Trust, Series 2023-3, Class A4, 5.34% 12/18/20281 |
|
|
320 |
|
|
|
322 |
|
|
|
GM Financial Revolving Receivables Trust, Series 2023-1, Class A, 5.12% 4/11/20351,6 |
|
|
4,815 |
|
|
|
4,825 |
|
|
|
GM Financial Revolving Receivables Trust, Series 2022-1, Class A, 5.91% 10/11/20351,6 |
|
|
2,703 |
|
|
|
2,781 |
|
|
|
GM Financial Revolving Receivables Trust, Series 2023-2, Class A, 5.77% 8/11/20361,6 |
|
|
3,984 |
|
|
|
4,095 |
|
|
|
GMF Floorplan Owner Revolving Trust, Series 2023-1, Class A1, 5.34% 6/15/20281,6 |
|
|
1,600 |
|
|
|
1,603 |
|
American Funds Insurance Series 164
The Bond Fund of America (continued)
|
|
|
|
|
|
|
|
|
|
|
| Bonds, notes & other debt instruments (continued) |
|
Principal amount
(000) |
|
|
Value (000) |
|
|
| Asset-backed obligations (continued) |
|
|
|
GMF Floorplan Owner Revolving Trust, Series 2023-1, Class A, 5.34% 6/17/20301,6 |
|
|
USD948 |
|
|
$ |
958 |
|
|
|
Hertz Vehicle Financing III, LLC, Series 2021-A, Class B, 9.44% 6/25/20251,6,8 |
|
|
8,590 |
|
|
|
8,590 |
|
|
|
Hertz Vehicle Financing III, LLC, Series 2021-1A, Class A, 1.21% 12/26/20251,6 |
|
|
12,703 |
|
|
|
12,536 |
|
|
|
Hertz Vehicle Financing III, LLC, Series 2021-1A, Class B, 1.56% 12/26/20251,6 |
|
|
1,171 |
|
|
|
1,155 |
|
|
|
Hertz Vehicle Financing III, LLC, Series 2021-1A, Class C, 2.05% 12/26/20251,6 |
|
|
810 |
|
|
|
799 |
|
|
|
Hertz Vehicle Financing III, LLC, Series 2023-1, Class 1D, 9.13% 6/25/20271,6 |
|
|
330 |
|
|
|
330 |
|
|
|
Hertz Vehicle Financing III, LLC, Series 2021-2A, Class A, 1.68% 12/27/20271,6 |
|
|
17,770 |
|
|
|
16,238 |
|
|
|
Hertz Vehicle Financing III, LLC, Series 2021-2A, Class B, 2.12% 12/27/20271,6 |
|
|
1,264 |
|
|
|
1,153 |
|
|
|
Hertz Vehicle Financing III, LLC, Series 2021-2A, Class C, 2.52% 12/27/20271,6 |
|
|
859 |
|
|
|
780 |
|
|
|
Hertz Vehicle Financing III, LLC, Series 2022-2, Class D, 5.16% 6/26/20281,6 |
|
|
1,174 |
|
|
|
1,054 |
|
|
|
Honda Auto Receivables Owner Trust, Series 2023-1, Class A3, 5.04% 4/21/20271 |
|
|
342 |
|
|
|
341 |
|
|
|
Honda Auto Receivables Owner Trust, Series 2023-1, Class A4, 4.97% 6/21/20291 |
|
|
188 |
|
|
|
187 |
|
|
|
Hyundai Auto Receivables Trust, Series 2023-B, Class A3, 5.48% 4/17/20281 |
|
|
160 |
|
|
|
161 |
|
|
|
Hyundai Auto Receivables Trust, Series 2023-B, Class A4, 5.31% 8/15/20291 |
|
|
160 |
|
|
|
161 |
|
|
|
LAD Auto Receivables Trust, Series 2021-1A, Class A, 1.30% 8/17/20261,6 |
|
|
54 |
|
|
|
54 |
|
|
|
LAD Auto Receivables Trust, Series 2023-1, Class A2, 5.68% 10/15/20261,6 |
|
|
584 |
|
|
|
584 |
|
|
|
LAD Auto Receivables Trust, Series 2021-1A, Class B, 1.94% 11/16/20261,6 |
|
|
304 |
|
|
|
300 |
|
|
|
LAD Auto Receivables Trust, Series 2022-1, Class A, 5.21% 6/15/20271,6 |
|
|
434 |
|
|
|
433 |
|
|
|
LAD Auto Receivables Trust, Series 2023-1, Class A3, 5.48% 6/15/20271,6 |
|
|
706 |
|
|
|
705 |
|
|
|
LAD Auto Receivables Trust, Series 2023-2, Class A2, 5.93% 6/15/20271,6 |
|
|
1,093 |
|
|
|
1,094 |
|
|
|
LAD Auto Receivables Trust, Series 2022-1, Class B, 5.87% 9/15/20271,6 |
|
|
438 |
|
|
|
438 |
|
|
|
LAD Auto Receivables Trust, Series 2023-4, Class A3, 6.10% 12/15/20271,6 |
|
|
1,622 |
|
|
|
1,630 |
|
|
|
LAD Auto Receivables Trust, Series 2023-2, Class A3, 5.42% 2/15/20281,6 |
|
|
861 |
|
|
|
860 |
|
|
|
LAD Auto Receivables Trust, Series 2023-2, Class B, 5.45% 4/15/20281,6 |
|
|
615 |
|
|
|
613 |
|
|
|
LAD Auto Receivables Trust, Series 2023-3, Class B, 6.09% 6/15/20281,6 |
|
|
848 |
|
|
|
854 |
|
|
|
LAD Auto Receivables Trust, Series 2023-2, Class C, 5.58% 9/15/20281,6 |
|
|
1,361 |
|
|
|
1,354 |
|
|
|
LAD Auto Receivables Trust, Series 2023-4, Class B, 6.39% 10/16/20281,6 |
|
|
3,223 |
|
|
|
3,269 |
|
|
|
LAD Auto Receivables Trust, Series 2023-3, Class C, 6.43% 12/15/20281,6 |
|
|
714 |
|
|
|
725 |
|
|
|
LAD Auto Receivables Trust, Series 2022-1, Class C, 6.85% 4/15/20301,6 |
|
|
623 |
|
|
|
628 |
|
|
|
LAD Auto Receivables Trust, Series 2023-3, Class D, 6.92% 12/16/20301,6 |
|
|
483 |
|
|
|
497 |
|
|
|
LAD Auto Receivables Trust, Series 2023-2, Class D, 6.30% 2/15/20311,6 |
|
|
123 |
|
|
|
123 |
|
|
|
Madison Park Funding, Ltd., CLO, Series 2015-17A, Class AR2,
(3-month USD CME Term SOFR + 1.262%) 6.586% 7/21/20301,2,6 |
|
|
739 |
|
|
|
740 |
|
|
|
Mercedes-Benz Auto Receivables Trust, Series 2023-2, Class A3, 5.95% 11/15/20281 |
|
|
1,050 |
|
|
|
1,064 |
|
|
|
Merchants Fleet Funding, LLC, Series 2023-1, Class A, 7.21% 5/20/20361,6 |
|
|
1,265 |
|
|
|
1,276 |
|
|
|
Merchants Fleet Funding, LLC, Series 2024-1, Class A, 5.82% 4/20/20371,6 |
|
|
7,752 |
|
|
|
7,759 |
|
|
|
Mission Lane Credit Card Master Trust, Series 2022-B, Class A1,
8.25% 1/15/20281,8,12 |
|
|
1,006 |
|
|
|
1,005 |
|
|
|
Mission Lane Credit Card Master Trust, Series 2022-B, Class A2,
8.73% 1/15/20281,8,12 |
|
|
150 |
|
|
|
150 |
|
|
|
Mission Lane Credit Card Master Trust, Series 2023-A, Class A,
7.23% 7/17/20281,6 |
|
|
3,155 |
|
|
|
3,173 |
|
|
|
Navient Student Loan Trust, Series 2021-C, Class A, 1.06% 10/15/20691,6 |
|
|
1,993 |
|
|
|
1,757 |
|
|
|
Navient Student Loan Trust, Series 2021-EA, Class A, 0.97% 12/16/20691,6 |
|
|
1,142 |
|
|
|
994 |
|
|
|
Navient Student Loan Trust, Series 2021-G, Class A, 1.58% 4/15/20701,6 |
|
|
714 |
|
|
|
624 |
|
|
|
Navigator Aircraft ABS, Ltd., Series 2021-1, Class A, 2.771% 11/15/20461,6 |
|
|
3,880 |
|
|
|
3,494 |
|
|
|
Nelnet Student Loan Trust, Series 2021-C, Class AFX, 1.32% 4/20/20621,6 |
|
|
216 |
|
|
|
196 |
|
|
|
Nelnet Student Loan Trust, Series 2021-A, Class APT1, 1.36% 4/20/20621,6 |
|
|
3,724 |
|
|
|
3,375 |
|
|
|
Nelnet Student Loan Trust, Series 2021-B, Class AFX, 1.42% 4/20/20621,6 |
|
|
8,519 |
|
|
|
7,784 |
|
|
|
Nelnet Student Loan Trust, Series 2021-C, Class AFL,
(1-month USD CME Term SOFR + 0.854%) 6.193% 4/20/20621,2,6 |
|
|
2,767 |
|
|
|
2,750 |
|
|
|
New Economy Assets Phase 1 Issuer, LLC, Series 2021-1, Class A1,
1.91% 10/20/20611,6 |
|
|
50,765 |
|
|
|
45,291 |
|
|
|
Newark BSL CLO 2, Ltd., Series 2017-1A, Class A1R,
(3-month USD CME Term SOFR + 1.232%) 6.555% 7/25/20301,2,6 |
|
|
217 |
|
|
|
217 |
|
|
|
Nissan Auto Receivables Owner Trust, Series 2023-B, Class A3, 5.93% 3/15/20281 |
|
|
598 |
|
|
|
604 |
|
|
|
Oportun Funding, LLC, Series 2021-A, Class A, 1.21% 3/8/20281,6 |
|
|
70 |
|
|
|
68 |
|
|
|
Palmer Square Loan Funding, CLO, Series 2021-1, Class A1,
(3-month USD CME Term SOFR + 1.162%) 6.486% 4/20/20291,2,6 |
|
|
51 |
|
|
|
51 |
|
|
|
PEAC Solutions Receivables, LLC, Series 2024-1, Class A2, 5.79% 6/21/20271,6 |
|
|
4,464 |
|
|
|
4,475 |
|
|
|
PFS Financing Corp., Series 2021-B, Class A, 0.77% 8/17/20261,6 |
|
|
7,884 |
|
|
|
7,833 |
|
|
|
PFS Financing Corp., Series 2022-D, Class A, 4.27% 8/16/20271,6 |
|
|
1,721 |
|
|
|
1,697 |
|
165 American Funds Insurance Series
The Bond Fund of America (continued)
|
|
|
|
|
|
|
|
|
|
|
| Bonds, notes & other debt instruments (continued) |
|
Principal amount
(000) |
|
|
Value (000) |
|
|
| Asset-backed obligations (continued) |
|
|
|
PFS Financing Corp., Series 2023-D, Class A,
(30-day Average USD-SOFR + 1.15%) 6.483% 8/16/20271,2,6 |
|
|
USD1,393 |
|
|
$ |
1,401 |
|
|
|
PFS Financing Corp., Series 2023-A, Class A, 5.80% 3/15/20281,6 |
|
|
1,710 |
|
|
|
1,722 |
|
|
|
PFS Financing Corp., Series 2023-B, Class A, 5.27% 5/15/20281,6 |
|
|
4,558 |
|
|
|
4,550 |
|
|
|
PFS Financing Corp., Series 2023-C, Class A, 5.52% 10/16/20281,6 |
|
|
909 |
|
|
|
914 |
|
|
|
Post Road Equipment Finance, Series 2024-1, Class A2, 5.59% 11/15/20291,6 |
|
|
2,524 |
|
|
|
2,524 |
|
|
|
Prestige Auto Receivables Trust, Series 2023-1, Class A2, 5.88% 3/16/20261,6 |
|
|
91 |
|
|
|
91 |
|
|
|
Prestige Auto Receivables Trust, Series 2023-2, Class B, 6.64% 12/15/20271,6 |
|
|
5,088 |
|
|
|
5,150 |
|
|
|
Prodigy Finance DAC, Series 2021-1A, Class A,
(1-month USD CME Term SOFR + 1.364%) 6.71% 7/25/20511,2,6 |
|
|
257 |
|
|
|
255 |
|
|
|
Santander Drive Auto Receivables Trust, Series 2023-2, Class A2, 5.87% 3/16/20261 |
|
|
34 |
|
|
|
34 |
|
|
|
Santander Drive Auto Receivables Trust, Series 2020-3, Class D, 1.64% 11/16/20261 |
|
|
522 |
|
|
|
518 |
|
|
|
Santander Drive Auto Receivables Trust, Series 2022-5, Class B, 4.43% 3/15/20271 |
|
|
917 |
|
|
|
912 |
|
|
|
Santander Drive Auto Receivables Trust, Series 2021-2, Class D, 1.35% 7/15/20271 |
|
|
1,327 |
|
|
|
1,293 |
|
|
|
Santander Drive Auto Receivables Trust, Series 2021-3, Class D, 1.33% 9/15/20271 |
|
|
2,074 |
|
|
|
2,016 |
|
|
|
Santander Drive Auto Receivables Trust, Series 2024-1, Class A3, 5.25% 4/17/20281 |
|
|
703 |
|
|
|
700 |
|
|
|
Santander Drive Auto Receivables Trust, Series 2022-5, Class C, 4.74% 10/15/20281 |
|
|
856 |
|
|
|
847 |
|
|
|
Santander Drive Auto Receivables Trust, Series 2023-4, Class B, 5.77% 12/15/20281 |
|
|
700 |
|
|
|
705 |
|
|
|
SBNA Auto Lease Trust, Series 2024-A, Class A3, 5.39% 11/20/20261,6 |
|
|
6,276 |
|
|
|
6,267 |
|
|
|
SCF Equipment Leasing, LLC, Series 2024-1, Class A2, 5.88% 11/20/20291,6 |
|
|
3,047 |
|
|
|
3,055 |
|
|
|
SFS Auto Receivables Securitization Trust, Series 2023-1, Class A2A,
5.89% 3/22/20271,6 |
|
|
1,101 |
|
|
|
1,102 |
|
|
|
SFS Auto Receivables Securitization Trust, Series 2023-1, Class A3,
5.47% 10/20/20281,6 |
|
|
624 |
|
|
|
625 |
|
|
|
SFS Auto Receivables Securitization Trust, Series 2023-1, Class A4,
5.47% 12/20/20291,6 |
|
|
361 |
|
|
|
363 |
|
|
|
SLAM, Ltd., Series 2021-1, Class A, 2.434% 6/15/20461,6 |
|
|
2,368 |
|
|
|
2,122 |
|
|
|
SLAM, Ltd., Series 2021-1, Class B, 3.422% 6/15/20461,6 |
|
|
436 |
|
|
|
388 |
|
|
|
SMB Private Education Loan Trust, Series 2023-C, Class A1A, 5.67% 11/15/20521,6 |
|
|
794 |
|
|
|
803 |
|
|
|
SMB Private Education Loan Trust, Series 2023-C, Class A1B,
(30-day Average USD-SOFR + 1.55%) 6.883% 11/15/20521,2,6 |
|
|
877 |
|
|
|
889 |
|
|
|
SOLRR Aircraft Aviation Holding, Ltd., Series 2021-1, Class A, 2.636% 10/15/20461,6 |
|
|
2,128 |
|
|
|
1,905 |
|
|
|
SPRITE, Ltd., Series 2021-1, Class A, 3.75% 11/15/20461,6 |
|
|
2,260 |
|
|
|
2,118 |
|
|
|
Stellar Jay Ireland DAC, Series 2021-1, Class A, 3.967% 10/15/20411,6 |
|
|
360 |
|
|
|
332 |
|
|
|
Stonepeak Infrastructure Partners, Series 2021-1A, Class AA, 2.301% 2/28/20331,6 |
|
|
690 |
|
|
|
641 |
|
|
|
Stonepeak Infrastructure Partners, Series 2021-1A, Class A, 2.675% 2/28/20331,6 |
|
|
780 |
|
|
|
722 |
|
|
|
SuttonPark Structured Settlements, Series 2021-1, Class A, 1.95% 9/15/20751,6 |
|
|
1,404 |
|
|
|
1,327 |
|
|
|
TAL Advantage V, LLC, Series 2020-1A, Class A, 2.05% 9/20/20451,6 |
|
|
2,358 |
|
|
|
2,155 |
|
|
|
Textainer Marine Containers, Ltd., Series 2020-1A, Class A, 2.73% 8/21/20451,6 |
|
|
967 |
|
|
|
906 |
|
|
|
Textainer Marine Containers, Ltd., Series 2020-2A, Class A, 2.10% 9/20/20451,6 |
|
|
1,803 |
|
|
|
1,641 |
|
|
|
Textainer Marine Containers, Ltd., Series 2021-1, Class A, 1.68% 2/20/20461,6 |
|
|
5,320 |
|
|
|
4,713 |
|
|
|
Textainer Marine Containers, Ltd., Series 2021-1, Class B, 2.52% 2/20/20461,6 |
|
|
297 |
|
|
|
262 |
|
|
|
Textainer Marine Containers, Ltd., Series 2021-2A, Class A, 2.23% 4/20/20461,6 |
|
|
4,480 |
|
|
|
4,014 |
|
|
|
TIF Funding II, LLC, Series 2020-1A, Class A, 2.09% 8/20/20451,6 |
|
|
3,719 |
|
|
|
3,375 |
|
|
|
TIF Funding II, LLC, Series 2021-1A, Class B, 2.54% 2/20/20461,6 |
|
|
111 |
|
|
|
97 |
|
|
|
Triton Container Finance VIII, LLC, Series 2020-1, Class A, 2.11% 9/20/20451,6 |
|
|
8,775 |
|
|
|
7,868 |
|
|
|
Triton Container Finance VIII, LLC, Series 2021-1, Class A, 1.86% 3/20/20461,6 |
|
|
3,030 |
|
|
|
2,669 |
|
|
|
Triton Container Finance VIII, LLC, Series 2021-1A, Class B, 2.58% 3/20/20461,6 |
|
|
295 |
|
|
|
258 |
|
|
|
Verizon Master Trust, Series 2023-2, Class A, 4.89% 4/13/20281 |
|
|
1,215 |
|
|
|
1,210 |
|
|
|
Verizon Master Trust, Series 2024-1, Class A1A, 5.00% 12/20/20281 |
|
|
7,985 |
|
|
|
7,957 |
|
|
|
Verizon Master Trust, Series 2023-3, Class A, 4.73% 4/21/20311,6 |
|
|
5,380 |
|
|
|
5,332 |
|
|
|
Westlake Automobile Receivables Trust, Series 2020-3A, Class D, 1.65% 2/17/20261,6 |
|
|
1,038 |
|
|
|
1,033 |
|
|
|
Westlake Automobile Receivables Trust, Series 2021-2, Class C, 0.89% 7/15/20261,6 |
|
|
754 |
|
|
|
749 |
|
|
|
Westlake Automobile Receivables Trust, Series 2023-2, Class A2A,
5.87% 7/15/20261,6 |
|
|
59 |
|
|
|
59 |
|
|
|
Westlake Automobile Receivables Trust, Series 2021-2, Class D, 1.23% 12/15/20261,6 |
|
|
1,446 |
|
|
|
1,403 |
|
|
|
Westlake Automobile Receivables Trust, Series 2023-2, Class A3, 5.80% 2/16/20271,6 |
|
|
1,799 |
|
|
|
1,801 |
|
|
|
Westlake Automobile Receivables Trust, Series 2023-3, Class A3, 5.82% 5/17/20271,6 |
|
|
3,420 |
|
|
|
3,428 |
|
|
|
Westlake Automobile Receivables Trust, Series 2023-4, Class A3, 6.24% 7/15/20271,6 |
|
|
3,052 |
|
|
|
3,076 |
|
|
|
Westlake Automobile Receivables Trust, Series 2023-3, Class B, 5.92% 9/15/20281,6 |
|
|
1,175 |
|
|
|
1,178 |
|
|
|
Westlake Automobile Receivables Trust, Series 2023-3, Class C, 6.02% 9/15/20281,6 |
|
|
2,219 |
|
|
|
2,226 |
|
American Funds Insurance Series 166
The Bond Fund of America (continued)
|
|
|
|
|
|
|
|
|
|
|
| Bonds, notes & other debt instruments (continued) |
|
Principal amount
(000) |
|
|
Value (000) |
|
|
|
| Asset-backed obligations (continued) |
|
|
|
|
|
|
|
Westlake Automobile Receivables Trust, Series 2023-3, Class D, 6.47% 3/15/20291,6 |
|
|
USD1,236 |
|
|
$ |
1,246 |
|
|
|
World Omni Auto Receivables Trust, Series 2023-C, Class A3, 5.15% 11/15/20281 |
|
|
290 |
|
|
|
289 |
|
|
|
World Omni Auto Receivables Trust, Series 2023-C, Class A4, 5.03% 11/15/20291 |
|
|
232 |
|
|
|
232 |
|
|
|
|
|
|
|
|
|
|
|
|
|
|
|
|
|
|
574,106 |
|
|
|
|
|
|
|
|
|
|
| Municipals 1.51% |
|
|
|
|
|
| California 0.02% |
|
G.O. Bonds, Series 2009, 7.50% 4/1/2034 |
|
|
2,100 |
|
|
|
2,427 |
|
|
|
|
|
|
|
|
|
|
|
|
|
|
|
|
|
|
|
|
| |
|
|
|
| Illinois 1.35% |
|
City of Chicago, Board of Education, Unlimited Tax G.O. Bonds (Dedicated Rev.), Series 2010-C, 6.319% 11/1/2029 |
|
|
65 |
|
|
|
65 |
|
|
|
City of Chicago, Board of Education, Unlimited Tax G.O. Bonds (Dedicated Rev.), Series 2009-E, 6.138% 12/1/2039 |
|
|
31,050 |
|
|
|
30,108 |
|
|
|
City of Chicago, Board of Education, Unlimited Tax G.O. Bonds (Dedicated Rev.), Series 2010-D, 6.519% 12/1/2040 |
|
|
8,945 |
|
|
|
8,941 |
|
|
|
City of Chicago, Board of Education, Unlimited Tax G.O. Bonds (Qualified School Construction Bonds), Series 2009-G, 1.75% 12/15/2025 |
|
|
2,500 |
|
|
|
2,339 |
|
|
|
G.O. Bonds, Pension Funding, Series 2003, 5.10% 6/1/2033 |
|
|
110,885 |
|
|
|
108,879 |
|
|
|
|
|
|
|
|
|
|
|
|
|
|
|
|
|
|
150,332 |
|
|
|
|
|
|
|
|
|
| |
|
|
|
|
|
|
|
|
|
|
| |
|
|
|
| Massachusetts 0.07% |
|
Educational Fncg. Auth., Education Loan Rev. Bonds, Series 2024-A, 6.352% 7/1/2049 |
|
|
7,500 |
|
|
|
7,572 |
|
|
|
|
|
|
|
|
|
| |
|
|
|
|
|
|
|
|
|
|
| |
|
|
|
| Texas 0.03% |
|
Grand Parkway Transportation Corp., Grand Parkway System Toll Rev. Ref. Bonds, Series 2020-B, 3.236% 10/1/2052 |
|
|
4,075 |
|
|
|
2,983 |
|
|
|
|
|
|
|
|
|
| |
|
|
|
|
|
|
|
|
|
|
| |
|
|
|
| Wisconsin 0.04% |
|
Public Fin. Auth., Federal Lease Rev. Bonds (Fort Sam Acquisition Fncg.), Series 2022, 4.95% 3/1/2034 |
|
|
4,545 |
|
|
|
4,318 |
|
|
|
|
|
|
|
|
|
|
|
Total municipals |
|
|
|
|
|
|
167,632 |
|
|
|
|
|
|
|
|
|
|
|
| Bonds & notes of governments & government agencies outside the U.S. 1.03% |
|
|
|
|
|
|
|
Chile (Republic of) 4.00% 1/31/2052 |
|
|
580 |
|
|
|
449 |
|
|
|
Colombia (Republic of) 7.50% 2/2/2034 |
|
|
2,530 |
|
|
|
2,539 |
|
|
|
Dominican Republic 5.95% 1/25/20276 |
|
|
8,100 |
|
|
|
8,044 |
|
|
|
Dominican Republic 7.05% 2/3/20316 |
|
|
680 |
|
|
|
700 |
|
|
|
Greece (Hellenic Republic of) 1.50% 6/18/2030 |
|
|
EUR10,830 |
|
|
|
10,445 |
|
|
|
Greece (Hellenic Republic of) 0.75% 6/18/2031 |
|
|
9,600 |
|
|
|
8,605 |
|
|
|
Greece (Hellenic Republic of) 4.25% 6/15/2033 |
|
|
23,825 |
|
|
|
26,763 |
|
|
|
Indonesia (Republic of), Series 96, 7.00% 2/15/2033 |
|
|
IDR43,391,000 |
|
|
|
2,639 |
|
|
|
Indonesia (Republic of), Series 100, 6.625% 2/15/2034 |
|
|
11,783,000 |
|
|
|
698 |
|
|
|
Indonesia (Republic of), Series 68, 8.375% 3/15/2034 |
|
|
53,026,000 |
|
|
|
3,538 |
|
|
|
Paraguay (Republic of) 5.00% 4/15/2026 |
|
|
USD960 |
|
|
|
948 |
|
|
|
Poland (Republic of) 5.75% 11/16/2032 |
|
|
555 |
|
|
|
576 |
|
|
|
Poland (Republic of) 4.875% 10/4/2033 |
|
|
830 |
|
|
|
811 |
|
|
|
Portuguese Republic 5.125% 10/15/2024 |
|
|
24,775 |
|
|
|
24,749 |
|
|
|
Qatar (State of) 4.50% 4/23/20286 |
|
|
5,100 |
|
|
|
5,045 |
|
|
|
Qatar (State of) 5.103% 4/23/20486 |
|
|
3,400 |
|
|
|
3,315 |
|
|
|
United Mexican States 6.00% 5/7/2036 |
|
|
14,755 |
|
|
|
14,402 |
|
|
|
|
|
|
|
|
|
|
|
|
|
|
|
|
|
|
114,266 |
|
|
|
|
|
|
|
|
|
167 American Funds Insurance Series
The Bond Fund of America (continued)
|
|
|
|
|
|
|
|
|
|
|
|
|
| Bonds, notes & other debt instruments (continued) |
|
Principal amount (000) |
|
|
Value (000) |
|
|
| Federal agency bonds & notes 0.10% |
|
|
|
Fannie Mae 2.125%4/24/2026 |
|
|
USD11,910 |
|
|
$ |
11,365 |
|
|
|
|
|
|
|
|
|
|
|
|
|
|
|
|
Total bonds, notes & other debt instruments (cost: $11,124,821,000) |
|
|
|
|
|
|
10,815,455 |
|
|
|
|
|
|
|
|
|
|
|
|
|
|
|
|
|
| Common stocks 0.00% |
|
Shares |
|
|
|
|
|
|
|
|
| Energy 0.00% |
|
FORESEA Holding SA, Class C, nonvoting shares6,13 |
|
|
555 |
|
|
|
14 |
|
|
|
FORESEA Holding SA, Class B6,13 |
|
|
61 |
|
|
|
1 |
|
|
|
|
|
|
|
|
|
|
|
|
|
|
|
|
Total common stocks (cost: $8,000) |
|
|
|
|
|
|
15 |
|
|
|
|
|
|
|
|
|
|
|
|
|
|
|
|
|
| Short-term securities 15.35% |
|
|
|
|
|
|
|
| Money market investments 15.35% |
|
|
|
|
|
|
|
Capital Group Central Cash Fund 5.37%14,15 |
|
|
17,102,873 |
|
|
|
1,710,287 |
|
|
|
|
|
|
|
|
|
|
|
|
|
|
|
|
|
|
|
|
Total short-term securities (cost: $1,710,028,000) |
|
|
|
|
|
|
1,710,287 |
|
|
|
|
|
|
|
|
|
|
|
|
|
|
|
|
|
|
|
|
Total investment securities 112.46% (cost: $12,834,857,000) |
|
|
|
|
|
|
12,525,757 |
|
|
|
|
|
|
|
Other assets less liabilities (12.46)% |
|
|
|
|
|
|
(1,388,068 |
) |
|
|
|
|
|
|
|
|
|
|
|
|
|
|
|
|
|
|
|
Net assets 100.00% |
|
|
|
|
|
$ |
11,137,689 |
|
|
|
|
|
|
|
|
|
|
|
|
|
|
|
|
|
|
|
|
|
|
|
|
|
|
|
|
|
|
|
|
|
|
|
|
|
|
|
|
|
|
|
|
|
|
|
|
|
|
|
|
|
| Futures contracts |
|
|
|
|
|
|
|
| Contracts |
|
Type |
|
|
Number of contracts |
|
|
Expiration date |
|
|
Notional amount (000) |
|
|
Value and unrealized appreciation (depreciation) at 6/30/2024 (000) |
|
| 30 Day Federal Funds Futures |
|
|
Long |
|
|
|
2,388 |
|
|
|
9/3/2024 |
|
|
|
USD942,291 |
|
|
|
|
|
|
$ |
(98 |
) |
| 30 Day Federal Funds Futures |
|
|
Long |
|
|
|
68 |
|
|
|
11/1/2024 |
|
|
|
26,875 |
|
|
|
|
|
|
|
(201 |
) |
| 30 Day Federal Funds Futures |
|
|
Short |
|
|
|
68 |
|
|
|
2/3/2025 |
|
|
|
(26,956 |
) |
|
|
|
|
|
|
224 |
|
| 3 Month SOFR Futures |
|
|
Long |
|
|
|
802 |
|
|
|
9/18/2024 |
|
|
|
189,778 |
|
|
|
|
|
|
|
(32 |
) |
| 3 Month SOFR Futures |
|
|
Long |
|
|
|
385 |
|
|
|
12/18/2024 |
|
|
|
91,293 |
|
|
|
|
|
|
|
(49 |
) |
| 3 Month SOFR Futures |
|
|
Long |
|
|
|
179 |
|
|
|
3/19/2025 |
|
|
|
42,577 |
|
|
|
|
|
|
|
34 |
|
| 3 Month SOFR Futures |
|
|
Short |
|
|
|
139 |
|
|
|
6/18/2025 |
|
|
|
(33,164 |
) |
|
|
|
|
|
|
(53 |
) |
| 3 Month SOFR Futures |
|
|
Long |
|
|
|
1,559 |
|
|
|
9/17/2025 |
|
|
|
372,932 |
|
|
|
|
|
|
|
1,117 |
|
| 3 Month SOFR Futures |
|
|
Long |
|
|
|
109 |
|
|
|
3/18/2026 |
|
|
|
26,168 |
|
|
|
|
|
|
|
8 |
|
| 3 Month SOFR Futures |
|
|
Long |
|
|
|
380 |
|
|
|
6/17/2026 |
|
|
|
91,328 |
|
|
|
|
|
|
|
290 |
|
| 3 Month SOFR Futures |
|
|
Short |
|
|
|
190 |
|
|
|
6/16/2027 |
|
|
|
(45,747 |
) |
|
|
|
|
|
|
(135 |
) |
| 2 Year U.S. Treasury Note Futures |
|
|
Long |
|
|
|
12,370 |
|
|
|
10/3/2024 |
|
|
|
2,526,186 |
|
|
|
|
|
|
|
5,231 |
|
| 5 Year U.S. Treasury Note Futures |
|
|
Long |
|
|
|
14,848 |
|
|
|
10/3/2024 |
|
|
|
1,582,472 |
|
|
|
|
|
|
|
8,566 |
|
| 10 Year French Government Bond Futures |
|
|
Long |
|
|
|
145 |
|
|
|
9/10/2024 |
|
|
|
19,119 |
|
|
|
|
|
|
|
(278 |
) |
| 10 Year Euro-Bund Futures |
|
|
Short |
|
|
|
18 |
|
|
|
9/10/2024 |
|
|
|
(2,537 |
) |
|
|
|
|
|
|
(23 |
) |
| 10 Year Ultra U.S. Treasury Note Futures |
|
|
Long |
|
|
|
2,399 |
|
|
|
9/30/2024 |
|
|
|
272,362 |
|
|
|
|
|
|
|
2,210 |
|
| 10 Year U.S. Treasury Note Futures |
|
|
Short |
|
|
|
1,032 |
|
|
|
9/30/2024 |
|
|
|
(113,504 |
) |
|
|
|
|
|
|
26 |
|
| 20 Year U.S. Treasury Bond Futures |
|
|
Short |
|
|
|
3,306 |
|
|
|
9/30/2024 |
|
|
|
(391,141 |
) |
|
|
|
|
|
|
(4,053 |
) |
| 30 Year Ultra U.S. Treasury Bond Futures |
|
|
Long |
|
|
|
4,077 |
|
|
|
9/30/2024 |
|
|
|
511,027 |
|
|
|
|
|
|
|
4,611 |
|
|
|
|
|
|
|
|
|
|
|
|
|
|
|
|
|
|
|
|
|
|
|
|
|
|
|
|
|
|
|
|
|
|
|
|
|
|
|
|
|
|
|
|
|
|
|
|
|
|
|
$ |
17,395 |
|
|
|
|
|
|
|
|
|
|
|
|
|
|
|
|
|
|
|
|
|
|
|
|
|
|
American Funds Insurance Series 168
The Bond Fund of America (continued)
|
|
|
|
|
|
|
|
|
|
|
|
|
|
|
|
|
|
|
|
|
|
|
|
|
|
|
|
|
|
|
| Forward currency contracts |
|
|
|
|
|
|
|
|
|
|
| |
|
|
|
|
|
|
|
|
|
|
|
|
|
|
|
|
|
|
|
Unrealized |
|
| Contract amount |
|
|
|
|
|
|
|
|
appreciation (depreciation) |
|
| Currency purchased (000) |
|
|
|
|
|
Currency sold (000) |
|
|
|
Counterparty |
|
Settlement date |
|
|
at 6/30/2024 (000) |
|
|
|
|
|
|
|
|
|
|
|
| USD |
|
|
56,655 |
|
|
|
|
|
|
|
EUR |
|
|
52,030 |
|
|
|
JPMorgan Chase |
|
|
7/10/2024 |
|
|
|
|
|
|
|
$902 |
|
| EUR |
|
|
5,400 |
|
|
|
|
|
|
|
USD |
|
|
5,791 |
|
|
|
HSBC Bank |
|
|
7/10/2024 |
|
|
|
|
|
|
|
(4 |
) |
| EUR |
|
|
12,366 |
|
|
|
|
|
|
|
USD |
|
|
13,307 |
|
|
|
Morgan Stanley |
|
|
7/10/2024 |
|
|
|
|
|
|
|
(57 |
) |
| USD |
|
|
2,593 |
|
|
|
|
|
|
|
JPY |
|
|
402,470 |
|
|
|
UBS AG |
|
|
7/11/2024 |
|
|
|
|
|
|
|
86 |
|
| EUR |
|
|
1,418 |
|
|
|
|
|
|
|
USD |
|
|
1,532 |
|
|
|
BNP Paribas |
|
|
7/22/2024 |
|
|
|
|
|
|
|
(11 |
) |
| USD |
|
|
46,933 |
|
|
|
|
|
|
|
EUR |
|
|
43,691 |
|
|
|
Citibank |
|
|
7/24/2024 |
|
|
|
|
|
|
|
83 |
|
| USD |
|
|
6,773 |
|
|
|
|
|
|
|
IDR |
|
|
111,703,701 |
|
|
|
Standard Chartered Bank |
|
|
7/25/2024 |
|
|
|
|
|
|
|
(53 |
) |
|
|
|
|
|
|
|
|
|
|
|
|
|
|
|
|
|
|
|
|
|
|
|
|
|
|
|
|
|
|
|
|
|
|
|
|
|
|
|
|
|
|
|
|
|
|
|
|
|
|
|
|
|
|
|
|
|
|
|
|
|
|
|
|
|
|
|
|
|
$ |
946 |
|
|
|
|
|
|
|
|
|
|
|
|
|
|
|
|
|
|
|
|
|
|
|
|
|
|
|
|
|
|
|
|
Swap contracts
Interest rate swaps
Centrally cleared interest rate swaps
|
|
|
|
|
|
|
|
|
|
|
|
|
|
|
|
|
|
|
|
|
|
|
|
|
|
|
|
|
|
|
|
|
|
|
|
|
|
|
|
|
|
|
|
|
|
|
| |
|
|
|
|
|
|
|
|
|
|
|
|
|
|
|
|
|
|
|
|
|
|
|
|
|
|
|
Upfront |
|
|
Unrealized |
|
| Receive |
|
|
|
|
|
Pay |
|
|
|
|
|
Notional |
|
|
Value at |
|
|
premium paid |
|
|
appreciation
(depreciation) |
|
| |
|
Payment |
|
|
|
|
|
|
|
Payment |
|
|
Expiration |
|
|
amount |
|
|
6/30/2024 |
|
|
(received) |
|
|
at 6/30/2024 |
|
| Rate |
|
frequency |
|
|
|
|
|
Rate |
|
frequency |
|
|
date |
|
|
(000) |
|
|
(000) |
|
|
(000) |
|
|
(000) |
|
|
|
|
|
|
|
|
|
|
|
|
|
|
| 4.9035% |
|
|
Annual |
|
|
|
|
|
|
SOFR |
|
|
Annual |
|
|
|
9/14/2025 |
|
|
|
USD42,065 |
|
|
|
|
|
|
$ |
(21 |
) |
|
|
|
|
|
$ |
– |
|
|
|
|
|
|
$ |
(21 |
) |
| 4.4555% |
|
|
Annual |
|
|
|
|
|
|
SOFR |
|
|
Annual |
|
|
|
12/6/2025 |
|
|
|
USD95,750 |
|
|
|
|
|
|
|
(499 |
) |
|
|
|
|
|
|
– |
|
|
|
|
|
|
|
(499 |
) |
| 3.998% |
|
|
Annual |
|
|
|
|
|
|
SOFR |
|
|
Annual |
|
|
|
12/4/2028 |
|
|
|
USD40,040 |
|
|
|
|
|
|
|
(182 |
) |
|
|
|
|
|
|
– |
|
|
|
|
|
|
|
(182 |
) |
| 9.79% |
|
|
28-day |
|
|
|
|
|
|
28-day MXN-TIIE |
|
|
28-day |
|
|
|
6/15/2029 |
|
|
|
MXN329,721 |
|
|
|
|
|
|
|
181 |
|
|
|
|
|
|
|
– |
|
|
|
|
|
|
|
181 |
|
| SOFR |
|
|
Annual |
|
|
|
|
|
|
4.017% |
|
|
Annual |
|
|
|
6/24/2029 |
|
|
|
USD14,500 |
|
|
|
|
|
|
|
27 |
|
|
|
|
|
|
|
– |
|
|
|
|
|
|
|
27 |
|
| SOFR |
|
|
Annual |
|
|
|
|
|
|
3.8275% |
|
|
Annual |
|
|
|
9/1/2033 |
|
|
|
USD9,600 |
|
|
|
|
|
|
|
77 |
|
|
|
|
|
|
|
– |
|
|
|
|
|
|
|
77 |
|
| SOFR |
|
|
Annual |
|
|
|
|
|
|
3.997% |
|
|
Annual |
|
|
|
9/14/2033 |
|
|
|
USD9,615 |
|
|
|
|
|
|
|
(48 |
) |
|
|
|
|
|
|
– |
|
|
|
|
|
|
|
(48 |
) |
| SOFR |
|
|
Annual |
|
|
|
|
|
|
3.6025% |
|
|
Annual |
|
|
|
1/8/2034 |
|
|
|
USD16,295 |
|
|
|
|
|
|
|
421 |
|
|
|
|
|
|
|
– |
|
|
|
|
|
|
|
421 |
|
| SOFR |
|
|
Annual |
|
|
|
|
|
|
3.5685% |
|
|
Annual |
|
|
|
1/9/2034 |
|
|
|
USD19,970 |
|
|
|
|
|
|
|
570 |
|
|
|
|
|
|
|
– |
|
|
|
|
|
|
|
570 |
|
| SOFR |
|
|
Annual |
|
|
|
|
|
|
3.871% |
|
|
Annual |
|
|
|
3/4/2034 |
|
|
|
USD28,120 |
|
|
|
|
|
|
|
133 |
|
|
|
|
|
|
|
– |
|
|
|
|
|
|
|
133 |
|
| 9.635% |
|
|
28-day |
|
|
|
|
|
|
28-day MXN-TIIE |
|
|
28-day |
|
|
|
6/9/2034 |
|
|
|
MXN202,507 |
|
|
|
|
|
|
|
178 |
|
|
|
|
|
|
|
– |
|
|
|
|
|
|
|
178 |
|
| SOFR |
|
|
Annual |
|
|
|
|
|
|
3.8575% |
|
|
Annual |
|
|
|
6/24/2034 |
|
|
|
USD7,900 |
|
|
|
|
|
|
|
44 |
|
|
|
|
|
|
|
– |
|
|
|
|
|
|
|
44 |
|
| SOFR |
|
|
Annual |
|
|
|
|
|
|
3.2975% |
|
|
Annual |
|
|
|
3/8/2051 |
|
|
|
USD39,095 |
|
|
|
|
|
|
|
3,059 |
|
|
|
|
|
|
|
– |
|
|
|
|
|
|
|
3,059 |
|
| SOFR |
|
|
Annual |
|
|
|
|
|
|
3.486% |
|
|
Annual |
|
|
|
1/17/2054 |
|
|
|
USD1,835 |
|
|
|
|
|
|
|
74 |
|
|
|
|
|
|
|
– |
|
|
|
|
|
|
|
74 |
|
|
|
|
|
|
|
|
|
|
|
|
|
|
|
|
|
|
|
|
|
|
|
|
|
|
|
|
|
|
|
|
|
|
|
|
|
|
|
|
|
|
|
|
|
|
|
|
|
|
|
|
|
|
|
|
|
|
|
|
|
|
|
|
|
|
|
|
|
|
|
|
|
|
|
|
|
|
|
|
|
|
|
|
|
|
|
|
|
$ |
4,014 |
|
|
|
|
|
|
$ |
– |
|
|
|
|
|
|
$ |
4,014 |
|
|
|
|
|
|
|
|
|
|
|
|
|
|
|
|
|
|
|
|
|
|
|
|
|
|
|
|
|
|
|
|
|
|
|
|
|
|
|
|
|
|
|
|
|
|
|
|
Credit default swaps
Centrally cleared credit default swaps on credit indices – buy protection
|
|
|
|
|
|
|
|
|
|
|
|
|
|
|
|
|
|
|
|
|
|
|
|
|
|
|
|
|
|
|
|
|
|
|
|
|
|
|
|
|
|
|
|
|
|
|
|
|
|
|
|
|
|
|
|
|
|
|
|
|
|
|
|
| Reference index |
|
Financing
rate paid |
|
|
|
|
|
Payment
frequency |
|
|
|
|
|
Expiration
date |
|
|
|
|
|
Notional
amount
(000) |
|
|
Value at
6/30/2024
(000) |
|
|
Upfront
premium paid (received)
(000) |
|
|
Unrealized
appreciation
(depreciation)
at 6/30/2024 (000) |
|
|
|
|
|
|
|
|
|
|
|
|
|
|
|
| CDX.NA.HY.42 |
|
|
5.00% |
|
|
|
|
|
|
|
Quarterly |
|
|
|
|
|
|
|
6/20/2029 |
|
|
|
|
|
|
|
USD85,725 |
|
|
|
|
|
|
$ |
(5,377 |
) |
|
|
|
|
|
$ |
(6,135 |
) |
|
|
|
|
|
$ |
758 |
|
| CDX.NA.IG.42 |
|
|
1.00% |
|
|
|
|
|
|
|
Quarterly |
|
|
|
|
|
|
|
6/20/2029 |
|
|
|
|
|
|
|
16,828 |
|
|
|
|
|
|
|
(346 |
) |
|
|
|
|
|
|
(384 |
) |
|
|
|
|
|
|
38 |
|
|
|
|
|
|
|
|
|
|
|
|
|
|
|
|
|
|
|
|
|
|
|
|
|
|
|
|
|
|
|
|
|
|
|
|
|
|
|
|
|
|
|
|
|
|
|
|
|
|
|
|
|
|
|
|
|
|
|
|
|
|
|
|
|
|
|
|
|
|
|
|
|
|
|
|
|
|
|
|
|
|
|
|
|
|
|
|
|
|
|
|
|
|
|
|
|
|
|
|
|
|
$ |
(5,723 |
) |
|
|
|
|
|
$ |
(6,519 |
) |
|
|
|
|
|
$ |
796 |
|
|
|
|
|
|
|
|
|
|
|
|
|
|
|
|
|
|
|
|
|
|
|
|
|
|
|
|
|
|
|
|
|
|
|
|
|
|
|
|
|
|
|
|
|
|
|
|
|
|
|
|
|
|
169 American Funds Insurance Series
The Bond Fund of America (continued)
|
|
|
|
|
|
|
|
|
|
|
|
|
|
|
|
|
|
|
|
|
|
|
|
|
|
|
|
|
| Investments in affiliates15 |
|
|
|
|
|
|
|
|
|
|
|
|
|
|
|
|
|
|
|
|
|
|
|
|
|
|
|
|
|
| |
|
Value at 1/1/2024 (000) |
|
|
Additions (000) |
|
|
Reductions (000) |
|
|
Net realized gain (loss) (000) |
|
|
Net unrealized appreciation (depreciation) (000) |
|
|
Value at 6/30/2024 (000) |
|
|
Dividend or interest income (000) |
|
|
|
|
|
|
|
|
|
| Short-term securities 15.35% |
|
|
|
|
|
|
|
|
|
|
|
|
|
|
|
|
|
|
|
|
|
|
|
|
|
|
|
|
| Money market investments 15.35% |
|
|
|
|
|
|
|
|
|
|
|
|
|
|
|
|
|
|
|
|
|
|
|
|
|
|
|
|
| Capital Group Central Cash Fund 5.37%14 |
|
$ |
2,168,331 |
|
|
$ |
1,373,840 |
|
|
|
$1,832,101 |
|
|
|
$(9 |
) |
|
|
$226 |
|
|
|
$1,710,287 |
|
|
|
$52,035 |
|
|
|
|
|
|
|
|
|
|
|
|
|
|
|
|
|
|
|
|
|
|
|
|
|
|
|
|
|
|
|
|
|
|
|
|
|
| Restricted securities12 |
|
|
|
|
|
|
|
|
|
|
|
|
|
|
|
|
|
|
|
|
|
|
| |
|
Acquisition date(s) |
|
|
|
Cost (000) |
|
|
|
Value (000) |
|
|
|
Percent of net assets |
|
|
|
|
|
|
|
|
| Mission Lane Credit Card Master Trust, Series 2022-B, Class A1, 8.25% 1/15/20281,8 |
|
|
|
12/6/2022 |
|
|
|
|
|
|
|
|
$ |
1,006 |
|
|
|
|
|
|
|
|
$ |
1,005 |
|
|
|
|
|
|
|
|
|
.01 |
% |
| Mission Lane Credit Card Master Trust, Series 2022-B, Class A2, 8.73% 1/15/20281,8 |
|
|
|
12/6/2022 |
|
|
|
|
|
|
|
|
|
150 |
|
|
|
|
|
|
|
|
|
150 |
|
|
|
|
|
|
|
|
|
.00 |
16 |
|
|
|
|
|
|
|
|
|
|
|
|
|
|
|
|
|
|
|
|
|
|
|
|
|
|
|
|
|
|
|
|
|
|
|
|
|
|
|
|
|
|
|
|
| Total |
|
|
|
|
|
|
|
|
|
|
|
|
$ |
1,156 |
|
|
|
|
|
|
|
|
$ |
1,155 |
|
|
|
|
|
|
|
|
|
.01 |
% |
|
|
|
|
|
|
|
|
|
|
|
|
|
|
|
|
|
|
|
|
|
|
|
|
|
|
|
|
|
|
|
|
|
|
|
|
| 1 |
Principal payments may be made periodically. Therefore, the effective maturity date may be earlier than the stated maturity date. |
| 2 |
Coupon rate may change periodically. Reference rate and spread are as of the most recent information available. Some coupon rates are determined by the issuer or agent based on current market conditions; therefore, the reference rate and spread are not available. |
| 3 |
All or a portion of this security was pledged as collateral. The total value of pledged collateral was $73,386,000, which represented .66% of the net assets of the fund. |
| 4 |
Amount less than one thousand. |
| 5 |
Purchased on a TBA basis. |
| 6 |
Acquired in a transaction exempt from registration under Rule 144A or, for commercial paper, Section 4(a)(2) of the Securities Act of 1933. May be resold in the U.S. in transactions exempt from registration, normally to qualified institutional buyers. The total value of all such securities was $1,520,823,000, which represented 13.65% of the net assets of the fund. |
| 7 |
Step bond; coupon rate may change at a later date. |
| 8 |
Value determined using significant unobservable inputs. |
| 9 |
Securities referencing LIBOR are expected to transition to an alternative reference rate by the security’s next scheduled coupon reset date. |
| 10 |
Scheduled interest and/or principal payment was not received. |
| 11 |
Index-linked bond whose principal amount moves with a government price index. |
| 12 |
Restricted security, other than Rule 144A securities or commercial paper issued pursuant to Section 4(a)(2) of the Securities Act of 1933. The total value of all such restricted securities was $1,155,000, which represented .01% of the net assets of the fund. |
| 13 |
Security did not produce income during the last 12 months. |
| 14 |
Rate represents the seven-day yield at 6/30/2024. |
| 15 |
Part of the same “group of investment companies” as the fund as defined under the Investment Company Act of 1940, as amended. |
| 16 |
Amount less than .01%. |
Key to abbreviation(s)
|
|
|
| Assn. = Association |
|
ICE = Intercontinental Exchange, Inc. |
| Auth. = Authority |
|
IDR = Indonesian rupiah |
| CLO = Collateralized Loan Obligations |
|
JPY = Japanese yen |
| CME = CME Group |
|
LIBOR = London Interbank Offered Rate |
| CMO = Collateralized Mortgage Obligations |
|
MXN = Mexican pesos |
| DAC = Designated Activity Company |
|
Ref. = Refunding |
| EUR = Euros |
|
Rev. = Revenue |
| EURIBOR = Euro Interbank Offered Rate |
|
SOFR = Secured Overnight Financing Rate |
| Fin. = Finance |
|
TBA = To be announced |
| Fncg. = Financing |
|
TIIE = Equilibrium Interbank Interest Rate |
| G.O. = General Obligation |
|
USD = U.S. dollars |
Refer to the notes to financial statements.
American Funds Insurance Series 170
Capital World Bond Fund
|
|
|
| Investment portfolio June 30, 2024 |
|
unaudited |
|
|
|
|
|
|
|
|
|
|
|
|
|
|
| Bonds, notes & other debt instruments 92.67% |
|
Principal amount (000) |
|
|
Value
(000) |
|
|
|
|
|
| Euros 17.59% |
|
AIA Group, Ltd. 0.88% 9/9/2033 (5-year EUR Mid-Swap + 1.10% on 9/9/2028)1 |
|
|
EUR2,800 |
|
|
$ |
2,598 |
|
|
|
Alpha Bank SA 5.50% 6/11/2031 (5-year EUR Mid-Swap + 5.823% on 6/11/2026)1 |
|
|
680 |
|
|
|
724 |
|
|
|
Altria Group, Inc. 3.125% 6/15/2031 |
|
|
800 |
|
|
|
798 |
|
|
|
American Honda Finance Corp. 1.95% 10/18/2024 |
|
|
560 |
|
|
|
596 |
|
|
|
American Tower Corp. 0.45% 1/15/2027 |
|
|
2,525 |
|
|
|
2,498 |
|
|
|
American Tower Corp. 0.875% 5/21/2029 |
|
|
1,470 |
|
|
|
1,370 |
|
|
|
Anheuser-Busch InBev SA/NV 1.125% 7/1/2027 |
|
|
2,000 |
|
|
|
2,017 |
|
|
|
AT&T, Inc. 1.60% 5/19/2028 |
|
|
2,350 |
|
|
|
2,347 |
|
|
|
AT&T, Inc. 4.30% 11/18/2034 |
|
|
260 |
|
|
|
288 |
|
|
|
Banco de Sabadell, SA 5.25% 2/7/2029
(1-year EUR Mid-Swap + 2.40% on 2/7/2028)1 |
|
|
900 |
|
|
|
1,001 |
|
|
|
Banco de Sabadell, SA 5.50% 9/8/2029
(1-year EUR-ICE Swap EURIBOR + 2.40% on 9/8/2028)1 |
|
|
700 |
|
|
|
791 |
|
|
|
Bank of America Corp. 3.648% 3/31/2029
(3-month EUR-EURIBOR + 3.67% on 3/31/2028)1,2 |
|
|
5,000 |
|
|
|
5,352 |
|
|
|
Banque Federative du Credit Mutuel 3.875% 6/16/2032
(5-year EUR Mid-Swap + 2.20% on 6/16/2027)1 |
|
|
2,800 |
|
|
|
2,960 |
|
|
|
Baxter International, Inc. 1.30% 5/15/2029 |
|
|
2,000 |
|
|
|
1,927 |
|
|
|
Belgium (Kingdom of), Series 97, 3.00% 6/22/2033 |
|
|
1,530 |
|
|
|
1,634 |
|
|
|
Belgium (Kingdom of), Series 100, 2.85% 10/22/2034 |
|
|
880 |
|
|
|
919 |
|
|
|
Belgium (Kingdom of), Series 98, 3.30% 6/22/2054 |
|
|
880 |
|
|
|
887 |
|
|
|
BPCE SA 1.00% 4/1/2025 |
|
|
2,900 |
|
|
|
3,043 |
|
|
|
BPCE SA 4.50% 1/13/2033 |
|
|
1,400 |
|
|
|
1,552 |
|
|
|
British American Tobacco PLC 3.00% subordinated perpetual bonds
(5-year EUR Mid-Swap + 3.372% on 12/27/2026)1 |
|
|
4,980 |
|
|
|
5,036 |
|
|
|
CaixaBank, SA 2.25% 4/17/2030
(5-year EUR Annual (vs. 6-month EUR-EURIBOR) + 1.68% on 4/17/2025)1 |
|
|
3,800 |
|
|
|
3,985 |
|
|
|
Celanese US Holdings, LLC 4.777% 7/19/2026 |
|
|
235 |
|
|
|
255 |
|
|
|
Commerzbank AG 4.625% 1/17/2031
(3-month EUR-EURIBOR + 2.10% on 1/17/2030)1 |
|
|
1,900 |
|
|
|
2,076 |
|
|
|
Deutsche Bank AG 1.75% 11/19/2030
(3-month EUR-EURIBOR + 2.05% on 11/19/2029)1 |
|
|
4,000 |
|
|
|
3,770 |
|
|
|
Deutsche Telekom International Finance BV 7.50% 1/24/2033 |
|
|
200 |
|
|
|
276 |
|
|
|
Dow Chemical Co. (The) 0.50% 3/15/2027 |
|
|
1,110 |
|
|
|
1,095 |
|
|
|
Egypt (Arab Republic of) 5.625% 4/16/2030 |
|
|
300 |
|
|
|
258 |
|
|
|
Electricité de France SA 2.625% junior subordinated perpetual bonds
(5-year EUR Mid-Swap + 2.86% on 6/1/2028)1 |
|
|
1,400 |
|
|
|
1,355 |
|
|
|
Electricité de France SA 7.50% perpetual bonds
(5-year EUR Mid-Swap + 4.86% on 12/6/2028)1 |
|
|
1,200 |
|
|
|
1,376 |
|
|
|
Equinor ASA 1.375% 5/22/2032 |
|
|
3,650 |
|
|
|
3,371 |
|
|
|
Eurobank Ergasias Services and Holdings SA 10.00% 12/6/2032
(5-year EUR Mid-Swap + 7.588% on 12/6/2027)1 |
|
|
2,870 |
|
|
|
3,508 |
|
|
|
Eurobank Ergasias Services and Holdings SA 6.25% 4/25/2034 (5-year EUR Mid-Swap + 3.707% on 4/25/2029)1 |
|
|
950 |
|
|
|
1,039 |
|
|
|
Eurobank SA 4.875% 4/30/2031
(5-year EUR Mid-Swap + 2.165% on 4/30/2030)1 |
|
|
255 |
|
|
|
274 |
|
|
|
European Investment Bank 0.25% 1/20/2032 |
|
|
4,900 |
|
|
|
4,307 |
|
|
|
European Investment Bank 1.50% 6/15/2032 |
|
|
1,000 |
|
|
|
963 |
|
|
|
European Investment Bank 2.875% 1/12/2033 |
|
|
4,500 |
|
|
|
4,771 |
|
|
|
European Union 0.25% 10/22/2026 |
|
|
610 |
|
|
|
614 |
|
|
|
European Union 2.875% 12/6/2027 |
|
|
560 |
|
|
|
597 |
|
|
|
European Union 3.125% 12/4/2030 |
|
|
190 |
|
|
|
205 |
|
|
|
European Union 0% 7/4/2031 |
|
|
705 |
|
|
|
615 |
|
|
|
European Union 0% 7/4/2035 |
|
|
220 |
|
|
|
168 |
|
|
|
European Union 0.20% 6/4/2036 |
|
|
1,500 |
|
|
|
1,140 |
|
|
|
European Union 3.375% 10/4/2039 |
|
|
1,700 |
|
|
|
1,812 |
|
|
|
European Union 0.70% 7/6/2051 |
|
|
3,000 |
|
|
|
1,716 |
|
|
|
European Union 3.375% 10/5/2054 |
|
|
540 |
|
|
|
559 |
|
|
|
Finland (Republic of) 3.00% 9/15/2033 |
|
|
2,370 |
|
|
|
2,531 |
|
|
|
French Republic O.A.T. 0.75% 2/25/2028 |
|
|
980 |
|
|
|
968 |
|
|
|
French Republic O.A.T. 0% 11/25/2030 |
|
|
19,550 |
|
|
|
17,277 |
|
|
|
French Republic O.A.T. 0% 5/25/2032 |
|
|
2,120 |
|
|
|
1,781 |
|
|
|
French Republic O.A.T. 2.00% 11/25/2032 |
|
|
3,170 |
|
|
|
3,107 |
|
171 American Funds Insurance Series
Capital World Bond Fund (continued)
|
|
|
|
|
|
|
|
|
|
|
| Bonds, notes & other debt instruments (continued) |
|
Principal amount
(000) |
|
|
Value
(000) |
|
|
|
|
|
| Euros (continued) |
|
French Republic O.A.T. 3.00% 5/25/2033 |
|
|
EUR1,920 |
|
|
$ |
2,024 |
|
|
|
French Republic O.A.T. 3.00% 11/25/2034 |
|
|
3,900 |
|
|
|
4,068 |
|
|
|
French Republic O.A.T. 0.50% 5/25/2040 |
|
|
600 |
|
|
|
409 |
|
|
|
French Republic O.A.T. 0.75% 5/25/2052 |
|
|
2,850 |
|
|
|
1,528 |
|
|
|
Germany (Federal Republic of) 0% 10/9/2026 |
|
|
2,305 |
|
|
|
2,324 |
|
|
|
Germany (Federal Republic of) 0% 11/15/2027 |
|
|
1,400 |
|
|
|
1,378 |
|
|
|
Germany (Federal Republic of) 2.10% 4/12/2029 |
|
|
1,545 |
|
|
|
1,628 |
|
|
|
Germany (Federal Republic of) 0% 2/15/2030 |
|
|
7,050 |
|
|
|
6,609 |
|
|
|
Germany (Federal Republic of) 0% 8/15/2030 |
|
|
6,285 |
|
|
|
5,831 |
|
|
|
Germany (Federal Republic of) 0% 8/15/2031 |
|
|
12,600 |
|
|
|
11,421 |
|
|
|
Germany (Federal Republic of) 1.70% 8/15/2032 |
|
|
1,886 |
|
|
|
1,915 |
|
|
|
Germany (Federal Republic of) 2.20% 2/15/2034 |
|
|
780 |
|
|
|
816 |
|
|
|
Germany (Federal Republic of) 1.00% 5/15/2038 |
|
|
130 |
|
|
|
113 |
|
|
|
Germany (Federal Republic of) 0% 8/15/2050 |
|
|
1,200 |
|
|
|
651 |
|
|
|
Goldman Sachs Group, Inc. 3.375% 3/27/20252 |
|
|
5,000 |
|
|
|
5,340 |
|
|
|
Greece (Hellenic Republic of) 3.875% 6/15/2028 |
|
|
7,155 |
|
|
|
7,859 |
|
|
|
Greece (Hellenic Republic of) 1.50% 6/18/2030 |
|
|
690 |
|
|
|
665 |
|
|
|
Greece (Hellenic Republic of) 0.75% 6/18/2031 |
|
|
700 |
|
|
|
627 |
|
|
|
Greece (Hellenic Republic of) 1.75% 6/18/2032 |
|
|
1,915 |
|
|
|
1,806 |
|
|
|
Greece (Hellenic Republic of) 3.90% 1/30/2033 |
|
|
3,200 |
|
|
|
3,500 |
|
|
|
ING Groep NV 5.25% 11/14/2033
(3-month EUR-EURIBOR + 2.15% on 11/14/2032)1 |
|
|
1,200 |
|
|
|
1,405 |
|
|
|
Ireland (Republic of) 2.60% 10/18/2034 |
|
|
4,850 |
|
|
|
5,038 |
|
|
|
Ireland (Republic of) 3.00% 10/18/2043 |
|
|
2,010 |
|
|
|
2,093 |
|
|
|
Italy (Republic of) 1.85% 7/1/2025 |
|
|
17,700 |
|
|
|
18,650 |
|
|
|
Italy (Republic of) 1.35% 4/1/2030 |
|
|
7 |
|
|
|
7 |
|
|
|
Italy (Republic of) 4.20% 3/1/2034 |
|
|
11,900 |
|
|
|
12,950 |
|
|
|
Italy (Republic of) 1.80% 3/1/2041 |
|
|
6,060 |
|
|
|
4,547 |
|
|
|
KfW 0.125% 6/30/2025 |
|
|
590 |
|
|
|
612 |
|
|
|
Lithuania (Republic of) 3.50% 7/3/2031 |
|
|
1,060 |
|
|
|
1,127 |
|
|
|
Lithuania (Republic of) 3.50% 2/13/2034 |
|
|
1,620 |
|
|
|
1,716 |
|
|
|
Magyar Export-Import Bank 6.00% 5/16/2029 |
|
|
1,430 |
|
|
|
1,613 |
|
|
|
Metropolitan Life Global Funding I 0.55% 6/16/20272 |
|
|
2,000 |
|
|
|
1,974 |
|
|
|
Morgan Stanley 2.103% 5/8/2026
(3-month EUR-EURIBOR + 0.904% on 5/8/2025)1 |
|
|
580 |
|
|
|
612 |
|
|
|
Morocco (Kingdom of) 1.50% 11/27/2031 |
|
|
1,920 |
|
|
|
1,668 |
|
|
|
National Bank of Greece SA 8.00% 1/3/2034
(5-year EUR-ICE Swap EURIBOR + 4.646% on 1/3/2029)1 |
|
|
1,100 |
|
|
|
1,300 |
|
|
|
NatWest Group PLC 0.78% 2/26/2030
(3-month EUR-EURIBOR + 0.949% on 2/26/2029)1 |
|
|
2,725 |
|
|
|
2,538 |
|
|
|
NatWest Group PLC 1.043% 9/14/2032
(5-year EUR Mid-Swap + 1.27% on 9/14/2027)1 |
|
|
185 |
|
|
|
179 |
|
|
|
PepsiCo, Inc. 0.75% 10/14/2033 |
|
|
2,000 |
|
|
|
1,705 |
|
|
|
Philippines (Republic of) 0.25% 4/28/2025 |
|
|
875 |
|
|
|
907 |
|
|
|
Portuguese Republic 0.475% 10/18/2030 |
|
|
1,610 |
|
|
|
1,490 |
|
|
|
Portuguese Republic 2.875% 10/20/2034 |
|
|
2,560 |
|
|
|
2,657 |
|
|
|
Portuguese Republic 3.50% 6/18/2038 |
|
|
3,140 |
|
|
|
3,367 |
|
|
|
Quebec (Province of) 0.25% 5/5/2031 |
|
|
920 |
|
|
|
811 |
|
|
|
Quebec (Province of) 0.50% 1/25/2032 |
|
|
1,155 |
|
|
|
1,016 |
|
|
|
Romania 2.125% 3/7/2028 |
|
|
1,440 |
|
|
|
1,426 |
|
|
|
Romania 3.75% 2/7/2034 |
|
|
530 |
|
|
|
488 |
|
|
|
Shell International Finance BV 1.50% 4/7/2028 |
|
|
2,000 |
|
|
|
2,003 |
|
|
|
Slovak Republic 3.75% 3/6/2034 |
|
|
640 |
|
|
|
687 |
|
|
|
Spain (Kingdom of) 0% 1/31/2028 |
|
|
900 |
|
|
|
866 |
|
|
|
Spain (Kingdom of) 1.45% 4/30/2029 |
|
|
1,890 |
|
|
|
1,884 |
|
|
|
Spain (Kingdom of) 1.25% 10/31/2030 |
|
|
1,295 |
|
|
|
1,241 |
|
|
|
Spain (Kingdom of) 0.50% 10/31/2031 |
|
|
1,247 |
|
|
|
1,107 |
|
|
|
Spain (Kingdom of) 3.15% 4/30/2033 |
|
|
3,647 |
|
|
|
3,867 |
|
|
|
Spain (Kingdom of) 3.55% 10/31/2033 |
|
|
6,240 |
|
|
|
6,797 |
|
|
|
Spain (Kingdom of) 3.25% 4/30/2034 |
|
|
2,630 |
|
|
|
2,789 |
|
|
|
Spain (Kingdom of) 3.45% 10/31/2034 |
|
|
740 |
|
|
|
795 |
|
|
|
Spain (Kingdom of) 1.90% 10/31/2052 |
|
|
1,010 |
|
|
|
710 |
|
American Funds Insurance Series 172
Capital World Bond Fund (continued)
|
|
|
|
|
|
|
|
|
|
|
| Bonds, notes & other debt instruments (continued) |
|
Principal amount
(000) |
|
|
Value
(000) |
|
|
|
|
|
| Euros (continued) |
|
State Grid Overseas Investment (2016), Ltd. 1.375% 5/2/2025 |
|
|
EUR441 |
|
|
$ |
463 |
|
|
|
State Grid Overseas Investment (2016), Ltd. 2.125% 5/2/2030 |
|
|
200 |
|
|
|
200 |
|
|
|
Stryker Corp. 0.25% 12/3/2024 |
|
|
480 |
|
|
|
506 |
|
|
|
Stryker Corp. 0.75% 3/1/2029 |
|
|
980 |
|
|
|
928 |
|
|
|
Stryker Corp. 1.00% 12/3/2031 |
|
|
450 |
|
|
|
402 |
|
|
|
TenneT Holding BV 5.25% junior subordinated perpetual bonds
(5-year EUR-ICE Swap EURIBOR + 1.947% on 6/21/2029)1 |
|
|
390 |
|
|
|
416 |
|
|
|
T-Mobile USA, Inc. 3.70% 5/8/2032 |
|
|
410 |
|
|
|
440 |
|
|
|
Toyota Motor Credit Corp. 0.125% 11/5/2027 |
|
|
1,850 |
|
|
|
1,782 |
|
|
|
Ukraine 4.375% 1/27/20323 |
|
|
2,105 |
|
|
|
599 |
|
|
|
Verizon Communications, Inc. 3.50% 6/28/2032 |
|
|
1,620 |
|
|
|
1,719 |
|
|
|
|
|
|
|
|
|
|
|
|
|
|
|
|
|
|
|
|
|
266,716 |
|
|
|
|
|
|
|
|
|
|
|
|
| |
|
|
|
|
|
|
|
|
|
|
|
|
|
|
| Japanese yen 5.11% |
|
Indonesia (Republic of) 0.57% 5/27/2026 |
|
|
JPY100,000 |
|
|
|
617 |
|
|
|
Indonesia (Republic of), Series 31, 0.99% 5/27/2027 |
|
|
300,000 |
|
|
|
1,863 |
|
|
|
Indonesia (Republic of), Series 32, 1.33% 5/25/2029 |
|
|
300,000 |
|
|
|
1,856 |
|
|
|
Japan, Series 19, 0.10% 9/10/20244 |
|
|
480,589 |
|
|
|
3,005 |
|
|
|
Japan, Series 346, 0.10% 3/20/2027 |
|
|
94,550 |
|
|
|
583 |
|
|
|
Japan, Series 356, 0.10% 9/20/2029 |
|
|
2,220,800 |
|
|
|
13,460 |
|
|
|
Japan, Series 116, 2.20% 3/20/2030 |
|
|
576,100 |
|
|
|
3,897 |
|
|
|
Japan, Series 362, 0.10% 3/20/2031 |
|
|
737,200 |
|
|
|
4,398 |
|
|
|
Japan, Series 374, 0.80% 3/20/2034 |
|
|
68,200 |
|
|
|
414 |
|
|
|
Japan, Series 152, 1.20% 3/20/2035 |
|
|
608,450 |
|
|
|
3,799 |
|
|
|
Japan, Series 21, 2.30% 12/20/2035 |
|
|
720,000 |
|
|
|
4,986 |
|
|
|
Japan, Series 162, 0.60% 9/20/2037 |
|
|
1,966,150 |
|
|
|
11,068 |
|
|
|
Japan, Series 179, 0.50% 12/20/2041 |
|
|
196,950 |
|
|
|
1,003 |
|
|
|
Japan, Series 182, 1.10% 9/20/2042 |
|
|
619,850 |
|
|
|
3,463 |
|
|
|
Japan, Series 186, 1.50% 9/20/2043 |
|
|
1,715,050 |
|
|
|
10,123 |
|
|
|
Japan, Series 188, 1.60% 3/20/2044 |
|
|
69,000 |
|
|
|
412 |
|
|
|
Japan, Series 37, 0.60% 6/20/2050 |
|
|
694,500 |
|
|
|
3,045 |
|
|
|
Japan, Series 73, 0.70% 12/20/2051 |
|
|
1,568,700 |
|
|
|
6,900 |
|
|
|
Japan, Series 74, 1.00% 3/20/2052 |
|
|
246,100 |
|
|
|
1,173 |
|
|
|
Japan, Series 79, 1.20% 6/20/2053 |
|
|
274,400 |
|
|
|
1,363 |
|
|
|
|
|
|
|
|
|
|
|
|
|
|
|
|
|
|
|
|
|
77,428 |
|
|
|
|
|
|
|
|
|
|
|
|
| |
|
|
|
|
|
|
|
|
|
|
|
|
|
|
| British pounds 4.21% |
|
American Honda Finance Corp. 0.75% 11/25/2026 |
|
|
GBP1,420 |
|
|
|
1,633 |
|
|
|
Asian Development Bank 1.125% 6/10/2025 |
|
|
740 |
|
|
|
903 |
|
|
|
KfW 1.125% 7/4/2025 |
|
|
1,165 |
|
|
|
1,418 |
|
|
|
Lloyds Bank PLC 7.625% 4/22/2025 |
|
|
655 |
|
|
|
841 |
|
|
|
Quebec (Province of) 2.25% 9/15/2026 |
|
|
1,870 |
|
|
|
2,239 |
|
|
|
United Kingdom 0.125% 1/30/2026 |
|
|
425 |
|
|
|
504 |
|
|
|
United Kingdom 4.25% 12/7/2027 |
|
|
5,910 |
|
|
|
7,502 |
|
|
|
United Kingdom 1.625% 10/22/2028 |
|
|
3,690 |
|
|
|
4,231 |
|
|
|
United Kingdom 4.75% 12/7/2030 |
|
|
6,920 |
|
|
|
9,111 |
|
|
|
United Kingdom 0.25% 7/31/2031 |
|
|
12,845 |
|
|
|
12,494 |
|
|
|
United Kingdom 1.00% 1/31/2032 |
|
|
7,120 |
|
|
|
7,215 |
|
|
|
United Kingdom 4.25% 6/7/2032 |
|
|
1,310 |
|
|
|
1,678 |
|
|
|
United Kingdom 3.25% 1/31/2033 |
|
|
1,090 |
|
|
|
1,292 |
|
|
|
United Kingdom 0.625% 7/31/2035 |
|
|
210 |
|
|
|
181 |
|
|
|
United Kingdom 0.875% 1/31/2046 |
|
|
4,917 |
|
|
|
3,067 |
|
|
|
United Kingdom 3.75% 10/22/2053 |
|
|
1,870 |
|
|
|
2,023 |
|
|
|
United Kingdom 4.375% 7/31/2054 |
|
|
6,285 |
|
|
|
7,577 |
|
|
|
|
|
|
|
|
|
|
|
|
|
|
|
|
|
|
|
|
|
63,909 |
|
|
|
|
|
|
|
|
|
|
|
|
| |
|
|
|
|
|
|
|
|
|
|
|
|
|
|
| Chinese yuan renminbi 3.46% |
|
China (People’s Republic of), Series INBK, 2.75% 2/17/2032 |
|
|
CNY39,260 |
|
|
|
5,618 |
|
|
|
China (People’s Republic of), Series INBK, 2.88% 2/25/2033 |
|
|
36,940 |
|
|
|
5,344 |
|
|
|
China (People’s Republic of), Series 1910, 3.86% 7/22/2049 |
|
|
79,090 |
|
|
|
13,710 |
|
|
|
China (People’s Republic of), Series INBK, 3.81% 9/14/2050 |
|
|
66,960 |
|
|
|
11,528 |
|
|
|
China (People’s Republic of), Series INBK, 3.53% 10/18/2051 |
|
|
35,700 |
|
|
|
5,914 |
|
173 American Funds Insurance Series
Capital World Bond Fund (continued)
|
|
|
|
|
|
|
|
|
|
|
| Bonds, notes & other debt instruments (continued) |
|
Principal amount
(000) |
|
|
Value
(000) |
|
|
|
|
|
| Chinese yuan renminbi (continued) |
|
China (People’s Republic of), Series INBK, 3.12% 10/25/2052 |
|
|
CNY42,610 |
|
|
$ |
6,603 |
|
|
|
China (People’s Republic of), Series INBK, 3.00% 10/15/2053 |
|
|
5,150 |
|
|
|
792 |
|
|
|
China Development Bank Corp., Series 1814, 4.15% 10/26/2025 |
|
|
20,900 |
|
|
|
2,965 |
|
|
|
|
|
|
|
|
|
|
|
|
|
|
|
|
|
|
|
|
|
52,474 |
|
|
|
|
|
|
|
|
|
|
|
|
| |
|
|
|
|
|
|
|
|
|
|
|
|
|
|
| Mexican pesos 2.76% |
|
América Móvil, SAB de CV 10.125% 1/22/2029 |
|
|
MXN32,700 |
|
|
|
1,740 |
|
|
|
América Móvil, SAB de CV 9.50% 1/27/2031 |
|
|
115,680 |
|
|
|
5,912 |
|
|
|
Petroleos Mexicanos 7.19% 9/12/2024 |
|
|
66,160 |
|
|
|
3,575 |
|
|
|
United Mexican States, Series M, 7.50% 6/3/2027 |
|
|
251,720 |
|
|
|
12,808 |
|
|
|
United Mexican States, Series M, 7.75% 5/29/2031 |
|
|
1,383 |
|
|
|
67 |
|
|
|
United Mexican States, Series M, 7.75% 11/23/2034 |
|
|
124,285 |
|
|
|
5,851 |
|
|
|
United Mexican States, Series M30, 8.50% 11/18/2038 |
|
|
21,100 |
|
|
|
1,023 |
|
|
|
United Mexican States, Series M, 8.00% 11/7/2047 |
|
|
7,830 |
|
|
|
350 |
|
|
|
United Mexican States, Series M, 8.00% 7/31/2053 |
|
|
198,770 |
|
|
|
8,779 |
|
|
|
United Mexican States, Series S, 4.00% 10/29/20544 |
|
|
39,374 |
|
|
|
1,803 |
|
|
|
|
|
|
|
|
|
|
|
|
|
|
|
|
|
|
|
|
|
41,908 |
|
|
|
|
|
|
|
|
|
|
|
|
| |
|
|
|
|
|
|
|
|
|
|
|
|
|
|
| Brazilian reais 2.56% |
|
Brazil (Federative Republic of) 6.00% 8/15/20244 |
|
|
BRL14,479 |
|
|
|
2,582 |
|
|
|
Brazil (Federative Republic of) 0% 1/1/2025 |
|
|
16,000 |
|
|
|
2,719 |
|
|
|
Brazil (Federative Republic of) 10.00% 1/1/2025 |
|
|
1,700 |
|
|
|
303 |
|
|
|
Brazil (Federative Republic of) 0% 4/1/2025 |
|
|
118,426 |
|
|
|
19,567 |
|
|
|
Brazil (Federative Republic of) 10.00% 1/1/2029 |
|
|
33,688 |
|
|
|
5,609 |
|
|
|
Brazil (Federative Republic of) 10.00% 1/1/2031 |
|
|
14,573 |
|
|
|
2,356 |
|
|
|
Brazil (Federative Republic of) 6.00% 8/15/20404 |
|
|
2,019 |
|
|
|
348 |
|
|
|
Brazil (Federative Republic of) 6.00% 8/15/20504 |
|
|
24,150 |
|
|
|
4,073 |
|
|
|
Brazil (Federative Republic of) 6.00% 8/15/20604 |
|
|
7,523 |
|
|
|
1,264 |
|
|
|
|
|
|
|
|
|
|
|
|
|
|
|
|
|
|
|
|
|
38,821 |
|
|
|
|
|
|
|
|
|
|
|
|
| |
|
|
|
|
|
|
|
|
|
|
|
|
|
|
| Canadian dollars 2.08% |
|
Canada 3.50% 3/1/2028 |
|
|
CAD25,228 |
|
|
|
18,382 |
|
|
|
Canada 3.25% 12/1/2033 |
|
|
15,230 |
|
|
|
10,904 |
|
|
|
Canada 2.75% 12/1/2048 |
|
|
3,500 |
|
|
|
2,274 |
|
|
|
|
|
|
|
|
|
|
|
|
|
|
|
|
|
|
|
|
|
31,560 |
|
|
|
|
|
|
|
|
|
|
|
|
| |
|
|
|
|
|
|
|
|
|
|
|
|
|
|
| South Korean won 1.93% |
|
South Korea (Republic of), Series 2503, 1.50% 3/10/2025 |
|
|
KRW5,183,670 |
|
|
|
3,720 |
|
|
|
South Korea (Republic of), Series 2709, 3.125% 9/10/2027 |
|
|
4,513,500 |
|
|
|
3,272 |
|
|
|
South Korea (Republic of), Series 2712, 2.375% 12/10/2027 |
|
|
5,158,930 |
|
|
|
3,648 |
|
|
|
South Korea (Republic of), Series 2803, 3.25% 3/10/2028 |
|
|
3,998,100 |
|
|
|
2,910 |
|
|
|
South Korea (Republic of), Series 3106, 2.00% 6/10/2031 |
|
|
2,131,440 |
|
|
|
1,430 |
|
|
|
South Korea (Republic of), Series 3212, 4.25% 12/10/2032 |
|
|
18,379,880 |
|
|
|
14,329 |
|
|
|
|
|
|
|
|
|
|
|
|
|
|
|
|
|
|
|
|
|
29,309 |
|
|
|
|
|
|
|
|
|
|
|
|
| |
|
|
|
|
|
|
|
|
|
|
|
|
|
|
| Australian dollars 1.66% |
|
Australia (Commonwealth of), Series 157, 1.50% 6/21/2031 |
|
|
AUD3,640 |
|
|
|
2,038 |
|
|
|
Australia (Commonwealth of), Series 163, 1.00% 11/21/2031 |
|
|
5,789 |
|
|
|
3,081 |
|
|
|
Australia (Commonwealth of), Series 167, 3.75% 5/21/2034 |
|
|
4,415 |
|
|
|
2,814 |
|
|
|
New South Wales Treasury Corp. 4.75% 2/20/2035 |
|
|
12,509 |
|
|
|
8,104 |
|
|
|
New South Wales Treasury Corp. 4.25% 2/20/2036 |
|
|
14,861 |
|
|
|
9,078 |
|
|
|
|
|
|
|
|
|
|
|
|
|
|
|
|
|
|
|
|
|
25,115 |
|
|
|
|
|
|
|
|
|
|
|
|
| |
|
|
|
|
|
|
|
|
|
|
|
|
|
|
| Indonesian rupiah 1.39% |
|
Indonesia (Republic of), Series 84, 7.25% 2/15/2026 |
|
|
IDR22,733,000 |
|
|
|
1,399 |
|
|
|
Indonesia (Republic of), Series 64, 6.125% 5/15/2028 |
|
|
20,866,000 |
|
|
|
1,247 |
|
|
|
Indonesia (Republic of), Series 95, 6.375% 8/15/2028 |
|
|
92,831,000 |
|
|
|
5,582 |
|
|
|
Indonesia (Republic of), Series 71, 9.00% 3/15/2029 |
|
|
26,010,000 |
|
|
|
1,718 |
|
|
|
Indonesia (Republic of), Series 82, 7.00% 9/15/2030 |
|
|
2,930,000 |
|
|
|
179 |
|
American Funds Insurance Series 174
Capital World Bond Fund (continued)
|
|
|
|
|
|
|
|
|
|
|
| Bonds, notes & other debt instruments (continued) |
|
Principal amount
(000) |
|
|
Value
(000) |
|
|
|
|
|
| Indonesian rupiah (continued) |
|
Indonesia (Republic of), Series 96, 7.00% 2/15/2033 |
|
|
IDR139,882,000 |
|
|
$ |
8,507 |
|
|
|
Indonesia (Republic of), Series 100, 6.625% 2/15/2034 |
|
|
10,687,000 |
|
|
|
634 |
|
|
|
Indonesia (Republic of), Series 68, 8.375% 3/15/2034 |
|
|
27,353,000 |
|
|
|
1,825 |
|
|
|
|
|
|
|
|
|
|
|
|
|
|
|
|
|
|
|
|
|
21,091 |
|
|
|
|
|
|
|
|
|
|
|
|
|
|
|
|
|
|
|
|
|
|
|
| |
|
|
|
| Norwegian kroner 0.65% |
|
Norway (Kingdom of) 1.75% 9/6/2029 |
|
|
NOK25,820 |
|
|
|
2,207 |
|
|
|
Norway (Kingdom of) 2.125% 5/18/2032 |
|
|
6,615 |
|
|
|
557 |
|
|
|
Norway (Kingdom of) 3.625% 4/13/2034 |
|
|
75,900 |
|
|
|
7,125 |
|
|
|
|
|
|
|
|
|
|
|
|
|
|
|
|
|
|
|
|
|
9,889 |
|
|
|
|
|
|
|
|
|
|
|
|
|
|
|
|
|
|
|
|
|
|
|
| |
|
|
|
| Indian rupees 0.53% |
|
Asian Development Bank 6.20% 10/6/2026 |
|
|
INR15,700 |
|
|
|
186 |
|
|
|
Asian Development Bank 6.72% 2/8/2028 |
|
|
144,700 |
|
|
|
1,732 |
|
|
|
European Bank for Reconstruction and Development 5.00% 1/15/2026 |
|
|
57,600 |
|
|
|
674 |
|
|
|
European Bank for Reconstruction and Development 5.25% 1/12/2027 |
|
|
81,400 |
|
|
|
932 |
|
|
|
European Bank for Reconstruction and Development 6.30% 10/26/2027 |
|
|
34,000 |
|
|
|
400 |
|
|
|
Inter-American Development Bank 7.00% 1/25/2029 |
|
|
220,000 |
|
|
|
2,627 |
|
|
|
International Bank for Reconstruction and Development 6.75% 9/8/2027 |
|
|
126,400 |
|
|
|
1,503 |
|
|
|
|
|
|
|
|
|
|
|
|
|
|
|
|
|
|
|
|
|
8,054 |
|
|
|
|
|
|
|
|
|
|
|
|
|
|
|
|
|
|
|
|
|
|
|
| |
|
|
|
| Israeli shekels 0.48% |
|
Israel (State of) 1.30% 4/30/2032 |
|
|
ILS24,480 |
|
|
|
5,014 |
|
|
|
Israel (State of) 4.00% 3/30/2035 |
|
|
9,030 |
|
|
|
2,207 |
|
|
|
|
|
|
|
|
|
|
|
|
|
|
|
|
|
|
|
|
|
7,221 |
|
|
|
|
|
|
|
|
|
|
|
|
|
|
|
|
|
|
|
|
|
|
|
| |
|
|
|
| New Zealand dollars 0.41% |
|
New Zealand 4.50% 5/15/2030 |
|
|
NZD10,208 |
|
|
|
6,207 |
|
|
|
|
|
|
|
|
|
|
|
|
|
|
|
|
|
|
|
|
|
|
|
| |
|
|
|
| Danish kroner 0.40% |
|
Nykredit Realkredit AS, Series 01E, 0.50% 10/1/20435 |
|
|
DKK51,044 |
|
|
|
5,835 |
|
|
|
Realkredit Danmark AS 1.00% 10/1/20535 |
|
|
2,587 |
|
|
|
281 |
|
|
|
|
|
|
|
|
|
|
|
|
|
|
|
|
|
|
|
|
|
6,116 |
|
|
|
|
|
|
|
|
|
|
|
|
|
|
|
|
|
|
|
|
|
|
|
| |
|
|
|
| Polish zloty 0.23% |
|
Poland (Republic of), Series 1029, 2.75% 10/25/2029 |
|
|
PLN4,900 |
|
|
|
1,068 |
|
|
|
Poland (Republic of), Series 1033, 6.00% 10/25/2033 |
|
|
9,280 |
|
|
|
2,362 |
|
|
|
|
|
|
|
|
|
|
|
|
|
|
|
|
|
|
|
|
|
3,430 |
|
|
|
|
|
|
|
|
|
|
|
|
|
|
|
|
|
|
|
|
|
|
|
| |
|
|
|
| Turkish lira 0.23% |
|
Turkey (Republic of) 12.60% 10/1/2025 |
|
|
TRY135,945 |
|
|
|
3,141 |
|
|
|
Turkey (Republic of) 17.80% 7/13/2033 |
|
|
12,175 |
|
|
|
270 |
|
|
|
|
|
|
|
|
|
|
|
|
|
|
|
|
|
|
|
|
|
3,411 |
|
|
|
|
|
|
|
|
|
|
|
|
|
|
|
|
|
|
|
|
|
|
|
| |
|
|
|
| Chilean pesos 0.17% |
|
Chile (Republic of) 1.50% 3/1/20264 |
|
|
CLP864,239 |
|
|
|
908 |
|
|
|
Chile (Republic of) 5.00% 10/1/2028 |
|
|
955,000 |
|
|
|
979 |
|
|
|
Chile (Republic of) 6.00% 4/1/2033 |
|
|
675,000 |
|
|
|
713 |
|
|
|
|
|
|
|
|
|
|
|
|
|
|
|
|
|
|
|
|
|
2,600 |
|
|
|
|
|
|
|
|
|
|
|
|
|
|
|
|
|
|
|
|
|
|
|
| |
|
|
|
| Malaysian ringgits 0.14% |
|
Malaysia (Federation of), Series 0519, 3.757% 5/22/2040 |
|
|
MYR10,588 |
|
|
|
2,166 |
|
|
|
|
|
|
|
|
|
|
|
|
|
|
|
|
|
|
|
|
|
|
|
| |
|
|
|
| South African rand 0.14% |
|
South Africa (Republic of), Series R-2030, 8.00% 1/31/2030 |
|
|
ZAR8,400 |
|
|
|
424 |
|
|
|
South Africa (Republic of), Series R-214, 6.50% 2/28/2041 |
|
|
49,100 |
|
|
|
1,650 |
|
|
|
|
|
|
|
|
|
|
|
|
|
|
|
|
|
|
|
|
|
2,074 |
|
|
|
|
|
|
|
|
|
|
|
|
175 American Funds Insurance Series
Capital World Bond Fund (continued)
|
|
|
|
|
|
|
|
|
|
|
| Bonds, notes & other debt instruments (continued) |
|
Principal amount
(000) |
|
|
Value
(000) |
|
|
|
|
|
| Colombian pesos 0.07% |
|
Colombia (Republic of), Series B, 7.25% 10/26/2050 |
|
|
COP7,150,600 |
|
|
$ |
1,121 |
|
|
|
|
|
|
|
|
|
|
|
|
|
|
|
|
|
|
|
|
|
|
|
| |
|
|
|
| Romanian leu 0.07% |
|
Romania 4.75% 2/24/2025 |
|
|
RON5,000 |
|
|
|
1,067 |
|
|
|
|
|
|
|
|
|
|
|
|
|
|
|
|
|
|
|
|
|
|
|
| |
|
|
|
| Ukrainian hryvnia 0.00% |
|
Ukraine 19.50% 1/15/2025 |
|
|
UAH285 |
|
|
|
6 |
|
|
|
|
|
|
|
|
|
|
|
|
|
|
|
|
|
|
|
|
|
|
|
| |
|
|
|
| U.S. dollars 46.40% |
|
3R Lux SARL 9.75% 2/5/20316 |
|
|
USD1,800 |
|
|
|
1,890 |
|
|
|
3R Lux SARL 9.75% 2/5/2031 |
|
|
1,380 |
|
|
|
1,449 |
|
|
|
7-Eleven, Inc. 0.95% 2/10/20266 |
|
|
520 |
|
|
|
484 |
|
|
|
7-Eleven, Inc. 1.30% 2/10/20286 |
|
|
2,180 |
|
|
|
1,900 |
|
|
|
AAR Escrow Issuer, LLC 6.75% 3/15/20296 |
|
|
27 |
|
|
|
28 |
|
|
|
AbbVie, Inc. 5.05% 3/15/2034 |
|
|
2,790 |
|
|
|
2,783 |
|
|
|
AbbVie, Inc. 5.35% 3/15/2044 |
|
|
75 |
|
|
|
74 |
|
|
|
AbbVie, Inc. 5.40% 3/15/2054 |
|
|
1,265 |
|
|
|
1,252 |
|
|
|
AbbVie, Inc. 5.50% 3/15/2064 |
|
|
150 |
|
|
|
148 |
|
|
|
Abu Dhabi Crude Oil Pipeline, LLC 4.60% 11/2/2047 |
|
|
775 |
|
|
|
696 |
|
|
|
ACHV ABS Trust, Series 2023-4CP, Class B, 7.24% 11/25/20305,6 |
|
|
763 |
|
|
|
767 |
|
|
|
Advance Auto Parts, Inc. 5.95% 3/9/2028 |
|
|
45 |
|
|
|
45 |
|
|
|
AerCap Ireland Capital DAC 2.45% 10/29/2026 |
|
|
2,102 |
|
|
|
1,962 |
|
|
|
Aeropuerto Internacional de Tocumen, SA 5.125% 8/11/20616 |
|
|
660 |
|
|
|
487 |
|
|
|
Affirm, Inc., Series 2023-X1, Class A, 7.11% 11/15/20285,6 |
|
|
162 |
|
|
|
162 |
|
|
|
AG Issuer, LLC 6.25% 3/1/20286 |
|
|
165 |
|
|
|
162 |
|
|
|
AG TTMT Escrow Issuer, LLC 8.625% 9/30/20276 |
|
|
88 |
|
|
|
91 |
|
|
|
AIB Group PLC 6.608% 9/13/2029 (USD-SOFR + 2.33% on 9/13/2028)1,6 |
|
|
1,147 |
|
|
|
1,185 |
|
|
|
AIB Group PLC 5.871% 3/28/2035 (USD-SOFR + 1.91% on 3/28/2034)1,6 |
|
|
1,560 |
|
|
|
1,550 |
|
|
|
Albertsons Companies, Inc. 3.50% 3/15/20296 |
|
|
140 |
|
|
|
126 |
|
|
|
Alcoa Nederland Holding BV 4.125% 3/31/20296 |
|
|
75 |
|
|
|
70 |
|
|
|
Alfa Desarrollo SpA 4.55% 9/27/2051 |
|
|
476 |
|
|
|
358 |
|
|
|
Alliance Resource Operating Partners, LP 8.625% 6/15/20296 |
|
|
50 |
|
|
|
51 |
|
|
|
Alliant Holdings Intermediate, LLC 6.75% 10/15/20276 |
|
|
290 |
|
|
|
286 |
|
|
|
Alliant Holdings Intermediate, LLC 5.875% 11/1/20296 |
|
|
120 |
|
|
|
112 |
|
|
|
Alliant Holdings Intermediate, LLC 7.00% 1/15/20316 |
|
|
70 |
|
|
|
71 |
|
|
|
Allied Universal Holdco, LLC 9.75% 7/15/20276 |
|
|
155 |
|
|
|
154 |
|
|
|
Allied Universal Holdco, LLC 6.00% 6/1/20296 |
|
|
300 |
|
|
|
263 |
|
|
|
Allwyn Entertainment Financing (UK) PLC 7.875% 4/30/20296 |
|
|
200 |
|
|
|
207 |
|
|
|
Amazon.com, Inc. 1.50% 6/3/2030 |
|
|
2,040 |
|
|
|
1,700 |
|
|
|
Amer Sports Co. 6.75% 2/16/20316 |
|
|
35 |
|
|
|
35 |
|
|
|
American Credit Acceptance Receivables Trust, Series 2022-3, Class C,
4.86% 10/13/20285,6 |
|
|
141 |
|
|
|
141 |
|
|
|
American Electric Power Co., Inc. 1.00% 11/1/2025 |
|
|
250 |
|
|
|
235 |
|
|
|
American Express Co. 5.532% 4/25/2030 (USD-SOFR + 1.09% on 4/25/2029)1 |
|
|
1,030 |
|
|
|
1,042 |
|
|
|
Amgen, Inc. 2.20% 2/21/2027 |
|
|
445 |
|
|
|
413 |
|
|
|
Amgen, Inc. 5.25% 3/2/2030 |
|
|
981 |
|
|
|
989 |
|
|
|
Amgen, Inc. 5.25% 3/2/2033 |
|
|
2,687 |
|
|
|
2,681 |
|
|
|
Amgen, Inc. 5.65% 3/2/2053 |
|
|
1,284 |
|
|
|
1,265 |
|
|
|
AmWINS Group, Inc. 6.375% 2/15/20296 |
|
|
75 |
|
|
|
75 |
|
|
|
AmWINS Group, Inc. 4.875% 6/30/20296 |
|
|
135 |
|
|
|
126 |
|
|
|
Angola (Republic of) 9.50% 11/12/2025 |
|
|
4,225 |
|
|
|
4,296 |
|
|
|
Angola (Republic of) 8.25% 5/9/2028 |
|
|
1,115 |
|
|
|
1,050 |
|
|
|
Anywhere Real Estate Group, LLC 5.75% 1/15/20296 |
|
|
110 |
|
|
|
68 |
|
|
|
Anywhere Real Estate Group, LLC 5.25% 4/15/20306 |
|
|
115 |
|
|
|
69 |
|
|
|
AP Core Holdings II, LLC, Term Loan B,
(3-month USD CME Term SOFR + 5.50%) 10.958% 9/1/20277,8 |
|
|
95 |
|
|
|
83 |
|
|
|
Apple Bidco, LLC, Term Loan,
(3-month USD CME Term SOFR + 2.75%) 8.208% 9/22/20287,8 |
|
|
146 |
|
|
|
146 |
|
|
|
Aretec Group, Inc. 7.50% 4/1/20296 |
|
|
245 |
|
|
|
236 |
|
American Funds Insurance Series 176
Capital World Bond Fund (continued)
|
|
|
|
|
|
|
|
|
|
|
| Bonds, notes & other debt instruments (continued) |
|
Principal amount
(000) |
|
|
Value
(000) |
|
|
|
|
|
| U.S. dollars (continued) |
|
Aretec Group, Inc. 10.00% 8/15/20306 |
|
|
USD50 |
|
|
$ |
54 |
|
|
|
Argentine Republic 0.75% 7/9/2030 (1.75% on 7/9/2027)1 |
|
|
1,991 |
|
|
|
1,126 |
|
|
|
Argentine Republic 3.625% 7/9/2035 (4.125% on 7/9/2024)1 |
|
|
3,025 |
|
|
|
1,274 |
|
|
|
Aris Mining Corp. 6.875% 8/9/2026 |
|
|
600 |
|
|
|
565 |
|
|
|
Artera Services, LLC 8.50% 2/15/20316 |
|
|
45 |
|
|
|
46 |
|
|
|
Asbury Automotive Group, Inc. 5.00% 2/15/20326 |
|
|
55 |
|
|
|
50 |
|
|
|
Ascent Resources Utica Holdings, LLC 8.25% 12/31/20286 |
|
|
160 |
|
|
|
164 |
|
|
|
Ascent Resources Utica Holdings, LLC 5.875% 6/30/20296 |
|
|
55 |
|
|
|
54 |
|
|
|
AssuredPartners, Inc. 5.625% 1/15/20296 |
|
|
365 |
|
|
|
342 |
|
|
|
AT&T, Inc. 3.50% 9/15/2053 |
|
|
2,070 |
|
|
|
1,406 |
|
|
|
ATI, Inc. 7.25% 8/15/2030 |
|
|
60 |
|
|
|
62 |
|
|
|
Atkore, Inc. 4.25% 6/1/20316 |
|
|
25 |
|
|
|
22 |
|
|
|
Avis Budget Rental Car Funding (AESOP), LLC, Series 2023-2, Class A,
5.20% 10/20/20275,6 |
|
|
1,817 |
|
|
|
1,809 |
|
|
|
Avis Budget Rental Car Funding (AESOP), LLC, Series 2023-6, Class A,
5.81% 12/20/20295,6 |
|
|
996 |
|
|
|
1,011 |
|
|
|
B&G Foods, Inc. 5.25% 4/1/2025 |
|
|
23 |
|
|
|
23 |
|
|
|
B&G Foods, Inc. 5.25% 9/15/2027 |
|
|
210 |
|
|
|
195 |
|
|
|
B&G Foods, Inc. 8.00% 9/15/20286 |
|
|
25 |
|
|
|
25 |
|
|
|
Baldwin Insurance Group Holdings, LLC 7.125% 5/15/20316 |
|
|
20 |
|
|
|
20 |
|
|
|
Bank Commercial Mortgage Trust, Series 2023-5YR4, Class AS, 7.274% 12/15/20565,8 |
|
|
219 |
|
|
|
231 |
|
|
|
Bank of America Corp. 2.456% 10/22/2025
(3-month USD CME Term SOFR + 1.132% on 10/22/2024)1 |
|
|
847 |
|
|
|
838 |
|
|
|
Bank of America Corp. 1.53% 12/6/2025
(USD-SOFR + 0.65% on 12/6/2024)1 |
|
|
6,260 |
|
|
|
6,144 |
|
|
|
Bank of America Corp. 2.299% 7/21/2032 (USD-SOFR + 1.22% on 7/21/2031)1 |
|
|
4,040 |
|
|
|
3,309 |
|
|
|
Bank of America Corp. 5.468% 1/23/2035
(3-month USD CME Term SOFR + 1.65% on 1/23/2034)1 |
|
|
1,535 |
|
|
|
1,534 |
|
|
|
Bank of East Asia, Ltd. 5.825% junior subordinated perpetual bonds
(5-year UST Yield Curve Rate T Note Constant Maturity + 5.527% on 10/21/2025)1 |
|
|
640 |
|
|
|
627 |
|
|
|
BAT Capital Corp. 2.789% 9/6/2024 |
|
|
1,150 |
|
|
|
1,143 |
|
|
|
BAT Capital Corp. 3.215% 9/6/2026 |
|
|
955 |
|
|
|
912 |
|
|
|
BAT Capital Corp. 3.462% 9/6/2029 |
|
|
1,150 |
|
|
|
1,048 |
|
|
|
Bath & Body Works, Inc. 6.625% 10/1/20306 |
|
|
120 |
|
|
|
120 |
|
|
|
Bath & Body Works, Inc. 6.875% 11/1/2035 |
|
|
75 |
|
|
|
76 |
|
|
|
Bausch Health Americas, Inc. 9.25% 4/1/20266 |
|
|
80 |
|
|
|
73 |
|
|
|
Bausch Health Companies, Inc. 5.50% 11/1/20256 |
|
|
75 |
|
|
|
70 |
|
|
|
Bausch Health Companies, Inc. 5.25% 2/15/20316 |
|
|
114 |
|
|
|
53 |
|
|
|
Baytex Energy Corp. 7.375% 3/15/20326 |
|
|
85 |
|
|
|
86 |
|
|
|
BBVA Bancomer SA 8.45% 6/29/2038
(5-year UST Yield Curve Rate T Note Constant Maturity + 4.661% on 6/29/2033)1 |
|
|
2,520 |
|
|
|
2,599 |
|
|
|
Beasley Mezzanine Holdings, LLC 8.625% 2/1/20266 |
|
|
30 |
|
|
|
18 |
|
|
|
Becton, Dickinson and Co. 4.298% 8/22/2032 |
|
|
320 |
|
|
|
300 |
|
|
|
Berkshire Hathaway Energy Co. 4.60% 5/1/2053 |
|
|
117 |
|
|
|
97 |
|
|
|
Bidvest Group (UK) PLC 3.625% 9/23/2026 |
|
|
500 |
|
|
|
467 |
|
|
|
BIP-V Chinook Holdco, LLC 5.50% 6/15/20316 |
|
|
400 |
|
|
|
379 |
|
|
|
Block, Inc. 6.50% 5/15/20326 |
|
|
240 |
|
|
|
244 |
|
|
|
BMW US Capital, LLC 3.90% 4/9/20256 |
|
|
900 |
|
|
|
889 |
|
|
|
BMW US Capital, LLC 4.15% 4/9/20306 |
|
|
900 |
|
|
|
863 |
|
|
|
BNP Paribas SA 2.159% 9/15/2029 (USD-SOFR + 1.218% on 9/15/2028)1,6 |
|
|
700 |
|
|
|
611 |
|
|
|
BNP Paribas SA 2.871% 4/19/2032 (USD-SOFR + 1.387% on 4/19/2031)1,6 |
|
|
1,275 |
|
|
|
1,069 |
|
|
|
Boeing Co. 6.259% 5/1/20276 |
|
|
45 |
|
|
|
45 |
|
|
|
Boeing Co. 5.15% 5/1/2030 |
|
|
2,451 |
|
|
|
2,354 |
|
|
|
Boeing Co. 3.625% 2/1/2031 |
|
|
718 |
|
|
|
629 |
|
|
|
Boeing Co. 6.388% 5/1/20316 |
|
|
723 |
|
|
|
736 |
|
|
|
Boeing Co. 6.528% 5/1/20346 |
|
|
457 |
|
|
|
468 |
|
|
|
Boeing Co. 6.858% 5/1/20546 |
|
|
576 |
|
|
|
592 |
|
|
|
Bombardier, Inc. 7.125% 6/15/20266 |
|
|
16 |
|
|
|
16 |
|
|
|
Boost Newco Borrower, LLC 7.50% 1/15/20316 |
|
|
25 |
|
|
|
26 |
|
|
|
Borr IHC, Ltd. 10.00% 11/15/20286 |
|
|
2,909 |
|
|
|
3,049 |
|
|
|
Borr IHC, Ltd. 10.375% 11/15/20306 |
|
|
942 |
|
|
|
987 |
|
|
|
Boxer Parent Co., Inc. 9.125% 3/1/20266 |
|
|
160 |
|
|
|
161 |
|
177 American Funds Insurance Series
Capital World Bond Fund (continued)
|
|
|
|
|
|
|
|
|
|
|
| Bonds, notes & other debt instruments (continued) |
|
Principal amount
(000) |
|
|
Value
(000) |
|
|
|
|
|
| U.S. dollars (continued) |
|
Boyd Gaming Corp. 4.75% 6/15/20316 |
|
|
USD45 |
|
|
$ |
41 |
|
|
|
Boyne USA, Inc. 4.75% 5/15/20296 |
|
|
107 |
|
|
|
100 |
|
|
|
BPCE SA 5.15% 7/21/20246 |
|
|
1,800 |
|
|
|
1,798 |
|
|
|
Braskem Idesa SAPI 7.45% 11/15/2029 |
|
|
4,620 |
|
|
|
3,765 |
|
|
|
Braskem Netherlands Finance BV 4.50% 1/31/2030 |
|
|
1,756 |
|
|
|
1,486 |
|
|
|
Braskem Netherlands Finance BV 8.50% 1/12/2031 |
|
|
4,939 |
|
|
|
5,049 |
|
|
|
Braskem Netherlands Finance BV 8.50% 1/12/20316 |
|
|
525 |
|
|
|
537 |
|
|
|
Bristol-Myers Squibb Co. 5.20% 2/22/2034 |
|
|
1,925 |
|
|
|
1,922 |
|
|
|
Bristol-Myers Squibb Co. 5.55% 2/22/2054 |
|
|
2,200 |
|
|
|
2,171 |
|
|
|
British Columbia (Province of) 4.20% 7/6/2033 |
|
|
1,240 |
|
|
|
1,189 |
|
|
|
Broadcom, Inc. 4.00% 4/15/20296 |
|
|
250 |
|
|
|
238 |
|
|
|
Broadcom, Inc. 3.419% 4/15/20336 |
|
|
698 |
|
|
|
602 |
|
|
|
Broadcom, Inc. 3.469% 4/15/20346 |
|
|
48 |
|
|
|
41 |
|
|
|
Broadcom, Inc. 3.137% 11/15/20356 |
|
|
185 |
|
|
|
148 |
|
|
|
Brookfield Property REIT, Inc. 5.75% 5/15/20266 |
|
|
95 |
|
|
|
93 |
|
|
|
Brookfield Property REIT, Inc. 4.50% 4/1/20276 |
|
|
50 |
|
|
|
47 |
|
|
|
Buffalo Energy Mexico Holdings 7.875% 2/15/20396 |
|
|
1,341 |
|
|
|
1,395 |
|
|
|
Burlington Northern Santa Fe, LLC 5.50% 3/15/2055 |
|
|
232 |
|
|
|
233 |
|
|
|
BWX Technologies, Inc. 4.125% 4/15/20296 |
|
|
175 |
|
|
|
162 |
|
|
|
BX Trust, Series 2021-VOLT, Class A,
(1-month USD CME Term SOFR + 0.814%) 6.143% 9/15/20365,6,8 |
|
|
1,310 |
|
|
|
1,295 |
|
|
|
BX Trust, Series 2021-ARIA, Class A,
(1-month USD CME Term SOFR + 1.014%) 6.342% 10/15/20365,6,8 |
|
|
989 |
|
|
|
977 |
|
|
|
Caesars Entertainment, Inc. 4.625% 10/15/20296 |
|
|
15 |
|
|
|
14 |
|
|
|
Caesars Entertainment, Inc. 7.00% 2/15/20306 |
|
|
64 |
|
|
|
65 |
|
|
|
Caesars Entertainment, Inc. 6.50% 2/15/20326 |
|
|
45 |
|
|
|
45 |
|
|
|
CaixaBank, SA 6.208% 1/18/2029 (USD-SOFR + 2.70% on 1/18/2028)1,6 |
|
|
2,150 |
|
|
|
2,185 |
|
|
|
CaixaBank, SA 6.84% 9/13/2034 (USD-SOFR + 2.77% on 9/13/2033)1,6 |
|
|
200 |
|
|
|
211 |
|
|
|
CaixaBank, SA 6.037% 6/15/2035 (USD-SOFR + 2.26% on 9/15/2034)1,6 |
|
|
200 |
|
|
|
201 |
|
|
|
California Resources Corp. 7.125% 2/1/20266 |
|
|
100 |
|
|
|
100 |
|
|
|
Canadian Pacific Railway Co. 3.10% 12/2/2051 |
|
|
1,378 |
|
|
|
916 |
|
|
|
CAN-PACK Spolka Akcyjna 3.875% 11/15/20296 |
|
|
90 |
|
|
|
81 |
|
|
|
Carnival Corp. 6.00% 5/1/20296 |
|
|
100 |
|
|
|
99 |
|
|
|
Catalent Pharma Solutions, Inc. 5.00% 7/15/20276 |
|
|
70 |
|
|
|
69 |
|
|
|
CCO Holdings, LLC 5.125% 5/1/20276 |
|
|
125 |
|
|
|
120 |
|
|
|
CCO Holdings, LLC 4.75% 3/1/20306 |
|
|
135 |
|
|
|
117 |
|
|
|
CCO Holdings, LLC 4.50% 8/15/20306 |
|
|
240 |
|
|
|
203 |
|
|
|
CCO Holdings, LLC 4.25% 2/1/20316 |
|
|
155 |
|
|
|
127 |
|
|
|
CCO Holdings, LLC 4.50% 6/1/20336 |
|
|
147 |
|
|
|
116 |
|
|
|
CCO Holdings, LLC 4.25% 1/15/20346 |
|
|
55 |
|
|
|
42 |
|
|
|
Centene Corp. 2.45% 7/15/2028 |
|
|
40 |
|
|
|
36 |
|
|
|
Centene Corp. 4.625% 12/15/2029 |
|
|
35 |
|
|
|
33 |
|
|
|
Centene Corp. 2.50% 3/1/2031 |
|
|
65 |
|
|
|
53 |
|
|
|
Central Garden & Pet Co. 4.125% 10/15/2030 |
|
|
74 |
|
|
|
66 |
|
|
|
Central Garden & Pet Co. 4.125% 4/30/20316 |
|
|
110 |
|
|
|
97 |
|
|
|
CFG Investments, Ltd., Series 2023-1, Class A, 8.56% 7/25/20345,6 |
|
|
925 |
|
|
|
929 |
|
|
|
Charter Communications Operating, LLC 3.75% 2/15/2028 |
|
|
2,650 |
|
|
|
2,464 |
|
|
|
Charter Communications Operating, LLC 5.25% 4/1/2053 |
|
|
1,900 |
|
|
|
1,492 |
|
|
|
Cheniere Energy Partners, LP 3.25% 1/31/2032 |
|
|
26 |
|
|
|
22 |
|
|
|
Chesapeake Energy Corp. 5.875% 2/1/20296 |
|
|
115 |
|
|
|
114 |
|
|
|
Chesapeake Energy Corp. 6.75% 4/15/20296 |
|
|
30 |
|
|
|
30 |
|
|
|
Chesapeake Energy Corp. 4.875% 4/15/20323 |
|
|
915 |
|
|
|
19 |
|
|
|
China Oil and Gas Group, Ltd. 4.70% 6/30/2026 |
|
|
5,585 |
|
|
|
5,138 |
|
|
|
Chubb INA Holdings, LLC 3.35% 5/3/2026 |
|
|
195 |
|
|
|
189 |
|
|
|
Chubb INA Holdings, LLC 4.35% 11/3/2045 |
|
|
425 |
|
|
|
367 |
|
|
|
Citigroup Commercial Mortgage Trust, Series 2023-PRM3, Class A,
6.572% 7/10/20285,6,8 |
|
|
805 |
|
|
|
819 |
|
|
|
Citigroup Commercial Mortgage Trust, Series 2023-SMRT, Class A,
6.015% 10/12/20405,6,8 |
|
|
1,240 |
|
|
|
1,243 |
|
|
|
Citigroup, Inc. 5.827% 2/13/2035 (USD-SOFR + 2.056% on 2/13/2034)1 |
|
|
2,250 |
|
|
|
2,228 |
|
|
|
Citizens Financial Group, Inc. 5.841% 1/23/2030
(USD-SOFR + 2.01% on 1/23/2029)1 |
|
|
1,380 |
|
|
|
1,376 |
|
American Funds Insurance Series 178
Capital World Bond Fund (continued)
|
|
|
|
|
|
|
|
|
|
|
| Bonds, notes & other debt instruments (continued) |
|
Principal amount
(000) |
|
|
Value
(000) |
|
|
|
|
|
| U.S. dollars (continued) |
|
Civitas Resources, Inc. 8.75% 7/1/20316 |
|
|
USD90 |
|
|
$ |
97 |
|
|
|
Clarios Global, LP 6.25% 5/15/20266 |
|
|
44 |
|
|
|
44 |
|
|
|
Clarios Global, LP 8.50% 5/15/20276 |
|
|
90 |
|
|
|
91 |
|
|
|
Clarivate Science Holdings Corp. 3.875% 7/1/20286 |
|
|
45 |
|
|
|
42 |
|
|
|
Clarivate Science Holdings Corp. 4.875% 7/1/20296 |
|
|
5 |
|
|
|
5 |
|
|
|
Cleveland-Cliffs, Inc. 4.875% 3/1/20316 |
|
|
100 |
|
|
|
89 |
|
|
|
Cloud Software Group, Inc. 6.50% 3/31/20296 |
|
|
235 |
|
|
|
226 |
|
|
|
Cloud Software Group, Inc. 9.00% 9/30/20296 |
|
|
175 |
|
|
|
170 |
|
|
|
Cloud Software Group, Inc., Term Loan,
(3-month USD CME Term SOFR + 4.00%) 9.335% 3/30/20297,8 |
|
|
342 |
|
|
|
342 |
|
|
|
CMS Energy Corp. 3.00% 5/15/2026 |
|
|
1,200 |
|
|
|
1,148 |
|
|
|
CNX Resources Corp. 7.25% 3/1/20326 |
|
|
110 |
|
|
|
112 |
|
|
|
Coinbase Global, Inc. 3.375% 10/1/20286 |
|
|
55 |
|
|
|
47 |
|
|
|
Coinbase Global, Inc. 3.625% 10/1/20316 |
|
|
85 |
|
|
|
68 |
|
|
|
Colombia (Republic of) 3.875% 4/25/2027 |
|
|
350 |
|
|
|
330 |
|
|
|
Colombia (Republic of) 8.00% 11/14/2035 |
|
|
445 |
|
|
|
459 |
|
|
|
Comcast Corp. 4.80% 5/15/2033 |
|
|
4,100 |
|
|
|
3,993 |
|
|
|
CommScope Technologies, LLC 6.00% 6/15/20256 |
|
|
160 |
|
|
|
131 |
|
|
|
CommScope, Inc. 6.00% 3/1/20266 |
|
|
53 |
|
|
|
47 |
|
|
|
CommScope, Inc., Term Loan B,
(3-month USD CME Term SOFR + 3.25%) 8.708% 4/6/20267,8 |
|
|
25 |
|
|
|
22 |
|
|
|
Compass Group Diversified Holdings, LLC 5.25% 4/15/20296 |
|
|
212 |
|
|
|
201 |
|
|
|
Compass Group Diversified Holdings, LLC 5.00% 1/15/20326 |
|
|
65 |
|
|
|
59 |
|
|
|
Comstock Resources, Inc. 6.75% 3/1/20296 |
|
|
95 |
|
|
|
92 |
|
|
|
Comstock Resources, Inc. 5.875% 1/15/20306 |
|
|
65 |
|
|
|
61 |
|
|
|
Connecticut Avenue Securities Trust, Series 2023-R04, Class 1M1,
(30-day Average USD-SOFR + 2.30%) 7.635% 5/25/20435,6,8 |
|
|
1,514 |
|
|
|
1,557 |
|
|
|
Connecticut Avenue Securities Trust, Series 2023-R04, Class 1M2,
(30-day Average USD-SOFR + 3.55%) 8.885% 5/25/20435,6,8 |
|
|
804 |
|
|
|
866 |
|
|
|
Connecticut Avenue Securities Trust, Series 2023-R05, Class 1M1,
(30-day Average USD-SOFR + 1.90%) 7.235% 6/25/20435,6,8 |
|
|
920 |
|
|
|
932 |
|
|
|
Connecticut Avenue Securities Trust, Series 2023-R05, Class 1M2,
(30-day Average USD-SOFR + 3.10%) 8.435% 6/25/20435,6,8 |
|
|
305 |
|
|
|
323 |
|
|
|
Connecticut Avenue Securities Trust, Series 2023-R06, Class 1M1,
(30-day Average USD-SOFR + 1.70%) 7.035% 7/25/20435,6,8 |
|
|
686 |
|
|
|
693 |
|
|
|
Connecticut Avenue Securities Trust, Series 2024-R01, Class 1M2,
(30-day Average USD-SOFR + 1.80%) 7.135% 1/25/20445,6,8 |
|
|
206 |
|
|
|
209 |
|
|
|
Connecticut Avenue Securities Trust, Series 2024-R04, Class 1M2,
(30-day Average USD-SOFR + 1.65%) 6.985% 5/25/20445,6,8 |
|
|
1,148 |
|
|
|
1,154 |
|
|
|
Constellation Oil Services Holding SA 3.00% Cash 12/31/20269 |
|
|
1,127 |
|
|
|
927 |
|
|
|
Constellium SE 3.75% 4/15/20296 |
|
|
125 |
|
|
|
114 |
|
|
|
Consumers Energy Co. 3.60% 8/15/2032 |
|
|
1,600 |
|
|
|
1,439 |
|
|
|
COPT Defense Properties, LP 2.75% 4/15/2031 |
|
|
1,212 |
|
|
|
1,003 |
|
|
|
Corebridge Financial, Inc. 3.90% 4/5/2032 |
|
|
748 |
|
|
|
670 |
|
|
|
CoreLogic, Inc. 4.50% 5/1/20286 |
|
|
339 |
|
|
|
308 |
|
|
|
CoreLogic, Inc., Term Loan,
(3-month USD CME Term SOFR + 6.50%) 11.958% 6/4/20297,8 |
|
|
65 |
|
|
|
64 |
|
|
|
Coty, Inc. 5.00% 4/15/20266 |
|
|
95 |
|
|
|
94 |
|
|
|
Coty, Inc. 4.75% 1/15/20296 |
|
|
65 |
|
|
|
62 |
|
|
|
Coty, Inc. 6.625% 7/15/20306 |
|
|
95 |
|
|
|
96 |
|
|
|
Cougar JV Subsidiary, LLC 8.00% 5/15/20326 |
|
|
65 |
|
|
|
67 |
|
|
|
CPS Auto Receivables Trust, Series 2022-C, Class B, 4.88% 4/15/20305,6 |
|
|
278 |
|
|
|
278 |
|
|
|
Crédit Agricole SA 4.375% 3/17/20256 |
|
|
1,100 |
|
|
|
1,087 |
|
|
|
Crédit Agricole SA 1.907% 6/16/2026 (USD-SOFR + 1.676% on 6/16/2025)1,6 |
|
|
2,675 |
|
|
|
2,575 |
|
|
|
Crescent Energy Finance, LLC 9.25% 2/15/20286 |
|
|
178 |
|
|
|
188 |
|
|
|
Crescent Energy Finance, LLC 7.625% 4/1/20326 |
|
|
110 |
|
|
|
112 |
|
|
|
Crown Castle, Inc. 2.50% 7/15/2031 |
|
|
767 |
|
|
|
634 |
|
|
|
CSX Corp. 3.80% 4/15/2050 |
|
|
75 |
|
|
|
57 |
|
|
|
CVR Partners, LP 6.125% 6/15/20286 |
|
|
65 |
|
|
|
63 |
|
|
|
Daimler Trucks Finance North America, LLC 3.65% 4/7/20276 |
|
|
725 |
|
|
|
694 |
|
|
|
Darling Ingredients, Inc. 6.00% 6/15/20306 |
|
|
10 |
|
|
|
10 |
|
|
|
Deluxe Corp. 8.00% 6/1/20296 |
|
|
20 |
|
|
|
19 |
|
179 American Funds Insurance Series
Capital World Bond Fund (continued)
|
|
|
|
|
|
|
|
|
|
|
| Bonds, notes & other debt instruments (continued) |
|
Principal amount
(000) |
|
|
Value
(000) |
|
|
|
|
|
| U.S. dollars (continued) |
|
Deutsche Bank AG 2.129% 11/24/2026 (USD-SOFR + 1.87% on 11/24/2025)1 |
|
|
USD850 |
|
|
$ |
807 |
|
|
|
Deutsche Bank AG 2.311% 11/16/2027 (USD-SOFR + 1.219% on 11/16/2026)1 |
|
|
1,160 |
|
|
|
1,071 |
|
|
|
Deutsche Telekom International Finance BV 9.25% 6/1/2032 |
|
|
930 |
|
|
|
1,155 |
|
|
|
Diamond Sports Group, LLC 6.625% 8/15/20273,6 |
|
|
310 |
|
|
|
6 |
|
|
|
Diamond Sports Group, LLC, Term Loan, 5.00% 12/2/20247,9 |
|
|
17 |
|
|
|
25 |
|
|
|
Diebold Nixdorf, Inc., Term Loan,
(3-month USD CME Term SOFR + 7.50%) 12.826% 8/11/20286,7,8 |
|
|
349 |
|
|
|
362 |
|
|
|
DIRECTV Financing, LLC 5.875% 8/15/20276 |
|
|
50 |
|
|
|
47 |
|
|
|
DIRECTV Financing, LLC, Term Loan,
(3-month USD CME Term SOFR + 5.00%) 10.458% 8/2/20277,8 |
|
|
41 |
|
|
|
41 |
|
|
|
DISH DBS Corp. 5.25% 12/1/20266 |
|
|
15 |
|
|
|
12 |
|
|
|
DISH Network Corp. 11.75% 11/15/20276 |
|
|
260 |
|
|
|
255 |
|
|
|
Dominican Republic 5.50% 1/27/20256 |
|
|
1,375 |
|
|
|
1,375 |
|
|
|
Dun & Bradstreet Corp. (The) 5.00% 12/15/20296 |
|
|
47 |
|
|
|
44 |
|
|
|
Ecopetrol SA 8.625% 1/19/2029 |
|
|
2,460 |
|
|
|
2,591 |
|
|
|
Ecopetrol SA 6.875% 4/29/2030 |
|
|
1,445 |
|
|
|
1,389 |
|
|
|
Ecopetrol SA 8.875% 1/13/2033 |
|
|
1,581 |
|
|
|
1,634 |
|
|
|
Ecopetrol SA 8.375% 1/19/2036 |
|
|
1,039 |
|
|
|
1,021 |
|
|
|
Edison International 4.125% 3/15/2028 |
|
|
2,390 |
|
|
|
2,284 |
|
|
|
Edison International 5.25% 11/15/2028 |
|
|
1,522 |
|
|
|
1,509 |
|
|
|
Edison International 5.00% junior subordinated perpetual bonds
(5-year UST Yield Curve Rate T Note Constant Maturity + 3.901% on 3/15/2027)1 |
|
|
100 |
|
|
|
95 |
|
|
|
Egypt (Arab Republic of) 6.588% 2/21/2028 |
|
|
1,550 |
|
|
|
1,404 |
|
|
|
Electricité de France SA 5.65% 4/22/20296 |
|
|
800 |
|
|
|
807 |
|
|
|
Electricité de France SA 9.125% junior subordinated perpetual bonds
(5-year UST Yield Curve Rate T Note Constant Maturity + 5.411% on 6/15/2033)1,6 |
|
|
300 |
|
|
|
327 |
|
|
|
Element Solutions, Inc. 3.875% 9/1/20286 |
|
|
105 |
|
|
|
97 |
|
|
|
Encino Acquisition Partners Holdings, LLC 8.75% 5/1/20316 |
|
|
30 |
|
|
|
31 |
|
|
|
Endo Finance Holdings, Inc. 8.50% 4/15/20316 |
|
|
190 |
|
|
|
196 |
|
|
|
Endo International PLC, Term Loan B,
(3-month USD CME Term SOFR + 4.50%) 9.826% 4/23/20317,8 |
|
|
85 |
|
|
|
85 |
|
|
|
Enel Finance International NV 1.375% 7/12/20266 |
|
|
1,248 |
|
|
|
1,156 |
|
|
|
Enel Finance International NV 1.875% 7/12/20286 |
|
|
1,227 |
|
|
|
1,081 |
|
|
|
Enfragen Energia Sur SA 5.375% 12/30/2030 |
|
|
3,329 |
|
|
|
2,781 |
|
|
|
Entergy Corp. 0.90% 9/15/2025 |
|
|
750 |
|
|
|
710 |
|
|
|
Entergy Louisiana, LLC 4.75% 9/15/2052 |
|
|
1,275 |
|
|
|
1,102 |
|
|
|
Enviri Corp. 5.75% 7/31/20276 |
|
|
145 |
|
|
|
138 |
|
|
|
EQM Midstream Partners, LP 6.50% 7/1/20276 |
|
|
125 |
|
|
|
126 |
|
|
|
EQM Midstream Partners, LP 6.375% 4/1/20296 |
|
|
20 |
|
|
|
20 |
|
|
|
EQM Midstream Partners, LP 7.50% 6/1/20306 |
|
|
45 |
|
|
|
48 |
|
|
|
EQM Midstream Partners, LP 6.50% 7/15/2048 |
|
|
40 |
|
|
|
40 |
|
|
|
Equinix, Inc. 1.80% 7/15/2027 |
|
|
1,145 |
|
|
|
1,035 |
|
|
|
Equinix, Inc. 2.15% 7/15/2030 |
|
|
3,216 |
|
|
|
2,698 |
|
|
|
EquipmentShare.com, Inc. 9.00% 5/15/20286 |
|
|
90 |
|
|
|
93 |
|
|
|
EquipmentShare.com, Inc. 8.625% 5/15/20326 |
|
|
15 |
|
|
|
16 |
|
|
|
ESAB Corp. 6.25% 4/15/20296 |
|
|
75 |
|
|
|
76 |
|
|
|
Eskom Holdings SOC, Ltd. 7.125% 2/11/2025 |
|
|
5,330 |
|
|
|
5,314 |
|
|
|
Exeter Automobile Receivables Trust, Series 2023-5, Class B, 6.58% 4/17/20285 |
|
|
78 |
|
|
|
79 |
|
|
|
Export-Import Bank of Thailand 5.354% 5/16/2029 |
|
|
1,420 |
|
|
|
1,427 |
|
|
|
Fair Isaac Corp. 4.00% 6/15/20286 |
|
|
15 |
|
|
|
14 |
|
|
|
Fannie Mae Pool #CB0046 3.00% 4/1/20515 |
|
|
1,735 |
|
|
|
1,485 |
|
|
|
Fannie Mae Pool #MA4577 2.00% 4/1/20525 |
|
|
1,497 |
|
|
|
1,174 |
|
|
|
Fannie Mae Pool #CB4852 4.50% 10/1/20525 |
|
|
4,281 |
|
|
|
4,043 |
|
|
|
Fannie Mae Pool #MA4919 5.50% 2/1/20535 |
|
|
105 |
|
|
|
104 |
|
|
|
Fannie Mae Pool #FS4191 5.50% 3/1/20535 |
|
|
225 |
|
|
|
222 |
|
|
|
Fannie Mae Pool #BY0943 4.00% 4/1/20535 |
|
|
29 |
|
|
|
26 |
|
|
|
Fannie Mae Pool #MA5027 4.00% 5/1/20535 |
|
|
997 |
|
|
|
913 |
|
|
|
Fannie Mae Pool #MA5010 5.50% 5/1/20535 |
|
|
18 |
|
|
|
18 |
|
|
|
Fannie Mae Pool #MA5039 5.50% 6/1/20535 |
|
|
64 |
|
|
|
64 |
|
|
|
Fannie Mae Pool #CB6626 4.00% 7/1/20535 |
|
|
29 |
|
|
|
26 |
|
American Funds Insurance Series 180
Capital World Bond Fund (continued)
|
|
|
|
|
|
|
|
|
|
|
| Bonds, notes & other debt instruments (continued) |
|
Principal amount
(000) |
|
|
Value
(000) |
|
|
|
|
|
| U.S. dollars (continued) |
|
Fannie Mae Pool #MA5072 5.50% 7/1/20535 |
|
|
USD241 |
|
|
$ |
238 |
|
|
|
Fannie Mae Pool #BX4568 4.00% 8/1/20535 |
|
|
534 |
|
|
|
489 |
|
|
|
Fannie Mae Pool #MA5177 4.00% 10/1/20535 |
|
|
964 |
|
|
|
882 |
|
|
|
Fannie Mae Pool #MA5165 5.50% 10/1/20535 |
|
|
938 |
|
|
|
926 |
|
|
|
Fannie Mae Pool #MA5166 6.00% 10/1/20535 |
|
|
2,208 |
|
|
|
2,215 |
|
|
|
Fannie Mae Pool #MA5207 4.00% 11/1/20535 |
|
|
36 |
|
|
|
33 |
|
|
|
Fannie Mae Pool #MA5191 6.00% 11/1/20535 |
|
|
2,604 |
|
|
|
2,613 |
|
|
|
Fannie Mae Pool #MA5274 7.00% 2/1/20545 |
|
|
9,172 |
|
|
|
9,437 |
|
|
|
Fannie Mae Pool #FS8131 5.50% 6/1/20545 |
|
|
1,777 |
|
|
|
1,759 |
|
|
|
Fannie Mae Pool #FS8153 6.00% 6/1/20545 |
|
|
1,720 |
|
|
|
1,736 |
|
|
|
Fannie Mae Pool #CB8755 6.00% 6/1/20545 |
|
|
705 |
|
|
|
710 |
|
|
|
Fannie Mae Pool #BU4699 5.50% 7/1/20545 |
|
|
1,095 |
|
|
|
1,083 |
|
|
|
Fannie Mae Pool #BU4700 6.00% 7/1/20545 |
|
|
935 |
|
|
|
942 |
|
|
|
Fertitta Entertainment, LLC 6.75% 1/15/20306 |
|
|
25 |
|
|
|
22 |
|
|
|
Fiesta Purchaser, Inc. 7.875% 3/1/20316 |
|
|
150 |
|
|
|
155 |
|
|
|
Fiesta Purchaser, Inc., Term Loan B,
(3-month USD CME Term SOFR + 4.00%) 9.344% 2/12/20317,8 |
|
|
15 |
|
|
|
15 |
|
|
|
Finastra USA, Inc., Term Loan B,
(3-month USD CME Term SOFR + 7.25%) 12.459% 9/13/20292,7,8 |
|
|
96 |
|
|
|
97 |
|
|
|
Finastra USA, Inc., Term Loan,
(3-month USD CME Term SOFR + 7.25%) 12.581% 9/13/20292,7,8 |
|
|
1 |
|
|
|
1 |
|
|
|
First Quantum Minerals, Ltd. 6.875% 10/15/20276 |
|
|
1,880 |
|
|
|
1,839 |
|
|
|
First Quantum Minerals, Ltd. 8.625% 6/1/20316 |
|
|
325 |
|
|
|
325 |
|
|
|
First Student Bidco, Inc. 4.00% 7/31/20296 |
|
|
45 |
|
|
|
41 |
|
|
|
FirstEnergy Corp., Series B, 4.15% 7/15/2027 |
|
|
1,763 |
|
|
|
1,693 |
|
|
|
Ford Motor Co. 6.10% 8/19/2032 |
|
|
30 |
|
|
|
30 |
|
|
|
Ford Motor Credit Co., LLC 4.95% 5/28/2027 |
|
|
300 |
|
|
|
293 |
|
|
|
Ford Motor Credit Co., LLC 3.815% 11/2/2027 |
|
|
200 |
|
|
|
188 |
|
|
|
Ford Motor Credit Co., LLC 7.35% 11/4/2027 |
|
|
200 |
|
|
|
209 |
|
|
|
Ford Motor Credit Co., LLC 2.90% 2/16/2028 |
|
|
200 |
|
|
|
181 |
|
|
|
Ford Motor Credit Co., LLC 4.00% 11/13/2030 |
|
|
125 |
|
|
|
112 |
|
|
|
Ford Otomotiv Sanayi AS 7.125% 4/25/20296 |
|
|
255 |
|
|
|
258 |
|
|
|
Freddie Mac, Series K153, Class A2, Multi Family, 3.82% 1/25/20335 |
|
|
3,975 |
|
|
|
3,711 |
|
|
|
Freddie Mac Pool #RB5111 2.00% 5/1/20415 |
|
|
2,277 |
|
|
|
1,924 |
|
|
|
Freddie Mac Pool #QE6084 5.00% 7/1/20525 |
|
|
989 |
|
|
|
959 |
|
|
|
Freddie Mac Pool #SD8276 5.00% 12/1/20525 |
|
|
3,572 |
|
|
|
3,458 |
|
|
|
Freddie Mac Pool #SD8331 5.50% 6/1/20535 |
|
|
287 |
|
|
|
283 |
|
|
|
Freddie Mac Pool #SD8341 5.00% 7/1/20535 |
|
|
23 |
|
|
|
23 |
|
|
|
Freddie Mac Pool #SD8342 5.50% 7/1/20535 |
|
|
762 |
|
|
|
752 |
|
|
|
Freddie Mac Pool #RA9795 4.00% 9/1/20535 |
|
|
35 |
|
|
|
32 |
|
|
|
Freddie Mac Pool #SD8362 5.50% 9/1/20535 |
|
|
2,752 |
|
|
|
2,716 |
|
|
|
Freddie Mac Pool #SD8379 4.00% 10/1/20535 |
|
|
987 |
|
|
|
903 |
|
|
|
Freddie Mac Pool #SD4977 5.00% 11/1/20535 |
|
|
31,680 |
|
|
|
30,634 |
|
|
|
Freddie Mac Pool #SD8372 5.50% 11/1/20535 |
|
|
12,119 |
|
|
|
11,959 |
|
|
|
Freddie Mac Pool #QI1357 4.00% 3/1/20545 |
|
|
941 |
|
|
|
862 |
|
|
|
Freddie Mac Pool #SD8408 5.50% 3/1/20545 |
|
|
1,021 |
|
|
|
1,008 |
|
|
|
Freddie Mac Pool #SD8420 5.50% 4/1/20545 |
|
|
1,159 |
|
|
|
1,144 |
|
|
|
Freddie Mac Pool #SD8435 4.00% 6/1/20545 |
|
|
747 |
|
|
|
684 |
|
|
|
Freddie Mac Pool #RJ1855 5.00% 6/1/20545 |
|
|
282 |
|
|
|
273 |
|
|
|
Freddie Mac Pool #RJ1857 5.50% 6/1/20545 |
|
|
15,420 |
|
|
|
15,256 |
|
|
|
Freddie Mac Pool #RJ1768 5.50% 6/1/20545 |
|
|
860 |
|
|
|
851 |
|
|
|
Freddie Mac Pool #RJ1785 6.00% 6/1/20545 |
|
|
3,620 |
|
|
|
3,643 |
|
|
|
Freddie Mac Pool #RJ1779 6.00% 6/1/20545 |
|
|
2,050 |
|
|
|
2,066 |
|
|
|
Freddie Mac Pool #RJ1859 6.00% 6/1/20545 |
|
|
1,080 |
|
|
|
1,088 |
|
|
|
Freddie Mac Pool #QI8872 5.50% 7/1/20545 |
|
|
532 |
|
|
|
526 |
|
|
|
Freddie Mac Pool #QI8874 6.00% 7/1/20545 |
|
|
373 |
|
|
|
376 |
|
|
|
Freddie Mac Structured Agency Credit Risk Debt Notes, Series 2022-DNA3,
Class M1B, (30-day Average USD-SOFR + 2.90%) 8.235% 4/25/20425,6,8 |
|
|
441 |
|
|
|
459 |
|
|
|
FXI Holdings, Inc. 12.25% 11/15/20266 |
|
|
497 |
|
|
|
494 |
|
|
|
Gartner, Inc. 3.75% 10/1/20306 |
|
|
70 |
|
|
|
63 |
|
|
|
GCAT Trust, Series 2024-NQM2, Class A1,
6.085% 6/25/2059 (7.359% on 5/1/2028)1,5,6 |
|
|
1,662 |
|
|
|
1,665 |
|
181 American Funds Insurance Series
Capital World Bond Fund (continued)
|
|
|
|
|
|
|
|
|
|
|
| Bonds, notes & other debt instruments (continued) |
|
Principal amount
(000) |
|
|
Value
(000) |
|
|
|
|
|
| U.S. dollars (continued) |
|
Genesis Energy, LP 8.00% 1/15/2027 |
|
|
USD125 |
|
|
$ |
128 |
|
|
|
Genesis Energy, LP 8.25% 1/15/2029 |
|
|
25 |
|
|
|
26 |
|
|
|
Genesis Energy, LP 8.875% 4/15/2030 |
|
|
38 |
|
|
|
40 |
|
|
|
Genesis Energy, LP 7.875% 5/15/2032 |
|
|
60 |
|
|
|
61 |
|
|
|
GeoPark, Ltd. 5.50% 1/17/2027 |
|
|
5,200 |
|
|
|
4,732 |
|
|
|
Georgia (Republic of) 2.75% 4/22/20266 |
|
|
400 |
|
|
|
368 |
|
|
|
Gilead Sciences, Inc. 5.25% 10/15/2033 |
|
|
1,342 |
|
|
|
1,352 |
|
|
|
Gilead Sciences, Inc. 5.55% 10/15/2053 |
|
|
1,155 |
|
|
|
1,154 |
|
|
|
Goldman Sachs Group, Inc. 1.542% 9/10/2027 (USD-SOFR + 0.818% on 9/10/2026)1 |
|
|
1,080 |
|
|
|
992 |
|
|
|
Goldman Sachs Group, Inc. 1.992% 1/27/2032 (USD-SOFR + 1.09% on 1/27/2031)1 |
|
|
769 |
|
|
|
624 |
|
|
|
Government National Mortgage Assn. Pool #785813 2.50% 12/20/20515 |
|
|
3,946 |
|
|
|
3,277 |
|
|
|
Government National Mortgage Assn. 6.50% 7/1/20545,10 |
|
|
10,325 |
|
|
|
10,474 |
|
|
|
Government National Mortgage Assn., Series 2021-2, Class AH, 1.50% 6/16/20635 |
|
|
770 |
|
|
|
574 |
|
|
|
Grand Parkway Transportation Corp., Grand Parkway System Toll Rev. Ref. Bonds, Series 2020-B, 3.236% 10/1/2052 |
|
|
965 |
|
|
|
706 |
|
|
|
Gray Television, Inc. 5.375% 11/15/20316 |
|
|
30 |
|
|
|
17 |
|
|
|
Greenko Dutch BV 3.85% 3/29/2026 |
|
|
2,812 |
|
|
|
2,656 |
|
|
|
Group 1 Automotive, Inc. 4.00% 8/15/20286 |
|
|
115 |
|
|
|
106 |
|
|
|
Grupo Energia Bogota SA ESP 4.875% 5/15/20306 |
|
|
660 |
|
|
|
629 |
|
|
|
Hanesbrands, Inc., Term Loan B,
(3-month USD CME Term SOFR + 3.75%) 9.094% 3/8/20307,8 |
|
|
38 |
|
|
|
39 |
|
|
|
Harvest Midstream I, LP 7.50% 9/1/20286 |
|
|
25 |
|
|
|
25 |
|
|
|
Harvest Midstream I, LP 7.50% 5/15/20326 |
|
|
25 |
|
|
|
25 |
|
|
|
HCA, Inc. 5.625% 9/1/2028 |
|
|
120 |
|
|
|
121 |
|
|
|
HealthEquity, Inc. 4.50% 10/1/20296 |
|
|
80 |
|
|
|
75 |
|
|
|
Helios Software Holdings, Inc. 8.75% 5/1/20296 |
|
|
200 |
|
|
|
204 |
|
|
|
Hess Midstream Operations, LP 5.50% 10/15/20306 |
|
|
14 |
|
|
|
14 |
|
|
|
Hightower Holding, LLC 6.75% 4/15/20296 |
|
|
235 |
|
|
|
220 |
|
|
|
Hilcorp Energy I, LP 6.00% 4/15/20306 |
|
|
105 |
|
|
|
102 |
|
|
|
Hilcorp Energy I, LP 6.00% 2/1/20316 |
|
|
25 |
|
|
|
24 |
|
|
|
Hilton Domestic Operating Co., Inc. 4.875% 1/15/2030 |
|
|
25 |
|
|
|
24 |
|
|
|
Hilton Domestic Operating Co., Inc. 4.00% 5/1/20316 |
|
|
115 |
|
|
|
103 |
|
|
|
Honduras (Republic of) 6.25% 1/19/2027 |
|
|
653 |
|
|
|
621 |
|
|
|
Howard Hughes Corp. (The) 5.375% 8/1/20286 |
|
|
275 |
|
|
|
262 |
|
|
|
Howard Hughes Corp. (The) 4.125% 2/1/20296 |
|
|
195 |
|
|
|
175 |
|
|
|
Howard Hughes Corp. (The) 4.375% 2/1/20316 |
|
|
120 |
|
|
|
103 |
|
|
|
Howden UK Refinance PLC 7.25% 2/15/20316 |
|
|
200 |
|
|
|
199 |
|
|
|
Howden UK Refinance 2 PLC 8.125% 2/15/20326 |
|
|
200 |
|
|
|
199 |
|
|
|
HSBC Holdings PLC 2.633% 11/7/2025 (USD-SOFR + 1.402% on 11/7/2024)1 |
|
|
305 |
|
|
|
301 |
|
|
|
HSBC Holdings PLC 4.292% 9/12/2026
(3-month USD CME Term SOFR + 1.609% on 9/12/2025)1 |
|
|
4,172 |
|
|
|
4,100 |
|
|
|
HSBC Holdings PLC 4.755% 6/9/2028 (USD-SOFR + 2.11% on 6/9/2027)1 |
|
|
1,700 |
|
|
|
1,672 |
|
|
|
HSBC Holdings PLC 7.399% 11/13/2034 (USD-SOFR + 3.02% on 11/13/2033)1 |
|
|
2,000 |
|
|
|
2,167 |
|
|
|
HSBC Holdings PLC 6.332% 3/9/2044 (USD-SOFR + 2.65% on 3/9/2043)1 |
|
|
1,200 |
|
|
|
1,256 |
|
|
|
HTL Commercial Mortgage Trust, Series 2024-T53, Class A, 6.072% 5/10/20395,6,8 |
|
|
396 |
|
|
|
396 |
|
|
|
HUB International, Ltd. 7.375% 1/31/20326 |
|
|
65 |
|
|
|
66 |
|
|
|
HUB International, Ltd., Term Loan B,
(3-month USD CME Term SOFR + 3.25%) 8.575% 6/20/20307,8 |
|
|
4 |
|
|
|
4 |
|
|
|
Hungary (Republic of) 5.50% 3/26/20366 |
|
|
290 |
|
|
|
279 |
|
|
|
Husky Injection Molding Systems, Ltd. 9.00% 2/15/20296 |
|
|
120 |
|
|
|
124 |
|
|
|
Husky Injection Molding Systems, Ltd., Term Loan B,
(3-month USD CME Term SOFR + 5.00%) 10.326% 2/15/20297,8 |
|
|
55 |
|
|
|
55 |
|
|
|
Hyundai Capital America 1.50% 6/15/20266 |
|
|
2,375 |
|
|
|
2,202 |
|
|
|
Hyundai Capital America 1.65% 9/17/20266 |
|
|
269 |
|
|
|
248 |
|
|
|
Hyundai Capital America 2.00% 6/15/20286 |
|
|
600 |
|
|
|
530 |
|
|
|
Hyundai Capital America 6.50% 1/16/20296 |
|
|
132 |
|
|
|
138 |
|
|
|
Icahn Enterprises, LP 9.75% 1/15/20296 |
|
|
65 |
|
|
|
67 |
|
|
|
Indonesia Asahan Aluminium (Persero) PT 5.45% 5/15/20306 |
|
|
500 |
|
|
|
491 |
|
|
|
Ingles Markets, Inc. 4.00% 6/15/20316 |
|
|
130 |
|
|
|
113 |
|
|
|
Intesa Sanpaolo SpA 7.00% 11/21/20256 |
|
|
225 |
|
|
|
229 |
|
|
|
IRB Infrastructure Developers, Ltd. 7.11% 3/11/20326 |
|
|
1,360 |
|
|
|
1,360 |
|
|
|
Iron Mountain Information Management Services, Inc. 5.00% 7/15/20326 |
|
|
55 |
|
|
|
50 |
|
American Funds Insurance Series 182
Capital World Bond Fund (continued)
|
|
|
|
|
|
|
|
|
|
|
| Bonds, notes & other debt instruments (continued) |
|
Principal amount
(000) |
|
|
Value
(000) |
|
|
|
|
|
| U.S. dollars (continued) |
|
Iron Mountain, Inc. 5.25% 7/15/20306 |
|
|
USD235 |
|
|
$ |
224 |
|
|
|
Israel (State of) 3.375% 1/15/2050 |
|
|
1,470 |
|
|
|
940 |
|
|
|
Israel (State of) 3.875% 7/3/2050 |
|
|
795 |
|
|
|
558 |
|
|
|
JPMorgan Chase & Co. 1.04% 2/4/2027 (USD-SOFR + 0.695% on 2/4/2026)1 |
|
|
1,243 |
|
|
|
1,158 |
|
|
|
JPMorgan Chase & Co. 1.953% 2/4/2032 (USD-SOFR + 1.065% on 2/4/2031)1 |
|
|
58 |
|
|
|
47 |
|
|
|
JPMorgan Chase & Co. 5.766% 4/22/2035 (USD-SOFR + 1.49% on 4/22/2034)1 |
|
|
575 |
|
|
|
590 |
|
|
|
Kantar Group, LLC, Term Loan B2,
(6-month USD CME Term SOFR + 4.50%) 10.108% 12/4/20267,8 |
|
|
46 |
|
|
|
46 |
|
|
|
KB Home 6.875% 6/15/2027 |
|
|
50 |
|
|
|
51 |
|
|
|
Kennedy-Wilson, Inc. 4.75% 3/1/2029 |
|
|
20 |
|
|
|
17 |
|
|
|
Kennedy-Wilson, Inc. 4.75% 2/1/2030 |
|
|
245 |
|
|
|
204 |
|
|
|
Kodiak Gas Services, LLC 7.25% 2/15/20296 |
|
|
10 |
|
|
|
10 |
|
|
|
Korea Electric Power Corp. 5.375% 7/31/20266 |
|
|
1,290 |
|
|
|
1,294 |
|
|
|
Korea Gas Corp. 5.00% 7/8/20296 |
|
|
225 |
|
|
|
225 |
|
|
|
Kronos Acquisition Holdings, Inc. 5.00% 12/31/20266 |
|
|
85 |
|
|
|
87 |
|
|
|
Kronos Acquisition Holdings, Inc. 7.00% 12/31/20276 |
|
|
125 |
|
|
|
129 |
|
|
|
LAD Auto Receivables Trust, Series 2023-1, Class A2, 5.68% 10/15/20265,6 |
|
|
81 |
|
|
|
81 |
|
|
|
LAD Auto Receivables Trust, Series 2023-1, Class A3, 5.48% 6/15/20275,6 |
|
|
651 |
|
|
|
650 |
|
|
|
LAD Auto Receivables Trust, Series 2023-4, Class B, 6.39% 10/16/20285,6 |
|
|
194 |
|
|
|
197 |
|
|
|
Lamar Media Corp. 3.75% 2/15/2028 |
|
|
10 |
|
|
|
9 |
|
|
|
Lamb Weston Holdings, Inc. 4.125% 1/31/20306 |
|
|
30 |
|
|
|
27 |
|
|
|
LCM Investments Holdings II, LLC 4.875% 5/1/20296 |
|
|
110 |
|
|
|
103 |
|
|
|
LCM Investments Holdings II, LLC 8.25% 8/1/20316 |
|
|
40 |
|
|
|
42 |
|
|
|
Levi Strauss & Co. 3.50% 3/1/20316 |
|
|
115 |
|
|
|
100 |
|
|
|
LGI Homes, Inc. 8.75% 12/15/20286 |
|
|
155 |
|
|
|
162 |
|
|
|
Light and Wonder International, Inc. 7.00% 5/15/20286 |
|
|
20 |
|
|
|
20 |
|
|
|
Lindblad Expeditions, LLC 6.75% 2/15/20276 |
|
|
5 |
|
|
|
5 |
|
|
|
Live Nation Entertainment, Inc. 4.75% 10/15/20276 |
|
|
130 |
|
|
|
125 |
|
|
|
Lloyds Banking Group PLC 1.627% 5/11/2027
(1-year UST Yield Curve Rate T Note Constant Maturity + 0.85% on 5/11/2026)1 |
|
|
7,000 |
|
|
|
6,505 |
|
|
|
Lockheed Martin Corp. 5.20% 2/15/2064 |
|
|
309 |
|
|
|
292 |
|
|
|
LSB Industries, Inc. 6.25% 10/15/20286 |
|
|
90 |
|
|
|
87 |
|
|
|
Marriott International, Inc. 2.75% 10/15/2033 |
|
|
5 |
|
|
|
4 |
|
|
|
Marriott Ownership Resorts, Inc. 4.50% 6/15/20296 |
|
|
45 |
|
|
|
41 |
|
|
|
Marsh & McLennan Companies, Inc. 5.70% 9/15/2053 |
|
|
282 |
|
|
|
285 |
|
|
|
Mastercard, Inc. 2.00% 11/18/2031 |
|
|
600 |
|
|
|
493 |
|
|
|
Matador Resources Co. 6.50% 4/15/20326 |
|
|
50 |
|
|
|
50 |
|
|
|
Medline Borrower, LP 5.25% 10/1/20296 |
|
|
40 |
|
|
|
38 |
|
|
|
Medline Borrower, LP, Term Loan B,
(3-month USD CME Term SOFR + 2.75%) 8.094% 10/23/20287,8 |
|
|
49 |
|
|
|
50 |
|
|
|
MEG Energy Corp. 5.875% 2/1/20296 |
|
|
30 |
|
|
|
29 |
|
|
|
Meituan 2.125% 10/28/2025 |
|
|
1,730 |
|
|
|
1,652 |
|
|
|
Melco Resorts Finance, Ltd. 7.625% 4/17/20326 |
|
|
650 |
|
|
|
646 |
|
|
|
Methanex Corp. 5.125% 10/15/2027 |
|
|
55 |
|
|
|
53 |
|
|
|
Methanex Corp. 5.25% 12/15/2029 |
|
|
5 |
|
|
|
5 |
|
|
|
MGM Resorts International 5.50% 4/15/2027 |
|
|
90 |
|
|
|
89 |
|
|
|
Midas OpCo Holdings, LLC 5.625% 8/15/20296 |
|
|
115 |
|
|
|
106 |
|
|
|
Mileage Plus Holdings, LLC 6.50% 6/20/20276 |
|
|
45 |
|
|
|
45 |
|
|
|
Mineral Resources, Ltd. 8.00% 11/1/20276 |
|
|
155 |
|
|
|
159 |
|
|
|
Mineral Resources, Ltd. 9.25% 10/1/20286 |
|
|
85 |
|
|
|
89 |
|
|
|
Minerva Luxembourg SA 8.875% 9/13/2033 |
|
|
1,940 |
|
|
|
2,005 |
|
|
|
Mission Lane Credit Card Master Trust, Series 2023-A, Class A, 7.23% 7/17/20285,6 |
|
|
761 |
|
|
|
765 |
|
|
|
Mission Lane Credit Card Master Trust, Series 2023-A, Class B, 8.15% 7/17/20285,6 |
|
|
225 |
|
|
|
227 |
|
|
|
Mission Lane Credit Card Master Trust, Series 2024-A, Class A1, 6.20% 8/15/20295,6 |
|
|
1,094 |
|
|
|
1,094 |
|
|
|
Mission Lane Credit Card Master Trust, Series 2024-A, Class B, 6.59% 8/15/20295,6 |
|
|
539 |
|
|
|
539 |
|
|
|
Molina Healthcare, Inc. 4.375% 6/15/20286 |
|
|
80 |
|
|
|
75 |
|
|
|
Molina Healthcare, Inc. 3.875% 11/15/20306 |
|
|
75 |
|
|
|
67 |
|
|
|
Morgan Stanley 1.593% 5/4/2027 (USD-SOFR + 0.879% on 5/4/2026)1 |
|
|
2,164 |
|
|
|
2,018 |
|
|
|
Morgan Stanley 1.794% 2/13/2032 (USD-SOFR + 1.034% on 2/13/2031)1 |
|
|
1,433 |
|
|
|
1,151 |
|
|
|
Mozambique (Republic of) 9.00% 9/15/2031 |
|
|
940 |
|
|
|
780 |
|
|
|
MSCI, Inc. 3.625% 11/1/20316 |
|
|
210 |
|
|
|
184 |
|
|
|
MSWF Commercial Mortgage Trust, Series 2023-2, Class A5, 6.014% 12/15/20565,8 |
|
|
336 |
|
|
|
354 |
|
183 American Funds Insurance Series
Capital World Bond Fund (continued)
|
|
|
|
|
|
|
|
|
|
|
| Bonds, notes & other debt instruments (continued) |
|
Principal amount
(000) |
|
|
Value
(000) |
|
|
|
|
|
| U.S. dollars (continued) |
|
Murphy Oil USA, Inc. 4.75% 9/15/2029 |
|
|
USD48 |
|
|
$ |
46 |
|
|
|
MV24 Capital BV 6.748% 6/1/2034 |
|
|
1,104 |
|
|
|
1,055 |
|
|
|
Nabors Industries, Inc. 7.375% 5/15/20276 |
|
|
55 |
|
|
|
56 |
|
|
|
Nabors Industries, Inc. 9.125% 1/31/20306 |
|
|
160 |
|
|
|
166 |
|
|
|
National Australia Bank, Ltd. 5.181% 6/11/20346 |
|
|
1,250 |
|
|
|
1,244 |
|
|
|
Nationstar Mortgage Holdings, Inc. 5.125% 12/15/20306 |
|
|
135 |
|
|
|
124 |
|
|
|
Navient Corp. 5.00% 3/15/2027 |
|
|
45 |
|
|
|
43 |
|
|
|
Navient Corp. 4.875% 3/15/2028 |
|
|
145 |
|
|
|
133 |
|
|
|
NCR Atleos, LLC, Term Loan B,
(3-month USD CME Term SOFR + 4.75%) 10.18% 4/16/20297,8 |
|
|
50 |
|
|
|
50 |
|
|
|
NCR Voyix Corp. 5.25% 10/1/20306 |
|
|
15 |
|
|
|
14 |
|
|
|
Neiman Marcus Group, Ltd., LLC 7.125% 4/1/20266 |
|
|
85 |
|
|
|
84 |
|
|
|
New Fortress Energy, Inc. 6.75% 9/15/20256 |
|
|
26 |
|
|
|
25 |
|
|
|
New Fortress Energy, Inc. 6.50% 9/30/20266 |
|
|
255 |
|
|
|
235 |
|
|
|
New Fortress Energy, Inc. 8.75% 3/15/20296 |
|
|
90 |
|
|
|
82 |
|
|
|
New York Life Global Funding 1.20% 8/7/20306 |
|
|
2,725 |
|
|
|
2,185 |
|
|
|
New York Life Global Funding 5.00% 1/9/20346 |
|
|
1,500 |
|
|
|
1,475 |
|
|
|
New York Mortgage Trust, Series 2024-CP1, Class A1, 3.75% 2/25/20685,6,8 |
|
|
606 |
|
|
|
559 |
|
|
|
Newell Brands, Inc. 5.70% 4/1/2026 |
|
|
80 |
|
|
|
79 |
|
|
|
Nexstar Media, Inc. 4.75% 11/1/20286 |
|
|
165 |
|
|
|
147 |
|
|
|
NGL Energy Operating, LLC 8.125% 2/15/20296 |
|
|
55 |
|
|
|
56 |
|
|
|
NGL Energy Operating, LLC 8.375% 2/15/20326 |
|
|
70 |
|
|
|
71 |
|
|
|
Niagara Mohawk Power Corp. 3.508% 10/1/20246 |
|
|
180 |
|
|
|
179 |
|
|
|
Norfolk Southern Corp. 5.35% 8/1/2054 |
|
|
496 |
|
|
|
473 |
|
|
|
Northern Oil and Gas, Inc. 8.125% 3/1/20286 |
|
|
150 |
|
|
|
152 |
|
|
|
NorthRiver Midstream Finance, LP 5.625% 2/15/20266 |
|
|
105 |
|
|
|
105 |
|
|
|
NOVA Chemicals Corp. 5.25% 6/1/20276 |
|
|
20 |
|
|
|
19 |
|
|
|
NOVA Chemicals Corp. 9.00% 2/15/20306 |
|
|
90 |
|
|
|
95 |
|
|
|
Novelis Corp. 4.75% 1/30/20306 |
|
|
80 |
|
|
|
74 |
|
|
|
Novelis Corp. 3.875% 8/15/20316 |
|
|
20 |
|
|
|
17 |
|
|
|
NuStar Logistics, LP 5.625% 4/28/2027 |
|
|
80 |
|
|
|
79 |
|
|
|
Occidental Petroleum Corp. 6.375% 9/1/2028 |
|
|
54 |
|
|
|
56 |
|
|
|
OCP SA 3.75% 6/23/2031 |
|
|
500 |
|
|
|
432 |
|
|
|
Oleoducto Central SA 4.00% 7/14/2027 |
|
|
879 |
|
|
|
815 |
|
|
|
OnDeck Asset Securitization Trust, LLC, Series 2024-1, Class A, 6.27% 6/17/20315,6 |
|
|
269 |
|
|
|
271 |
|
|
|
OnDeck Asset Securitization Trust, LLC, Series 2024-1, Class B, 7.15% 6/17/20315,6 |
|
|
120 |
|
|
|
121 |
|
|
|
ONEOK, Inc. 5.80% 11/1/2030 |
|
|
69 |
|
|
|
71 |
|
|
|
ONEOK, Inc. 6.05% 9/1/2033 |
|
|
514 |
|
|
|
529 |
|
|
|
ONEOK, Inc. 6.625% 9/1/2053 |
|
|
290 |
|
|
|
310 |
|
|
|
Onslow Bay Financial, LLC, Series 2024-NQM5, Class A1,
5.988% 3/25/2028 (6.988% on 3/1/2028)1,5,6 |
|
|
1,074 |
|
|
|
1,075 |
|
|
|
Onslow Bay Financial, LLC, Series 2024-NQM7, Class A1,
6.243% 3/25/2064 (7.243% on 4/1/2028)1,5,6 |
|
|
2,043 |
|
|
|
2,053 |
|
|
|
Open Text Corp. 3.875% 2/15/20286 |
|
|
25 |
|
|
|
23 |
|
|
|
Option Care Health, Inc. 4.375% 10/31/20296 |
|
|
25 |
|
|
|
23 |
|
|
|
Oracle Corp. 2.65% 7/15/2026 |
|
|
2,327 |
|
|
|
2,206 |
|
|
|
Oracle Corp. 3.25% 11/15/2027 |
|
|
1,880 |
|
|
|
1,773 |
|
|
|
Oracle Corp. 3.95% 3/25/2051 |
|
|
22 |
|
|
|
16 |
|
|
|
Orange 9.00% 3/1/20311 |
|
|
2,434 |
|
|
|
2,904 |
|
|
|
Osaic Holdings, Inc. 10.75% 8/1/20276 |
|
|
256 |
|
|
|
264 |
|
|
|
Owens & Minor, Inc. 6.625% 4/1/20306 |
|
|
40 |
|
|
|
36 |
|
|
|
Pacific Gas and Electric Co. 3.15% 1/1/2026 |
|
|
3,000 |
|
|
|
2,891 |
|
|
|
Pacific Gas and Electric Co. 4.65% 8/1/2028 |
|
|
542 |
|
|
|
525 |
|
|
|
Pacific Gas and Electric Co. 6.40% 6/15/2033 |
|
|
1,500 |
|
|
|
1,550 |
|
|
|
Pacific Gas and Electric Co. 3.30% 8/1/2040 |
|
|
4,525 |
|
|
|
3,226 |
|
|
|
PacifiCorp 5.30% 2/15/2031 |
|
|
800 |
|
|
|
798 |
|
|
|
PacifiCorp 5.45% 2/15/2034 |
|
|
350 |
|
|
|
346 |
|
|
|
PacifiCorp 3.30% 3/15/2051 |
|
|
150 |
|
|
|
97 |
|
|
|
PacifiCorp 2.90% 6/15/2052 |
|
|
280 |
|
|
|
165 |
|
|
|
PacifiCorp 5.35% 12/1/2053 |
|
|
525 |
|
|
|
477 |
|
|
|
PacifiCorp 5.50% 5/15/2054 |
|
|
980 |
|
|
|
911 |
|
|
|
PacifiCorp 5.80% 1/15/2055 |
|
|
500 |
|
|
|
485 |
|
American Funds Insurance Series 184
Capital World Bond Fund (continued)
|
|
|
|
|
|
|
|
|
|
|
| Bonds, notes & other debt instruments (continued) |
|
Principal amount
(000) |
|
|
Value
(000) |
|
|
|
|
|
| U.S. dollars (continued) |
|
Panama (Republic of) 3.75% 4/17/2026 |
|
|
USD465 |
|
|
$ |
438 |
|
|
|
Panama (Republic of) 7.50% 3/1/2031 |
|
|
415 |
|
|
|
435 |
|
|
|
Panama (Republic of) 6.40% 2/14/2035 |
|
|
850 |
|
|
|
807 |
|
|
|
Panama (Republic of) 8.00% 3/1/2038 |
|
|
755 |
|
|
|
797 |
|
|
|
Panama (Republic of) 7.875% 3/1/2057 |
|
|
4,690 |
|
|
|
4,894 |
|
|
|
Park Intermediate Holdings, LLC 4.875% 5/15/20296 |
|
|
65 |
|
|
|
61 |
|
|
|
Park Intermediate Holdings, LLC 7.00% 2/1/20306 |
|
|
55 |
|
|
|
56 |
|
|
|
Party City Holdings, Inc. 12.00% PIK 1/11/20296,9 |
|
|
1 |
|
|
|
1 |
|
|
|
Performance Food Group, Inc. 5.50% 10/15/20276 |
|
|
11 |
|
|
|
11 |
|
|
|
Permian Resources Operating, LLC 9.875% 7/15/20316 |
|
|
5 |
|
|
|
6 |
|
|
|
Permian Resources Operating, LLC 7.00% 1/15/20326 |
|
|
25 |
|
|
|
26 |
|
|
|
Petroleos Mexicanos 4.25% 1/15/2025 |
|
|
261 |
|
|
|
257 |
|
|
|
Petroleos Mexicanos 6.875% 10/16/2025 |
|
|
946 |
|
|
|
943 |
|
|
|
Petroleos Mexicanos 6.875% 8/4/2026 |
|
|
638 |
|
|
|
625 |
|
|
|
Petroleos Mexicanos 6.49% 1/23/2027 |
|
|
5,999 |
|
|
|
5,763 |
|
|
|
Petroleos Mexicanos 6.50% 3/13/2027 |
|
|
6,200 |
|
|
|
5,912 |
|
|
|
Petroleos Mexicanos 6.84% 1/23/2030 |
|
|
2,384 |
|
|
|
2,100 |
|
|
|
Petroleos Mexicanos 5.95% 1/28/2031 |
|
|
65 |
|
|
|
52 |
|
|
|
Petroleos Mexicanos 6.70% 2/16/2032 |
|
|
779 |
|
|
|
653 |
|
|
|
Petroleos Mexicanos 6.95% 1/28/2060 |
|
|
55 |
|
|
|
36 |
|
|
|
Petrorio Luxembourg Holding SARL 6.125% 6/9/2026 |
|
|
910 |
|
|
|
890 |
|
|
|
Pfizer Investment Enterprises Pte., Ltd. 4.75% 5/19/2033 |
|
|
2,128 |
|
|
|
2,074 |
|
|
|
Pfizer Investment Enterprises Pte., Ltd. 5.30% 5/19/2053 |
|
|
188 |
|
|
|
181 |
|
|
|
PG&E Corp. 5.00% 7/1/2028 |
|
|
145 |
|
|
|
140 |
|
|
|
PG&E Corp. 5.25% 7/1/2030 |
|
|
175 |
|
|
|
167 |
|
|
|
Philip Morris International, Inc. 5.125% 11/17/2027 |
|
|
315 |
|
|
|
315 |
|
|
|
Philip Morris International, Inc. 2.10% 5/1/2030 |
|
|
634 |
|
|
|
537 |
|
|
|
Philip Morris International, Inc. 5.75% 11/17/2032 |
|
|
1,554 |
|
|
|
1,587 |
|
|
|
Philip Morris International, Inc. 5.375% 2/15/2033 |
|
|
1,382 |
|
|
|
1,373 |
|
|
|
PNC Financial Services Group, Inc. 5.676% 1/22/2035
(USD-SOFR + 1.902% on 1/22/2034)1 |
|
|
375 |
|
|
|
377 |
|
|
|
POSCO Holdings, Inc. 4.875% 1/23/20276 |
|
|
510 |
|
|
|
504 |
|
|
|
Post Holdings, Inc. 5.625% 1/15/20286 |
|
|
85 |
|
|
|
84 |
|
|
|
Post Holdings, Inc. 5.50% 12/15/20296 |
|
|
80 |
|
|
|
77 |
|
|
|
Post Holdings, Inc. 4.625% 4/15/20306 |
|
|
444 |
|
|
|
408 |
|
|
|
Post Holdings, Inc. 6.25% 2/15/20326 |
|
|
33 |
|
|
|
33 |
|
|
|
Prestige Auto Receivables Trust, Series 2023-1, Class A2, 5.88% 3/16/20265,6 |
|
|
234 |
|
|
|
234 |
|
|
|
Procter & Gamble Co. 3.00% 3/25/2030 |
|
|
338 |
|
|
|
311 |
|
|
|
PT Bank Negara Indonesia (Persero) Tbk 4.30% junior subordinated perpetual bonds
(5-year UST Yield Curve Rate T Note Constant Maturity + 3.466% on 3/24/2027)1 |
|
|
1,938 |
|
|
|
1,801 |
|
|
|
Radiology Partners, Inc. 3.50% PIK and 4.28% Cash 1/31/20296,9 |
|
|
172 |
|
|
|
162 |
|
|
|
Radiology Partners, Inc. 9.78% PIK 2/15/20306,9 |
|
|
258 |
|
|
|
206 |
|
|
|
Radiology Partners, Inc., Term Loan B,
(3-month USD CME Term SOFR + 5.00%)
1.50% PIK and 9.08% Cash 1/31/20297,8,9 |
|
|
9 |
|
|
|
9 |
|
|
|
Raizen Fuels Finance SA 6.45% 3/5/20346 |
|
|
910 |
|
|
|
925 |
|
|
|
Range Resources Corp. 4.75% 2/15/20306 |
|
|
145 |
|
|
|
136 |
|
|
|
Real Hero Merger Sub 2, Inc. 6.25% 2/1/20296 |
|
|
25 |
|
|
|
21 |
|
|
|
Reworld Holding Corp. 4.875% 12/1/20296 |
|
|
25 |
|
|
|
23 |
|
|
|
RHP Hotel Properties, LP 7.25% 7/15/20286 |
|
|
80 |
|
|
|
83 |
|
|
|
RHP Hotel Properties, LP 4.50% 2/15/20296 |
|
|
90 |
|
|
|
84 |
|
|
|
RLJ Lodging Trust, LP 4.00% 9/15/20296 |
|
|
25 |
|
|
|
22 |
|
|
|
Roller Bearing Company of America, Inc. 4.375% 10/15/20296 |
|
|
20 |
|
|
|
18 |
|
|
|
Royal Caribbean Cruises, Ltd. 5.50% 4/1/20286 |
|
|
75 |
|
|
|
74 |
|
|
|
Royal Caribbean Cruises, Ltd. 7.25% 1/15/20306 |
|
|
4 |
|
|
|
4 |
|
|
|
Ryan Specialty Group, LLC 4.375% 2/1/20306 |
|
|
45 |
|
|
|
42 |
|
|
|
Sally Holdings, LLC 6.75% 3/1/2032 |
|
|
107 |
|
|
|
106 |
|
|
|
Sands China, Ltd. 5.40% 8/8/2028 |
|
|
2,710 |
|
|
|
2,655 |
|
|
|
Sands China, Ltd. 3.25% 8/8/2031 |
|
|
930 |
|
|
|
784 |
|
|
|
Santander Holdings USA, Inc. 3.244% 10/5/2026 |
|
|
3,750 |
|
|
|
3,555 |
|
|
|
Sasol Financing USA, LLC 8.75% 5/3/20292 |
|
|
1,330 |
|
|
|
1,354 |
|
|
|
Sats Treasury Pte., Ltd. 4.828% 1/23/2029 |
|
|
350 |
|
|
|
346 |
|
185 American Funds Insurance Series
Capital World Bond Fund (continued)
|
|
|
|
|
|
|
|
|
|
|
| Bonds, notes & other debt instruments (continued) |
|
Principal amount
(000) |
|
|
Value
(000) |
|
|
|
|
|
| U.S. dollars (continued) |
|
Saturn Oil & Gas, Inc. 9.625% 6/15/20296 |
|
|
USD75 |
|
|
$ |
76 |
|
|
|
Saudi Arabia (Kingdom of) 5.75% 1/16/20546 |
|
|
2,300 |
|
|
|
2,247 |
|
|
|
Scentre Group Trust 1 3.50% 2/12/20256 |
|
|
210 |
|
|
|
207 |
|
|
|
Scentre Group Trust 1 3.75% 3/23/20276 |
|
|
110 |
|
|
|
105 |
|
|
|
Scientific Games Holdings, LP 6.625% 3/1/20306 |
|
|
46 |
|
|
|
45 |
|
|
|
SCIH Salt Holdings, Inc. 4.875% 5/1/20286 |
|
|
115 |
|
|
|
107 |
|
|
|
Sealed Air Corp. 6.125% 2/1/20286 |
|
|
180 |
|
|
|
180 |
|
|
|
Sealed Air Corp. 6.50% 7/15/20326 |
|
|
123 |
|
|
|
122 |
|
|
|
Serbia (Republic of) 6.25% 5/26/20286 |
|
|
740 |
|
|
|
750 |
|
|
|
Service Properties Trust 8.625% 11/15/20316 |
|
|
60 |
|
|
|
63 |
|
|
|
ServiceNow, Inc. 1.40% 9/1/2030 |
|
|
1,830 |
|
|
|
1,486 |
|
|
|
Simmons Foods, Inc. 4.625% 3/1/20296 |
|
|
160 |
|
|
|
141 |
|
|
|
Sirius XM Radio, Inc. 3.125% 9/1/20266 |
|
|
50 |
|
|
|
47 |
|
|
|
Sirius XM Radio, Inc. 4.00% 7/15/20286 |
|
|
195 |
|
|
|
176 |
|
|
|
Sirius XM Radio, Inc. 4.125% 7/1/20306 |
|
|
39 |
|
|
|
33 |
|
|
|
Sirius XM Radio, Inc. 3.875% 9/1/20316 |
|
|
111 |
|
|
|
91 |
|
|
|
SK hynix, Inc. 3.00% 9/17/2024 |
|
|
1,602 |
|
|
|
1,593 |
|
|
|
SK hynix, Inc. 1.50% 1/19/2026 |
|
|
563 |
|
|
|
529 |
|
|
|
SM Energy Co. 6.50% 7/15/2028 |
|
|
45 |
|
|
|
45 |
|
|
|
SMB Private Education Loan Trust, Series 2023-C, Class A1B,
(30-day Average USD-SOFR + 1.55%) 6.883% 11/15/20525,6,8 |
|
|
673 |
|
|
|
682 |
|
|
|
Sonic Automotive, Inc. 4.625% 11/15/20296 |
|
|
45 |
|
|
|
41 |
|
|
|
Sonic Automotive, Inc. 4.875% 11/15/20316 |
|
|
20 |
|
|
|
18 |
|
|
|
Southern California Edison Co. 2.85% 8/1/2029 |
|
|
200 |
|
|
|
180 |
|
|
|
Southern California Edison Co. 3.65% 2/1/2050 |
|
|
1,700 |
|
|
|
1,210 |
|
|
|
Southwestern Energy Co. 5.375% 3/15/2030 |
|
|
55 |
|
|
|
53 |
|
|
|
Southwestern Energy Co. 4.75% 2/1/2032 |
|
|
15 |
|
|
|
14 |
|
|
|
Spirit AeroSystems, Inc. 9.375% 11/30/20296 |
|
|
17 |
|
|
|
18 |
|
|
|
Spirit AeroSystems, Inc. 9.75% 11/15/20306 |
|
|
71 |
|
|
|
78 |
|
|
|
Spirit AeroSystems, Inc., Term Loan,
(3-month CME Term SOFR + 4.25%) 9.58% 1/15/20277,8 |
|
|
5 |
|
|
|
5 |
|
|
|
Sprint, LLC 7.625% 3/1/2026 |
|
|
130 |
|
|
|
134 |
|
|
|
Station Casinos, LLC 6.625% 3/15/20326 |
|
|
35 |
|
|
|
35 |
|
|
|
Stellantis Finance US, Inc. 1.711% 1/29/20276 |
|
|
1,500 |
|
|
|
1,367 |
|
|
|
Stellantis Finance US, Inc. 5.625% 1/12/20286 |
|
|
2,560 |
|
|
|
2,594 |
|
|
|
Stellantis Finance US, Inc. 2.691% 9/15/20316 |
|
|
453 |
|
|
|
375 |
|
|
|
Stericycle, Inc. 3.875% 1/15/20296 |
|
|
110 |
|
|
|
103 |
|
|
|
Stillwater Mining Co. 4.00% 11/16/20262 |
|
|
2,090 |
|
|
|
1,912 |
|
|
|
Sunoco, LP 7.00% 5/1/20296 |
|
|
30 |
|
|
|
31 |
|
|
|
Sunoco, LP 4.50% 5/15/2029 |
|
|
290 |
|
|
|
271 |
|
|
|
Sunoco, LP 4.50% 4/30/2030 |
|
|
35 |
|
|
|
32 |
|
|
|
Surgery Center Holdings, Inc. 7.25% 4/15/20326 |
|
|
45 |
|
|
|
46 |
|
|
|
SVB Financial Group 4.70% junior subordinated perpetual bonds
(5-year UST Yield Curve Rate T Note Constant Maturity +
3.064% on 11/15/2031)1,3 |
|
|
12 |
|
|
|
– |
11 |
|
|
Swiss Re Finance (Luxembourg) SA 5.00% 4/2/2049
(5-year UST Yield Curve Rate T Note Constant Maturity + 3.582% on 4/2/2029)1,6 |
|
|
400 |
|
|
|
386 |
|
|
|
Talen Energy Supply, LLC 8.625% 6/1/20306 |
|
|
94 |
|
|
|
100 |
|
|
|
Talen Energy Supply, LLC, Term Loan B,
(3-month USD CME Term SOFR + 3.50%) 8.827% 5/17/20307,8 |
|
|
45 |
|
|
|
45 |
|
|
|
Talos Production, Inc. 9.00% 2/1/20296 |
|
|
15 |
|
|
|
16 |
|
|
|
Talos Production, Inc. 9.375% 2/1/20316 |
|
|
55 |
|
|
|
58 |
|
|
|
Tencent Holdings, Ltd. 3.24% 6/3/20506 |
|
|
3,450 |
|
|
|
2,261 |
|
|
|
Tenet Healthcare Corp. 6.125% 10/1/2028 |
|
|
25 |
|
|
|
25 |
|
|
|
Tierra Mojada Luxembourg II SARL 5.75% 12/1/2040 |
|
|
1,429 |
|
|
|
1,290 |
|
|
|
T-Mobile USA, Inc. 2.40% 3/15/2029 |
|
|
1,079 |
|
|
|
955 |
|
|
|
T-Mobile USA, Inc. 5.65% 1/15/2053 |
|
|
1,400 |
|
|
|
1,380 |
|
|
|
Toyota Motor Credit Corp. 3.375% 4/1/2030 |
|
|
453 |
|
|
|
417 |
|
|
|
TransDigm, Inc. 5.50% 11/15/2027 |
|
|
45 |
|
|
|
44 |
|
|
|
TransDigm, Inc. 4.875% 5/1/2029 |
|
|
80 |
|
|
|
75 |
|
|
|
TransDigm, Inc. 6.875% 12/15/20306 |
|
|
85 |
|
|
|
87 |
|
|
|
TransDigm, Inc. 6.625% 3/1/20326 |
|
|
45 |
|
|
|
46 |
|
American Funds Insurance Series 186
Capital World Bond Fund (continued)
|
|
|
|
|
|
|
|
|
|
|
| Bonds, notes & other debt instruments (continued) |
|
Principal amount
(000) |
|
|
Value
(000) |
|
|
|
|
|
| U.S. dollars (continued) |
|
Transocean Poseidon, Ltd. 6.875% 2/1/20276 |
|
|
USD51 |
|
|
$ |
51 |
|
|
|
Transocean Titan Financing, Ltd. 8.375% 2/1/20286 |
|
|
102 |
|
|
|
105 |
|
|
|
Transocean, Inc. 8.75% 2/15/20306 |
|
|
36 |
|
|
|
38 |
|
|
|
Transocean, Inc. 6.80% 3/15/2038 |
|
|
35 |
|
|
|
29 |
|
|
|
Treehouse Park Improvement Association No.1 9.75% 12/1/20336,12 |
|
|
100 |
|
|
|
98 |
|
|
|
Tricon Residential Trust, Series 2023-SFR1, Class B, 5.10% 7/17/20405,6 |
|
|
251 |
|
|
|
244 |
|
|
|
Tricon Residential Trust, Series 2023-SFR1, Class C, 5.10% 7/17/20405,6 |
|
|
100 |
|
|
|
96 |
|
|
|
Triumph Group, Inc. 9.00% 3/15/20286 |
|
|
57 |
|
|
|
60 |
|
|
|
Truist Insurance Holdings, LLC, Term Loan,
(1-month USD CME Term SOFR + 4.75%) 10.073% 3/8/20327,8 |
|
|
235 |
|
|
|
240 |
|
|
|
U.S. Treasury 4.25% 1/31/2026 |
|
|
1,202 |
|
|
|
1,191 |
|
|
|
U.S. Treasury 4.50% 4/15/2027 |
|
|
1,630 |
|
|
|
1,628 |
|
|
|
U.S. Treasury 1.125% 8/31/2028 |
|
|
2,155 |
|
|
|
1,888 |
|
|
|
U.S. Treasury 4.25% 2/28/2029 |
|
|
109 |
|
|
|
109 |
|
|
|
U.S. Treasury 4.125% 3/31/2029 |
|
|
24 |
|
|
|
24 |
|
|
|
U.S. Treasury 4.625% 4/30/2029 |
|
|
13 |
|
|
|
13 |
|
|
|
U.S. Treasury 4.375% 5/15/203413 |
|
|
2,363 |
|
|
|
2,364 |
|
|
|
U.S. Treasury 1.75% 8/15/204113 |
|
|
4,650 |
|
|
|
3,073 |
|
|
|
U.S. Treasury 4.75% 11/15/204313 |
|
|
2,650 |
|
|
|
2,686 |
|
|
|
U.S. Treasury 3.00% 8/15/204813 |
|
|
5,045 |
|
|
|
3,830 |
|
|
|
U.S. Treasury 1.25% 5/15/205013 |
|
|
1,625 |
|
|
|
806 |
|
|
|
U.S. Treasury 4.75% 11/15/205313 |
|
|
5,509 |
|
|
|
5,697 |
|
|
|
U.S. Treasury 4.25% 2/15/2054 |
|
|
681 |
|
|
|
649 |
|
|
|
U.S. Treasury Inflation-Protected Security 0.125% 7/15/20264 |
|
|
818 |
|
|
|
783 |
|
|
|
U.S. Treasury Inflation-Protected Security 2.375% 10/15/20284,13 |
|
|
10,330 |
|
|
|
10,468 |
|
|
|
U.S. Treasury Inflation-Protected Security 0.125% 2/15/20514 |
|
|
3,408 |
|
|
|
1,967 |
|
|
|
U.S. Treasury Inflation-Protected Security 1.50% 2/15/20534 |
|
|
179 |
|
|
|
150 |
|
|
|
UBS Group AG 4.49% 8/5/2025
(1-year UST Yield Curve Rate T Note Constant Maturity + 1.60% on 8/5/2024)1,6 |
|
|
2,265 |
|
|
|
2,262 |
|
|
|
UKG, Inc. 6.875% 2/1/20316 |
|
|
77 |
|
|
|
78 |
|
|
|
UKG, Inc., Term Loan B,
(3-month USD CME Term SOFR + 3.25%) 8.576% 2/10/20317,8 |
|
|
58 |
|
|
|
58 |
|
|
|
Ukraine 6.876% 5/21/20313 |
|
|
1,269 |
|
|
|
364 |
|
|
|
Uniform Mortgage-Backed Security 2.50% 7/1/20545,10 |
|
|
264 |
|
|
|
216 |
|
|
|
Uniform Mortgage-Backed Security 3.50% 7/1/20545,10 |
|
|
3,096 |
|
|
|
2,741 |
|
|
|
Uniform Mortgage-Backed Security 4.50% 7/1/20545,10 |
|
|
11,913 |
|
|
|
11,232 |
|
|
|
Uniform Mortgage-Backed Security 5.00% 7/1/20545,10 |
|
|
24,468 |
|
|
|
23,650 |
|
|
|
Uniform Mortgage-Backed Security 5.50% 7/1/20545,10 |
|
|
46,050 |
|
|
|
45,422 |
|
|
|
Uniform Mortgage-Backed Security 6.00% 7/1/20545,10 |
|
|
14,274 |
|
|
|
14,316 |
|
|
|
Uniform Mortgage-Backed Security 6.50% 7/1/20545,10 |
|
|
14,685 |
|
|
|
14,948 |
|
|
|
Uniform Mortgage-Backed Security 7.00% 7/1/20545,10 |
|
|
386 |
|
|
|
397 |
|
|
|
Uniform Mortgage-Backed Security 3.50% 8/1/20545,10 |
|
|
1,476 |
|
|
|
1,306 |
|
|
|
Uniform Mortgage-Backed Security 4.50% 8/1/20545,10 |
|
|
5,000 |
|
|
|
4,715 |
|
|
|
Uniform Mortgage-Backed Security 6.00% 8/1/20545,10 |
|
|
28,731 |
|
|
|
28,802 |
|
|
|
Uniform Mortgage-Backed Security 6.50% 8/1/20545,10 |
|
|
11,000 |
|
|
|
11,190 |
|
|
|
Uniform Mortgage-Backed Security 7.00% 8/1/20545,10 |
|
|
2,562 |
|
|
|
2,633 |
|
|
|
United Mexican States 6.00% 5/7/2036 |
|
|
970 |
|
|
|
947 |
|
|
|
United Mexican States 6.338% 5/4/2053 |
|
|
425 |
|
|
|
402 |
|
|
|
United Natural Foods, Inc. 6.75% 10/15/20286 |
|
|
85 |
|
|
|
77 |
|
|
|
United Rentals (North America), Inc. 3.875% 2/15/2031 |
|
|
130 |
|
|
|
116 |
|
|
|
Univision Communications, Inc. 4.50% 5/1/20296 |
|
|
250 |
|
|
|
210 |
|
|
|
US Foods, Inc. 4.625% 6/1/20306 |
|
|
35 |
|
|
|
33 |
|
|
|
Vail Resorts, Inc. 6.50% 5/15/20326 |
|
|
20 |
|
|
|
20 |
|
|
|
Valvoline, Inc. 3.625% 6/15/20316 |
|
|
85 |
|
|
|
73 |
|
|
|
Velocity Vehicle Group, LLC 8.00% 6/1/20296 |
|
|
30 |
|
|
|
31 |
|
|
|
Venator Material, LLC, Term Loan,
(3-month USD CME Term SOFR + 2.00%) 8.00% PIK and 7.31% Cash 1/16/20267,8,9 |
|
|
24 |
|
|
|
24 |
|
|
|
Venator Material, LLC, Term Loan,
(USD-SOFR + 10.00%) 8.00% PIK and 7.33% Cash 10/10/20287,8,9 |
|
|
49 |
|
|
|
49 |
|
|
|
Venture Global Calcasieu Pass, LLC 3.875% 8/15/20296 |
|
|
35 |
|
|
|
32 |
|
|
|
Venture Global Calcasieu Pass, LLC 6.25% 1/15/20306 |
|
|
31 |
|
|
|
31 |
|
187 American Funds Insurance Series
Capital World Bond Fund (continued)
|
|
|
|
|
|
|
|
|
|
|
| Bonds, notes & other debt instruments (continued) |
|
Principal amount
(000) |
|
|
Value (000) |
|
|
|
|
|
| U.S. dollars (continued) |
|
Venture Global Calcasieu Pass, LLC 4.125% 8/15/20316 |
|
|
USD110 |
|
|
$ |
99 |
|
|
|
Venture Global LNG, Inc. 8.125% 6/1/20286 |
|
|
80 |
|
|
|
82 |
|
|
|
Veralto Corp. 5.35% 9/18/20286 |
|
|
2,900 |
|
|
|
2,913 |
|
|
|
Verus Securitization Trust, Series 2024-4, Class A1,
6.218% 6/25/2069 (7.218% on 5/1/2028)1,5,6 |
|
|
805 |
|
|
|
808 |
|
|
|
VICI Properties, LP 4.375% 5/15/2025 |
|
|
1,563 |
|
|
|
1,544 |
|
|
|
Vital Energy, Inc. 7.875% 4/15/20326 |
|
|
30 |
|
|
|
31 |
|
|
|
VZ Secured Financing BV 5.00% 1/15/20326 |
|
|
200 |
|
|
|
171 |
|
|
|
W&T Offshore, Inc. 11.75% 2/1/20266 |
|
|
55 |
|
|
|
57 |
|
|
|
Wand NewCo 3, Inc. 7.625% 1/30/20326 |
|
|
35 |
|
|
|
36 |
|
|
|
WarnerMedia Holdings, Inc. 5.05% 3/15/2042 |
|
|
1,928 |
|
|
|
1,569 |
|
|
|
Warrior Met Coal, Inc. 7.875% 12/1/20286 |
|
|
71 |
|
|
|
73 |
|
|
|
WASH Multifamily Acquisition, Inc. 5.75% 4/15/20266 |
|
|
320 |
|
|
|
313 |
|
|
|
WEA Finance, LLC 3.75% 9/17/20246 |
|
|
535 |
|
|
|
531 |
|
|
|
Weatherford International, Ltd. 8.625% 4/30/20306 |
|
|
93 |
|
|
|
96 |
|
|
|
Wells Fargo & Co. 3.526% 3/24/2028 (USD-SOFR + 1.51% on 3/24/2027)1 |
|
|
4,698 |
|
|
|
4,482 |
|
|
|
Wells Fargo & Co. 4.611% 4/25/2053 (USD-SOFR + 2.13% on 4/25/2052)1 |
|
|
1,600 |
|
|
|
1,368 |
|
|
|
WESCO Distribution, Inc. 7.25% 6/15/20286 |
|
|
200 |
|
|
|
204 |
|
|
|
WESCO Distribution, Inc. 6.625% 3/15/20326 |
|
|
150 |
|
|
|
152 |
|
|
|
Western Midstream Operating, LP 3.10% 2/1/20251 |
|
|
85 |
|
|
|
84 |
|
|
|
Westlake Automobile Receivables Trust, Series 2023-1, Class A2A,
5.51% 6/15/20265,6 |
|
|
401 |
|
|
|
401 |
|
|
|
Westlake Automobile Receivables Trust, Series 2023-1, Class A3,
5.21% 1/18/20285,6 |
|
|
278 |
|
|
|
277 |
|
|
|
Westlake Automobile Receivables Trust, Series 2023-1, Class B,
5.41% 1/18/20285,6 |
|
|
60 |
|
|
|
60 |
|
|
|
Westpac Banking Corp. 2.894% 2/4/2030
(5-year UST Yield Curve Rate T Note Constant Maturity + 1.35% on 2/4/2025)1 |
|
|
1,250 |
|
|
|
1,226 |
|
|
|
WMG Acquisition Corp. 3.75% 12/1/20296 |
|
|
110 |
|
|
|
100 |
|
|
|
WMG Acquisition Corp. 3.875% 7/15/20306 |
|
|
135 |
|
|
|
121 |
|
|
|
WMG Acquisition Corp. 3.00% 2/15/20316 |
|
|
80 |
|
|
|
69 |
|
|
|
Wolfspeed, Inc. 9.875% 6/23/2030 (10.875% on 6/23/2026)1,2,12 |
|
|
105 |
|
|
|
102 |
|
|
|
Wynn Resorts Finance, LLC 7.125% 2/15/20316 |
|
|
43 |
|
|
|
45 |
|
|
|
Ziggo Bond Co. BV 5.125% 2/28/20306 |
|
|
200 |
|
|
|
170 |
|
|
|
Ziggo BV 4.875% 1/15/20306 |
|
|
300 |
|
|
|
267 |
|
|
|
|
|
|
|
|
|
|
|
|
|
|
|
|
|
|
|
|
|
703,556 |
|
|
|
|
|
|
|
|
|
|
|
|
|
|
Total bonds, notes & other debt instruments (cost: $1,497,896,000) |
|
|
|
|
|
|
1,405,249 |
|
|
|
|
|
|
|
|
|
|
|
|
|
|
|
|
|
|
|
|
|
|
|
|
|
|
|
| Preferred securities 0.00% |
|
Shares |
|
|
|
|
|
|
|
|
| U.S. dollars 0.00% |
|
ACR III LSC Holdings, LLC, Series B, preferred shares6,12,14 |
|
|
48 |
|
|
|
82 |
|
|
|
|
|
|
|
|
|
|
|
|
|
|
Total preferred securities (cost: $49,000) |
|
|
|
|
|
|
82 |
|
|
|
|
|
|
|
|
|
|
|
|
|
|
|
|
|
|
|
|
|
|
|
|
|
|
|
| Common stocks 0.04% |
|
|
|
|
|
|
|
|
|
|
| U.S. dollars 0.04% |
|
Constellation Oil Services Holding SA, Class B-112,14 |
|
|
1,214,969 |
|
|
|
194 |
|
|
|
Venator Materials PLC12,14 |
|
|
232 |
|
|
|
164 |
|
|
|
Altera Infrastructure, LP12,14 |
|
|
1,441 |
|
|
|
108 |
|
|
|
Endo, Inc.14 |
|
|
2,165 |
|
|
|
61 |
|
|
|
Endo, Inc.6,14 |
|
|
811 |
|
|
|
23 |
|
|
|
Endo, Inc., 1L 6.125% Escrow12,14 |
|
|
205,000 |
|
|
|
– |
11 |
|
|
WeWork, Inc.12,14 |
|
|
968 |
|
|
|
10 |
|
|
|
Party City Holdco, Inc.12,14 |
|
|
80 |
|
|
|
1 |
|
|
|
Party City Holdco, Inc.6,12,14 |
|
|
1 |
|
|
|
– |
11 |
|
|
Bighorn Permian Resources, LLC12 |
|
|
531 |
|
|
|
– |
11 |
|
|
|
|
|
|
|
|
|
|
|
|
|
Total common stocks (cost: $1,039,000) |
|
|
|
|
|
|
561 |
|
|
|
|
|
|
|
|
|
|
|
|
American Funds Insurance Series 188
Capital World Bond Fund (continued)
|
|
|
|
|
|
|
|
|
|
|
| Investment funds 1.36% |
|
Shares |
|
|
Value (000) |
|
|
|
|
|
|
|
Capital Group Central Corporate Bond Fund15 |
|
|
2,493,000 |
|
|
$ |
20,617 |
|
|
|
|
|
|
|
|
|
|
|
|
|
|
Total investment funds (cost: $19,454,000) |
|
|
|
|
|
|
20,617 |
|
|
|
|
|
|
|
|
|
|
|
|
|
|
|
| Short-term securities 16.98% |
|
|
|
|
|
|
|
|
|
| Money market investments 13.89% |
|
|
|
|
|
|
|
|
|
|
|
|
|
|
Capital Group Central Cash Fund 5.37%15,16 |
|
|
2,105,621 |
|
|
|
210,562 |
|
|
|
|
|
|
|
|
|
|
|
|
|
|
|
|
|
|
|
|
|
|
|
|
|
|
|
|
|
|
|
|
| |
|
|
|
Weighted average yield at acquisition |
|
|
Principal amount
(000) |
|
|
|
|
|
| Bills & notes of governments & government agencies outside the U.S. 3.09% |
|
|
|
Egypt (Arab Republic of) 10/1/2024 |
|
|
22.855 |
% |
|
|
EGP29,675 |
|
|
|
582 |
|
|
|
Egypt (Arab Republic of) 11/12/2024 |
|
|
22.326 |
|
|
|
43,850 |
|
|
|
837 |
|
|
|
Egypt (Arab Republic of) 11/19/2024 |
|
|
22.238 |
|
|
|
67,700 |
|
|
|
1,286 |
|
|
|
Egypt (Arab Republic of) 3/11/2025 |
|
|
21.301 |
|
|
|
94,475 |
|
|
|
1,674 |
|
|
|
Egypt (Arab Republic of) 3/18/2025 |
|
|
21.290 |
|
|
|
407,450 |
|
|
|
7,188 |
|
|
|
Japan Treasury 7/22/2024 |
|
|
0.005 |
|
|
|
JPY4,517,300 |
|
|
|
28,077 |
|
|
|
Nigeria (Republic of) 2/11/2025 |
|
|
18.000 |
|
|
|
NGN675,950 |
|
|
|
388 |
|
|
|
Nigeria (Republic of) 2/20/2025 |
|
|
17.782 |
|
|
|
901,265 |
|
|
|
518 |
|
|
|
Nigeria (Republic of) 2/25/2025 |
|
|
18.045 |
|
|
|
3,122,091 |
|
|
|
1,789 |
|
|
|
Nigeria (Republic of) 3/6/2025 |
|
|
17.824 |
|
|
|
3,750,997 |
|
|
|
2,134 |
|
|
|
Nigeria (Republic of) 3/13/2025 |
|
|
17.900 |
|
|
|
1,201,690 |
|
|
|
680 |
|
|
|
Nigeria (Republic of) 3/27/2025 |
|
|
18.586 |
|
|
|
3,072,227 |
|
|
|
1,720 |
|
|
|
|
|
|
|
|
|
|
|
|
|
|
|
|
|
|
|
|
|
|
|
46,873 |
|
|
|
|
|
|
|
|
|
|
|
|
|
|
|
Total short-term securities (cost: $259,567,000) |
|
|
|
|
|
|
|
257,435 |
|
|
|
|
|
|
|
|
|
|
|
|
|
|
|
|
| Options purchased (equity style) 0.06% |
|
|
|
|
|
|
|
|
|
Options purchased (equity style)* |
|
|
|
|
|
|
|
|
|
|
955 |
|
|
|
|
|
|
|
|
|
|
|
|
|
|
|
Total options purchased (equity style) (cost: $786,000) |
|
|
|
|
|
|
|
|
|
|
955 |
|
|
|
|
|
|
|
|
|
|
|
|
|
|
|
|
|
|
|
|
Total investment securities 111.11% (cost: $1,778,791,000) |
|
|
|
|
|
|
|
|
|
|
1,684,899 |
|
|
|
Total options written† (0.06) (premium received: $827,000) |
|
|
|
|
|
|
|
|
|
|
(920 |
) |
|
|
Other assets less liabilities (11.05)% |
|
|
|
|
|
|
|
|
|
|
(167,604 |
) |
|
|
|
|
|
|
|
|
|
|
|
|
|
|
|
|
|
|
|
Net assets 100.00% |
|
|
|
|
|
|
|
|
|
$ |
1,516,375 |
|
|
|
|
|
|
|
|
|
|
|
|
|
|
|
|
|
|
|
|
|
|
|
|
|
|
|
|
|
|
|
|
|
|
| *Options purchased (equity style) |
|
|
| Options on futures |
|
|
|
|
|
|
|
| Description |
|
Number of
contracts |
|
|
Expiration
date |
|
|
Exercise
price |
|
|
Notional
amount (000) |
|
|
Value at
6/30/2024
(000) |
|
| Put |
|
|
|
|
|
|
|
|
|
|
|
|
|
|
|
|
|
|
|
|
|
|
|
|
|
|
| 3 Month SOFR Futures Option |
|
|
427 |
|
|
|
12/13/2024 |
|
|
|
USD96.00 |
|
|
|
USD106,750 |
|
|
|
$950 |
|
189 American Funds Insurance Series
Capital World Bond Fund (continued)
|
|
|
|
|
|
|
|
|
|
|
|
|
|
|
|
|
|
|
|
|
| *Options purchased (equity style) (continued) |
|
|
| Options on foreign currencies |
|
|
|
|
|
|
|
| Description |
|
Counterparty |
|
|
Expiration
date |
|
|
Exercise
price |
|
|
Notional
amount
(000) |
|
|
Value at
6/30/2024
(000) |
|
| Call |
|
|
|
|
|
|
|
|
|
|
|
|
|
|
|
|
|
|
|
|
|
|
|
|
|
|
| EUR/USD Foreign Currency Options |
|
|
Citibank |
|
|
|
7/17/2024 |
|
|
|
USD1.09 |
|
|
|
EUR4,300 |
|
|
|
$5 |
|
|
|
|
|
|
|
|
|
|
|
|
|
|
|
|
|
|
|
|
| †Options written (equity style) |
|
| Options on futures |
|
|
|
|
|
|
| Description |
|
Number of
contracts |
|
|
Expiration
date |
|
|
Exercise
price |
|
|
Notional
amount
(000) |
|
|
Value at 6/30/2024 (000) |
| Put |
|
|
|
|
|
|
|
|
|
|
|
|
|
|
|
|
|
|
|
|
|
|
|
|
| 3 Month SOFR Futures Option |
|
|
823 |
|
|
|
12/13/2024 |
|
|
|
USD95.50 |
|
|
|
USD205,750 |
|
|
$(916) |
|
|
|
|
|
|
|
|
|
|
|
|
|
|
|
|
|
| Options on foreign currencies |
|
|
|
|
|
|
| Description |
|
Counterparty |
|
Expiration
date |
|
|
Exercise
price |
|
|
Notional
amount
(000) |
|
|
Value at 6/30/2024 (000) |
| Put |
|
|
|
|
|
|
|
|
|
|
|
|
|
|
|
|
|
|
|
|
|
|
| EUR/USD Foreign Currency Options |
|
Citibank |
|
|
7/17/2024 |
|
|
|
USD1.04 |
|
|
|
EUR(4,300 |
) |
|
$(4) |
|
|
|
|
|
|
|
|
|
|
|
|
|
|
|
|
|
|
|
|
|
|
|
|
|
| Futures contracts |
|
|
|
|
|
|
|
| Contracts |
|
Type |
|
|
Number of
contracts |
|
|
Expiration
date |
|
|
Notional
amount
(000) |
|
|
Value and
unrealized
appreciation
(depreciation) at 6/30/2024 (000) |
|
|
|
|
|
|
|
|
| 2 Year Euro-Schatz Futures |
|
|
Long |
|
|
|
110 |
|
|
|
9/10/2024 |
|
|
|
USD12,452 |
|
|
|
|
|
|
$ |
48 |
|
| 2 Year U.S. Treasury Note Futures |
|
|
Long |
|
|
|
1,291 |
|
|
|
10/3/2024 |
|
|
|
263,646 |
|
|
|
|
|
|
|
385 |
|
| 3 Year Australian Treasury Bond Futures |
|
|
Short |
|
|
|
1 |
|
|
|
9/17/2024 |
|
|
|
(70 |
) |
|
|
|
|
|
|
–11 |
|
| 5 Year Euro-Bobl Futures |
|
|
Long |
|
|
|
634 |
|
|
|
9/10/2024 |
|
|
|
79,061 |
|
|
|
|
|
|
|
546 |
|
| 5 Year U.S. Treasury Note Futures |
|
|
Long |
|
|
|
615 |
|
|
|
10/3/2024 |
|
|
|
65,546 |
|
|
|
|
|
|
|
477 |
|
| 10 Year Italy Government Bond Futures |
|
|
Long |
|
|
|
41 |
|
|
|
9/10/2024 |
|
|
|
5,062 |
|
|
|
|
|
|
|
(48 |
) |
| 10 Year French Government Bond Futures |
|
|
Short |
|
|
|
62 |
|
|
|
9/10/2024 |
|
|
|
(8,175 |
) |
|
|
|
|
|
|
124 |
|
| 10 Year Euro-Bund Futures |
|
|
Short |
|
|
|
149 |
|
|
|
9/10/2024 |
|
|
|
(21,003 |
) |
|
|
|
|
|
|
(18 |
) |
| 10 Year Australian Treasury Bond Futures |
|
|
Short |
|
|
|
102 |
|
|
|
9/16/2024 |
|
|
|
(7,728 |
) |
|
|
|
|
|
|
18 |
|
| 10 Year Japanese Government Bond Futures |
|
|
Short |
|
|
|
67 |
|
|
|
9/20/2024 |
|
|
|
(59,492 |
) |
|
|
|
|
|
|
227 |
|
| 10 Year UK Gilt Futures |
|
|
Long |
|
|
|
214 |
|
|
|
9/30/2024 |
|
|
|
26,394 |
|
|
|
|
|
|
|
(286 |
) |
| 10 Year Ultra U.S. Treasury Note Futures |
|
|
Long |
|
|
|
173 |
|
|
|
9/30/2024 |
|
|
|
19,641 |
|
|
|
|
|
|
|
(95 |
) |
| 10 Year U.S. Treasury Note Futures |
|
|
Short |
|
|
|
298 |
|
|
|
9/30/2024 |
|
|
|
(32,775 |
) |
|
|
|
|
|
|
(47 |
) |
| 20 Year U.S. Treasury Bond Futures |
|
|
Long |
|
|
|
65 |
|
|
|
9/30/2024 |
|
|
|
7,690 |
|
|
|
|
|
|
|
89 |
|
| 30 Year Euro-Buxl Futures |
|
|
Long |
|
|
|
24 |
|
|
|
9/10/2024 |
|
|
|
3,348 |
|
|
|
|
|
|
|
28 |
|
| 30 Year Ultra U.S. Treasury Bond Futures |
|
|
Long |
|
|
|
155 |
|
|
|
9/30/2024 |
|
|
|
19,428 |
|
|
|
|
|
|
|
113 |
|
|
|
|
|
|
|
|
|
|
|
|
|
|
|
|
|
|
|
|
|
|
|
|
|
|
|
|
|
|
|
|
|
|
|
|
|
|
|
|
|
|
|
|
|
|
|
|
|
|
|
|
|
|
|
|
$1,561 |
|
|
|
|
|
|
|
|
|
|
|
|
|
|
|
|
|
|
|
|
|
|
|
|
|
|
American Funds Insurance Series 190
Capital World Bond Fund (continued)
|
|
|
|
|
|
|
|
|
|
|
|
|
|
|
|
|
|
|
|
|
|
|
|
|
|
|
|
|
| Forward currency contracts |
|
|
|
|
|
|
|
|
|
| |
|
|
|
|
|
|
|
|
|
|
|
|
|
|
|
|
|
Unrealized appreciation
(depreciation) at 6/30/2024 (000) |
|
| Contract amount |
|
|
|
|
|
|
| Currency purchased (000) |
|
|
|
|
|
Currency sold (000) |
|
|
Counterparty |
|
Settlement
date |
|
|
|
|
|
|
|
|
|
|
| USD |
|
|
10,629 |
|
|
|
|
|
|
PLN |
|
|
43,525 |
|
|
Citibank |
|
|
7/3/2024 |
|
|
|
|
|
|
$ |
(182 |
) |
| PLN |
|
|
43,525 |
|
|
|
|
|
|
USD |
|
|
11,086 |
|
|
Bank of America |
|
|
7/3/2024 |
|
|
|
|
|
|
|
(275 |
) |
| USD |
|
|
2,246 |
|
|
|
|
|
|
HUF |
|
|
818,090 |
|
|
Standard Chartered Bank |
|
|
7/9/2024 |
|
|
|
|
|
|
|
28 |
|
| AUD |
|
|
4,100 |
|
|
|
|
|
|
USD |
|
|
2,727 |
|
|
Bank of America |
|
|
7/9/2024 |
|
|
|
|
|
|
|
9 |
|
| USD |
|
|
1,710 |
|
|
|
|
|
|
EUR |
|
|
1,590 |
|
|
Morgan Stanley |
|
|
7/9/2024 |
|
|
|
|
|
|
|
6 |
|
| USD |
|
|
1,773 |
|
|
|
|
|
|
EUR |
|
|
1,650 |
|
|
HSBC Bank |
|
|
7/9/2024 |
|
|
|
|
|
|
|
5 |
|
| USD |
|
|
1,119 |
|
|
|
|
|
|
EUR |
|
|
1,040 |
|
|
JPMorgan Chase |
|
|
7/9/2024 |
|
|
|
|
|
|
|
5 |
|
| EUR |
|
|
1,390 |
|
|
|
|
|
|
USD |
|
|
1,494 |
|
|
HSBC Bank |
|
|
7/9/2024 |
|
|
|
|
|
|
|
(5 |
) |
| HUF |
|
|
1,284,310 |
|
|
|
|
|
|
EUR |
|
|
3,268 |
|
|
Goldman Sachs |
|
|
7/9/2024 |
|
|
|
|
|
|
|
(21 |
) |
| THB |
|
|
190,470 |
|
|
|
|
|
|
USD |
|
|
5,214 |
|
|
Citibank |
|
|
7/9/2024 |
|
|
|
|
|
|
|
(26 |
) |
| CNH |
|
|
138,167 |
|
|
|
|
|
|
USD |
|
|
19,098 |
|
|
UBS AG |
|
|
7/9/2024 |
|
|
|
|
|
|
|
(153 |
) |
| EUR |
|
|
17,257 |
|
|
|
|
|
|
USD |
|
|
18,790 |
|
|
Citibank |
|
|
7/9/2024 |
|
|
|
|
|
|
|
(299 |
) |
| JPY |
|
|
1,836,980 |
|
|
|
|
|
|
USD |
|
|
11,925 |
|
|
Morgan Stanley |
|
|
7/9/2024 |
|
|
|
|
|
|
|
(489 |
) |
| USD |
|
|
3,794 |
|
|
|
|
|
|
GBP |
|
|
2,970 |
|
|
Morgan Stanley |
|
|
7/10/2024 |
|
|
|
|
|
|
|
39 |
|
| USD |
|
|
8,189 |
|
|
|
|
|
|
EUR |
|
|
7,610 |
|
|
Morgan Stanley |
|
|
7/10/2024 |
|
|
|
|
|
|
|
35 |
|
| USD |
|
|
1,892 |
|
|
|
|
|
|
GBP |
|
|
1,480 |
|
|
Citibank |
|
|
7/10/2024 |
|
|
|
|
|
|
|
21 |
|
| CAD |
|
|
11,293 |
|
|
|
|
|
|
USD |
|
|
8,244 |
|
|
Morgan Stanley |
|
|
7/10/2024 |
|
|
|
|
|
|
|
14 |
|
| USD |
|
|
2,397 |
|
|
|
|
|
|
EUR |
|
|
2,235 |
|
|
JPMorgan Chase |
|
|
7/10/2024 |
|
|
|
|
|
|
|
2 |
|
| USD |
|
|
1,050 |
|
|
|
|
|
|
EUR |
|
|
980 |
|
|
Goldman Sachs |
|
|
7/10/2024 |
|
|
|
|
|
|
|
– |
|
| USD |
|
|
1,528 |
|
|
|
|
|
|
GBP |
|
|
1,210 |
|
|
Citibank |
|
|
7/10/2024 |
|
|
|
|
|
|
|
(2 |
) |
| PLN |
|
|
20,540 |
|
|
|
|
|
|
EUR |
|
|
4,769 |
|
|
HSBC Bank |
|
|
7/10/2024 |
|
|
|
|
|
|
|
(8 |
) |
| PLN |
|
|
4,740 |
|
|
|
|
|
|
USD |
|
|
1,198 |
|
|
BNP Paribas |
|
|
7/10/2024 |
|
|
|
|
|
|
|
(20 |
) |
| EUR |
|
|
5,100 |
|
|
|
|
|
|
CAD |
|
|
7,616 |
|
|
HSBC Bank |
|
|
7/10/2024 |
|
|
|
|
|
|
|
(104 |
) |
| EUR |
|
|
6,830 |
|
|
|
|
|
|
USD |
|
|
7,446 |
|
|
Bank of America |
|
|
7/10/2024 |
|
|
|
|
|
|
|
(127 |
) |
| EUR |
|
|
35,700 |
|
|
|
|
|
|
USD |
|
|
38,873 |
|
|
JPMorgan Chase |
|
|
7/10/2024 |
|
|
|
|
|
|
|
(619 |
) |
| CAD |
|
|
7,880 |
|
|
|
|
|
|
USD |
|
|
5,757 |
|
|
BNP Paribas |
|
|
7/11/2024 |
|
|
|
|
|
|
|
5 |
|
| USD |
|
|
911 |
|
|
|
|
|
|
AUD |
|
|
1,367 |
|
|
Morgan Stanley |
|
|
7/11/2024 |
|
|
|
|
|
|
|
(1 |
) |
| USD |
|
|
912 |
|
|
|
|
|
|
CAD |
|
|
1,250 |
|
|
Bank of New York Mellon |
|
|
7/11/2024 |
|
|
|
|
|
|
|
(2 |
) |
| USD |
|
|
2,467 |
|
|
|
|
|
|
AUD |
|
|
3,700 |
|
|
Morgan Stanley |
|
|
7/11/2024 |
|
|
|
|
|
|
|
(3 |
) |
| USD |
|
|
2,953 |
|
|
|
|
|
|
AUD |
|
|
4,432 |
|
|
HSBC Bank |
|
|
7/11/2024 |
|
|
|
|
|
|
|
(4 |
) |
| SEK |
|
|
45,500 |
|
|
|
|
|
|
USD |
|
|
4,341 |
|
|
Bank of America |
|
|
7/11/2024 |
|
|
|
|
|
|
|
(45 |
) |
| USD |
|
|
1,751 |
|
|
|
|
|
|
MXN |
|
|
31,000 |
|
|
Morgan Stanley |
|
|
7/12/2024 |
|
|
|
|
|
|
|
60 |
|
| MYR |
|
|
2,580 |
|
|
|
|
|
|
USD |
|
|
550 |
|
|
Standard Chartered Bank |
|
|
7/12/2024 |
|
|
|
|
|
|
|
(3 |
) |
| MYR |
|
|
7,900 |
|
|
|
|
|
|
USD |
|
|
1,679 |
|
|
Standard Chartered Bank |
|
|
7/12/2024 |
|
|
|
|
|
|
|
(3 |
) |
| USD |
|
|
3,532 |
|
|
|
|
|
|
BRL |
|
|
18,700 |
|
|
Citibank |
|
|
7/15/2024 |
|
|
|
|
|
|
|
193 |
|
| USD |
|
|
14,161 |
|
|
|
|
|
|
KRW |
|
|
19,491,214 |
|
|
Citibank |
|
|
7/15/2024 |
|
|
|
|
|
|
|
26 |
|
| USD |
|
|
784 |
|
|
|
|
|
|
KRW |
|
|
1,065,590 |
|
|
Barclays Bank PLC |
|
|
7/15/2024 |
|
|
|
|
|
|
|
12 |
|
| INR |
|
|
152,720 |
|
|
|
|
|
|
USD |
|
|
1,829 |
|
|
JPMorgan Chase |
|
|
7/15/2024 |
|
|
|
|
|
|
|
2 |
|
| INR |
|
|
79,000 |
|
|
|
|
|
|
USD |
|
|
945 |
|
|
Bank of New York Mellon |
|
|
7/15/2024 |
|
|
|
|
|
|
|
2 |
|
| USD |
|
|
8,185 |
|
|
|
|
|
|
ILS |
|
|
30,290 |
|
|
BNP Paribas |
|
|
7/17/2024 |
|
|
|
|
|
|
|
159 |
|
| USD |
|
|
21,639 |
|
|
|
|
|
|
MXN |
|
|
404,520 |
|
|
Morgan Stanley |
|
|
7/17/2024 |
|
|
|
|
|
|
|
(407 |
) |
| SGD |
|
|
1,400 |
|
|
|
|
|
|
USD |
|
|
1,035 |
|
|
HSBC Bank |
|
|
7/18/2024 |
|
|
|
|
|
|
|
(1 |
) |
| JPY |
|
|
2,128,568 |
|
|
|
|
|
|
USD |
|
|
13,602 |
|
|
Morgan Stanley |
|
|
7/18/2024 |
|
|
|
|
|
|
|
(331 |
) |
| USD |
|
|
2,696 |
|
|
|
|
|
|
GBP |
|
|
2,110 |
|
|
HSBC Bank |
|
|
7/22/2024 |
|
|
|
|
|
|
|
28 |
|
| USD |
|
|
4,950 |
|
|
|
|
|
|
NZD |
|
|
8,091 |
|
|
Morgan Stanley |
|
|
7/22/2024 |
|
|
|
|
|
|
|
22 |
|
| AUD |
|
|
4,120 |
|
|
|
|
|
|
USD |
|
|
2,734 |
|
|
Standard Chartered Bank |
|
|
7/22/2024 |
|
|
|
|
|
|
|
16 |
|
| EUR |
|
|
11,260 |
|
|
|
|
|
|
USD |
|
|
12,065 |
|
|
UBS AG |
|
|
7/22/2024 |
|
|
|
|
|
|
|
7 |
|
| GBP |
|
|
590 |
|
|
|
|
|
|
USD |
|
|
746 |
|
|
Citibank |
|
|
7/22/2024 |
|
|
|
|
|
|
|
– |
11 |
| USD |
|
|
1,643 |
|
|
|
|
|
|
AUD |
|
|
2,465 |
|
|
HSBC Bank |
|
|
7/22/2024 |
|
|
|
|
|
|
|
(2 |
) |
| USD |
|
|
1,529 |
|
|
|
|
|
|
EUR |
|
|
1,430 |
|
|
UBS AG |
|
|
7/22/2024 |
|
|
|
|
|
|
|
(4 |
) |
| GBP |
|
|
2,370 |
|
|
|
|
|
|
USD |
|
|
3,007 |
|
|
Goldman Sachs |
|
|
7/22/2024 |
|
|
|
|
|
|
|
(10 |
) |
| EUR |
|
|
16,582 |
|
|
|
|
|
|
USD |
|
|
17,913 |
|
|
BNP Paribas |
|
|
7/22/2024 |
|
|
|
|
|
|
|
(134 |
) |
| TRY |
|
|
7,670 |
|
|
|
|
|
|
USD |
|
|
226 |
|
|
Barclays Bank PLC |
|
|
7/24/2024 |
|
|
|
|
|
|
|
2 |
|
| CZK |
|
|
18,000 |
|
|
|
|
|
|
USD |
|
|
775 |
|
|
BNP Paribas |
|
|
7/24/2024 |
|
|
|
|
|
|
|
(6 |
) |
| ZAR |
|
|
29,130 |
|
|
|
|
|
|
USD |
|
|
1,608 |
|
|
Bank of New York Mellon |
|
|
7/24/2024 |
|
|
|
|
|
|
|
(10 |
) |
| CZK |
|
|
47,290 |
|
|
|
|
|
|
EUR |
|
|
1,897 |
|
|
HSBC Bank |
|
|
7/24/2024 |
|
|
|
|
|
|
|
(11 |
) |
191 American Funds Insurance Series
Capital World Bond Fund (continued)
|
|
|
|
|
|
|
|
|
|
|
|
|
|
|
|
|
|
|
|
|
|
|
|
|
|
|
|
|
| Forward currency contracts (continued) |
|
|
|
|
|
|
|
|
|
| |
|
|
|
|
|
|
|
|
|
|
|
|
|
|
|
|
|
Unrealized appreciation
(depreciation) at 6/30/2024 (000) |
|
| Contract amount |
|
|
|
|
|
|
| Currency purchased (000) |
|
|
|
|
|
Currency sold (000) |
|
|
Counterparty |
|
Settlement
date |
|
|
|
|
|
|
|
|
|
|
| ILS |
|
|
4,200 |
|
|
|
|
|
|
USD |
|
|
1,129 |
|
|
BNP Paribas |
|
|
7/24/2024 |
|
|
|
|
|
|
$ |
(15 |
) |
| CHF |
|
|
2,790 |
|
|
|
|
|
|
USD |
|
|
3,139 |
|
|
JPMorgan Chase |
|
|
7/24/2024 |
|
|
|
|
|
|
|
(24 |
) |
| CNH |
|
|
207,270 |
|
|
|
|
|
|
USD |
|
|
28,507 |
|
|
Goldman Sachs |
|
|
7/24/2024 |
|
|
|
|
|
|
|
(54 |
) |
| USD |
|
|
8,199 |
|
|
|
|
|
|
NOK |
|
|
86,680 |
|
|
Morgan Stanley |
|
|
7/25/2024 |
|
|
|
|
|
|
|
74 |
|
| USD |
|
|
996 |
|
|
|
|
|
|
NOK |
|
|
10,495 |
|
|
UBS AG |
|
|
7/25/2024 |
|
|
|
|
|
|
|
13 |
|
| USD |
|
|
755 |
|
|
|
|
|
|
NOK |
|
|
7,930 |
|
|
Standard Chartered Bank |
|
|
7/25/2024 |
|
|
|
|
|
|
|
11 |
|
| USD |
|
|
1,520 |
|
|
|
|
|
|
JPY |
|
|
243,330 |
|
|
Goldman Sachs |
|
|
7/25/2024 |
|
|
|
|
|
|
|
1 |
|
| DKK |
|
|
46,980 |
|
|
|
|
|
|
EUR |
|
|
6,301 |
|
|
HSBC Bank |
|
|
7/25/2024 |
|
|
|
|
|
|
|
– |
11 |
| PLN |
|
|
405 |
|
|
|
|
|
|
USD |
|
|
100 |
|
|
Barclays Bank PLC |
|
|
7/25/2024 |
|
|
|
|
|
|
|
– |
11 |
| EUR |
|
|
3,199 |
|
|
|
|
|
|
PLN |
|
|
13,860 |
|
|
Morgan Stanley |
|
|
7/25/2024 |
|
|
|
|
|
|
|
(12 |
) |
| USD |
|
|
10,499 |
|
|
|
|
|
|
DKK |
|
|
73,090 |
|
|
HSBC Bank |
|
|
7/25/2024 |
|
|
|
|
|
|
|
(13 |
) |
| JPY |
|
|
1,980,863 |
|
|
|
|
|
|
USD |
|
|
12,518 |
|
|
JPMorgan Chase |
|
|
7/25/2024 |
|
|
|
|
|
|
|
(154 |
) |
| USD |
|
|
26,697 |
|
|
|
|
|
|
BRL |
|
|
145,837 |
|
|
JPMorgan Chase |
|
|
7/30/2024 |
|
|
|
|
|
|
|
710 |
|
| USD |
|
|
995 |
|
|
|
|
|
|
BRL |
|
|
5,500 |
|
|
Goldman Sachs |
|
|
7/30/2024 |
|
|
|
|
|
|
|
15 |
|
| COP |
|
|
2,800,000 |
|
|
|
|
|
|
USD |
|
|
673 |
|
|
Morgan Stanley |
|
|
7/30/2024 |
|
|
|
|
|
|
|
(2 |
) |
| USD |
|
|
3,851 |
|
|
|
|
|
|
IDR |
|
|
63,046,370 |
|
|
Standard Chartered Bank |
|
|
7/30/2024 |
|
|
|
|
|
|
|
(2 |
) |
| USD |
|
|
1,068 |
|
|
|
|
|
|
IDR |
|
|
17,556,760 |
|
|
Citibank |
|
|
7/30/2024 |
|
|
|
|
|
|
|
(5 |
) |
| CLP |
|
|
3,670,820 |
|
|
|
|
|
|
USD |
|
|
3,928 |
|
|
Morgan Stanley |
|
|
7/30/2024 |
|
|
|
|
|
|
|
(28 |
) |
| EUR |
|
|
6,770 |
|
|
|
|
|
|
USD |
|
|
7,331 |
|
|
Morgan Stanley |
|
|
8/15/2024 |
|
|
|
|
|
|
|
(64 |
) |
| USD |
|
|
1,093 |
|
|
|
|
|
|
MXN |
|
|
20,471 |
|
|
Morgan Stanley |
|
|
9/17/2024 |
|
|
|
|
|
|
|
(11 |
) |
| USD |
|
|
521 |
|
|
|
|
|
|
MXN |
|
|
9,920 |
|
|
BNP Paribas |
|
|
9/17/2024 |
|
|
|
|
|
|
|
(14 |
) |
| USD |
|
|
695 |
|
|
|
|
|
|
MXN |
|
|
13,187 |
|
|
Bank of New York Mellon |
|
|
9/17/2024 |
|
|
|
|
|
|
|
(16 |
) |
| USD |
|
|
1,119 |
|
|
|
|
|
|
MXN |
|
|
21,083 |
|
|
Standard Chartered Bank |
|
|
9/17/2024 |
|
|
|
|
|
|
|
(18 |
) |
| USD |
|
|
4,196 |
|
|
|
|
|
|
EUR |
|
|
3,900 |
|
|
HSBC Bank |
|
|
9/18/2024 |
|
|
|
|
|
|
|
3 |
|
| USD |
|
|
1,549 |
|
|
|
|
|
|
AUD |
|
|
2,320 |
|
|
Morgan Stanley |
|
|
9/18/2024 |
|
|
|
|
|
|
|
(2 |
) |
| USD |
|
|
1,355 |
|
|
|
|
|
|
AUD |
|
|
2,029 |
|
|
HSBC Bank |
|
|
9/18/2024 |
|
|
|
|
|
|
|
(2 |
) |
| JPY |
|
|
570,964 |
|
|
|
|
|
|
CHF |
|
|
3,300 |
|
|
UBS AG |
|
|
9/18/2024 |
|
|
|
|
|
|
|
(116 |
) |
| USD |
|
|
3,362 |
|
|
|
|
|
|
BRL |
|
|
17,410 |
|
|
Citibank |
|
|
4/1/2025 |
|
|
|
|
|
|
|
346 |
|
|
|
|
|
|
|
|
|
|
|
|
|
|
|
|
|
|
|
|
|
|
|
|
|
|
|
|
|
|
|
|
|
|
|
|
|
|
|
|
|
|
|
|
|
|
|
|
|
|
|
|
|
|
|
|
|
|
|
|
|
|
|
|
|
$ |
(1,988 |
) |
|
|
|
|
|
|
|
|
|
|
|
|
|
|
|
|
|
|
|
|
|
|
|
|
|
|
|
|
|
Swap contracts
Interest rate swaps
Centrally cleared interest rate swaps
|
|
|
|
|
|
|
|
|
|
|
|
|
|
|
|
|
|
|
|
|
|
|
|
|
|
|
|
|
|
|
|
|
|
|
|
|
|
|
| Receive |
|
Pay |
|
|
|
|
Notional amount (000) |
|
|
Value at 6/30/2024
(000) |
|
|
Upfront
premium paid (received)
(000) |
|
|
Unrealized
appreciation
(depreciation) at 6/30/2024
(000) |
|
| Rate |
|
Payment
frequency |
|
Rate |
|
Payment
frequency |
|
Expiration
date |
|
|
|
|
|
|
|
|
|
|
|
|
|
| 2.628% |
|
Annual |
|
SONIA |
|
Annual |
|
|
7/28/2024 |
|
|
|
GBP21,600 |
|
|
|
|
|
|
$ |
(61 |
) |
|
|
|
|
|
$ |
– |
|
|
|
|
|
|
$ |
(61 |
) |
| 10.87% |
|
28-day |
|
28-day MXN-TIIE |
|
28-day |
|
|
4/17/2025 |
|
|
|
MXN772,940 |
|
|
|
|
|
|
|
(8 |
) |
|
|
|
|
|
|
– |
|
|
|
|
|
|
|
(8 |
) |
| 6-month CZK-PRIBOR |
|
Semi-annual |
|
3.875% |
|
Annual |
|
|
2/14/2026 |
|
|
|
CZK83,740 |
|
|
|
|
|
|
|
21 |
|
|
|
|
|
|
|
– |
|
|
|
|
|
|
|
21 |
|
| 5.298% |
|
Annual |
|
6-month PLN-WIBOR |
|
Semi-annual |
|
|
2/14/2026 |
|
|
|
PLN14,940 |
|
|
|
|
|
|
|
(14 |
) |
|
|
|
|
|
|
– |
|
|
|
|
|
|
|
(14 |
) |
| 6.50% |
|
28-day |
|
28-day MXN-TIIE |
|
28-day |
|
|
6/17/2026 |
|
|
|
MXN13,900 |
|
|
|
|
|
|
|
(52 |
) |
|
|
|
|
|
|
– |
|
|
|
|
|
|
|
(52 |
) |
| 6.55% |
|
28-day |
|
28-day MXN-TIIE |
|
28-day |
|
|
6/17/2026 |
|
|
|
MXN43,000 |
|
|
|
|
|
|
|
(158 |
) |
|
|
|
|
|
|
– |
|
|
|
|
|
|
|
(158 |
) |
| 6.50% |
|
28-day |
|
28-day MXN-TIIE |
|
28-day |
|
|
6/18/2026 |
|
|
|
MXN27,800 |
|
|
|
|
|
|
|
(103 |
) |
|
|
|
|
|
|
– |
|
|
|
|
|
|
|
(103 |
) |
| 7.62% |
|
28-day |
|
28-day MXN-TIIE |
|
28-day |
|
|
10/29/2026 |
|
|
|
MXN43,375 |
|
|
|
|
|
|
|
(124 |
) |
|
|
|
|
|
|
– |
|
|
|
|
|
|
|
(124 |
) |
| 4.254% |
|
Annual |
|
SONIA |
|
Annual |
|
|
5/9/2027 |
|
|
|
GBP13,640 |
|
|
|
|
|
|
|
(22 |
) |
|
|
|
|
|
|
– |
|
|
|
|
|
|
|
(22 |
) |
| 4.98038% |
|
Annual |
|
SONIA |
|
Annual |
|
|
6/21/2028 |
|
|
|
GBP10,000 |
|
|
|
|
|
|
|
398 |
|
|
|
|
|
|
|
– |
|
|
|
|
|
|
|
398 |
|
| 4.96048% |
|
Annual |
|
SONIA |
|
Annual |
|
|
6/21/2028 |
|
|
|
GBP7,810 |
|
|
|
|
|
|
|
304 |
|
|
|
|
|
|
|
– |
|
|
|
|
|
|
|
304 |
|
| 3.968% |
|
Annual |
|
SONIA |
|
Annual |
|
|
2/16/2029 |
|
|
|
GBP13,830 |
|
|
|
|
|
|
|
(42 |
) |
|
|
|
|
|
|
– |
|
|
|
|
|
|
|
(42 |
) |
| 3.52697105% |
|
Annual |
|
SONIA |
|
Annual |
|
|
5/24/2029 |
|
|
|
GBP14,660 |
|
|
|
|
|
|
|
– |
|
|
|
|
|
|
|
(22 |
) |
|
|
|
|
|
|
22 |
|
| 6-month EURIBOR |
|
Semi-annual |
|
2.8272% |
|
Annual |
|
|
6/18/2029 |
|
|
|
EUR5,930 |
|
|
|
|
|
|
|
14 |
|
|
|
|
|
|
|
– |
|
|
|
|
|
|
|
14 |
|
American Funds Insurance Series 192
Capital World Bond Fund (continued)
Swap contracts (continued)
Interest rate swaps (continued)
Centrally cleared interest rate swaps (continued)
|
|
|
|
|
|
|
|
|
|
|
|
|
|
|
|
|
|
|
|
|
|
|
|
|
|
|
|
|
|
|
|
|
|
|
|
|
|
|
| Receive |
|
Pay |
|
|
|
|
Notional amount
(000) |
|
|
Value at 6/30/2024
(000) |
|
|
Upfront
premium paid (received)
(000) |
|
|
Unrealized
appreciation
(depreciation) at 6/30/2024 (000) |
|
| Rate |
|
Payment
frequency |
|
Rate |
|
Payment frequency |
|
Expiration
date |
|
|
|
|
|
|
|
|
|
|
|
|
|
| SOFR |
|
Annual |
|
3.4705% |
|
Annual |
|
|
2/10/2030 |
|
|
|
USD16,910 |
|
|
|
|
|
|
$ |
465 |
|
|
|
|
|
|
$ |
– |
|
|
|
|
|
|
$ |
465 |
|
| SONIA |
|
Annual |
|
4.34948% |
|
Annual |
|
|
6/21/2033 |
|
|
|
GBP4,240 |
|
|
|
|
|
|
|
(195 |
) |
|
|
|
|
|
|
– |
|
|
|
|
|
|
|
(195 |
) |
| SONIA |
|
Annual |
|
4.36738% |
|
Annual |
|
|
6/21/2033 |
|
|
|
GBP8,600 |
|
|
|
|
|
|
|
(409 |
) |
|
|
|
|
|
|
– |
|
|
|
|
|
|
|
(409 |
) |
| SONIA |
|
Annual |
|
3.9322% |
|
Annual |
|
|
2/16/2054 |
|
|
|
GBP3,550 |
|
|
|
|
|
|
|
4 |
|
|
|
|
|
|
|
– |
|
|
|
|
|
|
|
4 |
|
|
|
|
|
|
|
|
|
|
|
|
|
|
|
|
|
|
|
|
|
|
|
|
|
|
|
|
|
|
|
|
|
|
|
|
|
|
|
|
|
|
|
|
|
|
|
|
|
|
|
|
|
|
|
|
|
|
|
|
|
|
|
|
|
|
|
|
|
|
|
|
$ |
18 |
|
|
|
|
|
|
$ |
(22 |
) |
|
|
|
|
|
$ |
40 |
|
|
|
|
|
|
|
|
|
|
|
|
|
|
|
|
|
|
|
|
|
|
|
|
|
|
|
|
|
|
|
|
|
|
|
|
|
|
|
|
Bilateral interest rate swaps
|
|
|
|
|
|
|
|
|
|
|
|
|
|
|
|
|
|
|
|
|
|
|
|
|
|
|
|
|
|
|
|
|
|
|
|
|
|
|
|
|
|
|
|
|
|
|
| Receive |
|
|
Pay |
|
|
|
|
|
|
|
|
Notional amount
(000) |
|
|
Value at 6/30/2024 (000) |
|
|
Upfront premium paid (received) (000) |
|
|
Unrealized
appreciation
(depreciation) at 6/30/2024 (000) |
|
| Rate |
|
Payment
frequency |
|
|
Rate |
|
Payment
frequency |
|
|
Counterparty |
|
|
Expiration
date |
|
|
|
|
|
|
|
|
|
|
|
|
|
|
| 11.22441676% |
|
|
At maturity |
|
|
BZDIOVER |
|
|
At maturity |
|
|
|
Goldman Sachs |
|
|
|
1/4/2027 |
|
|
|
BRL30,865 |
|
|
|
|
|
|
$ |
(96 |
) |
|
|
|
|
|
$ |
– |
|
|
|
|
|
|
$ |
(96 |
) |
| 11.405% |
|
|
At maturity |
|
|
BZDIOVER |
|
|
At maturity |
|
|
|
Goldman Sachs |
|
|
|
1/4/2027 |
|
|
|
BRL100,270 |
|
|
|
|
|
|
|
(195 |
) |
|
|
|
|
|
|
– |
|
|
|
|
|
|
|
(195 |
) |
| 10.045% |
|
|
At maturity |
|
|
BZDIOVER |
|
|
At maturity |
|
|
|
Goldman Sachs |
|
|
|
1/2/2029 |
|
|
|
BRL55,145 |
|
|
|
|
|
|
|
(930 |
) |
|
|
|
|
|
|
– |
|
|
|
|
|
|
|
(930 |
) |
|
|
|
|
|
|
|
|
|
|
|
|
|
|
|
|
|
|
|
|
|
|
|
|
|
|
|
|
|
|
|
|
|
|
|
|
|
|
|
|
|
|
|
|
|
|
|
|
|
|
|
|
|
|
|
|
|
|
|
|
|
|
|
|
|
|
|
|
|
|
|
|
|
|
|
|
|
|
|
|
|
|
|
|
|
|
|
|
$ |
(1,221 |
) |
|
|
|
|
|
$ |
– |
|
|
|
|
|
|
$ |
(1,221 |
) |
|
|
|
|
|
|
|
|
|
|
|
|
|
|
|
|
|
|
|
|
|
|
|
|
|
|
|
|
|
|
|
|
|
|
|
|
|
|
|
|
|
|
|
|
|
|
|
Credit default swaps
Centrally cleared credit default swaps on credit indices – buy protection
|
|
|
|
|
|
|
|
|
|
|
|
|
|
|
|
|
|
|
|
|
|
|
|
|
|
|
|
|
|
|
|
|
|
|
|
|
|
|
| Reference index |
|
Financing
rate paid |
|
Payment
frequency |
|
|
Expiration date |
|
|
Notional amount (000) |
|
|
Value at 6/30/2024 (000) |
|
|
Upfront premium paid (received) (000) |
|
|
Unrealized appreciation (depreciation) at 6/30/2024 (000) |
|
|
|
|
|
|
|
|
|
|
|
|
| CDX.NA.HY.42 |
|
5.00% |
|
|
Quarterly |
|
|
|
6/20/2029 |
|
|
|
USD4,675 |
|
|
|
|
|
|
$ |
(293 |
) |
|
|
|
|
|
$ |
(312 |
) |
|
|
|
|
|
$ |
19 |
|
Credit default swaps
Centrally cleared credit default swaps on credit indices – sell protection
|
|
|
|
|
|
|
|
|
|
|
|
|
|
|
|
|
|
|
|
|
|
|
|
|
|
|
|
|
|
|
|
|
|
|
|
|
|
|
|
|
| Reference index |
|
|
Financing
rate received |
|
|
|
Payment
frequency |
|
|
|
Expiration
date |
|
|
|
Notional
amount (000) |
17 |
|
|
Value at
6/30/202418 (000) |
|
|
|
Upfront
premium paid (received) (000) |
|
|
|
Unrealized
appreciation (depreciation) at 6/30/2024 (000) |
|
|
|
|
|
|
|
|
|
|
|
|
| ITRX.EUR.IG.41 |
|
|
1.00% |
|
|
|
Quarterly |
|
|
|
6/20/2029 |
|
|
|
EUR2,980 |
|
|
|
|
|
|
$ |
56 |
|
|
|
|
|
|
$ |
71 |
|
|
|
|
|
|
$ |
(15 |
) |
| CDX.NA.IG.42 |
|
|
1.00% |
|
|
|
Quarterly |
|
|
|
6/20/2029 |
|
|
|
USD99,659 |
|
|
|
|
|
|
|
2,052 |
|
|
|
|
|
|
|
2,236 |
|
|
|
|
|
|
|
(184 |
) |
|
|
|
|
|
|
|
|
|
|
|
|
|
|
|
|
|
|
|
|
|
|
|
|
|
|
|
|
|
|
|
|
|
|
|
|
|
|
|
|
|
|
|
|
|
|
|
|
|
|
|
|
|
|
|
|
|
|
|
|
|
|
|
|
|
|
|
|
|
|
|
|
|
|
$ |
2,108 |
|
|
|
|
|
|
$ |
2,307 |
|
|
|
|
|
|
$ |
(199 |
) |
|
|
|
|
|
|
|
|
|
|
|
|
|
|
|
|
|
|
|
|
|
|
|
|
|
|
|
|
|
|
|
|
|
|
|
|
|
|
|
|
|
193 American Funds Insurance Series
Capital World Bond Fund (continued)
|
|
|
|
|
|
|
|
|
|
|
|
|
|
|
|
|
|
|
|
|
|
|
|
|
|
|
|
|
|
|
|
|
|
|
|
|
|
|
|
|
|
|
|
|
| Investments in affiliates15 |
|
|
|
|
|
|
|
|
|
| |
|
Value at
1/1/2024
(000) |
|
|
Additions
(000) |
|
|
Reductions
(000) |
|
|
Net
realized
gain (loss)
(000) |
|
|
Net
unrealized
appreciation
(depreciation)
(000) |
|
|
Value at 6/30/2024 (000) |
|
|
Dividend
or interest
income (000) |
|
|
|
|
|
|
|
|
|
|
|
|
|
| Investment funds 1.36% |
|
|
|
|
|
|
|
|
|
|
|
|
|
|
|
|
|
|
|
|
|
|
|
|
|
|
|
|
|
|
|
|
|
|
|
|
|
|
|
|
|
|
|
|
| Capital Group Central Corporate Bond Fund |
|
$ |
52,692 |
|
|
$ |
919 |
|
|
$ |
31,216 |
|
|
|
|
|
|
$ |
689 |
|
|
|
|
|
|
$ |
(2,467 |
) |
|
|
|
|
|
$ |
20,617 |
|
|
|
|
|
|
$ |
919 |
|
|
|
|
|
|
|
|
|
|
|
|
|
| Short-term securities 13.89% |
|
|
|
|
|
|
|
|
|
|
|
|
|
|
|
|
|
|
|
|
|
|
|
|
|
|
|
|
|
|
|
|
|
|
|
|
|
|
|
|
|
|
|
|
| Money market investments 13.89% |
|
|
|
|
|
|
|
|
|
|
|
|
|
|
|
|
|
|
|
|
|
|
|
|
|
|
|
|
|
|
|
|
|
|
|
|
|
|
|
|
|
|
|
|
| Capital Group Central Cash Fund 5.37%16 |
|
|
177,300 |
|
|
|
302,206 |
|
|
|
268,955 |
|
|
|
|
|
|
|
(9 |
) |
|
|
|
|
|
|
20 |
|
|
|
|
|
|
|
210,562 |
|
|
|
|
|
|
|
5,802 |
|
|
|
|
|
|
|
|
|
|
|
|
|
|
|
|
|
|
|
|
|
|
|
|
|
|
|
|
|
|
|
|
|
|
|
|
|
|
|
|
|
|
|
|
|
|
|
|
|
|
|
|
|
|
|
|
|
|
| Total 15.25% |
|
|
|
|
|
|
|
|
|
|
|
|
|
|
|
|
|
$ |
680 |
|
|
|
|
|
|
$ |
(2,447 |
) |
|
|
|
|
|
$ |
231,179 |
|
|
|
|
|
|
$ |
6,721 |
|
|
|
|
|
|
|
|
|
|
|
|
|
|
|
|
|
|
|
|
|
|
|
|
|
|
|
|
|
|
|
|
|
|
|
|
|
|
|
|
|
|
|
|
|
|
|
|
|
|
|
|
|
|
|
|
|
|
|
|
|
|
|
| Restricted securities2 |
|
|
|
|
|
|
| |
|
Acquisition date(s) |
|
|
Cost (000) |
|
|
Value (000) |
|
|
Percent
of net
assets |
|
|
|
|
|
|
| Bank of America Corp. 3.648% 3/31/2029
(3-month EUR-EURIBOR + 3.67% on 3/31/2028)1 |
|
|
5/19/2020 |
|
|
$ |
5,882 |
|
|
$ |
5,352 |
|
|
|
.35 |
% |
| Goldman Sachs Group, Inc. 3.375% 3/27/2025 |
|
|
5/19/2020 |
|
|
|
5,532 |
|
|
|
5,340 |
|
|
|
.35 |
|
| Metropolitan Life Global Funding I 0.55% 6/16/2027 |
|
|
12/11/2023 |
|
|
|
1,984 |
|
|
|
1,974 |
|
|
|
.13 |
|
| Stillwater Mining Co. 4.00% 11/16/2026 |
|
|
1/26/2024-2/20/2024 |
|
|
|
1,892 |
|
|
|
1,912 |
|
|
|
.12 |
|
| Sasol Financing USA, LLC 8.75% 5/3/2029 |
|
|
7/18/2023-2/16/2024 |
|
|
|
1,340 |
|
|
|
1,354 |
|
|
|
.09 |
|
| Wolfspeed, Inc. 9.875% 6/23/2030 (10.875% on 6/23/2026)1,12 |
|
|
6/23/2023 |
|
|
|
102 |
|
|
|
102 |
|
|
|
.01 |
|
| Finastra USA, Inc., Term Loan B,
(3-month USD CME Term SOFR + 7.25%) 12.459% 9/13/20297,8 |
|
|
9/13/2023 |
|
|
|
95 |
|
|
|
97 |
|
|
|
.01 |
|
| Finastra USA, Inc., Term Loan,
(3-month USD CME Term SOFR + 7.25%) 12.581% 9/13/20297,8 |
|
|
9/13/2023-6/13/2024 |
|
|
|
1 |
|
|
|
1 |
|
|
|
.00 |
19 |
|
|
|
|
|
|
|
|
|
|
|
|
|
|
|
|
|
|
|
|
|
|
| Total |
|
|
|
|
|
$ |
16,828 |
|
|
$ |
16,132 |
|
|
|
1.06 |
% |
|
|
|
|
|
|
|
|
|
|
|
|
|
|
|
|
|
American Funds Insurance Series 194
Capital World Bond Fund (continued)
| 1 |
Step bond; coupon rate may change at a later date. |
| 2 |
Restricted security, other than Rule 144A securities or commercial paper issued pursuant to Section 4(a)(2) of the Securities Act of 1933. The total value of all such restricted securities was $16,132,000, which represented 1.06% of the net assets of the fund. |
| 3 |
Scheduled interest and/or principal payment was not received. |
| 4 |
Index-linked bond whose principal amount moves with a government price index. |
| 5 |
Principal payments may be made periodically. Therefore, the effective maturity date may be earlier than the stated maturity date. |
| 6 |
Acquired in a transaction exempt from registration under Rule 144A or, for commercial paper, Section 4(a)(2) of the Securities Act of 1933. May be resold in the U.S. in transactions exempt from registration, normally to qualified institutional buyers. The total value of all such securities was $118,828,000, which represented 7.84% of the net assets of the fund. |
| 7 |
Loan participations and assignments; may be subject to legal or contractual restrictions on resale. The total value of all such loans was $1,957,000, which represented .13% of the net assets of the fund. |
| 8 |
Coupon rate may change periodically. Reference rate and spread are as of the most recent information available. Some coupon rates are determined by the issuer or agent based on current market conditions; therefore, the reference rate and spread are not available. |
| 9 |
Payment in kind; the issuer has the option of paying additional securities in lieu of cash. Payment methods and rates are as of the most recent payment when available. |
| 10 |
Purchased on a TBA basis. |
| 11 |
Amount less than one thousand. |
| 12 |
Value determined using significant unobservable inputs. |
| 13 |
All or a portion of this security was pledged as collateral. The total value of pledged collateral was $12,548,000, which represented .83% of the net assets of the fund. |
| 14 |
Security did not produce income during the last 12 months. |
| 15 |
Part of the same “group of investment companies” as the fund as defined under the Investment Company Act of 1940, as amended. |
| 16 |
Rate represents the seven-day yield at 6/30/2024. |
| 17 |
The maximum potential amount the fund may pay as a protection seller should a credit event occur. |
| 18 |
The prices and resulting values for credit default swap indices serve as an indicator of the current status of the payment/performance risk. As the value of a sell protection credit default swap increases or decreases, when compared to the notional amount of the swap, the payment/performance risk may decrease or increase, respectively. |
| 19 |
Amount less than .01%. |
|
|
|
| Key to abbreviation(s) |
|
|
| Assn. = Association |
|
MXN = Mexican pesos |
| AUD = Australian dollars |
|
MYR = Malaysian ringgits |
| BRL = Brazilian reais |
|
NGN = Nigerian naira |
| BZDIOVER = Overnight Brazilian Interbank Deposit Rate |
|
NOK = Norwegian kroner |
| CAD = Canadian dollars |
|
NZD = New Zealand dollars |
| CHF = Swiss francs |
|
PIK = Payment In Kind |
| CLP = Chilean pesos |
|
PLN = Polish zloty |
| CME = CME Group |
|
PRIBOR = Prague Interbank Offered Rate |
| CNH = Chinese yuan renminbi |
|
Ref. = Refunding |
| CNY = Chinese yuan |
|
REIT = Real Estate Investment Trust |
| COP = Colombian pesos |
|
Rev. = Revenue |
| CZK = Czech korunas |
|
RON = Romanian leu |
| DAC = Designated Activity Company |
|
SEK = Swedish kronor |
| DKK = Danish kroner |
|
SGD = Singapore dollars |
| EGP = Egyptian pounds |
|
SOFR = Secured Overnight Financing Rate |
| EUR = Euros |
|
SONIA = Sterling Overnight Interbank Average Rate |
| EURIBOR = Euro Interbank Offered Rate |
|
TBA = To be announced |
| GBP = British pounds |
|
THB = Thai baht |
| HUF = Hungarian forints |
|
TIIE = Equilibrium Interbank Interest Rate |
| ICE = Intercontinental Exchange, Inc. |
|
TRY = Turkish lira |
| IDR = Indonesian rupiah |
|
UAH = Ukrainian hryvnia |
| ILS = Israeli shekels |
|
USD = U.S. dollars |
| INR = Indian rupees |
|
WIBOR = Warsaw Interbank Offer Rate |
| JPY = Japanese yen |
|
ZAR = South African rand |
| KRW = South Korean won |
|
|
Refer to the notes to financial statements.
195 American Funds Insurance Series
|
|
|
| American High-Income Trust |
|
|
|
|
| Investment portfolio June 30, 2024 |
|
unaudited |
|
|
|
|
|
|
|
|
|
|
|
| Bonds, notes & other debt instruments 89.85% |
|
Principal amount (000) |
|
|
Value (000) |
|
|
|
|
| Corporate bonds, notes & loans 89.63% |
|
|
|
|
|
|
|
|
|
|
|
|
| Energy 14.67% |
|
3R Lux SARL 9.75% 2/5/20311 |
|
|
USD875 |
|
|
$ |
919 |
|
|
|
Aethon United BR, LP 8.25% 2/15/20261 |
|
|
435 |
|
|
|
440 |
|
|
|
Antero Midstream Partners, LP 5.375% 6/15/20291 |
|
|
570 |
|
|
|
553 |
|
|
|
Antero Resources Corp. 7.625% 2/1/20291 |
|
|
244 |
|
|
|
251 |
|
|
|
Antero Resources Corp. 5.375% 3/1/20301 |
|
|
130 |
|
|
|
126 |
|
|
|
Archrock Partners, LP 6.25% 4/1/20281 |
|
|
170 |
|
|
|
168 |
|
|
|
Ascent Resources Utica Holdings, LLC 7.00% 11/1/20261 |
|
|
2,040 |
|
|
|
2,044 |
|
|
|
Ascent Resources Utica Holdings, LLC 9.00% 11/1/20271 |
|
|
170 |
|
|
|
211 |
|
|
|
Ascent Resources Utica Holdings, LLC 8.25% 12/31/20281 |
|
|
271 |
|
|
|
278 |
|
|
|
Ascent Resources Utica Holdings, LLC 5.875% 6/30/20291 |
|
|
650 |
|
|
|
636 |
|
|
|
Baytex Energy Corp. 8.50% 4/30/20301 |
|
|
520 |
|
|
|
544 |
|
|
|
Baytex Energy Corp. 7.375% 3/15/20321 |
|
|
1,470 |
|
|
|
1,495 |
|
|
|
BIP-V Chinook Holdco, LLC 5.50% 6/15/20311 |
|
|
1,210 |
|
|
|
1,148 |
|
|
|
Blue Racer Midstream, LLC 7.00% 7/15/20291 |
|
|
125 |
|
|
|
127 |
|
|
|
Blue Racer Midstream, LLC 7.25% 7/15/20321 |
|
|
885 |
|
|
|
910 |
|
|
|
Borr IHC, Ltd. 10.00% 11/15/20281 |
|
|
2,668 |
|
|
|
2,797 |
|
|
|
Borr IHC, Ltd. 10.375% 11/15/20301 |
|
|
873 |
|
|
|
915 |
|
|
|
California Resources Corp. 7.125% 2/1/20261 |
|
|
390 |
|
|
|
391 |
|
|
|
California Resources Corp. 8.25% 6/15/20291 |
|
|
520 |
|
|
|
531 |
|
|
|
Cheniere Energy Partners, LP 4.50% 10/1/2029 |
|
|
58 |
|
|
|
55 |
|
|
|
Cheniere Energy, Inc. 4.625% 10/15/2028 |
|
|
1,041 |
|
|
|
1,011 |
|
|
|
Chesapeake Energy Corp. 5.50% 2/1/20261 |
|
|
790 |
|
|
|
783 |
|
|
|
Chesapeake Energy Corp. 5.875% 2/1/20291 |
|
|
1,670 |
|
|
|
1,654 |
|
|
|
Chesapeake Energy Corp. 6.75% 4/15/20291 |
|
|
755 |
|
|
|
757 |
|
|
|
Chesapeake Energy Corp. 4.875% 4/15/20322 |
|
|
4,300 |
|
|
|
90 |
|
|
|
Chord Energy Corp. 6.375% 6/1/20261 |
|
|
190 |
|
|
|
190 |
|
|
|
CITGO Petroleum Corp. 8.375% 1/15/20291 |
|
|
1,315 |
|
|
|
1,356 |
|
|
|
Civitas Resources, Inc. 5.00% 10/15/20261 |
|
|
905 |
|
|
|
882 |
|
|
|
Civitas Resources, Inc. 8.375% 7/1/20281 |
|
|
530 |
|
|
|
556 |
|
|
|
Civitas Resources, Inc. 8.625% 11/1/20301 |
|
|
730 |
|
|
|
783 |
|
|
|
Civitas Resources, Inc. 8.75% 7/1/20311 |
|
|
2,987 |
|
|
|
3,203 |
|
|
|
CNX Midstream Partners, LP 4.75% 4/15/20301 |
|
|
280 |
|
|
|
253 |
|
|
|
CNX Resources Corp. 6.00% 1/15/20291 |
|
|
1,504 |
|
|
|
1,473 |
|
|
|
CNX Resources Corp. 7.375% 1/15/20311 |
|
|
861 |
|
|
|
881 |
|
|
|
CNX Resources Corp. 7.25% 3/1/20321 |
|
|
965 |
|
|
|
985 |
|
|
|
Comstock Resources, Inc. 6.75% 3/1/20291 |
|
|
805 |
|
|
|
781 |
|
|
|
Comstock Resources, Inc. 5.875% 1/15/20301 |
|
|
1,095 |
|
|
|
1,020 |
|
|
|
Constellation Oil Services Holding SA 3.00% Cash 12/31/20263 |
|
|
3,201 |
|
|
|
2,633 |
|
|
|
Crescent Energy Finance, LLC 9.25% 2/15/20281 |
|
|
1,498 |
|
|
|
1,584 |
|
|
|
Crescent Energy Finance, LLC 7.625% 4/1/20321 |
|
|
1,435 |
|
|
|
1,463 |
|
|
|
Crescent Energy Finance, LLC 7.375% 1/15/20331 |
|
|
550 |
|
|
|
551 |
|
|
|
Delek Logistics Partners, LP 8.625% 3/15/20291 |
|
|
365 |
|
|
|
376 |
|
|
|
Devon Energy Corp. 5.875% 6/15/2028 |
|
|
202 |
|
|
|
203 |
|
|
|
Devon Energy Corp. 4.50% 1/15/2030 |
|
|
493 |
|
|
|
475 |
|
|
|
DT Midstream, Inc. 4.125% 6/15/20291 |
|
|
1,408 |
|
|
|
1,302 |
|
|
|
DT Midstream, Inc. 4.375% 6/15/20311 |
|
|
307 |
|
|
|
280 |
|
|
|
Ecopetrol SA 8.375% 1/19/2036 |
|
|
315 |
|
|
|
310 |
|
|
|
Encino Acquisition Partners Holdings, LLC 8.50% 5/1/20281 |
|
|
725 |
|
|
|
739 |
|
|
|
Encino Acquisition Partners Holdings, LLC 8.75% 5/1/20311 |
|
|
1,165 |
|
|
|
1,216 |
|
|
|
Energean Israel Finance, Ltd. 4.875% 3/30/20261 |
|
|
225 |
|
|
|
213 |
|
|
|
Energean Israel Finance, Ltd. 5.875% 3/30/20311 |
|
|
1,085 |
|
|
|
921 |
|
|
|
Energy Transfer, LP 6.00% 2/1/20291 |
|
|
55 |
|
|
|
55 |
|
|
|
EQM Midstream Partners, LP 4.125% 12/1/2026 |
|
|
87 |
|
|
|
84 |
|
|
|
EQM Midstream Partners, LP 6.50% 7/1/20271 |
|
|
1,120 |
|
|
|
1,133 |
|
|
|
EQM Midstream Partners, LP 5.50% 7/15/2028 |
|
|
586 |
|
|
|
577 |
|
|
|
EQM Midstream Partners, LP 6.375% 4/1/20291 |
|
|
185 |
|
|
|
187 |
|
|
|
EQM Midstream Partners, LP 4.75% 1/15/20311 |
|
|
1,690 |
|
|
|
1,581 |
|
|
|
EQM Midstream Partners, LP 6.50% 7/15/2048 |
|
|
1,115 |
|
|
|
1,126 |
|
|
|
EQT Corp. 5.00% 1/15/2029 |
|
|
170 |
|
|
|
167 |
|
|
|
EQT Corp. 3.625% 5/15/20311 |
|
|
290 |
|
|
|
256 |
|
|
|
Genesis Energy, LP 8.00% 1/15/2027 |
|
|
3,115 |
|
|
|
3,188 |
|
American Funds Insurance Series 196
American High-Income Trust (continued)
|
|
|
|
|
|
|
|
|
|
|
| Bonds, notes & other debt instruments (continued) |
|
Principal amount (000) |
|
|
Value (000) |
|
|
|
|
| Corporate bonds, notes & loans (continued) |
|
|
|
|
|
|
|
|
|
|
|
|
| Energy (continued) |
|
Genesis Energy, LP 7.75% 2/1/2028 |
|
|
USD87 |
|
|
$ |
88 |
|
|
|
Genesis Energy, LP 8.25% 1/15/2029 |
|
|
1,480 |
|
|
|
1,529 |
|
|
|
Genesis Energy, LP 8.875% 4/15/2030 |
|
|
1,110 |
|
|
|
1,169 |
|
|
|
Genesis Energy, LP 7.875% 5/15/2032 |
|
|
2,485 |
|
|
|
2,510 |
|
|
|
Global Partners, LP 6.875% 1/15/2029 |
|
|
135 |
|
|
|
134 |
|
|
|
Global Partners, LP 8.25% 1/15/20321 |
|
|
575 |
|
|
|
591 |
|
|
|
Harbour Energy PLC 5.50% 10/15/20261 |
|
|
1,545 |
|
|
|
1,516 |
|
|
|
Harvest Midstream I, LP 7.50% 9/1/20281 |
|
|
1,717 |
|
|
|
1,746 |
|
|
|
Harvest Midstream I, LP 7.50% 5/15/20321 |
|
|
900 |
|
|
|
915 |
|
|
|
Hess Midstream Operations, LP 5.125% 6/15/20281 |
|
|
156 |
|
|
|
151 |
|
|
|
Hess Midstream Operations, LP 6.50% 6/1/20291 |
|
|
405 |
|
|
|
411 |
|
|
|
Hess Midstream Operations, LP 4.25% 2/15/20301 |
|
|
1,430 |
|
|
|
1,314 |
|
|
|
Hess Midstream Operations, LP 5.50% 10/15/20301 |
|
|
400 |
|
|
|
387 |
|
|
|
Hilcorp Energy I, LP 6.25% 11/1/20281 |
|
|
145 |
|
|
|
143 |
|
|
|
Hilcorp Energy I, LP 5.75% 2/1/20291 |
|
|
985 |
|
|
|
954 |
|
|
|
Hilcorp Energy I, LP 6.00% 4/15/20301 |
|
|
922 |
|
|
|
891 |
|
|
|
Hilcorp Energy I, LP 6.00% 2/1/20311 |
|
|
938 |
|
|
|
899 |
|
|
|
Hilcorp Energy I, LP 6.25% 4/15/20321 |
|
|
970 |
|
|
|
934 |
|
|
|
Hilcorp Energy I, LP 8.375% 11/1/20331 |
|
|
2,023 |
|
|
|
2,157 |
|
|
|
Jonah Energy, LLC 12.00% 11/5/20254 |
|
|
852 |
|
|
|
852 |
|
|
|
Kodiak Gas Services, LLC 7.25% 2/15/20291 |
|
|
655 |
|
|
|
672 |
|
|
|
Matador Resources Co. 6.875% 4/15/20281 |
|
|
425 |
|
|
|
432 |
|
|
|
Matador Resources Co. 6.50% 4/15/20321 |
|
|
820 |
|
|
|
821 |
|
|
|
MEG Energy Corp. 5.875% 2/1/20291 |
|
|
485 |
|
|
|
472 |
|
|
|
Mesquite Energy, Inc. 7.25% 2/15/20231,2 |
|
|
739 |
|
|
|
39 |
|
|
|
Murphy Oil Corp. 6.375% 7/15/2028 |
|
|
243 |
|
|
|
245 |
|
|
|
Murphy Oil USA, Inc. 3.75% 2/15/20311 |
|
|
820 |
|
|
|
723 |
|
|
|
Nabors Industries, Inc. 7.375% 5/15/20271 |
|
|
1,190 |
|
|
|
1,211 |
|
|
|
Nabors Industries, Inc. 9.125% 1/31/20301 |
|
|
1,340 |
|
|
|
1,389 |
|
|
|
Nabors Industries, Ltd. 7.25% 1/15/20261 |
|
|
500 |
|
|
|
508 |
|
|
|
New Fortress Energy, Inc. 6.75% 9/15/20251 |
|
|
1,038 |
|
|
|
1,008 |
|
|
|
New Fortress Energy, Inc. 6.50% 9/30/20261 |
|
|
5,250 |
|
|
|
4,834 |
|
|
|
New Fortress Energy, Inc. 8.75% 3/15/20291 |
|
|
2,690 |
|
|
|
2,458 |
|
|
|
New Fortress Energy, Inc., Term Loan,
(3-month USD CME Term SOFR + 5.00%) 10.33% 10/30/20285,6 |
|
|
269 |
|
|
|
262 |
|
|
|
NGL Energy Operating, LLC 8.125% 2/15/20291 |
|
|
895 |
|
|
|
913 |
|
|
|
NGL Energy Operating, LLC 8.375% 2/15/20321 |
|
|
1,800 |
|
|
|
1,829 |
|
|
|
Noble Finance II, LLC 8.00% 4/15/20301 |
|
|
235 |
|
|
|
245 |
|
|
|
Northern Oil and Gas, Inc. 8.125% 3/1/20281 |
|
|
1,985 |
|
|
|
2,009 |
|
|
|
Northern Oil and Gas, Inc. 8.75% 6/15/20311 |
|
|
405 |
|
|
|
425 |
|
|
|
NuStar Logistics, LP 6.00% 6/1/2026 |
|
|
286 |
|
|
|
286 |
|
|
|
Parkland Corp. 4.625% 5/1/20301 |
|
|
440 |
|
|
|
402 |
|
|
|
Permian Resources Operating, LLC 8.00% 4/15/20271 |
|
|
58 |
|
|
|
59 |
|
|
|
Permian Resources Operating, LLC 9.875% 7/15/20311 |
|
|
1,840 |
|
|
|
2,038 |
|
|
|
Permian Resources Operating, LLC 7.00% 1/15/20321 |
|
|
1,165 |
|
|
|
1,198 |
|
|
|
Petroleos Mexicanos 6.875% 10/16/2025 |
|
|
350 |
|
|
|
349 |
|
|
|
Petroleos Mexicanos 8.75% 6/2/2029 |
|
|
732 |
|
|
|
719 |
|
|
|
Petroleos Mexicanos 5.95% 1/28/2031 |
|
|
485 |
|
|
|
391 |
|
|
|
Petroleos Mexicanos 6.95% 1/28/2060 |
|
|
425 |
|
|
|
281 |
|
|
|
Pluspetrol Camisea SA 6.24% 7/3/20361 |
|
|
150 |
|
|
|
150 |
|
|
|
Range Resources Corp. 4.875% 5/15/2025 |
|
|
362 |
|
|
|
360 |
|
|
|
Range Resources Corp. 8.25% 1/15/2029 |
|
|
585 |
|
|
|
607 |
|
|
|
Range Resources Corp. 4.75% 2/15/20301 |
|
|
538 |
|
|
|
505 |
|
|
|
Saturn Oil & Gas, Inc. 9.625% 6/15/20291 |
|
|
1,185 |
|
|
|
1,197 |
|
|
|
Southwestern Energy Co. 5.375% 3/15/2030 |
|
|
1,290 |
|
|
|
1,247 |
|
|
|
Southwestern Energy Co. 4.75% 2/1/2032 |
|
|
370 |
|
|
|
341 |
|
|
|
Suburban Propane Partners, LP 5.00% 6/1/20311 |
|
|
335 |
|
|
|
302 |
|
|
|
Sunoco, LP 6.00% 4/15/2027 |
|
|
547 |
|
|
|
547 |
|
|
|
Sunoco, LP 5.875% 3/15/2028 |
|
|
290 |
|
|
|
289 |
|
|
|
Sunoco, LP 7.00% 9/15/20281 |
|
|
1,645 |
|
|
|
1,687 |
|
|
|
Sunoco, LP 7.00% 5/1/20291 |
|
|
300 |
|
|
|
308 |
|
197 American Funds Insurance Series
American High-Income Trust (continued)
|
|
|
|
|
|
|
|
|
|
|
| Bonds, notes & other debt instruments (continued) |
|
Principal amount (000) |
|
|
Value (000) |
|
|
| Corporate bonds, notes & loans (continued) |
|
|
|
|
|
| Energy (continued) |
|
Sunoco, LP 4.50% 5/15/2029 |
|
|
USD1,970 |
|
|
$ |
1,844 |
|
|
|
Sunoco, LP 4.50% 4/30/2030 |
|
|
1,955 |
|
|
|
1,810 |
|
|
|
Sunoco, LP 7.25% 5/1/20321 |
|
|
785 |
|
|
|
813 |
|
|
|
Tallgrass Energy Partners, LP 7.50% 10/1/20251 |
|
|
85 |
|
|
|
85 |
|
|
|
Talos Production, Inc. 9.00% 2/1/20291 |
|
|
1,110 |
|
|
|
1,166 |
|
|
|
Talos Production, Inc. 9.375% 2/1/20311 |
|
|
1,145 |
|
|
|
1,210 |
|
|
|
Targa Resources Partners, LP 6.50% 7/15/2027 |
|
|
133 |
|
|
|
134 |
|
|
|
Targa Resources Partners, LP 6.875% 1/15/2029 |
|
|
915 |
|
|
|
939 |
|
|
|
Targa Resources Partners, LP 5.50% 3/1/2030 |
|
|
327 |
|
|
|
325 |
|
|
|
Targa Resources Partners, LP 4.875% 2/1/2031 |
|
|
695 |
|
|
|
664 |
|
|
|
Transocean Aquila, Ltd. 8.00% 9/30/20281 |
|
|
575 |
|
|
|
585 |
|
|
|
Transocean Poseidon, Ltd. 6.875% 2/1/20271 |
|
|
474 |
|
|
|
474 |
|
|
|
Transocean Titan Financing, Ltd. 8.375% 2/1/20281 |
|
|
1,032 |
|
|
|
1,066 |
|
|
|
Transocean, Inc. 8.25% 5/15/20291 |
|
|
290 |
|
|
|
291 |
|
|
|
Transocean, Inc. 8.75% 2/15/20301 |
|
|
512 |
|
|
|
538 |
|
|
|
Transocean, Inc. 8.50% 5/15/20311 |
|
|
520 |
|
|
|
521 |
|
|
|
Transocean, Inc. 6.80% 3/15/2038 |
|
|
540 |
|
|
|
448 |
|
|
|
USA Compression Partners, LP 6.875% 9/1/2027 |
|
|
247 |
|
|
|
248 |
|
|
|
USA Compression Partners, LP 7.125% 3/15/20291 |
|
|
700 |
|
|
|
706 |
|
|
|
Valaris, Ltd. 8.375% 4/30/20301 |
|
|
450 |
|
|
|
466 |
|
|
|
Venture Global Calcasieu Pass, LLC 3.875% 8/15/20291 |
|
|
1,190 |
|
|
|
1,085 |
|
|
|
Venture Global Calcasieu Pass, LLC 6.25% 1/15/20301 |
|
|
195 |
|
|
|
198 |
|
|
|
Venture Global Calcasieu Pass, LLC 4.125% 8/15/20311 |
|
|
2,250 |
|
|
|
2,021 |
|
|
|
Venture Global Calcasieu Pass, LLC 3.875% 11/1/20331 |
|
|
1,260 |
|
|
|
1,075 |
|
|
|
Venture Global LNG, Inc. 8.125% 6/1/20281 |
|
|
710 |
|
|
|
732 |
|
|
|
Venture Global LNG, Inc. 9.50% 2/1/20291 |
|
|
405 |
|
|
|
444 |
|
|
|
Venture Global LNG, Inc. 8.375% 6/1/20311 |
|
|
1,000 |
|
|
|
1,038 |
|
|
|
Vital Energy, Inc. 7.875% 4/15/20321 |
|
|
1,045 |
|
|
|
1,063 |
|
|
|
W&T Offshore, Inc. 11.75% 2/1/20261 |
|
|
355 |
|
|
|
365 |
|
|
|
Weatherford International, Ltd. 8.625% 4/30/20301 |
|
|
2,966 |
|
|
|
3,076 |
|
|
|
Western Midstream Operating, LP 3.10% 2/1/20257 |
|
|
35 |
|
|
|
34 |
|
|
|
Western Midstream Operating, LP 4.50% 3/1/2028 |
|
|
239 |
|
|
|
231 |
|
|
|
Western Midstream Operating, LP 5.25% 2/1/20507 |
|
|
300 |
|
|
|
263 |
|
|
|
|
|
|
|
|
|
|
|
|
|
|
|
|
|
|
|
|
|
130,824 |
|
|
|
|
|
|
|
|
|
|
|
|
|
| |
|
|
|
|
|
| Communication services 12.14% |
|
Altice France Holding SA 10.50% 5/15/20271 |
|
|
1,080 |
|
|
|
432 |
|
|
|
Altice France SA 5.125% 7/15/20291 |
|
|
2,227 |
|
|
|
1,468 |
|
|
|
Altice France SA 5.50% 10/15/20291 |
|
|
380 |
|
|
|
251 |
|
|
|
América Móvil, SAB de CV 10.125% 1/22/2029 |
|
|
MXN5,750 |
|
|
|
306 |
|
|
|
CCO Holdings, LLC 5.50% 5/1/20261 |
|
|
USD102 |
|
|
|
101 |
|
|
|
CCO Holdings, LLC 5.00% 2/1/20281 |
|
|
901 |
|
|
|
843 |
|
|
|
CCO Holdings, LLC 5.375% 6/1/20291 |
|
|
360 |
|
|
|
328 |
|
|
|
CCO Holdings, LLC 6.375% 9/1/20291 |
|
|
300 |
|
|
|
285 |
|
|
|
CCO Holdings, LLC 4.75% 3/1/20301 |
|
|
3,521 |
|
|
|
3,052 |
|
|
|
CCO Holdings, LLC 4.50% 8/15/20301 |
|
|
2,634 |
|
|
|
2,232 |
|
|
|
CCO Holdings, LLC 4.25% 2/1/20311 |
|
|
3,093 |
|
|
|
2,528 |
|
|
|
CCO Holdings, LLC 4.75% 2/1/20321 |
|
|
2,324 |
|
|
|
1,905 |
|
|
|
CCO Holdings, LLC 4.50% 5/1/2032 |
|
|
1,768 |
|
|
|
1,425 |
|
|
|
CCO Holdings, LLC 4.50% 6/1/20331 |
|
|
1,568 |
|
|
|
1,235 |
|
|
|
CCO Holdings, LLC 4.25% 1/15/20341 |
|
|
3,431 |
|
|
|
2,607 |
|
|
|
Charter Communications Operating, LLC 5.25% 4/1/2053 |
|
|
400 |
|
|
|
314 |
|
|
|
Clear Channel Outdoor Holdings, Inc. 7.75% 4/15/20281 |
|
|
570 |
|
|
|
499 |
|
|
|
Clear Channel Outdoor Holdings, Inc. 7.50% 6/1/20291 |
|
|
315 |
|
|
|
264 |
|
|
|
Cogent Communications Group, Inc. 3.50% 5/1/20261 |
|
|
690 |
|
|
|
661 |
|
|
|
Connect Finco SARL 6.75% 10/1/20261 |
|
|
3,510 |
|
|
|
3,391 |
|
|
|
Consolidated Communications, Inc. 5.00% 10/1/20281 |
|
|
225 |
|
|
|
186 |
|
|
|
CSC Holdings, LLC, Term Loan B,
(3-month USD CME Term SOFR + 4.50%) 9.829% 1/18/20285,6 |
|
|
1,157 |
|
|
|
1,115 |
|
|
|
Diamond Sports Group, LLC 5.375% 8/15/20261,2 |
|
|
503 |
|
|
|
10 |
|
American Funds Insurance Series 198
American High-Income Trust (continued)
|
|
|
|
|
|
|
|
|
|
|
| Bonds, notes & other debt instruments (continued) |
|
Principal amount (000) |
|
|
Value (000) |
|
|
| Corporate bonds, notes & loans (continued) |
|
|
|
|
|
| Communication services (continued) |
|
Diamond Sports Group, LLC 6.625% 8/15/20271,2 |
|
|
USD1,056 |
|
|
$ |
22 |
|
|
|
Diamond Sports Group, LLC, Term Loan, 5.00% 12/2/20243,5 |
|
|
87 |
|
|
|
124 |
|
|
|
DIRECTV Financing, LLC 5.875% 8/15/20271 |
|
|
3,021 |
|
|
|
2,844 |
|
|
|
DIRECTV Financing, LLC 8.875% 2/1/20301 |
|
|
325 |
|
|
|
318 |
|
|
|
DIRECTV Financing, LLC, Term Loan,
(3-month USD CME Term SOFR + 5.00%) 10.458% 8/2/20275,6 |
|
|
669 |
|
|
|
672 |
|
|
|
DISH DBS Corp. 5.875% 11/15/2024 |
|
|
11,610 |
|
|
|
11,034 |
|
|
|
DISH DBS Corp. 7.75% 7/1/2026 |
|
|
735 |
|
|
|
457 |
|
|
|
DISH DBS Corp. 5.25% 12/1/20261 |
|
|
515 |
|
|
|
407 |
|
|
|
DISH Network Corp. 11.75% 11/15/20271 |
|
|
5,840 |
|
|
|
5,732 |
|
|
|
Embarq Corp. 7.995% 6/1/2036 |
|
|
3,649 |
|
|
|
479 |
|
|
|
Frontier Communications Holdings, LLC 5.875% 10/15/20271 |
|
|
820 |
|
|
|
801 |
|
|
|
Frontier Communications Holdings, LLC 5.00% 5/1/20281 |
|
|
3,315 |
|
|
|
3,127 |
|
|
|
Frontier Communications Holdings, LLC 6.75% 5/1/20291 |
|
|
3,070 |
|
|
|
2,819 |
|
|
|
Frontier Communications Holdings, LLC 5.875% 11/1/2029 |
|
|
1,025 |
|
|
|
894 |
|
|
|
Frontier Communications Holdings, LLC 6.00% 1/15/20301 |
|
|
1,685 |
|
|
|
1,468 |
|
|
|
Frontier Communications Holdings, LLC 8.75% 5/15/20301 |
|
|
710 |
|
|
|
732 |
|
|
|
Frontier Communications Holdings, LLC 8.625% 3/15/20311 |
|
|
185 |
|
|
|
191 |
|
|
|
Gray Television, Inc. 7.00% 5/15/20271 |
|
|
2,580 |
|
|
|
2,378 |
|
|
|
Gray Television, Inc. 10.50% 7/15/20291 |
|
|
3,560 |
|
|
|
3,583 |
|
|
|
Gray Television, Inc. 4.75% 10/15/20301 |
|
|
817 |
|
|
|
491 |
|
|
|
Gray Television, Inc. 5.375% 11/15/20311 |
|
|
3,725 |
|
|
|
2,115 |
|
|
|
Gray Television, Inc., Term Loan B,
(1-month USD CME Term SOFR + 5.25%) 10.57% 5/23/20295,6 |
|
|
830 |
|
|
|
790 |
|
|
|
Intelsat Jackson Holdings SA 6.50% 3/15/20301 |
|
|
2,295 |
|
|
|
2,141 |
|
|
|
Lamar Media Corp. 4.00% 2/15/2030 |
|
|
260 |
|
|
|
236 |
|
|
|
Lamar Media Corp. 3.625% 1/15/2031 |
|
|
160 |
|
|
|
141 |
|
|
|
Level 3 Financing, Inc. 3.75% 7/15/20291 |
|
|
550 |
|
|
|
173 |
|
|
|
Ligado Networks, LLC 15.50% PIK 11/1/20231,2,3 |
|
|
2,558 |
|
|
|
377 |
|
|
|
Ligado Networks, LLC, Term Loan, 17.50% PIK 11/1/20232,3,4,5 |
|
|
347 |
|
|
|
330 |
|
|
|
Likewize Corp. 9.75% 10/15/20251 |
|
|
140 |
|
|
|
141 |
|
|
|
Merlin Entertainments Group U.S. Holdings, Inc. 7.375% 2/15/20311 |
|
|
330 |
|
|
|
337 |
|
|
|
Midas OpCo Holdings, LLC 5.625% 8/15/20291 |
|
|
1,975 |
|
|
|
1,826 |
|
|
|
News Corp. 3.875% 5/15/20291 |
|
|
1,240 |
|
|
|
1,143 |
|
|
|
Nexstar Media, Inc. 5.625% 7/15/20271 |
|
|
324 |
|
|
|
308 |
|
|
|
Nexstar Media, Inc. 4.75% 11/1/20281 |
|
|
3,195 |
|
|
|
2,844 |
|
|
|
Scripps Escrow II, Inc. 3.875% 1/15/20291 |
|
|
680 |
|
|
|
474 |
|
|
|
Sirius XM Radio, Inc. 3.125% 9/1/20261 |
|
|
1,865 |
|
|
|
1,756 |
|
|
|
Sirius XM Radio, Inc. 5.00% 8/1/20271 |
|
|
220 |
|
|
|
211 |
|
|
|
Sirius XM Radio, Inc. 4.00% 7/15/20281 |
|
|
2,914 |
|
|
|
2,635 |
|
|
|
Sirius XM Radio, Inc. 5.50% 7/1/20291 |
|
|
485 |
|
|
|
456 |
|
|
|
Sirius XM Radio, Inc. 4.125% 7/1/20301 |
|
|
1,973 |
|
|
|
1,687 |
|
|
|
Sirius XM Radio, Inc. 3.875% 9/1/20311 |
|
|
4,248 |
|
|
|
3,471 |
|
|
|
Sprint Capital Corp. 6.875% 11/15/2028 |
|
|
316 |
|
|
|
335 |
|
|
|
Sprint Capital Corp. 8.75% 3/15/2032 |
|
|
716 |
|
|
|
862 |
|
|
|
Sprint, LLC 7.625% 3/1/2026 |
|
|
480 |
|
|
|
494 |
|
|
|
TEGNA, Inc. 5.00% 9/15/2029 |
|
|
366 |
|
|
|
324 |
|
|
|
T-Mobile USA, Inc. 3.375% 4/15/2029 |
|
|
860 |
|
|
|
795 |
|
|
|
Univision Communications, Inc. 6.625% 6/1/20271 |
|
|
3,170 |
|
|
|
3,038 |
|
|
|
Univision Communications, Inc. 8.00% 8/15/20281 |
|
|
2,455 |
|
|
|
2,396 |
|
|
|
Univision Communications, Inc. 4.50% 5/1/20291 |
|
|
4,762 |
|
|
|
4,007 |
|
|
|
Univision Communications, Inc. 7.375% 6/30/20301 |
|
|
2,235 |
|
|
|
2,081 |
|
|
|
Univision Communications, Inc. 8.50% 7/31/20311 |
|
|
960 |
|
|
|
933 |
|
|
|
Univision Communications, Inc., Term Loan,
(3-month USD CME Term SOFR + 4.25%) 9.585% 6/24/20295,6 |
|
|
68 |
|
|
|
69 |
|
|
|
VMED O2 UK Financing I PLC 4.25% 1/31/20311 |
|
|
2,375 |
|
|
|
1,975 |
|
|
|
VZ Secured Financing BV 5.00% 1/15/20321 |
|
|
600 |
|
|
|
512 |
|
|
|
WMG Acquisition Corp. 3.75% 12/1/20291 |
|
|
1,450 |
|
|
|
1,316 |
|
199 American Funds Insurance Series
American High-Income Trust (continued)
|
|
|
|
|
|
|
|
|
|
|
| Bonds, notes & other debt instruments (continued) |
|
Principal amount (000) |
|
|
Value (000) |
|
|
| Corporate bonds, notes & loans (continued) |
|
| Communication services (continued) |
|
WMG Acquisition Corp. 3.875% 7/15/20301 |
|
|
USD580 |
|
|
$ |
518 |
|
|
|
WMG Acquisition Corp. 3.00% 2/15/20311 |
|
|
225 |
|
|
|
194 |
|
|
|
Ziggo BV 4.875% 1/15/20301 |
|
|
865 |
|
|
|
770 |
|
|
|
|
|
|
|
|
|
|
|
|
|
|
|
|
|
|
|
|
|
108,222 |
|
|
|
|
|
|
|
|
|
|
|
|
|
| |
|
|
|
|
|
| Consumer discretionary 10.40% |
|
Advance Auto Parts, Inc. 1.75% 10/1/2027 |
|
|
199 |
|
|
|
174 |
|
|
|
Advance Auto Parts, Inc. 5.95% 3/9/2028 |
|
|
933 |
|
|
|
926 |
|
|
|
Advance Auto Parts, Inc. 3.90% 4/15/2030 |
|
|
1,121 |
|
|
|
1,014 |
|
|
|
Advance Auto Parts, Inc. 3.50% 3/15/2032 |
|
|
1,004 |
|
|
|
854 |
|
|
|
Aimbridge Acquisition Co., Inc., Term Loan B,
(3-month USD CME Term SOFR + 3.75%) 9.208% 2/2/20265,6 |
|
|
338 |
|
|
|
331 |
|
|
|
Allied Universal Holdco, LLC 9.75% 7/15/20271 |
|
|
841 |
|
|
|
837 |
|
|
|
Allied Universal Holdco, LLC 4.625% 6/1/20281 |
|
|
265 |
|
|
|
242 |
|
|
|
Allied Universal Holdco, LLC 6.00% 6/1/20291 |
|
|
580 |
|
|
|
508 |
|
|
|
Allwyn Entertainment Financing (UK) PLC 7.875% 4/30/20291 |
|
|
1,904 |
|
|
|
1,968 |
|
|
|
Asbury Automotive Group, Inc. 4.625% 11/15/20291 |
|
|
1,275 |
|
|
|
1,180 |
|
|
|
Asbury Automotive Group, Inc. 5.00% 2/15/20321 |
|
|
865 |
|
|
|
784 |
|
|
|
Bath & Body Works, Inc. 6.875% 11/1/2035 |
|
|
1,836 |
|
|
|
1,854 |
|
|
|
Bath & Body Works, Inc. 6.75% 7/1/2036 |
|
|
875 |
|
|
|
872 |
|
|
|
Boyd Gaming Corp. 4.75% 12/1/2027 |
|
|
441 |
|
|
|
425 |
|
|
|
Boyd Gaming Corp. 4.75% 6/15/20311 |
|
|
345 |
|
|
|
313 |
|
|
|
Boyne USA, Inc. 4.75% 5/15/20291 |
|
|
650 |
|
|
|
607 |
|
|
|
Caesars Entertainment, Inc. 4.625% 10/15/20291 |
|
|
3,769 |
|
|
|
3,458 |
|
|
|
Caesars Entertainment, Inc. 7.00% 2/15/20301 |
|
|
1,967 |
|
|
|
2,011 |
|
|
|
Caesars Entertainment, Inc. 6.50% 2/15/20321 |
|
|
1,235 |
|
|
|
1,242 |
|
|
|
Carnival Corp. 5.75% 3/1/20271 |
|
|
890 |
|
|
|
880 |
|
|
|
Carnival Corp. 4.00% 8/1/20281 |
|
|
2,440 |
|
|
|
2,293 |
|
|
|
Carnival Corp. 6.00% 5/1/20291 |
|
|
2,556 |
|
|
|
2,526 |
|
|
|
Carnival Corp. 10.50% 6/1/20301 |
|
|
1,564 |
|
|
|
1,700 |
|
|
|
Clarios Global, LP 6.25% 5/15/20261 |
|
|
140 |
|
|
|
140 |
|
|
|
Clarios Global, LP 8.50% 5/15/20271 |
|
|
315 |
|
|
|
317 |
|
|
|
Cougar JV Subsidiary, LLC 8.00% 5/15/20321 |
|
|
1,540 |
|
|
|
1,594 |
|
|
|
Dana, Inc. 4.50% 2/15/2032 |
|
|
195 |
|
|
|
168 |
|
|
|
Fertitta Entertainment, LLC 4.625% 1/15/20291 |
|
|
1,295 |
|
|
|
1,180 |
|
|
|
Fertitta Entertainment, LLC 6.75% 1/15/20301 |
|
|
1,745 |
|
|
|
1,534 |
|
|
|
First Student Bidco, Inc. 4.00% 7/31/20291 |
|
|
1,365 |
|
|
|
1,231 |
|
|
|
First Student Bidco, Inc., Term Loan B,
(3-month USD CME Term SOFR + 3.00%) 8.596% 7/21/20285,6 |
|
|
336 |
|
|
|
337 |
|
|
|
First Student Bidco, Inc., Term Loan C,
(3-month USD CME Term SOFR + 3.00%) 8.596% 7/21/20285,6 |
|
|
102 |
|
|
|
102 |
|
|
|
Ford Motor Co. 3.25% 2/12/2032 |
|
|
210 |
|
|
|
174 |
|
|
|
Ford Motor Co. 6.10% 8/19/2032 |
|
|
250 |
|
|
|
250 |
|
|
|
Ford Motor Credit Co., LLC 6.95% 6/10/2026 |
|
|
799 |
|
|
|
815 |
|
|
|
Ford Motor Credit Co., LLC 4.271% 1/9/2027 |
|
|
695 |
|
|
|
670 |
|
|
|
Ford Motor Credit Co., LLC 3.815% 11/2/2027 |
|
|
115 |
|
|
|
108 |
|
|
|
Ford Motor Credit Co., LLC 5.113% 5/3/2029 |
|
|
300 |
|
|
|
290 |
|
|
|
Ford Motor Credit Co., LLC 7.20% 6/10/2030 |
|
|
370 |
|
|
|
389 |
|
|
|
Ford Motor Credit Co., LLC 4.00% 11/13/2030 |
|
|
770 |
|
|
|
688 |
|
|
|
Ford Motor Credit Co., LLC 7.122% 11/7/2033 |
|
|
1,215 |
|
|
|
1,285 |
|
|
|
Ford Otomotiv Sanayi AS 7.125% 4/25/20291 |
|
|
280 |
|
|
|
283 |
|
|
|
Gap, Inc. 3.625% 10/1/20291 |
|
|
170 |
|
|
|
147 |
|
|
|
Gap, Inc. 3.875% 10/1/20311 |
|
|
108 |
|
|
|
90 |
|
|
|
Garrett Motion Holdings, Inc. 7.75% 5/31/20321 |
|
|
225 |
|
|
|
228 |
|
|
|
Hanesbrands, Inc. 4.875% 5/15/20261 |
|
|
714 |
|
|
|
699 |
|
|
|
Hanesbrands, Inc. 9.00% 2/15/20311 |
|
|
1,821 |
|
|
|
1,910 |
|
|
|
Hanesbrands, Inc., Term Loan B,
(3-month USD CME Term SOFR + 3.75%) 9.094% 3/8/20305,6 |
|
|
1,258 |
|
|
|
1,264 |
|
|
|
Hilton Domestic Operating Co., Inc. 4.875% 1/15/2030 |
|
|
408 |
|
|
|
392 |
|
|
|
Hilton Domestic Operating Co., Inc. 4.00% 5/1/20311 |
|
|
1,045 |
|
|
|
936 |
|
American Funds Insurance Series 200
American High-Income Trust (continued)
|
|
|
|
|
|
|
|
|
|
|
| Bonds, notes & other debt instruments (continued) |
|
Principal amount (000) |
|
|
Value (000) |
|
|
| Corporate bonds, notes & loans (continued) |
|
|
|
|
|
| Consumer discretionary (continued) |
|
Hilton Grand Vacations Borrower, LLC 5.00% 6/1/20291 |
|
|
USD591 |
|
|
$ |
552 |
|
|
|
Hyundai Capital America 1.65% 9/17/20261 |
|
|
70 |
|
|
|
64 |
|
|
|
International Game Technology PLC 6.50% 2/15/20251 |
|
|
201 |
|
|
|
201 |
|
|
|
International Game Technology PLC 4.125% 4/15/20261 |
|
|
465 |
|
|
|
453 |
|
|
|
International Game Technology PLC 5.25% 1/15/20291 |
|
|
1,065 |
|
|
|
1,031 |
|
|
|
KB Home 6.875% 6/15/2027 |
|
|
330 |
|
|
|
338 |
|
|
|
KB Home 7.25% 7/15/2030 |
|
|
330 |
|
|
|
340 |
|
|
|
Kontoor Brands, Inc. 4.125% 11/15/20291 |
|
|
370 |
|
|
|
335 |
|
|
|
LCM Investments Holdings II, LLC 4.875% 5/1/20291 |
|
|
4,230 |
|
|
|
3,960 |
|
|
|
LCM Investments Holdings II, LLC 8.25% 8/1/20311 |
|
|
2,000 |
|
|
|
2,089 |
|
|
|
Levi Strauss & Co. 3.50% 3/1/20311 |
|
|
915 |
|
|
|
793 |
|
|
|
LGI Homes, Inc. 8.75% 12/15/20281 |
|
|
445 |
|
|
|
464 |
|
|
|
Light and Wonder International, Inc. 7.00% 5/15/20281 |
|
|
735 |
|
|
|
739 |
|
|
|
Light and Wonder International, Inc. 7.25% 11/15/20291 |
|
|
960 |
|
|
|
981 |
|
|
|
Light and Wonder International, Inc. 7.50% 9/1/20311 |
|
|
305 |
|
|
|
315 |
|
|
|
Lindblad Expeditions, LLC 6.75% 2/15/20271 |
|
|
205 |
|
|
|
203 |
|
|
|
Lithia Motors, Inc. 3.875% 6/1/20291 |
|
|
1,090 |
|
|
|
980 |
|
|
|
Lithia Motors, Inc. 4.375% 1/15/20311 |
|
|
700 |
|
|
|
624 |
|
|
|
M.D.C. Holdings, Inc. 6.00% 1/15/2043 |
|
|
803 |
|
|
|
846 |
|
|
|
Marriott Ownership Resorts, Inc. 4.50% 6/15/20291 |
|
|
690 |
|
|
|
635 |
|
|
|
Melco Resorts Finance, Ltd. 5.75% 7/21/20281 |
|
|
595 |
|
|
|
558 |
|
|
|
Merlin Entertainments PLC 5.75% 6/15/20261 |
|
|
492 |
|
|
|
485 |
|
|
|
MGM Resorts International 5.50% 4/15/2027 |
|
|
200 |
|
|
|
197 |
|
|
|
Motel 6 Operating, LP, Term Loan B,
(3-month USD CME Term SOFR + 5.00%) 10.446% 9/9/20265,6 |
|
|
227 |
|
|
|
228 |
|
|
|
NCL Corp., Ltd. 5.875% 2/15/20271 |
|
|
375 |
|
|
|
370 |
|
|
|
NCL Corp., Ltd. 7.75% 2/15/20291 |
|
|
360 |
|
|
|
375 |
|
|
|
Neiman Marcus Group, Ltd., LLC 7.125% 4/1/20261 |
|
|
1,650 |
|
|
|
1,632 |
|
|
|
Newell Brands Inc. 6.625% 9/15/2029 |
|
|
435 |
|
|
|
427 |
|
|
|
Party City Holdings, Inc. 0% 10/12/20284 |
|
|
500 |
|
|
|
– |
8 |
|
|
Party City Holdings, Inc. 12.00% PIK 1/11/20291,3 |
|
|
2,366 |
|
|
|
2,285 |
|
|
|
PENN Entertainment, Inc. 4.125% 7/1/20291 |
|
|
15 |
|
|
|
13 |
|
|
|
QVC, Inc. 4.45% 2/15/2025 |
|
|
580 |
|
|
|
571 |
|
|
|
Rakuten Group, Inc. 9.75% 4/15/20291 |
|
|
375 |
|
|
|
387 |
|
|
|
RHP Hotel Properties, LP 7.25% 7/15/20281 |
|
|
492 |
|
|
|
509 |
|
|
|
RHP Hotel Properties, LP 4.50% 2/15/20291 |
|
|
660 |
|
|
|
619 |
|
|
|
Royal Caribbean Cruises, Ltd. 5.50% 8/31/20261 |
|
|
70 |
|
|
|
69 |
|
|
|
Royal Caribbean Cruises, Ltd. 5.50% 4/1/20281 |
|
|
435 |
|
|
|
430 |
|
|
|
Royal Caribbean Cruises, Ltd. 8.25% 1/15/20291 |
|
|
860 |
|
|
|
909 |
|
|
|
Royal Caribbean Cruises, Ltd. 9.25% 1/15/20291 |
|
|
60 |
|
|
|
64 |
|
|
|
Royal Caribbean Cruises, Ltd. 7.25% 1/15/20301 |
|
|
553 |
|
|
|
573 |
|
|
|
Royal Caribbean Cruises, Ltd. 6.25% 3/15/20321 |
|
|
1,725 |
|
|
|
1,741 |
|
|
|
Sally Holdings, LLC 6.75% 3/1/2032 |
|
|
1,792 |
|
|
|
1,772 |
|
|
|
Scientific Games Holdings, LP 6.625% 3/1/20301 |
|
|
805 |
|
|
|
785 |
|
|
|
Scientific Games Holdings, LP, Term Loan,
(3-month USD CME Term SOFR + 3.00%) 8.306% 4/4/20295,6 |
|
|
497 |
|
|
|
497 |
|
|
|
Service Corp. International 4.00% 5/15/2031 |
|
|
305 |
|
|
|
272 |
|
|
|
Sonic Automotive, Inc. 4.625% 11/15/20291 |
|
|
1,735 |
|
|
|
1,568 |
|
|
|
Sonic Automotive, Inc. 4.875% 11/15/20311 |
|
|
2,525 |
|
|
|
2,225 |
|
|
|
Station Casinos, LLC 6.625% 3/15/20321 |
|
|
320 |
|
|
|
319 |
|
|
|
STL Holding Co., LLC 8.75% 2/15/20291 |
|
|
295 |
|
|
|
308 |
|
|
|
Tempur Sealy International, Inc. 4.00% 4/15/20291 |
|
|
95 |
|
|
|
86 |
|
|
|
Travel + Leisure Co. 4.50% 12/1/20291 |
|
|
370 |
|
|
|
341 |
|
|
|
Universal Entertainment Corp. 8.75% 12/11/20241 |
|
|
4,610 |
|
|
|
4,966 |
|
|
|
Vail Resorts, Inc. 6.50% 5/15/20321 |
|
|
1,075 |
|
|
|
1,089 |
|
|
|
Valvoline, Inc. 3.625% 6/15/20311 |
|
|
630 |
|
|
|
544 |
|
|
|
Velocity Vehicle Group, LLC 8.00% 6/1/20291 |
|
|
710 |
|
|
|
731 |
|
|
|
Wand NewCo 3, Inc. 7.625% 1/30/20321 |
|
|
1,435 |
|
|
|
1,483 |
|
|
|
Wand NewCo 3, Inc., Term Loan B,
(3-month USD CME Term SOFR + 3.75%) 9.094% 1/30/20315,6 |
|
|
420 |
|
|
|
423 |
|
|
|
WASH Multifamily Acquisition, Inc. 5.75% 4/15/20261 |
|
|
1,040 |
|
|
|
1,018 |
|
201 American Funds Insurance Series
American High-Income Trust (continued)
|
|
|
|
|
|
|
|
|
|
|
| Bonds, notes & other debt instruments (continued) |
|
Principal amount (000) |
|
|
Value (000) |
|
|
| Corporate bonds, notes & loans (continued) |
|
| Consumer discretionary (continued) |
|
Wyndham Hotels & Resorts, Inc. 4.375% 8/15/20281 |
|
|
USD455 |
|
|
$ |
424 |
|
|
|
Wynn Resorts Finance, LLC 5.125% 10/1/20291 |
|
|
482 |
|
|
|
459 |
|
|
|
Wynn Resorts Finance, LLC 7.125% 2/15/20311 |
|
|
247 |
|
|
|
256 |
|
|
|
ZF North America Capital, Inc. 4.75% 4/29/20251 |
|
|
300 |
|
|
|
296 |
|
|
|
ZF North America Capital, Inc. 7.125% 4/14/20301 |
|
|
250 |
|
|
|
259 |
|
|
|
|
|
|
|
|
|
|
|
|
|
|
|
|
|
|
|
|
|
92,726 |
|
|
|
|
|
|
|
|
|
|
|
|
|
| |
|
| Health care 9.26% |
|
AdaptHealth, LLC 6.125% 8/1/20281 |
|
|
535 |
|
|
|
511 |
|
|
|
AdaptHealth, LLC 4.625% 8/1/20291 |
|
|
1,015 |
|
|
|
881 |
|
|
|
AdaptHealth, LLC 5.125% 3/1/20301 |
|
|
1,475 |
|
|
|
1,292 |
|
|
|
AthenaHealth Group, Inc. 6.50% 2/15/20301 |
|
|
1,295 |
|
|
|
1,193 |
|
|
|
Avantor Funding, Inc. 4.625% 7/15/20281 |
|
|
2,040 |
|
|
|
1,943 |
|
|
|
Avantor Funding, Inc. 3.875% 11/1/20291 |
|
|
905 |
|
|
|
824 |
|
|
|
Bausch + Lomb Corp., Term Loan B,
(3-month USD CME Term SOFR + 3.25%) 8.689% 5/10/20275,6 |
|
|
450 |
|
|
|
446 |
|
|
|
Bausch Health Americas, Inc. 9.25% 4/1/20261 |
|
|
619 |
|
|
|
561 |
|
|
|
Bausch Health Americas, Inc. 8.50% 1/31/20271 |
|
|
716 |
|
|
|
499 |
|
|
|
Bausch Health Companies, Inc. 5.50% 11/1/20251 |
|
|
4,599 |
|
|
|
4,288 |
|
|
|
Bausch Health Companies, Inc. 9.00% 12/15/20251 |
|
|
1,256 |
|
|
|
1,139 |
|
|
|
Bausch Health Companies, Inc. 6.125% 2/1/20271 |
|
|
245 |
|
|
|
204 |
|
|
|
Bausch Health Companies, Inc. 5.75% 8/15/20271 |
|
|
875 |
|
|
|
698 |
|
|
|
Bausch Health Companies, Inc. 5.00% 1/30/20281 |
|
|
982 |
|
|
|
517 |
|
|
|
Bausch Health Companies, Inc. 4.875% 6/1/20281 |
|
|
3,610 |
|
|
|
2,706 |
|
|
|
Bausch Health Companies, Inc. 7.25% 5/30/20291 |
|
|
340 |
|
|
|
177 |
|
|
|
Bausch Health Companies, Inc. 5.25% 1/30/20301 |
|
|
1,732 |
|
|
|
814 |
|
|
|
Bausch Health Companies, Inc. 5.25% 2/15/20311 |
|
|
3,317 |
|
|
|
1,555 |
|
|
|
Bausch Health Companies, Inc., Term Loan,
(3-month USD CME Term SOFR + 5.25%) 10.694% 2/1/20275,6 |
|
|
351 |
|
|
|
321 |
|
|
|
Catalent Pharma Solutions, Inc. 5.00% 7/15/20271 |
|
|
815 |
|
|
|
800 |
|
|
|
Catalent Pharma Solutions, Inc. 3.125% 2/15/20291 |
|
|
455 |
|
|
|
436 |
|
|
|
Catalent Pharma Solutions, Inc. 3.50% 4/1/20301 |
|
|
1,078 |
|
|
|
1,033 |
|
|
|
Catalent Pharma Solutions, Inc., Term Loan B4,
(3-month USD CME Term SOFR + 3.00%) 8.344% 2/22/20285,6 |
|
|
562 |
|
|
|
563 |
|
|
|
Centene Corp. 4.25% 12/15/2027 |
|
|
337 |
|
|
|
322 |
|
|
|
Centene Corp. 4.625% 12/15/2029 |
|
|
1,495 |
|
|
|
1,415 |
|
|
|
Centene Corp. 3.375% 2/15/2030 |
|
|
217 |
|
|
|
193 |
|
|
|
Centene Corp. 3.00% 10/15/2030 |
|
|
295 |
|
|
|
252 |
|
|
|
Centene Corp. 2.50% 3/1/2031 |
|
|
1,125 |
|
|
|
924 |
|
|
|
Centene Corp. 2.625% 8/1/2031 |
|
|
615 |
|
|
|
506 |
|
|
|
Charles River Laboratories International, Inc. 4.25% 5/1/20281 |
|
|
186 |
|
|
|
176 |
|
|
|
Charles River Laboratories International, Inc. 3.75% 3/15/20291 |
|
|
680 |
|
|
|
621 |
|
|
|
CHS / Community Health Systems, Inc. 5.625% 3/15/20271 |
|
|
1,510 |
|
|
|
1,407 |
|
|
|
CHS / Community Health Systems, Inc. 5.25% 5/15/20301 |
|
|
1,845 |
|
|
|
1,523 |
|
|
|
CHS / Community Health Systems, Inc. 4.75% 2/15/20311 |
|
|
1,020 |
|
|
|
803 |
|
|
|
CHS / Community Health Systems, Inc. 10.875% 1/15/20321 |
|
|
185 |
|
|
|
193 |
|
|
|
Concentra Escrow Issuer Corp. 6.875% 7/15/20321 |
|
|
405 |
|
|
|
411 |
|
|
|
DaVita, Inc. 4.625% 6/1/20301 |
|
|
690 |
|
|
|
624 |
|
|
|
Endo Finance Holdings, Inc. 8.50% 4/15/20311 |
|
|
2,855 |
|
|
|
2,950 |
|
|
|
Endo International PLC, Term Loan B,
(3-month USD CME Term SOFR + 4.50%) 9.826% 4/23/20315,6 |
|
|
2,170 |
|
|
|
2,168 |
|
|
|
Fortrea Holdings, Inc., Term Loan B,
(3-month USD CME Term SOFR + 3.75%) 9.094% 7/1/20305,6 |
|
|
178 |
|
|
|
178 |
|
|
|
Grifols SA 4.75% 10/15/20281 |
|
|
1,960 |
|
|
|
1,693 |
|
|
|
Grifols, SA 7.50% 5/1/20304 |
|
|
EUR1,400 |
|
|
|
1,499 |
|
|
|
HCA, Inc. 5.625% 9/1/2028 |
|
|
USD1,300 |
|
|
|
1,312 |
|
|
|
HCA, Inc. 3.50% 9/1/2030 |
|
|
180 |
|
|
|
162 |
|
|
|
HCA, Inc. 4.625% 3/15/2052 |
|
|
233 |
|
|
|
188 |
|
|
|
HCA, Inc. 7.50% 11/15/2095 |
|
|
250 |
|
|
|
270 |
|
|
|
Hologic, Inc. 3.25% 2/15/20291 |
|
|
415 |
|
|
|
373 |
|
American Funds Insurance Series 202
American High-Income Trust (continued)
|
|
|
|
|
|
|
|
|
|
|
| Bonds, notes & other debt instruments (continued) |
|
Principal amount (000) |
|
|
Value (000) |
|
|
| Corporate bonds, notes & loans (continued) |
|
| Health care (continued) |
|
IQVIA, Inc. 5.00% 10/15/20261 |
|
|
USD603 |
|
|
$ |
592 |
|
|
|
IQVIA, Inc. 6.50% 5/15/20301 |
|
|
245 |
|
|
|
249 |
|
|
|
Jazz Securities DAC 4.375% 1/15/20291 |
|
|
261 |
|
|
|
242 |
|
|
|
Mallinckrodt International Finance SA 14.75% 11/14/20281 |
|
|
284 |
|
|
|
309 |
|
|
|
Medline Borrower, LP 3.875% 4/1/20291 |
|
|
225 |
|
|
|
207 |
|
|
|
Medline Borrower, LP 6.25% 4/1/20291 |
|
|
1,114 |
|
|
|
1,128 |
|
|
|
Medline Borrower, LP 5.25% 10/1/20291 |
|
|
1,760 |
|
|
|
1,681 |
|
|
|
Medline Borrower, LP, Term Loan B,
(3-month USD CME Term SOFR + 2.75%) 8.094% 10/23/20285,6 |
|
|
556 |
|
|
|
558 |
|
|
|
Molina Healthcare, Inc. 4.375% 6/15/20281 |
|
|
830 |
|
|
|
782 |
|
|
|
Molina Healthcare, Inc. 3.875% 11/15/20301 |
|
|
2,514 |
|
|
|
2,237 |
|
|
|
Molina Healthcare, Inc. 3.875% 5/15/20321 |
|
|
2,650 |
|
|
|
2,299 |
|
|
|
Option Care Health, Inc. 4.375% 10/31/20291 |
|
|
290 |
|
|
|
266 |
|
|
|
Owens & Minor, Inc. 4.50% 3/31/20291 |
|
|
1,710 |
|
|
|
1,476 |
|
|
|
Owens & Minor, Inc. 6.625% 4/1/20301 |
|
|
2,310 |
|
|
|
2,102 |
|
|
|
Radiology Partners, Inc. 3.50% PIK and 4.28% Cash 1/31/20291,3 |
|
|
2,468 |
|
|
|
2,317 |
|
|
|
Radiology Partners, Inc. 9.78% PIK 2/15/20301,3 |
|
|
2,427 |
|
|
|
1,945 |
|
|
|
Radiology Partners, Inc., Term Loan B,
(3-month USD CME Term SOFR + 5.00%)
1.50% PIK and 9.08% Cash 1/31/20293,5,6 |
|
|
1,761 |
|
|
|
1,675 |
|
|
|
Select Medical Corp. 6.25% 8/15/20261 |
|
|
554 |
|
|
|
557 |
|
|
|
Star Parent, Inc. 9.00% 10/1/20301 |
|
|
560 |
|
|
|
589 |
|
|
|
Sterigenics-Nordion Holdings, LLC 7.375% 6/1/20311 |
|
|
365 |
|
|
|
366 |
|
|
|
Surgery Center Holdings, Inc. 7.25% 4/15/20321 |
|
|
495 |
|
|
|
501 |
|
|
|
Surgery Center Holdings, Inc., Term Loan B2,
(1-month USD CME Term SOFR + 2.75%) 8.092% 12/19/20305,6 |
|
|
345 |
|
|
|
346 |
|
|
|
Team Health Holdings, Inc. 6.375% 2/1/20251 |
|
|
244 |
|
|
|
234 |
|
|
|
Team Health Holdings, Inc., Term Loan B,
(3-month USD CME Term SOFR + 5.25%) 10.58% 3/2/20275,6 |
|
|
271 |
|
|
|
253 |
|
|
|
Tenet Healthcare Corp. 6.25% 2/1/2027 |
|
|
500 |
|
|
|
500 |
|
|
|
Tenet Healthcare Corp. 5.125% 11/1/2027 |
|
|
265 |
|
|
|
260 |
|
|
|
Tenet Healthcare Corp. 4.625% 6/15/2028 |
|
|
440 |
|
|
|
419 |
|
|
|
Tenet Healthcare Corp. 6.125% 10/1/2028 |
|
|
460 |
|
|
|
458 |
|
|
|
Tenet Healthcare Corp. 4.25% 6/1/2029 |
|
|
1,535 |
|
|
|
1,431 |
|
|
|
Tenet Healthcare Corp. 4.375% 1/15/2030 |
|
|
895 |
|
|
|
830 |
|
|
|
Tenet Healthcare Corp. 6.125% 6/15/2030 |
|
|
25 |
|
|
|
25 |
|
|
|
Tenet Healthcare Corp. 6.75% 5/15/2031 |
|
|
1,490 |
|
|
|
1,514 |
|
|
|
Tenet Healthcare Corp. 6.875% 11/15/2031 |
|
|
100 |
|
|
|
106 |
|
|
|
Teva Pharmaceutical Finance Netherlands III BV 3.15% 10/1/2026 |
|
|
1,784 |
|
|
|
1,676 |
|
|
|
Teva Pharmaceutical Finance Netherlands III BV 4.75% 5/9/2027 |
|
|
745 |
|
|
|
719 |
|
|
|
Teva Pharmaceutical Finance Netherlands III BV 6.75% 3/1/2028 |
|
|
813 |
|
|
|
833 |
|
|
|
Teva Pharmaceutical Finance Netherlands III BV 5.125% 5/9/2029 |
|
|
5,640 |
|
|
|
5,430 |
|
|
|
Teva Pharmaceutical Finance Netherlands III BV 7.875% 9/15/2029 |
|
|
400 |
|
|
|
430 |
|
|
|
Teva Pharmaceutical Finance Netherlands III BV 8.125% 9/15/2031 |
|
|
754 |
|
|
|
839 |
|
|
|
Teva Pharmaceutical Finance Netherlands III BV 4.10% 10/1/2046 |
|
|
822 |
|
|
|
575 |
|
|
|
|
|
|
|
|
|
|
|
|
|
|
|
|
|
|
|
|
|
82,520 |
|
|
|
|
|
|
|
|
|
|
|
|
|
| |
|
| Materials 8.97% |
|
Alcoa Nederland Holding BV 5.50% 12/15/20271 |
|
|
510 |
|
|
|
503 |
|
|
|
Alliance Resource Operating Partners, LP 8.625% 6/15/20291 |
|
|
1,495 |
|
|
|
1,535 |
|
|
|
ArcelorMittal SA 6.80% 11/29/2032 |
|
|
315 |
|
|
|
332 |
|
|
|
ArcelorMittal SA 7.00% 10/15/2039 |
|
|
488 |
|
|
|
525 |
|
|
|
ArcelorMittal SA 6.75% 3/1/2041 |
|
|
755 |
|
|
|
771 |
|
|
|
Ardagh Metal Packaging Finance PLC 4.00% 9/1/20291 |
|
|
1,290 |
|
|
|
1,093 |
|
|
|
ATI, Inc. 4.875% 10/1/2029 |
|
|
690 |
|
|
|
646 |
|
|
|
ATI, Inc. 7.25% 8/15/2030 |
|
|
375 |
|
|
|
388 |
|
|
|
ATI, Inc. 5.125% 10/1/2031 |
|
|
1,110 |
|
|
|
1,027 |
|
|
|
Avient Corp. 7.125% 8/1/20301 |
|
|
335 |
|
|
|
342 |
|
|
|
Axalta Coating Systems Dutch Holding B BV 7.25% 2/15/20311 |
|
|
240 |
|
|
|
250 |
|
|
|
Axalta Coating Systems, LLC 4.75% 6/15/20271 |
|
|
460 |
|
|
|
448 |
|
203 American Funds Insurance Series
American High-Income Trust (continued)
|
|
|
|
|
|
|
|
|
|
|
| Bonds, notes & other debt instruments (continued) |
|
Principal amount (000) |
|
|
Value (000) |
|
|
| Corporate bonds, notes & loans (continued) |
|
| Materials (continued) |
|
Ball Corp. 6.875% 3/15/2028 |
|
|
USD465 |
|
|
$ |
478 |
|
|
|
Ball Corp. 6.00% 6/15/2029 |
|
|
350 |
|
|
|
352 |
|
|
|
Ball Corp. 2.875% 8/15/2030 |
|
|
160 |
|
|
|
136 |
|
|
|
Ball Corp. 3.125% 9/15/2031 |
|
|
1,220 |
|
|
|
1,033 |
|
|
|
CAN-PACK Spolka Akcyjna 3.875% 11/15/20291 |
|
|
1,300 |
|
|
|
1,167 |
|
|
|
Cleveland-Cliffs, Inc. 5.875% 6/1/2027 |
|
|
1,158 |
|
|
|
1,151 |
|
|
|
Cleveland-Cliffs, Inc. 4.625% 3/1/20291 |
|
|
1,871 |
|
|
|
1,773 |
|
|
|
Cleveland-Cliffs, Inc. 6.75% 4/15/20301 |
|
|
550 |
|
|
|
545 |
|
|
|
Cleveland-Cliffs, Inc. 4.875% 3/1/20311 |
|
|
2,240 |
|
|
|
1,986 |
|
|
|
Cleveland-Cliffs, Inc. 7.00% 3/15/20321 |
|
|
990 |
|
|
|
980 |
|
|
|
Consolidated Energy Finance SA 5.625% 10/15/20281 |
|
|
505 |
|
|
|
430 |
|
|
|
Consolidated Energy Finance SA 12.00% 2/15/20311 |
|
|
3,615 |
|
|
|
3,733 |
|
|
|
CVR Partners, LP 6.125% 6/15/20281 |
|
|
685 |
|
|
|
659 |
|
|
|
Element Solutions, Inc. 3.875% 9/1/20281 |
|
|
630 |
|
|
|
580 |
|
|
|
First Quantum Minerals, Ltd. 6.875% 10/15/20271 |
|
|
7,465 |
|
|
|
7,301 |
|
|
|
First Quantum Minerals, Ltd. 9.375% 3/1/20291 |
|
|
5,620 |
|
|
|
5,879 |
|
|
|
Freeport-McMoRan, Inc. 4.25% 3/1/2030 |
|
|
437 |
|
|
|
413 |
|
|
|
Freeport-McMoRan, Inc. 5.45% 3/15/2043 |
|
|
411 |
|
|
|
391 |
|
|
|
FXI Holdings, Inc. 12.25% 11/15/20261 |
|
|
9,072 |
|
|
|
9,012 |
|
|
|
FXI Holdings, Inc. 12.25% 11/15/20261 |
|
|
5,873 |
|
|
|
5,845 |
|
|
|
INEOS Finance PLC 6.75% 5/15/20281 |
|
|
500 |
|
|
|
502 |
|
|
|
INEOS Finance PLC 7.50% 4/15/20291 |
|
|
285 |
|
|
|
288 |
|
|
|
Kaiser Aluminum Corp. 4.625% 3/1/20281 |
|
|
638 |
|
|
|
598 |
|
|
|
LABL, Inc. 10.50% 7/15/20271 |
|
|
160 |
|
|
|
157 |
|
|
|
LABL, Inc. 5.875% 11/1/20281 |
|
|
730 |
|
|
|
667 |
|
|
|
LABL, Inc. 9.50% 11/1/20281 |
|
|
302 |
|
|
|
305 |
|
|
|
LSB Industries, Inc. 6.25% 10/15/20281 |
|
|
625 |
|
|
|
603 |
|
|
|
Mauser Packaging Solutions Holding Co. 7.875% 8/15/20261 |
|
|
382 |
|
|
|
383 |
|
|
|
Mauser Packaging Solutions Holding Co. 9.25% 4/15/20271 |
|
|
900 |
|
|
|
902 |
|
|
|
Methanex Corp. 5.125% 10/15/2027 |
|
|
2,415 |
|
|
|
2,331 |
|
|
|
Methanex Corp. 5.25% 12/15/2029 |
|
|
462 |
|
|
|
446 |
|
|
|
Methanex Corp. 5.65% 12/1/2044 |
|
|
465 |
|
|
|
402 |
|
|
|
Mineral Resources, Ltd. 8.125% 5/1/20271 |
|
|
263 |
|
|
|
265 |
|
|
|
Mineral Resources, Ltd. 8.00% 11/1/20271 |
|
|
1,549 |
|
|
|
1,586 |
|
|
|
Mineral Resources, Ltd. 9.25% 10/1/20281 |
|
|
1,960 |
|
|
|
2,060 |
|
|
|
Mineral Resources, Ltd. 8.50% 5/1/20301 |
|
|
630 |
|
|
|
653 |
|
|
|
NOVA Chemicals Corp. 5.25% 6/1/20271 |
|
|
1,741 |
|
|
|
1,667 |
|
|
|
NOVA Chemicals Corp. 8.50% 11/15/20281 |
|
|
245 |
|
|
|
260 |
|
|
|
NOVA Chemicals Corp. 4.25% 5/15/20291 |
|
|
1,555 |
|
|
|
1,372 |
|
|
|
NOVA Chemicals Corp. 9.00% 2/15/20301 |
|
|
2,125 |
|
|
|
2,245 |
|
|
|
Novelis Corp. 3.25% 11/15/20261 |
|
|
690 |
|
|
|
650 |
|
|
|
Novelis Corp. 4.75% 1/30/20301 |
|
|
478 |
|
|
|
444 |
|
|
|
Novelis Corp. 3.875% 8/15/20311 |
|
|
987 |
|
|
|
855 |
|
|
|
Olin Corp. 5.625% 8/1/2029 |
|
|
200 |
|
|
|
196 |
|
|
|
Olin Corp. 5.00% 2/1/2030 |
|
|
180 |
|
|
|
170 |
|
|
|
Owens-Brockway Glass Container, Inc. 7.375% 6/1/20321 |
|
|
600 |
|
|
|
601 |
|
|
|
SCIH Salt Holdings, Inc. 4.875% 5/1/20281 |
|
|
660 |
|
|
|
615 |
|
|
|
SCIH Salt Holdings, Inc. 6.625% 5/1/20291 |
|
|
1,285 |
|
|
|
1,210 |
|
|
|
Summit Materials, LLC 6.50% 3/15/20271 |
|
|
360 |
|
|
|
361 |
|
|
|
Summit Materials, LLC 5.25% 1/15/20291 |
|
|
755 |
|
|
|
729 |
|
|
|
Summit Materials, LLC 7.25% 1/15/20311 |
|
|
385 |
|
|
|
399 |
|
|
|
Trident TPI Holdings, Inc. 12.75% 12/31/20281 |
|
|
470 |
|
|
|
514 |
|
|
|
Trivium Packaging Finance BV 5.50% 8/15/20261 |
|
|
330 |
|
|
|
324 |
|
|
|
Trivium Packaging Finance BV 8.50% 8/15/20271 |
|
|
1,025 |
|
|
|
1,018 |
|
|
|
Tronox, Inc. 4.625% 3/15/20291 |
|
|
740 |
|
|
|
669 |
|
American Funds Insurance Series 204
American High-Income Trust (continued)
|
|
|
|
|
|
|
|
|
|
|
| Bonds, notes & other debt instruments (continued) |
|
Principal amount (000) |
|
|
Value (000) |
|
|
| Corporate bonds, notes & loans (continued) |
|
| Materials (continued) |
|
Venator Material, LLC, Term Loan,
(3-month USD CME Term SOFR + 2.00%) 8.00% PIK and 7.31% Cash 1/16/20263,5,6 |
|
|
USD393 |
|
|
$ |
396 |
|
|
|
Venator Material, LLC, Term Loan,
(USD-SOFR + 10.00%) 8.00% PIK and 7.33% Cash 10/10/20283,5,6 |
|
|
825 |
|
|
|
822 |
|
|
|
Warrior Met Coal, Inc. 7.875% 12/1/20281 |
|
|
623 |
|
|
|
637 |
|
|
|
|
|
|
|
|
|
|
|
|
|
|
|
|
|
|
|
|
|
80,006 |
|
|
|
|
|
|
|
|
|
|
|
|
|
| |
|
| Financials 8.23% |
|
AG Issuer, LLC 6.25% 3/1/20281 |
|
|
1,211 |
|
|
|
1,186 |
|
|
|
AG TTMT Escrow Issuer, LLC 8.625% 9/30/20271 |
|
|
907 |
|
|
|
941 |
|
|
|
Alliant Holdings Intermediate, LLC 4.25% 10/15/20271 |
|
|
660 |
|
|
|
619 |
|
|
|
Alliant Holdings Intermediate, LLC 6.75% 10/15/20271 |
|
|
1,801 |
|
|
|
1,778 |
|
|
|
Alliant Holdings Intermediate, LLC 5.875% 11/1/20291 |
|
|
1,460 |
|
|
|
1,368 |
|
|
|
Alliant Holdings Intermediate, LLC 7.00% 1/15/20311 |
|
|
660 |
|
|
|
667 |
|
|
|
AmWINS Group, Inc. 6.375% 2/15/20291 |
|
|
765 |
|
|
|
768 |
|
|
|
AmWINS Group, Inc. 4.875% 6/30/20291 |
|
|
1,220 |
|
|
|
1,137 |
|
|
|
Aretec Group, Inc. 7.50% 4/1/20291 |
|
|
3,168 |
|
|
|
3,057 |
|
|
|
Aretec Group, Inc. 10.00% 8/15/20301 |
|
|
1,260 |
|
|
|
1,372 |
|
|
|
AssuredPartners, Inc. 5.625% 1/15/20291 |
|
|
365 |
|
|
|
342 |
|
|
|
Baldwin Insurance Group Holdings, LLC 7.125% 5/15/20311 |
|
|
180 |
|
|
|
182 |
|
|
|
Block, Inc. 2.75% 6/1/2026 |
|
|
1,640 |
|
|
|
1,550 |
|
|
|
Block, Inc. 3.50% 6/1/2031 |
|
|
1,605 |
|
|
|
1,386 |
|
|
|
Block, Inc. 6.50% 5/15/20321 |
|
|
2,270 |
|
|
|
2,303 |
|
|
|
Blue Owl Capital Corp. 3.40% 7/15/2026 |
|
|
290 |
|
|
|
273 |
|
|
|
Blue Owl Capital Corp. III 3.125% 4/13/2027 |
|
|
600 |
|
|
|
549 |
|
|
|
Blue Owl Credit Income Corp. 4.70% 2/8/2027 |
|
|
965 |
|
|
|
919 |
|
|
|
Blue Owl Credit Income Corp. 6.65% 3/15/2031 |
|
|
380 |
|
|
|
372 |
|
|
|
Boost Newco Borrower, LLC 7.50% 1/15/20311 |
|
|
1,060 |
|
|
|
1,106 |
|
|
|
BroadStreet Partners, Inc. 5.875% 4/15/20291 |
|
|
575 |
|
|
|
537 |
|
|
|
Castlelake Aviation Finance DAC 5.00% 4/15/20271 |
|
|
835 |
|
|
|
808 |
|
|
|
Coinbase Global, Inc. 3.375% 10/1/20281 |
|
|
2,830 |
|
|
|
2,429 |
|
|
|
Coinbase Global, Inc. 3.625% 10/1/20311 |
|
|
2,745 |
|
|
|
2,203 |
|
|
|
Compass Group Diversified Holdings, LLC 5.25% 4/15/20291 |
|
|
4,290 |
|
|
|
4,073 |
|
|
|
Compass Group Diversified Holdings, LLC 5.00% 1/15/20321 |
|
|
1,230 |
|
|
|
1,114 |
|
|
|
GTCR (AP) Finance, Inc. 8.00% 5/15/20271 |
|
|
607 |
|
|
|
609 |
|
|
|
Hightower Holding, LLC 6.75% 4/15/20291 |
|
|
1,280 |
|
|
|
1,199 |
|
|
|
Howden UK Refinance PLC 7.25% 2/15/20311 |
|
|
960 |
|
|
|
954 |
|
|
|
Howden UK Refinance 2 PLC 8.125% 2/15/20321 |
|
|
885 |
|
|
|
880 |
|
|
|
HUB International, Ltd. 5.625% 12/1/20291 |
|
|
240 |
|
|
|
227 |
|
|
|
HUB International, Ltd. 7.25% 6/15/20301 |
|
|
767 |
|
|
|
787 |
|
|
|
HUB International, Ltd. 7.375% 1/31/20321 |
|
|
630 |
|
|
|
639 |
|
|
|
HUB International, Ltd., Term Loan B,
(3-month USD CME Term SOFR + 3.25%) 8.575% 6/20/20305,6 |
|
|
172 |
|
|
|
173 |
|
|
|
Intercontinental Exchange, Inc. 3.625% 9/1/20281 |
|
|
410 |
|
|
|
387 |
|
|
|
Iron Mountain Information Management Services, Inc. 5.00% 7/15/20321 |
|
|
1,335 |
|
|
|
1,221 |
|
|
|
JPMorgan Chase & Co. 2.956% 5/13/2031 (USD-SOFR + 2.515% on 5/13/2030)7 |
|
|
160 |
|
|
|
140 |
|
|
|
Ladder Capital Finance Holdings LLLP 7.00% 7/15/20311 |
|
|
445 |
|
|
|
449 |
|
|
|
LPL Holdings, Inc. 4.375% 5/15/20311 |
|
|
715 |
|
|
|
656 |
|
|
|
MSCI, Inc. 3.875% 2/15/20311 |
|
|
630 |
|
|
|
568 |
|
|
|
MSCI, Inc. 3.625% 11/1/20311 |
|
|
341 |
|
|
|
299 |
|
|
|
MSCI, Inc. 3.25% 8/15/20331 |
|
|
584 |
|
|
|
483 |
|
|
|
Nationstar Mortgage Holdings, Inc. 7.125% 2/1/20321 |
|
|
380 |
|
|
|
383 |
|
|
|
Navient Corp. 5.875% 10/25/2024 |
|
|
1,295 |
|
|
|
1,294 |
|
|
|
Navient Corp. 6.75% 6/25/2025 |
|
|
550 |
|
|
|
550 |
|
|
|
Navient Corp. 6.75% 6/15/2026 |
|
|
640 |
|
|
|
644 |
|
|
|
Navient Corp. 5.00% 3/15/2027 |
|
|
2,723 |
|
|
|
2,602 |
|
|
|
Navient Corp. 4.875% 3/15/2028 |
|
|
550 |
|
|
|
505 |
|
|
|
Navient Corp. 5.50% 3/15/2029 |
|
|
2,280 |
|
|
|
2,084 |
|
|
|
Navient Corp. 9.375% 7/25/2030 |
|
|
300 |
|
|
|
316 |
|
205 American Funds Insurance Series
American High-Income Trust (continued)
|
|
|
|
|
|
|
|
|
|
|
| Bonds, notes & other debt instruments (continued) |
|
Principal amount (000) |
|
|
Value (000) |
|
|
| Corporate bonds, notes & loans (continued) |
|
| Financials (continued) |
|
Navient Corp. 11.50% 3/15/2031 |
|
|
USD2,675 |
|
|
$ |
2,949 |
|
|
|
Navient Corp. 5.625% 8/1/2033 |
|
|
1,478 |
|
|
|
1,181 |
|
|
|
OneMain Finance Corp. 7.125% 3/15/2026 |
|
|
1,335 |
|
|
|
1,358 |
|
|
|
OneMain Finance Corp. 5.375% 11/15/2029 |
|
|
120 |
|
|
|
113 |
|
|
|
OneMain Finance Corp. 7.875% 3/15/2030 |
|
|
915 |
|
|
|
944 |
|
|
|
Osaic Holdings, Inc. 10.75% 8/1/20271 |
|
|
4,111 |
|
|
|
4,236 |
|
|
|
Osaic Holdings, Inc., Term Loan B3,
(3-month USD CME Term SOFR + 4.00%) 9.344% 8/17/20285,6 |
|
|
354 |
|
|
|
356 |
|
|
|
Owl Rock Capital Corp. 3.75% 7/22/2025 |
|
|
600 |
|
|
|
585 |
|
|
|
Oxford Finance, LLC 6.375% 2/1/20271 |
|
|
1,753 |
|
|
|
1,690 |
|
|
|
Panther Escrow Issuer, LLC 7.125% 6/1/20311 |
|
|
1,490 |
|
|
|
1,508 |
|
|
|
Rocket Mortgage, LLC 2.875% 10/15/20261 |
|
|
520 |
|
|
|
486 |
|
|
|
Ryan Specialty Group, LLC 4.375% 2/1/20301 |
|
|
720 |
|
|
|
668 |
|
|
|
Starwood Property Trust, Inc. 4.375% 1/15/20271 |
|
|
655 |
|
|
|
621 |
|
|
|
Starwood Property Trust, Inc. 7.25% 4/1/20291 |
|
|
225 |
|
|
|
228 |
|
|
|
Truist Insurance Holdings, LLC, Term Loan,
(1-month USD CME Term SOFR + 4.75%) 10.073% 3/8/20325,6 |
|
|
4,960 |
|
|
|
5,069 |
|
|
|
USI, Inc. 7.50% 1/15/20321 |
|
|
320 |
|
|
|
325 |
|
|
|
|
|
|
|
|
|
|
|
|
|
|
|
|
|
|
|
|
|
73,405 |
|
|
|
|
|
|
|
|
|
|
|
|
|
| |
|
| Information technology 7.22% |
|
Booz Allen Hamilton, Inc. 3.875% 9/1/20281 |
|
|
60 |
|
|
|
57 |
|
|
|
Booz Allen Hamilton, Inc. 4.00% 7/1/20291 |
|
|
580 |
|
|
|
544 |
|
|
|
Boxer Parent Co., Inc. 7.125% 10/2/20251 |
|
|
180 |
|
|
|
181 |
|
|
|
Boxer Parent Co., Inc. 9.125% 3/1/20261 |
|
|
240 |
|
|
|
241 |
|
|
|
Cloud Software Group, Inc. 6.50% 3/31/20291 |
|
|
1,205 |
|
|
|
1,158 |
|
|
|
Cloud Software Group, Inc. 9.00% 9/30/20291 |
|
|
5,385 |
|
|
|
5,229 |
|
|
|
Cloud Software Group, Inc. 8.25% 6/30/20321 |
|
|
1,400 |
|
|
|
1,428 |
|
|
|
Cloud Software Group, Inc., Term Loan,
(3-month USD CME Term SOFR + 4.00%) 9.335% 3/30/20295,6 |
|
|
2,185 |
|
|
|
2,186 |
|
|
|
CommScope Technologies, LLC 6.00% 6/15/20251 |
|
|
4,084 |
|
|
|
3,332 |
|
|
|
CommScope Technologies, LLC 5.00% 3/15/20271 |
|
|
1,340 |
|
|
|
557 |
|
|
|
CommScope, Inc. 6.00% 3/1/20261 |
|
|
2,253 |
|
|
|
1,980 |
|
|
|
CommScope, Inc. 8.25% 3/1/20271 |
|
|
762 |
|
|
|
362 |
|
|
|
CommScope, Inc. 7.125% 7/1/20281 |
|
|
309 |
|
|
|
128 |
|
|
|
CommScope, Inc. 4.75% 9/1/20291 |
|
|
530 |
|
|
|
368 |
|
|
|
CommScope, Inc., Term Loan B,
(3-month USD CME Term SOFR + 3.25%) 8.708% 4/6/20265,6 |
|
|
2,078 |
|
|
|
1,876 |
|
|
|
Diebold Nixdorf, Inc., Term Loan,
(3-month USD CME Term SOFR + 7.50%) 12.826% 8/11/20281,5,6 |
|
|
9,800 |
|
|
|
10,154 |
|
|
|
Entegris, Inc. 4.75% 4/15/20291 |
|
|
370 |
|
|
|
354 |
|
|
|
Fair Isaac Corp. 4.00% 6/15/20281 |
|
|
855 |
|
|
|
800 |
|
|
|
Finastra USA, Inc., Term Loan B,
(3-month USD CME Term SOFR + 7.25%) 12.459% 9/13/20295,6,9 |
|
|
3,647 |
|
|
|
3,665 |
|
|
|
Finastra USA, Inc., Term Loan,
(3-month USD CME Term SOFR + 7.25%) 12.581% 9/13/20295,6,9 |
|
|
40 |
|
|
|
40 |
|
|
|
Fortress Intermediate 3, Inc. 7.50% 6/1/20311 |
|
|
440 |
|
|
|
451 |
|
|
|
Gartner, Inc. 4.50% 7/1/20281 |
|
|
1,038 |
|
|
|
1,001 |
|
|
|
Gartner, Inc. 3.625% 6/15/20291 |
|
|
19 |
|
|
|
17 |
|
|
|
Gartner, Inc. 3.75% 10/1/20301 |
|
|
776 |
|
|
|
697 |
|
|
|
Go Daddy Operating Co., LLC 3.50% 3/1/20291 |
|
|
345 |
|
|
|
312 |
|
|
|
Helios Software Holdings, Inc. 8.75% 5/1/20291 |
|
|
2,750 |
|
|
|
2,803 |
|
|
|
Hughes Satellite Systems Corp. 5.25% 8/1/2026 |
|
|
3,255 |
|
|
|
2,523 |
|
|
|
Hughes Satellite Systems Corp. 6.625% 8/1/2026 |
|
|
2,380 |
|
|
|
1,109 |
|
|
|
Imola Merger Corp. 4.75% 5/15/20291 |
|
|
300 |
|
|
|
281 |
|
|
|
ION Trading Technologies SARL 9.50% 5/30/20291 |
|
|
1,400 |
|
|
|
1,427 |
|
|
|
McAfee Corp. 7.375% 2/15/20301 |
|
|
865 |
|
|
|
800 |
|
|
|
MicroStrategy, Inc. 6.125% 6/15/20281 |
|
|
760 |
|
|
|
737 |
|
|
|
NCR Atleos Corp. 9.50% 4/1/20291 |
|
|
2,530 |
|
|
|
2,737 |
|
American Funds Insurance Series 206
American High-Income Trust (continued)
|
|
|
|
|
|
|
|
|
|
|
| Bonds, notes & other debt instruments (continued) |
|
Principal amount (000) |
|
|
Value (000) |
|
|
| Corporate bonds, notes & loans (continued) |
|
| Information technology (continued) |
|
NCR Voyix Corp. 5.125% 4/15/20291 |
|
|
USD1,179 |
|
|
$ |
1,111 |
|
|
|
Open Text Corp. 3.875% 2/15/20281 |
|
|
645 |
|
|
|
598 |
|
|
|
Open Text Corp. 3.875% 12/1/20291 |
|
|
465 |
|
|
|
417 |
|
|
|
Open Text Holdings, Inc. 4.125% 12/1/20311 |
|
|
220 |
|
|
|
194 |
|
|
|
Rocket Software, Inc. 6.50% 2/15/20291 |
|
|
330 |
|
|
|
288 |
|
|
|
Synaptics, Inc. 4.00% 6/15/20291 |
|
|
375 |
|
|
|
340 |
|
|
|
UKG, Inc. 6.875% 2/1/20311 |
|
|
1,855 |
|
|
|
1,880 |
|
|
|
UKG, Inc., Term Loan B,
(3-month USD CME Term SOFR + 3.25%) 8.576% 2/10/20315,6 |
|
|
874 |
|
|
|
878 |
|
|
|
Unisys Corp. 6.875% 11/1/20271 |
|
|
975 |
|
|
|
857 |
|
|
|
Viasat, Inc. 5.625% 9/15/20251 |
|
|
1,445 |
|
|
|
1,403 |
|
|
|
Viasat, Inc. 5.625% 4/15/20271 |
|
|
600 |
|
|
|
538 |
|
|
|
Viasat, Inc. 6.50% 7/15/20281 |
|
|
870 |
|
|
|
659 |
|
|
|
Viasat, Inc. 7.50% 5/30/20311 |
|
|
2,079 |
|
|
|
1,384 |
|
|
|
Viavi Solutions, Inc. 3.75% 10/1/20291 |
|
|
230 |
|
|
|
195 |
|
|
|
Wolfspeed, Inc. 9.875% 6/23/2030 (10.875% on 6/23/2026)4,7,9 |
|
|
3,110 |
|
|
|
3,027 |
|
|
|
Xerox Holdings Corp. 5.50% 8/15/20281 |
|
|
435 |
|
|
|
375 |
|
|
|
Xerox Holdings Corp. 8.875% 11/30/20291 |
|
|
440 |
|
|
|
420 |
|
|
|
Zebra Technologies Corp. 6.50% 6/1/20321 |
|
|
300 |
|
|
|
304 |
|
|
|
|
|
|
|
|
|
|
|
|
|
|
|
|
|
|
|
|
|
64,403 |
|
|
|
|
|
|
|
|
|
|
|
|
|
| |
|
| Industrials 6.54% |
|
AAdvantage Loyalty IP, Ltd. 5.50% 4/20/20261 |
|
|
217 |
|
|
|
215 |
|
|
|
AAR Escrow Issuer, LLC 6.75% 3/15/20291 |
|
|
261 |
|
|
|
266 |
|
|
|
ADT Security Corp. 4.125% 8/1/20291 |
|
|
200 |
|
|
|
185 |
|
|
|
Allison Transmission, Inc. 3.75% 1/30/20311 |
|
|
1,045 |
|
|
|
917 |
|
|
|
Alta Equipment Group, Inc. 9.00% 6/1/20291 |
|
|
300 |
|
|
|
279 |
|
|
|
Ambipar Lux SARL 9.875% 2/6/20311 |
|
|
380 |
|
|
|
369 |
|
|
|
American Airlines, Inc. 8.50% 5/15/20291 |
|
|
415 |
|
|
|
431 |
|
|
|
Aramark Services, Inc. 5.00% 4/1/20251 |
|
|
140 |
|
|
|
139 |
|
|
|
Atkore, Inc. 4.25% 6/1/20311 |
|
|
915 |
|
|
|
807 |
|
|
|
Avis Budget Car Rental, LLC 5.75% 7/15/20271 |
|
|
885 |
|
|
|
851 |
|
|
|
Avis Budget Car Rental, LLC 4.75% 4/1/20281 |
|
|
55 |
|
|
|
51 |
|
|
|
Avis Budget Car Rental, LLC 5.375% 3/1/20291 |
|
|
1,325 |
|
|
|
1,214 |
|
|
|
Avis Budget Car Rental, LLC 8.00% 2/15/20311 |
|
|
1,055 |
|
|
|
1,046 |
|
|
|
Avolon Holdings Funding, Ltd. 2.528% 11/18/20271 |
|
|
2,098 |
|
|
|
1,888 |
|
|
|
Boeing Co. 6.528% 5/1/20341 |
|
|
896 |
|
|
|
918 |
|
|
|
Boeing Co. 6.858% 5/1/20541 |
|
|
386 |
|
|
|
396 |
|
|
|
Bombardier, Inc. 7.125% 6/15/20261 |
|
|
441 |
|
|
|
448 |
|
|
|
Bombardier, Inc. 7.875% 4/15/20271 |
|
|
535 |
|
|
|
537 |
|
|
|
Bombardier, Inc. 6.00% 2/15/20281 |
|
|
560 |
|
|
|
554 |
|
|
|
Bombardier, Inc. 7.45% 5/1/20341 |
|
|
115 |
|
|
|
129 |
|
|
|
Brand Industrial Services, Inc. 10.375% 8/1/20301 |
|
|
430 |
|
|
|
465 |
|
|
|
Brand Industrial Services, Inc., Term Loan C,
(3-month USD CME Term SOFR + 4.50%) 9.827% 8/1/20305,6 |
|
|
228 |
|
|
|
229 |
|
|
|
Brink’s Co. (The) 6.50% 6/15/20291 |
|
|
170 |
|
|
|
172 |
|
|
|
Brink’s Co. (The) 4.625% 10/15/20271 |
|
|
719 |
|
|
|
690 |
|
|
|
BWX Technologies, Inc. 4.125% 6/30/20281 |
|
|
165 |
|
|
|
154 |
|
|
|
BWX Technologies, Inc. 4.125% 4/15/20291 |
|
|
335 |
|
|
|
310 |
|
|
|
Champions Financing, Inc. 8.75% 2/15/20291 |
|
|
715 |
|
|
|
734 |
|
|
|
Chart Industries, Inc. 7.50% 1/1/20301 |
|
|
523 |
|
|
|
541 |
|
|
|
Clarivate Science Holdings Corp. 3.875% 7/1/20281 |
|
|
915 |
|
|
|
851 |
|
|
|
Clarivate Science Holdings Corp. 4.875% 7/1/20291 |
|
|
890 |
|
|
|
827 |
|
|
|
Clean Harbors, Inc. 4.875% 7/15/20271 |
|
|
766 |
|
|
|
742 |
|
|
|
Clean Harbors, Inc. 6.375% 2/1/20311 |
|
|
116 |
|
|
|
116 |
|
|
|
CoreLogic, Inc. 4.50% 5/1/20281 |
|
|
2,824 |
|
|
|
2,566 |
|
|
|
CoreLogic, Inc., Term Loan,
(3-month USD CME Term SOFR + 6.50%) 11.958% 6/4/20295,6 |
|
|
660 |
|
|
|
648 |
|
|
|
Dun & Bradstreet Corp. (The) 5.00% 12/15/20291 |
|
|
980 |
|
|
|
911 |
|
|
|
Enviri Corp. 5.75% 7/31/20271 |
|
|
480 |
|
|
|
457 |
|
207 American Funds Insurance Series
American High-Income Trust (continued)
|
|
|
|
|
|
|
|
|
|
|
| Bonds, notes & other debt instruments (continued) |
|
Principal amount (000) |
|
|
Value (000) |
|
|
| Corporate bonds, notes & loans (continued) |
|
| Industrials (continued) |
|
EquipmentShare.com, Inc. 9.00% 5/15/20281 |
|
|
USD1,850 |
|
|
$ |
1,911 |
|
|
|
EquipmentShare.com, Inc. 8.625% 5/15/20321 |
|
|
575 |
|
|
|
597 |
|
|
|
ESAB Corp. 6.25% 4/15/20291 |
|
|
525 |
|
|
|
529 |
|
|
|
GFL Environmental, Inc. 4.00% 8/1/20281 |
|
|
430 |
|
|
|
400 |
|
|
|
Herc Holdings, Inc. 5.50% 7/15/20271 |
|
|
200 |
|
|
|
197 |
|
|
|
Herc Holdings, Inc. 6.625% 6/15/20291 |
|
|
235 |
|
|
|
239 |
|
|
|
Hertz Corp. (The) 4.625% 12/1/20261 |
|
|
220 |
|
|
|
160 |
|
|
|
Hertz Corp. (The), Term Loan B-EXIT,
(3-month USD CME Term SOFR + 3.25%) 8.859% 6/30/20285,6 |
|
|
151 |
|
|
|
137 |
|
|
|
Hertz Corp. (The), Term Loan C-EXIT,
(3-month USD CME Term SOFR + 3.25%) 8.859% 6/30/20285,6 |
|
|
29 |
|
|
|
26 |
|
|
|
Husky Injection Molding Systems, Ltd. 9.00% 2/15/20291 |
|
|
745 |
|
|
|
772 |
|
|
|
Husky Injection Molding Systems, Ltd., Term Loan B,
(3-month USD CME Term SOFR + 5.00%) 10.326% 2/15/20295,6 |
|
|
350 |
|
|
|
351 |
|
|
|
Icahn Enterprises, LP 6.25% 5/15/2026 |
|
|
897 |
|
|
|
891 |
|
|
|
Icahn Enterprises, LP 5.25% 5/15/2027 |
|
|
1,219 |
|
|
|
1,145 |
|
|
|
Icahn Enterprises, LP 9.75% 1/15/20291 |
|
|
745 |
|
|
|
773 |
|
|
|
Icahn Enterprises, LP 4.375% 2/1/2029 |
|
|
675 |
|
|
|
578 |
|
|
|
Maxim Crane Works Holdings Capital, LLC 11.50% 9/1/20281 |
|
|
450 |
|
|
|
465 |
|
|
|
Mileage Plus Holdings, LLC 6.50% 6/20/20271 |
|
|
1,282 |
|
|
|
1,285 |
|
|
|
Miter Brands Acquisition Holdco, Inc. 6.75% 4/1/20321 |
|
|
309 |
|
|
|
311 |
|
|
|
Moog, Inc. 4.25% 12/9/20271 |
|
|
395 |
|
|
|
375 |
|
|
|
Mueller Water Products, Inc. 4.00% 6/15/20291 |
|
|
275 |
|
|
|
252 |
|
|
|
NESCO Holdings II, Inc. 5.50% 4/15/20291 |
|
|
315 |
|
|
|
292 |
|
|
|
Owens Corning 3.50% 2/15/20301 |
|
|
530 |
|
|
|
483 |
|
|
|
Pitney Bowes, Inc. 6.875% 3/15/20271 |
|
|
600 |
|
|
|
567 |
|
|
|
PM General Purchaser, LLC 9.50% 10/1/20281 |
|
|
1,320 |
|
|
|
1,350 |
|
|
|
Prime Security Services Borrower, LLC 3.375% 8/31/20271 |
|
|
475 |
|
|
|
440 |
|
|
|
Reworld Holding Corp. 4.875% 12/1/20291 |
|
|
990 |
|
|
|
905 |
|
|
|
Reworld Holding Corp. 5.00% 9/1/2030 |
|
|
1,455 |
|
|
|
1,318 |
|
|
|
Ritchie Bros. Holdings, Inc. 6.75% 3/15/20281 |
|
|
581 |
|
|
|
592 |
|
|
|
Ritchie Bros. Holdings, Inc. 7.75% 3/15/20311 |
|
|
468 |
|
|
|
489 |
|
|
|
Roller Bearing Company of America, Inc. 4.375% 10/15/20291 |
|
|
110 |
|
|
|
101 |
|
|
|
Sabre GLBL, Inc. 8.625% 6/1/20271 |
|
|
50 |
|
|
|
46 |
|
|
|
Seagate HDD Cayman 8.25% 12/15/2029 |
|
|
190 |
|
|
|
204 |
|
|
|
Seagate HDD Cayman 8.50% 7/15/2031 |
|
|
455 |
|
|
|
490 |
|
|
|
Sensata Technologies, Inc. 3.75% 2/15/20311 |
|
|
795 |
|
|
|
694 |
|
|
|
SkyMiles IP, Ltd. 4.75% 10/20/20281 |
|
|
440 |
|
|
|
429 |
|
|
|
Spirit AeroSystems, Inc. 4.60% 6/15/2028 |
|
|
1,218 |
|
|
|
1,142 |
|
|
|
Spirit AeroSystems, Inc. 9.375% 11/30/20291 |
|
|
1,249 |
|
|
|
1,346 |
|
|
|
Spirit AeroSystems, Inc. 9.75% 11/15/20301 |
|
|
3,190 |
|
|
|
3,523 |
|
|
|
Spirit AeroSystems, Inc., Term Loan,
(3-month CME Term SOFR + 4.25%) 9.58% 1/15/20275,6 |
|
|
1,092 |
|
|
|
1,101 |
|
|
|
Stericycle, Inc. 3.875% 1/15/20291 |
|
|
65 |
|
|
|
61 |
|
|
|
Titan International, Inc. 7.00% 4/30/2028 |
|
|
750 |
|
|
|
722 |
|
|
|
TransDigm, Inc. 5.50% 11/15/2027 |
|
|
1,030 |
|
|
|
1,012 |
|
|
|
TransDigm, Inc. 6.375% 3/1/20291 |
|
|
1,320 |
|
|
|
1,328 |
|
|
|
TransDigm, Inc. 4.875% 5/1/2029 |
|
|
380 |
|
|
|
356 |
|
|
|
TransDigm, Inc. 6.875% 12/15/20301 |
|
|
355 |
|
|
|
363 |
|
|
|
TransDigm, Inc. 6.625% 3/1/20321 |
|
|
1,225 |
|
|
|
1,239 |
|
|
|
United Rentals (North America), Inc. 6.00% 12/15/20291 |
|
|
115 |
|
|
|
116 |
|
|
|
United Rentals (North America), Inc. 3.875% 2/15/2031 |
|
|
720 |
|
|
|
643 |
|
|
|
United Rentals (North America), Inc. 3.75% 1/15/2032 |
|
|
505 |
|
|
|
440 |
|
|
|
United Rentals (North America), Inc. 6.125% 3/15/20341 |
|
|
310 |
|
|
|
309 |
|
|
|
WESCO Distribution, Inc. 6.625% 3/15/20321 |
|
|
1,600 |
|
|
|
1,619 |
|
|
|
Wrangler Holdco Corp. 6.625% 4/1/20321 |
|
|
325 |
|
|
|
324 |
|
|
|
XPO, Inc. 7.125% 6/1/20311 |
|
|
533 |
|
|
|
545 |
|
|
|
XPO, Inc. 7.125% 2/1/20321 |
|
|
270 |
|
|
|
277 |
|
|
|
|
|
|
|
|
|
|
|
|
|
|
|
|
|
|
|
|
|
58,313 |
|
|
|
|
|
|
|
|
|
|
|
|
American Funds Insurance Series 208
American High-Income Trust (continued)
|
|
|
|
|
|
|
|
|
|
|
| Bonds, notes & other debt instruments (continued) |
|
Principal amount (000) |
|
|
Value (000) |
|
|
| Corporate bonds, notes & loans (continued) |
|
| Real estate 5.89% |
|
Anywhere Real Estate Group, LLC 5.75% 1/15/20291 |
|
|
USD2,063 |
|
|
$ |
1,272 |
|
|
|
Anywhere Real Estate Group, LLC 5.25% 4/15/20301 |
|
|
1,392 |
|
|
|
832 |
|
|
|
Anywhere Real Estate Group, LLC 7.00% 4/15/20301 |
|
|
465 |
|
|
|
381 |
|
|
|
Brookfield Property REIT, Inc. 5.75% 5/15/20261 |
|
|
1,369 |
|
|
|
1,342 |
|
|
|
Brookfield Property REIT, Inc. 4.50% 4/1/20271 |
|
|
574 |
|
|
|
535 |
|
|
|
Cushman & Wakefield U.S. Borrower, LLC, Term Loan B,
(3-month USD CME Term SOFR + 3.75%) 9.094% 1/31/20305,6 |
|
|
294 |
|
|
|
296 |
|
|
|
Forestar Group, Inc. 3.85% 5/15/20261 |
|
|
465 |
|
|
|
446 |
|
|
|
Forestar Group, Inc. 5.00% 3/1/20281 |
|
|
92 |
|
|
|
88 |
|
|
|
Greystar Real Estate Partners, LLC 7.75% 9/1/20301 |
|
|
255 |
|
|
|
269 |
|
|
|
HAT Holdings I, LLC 8.00% 6/15/20271 |
|
|
300 |
|
|
|
312 |
|
|
|
Howard Hughes Corp. (The) 5.375% 8/1/20281 |
|
|
1,327 |
|
|
|
1,263 |
|
|
|
Howard Hughes Corp. (The) 4.125% 2/1/20291 |
|
|
2,513 |
|
|
|
2,250 |
|
|
|
Howard Hughes Corp. (The) 4.375% 2/1/20311 |
|
|
3,083 |
|
|
|
2,658 |
|
|
|
Iron Mountain, Inc. 4.875% 9/15/20271 |
|
|
1,006 |
|
|
|
976 |
|
|
|
Iron Mountain, Inc. 5.25% 3/15/20281 |
|
|
1,214 |
|
|
|
1,176 |
|
|
|
Iron Mountain, Inc. 5.00% 7/15/20281 |
|
|
367 |
|
|
|
352 |
|
|
|
Iron Mountain, Inc. 7.00% 2/15/20291 |
|
|
210 |
|
|
|
214 |
|
|
|
Iron Mountain, Inc. 5.25% 7/15/20301 |
|
|
3,075 |
|
|
|
2,925 |
|
|
|
Iron Mountain, Inc. 4.50% 2/15/20311 |
|
|
1,660 |
|
|
|
1,500 |
|
|
|
Kennedy-Wilson, Inc. 4.75% 3/1/2029 |
|
|
2,270 |
|
|
|
1,944 |
|
|
|
Kennedy-Wilson, Inc. 4.75% 2/1/2030 |
|
|
2,750 |
|
|
|
2,285 |
|
|
|
Kennedy-Wilson, Inc. 5.00% 3/1/2031 |
|
|
2,255 |
|
|
|
1,846 |
|
|
|
Ladder Capital Finance Holdings LLP 5.25% 10/1/20251 |
|
|
650 |
|
|
|
645 |
|
|
|
Ladder Capital Finance Holdings LLP 4.25% 2/1/20271 |
|
|
1,249 |
|
|
|
1,184 |
|
|
|
Ladder Capital Finance Holdings LLP 4.75% 6/15/20291 |
|
|
780 |
|
|
|
721 |
|
|
|
MPT Operating Partnership, LP 5.00% 10/15/2027 |
|
|
5,968 |
|
|
|
4,935 |
|
|
|
MPT Operating Partnership, LP 3.50% 3/15/2031 |
|
|
1,134 |
|
|
|
740 |
|
|
|
Park Intermediate Holdings, LLC 4.875% 5/15/20291 |
|
|
820 |
|
|
|
770 |
|
|
|
Park Intermediate Holdings, LLC 7.00% 2/1/20301 |
|
|
380 |
|
|
|
385 |
|
|
|
RLJ Lodging Trust, LP 4.00% 9/15/20291 |
|
|
800 |
|
|
|
707 |
|
|
|
SBA Communications Corp. 3.125% 2/1/2029 |
|
|
131 |
|
|
|
117 |
|
|
|
Service Properties Trust 5.25% 2/15/2026 |
|
|
117 |
|
|
|
113 |
|
|
|
Service Properties Trust 4.75% 10/1/2026 |
|
|
1,445 |
|
|
|
1,355 |
|
|
|
Service Properties Trust 4.95% 2/15/2027 |
|
|
1,931 |
|
|
|
1,756 |
|
|
|
Service Properties Trust 5.50% 12/15/2027 |
|
|
350 |
|
|
|
325 |
|
|
|
Service Properties Trust 3.95% 1/15/2028 |
|
|
2,682 |
|
|
|
2,249 |
|
|
|
Service Properties Trust 8.375% 6/15/2029 |
|
|
1,985 |
|
|
|
1,953 |
|
|
|
Service Properties Trust 4.95% 10/1/2029 |
|
|
2,139 |
|
|
|
1,625 |
|
|
|
Service Properties Trust 4.375% 2/15/2030 |
|
|
941 |
|
|
|
666 |
|
|
|
Service Properties Trust 8.625% 11/15/20311 |
|
|
4,465 |
|
|
|
4,658 |
|
|
|
Service Properties Trust 8.875% 6/15/2032 |
|
|
1,050 |
|
|
|
980 |
|
|
|
VICI Properties, LP 3.50% 2/15/20251 |
|
|
261 |
|
|
|
258 |
|
|
|
VICI Properties, LP 4.625% 6/15/20251 |
|
|
620 |
|
|
|
612 |
|
|
|
VICI Properties, LP 3.875% 2/15/20291 |
|
|
650 |
|
|
|
602 |
|
|
|
|
|
|
|
|
|
|
|
|
|
|
|
|
|
|
|
|
|
52,518 |
|
|
|
|
|
|
|
|
|
|
|
|
|
| |
|
| Consumer staples 4.47% |
|
Albertsons Companies, Inc. 4.625% 1/15/20271 |
|
|
900 |
|
|
|
870 |
|
|
|
Albertsons Companies, Inc. 3.50% 3/15/20291 |
|
|
993 |
|
|
|
894 |
|
|
|
Albertsons Companies, Inc. 4.875% 2/15/20301 |
|
|
465 |
|
|
|
440 |
|
|
|
Amer Sports Co. 6.75% 2/16/20311 |
|
|
575 |
|
|
|
574 |
|
|
|
B&G Foods, Inc. 5.25% 4/1/2025 |
|
|
183 |
|
|
|
183 |
|
|
|
B&G Foods, Inc. 5.25% 9/15/2027 |
|
|
1,383 |
|
|
|
1,283 |
|
|
|
B&G Foods, Inc. 8.00% 9/15/20281 |
|
|
965 |
|
|
|
982 |
|
|
|
BJ’s Wholesale Club, Term Loan B,
(3-month USD CME Term SOFR + 2.00%) 7.329% 2/5/20295,6 |
|
|
222 |
|
|
|
223 |
|
|
|
Central Garden & Pet Co. 4.125% 10/15/2030 |
|
|
915 |
|
|
|
816 |
|
|
|
Central Garden & Pet Co. 4.125% 4/30/20311 |
|
|
880 |
|
|
|
777 |
|
|
|
Coty, Inc. 5.00% 4/15/20261 |
|
|
1,135 |
|
|
|
1,121 |
|
209 American Funds Insurance Series
American High-Income Trust (continued)
|
|
|
|
|
|
|
|
|
|
|
| Bonds, notes & other debt instruments (continued) |
|
Principal amount (000) |
|
|
Value (000) |
|
|
| Corporate bonds, notes & loans (continued) |
|
| Consumer staples (continued) |
|
Coty, Inc. 4.75% 1/15/20291 |
|
|
USD1,880 |
|
|
$ |
1,788 |
|
|
|
Coty, Inc. 6.625% 7/15/20301 |
|
|
925 |
|
|
|
939 |
|
|
|
Darling Ingredients, Inc. 6.00% 6/15/20301 |
|
|
1,085 |
|
|
|
1,068 |
|
|
|
Energizer Holdings, Inc. 4.375% 3/31/20291 |
|
|
465 |
|
|
|
421 |
|
|
|
Fiesta Purchaser, Inc. 7.875% 3/1/20311 |
|
|
1,120 |
|
|
|
1,158 |
|
|
|
Fiesta Purchaser, Inc., Term Loan B,
(3-month USD CME Term SOFR + 4.00%) 9.344% 2/12/20315,6 |
|
|
160 |
|
|
|
161 |
|
|
|
H.J. Heinz Co. 3.875% 5/15/2027 |
|
|
275 |
|
|
|
266 |
|
|
|
H.J. Heinz Co. 4.375% 6/1/2046 |
|
|
26 |
|
|
|
21 |
|
|
|
Ingles Markets, Inc. 4.00% 6/15/20311 |
|
|
370 |
|
|
|
322 |
|
|
|
KeHE Distributors, LLC 9.00% 2/15/20291 |
|
|
485 |
|
|
|
498 |
|
|
|
Kronos Acquisition Holdings, Inc. 5.00% 12/31/20261 |
|
|
2,223 |
|
|
|
2,277 |
|
|
|
Kronos Acquisition Holdings, Inc. 7.00% 12/31/20271 |
|
|
3,390 |
|
|
|
3,508 |
|
|
|
Kronos Acquisition Holdings, Inc. 8.25% 6/30/20311 |
|
|
640 |
|
|
|
641 |
|
|
|
Kronos Acquisition Holdings, Inc. 10.75% 6/30/20321 |
|
|
425 |
|
|
|
408 |
|
|
|
Lamb Weston Holdings, Inc. 4.125% 1/31/20301 |
|
|
1,920 |
|
|
|
1,745 |
|
|
|
Performance Food Group, Inc. 5.50% 10/15/20271 |
|
|
705 |
|
|
|
690 |
|
|
|
Performance Food Group, Inc. 4.25% 8/1/20291 |
|
|
483 |
|
|
|
440 |
|
|
|
Post Holdings, Inc. 5.625% 1/15/20281 |
|
|
1,199 |
|
|
|
1,181 |
|
|
|
Post Holdings, Inc. 5.50% 12/15/20291 |
|
|
451 |
|
|
|
436 |
|
|
|
Post Holdings, Inc. 4.625% 4/15/20301 |
|
|
3,355 |
|
|
|
3,085 |
|
|
|
Post Holdings, Inc. 4.50% 9/15/20311 |
|
|
1,145 |
|
|
|
1,027 |
|
|
|
Post Holdings, Inc. 6.25% 2/15/20321 |
|
|
2,165 |
|
|
|
2,171 |
|
|
|
Prestige Brands, Inc. 5.125% 1/15/20281 |
|
|
138 |
|
|
|
134 |
|
|
|
Prestige Brands, Inc. 3.75% 4/1/20311 |
|
|
1,275 |
|
|
|
1,111 |
|
|
|
Simmons Foods, Inc. 4.625% 3/1/20291 |
|
|
558 |
|
|
|
491 |
|
|
|
TreeHouse Foods, Inc. 4.00% 9/1/2028 |
|
|
1,925 |
|
|
|
1,731 |
|
|
|
United Natural Foods, Inc. 6.75% 10/15/20281 |
|
|
2,378 |
|
|
|
2,149 |
|
|
|
United Natural Foods, Inc., Term Loan B,
(3-month USD CME Term SOFR + 4.75%) 10.094% 5/1/20315,6 |
|
|
1,345 |
|
|
|
1,353 |
|
|
|
US Foods, Inc. 4.625% 6/1/20301 |
|
|
510 |
|
|
|
474 |
|
|
|
|
|
|
|
|
|
|
|
|
|
|
|
|
|
|
|
|
|
39,857 |
|
|
|
|
|
|
|
|
|
|
|
|
|
| |
|
| Utilities 1.82% |
|
Aegea Finance SARL 9.00% 1/20/20311 |
|
|
330 |
|
|
|
343 |
|
|
|
AmeriGas Partners, LP 5.50% 5/20/2025 |
|
|
102 |
|
|
|
102 |
|
|
|
AmeriGas Partners, LP 5.75% 5/20/2027 |
|
|
302 |
|
|
|
285 |
|
|
|
Calpine Corp. 4.50% 2/15/20281 |
|
|
150 |
|
|
|
143 |
|
|
|
Calpine Corp. 5.125% 3/15/20281 |
|
|
518 |
|
|
|
499 |
|
|
|
Calpine Corp. 3.75% 3/1/20311 |
|
|
500 |
|
|
|
442 |
|
|
|
DPL, Inc. 4.125% 7/1/2025 |
|
|
555 |
|
|
|
546 |
|
|
|
Emera, Inc. 6.75% 6/15/2076 (3-month USD-LIBOR + 5.44% on 6/15/2026)7,10 |
|
|
1,155 |
|
|
|
1,151 |
|
|
|
Enfragen Energia Sur SA 5.375% 12/30/2030 |
|
|
200 |
|
|
|
167 |
|
|
|
FirstEnergy Corp. 2.25% 9/1/2030 |
|
|
980 |
|
|
|
821 |
|
|
|
MIWD Holdco II, LLC, Term Loan B,
(3-month USD CME Term SOFR + 3.50%) 8.844% 3/28/20315,6 |
|
|
280 |
|
|
|
282 |
|
|
|
NextEra Energy Operating Partners, LP 4.25% 7/15/20241 |
|
|
122 |
|
|
|
122 |
|
|
|
NRG Energy, Inc. 3.625% 2/15/20311 |
|
|
110 |
|
|
|
94 |
|
|
|
Pacific Gas and Electric Co. 3.30% 8/1/2040 |
|
|
280 |
|
|
|
200 |
|
|
|
Pacific Gas and Electric Co. 4.95% 7/1/2050 |
|
|
745 |
|
|
|
616 |
|
|
|
Pacific Gas and Electric Co. 3.50% 8/1/2050 |
|
|
2,020 |
|
|
|
1,320 |
|
|
|
PG&E Corp. 5.00% 7/1/2028 |
|
|
2,935 |
|
|
|
2,827 |
|
|
|
PG&E Corp. 5.25% 7/1/2030 |
|
|
3,365 |
|
|
|
3,216 |
|
|
|
Talen Energy Supply, LLC 8.625% 6/1/20301 |
|
|
2,362 |
|
|
|
2,520 |
|
|
|
Talen Energy Supply, LLC, Term Loan B,
(3-month USD CME Term SOFR + 3.50%) 8.827% 5/17/20305,6 |
|
|
282 |
|
|
|
285 |
|
|
|
Vistra Operations Co., LLC 3.55% 7/15/20241 |
|
|
231 |
|
|
|
231 |
|
|
|
|
|
|
|
|
|
|
|
|
|
|
|
|
|
|
|
|
|
16,212 |
|
|
|
|
|
|
|
|
|
|
|
|
American Funds Insurance Series 210
American High-Income Trust (continued)
|
|
|
|
|
|
|
|
|
|
|
| Bonds, notes & other debt instruments (continued) |
|
Principal amount (000) |
|
|
Value (000) |
|
|
| Corporate bonds, notes & loans (continued) |
|
| Municipals 0.02% |
|
Aeropuertos Dominicanos Siglo XXI, SA 7.00% 6/30/20341 |
|
|
USD200 |
|
|
$ |
203 |
|
|
|
|
|
|
|
|
|
|
|
|
|
|
|
|
|
|
Total corporate bonds, notes & loans |
|
|
|
|
|
|
799,209 |
|
|
|
|
|
|
|
|
|
|
|
|
|
| U.S. Treasury bonds & notes 0.10% |
|
| U.S. Treasury 0.10% |
|
U.S. Treasury 3.875% 8/15/203311 |
|
|
920 |
|
|
|
885 |
|
|
|
|
|
|
|
|
|
|
|
|
|
| Mortgage-backed obligations 0.08% |
|
Collateralized mortgage-backed obligations
0.08% |
|
Treehouse Park Improvement Association No.1 9.75% 12/1/20331,4 |
|
|
712 |
|
|
|
696 |
|
|
|
|
|
|
|
|
|
|
|
|
|
| Bonds & notes of governments & government agencies outside the U.S. 0.04% |
|
|
|
Argentine Republic 0.75% 7/9/2030 (1.75% on 7/9/2027)7 |
|
|
600 |
|
|
|
339 |
|
|
|
|
|
|
|
|
|
|
|
|
|
|
|
|
|
|
Total bonds, notes & other debt instruments (cost: $822,620,000) |
|
|
|
|
|
|
801,129 |
|
|
|
|
|
|
|
|
|
|
|
|
|
| Convertible bonds & notes 0.07% |
|
| Communication services 0.07% |
|
DISH Network Corp., convertible notes, 3.375% 8/15/2026 |
|
|
925 |
|
|
|
578 |
|
|
|
|
|
|
|
|
|
|
|
|
|
|
|
|
|
|
Total convertible bonds & notes (cost: $835,000) |
|
|
|
|
|
|
578 |
|
|
|
|
|
|
|
|
|
|
|
|
|
|
|
| Common stocks 6.14% |
|
Shares |
|
|
|
|
| Health care 2.56% |
|
Rotech Healthcare, Inc.4,9,12 |
|
|
201,793 |
|
|
|
19,877 |
|
|
|
Endo, Inc.12 |
|
|
72,421 |
|
|
|
2,037 |
|
|
|
Endo, Inc.1,12 |
|
|
25,905 |
|
|
|
728 |
|
|
|
Endo, Inc. GUC 6.00% Escrow4,12 |
|
|
2,313,000 |
|
|
|
– |
8 |
|
|
Endo, Inc., 1L 7.50% Escrow4,12 |
|
|
5,505,000 |
|
|
|
– |
8 |
|
|
Endo, Inc., 2L 9.50% Escrow4,12 |
|
|
311,000 |
|
|
|
– |
8 |
|
|
Endo, Inc., 1L 6.875% Escrow4,12 |
|
|
520,000 |
|
|
|
– |
8 |
|
|
Endo, Inc., 1L 6.125% Escrow4,12 |
|
|
525,000 |
|
|
|
– |
8 |
|
|
Mallinckrodt PLC12 |
|
|
3,631 |
|
|
|
194 |
|
|
|
|
|
|
|
|
|
|
|
|
|
|
|
|
|
|
|
|
|
|
|
|
|
22,836 |
|
|
|
|
|
|
|
|
|
|
|
|
|
| |
|
| Information technology 1.21% |
|
Diebold Nixdorf, Inc.12 |
|
|
281,243 |
|
|
|
10,822 |
|
|
|
|
|
|
|
|
|
|
|
|
|
| |
|
| Energy 0.90% |
|
Ascent Resources - Utica, LLC, Class A4,9 |
|
|
62,978 |
|
|
|
2,647 |
|
|
|
Chesapeake Energy Corp. |
|
|
29,829 |
|
|
|
2,452 |
|
|
|
Weatherford International12 |
|
|
10,059 |
|
|
|
1,232 |
|
|
|
Altera Infrastructure, LP4,12 |
|
|
9,127 |
|
|
|
682 |
|
|
|
Constellation Oil Services Holding SA, Class B-14,12 |
|
|
3,449,949 |
|
|
|
552 |
|
|
|
Diamond Offshore Drilling, Inc.12 |
|
|
13,372 |
|
|
|
207 |
|
|
|
Mesquite Energy, Inc.4,12 |
|
|
3,558 |
|
|
|
202 |
|
|
|
Exxon Mobil Corp. |
|
|
739 |
|
|
|
85 |
|
|
|
Bighorn Permian Resources, LLC4 |
|
|
2,894 |
|
|
|
– |
8 |
|
|
|
|
|
|
|
|
|
|
|
|
|
|
|
|
|
|
|
|
|
|
|
|
8,059 |
|
|
|
|
|
|
|
|
|
|
|
|
211 American Funds Insurance Series
American High-Income Trust (continued)
|
|
|
|
|
|
|
| Common stocks (continued) |
|
Shares |
|
Value (000) |
|
|
|
|
|
|
|
|
|
|
|
| Utilities 0.69% |
|
Talen Energy Corp.12 |
|
|
52,138 |
|
|
$ |
5,789 |
|
|
|
PG&E Corp. |
|
|
18,786 |
|
|
|
328 |
|
|
|
|
|
|
|
|
|
|
|
|
|
|
|
|
|
|
|
|
|
|
|
|
|
6,117 |
|
|
|
|
|
|
|
|
|
|
|
|
|
| |
|
| Consumer discretionary 0.38% |
|
Party City Holdco, Inc.4,12 |
|
|
126,254 |
|
|
|
2,199 |
|
|
|
Party City Holdco, Inc.1,4,12 |
|
|
1,260 |
|
|
|
22 |
|
|
|
NMG Parent, LLC12 |
|
|
9,965 |
|
|
|
1,134 |
|
|
|
MYT Holding Co., Class B12 |
|
|
608,846 |
|
|
|
69 |
|
|
|
|
|
|
|
|
|
|
|
|
|
|
|
|
|
|
|
|
|
|
|
|
|
3,424 |
|
|
|
|
|
|
|
|
|
|
|
|
|
| |
|
| Materials 0.26% |
|
Venator Materials PLC4,12 |
|
|
3,232 |
|
|
|
2,280 |
|
|
|
|
|
|
|
|
|
|
|
|
|
| |
|
| Real estate 0.07% |
|
WeWork, Inc.4,12 |
|
|
57,167 |
|
|
|
573 |
|
|
|
|
|
|
|
|
|
|
|
|
|
| |
|
| Communication services 0.04% |
|
Intelsat SA |
|
|
8,182 |
|
|
|
307 |
|
|
|
iHeartMedia, Inc., Class A12 |
|
|
22,639 |
|
|
|
25 |
|
|
|
|
|
|
|
|
|
|
|
|
|
|
|
|
|
|
|
|
|
|
|
|
|
332 |
|
|
|
|
|
|
|
|
|
|
|
|
|
| |
|
| Financials 0.03% |
|
Navient Corp. |
|
|
20,000 |
|
|
|
291 |
|
|
|
|
|
|
|
|
|
|
|
|
|
|
|
|
|
|
Total common stocks (cost: $36,385,000) |
|
|
|
|
|
|
54,734 |
|
|
|
|
|
|
|
|
|
|
|
|
|
|
|
| Preferred securities 0.35% |
|
|
|
|
|
|
| Industrials 0.19% |
|
ACR III LSC Holdings, LLC, Series B, preferred shares1,4,12 |
|
|
1,022 |
|
|
|
1,751 |
|
|
|
|
|
|
|
|
|
|
|
|
|
| |
|
| Consumer discretionary 0.16% |
|
MYT Holdings, LLC, Series A, 10.00% preferred shares12 |
|
|
2,095,904 |
|
|
|
1,416 |
|
|
|
|
|
|
|
|
|
|
|
|
|
|
|
|
|
|
Total preferred securities (cost: $2,933,000) |
|
|
|
|
|
|
3,167 |
|
|
|
|
|
|
|
|
|
|
|
|
|
|
|
| Rights & warrants 0.03% |
|
|
|
|
|
|
| Consumer discretionary 0.03% |
|
NMG Parent, LLC, warrants, expire 9/24/202712 |
|
|
27,111 |
|
|
|
265 |
|
|
|
|
|
|
|
|
|
|
|
|
|
|
|
|
|
|
Total rights & warrants (cost: $164,000) |
|
|
|
|
|
|
265 |
|
|
|
|
|
|
|
|
|
|
|
|
|
|
|
| Short-term securities 2.29% |
|
|
|
|
|
|
|
| Money market investments 2.29% |
|
|
|
Capital Group Central Cash Fund 5.37%13,14 |
|
|
204,360 |
|
|
|
20,436 |
|
|
|
|
|
|
|
|
|
|
|
|
|
|
|
|
|
|
Total short-term securities (cost: $20,435,000) |
|
|
|
|
|
|
20,436 |
|
|
|
|
|
|
|
|
|
|
|
|
|
|
|
|
|
|
Total investment securities 98.73% (cost: $883,372,000) |
|
|
|
|
|
|
880,309 |
|
|
|
Other assets less liabilities 1.27% |
|
|
|
|
|
|
11,355 |
|
|
|
|
|
|
|
|
|
|
|
|
|
|
|
|
|
|
Net assets 100.00% |
|
|
|
|
|
$ |
891,664 |
|
|
|
|
|
|
|
|
|
|
|
|
American Funds Insurance Series 212
American High-Income Trust (continued)
|
|
|
|
|
|
|
|
|
|
|
|
|
|
|
|
|
|
|
|
|
|
|
|
|
| Futures contracts |
|
|
|
|
|
|
|
| Contracts |
|
Type |
|
|
Number of contracts |
|
|
Expiration date |
|
|
Notional amount (000) |
|
|
Value and unrealized appreciation (depreciation) at 6/30/2024 (000) |
|
|
|
|
|
|
|
|
| 30 Day Federal Funds Futures |
|
|
Long |
|
|
|
184 |
|
|
|
9/3/2024 |
|
|
|
USD72,605 |
|
|
|
|
|
|
$ |
(36 |
) |
| 2 Year U.S. Treasury Note Futures |
|
|
Long |
|
|
|
118 |
|
|
|
10/3/2024 |
|
|
|
24,098 |
|
|
|
|
|
|
|
51 |
|
| 5 Year U.S. Treasury Note Futures |
|
|
Long |
|
|
|
135 |
|
|
|
10/3/2024 |
|
|
|
14,388 |
|
|
|
|
|
|
|
86 |
|
| 10 Year Ultra U.S. Treasury Note Futures |
|
|
Short |
|
|
|
8 |
|
|
|
9/30/2024 |
|
|
|
(908 |
) |
|
|
|
|
|
|
(6 |
) |
| 10 Year U.S. Treasury Note Futures |
|
|
Short |
|
|
|
14 |
|
|
|
9/30/2024 |
|
|
|
(1,540 |
) |
|
|
|
|
|
|
(14 |
) |
| 30 Year Ultra U.S. Treasury Bond Futures |
|
|
Short |
|
|
|
1 |
|
|
|
9/30/2024 |
|
|
|
(125 |
) |
|
|
|
|
|
|
(2 |
) |
|
|
|
|
|
|
|
|
|
|
|
|
|
|
|
|
|
|
|
|
|
|
|
|
|
|
|
|
|
|
|
|
|
|
|
|
|
|
|
|
|
|
|
|
|
|
|
|
|
|
|
|
|
|
$ |
79 |
|
|
|
|
|
|
|
|
|
|
|
|
|
|
|
|
|
|
|
|
|
|
|
|
|
|
Swap contracts
Credit default swaps
Centrally cleared credit default swaps on credit indices – buy protection
|
|
|
|
|
|
|
|
|
|
|
|
|
|
|
|
|
|
|
|
|
|
|
|
|
|
|
|
|
|
|
|
|
|
|
|
|
|
|
|
|
|
|
|
|
|
|
|
|
|
|
|
| Reference index |
|
Financing
rate paid |
|
|
|
|
Payment frequency |
|
|
Expiration date |
|
|
Notional amount (000) |
|
|
Value at 6/30/2024 (000) |
|
|
Upfront premium paid (received) (000) |
|
|
Unrealized appreciation (depreciation) at 6/30/2024 (000) |
|
|
|
|
|
|
|
|
|
|
|
|
|
| CDX.NA.HY.41 |
|
5.00% |
|
|
|
|
|
|
Quarterly |
|
|
|
12/20/2028 |
|
|
|
USD5,069 |
|
|
|
|
|
|
|
$(323 |
) |
|
|
|
|
|
|
$(319 |
) |
|
|
|
|
|
|
$(4 |
) |
| CDX.NA.HY.42 |
|
5.00% |
|
|
|
|
|
|
Quarterly |
|
|
|
6/20/2029 |
|
|
|
4,645 |
|
|
|
|
|
|
|
(291 |
) |
|
|
|
|
|
|
(304 |
) |
|
|
|
|
|
|
13 |
|
| CDX.NA.IG.42 |
|
1.00% |
|
|
|
|
|
|
Quarterly |
|
|
|
6/20/2029 |
|
|
|
13,634 |
|
|
|
|
|
|
|
(281 |
) |
|
|
|
|
|
|
(293 |
) |
|
|
|
|
|
|
12 |
|
|
|
|
|
|
|
|
|
|
|
|
|
|
|
|
|
|
|
|
|
|
|
|
|
|
|
|
|
|
|
|
|
|
|
|
|
|
|
|
|
|
|
|
|
|
|
|
|
|
|
|
|
|
|
|
|
|
|
|
|
|
|
|
|
|
|
|
|
|
|
|
|
|
|
|
|
|
|
|
|
$(895 |
) |
|
|
|
|
|
|
$(916 |
) |
|
|
|
|
|
|
$21 |
|
|
|
|
|
|
|
|
|
|
|
|
|
|
|
|
|
|
|
|
|
|
|
|
|
|
|
|
|
|
|
|
|
|
|
|
|
|
|
|
|
|
|
|
Investments in affiliates14
|
|
|
|
|
|
|
|
|
|
|
|
|
|
|
|
|
|
|
|
|
|
|
|
|
|
|
|
|
| |
|
|
|
|
|
|
|
|
|
|
|
|
|
Net |
|
|
|
|
|
|
|
| |
|
|
|
|
|
|
|
|
|
|
Net |
|
|
unrealized |
|
|
|
|
|
Dividend |
|
| |
|
Value at |
|
|
|
|
|
|
|
|
realized |
|
|
appreciation |
|
|
Value at |
|
|
or interest |
|
| |
|
1/1/2024 |
|
|
Additions |
|
|
Reductions |
|
|
gain (loss) |
|
|
(depreciation) |
|
|
6/30/2024 |
|
|
income |
|
| |
|
(000) |
|
|
(000) |
|
|
(000) |
|
|
(000) |
|
|
(000) |
|
|
(000) |
|
|
(000) |
|
|
|
|
|
|
|
|
|
| Short-term securities 2.29% |
|
|
|
|
|
|
|
|
|
|
|
|
|
|
|
|
|
|
|
|
|
|
|
|
|
|
|
|
| Money market investments 2.29% |
|
|
|
|
|
|
|
|
|
|
|
|
|
|
|
|
|
|
|
|
|
|
|
|
|
|
|
|
| Capital Group Central Cash Fund 5.37%13 |
|
|
$27,114 |
|
|
|
$112,431 |
|
|
|
$119,114 |
|
|
|
$3 |
|
|
|
$2 |
|
|
|
$20,436 |
|
|
|
$797 |
|
Restricted securities9
|
|
|
|
|
|
|
|
|
|
|
|
|
|
|
|
|
|
|
|
|
| |
|
|
|
|
|
|
|
Percent |
| |
|
Acquisition |
|
Cost |
|
Value |
|
of net |
| |
|
date(s) |
|
(000) |
|
(000) |
|
assets |
|
|
|
|
|
| Rotech Healthcare, Inc.4,12 |
|
|
|
9/26/2013 |
|
|
|
$ |
4,331 |
|
|
|
$ |
19,877 |
|
|
|
|
2.23 |
% |
|
|
|
|
|
| Finastra USA, Inc., Term Loan B, |
|
|
|
|
|
|
|
|
|
|
|
|
|
|
|
|
|
|
|
|
|
|
|
|
|
| (3-month USD CME Term SOFR + 7.25%) 12.459% 9/13/20295,6 |
|
|
|
9/13/2023-5/31/2024 |
|
|
|
|
3,580 |
|
|
|
|
3,665 |
|
|
|
|
.41 |
|
|
|
|
|
|
| Finastra USA, Inc., Term Loan, |
|
|
|
|
|
|
|
|
|
|
|
|
|
|
|
|
|
|
|
|
|
|
|
|
|
| (3-month USD CME Term SOFR + 7.25%) 12.581% 9/13/20295,6 |
|
|
|
9/13/2023-6/13/2024 |
|
|
|
|
40 |
|
|
|
|
40 |
|
|
|
|
.00 |
15 |
213 American Funds Insurance Series
American High-Income Trust (continued)
Restricted securities9 (continued)
|
|
|
|
|
|
|
|
|
|
|
|
|
|
|
|
|
|
|
|
|
| |
|
|
|
|
|
|
|
Percent |
| |
|
Acquisition |
|
Cost |
|
Value |
|
of net |
| |
|
date(s) |
|
(000) |
|
(000) |
|
assets |
|
|
|
|
|
| Wolfspeed, Inc. 9.875% 6/23/2030 (10.875% on 6/23/2026)4,7 |
|
|
|
6/23/2023 |
|
|
|
$ |
3,024 |
|
|
|
$ |
3,027 |
|
|
|
|
.34 |
% |
|
|
|
|
|
| Ascent Resources - Utica, LLC, Class A4 |
|
|
|
11/15/2016 |
|
|
|
|
302 |
|
|
|
|
2,647 |
|
|
|
|
.30 |
|
|
|
|
|
|
|
|
|
|
|
|
|
|
|
|
|
|
|
|
|
|
|
|
|
|
|
| Total |
|
|
|
|
|
|
|
$ |
11,277 |
|
|
|
$ |
29,256 |
|
|
|
|
3.28 |
% |
|
|
|
|
|
|
|
|
|
|
|
|
|
|
|
|
|
|
|
|
|
| 1 |
Acquired in a transaction exempt from registration under Rule 144A or, for commercial paper, Section 4(a)(2) of the Securities Act of 1933. May be resold in the U.S. in transactions exempt from registration, normally to qualified institutional buyers. The total value of all such securities was $597,161,000, which represented 66.97% of the net assets of the fund. |
| 2 |
Scheduled interest and/or principal payment was not received. |
| 3 |
Payment in kind; the issuer has the option of paying additional securities in lieu of cash. Payment methods and rates are as of the most recent payment when available. |
| 4 |
Value determined using significant unobservable inputs. |
| 5 |
Loan participations and assignments; may be subject to legal or contractual restrictions on resale. The total value of all such loans was $43,759,000, which represented 4.91% of the net assets of the fund. |
| 6 |
Coupon rate may change periodically. Reference rate and spread are as of the most recent information available. Some coupon rates are determined by the issuer or agent based on current market conditions; therefore, the reference rate and spread are not available. |
| 7 |
Step bond; coupon rate may change at a later date. |
| 8 |
Amount less than one thousand. |
| 9 |
Restricted security, other than Rule 144A securities or commercial paper issued pursuant to Section 4(a)(2) of the Securities Act of 1933. The total value of all such restricted securities was $29,256,000, which represented 3.28% of the net assets of the fund. |
| 10 |
Securities referencing LIBOR are expected to transition to an alternative reference rate by the security’s next scheduled coupon reset date. |
| 11 |
All or a portion of this security was pledged as collateral. The total value of pledged collateral was $421,000, which represented .05% of the net assets of the fund. |
| 12 |
Security did not produce income during the last 12 months. |
| 13 |
Rate represents the seven-day yield at 6/30/2024. |
| 14 |
Part of the same “group of investment companies” as the fund as defined under the Investment Company Act of 1940, as amended. |
| 15 |
Amount less than .01%. |
Key to abbreviation(s)
CME = CME Group
DAC = Designated Activity Company
EUR = Euros
LIBOR = London Interbank Offered Rate
MXN = Mexican pesos
PIK = Payment In Kind
REIT = Real Estate Investment Trust
SOFR = Secured Overnight Financing Rate
USD = U.S. dollars
Refer to the notes to financial statements.
American Funds Insurance Series 214
|
|
|
| American Funds Mortgage Fund |
|
|
| Investment portfolio June 30, 2024 |
|
unaudited |
|
|
|
|
|
|
|
|
|
|
|
|
|
|
|
| Bonds, notes & other debt instruments 96.08% |
|
|
|
|
Principal amount
(000) |
|
|
Value (000) |
|
|
|
|
|
| Mortgage-backed obligations 88.85% |
|
|
|
|
|
|
|
|
|
|
|
|
| Federal agency mortgage-backed obligations 86.83% |
|
Fannie Mae Pool #695412 5.00% 6/1/20331 |
|
|
|
|
|
|
USD– |
2 |
|
$ |
– |
2 |
|
|
Fannie Mae Pool #AD3566 5.00% 10/1/20351 |
|
|
|
|
|
|
1 |
|
|
|
1 |
|
|
|
Fannie Mae Pool #256583 5.00% 12/1/20361 |
|
|
|
|
|
|
30 |
|
|
|
29 |
|
|
|
Fannie Mae Pool #931768 5.00% 8/1/20391 |
|
|
|
|
|
|
1 |
|
|
|
1 |
|
|
|
Fannie Mae Pool #AC0794 5.00% 10/1/20391 |
|
|
|
|
|
|
5 |
|
|
|
5 |
|
|
|
Fannie Mae Pool #932606 5.00% 2/1/20401 |
|
|
|
|
|
|
2 |
|
|
|
2 |
|
|
|
Fannie Mae Pool #MA4232 2.00% 1/1/20411 |
|
|
|
|
|
|
138 |
|
|
|
116 |
|
|
|
Fannie Mae Pool #BQ7816 1.50% 4/1/20411 |
|
|
|
|
|
|
240 |
|
|
|
195 |
|
|
|
Fannie Mae Pool #BR0986 1.50% 5/1/20411 |
|
|
|
|
|
|
306 |
|
|
|
248 |
|
|
|
Fannie Mae Pool #AE1248 5.00% 6/1/20411 |
|
|
|
|
|
|
8 |
|
|
|
8 |
|
|
|
Fannie Mae Pool #MA4387 2.00% 7/1/20411 |
|
|
|
|
|
|
17 |
|
|
|
14 |
|
|
|
Fannie Mae Pool #MA4388 2.50% 7/1/20411 |
|
|
|
|
|
|
79 |
|
|
|
68 |
|
|
|
Fannie Mae Pool #MA4447 2.50% 10/1/20411 |
|
|
|
|
|
|
165 |
|
|
|
142 |
|
|
|
Fannie Mae Pool #FM9117 2.50% 10/1/20411 |
|
|
|
|
|
|
86 |
|
|
|
75 |
|
|
|
Fannie Mae Pool #AJ1873 4.00% 10/1/20411 |
|
|
|
|
|
|
6 |
|
|
|
5 |
|
|
|
Fannie Mae Pool #AE1274 5.00% 10/1/20411 |
|
|
|
|
|
|
4 |
|
|
|
4 |
|
|
|
Fannie Mae Pool #AE1277 5.00% 11/1/20411 |
|
|
|
|
|
|
3 |
|
|
|
3 |
|
|
|
Fannie Mae Pool #MA4502 2.50% 12/1/20411 |
|
|
|
|
|
|
186 |
|
|
|
161 |
|
|
|
Fannie Mae Pool #AE1283 5.00% 12/1/20411 |
|
|
|
|
|
|
2 |
|
|
|
2 |
|
|
|
Fannie Mae Pool #MA4521 2.50% 1/1/20421 |
|
|
|
|
|
|
235 |
|
|
|
203 |
|
|
|
Fannie Mae Pool #MA4540 2.00% 2/1/20421 |
|
|
|
|
|
|
248 |
|
|
|
208 |
|
|
|
Fannie Mae Pool #AE1290 5.00% 2/1/20421 |
|
|
|
|
|
|
4 |
|
|
|
4 |
|
|
|
Fannie Mae Pool #MA4570 2.00% 3/1/20421 |
|
|
|
|
|
|
106 |
|
|
|
89 |
|
|
|
Fannie Mae Pool #AT0300 3.50% 3/1/20431 |
|
|
|
|
|
|
1 |
|
|
|
1 |
|
|
|
Fannie Mae Pool #AT3954 3.50% 4/1/20431 |
|
|
|
|
|
|
2 |
|
|
|
1 |
|
|
|
Fannie Mae Pool #AY1829 3.50% 12/1/20441 |
|
|
|
|
|
|
2 |
|
|
|
2 |
|
|
|
Fannie Mae Pool #FS3767 2.00% 4/1/20471 |
|
|
|
|
|
|
27 |
|
|
|
22 |
|
|
|
Fannie Mae Pool #BH3122 4.00% 6/1/20471 |
|
|
|
|
|
|
1 |
|
|
|
1 |
|
|
|
Fannie Mae Pool #BJ5015 4.00% 12/1/20471 |
|
|
|
|
|
|
29 |
|
|
|
27 |
|
|
|
Fannie Mae Pool #BK5232 4.00% 5/1/20481 |
|
|
|
|
|
|
17 |
|
|
|
16 |
|
|
|
Fannie Mae Pool #BK6840 4.00% 6/1/20481 |
|
|
|
|
|
|
24 |
|
|
|
22 |
|
|
|
Fannie Mae Pool #BK9743 4.00% 8/1/20481 |
|
|
|
|
|
|
6 |
|
|
|
6 |
|
|
|
Fannie Mae Pool #BK9761 4.50% 8/1/20481 |
|
|
|
|
|
|
4 |
|
|
|
4 |
|
|
|
Fannie Mae Pool #FS3745 2.00% 8/1/20501 |
|
|
|
|
|
|
18 |
|
|
|
14 |
|
|
|
Fannie Mae Pool #CA7052 3.00% 9/1/20501 |
|
|
|
|
|
|
5 |
|
|
|
4 |
|
|
|
Fannie Mae Pool #BQ3005 2.50% 10/1/20501 |
|
|
|
|
|
|
69 |
|
|
|
57 |
|
|
|
Fannie Mae Pool #CA8108 2.00% 12/1/20501 |
|
|
|
|
|
|
141 |
|
|
|
112 |
|
|
|
Fannie Mae Pool #MA4208 2.00% 12/1/20501 |
|
|
|
|
|
|
12 |
|
|
|
9 |
|
|
|
Fannie Mae Pool #FM6113 2.50% 1/1/20511,3 |
|
|
|
|
|
|
1,519 |
|
|
|
1,252 |
|
|
|
Fannie Mae Pool #FM5940 2.00% 2/1/20511 |
|
|
|
|
|
|
1,610 |
|
|
|
1,276 |
|
|
|
Fannie Mae Pool #CA8820 2.00% 2/1/20511 |
|
|
|
|
|
|
367 |
|
|
|
291 |
|
|
|
Fannie Mae Pool #MA4305 2.00% 4/1/20511 |
|
|
|
|
|
|
1 |
|
|
|
1 |
|
|
|
Fannie Mae Pool #CB0041 3.00% 4/1/20511 |
|
|
|
|
|
|
189 |
|
|
|
164 |
|
|
|
Fannie Mae Pool #FM7900 2.50% 7/1/20511 |
|
|
|
|
|
|
25 |
|
|
|
21 |
|
|
|
Fannie Mae Pool #FM8038 3.00% 7/1/20511 |
|
|
|
|
|
|
34 |
|
|
|
30 |
|
|
|
Fannie Mae Pool #CB1527 2.50% 9/1/20511 |
|
|
|
|
|
|
408 |
|
|
|
337 |
|
|
|
Fannie Mae Pool #FS0965 2.00% 11/1/20511 |
|
|
|
|
|
|
3 |
|
|
|
2 |
|
|
|
Fannie Mae Pool #FM9492 2.50% 11/1/20511 |
|
|
|
|
|
|
420 |
|
|
|
350 |
|
|
|
Fannie Mae Pool #FM9694 2.50% 11/1/20511 |
|
|
|
|
|
|
198 |
|
|
|
166 |
|
|
|
Fannie Mae Pool #FM9804 2.50% 12/1/20511 |
|
|
|
|
|
|
218 |
|
|
|
182 |
|
|
|
Fannie Mae Pool #FM9976 3.00% 12/1/20511 |
|
|
|
|
|
|
87 |
|
|
|
76 |
|
|
|
Fannie Mae Pool #CB2544 3.00% 1/1/20521 |
|
|
|
|
|
|
253 |
|
|
|
218 |
|
|
|
Fannie Mae Pool #FS5851 4.00% 7/1/20521 |
|
|
|
|
|
|
1,111 |
|
|
|
1,019 |
|
|
|
Fannie Mae Pool #FS6362 3.50% 8/1/20521 |
|
|
|
|
|
|
180 |
|
|
|
160 |
|
|
|
Fannie Mae Pool #BW1289 5.50% 10/1/20521 |
|
|
|
|
|
|
40 |
|
|
|
40 |
|
|
|
Fannie Mae Pool #BW1243 5.50% 10/1/20521 |
|
|
|
|
|
|
36 |
|
|
|
36 |
|
|
|
Fannie Mae Pool #MA4840 4.50% 12/1/20521 |
|
|
|
|
|
|
461 |
|
|
|
435 |
|
|
|
Fannie Mae Pool #BX5673 5.00% 12/1/20521 |
|
|
|
|
|
|
98 |
|
|
|
95 |
|
|
|
Fannie Mae Pool #MA4919 5.50% 2/1/20531 |
|
|
|
|
|
|
72 |
|
|
|
71 |
|
|
|
Fannie Mae Pool #FS3759 6.00% 2/1/20531 |
|
|
|
|
|
|
111 |
|
|
|
113 |
|
|
|
Fannie Mae Pool #BY2249 4.00% 4/1/20531 |
|
|
|
|
|
|
30 |
|
|
|
28 |
|
215 American Funds Insurance Series
American Funds Mortgage Fund (continued)
|
|
|
|
|
|
|
|
|
|
|
|
|
|
|
| Bonds, notes & other debt instruments (continued) |
|
|
|
|
Principal amount
(000) |
|
|
Value (000) |
|
|
|
|
|
| Mortgage-backed obligations (continued) |
|
|
|
|
|
|
|
|
|
|
|
|
| Federal agency mortgage-backed obligations (continued) |
|
Fannie Mae Pool #MA4978 5.00% 4/1/20531 |
|
|
|
|
|
|
USD2,540 |
|
|
$ |
2,458 |
|
|
|
Fannie Mae Pool #CB6106 6.50% 4/1/20531 |
|
|
|
|
|
|
72 |
|
|
|
74 |
|
|
|
Fannie Mae Pool #MA5008 4.50% 5/1/20531 |
|
|
|
|
|
|
45 |
|
|
|
42 |
|
|
|
Fannie Mae Pool #FS4563 5.00% 5/1/20531 |
|
|
|
|
|
|
51 |
|
|
|
50 |
|
|
|
Fannie Mae Pool #MA5010 5.50% 5/1/20531 |
|
|
|
|
|
|
55 |
|
|
|
54 |
|
|
|
Fannie Mae Pool #MA5011 6.00% 5/1/20531 |
|
|
|
|
|
|
302 |
|
|
|
304 |
|
|
|
Fannie Mae Pool #MA5038 5.00% 6/1/20531 |
|
|
|
|
|
|
280 |
|
|
|
270 |
|
|
|
Fannie Mae Pool #FS5192 5.50% 6/1/20531 |
|
|
|
|
|
|
829 |
|
|
|
821 |
|
|
|
Fannie Mae Pool #MA5040 6.00% 6/1/20531 |
|
|
|
|
|
|
410 |
|
|
|
413 |
|
|
|
Fannie Mae Pool #MA5072 5.50% 7/1/20531 |
|
|
|
|
|
|
221 |
|
|
|
218 |
|
|
|
Fannie Mae Pool #FS5343 6.00% 7/1/20531 |
|
|
|
|
|
|
502 |
|
|
|
505 |
|
|
|
Fannie Mae Pool #CB6853 4.50% 8/1/20531 |
|
|
|
|
|
|
95 |
|
|
|
90 |
|
|
|
Fannie Mae Pool #MA5107 5.50% 8/1/20531 |
|
|
|
|
|
|
530 |
|
|
|
523 |
|
|
|
Fannie Mae Pool #MA5136 4.50% 9/1/20531 |
|
|
|
|
|
|
574 |
|
|
|
541 |
|
|
|
Fannie Mae Pool #MA5165 5.50% 10/1/20531 |
|
|
|
|
|
|
1,911 |
|
|
|
1,885 |
|
|
|
Fannie Mae Pool #MA5207 4.00% 11/1/20531 |
|
|
|
|
|
|
12 |
|
|
|
11 |
|
|
|
Fannie Mae Pool #FS7979 2.00% 12/1/20531 |
|
|
|
|
|
|
44 |
|
|
|
34 |
|
|
|
Fannie Mae Pool #FS6668 5.50% 12/1/20531 |
|
|
|
|
|
|
166 |
|
|
|
164 |
|
|
|
Fannie Mae Pool #MA5215 5.50% 12/1/20531 |
|
|
|
|
|
|
86 |
|
|
|
85 |
|
|
|
Fannie Mae Pool #FS6873 6.50% 1/1/20541 |
|
|
|
|
|
|
569 |
|
|
|
580 |
|
|
|
Fannie Mae Pool #MA5271 5.50% 2/1/20541 |
|
|
|
|
|
|
1,632 |
|
|
|
1,610 |
|
|
|
Fannie Mae Pool #FS6809 5.50% 2/1/20541 |
|
|
|
|
|
|
164 |
|
|
|
162 |
|
|
|
Fannie Mae Pool #MA5274 7.00% 2/1/20541 |
|
|
|
|
|
|
436 |
|
|
|
449 |
|
|
|
Fannie Mae Pool #MA5296 5.50% 3/1/20541 |
|
|
|
|
|
|
156 |
|
|
|
154 |
|
|
|
Fannie Mae Pool #DB1235 6.00% 4/1/20541 |
|
|
|
|
|
|
150 |
|
|
|
151 |
|
|
|
Fannie Mae Pool #CB8387 6.50% 4/1/20541 |
|
|
|
|
|
|
21 |
|
|
|
21 |
|
|
|
Fannie Mae Pool #MA5353 5.50% 5/1/20541 |
|
|
|
|
|
|
1,086 |
|
|
|
1,072 |
|
|
|
Fannie Mae Pool #FS8153 6.00% 6/1/20541 |
|
|
|
|
|
|
260 |
|
|
|
262 |
|
|
|
Fannie Mae Pool #CB8755 6.00% 6/1/20541 |
|
|
|
|
|
|
23 |
|
|
|
23 |
|
|
|
Fannie Mae Pool #BU4700 6.00% 7/1/20541 |
|
|
|
|
|
|
619 |
|
|
|
624 |
|
|
|
Fannie Mae Pool #BF0379 3.50% 4/1/20591 |
|
|
|
|
|
|
124 |
|
|
|
109 |
|
|
|
Fannie Mae Pool #BF0481 3.50% 6/1/20601 |
|
|
|
|
|
|
138 |
|
|
|
121 |
|
|
|
Fannie Mae Pool #BF0497 3.00% 7/1/20601 |
|
|
|
|
|
|
46 |
|
|
|
39 |
|
|
|
Fannie Mae Pool #BF0585 4.50% 12/1/20611 |
|
|
|
|
|
|
48 |
|
|
|
45 |
|
|
|
Fannie Mae Pool #BF0765 3.50% 9/1/20631 |
|
|
|
|
|
|
788 |
|
|
|
687 |
|
|
|
Freddie Mac Pool #ZA1922 5.00% 2/1/20261,3 |
|
|
|
|
|
|
– |
2 |
|
|
– |
2 |
|
|
Freddie Mac Pool #ZS8950 5.00% 10/1/20291 |
|
|
|
|
|
|
1 |
|
|
|
1 |
|
|
|
Freddie Mac Pool #A18781 5.00% 3/1/20341,3 |
|
|
|
|
|
|
518 |
|
|
|
512 |
|
|
|
Freddie Mac Pool #RB5113 1.50% 6/1/20411 |
|
|
|
|
|
|
1,584 |
|
|
|
1,282 |
|
|
|
Freddie Mac Pool #RB5115 2.50% 6/1/20411 |
|
|
|
|
|
|
298 |
|
|
|
260 |
|
|
|
Freddie Mac Pool #RB5138 2.00% 12/1/20411 |
|
|
|
|
|
|
90 |
|
|
|
75 |
|
|
|
Freddie Mac Pool #RB5145 2.00% 2/1/20421 |
|
|
|
|
|
|
84 |
|
|
|
70 |
|
|
|
Freddie Mac Pool #RB5148 2.00% 3/1/20421 |
|
|
|
|
|
|
28 |
|
|
|
23 |
|
|
|
Freddie Mac Pool #Q15874 4.00% 2/1/20431 |
|
|
|
|
|
|
1 |
|
|
|
1 |
|
|
|
Freddie Mac Pool #760014 2.838% 8/1/20451,4 |
|
|
|
|
|
|
265 |
|
|
|
256 |
|
|
|
Freddie Mac Pool #Q47615 3.50% 4/1/20471 |
|
|
|
|
|
|
16 |
|
|
|
14 |
|
|
|
Freddie Mac Pool #Q52069 3.50% 11/1/20471 |
|
|
|
|
|
|
24 |
|
|
|
21 |
|
|
|
Freddie Mac Pool #Q55971 4.00% 5/1/20481 |
|
|
|
|
|
|
16 |
|
|
|
15 |
|
|
|
Freddie Mac Pool #Q56175 4.00% 5/1/20481 |
|
|
|
|
|
|
14 |
|
|
|
13 |
|
|
|
Freddie Mac Pool #Q55970 4.00% 5/1/20481 |
|
|
|
|
|
|
7 |
|
|
|
7 |
|
|
|
Freddie Mac Pool #Q56599 4.00% 6/1/20481 |
|
|
|
|
|
|
24 |
|
|
|
22 |
|
|
|
Freddie Mac Pool #Q58411 4.50% 9/1/20481 |
|
|
|
|
|
|
45 |
|
|
|
43 |
|
|
|
Freddie Mac Pool #Q58436 4.50% 9/1/20481 |
|
|
|
|
|
|
23 |
|
|
|
23 |
|
|
|
Freddie Mac Pool #Q58378 4.50% 9/1/20481 |
|
|
|
|
|
|
15 |
|
|
|
15 |
|
|
|
Freddie Mac Pool #QA2748 3.50% 9/1/20491 |
|
|
|
|
|
|
16 |
|
|
|
14 |
|
|
|
Freddie Mac Pool #SD7512 3.00% 2/1/20501 |
|
|
|
|
|
|
141 |
|
|
|
122 |
|
|
|
Freddie Mac Pool #RA3384 3.00% 8/1/20501 |
|
|
|
|
|
|
5 |
|
|
|
4 |
|
|
|
Freddie Mac Pool #SI2062 2.00% 9/1/20501 |
|
|
|
|
|
|
182 |
|
|
|
144 |
|
|
|
Freddie Mac Pool #RA3987 2.50% 11/1/20501 |
|
|
|
|
|
|
195 |
|
|
|
161 |
|
|
|
Freddie Mac Pool #RA4352 2.00% 1/1/20511 |
|
|
|
|
|
|
320 |
|
|
|
254 |
|
|
|
Freddie Mac Pool #SD8128 2.00% 2/1/20511 |
|
|
|
|
|
|
2 |
|
|
|
1 |
|
American Funds Insurance Series 216
American Funds Mortgage Fund (continued)
|
|
|
|
|
|
|
|
|
|
|
|
|
|
|
| Bonds, notes & other debt instruments (continued) |
|
|
|
|
Principal amount
(000) |
|
|
Value (000) |
|
|
|
|
|
| Mortgage-backed obligations (continued) |
|
|
|
|
|
|
|
|
|
|
|
|
| Federal agency mortgage-backed obligations (continued) |
|
Freddie Mac Pool #SD8134 2.00% 3/1/20511 |
|
|
|
|
|
|
USD3 |
|
|
$ |
2 |
|
|
|
Freddie Mac Pool #RA5288 2.00% 5/1/20511 |
|
|
|
|
|
|
297 |
|
|
|
236 |
|
|
|
Freddie Mac Pool #QC7626 3.00% 9/1/20511 |
|
|
|
|
|
|
228 |
|
|
|
196 |
|
|
|
Freddie Mac Pool #RA6406 2.00% 11/1/20511 |
|
|
|
|
|
|
74 |
|
|
|
58 |
|
|
|
Freddie Mac Pool #SD1385 2.50% 11/1/20511 |
|
|
|
|
|
|
60 |
|
|
|
50 |
|
|
|
Freddie Mac Pool #RA6598 3.50% 1/1/20521 |
|
|
|
|
|
|
173 |
|
|
|
155 |
|
|
|
Freddie Mac Pool #SD0873 3.50% 2/1/20521,3 |
|
|
|
|
|
|
1,031 |
|
|
|
929 |
|
|
|
Freddie Mac Pool #QD7089 3.50% 2/1/20521 |
|
|
|
|
|
|
7 |
|
|
|
7 |
|
|
|
Freddie Mac Pool #SD8214 3.50% 5/1/20521 |
|
|
|
|
|
|
371 |
|
|
|
329 |
|
|
|
Freddie Mac Pool #SD8225 3.00% 7/1/20521 |
|
|
|
|
|
|
1,114 |
|
|
|
949 |
|
|
|
Freddie Mac Pool #SD8242 3.00% 9/1/20521 |
|
|
|
|
|
|
119 |
|
|
|
101 |
|
|
|
Freddie Mac Pool #QF0213 4.50% 9/1/20521 |
|
|
|
|
|
|
1,193 |
|
|
|
1,127 |
|
|
|
Freddie Mac Pool #RA7938 5.00% 9/1/20521 |
|
|
|
|
|
|
639 |
|
|
|
619 |
|
|
|
Freddie Mac Pool #QF0924 5.50% 9/1/20521 |
|
|
|
|
|
|
219 |
|
|
|
217 |
|
|
|
Freddie Mac Pool #SD8258 5.00% 10/1/20521 |
|
|
|
|
|
|
248 |
|
|
|
240 |
|
|
|
Freddie Mac Pool #RA8059 5.50% 10/1/20521 |
|
|
|
|
|
|
110 |
|
|
|
109 |
|
|
|
Freddie Mac Pool #SD1895 4.50% 11/1/20521 |
|
|
|
|
|
|
358 |
|
|
|
345 |
|
|
|
Freddie Mac Pool #SD8266 4.50% 11/1/20521 |
|
|
|
|
|
|
338 |
|
|
|
319 |
|
|
|
Freddie Mac Pool #SD8280 6.50% 11/1/20521 |
|
|
|
|
|
|
775 |
|
|
|
793 |
|
|
|
Freddie Mac Pool #SD2602 3.00% 12/1/20521 |
|
|
|
|
|
|
31 |
|
|
|
27 |
|
|
|
Freddie Mac Pool #SD4116 4.50% 12/1/20521 |
|
|
|
|
|
|
392 |
|
|
|
370 |
|
|
|
Freddie Mac Pool #SD8288 5.00% 1/1/20531 |
|
|
|
|
|
|
43 |
|
|
|
41 |
|
|
|
Freddie Mac Pool #SD8315 5.00% 4/1/20531 |
|
|
|
|
|
|
121 |
|
|
|
117 |
|
|
|
Freddie Mac Pool #SD2716 5.00% 4/1/20531 |
|
|
|
|
|
|
84 |
|
|
|
81 |
|
|
|
Freddie Mac Pool #SD8316 5.50% 4/1/20531 |
|
|
|
|
|
|
95 |
|
|
|
94 |
|
|
|
Freddie Mac Pool #SD8322 4.50% 5/1/20531 |
|
|
|
|
|
|
236 |
|
|
|
223 |
|
|
|
Freddie Mac Pool #SD2861 6.00% 5/1/20531 |
|
|
|
|
|
|
61 |
|
|
|
62 |
|
|
|
Freddie Mac Pool #SD8329 5.00% 6/1/20531 |
|
|
|
|
|
|
27 |
|
|
|
26 |
|
|
|
Freddie Mac Pool #SD8331 5.50% 6/1/20531 |
|
|
|
|
|
|
304 |
|
|
|
300 |
|
|
|
Freddie Mac Pool #RA9279 6.00% 6/1/20531 |
|
|
|
|
|
|
67 |
|
|
|
68 |
|
|
|
Freddie Mac Pool #RA9283 6.00% 6/1/20531 |
|
|
|
|
|
|
62 |
|
|
|
63 |
|
|
|
Freddie Mac Pool #RA9281 6.00% 6/1/20531 |
|
|
|
|
|
|
42 |
|
|
|
42 |
|
|
|
Freddie Mac Pool #RA9284 6.00% 6/1/20531 |
|
|
|
|
|
|
29 |
|
|
|
29 |
|
|
|
Freddie Mac Pool #SD8341 5.00% 7/1/20531 |
|
|
|
|
|
|
2 |
|
|
|
2 |
|
|
|
Freddie Mac Pool #SD8342 5.50% 7/1/20531 |
|
|
|
|
|
|
878 |
|
|
|
867 |
|
|
|
Freddie Mac Pool #SD3386 5.50% 7/1/20531 |
|
|
|
|
|
|
53 |
|
|
|
52 |
|
|
|
Freddie Mac Pool #SD8350 6.00% 8/1/20531,3 |
|
|
|
|
|
|
5,499 |
|
|
|
5,518 |
|
|
|
Freddie Mac Pool #RA9857 6.00% 9/1/20531 |
|
|
|
|
|
|
1,048 |
|
|
|
1,054 |
|
|
|
Freddie Mac Pool #RA9854 6.00% 9/1/20531 |
|
|
|
|
|
|
123 |
|
|
|
125 |
|
|
|
Freddie Mac Pool #SD4053 6.00% 10/1/20531 |
|
|
|
|
|
|
703 |
|
|
|
707 |
|
|
|
Freddie Mac Pool #SD8368 6.00% 10/1/20531 |
|
|
|
|
|
|
496 |
|
|
|
497 |
|
|
|
Freddie Mac Pool #SD8369 6.50% 10/1/20531 |
|
|
|
|
|
|
136 |
|
|
|
139 |
|
|
|
Freddie Mac Pool #SD8371 5.00% 11/1/20531 |
|
|
|
|
|
|
1,077 |
|
|
|
1,042 |
|
|
|
Freddie Mac Pool #SD4977 5.00% 11/1/20531 |
|
|
|
|
|
|
667 |
|
|
|
645 |
|
|
|
Freddie Mac Pool #SD8395 5.50% 1/1/20541 |
|
|
|
|
|
|
481 |
|
|
|
475 |
|
|
|
Freddie Mac Pool #RJ0668 6.00% 1/1/20541 |
|
|
|
|
|
|
1,729 |
|
|
|
1,740 |
|
|
|
Freddie Mac Pool #SD4795 6.00% 1/1/20541 |
|
|
|
|
|
|
1,424 |
|
|
|
1,434 |
|
|
|
Freddie Mac Pool #QI0006 6.00% 2/1/20541 |
|
|
|
|
|
|
57 |
|
|
|
57 |
|
|
|
Freddie Mac Pool #RJ1216 5.50% 4/1/20541 |
|
|
|
|
|
|
69 |
|
|
|
69 |
|
|
|
Freddie Mac Pool #SD8420 5.50% 4/1/20541 |
|
|
|
|
|
|
20 |
|
|
|
19 |
|
|
|
Freddie Mac Pool #RJ1215 5.50% 4/1/20541 |
|
|
|
|
|
|
15 |
|
|
|
15 |
|
|
|
Freddie Mac Pool #QI2895 6.00% 4/1/20541 |
|
|
|
|
|
|
102 |
|
|
|
102 |
|
|
|
Freddie Mac Pool #RJ1448 5.50% 5/1/20541 |
|
|
|
|
|
|
65 |
|
|
|
64 |
|
|
|
Freddie Mac Pool #SD5404 6.50% 5/1/20541 |
|
|
|
|
|
|
497 |
|
|
|
509 |
|
|
|
Freddie Mac Pool #RJ1447 6.50% 5/1/20541 |
|
|
|
|
|
|
77 |
|
|
|
79 |
|
|
|
Freddie Mac Pool #RJ1726 6.50% 6/1/20541 |
|
|
|
|
|
|
236 |
|
|
|
241 |
|
|
|
Freddie Mac Pool #QI8874 6.00% 7/1/20541 |
|
|
|
|
|
|
248 |
|
|
|
250 |
|
|
|
Freddie Mac, Series K751, Class A2, Multi Family, 4.412% 3/25/20301 |
|
|
|
|
|
|
300 |
|
|
|
294 |
|
|
|
Freddie Mac Seasoned Credit Risk Transfer Trust, Series 2017-1, Class HA,
3.00% 1/25/20561,4 |
|
|
|
|
|
|
88 |
|
|
|
81 |
|
217 American Funds Insurance Series
American Funds Mortgage Fund (continued)
|
|
|
|
|
|
|
|
|
|
|
|
|
|
|
| Bonds, notes & other debt instruments (continued) |
|
|
|
|
Principal amount
(000) |
|
|
Value (000) |
|
|
|
|
|
| Mortgage-backed obligations (continued) |
|
|
|
|
|
|
|
|
|
|
|
|
| Federal agency mortgage-backed obligations (continued) |
|
Freddie Mac Seasoned Credit Risk Transfer Trust, Series 2017-3, Class HT,
3.25% 7/25/20561 |
|
|
|
|
|
|
USD83 |
|
|
$ |
73 |
|
|
|
Freddie Mac Seasoned Credit Risk Transfer Trust, Series 2017-2, Class MA,
3.00% 8/25/20561 |
|
|
|
|
|
|
169 |
|
|
|
154 |
|
|
|
Freddie Mac Seasoned Credit Risk Transfer Trust, Series 2017-2, Class HA,
3.00% 8/25/20561,4 |
|
|
|
|
|
|
118 |
|
|
|
109 |
|
|
|
Freddie Mac Seasoned Credit Risk Transfer Trust, Series 2018-1, Class HT,
3.00% 5/25/20571 |
|
|
|
|
|
|
22 |
|
|
|
18 |
|
|
|
Freddie Mac Seasoned Credit Risk Transfer Trust, Series 2018-3, Class MA,
3.50% 8/25/20571 |
|
|
|
|
|
|
95 |
|
|
|
90 |
|
|
|
Freddie Mac Seasoned Credit Risk Transfer Trust, Series 2019-2, Class MT,
3.50% 8/26/20581 |
|
|
|
|
|
|
28 |
|
|
|
24 |
|
|
|
Freddie Mac Seasoned Credit Risk Transfer Trust, Series 2019-3, Class MT,
3.50% 10/25/20581 |
|
|
|
|
|
|
16 |
|
|
|
14 |
|
|
|
Freddie Mac Seasoned Loan Structured Transaction Trust, Series 2018-1, Class A1, 3.50% 6/25/20281 |
|
|
|
|
|
|
220 |
|
|
|
207 |
|
|
|
Freddie Mac Seasoned Loan Structured Transaction Trust, Series 2018-2, Class A1, 3.50% 11/25/20281 |
|
|
|
|
|
|
12 |
|
|
|
11 |
|
|
|
Freddie Mac Seasoned Loan Structured Transaction Trust, Series 20-3,
Class AC, 2.00% 11/25/20301 |
|
|
|
|
|
|
312 |
|
|
|
271 |
|
|
|
Freddie Mac Seasoned Loan Structured Transaction Trust, Series 21-1,
Class AC, 2.25% 5/26/20311 |
|
|
|
|
|
|
324 |
|
|
|
285 |
|
|
|
Freddie Mac Seasoned Loan Structured Transaction Trust, Series 21-2,
Class AD, 2.00% 7/25/20311 |
|
|
|
|
|
|
271 |
|
|
|
235 |
|
|
|
Freddie Mac Seasoned Loan Structured Transaction Trust, Series 2022-1, Class A1, 3.50% 5/25/20321 |
|
|
|
|
|
|
286 |
|
|
|
269 |
|
|
|
Freddie Mac Seasoned Loan Structured Transaction Trust, Series 20-2,
Class AC, 2.00% 9/27/20601 |
|
|
|
|
|
|
324 |
|
|
|
282 |
|
|
|
Government National Mortgage Assn. 2.50% 7/1/20541,5 |
|
|
|
|
|
|
115 |
|
|
|
97 |
|
|
|
Government National Mortgage Assn. 3.00% 7/1/20541,5 |
|
|
|
|
|
|
113 |
|
|
|
98 |
|
|
|
Government National Mortgage Assn. 4.00% 7/1/20541,5 |
|
|
|
|
|
|
82 |
|
|
|
76 |
|
|
|
Government National Mortgage Assn. 5.00% 7/1/20541,5 |
|
|
|
|
|
|
5 |
|
|
|
5 |
|
|
|
Government National Mortgage Assn. 5.50% 7/1/20541,5 |
|
|
|
|
|
|
274 |
|
|
|
272 |
|
|
|
Government National Mortgage Assn. 6.50% 7/1/20541,5 |
|
|
|
|
|
|
310 |
|
|
|
314 |
|
|
|
Government National Mortgage Assn. Pool #AH5894 3.75% 5/20/20341 |
|
|
|
|
|
|
626 |
|
|
|
596 |
|
|
|
Government National Mortgage Assn. Pool #AD0028 3.75% 7/20/20381 |
|
|
|
|
|
|
247 |
|
|
|
231 |
|
|
|
Government National Mortgage Assn. Pool #004410 4.00% 4/20/20391 |
|
|
|
|
|
|
50 |
|
|
|
47 |
|
|
|
Government National Mortgage Assn. Pool #AH5897 3.75% 7/20/20391 |
|
|
|
|
|
|
496 |
|
|
|
464 |
|
|
|
Government National Mortgage Assn. Pool #783690 6.00% 9/20/20391 |
|
|
|
|
|
|
70 |
|
|
|
72 |
|
|
|
Government National Mortgage Assn. Pool #004823 4.00% 10/20/20401 |
|
|
|
|
|
|
77 |
|
|
|
73 |
|
|
|
Government National Mortgage Assn. Pool #005104 5.00% 6/20/20411 |
|
|
|
|
|
|
160 |
|
|
|
159 |
|
|
|
Government National Mortgage Assn. Pool #005142 4.50% 8/20/20411 |
|
|
|
|
|
|
11 |
|
|
|
11 |
|
|
|
Government National Mortgage Assn. Pool #005165 6.50% 8/20/20411 |
|
|
|
|
|
|
80 |
|
|
|
79 |
|
|
|
Government National Mortgage Assn. Pool #AA5326 3.50% 5/20/20421 |
|
|
|
|
|
|
80 |
|
|
|
70 |
|
|
|
Government National Mortgage Assn. Pool #MA0366 3.50% 6/20/20421 |
|
|
|
|
|
|
187 |
|
|
|
170 |
|
|
|
Government National Mortgage Assn. Pool #AD4360 3.50% 7/20/20431 |
|
|
|
|
|
|
86 |
|
|
|
78 |
|
|
|
Government National Mortgage Assn. Pool #AH5884 4.25% 7/20/20441 |
|
|
|
|
|
|
808 |
|
|
|
761 |
|
|
|
Government National Mortgage Assn. Pool #MA6994 2.00% 11/20/20501 |
|
|
|
|
|
|
91 |
|
|
|
73 |
|
|
|
Government National Mortgage Assn. Pool #BZ3978 2.50% 11/20/20501 |
|
|
|
|
|
|
37 |
|
|
|
31 |
|
|
|
Government National Mortgage Assn. Pool #MA7051 2.00% 12/20/20501 |
|
|
|
|
|
|
81 |
|
|
|
65 |
|
|
|
Government National Mortgage Assn. Pool #785575 2.50% 8/20/20511 |
|
|
|
|
|
|
350 |
|
|
|
290 |
|
|
|
Government National Mortgage Assn. Pool #785659 2.50% 10/20/20511 |
|
|
|
|
|
|
86 |
|
|
|
71 |
|
|
|
Government National Mortgage Assn. Pool #786706 2.50% 12/20/20511 |
|
|
|
|
|
|
537 |
|
|
|
456 |
|
|
|
Government National Mortgage Assn. Pool #786502 2.50% 2/20/20521 |
|
|
|
|
|
|
337 |
|
|
|
282 |
|
|
|
Government National Mortgage Assn. Pool #786647 2.50% 3/20/20521 |
|
|
|
|
|
|
182 |
|
|
|
152 |
|
|
|
Government National Mortgage Assn. Pool #786701 2.50% 3/20/20521 |
|
|
|
|
|
|
156 |
|
|
|
130 |
|
|
|
Government National Mortgage Assn. Pool #MA7987 2.50% 4/20/20521 |
|
|
|
|
|
|
240 |
|
|
|
202 |
|
|
|
Government National Mortgage Assn. Pool #MA8266 3.50% 9/20/20521 |
|
|
|
|
|
|
5 |
|
|
|
4 |
|
|
|
Government National Mortgage Assn. Pool #MA8346 4.00% 10/20/20521 |
|
|
|
|
|
|
169 |
|
|
|
157 |
|
|
|
Government National Mortgage Assn. Pool #MA9015 4.50% 7/20/20531 |
|
|
|
|
|
|
257 |
|
|
|
244 |
|
|
|
Government National Mortgage Assn. Pool #MA9016 5.00% 7/20/20531 |
|
|
|
|
|
|
15 |
|
|
|
14 |
|
American Funds Insurance Series 218
American Funds Mortgage Fund (continued)
|
|
|
|
|
|
|
|
|
|
|
|
|
|
|
| Bonds, notes & other debt instruments (continued) |
|
|
|
|
Principal amount
(000) |
|
|
Value
(000) |
|
|
|
|
|
| Mortgage-backed obligations (continued) |
|
|
|
|
|
|
|
|
|
|
|
|
| Federal agency mortgage-backed obligations (continued) |
|
Government National Mortgage Assn. Pool #AN1825 4.518% 6/20/20651 |
|
|
|
|
|
|
USD40 |
|
|
$ |
39 |
|
|
|
Government National Mortgage Assn. Pool #AO0461 4.539% 8/20/20651 |
|
|
|
|
|
|
12 |
|
|
|
12 |
|
|
|
Government National Mortgage Assn. Pool #AO0409 4.561% 12/20/20651 |
|
|
|
|
|
|
37 |
|
|
|
36 |
|
|
|
Government National Mortgage Assn. Pool #AO0385 4.439% 1/20/20661 |
|
|
|
|
|
|
261 |
|
|
|
256 |
|
|
|
Government National Mortgage Assn. Pool #725897 5.20% 1/20/20661 |
|
|
|
|
|
|
1 |
|
|
|
1 |
|
|
|
Government National Mortgage Assn., Series 2021-2, Class AH, 1.50% 6/16/20631 |
|
|
|
|
|
|
208 |
|
|
|
155 |
|
|
|
Uniform Mortgage-Backed Security 2.50% 7/1/20391,5 |
|
|
|
|
|
|
350 |
|
|
|
316 |
|
|
|
Uniform Mortgage-Backed Security 4.00% 7/1/20391,5 |
|
|
|
|
|
|
125 |
|
|
|
120 |
|
|
|
Uniform Mortgage-Backed Security 2.00% 7/1/20541,5 |
|
|
|
|
|
|
547 |
|
|
|
428 |
|
|
|
Uniform Mortgage-Backed Security 3.00% 7/1/20541,5 |
|
|
|
|
|
|
2,624 |
|
|
|
2,233 |
|
|
|
Uniform Mortgage-Backed Security 3.50% 7/1/20541,5 |
|
|
|
|
|
|
1,133 |
|
|
|
1,003 |
|
|
|
Uniform Mortgage-Backed Security 4.00% 7/1/20541,5 |
|
|
|
|
|
|
1,290 |
|
|
|
1,181 |
|
|
|
Uniform Mortgage-Backed Security 4.50% 7/1/20541,5 |
|
|
|
|
|
|
2,573 |
|
|
|
2,426 |
|
|
|
Uniform Mortgage-Backed Security 5.00% 7/1/20541,5 |
|
|
|
|
|
|
5,770 |
|
|
|
5,577 |
|
|
|
Uniform Mortgage-Backed Security 5.50% 7/1/20541,5 |
|
|
|
|
|
|
1,624 |
|
|
|
1,602 |
|
|
|
Uniform Mortgage-Backed Security 6.00% 7/1/20541,5 |
|
|
|
|
|
|
5,198 |
|
|
|
5,213 |
|
|
|
Uniform Mortgage-Backed Security 6.50% 7/1/20541,5 |
|
|
|
|
|
|
8,228 |
|
|
|
8,375 |
|
|
|
Uniform Mortgage-Backed Security 7.00% 7/1/20541,5 |
|
|
|
|
|
|
111 |
|
|
|
115 |
|
|
|
Uniform Mortgage-Backed Security 3.00% 8/1/20541,5 |
|
|
|
|
|
|
1,123 |
|
|
|
956 |
|
|
|
Uniform Mortgage-Backed Security 4.50% 8/1/20541,5 |
|
|
|
|
|
|
445 |
|
|
|
420 |
|
|
|
Uniform Mortgage-Backed Security 6.00% 8/1/20541,5 |
|
|
|
|
|
|
2,263 |
|
|
|
2,269 |
|
|
|
Uniform Mortgage-Backed Security 6.50% 8/1/20541,5 |
|
|
|
|
|
|
3,746 |
|
|
|
3,811 |
|
|
|
Uniform Mortgage-Backed Security 7.00% 8/1/20541,5 |
|
|
|
|
|
|
741 |
|
|
|
761 |
|
|
|
|
|
|
|
|
|
|
|
|
|
|
|
|
|
|
|
|
|
|
|
|
|
|
|
|
|
95,840 |
|
|
|
|
|
|
|
|
|
|
|
|
|
|
|
|
| |
|
|
|
|
|
|
|
|
|
|
|
|
|
|
| Commercial mortgage-backed securities 1.61% |
|
BOCA Commercial Mortgage Trust, Series 2022-BOCA, Class A,
(1-month USD CME Term SOFR + 1.77%) 7.098% 5/15/20391,4,6 |
|
|
|
|
|
|
100 |
|
|
|
100 |
|
|
|
BX Trust, Series 2022-CSMO, Class A,
(1-month USD CME Term SOFR + 2.115%) 7.444% 6/15/20271,4,6 |
|
|
|
|
|
|
100 |
|
|
|
100 |
|
|
|
BX Trust, Series 2021-ARIA, Class A,
(1-month USD CME Term SOFR + 1.014%) 6.342% 10/15/20361,4,6 |
|
|
|
|
|
|
891 |
|
|
|
881 |
|
|
|
BX Trust, Series 2022-IND, Class A,
(1-month USD CME Term SOFR + 1.491%) 6.82% 4/15/20371,4,6 |
|
|
|
|
|
|
122 |
|
|
|
122 |
|
|
|
Citigroup Commercial Mortgage Trust, Series 2023-SMRT, Class A,
6.015% 10/12/20401,4,6 |
|
|
|
|
|
|
379 |
|
|
|
380 |
|
|
|
Extended Stay America Trust, Series 2021-ESH, Class A,
(1-month USD CME Term SOFR + 1.194%) 6.523% 7/15/20381,4,6 |
|
|
|
|
|
|
91 |
|
|
|
91 |
|
|
|
Intown 2022-Stay Mortgage Trust, Series 2022-STAY, Class A,
(1-month USD CME Term SOFR + 2.489%) 7.817% 8/15/20391,4 |
|
|
|
|
|
|
100 |
|
|
|
100 |
|
|
|
|
|
|
|
|
|
|
|
|
|
|
|
|
|
|
|
|
|
|
|
|
|
|
|
|
|
1,774 |
|
|
|
|
|
|
|
|
|
|
|
|
|
|
|
|
| |
|
|
|
|
|
|
|
|
|
|
|
|
|
|
| Collateralized mortgage-backed obligations (privately originated) 0.41% |
|
CIM Trust, Series 2022-R2, Class A1, 3.75% 12/25/20611,4,6 |
|
|
|
|
|
|
153 |
|
|
|
142 |
|
|
|
COLT Mortgage Loan Trust, Series 2021-5, Class A1, 1.726% 11/26/20661,4,6 |
|
|
|
|
|
|
68 |
|
|
|
59 |
|
|
|
FARM Mortgage Trust, Series 2024-1, Class A, 4.721% 10/1/20531,4,6 |
|
|
|
|
|
|
203 |
|
|
|
193 |
|
|
|
Reverse Mortgage Investment Trust, Series 2021-HB1, Class A,
1.259% 11/25/20311,4,6 |
|
|
|
|
|
|
22 |
|
|
|
21 |
|
|
|
Towd Point Mortgage Trust, Series 2015-4, Class M2, 3.75% 4/25/20551,4,6 |
|
|
|
|
|
|
35 |
|
|
|
35 |
|
|
|
|
|
|
|
|
|
|
|
|
|
|
|
|
|
|
|
|
|
|
|
|
|
|
|
|
|
450 |
|
|
|
|
|
|
|
|
|
|
|
|
|
|
|
|
|
|
Total mortgage-backed obligations |
|
|
|
|
|
|
|
|
|
|
98,064 |
|
|
|
|
|
|
|
|
|
|
|
|
|
|
|
|
|
|
|
|
| U.S. Treasury bonds & notes 6.04% |
|
|
|
|
|
|
|
|
|
|
|
|
| U.S. Treasury 6.04% |
|
U.S. Treasury 4.25% 1/31/2026 |
|
|
|
|
|
|
1,410 |
|
|
|
1,397 |
|
|
|
U.S. Treasury 4.50% 3/31/20263 |
|
|
|
|
|
|
210 |
|
|
|
209 |
|
|
|
U.S. Treasury 4.125% 7/31/2028 |
|
|
|
|
|
|
1,250 |
|
|
|
1,236 |
|
|
|
U.S. Treasury 4.50% 5/31/2029 |
|
|
|
|
|
|
3,505 |
|
|
|
3,529 |
|
|
|
U.S. Treasury 1.875% 2/15/2032 |
|
|
|
|
|
|
10 |
|
|
|
8 |
|
219 American Funds Insurance Series
American Funds Mortgage Fund (continued)
|
|
|
|
|
|
|
|
|
|
|
|
|
|
|
| Bonds, notes & other debt instruments (continued) |
|
|
|
|
Principal amount
(000) |
|
|
Value
(000) |
|
| U.S. Treasury bonds & notes (continued) |
|
|
|
|
|
|
|
|
|
|
|
|
| U.S. Treasury (continued) |
|
U.S. Treasury 1.875% 2/15/2041 |
|
|
|
|
|
|
USD240 |
|
|
$ |
164 |
|
|
|
U.S. Treasury 3.25% 5/15/2042 |
|
|
|
|
|
|
106 |
|
|
|
88 |
|
|
|
U.S. Treasury 1.875% 11/15/2051 |
|
|
|
|
|
|
65 |
|
|
|
38 |
|
|
|
|
|
|
|
|
|
|
|
|
|
|
|
|
|
|
Total U.S. Treasury bonds & notes |
|
|
|
|
|
|
|
|
|
|
6,669 |
|
|
|
|
|
|
|
|
|
|
|
|
|
|
|
|
|
|
|
|
| Asset-backed obligations 1.19% |
|
|
|
|
|
|
|
|
|
|
|
|
|
|
Citizens Auto Receivables Trust, Series 2023-2, Class A2A, 6.09% 10/15/20261,6 |
|
|
|
62 |
|
|
|
62 |
|
|
|
Ford Credit Auto Owner Trust, Series 2023-2, Class A, 5.28% 2/15/20361,6 |
|
|
|
257 |
|
|
|
259 |
|
|
|
Hertz Vehicle Financing III, LLC, Series 2021-1A, Class A, 1.21% 12/26/20251,6 |
|
|
|
86 |
|
|
|
85 |
|
|
|
LAD Auto Receivables Trust, Series 2023-2, Class A2, 5.93% 6/15/20271,6 |
|
|
|
60 |
|
|
|
61 |
|
|
|
Navient Student Loan Trust, Series 2021-A, Class A, 0.84% 5/15/20691,6 |
|
|
|
85 |
|
|
|
75 |
|
|
|
Navient Student Loan Trust, Series 2021-C, Class A, 1.06% 10/15/20691,6 |
|
|
|
105 |
|
|
|
93 |
|
|
|
Nelnet Student Loan Trust, Series 2021-A, Class APT1, 1.36% 4/20/20621,6 |
|
|
|
134 |
|
|
|
121 |
|
|
|
Nelnet Student Loan Trust, Series 2021-C, Class AFL,
(1-month USD CME Term SOFR + 0.854%) 6.193% 4/20/20621,4,6 |
|
|
|
109 |
|
|
|
109 |
|
|
|
New Economy Assets Phase 1 Issuer, LLC, Series 2021-1, Class A1,
1.91% 10/20/20611,6 |
|
|
|
100 |
|
|
|
89 |
|
|
|
Synchrony Card Issuance Trust, Series 2023-A, Class A, 5.54% 7/15/20291 |
|
|
|
12 |
|
|
|
12 |
|
|
|
Toyota Auto Loan Extended Note Trust, Series 2023-1, Class A, 4.93% 6/25/20361,6 |
|
|
|
100 |
|
|
|
100 |
|
|
|
Toyota Auto Receivables Owner Trust, Series 2023-C, Class A3, 5.16% 4/17/20281 |
|
|
|
243 |
|
|
|
243 |
|
|
|
|
|
|
|
|
|
|
|
|
|
|
|
|
|
|
|
|
|
|
|
1,309 |
|
|
|
|
|
|
|
|
|
|
|
|
|
|
|
Total bonds, notes & other debt instruments (cost: $107,355,000) |
|
|
|
|
|
|
|
106,042 |
|
|
|
|
|
|
|
|
|
|
|
|
|
|
|
|
|
|
|
|
|
|
|
|
|
|
|
|
|
|
|
| Short-term securities 36.85% |
|
Weighted
average yield
at acquisition |
|
|
|
|
|
|
|
|
|
|
|
| Commercial paper 20.61% |
|
|
|
|
|
|
|
|
|
|
|
|
|
|
BofA Securities, Inc. 7/19/20246 |
|
|
5.330 |
% |
|
|
2,170 |
|
|
|
2,163 |
|
|
|
Chariot Funding, LLC 7/22/20246 |
|
|
5.360 |
|
|
|
2,300 |
|
|
|
2,292 |
|
|
|
Coca-Cola Co. 7/17/20246 |
|
|
5.330 |
|
|
|
1,656 |
|
|
|
1,651 |
|
|
|
Eli Lilly and Co. 8/9/20246 |
|
|
5.320 |
|
|
|
1,200 |
|
|
|
1,193 |
|
|
|
Honeywell International, Inc. 9/24/20246 |
|
|
5.300 |
|
|
|
1,400 |
|
|
|
1,382 |
|
|
|
Johnson & Johnson 7/11/20246 |
|
|
5.310 |
|
|
|
2,300 |
|
|
|
2,296 |
|
|
|
Linde, Inc. 7/12/2024 |
|
|
5.310 |
|
|
|
2,500 |
|
|
|
2,495 |
|
|
|
Microsoft Corp. 7/10/20246 |
|
|
5.300 |
|
|
|
2,300 |
|
|
|
2,296 |
|
|
|
Paccar Financial Corp. 7/12/2024 |
|
|
5.320 |
|
|
|
2,000 |
|
|
|
1,996 |
|
|
|
PepsiCo, Inc. 8/8/20246 |
|
|
5.300 |
|
|
|
1,750 |
|
|
|
1,739 |
|
|
|
Procter & Gamble Co. 7/10/20246 |
|
|
5.320 |
|
|
|
2,000 |
|
|
|
1,996 |
|
|
|
Wal-Mart Stores, Inc. 7/24/20246 |
|
|
5.310 |
|
|
|
1,250 |
|
|
|
1,245 |
|
|
|
|
|
|
|
|
|
|
|
|
|
|
|
|
|
|
|
|
|
|
|
|
|
|
|
|
|
22,744 |
|
|
|
|
|
|
|
|
|
|
|
|
|
|
|
|
|
|
|
|
|
|
|
|
|
|
|
|
|
|
|
|
|
|
|
|
| |
|
|
|
| U.S. Treasury bills 1.17% |
|
|
|
|
|
|
|
|
|
|
|
|
|
|
U.S. Treasury 9/19/2024 |
|
|
5.102 |
|
|
|
1,300 |
|
|
|
1,285 |
|
|
|
|
|
|
|
|
|
|
|
|
|
|
|
|
|
|
|
|
|
|
|
|
|
|
|
|
|
|
|
|
|
|
|
|
| |
|
|
|
| Federal agency bills & notes 15.07% |
|
|
|
|
|
|
|
|
|
|
|
|
|
|
Federal Farm Credit Banks 8/27/2024 |
|
|
5.130 |
|
|
|
1,000 |
|
|
|
992 |
|
|
|
Federal Home Loan Bank 7/1/2024 |
|
|
5.200 |
|
|
|
1,400 |
|
|
|
1,399 |
|
|
|
Federal Home Loan Bank 7/3/2024 |
|
|
5.248 |
|
|
|
5,000 |
|
|
|
4,998 |
|
|
|
Federal Home Loan Bank 8/2/2024 |
|
|
5.260 |
|
|
|
2,000 |
|
|
|
1,991 |
|
|
|
Federal Home Loan Bank 8/7/2024 |
|
|
5.258 |
|
|
|
2,300 |
|
|
|
2,288 |
|
American Funds Insurance Series 220
American Funds Mortgage Fund (continued)
|
|
|
|
|
|
|
|
|
|
|
|
|
|
|
|
|
|
|
| Short-term securities (continued) |
|
Weighted
average yield
at acquisition |
|
|
Principal amount
(000) |
|
|
Value
(000) |
|
|
| Federal agency bills & notes (continued) |
|
|
|
Federal Home Loan Bank 8/23/2024 |
|
|
5.260 |
% |
|
|
USD2,500 |
|
|
$ |
2,481 |
|
|
|
Federal Home Loan Bank 8/30/2024 |
|
|
5.240 |
|
|
|
1,000 |
|
|
|
991 |
|
|
|
Tennessee Valley Authority 7/17/2024 |
|
|
5.267 |
|
|
|
1,500 |
|
|
|
1,496 |
|
|
|
|
|
|
|
|
|
|
|
|
|
|
|
|
|
|
|
|
|
|
|
Total short-term securities (cost: $40,676,000) |
|
|
|
|
|
|
|
|
|
|
40,665 |
|
|
|
|
|
|
|
|
|
|
|
|
|
|
|
|
|
|
|
|
|
|
|
Total investment securities 132.93% (cost: $148,031,000) |
|
|
|
|
|
|
|
|
|
|
146,707 |
|
|
|
Other assets less liabilities (32.93)% |
|
|
|
|
|
|
|
|
|
|
(36,339 |
) |
|
|
|
|
|
|
|
|
|
|
|
|
|
|
|
|
|
|
|
|
|
Net assets 100.00% |
|
|
|
|
|
|
$ |
110,368 |
|
|
|
|
|
|
|
|
|
|
|
|
|
|
|
|
|
|
|
|
|
|
|
|
|
|
|
|
|
|
|
|
|
|
|
|
|
|
|
|
|
| Futures contracts |
|
|
|
|
|
|
|
| Contracts |
|
Type |
|
|
Number of
contracts |
|
|
Expiration
date |
|
|
Notional amount (000) |
|
|
Value and unrealized appreciation (depreciation) at 6/30/2024 (000) |
|
| 30 Day Federal Funds Futures |
|
|
Long |
|
|
|
47 |
|
|
|
9/3/2024 |
|
|
|
USD18,546 |
|
|
|
|
|
|
$ |
(4 |
) |
| 2 Year U.S. Treasury Note Futures |
|
|
Long |
|
|
|
286 |
|
|
|
10/3/2024 |
|
|
|
58,407 |
|
|
|
|
|
|
|
109 |
|
| 5 Year U.S. Treasury Note Futures |
|
|
Long |
|
|
|
191 |
|
|
|
10/3/2024 |
|
|
|
20,356 |
|
|
|
|
|
|
|
120 |
|
| 10 Year Ultra U.S. Treasury Note Futures |
|
|
Long |
|
|
|
67 |
|
|
|
9/30/2024 |
|
|
|
7,607 |
|
|
|
|
|
|
|
71 |
|
| 10 Year U.S. Treasury Note Futures |
|
|
Long |
|
|
|
34 |
|
|
|
9/30/2024 |
|
|
|
3,739 |
|
|
|
|
|
|
|
34 |
|
| 20 Year U.S. Treasury Bond Futures |
|
|
Short |
|
|
|
52 |
|
|
|
9/30/2024 |
|
|
|
(6,152 |
) |
|
|
|
|
|
|
(64 |
) |
| 30 Year Ultra U.S. Treasury Bond Futures |
|
|
Long |
|
|
|
16 |
|
|
|
9/30/2024 |
|
|
|
2,005 |
|
|
|
|
|
|
|
19 |
|
|
|
|
|
|
|
|
|
|
|
|
|
|
|
|
|
|
|
|
|
|
|
|
|
|
|
|
|
|
|
|
|
|
|
|
|
|
|
|
|
|
|
|
|
|
|
|
|
|
|
|
|
|
|
$ |
285 |
|
|
|
|
|
|
|
|
|
|
|
|
|
|
|
|
|
|
|
|
|
|
|
|
|
|
Interest rate swaps
Centrally cleared interest rate swaps
|
|
|
|
|
|
|
|
|
|
|
|
|
|
|
|
|
|
|
|
|
|
|
|
|
|
|
|
|
|
|
|
|
|
|
|
|
|
|
|
|
|
|
|
|
|
|
| |
|
|
|
|
|
|
|
|
|
|
|
|
|
|
|
|
|
|
|
|
|
|
|
|
Upfront |
|
|
Unrealized |
|
| Receive |
|
|
|
|
|
Pay |
|
|
|
|
|
Notional |
|
|
Value at |
|
|
premium paid |
|
|
appreciation (depreciation) |
|
| |
|
Payment |
|
|
|
|
|
|
|
Payment |
|
|
Expiration |
|
|
amount |
|
|
6/30/2024 |
|
|
(received) |
|
|
at 6/30/2024 |
|
| Rate |
|
frequency |
|
|
|
|
|
Rate |
|
frequency |
|
|
date |
|
|
(000) |
|
|
(000) |
|
|
(000) |
|
|
|
|
|
(000) |
|
|
|
|
|
|
|
|
|
|
|
|
|
|
| SOFR |
|
|
Annual |
|
|
|
|
|
|
3.6025% |
|
|
Annual |
|
|
|
1/8/2034 |
|
|
|
USD495 |
|
|
|
|
|
|
$ |
13 |
|
|
|
|
|
|
$ |
– |
|
|
|
|
|
|
$ |
13 |
|
| SOFR |
|
|
Annual |
|
|
|
|
|
|
3.41% |
|
|
Annual |
|
|
|
7/28/2045 |
|
|
|
USD1,300 |
|
|
|
|
|
|
|
86 |
|
|
|
|
|
|
|
– |
|
|
|
|
|
|
|
86 |
|
|
|
|
|
|
|
|
|
|
|
|
|
|
|
|
|
|
|
|
|
|
|
|
|
|
|
|
|
|
|
|
|
|
|
|
|
|
|
|
|
|
|
|
|
|
|
|
|
|
|
|
|
|
|
|
|
|
|
|
|
|
|
|
|
|
|
|
|
|
|
|
|
|
|
|
|
|
|
|
|
|
|
|
|
|
|
|
|
$ |
99 |
|
|
|
|
|
|
$ |
– |
|
|
|
|
|
|
$ |
99 |
|
|
|
|
|
|
|
|
|
|
|
|
|
|
|
|
|
|
|
|
|
|
|
|
|
|
|
|
|
|
|
|
|
|
|
|
|
|
|
|
|
|
|
|
|
|
|
|
| 1 |
Principal payments may be made periodically. Therefore, the effective maturity date may be earlier than the stated maturity date. |
| 2 |
Amount less than one thousand. |
| 3 |
All or a portion of this security was pledged as collateral. The total value of pledged collateral was $945,000, which represented .86% of the net assets of the fund. |
| 4 |
Coupon rate may change periodically. Reference rate and spread are as of the most recent information available. Some coupon rates are determined by the issuer or agent based on current market conditions; therefore, the reference rate and spread are not available. |
| 5 |
Purchased on a TBA basis. |
| 6 |
Acquired in a transaction exempt from registration under Rule 144A or, for commercial paper, Section 4(a)(2) of the Securities Act of 1933. May be resold in the U.S. in transactions exempt from registration, normally to qualified institutional buyers. The total value of all such securities was $21,431,000, which represented 19.42% of the net assets of the fund. |
221 American Funds Insurance Series
American Funds Mortgage Fund (continued)
Key to abbreviation(s)
Assn. = Association
CME = CME Group
SOFR = Secured Overnight Financing Rate
TBA = To be announced
USD = U.S. dollars
Refer to the notes to financial statements.
American Funds Insurance Series 222
|
|
|
| Ultra-Short Bond Fund Investment portfolio June 30, 2024 |
|
unaudited |
|
|
|
|
|
|
|
|
|
|
|
|
|
|
|
|
|
| Short-term securities 97.89% |
|
Weighted
average yield
at acquisition |
|
|
Principal amount
(000) |
|
|
Value
(000) |
|
|
| Commercial paper 93.14% |
|
|
|
Alberta (Province of) 7/2/20241 |
|
|
5.300 |
% |
|
|
USD10,000 |
|
|
$ |
9,994 |
|
|
|
British Columbia (Province of) 7/25/2024 |
|
|
5.320 |
|
|
|
12,800 |
|
|
|
12,749 |
|
|
|
Cabot Trail Funding, LLC. 9/11/20241 |
|
|
5.370 |
|
|
|
13,000 |
|
|
|
12,853 |
|
|
|
Chariot Funding, LLC 8/13/20241 |
|
|
5.360 |
|
|
|
11,000 |
|
|
|
10,924 |
|
|
|
Chariot Funding, LLC 9/5/20241 |
|
|
5.286 |
|
|
|
2,400 |
|
|
|
2,375 |
|
|
|
Cisco Systems, Inc. 10/1/20241 |
|
|
5.320 |
|
|
|
10,000 |
|
|
|
9,859 |
|
|
|
Eli Lilly and Co. 8/9/20241 |
|
|
5.320 |
|
|
|
11,800 |
|
|
|
11,727 |
|
|
|
Federation Des Caisses Desjardins 7/11/20241 |
|
|
5.360 |
|
|
|
11,300 |
|
|
|
11,278 |
|
|
|
Honeywell International, Inc. 7/12/20241 |
|
|
5.220 |
|
|
|
10,000 |
|
|
|
9,979 |
|
|
|
ING (U.S.) Funding, LLC 10/21/20241 |
|
|
5.305 |
|
|
|
3,800 |
|
|
|
3,735 |
|
|
|
Johnson & Johnson 7/11/20241 |
|
|
5.310 |
|
|
|
12,000 |
|
|
|
11,977 |
|
|
|
Komatsu Finance America, Inc. 8/1/20241 |
|
|
5.350 |
|
|
|
10,100 |
|
|
|
10,049 |
|
|
|
Liberty Street Funding, LLC 7/25/20241 |
|
|
5.380 |
|
|
|
10,700 |
|
|
|
10,657 |
|
|
|
L’Oréal USA, Inc. 9/11/20241 |
|
|
5.330 |
|
|
|
9,000 |
|
|
|
8,900 |
|
|
|
LVMH Moët Hennessy Louis Vuitton, Inc. 7/9/20241 |
|
|
5.139 |
|
|
|
12,000 |
|
|
|
11,981 |
|
|
|
Microsoft Corp. 7/18/20241 |
|
|
5.300 |
|
|
|
12,000 |
|
|
|
11,965 |
|
|
|
Mizuho Bank, Ltd. 9/3/20241 |
|
|
5.370 |
|
|
|
12,000 |
|
|
|
11,879 |
|
|
|
National Bank of Canada 7/26/20241 |
|
|
5.350 |
|
|
|
11,600 |
|
|
|
11,552 |
|
|
|
Nederlandse Waterschapsbank NV 7/30/20241 |
|
|
5.244 |
|
|
|
12,000 |
|
|
|
11,943 |
|
|
|
Nestlé Finance International, Ltd. 8/2/20241 |
|
|
5.220 |
|
|
|
12,000 |
|
|
|
11,939 |
|
|
|
Novartis Finance Corp. 7/1/20241 |
|
|
5.040 |
|
|
|
12,000 |
|
|
|
11,995 |
|
|
|
Oversea-Chinese Banking Corp., Ltd. 8/12/20241 |
|
|
5.370 |
|
|
|
12,000 |
|
|
|
11,920 |
|
|
|
Pfizer, Inc. 7/16/20241 |
|
|
5.280 |
|
|
|
6,500 |
|
|
|
6,483 |
|
|
|
Procter & Gamble Co. 7/10/20241 |
|
|
5.320 |
|
|
|
12,000 |
|
|
|
11,979 |
|
|
|
Sanofi 9/6/20241 |
|
|
5.340 |
|
|
|
12,000 |
|
|
|
11,876 |
|
|
|
Siemens Capital Co., LLC 8/27/20241 |
|
|
5.320 |
|
|
|
12,000 |
|
|
|
11,894 |
|
|
|
Starbird Funding Corp. 12/30/20241 |
|
|
5.292 |
|
|
|
9,000 |
|
|
|
8,753 |
|
|
|
Thunder Bay Funding, LLC 9/6/20241 |
|
|
5.232 |
|
|
|
12,000 |
|
|
|
11,875 |
|
|
|
United Overseas Bank, Ltd. 8/12/20241 |
|
|
5.360 |
|
|
|
11,800 |
|
|
|
11,721 |
|
|
|
Victory Receivables Corp. 8/5/20241 |
|
|
5.310 |
|
|
|
12,000 |
|
|
|
11,932 |
|
|
|
Wal-Mart Stores, Inc. 7/24/20241 |
|
|
5.217 |
|
|
|
12,200 |
|
|
|
12,153 |
|
|
|
|
|
|
|
|
|
|
|
|
|
|
|
|
|
|
|
|
|
|
|
|
|
|
|
|
|
|
|
330,896 |
|
|
|
|
|
|
|
|
|
|
|
|
|
|
|
|
|
|
|
| U.S. Treasury bills 2.81% |
|
|
|
U.S. Treasury 7/9/2024 |
|
|
5.160 |
|
|
|
10,000 |
|
|
|
9,988 |
|
|
|
|
|
|
|
|
|
|
|
|
|
|
|
|
|
|
|
| Federal agency bills & notes 1.94% |
|
|
|
Federal Home Loan Bank 8/30/2024 |
|
|
5.240 |
|
|
|
2,000 |
|
|
|
1,982 |
|
|
|
Federal Home Loan Bank 11/6/2024 |
|
|
5.135 |
|
|
|
5,000 |
|
|
|
4,908 |
|
|
|
|
|
|
|
|
|
|
|
|
|
|
|
|
|
|
|
|
|
|
|
|
|
|
|
|
|
|
|
6,890 |
|
|
|
|
|
|
|
|
|
|
|
|
|
|
|
|
|
|
|
|
Total short-term securities (cost: $347,924,000) |
|
|
|
|
|
|
|
|
|
|
347,774 |
|
|
|
|
|
|
|
|
|
|
|
|
|
|
|
|
|
|
|
|
|
|
|
|
|
Total investment securities 97.89% (cost: $347,924,000) |
|
|
|
|
|
|
|
|
|
|
347,774 |
|
|
|
Other assets less liabilities 2.11% |
|
|
|
|
|
|
|
|
|
|
7,508 |
|
|
|
|
|
|
|
|
|
|
|
|
|
|
|
|
|
|
|
|
|
|
|
|
|
Net assets 100.00% |
|
|
|
|
|
|
|
|
|
$ |
355,282 |
|
|
|
|
|
|
|
|
|
|
|
|
|
|
|
|
|
|
| 1 |
Acquired in a transaction exempt from registration under Rule 144A or, for commercial paper, Section 4(a)(2) of the Securities Act of 1933. May be resold in the U.S. in transactions exempt from registration, normally to qualified institutional buyers. The total value of all such securities was $318,147,000, which represented 89.55% of the net assets of the fund. |
Key to abbreviation(s)
USD = U.S. dollars
Refer to the notes to financial statements.
223 American Funds Insurance Series
|
|
|
| U.S. Government Securities Fund |
|
|
|
|
| Investment portfolio June 30, 2024 |
|
unaudited |
|
|
|
|
|
|
|
|
|
|
|
| Bonds, notes & other debt instruments 97.72% |
|
Principal amount (000) |
|
|
Value (000) |
|
|
|
|
| Mortgage-backed obligations 59.12% |
|
|
|
|
|
|
|
|
| Federal agency mortgage-backed obligations 59.06% |
|
Fannie Mae Pool #735070 6.50% 10/1/20241 |
|
|
USD– |
2 |
|
$ |
– |
2 |
|
|
Fannie Mae Pool #745316 6.50% 2/1/20261 |
|
|
18 |
|
|
|
18 |
|
|
|
Fannie Mae Pool #AL9870 6.50% 2/1/20281 |
|
|
19 |
|
|
|
19 |
|
|
|
Fannie Mae Pool #257431 6.50% 10/1/20281 |
|
|
1 |
|
|
|
1 |
|
|
|
Fannie Mae Pool #695412 5.00% 6/1/20331 |
|
|
– |
2 |
|
|
– |
2 |
|
|
Fannie Mae Pool #AD3566 5.00% 10/1/20351 |
|
|
3 |
|
|
|
3 |
|
|
|
Fannie Mae Pool #MA2588 4.00% 4/1/20361 |
|
|
533 |
|
|
|
514 |
|
|
|
Fannie Mae Pool #MA2746 4.00% 9/1/20361 |
|
|
1,178 |
|
|
|
1,136 |
|
|
|
Fannie Mae Pool #940890 6.50% 6/1/20371 |
|
|
– |
2 |
|
|
– |
2 |
|
|
Fannie Mae Pool #256828 7.00% 7/1/20371 |
|
|
3 |
|
|
|
3 |
|
|
|
Fannie Mae Pool #256860 6.50% 8/1/20371 |
|
|
10 |
|
|
|
10 |
|
|
|
Fannie Mae Pool #888698 7.00% 10/1/20371 |
|
|
12 |
|
|
|
12 |
|
|
|
Fannie Mae Pool #970343 6.00% 2/1/20381 |
|
|
13 |
|
|
|
13 |
|
|
|
Fannie Mae Pool #931768 5.00% 8/1/20391 |
|
|
4 |
|
|
|
4 |
|
|
|
Fannie Mae Pool #AC0794 5.00% 10/1/20391 |
|
|
19 |
|
|
|
19 |
|
|
|
Fannie Mae Pool #932606 5.00% 2/1/20401 |
|
|
8 |
|
|
|
8 |
|
|
|
Fannie Mae Pool #FM7365 2.00% 5/1/20411 |
|
|
26,307 |
|
|
|
22,139 |
|
|
|
Fannie Mae Pool #AI1862 5.00% 5/1/20411 |
|
|
287 |
|
|
|
283 |
|
|
|
Fannie Mae Pool #AI3510 5.00% 6/1/20411 |
|
|
158 |
|
|
|
156 |
|
|
|
Fannie Mae Pool #AE1248 5.00% 6/1/20411 |
|
|
31 |
|
|
|
31 |
|
|
|
Fannie Mae Pool #AJ0704 5.00% 9/1/20411 |
|
|
134 |
|
|
|
133 |
|
|
|
Fannie Mae Pool #AJ1873 4.00% 10/1/20411 |
|
|
22 |
|
|
|
21 |
|
|
|
Fannie Mae Pool #AJ5391 5.00% 11/1/20411 |
|
|
97 |
|
|
|
96 |
|
|
|
Fannie Mae Pool #AE1277 5.00% 11/1/20411 |
|
|
13 |
|
|
|
13 |
|
|
|
Fannie Mae Pool #MA4501 2.00% 12/1/20411 |
|
|
2,623 |
|
|
|
2,195 |
|
|
|
Fannie Mae Pool #AE1283 5.00% 12/1/20411 |
|
|
8 |
|
|
|
8 |
|
|
|
Fannie Mae Pool #MA4540 2.00% 2/1/20421 |
|
|
1,206 |
|
|
|
1,009 |
|
|
|
Fannie Mae Pool #AE1290 5.00% 2/1/20421 |
|
|
17 |
|
|
|
17 |
|
|
|
Fannie Mae Pool #MA4570 2.00% 3/1/20421 |
|
|
782 |
|
|
|
654 |
|
|
|
Fannie Mae Pool #AT0300 3.50% 3/1/20431 |
|
|
4 |
|
|
|
4 |
|
|
|
Fannie Mae Pool #AT3954 3.50% 4/1/20431 |
|
|
6 |
|
|
|
6 |
|
|
|
Fannie Mae Pool #AT7161 3.50% 6/1/20431 |
|
|
34 |
|
|
|
31 |
|
|
|
Fannie Mae Pool #AY1829 3.50% 12/1/20441 |
|
|
7 |
|
|
|
6 |
|
|
|
Fannie Mae Pool #BE5017 3.50% 2/1/20451 |
|
|
58 |
|
|
|
52 |
|
|
|
Fannie Mae Pool #FM9416 3.50% 7/1/20451 |
|
|
3,895 |
|
|
|
3,532 |
|
|
|
Fannie Mae Pool #BE8740 3.50% 5/1/20471 |
|
|
48 |
|
|
|
43 |
|
|
|
Fannie Mae Pool #BE8742 3.50% 5/1/20471 |
|
|
14 |
|
|
|
13 |
|
|
|
Fannie Mae Pool #BH2846 3.50% 5/1/20471 |
|
|
7 |
|
|
|
7 |
|
|
|
Fannie Mae Pool #BH2848 3.50% 5/1/20471 |
|
|
6 |
|
|
|
6 |
|
|
|
Fannie Mae Pool #BH2847 3.50% 5/1/20471 |
|
|
3 |
|
|
|
3 |
|
|
|
Fannie Mae Pool #BH3122 4.00% 6/1/20471 |
|
|
5 |
|
|
|
5 |
|
|
|
Fannie Mae Pool #BJ5015 4.00% 12/1/20471 |
|
|
115 |
|
|
|
107 |
|
|
|
Fannie Mae Pool #BM3788 3.50% 3/1/20481 |
|
|
2,802 |
|
|
|
2,535 |
|
|
|
Fannie Mae Pool #BJ4901 3.50% 3/1/20481 |
|
|
36 |
|
|
|
32 |
|
|
|
Fannie Mae Pool #BK5232 4.00% 5/1/20481 |
|
|
70 |
|
|
|
65 |
|
|
|
Fannie Mae Pool #BK6840 4.00% 6/1/20481 |
|
|
94 |
|
|
|
88 |
|
|
|
Fannie Mae Pool #BK9743 4.00% 8/1/20481 |
|
|
25 |
|
|
|
23 |
|
|
|
Fannie Mae Pool #BK9761 4.50% 8/1/20481 |
|
|
15 |
|
|
|
15 |
|
|
|
Fannie Mae Pool #FM3280 3.50% 5/1/20491 |
|
|
1,005 |
|
|
|
911 |
|
|
|
Fannie Mae Pool #FM1062 3.50% 6/1/20491 |
|
|
382 |
|
|
|
346 |
|
|
|
Fannie Mae Pool #BJ8411 3.50% 8/1/20491 |
|
|
96 |
|
|
|
86 |
|
|
|
Fannie Mae Pool #CA4151 3.50% 9/1/20491 |
|
|
495 |
|
|
|
447 |
|
|
|
Fannie Mae Pool #FM1443 3.50% 9/1/20491 |
|
|
275 |
|
|
|
247 |
|
|
|
Fannie Mae Pool #FM2179 3.00% 1/1/20501 |
|
|
3,160 |
|
|
|
2,741 |
|
|
|
Fannie Mae Pool #CA6593 2.50% 8/1/20501 |
|
|
818 |
|
|
|
681 |
|
|
|
Fannie Mae Pool #CA7052 3.00% 9/1/20501 |
|
|
29 |
|
|
|
25 |
|
|
|
Fannie Mae Pool #BQ3005 2.50% 10/1/20501 |
|
|
507 |
|
|
|
418 |
|
|
|
Fannie Mae Pool #CA7257 2.50% 10/1/20501 |
|
|
172 |
|
|
|
143 |
|
|
|
Fannie Mae Pool #CA7739 2.50% 11/1/20501 |
|
|
1,722 |
|
|
|
1,431 |
|
|
|
Fannie Mae Pool #MA4208 2.00% 12/1/20501 |
|
|
208 |
|
|
|
164 |
|
|
|
Fannie Mae Pool #MA4237 2.00% 1/1/20511 |
|
|
73 |
|
|
|
58 |
|
224
U.S. Government Securities Fund (continued)
|
|
|
|
|
|
|
|
|
|
|
| Bonds, notes & other debt instruments (continued) |
|
Principal amount (000) |
|
|
Value (000) |
|
|
|
|
| Mortgage-backed obligations (continued) |
|
|
|
|
|
|
|
|
| Federal agency mortgage-backed obligations (continued) |
|
Fannie Mae Pool #FM6548 2.00% 3/1/20511 |
|
|
USD980 |
|
|
$ |
782 |
|
|
|
Fannie Mae Pool #CB0290 2.00% 4/1/20511 |
|
|
622 |
|
|
|
491 |
|
|
|
Fannie Mae Pool #MA4305 2.00% 4/1/20511 |
|
|
10 |
|
|
|
8 |
|
|
|
Fannie Mae Pool #BR1035 2.00% 5/1/20511 |
|
|
6 |
|
|
|
5 |
|
|
|
Fannie Mae Pool #FM7687 3.00% 6/1/20511 |
|
|
4,965 |
|
|
|
4,297 |
|
|
|
Fannie Mae Pool #BR2095 2.50% 7/1/20511 |
|
|
1,457 |
|
|
|
1,201 |
|
|
|
Fannie Mae Pool #FM7900 2.50% 7/1/20511 |
|
|
174 |
|
|
|
145 |
|
|
|
Fannie Mae Pool #CB1527 2.50% 9/1/20511 |
|
|
636 |
|
|
|
525 |
|
|
|
Fannie Mae Pool #FS0965 2.00% 11/1/20511 |
|
|
45 |
|
|
|
36 |
|
|
|
Fannie Mae Pool #CB2286 2.50% 12/1/20511 |
|
|
1,135 |
|
|
|
941 |
|
|
|
Fannie Mae Pool #FM9976 3.00% 12/1/20511 |
|
|
734 |
|
|
|
639 |
|
|
|
Fannie Mae Pool #CB2544 3.00% 1/1/20521 |
|
|
2,128 |
|
|
|
1,833 |
|
|
|
Fannie Mae Pool #BV3076 2.00% 2/1/20521 |
|
|
424 |
|
|
|
333 |
|
|
|
Fannie Mae Pool #FS0523 2.50% 2/1/20521 |
|
|
181 |
|
|
|
150 |
|
|
|
Fannie Mae Pool #FS0647 3.00% 2/1/20521 |
|
|
3,390 |
|
|
|
2,940 |
|
|
|
Fannie Mae Pool #CB3140 4.00% 3/1/20521 |
|
|
465 |
|
|
|
427 |
|
|
|
Fannie Mae Pool #CB3528 4.00% 5/1/20521 |
|
|
621 |
|
|
|
569 |
|
|
|
Fannie Mae Pool #FS7329 2.00% 6/1/20521 |
|
|
108 |
|
|
|
85 |
|
|
|
Fannie Mae Pool #CB3774 4.00% 6/1/20521 |
|
|
2,944 |
|
|
|
2,700 |
|
|
|
Fannie Mae Pool #FS2159 5.00% 6/1/20521 |
|
|
57 |
|
|
|
56 |
|
|
|
Fannie Mae Pool #BV2558 5.00% 6/1/20521 |
|
|
50 |
|
|
|
49 |
|
|
|
Fannie Mae Pool #FS6986 2.00% 7/1/20521 |
|
|
229 |
|
|
|
179 |
|
|
|
Fannie Mae Pool #FS6362 3.50% 8/1/20521 |
|
|
2,499 |
|
|
|
2,214 |
|
|
|
Fannie Mae Pool #BW7327 4.50% 8/1/20521 |
|
|
2,966 |
|
|
|
2,801 |
|
|
|
Fannie Mae Pool #BV8976 5.00% 8/1/20521 |
|
|
335 |
|
|
|
325 |
|
|
|
Fannie Mae Pool #FS2489 5.00% 8/1/20521 |
|
|
53 |
|
|
|
51 |
|
|
|
Fannie Mae Pool #MA4732 4.00% 9/1/20521 |
|
|
1,340 |
|
|
|
1,228 |
|
|
|
Fannie Mae Pool #BW1192 4.50% 9/1/20521 |
|
|
705 |
|
|
|
666 |
|
|
|
Fannie Mae Pool #FS4611 5.00% 9/1/20521 |
|
|
9,296 |
|
|
|
9,007 |
|
|
|
Fannie Mae Pool #BW9458 4.50% 10/1/20521 |
|
|
949 |
|
|
|
898 |
|
|
|
Fannie Mae Pool #BX0097 4.50% 10/1/20521 |
|
|
855 |
|
|
|
809 |
|
|
|
Fannie Mae Pool #FS5994 5.00% 10/1/20521 |
|
|
9,067 |
|
|
|
8,791 |
|
|
|
Fannie Mae Pool #BX1004 5.00% 10/1/20521 |
|
|
5,163 |
|
|
|
4,995 |
|
|
|
Fannie Mae Pool #BW1289 5.50% 10/1/20521 |
|
|
684 |
|
|
|
677 |
|
|
|
Fannie Mae Pool #BW1243 5.50% 10/1/20521 |
|
|
611 |
|
|
|
604 |
|
|
|
Fannie Mae Pool #CB4917 5.50% 10/1/20521 |
|
|
94 |
|
|
|
94 |
|
|
|
Fannie Mae Pool #MA4820 6.50% 10/1/20521 |
|
|
239 |
|
|
|
244 |
|
|
|
Fannie Mae Pool #MA4840 4.50% 12/1/20521 |
|
|
2,769 |
|
|
|
2,615 |
|
|
|
Fannie Mae Pool #BX6121 6.00% 1/1/20531 |
|
|
2,325 |
|
|
|
2,339 |
|
|
|
Fannie Mae Pool #MA4919 5.50% 2/1/20531 |
|
|
10 |
|
|
|
10 |
|
|
|
Fannie Mae Pool #FS3759 6.00% 2/1/20531 |
|
|
834 |
|
|
|
851 |
|
|
|
Fannie Mae Pool #BX6803 6.00% 3/1/20531 |
|
|
991 |
|
|
|
996 |
|
|
|
Fannie Mae Pool #CB5919 6.00% 3/1/20531 |
|
|
893 |
|
|
|
898 |
|
|
|
Fannie Mae Pool #MA4979 5.50% 4/1/20531 |
|
|
2,361 |
|
|
|
2,332 |
|
|
|
Fannie Mae Pool #CB6106 6.50% 4/1/20531 |
|
|
422 |
|
|
|
434 |
|
|
|
Fannie Mae Pool #MA5027 4.00% 5/1/20531 |
|
|
997 |
|
|
|
912 |
|
|
|
Fannie Mae Pool #MA5010 5.50% 5/1/20531 |
|
|
352 |
|
|
|
347 |
|
|
|
Fannie Mae Pool #MA5011 6.00% 5/1/20531 |
|
|
2,123 |
|
|
|
2,133 |
|
|
|
Fannie Mae Pool #MA5039 5.50% 6/1/20531 |
|
|
3,182 |
|
|
|
3,141 |
|
|
|
Fannie Mae Pool #CB6485 6.00% 6/1/20531 |
|
|
3,311 |
|
|
|
3,335 |
|
|
|
Fannie Mae Pool #FS4933 6.00% 6/1/20531 |
|
|
2,253 |
|
|
|
2,266 |
|
|
|
Fannie Mae Pool #CB6486 6.00% 6/1/20531 |
|
|
2,031 |
|
|
|
2,045 |
|
|
|
Fannie Mae Pool #MA5040 6.00% 6/1/20531 |
|
|
1,680 |
|
|
|
1,688 |
|
|
|
Fannie Mae Pool #CB6465 6.00% 6/1/20531 |
|
|
1,498 |
|
|
|
1,510 |
|
|
|
Fannie Mae Pool #MA5070 4.50% 7/1/20531 |
|
|
3,039 |
|
|
|
2,869 |
|
|
|
Fannie Mae Pool #CB6719 4.50% 7/1/20531 |
|
|
392 |
|
|
|
370 |
|
|
|
Fannie Mae Pool #MA5072 5.50% 7/1/20531 |
|
|
10,796 |
|
|
|
10,653 |
|
|
|
Fannie Mae Pool #MA5073 6.00% 7/1/20531 |
|
|
1,952 |
|
|
|
1,960 |
|
|
|
Fannie Mae Pool #FS5343 6.00% 7/1/20531 |
|
|
337 |
|
|
|
339 |
|
|
|
Fannie Mae Pool #CB6853 4.50% 8/1/20531 |
|
|
476 |
|
|
|
449 |
|
|
|
Fannie Mae Pool #MA5107 5.50% 8/1/20531 |
|
|
223 |
|
|
|
220 |
|
225
U.S. Government Securities Fund (continued)
|
|
|
|
|
|
|
|
|
|
|
| Bonds, notes & other debt instruments (continued) |
|
Principal amount (000) |
|
|
Value (000) |
|
|
|
|
| Mortgage-backed obligations (continued) |
|
|
|
|
|
|
|
|
| Federal agency mortgage-backed obligations (continued) |
|
Fannie Mae Pool #CB7216 4.00% 9/1/20531 |
|
|
USD28 |
|
|
$ |
26 |
|
|
|
Fannie Mae Pool #FS5749 6.50% 9/1/20531 |
|
|
7,901 |
|
|
|
8,061 |
|
|
|
Fannie Mae Pool #MA5177 4.00% 10/1/20531 |
|
|
2,783 |
|
|
|
2,548 |
|
|
|
Fannie Mae Pool #MA5165 5.50% 10/1/20531 |
|
|
24,197 |
|
|
|
23,878 |
|
|
|
Fannie Mae Pool #MA5166 6.00% 10/1/20531 |
|
|
615 |
|
|
|
617 |
|
|
|
Fannie Mae Pool #MA5207 4.00% 11/1/20531 |
|
|
1,256 |
|
|
|
1,150 |
|
|
|
Fannie Mae Pool #FS7252 5.00% 11/1/20531 |
|
|
9,794 |
|
|
|
9,470 |
|
|
|
Fannie Mae Pool #MA5191 6.00% 11/1/20531 |
|
|
11,542 |
|
|
|
11,582 |
|
|
|
Fannie Mae Pool #FS7979 2.00% 12/1/20531 |
|
|
1,162 |
|
|
|
912 |
|
|
|
Fannie Mae Pool #MA5236 4.00% 12/1/20531 |
|
|
25 |
|
|
|
23 |
|
|
|
Fannie Mae Pool #FS6668 5.50% 12/1/20531 |
|
|
557 |
|
|
|
550 |
|
|
|
Fannie Mae Pool #MA5215 5.50% 12/1/20531 |
|
|
161 |
|
|
|
159 |
|
|
|
Fannie Mae Pool #CB7624 6.50% 12/1/20531 |
|
|
15,334 |
|
|
|
15,651 |
|
|
|
Fannie Mae Pool #FS6873 6.50% 1/1/20541 |
|
|
4,372 |
|
|
|
4,457 |
|
|
|
Fannie Mae Pool #MA5283 4.00% 2/1/20541 |
|
|
941 |
|
|
|
861 |
|
|
|
Fannie Mae Pool #FS6809 5.50% 2/1/20541 |
|
|
529 |
|
|
|
522 |
|
|
|
Fannie Mae Pool #MA5274 7.00% 2/1/20541 |
|
|
2,812 |
|
|
|
2,894 |
|
|
|
Fannie Mae Pool #MA5296 5.50% 3/1/20541 |
|
|
1,073 |
|
|
|
1,059 |
|
|
|
Fannie Mae Pool #CB8328 5.50% 4/1/20541 |
|
|
1,339 |
|
|
|
1,325 |
|
|
|
Fannie Mae Pool #MA5331 5.50% 4/1/20541 |
|
|
235 |
|
|
|
232 |
|
|
|
Fannie Mae Pool #DB1235 6.00% 4/1/20541 |
|
|
735 |
|
|
|
742 |
|
|
|
Fannie Mae Pool #CB8387 6.50% 4/1/20541 |
|
|
1,509 |
|
|
|
1,550 |
|
|
|
Fannie Mae Pool #MA5353 5.50% 5/1/20541 |
|
|
6,251 |
|
|
|
6,167 |
|
|
|
Fannie Mae Pool #CB8755 6.00% 6/1/20541 |
|
|
3,356 |
|
|
|
3,381 |
|
|
|
Fannie Mae Pool #BU4700 6.00% 7/1/20541 |
|
|
8,385 |
|
|
|
8,447 |
|
|
|
Fannie Mae Pool #BF0497 3.00% 7/1/20601 |
|
|
1,250 |
|
|
|
1,040 |
|
|
|
Fannie Mae Pool #BF0585 4.50% 12/1/20611 |
|
|
393 |
|
|
|
371 |
|
|
|
Fannie Mae Pool #BF0765 3.50% 9/1/20631 |
|
|
484 |
|
|
|
421 |
|
|
|
Fannie Mae, Series 2001-4, Class GA, 9.00% 4/17/20251,3 |
|
|
– |
2 |
|
|
– |
2 |
|
|
Fannie Mae, Series 2001-4, Class NA, 9.00% 10/25/20251,3 |
|
|
– |
2 |
|
|
– |
2 |
|
|
Freddie Mac Pool #ZS8907 6.50% 10/1/20261 |
|
|
1 |
|
|
|
1 |
|
|
|
Freddie Mac Pool #ZA2024 6.50% 9/1/20271 |
|
|
1 |
|
|
|
1 |
|
|
|
Freddie Mac Pool #1H1354 6.328% 11/1/20361,3 |
|
|
40 |
|
|
|
41 |
|
|
|
Freddie Mac Pool #C03518 5.00% 9/1/20401 |
|
|
247 |
|
|
|
244 |
|
|
|
Freddie Mac Pool #G06459 5.00% 5/1/20411 |
|
|
541 |
|
|
|
535 |
|
|
|
Freddie Mac Pool #RB5138 2.00% 12/1/20411 |
|
|
702 |
|
|
|
588 |
|
|
|
Freddie Mac Pool #RB5145 2.00% 2/1/20421 |
|
|
687 |
|
|
|
575 |
|
|
|
Freddie Mac Pool #RB5148 2.00% 3/1/20421 |
|
|
1,628 |
|
|
|
1,361 |
|
|
|
Freddie Mac Pool #RB5154 2.50% 4/1/20421 |
|
|
9,902 |
|
|
|
8,471 |
|
|
|
Freddie Mac Pool #Q15874 4.00% 2/1/20431 |
|
|
3 |
|
|
|
3 |
|
|
|
Freddie Mac Pool #Q17696 3.50% 4/1/20431 |
|
|
23 |
|
|
|
21 |
|
|
|
Freddie Mac Pool #Q19133 3.50% 6/1/20431 |
|
|
26 |
|
|
|
24 |
|
|
|
Freddie Mac Pool #Q23190 4.00% 11/1/20431 |
|
|
135 |
|
|
|
128 |
|
|
|
Freddie Mac Pool #Q28558 3.50% 9/1/20441 |
|
|
176 |
|
|
|
160 |
|
|
|
Freddie Mac Pool #760014 2.838% 8/1/20451,3 |
|
|
224 |
|
|
|
217 |
|
|
|
Freddie Mac Pool #Q47615 3.50% 4/1/20471 |
|
|
43 |
|
|
|
38 |
|
|
|
Freddie Mac Pool #Q52069 3.50% 11/1/20471 |
|
|
64 |
|
|
|
58 |
|
|
|
Freddie Mac Pool #SD0470 4.00% 11/1/20471 |
|
|
6,295 |
|
|
|
5,865 |
|
|
|
Freddie Mac Pool #Q54709 3.50% 3/1/20481 |
|
|
47 |
|
|
|
42 |
|
|
|
Freddie Mac Pool #Q54701 3.50% 3/1/20481 |
|
|
45 |
|
|
|
41 |
|
|
|
Freddie Mac Pool #Q54700 3.50% 3/1/20481 |
|
|
36 |
|
|
|
32 |
|
|
|
Freddie Mac Pool #Q54781 3.50% 3/1/20481 |
|
|
33 |
|
|
|
30 |
|
|
|
Freddie Mac Pool #Q54782 3.50% 3/1/20481 |
|
|
26 |
|
|
|
24 |
|
|
|
Freddie Mac Pool #Q54699 3.50% 3/1/20481 |
|
|
19 |
|
|
|
18 |
|
|
|
Freddie Mac Pool #Q54831 3.50% 3/1/20481 |
|
|
12 |
|
|
|
11 |
|
|
|
Freddie Mac Pool #Q54698 3.50% 3/1/20481 |
|
|
12 |
|
|
|
11 |
|
|
|
Freddie Mac Pool #G67711 4.00% 3/1/20481 |
|
|
1,204 |
|
|
|
1,130 |
|
|
|
Freddie Mac Pool #Q55971 4.00% 5/1/20481 |
|
|
63 |
|
|
|
59 |
|
|
|
Freddie Mac Pool #Q56175 4.00% 5/1/20481 |
|
|
57 |
|
|
|
53 |
|
|
|
Freddie Mac Pool #Q56590 3.50% 6/1/20481 |
|
|
24 |
|
|
|
22 |
|
|
|
Freddie Mac Pool #Q56589 3.50% 6/1/20481 |
|
|
14 |
|
|
|
13 |
|
226
U.S. Government Securities Fund (continued)
|
|
|
|
|
|
|
|
|
|
|
| Bonds, notes & other debt instruments (continued) |
|
Principal amount (000) |
|
|
Value (000) |
|
|
|
|
| Mortgage-backed obligations (continued) |
|
|
|
|
|
|
|
|
| Federal agency mortgage-backed obligations (continued) |
|
Freddie Mac Pool #Q56599 4.00% 6/1/20481 |
|
|
USD95 |
|
|
$ |
89 |
|
|
|
Freddie Mac Pool #ZT2265 4.00% 8/1/20481 |
|
|
6,020 |
|
|
|
5,585 |
|
|
|
Freddie Mac Pool #Q58411 4.50% 9/1/20481 |
|
|
180 |
|
|
|
173 |
|
|
|
Freddie Mac Pool #Q58436 4.50% 9/1/20481 |
|
|
94 |
|
|
|
90 |
|
|
|
Freddie Mac Pool #Q58378 4.50% 9/1/20481 |
|
|
62 |
|
|
|
59 |
|
|
|
Freddie Mac Pool #ZT0522 4.50% 9/1/20481 |
|
|
19 |
|
|
|
18 |
|
|
|
Freddie Mac Pool #QA0284 3.50% 6/1/20491 |
|
|
154 |
|
|
|
139 |
|
|
|
Freddie Mac Pool #QA2748 3.50% 9/1/20491 |
|
|
43 |
|
|
|
39 |
|
|
|
Freddie Mac Pool #RA1463 3.50% 10/1/20491 |
|
|
341 |
|
|
|
308 |
|
|
|
Freddie Mac Pool #RA1580 3.50% 10/1/20491 |
|
|
175 |
|
|
|
158 |
|
|
|
Freddie Mac Pool #RA3384 3.00% 8/1/20501 |
|
|
30 |
|
|
|
26 |
|
|
|
Freddie Mac Pool #SD8106 2.00% 11/1/20501 |
|
|
1,259 |
|
|
|
991 |
|
|
|
Freddie Mac Pool #RA3987 2.50% 11/1/20501 |
|
|
1,952 |
|
|
|
1,609 |
|
|
|
Freddie Mac Pool #SD8128 2.00% 2/1/20511 |
|
|
34 |
|
|
|
27 |
|
|
|
Freddie Mac Pool #SD8134 2.00% 3/1/20511 |
|
|
56 |
|
|
|
44 |
|
|
|
Freddie Mac Pool #RA5288 2.00% 5/1/20511 |
|
|
2,179 |
|
|
|
1,731 |
|
|
|
Freddie Mac Pool #SD7544 3.00% 7/1/20511 |
|
|
148 |
|
|
|
128 |
|
|
|
Freddie Mac Pool #SD0726 2.50% 10/1/20511 |
|
|
9,069 |
|
|
|
7,556 |
|
|
|
Freddie Mac Pool #RA6406 2.00% 11/1/20511 |
|
|
451 |
|
|
|
355 |
|
|
|
Freddie Mac Pool #SD1385 2.50% 11/1/20511 |
|
|
473 |
|
|
|
393 |
|
|
|
Freddie Mac Pool #SD7552 2.50% 1/1/20521 |
|
|
296 |
|
|
|
246 |
|
|
|
Freddie Mac Pool #SD0813 3.00% 1/1/20521 |
|
|
139 |
|
|
|
120 |
|
|
|
Freddie Mac Pool #SD0873 3.50% 2/1/20521 |
|
|
12,058 |
|
|
|
10,865 |
|
|
|
Freddie Mac Pool #QD7089 3.50% 2/1/20521 |
|
|
170 |
|
|
|
151 |
|
|
|
Freddie Mac Pool #QD9477 4.00% 4/1/20521 |
|
|
377 |
|
|
|
345 |
|
|
|
Freddie Mac Pool #8D0226 2.545% 5/1/20521,3 |
|
|
466 |
|
|
|
411 |
|
|
|
Freddie Mac Pool #SD8214 3.50% 5/1/20521 |
|
|
7,955 |
|
|
|
7,048 |
|
|
|
Freddie Mac Pool #QE8579 4.50% 8/1/20521 |
|
|
193 |
|
|
|
183 |
|
|
|
Freddie Mac Pool #QE8282 5.00% 8/1/20521 |
|
|
800 |
|
|
|
774 |
|
|
|
Freddie Mac Pool #QE7647 5.00% 8/1/20521 |
|
|
51 |
|
|
|
50 |
|
|
|
Freddie Mac Pool #SD1496 5.00% 8/1/20521 |
|
|
46 |
|
|
|
45 |
|
|
|
Freddie Mac Pool #QF0212 4.50% 9/1/20521 |
|
|
890 |
|
|
|
841 |
|
|
|
Freddie Mac Pool #QE9497 4.50% 9/1/20521 |
|
|
218 |
|
|
|
206 |
|
|
|
Freddie Mac Pool #SD1608 4.50% 9/1/20521 |
|
|
129 |
|
|
|
122 |
|
|
|
Freddie Mac Pool #RA7938 5.00% 9/1/20521 |
|
|
10,604 |
|
|
|
10,268 |
|
|
|
Freddie Mac Pool #SD8256 4.00% 10/1/20521 |
|
|
2,020 |
|
|
|
1,849 |
|
|
|
Freddie Mac Pool #SD3782 4.50% 10/1/20521 |
|
|
3,458 |
|
|
|
3,266 |
|
|
|
Freddie Mac Pool #SD8257 4.50% 10/1/20521 |
|
|
3,350 |
|
|
|
3,162 |
|
|
|
Freddie Mac Pool #SD2465 4.50% 10/1/20521 |
|
|
85 |
|
|
|
80 |
|
|
|
Freddie Mac Pool #SD1895 4.50% 11/1/20521 |
|
|
1,116 |
|
|
|
1,079 |
|
|
|
Freddie Mac Pool #QF2560 4.50% 11/1/20521 |
|
|
974 |
|
|
|
922 |
|
|
|
Freddie Mac Pool #SD2948 5.50% 11/1/20521 |
|
|
2,096 |
|
|
|
2,073 |
|
|
|
Freddie Mac Pool #SD8281 6.50% 12/1/20521 |
|
|
4,982 |
|
|
|
5,099 |
|
|
|
Freddie Mac Pool #SD8297 4.00% 2/1/20531 |
|
|
5,073 |
|
|
|
4,651 |
|
|
|
Freddie Mac Pool #SD8305 4.00% 3/1/20531 |
|
|
819 |
|
|
|
750 |
|
|
|
Freddie Mac Pool #SD8316 5.50% 4/1/20531 |
|
|
955 |
|
|
|
943 |
|
|
|
Freddie Mac Pool #QG1653 6.00% 4/1/20531 |
|
|
908 |
|
|
|
914 |
|
|
|
Freddie Mac Pool #QG0259 6.00% 4/1/20531 |
|
|
474 |
|
|
|
478 |
|
|
|
Freddie Mac Pool #RA8647 4.50% 5/1/20531 |
|
|
89 |
|
|
|
84 |
|
|
|
Freddie Mac Pool #SD8324 5.50% 5/1/20531 |
|
|
854 |
|
|
|
843 |
|
|
|
Freddie Mac Pool #SD3369 5.50% 5/1/20531 |
|
|
561 |
|
|
|
555 |
|
|
|
Freddie Mac Pool #SD8325 6.00% 5/1/20531 |
|
|
8,262 |
|
|
|
8,300 |
|
|
|
Freddie Mac Pool #QG3763 6.00% 5/1/20531 |
|
|
1,930 |
|
|
|
1,942 |
|
|
|
Freddie Mac Pool #SD2979 6.50% 5/1/20531 |
|
|
300 |
|
|
|
308 |
|
|
|
Freddie Mac Pool #SD8331 5.50% 6/1/20531 |
|
|
1,610 |
|
|
|
1,589 |
|
|
|
Freddie Mac Pool #SD8332 6.00% 6/1/20531 |
|
|
16,740 |
|
|
|
16,827 |
|
|
|
Freddie Mac Pool #SD3175 6.00% 6/1/20531 |
|
|
4,066 |
|
|
|
4,088 |
|
|
|
Freddie Mac Pool #SD3083 6.00% 6/1/20531 |
|
|
2,158 |
|
|
|
2,170 |
|
|
|
Freddie Mac Pool #QG5227 6.00% 6/1/20531 |
|
|
920 |
|
|
|
925 |
|
|
|
Freddie Mac Pool #RA9279 6.00% 6/1/20531 |
|
|
471 |
|
|
|
475 |
|
|
|
Freddie Mac Pool #RA9283 6.00% 6/1/20531 |
|
|
436 |
|
|
|
439 |
|
227
U.S. Government Securities Fund (continued)
|
|
|
|
|
|
|
|
|
|
|
| Bonds, notes & other debt instruments (continued) |
|
Principal amount (000) |
|
|
Value (000) |
|
|
|
|
| Mortgage-backed obligations (continued) |
|
|
|
|
|
|
|
|
| Federal agency mortgage-backed obligations (continued) |
|
Freddie Mac Pool #RA9281 6.00% 6/1/20531 |
|
|
USD294 |
|
|
$ |
296 |
|
|
|
Freddie Mac Pool #RA9284 6.00% 6/1/20531 |
|
|
202 |
|
|
|
206 |
|
|
|
Freddie Mac Pool #RA9294 6.50% 6/1/20531 |
|
|
2,444 |
|
|
|
2,509 |
|
|
|
Freddie Mac Pool #RA9292 6.50% 6/1/20531 |
|
|
2,144 |
|
|
|
2,191 |
|
|
|
Freddie Mac Pool #RA9289 6.50% 6/1/20531 |
|
|
1,971 |
|
|
|
2,027 |
|
|
|
Freddie Mac Pool #RA9288 6.50% 6/1/20531 |
|
|
1,897 |
|
|
|
1,955 |
|
|
|
Freddie Mac Pool #RA9287 6.50% 6/1/20531 |
|
|
1,365 |
|
|
|
1,410 |
|
|
|
Freddie Mac Pool #RA9290 6.50% 6/1/20531 |
|
|
1,000 |
|
|
|
1,026 |
|
|
|
Freddie Mac Pool #RA9291 6.50% 6/1/20531 |
|
|
735 |
|
|
|
750 |
|
|
|
Freddie Mac Pool #RA9295 6.50% 6/1/20531 |
|
|
536 |
|
|
|
555 |
|
|
|
Freddie Mac Pool #SD8342 5.50% 7/1/20531 |
|
|
18,552 |
|
|
|
18,310 |
|
|
|
Freddie Mac Pool #SD3386 5.50% 7/1/20531 |
|
|
651 |
|
|
|
644 |
|
|
|
Freddie Mac Pool #SD8343 6.00% 7/1/20531 |
|
|
27,043 |
|
|
|
27,168 |
|
|
|
Freddie Mac Pool #SD8350 6.00% 8/1/20531 |
|
|
23,237 |
|
|
|
23,315 |
|
|
|
Freddie Mac Pool #SD8362 5.50% 9/1/20531 |
|
|
794 |
|
|
|
784 |
|
|
|
Freddie Mac Pool #SD3857 6.00% 9/1/20531 |
|
|
43,432 |
|
|
|
43,754 |
|
|
|
Freddie Mac Pool #RA9857 6.00% 9/1/20531 |
|
|
2,389 |
|
|
|
2,402 |
|
|
|
Freddie Mac Pool #SD3825 6.50% 9/1/20531 |
|
|
109 |
|
|
|
111 |
|
|
|
Freddie Mac Pool #SD8379 4.00% 10/1/20531 |
|
|
1,976 |
|
|
|
1,809 |
|
|
|
Freddie Mac Pool #SD8366 5.00% 10/1/20531 |
|
|
15,438 |
|
|
|
14,927 |
|
|
|
Freddie Mac Pool #SD4053 6.00% 10/1/20531 |
|
|
5,535 |
|
|
|
5,564 |
|
|
|
Freddie Mac Pool #SD8369 6.50% 10/1/20531 |
|
|
14,828 |
|
|
|
15,102 |
|
|
|
Freddie Mac Pool #SD8370 4.50% 11/1/20531 |
|
|
749 |
|
|
|
706 |
|
|
|
Freddie Mac Pool #SD8372 5.50% 11/1/20531 |
|
|
3,491 |
|
|
|
3,445 |
|
|
|
Freddie Mac Pool #SD8381 4.50% 12/1/20531 |
|
|
832 |
|
|
|
784 |
|
|
|
Freddie Mac Pool #SD8406 4.00% 1/1/20541 |
|
|
1,032 |
|
|
|
945 |
|
|
|
Freddie Mac Pool #SD8393 4.50% 1/1/20541 |
|
|
175 |
|
|
|
165 |
|
|
|
Freddie Mac Pool #SD8395 5.50% 1/1/20541 |
|
|
2,190 |
|
|
|
2,161 |
|
|
|
Freddie Mac Pool #RA9888 6.50% 1/1/20541 |
|
|
6,718 |
|
|
|
6,856 |
|
|
|
Freddie Mac Pool #SD4894 6.00% 2/1/20541 |
|
|
4,955 |
|
|
|
4,994 |
|
|
|
Freddie Mac Pool #SD4975 6.00% 2/1/20541 |
|
|
261 |
|
|
|
262 |
|
|
|
Freddie Mac Pool #SD8420 5.50% 4/1/20541 |
|
|
814 |
|
|
|
804 |
|
|
|
Freddie Mac Pool #RJ1216 5.50% 4/1/20541 |
|
|
623 |
|
|
|
617 |
|
|
|
Freddie Mac Pool #RJ1215 5.50% 4/1/20541 |
|
|
113 |
|
|
|
112 |
|
|
|
Freddie Mac Pool #QI2895 6.00% 4/1/20541 |
|
|
500 |
|
|
|
503 |
|
|
|
Freddie Mac Pool #RJ1448 5.50% 5/1/20541 |
|
|
504 |
|
|
|
499 |
|
|
|
Freddie Mac Pool #SD5404 6.50% 5/1/20541 |
|
|
2,785 |
|
|
|
2,850 |
|
|
|
Freddie Mac Pool #RJ1779 6.00% 6/1/20541 |
|
|
12,810 |
|
|
|
12,913 |
|
|
|
Freddie Mac Pool #RJ1726 6.50% 6/1/20541 |
|
|
1,167 |
|
|
|
1,194 |
|
|
|
Freddie Mac Pool #QI8874 6.00% 7/1/20541 |
|
|
3,347 |
|
|
|
3,372 |
|
|
|
Freddie Mac, Series K040, Class A2, Multi Family, 3.241% 9/25/20241 |
|
|
1,074 |
|
|
|
1,068 |
|
|
|
Freddie Mac, Series K751, Class A2, Multi Family, 4.412% 3/25/20301 |
|
|
3,875 |
|
|
|
3,803 |
|
|
|
Freddie Mac Seasoned Credit Risk Transfer Trust, Series 2017-1, Class HA, 3.00% 1/25/20561,3 |
|
|
3,926 |
|
|
|
3,600 |
|
|
|
Freddie Mac Seasoned Credit Risk Transfer Trust, Series 2017-3, Class MT, 3.00% 7/25/20561 |
|
|
759 |
|
|
|
651 |
|
|
|
Freddie Mac Seasoned Credit Risk Transfer Trust, Series 2017-3, Class HT, 3.25% 7/25/20561 |
|
|
307 |
|
|
|
267 |
|
|
|
Freddie Mac Seasoned Credit Risk Transfer Trust, Series 2017-2, Class MA, 3.00% 8/25/20561 |
|
|
3,988 |
|
|
|
3,638 |
|
|
|
Freddie Mac Seasoned Credit Risk Transfer Trust, Series 2017-2, Class HA, 3.00% 8/25/20561,3 |
|
|
3,567 |
|
|
|
3,268 |
|
|
|
Freddie Mac Seasoned Credit Risk Transfer Trust, Series 2018-1, Class HT, 3.00% 5/25/20571 |
|
|
835 |
|
|
|
701 |
|
|
|
Freddie Mac Seasoned Credit Risk Transfer Trust, Series 2017-4, Class HT, 3.25% 6/25/20571,3 |
|
|
1,181 |
|
|
|
1,048 |
|
|
|
Freddie Mac Seasoned Credit Risk Transfer Trust, Series 2018-3, Class MA, 3.50% 8/25/20571 |
|
|
407 |
|
|
|
383 |
|
|
|
Freddie Mac Seasoned Credit Risk Transfer Trust, Series 2018-2, Class MT, 3.50% 11/25/20571 |
|
|
3,736 |
|
|
|
3,289 |
|
228
U.S. Government Securities Fund (continued)
|
|
|
|
|
|
|
|
|
|
|
| Bonds, notes & other debt instruments (continued) |
|
Principal amount (000) |
|
|
Value (000) |
|
|
|
|
| Mortgage-backed obligations (continued) |
|
|
|
|
|
|
|
|
| Federal agency mortgage-backed obligations (continued) |
|
Freddie Mac Seasoned Credit Risk Transfer Trust, Series 2019-1, Class MA, 3.50% 7/25/20581 |
|
|
USD474 |
|
|
$ |
443 |
|
|
|
Freddie Mac Seasoned Credit Risk Transfer Trust, Series 2019-2, Class MA, 3.50% 8/25/20581 |
|
|
1,776 |
|
|
|
1,649 |
|
|
|
Freddie Mac Seasoned Credit Risk Transfer Trust, Series 2019-2, Class MT, 3.50% 8/26/20581 |
|
|
656 |
|
|
|
576 |
|
|
|
Freddie Mac Seasoned Credit Risk Transfer Trust, Series 2019-3, Class MT, 3.50% 10/25/20581 |
|
|
353 |
|
|
|
310 |
|
|
|
Freddie Mac Seasoned Credit Risk Transfer Trust, Series 2019-4, Class MA, 3.00% 2/25/20591 |
|
|
1,534 |
|
|
|
1,385 |
|
|
|
Freddie Mac Seasoned Loan Structured Transaction Trust, Series 2018-2, Class A1, 3.50% 11/25/20281 |
|
|
15,623 |
|
|
|
14,692 |
|
|
|
Freddie Mac Seasoned Loan Structured Transaction Trust, Series 2019-3, Class A1C, 2.75% 11/25/20291 |
|
|
4,021 |
|
|
|
3,714 |
|
|
|
Freddie Mac Seasoned Loan Structured Transaction Trust, Series 2020-1, Class A1D, 2.00% 7/25/20301 |
|
|
1,129 |
|
|
|
999 |
|
|
|
Freddie Mac Seasoned Loan Structured Transaction Trust, Series 2020-1, Class A2D, 2.00% 7/25/20301 |
|
|
435 |
|
|
|
363 |
|
|
|
Freddie Mac Seasoned Loan Structured Transaction Trust, Series 2022-1, Class A1, 3.50% 5/25/20321 |
|
|
3,850 |
|
|
|
3,626 |
|
|
|
Government National Mortgage Assn. 3.00% 7/1/20541,4 |
|
|
435 |
|
|
|
379 |
|
|
|
Government National Mortgage Assn. 3.50% 7/1/20541,4 |
|
|
4,430 |
|
|
|
3,978 |
|
|
|
Government National Mortgage Assn. 4.00% 7/1/20541,4 |
|
|
4,565 |
|
|
|
4,219 |
|
|
|
Government National Mortgage Assn. 5.50% 7/1/20541,4 |
|
|
1,905 |
|
|
|
1,890 |
|
|
|
Government National Mortgage Assn. Pool #782365 6.00% 7/15/20381 |
|
|
66 |
|
|
|
68 |
|
|
|
Government National Mortgage Assn. Pool #700778 5.50% 10/15/20381 |
|
|
16 |
|
|
|
16 |
|
|
|
Government National Mortgage Assn. Pool #004269 6.50% 10/20/20381 |
|
|
137 |
|
|
|
144 |
|
|
|
Government National Mortgage Assn. Pool #698668 5.50% 11/15/20381 |
|
|
27 |
|
|
|
27 |
|
|
|
Government National Mortgage Assn. Pool #698406 5.00% 7/15/20391 |
|
|
149 |
|
|
|
150 |
|
|
|
Government National Mortgage Assn. Pool #783690 6.00% 9/20/20391 |
|
|
70 |
|
|
|
73 |
|
|
|
Government National Mortgage Assn. Pool #783689 5.50% 2/20/20401 |
|
|
2,033 |
|
|
|
2,068 |
|
|
|
Government National Mortgage Assn. Pool #783688 5.00% 6/20/20411 |
|
|
727 |
|
|
|
734 |
|
|
|
Government National Mortgage Assn. Pool #783687 4.50% 12/20/20411 |
|
|
468 |
|
|
|
453 |
|
|
|
Government National Mortgage Assn. Pool #MA0533 3.00% 11/20/20421 |
|
|
16 |
|
|
|
15 |
|
|
|
Government National Mortgage Assn. Pool #MA6994 2.00% 11/20/20501 |
|
|
836 |
|
|
|
678 |
|
|
|
Government National Mortgage Assn. Pool #MA7051 2.00% 12/20/20501 |
|
|
733 |
|
|
|
594 |
|
|
|
Government National Mortgage Assn. Pool #785575 2.50% 8/20/20511 |
|
|
4,983 |
|
|
|
4,131 |
|
|
|
Government National Mortgage Assn. Pool #MA7534 2.50% 8/20/20511 |
|
|
2,150 |
|
|
|
1,809 |
|
|
|
Government National Mortgage Assn. Pool #785659 2.50% 10/20/20511 |
|
|
704 |
|
|
|
585 |
|
|
|
Government National Mortgage Assn. Pool #786706 2.50% 12/20/20511 |
|
|
3,818 |
|
|
|
3,238 |
|
|
|
Government National Mortgage Assn. Pool #MA7827 2.50% 1/20/20521 |
|
|
90 |
|
|
|
75 |
|
|
|
Government National Mortgage Assn. Pool #786502 2.50% 2/20/20521 |
|
|
3,259 |
|
|
|
2,730 |
|
|
|
Government National Mortgage Assn. Pool #786647 2.50% 3/20/20521 |
|
|
1,735 |
|
|
|
1,455 |
|
|
|
Government National Mortgage Assn. Pool #786701 2.50% 3/20/20521 |
|
|
1,105 |
|
|
|
926 |
|
|
|
Government National Mortgage Assn. Pool #785998 2.50% 3/20/20521 |
|
|
781 |
|
|
|
650 |
|
|
|
Government National Mortgage Assn. Pool #MA7987 2.50% 4/20/20521 |
|
|
959 |
|
|
|
806 |
|
|
|
Government National Mortgage Assn. Pool #MA8266 3.50% 9/20/20521 |
|
|
2,884 |
|
|
|
2,591 |
|
|
|
Government National Mortgage Assn. Pool #MA8346 4.00% 10/20/20521 |
|
|
340 |
|
|
|
314 |
|
|
|
Government National Mortgage Assn. Pool #MA8567 4.00% 1/20/20531 |
|
|
460 |
|
|
|
425 |
|
|
|
Government National Mortgage Assn. Pool #MA8723 4.00% 3/20/20531 |
|
|
231 |
|
|
|
213 |
|
|
|
Government National Mortgage Assn. Pool #MA8947 5.00% 6/20/20531 |
|
|
58 |
|
|
|
57 |
|
|
|
Government National Mortgage Assn. Pool #MA9015 4.50% 7/20/20531 |
|
|
4,609 |
|
|
|
4,384 |
|
|
|
Government National Mortgage Assn. Pool #MA9104 4.50% 8/20/20531 |
|
|
2,943 |
|
|
|
2,799 |
|
|
|
Government National Mortgage Assn. Pool #MA9169 4.50% 9/20/20531 |
|
|
1,225 |
|
|
|
1,165 |
|
|
|
Government National Mortgage Assn., Series 2021-2, Class AH, 1.50% 6/16/20631 |
|
|
433 |
|
|
|
323 |
|
|
|
Uniform Mortgage-Backed Security 2.00% 7/1/20391,4 |
|
|
1,115 |
|
|
|
980 |
|
|
|
Uniform Mortgage-Backed Security 2.50% 7/1/20391,4 |
|
|
2,275 |
|
|
|
2,055 |
|
|
|
Uniform Mortgage-Backed Security 4.00% 7/1/20391,4 |
|
|
920 |
|
|
|
885 |
|
|
|
Uniform Mortgage-Backed Security 5.00% 7/1/20391,4 |
|
|
780 |
|
|
|
773 |
|
|
|
Uniform Mortgage-Backed Security 2.00% 7/1/20541,4 |
|
|
2,707 |
|
|
|
2,118 |
|
|
|
Uniform Mortgage-Backed Security 3.00% 7/1/20541,4 |
|
|
18,627 |
|
|
|
15,847 |
|
229
U.S. Government Securities Fund (continued)
|
|
|
|
|
|
|
|
|
|
|
| Bonds, notes & other debt instruments (continued) |
|
Principal amount (000) |
|
|
Value (000) |
|
|
|
|
| Mortgage-backed obligations (continued) |
|
|
|
|
|
|
|
|
| Federal agency mortgage-backed obligations (continued) |
|
Uniform Mortgage-Backed Security 3.50% 7/1/20541,4 |
|
|
USD6,508 |
|
|
$ |
5,761 |
|
|
|
Uniform Mortgage-Backed Security 5.00% 7/1/20541,4 |
|
|
585 |
|
|
|
565 |
|
|
|
Uniform Mortgage-Backed Security 5.50% 7/1/20541,4 |
|
|
4,911 |
|
|
|
4,844 |
|
|
|
Uniform Mortgage-Backed Security 6.00% 7/1/20541,4 |
|
|
3,176 |
|
|
|
3,186 |
|
|
|
Uniform Mortgage-Backed Security 6.50% 7/1/20541,4 |
|
|
174,084 |
|
|
|
177,199 |
|
|
|
Uniform Mortgage-Backed Security 7.00% 7/1/20541,4 |
|
|
1,088 |
|
|
|
1,119 |
|
|
|
Uniform Mortgage-Backed Security 3.00% 8/1/20541,4 |
|
|
3,086 |
|
|
|
2,628 |
|
|
|
Uniform Mortgage-Backed Security 3.50% 8/1/20541,4 |
|
|
7,000 |
|
|
|
6,197 |
|
|
|
Uniform Mortgage-Backed Security 4.50% 8/1/20541,4 |
|
|
2,000 |
|
|
|
1,886 |
|
|
|
Uniform Mortgage-Backed Security 6.00% 8/1/20541,4 |
|
|
66,672 |
|
|
|
66,836 |
|
|
|
Uniform Mortgage-Backed Security 6.50% 8/1/20541,4 |
|
|
19,966 |
|
|
|
20,311 |
|
|
|
Uniform Mortgage-Backed Security 7.00% 8/1/20541,4 |
|
|
17,229 |
|
|
|
17,710 |
|
|
|
|
|
|
|
|
|
|
|
|
|
|
|
|
|
|
|
|
|
1,016,742 |
|
|
|
|
|
|
|
|
|
|
|
|
| |
|
|
|
|
|
|
|
|
|
|
| Collateralized mortgage-backed obligations 0.06% |
|
FARM Mortgage Trust, Series 2024-1, Class A, 4.721% 10/1/20531,3,5 |
|
|
1,094 |
|
|
|
1,039 |
|
|
|
|
|
|
|
|
|
|
|
|
|
|
Total mortgage-backed obligations |
|
|
|
|
|
|
1,017,781 |
|
|
|
|
|
|
|
|
|
|
|
|
|
|
|
| U.S. Treasury bonds & notes 34.36% |
|
|
|
|
|
|
|
|
| U.S. Treasury 31.33% |
|
U.S. Treasury 1.75% 7/31/2024 |
|
|
10,270 |
|
|
|
10,241 |
|
|
|
U.S. Treasury 3.00% 7/31/2024 |
|
|
1,470 |
|
|
|
1,467 |
|
|
|
U.S. Treasury 4.50% 11/30/2024 |
|
|
7,848 |
|
|
|
7,823 |
|
|
|
U.S. Treasury 4.125% 1/31/2025 |
|
|
2,906 |
|
|
|
2,886 |
|
|
|
U.S. Treasury 2.00% 2/15/2025 |
|
|
890 |
|
|
|
872 |
|
|
|
U.S. Treasury 4.625% 2/28/2025 |
|
|
30,265 |
|
|
|
30,143 |
|
|
|
U.S. Treasury 3.875% 4/30/2025 |
|
|
250 |
|
|
|
247 |
|
|
|
U.S. Treasury 3.125% 8/15/2025 |
|
|
390 |
|
|
|
382 |
|
|
|
U.S. Treasury 0.25% 8/31/2025 |
|
|
1,023 |
|
|
|
968 |
|
|
|
U.S. Treasury 3.50% 9/15/2025 |
|
|
28,780 |
|
|
|
28,263 |
|
|
|
U.S. Treasury 3.00% 9/30/2025 |
|
|
2,235 |
|
|
|
2,181 |
|
|
|
U.S. Treasury 5.00% 9/30/2025 |
|
|
3,170 |
|
|
|
3,169 |
|
|
|
U.S. Treasury 4.25% 12/31/2025 |
|
|
17,685 |
|
|
|
17,516 |
|
|
|
U.S. Treasury 4.25% 1/31/2026 |
|
|
30,610 |
|
|
|
30,317 |
|
|
|
U.S. Treasury 4.625% 2/28/2026 |
|
|
9,375 |
|
|
|
9,341 |
|
|
|
U.S. Treasury 4.625% 3/15/2026 |
|
|
11,050 |
|
|
|
11,012 |
|
|
|
U.S. Treasury 4.50% 3/31/2026 |
|
|
1,435 |
|
|
|
1,427 |
|
|
|
U.S. Treasury 4.875% 4/30/2026 |
|
|
35,525 |
|
|
|
35,578 |
|
|
|
U.S. Treasury 4.50% 7/15/2026 |
|
|
10,366 |
|
|
|
10,322 |
|
|
|
U.S. Treasury 4.625% 9/15/2026 |
|
|
10,209 |
|
|
|
10,196 |
|
|
|
U.S. Treasury 4.375% 12/15/2026 |
|
|
8,511 |
|
|
|
8,463 |
|
|
|
U.S. Treasury 1.25% 12/31/2026 |
|
|
8,665 |
|
|
|
7,989 |
|
|
|
U.S. Treasury 4.25% 3/15/2027 |
|
|
8,015 |
|
|
|
7,951 |
|
|
|
U.S. Treasury 4.50% 4/15/2027 |
|
|
30,000 |
|
|
|
29,954 |
|
|
|
U.S. Treasury 0.50% 4/30/2027 |
|
|
1,250 |
|
|
|
1,117 |
|
|
|
U.S. Treasury 2.625% 5/31/2027 |
|
|
2,290 |
|
|
|
2,172 |
|
|
|
U.S. Treasury 3.625% 5/31/2028 |
|
|
14,850 |
|
|
|
14,422 |
|
|
|
U.S. Treasury 1.25% 6/30/2028 |
|
|
3,325 |
|
|
|
2,941 |
|
|
|
U.S. Treasury 4.00% 6/30/2028 |
|
|
6,907 |
|
|
|
6,802 |
|
|
|
U.S. Treasury 1.00% 7/31/2028 |
|
|
970 |
|
|
|
847 |
|
|
|
U.S. Treasury 4.125% 7/31/2028 |
|
|
17,685 |
|
|
|
17,493 |
|
|
|
U.S. Treasury 4.375% 11/30/2028 |
|
|
16,130 |
|
|
|
16,123 |
|
|
|
U.S. Treasury 4.625% 4/30/2029 |
|
|
15,000 |
|
|
|
15,169 |
|
|
|
U.S. Treasury 4.50% 5/31/2029 |
|
|
17,450 |
|
|
|
17,567 |
|
|
|
U.S. Treasury 2.625% 7/31/2029 |
|
|
9,309 |
|
|
|
8,579 |
|
|
|
U.S. Treasury 3.75% 6/30/2030 |
|
|
32,030 |
|
|
|
31,002 |
|
|
|
U.S. Treasury 4.625% 9/30/2030 |
|
|
1,290 |
|
|
|
1,308 |
|
|
|
U.S. Treasury 4.875% 10/31/2030 |
|
|
625 |
|
|
|
643 |
|
|
|
U.S. Treasury 2.75% 8/15/2032 |
|
|
8,095 |
|
|
|
7,202 |
|
230
U.S. Government Securities Fund (continued)
|
|
|
|
|
|
|
|
|
|
|
| Bonds, notes & other debt instruments (continued) |
|
Principal amount (000) |
|
|
Value (000) |
|
|
|
|
| U.S. Treasury bonds & notes (continued) |
|
|
|
|
|
|
|
|
| U.S. Treasury (continued) |
|
U.S. Treasury 3.50% 2/15/2033 |
|
|
USD14,341 |
|
|
$ |
13,439 |
|
|
|
U.S. Treasury 3.875% 8/15/2033 |
|
|
14,670 |
|
|
|
14,114 |
|
|
|
U.S. Treasury 4.00% 2/15/2034 |
|
|
2,438 |
|
|
|
2,367 |
|
|
|
U.S. Treasury 4.375% 5/15/2034 |
|
|
15,387 |
|
|
|
15,393 |
|
|
|
U.S. Treasury 4.50% 8/15/20396 |
|
|
13,655 |
|
|
|
13,701 |
|
|
|
U.S. Treasury 4.625% 2/15/2040 |
|
|
90 |
|
|
|
91 |
|
|
|
U.S. Treasury 1.125% 5/15/2040 |
|
|
3,350 |
|
|
|
2,063 |
|
|
|
U.S. Treasury, interest only, 0% 11/15/20406 |
|
|
1,110 |
|
|
|
511 |
|
|
|
U.S. Treasury 3.875% 5/15/2043 |
|
|
820 |
|
|
|
740 |
|
|
|
U.S. Treasury 4.375% 8/15/2043 |
|
|
40 |
|
|
|
39 |
|
|
|
U.S. Treasury 2.50% 2/15/2045 |
|
|
4,850 |
|
|
|
3,461 |
|
|
|
U.S. Treasury 2.50% 2/15/2046 |
|
|
3,900 |
|
|
|
2,749 |
|
|
|
U.S. Treasury 2.50% 5/15/2046 |
|
|
1,585 |
|
|
|
1,115 |
|
|
|
U.S. Treasury 2.875% 11/15/2046 |
|
|
2,700 |
|
|
|
2,028 |
|
|
|
U.S. Treasury 1.25% 5/15/20506 |
|
|
14,825 |
|
|
|
7,351 |
|
|
|
U.S. Treasury 1.375% 8/15/2050 |
|
|
4,330 |
|
|
|
2,217 |
|
|
|
U.S. Treasury 1.625% 11/15/20506 |
|
|
26,165 |
|
|
|
14,333 |
|
|
|
U.S. Treasury 1.875% 2/15/2051 |
|
|
5,892 |
|
|
|
3,442 |
|
|
|
U.S. Treasury 2.375% 5/15/2051 |
|
|
6,280 |
|
|
|
4,138 |
|
|
|
U.S. Treasury 2.00% 8/15/2051 |
|
|
5,226 |
|
|
|
3,140 |
|
|
|
U.S. Treasury 1.875% 11/15/2051 |
|
|
3,164 |
|
|
|
1,837 |
|
|
|
U.S. Treasury 3.00% 8/15/2052 |
|
|
895 |
|
|
|
674 |
|
|
|
U.S. Treasury 4.00% 11/15/2052 |
|
|
1,199 |
|
|
|
1,093 |
|
|
|
U.S. Treasury 4.75% 11/15/2053 |
|
|
1,175 |
|
|
|
1,215 |
|
|
|
U.S. Treasury 4.25% 2/15/20546 |
|
|
11,690 |
|
|
|
11,136 |
|
|
|
U.S. Treasury 4.625% 5/15/2054 |
|
|
4,795 |
|
|
|
4,861 |
|
|
|
|
|
|
|
|
|
|
|
|
|
|
|
|
|
|
|
|
|
539,343 |
|
|
|
|
|
|
|
|
|
|
|
|
| |
|
|
|
|
|
|
|
|
|
|
| U.S. Treasury inflation-protected securities 3.03% |
|
U.S. Treasury Inflation-Protected Security 0.125% 4/15/20257 |
|
|
19,165 |
|
|
|
18,648 |
|
|
|
U.S. Treasury Inflation-Protected Security 0.375% 7/15/20257 |
|
|
2,344 |
|
|
|
2,286 |
|
|
|
U.S. Treasury Inflation-Protected Security 0.125% 7/15/20267 |
|
|
5,604 |
|
|
|
5,358 |
|
|
|
U.S. Treasury Inflation-Protected Security 0.125% 10/15/20267 |
|
|
11,007 |
|
|
|
10,480 |
|
|
|
U.S. Treasury Inflation-Protected Security 0.125% 4/15/20277 |
|
|
2,850 |
|
|
|
2,682 |
|
|
|
U.S. Treasury Inflation-Protected Security 0.125% 7/15/20317 |
|
|
1,053 |
|
|
|
924 |
|
|
|
U.S. Treasury Inflation-Protected Security 0.125% 1/15/20327 |
|
|
3,273 |
|
|
|
2,832 |
|
|
|
U.S. Treasury Inflation-Protected Security 2.125% 2/15/20417 |
|
|
136 |
|
|
|
135 |
|
|
|
U.S. Treasury Inflation-Protected Security 0.75% 2/15/20426,7 |
|
|
1,450 |
|
|
|
1,136 |
|
|
|
U.S. Treasury Inflation-Protected Security 0.625% 2/15/20437 |
|
|
1,691 |
|
|
|
1,273 |
|
|
|
U.S. Treasury Inflation-Protected Security 1.00% 2/15/20497 |
|
|
311 |
|
|
|
237 |
|
|
|
U.S. Treasury Inflation-Protected Security 0.25% 2/15/20507 |
|
|
354 |
|
|
|
216 |
|
|
|
U.S. Treasury Inflation-Protected Security 0.125% 2/15/20517 |
|
|
5,774 |
|
|
|
3,333 |
|
|
|
U.S. Treasury Inflation-Protected Security 0.125% 2/15/20527 |
|
|
2,820 |
|
|
|
1,598 |
|
|
|
U.S. Treasury Inflation-Protected Security 1.50% 2/15/20537 |
|
|
1,245 |
|
|
|
1,044 |
|
|
|
|
|
|
|
|
|
|
|
|
|
|
|
|
|
|
|
|
|
52,182 |
|
|
|
|
|
|
|
|
|
|
|
|
|
|
Total U.S. Treasury bonds & notes |
|
|
|
|
|
|
591,525 |
|
|
|
|
|
|
|
|
|
|
|
|
|
|
|
| Federal agency bonds & notes 4.24% |
|
|
|
|
|
|
|
|
|
|
Export-Import Bank of the United States-Guaranteed, Ethiopian Leasing 2012, LLC 2.646% 5/12/2026 |
|
|
180 |
|
|
|
175 |
|
|
|
Fannie Mae 7.125% 1/15/2030 |
|
|
2,000 |
|
|
|
2,260 |
|
|
|
Federal Home Loan Bank 3.25% 11/16/2028 |
|
|
6,500 |
|
|
|
6,205 |
|
|
|
Federal Home Loan Bank 5.50% 7/15/2036 |
|
|
300 |
|
|
|
325 |
|
|
|
Private Export Funding Corp. 1.40% 7/15/2028 |
|
|
3,000 |
|
|
|
2,659 |
|
|
|
Tennessee Valley Authority 0.75% 5/15/2025 |
|
|
3,700 |
|
|
|
3,562 |
|
|
|
Tennessee Valley Authority 2.875% 2/1/2027 |
|
|
5,000 |
|
|
|
4,791 |
|
|
|
Tennessee Valley Authority 4.65% 6/15/2035 |
|
|
1,780 |
|
|
|
1,768 |
|
|
|
Tennessee Valley Authority 5.88% 4/1/2036 |
|
|
875 |
|
|
|
962 |
|
|
|
Tennessee Valley Authority, Series A, 4.625% 9/15/2060 |
|
|
250 |
|
|
|
230 |
|
231
U.S. Government Securities Fund (continued)
|
|
|
|
|
|
|
|
|
|
|
| Bonds, notes & other debt instruments (continued) |
|
Principal amount (000) |
|
|
Value (000) |
|
|
|
|
| Federal agency bonds & notes (continued) |
|
|
|
|
|
|
|
|
|
|
Tennessee Valley Authority, Southaven Combined Cycle Generation, LLC, 3.846% 8/15/2033 |
|
|
USD763 |
|
|
$ |
694 |
|
|
|
U.S. Agency for International Development, Jordan (Kingdom of) 3.00% 6/30/2025 |
|
|
14,779 |
|
|
|
14,402 |
|
|
|
U.S. Agency for International Development, Morocco (Kingdom of) 7.55% 7/15/2026 |
|
|
1,372 |
|
|
|
1,401 |
|
|
|
U.S. Department of Housing and Urban Development, Series 2015-A-10, 2.85% 8/1/2024 |
|
|
2,250 |
|
|
|
2,245 |
|
|
|
U.S. Department of Housing and Urban Development, Series 2015-A-11, 2.95% 8/1/2025 |
|
|
2,640 |
|
|
|
2,578 |
|
|
|
U.S. Department of Housing and Urban Development, Series 2015-A-12, 3.10% 8/1/2026 |
|
|
2,625 |
|
|
|
2,532 |
|
|
|
U.S. Department of Housing and Urban Development, Series 2015-A-13, 3.15% 8/1/2027 |
|
|
11,482 |
|
|
|
10,982 |
|
|
|
U.S. Department of Housing and Urban Development, Series 2015-A-14, 3.25% 8/1/2028 |
|
|
3,856 |
|
|
|
3,662 |
|
|
|
U.S. Department of Housing and Urban Development, Series 2015-A-15, 3.35% 8/1/2029 |
|
|
2,650 |
|
|
|
2,499 |
|
|
|
U.S. Department of Housing and Urban Development, Series 2015-A-16, 3.50% 8/1/2030 |
|
|
2,482 |
|
|
|
2,293 |
|
|
|
U.S. Department of Housing and Urban Development, Series 2015-A-17, 3.55% 8/1/2031 |
|
|
2,475 |
|
|
|
2,257 |
|
|
|
U.S. Department of Housing and Urban Development, Series 2015-A-18, 3.60% 8/1/2032 |
|
|
2,377 |
|
|
|
2,153 |
|
|
|
U.S. Department of Housing and Urban Development, Series 2015-A-19, 3.65% 8/1/2033 |
|
|
2,059 |
|
|
|
1,856 |
|
|
|
U.S. Department of Housing and Urban Development, Series 2015-A-20, 3.70% 8/1/2034 |
|
|
651 |
|
|
|
585 |
|
|
|
|
|
|
|
|
|
|
|
|
|
|
|
|
|
|
|
|
|
73,076 |
|
|
|
|
|
|
|
|
|
|
|
|
|
|
Total bonds, notes & other debt instruments (cost: $1,736,905,000) |
|
|
|
|
|
|
1,682,382 |
|
|
|
|
|
|
|
|
|
|
|
|
|
|
|
|
|
|
|
|
|
|
|
|
|
|
|
| Short-term securities 19.51% |
|
Weighted average yield at acquisition |
|
|
|
|
|
|
|
|
| Commercial paper 13.03% |
|
|
|
CAFCO, LLC 12/16/20245 |
|
|
5.330 |
% |
|
|
15,000 |
|
|
|
14,621 |
|
|
|
Chariot Funding, LLC 7/22/20245 |
|
|
5.360 |
|
|
|
14,500 |
|
|
|
14,448 |
|
|
|
Cisco Systems, Inc. 10/1/20245 |
|
|
5.320 |
|
|
|
20,000 |
|
|
|
19,719 |
|
|
|
Eli Lilly and Co. 7/29/20245 |
|
|
5.330 |
|
|
|
20,000 |
|
|
|
19,908 |
|
|
|
Eli Lilly and Co. 8/9/20245 |
|
|
5.320 |
|
|
|
10,000 |
|
|
|
9,938 |
|
|
|
Honeywell International, Inc. 9/24/20245 |
|
|
5.300 |
|
|
|
18,720 |
|
|
|
18,476 |
|
|
|
Johnson & Johnson 7/1/20245 |
|
|
5.310 |
|
|
|
20,000 |
|
|
|
19,991 |
|
|
|
Johnson & Johnson 7/11/20245 |
|
|
5.310 |
|
|
|
6,450 |
|
|
|
6,438 |
|
|
|
Komatsu Finance America, Inc. 8/1/20245 |
|
|
5.350 |
|
|
|
19,900 |
|
|
|
19,800 |
|
|
|
Linde, Inc. 7/12/2024 |
|
|
5.310 |
|
|
|
9,500 |
|
|
|
9,480 |
|
|
|
Microsoft Corp. 7/10/20245 |
|
|
5.300 |
|
|
|
1,209 |
|
|
|
1,207 |
|
|
|
Paccar Financial Corp. 7/15/2024 |
|
|
5.320 |
|
|
|
7,725 |
|
|
|
7,705 |
|
|
|
Paccar Financial Corp. 7/19/2024 |
|
|
5.320 |
|
|
|
20,000 |
|
|
|
19,936 |
|
|
|
PepsiCo, Inc. 8/8/20245 |
|
|
5.300 |
|
|
|
14,174 |
|
|
|
14,089 |
|
|
|
Pfizer Investment Capital PLC 11/21/20245 |
|
|
5.310 |
|
|
|
22,950 |
|
|
|
22,461 |
|
|
|
Procter & Gamble Co. 7/10/20245 |
|
|
5.320 |
|
|
|
6,000 |
|
|
|
5,990 |
|
|
|
|
|
|
|
|
|
|
|
|
|
|
|
|
|
|
|
|
|
|
|
|
|
|
|
|
|
224,207 |
|
|
|
|
|
|
|
|
|
|
|
|
|
|
|
|
|
|
|
|
| |
|
|
|
|
|
|
|
|
|
|
| U.S. Treasury bills 1.67% |
|
|
|
U.S. Treasury 7/2/2024 |
|
|
5.273 |
|
|
|
28,800 |
|
|
|
28,796 |
|
|
|
|
|
|
|
|
|
|
|
|
|
|
|
|
232
U.S. Government Securities Fund (continued)
|
|
|
|
|
|
|
|
|
|
|
|
|
|
|
| Short-term securities (continued) |
|
Weighted average yield at acquisition |
|
|
Principal amount (000) |
|
|
Value (000) |
|
|
| Federal agency bills & notes 4.81% |
|
|
|
Federal Farm Credit Banks 8/27/2024 |
|
|
5.130 |
% |
|
|
USD9,900 |
|
|
$ |
9,817 |
|
|
|
Federal Farm Credit Banks 10/22/2024 |
|
|
5.190 |
|
|
|
15,000 |
|
|
|
14,756 |
|
|
|
Federal Home Loan Bank 7/3/2024 |
|
|
5.225 |
|
|
|
10,000 |
|
|
|
9,997 |
|
|
|
Federal Home Loan Bank 8/7/2024 |
|
|
5.199 |
|
|
|
40,000 |
|
|
|
39,784 |
|
|
|
Federal Home Loan Bank 9/27/2024 |
|
|
5.250 |
|
|
|
8,600 |
|
|
|
8,490 |
|
|
|
|
|
|
|
|
|
|
|
|
|
|
|
|
|
|
|
|
|
|
|
Total short-term securities (cost: $335,948,000) |
|
|
|
|
|
|
|
|
|
|
335,847 |
|
|
|
|
|
|
|
|
|
|
|
|
|
|
|
|
|
|
|
|
| Options purchased (equity style) 0.03% |
|
|
|
|
|
|
|
|
|
|
|
Options purchased (equity style)* |
|
|
|
|
|
|
|
|
|
|
578 |
|
|
|
|
|
|
|
|
|
|
|
|
|
|
|
|
|
|
|
|
|
|
|
Total options purchased (equity style) (cost: $629,000) |
|
|
|
|
|
|
|
|
|
|
578 |
|
|
|
|
|
|
|
|
|
|
|
|
|
|
|
|
|
|
|
|
|
|
|
Total investment securities 117.26% (cost: $2,073,482,000) |
|
|
|
|
|
|
|
|
|
|
2,018,807 |
|
|
|
Total options written† (0.03)% (premium received: $512,000) |
|
|
|
|
|
|
|
|
|
|
(496 |
) |
|
|
Other assets less liabilities (17.23)% |
|
|
|
|
|
|
|
|
|
|
(296,705 |
) |
|
|
|
|
|
|
|
|
|
|
|
|
|
|
|
|
|
|
|
|
|
|
Net assets 100.00% |
|
|
|
|
|
|
|
|
|
$ |
1,721,606 |
|
|
|
|
|
|
|
|
|
|
|
|
|
|
|
|
233
U.S. Government Securities Fund (continued)
|
|
|
|
|
|
|
|
|
|
|
|
|
|
|
|
|
|
|
|
|
|
|
|
|
| *Options purchased (equity style) |
|
|
|
|
|
|
|
|
| Options on futures |
|
|
|
|
|
|
|
|
|
|
|
|
|
|
|
|
|
|
|
|
|
|
|
|
| Description |
|
Number of
contracts |
|
|
Expiration
date |
|
|
Exercise
price |
|
|
Notional amount (000) |
|
|
Value at
6/30/2024
(000) |
|
| Put |
|
|
|
|
|
|
|
|
|
|
|
|
|
|
|
|
|
|
|
|
|
|
|
|
|
|
|
|
|
|
|
| 3 Month SOFR Futures Option |
|
|
683 |
|
|
|
12/13/2024 |
|
|
|
USD94.38 |
|
|
|
USD170,750 |
|
|
|
|
|
|
$ |
9 |
|
| 3 Month SOFR Futures Option |
|
|
149 |
|
|
|
12/13/2024 |
|
|
|
96.00 |
|
|
|
37,250 |
|
|
|
|
|
|
|
331 |
|
|
|
|
|
|
|
|
|
|
|
|
|
|
|
|
|
|
|
|
|
|
|
|
|
|
|
|
|
|
|
|
|
|
|
|
|
|
|
|
|
|
|
|
|
|
|
|
|
|
|
|
|
|
|
$ |
340 |
|
|
|
|
|
|
|
|
|
|
|
|
|
|
|
|
|
|
|
|
|
|
|
|
|
|
| Call |
|
|
|
|
|
|
|
|
|
|
|
|
|
|
|
|
|
|
|
|
|
|
|
|
|
|
|
|
|
|
|
| 3 Month SOFR Futures Option |
|
|
204 |
|
|
|
12/13/2024 |
|
|
|
USD96.00 |
|
|
|
51,000 |
|
|
|
|
|
|
$ |
181 |
|
| 3 Month SOFR Futures Option |
|
|
33 |
|
|
|
12/13/2024 |
|
|
|
96.50 |
|
|
|
8,250 |
|
|
|
|
|
|
|
14 |
|
| 3 Month SOFR Futures Option |
|
|
145 |
|
|
|
12/13/2024 |
|
|
|
97.50 |
|
|
|
36,250 |
|
|
|
|
|
|
|
4 |
|
| 3 Month SOFR Futures Option |
|
|
204 |
|
|
|
12/13/2024 |
|
|
|
97.50 |
|
|
|
51,000 |
|
|
|
|
|
|
|
15 |
|
| 3 Month SOFR Futures Option |
|
|
203 |
|
|
|
3/14/2025 |
|
|
|
97.00 |
|
|
|
50,750 |
|
|
|
|
|
|
|
24 |
|
|
|
|
|
|
|
|
|
|
|
|
|
|
|
|
|
|
|
|
|
|
|
|
|
|
|
|
|
|
|
|
|
|
|
|
|
|
|
|
|
|
|
|
|
|
|
|
|
|
|
|
|
|
|
$ |
238 |
|
|
|
|
|
|
|
|
|
|
|
|
|
|
|
|
|
|
|
|
|
|
|
|
|
|
|
|
|
|
|
|
|
|
|
|
|
|
|
|
|
|
|
|
|
|
|
|
|
|
|
|
|
|
|
$ |
578 |
|
|
|
|
|
|
|
|
|
|
|
|
|
|
|
|
|
|
|
|
|
|
|
|
|
|
|
|
|
|
|
|
|
|
|
|
|
|
|
|
|
|
|
|
|
|
|
|
|
|
|
| †Options written (equity style) |
|
|
|
|
|
|
|
|
| Options on futures |
|
|
|
|
|
|
|
|
|
|
|
|
|
|
|
|
|
|
|
|
|
|
|
|
| Description |
|
Number of
contracts |
|
|
Expiration
date |
|
|
Exercise
price |
|
|
Notional amount (000) |
|
|
Value at
6/30/2024
(000) |
|
| Put |
|
|
|
|
|
|
|
|
|
|
|
|
|
|
|
|
|
|
|
|
|
|
|
|
|
|
|
|
|
|
|
| 3 Month SOFR Futures Option |
|
|
71 |
|
|
|
12/13/2024 |
|
|
|
USD95.25 |
|
|
|
USD17,750 |
|
|
|
|
|
|
$ |
(45 |
) |
| 3 Month SOFR Futures Option |
|
|
300 |
|
|
|
12/13/2024 |
|
|
|
95.50 |
|
|
|
75,000 |
|
|
|
|
|
|
|
(334 |
) |
|
|
|
|
|
|
|
|
|
|
|
|
|
|
|
|
|
|
|
|
|
|
|
|
|
|
|
|
|
|
|
|
|
|
|
|
|
|
|
|
|
|
|
|
|
|
|
|
|
|
|
|
|
|
$ |
(379 |
) |
|
|
|
|
|
|
|
|
|
|
|
|
|
|
|
|
|
|
|
|
|
|
|
|
|
| Call |
|
|
|
|
|
|
|
|
|
|
|
|
|
|
|
|
|
|
|
|
|
|
|
|
|
|
|
|
|
|
|
| 3 Month SOFR Futures Option |
|
|
71 |
|
|
|
12/13/2024 |
|
|
|
USD95.75 |
|
|
|
17,750 |
|
|
|
|
|
|
$ |
(11 |
) |
| 3 Month SOFR Futures Option |
|
|
33 |
|
|
|
12/13/2024 |
|
|
|
96.50 |
|
|
|
8,250 |
|
|
|
|
|
|
|
(19 |
) |
| 3 Month SOFR Futures Option |
|
|
407 |
|
|
|
12/13/2024 |
|
|
|
97.00 |
|
|
|
101,750 |
|
|
|
|
|
|
|
(79 |
) |
| 3 Month SOFR Futures Option |
|
|
203 |
|
|
|
3/14/2025 |
|
|
|
98.00 |
|
|
|
50,750 |
|
|
|
|
|
|
|
(8 |
) |
|
|
|
|
|
|
|
|
|
|
|
|
|
|
|
|
|
|
|
|
|
|
|
|
|
|
|
|
|
|
|
|
|
|
|
|
|
|
|
|
|
|
|
|
|
|
|
|
|
|
|
|
|
|
$ |
(117 |
) |
|
|
|
|
|
|
|
|
|
|
|
|
|
|
|
|
|
|
|
|
|
|
|
|
|
|
|
|
|
|
|
|
|
|
|
|
|
|
|
|
|
|
|
|
|
|
|
|
|
|
|
|
|
|
$ |
(496 |
) |
|
|
|
|
|
|
|
|
|
|
|
|
|
|
|
|
|
|
|
|
|
|
|
|
|
|
|
|
|
|
|
|
|
|
|
|
|
|
|
|
|
|
|
|
|
|
|
|
|
|
| Futures contracts |
|
|
|
|
|
|
|
| Contracts |
|
Type |
|
|
Number of
contracts |
|
|
Expiration
date |
|
|
Notional amount (000) |
|
|
Value and
unrealized
appreciation
(depreciation)
at 6/30/2024
(000) |
|
| 30 Day Federal Funds Futures |
|
|
Long |
|
|
|
728 |
|
|
|
9/3/2024 |
|
|
|
USD287,264 |
|
|
|
|
|
|
|
$ (25 |
) |
| 3 Month SOFR Futures |
|
|
Long |
|
|
|
1,227 |
|
|
|
9/18/2024 |
|
|
|
290,346 |
|
|
|
|
|
|
|
(48 |
) |
| 3 Month SOFR Futures |
|
|
Long |
|
|
|
225 |
|
|
|
12/18/2024 |
|
|
|
53,353 |
|
|
|
|
|
|
|
(11 |
) |
| 3 Month SOFR Futures |
|
|
Long |
|
|
|
1,297 |
|
|
|
3/19/2025 |
|
|
|
308,508 |
|
|
|
|
|
|
|
234 |
|
| 3 Month SOFR Futures |
|
|
Short |
|
|
|
2 |
|
|
|
6/18/2025 |
|
|
|
(477 |
) |
|
|
|
|
|
|
(1 |
) |
| 3 Month SOFR Futures |
|
|
Long |
|
|
|
3 |
|
|
|
9/17/2025 |
|
|
|
718 |
|
|
|
|
|
|
|
(1 |
) |
| 3 Month SOFR Futures |
|
|
Short |
|
|
|
1 |
|
|
|
3/18/2026 |
|
|
|
(240 |
) |
|
|
|
|
|
|
(1 |
) |
234
U.S. Government Securities Fund (continued)
|
|
|
|
|
|
|
|
|
|
|
|
|
|
|
|
|
|
|
|
|
|
|
|
|
| Futures contracts (continued) |
|
|
|
|
|
|
|
| Contracts |
|
Type |
|
|
Number of
contracts |
|
|
Expiration
date |
|
|
Notional amount (000) |
|
|
Value and
unrealized
appreciation
(depreciation)
at 6/30/2024
(000) |
|
| 3 Month SOFR Futures |
|
|
Short |
|
|
|
64 |
|
|
|
9/16/2026 |
|
|
|
USD(15,393 |
) |
|
|
|
|
|
$ |
48 |
|
| 2 Year U.S. Treasury Note Futures |
|
|
Long |
|
|
|
4,130 |
|
|
|
10/3/2024 |
|
|
|
843,423 |
|
|
|
|
|
|
|
1,143 |
|
| 5 Year U.S. Treasury Note Futures |
|
|
Long |
|
|
|
3,922 |
|
|
|
10/3/2024 |
|
|
|
417,999 |
|
|
|
|
|
|
|
2,380 |
|
| 10 Year Ultra U.S. Treasury Note Futures |
|
|
Long |
|
|
|
440 |
|
|
|
9/30/2024 |
|
|
|
49,954 |
|
|
|
|
|
|
|
444 |
|
| 10 Year U.S. Treasury Note Futures |
|
|
Short |
|
|
|
878 |
|
|
|
9/30/2024 |
|
|
|
(96,566 |
) |
|
|
|
|
|
|
(571 |
) |
| 20 Year U.S. Treasury Bond Futures |
|
|
Short |
|
|
|
884 |
|
|
|
9/30/2024 |
|
|
|
(104,588 |
) |
|
|
|
|
|
|
(1,142 |
) |
| 30 Year Ultra U.S. Treasury Bond Futures |
|
|
Long |
|
|
|
265 |
|
|
|
9/30/2024 |
|
|
|
33,216 |
|
|
|
|
|
|
|
313 |
|
|
|
|
|
|
|
|
|
|
|
|
|
|
|
|
|
|
|
|
|
|
|
|
|
|
|
|
|
|
|
|
|
|
|
|
|
|
|
|
|
|
|
|
|
|
|
|
|
|
|
|
|
|
|
$ |
2,762 |
|
|
|
|
|
|
|
|
|
|
|
|
|
|
|
|
|
|
|
|
|
|
|
|
|
|
Swap contracts
Interest rate swaps
Centrally cleared interest rate swaps
|
|
|
|
|
|
|
|
|
|
|
|
|
|
|
|
|
|
|
|
|
|
|
|
|
|
|
| |
|
|
|
|
|
|
|
|
|
|
|
|
|
|
|
|
|
|
|
Upfront |
|
Unrealized |
| Receive |
|
|
|
Pay |
|
|
|
|
|
Notional |
|
Value at |
|
premium paid |
|
appreciation (depreciation) |
| |
|
Payment |
|
|
|
|
|
Payment |
|
Expiration |
|
|
|
amount |
|
6/30/2024 |
|
(received) |
|
at 6/30/2024 |
| Rate |
|
frequency |
|
|
|
Rate |
|
frequency |
|
date |
|
|
|
(000) |
|
(000) |
|
(000) |
|
(000) |
|
|
|
|
|
|
|
|
|
|
|
|
|
|
| U.S. EFFR |
|
Annual |
|
|
|
0.1275% |
|
Annual |
|
6/25/2025 |
|
|
|
USD20,100 |
|
|
|
$ 941 |
|
|
|
$– |
|
|
|
$ 941 |
| U.S. EFFR |
|
Annual |
|
|
|
0.126% |
|
Annual |
|
6/25/2025 |
|
|
|
USD20,100 |
|
|
|
941 |
|
|
|
– |
|
|
|
941 |
| U.S. EFFR |
|
Annual |
|
|
|
0.106% |
|
Annual |
|
6/30/2025 |
|
|
|
USD22,492 |
|
|
|
2,286 |
|
|
|
– |
|
|
|
2,286 |
| SOFR |
|
Annual |
|
|
|
3.916% |
|
Annual |
|
7/11/2025 |
|
|
|
USD46,800 |
|
|
|
518 |
|
|
|
– |
|
|
|
518 |
| 4.8189% |
|
Annual |
|
|
|
SOFR |
|
Annual |
|
8/25/2025 |
|
|
|
USD8,640 |
|
|
|
(15) |
|
|
|
– |
|
|
|
(15) |
| 4.8195% |
|
Annual |
|
|
|
SOFR |
|
Annual |
|
9/1/2025 |
|
|
|
USD10,300 |
|
|
|
(17) |
|
|
|
– |
|
|
|
(17) |
| 4.2045% |
|
Annual |
|
|
|
SOFR |
|
Annual |
|
1/10/2026 |
|
|
|
USD1,020 |
|
|
|
(9) |
|
|
|
– |
|
|
|
(9) |
| 4.2035% |
|
Annual |
|
|
|
SOFR |
|
Annual |
|
1/10/2026 |
|
|
|
USD18,497 |
|
|
|
(158) |
|
|
|
– |
|
|
|
(158) |
| 4.184% |
|
Annual |
|
|
|
SOFR |
|
Annual |
|
1/10/2026 |
|
|
|
USD18,498 |
|
|
|
(164) |
|
|
|
– |
|
|
|
(164) |
| 4.265% |
|
Annual |
|
|
|
SOFR |
|
Annual |
|
2/16/2026 |
|
|
|
USD4,777 |
|
|
|
(35) |
|
|
|
– |
|
|
|
(35) |
| 4.27% |
|
Annual |
|
|
|
SOFR |
|
Annual |
|
2/16/2026 |
|
|
|
USD9,621 |
|
|
|
(71) |
|
|
|
– |
|
|
|
(71) |
| 4.3005% |
|
Annual |
|
|
|
SOFR |
|
Annual |
|
2/17/2026 |
|
|
|
USD1,989 |
|
|
|
(14) |
|
|
|
– |
|
|
|
(14) |
| 4.288% |
|
Annual |
|
|
|
SOFR |
|
Annual |
|
2/17/2026 |
|
|
|
USD2,021 |
|
|
|
(14) |
|
|
|
– |
|
|
|
(14) |
| 4.3035% |
|
Annual |
|
|
|
SOFR |
|
Annual |
|
2/17/2026 |
|
|
|
USD2,874 |
|
|
|
(20) |
|
|
|
– |
|
|
|
(20) |
| 4.2675% |
|
Annual |
|
|
|
SOFR |
|
Annual |
|
2/17/2026 |
|
|
|
USD2,771 |
|
|
|
(20) |
|
|
|
– |
|
|
|
(20) |
| 4.2515% |
|
Annual |
|
|
|
SOFR |
|
Annual |
|
2/17/2026 |
|
|
|
USD2,847 |
|
|
|
(22) |
|
|
|
– |
|
|
|
(22) |
| 4.568% |
|
Annual |
|
|
|
SOFR |
|
Annual |
|
3/1/2026 |
|
|
|
USD27,000 |
|
|
|
(67) |
|
|
|
– |
|
|
|
(67) |
| 4.56% |
|
Annual |
|
|
|
SOFR |
|
Annual |
|
3/1/2026 |
|
|
|
USD27,400 |
|
|
|
(72) |
|
|
|
– |
|
|
|
(72) |
| 4.776% |
|
Annual |
|
|
|
SOFR |
|
Annual |
|
3/15/2026 |
|
|
|
USD4,450 |
|
|
|
6 |
|
|
|
– |
|
|
|
6 |
| 4.6275% |
|
Annual |
|
|
|
SOFR |
|
Annual |
|
3/20/2026 |
|
|
|
USD49,370 |
|
|
|
(60) |
|
|
|
– |
|
|
|
(60) |
| 4.9005% |
|
Annual |
|
|
|
SOFR |
|
Annual |
|
4/17/2026 |
|
|
|
USD14,100 |
|
|
|
56 |
|
|
|
– |
|
|
|
56 |
| 4.8705% |
|
Annual |
|
|
|
SOFR |
|
Annual |
|
4/18/2026 |
|
|
|
USD12,640 |
|
|
|
45 |
|
|
|
– |
|
|
|
45 |
| 4.815% |
|
Annual |
|
|
|
SOFR |
|
Annual |
|
5/6/2026 |
|
|
|
USD31,500 |
|
|
|
95 |
|
|
|
– |
|
|
|
95 |
| 4.723% |
|
Annual |
|
|
|
SOFR |
|
Annual |
|
5/7/2026 |
|
|
|
USD30,490 |
|
|
|
43 |
|
|
|
– |
|
|
|
43 |
| 4.659% |
|
Annual |
|
|
|
SOFR |
|
Annual |
|
5/17/2026 |
|
|
|
USD55,600 |
|
|
|
29 |
|
|
|
– |
|
|
|
29 |
| SOFR |
|
Annual |
|
|
|
4.5335% |
|
Annual |
|
6/18/2026 |
|
|
|
USD10,700 |
|
|
|
12 |
|
|
|
– |
|
|
|
12 |
| SOFR |
|
Annual |
|
|
|
4.5265% |
|
Annual |
|
6/18/2026 |
|
|
|
USD5,380 |
|
|
|
7 |
|
|
|
– |
|
|
|
7 |
| SOFR |
|
Annual |
|
|
|
4.528% |
|
Annual |
|
6/18/2026 |
|
|
|
USD5,300 |
|
|
|
6 |
|
|
|
– |
|
|
|
6 |
| 3.53% |
|
Annual |
|
|
|
SOFR |
|
Annual |
|
1/23/2027 |
|
|
|
USD7,300 |
|
|
|
(83) |
|
|
|
– |
|
|
|
(83) |
| 3.5405% |
|
Annual |
|
|
|
SOFR |
|
Annual |
|
1/23/2027 |
|
|
|
USD12,100 |
|
|
|
(135) |
|
|
|
– |
|
|
|
(135) |
| 3.535% |
|
Annual |
|
|
|
SOFR |
|
Annual |
|
1/23/2027 |
|
|
|
USD13,000 |
|
|
|
(146) |
|
|
|
– |
|
|
|
(146) |
| 3.761% |
|
Annual |
|
|
|
SOFR |
|
Annual |
|
2/20/2027 |
|
|
|
USD11,800 |
|
|
|
(73) |
|
|
|
– |
|
|
|
(73) |
| 3.7645% |
|
Annual |
|
|
|
SOFR |
|
Annual |
|
2/20/2027 |
|
|
|
USD23,600 |
|
|
|
(144) |
|
|
|
– |
|
|
|
(144) |
| 4.5895% |
|
Annual |
|
|
|
SOFR |
|
Annual |
|
5/6/2027 |
|
|
|
USD22,710 |
|
|
|
145 |
|
|
|
– |
|
|
|
145 |
235
U.S. Government Securities Fund (continued)
Swap contracts (continued)
Interest rate swaps (continued)
Centrally cleared interest rate swaps (continued)
|
|
|
|
|
|
|
|
|
|
|
|
|
|
|
|
|
|
|
|
|
|
|
|
|
|
|
| |
|
|
|
|
|
|
|
|
|
|
|
|
|
|
|
|
|
|
|
Upfront |
|
Unrealized |
| Receive |
|
|
|
Pay |
|
|
|
|
|
Notional |
|
Value at |
|
premium paid |
|
appreciation (depreciation) |
| |
|
Payment |
|
|
|
|
|
Payment |
|
Expiration |
|
|
|
amount |
|
6/30/2024 |
|
(received) |
|
at 6/30/2024 |
| Rate |
|
frequency |
|
|
|
Rate |
|
frequency |
|
date |
|
|
|
(000) |
|
(000) |
|
(000) |
|
(000) |
|
|
|
|
|
|
|
|
|
|
|
|
|
|
| 3.45% |
|
Annual |
|
|
|
SOFR |
|
Annual |
|
2/1/2028 |
|
|
|
USD12,500 |
|
|
|
$(315) |
|
|
|
$– |
|
|
|
$(315) |
| 3.47% |
|
Annual |
|
|
|
SOFR |
|
Annual |
|
2/2/2028 |
|
|
|
USD11,600 |
|
|
|
(284) |
|
|
|
– |
|
|
|
(284) |
| 3.616% |
|
Annual |
|
|
|
SOFR |
|
Annual |
|
2/20/2028 |
|
|
|
USD4,700 |
|
|
|
(10) |
|
|
|
– |
|
|
|
(10) |
| 3.624% |
|
Annual |
|
|
|
SOFR |
|
Annual |
|
2/20/2028 |
|
|
|
USD9,800 |
|
|
|
(20) |
|
|
|
– |
|
|
|
(20) |
| 3.6475% |
|
Annual |
|
|
|
SOFR |
|
Annual |
|
2/27/2028 |
|
|
|
USD19,700 |
|
|
|
(31) |
|
|
|
– |
|
|
|
(31) |
| 3.379% |
|
Annual |
|
|
|
SOFR |
|
Annual |
|
3/17/2028 |
|
|
|
USD3,100 |
|
|
|
(19) |
|
|
|
– |
|
|
|
(19) |
| 3.355% |
|
Annual |
|
|
|
SOFR |
|
Annual |
|
3/17/2028 |
|
|
|
USD3,200 |
|
|
|
(21) |
|
|
|
– |
|
|
|
(21) |
| 3.7245% |
|
Annual |
|
|
|
SOFR |
|
Annual |
|
3/18/2028 |
|
|
|
USD3,230 |
|
|
|
–2 |
|
|
|
– |
|
|
|
–2 |
| SOFR |
|
Annual |
|
|
|
3.5485% |
|
Annual |
|
1/29/2030 |
|
|
|
USD5,200 |
|
|
|
70 |
|
|
|
– |
|
|
|
70 |
| SOFR |
|
Annual |
|
|
|
3.529% |
|
Annual |
|
1/29/2030 |
|
|
|
USD4,800 |
|
|
|
69 |
|
|
|
– |
|
|
|
69 |
| SOFR |
|
Annual |
|
|
|
3.528% |
|
Annual |
|
1/29/2030 |
|
|
|
USD4,000 |
|
|
|
57 |
|
|
|
– |
|
|
|
57 |
| U.S. EFFR |
|
Annual |
|
|
|
0.5385% |
|
Annual |
|
3/26/2030 |
|
|
|
USD49,000 |
|
|
|
8,520 |
|
|
|
– |
|
|
|
8,520 |
| 3.18% |
|
Annual |
|
|
|
SOFR |
|
Annual |
|
4/17/2030 |
|
|
|
USD2,600 |
|
|
|
(111) |
|
|
|
– |
|
|
|
(111) |
| 3.275% |
|
Annual |
|
|
|
SOFR |
|
Annual |
|
4/18/2030 |
|
|
|
USD2,600 |
|
|
|
(98) |
|
|
|
– |
|
|
|
(98) |
| 3.353% |
|
Annual |
|
|
|
SOFR |
|
Annual |
|
4/19/2030 |
|
|
|
USD2,600 |
|
|
|
(88) |
|
|
|
– |
|
|
|
(88) |
| 3.342% |
|
Annual |
|
|
|
SOFR |
|
Annual |
|
4/19/2030 |
|
|
|
USD2,600 |
|
|
|
(89) |
|
|
|
– |
|
|
|
(89) |
| 3.344% |
|
Annual |
|
|
|
SOFR |
|
Annual |
|
4/20/2030 |
|
|
|
USD2,600 |
|
|
|
(89) |
|
|
|
– |
|
|
|
(89) |
| 3.128% |
|
Annual |
|
|
|
SOFR |
|
Annual |
|
4/28/2030 |
|
|
|
USD2,600 |
|
|
|
(118) |
|
|
|
– |
|
|
|
(118) |
| 3.285% |
|
Annual |
|
|
|
SOFR |
|
Annual |
|
5/1/2030 |
|
|
|
USD2,500 |
|
|
|
(93) |
|
|
|
– |
|
|
|
(93) |
| 3.259% |
|
Annual |
|
|
|
SOFR |
|
Annual |
|
5/1/2030 |
|
|
|
USD2,600 |
|
|
|
(100) |
|
|
|
– |
|
|
|
(100) |
| 3.186% |
|
Annual |
|
|
|
SOFR |
|
Annual |
|
5/9/2030 |
|
|
|
USD2,600 |
|
|
|
(110) |
|
|
|
– |
|
|
|
(110) |
| 3.215% |
|
Annual |
|
|
|
SOFR |
|
Annual |
|
5/10/2030 |
|
|
|
USD2,500 |
|
|
|
(102) |
|
|
|
– |
|
|
|
(102) |
| 3.29% |
|
Annual |
|
|
|
SOFR |
|
Annual |
|
5/19/2030 |
|
|
|
USD3,100 |
|
|
|
(115) |
|
|
|
– |
|
|
|
(115) |
| 3.31% |
|
Annual |
|
|
|
SOFR |
|
Annual |
|
6/9/2030 |
|
|
|
USD26,800 |
|
|
|
(973) |
|
|
|
– |
|
|
|
(973) |
| U.S. EFFR |
|
Annual |
|
|
|
0.666% |
|
Annual |
|
11/19/2030 |
|
|
|
USD15,500 |
|
|
|
2,832 |
|
|
|
– |
|
|
|
2,832 |
| SOFR |
|
Annual |
|
|
|
4.1405% |
|
Annual |
|
2/28/2031 |
|
|
|
USD1,310 |
|
|
|
(13) |
|
|
|
– |
|
|
|
(13) |
| SOFR |
|
Annual |
|
|
|
4.1615% |
|
Annual |
|
5/15/2033 |
|
|
|
USD330 |
|
|
|
(6) |
|
|
|
– |
|
|
|
(6) |
| SOFR |
|
Annual |
|
|
|
4.15% |
|
Annual |
|
5/15/2033 |
|
|
|
USD880 |
|
|
|
(14) |
|
|
|
– |
|
|
|
(14) |
| 4.0135% |
|
Annual |
|
|
|
SOFR |
|
Annual |
|
8/21/2033 |
|
|
|
USD1,185 |
|
|
|
7 |
|
|
|
– |
|
|
|
7 |
| SOFR |
|
Annual |
|
|
|
4.061% |
|
Annual |
|
8/24/2033 |
|
|
|
USD3,230 |
|
|
|
(32) |
|
|
|
– |
|
|
|
(32) |
| SOFR |
|
Annual |
|
|
|
3.9519% |
|
Annual |
|
8/25/2033 |
|
|
|
USD3,225 |
|
|
|
(5) |
|
|
|
– |
|
|
|
(5) |
| SOFR |
|
Annual |
|
|
|
3.8275% |
|
Annual |
|
9/1/2033 |
|
|
|
USD2,300 |
|
|
|
18 |
|
|
|
– |
|
|
|
18 |
| SOFR |
|
Annual |
|
|
|
3.6025% |
|
Annual |
|
1/8/2034 |
|
|
|
USD4,655 |
|
|
|
120 |
|
|
|
– |
|
|
|
120 |
| SOFR |
|
Annual |
|
|
|
3.175% |
|
Annual |
|
2/1/2038 |
|
|
|
USD16,000 |
|
|
|
711 |
|
|
|
– |
|
|
|
711 |
| 3.065% |
|
Annual |
|
|
|
SOFR |
|
Annual |
|
4/7/2040 |
|
|
|
USD12,300 |
|
|
|
(1,237) |
|
|
|
– |
|
|
|
(1,237) |
| SOFR |
|
Annual |
|
|
|
3.045% |
|
Annual |
|
7/27/2050 |
|
|
|
USD3,600 |
|
|
|
433 |
|
|
|
– |
|
|
|
433 |
| SOFR |
|
Annual |
|
|
|
2.85282% |
|
Annual |
|
12/6/2052 |
|
|
|
USD540 |
|
|
|
82 |
|
|
|
– |
|
|
|
82 |
| SOFR |
|
Annual |
|
|
|
2.93542% |
|
Annual |
|
12/6/2052 |
|
|
|
USD550 |
|
|
|
76 |
|
|
|
– |
|
|
|
76 |
| SOFR |
|
Annual |
|
|
|
3.01413% |
|
Annual |
|
1/12/2053 |
|
|
|
USD1,402 |
|
|
|
174 |
|
|
|
– |
|
|
|
174 |
| SOFR |
|
Annual |
|
|
|
3.02% |
|
Annual |
|
1/12/2053 |
|
|
|
USD1,400 |
|
|
|
173 |
|
|
|
– |
|
|
|
173 |
| SOFR |
|
Annual |
|
|
|
2.974% |
|
Annual |
|
4/17/2053 |
|
|
|
USD800 |
|
|
|
105 |
|
|
|
– |
|
|
|
105 |
| SOFR |
|
Annual |
|
|
|
3.044% |
|
Annual |
|
4/18/2053 |
|
|
|
USD800 |
|
|
|
95 |
|
|
|
– |
|
|
|
95 |
| SOFR |
|
Annual |
|
|
|
3.0875% |
|
Annual |
|
4/19/2053 |
|
|
|
USD800 |
|
|
|
89 |
|
|
|
– |
|
|
|
89 |
| SOFR |
|
Annual |
|
|
|
3.1035% |
|
Annual |
|
4/19/2053 |
|
|
|
USD800 |
|
|
|
87 |
|
|
|
– |
|
|
|
87 |
| SOFR |
|
Annual |
|
|
|
3.0895% |
|
Annual |
|
4/20/2053 |
|
|
|
USD800 |
|
|
|
89 |
|
|
|
– |
|
|
|
89 |
| SOFR |
|
Annual |
|
|
|
2.9405% |
|
Annual |
|
4/28/2053 |
|
|
|
USD800 |
|
|
|
109 |
|
|
|
– |
|
|
|
109 |
| SOFR |
|
Annual |
|
|
|
3.0535% |
|
Annual |
|
5/1/2053 |
|
|
|
USD1,600 |
|
|
|
187 |
|
|
|
– |
|
|
|
187 |
| SOFR |
|
Annual |
|
|
|
3.085% |
|
Annual |
|
5/9/2053 |
|
|
|
USD900 |
|
|
|
100 |
|
|
|
– |
|
|
|
100 |
| SOFR |
|
Annual |
|
|
|
3.1135% |
|
Annual |
|
5/10/2053 |
|
|
|
USD800 |
|
|
|
85 |
|
|
|
– |
|
|
|
85 |
| SOFR |
|
Annual |
|
|
|
3.1605% |
|
Annual |
|
5/19/2053 |
|
|
|
USD1,000 |
|
|
|
98 |
|
|
|
– |
|
|
|
98 |
| SOFR |
|
Annual |
|
|
|
3.6765% |
|
Annual |
|
2/20/2054 |
|
|
|
USD2,869 |
|
|
|
19 |
|
|
|
– |
|
|
|
19 |
| SOFR |
|
Annual |
|
|
|
3.6815% |
|
Annual |
|
2/20/2054 |
|
|
|
USD2,700 |
|
|
|
15 |
|
|
|
– |
|
|
|
15 |
| SOFR |
|
Annual |
|
|
|
3.7205% |
|
Annual |
|
2/21/2054 |
|
|
|
USD520 |
|
|
|
(1) |
|
|
|
– |
|
|
|
(1) |
236
U.S. Government Securities Fund (continued)
Swap contracts (continued)
Interest rate swaps (continued)
Centrally cleared interest rate swaps (continued)
|
|
|
|
|
|
|
|
|
|
|
|
|
|
|
|
|
|
|
|
|
|
|
|
|
|
|
|
|
|
|
|
|
| |
|
|
|
|
|
|
|
|
|
|
|
|
|
|
|
|
|
|
|
|
Upfront |
|
|
Unrealized |
|
| Receive |
|
|
|
Pay |
|
|
|
|
|
Notional |
|
Value at |
|
|
premium paid |
|
|
appreciation (depreciation) |
|
| |
|
Payment |
|
|
|
|
|
Payment |
|
Expiration |
|
|
|
amount |
|
6/30/2024 |
|
|
(received) |
|
|
at 6/30/2024 |
|
| Rate |
|
frequency |
|
|
|
Rate |
|
frequency |
|
date |
|
|
|
(000) |
|
(000) |
|
|
(000) |
|
|
(000) |
|
|
|
|
|
|
|
|
|
|
|
|
|
|
|
| SOFR |
|
Annual |
|
|
|
3.3985% |
|
Annual |
|
3/17/2056 |
|
|
|
USD335 |
|
|
|
$ |
10 |
|
|
|
|
$ |
– |
|
|
|
|
$ |
10 |
|
| SOFR |
|
Annual |
|
|
|
3.413% |
|
Annual |
|
3/17/2056 |
|
|
|
USD300 |
|
|
|
|
8 |
|
|
|
|
|
– |
|
|
|
|
|
8 |
|
| SOFR |
|
Annual |
|
|
|
3.531% |
|
Annual |
|
3/18/2056 |
|
|
|
USD350 |
|
|
|
|
2 |
|
|
|
|
|
– |
|
|
|
|
|
2 |
|
|
|
|
|
|
|
|
|
|
|
|
|
|
|
|
|
|
|
|
|
|
|
|
|
|
|
|
|
|
|
|
|
|
|
|
|
|
|
|
|
|
|
|
|
|
|
|
|
|
|
|
|
|
|
|
|
|
|
|
|
|
|
|
|
|
$ |
14,137 |
|
|
|
|
$ |
– |
|
|
|
|
$ |
14,137 |
|
|
|
|
|
|
|
|
|
|
|
|
|
|
|
|
|
|
|
|
|
|
|
|
|
|
|
|
|
|
|
|
|
|
| 1 |
Principal payments may be made periodically. Therefore, the effective maturity date may be earlier than the stated maturity date. |
| 2 |
Amount less than one thousand. |
| 3 |
Coupon rate may change periodically. Reference rate and spread are as of the most recent information available. Some coupon rates are determined by the issuer or agent based on current market conditions; therefore, the reference rate and spread are not available. For short-term securities, the date of the next scheduled coupon rate change is considered to be the maturity date. |
| 4 |
Purchased on a TBA basis. |
| 5 |
Acquired in a transaction exempt from registration under Rule 144A or, for commercial paper, Section 4(a)(2) of the Securities Act of 1933. May be resold in the U.S. in transactions exempt from registration, normally to qualified institutional buyers. The total value of all such securities was $188,125,000, which represented 10.93% of the net assets of the fund. |
| 6 |
All or a portion of this security was pledged as collateral. The total value of pledged collateral was $13,845,000, which represented .80% of the net assets of the fund. |
7 Index-linked bond whose principal amount moves with a government price index.
Key to abbreviation(s)
Assn. = Association
EFFR = Effective Federal Funds Rate
SOFR = Secured Overnight Financing Rate
TBA = To be announced
USD = U.S. dollars
Refer to the notes to financial statements.
237
|
|
|
| Managed Risk Growth Fund |
|
|
|
|
| Investment portfolio June 30, 2024 |
|
unaudited |
|
|
|
|
|
|
|
|
|
|
|
| Growth funds 84.99% |
|
Shares |
|
|
Value (000) |
|
|
|
|
|
|
|
American Funds Insurance Series - Growth Fund, Class 1 |
|
|
3,921,326 |
|
|
$ |
441,737 |
|
|
|
|
|
|
|
|
|
|
|
|
|
|
|
|
|
|
Total growth funds (cost: $319,229,000) |
|
|
|
|
|
|
441,737 |
|
|
|
|
|
|
|
|
|
|
|
|
|
|
|
| Fixed income funds 10.00% |
|
|
|
|
|
|
|
|
|
|
|
|
American Funds Insurance Series - The Bond Fund of America, Class 1 |
|
|
5,519,049 |
|
|
|
51,990 |
|
|
|
|
|
|
|
|
|
|
|
|
|
|
|
|
|
|
Total fixed income funds (cost: $52,461,000) |
|
|
|
|
|
|
51,990 |
|
|
|
|
|
|
|
|
|
|
|
|
|
|
|
| Short-term securities 4.83% |
|
|
|
|
|
|
|
|
|
|
|
|
State Street Institutional U.S. Government Money Market Fund, Premier Class 5.25%1 |
|
|
25,082,258 |
|
|
|
25,082 |
|
|
|
|
|
|
|
|
|
|
|
|
|
|
|
|
|
|
Total short-term securities (cost: $25,082,000) |
|
|
|
|
|
|
25,082 |
|
|
|
|
|
|
|
|
|
|
|
|
|
|
|
| Options purchased (equity style) 0.17% |
|
|
|
|
|
|
|
|
|
|
|
|
Options purchased (equity style)* |
|
|
|
|
|
|
866 |
|
|
|
|
|
|
|
|
|
|
|
|
|
|
|
|
|
|
Total options purchased (cost: $1,681,000) |
|
|
|
|
|
|
866 |
|
|
|
|
|
|
|
|
|
|
|
|
|
|
|
|
|
|
Total investment securities 99.99% (cost: $398,453,000) |
|
|
|
|
|
|
519,675 |
|
|
|
Other assets less liabilities 0.01% |
|
|
|
|
|
|
70 |
|
|
|
|
|
|
|
|
|
|
|
|
|
|
|
|
|
|
Net assets 100.00% |
|
|
|
|
|
$ |
519,745 |
|
|
|
|
|
|
|
|
|
|
|
|
|
|
|
|
|
|
|
|
|
|
|
|
|
|
|
|
|
|
|
|
|
|
|
|
|
| *Options purchased (equity style) |
|
|
| Equity index options |
|
|
|
|
|
|
|
| Description |
|
Number of contracts |
|
|
Notional amount (000) |
|
|
Exercise price |
|
|
Expiration date |
|
|
Value at 6/30/2024 (000) |
|
|
|
|
|
|
|
|
| Put |
|
|
|
|
|
|
|
|
|
|
|
|
|
|
|
|
|
|
|
|
|
|
|
|
|
|
|
|
|
|
|
| S&P 500 Index |
|
|
25 |
|
|
|
USD13,651 |
|
|
|
USD3,700.00 |
|
|
|
9/20/2024 |
|
|
|
|
|
|
$ |
7 |
|
| S&P 500 Index |
|
|
210 |
|
|
|
114,670 |
|
|
|
3,800.00 |
|
|
|
9/20/2024 |
|
|
|
|
|
|
|
63 |
|
| S&P 500 Index |
|
|
20 |
|
|
|
10,921 |
|
|
|
3,900.00 |
|
|
|
9/20/2024 |
|
|
|
|
|
|
|
7 |
|
| S&P 500 Index |
|
|
15 |
|
|
|
8,191 |
|
|
|
4,100.00 |
|
|
|
9/20/2024 |
|
|
|
|
|
|
|
6 |
|
| S&P 500 Index |
|
|
25 |
|
|
|
13,651 |
|
|
|
4,050.00 |
|
|
|
12/20/2024 |
|
|
|
|
|
|
|
35 |
|
| S&P 500 Index |
|
|
415 |
|
|
|
226,610 |
|
|
|
4,125.00 |
|
|
|
12/20/2024 |
|
|
|
|
|
|
|
672 |
|
| S&P 500 Index |
|
|
15 |
|
|
|
8,191 |
|
|
|
4,200.00 |
|
|
|
12/20/2024 |
|
|
|
|
|
|
|
27 |
|
| S&P 500 Index |
|
|
25 |
|
|
|
13,651 |
|
|
|
4,275.00 |
|
|
|
12/20/2024 |
|
|
|
|
|
|
|
49 |
|
|
|
|
|
|
|
|
|
|
|
|
|
|
|
|
|
|
|
|
|
|
|
|
|
|
|
|
|
|
|
|
|
|
|
|
|
|
|
|
|
|
|
|
|
|
|
|
|
|
|
|
|
|
|
$ |
866 |
|
|
|
|
|
|
|
|
|
|
|
|
|
|
|
|
|
|
|
|
|
|
|
|
|
|
|
|
|
|
|
|
|
|
|
|
|
|
|
|
|
|
|
|
|
|
|
|
|
|
|
| Futures contracts |
|
|
|
|
|
|
|
| Contracts |
|
Type |
|
|
Number of contracts |
|
|
Expiration date |
|
|
Notional amount (000) |
|
|
Value and unrealized appreciation (depreciation) at 6/30/2024 (000) |
|
| S&P 500 E-mini Index Futures |
|
|
Long |
|
|
|
44 |
|
|
|
9/1/2024 |
|
|
|
USD12,147 |
|
|
|
|
|
|
$ |
40 |
|
| U.S. Treasury 5-Year Note |
|
|
Long |
|
|
|
5 |
|
|
|
9/1/2024 |
|
|
|
533 |
|
|
|
|
|
|
|
5 |
|
|
|
|
|
|
|
|
|
|
|
|
|
|
|
|
|
|
|
|
|
|
|
|
|
|
|
|
|
|
|
|
|
|
|
|
|
|
|
|
|
|
|
|
|
|
|
|
|
|
|
|
|
|
|
$ |
45 |
|
|
|
|
|
|
|
|
|
|
|
|
|
|
|
|
|
|
|
|
|
|
|
|
|
|
American Funds Insurance Series 238
Managed Risk Growth Fund (continued)
|
|
|
|
|
|
|
|
|
|
|
|
|
|
|
|
|
|
|
|
|
|
|
|
|
|
|
|
|
|
|
|
|
|
|
|
|
|
|
|
|
|
|
|
|
|
|
|
|
|
|
| Investments in affiliates2 |
|
|
|
|
|
|
|
|
|
|
|
|
|
|
|
|
|
|
|
|
|
|
|
|
|
|
|
|
|
|
|
|
|
|
|
|
|
|
|
|
|
|
|
|
|
|
|
|
|
|
|
|
|
|
|
|
|
|
|
| |
|
Value at 1/1/2024 (000) |
|
|
Additions (000) |
|
|
Reductions (000) |
|
|
Net realized gain (loss) (000) |
|
|
Net unrealized appreciation (depreciation) (000) |
|
|
Value at 6/30/2024 (000) |
|
|
Dividend income (000) |
|
|
Capital gain distributions received (000) |
|
|
|
|
|
|
|
|
|
|
|
|
|
|
|
| Growth funds 84.99% |
|
|
|
|
|
|
|
|
|
|
|
|
|
|
|
|
|
|
|
|
|
|
|
|
|
|
|
|
|
|
|
|
|
|
|
|
|
|
|
|
|
|
|
|
|
|
|
|
|
|
| American Funds Insurance Series - |
|
|
|
|
|
|
|
|
|
|
|
|
|
|
|
|
|
|
|
|
|
|
|
|
|
|
|
|
|
|
|
|
|
|
|
|
|
|
|
|
|
|
|
|
|
|
|
|
|
|
| Growth Fund, Class 1 |
|
$ |
431,195 |
|
|
$ |
14,201 |
|
|
$ |
59,003 |
|
|
|
|
|
|
$ |
16,571 |
|
|
|
|
|
|
$ |
38,773 |
|
|
|
|
$ |
441,737 |
|
|
|
|
|
|
$ |
860 |
|
|
|
|
|
|
$ |
10,033 |
|
|
|
|
|
|
|
|
|
|
|
|
|
|
|
| Fixed income funds 10.00% |
|
|
|
|
|
|
|
|
|
|
|
|
|
|
|
|
|
|
|
|
|
|
|
|
|
|
|
|
|
|
|
|
|
|
|
|
|
|
|
|
|
|
|
|
|
|
|
|
|
|
| American Funds Insurance Series - |
|
|
|
|
|
|
|
|
|
|
|
|
|
|
|
|
|
|
|
|
|
|
|
|
|
|
|
|
|
|
|
|
|
|
|
|
|
|
|
|
|
|
|
|
|
|
|
|
|
|
| The Bond Fund of America, Class 1 |
|
|
50,749 |
|
|
|
12,165 |
|
|
|
10,260 |
|
|
|
|
|
|
|
(304 |
) |
|
|
|
|
|
|
(360 |
) |
|
|
|
|
51,990 |
|
|
|
|
|
|
|
350 |
|
|
|
|
|
|
|
– |
|
|
|
|
|
|
|
|
|
|
|
|
|
|
|
|
|
|
|
|
|
|
|
|
|
|
|
|
|
|
|
|
|
|
|
|
|
|
|
|
|
|
|
|
|
|
|
|
|
|
|
|
|
|
|
|
|
|
|
|
|
|
|
|
|
|
| Total 94.99% |
|
|
|
|
|
|
|
|
|
|
|
|
|
|
|
|
|
$ |
16,267 |
|
|
|
|
|
|
$ |
38,413 |
|
|
|
|
$ |
493,727 |
|
|
|
|
|
|
$ |
1,210 |
|
|
|
|
|
|
$ |
10,033 |
|
|
|
|
|
|
|
|
|
|
|
|
|
|
|
|
|
|
|
|
|
|
|
|
|
|
|
|
|
|
|
|
|
|
|
|
|
|
|
|
|
|
|
|
|
|
|
|
|
|
|
|
1Rate represents the seven-day yield at 6/30/2024.
2Part of the same “group of investment companies” as the fund as defined under the Investment Company Act of 1940, as amended.
Key to abbreviation(s)
USD = U.S. dollars
Refer to the notes to financial statements.
239 American Funds Insurance Series
Managed Risk International Fund
|
|
|
|
|
| Investment portfolio June 30, 2024 |
|
unaudited |
|
|
|
|
|
|
|
|
|
|
|
| Growth funds 84.37% |
|
Shares |
|
|
Value (000) |
|
|
|
|
|
|
|
American Funds Insurance Series - International Fund, Class 1 |
|
|
5,541,924 |
|
|
$ |
103,856 |
|
|
|
|
|
|
|
|
|
|
|
|
|
|
|
|
|
|
Total growth funds (cost: $86,084,000) |
|
|
|
|
|
|
103,856 |
|
|
|
|
|
|
|
|
|
|
|
|
|
|
|
| Fixed income funds 9.93% |
|
|
|
|
|
|
|
|
|
|
|
|
American Funds Insurance Series - The Bond Fund of America, Class 1 |
|
|
1,297,568 |
|
|
|
12,223 |
|
|
|
|
|
|
|
|
|
|
|
|
|
|
|
|
|
|
Total fixed income funds (cost: $12,268,000) |
|
|
|
|
|
|
12,223 |
|
|
|
|
|
|
|
|
|
|
|
|
|
|
|
| Short-term securities 4.78% |
|
|
|
|
|
|
|
|
|
|
|
|
State Street Institutional U.S. Government Money Market Fund, Premier Class 5.25%1 |
|
|
5,885,944 |
|
|
|
5,886 |
|
|
|
|
|
|
|
|
|
|
|
|
|
|
|
|
|
|
Total short-term securities (cost: $5,886,000) |
|
|
|
|
|
|
5,886 |
|
|
|
|
|
|
|
|
|
|
|
|
|
|
|
| Options purchased (equity style) 0.76% |
|
|
|
|
|
|
|
|
|
|
|
|
Options purchased (equity style)* |
|
|
|
|
|
|
934 |
|
|
|
|
|
|
|
|
|
|
|
|
|
|
|
|
|
|
Total options purchased (cost: $536,000) |
|
|
|
|
|
|
934 |
|
|
|
|
|
|
|
|
|
|
|
|
|
|
|
|
|
|
Total investment securities 99.84% (cost: $104,774,000) |
|
|
|
|
|
|
122,899 |
|
|
|
|
|
|
|
Other assets less liabilities 0.16% |
|
|
|
|
|
|
192 |
|
|
|
|
|
|
|
|
|
|
|
|
|
|
|
|
|
|
Net assets 100.00% |
|
|
|
|
|
$ |
123,091 |
|
|
|
|
|
|
|
|
|
|
|
|
|
|
|
|
|
|
|
|
|
|
|
|
|
|
|
|
|
|
|
|
|
|
|
|
|
| *Options purchased (equity style) |
|
|
| Equity index options |
|
|
|
|
|
|
|
| Description |
|
Number of contracts |
|
|
Notional amount (000) |
|
|
Exercise price |
|
|
Expiration date |
|
|
Value at 6/30/2024 (000) |
|
|
|
|
|
|
|
|
| Put |
|
|
|
|
|
|
|
|
|
|
|
|
|
|
|
|
|
|
|
|
|
|
|
|
|
|
|
|
|
|
|
| iShares MSCI EAFE ETF |
|
|
200 |
|
|
|
USD1,567 |
|
|
|
USD57.00 |
|
|
|
9/20/2024 |
|
|
|
|
|
|
$ |
8 |
|
| iShares MSCI EAFE ETF |
|
|
1,700 |
|
|
|
13,316 |
|
|
|
59.00 |
|
|
|
9/20/2024 |
|
|
|
|
|
|
|
64 |
|
| iShares MSCI EAFE ETF |
|
|
2,900 |
|
|
|
22,716 |
|
|
|
60.00 |
|
|
|
9/20/2024 |
|
|
|
|
|
|
|
112 |
|
| iShares MSCI EAFE ETF |
|
|
300 |
|
|
|
2,350 |
|
|
|
63.00 |
|
|
|
9/20/2024 |
|
|
|
|
|
|
|
11 |
|
| iShares MSCI EAFE ETF |
|
|
500 |
|
|
|
3,916 |
|
|
|
69.00 |
|
|
|
9/20/2024 |
|
|
|
|
|
|
|
7 |
|
| iShares MSCI EAFE ETF |
|
|
5,650 |
|
|
|
44,256 |
|
|
|
65.00 |
|
|
|
12/20/2024 |
|
|
|
|
|
|
|
715 |
|
| iShares MSCI EAFE ETF |
|
|
450 |
|
|
|
3,525 |
|
|
|
66.00 |
|
|
|
12/20/2024 |
|
|
|
|
|
|
|
17 |
|
|
|
|
|
|
|
|
|
|
|
|
|
|
|
|
|
|
|
|
|
|
|
|
|
|
|
|
|
|
|
|
|
|
|
|
|
|
|
|
|
|
|
|
|
|
|
|
|
|
|
|
|
|
|
$ |
934 |
|
|
|
|
|
|
|
|
|
|
|
|
|
|
|
|
|
|
|
|
|
|
|
|
|
|
|
|
|
|
|
|
|
|
|
|
|
|
|
|
|
|
|
|
|
|
|
|
|
|
|
| Futures contracts |
|
|
|
|
|
|
|
| Contracts |
|
Type |
|
|
Number of contracts |
|
|
Expiration date |
|
|
Notional amount (000) |
|
|
Value and unrealized appreciation (depreciation) at 6/30/2024 (000) |
|
| MSCI EAFE Index Futures |
|
|
Long |
|
|
|
70 |
|
|
|
9/1/2024 |
|
|
|
USD8,201 |
|
|
|
|
|
|
$ |
16 |
|
| U.S. Treasury 5-Year Note |
|
|
Long |
|
|
|
10 |
|
|
|
9/1/2024 |
|
|
|
1,066 |
|
|
|
|
|
|
|
9 |
|
| Mini MSCI Emerging Market Index Futures |
|
|
Short |
|
|
|
3 |
|
|
|
9/1/2024 |
|
|
|
(163 |
) |
|
|
|
|
|
|
1 |
|
| S&P 500 E-mini Index Futures |
|
|
Short |
|
|
|
1 |
|
|
|
9/1/2024 |
|
|
|
(276 |
) |
|
|
|
|
|
|
1 |
|
|
|
|
|
|
|
|
|
|
|
|
|
|
|
|
|
|
|
|
|
|
|
|
|
|
|
|
|
|
|
|
|
|
|
|
|
|
|
|
|
|
|
|
|
|
|
|
|
|
|
|
|
|
|
$ |
27 |
|
|
|
|
|
|
|
|
|
|
|
|
|
|
|
|
|
|
|
|
|
|
|
|
|
|
American Funds Insurance Series 240
Managed Risk International Fund (continued)
|
|
|
|
|
|
|
|
|
|
|
|
|
|
|
|
|
|
|
|
|
|
|
|
|
|
|
|
|
|
|
|
|
|
|
|
|
|
|
|
|
|
|
|
|
|
|
| Investments in affiliates2 |
|
|
|
|
|
|
|
|
|
|
|
|
|
|
|
|
|
|
|
|
|
|
|
|
|
|
|
|
|
|
|
|
|
|
|
|
|
|
|
|
|
|
|
|
|
|
|
|
|
|
|
|
|
|
|
| |
|
Value at
1/1/2024
(000) |
|
|
Additions
(000) |
|
|
Reductions (000) |
|
|
Net realized gain (loss) (000) |
|
|
Net unrealized appreciation (depreciation) (000) |
|
|
Value at 6/30/2024 (000) |
|
Dividend income (000) |
|
Capital gain distributions received (000) |
|
|
|
|
|
|
|
|
|
|
|
|
|
|
| Growth funds 84.37% |
|
|
|
|
|
|
|
|
|
|
|
|
|
|
|
|
|
|
|
|
|
|
|
|
|
|
|
|
|
|
|
|
|
|
|
|
|
|
|
|
|
|
|
|
|
|
| American Funds Insurance Series - |
|
|
|
|
|
|
|
|
|
|
|
|
|
|
|
|
|
|
|
|
|
|
|
|
|
|
|
|
|
|
|
|
|
|
|
|
|
|
|
|
|
|
|
|
|
|
| International Fund, Class 1 |
|
$ |
105,419 |
|
|
$ |
1,109 |
|
|
$ |
10,043 |
|
|
|
|
|
|
$ |
465 |
|
|
|
|
|
|
$ |
6,906 |
|
|
|
|
|
|
$103,856 |
|
|
|
|
|
$257 |
|
|
|
|
|
$– |
|
|
|
|
|
|
|
|
|
|
|
|
|
|
| Fixed income funds 9.93% |
|
|
|
|
|
|
|
|
|
|
|
|
|
|
|
|
|
|
|
|
|
|
|
|
|
|
|
|
|
|
|
|
|
|
|
|
|
|
|
|
|
|
|
|
|
|
| American Funds Insurance Series - |
|
|
|
|
|
|
|
|
|
|
|
|
|
|
|
|
|
|
|
|
|
|
|
|
|
|
|
|
|
|
|
|
|
|
|
|
|
|
|
|
|
|
|
|
|
|
| The Bond Fund of America, Class 1 |
|
|
12,408 |
|
|
|
2,109 |
|
|
|
2,141 |
|
|
|
|
|
|
|
(101 |
) |
|
|
|
|
|
|
(52 |
) |
|
|
|
|
|
12,223 |
|
|
|
|
|
86 |
|
|
|
|
|
– |
|
|
|
|
|
|
|
|
|
|
|
|
|
|
|
|
|
|
|
|
|
|
|
|
|
|
|
|
|
|
|
|
|
|
|
|
|
|
|
|
|
|
|
|
|
|
|
|
|
|
|
|
|
|
|
|
|
|
|
|
|
| Total 94.30% |
|
|
|
|
|
|
|
|
|
|
|
|
|
|
|
|
|
$ |
364 |
|
|
|
|
|
|
$ |
6,854 |
|
|
|
|
|
|
$116,079 |
|
|
|
|
|
$343 |
|
|
|
|
|
$– |
|
|
|
|
|
|
|
|
|
|
|
|
|
|
|
|
|
|
|
|
|
|
|
|
|
|
|
|
|
|
|
|
|
|
|
|
|
|
|
|
|
|
|
|
|
|
|
1Rate represents the seven-day yield at 6/30/2024.
2Part of the same “group of investment companies” as the fund as defined under the Investment Company Act of 1940, as amended.
Key to abbreviation(s)
USD = U.S. dollars
Refer to the notes to financial statements.
241 American Funds Insurance Series
Managed Risk Washington Mutual Investors Fund
|
|
|
|
|
| Investment portfolio June 30, 2024 |
|
unaudited |
|
|
|
|
|
|
|
|
|
|
|
| Growth-and-income funds 84.96% |
|
Shares |
|
|
Value (000) |
|
|
|
|
|
|
|
American Funds Insurance Series - Washington Mutual Investors Fund, Class 1 |
|
|
17,534,672 |
|
|
$ |
279,678 |
|
|
|
|
|
|
|
|
|
|
|
|
|
|
|
|
|
|
Total growth-and-income funds (cost: $227,214,000) |
|
|
|
|
|
|
279,678 |
|
|
|
|
|
|
|
|
|
|
|
|
|
|
|
|
|
|
|
|
|
|
|
|
|
|
|
| Fixed income funds 10.00% |
|
|
|
|
|
|
|
|
|
|
|
|
American Funds Insurance Series - U.S. Government Securities Fund, Class 1 |
|
|
3,376,017 |
|
|
|
32,916 |
|
|
|
|
|
|
|
|
|
|
|
|
|
|
|
|
|
|
Total fixed income funds (cost: $34,025,000) |
|
|
|
|
|
|
32,916 |
|
|
|
|
|
|
|
|
|
|
|
|
|
|
|
|
|
|
|
|
|
|
|
|
|
|
|
| Short-term securities 4.86% |
|
|
|
|
|
|
|
|
|
|
|
|
State Street Institutional U.S. Government Money Market Fund, Premier Class 5.25%1 |
|
|
15,996,413 |
|
|
|
15,996 |
|
|
|
|
|
|
|
|
|
|
|
|
|
|
|
|
|
|
Total short-term securities (cost: $15,996,000) |
|
|
|
|
|
|
15,996 |
|
|
|
|
|
|
|
|
|
|
|
|
|
|
|
|
|
|
|
|
|
|
|
|
|
|
|
| Options purchased (equity style) 0.14% |
|
|
|
|
|
|
|
|
|
|
|
|
Options purchased (equity style)* |
|
|
|
|
|
|
458 |
|
|
|
|
|
|
|
|
|
|
|
|
|
|
|
|
|
|
Total options purchased (cost: $1,152,000) |
|
|
|
|
|
|
458 |
|
|
|
|
|
|
|
|
|
|
|
|
|
|
|
|
|
|
Total investment securities 99.96% (cost: $278,387,000) |
|
|
|
|
|
|
329,048 |
|
|
|
|
|
|
|
Other assets less liabilities 0.04% |
|
|
|
|
|
|
136 |
|
|
|
|
|
|
|
|
|
|
|
|
|
|
|
|
|
|
Net assets 100.00% |
|
|
|
|
|
$ |
329,184 |
|
|
|
|
|
|
|
|
|
|
|
|
|
|
|
|
|
|
|
|
|
|
|
|
|
|
|
|
|
|
|
|
|
|
|
| *Options purchased (equity style) |
|
|
| Equity index options |
|
|
|
|
|
|
|
| Description |
|
Number of contracts |
|
|
Notional
amount (000) |
|
|
Exercise price |
|
|
Expiration date |
|
Value at 6/30/2024 (000) |
|
|
|
|
|
|
|
|
| Put |
|
|
|
|
|
|
|
|
|
|
|
|
|
|
|
|
|
|
|
|
|
|
| S&P 500 Index |
|
|
30 |
|
|
|
USD16,381 |
|
|
|
USD3,625.00 |
|
|
9/20/2024 |
|
|
|
|
|
|
$ 7 |
|
| S&P 500 Index |
|
|
20 |
|
|
|
10,921 |
|
|
|
3,725.00 |
|
|
9/20/2024 |
|
|
|
|
|
|
5 |
|
| S&P 500 Index |
|
|
215 |
|
|
|
117,400 |
|
|
|
3,800.00 |
|
|
9/20/2024 |
|
|
|
|
|
|
65 |
|
| S&P 500 Index |
|
|
10 |
|
|
|
5,461 |
|
|
|
3,900.00 |
|
|
9/20/2024 |
|
|
|
|
|
|
3 |
|
| S&P 500 Index |
|
|
10 |
|
|
|
5,461 |
|
|
|
4,100.00 |
|
|
9/20/2024 |
|
|
|
|
|
|
4 |
|
| S&P 500 Index |
|
|
190 |
|
|
|
103,749 |
|
|
|
4,125.00 |
|
|
12/20/2024 |
|
|
|
|
|
|
308 |
|
| S&P 500 Index |
|
|
10 |
|
|
|
5,460 |
|
|
|
4,175.00 |
|
|
12/20/2024 |
|
|
|
|
|
|
17 |
|
| S&P 500 Index |
|
|
25 |
|
|
|
13,651 |
|
|
|
4,275.00 |
|
|
12/20/2024 |
|
|
|
|
|
|
49 |
|
|
|
|
|
|
|
|
|
|
|
|
|
|
|
|
|
|
|
|
|
|
|
|
|
|
|
|
|
|
|
|
|
|
|
|
|
|
|
|
|
|
|
|
|
|
|
|
|
|
|
|
$458 |
|
|
|
|
|
|
|
|
|
|
|
|
|
|
|
|
|
|
|
|
|
|
|
|
|
|
|
|
|
|
|
|
|
|
|
|
|
|
|
|
|
|
|
|
|
|
|
|
|
| Futures contracts |
|
|
|
|
|
|
|
| Contracts |
|
Type |
|
|
Number of contracts |
|
|
Expiration date |
|
|
Notional amount (000) |
|
|
Value and unrealized appreciation (depreciation) at 6/30/2024 (000) |
|
| S&P 500 E-mini Index Futures |
|
|
Long |
|
|
|
22 |
|
|
|
9/1/2024 |
|
|
|
USD6,074 |
|
|
|
|
|
|
$ |
20 |
|
| U.S. Treasury 5-Year Note |
|
|
Long |
|
|
|
23 |
|
|
|
9/1/2024 |
|
|
|
2,451 |
|
|
|
|
|
|
|
22 |
|
|
|
|
|
|
|
|
|
|
|
|
|
|
|
|
|
|
|
|
|
|
|
|
|
|
|
|
|
|
|
|
|
|
|
|
|
|
|
|
|
|
|
|
|
|
|
|
|
|
|
|
|
|
|
$ |
42 |
|
|
|
|
|
|
|
|
|
|
|
|
|
|
|
|
|
|
|
|
|
|
|
|
|
|
American Funds Insurance Series 242
Managed Risk Washington Mutual Investors Fund (continued)
Investments in affiliates2
|
|
|
|
|
|
|
|
|
|
|
|
|
|
|
|
|
|
|
|
|
|
|
|
|
|
|
|
|
|
|
|
|
|
|
|
|
|
|
|
|
|
|
|
|
|
|
|
|
|
|
|
|
|
|
| |
|
Value at
1/1/2024
(000) |
|
Additions (000) |
|
Reductions (000) |
|
Net realized gain (loss)
(000) |
|
Net unrealized
appreciation
(depreciation)
(000) |
|
Value at
6/30/2024
(000) |
|
Dividend income (000) |
|
Capital gain distributions received (000) |
|
|
|
|
|
|
|
|
|
|
| Growth-and-income funds 84.96% |
|
|
|
|
|
|
|
|
|
|
|
|
|
|
|
|
|
|
|
|
|
|
|
|
|
|
|
|
|
|
|
|
|
|
|
|
|
|
|
|
|
|
|
|
|
|
|
|
|
|
|
|
|
|
|
| American Funds Insurance Series -
Washington Mutual Investors Fund, Class 1 |
|
|
$ |
275,370 |
|
|
|
$ |
5,684 |
|
|
|
$ |
28,198 |
|
|
|
$ |
(2,993 |
) |
|
|
|
$29,815 |
|
|
|
$ |
279,678 |
|
|
|
$ |
1,120 |
|
|
|
|
|
|
|
|
$ |
2,242 |
|
|
|
|
|
|
|
|
|
|
|
| Fixed income funds 10.00% |
|
|
|
|
|
|
|
|
|
|
|
|
|
|
|
|
|
|
|
|
|
|
|
|
|
|
|
|
|
|
|
|
|
|
|
|
|
|
|
|
|
|
|
|
|
|
|
|
|
|
|
|
|
|
|
| American Funds Insurance Series -
U.S. Government Securities Fund, Class 1 |
|
|
|
32,409 |
|
|
|
|
5,629 |
|
|
|
|
4,592 |
|
|
|
|
(494 |
) |
|
|
|
(36 |
) |
|
|
|
32,916 |
|
|
|
|
230 |
|
|
|
|
|
|
|
|
|
– |
|
|
|
|
|
|
|
|
|
|
|
|
|
|
|
|
|
|
|
|
|
|
|
|
|
|
|
|
|
|
|
|
|
|
|
|
|
|
|
|
|
|
|
|
|
|
|
|
|
|
|
|
|
|
|
|
|
| Total 94.96% |
|
|
|
|
|
|
|
|
|
|
|
|
|
|
|
|
|
$ |
(3,487 |
) |
|
|
|
$29,779 |
|
|
|
$ |
312,594 |
|
|
|
$ |
1,350 |
|
|
|
|
|
|
|
|
$ |
2,242 |
|
|
|
|
|
|
|
|
|
|
|
|
|
|
|
|
|
|
|
|
|
|
|
|
|
|
|
|
|
|
|
|
|
|
|
|
|
|
|
|
|
|
|
|
|
|
|
1 Rate represents the seven-day yield at 6/30/2024.
2 Part of the same “group of investment companies” as the fund as defined under the Investment Company Act of 1940, as amended.
Key to abbreviation(s)
USD = U.S. dollars
Refer to the notes to financial statements.
243 American Funds Insurance Series
|
|
|
| Managed Risk Growth-Income Fund |
|
|
|
|
| Investment portfolio June 30, 2024 |
|
unaudited |
|
|
|
|
|
|
|
|
|
|
|
|
|
| Growth-and-income funds 80.00% |
|
Shares |
|
|
|
|
Value (000) |
|
|
|
|
|
|
|
|
American Funds Insurance Series - Growth-Income Fund, Class 1 |
|
|
27,695,982 |
|
|
|
|
$ |
1,786,114 |
|
|
|
|
|
|
|
|
|
|
|
|
|
|
|
|
|
|
|
|
|
Total growth-and-income funds (cost: $1,463,497,000) |
|
|
|
|
|
|
|
|
1,786,114 |
|
|
|
|
|
|
|
|
|
|
|
|
|
|
|
|
|
|
| Fixed income funds 15.00% |
|
|
|
|
|
|
|
|
|
|
|
|
|
|
|
|
|
American Funds Insurance Series - The Bond Fund of America, Class 1 |
|
|
35,553,037 |
|
|
|
|
|
334,909 |
|
|
|
|
|
|
|
|
|
|
|
|
|
|
|
|
|
|
|
|
|
Total fixed income funds (cost: $341,712,000) |
|
|
|
|
|
|
|
|
334,909 |
|
|
|
|
|
|
|
|
|
|
|
|
|
|
|
|
|
|
| Short-term securities 4.73% |
|
|
|
|
|
|
|
|
|
|
|
|
|
|
|
|
|
State Street Institutional U.S. Government Money Market Fund, Premier Class 5.25%1 |
|
|
105,718,346 |
|
|
|
|
|
105,718 |
|
|
|
|
|
|
|
|
|
|
|
|
|
|
|
|
|
|
|
|
|
Total short-term securities (cost: $105,718,000) |
|
|
|
|
|
|
|
|
105,718 |
|
|
|
|
|
|
|
|
|
|
|
|
|
|
|
|
|
|
| Options purchased (equity style) 0.21% |
|
|
|
|
|
|
|
|
|
|
|
|
|
|
|
|
|
Options purchased (equity style)* |
|
|
|
|
|
|
|
|
4,616 |
|
|
|
|
|
|
|
|
|
|
|
|
|
|
|
|
|
|
|
|
|
Total options purchased (cost: $12,103,000) |
|
|
|
|
|
|
|
|
4,616 |
|
|
|
|
|
|
|
|
|
|
|
|
|
|
|
|
|
|
|
|
|
Total investment securities 99.94% (cost: $1,923,030,000) |
|
|
|
|
|
|
|
|
2,231,357 |
|
|
|
|
|
|
|
|
Other assets less liabilities 0.06% |
|
|
|
|
|
|
|
|
1,304 |
|
|
|
|
|
|
|
|
|
|
|
|
|
|
|
|
|
|
|
|
|
Net assets 100.00% |
|
|
|
|
|
|
|
$ |
2,232,661 |
|
|
|
|
|
|
|
|
|
|
|
|
|
|
*Options purchased (equity style)
Equity index options
|
|
|
|
|
|
|
|
|
|
|
|
|
|
|
|
|
|
|
|
|
|
|
|
|
|
|
|
|
|
|
|
|
|
|
| Description |
|
Number of
contracts |
|
|
Notional amount (000) |
|
|
Exercise price |
|
|
Expiration date |
|
|
Value at 6/30/2024 (000) |
|
|
|
|
|
|
|
|
|
|
|
| Put |
|
|
|
|
|
|
|
|
|
|
|
|
|
|
|
|
|
|
|
|
|
|
|
|
|
|
|
|
|
|
|
|
|
|
|
|
|
|
| S&P 500 Index |
|
|
50 |
|
|
|
|
|
USD27,302 |
|
|
|
|
|
USD3,300.00 |
|
|
|
|
|
9/20/2024 |
|
|
|
|
$ |
10 |
|
| S&P 500 Index |
|
|
175 |
|
|
|
|
|
95,558 |
|
|
|
|
|
3,325.00 |
|
|
|
|
|
9/20/2024 |
|
|
|
|
|
39 |
|
| S&P 500 Index |
|
|
70 |
|
|
|
|
|
38,223 |
|
|
|
|
|
3,375.00 |
|
|
|
|
|
9/20/2024 |
|
|
|
|
|
18 |
|
| S&P 500 Index |
|
|
10 |
|
|
|
|
|
5,461 |
|
|
|
|
|
3,450.00 |
|
|
|
|
|
9/20/2024 |
|
|
|
|
|
3 |
|
| S&P 500 Index |
|
|
30 |
|
|
|
|
|
16,381 |
|
|
|
|
|
3,475.00 |
|
|
|
|
|
9/20/2024 |
|
|
|
|
|
8 |
|
| S&P 500 Index |
|
|
2,510 |
|
|
|
|
|
1,370,581 |
|
|
|
|
|
3,525.00 |
|
|
|
|
|
9/20/2024 |
|
|
|
|
|
753 |
|
| S&P 500 Index |
|
|
180 |
|
|
|
|
|
98,289 |
|
|
|
|
|
3,575.00 |
|
|
|
|
|
9/20/2024 |
|
|
|
|
|
58 |
|
| S&P 500 Index |
|
|
70 |
|
|
|
|
|
38,223 |
|
|
|
|
|
3,625.00 |
|
|
|
|
|
9/20/2024 |
|
|
|
|
|
29 |
|
| S&P 500 Index |
|
|
10 |
|
|
|
|
|
5,461 |
|
|
|
|
|
3,700.00 |
|
|
|
|
|
12/20/2024 |
|
|
|
|
|
11 |
|
| S&P 500 Index |
|
|
150 |
|
|
|
|
|
81,907 |
|
|
|
|
|
3,725.00 |
|
|
|
|
|
12/20/2024 |
|
|
|
|
|
203 |
|
| S&P 500 Index |
|
|
1,745 |
|
|
|
|
|
952,854 |
|
|
|
|
|
3,750.00 |
|
|
|
|
|
12/20/2024 |
|
|
|
|
|
2,827 |
|
| S&P 500 Index |
|
|
70 |
|
|
|
|
|
38,223 |
|
|
|
|
|
3,800.00 |
|
|
|
|
|
12/20/2024 |
|
|
|
|
|
122 |
|
| S&P 500 Index |
|
|
130 |
|
|
|
|
|
70,986 |
|
|
|
|
|
3,900.00 |
|
|
|
|
|
12/20/2024 |
|
|
|
|
|
234 |
|
| S&P 500 Index |
|
|
155 |
|
|
|
|
|
84,638 |
|
|
|
|
|
4,100.00 |
|
|
|
|
|
12/20/2024 |
|
|
|
|
|
301 |
|
|
|
|
|
|
|
|
|
|
|
|
|
|
|
|
|
|
|
|
|
|
|
|
|
|
|
|
|
|
|
|
|
|
|
|
|
|
|
|
|
|
|
|
|
|
|
|
|
|
|
|
|
|
|
|
|
|
|
|
|
|
|
|
|
|
$ |
4,616 |
|
|
|
|
|
|
|
|
|
|
|
|
|
|
|
|
|
|
|
|
|
|
|
|
|
|
|
|
|
|
American Funds Insurance Series 244
Managed Risk Growth-Income Fund (continued)
Futures contracts
|
|
|
|
|
|
|
|
|
|
|
|
|
|
|
|
|
|
|
|
|
|
|
|
|
|
|
|
|
|
|
|
|
|
|
|
|
|
|
| Contracts |
|
Type |
|
|
|
|
Number of
contracts |
|
|
|
|
|
Expiration
date |
|
|
|
|
|
Notional
amount
(000) |
|
|
|
|
Value and unrealized appreciation (depreciation) at 6/30/2024 (000) |
|
|
|
|
|
|
|
|
|
|
|
|
| S&P 500 E-mini Index Futures |
|
Long |
|
|
|
|
218 |
|
|
|
|
|
9/1/2024 |
|
|
|
|
|
USD60,185 |
|
|
|
|
|
|
$ |
201 |
|
| U.S. Treasury 5-Year Note |
|
Long |
|
|
|
|
54 |
|
|
|
|
|
9/1/2024 |
|
|
|
|
|
5,755 |
|
|
|
|
|
|
|
51 |
|
|
|
|
|
|
|
|
|
|
|
|
|
|
|
|
|
|
|
|
|
|
|
|
|
|
|
|
|
|
|
|
|
|
|
|
|
|
|
|
|
|
|
|
|
|
|
|
|
|
|
|
|
|
|
|
|
|
|
|
|
|
|
|
|
|
|
$ |
252 |
|
|
|
|
|
|
|
|
|
|
|
|
|
|
|
|
|
|
|
|
|
|
|
|
|
|
|
|
|
|
Investments in affiliates2
|
|
|
|
|
|
|
|
|
|
|
|
|
|
|
|
|
|
|
|
|
|
|
|
|
|
|
|
|
|
|
|
|
|
|
|
|
|
|
|
|
|
|
|
|
|
|
|
|
|
|
|
|
|
|
| |
|
Value at
1/1/2024
(000) |
|
Additions
(000) |
|
Reductions
(000) |
|
Net realized
gain (loss)
(000) |
|
Net unrealized
appreciation
(depreciation)
(000) |
|
Value at
6/30/2024
(000) |
|
Dividend
income
(000) |
|
Capital gain
distributions
received
(000) |
|
|
|
|
|
|
|
|
|
|
| Growth-and-income funds 80.00% |
|
|
|
|
|
|
|
|
|
|
|
|
|
|
|
|
|
|
|
|
|
|
|
|
|
|
|
|
|
|
|
|
|
|
|
|
|
|
|
|
|
|
|
|
|
|
|
|
|
|
|
|
|
|
|
| American Funds Insurance Series -
Growth-Income Fund, Class 1 |
|
|
$ |
1,749,625 |
|
|
|
$ |
92,257 |
|
|
|
$ |
210,362 |
|
|
|
$ |
3,136 |
|
|
|
|
$151,458 |
|
|
|
$ |
1,786,114 |
|
|
|
$ |
5,421 |
|
|
|
|
|
|
|
|
$ |
79,172 |
|
|
|
|
|
|
|
|
|
|
|
| Fixed income funds 15.00% |
|
|
|
|
|
|
|
|
|
|
|
|
|
|
|
|
|
|
|
|
|
|
|
|
|
|
|
|
|
|
|
|
|
|
|
|
|
|
|
|
|
|
|
|
|
|
|
|
|
|
|
|
|
|
|
| American Funds Insurance Series -
The Bond Fund of America, Class 1 |
|
|
|
328,068 |
|
|
|
|
60,671 |
|
|
|
|
49,693 |
|
|
|
|
(6,049 |
) |
|
|
|
1,912 |
|
|
|
|
334,909 |
|
|
|
|
2,282 |
|
|
|
|
|
|
|
|
|
– |
|
|
|
|
|
|
|
|
|
|
|
|
|
|
|
|
|
|
|
|
|
|
|
|
|
|
|
|
|
|
|
|
|
|
|
|
|
|
|
|
|
|
|
|
|
|
|
|
|
|
|
|
|
|
|
|
|
| Total 95.00% |
|
|
|
|
|
|
|
|
|
|
|
|
|
|
|
|
|
$ |
(2,913 |
) |
|
|
|
$153,370 |
|
|
|
$ |
2,121,023 |
|
|
|
$ |
7,703 |
|
|
|
|
|
|
|
|
$ |
79,172 |
|
|
|
|
|
|
|
|
|
|
|
|
|
|
|
|
|
|
|
|
|
|
|
|
|
|
|
|
|
|
|
|
|
|
|
|
|
|
|
|
|
|
|
|
|
|
|
1 Rate represents the seven-day yield at 6/30/2024.
2 Part of the same “group of investment companies” as the fund as defined under the Investment Company Act of 1940, as amended.
Key to abbreviation(s)
USD = U.S. dollars
Refer to the notes to financial statements.
245 American Funds Insurance Series
|
|
|
| Managed Risk Asset Allocation Fund |
|
|
|
|
| Investment portfolio June 30, 2024 |
|
unaudited |
|
|
|
|
|
|
|
|
|
|
|
|
|
| Asset allocation funds 95.27% |
|
Shares |
|
|
|
|
Value (000) |
|
|
|
|
|
|
|
|
American Funds Insurance Series - Asset Allocation Fund, Class 1 |
|
|
80,083,731 |
|
|
|
|
$ |
1,993,284 |
|
|
|
|
|
|
|
|
|
|
|
|
|
|
|
|
|
|
|
|
|
Total asset allocation funds (cost: $1,894,128,000) |
|
|
|
|
|
|
|
|
1,993,284 |
|
|
|
|
|
|
|
|
|
|
|
|
|
|
|
|
|
|
| Short-term securities 4.73% |
|
|
|
|
|
|
|
|
|
|
|
|
|
|
|
|
|
State Street Institutional U.S. Government Money Market Fund, Premier Class 5.25%1 |
|
|
98,953,206 |
|
|
|
|
|
98,953 |
|
|
|
|
|
|
|
|
|
|
|
|
|
|
|
|
|
|
|
|
|
Total short-term securities (cost: $98,953,000) |
|
|
|
|
|
|
|
|
98,953 |
|
|
|
|
|
|
|
|
|
|
|
|
|
|
|
|
|
|
| Options purchased (equity style) 0.04% |
|
|
|
|
|
|
|
|
|
|
|
|
|
|
|
|
|
Options purchased (equity style)* |
|
|
|
|
|
|
|
|
698 |
|
|
|
|
|
|
|
|
|
|
|
|
|
|
|
|
|
|
|
|
|
Total options purchased (cost: $1,352,000) |
|
|
|
|
|
|
|
|
698 |
|
|
|
|
|
|
|
|
|
|
|
|
|
|
|
|
|
|
|
|
|
Total investment securities 100.04% (cost: $1,994,433,000) |
|
|
|
|
|
|
|
|
2,092,935 |
|
|
|
|
|
|
|
|
Other assets less liabilities (0.04)% |
|
|
|
|
|
|
|
|
(754 |
) |
|
|
|
|
|
|
|
|
|
|
|
|
|
|
|
|
|
|
|
|
Net assets 100.00% |
|
|
|
|
|
|
|
$ |
2,092,181 |
|
|
|
|
|
|
|
|
|
|
|
|
|
|
*Options purchased (equity style)
Equity index options
|
|
|
|
|
|
|
|
|
|
|
|
|
|
|
|
|
|
|
|
|
|
|
|
|
|
|
|
|
|
|
|
|
|
|
| Description |
|
Number of
contracts |
|
|
Notional amount (000) |
|
|
Exercise price |
|
|
Expiration date |
|
|
Value at 6/30/2024 (000) |
|
|
|
|
|
|
|
|
|
|
|
| Put |
|
|
|
|
|
|
|
|
|
|
|
|
|
|
|
|
|
|
|
|
|
|
|
|
|
|
|
|
|
|
|
|
|
|
|
|
|
|
| S&P 500 Index |
|
|
30 |
|
|
|
|
|
USD16,381 |
|
|
|
|
|
USD3,625.00 |
|
|
|
|
|
9/20/2024 |
|
|
|
|
$ |
7 |
|
| S&P 500 Index |
|
|
10 |
|
|
|
|
|
5,461 |
|
|
|
|
|
3,725.00 |
|
|
|
|
|
9/20/2024 |
|
|
|
|
|
3 |
|
| S&P 500 Index |
|
|
20 |
|
|
|
|
|
10,921 |
|
|
|
|
|
3,750.00 |
|
|
|
|
|
9/20/2024 |
|
|
|
|
|
6 |
|
| S&P 500 Index |
|
|
120 |
|
|
|
|
|
65,526 |
|
|
|
|
|
3,800.00 |
|
|
|
|
|
9/20/2024 |
|
|
|
|
|
36 |
|
| S&P 500 Index |
|
|
15 |
|
|
|
|
|
8,191 |
|
|
|
|
|
3,900.00 |
|
|
|
|
|
9/20/2024 |
|
|
|
|
|
5 |
|
| S&P 500 Index |
|
|
15 |
|
|
|
|
|
8,191 |
|
|
|
|
|
4,100.00 |
|
|
|
|
|
9/20/2024 |
|
|
|
|
|
6 |
|
| S&P 500 Index |
|
|
10 |
|
|
|
|
|
5,460 |
|
|
|
|
|
3,775.00 |
|
|
|
|
|
12/20/2024 |
|
|
|
|
|
11 |
|
| S&P 500 Index |
|
|
20 |
|
|
|
|
|
10,921 |
|
|
|
|
|
4,050.00 |
|
|
|
|
|
12/20/2024 |
|
|
|
|
|
28 |
|
| S&P 500 Index |
|
|
310 |
|
|
|
|
|
169,275 |
|
|
|
|
|
4,125.00 |
|
|
|
|
|
12/20/2024 |
|
|
|
|
|
502 |
|
| S&P 500 Index |
|
|
10 |
|
|
|
|
|
5,460 |
|
|
|
|
|
4,200.00 |
|
|
|
|
|
12/20/2024 |
|
|
|
|
|
18 |
|
| S&P 500 Index |
|
|
40 |
|
|
|
|
|
21,842 |
|
|
|
|
|
4,250.00 |
|
|
|
|
|
12/20/2024 |
|
|
|
|
|
76 |
|
|
|
|
|
|
|
|
|
|
|
|
|
|
|
|
|
|
|
|
|
|
|
|
|
|
|
|
|
|
|
|
|
|
|
|
|
|
|
|
|
|
|
|
|
|
|
|
|
|
|
|
|
|
|
|
|
|
|
|
|
|
|
|
|
|
$ |
698 |
|
|
|
|
|
|
|
|
|
|
|
|
|
|
|
|
|
|
|
|
|
|
|
|
|
|
|
|
|
|
Futures contracts
|
|
|
|
|
|
|
|
|
|
|
|
|
|
|
|
|
|
|
|
|
|
|
|
|
|
|
|
|
|
|
|
|
|
|
|
|
|
|
| Contracts |
|
Type |
|
|
|
|
Number of
contracts |
|
|
|
|
|
Expiration
date |
|
|
|
|
|
Notional
amount
(000) |
|
|
|
|
Value and unrealized appreciation (depreciation) at 6/30/2024 (000) |
|
|
|
|
|
|
|
|
|
|
|
|
| U.S. Treasury 5-Year Note |
|
Long |
|
|
|
|
390 |
|
|
|
|
|
9/1/2024 |
|
|
|
|
|
USD41,566 |
|
|
|
|
|
|
$ |
368 |
|
| S&P 500 E-mini Index Futures |
|
Long |
|
|
|
|
41 |
|
|
|
|
|
9/1/2024 |
|
|
|
|
|
11,319 |
|
|
|
|
|
|
|
38 |
|
|
|
|
|
|
|
|
|
|
|
|
|
|
|
|
|
|
|
|
|
|
|
|
|
|
|
|
|
|
|
|
|
|
|
|
|
|
|
|
|
|
|
|
|
|
|
|
|
|
|
|
|
|
|
|
|
|
|
|
|
|
|
|
|
|
|
$ |
406 |
|
|
|
|
|
|
|
|
|
|
|
|
|
|
|
|
|
|
|
|
|
|
|
|
|
|
|
|
|
|
American Funds Insurance Series 246
Managed Risk Asset Allocation Fund (continued)
Investments in affiliates2
|
|
|
|
|
|
|
|
|
|
|
|
|
|
|
|
|
|
|
|
|
|
|
|
|
|
|
|
|
|
|
|
|
|
|
|
|
|
|
|
|
|
|
|
|
|
|
|
|
|
|
|
|
|
|
|
| |
|
Value at
1/1/2024
(000) |
|
|
Additions
(000) |
|
|
Reductions
(000) |
|
|
Net realized
gain (loss)
(000) |
|
|
Net unrealized
appreciation
(depreciation)
(000) |
|
|
Value at
6/30/2024
(000) |
|
Dividend
income
(000) |
|
Capital gain
distributions
received
(000) |
|
|
|
|
|
|
|
|
|
|
|
|
|
|
| Asset allocation funds 95.27% |
|
|
|
|
|
|
|
|
|
|
|
|
|
|
|
|
|
|
|
|
|
|
|
|
|
|
|
|
|
|
|
|
|
|
|
|
|
|
|
|
|
|
|
|
|
|
|
|
|
|
|
|
|
|
|
|
|
|
|
|
| American Funds Insurance Series -
Asset Allocation Fund, Class 1 |
|
$ |
1,999,492 |
|
|
$ |
96,569 |
|
|
$ |
191,155 |
|
|
|
|
|
|
$ |
26,249 |
|
|
|
|
|
|
|
$62,129 |
|
|
|
|
|
|
$1,993,284 |
|
|
|
|
|
$9,939 |
|
|
|
|
|
$84,687 |
1 Rate represents the seven-day yield at 6/30/2024.
2 Part of the same “group of investment companies” as the fund as defined under the Investment Company Act of 1940, as amended.
Key to abbreviation(s)
USD = U.S. dollars
Refer to the notes to financial statements.
247 American Funds Insurance Series
|
|
|
| Financial statements Statements of assets and liabilities at June 30, 2024 |
|
unaudited (dollars in thousands) |
|
|
|
|
|
|
|
|
|
|
|
|
|
|
|
|
|
|
|
|
|
|
|
|
|
|
|
|
|
| |
|
Global
Growth
Fund |
|
|
Global Small
Capitalization
Fund |
|
|
Growth
Fund |
|
|
International
Fund |
|
|
New
World
Fund |
|
|
|
|
|
|
|
|
|
| Assets: |
|
|
|
|
|
|
|
|
|
|
|
|
|
|
|
|
|
|
|
|
|
|
|
|
|
|
|
|
| Investment securities, at value: |
|
|
|
|
|
|
|
|
|
|
|
|
|
|
|
|
|
|
|
|
|
|
|
|
|
|
|
|
| Unaffiliated issuers |
|
$ |
7,966,750 |
|
|
|
|
|
|
$ |
2,974,857 |
|
|
$ |
42,948,920 |
|
|
|
|
|
|
$ |
7,020,180 |
|
|
$ |
3,403,678 |
|
| Affiliated issuers |
|
|
295,186 |
|
|
|
|
|
|
|
113,977 |
|
|
|
965,003 |
|
|
|
|
|
|
|
254,704 |
|
|
|
138,525 |
|
| Cash |
|
|
232 |
|
|
|
|
|
|
|
903 |
|
|
|
518 |
|
|
|
|
|
|
|
819 |
|
|
|
4,139 |
|
| Cash collateral received for securities on loan |
|
|
479 |
|
|
|
|
|
|
|
1,722 |
|
|
|
3,903 |
|
|
|
|
|
|
|
– |
|
|
|
748 |
|
| Cash collateral pledged for futures contracts |
|
|
– |
|
|
|
|
|
|
|
– |
|
|
|
– |
|
|
|
|
|
|
|
– |
|
|
|
– |
|
| Cash collateral pledged for swap contracts |
|
|
– |
|
|
|
|
|
|
|
– |
|
|
|
– |
|
|
|
|
|
|
|
– |
|
|
|
– |
|
| Cash denominated in currencies other than U.S. dollars |
|
|
50 |
|
|
|
|
|
|
|
119 |
|
|
|
877 |
|
|
|
|
|
|
|
1,442 |
|
|
|
667 |
|
| Unrealized appreciation on open forward currency contracts |
|
|
– |
|
|
|
|
|
|
|
– |
|
|
|
– |
|
|
|
|
|
|
|
– |
|
|
|
131 |
|
| Unrealized appreciation on unfunded commitments* |
|
|
– |
|
|
|
|
|
|
|
– |
|
|
|
– |
|
|
|
|
|
|
|
– |
|
|
|
– |
|
| Receivables for: |
|
|
|
|
|
|
|
|
|
|
|
|
|
|
|
|
|
|
|
|
|
|
|
|
|
|
|
|
| Sales of investments |
|
|
19,976 |
|
|
|
|
|
|
|
3,927 |
|
|
|
13,214 |
|
|
|
|
|
|
|
3,283 |
|
|
|
45,061 |
|
| Sales of fund’s shares |
|
|
2,424 |
|
|
|
|
|
|
|
1,672 |
|
|
|
16,037 |
|
|
|
|
|
|
|
3,440 |
|
|
|
3,780 |
|
| Dividends and interest |
|
|
11,534 |
|
|
|
|
|
|
|
2,747 |
|
|
|
16,118 |
|
|
|
|
|
|
|
17,776 |
|
|
|
11,185 |
|
| Variation margin on futures contracts |
|
|
– |
|
|
|
|
|
|
|
– |
|
|
|
– |
|
|
|
|
|
|
|
– |
|
|
|
35 |
|
| Variation margin on centrally cleared swap contracts |
|
|
– |
|
|
|
|
|
|
|
– |
|
|
|
– |
|
|
|
|
|
|
|
– |
|
|
|
8 |
|
| Securities lending income |
|
|
1 |
|
|
|
|
|
|
|
38 |
|
|
|
26 |
|
|
|
|
|
|
|
4 |
|
|
|
7 |
|
| Other |
|
|
– |
|
|
|
|
|
|
|
– |
† |
|
|
– |
|
|
|
|
|
|
|
– |
† |
|
|
– |
|
|
|
|
|
|
|
|
|
|
|
|
8,296,632 |
|
|
|
|
|
|
|
3,099,962 |
|
|
|
43,964,616 |
|
|
|
|
|
|
|
7,301,648 |
|
|
|
3,607,964 |
|
|
|
|
|
|
|
|
|
| Liabilities: |
|
|
|
|
|
|
|
|
|
|
|
|
|
|
|
|
|
|
|
|
|
|
|
|
|
|
|
|
| Collateral for securities on loan |
|
|
4,789 |
|
|
|
|
|
|
|
17,225 |
|
|
|
39,028 |
|
|
|
|
|
|
|
– |
|
|
|
7,477 |
|
| Unrealized depreciation on open forward currency contracts |
|
|
– |
|
|
|
|
|
|
|
– |
|
|
|
– |
|
|
|
|
|
|
|
– |
|
|
|
195 |
|
| Bilateral swaps, at value |
|
|
– |
|
|
|
|
|
|
|
– |
|
|
|
– |
|
|
|
|
|
|
|
– |
|
|
|
197 |
|
| Options written, at value |
|
|
– |
|
|
|
|
|
|
|
– |
|
|
|
– |
|
|
|
|
|
|
|
– |
|
|
|
– |
|
| Payables for: |
|
|
|
|
|
|
|
|
|
|
|
|
|
|
|
|
|
|
|
|
|
|
|
|
|
|
|
|
| Purchases of investments |
|
|
34,552 |
|
|
|
|
|
|
|
4,217 |
|
|
|
11,404 |
|
|
|
|
|
|
|
5,168 |
|
|
|
6,473 |
|
| Repurchases of fund’s shares |
|
|
13,192 |
|
|
|
|
|
|
|
1,779 |
|
|
|
58,743 |
|
|
|
|
|
|
|
4,934 |
|
|
|
3,938 |
|
| Investment advisory services |
|
|
2,469 |
|
|
|
|
|
|
|
1,525 |
|
|
|
10,894 |
|
|
|
|
|
|
|
2,859 |
|
|
|
1,462 |
|
| Insurance administrative fees |
|
|
526 |
|
|
|
|
|
|
|
185 |
|
|
|
2,704 |
|
|
|
|
|
|
|
280 |
|
|
|
507 |
|
| Services provided by related parties |
|
|
1,135 |
|
|
|
|
|
|
|
505 |
|
|
|
5,829 |
|
|
|
|
|
|
|
980 |
|
|
|
420 |
|
| Trustees’ deferred compensation |
|
|
108 |
|
|
|
|
|
|
|
63 |
|
|
|
592 |
|
|
|
|
|
|
|
187 |
|
|
|
50 |
|
| Variation margin on futures contracts |
|
|
– |
|
|
|
|
|
|
|
– |
|
|
|
– |
|
|
|
|
|
|
|
– |
|
|
|
10 |
|
| Variation margin on centrally cleared swap contracts |
|
|
– |
|
|
|
|
|
|
|
– |
|
|
|
– |
|
|
|
|
|
|
|
– |
|
|
|
3 |
|
| Non-U.S. taxes |
|
|
5,454 |
|
|
|
|
|
|
|
18,507 |
|
|
|
– |
|
|
|
|
|
|
|
32,220 |
|
|
|
19,505 |
|
| Other |
|
|
773 |
|
|
|
|
|
|
|
206 |
|
|
|
767 |
|
|
|
|
|
|
|
1,104 |
|
|
|
430 |
|
|
|
|
|
|
|
|
|
|
|
|
62,998 |
|
|
|
|
|
|
|
44,212 |
|
|
|
129,961 |
|
|
|
|
|
|
|
47,732 |
|
|
|
40,667 |
|
| Commitments and contingencies* |
|
|
|
|
|
|
|
|
|
|
|
|
|
|
|
|
|
|
|
|
|
|
|
|
|
|
|
|
|
|
|
|
|
|
|
|
| Net assets at June 30, 2024 |
|
$ |
8,233,634 |
|
|
|
|
|
|
$ |
3,055,750 |
|
|
$ |
43,834,655 |
|
|
|
|
|
|
$ |
7,253,916 |
|
|
$ |
3,567,297 |
|
|
|
|
|
|
|
|
|
|
|
|
|
|
| Net assets consist of: |
|
|
|
|
|
|
|
|
|
|
|
|
|
|
|
|
|
|
|
|
|
|
|
|
|
|
|
|
| Capital paid in on shares of beneficial interest |
|
$ |
4,188,838 |
|
|
|
|
|
|
$ |
2,402,001 |
|
|
$ |
18,626,919 |
|
|
|
|
|
|
$ |
5,566,137 |
|
|
$ |
2,431,342 |
|
| Total distributable earnings (accumulated loss) |
|
|
4,044,796 |
|
|
|
|
|
|
|
653,749 |
|
|
|
25,207,736 |
|
|
|
|
|
|
|
1,687,779 |
|
|
|
1,135,955 |
|
|
|
|
|
|
|
|
|
| Net assets at June 30, 2024 |
|
$ |
8,233,634 |
|
|
|
|
|
|
$ |
3,055,750 |
|
|
$ |
43,834,655 |
|
|
|
|
|
|
$ |
7,253,916 |
|
|
$ |
3,567,297 |
|
|
|
|
|
|
|
|
|
|
|
|
|
|
| Investment securities on loan, at value |
|
$ |
4,457 |
|
|
|
|
|
|
$ |
41,131 |
|
|
$ |
38,162 |
|
|
|
|
|
|
$ |
9,093 |
|
|
$ |
14,933 |
|
| Investment securities, at cost |
|
|
|
|
|
|
|
|
|
|
|
|
|
|
|
|
|
|
|
|
|
|
|
|
|
|
|
|
| Unaffiliated issuers |
|
|
4,878,864 |
|
|
|
|
|
|
|
2,314,045 |
|
|
|
19,847,748 |
|
|
|
|
|
|
|
4,976,685 |
|
|
|
2,361,239 |
|
| Affiliated issuers |
|
|
295,172 |
|
|
|
|
|
|
|
100,243 |
|
|
|
964,947 |
|
|
|
|
|
|
|
254,706 |
|
|
|
138,525 |
|
| Cash denominated in currencies other than U.S. dollars, at cost |
|
|
53 |
|
|
|
|
|
|
|
120 |
|
|
|
876 |
|
|
|
|
|
|
|
1,442 |
|
|
|
669 |
|
| Premiums received on options written |
|
|
– |
|
|
|
|
|
|
|
– |
|
|
|
– |
|
|
|
|
|
|
|
– |
|
|
|
– |
|
Refer to the end of the statements of assets and liabilities for footnotes.
Refer to the notes to financial statements.
American Funds Insurance Series 248
|
|
|
| Financial statements (continued) Statements of assets and liabilities at June 30, 2024 (continued) |
|
unaudited (dollars in thousands) |
|
|
|
|
|
|
|
|
|
|
|
|
|
|
|
|
|
|
|
|
|
|
|
|
|
|
| |
|
Washington
Mutual
Investors
Fund |
|
Capital
World Growth
and Income
Fund |
|
Growth-
Income
Fund |
|
International
Growth
and Income
Fund |
|
Capital
Income
Builder |
|
|
|
|
|
|
| Assets: |
|
|
|
|
|
|
|
|
|
|
|
|
|
|
|
|
|
|
|
|
|
|
|
|
|
| Investment securities, at value: |
|
|
|
|
|
|
|
|
|
|
|
|
|
|
|
|
|
|
|
|
|
|
|
|
|
| Unaffiliated issuers |
|
|
$ |
10,435,918 |
|
|
|
$ |
1,849,795 |
|
|
|
$ |
38,704,827 |
|
|
|
$ |
309,553 |
|
|
|
$ |
1,245,997 |
|
| Affiliated issuers |
|
|
|
419,230 |
|
|
|
|
62,675 |
|
|
|
|
1,400,527 |
|
|
|
|
19,520 |
|
|
|
|
110,564 |
|
| Cash |
|
|
|
233 |
|
|
|
|
47 |
|
|
|
|
424 |
|
|
|
|
55 |
|
|
|
|
194 |
|
| Cash collateral received for securities on loan |
|
|
|
– |
|
|
|
|
966 |
|
|
|
|
11,983 |
|
|
|
|
– |
|
|
|
|
1,650 |
|
| Cash collateral pledged for futures contracts |
|
|
|
– |
|
|
|
|
– |
|
|
|
|
– |
|
|
|
|
– |
|
|
|
|
– |
|
| Cash collateral pledged for swap contracts |
|
|
|
– |
|
|
|
|
– |
|
|
|
|
– |
|
|
|
|
– |
|
|
|
|
– |
|
| Cash denominated in currencies other than U.S. dollars |
|
|
|
4 |
|
|
|
|
394 |
|
|
|
|
2,935 |
|
|
|
|
192 |
|
|
|
|
240 |
|
| Unrealized appreciation on open forward currency contracts |
|
|
|
– |
|
|
|
|
– |
|
|
|
|
– |
|
|
|
|
– |
|
|
|
|
– |
|
| Unrealized appreciation on unfunded commitments* |
|
|
|
– |
|
|
|
|
– |
|
|
|
|
– |
|
|
|
|
– |
|
|
|
|
– |
|
| Receivables for: |
|
|
|
|
|
|
|
|
|
|
|
|
|
|
|
|
|
|
|
|
|
|
|
|
|
| Sales of investments |
|
|
|
20,607 |
|
|
|
|
3,793 |
|
|
|
|
162,974 |
|
|
|
|
143 |
|
|
|
|
29,467 |
|
| Sales of fund’s shares |
|
|
|
3,225 |
|
|
|
|
96 |
|
|
|
|
4,397 |
|
|
|
|
168 |
|
|
|
|
1,593 |
|
| Dividends and interest |
|
|
|
13,866 |
|
|
|
|
4,400 |
|
|
|
|
50,813 |
|
|
|
|
1,545 |
|
|
|
|
5,698 |
|
| Variation margin on futures contracts |
|
|
|
– |
|
|
|
|
– |
|
|
|
|
– |
|
|
|
|
– |
|
|
|
|
6 |
|
| Variation margin on centrally cleared swap contracts |
|
|
|
– |
|
|
|
|
– |
|
|
|
|
– |
|
|
|
|
– |
|
|
|
|
21 |
|
| Securities lending income |
|
|
|
10 |
|
|
|
|
5 |
|
|
|
|
45 |
|
|
|
|
– |
† |
|
|
|
7 |
|
| Other |
|
|
|
4 |
|
|
|
|
13 |
|
|
|
|
– |
|
|
|
|
– |
|
|
|
|
7 |
|
|
|
|
|
|
|
|
|
|
|
10,893,097 |
|
|
|
|
1,922,184 |
|
|
|
|
40,338,925 |
|
|
|
|
331,176 |
|
|
|
|
1,395,444 |
|
|
|
|
|
|
|
| Liabilities: |
|
|
|
|
|
|
|
|
|
|
|
|
|
|
|
|
|
|
|
|
|
|
|
|
|
| Collateral for securities on loan |
|
|
|
– |
|
|
|
|
9,661 |
|
|
|
|
119,835 |
|
|
|
|
– |
|
|
|
|
16,497 |
|
| Unrealized depreciation on open forward currency contracts |
|
|
|
– |
|
|
|
|
– |
|
|
|
|
– |
|
|
|
|
– |
|
|
|
|
– |
|
| Bilateral swaps, at value |
|
|
|
– |
|
|
|
|
– |
|
|
|
|
– |
|
|
|
|
– |
|
|
|
|
– |
|
| Options written, at value |
|
|
|
– |
|
|
|
|
– |
|
|
|
|
– |
|
|
|
|
– |
|
|
|
|
– |
|
| Payables for: |
|
|
|
|
|
|
|
|
|
|
|
|
|
|
|
|
|
|
|
|
|
|
|
|
|
| Purchases of investments |
|
|
|
11,648 |
|
|
|
|
640 |
|
|
|
|
17,131 |
|
|
|
|
210 |
|
|
|
|
66,823 |
|
| Repurchases of fund’s shares |
|
|
|
9,547 |
|
|
|
|
1,300 |
|
|
|
|
77,940 |
|
|
|
|
361 |
|
|
|
|
458 |
|
| Investment advisory services |
|
|
|
2,076 |
|
|
|
|
589 |
|
|
|
|
8,193 |
|
|
|
|
132 |
|
|
|
|
244 |
|
| Insurance administrative fees |
|
|
|
931 |
|
|
|
|
159 |
|
|
|
|
1,446 |
|
|
|
|
97 |
|
|
|
|
367 |
|
| Services provided by related parties |
|
|
|
1,183 |
|
|
|
|
317 |
|
|
|
|
4,259 |
|
|
|
|
72 |
|
|
|
|
153 |
|
| Trustees’ deferred compensation |
|
|
|
131 |
|
|
|
|
30 |
|
|
|
|
631 |
|
|
|
|
14 |
|
|
|
|
12 |
|
| Variation margin on futures contracts |
|
|
|
– |
|
|
|
|
– |
|
|
|
|
– |
|
|
|
|
– |
|
|
|
|
191 |
|
| Variation margin on centrally cleared swap contracts |
|
|
|
– |
|
|
|
|
– |
|
|
|
|
– |
|
|
|
|
– |
|
|
|
|
2 |
|
| Non-U.S. taxes |
|
|
|
213 |
|
|
|
|
967 |
|
|
|
|
1,763 |
|
|
|
|
189 |
|
|
|
|
406 |
|
| Other |
|
|
|
4 |
|
|
|
|
20 |
|
|
|
|
107 |
|
|
|
|
50 |
|
|
|
|
157 |
|
|
|
|
|
|
|
|
|
|
|
25,733 |
|
|
|
|
13,683 |
|
|
|
|
231,305 |
|
|
|
|
1,125 |
|
|
|
|
85,310 |
|
| Commitments and contingencies* |
|
|
|
|
|
|
|
|
|
|
|
|
|
|
|
|
|
|
|
|
|
|
|
|
|
|
|
|
|
|
|
| Net assets at June 30, 2024 |
|
|
$ |
10,867,364 |
|
|
|
$ |
1,908,501 |
|
|
|
$ |
40,107,620 |
|
|
|
$ |
330,051 |
|
|
|
$ |
1,310,134 |
|
|
|
|
|
|
|
|
|
|
|
|
|
| Net assets consist of: |
|
|
|
|
|
|
|
|
|
|
|
|
|
|
|
|
|
|
|
|
|
|
|
|
|
| Capital paid in on shares of beneficial interest |
|
|
$ |
6,736,929 |
|
|
|
$ |
1,236,822 |
|
|
|
$ |
18,824,836 |
|
|
|
$ |
296,075 |
|
|
|
$ |
1,094,668 |
|
| Total distributable earnings (accumulated loss) |
|
|
|
4,130,435 |
|
|
|
|
671,679 |
|
|
|
|
21,282,784 |
|
|
|
|
33,976 |
|
|
|
|
215,466 |
|
|
|
|
|
|
|
| Net assets at June 30, 2024 |
|
|
$ |
10,867,364 |
|
|
|
$ |
1,908,501 |
|
|
|
$ |
40,107,620 |
|
|
|
$ |
330,051 |
|
|
|
$ |
1,310,134 |
|
|
|
|
|
|
|
|
|
|
|
|
|
| Investment securities on loan, at value |
|
|
$ |
– |
|
|
|
$ |
10,543 |
|
|
|
$ |
114,087 |
|
|
|
$ |
715 |
|
|
|
$ |
20,164 |
|
| Investment securities, at cost |
|
|
|
|
|
|
|
|
|
|
|
|
|
|
|
|
|
|
|
|
|
|
|
|
|
| Unaffiliated issuers |
|
|
|
6,952,628 |
|
|
|
|
1,190,067 |
|
|
|
|
23,447,509 |
|
|
|
|
251,174 |
|
|
|
|
1,028,856 |
|
| Affiliated issuers |
|
|
|
419,195 |
|
|
|
|
62,674 |
|
|
|
|
1,348,742 |
|
|
|
|
19,517 |
|
|
|
|
114,153 |
|
| Cash denominated in currencies other than U.S. dollars, at cost |
|
|
|
4 |
|
|
|
|
394 |
|
|
|
|
2,936 |
|
|
|
|
192 |
|
|
|
|
240 |
|
| Premiums received on options written |
|
|
|
– |
|
|
|
|
– |
|
|
|
|
– |
|
|
|
|
– |
|
|
|
|
– |
|
Refer to the end of the statements of assets and liabilities for footnotes.
Refer to the notes to financial statements.
249 American Funds Insurance Series
|
|
|
| Financial statements (continued) Statements of assets and liabilities at June 30, 2024 (continued) |
|
unaudited (dollars in thousands) |
|
|
|
|
|
|
|
|
|
|
|
|
|
|
|
|
|
|
|
|
|
|
|
|
|
|
| |
|
Asset
Allocation
Fund |
|
American
Funds
Global
Balanced
Fund |
|
The Bond
Fund
of America |
|
Capital
World Bond
Fund |
|
American
High-Income
Trust |
|
|
|
|
|
|
| Assets: |
|
|
|
|
|
|
|
|
|
|
|
|
|
|
|
|
|
|
|
|
|
|
|
|
|
| Investment securities, at value: |
|
|
|
|
|
|
|
|
|
|
|
|
|
|
|
|
|
|
|
|
|
|
|
|
|
| Unaffiliated issuers |
|
|
$ |
24,770,361 |
|
|
|
$ |
374,998 |
|
|
|
$ |
10,815,470 |
|
|
|
$ |
1,453,720 |
|
|
|
$ |
859,873 |
|
| Affiliated issuers |
|
|
|
3,193,004 |
|
|
|
|
35,995 |
|
|
|
|
1,710,287 |
|
|
|
|
231,179 |
|
|
|
|
20,436 |
|
| Cash |
|
|
|
3,185 |
|
|
|
|
73 |
|
|
|
|
4,880 |
|
|
|
|
357 |
|
|
|
|
1,173 |
|
| Cash collateral received for securities on loan |
|
|
|
1,991 |
|
|
|
|
15 |
|
|
|
|
– |
|
|
|
|
– |
|
|
|
|
– |
|
| Cash collateral pledged for futures contracts |
|
|
|
– |
|
|
|
|
– |
|
|
|
|
– |
|
|
|
|
– |
|
|
|
|
153 |
|
| Cash collateral pledged for swap contracts |
|
|
|
– |
|
|
|
|
– |
|
|
|
|
– |
|
|
|
|
– |
|
|
|
|
491 |
|
| Cash denominated in currencies other than U.S. dollars |
|
|
|
336 |
|
|
|
|
83 |
|
|
|
|
195 |
|
|
|
|
46 |
|
|
|
|
4 |
|
| Unrealized appreciation on open forward currency contracts |
|
|
|
– |
|
|
|
|
183 |
|
|
|
|
1,071 |
|
|
|
|
1,871 |
|
|
|
|
– |
|
| Unrealized appreciation on unfunded commitments* |
|
|
|
1 |
|
|
|
|
– |
|
|
|
|
– |
|
|
|
|
– |
|
|
|
|
2 |
|
| Receivables for: |
|
|
|
|
|
|
|
|
|
|
|
|
|
|
|
|
|
|
|
|
|
|
|
|
|
| Sales of investments |
|
|
|
364,046 |
|
|
|
|
8,514 |
|
|
|
|
1,087,237 |
|
|
|
|
87,857 |
|
|
|
|
331 |
|
| Sales of fund’s shares |
|
|
|
3,226 |
|
|
|
|
260 |
|
|
|
|
6,844 |
|
|
|
|
1,124 |
|
|
|
|
124 |
|
| Dividends and interest |
|
|
|
87,227 |
|
|
|
|
2,095 |
|
|
|
|
87,998 |
|
|
|
|
14,722 |
|
|
|
|
13,662 |
|
| Variation margin on futures contracts |
|
|
|
2,785 |
|
|
|
|
44 |
|
|
|
|
3,736 |
|
|
|
|
524 |
|
|
|
|
9 |
|
| Variation margin on centrally cleared swap contracts |
|
|
|
380 |
|
|
|
|
18 |
|
|
|
|
1,034 |
|
|
|
|
270 |
|
|
|
|
8 |
|
| Securities lending income |
|
|
|
55 |
|
|
|
|
– |
† |
|
|
|
– |
|
|
|
|
– |
|
|
|
|
– |
|
| Other |
|
|
|
93 |
|
|
|
|
– |
|
|
|
|
– |
|
|
|
|
– |
|
|
|
|
2 |
|
|
|
|
|
|
|
|
|
|
|
28,426,690 |
|
|
|
|
422,278 |
|
|
|
|
13,718,752 |
|
|
|
|
1,791,670 |
|
|
|
|
896,268 |
|
|
|
|
|
|
|
| Liabilities: |
|
|
|
|
|
|
|
|
|
|
|
|
|
|
|
|
|
|
|
|
|
|
|
|
|
| Collateral for securities on loan |
|
|
|
19,914 |
|
|
|
|
147 |
|
|
|
|
– |
|
|
|
|
– |
|
|
|
|
– |
|
| Unrealized depreciation on open forward currency contracts |
|
|
|
– |
|
|
|
|
286 |
|
|
|
|
125 |
|
|
|
|
3,859 |
|
|
|
|
– |
|
| Bilateral swaps, at value |
|
|
|
– |
|
|
|
|
157 |
|
|
|
|
– |
|
|
|
|
1,221 |
|
|
|
|
– |
|
| Options written, at value |
|
|
|
– |
|
|
|
|
– |
|
|
|
|
– |
|
|
|
|
920 |
|
|
|
|
– |
|
| Payables for: |
|
|
|
|
|
|
|
|
|
|
|
|
|
|
|
|
|
|
|
|
|
|
|
|
|
| Purchases of investments |
|
|
|
1,432,645 |
|
|
|
|
29,199 |
|
|
|
|
2,558,995 |
|
|
|
|
266,084 |
|
|
|
|
3,787 |
|
| Repurchases of fund’s shares |
|
|
|
31,140 |
|
|
|
|
105 |
|
|
|
|
7,847 |
|
|
|
|
1,062 |
|
|
|
|
319 |
|
| Investment advisory services |
|
|
|
5,824 |
|
|
|
|
141 |
|
|
|
|
1,850 |
|
|
|
|
539 |
|
|
|
|
208 |
|
| Insurance administrative fees |
|
|
|
3,850 |
|
|
|
|
84 |
|
|
|
|
771 |
|
|
|
|
48 |
|
|
|
|
75 |
|
| Services provided by related parties |
|
|
|
2,850 |
|
|
|
|
69 |
|
|
|
|
1,070 |
|
|
|
|
214 |
|
|
|
|
158 |
|
| Trustees’ deferred compensation |
|
|
|
380 |
|
|
|
|
5 |
|
|
|
|
157 |
|
|
|
|
30 |
|
|
|
|
33 |
|
| Variation margin on futures contracts |
|
|
|
1,661 |
|
|
|
|
69 |
|
|
|
|
9,981 |
|
|
|
|
926 |
|
|
|
|
18 |
|
| Variation margin on centrally cleared swap contracts |
|
|
|
371 |
|
|
|
|
8 |
|
|
|
|
232 |
|
|
|
|
179 |
|
|
|
|
5 |
|
| Non-U.S. taxes |
|
|
|
– |
|
|
|
|
190 |
|
|
|
|
17 |
|
|
|
|
93 |
|
|
|
|
– |
|
| Other |
|
|
|
1,263 |
|
|
|
|
21 |
|
|
|
|
18 |
|
|
|
|
120 |
|
|
|
|
1 |
|
|
|
|
|
|
|
|
|
|
|
1,499,898 |
|
|
|
|
30,481 |
|
|
|
|
2,581,063 |
|
|
|
|
275,295 |
|
|
|
|
4,604 |
|
| Commitments and contingencies* |
|
|
|
|
|
|
|
|
|
|
|
|
|
|
|
|
|
|
|
|
|
|
|
|
|
|
|
|
|
|
|
| Net assets at June 30, 2024 |
|
|
$ |
26,926,792 |
|
|
|
$ |
391,797 |
|
|
|
$ |
11,137,689 |
|
|
|
$ |
1,516,375 |
|
|
|
$ |
891,664 |
|
|
|
|
|
|
|
|
|
|
|
|
|
| Net assets consist of: |
|
|
|
|
|
|
|
|
|
|
|
|
|
|
|
|
|
|
|
|
|
|
|
|
|
| Capital paid in on shares of beneficial interest |
|
|
$ |
18,791,744 |
|
|
|
$ |
329,610 |
|
|
|
$ |
12,772,384 |
|
|
|
$ |
1,810,706 |
|
|
|
$ |
1,200,060 |
|
| Total distributable earnings (accumulated loss) |
|
|
|
8,135,048 |
|
|
|
|
62,187 |
|
|
|
|
(1,634,695 |
) |
|
|
|
(294,331 |
) |
|
|
|
(308,396 |
) |
|
|
|
|
|
|
| Net assets at June 30, 2024 |
|
|
$ |
26,926,792 |
|
|
|
$ |
391,797 |
|
|
|
$ |
11,137,689 |
|
|
|
$ |
1,516,375 |
|
|
|
$ |
891,664 |
|
|
|
|
|
|
|
|
|
|
|
|
|
| Investment securities on loan, at value |
|
|
$ |
19,113 |
|
|
|
$ |
143 |
|
|
|
$ |
– |
|
|
|
$ |
– |
|
|
|
$ |
– |
|
| Investment securities, at cost |
|
|
|
|
|
|
|
|
|
|
|
|
|
|
|
|
|
|
|
|
|
|
|
|
|
| Unaffiliated issuers |
|
|
|
17,261,076 |
|
|
|
|
322,755 |
|
|
|
|
11,124,829 |
|
|
|
|
1,548,780 |
|
|
|
|
862,937 |
|
| Affiliated issuers |
|
|
|
3,391,993 |
|
|
|
|
35,821 |
|
|
|
|
1,710,028 |
|
|
|
|
230,011 |
|
|
|
|
20,435 |
|
| Cash denominated in currencies other than U.S. dollars, at cost |
|
|
|
336 |
|
|
|
|
83 |
|
|
|
|
195 |
|
|
|
|
47 |
|
|
|
|
4 |
|
| Premiums received on options written |
|
|
|
– |
|
|
|
|
– |
|
|
|
|
– |
|
|
|
|
827 |
|
|
|
|
– |
|
Refer to the end of the statements of assets and liabilities for footnotes.
Refer to the notes to financial statements.
American Funds Insurance Series 250
|
|
|
| Financial statements (continued) Statements of assets and liabilities at June 30, 2024 (continued) |
|
unaudited (dollars in thousands) |
|
|
|
|
|
|
|
|
|
|
|
|
|
|
|
|
|
|
|
|
|
|
|
|
|
|
| |
|
American
Funds
Mortgage
Fund |
|
Ultra-Short
Bond Fund |
|
U.S.
Government
Securities
Fund |
|
Managed
Risk
Growth
Fund |
|
Managed
Risk
International
Fund |
|
|
|
|
|
|
| Assets: |
|
|
|
|
|
|
|
|
|
|
|
|
|
|
|
|
|
|
|
|
|
|
|
|
|
| Investment securities, at value: |
|
|
|
|
|
|
|
|
|
|
|
|
|
|
|
|
|
|
|
|
|
|
|
|
|
| Unaffiliated issuers |
|
|
$ |
146,707 |
|
|
|
$ |
347,774 |
|
|
|
$ |
2,018,807 |
|
|
|
$ |
25,948 |
|
|
|
$ |
6,820 |
|
| Affiliated issuers |
|
|
|
– |
|
|
|
|
– |
|
|
|
|
– |
|
|
|
|
493,727 |
|
|
|
|
116,079 |
|
| Cash |
|
|
|
2,695 |
|
|
|
|
9,119 |
|
|
|
|
40,914 |
|
|
|
|
– |
|
|
|
|
– |
|
| Cash collateral received for securities on loan |
|
|
|
– |
|
|
|
|
– |
|
|
|
|
– |
|
|
|
|
– |
|
|
|
|
– |
|
| Cash collateral pledged for futures contracts |
|
|
|
– |
|
|
|
|
– |
|
|
|
|
– |
|
|
|
|
526 |
|
|
|
|
275 |
|
| Cash collateral pledged for swap contracts |
|
|
|
– |
|
|
|
|
– |
|
|
|
|
– |
|
|
|
|
– |
|
|
|
|
– |
|
| Cash denominated in currencies other than U.S. dollars |
|
|
|
– |
|
|
|
|
– |
|
|
|
|
– |
|
|
|
|
– |
|
|
|
|
– |
|
| Unrealized appreciation on open forward currency contracts |
|
|
|
– |
|
|
|
|
– |
|
|
|
|
– |
|
|
|
|
– |
|
|
|
|
– |
|
| Unrealized appreciation on unfunded commitments* |
|
|
|
– |
|
|
|
|
– |
|
|
|
|
– |
|
|
|
|
– |
|
|
|
|
– |
|
| Receivables for: |
|
|
|
|
|
|
|
|
|
|
|
|
|
|
|
|
|
|
|
|
|
|
|
|
|
| Sales of investments |
|
|
|
14,575 |
|
|
|
|
– |
|
|
|
|
179,227 |
|
|
|
|
1,315 |
|
|
|
|
134 |
|
| Sales of fund’s shares |
|
|
|
513 |
|
|
|
|
242 |
|
|
|
|
351 |
|
|
|
|
– |
† |
|
|
|
1 |
|
| Dividends and interest |
|
|
|
399 |
|
|
|
|
40 |
|
|
|
|
10,937 |
|
|
|
|
111 |
|
|
|
|
27 |
|
| Variation margin on futures contracts |
|
|
|
52 |
|
|
|
|
– |
|
|
|
|
1,167 |
|
|
|
|
– |
|
|
|
|
11 |
|
| Variation margin on centrally cleared swap contracts |
|
|
|
13 |
|
|
|
|
– |
|
|
|
|
1,981 |
|
|
|
|
– |
|
|
|
|
– |
|
| Securities lending income |
|
|
|
– |
|
|
|
|
– |
|
|
|
|
– |
|
|
|
|
– |
|
|
|
|
– |
|
| Other |
|
|
|
1 |
|
|
|
|
– |
|
|
|
|
– |
|
|
|
|
– |
|
|
|
|
– |
|
|
|
|
|
|
|
|
|
|
|
164,955 |
|
|
|
|
357,175 |
|
|
|
|
2,253,384 |
|
|
|
|
521,627 |
|
|
|
|
123,347 |
|
|
|
|
|
|
|
| Liabilities: |
|
|
|
|
|
|
|
|
|
|
|
|
|
|
|
|
|
|
|
|
|
|
|
|
|
| Collateral for securities on loan |
|
|
|
– |
|
|
|
|
– |
|
|
|
|
– |
|
|
|
|
– |
|
|
|
|
– |
|
| Unrealized depreciation on open forward currency contracts |
|
|
|
– |
|
|
|
|
– |
|
|
|
|
– |
|
|
|
|
– |
|
|
|
|
– |
|
| Bilateral swaps, at value |
|
|
|
– |
|
|
|
|
– |
|
|
|
|
– |
|
|
|
|
– |
|
|
|
|
– |
|
| Options written, at value |
|
|
|
– |
|
|
|
|
– |
|
|
|
|
496 |
|
|
|
|
– |
|
|
|
|
– |
|
| Payables for: |
|
|
|
|
|
|
|
|
|
|
|
|
|
|
|
|
|
|
|
|
|
|
|
|
|
| Purchases of investments |
|
|
|
54,329 |
|
|
|
|
– |
|
|
|
|
527,504 |
|
|
|
|
410 |
|
|
|
|
80 |
|
| Repurchases of fund’s shares |
|
|
|
88 |
|
|
|
|
1,700 |
|
|
|
|
1,318 |
|
|
|
|
953 |
|
|
|
|
58 |
|
| Investment advisory services |
|
|
|
19 |
|
|
|
|
75 |
|
|
|
|
317 |
|
|
|
|
42 |
|
|
|
|
10 |
|
| Insurance administrative fees |
|
|
|
30 |
|
|
|
|
32 |
|
|
|
|
191 |
|
|
|
|
316 |
|
|
|
|
77 |
|
| Services provided by related parties |
|
|
|
21 |
|
|
|
|
74 |
|
|
|
|
300 |
|
|
|
|
101 |
|
|
|
|
25 |
|
| Trustees’ deferred compensation |
|
|
|
3 |
|
|
|
|
12 |
|
|
|
|
46 |
|
|
|
|
6 |
|
|
|
|
2 |
|
| Variation margin on futures contracts |
|
|
|
96 |
|
|
|
|
– |
|
|
|
|
1,155 |
|
|
|
|
54 |
|
|
|
|
4 |
|
| Variation margin on centrally cleared swap contracts |
|
|
|
1 |
|
|
|
|
– |
|
|
|
|
450 |
|
|
|
|
– |
|
|
|
|
– |
|
| Non-U.S. taxes |
|
|
|
– |
|
|
|
|
– |
|
|
|
|
– |
|
|
|
|
– |
|
|
|
|
– |
|
| Other |
|
|
|
– |
† |
|
|
|
–1 |
|
|
|
|
|
|
|
|
|
– |
|
|
|
|
– |
|
|
|
|
|
|
|
|
|
|
|
54,587 |
|
|
|
|
1,893 |
|
|
|
|
531,778 |
|
|
|
|
1,882 |
|
|
|
|
256 |
|
| Commitments and contingencies* |
|
|
|
|
|
|
|
|
|
|
|
|
|
|
|
|
|
|
|
|
|
|
|
|
|
|
|
|
|
|
|
| Net assets at June 30, 2024 |
|
|
$ |
110,368 |
|
|
|
$ |
355,282 |
|
|
|
$ |
1,721,606 |
|
|
|
$ |
519,745 |
|
|
|
$ |
123,091 |
|
|
|
|
|
|
|
|
|
|
|
|
|
| Net assets consist of: |
|
|
|
|
|
|
|
|
|
|
|
|
|
|
|
|
|
|
|
|
|
|
|
|
|
| Capital paid in on shares of beneficial interest |
|
|
$ |
123,544 |
|
|
|
$ |
346,582 |
|
|
|
$ |
2,001,634 |
|
|
|
$ |
487,969 |
|
|
|
$ |
143,670 |
|
| Total distributable earnings (accumulated loss) |
|
|
|
(13,176 |
) |
|
|
|
8,700 |
|
|
|
|
(280,028 |
) |
|
|
|
31,776 |
|
|
|
|
(20,579 |
) |
|
|
|
|
|
|
| Net assets at June 30, 2024 |
|
|
$ |
110,368 |
|
|
|
$ |
355,282 |
|
|
|
$ |
1,721,606 |
|
|
|
$ |
519,745 |
|
|
|
$ |
123,091 |
|
|
|
|
|
|
|
|
|
|
|
|
|
| Investment securities on loan, at value |
|
|
$ |
– |
|
|
|
$ |
– |
|
|
|
$ |
– |
|
|
|
$ |
– |
|
|
|
$ |
– |
|
| Investment securities, at cost |
|
|
|
|
|
|
|
|
|
|
|
|
|
|
|
|
|
|
|
|
|
|
|
|
|
| Unaffiliated issuers |
|
|
|
148,031 |
|
|
|
|
347,924 |
|
|
|
|
2,073,482 |
|
|
|
|
26,763 |
|
|
|
|
6,422 |
|
| Affiliated issuers |
|
|
|
– |
|
|
|
|
– |
|
|
|
|
– |
|
|
|
|
371,690 |
|
|
|
|
98,352 |
|
| Cash denominated in currencies other than U.S. dollars, at cost |
|
|
|
– |
|
|
|
|
– |
|
|
|
|
– |
|
|
|
|
– |
|
|
|
|
– |
|
| Premiums received on options written |
|
|
|
– |
|
|
|
|
– |
|
|
|
|
512 |
|
|
|
|
– |
|
|
|
|
– |
|
Refer to the end of the statements of assets and liabilities for footnotes.
Refer to the notes to financial statements.
251 American Funds Insurance Series
|
|
|
| Financial statements (continued) Statements of assets and liabilities at June 30, 2024 (continued) |
|
unaudited (dollars in thousands) |
|
|
|
|
|
|
|
|
|
|
|
|
|
| |
|
Managed Risk
Washington
Mutual
Investors
Fund |
|
|
Managed
Risk
Growth-
Income
Fund |
|
|
Managed
Risk
Asset
Allocation
Fund |
|
|
|
|
|
| Assets: |
|
|
|
|
|
|
|
|
|
|
|
|
| Investment securities, at value: |
|
|
|
|
|
|
|
|
|
|
|
|
| Unaffiliated issuers |
|
|
$16,454 |
|
|
|
$110,334 |
|
|
|
$99,651 |
|
| Affiliated issuers |
|
|
312,594 |
|
|
|
2,121,023 |
|
|
|
1,993,284 |
|
| Cash |
|
|
– |
|
|
|
– |
|
|
|
– |
|
| Cash collateral received for securities on loan |
|
|
– |
|
|
|
– |
|
|
|
– |
|
| Cash collateral pledged for futures contracts |
|
|
372 |
|
|
|
3,268 |
|
|
|
991 |
|
| Cash collateral pledged for swap contracts |
|
|
– |
|
|
|
– |
|
|
|
– |
|
| Cash denominated in currencies other than U.S. dollars |
|
|
– |
|
|
|
– |
|
|
|
– |
|
| Unrealized appreciation on open forward currency contracts |
|
|
– |
|
|
|
– |
|
|
|
– |
|
| Unrealized appreciation on unfunded commitments* |
|
|
– |
|
|
|
– |
|
|
|
– |
|
| Receivables for: |
|
|
|
|
|
|
|
|
|
|
|
|
| Sales of investments |
|
|
242 |
|
|
|
11,307 |
|
|
|
3,213 |
|
| Sales of fund’s shares |
|
|
438 |
|
|
|
1 |
|
|
|
64 |
|
| Dividends and interest |
|
|
72 |
|
|
|
470 |
|
|
|
443 |
|
| Variation margin on futures contracts |
|
|
– |
|
|
|
– |
|
|
|
– |
|
| Variation margin on centrally cleared swap contracts |
|
|
– |
|
|
|
– |
|
|
|
– |
|
| Securities lending income |
|
|
– |
|
|
|
– |
|
|
|
– |
|
| Other |
|
|
– |
|
|
|
– |
|
|
|
– |
|
|
|
|
|
|
|
|
330,172 |
|
|
|
2,246,403 |
|
|
|
2,097,646 |
|
|
|
|
|
| Liabilities: |
|
|
|
|
|
|
|
|
|
|
|
|
| Collateral for securities on loan |
|
|
– |
|
|
|
– |
|
|
|
– |
|
| Unrealized depreciation on open forward currency contracts |
|
|
– |
|
|
|
– |
|
|
|
– |
|
| Bilateral swaps, at value |
|
|
– |
|
|
|
– |
|
|
|
– |
|
| Options written, at value |
|
|
– |
|
|
|
– |
|
|
|
– |
|
| Payables for: |
|
|
|
|
|
|
|
|
|
|
|
|
| Purchases of investments |
|
|
474 |
|
|
|
75 |
|
|
|
– |
|
| Repurchases of fund’s shares |
|
|
195 |
|
|
|
11,825 |
|
|
|
3,446 |
|
| Investment advisory services |
|
|
27 |
|
|
|
183 |
|
|
|
172 |
|
| Insurance administrative fees |
|
|
201 |
|
|
|
1,366 |
|
|
|
1,296 |
|
| Services provided by related parties |
|
|
65 |
|
|
|
57 |
|
|
|
424 |
|
| Trustees’ deferred compensation |
|
|
4 |
|
|
|
22 |
|
|
|
34 |
|
| Variation margin on futures contracts |
|
|
22 |
|
|
|
214 |
|
|
|
93 |
|
| Variation margin on centrally cleared swap contracts |
|
|
– |
|
|
|
– |
|
|
|
– |
|
| Non-U.S. taxes |
|
|
– |
|
|
|
– |
|
|
|
– |
|
| Other |
|
|
– |
|
|
|
– |
|
|
|
– |
|
|
|
|
|
|
|
|
988 |
|
|
|
13,742 |
|
|
|
5,465 |
|
| Commitments and contingencies* |
|
|
|
|
|
|
|
|
|
|
|
|
|
|
|
|
| Net assets at June 30, 2024 |
|
|
$329,184 |
|
|
|
$2,232,661 |
|
|
|
$2,092,181 |
|
|
|
|
|
|
|
|
|
|
| Net assets consist of: |
|
|
|
|
|
|
|
|
|
|
|
|
| Capital paid in on shares of beneficial interest |
|
|
$322,570 |
|
|
|
$1,904,174 |
|
|
|
$1,909,929 |
|
| Total distributable earnings (accumulated loss) |
|
|
6,614 |
|
|
|
328,487 |
|
|
|
182,252 |
|
|
|
|
|
| Net assets at June 30, 2024 |
|
|
$329,184 |
|
|
|
$2,232,661 |
|
|
|
$2,092,181 |
|
|
|
|
|
|
|
|
|
|
| Investment securities on loan, at value |
|
|
$– |
|
|
|
$– |
|
|
|
$– |
|
| Investment securities, at cost |
|
|
|
|
|
|
|
|
|
|
|
|
| Unaffiliated issuers |
|
|
17,148 |
|
|
|
117,821 |
|
|
|
100,305 |
|
| Affiliated issuers |
|
|
261,239 |
|
|
|
1,805,209 |
|
|
|
1,894,128 |
|
| Cash denominated in currencies other than U.S. dollars, at cost |
|
|
– |
|
|
|
– |
|
|
|
– |
|
| Premiums received on options written |
|
|
– |
|
|
|
– |
|
|
|
– |
|
Refer to the end of the statements of assets and liabilities for footnotes.
Refer to the notes to financial statements.
American Funds Insurance Series 252
|
|
|
| Financial statements (continued) Statements of assets and liabilities at June 30, 2024 (continued) |
|
unaudited (dollars and shares in thousands, except per-share amounts) |
|
|
|
|
|
|
|
|
|
|
|
|
|
|
|
|
|
|
|
|
|
|
|
|
|
| |
|
|
|
|
|
Global
Growth Fund |
|
|
Global Small
Capitalization
Fund |
|
|
Growth
Fund |
|
|
International
Fund |
|
|
New World Fund |
|
|
|
|
|
|
|
| Shares of beneficial interest issued and outstanding
(no stated par value) – unlimited shares authorized |
|
|
|
|
|
|
|
|
|
|
|
|
|
|
|
|
|
|
|
|
|
|
|
|
|
|
|
|
| Class 1: |
|
Net assets |
|
|
|
|
$3,634,539 |
|
|
|
$966,566 |
|
|
|
$19,612,211 |
|
|
|
$3,344,759 |
|
|
|
$1,915,934 |
|
|
|
Shares outstanding |
|
|
|
|
97,196 |
|
|
|
54,094 |
|
|
|
174,099 |
|
|
|
178,512 |
|
|
|
70,907 |
|
|
|
Net asset value per share |
|
|
|
|
$37.39 |
|
|
|
$17.87 |
|
|
|
$112.65 |
|
|
|
$18.74 |
|
|
|
$27.02 |
|
|
|
|
|
|
|
|
|
| Class 1A: |
|
Net assets |
|
|
|
|
$19,555 |
|
|
|
$5,243 |
|
|
|
$329,434 |
|
|
|
$12,566 |
|
|
|
$10,613 |
|
|
|
Shares outstanding |
|
|
|
|
526 |
|
|
|
298 |
|
|
|
2,957 |
|
|
|
675 |
|
|
|
395 |
|
|
|
Net asset value per share |
|
|
|
|
$37.15 |
|
|
|
$17.59 |
|
|
|
$111.40 |
|
|
|
$18.62 |
|
|
|
$26.87 |
|
|
|
|
|
|
|
|
|
| Class 2: |
|
Net assets |
|
|
|
|
$3,713,964 |
|
|
|
$1,787,961 |
|
|
|
$19,295,635 |
|
|
|
$3,436,567 |
|
|
|
$826,781 |
|
|
|
Shares outstanding |
|
|
|
|
100,877 |
|
|
|
106,573 |
|
|
|
173,672 |
|
|
|
184,488 |
|
|
|
31,014 |
|
|
|
Net asset value per share |
|
|
|
|
$36.82 |
|
|
|
$16.78 |
|
|
|
$111.10 |
|
|
|
$18.63 |
|
|
|
$26.66 |
|
|
|
|
|
|
|
|
|
| Class 3: |
|
Net assets |
|
|
|
|
|
|
|
|
|
|
|
|
$259,121 |
|
|
|
$16,271 |
|
|
|
|
|
|
|
Shares outstanding |
|
|
|
|
Not applicable |
|
|
|
Not applicable |
|
|
|
2,276 |
|
|
|
866 |
|
|
|
Not applicable |
|
|
|
Net asset value per share |
|
|
|
|
|
|
|
|
|
|
|
|
$113.85 |
|
|
|
$18.79 |
|
|
|
|
|
|
|
|
|
|
|
|
|
| Class 4: |
|
Net assets |
|
|
|
|
$865,576 |
|
|
|
$295,980 |
|
|
|
$4,338,254 |
|
|
|
$443,753 |
|
|
|
$813,969 |
|
|
|
Shares outstanding |
|
|
|
|
23,801 |
|
|
|
17,693 |
|
|
|
40,134 |
|
|
|
24,231 |
|
|
|
30,829 |
|
|
|
Net asset value per share |
|
|
|
|
$36.37 |
|
|
|
$16.73 |
|
|
|
$108.09 |
|
|
|
$18.31 |
|
|
|
$26.40 |
|
|
|
|
|
|
|
|
|
|
|
|
|
|
|
|
|
|
|
|
|
|
|
|
|
|
| |
|
|
|
|
|
Washington
Mutual
Investors
Fund |
|
|
Capital
World Growth
and Income
Fund |
|
|
Growth-
Income
Fund |
|
|
International
Growth
and Income
Fund |
|
|
Capital
Income
Builder |
|
|
|
|
|
|
|
| Shares of beneficial interest issued and outstanding
(no stated par value) – unlimited shares authorized |
|
|
|
|
|
|
|
|
|
|
|
|
|
|
|
|
|
|
|
|
|
|
|
|
|
|
|
|
| Class 1: |
|
Net assets |
|
|
|
|
$6,284,651 |
|
|
|
$594,076 |
|
|
|
$23,840,100 |
|
|
|
$16,295 |
|
|
|
$692,173 |
|
|
|
Shares outstanding |
|
|
|
|
393,951 |
|
|
|
39,150 |
|
|
|
369,692 |
|
|
|
1,532 |
|
|
|
57,693 |
|
|
|
Net asset value per share |
|
|
|
|
$15.95 |
|
|
|
$15.17 |
|
|
|
$64.49 |
|
|
|
$10.64 |
|
|
|
$12.00 |
|
|
|
|
|
|
|
|
|
| Class 1A: |
|
Net assets |
|
|
|
|
$26,468 |
|
|
|
$8,281 |
|
|
|
$39,602 |
|
|
|
$5,972 |
|
|
|
$10,824 |
|
|
|
Shares outstanding |
|
|
|
|
1,667 |
|
|
|
550 |
|
|
|
619 |
|
|
|
578 |
|
|
|
903 |
|
|
|
Net asset value per share |
|
|
|
|
$15.87 |
|
|
|
$15.07 |
|
|
|
$64.00 |
|
|
|
$10.34 |
|
|
|
$11.98 |
|
|
|
|
|
|
|
|
|
| Class 2: |
|
Net assets |
|
|
|
|
$3,005,179 |
|
|
|
$1,051,762 |
|
|
|
$13,670,858 |
|
|
|
$157,580 |
|
|
|
$15,792 |
|
|
|
Shares outstanding |
|
|
|
|
192,244 |
|
|
|
69,574 |
|
|
|
215,853 |
|
|
|
15,243 |
|
|
|
1,318 |
|
|
|
Net asset value per share |
|
|
|
|
$15.63 |
|
|
|
$15.12 |
|
|
|
$63.33 |
|
|
|
$10.34 |
|
|
|
$11.99 |
|
|
|
|
|
|
|
|
|
| Class 3: |
|
Net assets |
|
|
|
|
|
|
|
|
|
|
|
|
$151,885 |
|
|
|
|
|
|
|
|
|
|
|
Shares outstanding |
|
|
|
|
Not applicable |
|
|
|
Not applicable |
|
|
|
2,351 |
|
|
|
Not applicable |
|
|
|
Not applicable |
|
|
|
Net asset value per share |
|
|
|
|
|
|
|
|
|
|
|
|
$64.61 |
|
|
|
|
|
|
|
|
|
|
|
|
|
|
|
|
|
| Class 4: |
|
Net assets |
|
|
|
|
$1,551,066 |
|
|
|
$254,382 |
|
|
|
$2,405,175 |
|
|
|
$150,204 |
|
|
|
$591,345 |
|
|
|
Shares outstanding |
|
|
|
|
100,410 |
|
|
|
17,287 |
|
|
|
38,685 |
|
|
|
14,783 |
|
|
|
49,406 |
|
|
|
Net asset value per share |
|
|
|
|
$15.45 |
|
|
|
$14.72 |
|
|
|
$62.17 |
|
|
|
$10.16 |
|
|
|
$11.97 |
|
Refer to the end of the statements of assets and liabilities for footnotes.
Refer to the notes to financial statements.
253 American Funds Insurance Series
|
|
|
| Financial statements (continued) Statements of assets and liabilities at June 30, 2024 (continued) |
|
unaudited (dollars and shares in thousands, except per-share amounts) |
|
|
|
|
|
|
|
|
|
|
|
|
|
|
|
|
|
|
|
|
|
|
|
|
|
| |
|
|
|
|
|
Asset
Allocation
Fund |
|
|
American
Funds
Global
Balanced
Fund |
|
|
The Bond
Fund
of America |
|
|
Capital
World Bond
Fund |
|
|
American
High-Income
Trust |
|
|
|
|
|
|
|
| Shares of beneficial interest issued and outstanding
(no stated par value) – unlimited shares authorized |
|
|
|
|
|
|
|
|
|
|
|
|
|
|
|
|
|
|
|
|
|
|
|
|
|
|
|
|
| Class 1: |
|
Net assets |
|
|
|
|
$16,050,995 |
|
|
|
$98,257 |
|
|
|
$7,062,850 |
|
|
|
$633,847 |
|
|
|
$227,066 |
|
|
|
Shares outstanding |
|
|
|
|
644,952 |
|
|
|
7,657 |
|
|
|
749,934 |
|
|
|
64,831 |
|
|
|
24,705 |
|
|
|
Net asset value per share |
|
|
|
|
$24.89 |
|
|
|
$12.83 |
|
|
|
$9.42 |
|
|
|
$9.78 |
|
|
|
$9.19 |
|
|
|
|
|
|
|
|
|
| Class 1A: |
|
Net assets |
|
|
|
|
$33,567 |
|
|
|
$2,733 |
|
|
|
$209,966 |
|
|
|
$37,013 |
|
|
|
$2,908 |
|
|
|
Shares outstanding |
|
|
|
|
1,357 |
|
|
|
215 |
|
|
|
22,469 |
|
|
|
3,821 |
|
|
|
318 |
|
|
|
Net asset value per share |
|
|
|
|
$24.73 |
|
|
|
$12.75 |
|
|
|
$9.34 |
|
|
|
$9.69 |
|
|
|
$9.15 |
|
|
|
|
|
|
|
|
|
| Class 2: |
|
Net assets |
|
|
|
|
$4,356,251 |
|
|
|
$156,656 |
|
|
|
$2,807,280 |
|
|
|
$789,090 |
|
|
|
$528,468 |
|
|
|
Shares outstanding |
|
|
|
|
177,818 |
|
|
|
12,283 |
|
|
|
302,898 |
|
|
|
81,673 |
|
|
|
58,951 |
|
|
|
Net asset value per share |
|
|
|
|
$24.50 |
|
|
|
$12.75 |
|
|
|
$9.27 |
|
|
|
$9.66 |
|
|
|
$8.96 |
|
|
|
|
|
|
|
|
|
| Class 3: |
|
Net assets |
|
|
|
|
$31,592 |
|
|
|
|
|
|
|
|
|
|
|
|
|
|
|
$8,047 |
|
|
|
Shares outstanding |
|
|
|
|
1,268 |
|
|
|
Not applicable |
|
|
|
Not applicable |
|
|
|
Not applicable |
|
|
|
871 |
|
|
|
Net asset value per share |
|
|
|
|
$24.91 |
|
|
|
|
|
|
|
|
|
|
|
|
|
|
|
$9.24 |
|
|
|
|
|
|
|
|
|
| Class 4: |
|
Net assets |
|
|
|
|
$6,454,387 |
|
|
|
$134,151 |
|
|
|
$1,057,593 |
|
|
|
$56,425 |
|
|
|
$125,175 |
|
|
|
Shares outstanding |
|
|
|
|
265,952 |
|
|
|
10,705 |
|
|
|
114,789 |
|
|
|
5,936 |
|
|
|
12,499 |
|
|
|
Net asset value per share |
|
|
|
|
$24.27 |
|
|
|
$12.53 |
|
|
|
$9.21 |
|
|
|
$9.51 |
|
|
|
$10.01 |
|
|
|
|
|
|
|
|
|
|
|
|
|
|
|
|
|
|
|
|
|
|
|
|
|
|
| |
|
|
|
|
|
American
Funds
Mortgage
Fund |
|
|
Ultra-Short
Bond Fund |
|
|
U.S.
Government
Securities
Fund |
|
|
Managed
Risk Growth Fund |
|
|
Managed
Risk
International
Fund |
|
|
|
|
|
|
|
| Shares of beneficial interest issued and outstanding
(no stated par value) – unlimited shares authorized |
|
|
|
|
|
|
|
|
|
|
|
|
|
|
|
|
|
|
|
|
|
|
|
|
|
|
|
|
| Class 1: |
|
Net assets |
|
|
|
|
$16,592 |
|
|
|
$38,963 |
|
|
|
$258,713 |
|
|
|
|
|
|
|
|
|
|
|
Shares outstanding |
|
|
|
|
1,791 |
|
|
|
3,378 |
|
|
|
26,530 |
|
|
|
Not applicable |
|
|
|
Not applicable |
|
|
|
Net asset value per share |
|
|
|
|
$9.26 |
|
|
|
$11.53 |
|
|
|
$9.75 |
|
|
|
|
|
|
|
|
|
|
|
|
|
|
|
|
|
| Class 1A: |
|
Net assets |
|
|
|
|
$2,219 |
|
|
|
$122 |
|
|
|
$214,486 |
|
|
|
|
|
|
|
|
|
|
|
Shares outstanding |
|
|
|
|
243 |
|
|
|
11 |
|
|
|
22,107 |
|
|
|
Not applicable |
|
|
|
Not applicable |
|
|
|
Net asset value per share |
|
|
|
|
$9.14 |
|
|
|
$11.52 |
|
|
|
$9.70 |
|
|
|
|
|
|
|
|
|
|
|
|
|
|
|
|
|
| Class 2: |
|
Net assets |
|
|
|
|
$42,945 |
|
|
|
$262,572 |
|
|
|
$1,058,967 |
|
|
|
|
|
|
|
|
|
|
|
Shares outstanding |
|
|
|
|
4,688 |
|
|
|
23,559 |
|
|
|
110,118 |
|
|
|
Not applicable |
|
|
|
Not applicable |
|
|
|
Net asset value per share |
|
|
|
|
$9.16 |
|
|
|
$11.15 |
|
|
|
$9.62 |
|
|
|
|
|
|
|
|
|
|
|
|
|
|
|
|
|
| Class 3: |
|
Net assets |
|
|
|
|
|
|
|
|
$3,935 |
|
|
|
$5,155 |
|
|
|
|
|
|
|
|
|
|
|
Shares outstanding |
|
|
|
|
Not applicable |
|
|
|
348 |
|
|
|
527 |
|
|
|
Not applicable |
|
|
|
Not applicable |
|
|
|
Net asset value per share |
|
|
|
|
|
|
|
|
$11.30 |
|
|
|
$9.78 |
|
|
|
|
|
|
|
|
|
|
|
|
|
|
|
|
|
| Class 4: |
|
Net assets |
|
|
|
|
$48,612 |
|
|
|
$49,690 |
|
|
|
$184,285 |
|
|
|
|
|
|
|
|
|
|
|
Shares outstanding |
|
|
|
|
5,379 |
|
|
|
4,433 |
|
|
|
19,196 |
|
|
|
Not applicable |
|
|
|
Not applicable |
|
|
|
Net asset value per share |
|
|
|
|
$9.04 |
|
|
|
$11.21 |
|
|
|
$9.60 |
|
|
|
|
|
|
|
|
|
|
|
|
|
|
|
|
|
| Class P1: |
|
Net assets |
|
|
|
|
|
|
|
|
|
|
|
|
|
|
|
|
$13,060 |
|
|
|
$1,910 |
|
|
|
Shares outstanding |
|
|
|
|
Not applicable |
|
|
|
Not applicable |
|
|
|
Not applicable |
|
|
|
1,074 |
|
|
|
219 |
|
|
|
Net asset value per share |
|
|
|
|
|
|
|
|
|
|
|
|
|
|
|
|
$12.16 |
|
|
|
$8.74 |
|
|
|
|
|
|
|
|
|
| Class P2: |
|
Net assets |
|
|
|
|
|
|
|
|
|
|
|
|
|
|
|
|
$506,685 |
|
|
|
$121,181 |
|
|
|
Shares outstanding |
|
|
|
|
Not applicable |
|
|
|
Not applicable |
|
|
|
Not applicable |
|
|
|
42,107 |
|
|
|
13,928 |
|
|
|
Net asset value per share |
|
|
|
|
|
|
|
|
|
|
|
|
|
|
|
|
$12.03 |
|
|
|
$8.70 |
|
Refer to the end of the statements of assets and liabilities for footnotes.
Refer to the notes to financial statements.
American Funds Insurance Series 254
|
|
|
| Financial statements (continued) Statements of assets and liabilities at June 30, 2024 (continued) |
|
unaudited (dollars and shares in thousands, except per-share amounts) |
|
|
|
|
|
|
|
|
|
|
|
|
|
|
|
|
|
| |
|
|
|
|
|
Managed Risk
Washington
Mutual
Investors
Fund |
|
|
Managed
Risk
Growth-
Income
Fund |
|
|
Managed
Risk Asset Allocation
Fund |
|
|
|
|
|
|
| Shares of beneficial interest issued and outstanding
(no stated par value) – unlimited shares authorized |
|
|
|
|
|
|
|
|
|
|
|
|
|
|
|
|
|
|
|
|
| Class P1: |
|
Net assets |
|
|
|
|
$2,744 |
|
|
|
$1,951,328 |
|
|
|
$10,444 |
|
|
|
Shares outstanding |
|
|
|
|
243 |
|
|
|
144,216 |
|
|
|
832 |
|
|
|
Net asset value per share |
|
|
|
|
$11.28 |
|
|
|
$13.53 |
|
|
|
$12.56 |
|
|
|
|
|
|
|
| Class P2: |
|
Net assets |
|
|
|
|
$326,440 |
|
|
|
$281,333 |
|
|
|
$2,081,737 |
|
|
|
Shares outstanding |
|
|
|
|
29,165 |
|
|
|
20,952 |
|
|
|
171,400 |
|
|
|
Net asset value per share |
|
|
|
|
$11.19 |
|
|
|
$13.43 |
|
|
|
$12.15 |
|
*Refer to Note 5 for further information on unfunded commitments and refer to Note 7 for further information on expense recoupment.
† Amount less than one thousand.
Refer to the notes to financial statements.
255 American Funds Insurance Series
|
|
|
| Financial statements (continued) Statements of operations for the six months ended June 30, 2024 |
|
unaudited (dollars in thousands) |
|
|
|
|
|
|
|
|
|
|
|
|
|
|
|
|
|
|
|
|
|
| |
|
Global Growth Fund |
|
|
Global Small Capitalization Fund |
|
|
Growth Fund |
|
|
International Fund |
|
|
New World Fund |
|
|
|
|
|
|
|
| Investment income: |
|
|
|
|
|
|
|
|
|
|
|
|
|
|
|
|
|
|
|
|
| Income (net of non-U.S. taxes*): |
|
|
|
|
|
|
|
|
|
|
|
|
|
|
|
|
|
|
|
|
| Dividends: |
|
|
|
|
|
|
|
|
|
|
|
|
|
|
|
|
|
|
|
|
| Unaffiliated issuers |
|
$ |
66,243 |
|
|
$ |
22,541 |
|
|
$ |
134,655 |
|
|
$ |
74,268 |
|
|
$ |
34,857 |
|
| Affiliated issuers |
|
|
11,421 |
|
|
|
2,890 |
|
|
|
27,383 |
|
|
|
6,516 |
|
|
|
4,142 |
|
|
|
|
|
|
|
|
|
|
77,664 |
|
|
|
25,431 |
|
|
|
162,038 |
|
|
|
80,784 |
|
|
|
38,999 |
|
| Interest from unaffiliated issuers |
|
|
942 |
|
|
|
38 |
|
|
|
201 |
|
|
|
36 |
|
|
|
5,544 |
|
| Securities lending income (net of fees) |
|
|
51 |
|
|
|
211 |
|
|
|
132 |
|
|
|
29 |
|
|
|
22 |
|
|
|
|
|
|
|
|
|
|
78,657 |
|
|
|
25,680 |
|
|
|
162,371 |
|
|
|
80,849 |
|
|
|
44,565 |
|
| Fees and expenses*: |
|
|
|
|
|
|
|
|
|
|
|
|
|
|
|
|
|
|
|
|
| Investment advisory services |
|
|
18,991 |
|
|
|
9,975 |
|
|
|
63,952 |
|
|
|
17,324 |
|
|
|
9,872 |
|
| Distribution services |
|
|
5,549 |
|
|
|
2,629 |
|
|
|
28,397 |
|
|
|
4,835 |
|
|
|
2,021 |
|
| Insurance administrative services |
|
|
1,023 |
|
|
|
373 |
|
|
|
5,249 |
|
|
|
554 |
|
|
|
1,012 |
|
| Transfer agent services |
|
|
1 |
|
|
|
– |
† |
|
|
5 |
|
|
|
1 |
|
|
|
– |
† |
| Administrative services |
|
|
1,199 |
|
|
|
463 |
|
|
|
6,239 |
|
|
|
1,087 |
|
|
|
513 |
|
| Accounting and administrative services |
|
|
– |
|
|
|
– |
|
|
|
– |
|
|
|
– |
|
|
|
– |
|
| Reports to shareholders |
|
|
51 |
|
|
|
21 |
|
|
|
278 |
|
|
|
51 |
|
|
|
24 |
|
| Registration statement and prospectus |
|
|
6 |
|
|
|
4 |
|
|
|
46 |
|
|
|
10 |
|
|
|
5 |
|
| Trustees’ compensation |
|
|
24 |
|
|
|
9 |
|
|
|
122 |
|
|
|
21 |
|
|
|
10 |
|
| Auditing and legal |
|
|
23 |
|
|
|
58 |
|
|
|
44 |
|
|
|
38 |
|
|
|
69 |
|
| Custodian |
|
|
296 |
|
|
|
282 |
|
|
|
249 |
|
|
|
477 |
|
|
|
394 |
|
|
|
|
|
|
|
| Other |
|
|
3 |
|
|
|
23 |
|
|
|
19 |
|
|
|
5 |
|
|
|
25 |
|
|
|
|
|
|
|
| Total fees and expenses before waivers/reimbursement |
|
|
27,166 |
|
|
|
13,837 |
|
|
|
104,600 |
|
|
|
24,403 |
|
|
|
13,945 |
|
| Less waivers/reimbursement of fees and expenses: |
|
|
|
|
|
|
|
|
|
|
|
|
|
|
|
|
|
|
|
|
| Investment advisory services waivers |
|
|
4,398 |
|
|
|
415 |
|
|
|
– |
|
|
|
– |
|
|
|
1,198 |
|
| Miscellaneous fee reimbursement |
|
|
– |
|
|
|
– |
|
|
|
– |
|
|
|
– |
|
|
|
– |
|
|
|
|
|
|
|
| Total waivers/reimbursement of fees and expenses |
|
|
4,398 |
|
|
|
415 |
|
|
|
– |
|
|
|
– |
|
|
|
1,198 |
|
|
|
|
|
|
|
| Total fees and expenses after waivers/reimbursement |
|
|
22,768 |
|
|
|
13,422 |
|
|
|
104,600 |
|
|
|
24,403 |
|
|
|
12,747 |
|
|
|
|
|
|
|
| Net investment income |
|
|
55,889 |
|
|
|
12,258 |
|
|
|
57,771 |
|
|
|
56,446 |
|
|
|
31,818 |
|
|
|
|
|
|
|
| Net realized gain (loss) and unrealized appreciation (depreciation): |
|
|
|
|
|
|
|
|
|
|
|
|
|
|
|
|
|
|
|
|
| Net realized gain (loss)* on: |
|
|
|
|
|
|
|
|
|
|
|
|
|
|
|
|
|
|
|
|
| Investments in: |
|
|
|
|
|
|
|
|
|
|
|
|
|
|
|
|
|
|
|
|
| Unaffiliated issuers |
|
|
935,602 |
|
|
|
23,056 |
|
|
|
2,107,582 |
|
|
|
179,028 |
|
|
|
108,730 |
|
| Affiliated issuers |
|
|
(31 |
) |
|
|
7 |
|
|
|
(28 |
) |
|
|
(19 |
) |
|
|
19 |
|
| Options purchased (futures style) |
|
|
– |
|
|
|
– |
|
|
|
– |
|
|
|
– |
|
|
|
– |
|
| Options written |
|
|
– |
|
|
|
– |
|
|
|
– |
|
|
|
– |
|
|
|
– |
|
| Futures contracts |
|
|
– |
|
|
|
– |
|
|
|
– |
|
|
|
– |
|
|
|
(111 |
) |
| Forward currency contracts |
|
|
– |
|
|
|
1 |
|
|
|
– |
|
|
|
– |
|
|
|
64 |
|
| Swap contracts |
|
|
– |
|
|
|
– |
|
|
|
– |
|
|
|
– |
|
|
|
(113 |
) |
| Currency transactions |
|
|
(158 |
) |
|
|
(42 |
) |
|
|
68 |
|
|
|
611 |
|
|
|
(671 |
) |
| Capital gain distributions received from affiliated issuers |
|
|
– |
|
|
|
– |
|
|
|
– |
|
|
|
– |
|
|
|
– |
|
|
|
|
|
|
|
|
|
|
935,413 |
|
|
|
23,022 |
|
|
|
2,107,622 |
|
|
|
179,620 |
|
|
|
107,918 |
|
| Net unrealized appreciation (depreciation)* on: |
|
|
|
|
|
|
|
|
|
|
|
|
|
|
|
|
|
|
|
|
| Investments in: |
|
|
|
|
|
|
|
|
|
|
|
|
|
|
|
|
|
|
|
|
| Unaffiliated issuers |
|
|
59,871 |
|
|
|
(28,677 |
) |
|
|
4,043,764 |
|
|
|
276,343 |
|
|
|
87,381 |
|
| Affiliated issuers |
|
|
27 |
|
|
|
8,469 |
|
|
|
45 |
|
|
|
(3 |
) |
|
|
(9 |
) |
| Options written |
|
|
– |
|
|
|
– |
|
|
|
– |
|
|
|
– |
|
|
|
– |
|
| Futures contracts |
|
|
– |
|
|
|
– |
|
|
|
– |
|
|
|
– |
|
|
|
1 |
|
| Forward currency contracts |
|
|
– |
|
|
|
– |
|
|
|
– |
|
|
|
– |
|
|
|
49 |
|
| Swap contracts |
|
|
– |
|
|
|
– |
|
|
|
– |
|
|
|
– |
|
|
|
(291 |
) |
| Currency translations |
|
|
(237 |
) |
|
|
(110 |
) |
|
|
(126 |
) |
|
|
(379 |
) |
|
|
(264 |
) |
|
|
|
|
|
|
|
|
|
59,661 |
|
|
|
(20,318 |
) |
|
|
4,043,683 |
|
|
|
275,961 |
|
|
|
86,867 |
|
|
|
|
|
|
|
| Net realized gain (loss) and unrealized appreciation (depreciation) |
|
|
995,074 |
|
|
|
2,704 |
|
|
|
6,151,305 |
|
|
|
455,581 |
|
|
|
194,785 |
|
|
|
|
|
|
|
| Net increase (decrease) in net assets resulting from operations |
|
$ |
1,050,963 |
|
|
$ |
14,962 |
|
|
$ |
6,209,076 |
|
|
$ |
512,027 |
|
|
$ |
226,603 |
|
|
|
|
|
|
Refer to the end of the statements of operations for footnotes.
Refer to the notes to financial statements.
American Funds Insurance Series 256
|
|
|
| Financial statements (continued) Statements of operations for the six months ended June 30, 2024 (continued) |
|
unaudited (dollars in thousands) |
|
|
|
|
|
|
|
|
|
|
|
|
|
|
|
|
|
|
|
|
|
|
|
|
|
|
| |
|
Washington Mutual Investors Fund |
|
Capital World Growth and Income Fund |
|
Growth- Income Fund |
|
International Growth and Income Fund |
|
Capital Income Builder |
|
|
|
|
|
|
| Investment income: |
|
|
|
|
|
|
|
|
|
|
|
|
|
|
|
|
|
|
|
|
|
|
|
|
|
| Income (net of non-U.S. taxes*): |
|
|
|
|
|
|
|
|
|
|
|
|
|
|
|
|
|
|
|
|
|
|
|
|
|
| Dividends: |
|
|
|
|
|
|
|
|
|
|
|
|
|
|
|
|
|
|
|
|
|
|
|
|
|
| Unaffiliated issuers |
|
|
$ |
102,890 |
|
|
|
$ |
22,005 |
|
|
|
$ |
288,028 |
|
|
|
$ |
6,340 |
|
|
|
$ |
19,921 |
|
| Affiliated issuers |
|
|
|
9,616 |
|
|
|
|
1,790 |
|
|
|
|
33,109 |
|
|
|
|
385 |
|
|
|
|
3,052 |
|
|
|
|
|
|
|
|
|
|
|
112,506 |
|
|
|
|
23,795 |
|
|
|
|
321,137 |
|
|
|
|
6,725 |
|
|
|
|
22,973 |
|
| Interest from unaffiliated issuers |
|
|
|
8 |
|
|
|
|
146 |
|
|
|
|
201 |
|
|
|
|
30 |
|
|
|
|
3,548 |
|
| Securities lending income (net of fees) |
|
|
|
140 |
|
|
|
|
12 |
|
|
|
|
126 |
|
|
|
|
2 |
|
|
|
|
16 |
|
|
|
|
|
|
|
|
|
|
|
112,654 |
|
|
|
|
23,953 |
|
|
|
|
321,464 |
|
|
|
|
6,757 |
|
|
|
|
26,537 |
|
| Fees and expenses*: |
|
|
|
|
|
|
|
|
|
|
|
|
|
|
|
|
|
|
|
|
|
|
|
|
|
| Investment advisory services |
|
|
|
19,738 |
|
|
|
|
4,484 |
|
|
|
|
48,698 |
|
|
|
|
816 |
|
|
|
|
2,271 |
|
| Distribution services |
|
|
|
5,476 |
|
|
|
|
1,615 |
|
|
|
|
19,546 |
|
|
|
|
388 |
|
|
|
|
736 |
|
| Insurance administrative services |
|
|
|
1,827 |
|
|
|
|
316 |
|
|
|
|
2,832 |
|
|
|
|
192 |
|
|
|
|
730 |
|
| Transfer agent services |
|
|
|
1 |
|
|
|
|
– |
† |
|
|
|
4 |
|
|
|
|
– |
† |
|
|
|
– |
† |
| Administrative services |
|
|
|
1,583 |
|
|
|
|
283 |
|
|
|
|
5,823 |
|
|
|
|
50 |
|
|
|
|
191 |
|
| Accounting and administrative services |
|
|
|
– |
|
|
|
|
– |
|
|
|
|
– |
|
|
|
|
– |
|
|
|
|
– |
|
| Reports to shareholders |
|
|
|
51 |
|
|
|
|
11 |
|
|
|
|
243 |
|
|
|
|
5 |
|
|
|
|
9 |
|
| Registration statement and prospectus |
|
|
|
3 |
|
|
|
|
2 |
|
|
|
|
44 |
|
|
|
|
2 |
|
|
|
|
9 |
|
| Trustees’ compensation |
|
|
|
31 |
|
|
|
|
5 |
|
|
|
|
115 |
|
|
|
|
1 |
|
|
|
|
4 |
|
| Auditing and legal |
|
|
|
21 |
|
|
|
|
38 |
|
|
|
|
40 |
|
|
|
|
25 |
|
|
|
|
36 |
|
| Custodian |
|
|
|
131 |
|
|
|
|
68 |
|
|
|
|
290 |
|
|
|
|
27 |
|
|
|
|
38 |
|
|
|
|
|
|
|
| Other |
|
|
|
4 |
|
|
|
|
2 |
|
|
|
|
16 |
|
|
|
|
– |
† |
|
|
|
1 |
|
|
|
|
|
|
|
| Total fees and expenses before waivers/reimbursement |
|
|
|
28,866 |
|
|
|
|
6,824 |
|
|
|
|
77,651 |
|
|
|
|
1,506 |
|
|
|
|
4,025 |
|
| Less waivers/reimbursement of fees and expenses: |
|
|
|
|
|
|
|
|
|
|
|
|
|
|
|
|
|
|
|
|
|
|
|
|
|
| Investment advisory services waivers |
|
|
|
8,393 |
|
|
|
|
1,006 |
|
|
|
|
– |
|
|
|
|
– |
|
|
|
|
869 |
|
| Miscellaneous fee reimbursement |
|
|
|
– |
|
|
|
|
– |
|
|
|
|
– |
|
|
|
|
– |
|
|
|
|
– |
|
|
|
|
|
|
|
| Total waivers/reimbursement of fees and expenses |
|
|
|
8,393 |
|
|
|
|
1,006 |
|
|
|
|
– |
|
|
|
|
– |
|
|
|
|
869 |
|
|
|
|
|
|
|
| Total fees and expenses after waivers/reimbursement |
|
|
|
20,473 |
|
|
|
|
5,818 |
|
|
|
|
77,651 |
|
|
|
|
1,506 |
|
|
|
|
3,156 |
|
|
|
|
|
|
|
| Net investment income |
|
|
|
92,181 |
|
|
|
|
18,135 |
|
|
|
|
243,813 |
|
|
|
|
5,251 |
|
|
|
|
23,381 |
|
|
|
|
|
|
|
| Net realized gain (loss) and unrealized appreciation (depreciation): |
|
|
|
|
|
|
|
|
|
|
|
|
|
|
|
|
|
|
|
|
|
|
|
|
|
| Net realized gain (loss)* on: |
|
|
|
|
|
|
|
|
|
|
|
|
|
|
|
|
|
|
|
|
|
|
|
|
|
| Investments in: |
|
|
|
|
|
|
|
|
|
|
|
|
|
|
|
|
|
|
|
|
|
|
|
|
|
| Unaffiliated issuers |
|
|
|
577,271 |
|
|
|
|
75,820 |
|
|
|
|
5,717,125 |
|
|
|
|
(3,503 |
) |
|
|
|
10,308 |
|
| Affiliated issuers |
|
|
|
(5 |
) |
|
|
|
(3 |
) |
|
|
|
509 |
|
|
|
|
– |
† |
|
|
|
(941 |
) |
| Options purchased (futures style) |
|
|
|
– |
|
|
|
|
– |
|
|
|
|
– |
|
|
|
|
– |
|
|
|
|
– |
|
| Options written |
|
|
|
– |
|
|
|
|
– |
|
|
|
|
– |
|
|
|
|
– |
|
|
|
|
– |
|
| Futures contracts |
|
|
|
– |
|
|
|
|
– |
|
|
|
|
– |
|
|
|
|
– |
|
|
|
|
(948 |
) |
| Forward currency contracts |
|
|
|
– |
|
|
|
|
– |
|
|
|
|
– |
|
|
|
|
– |
|
|
|
|
– |
† |
| Swap contracts |
|
|
|
– |
|
|
|
|
– |
|
|
|
|
– |
|
|
|
|
– |
|
|
|
|
441 |
|
| Currency transactions |
|
|
|
(19 |
) |
|
|
|
(46 |
) |
|
|
|
729 |
|
|
|
|
(31 |
) |
|
|
|
(22 |
) |
| Capital gain distributions received from affiliated issuers |
|
|
|
– |
|
|
|
|
– |
|
|
|
|
– |
|
|
|
|
– |
|
|
|
|
– |
|
|
|
|
|
|
|
|
|
|
|
577,247 |
|
|
|
|
75,771 |
|
|
|
|
5,718,363 |
|
|
|
|
(3,534 |
) |
|
|
|
8,838 |
|
| Net unrealized appreciation (depreciation)* on: |
|
|
|
|
|
|
|
|
|
|
|
|
|
|
|
|
|
|
|
|
|
|
|
|
|
| Investments in: |
|
|
|
|
|
|
|
|
|
|
|
|
|
|
|
|
|
|
|
|
|
|
|
|
|
| Unaffiliated issuers |
|
|
|
474,404 |
|
|
|
|
85,428 |
|
|
|
|
(775,824 |
) |
|
|
|
16,945 |
|
|
|
|
24,825 |
|
| Affiliated issuers |
|
|
|
11 |
|
|
|
|
5 |
|
|
|
|
(1,587 |
) |
|
|
|
1 |
|
|
|
|
161 |
|
| Options written |
|
|
|
– |
|
|
|
|
– |
|
|
|
|
– |
|
|
|
|
– |
|
|
|
|
– |
|
| Futures contracts |
|
|
|
– |
|
|
|
|
– |
|
|
|
|
– |
|
|
|
|
– |
|
|
|
|
(1,882 |
) |
| Forward currency contracts |
|
|
|
– |
|
|
|
|
– |
|
|
|
|
– |
|
|
|
|
– |
|
|
|
|
– |
|
| Swap contracts |
|
|
|
– |
|
|
|
|
– |
|
|
|
|
– |
|
|
|
|
– |
|
|
|
|
14 |
|
| Currency translations |
|
|
|
(14 |
) |
|
|
|
(95 |
) |
|
|
|
(317 |
) |
|
|
|
(48 |
) |
|
|
|
(70 |
) |
|
|
|
|
|
|
|
|
|
|
474,401 |
|
|
|
|
85,338 |
|
|
|
|
(777,728 |
) |
|
|
|
16,898 |
|
|
|
|
23,048 |
|
|
|
|
|
|
|
| Net realized gain (loss) and unrealized appreciation (depreciation) |
|
|
|
1,051,648 |
|
|
|
|
161,109 |
|
|
|
|
4,940,635 |
|
|
|
|
13,364 |
|
|
|
|
31,886 |
|
|
|
|
|
|
|
| Net increase (decrease) in net assets resulting from operations |
|
|
$ |
1,143,829 |
|
|
|
$ |
179,244 |
|
|
|
$ |
5,184,448 |
|
|
|
$ |
18,615 |
|
|
|
$ |
55,267 |
|
|
|
|
|
|
|
Refer to the end of the statements of operations for footnotes.
Refer to the notes to financial statements.
257 American Funds Insurance Series
|
|
|
| Financial statements (continued) Statements of operations for the six months ended June 30, 2024 (continued) |
|
unaudited (dollars in thousands) |
|
|
|
|
|
|
|
|
|
|
|
|
|
|
|
|
|
|
|
|
|
|
|
|
|
|
| |
|
Asset
Allocation
Fund |
|
American
Funds
Global
Balanced
Fund |
|
The Bond
Fund of America |
|
Capital
World Bond
Fund |
|
American
High-Income
Trust |
|
|
|
|
|
|
| Investment income: |
|
|
|
|
|
|
|
|
|
|
|
|
|
|
|
|
|
|
|
|
|
|
|
|
|
| Income (net of non-U.S. taxes*): |
|
|
|
|
|
|
|
|
|
|
|
|
|
|
|
|
|
|
|
|
|
|
|
|
|
| Dividends: |
|
|
|
|
|
|
|
|
|
|
|
|
|
|
|
|
|
|
|
|
|
|
|
|
|
| Unaffiliated issuers |
|
|
$ |
134,178 |
|
|
|
$ |
3,562 |
|
|
|
$ |
– |
|
|
|
$ |
1 |
|
|
|
$ |
120 |
|
| Affiliated issuers |
|
|
|
89,964 |
|
|
|
|
1,016 |
|
|
|
|
52,035 |
|
|
|
|
6,721 |
|
|
|
|
797 |
|
|
|
|
|
|
|
|
|
|
|
224,142 |
|
|
|
|
4,578 |
|
|
|
|
52,035 |
|
|
|
|
6,722 |
|
|
|
|
917 |
|
| Interest from unaffiliated issuers |
|
|
|
127,357 |
|
|
|
|
2,101 |
|
|
|
|
214,982 |
|
|
|
|
27,721 |
|
|
|
|
30,922 |
|
| Securities lending income (net of fees) |
|
|
|
227 |
|
|
|
|
2 |
|
|
|
|
– |
|
|
|
|
– |
|
|
|
|
– |
|
|
|
|
|
|
|
|
|
|
|
351,726 |
|
|
|
|
6,681 |
|
|
|
|
267,017 |
|
|
|
|
34,443 |
|
|
|
|
31,839 |
|
| Fees and expenses*: |
|
|
|
|
|
|
|
|
|
|
|
|
|
|
|
|
|
|
|
|
|
|
|
|
|
| Investment advisory services |
|
|
|
34,645 |
|
|
|
|
867 |
|
|
|
|
19,286 |
|
|
|
|
3,228 |
|
|
|
|
1,777 |
|
| Distribution services |
|
|
|
12,962 |
|
|
|
|
360 |
|
|
|
|
4,747 |
|
|
|
|
1,059 |
|
|
|
|
813 |
|
| Insurance administrative services |
|
|
|
7,613 |
|
|
|
|
167 |
|
|
|
|
1,544 |
|
|
|
|
84 |
|
|
|
|
149 |
|
| Transfer agent services |
|
|
|
3 |
|
|
|
|
– |
† |
|
|
|
1 |
|
|
|
|
– |
† |
|
|
|
– |
† |
| Administrative services |
|
|
|
3,919 |
|
|
|
|
58 |
|
|
|
|
1,644 |
|
|
|
|
225 |
|
|
|
|
132 |
|
| Accounting and administrative services |
|
|
|
– |
|
|
|
|
– |
|
|
|
|
– |
|
|
|
|
– |
|
|
|
|
– |
|
| Reports to shareholders |
|
|
|
141 |
|
|
|
|
4 |
|
|
|
|
71 |
|
|
|
|
10 |
|
|
|
|
8 |
|
| Registration statement and prospectus |
|
|
|
20 |
|
|
|
|
2 |
|
|
|
|
14 |
|
|
|
|
2 |
|
|
|
|
3 |
|
| Trustees’ compensation |
|
|
|
78 |
|
|
|
|
1 |
|
|
|
|
33 |
|
|
|
|
5 |
|
|
|
|
2 |
|
| Auditing and legal |
|
|
|
33 |
|
|
|
|
27 |
|
|
|
|
7 |
|
|
|
|
4 |
|
|
|
|
2 |
|
| Custodian |
|
|
|
113 |
|
|
|
|
44 |
|
|
|
|
52 |
|
|
|
|
116 |
|
|
|
|
9 |
|
|
|
|
|
|
|
| Other |
|
|
|
11 |
|
|
|
|
– |
† |
|
|
|
5 |
|
|
|
|
1 |
|
|
|
|
7 |
|
|
|
|
|
|
|
| Total fees and expenses before waivers/reimbursement |
|
|
|
59,538 |
|
|
|
|
1,530 |
|
|
|
|
27,404 |
|
|
|
|
4,734 |
|
|
|
|
2,902 |
|
| Less waivers/reimbursement of fees and expenses: |
|
|
|
|
|
|
|
|
|
|
|
|
|
|
|
|
|
|
|
|
|
|
|
|
|
| Investment advisory services waivers |
|
|
|
– |
|
|
|
|
19 |
|
|
|
|
7,525 |
|
|
|
|
– |
|
|
|
|
586 |
|
| Miscellaneous fee reimbursement |
|
|
|
– |
|
|
|
|
– |
|
|
|
|
– |
|
|
|
|
– |
|
|
|
|
– |
|
|
|
|
|
|
|
| Total waivers/reimbursement of fees and expenses |
|
|
|
– |
|
|
|
|
19 |
|
|
|
|
7,525 |
|
|
|
|
– |
|
|
|
|
586 |
|
|
|
|
|
|
|
| Total fees and expenses after waivers/reimbursement |
|
|
|
59,538 |
|
|
|
|
1,511 |
|
|
|
|
19,879 |
|
|
|
|
4,734 |
|
|
|
|
2,316 |
|
|
|
|
|
|
|
| Net investment income |
|
|
|
292,188 |
|
|
|
|
5,170 |
|
|
|
|
247,138 |
|
|
|
|
29,709 |
|
|
|
|
29,523 |
|
|
|
|
|
|
|
| Net realized gain (loss) and unrealized appreciation (depreciation): |
|
|
|
|
|
|
|
|
|
|
|
|
|
|
|
|
|
|
|
|
|
|
|
|
|
| Net realized gain (loss)* on: |
|
|
|
|
|
|
|
|
|
|
|
|
|
|
|
|
|
|
|
|
|
|
|
|
|
| Investments in: |
|
|
|
|
|
|
|
|
|
|
|
|
|
|
|
|
|
|
|
|
|
|
|
|
|
| Unaffiliated issuers |
|
|
|
608,345 |
|
|
|
|
10,298 |
|
|
|
|
(96,846 |
) |
|
|
|
(22,666 |
) |
|
|
|
(1,053 |
) |
| Affiliated issuers |
|
|
|
(3,616 |
) |
|
|
|
45 |
|
|
|
|
(9 |
) |
|
|
|
680 |
|
|
|
|
3 |
|
| Options purchased (futures style) |
|
|
|
– |
|
|
|
|
– |
|
|
|
|
– |
|
|
|
|
(66 |
) |
|
|
|
– |
|
| Options written |
|
|
|
– |
|
|
|
|
– |
|
|
|
|
– |
|
|
|
|
300 |
|
|
|
|
– |
|
| Futures contracts |
|
|
|
(23,417 |
) |
|
|
|
(52 |
) |
|
|
|
(65,889 |
) |
|
|
|
(91 |
) |
|
|
|
(100 |
) |
| Forward currency contracts |
|
|
|
– |
|
|
|
|
(57 |
) |
|
|
|
1,525 |
|
|
|
|
(1,028 |
) |
|
|
|
– |
|
| Swap contracts |
|
|
|
828 |
|
|
|
|
(212 |
) |
|
|
|
(6,930 |
) |
|
|
|
(1,368 |
) |
|
|
|
(213 |
) |
| Currency transactions |
|
|
|
(86 |
) |
|
|
|
(8 |
) |
|
|
|
5 |
|
|
|
|
(723 |
) |
|
|
|
7 |
|
| Capital gain distributions received from affiliated issuers |
|
|
|
– |
|
|
|
|
– |
|
|
|
|
– |
|
|
|
|
– |
|
|
|
|
– |
|
|
|
|
|
|
|
|
|
|
|
582,054 |
|
|
|
|
10,014 |
|
|
|
|
(168,144 |
) |
|
|
|
(24,962 |
) |
|
|
|
(1,356 |
) |
| Net unrealized appreciation (depreciation)* on: |
|
|
|
|
|
|
|
|
|
|
|
|
|
|
|
|
|
|
|
|
|
|
|
|
|
| Investments in: |
|
|
|
|
|
|
|
|
|
|
|
|
|
|
|
|
|
|
|
|
|
|
|
|
|
| Unaffiliated issuers |
|
|
|
1,549,070 |
|
|
|
|
1,474 |
|
|
|
|
(113,171 |
) |
|
|
|
(45,847 |
) |
|
|
|
5,451 |
|
| Affiliated issuers |
|
|
|
(31,662 |
) |
|
|
|
(305 |
) |
|
|
|
226 |
|
|
|
|
(2,447 |
) |
|
|
|
2 |
|
| Options written |
|
|
|
– |
|
|
|
|
– |
|
|
|
|
– |
|
|
|
|
(93 |
) |
|
|
|
– |
|
| Futures contracts |
|
|
|
(3,393 |
) |
|
|
|
(144 |
) |
|
|
|
(40,875 |
) |
|
|
|
(4,341 |
) |
|
|
|
70 |
|
| Forward currency contracts |
|
|
|
– |
|
|
|
|
(421 |
) |
|
|
|
1,842 |
|
|
|
|
(5,821 |
) |
|
|
|
– |
|
| Swap contracts |
|
|
|
133 |
|
|
|
|
(1 |
) |
|
|
|
5,924 |
|
|
|
|
(994 |
) |
|
|
|
1 |
|
| Currency translations |
|
|
|
(354 |
) |
|
|
|
(47 |
) |
|
|
|
(36 |
) |
|
|
|
(291 |
) |
|
|
|
(27 |
) |
|
|
|
|
|
|
|
|
|
|
1,513,794 |
|
|
|
|
556 |
|
|
|
|
(146,090 |
) |
|
|
|
(59,834 |
) |
|
|
|
5,497 |
|
|
|
|
|
|
|
| Net realized gain (loss) and unrealized appreciation (depreciation) |
|
|
|
2,095,848 |
|
|
|
|
10,570 |
|
|
|
|
(314,234 |
) |
|
|
|
(84,796 |
) |
|
|
|
4,141 |
|
|
|
|
|
|
|
| Net increase (decrease) in net assets resulting from operations |
|
|
$ |
2,388,036 |
|
|
|
$ |
15,740 |
|
|
|
$ |
(67,096 |
) |
|
|
$ |
(55,087 |
) |
|
|
$ |
33,664 |
|
|
|
|
|
|
|
Refer to the end of the statements of operations for footnotes.
Refer to the notes to financial statements.
American Funds Insurance Series 258
|
|
|
| Financial statements (continued) Statements of operations for the six months ended June 30, 2024 (continued) |
|
unaudited (dollars in thousands) |
|
|
|
|
|
|
|
|
|
|
|
|
|
|
|
|
|
|
|
|
|
|
|
|
|
|
| |
|
American
Funds
Mortgage
Fund |
|
Ultra-Short
Bond Fund |
|
U.S.
Government
Securities
Fund |
|
Managed
Risk
Growth
Fund |
|
Managed
Risk
International
Fund |
|
|
|
|
|
|
| Investment income: |
|
|
|
|
|
|
|
|
|
|
|
|
|
|
|
|
|
|
|
|
|
|
|
|
|
| Income (net of non-U.S. taxes*): |
|
|
|
|
|
|
|
|
|
|
|
|
|
|
|
|
|
|
|
|
|
|
|
|
|
| Dividends: |
|
|
|
|
|
|
|
|
|
|
|
|
|
|
|
|
|
|
|
|
|
|
|
|
|
| Unaffiliated issuers |
|
|
$ |
– |
|
|
|
$ |
– |
|
|
|
$ |
– |
|
|
|
$ |
645 |
|
|
|
$ |
156 |
|
| Affiliated issuers |
|
|
|
– |
|
|
|
|
– |
|
|
|
|
– |
|
|
|
|
1,210 |
|
|
|
|
343 |
|
|
|
|
|
|
|
|
|
|
|
– |
|
|
|
|
– |
|
|
|
|
– |
|
|
|
|
1,855 |
|
|
|
|
499 |
|
| Interest from unaffiliated issuers |
|
|
|
2,904 |
|
|
|
|
9,854 |
|
|
|
|
38,207 |
|
|
|
|
– |
|
|
|
|
– |
|
| Securities lending income (net of fees) |
|
|
|
– |
|
|
|
|
– |
|
|
|
|
– |
|
|
|
|
– |
|
|
|
|
– |
|
|
|
|
|
|
|
|
|
|
|
2,904 |
|
|
|
|
9,854 |
|
|
|
|
38,207 |
|
|
|
|
1,855 |
|
|
|
|
499 |
|
| Fees and expenses*: |
|
|
|
|
|
|
|
|
|
|
|
|
|
|
|
|
|
|
|
|
|
|
|
|
|
| Investment advisory services |
|
|
|
158 |
|
|
|
|
465 |
|
|
|
|
2,299 |
|
|
|
|
385 |
|
|
|
|
93 |
|
| Distribution services |
|
|
|
110 |
|
|
|
|
399 |
|
|
|
|
1,545 |
|
|
|
|
625 |
|
|
|
|
153 |
|
| Insurance administrative services |
|
|
|
60 |
|
|
|
|
65 |
|
|
|
|
308 |
|
|
|
|
641 |
|
|
|
|
155 |
|
| Transfer agent services |
|
|
|
– |
† |
|
|
|
– |
† |
|
|
|
– |
† |
|
|
|
– |
† |
|
|
|
– |
† |
| Administrative services |
|
|
|
16 |
|
|
|
|
54 |
|
|
|
|
234 |
|
|
|
|
– |
|
|
|
|
– |
|
| Accounting and administrative services |
|
|
|
– |
|
|
|
|
– |
|
|
|
|
– |
|
|
|
|
30 |
|
|
|
|
27 |
|
| Reports to shareholders |
|
|
|
4 |
|
|
|
|
5 |
|
|
|
|
12 |
|
|
|
|
– |
|
|
|
|
– |
|
| Registration statement and prospectus |
|
|
|
2 |
|
|
|
|
2 |
|
|
|
|
4 |
|
|
|
|
6 |
|
|
|
|
5 |
|
| Trustees’ compensation |
|
|
|
– |
† |
|
|
|
1 |
|
|
|
|
5 |
|
|
|
|
1 |
|
|
|
|
– |
† |
| Auditing and legal |
|
|
|
– |
† |
|
|
|
– |
† |
|
|
|
1 |
|
|
|
|
1 |
|
|
|
|
– |
† |
| Custodian |
|
|
|
7 |
|
|
|
|
– |
† |
|
|
|
14 |
|
|
|
|
3 |
|
|
|
|
3 |
|
|
|
|
|
|
|
| Other |
|
|
|
– |
† |
|
|
|
– |
† |
|
|
|
1 |
|
|
|
|
10 |
|
|
|
|
– |
† |
| |
|
|
|
|
|
| Total fees and expenses before waivers/reimbursement |
|
|
|
357 |
|
|
|
|
991 |
|
|
|
|
4,423 |
|
|
|
|
1,702 |
|
|
|
|
436 |
|
| Less waivers/reimbursement of fees and expenses: |
|
|
|
|
|
|
|
|
|
|
|
|
|
|
|
|
|
|
|
|
|
|
|
|
|
| Investment advisory services waivers |
|
|
|
36 |
|
|
|
|
– |
|
|
|
|
495 |
|
|
|
|
128 |
|
|
|
|
31 |
|
| Miscellaneous fee reimbursement |
|
|
|
– |
|
|
|
|
– |
|
|
|
|
– |
|
|
|
|
– |
|
|
|
|
7 |
|
|
|
|
|
|
|
| Total waivers/reimbursement of fees and expenses |
|
|
|
36 |
|
|
|
|
– |
|
|
|
|
495 |
|
|
|
|
128 |
|
|
|
|
38 |
|
|
|
|
|
|
|
| Total fees and expenses after waivers/reimbursement |
|
|
|
321 |
|
|
|
|
991 |
|
|
|
|
3,928 |
|
|
|
|
1,574 |
|
|
|
|
398 |
|
|
|
|
|
|
|
| Net investment income |
|
|
|
2,583 |
|
|
|
|
8,863 |
|
|
|
|
34,279 |
|
|
|
|
281 |
|
|
|
|
101 |
|
|
|
|
|
|
|
| Net realized gain (loss) and unrealized appreciation (depreciation): |
|
|
|
|
|
|
|
|
|
|
|
|
|
|
|
|
|
|
|
|
|
|
|
|
|
| Net realized gain (loss)* on: |
|
|
|
|
|
|
|
|
|
|
|
|
|
|
|
|
|
|
|
|
|
|
|
|
|
| Investments in: |
|
|
|
|
|
|
|
|
|
|
|
|
|
|
|
|
|
|
|
|
|
|
|
|
|
| Unaffiliated issuers |
|
|
|
(1,071 |
) |
|
|
|
– |
|
|
|
|
(2,183 |
) |
|
|
|
(2,269 |
) |
|
|
|
(437 |
) |
| Affiliated issuers |
|
|
|
– |
|
|
|
|
– |
|
|
|
|
– |
|
|
|
|
16,267 |
|
|
|
|
364 |
|
| Options purchased (futures style) |
|
|
|
– |
|
|
|
|
– |
|
|
|
|
– |
|
|
|
|
– |
|
|
|
|
– |
|
| Options written |
|
|
|
– |
|
|
|
|
– |
|
|
|
|
92 |
|
|
|
|
– |
|
|
|
|
– |
|
| Futures contracts |
|
|
|
(761 |
) |
|
|
|
– |
|
|
|
|
(3,042 |
) |
|
|
|
(1,082 |
) |
|
|
|
(272 |
) |
| Forward currency contracts |
|
|
|
– |
|
|
|
|
– |
|
|
|
|
– |
|
|
|
|
– |
|
|
|
|
– |
|
| Swap contracts |
|
|
|
20 |
|
|
|
|
– |
|
|
|
|
2,656 |
|
|
|
|
– |
|
|
|
|
– |
|
| Currency transactions |
|
|
|
– |
|
|
|
|
– |
|
|
|
|
– |
|
|
|
|
24 |
|
|
|
|
2 |
|
| Capital gain distributions received from affiliated issuers |
|
|
|
– |
|
|
|
|
– |
|
|
|
|
– |
|
|
|
|
10,033 |
|
|
|
|
– |
|
|
|
|
|
|
|
|
|
|
|
(1,812 |
) |
|
|
|
– |
|
|
|
|
(2,477 |
) |
|
|
|
22,973 |
|
|
|
|
(343 |
) |
| Net unrealized appreciation (depreciation)* on: |
|
|
|
|
|
|
|
|
|
|
|
|
|
|
|
|
|
|
|
|
|
|
|
|
|
| Investments in: |
|
|
|
|
|
|
|
|
|
|
|
|
|
|
|
|
|
|
|
|
|
|
|
|
|
| Unaffiliated issuers |
|
|
|
(1,435 |
) |
|
|
|
(43 |
) |
|
|
|
(27,820 |
) |
|
|
|
522 |
|
|
|
|
588 |
|
| Affiliated issuers |
|
|
|
– |
|
|
|
|
– |
|
|
|
|
– |
|
|
|
|
38,413 |
|
|
|
|
6,854 |
|
| Options written |
|
|
|
– |
|
|
|
|
– |
|
|
|
|
360 |
|
|
|
|
– |
|
|
|
|
– |
|
| Futures contracts |
|
|
|
(715 |
) |
|
|
|
– |
|
|
|
|
(16,056 |
) |
|
|
|
(436 |
) |
|
|
|
66 |
|
| Forward currency contracts |
|
|
|
– |
|
|
|
|
– |
|
|
|
|
– |
|
|
|
|
– |
|
|
|
|
– |
|
| Swap contracts |
|
|
|
89 |
|
|
|
|
– |
|
|
|
|
(916 |
) |
|
|
|
– |
|
|
|
|
– |
|
| Currency translations |
|
|
|
– |
|
|
|
|
– |
|
|
|
|
– |
|
|
|
|
– |
|
|
|
|
– |
|
|
|
|
|
|
|
|
|
|
|
(2,061 |
) |
|
|
|
(43 |
) |
|
|
|
(44,433 |
) |
|
|
|
38,499 |
|
|
|
|
7,508 |
|
|
|
|
|
|
|
| Net realized gain (loss) and unrealized appreciation (depreciation) |
|
|
|
(3,873 |
) |
|
|
|
(43 |
) |
|
|
|
(46,910 |
) |
|
|
|
61,472 |
|
|
|
|
7,165 |
|
|
|
|
|
|
|
| Net increase (decrease) in net assets resulting from operations |
|
|
$ |
(1,290 |
) |
|
|
$ |
8,820 |
|
|
|
$ |
(12,631 |
) |
|
|
$ |
61,753 |
|
|
|
$ |
7,266 |
|
|
|
|
|
|
|
Refer to the end of the statements of operations for footnotes.
Refer to the notes to financial statements.
259 American Funds Insurance Series
|
|
|
| Financial statements (continued) Statements of operations for the six months ended June 30, 2024 (continued) |
|
unaudited (dollars in thousands) |
|
|
|
|
|
|
|
|
|
|
|
|
|
|
|
|
| |
|
Managed Risk
Washington
Mutual
Investors
Fund |
|
Managed
Risk
Growth-
Income
Fund |
|
Managed
Risk Asset
Allocation
Fund |
|
|
|
|
| Investment income: |
|
|
|
|
|
|
|
|
|
|
|
|
|
|
|
| Income (net of non-U.S. taxes*): |
|
|
|
|
|
|
|
|
|
|
|
|
|
|
|
| Dividends: |
|
|
|
|
|
|
|
|
|
|
|
|
|
|
|
| Unaffiliated issuers |
|
|
$ |
414 |
|
|
|
$ |
2,778 |
|
|
|
$ |
2,668 |
|
| Affiliated issuers |
|
|
|
1,350 |
|
|
|
|
7,703 |
|
|
|
|
9,939 |
|
|
|
|
|
|
|
|
|
1,764 |
|
|
|
|
10,481 |
|
|
|
|
12,607 |
|
| Interest from unaffiliated issuers |
|
|
|
– |
|
|
|
|
– |
|
|
|
|
– |
|
| Securities lending income (net of fees) |
|
|
|
– |
|
|
|
|
– |
|
|
|
|
– |
|
|
|
|
|
|
|
|
|
1,764 |
|
|
|
|
10,481 |
|
|
|
|
12,607 |
|
| Fees and expenses*: |
|
|
|
|
|
|
|
|
|
|
|
|
|
|
|
| Investment advisory services |
|
|
|
244 |
|
|
|
|
1,662 |
|
|
|
|
1,565 |
|
| Distribution services |
|
|
|
403 |
|
|
|
|
349 |
|
|
|
|
2,596 |
|
| Insurance administrative services |
|
|
|
407 |
|
|
|
|
2,770 |
|
|
|
|
2,609 |
|
| Transfer agent services |
|
|
|
– |
† |
|
|
|
– |
† |
|
|
|
– |
† |
| Administrative services |
|
|
|
– |
|
|
|
|
– |
|
|
|
|
– |
|
| Accounting and administrative services |
|
|
|
28 |
|
|
|
|
46 |
|
|
|
|
45 |
|
| Reports to shareholders |
|
|
|
– |
|
|
|
|
– |
|
|
|
|
– |
|
| Registration statement and prospectus |
|
|
|
5 |
|
|
|
|
12 |
|
|
|
|
13 |
|
| Trustees’ compensation |
|
|
|
1 |
|
|
|
|
7 |
|
|
|
|
6 |
|
| Auditing and legal |
|
|
|
1 |
|
|
|
|
2 |
|
|
|
|
2 |
|
| Custodian |
|
|
|
3 |
|
|
|
|
3 |
|
|
|
|
3 |
|
|
|
|
|
| Other |
|
|
|
– |
† |
|
|
|
1 |
|
|
|
|
1 |
|
|
|
|
|
| Total fees and expenses before waivers/reimbursement |
|
|
|
1,092 |
|
|
|
|
4,852 |
|
|
|
|
6,840 |
|
| Less waivers/reimbursement of fees and expenses: |
|
|
|
|
|
|
|
|
|
|
|
|
|
|
|
| Investment advisory services waivers |
|
|
|
81 |
|
|
|
|
554 |
|
|
|
|
522 |
|
| Miscellaneous fee reimbursement |
|
|
|
7 |
|
|
|
|
– |
|
|
|
|
– |
|
|
|
|
|
| Total waivers/reimbursement of fees and expenses |
|
|
|
88 |
|
|
|
|
554 |
|
|
|
|
522 |
|
|
|
|
|
| Total fees and expenses after waivers/reimbursement |
|
|
|
1,004 |
|
|
|
|
4,298 |
|
|
|
|
6,318 |
|
|
|
|
|
| Net investment income |
|
|
|
760 |
|
|
|
|
6,183 |
|
|
|
|
6,289 |
|
|
|
|
|
| Net realized gain (loss) and unrealized appreciation (depreciation): |
|
|
|
|
|
|
|
|
|
|
|
|
|
|
|
| Net realized gain (loss)* on: |
|
|
|
|
|
|
|
|
|
|
|
|
|
|
|
| Investments in: |
|
|
|
|
|
|
|
|
|
|
|
|
|
|
|
| Unaffiliated issuers |
|
|
|
(1,485 |
) |
|
|
|
(15,868 |
) |
|
|
|
(1,481 |
) |
| Affiliated issuers |
|
|
|
(3,487 |
) |
|
|
|
(2,913 |
) |
|
|
|
26,249 |
|
| Options purchased (futures style) |
|
|
|
– |
|
|
|
|
– |
|
|
|
|
– |
|
| Options written |
|
|
|
– |
|
|
|
|
– |
|
|
|
|
– |
|
| Futures contracts |
|
|
|
382 |
|
|
|
|
7,821 |
|
|
|
|
(410 |
) |
| Forward currency contracts |
|
|
|
– |
|
|
|
|
– |
|
|
|
|
– |
|
| Swap contracts |
|
|
|
– |
|
|
|
|
– |
|
|
|
|
– |
|
| Currency transactions |
|
|
|
10 |
|
|
|
|
81 |
|
|
|
|
28 |
|
| Capital gain distributions received from affiliated issuers |
|
|
|
2,242 |
|
|
|
|
79,172 |
|
|
|
|
84,687 |
|
|
|
|
|
|
|
|
|
(2,338 |
) |
|
|
|
68,293 |
|
|
|
|
109,073 |
|
| Net unrealized appreciation (depreciation)* on: |
|
|
|
|
|
|
|
|
|
|
|
|
|
|
|
| Investments in: |
|
|
|
|
|
|
|
|
|
|
|
|
|
|
|
| Unaffiliated issuers |
|
|
|
334 |
|
|
|
|
3,986 |
|
|
|
|
157 |
|
| Affiliated issuers |
|
|
|
29,779 |
|
|
|
|
153,370 |
|
|
|
|
62,129 |
|
| Options written |
|
|
|
– |
|
|
|
|
– |
|
|
|
|
– |
|
| Futures contracts |
|
|
|
(279 |
) |
|
|
|
(1,796 |
) |
|
|
|
(999 |
) |
| Forward currency contracts |
|
|
|
– |
|
|
|
|
– |
|
|
|
|
– |
|
| Swap contracts |
|
|
|
– |
|
|
|
|
– |
|
|
|
|
– |
|
| Currency translations |
|
|
|
– |
|
|
|
|
– |
|
|
|
|
– |
|
|
|
|
|
|
|
|
|
29,834 |
|
|
|
|
155,560 |
|
|
|
|
61,287 |
|
|
|
|
|
| Net realized gain (loss) and unrealized appreciation (depreciation) |
|
|
|
27,496 |
|
|
|
|
223,853 |
|
|
|
|
170,360 |
|
|
|
|
|
| Net increase (decrease) in net assets resulting from operations |
|
|
$ |
28,256 |
|
|
|
$ |
230,036 |
|
|
|
$ |
176,649 |
|
|
|
|
|
|
|
* Additional information related to non-U.S. taxes and class-specific fees and expenses is included in the notes to financial statements.
† Amount less than one thousand.
Refer to the notes to financial statements.
American Funds Insurance Series 260
|
|
|
| Financial statements (continued) Statements of changes in net assets |
|
(dollars in thousands) |
|
|
|
|
|
|
|
|
|
|
|
|
|
|
|
|
|
|
|
|
|
|
|
|
|
| |
|
|
|
|
|
|
|
Global Small |
|
|
|
|
|
|
|
| |
|
Global Growth Fund |
|
|
Capitalization Fund |
|
|
Growth Fund |
|
|
|
|
|
|
|
|
| |
|
Six months |
|
|
|
|
|
Six months |
|
|
|
|
|
Six months |
|
|
|
|
| |
|
ended |
|
|
Year ended |
|
|
ended |
|
|
Year ended |
|
|
ended |
|
|
Year ended |
|
| |
|
June 30, |
|
|
December 31, |
|
|
June 30, |
|
|
December 31, |
|
|
June 30, |
|
|
December 31, |
|
| |
|
2024* |
|
|
2023 |
|
|
2024* |
|
|
2023 |
|
|
2024* |
|
|
2023 |
|
| Operations: |
|
|
|
|
|
|
|
|
|
|
|
|
|
|
|
|
|
|
|
|
|
|
|
|
| Net investment income (loss) |
|
|
$ 55,889 |
|
|
|
$ 69,987 |
|
|
$ |
12,258 |
|
|
|
$ 13,170 |
|
|
|
$ 57,771 |
|
|
|
$ 172,421 |
|
| Net realized gain (loss) |
|
|
935,413 |
|
|
|
229,855 |
|
|
|
23,022 |
|
|
|
110,112 |
|
|
|
2,107,622 |
|
|
|
1,075,677 |
|
| Net unrealized appreciation (depreciation) |
|
|
59,661 |
|
|
|
1,183,746 |
|
|
|
(20,318 |
) |
|
|
339,201 |
|
|
|
4,043,683 |
|
|
|
10,184,557 |
|
|
|
|
|
|
|
|
| Net increase (decrease) in net assets resulting from operations |
|
|
1,050,963 |
|
|
|
1,483,588 |
|
|
|
14,962 |
|
|
|
462,483 |
|
|
|
6,209,076 |
|
|
|
11,432,655 |
|
|
|
|
|
|
|
|
| Distributions paid to shareholders |
|
|
(276,055 |
) |
|
|
(620,422 |
) |
|
|
(136,770 |
) |
|
|
(48,426 |
) |
|
|
(1,072,862 |
) |
|
|
(2,137,413 |
) |
|
|
|
|
|
|
|
| Net capital share transactions |
|
|
(231,456 |
) |
|
|
(108,638 |
) |
|
|
(6,998 |
) |
|
|
(172,404 |
) |
|
|
(600,369 |
) |
|
|
(892,780 |
) |
|
|
|
|
|
|
|
| Total increase (decrease) in net assets |
|
|
543,452 |
|
|
|
754,528 |
|
|
|
(128,806 |
) |
|
|
241,653 |
|
|
|
4,535,845 |
|
|
|
8,402,462 |
|
|
|
|
|
|
|
|
| Net assets: |
|
|
|
|
|
|
|
|
|
|
|
|
|
|
|
|
|
|
|
|
|
|
|
|
| Beginning of period |
|
|
7,690,182 |
|
|
|
6,935,654 |
|
|
|
3,184,556 |
|
|
|
2,942,903 |
|
|
|
39,298,810 |
|
|
|
30,896,348 |
|
|
|
|
|
|
|
|
| End of period |
|
|
$8,233,634 |
|
|
|
$7,690,182 |
|
|
$ |
3,055,750 |
|
|
|
$3,184,556 |
|
|
|
$43,834,655 |
|
|
|
$39,298,810 |
|
|
|
|
|
|
|
|
|
|
|
|
|
|
|
|
|
|
|
|
|
|
|
|
|
|
|
|
|
|
|
|
|
|
|
|
|
|
|
|
|
|
|
|
|
|
|
|
|
|
|
| |
|
|
|
|
|
|
|
|
|
|
Washington Mutual |
|
| |
|
International Fund |
|
|
New World Fund |
|
|
Investors Fund |
|
|
|
|
|
|
|
|
| |
|
Six months |
|
|
|
|
|
Six months |
|
|
|
|
|
Six months |
|
|
|
|
| |
|
ended |
|
|
Year ended |
|
|
ended |
|
|
Year ended |
|
|
ended |
|
|
Year ended |
|
| |
|
June 30, |
|
|
December 31, |
|
|
June 30, |
|
|
December 31, |
|
|
June 30, |
|
|
December 31, |
|
| |
|
2024* |
|
|
2023 |
|
|
2024* |
|
|
2023 |
|
|
2024* |
|
|
2023 |
|
| Operations: |
|
|
|
|
|
|
|
|
|
|
|
|
|
|
|
|
|
|
|
|
|
|
|
|
| Net investment income (loss) |
|
|
$ 56,446 |
|
|
|
$ 93,802 |
|
|
$ |
31,818 |
|
|
|
$ 47,669 |
|
|
|
$ 92,181 |
|
|
|
$ 187,985 |
|
| Net realized gain (loss) |
|
|
179,620 |
|
|
|
(166,257 |
) |
|
|
107,918 |
|
|
|
20,610 |
|
|
|
577,247 |
|
|
|
89,709 |
|
| Net unrealized appreciation (depreciation) |
|
|
275,961 |
|
|
|
1,106,146 |
|
|
|
86,867 |
|
|
|
413,836 |
|
|
|
474,401 |
|
|
|
1,300,455 |
|
|
|
|
|
|
|
|
| Net increase (decrease) in net assets resulting from operations |
|
|
512,027 |
|
|
|
1,033,691 |
|
|
|
226,603 |
|
|
|
482,115 |
|
|
|
1,143,829 |
|
|
|
1,578,149 |
|
|
|
|
|
|
|
|
| Distributions paid to shareholders |
|
|
(16,290 |
) |
|
|
(97,498 |
) |
|
|
(28,729 |
) |
|
|
(49,443 |
) |
|
|
(129,380 |
) |
|
|
(280,747 |
) |
|
|
|
|
|
|
|
| Net capital share transactions |
|
|
(420,833 |
) |
|
|
(476,762 |
) |
|
|
(8,864 |
) |
|
|
(138,169 |
) |
|
|
(433,426 |
) |
|
|
(454,761 |
) |
|
|
|
|
|
|
|
| Total increase (decrease) in net assets |
|
|
74,904 |
|
|
|
459,431 |
|
|
|
189,010 |
|
|
|
294,503 |
|
|
|
581,023 |
|
|
|
842,641 |
|
|
|
|
|
|
|
|
| Net assets: |
|
|
|
|
|
|
|
|
|
|
|
|
|
|
|
|
|
|
|
|
|
|
|
|
| Beginning of period |
|
|
7,179,012 |
|
|
|
6,719,581 |
|
|
|
3,378,287 |
|
|
|
3,083,784 |
|
|
|
10,286,341 |
|
|
|
9,443,700 |
|
|
|
|
|
|
|
|
| End of period |
|
|
$7,253,916 |
|
|
|
$7,179,012 |
|
|
$ |
3,567,297 |
|
|
|
$3,378,287 |
|
|
|
$10,867,364 |
|
|
|
$10,286,341 |
|
|
|
|
|
|
|
|
|
|
|
|
|
|
|
|
|
|
|
|
|
|
|
|
|
|
Refer to the end of the statements of changes in net assets for footnotes.
Refer to the notes to financial statements.
261 American Funds Insurance Series
|
|
|
| Financial statements (continued) Statements of changes in net assets (continued) |
|
(dollars in thousands) |
|
|
|
|
|
|
|
|
|
|
|
|
|
|
|
|
|
|
|
|
|
|
|
|
|
| |
|
Capital |
|
|
|
|
|
|
|
|
|
|
| |
|
World Growth |
|
|
|
|
|
International Growth |
|
| |
|
and Income Fund |
|
|
Growth-Income Fund |
|
|
and Income Fund |
|
|
|
|
|
|
|
|
| |
|
Six months |
|
|
|
|
|
Six months |
|
|
|
|
|
Six months |
|
|
|
|
| |
|
ended |
|
|
Year ended |
|
|
ended |
|
|
Year ended |
|
|
ended |
|
|
Year ended |
|
| |
|
June 30, |
|
|
December 31, |
|
|
June 30, |
|
|
December 31, |
|
|
June 30, |
|
|
December 31, |
|
| |
|
2024* |
|
|
2023 |
|
|
2024* |
|
|
2023 |
|
|
2024* |
|
|
2023 |
|
| Operations: |
|
|
|
|
|
|
|
|
|
|
|
|
|
|
|
|
|
|
|
|
|
|
|
|
| Net investment income (loss) |
|
|
$ 18,135 |
|
|
|
$ 33,421 |
|
|
$ |
243,813 |
|
|
|
$ 514,726 |
|
|
|
$ 5,251 |
|
|
|
$ 7,699 |
|
| Net realized gain (loss) |
|
|
75,771 |
|
|
|
5,322 |
|
|
|
5,718,363 |
|
|
|
1,802,151 |
|
|
|
(3,534 |
) |
|
|
(10 |
) |
| Net unrealized appreciation (depreciation) |
|
|
85,338 |
|
|
|
302,180 |
|
|
|
(777,728 |
) |
|
|
5,849,685 |
|
|
|
16,898 |
|
|
|
38,198 |
|
|
|
|
|
|
|
|
| Net increase (decrease) in net assets resulting from operations |
|
|
179,244 |
|
|
|
340,923 |
|
|
|
5,184,448 |
|
|
|
8,166,562 |
|
|
|
18,615 |
|
|
|
45,887 |
|
|
|
|
|
|
|
|
| Distributions paid to shareholders |
|
|
(7,480 |
) |
|
|
(33,998 |
) |
|
|
(1,893,256 |
) |
|
|
(2,341,589 |
) |
|
|
(1,606 |
) |
|
|
(7,633 |
) |
|
|
|
|
|
|
|
| Net capital share transactions |
|
|
(124,598 |
) |
|
|
(170,988 |
) |
|
|
(635,548 |
) |
|
|
(1,355,964 |
) |
|
|
(15,538 |
) |
|
|
(10,671 |
) |
|
|
|
|
|
|
|
| Total increase (decrease) in net assets |
|
|
47,166 |
|
|
|
135,937 |
|
|
|
2,655,644 |
|
|
|
4,469,009 |
|
|
|
1,471 |
|
|
|
27,583 |
|
|
|
|
|
|
|
|
| Net assets: |
|
|
|
|
|
|
|
|
|
|
|
|
|
|
|
|
|
|
|
|
|
|
|
|
| Beginning of period |
|
|
1,861,335 |
|
|
|
1,725,398 |
|
|
|
37,451,976 |
|
|
|
32,982,967 |
|
|
|
328,580 |
|
|
|
300,997 |
|
|
|
|
|
|
|
|
| End of period |
|
|
$1,908,501 |
|
|
|
$1,861,335 |
|
|
$ |
40,107,620 |
|
|
|
$37,451,976 |
|
|
|
$330,051 |
|
|
|
$328,580 |
|
|
|
|
|
|
|
|
|
|
|
|
|
|
|
|
|
|
|
|
|
|
|
|
|
|
|
|
|
|
|
|
|
|
|
|
|
|
|
|
|
|
|
|
|
|
|
|
|
|
|
| |
|
|
|
|
|
|
|
|
|
|
American Funds |
|
| |
|
Capital Income Builder |
|
|
Asset Allocation Fund |
|
|
Global Balanced Fund |
|
|
|
|
|
|
|
|
| |
|
Six months |
|
|
|
|
|
Six months |
|
|
|
|
|
Six months |
|
|
|
|
| |
|
ended |
|
|
Year ended |
|
|
ended |
|
|
Year ended |
|
|
ended |
|
|
Year ended |
|
| |
|
June 30, |
|
|
December 31, |
|
|
June 30, |
|
|
December 31, |
|
|
June 30, |
|
|
December 31, |
|
| |
|
2024* |
|
|
2023 |
|
|
2024* |
|
|
2023 |
|
|
2024* |
|
|
2023 |
|
| Operations: |
|
|
|
|
|
|
|
|
|
|
|
|
|
|
|
|
|
|
|
|
|
|
|
|
| Net investment income (loss) |
|
|
$ 23,381 |
|
|
|
$ 40,324 |
|
|
$ |
292,188 |
|
|
|
$ 579,492 |
|
|
|
$ 5,170 |
|
|
|
$ 9,009 |
|
| Net realized gain (loss) |
|
|
8,838 |
|
|
|
242 |
|
|
|
582,054 |
|
|
|
1,163,038 |
|
|
|
10,014 |
|
|
|
(7,714 |
) |
| Net unrealized appreciation (depreciation) |
|
|
23,048 |
|
|
|
63,347 |
|
|
|
1,513,794 |
|
|
|
1,605,426 |
|
|
|
556 |
|
|
|
47,126 |
|
|
|
|
|
|
|
|
| Net increase (decrease) in net assets resulting from operations |
|
|
55,267 |
|
|
|
103,913 |
|
|
|
2,388,036 |
|
|
|
3,347,956 |
|
|
|
15,740 |
|
|
|
48,421 |
|
|
|
|
|
|
|
|
| Distributions paid to shareholders |
|
|
(15,346 |
) |
|
|
(34,911 |
) |
|
|
(1,276,340 |
) |
|
|
(1,526,238 |
) |
|
|
(1,796 |
) |
|
|
(50,940 |
) |
|
|
|
|
|
|
|
| Net capital share transactions |
|
|
18,944 |
|
|
|
43,201 |
|
|
|
129,766 |
|
|
|
(936,962 |
) |
|
|
(10,911 |
) |
|
|
23,523 |
|
|
|
|
|
|
|
|
| Total increase (decrease) in net assets |
|
|
58,865 |
|
|
|
112,203 |
|
|
|
1,241,462 |
|
|
|
884,756 |
|
|
|
3,033 |
|
|
|
21,004 |
|
|
|
|
|
|
|
|
| Net assets: |
|
|
|
|
|
|
|
|
|
|
|
|
|
|
|
|
|
|
|
|
|
|
|
|
| Beginning of period |
|
|
1,251,269 |
|
|
|
1,139,066 |
|
|
|
25,685,330 |
|
|
|
24,800,574 |
|
|
|
388,764 |
|
|
|
367,760 |
|
|
|
|
|
|
|
|
| End of period |
|
|
$1,310,134 |
|
|
|
$1,251,269 |
|
|
$ |
26,926,792 |
|
|
|
$25,685,330 |
|
|
|
$391,797 |
|
|
|
$388,764 |
|
|
|
|
|
|
|
|
|
|
|
|
|
|
|
|
|
|
|
|
|
|
|
|
|
|
Refer to the end of the statements of changes in net assets for footnotes.
Refer to the notes to financial statements.
American Funds Insurance Series 262
|
|
|
| Financial statements (continued) Statements of changes in net assets (continued) |
|
(dollars in thousands) |
|
|
|
|
|
|
|
|
|
|
|
|
|
|
|
|
|
|
|
|
|
|
|
|
|
| |
|
The Bond Fund |
|
|
|
|
|
American |
|
| |
|
of America |
|
|
Capital World Bond Fund |
|
|
High-Income Trust |
|
|
|
|
|
|
|
|
| |
|
Six months |
|
|
|
|
|
Six months |
|
|
|
|
|
Six months |
|
|
|
|
| |
|
ended |
|
|
Year ended |
|
|
ended |
|
|
Year ended |
|
|
ended |
|
|
Year ended |
|
| |
|
June 30, |
|
|
December 31, |
|
|
June 30, |
|
|
December 31, |
|
|
June 30, |
|
|
December 31, |
|
| |
|
2024* |
|
|
2023 |
|
|
2024* |
|
|
2023 |
|
|
2024* |
|
|
2023 |
|
| Operations: |
|
|
|
|
|
|
|
|
|
|
|
|
|
|
|
|
|
|
|
|
|
|
|
|
| Net investment income (loss) |
|
|
$ 247,138 |
|
|
|
$ 426,022 |
|
|
|
$ 29,709 |
|
|
|
$ 46,485 |
|
|
|
$ 29,523 |
|
|
|
$ 57,760 |
|
| Net realized gain (loss) |
|
|
(168,144 |
) |
|
|
(554,664 |
) |
|
|
(24,962 |
) |
|
|
(105,717 |
) |
|
|
(1,356 |
) |
|
|
(33,292 |
) |
| Net unrealized appreciation (depreciation) |
|
|
(146,090 |
) |
|
|
653,577 |
|
|
|
(59,834 |
) |
|
|
149,374 |
|
|
|
5,497 |
|
|
|
73,317 |
|
|
|
|
|
|
|
|
| Net increase (decrease) in net assets resulting from operations |
|
|
(67,096 |
) |
|
|
524,935 |
|
|
|
(55,087 |
) |
|
|
90,142 |
|
|
|
33,664 |
|
|
|
97,785 |
|
|
|
|
|
|
|
|
| Distributions paid to shareholders |
|
|
(75,485 |
) |
|
|
(382,616 |
) |
|
|
(2,628 |
) |
|
|
– |
|
|
|
(9,874 |
) |
|
|
(58,266 |
) |
|
|
|
|
|
|
|
| Net capital share transactions |
|
|
272,356 |
|
|
|
644,513 |
|
|
|
33,749 |
|
|
|
(31,695 |
) |
|
|
(5,971 |
) |
|
|
2,772 |
|
|
|
|
|
|
|
|
| Total increase (decrease) in net assets |
|
|
129,775 |
|
|
|
786,832 |
|
|
|
(23,966 |
) |
|
|
58,447 |
|
|
|
17,819 |
|
|
|
42,291 |
|
|
|
|
|
|
|
|
| Net assets: |
|
|
|
|
|
|
|
|
|
|
|
|
|
|
|
|
|
|
|
|
|
|
|
|
| Beginning of period |
|
|
11,007,914 |
|
|
|
10,221,082 |
|
|
|
1,540,341 |
|
|
|
1,481,894 |
|
|
|
873,845 |
|
|
|
831,554 |
|
|
|
|
|
|
|
|
| End of period |
|
|
$11,137,689 |
|
|
|
$11,007,914 |
|
|
|
$1,516,375 |
|
|
|
$1,540,341 |
|
|
|
$891,664 |
|
|
|
$873,845 |
|
|
|
|
|
|
|
|
|
|
|
|
|
|
|
|
|
|
|
|
|
|
|
|
|
|
|
|
|
|
|
|
|
|
|
|
|
|
|
|
|
|
|
|
|
|
|
|
|
|
|
| |
|
American Funds |
|
|
|
|
|
U.S. Government |
|
| |
|
Mortgage Fund |
|
|
Ultra-Short Bond Fund |
|
|
Securities Fund |
|
|
|
|
|
|
|
|
| |
|
Six months |
|
|
|
|
|
Six months |
|
|
|
|
|
Six months |
|
|
|
|
| |
|
ended |
|
|
Year ended |
|
|
ended |
|
|
Year ended |
|
|
ended |
|
|
Year ended |
|
| |
|
June 30, |
|
|
December 31, |
|
|
June 30, |
|
|
December 31, |
|
|
June 30, |
|
|
December 31, |
|
| |
|
2024* |
|
|
2023 |
|
|
2024* |
|
|
2023 |
|
|
2024* |
|
|
2023 |
|
| Operations: |
|
|
|
|
|
|
|
|
|
|
|
|
|
|
|
|
|
|
|
|
|
|
|
|
| Net investment income (loss) |
|
|
$ 2,583 |
|
|
|
$ 4,435 |
|
|
|
$ 8,863 |
|
|
|
$ 18,122 |
|
|
|
$ 34,279 |
|
|
|
$ 57,199 |
|
| Net realized gain (loss) |
|
|
(1,812 |
) |
|
|
(3,678 |
) |
|
|
– |
† |
|
|
– |
† |
|
|
(2,477 |
) |
|
|
(96,180 |
) |
| Net unrealized appreciation (depreciation) |
|
|
(2,061 |
) |
|
|
3,010 |
|
|
|
(43 |
) |
|
|
(50 |
) |
|
|
(44,433 |
) |
|
|
81,462 |
|
|
|
|
|
|
|
|
| Net increase (decrease) in net assets resulting from operations |
|
|
(1,290 |
) |
|
|
3,767 |
|
|
|
8,820 |
|
|
|
18,072 |
|
|
|
(12,631 |
) |
|
|
42,481 |
|
|
|
|
|
|
|
|
| Distributions paid to shareholders |
|
|
(855 |
) |
|
|
(3,960 |
) |
|
|
(3,299 |
) |
|
|
(17,531 |
) |
|
|
(11,753 |
) |
|
|
(55,687 |
) |
|
|
|
|
|
|
|
| Net capital share transactions |
|
|
4,722 |
|
|
|
18,941 |
|
|
|
(22,993 |
) |
|
|
(60,048 |
) |
|
|
221,961 |
|
|
|
36,513 |
|
|
|
|
|
|
|
|
| Total increase (decrease) in net assets |
|
|
2,577 |
|
|
|
18,748 |
|
|
|
(17,472 |
) |
|
|
(59,507 |
) |
|
|
197,577 |
|
|
|
23,307 |
|
|
|
|
|
|
|
|
| Net assets: |
|
|
|
|
|
|
|
|
|
|
|
|
|
|
|
|
|
|
|
|
|
|
|
|
| Beginning of period |
|
|
107,791 |
|
|
|
89,043 |
|
|
|
372,754 |
|
|
|
432,261 |
|
|
|
1,524,029 |
|
|
|
1,500,722 |
|
|
|
|
|
|
|
|
| End of period |
|
|
$110,368 |
|
|
|
$107,791 |
|
|
|
$355,282 |
|
|
|
$372,754 |
|
|
|
$1,721,606 |
|
|
|
$1,524,029 |
|
|
|
|
|
|
|
|
|
|
|
|
|
|
|
|
|
|
|
|
|
|
|
|
|
|
Refer to the end of the statements of changes in net assets for footnotes.
Refer to the notes to financial statements.
263 American Funds Insurance Series
|
|
|
| Financial statements (continued) Statements of changes in net assets (continued) |
|
(dollars in thousands) |
|
|
|
|
|
|
|
|
|
|
|
|
|
|
|
|
|
|
|
|
|
|
|
|
|
| |
|
|
|
|
|
|
|
Managed Risk |
|
| |
|
Managed Risk |
|
|
Managed Risk |
|
|
Washington Mutual |
|
| |
|
Growth Fund |
|
|
International Fund |
|
|
Investors Fund |
|
|
|
|
|
|
|
|
| |
|
Six months
ended
June 30,
2024* |
|
|
Year ended
December 31,
2023 |
|
|
Six months
ended
June 30,
2024* |
|
|
Year ended
December 31,
2023 |
|
|
Six months
ended
June 30,
2024* |
|
|
Year ended
December 31,
2023 |
|
| Operations: |
|
|
|
|
|
|
|
|
|
|
|
|
|
|
|
|
|
|
|
|
|
|
|
|
| Net investment income (loss) |
|
|
$ 281 |
|
|
|
$ 2,083 |
|
|
|
$ 101 |
|
|
|
$ 1,506 |
|
|
|
$ 760 |
|
|
|
$ 5,418 |
|
| Net realized gain (loss) |
|
|
22,973 |
|
|
|
(30,059 |
) |
|
|
(343 |
) |
|
|
(17,554 |
) |
|
|
(2,338 |
) |
|
|
(22,528 |
) |
| Net unrealized appreciation (depreciation) |
|
|
38,499 |
|
|
|
129,616 |
|
|
|
7,508 |
|
|
|
23,557 |
|
|
|
29,834 |
|
|
|
46,582 |
|
|
|
|
|
|
|
|
| Net increase (decrease) in net assets resulting from operations |
|
|
61,753 |
|
|
|
101,640 |
|
|
|
7,266 |
|
|
|
7,509 |
|
|
|
28,256 |
|
|
|
29,472 |
|
|
|
|
|
|
|
|
| Distributions paid to shareholders |
|
|
(2,419 |
) |
|
|
(111,683 |
) |
|
|
(1,561 |
) |
|
|
(10,852 |
) |
|
|
(5,148 |
) |
|
|
(47,987 |
) |
|
|
|
|
|
|
|
| Net capital share transactions |
|
|
(47,224 |
) |
|
|
63,436 |
|
|
|
(6,796 |
) |
|
|
1,591 |
|
|
|
(18,115 |
) |
|
|
19,234 |
|
|
|
|
|
|
|
|
| Total increase (decrease) in net assets |
|
|
12,110 |
|
|
|
53,393 |
|
|
|
(1,091 |
) |
|
|
(1,752 |
) |
|
|
4,993 |
|
|
|
719 |
|
|
|
|
|
|
|
|
| Net assets: |
|
|
|
|
|
|
|
|
|
|
|
|
|
|
|
|
|
|
|
|
|
|
|
|
| Beginning of period |
|
|
507,635 |
|
|
|
454,242 |
|
|
|
124,182 |
|
|
|
125,934 |
|
|
|
324,191 |
|
|
|
323,472 |
|
|
|
|
|
|
|
|
| End of period |
|
|
$519,745 |
|
|
|
$507,635 |
|
|
|
$123,091 |
|
|
|
$124,182 |
|
|
|
$329,184 |
|
|
|
$324,191 |
|
|
|
|
|
|
|
|
|
|
|
|
|
|
|
|
|
|
|
|
|
|
|
|
|
|
|
|
|
|
|
|
|
|
|
|
|
|
|
|
|
|
|
| |
|
Managed Risk |
|
|
Managed Risk |
|
| |
|
Growth-Income Fund |
|
|
Asset Allocation Fund |
|
|
|
|
|
|
| |
|
Six months
ended
June 30,
2024* |
|
|
Year ended
December 31,
2023 |
|
|
Six months
ended
June 30,
2024* |
|
|
Year ended
December 31,
2023 |
|
| Operations: |
|
|
|
|
|
|
|
|
|
|
|
|
|
|
|
|
| Net investment income (loss) |
|
|
$ 6,183 |
|
|
|
$ 34,077 |
|
|
|
$ 6,289 |
|
|
|
$ 39,329 |
|
| Net realized gain (loss) |
|
|
68,293 |
|
|
|
24,747 |
|
|
|
109,073 |
|
|
|
47,040 |
|
| Net unrealized appreciation (depreciation) |
|
|
155,560 |
|
|
|
260,383 |
|
|
|
61,287 |
|
|
|
116,167 |
|
|
|
|
|
|
| Net increase (decrease) in net assets resulting from operations |
|
|
230,036 |
|
|
|
319,207 |
|
|
|
176,649 |
|
|
|
202,536 |
|
|
|
|
|
|
| Distributions paid to shareholders |
|
|
(58,907 |
) |
|
|
(297,374 |
) |
|
|
(65,362 |
) |
|
|
(287,115 |
) |
|
|
|
|
|
| Net capital share transactions |
|
|
(125,724 |
) |
|
|
63,979 |
|
|
|
(122,302 |
) |
|
|
(1,697 |
) |
|
|
|
|
|
| Total increase (decrease) in net assets |
|
|
45,405 |
|
|
|
85,812 |
|
|
|
(11,015 |
) |
|
|
(86,276 |
) |
|
|
|
|
|
| Net assets: |
|
|
|
|
|
|
|
|
|
|
|
|
|
|
|
|
| Beginning of period |
|
|
2,187,256 |
|
|
|
2,101,444 |
|
|
|
2,103,196 |
|
|
|
2,189,472 |
|
|
|
|
|
|
| End of period |
|
|
$2,232,661 |
|
|
|
$2,187,256 |
|
|
|
$2,092,181 |
|
|
|
$2,103,196 |
|
|
|
|
|
|
|
|
|
|
|
|
|
|
|
|
|
|
* Unaudited.
† Amount less than one thousand.
Refer to the notes to financial statements.
American Funds Insurance Series 264
|
|
|
| Notes to financial statements |
|
unaudited |
1. Organization
American Funds Insurance Series (the “series”) is registered under the Investment Company Act of 1940, as amended (the “1940 Act”), as an open-end, diversified management investment company with 40 different funds (“the funds”), including 23 funds in the series covered in this report. The other 17 funds in the series are covered in separate reports. Twelve funds in the series are covered in the American Funds Insurance Series - Target Date Series report and five funds in the series are covered in the American Funds Insurance Series - Portfolio Series report. The assets of each fund are segregated, with each fund accounted for separately. Capital Research and Management Company (“CRMC”) is the series’ investment adviser. Milliman Financial Risk Management LLC (“Milliman FRM”) is the subadviser for the risk management strategy for eight of the funds (the “managed risk funds”), five of which are covered in this report.
The managed risk funds covered in this report are Managed Risk Growth Fund, Managed Risk International Fund, Managed Risk Washington Mutual Investors Fund, Managed Risk Growth-Income Fund and Managed Risk Asset Allocation Fund. The managed risk funds invest in other funds within the series (the “underlying funds”) and employ Milliman FRM to implement the risk management strategy, which consists of using hedging instruments – primarily exchange-traded options and futures contracts – to attempt to stabilize the volatility of the funds around target volatility levels and reduce the downside exposure of the funds during periods of significant market declines.
Shareholders approved a proposal to reorganize the series from a Massachusetts business trust to a Delaware statutory trust. The series reserved the right to delay implementing the reorganization and has elected to do so.
The investment objective(s) for each fund covered in this report are as follows:
Global Growth Fund – To provide long-term growth of capital.
Global Small Capitalization Fund – To provide long-term growth of capital.
Growth Fund – To provide growth of capital.
International Fund – To provide long-term growth of capital.
New World Fund – To provide long-term capital appreciation.
Washington Mutual Investors Fund – To produce income exceeding the average yield on U.S. stocks generally and to provide an opportunity for growth of principal consistent with sound common stock investing.
Capital World Growth and Income Fund – To provide long-term growth of capital while providing current income.
Growth-Income Fund – To achieve long-term growth of capital and income.
International Growth and Income Fund – To provide long-term growth of capital while providing current income.
Capital Income Builder – The two primary objectives are (1) to provide a level of current income that exceeds the average yield on U.S. stocks generally and (2) to provide a growing stream of income over the years. The secondary objective is to provide growth of capital.
Asset Allocation Fund – To provide high total return (including income and capital gains) consistent with preservation of capital over the long term.
American Funds Global Balanced Fund – Seeks the balanced accomplishment of three objectives: long-term growth of capital, conservation of principal and current income.
The Bond Fund of America – To provide as high a level of current income as is consistent with the preservation of capital.
Capital World Bond Fund – To provide, over the long term, a high level of total return consistent with prudent investment management.
American High-Income Trust – The primary objective is to provide a high level of current income. The secondary objective is capital appreciation.
265 American Funds Insurance Series
American Funds Mortgage Fund – To provide current income and preservation of capital.
Ultra-Short Bond Fund – To provide current income, consistent with the maturity and quality standards applicable to the fund, and preservation of capital and liquidity.
U.S. Government Securities Fund – To provide a high level of current income consistent with prudent investment risk and preservation of capital.
Managed Risk Growth Fund – To provide growth of capital while seeking to manage volatility and provide downside protection.
Managed Risk International Fund – To provide long-term growth of capital while seeking to manage volatility and provide downside protection.
Managed Risk Washington Mutual Investors Fund – To produce income exceeding the average yield on U.S. stocks generally and to provide an opportunity for growth of principal consistent with sound common stock investing, in each case while seeking to manage volatility and provide downside protection.
Managed Risk Growth-Income Fund – To achieve long-term growth of capital and income while seeking to manage volatility and provide downside protection.
Managed Risk Asset Allocation Fund – To provide high total return (including income and capital gains) consistent with preservation of capital over the long term while seeking to manage volatility and provide downside protection.
Each fund in the series, except the managed risk funds, offers either four or five share classes (Classes 1, 1A, 2, 3 or 4); the managed risk funds offer two share classes (Classes P1 and P2). Holders of all share classes of each fund have equal pro rata rights to assets, dividends and liquidation proceeds of each fund held. Each share class of each fund has identical voting rights, except for the exclusive right to vote on matters affecting only its class. Share classes have different fees and expenses (“class-specific fees and expenses”), primarily due to different arrangements for certain distribution expenses. Differences in class-specific fees and expenses will result in differences in net investment income and, therefore, the payment of different per-share dividends by each class of each fund.
2. Significant accounting policies
Each fund is an investment company that applies the accounting and reporting guidance issued in Topic 946 by the U.S. Financial Accounting Standards Board. Each fund’s financial statements have been prepared to comply with U.S. generally accepted accounting principles (“U.S. GAAP”). These principles require the series’ investment adviser to make estimates and assumptions that affect reported amounts and disclosures. Actual results could differ from those estimates. Subsequent events, if any, have been evaluated through the date of issuance in the preparation of the financial statements. The funds follow the significant accounting policies described in this section, as well as the valuation policies described in the next section on valuation.
Cash – Cash may include amounts held in an interest bearing deposit facility.
Security transactions and related investment income – Security transactions are recorded by each fund as of the date the trades are executed with brokers. Realized gains and losses from security transactions are determined based on the specific identified cost of the securities. In the event a security is purchased with a delayed payment date, each fund will segregate liquid assets sufficient to meet their payment obligations. Dividend income is recognized on the ex-dividend date and interest income is recognized on an accrual basis. Market discounts, premiums and original issue discounts on fixed-income securities are amortized daily over the expected life of the security.
Fees and expenses – The fees and expenses of the underlying funds held by the managed risk funds are not included in the fees and expenses reported for each of the managed risk funds; however, they are indirectly reflected in the valuation of each of the underlying funds. These fees are included in the unaudited net effective expense ratios that are provided as additional information in the financial highlights tables.
American Funds Insurance Series 266
Class allocations – Income, fees and expenses (other than class-specific fees and expenses), realized gains and losses and unrealized appreciation and depreciation are allocated daily among the various share classes of each fund based on their relative net assets. Class-specific fees and expenses, such as distribution expenses, are accrued daily and charged directly to the respective share class of each fund.
Distributions paid to shareholders – Income dividends and capital gain distributions are recorded on each fund’s ex-dividend date.
Currency translation – Assets and liabilities, including investment securities, denominated in currencies other than U.S. dollars are translated into U.S. dollars at the exchange rates supplied by one or more pricing vendors on the valuation date. Purchases and sales of investment securities and income and expenses are translated into U.S. dollars at the exchange rates on the dates of such transactions. The effects of changes in exchange rates on investment securities are included with the net realized gain or loss and net unrealized appreciation or depreciation on investments in the funds’ statements of operations. The realized gain or loss and unrealized appreciation or depreciation resulting from all other transactions denominated in currencies other than U.S. dollars are disclosed separately.
3. Valuation
CRMC, the series’ investment adviser, values the funds’ investments at fair value as defined by U.S. GAAP. The net asset value per share is calculated once daily as of the close of regular trading on the New York Stock Exchange, normally 4 p.m. New York time, each day the New York Stock Exchange is open.
Methods and inputs – The series’ investment adviser uses the following methods and inputs to establish the fair value of each fund’s assets and liabilities. Use of particular methods and inputs may vary over time based on availability and relevance as market and economic conditions evolve.
Equity securities, including depositary receipts, are generally valued at the official closing price of, or the last reported sale price on, the exchange or market on which such securities are traded, as of the close of business on the day the securities are being valued or, lacking any sales, at the last available bid price. Prices for each security are taken from the principal exchange or market on which the security trades. The value of an underlying fund is based on its reported net asset value.
Fixed-income securities, including short-term securities, are generally valued at evaluated prices obtained from third-party pricing vendors. Vendors value such securities based on one or more of the inputs described in the following table. The table provides examples of inputs that are commonly relevant for valuing particular classes of fixed-income securities in which the funds are authorized to invest. However, these classifications are not exclusive and any of the inputs may be used to value any other class of fixed-income security.
|
|
|
| Fixed-income class |
|
Examples of standard inputs |
|
|
| All |
|
Benchmark yields, transactions, bids, offers, quotations from dealers and trading systems, new issues, spreads and other relationships observed in the markets among comparable securities; and proprietary pricing models such as yield measures calculated using factors such as cash flows, financial or collateral performance and other reference data (collectively referred to as “standard inputs”) |
|
|
| Corporate bonds, notes & loans; convertible securities |
|
Standard inputs and underlying equity of the issuer |
|
|
| Bonds & notes of governments & government agencies |
|
Standard inputs and interest rate volatilities |
|
|
| Mortgage-backed; asset-backed obligations |
|
Standard inputs and cash flows, prepayment information, default rates, delinquency and loss assumptions, collateral characteristics, credit enhancements and specific deal information |
|
|
| Municipal securities |
|
Standard inputs and, for certain distressed securities, cash flows or liquidation values using a net present value calculation based on inputs that include, but are not limited to, financial statements and debt contracts |
267 American Funds Insurance Series
Securities with both fixed-income and equity characteristics, or equity securities traded principally among fixed-income dealers, are generally valued in the manner described for either equity or fixed-income securities, depending on which method is deemed most appropriate by the series’ investment adviser. The Capital Group Central Corporate Bond Fund (“CCBF”), a fund within the Capital Group Central Fund Series II, and Capital Group Central Cash Fund (“CCF”), a fund within the Capital Group Central Fund Series (collectively the “Central Funds“), are each valued based upon a floating net asset value, which fluctuates with changes in the value of each fund’s portfolio securities. The underlying securities are valued based on the policies and procedures in the Central Funds’ statements of additional information. The State Street Institutional U.S. Government Money Market Fund held by the managed risk funds is managed to maintain a $1.00 net asset value per share. The net asset value of each share class of each managed risk fund is calculated based on the reported net asset values of the underlying funds in which each fund invests.
Exchange-traded options and futures are generally valued at the official closing price for options and official settlement price for futures of the exchange or market on which such instruments are traded, as of the close of business on the day such instruments are being valued. Forward currency contracts are valued based on the spot and forward exchange rates obtained from a third-party pricing vendor. Swaps and over-the-counter (OTC) options are generally valued using evaluated prices obtained from third-party pricing vendors who calculate these values based on market inputs that may include the yields of the indices referenced in the instrument and the relevant curve, dealer quotes, default probabilities and recovery rates, exchange rates, implied option volatilites, and terms of the contract.
Securities and other assets for which representative market quotations are not readily available or are considered unreliable by the series’ investment adviser are fair valued as determined in good faith under fair value guidelines adopted by the series’ investment adviser and approved by the board of trustees as further described. The investment adviser follows fair valuation guidelines, consistent with U.S. Securities and Exchange Commission rules and guidance, to consider relevant principles and factors when making fair value determinations. The investment adviser considers relevant indications of value that are reasonably and timely available to it in determining the fair value to be assigned to a particular security, such as the type and cost of the security, restrictions on resale of the security, relevant financial or business developments of the issuer, actively traded similar or related securities, dealer or broker quotes, conversion or exchange rights on the security, related corporate actions, significant events occurring after the close of trading in the security, and changes in overall market conditions. In addition, the closing prices of equity securities and futures that trade in markets outside U.S. time zones may be adjusted to reflect significant events that occur after the close of local trading but before the net asset value of each share class of each fund is determined. Fair valuations of investments that are not actively trading involve judgment and may differ materially from valuations that would have been used had greater market activity occurred.
Processes and structure – The series’ board of trustees has designated the series’ investment adviser to make fair value determinations, subject to board oversight. The investment adviser has established a Joint Fair Valuation Committee (the “Committee”) to administer, implement and oversee the fair valuation process, and to make fair value decisions. The Committee regularly reviews its own fair value decisions, as well as decisions made under its standing instructions to the investment adviser’s valuation team. The Committee reviews changes in fair value measurements from period to period, pricing vendor information and market data, and may, as deemed appropriate, update the fair valuation guidelines to better reflect the results of back testing and address new or evolving issues. Pricing decisions, processes and controls over security valuation are also subject to additional internal reviews facilitated by the investment adviser’s global risk management group. The Committee reports changes to the fair valuation guidelines to the board of trustees. The series’ board and audit committee also regularly review reports that describe fair value determinations and methods.
Classifications – The series’ investment adviser classifies the funds’ assets and liabilities into three levels based on the inputs used to value the assets or liabilities. Level 1 values are based on quoted prices in active markets for identical securities. Level 2 values are based on significant observable market inputs, such as quoted prices for similar securities and quoted prices in inactive markets. Certain securities trading outside the U.S. may transfer between Level 1 and Level 2 due to valuation adjustments resulting from significant market movements following the close of local trading. Level 3 values are based on significant unobservable inputs that reflect the investment adviser’s determination of assumptions that market participants might reasonably use in valuing the securities.
The valuation levels are not necessarily an indication of the risk or liquidity associated with the underlying investment. For example, U.S. government securities are reflected as Level 2 because the inputs used to determine fair value may not always be quoted prices in an active market. The tables on the following pages present the funds’ valuation levels as of June 30, 2024 (dollars in thousands):
American Funds Insurance Series 268
Global Growth Fund
|
|
|
|
|
|
|
|
|
|
|
|
|
|
|
|
|
|
|
|
|
|
|
|
|
|
|
|
|
| |
|
Investment securities |
|
|
|
|
|
|
|
|
|
| |
|
Level 1 |
|
|
|
|
Level 2 |
|
|
|
|
|
Level 3 |
|
|
|
|
|
Total |
|
|
|
| |
|
|
|
|
|
|
|
|
|
| Assets: |
|
|
|
|
|
|
|
|
|
|
|
|
|
|
|
|
|
|
|
|
|
|
|
|
|
|
|
|
| Common stocks: |
|
|
|
|
|
|
|
|
|
|
|
|
|
|
|
|
|
|
|
|
|
|
|
|
|
|
|
|
| Information technology |
|
|
$1,496,538 |
|
|
|
|
|
$ 835,497 |
|
|
|
|
|
|
|
$– |
|
|
|
|
|
|
|
$2,332,035 |
|
|
|
| Health care |
|
|
783,131 |
|
|
|
|
|
486,858 |
|
|
|
|
|
|
|
– |
|
|
|
|
|
|
|
1,269,989 |
|
|
|
| Industrials |
|
|
504,090 |
|
|
|
|
|
612,266 |
|
|
|
|
|
|
|
– |
|
|
|
|
|
|
|
1,116,356 |
|
|
|
| Consumer discretionary |
|
|
493,789 |
|
|
|
|
|
549,217 |
|
|
|
|
|
|
|
– |
|
|
|
|
|
|
|
1,043,006 |
|
|
|
| Financials |
|
|
474,495 |
|
|
|
|
|
412,949 |
|
|
|
|
|
|
|
– |
* |
|
|
|
|
|
|
887,444 |
|
|
|
| Communication services |
|
|
358,906 |
|
|
|
|
|
111,356 |
|
|
|
|
|
|
|
– |
|
|
|
|
|
|
|
470,262 |
|
|
|
| Energy |
|
|
230,378 |
|
|
|
|
|
97,226 |
|
|
|
|
|
|
|
– |
* |
|
|
|
|
|
|
327,604 |
|
|
|
| Consumer staples |
|
|
173,887 |
|
|
|
|
|
100,136 |
|
|
|
|
|
|
|
– |
|
|
|
|
|
|
|
274,023 |
|
|
|
| Materials |
|
|
142,845 |
|
|
|
|
|
55,327 |
|
|
|
|
|
|
|
– |
|
|
|
|
|
|
|
198,172 |
|
|
|
| Real estate |
|
|
13,934 |
|
|
|
|
|
– |
|
|
|
|
|
|
|
– |
|
|
|
|
|
|
|
13,934 |
|
|
|
| Utilities |
|
|
10,957 |
|
|
|
|
|
– |
|
|
|
|
|
|
|
– |
|
|
|
|
|
|
|
10,957 |
|
|
|
| Preferred securities |
|
|
– |
|
|
|
|
|
18,658 |
|
|
|
|
|
|
|
– |
|
|
|
|
|
|
|
18,658 |
|
|
|
| Short-term securities |
|
|
299,496 |
|
|
|
|
|
– |
|
|
|
|
|
|
|
– |
|
|
|
|
|
|
|
299,496 |
|
|
|
| |
|
|
|
|
|
|
|
|
|
| Total |
|
|
$4,982,446 |
|
|
|
|
|
$3,279,490 |
|
|
|
|
|
|
|
$– |
* |
|
|
|
|
|
|
$8,261,936 |
|
|
|
| |
*Amount less than one thousand.
Global Small Capitalization Fund
|
|
|
|
|
|
|
|
|
|
|
|
|
|
|
|
|
|
|
|
|
|
|
|
|
|
|
|
|
| |
|
Investment securities |
|
|
|
|
|
|
|
|
|
| |
|
Level 1 |
|
|
|
|
Level 2 |
|
|
|
|
|
Level 3 |
|
|
|
|
|
Total |
|
|
|
| |
|
|
|
|
|
|
|
|
|
| Assets: |
|
|
|
|
|
|
|
|
|
|
|
|
|
|
|
|
|
|
|
|
|
|
|
|
|
|
|
|
| Common stocks: |
|
|
|
|
|
|
|
|
|
|
|
|
|
|
|
|
|
|
|
|
|
|
|
|
|
|
|
|
| Industrials |
|
|
$ 333,520 |
|
|
|
|
|
$ 472,428 |
|
|
|
|
|
|
|
$ – |
|
|
|
|
|
|
|
$ 805,948 |
|
|
|
| Consumer discretionary |
|
|
370,427 |
|
|
|
|
|
124,803 |
|
|
|
|
|
|
|
– |
|
|
|
|
|
|
|
495,230 |
|
|
|
| Information technology |
|
|
292,194 |
|
|
|
|
|
184,507 |
|
|
|
|
|
|
|
964 |
|
|
|
|
|
|
|
477,665 |
|
|
|
| Health care |
|
|
322,651 |
|
|
|
|
|
127,668 |
|
|
|
|
|
|
|
– |
|
|
|
|
|
|
|
450,319 |
|
|
|
| Financials |
|
|
96,921 |
|
|
|
|
|
198,131 |
|
|
|
|
|
|
|
– |
|
|
|
|
|
|
|
295,052 |
|
|
|
| Communication services |
|
|
67,832 |
|
|
|
|
|
67,363 |
|
|
|
|
|
|
|
– |
|
|
|
|
|
|
|
135,195 |
|
|
|
| Materials |
|
|
37,887 |
|
|
|
|
|
83,545 |
|
|
|
|
|
|
|
– |
|
|
|
|
|
|
|
121,432 |
|
|
|
| Real estate |
|
|
27,198 |
|
|
|
|
|
52,921 |
|
|
|
|
|
|
|
– |
|
|
|
|
|
|
|
80,119 |
|
|
|
| Energy |
|
|
36,583 |
|
|
|
|
|
11,289 |
|
|
|
|
|
|
|
– |
|
|
|
|
|
|
|
47,872 |
|
|
|
| Utilities |
|
|
18,763 |
|
|
|
|
|
23,994 |
|
|
|
|
|
|
|
– |
|
|
|
|
|
|
|
42,757 |
|
|
|
| Consumer staples |
|
|
3,059 |
|
|
|
|
|
19,572 |
|
|
|
|
|
|
|
– |
|
|
|
|
|
|
|
22,631 |
|
|
|
| Preferred securities |
|
|
1,920 |
|
|
|
|
|
– |
|
|
|
|
|
|
|
16,680 |
|
|
|
|
|
|
|
18,600 |
|
|
|
| Short-term securities |
|
|
96,014 |
|
|
|
|
|
– |
|
|
|
|
|
|
|
– |
|
|
|
|
|
|
|
96,014 |
|
|
|
| |
|
|
|
|
|
|
|
|
|
| Total |
|
|
$1,704,969 |
|
|
|
|
|
$1,366,221 |
|
|
|
|
|
|
|
$17,644 |
|
|
|
|
|
|
|
$3,088,834 |
|
|
|
| |
269 American Funds Insurance Series
Growth Fund
|
|
|
|
|
|
|
|
|
|
|
|
|
|
|
|
|
|
|
|
|
|
|
|
|
|
|
|
|
| |
|
Investment securities |
|
|
|
|
|
|
|
|
|
| |
|
Level 1 |
|
|
|
|
Level 2 |
|
|
|
|
|
Level 3 |
|
|
|
|
|
Total |
|
|
|
| |
|
|
|
|
|
|
|
|
|
| Assets: |
|
|
|
|
|
|
|
|
|
|
|
|
|
|
|
|
|
|
|
|
|
|
|
|
|
|
|
|
| Common stocks: |
|
|
|
|
|
|
|
|
|
|
|
|
|
|
|
|
|
|
|
|
|
|
|
|
|
|
|
|
| Information technology |
|
|
$ 9,917,689 |
|
|
|
|
|
$ 562,348 |
|
|
|
|
|
|
|
$ 4,384 |
|
|
|
|
|
|
|
$10,484,421 |
|
|
|
| Communication services |
|
|
8,695,327 |
|
|
|
|
|
– |
|
|
|
|
|
|
|
– |
|
|
|
|
|
|
|
8,695,327 |
|
|
|
| Health care |
|
|
6,280,230 |
|
|
|
|
|
252,547 |
|
|
|
|
|
|
|
31,351 |
|
|
|
|
|
|
|
6,564,128 |
|
|
|
| Consumer discretionary |
|
|
4,964,660 |
|
|
|
|
|
387,171 |
|
|
|
|
|
|
|
– |
|
|
|
|
|
|
|
5,351,831 |
|
|
|
| Industrials |
|
|
4,555,144 |
|
|
|
|
|
231,471 |
|
|
|
|
|
|
|
2,674 |
|
|
|
|
|
|
|
4,789,289 |
|
|
|
| Financials |
|
|
3,007,253 |
|
|
|
|
|
44,932 |
|
|
|
|
|
|
|
– |
|
|
|
|
|
|
|
3,052,185 |
|
|
|
| Energy |
|
|
1,645,161 |
|
|
|
|
|
– |
|
|
|
|
|
|
|
– |
|
|
|
|
|
|
|
1,645,161 |
|
|
|
| Consumer staples |
|
|
1,160,149 |
|
|
|
|
|
– |
|
|
|
|
|
|
|
– |
|
|
|
|
|
|
|
1,160,149 |
|
|
|
| Materials |
|
|
634,937 |
|
|
|
|
|
30,077 |
|
|
|
|
|
|
|
– |
|
|
|
|
|
|
|
665,014 |
|
|
|
| Utilities |
|
|
341,689 |
|
|
|
|
|
– |
|
|
|
|
|
|
|
– |
|
|
|
|
|
|
|
341,689 |
|
|
|
| Real estate |
|
|
66,223 |
|
|
|
|
|
– |
|
|
|
|
|
|
|
– |
|
|
|
|
|
|
|
66,223 |
|
|
|
| Preferred securities |
|
|
– |
|
|
|
|
|
– |
|
|
|
|
|
|
|
116,405 |
|
|
|
|
|
|
|
116,405 |
|
|
|
| Rights & warrants |
|
|
– |
|
|
|
|
|
– |
* |
|
|
|
|
|
|
– |
|
|
|
|
|
|
|
– |
* |
|
|
| Convertible stocks |
|
|
6,005 |
|
|
|
|
|
– |
|
|
|
|
|
|
|
– |
|
|
|
|
|
|
|
6,005 |
|
|
|
| Short-term securities |
|
|
976,096 |
|
|
|
|
|
– |
|
|
|
|
|
|
|
– |
|
|
|
|
|
|
|
976,096 |
|
|
|
| |
|
|
|
|
|
|
|
|
|
| Total |
|
|
$42,250,563 |
|
|
|
|
|
$1,508,546 |
|
|
|
|
|
|
|
$154,814 |
|
|
|
|
|
|
|
$43,913,923 |
|
|
|
| |
*Amount less than one thousand.
International Fund
|
|
|
|
|
|
|
|
|
|
|
|
|
|
|
|
|
|
|
|
|
|
|
|
|
|
|
|
|
| |
|
Investment securities |
|
|
|
|
|
|
|
|
|
| |
|
Level 1 |
|
|
|
|
Level 2 |
|
|
|
|
|
Level 3 |
|
|
|
|
|
Total |
|
|
|
| |
|
|
|
|
|
|
|
|
|
| Assets: |
|
|
|
|
|
|
|
|
|
|
|
|
|
|
|
|
|
|
|
|
|
|
|
|
|
|
|
|
| Common stocks: |
|
|
|
|
|
|
|
|
|
|
|
|
|
|
|
|
|
|
|
|
|
|
|
|
|
|
|
|
| Industrials |
|
|
$ 30,605 |
|
|
|
|
|
$1,241,269 |
|
|
|
|
|
|
|
$ – |
|
|
|
|
|
|
|
$1,271,874 |
|
|
|
| Information technology |
|
|
225,072 |
|
|
|
|
|
795,333 |
|
|
|
|
|
|
|
5,140 |
|
|
|
|
|
|
|
1,025,545 |
|
|
|
| Health care |
|
|
9,414 |
|
|
|
|
|
925,782 |
|
|
|
|
|
|
|
– |
|
|
|
|
|
|
|
935,196 |
|
|
|
| Materials |
|
|
300,585 |
|
|
|
|
|
574,695 |
|
|
|
|
|
|
|
– |
|
|
|
|
|
|
|
875,280 |
|
|
|
| Consumer discretionary |
|
|
238,676 |
|
|
|
|
|
569,978 |
|
|
|
|
|
|
|
– |
|
|
|
|
|
|
|
808,654 |
|
|
|
| Financials |
|
|
207,655 |
|
|
|
|
|
569,258 |
|
|
|
|
|
|
|
– |
|
|
|
|
|
|
|
776,913 |
|
|
|
| Energy |
|
|
195,370 |
|
|
|
|
|
304,691 |
|
|
|
|
|
|
|
– |
|
|
|
|
|
|
|
500,061 |
|
|
|
| Communication services |
|
|
– |
|
|
|
|
|
366,276 |
|
|
|
|
|
|
|
– |
|
|
|
|
|
|
|
366,276 |
|
|
|
| Consumer staples |
|
|
73,820 |
|
|
|
|
|
227,237 |
|
|
|
|
|
|
|
– |
|
|
|
|
|
|
|
301,057 |
|
|
|
| Utilities |
|
|
– |
|
|
|
|
|
82,776 |
|
|
|
|
|
|
|
– |
|
|
|
|
|
|
|
82,776 |
|
|
|
| Real estate |
|
|
– |
|
|
|
|
|
50,416 |
|
|
|
|
|
|
|
– |
|
|
|
|
|
|
|
50,416 |
|
|
|
| Preferred securities |
|
|
7,588 |
|
|
|
|
|
18,074 |
|
|
|
|
|
|
|
470 |
|
|
|
|
|
|
|
26,132 |
|
|
|
| Rights & warrants |
|
|
– |
|
|
|
|
|
– |
* |
|
|
|
|
|
|
– |
|
|
|
|
|
|
|
– |
* |
|
|
| Short-term securities |
|
|
254,704 |
|
|
|
|
|
– |
|
|
|
|
|
|
|
– |
|
|
|
|
|
|
|
254,704 |
|
|
|
| |
|
|
|
|
|
|
|
|
|
| Total |
|
|
$1,543,489 |
|
|
|
|
|
$5,725,785 |
|
|
|
|
|
|
|
$5,610 |
|
|
|
|
|
|
|
$7,274,884 |
|
|
|
| |
*Amount less than one thousand.
American Funds Insurance Series 270
New World Fund
|
|
|
|
|
|
|
|
|
|
|
|
|
|
|
|
|
|
|
|
|
|
|
|
|
|
|
|
|
| |
|
Investment securities |
|
|
|
|
|
|
|
|
|
| |
|
Level 1 |
|
|
|
|
Level 2 |
|
|
|
|
|
Level 3 |
|
|
|
|
|
Total |
|
|
|
| |
|
|
|
|
|
|
|
|
|
| Assets: |
|
|
|
|
|
|
|
|
|
|
|
|
|
|
|
|
|
|
|
|
|
|
|
|
|
|
|
|
| Common stocks: |
|
|
|
|
|
|
|
|
|
|
|
|
|
|
|
|
|
|
|
|
|
|
|
|
|
|
|
|
| Information technology |
|
|
$ 262,334 |
|
|
|
|
|
$ 324,569 |
|
|
|
|
|
|
|
$ 411 |
|
|
|
|
|
|
|
$ 587,314 |
|
|
|
| Financials |
|
|
141,383 |
|
|
|
|
|
421,482 |
|
|
|
|
|
|
|
– |
* |
|
|
|
|
|
|
562,865 |
|
|
|
| Industrials |
|
|
105,231 |
|
|
|
|
|
285,250 |
|
|
|
|
|
|
|
– |
|
|
|
|
|
|
|
390,481 |
|
|
|
| Consumer discretionary |
|
|
129,842 |
|
|
|
|
|
250,165 |
|
|
|
|
|
|
|
– |
* |
|
|
|
|
|
|
380,007 |
|
|
|
| Health care |
|
|
145,370 |
|
|
|
|
|
217,767 |
|
|
|
|
|
|
|
– |
|
|
|
|
|
|
|
363,137 |
|
|
|
| Communication services |
|
|
130,846 |
|
|
|
|
|
181,115 |
|
|
|
|
|
|
|
– |
|
|
|
|
|
|
|
311,961 |
|
|
|
| Consumer staples |
|
|
55,651 |
|
|
|
|
|
184,935 |
|
|
|
|
|
|
|
– |
|
|
|
|
|
|
|
240,586 |
|
|
|
| Materials |
|
|
141,138 |
|
|
|
|
|
85,753 |
|
|
|
|
|
|
|
– |
* |
|
|
|
|
|
|
226,891 |
|
|
|
| Energy |
|
|
32,790 |
|
|
|
|
|
54,044 |
|
|
|
|
|
|
|
– |
* |
|
|
|
|
|
|
86,834 |
|
|
|
| Real estate |
|
|
13,751 |
|
|
|
|
|
48,224 |
|
|
|
|
|
|
|
– |
|
|
|
|
|
|
|
61,975 |
|
|
|
| Utilities |
|
|
11,565 |
|
|
|
|
|
22,452 |
|
|
|
|
|
|
|
– |
|
|
|
|
|
|
|
34,017 |
|
|
|
| Preferred securities |
|
|
9,731 |
|
|
|
|
|
9,004 |
|
|
|
|
|
|
|
6,048 |
|
|
|
|
|
|
|
24,783 |
|
|
|
| Rights & warrants |
|
|
– |
|
|
|
|
|
1,140 |
|
|
|
|
|
|
|
– |
|
|
|
|
|
|
|
1,140 |
|
|
|
| Convertible stocks |
|
|
266 |
|
|
|
|
|
– |
|
|
|
|
|
|
|
– |
|
|
|
|
|
|
|
266 |
|
|
|
| Bonds, notes & other debt instruments |
|
|
– |
|
|
|
|
|
123,092 |
|
|
|
|
|
|
|
– |
|
|
|
|
|
|
|
123,092 |
|
|
|
| Short-term securities |
|
|
145,254 |
|
|
|
|
|
1,600 |
|
|
|
|
|
|
|
– |
|
|
|
|
|
|
|
146,854 |
|
|
|
| |
|
|
|
|
|
|
|
|
|
| Total |
|
|
$1,325,152 |
|
|
|
|
|
$2,210,592 |
|
|
|
|
|
|
|
$6,459 |
|
|
|
|
|
|
|
$3,542,203 |
|
|
|
| |
|
|
|
|
|
|
|
|
|
|
|
|
|
|
|
|
|
|
|
|
|
|
|
|
|
|
|
|
|
| |
|
Other investments† |
|
|
|
|
|
|
|
|
|
| |
|
Level 1 |
|
|
|
|
Level 2 |
|
|
|
|
|
Level 3 |
|
|
|
|
|
Total |
|
|
|
| |
|
|
|
|
|
|
|
|
|
| Assets: |
|
|
|
|
|
|
|
|
|
|
|
|
|
|
|
|
|
|
|
|
|
|
|
|
|
|
|
|
| Unrealized appreciation on futures contracts |
|
|
$ 51 |
|
|
|
|
|
$ – |
|
|
|
|
|
|
|
$– |
|
|
|
|
|
|
|
$ 51 |
|
|
|
| Unrealized appreciation on open forward currency contracts |
|
|
– |
|
|
|
|
|
131 |
|
|
|
|
|
|
|
– |
|
|
|
|
|
|
|
131 |
|
|
|
| Unrealized appreciation on centrally cleared interest rate swaps |
|
|
– |
|
|
|
|
|
7 |
|
|
|
|
|
|
|
– |
|
|
|
|
|
|
|
7 |
|
|
|
|
|
|
|
|
|
|
|
|
| Liabilities: |
|
|
|
|
|
|
|
|
|
|
|
|
|
|
|
|
|
|
|
|
|
|
|
|
|
|
|
|
| Unrealized depreciation on futures contracts |
|
|
(71 |
) |
|
|
|
|
– |
|
|
|
|
|
|
|
– |
|
|
|
|
|
|
|
(71 |
) |
|
|
| Unrealized depreciation on open forward currency contracts |
|
|
– |
|
|
|
|
|
(195 |
) |
|
|
|
|
|
|
– |
|
|
|
|
|
|
|
(195 |
) |
|
|
| Unrealized depreciation on centrally cleared interest rate swaps |
|
|
– |
|
|
|
|
|
(6 |
) |
|
|
|
|
|
|
– |
|
|
|
|
|
|
|
(6 |
) |
|
|
| Unrealized depreciation on bilateral interest rate swaps |
|
|
– |
|
|
|
|
|
(197 |
) |
|
|
|
|
|
|
– |
|
|
|
|
|
|
|
(197 |
) |
|
|
| |
|
|
|
|
|
|
|
|
|
| Total |
|
|
$(20 |
) |
|
|
|
|
$(260 |
) |
|
|
|
|
|
|
$– |
|
|
|
|
|
|
|
$(280 |
) |
|
|
| |
*Amount less than one thousand.
†Futures contracts, forward currency contracts and interest rate swaps are not included in the fund’s investment portfolio.
Washington Mutual Investors Fund
As of June 30, 2024, all of the fund’s investment securities were classified as Level 1.
271 American Funds Insurance Series
Capital World Growth and Income Fund
|
|
|
|
|
|
|
|
|
|
|
|
|
|
|
|
|
|
|
|
|
|
|
|
|
|
|
|
|
| |
|
Investment securities |
|
|
|
|
|
|
|
|
|
| |
|
Level 1 |
|
|
|
|
Level 2 |
|
|
|
|
|
Level 3 |
|
|
|
|
|
Total |
|
|
|
| |
|
|
|
|
|
|
|
|
|
| Assets: |
|
|
|
|
|
|
|
|
|
|
|
|
|
|
|
|
|
|
|
|
|
|
|
|
|
|
|
|
| Common stocks: |
|
|
|
|
|
|
|
|
|
|
|
|
|
|
|
|
|
|
|
|
|
|
|
|
|
|
|
|
| Information technology |
|
|
$ 288,987 |
|
|
|
|
|
$140,656 |
|
|
|
|
|
|
|
$– |
|
|
|
|
|
|
|
$ 429,643 |
|
|
|
| Industrials |
|
|
114,248 |
|
|
|
|
|
146,844 |
|
|
|
|
|
|
|
– |
|
|
|
|
|
|
|
261,092 |
|
|
|
| Health care |
|
|
164,291 |
|
|
|
|
|
87,733 |
|
|
|
|
|
|
|
– |
|
|
|
|
|
|
|
252,024 |
|
|
|
| Financials |
|
|
99,630 |
|
|
|
|
|
110,715 |
|
|
|
|
|
|
|
– |
* |
|
|
|
|
|
|
210,345 |
|
|
|
| Consumer discretionary |
|
|
107,808 |
|
|
|
|
|
67,587 |
|
|
|
|
|
|
|
– |
|
|
|
|
|
|
|
175,395 |
|
|
|
| Communication services |
|
|
82,784 |
|
|
|
|
|
44,791 |
|
|
|
|
|
|
|
– |
|
|
|
|
|
|
|
127,575 |
|
|
|
| Consumer staples |
|
|
63,456 |
|
|
|
|
|
54,404 |
|
|
|
|
|
|
|
– |
|
|
|
|
|
|
|
117,860 |
|
|
|
| Materials |
|
|
56,110 |
|
|
|
|
|
59,443 |
|
|
|
|
|
|
|
– |
|
|
|
|
|
|
|
115,553 |
|
|
|
| Energy |
|
|
77,243 |
|
|
|
|
|
18,285 |
|
|
|
|
|
|
|
– |
* |
|
|
|
|
|
|
95,528 |
|
|
|
| Utilities |
|
|
21,117 |
|
|
|
|
|
17,151 |
|
|
|
|
|
|
|
– |
|
|
|
|
|
|
|
38,268 |
|
|
|
| Real estate |
|
|
8,777 |
|
|
|
|
|
3,167 |
|
|
|
|
|
|
|
– |
|
|
|
|
|
|
|
11,944 |
|
|
|
| Preferred securities |
|
|
– |
|
|
|
|
|
1,284 |
|
|
|
|
|
|
|
– |
|
|
|
|
|
|
|
1,284 |
|
|
|
| Convertible stocks |
|
|
2,193 |
|
|
|
|
|
– |
|
|
|
|
|
|
|
– |
|
|
|
|
|
|
|
2,193 |
|
|
|
| Bonds, notes & other debt instruments |
|
|
– |
|
|
|
|
|
2,396 |
|
|
|
|
|
|
|
– |
|
|
|
|
|
|
|
2,396 |
|
|
|
| Short-term securities |
|
|
71,370 |
|
|
|
|
|
– |
|
|
|
|
|
|
|
– |
|
|
|
|
|
|
|
71,370 |
|
|
|
| |
|
|
|
|
|
|
|
|
|
| Total |
|
|
$1,158,014 |
|
|
|
|
|
$754,456 |
|
|
|
|
|
|
|
$– |
* |
|
|
|
|
|
|
$1,912,470 |
|
|
|
| |
*Amount less than one thousand.
Growth-Income Fund
|
|
|
|
|
|
|
|
|
|
|
|
|
|
|
|
|
|
|
|
|
|
|
|
|
|
|
|
|
| |
|
Investment securities |
|
|
|
|
|
|
|
|
|
| |
|
Level 1 |
|
|
|
|
Level 2 |
|
|
|
|
|
Level 3 |
|
|
|
|
|
Total |
|
|
|
| |
|
|
|
|
|
|
|
|
|
| Assets: |
|
|
|
|
|
|
|
|
|
|
|
|
|
|
|
|
|
|
|
|
|
|
|
|
|
|
|
|
| Common stocks: |
|
|
|
|
|
|
|
|
|
|
|
|
|
|
|
|
|
|
|
|
|
|
|
|
|
|
|
|
| Information technology |
|
|
$ 9,974,592 |
|
|
|
|
|
$ 468,429 |
|
|
|
|
|
|
|
$– |
|
|
|
|
|
|
|
$10,443,021 |
|
|
|
| Industrials |
|
|
5,400,370 |
|
|
|
|
|
265,011 |
|
|
|
|
|
|
|
– |
|
|
|
|
|
|
|
5,665,381 |
|
|
|
| Health care |
|
|
5,144,347 |
|
|
|
|
|
283,784 |
|
|
|
|
|
|
|
– |
|
|
|
|
|
|
|
5,428,131 |
|
|
|
| Communication services |
|
|
4,197,118 |
|
|
|
|
|
– |
|
|
|
|
|
|
|
– |
|
|
|
|
|
|
|
4,197,118 |
|
|
|
| Consumer discretionary |
|
|
3,601,831 |
|
|
|
|
|
293,612 |
|
|
|
|
|
|
|
– |
|
|
|
|
|
|
|
3,895,443 |
|
|
|
| Financials |
|
|
3,879,668 |
|
|
|
|
|
– |
|
|
|
|
|
|
|
– |
|
|
|
|
|
|
|
3,879,668 |
|
|
|
| Consumer staples |
|
|
815,121 |
|
|
|
|
|
569,845 |
|
|
|
|
|
|
|
– |
|
|
|
|
|
|
|
1,384,966 |
|
|
|
| Energy |
|
|
1,212,871 |
|
|
|
|
|
– |
|
|
|
|
|
|
|
– |
|
|
|
|
|
|
|
1,212,871 |
|
|
|
| Materials |
|
|
1,210,526 |
|
|
|
|
|
– |
|
|
|
|
|
|
|
– |
|
|
|
|
|
|
|
1,210,526 |
|
|
|
| Utilities |
|
|
931,665 |
|
|
|
|
|
– |
|
|
|
|
|
|
|
– |
|
|
|
|
|
|
|
931,665 |
|
|
|
| Real estate |
|
|
729,800 |
|
|
|
|
|
– |
|
|
|
|
|
|
|
– |
|
|
|
|
|
|
|
729,800 |
|
|
|
| Bonds, notes & other debt instruments |
|
|
– |
|
|
|
|
|
5,638 |
|
|
|
|
|
|
|
– |
|
|
|
|
|
|
|
5,638 |
|
|
|
| Short-term securities |
|
|
1,121,126 |
|
|
|
|
|
– |
|
|
|
|
|
|
|
– |
|
|
|
|
|
|
|
1,121,126 |
|
|
|
| |
|
|
|
|
|
|
|
|
|
| Total |
|
|
$38,219,035 |
|
|
|
|
|
$1,886,319 |
|
|
|
|
|
|
|
$– |
|
|
|
|
|
|
|
$40,105,354 |
|
|
|
| |
American Funds Insurance Series 272
International Growth and Income Fund
|
|
|
|
|
|
|
|
|
|
|
|
|
|
|
|
|
|
|
|
|
|
|
|
|
|
|
| |
|
Investment securities |
|
|
|
|
|
|
|
|
|
| |
|
Level 1 |
|
|
|
Level 2 |
|
|
|
|
|
Level 3 |
|
|
|
|
|
Total |
|
|
|
| |
| Assets: |
|
|
|
|
|
|
|
|
|
|
|
|
|
|
|
|
|
|
|
|
|
|
|
|
|
|
| Common stocks: |
|
|
|
|
|
|
|
|
|
|
|
|
|
|
|
|
|
|
|
|
|
|
|
|
|
|
| Financials |
|
$ 4,829 |
|
|
|
|
$ 56,328 |
|
|
|
|
|
|
|
$– |
* |
|
|
|
|
|
|
$ 61,157 |
|
|
|
| Information technology |
|
4,793 |
|
|
|
|
44,468 |
|
|
|
|
|
|
|
– |
|
|
|
|
|
|
|
49,261 |
|
|
|
| Industrials |
|
7,610 |
|
|
|
|
37,626 |
|
|
|
|
|
|
|
– |
|
|
|
|
|
|
|
45,236 |
|
|
|
| Consumer discretionary |
|
4,003 |
|
|
|
|
28,983 |
|
|
|
|
|
|
|
– |
|
|
|
|
|
|
|
32,986 |
|
|
|
| Health care |
|
844 |
|
|
|
|
27,802 |
|
|
|
|
|
|
|
– |
|
|
|
|
|
|
|
28,646 |
|
|
|
| Consumer staples |
|
5,502 |
|
|
|
|
21,656 |
|
|
|
|
|
|
|
– |
|
|
|
|
|
|
|
27,158 |
|
|
|
| Communication services |
|
2,254 |
|
|
|
|
19,795 |
|
|
|
|
|
|
|
– |
|
|
|
|
|
|
|
22,049 |
|
|
|
| Energy |
|
5,807 |
|
|
|
|
9,819 |
|
|
|
|
|
|
|
– |
* |
|
|
|
|
|
|
15,626 |
|
|
|
| Materials |
|
8,436 |
|
|
|
|
7,056 |
|
|
|
|
|
|
|
– |
* |
|
|
|
|
|
|
15,492 |
|
|
|
| Utilities |
|
970 |
|
|
|
|
5,452 |
|
|
|
|
|
|
|
– |
|
|
|
|
|
|
|
6,422 |
|
|
|
| Real estate |
|
842 |
|
|
|
|
4,244 |
|
|
|
|
|
|
|
– |
|
|
|
|
|
|
|
5,086 |
|
|
|
| Preferred securities |
|
247 |
|
|
|
|
187 |
|
|
|
|
|
|
|
– |
|
|
|
|
|
|
|
434 |
|
|
|
| Short-term securities |
|
19,520 |
|
|
|
|
– |
|
|
|
|
|
|
|
– |
|
|
|
|
|
|
|
19,520 |
|
|
|
|
|
|
|
|
|
|
|
|
| Total |
|
$65,657 |
|
|
|
|
$263,416 |
|
|
|
|
|
|
|
$– |
* |
|
|
|
|
|
|
$329,073 |
|
|
|
| |
*Amount less than one thousand.
Capital Income Builder
|
|
|
|
|
|
|
|
|
|
|
|
|
|
|
|
|
|
|
|
|
|
|
|
|
|
|
| |
|
Investment securities |
|
|
|
|
|
|
|
|
|
| |
|
Level 1 |
|
|
|
Level 2 |
|
|
|
|
|
Level 3 |
|
|
|
|
|
Total |
|
|
|
| |
| Assets: |
|
|
|
|
|
|
|
|
|
|
|
|
|
|
|
|
|
|
|
|
|
|
|
|
|
|
| Common stocks: |
|
|
|
|
|
|
|
|
|
|
|
|
|
|
|
|
|
|
|
|
|
|
|
|
|
|
| Financials |
|
$100,714 |
|
|
|
|
$ 69,319 |
|
|
|
|
|
|
|
$ – |
* |
|
|
|
|
|
|
$ 170,033 |
|
|
|
| Information technology |
|
116,169 |
|
|
|
|
35,965 |
|
|
|
|
|
|
|
– |
|
|
|
|
|
|
|
152,134 |
|
|
|
| Health care |
|
94,374 |
|
|
|
|
34,786 |
|
|
|
|
|
|
|
– |
|
|
|
|
|
|
|
129,160 |
|
|
|
| Industrials |
|
63,400 |
|
|
|
|
55,975 |
|
|
|
|
|
|
|
– |
|
|
|
|
|
|
|
119,375 |
|
|
|
| Consumer staples |
|
69,924 |
|
|
|
|
44,266 |
|
|
|
|
|
|
|
– |
|
|
|
|
|
|
|
114,190 |
|
|
|
| Energy |
|
59,901 |
|
|
|
|
22,075 |
|
|
|
|
|
|
|
– |
* |
|
|
|
|
|
|
81,976 |
|
|
|
| Utilities |
|
45,923 |
|
|
|
|
33,806 |
|
|
|
|
|
|
|
– |
|
|
|
|
|
|
|
79,729 |
|
|
|
| Consumer discretionary |
|
33,679 |
|
|
|
|
23,036 |
|
|
|
|
|
|
|
– |
|
|
|
|
|
|
|
56,715 |
|
|
|
| Real estate |
|
44,779 |
|
|
|
|
7,895 |
|
|
|
|
|
|
|
– |
|
|
|
|
|
|
|
52,674 |
|
|
|
| Communication services |
|
17,630 |
|
|
|
|
18,790 |
|
|
|
|
|
|
|
– |
|
|
|
|
|
|
|
36,420 |
|
|
|
| Materials |
|
15,932 |
|
|
|
|
14,052 |
|
|
|
|
|
|
|
– |
|
|
|
|
|
|
|
29,984 |
|
|
|
| Convertible stocks |
|
1,435 |
|
|
|
|
– |
|
|
|
|
|
|
|
– |
|
|
|
|
|
|
|
1,435 |
|
|
|
| Bonds, notes & other debt instruments: |
|
|
|
|
|
|
|
|
|
|
|
|
|
|
|
|
|
|
|
|
|
|
|
|
|
|
| Mortgage-backed obligations |
|
– |
|
|
|
|
103,963 |
|
|
|
|
|
|
|
98 |
|
|
|
|
|
|
|
104,061 |
|
|
|
| U.S. Treasury bonds & notes |
|
– |
|
|
|
|
59,854 |
|
|
|
|
|
|
|
– |
|
|
|
|
|
|
|
59,854 |
|
|
|
| Corporate bonds, notes & loans |
|
– |
|
|
|
|
31,284 |
|
|
|
|
|
|
|
– |
|
|
|
|
|
|
|
31,284 |
|
|
|
| Asset-backed obligations |
|
– |
|
|
|
|
11,035 |
|
|
|
|
|
|
|
– |
|
|
|
|
|
|
|
11,035 |
|
|
|
| Bonds & notes of governments & government agencies outside the U.S. |
|
– |
|
|
|
|
746 |
|
|
|
|
|
|
|
– |
|
|
|
|
|
|
|
746 |
|
|
|
| Municipals |
|
– |
|
|
|
|
344 |
|
|
|
|
|
|
|
– |
|
|
|
|
|
|
|
344 |
|
|
|
| Investment funds |
|
30,145 |
|
|
|
|
– |
|
|
|
|
|
|
|
– |
|
|
|
|
|
|
|
30,145 |
|
|
|
| Short-term securities |
|
95,267 |
|
|
|
|
– |
|
|
|
|
|
|
|
– |
|
|
|
|
|
|
|
95,267 |
|
|
|
|
|
|
|
|
|
|
|
|
| Total |
|
$789,272 |
|
|
|
|
$567,191 |
|
|
|
|
|
|
|
$98 |
|
|
|
|
|
|
|
$1,356,561 |
|
|
|
| |
Refer to the next page for footnote.
273 American Funds Insurance Series
|
|
|
|
|
|
|
|
|
|
|
|
|
|
|
|
|
|
|
|
|
|
|
|
|
|
|
| |
|
Other investments† |
|
|
|
|
|
|
|
|
|
| |
|
Level 1 |
|
|
|
Level 2 |
|
|
|
|
|
Level 3 |
|
|
|
|
|
Total |
|
|
|
| |
| Assets: |
|
|
|
|
|
|
|
|
|
|
|
|
|
|
|
|
|
|
|
|
|
|
|
|
|
|
| Unrealized appreciation on futures contracts |
|
$577 |
|
|
|
|
$ – |
|
|
|
|
|
|
|
$– |
|
|
|
|
|
|
|
$ 577 |
|
|
|
| Unrealized appreciation on centrally cleared interest rate swaps |
|
– |
|
|
|
|
446 |
|
|
|
|
|
|
|
– |
|
|
|
|
|
|
|
446 |
|
|
|
| Unrealized appreciation on centrally cleared credit default swaps |
|
– |
|
|
|
|
2 |
|
|
|
|
|
|
|
– |
|
|
|
|
|
|
|
2 |
|
|
|
| Liabilities: |
|
|
|
|
|
|
|
|
|
|
|
|
|
|
|
|
|
|
|
|
|
|
|
|
|
|
| Unrealized depreciation on futures contracts |
|
(3) |
|
|
|
|
– |
|
|
|
|
|
|
|
– |
|
|
|
|
|
|
|
(3 |
) |
|
|
|
|
|
|
|
|
|
|
|
| Total |
|
$574 |
|
|
|
|
$448 |
|
|
|
|
|
|
|
$– |
|
|
|
|
|
|
|
$1,022 |
|
|
|
| |
*Amount less than one thousand.
†Futures contracts, interest rate swaps and credit default swaps are not included in the fund’s investment portfolio.
Asset Allocation Fund
|
|
|
|
|
|
|
|
|
|
|
|
|
|
|
|
|
|
|
|
|
|
|
|
|
|
|
| |
|
Investment securities |
|
|
|
|
|
|
|
|
|
| |
|
Level 1 |
|
|
|
Level 2 |
|
|
|
|
|
Level 3 |
|
|
|
|
|
Total |
|
|
|
| |
| Assets: |
|
|
|
|
|
|
|
|
|
|
|
|
|
|
|
|
|
|
|
|
|
|
|
|
|
|
| Common stocks: |
|
|
|
|
|
|
|
|
|
|
|
|
|
|
|
|
|
|
|
|
|
|
|
|
|
|
| Information technology |
|
$ 4,353,314 |
|
|
|
|
$ 22,990 |
|
|
|
|
|
|
|
$ – |
|
|
|
|
|
|
|
$ 4,376,304 |
|
|
|
| Health care |
|
2,525,391 |
|
|
|
|
218,654 |
|
|
|
|
|
|
|
18,138 |
|
|
|
|
|
|
|
2,762,183 |
|
|
|
| Financials |
|
2,608,729 |
|
|
|
|
54,564 |
|
|
|
|
|
|
|
– |
* |
|
|
|
|
|
|
2,663,293 |
|
|
|
| Communication services |
|
1,804,461 |
|
|
|
|
– |
|
|
|
|
|
|
|
– |
|
|
|
|
|
|
|
1,804,461 |
|
|
|
| Consumer discretionary |
|
1,539,970 |
|
|
|
|
240,597 |
|
|
|
|
|
|
|
1,199 |
|
|
|
|
|
|
|
1,781,766 |
|
|
|
| Industrials |
|
1,545,510 |
|
|
|
|
155,442 |
|
|
|
|
|
|
|
– |
|
|
|
|
|
|
|
1,700,952 |
|
|
|
| Materials |
|
1,131,819 |
|
|
|
|
– |
|
|
|
|
|
|
|
2,890 |
|
|
|
|
|
|
|
1,134,709 |
|
|
|
| Consumer staples |
|
865,162 |
|
|
|
|
95,409 |
|
|
|
|
|
|
|
– |
|
|
|
|
|
|
|
960,571 |
|
|
|
| Energy |
|
862,445 |
|
|
|
|
– |
|
|
|
|
|
|
|
1,282 |
|
|
|
|
|
|
|
863,727 |
|
|
|
| Real estate |
|
289,295 |
|
|
|
|
– |
|
|
|
|
|
|
|
– |
|
|
|
|
|
|
|
289,295 |
|
|
|
| Utilities |
|
43,079 |
|
|
|
|
– |
|
|
|
|
|
|
|
– |
|
|
|
|
|
|
|
43,079 |
|
|
|
| Preferred securities |
|
– |
|
|
|
|
– |
|
|
|
|
|
|
|
771 |
|
|
|
|
|
|
|
771 |
|
|
|
| Rights & warrants |
|
– |
|
|
|
|
– |
|
|
|
|
|
|
|
– |
* |
|
|
|
|
|
|
– |
* |
|
|
| Convertible stocks |
|
– |
|
|
|
|
– |
|
|
|
|
|
|
|
11,596 |
|
|
|
|
|
|
|
11,596 |
|
|
|
| Convertible bonds & notes |
|
– |
|
|
|
|
2,501 |
|
|
|
|
|
|
|
– |
|
|
|
|
|
|
|
2,501 |
|
|
|
| Bonds, notes & other debt instruments: |
|
|
|
|
|
|
|
|
|
|
|
|
|
|
|
|
|
|
|
|
|
|
|
|
|
|
| Mortgage-backed obligations |
|
– |
|
|
|
|
2,453,506 |
|
|
|
|
|
|
|
– |
|
|
|
|
|
|
|
2,453,506 |
|
|
|
| U.S. Treasury bonds & notes |
|
– |
|
|
|
|
1,626,887 |
|
|
|
|
|
|
|
– |
|
|
|
|
|
|
|
1,626,887 |
|
|
|
| Corporate bonds, notes & loans |
|
– |
|
|
|
|
1,585,311 |
|
|
|
|
|
|
|
3,079 |
|
|
|
|
|
|
|
1,588,390 |
|
|
|
| Asset-backed obligations |
|
– |
|
|
|
|
613,243 |
|
|
|
|
|
|
|
5,930 |
|
|
|
|
|
|
|
619,173 |
|
|
|
| Bonds & notes of governments & government agencies outside the U.S. |
|
– |
|
|
|
|
46,638 |
|
|
|
|
|
|
|
– |
|
|
|
|
|
|
|
46,638 |
|
|
|
| Municipals |
|
– |
|
|
|
|
29,674 |
|
|
|
|
|
|
|
– |
|
|
|
|
|
|
|
29,674 |
|
|
|
| Investment funds |
|
1,423,069 |
|
|
|
|
– |
|
|
|
|
|
|
|
– |
|
|
|
|
|
|
|
1,423,069 |
|
|
|
| Short-term securities |
|
1,780,820 |
|
|
|
|
– |
|
|
|
|
|
|
|
– |
|
|
|
|
|
|
|
1,780,820 |
|
|
|
|
|
|
|
|
|
|
|
|
| Total |
|
$20,773,064 |
|
|
|
|
$7,145,416 |
|
|
|
|
|
|
|
$44,885 |
|
|
|
|
|
|
|
$27,963,365 |
|
|
|
| |
|
|
|
|
|
|
|
|
|
|
|
|
|
|
|
|
|
|
|
|
|
|
|
|
|
|
|
| |
|
Other investments† |
|
|
|
|
|
|
|
|
|
| |
|
Level 1 |
|
|
|
Level 2 |
|
|
|
|
|
Level 3 |
|
|
|
|
|
Total |
|
|
|
| |
| Assets: |
|
|
|
|
|
|
|
|
|
|
|
|
|
|
|
|
|
|
|
|
|
|
|
|
|
|
| Unrealized appreciation on futures contracts |
|
$7,673 |
|
|
|
|
$ – |
|
|
|
|
|
|
|
$– |
|
|
|
|
|
|
|
$7,673 |
|
|
|
| Unrealized appreciation on centrally cleared interest rate swaps |
|
– |
|
|
|
|
1,397 |
|
|
|
|
|
|
|
– |
|
|
|
|
|
|
|
1,397 |
|
|
|
| Liabilities: |
|
|
|
|
|
|
|
|
|
|
|
|
|
|
|
|
|
|
|
|
|
|
|
|
|
|
| Unrealized depreciation on futures contracts |
|
(3,890) |
|
|
|
|
– |
|
|
|
|
|
|
|
– |
|
|
|
|
|
|
|
(3,890 |
) |
|
|
| Unrealized depreciation on centrally cleared credit default swaps |
|
– |
|
|
|
|
(28 |
) |
|
|
|
|
|
|
– |
|
|
|
|
|
|
|
(28 |
) |
|
|
|
|
|
|
|
|
|
|
|
| Total |
|
$3,783 |
|
|
|
|
$1,369 |
|
|
|
|
|
|
|
$– |
|
|
|
|
|
|
|
$5,152 |
|
|
|
| |
*Amount less than one thousand.
†Futures contracts, interest rate swaps and credit default swaps are not included in the fund’s investment portfolio.
American Funds Insurance Series 274
American Funds Global Balanced Fund
|
|
|
|
|
|
|
|
|
|
|
|
|
|
|
|
|
|
|
|
|
|
|
|
|
|
|
| |
|
Investment securities |
|
|
|
|
|
|
|
|
|
| |
|
Level 1 |
|
|
|
Level 2 |
|
|
|
|
|
Level 3 |
|
|
|
|
|
Total |
|
|
|
| |
| Assets: |
|
|
|
|
|
|
|
|
|
|
|
|
|
|
|
|
|
|
|
|
|
|
|
|
|
|
| Common stocks: |
|
|
|
|
|
|
|
|
|
|
|
|
|
|
|
|
|
|
|
|
|
|
|
|
|
|
| Information technology |
|
$ 37,992 |
|
|
|
|
$ 9,482 |
|
|
|
|
|
|
|
$– |
|
|
|
|
|
|
|
$ 47,474 |
|
|
|
| Health care |
|
21,907 |
|
|
|
|
16,099 |
|
|
|
|
|
|
|
– |
|
|
|
|
|
|
|
38,006 |
|
|
|
| Industrials |
|
19,771 |
|
|
|
|
12,069 |
|
|
|
|
|
|
|
– |
|
|
|
|
|
|
|
31,840 |
|
|
|
| Financials |
|
11,701 |
|
|
|
|
18,498 |
|
|
|
|
|
|
|
– |
|
|
|
|
|
|
|
30,199 |
|
|
|
| Consumer staples |
|
3,912 |
|
|
|
|
18,250 |
|
|
|
|
|
|
|
– |
|
|
|
|
|
|
|
22,162 |
|
|
|
| Materials |
|
11,783 |
|
|
|
|
7,524 |
|
|
|
|
|
|
|
– |
|
|
|
|
|
|
|
19,307 |
|
|
|
| Communication services |
|
16,421 |
|
|
|
|
1,735 |
|
|
|
|
|
|
|
– |
|
|
|
|
|
|
|
18,156 |
|
|
|
| Consumer discretionary |
|
9,682 |
|
|
|
|
6,096 |
|
|
|
|
|
|
|
– |
|
|
|
|
|
|
|
15,778 |
|
|
|
| Energy |
|
8,591 |
|
|
|
|
3,541 |
|
|
|
|
|
|
|
– |
|
|
|
|
|
|
|
12,132 |
|
|
|
| Utilities |
|
7,953 |
|
|
|
|
3,955 |
|
|
|
|
|
|
|
– |
|
|
|
|
|
|
|
11,908 |
|
|
|
| Real estate |
|
1,613 |
|
|
|
|
3,125 |
|
|
|
|
|
|
|
– |
|
|
|
|
|
|
|
4,738 |
|
|
|
| Preferred securities |
|
– |
|
|
|
|
315 |
|
|
|
|
|
|
|
– |
|
|
|
|
|
|
|
315 |
|
|
|
| Convertible stocks |
|
1,975 |
|
|
|
|
– |
|
|
|
|
|
|
|
– |
|
|
|
|
|
|
|
1,975 |
|
|
|
| Bonds, notes & other debt instruments: |
|
|
|
|
|
|
|
|
|
|
|
|
|
|
|
|
|
|
|
|
|
|
|
|
|
|
| Bonds & notes of governments & government agencies outside the U.S. |
|
– |
|
|
|
|
50,730 |
|
|
|
|
|
|
|
– |
|
|
|
|
|
|
|
50,730 |
|
|
|
| Mortgage-backed obligations |
|
– |
|
|
|
|
27,047 |
|
|
|
|
|
|
|
– |
|
|
|
|
|
|
|
27,047 |
|
|
|
| Corporate bonds, notes & loans |
|
– |
|
|
|
|
22,836 |
|
|
|
|
|
|
|
– |
|
|
|
|
|
|
|
22,836 |
|
|
|
| U.S. Treasury bonds & notes |
|
– |
|
|
|
|
17,016 |
|
|
|
|
|
|
|
– |
|
|
|
|
|
|
|
17,016 |
|
|
|
| Asset-backed obligations |
|
– |
|
|
|
|
1,218 |
|
|
|
|
|
|
|
– |
|
|
|
|
|
|
|
1,218 |
|
|
|
| Federal agency bonds & notes |
|
– |
|
|
|
|
201 |
|
|
|
|
|
|
|
– |
|
|
|
|
|
|
|
201 |
|
|
|
| Municipals |
|
– |
|
|
|
|
135 |
|
|
|
|
|
|
|
– |
|
|
|
|
|
|
|
135 |
|
|
|
| Investment funds |
|
3,858 |
|
|
|
|
– |
|
|
|
|
|
|
|
– |
|
|
|
|
|
|
|
3,858 |
|
|
|
| Short-term securities |
|
32,269 |
|
|
|
|
1,693 |
|
|
|
|
|
|
|
– |
|
|
|
|
|
|
|
33,962 |
|
|
|
|
|
|
|
|
|
|
|
|
| Total |
|
$189,428 |
|
|
|
|
$221,565 |
|
|
|
|
|
|
|
$– |
|
|
|
|
|
|
|
$410,993 |
|
|
|
| |
|
|
|
|
|
|
|
|
|
|
|
|
|
|
|
|
|
|
|
|
|
|
|
|
|
|
|
| |
|
Other investments* |
|
|
|
|
|
|
|
|
|
| |
|
Level 1 |
|
|
|
Level 2 |
|
|
|
|
|
Level 3 |
|
|
|
|
|
Total |
|
|
|
| |
| Assets: |
|
|
|
|
|
|
|
|
|
|
|
|
|
|
|
|
|
|
|
|
|
|
|
|
|
|
| Unrealized appreciation on futures contracts |
|
$230 |
|
|
|
|
$ – |
|
|
|
|
|
|
|
$– |
|
|
|
|
|
|
|
$ 230 |
|
|
|
| Unrealized appreciation on open forward currency contracts |
|
– |
|
|
|
|
183 |
|
|
|
|
|
|
|
– |
|
|
|
|
|
|
|
183 |
|
|
|
| Unrealized appreciation on centrally cleared interest rate swaps |
|
– |
|
|
|
|
205 |
|
|
|
|
|
|
|
– |
|
|
|
|
|
|
|
205 |
|
|
|
| Liabilities: |
|
|
|
|
|
|
|
|
|
|
|
|
|
|
|
|
|
|
|
|
|
|
|
|
|
|
| Unrealized depreciation on futures contracts |
|
(27) |
|
|
|
|
– |
|
|
|
|
|
|
|
– |
|
|
|
|
|
|
|
(27 |
) |
|
|
| Unrealized depreciation on open forward currency contracts |
|
– |
|
|
|
|
(286 |
) |
|
|
|
|
|
|
– |
|
|
|
|
|
|
|
(286 |
) |
|
|
| Unrealized depreciation on centrally cleared interest rate swaps |
|
– |
|
|
|
|
(94 |
) |
|
|
|
|
|
|
– |
|
|
|
|
|
|
|
(94 |
) |
|
|
| Unrealized depreciation on bilateral interest rate swaps |
|
– |
|
|
|
|
(157 |
) |
|
|
|
|
|
|
– |
|
|
|
|
|
|
|
(157 |
) |
|
|
| Unrealized depreciation on centrally cleared credit default swaps |
|
– |
|
|
|
|
(19 |
) |
|
|
|
|
|
|
– |
|
|
|
|
|
|
|
(19 |
) |
|
|
|
|
|
|
|
|
|
|
|
| Total |
|
$203 |
|
|
|
|
$(168 |
) |
|
|
|
|
|
|
$– |
|
|
|
|
|
|
|
$ 35 |
|
|
|
| |
*Futures contracts, forward currency contracts, interest rate swaps and credit default swaps are not included in the fund’s investment portfolio.
275 American Funds Insurance Series
The Bond Fund of America
|
|
|
|
|
|
|
|
|
|
|
|
|
|
|
|
|
|
|
|
|
|
|
|
|
|
|
| |
|
Investment securities |
|
|
|
|
|
|
|
|
|
| |
|
Level 1 |
|
|
|
Level 2 |
|
|
|
|
|
Level 3 |
|
|
|
|
|
Total |
|
|
|
| |
| Assets: |
|
|
|
|
|
|
|
|
|
|
|
|
|
|
|
|
|
|
|
|
|
|
|
|
|
|
| Bonds, notes & other debt instruments: |
|
|
|
|
|
|
|
|
|
|
|
|
|
|
|
|
|
|
|
|
|
|
|
|
|
|
| Mortgage-backed obligations |
|
$ – |
|
|
|
|
$ 4,607,884 |
|
|
|
|
|
|
|
$ 1,642 |
|
|
|
|
|
|
|
$ 4,609,526 |
|
|
|
| Corporate bonds, notes & loans |
|
– |
|
|
|
|
3,399,615 |
|
|
|
|
|
|
|
– |
|
|
|
|
|
|
|
3,399,615 |
|
|
|
| U.S. Treasury bonds & notes |
|
– |
|
|
|
|
1,938,945 |
|
|
|
|
|
|
|
– |
|
|
|
|
|
|
|
1,938,945 |
|
|
|
| Asset-backed obligations |
|
– |
|
|
|
|
564,361 |
|
|
|
|
|
|
|
9,745 |
|
|
|
|
|
|
|
574,106 |
|
|
|
| Municipals |
|
– |
|
|
|
|
167,632 |
|
|
|
|
|
|
|
– |
|
|
|
|
|
|
|
167,632 |
|
|
|
| Bonds & notes of governments & government agencies outside the U.S. |
|
– |
|
|
|
|
114,266 |
|
|
|
|
|
|
|
– |
|
|
|
|
|
|
|
114,266 |
|
|
|
| Federal agency bonds & notes |
|
– |
|
|
|
|
11,365 |
|
|
|
|
|
|
|
– |
|
|
|
|
|
|
|
11,365 |
|
|
|
| Common stocks |
|
– |
|
|
|
|
15 |
|
|
|
|
|
|
|
– |
|
|
|
|
|
|
|
15 |
|
|
|
| Short-term securities |
|
1,710,287 |
|
|
|
|
– |
|
|
|
|
|
|
|
– |
|
|
|
|
|
|
|
1,710,287 |
|
|
|
|
|
|
|
|
|
|
|
|
| Total |
|
$1,710,287 |
|
|
|
|
$10,804,083 |
|
|
|
|
|
|
|
$11,387 |
|
|
|
|
|
|
|
$12,525,757 |
|
|
|
| |
|
|
|
|
|
|
|
|
|
|
|
|
|
|
|
|
|
|
|
|
|
|
|
|
|
|
|
| |
|
Other investments* |
|
|
|
|
|
|
|
|
|
| |
|
Level 1 |
|
|
|
Level 2 |
|
|
|
|
|
Level 3 |
|
|
|
|
|
Total |
|
|
|
| |
| Assets: |
|
|
|
|
|
|
|
|
|
|
|
|
|
|
|
|
|
|
|
|
|
|
|
|
|
|
| Unrealized appreciation on futures contracts |
|
$22,317 |
|
|
|
|
$ – |
|
|
|
|
|
|
|
$– |
|
|
|
|
|
|
|
$22,317 |
|
|
|
| Unrealized appreciation on open forward currency contracts |
|
– |
|
|
|
|
1,071 |
|
|
|
|
|
|
|
– |
|
|
|
|
|
|
|
1,071 |
|
|
|
| Unrealized appreciation on centrally cleared interest rate swaps |
|
– |
|
|
|
|
4,764 |
|
|
|
|
|
|
|
– |
|
|
|
|
|
|
|
4,764 |
|
|
|
| Unrealized appreciation on centrally cleared credit default swaps |
|
– |
|
|
|
|
796 |
|
|
|
|
|
|
|
– |
|
|
|
|
|
|
|
796 |
|
|
|
| Liabilities: |
|
|
|
|
|
|
|
|
|
|
|
|
|
|
|
|
|
|
|
|
|
|
|
|
|
|
| Unrealized depreciation on futures contracts |
|
(4,922) |
|
|
|
|
– |
|
|
|
|
|
|
|
– |
|
|
|
|
|
|
|
(4,922 |
) |
|
|
| Unrealized depreciation on open forward currency contracts |
|
– |
|
|
|
|
(125 |
) |
|
|
|
|
|
|
– |
|
|
|
|
|
|
|
(125 |
) |
|
|
| Unrealized depreciation on centrally cleared interest rate swaps |
|
– |
|
|
|
|
(750 |
) |
|
|
|
|
|
|
– |
|
|
|
|
|
|
|
(750 |
) |
|
|
|
|
|
|
|
|
|
|
|
| Total |
|
$17,395 |
|
|
|
|
$5,756 |
|
|
|
|
|
|
|
$– |
|
|
|
|
|
|
|
$23,151 |
|
|
|
| |
*Futures contracts, forward currency contracts, interest rate swaps and credit default swaps are not included in the fund’s investment portfolio.
American Funds Insurance Series 276
Capital World Bond Fund
|
|
|
|
|
|
|
|
|
|
|
|
|
|
|
|
|
|
|
|
|
|
|
|
|
|
|
| |
|
Investment securities |
|
|
|
|
|
|
|
|
|
| |
|
Level 1 |
|
|
|
Level 2 |
|
|
|
|
|
Level 3 |
|
|
|
|
|
Total |
|
|
|
| |
| Assets: |
|
|
|
|
|
|
|
|
|
|
|
|
|
|
|
|
|
|
|
|
|
|
|
|
|
|
| Bonds, notes & other debt instruments: |
|
|
|
|
|
|
|
|
|
|
|
|
|
|
|
|
|
|
|
|
|
|
|
|
|
|
| Euros |
|
$ – |
|
|
|
|
$ 266,716 |
|
|
|
|
|
|
|
$ – |
|
|
|
|
|
|
|
$ 266,716 |
|
|
|
| Japanese yen |
|
– |
|
|
|
|
77,428 |
|
|
|
|
|
|
|
– |
|
|
|
|
|
|
|
77,428 |
|
|
|
| British pounds |
|
– |
|
|
|
|
63,909 |
|
|
|
|
|
|
|
– |
|
|
|
|
|
|
|
63,909 |
|
|
|
| Chinese yuan renminbi |
|
– |
|
|
|
|
52,474 |
|
|
|
|
|
|
|
– |
|
|
|
|
|
|
|
52,474 |
|
|
|
| Mexican pesos |
|
– |
|
|
|
|
41,908 |
|
|
|
|
|
|
|
– |
|
|
|
|
|
|
|
41,908 |
|
|
|
| Brazilian reais |
|
– |
|
|
|
|
38,821 |
|
|
|
|
|
|
|
– |
|
|
|
|
|
|
|
38,821 |
|
|
|
| Canadian dollars |
|
– |
|
|
|
|
31,560 |
|
|
|
|
|
|
|
– |
|
|
|
|
|
|
|
31,560 |
|
|
|
| South Korean won |
|
– |
|
|
|
|
29,309 |
|
|
|
|
|
|
|
– |
|
|
|
|
|
|
|
29,309 |
|
|
|
| Australian dollars |
|
– |
|
|
|
|
25,115 |
|
|
|
|
|
|
|
– |
|
|
|
|
|
|
|
25,115 |
|
|
|
| Indonesian rupiah |
|
– |
|
|
|
|
21,091 |
|
|
|
|
|
|
|
– |
|
|
|
|
|
|
|
21,091 |
|
|
|
| Norwegian kroner |
|
– |
|
|
|
|
9,889 |
|
|
|
|
|
|
|
– |
|
|
|
|
|
|
|
9,889 |
|
|
|
| Indian rupees |
|
– |
|
|
|
|
8,054 |
|
|
|
|
|
|
|
– |
|
|
|
|
|
|
|
8,054 |
|
|
|
| Israeli shekels |
|
– |
|
|
|
|
7,221 |
|
|
|
|
|
|
|
– |
|
|
|
|
|
|
|
7,221 |
|
|
|
| New Zealand dollars |
|
– |
|
|
|
|
6,207 |
|
|
|
|
|
|
|
– |
|
|
|
|
|
|
|
6,207 |
|
|
|
| Danish kroner |
|
– |
|
|
|
|
6,116 |
|
|
|
|
|
|
|
– |
|
|
|
|
|
|
|
6,116 |
|
|
|
| Polish zloty |
|
– |
|
|
|
|
3,430 |
|
|
|
|
|
|
|
– |
|
|
|
|
|
|
|
3,430 |
|
|
|
| Turkish lira |
|
– |
|
|
|
|
3,411 |
|
|
|
|
|
|
|
– |
|
|
|
|
|
|
|
3,411 |
|
|
|
| Chilean pesos |
|
– |
|
|
|
|
2,600 |
|
|
|
|
|
|
|
– |
|
|
|
|
|
|
|
2,600 |
|
|
|
| Malaysian ringgits |
|
– |
|
|
|
|
2,166 |
|
|
|
|
|
|
|
– |
|
|
|
|
|
|
|
2,166 |
|
|
|
| South African rand |
|
– |
|
|
|
|
2,074 |
|
|
|
|
|
|
|
– |
|
|
|
|
|
|
|
2,074 |
|
|
|
| Colombian pesos |
|
– |
|
|
|
|
1,121 |
|
|
|
|
|
|
|
– |
|
|
|
|
|
|
|
1,121 |
|
|
|
| Romanian leu |
|
– |
|
|
|
|
1,067 |
|
|
|
|
|
|
|
– |
|
|
|
|
|
|
|
1,067 |
|
|
|
| Ukrainian hryvnia |
|
– |
|
|
|
|
6 |
|
|
|
|
|
|
|
– |
|
|
|
|
|
|
|
6 |
|
|
|
| U.S. dollars |
|
– |
|
|
|
|
703,356 |
|
|
|
|
|
|
|
200 |
|
|
|
|
|
|
|
703,556 |
|
|
|
| Preferred securities |
|
– |
|
|
|
|
– |
|
|
|
|
|
|
|
82 |
|
|
|
|
|
|
|
82 |
|
|
|
| Common stocks |
|
– |
|
|
|
|
84 |
|
|
|
|
|
|
|
477 |
|
|
|
|
|
|
|
561 |
|
|
|
| Investment funds |
|
20,617 |
|
|
|
|
– |
|
|
|
|
|
|
|
– |
|
|
|
|
|
|
|
20,617 |
|
|
|
| Short-term securities |
|
210,562 |
|
|
|
|
46,873 |
|
|
|
|
|
|
|
– |
|
|
|
|
|
|
|
257,435 |
|
|
|
| Options purchased on futures (equity style) |
|
950 |
|
|
|
|
– |
|
|
|
|
|
|
|
– |
|
|
|
|
|
|
|
950 |
|
|
|
| Options purchased on foreign currency (equity style) |
|
– |
|
|
|
|
5 |
|
|
|
|
|
|
|
– |
|
|
|
|
|
|
|
5 |
|
|
|
|
|
|
|
|
|
|
|
|
| Total |
|
$232,129 |
|
|
|
|
$1,452,011 |
|
|
|
|
|
|
|
$759 |
|
|
|
|
|
|
|
$1,684,899 |
|
|
|
| |
|
|
|
|
|
|
|
|
|
|
|
|
|
|
|
|
|
|
|
|
|
|
|
|
|
|
|
| |
|
Other investments* |
|
|
|
|
|
|
|
|
|
| |
|
Level 1 |
|
|
|
Level 2 |
|
|
|
|
|
Level 3 |
|
|
|
|
|
Total |
|
|
|
| |
| Assets: |
|
|
|
|
|
|
|
|
|
|
|
|
|
|
|
|
|
|
|
|
|
|
|
|
|
|
| Unrealized appreciation on futures contracts |
|
$2,055 |
|
|
|
|
$ – |
|
|
|
|
|
|
|
$– |
|
|
|
|
|
|
|
$ 2,055 |
|
|
|
| Unrealized appreciation on open forward currency contracts |
|
– |
|
|
|
|
1,871 |
|
|
|
|
|
|
|
– |
|
|
|
|
|
|
|
1,871 |
|
|
|
| Unrealized appreciation on centrally cleared interest rate swaps |
|
– |
|
|
|
|
1,228 |
|
|
|
|
|
|
|
– |
|
|
|
|
|
|
|
1,228 |
|
|
|
| Unrealized appreciation on centrally cleared credit default swaps |
|
– |
|
|
|
|
19 |
|
|
|
|
|
|
|
– |
|
|
|
|
|
|
|
19 |
|
|
|
| Liabilities: |
|
|
|
|
|
|
|
|
|
|
|
|
|
|
|
|
|
|
|
|
|
|
|
|
|
|
| Value of options written |
|
(916) |
|
|
|
|
(4 |
) |
|
|
|
|
|
|
– |
|
|
|
|
|
|
|
(920 |
) |
|
|
| Unrealized depreciation on futures contracts |
|
(494) |
|
|
|
|
– |
|
|
|
|
|
|
|
– |
|
|
|
|
|
|
|
(494 |
) |
|
|
| Unrealized depreciation on open forward currency contracts |
|
– |
|
|
|
|
(3,859 |
) |
|
|
|
|
|
|
– |
|
|
|
|
|
|
|
(3,859 |
) |
|
|
| Unrealized depreciation on centrally cleared interest rate swaps |
|
– |
|
|
|
|
(1,188 |
) |
|
|
|
|
|
|
– |
|
|
|
|
|
|
|
(1,188 |
) |
|
|
| Unrealized depreciation on bilateral interest rate swaps |
|
– |
|
|
|
|
(1,221 |
) |
|
|
|
|
|
|
– |
|
|
|
|
|
|
|
(1,221 |
) |
|
|
| Unrealized depreciation on centrally cleared credit default swaps |
|
– |
|
|
|
|
(199 |
) |
|
|
|
|
|
|
– |
|
|
|
|
|
|
|
(199 |
) |
|
|
|
|
|
|
|
|
|
|
|
| Total |
|
$ 645 |
|
|
|
|
$(3,353 |
) |
|
|
|
|
|
|
$– |
|
|
|
|
|
|
|
$(2,708 |
) |
|
|
| |
*Options written, futures contracts, forward currency contracts, interest rate swaps and credit default swaps are not included in the fund’s investment portfolio.
277 American Funds Insurance Series
American High-Income Trust
|
|
|
|
|
|
|
|
|
|
|
|
|
|
|
|
|
|
|
|
|
|
|
|
|
|
|
| |
|
Investment securities |
|
|
|
|
|
|
|
|
|
| |
|
Level 1 |
|
|
|
Level 2 |
|
|
|
|
|
Level 3 |
|
|
|
|
|
Total |
|
|
|
| |
| Assets: |
|
|
|
|
|
|
|
|
|
|
|
|
|
|
|
|
|
|
|
|
|
|
|
|
|
|
| Bonds, notes & other debt instruments: |
|
|
|
|
|
|
|
|
|
|
|
|
|
|
|
|
|
|
|
|
|
|
|
|
|
|
| Corporate bonds, notes & loans |
|
$ – |
|
|
|
|
$793,501 |
|
|
|
|
|
|
|
$ 5,708 |
|
|
|
|
|
|
|
$799,209 |
|
|
|
| U.S. Treasury bonds & notes |
|
– |
|
|
|
|
885 |
|
|
|
|
|
|
|
– |
|
|
|
|
|
|
|
885 |
|
|
|
| Mortgage-backed obligations |
|
– |
|
|
|
|
– |
|
|
|
|
|
|
|
696 |
|
|
|
|
|
|
|
696 |
|
|
|
| Bonds & notes of governments & government agencies outside the U.S. |
|
– |
|
|
|
|
339 |
|
|
|
|
|
|
|
– |
|
|
|
|
|
|
|
339 |
|
|
|
| Convertible bonds & notes |
|
– |
|
|
|
|
578 |
|
|
|
|
|
|
|
– |
|
|
|
|
|
|
|
578 |
|
|
|
| Common stocks |
|
21,231 |
|
|
|
|
4,469 |
|
|
|
|
|
|
|
29,034 |
|
|
|
|
|
|
|
54,734 |
|
|
|
| Preferred securities |
|
– |
|
|
|
|
1,416 |
|
|
|
|
|
|
|
1,751 |
|
|
|
|
|
|
|
3,167 |
|
|
|
| Rights & warrants |
|
– |
|
|
|
|
265 |
|
|
|
|
|
|
|
– |
|
|
|
|
|
|
|
265 |
|
|
|
| Short-term securities |
|
20,436 |
|
|
|
|
– |
|
|
|
|
|
|
|
– |
|
|
|
|
|
|
|
20,436 |
|
|
|
|
|
|
|
|
|
|
|
|
| Total |
|
$41,667 |
|
|
|
|
$801,453 |
|
|
|
|
|
|
|
$37,189 |
|
|
|
|
|
|
|
$880,309 |
|
|
|
| |
|
|
|
|
|
|
|
|
|
|
|
|
|
|
|
|
|
|
|
|
|
|
|
|
|
|
|
| |
|
Other investments1 |
|
|
|
|
|
|
|
|
|
| |
|
Level 1 |
|
|
|
Level 2 |
|
|
|
|
|
Level 3 |
|
|
|
|
|
Total |
|
|
|
| |
| Assets: |
|
|
|
|
|
|
|
|
|
|
|
|
|
|
|
|
|
|
|
|
|
|
|
|
|
|
| Unrealized appreciation on futures contracts |
|
$137 |
|
|
|
|
$– |
|
|
|
|
|
|
|
$– |
|
|
|
|
|
|
|
$137 |
|
|
|
| Unrealized appreciation on centrally cleared credit default swaps |
|
– |
|
|
|
|
25 |
|
|
|
|
|
|
|
– |
|
|
|
|
|
|
|
25 |
|
|
|
| Liabilities: |
|
|
|
|
|
|
|
|
|
|
|
|
|
|
|
|
|
|
|
|
|
|
|
|
|
|
| Unrealized depreciation on futures contracts |
|
(58) |
|
|
|
|
– |
|
|
|
|
|
|
|
– |
|
|
|
|
|
|
|
(58 |
) |
|
|
| Unrealized depreciation on centrally cleared credit default swaps |
|
– |
|
|
|
|
(4 |
) |
|
|
|
|
|
|
– |
|
|
|
|
|
|
|
(4 |
) |
|
|
|
|
|
|
|
|
|
|
|
| Total |
|
$79 |
|
|
|
|
$21 |
|
|
|
|
|
|
|
$– |
|
|
|
|
|
|
|
$100 |
|
|
|
| |
1Futures contracts and credit default swaps are not included in the investment portfolio.
The following table reconciles the valuation of the fund’s Level 3 investment securities and related transactions for the six months ended June 30, 2024 (dollars in thousands):
|
|
|
|
|
|
|
|
|
|
|
|
|
|
|
|
|
|
|
|
|
|
|
|
|
|
|
|
|
|
|
|
|
| |
|
|
Beginning
value at 1/1/2024 |
|
|
|
Transfers
into Level 3 |
2 |
|
|
Purchases |
|
|
|
Sales |
|
|
|
Net
realized gain |
3 |
|
|
Unrealized
depreciation |
3 |
|
|
Transfers
out of Level 3 |
2 |
|
|
Ending
value at 6/30/2024 |
|
| Investment securities |
|
|
$37,049 |
|
|
|
$– |
|
|
|
$2,144 |
|
|
|
$– |
4 |
|
|
$– |
|
|
|
$(1,548 |
) |
|
|
$(456 |
) |
|
|
$37,189 |
|
|
|
| Net unrealized depreciation during the period on Level 3 investment securities held at June 30, 2024 |
|
|
|
$ (1,595 |
) |
| 2 |
Transfers into or out of Level 3 are based on the beginning market value of the quarter in which they occurred. These transfers are the result of changes in the availability of pricing sources and/or in the observability of significant inputs used in valuing the securities. |
| 3 |
Net realized gain and unrealized depreciation are included in the related amounts on investments in the fund’s statement of operations. |
| 4 |
Amount less than one thousand. |
American Funds Insurance Series 278
Unobservable inputs – Valuation of the fund’s Level 3 securities is based on significant unobservable inputs that reflect the investment adviser’s determination of assumptions that market participants might reasonably use in valuing the securities. The following table provides additional information used by the fund’s investment adviser to fair value the fund’s Level 3 securities (dollars in thousands):
|
|
|
|
|
|
|
|
|
|
|
|
|
|
|
|
|
|
|
|
|
|
|
| |
|
Value at 6/30/2024 |
|
|
Valuation techniques |
|
|
|
Unobservable inputs |
|
Range (if applicable) |
|
|
Weighted average* |
|
Impact to valuation from an increase in input† |
|
|
|
|
|
|
|
|
|
| Bonds, notes & other debt instruments |
|
|
|
|
|
|
|
|
|
Estimated recovery value |
|
|
|
Expected proceeds |
|
|
Not applicable |
|
|
Not applicable |
|
Not applicable |
| |
|
|
|
|
|
|
|
|
|
|
De minimis |
|
|
Not applicable |
|
|
Not applicable |
|
Not applicable |
| |
|
|
|
|
|
|
|
|
|
|
Discount for uncertainty |
|
|
5% |
|
|
5% |
|
Decrease |
| |
|
|
|
|
|
$ 6,404 |
|
|
Transaction |
|
|
|
Transaction price |
|
|
Not applicable |
|
|
Not applicable |
|
Not applicable |
| |
|
|
|
|
|
|
Net adjustment (decrease) based |
|
|
1% |
|
|
1% |
|
Decrease |
| |
|
|
|
|
|
|
|
|
|
|
on movement of market |
| |
|
|
|
|
|
|
|
|
|
|
comparables |
| |
|
|
|
|
|
|
|
|
Market comparables |
|
|
|
Yield |
|
|
11% |
|
|
11% |
|
Decrease |
| |
|
|
|
|
|
|
|
|
|
|
|
|
|
|
|
|
|
|
|
|
|
|
|
|
|
|
|
|
Estimated recovery value |
|
|
|
Expected proceeds |
|
|
Not applicable |
|
|
Not applicable |
|
Not applicable |
|
|
|
|
|
|
|
|
|
|
|
|
Discount for uncertainty |
|
|
20% |
|
|
20% |
|
Decrease |
|
|
|
|
|
|
|
|
|
|
|
|
De minimis |
|
|
Not applicable |
|
|
Not applicable |
|
Not applicable |
|
|
|
|
|
|
|
|
|
|
|
|
Vendor price |
|
|
Not applicable |
|
|
Not applicable |
|
Not applicable |
|
|
|
|
|
|
|
|
|
|
|
|
|
|
|
|
|
|
|
Transaction |
|
|
|
Transaction price |
|
|
Not applicable |
|
|
Not applicable |
|
Not applicable |
|
|
|
|
|
|
|
|
|
| Common stocks |
|
|
|
|
|
|
29,034 |
|
|
Market comparables |
|
|
|
EV/EBITDA multiple |
|
|
5.7x - 7.9x |
|
|
6.3x |
|
Increase |
| |
|
|
|
|
|
|
Premium to EV/EBITDA multiple |
|
|
14% |
|
|
14% |
|
Increase |
|
|
|
|
|
|
|
|
|
|
|
|
Discount to EV/EBITDA multiple |
|
|
13% |
|
|
13% |
|
Decrease |
|
|
|
|
|
|
|
|
|
|
|
|
EV/EBITDA less CapEx multiple |
|
|
11.2x |
|
|
11.2x |
|
Increase |
|
|
|
|
|
|
|
|
|
|
|
|
P/BV multiple |
|
|
0.7x |
|
|
0.7x |
|
Increase |
|
|
|
|
|
|
|
|
|
|
|
|
Premium to P/BV multiple |
|
|
30% |
|
|
30% |
|
Increase |
| |
|
|
|
|
|
|
|
|
|
|
|
DLOM |
|
|
6% - 16% |
|
|
12% |
|
Decrease |
|
|
|
|
|
|
|
|
|
| Preferred securities |
|
|
|
|
|
|
1,751 |
|
|
Market comparables |
|
|
|
EV/EBITDA multiple |
|
|
4.5x |
|
|
4.5x |
|
Increase |
| |
|
|
|
|
|
|
DLOM |
|
|
15% |
|
|
15% |
|
Decrease |
|
|
|
|
|
|
|
|
|
|
|
|
|
|
|
|
$37,189 |
|
|
|
|
|
|
|
|
|
|
|
|
|
|
|
|
|
|
|
|
|
|
|
|
|
|
|
|
|
|
|
|
|
|
|
|
|
|
| * |
Weighted average is by relative fair value. |
| † |
This column represents the directional change in fair value of the Level 3 securities that would result in an increase from the corresponding input. Significant increases and decreases in these inputs in isolation could result in significantly higher or lower fair value measurements. |
Key to abbreviations and symbols
CapEx = Capital expenditures
DLOM = Discount for lack of marketability
EBITDA = Earnings before interest, taxes, depreciation and amortization
EV = Enterprise value
P/BV = Price to book value
American Funds Mortgage Fund
|
|
|
|
|
|
|
|
|
|
|
|
|
|
|
|
|
|
|
|
|
|
|
|
|
|
|
| |
|
Investment securities |
|
|
|
|
|
|
|
|
|
| |
|
Level 1 |
|
|
|
Level 2 |
|
|
|
|
|
Level 3 |
|
|
|
|
|
Total |
|
|
|
| |
| Assets: |
|
|
|
|
|
|
|
|
|
|
|
|
|
|
|
|
|
|
|
|
|
|
|
|
|
|
| Bonds, notes & other debt instruments: |
|
|
|
|
|
|
|
|
|
|
|
|
|
|
|
|
|
|
|
|
|
|
|
|
|
|
| Mortgage-backed obligations |
|
$– |
|
|
|
|
$ 98,064 |
|
|
|
|
|
|
|
$– |
|
|
|
|
|
|
|
$ 98,064 |
|
|
|
| U.S. Treasury bonds & notes |
|
– |
|
|
|
|
6,669 |
|
|
|
|
|
|
|
– |
|
|
|
|
|
|
|
6,669 |
|
|
|
| Asset-backed obligations |
|
– |
|
|
|
|
1,309 |
|
|
|
|
|
|
|
– |
|
|
|
|
|
|
|
1,309 |
|
|
|
| Short-term securities |
|
– |
|
|
|
|
40,665 |
|
|
|
|
|
|
|
– |
|
|
|
|
|
|
|
40,665 |
|
|
|
|
|
|
|
|
|
|
|
|
| Total |
|
$– |
|
|
|
|
$146,707 |
|
|
|
|
|
|
|
$– |
|
|
|
|
|
|
|
$146,707 |
|
|
|
| |
279 American Funds Insurance Series
|
|
|
|
|
|
|
|
|
|
|
|
|
|
|
|
|
|
|
|
|
|
|
|
|
|
|
| |
|
Other investments* |
|
|
|
|
|
|
|
|
|
| |
|
Level 1 |
|
|
|
Level 2 |
|
|
|
|
|
Level 3 |
|
|
|
|
|
Total |
|
|
|
| |
| Assets: |
|
|
|
|
|
|
|
|
|
|
|
|
|
|
|
|
|
|
|
|
|
|
|
|
|
|
| Unrealized appreciation on futures contracts |
|
$353 |
|
|
|
|
$ – |
|
|
|
|
|
|
|
$– |
|
|
|
|
|
|
|
$353 |
|
|
|
| Unrealized appreciation on centrally cleared interest rate swaps |
|
– |
|
|
|
|
99 |
|
|
|
|
|
|
|
– |
|
|
|
|
|
|
|
99 |
|
|
|
| Liabilities: |
|
|
|
|
|
|
|
|
|
|
|
|
|
|
|
|
|
|
|
|
|
|
|
|
|
|
| Unrealized depreciation on futures contracts |
|
(68) |
|
|
|
|
– |
|
|
|
|
|
|
|
– |
|
|
|
|
|
|
|
(68 |
) |
|
|
|
|
|
|
|
|
|
|
|
| Total |
|
$285 |
|
|
|
|
$99 |
|
|
|
|
|
|
|
$– |
|
|
|
|
|
|
|
$384 |
|
|
|
| |
*Futures contracts and interest rate swaps are not included in the fund’s investment portfolio.
Ultra-Short Bond Fund
As of June 30, 2024, all of the fund’s investment securities were classified as Level 2.
U.S. Government Securities Fund
|
|
|
|
|
|
|
|
|
|
|
|
|
|
|
|
|
|
|
|
|
|
|
|
|
|
|
| |
|
Investment securities |
|
|
|
|
|
|
|
|
|
| |
|
Level 1 |
|
|
|
Level 2 |
|
|
|
|
|
Level 3 |
|
|
|
|
|
Total |
|
|
|
| |
| Assets: |
|
|
|
|
|
|
|
|
|
|
|
|
|
|
|
|
|
|
|
|
|
|
|
|
|
|
| Bonds, notes & other debt instruments: |
|
|
|
|
|
|
|
|
|
|
|
|
|
|
|
|
|
|
|
|
|
|
|
|
|
|
| Mortgage-backed obligations |
|
$ – |
|
|
|
|
$1,017,781 |
|
|
|
|
|
|
|
$– |
|
|
|
|
|
|
|
$1,017,781 |
|
|
|
| U.S. Treasury bonds & notes |
|
– |
|
|
|
|
591,525 |
|
|
|
|
|
|
|
– |
|
|
|
|
|
|
|
591,525 |
|
|
|
| Federal agency bonds & notes |
|
– |
|
|
|
|
73,076 |
|
|
|
|
|
|
|
– |
|
|
|
|
|
|
|
73,076 |
|
|
|
| Short-term securities |
|
– |
|
|
|
|
335,847 |
|
|
|
|
|
|
|
– |
|
|
|
|
|
|
|
335,847 |
|
|
|
| Options purchased on futures (equity style) |
|
578 |
|
|
|
|
– |
|
|
|
|
|
|
|
– |
|
|
|
|
|
|
|
578 |
|
|
|
|
|
|
|
|
|
|
|
|
| Total |
|
$578 |
|
|
|
|
$2,018,229 |
|
|
|
|
|
|
|
$– |
|
|
|
|
|
|
|
$2,018,807 |
|
|
|
| |
|
|
|
|
|
|
|
|
|
|
|
|
|
|
|
|
|
|
|
|
|
|
|
|
|
|
|
| |
|
Other investments* |
|
|
|
|
|
|
|
|
|
| |
|
Level 1 |
|
|
|
Level 2 |
|
|
|
|
|
Level 3 |
|
|
|
|
|
Total |
|
|
|
| |
| Assets: |
|
|
|
|
|
|
|
|
|
|
|
|
|
|
|
|
|
|
|
|
|
|
|
|
|
|
| Unrealized appreciation on futures contracts |
|
$ 4,562 |
|
|
|
|
$ – |
|
|
|
|
|
|
|
$– |
|
|
|
|
|
|
|
$ 4,562 |
|
|
|
| Unrealized appreciation on centrally cleared interest rate swaps |
|
– |
|
|
|
|
19,570 |
|
|
|
|
|
|
|
– |
|
|
|
|
|
|
|
19,570 |
|
|
|
| Liabilities: |
|
|
|
|
|
|
|
|
|
|
|
|
|
|
|
|
|
|
|
|
|
|
|
|
|
|
| Value of options written |
|
(496) |
|
|
|
|
– |
|
|
|
|
|
|
|
– |
|
|
|
|
|
|
|
(496 |
) |
|
|
| Unrealized depreciation on futures contracts |
|
(1,800) |
|
|
|
|
– |
|
|
|
|
|
|
|
– |
|
|
|
|
|
|
|
(1,800 |
) |
|
|
| Unrealized depreciation on centrally cleared interest rate swaps |
|
– |
|
|
|
|
(5,433 |
) |
|
|
|
|
|
|
– |
|
|
|
|
|
|
|
(5,433 |
) |
|
|
|
|
|
|
|
|
|
|
|
| Total |
|
$ 2,266 |
|
|
|
|
$14,137 |
|
|
|
|
|
|
|
$– |
|
|
|
|
|
|
|
$16,403 |
|
|
|
| |
*Options written, futures contracts and interest rate swaps are not included in the fund’s investment portfolio.
Managed Risk Growth Fund
As of June 30, 2024, all of the fund’s investments were classified as Level 1.
Managed Risk International Fund
As of June 30, 2024, all of the fund’s investments were classified as Level 1.
Managed Risk Washington Mutual Investors Fund
As of June 30, 2024, all of the fund’s investments were classified as Level 1.
Managed Risk Growth-Income Fund
As of June 30, 2024, all of the fund’s investments were classified as Level 1.
Managed Risk Asset Allocation Fund
As of June 30, 2024, all of the fund’s investments were classified as Level 1.
American Funds Insurance Series 280
4. Risk factors
Investing in the funds may involve certain risks including, but not limited to, those described below.
Market conditions – The prices of, and the income generated by, the common stocks, bonds and other securities held by a fund may decline – sometimes rapidly or unpredictably – due to various factors, including events or conditions affecting the general economy or particular industries or companies; overall market changes; local, regional or global political, social or economic instability; governmental, governmental agency or central bank responses to economic conditions; changes in inflation rates; and currency exchange rate, interest rate and commodity price fluctuations. These risks may be heightened in the case of smaller capitalization stocks.
Economies and financial markets throughout the world are highly interconnected. Economic, financial or political events, trading and tariff arrangements, wars, terrorism, cybersecurity events, natural disasters, public health emergencies (such as the spread of infectious disease), bank failures and other circumstances in one country or region, including actions taken by governmental or quasi-governmental authorities in response to any of the foregoing, could have impacts on global economies or markets. As a result, whether or not a fund invests in securities of issuers located in or with significant exposure to the countries affected, the value and liquidity of a fund’s investments may be negatively affected by developments in other countries and regions.
Issuer risks – The prices of, and the income generated by, securities held by a fund may decline in response to various factors directly related to the issuers of such securities, including reduced demand for an issuer’s goods or services, poor management performance, major litigation, investigations or other controversies related to the issuer, changes in the issuer’s financial condition or credit rating, changes in government regulations affecting the issuer or its competitive environment and strategic initiatives such as mergers, acquisitions or dispositions and the market response to any such initiatives. An individual security may also be affected by factors relating to the industry or sector of the issuer or the securities markets as a whole, and conversely an industry or sector or the securities markets may be affected by a change in financial condition or other event affecting a single issuer.
Investing in income-oriented stocks – The value of a fund’s securities and income provided by a fund may be reduced by changes in the dividend policies of, and the capital resources available for dividend payments at, the companies in which the fund invests.
Investing in growth-oriented stocks – Growth-oriented common stocks and other equity-type securities (such as preferred stocks, convertible preferred stocks and convertible bonds) may involve larger price swings and greater potential for loss than other types of investments. These risks may be even greater in the case of smaller capitalization stocks.
Investing in small companies – Investing in smaller companies may pose additional risks. For example, it is often more difficult to value or dispose of small company stocks and more difficult to obtain information about smaller companies than about larger companies. Furthermore, smaller companies often have limited product lines, operating histories, markets and/or financial resources, may be dependent on one or a few key persons for management, and can be more susceptible to losses. Moreover, the prices of their stocks may be more volatile than stocks of larger, more established companies, particularly during times of market turmoil.
Investing outside the U.S. – Securities of issuers domiciled outside the U.S. or with significant operations or revenues outside the U.S., and securities tied economically to countries outside the U.S., may lose value because of adverse political, social, economic or market developments (including social instability, regional conflicts, terrorism and war) in the countries or regions in which the issuers are domiciled, operate or generate revenue or to which the securities are tied economically. These securities may also lose value due to changes in foreign currency exchange rates against the U.S. dollar and/or currencies of other countries. Issuers of these securities may be more susceptible to actions of foreign governments, such as nationalization, currency blockage or the imposition of price controls, sanctions, or punitive taxes, each of which could adversely impact the value of these securities. Securities markets in certain countries may be more volatile and/or less liquid than those in the U.S. Investments outside the U.S. may also be subject to different regulatory, legal, accounting, auditing, financial reporting and recordkeeping requirements, and may be more difficult to value, than those in the U.S. In addition, the value of investments outside the U.S. may be reduced by foreign taxes, including foreign withholding taxes on interest and dividends. Further, there may be increased risks of delayed settlement of securities purchased or sold by the fund, which could impact the liquidity of the fund’s portfolio. The risks of investing outside the U.S. may be heightened in connection with investments in emerging markets.
Investing in developing countries – Investing in countries with developing economies and/or markets may involve risks in addition to and greater than those generally associated with investing in developed countries. For instance, developing countries tend to have less developed political, economic and legal systems than those in developed countries. Accordingly, the governments of these countries
281 American Funds Insurance Series
may be less stable and more likely to intervene in the market economy, for example, by imposing capital controls, nationalizing a company or industry, placing restrictions on foreign ownership and on withdrawing sale proceeds of securities from the country, and/or imposing punitive taxes that could adversely affect the prices of securities. Information regarding issuers in developing countries may be limited, incomplete or inaccurate, and such issuers may not be subject to regulatory, accounting, auditing, and financial reporting and recordkeeping standards comparable to those to which issuers in developed countries are subject. A fund’s rights with respect to its investments in developing countries, if any, will generally be governed by local law, which may make it difficult or impossible for the fund to pursue legal remedies or to obtain and enforce judgments in local courts. In addition, the economies of these countries may be dependent on relatively few industries, may have limited access to capital and may be more susceptible to changes in local and global trade conditions and downturns in the world economy. Securities markets in these countries can also be relatively small and have substantially lower trading volumes. As a result, securities issued in these countries may be more volatile and less liquid, more vulnerable to market manipulation, and more difficult to value, than securities issued in countries with more developed economies and/or markets. Less certainty with respect to security valuations may lead to additional challenges and risks in calculating a fund’s net asset value. Additionally, developing countries are more likely to experience problems with the clearing and settling of trades and the holding of securities by banks, agents and depositories that are less established than those in developed countries.
Investing in emerging markets – Investing in emerging markets may involve risks in addition to and greater than those generally associated with investing in the securities markets of developed countries. For instance, emerging market countries tend to have less developed political, economic and legal systems than those in developed countries. Accordingly, the governments of these countries may be less stable and more likely to intervene in the market economy, for example, by imposing capital controls, nationalizing a company or industry, placing restrictions on foreign ownership and on withdrawing sale proceeds of securities from the country, and/or imposing punitive taxes that could adversely affect the prices of securities. Information regarding issuers in emerging markets may be limited, incomplete or inaccurate, and such issuers may not be subject to regulatory, accounting, auditing, and financial reporting and recordkeeping standards comparable to those to which issuers in more developed markets are subject. A fund’s rights with respect to its investments in emerging markets, if any, will generally be governed by local law, which may make it difficult or impossible for the fund to pursue legal remedies or to obtain and enforce judgments in local courts. In addition, the economies of these countries may be dependent on relatively few industries, may have limited access to capital and may be more susceptible to changes in local and global trade conditions and downturns in the world economy. Securities markets in these countries can also be relatively small and have substantially lower trading volumes. As a result, securities issued in these countries may be more volatile and less liquid, more vulnerable to market manipulation, and more difficult to value, than securities issued in countries with more developed economies and/or markets. Less certainty with respect to security valuations may lead to additional challenges and risks in calculating a fund’s net asset value. Additionally, emerging markets are more likely to experience problems with the clearing and settling of trades and the holding of securities by banks, agents and depositories that are less established than those in developed countries.
Investing in debt instruments – The prices of, and the income generated by, bonds and other debt securities held by a fund may be affected by factors such as the interest rates, maturities and credit quality of these securities.
Rising interest rates will generally cause the prices of bonds and other debt securities to fall. Also, when interest rates rise, issuers of debt securities that may be prepaid at any time, such as mortgage-or other asset-backed securities, are less likely to refinance existing debt securities, causing the average life of such securities to extend. A general change in interest rates may cause investors to sell debt securities on a large scale, which could also adversely affect the price and liquidity of debt securities and could also result in increased redemptions from a fund. Falling interest rates may cause an issuer to redeem, call or refinance a debt security before its stated maturity, which may result in a fund having to reinvest the proceeds in lower yielding securities. Longer maturity debt securities generally have greater sensitivity to changes in interest rates and may be subject to greater price fluctuations than shorter maturity debt securities.
Bonds and other debt securities are also subject to credit risk, which is the possibility that the credit strength of an issuer or guarantor will weaken or be perceived to be weaker, and/or an issuer of a debt security will fail to make timely payments of principal or interest and the security will go into default. Changes in actual or perceived creditworthiness may occur quickly. A downgrade or default affecting any of a fund’s securities could cause the value of a fund’s shares to decrease. Lower quality debt securities generally have higher rates of interest and may be subject to greater price fluctuations than higher quality debt securities. Credit risk is gauged, in part, by the credit ratings of the debt securities in which a fund invests. However, ratings are only the opinions of the rating agencies issuing them and are not guarantees as to credit quality or an evaluation of market risk. The fund’s investment adviser relies on its own credit analysts to research issuers and issues in assessing credit and default risks.
American Funds Insurance Series 282
Investing in lower rated debt instruments – Lower rated bonds and other lower rated debt securities generally have higher rates of interest and involve greater risk of default or price declines due to changes in the issuer’s creditworthiness than those of higher quality debt securities. The market prices of these securities may fluctuate more than the prices of higher quality debt securities and may decline significantly in periods of general economic difficulty. These risks may be increased with respect to investments in junk bonds.
Investing in derivatives – The use of derivatives involves a variety of risks, which may be different from, or greater than, the risks associated with investing in traditional securities, such as stocks and bonds. Changes in the value of a derivative may not correlate perfectly with, and may be more sensitive to market events than, the underlying asset, rate or index, and a derivative instrument may cause a fund to lose significantly more than its initial investment. Derivatives may be difficult to value, difficult for a fund to buy or sell at an opportune time or price and difficult, or even impossible, to terminate or otherwise offset. A fund’s use of derivatives may result in losses to the fund, and investing in derivatives may reduce a fund’s returns and increase a fund’s price volatility. A fund’s counterparty to a derivative transaction (including, if applicable, the fund’s clearing broker, the derivatives exchange or the clearinghouse) may be unable or unwilling to honor its financial obligations in respect of the transaction. In certain cases, the fund may be hindered or delayed in exercising remedies against or closing out derivative instruments with a counterparty, which may result in additional losses.
Derivatives are also subject to operational risk (such as documentation issues, settlement issues and systems failures) and legal risk (such as insufficient documentation, insufficient capacity or authority of a counterparty, and issues with the legality or enforceability of a contract).
Currency – The prices of, and the income generated by, many debt securities held by a fund may also be affected by changes in relative currency values. If the U.S. dollar appreciates against foreign currencies, the value in U.S. dollars of a fund’s securities denominated in such currencies would generally fall and vice versa.
Investing in mortgage-related and other asset-backed securities – Mortgage-related securities, such as mortgage-backed securities, and other asset-backed securities, include debt obligations that represent interests in pools of mortgages or other income-bearing assets, such as residential mortgage loans, home equity loans, mortgages on commercial buildings, consumer loans or receivables and equipment leases. While such securities are subject to the risks associated with investments in debt instruments generally (for example, credit, extension and interest rate risks), they are also subject to other and different risks. Mortgage-backed and other asset-backed securities are subject to changes in the payment patterns of borrowers of the underlying debt, potentially increasing the volatility of the securities and a fund’s net asset value. When interest rates fall, borrowers are more likely to refinance or prepay their debt before its stated maturity. This may result in a fund having to reinvest the proceeds in lower yielding securities, effectively reducing a fund’s income. Conversely, if interest rates rise and borrowers repay their debt more slowly than expected, the time in which the mortgage-backed and other asset-backed securities are paid off could be extended, reducing a fund’s cash available for reinvestment in higher yielding securities. Mortgage-backed securities are also subject to the risk that underlying borrowers will be unable to meet their obligations and the value of property that secures the mortgages may decline in value and be insufficient, upon foreclosure, to repay the associated loans. Investments in asset-backed securities are subject to similar risks.
Investing in future delivery contracts – A fund may enter into contracts, such as to-be-announced contracts and mortgage dollar rolls, that involve a fund selling mortgage-related securities and simultaneously contracting to repurchase similar securities for delivery at a future date at a predetermined price. This can increase a fund’s market exposure, and the market price of the securities that the fund contracts to repurchase could drop below their purchase price. While a fund can preserve and generate capital through the use of such contracts by, for example, realizing the difference between the sale price and the future purchase price, the income generated by the fund may be reduced by engaging in such transactions. In addition, these transactions increase the turnover rate of a fund.
Investing in inflation-linked bonds – The values of inflation-linked bonds generally fluctuate in response to changes in real interest rates – i.e., rates of interest after factoring in inflation. A rise in real interest rates may cause the prices of inflation-linked securities to fall, while a decline in real interest rates may cause the prices to increase. Inflation-linked bonds may experience greater losses than other debt securities with similar durations when real interest rates rise faster than nominal interest rates. There can be no assurance that the value of an inflation-linked security will be directly correlated to changes in interest rates; for example, if interest rates rise for reasons other than inflation, the increase may not be reflected in the security’s inflation measure.
Investing in inflation-linked bonds may also reduce a fund’s distributable income during periods of deflation. If prices for goods and services decline throughout the economy, the principal and income on inflation-linked securities may decline and result in losses to a fund.
283 American Funds Insurance Series
Investing in securities backed by the U.S. government – Securities backed by the U.S. Treasury or the full faith and credit of the U.S. government are guaranteed only as to the timely payment of interest and principal when held to maturity. Accordingly, the current market values for these securities will fluctuate with changes in interest rates and the credit rating of the U.S. government. Notwithstanding that these securities are backed by the full faith and credit of the U.S. government, circumstances could arise that would prevent or delay the payment of interest or principal on these securities, which could adversely affect their value and cause the fund to suffer losses. Such an event could lead to significant disruptions in U.S. and global markets. Securities issued by U.S. government-sponsored entities and federal agencies and instrumentalities that are not backed by the full faith and credit of the U.S. government are neither issued nor guaranteed by the U.S. government. U.S. government securities are subject to market risk, interest rate risk and credit risk.
Investing in repurchase agreements – Upon entering into a repurchase agreement, a fund purchases a security from a bank or broker-dealer, which simultaneously commits to repurchase the security within a specified time at the fund’s cost with interest. The security purchased by the fund constitutes collateral for the seller’s repurchase obligation. If the party agreeing to repurchase should default, the fund may seek to sell the security it holds as collateral. The fund may incur a loss if the value of the collateral securing the repurchase obligation falls below the repurchase price. The fund may also incur disposition costs and encounter procedural delays in connection with liquidating the collateral.
Interest rate risk – The values and liquidity of the securities held by a fund may be affected by changing interest rates. For example, the values of these securities may decline when interest rates rise and increase when interest rates fall. Longer maturity debt securities generally have greater sensitivity to changes in interest rates and may be subject to greater price fluctuations than shorter maturity debt securities. A fund may invest in variable and floating rate securities. When a fund holds variable or floating rate securities, a decrease in market interest rates will adversely affect the income received from such securities and the net asset value of a fund’s shares. Although the values of such securities are generally less sensitive to interest rate changes than those of other debt securities, the value of variable and floating rate securities may decline if their interest rates do not rise as quickly, or as much, as market interest rates. Conversely, floating rate securities will not generally increase in value if interest rates decline. During periods of extremely low short-term interest rates, a fund may not be able to maintain a positive yield or total return and, in relatively low interest rate environments, there are heightened risks associated with rising interest rates.
Credit and liquidity support – Changes in the credit quality of banks and financial institutions providing credit and liquidity support features with respect to securities held by a fund could cause the values of these securities to decline.
Asset allocation – A fund’s percentage allocation to equity securities, debt securities and money market instruments could cause the fund to underperform relative to relevant benchmarks and other funds with similar investment objectives.
Liquidity risk – Certain fund holdings may be or may become difficult or impossible to sell, particularly during times of market turmoil. Liquidity may be impacted by the lack of an active market for a holding, legal or contractual restrictions on resale, or the reduced number and capacity of market participants to make a market in such holding. Market prices for less liquid or illiquid holdings may be volatile or difficult to determine, and reduced liquidity may have an adverse impact on the market price of such holdings. Additionally, the sale of less liquid or illiquid holdings may involve substantial delays (including delays in settlement) and additional costs and the fund may be unable to sell such holdings when necessary to meet its liquidity needs, or to try to limit losses, or may be forced to sell at a loss.
Management – The investment adviser to the funds actively manages the funds’ investments. Consequently, the funds are subject to the risk that the methods and analyses, including models, tools and data, employed by the investment adviser in this process may be flawed or incorrect and may not produce the desired results. This could cause the funds to lose value or their investment results to lag relevant benchmarks or other funds with similar objectives.
Investing in the managed risk funds may involve additional risks including, but not limited to, those described below.
Fund structure – The managed risk funds invest in underlying funds and incur expenses related to those underlying funds. In addition, investors in the managed risk funds will incur fees to pay for certain expenses related to the operations of the managed risk funds. An investor holding the underlying fund directly would incur lower overall expenses but would not receive the benefit of the managed risk strategy. Additionally, in accordance with an exemption under the Investment Company Act of 1940, as amended, the investment adviser considers only proprietary funds when selecting underlying investment options and allocations. This means that the fund’s investment adviser does not, nor does it expect to, consider any unaffiliated funds as underlying investment options for the fund. This strategy could raise certain conflicts of interest when determining the overall asset allocation of the fund or choosing underlying investments for the fund, including the selection of funds that result in greater compensation to the adviser or funds with relatively
American Funds Insurance Series 284
lower historical investment results. The investment adviser has policies and procedures designed to mitigate material conflicts of interest that may arise in connection with its management of the fund.
Management – The managed risk funds are subject to the risk that the managed risk strategy or the methods employed by the subadviser in implementing the managed risk strategy may not produce the desired results. This could cause the managed risk funds to lose value or their investment results to lag relevant benchmarks or other funds with similar objectives.
Underlying fund risks – Because the managed risk funds’ investments consist of investments in underlying funds, the managed risk funds’ risks are directly related to the risks of the respective underlying fund in which each managed risk fund invests. For this reason, it is important to understand the risks associated with investing both in the managed risk fund and in each of the underlying funds.
Investing in options and futures contracts – In addition to the risks generally associated with investing in derivative instruments, options and futures contracts are subject to the creditworthiness of the clearing organizations, exchanges and, in the case of futures, futures commission merchants with which a fund transacts. While both options and futures contracts are generally liquid instruments, under certain market conditions, options and futures may be deemed to be illiquid. For example, a fund may be temporarily prohibited from closing out its position in an options or futures contract if intraday price change limits or limits on trading volume imposed by the applicable exchange are triggered. If a fund is unable to close out a position on an options or futures contract, the fund would remain subject to the risk of adverse price movements until the fund is able to close out the position in question. The ability of a fund to successfully utilize options and futures contracts may depend in part upon the ability of the fund’s investment adviser or subadviser to accurately forecast interest rates and other economic factors and to assess and predict the impact of such economic factors on the options and futures in which the fund invests. If the investment adviser or subadviser incorrectly forecasts economic developments or incorrectly predicts the impact of such developments on the options and futures in which it invests, a fund could suffer losses. Whereas the risk of loss on a put option purchased by the fund is limited to the initial cost of the option, the amount of a potential loss on a futures contract could greatly exceed the relatively small initial amount invested in entering the futures position.
Hedging – There may be imperfect or even negative correlation between the prices of the options and futures contracts in which a fund invests and the prices of the underlying securities or indexes which the fund seeks to hedge. For example, options and futures contracts may not provide an effective hedge because changes in options and futures contract prices may not track those of the underlying securities or indexes they are intended to hedge. In addition, there are significant differences between the securities market, on the one hand, and the options and futures markets, on the other, that could result in an imperfect correlation between the markets, causing a given hedge not to achieve its objectives. The degree of imperfection of correlation depends on circumstances such as variations in speculative market demand for options and futures, including technical influences in options and futures trading, and differences between the financial instruments being hedged and the instruments underlying the standard contracts available for trading. A decision as to whether, when and how to hedge involves the exercise of skill and judgment, and even a well-conceived hedge may be unsuccessful to some degree because of market behavior or unexpected interest rate trends. In addition, the fund’s investment in exchange-traded options and futures and their resulting costs could limit the fund’s gains in rising markets relative to those of the underlying funds, or to those of unhedged funds in general.
Short positions – The fund may suffer losses from short positions in futures contracts. Losses from short positions in futures contracts occur when the underlying index increases in value. As the underlying index increases in value, the holder of the short position in the corresponding futures contract is required to pay the difference in value of the futures contract resulting from the increase in the index on a daily basis. Losses from a short position in an index futures contract could potentially be very large if the value of the underlying index rises dramatically in a short period of time.
Nondiversification risk – As nondiversified funds, the managed risk funds have the ability to invest a larger percentage of their assets in the securities of a smaller number of issuers than diversified funds. To the extent that a managed risk fund invests a larger percentage of its assets in securities of one or more issuers, poor performance by these securities could have a greater adverse impact on the fund’s investment results.
5. Certain investment techniques
Securities lending – Some of the funds have entered into securities lending transactions in which the funds earn income by lending investment securities to brokers, dealers or other institutions. Each transaction involves three parties: the fund, acting as the lender of the securities, a borrower, and a lending agent that acts as an intermediary.
285 American Funds Insurance Series
Securities lending transactions are entered into by the fund under the securities lending agreement with the lending agent. The lending agent facilitates the exchange of securities between the lender and the borrower, generally provides protection from borrower default, marks to market the value of collateral daily, secures additional collateral from the borrower if it falls below preset terms, and may reinvest the collateral on behalf of the fund according to agreed parameters. The lending agent has indemnified the fund against losses resulting from borrower default. Although risk is mitigated by the collateral and indemnification, the fund could experience a delay in recovering its securities and a potential loss of income or value if the borrower fails to return the securities, collateral investments decline in value or the lending agent fails to perform.
The borrower is required to post highly liquid assets, such as cash or U.S. government securities, as collateral for the loan in an amount at least equal to the value of the securities loaned. Investments made with cash collateral are recognized as assets in the fund’s investment portfolio. The same amount is recorded as a liability in the fund’s statement of assets and liabilities. While securities are on loan, the fund will continue to receive the equivalent of the interest, dividends or other distributions paid by the issuer, as well as a portion of the interest on the investment of the collateral. Additionally, although the fund does not have the right to vote on securities while they are on loan, the fund has a right to consent on corporate actions and a right to recall loaned securities to vote on proposals affecting them. The borrower is obligated to return the loaned security at the conclusion of the loan or, during the pendency of the loan, on demand from the fund.
The following table presents the value of the securities on loan, the type and value of collateral received and the value of the investment securities purchased, if any, from the cash collateral received by each fund (dollars in thousands):
|
|
|
|
|
|
|
|
|
|
|
|
|
|
|
|
|
|
|
|
|
|
|
|
|
|
|
|
|
| |
|
|
|
|
|
|
Collateral received |
|
|
|
|
|
|
|
| Funds |
|
Value of investment securities on loan |
|
|
Cash |
|
|
U.S. government securities |
|
|
Value of investment securities purchased |
|
|
|
|
|
|
|
|
|
| Global Growth Fund |
|
|
|
|
|
$ |
4,457 |
|
|
$ |
4,789 |
|
|
|
|
|
|
$ |
10 |
|
|
|
|
|
|
$ |
4,310 |
|
| Global Small Capitalization Fund |
|
|
|
|
|
|
41,131 |
|
|
|
17,225 |
|
|
|
|
|
|
|
26,164 |
|
|
|
|
|
|
|
15,503 |
|
| Growth Fund |
|
|
|
|
|
|
38,162 |
|
|
|
39,028 |
|
|
|
|
|
|
|
– |
|
|
|
|
|
|
|
35,125 |
|
| International Fund |
|
|
|
|
|
|
9,093 |
|
|
|
– |
|
|
|
|
|
|
|
9,548 |
|
|
|
|
|
|
|
– |
|
| New World Fund |
|
|
|
|
|
|
14,933 |
|
|
|
7,477 |
|
|
|
|
|
|
|
8,154 |
|
|
|
|
|
|
|
6,729 |
|
| Capital World Growth and Income Fund |
|
|
|
|
|
|
10,543 |
|
|
|
9,661 |
|
|
|
|
|
|
|
1,447 |
|
|
|
|
|
|
|
8,695 |
|
| Growth-Income Fund |
|
|
|
|
|
|
114,087 |
|
|
|
119,835 |
|
|
|
|
|
|
|
– |
|
|
|
|
|
|
|
107,852 |
|
| International Growth and Income Fund |
|
|
|
|
|
|
715 |
|
|
|
– |
|
|
|
|
|
|
|
776 |
|
|
|
|
|
|
|
– |
|
| Capital Income Builder |
|
|
|
|
|
|
20,164 |
|
|
|
16,497 |
|
|
|
|
|
|
|
4,730 |
|
|
|
|
|
|
|
14,847 |
|
| Asset Allocation Fund |
|
|
|
|
|
|
19,113 |
|
|
|
19,914 |
|
|
|
|
|
|
|
– |
|
|
|
|
|
|
|
17,923 |
|
| American Funds Global Balanced Fund |
|
|
|
|
|
|
143 |
|
|
|
147 |
|
|
|
|
|
|
|
– |
|
|
|
|
|
|
|
132 |
|
Investment securities purchased from cash collateral are disclosed in the investment portfolio as short-term securities. Securities received as collateral, if any, are not recognized as fund assets. The contractual maturity of collateral received under the securities lending agreement is classified as overnight and continuous.
Index-linked bonds – Some of the funds have invested in index-linked bonds, which are fixed-income securities whose principal value is periodically adjusted to a government price index. Over the life of an index-linked bond, interest is paid on the adjusted principal value. Increases or decreases in the principal value of index-linked bonds are recorded as interest income in the fund’s statement of operations.
Mortgage dollar rolls – Some of the funds have entered into mortgage dollar roll transactions of TBA securities in which the fund sells a TBA mortgage-backed security to a counterparty and simultaneously enters into an agreement with the same counterparty to buy back a similar TBA security on a specific future date at a predetermined price. Mortgage dollar rolls are accounted for as purchase and sale transactions and may result in an increase to the fund’s portfolio turnover rate. Portfolio turnover rates excluding and including mortgage dollar rolls are presented at the end of the financial highlights tables.
Loan transactions – Some of the funds have entered into loan transactions in which the fund acquires a loan either through an agent, by assignment from another holder, or as a participation interest in another holder’s portion of a loan. The loan is often administered by a financial institution that acts as agent for the holders of the loan, and the fund may be required to receive approval from the agent and/or borrower prior to the sale of the investment. The loan’s interest rate and maturity date may change based on the terms of the loan, including potential early payments of principal.
American Funds Insurance Series 286
Short-term securities – The managed risk funds hold shares of State Street Institutional U.S. Government Money Market Fund, a cash management vehicle offered and managed by State Street Bank and Trust Company.
Unfunded commitments – Asset Allocation Fund, Capital World Bond Fund and American High-Income Trust have participated in transactions that involve unfunded commitments, which may obligate each fund to purchase new or additional bonds and/or purchase additional shares of the applicable issuer if certain contingencies are met. As of June 30, 2024, the maximum exposure from these unfunded commitments for Asset Allocation Fund, Capital World Bond Fund and American High-Income Trust was $447,000, $31,000 and $462,000, respectively, which would represent less than 0.01% for Asset Allocation Fund and Capital World Bond Fund and 0.05% for American High-Income Trust, respectively, of the net assets of each fund should such commitments become due. Unrealized appreciation on these unfunded commitments for Asset Allocation Fund, Capital World Bond Fund and American High-Income Trust of $1,000, less than $1,000 and $2,000, respectively, is disclosed as unrealized appreciation on unfunded commitments in each fund’s statement of assets and liabilities. Unrealized appreciation is included in net unrealized appreciation (depreciation) on investments in unaffiliated issuers in each fund’s statement of operations.
Option contracts – Some of the funds have entered into option contracts, which give the purchaser of the option, in return for a premium payment, the right to buy from (in the case of a call) or sell to (in the case of a put) the writer of the option the reference instrument underlying the option (or the cash value of the instrument or index underlying the option) at a specified exercise price. The writer of an option has the obligation, upon exercise of the option, to cash settle or deliver the underlying instrument or index upon payment of the exercise price (in the case of a call) or to cash settle or take delivery of the underlying instrument or index and pay the exercise price (in the case of a put).
By purchasing a put option, the fund obtains the right (but not the obligation) to sell the instrument underlying the option (or to deliver the cash value of the instrument or index underlying the option) at a specified exercise price. In return for this right, the fund pays the current market price, or the option premium, for the option. The fund may terminate its position in a put option by allowing the option to expire or by exercising the option. If the option is allowed to expire, the fund will lose the entire amount of the premium paid. If the option is exercised, the fund completes the sale of the underlying instrument (or delivers the cash value of the index underlying the option) at the exercise price. The fund may also terminate a put option position by entering into opposing close-out transactions in advance of the option expiration date.
The features of call options are essentially the same as those of put options, except that the purchaser of a call option obtains the right (but not the obligation) to purchase, rather than sell, the underlying instrument (or the cash value of the index underlying the option) at the specified exercise price. The buyer of a call option typically attempts to participate in potential price increases of the underlying instrument or index with risk limited to the cost of the option if the price of the underlying instrument or index falls. At the same time, the call option buyer can expect to suffer a loss if the price of the underlying instrument or index does not rise sufficiently to offset the cost of the option.
The writer of a put or call option takes the opposite side of the transaction from the option purchaser. In return for receipt of the option premium, the writer assumes the obligation to pay or receive the exercise price for the option’s underlying instrument or index if the other party to the option chooses to exercise it. The writer may seek to terminate a position in a put option before exercise by entering into opposing close-out transactions in advance of the option expiration date. If the market for the relevant put option is not liquid, however, the writer must be prepared to pay the exercise price while the option is outstanding, regardless of price changes. Writing a call option obligates the writer to, upon exercise of the option, deliver the option’s underlying instrument in return for the exercise price or to make a net cash settlement payment, as applicable. The characteristics of writing call options are similar to those of writing put options, except that writing call options is generally a profitable strategy if prices remain the same or fall. The potential gain for the option seller in such a transaction would be capped at the premium received.
Option contracts can be either equity style (premium is paid in full when the option is opened) or futures style (premium moves as part of variation margin over the life of the option, and is paid in full when the option is closed). For equity style options, premiums paid on options purchased, as well as the daily fluctuation in market value, are included in investment securities from unaffiliated issuers in each fund’s statement of asset and liabilities, and premiums received on options written, as well as the daily fluctuation in market value, are included in options written at value in each fund’s statement of assets and liabilities. The net realized gains or losses and net unrealized appreciation or depreciation from equity style options are recorded in investments for purchased options and in options written for written options in the fund’s statement of operations and statement of changes in net assets.
287 American Funds Insurance Series
For futures style options, on a daily basis for both purchased and written options, the fund pays or receives variation margin based on the premium paid and the daily fluctuation in market value, and records variation margin in the statement of assets and liabilities. Realized gains or losses are recorded at the time the option contract is closed or expires. The net realized gains or losses and net unrealized appreciation or depreciation from futures style options are recorded in options purchased (futures style) in the fund’s statement of operations and statement of changes in net assets.
Option contracts can take different forms. Some of the funds have entered into the following types of options contracts:
Options on equity indexes – As part of their managed risk strategy, the managed risk funds will at times purchase put options on equity indexes in standardized contracts traded on foreign or domestic securities exchanges, boards of trade, or similar entities.
Options on futures – One of the funds has entered into options on future contracts to seek to manage the fund’s interest rate sensitivity by increasing or decreasing the duration of the fund or a portion of the fund’s portfolio. An option on a futures contract gives the purchaser of the option the right to buy or sell a position in a futures contract from or to the writer of the option, at a specified price on or before the specified expiration date.
Futures contracts – Some of the funds have entered into futures contracts, which provide for the future sale by one party and purchase by another party of a specified amount of a specific financial instrument for a specified price, date, time and place designated at the time the contract is made. Futures contracts are used to strategically manage the fund’s interest rate sensitivity by increasing or decreasing the duration of the fund or a portion of the fund’s portfolio. For the managed risk funds, futures contracts are used to strategically manage portfolio volatility and downside equity risk.
Upon entering into futures contracts, and to maintain the fund’s open positions in futures contracts, the fund is required to deposit with a futures broker, known as a futures commission merchant (“FCM“), in a segregated account in the name of the FCM an amount of cash, U.S. government securities or other liquid securities, known as initial margin. The margin required for a particular futures contract is set by the exchange on which the contract is traded to serve as collateral, and may be significantly modified from time to time by the exchange during the term of the contract.
On a daily basis, each fund pays or receives variation margin based on the increase or decrease in the value of the futures contracts and records variation margin on futures contracts in each fund’s statement of assets and liabilities. Futures contracts may involve a risk of loss in excess of the variation margin shown on each fund’s statement of assets and liabilities. Each fund records realized gains or losses at the time the futures contract is closed or expires. Net realized gains or losses and net unrealized appreciation or depreciation from futures contracts are recorded in each fund’s statement of operations.
Forward currency contracts – Some of the funds have entered into forward currency contracts, which represent agreements to exchange currencies on specific future dates at predetermined rates. The series’ investment adviser uses forward currency contracts to manage the fund’s exposure to changes in exchange rates. Upon entering into these contracts, risks may arise from the potential inability of counterparties to meet the terms of their contracts and from possible movements in exchange rates.
On a daily basis, the series’ investment adviser values forward currency contracts based on the applicable exchange rates and records unrealized appreciation or depreciation for open forward currency contracts in each fund’s statement of assets and liabilities. Realized gains or losses are recorded at the time the forward contract is closed or offset by another contract with the same broker for the same settlement date and currency. Closed forward currency contracts that have not reached their settlement date are included in the respective receivables or payables for closed forward currency contracts in each fund’s statement of assets and liabilities. Net realized gains or losses from closed forward currency contracts and net unrealized appreciation or depreciation from open forward currency contracts are recorded in each fund’s statement of operations.
Swap contracts – Some of the funds have entered into swap agreements, which are two-party contracts entered into primarily by institutional investors for a specified time period. In a typical swap transaction, two parties agree to exchange the returns earned or realized from one or more underlying assets or rates of return. Swap agreements can be traded on a swap execution facility (SEF) and cleared through a central clearinghouse (cleared), traded over-the-counter (OTC) and cleared, or traded bilaterally and not cleared. Because clearing interposes a central clearinghouse as the ultimate counterparty to each participant’s swap, and margin is required to be exchanged under the rules of the clearinghouse, central clearing is intended to decrease (but not eliminate) counterparty risk relative to uncleared bilateral swaps. To the extent the funds enter into bilaterally negotiated swap transactions, the funds will enter into swap agreements only with counterparties that meet certain credit standards and subject to agreed collateralized procedures. The term of a swap can be days, months or years and certain swaps may be less liquid than others.
American Funds Insurance Series 288
Upon entering into a centrally cleared swap contract, the funds are required to deposit cash, U.S. government securities or other liquid securities, which is known as initial margin. Generally, the initial margin required for a particular swap is set and held as collateral by the clearinghouse on which the contract is cleared. The amount of initial margin required may be significantly modified from time to time by the clearinghouse during the term of the contract.
On a daily basis, interest accruals related to the exchange of future payments are recorded as a receivable and payable in the funds’ statement of assets and liabilities for centrally cleared swaps and as unrealized appreciation or depreciation in the funds’ statement of assets and liabilities for bilateral swaps. For centrally cleared swaps, the fund also pays or receives a variation margin based on the increase or decrease in the value of the swaps, including accrued interest as applicable, and records variation margin in the statement of assets and liabilities. The funds record realized gains and losses on both the net accrued interest and any gain or loss recognized at the time the swap is closed or expires. Net realized gains or losses, as well as any net unrealized appreciation or depreciation, from swaps are recorded in the funds’ statement of operations.
Swap agreements can take different forms. Some of the funds have entered into the following types of swap agreements:
Interest rate swaps – Some of the funds have entered into interest rate swaps, which seek to manage the interest rate sensitivity of the fund by increasing or decreasing the duration of the funds or a portion of the funds’ portfolio. An interest rate swap is an agreement between two parties to exchange or swap payments based on changes in an interest rate or rates. Typically, one interest rate is fixed and the other is variable based on a designated short-term interest rate such as the Secured Overnight Financing Rate (SOFR), prime rate or other benchmark. In other types of interest rate swaps, known as basis swaps, the parties agree to swap variable interest rates based on different designated short-term interest rates. Interest rate swaps generally do not involve the delivery of securities or other principal amounts. Rather, cash payments are exchanged by the parties based on the application of the designated interest rates to a notional amount, which is the predetermined dollar principal of the trade upon which payment obligations are computed. Accordingly, the funds’ current obligation or right under the swap agreement is generally equal to the net amount to be paid or received under the swap agreement based on the relative value of the position held by each party.
Credit default swap indices – Some of the funds have entered into centrally cleared credit default swap indices, including CDX and iTraxx indices (collectively referred to as “CDSIs”), in order to assume exposure to a diversified portfolio of credits or to hedge against existing credit risks. A CDSI is based on a portfolio of credit default swaps with similar characteristics, such as credit default swaps on high-yield bonds. In a typical CDSI transaction, one party (the protection buyer) is obligated to pay the other party (the protection seller) a stream of periodic payments over the term of the contract. If a credit event, such as a default or restructuring, occurs with respect to any of the underlying reference obligations, the protection seller must pay the protection buyer the loss on those credits.
The funds may enter into a CDSI transaction as either protection buyer or protection seller. If the funds are protection buyers, they would pay the counterparty a periodic stream of payments over the term of the contract and would not recover any of those payments if no credit events were to occur with respect to any of the underlying reference obligations. However, if a credit event did occur, the funds, as protection buyers, would have the right to deliver the referenced debt obligations or a specified amount of cash, depending on the terms of the applicable agreement, and to receive the par value of such debt obligations from the counterparty protection seller. As protection sellers, the funds would receive fixed payments throughout the term of the contract if no credit events were to occur with respect to any of the underlying reference obligations. If a credit event were to occur, however, the value of any deliverable obligation received by the funds, coupled with the periodic payments previously received by the funds, may be less than the full notional value that the funds, as a protection seller, pays to the counterparty protection buyer, effectively resulting in a loss of value to the funds. Furthermore, as protection sellers, the funds would effectively add leverage to their portfolio because it would have investment exposure to the notional amount of the swap transaction.
289 American Funds Insurance Series
The following table presents the average month-end notional amounts of options contracts purchased, futures contracts, forward currency contracts, interest rate swaps and credit default swaps while held for each fund (dollars in thousands):
|
|
|
|
|
|
|
|
|
|
|
|
|
|
|
|
|
|
|
|
|
|
|
|
|
| |
|
Options on futures |
|
|
Options on foreign currencies |
|
|
Futures contracts |
|
|
Forward currency contracts |
|
|
Interest rate swaps |
|
|
Credit default swaps |
|
|
|
|
|
|
|
| New World Fund |
|
|
Not applicable |
|
|
|
Not applicable |
|
|
|
$ 25,058 |
|
|
|
$ 22,753 |
|
|
|
$ 4,892 |
|
|
|
Not applicable |
|
| Capital Income Builder |
|
|
Not applicable |
|
|
|
Not applicable |
|
|
|
120,340 |
|
|
|
7 |
* |
|
|
35,978 |
|
|
|
5,611 |
|
| Asset Allocation Fund |
|
|
Not applicable |
|
|
|
Not applicable |
|
|
|
3,234,309 |
|
|
|
Not applicable |
|
|
|
255,086 |
|
|
|
26,850 |
|
| Global Balanced Fund |
|
|
$ 10,100 |
* |
|
|
Not applicable |
|
|
|
45,558 |
|
|
|
34,490 |
|
|
|
19,141 |
|
|
|
4,183 |
|
| Capital World Bond Fund |
|
|
329,760 |
|
|
|
$7,708 |
|
|
|
583,683 |
|
|
|
525,898 |
|
|
|
228,366 |
|
|
|
57,843 |
|
| The Bond Fund of America |
|
|
Not applicable |
|
|
|
Not applicable |
|
|
|
7,050,960 |
|
|
|
91,159 |
|
|
|
611,143 |
|
|
|
85,511 |
|
| American High-Income Trust |
|
|
Not applicable |
|
|
|
Not applicable |
|
|
|
29,295 |
|
|
|
Not applicable |
|
|
|
Not applicable |
|
|
|
14,833 |
|
| American Funds Mortgage Fund |
|
|
600 |
* |
|
|
Not applicable |
|
|
|
86,936 |
|
|
|
Not applicable |
|
|
|
4,206 |
|
|
|
Not applicable |
|
| U.S. Government Securities Fund |
|
|
333,790 |
|
|
|
Not applicable |
|
|
|
1,954,574 |
|
|
|
Not applicable |
|
|
|
765,828 |
|
|
|
Not applicable |
|
| Managed Risk Growth Fund |
|
|
484,810 |
|
|
|
Not applicable |
|
|
|
9,732 |
|
|
|
Not applicable |
|
|
|
Not applicable |
|
|
|
Not applicable |
|
| Managed Risk International Fund |
|
|
102,520 |
|
|
|
Not applicable |
|
|
|
1,251 |
|
|
|
Not applicable |
|
|
|
Not applicable |
|
|
|
Not applicable |
|
| Managed Risk Washington Mutual Investors Fund |
|
|
333,840 |
|
|
|
Not applicable |
|
|
|
3,266 |
|
|
|
Not applicable |
|
|
|
Not applicable |
|
|
|
Not applicable |
|
| Managed Risk Growth-Income Fund |
|
|
3,499,679 |
|
|
|
Not applicable |
|
|
|
37,945 |
|
|
|
Not applicable |
|
|
|
Not applicable |
|
|
|
Not applicable |
|
| Managed Risk Asset Allocation Fund |
|
|
369,433 |
|
|
|
Not applicable |
|
|
|
46,989 |
|
|
|
Not applicable |
|
|
|
Not applicable |
|
|
|
Not applicable |
|
1No contracts were held at the end of the reporting period; amount represents the average month-end notional amount of contracts while they were held.
The following tables identify the location and fair value amounts on each fund’s statement of assets and liabilities and/or the effect on each fund’s statement of operations resulting from each fund’s use of options, futures contracts, forward currency contracts, interest rate swaps and/or credit default swaps as of, or for the six months ended, June 30, 2024 (dollars in thousands):
New World Fund
|
|
|
|
|
|
|
|
|
|
|
|
|
|
|
| |
|
|
|
Assets |
|
|
Liabilities |
|
|
|
|
|
|
|
| Contracts |
|
Risk type |
|
Location on statement of assets and liabilities |
|
Value |
|
|
Location on statement of assets and liabilities |
|
Value |
|
|
|
|
|
|
|
| Futures |
|
Interest |
|
Unrealized appreciation2 |
|
|
$ 51 |
|
|
Unrealized depreciation2 |
|
|
$ 71 |
|
|
|
|
|
|
|
| Forward currency |
|
Currency |
|
Unrealized appreciation on open forward currency contracts |
|
|
131 |
|
|
Unrealized depreciation on open forward currency contracts |
|
|
195 |
|
|
|
|
|
|
|
| Swap (centrally cleared) |
|
Interest |
|
Unrealized appreciation2 |
|
|
7 |
|
|
Unrealized depreciation2 |
|
|
6 |
|
|
|
|
|
|
|
| Swap (bilateral) |
|
Interest |
|
Bilateral swaps, at value |
|
|
– |
|
|
Bilateral swaps, at value |
|
|
197 |
|
|
|
|
|
|
|
|
|
|
|
|
|
|
|
|
|
|
|
|
|
|
|
$189 |
|
|
|
|
|
$469 |
|
|
|
|
|
|
|
|
|
|
|
|
|
|
|
|
| |
|
|
|
Net realized gain (loss) |
|
|
Net unrealized appreciation (depreciation) |
|
|
|
|
|
|
|
| Contracts |
|
Risk type |
|
Location on statement of operations |
|
Value |
|
|
Location on statement of operations |
|
Value |
|
|
|
|
|
|
|
| Futures |
|
Interest |
|
Net realized gain (loss) on futures contracts |
|
|
$(111 |
) |
|
Net unrealized appreciation (depreciation) on futures contracts |
|
|
$ 1 |
|
|
|
|
|
|
|
| Forward currency |
|
Currency |
|
Net realized gain (loss) on forward currency contracts |
|
|
64 |
|
|
Net unrealized appreciation (depreciation) on forward currency contracts |
|
|
49 |
|
|
|
|
|
|
|
| Swap |
|
Interest |
|
Net realized gain (loss) on swap contracts |
|
|
(113 |
) |
|
Net unrealized appreciation (depreciation) on swap contracts |
|
|
(291 |
) |
|
|
|
|
|
|
|
|
|
|
|
|
|
|
|
|
|
|
|
|
|
|
$(160 |
) |
|
|
|
|
$(241 |
) |
Refer to the end of the tables for footnotes.
American Funds Insurance Series 290
Capital Income Builder
|
|
|
|
|
|
|
|
|
|
|
|
|
|
|
| |
|
|
|
Assets |
|
|
Liabilities |
|
|
|
|
|
|
|
| Contracts |
|
Risk type |
|
Location on statement of assets and liabilities |
|
Value |
|
|
Location on statement of assets and liabilities |
|
Value |
|
|
|
|
|
|
|
| Futures |
|
Interest |
|
Unrealized appreciation2 |
|
|
$577 |
|
|
Unrealized depreciation2 |
|
|
$3 |
|
|
|
|
|
|
|
| Swap (centrally cleared) |
|
Interest |
|
Unrealized appreciation2 |
|
|
446 |
|
|
Unrealized depreciation2 |
|
|
– |
|
|
|
|
|
|
|
| Swap (centrally cleared) |
|
Credit |
|
Unrealized appreciation2 |
|
|
2 |
|
|
Unrealized depreciation2 |
|
|
– |
|
|
|
|
|
|
|
|
|
|
|
|
|
|
|
|
|
|
|
|
|
|
|
|
|
|
|
|
|
$1,025 |
|
|
|
|
|
$3 |
|
|
|
|
|
|
|
|
|
|
|
|
|
|
|
|
| |
|
|
|
Net realized gain (loss) |
|
|
Net unrealized appreciation (depreciation) |
|
|
|
|
|
|
|
| Contracts |
|
Risk type |
|
Location on statement of operations |
|
Value |
|
|
Location on statement of operations |
|
Value |
|
|
|
|
|
|
|
| Futures |
|
Interest |
|
Net realized gain (loss) on futures contracts |
|
|
$(948 |
) |
|
Net unrealized appreciation (depreciation) on futures contracts |
|
|
$(1,882 |
) |
|
|
|
|
|
|
| Swap |
|
Interest |
|
Net realized gain (loss) on swap contracts |
|
|
(121 |
) |
|
Net unrealized appreciation (depreciation) on swap contracts |
|
|
392 |
|
|
|
|
|
|
|
| Swap |
|
Credit |
|
Net realized gain (loss) on swap contracts |
|
|
562 |
|
|
Net unrealized appreciation (depreciation) on swap contracts |
|
|
(378 |
) |
|
|
|
|
|
|
|
|
|
|
|
|
|
|
|
|
|
|
|
|
|
|
|
|
|
|
|
|
$(507 |
) |
|
|
|
|
$(1,868 |
) |
Asset Allocation Fund
|
|
|
|
|
|
|
|
|
|
|
|
|
|
|
| |
|
|
|
Assets |
|
|
Liabilities |
|
|
|
|
|
|
|
| Contracts |
|
Risk type |
|
Location on statement of assets and liabilities |
|
Value |
|
|
Location on statement of assets and liabilities |
|
Value |
|
|
|
|
|
|
|
| Futures |
|
Interest |
|
Unrealized appreciation2 |
|
|
$7,673 |
|
|
Unrealized depreciation2 |
|
|
$3,890 |
|
|
|
|
|
|
|
| Swap (centrally cleared) |
|
Interest |
|
Unrealized appreciation2 |
|
|
1,397 |
|
|
Unrealized depreciation2 |
|
|
– |
|
|
|
|
|
|
|
| Swap (centrally cleared) |
|
Credit |
|
Unrealized appreciation2 |
|
|
– |
|
|
Unrealized depreciation2 |
|
|
28 |
|
|
|
|
|
|
|
|
|
|
|
|
|
|
|
|
|
|
|
|
|
|
|
|
|
|
|
|
|
$9,070 |
|
|
|
|
|
$3,918 |
|
|
|
|
|
|
|
|
|
|
|
|
|
|
|
|
| |
|
|
|
Net realized gain (loss) |
|
|
Net unrealized appreciation (depreciation) |
|
|
|
|
|
|
|
| Contracts |
|
Risk type |
|
Location on statement of operations |
|
Value |
|
|
Location on statement of operations |
|
Value |
|
|
|
|
|
|
|
| Futures |
|
Interest |
|
Net realized gain (loss) on futures contracts |
|
|
$(23,417 |
) |
|
Net unrealized appreciation (depreciation) on futures contracts |
|
|
$(3,393 |
) |
|
|
|
|
|
|
| Swap |
|
Interest |
|
Net realized gain (loss) on swap contracts |
|
|
579 |
|
|
Net unrealized appreciation (depreciation) on swap contracts |
|
|
257 |
|
|
|
|
|
|
|
| Swap |
|
Credit |
|
Net realized gain (loss) on swap contracts |
|
|
249 |
|
|
Net unrealized appreciation (depreciation) on swap contracts |
|
|
(124 |
) |
|
|
|
|
|
|
|
|
|
|
|
|
|
|
|
|
|
|
|
|
|
|
|
|
|
|
|
|
$(22,589 |
) |
|
|
|
|
$(3,260 |
) |
Refer to the end of the tables for footnotes.
291 American Funds Insurance Series
American Funds Global Balanced Fund
|
|
|
|
|
|
|
|
|
|
|
|
|
|
|
| |
|
|
|
Assets |
|
|
Liabilities |
|
|
|
|
|
|
|
| Contracts |
|
Risk type |
|
Location on statement of assets and liabilities |
|
Value |
|
|
Location on statement of assets and liabilities |
|
Value |
|
|
|
|
|
|
|
| Futures |
|
Interest |
|
Unrealized appreciation2 |
|
|
$230 |
|
|
Unrealized depreciation2 |
|
|
$ 27 |
|
|
|
|
|
|
|
| Forward currency |
|
Currency |
|
Unrealized appreciation on open forward currency contracts |
|
|
183 |
|
|
Unrealized depreciation on open forward currency contracts |
|
|
286 |
|
|
|
|
|
|
|
| Swap (centrally cleared) |
|
Interest |
|
Unrealized appreciation2 |
|
|
205 |
|
|
Unrealized depreciation2 |
|
|
94 |
|
|
|
|
|
|
|
| Swap (bilateral) |
|
Interest |
|
Bilateral swaps, at value |
|
|
– |
|
|
Bilateral swaps, at value |
|
|
157 |
|
|
|
|
|
|
|
| Swap (centrally cleared) |
|
Credit |
|
Unrealized appreciation2 |
|
|
– |
|
|
Unrealized depreciation2 |
|
|
19 |
|
|
|
|
|
|
|
|
|
|
|
|
|
|
|
|
|
|
|
|
|
|
|
|
|
|
|
|
|
$618 |
|
|
|
|
|
$583 |
|
|
|
|
|
|
|
|
|
|
|
|
|
|
|
|
| |
|
|
|
Net realized gain (loss) |
|
|
Net unrealized appreciation (depreciation) |
|
|
|
|
|
|
|
| Contracts |
|
Risk type |
|
Location on statement of operations |
|
Value |
|
|
Location on statement of operations |
|
Value |
|
|
|
|
|
|
|
| Futures |
|
Interest |
|
Net realized gain (loss) on futures contracts |
|
|
$ (52 |
) |
|
Net unrealized appreciation (depreciation) on futures contracts |
|
|
$(144 |
) |
|
|
|
|
|
|
| Forward currency |
|
Currency |
|
Net realized gain (loss) on forward currency contracts |
|
|
(57 |
) |
|
Net unrealized appreciation (depreciation) on forward currency contracts |
|
|
(421 |
) |
|
|
|
|
|
|
| Swap |
|
Interest |
|
Net realized gain (loss) on swap contracts |
|
|
(264 |
) |
|
Net unrealized appreciation (depreciation) on swap contracts |
|
|
28 |
|
|
|
|
|
|
|
| Swap |
|
Credit |
|
Net realized gain (loss) on swap contracts |
|
|
52 |
|
|
Net unrealized appreciation (depreciation) on swap contracts |
|
|
(29 |
) |
|
|
|
|
|
|
|
|
|
|
|
|
|
|
|
|
|
|
|
|
|
|
$(321 |
) |
|
|
|
|
$(566 |
) |
The Bond Fund of America
|
|
|
|
|
|
|
|
|
|
|
|
|
|
|
| |
|
|
|
Assets |
|
|
Liabilities |
|
|
|
|
|
|
|
| Contracts |
|
Risk type |
|
Location on statement of assets and liabilities |
|
Value |
|
|
Location on statement of assets and liabilities |
|
Value |
|
|
|
|
|
|
|
| Futures |
|
Interest |
|
Unrealized appreciation2 |
|
|
$22,317 |
|
|
Unrealized depreciation2 |
|
|
$4,922 |
|
|
|
|
|
|
|
| Forward currency |
|
Currency |
|
Unrealized appreciation on open forward currency contracts |
|
|
1,071 |
|
|
Unrealized depreciation on open forward currency contracts |
|
|
125 |
|
|
|
|
|
|
|
| Swap (centrally cleared) |
|
Interest |
|
Unrealized appreciation2 |
|
|
4,764 |
|
|
Unrealized depreciation2 |
|
|
750 |
|
|
|
|
|
|
|
| Swap (centrally cleared) |
|
Credit |
|
Unrealized appreciation2 |
|
|
796 |
|
|
Unrealized depreciation2 |
|
|
– |
|
|
|
|
|
|
|
|
|
|
|
|
|
|
|
|
|
|
|
|
|
|
|
$28,948 |
|
|
|
|
|
$5,797 |
|
Refer to the end of the tables for footnotes.
American Funds Insurance Series 292
|
|
|
|
|
|
|
|
|
|
|
|
|
|
|
| |
|
|
|
Net realized gain (loss) |
|
|
Net unrealized appreciation (depreciation) |
|
|
|
|
|
|
|
| Contracts |
|
Risk type |
|
Location on statement of operations |
|
Value |
|
|
Location on statement of operations |
|
Value |
|
|
|
|
|
|
|
| Futures |
|
Interest |
|
Net realized gain (loss) on futures contracts |
|
|
$(65,889 |
) |
|
Net unrealized appreciation (depreciation) on futures contracts |
|
|
$(40,875 |
) |
|
|
|
|
|
|
| Forward currency |
|
Currency |
|
Net realized gain (loss) on forward currency contracts |
|
|
1,525 |
|
|
Net unrealized appreciation (depreciation) on forward currency contracts |
|
|
1,842 |
|
|
|
|
|
|
|
| Swap |
|
Interest |
|
Net realized gain (loss) on swap contracts |
|
|
(2,115 |
) |
|
Net unrealized appreciation (depreciation) on swap contracts |
|
|
3,659 |
|
|
|
|
|
|
|
| Swap |
|
Credit |
|
Net realized gain (loss) on swap contracts |
|
|
(4,815 |
) |
|
Net unrealized appreciation (depreciation) on swap contracts |
|
|
2,265 |
|
|
|
|
|
|
|
|
|
|
|
|
|
|
|
|
|
|
|
|
|
|
|
|
|
|
|
|
|
$(71,294 |
) |
|
|
|
|
$(33,109 |
) |
Capital World Bond Fund
|
|
|
|
|
|
|
|
|
|
|
|
|
|
|
| |
|
|
|
Assets |
|
|
Liabilities |
|
|
|
|
|
|
|
| Contracts |
|
Risk type |
|
Location on statement of assets and liabilities |
|
Value |
|
|
Location on statement of assets and liabilities |
|
Value |
|
|
|
|
|
|
|
| Options purchased (equity style) |
|
Currency |
|
Investment securities |
|
|
$ 5 |
|
|
Investment securities |
|
|
$ – |
|
|
|
|
|
|
|
| Options purchased (equity style) |
|
Interest |
|
Investment securities |
|
|
950 |
|
|
Investment securities |
|
|
– |
|
|
|
|
|
|
|
| Options written (equity style) |
|
Currency |
|
Options written, at value |
|
|
– |
|
|
Options written, at value |
|
|
4 |
|
|
|
|
|
|
|
| Options written (equity style) |
|
Interest |
|
Options written, at value |
|
|
– |
|
|
Options written, at value |
|
|
916 |
|
|
|
|
|
|
|
| Futures |
|
Interest |
|
Unrealized appreciation2 |
|
|
2,055 |
|
|
Unrealized depreciation2 |
|
|
494 |
|
|
|
|
|
|
|
| Forward currency |
|
Currency |
|
Unrealized appreciation on open forward currency contracts |
|
|
1,871 |
|
|
Unrealized depreciation on open forward currency contracts |
|
|
3,859 |
|
|
|
|
|
|
|
| Swap (centrally cleared) |
|
Interest |
|
Unrealized appreciation2 |
|
|
1,228 |
|
|
Unrealized depreciation2 |
|
|
1,188 |
|
|
|
|
|
|
|
| Swap (bilateral) |
|
Interest |
|
Bilateral swaps, at value |
|
|
– |
|
|
Bilateral swaps, at value |
|
|
1,221 |
|
|
|
|
|
|
|
| Swap (centrally cleared) |
|
Credit |
|
Unrealized appreciation2 |
|
|
19 |
|
|
Unrealized depreciation2 |
|
|
199 |
|
|
|
|
|
|
|
|
|
|
|
|
|
|
|
|
|
|
|
|
|
|
|
|
|
|
|
|
|
$6,128 |
|
|
|
|
|
$7,881 |
|
Refer to the end of the tables for footnotes.
293 American Funds Insurance Series
|
|
|
|
|
|
|
|
|
|
|
|
|
|
|
| |
|
|
|
Net realized gain (loss) |
|
|
Net unrealized appreciation (depreciation) |
|
|
|
|
|
|
|
| Contracts |
|
Risk type |
|
Location on statement of operations |
|
Value |
|
|
Location on statement of operations |
|
Value |
|
|
|
|
|
|
|
| Options purchased (equity style) |
|
Currency |
|
Net realized gain (loss) on investments |
|
|
$ 18 |
|
|
Net unrealized appreciation (depreciation) on investments |
|
|
$ (19 |
) |
|
|
|
|
|
|
| Options purchased (equity style) |
|
Interest |
|
Net realized gain (loss) on investments |
|
|
– |
|
|
Net unrealized appreciation (depreciation) on investments |
|
|
188 |
|
|
|
|
|
|
|
| Options purchased (futures style) |
|
Interest |
|
Net realized gain (loss) on options purchased |
|
|
(66 |
) |
|
Net unrealized appreciation (depreciation) on options purchased |
|
|
– |
|
|
|
|
|
|
|
| Options written (equity style) |
|
Interest |
|
Net realized gain (loss) on options written |
|
|
300 |
|
|
Net unrealized appreciation (depreciation) on options written |
|
|
(93 |
) |
|
|
|
|
|
|
| Futures |
|
Interest |
|
Net realized gain (loss) on futures contracts |
|
|
(91 |
) |
|
Net unrealized appreciation (depreciation) on futures contracts |
|
|
(4,341 |
) |
|
|
|
|
|
|
| Forward currency |
|
Currency |
|
Net realized gain (loss) on forward currency contracts |
|
|
(1,028 |
) |
|
Net unrealized appreciation (depreciation) on forward currency contracts |
|
|
(5,821 |
) |
|
|
|
|
|
|
| Swap |
|
Interest |
|
Net realized gain (loss) on swap contracts |
|
|
(2,170 |
) |
|
Net unrealized appreciation (depreciation) on swap contracts |
|
|
(296 |
) |
|
|
|
|
|
|
| Swap |
|
Credit |
|
Net realized gain (loss) on swap contracts |
|
|
802 |
|
|
Net unrealized appreciation (depreciation) on swap contracts |
|
|
(698 |
) |
|
|
|
|
|
|
|
|
|
|
|
|
|
|
|
|
|
|
|
|
|
|
$(2,235 |
) |
|
|
|
|
$(11,080 |
) |
American High-Income Trust
|
|
|
|
|
|
|
|
|
|
|
|
|
|
|
| |
|
|
|
Assets |
|
|
Liabilities |
|
|
|
|
|
|
|
| Contracts |
|
Risk type |
|
Location on statement of assets and liabilities |
|
Value |
|
|
Location on statement of assets and liabilities |
|
Value |
|
|
|
|
|
|
|
| Futures |
|
Interest |
|
Unrealized appreciation2 |
|
|
$137 |
|
|
Unrealized depreciation2 |
|
|
$58 |
|
|
|
|
|
|
|
| Swap (centrally cleared) |
|
Credit |
|
Unrealized appreciation2 |
|
|
25 |
|
|
Unrealized depreciation2 |
|
|
4 |
|
|
|
|
|
|
|
|
|
|
|
|
|
|
|
|
|
|
|
|
|
|
|
$162 |
|
|
|
|
|
$62 |
|
|
|
|
|
|
|
|
|
|
|
|
|
|
|
|
| |
|
|
|
Net realized gain (loss) |
|
|
Net unrealized appreciation (depreciation) |
|
|
|
|
|
|
|
| Contracts |
|
Risk type |
|
Location on statement of operations |
|
Value |
|
|
Location on statement of operations |
|
Value |
|
|
|
|
|
|
|
| Futures |
|
Interest |
|
Net realized gain (loss) on futures contracts |
|
|
$(100 |
) |
|
Net unrealized appreciation (depreciation) on futures contracts |
|
|
$70 |
|
|
|
|
|
|
|
| Swap |
|
Credit |
|
Net realized gain (loss) on swap contracts |
|
|
(213 |
) |
|
Net unrealized appreciation (depreciation) on swap contracts |
|
|
1 |
|
|
|
|
|
|
|
|
|
|
|
|
|
|
|
|
|
|
|
|
|
|
|
$(313 |
) |
|
|
|
|
$71 |
|
American Funds Mortgage Fund
|
|
|
|
|
|
|
|
|
|
|
|
|
|
|
| |
|
|
|
Assets |
|
|
Liabilities |
|
|
|
|
|
|
|
| Contracts |
|
Risk type |
|
Location on statement of assets and liabilities |
|
Value |
|
|
Location on statement of assets and liabilities |
|
Value |
|
|
|
|
|
|
|
| Futures |
|
Interest |
|
Unrealized appreciation2 |
|
|
$353 |
|
|
Unrealized depreciation2 |
|
|
$68 |
|
|
|
|
|
|
|
| Swap (centrally cleared) |
|
Interest |
|
Unrealized appreciation2 |
|
|
99 |
|
|
Unrealized depreciation2 |
|
|
– |
|
|
|
|
|
|
|
|
|
|
|
|
|
|
|
|
|
|
|
|
|
|
|
$452 |
|
|
|
|
|
$68 |
|
Refer to the end of the tables for footnotes.
American Funds Insurance Series 294
|
|
|
|
|
|
|
|
|
|
|
|
|
|
|
| |
|
|
|
Net realized gain (loss) |
|
|
Net unrealized appreciation (depreciation) |
|
|
|
|
|
|
|
| Contracts |
|
Risk type |
|
Location on statement of operations |
|
Value |
|
|
Location on statement of operations |
|
Value |
|
|
|
|
|
|
|
| Futures |
|
Interest |
|
Net realized gain (loss) on futures contracts |
|
|
$(761 |
) |
|
Net unrealized appreciation (depreciation) on futures contracts |
|
|
$(715 |
) |
|
|
|
|
|
|
| Swap |
|
Interest |
|
Net realized gain (loss) on swap contracts |
|
|
20 |
|
|
Net unrealized appreciation (depreciation) on swap contracts |
|
|
89 |
|
|
|
|
|
|
|
|
|
|
|
|
|
|
|
|
|
|
|
|
|
|
|
$(741) |
|
|
|
|
|
$(626) |
|
U.S. Government Securities Fund
|
|
|
|
|
|
|
|
|
|
|
|
|
|
|
| |
|
|
|
Assets |
|
|
Liabilities |
|
|
|
|
|
|
|
| Contracts |
|
Risk type |
|
Location on statement of assets and liabilities |
|
Value |
|
|
Location on statement of assets and liabilities |
|
Value |
|
|
|
|
|
|
|
| Options purchased (equity style) |
|
Interest |
|
Investment securities |
|
|
$ 578 |
|
|
Investment securities |
|
|
$ – |
|
|
|
|
|
|
|
| Options written (equity style) |
|
Interest |
|
Options written, at value |
|
|
– |
|
|
Options written, at value |
|
|
496 |
|
|
|
|
|
|
|
| Futures |
|
Interest |
|
Unrealized appreciation2 |
|
|
4,562 |
|
|
Unrealized depreciation2 |
|
|
1,800 |
|
|
|
|
|
|
|
| Swap (centrally cleared) |
|
Interest |
|
Unrealized appreciation2 |
|
|
19,570 |
|
|
Unrealized depreciation2 |
|
|
5,433 |
|
|
|
|
|
|
|
|
|
|
|
|
|
|
|
|
|
|
|
|
|
|
|
$24,710 |
|
|
|
|
|
$7,729 |
|
|
|
|
|
|
|
|
|
|
|
|
|
|
|
|
| |
|
|
|
Net realized gain (loss) |
|
|
Net unrealized appreciation (depreciation) |
|
|
|
|
|
|
|
| Contracts |
|
Risk type |
|
Location on statement of operations |
|
Value |
|
|
Location on statement of operations |
|
Value |
|
|
|
|
|
|
|
| Options purchased (equity style) |
|
Interest |
|
Net realized gain (loss) on investments |
|
|
$ (51 |
) |
|
Net unrealized appreciation (depreciation) on investments |
|
|
$ (372 |
) |
|
|
|
|
|
|
| Options written (equity style) |
|
Interest |
|
Net realized gain (loss) on options written |
|
|
92 |
|
|
Net unrealized appreciation (depreciation) on options written |
|
|
360 |
|
|
|
|
|
|
|
| Futures |
|
Interest |
|
Net realized gain (loss) on futures contracts |
|
|
(3,042 |
) |
|
Net unrealized appreciation (depreciation) on futures contracts |
|
|
(16,056 |
) |
|
|
|
|
|
|
| Swap |
|
Interest |
|
Net realized gain (loss) on swap contracts |
|
|
2,656 |
|
|
Net unrealized appreciation (depreciation) on swap contracts |
|
|
(916 |
) |
|
|
|
|
|
|
|
|
|
|
|
|
|
|
|
|
|
|
|
|
|
|
$(345 |
) |
|
|
|
|
$(16,984 |
) |
Managed Risk Growth Fund
|
|
|
|
|
|
|
|
|
|
|
|
|
|
|
| |
|
|
|
Assets |
|
|
Liabilities |
|
|
|
|
|
|
|
| Contracts |
|
Risk type |
|
Location on statement of assets and liabilities |
|
Value |
|
|
Location on statement of assets and liabilities |
|
Value |
|
|
|
|
|
|
|
| Options purchased (equity style) |
|
Equity |
|
Investment securities from unaffiliated issuers3 |
|
|
$866 |
|
|
Investment securities from unaffiliated issuers3 |
|
|
$– |
|
|
|
|
|
|
|
| Futures |
|
Equity |
|
Unrealized appreciation2 |
|
|
40 |
|
|
Unrealized depreciation2 |
|
|
– |
|
|
|
|
|
|
|
| Futures |
|
Interest |
|
Unrealized appreciation2 |
|
|
5 |
|
|
Unrealized depreciation2 |
|
|
– |
|
|
|
|
|
|
|
|
|
|
|
|
|
|
|
|
|
|
|
|
|
|
|
$911 |
|
|
|
|
|
$– |
|
Refer to the end of the tables for footnotes.
295 American Funds Insurance Series
|
|
|
|
|
|
|
|
|
|
|
|
|
|
|
| |
|
|
|
Net realized gain (loss) |
|
|
Net unrealized appreciation (depreciation) |
|
|
|
|
|
|
|
| Contracts |
|
Risk type |
|
Location on statement of operations |
|
Value |
|
|
Location on statement of operations |
|
Value |
|
|
|
|
|
|
|
| Options purchased (equity style) |
|
Equity |
|
Net realized gain (loss) on investments in unaffiliated issuers |
|
|
$(2,269 |
) |
|
Net unrealized appreciation (depreciation) on investments in unaffiliated issuers |
|
|
$522 |
|
|
|
|
|
|
|
| Futures |
|
Currency |
|
Net realized gain (loss) on futures contracts |
|
|
(36 |
) |
|
Net realized appreciation (depreciation) on futures contracts |
|
|
– |
|
|
|
|
|
|
|
| Futures |
|
Equity |
|
Net realized gain (loss) on futures contracts |
|
|
(1,064 |
) |
|
Net realized appreciation (depreciation) on futures contracts |
|
|
(350 |
) |
|
|
|
|
|
|
| Futures |
|
Interest |
|
Net realized gain (loss) on futures contracts |
|
|
18 |
|
|
Net realized appreciation (depreciation) on futures contracts |
|
|
(86 |
) |
|
|
|
|
|
|
|
|
|
|
|
|
|
|
|
|
|
|
|
|
|
|
$(3,351 |
) |
|
|
|
|
$ 86 |
|
Managed Risk International Fund
|
|
|
|
|
|
|
|
|
|
|
|
|
|
|
| |
|
|
|
Assets |
|
|
Liabilities |
|
|
|
|
|
|
|
| Contracts |
|
Risk type |
|
Location on statement of assets and liabilities |
|
Value |
|
|
Location on statement of assets and liabilities |
|
Value |
|
|
|
|
|
|
|
| Options purchased (equity style) |
|
Equity |
|
Investment securities from unaffiliated issuers3 |
|
|
$934 |
|
|
Investment securities from unaffiliated issuers3 |
|
|
$– |
|
|
|
|
|
|
|
| Futures |
|
Equity |
|
Unrealized appreciation2 |
|
|
18 |
|
|
Unrealized depreciation2 |
|
|
– |
|
|
|
|
|
|
|
| Futures |
|
Interest |
|
Unrealized appreciation2 |
|
|
9 |
|
|
Unrealized depreciation2 |
|
|
– |
|
|
|
|
|
|
|
|
|
|
|
|
|
|
|
|
|
|
|
|
|
|
|
$961 |
|
|
|
|
|
$– |
|
|
|
|
|
|
|
|
|
|
|
|
|
|
|
|
| |
|
|
|
Net realized gain (loss) |
|
|
Net unrealized appreciation (depreciation) |
|
|
|
|
|
|
|
| Contracts |
|
Risk type |
|
Location on statement of operations |
|
Value |
|
|
Location on statement of operations |
|
Value |
|
|
|
|
|
|
|
| Options purchased (equity style) |
|
Equity |
|
Net realized gain (loss) on investments in unaffiliated issuers |
|
|
$(437 |
) |
|
Net unrealized appreciation (depreciation) on investments in unaffiliated issuers |
|
|
$588 |
|
|
|
|
|
|
|
| Futures |
|
Equity |
|
Net realized gain (loss) on futures contracts |
|
|
(255 |
) |
|
Net realized appreciation (depreciation) on futures contracts |
|
|
83 |
|
|
|
|
|
|
|
| Futures |
|
Interest |
|
Net realized gain (loss) on futures contracts |
|
|
(17 |
) |
|
Net realized appreciation (depreciation) on futures contracts |
|
|
(17 |
) |
|
|
|
|
|
|
|
|
|
|
|
|
|
|
|
|
|
|
|
|
|
|
$(709 |
) |
|
|
|
|
$654 |
|
Managed Risk Washington Mutual Investors Fund
|
|
|
|
|
|
|
|
|
|
|
|
|
|
|
| |
|
|
|
Assets |
|
|
Liabilities |
|
|
|
|
|
|
|
| Contracts |
|
Risk type |
|
Location on statement of assets and liabilities |
|
Value |
|
|
Location on statement of assets and liabilities |
|
Value |
|
|
|
|
|
|
|
| Options purchased (equity style) |
|
Equity |
|
Investment securities from unaffiliated issuers3 |
|
|
$458 |
|
|
Investment securities from unaffiliated issuers3 |
|
|
$– |
|
|
|
|
|
|
|
| Futures |
|
Equity |
|
Unrealized appreciation2 |
|
|
20 |
|
|
Unrealized depreciation2 |
|
|
– |
|
|
|
|
|
|
|
| Futures |
|
Interest |
|
Unrealized appreciation2 |
|
|
22 |
|
|
Unrealized depreciation2 |
|
|
– |
|
|
|
|
|
|
|
|
|
|
|
|
|
|
|
|
|
|
|
|
|
|
|
$500 |
|
|
|
|
|
$– |
|
Refer to the end of the tables for footnotes.
American Funds Insurance Series 296
|
|
|
|
|
|
|
|
|
|
|
|
|
|
|
| |
|
|
|
Net realized gain (loss) |
|
|
Net unrealized appreciation (depreciation) |
|
|
|
|
|
|
|
| Contracts |
|
Risk type |
|
Location on statement of operations |
|
Value |
|
|
Location on statement of operations |
|
Value |
|
|
|
|
|
|
|
| Options purchased (equity style) |
|
Equity |
|
Net realized gain (loss) on investments in unaffiliated issuers |
|
|
$(1,485 |
) |
|
Net unrealized appreciation (depreciation) on investments in unaffiliated issuers |
|
|
$334 |
|
|
|
|
|
|
|
| Futures |
|
Currency |
|
Net realized gain (loss) on futures contracts |
|
|
(7 |
) |
|
Net realized appreciation (depreciation) on futures contracts |
|
|
– |
|
|
|
|
|
|
|
| Futures |
|
Equity |
|
Net realized gain (loss) on futures contracts |
|
|
428 |
|
|
Net realized appreciation (depreciation) on futures contracts |
|
|
(236 |
) |
|
|
|
|
|
|
| Futures |
|
Interest |
|
Net realized gain (loss) on futures contracts |
|
|
(39 |
) |
|
Net realized appreciation (depreciation) on futures contracts |
|
|
(43 |
) |
|
|
|
|
|
|
|
|
|
|
|
|
|
|
|
|
|
|
|
|
|
|
$(1,103 |
) |
|
|
|
|
$ 55 |
|
Managed Risk Growth-Income Fund
|
|
|
|
|
|
|
|
|
|
|
|
|
|
|
| |
|
|
|
Assets |
|
|
Liabilities |
|
|
|
|
|
|
|
| Contracts |
|
Risk type |
|
Location on statement of assets and liabilities |
|
Value |
|
|
Location on statement of assets and liabilities |
|
Value |
|
|
|
|
|
|
|
| Options purchased (equity style) |
|
Equity |
|
Investment securities from unaffiliated issuers3 |
|
|
$4,616 |
|
|
Investment securities from unaffiliated issuers3 |
|
|
$– |
|
|
|
|
|
|
|
| Futures |
|
Equity |
|
Unrealized appreciation2 |
|
|
201 |
|
|
Unrealized depreciation2 |
|
|
– |
|
|
|
|
|
|
|
| Futures |
|
Interest |
|
Unrealized appreciation2 |
|
|
51 |
|
|
Unrealized depreciation2 |
|
|
– |
|
|
|
|
|
|
|
|
|
|
|
|
|
|
|
|
|
|
|
|
|
|
|
$4,868 |
|
|
|
|
|
$– |
|
|
|
|
|
|
|
|
|
|
|
|
|
|
|
|
| |
|
|
|
Net realized gain (loss) |
|
|
Net unrealized appreciation (depreciation) |
|
|
|
|
|
|
|
| Contracts |
|
Risk type |
|
Location on statement of operations |
|
Value |
|
|
Location on statement of operations |
|
Value |
|
|
|
|
|
|
|
| Options purchased (equity style) |
|
Equity |
|
Net realized gain (loss) on investments in unaffiliated issuers |
|
|
$(15,868 |
) |
|
Net unrealized appreciation (depreciation) on investments in unaffiliated issuers |
|
|
$3,986 |
|
|
|
|
|
|
|
| Futures |
|
Currency |
|
Net realized gain (loss) on futures contracts |
|
|
(28 |
) |
|
Net realized appreciation (depreciation) on futures contracts |
|
|
– |
|
|
|
|
|
|
|
| Futures |
|
Equity |
|
Net realized gain (loss) on futures contracts |
|
|
7,935 |
|
|
Net realized appreciation (depreciation) on futures contracts |
|
|
(1,707 |
) |
|
|
|
|
|
|
| Futures |
|
Interest |
|
Net realized gain (loss) on futures contracts |
|
|
(86 |
) |
|
Net realized appreciation (depreciation) on futures contracts |
|
|
(89 |
) |
|
|
|
|
|
|
|
|
|
|
|
|
|
|
|
|
|
|
|
|
|
|
$ (8,047 |
) |
|
|
|
|
$2,190 |
|
Managed Risk Asset Allocation Fund
|
|
|
|
|
|
|
|
|
|
|
|
|
|
|
| |
|
|
|
Assets |
|
|
Liabilities |
|
|
|
|
|
|
|
| Contracts |
|
Risk type |
|
Location on statement of assets and liabilities |
|
Value |
|
|
Location on statement of assets and liabilities |
|
Value |
|
|
|
|
|
|
|
| Options purchased (equity style) |
|
Equity |
|
Investment securities from unaffiliated issuers3 |
|
|
$ 698 |
|
|
Investment securities from unaffiliated issuers3 |
|
|
$– |
|
|
|
|
|
|
|
| Futures |
|
Equity |
|
Unrealized appreciation2 |
|
|
38 |
|
|
Unrealized depreciation2 |
|
|
– |
|
|
|
|
|
|
|
| Futures |
|
Interest |
|
Unrealized appreciation2 |
|
|
368 |
|
|
Unrealized depreciation2 |
|
|
– |
|
|
|
|
|
|
|
|
|
|
|
|
|
|
|
|
|
|
|
|
|
|
|
$1,104 |
|
|
|
|
|
$– |
|
Refer to the end of the tables for footnotes.
297 American Funds Insurance Series
|
|
|
|
|
|
|
|
|
|
|
|
|
|
|
| |
|
|
|
Net realized gain (loss) |
|
|
Net unrealized appreciation (depreciation) |
|
|
|
|
|
|
|
| Contracts |
|
Risk type |
|
Location on statement of operations |
|
Value |
|
|
Location on statement of operations |
|
Value |
|
|
|
|
|
|
|
| Options purchased (equity style) |
|
Equity |
|
Net realized gain (loss) on investments in unaffiliated issuers |
|
|
$(1,481 |
) |
|
Net unrealized appreciation (depreciation) on investments in unaffiliated issuers |
|
|
$157 |
|
|
|
|
|
|
|
| Futures |
|
Currency |
|
Net realized gain (loss) on futures contracts |
|
|
(24 |
) |
|
Net realized appreciation (depreciation) on futures contracts |
|
|
– |
|
|
|
|
|
|
|
| Futures |
|
Equity |
|
Net realized gain (loss) on futures contracts |
|
|
241 |
|
|
Net realized appreciation (depreciation) on futures contracts |
|
|
(354 |
) |
|
|
|
|
|
|
| Futures |
|
Interest |
|
Net realized gain (loss) on futures contracts |
|
|
(627 |
) |
|
Net realized appreciation (depreciation) on futures contracts |
|
|
(645 |
) |
|
|
|
|
|
|
|
|
|
|
|
|
|
|
|
|
|
|
|
|
|
|
$(1,891 |
) |
|
|
|
|
$(842 |
) |
| |
2 |
Includes cumulative appreciation/depreciation on futures contracts, centrally cleared interest rate swaps and/or centrally cleared credit default swaps as reported in the applicable table following each fund’s investment portfolio. Only current day’s variation margin is reported within each fund’s statement of assets and liabilities. |
| |
3 |
Includes options purchased as reported in each fund’s investment portfolio. |
Collateral – Some funds either receive or pledge highly liquid assets, such as cash or U.S. government securities, as collateral due to securities lending and/or their use of option contracts, futures contracts, forward currency contracts, interest rate swaps, credit default swaps and/or future delivery contracts. For securities lending, each participating fund receives collateral in exchange for lending investment securities. The lending agent may reinvest collateral from securities lending transactions according to agreed parameters. For options on equity indexes, options on futures, futures contracts, centrally cleared interest rate swaps and centrally cleared credit default swaps, the program calls for each participating fund to pledge collateral for initial and variation margin by contract. For options on foreign currencies, forward currency contracts and bilateral swaps, the program calls for each participating fund to either receive or pledge collateral based on the net gain or loss on unsettled contracts by counterparty. For future delivery contracts, the program calls for each participating fund to either receive or pledge collateral based on the net gain or loss on unsettled contracts by certain counterparties. The purpose of the collateral is to cover potential losses that could occur in the event that either party cannot meet its contractual obligation. Non-cash collateral pledged by each participating fund, if any, is disclosed in each fund’s investment portfolio, and cash collateral pledged by each participating fund, if any, is held in a segregated account with the fund’s custodian, which is reflected as pledged cash collateral in each fund’s statement of assets and liabilities.
Rights of offset – Funds that hold forward currency contracts, options on foreign currencies and bilateral swaps have enforceable master netting agreements with certain counterparties, where amounts payable by each party to the other in the same currency (with the same settlement date and with the same counterparty) are settled net of each party’s payment obligation. If an early termination date occurs under these agreements following an event of default or termination event, all obligations of each party to its counterparty are settled net through a single payment in a single currency (“close-out netting“). For financial reporting purposes, the funds do not offset financial assets and financial liabilities that are subject to these master netting arrangements in the statements of assets and liabilities.
The tables on the following pages present each fund’s forward currency contracts, options on foreign currencies and bilateral swaps by counterparty that are subject to master netting agreements but that are not offset in the funds’ statements of assets and liabilities. The net amount column shows the impact of offsetting on the funds’ statement of assets and liabilities as of June 30, 2024, if close-out netting was exercised (dollars in thousands):
American Funds Insurance Series 298
New World Fund
|
|
|
|
|
|
|
|
|
|
|
|
|
|
|
|
|
|
|
|
|
|
|
|
|
|
|
| |
|
Gross amounts recognized in the
statement of assets
and liabilities |
|
|
|
|
|
Gross amounts not offset in the
statement of assets and liabilities and
subject to a master netting agreement |
|
|
|
|
|
|
| Counterparty |
|
|
|
|
Available
to offset |
|
|
Non-cash
collateral* |
|
|
Cash
collateral* |
|
|
Net
amount |
|
|
|
|
|
|
|
|
|
|
|
| Assets: |
|
|
|
|
|
|
|
|
|
|
|
|
|
|
|
|
|
|
|
|
|
|
|
|
|
|
| Bank of America |
|
|
$ – |
† |
|
|
|
|
|
|
$ – |
|
|
|
$– |
|
|
|
$– |
|
|
|
$ – |
† |
|
|
| Bank of New York Mellon |
|
|
1 |
|
|
|
|
|
|
|
– |
|
|
|
– |
|
|
|
– |
|
|
|
1 |
|
|
|
| Barclays Bank PLC |
|
|
59 |
|
|
|
|
|
|
|
(59 |
) |
|
|
– |
|
|
|
– |
|
|
|
– |
|
|
|
| BNP Paribas |
|
|
1 |
|
|
|
|
|
|
|
(1 |
) |
|
|
– |
|
|
|
– |
|
|
|
– |
|
|
|
| Citibank |
|
|
33 |
|
|
|
|
|
|
|
(15 |
) |
|
|
– |
|
|
|
– |
|
|
|
18 |
|
|
|
| Goldman Sachs |
|
|
5 |
|
|
|
|
|
|
|
(5 |
) |
|
|
– |
|
|
|
– |
|
|
|
– |
|
|
|
| HSBC Bank |
|
|
1 |
|
|
|
|
|
|
|
– |
|
|
|
– |
|
|
|
– |
|
|
|
1 |
|
|
|
| JPMorgan Chase |
|
|
22 |
|
|
|
|
|
|
|
(22 |
) |
|
|
– |
|
|
|
– |
|
|
|
– |
|
|
|
| Morgan Stanley |
|
|
– |
† |
|
|
|
|
|
|
– |
|
|
|
– |
|
|
|
– |
|
|
|
– |
† |
|
|
| Standard Chartered Bank |
|
|
– |
† |
|
|
|
|
|
|
– |
|
|
|
– |
|
|
|
– |
|
|
|
– |
† |
|
|
| UBS AG |
|
|
9 |
|
|
|
|
|
|
|
– |
|
|
|
– |
|
|
|
– |
|
|
|
9 |
|
|
|
|
|
|
|
|
|
|
|
|
|
|
|
| Total |
|
|
$131 |
|
|
|
|
|
|
|
$(102 |
) |
|
|
$– |
|
|
|
$– |
|
|
|
$ 29 |
|
|
|
|
|
|
|
| Liabilities: |
|
|
|
|
|
|
|
|
|
|
|
|
|
|
|
|
|
|
|
|
|
|
|
|
|
|
| Bank of America |
|
|
$ 28 |
|
|
|
|
|
|
|
$ – |
|
|
|
$– |
|
|
|
$– |
|
|
|
$ 28 |
|
|
|
| Barclays Bank PLC |
|
|
84 |
|
|
|
|
|
|
|
(59 |
) |
|
|
– |
|
|
|
– |
|
|
|
25 |
|
|
|
| BNP Paribas |
|
|
16 |
|
|
|
|
|
|
|
(1 |
) |
|
|
– |
|
|
|
– |
|
|
|
15 |
|
|
|
| Citibank |
|
|
15 |
|
|
|
|
|
|
|
(15 |
) |
|
|
– |
|
|
|
– |
|
|
|
– |
|
|
|
| Goldman Sachs |
|
|
105 |
|
|
|
|
|
|
|
(5 |
) |
|
|
– |
|
|
|
– |
|
|
|
99 |
|
|
|
| JPMorgan Chase |
|
|
32 |
|
|
|
|
|
|
|
(22 |
) |
|
|
– |
|
|
|
– |
|
|
|
10 |
|
|
|
| Morgan Stanley |
|
|
67 |
|
|
|
|
|
|
|
– |
|
|
|
– |
|
|
|
– |
|
|
|
67 |
|
|
|
| Standard Chartered Bank |
|
|
45 |
|
|
|
|
|
|
|
– |
|
|
|
– |
|
|
|
– |
|
|
|
45 |
|
|
|
|
|
|
|
|
|
|
|
|
|
|
|
| Total |
|
|
$392 |
|
|
|
|
|
|
|
$(102 |
) |
|
|
$– |
|
|
|
$– |
|
|
|
$289 |
|
|
|
|
|
|
|
*Collateral is shown on a settlement basis.
†Amount less than one thousand.
Refer to the end of the tables for footnotes.
299 American Funds Insurance Series
American Funds Global Balanced Fund
|
|
|
|
|
|
|
|
|
|
|
|
|
|
|
|
|
|
|
|
|
|
|
|
|
|
|
| |
|
Gross amounts recognized in the
statement of assets
and liabilities |
|
|
|
|
|
Gross amounts not offset in the
statement of assets and liabilities and
subject to a master netting agreement |
|
|
|
|
|
|
| Counterparty |
|
|
|
|
Available
to offset |
|
|
Non-cash
collateral* |
|
|
Cash
collateral* |
|
|
Net
amount |
|
|
|
|
|
|
|
|
|
|
|
| Assets: |
|
|
|
|
|
|
|
|
|
|
|
|
|
|
|
|
|
|
|
|
|
|
|
|
|
|
| Bank of America |
|
|
$ 3 |
|
|
|
|
|
|
|
$ (3 |
) |
|
|
$– |
|
|
|
$– |
|
|
|
$ – |
|
|
|
| Bank of New York Mellon |
|
|
– |
† |
|
|
|
|
|
|
– |
|
|
|
– |
|
|
|
– |
|
|
|
– |
† |
|
|
| Barclays Bank PLC |
|
|
1 |
|
|
|
|
|
|
|
– |
|
|
|
– |
|
|
|
– |
|
|
|
1 |
|
|
|
| BNP Paribas |
|
|
16 |
|
|
|
|
|
|
|
(16 |
) |
|
|
– |
|
|
|
– |
|
|
|
– |
|
|
|
| Citibank |
|
|
32 |
|
|
|
|
|
|
|
(21 |
) |
|
|
– |
|
|
|
– |
|
|
|
11 |
|
|
|
| Goldman Sachs |
|
|
7 |
|
|
|
|
|
|
|
(7 |
) |
|
|
– |
|
|
|
– |
|
|
|
– |
|
|
|
| HSBC Bank |
|
|
1 |
|
|
|
|
|
|
|
– |
|
|
|
– |
|
|
|
– |
|
|
|
1 |
|
|
|
| JPMorgan Chase |
|
|
50 |
|
|
|
|
|
|
|
(27 |
) |
|
|
– |
|
|
|
– |
|
|
|
23 |
|
|
|
| Morgan Stanley |
|
|
68 |
|
|
|
|
|
|
|
(68 |
) |
|
|
– |
|
|
|
– |
|
|
|
– |
|
|
|
| Standard Chartered Bank |
|
|
4 |
|
|
|
|
|
|
|
(1 |
) |
|
|
– |
|
|
|
– |
|
|
|
3 |
|
|
|
| UBS AG |
|
|
1 |
|
|
|
|
|
|
|
(1 |
) |
|
|
– |
|
|
|
– |
|
|
|
– |
|
|
|
|
|
|
|
|
|
|
|
|
|
|
|
| Total |
|
|
$183 |
|
|
|
|
|
|
|
$(144 |
) |
|
|
$– |
|
|
|
$– |
|
|
|
$ 39 |
|
|
|
|
|
|
|
| Liabilities: |
|
|
|
|
|
|
|
|
|
|
|
|
|
|
|
|
|
|
|
|
|
|
|
|
|
|
| Bank of America |
|
|
$ 43 |
|
|
|
|
|
|
|
$(3 |
) |
|
|
$– |
|
|
|
$– |
|
|
|
$ 40 |
|
|
|
| BNP Paribas |
|
|
16 |
|
|
|
|
|
|
|
(16 |
) |
|
|
– |
|
|
|
– |
|
|
|
– |
|
|
|
| Citibank |
|
|
21 |
|
|
|
|
|
|
|
(21 |
) |
|
|
– |
|
|
|
– |
|
|
|
– |
|
|
|
| Goldman Sachs |
|
|
157 |
|
|
|
|
|
|
|
(7 |
) |
|
|
– |
|
|
|
– |
|
|
|
150 |
|
|
|
| HSBC Bank |
|
|
– |
† |
|
|
|
|
|
|
– |
|
|
|
– |
|
|
|
– |
|
|
|
– |
† |
|
|
| JPMorgan Chase |
|
|
27 |
|
|
|
|
|
|
|
(27 |
) |
|
|
– |
|
|
|
– |
|
|
|
– |
|
|
|
| Morgan Stanley |
|
|
106 |
|
|
|
|
|
|
|
(68 |
) |
|
|
– |
|
|
|
– |
|
|
|
38 |
|
|
|
| Standard Chartered Bank |
|
|
1 |
|
|
|
|
|
|
|
(1 |
) |
|
|
– |
|
|
|
– |
|
|
|
– |
|
|
|
| UBS AG |
|
|
72 |
|
|
|
|
|
|
|
(1 |
) |
|
|
– |
|
|
|
– |
|
|
|
71 |
|
|
|
|
|
|
|
|
|
|
|
|
|
|
|
| Total |
|
|
$443 |
|
|
|
|
|
|
|
$(144 |
) |
|
|
$– |
|
|
|
$– |
|
|
|
$299 |
|
|
|
|
|
|
|
The Bond Fund of America
|
|
|
|
|
|
|
|
|
|
|
|
|
|
|
|
|
|
|
|
|
|
|
|
|
|
|
| |
|
Gross amounts recognized in the
statement of assets
and liabilities |
|
|
|
|
|
Gross amounts not offset in the
statement of assets and liabilities and
subject to a master netting agreement |
|
|
|
|
|
|
| Counterparty |
|
|
|
|
Available
to offset |
|
|
Non-cash
collateral* |
|
|
Cash
collateral* |
|
|
Net
amount |
|
|
|
|
|
|
|
|
|
|
|
| Assets: |
|
|
|
|
|
|
|
|
|
|
|
|
|
|
|
|
|
|
|
|
|
|
|
|
|
|
| Citibank |
|
|
$ 83 |
|
|
|
|
|
|
|
$– |
|
|
|
$– |
|
|
|
$ – |
|
|
|
$ 83 |
|
|
|
| JPMorgan Chase |
|
|
902 |
|
|
|
|
|
|
|
– |
|
|
|
– |
|
|
|
(902 |
) |
|
|
– |
|
|
|
| UBS AG |
|
|
86 |
|
|
|
|
|
|
|
– |
|
|
|
– |
|
|
|
– |
|
|
|
86 |
|
|
|
|
|
|
|
|
|
|
|
|
|
|
|
| Total |
|
|
$1,071 |
|
|
|
|
|
|
|
$– |
|
|
|
$– |
|
|
|
$(902 |
) |
|
|
$169 |
|
|
|
|
|
|
|
| Liabilities: |
|
|
|
|
|
|
|
|
|
|
|
|
|
|
|
|
|
|
|
|
|
|
|
|
|
|
| BNP Paribas |
|
|
$ 11 |
|
|
|
|
|
|
|
$– |
|
|
|
$– |
|
|
|
$ – |
|
|
|
$ 11 |
|
|
|
| HSBC Bank |
|
|
4 |
|
|
|
|
|
|
|
– |
|
|
|
– |
|
|
|
– |
|
|
|
5 |
|
|
|
| Morgan Stanley |
|
|
57 |
|
|
|
|
|
|
|
– |
|
|
|
– |
|
|
|
– |
|
|
|
56 |
|
|
|
| Standard Chartered Bank |
|
|
53 |
|
|
|
|
|
|
|
– |
|
|
|
– |
|
|
|
– |
|
|
|
53 |
|
|
|
|
|
|
|
|
|
|
|
|
|
|
|
| Total |
|
|
$ 125 |
|
|
|
|
|
|
|
$– |
|
|
|
$– |
|
|
|
$ – |
|
|
|
$125 |
|
|
|
|
|
|
|
Refer to the end of the tables for footnotes.
American Funds Insurance Series 300
Capital World Bond Fund
|
|
|
|
|
|
|
|
|
|
|
|
|
|
|
|
|
|
|
|
|
|
|
|
|
|
|
| |
|
Gross amounts recognized in the
statement of assets
and liabilities |
|
|
|
|
|
Gross amounts not offset in the
statement of assets and liabilities and
subject to a master netting agreement |
|
|
|
|
|
|
| Counterparty |
|
|
|
|
Available
to offset |
|
|
Non-cash
collateral* |
|
|
Cash
collateral* |
|
|
Net
amount |
|
|
|
|
|
|
|
|
|
|
|
| Assets: |
|
|
|
|
|
|
|
|
|
|
|
|
|
|
|
|
|
|
|
|
|
|
|
|
|
|
| Bank of America |
|
|
$ 9 |
|
|
|
|
|
|
|
$ (9 |
) |
|
|
$ – |
|
|
|
$ – |
|
|
|
$ – |
|
|
|
| Bank of New York Mellon |
|
|
2 |
|
|
|
|
|
|
|
(2 |
) |
|
|
– |
|
|
|
– |
|
|
|
– |
|
|
|
| Barclays Bank PLC |
|
|
14 |
|
|
|
|
|
|
|
– |
|
|
|
– |
|
|
|
– |
|
|
|
14 |
|
|
|
| BNP Paribas |
|
|
164 |
|
|
|
|
|
|
|
(164 |
) |
|
|
– |
|
|
|
– |
|
|
|
– |
|
|
|
| Citibank |
|
|
604 |
|
|
|
|
|
|
|
(533 |
) |
|
|
– |
|
|
|
(70 |
) |
|
|
1 |
|
|
|
| Goldman Sachs |
|
|
16 |
|
|
|
|
|
|
|
(16 |
) |
|
|
– |
|
|
|
– |
|
|
|
– |
|
|
|
| HSBC Bank |
|
|
36 |
|
|
|
|
|
|
|
(36 |
) |
|
|
– |
|
|
|
– |
|
|
|
– |
|
|
|
| JPMorgan Chase |
|
|
719 |
|
|
|
|
|
|
|
(719 |
) |
|
|
– |
|
|
|
– |
|
|
|
– |
|
|
|
| Morgan Stanley |
|
|
250 |
|
|
|
|
|
|
|
(250 |
) |
|
|
– |
|
|
|
– |
|
|
|
– |
|
|
|
| Standard Chartered Bank |
|
|
55 |
|
|
|
|
|
|
|
(26 |
) |
|
|
– |
|
|
|
– |
|
|
|
29 |
|
|
|
| UBS AG |
|
|
20 |
|
|
|
|
|
|
|
(20 |
) |
|
|
– |
|
|
|
– |
|
|
|
– |
|
|
|
|
|
|
|
|
|
|
|
|
|
|
|
| Total |
|
|
$1,889 |
|
|
|
|
|
|
|
$(1,775 |
) |
|
|
$ – |
|
|
|
$(70 |
) |
|
|
$ 44 |
|
|
|
|
|
|
|
| Liabilities: |
|
|
|
|
|
|
|
|
|
|
|
|
|
|
|
|
|
|
|
|
|
|
|
|
|
|
| Bank of America |
|
|
$ 447 |
|
|
|
|
|
|
|
$ (9 |
) |
|
|
$ (341 |
) |
|
|
$ – |
|
|
|
$ 97 |
|
|
|
| Bank of New York Mellon |
|
|
28 |
|
|
|
|
|
|
|
(2 |
) |
|
|
– |
|
|
|
– |
|
|
|
26 |
|
|
|
| BNP Paribas |
|
|
189 |
|
|
|
|
|
|
|
(164 |
) |
|
|
(25 |
) |
|
|
– |
|
|
|
– |
|
|
|
| Citibank |
|
|
533 |
|
|
|
|
|
|
|
(534 |
) |
|
|
– |
|
|
|
– |
|
|
|
– |
|
|
|
| Goldman Sachs |
|
|
1,306 |
|
|
|
|
|
|
|
(16 |
) |
|
|
(1,055 |
) |
|
|
– |
|
|
|
235 |
|
|
|
| HSBC Bank |
|
|
150 |
|
|
|
|
|
|
|
(36 |
) |
|
|
– |
|
|
|
– |
|
|
|
114 |
|
|
|
| JPMorgan Chase |
|
|
797 |
|
|
|
|
|
|
|
(719 |
) |
|
|
(78 |
) |
|
|
– |
|
|
|
– |
|
|
|
| Morgan Stanley |
|
|
1,350 |
|
|
|
|
|
|
|
(250 |
) |
|
|
(1,100 |
) |
|
|
– |
|
|
|
– |
|
|
|
| Standard Chartered Bank |
|
|
26 |
|
|
|
|
|
|
|
(26 |
) |
|
|
– |
|
|
|
– |
|
|
|
– |
|
|
|
| UBS AG |
|
|
273 |
|
|
|
|
|
|
|
(20 |
) |
|
|
(253 |
) |
|
|
– |
|
|
|
– |
|
|
|
|
|
|
|
|
|
|
|
|
|
|
|
| Total |
|
|
$5,099 |
|
|
|
|
|
|
|
$(1,775 |
) |
|
|
$(2,852 |
) |
|
|
$ – |
|
|
|
$472 |
|
|
|
|
|
|
|
*Collateral is shown on a settlement basis.
6. Taxation and distributions
Federal income taxation – Each fund complies with the requirements under Subchapter M of the Internal Revenue Code applicable to regulated investment companies and intends to distribute substantially all of its net taxable income and net capital gains each year. The funds are not subject to income taxes to the extent such distributions are made. Therefore, no federal income tax provision is required.
As of and during the period ended June 30, 2024, none of the funds had a liability for any unrecognized tax benefits. Each fund recognizes interest and penalties, if any, related to unrecognized tax benefits as income tax expense in their respective statements of operations. During the period, none of the funds incurred any significant interest or penalties.
Each fund’s tax returns are generally not subject to examination by federal, state and, if applicable, non-U.S. tax authorities after the expiration of each jurisdiction’s statute of limitations, which is typically three years after the date of filing but can be extended in certain jurisdictions.
Non-U.S. taxation – Dividend and interest income, if any, are recorded net of non-U.S. taxes paid. The funds may file withholding tax reclaims in certain jurisdictions to recover a portion of amounts previously withheld. As a result of rulings from European courts, the funds filed for additional reclaims related to prior years. These reclaims are recorded when the amount is known and there are no significant uncertainties on collectability. During the six months ended June 30, 2024, some of the funds recognized reclaims (net of
301 American Funds Insurance Series
fees and the effect of realized gain or loss from currency translations) and interest related to European court rulings as follows (dollars in thousands):
|
|
|
|
|
|
|
|
|
|
|
|
|
| Fund |
|
Reclaims |
|
|
Fees |
|
|
Interest |
| Global Growth Fund |
|
|
$2,478 |
|
|
|
$26 |
|
|
|
$935 |
|
| Growth Fund |
|
|
1,938 |
|
|
|
2 |
|
|
|
147 |
|
| New World Fund |
|
|
717 |
|
|
|
3 |
|
|
|
88 |
|
| Washington Mutual Investors Fund |
|
|
31 |
|
|
|
1 |
|
|
|
2 |
|
| Growth-Income Fund |
|
|
119 |
|
|
|
12 |
|
|
|
2 |
|
| International Growth and Income Fund |
|
|
10 |
|
|
|
2 |
|
|
|
1 |
|
The reclaims and interest are included in dividend income and interest income, respectively, in each fund’s statements of operations. Gains realized by the funds on the sale of securities in certain countries, if any, may be subject to non-U.S. taxes. The funds generally record an estimated deferred tax liability based on unrealized gains to provide for potential non-U.S. taxes payable upon the sale of these securities.
Distributions – Distributions determined on a tax basis may differ from net investment income and net realized gains for financial reporting purposes. These differences are due primarily to different treatment for items such as currency gains and losses; short-term capital gains and losses; capital losses related to sales of certain securities within 30 days of purchase; unrealized appreciation of certain investments in securities outside the U.S.; deferred expenses; cost of investments sold; paydowns on fixed-income securities; net capital losses; non-U.S. taxes on capital gains; amortization of premiums and discounts and income on certain investments. The fiscal year in which amounts are distributed may differ from the year in which the net investment income and net realized gains are recorded by the funds for financial reporting purposes.
Additional tax basis disclosures for each fund are as follows (dollars in thousands):
|
|
|
|
|
|
|
|
|
|
|
|
|
|
|
|
|
|
|
|
|
|
|
|
|
| |
|
Global
Growth Fund |
|
Global Small Capitalization Fund |
|
Growth Fund |
|
International Fund |
|
New World Fund |
|
Washington Mutual Investors Fund |
|
|
|
|
|
|
|
| As of December 31, 2023: |
|
|
|
|
|
|
|
|
|
|
|
|
|
|
|
|
|
|
|
|
|
|
|
|
| Undistributed ordinary income |
|
|
$ 49,194 |
|
|
|
$ 64,690 |
|
|
|
$ 95,057 |
|
|
|
$ 16,271 |
|
|
|
$ 12,831 |
|
|
|
$ 41,555 |
|
| Undistributed long-term capital gains |
|
|
226,821 |
|
|
|
72,052 |
|
|
|
977,737 |
|
|
|
– |
|
|
|
15,882 |
|
|
|
87,738 |
|
| Capital loss carryforward* |
|
|
– |
|
|
|
– |
|
|
|
– |
|
|
|
(540,672 |
) |
|
|
– |
|
|
|
– |
|
|
|
|
|
|
|
|
| As of June 30, 2024: |
|
|
|
|
|
|
|
|
|
|
|
|
|
|
|
|
|
|
|
|
|
|
|
|
| Gross unrealized appreciation on investments |
|
|
3,334,213 |
|
|
|
836,174 |
|
|
|
23,803,423 |
|
|
|
2,265,460 |
|
|
|
1,168,125 |
|
|
|
3,587,265 |
|
| Gross unrealized depreciation on investments |
|
|
(275,098 |
) |
|
|
(198,083 |
) |
|
|
(760,476 |
) |
|
|
(241,398 |
) |
|
|
(152,011 |
) |
|
|
(126,063 |
) |
| Net unrealized appreciation
(depreciation) on investments |
|
|
3,059,115 |
|
|
|
638,091 |
|
|
|
23,042,947 |
|
|
|
2,024,062 |
|
|
|
1,016,114 |
|
|
|
3,461,202 |
|
|
|
|
|
|
|
|
| Cost of investments |
|
|
5,202,821 |
|
|
|
2,450,743 |
|
|
|
20,870,976 |
|
|
|
5,250,822 |
|
|
|
2,525,810 |
|
|
|
7,393,946 |
|
Refer to the end of the tables for footnote.
American Funds Insurance Series 302
|
|
|
|
|
|
|
|
|
|
|
|
|
|
|
|
|
|
|
|
|
|
|
|
|
| |
|
Capital World Growth and
Income Fund |
|
Growth-
Income
Fund |
|
International
Growth
and Income
Fund |
|
Capital
Income
Builder |
|
Asset
Allocation Fund |
|
American
Funds Global
Balanced Fund |
|
|
|
|
|
|
|
| As of December 31, 2023: |
|
|
|
|
|
|
|
|
|
|
|
|
|
|
|
|
|
|
|
|
|
|
|
|
| Undistributed ordinary income |
|
|
$ 7,472 |
|
|
|
$ 158,609 |
|
|
|
$ 1,604 |
|
|
|
$ 16,757 |
|
|
|
$ 128,322 |
|
|
|
$ 1,794 |
|
| Undistributed long-term capital gains |
|
|
– |
|
|
|
1,734,565 |
|
|
|
– |
|
|
|
– |
|
|
|
1,147,945 |
|
|
|
– |
|
| Capital loss carryforward* |
|
|
(69,742 |
) |
|
|
– |
|
|
|
(23,775 |
) |
|
|
(25,818 |
) |
|
|
– |
|
|
|
(3,502 |
) |
| Capital loss carryforward utilized |
|
|
2,434 |
|
|
|
– |
|
|
|
53 |
|
|
|
2,422 |
|
|
|
– |
|
|
|
– |
|
|
|
|
|
|
|
|
| As of June 30, 2024: |
|
|
|
|
|
|
|
|
|
|
|
|
|
|
|
|
|
|
|
|
|
|
|
|
| Gross unrealized appreciation on investments |
|
|
716,001 |
|
|
|
15,734,256 |
|
|
|
78,492 |
|
|
|
252,541 |
|
|
|
8,105,020 |
|
|
|
67,750 |
|
| Gross unrealized depreciation on investments |
|
|
(67,700 |
) |
|
|
(412,968 |
) |
|
|
(22,273 |
) |
|
|
(40,938 |
) |
|
|
(821,861 |
) |
|
|
(16,781 |
) |
| Net unrealized appreciation (depreciation) on investments |
|
|
648,301 |
|
|
|
15,321,288 |
|
|
|
56,219 |
|
|
|
211,603 |
|
|
|
7,283,159 |
|
|
|
50,969 |
|
|
|
|
|
|
|
|
| Cost of investments |
|
|
1,264,169 |
|
|
|
24,784,066 |
|
|
|
272,854 |
|
|
|
1,145,971 |
|
|
|
20,684,961 |
|
|
|
359,798 |
|
|
|
|
|
|
|
|
|
|
|
|
|
|
|
|
|
|
|
|
|
|
|
|
|
|
| |
|
The Bond
Fund of
America |
|
Capital
World
Bond Fund |
|
American
High-Income
Trust |
|
American
Funds
Mortgage
Fund |
|
Ultra-Short
Bond Fund |
|
U.S.
Government
Securities
Fund |
|
|
|
|
|
|
|
| As of December 31, 2023: |
|
|
|
|
|
|
|
|
|
|
|
|
|
|
|
|
|
|
|
|
|
|
|
|
| Undistributed ordinary income |
|
|
$ 75,445 |
|
|
|
$ 2,620 |
|
|
|
$ 9,868 |
|
|
|
$ 855 |
|
|
|
$ 3,298 |
|
|
|
$ 11,745 |
|
| Capital loss carryforward* |
|
|
(1,359,397 |
) |
|
|
(186,363 |
) |
|
|
(331,897 |
) |
|
|
(11,994 |
) |
|
|
(1 |
) |
|
|
(254,504 |
) |
|
|
|
|
|
|
|
| As of June 30, 2024: |
|
|
|
|
|
|
|
|
|
|
|
|
|
|
|
|
|
|
|
|
|
|
|
|
| Gross unrealized appreciation on investments |
|
|
29,945 |
|
|
|
8,677 |
|
|
|
44,282 |
|
|
|
(166 |
) |
|
|
– |
|
|
|
– |
|
| Gross unrealized depreciation on investments |
|
|
(373,101 |
) |
|
|
(114,867 |
) |
|
|
(48,276 |
) |
|
|
(1,784 |
) |
|
|
(150 |
) |
|
|
– |
|
| Net unrealized appreciation (depreciation) on investments |
|
|
(343,156 |
) |
|
|
(106,190 |
) |
|
|
(3,994 |
) |
|
|
(1,950 |
) |
|
|
(150 |
) |
|
|
– |
|
|
|
|
|
|
|
|
| Cost of investments |
|
|
12,898,585 |
|
|
|
1,786,407 |
|
|
|
885,320 |
|
|
|
149,041 |
|
|
|
347,924 |
|
|
|
– |
|
|
|
|
|
|
|
|
|
|
|
|
|
|
|
|
|
|
|
|
|
|
|
|
|
|
| |
|
Managed
Risk Growth Fund |
|
Managed
Risk
International
Fund |
|
Managed
Risk
Washington
Mutual
Investors
Fund |
|
Managed Risk Growth-
Income Fund |
|
Managed
Risk Asset
Allocation
Fund |
|
|
|
|
|
|
|
|
|
| As of December 31, 2023: |
|
|
|
|
|
|
|
|
|
|
|
|
|
|
|
|
|
|
|
|
|
|
|
|
| Undistributed ordinary income |
|
|
$ 2,419 |
|
|
|
$ 1,560 |
|
|
|
$ 5,147 |
|
|
|
$ 30,091 |
|
|
|
$ 36,425 |
|
|
|
|
|
| Undistributed long-term capital gains |
|
|
– |
|
|
|
– |
|
|
|
– |
|
|
|
28,787 |
|
|
|
28,917 |
|
|
|
|
|
| Capital loss carryforward* |
|
|
(12,281 |
) |
|
|
(13,949 |
) |
|
|
(17,511 |
) |
|
|
– |
|
|
|
– |
|
|
|
|
|
|
|
|
|
|
|
|
| As of June 30, 2024: |
|
|
|
|
|
|
|
|
|
|
|
|
|
|
|
|
|
|
|
|
|
|
|
|
| Gross unrealized appreciation on investments |
|
|
122,554 |
|
|
|
18,260 |
|
|
|
52,506 |
|
|
|
322,868 |
|
|
|
99,562 |
|
|
|
|
|
| Gross unrealized depreciation on investments |
|
|
(102,050 |
) |
|
|
(23,350 |
) |
|
|
(28,475 |
) |
|
|
(84,269 |
) |
|
|
(31,883 |
) |
|
|
|
|
| Net unrealized appreciation (depreciation) on investments |
|
|
20,504 |
|
|
|
(5,090 |
) |
|
|
24,031 |
|
|
|
238,599 |
|
|
|
67,679 |
|
|
|
|
|
|
|
|
|
|
|
|
| Cost of investments |
|
|
499,216 |
|
|
|
128,016 |
|
|
|
305,059 |
|
|
|
1,993,010 |
|
|
|
2,025,662 |
|
|
|
|
|
| * |
Each fund’s capital loss carryforward will be used to offset any capital gains realized by the fund in the current year or in subsequent years. Funds with a capital loss carryforward will not make distributions from capital gains while a capital loss carryforward remains. |
303 American Funds Insurance Series
Distributions paid by each fund were characterized for tax purposes as follows (dollars in thousands):
Global Growth Fund
|
|
|
|
|
|
|
|
|
|
|
|
|
|
|
|
|
|
|
|
|
|
|
|
|
|
|
|
|
| |
|
Six months ended June 30, 2024 |
|
|
|
|
|
Year ended December 31, 2023 |
|
|
|
|
|
|
|
|
|
|
|
|
|
|
| Share class |
|
Ordinary
income |
|
|
Long-term
capital gains |
|
|
Total
distributions
paid |
|
|
|
|
|
Ordinary
income |
|
|
Long-term
capital gains |
|
|
Total
distributions
paid |
|
| |
|
|
|
|
|
|
|
|
|
|
|
|
|
|
|
|
|
| Class 1 |
|
|
$22,379 |
|
|
|
$ 99,126 |
|
|
|
$121,505 |
|
|
|
|
|
|
|
$36,245 |
|
|
|
$238,315 |
|
|
|
$274,560 |
|
| Class 1A |
|
|
115 |
|
|
|
536 |
|
|
|
651 |
|
|
|
|
|
|
|
148 |
|
|
|
1,195 |
|
|
|
1,343 |
|
| Class 2 |
|
|
21,905 |
|
|
|
103,301 |
|
|
|
125,206 |
|
|
|
|
|
|
|
30,048 |
|
|
|
259,863 |
|
|
|
289,911 |
|
| Class 4 |
|
|
4,815 |
|
|
|
23,878 |
|
|
|
28,693 |
|
|
|
|
|
|
|
4,681 |
|
|
|
49,927 |
|
|
|
54,608 |
|
|
|
|
|
|
|
|
|
|
|
|
|
|
|
|
|
|
|
|
|
|
| Total |
|
|
$49,214 |
|
|
|
$226,841 |
|
|
|
$276,055 |
|
|
|
|
|
|
|
$71,122 |
|
|
|
$549,300 |
|
|
|
$620,422 |
|
|
|
|
|
|
|
|
|
|
|
|
|
|
Global Small Capitalization Fund
|
|
|
|
|
|
|
|
|
|
|
|
|
|
|
|
|
|
|
|
|
|
|
|
|
|
|
|
|
| |
|
Six months ended June 30, 2024 |
|
|
|
|
|
Year ended December 31, 2023 |
|
|
|
|
|
|
|
|
|
|
|
|
|
|
| Share class |
|
Ordinary
income |
|
|
Long-term
capital gains |
|
|
Total
distributions
paid |
|
|
|
|
|
Ordinary
income |
|
|
Long-term
capital gains |
|
|
Total
distributions
paid |
|
| |
|
|
|
|
|
|
|
|
|
|
|
|
|
|
|
|
|
| Class 1 |
|
|
$19,885 |
|
|
|
$21,820 |
|
|
|
$ 41,705 |
|
|
|
|
|
|
|
$4,595 |
|
|
|
$11,794 |
|
|
|
$16,389 |
|
| Class 1A |
|
|
107 |
|
|
|
119 |
|
|
|
226 |
|
|
|
|
|
|
|
12 |
|
|
|
59 |
|
|
|
71 |
|
| Class 2 |
|
|
38,505 |
|
|
|
43,051 |
|
|
|
81,556 |
|
|
|
|
|
|
|
4,713 |
|
|
|
23,554 |
|
|
|
28,267 |
|
| Class 4 |
|
|
6,213 |
|
|
|
7,070 |
|
|
|
13,283 |
|
|
|
|
|
|
|
76 |
|
|
|
3,623 |
|
|
|
3,699 |
|
|
|
|
|
|
|
|
|
|
|
|
|
|
|
|
|
|
|
|
|
|
| Total |
|
|
$64,710 |
|
|
|
$72,060 |
|
|
|
$136,770 |
|
|
|
|
|
|
|
$9,396 |
|
|
|
$39,030 |
|
|
|
$48,426 |
|
|
|
|
|
|
|
|
|
|
|
|
|
|
Growth Fund
|
|
|
|
|
|
|
|
|
|
|
|
|
|
|
|
|
|
|
|
|
|
|
|
|
|
|
|
|
| |
|
Six months ended June 30, 2024 |
|
|
|
|
|
Year ended December 31, 2023 |
|
|
|
|
|
|
|
|
|
|
|
|
|
|
| Share class |
|
Ordinary
income |
|
|
Long-term
capital gains |
|
|
Total
distributions
paid |
|
|
|
|
|
Ordinary
income |
|
|
Long-term
capital gains |
|
|
Total
distributions
paid |
|
| |
|
|
|
|
|
|
|
|
|
|
|
|
|
|
|
|
|
| Class 1 |
|
|
$46,569 |
|
|
|
$433,019 |
|
|
|
$ 479,588 |
|
|
|
|
|
|
|
$ 93,186 |
|
|
|
$ 861,352 |
|
|
|
$ 954,538 |
|
| Class 1A |
|
|
672 |
|
|
|
7,268 |
|
|
|
7,940 |
|
|
|
|
|
|
|
926 |
|
|
|
13,243 |
|
|
|
14,169 |
|
| Class 2 |
|
|
39,506 |
|
|
|
433,759 |
|
|
|
473,265 |
|
|
|
|
|
|
|
58,531 |
|
|
|
924,799 |
|
|
|
983,330 |
|
| Class 3 |
|
|
548 |
|
|
|
5,725 |
|
|
|
6,273 |
|
|
|
|
|
|
|
883 |
|
|
|
11,837 |
|
|
|
12,720 |
|
| Class 4 |
|
|
7,808 |
|
|
|
97,988 |
|
|
|
105,796 |
|
|
|
|
|
|
|
5,132 |
|
|
|
167,524 |
|
|
|
172,656 |
|
|
|
|
|
|
|
|
|
|
|
|
|
|
|
|
|
|
|
|
|
|
| Total |
|
|
$95,103 |
|
|
|
$977,759 |
|
|
|
$1,072,862 |
|
|
|
|
|
|
|
$158,658 |
|
|
|
$1,978,755 |
|
|
|
$2,137,413 |
|
|
|
|
|
|
|
|
|
|
|
|
|
|
International Fund
|
|
|
|
|
|
|
|
|
|
|
|
|
|
|
|
|
|
|
|
|
|
|
|
|
|
|
|
|
| |
|
Six months ended June 30, 2024 |
|
|
|
|
|
Year ended December 31, 2023 |
|
|
|
|
|
|
|
|
|
|
|
|
|
|
| Share class |
|
Ordinary
income |
|
|
Long-term
capital gains |
|
|
Total
distributions
paid |
|
|
|
|
|
Ordinary
income |
|
|
Long-term
capital gains |
|
|
Total
distributions
paid |
|
| |
|
|
|
|
|
|
|
|
|
|
|
|
|
|
|
|
|
| Class 1 |
|
|
$ 8,264 |
|
|
|
$– |
|
|
|
$ 8,264 |
|
|
|
|
|
|
|
$50,154 |
|
|
|
$– |
|
|
|
$50,154 |
|
| Class 1A |
|
|
26 |
|
|
|
– |
|
|
|
26 |
|
|
|
|
|
|
|
150 |
|
|
|
– |
|
|
|
150 |
|
| Class 2 |
|
|
7,183 |
|
|
|
– |
|
|
|
7,183 |
|
|
|
|
|
|
|
42,608 |
|
|
|
– |
|
|
|
42,608 |
|
| Class 3 |
|
|
36 |
|
|
|
– |
|
|
|
36 |
|
|
|
|
|
|
|
219 |
|
|
|
– |
|
|
|
219 |
|
| Class 4 |
|
|
781 |
|
|
|
– |
|
|
|
781 |
|
|
|
|
|
|
|
4,367 |
|
|
|
– |
|
|
|
4,367 |
|
|
|
|
|
|
|
|
|
|
|
|
|
|
|
|
|
|
|
|
|
|
| Total |
|
|
$16,290 |
|
|
|
$– |
|
|
|
$16,290 |
|
|
|
|
|
|
|
$97,498 |
|
|
|
$– |
|
|
|
$97,498 |
|
|
|
|
|
|
|
|
|
|
|
|
|
|
American Funds Insurance Series 304
New World Fund
|
|
|
|
|
|
|
|
|
|
|
|
|
|
|
|
|
|
|
|
|
|
|
|
|
|
|
|
|
| |
|
Six months ended June 30, 2024 |
|
|
|
|
|
Year ended December 31, 2023 |
|
|
|
|
|
|
|
|
|
|
|
|
|
|
| Share class |
|
Ordinary
income |
|
|
Long-term
capital gains |
|
|
Total
distributions
paid |
|
|
|
|
|
Ordinary
income |
|
|
Long-term
capital gains |
|
|
Total
distributions
paid |
|
| |
|
|
|
|
|
|
|
|
|
|
|
|
|
|
|
|
|
| Class 1 |
|
|
$ 7,141 |
|
|
|
$ 8,227 |
|
|
|
$15,368 |
|
|
|
|
|
|
|
$28,772 |
|
|
|
$– |
|
|
|
$28,772 |
|
| Class 1A |
|
|
38 |
|
|
|
49 |
|
|
|
87 |
|
|
|
|
|
|
|
146 |
|
|
|
– |
|
|
|
146 |
|
| Class 2 |
|
|
3,001 |
|
|
|
3,828 |
|
|
|
6,829 |
|
|
|
|
|
|
|
11,303 |
|
|
|
– |
|
|
|
11,303 |
|
| Class 4 |
|
|
2,660 |
|
|
|
3,785 |
|
|
|
6,445 |
|
|
|
|
|
|
|
9,222 |
|
|
|
– |
|
|
|
9,222 |
|
|
|
|
|
|
|
|
|
|
|
|
|
|
|
|
|
|
|
|
|
|
| Total |
|
|
$12,840 |
|
|
|
$15,889 |
|
|
|
$28,729 |
|
|
|
|
|
|
|
$49,443 |
|
|
|
$– |
|
|
|
$49,443 |
|
|
|
|
|
|
|
|
|
|
|
|
|
|
Washington Mutual Investors Fund
|
|
|
|
|
|
|
|
|
|
|
|
|
|
|
|
|
|
|
|
|
|
|
|
|
|
|
|
|
| |
|
Six months ended June 30, 2024 |
|
|
|
|
|
Year ended December 31, 2023 |
|
|
|
|
|
|
|
|
|
|
|
|
|
|
| Share class |
|
Ordinary
income |
|
|
Long-term
capital gains |
|
|
Total
distributions
paid |
|
|
|
|
|
Ordinary
income |
|
|
Long-term
capital gains |
|
|
Total
distributions
paid |
|
| |
|
|
|
|
|
|
|
|
|
|
|
|
|
|
|
|
|
| Class 1 |
|
|
$25,177 |
|
|
|
$50,394 |
|
|
|
$ 75,571 |
|
|
|
|
|
|
|
$118,356 |
|
|
|
$52,370 |
|
|
|
$170,726 |
|
| Class 1A |
|
|
92 |
|
|
|
202 |
|
|
|
294 |
|
|
|
|
|
|
|
338 |
|
|
|
194 |
|
|
|
532 |
|
| Class 2 |
|
|
11,104 |
|
|
|
24,567 |
|
|
|
35,671 |
|
|
|
|
|
|
|
51,574 |
|
|
|
26,108 |
|
|
|
77,682 |
|
| Class 4 |
|
|
5,236 |
|
|
|
12,608 |
|
|
|
17,844 |
|
|
|
|
|
|
|
20,772 |
|
|
|
11,035 |
|
|
|
31,807 |
|
|
|
|
|
|
|
|
|
|
|
|
|
|
|
|
|
|
|
|
|
|
| Total |
|
|
$41,609 |
|
|
|
$87,771 |
|
|
|
$129,380 |
|
|
|
|
|
|
|
$191,040 |
|
|
|
$89,707 |
|
|
|
$280,747 |
|
|
|
|
|
|
|
|
|
|
|
|
|
|
Capital World Growth and Income Fund
|
|
|
|
|
|
|
|
|
|
|
|
|
|
|
|
|
|
|
|
|
|
|
|
|
|
|
|
|
| |
|
Six months ended June 30, 2024 |
|
|
|
|
|
Year ended December 31, 2023 |
|
|
|
|
|
|
|
|
|
|
|
|
|
|
| Share class |
|
Ordinary
income |
|
|
Long-term
capital gains |
|
|
Total
distributions
paid |
|
|
|
|
|
Ordinary
income |
|
|
Long-term
capital gains |
|
|
Total
distributions
paid |
|
| |
|
|
|
|
|
|
|
|
|
|
|
|
|
|
|
|
|
| Class 1 |
|
|
$2,490 |
|
|
|
$– |
|
|
|
$2,490 |
|
|
|
|
|
|
|
$11,646 |
|
|
|
$– |
|
|
|
$11,646 |
|
| Class 1A |
|
|
32 |
|
|
|
– |
|
|
|
32 |
|
|
|
|
|
|
|
125 |
|
|
|
– |
|
|
|
125 |
|
| Class 2 |
|
|
4,048 |
|
|
|
– |
|
|
|
4,048 |
|
|
|
|
|
|
|
18,495 |
|
|
|
– |
|
|
|
18,495 |
|
| Class 4 |
|
|
910 |
|
|
|
– |
|
|
|
910 |
|
|
|
|
|
|
|
3,732 |
|
|
|
– |
|
|
|
3,732 |
|
|
|
|
|
|
|
|
|
|
|
|
|
|
|
|
|
|
|
|
|
|
| Total |
|
|
$7,480 |
|
|
|
$– |
|
|
|
$7,480 |
|
|
|
|
|
|
|
$33,998 |
|
|
|
$– |
|
|
|
$33,998 |
|
|
|
|
|
|
|
|
|
|
|
|
|
|
Growth-Income Fund
|
|
|
|
|
|
|
|
|
|
|
|
|
|
|
|
|
|
|
|
|
|
|
|
|
|
|
|
|
| |
|
Six months ended June 30, 2024 |
|
|
|
|
|
Year ended December 31, 2023 |
|
|
|
|
|
|
|
|
|
|
|
|
|
|
| Share class |
|
Ordinary
income |
|
|
Long-term
capital gains |
|
|
Total
distributions
paid |
|
|
|
|
|
Ordinary
income |
|
|
Long-term
capital gains |
|
|
Total
distributions
paid |
|
| |
|
|
|
|
|
|
|
|
|
|
|
|
|
|
|
|
|
| Class 1 |
|
|
$ 97,641 |
|
|
|
$1,023,186 |
|
|
|
$1,120,827 |
|
|
|
|
|
|
|
$327,645 |
|
|
|
$1,077,919 |
|
|
|
$1,405,564 |
|
| Class 1A |
|
|
148 |
|
|
|
1,702 |
|
|
|
1,850 |
|
|
|
|
|
|
|
440 |
|
|
|
1,649 |
|
|
|
2,089 |
|
| Class 2 |
|
|
51,870 |
|
|
|
597,677 |
|
|
|
649,547 |
|
|
|
|
|
|
|
164,035 |
|
|
|
642,837 |
|
|
|
806,872 |
|
| Class 3 |
|
|
580 |
|
|
|
6,513 |
|
|
|
7,093 |
|
|
|
|
|
|
|
1,848 |
|
|
|
6,857 |
|
|
|
8,705 |
|
| Class 4 |
|
|
8,444 |
|
|
|
105,495 |
|
|
|
113,939 |
|
|
|
|
|
|
|
22,003 |
|
|
|
96,356 |
|
|
|
118,359 |
|
|
|
|
|
|
|
|
|
|
|
|
|
|
|
|
|
|
|
|
|
|
| Total |
|
|
$158,683 |
|
|
|
$1,734,573 |
|
|
|
$1,893,256 |
|
|
|
|
|
|
|
$515,971 |
|
|
|
$1,825,618 |
|
|
|
$2,341,589 |
|
|
|
|
|
|
|
|
|
|
|
|
|
|
International Growth and Income Fund
|
|
|
|
|
|
|
|
|
|
|
|
|
|
|
|
|
|
|
|
|
|
|
|
|
|
|
|
|
| |
|
Six months ended June 30, 2024 |
|
|
|
|
|
Year ended December 31, 2023 |
|
|
|
|
|
|
|
|
|
|
|
|
|
|
| Share class |
|
Ordinary
income |
|
|
Long-term
capital gains |
|
|
Total
distributions
paid |
|
|
|
|
|
Ordinary
income |
|
|
Long-term
capital gains |
|
|
Total
distributions
paid |
|
| |
|
|
|
|
|
|
|
|
|
|
|
|
|
|
|
|
|
| Class 1 |
|
|
$ 84 |
|
|
|
$– |
|
|
|
$ 84 |
|
|
|
|
|
|
|
$ 394 |
|
|
|
$– |
|
|
|
$ 394 |
|
| Class 1A |
|
|
30 |
|
|
|
– |
|
|
|
30 |
|
|
|
|
|
|
|
151 |
|
|
|
– |
|
|
|
151 |
|
| Class 2 |
|
|
793 |
|
|
|
– |
|
|
|
793 |
|
|
|
|
|
|
|
3,949 |
|
|
|
– |
|
|
|
3,949 |
|
| Class 4 |
|
|
699 |
|
|
|
– |
|
|
|
699 |
|
|
|
|
|
|
|
3,139 |
|
|
|
– |
|
|
|
3,139 |
|
|
|
|
|
|
|
|
|
|
|
|
|
|
|
|
|
|
|
|
|
|
| Total |
|
|
$1,606 |
|
|
|
$– |
|
|
|
$1,606 |
|
|
|
|
|
|
|
$7,633 |
|
|
|
$– |
|
|
|
$7,633 |
|
|
|
|
|
|
|
|
|
|
|
|
|
|
305 American Funds Insurance Series
Capital Income Builder
|
|
|
|
|
|
|
|
|
|
|
|
|
|
|
|
|
|
|
|
|
|
|
|
|
|
|
|
|
| |
|
Six months ended June 30, 2024 |
|
|
|
|
|
Year ended December 31, 2023 |
|
|
|
|
|
|
|
|
|
|
|
|
|
|
| Share class |
|
Ordinary
income |
|
|
Long-term
capital gains |
|
|
Total
distributions
paid |
|
|
|
|
|
Ordinary
income |
|
|
Long-term
capital gains |
|
|
Total
distributions
paid |
|
| |
|
|
|
|
|
|
|
|
|
|
|
|
|
|
|
|
|
| Class 1 |
|
|
$ 8,883 |
|
|
|
$– |
|
|
|
$ 8,883 |
|
|
|
|
|
|
|
$19,561 |
|
|
|
$– |
|
|
|
$19,561 |
|
| Class 1A |
|
|
127 |
|
|
|
– |
|
|
|
127 |
|
|
|
|
|
|
|
290 |
|
|
|
– |
|
|
|
290 |
|
| Class 2 |
|
|
182 |
|
|
|
– |
|
|
|
182 |
|
|
|
|
|
|
|
410 |
|
|
|
– |
|
|
|
410 |
|
| Class 4 |
|
|
6,154 |
|
|
|
– |
|
|
|
6,154 |
|
|
|
|
|
|
|
14,650 |
|
|
|
– |
|
|
|
14,650 |
|
|
|
|
|
|
|
|
|
|
|
|
|
|
|
|
|
|
|
|
|
|
| Total |
|
|
$15,346 |
|
|
|
$– |
|
|
|
$15,346 |
|
|
|
|
|
|
|
$34,911 |
|
|
|
$– |
|
|
|
$34,911 |
|
|
|
|
|
|
|
|
|
|
|
|
|
|
Asset Allocation Fund
|
|
|
|
|
|
|
|
|
|
|
|
|
|
|
|
|
|
|
|
|
|
|
|
|
|
|
|
|
| |
|
Six months ended June 30, 2024 |
|
|
|
|
|
Year ended December 31, 2023 |
|
|
|
|
|
|
|
|
|
|
|
|
|
|
| Share class |
|
Ordinary
income |
|
|
Long-term
capital gains |
|
|
Total
distributions
paid |
|
|
|
|
|
Ordinary
income |
|
|
Long-term
capital gains |
|
|
Total
distributions
paid |
|
| |
|
|
|
|
|
|
|
|
|
|
|
|
|
|
|
|
|
| Class 1 |
|
|
$ 79,659 |
|
|
|
$ 678,739 |
|
|
|
$ 758,398 |
|
|
|
|
|
|
|
$364,001 |
|
|
|
$578,217 |
|
|
|
$ 942,218 |
|
| Class 1A |
|
|
154 |
|
|
|
1,422 |
|
|
|
1,576 |
|
|
|
|
|
|
|
663 |
|
|
|
1,038 |
|
|
|
1,701 |
|
| Class 2 |
|
|
20,306 |
|
|
|
187,595 |
|
|
|
207,901 |
|
|
|
|
|
|
|
91,196 |
|
|
|
163,182 |
|
|
|
254,378 |
|
| Class 3 |
|
|
147 |
|
|
|
1,326 |
|
|
|
1,473 |
|
|
|
|
|
|
|
644 |
|
|
|
1,097 |
|
|
|
1,741 |
|
| Class 4 |
|
|
28,102 |
|
|
|
278,890 |
|
|
|
306,992 |
|
|
|
|
|
|
|
111,055 |
|
|
|
215,145 |
|
|
|
326,200 |
|
|
|
|
|
|
|
|
|
|
|
|
|
|
|
|
|
|
|
|
|
|
| Total |
|
|
$128,368 |
|
|
|
$1,147,972 |
|
|
|
$1,276,340 |
|
|
|
|
|
|
|
$567,559 |
|
|
|
$958,679 |
|
|
|
$1,526,238 |
|
|
|
|
|
|
|
|
|
|
|
|
|
|
American Funds Global Balanced Fund
|
|
|
|
|
|
|
|
|
|
|
|
|
|
|
|
|
|
|
|
|
|
|
|
|
|
|
|
|
| |
|
Six months ended June 30, 2024 |
|
|
|
|
|
Year ended December 31, 2023 |
|
|
|
|
|
|
|
|
|
|
|
|
|
|
| Share class |
|
Ordinary
income |
|
|
Long-term
capital gains |
|
|
Total
distributions
paid |
|
|
|
|
|
Ordinary
income |
|
|
Long-term
capital gains |
|
|
Total
distributions
paid |
|
| |
|
|
|
|
|
|
|
|
|
|
|
|
|
|
|
|
|
| Class 1 |
|
|
$ 485 |
|
|
|
$– |
|
|
|
$ 485 |
|
|
|
|
|
|
|
$1,780 |
|
|
|
$11,386 |
|
|
|
$13,166 |
|
| Class 1A |
|
|
13 |
|
|
|
– |
|
|
|
13 |
|
|
|
|
|
|
|
43 |
|
|
|
310 |
|
|
|
353 |
|
| Class 2 |
|
|
721 |
|
|
|
– |
|
|
|
721 |
|
|
|
|
|
|
|
2,558 |
|
|
|
18,886 |
|
|
|
21,444 |
|
| Class 4 |
|
|
577 |
|
|
|
– |
|
|
|
577 |
|
|
|
|
|
|
|
1,750 |
|
|
|
14,227 |
|
|
|
15,977 |
|
|
|
|
|
|
|
|
|
|
|
|
|
|
|
|
|
|
|
|
|
|
| Total |
|
|
$1,796 |
|
|
|
$– |
|
|
|
$1,796 |
|
|
|
|
|
|
|
$6,131 |
|
|
|
$44,809 |
|
|
|
$50,940 |
|
|
|
|
|
|
|
|
|
|
|
|
|
|
The Bond Fund of America
|
|
|
|
|
|
|
|
|
|
|
|
|
|
|
|
|
|
|
|
|
|
|
|
|
|
|
|
|
| |
|
Six months ended June 30, 2024 |
|
|
|
|
|
Year ended December 31, 2023 |
|
|
|
|
|
|
|
|
|
|
|
|
|
|
| Share class |
|
Ordinary
income |
|
|
Long-term
capital gains |
|
|
Total
distributions
paid |
|
|
|
|
|
Ordinary
income |
|
|
Long-term
capital gains |
|
|
Total
distributions
paid |
|
| |
|
|
|
|
|
|
|
|
|
|
|
|
|
|
|
|
|
| Class 1 |
|
|
$48,870 |
|
|
|
$– |
|
|
|
$48,870 |
|
|
|
|
|
|
|
$246,119 |
|
|
|
$– |
|
|
|
$246,119 |
|
| Class 1A |
|
|
1,353 |
|
|
|
– |
|
|
|
1,353 |
|
|
|
|
|
|
|
8,577 |
|
|
|
– |
|
|
|
8,577 |
|
| Class 2 |
|
|
18,656 |
|
|
|
– |
|
|
|
18,656 |
|
|
|
|
|
|
|
97,823 |
|
|
|
– |
|
|
|
97,823 |
|
| Class 4 |
|
|
6,606 |
|
|
|
– |
|
|
|
6,606 |
|
|
|
|
|
|
|
30,097 |
|
|
|
– |
|
|
|
30,097 |
|
|
|
|
|
|
|
|
|
|
|
|
|
|
|
|
|
|
|
|
|
|
| Total |
|
|
$75,485 |
|
|
|
$– |
|
|
|
$75,485 |
|
|
|
|
|
|
|
$382,616 |
|
|
|
$– |
|
|
|
$382,616 |
|
|
|
|
|
|
|
|
|
|
|
|
|
|
Capital World Bond Fund
|
|
|
|
|
|
|
|
|
|
|
|
|
|
|
|
|
|
|
|
|
|
|
|
|
|
|
|
|
| |
|
Six months ended June 30, 2024 |
|
|
|
|
|
Year ended December 31, 2023 |
|
|
|
|
|
|
|
|
|
|
|
|
|
|
| Share class |
|
Ordinary
income |
|
|
Long-term
capital gains |
|
|
Total
distributions
paid |
|
|
|
|
|
Ordinary
income |
|
|
Long-term
capital gains |
|
|
Total
distributions
paid |
|
| |
|
|
|
|
|
|
|
|
|
|
|
|
|
|
|
|
|
| Class 1 |
|
|
$1,933 |
|
|
|
$– |
|
|
|
$1,933 |
|
|
|
|
|
|
|
$– |
|
|
|
$– |
|
|
|
$– |
|
| Class 1A |
|
|
122 |
|
|
|
– |
|
|
|
122 |
|
|
|
|
|
|
|
– |
|
|
|
– |
|
|
|
– |
|
| Class 2 |
|
|
573 |
|
|
|
– |
|
|
|
573 |
|
|
|
|
|
|
|
– |
|
|
|
– |
|
|
|
– |
|
| Class 4 |
|
|
– |
|
|
|
– |
|
|
|
– |
|
|
|
|
|
|
|
– |
|
|
|
– |
|
|
|
– |
|
|
|
|
|
|
|
|
|
|
|
|
|
|
|
|
|
|
|
|
|
|
| Total |
|
|
$2,628 |
|
|
|
$– |
|
|
|
$2,628 |
|
|
|
|
|
|
|
$– |
|
|
|
$– |
|
|
|
$– |
|
|
|
|
|
|
|
|
|
|
|
|
|
|
American Funds Insurance Series 306
American High-Income Trust
|
|
|
|
|
|
|
|
|
|
|
|
|
|
|
|
|
|
|
|
|
|
|
|
|
|
|
|
|
| |
|
Six months ended June 30, 2024 |
|
|
|
|
|
Year ended December 31, 2023 |
|
|
|
|
|
|
|
|
|
|
|
|
|
|
| Share class |
|
Ordinary
income |
|
|
Long-term
capital gains |
|
|
Total
distributions
paid |
|
|
|
|
|
Ordinary
income |
|
|
Long-term
capital gains |
|
|
Total
distributions
paid |
|
| |
|
|
|
|
|
|
|
|
|
|
|
|
|
|
|
|
|
| Class 1 |
|
|
$2,576 |
|
|
|
$– |
|
|
|
$2,576 |
|
|
|
|
|
|
|
$15,308 |
|
|
|
$– |
|
|
|
$15,308 |
|
| Class 1A |
|
|
33 |
|
|
|
– |
|
|
|
33 |
|
|
|
|
|
|
|
171 |
|
|
|
– |
|
|
|
171 |
|
| Class 2 |
|
|
5,989 |
|
|
|
– |
|
|
|
5,989 |
|
|
|
|
|
|
|
36,274 |
|
|
|
– |
|
|
|
36,274 |
|
| Class 3 |
|
|
88 |
|
|
|
– |
|
|
|
88 |
|
|
|
|
|
|
|
556 |
|
|
|
– |
|
|
|
556 |
|
| Class 4 |
|
|
1,188 |
|
|
|
– |
|
|
|
1,188 |
|
|
|
|
|
|
|
5,957 |
|
|
|
– |
|
|
|
5,957 |
|
|
|
|
|
|
|
|
|
|
|
|
|
|
|
|
|
|
|
|
|
|
| Total |
|
|
$9,874 |
|
|
|
$– |
|
|
|
$9,874 |
|
|
|
|
|
|
|
$58,266 |
|
|
|
$– |
|
|
|
$58,266 |
|
|
|
|
|
|
|
|
|
|
|
|
|
|
American Funds Mortgage Fund
|
|
|
|
|
|
|
|
|
|
|
|
|
|
|
|
|
|
|
|
|
|
|
|
|
|
|
|
|
| |
|
Six months ended June 30, 2024 |
|
|
|
|
|
Year ended December 31, 2023 |
|
|
|
|
|
|
|
|
|
|
|
|
|
|
| Share class |
|
Ordinary
income |
|
|
Long-term
capital gains |
|
|
Total
distributions
paid |
|
|
|
|
|
Ordinary
income |
|
|
Long-term
capital gains |
|
|
Total
distributions
paid |
|
| |
|
|
|
|
|
|
|
|
|
|
|
|
|
|
|
|
|
| Class 1 |
|
|
$136 |
|
|
|
$– |
|
|
|
$136 |
|
|
|
|
|
|
|
$ 656 |
|
|
|
$– |
|
|
|
$ 656 |
|
| Class 1A |
|
|
18 |
|
|
|
– |
|
|
|
18 |
|
|
|
|
|
|
|
71 |
|
|
|
– |
|
|
|
71 |
|
| Class 2 |
|
|
341 |
|
|
|
– |
|
|
|
341 |
|
|
|
|
|
|
|
1,633 |
|
|
|
– |
|
|
|
1,633 |
|
| Class 4 |
|
|
360 |
|
|
|
– |
|
|
|
360 |
|
|
|
|
|
|
|
1,600 |
|
|
|
– |
|
|
|
1,600 |
|
|
|
|
|
|
|
|
|
|
|
|
|
|
|
|
|
|
|
|
|
|
| Total |
|
|
$855 |
|
|
|
$– |
|
|
|
$855 |
|
|
|
|
|
|
|
$3,960 |
|
|
|
$– |
|
|
|
$3,960 |
|
|
|
|
|
|
|
|
|
|
|
|
|
|
Ultra-Short Bond Fund
|
|
|
|
|
|
|
|
|
|
|
|
|
|
|
|
|
|
|
|
|
|
|
|
|
|
|
|
|
| |
|
Six months ended June 30, 2024 |
|
|
|
|
|
Year ended December 31, 2023 |
|
|
|
|
|
|
|
|
|
|
|
|
|
|
| Share class |
|
Ordinary
income |
|
|
Long-term
capital gains |
|
|
Total
distributions
paid |
|
|
|
|
|
Ordinary
income |
|
|
Long-term
capital gains |
|
|
Total
distributions
paid |
|
| |
|
|
|
|
|
|
|
|
|
|
|
|
|
|
|
|
|
| Class 1 |
|
|
$ 368 |
|
|
|
$– |
|
|
|
$ 368 |
|
|
|
|
|
|
|
$ 1,981 |
|
|
|
$– |
|
|
|
$ 1,981 |
|
| Class 1A |
|
|
1 |
|
|
|
– |
|
|
|
1 |
|
|
|
|
|
|
|
5 |
|
|
|
– |
|
|
|
5 |
|
| Class 2 |
|
|
2,445 |
|
|
|
– |
|
|
|
2,445 |
|
|
|
|
|
|
|
12,823 |
|
|
|
– |
|
|
|
12,823 |
|
| Class 3 |
|
|
36 |
|
|
|
– |
|
|
|
36 |
|
|
|
|
|
|
|
198 |
|
|
|
– |
|
|
|
198 |
|
| Class 4 |
|
|
449 |
|
|
|
– |
|
|
|
449 |
|
|
|
|
|
|
|
2,524 |
|
|
|
– |
|
|
|
2,524 |
|
|
|
|
|
|
|
|
|
|
|
|
|
|
|
|
|
|
|
|
|
|
| Total |
|
|
$3,299 |
|
|
|
$– |
|
|
|
$3,299 |
|
|
|
|
|
|
|
$17,531 |
|
|
|
$– |
|
|
|
$17,531 |
|
|
|
|
|
|
|
|
|
|
|
|
|
|
U.S. Government Securities Fund
|
|
|
|
|
|
|
|
|
|
|
|
|
|
|
|
|
|
|
|
|
|
|
|
|
|
|
|
|
| |
|
Six months ended June 30, 2024 |
|
|
|
|
|
Year ended December 31, 2023 |
|
|
|
|
|
|
|
|
|
|
|
|
|
|
| Share class |
|
Ordinary
income |
|
|
Long-term
capital gains |
|
|
Total
distributions
paid |
|
|
|
|
|
Ordinary
income |
|
|
Long-term
capital gains |
|
|
Total
distributions
paid |
|
| |
|
|
|
|
|
|
|
|
|
|
|
|
|
|
|
|
|
| Class 1 |
|
|
$ 1,833 |
|
|
|
$– |
|
|
|
$ 1,833 |
|
|
|
|
|
|
|
$ 9,817 |
|
|
|
$– |
|
|
|
$ 9,817 |
|
| Class 1A |
|
|
1,537 |
|
|
|
– |
|
|
|
1,537 |
|
|
|
|
|
|
|
171 |
|
|
|
– |
|
|
|
171 |
|
| Class 2 |
|
|
7,184 |
|
|
|
– |
|
|
|
7,184 |
|
|
|
|
|
|
|
39,205 |
|
|
|
– |
|
|
|
39,205 |
|
| Class 3 |
|
|
34 |
|
|
|
– |
|
|
|
34 |
|
|
|
|
|
|
|
219 |
|
|
|
– |
|
|
|
219 |
|
| Class 4 |
|
|
1,165 |
|
|
|
– |
|
|
|
1,165 |
|
|
|
|
|
|
|
6,275 |
|
|
|
– |
|
|
|
6,275 |
|
|
|
|
|
|
|
|
|
|
|
|
|
|
|
|
|
|
|
|
|
|
| Total |
|
|
$11,753 |
|
|
|
$– |
|
|
|
$11,753 |
|
|
|
|
|
|
|
$55,687 |
|
|
|
$– |
|
|
|
$55,687 |
|
|
|
|
|
|
|
|
|
|
|
|
|
|
Managed Risk Growth Fund
|
|
|
|
|
|
|
|
|
|
|
|
|
|
|
|
|
|
|
|
|
|
|
|
|
|
|
|
|
| |
|
Six months ended June 30, 2024 |
|
|
|
|
|
Year ended December 31, 2023 |
|
|
|
|
|
|
|
|
|
|
|
|
|
|
| Share class |
|
Ordinary
income |
|
|
Long-term
capital gains |
|
|
Total
distributions
paid |
|
|
|
|
|
Ordinary
income |
|
|
Long-term
capital gains |
|
|
Total
distributions
paid |
|
| |
|
|
|
|
|
|
|
|
|
| Class P1 |
|
|
$ 93 |
|
|
|
$– |
|
|
|
$ 93 |
|
|
|
|
|
|
|
$ 129 |
|
|
|
$ 2,315 |
|
|
|
$ 2,444 |
|
| Class P2 |
|
|
2,326 |
|
|
|
– |
|
|
|
2,326 |
|
|
|
|
|
|
|
5,596 |
|
|
|
103,643 |
|
|
|
109,239 |
|
|
|
|
|
|
|
|
|
|
|
|
|
|
|
|
|
|
|
|
|
|
| Total |
|
|
$2,419 |
|
|
|
$– |
|
|
|
$2,419 |
|
|
|
|
|
|
|
$5,725 |
|
|
|
$105,958 |
|
|
|
$111,683 |
|
|
|
|
|
|
|
|
|
|
|
|
|
|
307 American Funds Insurance Series
Managed Risk International Fund
|
|
|
|
|
|
|
|
|
|
|
|
|
|
|
|
|
|
|
|
|
|
|
|
|
|
|
|
|
| |
|
Six months ended June 30, 2024 |
|
|
|
|
|
Year ended December 31, 2023 |
|
|
|
|
|
|
|
|
|
|
|
|
|
|
| Share class |
|
Ordinary
income |
|
|
Long-term
capital gains |
|
|
Total
distributions
paid |
|
|
|
|
|
Ordinary
income |
|
|
Long-term
capital gains |
|
|
Total
distributions
paid |
|
| |
|
|
|
|
|
|
|
|
|
| Class P1 |
|
|
$ 29 |
|
|
|
$– |
|
|
|
$ 29 |
|
|
|
|
|
|
|
$ 29 |
|
|
|
$ 127 |
|
|
|
$ 156 |
|
| Class P2 |
|
|
1,532 |
|
|
|
– |
|
|
|
1,532 |
|
|
|
|
|
|
|
1,939 |
|
|
|
8,757 |
|
|
|
10,696 |
|
|
|
|
|
|
|
|
|
|
|
|
|
|
|
|
|
|
|
|
|
|
| Total |
|
|
$1,561 |
|
|
|
$– |
|
|
|
$1,561 |
|
|
|
|
|
|
|
$1,968 |
|
|
|
$8,884 |
|
|
|
$10,852 |
|
|
|
|
|
|
|
|
|
|
|
|
|
|
Managed Risk Washington Mutual Investors Fund
|
|
|
|
|
|
|
|
|
|
|
|
|
|
|
|
|
|
|
|
|
|
|
|
|
|
|
|
|
| |
|
Six months ended June 30, 2024 |
|
|
|
|
|
Year ended December 31, 2023 |
|
|
|
|
|
|
|
|
|
|
|
|
|
|
| Share class |
|
Ordinary
income |
|
|
Long-term
capital gains |
|
|
Total
distributions
paid |
|
|
|
|
|
Ordinary
income |
|
|
Long-term
capital gains |
|
|
Total
distributions
paid |
|
| |
|
|
|
|
|
|
|
|
|
| Class P1 |
|
|
$ 43 |
|
|
|
$– |
|
|
|
$ 43 |
|
|
|
|
|
|
|
$ 58 |
|
|
|
$ 363 |
|
|
|
$ 421 |
|
| Class P2 |
|
|
5,105 |
|
|
|
– |
|
|
|
5,105 |
|
|
|
|
|
|
|
5,936 |
|
|
|
41,630 |
|
|
|
47,566 |
|
|
|
|
|
|
|
|
|
|
|
|
|
|
|
|
|
|
|
|
|
|
| Total |
|
|
$5,148 |
|
|
|
$– |
|
|
|
$5,148 |
|
|
|
|
|
|
|
$5,994 |
|
|
|
$41,993 |
|
|
|
$47,987 |
|
|
|
|
|
|
|
|
|
|
|
|
|
|
Managed Risk Growth-Income Fund
|
|
|
|
|
|
|
|
|
|
|
|
|
|
|
|
|
|
|
|
|
|
|
|
|
|
|
|
|
| |
|
Six months ended June 30, 2024 |
|
|
|
|
|
Year ended December 31, 2023 |
|
|
|
|
|
|
|
|
|
|
|
|
|
|
| Share class |
|
Ordinary
income |
|
|
Long-term
capital gains |
|
|
Total
distributions
paid |
|
|
|
|
|
Ordinary
income |
|
|
Long-term
capital gains |
|
|
Total
distributions
paid |
|
| |
|
|
|
|
|
|
|
|
|
| Class P1 |
|
|
$26,378 |
|
|
|
$25,142 |
|
|
|
$51,520 |
|
|
|
|
|
|
|
$30,230 |
|
|
|
$230,056 |
|
|
|
$260,286 |
|
| Class P2 |
|
|
3,727 |
|
|
|
3,660 |
|
|
|
7,387 |
|
|
|
|
|
|
|
3,723 |
|
|
|
33,365 |
|
|
|
37,088 |
|
|
|
|
|
|
|
|
|
|
|
|
|
|
|
|
|
|
|
|
|
|
| Total |
|
|
$30,105 |
|
|
|
$28,802 |
|
|
|
$58,907 |
|
|
|
|
|
|
|
$33,953 |
|
|
|
$263,421 |
|
|
|
$297,374 |
|
|
|
|
|
|
|
|
|
|
|
|
|
|
Managed Risk Asset Allocation Fund
|
|
|
|
|
|
|
|
|
|
|
|
|
|
|
|
|
|
|
|
|
|
|
|
|
|
|
|
|
| |
|
Six months ended June 30, 2024 |
|
|
|
|
|
Year ended December 31, 2023 |
|
|
|
|
|
|
|
|
|
|
|
|
|
|
| Share class |
|
Ordinary
income |
|
|
Long-term
capital gains |
|
|
Total
distributions
paid |
|
|
|
|
|
Ordinary
income |
|
|
Long-term
capital gains |
|
|
Total
distributions
paid |
|
| |
|
|
|
|
|
|
|
|
|
| Class P1 |
|
|
$ 179 |
|
|
|
$ 138 |
|
|
|
$ 317 |
|
|
|
|
|
|
|
$ 164 |
|
|
|
$ 851 |
|
|
|
$ 1,015 |
|
| Class P2 |
|
|
36,259 |
|
|
|
28,786 |
|
|
|
65,045 |
|
|
|
|
|
|
|
38,569 |
|
|
|
247,531 |
|
|
|
286,100 |
|
|
|
|
|
|
|
|
|
|
|
|
|
|
|
|
|
|
|
|
|
|
| Total |
|
|
$36,438 |
|
|
|
$28,924 |
|
|
|
$65,362 |
|
|
|
|
|
|
|
$38,733 |
|
|
|
$248,382 |
|
|
|
$287,115 |
|
|
|
|
|
|
|
|
|
|
|
|
|
|
7. Fees and transactions
CRMC, the series’ investment adviser, is the parent company of American Funds Distributors®, Inc. (“AFD”), the distributor of the series’ shares, and American Funds Service Company® (“AFS”), the series’ transfer agent. CRMC, AFD and AFS are considered related parties to the series.
Investment advisory services – The series has an investment advisory and service agreement with CRMC that provides for monthly fees accrued daily. These fees are based on annual rates that generally decrease as net asset levels increase. CRMC receives investment advisory fees from the underlying funds held by the managed risk funds, which are included in the unaudited net effective expense ratios that are provided as additional information in the financial highlights tables. Subadvisory fees for the managed risk funds are paid by CRMC to Milliman FRM. The managed risk funds are not responsible for paying any subadvisory fees.
Investment advisory services waivers – CRMC is waiving a portion of its investment advisory services fees for some of the funds. For the six months ended June 30, 2024, total investment advisory services fees waived by CRMC were $26,277,000. CRMC does not intend to recoup these waivers. Investment advisory fees in each fund’s statement of operations are presented gross of any waivers from CRMC.
American Funds Insurance Series 308
The range of rates, net asset levels and the current annualized rates of average daily net assets for each fund before and after any investment advisory services waivers, if applicable, are as follows:
|
|
|
|
|
|
|
|
|
|
|
|
|
|
|
|
|
|
|
|
|
|
|
|
|
| |
|
Rates |
|
|
Net asset level
(in billions) |
|
|
For the
six months
ended June 30, 2024,
before waiver |
|
|
For the six months
ended
June 30, 2024,
after waiver |
|
| Fund |
|
Beginning
with |
|
|
Ending
with |
|
|
Up to |
|
|
In excess of |
|
|
|
|
|
|
|
|
| Global Growth Fund |
|
|
.475 |
% |
|
|
.435 |
% |
|
|
$15.0 |
|
|
|
$15.0 |
|
|
|
.475 |
% |
|
|
.365 |
% |
| Global Small Capitalization Fund |
|
|
.647 |
|
|
|
.615 |
|
|
|
15.0 |
|
|
|
15.0 |
|
|
|
.647 |
|
|
|
.620 |
|
| Growth Fund |
|
|
.500 |
|
|
|
.275 |
|
|
|
.6 |
|
|
|
44.0 |
|
|
|
.307 |
|
|
|
.307 |
|
| International Fund |
|
|
.478 |
|
|
|
.430 |
|
|
|
15.0 |
|
|
|
21.0 |
|
|
|
.478 |
|
|
|
.478 |
|
| New World Fund |
|
|
.577 |
|
|
|
.510 |
|
|
|
15.0 |
|
|
|
15.0 |
|
|
|
.577 |
|
|
|
.507 |
|
| Washington Mutual Investors Fund |
|
|
.374 |
|
|
|
.350 |
|
|
|
15.0 |
|
|
|
15.0 |
|
|
|
.374 |
|
|
|
.215 |
|
| Capital World Growth and Income Fund |
|
|
.475 |
|
|
|
.435 |
|
|
|
15.0 |
|
|
|
15.0 |
|
|
|
.475 |
|
|
|
.368 |
|
| Growth-Income Fund |
|
|
.500 |
|
|
|
.217 |
|
|
|
.6 |
|
|
|
44.0 |
|
|
|
.251 |
|
|
|
.251 |
|
| International Growth and Income Fund |
|
|
.478 |
|
|
|
.450 |
|
|
|
15.0 |
|
|
|
15.0 |
|
|
|
.491 |
|
|
|
.491 |
|
| Capital Income Builder |
|
|
.357 |
|
|
|
.330 |
|
|
|
15.0 |
|
|
|
15.0 |
|
|
|
.357 |
|
|
|
.220 |
|
| Asset Allocation Fund |
|
|
.500 |
|
|
|
.236 |
|
|
|
.6 |
|
|
|
34.0 |
|
|
|
.265 |
|
|
|
.265 |
|
| American Funds Global Balanced Fund |
|
|
.446 |
|
|
|
.420 |
|
|
|
15.0 |
|
|
|
15.0 |
|
|
|
.446 |
|
|
|
.436 |
|
| The Bond Fund of America |
|
|
.352 |
|
|
|
.320 |
|
|
|
15.0 |
|
|
|
15.0 |
|
|
|
.352 |
|
|
|
.215 |
|
| Capital World Bond Fund |
|
|
.431 |
|
|
|
.360 |
|
|
|
15.0 |
|
|
|
15.0 |
|
|
|
.431 |
|
|
|
.431 |
|
| American High-Income Trust |
|
|
.404 |
|
|
|
.386 |
|
|
|
15.0 |
|
|
|
15.0 |
|
|
|
.404 |
|
|
|
.271 |
|
| American Funds Mortgage Fund |
|
|
.295 |
|
|
|
.280 |
|
|
|
15.0 |
|
|
|
15.0 |
|
|
|
.295 |
|
|
|
.228 |
|
| Ultra-Short Bond Fund |
|
|
.257 |
|
|
|
.242 |
|
|
|
15.0 |
|
|
|
15.0 |
|
|
|
.257 |
|
|
|
.257 |
|
| U.S. Government Securities Fund |
|
|
.295 |
|
|
|
.280 |
|
|
|
15.0 |
|
|
|
15.0 |
|
|
|
.295 |
|
|
|
.232 |
|
| Managed Risk Growth Fund |
|
|
.150 |
|
|
|
|
|
|
|
all |
|
|
|
|
|
|
|
.150 |
|
|
|
.100 |
|
| Managed Risk International Fund |
|
|
.150 |
|
|
|
|
|
|
|
all |
|
|
|
|
|
|
|
.150 |
|
|
|
.100 |
|
| Managed Risk Washington Mutual Investors Fund |
|
|
.150 |
|
|
|
|
|
|
|
all |
|
|
|
|
|
|
|
.150 |
|
|
|
.100 |
|
| Managed Risk Growth-Income Fund |
|
|
.150 |
|
|
|
|
|
|
|
all |
|
|
|
|
|
|
|
.150 |
|
|
|
.100 |
|
| Managed Risk Asset Allocation Fund |
|
|
.150 |
|
|
|
|
|
|
|
all |
|
|
|
|
|
|
|
.150 |
|
|
|
.100 |
|
Class-specific fees and expenses – Expenses that are specific to individual share classes are accrued directly to the respective share class. The principal class-specific fees and expenses are further described below:
Distribution services – The series has plans of distribution for all share classes except Class 1. Under the plans, the board of trustees approves certain categories of expenses that are used to finance activities primarily intended to sell fund shares. The plans provide for payments to pay service fees to firms that have entered into agreements with the series. These payments, based on an annualized percentage of average daily net assets, range from 0.18% to 0.50% as noted in the table below. In some cases, the board of trustees has limited the amounts that may be paid to less than the maximum allowed by the plans.
|
|
|
|
|
| Share class |
|
Currently approved limits |
|
Plan limits |
| Class 1A |
|
0.00% |
|
0.25% |
| Class 2 |
|
0.25 |
|
0.25 |
| Class 3 |
|
0.18 |
|
0.18 |
| Class 4 |
|
0.25 |
|
0.25 |
| Class P1 |
|
0.00 |
|
0.25 |
| Class P2 |
|
0.25 |
|
0.50 |
Insurance administrative services – The series has an insurance administrative services plan for Class 1A, 4, P1 and P2 shares. Under the plan, these share classes pay 0.25% of each insurance company’s respective average daily net assets in each share class to compensate the insurance companies for services provided to their separate accounts and contractholders for which the shares of the fund are beneficially owned as underlying investments of such contractholders’ annuities. These services include, but are not limited to, maintenance, shareholder communications and transactional services. The insurance companies are not related parties to the series.
309 American Funds Insurance Series
Transfer agent services – The series has a shareholder services agreement with AFS under which the funds compensate AFS for providing transfer agent services to all of the funds’ share classes. These services include recordkeeping, shareholder communications and transaction processing. Under this agreement, the managed risk funds also pays sub-transfer agency fees to AFS. These fees are paid by AFS to third parties for performing transfer agent services on behalf of fund shareholders.
Administrative services – The series has an administrative services agreement with CRMC under which each fund compensates CRMC for providing administrative services to all of the funds’ share classes except Class P1 and P2 shares. Administrative services are provided by CRMC and its affiliates to help assist third parties providing non-distribution services to fund shareholders. These services include providing in-depth information on each fund and market developments that impact fund investments. Administrative services also include, but are not limited to, coordinating, monitoring and overseeing third parties that provide services to fund shareholders. The agreement provides each fund, other than the managed risk funds, the ability to charge an administrative services fee at the annual rate of 0.05% of average daily net assets attributable to each share class. Currently each fund, other than the managed-risk funds, pays CRMC an administrative services fee at the annual rate of 0.03% of average daily net assets of each share class for CRMC’s provision of administrative services. For the managed risk funds, CRMC receives administrative services fees at an annual rate of 0.03% of average daily net assets from Class 1 shares of the underlying funds for administrative services provided to the series.
Accounting and administrative services – The managed risk funds have a subadministration agreement with Bank of New York Mellon (“BNY Mellon“) under which the fund compensates BNY Mellon for providing accounting and administrative services to each of the managed risk funds’ share classes. These services include, but are not limited to, fund accounting (including calculation of net asset value), financial reporting and tax services. BNY Mellon is not a related party to the managed risk funds.
Class-specific expenses under the agreements described above were as follows (dollars in thousands):
Global Growth Fund
|
|
|
|
|
|
|
|
|
|
|
| Share class |
|
Distribution services |
|
|
Insurance administrative services |
|
Administrative services |
|
|
|
|
|
| Class 1 |
|
|
Not applicable |
|
|
Not applicable |
|
|
$ 530 |
|
| Class 1A |
|
|
$ – |
|
|
$ 24 |
|
|
3 |
|
| Class 2 |
|
|
4,550 |
|
|
Not applicable |
|
|
546 |
|
| Class 4 |
|
|
999 |
|
|
999 |
|
|
120 |
|
|
|
|
|
|
| Total class-specific
expenses |
|
|
$5,549 |
|
|
$1,023 |
|
|
$1,199 |
|
|
|
|
|
|
Growth Fund
|
|
|
|
|
|
|
|
|
|
|
|
|
| Share class |
|
Distribution services |
|
|
Insurance administrative services |
|
|
Administrative services |
|
|
|
|
|
| Class 1 |
|
|
Not applicable |
|
|
|
Not applicable |
|
|
|
$2,776 |
|
| Class 1A |
|
|
$ – |
|
|
|
$ 376 |
|
|
|
45 |
|
| Class 2 |
|
|
23,299 |
|
|
|
Not applicable |
|
|
|
2,796 |
|
| Class 3 |
|
|
225 |
|
|
|
Not applicable |
|
|
|
37 |
|
| Class 4 |
|
|
4,873 |
|
|
|
4,873 |
|
|
|
585 |
|
|
|
|
|
|
| Total class-specific
expenses |
|
|
$28,397 |
|
|
|
$5,249 |
|
|
|
$6,239 |
|
|
|
|
|
|
Global Small Capitalization Fund
|
|
|
|
|
|
|
|
|
|
|
|
|
| Share class |
|
Distribution services |
|
|
Insurance administrative services |
|
|
Administrative services |
|
|
|
|
|
| Class 1 |
|
|
Not applicable |
|
|
|
Not applicable |
|
|
|
$146 |
|
| Class 1A |
|
|
$ – |
|
|
|
$ 6 |
|
|
|
1 |
|
| Class 2 |
|
|
2,262 |
|
|
|
Not applicable |
|
|
|
272 |
|
| Class 4 |
|
|
367 |
|
|
|
367 |
|
|
|
44 |
|
|
|
|
|
|
| Total class-specific
expenses |
|
|
$2,629 |
|
|
|
$373 |
|
|
|
$463 |
|
|
|
|
|
|
International Fund
|
|
|
|
|
|
|
|
|
|
|
|
|
| Share class |
|
Distribution services |
|
|
Insurance administrative services |
|
|
Administrative services |
|
|
|
|
|
| Class 1 |
|
|
Not applicable |
|
|
|
Not applicable |
|
|
|
$ 504 |
|
| Class 1A |
|
|
$ – |
|
|
|
$ 16 |
|
|
|
2 |
|
| Class 2 |
|
|
4,282 |
|
|
|
Not applicable |
|
|
|
514 |
|
| Class 3 |
|
|
15 |
|
|
|
Not applicable |
|
|
|
2 |
|
| Class 4 |
|
|
538 |
|
|
|
538 |
|
|
|
65 |
|
|
|
|
|
|
| Total class-specific
expenses |
|
|
$4,835 |
|
|
|
$554 |
|
|
|
$1,087 |
|
|
|
|
|
|
American Funds Insurance Series 310
New World Fund
|
|
|
|
|
|
|
|
|
| Share class |
|
Distribution services |
|
|
Insurance administrative services |
|
Administrative services |
|
|
|
|
| Class 1 |
|
|
Not applicable |
|
|
Not applicable |
|
$269 |
| Class 1A |
|
|
$ – |
|
|
$ 13 |
|
1 |
| Class 2 |
|
|
1,023 |
|
|
Not applicable |
|
123 |
| Class 4 |
|
|
998 |
|
|
999 |
|
120 |
|
|
|
|
|
|
|
|
| Total class-specific
expenses |
|
|
$2,021 |
|
|
$1,012 |
|
$513 |
|
|
|
|
Capital World Growth and Income Fund
|
|
|
|
|
|
|
|
|
| Share class |
|
Distribution services |
|
|
Insurance administrative services |
|
Administrative services |
|
|
|
|
| Class 1 |
|
|
Not applicable |
|
|
Not applicable |
|
$ 88 |
| Class 1A |
|
|
$ – |
|
|
$ 10 |
|
1 |
| Class 2 |
|
|
1,310 |
|
|
Not applicable |
|
157 |
| Class 4 |
|
|
305 |
|
|
306 |
|
37 |
|
|
|
|
|
|
|
|
| Total class-specific
expenses |
|
|
$1,615 |
|
|
$316 |
|
$283 |
|
|
|
|
International Growth and Income Fund
|
|
|
|
|
|
|
|
|
| Share class |
|
Distribution services |
|
|
Insurance administrative services |
|
Administrative services |
|
|
|
|
| Class 1 |
|
|
Not applicable |
|
|
Not applicable |
|
$ 2 |
| Class 1A |
|
|
$ – |
|
|
$ 8 |
|
1 |
| Class 2 |
|
|
204 |
|
|
Not applicable |
|
25 |
| Class 4 |
|
|
184 |
|
|
184 |
|
22 |
|
|
|
|
|
|
|
|
| Total class-specific
expenses |
|
|
$388 |
|
|
$192 |
|
$50 |
|
|
|
|
Asset Allocation Fund
|
|
|
|
|
|
|
|
|
| Share class |
|
Distribution services |
|
|
Insurance administrative services |
|
Administrative services |
|
|
|
|
| Class 1 |
|
|
Not applicable |
|
|
Not applicable |
|
$2,358 |
| Class 1A |
|
|
$ – |
|
|
$ 40 |
|
5 |
| Class 2 |
|
|
5,361 |
|
|
Not applicable |
|
643 |
| Class 3 |
|
|
28 |
|
|
Not applicable |
|
4 |
| Class 4 |
|
|
7,573 |
|
|
7,573 |
|
909 |
|
|
|
|
|
|
|
|
| Total class-specific
expenses |
|
|
$12,962 |
|
|
$7,613 |
|
$3,919 |
|
|
|
|
Refer to the end of the tables for footnote.
Washington Mutual Investors Fund
|
|
|
|
|
|
|
|
|
| Share class |
|
Distribution services |
|
|
Insurance administrative services |
|
Administrative services |
|
|
|
|
| Class 1 |
|
|
Not applicable |
|
|
Not applicable |
|
$ 922 |
| Class 1A |
|
|
$ – |
|
|
$ 30 |
|
4 |
| Class 2 |
|
|
3,680 |
|
|
Not applicable |
|
442 |
| Class 4 |
|
|
1,796 |
|
|
1,797 |
|
215 |
|
|
|
|
|
|
|
|
| Total class-specific
expenses |
|
|
$5,476 |
|
|
$1,827 |
|
$1,583 |
|
|
|
|
Growth-Income Fund
|
|
|
|
|
|
|
|
|
| Share class |
|
Distribution services |
|
|
Insurance administrative services |
|
Administrative services |
|
|
|
|
| Class 1 |
|
|
Not applicable |
|
|
Not applicable |
|
$3,466 |
| Class 1A |
|
|
$ – |
|
|
$ 47 |
|
6 |
| Class 2 |
|
|
16,629 |
|
|
Not applicable |
|
1,995 |
| Class 3 |
|
|
132 |
|
|
Not applicable |
|
22 |
| Class 4 |
|
|
2,785 |
|
|
2,785 |
|
334 |
|
|
|
|
| Total class-specific
expenses |
|
|
$19,546 |
|
|
$2,832 |
|
$5,823 |
|
|
|
|
Capital Income Builder
|
|
|
|
|
|
|
|
|
| Share class |
|
Distribution services |
|
|
Insurance administrative services |
|
Administrative services |
|
|
|
|
| Class 1 |
|
|
Not applicable |
|
|
Not applicable |
|
$101 |
| Class 1A |
|
|
$ – |
|
|
$ 13 |
|
2 |
| Class 2 |
|
|
19 |
|
|
Not applicable |
|
2 |
| Class 4 |
|
|
717 |
|
|
717 |
|
86 |
|
|
|
|
|
|
|
|
| Total class-specific
expenses |
|
|
$736 |
|
|
$730 |
|
$191 |
|
|
|
|
American Funds Global Balanced Fund
|
|
|
|
|
|
|
|
|
| Share class |
|
Distribution services |
|
|
Insurance administrative services |
|
Administrative services |
|
|
|
|
| Class 1 |
|
|
Not applicable |
|
|
Not applicable |
|
$15 |
| Class 1A |
|
|
$ – |
|
|
$ 4 |
|
—* |
| Class 2 |
|
|
197 |
|
|
Not applicable |
|
24 |
| Class 4 |
|
|
163 |
|
|
163 |
|
19 |
|
|
|
|
|
|
|
|
| Total class-specific
expenses |
|
|
$360 |
|
|
$167 |
|
$58 |
|
|
|
|
311 American Funds Insurance Series
The Bond Fund of America
|
|
|
|
|
|
|
|
|
|
|
|
|
| Share class |
|
Distribution services |
|
|
Insurance administrative services |
|
|
Administrative services |
|
|
|
|
|
| Class 1 |
|
|
Not applicable |
|
|
|
Not applicable |
|
|
|
$1,037 |
|
| Class 1A |
|
|
$ – |
|
|
|
$ 305 |
|
|
|
37 |
|
| Class 2 |
|
|
3,508 |
|
|
|
Not applicable |
|
|
|
421 |
|
| Class 4 |
|
|
1,239 |
|
|
|
1,239 |
|
|
|
149 |
|
|
|
|
|
|
| Total class-specific
expenses |
|
|
$4,747 |
|
|
|
$1,544 |
|
|
|
$1,644 |
|
|
|
|
|
|
American High-Income Trust
|
|
|
|
|
|
|
|
|
|
|
|
|
| Share class |
|
Distribution services |
|
|
Insurance administrative services |
|
|
Administrative services |
|
|
|
|
|
| Class 1 |
|
|
Not applicable |
|
|
|
Not applicable |
|
|
|
$ 34 |
|
| Class 1A |
|
|
$ – |
|
|
|
$ 4 |
|
|
|
– |
* |
| Class 2 |
|
|
661 |
|
|
|
Not applicable |
|
|
|
79 |
|
| Class 3 |
|
|
7 |
|
|
|
Not applicable |
|
|
|
1 |
|
| Class 4 |
|
|
145 |
|
|
|
145 |
|
|
|
18 |
|
|
|
|
|
|
| Total class-specific
expenses |
|
|
$813 |
|
|
|
$149 |
|
|
|
$132 |
|
|
|
|
|
|
Ultra-Short Bond Fund
|
|
|
|
|
|
|
|
|
|
|
|
|
| Share class |
|
Distribution services |
|
|
Insurance administrative services |
|
|
Administrative services |
|
|
|
|
|
| Class 1 |
|
|
Not applicable |
|
|
|
Not applicable |
|
|
|
$ 6 |
|
| Class 1A |
|
|
$ – |
|
|
|
$ – |
* |
|
|
– |
* |
| Class 2 |
|
|
331 |
|
|
|
Not applicable |
|
|
|
40 |
|
| Class 3 |
|
|
4 |
|
|
|
Not applicable |
|
|
|
– |
* |
| Class 4 |
|
|
64 |
|
|
|
65 |
|
|
|
8 |
|
|
|
|
|
|
| Total class-specific
expenses |
|
|
$399 |
|
|
|
$65 |
|
|
|
$54 |
|
|
|
|
|
|
Managed Risk Growth Fund
|
|
|
|
|
|
|
|
|
|
|
| Share class |
|
Distribution services |
|
|
Insurance administrative services |
|
|
|
| Class P1 |
|
|
Not applicable |
|
|
|
$ 16 |
|
| Class P2 |
|
|
$625 |
|
|
|
625 |
|
|
|
|
|
|
| Total class-specific
expenses |
|
|
$625 |
|
|
|
$641 |
|
|
|
|
|
|
Refer to the end of the tables for footnote.
Capital World Bond Fund
|
|
|
|
|
|
|
|
|
|
|
|
|
| Share class |
|
Distribution services |
|
|
Insurance administrative services |
|
|
Administrative services |
|
|
|
|
|
| Class 1 |
|
|
Not applicable |
|
|
|
Not applicable |
|
|
|
$ 96 |
|
| Class 1A |
|
|
$ – |
|
|
|
$15 |
|
|
|
2 |
|
| Class 2 |
|
|
990 |
|
|
|
Not applicable |
|
|
|
119 |
|
| Class 4 |
|
|
69 |
|
|
|
69 |
|
|
|
8 |
|
|
|
|
|
|
| Total class-specific
expenses |
|
|
$1,059 |
|
|
|
$84 |
|
|
|
$225 |
|
|
|
|
|
|
American Funds Mortgage Fund
|
|
|
|
|
|
|
|
|
|
|
|
|
| Share class |
|
Distribution services |
|
|
Insurance administrative services |
|
|
Administrative services |
|
|
|
|
|
| Class 1 |
|
|
Not applicable |
|
|
|
Not applicable |
|
|
|
$ 3 |
|
| Class 1A |
|
|
$ – |
|
|
|
$ 3 |
|
|
|
— |
* |
| Class 2 |
|
|
53 |
|
|
|
Not applicable |
|
|
|
6 |
|
| Class 4 |
|
|
57 |
|
|
|
57 |
|
|
|
7 |
|
|
|
|
|
|
| Total class-specific
expenses |
|
|
$110 |
|
|
|
$60 |
|
|
|
$16 |
|
|
|
|
|
|
U.S. Government Securities Fund
|
|
|
|
|
|
|
|
|
|
|
|
|
| Share class |
|
Distribution services |
|
|
Insurance administrative services |
|
|
Administrative services |
|
|
|
|
|
| Class 1 |
|
|
Not applicable |
|
|
|
Not applicable |
|
|
|
$ 38 |
|
| Class 1A |
|
|
$ – |
|
|
|
$ 83 |
|
|
|
10 |
|
| Class 2 |
|
|
1,314 |
|
|
|
Not applicable |
|
|
|
158 |
|
| Class 3 |
|
|
5 |
|
|
|
Not applicable |
|
|
|
1 |
|
| Class 4 |
|
|
226 |
|
|
|
225 |
|
|
|
27 |
|
|
|
|
|
|
| Total class-specific
expenses |
|
|
$1,545 |
|
|
|
$308 |
|
|
|
$234 |
|
|
|
|
|
|
Managed Risk International Fund
|
|
|
|
|
|
|
|
|
|
|
| Share class |
|
Distribution services |
|
|
Insurance administrative services |
|
|
|
| Class P1 |
|
|
Not applicable |
|
|
|
$ 2 |
|
| Class P2 |
|
|
$153 |
|
|
|
153 |
|
|
|
|
|
|
| Total class-specific
expenses |
|
|
$153 |
|
|
|
$155 |
|
|
|
|
|
|
American Funds Insurance Series 312
Managed Risk Washington
Mutual Investors Fund
|
|
|
|
|
|
|
|
|
|
|
| Share class |
|
Distribution services |
|
|
Insurance administrative services |
|
|
|
| Class P1 |
|
|
Not applicable |
|
|
|
$ 4 |
|
| Class P2 |
|
|
$403 |
|
|
|
403 |
|
|
|
|
|
|
| Total class-specific
expenses |
|
|
$403 |
|
|
|
$407 |
|
|
|
|
|
|
Managed Risk Asset Allocation Fund
|
|
|
|
|
|
|
|
|
|
|
| Share class |
|
Distribution services |
|
|
Insurance administrative services |
|
|
|
| Class P1 |
|
|
Not applicable |
|
|
|
$ 13 |
|
| Class P2 |
|
|
$2,596 |
|
|
|
2,596 |
|
|
|
|
|
|
| Total class-specific
expenses |
|
|
$2,596 |
|
|
|
$2,609 |
|
|
|
|
|
|
| |
* |
Amount less than one thousand. |
Managed Risk Growth-Income Fund
|
|
|
|
|
|
|
|
|
|
|
| Share class |
|
Distribution services |
|
|
Insurance administrative services |
|
|
|
| Class P1 |
|
|
Not applicable |
|
|
|
$2,421 |
|
| Class P2 |
|
|
$349 |
|
|
|
349 |
|
|
|
|
|
|
| Total class-specific
expenses |
|
|
$349 |
|
|
|
$2,770 |
|
|
|
|
|
|
Miscellaneous fee reimbursements – CRMC reimbursed a portion of miscellaneous fees and expenses for Managed Risk International Fund and Managed Risk Washington Mutual Investors Fund. This reimbursement may be adjusted or discontinued by CRMC, subject to any restrictions in the series’ prospectus. For the six months ended June 30, 2024, total fees and expenses reimbursed by CRMC were $14,000. CRMC may recoup all or a portion of these reimbursements during the current fiscal year. Fees and expenses in each fund’s statement of operations are presented gross of any reimbursements from CRMC.
Trustees’ deferred compensation – Trustees who are unaffiliated with CRMC may elect to defer the cash payment of part or all of their compensation. These deferred amounts, which remain as liabilities of the funds, are treated as if invested in one or more of the American Funds. These amounts represent general, unsecured liabilities of the funds and vary according to the total returns of the selected funds. Trustees’ compensation, shown on the accompanying financial statements, reflects current fees (either paid in cash or deferred) and a net increase in the value of the deferred amounts as follows (dollars in thousands):
|
|
|
|
|
|
|
|
|
|
|
|
|
| Fund |
|
Current fees |
|
|
Increase in value of deferred amounts |
|
|
Total trustees’ compensation |
|
|
|
|
|
| Global Growth Fund |
|
|
$10 |
|
|
|
$14 |
|
|
|
$ 24 |
|
| Global Small Capitalization Fund |
|
|
4 |
|
|
|
5 |
|
|
|
9 |
|
| Growth Fund |
|
|
51 |
|
|
|
71 |
|
|
|
122 |
|
| International Fund |
|
|
9 |
|
|
|
12 |
|
|
|
21 |
|
| New World Fund |
|
|
4 |
|
|
|
6 |
|
|
|
10 |
|
| Washington Mutual Investors Fund |
|
|
13 |
|
|
|
18 |
|
|
|
31 |
|
| Capital World Growth and Income Fund |
|
|
2 |
|
|
|
3 |
|
|
|
5 |
|
| Growth-Income Fund |
|
|
48 |
|
|
|
67 |
|
|
|
115 |
|
| International Growth and Income Fund |
|
|
– |
* |
|
|
1 |
|
|
|
1 |
|
| Capital Income Builder |
|
|
2 |
|
|
|
2 |
|
|
|
4 |
|
| Asset Allocation Fund |
|
|
33 |
|
|
|
45 |
|
|
|
78 |
|
| American Funds Global Balanced Fund |
|
|
– |
* |
|
|
1 |
|
|
|
1 |
|
| The Bond Fund of America |
|
|
14 |
|
|
|
19 |
|
|
|
33 |
|
| Capital World Bond Fund |
|
|
2 |
|
|
|
3 |
|
|
|
5 |
|
| American High-Income Trust |
|
|
1 |
|
|
|
1 |
|
|
|
2 |
|
| American Funds Mortgage Fund |
|
|
– |
* |
|
|
– |
* |
|
|
– |
* |
| Ultra-Short Bond Fund |
|
|
– |
* |
|
|
1 |
|
|
|
1 |
|
| U.S. Government Securities Fund |
|
|
2 |
|
|
|
3 |
|
|
|
5 |
|
| Managed Risk Growth Fund |
|
|
– |
* |
|
|
1 |
|
|
|
1 |
|
| Managed Risk International Fund |
|
|
– |
* |
|
|
– |
* |
|
|
– |
* |
| Managed Risk Washington Mutual Investors Fund |
|
|
1 |
|
|
|
– |
* |
|
|
1 |
|
| Managed Risk Growth-Income Fund |
|
|
4 |
|
|
|
3 |
|
|
|
7 |
|
| Managed Risk Asset Allocation Fund |
|
|
3 |
|
|
|
3 |
|
|
|
6 |
|
| |
* |
Amount less than one thousand. |
313 American Funds Insurance Series
Affiliated officers and trustees – Officers and certain trustees of the series are or may be considered to be affiliated with CRMC, AFD and AFS. No affiliated officers or trustees received any compensation directly from any fund in the series.
Investments in CCBF and CCF – Some of the funds hold shares of CCBF, a corporate bond fund, and/or CCF, an institutional prime money market fund ,which are both managed by CRMC. CCBF seeks to provide maximum total return consistent with capital preservation and prudent risk management by investing primarily in corporate debt instruments. CCBF is used as an investment vehicle for some of the funds’ corporate bond investments. CCF invests in high-quality, short-term money market instruments. CCF is used as the primary investment vehicle for some of the funds’ short-term investments. Both CCBF and CCF shares are only available for purchase by CRMC, its affiliates, and other funds managed by CRMC or its affiliates, and are not available to the public. CRMC does not receive an investment advisory services fee from either CCBF or CCF.
Security transactions with related funds – The funds may purchase from, or sell securities to, other CRMC-managed funds (or funds managed by certain affiliates of CRMC) under procedures adopted by the fund’s board of trustees. The funds involved in such transactions are considered related by virtue of having a common investment adviser (or affiliated investment advisers), common trustees and/or common officers. When such transactions occur, each transaction is executed at the current market price of the security and no brokerage commissions or fees are paid in accordance with Rule 17a-7 of the 1940 Act.
The following table presents purchase and sale transactions between each fund and related funds, and net realized gain or loss from such sales, if any, as of June 30, 2024 (dollars in thousands):
|
|
|
|
|
|
|
|
|
|
|
|
|
| Fund |
|
Purchases |
|
|
Sales |
|
|
Net realized gain (loss) |
|
| Global Growth Fund |
|
|
$185,363 |
|
|
|
$162,530 |
|
|
|
$100,137 |
|
| Global Small Capitalization Fund |
|
|
9,779 |
|
|
|
10,261 |
|
|
|
4,487 |
|
| Growth Fund |
|
|
276,084 |
|
|
|
113,332 |
|
|
|
33,608 |
|
| International Fund |
|
|
47,479 |
|
|
|
45,425 |
|
|
|
(9,681 |
) |
| New World Fund |
|
|
28,659 |
|
|
|
33,191 |
|
|
|
1,490 |
|
| Washington Mutual Investors Fund |
|
|
62,337 |
|
|
|
51,105 |
|
|
|
11,435 |
|
| Capital World Growth and Income Fund |
|
|
12,242 |
|
|
|
11,753 |
|
|
|
2,067 |
|
| Growth-Income Fund |
|
|
429,956 |
|
|
|
444,772 |
|
|
|
175,461 |
|
| International Growth and Income Fund |
|
|
2,925 |
|
|
|
1,842 |
|
|
|
(528 |
) |
| Capital Income Builder |
|
|
10,716 |
|
|
|
3,820 |
|
|
|
427 |
|
| Asset Allocation Fund |
|
|
149,337 |
|
|
|
34,973 |
|
|
|
8,303 |
|
| American Funds Global Balanced Fund |
|
|
2,168 |
|
|
|
4,003 |
|
|
|
1,180 |
|
| American High-Income Trust |
|
|
220 |
|
|
|
220 |
|
|
|
– |
|
8. Indemnifications
The series’ organizational documents provide board members and officers with indemnification against certain liabilities or expenses in connection with the performance of their duties to the series. In the normal course of business, the series may also enter into contracts that provide general indemnifications. Each fund’s maximum exposure under these arrangements is unknown since it is dependent on future claims that may be made against the series. The risk of material loss from such claims is considered remote. Insurance policies are also available to the series’ board members and officers.
9. Committed line of credit
Global Small Capitalization Fund, New World Fund and American High-Income Trust participate with other funds managed by CRMC in a $1.5 billion credit facility (the “line of credit”) to be utilized for temporary purposes to fund shareholder redemptions. Each fund has agreed to pay commitment fees on its pro-rata portion of the line of credit, which are reflected in other expenses in each fund’s statement of operations. None of the funds borrowed on this line of credit at any time during the six months ended June 30, 2024.
American Funds Insurance Series 314
10. Capital share transactions
Capital share transactions in each fund were as follows (dollars and shares in thousands):
Global Growth Fund
|
|
|
|
|
|
|
|
|
|
|
|
|
|
|
|
|
|
|
|
|
|
|
|
|
|
|
|
|
|
|
|
|
| |
|
Sales* |
|
|
Reinvestments of
distributions |
|
|
Repurchases* |
|
|
Net increase
(decrease) |
|
|
|
|
|
|
|
|
|
|
| Share class |
|
Amount |
|
|
Shares |
|
|
Amount |
|
|
Shares |
|
|
Amount |
|
|
Shares |
|
|
Amount |
|
|
Shares |
|
|
| Six months ended June 30, 2024 |
|
| Class 1 |
|
$ |
58,023 |
|
|
|
1,586 |
|
|
$ |
121,506 |
|
|
|
3,310 |
|
|
$ |
(311,481 |
) |
|
|
(8,480 |
) |
|
$ |
(131,952 |
) |
|
|
(3,584 |
) |
| Class 1A |
|
|
990 |
|
|
|
27 |
|
|
|
650 |
|
|
|
18 |
|
|
|
(1,496 |
) |
|
|
(41 |
) |
|
|
144 |
|
|
|
4 |
|
| Class 2 |
|
|
40,356 |
|
|
|
1,127 |
|
|
|
125,206 |
|
|
|
3,463 |
|
|
|
(325,272 |
) |
|
|
(9,039 |
) |
|
|
(159,710 |
) |
|
|
(4,449 |
) |
| Class 4 |
|
|
70,829 |
|
|
|
1,986 |
|
|
|
28,693 |
|
|
|
803 |
|
|
|
(39,460 |
) |
|
|
(1,106 |
) |
|
|
60,062 |
|
|
|
1,683 |
|
|
|
|
|
|
|
|
|
|
|
|
|
|
|
| Total net increase (decrease) |
|
$ |
170,198 |
|
|
|
4,726 |
|
|
$ |
276,055 |
|
|
|
7,594 |
|
|
$ |
(677,709 |
) |
|
|
(18,666 |
) |
|
$ |
(231,456 |
) |
|
|
(6,346 |
) |
|
|
|
|
|
|
| Year ended December 31, 2023 |
|
| Class 1 |
|
$ |
192,718 |
|
|
|
6,033 |
|
|
$ |
274,560 |
|
|
|
8,748 |
|
|
$ |
(540,248 |
) |
|
|
(16,855 |
) |
|
$ |
(72,970 |
) |
|
|
(2,074 |
) |
| Class 1A |
|
|
2,158 |
|
|
|
68 |
|
|
|
1,343 |
|
|
|
43 |
|
|
|
(2,107 |
) |
|
|
(66 |
) |
|
|
1,394 |
|
|
|
45 |
|
| Class 2 |
|
|
39,498 |
|
|
|
1,245 |
|
|
|
289,912 |
|
|
|
9,380 |
|
|
|
(438,910 |
) |
|
|
(13,838 |
) |
|
|
(109,500 |
) |
|
|
(3,213 |
) |
| Class 4 |
|
|
95,674 |
|
|
|
3,056 |
|
|
|
54,608 |
|
|
|
1,787 |
|
|
|
(77,844 |
) |
|
|
(2,499 |
) |
|
|
72,438 |
|
|
|
2,344 |
|
|
|
|
|
|
|
|
|
|
|
|
|
|
|
| Total net increase (decrease) |
|
$ |
330,048 |
|
|
|
10,402 |
|
|
$ |
620,423 |
|
|
|
19,958 |
|
|
$ |
(1,059,109 |
) |
|
|
(33,258 |
) |
|
$ |
(108,638 |
) |
|
|
(2,898 |
) |
|
|
|
|
|
Global Small Capitalization Fund
|
|
|
|
|
|
|
|
|
|
|
|
|
|
|
|
|
|
|
|
|
|
|
|
|
|
|
|
|
|
|
|
|
| |
|
Sales* |
|
|
Reinvestments of
distributions |
|
|
Repurchases* |
|
|
Net increase
(decrease) |
|
|
|
|
|
|
|
|
|
|
| Share class |
|
Amount |
|
|
Shares |
|
|
Amount |
|
|
Shares |
|
|
Amount |
|
|
Shares |
|
|
Amount |
|
|
Shares |
|
|
|
|
|
|
|
|
|
|
| Six months ended June 30, 2024 |
|
|
|
|
|
|
|
|
|
|
|
|
|
|
|
|
|
|
|
|
|
|
|
|
|
|
|
|
|
|
|
|
| Class 1 |
|
$ |
33,400 |
|
|
|
1,823 |
|
|
$ |
41,576 |
|
|
|
2,342 |
|
|
$ |
(73,779 |
) |
|
|
(3,995 |
) |
|
$ |
1,197 |
|
|
|
170 |
|
| Class 1A |
|
|
247 |
|
|
|
14 |
|
|
|
226 |
|
|
|
13 |
|
|
|
(260 |
) |
|
|
(14 |
) |
|
|
213 |
|
|
|
13 |
|
| Class 2 |
|
|
39,656 |
|
|
|
2,261 |
|
|
|
81,556 |
|
|
|
4,892 |
|
|
|
(138,161 |
) |
|
|
(7,948 |
) |
|
|
(16,949 |
) |
|
|
(795 |
) |
| Class 4 |
|
|
16,529 |
|
|
|
955 |
|
|
|
13,283 |
|
|
|
799 |
|
|
|
(21,271 |
) |
|
|
(1,225 |
) |
|
|
8,541 |
|
|
|
529 |
|
|
|
|
|
|
|
|
|
|
|
|
|
|
|
| Total net increase (decrease) |
|
$ |
89,832 |
|
|
|
5,053 |
|
|
$ |
136,641 |
|
|
|
8,046 |
|
|
$ |
(233,471 |
) |
|
|
(13,182 |
) |
|
$ |
(6,998 |
) |
|
|
(83 |
) |
|
|
|
|
|
|
| Year ended December 31, 2023 |
|
| Class 1 |
|
$ |
91,477 |
|
|
|
5,345 |
|
|
$ |
16,333 |
|
|
|
935 |
|
|
$ |
(152,565 |
) |
|
|
(8,792 |
) |
|
$ |
(44,755 |
) |
|
|
(2,512 |
) |
| Class 1A |
|
|
781 |
|
|
|
46 |
|
|
|
71 |
|
|
|
4 |
|
|
|
(530 |
) |
|
|
(31 |
) |
|
|
322 |
|
|
|
19 |
|
| Class 2 |
|
|
39,394 |
|
|
|
2,481 |
|
|
|
28,267 |
|
|
|
1,715 |
|
|
|
(197,235 |
) |
|
|
(11,995 |
) |
|
|
(129,574 |
) |
|
|
(7,799 |
) |
| Class 4 |
|
|
34,683 |
|
|
|
2,137 |
|
|
|
3,699 |
|
|
|
225 |
|
|
|
(36,779 |
) |
|
|
(2,285 |
) |
|
|
1,603 |
|
|
|
77 |
|
|
|
|
|
|
|
|
|
|
|
|
|
|
|
| Total net increase (decrease) |
|
$ |
166,335 |
|
|
|
10,009 |
|
|
$ |
48,370 |
|
|
|
2,879 |
|
|
$ |
(387,109 |
) |
|
|
(23,103 |
) |
|
$ |
(172,404 |
) |
|
|
(10,215 |
) |
|
|
|
|
|
Refer to the end of the tables for footnotes.
315 American Funds Insurance Series
Growth Fund
|
|
|
|
|
|
|
|
|
|
|
|
|
|
|
|
|
|
|
|
|
|
|
|
|
|
|
|
|
|
|
|
|
| |
|
Sales* |
|
|
Reinvestments of
distributions |
|
|
Repurchases* |
|
|
Net increase
(decrease) |
|
|
|
|
|
|
|
|
|
|
| Share class |
|
Amount |
|
|
Shares |
|
|
Amount |
|
|
Shares |
|
|
Amount |
|
|
Shares |
|
|
Amount |
|
|
Shares |
|
|
| Six months ended June 30, 2024 |
|
| Class 1 |
|
$ |
655,575 |
|
|
|
5,971 |
|
|
$ |
479,015 |
|
|
|
4,433 |
|
|
$ |
(1,195,371 |
) |
|
|
(11,103 |
) |
|
$ |
(60,781 |
) |
|
|
(699 |
) |
| Class 1A |
|
|
21,734 |
|
|
|
201 |
|
|
|
7,940 |
|
|
|
74 |
|
|
|
(16,090 |
) |
|
|
(156 |
) |
|
|
13,584 |
|
|
|
119 |
|
| Class 2 |
|
|
176,918 |
|
|
|
1,667 |
|
|
|
473,265 |
|
|
|
4,440 |
|
|
|
(1,542,724 |
) |
|
|
(14,509 |
) |
|
|
(892,541 |
) |
|
|
(8,402 |
) |
| Class 3 |
|
|
954 |
|
|
|
9 |
|
|
|
6,273 |
|
|
|
57 |
|
|
|
(15,223 |
) |
|
|
(138 |
) |
|
|
(7,996 |
) |
|
|
(72 |
) |
| Class 4 |
|
|
410,452 |
|
|
|
3,941 |
|
|
|
105,797 |
|
|
|
1,020 |
|
|
|
(168,884 |
) |
|
|
(1,630 |
) |
|
|
347,365 |
|
|
|
3,331 |
|
|
|
|
|
|
|
|
|
|
|
|
|
|
|
| Total net increase (decrease) |
|
$ |
1,265,633 |
|
|
|
11,789 |
|
|
$ |
1,072,290 |
|
|
|
10,024 |
|
|
$ |
(2,938,292 |
) |
|
|
(27,536 |
) |
|
$ |
(600,369 |
) |
|
|
(5,723 |
) |
|
|
|
|
|
|
| Year ended December 31, 2023 |
|
| Class 1 |
|
$ |
1,126,344 |
|
|
|
13,031 |
|
|
$ |
952,995 |
|
|
|
11,055 |
|
|
$ |
(2,473,911 |
) |
|
|
(28,345 |
) |
|
$ |
(394,572 |
) |
|
|
(4,259 |
) |
| Class 1A |
|
|
39,167 |
|
|
|
473 |
|
|
|
14,169 |
|
|
|
166 |
|
|
|
(24,617 |
) |
|
|
(280 |
) |
|
|
28,719 |
|
|
|
359 |
|
| Class 2 |
|
|
378,332 |
|
|
|
4,358 |
|
|
|
983,331 |
|
|
|
11,587 |
|
|
|
(2,226,251 |
) |
|
|
(25,522 |
) |
|
|
(864,588 |
) |
|
|
(9,577 |
) |
| Class 3 |
|
|
2,841 |
|
|
|
32 |
|
|
|
12,720 |
|
|
|
146 |
|
|
|
(23,828 |
) |
|
|
(268 |
) |
|
|
(8,267 |
) |
|
|
(90 |
) |
| Class 4 |
|
|
479,958 |
|
|
|
5,642 |
|
|
|
172,656 |
|
|
|
2,092 |
|
|
|
(306,686 |
) |
|
|
(3,644 |
) |
|
|
345,928 |
|
|
|
4,090 |
|
|
|
|
|
|
|
|
|
|
|
|
|
|
|
| Total net increase (decrease) |
|
$ |
2,026,642 |
|
|
|
23,536 |
|
|
$ |
2,135,871 |
|
|
|
25,046 |
|
|
$ |
(5,055,293 |
) |
|
|
(58,059 |
) |
|
$ |
(892,780 |
) |
|
|
(9,477 |
) |
|
|
|
|
|
International Fund
|
|
|
|
|
|
|
|
|
|
|
|
|
|
|
|
|
|
|
|
|
|
|
|
|
|
|
|
|
|
|
|
|
| |
|
Sales* |
|
|
Reinvestments of
distributions |
|
|
Repurchases* |
|
|
Net increase
(decrease) |
|
|
|
|
|
|
|
|
|
|
| Share class |
|
Amount |
|
|
Shares |
|
|
Amount |
|
|
Shares |
|
|
Amount |
|
|
Shares |
|
|
Amount |
|
|
Shares |
|
|
| Six months ended June 30, 2024 |
|
| Class 1 |
|
$ |
35,441 |
|
|
|
1,941 |
|
|
|
$ 8,265 |
|
|
|
441 |
|
|
$ |
(284,297 |
) |
|
|
(15,512 |
) |
|
$ |
(240,591 |
) |
|
|
(13,130 |
) |
| Class 1A |
|
|
883 |
|
|
|
50 |
|
|
|
26 |
|
|
|
1 |
|
|
|
(1,342 |
) |
|
|
(74 |
) |
|
|
(433 |
) |
|
|
(23 |
) |
| Class 2 |
|
|
182,063 |
|
|
|
10,178 |
|
|
|
7,183 |
|
|
|
385 |
|
|
|
(367,567 |
) |
|
|
(20,317 |
) |
|
|
(178,321 |
) |
|
|
(9,754 |
) |
| Class 3 |
|
|
– |
|
|
|
– |
|
|
|
36 |
|
|
|
2 |
|
|
|
(1,417 |
) |
|
|
(77 |
) |
|
|
(1,381 |
) |
|
|
(75 |
) |
| Class 4 |
|
|
25,219 |
|
|
|
1,407 |
|
|
|
781 |
|
|
|
43 |
|
|
|
(26,107 |
) |
|
|
(1,458 |
) |
|
|
(107 |
) |
|
|
(8 |
) |
|
|
|
|
|
|
|
|
|
|
|
|
|
|
| Total net increase (decrease) |
|
$ |
243,606 |
|
|
|
13,576 |
|
|
|
$16,291 |
|
|
|
872 |
|
|
$ |
(680,730 |
) |
|
|
(37,438 |
) |
|
$ |
(420,833 |
) |
|
|
(22,990 |
) |
|
|
|
|
|
|
| Year ended December 31, 2023 |
|
| Class 1 |
|
$ |
116,405 |
|
|
|
7,036 |
|
|
|
$50,154 |
|
|
|
3,024 |
|
|
$ |
(410,379 |
) |
|
|
(24,700 |
) |
|
$ |
(243,820 |
) |
|
|
(14,640 |
) |
| Class 1A |
|
|
1,488 |
|
|
|
90 |
|
|
|
150 |
|
|
|
9 |
|
|
|
(1,420 |
) |
|
|
(86 |
) |
|
|
218 |
|
|
|
13 |
|
| Class 2 |
|
|
132,534 |
|
|
|
7,999 |
|
|
|
42,608 |
|
|
|
2,582 |
|
|
|
(397,669 |
) |
|
|
(24,084 |
) |
|
|
(222,527 |
) |
|
|
(13,503 |
) |
| Class 3 |
|
|
199 |
|
|
|
12 |
|
|
|
219 |
|
|
|
13 |
|
|
|
(1,551 |
) |
|
|
(92 |
) |
|
|
(1,133 |
) |
|
|
(67 |
) |
| Class 4 |
|
|
41,507 |
|
|
|
2,540 |
|
|
|
4,367 |
|
|
|
269 |
|
|
|
(55,374 |
) |
|
|
(3,413 |
) |
|
|
(9,500 |
) |
|
|
(604 |
) |
|
|
|
|
|
|
|
|
|
|
|
|
|
|
| Total net increase (decrease) |
|
$ |
292,133 |
|
|
|
17,677 |
|
|
|
$97,498 |
|
|
|
5,897 |
|
|
$ |
(866,393 |
) |
|
|
(52,375 |
) |
|
$ |
(476,762 |
) |
|
|
(28,801 |
) |
|
|
|
|
|
Refer to the end of the tables for footnotes.
American Funds Insurance Series 316
New World Fund
|
|
|
|
|
|
|
|
|
|
|
|
|
|
|
|
|
|
|
|
|
|
|
|
|
|
|
|
|
|
|
|
|
| |
|
Sales* |
|
|
Reinvestments of
distributions |
|
|
Repurchases* |
|
|
Net increase
(decrease) |
|
|
|
|
|
|
|
|
|
|
| Share class |
|
Amount |
|
|
Shares |
|
|
Amount |
|
|
Shares |
|
|
Amount |
|
|
Shares |
|
|
Amount |
|
|
Shares |
|
|
| Six months ended June 30, 2024 |
|
| Class 1 |
|
$ |
167,382 |
|
|
|
6,188 |
|
|
$ |
15,367 |
|
|
|
576 |
|
|
$ |
(149,225 |
) |
|
|
(5,629 |
) |
|
$ |
33,524 |
|
|
|
1,135 |
|
| Class 1A |
|
|
300 |
|
|
|
12 |
|
|
|
87 |
|
|
|
3 |
|
|
|
(768 |
) |
|
|
(29 |
) |
|
|
(381 |
) |
|
|
(14 |
) |
| Class 2 |
|
|
59,646 |
|
|
|
2,310 |
|
|
|
6,829 |
|
|
|
259 |
|
|
|
(89,918 |
) |
|
|
(3,452 |
) |
|
|
(23,443 |
) |
|
|
(883 |
) |
| Class 4 |
|
|
35,488 |
|
|
|
1,373 |
|
|
|
6,446 |
|
|
|
247 |
|
|
|
(60,498 |
) |
|
|
(2,337 |
) |
|
|
(18,564 |
) |
|
|
(717 |
) |
|
|
|
|
|
|
|
|
|
|
|
|
|
|
| Total net increase (decrease) |
|
$ |
262,816 |
|
|
|
9,883 |
|
|
$ |
28,729 |
|
|
|
1,085 |
|
|
$ |
(300,409 |
) |
|
|
(11,447 |
) |
|
$ |
(8,864 |
) |
|
|
(479 |
) |
|
|
|
|
|
|
| Year ended December 31, 2023 |
|
| Class 1 |
|
$ |
86,114 |
|
|
|
3,585 |
|
|
$ |
28,772 |
|
|
|
1,188 |
|
|
$ |
(174,819 |
) |
|
|
(7,226 |
) |
|
$ |
(59,933 |
) |
|
|
(2,453 |
) |
| Class 1A |
|
|
1,115 |
|
|
|
47 |
|
|
|
146 |
|
|
|
6 |
|
|
|
(1,025 |
) |
|
|
(43 |
) |
|
|
236 |
|
|
|
10 |
|
| Class 2 |
|
|
59,693 |
|
|
|
2,497 |
|
|
|
11,303 |
|
|
|
473 |
|
|
|
(136,698 |
) |
|
|
(5,745 |
) |
|
|
(65,702 |
) |
|
|
(2,775 |
) |
| Class 4 |
|
|
71,676 |
|
|
|
3,024 |
|
|
|
9,222 |
|
|
|
389 |
|
|
|
(93,668 |
) |
|
|
(3,971 |
) |
|
|
(12,770 |
) |
|
|
(558 |
) |
|
|
|
|
|
|
|
|
|
|
|
|
|
|
| Total net increase (decrease) |
|
$ |
218,598 |
|
|
|
9,153 |
|
|
$ |
49,443 |
|
|
|
2,056 |
|
|
$ |
(406,210 |
) |
|
|
(16,985 |
) |
|
$ |
(138,169 |
) |
|
|
(5,776 |
) |
|
|
|
|
|
Washington Mutual Investors Fund
|
|
|
|
|
|
|
|
|
|
|
|
|
|
|
|
|
|
|
|
|
|
|
|
|
|
|
|
|
|
|
|
|
| |
|
Sales* |
|
|
Reinvestments of
distributions |
|
|
Repurchases* |
|
|
Net increase
(decrease) |
|
|
|
|
|
|
|
|
|
|
| Share class |
|
Amount |
|
|
Shares |
|
|
Amount |
|
|
Shares |
|
|
Amount |
|
|
Shares |
|
|
Amount |
|
|
Shares |
|
|
| Six months ended June 30, 2024 |
|
| Class 1 |
|
$ |
41,139 |
|
|
|
2,672 |
|
|
$ |
75,293 |
|
|
|
4,855 |
|
|
$ |
(447,475 |
) |
|
|
(29,070 |
) |
|
$ |
(331,043 |
) |
|
|
(21,543 |
) |
| Class 1A |
|
|
2,258 |
|
|
|
146 |
|
|
|
293 |
|
|
|
19 |
|
|
|
(1,605 |
) |
|
|
(107 |
) |
|
|
946 |
|
|
|
58 |
|
| Class 2 |
|
|
22,273 |
|
|
|
1,482 |
|
|
|
35,671 |
|
|
|
2,347 |
|
|
|
(233,377 |
) |
|
|
(15,531 |
) |
|
|
(175,433 |
) |
|
|
(11,702 |
) |
| Class 4 |
|
|
105,101 |
|
|
|
7,046 |
|
|
|
17,844 |
|
|
|
1,188 |
|
|
|
(50,841 |
) |
|
|
(3,435 |
) |
|
|
72,104 |
|
|
|
4,799 |
|
|
|
|
|
|
|
|
|
|
|
|
|
|
|
| Total net increase (decrease) |
|
$ |
170,771 |
|
|
|
11,346 |
|
|
$ |
129,101 |
|
|
|
8,409 |
|
|
$ |
(733,298 |
) |
|
|
(48,143 |
) |
|
$ |
(433,426 |
) |
|
|
(28,388 |
) |
|
|
|
|
|
|
| Year ended December 31, 2023 |
|
| Class 1 |
|
$ |
277,677 |
|
|
|
21,465 |
|
|
$ |
170,023 |
|
|
|
12,648 |
|
|
$ |
(697,429 |
) |
|
|
(52,419 |
) |
|
$ |
(249,729 |
) |
|
|
(18,306 |
) |
| Class 1A |
|
|
9,396 |
|
|
|
729 |
|
|
|
532 |
|
|
|
40 |
|
|
|
(54,463 |
) |
|
|
(4,239 |
) |
|
|
(44,535 |
) |
|
|
(3,470 |
) |
| Class 2 |
|
|
33,904 |
|
|
|
2,614 |
|
|
|
77,682 |
|
|
|
5,899 |
|
|
|
(358,013 |
) |
|
|
(27,290 |
) |
|
|
(246,427 |
) |
|
|
(18,777 |
) |
| Class 4 |
|
|
156,923 |
|
|
|
12,161 |
|
|
|
31,807 |
|
|
|
2,442 |
|
|
|
(102,800 |
) |
|
|
(7,983 |
) |
|
|
85,930 |
|
|
|
6,620 |
|
|
|
|
|
|
|
|
|
|
|
|
|
|
|
| Total net increase (decrease) |
|
$ |
477,900 |
|
|
|
36,969 |
|
|
$ |
280,044 |
|
|
|
21,029 |
|
|
$ |
(1,212,705 |
) |
|
|
(91,931 |
) |
|
$ |
(454,761 |
) |
|
|
(33,933 |
) |
|
|
|
|
|
Capital World Growth and Income Fund
|
|
|
|
|
|
|
|
|
|
|
|
|
|
|
|
|
|
|
|
|
|
|
|
|
|
|
|
|
|
|
|
|
| |
|
Sales* |
|
|
Reinvestments of
distributions |
|
|
Repurchases* |
|
|
Net increase
(decrease) |
|
|
|
|
|
|
|
|
|
|
| Share class |
|
Amount |
|
|
Shares |
|
|
Amount |
|
|
Shares |
|
|
Amount |
|
|
Shares |
|
|
Amount |
|
|
Shares |
|
|
| Six months ended June 30, 2024 |
|
| Class 1 |
|
$ |
14,937 |
|
|
|
1,023 |
|
|
$ |
2,432 |
|
|
|
162 |
|
|
$ |
(56,976 |
) |
|
|
(3,880 |
) |
|
$ |
(39,607 |
) |
|
|
(2,695 |
) |
| Class 1A |
|
|
754 |
|
|
|
54 |
|
|
|
32 |
|
|
|
3 |
|
|
|
(317 |
) |
|
|
(22 |
) |
|
|
469 |
|
|
|
35 |
|
| Class 2 |
|
|
5,731 |
|
|
|
393 |
|
|
|
4,049 |
|
|
|
271 |
|
|
|
(93,127 |
) |
|
|
(6,391 |
) |
|
|
(83,347 |
) |
|
|
(5,727 |
) |
| Class 4 |
|
|
12,505 |
|
|
|
880 |
|
|
|
910 |
|
|
|
62 |
|
|
|
(15,528 |
) |
|
|
(1,093 |
) |
|
|
(2,113 |
) |
|
|
(151 |
) |
|
|
|
|
|
|
|
|
|
|
|
|
|
|
| Total net increase (decrease) |
|
$ |
33,927 |
|
|
|
2,350 |
|
|
$ |
7,423 |
|
|
|
498 |
|
|
$ |
(165,948 |
) |
|
|
(11,386 |
) |
|
$ |
(124,598 |
) |
|
|
(8,538 |
) |
|
|
|
|
|
|
| Year ended December 31, 2023 |
|
| Class 1 |
|
$ |
65,556 |
|
|
|
5,277 |
|
|
$ |
11,348 |
|
|
|
873 |
|
|
$ |
(143,262 |
) |
|
|
(11,299 |
) |
|
$ |
(66,358 |
) |
|
|
(5,149 |
) |
| Class 1A |
|
|
755 |
|
|
|
60 |
|
|
|
126 |
|
|
|
9 |
|
|
|
(615 |
) |
|
|
(50 |
) |
|
|
266 |
|
|
|
19 |
|
| Class 2 |
|
|
13,750 |
|
|
|
1,078 |
|
|
|
18,495 |
|
|
|
1,427 |
|
|
|
(147,991 |
) |
|
|
(11,668 |
) |
|
|
(115,746 |
) |
|
|
(9,163 |
) |
| Class 4 |
|
|
31,436 |
|
|
|
2,536 |
|
|
|
3,732 |
|
|
|
296 |
|
|
|
(24,318 |
) |
|
|
(1,970 |
) |
|
|
10,850 |
|
|
|
862 |
|
|
|
|
|
|
|
|
|
|
|
|
|
|
|
| Total net increase (decrease) |
|
$ |
111,497 |
|
|
|
8,951 |
|
|
$ |
33,701 |
|
|
|
2,605 |
|
|
$ |
(316,186 |
) |
|
|
(24,987 |
) |
|
$ |
(170,988 |
) |
|
|
(13,431 |
) |
|
|
|
|
|
Refer to the end of the tables for footnotes.
317 American Funds Insurance Series
Growth-Income Fund
|
|
|
|
|
|
|
|
|
|
|
|
|
|
|
|
|
|
|
|
|
|
|
|
|
|
|
|
|
|
|
|
|
| |
|
Sales* |
|
|
Reinvestments of
distributions |
|
|
Repurchases* |
|
|
Net increase
(decrease) |
|
|
|
|
|
|
|
|
|
|
| Share class |
|
Amount |
|
|
Shares |
|
|
Amount |
|
|
Shares |
|
|
Amount |
|
|
Shares |
|
|
Amount |
|
|
Shares |
|
|
| Six months ended June 30, 2024 |
|
| Class 1 |
|
$ |
135,226 |
|
|
|
2,132 |
|
|
$ |
1,119,883 |
|
|
|
17,901 |
|
|
$ |
(1,713,135 |
) |
|
|
(26,985 |
) |
|
$ |
(458,026 |
) |
|
|
(6,952 |
) |
| Class 1A |
|
|
1,374 |
|
|
|
21 |
|
|
|
1,851 |
|
|
|
30 |
|
|
|
(2,255 |
) |
|
|
(36 |
) |
|
|
970 |
|
|
|
15 |
|
| Class 2 |
|
|
55,518 |
|
|
|
891 |
|
|
|
649,546 |
|
|
|
10,570 |
|
|
|
(1,046,975 |
) |
|
|
(16,786 |
) |
|
|
(341,911 |
) |
|
|
(5,325 |
) |
| Class 3 |
|
|
158 |
|
|
|
3 |
|
|
|
7,093 |
|
|
|
113 |
|
|
|
(9,594 |
) |
|
|
(152 |
) |
|
|
(2,343 |
) |
|
|
(36 |
) |
| Class 4 |
|
|
143,054 |
|
|
|
2,332 |
|
|
|
113,940 |
|
|
|
1,888 |
|
|
|
(91,232 |
) |
|
|
(1,492 |
) |
|
|
165,762 |
|
|
|
2,728 |
|
|
|
|
|
|
|
|
|
|
|
|
|
|
|
| Total net increase (decrease) |
|
$ |
335,330 |
|
|
|
5,379 |
|
|
$ |
1,892,313 |
|
|
|
30,502 |
|
|
$ |
(2,863,191 |
) |
|
|
(45,451 |
) |
|
$ |
(635,548 |
) |
|
|
(9,570 |
) |
|
|
|
|
|
|
| Year ended December 31, 2023 |
|
| Class 1 |
|
$ |
479,730 |
|
|
|
9,041 |
|
|
$ |
1,404,035 |
|
|
|
26,362 |
|
|
$ |
(2,739,803 |
) |
|
|
(50,914 |
) |
|
$ |
(856,038 |
) |
|
|
(15,511 |
) |
| Class 1A |
|
|
4,149 |
|
|
|
77 |
|
|
|
2,090 |
|
|
|
40 |
|
|
|
(4,268 |
) |
|
|
(80 |
) |
|
|
1,971 |
|
|
|
37 |
|
| Class 2 |
|
|
112,392 |
|
|
|
2,119 |
|
|
|
806,872 |
|
|
|
15,426 |
|
|
|
(1,545,914 |
) |
|
|
(29,027 |
) |
|
|
(626,650 |
) |
|
|
(11,482 |
) |
| Class 3 |
|
|
280 |
|
|
|
5 |
|
|
|
8,705 |
|
|
|
163 |
|
|
|
(14,068 |
) |
|
|
(259 |
) |
|
|
(5,083 |
) |
|
|
(91 |
) |
| Class 4 |
|
|
187,357 |
|
|
|
3,563 |
|
|
|
118,358 |
|
|
|
2,303 |
|
|
|
(175,879 |
) |
|
|
(3,369 |
) |
|
|
129,836 |
|
|
|
2,497 |
|
|
|
|
|
|
|
|
|
|
|
|
|
|
|
| Total net increase (decrease) |
|
$ |
783,908 |
|
|
|
14,805 |
|
|
$ |
2,340,060 |
|
|
|
44,294 |
|
|
$ |
(4,479,932 |
) |
|
|
(83,649 |
) |
|
$ |
(1,355,964 |
) |
|
|
(24,550 |
) |
|
|
|
|
|
International Growth and Income Fund
|
|
|
|
|
|
|
|
|
|
|
|
|
|
|
|
|
|
|
|
|
|
|
|
|
|
|
|
|
|
|
|
|
| |
|
Sales* |
|
|
Reinvestments of
distributions |
|
|
Repurchases* |
|
|
Net increase
(decrease) |
|
|
|
|
|
|
|
|
|
|
| Share class |
|
Amount |
|
|
Shares |
|
|
Amount |
|
|
Shares |
|
|
Amount |
|
|
Shares |
|
|
Amount |
|
|
Shares |
|
|
| Six months ended June 30, 2024 |
|
| Class 1 |
|
|
$ 1,145 |
|
|
|
109 |
|
|
|
$ 84 |
|
|
|
8 |
|
|
|
$ (1,067 |
) |
|
|
(101 |
) |
|
$ |
162 |
|
|
|
16 |
|
| Class 1A |
|
|
145 |
|
|
|
14 |
|
|
|
29 |
|
|
|
3 |
|
|
|
(764 |
) |
|
|
(77 |
) |
|
|
(590 |
) |
|
|
(60 |
) |
| Class 2 |
|
|
1,862 |
|
|
|
183 |
|
|
|
793 |
|
|
|
75 |
|
|
|
(17,931 |
) |
|
|
(1,742 |
) |
|
|
(15,276 |
) |
|
|
(1,484 |
) |
| Class 4 |
|
|
8,674 |
|
|
|
872 |
|
|
|
699 |
|
|
|
68 |
|
|
|
(9,207 |
) |
|
|
(917 |
) |
|
|
166 |
|
|
|
23 |
|
|
|
|
|
|
|
|
|
|
|
|
|
|
|
| Total net increase (decrease) |
|
|
$11,826 |
|
|
|
1,178 |
|
|
|
$1,605 |
|
|
|
154 |
|
|
|
$(28,969 |
) |
|
|
(2,837 |
) |
|
$ |
(15,538 |
) |
|
|
(1,505 |
) |
|
|
|
|
|
|
| Year ended December 31, 2023 |
|
| Class 1 |
|
|
$ 3,526 |
|
|
|
363 |
|
|
|
$ 394 |
|
|
|
41 |
|
|
|
$ (3,717 |
) |
|
|
(387 |
) |
|
$ |
203 |
|
|
|
17 |
|
| Class 1A |
|
|
1,556 |
|
|
|
164 |
|
|
|
151 |
|
|
|
17 |
|
|
|
(992 |
) |
|
|
(105 |
) |
|
|
715 |
|
|
|
76 |
|
| Class 2 |
|
|
3,978 |
|
|
|
424 |
|
|
|
3,950 |
|
|
|
423 |
|
|
|
(25,662 |
) |
|
|
(2,748 |
) |
|
|
(17,734 |
) |
|
|
(1,901 |
) |
| Class 4 |
|
|
24,171 |
|
|
|
2,625 |
|
|
|
3,138 |
|
|
|
342 |
|
|
|
(21,164 |
) |
|
|
(2,297 |
) |
|
|
6,145 |
|
|
|
670 |
|
|
|
|
|
|
|
|
|
|
|
|
|
|
|
| Total net increase (decrease) |
|
|
$33,231 |
|
|
|
3,576 |
|
|
|
$7,633 |
|
|
|
823 |
|
|
|
$(51,535 |
) |
|
|
(5,537 |
) |
|
$ |
(10,671 |
) |
|
|
(1,138 |
) |
|
|
|
|
|
Refer to the end of the tables for footnotes.
American Funds Insurance Series 318
Capital Income Builder
|
|
|
|
|
|
|
|
|
|
|
|
|
|
|
|
|
|
|
|
|
|
|
|
|
|
|
|
|
|
|
|
|
| |
|
Sales* |
|
|
Reinvestments of
distributions |
|
|
Repurchases* |
|
|
Net increase
(decrease) |
|
|
|
|
|
|
|
|
|
|
| Share class |
|
Amount |
|
|
Shares |
|
|
Amount |
|
|
Shares |
|
|
Amount |
|
|
Shares |
|
|
Amount |
|
|
Shares |
|
|
| Six months ended June 30, 2024 |
|
| Class 1 |
|
$ |
32,263 |
|
|
|
2,744 |
|
|
$ |
8,883 |
|
|
|
747 |
|
|
|
$ (30,017 |
) |
|
|
(2,538 |
) |
|
|
$11,129 |
|
|
|
953 |
|
| Class 1A |
|
|
353 |
|
|
|
30 |
|
|
|
127 |
|
|
|
11 |
|
|
|
(407 |
) |
|
|
(35 |
) |
|
|
73 |
|
|
|
6 |
|
| Class 2 |
|
|
758 |
|
|
|
65 |
|
|
|
182 |
|
|
|
15 |
|
|
|
(556 |
) |
|
|
(47 |
) |
|
|
384 |
|
|
|
33 |
|
| Class 4 |
|
|
28,293 |
|
|
|
2,403 |
|
|
|
6,154 |
|
|
|
519 |
|
|
|
(27,089 |
) |
|
|
(2,301 |
) |
|
|
7,358 |
|
|
|
621 |
|
|
|
|
|
|
|
|
|
|
|
|
|
|
|
| Total net increase (decrease) |
|
$ |
61,667 |
|
|
|
5,242 |
|
|
$ |
15,346 |
|
|
|
1,292 |
|
|
|
$ (58,069 |
) |
|
|
(4,921 |
) |
|
|
$18,944 |
|
|
|
1,613 |
|
|
|
|
|
|
|
| Year ended December 31, 2023 |
|
| Class 1 |
|
$ |
77,581 |
|
|
|
6,983 |
|
|
$ |
19,561 |
|
|
|
1,773 |
|
|
|
$ (60,168 |
) |
|
|
(5,393 |
) |
|
|
$36,974 |
|
|
|
3,363 |
|
| Class 1A |
|
|
524 |
|
|
|
47 |
|
|
|
290 |
|
|
|
26 |
|
|
|
(737 |
) |
|
|
(66 |
) |
|
|
77 |
|
|
|
7 |
|
| Class 2 |
|
|
1,719 |
|
|
|
155 |
|
|
|
410 |
|
|
|
37 |
|
|
|
(1,019 |
) |
|
|
(92 |
) |
|
|
1,110 |
|
|
|
100 |
|
| Class 4 |
|
|
50,560 |
|
|
|
4,553 |
|
|
|
14,650 |
|
|
|
1,330 |
|
|
|
(60,170 |
) |
|
|
(5,412 |
) |
|
|
5,040 |
|
|
|
471 |
|
|
|
|
|
|
|
|
|
|
|
|
|
|
|
| Total net increase (decrease) |
|
$ |
130,384 |
|
|
|
11,738 |
|
|
$ |
34,911 |
|
|
|
3,166 |
|
|
|
$(122,094 |
) |
|
|
(10,963 |
) |
|
|
$43,201 |
|
|
|
3,941 |
|
|
|
|
|
|
Asset Allocation Fund
|
|
|
|
|
|
|
|
|
|
|
|
|
|
|
|
|
|
|
|
|
|
|
|
|
|
|
|
|
|
|
|
|
| |
|
Sales* |
|
|
Reinvestments of
distributions |
|
|
Repurchases* |
|
|
Net increase
(decrease) |
|
|
|
|
|
|
|
|
|
|
| Share class |
|
Amount |
|
|
Shares |
|
|
Amount |
|
|
Shares |
|
|
Amount |
|
|
Shares |
|
|
Amount |
|
|
Shares |
|
|
| Six months ended June 30, 2024 |
|
| Class 1 |
|
$ |
76,518 |
|
|
|
3,092 |
|
|
$ |
758,398 |
|
|
|
31,274 |
|
|
$ |
(1,025,451 |
) |
|
|
(41,314 |
) |
|
$ |
(190,535 |
) |
|
|
(6,948 |
) |
| Class 1A |
|
|
804 |
|
|
|
32 |
|
|
|
1,576 |
|
|
|
65 |
|
|
|
(2,356 |
) |
|
|
(97 |
) |
|
|
24 |
|
|
|
– |
† |
| Class 2 |
|
|
26,922 |
|
|
|
1,105 |
|
|
|
207,902 |
|
|
|
8,706 |
|
|
|
(320,327 |
) |
|
|
(13,108 |
) |
|
|
(85,503 |
) |
|
|
(3,297 |
) |
| Class 3 |
|
|
526 |
|
|
|
21 |
|
|
|
1,473 |
|
|
|
61 |
|
|
|
(1,675 |
) |
|
|
(69 |
) |
|
|
324 |
|
|
|
13 |
|
| Class 4 |
|
|
411,381 |
|
|
|
17,039 |
|
|
|
306,992 |
|
|
|
12,975 |
|
|
|
(312,917 |
) |
|
|
(12,896 |
) |
|
|
405,456 |
|
|
|
17,118 |
|
|
|
|
|
|
|
|
|
|
|
|
|
|
|
| Total net increase (decrease) |
|
$ |
516,151 |
|
|
|
21,289 |
|
|
$ |
1,276,341 |
|
|
|
53,081 |
|
|
$ |
(1,662,726 |
) |
|
|
(67,484 |
) |
|
$ |
129,766 |
|
|
|
6,886 |
|
|
|
|
|
|
|
| Year ended December 31, 2023 |
|
| Class 1 |
|
$ |
315,966 |
|
|
|
14,009 |
|
|
$ |
942,218 |
|
|
|
42,101 |
|
|
$ |
(1,956,417 |
) |
|
|
(86,110 |
) |
|
$ |
(698,233 |
) |
|
|
(30,000 |
) |
| Class 1A |
|
|
6,331 |
|
|
|
281 |
|
|
|
1,702 |
|
|
|
77 |
|
|
|
(4,607 |
) |
|
|
(204 |
) |
|
|
3,426 |
|
|
|
154 |
|
| Class 2 |
|
|
42,695 |
|
|
|
1,904 |
|
|
|
254,377 |
|
|
|
11,536 |
|
|
|
(565,941 |
) |
|
|
(25,320 |
) |
|
|
(268,869 |
) |
|
|
(11,880 |
) |
| Class 3 |
|
|
436 |
|
|
|
19 |
|
|
|
1,741 |
|
|
|
78 |
|
|
|
(2,528 |
) |
|
|
(111 |
) |
|
|
(351 |
) |
|
|
(14 |
) |
| Class 4 |
|
|
217,843 |
|
|
|
9,818 |
|
|
|
326,200 |
|
|
|
14,919 |
|
|
|
(516,978 |
) |
|
|
(23,318 |
) |
|
|
27,065 |
|
|
|
1,419 |
|
|
|
|
|
|
|
|
|
|
|
|
|
|
|
| Total net increase (decrease) |
|
$ |
583,271 |
|
|
|
26,031 |
|
|
$ |
1,526,238 |
|
|
|
68,711 |
|
|
$ |
(3,046,471 |
) |
|
|
(135,063 |
) |
|
$ |
(936,962 |
) |
|
|
(40,321 |
) |
|
|
|
|
|
Refer to the end of the tables for footnotes.
319 American Funds Insurance Series
American Funds Global Balanced Fund
|
|
|
|
|
|
|
|
|
|
|
|
|
|
|
|
|
|
|
|
|
|
|
|
|
|
|
|
|
|
|
|
|
| |
|
Sales* |
|
|
Reinvestments of
distributions |
|
|
Repurchases* |
|
|
Net increase
(decrease) |
|
|
|
|
|
|
|
|
|
|
| Share class |
|
Amount |
|
|
Shares |
|
|
Amount |
|
|
Shares |
|
|
Amount |
|
|
Shares |
|
|
Amount |
|
|
Shares |
|
|
| Six months ended June 30, 2024 |
|
| Class 1 |
|
|
$ 2,027 |
|
|
|
162 |
|
|
|
$ 485 |
|
|
|
38 |
|
|
|
$ (5,427 |
) |
|
|
(430 |
) |
|
|
$ (2,915 |
) |
|
|
(230 |
) |
| Class 1A |
|
|
86 |
|
|
|
7 |
|
|
|
13 |
|
|
|
1 |
|
|
|
(227 |
) |
|
|
(17 |
) |
|
|
(128 |
) |
|
|
(9 |
) |
| Class 2 |
|
|
1,622 |
|
|
|
130 |
|
|
|
721 |
|
|
|
57 |
|
|
|
(11,544 |
) |
|
|
(920 |
) |
|
|
(9,201 |
) |
|
|
(733 |
) |
| Class 4 |
|
|
8,164 |
|
|
|
659 |
|
|
|
577 |
|
|
|
46 |
|
|
|
(7,408 |
) |
|
|
(598 |
) |
|
|
1,333 |
|
|
|
107 |
|
|
|
|
|
|
|
|
|
|
|
|
|
|
|
| Total net increase (decrease) |
|
|
$11,899 |
|
|
|
958 |
|
|
|
$ 1,796 |
|
|
|
142 |
|
|
|
$(24,606 |
) |
|
|
(1,965 |
) |
|
|
$(10,911 |
) |
|
|
(865 |
) |
|
|
|
|
|
|
| Year ended December 31, 2023 |
|
| Class 1 |
|
|
$24,292 |
|
|
|
2,019 |
|
|
|
$13,166 |
|
|
|
1,134 |
|
|
|
$(35,782 |
) |
|
|
(2,948 |
) |
|
|
$ 1,676 |
|
|
|
205 |
|
| Class 1A |
|
|
85 |
|
|
|
7 |
|
|
|
353 |
|
|
|
31 |
|
|
|
(220 |
) |
|
|
(18 |
) |
|
|
218 |
|
|
|
20 |
|
| Class 2 |
|
|
4,268 |
|
|
|
348 |
|
|
|
21,444 |
|
|
|
1,856 |
|
|
|
(22,190 |
) |
|
|
(1,820 |
) |
|
|
3,522 |
|
|
|
384 |
|
| Class 4 |
|
|
14,257 |
|
|
|
1,202 |
|
|
|
15,977 |
|
|
|
1,406 |
|
|
|
(12,127 |
) |
|
|
(1,019 |
) |
|
|
18,107 |
|
|
|
1,589 |
|
|
|
|
|
|
|
|
|
|
|
|
|
|
|
| Total net increase (decrease) |
|
|
$42,902 |
|
|
|
3,576 |
|
|
|
$50,940 |
|
|
|
4,427 |
|
|
|
$(70,319 |
) |
|
|
(5,805 |
) |
|
|
$23,523 |
|
|
|
2,198 |
|
|
|
|
|
|
The Bond Fund of America
|
|
|
|
|
|
|
|
|
|
|
|
|
|
|
|
|
|
|
|
|
|
|
|
|
|
|
|
|
|
|
|
|
| |
|
Sales* |
|
|
Reinvestments of
distributions |
|
|
Repurchases* |
|
|
Net increase
(decrease) |
|
|
|
|
|
|
|
|
|
|
| Share class |
|
Amount |
|
|
Shares |
|
|
Amount |
|
|
Shares |
|
|
Amount |
|
|
Shares |
|
|
Amount |
|
|
Shares |
|
|
| Six months ended June 30, 2024 |
|
| Class 1 |
|
$ |
595,645 |
|
|
|
63,533 |
|
|
$ |
48,579 |
|
|
|
5,162 |
|
|
$ |
(403,488 |
) |
|
|
(42,951 |
) |
|
$ |
240,736 |
|
|
|
25,744 |
|
| Class 1A |
|
|
18,171 |
|
|
|
1,943 |
|
|
|
1,353 |
|
|
|
145 |
|
|
|
(64,102 |
) |
|
|
(6,883 |
) |
|
|
(44,578 |
) |
|
|
(4,795 |
) |
| Class 2 |
|
|
66,146 |
|
|
|
7,142 |
|
|
|
18,656 |
|
|
|
2,013 |
|
|
|
(117,606 |
) |
|
|
(12,696 |
) |
|
|
(32,804 |
) |
|
|
(3,541 |
) |
| Class 4 |
|
|
145,085 |
|
|
|
15,770 |
|
|
|
6,606 |
|
|
|
717 |
|
|
|
(42,689 |
) |
|
|
(4,635 |
) |
|
|
109,002 |
|
|
|
11,852 |
|
|
|
|
|
|
|
|
|
|
|
|
|
|
|
| Total net increase (decrease) |
|
$ |
825,047 |
|
|
|
88,388 |
|
|
$ |
75,194 |
|
|
|
8,037 |
|
|
$ |
(627,885 |
) |
|
|
(67,165 |
) |
|
$ |
272,356 |
|
|
|
29,260 |
|
|
|
|
|
|
|
| Year ended December 31, 2023 |
|
| Class 1 |
|
$ |
988,201 |
|
|
|
104,121 |
|
|
$ |
244,526 |
|
|
|
26,118 |
|
|
$ |
(784,964 |
) |
|
|
(82,958 |
) |
|
$ |
447,763 |
|
|
|
47,281 |
|
| Class 1A |
|
|
47,994 |
|
|
|
5,083 |
|
|
|
8,577 |
|
|
|
923 |
|
|
|
(22,212 |
) |
|
|
(2,334 |
) |
|
|
34,359 |
|
|
|
3,672 |
|
| Class 2 |
|
|
129,127 |
|
|
|
13,768 |
|
|
|
97,823 |
|
|
|
10,606 |
|
|
|
(228,846 |
) |
|
|
(24,571 |
) |
|
|
(1,896 |
) |
|
|
(197 |
) |
| Class 4 |
|
|
200,494 |
|
|
|
21,589 |
|
|
|
30,097 |
|
|
|
3,279 |
|
|
|
(66,304 |
) |
|
|
(7,144 |
) |
|
|
164,287 |
|
|
|
17,724 |
|
|
|
|
|
|
|
|
|
|
|
|
|
|
|
| Total net increase (decrease) |
|
$ |
1,365,816 |
|
|
|
144,561 |
|
|
$ |
381,023 |
|
|
|
40,926 |
|
|
$ |
(1,102,326 |
) |
|
|
(117,007 |
) |
|
$ |
644,513 |
|
|
|
68,480 |
|
|
|
|
|
|
Capital World Bond Fund
|
|
|
|
|
|
|
|
|
|
|
|
|
|
|
|
|
|
|
|
|
|
|
|
|
|
|
|
|
|
|
|
|
| |
|
Sales* |
|
|
Reinvestments of
distributions |
|
|
Repurchases* |
|
|
Net increase
(decrease) |
|
|
|
|
|
|
|
|
|
|
| Share class |
|
Amount |
|
|
Shares |
|
|
Amount |
|
|
Shares |
|
|
Amount |
|
|
Shares |
|
|
Amount |
|
|
Shares |
|
|
| Six months ended June 30, 2024 |
|
| Class 1 |
|
$ |
27,413 |
|
|
|
2,783 |
|
|
|
$1,932 |
|
|
|
196 |
|
|
$ |
(35,609 |
) |
|
|
(3,610 |
) |
|
$ |
(6,264 |
) |
|
|
(631 |
) |
| Class 1A |
|
|
36,344 |
|
|
|
3,728 |
|
|
|
122 |
|
|
|
12 |
|
|
|
(629 |
) |
|
|
(64 |
) |
|
|
35,837 |
|
|
|
3,676 |
|
| Class 2 |
|
|
67,843 |
|
|
|
6,954 |
|
|
|
574 |
|
|
|
59 |
|
|
|
(66,333 |
) |
|
|
(6,796 |
) |
|
|
2,084 |
|
|
|
217 |
|
| Class 4 |
|
|
5,705 |
|
|
|
596 |
|
|
|
— |
|
|
|
— |
|
|
|
(3,613 |
) |
|
|
(378 |
) |
|
|
2,092 |
|
|
|
218 |
|
|
|
|
|
|
|
|
|
|
|
|
|
|
|
| Total net increase (decrease) |
|
$ |
137,305 |
|
|
|
14,061 |
|
|
|
$2,628 |
|
|
|
267 |
|
|
$ |
(106,184 |
) |
|
|
(10,848 |
) |
|
$ |
33,749 |
|
|
|
3,480 |
|
|
|
|
|
|
|
| Year ended December 31, 2023 |
|
| Class 1 |
|
$ |
41,684 |
|
|
|
4,293 |
|
|
|
$ – |
|
|
|
– |
|
|
$ |
(80,001 |
) |
|
|
(8,267 |
) |
|
$ |
(38,317 |
) |
|
|
(3,974 |
) |
| Class 1A |
|
|
206 |
|
|
|
21 |
|
|
|
– |
|
|
|
– |
|
|
|
(169 |
) |
|
|
(17 |
) |
|
|
37 |
|
|
|
4 |
|
| Class 2 |
|
|
88,520 |
|
|
|
9,189 |
|
|
|
– |
|
|
|
– |
|
|
|
(82,729 |
) |
|
|
(8,647 |
) |
|
|
5,791 |
|
|
|
542 |
|
| Class 4 |
|
|
7,131 |
|
|
|
757 |
|
|
|
– |
|
|
|
– |
|
|
|
(6,337 |
) |
|
|
(672 |
) |
|
|
794 |
|
|
|
85 |
|
|
|
|
|
|
|
|
|
|
|
|
|
|
|
| Total net increase (decrease) |
|
$ |
137,541 |
|
|
|
14,260 |
|
|
|
$ – |
|
|
|
– |
|
|
$ |
(169,236 |
) |
|
|
(17,603 |
) |
|
$ |
(31,695 |
) |
|
|
(3,343 |
) |
|
|
|
|
|
Refer to the end of the tables for footnotes.
American Funds Insurance Series 320
American High-Income Trust
|
|
|
|
|
|
|
|
|
|
|
|
|
|
|
|
|
|
|
|
|
|
|
|
|
|
|
|
|
|
|
|
|
| |
|
Sales* |
|
|
Reinvestments of
distributions |
|
|
Repurchases* |
|
|
Net increase
(decrease) |
|
|
|
|
|
|
|
|
|
|
| Share class |
|
Amount |
|
|
Shares |
|
|
Amount |
|
|
Shares |
|
|
Amount |
|
|
Shares |
|
|
Amount |
|
|
Shares |
|
|
| Six months ended June 30, 2024 |
|
| Class 1 |
|
|
$ 5,678 |
|
|
|
623 |
|
|
|
$ 2,559 |
|
|
|
279 |
|
|
|
$ (10,564 |
) |
|
|
(1,163 |
) |
|
|
$ (2,327 |
) |
|
|
(261 |
) |
| Class 1A |
|
|
415 |
|
|
|
46 |
|
|
|
33 |
|
|
|
3 |
|
|
|
(228 |
) |
|
|
(25 |
) |
|
|
220 |
|
|
|
24 |
|
| Class 2 |
|
|
7,238 |
|
|
|
816 |
|
|
|
5,988 |
|
|
|
670 |
|
|
|
(31,812 |
) |
|
|
(3,583 |
) |
|
|
(18,586 |
) |
|
|
(2,097 |
) |
| Class 3 |
|
|
68 |
|
|
|
7 |
|
|
|
89 |
|
|
|
10 |
|
|
|
(666 |
) |
|
|
(73 |
) |
|
|
(509 |
) |
|
|
(56 |
) |
| Class 4 |
|
|
44,496 |
|
|
|
4,502 |
|
|
|
1,188 |
|
|
|
119 |
|
|
|
(30,453 |
) |
|
|
(3,094 |
) |
|
|
15,231 |
|
|
|
1,527 |
|
|
|
|
|
|
|
|
|
|
|
|
|
|
|
| Total net increase (decrease) |
|
|
$57,895 |
|
|
|
5,994 |
|
|
|
$ 9,857 |
|
|
|
1,081 |
|
|
|
$ (73,723 |
) |
|
|
(7,938 |
) |
|
|
$ (5,971 |
) |
|
|
(863 |
) |
|
|
|
|
|
|
| Year ended December 31, 2023 |
|
| Class 1 |
|
|
$ 4,239 |
|
|
|
480 |
|
|
|
$15,199 |
|
|
|
1,751 |
|
|
|
$ (30,729 |
) |
|
|
(3,495 |
) |
|
|
$(11,291 |
) |
|
|
(1,264 |
) |
| Class 1A |
|
|
1,264 |
|
|
|
146 |
|
|
|
171 |
|
|
|
20 |
|
|
|
(180 |
) |
|
|
(20 |
) |
|
|
1,255 |
|
|
|
146 |
|
| Class 2 |
|
|
12,480 |
|
|
|
1,448 |
|
|
|
36,273 |
|
|
|
4,277 |
|
|
|
(61,378 |
) |
|
|
(7,129 |
) |
|
|
(12,625 |
) |
|
|
(1,404 |
) |
| Class 3 |
|
|
178 |
|
|
|
20 |
|
|
|
556 |
|
|
|
64 |
|
|
|
(1,269 |
) |
|
|
(144 |
) |
|
|
(535 |
) |
|
|
(60 |
) |
| Class 4 |
|
|
55,861 |
|
|
|
5,819 |
|
|
|
5,958 |
|
|
|
629 |
|
|
|
(35,851 |
) |
|
|
(3,767 |
) |
|
|
25,968 |
|
|
|
2,681 |
|
|
|
|
|
|
|
|
|
|
|
|
|
|
|
| Total net increase (decrease) |
|
|
$74,022 |
|
|
|
7,913 |
|
|
|
$58,157 |
|
|
|
6,741 |
|
|
|
$(129,407 |
) |
|
|
(14,555 |
) |
|
|
$ 2,772 |
|
|
|
99 |
|
|
|
|
|
|
American Funds Mortgage Fund
|
|
|
|
|
|
|
|
|
|
|
|
|
|
|
|
|
|
|
|
|
|
|
|
|
|
|
|
|
|
|
|
|
| |
|
Sales* |
|
|
Reinvestments of
distributions |
|
|
Repurchases* |
|
|
Net increase
(decrease) |
|
|
|
|
|
|
|
|
|
|
| Share class |
|
Amount |
|
|
Shares |
|
|
Amount |
|
|
Shares |
|
|
Amount |
|
|
Shares |
|
|
Amount |
|
|
Shares |
|
|
| Six months ended June 30, 2024 |
|
| Class 1 |
|
|
$ 115 |
|
|
|
12 |
|
|
|
$ 136 |
|
|
|
15 |
|
|
|
$ (145 |
) |
|
|
(16 |
) |
|
|
$ 106 |
|
|
|
11 |
|
| Class 1A |
|
|
441 |
|
|
|
48 |
|
|
|
18 |
|
|
|
2 |
|
|
|
(80 |
) |
|
|
(8 |
) |
|
|
379 |
|
|
|
42 |
|
| Class 2 |
|
|
1,859 |
|
|
|
203 |
|
|
|
341 |
|
|
|
37 |
|
|
|
(2,244 |
) |
|
|
(245 |
) |
|
|
(44 |
) |
|
|
(5 |
) |
| Class 4 |
|
|
6,219 |
|
|
|
686 |
|
|
|
360 |
|
|
|
40 |
|
|
|
(2,298 |
) |
|
|
(254 |
) |
|
|
4,281 |
|
|
|
472 |
|
|
|
|
|
|
|
|
|
|
|
|
|
|
|
| Total net increase (decrease) |
|
|
$ 8,634 |
|
|
|
949 |
|
|
|
$ 855 |
|
|
|
94 |
|
|
|
$ (4,767 |
) |
|
|
(523 |
) |
|
|
$ 4,722 |
|
|
|
520 |
|
|
|
|
|
|
|
| Year ended December 31, 2023 |
|
| Class 1 |
|
|
$15,434 |
|
|
|
1,633 |
|
|
|
$ 656 |
|
|
|
71 |
|
|
|
$(274 |
) |
|
|
(29 |
) |
|
|
$15,816 |
|
|
|
1,675 |
|
| Class 1A |
|
|
494 |
|
|
|
53 |
|
|
|
71 |
|
|
|
8 |
|
|
|
(343 |
) |
|
|
(37 |
) |
|
|
222 |
|
|
|
24 |
|
| Class 2 |
|
|
1,572 |
|
|
|
168 |
|
|
|
1,634 |
|
|
|
178 |
|
|
|
(5,679 |
) |
|
|
(604 |
) |
|
|
(2,473 |
) |
|
|
(258 |
) |
| Class 4 |
|
|
11,209 |
|
|
|
1,208 |
|
|
|
1,600 |
|
|
|
177 |
|
|
|
(7,433 |
) |
|
|
(812 |
) |
|
|
5,376 |
|
|
|
573 |
|
|
|
|
|
|
|
|
|
|
|
|
|
|
|
| Total net increase (decrease) |
|
|
$28,709 |
|
|
|
3,062 |
|
|
|
$3,961 |
|
|
|
434 |
|
|
|
$(13,729 |
) |
|
|
(1,482 |
) |
|
|
$18,941 |
|
|
|
2,014 |
|
|
|
|
|
|
Refer to the end of the tables for footnotes.
321 American Funds Insurance Series
Ultra-Short Bond Fund
|
|
|
|
|
|
|
|
|
|
|
|
|
|
|
|
|
|
|
|
|
|
|
|
|
|
|
|
|
|
|
|
|
| |
|
Sales* |
|
|
Reinvestments of
distributions |
|
|
Repurchases* |
|
|
Net increase
(decrease) |
|
|
|
|
|
|
|
|
|
|
| Share class |
|
Amount |
|
|
Shares |
|
|
Amount |
|
|
Shares |
|
|
Amount |
|
|
Shares |
|
|
Amount |
|
|
Shares |
|
|
| Six months ended June 30, 2024 |
|
| Class 1 |
|
|
$ 9,814 |
|
|
|
854 |
|
|
|
$ 368 |
|
|
|
32 |
|
|
|
$ (12,283 |
) |
|
|
(1,064 |
) |
|
|
$ (2,101 |
) |
|
|
(178 |
) |
| Class 1A |
|
|
– |
|
|
|
– |
|
|
|
1 |
|
|
|
1 |
|
|
|
– |
|
|
|
– |
|
|
|
1 |
|
|
|
1 |
|
| Class 2 |
|
|
28,923 |
|
|
|
2,603 |
|
|
|
2,445 |
|
|
|
220 |
|
|
|
(45,277 |
) |
|
|
(4,082 |
) |
|
|
(13,909 |
) |
|
|
(1,259 |
) |
| Class 3 |
|
|
2 |
|
|
|
– |
† |
|
|
36 |
|
|
|
3 |
|
|
|
(432 |
) |
|
|
(38 |
) |
|
|
(394 |
) |
|
|
(35 |
) |
| Class 4 |
|
|
6,619 |
|
|
|
592 |
|
|
|
449 |
|
|
|
40 |
|
|
|
(13,658 |
) |
|
|
(1,226 |
) |
|
|
(6,590 |
) |
|
|
(594 |
) |
|
|
|
|
|
|
|
|
|
|
|
|
|
|
| Total net increase (decrease) |
|
|
$45,358 |
|
|
|
4,049 |
|
|
|
$3,299 |
|
|
|
296 |
|
|
|
$ (71,650 |
) |
|
|
(6,410 |
) |
|
|
$(22,993 |
) |
|
|
(2,065 |
) |
|
|
|
|
|
|
| Year ended December 31, 2023 |
|
| Class 1 |
|
|
$15,301 |
|
|
|
1,322 |
|
|
|
$ 1,981 |
|
|
|
175 |
|
|
|
$ (27,332 |
) |
|
|
(2,377 |
) |
|
|
$(10,050 |
) |
|
|
(880 |
) |
| Class 1A |
|
|
104 |
|
|
|
9 |
|
|
|
5 |
|
|
|
– |
† |
|
|
– |
|
|
|
– |
|
|
|
109 |
|
|
|
9 |
|
| Class 2 |
|
|
49,580 |
|
|
|
4,448 |
|
|
|
12,823 |
|
|
|
1,169 |
|
|
|
(87,341 |
) |
|
|
(7,830 |
) |
|
|
(24,938 |
) |
|
|
(2,213 |
) |
| Class 3 |
|
|
319 |
|
|
|
28 |
|
|
|
198 |
|
|
|
17 |
|
|
|
(579 |
) |
|
|
(51 |
) |
|
|
(62 |
) |
|
|
(6 |
) |
| Class 4 |
|
|
32,945 |
|
|
|
2,924 |
|
|
|
2,524 |
|
|
|
229 |
|
|
|
(60,576 |
) |
|
|
(5,393 |
) |
|
|
(25,107 |
) |
|
|
(2,240 |
) |
|
|
|
|
|
|
|
|
|
|
|
|
|
|
| Total net increase (decrease) |
|
|
$98,249 |
|
|
|
8,731 |
|
|
|
$17,531 |
|
|
|
1,590 |
|
|
|
$(175,828 |
) |
|
|
(15,651 |
) |
|
|
$(60,048 |
) |
|
|
(5,330 |
) |
|
|
|
|
|
U.S. Government Securities Fund
|
|
|
|
|
|
|
|
|
|
|
|
|
|
|
|
|
|
|
|
|
|
|
|
|
|
|
|
|
|
|
|
|
| |
|
Sales* |
|
|
Reinvestments of
distributions |
|
|
Repurchases* |
|
|
Net increase
(decrease) |
|
|
|
|
|
|
|
|
|
|
| Share class |
|
Amount |
|
|
Shares |
|
|
Amount |
|
|
Shares |
|
|
Amount |
|
|
Shares |
|
|
Amount |
|
|
Shares |
|
|
| Six months ended June 30, 2024 |
|
| Class 1 |
|
|
$ 30,407 |
|
|
|
3,120 |
|
|
|
$ 1,747 |
|
|
|
180 |
|
|
|
$ (26,853 |
) |
|
|
(2,757 |
) |
|
|
$ 5,301 |
|
|
|
543 |
|
| Class 1A |
|
|
209,387 |
|
|
|
21,674 |
|
|
|
1,537 |
|
|
|
159 |
|
|
|
(2,087 |
) |
|
|
(215 |
) |
|
|
208,837 |
|
|
|
21,618 |
|
| Class 2 |
|
|
58,108 |
|
|
|
6,044 |
|
|
|
7,184 |
|
|
|
748 |
|
|
|
(61,637 |
) |
|
|
(6,412 |
) |
|
|
3,655 |
|
|
|
380 |
|
| Class 3 |
|
|
680 |
|
|
|
69 |
|
|
|
34 |
|
|
|
3 |
|
|
|
(1,355 |
) |
|
|
(138 |
) |
|
|
(641 |
) |
|
|
(66 |
) |
| Class 4 |
|
|
24,266 |
|
|
|
2,530 |
|
|
|
1,165 |
|
|
|
122 |
|
|
|
(20,622 |
) |
|
|
(2,155 |
) |
|
|
4,809 |
|
|
|
497 |
|
|
|
|
|
|
|
|
|
|
|
|
|
|
|
| Total net increase (decrease) |
|
|
$322,848 |
|
|
|
33,437 |
|
|
|
$11,667 |
|
|
|
1,212 |
|
|
|
$(112,554 |
) |
|
|
(11,677 |
) |
|
|
$221,961 |
|
|
|
22,972 |
|
|
|
|
|
|
|
| Year ended December 31, 2023 |
|
| Class 1 |
|
|
$ 55,970 |
|
|
|
5,604 |
|
|
|
$ 9,373 |
|
|
|
959 |
|
|
|
$ (47,478 |
) |
|
|
(4,765 |
) |
|
|
$ 17,865 |
|
|
|
1,798 |
|
| Class 1A |
|
|
1,646 |
|
|
|
166 |
|
|
|
171 |
|
|
|
18 |
|
|
|
(905 |
) |
|
|
(92 |
) |
|
|
912 |
|
|
|
92 |
|
| Class 2 |
|
|
89,575 |
|
|
|
9,065 |
|
|
|
39,206 |
|
|
|
4,068 |
|
|
|
(104,906 |
) |
|
|
(10,680 |
) |
|
|
23,875 |
|
|
|
2,453 |
|
| Class 3 |
|
|
185 |
|
|
|
19 |
|
|
|
219 |
|
|
|
22 |
|
|
|
(967 |
) |
|
|
(97 |
) |
|
|
(563 |
) |
|
|
(56 |
) |
| Class 4 |
|
|
58,408 |
|
|
|
5,912 |
|
|
|
6,275 |
|
|
|
651 |
|
|
|
(70,259 |
) |
|
|
(7,138 |
) |
|
|
(5,576 |
) |
|
|
(575 |
) |
|
|
|
|
|
|
|
|
|
|
|
|
|
|
| Total net increase (decrease) |
|
|
$205,784 |
|
|
|
20,766 |
|
|
|
$55,244 |
|
|
|
5,718 |
|
|
|
$(224,515 |
) |
|
|
(22,772 |
) |
|
|
$ 36,513 |
|
|
|
3,712 |
|
|
|
|
|
|
Managed Risk Growth Fund
|
|
|
|
|
|
|
|
|
|
|
|
|
|
|
|
|
|
|
|
|
|
|
|
|
|
|
|
|
|
|
|
|
| |
|
Sales |
|
|
Reinvestments of
distributions |
|
|
Repurchases |
|
|
Net increase
(decrease) |
|
|
|
|
|
|
|
|
|
|
| Share class |
|
Amount |
|
|
Shares |
|
|
Amount |
|
|
Shares |
|
|
Amount |
|
|
Shares |
|
|
Amount |
|
|
Shares |
|
|
| Six months ended June 30, 2024 |
|
| Class P1 |
|
|
$ 440 |
|
|
|
38 |
|
|
|
$ 93 |
|
|
|
8 |
|
|
|
$ (1,460) |
|
|
|
(127 |
) |
|
|
$ (927) |
|
|
|
(81 |
) |
| Class P2 |
|
|
3,809 |
|
|
|
343 |
|
|
|
2,326 |
|
|
|
197 |
|
|
|
(52,432) |
|
|
|
(4,584 |
) |
|
|
(46,297) |
|
|
|
(4,044 |
) |
|
|
|
|
|
|
|
|
|
|
|
|
|
|
| Total net increase (decrease) |
|
|
$ 4,249 |
|
|
|
381 |
|
|
|
$ 2,419 |
|
|
|
205 |
|
|
|
$(53,892) |
|
|
|
(4,711 |
) |
|
|
$(47,224) |
|
|
|
(4,125 |
) |
|
|
|
|
|
|
| Year ended December 31, 2023 |
|
| Class P1 |
|
|
$ 2,318 |
|
|
|
221 |
|
|
|
$ 2,445 |
|
|
|
252 |
|
|
|
$ (1,380) |
|
|
|
(131 |
) |
|
|
$ 3,383 |
|
|
|
342 |
|
| Class P2 |
|
|
15,188 |
|
|
|
1,407 |
|
|
|
109,238 |
|
|
|
11,379 |
|
|
|
(64,373) |
|
|
|
(6,069 |
) |
|
|
60,053 |
|
|
|
6,717 |
|
|
|
|
|
|
|
|
|
|
|
|
|
|
|
| Total net increase (decrease) |
|
|
$17,506 |
|
|
|
1,628 |
|
|
|
$111,683 |
|
|
|
11,631 |
|
|
|
$(65,753) |
|
|
|
(6,200 |
) |
|
|
$ 63,436 |
|
|
|
7,059 |
|
|
|
|
|
|
Refer to the end of the tables for footnotes.
American Funds Insurance Series 322
Managed Risk International Fund
|
|
|
|
|
|
|
|
|
|
|
|
|
|
|
|
|
|
|
|
|
|
|
|
|
|
|
|
|
|
|
|
|
| |
|
Sales |
|
|
Reinvestments of
distributions |
|
|
Repurchases |
|
|
Net increase
(decrease) |
|
|
|
|
|
|
|
|
|
|
| Share class |
|
Amount |
|
|
Shares |
|
|
Amount |
|
|
Shares |
|
|
Amount |
|
|
Shares |
|
|
Amount |
|
|
Shares |
|
|
| Six months ended June 30, 2024 |
|
| Class P1 |
|
|
$24 |
|
|
|
3 |
|
|
|
$ 29 |
|
|
|
3 |
|
|
|
$ (161) |
|
|
|
(18 |
) |
|
|
$ (108) |
|
|
|
(12 |
) |
| Class P2 |
|
|
880 |
|
|
|
104 |
|
|
|
1,532 |
|
|
|
174 |
|
|
|
(9,100) |
|
|
|
(1,049 |
) |
|
|
(6,688) |
|
|
|
(771 |
) |
|
|
|
|
|
|
|
|
|
|
|
|
|
|
| Total net increase (decrease) |
|
|
$904 |
|
|
|
107 |
|
|
|
$ 1,561 |
|
|
|
177 |
|
|
|
$ (9,261) |
|
|
|
(1,067 |
) |
|
|
$(6,796) |
|
|
|
(783 |
) |
|
|
|
|
|
|
| Year ended December 31, 2023 |
|
| Class P1 |
|
|
$282 |
|
|
|
34 |
|
|
|
$ 156 |
|
|
|
19 |
|
|
|
$ (230) |
|
|
|
(27 |
) |
|
|
$ 208 |
|
|
|
26 |
|
| Class P2 |
|
|
3,795 |
|
|
|
459 |
|
|
|
10,696 |
|
|
|
1,309 |
|
|
|
(13,108) |
|
|
|
(1,539 |
) |
|
|
1,383 |
|
|
|
229 |
|
|
|
|
|
|
|
|
|
|
|
|
|
|
|
| Total net increase (decrease) |
|
|
$4,077 |
|
|
|
493 |
|
|
|
$10,852 |
|
|
|
1,328 |
|
|
|
$(13,338) |
|
|
|
(1,566 |
) |
|
|
$ 1,591 |
|
|
|
255 |
|
|
|
|
|
|
Managed Risk Washington Mutual Investors Fund
|
|
|
|
|
|
|
|
|
|
|
|
|
|
|
|
|
|
|
|
|
|
|
|
|
|
|
|
|
|
|
|
|
| |
|
Sales |
|
|
Reinvestments of
distributions |
|
|
Repurchases |
|
|
Net increase
(decrease) |
|
|
|
|
|
|
|
|
|
|
| Share class |
|
Amount |
|
|
Shares |
|
|
Amount |
|
|
Shares |
|
|
Amount |
|
|
Shares |
|
|
Amount |
|
|
Shares |
|
|
| Six months ended June 30, 2024 |
|
| Class P1 |
|
|
$ 168 |
|
|
|
16 |
|
|
|
$ 43 |
|
|
|
4 |
|
|
|
$ (345) |
|
|
|
(32 |
) |
|
|
$ (134 |
) |
|
|
(12 |
) |
| Class P2 |
|
|
4,327 |
|
|
|
397 |
|
|
|
5,105 |
|
|
|
463 |
|
|
|
(27,413) |
|
|
|
(2,515 |
) |
|
|
(17,981 |
) |
|
|
(1,655 |
) |
|
|
|
|
|
|
|
|
|
|
|
|
|
|
| Total net increase (decrease) |
|
|
$ 4,495 |
|
|
|
413 |
|
|
|
$ 5,148 |
|
|
|
467 |
|
|
|
$(27,758) |
|
|
|
(2,547 |
) |
|
|
$(18,115 |
) |
|
|
(1,667 |
) |
|
|
|
|
|
|
| Year ended December 31, 2023 |
|
| Class P1 |
|
|
$ 158 |
|
|
|
15 |
|
|
|
$ 422 |
|
|
|
43 |
|
|
|
$ (478) |
|
|
|
(47 |
) |
|
|
$ 102 |
|
|
|
11 |
|
| Class P2 |
|
|
12,514 |
|
|
|
1,194 |
|
|
|
47,565 |
|
|
|
4,928 |
|
|
|
(40,947) |
|
|
|
(3,988 |
) |
|
|
19,132 |
|
|
|
2,134 |
|
|
|
|
|
|
|
|
|
|
|
|
|
|
|
| Total net increase (decrease) |
|
|
$12,672 |
|
|
|
1,209 |
|
|
|
$47,987 |
|
|
|
4,971 |
|
|
|
$(41,425) |
|
|
|
(4,035 |
) |
|
|
$ 19,234 |
|
|
|
2,145 |
|
|
|
|
|
|
Managed Risk Growth-Income Fund
|
|
|
|
|
|
|
|
|
|
|
|
|
|
|
|
|
|
|
|
|
|
|
|
|
|
|
|
|
|
|
|
|
| |
|
Sales |
|
|
Reinvestments of
distributions |
|
|
Repurchases |
|
|
Net increase
(decrease) |
|
|
|
|
|
|
|
|
|
|
| Share class |
|
Amount |
|
|
Shares |
|
|
Amount |
|
|
Shares |
|
|
Amount |
|
|
Shares |
|
|
Amount |
|
|
Shares |
|
|
| Six months ended June 30, 2024 |
|
| Class P1 |
|
|
$ 4,702 |
|
|
|
363 |
|
|
|
$ 51,520 |
|
|
|
3,857 |
|
|
|
$(164,599) |
|
|
|
(12,385 |
) |
|
|
$(108,377 |
) |
|
|
(8,165 |
) |
| Class P2 |
|
|
1,309 |
|
|
|
102 |
|
|
|
7,387 |
|
|
|
557 |
|
|
|
(26,043) |
|
|
|
(1,978 |
) |
|
|
(17,347 |
) |
|
|
(1,319 |
) |
|
|
|
|
|
|
|
|
|
|
|
|
|
|
| Total net increase (decrease) |
|
|
$ 6,011 |
|
|
|
465 |
|
|
|
$ 58,907 |
|
|
|
4,414 |
|
|
|
$(190,642) |
|
|
|
(14,363 |
) |
|
|
$(125,724 |
) |
|
|
(9,484 |
) |
|
|
|
|
|
|
| Year ended December 31, 2023 |
|
| Class P1 |
|
|
$30,902 |
|
|
|
2,476 |
|
|
|
$260,286 |
|
|
|
22,694 |
|
|
|
$(233,754) |
|
|
|
(19,325 |
) |
|
|
$ 57,434 |
|
|
|
5,845 |
|
| Class P2 |
|
|
7,934 |
|
|
|
662 |
|
|
|
37,088 |
|
|
|
3,259 |
|
|
|
(38,477) |
|
|
|
(3,190 |
) |
|
|
6,545 |
|
|
|
731 |
|
|
|
|
|
|
|
|
|
|
|
|
|
|
|
| Total net increase (decrease) |
|
|
$38,836 |
|
|
|
3,138 |
|
|
|
$297,374 |
|
|
|
25,953 |
|
|
|
$(272,231) |
|
|
|
(22,515 |
) |
|
|
$ 63,979 |
|
|
|
6,576 |
|
|
|
|
|
|
Refer to the end of the tables for footnotes.
323 American Funds Insurance Series
Managed Risk Asset Allocation Fund
|
|
|
|
|
|
|
|
|
|
|
|
|
|
|
|
|
|
|
|
|
|
|
|
|
|
|
|
|
|
|
|
|
| |
|
Sales |
|
|
Reinvestments of
distributions |
|
|
Repurchases |
|
|
Net increase
(decrease) |
|
|
|
|
|
|
|
|
|
|
| Share class |
|
Amount |
|
|
Shares |
|
|
Amount |
|
|
Shares |
|
|
Amount |
|
|
Shares |
|
|
Amount |
|
|
Shares |
|
|
| Six months ended June 30, 2024 |
|
| Class P1 |
|
$ |
472 |
|
|
|
38 |
|
|
$ |
317 |
|
|
|
26 |
|
|
$ |
(941 |
) |
|
|
(78 |
) |
|
$ |
(152 |
) |
|
|
(14 |
) |
| Class P2 |
|
|
11,099 |
|
|
|
933 |
|
|
|
65,045 |
|
|
|
5,425 |
|
|
|
(198,294 |
) |
|
|
(16,553 |
) |
|
|
(122,150 |
) |
|
|
(10,195 |
) |
|
|
|
|
|
|
|
|
|
|
|
|
|
|
| Total net increase (decrease) |
|
$ |
11,571 |
|
|
|
971 |
|
|
$ |
65,362 |
|
|
|
5,451 |
|
|
$ |
(199,235 |
) |
|
|
(16,631 |
) |
|
$ |
(122,302 |
) |
|
|
(10,209 |
) |
|
|
|
|
|
|
| Year ended December 31, 2023 |
|
| Class P1 |
|
$ |
3,002 |
|
|
|
267 |
|
|
$ |
1,016 |
|
|
|
92 |
|
|
$ |
(1,021 |
) |
|
|
(88 |
) |
|
$ |
2,997 |
|
|
|
271 |
|
| Class P2 |
|
|
18,885 |
|
|
|
1,651 |
|
|
|
286,099 |
|
|
|
26,654 |
|
|
|
(309,678 |
) |
|
|
(27,225 |
) |
|
|
(4,694 |
) |
|
|
1,080 |
|
|
|
|
|
|
|
|
|
|
|
|
|
|
|
| Total net increase (decrease) |
|
$ |
21,887 |
|
|
|
1,918 |
|
|
$ |
287,115 |
|
|
|
26,746 |
|
|
$ |
(310,699 |
) |
|
|
(27,313 |
) |
|
$ |
(1,697 |
) |
|
|
1,351 |
|
|
|
|
|
|
*Includes exchanges between share classes of the fund.
†Amount less than one thousand.
11. Investment transactions and other disclosures
The following tables present additional information for each fund for the six months ended June 30, 2024 (dollars in thousands):
|
|
|
|
|
|
|
|
|
|
|
|
|
|
|
|
|
|
|
|
|
|
|
|
|
| |
|
Global Growth Fund |
|
|
Global Small
Capitalization
Fund |
|
|
Growth Fund |
|
|
International
Fund |
|
|
New World
Fund |
|
|
Washington
Mutual
Investors
Fund |
|
|
|
|
|
|
|
|
| Purchases of investment securities* |
|
|
$2,171,432 |
|
|
|
$603,099 |
|
|
|
$5,478,826 |
|
|
|
$1,185,376 |
|
|
|
$1,122,268 |
|
|
|
$1,917,097 |
|
| Sales of investment securities* |
|
|
2,616,615 |
|
|
|
710,448 |
|
|
|
7,461,210 |
|
|
|
1,648,919 |
|
|
|
1,188,340 |
|
|
|
2,472,766 |
|
| Non-U.S. taxes paid on dividend income |
|
|
3,274 |
|
|
|
3,233 |
|
|
|
4,735 |
|
|
|
6,702 |
|
|
|
3,443 |
|
|
|
1,195 |
|
| Non-U.S. taxes paid on interest income |
|
|
– |
|
|
|
25 |
|
|
|
– |
|
|
|
– |
|
|
|
40 |
|
|
|
– |
|
| Non-U.S. taxes paid on realized gains |
|
|
– |
|
|
|
3,480 |
|
|
|
– |
|
|
|
11,482 |
|
|
|
7,010 |
|
|
|
– |
|
| Non-U.S. taxes provided on unrealized appreciation |
|
|
5,454 |
|
|
|
19,474 |
|
|
|
– |
|
|
|
31,391 |
|
|
|
18,548 |
|
|
|
– |
|
|
|
|
|
|
|
|
|
|
|
|
|
|
|
|
|
|
|
|
|
|
|
|
|
|
|
|
|
|
|
|
|
| |
|
Capital World Growth and Income Fund |
|
|
Growth- Income Fund |
|
|
International Growth and Income Fund |
|
|
Capital Income Builder |
|
|
Asset Allocation Fund |
|
|
American Funds Global Balanced Fund |
|
|
|
|
|
|
|
|
| Purchases of investment securities* |
|
|
$284,998 |
|
|
|
$13,366,582 |
|
|
|
$56,142 |
|
|
|
$729,369 |
|
|
|
$18,382,702 |
|
|
|
$299,957 |
|
| Sales of investment securities* |
|
|
401,668 |
|
|
|
15,329,297 |
|
|
|
77,715 |
|
|
|
694,236 |
|
|
|
17,874,428 |
|
|
|
292,946 |
|
| Non-U.S. taxes paid on dividend income |
|
|
1,012 |
|
|
|
4,101 |
|
|
|
555 |
|
|
|
1,177 |
|
|
|
3,741 |
|
|
|
226 |
|
| Non-U.S. taxes paid on interest income |
|
|
– |
|
|
|
16 |
|
|
|
1 |
|
|
|
– |
|
|
|
– |
|
|
|
4 |
|
| Non-U.S. taxes paid (refunded) on realized gains |
|
|
201 |
|
|
|
(581 |
) |
|
|
(6 |
) |
|
|
173 |
|
|
|
– |
|
|
|
24 |
|
| Non-U.S. taxes provided on unrealized appreciation |
|
|
764 |
|
|
|
– |
|
|
|
126 |
|
|
|
406 |
|
|
|
– |
|
|
|
145 |
|
|
|
|
|
|
|
|
| |
|
The Bond Fund of America |
|
|
Capital World Bond Fund |
|
|
American High-Income Trust |
|
|
American Funds Mortgage Fund |
|
|
Ultra-Short Bond Fund |
|
|
U.S. Government Securities Fund |
|
|
|
|
|
|
|
|
| Purchases of investment securities* |
|
|
$23,571,772 |
|
|
|
$2,374,526 |
|
|
|
$204,820 |
|
|
|
$385,936 |
|
|
|
$– |
|
|
|
$3,035,695 |
|
| Sales of investment securities* |
|
|
23,330,066 |
|
|
|
2,330,992 |
|
|
|
191,372 |
|
|
|
384,712 |
|
|
|
– |
|
|
|
2,985,384 |
|
| Non-U.S. taxes paid on interest income |
|
|
25 |
|
|
|
62 |
|
|
|
– |
|
|
|
– |
|
|
|
– |
|
|
|
– |
|
| Non-U.S. taxes paid on realized gains |
|
|
– |
|
|
|
1 |
|
|
|
– |
|
|
|
– |
|
|
|
– |
|
|
|
– |
|
| Non-U.S. taxes provided on unrealized appreciation |
|
|
– |
|
|
|
134 |
|
|
|
– |
|
|
|
– |
|
|
|
– |
|
|
|
– |
|
Refer to the end of the tables for footnote.
American Funds Insurance Series 324
|
|
|
|
|
|
|
|
|
|
|
|
|
|
|
|
|
|
|
|
|
|
|
|
|
|
|
| |
|
Managed
Risk Growth Fund |
|
|
Managed Risk International Fund |
|
|
Managed
Risk
Washington Mutual
Investors
Fund |
|
|
Managed Risk Growth-
Income Fund |
|
|
Managed Risk Asset Allocation Fund |
|
| Purchases of investment securities* |
|
|
$26,366 |
|
|
|
$3,218 |
|
|
|
$11,313 |
|
|
|
$152,928 |
|
|
|
$96,569 |
|
| Sales of investment securities* |
|
|
69,263 |
|
|
|
12,184 |
|
|
|
32,790 |
|
|
|
260,055 |
|
|
|
191,155 |
|
*Excludes short-term securities and U.S. government obligations, if any.
12. Ownership concentration
At June 30, 2024, American Funds Insurance Series - Portfolio Series - Managed Risk Growth and Income Portfolio held 18% and 16% of the outstanding shares of American Funds Insurance Series - Capital World Growth and Income Fund and American Funds Insurance Series - Capital Income Builder, respectively. In addition, American Funds Insurance Series - Portfolio Series - Managed Risk Global Allocation Portfolio held 19% of the outstanding shares of American Funds Insurance Series - American Funds Global Balanced Fund.
325 American Funds Insurance Series
Financial highlights
|
|
|
|
|
|
|
|
|
|
|
|
|
|
|
|
|
|
|
|
|
|
|
|
|
|
|
|
|
|
|
|
|
|
|
|
|
|
|
|
|
|
|
|
|
|
|
|
|
|
|
|
|
|
|
|
|
|
|
|
|
|
|
|
|
|
|
|
| |
|
|
|
Income (loss) from investment operations1 |
|
|
|
Dividends and distributions |
|
|
|
|
|
|
|
|
|
|
|
|
|
|
|
|
|
|
|
|
|
|
|
|
|
|
|
| Year ended |
|
Net asset value, beginning of year |
|
Net investment income (loss) |
|
Net gains (losses) on securities (both realized and unrealized) |
|
Total from investment operations |
|
|
|
Dividends (from net investment income) |
|
Distributions (from capital gains) |
|
Total dividends and distributions |
|
Net asset value, end of year |
|
Total return2 |
|
Net assets, end of year (in millions) |
|
Ratio of expenses to average net assets before waivers3 |
|
Ratio of expenses to average net assets after waivers2,3 |
|
Ratio of net income (loss) to average net assets2 |
|
|
|
|
|
|
|
|
|
|
|
|
| Global Growth Fund |
|
|
|
|
|
|
|
|
|
|
|
|
|
|
|
|
|
|
|
|
|
|
|
|
|
|
|
|
|
|
|
|
|
|
|
|
|
|
|
|
|
|
|
|
|
|
|
|
|
|
|
|
|
|
|
|
|
|
|
|
|
|
|
|
|
|
|
|
| Class 1: |
|
|
|
|
|
|
|
|
|
|
|
|
|
|
|
|
|
|
|
|
|
|
|
|
|
|
|
|
|
|
|
|
|
|
|
|
|
|
|
|
|
|
|
|
|
|
|
|
|
|
|
|
|
|
|
|
|
|
|
|
|
|
|
|
|
|
|
| 6/30/20244,5 |
|
|
|
$33.92 |
|
|
|
|
$.28 |
|
|
|
|
$ 4.48 |
|
|
|
|
$ 4.76 |
|
|
|
|
|
|
$(.22 |
) |
|
|
|
$(1.07 |
) |
|
|
|
$(1.29 |
) |
|
|
|
$37.39 |
|
|
|
|
14.09 |
%6 |
|
|
|
$3,634 |
|
|
|
|
.52 |
%7 |
|
|
|
.41 |
%7 |
|
|
|
1.56 |
%7 |
| 12/31/2023 |
|
|
|
30.18 |
|
|
|
|
.36 |
|
|
|
|
6.30 |
|
|
|
|
6.66 |
|
|
|
|
|
|
(.37 |
) |
|
|
|
(2.55 |
) |
|
|
|
(2.92 |
) |
|
|
|
33.92 |
|
|
|
|
22.91 |
|
|
|
|
3,418 |
|
|
|
|
.52 |
|
|
|
|
.41 |
|
|
|
|
1.13 |
|
| 12/31/2022 |
|
|
|
45.46 |
|
|
|
|
.34 |
|
|
|
|
(11.34 |
) |
|
|
|
(11.00 |
) |
|
|
|
|
|
(.31 |
) |
|
|
|
(3.97 |
) |
|
|
|
(4.28 |
) |
|
|
|
30.18 |
|
|
|
|
(24.54 |
) |
|
|
|
3,104 |
|
|
|
|
.53 |
|
|
|
|
.46 |
|
|
|
|
1.01 |
|
| 12/31/2021 |
|
|
|
41.16 |
|
|
|
|
.25 |
|
|
|
|
6.48 |
|
|
|
|
6.73 |
|
|
|
|
|
|
(.26 |
) |
|
|
|
(2.17 |
) |
|
|
|
(2.43 |
) |
|
|
|
45.46 |
|
|
|
|
16.72 |
|
|
|
|
4,270 |
|
|
|
|
.55 |
|
|
|
|
.54 |
|
|
|
|
.56 |
|
| 12/31/2020 |
|
|
|
32.57 |
|
|
|
|
.20 |
|
|
|
|
9.56 |
|
|
|
|
9.76 |
|
|
|
|
|
|
(.21 |
) |
|
|
|
(.96 |
) |
|
|
|
(1.17 |
) |
|
|
|
41.16 |
|
|
|
|
30.79 |
|
|
|
|
3,309 |
|
|
|
|
.56 |
|
|
|
|
.56 |
|
|
|
|
.59 |
|
| 12/31/2019 |
|
|
|
25.74 |
|
|
|
|
.32 |
|
|
|
|
8.60 |
|
|
|
|
8.92 |
|
|
|
|
|
|
(.41 |
) |
|
|
|
(1.68 |
) |
|
|
|
(2.09 |
) |
|
|
|
32.57 |
|
|
|
|
35.61 |
|
|
|
|
2,515 |
|
|
|
|
.56 |
|
|
|
|
.56 |
|
|
|
|
1.07 |
|
| Class 1A: |
|
|
|
|
|
|
|
|
|
|
|
|
|
|
|
|
|
|
|
|
|
|
|
|
|
|
|
|
|
|
|
|
|
|
|
|
|
|
|
|
|
|
|
|
|
|
|
|
|
|
|
|
|
|
|
|
|
|
|
|
|
|
|
|
|
|
|
| 6/30/20244,5 |
|
|
|
33.74 |
|
|
|
|
.24 |
|
|
|
|
4.45 |
|
|
|
|
4.69 |
|
|
|
|
|
|
(.21 |
) |
|
|
|
(1.07 |
) |
|
|
|
(1.28 |
) |
|
|
|
37.15 |
|
|
|
|
13.94 |
6 |
|
|
|
20 |
|
|
|
|
.77 |
7 |
|
|
|
.66 |
7 |
|
|
|
1.32 |
7 |
| 12/31/2023 |
|
|
|
30.04 |
|
|
|
|
.28 |
|
|
|
|
6.26 |
|
|
|
|
6.54 |
|
|
|
|
|
|
(.29 |
) |
|
|
|
(2.55 |
) |
|
|
|
(2.84 |
) |
|
|
|
33.74 |
|
|
|
|
22.60 |
|
|
|
|
18 |
|
|
|
|
.77 |
|
|
|
|
.66 |
|
|
|
|
.88 |
|
| 12/31/2022 |
|
|
|
45.28 |
|
|
|
|
.26 |
|
|
|
|
(11.31 |
) |
|
|
|
(11.05 |
) |
|
|
|
|
|
(.22 |
) |
|
|
|
(3.97 |
) |
|
|
|
(4.19 |
) |
|
|
|
30.04 |
|
|
|
|
(24.73 |
) |
|
|
|
14 |
|
|
|
|
.78 |
|
|
|
|
.71 |
|
|
|
|
.78 |
|
| 12/31/2021 |
|
|
|
41.02 |
|
|
|
|
.14 |
|
|
|
|
6.46 |
|
|
|
|
6.60 |
|
|
|
|
|
|
(.17 |
) |
|
|
|
(2.17 |
) |
|
|
|
(2.34 |
) |
|
|
|
45.28 |
|
|
|
|
16.45 |
|
|
|
|
18 |
|
|
|
|
.80 |
|
|
|
|
.79 |
|
|
|
|
.33 |
|
| 12/31/2020 |
|
|
|
32.47 |
|
|
|
|
.12 |
|
|
|
|
9.52 |
|
|
|
|
9.64 |
|
|
|
|
|
|
(.13 |
) |
|
|
|
(.96 |
) |
|
|
|
(1.09 |
) |
|
|
|
41.02 |
|
|
|
|
30.49 |
|
|
|
|
12 |
|
|
|
|
.81 |
|
|
|
|
.81 |
|
|
|
|
.34 |
|
| 12/31/2019 |
|
|
|
25.69 |
|
|
|
|
.25 |
|
|
|
|
8.55 |
|
|
|
|
8.80 |
|
|
|
|
|
|
(.34 |
) |
|
|
|
(1.68 |
) |
|
|
|
(2.02 |
) |
|
|
|
32.47 |
|
|
|
|
35.22 |
|
|
|
|
8 |
|
|
|
|
.81 |
|
|
|
|
.81 |
|
|
|
|
.83 |
|
| Class 2: |
|
|
|
|
|
|
|
|
|
|
|
|
|
|
|
|
|
|
|
|
|
|
|
|
|
|
|
|
|
|
|
|
|
|
|
|
|
|
|
|
|
|
|
|
|
|
|
|
|
|
|
|
|
|
|
|
|
|
|
|
|
|
|
|
|
|
|
| 6/30/20244,5 |
|
|
|
33.44 |
|
|
|
|
.23 |
|
|
|
|
4.43 |
|
|
|
|
4.66 |
|
|
|
|
|
|
(.21 |
) |
|
|
|
(1.07 |
) |
|
|
|
(1.28 |
) |
|
|
|
36.82 |
|
|
|
|
13.98 |
6 |
|
|
|
3,714 |
|
|
|
|
.77 |
7 |
|
|
|
.66 |
7 |
|
|
|
1.31 |
7 |
| 12/31/2023 |
|
|
|
29.79 |
|
|
|
|
.28 |
|
|
|
|
6.21 |
|
|
|
|
6.49 |
|
|
|
|
|
|
(.29 |
) |
|
|
|
(2.55 |
) |
|
|
|
(2.84 |
) |
|
|
|
33.44 |
|
|
|
|
22.60 |
|
|
|
|
3,522 |
|
|
|
|
.77 |
|
|
|
|
.66 |
|
|
|
|
.88 |
|
| 12/31/2022 |
|
|
|
44.94 |
|
|
|
|
.25 |
|
|
|
|
(11.21 |
) |
|
|
|
(10.96 |
) |
|
|
|
|
|
(.22 |
) |
|
|
|
(3.97 |
) |
|
|
|
(4.19 |
) |
|
|
|
29.79 |
|
|
|
|
(24.74 |
) |
|
|
|
3,234 |
|
|
|
|
.78 |
|
|
|
|
.71 |
|
|
|
|
.76 |
|
| 12/31/2021 |
|
|
|
40.72 |
|
|
|
|
.13 |
|
|
|
|
6.41 |
|
|
|
|
6.54 |
|
|
|
|
|
|
(.15 |
) |
|
|
|
(2.17 |
) |
|
|
|
(2.32 |
) |
|
|
|
44.94 |
|
|
|
|
16.42 |
|
|
|
|
4,559 |
|
|
|
|
.80 |
|
|
|
|
.80 |
|
|
|
|
.30 |
|
| 12/31/2020 |
|
|
|
32.24 |
|
|
|
|
.12 |
|
|
|
|
9.44 |
|
|
|
|
9.56 |
|
|
|
|
|
|
(.12 |
) |
|
|
|
(.96 |
) |
|
|
|
(1.08 |
) |
|
|
|
40.72 |
|
|
|
|
30.47 |
|
|
|
|
4,387 |
|
|
|
|
.81 |
|
|
|
|
.81 |
|
|
|
|
.34 |
|
| 12/31/2019 |
|
|
|
25.50 |
|
|
|
|
.24 |
|
|
|
|
8.51 |
|
|
|
|
8.75 |
|
|
|
|
|
|
(.33 |
) |
|
|
|
(1.68 |
) |
|
|
|
(2.01 |
) |
|
|
|
32.24 |
|
|
|
|
35.28 |
|
|
|
|
3,895 |
|
|
|
|
.81 |
|
|
|
|
.81 |
|
|
|
|
.83 |
|
| Class 4: |
|
|
|
|
|
|
|
|
|
|
|
|
|
|
|
|
|
|
|
|
|
|
|
|
|
|
|
|
|
|
|
|
|
|
|
|
|
|
|
|
|
|
|
|
|
|
|
|
|
|
|
|
|
|
|
|
|
|
|
|
|
|
|
|
|
|
|
| 6/30/20244,5 |
|
|
|
33.08 |
|
|
|
|
.19 |
|
|
|
|
4.36 |
|
|
|
|
4.55 |
|
|
|
|
|
|
(.19 |
) |
|
|
|
(1.07 |
) |
|
|
|
(1.26 |
) |
|
|
|
36.37 |
|
|
|
|
13.83 |
6 |
|
|
|
866 |
|
|
|
|
1.02 |
7 |
|
|
|
.91 |
7 |
|
|
|
1.08 |
7 |
| 12/31/2023 |
|
|
|
29.51 |
|
|
|
|
.20 |
|
|
|
|
6.14 |
|
|
|
|
6.34 |
|
|
|
|
|
|
(.22 |
) |
|
|
|
(2.55 |
) |
|
|
|
(2.77 |
) |
|
|
|
33.08 |
|
|
|
|
22.29 |
|
|
|
|
732 |
|
|
|
|
1.02 |
|
|
|
|
.91 |
|
|
|
|
.63 |
|
| 12/31/2022 |
|
|
|
44.57 |
|
|
|
|
.17 |
|
|
|
|
(11.12 |
) |
|
|
|
(10.95 |
) |
|
|
|
|
|
(.14 |
) |
|
|
|
(3.97 |
) |
|
|
|
(4.11 |
) |
|
|
|
29.51 |
|
|
|
|
(24.92 |
) |
|
|
|
584 |
|
|
|
|
1.03 |
|
|
|
|
.96 |
|
|
|
|
.52 |
|
| 12/31/2021 |
|
|
|
40.45 |
|
|
|
|
.03 |
|
|
|
|
6.35 |
|
|
|
|
6.38 |
|
|
|
|
|
|
(.09 |
) |
|
|
|
(2.17 |
) |
|
|
|
(2.26 |
) |
|
|
|
44.57 |
|
|
|
|
16.14 |
|
|
|
|
744 |
|
|
|
|
1.05 |
|
|
|
|
1.04 |
|
|
|
|
.07 |
|
| 12/31/2020 |
|
|
|
32.05 |
|
|
|
|
.03 |
|
|
|
|
9.38 |
|
|
|
|
9.41 |
|
|
|
|
|
|
(.05 |
) |
|
|
|
(.96 |
) |
|
|
|
(1.01 |
) |
|
|
|
40.45 |
|
|
|
|
30.17 |
|
|
|
|
533 |
|
|
|
|
1.06 |
|
|
|
|
1.06 |
|
|
|
|
.09 |
|
| 12/31/2019 |
|
|
|
25.39 |
|
|
|
|
.17 |
|
|
|
|
8.45 |
|
|
|
|
8.62 |
|
|
|
|
|
|
(.28 |
) |
|
|
|
(1.68 |
) |
|
|
|
(1.96 |
) |
|
|
|
32.05 |
|
|
|
|
34.87 |
|
|
|
|
382 |
|
|
|
|
1.06 |
|
|
|
|
1.06 |
|
|
|
|
.57 |
|
Refer to the end of the tables for footnotes.
American Funds Insurance Series 326
Financial highlights (continued)
|
|
|
|
|
|
|
|
|
|
|
|
|
|
|
|
|
|
|
|
|
|
|
|
|
|
|
|
|
|
|
|
|
|
|
|
|
|
|
|
|
|
|
|
|
|
|
|
|
|
|
|
|
|
|
|
|
|
|
|
|
|
|
|
|
|
|
|
| |
|
|
|
Income (loss) from investment operations1 |
|
|
|
Dividends and distributions |
|
|
|
|
|
|
|
|
|
|
|
|
|
|
|
|
|
|
|
|
|
|
|
|
|
|
|
| Year ended |
|
Net asset value, beginning of year |
|
Net investment income (loss) |
|
Net gains (losses) on securities (both realized and unrealized) |
|
Total from investment operations |
|
|
|
Dividends (from net investment income) |
|
Distributions (from capital gains) |
|
Total dividends and distributions |
|
Net asset value, end of year |
|
Total return2 |
|
Net assets, end of year (in millions) |
|
Ratio of expenses to average net assets before waivers3 |
|
Ratio of expenses to average net assets after waivers2,3 |
|
Ratio of net income (loss) to average net assets2 |
|
|
|
|
|
|
|
|
|
|
|
|
| Global Small Capitalization Fund |
|
|
|
|
|
|
|
|
|
|
|
|
|
|
|
|
|
|
|
|
|
|
|
|
|
|
|
|
|
|
|
|
|
|
|
|
|
|
|
|
|
|
|
|
|
|
|
|
|
|
|
|
|
|
|
|
|
|
|
|
|
|
|
|
|
|
|
|
| Class 1: |
|
|
|
|
|
|
|
|
|
|
|
|
|
|
|
|
|
|
|
|
|
|
|
|
|
|
|
|
|
|
|
|
|
|
|
|
|
|
|
|
|
|
|
|
|
|
|
|
|
|
|
|
|
|
|
|
|
|
|
|
|
|
|
|
|
|
|
| 6/30/20244,5 |
|
|
|
$18.57 |
|
|
|
|
$ .09 |
|
|
|
|
$ .01 |
|
|
|
|
$ .10 |
|
|
|
|
|
|
$(.15 |
) |
|
|
|
$ (.65 |
) |
|
|
|
$ (.80 |
) |
|
|
|
$17.87 |
|
|
|
|
.59 |
%6 |
|
|
|
$ 967 |
|
|
|
|
.70 |
%7 |
|
|
|
.68 |
%7 |
|
|
|
.99 |
%7 |
| 12/31/2023 |
|
|
|
16.22 |
|
|
|
|
.11 |
|
|
|
|
2.53 |
|
|
|
|
2.64 |
|
|
|
|
|
|
(.08 |
) |
|
|
|
(.21 |
) |
|
|
|
(.29 |
) |
|
|
|
18.57 |
|
|
|
|
16.45 |
|
|
|
|
1,001 |
|
|
|
|
.70 |
|
|
|
|
.65 |
|
|
|
|
.63 |
|
| 12/31/2022 |
|
|
|
34.17 |
|
|
|
|
.05 |
|
|
|
|
(9.50 |
) |
|
|
|
(9.45 |
) |
|
|
|
|
|
– |
|
|
|
|
(8.50 |
) |
|
|
|
(8.50 |
) |
|
|
|
16.22 |
|
|
|
|
(29.37 |
) |
|
|
|
916 |
|
|
|
|
.72 |
|
|
|
|
.69 |
|
|
|
|
.24 |
|
| 12/31/2021 |
|
|
|
32.64 |
|
|
|
|
(.02 |
) |
|
|
|
2.32 |
|
|
|
|
2.30 |
|
|
|
|
|
|
– |
|
|
|
|
(.77 |
) |
|
|
|
(.77 |
) |
|
|
|
34.17 |
|
|
|
|
6.98 |
|
|
|
|
1,707 |
|
|
|
|
.74 |
|
|
|
|
.74 |
|
|
|
|
(.07 |
) |
| 12/31/2020 |
|
|
|
26.80 |
|
|
|
|
(.01 |
) |
|
|
|
7.49 |
|
|
|
|
7.48 |
|
|
|
|
|
|
(.05 |
) |
|
|
|
(1.59 |
) |
|
|
|
(1.64 |
) |
|
|
|
32.64 |
|
|
|
|
30.04 |
|
|
|
|
2,391 |
|
|
|
|
.75 |
|
|
|
|
.75 |
|
|
|
|
(.06 |
) |
| 12/31/2019 |
|
|
|
21.75 |
|
|
|
|
.12 |
|
|
|
|
6.61 |
|
|
|
|
6.73 |
|
|
|
|
|
|
(.10 |
) |
|
|
|
(1.58 |
) |
|
|
|
(1.68 |
) |
|
|
|
26.80 |
|
|
|
|
31.84 |
|
|
|
|
2,050 |
|
|
|
|
.75 |
|
|
|
|
.75 |
|
|
|
|
.48 |
|
| Class 1A: |
|
|
|
|
|
|
|
|
|
|
|
|
|
|
|
|
|
|
|
|
|
|
|
|
|
|
|
|
|
|
|
|
|
|
|
|
|
|
|
|
|
|
|
|
|
|
|
|
|
|
|
|
|
|
|
|
|
|
|
|
|
|
|
|
|
|
|
| 6/30/20244,5 |
|
|
|
18.31 |
|
|
|
|
.07 |
|
|
|
|
– |
8 |
|
|
|
.07 |
|
|
|
|
|
|
(.14 |
) |
|
|
|
(.65 |
) |
|
|
|
(.79 |
) |
|
|
|
17.59 |
|
|
|
|
.45 |
6 |
|
|
|
5 |
|
|
|
|
.95 |
7 |
|
|
|
.93 |
7 |
|
|
|
.74 |
7 |
| 12/31/2023 |
|
|
|
16.00 |
|
|
|
|
.06 |
|
|
|
|
2.50 |
|
|
|
|
2.56 |
|
|
|
|
|
|
(.04 |
) |
|
|
|
(.21 |
) |
|
|
|
(.25 |
) |
|
|
|
18.31 |
|
|
|
|
16.15 |
|
|
|
|
5 |
|
|
|
|
.95 |
|
|
|
|
.90 |
|
|
|
|
.38 |
|
| 12/31/2022 |
|
|
|
33.93 |
|
|
|
|
– |
8 |
|
|
|
(9.43 |
) |
|
|
|
(9.43 |
) |
|
|
|
|
|
– |
|
|
|
|
(8.50 |
) |
|
|
|
(8.50 |
) |
|
|
|
16.00 |
|
|
|
|
(29.54 |
) |
|
|
|
4 |
|
|
|
|
.97 |
|
|
|
|
.94 |
|
|
|
|
– |
9 |
| 12/31/2021 |
|
|
|
32.49 |
|
|
|
|
(.07 |
) |
|
|
|
2.28 |
|
|
|
|
2.21 |
|
|
|
|
|
|
– |
|
|
|
|
(.77 |
) |
|
|
|
(.77 |
) |
|
|
|
33.93 |
|
|
|
|
6.73 |
|
|
|
|
5 |
|
|
|
|
.99 |
|
|
|
|
.99 |
|
|
|
|
(.21 |
) |
| 12/31/2020 |
|
|
|
26.74 |
|
|
|
|
(.09 |
) |
|
|
|
7.48 |
|
|
|
|
7.39 |
|
|
|
|
|
|
(.05 |
) |
|
|
|
(1.59 |
) |
|
|
|
(1.64 |
) |
|
|
|
32.49 |
|
|
|
|
29.72 |
|
|
|
|
1 |
|
|
|
|
.99 |
|
|
|
|
.99 |
|
|
|
|
(.33 |
) |
| 12/31/2019 |
|
|
|
21.71 |
|
|
|
|
.05 |
|
|
|
|
6.61 |
|
|
|
|
6.66 |
|
|
|
|
|
|
(.05 |
) |
|
|
|
(1.58 |
) |
|
|
|
(1.63 |
) |
|
|
|
26.74 |
|
|
|
|
31.56 |
|
|
|
|
1 |
|
|
|
|
.99 |
|
|
|
|
.99 |
|
|
|
|
.22 |
|
| Class 2: |
|
|
|
|
|
|
|
|
|
|
|
|
|
|
|
|
|
|
|
|
|
|
|
|
|
|
|
|
|
|
|
|
|
|
|
|
|
|
|
|
|
|
|
|
|
|
|
|
|
|
|
|
|
|
|
|
|
|
|
|
|
|
|
|
|
|
|
| 6/30/20244,5 |
|
|
|
17.50 |
|
|
|
|
.06 |
|
|
|
|
.01 |
|
|
|
|
.07 |
|
|
|
|
|
|
(.14 |
) |
|
|
|
(.65 |
) |
|
|
|
(.79 |
) |
|
|
|
16.78 |
|
|
|
|
.47 |
6 |
|
|
|
1,788 |
|
|
|
|
.95 |
7 |
|
|
|
.93 |
7 |
|
|
|
.74 |
7 |
| 12/31/2023 |
|
|
|
15.30 |
|
|
|
|
.06 |
|
|
|
|
2.39 |
|
|
|
|
2.45 |
|
|
|
|
|
|
(.04 |
) |
|
|
|
(.21 |
) |
|
|
|
(.25 |
) |
|
|
|
17.50 |
|
|
|
|
16.17 |
|
|
|
|
1,879 |
|
|
|
|
.95 |
|
|
|
|
.90 |
|
|
|
|
.38 |
|
| 12/31/2022 |
|
|
|
32.94 |
|
|
|
|
– |
8 |
|
|
|
(9.14 |
) |
|
|
|
(9.14 |
) |
|
|
|
|
|
– |
|
|
|
|
(8.50 |
) |
|
|
|
(8.50 |
) |
|
|
|
15.30 |
|
|
|
|
(29.55 |
) |
|
|
|
1,762 |
|
|
|
|
.97 |
|
|
|
|
.94 |
|
|
|
|
– |
9 |
| 12/31/2021 |
|
|
|
31.56 |
|
|
|
|
(.10 |
) |
|
|
|
2.25 |
|
|
|
|
2.15 |
|
|
|
|
|
|
– |
|
|
|
|
(.77 |
) |
|
|
|
(.77 |
) |
|
|
|
32.94 |
|
|
|
|
6.74 |
|
|
|
|
2,521 |
|
|
|
|
.99 |
|
|
|
|
.99 |
|
|
|
|
(.30 |
) |
| 12/31/2020 |
|
|
|
26.02 |
|
|
|
|
(.08 |
) |
|
|
|
7.25 |
|
|
|
|
7.17 |
|
|
|
|
|
|
(.04 |
) |
|
|
|
(1.59 |
) |
|
|
|
(1.63 |
) |
|
|
|
31.56 |
|
|
|
|
29.72 |
|
|
|
|
2,653 |
|
|
|
|
1.00 |
|
|
|
|
1.00 |
|
|
|
|
(.31 |
) |
| 12/31/2019 |
|
|
|
21.16 |
|
|
|
|
.05 |
|
|
|
|
6.43 |
|
|
|
|
6.48 |
|
|
|
|
|
|
(.04 |
) |
|
|
|
(1.58 |
) |
|
|
|
(1.62 |
) |
|
|
|
26.02 |
|
|
|
|
31.52 |
|
|
|
|
2,363 |
|
|
|
|
1.00 |
|
|
|
|
1.00 |
|
|
|
|
.22 |
|
| Class 4: |
|
|
|
|
|
|
|
|
|
|
|
|
|
|
|
|
|
|
|
|
|
|
|
|
|
|
|
|
|
|
|
|
|
|
|
|
|
|
|
|
|
|
|
|
|
|
|
|
|
|
|
|
|
|
|
|
|
|
|
|
|
|
|
|
|
|
|
| 6/30/20244,5 |
|
|
|
17.46 |
|
|
|
|
.04 |
|
|
|
|
.02 |
|
|
|
|
.06 |
|
|
|
|
|
|
(.14 |
) |
|
|
|
(.65 |
) |
|
|
|
(.79 |
) |
|
|
|
16.73 |
|
|
|
|
.37 |
6 |
|
|
|
296 |
|
|
|
|
1.20 |
7 |
|
|
|
1.18 |
7 |
|
|
|
.49 |
7 |
| 12/31/2023 |
|
|
|
15.28 |
|
|
|
|
.02 |
|
|
|
|
2.37 |
|
|
|
|
2.39 |
|
|
|
|
|
|
– |
8 |
|
|
|
(.21 |
) |
|
|
|
(.21 |
) |
|
|
|
17.46 |
|
|
|
|
15.79 |
|
|
|
|
300 |
|
|
|
|
1.20 |
|
|
|
|
1.15 |
|
|
|
|
.13 |
|
| 12/31/2022 |
|
|
|
32.96 |
|
|
|
|
(.05 |
) |
|
|
|
(9.13 |
) |
|
|
|
(9.18 |
) |
|
|
|
|
|
– |
|
|
|
|
(8.50 |
) |
|
|
|
(8.50 |
) |
|
|
|
15.28 |
|
|
|
|
(29.69 |
) |
|
|
|
261 |
|
|
|
|
1.22 |
|
|
|
|
1.19 |
|
|
|
|
(.25 |
) |
| 12/31/2021 |
|
|
|
31.67 |
|
|
|
|
(.18 |
) |
|
|
|
2.24 |
|
|
|
|
2.06 |
|
|
|
|
|
|
– |
|
|
|
|
(.77 |
) |
|
|
|
(.77 |
) |
|
|
|
32.96 |
|
|
|
|
6.43 |
|
|
|
|
344 |
|
|
|
|
1.24 |
|
|
|
|
1.24 |
|
|
|
|
(.53 |
) |
| 12/31/2020 |
|
|
|
26.16 |
|
|
|
|
(.14 |
) |
|
|
|
7.27 |
|
|
|
|
7.13 |
|
|
|
|
|
|
(.03 |
) |
|
|
|
(1.59 |
) |
|
|
|
(1.62 |
) |
|
|
|
31.67 |
|
|
|
|
29.39 |
|
|
|
|
268 |
|
|
|
|
1.25 |
|
|
|
|
1.25 |
|
|
|
|
(.56 |
) |
| 12/31/2019 |
|
|
|
21.28 |
|
|
|
|
(.01 |
) |
|
|
|
6.47 |
|
|
|
|
6.46 |
|
|
|
|
|
|
– |
8 |
|
|
|
(1.58 |
) |
|
|
|
(1.58 |
) |
|
|
|
26.16 |
|
|
|
|
31.24 |
|
|
|
|
206 |
|
|
|
|
1.25 |
|
|
|
|
1.25 |
|
|
|
|
(.04 |
) |
Refer to the end of the tables for footnotes.
327 American Funds Insurance Series
Financial highlights (continued)
|
|
|
|
|
|
|
|
|
|
|
|
|
|
|
|
|
|
|
|
|
|
|
|
|
|
|
|
|
|
|
|
|
|
|
|
|
|
|
|
|
|
|
|
|
|
|
|
|
|
|
|
|
|
|
|
|
|
|
|
|
|
|
| |
|
|
|
Income (loss) from investment operations1 |
|
|
|
Dividends and distributions |
|
|
|
|
|
|
|
|
|
|
|
|
|
|
|
|
|
|
|
|
|
|
|
|
| Year ended |
|
Net asset value, beginning of year |
|
Net investment income (loss) |
|
Net gains (losses) on securities (both realized and unrealized) |
|
Total from investment operations |
|
|
|
Dividends (from net investment income) |
|
Distributions (from capital gains) |
|
Total dividends and distributions |
|
Net asset value, end of year |
|
Total return |
|
Net assets, end of year (in millions) |
|
Ratio of expenses to average net assets3 |
|
Ratio of net income (loss) to average net assets |
|
|
|
|
|
|
|
|
|
|
|
| Growth Fund |
|
|
|
|
|
|
|
|
|
|
|
|
|
|
|
|
|
|
|
|
|
|
|
|
|
|
|
|
|
|
|
|
|
|
|
|
|
|
|
|
|
|
|
|
|
|
|
|
|
|
|
|
|
|
|
|
|
|
|
|
|
|
| Class 1: |
|
|
|
|
|
|
|
|
|
|
|
|
|
|
|
|
|
|
|
|
|
|
|
|
|
|
|
|
|
|
|
|
|
|
|
|
|
|
|
|
|
|
|
|
|
|
|
|
|
|
|
|
|
|
|
|
|
|
|
|
|
|
| 6/30/20244,5 |
|
|
|
$ 99.44 |
|
|
|
|
$ .24 |
|
|
|
|
$ 15.78 |
|
|
|
|
$ 16.02 |
|
|
|
|
|
|
$(.22 |
) |
|
|
|
$ (2.59 |
) |
|
|
|
$ (2.81 |
) |
|
|
|
$112.65 |
|
|
|
|
16.23 |
%6 |
|
|
|
$19,612 |
|
|
|
|
.34 |
%7 |
|
|
|
.44 |
%7 |
| 12/31/2023 |
|
|
|
76.29 |
|
|
|
|
.57 |
|
|
|
|
28.16 |
|
|
|
|
28.73 |
|
|
|
|
|
|
(.54 |
) |
|
|
|
(5.04 |
) |
|
|
|
(5.58 |
) |
|
|
|
99.44 |
|
|
|
|
38.81 |
|
|
|
|
17,382 |
|
|
|
|
.35 |
|
|
|
|
.65 |
|
| 12/31/2022 |
|
|
|
127.58 |
|
|
|
|
.58 |
|
|
|
|
(37.03 |
) |
|
|
|
(36.45 |
) |
|
|
|
|
|
(.53 |
) |
|
|
|
(14.31 |
) |
|
|
|
(14.84 |
) |
|
|
|
76.29 |
|
|
|
|
(29.75 |
) |
|
|
|
13,660 |
|
|
|
|
.35 |
|
|
|
|
.64 |
|
| 12/31/2021 |
|
|
|
120.22 |
|
|
|
|
.46 |
|
|
|
|
24.29 |
|
|
|
|
24.75 |
|
|
|
|
|
|
(.58 |
) |
|
|
|
(16.81 |
) |
|
|
|
(17.39 |
) |
|
|
|
127.58 |
|
|
|
|
22.30 |
|
|
|
|
19,783 |
|
|
|
|
.34 |
|
|
|
|
.37 |
|
| 12/31/2020 |
|
|
|
81.22 |
|
|
|
|
.43 |
|
|
|
|
41.28 |
|
|
|
|
41.71 |
|
|
|
|
|
|
(.53 |
) |
|
|
|
(2.18 |
) |
|
|
|
(2.71 |
) |
|
|
|
120.22 |
|
|
|
|
52.45 |
|
|
|
|
15,644 |
|
|
|
|
.35 |
|
|
|
|
.46 |
|
| 12/31/2019 |
|
|
|
69.96 |
|
|
|
|
.83 |
|
|
|
|
19.63 |
|
|
|
|
20.46 |
|
|
|
|
|
|
(.76 |
) |
|
|
|
(8.44 |
) |
|
|
|
(9.20 |
) |
|
|
|
81.22 |
|
|
|
|
31.11 |
|
|
|
|
10,841 |
|
|
|
|
.35 |
|
|
|
|
1.09 |
|
| Class 1A: |
|
|
|
|
|
|
|
|
|
|
|
|
|
|
|
|
|
|
|
|
|
|
|
|
|
|
|
|
|
|
|
|
|
|
|
|
|
|
|
|
|
|
|
|
|
|
|
|
|
|
|
|
|
|
|
|
|
|
|
|
|
|
| 6/30/20244,5 |
|
|
|
98.46 |
|
|
|
|
.10 |
|
|
|
|
15.61 |
|
|
|
|
15.71 |
|
|
|
|
|
|
(.18 |
) |
|
|
|
(2.59 |
) |
|
|
|
(2.77 |
) |
|
|
|
111.40 |
|
|
|
|
16.07 |
6 |
|
|
|
330 |
|
|
|
|
.59 |
7 |
|
|
|
.19 |
7 |
| 12/31/2023 |
|
|
|
75.61 |
|
|
|
|
.35 |
|
|
|
|
27.88 |
|
|
|
|
28.23 |
|
|
|
|
|
|
(.34 |
) |
|
|
|
(5.04 |
) |
|
|
|
(5.38 |
) |
|
|
|
98.46 |
|
|
|
|
38.47 |
|
|
|
|
280 |
|
|
|
|
.60 |
|
|
|
|
.40 |
|
| 12/31/2022 |
|
|
|
126.70 |
|
|
|
|
.39 |
|
|
|
|
(36.79 |
) |
|
|
|
(36.40 |
) |
|
|
|
|
|
(.38 |
) |
|
|
|
(14.31 |
) |
|
|
|
(14.69 |
) |
|
|
|
75.61 |
|
|
|
|
(29.93 |
) |
|
|
|
187 |
|
|
|
|
.60 |
|
|
|
|
.45 |
|
| 12/31/2021 |
|
|
|
119.59 |
|
|
|
|
.16 |
|
|
|
|
24.11 |
|
|
|
|
24.27 |
|
|
|
|
|
|
(.35 |
) |
|
|
|
(16.81 |
) |
|
|
|
(17.16 |
) |
|
|
|
126.70 |
|
|
|
|
21.97 |
|
|
|
|
121 |
|
|
|
|
.59 |
|
|
|
|
.13 |
|
| 12/31/2020 |
|
|
|
80.92 |
|
|
|
|
.20 |
|
|
|
|
41.05 |
|
|
|
|
41.25 |
|
|
|
|
|
|
(.40 |
) |
|
|
|
(2.18 |
) |
|
|
|
(2.58 |
) |
|
|
|
119.59 |
|
|
|
|
52.07 |
|
|
|
|
60 |
|
|
|
|
.60 |
|
|
|
|
.21 |
|
| 12/31/2019 |
|
|
|
69.77 |
|
|
|
|
.65 |
|
|
|
|
19.55 |
|
|
|
|
20.20 |
|
|
|
|
|
|
(.61 |
) |
|
|
|
(8.44 |
) |
|
|
|
(9.05 |
) |
|
|
|
80.92 |
|
|
|
|
30.79 |
|
|
|
|
18 |
|
|
|
|
.60 |
|
|
|
|
.85 |
|
| Class 2: |
|
|
|
|
|
|
|
|
|
|
|
|
|
|
|
|
|
|
|
|
|
|
|
|
|
|
|
|
|
|
|
|
|
|
|
|
|
|
|
|
|
|
|
|
|
|
|
|
|
|
|
|
|
|
|
|
|
|
|
|
|
|
| 6/30/20244,5 |
|
|
|
98.20 |
|
|
|
|
.10 |
|
|
|
|
15.57 |
|
|
|
|
15.67 |
|
|
|
|
|
|
(.18 |
) |
|
|
|
(2.59 |
) |
|
|
|
(2.77 |
) |
|
|
|
111.10 |
|
|
|
|
16.07 |
6 |
|
|
|
19,296 |
|
|
|
|
.59 |
7 |
|
|
|
.19 |
7 |
| 12/31/2023 |
|
|
|
75.41 |
|
|
|
|
.35 |
|
|
|
|
27.80 |
|
|
|
|
28.15 |
|
|
|
|
|
|
(.32 |
) |
|
|
|
(5.04 |
) |
|
|
|
(5.36 |
) |
|
|
|
98.20 |
|
|
|
|
38.49 |
|
|
|
|
17,879 |
|
|
|
|
.60 |
|
|
|
|
.40 |
|
| 12/31/2022 |
|
|
|
126.28 |
|
|
|
|
.35 |
|
|
|
|
(36.62 |
) |
|
|
|
(36.27 |
) |
|
|
|
|
|
(.29 |
) |
|
|
|
(14.31 |
) |
|
|
|
(14.60 |
) |
|
|
|
75.41 |
|
|
|
|
(29.94 |
) |
|
|
|
14,452 |
|
|
|
|
.60 |
|
|
|
|
.38 |
|
| 12/31/2021 |
|
|
|
119.18 |
|
|
|
|
.15 |
|
|
|
|
24.03 |
|
|
|
|
24.18 |
|
|
|
|
|
|
(.27 |
) |
|
|
|
(16.81 |
) |
|
|
|
(17.08 |
) |
|
|
|
126.28 |
|
|
|
|
21.97 |
|
|
|
|
21,986 |
|
|
|
|
.59 |
|
|
|
|
.12 |
|
| 12/31/2020 |
|
|
|
80.57 |
|
|
|
|
.19 |
|
|
|
|
40.89 |
|
|
|
|
41.08 |
|
|
|
|
|
|
(.29 |
) |
|
|
|
(2.18 |
) |
|
|
|
(2.47 |
) |
|
|
|
119.18 |
|
|
|
|
52.10 |
|
|
|
|
20,594 |
|
|
|
|
.60 |
|
|
|
|
.21 |
|
| 12/31/2019 |
|
|
|
69.48 |
|
|
|
|
.63 |
|
|
|
|
19.47 |
|
|
|
|
20.10 |
|
|
|
|
|
|
(.57 |
) |
|
|
|
(8.44 |
) |
|
|
|
(9.01 |
) |
|
|
|
80.57 |
|
|
|
|
30.77 |
|
|
|
|
15,885 |
|
|
|
|
.60 |
|
|
|
|
.83 |
|
| Class 3: |
|
|
|
|
|
|
|
|
|
|
|
|
|
|
|
|
|
|
|
|
|
|
|
|
|
|
|
|
|
|
|
|
|
|
|
|
|
|
|
|
|
|
|
|
|
|
|
|
|
|
|
|
|
|
|
|
|
|
|
|
|
|
| 6/30/20244,5 |
|
|
|
100.54 |
|
|
|
|
.14 |
|
|
|
|
15.95 |
|
|
|
|
16.09 |
|
|
|
|
|
|
(.19 |
) |
|
|
|
(2.59 |
) |
|
|
|
(2.78 |
) |
|
|
|
113.85 |
|
|
|
|
16.12 |
6 |
|
|
|
259 |
|
|
|
|
.52 |
7 |
|
|
|
.26 |
7 |
| 12/31/2023 |
|
|
|
77.09 |
|
|
|
|
.42 |
|
|
|
|
28.45 |
|
|
|
|
28.87 |
|
|
|
|
|
|
(.38 |
) |
|
|
|
(5.04 |
) |
|
|
|
(5.42 |
) |
|
|
|
100.54 |
|
|
|
|
38.56 |
|
|
|
|
236 |
|
|
|
|
.53 |
|
|
|
|
.47 |
|
| 12/31/2022 |
|
|
|
128.68 |
|
|
|
|
.42 |
|
|
|
|
(37.35 |
) |
|
|
|
(36.93 |
) |
|
|
|
|
|
(.35 |
) |
|
|
|
(14.31 |
) |
|
|
|
(14.66 |
) |
|
|
|
77.09 |
|
|
|
|
(29.89 |
) |
|
|
|
188 |
|
|
|
|
.53 |
|
|
|
|
.45 |
|
| 12/31/2021 |
|
|
|
121.13 |
|
|
|
|
.24 |
|
|
|
|
24.47 |
|
|
|
|
24.71 |
|
|
|
|
|
|
(.35 |
) |
|
|
|
(16.81 |
) |
|
|
|
(17.16 |
) |
|
|
|
128.68 |
|
|
|
|
22.07 |
|
|
|
|
302 |
|
|
|
|
.52 |
|
|
|
|
.19 |
|
| 12/31/2020 |
|
|
|
81.84 |
|
|
|
|
.26 |
|
|
|
|
41.56 |
|
|
|
|
41.82 |
|
|
|
|
|
|
(.35 |
) |
|
|
|
(2.18 |
) |
|
|
|
(2.53 |
) |
|
|
|
121.13 |
|
|
|
|
52.20 |
|
|
|
|
279 |
|
|
|
|
.53 |
|
|
|
|
.28 |
|
| 12/31/2019 |
|
|
|
70.44 |
|
|
|
|
.69 |
|
|
|
|
19.77 |
|
|
|
|
20.46 |
|
|
|
|
|
|
(.62 |
) |
|
|
|
(8.44 |
) |
|
|
|
(9.06 |
) |
|
|
|
81.84 |
|
|
|
|
30.86 |
|
|
|
|
213 |
|
|
|
|
.53 |
|
|
|
|
.90 |
|
| Class 4: |
|
|
|
|
|
|
|
|
|
|
|
|
|
|
|
|
|
|
|
|
|
|
|
|
|
|
|
|
|
|
|
|
|
|
|
|
|
|
|
|
|
|
|
|
|
|
|
|
|
|
|
|
|
|
|
|
|
|
|
|
|
|
| 6/30/20244,5 |
|
|
|
95.70 |
|
|
|
|
(.03 |
) |
|
|
|
15.16 |
|
|
|
|
15.13 |
|
|
|
|
|
|
(.15 |
) |
|
|
|
(2.59 |
) |
|
|
|
(2.74 |
) |
|
|
|
108.09 |
|
|
|
|
15.93 |
6 |
|
|
|
4,338 |
|
|
|
|
.84 |
7 |
|
|
|
(.06 |
)7 |
| 12/31/2023 |
|
|
|
73.64 |
|
|
|
|
.13 |
|
|
|
|
27.12 |
|
|
|
|
27.25 |
|
|
|
|
|
|
(.15 |
) |
|
|
|
(5.04 |
) |
|
|
|
(5.19 |
) |
|
|
|
95.70 |
|
|
|
|
38.13 |
|
|
|
|
3,522 |
|
|
|
|
.85 |
|
|
|
|
.15 |
|
| 12/31/2022 |
|
|
|
123.79 |
|
|
|
|
.12 |
|
|
|
|
(35.87 |
) |
|
|
|
(35.75 |
) |
|
|
|
|
|
(.09 |
) |
|
|
|
(14.31 |
) |
|
|
|
(14.40 |
) |
|
|
|
73.64 |
|
|
|
|
(30.11 |
) |
|
|
|
2,409 |
|
|
|
|
.85 |
|
|
|
|
.14 |
|
| 12/31/2021 |
|
|
|
117.24 |
|
|
|
|
(.15 |
) |
|
|
|
23.59 |
|
|
|
|
23.44 |
|
|
|
|
|
|
(.08 |
) |
|
|
|
(16.81 |
) |
|
|
|
(16.89 |
) |
|
|
|
123.79 |
|
|
|
|
21.69 |
|
|
|
|
3,214 |
|
|
|
|
.84 |
|
|
|
|
(.13 |
) |
| 12/31/2020 |
|
|
|
79.41 |
|
|
|
|
(.04 |
) |
|
|
|
40.24 |
|
|
|
|
40.20 |
|
|
|
|
|
|
(.19 |
) |
|
|
|
(2.18 |
) |
|
|
|
(2.37 |
) |
|
|
|
117.24 |
|
|
|
|
51.71 |
|
|
|
|
2,347 |
|
|
|
|
.85 |
|
|
|
|
(.04 |
) |
| 12/31/2019 |
|
|
|
68.64 |
|
|
|
|
.44 |
|
|
|
|
19.19 |
|
|
|
|
19.63 |
|
|
|
|
|
|
(.42 |
) |
|
|
|
(8.44 |
) |
|
|
|
(8.86 |
) |
|
|
|
79.41 |
|
|
|
|
30.44 |
|
|
|
|
1,513 |
|
|
|
|
.85 |
|
|
|
|
.59 |
|
Refer to the end of the tables for footnotes.
American Funds Insurance Series 328
Financial highlights (continued)
|
|
|
|
|
|
|
|
|
|
|
|
|
|
|
|
|
|
|
|
|
|
|
|
|
|
|
|
|
|
|
|
|
|
|
|
|
|
|
|
|
|
|
|
|
|
|
|
|
|
|
|
|
|
|
|
|
|
|
|
|
|
|
| |
|
|
|
Income (loss) from investment operations1 |
|
|
|
Dividends and distributions |
|
|
|
|
|
|
|
|
|
|
|
|
|
|
|
|
|
|
|
|
|
|
|
|
| Year ended |
|
Net asset value, beginning of year |
|
Net investment income (loss) |
|
Net gains (losses) on securities (both realized and unrealized) |
|
Total from investment operations |
|
|
|
Dividends (from net investment income) |
|
Distributions (from capital gains) |
|
Total dividends and distributions |
|
Net asset value, end of year |
|
Total return |
|
Net assets, end of year (in millions) |
|
Ratio of expenses to average net assets3 |
|
Ratio of net income (loss) to average net assets |
|
|
|
|
|
|
|
|
|
|
|
| International Fund |
|
|
|
|
|
|
|
|
|
|
|
|
|
|
|
|
|
|
|
|
|
|
|
|
|
|
|
|
|
|
|
|
|
|
|
|
|
|
|
|
|
|
|
|
|
|
|
|
|
|
|
|
|
|
|
|
|
|
|
|
|
|
| Class 1: |
|
|
|
|
|
|
|
|
|
|
|
|
|
|
|
|
|
|
|
|
|
|
|
|
|
|
|
|
|
|
|
|
|
|
|
|
|
|
|
|
|
|
|
|
|
|
|
|
|
|
|
|
|
|
|
|
|
|
|
|
|
|
| 6/30/20244,5 |
|
|
|
$17.50 |
|
|
|
|
$.15 |
|
|
|
|
$ 1.14 |
|
|
|
|
$ 1.29 |
|
|
|
|
|
|
$(.05 |
) |
|
|
|
$ – |
|
|
|
|
$ (.05 |
) |
|
|
|
$18.74 |
|
|
|
|
7.35 |
%6 |
|
|
|
$3,345 |
|
|
|
|
.52 |
%7 |
|
|
|
1.70 |
%7 |
| 12/31/2023 |
|
|
|
15.31 |
|
|
|
|
.25 |
|
|
|
|
2.20 |
|
|
|
|
2.45 |
|
|
|
|
|
|
(.26 |
) |
|
|
|
– |
|
|
|
|
(.26 |
) |
|
|
|
17.50 |
|
|
|
|
16.12 |
|
|
|
|
3,353 |
|
|
|
|
.53 |
|
|
|
|
1.50 |
|
| 12/31/2022 |
|
|
|
22.70 |
|
|
|
|
.34 |
|
|
|
|
(4.79 |
) |
|
|
|
(4.45 |
) |
|
|
|
|
|
(.34 |
) |
|
|
|
(2.60 |
) |
|
|
|
(2.94 |
) |
|
|
|
15.31 |
|
|
|
|
(20.57 |
) |
|
|
|
3,157 |
|
|
|
|
.54 |
|
|
|
|
1.95 |
|
| 12/31/2021 |
|
|
|
23.64 |
|
|
|
|
.38 |
|
|
|
|
(.67 |
) |
|
|
|
(.29 |
) |
|
|
|
|
|
(.65 |
) |
|
|
|
– |
|
|
|
|
(.65 |
) |
|
|
|
22.70 |
|
|
|
|
(1.23 |
) |
|
|
|
4,747 |
|
|
|
|
.55 |
|
|
|
|
1.57 |
|
| 12/31/2020 |
|
|
|
20.86 |
|
|
|
|
.14 |
|
|
|
|
2.82 |
|
|
|
|
2.96 |
|
|
|
|
|
|
(.18 |
) |
|
|
|
– |
|
|
|
|
(.18 |
) |
|
|
|
23.64 |
|
|
|
|
14.28 |
|
|
|
|
5,652 |
|
|
|
|
.55 |
|
|
|
|
.71 |
|
| 12/31/2019 |
|
|
|
17.66 |
|
|
|
|
.30 |
|
|
|
|
3.74 |
|
|
|
|
4.04 |
|
|
|
|
|
|
(.34 |
) |
|
|
|
(.50 |
) |
|
|
|
(.84 |
) |
|
|
|
20.86 |
|
|
|
|
23.21 |
|
|
|
|
5,353 |
|
|
|
|
.54 |
|
|
|
|
1.54 |
|
| Class 1A: |
|
|
|
|
|
|
|
|
|
|
|
|
|
|
|
|
|
|
|
|
|
|
|
|
|
|
|
|
|
|
|
|
|
|
|
|
|
|
|
|
|
|
|
|
|
|
|
|
|
|
|
|
|
|
|
|
|
|
|
|
|
|
| 6/30/20244,5 |
|
|
|
17.41 |
|
|
|
|
.13 |
|
|
|
|
1.12 |
|
|
|
|
1.25 |
|
|
|
|
|
|
(.04 |
) |
|
|
|
– |
|
|
|
|
(.04 |
) |
|
|
|
18.62 |
|
|
|
|
7.23 |
6 |
|
|
|
12 |
|
|
|
|
.77 |
7 |
|
|
|
1.46 |
7 |
| 12/31/2023 |
|
|
|
15.23 |
|
|
|
|
.21 |
|
|
|
|
2.19 |
|
|
|
|
2.40 |
|
|
|
|
|
|
(.22 |
) |
|
|
|
– |
|
|
|
|
(.22 |
) |
|
|
|
17.41 |
|
|
|
|
15.85 |
|
|
|
|
12 |
|
|
|
|
.78 |
|
|
|
|
1.24 |
|
| 12/31/2022 |
|
|
|
22.61 |
|
|
|
|
.30 |
|
|
|
|
(4.78 |
) |
|
|
|
(4.48 |
) |
|
|
|
|
|
(.30 |
) |
|
|
|
(2.60 |
) |
|
|
|
(2.90 |
) |
|
|
|
15.23 |
|
|
|
|
(20.80 |
) |
|
|
|
10 |
|
|
|
|
.79 |
|
|
|
|
1.73 |
|
| 12/31/2021 |
|
|
|
23.55 |
|
|
|
|
.33 |
|
|
|
|
(.67 |
) |
|
|
|
(.34 |
) |
|
|
|
|
|
(.60 |
) |
|
|
|
– |
|
|
|
|
(.60 |
) |
|
|
|
22.61 |
|
|
|
|
(1.47 |
) |
|
|
|
12 |
|
|
|
|
.80 |
|
|
|
|
1.39 |
|
| 12/31/2020 |
|
|
|
20.80 |
|
|
|
|
.08 |
|
|
|
|
2.81 |
|
|
|
|
2.89 |
|
|
|
|
|
|
(.14 |
) |
|
|
|
– |
|
|
|
|
(.14 |
) |
|
|
|
23.55 |
|
|
|
|
13.96 |
|
|
|
|
10 |
|
|
|
|
.80 |
|
|
|
|
.43 |
|
| 12/31/2019 |
|
|
|
17.62 |
|
|
|
|
.25 |
|
|
|
|
3.72 |
|
|
|
|
3.97 |
|
|
|
|
|
|
(.29 |
) |
|
|
|
(.50 |
) |
|
|
|
(.79 |
) |
|
|
|
20.80 |
|
|
|
|
22.90 |
|
|
|
|
7 |
|
|
|
|
.79 |
|
|
|
|
1.27 |
|
| Class 2: |
|
|
|
|
|
|
|
|
|
|
|
|
|
|
|
|
|
|
|
|
|
|
|
|
|
|
|
|
|
|
|
|
|
|
|
|
|
|
|
|
|
|
|
|
|
|
|
|
|
|
|
|
|
|
|
|
|
|
|
|
|
|
| 6/30/20244,5 |
|
|
|
17.41 |
|
|
|
|
.13 |
|
|
|
|
1.13 |
|
|
|
|
1.26 |
|
|
|
|
|
|
(.04 |
) |
|
|
|
– |
|
|
|
|
(.04 |
) |
|
|
|
18.63 |
|
|
|
|
7.23 |
6 |
|
|
|
3,437 |
|
|
|
|
.77 |
7 |
|
|
|
1.46 |
7 |
| 12/31/2023 |
|
|
|
15.23 |
|
|
|
|
.21 |
|
|
|
|
2.19 |
|
|
|
|
2.40 |
|
|
|
|
|
|
(.22 |
) |
|
|
|
– |
|
|
|
|
(.22 |
) |
|
|
|
17.41 |
|
|
|
|
15.84 |
|
|
|
|
3,382 |
|
|
|
|
.78 |
|
|
|
|
1.24 |
|
| 12/31/2022 |
|
|
|
22.60 |
|
|
|
|
.29 |
|
|
|
|
(4.76 |
) |
|
|
|
(4.47 |
) |
|
|
|
|
|
(.30 |
) |
|
|
|
(2.60 |
) |
|
|
|
(2.90 |
) |
|
|
|
15.23 |
|
|
|
|
(20.79 |
) |
|
|
|
3,164 |
|
|
|
|
.79 |
|
|
|
|
1.71 |
|
| 12/31/2021 |
|
|
|
23.54 |
|
|
|
|
.33 |
|
|
|
|
(.68 |
) |
|
|
|
(.35 |
) |
|
|
|
|
|
(.59 |
) |
|
|
|
– |
|
|
|
|
(.59 |
) |
|
|
|
22.60 |
|
|
|
|
(1.49 |
) |
|
|
|
4,190 |
|
|
|
|
.80 |
|
|
|
|
1.35 |
|
| 12/31/2020 |
|
|
|
20.78 |
|
|
|
|
.09 |
|
|
|
|
2.80 |
|
|
|
|
2.89 |
|
|
|
|
|
|
(.13 |
) |
|
|
|
– |
|
|
|
|
(.13 |
) |
|
|
|
23.54 |
|
|
|
|
13.97 |
|
|
|
|
4,481 |
|
|
|
|
.80 |
|
|
|
|
.46 |
|
| 12/31/2019 |
|
|
|
17.60 |
|
|
|
|
.25 |
|
|
|
|
3.72 |
|
|
|
|
3.97 |
|
|
|
|
|
|
(.29 |
) |
|
|
|
(.50 |
) |
|
|
|
(.79 |
) |
|
|
|
20.78 |
|
|
|
|
22.88 |
|
|
|
|
4,311 |
|
|
|
|
.79 |
|
|
|
|
1.29 |
|
| Class 3: |
|
|
|
|
|
|
|
|
|
|
|
|
|
|
|
|
|
|
|
|
|
|
|
|
|
|
|
|
|
|
|
|
|
|
|
|
|
|
|
|
|
|
|
|
|
|
|
|
|
|
|
|
|
|
|
|
|
|
|
|
|
|
| 6/30/20244,5 |
|
|
|
17.56 |
|
|
|
|
.14 |
|
|
|
|
1.13 |
|
|
|
|
1.27 |
|
|
|
|
|
|
(.04 |
) |
|
|
|
– |
|
|
|
|
(.04 |
) |
|
|
|
18.79 |
|
|
|
|
7.24 |
6 |
|
|
|
16 |
|
|
|
|
.70 |
7 |
|
|
|
1.52 |
7 |
| 12/31/2023 |
|
|
|
15.35 |
|
|
|
|
.22 |
|
|
|
|
2.22 |
|
|
|
|
2.44 |
|
|
|
|
|
|
(.23 |
) |
|
|
|
– |
|
|
|
|
(.23 |
) |
|
|
|
17.56 |
|
|
|
|
15.99 |
|
|
|
|
17 |
|
|
|
|
.71 |
|
|
|
|
1.32 |
|
| 12/31/2022 |
|
|
|
22.76 |
|
|
|
|
.31 |
|
|
|
|
(4.81 |
) |
|
|
|
(4.50 |
) |
|
|
|
|
|
(.31 |
) |
|
|
|
(2.60 |
) |
|
|
|
(2.91 |
) |
|
|
|
15.35 |
|
|
|
|
(20.76 |
) |
|
|
|
16 |
|
|
|
|
.72 |
|
|
|
|
1.78 |
|
| 12/31/2021 |
|
|
|
23.69 |
|
|
|
|
.34 |
|
|
|
|
(.67 |
) |
|
|
|
(.33 |
) |
|
|
|
|
|
(.60 |
) |
|
|
|
– |
|
|
|
|
(.60 |
) |
|
|
|
22.76 |
|
|
|
|
(1.39 |
) |
|
|
|
21 |
|
|
|
|
.73 |
|
|
|
|
1.41 |
|
| 12/31/2020 |
|
|
|
20.92 |
|
|
|
|
.10 |
|
|
|
|
2.81 |
|
|
|
|
2.91 |
|
|
|
|
|
|
(.14 |
) |
|
|
|
– |
|
|
|
|
(.14 |
) |
|
|
|
23.69 |
|
|
|
|
14.00 |
|
|
|
|
25 |
|
|
|
|
.73 |
|
|
|
|
.53 |
|
| 12/31/2019 |
|
|
|
17.70 |
|
|
|
|
.27 |
|
|
|
|
3.75 |
|
|
|
|
4.02 |
|
|
|
|
|
|
(.30 |
) |
|
|
|
(.50 |
) |
|
|
|
(.80 |
) |
|
|
|
20.92 |
|
|
|
|
23.05 |
|
|
|
|
25 |
|
|
|
|
.72 |
|
|
|
|
1.37 |
|
| Class 4: |
|
|
|
|
|
|
|
|
|
|
|
|
|
|
|
|
|
|
|
|
|
|
|
|
|
|
|
|
|
|
|
|
|
|
|
|
|
|
|
|
|
|
|
|
|
|
|
|
|
|
|
|
|
|
|
|
|
|
|
|
|
|
| 6/30/20244,5 |
|
|
|
17.13 |
|
|
|
|
.11 |
|
|
|
|
1.10 |
|
|
|
|
1.21 |
|
|
|
|
|
|
(.03 |
) |
|
|
|
– |
|
|
|
|
(.03 |
) |
|
|
|
18.31 |
|
|
|
|
7.14 |
6 |
|
|
|
444 |
|
|
|
|
1.02 |
7 |
|
|
|
1.22 |
7 |
| 12/31/2023 |
|
|
|
14.99 |
|
|
|
|
.16 |
|
|
|
|
2.16 |
|
|
|
|
2.32 |
|
|
|
|
|
|
(.18 |
) |
|
|
|
– |
|
|
|
|
(.18 |
) |
|
|
|
17.13 |
|
|
|
|
15.56 |
|
|
|
|
415 |
|
|
|
|
1.03 |
|
|
|
|
.99 |
|
| 12/31/2022 |
|
|
|
22.31 |
|
|
|
|
.25 |
|
|
|
|
(4.71 |
) |
|
|
|
(4.46 |
) |
|
|
|
|
|
(.26 |
) |
|
|
|
(2.60 |
) |
|
|
|
(2.86 |
) |
|
|
|
14.99 |
|
|
|
|
(21.02 |
) |
|
|
|
373 |
|
|
|
|
1.04 |
|
|
|
|
1.47 |
|
| 12/31/2021 |
|
|
|
23.25 |
|
|
|
|
.27 |
|
|
|
|
(.67 |
) |
|
|
|
(.40 |
) |
|
|
|
|
|
(.54 |
) |
|
|
|
– |
|
|
|
|
(.54 |
) |
|
|
|
22.31 |
|
|
|
|
(1.71 |
) |
|
|
|
459 |
|
|
|
|
1.05 |
|
|
|
|
1.13 |
|
| 12/31/2020 |
|
|
|
20.54 |
|
|
|
|
.04 |
|
|
|
|
2.76 |
|
|
|
|
2.80 |
|
|
|
|
|
|
(.09 |
) |
|
|
|
– |
|
|
|
|
(.09 |
) |
|
|
|
23.25 |
|
|
|
|
13.66 |
|
|
|
|
423 |
|
|
|
|
1.05 |
|
|
|
|
.21 |
|
| 12/31/2019 |
|
|
|
17.40 |
|
|
|
|
.20 |
|
|
|
|
3.69 |
|
|
|
|
3.89 |
|
|
|
|
|
|
(.25 |
) |
|
|
|
(.50 |
) |
|
|
|
(.75 |
) |
|
|
|
20.54 |
|
|
|
|
22.67 |
|
|
|
|
379 |
|
|
|
|
1.04 |
|
|
|
|
1.03 |
|
Refer to the end of the tables for footnotes.
329 American Funds Insurance Series
Financial highlights (continued)
|
|
|
|
|
|
|
|
|
|
|
|
|
|
|
|
|
|
|
|
|
|
|
|
|
|
|
|
|
|
|
|
|
|
|
|
|
|
|
|
|
|
|
|
|
|
|
|
|
|
|
|
|
|
|
|
|
|
|
|
|
|
|
|
|
|
|
|
| |
|
|
|
Income (loss) from investment operations1 |
|
|
|
Dividends and distributions |
|
|
|
|
|
|
|
|
|
|
|
|
|
|
|
|
|
|
|
|
|
|
|
|
|
|
|
| Year ended |
|
Net asset value, beginning of year |
|
Net investment income (loss) |
|
Net gains (losses) on securities (both realized and unrealized) |
|
Total from investment operations |
|
|
|
Dividends (from net investment income) |
|
Distributions (from capital gains) |
|
Total dividends and distributions |
|
Net asset value, end of year |
|
Total return2 |
|
Net assets, end of year (in millions) |
|
Ratio of expenses to average net assets before waivers3 |
|
Ratio of expenses to average net assets after waivers2,3 |
|
Ratio of net income (loss) to average net assets2 |
|
|
|
|
|
|
|
|
|
|
|
|
| New World Fund |
|
|
|
|
|
|
|
|
|
|
|
|
|
|
|
|
|
|
|
|
|
|
|
|
|
|
|
|
|
|
|
|
|
|
|
|
|
|
|
|
|
|
|
|
|
|
|
|
|
|
|
|
|
|
|
|
|
|
|
|
|
|
|
|
|
|
|
|
| Class 1: |
|
|
|
|
|
|
|
|
|
|
|
|
|
|
|
|
|
|
|
|
|
|
|
|
|
|
|
|
|
|
|
|
|
|
|
|
|
|
|
|
|
|
|
|
|
|
|
|
|
|
|
|
|
|
|
|
|
|
|
|
|
|
|
|
|
|
|
| 6/30/20244,5 |
|
|
|
$25.48 |
|
|
|
|
$.27 |
|
|
|
|
$ 1.50 |
|
|
|
|
$ 1.77 |
|
|
|
|
|
|
$(.11 |
) |
|
|
|
$ (.12 |
) |
|
|
|
$ (.23 |
) |
|
|
|
$27.02 |
|
|
|
|
6.96 |
%6 |
|
|
|
$1,916 |
|
|
|
|
.64 |
%7 |
|
|
|
.57 |
%7 |
|
|
|
2.04 |
%7 |
| 12/31/2023 |
|
|
|
22.30 |
|
|
|
|
.40 |
|
|
|
|
3.19 |
|
|
|
|
3.59 |
|
|
|
|
|
|
(.41 |
) |
|
|
|
– |
|
|
|
|
(.41 |
) |
|
|
|
25.48 |
|
|
|
|
16.22 |
|
|
|
|
1,778 |
|
|
|
|
.64 |
|
|
|
|
.57 |
|
|
|
|
1.64 |
|
| 12/31/2022 |
|
|
|
31.83 |
|
|
|
|
.37 |
|
|
|
|
(7.17 |
) |
|
|
|
(6.80 |
) |
|
|
|
|
|
(.39 |
) |
|
|
|
(2.34 |
) |
|
|
|
(2.73 |
) |
|
|
|
22.30 |
|
|
|
|
(21.86 |
) |
|
|
|
1,610 |
|
|
|
|
.68 |
|
|
|
|
.57 |
|
|
|
|
1.48 |
|
| 12/31/2021 |
|
|
|
31.59 |
|
|
|
|
.29 |
|
|
|
|
1.38 |
|
|
|
|
1.67 |
|
|
|
|
|
|
(.36 |
) |
|
|
|
(1.07 |
) |
|
|
|
(1.43 |
) |
|
|
|
31.83 |
|
|
|
|
5.16 |
|
|
|
|
2,443 |
|
|
|
|
.74 |
|
|
|
|
.56 |
|
|
|
|
.88 |
|
| 12/31/2020 |
|
|
|
25.84 |
|
|
|
|
.15 |
|
|
|
|
5.93 |
|
|
|
|
6.08 |
|
|
|
|
|
|
(.06 |
) |
|
|
|
(.27 |
) |
|
|
|
(.33 |
) |
|
|
|
31.59 |
|
|
|
|
23.89 |
|
|
|
|
2,309 |
|
|
|
|
.76 |
|
|
|
|
.64 |
|
|
|
|
.58 |
|
| 12/31/2019 |
|
|
|
20.98 |
|
|
|
|
.28 |
|
|
|
|
5.79 |
|
|
|
|
6.07 |
|
|
|
|
|
|
(.29 |
) |
|
|
|
(.92 |
) |
|
|
|
(1.21 |
) |
|
|
|
25.84 |
|
|
|
|
29.47 |
|
|
|
|
2,129 |
|
|
|
|
.76 |
|
|
|
|
.76 |
|
|
|
|
1.18 |
|
| Class 1A: |
|
|
|
|
|
|
|
|
|
|
|
|
|
|
|
|
|
|
|
|
|
|
|
|
|
|
|
|
|
|
|
|
|
|
|
|
|
|
|
|
|
|
|
|
|
|
|
|
|
|
|
|
|
|
|
|
|
|
|
|
|
|
|
|
|
|
|
| 6/30/20244,5 |
|
|
|
25.36 |
|
|
|
|
.23 |
|
|
|
|
1.50 |
|
|
|
|
1.73 |
|
|
|
|
|
|
(.10 |
) |
|
|
|
(.12 |
) |
|
|
|
(.22 |
) |
|
|
|
26.87 |
|
|
|
|
6.83 |
6 |
|
|
|
10 |
|
|
|
|
.89 |
7 |
|
|
|
.82 |
7 |
|
|
|
1.78 |
7 |
| 12/31/2023 |
|
|
|
22.19 |
|
|
|
|
.33 |
|
|
|
|
3.20 |
|
|
|
|
3.53 |
|
|
|
|
|
|
(.36 |
) |
|
|
|
– |
|
|
|
|
(.36 |
) |
|
|
|
25.36 |
|
|
|
|
15.98 |
|
|
|
|
10 |
|
|
|
|
.89 |
|
|
|
|
.82 |
|
|
|
|
1.38 |
|
| 12/31/2022 |
|
|
|
31.70 |
|
|
|
|
.30 |
|
|
|
|
(7.15 |
) |
|
|
|
(6.85 |
) |
|
|
|
|
|
(.32 |
) |
|
|
|
(2.34 |
) |
|
|
|
(2.66 |
) |
|
|
|
22.19 |
|
|
|
|
(22.09 |
) |
|
|
|
9 |
|
|
|
|
.93 |
|
|
|
|
.82 |
|
|
|
|
1.24 |
|
| 12/31/2021 |
|
|
|
31.43 |
|
|
|
|
.17 |
|
|
|
|
1.41 |
|
|
|
|
1.58 |
|
|
|
|
|
|
(.24 |
) |
|
|
|
(1.07 |
) |
|
|
|
(1.31 |
) |
|
|
|
31.70 |
|
|
|
|
4.90 |
|
|
|
|
12 |
|
|
|
|
.99 |
|
|
|
|
.81 |
|
|
|
|
.54 |
|
| 12/31/2020 |
|
|
|
25.74 |
|
|
|
|
.07 |
|
|
|
|
5.92 |
|
|
|
|
5.99 |
|
|
|
|
|
|
(.03 |
) |
|
|
|
(.27 |
) |
|
|
|
(.30 |
) |
|
|
|
31.43 |
|
|
|
|
23.63 |
|
|
|
|
18 |
|
|
|
|
1.01 |
|
|
|
|
.87 |
|
|
|
|
.26 |
|
| 12/31/2019 |
|
|
|
20.92 |
|
|
|
|
.22 |
|
|
|
|
5.76 |
|
|
|
|
5.98 |
|
|
|
|
|
|
(.24 |
) |
|
|
|
(.92 |
) |
|
|
|
(1.16 |
) |
|
|
|
25.74 |
|
|
|
|
29.11 |
|
|
|
|
4 |
|
|
|
|
1.01 |
|
|
|
|
1.01 |
|
|
|
|
.92 |
|
| Class 2: |
|
|
|
|
|
|
|
|
|
|
|
|
|
|
|
|
|
|
|
|
|
|
|
|
|
|
|
|
|
|
|
|
|
|
|
|
|
|
|
|
|
|
|
|
|
|
|
|
|
|
|
|
|
|
|
|
|
|
|
|
|
|
|
|
|
|
|
| 6/30/20244,5 |
|
|
|
25.17 |
|
|
|
|
.23 |
|
|
|
|
1.48 |
|
|
|
|
1.71 |
|
|
|
|
|
|
(.10 |
) |
|
|
|
(.12 |
) |
|
|
|
(.22 |
) |
|
|
|
26.66 |
|
|
|
|
6.81 |
6 |
|
|
|
827 |
|
|
|
|
.89 |
7 |
|
|
|
.82 |
7 |
|
|
|
1.79 |
7 |
| 12/31/2023 |
|
|
|
22.02 |
|
|
|
|
.33 |
|
|
|
|
3.17 |
|
|
|
|
3.50 |
|
|
|
|
|
|
(.35 |
) |
|
|
|
– |
|
|
|
|
(.35 |
) |
|
|
|
25.17 |
|
|
|
|
15.99 |
|
|
|
|
803 |
|
|
|
|
.89 |
|
|
|
|
.82 |
|
|
|
|
1.39 |
|
| 12/31/2022 |
|
|
|
31.48 |
|
|
|
|
.30 |
|
|
|
|
(7.10 |
) |
|
|
|
(6.80 |
) |
|
|
|
|
|
(.32 |
) |
|
|
|
(2.34 |
) |
|
|
|
(2.66 |
) |
|
|
|
22.02 |
|
|
|
|
(22.10 |
) |
|
|
|
764 |
|
|
|
|
.93 |
|
|
|
|
.82 |
|
|
|
|
1.24 |
|
| 12/31/2021 |
|
|
|
31.25 |
|
|
|
|
.20 |
|
|
|
|
1.38 |
|
|
|
|
1.58 |
|
|
|
|
|
|
(.28 |
) |
|
|
|
(1.07 |
) |
|
|
|
(1.35 |
) |
|
|
|
31.48 |
|
|
|
|
4.92 |
|
|
|
|
1,086 |
|
|
|
|
.99 |
|
|
|
|
.81 |
|
|
|
|
.63 |
|
| 12/31/2020 |
|
|
|
25.59 |
|
|
|
|
.08 |
|
|
|
|
5.87 |
|
|
|
|
5.95 |
|
|
|
|
|
|
(.02 |
) |
|
|
|
(.27 |
) |
|
|
|
(.29 |
) |
|
|
|
31.25 |
|
|
|
|
23.58 |
|
|
|
|
1,109 |
|
|
|
|
1.01 |
|
|
|
|
.89 |
|
|
|
|
.34 |
|
| 12/31/2019 |
|
|
|
20.79 |
|
|
|
|
.22 |
|
|
|
|
5.73 |
|
|
|
|
5.95 |
|
|
|
|
|
|
(.23 |
) |
|
|
|
(.92 |
) |
|
|
|
(1.15 |
) |
|
|
|
25.59 |
|
|
|
|
29.15 |
|
|
|
|
981 |
|
|
|
|
1.01 |
|
|
|
|
1.01 |
|
|
|
|
.93 |
|
| Class 4: |
|
|
|
|
|
|
|
|
|
|
|
|
|
|
|
|
|
|
|
|
|
|
|
|
|
|
|
|
|
|
|
|
|
|
|
|
|
|
|
|
|
|
|
|
|
|
|
|
|
|
|
|
|
|
|
|
|
|
|
|
|
|
|
|
|
|
|
| 6/30/20244,5 |
|
|
|
24.95 |
|
|
|
|
.20 |
|
|
|
|
1.46 |
|
|
|
|
1.66 |
|
|
|
|
|
|
(.09 |
) |
|
|
|
(.12 |
) |
|
|
|
(.21 |
) |
|
|
|
26.40 |
|
|
|
|
6.70 |
6 |
|
|
|
814 |
|
|
|
|
1.14 |
7 |
|
|
|
1.07 |
7 |
|
|
|
1.54 |
7 |
| 12/31/2023 |
|
|
|
21.84 |
|
|
|
|
.27 |
|
|
|
|
3.14 |
|
|
|
|
3.41 |
|
|
|
|
|
|
(.30 |
) |
|
|
|
– |
|
|
|
|
(.30 |
) |
|
|
|
24.95 |
|
|
|
|
15.67 |
|
|
|
|
787 |
|
|
|
|
1.14 |
|
|
|
|
1.07 |
|
|
|
|
1.14 |
|
| 12/31/2022 |
|
|
|
31.24 |
|
|
|
|
.24 |
|
|
|
|
(7.03 |
) |
|
|
|
(6.79 |
) |
|
|
|
|
|
(.27 |
) |
|
|
|
(2.34 |
) |
|
|
|
(2.61 |
) |
|
|
|
21.84 |
|
|
|
|
(22.25 |
) |
|
|
|
701 |
|
|
|
|
1.18 |
|
|
|
|
1.07 |
|
|
|
|
.99 |
|
| 12/31/2021 |
|
|
|
31.04 |
|
|
|
|
.12 |
|
|
|
|
1.36 |
|
|
|
|
1.48 |
|
|
|
|
|
|
(.21 |
) |
|
|
|
(1.07 |
) |
|
|
|
(1.28 |
) |
|
|
|
31.24 |
|
|
|
|
4.63 |
|
|
|
|
906 |
|
|
|
|
1.24 |
|
|
|
|
1.06 |
|
|
|
|
.38 |
|
| 12/31/2020 |
|
|
|
25.47 |
|
|
|
|
.02 |
|
|
|
|
5.83 |
|
|
|
|
5.85 |
|
|
|
|
|
|
(.01 |
) |
|
|
|
(.27 |
) |
|
|
|
(.28 |
) |
|
|
|
31.04 |
|
|
|
|
23.29 |
|
|
|
|
807 |
|
|
|
|
1.26 |
|
|
|
|
1.14 |
|
|
|
|
.08 |
|
| 12/31/2019 |
|
|
|
20.71 |
|
|
|
|
.16 |
|
|
|
|
5.70 |
|
|
|
|
5.86 |
|
|
|
|
|
|
(.18 |
) |
|
|
|
(.92 |
) |
|
|
|
(1.10 |
) |
|
|
|
25.47 |
|
|
|
|
28.82 |
|
|
|
|
646 |
|
|
|
|
1.26 |
|
|
|
|
1.26 |
|
|
|
|
.67 |
|
Refer to the end of the tables for footnotes.
American Funds Insurance Series 330
Financial highlights (continued)
|
|
|
|
|
|
|
|
|
|
|
|
|
|
|
|
|
|
|
|
|
|
|
|
|
|
|
|
|
|
|
|
|
|
|
|
|
|
|
|
|
|
|
|
|
|
|
|
|
|
|
|
|
|
|
|
|
|
|
|
|
|
|
|
|
|
|
|
| |
|
|
|
Income (loss) from investment operations1 |
|
|
|
Dividends and distributions |
|
|
|
|
|
|
|
|
|
|
|
|
|
|
|
|
|
|
|
|
|
|
|
|
|
|
|
| Year ended |
|
Net asset value, beginning of year |
|
Net investment income (loss) |
|
Net gains (losses) on securities (both realized and unrealized) |
|
Total from investment operations |
|
|
|
Dividends (from net investment income) |
|
Distributions (from capital gains) |
|
Total dividends and distributions |
|
Net asset value, end of year |
|
Total return2 |
|
Net assets, end of year (in millions) |
|
Ratio of expenses to average net assets before waivers3 |
|
Ratio of expenses to average net assets after waivers2,3 |
|
Ratio of net income (loss) to average net assets2 |
|
|
|
|
|
|
|
|
|
|
|
|
| Washington Mutual Investors Fund |
|
|
|
|
|
|
|
|
|
|
|
|
|
|
|
|
|
|
|
|
|
|
|
|
|
|
|
|
|
|
|
|
|
|
|
|
|
|
|
|
|
|
|
|
|
|
|
|
|
|
|
|
|
|
|
|
|
|
|
|
|
|
|
|
|
|
|
|
| Class 1: |
|
|
|
|
|
|
|
|
|
|
|
|
|
|
|
|
|
|
|
|
|
|
|
|
|
|
|
|
|
|
|
|
|
|
|
|
|
|
|
|
|
|
|
|
|
|
|
|
|
|
|
|
|
|
|
|
|
|
|
|
|
|
|
|
|
|
|
| 6/30/20244,5 |
|
|
|
$14.49 |
|
|
|
|
$.14 |
|
|
|
|
$ 1.51 |
|
|
|
|
$ 1.65 |
|
|
|
|
|
|
$(.06 |
) |
|
|
|
$ (.13 |
) |
|
|
|
$ (.19 |
) |
|
|
|
$15.95 |
|
|
|
|
11.44 |
%6 |
|
|
|
$6,285 |
|
|
|
|
.41 |
%7 |
|
|
|
.25 |
%7 |
|
|
|
1.88 |
%7 |
| 12/31/2023 |
|
|
|
12.69 |
|
|
|
|
.28 |
|
|
|
|
1.92 |
|
|
|
|
2.20 |
|
|
|
|
|
|
(.28 |
) |
|
|
|
(.12 |
) |
|
|
|
(.40 |
) |
|
|
|
14.49 |
|
|
|
|
17.66 |
|
|
|
|
6,020 |
|
|
|
|
.41 |
|
|
|
|
.27 |
|
|
|
|
2.07 |
|
| 12/31/2022 |
|
|
|
18.09 |
|
|
|
|
.31 |
|
|
|
|
(1.69 |
) |
|
|
|
(1.38 |
) |
|
|
|
|
|
(.30 |
) |
|
|
|
(3.72 |
) |
|
|
|
(4.02 |
) |
|
|
|
12.69 |
|
|
|
|
(8.28 |
) |
|
|
|
5,507 |
|
|
|
|
.41 |
|
|
|
|
.26 |
|
|
|
|
2.13 |
|
| 12/31/2021 |
|
|
|
14.35 |
|
|
|
|
.29 |
|
|
|
|
3.73 |
|
|
|
|
4.02 |
|
|
|
|
|
|
(.28 |
) |
|
|
|
– |
|
|
|
|
(.28 |
) |
|
|
|
18.09 |
|
|
|
|
28.12 |
|
|
|
|
6,766 |
|
|
|
|
.42 |
|
|
|
|
.31 |
|
|
|
|
1.79 |
|
| 12/31/2020 |
|
|
|
13.56 |
|
|
|
|
.25 |
|
|
|
|
.95 |
|
|
|
|
1.20 |
|
|
|
|
|
|
(.26 |
) |
|
|
|
(.15 |
) |
|
|
|
(.41 |
) |
|
|
|
14.35 |
|
|
|
|
9.04 |
|
|
|
|
5,684 |
|
|
|
|
.43 |
|
|
|
|
.43 |
|
|
|
|
2.00 |
|
| 12/31/2019 |
|
|
|
12.38 |
|
|
|
|
.30 |
|
|
|
|
2.25 |
|
|
|
|
2.55 |
|
|
|
|
|
|
(.30 |
) |
|
|
|
(1.07 |
) |
|
|
|
(1.37 |
) |
|
|
|
13.56 |
|
|
|
|
21.66 |
|
|
|
|
5,559 |
|
|
|
|
.42 |
|
|
|
|
.42 |
|
|
|
|
2.28 |
|
| Class 1A: |
|
|
|
|
|
|
|
|
|
|
|
|
|
|
|
|
|
|
|
|
|
|
|
|
|
|
|
|
|
|
|
|
|
|
|
|
|
|
|
|
|
|
|
|
|
|
|
|
|
|
|
|
|
|
|
|
|
|
|
|
|
|
|
|
|
|
|
| 6/30/20244,5 |
|
|
|
14.43 |
|
|
|
|
.12 |
|
|
|
|
1.51 |
|
|
|
|
1.63 |
|
|
|
|
|
|
(.06 |
) |
|
|
|
(.13 |
) |
|
|
|
(.19 |
) |
|
|
|
15.87 |
|
|
|
|
11.30 |
6 |
|
|
|
26 |
|
|
|
|
.66 |
7 |
|
|
|
.50 |
7 |
|
|
|
1.64 |
7 |
| 12/31/2023 |
|
|
|
12.61 |
|
|
|
|
.23 |
|
|
|
|
1.92 |
|
|
|
|
2.15 |
|
|
|
|
|
|
(.21 |
) |
|
|
|
(.12 |
) |
|
|
|
(.33 |
) |
|
|
|
14.43 |
|
|
|
|
17.29 |
|
|
|
|
23 |
|
|
|
|
.66 |
|
|
|
|
.52 |
|
|
|
|
1.77 |
|
| 12/31/2022 |
|
|
|
17.96 |
|
|
|
|
.27 |
|
|
|
|
(1.67 |
) |
|
|
|
(1.40 |
) |
|
|
|
|
|
(.23 |
) |
|
|
|
(3.72 |
) |
|
|
|
(3.95 |
) |
|
|
|
12.61 |
|
|
|
|
(8.45 |
) |
|
|
|
64 |
|
|
|
|
.66 |
|
|
|
|
.51 |
|
|
|
|
1.76 |
|
| 12/31/2021 |
|
|
|
14.28 |
|
|
|
|
.27 |
|
|
|
|
3.67 |
|
|
|
|
3.94 |
|
|
|
|
|
|
(.26 |
) |
|
|
|
– |
|
|
|
|
(.26 |
) |
|
|
|
17.96 |
|
|
|
|
27.70 |
|
|
|
|
169 |
|
|
|
|
.67 |
|
|
|
|
.53 |
|
|
|
|
1.62 |
|
| 12/31/2020 |
|
|
|
13.51 |
|
|
|
|
.23 |
|
|
|
|
.93 |
|
|
|
|
1.16 |
|
|
|
|
|
|
(.24 |
) |
|
|
|
(.15 |
) |
|
|
|
(.39 |
) |
|
|
|
14.28 |
|
|
|
|
8.79 |
|
|
|
|
25 |
|
|
|
|
.67 |
|
|
|
|
.67 |
|
|
|
|
1.78 |
|
| 12/31/2019 |
|
|
|
12.35 |
|
|
|
|
.26 |
|
|
|
|
2.24 |
|
|
|
|
2.50 |
|
|
|
|
|
|
(.27 |
) |
|
|
|
(1.07 |
) |
|
|
|
(1.34 |
) |
|
|
|
13.51 |
|
|
|
|
21.35 |
|
|
|
|
9 |
|
|
|
|
.67 |
|
|
|
|
.67 |
|
|
|
|
2.03 |
|
| Class 2: |
|
|
|
|
|
|
|
|
|
|
|
|
|
|
|
|
|
|
|
|
|
|
|
|
|
|
|
|
|
|
|
|
|
|
|
|
|
|
|
|
|
|
|
|
|
|
|
|
|
|
|
|
|
|
|
|
|
|
|
|
|
|
|
|
|
|
|
| 6/30/20244,5 |
|
|
|
14.21 |
|
|
|
|
.12 |
|
|
|
|
1.49 |
|
|
|
|
1.61 |
|
|
|
|
|
|
(.06 |
) |
|
|
|
(.13 |
) |
|
|
|
(.19 |
) |
|
|
|
15.63 |
|
|
|
|
11.34 |
6 |
|
|
|
3,005 |
|
|
|
|
.66 |
7 |
|
|
|
.50 |
7 |
|
|
|
1.63 |
7 |
| 12/31/2023 |
|
|
|
12.46 |
|
|
|
|
.24 |
|
|
|
|
1.88 |
|
|
|
|
2.12 |
|
|
|
|
|
|
(.25 |
) |
|
|
|
(.12 |
) |
|
|
|
(.37 |
) |
|
|
|
14.21 |
|
|
|
|
17.29 |
|
|
|
|
2,899 |
|
|
|
|
.66 |
|
|
|
|
.52 |
|
|
|
|
1.82 |
|
| 12/31/2022 |
|
|
|
17.83 |
|
|
|
|
.26 |
|
|
|
|
(1.65 |
) |
|
|
|
(1.39 |
) |
|
|
|
|
|
(.26 |
) |
|
|
|
(3.72 |
) |
|
|
|
(3.98 |
) |
|
|
|
12.46 |
|
|
|
|
(8.45 |
) |
|
|
|
2,775 |
|
|
|
|
.66 |
|
|
|
|
.51 |
|
|
|
|
1.88 |
|
| 12/31/2021 |
|
|
|
14.15 |
|
|
|
|
.25 |
|
|
|
|
3.67 |
|
|
|
|
3.92 |
|
|
|
|
|
|
(.24 |
) |
|
|
|
– |
|
|
|
|
(.24 |
) |
|
|
|
17.83 |
|
|
|
|
27.78 |
|
|
|
|
3,426 |
|
|
|
|
.67 |
|
|
|
|
.56 |
|
|
|
|
1.54 |
|
| 12/31/2020 |
|
|
|
13.39 |
|
|
|
|
.22 |
|
|
|
|
.91 |
|
|
|
|
1.13 |
|
|
|
|
|
|
(.22 |
) |
|
|
|
(.15 |
) |
|
|
|
(.37 |
) |
|
|
|
14.15 |
|
|
|
|
8.68 |
|
|
|
|
3,082 |
|
|
|
|
.68 |
|
|
|
|
.68 |
|
|
|
|
1.75 |
|
| 12/31/2019 |
|
|
|
12.24 |
|
|
|
|
.26 |
|
|
|
|
2.22 |
|
|
|
|
2.48 |
|
|
|
|
|
|
(.26 |
) |
|
|
|
(1.07 |
) |
|
|
|
(1.33 |
) |
|
|
|
13.39 |
|
|
|
|
21.38 |
|
|
|
|
3,093 |
|
|
|
|
.67 |
|
|
|
|
.67 |
|
|
|
|
2.03 |
|
| Class 4: |
|
|
|
|
|
|
|
|
|
|
|
|
|
|
|
|
|
|
|
|
|
|
|
|
|
|
|
|
|
|
|
|
|
|
|
|
|
|
|
|
|
|
|
|
|
|
|
|
|
|
|
|
|
|
|
|
|
|
|
|
|
|
|
|
|
|
|
| 6/30/20244,5 |
|
|
|
14.06 |
|
|
|
|
.10 |
|
|
|
|
1.47 |
|
|
|
|
1.57 |
|
|
|
|
|
|
(.05 |
) |
|
|
|
(.13 |
) |
|
|
|
(.18 |
) |
|
|
|
15.45 |
|
|
|
|
11.21 |
6 |
|
|
|
1,551 |
|
|
|
|
.91 |
7 |
|
|
|
.75 |
7 |
|
|
|
1.39 |
7 |
| 12/31/2023 |
|
|
|
12.34 |
|
|
|
|
.20 |
|
|
|
|
1.86 |
|
|
|
|
2.06 |
|
|
|
|
|
|
(.22 |
) |
|
|
|
(.12 |
) |
|
|
|
(.34 |
) |
|
|
|
14.06 |
|
|
|
|
16.97 |
|
|
|
|
1,344 |
|
|
|
|
.91 |
|
|
|
|
.77 |
|
|
|
|
1.58 |
|
| 12/31/2022 |
|
|
|
17.71 |
|
|
|
|
.23 |
|
|
|
|
(1.64 |
) |
|
|
|
(1.41 |
) |
|
|
|
|
|
(.24 |
) |
|
|
|
(3.72 |
) |
|
|
|
(3.96 |
) |
|
|
|
12.34 |
|
|
|
|
(8.69 |
) |
|
|
|
1,098 |
|
|
|
|
.91 |
|
|
|
|
.77 |
|
|
|
|
1.64 |
|
| 12/31/2021 |
|
|
|
14.06 |
|
|
|
|
.21 |
|
|
|
|
3.65 |
|
|
|
|
3.86 |
|
|
|
|
|
|
(.21 |
) |
|
|
|
– |
|
|
|
|
(.21 |
) |
|
|
|
17.71 |
|
|
|
|
27.51 |
|
|
|
|
1,104 |
|
|
|
|
.92 |
|
|
|
|
.81 |
|
|
|
|
1.30 |
|
| 12/31/2020 |
|
|
|
13.31 |
|
|
|
|
.19 |
|
|
|
|
.91 |
|
|
|
|
1.10 |
|
|
|
|
|
|
(.20 |
) |
|
|
|
(.15 |
) |
|
|
|
(.35 |
) |
|
|
|
14.06 |
|
|
|
|
8.47 |
|
|
|
|
788 |
|
|
|
|
.93 |
|
|
|
|
.93 |
|
|
|
|
1.51 |
|
| 12/31/2019 |
|
|
|
12.19 |
|
|
|
|
.23 |
|
|
|
|
2.20 |
|
|
|
|
2.43 |
|
|
|
|
|
|
(.24 |
) |
|
|
|
(1.07 |
) |
|
|
|
(1.31 |
) |
|
|
|
13.31 |
|
|
|
|
21.03 |
|
|
|
|
621 |
|
|
|
|
.92 |
|
|
|
|
.92 |
|
|
|
|
1.78 |
|
Refer to the end of the tables for footnotes.
331 American Funds Insurance Series
Financial highlights (continued)
|
|
|
|
|
|
|
|
|
|
|
|
|
|
|
|
|
|
|
|
|
|
|
|
|
|
|
|
|
|
|
|
|
|
|
|
|
|
|
|
|
|
|
|
|
|
|
|
|
|
|
|
|
|
|
|
|
|
|
|
|
|
|
|
|
|
|
|
| |
|
|
|
Income (loss) from investment operations1 |
|
|
|
Dividends and distributions |
|
|
|
|
|
|
|
|
|
|
|
|
|
|
|
|
|
|
|
|
|
|
|
|
|
|
|
| Year ended |
|
Net asset value, beginning of year |
|
Net investment income (loss) |
|
Net gains (losses) on securities (both realized and unrealized) |
|
Total from investment operations |
|
|
|
Dividends (from net investment income) |
|
Distributions (from capital gains) |
|
Total dividends and distributions |
|
Net asset value, end of year |
|
Total return2 |
|
Net assets, end of year (in millions) |
|
Ratio of expenses to average net assets before waivers3 |
|
Ratio of expenses to average net assets after waivers2,3 |
|
Ratio of net income (loss) to average net assets2 |
|
|
|
|
|
|
|
|
|
|
|
| Capital World Growth and Income Fund |
|
|
|
|
|
|
|
|
|
|
|
|
|
|
|
|
|
|
|
|
|
|
|
|
|
|
|
|
|
|
|
|
|
|
|
|
|
|
|
|
|
|
|
|
|
|
|
|
|
|
|
|
|
|
|
|
|
|
|
|
|
|
|
| Class 1: |
|
|
|
|
|
|
|
|
|
|
|
|
|
|
|
|
|
|
|
|
|
|
|
|
|
|
|
|
|
|
|
|
|
|
|
|
|
|
|
|
|
|
|
|
|
|
|
|
|
|
|
|
|
|
|
|
|
|
|
|
|
|
|
|
|
|
|
| 6/30/20244,5 |
|
|
|
$13.85 |
|
|
|
|
$.15 |
|
|
|
|
$ 1.23 |
|
|
|
|
$ 1.38 |
|
|
|
|
|
|
$(.06 |
) |
|
|
|
$ – |
|
|
|
|
$ (.06 |
) |
|
|
|
$15.17 |
|
|
|
|
10.00 |
%6 |
|
|
|
$ 594 |
|
|
|
|
.52 |
%7 |
|
|
|
.41 |
%7 |
|
|
|
2.12 |
%7 |
| 12/31/2023 |
|
|
|
11.67 |
|
|
|
|
.27 |
|
|
|
|
2.19 |
|
|
|
|
2.46 |
|
|
|
|
|
|
(.28 |
) |
|
|
|
– |
|
|
|
|
(.28 |
) |
|
|
|
13.85 |
|
|
|
|
21.22 |
|
|
|
|
579 |
|
|
|
|
.52 |
|
|
|
|
.41 |
|
|
|
|
2.08 |
|
| 12/31/2022 |
|
|
|
18.42 |
|
|
|
|
.32 |
|
|
|
|
(3.28 |
) |
|
|
|
(2.96 |
) |
|
|
|
|
|
(.34 |
) |
|
|
|
(3.45 |
) |
|
|
|
(3.79 |
) |
|
|
|
11.67 |
|
|
|
|
(17.13 |
) |
|
|
|
548 |
|
|
|
|
.57 |
|
|
|
|
.41 |
|
|
|
|
2.36 |
|
| 12/31/2021 |
|
|
|
16.67 |
|
|
|
|
.38 |
|
|
|
|
2.10 |
|
|
|
|
2.48 |
|
|
|
|
|
|
(.33 |
) |
|
|
|
(.40 |
) |
|
|
|
(.73 |
) |
|
|
|
18.42 |
|
|
|
|
15.03 |
|
|
|
|
812 |
|
|
|
|
.63 |
|
|
|
|
.47 |
|
|
|
|
2.14 |
|
| 12/31/2020 |
|
|
|
15.92 |
|
|
|
|
.22 |
|
|
|
|
1.14 |
|
|
|
|
1.36 |
|
|
|
|
|
|
(.23 |
) |
|
|
|
(.38 |
) |
|
|
|
(.61 |
) |
|
|
|
16.67 |
|
|
|
|
9.03 |
|
|
|
|
657 |
|
|
|
|
.66 |
|
|
|
|
.66 |
|
|
|
|
1.49 |
|
| 12/31/2019 |
|
|
|
13.02 |
|
|
|
|
.31 |
|
|
|
|
3.67 |
|
|
|
|
3.98 |
|
|
|
|
|
|
(.32 |
) |
|
|
|
(.76 |
) |
|
|
|
(1.08 |
) |
|
|
|
15.92 |
|
|
|
|
31.39 |
|
|
|
|
625 |
|
|
|
|
.65 |
|
|
|
|
.65 |
|
|
|
|
2.08 |
|
| Class 1A: |
|
|
|
|
|
|
|
|
|
|
|
|
|
|
|
|
|
|
|
|
|
|
|
|
|
|
|
|
|
|
|
|
|
|
|
|
|
|
|
|
|
|
|
|
|
|
|
|
|
|
|
|
|
|
|
|
|
|
|
|
|
|
|
|
|
|
|
| 6/30/20244,5 |
|
|
|
13.77 |
|
|
|
|
.14 |
|
|
|
|
1.22 |
|
|
|
|
1.36 |
|
|
|
|
|
|
(.06 |
) |
|
|
|
– |
|
|
|
|
(.06 |
) |
|
|
|
15.07 |
|
|
|
|
9.87 |
6 |
|
|
|
8 |
|
|
|
|
.77 |
7 |
|
|
|
.66 |
7 |
|
|
|
1.90 |
7 |
| 12/31/2023 |
|
|
|
11.61 |
|
|
|
|
.23 |
|
|
|
|
2.18 |
|
|
|
|
2.41 |
|
|
|
|
|
|
(.25 |
) |
|
|
|
– |
|
|
|
|
(.25 |
) |
|
|
|
13.77 |
|
|
|
|
20.87 |
|
|
|
|
7 |
|
|
|
|
.77 |
|
|
|
|
.66 |
|
|
|
|
1.83 |
|
| 12/31/2022 |
|
|
|
18.34 |
|
|
|
|
.28 |
|
|
|
|
(3.25 |
) |
|
|
|
(2.97 |
) |
|
|
|
|
|
(.31 |
) |
|
|
|
(3.45 |
) |
|
|
|
(3.76 |
) |
|
|
|
11.61 |
|
|
|
|
(17.29 |
) |
|
|
|
6 |
|
|
|
|
.82 |
|
|
|
|
.66 |
|
|
|
|
2.13 |
|
| 12/31/2021 |
|
|
|
16.62 |
|
|
|
|
.37 |
|
|
|
|
2.06 |
|
|
|
|
2.43 |
|
|
|
|
|
|
(.31 |
) |
|
|
|
(.40 |
) |
|
|
|
(.71 |
) |
|
|
|
18.34 |
|
|
|
|
14.71 |
|
|
|
|
7 |
|
|
|
|
.88 |
|
|
|
|
.70 |
|
|
|
|
2.08 |
|
| 12/31/2020 |
|
|
|
15.88 |
|
|
|
|
.18 |
|
|
|
|
1.13 |
|
|
|
|
1.31 |
|
|
|
|
|
|
(.19 |
) |
|
|
|
(.38 |
) |
|
|
|
(.57 |
) |
|
|
|
16.62 |
|
|
|
|
8.78 |
|
|
|
|
2 |
|
|
|
|
.90 |
|
|
|
|
.90 |
|
|
|
|
1.23 |
|
| 12/31/2019 |
|
|
|
13.00 |
|
|
|
|
.26 |
|
|
|
|
3.68 |
|
|
|
|
3.94 |
|
|
|
|
|
|
(.30 |
) |
|
|
|
(.76 |
) |
|
|
|
(1.06 |
) |
|
|
|
15.88 |
|
|
|
|
31.04 |
|
|
|
|
2 |
|
|
|
|
.90 |
|
|
|
|
.90 |
|
|
|
|
1.77 |
|
| Class 2: |
|
|
|
|
|
|
|
|
|
|
|
|
|
|
|
|
|
|
|
|
|
|
|
|
|
|
|
|
|
|
|
|
|
|
|
|
|
|
|
|
|
|
|
|
|
|
|
|
|
|
|
|
|
|
|
|
|
|
|
|
|
|
|
|
|
|
|
| 6/30/20244,5 |
|
|
|
13.81 |
|
|
|
|
.14 |
|
|
|
|
1.23 |
|
|
|
|
1.37 |
|
|
|
|
|
|
(.06 |
) |
|
|
|
– |
|
|
|
|
(.06 |
) |
|
|
|
15.12 |
|
|
|
|
9.91 |
6 |
|
|
|
1,052 |
|
|
|
|
.77 |
7 |
|
|
|
.66 |
7 |
|
|
|
1.87 |
7 |
| 12/31/2023 |
|
|
|
11.64 |
|
|
|
|
.23 |
|
|
|
|
2.18 |
|
|
|
|
2.41 |
|
|
|
|
|
|
(.24 |
) |
|
|
|
– |
|
|
|
|
(.24 |
) |
|
|
|
13.81 |
|
|
|
|
20.88 |
|
|
|
|
1,040 |
|
|
|
|
.77 |
|
|
|
|
.66 |
|
|
|
|
1.83 |
|
| 12/31/2022 |
|
|
|
18.38 |
|
|
|
|
.28 |
|
|
|
|
(3.26 |
) |
|
|
|
(2.98 |
) |
|
|
|
|
|
(.31 |
) |
|
|
|
(3.45 |
) |
|
|
|
(3.76 |
) |
|
|
|
11.64 |
|
|
|
|
(17.33 |
) |
|
|
|
983 |
|
|
|
|
.82 |
|
|
|
|
.66 |
|
|
|
|
2.11 |
|
| 12/31/2021 |
|
|
|
16.63 |
|
|
|
|
.33 |
|
|
|
|
2.11 |
|
|
|
|
2.44 |
|
|
|
|
|
|
(.29 |
) |
|
|
|
(.40 |
) |
|
|
|
(.69 |
) |
|
|
|
18.38 |
|
|
|
|
14.78 |
|
|
|
|
1,340 |
|
|
|
|
.88 |
|
|
|
|
.73 |
|
|
|
|
1.85 |
|
| 12/31/2020 |
|
|
|
15.89 |
|
|
|
|
.18 |
|
|
|
|
1.13 |
|
|
|
|
1.31 |
|
|
|
|
|
|
(.19 |
) |
|
|
|
(.38 |
) |
|
|
|
(.57 |
) |
|
|
|
16.63 |
|
|
|
|
8.73 |
|
|
|
|
1,349 |
|
|
|
|
.91 |
|
|
|
|
.91 |
|
|
|
|
1.23 |
|
| 12/31/2019 |
|
|
|
12.99 |
|
|
|
|
.27 |
|
|
|
|
3.68 |
|
|
|
|
3.95 |
|
|
|
|
|
|
(.29 |
) |
|
|
|
(.76 |
) |
|
|
|
(1.05 |
) |
|
|
|
15.89 |
|
|
|
|
31.14 |
|
|
|
|
1,366 |
|
|
|
|
.90 |
|
|
|
|
.90 |
|
|
|
|
1.84 |
|
| Class 4: |
|
|
|
|
|
|
|
|
|
|
|
|
|
|
|
|
|
|
|
|
|
|
|
|
|
|
|
|
|
|
|
|
|
|
|
|
|
|
|
|
|
|
|
|
|
|
|
|
|
|
|
|
|
|
|
|
|
|
|
|
|
|
|
|
|
|
|
| 6/30/20244,5 |
|
|
|
13.46 |
|
|
|
|
.12 |
|
|
|
|
1.19 |
|
|
|
|
1.31 |
|
|
|
|
|
|
(.05 |
) |
|
|
|
– |
|
|
|
|
(.05 |
) |
|
|
|
14.72 |
|
|
|
|
9.76 |
6 |
|
|
|
255 |
|
|
|
|
1.02 |
7 |
|
|
|
.91 |
7 |
|
|
|
1.63 |
7 |
| 12/31/2023 |
|
|
|
11.35 |
|
|
|
|
.19 |
|
|
|
|
2.14 |
|
|
|
|
2.33 |
|
|
|
|
|
|
(.22 |
) |
|
|
|
– |
|
|
|
|
(.22 |
) |
|
|
|
13.46 |
|
|
|
|
20.65 |
|
|
|
|
235 |
|
|
|
|
1.02 |
|
|
|
|
.91 |
|
|
|
|
1.57 |
|
| 12/31/2022 |
|
|
|
18.04 |
|
|
|
|
.24 |
|
|
|
|
(3.20 |
) |
|
|
|
(2.96 |
) |
|
|
|
|
|
(.28 |
) |
|
|
|
(3.45 |
) |
|
|
|
(3.73 |
) |
|
|
|
11.35 |
|
|
|
|
(17.57 |
) |
|
|
|
188 |
|
|
|
|
1.07 |
|
|
|
|
.91 |
|
|
|
|
1.86 |
|
| 12/31/2021 |
|
|
|
16.35 |
|
|
|
|
.29 |
|
|
|
|
2.06 |
|
|
|
|
2.35 |
|
|
|
|
|
|
(.26 |
) |
|
|
|
(.40 |
) |
|
|
|
(.66 |
) |
|
|
|
18.04 |
|
|
|
|
14.46 |
|
|
|
|
225 |
|
|
|
|
1.13 |
|
|
|
|
.97 |
|
|
|
|
1.65 |
|
| 12/31/2020 |
|
|
|
15.63 |
|
|
|
|
.14 |
|
|
|
|
1.12 |
|
|
|
|
1.26 |
|
|
|
|
|
|
(.16 |
) |
|
|
|
(.38 |
) |
|
|
|
(.54 |
) |
|
|
|
16.35 |
|
|
|
|
8.55 |
|
|
|
|
166 |
|
|
|
|
1.16 |
|
|
|
|
1.16 |
|
|
|
|
.97 |
|
| 12/31/2019 |
|
|
|
12.81 |
|
|
|
|
.23 |
|
|
|
|
3.61 |
|
|
|
|
3.84 |
|
|
|
|
|
|
(.26 |
) |
|
|
|
(.76 |
) |
|
|
|
(1.02 |
) |
|
|
|
15.63 |
|
|
|
|
30.73 |
|
|
|
|
145 |
|
|
|
|
1.15 |
|
|
|
|
1.15 |
|
|
|
|
1.56 |
|
Refer to the end of the tables for footnotes.
American Funds Insurance Series 332
Financial highlights (continued)
|
|
|
|
|
|
|
|
|
|
|
|
|
|
|
|
|
|
|
|
|
|
|
|
|
|
|
|
|
|
|
|
|
|
|
|
|
|
|
|
|
|
|
|
|
|
|
|
|
|
|
|
|
|
|
|
|
|
|
|
|
|
|
| |
|
|
|
Income (loss) from investment operations1 |
|
|
|
Dividends and distributions |
|
|
|
|
|
|
|
|
|
|
|
|
|
|
|
|
|
|
|
|
|
|
|
|
| Year ended |
|
Net asset value, beginning of year |
|
Net investment income (loss) |
|
Net gains (losses) on securities (both realized and unrealized) |
|
Total from investment operations |
|
|
|
Dividends (from net investment income) |
|
Distributions (from capital gains) |
|
Total dividends and distributions |
|
Net asset value, end of year |
|
Total return |
|
Net assets, end of year (in millions) |
|
Ratio of expenses to average net assets3 |
|
Ratio of net income (loss) to average net assets |
|
|
|
|
|
|
|
|
|
|
|
| Growth-Income Fund |
|
|
|
|
|
|
|
|
|
|
|
|
|
|
|
|
|
|
|
|
|
|
|
|
|
|
|
|
|
|
|
|
|
|
|
|
|
|
|
|
|
|
|
|
|
|
|
|
|
|
|
|
|
|
|
|
|
|
|
|
|
|
| Class 1: |
|
|
|
|
|
|
|
|
|
|
|
|
|
|
|
|
|
|
|
|
|
|
|
|
|
|
|
|
|
|
|
|
|
|
|
|
|
|
|
|
|
|
|
|
|
|
|
|
|
|
|
|
|
|
|
|
|
|
|
|
|
|
| 6/30/20244,5 |
|
|
|
$59.26 |
|
|
|
|
$ .43 |
|
|
|
|
$ 7.95 |
|
|
|
|
$ 8.38 |
|
|
|
|
|
|
$(.20 |
) |
|
|
|
$(2.95 |
) |
|
|
|
$(3.15 |
) |
|
|
|
$64.49 |
|
|
|
|
14.32 |
%6 |
|
|
|
$23,840 |
|
|
|
|
.28 |
%7 |
|
|
|
1.37 |
%7 |
| 12/31/2023 |
|
|
|
50.21 |
|
|
|
|
.86 |
|
|
|
|
11.96 |
|
|
|
|
12.82 |
|
|
|
|
|
|
(.88 |
) |
|
|
|
(2.89 |
) |
|
|
|
(3.77 |
) |
|
|
|
59.26 |
|
|
|
|
26.47 |
|
|
|
|
22,319 |
|
|
|
|
.29 |
|
|
|
|
1.60 |
|
| 12/31/2022 |
|
|
|
67.35 |
|
|
|
|
.85 |
|
|
|
|
(11.50 |
) |
|
|
|
(10.65 |
) |
|
|
|
|
|
(.83 |
) |
|
|
|
(5.66 |
) |
|
|
|
(6.49 |
) |
|
|
|
50.21 |
|
|
|
|
(16.28 |
) |
|
|
|
19,692 |
|
|
|
|
.29 |
|
|
|
|
1.54 |
|
| 12/31/2021 |
|
|
|
55.38 |
|
|
|
|
.79 |
|
|
|
|
12.64 |
|
|
|
|
13.43 |
|
|
|
|
|
|
(.86 |
) |
|
|
|
(.60 |
) |
|
|
|
(1.46 |
) |
|
|
|
67.35 |
|
|
|
|
24.42 |
|
|
|
|
25,507 |
|
|
|
|
.29 |
|
|
|
|
1.28 |
|
| 12/31/2020 |
|
|
|
50.71 |
|
|
|
|
.75 |
|
|
|
|
6.02 |
|
|
|
|
6.77 |
|
|
|
|
|
|
(.80 |
) |
|
|
|
(1.30 |
) |
|
|
|
(2.10 |
) |
|
|
|
55.38 |
|
|
|
|
13.81 |
|
|
|
|
22,903 |
|
|
|
|
.29 |
|
|
|
|
1.52 |
|
| 12/31/2019 |
|
|
|
45.39 |
|
|
|
|
1.00 |
|
|
|
|
10.40 |
|
|
|
|
11.40 |
|
|
|
|
|
|
(.92 |
) |
|
|
|
(5.16 |
) |
|
|
|
(6.08 |
) |
|
|
|
50.71 |
|
|
|
|
26.46 |
|
|
|
|
21,057 |
|
|
|
|
.29 |
|
|
|
|
2.05 |
|
| Class 1A: |
|
|
|
|
|
|
|
|
|
|
|
|
|
|
|
|
|
|
|
|
|
|
|
|
|
|
|
|
|
|
|
|
|
|
|
|
|
|
|
|
|
|
|
|
|
|
|
|
|
|
|
|
|
|
|
|
|
|
|
|
|
|
| 6/30/20244,5 |
|
|
|
58.88 |
|
|
|
|
.35 |
|
|
|
|
7.90 |
|
|
|
|
8.25 |
|
|
|
|
|
|
(.18 |
) |
|
|
|
(2.95 |
) |
|
|
|
(3.13 |
) |
|
|
|
64.00 |
|
|
|
|
14.18 |
6 |
|
|
|
40 |
|
|
|
|
.53 |
7 |
|
|
|
1.12 |
7 |
| 12/31/2023 |
|
|
|
49.93 |
|
|
|
|
.72 |
|
|
|
|
11.87 |
|
|
|
|
12.59 |
|
|
|
|
|
|
(.75 |
) |
|
|
|
(2.89 |
) |
|
|
|
(3.64 |
) |
|
|
|
58.88 |
|
|
|
|
26.12 |
|
|
|
|
35 |
|
|
|
|
.54 |
|
|
|
|
1.35 |
|
| 12/31/2022 |
|
|
|
67.02 |
|
|
|
|
.71 |
|
|
|
|
(11.44 |
) |
|
|
|
(10.73 |
) |
|
|
|
|
|
(.70 |
) |
|
|
|
(5.66 |
) |
|
|
|
(6.36 |
) |
|
|
|
49.93 |
|
|
|
|
(16.48 |
) |
|
|
|
28 |
|
|
|
|
.54 |
|
|
|
|
1.30 |
|
| 12/31/2021 |
|
|
|
55.16 |
|
|
|
|
.65 |
|
|
|
|
12.55 |
|
|
|
|
13.20 |
|
|
|
|
|
|
(.74 |
) |
|
|
|
(.60 |
) |
|
|
|
(1.34 |
) |
|
|
|
67.02 |
|
|
|
|
24.08 |
|
|
|
|
32 |
|
|
|
|
.53 |
|
|
|
|
1.04 |
|
| 12/31/2020 |
|
|
|
50.54 |
|
|
|
|
.63 |
|
|
|
|
5.99 |
|
|
|
|
6.62 |
|
|
|
|
|
|
(.70 |
) |
|
|
|
(1.30 |
) |
|
|
|
(2.00 |
) |
|
|
|
55.16 |
|
|
|
|
13.55 |
|
|
|
|
16 |
|
|
|
|
.54 |
|
|
|
|
1.28 |
|
| 12/31/2019 |
|
|
|
45.28 |
|
|
|
|
.89 |
|
|
|
|
10.36 |
|
|
|
|
11.25 |
|
|
|
|
|
|
(.83 |
) |
|
|
|
(5.16 |
) |
|
|
|
(5.99 |
) |
|
|
|
50.54 |
|
|
|
|
26.14 |
|
|
|
|
11 |
|
|
|
|
.54 |
|
|
|
|
1.82 |
|
| Class 2: |
|
|
|
|
|
|
|
|
|
|
|
|
|
|
|
|
|
|
|
|
|
|
|
|
|
|
|
|
|
|
|
|
|
|
|
|
|
|
|
|
|
|
|
|
|
|
|
|
|
|
|
|
|
|
|
|
|
|
|
|
|
|
| 6/30/20244,5 |
|
|
|
58.30 |
|
|
|
|
.35 |
|
|
|
|
7.81 |
|
|
|
|
8.16 |
|
|
|
|
|
|
(.18 |
) |
|
|
|
(2.95 |
) |
|
|
|
(3.13 |
) |
|
|
|
63.33 |
|
|
|
|
14.16 |
6 |
|
|
|
13,671 |
|
|
|
|
.53 |
7 |
|
|
|
1.12 |
7 |
| 12/31/2023 |
|
|
|
49.46 |
|
|
|
|
.72 |
|
|
|
|
11.75 |
|
|
|
|
12.47 |
|
|
|
|
|
|
(.74 |
) |
|
|
|
(2.89 |
) |
|
|
|
(3.63 |
) |
|
|
|
58.30 |
|
|
|
|
26.14 |
|
|
|
|
12,894 |
|
|
|
|
.54 |
|
|
|
|
1.35 |
|
| 12/31/2022 |
|
|
|
66.44 |
|
|
|
|
.70 |
|
|
|
|
(11.33 |
) |
|
|
|
(10.63 |
) |
|
|
|
|
|
(.69 |
) |
|
|
|
(5.66 |
) |
|
|
|
(6.35 |
) |
|
|
|
49.46 |
|
|
|
|
(16.50 |
) |
|
|
|
11,508 |
|
|
|
|
.54 |
|
|
|
|
1.29 |
|
| 12/31/2021 |
|
|
|
54.66 |
|
|
|
|
.63 |
|
|
|
|
12.45 |
|
|
|
|
13.08 |
|
|
|
|
|
|
(.70 |
) |
|
|
|
(.60 |
) |
|
|
|
(1.30 |
) |
|
|
|
66.44 |
|
|
|
|
24.10 |
|
|
|
|
15,319 |
|
|
|
|
.54 |
|
|
|
|
1.03 |
|
| 12/31/2020 |
|
|
|
50.08 |
|
|
|
|
.62 |
|
|
|
|
5.93 |
|
|
|
|
6.55 |
|
|
|
|
|
|
(.67 |
) |
|
|
|
(1.30 |
) |
|
|
|
(1.97 |
) |
|
|
|
54.66 |
|
|
|
|
13.54 |
|
|
|
|
14,012 |
|
|
|
|
.54 |
|
|
|
|
1.27 |
|
| 12/31/2019 |
|
|
|
44.90 |
|
|
|
|
.87 |
|
|
|
|
10.27 |
|
|
|
|
11.14 |
|
|
|
|
|
|
(.80 |
) |
|
|
|
(5.16 |
) |
|
|
|
(5.96 |
) |
|
|
|
50.08 |
|
|
|
|
26.14 |
|
|
|
|
13,586 |
|
|
|
|
.53 |
|
|
|
|
1.80 |
|
| Class 3: |
|
|
|
|
|
|
|
|
|
|
|
|
|
|
|
|
|
|
|
|
|
|
|
|
|
|
|
|
|
|
|
|
|
|
|
|
|
|
|
|
|
|
|
|
|
|
|
|
|
|
|
|
|
|
|
|
|
|
|
|
|
|
| 6/30/20244,5 |
|
|
|
59.40 |
|
|
|
|
.38 |
|
|
|
|
7.96 |
|
|
|
|
8.34 |
|
|
|
|
|
|
(.18 |
) |
|
|
|
(2.95 |
) |
|
|
|
(3.13 |
) |
|
|
|
64.61 |
|
|
|
|
14.21 |
6 |
|
|
|
152 |
|
|
|
|
.46 |
7 |
|
|
|
1.19 |
7 |
| 12/31/2023 |
|
|
|
50.33 |
|
|
|
|
.77 |
|
|
|
|
11.97 |
|
|
|
|
12.74 |
|
|
|
|
|
|
(.78 |
) |
|
|
|
(2.89 |
) |
|
|
|
(3.67 |
) |
|
|
|
59.40 |
|
|
|
|
26.23 |
|
|
|
|
142 |
|
|
|
|
.47 |
|
|
|
|
1.42 |
|
| 12/31/2022 |
|
|
|
67.48 |
|
|
|
|
.75 |
|
|
|
|
(11.51 |
) |
|
|
|
(10.76 |
) |
|
|
|
|
|
(.73 |
) |
|
|
|
(5.66 |
) |
|
|
|
(6.39 |
) |
|
|
|
50.33 |
|
|
|
|
(16.43 |
) |
|
|
|
125 |
|
|
|
|
.47 |
|
|
|
|
1.36 |
|
| 12/31/2021 |
|
|
|
55.49 |
|
|
|
|
.68 |
|
|
|
|
12.65 |
|
|
|
|
13.33 |
|
|
|
|
|
|
(.74 |
) |
|
|
|
(.60 |
) |
|
|
|
(1.34 |
) |
|
|
|
67.48 |
|
|
|
|
24.18 |
|
|
|
|
166 |
|
|
|
|
.47 |
|
|
|
|
1.10 |
|
| 12/31/2020 |
|
|
|
50.81 |
|
|
|
|
.66 |
|
|
|
|
6.02 |
|
|
|
|
6.68 |
|
|
|
|
|
|
(.70 |
) |
|
|
|
(1.30 |
) |
|
|
|
(2.00 |
) |
|
|
|
55.49 |
|
|
|
|
13.60 |
|
|
|
|
154 |
|
|
|
|
.47 |
|
|
|
|
1.34 |
|
| 12/31/2019 |
|
|
|
45.47 |
|
|
|
|
.91 |
|
|
|
|
10.43 |
|
|
|
|
11.34 |
|
|
|
|
|
|
(.84 |
) |
|
|
|
(5.16 |
) |
|
|
|
(6.00 |
) |
|
|
|
50.81 |
|
|
|
|
26.24 |
|
|
|
|
156 |
|
|
|
|
.46 |
|
|
|
|
1.87 |
|
| Class 4: |
|
|
|
|
|
|
|
|
|
|
|
|
|
|
|
|
|
|
|
|
|
|
|
|
|
|
|
|
|
|
|
|
|
|
|
|
|
|
|
|
|
|
|
|
|
|
|
|
|
|
|
|
|
|
|
|
|
|
|
|
|
|
| 6/30/20244,5 |
|
|
|
57.34 |
|
|
|
|
.27 |
|
|
|
|
7.67 |
|
|
|
|
7.94 |
|
|
|
|
|
|
(.16 |
) |
|
|
|
(2.95 |
) |
|
|
|
(3.11 |
) |
|
|
|
62.17 |
|
|
|
|
14.02 |
6 |
|
|
|
2,405 |
|
|
|
|
.78 |
7 |
|
|
|
.88 |
7 |
| 12/31/2023 |
|
|
|
48.72 |
|
|
|
|
.57 |
|
|
|
|
11.57 |
|
|
|
|
12.14 |
|
|
|
|
|
|
(.63 |
) |
|
|
|
(2.89 |
) |
|
|
|
(3.52 |
) |
|
|
|
57.34 |
|
|
|
|
25.82 |
|
|
|
|
2,062 |
|
|
|
|
.79 |
|
|
|
|
1.10 |
|
| 12/31/2022 |
|
|
|
65.57 |
|
|
|
|
.56 |
|
|
|
|
(11.18 |
) |
|
|
|
(10.62 |
) |
|
|
|
|
|
(.57 |
) |
|
|
|
(5.66 |
) |
|
|
|
(6.23 |
) |
|
|
|
48.72 |
|
|
|
|
(16.70 |
) |
|
|
|
1,630 |
|
|
|
|
.79 |
|
|
|
|
1.05 |
|
| 12/31/2021 |
|
|
|
53.99 |
|
|
|
|
.48 |
|
|
|
|
12.28 |
|
|
|
|
12.76 |
|
|
|
|
|
|
(.58 |
) |
|
|
|
(.60 |
) |
|
|
|
(1.18 |
) |
|
|
|
65.57 |
|
|
|
|
23.80 |
|
|
|
|
1,928 |
|
|
|
|
.79 |
|
|
|
|
.79 |
|
| 12/31/2020 |
|
|
|
49.52 |
|
|
|
|
.49 |
|
|
|
|
5.85 |
|
|
|
|
6.34 |
|
|
|
|
|
|
(.57 |
) |
|
|
|
(1.30 |
) |
|
|
|
(1.87 |
) |
|
|
|
53.99 |
|
|
|
|
13.25 |
|
|
|
|
1,407 |
|
|
|
|
.79 |
|
|
|
|
1.02 |
|
| 12/31/2019 |
|
|
|
44.47 |
|
|
|
|
.74 |
|
|
|
|
10.18 |
|
|
|
|
10.92 |
|
|
|
|
|
|
(.71 |
) |
|
|
|
(5.16 |
) |
|
|
|
(5.87 |
) |
|
|
|
49.52 |
|
|
|
|
25.86 |
|
|
|
|
1,216 |
|
|
|
|
.79 |
|
|
|
|
1.56 |
|
Refer to the end of the tables for footnotes.
333 American Funds Insurance Series
Financial highlights (continued)
|
|
|
|
|
|
|
|
|
|
|
|
|
|
|
|
|
|
|
|
|
|
|
|
|
|
|
|
|
|
|
|
|
|
|
|
|
|
|
|
|
|
|
|
|
|
|
|
|
|
|
|
|
|
|
|
|
|
|
|
|
|
|
|
|
|
|
|
| |
|
|
|
Income (loss) from investment operations1 |
|
|
|
Dividends and distributions |
|
|
|
|
|
|
|
|
|
|
|
|
|
|
|
|
|
|
|
|
|
|
|
|
|
|
|
| Year ended |
|
Net asset value, beginning of year |
|
Net investment income (loss) |
|
Net gains (losses) on securities (both realized and unrealized) |
|
Total from investment operations |
|
|
|
Dividends (from net investment income) |
|
Distributions (from capital gains) |
|
Total dividends and distributions |
|
Net asset value, end of year |
|
Total return2 |
|
Net assets, end of year (in millions) |
|
Ratio of expenses to average net assets before waivers3 |
|
Ratio of expenses to average net assets after waivers2,3 |
|
Ratio of net income (loss) to average net assets2 |
|
|
|
|
|
|
|
|
| International Growth and Income Fund |
|
|
|
|
|
|
|
|
|
|
|
|
|
|
|
|
|
|
|
|
|
|
|
|
|
|
|
|
|
|
|
|
|
|
|
|
|
|
|
|
|
|
|
|
|
|
|
|
|
|
|
| Class 1: |
|
|
|
|
|
|
|
|
|
|
|
|
|
|
|
|
|
|
|
|
|
|
|
|
|
|
|
|
|
|
|
|
|
|
|
|
|
|
|
|
|
|
|
|
|
|
|
|
|
|
|
|
|
|
|
|
|
|
|
|
|
|
|
|
|
|
|
| 6/30/20244,5 |
|
|
|
$10.10 |
|
|
|
|
$.18 |
|
|
|
|
$ .42 |
|
|
|
|
$ .60 |
|
|
|
|
|
|
$(.06 |
) |
|
|
|
$ – |
|
|
|
|
$ (.06 |
) |
|
|
|
$10.64 |
|
|
|
|
5.88 |
%6 |
|
|
|
$ 16 |
|
|
|
|
.56 |
%7 |
|
|
|
.56 |
%7 |
|
|
|
3.52 |
%7 |
| 12/31/2023 |
|
|
|
8.94 |
|
|
|
|
.27 |
|
|
|
|
1.15 |
|
|
|
|
1.42 |
|
|
|
|
|
|
(.26 |
) |
|
|
|
– |
|
|
|
|
(.26 |
) |
|
|
|
10.10 |
|
|
|
|
16.08 |
|
|
|
|
15 |
|
|
|
|
.56 |
|
|
|
|
.55 |
|
|
|
|
2.82 |
|
| 12/31/2022 |
|
|
|
19.62 |
|
|
|
|
.39 |
|
|
|
|
(3.09 |
) |
|
|
|
(2.70 |
) |
|
|
|
|
|
(.28 |
) |
|
|
|
(7.70 |
) |
|
|
|
(7.98 |
) |
|
|
|
8.94 |
|
|
|
|
(15.00 |
) |
|
|
|
13 |
|
|
|
|
.64 |
|
|
|
|
.54 |
|
|
|
|
3.29 |
|
| 12/31/2021 |
|
|
|
19.01 |
|
|
|
|
.54 |
|
|
|
|
.53 |
|
|
|
|
1.07 |
|
|
|
|
|
|
(.46 |
) |
|
|
|
– |
|
|
|
|
(.46 |
) |
|
|
|
19.62 |
|
|
|
|
5.64 |
|
|
|
|
30 |
|
|
|
|
.67 |
|
|
|
|
.67 |
|
|
|
|
2.70 |
|
| 12/31/2020 |
|
|
|
18.18 |
|
|
|
|
.27 |
|
|
|
|
.85 |
|
|
|
|
1.12 |
|
|
|
|
|
|
(.29 |
) |
|
|
|
– |
|
|
|
|
(.29 |
) |
|
|
|
19.01 |
|
|
|
|
6.24 |
|
|
|
|
1,120 |
|
|
|
|
.68 |
|
|
|
|
.68 |
|
|
|
|
1.70 |
|
| 12/31/2019 |
|
|
|
15.35 |
|
|
|
|
.46 |
|
|
|
|
3.03 |
|
|
|
|
3.49 |
|
|
|
|
|
|
(.47 |
) |
|
|
|
(.19 |
) |
|
|
|
(.66 |
) |
|
|
|
18.18 |
|
|
|
|
23.06 |
|
|
|
|
1,140 |
|
|
|
|
.66 |
|
|
|
|
.66 |
|
|
|
|
2.73 |
|
| Class 1A: |
|
|
|
|
|
|
|
|
|
|
|
|
|
|
|
|
|
|
|
|
|
|
|
|
|
|
|
|
|
|
|
|
|
|
|
|
|
|
|
|
|
|
|
|
|
|
|
|
|
|
|
|
|
|
|
|
|
|
|
|
|
|
|
|
|
|
|
| 6/30/20244,5 |
|
|
|
9.83 |
|
|
|
|
.16 |
|
|
|
|
.40 |
|
|
|
|
.56 |
|
|
|
|
|
|
(.05 |
) |
|
|
|
– |
|
|
|
|
(.05 |
) |
|
|
|
10.34 |
|
|
|
|
5.70 |
6 |
|
|
|
6 |
|
|
|
|
.81 |
7 |
|
|
|
.81 |
7 |
|
|
|
3.21 |
7 |
| 12/31/2023 |
|
|
|
8.70 |
|
|
|
|
.24 |
|
|
|
|
1.13 |
|
|
|
|
1.37 |
|
|
|
|
|
|
(.24 |
) |
|
|
|
– |
|
|
|
|
(.24 |
) |
|
|
|
9.83 |
|
|
|
|
15.92 |
|
|
|
|
6 |
|
|
|
|
.81 |
|
|
|
|
.80 |
|
|
|
|
2.54 |
|
| 12/31/2022 |
|
|
|
19.39 |
|
|
|
|
.35 |
|
|
|
|
(3.05 |
) |
|
|
|
(2.70 |
) |
|
|
|
|
|
(.29 |
) |
|
|
|
(7.70 |
) |
|
|
|
(7.99 |
) |
|
|
|
8.70 |
|
|
|
|
(15.31 |
) |
|
|
|
5 |
|
|
|
|
.88 |
|
|
|
|
.79 |
|
|
|
|
3.15 |
|
| 12/31/2021 |
|
|
|
18.97 |
|
|
|
|
.50 |
|
|
|
|
.52 |
|
|
|
|
1.02 |
|
|
|
|
|
|
(.60 |
) |
|
|
|
– |
|
|
|
|
(.60 |
) |
|
|
|
19.39 |
|
|
|
|
5.39 |
|
|
|
|
6 |
|
|
|
|
.94 |
|
|
|
|
.92 |
|
|
|
|
2.50 |
|
| 12/31/2020 |
|
|
|
18.15 |
|
|
|
|
.22 |
|
|
|
|
.85 |
|
|
|
|
1.07 |
|
|
|
|
|
|
(.25 |
) |
|
|
|
– |
|
|
|
|
(.25 |
) |
|
|
|
18.97 |
|
|
|
|
5.98 |
|
|
|
|
3 |
|
|
|
|
.93 |
|
|
|
|
.93 |
|
|
|
|
1.38 |
|
| 12/31/2019 |
|
|
|
15.33 |
|
|
|
|
.41 |
|
|
|
|
3.04 |
|
|
|
|
3.45 |
|
|
|
|
|
|
(.44 |
) |
|
|
|
(.19 |
) |
|
|
|
(.63 |
) |
|
|
|
18.15 |
|
|
|
|
22.76 |
|
|
|
|
2 |
|
|
|
|
.91 |
|
|
|
|
.91 |
|
|
|
|
2.41 |
|
| Class 2: |
|
|
|
|
|
|
|
|
|
|
|
|
|
|
|
|
|
|
|
|
|
|
|
|
|
|
|
|
|
|
|
|
|
|
|
|
|
|
|
|
|
|
|
|
|
|
|
|
|
|
|
|
|
|
|
|
|
|
|
|
|
|
|
|
|
|
|
| 6/30/20244,5 |
|
|
|
9.82 |
|
|
|
|
.16 |
|
|
|
|
.41 |
|
|
|
|
.57 |
|
|
|
|
|
|
(.05 |
) |
|
|
|
– |
|
|
|
|
(.05 |
) |
|
|
|
10.34 |
|
|
|
|
5.81 |
6 |
|
|
|
158 |
|
|
|
|
.81 |
7 |
|
|
|
.81 |
7 |
|
|
|
3.24 |
7 |
| 12/31/2023 |
|
|
|
8.70 |
|
|
|
|
.24 |
|
|
|
|
1.12 |
|
|
|
|
1.36 |
|
|
|
|
|
|
(.24 |
) |
|
|
|
– |
|
|
|
|
(.24 |
) |
|
|
|
9.82 |
|
|
|
|
15.76 |
|
|
|
|
165 |
|
|
|
|
.81 |
|
|
|
|
.80 |
|
|
|
|
2.54 |
|
| 12/31/2022 |
|
|
|
19.38 |
|
|
|
|
.36 |
|
|
|
|
(3.05 |
) |
|
|
|
(2.69 |
) |
|
|
|
|
|
(.29 |
) |
|
|
|
(7.70 |
) |
|
|
|
(7.99 |
) |
|
|
|
8.70 |
|
|
|
|
(15.25 |
) |
|
|
|
162 |
|
|
|
|
.88 |
|
|
|
|
.78 |
|
|
|
|
3.24 |
|
| 12/31/2021 |
|
|
|
18.95 |
|
|
|
|
.48 |
|
|
|
|
.53 |
|
|
|
|
1.01 |
|
|
|
|
|
|
(.58 |
) |
|
|
|
– |
|
|
|
|
(.58 |
) |
|
|
|
19.38 |
|
|
|
|
5.37 |
|
|
|
|
211 |
|
|
|
|
.93 |
|
|
|
|
.92 |
|
|
|
|
2.44 |
|
| 12/31/2020 |
|
|
|
18.12 |
|
|
|
|
.23 |
|
|
|
|
.85 |
|
|
|
|
1.08 |
|
|
|
|
|
|
(.25 |
) |
|
|
|
– |
|
|
|
|
(.25 |
) |
|
|
|
18.95 |
|
|
|
|
6.01 |
|
|
|
|
221 |
|
|
|
|
.93 |
|
|
|
|
.93 |
|
|
|
|
1.43 |
|
| 12/31/2019 |
|
|
|
15.30 |
|
|
|
|
.42 |
|
|
|
|
3.02 |
|
|
|
|
3.44 |
|
|
|
|
|
|
(.43 |
) |
|
|
|
(.19 |
) |
|
|
|
(.62 |
) |
|
|
|
18.12 |
|
|
|
|
22.76 |
|
|
|
|
257 |
|
|
|
|
.91 |
|
|
|
|
.91 |
|
|
|
|
2.49 |
|
| Class 4: |
|
|
|
|
|
|
|
|
|
|
|
|
|
|
|
|
|
|
|
|
|
|
|
|
|
|
|
|
|
|
|
|
|
|
|
|
|
|
|
|
|
|
|
|
|
|
|
|
|
|
|
|
|
|
|
|
|
|
|
|
|
|
|
|
|
|
|
| 6/30/20244,5 |
|
|
|
9.67 |
|
|
|
|
.15 |
|
|
|
|
.39 |
|
|
|
|
.54 |
|
|
|
|
|
|
(.05 |
) |
|
|
|
– |
|
|
|
|
(.05 |
) |
|
|
|
10.16 |
|
|
|
|
5.55 |
6 |
|
|
|
150 |
|
|
|
|
1.06 |
7 |
|
|
|
1.06 |
7 |
|
|
|
3.02 |
7 |
| 12/31/2023 |
|
|
|
8.56 |
|
|
|
|
.21 |
|
|
|
|
1.12 |
|
|
|
|
1.33 |
|
|
|
|
|
|
(.22 |
) |
|
|
|
– |
|
|
|
|
(.22 |
) |
|
|
|
9.67 |
|
|
|
|
15.66 |
|
|
|
|
143 |
|
|
|
|
1.06 |
|
|
|
|
1.05 |
|
|
|
|
2.29 |
|
| 12/31/2022 |
|
|
|
19.23 |
|
|
|
|
.33 |
|
|
|
|
(3.04 |
) |
|
|
|
(2.71 |
) |
|
|
|
|
|
(.26 |
) |
|
|
|
(7.70 |
) |
|
|
|
(7.96 |
) |
|
|
|
8.56 |
|
|
|
|
(15.52 |
) |
|
|
|
121 |
|
|
|
|
1.13 |
|
|
|
|
1.04 |
|
|
|
|
3.01 |
|
| 12/31/2021 |
|
|
|
18.82 |
|
|
|
|
.44 |
|
|
|
|
.51 |
|
|
|
|
.95 |
|
|
|
|
|
|
(.54 |
) |
|
|
|
– |
|
|
|
|
(.54 |
) |
|
|
|
19.23 |
|
|
|
|
5.09 |
|
|
|
|
132 |
|
|
|
|
1.18 |
|
|
|
|
1.17 |
|
|
|
|
2.21 |
|
| 12/31/2020 |
|
|
|
18.01 |
|
|
|
|
.19 |
|
|
|
|
.83 |
|
|
|
|
1.02 |
|
|
|
|
|
|
(.21 |
) |
|
|
|
– |
|
|
|
|
(.21 |
) |
|
|
|
18.82 |
|
|
|
|
5.73 |
|
|
|
|
112 |
|
|
|
|
1.18 |
|
|
|
|
1.18 |
|
|
|
|
1.19 |
|
| 12/31/2019 |
|
|
|
15.22 |
|
|
|
|
.37 |
|
|
|
|
3.01 |
|
|
|
|
3.38 |
|
|
|
|
|
|
(.40 |
) |
|
|
|
(.19 |
) |
|
|
|
(.59 |
) |
|
|
|
18.01 |
|
|
|
|
22.47 |
|
|
|
|
101 |
|
|
|
|
1.16 |
|
|
|
|
1.16 |
|
|
|
|
2.18 |
|
Refer to the end of the tables for footnotes.
American Funds Insurance Series 334
Financial highlights (continued)
|
|
|
|
|
|
|
|
|
|
|
|
|
|
|
|
|
|
|
|
|
|
|
|
|
|
|
|
|
|
|
|
|
|
|
|
|
|
|
|
|
|
|
|
|
|
|
|
|
|
|
|
|
|
|
|
|
|
|
|
|
|
|
|
|
|
|
|
| |
|
|
|
Income (loss) from investment operations1 |
|
|
|
Dividends and distributions |
|
|
|
|
|
|
|
|
|
|
|
|
|
|
|
|
|
|
|
|
|
|
|
|
|
|
|
| Year ended |
|
Net asset value, beginning of year |
|
Net investment income (loss) |
|
Net gains (losses) on securities (both realized and unrealized) |
|
Total from investment operations |
|
|
|
Dividends (from net investment income) |
|
Distributions (from capital gains) |
|
Total dividends and distributions |
|
Net asset value, end of year |
|
Total return2 |
|
Net assets, end of year (in millions) |
|
Ratio of expenses to average net assets before waivers3 |
|
Ratio of expenses to average net assets after waivers2,3 |
|
Ratio of net income (loss) to average net assets2 |
|
|
|
|
|
|
|
|
| Capital Income Builder |
|
|
|
|
|
|
|
|
|
|
|
|
|
|
|
|
|
|
|
|
|
|
|
|
|
|
|
|
|
|
|
|
|
|
|
|
|
|
|
|
|
|
|
|
|
|
|
|
|
|
|
| Class 1: |
|
|
|
|
|
|
|
|
|
|
|
|
|
|
|
|
|
|
|
|
|
|
|
|
|
|
|
|
|
|
|
|
|
|
|
|
|
|
|
|
|
|
|
|
|
|
|
|
|
|
|
|
|
|
|
|
|
|
|
|
|
|
|
|
|
|
|
| 6/30/20244,5 |
|
|
|
$11.63 |
|
|
|
|
$.23 |
|
|
|
|
$ .30 |
|
|
|
|
$ .53 |
|
|
|
|
|
|
$(.16 |
) |
|
|
|
$– |
|
|
|
|
$(.16 |
) |
|
|
|
$12.00 |
|
|
|
|
4.53 |
%6 |
|
|
|
$692 |
|
|
|
|
.40 |
%7 |
|
|
|
.27 |
%7 |
|
|
|
3.91 |
%7 |
| 12/31/2023 |
|
|
|
10.99 |
|
|
|
|
.41 |
|
|
|
|
.59 |
|
|
|
|
1.00 |
|
|
|
|
|
|
(.36 |
) |
|
|
|
– |
|
|
|
|
(.36 |
) |
|
|
|
11.63 |
|
|
|
|
9.28 |
|
|
|
|
660 |
|
|
|
|
.40 |
|
|
|
|
.26 |
|
|
|
|
3.68 |
|
| 12/31/2022 |
|
|
|
12.17 |
|
|
|
|
.37 |
|
|
|
|
(1.21 |
) |
|
|
|
(.84 |
) |
|
|
|
|
|
(.34 |
) |
|
|
|
– |
|
|
|
|
(.34 |
) |
|
|
|
10.99 |
|
|
|
|
(6.90 |
) |
|
|
|
586 |
|
|
|
|
.44 |
|
|
|
|
.26 |
|
|
|
|
3.31 |
|
| 12/31/2021 |
|
|
|
10.87 |
|
|
|
|
.37 |
|
|
|
|
1.28 |
|
|
|
|
1.65 |
|
|
|
|
|
|
(.35 |
) |
|
|
|
– |
|
|
|
|
(.35 |
) |
|
|
|
12.17 |
|
|
|
|
15.31 |
|
|
|
|
563 |
|
|
|
|
.53 |
|
|
|
|
.27 |
|
|
|
|
3.19 |
|
| 12/31/2020 |
|
|
|
10.73 |
|
|
|
|
.31 |
|
|
|
|
.15 |
|
|
|
|
.46 |
|
|
|
|
|
|
(.32 |
) |
|
|
|
– |
|
|
|
|
(.32 |
) |
|
|
|
10.87 |
|
|
|
|
4.64 |
|
|
|
|
621 |
|
|
|
|
.53 |
|
|
|
|
.35 |
|
|
|
|
3.07 |
|
| 12/31/2019 |
|
|
|
9.37 |
|
|
|
|
.32 |
|
|
|
|
1.36 |
|
|
|
|
1.68 |
|
|
|
|
|
|
(.32 |
) |
|
|
|
– |
|
|
|
|
(.32 |
) |
|
|
|
10.73 |
|
|
|
|
18.16 |
|
|
|
|
533 |
|
|
|
|
.53 |
|
|
|
|
.53 |
|
|
|
|
3.17 |
|
| Class 1A: |
|
|
|
|
|
|
|
|
|
|
|
|
|
|
|
|
|
|
|
|
|
|
|
|
|
|
|
|
|
|
|
|
|
|
|
|
|
|
|
|
|
|
|
|
|
|
|
|
|
|
|
|
|
|
|
|
|
|
|
|
|
|
|
|
|
|
|
| 6/30/20244,5 |
|
|
|
11.62 |
|
|
|
|
.21 |
|
|
|
|
.29 |
|
|
|
|
.50 |
|
|
|
|
|
|
(.14 |
) |
|
|
|
– |
|
|
|
|
(.14 |
) |
|
|
|
11.98 |
|
|
|
|
4.32 |
6 |
|
|
|
11 |
|
|
|
|
.65 |
7 |
|
|
|
.52 |
7 |
|
|
|
3.66 |
7 |
| 12/31/2023 |
|
|
|
10.98 |
|
|
|
|
.38 |
|
|
|
|
.59 |
|
|
|
|
.97 |
|
|
|
|
|
|
(.33 |
) |
|
|
|
– |
|
|
|
|
(.33 |
) |
|
|
|
11.62 |
|
|
|
|
9.01 |
|
|
|
|
10 |
|
|
|
|
.65 |
|
|
|
|
.51 |
|
|
|
|
3.42 |
|
| 12/31/2022 |
|
|
|
12.15 |
|
|
|
|
.34 |
|
|
|
|
(1.19 |
) |
|
|
|
(.85 |
) |
|
|
|
|
|
(.32 |
) |
|
|
|
– |
|
|
|
|
(.32 |
) |
|
|
|
10.98 |
|
|
|
|
(7.06 |
) |
|
|
|
10 |
|
|
|
|
.69 |
|
|
|
|
.52 |
|
|
|
|
3.06 |
|
| 12/31/2021 |
|
|
|
10.86 |
|
|
|
|
.34 |
|
|
|
|
1.27 |
|
|
|
|
1.61 |
|
|
|
|
|
|
(.32 |
) |
|
|
|
– |
|
|
|
|
(.32 |
) |
|
|
|
12.15 |
|
|
|
|
14.95 |
|
|
|
|
10 |
|
|
|
|
.78 |
|
|
|
|
.52 |
|
|
|
|
2.94 |
|
| 12/31/2020 |
|
|
|
10.72 |
|
|
|
|
.28 |
|
|
|
|
.16 |
|
|
|
|
.44 |
|
|
|
|
|
|
(.30 |
) |
|
|
|
– |
|
|
|
|
(.30 |
) |
|
|
|
10.86 |
|
|
|
|
4.38 |
|
|
|
|
6 |
|
|
|
|
.78 |
|
|
|
|
.60 |
|
|
|
|
2.81 |
|
| 12/31/2019 |
|
|
|
9.36 |
|
|
|
|
.29 |
|
|
|
|
1.37 |
|
|
|
|
1.66 |
|
|
|
|
|
|
(.30 |
) |
|
|
|
– |
|
|
|
|
(.30 |
) |
|
|
|
10.72 |
|
|
|
|
17.90 |
|
|
|
|
6 |
|
|
|
|
.78 |
|
|
|
|
.78 |
|
|
|
|
2.84 |
|
| Class 2: |
|
|
|
|
|
|
|
|
|
|
|
|
|
|
|
|
|
|
|
|
|
|
|
|
|
|
|
|
|
|
|
|
|
|
|
|
|
|
|
|
|
|
|
|
|
|
|
|
|
|
|
|
|
|
|
|
|
|
|
|
|
|
|
|
|
|
|
| 6/30/20244,5 |
|
|
|
11.62 |
|
|
|
|
.21 |
|
|
|
|
.30 |
|
|
|
|
.51 |
|
|
|
|
|
|
(.14 |
) |
|
|
|
– |
|
|
|
|
(.14 |
) |
|
|
|
11.99 |
|
|
|
|
4.41 |
6 |
|
|
|
16 |
|
|
|
|
.65 |
7 |
|
|
|
.52 |
7 |
|
|
|
3.66 |
7 |
| 12/31/2023 |
|
|
|
10.98 |
|
|
|
|
.38 |
|
|
|
|
.59 |
|
|
|
|
.97 |
|
|
|
|
|
|
(.33 |
) |
|
|
|
– |
|
|
|
|
(.33 |
) |
|
|
|
11.62 |
|
|
|
|
9.01 |
|
|
|
|
15 |
|
|
|
|
.65 |
|
|
|
|
.51 |
|
|
|
|
3.43 |
|
| 12/31/2022 |
|
|
|
12.16 |
|
|
|
|
.34 |
|
|
|
|
(1.20 |
) |
|
|
|
(.86 |
) |
|
|
|
|
|
(.32 |
) |
|
|
|
– |
|
|
|
|
(.32 |
) |
|
|
|
10.98 |
|
|
|
|
(7.13 |
) |
|
|
|
13 |
|
|
|
|
.69 |
|
|
|
|
.51 |
|
|
|
|
3.06 |
|
| 12/31/2021 |
|
|
|
10.87 |
|
|
|
|
.34 |
|
|
|
|
1.27 |
|
|
|
|
1.61 |
|
|
|
|
|
|
(.32 |
) |
|
|
|
– |
|
|
|
|
(.32 |
) |
|
|
|
12.16 |
|
|
|
|
14.94 |
|
|
|
|
13 |
|
|
|
|
.78 |
|
|
|
|
.52 |
|
|
|
|
2.93 |
|
| 12/31/2020 |
|
|
|
10.72 |
|
|
|
|
.29 |
|
|
|
|
.16 |
|
|
|
|
.45 |
|
|
|
|
|
|
(.30 |
) |
|
|
|
– |
|
|
|
|
(.30 |
) |
|
|
|
10.87 |
|
|
|
|
4.48 |
|
|
|
|
8 |
|
|
|
|
.78 |
|
|
|
|
.60 |
|
|
|
|
2.83 |
|
| 12/31/2019 |
|
|
|
9.36 |
|
|
|
|
.30 |
|
|
|
|
1.35 |
|
|
|
|
1.65 |
|
|
|
|
|
|
(.29 |
) |
|
|
|
– |
|
|
|
|
(.29 |
) |
|
|
|
10.72 |
|
|
|
|
17.89 |
|
|
|
|
6 |
|
|
|
|
.78 |
|
|
|
|
.78 |
|
|
|
|
2.91 |
|
| Class 4: |
|
|
|
|
|
|
|
|
|
|
|
|
|
|
|
|
|
|
|
|
|
|
|
|
|
|
|
|
|
|
|
|
|
|
|
|
|
|
|
|
|
|
|
|
|
|
|
|
|
|
|
|
|
|
|
|
|
|
|
|
|
|
|
|
|
|
|
| 6/30/20244,5 |
|
|
|
11.60 |
|
|
|
|
.20 |
|
|
|
|
.30 |
|
|
|
|
.50 |
|
|
|
|
|
|
(.13 |
) |
|
|
|
– |
|
|
|
|
(.13 |
) |
|
|
|
11.97 |
|
|
|
|
4.29 |
6 |
|
|
|
591 |
|
|
|
|
.90 |
7 |
|
|
|
.77 |
7 |
|
|
|
3.40 |
7 |
| 12/31/2023 |
|
|
|
10.96 |
|
|
|
|
.35 |
|
|
|
|
.59 |
|
|
|
|
.94 |
|
|
|
|
|
|
(.30 |
) |
|
|
|
– |
|
|
|
|
(.30 |
) |
|
|
|
11.60 |
|
|
|
|
8.75 |
|
|
|
|
566 |
|
|
|
|
.90 |
|
|
|
|
.76 |
|
|
|
|
3.18 |
|
| 12/31/2022 |
|
|
|
12.14 |
|
|
|
|
.31 |
|
|
|
|
(1.20 |
) |
|
|
|
(.89 |
) |
|
|
|
|
|
(.29 |
) |
|
|
|
– |
|
|
|
|
(.29 |
) |
|
|
|
10.96 |
|
|
|
|
(7.37 |
) |
|
|
|
530 |
|
|
|
|
.94 |
|
|
|
|
.76 |
|
|
|
|
2.81 |
|
| 12/31/2021 |
|
|
|
10.85 |
|
|
|
|
.31 |
|
|
|
|
1.27 |
|
|
|
|
1.58 |
|
|
|
|
|
|
(.29 |
) |
|
|
|
– |
|
|
|
|
(.29 |
) |
|
|
|
12.14 |
|
|
|
|
14.68 |
|
|
|
|
559 |
|
|
|
|
1.03 |
|
|
|
|
.77 |
|
|
|
|
2.69 |
|
| 12/31/2020 |
|
|
|
10.71 |
|
|
|
|
.26 |
|
|
|
|
.15 |
|
|
|
|
.41 |
|
|
|
|
|
|
(.27 |
) |
|
|
|
– |
|
|
|
|
(.27 |
) |
|
|
|
10.85 |
|
|
|
|
4.11 |
|
|
|
|
462 |
|
|
|
|
1.03 |
|
|
|
|
.85 |
|
|
|
|
2.55 |
|
| 12/31/2019 |
|
|
|
9.35 |
|
|
|
|
.27 |
|
|
|
|
1.36 |
|
|
|
|
1.63 |
|
|
|
|
|
|
(.27 |
) |
|
|
|
– |
|
|
|
|
(.27 |
) |
|
|
|
10.71 |
|
|
|
|
17.62 |
|
|
|
|
454 |
|
|
|
|
1.03 |
|
|
|
|
1.03 |
|
|
|
|
2.68 |
|
Refer to the end of the tables for footnotes.
335 American Funds Insurance Series
Financial highlights (continued)
|
|
|
|
|
|
|
|
|
|
|
|
|
|
|
|
|
|
|
|
|
|
|
|
|
|
|
|
|
|
|
|
|
|
|
|
|
|
|
|
|
|
|
|
|
|
|
|
|
|
|
|
|
|
|
|
|
|
|
|
|
|
|
| |
|
|
|
Income (loss) from investment operations1 |
|
|
|
Dividends and distributions |
|
|
|
|
|
|
|
|
|
|
|
|
|
|
|
|
|
|
|
|
|
|
|
|
| Year ended |
|
Net asset value, beginning of year |
|
Net investment income (loss) |
|
Net gains (losses) on securities (both realized and unrealized) |
|
Total from investment operations |
|
|
|
Dividends (from net investment income) |
|
Distributions (from capital gains) |
|
Total dividends and distributions |
|
Net asset value, end of year |
|
Total return |
|
Net assets, end of year (in millions) |
|
Ratio of expenses to average net assets3 |
|
Ratio of net income (loss) to average net assets |
|
|
|
|
|
|
|
| Asset Allocation Fund |
|
|
|
|
|
|
|
|
|
|
|
|
|
|
|
|
|
|
|
|
|
|
|
|
|
|
|
|
|
|
|
|
|
|
|
|
|
|
|
|
|
|
|
|
|
| Class 1: |
|
|
|
|
|
|
|
|
|
|
|
|
|
|
|
|
|
|
|
|
|
|
|
|
|
|
|
|
|
|
|
|
|
|
|
|
|
|
|
|
|
|
|
|
|
|
|
|
|
|
|
|
|
|
|
|
|
|
|
|
|
|
| 6/30/20244,5 |
|
|
|
$23.86 |
|
|
|
|
$.30 |
|
|
|
|
$ 1.96 |
|
|
|
|
$2.26 |
|
|
|
|
|
|
$(.13 |
) |
|
|
|
$(1.10 |
) |
|
|
|
$(1.23 |
) |
|
|
|
$24.89 |
|
|
|
|
9.59 |
%6 |
|
|
|
$16,051 |
|
|
|
|
.30 |
%7 |
|
|
|
2.39 |
%7 |
| 12/31/2023 |
|
|
|
22.20 |
|
|
|
|
.57 |
|
|
|
|
2.54 |
|
|
|
|
3.11 |
|
|
|
|
|
|
(.56 |
) |
|
|
|
(.89 |
) |
|
|
|
(1.45 |
) |
|
|
|
23.86 |
|
|
|
|
14.55 |
|
|
|
|
15,555 |
|
|
|
|
.30 |
|
|
|
|
2.49 |
|
| 12/31/2022 |
|
|
|
29.08 |
|
|
|
|
.52 |
|
|
|
|
(4.24 |
) |
|
|
|
(3.72 |
) |
|
|
|
|
|
(.51 |
) |
|
|
|
(2.65 |
) |
|
|
|
(3.16 |
) |
|
|
|
22.20 |
|
|
|
|
(13.19 |
) |
|
|
|
15,138 |
|
|
|
|
.30 |
|
|
|
|
2.15 |
|
| 12/31/2021 |
|
|
|
26.50 |
|
|
|
|
.48 |
|
|
|
|
3.54 |
|
|
|
|
4.02 |
|
|
|
|
|
|
(.50 |
) |
|
|
|
(.94 |
) |
|
|
|
(1.44 |
) |
|
|
|
29.08 |
|
|
|
|
15.40 |
|
|
|
|
18,836 |
|
|
|
|
.30 |
|
|
|
|
1.71 |
|
| 12/31/2020 |
|
|
|
24.05 |
|
|
|
|
.43 |
|
|
|
|
2.59 |
|
|
|
|
3.02 |
|
|
|
|
|
|
(.46 |
) |
|
|
|
(.11 |
) |
|
|
|
(.57 |
) |
|
|
|
26.50 |
|
|
|
|
12.71 |
|
|
|
|
19,238 |
|
|
|
|
.30 |
|
|
|
|
1.80 |
|
| 12/31/2019 |
|
|
|
21.29 |
|
|
|
|
.51 |
|
|
|
|
3.94 |
|
|
|
|
4.45 |
|
|
|
|
|
|
(.50 |
) |
|
|
|
(1.19 |
) |
|
|
|
(1.69 |
) |
|
|
|
24.05 |
|
|
|
|
21.54 |
|
|
|
|
17,730 |
|
|
|
|
.29 |
|
|
|
|
2.21 |
|
| Class 1A: |
|
|
|
|
|
|
|
|
|
|
|
|
|
|
|
|
|
|
|
|
|
|
|
|
|
|
|
|
|
|
|
|
|
|
|
|
|
|
|
|
|
|
|
|
|
|
|
|
|
|
|
|
|
|
|
|
|
|
|
|
|
|
| 6/30/20244,5 |
|
|
|
23.74 |
|
|
|
|
.26 |
|
|
|
|
1.95 |
|
|
|
|
2.21 |
|
|
|
|
|
|
(.12 |
) |
|
|
|
(1.10 |
) |
|
|
|
(1.22 |
) |
|
|
|
24.73 |
|
|
|
|
9.42 |
6 |
|
|
|
34 |
|
|
|
|
.55 |
7 |
|
|
|
2.15 |
7 |
| 12/31/2023 |
|
|
|
22.10 |
|
|
|
|
.51 |
|
|
|
|
2.53 |
|
|
|
|
3.04 |
|
|
|
|
|
|
(.51 |
) |
|
|
|
(.89 |
) |
|
|
|
(1.40 |
) |
|
|
|
23.74 |
|
|
|
|
14.32 |
|
|
|
|
32 |
|
|
|
|
.55 |
|
|
|
|
2.25 |
|
| 12/31/2022 |
|
|
|
28.97 |
|
|
|
|
.46 |
|
|
|
|
(4.22 |
) |
|
|
|
(3.76 |
) |
|
|
|
|
|
(.46 |
) |
|
|
|
(2.65 |
) |
|
|
|
(3.11 |
) |
|
|
|
22.10 |
|
|
|
|
(13.43 |
) |
|
|
|
27 |
|
|
|
|
.55 |
|
|
|
|
1.95 |
|
| 12/31/2021 |
|
|
|
26.42 |
|
|
|
|
.42 |
|
|
|
|
3.52 |
|
|
|
|
3.94 |
|
|
|
|
|
|
(.45 |
) |
|
|
|
(.94 |
) |
|
|
|
(1.39 |
) |
|
|
|
28.97 |
|
|
|
|
15.13 |
|
|
|
|
24 |
|
|
|
|
.55 |
|
|
|
|
1.49 |
|
| 12/31/2020 |
|
|
|
23.99 |
|
|
|
|
.37 |
|
|
|
|
2.58 |
|
|
|
|
2.95 |
|
|
|
|
|
|
(.41 |
) |
|
|
|
(.11 |
) |
|
|
|
(.52 |
) |
|
|
|
26.42 |
|
|
|
|
12.43 |
|
|
|
|
14 |
|
|
|
|
.55 |
|
|
|
|
1.56 |
|
| 12/31/2019 |
|
|
|
21.26 |
|
|
|
|
.45 |
|
|
|
|
3.92 |
|
|
|
|
4.37 |
|
|
|
|
|
|
(.45 |
) |
|
|
|
(1.19 |
) |
|
|
|
(1.64 |
) |
|
|
|
23.99 |
|
|
|
|
21.19 |
|
|
|
|
11 |
|
|
|
|
.54 |
|
|
|
|
1.95 |
|
| Class 2: |
|
|
|
|
|
|
|
|
|
|
|
|
|
|
|
|
|
|
|
|
|
|
|
|
|
|
|
|
|
|
|
|
|
|
|
|
|
|
|
|
|
|
|
|
|
|
|
|
|
|
|
|
|
|
|
|
|
|
|
|
|
|
| 6/30/20244,5 |
|
|
|
23.53 |
|
|
|
|
.26 |
|
|
|
|
1.93 |
|
|
|
|
2.19 |
|
|
|
|
|
|
(.12 |
) |
|
|
|
(1.10 |
) |
|
|
|
(1.22 |
) |
|
|
|
24.50 |
|
|
|
|
9.42 |
6 |
|
|
|
4,356 |
|
|
|
|
.55 |
7 |
|
|
|
2.14 |
7 |
| 12/31/2023 |
|
|
|
21.91 |
|
|
|
|
.50 |
|
|
|
|
2.52 |
|
|
|
|
3.02 |
|
|
|
|
|
|
(.51 |
) |
|
|
|
(.89 |
) |
|
|
|
(1.40 |
) |
|
|
|
23.53 |
|
|
|
|
14.27 |
|
|
|
|
4,261 |
|
|
|
|
.55 |
|
|
|
|
2.24 |
|
| 12/31/2022 |
|
|
|
28.74 |
|
|
|
|
.46 |
|
|
|
|
(4.19 |
) |
|
|
|
(3.73 |
) |
|
|
|
|
|
(.45 |
) |
|
|
|
(2.65 |
) |
|
|
|
(3.10 |
) |
|
|
|
21.91 |
|
|
|
|
(13.41 |
) |
|
|
|
4,228 |
|
|
|
|
.55 |
|
|
|
|
1.90 |
|
| 12/31/2021 |
|
|
|
26.21 |
|
|
|
|
.41 |
|
|
|
|
3.49 |
|
|
|
|
3.90 |
|
|
|
|
|
|
(.43 |
) |
|
|
|
(.94 |
) |
|
|
|
(1.37 |
) |
|
|
|
28.74 |
|
|
|
|
15.10 |
|
|
|
|
5,473 |
|
|
|
|
.55 |
|
|
|
|
1.46 |
|
| 12/31/2020 |
|
|
|
23.79 |
|
|
|
|
.37 |
|
|
|
|
2.56 |
|
|
|
|
2.93 |
|
|
|
|
|
|
(.40 |
) |
|
|
|
(.11 |
) |
|
|
|
(.51 |
) |
|
|
|
26.21 |
|
|
|
|
12.46 |
|
|
|
|
5,242 |
|
|
|
|
.55 |
|
|
|
|
1.55 |
|
| 12/31/2019 |
|
|
|
21.08 |
|
|
|
|
.45 |
|
|
|
|
3.89 |
|
|
|
|
4.34 |
|
|
|
|
|
|
(.44 |
) |
|
|
|
(1.19 |
) |
|
|
|
(1.63 |
) |
|
|
|
23.79 |
|
|
|
|
21.23 |
|
|
|
|
5,154 |
|
|
|
|
.54 |
|
|
|
|
1.96 |
|
| Class 3: |
|
|
|
|
|
|
|
|
|
|
|
|
|
|
|
|
|
|
|
|
|
|
|
|
|
|
|
|
|
|
|
|
|
|
|
|
|
|
|
|
|
|
|
|
|
|
|
|
|
|
|
|
|
|
|
|
|
|
|
|
|
|
| 6/30/20244,5 |
|
|
|
23.90 |
|
|
|
|
.27 |
|
|
|
|
1.96 |
|
|
|
|
2.23 |
|
|
|
|
|
|
(.12 |
) |
|
|
|
(1.10 |
) |
|
|
|
(1.22 |
) |
|
|
|
24.91 |
|
|
|
|
9.46 |
6 |
|
|
|
32 |
|
|
|
|
.48 |
7 |
|
|
|
2.22 |
7 |
| 12/31/2023 |
|
|
|
22.23 |
|
|
|
|
.53 |
|
|
|
|
2.55 |
|
|
|
|
3.08 |
|
|
|
|
|
|
(.52 |
) |
|
|
|
(.89 |
) |
|
|
|
(1.41 |
) |
|
|
|
23.90 |
|
|
|
|
14.37 |
|
|
|
|
30 |
|
|
|
|
.48 |
|
|
|
|
2.31 |
|
| 12/31/2022 |
|
|
|
29.12 |
|
|
|
|
.48 |
|
|
|
|
(4.25 |
) |
|
|
|
(3.77 |
) |
|
|
|
|
|
(.47 |
) |
|
|
|
(2.65 |
) |
|
|
|
(3.12 |
) |
|
|
|
22.23 |
|
|
|
|
(13.37 |
) |
|
|
|
28 |
|
|
|
|
.48 |
|
|
|
|
1.97 |
|
| 12/31/2021 |
|
|
|
26.53 |
|
|
|
|
.43 |
|
|
|
|
3.55 |
|
|
|
|
3.98 |
|
|
|
|
|
|
(.45 |
) |
|
|
|
(.94 |
) |
|
|
|
(1.39 |
) |
|
|
|
29.12 |
|
|
|
|
15.22 |
|
|
|
|
36 |
|
|
|
|
.48 |
|
|
|
|
1.53 |
|
| 12/31/2020 |
|
|
|
24.08 |
|
|
|
|
.39 |
|
|
|
|
2.59 |
|
|
|
|
2.98 |
|
|
|
|
|
|
(.42 |
) |
|
|
|
(.11 |
) |
|
|
|
(.53 |
) |
|
|
|
26.53 |
|
|
|
|
12.50 |
|
|
|
|
33 |
|
|
|
|
.48 |
|
|
|
|
1.62 |
|
| 12/31/2019 |
|
|
|
21.32 |
|
|
|
|
.47 |
|
|
|
|
3.93 |
|
|
|
|
4.40 |
|
|
|
|
|
|
(.45 |
) |
|
|
|
(1.19 |
) |
|
|
|
(1.64 |
) |
|
|
|
24.08 |
|
|
|
|
21.30 |
|
|
|
|
32 |
|
|
|
|
.47 |
|
|
|
|
2.02 |
|
| Class 4: |
|
|
|
|
|
|
|
|
|
|
|
|
|
|
|
|
|
|
|
|
|
|
|
|
|
|
|
|
|
|
|
|
|
|
|
|
|
|
|
|
|
|
|
|
|
|
|
|
|
|
|
|
|
|
|
|
|
|
|
|
|
|
| 6/30/20244,5 |
|
|
|
23.34 |
|
|
|
|
.23 |
|
|
|
|
1.91 |
|
|
|
|
2.14 |
|
|
|
|
|
|
(.11 |
) |
|
|
|
(1.10 |
) |
|
|
|
(1.21 |
) |
|
|
|
24.27 |
|
|
|
|
9.29 |
6 |
|
|
|
6,454 |
|
|
|
|
.80 |
7 |
|
|
|
1.90 |
7 |
| 12/31/2023 |
|
|
|
21.75 |
|
|
|
|
.44 |
|
|
|
|
2.49 |
|
|
|
|
2.93 |
|
|
|
|
|
|
(.45 |
) |
|
|
|
(.89 |
) |
|
|
|
(1.34 |
) |
|
|
|
23.34 |
|
|
|
|
14.02 |
|
|
|
|
5,807 |
|
|
|
|
.80 |
|
|
|
|
1.99 |
|
| 12/31/2022 |
|
|
|
28.56 |
|
|
|
|
.39 |
|
|
|
|
(4.16 |
) |
|
|
|
(3.77 |
) |
|
|
|
|
|
(.39 |
) |
|
|
|
(2.65 |
) |
|
|
|
(3.04 |
) |
|
|
|
21.75 |
|
|
|
|
(13.66 |
) |
|
|
|
5,380 |
|
|
|
|
.80 |
|
|
|
|
1.66 |
|
| 12/31/2021 |
|
|
|
26.06 |
|
|
|
|
.34 |
|
|
|
|
3.47 |
|
|
|
|
3.81 |
|
|
|
|
|
|
(.37 |
) |
|
|
|
(.94 |
) |
|
|
|
(1.31 |
) |
|
|
|
28.56 |
|
|
|
|
14.84 |
|
|
|
|
6,337 |
|
|
|
|
.80 |
|
|
|
|
1.22 |
|
| 12/31/2020 |
|
|
|
23.67 |
|
|
|
|
.31 |
|
|
|
|
2.54 |
|
|
|
|
2.85 |
|
|
|
|
|
|
(.35 |
) |
|
|
|
(.11 |
) |
|
|
|
(.46 |
) |
|
|
|
26.06 |
|
|
|
|
12.16 |
|
|
|
|
5,131 |
|
|
|
|
.80 |
|
|
|
|
1.30 |
|
| 12/31/2019 |
|
|
|
20.99 |
|
|
|
|
.39 |
|
|
|
|
3.87 |
|
|
|
|
4.26 |
|
|
|
|
|
|
(.39 |
) |
|
|
|
(1.19 |
) |
|
|
|
(1.58 |
) |
|
|
|
23.67 |
|
|
|
|
20.92 |
|
|
|
|
4,493 |
|
|
|
|
.79 |
|
|
|
|
1.71 |
|
Refer to the end of the tables for footnotes.
American Funds Insurance Series 336
Financial highlights (continued)
|
|
|
|
|
|
|
|
|
|
|
|
|
|
|
|
|
|
|
|
|
|
|
|
|
|
|
|
|
|
|
|
|
|
|
|
|
|
|
|
|
|
|
|
|
|
|
|
|
|
|
|
|
|
|
|
|
|
|
|
|
|
|
|
|
|
|
|
| |
|
|
|
Income (loss) from investment operations1 |
|
|
|
Dividends and distributions |
|
|
|
|
|
|
|
|
|
|
|
|
|
|
|
|
|
|
|
|
|
|
|
|
|
|
|
| Year ended |
|
Net asset value, beginning of year |
|
Net investment income (loss) |
|
Net gains (losses) on securities (both realized and unrealized) |
|
Total from investment operations |
|
|
|
Dividends (from net investment income) |
|
Distributions (from capital gains) |
|
Total dividends and distributions |
|
Net asset value, end of year |
|
Total return2 |
|
Net assets, end of year (in millions) |
|
Ratio of expenses to average net assets before waivers3 |
|
Ratio of expenses to average net assets after waivers2,3 |
|
Ratio of net income (loss) to average net assets2 |
|
|
|
|
|
|
|
|
| American Funds Global Balanced Fund |
|
|
|
|
|
|
|
|
|
|
|
|
|
|
|
|
|
|
|
|
|
|
|
|
|
|
|
|
|
|
|
|
|
|
|
|
|
|
|
|
|
|
|
|
|
|
|
|
|
|
|
| Class 1: |
|
|
|
|
|
|
|
|
|
|
|
|
|
|
|
|
|
|
|
|
|
|
|
|
|
|
|
|
|
|
|
|
|
|
|
|
|
|
|
|
|
|
|
|
|
|
|
|
|
|
|
|
|
|
|
|
|
|
|
|
|
|
|
|
|
|
|
| 6/30/20244,5 |
|
|
|
$12.37 |
|
|
|
|
$.18 |
|
|
|
|
$ .34 |
|
|
|
|
$ .52 |
|
|
|
|
|
|
$(.06 |
) |
|
|
|
$ – |
|
|
|
|
$ (.06 |
) |
|
|
|
$12.83 |
|
|
|
|
4.23 |
%6 |
|
|
|
$ 98 |
|
|
|
|
.52 |
%7 |
|
|
|
.51 |
%7 |
|
|
|
2.93 |
%7 |
| 12/31/2023 |
|
|
|
12.55 |
|
|
|
|
.33 |
|
|
|
|
1.29 |
|
|
|
|
1.62 |
|
|
|
|
|
|
(.23 |
) |
|
|
|
(1.57 |
) |
|
|
|
(1.80 |
) |
|
|
|
12.37 |
|
|
|
|
14.05 |
|
|
|
|
98 |
|
|
|
|
.53 |
|
|
|
|
.52 |
|
|
|
|
2.67 |
|
| 12/31/2022 |
|
|
|
14.73 |
|
|
|
|
.26 |
|
|
|
|
(2.37 |
) |
|
|
|
(2.11 |
) |
|
|
|
|
|
– |
|
|
|
|
(.07 |
) |
|
|
|
(.07 |
) |
|
|
|
12.55 |
|
|
|
|
(14.33 |
) |
|
|
|
96 |
|
|
|
|
.59 |
|
|
|
|
.58 |
|
|
|
|
1.99 |
|
| 12/31/2021 |
|
|
|
14.19 |
|
|
|
|
.18 |
|
|
|
|
1.37 |
|
|
|
|
1.55 |
|
|
|
|
|
|
(.19 |
) |
|
|
|
(.82 |
) |
|
|
|
(1.01 |
) |
|
|
|
14.73 |
|
|
|
|
11.05 |
|
|
|
|
120 |
|
|
|
|
.73 |
|
|
|
|
.73 |
|
|
|
|
1.24 |
|
| 12/31/2020 |
|
|
|
13.51 |
|
|
|
|
.17 |
|
|
|
|
1.24 |
|
|
|
|
1.41 |
|
|
|
|
|
|
(.19 |
) |
|
|
|
(.54 |
) |
|
|
|
(.73 |
) |
|
|
|
14.19 |
|
|
|
|
10.53 |
|
|
|
|
139 |
|
|
|
|
.72 |
|
|
|
|
.72 |
|
|
|
|
1.29 |
|
| 12/31/2019 |
|
|
|
11.67 |
|
|
|
|
.24 |
|
|
|
|
2.17 |
|
|
|
|
2.41 |
|
|
|
|
|
|
(.20 |
) |
|
|
|
(.37 |
) |
|
|
|
(.57 |
) |
|
|
|
13.51 |
|
|
|
|
20.79 |
|
|
|
|
134 |
|
|
|
|
.72 |
|
|
|
|
.72 |
|
|
|
|
1.88 |
|
| Class 1A: |
|
|
|
|
|
|
|
|
|
|
|
|
|
|
|
|
|
|
|
|
|
|
|
|
|
|
|
|
|
|
|
|
|
|
|
|
|
|
|
|
|
|
|
|
|
|
|
|
|
|
|
|
|
|
|
|
|
|
|
|
|
|
|
|
|
|
|
| 6/30/20244,5 |
|
|
|
12.30 |
|
|
|
|
.17 |
|
|
|
|
.34 |
|
|
|
|
.51 |
|
|
|
|
|
|
(.06 |
) |
|
|
|
– |
|
|
|
|
(.06 |
) |
|
|
|
12.75 |
|
|
|
|
4.14 |
6 |
|
|
|
3 |
|
|
|
|
.77 |
7 |
|
|
|
.76 |
7 |
|
|
|
2.68 |
7 |
| 12/31/2023 |
|
|
|
12.49 |
|
|
|
|
.29 |
|
|
|
|
1.30 |
|
|
|
|
1.59 |
|
|
|
|
|
|
(.21 |
) |
|
|
|
(1.57 |
) |
|
|
|
(1.78 |
) |
|
|
|
12.30 |
|
|
|
|
13.77 |
|
|
|
|
3 |
|
|
|
|
.78 |
|
|
|
|
.77 |
|
|
|
|
2.42 |
|
| 12/31/2022 |
|
|
|
14.70 |
|
|
|
|
.22 |
|
|
|
|
(2.36 |
) |
|
|
|
(2.14 |
) |
|
|
|
|
|
– |
|
|
|
|
(.07 |
) |
|
|
|
(.07 |
) |
|
|
|
12.49 |
|
|
|
|
(14.56 |
) |
|
|
|
3 |
|
|
|
|
.84 |
|
|
|
|
.84 |
|
|
|
|
1.71 |
|
| 12/31/2021 |
|
|
|
14.16 |
|
|
|
|
.15 |
|
|
|
|
1.36 |
|
|
|
|
1.51 |
|
|
|
|
|
|
(.15 |
) |
|
|
|
(.82 |
) |
|
|
|
(.97 |
) |
|
|
|
14.70 |
|
|
|
|
10.83 |
|
|
|
|
4 |
|
|
|
|
.98 |
|
|
|
|
.98 |
|
|
|
|
1.02 |
|
| 12/31/2020 |
|
|
|
13.49 |
|
|
|
|
.14 |
|
|
|
|
1.23 |
|
|
|
|
1.37 |
|
|
|
|
|
|
(.16 |
) |
|
|
|
(.54 |
) |
|
|
|
(.70 |
) |
|
|
|
14.16 |
|
|
|
|
10.25 |
|
|
|
|
3 |
|
|
|
|
.97 |
|
|
|
|
.97 |
|
|
|
|
1.03 |
|
| 12/31/2019 |
|
|
|
11.65 |
|
|
|
|
.21 |
|
|
|
|
2.17 |
|
|
|
|
2.38 |
|
|
|
|
|
|
(.17 |
) |
|
|
|
(.37 |
) |
|
|
|
(.54 |
) |
|
|
|
13.49 |
|
|
|
|
20.54 |
|
|
|
|
2 |
|
|
|
|
.97 |
|
|
|
|
.97 |
|
|
|
|
1.63 |
|
| Class 2: |
|
|
|
|
|
|
|
|
|
|
|
|
|
|
|
|
|
|
|
|
|
|
|
|
|
|
|
|
|
|
|
|
|
|
|
|
|
|
|
|
|
|
|
|
|
|
|
|
|
|
|
|
|
|
|
|
|
|
|
|
|
|
|
|
|
|
|
| 6/30/20244,5 |
|
|
|
12.31 |
|
|
|
|
.17 |
|
|
|
|
.33 |
|
|
|
|
.50 |
|
|
|
|
|
|
(.06 |
) |
|
|
|
– |
|
|
|
|
(.06 |
) |
|
|
|
12.75 |
|
|
|
|
4.05 |
6 |
|
|
|
157 |
|
|
|
|
.77 |
7 |
|
|
|
.76 |
7 |
|
|
|
2.68 |
7 |
| 12/31/2023 |
|
|
|
12.49 |
|
|
|
|
.30 |
|
|
|
|
1.29 |
|
|
|
|
1.59 |
|
|
|
|
|
|
(.20 |
) |
|
|
|
(1.57 |
) |
|
|
|
(1.77 |
) |
|
|
|
12.31 |
|
|
|
|
13.83 |
|
|
|
|
160 |
|
|
|
|
.78 |
|
|
|
|
.77 |
|
|
|
|
2.42 |
|
| 12/31/2022 |
|
|
|
14.70 |
|
|
|
|
.22 |
|
|
|
|
(2.36 |
) |
|
|
|
(2.14 |
) |
|
|
|
|
|
– |
|
|
|
|
(.07 |
) |
|
|
|
(.07 |
) |
|
|
|
12.49 |
|
|
|
|
(14.56 |
) |
|
|
|
158 |
|
|
|
|
.84 |
|
|
|
|
.83 |
|
|
|
|
1.73 |
|
| 12/31/2021 |
|
|
|
14.16 |
|
|
|
|
.15 |
|
|
|
|
1.36 |
|
|
|
|
1.51 |
|
|
|
|
|
|
(.15 |
) |
|
|
|
(.82 |
) |
|
|
|
(.97 |
) |
|
|
|
14.70 |
|
|
|
|
10.79 |
|
|
|
|
208 |
|
|
|
|
.98 |
|
|
|
|
.98 |
|
|
|
|
1.01 |
|
| 12/31/2020 |
|
|
|
13.48 |
|
|
|
|
.14 |
|
|
|
|
1.23 |
|
|
|
|
1.37 |
|
|
|
|
|
|
(.15 |
) |
|
|
|
(.54 |
) |
|
|
|
(.69 |
) |
|
|
|
14.16 |
|
|
|
|
10.30 |
|
|
|
|
208 |
|
|
|
|
.97 |
|
|
|
|
.97 |
|
|
|
|
1.03 |
|
| 12/31/2019 |
|
|
|
11.65 |
|
|
|
|
.21 |
|
|
|
|
2.16 |
|
|
|
|
2.37 |
|
|
|
|
|
|
(.17 |
) |
|
|
|
(.37 |
) |
|
|
|
(.54 |
) |
|
|
|
13.48 |
|
|
|
|
20.44 |
|
|
|
|
207 |
|
|
|
|
.97 |
|
|
|
|
.97 |
|
|
|
|
1.64 |
|
| Class 4: |
|
|
|
|
|
|
|
|
|
|
|
|
|
|
|
|
|
|
|
|
|
|
|
|
|
|
|
|
|
|
|
|
|
|
|
|
|
|
|
|
|
|
|
|
|
|
|
|
|
|
|
|
|
|
|
|
|
|
|
|
|
|
|
|
|
|
|
| 6/30/20244,5 |
|
|
|
12.10 |
|
|
|
|
.15 |
|
|
|
|
.33 |
|
|
|
|
.48 |
|
|
|
|
|
|
(.05 |
) |
|
|
|
– |
|
|
|
|
(.05 |
) |
|
|
|
12.53 |
|
|
|
|
4.00 |
6 |
|
|
|
134 |
|
|
|
|
1.02 |
7 |
|
|
|
1.01 |
7 |
|
|
|
2.44 |
7 |
| 12/31/2023 |
|
|
|
12.32 |
|
|
|
|
.26 |
|
|
|
|
1.27 |
|
|
|
|
1.53 |
|
|
|
|
|
|
(.18 |
) |
|
|
|
(1.57 |
) |
|
|
|
(1.75 |
) |
|
|
|
12.10 |
|
|
|
|
13.45 |
|
|
|
|
128 |
|
|
|
|
1.03 |
|
|
|
|
1.02 |
|
|
|
|
2.17 |
|
| 12/31/2022 |
|
|
|
14.53 |
|
|
|
|
.19 |
|
|
|
|
(2.33 |
) |
|
|
|
(2.14 |
) |
|
|
|
|
|
– |
|
|
|
|
(.07 |
) |
|
|
|
(.07 |
) |
|
|
|
12.32 |
|
|
|
|
(14.73 |
) |
|
|
|
111 |
|
|
|
|
1.09 |
|
|
|
|
1.08 |
|
|
|
|
1.49 |
|
| 12/31/2021 |
|
|
|
14.02 |
|
|
|
|
.11 |
|
|
|
|
1.34 |
|
|
|
|
1.45 |
|
|
|
|
|
|
(.12 |
) |
|
|
|
(.82 |
) |
|
|
|
(.94 |
) |
|
|
|
14.53 |
|
|
|
|
10.46 |
|
|
|
|
135 |
|
|
|
|
1.23 |
|
|
|
|
1.23 |
|
|
|
|
.77 |
|
| 12/31/2020 |
|
|
|
13.36 |
|
|
|
|
.10 |
|
|
|
|
1.22 |
|
|
|
|
1.32 |
|
|
|
|
|
|
(.12 |
) |
|
|
|
(.54 |
) |
|
|
|
(.66 |
) |
|
|
|
14.02 |
|
|
|
|
10.00 |
|
|
|
|
105 |
|
|
|
|
1.22 |
|
|
|
|
1.22 |
|
|
|
|
.78 |
|
| 12/31/2019 |
|
|
|
11.55 |
|
|
|
|
.18 |
|
|
|
|
2.14 |
|
|
|
|
2.32 |
|
|
|
|
|
|
(.14 |
) |
|
|
|
(.37 |
) |
|
|
|
(.51 |
) |
|
|
|
13.36 |
|
|
|
|
20.21 |
|
|
|
|
94 |
|
|
|
|
1.22 |
|
|
|
|
1.22 |
|
|
|
|
1.37 |
|
Refer to the end of the tables for footnotes.
337 American Funds Insurance Series
Financial highlights (continued)
|
|
|
|
|
|
|
|
|
|
|
|
|
|
|
|
|
|
|
|
|
|
|
|
|
|
|
|
|
|
|
|
|
|
|
|
|
|
|
|
|
|
|
|
|
|
|
|
|
|
|
|
|
|
|
|
|
|
|
|
|
|
|
|
|
|
|
|
| |
|
|
|
Income (loss) from investment operations1 |
|
|
|
Dividends and distributions |
|
|
|
|
|
|
|
|
|
|
|
|
|
|
|
|
|
|
|
|
|
|
|
|
|
|
|
| Year ended |
|
Net asset value, beginning of year |
|
Net investment income (loss) |
|
Net gains (losses) on securities (both realized and unrealized) |
|
Total from investment operations |
|
|
|
Dividends (from net investment income) |
|
Distributions (from capital gains) |
|
Total dividends and distributions |
|
Net asset value, end of year |
|
Total return2 |
|
Net assets, end of year (in millions) |
|
Ratio of expenses to average net assets before waivers3 |
|
Ratio of expenses to average net assets after waivers2,3 |
|
Ratio of net income (loss) to average net assets2 |
|
|
|
|
|
|
|
| The Bond Fund of America |
|
|
|
|
|
|
|
|
|
|
|
|
|
|
|
|
|
|
|
|
|
|
|
|
|
|
|
|
|
|
|
|
|
|
|
|
|
|
|
|
|
|
|
|
|
|
| Class 1: |
|
|
|
|
|
|
|
|
|
|
|
|
|
|
|
|
|
|
|
|
|
|
|
|
|
|
|
|
|
|
|
|
|
|
|
|
|
|
|
|
|
|
|
|
|
|
|
|
|
|
|
|
|
|
|
|
|
|
|
|
|
|
|
|
|
|
|
| 6/30/20244,5 |
|
|
|
$ 9.54 |
|
|
|
|
$.22 |
|
|
|
|
$ (.27 |
) |
|
|
|
$ (.05 |
) |
|
|
|
|
|
$(.07 |
) |
|
|
|
$ – |
|
|
|
|
$(.07 |
) |
|
|
|
$ 9.42 |
|
|
|
|
(.57 |
)%6 |
|
|
|
$7,063 |
|
|
|
|
.39 |
%7 |
|
|
|
.25 |
%7 |
|
|
|
4.63 |
%7 |
| 12/31/2023 |
|
|
|
9.41 |
|
|
|
|
.39 |
|
|
|
|
.09 |
|
|
|
|
.48 |
|
|
|
|
|
|
(.35 |
) |
|
|
|
– |
|
|
|
|
(.35 |
) |
|
|
|
9.54 |
|
|
|
|
5.21 |
|
|
|
|
6,908 |
|
|
|
|
.39 |
|
|
|
|
.20 |
|
|
|
|
4.15 |
|
| 12/31/2022 |
|
|
|
11.21 |
|
|
|
|
.31 |
|
|
|
|
(1.67 |
) |
|
|
|
(1.36 |
) |
|
|
|
|
|
(.32 |
) |
|
|
|
(.12 |
) |
|
|
|
(.44 |
) |
|
|
|
9.41 |
|
|
|
|
(12.26 |
) |
|
|
|
6,370 |
|
|
|
|
.39 |
|
|
|
|
.20 |
|
|
|
|
3.09 |
|
| 12/31/2021 |
|
|
|
11.89 |
|
|
|
|
.21 |
|
|
|
|
(.23 |
) |
|
|
|
(.02 |
) |
|
|
|
|
|
(.19 |
) |
|
|
|
(.47 |
) |
|
|
|
(.66 |
) |
|
|
|
11.21 |
|
|
|
|
(.14 |
) |
|
|
|
8,555 |
|
|
|
|
.39 |
|
|
|
|
.26 |
|
|
|
|
1.84 |
|
| 12/31/2020 |
|
|
|
11.17 |
|
|
|
|
.23 |
|
|
|
|
.87 |
|
|
|
|
1.10 |
|
|
|
|
|
|
(.27 |
) |
|
|
|
(.11 |
) |
|
|
|
(.38 |
) |
|
|
|
11.89 |
|
|
|
|
9.96 |
|
|
|
|
6,844 |
|
|
|
|
.40 |
|
|
|
|
.40 |
|
|
|
|
2.00 |
|
| 12/31/2019 |
|
|
|
10.47 |
|
|
|
|
.30 |
|
|
|
|
.71 |
|
|
|
|
1.01 |
|
|
|
|
|
|
(.31 |
) |
|
|
|
– |
|
|
|
|
(.31 |
) |
|
|
|
11.17 |
|
|
|
|
9.70 |
|
|
|
|
6,481 |
|
|
|
|
.39 |
|
|
|
|
.39 |
|
|
|
|
2.76 |
|
| Class 1A: |
|
|
|
|
|
|
|
|
|
|
|
|
|
|
|
|
|
|
|
|
|
|
|
|
|
|
|
|
|
|
|
|
|
|
|
|
|
|
|
|
|
|
|
|
|
|
|
|
|
|
|
|
|
|
|
|
|
|
|
|
|
|
|
|
|
|
|
| 6/30/20244,5 |
|
|
|
9.47 |
|
|
|
|
.20 |
|
|
|
|
(.27 |
) |
|
|
|
(.07 |
) |
|
|
|
|
|
(.06 |
) |
|
|
|
– |
|
|
|
|
(.06 |
) |
|
|
|
9.34 |
|
|
|
|
(.63 |
)6 |
|
|
|
210 |
|
|
|
|
.64 |
7 |
|
|
|
.50 |
7 |
|
|
|
4.37 |
7 |
| 12/31/2023 |
|
|
|
9.35 |
|
|
|
|
.37 |
|
|
|
|
.08 |
|
|
|
|
.45 |
|
|
|
|
|
|
(.33 |
) |
|
|
|
– |
|
|
|
|
(.33 |
) |
|
|
|
9.47 |
|
|
|
|
4.89 |
|
|
|
|
258 |
|
|
|
|
.64 |
|
|
|
|
.45 |
|
|
|
|
3.90 |
|
| 12/31/2022 |
|
|
|
11.16 |
|
|
|
|
.31 |
|
|
|
|
(1.69 |
) |
|
|
|
(1.38 |
) |
|
|
|
|
|
(.31 |
) |
|
|
|
(.12 |
) |
|
|
|
(.43 |
) |
|
|
|
9.35 |
|
|
|
|
(12.49 |
) |
|
|
|
220 |
|
|
|
|
.64 |
|
|
|
|
.45 |
|
|
|
|
3.15 |
|
| 12/31/2021 |
|
|
|
11.84 |
|
|
|
|
.18 |
|
|
|
|
(.23 |
) |
|
|
|
(.05 |
) |
|
|
|
|
|
(.16 |
) |
|
|
|
(.47 |
) |
|
|
|
(.63 |
) |
|
|
|
11.16 |
|
|
|
|
(.36 |
) |
|
|
|
12 |
|
|
|
|
.64 |
|
|
|
|
.51 |
|
|
|
|
1.59 |
|
| 12/31/2020 |
|
|
|
11.13 |
|
|
|
|
.20 |
|
|
|
|
.87 |
|
|
|
|
1.07 |
|
|
|
|
|
|
(.25 |
) |
|
|
|
(.11 |
) |
|
|
|
(.36 |
) |
|
|
|
11.84 |
|
|
|
|
9.68 |
|
|
|
|
9 |
|
|
|
|
.65 |
|
|
|
|
.65 |
|
|
|
|
1.74 |
|
| 12/31/2019 |
|
|
|
10.45 |
|
|
|
|
.27 |
|
|
|
|
.71 |
|
|
|
|
.98 |
|
|
|
|
|
|
(.30 |
) |
|
|
|
– |
|
|
|
|
(.30 |
) |
|
|
|
11.13 |
|
|
|
|
9.36 |
|
|
|
|
7 |
|
|
|
|
.64 |
|
|
|
|
.64 |
|
|
|
|
2.48 |
|
| Class 2: |
|
|
|
|
|
|
|
|
|
|
|
|
|
|
|
|
|
|
|
|
|
|
|
|
|
|
|
|
|
|
|
|
|
|
|
|
|
|
|
|
|
|
|
|
|
|
|
|
|
|
|
|
|
|
|
|
|
|
|
|
|
|
|
|
|
|
|
| 6/30/20244,5 |
|
|
|
9.40 |
|
|
|
|
.20 |
|
|
|
|
(.27 |
) |
|
|
|
(.07 |
) |
|
|
|
|
|
(.06 |
) |
|
|
|
– |
|
|
|
|
(.06 |
) |
|
|
|
9.27 |
|
|
|
|
(.73 |
)6 |
|
|
|
2,807 |
|
|
|
|
.64 |
7 |
|
|
|
.50 |
7 |
|
|
|
4.37 |
7 |
| 12/31/2023 |
|
|
|
9.27 |
|
|
|
|
.36 |
|
|
|
|
.10 |
|
|
|
|
.46 |
|
|
|
|
|
|
(.33 |
) |
|
|
|
– |
|
|
|
|
(.33 |
) |
|
|
|
9.40 |
|
|
|
|
5.02 |
|
|
|
|
2,879 |
|
|
|
|
.64 |
|
|
|
|
.45 |
|
|
|
|
3.89 |
|
| 12/31/2022 |
|
|
|
11.06 |
|
|
|
|
.28 |
|
|
|
|
(1.66 |
) |
|
|
|
(1.38 |
) |
|
|
|
|
|
(.29 |
) |
|
|
|
(.12 |
) |
|
|
|
(.41 |
) |
|
|
|
9.27 |
|
|
|
|
(12.58 |
) |
|
|
|
2,844 |
|
|
|
|
.64 |
|
|
|
|
.45 |
|
|
|
|
2.84 |
|
| 12/31/2021 |
|
|
|
11.73 |
|
|
|
|
.18 |
|
|
|
|
(.22 |
) |
|
|
|
(.04 |
) |
|
|
|
|
|
(.16 |
) |
|
|
|
(.47 |
) |
|
|
|
(.63 |
) |
|
|
|
11.06 |
|
|
|
|
(.31 |
) |
|
|
|
3,729 |
|
|
|
|
.64 |
|
|
|
|
.52 |
|
|
|
|
1.57 |
|
| 12/31/2020 |
|
|
|
11.02 |
|
|
|
|
.20 |
|
|
|
|
.86 |
|
|
|
|
1.06 |
|
|
|
|
|
|
(.24 |
) |
|
|
|
(.11 |
) |
|
|
|
(.35 |
) |
|
|
|
11.73 |
|
|
|
|
9.73 |
|
|
|
|
3,840 |
|
|
|
|
.65 |
|
|
|
|
.65 |
|
|
|
|
1.75 |
|
| 12/31/2019 |
|
|
|
10.34 |
|
|
|
|
.27 |
|
|
|
|
.70 |
|
|
|
|
.97 |
|
|
|
|
|
|
(.29 |
) |
|
|
|
– |
|
|
|
|
(.29 |
) |
|
|
|
11.02 |
|
|
|
|
9.36 |
|
|
|
|
3,561 |
|
|
|
|
.64 |
|
|
|
|
.64 |
|
|
|
|
2.51 |
|
| Class 4: |
|
|
|
|
|
|
|
|
|
|
|
|
|
|
|
|
|
|
|
|
|
|
|
|
|
|
|
|
|
|
|
|
|
|
|
|
|
|
|
|
|
|
|
|
|
|
|
|
|
|
|
|
|
|
|
|
|
|
|
|
|
|
|
|
|
|
|
| 6/30/20244,5 |
|
|
|
9.35 |
|
|
|
|
.19 |
|
|
|
|
(.27 |
) |
|
|
|
(.08 |
) |
|
|
|
|
|
(.06 |
) |
|
|
|
– |
|
|
|
|
(.06 |
) |
|
|
|
9.21 |
|
|
|
|
(.87 |
)6 |
|
|
|
1,058 |
|
|
|
|
.89 |
7 |
|
|
|
.75 |
7 |
|
|
|
4.13 |
7 |
| 12/31/2023 |
|
|
|
9.23 |
|
|
|
|
.34 |
|
|
|
|
.09 |
|
|
|
|
.43 |
|
|
|
|
|
|
(.31 |
) |
|
|
|
– |
|
|
|
|
(.31 |
) |
|
|
|
9.35 |
|
|
|
|
4.72 |
|
|
|
|
963 |
|
|
|
|
.89 |
|
|
|
|
.70 |
|
|
|
|
3.66 |
|
| 12/31/2022 |
|
|
|
11.01 |
|
|
|
|
.26 |
|
|
|
|
(1.65 |
) |
|
|
|
(1.39 |
) |
|
|
|
|
|
(.27 |
) |
|
|
|
(.12 |
) |
|
|
|
(.39 |
) |
|
|
|
9.23 |
|
|
|
|
(12.75 |
) |
|
|
|
787 |
|
|
|
|
.89 |
|
|
|
|
.70 |
|
|
|
|
2.61 |
|
| 12/31/2021 |
|
|
|
11.69 |
|
|
|
|
.15 |
|
|
|
|
(.22 |
) |
|
|
|
(.07 |
) |
|
|
|
|
|
(.14 |
) |
|
|
|
(.47 |
) |
|
|
|
(.61 |
) |
|
|
|
11.01 |
|
|
|
|
(.59 |
) |
|
|
|
891 |
|
|
|
|
.89 |
|
|
|
|
.76 |
|
|
|
|
1.34 |
|
| 12/31/2020 |
|
|
|
11.00 |
|
|
|
|
.17 |
|
|
|
|
.85 |
|
|
|
|
1.02 |
|
|
|
|
|
|
(.22 |
) |
|
|
|
(.11 |
) |
|
|
|
(.33 |
) |
|
|
|
11.69 |
|
|
|
|
9.38 |
|
|
|
|
714 |
|
|
|
|
.90 |
|
|
|
|
.90 |
|
|
|
|
1.48 |
|
| 12/31/2019 |
|
|
|
10.33 |
|
|
|
|
.24 |
|
|
|
|
.70 |
|
|
|
|
.94 |
|
|
|
|
|
|
(.27 |
) |
|
|
|
– |
|
|
|
|
(.27 |
) |
|
|
|
11.00 |
|
|
|
|
9.08 |
|
|
|
|
502 |
|
|
|
|
.89 |
|
|
|
|
.89 |
|
|
|
|
2.25 |
|
Refer to the end of the tables for footnotes.
American Funds Insurance Series 338
Financial highlights (continued)
|
|
|
|
|
|
|
|
|
|
|
|
|
|
|
|
|
|
|
|
|
|
|
|
|
|
|
|
|
|
|
|
|
|
|
|
|
|
|
|
|
|
|
|
|
|
|
|
|
|
|
|
|
|
|
|
|
|
|
|
|
|
|
|
|
|
|
|
| |
|
|
|
Income (loss) from investment operations1 |
|
|
|
Dividends and distributions |
|
|
|
|
|
|
|
|
|
|
|
|
|
|
|
|
|
|
|
|
|
|
|
|
|
|
|
| Year ended |
|
Net asset value, beginning of year |
|
Net investment income (loss) |
|
Net gains (losses) on securities (both realized and unrealized) |
|
Total from investment operations |
|
|
|
Dividends (from net investment income) |
|
Distributions (from capital gains) |
|
Total dividends and distributions |
|
Net asset value, end of year |
|
Total return2 |
|
Net assets, end of year (in millions) |
|
Ratio of expenses to average net assets before waivers3 |
|
Ratio of expenses to average net assets after waivers2,3 |
|
Ratio of net income (loss) to average net assets2 |
|
|
|
|
|
|
|
| Capital World Bond Fund |
|
|
|
|
|
|
|
|
|
|
|
|
|
|
|
|
|
|
|
|
|
|
|
|
|
|
|
|
|
|
|
|
|
|
|
|
|
|
|
|
|
|
|
|
|
|
| Class 1: |
|
|
|
|
|
|
|
|
|
|
|
|
|
|
|
|
|
|
|
|
|
|
|
|
|
|
|
|
|
|
|
|
|
|
|
|
|
|
|
|
|
|
|
|
|
|
|
|
|
|
|
|
|
|
|
|
|
|
|
|
|
|
|
|
|
|
|
| 6/30/20244,5 |
|
|
|
$10.16 |
|
|
|
|
$.20 |
|
|
|
|
$ (.55 |
) |
|
|
|
$ (.35 |
) |
|
|
|
|
|
$(.03 |
) |
|
|
|
$ – |
|
|
|
|
$(.03 |
) |
|
|
|
$ 9.78 |
|
|
|
|
(3.45 |
)%6 |
|
|
|
$ 634 |
|
|
|
|
.48 |
%7 |
|
|
|
.48 |
%7 |
|
|
|
4.12 |
%7 |
| 12/31/2023 |
|
|
|
9.55 |
|
|
|
|
.32 |
|
|
|
|
.29 |
|
|
|
|
.61 |
|
|
|
|
|
|
– |
|
|
|
|
– |
|
|
|
|
– |
|
|
|
|
10.16 |
|
|
|
|
6.39 |
|
|
|
|
665 |
|
|
|
|
.48 |
|
|
|
|
.48 |
|
|
|
|
3.33 |
|
| 12/31/2022 |
|
|
|
11.79 |
|
|
|
|
.25 |
|
|
|
|
(2.30 |
) |
|
|
|
(2.05 |
) |
|
|
|
|
|
(.03 |
) |
|
|
|
(.16 |
) |
|
|
|
(.19 |
) |
|
|
|
9.55 |
|
|
|
|
(17.43 |
) |
|
|
|
663 |
|
|
|
|
.51 |
|
|
|
|
.48 |
|
|
|
|
2.43 |
|
| 12/31/2021 |
|
|
|
12.94 |
|
|
|
|
.25 |
|
|
|
|
(.85 |
) |
|
|
|
(.60 |
) |
|
|
|
|
|
(.24 |
) |
|
|
|
(.31 |
) |
|
|
|
(.55 |
) |
|
|
|
11.79 |
|
|
|
|
(4.73 |
) |
|
|
|
988 |
|
|
|
|
.60 |
|
|
|
|
.50 |
|
|
|
|
2.06 |
|
| 12/31/2020 |
|
|
|
12.12 |
|
|
|
|
.26 |
|
|
|
|
.95 |
|
|
|
|
1.21 |
|
|
|
|
|
|
(.18 |
) |
|
|
|
(.21 |
) |
|
|
|
(.39 |
) |
|
|
|
12.94 |
|
|
|
|
10.17 |
|
|
|
|
1,219 |
|
|
|
|
.59 |
|
|
|
|
.52 |
|
|
|
|
2.08 |
|
| 12/31/2019 |
|
|
|
11.42 |
|
|
|
|
.31 |
|
|
|
|
.61 |
|
|
|
|
.92 |
|
|
|
|
|
|
(.22 |
) |
|
|
|
– |
|
|
|
|
(.22 |
) |
|
|
|
12.12 |
|
|
|
|
8.08 |
|
|
|
|
1,077 |
|
|
|
|
.58 |
|
|
|
|
.58 |
|
|
|
|
2.60 |
|
| Class 1A: |
|
|
|
|
|
|
|
|
|
|
|
|
|
|
|
|
|
|
|
|
|
|
|
|
|
|
|
|
|
|
|
|
|
|
|
|
|
|
|
|
|
|
|
|
|
|
|
|
|
|
|
|
|
|
|
|
|
|
|
|
|
|
|
|
|
|
|
| 6/30/20244,5 |
|
|
|
10.08 |
|
|
|
|
.20 |
|
|
|
|
(.56 |
) |
|
|
|
(.36 |
) |
|
|
|
|
|
(.03 |
) |
|
|
|
– |
|
|
|
|
(.03 |
) |
|
|
|
9.69 |
|
|
|
|
(3.56 |
)6 |
|
|
|
37 |
|
|
|
|
.73 |
7 |
|
|
|
.73 |
7 |
|
|
|
4.12 |
7 |
| 12/31/2023 |
|
|
|
9.50 |
|
|
|
|
.30 |
|
|
|
|
.28 |
|
|
|
|
.58 |
|
|
|
|
|
|
– |
|
|
|
|
– |
|
|
|
|
– |
|
|
|
|
10.08 |
|
|
|
|
6.11 |
|
|
|
|
1 |
|
|
|
|
.73 |
|
|
|
|
.73 |
|
|
|
|
3.08 |
|
| 12/31/2022 |
|
|
|
11.76 |
|
|
|
|
.22 |
|
|
|
|
(2.30 |
) |
|
|
|
(2.08 |
) |
|
|
|
|
|
(.02 |
) |
|
|
|
(.16 |
) |
|
|
|
(.18 |
) |
|
|
|
9.50 |
|
|
|
|
(17.69 |
) |
|
|
|
1 |
|
|
|
|
.76 |
|
|
|
|
.73 |
|
|
|
|
2.19 |
|
| 12/31/2021 |
|
|
|
12.91 |
|
|
|
|
.23 |
|
|
|
|
(.85 |
) |
|
|
|
(.62 |
) |
|
|
|
|
|
(.22 |
) |
|
|
|
(.31 |
) |
|
|
|
(.53 |
) |
|
|
|
11.76 |
|
|
|
|
(4.88 |
) |
|
|
|
1 |
|
|
|
|
.85 |
|
|
|
|
.75 |
|
|
|
|
1.85 |
|
| 12/31/2020 |
|
|
|
12.10 |
|
|
|
|
.23 |
|
|
|
|
.95 |
|
|
|
|
1.18 |
|
|
|
|
|
|
(.16 |
) |
|
|
|
(.21 |
) |
|
|
|
(.37 |
) |
|
|
|
12.91 |
|
|
|
|
9.89 |
|
|
|
|
1 |
|
|
|
|
.83 |
|
|
|
|
.76 |
|
|
|
|
1.83 |
|
| 12/31/2019 |
|
|
|
11.41 |
|
|
|
|
.28 |
|
|
|
|
.60 |
|
|
|
|
.88 |
|
|
|
|
|
|
(.19 |
) |
|
|
|
– |
|
|
|
|
(.19 |
) |
|
|
|
12.10 |
|
|
|
|
7.75 |
|
|
|
|
1 |
|
|
|
|
.83 |
|
|
|
|
.83 |
|
|
|
|
2.35 |
|
| Class 2: |
|
|
|
|
|
|
|
|
|
|
|
|
|
|
|
|
|
|
|
|
|
|
|
|
|
|
|
|
|
|
|
|
|
|
|
|
|
|
|
|
|
|
|
|
|
|
|
|
|
|
|
|
|
|
|
|
|
|
|
|
|
|
|
|
|
|
|
| 6/30/20244,5 |
|
|
|
10.03 |
|
|
|
|
.19 |
|
|
|
|
(.55 |
) |
|
|
|
(.36 |
) |
|
|
|
|
|
(.01 |
) |
|
|
|
– |
|
|
|
|
(.01 |
) |
|
|
|
9.66 |
|
|
|
|
(3.62 |
)6 |
|
|
|
789 |
|
|
|
|
.73 |
7 |
|
|
|
.73 |
7 |
|
|
|
3.87 |
7 |
| 12/31/2023 |
|
|
|
9.45 |
|
|
|
|
.29 |
|
|
|
|
.29 |
|
|
|
|
.58 |
|
|
|
|
|
|
– |
|
|
|
|
– |
|
|
|
|
– |
|
|
|
|
10.03 |
|
|
|
|
6.14 |
|
|
|
|
817 |
|
|
|
|
.73 |
|
|
|
|
.73 |
|
|
|
|
3.08 |
|
| 12/31/2022 |
|
|
|
11.70 |
|
|
|
|
.22 |
|
|
|
|
(2.29 |
) |
|
|
|
(2.07 |
) |
|
|
|
|
|
(.02 |
) |
|
|
|
(.16 |
) |
|
|
|
(.18 |
) |
|
|
|
9.45 |
|
|
|
|
(17.70 |
) |
|
|
|
765 |
|
|
|
|
.76 |
|
|
|
|
.73 |
|
|
|
|
2.18 |
|
| 12/31/2021 |
|
|
|
12.84 |
|
|
|
|
.22 |
|
|
|
|
(.84 |
) |
|
|
|
(.62 |
) |
|
|
|
|
|
(.21 |
) |
|
|
|
(.31 |
) |
|
|
|
(.52 |
) |
|
|
|
11.70 |
|
|
|
|
(4.92 |
) |
|
|
|
1,030 |
|
|
|
|
.85 |
|
|
|
|
.75 |
|
|
|
|
1.82 |
|
| 12/31/2020 |
|
|
|
12.03 |
|
|
|
|
.22 |
|
|
|
|
.95 |
|
|
|
|
1.17 |
|
|
|
|
|
|
(.15 |
) |
|
|
|
(.21 |
) |
|
|
|
(.36 |
) |
|
|
|
12.84 |
|
|
|
|
9.90 |
|
|
|
|
1,058 |
|
|
|
|
.84 |
|
|
|
|
.77 |
|
|
|
|
1.83 |
|
| 12/31/2019 |
|
|
|
11.34 |
|
|
|
|
.28 |
|
|
|
|
.60 |
|
|
|
|
.88 |
|
|
|
|
|
|
(.19 |
) |
|
|
|
– |
|
|
|
|
(.19 |
) |
|
|
|
12.03 |
|
|
|
|
7.77 |
|
|
|
|
1,002 |
|
|
|
|
.83 |
|
|
|
|
.83 |
|
|
|
|
2.35 |
|
| Class 4: |
|
|
|
|
|
|
|
|
|
|
|
|
|
|
|
|
|
|
|
|
|
|
|
|
|
|
|
|
|
|
|
|
|
|
|
|
|
|
|
|
|
|
|
|
|
|
|
|
|
|
|
|
|
|
|
|
|
|
|
|
|
|
|
|
|
|
|
| 6/30/20244,5 |
|
|
|
9.88 |
|
|
|
|
.17 |
|
|
|
|
(.54 |
) |
|
|
|
(.37 |
) |
|
|
|
|
|
– |
|
|
|
|
– |
|
|
|
|
– |
|
|
|
|
9.51 |
|
|
|
|
(3.74 |
)6 |
|
|
|
56 |
|
|
|
|
.98 |
7 |
|
|
|
.98 |
7 |
|
|
|
3.62 |
7 |
| 12/31/2023 |
|
|
|
9.33 |
|
|
|
|
.27 |
|
|
|
|
.28 |
|
|
|
|
.55 |
|
|
|
|
|
|
– |
|
|
|
|
– |
|
|
|
|
– |
|
|
|
|
9.88 |
|
|
|
|
5.89 |
|
|
|
|
57 |
|
|
|
|
.98 |
|
|
|
|
.98 |
|
|
|
|
2.84 |
|
| 12/31/2022 |
|
|
|
11.57 |
|
|
|
|
.19 |
|
|
|
|
(2.25 |
) |
|
|
|
(2.06 |
) |
|
|
|
|
|
(.02 |
) |
|
|
|
(.16 |
) |
|
|
|
(.18 |
) |
|
|
|
9.33 |
|
|
|
|
(17.84 |
) |
|
|
|
53 |
|
|
|
|
1.01 |
|
|
|
|
.98 |
|
|
|
|
1.94 |
|
| 12/31/2021 |
|
|
|
12.71 |
|
|
|
|
.19 |
|
|
|
|
(.84 |
) |
|
|
|
(.65 |
) |
|
|
|
|
|
(.18 |
) |
|
|
|
(.31 |
) |
|
|
|
(.49 |
) |
|
|
|
11.57 |
|
|
|
|
(5.18 |
) |
|
|
|
66 |
|
|
|
|
1.10 |
|
|
|
|
1.00 |
|
|
|
|
1.57 |
|
| 12/31/2020 |
|
|
|
11.92 |
|
|
|
|
.19 |
|
|
|
|
.94 |
|
|
|
|
1.13 |
|
|
|
|
|
|
(.13 |
) |
|
|
|
(.21 |
) |
|
|
|
(.34 |
) |
|
|
|
12.71 |
|
|
|
|
9.62 |
|
|
|
|
61 |
|
|
|
|
1.09 |
|
|
|
|
1.02 |
|
|
|
|
1.58 |
|
| 12/31/2019 |
|
|
|
11.24 |
|
|
|
|
.24 |
|
|
|
|
.60 |
|
|
|
|
.84 |
|
|
|
|
|
|
(.16 |
) |
|
|
|
– |
|
|
|
|
(.16 |
) |
|
|
|
11.92 |
|
|
|
|
7.54 |
|
|
|
|
49 |
|
|
|
|
1.08 |
|
|
|
|
1.08 |
|
|
|
|
2.09 |
|
Refer to the end of the tables for footnotes.
339 American Funds Insurance Series
Financial highlights (continued)
|
|
|
|
|
|
|
|
|
|
|
|
|
|
|
|
|
|
|
|
|
|
|
|
|
|
|
|
|
|
|
|
|
|
|
|
|
|
|
|
|
|
|
|
|
|
|
|
|
|
|
|
|
|
|
|
|
|
|
|
|
|
|
|
|
|
|
|
| |
|
|
|
Income (loss) from investment operations1 |
|
|
|
Dividends and distributions |
|
|
|
|
|
|
|
|
|
|
|
|
|
|
|
|
|
|
|
|
|
|
|
|
|
|
|
| Year ended |
|
Net asset value, beginning of year |
|
Net investment income (loss) |
|
Net gains (losses) on securities (both realized and unrealized) |
|
Total from investment operations |
|
|
|
Dividends (from net investment income) |
|
Distributions (from capital gains) |
|
Total dividends and distributions |
|
Net asset value, end of year |
|
Total return2 |
|
Net assets, end of year (in millions) |
|
Ratio of expenses to average net assets before waivers3 |
|
Ratio of expenses to average net assets after waivers2,3 |
|
Ratio of net income (loss) to average net assets2 |
|
|
|
|
|
|
|
|
|
|
|
|
| American High-Income Trust |
|
|
|
|
|
|
|
|
|
|
|
|
|
|
|
|
|
|
|
|
|
|
|
|
|
|
|
|
|
|
|
|
|
|
|
|
|
|
|
|
|
|
|
|
|
|
|
|
|
|
|
|
|
|
|
|
|
|
|
|
|
|
|
|
|
|
|
|
| Class 1: |
|
|
|
|
|
|
|
|
|
|
|
|
|
|
|
|
|
|
|
|
|
|
|
|
|
|
|
|
|
|
|
|
|
|
|
|
|
|
|
|
|
|
|
|
|
|
|
|
|
|
|
|
|
|
|
|
|
|
|
|
|
|
|
|
|
|
|
| 6/30/20244,5 |
|
|
|
$ 8.94 |
|
|
|
|
$.31 |
|
|
|
|
$ .05 |
|
|
|
|
$ .36 |
|
|
|
|
|
|
$(.11 |
) |
|
|
|
$– |
|
|
|
|
$(.11 |
) |
|
|
|
$ 9.19 |
|
|
|
|
3.98 |
%6 |
|
|
|
$227 |
|
|
|
|
.44 |
%7 |
|
|
|
.31 |
%7 |
|
|
|
6.93 |
%7 |
| 12/31/2023 |
|
|
|
8.53 |
|
|
|
|
.63 |
|
|
|
|
.43 |
|
|
|
|
1.06 |
|
|
|
|
|
|
(.65 |
) |
|
|
|
– |
|
|
|
|
(.65 |
) |
|
|
|
8.94 |
|
|
|
|
12.69 |
|
|
|
|
223 |
|
|
|
|
.45 |
|
|
|
|
.31 |
|
|
|
|
7.10 |
|
| 12/31/2022 |
|
|
|
10.19 |
|
|
|
|
.56 |
|
|
|
|
(1.47 |
) |
|
|
|
(.91 |
) |
|
|
|
|
|
(.75 |
) |
|
|
|
– |
|
|
|
|
(.75 |
) |
|
|
|
8.53 |
|
|
|
|
(9.01 |
) |
|
|
|
224 |
|
|
|
|
.47 |
|
|
|
|
.32 |
|
|
|
|
5.95 |
|
| 12/31/2021 |
|
|
|
9.80 |
|
|
|
|
.51 |
|
|
|
|
.34 |
|
|
|
|
.85 |
|
|
|
|
|
|
(.46 |
) |
|
|
|
– |
|
|
|
|
(.46 |
) |
|
|
|
10.19 |
|
|
|
|
8.74 |
|
|
|
|
278 |
|
|
|
|
.53 |
|
|
|
|
.37 |
|
|
|
|
4.95 |
|
| 12/31/2020 |
|
|
|
9.87 |
|
|
|
|
.61 |
|
|
|
|
.17 |
|
|
|
|
.78 |
|
|
|
|
|
|
(.85 |
) |
|
|
|
– |
|
|
|
|
(.85 |
) |
|
|
|
9.80 |
|
|
|
|
8.21 |
|
|
|
|
123 |
|
|
|
|
.52 |
|
|
|
|
.52 |
|
|
|
|
6.46 |
|
| 12/31/2019 |
|
|
|
9.34 |
|
|
|
|
.67 |
|
|
|
|
.52 |
|
|
|
|
1.19 |
|
|
|
|
|
|
(.66 |
) |
|
|
|
– |
|
|
|
|
(.66 |
) |
|
|
|
9.87 |
|
|
|
|
12.85 |
|
|
|
|
525 |
|
|
|
|
.51 |
|
|
|
|
.51 |
|
|
|
|
6.71 |
|
| Class 1A: |
|
|
|
|
|
|
|
|
|
|
|
|
|
|
|
|
|
|
|
|
|
|
|
|
|
|
|
|
|
|
|
|
|
|
|
|
|
|
|
|
|
|
|
|
|
|
|
|
|
|
|
|
|
|
|
|
|
|
|
|
|
|
|
|
|
|
|
| 6/30/20244,5 |
|
|
|
8.90 |
|
|
|
|
.30 |
|
|
|
|
.05 |
|
|
|
|
.35 |
|
|
|
|
|
|
(.10 |
) |
|
|
|
– |
|
|
|
|
(.10 |
) |
|
|
|
9.15 |
|
|
|
|
3.96 |
6 |
|
|
|
3 |
|
|
|
|
.69 |
7 |
|
|
|
.56 |
7 |
|
|
|
6.69 |
7 |
| 12/31/2023 |
|
|
|
8.51 |
|
|
|
|
.61 |
|
|
|
|
.41 |
|
|
|
|
1.02 |
|
|
|
|
|
|
(.63 |
) |
|
|
|
– |
|
|
|
|
(.63 |
) |
|
|
|
8.90 |
|
|
|
|
12.40 |
|
|
|
|
3 |
|
|
|
|
.70 |
|
|
|
|
.56 |
|
|
|
|
6.90 |
|
| 12/31/2022 |
|
|
|
10.16 |
|
|
|
|
.53 |
|
|
|
|
(1.46 |
) |
|
|
|
(.93 |
) |
|
|
|
|
|
(.72 |
) |
|
|
|
– |
|
|
|
|
(.72 |
) |
|
|
|
8.51 |
|
|
|
|
(9.29 |
) |
|
|
|
1 |
|
|
|
|
.72 |
|
|
|
|
.57 |
|
|
|
|
5.70 |
|
| 12/31/2021 |
|
|
|
9.78 |
|
|
|
|
.49 |
|
|
|
|
.33 |
|
|
|
|
.82 |
|
|
|
|
|
|
(.44 |
) |
|
|
|
– |
|
|
|
|
(.44 |
) |
|
|
|
10.16 |
|
|
|
|
8.42 |
|
|
|
|
1 |
|
|
|
|
.78 |
|
|
|
|
.64 |
|
|
|
|
4.75 |
|
| 12/31/2020 |
|
|
|
9.86 |
|
|
|
|
.56 |
|
|
|
|
.20 |
|
|
|
|
.76 |
|
|
|
|
|
|
(.84 |
) |
|
|
|
– |
|
|
|
|
(.84 |
) |
|
|
|
9.78 |
|
|
|
|
7.94 |
|
|
|
|
1 |
|
|
|
|
.78 |
|
|
|
|
.78 |
|
|
|
|
5.85 |
|
| 12/31/2019 |
|
|
|
9.33 |
|
|
|
|
.65 |
|
|
|
|
.51 |
|
|
|
|
1.16 |
|
|
|
|
|
|
(.63 |
) |
|
|
|
– |
|
|
|
|
(.63 |
) |
|
|
|
9.86 |
|
|
|
|
12.61 |
|
|
|
|
1 |
|
|
|
|
.75 |
|
|
|
|
.75 |
|
|
|
|
6.47 |
|
| Class 2: |
|
|
|
|
|
|
|
|
|
|
|
|
|
|
|
|
|
|
|
|
|
|
|
|
|
|
|
|
|
|
|
|
|
|
|
|
|
|
|
|
|
|
|
|
|
|
|
|
|
|
|
|
|
|
|
|
|
|
|
|
|
|
|
|
|
|
|
| 6/30/20244,5 |
|
|
|
8.73 |
|
|
|
|
.29 |
|
|
|
|
.04 |
|
|
|
|
.33 |
|
|
|
|
|
|
(.10 |
) |
|
|
|
– |
|
|
|
|
(.10 |
) |
|
|
|
8.96 |
|
|
|
|
3.80 |
6 |
|
|
|
529 |
|
|
|
|
.69 |
7 |
|
|
|
.56 |
7 |
|
|
|
6.68 |
7 |
| 12/31/2023 |
|
|
|
8.35 |
|
|
|
|
.59 |
|
|
|
|
.41 |
|
|
|
|
1.00 |
|
|
|
|
|
|
(.62 |
) |
|
|
|
– |
|
|
|
|
(.62 |
) |
|
|
|
8.73 |
|
|
|
|
12.45 |
|
|
|
|
533 |
|
|
|
|
.70 |
|
|
|
|
.56 |
|
|
|
|
6.85 |
|
| 12/31/2022 |
|
|
|
9.98 |
|
|
|
|
.52 |
|
|
|
|
(1.43 |
) |
|
|
|
(.91 |
) |
|
|
|
|
|
(.72 |
) |
|
|
|
– |
|
|
|
|
(.72 |
) |
|
|
|
8.35 |
|
|
|
|
(9.26 |
) |
|
|
|
521 |
|
|
|
|
.72 |
|
|
|
|
.57 |
|
|
|
|
5.68 |
|
| 12/31/2021 |
|
|
|
9.61 |
|
|
|
|
.48 |
|
|
|
|
.33 |
|
|
|
|
.81 |
|
|
|
|
|
|
(.44 |
) |
|
|
|
– |
|
|
|
|
(.44 |
) |
|
|
|
9.98 |
|
|
|
|
8.42 |
|
|
|
|
673 |
|
|
|
|
.78 |
|
|
|
|
.65 |
|
|
|
|
4.80 |
|
| 12/31/2020 |
|
|
|
9.70 |
|
|
|
|
.55 |
|
|
|
|
.19 |
|
|
|
|
.74 |
|
|
|
|
|
|
(.83 |
) |
|
|
|
– |
|
|
|
|
(.83 |
) |
|
|
|
9.61 |
|
|
|
|
7.94 |
|
|
|
|
665 |
|
|
|
|
.78 |
|
|
|
|
.78 |
|
|
|
|
5.88 |
|
| 12/31/2019 |
|
|
|
9.19 |
|
|
|
|
.64 |
|
|
|
|
.50 |
|
|
|
|
1.14 |
|
|
|
|
|
|
(.63 |
) |
|
|
|
– |
|
|
|
|
(.63 |
) |
|
|
|
9.70 |
|
|
|
|
12.55 |
|
|
|
|
667 |
|
|
|
|
.76 |
|
|
|
|
.76 |
|
|
|
|
6.45 |
|
| Class 3: |
|
|
|
|
|
|
|
|
|
|
|
|
|
|
|
|
|
|
|
|
|
|
|
|
|
|
|
|
|
|
|
|
|
|
|
|
|
|
|
|
|
|
|
|
|
|
|
|
|
|
|
|
|
|
|
|
|
|
|
|
|
|
|
|
|
|
|
| 6/30/20244,5 |
|
|
|
8.99 |
|
|
|
|
.31 |
|
|
|
|
.04 |
|
|
|
|
.35 |
|
|
|
|
|
|
(.10 |
) |
|
|
|
– |
|
|
|
|
(.10 |
) |
|
|
|
9.24 |
|
|
|
|
3.92 |
6 |
|
|
|
8 |
|
|
|
|
.62 |
7 |
|
|
|
.49 |
7 |
|
|
|
6.75 |
7 |
| 12/31/2023 |
|
|
|
8.58 |
|
|
|
|
.61 |
|
|
|
|
.43 |
|
|
|
|
1.04 |
|
|
|
|
|
|
(.63 |
) |
|
|
|
– |
|
|
|
|
(.63 |
) |
|
|
|
8.99 |
|
|
|
|
12.54 |
|
|
|
|
8 |
|
|
|
|
.63 |
|
|
|
|
.49 |
|
|
|
|
6.91 |
|
| 12/31/2022 |
|
|
|
10.24 |
|
|
|
|
.54 |
|
|
|
|
(1.47 |
) |
|
|
|
(.93 |
) |
|
|
|
|
|
(.73 |
) |
|
|
|
– |
|
|
|
|
(.73 |
) |
|
|
|
8.58 |
|
|
|
|
(9.25 |
) |
|
|
|
9 |
|
|
|
|
.65 |
|
|
|
|
.50 |
|
|
|
|
5.76 |
|
| 12/31/2021 |
|
|
|
9.84 |
|
|
|
|
.50 |
|
|
|
|
.34 |
|
|
|
|
.84 |
|
|
|
|
|
|
(.44 |
) |
|
|
|
– |
|
|
|
|
(.44 |
) |
|
|
|
10.24 |
|
|
|
|
8.60 |
|
|
|
|
10 |
|
|
|
|
.71 |
|
|
|
|
.58 |
|
|
|
|
4.86 |
|
| 12/31/2020 |
|
|
|
9.92 |
|
|
|
|
.57 |
|
|
|
|
.19 |
|
|
|
|
.76 |
|
|
|
|
|
|
(.84 |
) |
|
|
|
– |
|
|
|
|
(.84 |
) |
|
|
|
9.84 |
|
|
|
|
7.93 |
|
|
|
|
10 |
|
|
|
|
.71 |
|
|
|
|
.71 |
|
|
|
|
5.94 |
|
| 12/31/2019 |
|
|
|
9.38 |
|
|
|
|
.66 |
|
|
|
|
.52 |
|
|
|
|
1.18 |
|
|
|
|
|
|
(.64 |
) |
|
|
|
– |
|
|
|
|
(.64 |
) |
|
|
|
9.92 |
|
|
|
|
12.70 |
|
|
|
|
10 |
|
|
|
|
.69 |
|
|
|
|
.69 |
|
|
|
|
6.52 |
|
| Class 4: |
|
|
|
|
|
|
|
|
|
|
|
|
|
|
|
|
|
|
|
|
|
|
|
|
|
|
|
|
|
|
|
|
|
|
|
|
|
|
|
|
|
|
|
|
|
|
|
|
|
|
|
|
|
|
|
|
|
|
|
|
|
|
|
|
|
|
|
| 6/30/20244,5 |
|
|
|
9.75 |
|
|
|
|
.32 |
|
|
|
|
.04 |
|
|
|
|
.36 |
|
|
|
|
|
|
(.10 |
) |
|
|
|
– |
|
|
|
|
(.10 |
) |
|
|
|
10.01 |
|
|
|
|
3.68 |
6 |
|
|
|
125 |
|
|
|
|
.94 |
7 |
|
|
|
.81 |
7 |
|
|
|
6.43 |
7 |
| 12/31/2023 |
|
|
|
9.26 |
|
|
|
|
.63 |
|
|
|
|
.46 |
|
|
|
|
1.09 |
|
|
|
|
|
|
(.60 |
) |
|
|
|
– |
|
|
|
|
(.60 |
) |
|
|
|
9.75 |
|
|
|
|
12.18 |
|
|
|
|
107 |
|
|
|
|
.95 |
|
|
|
|
.81 |
|
|
|
|
6.62 |
|
| 12/31/2022 |
|
|
|
10.99 |
|
|
|
|
.55 |
|
|
|
|
(1.58 |
) |
|
|
|
(1.03 |
) |
|
|
|
|
|
(.70 |
) |
|
|
|
– |
|
|
|
|
(.70 |
) |
|
|
|
9.26 |
|
|
|
|
(9.53 |
) |
|
|
|
77 |
|
|
|
|
.97 |
|
|
|
|
.82 |
|
|
|
|
5.44 |
|
| 12/31/2021 |
|
|
|
10.54 |
|
|
|
|
.50 |
|
|
|
|
.36 |
|
|
|
|
.86 |
|
|
|
|
|
|
(.41 |
) |
|
|
|
– |
|
|
|
|
(.41 |
) |
|
|
|
10.99 |
|
|
|
|
8.18 |
|
|
|
|
90 |
|
|
|
|
1.03 |
|
|
|
|
.89 |
|
|
|
|
4.52 |
|
| 12/31/2020 |
|
|
|
10.56 |
|
|
|
|
.57 |
|
|
|
|
.22 |
|
|
|
|
.79 |
|
|
|
|
|
|
(.81 |
) |
|
|
|
– |
|
|
|
|
(.81 |
) |
|
|
|
10.54 |
|
|
|
|
7.74 |
|
|
|
|
69 |
|
|
|
|
1.03 |
|
|
|
|
1.03 |
|
|
|
|
5.58 |
|
| 12/31/2019 |
|
|
|
9.96 |
|
|
|
|
.67 |
|
|
|
|
.54 |
|
|
|
|
1.21 |
|
|
|
|
|
|
(.61 |
) |
|
|
|
– |
|
|
|
|
(.61 |
) |
|
|
|
10.56 |
|
|
|
|
12.27 |
|
|
|
|
63 |
|
|
|
|
1.01 |
|
|
|
|
1.01 |
|
|
|
|
6.21 |
|
Refer to the end of the tables for footnotes.
American Funds Insurance Series 340
Financial highlights (continued)
|
|
|
|
|
|
|
|
|
|
|
|
|
|
|
|
|
|
|
|
|
|
|
|
|
|
|
|
|
|
|
|
|
|
|
|
|
|
|
|
|
|
|
|
|
|
|
|
|
|
|
|
|
|
|
|
|
|
|
|
|
|
|
|
|
|
|
|
| |
|
|
|
Income (loss) from investment operations1 |
|
|
|
Dividends and distributions |
|
|
|
|
|
|
|
|
|
|
|
|
|
|
|
|
|
|
|
|
|
|
|
|
|
|
|
| Year ended |
|
Net asset value, beginning of year |
|
Net investment income (loss) |
|
Net gains (losses) on securities (both realized and unrealized) |
|
Total from investment operations |
|
|
|
Dividends (from net investment income) |
|
Distributions (from capital gains) |
|
Total dividends and distributions |
|
Net asset value, end of year |
|
Total return2 |
|
Net assets, end of year (in millions) |
|
Ratio of expenses to average net assets before waivers |
|
Ratio of expenses to average net assets after waivers2 |
|
Ratio of net income (loss) to average net assets2 |
|
|
|
|
|
|
|
|
|
|
|
|
| American Funds Mortgage Fund |
|
|
|
|
|
|
|
|
|
|
|
|
|
|
|
|
|
|
|
|
|
|
|
|
|
|
|
|
|
|
|
|
|
|
|
|
|
|
|
|
|
|
|
|
|
|
|
|
|
|
|
|
|
|
|
|
|
|
|
|
|
|
|
|
|
|
|
|
| Class 1: |
|
|
|
|
|
|
|
|
|
|
|
|
|
|
|
|
|
|
|
|
|
|
|
|
|
|
|
|
|
|
|
|
|
|
|
|
|
|
|
|
|
|
|
|
|
|
|
|
|
|
|
|
|
|
|
|
|
|
|
|
|
|
|
|
|
|
|
| 6/30/20244,5 |
|
|
|
$ 9.44 |
|
|
|
|
$.24 |
|
|
|
|
$ (.34 |
) |
|
|
|
$ (.10 |
) |
|
|
|
|
|
$(.08 |
) |
|
|
|
$ – |
|
|
|
|
$(.08 |
) |
|
|
|
$ 9.26 |
|
|
|
|
(1.09 |
)%6 |
|
|
|
$ 16 |
|
|
|
|
.35 |
%7 |
|
|
|
.28 |
%7 |
|
|
|
5.15 |
%7 |
| 12/31/2023 |
|
|
|
9.45 |
|
|
|
|
.45 |
|
|
|
|
(.08 |
) |
|
|
|
.37 |
|
|
|
|
|
|
(.38 |
) |
|
|
|
– |
|
|
|
|
(.38 |
) |
|
|
|
9.44 |
|
|
|
|
4.03 |
|
|
|
|
17 |
|
|
|
|
.41 |
|
|
|
|
.29 |
|
|
|
|
4.76 |
|
| 12/31/2022 |
|
|
|
10.63 |
|
|
|
|
.07 |
|
|
|
|
(1.10 |
) |
|
|
|
(1.03 |
) |
|
|
|
|
|
(.15 |
) |
|
|
|
– |
|
|
|
|
(.15 |
) |
|
|
|
9.45 |
|
|
|
|
(9.76 |
) |
|
|
|
1 |
|
|
|
|
.45 |
|
|
|
|
.25 |
|
|
|
|
.70 |
|
| 12/31/2021 |
|
|
|
11.11 |
|
|
|
|
.06 |
|
|
|
|
(.09 |
) |
|
|
|
(.03 |
) |
|
|
|
|
|
(.08 |
) |
|
|
|
(.37 |
) |
|
|
|
(.45 |
) |
|
|
|
10.63 |
|
|
|
|
(.32 |
) |
|
|
|
231 |
|
|
|
|
.49 |
|
|
|
|
.29 |
|
|
|
|
.58 |
|
| 12/31/2020 |
|
|
|
10.56 |
|
|
|
|
.10 |
|
|
|
|
.64 |
|
|
|
|
.74 |
|
|
|
|
|
|
(.17 |
) |
|
|
|
(.02 |
) |
|
|
|
(.19 |
) |
|
|
|
11.11 |
|
|
|
|
6.98 |
|
|
|
|
224 |
|
|
|
|
.48 |
|
|
|
|
.36 |
|
|
|
|
.93 |
|
| 12/31/2019 |
|
|
|
10.30 |
|
|
|
|
.24 |
|
|
|
|
.30 |
|
|
|
|
.54 |
|
|
|
|
|
|
(.28 |
) |
|
|
|
– |
|
|
|
|
(.28 |
) |
|
|
|
10.56 |
|
|
|
|
5.30 |
|
|
|
|
210 |
|
|
|
|
.47 |
|
|
|
|
.47 |
|
|
|
|
2.26 |
|
| Class 1A: |
|
|
|
|
|
|
|
|
|
|
|
|
|
|
|
|
|
|
|
|
|
|
|
|
|
|
|
|
|
|
|
|
|
|
|
|
|
|
|
|
|
|
|
|
|
|
|
|
|
|
|
|
|
|
|
|
|
|
|
|
|
|
|
|
|
|
|
| 6/30/20244,5 |
|
|
|
9.32 |
|
|
|
|
.22 |
|
|
|
|
(.33 |
) |
|
|
|
(.11 |
) |
|
|
|
|
|
(.07 |
) |
|
|
|
– |
|
|
|
|
(.07 |
) |
|
|
|
9.14 |
|
|
|
|
(1.14 |
)6 |
|
|
|
2 |
|
|
|
|
.60 |
7 |
|
|
|
.53 |
7 |
|
|
|
4.90 |
7 |
| 12/31/2023 |
|
|
|
9.34 |
|
|
|
|
.41 |
|
|
|
|
(.07 |
) |
|
|
|
.34 |
|
|
|
|
|
|
(.36 |
) |
|
|
|
– |
|
|
|
|
(.36 |
) |
|
|
|
9.32 |
|
|
|
|
3.72 |
|
|
|
|
2 |
|
|
|
|
.65 |
|
|
|
|
.53 |
|
|
|
|
4.38 |
|
| 12/31/2022 |
|
|
|
10.59 |
|
|
|
|
.19 |
|
|
|
|
(1.24 |
) |
|
|
|
(1.05 |
) |
|
|
|
|
|
(.20 |
) |
|
|
|
– |
|
|
|
|
(.20 |
) |
|
|
|
9.34 |
|
|
|
|
(10.03 |
) |
|
|
|
2 |
|
|
|
|
.69 |
|
|
|
|
.54 |
|
|
|
|
1.91 |
|
| 12/31/2021 |
|
|
|
11.08 |
|
|
|
|
.04 |
|
|
|
|
(.10 |
) |
|
|
|
(.06 |
) |
|
|
|
|
|
(.06 |
) |
|
|
|
(.37 |
) |
|
|
|
(.43 |
) |
|
|
|
10.59 |
|
|
|
|
(.47 |
) |
|
|
|
2 |
|
|
|
|
.74 |
|
|
|
|
.54 |
|
|
|
|
.33 |
|
| 12/31/2020 |
|
|
|
10.55 |
|
|
|
|
.07 |
|
|
|
|
.63 |
|
|
|
|
.70 |
|
|
|
|
|
|
(.15 |
) |
|
|
|
(.02 |
) |
|
|
|
(.17 |
) |
|
|
|
11.08 |
|
|
|
|
6.63 |
|
|
|
|
1 |
|
|
|
|
.73 |
|
|
|
|
.59 |
|
|
|
|
.61 |
|
| 12/31/2019 |
|
|
|
10.28 |
|
|
|
|
.22 |
|
|
|
|
.30 |
|
|
|
|
.52 |
|
|
|
|
|
|
(.25 |
) |
|
|
|
– |
|
|
|
|
(.25 |
) |
|
|
|
10.55 |
|
|
|
|
5.09 |
|
|
|
|
1 |
|
|
|
|
.71 |
|
|
|
|
.71 |
|
|
|
|
2.04 |
|
| Class 2: |
|
|
|
|
|
|
|
|
|
|
|
|
|
|
|
|
|
|
|
|
|
|
|
|
|
|
|
|
|
|
|
|
|
|
|
|
|
|
|
|
|
|
|
|
|
|
|
|
|
|
|
|
|
|
|
|
|
|
|
|
|
|
|
|
|
|
|
| 6/30/20244,5 |
|
|
|
9.34 |
|
|
|
|
.22 |
|
|
|
|
(.33 |
) |
|
|
|
(.11 |
) |
|
|
|
|
|
(.07 |
) |
|
|
|
– |
|
|
|
|
(.07 |
) |
|
|
|
9.16 |
|
|
|
|
(1.15 |
)6 |
|
|
|
43 |
|
|
|
|
.60 |
7 |
|
|
|
.53 |
7 |
|
|
|
4.90 |
7 |
| 12/31/2023 |
|
|
|
9.36 |
|
|
|
|
.41 |
|
|
|
|
(.07 |
) |
|
|
|
.34 |
|
|
|
|
|
|
(.36 |
) |
|
|
|
– |
|
|
|
|
(.36 |
) |
|
|
|
9.34 |
|
|
|
|
3.68 |
|
|
|
|
44 |
|
|
|
|
.64 |
|
|
|
|
.52 |
|
|
|
|
4.35 |
|
| 12/31/2022 |
|
|
|
10.61 |
|
|
|
|
.18 |
|
|
|
|
(1.23 |
) |
|
|
|
(1.05 |
) |
|
|
|
|
|
(.20 |
) |
|
|
|
– |
|
|
|
|
(.20 |
) |
|
|
|
9.36 |
|
|
|
|
(9.94 |
) |
|
|
|
46 |
|
|
|
|
.69 |
|
|
|
|
.54 |
|
|
|
|
1.87 |
|
| 12/31/2021 |
|
|
|
11.09 |
|
|
|
|
.04 |
|
|
|
|
(.10 |
) |
|
|
|
(.06 |
) |
|
|
|
|
|
(.05 |
) |
|
|
|
(.37 |
) |
|
|
|
(.42 |
) |
|
|
|
10.61 |
|
|
|
|
(.57 |
) |
|
|
|
58 |
|
|
|
|
.74 |
|
|
|
|
.54 |
|
|
|
|
.33 |
|
| 12/31/2020 |
|
|
|
10.54 |
|
|
|
|
.08 |
|
|
|
|
.63 |
|
|
|
|
.71 |
|
|
|
|
|
|
(.14 |
) |
|
|
|
(.02 |
) |
|
|
|
(.16 |
) |
|
|
|
11.09 |
|
|
|
|
6.72 |
|
|
|
|
58 |
|
|
|
|
.73 |
|
|
|
|
.60 |
|
|
|
|
.68 |
|
| 12/31/2019 |
|
|
|
10.28 |
|
|
|
|
.21 |
|
|
|
|
.31 |
|
|
|
|
.52 |
|
|
|
|
|
|
(.26 |
) |
|
|
|
– |
|
|
|
|
(.26 |
) |
|
|
|
10.54 |
|
|
|
|
5.04 |
|
|
|
|
56 |
|
|
|
|
.72 |
|
|
|
|
.72 |
|
|
|
|
2.01 |
|
| Class 4: |
|
|
|
|
|
|
|
|
|
|
|
|
|
|
|
|
|
|
|
|
|
|
|
|
|
|
|
|
|
|
|
|
|
|
|
|
|
|
|
|
|
|
|
|
|
|
|
|
|
|
|
|
|
|
|
|
|
|
|
|
|
|
|
|
|
|
|
| 6/30/20244,5 |
|
|
|
9.23 |
|
|
|
|
.21 |
|
|
|
|
(.33 |
) |
|
|
|
(.12 |
) |
|
|
|
|
|
(.07 |
) |
|
|
|
– |
|
|
|
|
(.07 |
) |
|
|
|
9.04 |
|
|
|
|
(1.30 |
)6 |
|
|
|
49 |
|
|
|
|
.85 |
7 |
|
|
|
.78 |
7 |
|
|
|
4.65 |
7 |
| 12/31/2023 |
|
|
|
9.25 |
|
|
|
|
.38 |
|
|
|
|
(.06 |
) |
|
|
|
.32 |
|
|
|
|
|
|
(.34 |
) |
|
|
|
– |
|
|
|
|
(.34 |
) |
|
|
|
9.23 |
|
|
|
|
3.51 |
|
|
|
|
45 |
|
|
|
|
.90 |
|
|
|
|
.78 |
|
|
|
|
4.12 |
|
| 12/31/2022 |
|
|
|
10.49 |
|
|
|
|
.16 |
|
|
|
|
(1.22 |
) |
|
|
|
(1.06 |
) |
|
|
|
|
|
(.18 |
) |
|
|
|
– |
|
|
|
|
(.18 |
) |
|
|
|
9.25 |
|
|
|
|
(10.16 |
) |
|
|
|
40 |
|
|
|
|
.94 |
|
|
|
|
.79 |
|
|
|
|
1.66 |
|
| 12/31/2021 |
|
|
|
10.97 |
|
|
|
|
.01 |
|
|
|
|
(.09 |
) |
|
|
|
(.08 |
) |
|
|
|
|
|
(.03 |
) |
|
|
|
(.37 |
) |
|
|
|
(.40 |
) |
|
|
|
10.49 |
|
|
|
|
(.78 |
) |
|
|
|
43 |
|
|
|
|
.99 |
|
|
|
|
.79 |
|
|
|
|
.08 |
|
| 12/31/2020 |
|
|
|
10.44 |
|
|
|
|
.04 |
|
|
|
|
.63 |
|
|
|
|
.67 |
|
|
|
|
|
|
(.12 |
) |
|
|
|
(.02 |
) |
|
|
|
(.14 |
) |
|
|
|
10.97 |
|
|
|
|
6.38 |
|
|
|
|
37 |
|
|
|
|
.98 |
|
|
|
|
.85 |
|
|
|
|
.41 |
|
| 12/31/2019 |
|
|
|
10.19 |
|
|
|
|
.18 |
|
|
|
|
.31 |
|
|
|
|
.49 |
|
|
|
|
|
|
(.24 |
) |
|
|
|
– |
|
|
|
|
(.24 |
) |
|
|
|
10.44 |
|
|
|
|
4.80 |
|
|
|
|
28 |
|
|
|
|
.97 |
|
|
|
|
.97 |
|
|
|
|
1.71 |
|
Refer to the end of the tables for footnotes.
341 American Funds Insurance Series
Financial highlights (continued)
|
|
|
|
|
|
|
|
|
|
|
|
|
|
|
|
|
|
|
|
|
|
|
|
|
|
|
|
|
|
|
|
|
|
|
|
|
|
|
|
|
|
|
|
|
|
|
|
|
|
|
|
|
|
|
|
|
|
|
|
|
|
|
| |
|
|
|
Income (loss) from investment operations1 |
|
|
|
Dividends and distributions |
|
|
|
|
|
|
|
|
|
|
|
|
|
|
|
|
|
|
|
|
|
|
|
|
| Year ended |
|
Net asset value, beginning of year |
|
Net investment income (loss) |
|
Net gains (losses) on securities (both realized and unrealized) |
|
Total from investment operations |
|
|
|
Dividends (from net investment income) |
|
Distributions (from capital gains) |
|
Total dividends and distributions |
|
Net asset value, end of year |
|
Total return |
|
Net assets, end of year (in millions) |
|
Ratio of expenses to average net assets |
|
Ratio of net income (loss) to average net assets |
|
|
|
|
|
|
|
|
|
|
|
| Ultra-Short Bond Fund |
|
|
|
|
|
|
|
|
|
|
|
|
|
|
|
|
|
|
|
|
|
|
|
|
|
|
|
|
|
|
|
|
|
|
|
|
|
|
|
|
|
|
|
|
|
|
|
|
|
|
|
|
|
|
|
|
|
|
|
|
|
|
| Class 1: |
|
|
|
|
|
|
|
|
|
|
|
|
|
|
|
|
|
|
|
|
|
|
|
|
|
|
|
|
|
|
|
|
|
|
|
|
|
|
|
|
|
|
|
|
|
|
|
|
|
|
|
|
|
|
|
|
|
|
|
|
|
|
| 6/30/20244,5 |
|
|
|
$11.35 |
|
|
|
|
$ .29 |
|
|
|
|
$ – |
8 |
|
|
|
$ .29 |
|
|
|
|
|
|
$(.11 |
) |
|
|
|
$– |
|
|
|
|
$(.11 |
) |
|
|
|
$11.53 |
|
|
|
|
2.54 |
%6 |
|
|
|
$39 |
|
|
|
|
.29 |
%7 |
|
|
|
5.16 |
%7 |
| 12/31/2023 |
|
|
|
11.35 |
|
|
|
|
.55 |
|
|
|
|
.01 |
|
|
|
|
.56 |
|
|
|
|
|
|
(.56 |
) |
|
|
|
– |
|
|
|
|
(.56 |
) |
|
|
|
11.35 |
|
|
|
|
4.94 |
|
|
|
|
40 |
|
|
|
|
.30 |
|
|
|
|
4.81 |
|
| 12/31/2022 |
|
|
|
11.27 |
|
|
|
|
.17 |
|
|
|
|
(.01 |
) |
|
|
|
.16 |
|
|
|
|
|
|
(.08 |
) |
|
|
|
– |
|
|
|
|
(.08 |
) |
|
|
|
11.35 |
|
|
|
|
1.42 |
|
|
|
|
51 |
|
|
|
|
.32 |
|
|
|
|
1.48 |
|
| 12/31/2021 |
|
|
|
11.31 |
|
|
|
|
(.03 |
) |
|
|
|
(.01 |
) |
|
|
|
(.04 |
) |
|
|
|
|
|
– |
|
|
|
|
– |
|
|
|
|
– |
|
|
|
|
11.27 |
|
|
|
|
(.35 |
) |
|
|
|
37 |
|
|
|
|
.37 |
|
|
|
|
(.28 |
) |
| 12/31/2020 |
|
|
|
11.30 |
|
|
|
|
.02 |
|
|
|
|
.02 |
|
|
|
|
.04 |
|
|
|
|
|
|
(.03 |
) |
|
|
|
– |
|
|
|
|
(.03 |
) |
|
|
|
11.31 |
|
|
|
|
.34 |
|
|
|
|
44 |
|
|
|
|
.37 |
|
|
|
|
.16 |
|
| 12/31/2019 |
|
|
|
11.31 |
|
|
|
|
.22 |
|
|
|
|
– |
8 |
|
|
|
.22 |
|
|
|
|
|
|
(.23 |
) |
|
|
|
– |
|
|
|
|
(.23 |
) |
|
|
|
11.30 |
|
|
|
|
1.92 |
|
|
|
|
30 |
|
|
|
|
.36 |
|
|
|
|
1.92 |
|
| Class 1A: |
|
|
|
|
|
|
|
|
|
|
|
|
|
|
|
|
|
|
|
|
|
|
|
|
|
|
|
|
|
|
|
|
|
|
|
|
|
|
|
|
|
|
|
|
|
|
|
|
|
|
|
|
|
|
|
|
|
|
|
|
|
|
| 6/30/20244,5 |
|
|
|
11.35 |
|
|
|
|
.28 |
|
|
|
|
(.01 |
) |
|
|
|
.27 |
|
|
|
|
|
|
(.10 |
) |
|
|
|
– |
|
|
|
|
(.10 |
) |
|
|
|
11.52 |
|
|
|
|
2.41 |
6 |
|
|
|
– |
10 |
|
|
|
.52 |
7 |
|
|
|
4.93 |
7 |
| 12/31/2023 |
|
|
|
11.35 |
|
|
|
|
.54 |
|
|
|
|
– |
|
|
|
|
.54 |
|
|
|
|
|
|
(.54 |
) |
|
|
|
– |
|
|
|
|
(.54 |
) |
|
|
|
11.35 |
|
|
|
|
4.79 |
|
|
|
|
– |
10 |
|
|
|
.53 |
|
|
|
|
4.69 |
|
| 12/31/2022 |
|
|
|
11.28 |
|
|
|
|
.16 |
|
|
|
|
(.01 |
) |
|
|
|
.15 |
|
|
|
|
|
|
(.08 |
) |
|
|
|
– |
|
|
|
|
(.08 |
) |
|
|
|
11.35 |
|
|
|
|
1.32 |
|
|
|
|
– |
10 |
|
|
|
.31 |
|
|
|
|
1.40 |
|
| 12/31/2021 |
|
|
|
11.31 |
|
|
|
|
(.03 |
) |
|
|
|
– |
8 |
|
|
|
(.03 |
) |
|
|
|
|
|
– |
|
|
|
|
– |
|
|
|
|
– |
|
|
|
|
11.28 |
|
|
|
|
(.27 |
) |
|
|
|
– |
10 |
|
|
|
.36 |
|
|
|
|
(.28 |
) |
| 12/31/2020 |
|
|
|
11.30 |
|
|
|
|
.03 |
|
|
|
|
.01 |
|
|
|
|
.04 |
|
|
|
|
|
|
(.03 |
) |
|
|
|
– |
|
|
|
|
(.03 |
) |
|
|
|
11.31 |
|
|
|
|
.32 |
|
|
|
|
– |
10 |
|
|
|
.35 |
|
|
|
|
.26 |
|
| 12/31/2019 |
|
|
|
11.31 |
|
|
|
|
.22 |
|
|
|
|
– |
8 |
|
|
|
.22 |
|
|
|
|
|
|
(.23 |
) |
|
|
|
– |
|
|
|
|
(.23 |
) |
|
|
|
11.30 |
|
|
|
|
1.92 |
|
|
|
|
– |
10 |
|
|
|
.37 |
|
|
|
|
1.90 |
|
| Class 2: |
|
|
|
|
|
|
|
|
|
|
|
|
|
|
|
|
|
|
|
|
|
|
|
|
|
|
|
|
|
|
|
|
|
|
|
|
|
|
|
|
|
|
|
|
|
|
|
|
|
|
|
|
|
|
|
|
|
|
|
|
|
|
| 6/30/20244,5 |
|
|
|
10.98 |
|
|
|
|
.27 |
|
|
|
|
– |
8 |
|
|
|
.27 |
|
|
|
|
|
|
(.10 |
) |
|
|
|
– |
|
|
|
|
(.10 |
) |
|
|
|
11.15 |
|
|
|
|
2.49 |
6 |
|
|
|
262 |
|
|
|
|
.54 |
7 |
|
|
|
4.91 |
7 |
| 12/31/2023 |
|
|
|
11.00 |
|
|
|
|
.51 |
|
|
|
|
– |
8 |
|
|
|
.51 |
|
|
|
|
|
|
(.53 |
) |
|
|
|
– |
|
|
|
|
(.53 |
) |
|
|
|
10.98 |
|
|
|
|
4.64 |
|
|
|
|
273 |
|
|
|
|
.55 |
|
|
|
|
4.56 |
|
| 12/31/2022 |
|
|
|
10.93 |
|
|
|
|
.13 |
|
|
|
|
– |
8 |
|
|
|
.13 |
|
|
|
|
|
|
(.06 |
) |
|
|
|
– |
|
|
|
|
(.06 |
) |
|
|
|
11.00 |
|
|
|
|
1.17 |
|
|
|
|
297 |
|
|
|
|
.57 |
|
|
|
|
1.23 |
|
| 12/31/2021 |
|
|
|
10.99 |
|
|
|
|
(.06 |
) |
|
|
|
– |
8 |
|
|
|
(.06 |
) |
|
|
|
|
|
– |
|
|
|
|
– |
|
|
|
|
– |
|
|
|
|
10.93 |
|
|
|
|
(.55 |
) |
|
|
|
245 |
|
|
|
|
.62 |
|
|
|
|
(.53 |
) |
| 12/31/2020 |
|
|
|
11.01 |
|
|
|
|
– |
8 |
|
|
|
– |
8 |
|
|
|
— |
8 |
|
|
|
|
|
(.02 |
) |
|
|
|
– |
|
|
|
|
(.02 |
) |
|
|
|
10.99 |
|
|
|
|
.03 |
|
|
|
|
288 |
|
|
|
|
.62 |
|
|
|
|
(.05 |
) |
| 12/31/2019 |
|
|
|
11.03 |
|
|
|
|
.18 |
|
|
|
|
– |
8 |
|
|
|
.18 |
|
|
|
|
|
|
(.20 |
) |
|
|
|
– |
|
|
|
|
(.20 |
) |
|
|
|
11.01 |
|
|
|
|
1.62 |
|
|
|
|
230 |
|
|
|
|
.61 |
|
|
|
|
1.66 |
|
| Class 3: |
|
|
|
|
|
|
|
|
|
|
|
|
|
|
|
|
|
|
|
|
|
|
|
|
|
|
|
|
|
|
|
|
|
|
|
|
|
|
|
|
|
|
|
|
|
|
|
|
|
|
|
|
|
|
|
|
|
|
|
|
|
|
| 6/30/20244,5 |
|
|
|
11.13 |
|
|
|
|
.28 |
|
|
|
|
(.01 |
) |
|
|
|
.27 |
|
|
|
|
|
|
(.10 |
) |
|
|
|
– |
|
|
|
|
(.10 |
) |
|
|
|
11.30 |
|
|
|
|
2.47 |
6 |
|
|
|
4 |
|
|
|
|
.47 |
7 |
|
|
|
4.98 |
7 |
| 12/31/2023 |
|
|
|
11.14 |
|
|
|
|
.52 |
|
|
|
|
.01 |
|
|
|
|
.53 |
|
|
|
|
|
|
(.54 |
) |
|
|
|
– |
|
|
|
|
(.54 |
) |
|
|
|
11.13 |
|
|
|
|
4.75 |
|
|
|
|
4 |
|
|
|
|
.48 |
|
|
|
|
4.64 |
|
| 12/31/2022 |
|
|
|
11.07 |
|
|
|
|
.13 |
|
|
|
|
– |
8 |
|
|
|
.13 |
|
|
|
|
|
|
(.06 |
) |
|
|
|
– |
|
|
|
|
(.06 |
) |
|
|
|
11.14 |
|
|
|
|
1.19 |
|
|
|
|
4 |
|
|
|
|
.50 |
|
|
|
|
1.19 |
|
| 12/31/2021 |
|
|
|
11.12 |
|
|
|
|
(.05 |
) |
|
|
|
– |
8 |
|
|
|
(.05 |
) |
|
|
|
|
|
– |
|
|
|
|
– |
|
|
|
|
– |
|
|
|
|
11.07 |
|
|
|
|
(.45 |
) |
|
|
|
5 |
|
|
|
|
.55 |
|
|
|
|
(.46 |
) |
| 12/31/2020 |
|
|
|
11.13 |
|
|
|
|
– |
8 |
|
|
|
.02 |
|
|
|
|
.02 |
|
|
|
|
|
|
(.03 |
) |
|
|
|
– |
|
|
|
|
(.03 |
) |
|
|
|
11.12 |
|
|
|
|
.13 |
|
|
|
|
4 |
|
|
|
|
.55 |
|
|
|
|
.03 |
|
| 12/31/2019 |
|
|
|
11.14 |
|
|
|
|
.20 |
|
|
|
|
– |
8 |
|
|
|
.20 |
|
|
|
|
|
|
(.21 |
) |
|
|
|
– |
|
|
|
|
(.21 |
) |
|
|
|
11.13 |
|
|
|
|
1.76 |
|
|
|
|
3 |
|
|
|
|
.54 |
|
|
|
|
1.74 |
|
| Class 4: |
|
|
|
|
|
|
|
|
|
|
|
|
|
|
|
|
|
|
|
|
|
|
|
|
|
|
|
|
|
|
|
|
|
|
|
|
|
|
|
|
|
|
|
|
|
|
|
|
|
|
|
|
|
|
|
|
|
|
|
|
|
|
| 6/30/20244,5 |
|
|
|
11.05 |
|
|
|
|
.26 |
|
|
|
|
– |
8 |
|
|
|
.26 |
|
|
|
|
|
|
(.10 |
) |
|
|
|
– |
|
|
|
|
(.10 |
) |
|
|
|
11.21 |
|
|
|
|
2.33 |
6 |
|
|
|
50 |
|
|
|
|
.79 |
7 |
|
|
|
4.66 |
7 |
| 12/31/2023 |
|
|
|
11.05 |
|
|
|
|
.48 |
|
|
|
|
.01 |
|
|
|
|
.49 |
|
|
|
|
|
|
(.49 |
) |
|
|
|
– |
|
|
|
|
(.49 |
) |
|
|
|
11.05 |
|
|
|
|
4.44 |
|
|
|
|
56 |
|
|
|
|
.80 |
|
|
|
|
4.28 |
|
| 12/31/2022 |
|
|
|
11.00 |
|
|
|
|
.12 |
|
|
|
|
(.03 |
) |
|
|
|
.09 |
|
|
|
|
|
|
(.04 |
) |
|
|
|
– |
|
|
|
|
(.04 |
) |
|
|
|
11.05 |
|
|
|
|
.83 |
|
|
|
|
80 |
|
|
|
|
.82 |
|
|
|
|
1.05 |
|
| 12/31/2021 |
|
|
|
11.08 |
|
|
|
|
(.09 |
) |
|
|
|
.01 |
|
|
|
|
(.08 |
) |
|
|
|
|
|
– |
|
|
|
|
– |
|
|
|
|
– |
|
|
|
|
11.00 |
|
|
|
|
(.72 |
) |
|
|
|
46 |
|
|
|
|
.87 |
|
|
|
|
(.79 |
) |
| 12/31/2020 |
|
|
|
11.13 |
|
|
|
|
(.04 |
) |
|
|
|
.01 |
|
|
|
|
(.03 |
) |
|
|
|
|
|
(.02 |
) |
|
|
|
– |
|
|
|
|
(.02 |
) |
|
|
|
11.08 |
|
|
|
|
(.25 |
) |
|
|
|
40 |
|
|
|
|
.87 |
|
|
|
|
(.35 |
) |
| 12/31/2019 |
|
|
|
11.15 |
|
|
|
|
.16 |
|
|
|
|
– |
8 |
|
|
|
.16 |
|
|
|
|
|
|
(.18 |
) |
|
|
|
– |
|
|
|
|
(.18 |
) |
|
|
|
11.13 |
|
|
|
|
1.40 |
|
|
|
|
22 |
|
|
|
|
.86 |
|
|
|
|
1.40 |
|
Refer to the end of the tables for footnotes.
American Funds Insurance Series 342
Financial highlights (continued)
|
|
|
|
|
|
|
|
|
|
|
|
|
|
|
|
|
|
|
|
|
|
|
|
|
|
|
|
|
|
|
|
|
|
|
|
|
|
|
|
|
|
|
|
|
|
|
|
|
|
|
|
|
|
|
|
|
|
|
|
|
|
|
|
|
|
|
|
| |
|
|
|
Income (loss) from investment operations1 |
|
|
|
Dividends and distributions |
|
|
|
|
|
|
|
|
|
|
|
|
|
|
|
|
|
|
|
|
|
|
|
|
|
|
|
| Year ended |
|
Net asset value, beginning of year |
|
Net investment income (loss) |
|
Net gains (losses) on securities (both realized and unrealized) |
|
Total from investment operations |
|
|
|
Dividends (from net investment income) |
|
Distributions (from capital gains) |
|
Total dividends and distributions |
|
Net asset value, end of year |
|
Total return2 |
|
Net assets, end of year (in millions) |
|
Ratio of expenses to average net assets before waivers |
|
Ratio of expenses to average net assets after waivers2 |
|
Ratio of net income (loss) to average net assets2 |
|
|
|
|
|
|
|
|
|
|
|
|
| U.S. Government Securities Fund |
|
|
|
|
|
|
|
|
|
|
|
|
|
|
|
|
|
|
|
|
|
|
|
|
|
|
|
|
|
|
|
|
|
|
|
|
|
|
|
|
|
|
|
|
|
|
|
|
|
|
|
|
|
|
|
|
|
|
|
|
|
|
|
|
|
|
|
|
| Class 1: |
|
|
|
|
|
|
|
|
|
|
|
|
|
|
|
|
|
|
|
|
|
|
|
|
|
|
|
|
|
|
|
|
|
|
|
|
|
|
|
|
|
|
|
|
|
|
|
|
|
|
|
|
|
|
|
|
|
|
|
|
|
|
|
|
|
|
|
| 6/30/20244,5 |
|
|
|
$ 9.91 |
|
|
|
|
$.22 |
|
|
|
|
$ (.31 |
) |
|
|
|
$ (.09 |
) |
|
|
|
|
|
$(.07 |
) |
|
|
|
$ – |
|
|
|
|
$ (.07 |
) |
|
|
|
$ 9.75 |
|
|
|
|
(.91 |
)%6 |
|
|
|
$ 259 |
|
|
|
|
.33 |
%7 |
|
|
|
.27 |
%7 |
|
|
|
4.64 |
%7 |
| 12/31/2023 |
|
|
|
9.99 |
|
|
|
|
.40 |
|
|
|
|
(.09 |
) |
|
|
|
.31 |
|
|
|
|
|
|
(.39 |
) |
|
|
|
– |
|
|
|
|
(.39 |
) |
|
|
|
9.91 |
|
|
|
|
3.21 |
|
|
|
|
257 |
|
|
|
|
.33 |
|
|
|
|
.21 |
|
|
|
|
4.05 |
|
| 12/31/2022 |
|
|
|
11.67 |
|
|
|
|
.32 |
|
|
|
|
(1.56 |
) |
|
|
|
(1.24 |
) |
|
|
|
|
|
(.44 |
) |
|
|
|
– |
|
|
|
|
(.44 |
) |
|
|
|
9.99 |
|
|
|
|
(10.75 |
) |
|
|
|
242 |
|
|
|
|
.36 |
|
|
|
|
.22 |
|
|
|
|
2.90 |
|
| 12/31/2021 |
|
|
|
13.04 |
|
|
|
|
.18 |
|
|
|
|
(.26 |
) |
|
|
|
(.08 |
) |
|
|
|
|
|
(.18 |
) |
|
|
|
(1.11 |
) |
|
|
|
(1.29 |
) |
|
|
|
11.67 |
|
|
|
|
(.44 |
) |
|
|
|
522 |
|
|
|
|
.39 |
|
|
|
|
.29 |
|
|
|
|
1.50 |
|
| 12/31/2020 |
|
|
|
12.34 |
|
|
|
|
.16 |
|
|
|
|
1.07 |
|
|
|
|
1.23 |
|
|
|
|
|
|
(.26 |
) |
|
|
|
(.27 |
) |
|
|
|
(.53 |
) |
|
|
|
13.04 |
|
|
|
|
10.09 |
|
|
|
|
429 |
|
|
|
|
.38 |
|
|
|
|
.38 |
|
|
|
|
1.21 |
|
| 12/31/2019 |
|
|
|
11.94 |
|
|
|
|
.25 |
|
|
|
|
.43 |
|
|
|
|
.68 |
|
|
|
|
|
|
(.28 |
) |
|
|
|
– |
|
|
|
|
(.28 |
) |
|
|
|
12.34 |
|
|
|
|
5.69 |
|
|
|
|
1,418 |
|
|
|
|
.37 |
|
|
|
|
.37 |
|
|
|
|
2.07 |
|
| Class 1A: |
|
|
|
|
|
|
|
|
|
|
|
|
|
|
|
|
|
|
|
|
|
|
|
|
|
|
|
|
|
|
|
|
|
|
|
|
|
|
|
|
|
|
|
|
|
|
|
|
|
|
|
|
|
|
|
|
|
|
|
|
|
|
|
|
|
|
|
| 6/30/20244,5 |
|
|
|
9.87 |
|
|
|
|
.21 |
|
|
|
|
(.31 |
) |
|
|
|
(.10 |
) |
|
|
|
|
|
(.07 |
) |
|
|
|
– |
|
|
|
|
(.07 |
) |
|
|
|
9.70 |
|
|
|
|
(1.01 |
)6 |
|
|
|
215 |
|
|
|
|
.58 |
7 |
|
|
|
.51 |
7 |
|
|
|
4.45 |
7 |
| 12/31/2023 |
|
|
|
9.96 |
|
|
|
|
.38 |
|
|
|
|
(.10 |
) |
|
|
|
.28 |
|
|
|
|
|
|
(.37 |
) |
|
|
|
– |
|
|
|
|
(.37 |
) |
|
|
|
9.87 |
|
|
|
|
2.88 |
|
|
|
|
5 |
|
|
|
|
.58 |
|
|
|
|
.46 |
|
|
|
|
3.83 |
|
| 12/31/2022 |
|
|
|
11.63 |
|
|
|
|
.29 |
|
|
|
|
(1.55 |
) |
|
|
|
(1.26 |
) |
|
|
|
|
|
(.41 |
) |
|
|
|
– |
|
|
|
|
(.41 |
) |
|
|
|
9.96 |
|
|
|
|
(10.93 |
) |
|
|
|
4 |
|
|
|
|
.60 |
|
|
|
|
.47 |
|
|
|
|
2.70 |
|
| 12/31/2021 |
|
|
|
13.00 |
|
|
|
|
.16 |
|
|
|
|
(.26 |
) |
|
|
|
(.10 |
) |
|
|
|
|
|
(.16 |
) |
|
|
|
(1.11 |
) |
|
|
|
(1.27 |
) |
|
|
|
11.63 |
|
|
|
|
(.65 |
) |
|
|
|
5 |
|
|
|
|
.64 |
|
|
|
|
.53 |
|
|
|
|
1.28 |
|
| 12/31/2020 |
|
|
|
12.32 |
|
|
|
|
.09 |
|
|
|
|
1.10 |
|
|
|
|
1.19 |
|
|
|
|
|
|
(.24 |
) |
|
|
|
(.27 |
) |
|
|
|
(.51 |
) |
|
|
|
13.00 |
|
|
|
|
9.75 |
|
|
|
|
4 |
|
|
|
|
.64 |
|
|
|
|
.64 |
|
|
|
|
.69 |
|
| 12/31/2019 |
|
|
|
11.93 |
|
|
|
|
.22 |
|
|
|
|
.43 |
|
|
|
|
.65 |
|
|
|
|
|
|
(.26 |
) |
|
|
|
– |
|
|
|
|
(.26 |
) |
|
|
|
12.32 |
|
|
|
|
5.42 |
|
|
|
|
2 |
|
|
|
|
.62 |
|
|
|
|
.62 |
|
|
|
|
1.82 |
|
| Class 2: |
|
|
|
|
|
|
|
|
|
|
|
|
|
|
|
|
|
|
|
|
|
|
|
|
|
|
|
|
|
|
|
|
|
|
|
|
|
|
|
|
|
|
|
|
|
|
|
|
|
|
|
|
|
|
|
|
|
|
|
|
|
|
|
|
|
|
|
| 6/30/20244,5 |
|
|
|
9.78 |
|
|
|
|
.21 |
|
|
|
|
(.30 |
) |
|
|
|
(.09 |
) |
|
|
|
|
|
(.07 |
) |
|
|
|
– |
|
|
|
|
(.07 |
) |
|
|
|
9.62 |
|
|
|
|
(1.07 |
)6 |
|
|
|
1,059 |
|
|
|
|
.58 |
7 |
|
|
|
.52 |
7 |
|
|
|
4.38 |
7 |
| 12/31/2023 |
|
|
|
9.87 |
|
|
|
|
.37 |
|
|
|
|
(.09 |
) |
|
|
|
.28 |
|
|
|
|
|
|
(.37 |
) |
|
|
|
– |
|
|
|
|
(.37 |
) |
|
|
|
9.78 |
|
|
|
|
2.89 |
|
|
|
|
1,073 |
|
|
|
|
.58 |
|
|
|
|
.46 |
|
|
|
|
3.80 |
|
| 12/31/2022 |
|
|
|
11.53 |
|
|
|
|
.29 |
|
|
|
|
(1.54 |
) |
|
|
|
(1.25 |
) |
|
|
|
|
|
(.41 |
) |
|
|
|
– |
|
|
|
|
(.41 |
) |
|
|
|
9.87 |
|
|
|
|
(10.95 |
) |
|
|
|
1,059 |
|
|
|
|
.61 |
|
|
|
|
.47 |
|
|
|
|
2.69 |
|
| 12/31/2021 |
|
|
|
12.89 |
|
|
|
|
.15 |
|
|
|
|
(.25 |
) |
|
|
|
(.10 |
) |
|
|
|
|
|
(.15 |
) |
|
|
|
(1.11 |
) |
|
|
|
(1.26 |
) |
|
|
|
11.53 |
|
|
|
|
(.62 |
) |
|
|
|
1,391 |
|
|
|
|
.64 |
|
|
|
|
.54 |
|
|
|
|
1.24 |
|
| 12/31/2020 |
|
|
|
12.21 |
|
|
|
|
.09 |
|
|
|
|
1.10 |
|
|
|
|
1.19 |
|
|
|
|
|
|
(.24 |
) |
|
|
|
(.27 |
) |
|
|
|
(.51 |
) |
|
|
|
12.89 |
|
|
|
|
9.80 |
|
|
|
|
1,439 |
|
|
|
|
.64 |
|
|
|
|
.64 |
|
|
|
|
.73 |
|
| 12/31/2019 |
|
|
|
11.82 |
|
|
|
|
.22 |
|
|
|
|
.42 |
|
|
|
|
.64 |
|
|
|
|
|
|
(.25 |
) |
|
|
|
– |
|
|
|
|
(.25 |
) |
|
|
|
12.21 |
|
|
|
|
5.31 |
|
|
|
|
1,343 |
|
|
|
|
.62 |
|
|
|
|
.62 |
|
|
|
|
1.82 |
|
| Class 3: |
|
|
|
|
|
|
|
|
|
|
|
|
|
|
|
|
|
|
|
|
|
|
|
|
|
|
|
|
|
|
|
|
|
|
|
|
|
|
|
|
|
|
|
|
|
|
|
|
|
|
|
|
|
|
|
|
|
|
|
|
|
|
|
|
|
|
|
| 6/30/20244,5 |
|
|
|
9.94 |
|
|
|
|
.22 |
|
|
|
|
(.31 |
) |
|
|
|
(.09 |
) |
|
|
|
|
|
(.07 |
) |
|
|
|
– |
|
|
|
|
(.07 |
) |
|
|
|
9.78 |
|
|
|
|
(1.04 |
)6 |
|
|
|
5 |
|
|
|
|
.51 |
7 |
|
|
|
.45 |
7 |
|
|
|
4.45 |
7 |
| 12/31/2023 |
|
|
|
10.02 |
|
|
|
|
.39 |
|
|
|
|
(.10 |
) |
|
|
|
.29 |
|
|
|
|
|
|
(.37 |
) |
|
|
|
– |
|
|
|
|
(.37 |
) |
|
|
|
9.94 |
|
|
|
|
3.00 |
|
|
|
|
6 |
|
|
|
|
.51 |
|
|
|
|
.39 |
|
|
|
|
3.85 |
|
| 12/31/2022 |
|
|
|
11.70 |
|
|
|
|
.30 |
|
|
|
|
(1.57 |
) |
|
|
|
(1.27 |
) |
|
|
|
|
|
(.41 |
) |
|
|
|
– |
|
|
|
|
(.41 |
) |
|
|
|
10.02 |
|
|
|
|
(10.90 |
) |
|
|
|
6 |
|
|
|
|
.54 |
|
|
|
|
.40 |
|
|
|
|
2.76 |
|
| 12/31/2021 |
|
|
|
13.07 |
|
|
|
|
.16 |
|
|
|
|
(.26 |
) |
|
|
|
(.10 |
) |
|
|
|
|
|
(.16 |
) |
|
|
|
(1.11 |
) |
|
|
|
(1.27 |
) |
|
|
|
11.70 |
|
|
|
|
(.62 |
) |
|
|
|
9 |
|
|
|
|
.57 |
|
|
|
|
.47 |
|
|
|
|
1.31 |
|
| 12/31/2020 |
|
|
|
12.37 |
|
|
|
|
.10 |
|
|
|
|
1.12 |
|
|
|
|
1.22 |
|
|
|
|
|
|
(.25 |
) |
|
|
|
(.27 |
) |
|
|
|
(.52 |
) |
|
|
|
13.07 |
|
|
|
|
9.91 |
|
|
|
|
10 |
|
|
|
|
.57 |
|
|
|
|
.57 |
|
|
|
|
.78 |
|
| 12/31/2019 |
|
|
|
11.97 |
|
|
|
|
.23 |
|
|
|
|
.43 |
|
|
|
|
.66 |
|
|
|
|
|
|
(.26 |
) |
|
|
|
– |
|
|
|
|
(.26 |
) |
|
|
|
12.37 |
|
|
|
|
5.49 |
|
|
|
|
9 |
|
|
|
|
.55 |
|
|
|
|
.55 |
|
|
|
|
1.88 |
|
| Class 4: |
|
|
|
|
|
|
|
|
|
|
|
|
|
|
|
|
|
|
|
|
|
|
|
|
|
|
|
|
|
|
|
|
|
|
|
|
|
|
|
|
|
|
|
|
|
|
|
|
|
|
|
|
|
|
|
|
|
|
|
|
|
|
|
|
|
|
|
| 6/30/20244,5 |
|
|
|
9.77 |
|
|
|
|
.20 |
|
|
|
|
(.31 |
) |
|
|
|
(.11 |
) |
|
|
|
|
|
(.06 |
) |
|
|
|
– |
|
|
|
|
(.06 |
) |
|
|
|
9.60 |
|
|
|
|
(1.21 |
)6 |
|
|
|
184 |
|
|
|
|
.83 |
7 |
|
|
|
.77 |
7 |
|
|
|
4.13 |
7 |
| 12/31/2023 |
|
|
|
9.86 |
|
|
|
|
.35 |
|
|
|
|
(.10 |
) |
|
|
|
.25 |
|
|
|
|
|
|
(.34 |
) |
|
|
|
– |
|
|
|
|
(.34 |
) |
|
|
|
9.77 |
|
|
|
|
2.62 |
|
|
|
|
183 |
|
|
|
|
.83 |
|
|
|
|
.71 |
|
|
|
|
3.54 |
|
| 12/31/2022 |
|
|
|
11.52 |
|
|
|
|
.26 |
|
|
|
|
(1.54 |
) |
|
|
|
(1.28 |
) |
|
|
|
|
|
(.38 |
) |
|
|
|
– |
|
|
|
|
(.38 |
) |
|
|
|
9.86 |
|
|
|
|
(11.19 |
) |
|
|
|
190 |
|
|
|
|
.85 |
|
|
|
|
.72 |
|
|
|
|
2.45 |
|
| 12/31/2021 |
|
|
|
12.88 |
|
|
|
|
.12 |
|
|
|
|
(.25 |
) |
|
|
|
(.13 |
) |
|
|
|
|
|
(.12 |
) |
|
|
|
(1.11 |
) |
|
|
|
(1.23 |
) |
|
|
|
11.52 |
|
|
|
|
(.88 |
) |
|
|
|
238 |
|
|
|
|
.89 |
|
|
|
|
.79 |
|
|
|
|
.98 |
|
| 12/31/2020 |
|
|
|
12.22 |
|
|
|
|
.05 |
|
|
|
|
1.10 |
|
|
|
|
1.15 |
|
|
|
|
|
|
(.22 |
) |
|
|
|
(.27 |
) |
|
|
|
(.49 |
) |
|
|
|
12.88 |
|
|
|
|
9.48 |
|
|
|
|
272 |
|
|
|
|
.89 |
|
|
|
|
.89 |
|
|
|
|
.42 |
|
| 12/31/2019 |
|
|
|
11.84 |
|
|
|
|
.19 |
|
|
|
|
.42 |
|
|
|
|
.61 |
|
|
|
|
|
|
(.23 |
) |
|
|
|
– |
|
|
|
|
(.23 |
) |
|
|
|
12.22 |
|
|
|
|
5.14 |
|
|
|
|
124 |
|
|
|
|
.87 |
|
|
|
|
.87 |
|
|
|
|
1.56 |
|
Refer to the end of the tables for footnotes.
343 American Funds Insurance Series
Financial highlights (continued)
|
|
|
|
|
|
|
|
|
|
|
|
|
|
|
|
|
|
|
|
|
|
|
|
|
|
|
|
|
|
|
|
|
|
|
|
|
|
|
|
|
|
|
|
|
|
|
|
|
|
|
|
|
|
|
|
|
|
|
|
|
|
|
|
|
|
|
|
|
|
|
|
|
| |
|
|
|
Income (loss) from investment operations1 |
|
|
|
Dividends and distributions |
|
Net asset value, end of year |
|
|
|
|
|
Ratio of expenses to average net assets before waivers/ reimburse- ments11 |
|
Ratio of expenses to average net assets after waivers/ reimburse- ments2,11 |
|
Net effective expense ratio2,5,12 |
|
Ratio of net income (loss) to average net assets2 |
| Year ended |
|
Net asset value, beginning of year |
|
Net investment income (loss) |
|
Net gains (losses) on securities (both realized and unrealized) |
|
Total from investment operations |
|
|
|
Dividends (from net investment income) |
|
Distributions (from capital gains) |
|
Total dividends and distributions |
|
Total return2 |
|
Net assets, end of year (in millions) |
|
|
|
|
|
|
|
|
|
|
|
|
|
| Managed Risk Growth Fund |
|
|
|
|
|
|
|
|
|
|
|
|
|
|
|
|
|
|
|
|
|
|
|
|
|
|
|
|
|
|
|
|
|
|
|
|
|
|
|
|
|
|
|
|
|
|
|
|
|
|
|
|
|
|
|
|
|
|
|
|
|
|
|
|
|
|
|
|
|
|
|
|
|
|
| Class P1: |
|
|
|
|
|
|
|
|
|
|
|
|
|
|
|
|
|
|
|
|
|
|
|
|
|
|
|
|
|
|
|
|
|
|
|
|
|
|
|
|
|
|
|
|
|
|
|
|
|
|
|
|
|
|
|
|
|
|
|
|
|
|
|
|
|
|
|
|
|
|
|
|
| 6/30/20244,5 |
|
|
|
$10.86 |
|
|
|
|
$ .02 |
|
|
|
|
$ 1.37 |
|
|
|
|
$ 1.39 |
|
|
|
|
|
|
$(.09 |
) |
|
|
|
$ – |
|
|
|
|
$ (.09 |
) |
|
|
|
$12.16 |
|
|
|
|
12.78 |
%6 |
|
|
|
$ 13 |
|
|
|
|
.42 |
%7 |
|
|
|
.37 |
%7 |
|
|
|
.69 |
%7 |
|
|
|
.36 |
%7 |
| 12/31/2023 |
|
|
|
11.37 |
|
|
|
|
.08 |
|
|
|
|
2.28 |
|
|
|
|
2.36 |
|
|
|
|
|
|
(.08 |
) |
|
|
|
(2.79 |
) |
|
|
|
(2.87 |
) |
|
|
|
10.86 |
|
|
|
|
23.77 |
|
|
|
|
13 |
|
|
|
|
.42 |
|
|
|
|
.37 |
|
|
|
|
.70 |
|
|
|
|
.77 |
|
| 12/31/2022 |
|
|
|
18.53 |
|
|
|
|
.06 |
|
|
|
|
(4.46 |
) |
|
|
|
(4.40 |
) |
|
|
|
|
|
(.22 |
) |
|
|
|
(2.54 |
) |
|
|
|
(2.76 |
) |
|
|
|
11.37 |
|
|
|
|
(24.62 |
) |
|
|
|
9 |
|
|
|
|
.41 |
|
|
|
|
.36 |
|
|
|
|
.68 |
|
|
|
|
.47 |
|
| 12/31/2021 |
|
|
|
17.25 |
|
|
|
|
.04 |
|
|
|
|
2.16 |
|
|
|
|
2.20 |
|
|
|
|
|
|
(.18 |
) |
|
|
|
(.74 |
) |
|
|
|
(.92 |
) |
|
|
|
18.53 |
|
|
|
|
13.08 |
|
|
|
|
13 |
|
|
|
|
.41 |
|
|
|
|
.36 |
|
|
|
|
.69 |
|
|
|
|
.19 |
|
| 12/31/2020 |
|
|
|
13.78 |
|
|
|
|
.07 |
|
|
|
|
4.20 |
|
|
|
|
4.27 |
|
|
|
|
|
|
(.12 |
) |
|
|
|
(.68 |
) |
|
|
|
(.80 |
) |
|
|
|
17.25 |
|
|
|
|
32.45 |
|
|
|
|
11 |
|
|
|
|
.42 |
|
|
|
|
.37 |
|
|
|
|
.72 |
|
|
|
|
.49 |
|
| 12/31/2019 |
|
|
|
12.30 |
|
|
|
|
.15 |
|
|
|
|
2.44 |
|
|
|
|
2.59 |
|
|
|
|
|
|
(.19 |
) |
|
|
|
(.92 |
) |
|
|
|
(1.11 |
) |
|
|
|
13.78 |
|
|
|
|
22.01 |
|
|
|
|
6 |
|
|
|
|
.42 |
|
|
|
|
.37 |
|
|
|
|
.73 |
|
|
|
|
1.19 |
|
| Class P2: |
|
|
|
|
|
|
|
|
|
|
|
|
|
|
|
|
|
|
|
|
|
|
|
|
|
|
|
|
|
|
|
|
|
|
|
|
|
|
|
|
|
|
|
|
|
|
|
|
|
|
|
|
|
|
|
|
|
|
|
|
|
|
|
|
|
|
|
|
|
|
|
|
| 6/30/20244,5 |
|
|
|
10.73 |
|
|
|
|
.01 |
|
|
|
|
1.35 |
|
|
|
|
1.36 |
|
|
|
|
|
|
(.06 |
) |
|
|
|
– |
|
|
|
|
(.06 |
) |
|
|
|
12.03 |
|
|
|
|
12.64 |
6 |
|
|
|
507 |
|
|
|
|
.67 |
7 |
|
|
|
.62 |
7 |
|
|
|
.94 |
7 |
|
|
|
.10 |
7 |
| 12/31/2023 |
|
|
|
11.28 |
|
|
|
|
.05 |
|
|
|
|
2.26 |
|
|
|
|
2.31 |
|
|
|
|
|
|
(.07 |
) |
|
|
|
(2.79 |
) |
|
|
|
(2.86 |
) |
|
|
|
10.73 |
|
|
|
|
23.50 |
|
|
|
|
495 |
|
|
|
|
.67 |
|
|
|
|
.62 |
|
|
|
|
.95 |
|
|
|
|
.43 |
|
| 12/31/2022 |
|
|
|
18.42 |
|
|
|
|
.03 |
|
|
|
|
(4.45 |
) |
|
|
|
(4.42 |
) |
|
|
|
|
|
(.18 |
) |
|
|
|
(2.54 |
) |
|
|
|
(2.72 |
) |
|
|
|
11.28 |
|
|
|
|
(24.88 |
) |
|
|
|
445 |
|
|
|
|
.67 |
|
|
|
|
.62 |
|
|
|
|
.94 |
|
|
|
|
.20 |
|
| 12/31/2021 |
|
|
|
17.11 |
|
|
|
|
(.01 |
) |
|
|
|
2.16 |
|
|
|
|
2.15 |
|
|
|
|
|
|
(.10 |
) |
|
|
|
(.74 |
) |
|
|
|
(.84 |
) |
|
|
|
18.42 |
|
|
|
|
12.89 |
|
|
|
|
584 |
|
|
|
|
.67 |
|
|
|
|
.62 |
|
|
|
|
.95 |
|
|
|
|
(.07 |
) |
| 12/31/2020 |
|
|
|
13.71 |
|
|
|
|
.03 |
|
|
|
|
4.16 |
|
|
|
|
4.19 |
|
|
|
|
|
|
(.11 |
) |
|
|
|
(.68 |
) |
|
|
|
(.79 |
) |
|
|
|
17.11 |
|
|
|
|
32.03 |
|
|
|
|
554 |
|
|
|
|
.67 |
|
|
|
|
.62 |
|
|
|
|
.97 |
|
|
|
|
.20 |
|
| 12/31/2019 |
|
|
|
12.21 |
|
|
|
|
.09 |
|
|
|
|
2.45 |
|
|
|
|
2.54 |
|
|
|
|
|
|
(.12 |
) |
|
|
|
(.92 |
) |
|
|
|
(1.04 |
) |
|
|
|
13.71 |
|
|
|
|
21.74 |
|
|
|
|
434 |
|
|
|
|
.68 |
|
|
|
|
.63 |
|
|
|
|
.99 |
|
|
|
|
.73 |
|
|
|
|
|
|
|
|
|
|
|
|
|
|
| Managed Risk International Fund |
|
|
|
|
|
|
|
|
|
|
|
|
|
|
|
|
|
|
|
|
|
|
|
|
|
|
|
|
|
|
|
|
|
|
|
|
|
|
|
|
|
|
|
|
|
|
|
|
|
|
|
|
|
|
|
|
|
|
|
|
|
|
|
|
|
|
|
|
|
|
|
|
|
|
| Class P1: |
|
|
|
|
|
|
|
|
|
|
|
|
|
|
|
|
|
|
|
|
|
|
|
|
|
|
|
|
|
|
|
|
|
|
|
|
|
|
|
|
|
|
|
|
|
|
|
|
|
|
|
|
|
|
|
|
|
|
|
|
|
|
|
|
|
|
|
|
|
|
|
|
| 6/30/20244,5 |
|
|
|
$ 8.36 |
|
|
|
|
$ .02 |
|
|
|
|
$ .50 |
|
|
|
|
$ .52 |
|
|
|
|
|
|
$(.14 |
) |
|
|
|
$ – |
|
|
|
|
$ (.14 |
) |
|
|
|
$ 8.74 |
|
|
|
|
6.14 |
%6 |
|
|
|
$ 2 |
|
|
|
|
.44 |
%7 |
|
|
|
.38 |
%7 |
|
|
|
.85 |
%7 |
|
|
|
.42 |
%7 |
| 12/31/2023 |
|
|
|
8.61 |
|
|
|
|
.13 |
|
|
|
|
.41 |
|
|
|
|
.54 |
|
|
|
|
|
|
(.15 |
) |
|
|
|
(.64 |
) |
|
|
|
(.79 |
) |
|
|
|
8.36 |
|
|
|
|
6.36 |
|
|
|
|
2 |
|
|
|
|
.46 |
|
|
|
|
.36 |
|
|
|
|
.84 |
|
|
|
|
1.60 |
|
| 12/31/2022 |
|
|
|
10.55 |
|
|
|
|
.15 |
|
|
|
|
(1.75 |
) |
|
|
|
(1.60 |
) |
|
|
|
|
|
(.34 |
) |
|
|
|
– |
|
|
|
|
(.34 |
) |
|
|
|
8.61 |
|
|
|
|
(15.27 |
) |
|
|
|
2 |
|
|
|
|
.44 |
|
|
|
|
.37 |
|
|
|
|
.85 |
|
|
|
|
1.70 |
|
| 12/31/2021 |
|
|
|
11.07 |
|
|
|
|
.24 |
|
|
|
|
(.67 |
) |
|
|
|
(.43 |
) |
|
|
|
|
|
(.09 |
) |
|
|
|
– |
|
|
|
|
(.09 |
) |
|
|
|
10.55 |
|
|
|
|
(3.92 |
) |
|
|
|
2 |
|
|
|
|
.44 |
|
|
|
|
.36 |
|
|
|
|
.86 |
|
|
|
|
2.12 |
|
| 12/31/2020 |
|
|
|
11.01 |
|
|
|
|
.08 |
|
|
|
|
.22 |
|
|
|
|
.30 |
|
|
|
|
|
|
(.16 |
) |
|
|
|
(.08 |
) |
|
|
|
(.24 |
) |
|
|
|
11.07 |
|
|
|
|
3.13 |
|
|
|
|
2 |
|
|
|
|
.43 |
|
|
|
|
.35 |
|
|
|
|
.86 |
|
|
|
|
.82 |
|
| 12/31/2019 |
|
|
|
9.82 |
|
|
|
|
.17 |
|
|
|
|
1.54 |
|
|
|
|
1.71 |
|
|
|
|
|
|
(.20 |
) |
|
|
|
(.32 |
) |
|
|
|
(.52 |
) |
|
|
|
11.01 |
|
|
|
|
17.91 |
|
|
|
|
1 |
|
|
|
|
.41 |
|
|
|
|
.33 |
|
|
|
|
.84 |
|
|
|
|
1.64 |
|
| Class P2: |
|
|
|
|
|
|
|
|
|
|
|
|
|
|
|
|
|
|
|
|
|
|
|
|
|
|
|
|
|
|
|
|
|
|
|
|
|
|
|
|
|
|
|
|
|
|
|
|
|
|
|
|
|
|
|
|
|
|
|
|
|
|
|
|
|
|
|
|
|
|
|
|
| 6/30/20244,5 |
|
|
|
8.32 |
|
|
|
|
.01 |
|
|
|
|
.48 |
|
|
|
|
.49 |
|
|
|
|
|
|
(.11 |
) |
|
|
|
– |
|
|
|
|
(.11 |
) |
|
|
|
8.70 |
|
|
|
|
5.88 |
6 |
|
|
|
121 |
|
|
|
|
.71 |
7 |
|
|
|
.64 |
7 |
|
|
|
1.11 |
7 |
|
|
|
.16 |
7 |
| 12/31/2023 |
|
|
|
8.58 |
|
|
|
|
.10 |
|
|
|
|
.42 |
|
|
|
|
.52 |
|
|
|
|
|
|
(.14 |
) |
|
|
|
(.64 |
) |
|
|
|
(.78 |
) |
|
|
|
8.32 |
|
|
|
|
6.22 |
|
|
|
|
122 |
|
|
|
|
.73 |
|
|
|
|
.63 |
|
|
|
|
1.11 |
|
|
|
|
1.21 |
|
| 12/31/2022 |
|
|
|
10.48 |
|
|
|
|
.12 |
|
|
|
|
(1.74 |
) |
|
|
|
(1.62 |
) |
|
|
|
|
|
(.28 |
) |
|
|
|
– |
|
|
|
|
(.28 |
) |
|
|
|
8.58 |
|
|
|
|
(15.54 |
) |
|
|
|
124 |
|
|
|
|
.70 |
|
|
|
|
.63 |
|
|
|
|
1.11 |
|
|
|
|
1.36 |
|
| 12/31/2021 |
|
|
|
10.99 |
|
|
|
|
.20 |
|
|
|
|
(.65 |
) |
|
|
|
(.45 |
) |
|
|
|
|
|
(.06 |
) |
|
|
|
– |
|
|
|
|
(.06 |
) |
|
|
|
10.48 |
|
|
|
|
(4.13 |
) |
|
|
|
160 |
|
|
|
|
.71 |
|
|
|
|
.63 |
|
|
|
|
1.13 |
|
|
|
|
1.79 |
|
| 12/31/2020 |
|
|
|
10.92 |
|
|
|
|
.04 |
|
|
|
|
.23 |
|
|
|
|
.27 |
|
|
|
|
|
|
(.12 |
) |
|
|
|
(.08 |
) |
|
|
|
(.20 |
) |
|
|
|
10.99 |
|
|
|
|
2.80 |
|
|
|
|
168 |
|
|
|
|
.71 |
|
|
|
|
.63 |
|
|
|
|
1.14 |
|
|
|
|
.42 |
|
| 12/31/2019 |
|
|
|
9.76 |
|
|
|
|
.13 |
|
|
|
|
1.55 |
|
|
|
|
1.68 |
|
|
|
|
|
|
(.20 |
) |
|
|
|
(.32 |
) |
|
|
|
(.52 |
) |
|
|
|
10.92 |
|
|
|
|
17.64 |
|
|
|
|
165 |
|
|
|
|
.71 |
|
|
|
|
.63 |
|
|
|
|
1.14 |
|
|
|
|
1.21 |
|
|
|
|
|
|
|
|
|
| Managed Risk Washington Mutual Investors Fund |
|
|
|
|
|
|
|
|
|
|
|
|
|
|
|
|
|
|
|
|
|
|
|
|
|
|
|
|
|
|
|
|
|
|
|
|
|
|
|
|
|
|
|
|
|
|
|
|
|
|
|
|
| Class P1: |
|
|
|
|
|
|
|
|
|
|
|
|
|
|
|
|
|
|
|
|
|
|
|
|
|
|
|
|
|
|
|
|
|
|
|
|
|
|
|
|
|
|
|
|
|
|
|
|
|
|
|
|
|
|
|
|
|
|
|
|
|
|
|
|
|
|
|
|
|
|
|
|
| 6/30/20244,5 |
|
|
|
$10.50 |
|
|
|
|
$ .04 |
|
|
|
|
$ .92 |
|
|
|
|
$ .96 |
|
|
|
|
|
|
$(.18 |
) |
|
|
|
$ – |
|
|
|
|
$ (.18 |
) |
|
|
|
$11.28 |
|
|
|
|
9.18 |
%6 |
|
|
|
$ 3 |
|
|
|
|
.41 |
%7 |
|
|
|
.35 |
%7 |
|
|
|
.61 |
%7 |
|
|
|
.73 |
%7 |
| 12/31/2023 |
|
|
|
11.24 |
|
|
|
|
.20 |
|
|
|
|
.79 |
|
|
|
|
.99 |
|
|
|
|
|
|
(.24 |
) |
|
|
|
(1.49 |
) |
|
|
|
(1.73 |
) |
|
|
|
10.50 |
|
|
|
|
10.04 |
|
|
|
|
3 |
|
|
|
|
.42 |
|
|
|
|
.37 |
|
|
|
|
.63 |
|
|
|
|
1.91 |
|
| 12/31/2022 |
|
|
|
12.95 |
|
|
|
|
.23 |
|
|
|
|
(1.38 |
) |
|
|
|
(1.15 |
) |
|
|
|
|
|
(.56 |
) |
|
|
|
– |
|
|
|
|
(.56 |
) |
|
|
|
11.24 |
|
|
|
|
(8.92 |
) |
|
|
|
3 |
|
|
|
|
.41 |
|
|
|
|
.36 |
|
|
|
|
.60 |
|
|
|
|
1.96 |
|
| 12/31/2021 |
|
|
|
11.24 |
|
|
|
|
.16 |
|
|
|
|
1.79 |
|
|
|
|
1.95 |
|
|
|
|
|
|
(.24 |
) |
|
|
|
– |
|
|
|
|
(.24 |
) |
|
|
|
12.95 |
|
|
|
|
17.46 |
|
|
|
|
2 |
|
|
|
|
.41 |
|
|
|
|
.36 |
|
|
|
|
.66 |
|
|
|
|
1.33 |
|
| 12/31/2020 |
|
|
|
12.01 |
|
|
|
|
.18 |
|
|
|
|
(.35 |
) |
|
|
|
(.17 |
) |
|
|
|
|
|
(.26 |
) |
|
|
|
(.34 |
) |
|
|
|
(.60 |
) |
|
|
|
11.24 |
|
|
|
|
(.93 |
) |
|
|
|
2 |
|
|
|
|
.40 |
|
|
|
|
.35 |
|
|
|
|
.76 |
|
|
|
|
1.66 |
|
| 12/31/2019 |
|
|
|
11.28 |
|
|
|
|
.25 |
|
|
|
|
1.28 |
|
|
|
|
1.53 |
|
|
|
|
|
|
(.20 |
) |
|
|
|
(.60 |
) |
|
|
|
(.80 |
) |
|
|
|
12.01 |
|
|
|
|
14.14 |
|
|
|
|
1 |
|
|
|
|
.38 |
|
|
|
|
.33 |
|
|
|
|
.74 |
|
|
|
|
2.14 |
|
| Class P2: |
|
|
|
|
|
|
|
|
|
|
|
|
|
|
|
|
|
|
|
|
|
|
|
|
|
|
|
|
|
|
|
|
|
|
|
|
|
|
|
|
|
|
|
|
|
|
|
|
|
|
|
|
|
|
|
|
|
|
|
|
|
|
|
|
|
|
|
|
|
|
|
|
| 6/30/20244,5 |
|
|
|
10.43 |
|
|
|
|
.03 |
|
|
|
|
.91 |
|
|
|
|
.94 |
|
|
|
|
|
|
(.18 |
) |
|
|
|
– |
|
|
|
|
(.18 |
) |
|
|
|
11.19 |
|
|
|
|
9.01 |
6 |
|
|
|
326 |
|
|
|
|
.67 |
7 |
|
|
|
.62 |
7 |
|
|
|
.88 |
7 |
|
|
|
.46 |
7 |
| 12/31/2023 |
|
|
|
11.18 |
|
|
|
|
.18 |
|
|
|
|
.77 |
|
|
|
|
.95 |
|
|
|
|
|
|
(.21 |
) |
|
|
|
(1.49 |
) |
|
|
|
(1.70 |
) |
|
|
|
10.43 |
|
|
|
|
9.73 |
|
|
|
|
322 |
|
|
|
|
.68 |
|
|
|
|
.63 |
|
|
|
|
.89 |
|
|
|
|
1.71 |
|
| 12/31/2022 |
|
|
|
12.88 |
|
|
|
|
.19 |
|
|
|
|
(1.37 |
) |
|
|
|
(1.18 |
) |
|
|
|
|
|
(.52 |
) |
|
|
|
– |
|
|
|
|
(.52 |
) |
|
|
|
11.18 |
|
|
|
|
(9.16 |
) |
|
|
|
321 |
|
|
|
|
.67 |
|
|
|
|
.62 |
|
|
|
|
.86 |
|
|
|
|
1.62 |
|
| 12/31/2021 |
|
|
|
11.18 |
|
|
|
|
.11 |
|
|
|
|
1.79 |
|
|
|
|
1.90 |
|
|
|
|
|
|
(.20 |
) |
|
|
|
– |
|
|
|
|
(.20 |
) |
|
|
|
12.88 |
|
|
|
|
17.11 |
|
|
|
|
371 |
|
|
|
|
.68 |
|
|
|
|
.62 |
|
|
|
|
.92 |
|
|
|
|
.91 |
|
| 12/31/2020 |
|
|
|
11.91 |
|
|
|
|
.13 |
|
|
|
|
(.33 |
) |
|
|
|
(.20 |
) |
|
|
|
|
|
(.19 |
) |
|
|
|
(.34 |
) |
|
|
|
(.53 |
) |
|
|
|
11.18 |
|
|
|
|
(1.25 |
) |
|
|
|
355 |
|
|
|
|
.68 |
|
|
|
|
.63 |
|
|
|
|
1.04 |
|
|
|
|
1.18 |
|
| 12/31/2019 |
|
|
|
11.21 |
|
|
|
|
.18 |
|
|
|
|
1.31 |
|
|
|
|
1.49 |
|
|
|
|
|
|
(.19 |
) |
|
|
|
(.60 |
) |
|
|
|
(.79 |
) |
|
|
|
11.91 |
|
|
|
|
13.88 |
|
|
|
|
365 |
|
|
|
|
.68 |
|
|
|
|
.63 |
|
|
|
|
1.04 |
|
|
|
|
1.62 |
|
Refer to the end of the tables for footnotes.
American Funds Insurance Series 344
Financial highlights (continued)
|
|
|
|
|
|
|
|
|
|
|
|
|
|
|
|
|
|
|
|
|
|
|
|
|
|
|
|
|
|
|
|
|
|
|
|
|
|
|
|
|
|
|
|
|
|
|
|
|
|
|
|
|
|
|
|
|
|
|
|
|
|
|
|
|
|
|
|
|
|
|
|
|
| |
|
|
|
Income (loss) from investment operations1 |
|
|
|
Dividends and distributions |
|
|
|
|
|
|
|
Ratio of expenses to average net assets before waivers/ reimburse- ments11 |
|
Ratio of expenses to average net assets after waivers/ reimburse- ments2,11 |
|
|
|
|
| Year ended |
|
Net asset value, beginning of year |
|
Net investment income (loss) |
|
Net gains (losses) on securities (both realized and unrealized) |
|
Total from investment operations |
|
|
|
Dividends (from net investment income) |
|
Distributions (from capital gains) |
|
Total dividends and distributions |
|
Net asset value, end of year |
|
Total return2 |
|
Net assets, end of year (in millions) |
|
Net effective expense ratio2,5,12 |
|
Ratio of net income (loss) to average net assets2 |
|
|
|
|
|
|
|
|
|
|
|
|
|
| Managed Risk Growth-Income Fund |
|
|
|
|
|
|
|
|
|
|
|
|
|
|
|
|
|
|
|
|
|
|
|
|
|
|
|
|
|
|
|
|
|
|
|
|
|
|
|
|
|
|
|
|
|
|
|
|
|
|
|
|
|
|
|
|
|
|
|
|
|
|
|
|
|
|
|
|
|
|
|
|
|
|
| Class P1: |
|
|
|
|
|
|
|
|
|
|
|
|
|
|
|
|
|
|
|
|
|
|
|
|
|
|
|
|
|
|
|
|
|
|
|
|
|
|
|
|
|
|
|
|
|
|
|
|
|
|
|
|
|
|
|
|
|
|
|
|
|
|
|
|
|
|
|
|
|
|
|
|
| 6/30/20244,5 |
|
|
|
$12.53 |
|
|
|
|
$.04 |
|
|
|
|
$ 1.33 |
|
|
|
|
$ 1.37 |
|
|
|
|
|
|
$(.19 |
) |
|
|
|
$ (.18 |
) |
|
|
|
$ (.37 |
) |
|
|
|
$13.53 |
|
|
|
|
10.91 |
%6 |
|
|
|
$1,951 |
|
|
|
|
.41 |
%7 |
|
|
|
.36 |
%7 |
|
|
|
.62 |
%7 |
|
|
|
.59 |
%7 |
| 12/31/2023 |
|
|
|
12.51 |
|
|
|
|
.20 |
|
|
|
|
1.65 |
|
|
|
|
1.85 |
|
|
|
|
|
|
(.21 |
) |
|
|
|
(1.62 |
) |
|
|
|
(1.83 |
) |
|
|
|
12.53 |
|
|
|
|
16.17 |
|
|
|
|
1,910 |
|
|
|
|
.41 |
|
|
|
|
.36 |
|
|
|
|
.63 |
|
|
|
|
1.64 |
|
| 12/31/2022 |
|
|
|
15.73 |
|
|
|
|
.18 |
|
|
|
|
(2.79 |
) |
|
|
|
(2.61 |
) |
|
|
|
|
|
(.30 |
) |
|
|
|
(.31 |
) |
|
|
|
(.61 |
) |
|
|
|
12.51 |
|
|
|
|
(16.74 |
) |
|
|
|
1,833 |
|
|
|
|
.41 |
|
|
|
|
.36 |
|
|
|
|
.62 |
|
|
|
|
1.33 |
|
| 12/31/2021 |
|
|
|
14.01 |
|
|
|
|
.14 |
|
|
|
|
1.99 |
|
|
|
|
2.13 |
|
|
|
|
|
|
(.21 |
) |
|
|
|
(.20 |
) |
|
|
|
(.41 |
) |
|
|
|
15.73 |
|
|
|
|
15.32 |
|
|
|
|
2,328 |
|
|
|
|
.41 |
|
|
|
|
.36 |
|
|
|
|
.64 |
|
|
|
|
.96 |
|
| 12/31/2020 |
|
|
|
13.76 |
|
|
|
|
.17 |
|
|
|
|
1.08 |
|
|
|
|
1.25 |
|
|
|
|
|
|
(.26 |
) |
|
|
|
(.74 |
) |
|
|
|
(1.00 |
) |
|
|
|
14.01 |
|
|
|
|
9.85 |
|
|
|
|
2,120 |
|
|
|
|
.41 |
|
|
|
|
.36 |
|
|
|
|
.66 |
|
|
|
|
1.24 |
|
| 12/31/2019 |
|
|
|
11.73 |
|
|
|
|
.22 |
|
|
|
|
2.01 |
|
|
|
|
2.23 |
|
|
|
|
|
|
(.10 |
) |
|
|
|
(.10 |
) |
|
|
|
(.20 |
) |
|
|
|
13.76 |
|
|
|
|
19.14 |
|
|
|
|
1,987 |
|
|
|
|
.42 |
|
|
|
|
.37 |
|
|
|
|
.67 |
|
|
|
|
1.71 |
|
| Class P2: |
|
|
|
|
|
|
|
|
|
|
|
|
|
|
|
|
|
|
|
|
|
|
|
|
|
|
|
|
|
|
|
|
|
|
|
|
|
|
|
|
|
|
|
|
|
|
|
|
|
|
|
|
|
|
|
|
|
|
|
|
|
|
|
|
|
|
|
|
|
|
|
|
| 6/30/20244,5 |
|
|
|
12.45 |
|
|
|
|
.02 |
|
|
|
|
1.32 |
|
|
|
|
1.34 |
|
|
|
|
|
|
(.18 |
) |
|
|
|
(.18 |
) |
|
|
|
(.36 |
) |
|
|
|
13.43 |
|
|
|
|
10.78 |
6 |
|
|
|
281 |
|
|
|
|
.66 |
7 |
|
|
|
.61 |
7 |
|
|
|
.87 |
7 |
|
|
|
.34 |
7 |
| 12/31/2023 |
|
|
|
12.44 |
|
|
|
|
.17 |
|
|
|
|
1.64 |
|
|
|
|
1.81 |
|
|
|
|
|
|
(.18 |
) |
|
|
|
(1.62 |
) |
|
|
|
(1.80 |
) |
|
|
|
12.45 |
|
|
|
|
15.90 |
|
|
|
|
277 |
|
|
|
|
.66 |
|
|
|
|
.61 |
|
|
|
|
.88 |
|
|
|
|
1.39 |
|
| 12/31/2022 |
|
|
|
15.64 |
|
|
|
|
.15 |
|
|
|
|
(2.78 |
) |
|
|
|
(2.63 |
) |
|
|
|
|
|
(.26 |
) |
|
|
|
(.31 |
) |
|
|
|
(.57 |
) |
|
|
|
12.44 |
|
|
|
|
(16.93 |
) |
|
|
|
268 |
|
|
|
|
.66 |
|
|
|
|
.61 |
|
|
|
|
.87 |
|
|
|
|
1.10 |
|
| 12/31/2021 |
|
|
|
13.93 |
|
|
|
|
.10 |
|
|
|
|
1.98 |
|
|
|
|
2.08 |
|
|
|
|
|
|
(.17 |
) |
|
|
|
(.20 |
) |
|
|
|
(.37 |
) |
|
|
|
15.64 |
|
|
|
|
15.05 |
|
|
|
|
340 |
|
|
|
|
.66 |
|
|
|
|
.61 |
|
|
|
|
.89 |
|
|
|
|
.70 |
|
| 12/31/2020 |
|
|
|
13.69 |
|
|
|
|
.14 |
|
|
|
|
1.07 |
|
|
|
|
1.21 |
|
|
|
|
|
|
(.23 |
) |
|
|
|
(.74 |
) |
|
|
|
(.97 |
) |
|
|
|
13.93 |
|
|
|
|
9.58 |
|
|
|
|
315 |
|
|
|
|
.66 |
|
|
|
|
.61 |
|
|
|
|
.91 |
|
|
|
|
1.02 |
|
| 12/31/2019 |
|
|
|
11.67 |
|
|
|
|
.19 |
|
|
|
|
2.00 |
|
|
|
|
2.19 |
|
|
|
|
|
|
(.07 |
) |
|
|
|
(.10 |
) |
|
|
|
(.17 |
) |
|
|
|
13.69 |
|
|
|
|
18.84 |
|
|
|
|
283 |
|
|
|
|
.67 |
|
|
|
|
.62 |
|
|
|
|
.92 |
|
|
|
|
1.47 |
|
|
|
|
|
|
|
|
|
|
|
|
|
|
| Managed Risk Asset Allocation Fund |
|
|
|
|
|
|
|
|
|
|
|
|
|
|
|
|
|
|
|
|
|
|
|
|
|
|
|
|
|
|
|
|
|
|
|
|
|
|
|
|
|
|
|
|
|
|
|
|
|
|
|
|
|
|
|
|
|
|
|
|
|
|
|
|
|
|
|
|
|
|
|
|
|
|
| Class P1: |
|
|
|
|
|
|
|
|
|
|
|
|
|
|
|
|
|
|
|
|
|
|
|
|
|
|
|
|
|
|
|
|
|
|
|
|
|
|
|
|
|
|
|
|
|
|
|
|
|
|
|
|
|
|
|
|
|
|
|
|
|
|
|
|
|
|
|
|
|
|
|
|
| 6/30/20244,5 |
|
|
|
$11.90 |
|
|
|
|
$.05 |
|
|
|
|
$ 1.00 |
|
|
|
|
$ 1.05 |
|
|
|
|
|
|
$(.22 |
) |
|
|
|
$ (.17 |
) |
|
|
|
$ (.39 |
) |
|
|
|
$12.56 |
|
|
|
|
8.89 |
%6 |
|
|
|
$ 10 |
|
|
|
|
.41 |
%7 |
|
|
|
.36 |
%7 |
|
|
|
.65 |
%7 |
|
|
|
.88 |
%7 |
| 12/31/2023 |
|
|
|
12.43 |
|
|
|
|
.31 |
|
|
|
|
.87 |
|
|
|
|
1.18 |
|
|
|
|
|
|
(.26 |
) |
|
|
|
(1.45 |
) |
|
|
|
(1.71 |
) |
|
|
|
11.90 |
|
|
|
|
10.51 |
|
|
|
|
10 |
|
|
|
|
.41 |
|
|
|
|
.36 |
|
|
|
|
.66 |
|
|
|
|
2.61 |
|
| 12/31/2022 |
|
|
|
15.33 |
|
|
|
|
.24 |
|
|
|
|
(2.34 |
) |
|
|
|
(2.10 |
) |
|
|
|
|
|
(.32 |
) |
|
|
|
(.48 |
) |
|
|
|
(.80 |
) |
|
|
|
12.43 |
|
|
|
|
(13.75 |
) |
|
|
|
7 |
|
|
|
|
.41 |
|
|
|
|
.36 |
|
|
|
|
.65 |
|
|
|
|
1.80 |
|
| 12/31/2021 |
|
|
|
13.84 |
|
|
|
|
.21 |
|
|
|
|
1.55 |
|
|
|
|
1.76 |
|
|
|
|
|
|
(.27 |
) |
|
|
|
– |
|
|
|
|
(.27 |
) |
|
|
|
15.33 |
|
|
|
|
12.82 |
|
|
|
|
7 |
|
|
|
|
.41 |
|
|
|
|
.36 |
|
|
|
|
.66 |
|
|
|
|
1.43 |
|
| 12/31/2020 |
|
|
|
13.81 |
|
|
|
|
.25 |
|
|
|
|
.51 |
|
|
|
|
.76 |
|
|
|
|
|
|
(.21 |
) |
|
|
|
(.52 |
) |
|
|
|
(.73 |
) |
|
|
|
13.84 |
|
|
|
|
6.10 |
|
|
|
|
5 |
|
|
|
|
.41 |
|
|
|
|
.36 |
|
|
|
|
.66 |
|
|
|
|
1.91 |
|
| 12/31/2019 |
|
|
|
12.23 |
|
|
|
|
.26 |
|
|
|
|
1.92 |
|
|
|
|
2.18 |
|
|
|
|
|
|
(.03 |
) |
|
|
|
(.57 |
) |
|
|
|
(.60 |
) |
|
|
|
13.81 |
|
|
|
|
18.25 |
|
|
|
|
2 |
|
|
|
|
.41 |
|
|
|
|
.36 |
|
|
|
|
.65 |
|
|
|
|
2.01 |
|
| Class P2: |
|
|
|
|
|
|
|
|
|
|
|
|
|
|
|
|
|
|
|
|
|
|
|
|
|
|
|
|
|
|
|
|
|
|
|
|
|
|
|
|
|
|
|
|
|
|
|
|
|
|
|
|
|
|
|
|
|
|
|
|
|
|
|
|
|
|
|
|
|
|
|
|
| 6/30/20244,5 |
|
|
|
11.53 |
|
|
|
|
.04 |
|
|
|
|
.97 |
|
|
|
|
1.01 |
|
|
|
|
|
|
(.22 |
) |
|
|
|
(.17 |
) |
|
|
|
(.39 |
) |
|
|
|
12.15 |
|
|
|
|
8.78 |
6 |
|
|
|
2,082 |
|
|
|
|
.66 |
7 |
|
|
|
.61 |
7 |
|
|
|
.90 |
7 |
|
|
|
.60 |
7 |
| 12/31/2023 |
|
|
|
12.09 |
|
|
|
|
.21 |
|
|
|
|
.90 |
|
|
|
|
1.11 |
|
|
|
|
|
|
(.22 |
) |
|
|
|
(1.45 |
) |
|
|
|
(1.67 |
) |
|
|
|
11.53 |
|
|
|
|
10.23 |
|
|
|
|
2,093 |
|
|
|
|
.66 |
|
|
|
|
.61 |
|
|
|
|
.91 |
|
|
|
|
1.86 |
|
| 12/31/2022 |
|
|
|
14.93 |
|
|
|
|
.18 |
|
|
|
|
(2.25 |
) |
|
|
|
(2.07 |
) |
|
|
|
|
|
(.29 |
) |
|
|
|
(.48 |
) |
|
|
|
(.77 |
) |
|
|
|
12.09 |
|
|
|
|
(13.97 |
) |
|
|
|
2,182 |
|
|
|
|
.66 |
|
|
|
|
.61 |
|
|
|
|
.90 |
|
|
|
|
1.40 |
|
| 12/31/2021 |
|
|
|
13.45 |
|
|
|
|
.15 |
|
|
|
|
1.53 |
|
|
|
|
1.68 |
|
|
|
|
|
|
(.20 |
) |
|
|
|
– |
|
|
|
|
(.20 |
) |
|
|
|
14.93 |
|
|
|
|
12.50 |
|
|
|
|
2,812 |
|
|
|
|
.66 |
|
|
|
|
.61 |
|
|
|
|
.91 |
|
|
|
|
1.03 |
|
| 12/31/2020 |
|
|
|
13.46 |
|
|
|
|
.15 |
|
|
|
|
.56 |
|
|
|
|
.71 |
|
|
|
|
|
|
(.20 |
) |
|
|
|
(.52 |
) |
|
|
|
(.72 |
) |
|
|
|
13.45 |
|
|
|
|
5.88 |
|
|
|
|
2,773 |
|
|
|
|
.66 |
|
|
|
|
.61 |
|
|
|
|
.91 |
|
|
|
|
1.15 |
|
| 12/31/2019 |
|
|
|
12.22 |
|
|
|
|
.19 |
|
|
|
|
1.93 |
|
|
|
|
2.12 |
|
|
|
|
|
|
(.31 |
) |
|
|
|
(.57 |
) |
|
|
|
(.88 |
) |
|
|
|
13.46 |
|
|
|
|
17.98 |
|
|
|
|
2,830 |
|
|
|
|
.66 |
|
|
|
|
.61 |
|
|
|
|
.90 |
|
|
|
|
1.51 |
|
Refer to the end of the tables for footnotes.
345 American Funds Insurance Series
Financial highlights (continued)
|
|
|
|
|
|
|
|
|
|
|
|
|
|
|
|
|
|
|
|
|
|
|
|
|
|
|
|
|
| Portfolio turnover rate for all share classes |
|
Six months ended |
|
|
|
|
Year ended December 31, |
|
|
|
|
|
|
|
|
|
|
|
|
| excluding mortgage dollar roll transactions13,14 |
|
June 30, 20244,5,6 |
|
|
|
|
2023 |
|
|
2022 |
|
|
2021 |
|
|
2020 |
|
|
2019 |
|
|
|
|
|
|
|
|
|
|
|
|
| Capital Income Builder |
|
26% |
|
|
|
|
|
|
59% |
|
|
|
48% |
|
|
|
60% |
|
|
|
110% |
|
|
|
44% |
|
|
|
| Asset Allocation Fund |
|
19 |
|
|
|
|
|
|
54 |
|
|
|
42 |
|
|
|
45 |
|
|
|
49 |
|
|
|
47 |
|
|
|
| American Funds Global Balanced Fund |
|
27 |
|
|
|
|
|
|
43 |
|
|
|
111 |
|
|
|
36 |
|
|
|
68 |
|
|
|
60 |
|
|
|
| The Bond Fund of America |
|
54 |
|
|
|
|
|
|
129 |
|
|
|
77 |
|
|
|
87 |
|
|
|
72 |
|
|
|
146 |
|
|
|
| Capital World Bond Fund |
|
31 |
|
|
|
|
|
|
110 |
|
|
|
114 |
|
|
|
64 |
|
|
|
88 |
|
|
|
110 |
|
|
|
| American Funds Mortgage Fund |
|
25 |
|
|
|
|
|
|
85 |
|
|
|
56 |
|
|
|
38 |
|
|
|
123 |
|
|
|
84 |
|
|
|
| U.S. Government Securities Fund |
|
17 |
|
|
|
|
|
|
113 |
|
|
|
77 |
|
|
|
126 |
|
|
|
112 |
|
|
|
103 |
|
|
|
|
|
|
|
|
|
|
|
|
|
|
|
|
|
|
|
|
|
|
|
|
|
|
|
|
|
|
|
|
|
|
|
|
|
| Portfolio turnover rate for all share classes |
|
Six months ended |
|
|
|
|
Year ended December 31, |
|
|
|
|
|
|
|
|
|
|
|
|
| including mortgage dollar roll transactions, if any13,14 |
|
June 30, 20244,5,6 |
|
|
|
|
2023 |
|
|
2022 |
|
|
2021 |
|
|
2020 |
|
|
2019 |
|
|
|
|
|
|
|
|
|
|
|
|
| Global Growth Fund |
|
28% |
|
|
|
|
|
|
29% |
|
|
|
29% |
|
|
|
18% |
|
|
|
17% |
|
|
|
14% |
|
|
|
| Global Small Capitalization Fund |
|
20 |
|
|
|
|
|
|
36 |
|
|
|
40 |
|
|
|
29 |
|
|
|
38 |
|
|
|
50 |
|
|
|
| Growth Fund |
|
13 |
|
|
|
|
|
|
23 |
|
|
|
29 |
|
|
|
25 |
|
|
|
32 |
|
|
|
21 |
|
|
|
| International Fund |
|
17 |
|
|
|
|
|
|
28 |
|
|
|
42 |
|
|
|
44 |
|
|
|
40 |
|
|
|
32 |
|
|
|
| New World Fund |
|
34 |
|
|
|
|
|
|
36 |
|
|
|
40 |
|
|
|
43 |
|
|
|
70 |
|
|
|
38 |
|
|
|
| Washington Mutual Investors Fund |
|
19 |
|
|
|
|
|
|
29 |
|
|
|
30 |
|
|
|
90 |
|
|
|
40 |
|
|
|
37 |
|
|
|
| Capital World Growth and Income Fund |
|
16 |
|
|
|
|
|
|
29 |
|
|
|
42 |
|
|
|
85 |
|
|
|
36 |
|
|
|
29 |
|
|
|
| Growth-Income Fund |
|
36 |
|
|
|
|
|
|
26 |
|
|
|
25 |
|
|
|
24 |
|
|
|
33 |
|
|
|
27 |
|
|
|
| International Growth and Income Fund |
|
18 |
|
|
|
|
|
|
38 |
|
|
|
48 |
|
|
|
41 |
|
|
|
56 |
|
|
|
28 |
|
|
|
| Capital Income Builder |
|
66 |
|
|
|
|
|
|
149 |
|
|
|
126 |
|
|
|
93 |
|
|
|
184 |
|
|
|
72 |
|
|
|
| Asset Allocation Fund |
|
71 |
|
|
|
|
|
|
159 |
|
|
|
118 |
|
|
|
124 |
|
|
|
145 |
|
|
|
79 |
|
|
|
| American Funds Global Balanced Fund |
|
79 |
|
|
|
|
|
|
103 |
|
|
|
126 |
|
|
|
39 |
|
|
|
86 |
|
|
|
74 |
|
|
|
| The Bond Fund of America |
|
255 |
|
|
|
|
|
|
545 |
|
|
|
415 |
|
|
|
456 |
|
|
|
461 |
|
|
|
373 |
|
|
|
| Capital World Bond Fund |
|
170 |
|
|
|
|
|
|
286 |
|
|
|
188 |
|
|
|
91 |
|
|
|
145 |
|
|
|
159 |
|
|
|
| American High-Income Trust |
|
23 |
|
|
|
|
|
|
40 |
|
|
|
34 |
|
|
|
56 |
|
|
|
78 |
|
|
|
58 |
|
|
|
| American Funds Mortgage Fund |
|
373 |
|
|
|
|
|
|
1053 |
|
|
|
1141 |
|
|
|
975 |
|
|
|
1143 |
|
|
|
350 |
|
|
|
| U.S. Government Securities Fund |
|
204 |
|
|
|
|
|
|
744 |
|
|
|
695 |
|
|
|
433 |
|
|
|
867 |
|
|
|
277 |
|
|
|
| Ultra-Short Bond Fund |
|
–15 |
|
|
|
|
|
|
–15 |
|
|
|
–15 |
|
|
|
–15 |
|
|
|
–15 |
|
|
|
–15 |
|
|
|
| Managed Risk Growth Fund |
|
6 |
|
|
|
|
|
|
39 |
|
|
|
97 |
|
|
|
32 |
|
|
|
80 |
|
|
|
10 |
|
|
|
| Managed Risk International Fund |
|
3 |
|
|
|
|
|
|
27 |
|
|
|
82 |
|
|
|
24 |
|
|
|
71 |
|
|
|
8 |
|
|
|
| Managed Risk Washington Mutual Investors Fund |
|
4 |
|
|
|
|
|
|
19 |
|
|
|
70 |
|
|
|
16 |
|
|
|
101 |
|
|
|
13 |
|
|
|
| Managed Risk Growth-Income Fund |
|
8 |
|
|
|
|
|
|
21 |
|
|
|
67 |
|
|
|
13 |
|
|
|
38 |
|
|
|
6 |
|
|
|
| Managed Risk Asset Allocation Fund |
|
6 |
|
|
|
|
|
|
13 |
|
|
|
48 |
|
|
|
5 |
|
|
|
30 |
|
|
|
8 |
|
|
|
| 1 |
Based on average shares outstanding. |
| 2 |
This column reflects the impact of certain waivers/reimbursements from CRMC. During some of the years shown, CRMC waived a portion of investment advisory services fees on some funds, including each of the managed risk funds. In addition, during some of the years shown, CRMC reimbursed a portion of miscellaneous fees and expenses for some of the managed risk funds. |
| 3 |
Ratios do not include expenses of any Central Funds. The fund indirectly bears its proportionate share of the expenses of any Central Funds, if applicable. |
| 4 |
Based on operations for a period that is less than a full year. |
| 10 |
Amount less than $1 million. |
| 11 |
This column does not include expenses of the underlying funds in which each fund invests. |
| 12 |
This column reflects the net effective expense ratios for each fund and class, which include each class’s expense ratio combined with the weighted average net expense ratio of the underlying funds for the periods presented. |
| 13 |
Refer to Note 5 for further information on mortgage dollar rolls. |
| 14 |
Rates do not include the fund’s portfolio activity with respect to any Central Funds, if applicable. |
| 15 |
Amount is either less than 1% or there is no turnover. |
Refer to the notes to financial statements.
American Funds Insurance Series 346
Changes in and disagreements with accountants
Not applicable
Matters submitted for shareholder vote
Not applicable
Remuneration paid to directors, officers and others
Refer to information in the financial statements.
347 American Funds Insurance Series
Approval of Investment Advisory and Service Agreement – American Funds Insurance Series
|
|
|
| The series’ board has approved the continuation of the series’ Investment Advisory and Service Agreement (the “agreement”) with Capital Research and Management Company (“CRMC”) for an additional one-year term through April 30, 2025. The board approved the agreement following the recommendation of the series’ Contracts Committee (the “committee”), which is composed of all the series’ independent board members. The board and the committee determined in the exercise of their business judgment that the advisory fee structure for each fund within the series was fair and reasonable in relation to the services provided, and that approving the agreement was in the best interests of each fund and its shareholders. In reaching this decision, the board and the committee took into account their interactions with CRMC and information furnished to them throughout the year and otherwise provided to them, as well as information prepared specifically in connection with their review of the agreement, and they were advised by their independent counsel with respect to the matters considered. They considered the following factors, among others, but did not identify any single issue or particular piece of information that, in isolation, was the controlling factor, and each board and committee member did not necessarily attribute the same weight to each factor. |
|
1. Nature, extent and quality of services The board and the committee considered the depth and quality of CRMC’s investment management process, including its global research capabilities; the experience, capability and integrity of its senior management and other personnel; the low turnover rates of its key personnel; the overall financial strength and stability of CRMC and the Capital Group organization; the resources and systems CRMC devotes to investment management (the manner in which each fund’s assets are managed, including liquidity management), financial, investment operations, compliance, trading, proxy voting, shareholder communications, and other services; and the ongoing evolution of CRMC’s organizational structure designed to maintain and strengthen these qualities. The board and the committee also considered the nature, extent and quality of administrative and shareholder services provided by CRMC to the funds under the agreement and other agreements, as well as the benefits to each fund’s shareholders from investing in a fund that is part of a large family of funds. The board and the committee considered the risks assumed by CRMC in providing services to the funds, including operational, business, financial, reputational, regulatory and litigation risks. The board and the committee concluded that the nature, extent and quality of the services provided by CRMC have benefited and should continue to benefit each fund and its shareholders. 2. Investment results The board and the committee considered the investment results of each fund in light of its objectives. They compared each fund’s investment results with those of other funds (including funds that currently form the basis of the Lipper index for the category in which each fund is included) and data such as publicly disclosed benchmarks, including applicable market and fund indexes over various periods (including each fund’s lifetime) through September 30, 2023. They generally placed greater emphasis on investment results over longer term periods and relative to benchmarks consistent with each fund’s objective. On the basis of this evaluation and the board’s and the committee’s ongoing review of investment results, and considering the relative market conditions during certain reporting periods, the board and the committee concluded that each fund’s investment results have been satisfactory for renewal of the agreement, and that CRMC’s record in managing the funds indicated that its continued management should benefit each fund and its shareholders. 3. Advisory fees and total expenses The board and the committee compared the advisory fees and total expense levels of each fund to those of other relevant funds. They observed that the advisory fees and total expenses of each fund generally compared favorably to those of other similar funds included in the comparable Lipper category. The board and the committee also considered the breakpoint discounts in each fund’s advisory fee structure that reduce the level of fees charged by CRMC to the fund as fund assets increase. The board also considered and approved the amended fee schedule to the agreement that lowered the current fee schedule and resulted in an overall lower advisory fee. The board noted that there would be no diminution in services provided as a result of the lower advisory fee for certain funds. |
American Funds Insurance Series 348
|
|
|
| |
|
|
|
In addition, the board and committee reviewed information regarding the effective advisory fees charged to non-mutual fund clients by CRMC and its affiliates. They noted that, to the extent there were differences between the advisory fees paid by each fund and the advisory fees paid by those clients, the differences appropriately reflected the investment, operational, regulatory and market differences between advising the funds and the other clients. The board and the committee concluded that each fund’s cost structure was fair and reasonable in relation to the services provided, as well as in relation to the risks assumed by the adviser in sponsoring and managing each fund, and that each fund’s shareholders receive reasonable value in return for the advisory fees and other amounts paid to CRMC by the funds. 4. Ancillary benefits The board and the committee considered a variety of other benefits that CRMC and its affiliates receive as a result of CRMC’s relationship with the series and other American Funds, including fees for administrative services provided to certain share classes; fees paid to CRMC’s affiliated transfer agent; sales charges and distribution fees received and retained by the series’ principal underwriter, an affiliate of CRMC; and possible ancillary benefits to CRMC and its institutional management affiliates in managing other investment vehicles. The board and the committee reviewed CRMC’s portfolio trading practices, noting that CRMC bears the cost of third-party research. The board and committee also noted that CRMC benefited from the use of commissions from portfolio transactions made on behalf of each fund to facilitate payment to certain broker-dealers for research to comply with regulatory requirements applicable to these firms, with all such amounts reimbursed by CRMC. The board and the committee took these ancillary benefits into account in evaluating the reasonableness of the other amounts paid to CRMC by the funds. 5. Adviser financial information The board and the committee reviewed information regarding CRMC’s costs of providing services to the American Funds, including personnel, systems and resources of investment, compliance, trading, accounting and other administrative operations. They considered CRMC’s costs and related cost allocation methodology, as well as its track record of investing in technology, infrastructure and staff to maintain and expand services and capabilities, respond to industry and regulatory developments, and attract and retain qualified personnel. They noted information regarding the compensation structure for CRMC’s investment professionals. They reviewed information on the profitability of the investment adviser and its affiliates. The board and the committee also compared CRMC’s profitability and compensation data to the reported results and data of a number of large, publicly held investment management companies. The board and the committee noted the competitiveness and cyclicality of both the mutual fund industry and the capital markets, and the importance in that environment of CRMC’s long-term profitability for maintaining its independence, company culture and management continuity. They further considered the breakpoint discounts in the funds’ advisory fee structure and CRMC’s sharing of potential economies of scale, or efficiencies, through breakpoints and other fee reductions and costs voluntarily absorbed. The board and the committee concluded that each fund’s advisory fee structure reflected a reasonable sharing of benefits between CRMC and the funds’ shareholders. |
349 American Funds Insurance Series
Approval of Investment Advisory and Service Agreement and Subadvisory Agreement – American Funds Insurance Series Managed Risk Funds
|
|
|
| The series’ board has approved the continuation of the series’ Investment Advisory and Service Agreement (the “advisory agreement”) with Capital Research and Management Company (“CRMC”) with respect to the Managed Risk Funds for an additional one-year term through April 30, 2024. The board has also approved the series’ Subadvisory Agreement (the “subadvisory agreement”) with CRMC and Milliman Financial Risk Management LLC (“Milliman FRM”) with respect to these funds for the same term. The advisory and subadvisory agreements are jointly referred to below as the “agreements.” The board approved the agreement following the recommendation of the series’ Contracts Committee (the “committee”), which is composed of all the series’ independent board members. The board and the committee determined in the exercise of their business judgment that the advisory fee structure for each fund within the series was fair and reasonable in relation to the services provided, and that approving the agreement was in the best interests of each fund and its shareholders. In reaching this decision, the board and the committee took into account their interactions with CRMC and Milliman FRM and information furnished to them throughout the year and otherwise provided to them, as well as information prepared specifically in connection with their review of the agreements, and they were advised by their independent counsel with respect to the matters considered. They considered the following factors, among others, but did not identify any single issue or particular piece of information that, in isolation, was the controlling factor, and each board and committee member did not necessarily attribute the same weight to each factor. |
|
1. Nature, extent and quality of services The board and the committee considered the depth and quality of CRMC’s investment management process, including its global research capabilities; the experience, capability and integrity of its senior management and other personnel; the low turnover rates of its key personnel; the overall financial strength and stability of CRMC and the Capital Group organization; the resources and systems CRMC devotes to investment management (the manner in which each fund’s assets are managed, including liquidity management), financial, investment operations, compliance, trading, proxy voting, shareholder communications, and other services; and the ongoing evolution of CRMC’s organizational structure designed to maintain and strengthen these qualities. The board and the committee also considered the nature, extent and quality of the oversight of Milliman FRM’s services provided by CRMC, administrative and shareholder services provided by CRMC to the funds under the advisory agreement and other agreements, as well as the benefits to each fund’s shareholders from investing in a fund that is part of a large family of funds. The board and the committee considered the risks assumed by CRMC in providing services to the funds, including operational, business, financial, reputational, regulatory and litigation risks. The board and the committee concluded that the nature, extent and quality of the services provided by CRMC have benefited and should continue to benefit each fund and its shareholders. The board and the committee also considered the depth and quality of Milliman FRM’s investment management process, including its experience in applying the Milliman Managed Risk Strategy to other funds in the series and risk management services for other clients; the experience, capability and integrity of its senior management and other personnel; and the services provided to each fund under the subadvisory agreement. The board and the committee concluded that the nature, extent and quality of the services provided by Milliman FRM have benefited and should continue to benefit each fund and its shareholders. 2. Investment results The board and the committee considered the investment results of each fund in light of its objectives. They compared each fund’s investment results with those of other funds (including funds that currently form the basis of the Lipper index for the category in which each fund is included), and data such as publicly disclosed benchmarks, including applicable market and fund indexes over various periods (including each fund’s lifetime) through September 30, 2023. They generally placed greater emphasis on investment results over longer term periods and relative to benchmarks consistent with each fund’s objective. The board and the committee also considered the volatility of the funds compared with the S&P 500 Managed Risk indexes and those of a group of funds with volatility management strategies identified by management over various periods (including each fund’s lifetime) through September 30, 2023. On the basis of this evaluation and the board’s and the committee’s ongoing review of investment results, and considering the relative market conditions during certain reporting periods, the board and the committee concluded that each fund’s investment results and the results of the services provided by CRMC and Milliman FRM have been satisfactory for renewal of the agreements, and that CRMC’s and Milliman FRM’s record in managing the funds indicated that their continued management should benefit each fund and its shareholders. |
American Funds Insurance Series 350
|
|
|
| |
|
|
|
3. Advisory fees and total expenses The board and the committee compared the advisory fees and total expense levels of each fund to those of other relevant funds. The board and the committee noted CRMC’s waiver of a portion of the advisory fee payable by each fund under the advisory agreement, CRMC’s commitment not to remove the waiver without board approval and CRMC’s agreement to pay the fees due to Milliman FRM under the subadvisory agreement. They observed that each fund’s advisory fees and total expenses generally compared favorably to those of other similar funds included in the comparable Lipper category. The board and the committee also considered the breakpoint discounts in each underlying fund’s advisory fee structure that reduce the level of fees charged by CRMC to the underlying fund as its assets increase. In addition, they reviewed information regarding the effective advisory fees charged to non-mutual fund clients by CRMC and its affiliates. They noted that, to the extent there were differences between the advisory fees paid by each fund and the advisory fees paid by those clients, the differences appropriately reflected the investment, operational, regulatory and market differences between advising the funds and the other clients. They also reviewed the fees paid to Milliman FRM by other funds which it advised or subadvised. The board and the committee concluded that each fund’s cost structure was fair and reasonable in relation to the services that CRMC provided, directly and through Milliman FRM, as well as in relation to the risks assumed by the adviser in sponsoring and managing each fund, and that each fund’s shareholders receive reasonable value in return for the advisory fees and other amounts paid to CRMC (and indirectly to Milliman FRM) by the funds. 4. Ancillary benefits The board and the committee considered a variety of other benefits that CRMC and its affiliates receive as a result of CRMC’s relationship with the series and the other American Funds, including fees for administrative services provided to certain share classes; fees paid to CRMC’s affiliated transfer agent; sales charges and distribution fees received and retained by the series’ principal underwriter, an affiliate of CRMC; and possible ancillary benefits to CRMC and its institutional management affiliates in managing other investment vehicles. The board and the committee reviewed CRMC’s portfolio trading practices, noting that CRMC bears the cost of third-party research. The board and committee also noted that CRMC benefited from the use of commissions from portfolio transactions made on behalf of each fund to facilitate payment to certain broker-dealers for research to comply with regulatory requirements applicable to these firms, with all such amounts reimbursed by CRMC. The board and the committee also reviewed similar ancillary benefits received by Milliman FRM as a result of its relationship with the series. The board and the committee took these ancillary benefits into account in evaluating the reasonableness of the advisory fees and other amounts paid to CRMC (and indirectly to Milliman FRM) by each fund. |
351 American Funds Insurance Series
|
|
|
| |
|
|
|
5. Adviser financial information The board and the committee reviewed information regarding CRMC’s costs of providing services to the American Funds, including personnel, systems and resources of investment, compliance, trading, accounting and other administrative operations. They considered CRMC’s costs and related cost allocation methodology, as well as its track record of investing in technology, infrastructure and staff to maintain and expand services and capabilities, respond to industry and regulatory developments, and attract and retain qualified personnel. They noted information regarding the compensation structure for CRMC’s investment professionals. They reviewed information on the profitability of the investment adviser and its affiliates. The board and the committee also compared CRMC’s profitability and compensation data to the reported results and data of a number of large, publicly held investment management companies. The board and the committee noted the competitiveness and cyclicality of both the mutual fund industry and the capital markets, and the importance in that environment of CRMC’s long-term profitability for maintaining its independence, company culture and management continuity. They further considered the breakpoint discounts in the funds’ advisory fee structure and CRMC’s sharing of potential economies of scale, or efficiencies, through breakpoints and other fee reductions and costs voluntarily absorbed. The board and the committee concluded that each fund’s advisory fee structure reflected a reasonable sharing of benefits between CRMC and the funds’ shareholders. |
American Funds Insurance Series 352
Transamerica Series Trust Semi-Annual Financial Statements
June 30, 2024
1801 California St., Suite 5200
Denver, CO 80202
Distributor: Transamerica Capital, Inc.
Customer Service: 1-800-851-9777
The following pages contain the most recent semi-annual financial statements for the investment options in which you are invested. In compliance with Securities and Exchange Commission regulations, we present these reports on an annual and semi-annual basis with the hope that they will foster greater understanding of the investment options’ holdings, performance, financial data, accounting policies and other issues. This streamlined version provides information only on the investment options in which you are invested.
If you have any questions about these reports, please do not hesitate to contact your financial professional. As always, we thank you for your trust and the opportunity to serve you.
Transamerica BlackRock Government Money Market VP
SCHEDULE OF INVESTMENTS
At June 30, 2024
(unaudited)
|
|
|
|
|
|
|
|
|
| |
|
Principal |
|
|
Value |
|
| |
|
|
|
| U.S. GOVERNMENT OBLIGATIONS - 7.9% |
|
|
|
|
|
| U.S. Treasury - 7.9% |
|
|
|
|
|
| U.S. Treasury Floating Rate Notes |
|
|
|
|
|
|
|
|
| 3-Month Treasury Money Market Yield + 0.13%, 5.43% (A), 07/31/2025 |
|
$ |
17,375,000 |
|
|
$ |
17,373,275 |
|
| 3-Month Treasury Money Market Yield + 0.14%, 5.45% (A), 10/31/2024 |
|
|
7,410,000 |
|
|
|
7,411,513 |
|
| 3-Month Treasury Money Market Yield + 0.15%, 5.46% (A), 04/30/2026 |
|
|
8,800,000 |
|
|
|
8,801,335 |
|
| 3-Month Treasury Money Market Yield + 0.17%, 5.48% (A), 10/31/2025 |
|
|
3,065,000 |
|
|
|
3,063,743 |
|
| 3-Month Treasury Money Market Yield + 0.20%, 5.51% (A), 01/31/2025 |
|
|
15,000,000 |
|
|
|
15,000,000 |
|
| 3-Month Treasury Money Market Yield + 0.25%, 5.55% (A), 01/31/2026 |
|
|
8,825,000 |
|
|
|
8,825,000 |
|
| U.S. Treasury Notes |
|
|
|
|
|
|
|
|
| 1.13%, 02/28/2025 |
|
|
181,000 |
|
|
|
176,490 |
|
| 2.75%, 02/28/2025 |
|
|
181,000 |
|
|
|
178,342 |
|
|
|
|
|
|
|
|
|
|
|
|
| Total U.S. Government Obligations
(Cost $60,829,698) |
|
|
|
60,829,698 |
|
|
|
|
|
|
|
|
|
|
|
|
| U.S. GOVERNMENT AGENCY OBLIGATIONS - 6.5% |
|
|
|
|
|
| Federal Farm Credit Banks Funding Corp. |
|
|
|
|
|
|
|
|
| 3-Month SOFR + 0.05%,
5.39% (A), 06/20/2025 |
|
|
318,000 |
|
|
|
318,000 |
|
| 3-Month SOFR + 0.07%,
5.41% (A), 11/17/2025 |
|
|
1,200,000 |
|
|
|
1,200,000 |
|
| 3-Month SOFR + 0.08%,
5.42% (A), 12/30/2024 |
|
|
1,500,000 |
|
|
|
1,500,556 |
|
| 3-Month SOFR + 0.09%,
5.43% (A), 08/26/2024 |
|
|
7,280,000 |
|
|
|
7,280,000 |
|
| 3-Month SOFR + 0.09%,
5.43% (A), 09/23/2024 |
|
|
2,765,000 |
|
|
|
2,765,000 |
|
| 3-Month SOFR + 0.10%,
5.44% (A), 08/01/2024 - 06/26/2026 |
|
|
3,525,000 |
|
|
|
3,525,000 |
|
| 3-Month SOFR + 0.14%,
5.48% (A), 11/07/2024 - 05/27/2025 |
|
|
10,360,000 |
|
|
|
10,360,000 |
|
| 3-Month SOFR + 0.17%,
5.51% (A), 01/23/2025 |
|
|
4,425,000 |
|
|
|
4,425,000 |
|
| Federal Home Loan Banks |
|
|
|
|
|
|
|
|
| 3-Month SOFR + 0.11%,
5.45% (A), 10/28/2024 |
|
|
3,600,000 |
|
|
|
3,600,020 |
|
| 3-Month SOFR + 0.16%,
5.50% (A), 07/21/2025 |
|
|
7,050,000 |
|
|
|
7,050,000 |
|
| 3-Month SOFR + 0.20%,
5.54% (A), 11/13/2025 |
|
|
5,315,000 |
|
|
|
5,315,000 |
|
| Federal National Mortgage Association |
|
|
|
|
|
|
|
|
| 2.63%, 09/06/2024 |
|
|
3,295,000 |
|
|
|
3,277,694 |
|
|
|
|
|
|
|
|
|
|
|
|
| Total U.S. Government Agency Obligations
(Cost $50,616,270) |
|
|
|
50,616,270 |
|
|
|
|
|
|
|
|
|
|
|
| SHORT-TERM U.S. GOVERNMENT AGENCY OBLIGATIONS - 12.9% |
|
| Federal Farm Credit Banks Funding Corp. |
|
|
|
|
|
|
|
|
| 5.00% (B), 04/04/2025 |
|
|
1,012,000 |
|
|
|
1,011,435 |
|
| 5.13% (B), 12/04/2024 |
|
|
1,278,000 |
|
|
|
1,277,777 |
|
| Federal Farm Credit Discount Notes |
|
|
|
|
|
|
|
|
| 5.31% (B), 01/17/2025 |
|
|
11,400,000 |
|
|
|
11,074,410 |
|
| 5.51% (B), 09/19/2024 |
|
|
2,060,000 |
|
|
|
2,035,694 |
|
| Federal Home Loan Bank Discount Notes |
|
|
|
|
|
|
|
|
| 4.87% (B), 12/30/2024 |
|
|
2,496,000 |
|
|
|
2,437,444 |
|
|
|
|
|
|
|
|
|
|
| |
|
Principal |
|
|
Value |
|
| |
|
|
| SHORT-TERM U.S. GOVERNMENT AGENCY OBLIGATIONS (continued) |
|
| 4.92% (B), 01/27/2025 |
|
$ |
5,751,000 |
|
|
$ |
5,594,196 |
|
| 4.99% (B), 11/01/2024 - 11/12/2024 |
|
|
1,797,000 |
|
|
|
1,766,208 |
|
| 5.00% (B), 11/26/2024 |
|
|
5,460,000 |
|
|
|
5,352,506 |
|
| 5.07% (B), 02/10/2025 - 02/11/2025 |
|
|
6,129,000 |
|
|
|
5,945,338 |
|
| 5.08% (B), 01/24/2025 |
|
|
940,000 |
|
|
|
913,887 |
|
| 5.09% (B), 09/03/2024 |
|
|
952,000 |
|
|
|
943,544 |
|
| 5.22% (B), 11/04/2024 |
|
|
973,000 |
|
|
|
956,014 |
|
| 5.34% (B), 11/01/2024 |
|
|
8,385,000 |
|
|
|
8,238,845 |
|
| Federal Home Loan Banks |
|
|
|
|
|
|
|
|
| 5.34% (B), 07/29/2024 - 12/02/2024 |
|
|
29,440,000 |
|
|
|
29,439,993 |
|
| 3-Month SOFR + 0.01%, 5.35% (A), 10/02/2024 - 11/21/2024 |
|
|
7,600,000 |
|
|
|
7,600,000 |
|
| 3-Month SOFR + 0.01%, 5.35% (A), 10/16/2024 - 11/18/2024 |
|
|
10,490,000 |
|
|
|
10,490,000 |
|
| 5.50% (B), 04/15/2025 |
|
|
4,465,000 |
|
|
|
4,465,000 |
|
|
|
|
|
|
|
|
|
|
|
|
| Total Short-Term U.S. Government Agency Obligations
(Cost $99,542,291) |
|
|
|
99,542,291 |
|
|
|
|
|
|
|
|
|
|
|
| SHORT-TERM U.S. GOVERNMENT OBLIGATIONS - 32.1% |
|
| U.S. Treasury Bills |
|
|
|
|
|
|
|
|
| 4.84% (B), 12/26/2024 |
|
|
891,000 |
|
|
|
870,667 |
|
| 4.86% (B), 01/23/2025 |
|
|
4,030,100 |
|
|
|
3,923,662 |
|
| 4.87% (B), 12/26/2024 |
|
|
1,838,000 |
|
|
|
1,795,806 |
|
| 4.90% (B), 12/26/2024 |
|
|
447,000 |
|
|
|
436,697 |
|
| 4.91% (B), 12/26/2024 |
|
|
804,000 |
|
|
|
785,428 |
|
| 5.13% (B), 03/20/2025 |
|
|
1,357,000 |
|
|
|
1,309,134 |
|
| 5.15% (B), 07/11/2024 |
|
|
1,325,000 |
|
|
|
1,322,809 |
|
| 5.17% (B), 07/18/2024 - 08/01/2024 |
|
|
18,095,000 |
|
|
|
18,046,081 |
|
| 5.18% (B), 08/01/2024 |
|
|
8,513,000 |
|
|
|
8,474,099 |
|
| 5.20% (B), 07/25/2024 |
|
|
1,344,000 |
|
|
|
1,339,147 |
|
| 5.21% (B), 07/18/2024 |
|
|
1,679,000 |
|
|
|
1,674,561 |
|
| 5.22% (B), 07/25/2024 |
|
|
13,532,000 |
|
|
|
13,482,939 |
|
| 5.23% (B), 07/11/2024 |
|
|
10,677,000 |
|
|
|
10,659,098 |
|
| 5.25% (B), 07/05/2024 |
|
|
11,965,000 |
|
|
|
11,954,940 |
|
| 5.26% (B), 07/05/2024 |
|
|
2,772,000 |
|
|
|
2,769,665 |
|
| 5.31% (B), 09/05/2024 - 10/10/2024 |
|
|
8,309,000 |
|
|
|
8,221,964 |
|
| 5.33% (B), 10/10/2024 |
|
|
1,932,300 |
|
|
|
1,903,994 |
|
| 5.34% (B), 09/19/2024 - 12/05/2024 |
|
|
3,991,500 |
|
|
|
3,936,063 |
|
| 5.35% (B), 12/05/2024 - 12/26/2024 |
|
|
8,124,300 |
|
|
|
7,919,427 |
|
| 5.36% (B), 07/09/2024 - 12/19/2024 |
|
|
25,473,600 |
|
|
|
25,152,184 |
|
| 5.37% (B), 07/11/2024 - 12/05/2024 |
|
|
44,944,900 |
|
|
|
44,292,918 |
|
| 5.38% (B), 07/23/2024 - 11/29/2024 |
|
|
37,102,000 |
|
|
|
36,470,648 |
|
| 5.39% (B), 07/09/2024 - 08/08/2024 |
|
|
23,210,000 |
|
|
|
23,158,044 |
|
| 5.40% (B), 08/13/2024 |
|
|
4,000,000 |
|
|
|
3,973,850 |
|
| 5.41% (B), 08/27/2024 |
|
|
9,140,000 |
|
|
|
9,061,508 |
|
| 5.44% (B), 10/31/2024 |
|
|
1,484,000 |
|
|
|
1,457,969 |
|
| 5.50% (B), 09/05/2024 |
|
|
2,960,000 |
|
|
|
2,931,206 |
|
|
|
|
|
|
|
|
|
|
|
|
| Total Short-Term U.S. Government Obligations
(Cost $247,324,508) |
|
|
|
247,324,508 |
|
|
|
|
|
|
|
|
|
|
|
| REPURCHASE AGREEMENTS - 41.9% |
|
| Barclays Capital, Inc., |
|
|
|
|
|
|
|
|
| 5.32% (B), dated 06/28/2024, to be repurchased at $35,015,517 on 07/01/2024. Collateralized by a U.S. Government Obligation, 4.75%, due 11/15/2043, and with a value of $35,700,030. |
|
|
35,000,000 |
|
|
|
35,000,000 |
|
The Notes to Financial Statements are an integral part of this report.
|
|
|
|
|
| Transamerica Series Trust |
|
|
|
Semi-Annual Financial Statements 2024 |
|
|
Page 1 |
|
|
Transamerica BlackRock Government Money Market VP
SCHEDULE OF INVESTMENTS (continued)
At June 30, 2024
(unaudited)
|
|
|
|
|
|
|
|
|
| |
|
Principal |
|
|
Value |
|
| |
|
|
| REPURCHASE AGREEMENTS (continued) |
|
| BNP Paribas SA, |
|
|
|
|
|
|
|
|
| 5.32% (B), dated 06/28/2024, to be repurchased at $30,013,300 on 07/01/2024. Collateralized by U.S. Government Obligations, 0.00% - 5.43%, due 10/15/2025 - 08/15/2053, and with a total value of $30,600,000. |
|
$ |
30,000,000 |
|
|
$ |
30,000,000 |
|
| BNP Paribas SA, |
|
|
|
|
|
|
|
|
| 5.33% (B), dated 06/28/2024, to be repurchased at $20,008,883 on 07/01/2024. Collateralized by U.S. Government Agency Obligations, 2.00% - 7.00%, due 07/01/2025 - 12/01/2052, and with a total value of $20,400.020. |
|
|
20,000,000 |
|
|
|
20,000,000 |
|
| Citigroup Global Markets, Inc., |
|
|
|
|
|
|
|
|
| 5.33% (B), dated 06/28/2024, to be repurchased at $55,024,429 on 07/01/2024. Collateralized by a U.S. Government Obligation, 4.88%, due 04/30/2026, and with a value of $56,100,098. |
|
|
55,000,000 |
|
|
|
55,000,000 |
|
| Fixed Income Clearing Corp., |
|
|
|
|
|
|
|
|
| 2.50% (B), dated 06/28/2024, to be repurchased at $704,495 on 07/01/2024. Collateralized by a U.S. Government Obligation, 0.75%, due 04/30/2026, and with a value of $718,607. |
|
|
704,348 |
|
|
|
704,348 |
|
| Goldman Sachs & Co., |
|
|
|
|
|
|
|
|
| 5.32% (B), dated 06/28/2024, to be repurchased at $30,013,300 on 07/01/2024. Collateralized by U.S. Government Obligations, 1.88% - 4.38%, due 02/28/2029 - 08/15/2043, and with a total value of $30,600,015. |
|
|
30,000,000 |
|
|
|
30,000,000 |
|
| Goldman Sachs & Co., |
|
|
|
|
|
|
|
|
| 5.33% (B), dated 06/28/2024, to be repurchased at $18,007,995 on 07/01/2024. Collateralized by U.S. Government Agency Obligations, 5.00% - 6.00%, due 07/20/2042 - 05/20/2054, and with a total value of $18,360,001. |
|
|
18,000,000 |
|
|
|
18,000,000 |
|
| JPMorgan Chase & Co., |
|
|
|
|
|
|
|
|
| 5.32% (B), dated 06/28/2024, to be repurchased at $25,011,083 on 07/01/2024. Collateralized by U.S. Government Obligations, 0.00% - 6.88%, due 08/29/2024 - 08/15/2052, and with a total value of $25,500,000. |
|
|
25,000,000 |
|
|
|
25,000,000 |
|
|
|
|
|
|
|
|
|
|
| |
|
Principal |
|
|
Value |
|
| |
|
|
| REPURCHASE AGREEMENTS (continued) |
|
| JPMorgan Chase & Co., |
|
|
|
|
|
|
|
|
| 5.33% (B), dated 06/28/2024, to be repurchased at $15,006,663 on 07/01/2024. Collateralized by U.S. Government Agency Obligations, 5.50% - 7.00%, due 06/20/2035 - 05/20/2064, and with a total value of $15,364,712. |
|
$ |
15,000,000 |
|
|
$ |
15,000,000 |
|
| Merrill Lynch & Co., Inc., |
|
|
|
|
|
|
|
|
| 5.32% (B), dated 06/28/2024, to be repurchased at $30,013,300 on 07/01/2024. Collateralized by U.S. Government Obligations, 0.00%, due 08/15/2025 - 05/15/2049 and with a total value of $36,600,001. |
|
|
30,000,000 |
|
|
|
30,000,000 |
|
| Merrill Lynch & Co., Inc., |
|
|
|
|
|
|
|
|
| 5.33% (B), dated 06/28/2024, to be repurchased at $20,008,883 on 07/01/2024. Collateralized by U.S. Government Agency Obligations, 3.00% - 4.00%, due 09/20/2043 - 08/20/2047, and with a total value of $20,400.001. |
|
|
20,000,000 |
|
|
|
20,000,000 |
|
| Toronto-Dominion Bank, |
|
|
|
|
|
|
|
|
| 5.32% (B), dated 06/28/2024, to be repurchased at $25,011,083 on 07/01/2024. Collateralized by U.S. Government Obligations, 0.38% - 2.75%, due 02/28/2025 - 07/31/2026, and with a total value of $25,500,038. |
|
|
25,000,000 |
|
|
|
25,000,000 |
|
| Toronto-Dominion Bank, |
|
|
|
|
|
|
|
|
| 5.33% (B), dated 06/28/2024, to be repurchased at $20,008,883 on 07/01/2024. Collateralized by a U.S. Government Agency Obligation, 5.00%, due 09/01/2053, and with a value of $20,600,001. |
|
|
20,000,000 |
|
|
|
20,000,000 |
|
|
|
|
|
|
|
|
|
|
|
|
| Total Repurchase Agreements
(Cost $323,704,348) |
|
|
|
323,704,348 |
|
|
|
|
|
|
|
|
|
|
| Total Investments
(Cost $782,017,115) |
|
|
|
782,017,115 |
|
|
|
|
|
|
|
|
|
|
| Net Other Assets (Liabilities) - (1.3)% |
|
|
|
(10,011,618) |
|
|
|
|
|
|
|
|
|
|
|
|
| Net Assets - 100.0% |
|
|
$ |
772,005,497 |
|
|
|
|
|
|
|
|
|
|
INVESTMENT VALUATION:
Valuation Inputs (C)
|
|
|
|
|
|
|
|
|
|
|
|
|
|
|
|
|
| |
|
Level 1 - Unadjusted Quoted Prices |
|
|
Level 2 - Other Significant Observable Inputs |
|
|
Level 3 - Significant Unobservable Inputs |
|
|
Value |
|
| |
|
|
|
|
|
|
| ASSETS |
|
|
|
|
|
|
|
|
|
|
|
|
|
|
|
|
| Investments |
|
|
|
|
|
|
|
|
|
|
|
|
|
|
|
|
| U.S. Government Obligations |
|
$ |
— |
|
|
$ |
60,829,698 |
|
|
$ |
— |
|
|
$ |
60,829,698 |
|
| U.S. Government Agency Obligations |
|
|
— |
|
|
|
50,616,270 |
|
|
|
— |
|
|
|
50,616,270 |
|
| Short-Term U.S. Government Agency Obligations |
|
|
— |
|
|
|
99,542,291 |
|
|
|
— |
|
|
|
99,542,291 |
|
| Short-Term U.S. Government Obligations |
|
|
— |
|
|
|
247,324,508 |
|
|
|
— |
|
|
|
247,324,508 |
|
| Repurchase Agreements |
|
|
— |
|
|
|
323,704,348 |
|
|
|
— |
|
|
|
323,704,348 |
|
|
|
|
|
|
|
|
|
|
|
|
|
|
|
|
|
|
| Total Investments |
|
$ |
— |
|
|
$ |
782,017,115 |
|
|
$ |
— |
|
|
$ |
782,017,115 |
|
|
|
|
|
|
|
|
|
|
|
|
|
|
|
|
|
|
The Notes to Financial Statements are an integral part of this report.
|
|
|
|
|
| Transamerica Series Trust |
|
|
|
Semi-Annual Financial Statements 2024 |
|
|
Page 2 |
|
|
Transamerica BlackRock Government Money Market VP
SCHEDULE OF INVESTMENTS (continued)
At June 30, 2024
(unaudited)
FOOTNOTES TO SCHEDULE OF INVESTMENTS:
| (A) |
Floating or variable rate security. The rate disclosed is as of June 30, 2024. For securities based on a published reference rate and spread, the reference rate and spread are indicated within the description. Variable rate securities with a floor or ceiling feature are disclosed at the inherent rate, where applicable. Certain variable rate securities are not based on a published reference rate and spread, but are determined by the issuer or agent and are based on current market conditions; these securities do not indicate a reference rate and spread in the description. |
| (B) |
Rate disclosed reflects the yield at June 30, 2024. |
| (C) |
There were no transfers in or out of Level 3 during the period ended June 30, 2024. Please reference the Investment Valuation section of the Notes to Financial Statements for more information regarding investment valuation and pricing inputs. |
PORTFOLIO ABBREVIATION(S):
SOFR Secured Overnight Financing Rate
The Notes to Financial Statements are an integral part of this report.
|
|
|
|
|
| Transamerica Series Trust |
|
|
|
Semi-Annual Financial Statements 2024 |
|
|
Page 3 |
|
|
Transamerica BlackRock Government Money Market VP
STATEMENT OF ASSETS AND LIABILITIES
At June 30, 2024
(unaudited)
|
|
|
|
|
|
|
| Assets: |
|
|
|
|
| Investments, at value (cost $458,312,767) |
|
$ |
458,312,767 |
|
| Repurchase agreement, at value (cost $323,704,348) |
|
|
323,704,348 |
|
| Receivables and other assets: |
|
|
|
|
| Shares of beneficial interest sold |
|
|
85,072 |
|
| Interest |
|
|
1,270,794 |
|
| Prepaid expenses |
|
|
3,178 |
|
|
|
| Total assets |
|
|
783,376,159 |
|
|
|
| Liabilities: |
|
|
|
|
| Payables and other liabilities: |
|
|
|
|
| Investments purchased |
|
|
6,700,000 |
|
| Shares of beneficial interest redeemed |
|
|
4,261,079 |
|
| Investment management fees |
|
|
143,904 |
|
| Distribution and service fees |
|
|
109,827 |
|
| Transfer agent costs |
|
|
1,034 |
|
| Trustee and CCO fees |
|
|
2,649 |
|
| Audit and tax fees |
|
|
12,705 |
|
| Custody fees |
|
|
61,354 |
|
| Legal fees |
|
|
19,837 |
|
| Printing and shareholder reports fees |
|
|
36,823 |
|
| Other accrued expenses |
|
|
21,450 |
|
|
|
| Total liabilities |
|
|
11,370,662 |
|
|
|
| Net assets |
|
$ |
772,005,497 |
|
|
|
| Net assets consist of: |
|
|
|
|
| Capital stock ($0.01 par value) |
|
$ |
7,720,062 |
|
| Additional paid-in capital |
|
|
764,285,052 |
|
| Total distributable earnings (accumulated losses) |
|
|
383 |
|
|
|
| Net assets |
|
$ |
772,005,497 |
|
|
|
| Net assets by class: |
|
|
|
|
| Initial Class |
|
$ |
209,169,143 |
|
| Service Class |
|
|
562,836,354 |
|
|
|
| Shares outstanding: |
|
|
|
|
| Initial Class |
|
|
209,170,241 |
|
| Service Class |
|
|
562,835,955 |
|
|
|
| Net asset value and offering price per share: |
|
|
|
|
| Initial Class |
|
$ |
1.00 |
|
| Service Class |
|
|
1.00 |
|
STATEMENT OF OPERATIONS
For the period ended June 30, 2024
(unaudited)
|
|
|
|
|
|
|
| Investment income: |
|
|
|
|
| Interest income |
|
$ |
21,294,053 |
|
|
|
| Total investment income |
|
|
21,294,053 |
|
|
|
| Expenses: |
|
|
|
|
| Investment management fees |
|
|
950,623 |
|
| Distribution and service fees: |
|
|
|
|
| Service Class |
|
|
730,183 |
|
| Transfer agent costs |
|
|
4,710 |
|
| Trustee and CCO fees |
|
|
18,706 |
|
| Audit and tax fees |
|
|
12,538 |
|
| Custody fees |
|
|
61,553 |
|
| Legal fees |
|
|
34,903 |
|
| Printing and shareholder reports fees |
|
|
36,924 |
|
| Other |
|
|
27,782 |
|
|
|
| Total expenses |
|
|
1,877,922 |
|
|
|
| Net investment income (loss) |
|
|
19,416,131 |
|
|
|
| Net increase (decrease) in net assets resulting from operations |
|
$ |
19,416,131 |
|
The Notes to Financial Statements are an integral part of this report.
|
|
|
|
|
| Transamerica Series Trust |
|
|
|
Semi-Annual Financial Statements 2024 |
|
|
Page 4 |
|
|
Transamerica BlackRock Government Money Market VP
STATEMENT OF CHANGES IN NET ASSETS
For the period and year ended:
|
|
|
|
|
|
|
|
|
| |
|
June 30, 2024 (unaudited) |
|
December 31, 2023 |
|
|
|
| From operations: |
|
|
|
|
|
|
|
|
| Net investment income (loss) |
|
$ |
19,416,131 |
|
|
$ |
40,015,283 |
|
| Net realized gain (loss) |
|
|
— |
|
|
|
6,992 |
|
|
|
|
| Net increase (decrease) in net assets resulting from operations |
|
|
19,416,131 |
|
|
|
40,022,275 |
|
|
|
|
| Dividends and/or distributions to shareholders: |
|
|
|
|
|
|
|
|
| Initial Class |
|
|
(5,293,163 |
) |
|
|
(10,187,233 |
) |
| Service Class |
|
|
(14,122,967 |
) |
|
|
(29,828,050 |
) |
|
|
|
| Net increase (decrease) in net assets resulting from dividends and/or distributions to shareholders |
|
|
(19,416,130 |
) |
|
|
(40,015,283 |
) |
|
|
|
| Capital share transactions: |
|
|
|
|
|
|
|
|
| Proceeds from shares sold: |
|
|
|
|
|
|
|
|
| Initial Class |
|
|
22,362,956 |
|
|
|
46,152,646 |
|
| Service Class |
|
|
64,871,328 |
|
|
|
130,998,840 |
|
|
|
|
| |
|
|
87,234,284 |
|
|
|
177,151,486 |
|
| Dividends and/or distributions reinvested: |
|
|
|
|
|
|
|
|
| Initial Class |
|
|
5,293,163 |
|
|
|
10,187,144 |
|
| Service Class |
|
|
14,122,967 |
|
|
|
29,828,534 |
|
| |
|
|
19,416,130 |
|
|
|
40,015,678 |
|
| Cost of shares redeemed: |
|
|
|
|
|
|
|
|
| Initial Class |
|
|
(31,015,001 |
) |
|
|
(62,803,090 |
) |
| Service Class |
|
|
(142,190,231 |
) |
|
|
(205,746,381 |
) |
|
|
|
| |
|
|
(173,205,232 |
) |
|
|
(268,549,471 |
) |
|
|
|
| Net increase (decrease) in net assets resulting from capital share transactions |
|
|
(66,554,818 |
) |
|
|
(51,382,307 |
) |
|
|
|
| Net increase (decrease) in net assets |
|
|
(66,554,817 |
) |
|
|
(51,375,315 |
) |
|
|
|
| Net assets: |
|
|
|
|
|
|
|
|
| Beginning of period/year |
|
|
838,560,314 |
|
|
|
889,935,629 |
|
| End of period/year |
|
$ |
772,005,497 |
|
|
$ |
838,560,314 |
|
|
|
|
| Capital share transactions - shares: |
|
|
|
|
|
|
|
|
| Shares issued: |
|
|
|
|
|
|
|
|
| Initial Class |
|
|
22,362,956 |
|
|
|
46,153,202 |
|
| Service Class |
|
|
64,871,328 |
|
|
|
131,000,537 |
|
|
|
|
| |
|
|
87,234,284 |
|
|
|
177,153,739 |
|
| Shares reinvested: |
|
|
|
|
|
|
|
|
| Initial Class |
|
|
5,293,163 |
|
|
|
10,187,144 |
|
| Service Class |
|
|
14,122,967 |
|
|
|
29,828,534 |
|
|
|
|
| |
|
|
19,416,130 |
|
|
|
40,015,678 |
|
| Shares redeemed: |
|
|
|
|
|
|
|
|
| Initial Class |
|
|
(31,015,001 |
) |
|
|
(62,803,090 |
) |
| Service Class |
|
|
(142,190,231 |
) |
|
|
(205,746,381 |
) |
|
|
|
| |
|
|
(173,205,232 |
) |
|
|
(268,549,471 |
) |
|
|
|
| Net increase (decrease) in shares outstanding: |
|
|
|
|
|
|
|
|
| Initial Class |
|
|
(3,358,882 |
) |
|
|
(6,462,744 |
) |
| Service Class |
|
|
(63,195,936 |
) |
|
|
(44,917,310 |
) |
|
|
|
| |
|
|
(66,554,818 |
) |
|
|
(51,380,054 |
) |
The Notes to Financial Statements are an integral part of this report.
|
|
|
|
|
| Transamerica Series Trust |
|
|
|
Semi-Annual Financial Statements 2024 |
|
|
Page 5 |
|
|
Transamerica BlackRock Government Money Market VP
FINANCIAL HIGHLIGHTS
|
|
|
|
|
|
|
|
|
|
|
|
|
|
|
|
|
|
|
|
|
|
|
|
|
| For a share outstanding during the period and years indicated: |
|
Initial Class |
|
|
|
|
|
|
|
| |
|
June 30, 2024 (unaudited) |
|
December 31, 2023 |
|
December 31, 2022 |
|
December 31, 2021 |
|
December 31, 2020 |
|
December 31, 2019 |
|
|
|
|
|
|
|
| Net asset value, beginning of period/year |
|
$ |
1.00 |
|
|
$ |
1.00 |
|
|
$ |
1.00 |
|
|
$ |
1.00 |
|
|
$ |
1.00 |
|
|
$ |
1.00 |
|
|
|
|
|
|
|
|
| Investment operations: |
|
|
|
|
|
|
|
|
|
|
|
|
|
|
|
|
|
|
|
|
|
|
|
|
|
|
|
|
|
|
|
| Net investment income (loss)(A) |
|
|
0.03 |
|
|
|
0.05 |
|
|
|
0.01 |
|
|
|
0.00 |
(B) |
|
|
0.00 |
(B) |
|
|
0.02 |
|
|
|
|
|
|
|
|
| Net realized and unrealized gain (loss) |
|
|
— |
|
|
|
0.00 |
(B) |
|
|
— |
|
|
|
— |
|
|
|
— |
|
|
|
— |
|
|
|
|
|
|
|
|
| Total investment operations |
|
|
0.03 |
|
|
|
0.05 |
|
|
|
0.01 |
|
|
|
0.00 |
(B) |
|
|
0.00 |
(B) |
|
|
0.02 |
|
|
|
|
|
|
|
|
| Dividends and/or distributions to shareholders: |
|
|
|
|
|
|
|
|
|
|
|
|
|
|
|
|
|
|
|
|
|
|
|
|
|
|
|
|
|
|
|
| Net investment income |
|
|
(0.03 |
) |
|
|
(0.05 |
) |
|
|
(0.01 |
) |
|
|
(0.00 |
)(B) |
|
|
(0.00 |
)(B) |
|
|
(0.02 |
) |
|
|
|
|
|
|
|
| Net asset value, end of period/year |
|
$ |
1.00 |
|
|
$ |
1.00 |
|
|
$ |
1.00 |
|
|
$ |
1.00 |
|
|
$ |
1.00 |
|
|
$ |
1.00 |
|
| |
|
|
|
|
|
|
|
|
|
|
|
|
|
|
|
|
|
|
|
|
|
|
|
|
|
|
|
|
|
|
|
| Total return |
|
|
2.54 |
%(C) |
|
|
4.87 |
% |
|
|
1.39 |
% |
|
|
0.00 |
% |
|
|
0.29 |
% |
|
|
1.95 |
% |
|
|
|
|
|
|
|
| Ratio and supplemental data: |
|
|
|
|
|
|
|
|
|
|
|
|
|
|
|
|
|
|
|
|
|
|
|
|
|
|
|
|
|
|
|
| Net assets end of period/year (000’s) |
|
$ |
209,169 |
|
|
$ |
212,528 |
|
|
$ |
218,990 |
|
|
$ |
197,487 |
|
|
$ |
228,116 |
|
|
$ |
176,468 |
|
|
|
|
|
|
|
|
| Expenses to average net assets |
|
|
|
|
|
|
|
|
|
|
|
|
|
|
|
|
|
|
|
|
|
|
|
|
|
|
|
|
|
|
|
| Excluding waiver and/or reimbursement and recapture |
|
|
0.29 |
%(D) |
|
|
0.29 |
% |
|
|
0.28 |
% |
|
|
0.29 |
% |
|
|
0.37 |
% |
|
|
0.29 |
% |
|
|
|
|
|
|
|
| Including waiver and/or reimbursement and recapture |
|
|
0.29 |
%(D) |
|
|
0.29 |
%(E) |
|
|
0.24 |
%(E) |
|
|
0.07 |
%(E) |
|
|
0.25 |
%(E) |
|
|
0.29 |
% |
|
|
|
|
|
|
|
| Net investment income (loss) to average net assets |
|
|
5.09 |
%(D) |
|
|
4.75 |
% |
|
|
1.42 |
% |
|
|
0.00 |
%(F) |
|
|
0.25 |
% |
|
|
1.96 |
% |
| (A) |
Calculated based on average number of shares outstanding. |
| (B) |
Rounds to less than $0.01 or $(0.01). |
| (E) |
Transamerica Asset Management, Inc. or any of its affiliates may voluntarily waive fees and/or reimburse expenses of the class for competitive reasons such as to maintain the expense ratio, or when appropriate, to maintain the yield from becoming negative. Any such voluntary waiver or expense reimbursement may be discontinued by Transamerica Asset Management, Inc. or its affiliates at any time. Transamerica Asset Management, Inc. is entitled to reimbursement by the class of amounts voluntarily waived and/or reimbursed during the previous 36 months so long as the reimbursement does not result in the class’s effective daily yield being negative. Any such reimbursement may result in the class’s expenses exceeding the contractual expense cap for the class. See the Fees and Other Affiliated Transactions section of the Notes to Financial Statements for more information. |
| (F) |
Rounds to less than 0.01% or (0.01)%. |
The Notes to Financial Statements are an integral part of this report.
|
|
|
|
|
| Transamerica Series Trust |
|
|
|
Semi-Annual Financial Statements 2024 |
|
|
Page 6 |
|
|
Transamerica BlackRock Government Money Market VP
FINANCIAL HIGHLIGHTS (continued)
|
|
|
|
|
|
|
|
|
|
|
|
|
|
|
|
|
|
|
|
|
|
|
|
|
| For a share outstanding during the period and years indicated: |
|
Service Class |
|
|
|
|
|
|
|
| |
|
June 30, 2024 (unaudited) |
|
December 31, 2023 |
|
December 31, 2022 |
|
December 31, 2021 |
|
December 31, 2020 |
|
December 31, 2019 |
|
|
|
|
|
|
|
| Net asset value, beginning of period/year |
|
$ |
1.00 |
|
|
$ |
1.00 |
|
|
$ |
1.00 |
|
|
$ |
1.00 |
|
|
$ |
1.00 |
|
|
$ |
1.00 |
|
|
|
|
|
|
|
|
| Investment operations: |
|
|
|
|
|
|
|
|
|
|
|
|
|
|
|
|
|
|
|
|
|
|
|
|
|
|
|
|
|
|
|
| Net investment income (loss)(A) |
|
|
0.02 |
|
|
|
0.05 |
|
|
|
0.01 |
|
|
|
0.00 |
(B) |
|
|
0.00 |
(B) |
|
|
0.02 |
|
|
|
|
|
|
|
|
| Net realized and unrealized gain (loss) |
|
|
— |
|
|
|
0.00 |
(B) |
|
|
— |
|
|
|
— |
|
|
|
— |
|
|
|
— |
|
|
|
|
|
|
|
|
| Total investment operations |
|
|
0.02 |
|
|
|
0.05 |
|
|
|
0.01 |
|
|
|
0.00 |
(B) |
|
|
0.00 |
(B) |
|
|
0.02 |
|
|
|
|
|
|
|
|
| Dividends and/or distributions to shareholders: |
|
|
|
|
|
|
|
|
|
|
|
|
|
|
|
|
|
|
|
|
|
|
|
|
|
|
|
|
|
|
|
| Net investment income |
|
|
(0.02 |
) |
|
|
(0.05 |
) |
|
|
(0.01 |
) |
|
|
(0.00 |
)(B) |
|
|
(0.00 |
)(B) |
|
|
(0.02 |
) |
|
|
|
|
|
|
|
| Net asset value, end of period/year |
|
$ |
1.00 |
|
|
$ |
1.00 |
|
|
$ |
1.00 |
|
|
$ |
1.00 |
|
|
$ |
1.00 |
|
|
$ |
1.00 |
|
| |
|
|
|
|
|
|
|
|
|
|
|
|
|
|
|
|
|
|
|
|
|
|
|
|
|
|
|
|
|
|
|
| Total return |
|
|
2.42 |
%(C) |
|
|
4.67 |
% |
|
|
1.39 |
% |
|
|
0.00 |
% |
|
|
0.25 |
% |
|
|
1.70 |
% |
|
|
|
|
|
|
|
| Ratio and supplemental data: |
|
|
|
|
|
|
|
|
|
|
|
|
|
|
|
|
|
|
|
|
|
|
|
|
|
|
|
|
|
|
|
| Net assets end of period/year (000’s) |
|
$ |
562,836 |
|
|
$ |
626,032 |
|
|
$ |
670,946 |
|
|
$ |
552,199 |
|
|
$ |
671,955 |
|
|
$ |
386,123 |
|
|
|
|
|
|
|
|
| Expenses to average net assets |
|
|
|
|
|
|
|
|
|
|
|
|
|
|
|
|
|
|
|
|
|
|
|
|
|
|
|
|
|
|
|
| Excluding waiver and/or reimbursement and recapture |
|
|
0.54 |
%(D) |
|
|
0.54 |
% |
|
|
0.53 |
% |
|
|
0.54 |
% |
|
|
0.62 |
% |
|
|
0.54 |
% |
|
|
|
|
|
|
|
| Including waiver and/or reimbursement and recapture |
|
|
0.54 |
%(D) |
|
|
0.48 |
%(E) |
|
|
0.24 |
%(E) |
|
|
0.07 |
%(E) |
|
|
0.27 |
%(E) |
|
|
0.54 |
% |
|
|
|
|
|
|
|
| Net investment income (loss) to average net assets |
|
|
4.84 |
%(D) |
|
|
4.56 |
% |
|
|
1.47 |
% |
|
|
0.00 |
%(F) |
|
|
0.17 |
% |
|
|
1.70 |
% |
| (A) |
Calculated based on average number of shares outstanding. |
| (B) |
Rounds to less than $0.01 or $(0.01). |
| (E) |
Transamerica Asset Management, Inc. or any of its affiliates may voluntarily waive fees and/or reimburse expenses of the class for competitive reasons such as to maintain the expense ratio, or when appropriate, to maintain the yield from becoming negative. Any such voluntary waiver or expense reimbursement may be discontinued by Transamerica Asset Management, Inc. or its affiliates at any time. Transamerica Asset Management, Inc. is entitled to reimbursement by the class of amounts voluntarily waived and/or reimbursed during the previous 36 months so long as the reimbursement does not result in the class’s effective daily yield being negative. Any such reimbursement may result in the class’s expenses exceeding the contractual expense cap for the class. See the Fees and Other Affiliated Transactions section of the Notes to Financial Statements for more information. |
| (F) |
Rounds to less than 0.01% or (0.01)%. |
The Notes to Financial Statements are an integral part of this report.
|
|
|
|
|
| Transamerica Series Trust |
|
|
|
Semi-Annual Financial Statements 2024 |
|
|
Page 7 |
|
|
Transamerica BlackRock Government Money Market VP
NOTES TO FINANCIAL STATEMENTS
At June 30, 2024
(unaudited)
1. ORGANIZATION
Transamerica Series Trust (“TST”) is an open-end management investment company registered under the Investment Company Act of 1940, as amended (the “1940 Act”). TST applies investment company accounting and reporting guidance. TST serves as a funding vehicle for variable life insurance, variable annuity, and group annuity products. Transamerica BlackRock Government Money Market VP (the “Portfolio”) is a series of TST and is classified as diversified under the 1940 Act. The Portfolio currently offers two classes of shares, Initial Class and Service Class.
The only shareholders of the Portfolio are affiliated insurance company separate accounts and/or affiliated asset allocation portfolios. Contract holders of the variable life and annuity contracts are not shareholders of the Portfolio. For ease of reference, shareholders and contract holders are collectively referred to in this report as “shareholders.”
This report must be accompanied or preceded by the Portfolio’s current prospectus, which contains additional information about the Portfolio, including risks, as well as investment objectives and strategies.
Transamerica Asset Management, Inc. (“TAM”) serves as investment manager for the Portfolio pursuant to an investment management agreement. TAM provides continuous and regular investment management services to the Portfolio. TAM supervises the Portfolio’s investments, conducts its investment program and provides supervisory, compliance and administrative services to the Portfolio.
TAM currently acts as a “manager of managers” and has hired sub-advisers to furnish day-to-day investment advice and recommendations. TAM may, in the future, determine to provide all aspects of the day-to-day management of the Portfolio without the use of a sub-adviser. When acting as a manager of managers, TAM provides investment management services that include, without limitation, the design and development of the Portfolio and its investment strategies and the ongoing review and evaluation of those investment strategies including recommending changes in strategy where it believes appropriate or advisable; the selection of one or more sub-advisers for the Portfolio employing a combination of quantitative and qualitative screens, research, analysis and due diligence; negotiation of sub-advisory agreements and fees; oversight and monitoring of sub-advisers and recommending changes to sub-advisers where it believes appropriate or advisable; recommending portfolio combinations and liquidations where it believes appropriate or advisable; selection and oversight of transition managers, as needed; regular supervision of the Portfolio’s investments; regular review and evaluation of sub-adviser performance; daily monitoring of the sub-advisers’ buying and selling of securities for the Portfolio; regular review of holdings; ongoing trade oversight and analysis; regular monitoring to ensure adherence to investment process; regular calls and periodic on-site visits with sub-advisers; portfolio construction and asset allocation when using multiple sub-advisers for the Portfolio; risk management oversight and analysis; oversight of negotiation of investment documentation and agreements; design, development, implementation and regular monitoring of the valuation process; periodic due diligence reviews of pricing vendors and vendor methodology; design, development, implementation and regular monitoring of the compliance process; respond to regulatory inquiries and determine appropriate litigation strategy, as needed; review of proxies voted by sub-advisers; oversight of preparation and review of materials for meetings of the Portfolio’s Board of Trustees (the “Board”), participation in these meetings and preparation of regular communications with the Board; oversight of preparation and review of prospectuses, shareholder reports and other disclosure materials and regulatory filings for the Portfolio; oversight of other service providers to the Portfolio, such as the custodian, the transfer agent, the Portfolio’s independent accounting firm and legal counsel; supervision of the performance of recordkeeping and shareholder relations functions for the Portfolio; and oversight of cash management services. TAM uses a variety of quantitative and qualitative tools to carry out its investment management services. TAM, not the Portfolio, is responsible for paying the sub-adviser(s) for their services, and sub-advisory fees are TAM’s expense.
TAM’s investment management services also include the provision of supervisory and administrative services to the Portfolio. These services include performing certain administrative services for the Portfolio and supervising and overseeing the administrative, clerical, recordkeeping and bookkeeping services provided to the Portfolio by State Street Bank and Trust Company (“State Street”), to whom TAM has outsourced the provision of certain sub-administration services. To the extent agreed upon by TAM and the Portfolio from time to time, TAM’s supervisory and administrative services include, but are not limited to: monitoring and verifying the custodian’s daily calculation of the Net Asset Values (“NAV”); shareholder relations functions; compliance services; valuation services; assisting in due diligence and in the oversight and monitoring of certain activities of sub-advisers and certain aspects of Portfolio investments; assisting with Portfolio combinations and liquidations; oversight of the preparation and filing, and review, of all returns and reports, in connection with federal, state and local taxes; oversight and review of regulatory reporting; supervising and coordinating the Portfolio’s custodian and dividend disbursing agent and monitoring their services to the Portfolio; assisting the Portfolio in preparing reports to shareholders; acting as liaison with the Portfolio’s independent public accountants and providing, upon request, analyses, fiscal year summaries and other audit related services; assisting in the preparation of agendas and supporting documents for and minutes of meetings of trustees and committees of trustees; assisting in the preparation of regular communications with the trustees; and providing personnel and office space, telephones and other office equipment as necessary in order for TAM to perform supervisory and administrative services to the Portfolio. The Portfolio
|
|
|
| Transamerica Series Trust |
|
Semi-Annual Financial Statements 2024 |
Page 8
Transamerica BlackRock Government Money Market VP
NOTES TO FINANCIAL STATEMENTS (continued)
At June 30, 2024
(unaudited)
1. ORGANIZATION (continued)
pays certain fees and expenses to State Street for sub-administration services which are not administrative services covered by the management agreement with TAM or paid for through the management fees payable thereunder. For the period ended June 30, 2024, (i) the expenses paid to State Street for sub-administration services by the Portfolio are shown as a part of Other expenses within the Statement of Operations and (ii) the expenses payable to State Street for sub-administration services from the Portfolio are shown as part of Other accrued expenses within the Statement of Assets and Liabilities.
2. SIGNIFICANT ACCOUNTING POLICIES
In preparing the Portfolio’s financial statements in accordance with Generally Accepted Accounting Principles in the United States of America (“GAAP”), estimates or assumptions (which could differ from actual results) may be used that affect reported amounts and disclosures. The following is a summary of significant accounting policies followed by the Portfolio.
Security transactions and investment income: Security transactions are accounted for on the trade date. Security gains and losses are calculated on a first-in, first-out basis. Dividend income, if any, is recorded on the ex-dividend date or, in the case of foreign securities, as soon as the Portfolio is informed of the ex-dividend dates, net of foreign taxes. Non-cash dividends, if any, are recorded on the ex-dividend date at fair value. Interest income, if any, is recorded on the accrual basis from settlement date, net of foreign taxes. Fixed income premiums and discounts are amortized and/or accreted over the lives of the respective securities.
Multiple class operations, income, and expenses: Income, non-class specific expenses, and realized and unrealized gains and losses are allocated to each class daily based upon net assets. Each class bears its own specific expenses in addition to the allocated non-class specific expenses.
Distributions to shareholders: Distributions are recorded on the ex-dividend date and are determined in accordance with federal income tax regulations, which may differ from GAAP.
Commission recapture: The sub-adviser(s), to the extent consistent with the best execution and usual commission rate policies and practices, may elect to place security transactions of the Portfolio with broker/dealers with which TST has established a commission recapture program. A commission recapture program is any arrangement under which a broker/dealer applies a portion of the commissions received by such broker/dealer on the security transactions to the Portfolio. In no event will commissions, paid by the Portfolio, be used to pay expenses that would otherwise be borne by any other Portfolios within TST, or by any other party.
There were no commissions recaptured during the period ended June 30, 2024 by the Portfolio.
Indemnification: In the normal course of business, the Portfolio enters into contracts that contain a variety of representations that provide general indemnifications. The Portfolio’s maximum exposure under these arrangements is unknown, as this would involve future claims that may be made against the Portfolio and/or its affiliates that have not yet occurred. However, based on experience, the Portfolio expects the risk of loss to be remote.
3. INVESTMENT VALUATION
TAM has been designated as the Portfolio’s valuation designee pursuant to Rule 2a-5 under the 1940 Act with responsibility for fair valuation subject to oversight by the Portfolio’s Board of Trustees. The net asset value of the Portfolio is computed as of the official close of the New York Stock Exchange (“NYSE”) each day the NYSE is open for business.
TAM utilizes various methods to measure the fair value of its investments on a recurring basis. GAAP establishes a hierarchy that prioritizes inputs to valuation methods. The inputs or methodology used for valuing securities are not necessarily an indication of the risk associated with investing in those securities. The three levels (“Levels”) of inputs of the fair value hierarchy are defined as follows:
Level 1—Unadjusted quoted prices in active markets for identical securities.
Level 2—Inputs, other than quoted prices included in Level 1, which are observable, either directly or indirectly. These inputs may include quoted prices for the identical instrument on an inactive market, prices for similar instruments, interest rates, prepayment speeds, credit risk, yield curves, default rates, and similar data.
Level 3—Unobservable inputs based on the best information available in the circumstances, to the extent observable inputs are not available, which may include TAM’s own assumptions used in determining the fair value of the Portfolio’s investments.
|
|
|
| Transamerica Series Trust |
|
Semi-Annual Financial Statements 2024 |
Page 9
Transamerica BlackRock Government Money Market VP
NOTES TO FINANCIAL STATEMENTS (continued)
At June 30, 2024
(unaudited)
3. INVESTMENT VALUATION (continued)
The inputs used to measure fair value may fall into different Levels of the fair value hierarchy. In such cases, for disclosure purposes, the Level in the fair value hierarchy that is assigned to the fair value measurement of a security is determined based on the lowest Level input that is significant to the fair value measurement in its entirety. Certain investments that are measured at fair value using NAV per share, or its equivalent, using the “practical expedient” have not been classified in the fair value Levels. The hierarchy classification of inputs used to value the Portfolio’s investments at June 30, 2024, is disclosed within the Investment Valuation section of the Schedule of Investments.
The availability of observable inputs can vary from security to security and is affected by a wide variety of factors, including, but not limited to, the type of security, whether the security is new and not yet established in the marketplace, the liquidity of markets, and other characteristics particular to the security. To the extent that valuation is based on models or inputs that are less observable or unobservable in the market, the determination of fair value requires more judgment. Accordingly, the degree of judgment exercised in determining fair value is generally greatest for instruments categorized in Level 3. Due to the inherent uncertainty of valuation, the determination of values may differ significantly from values that would have been realized had a ready market for investments existed, and the differences could be material.
Fair value measurements: Descriptions of the valuation techniques applied to the Portfolio’s significant categories of assets and liabilities measured at fair value on a recurring basis are as follows:
U.S. government agency obligations: U.S. government agency obligations are comprised of two main categories consisting of agency issued debt and mortgage pass-throughs. Generally, agency issued debt securities are valued in a manner similar to U.S. government obligations. Mortgage pass-throughs include to be announced (“TBA”) securities and mortgage pass-through certificates. Generally, TBA securities and mortgage pass-throughs are valued using dealer quotations. Depending on market activity levels and whether quotations or other observable data are used, these securities are typically categorized in Level 2 of the fair value hierarchy; otherwise they would be categorized in Level 3.
U.S. government obligations: U.S. government obligations are normally valued using a model that incorporates market observable data such as reported sales of similar securities, broker quotes, yields, bids, offers, and reference data. Certain securities are valued by principally using dealer quotations. U.S. government obligations generally are categorized in Level 2 of the fair value hierarchy, or Level 3 if inputs are unobservable.
Short-term notes: The Portfolio normally values short-term government and U.S. government agency securities using a model that incorporates market observable data such as reported sales of similar securities, broker quotes, yields, bids, offers and reference data. Certain securities are valued by principally using dealer quotations. Short-term government and U.S. government agency securities generally are categorized in Level 2 of the fair value hierarchy, or Level 3 if inputs are unobservable.
Repurchase agreements: Repurchase agreements are valued at cost, which approximates fair value. To the extent the inputs are observable and timely, the values are generally categorized in Level 2 of the fair value hierarchy.
4. BORROWINGS AND OTHER FINANCING TRANSACTIONS
The Portfolio may engage in borrowing transactions as a means of raising cash to satisfy redemption requests, for other temporary or emergency purposes or, to the extent permitted by its investment policies, to raise additional cash to be invested in other securities or instruments. When the Portfolio invests borrowing proceeds in other securities, the Portfolio will bear the risk that the market value of the securities in which such proceeds are invested goes down and is insufficient to repay the borrowed proceeds. The Portfolio may borrow on a secured or on an unsecured basis. If the Portfolio enters into a secured borrowing arrangement, a portion of the Portfolio’s assets will be used as collateral. The 1940 Act requires the Portfolio to maintain asset coverage of at least 300% of the amount of its borrowings. Asset coverage means the ratio that the value of the Portfolio’s total assets, minus liabilities other than borrowings, bears to the aggregate amount of all borrowings. Although complying with this requirement has the effect of limiting the amount that the Portfolio may borrow, it does not otherwise mitigate the risks of entering into borrowing transactions.
Interfund lending: The Portfolio, along with other funds and portfolios advised by TAM, may participate in an interfund lending program pursuant to exemptive relief granted by the Securities and Exchange Commission on January 18, 2017. This program allows the Portfolio to lend to and borrow from other funds and portfolios advised by TAM. Interfund lending transactions are subject to the conditions of the exemptive relief which places limits on the amount of lending or borrowing a Portfolio may participate in under the program. Interest earned or paid on an interfund lending transaction will be based on the average of certain current market rates. For the period ended June 30, 2024, the Portfolio has not utilized the program.
|
|
|
| Transamerica Series Trust |
|
Semi-Annual Financial Statements 2024 |
Page 10
Transamerica BlackRock Government Money Market VP
NOTES TO FINANCIAL STATEMENTS (continued)
At June 30, 2024
(unaudited)
4. BORROWINGS AND OTHER FINANCING TRANSACTIONS (continued)
Repurchase agreements: In a repurchase agreement, the Portfolio purchases a security and simultaneously commits to resell that security to the seller at an agreed-upon price on an agreed-upon date. Securities purchased subject to a repurchase agreement are held at the Portfolio’s custodian, or designated sub-custodian related to tri-party repurchase agreements, and, pursuant to the terms of the repurchase agreement, must be collateralized by securities with an aggregate market value greater than or equal to 100% of the resale price. The Portfolio will bear the risk of value fluctuations until the securities can be sold and may encounter delays and incur costs in liquidating the securities. In the event of bankruptcy or insolvency of the seller, delays and costs may be incurred.
Repurchase agreements are subject to netting agreements, which are agreements between the Portfolio and its counterparties that provide for the net settlement of all transactions and collateral with the Portfolio, through a single payment, in the event of default or termination. Amounts presented within the Schedule of Investments, and as part of Repurchase agreements, at value within the Statement of Assets and Liabilities are shown on a gross basis. The value of the related collateral for each repurchase agreement, as reflected within the Schedule of Investments, exceeds the value of each repurchase agreement at June 30, 2024.
Repurchase agreements at June 30, 2024, if any, are included within the Schedule of Investments and Statement of Assets and Liabilities.
5. RISK FACTORS
Investing in the Portfolio involves certain key risks related to the Portfolio’s trading activity. Please reference the Portfolio’s prospectus for a more complete discussion of the following risk(s), as well as other risks of investing in the Portfolio.
Market risk: The market prices of the Portfolio’s securities or other assets may go up or down, sometimes rapidly or unpredictably, due to factors such as economic events, inflation, changes in interest rates, governmental actions or interventions, actions taken by the U.S. Federal Reserve or foreign central banks, market disruptions caused by tariffs, trade disputes or other factors, political developments, armed conflicts, economic sanctions, cybersecurity events, investor sentiment, the global and domestic effects of widespread or local health, weather or climate events, and other factors that may or may not be related to the issuer of the security or other asset. If the market prices of the Portfolio’s securities and assets fall, the value of your investment in the Portfolio could go down.
Economies and financial markets throughout the world are increasingly interconnected. Events or circumstances in one or more countries or regions could be highly disruptive to, and have profound impacts on, global economies or markets. As a result, whether or not the Portfolio invests in securities of issuers located in or with significant exposure to the countries directly affected, the value and liquidity of the Portfolio’s investments may go down.
Government money market fund risk: The Portfolio operates as a “government” money market portfolio under applicable federal regulations and invests in U.S. government securities. Circumstances could arise that would prevent the payment of interest or principal on U.S. government securities, which could adversely affect their value and the Portfolio’s ability to preserve the value of your investment at $1.00 per share. Recent changes in the rules governing money market funds are likely to result in an increased demand for U.S. government securities, which could affect the availability of such instruments for investment and the Portfolio’s ability to pursue its investment strategies. The Portfolio does not currently intend to avail itself of the ability to impose “liquidity fees” on portfolio redemptions, as permitted under Rule 2a-7. However, the Board reserves the right, with notice to shareholders, to change this policy.
Repurchase agreements risk: In a repurchase agreement, the Portfolio purchases securities from a broker-dealer or a bank, called the counterparty, upon the agreement of the counterparty to repurchase the securities from the Portfolio at a later date, and at a specified price. The securities purchased serve as the Portfolio’s collateral for the obligation of the counterparty to repurchase the securities. If the counterparty does not repurchase the securities, the Portfolio is entitled to sell the securities, but the Portfolio may not be able to sell them for the price at which they were purchased, thus causing a loss. If the counterparty becomes insolvent, there is some risk that the Portfolio will not have a right to the securities, or the immediate right to sell the securities.
6. FEES AND OTHER AFFILIATED TRANSACTIONS
TST serves as a funding vehicle for certain affiliated asset allocation portfolios and certain affiliated separate accounts of Transamerica Life Insurance Company (“TLIC”) and Transamerica Financial Life Insurance Company.
TAM, the Portfolio’s investment manager, is directly owned by TLIC and AUSA Holding, LLC (“AUSA”), both of which are indirect, wholly owned subsidiaries of Aegon Ltd. TLIC is owned by Commonwealth General Corporation (“Commonwealth”). Commonwealth and AUSA
|
|
|
| Transamerica Series Trust |
|
Semi-Annual Financial Statements 2024 |
Page 11
Transamerica BlackRock Government Money Market VP
NOTES TO FINANCIAL STATEMENTS (continued)
At June 30, 2024
(unaudited)
6. FEES AND OTHER AFFILIATED TRANSACTIONS (continued)
are wholly owned by Transamerica Corporation (DE). Transamerica Corporation (DE) is wholly owned by Aegon International B.V., which is wholly owned by Aegon Ltd., a Bermuda exempted company with liability limited by shares (formerly, Aegon NV, a Netherlands corporation) and a publicly traded international insurance group.
Transamerica Fund Services, Inc. (“TFS”) is the Portfolio’s transfer agent. Transamerica Capital, Inc. (“TCI”) is the Portfolio’s distributor/principal underwriter. TAM, TFS and TCI are affiliates of Aegon Ltd.
Certain officers and trustees of the Portfolio may also be officers and/or trustees of TAM, TFS and TCI. No interested trustee who is deemed an interested person due to current or former service with TAM or an affiliate of TAM receives compensation from the Portfolio. The Portfolio does pay non-interested persons (independent trustees), as disclosed in Trustee and CCO fees within the Statement of Operations.
Investment management fees: TAM serves as the Portfolio’s investment manager, performing administration as well as investment advisory services. TAM renders investment advisory, supervisory, and administration services under an investment management agreement and the Portfolio pays a single management fee, which is reflected in Investment management fees within the Statement of Operations.
The Portfolio pays a management fee to TAM based on daily average net assets at the following rates:
|
|
|
|
|
| Breakpoints |
|
Rate |
| First $1 billion |
|
|
0.24 |
% |
| Over $1 billion up to $3 billion |
|
|
0.22 |
|
| Over $3 billion |
|
|
0.21 |
|
TAM has contractually agreed to waive fees and/or reimburse Portfolio expenses to the extent that the total operating expenses excluding, as applicable, acquired fund fees and expenses, interest (including borrowing costs and overdraft charges), taxes, brokerage commissions, dividend and interest expenses on securities sold short, extraordinary expenses and other expenses not incurred in the ordinary course of the Portfolio’s business, exceed the following stated annual operating expense limits to the Portfolio’s daily average net assets. To the extent an expense limit changed during the period, the prior limit is also listed below. The expenses waived and/or reimbursed, if any, are included in Expenses waived and/or reimbursed within the Statement of Operations.
|
|
|
|
|
|
|
| Class |
|
Operating Expense Limit |
|
Operating Expense Limit Effective Through |
| Initial Class |
|
|
0.38 |
% |
|
May 1, 2025 |
| Service Class |
|
|
0.63 |
|
|
May 1, 2025 |
TAM is permitted to recapture amounts contractually waived and/or reimbursed to a class during any of the 36 months from the date on which TAM waived fees and/or reimbursed expenses for the class. A class may recapture and reimburse TAM only if such amount does not cause, on any particular business day of the Portfolio, the class’s total annual operating expenses (after the recapture is taken into account) to exceed the Operating Expense Limits or any other lower limit then in effect. Amounts recaptured, if any, by TAM for the period ended June 30, 2024 are disclosed in Recapture of previously waived and/or reimbursed fees within the Statement of Operations.
TAM, on a voluntary basis and in addition to the contractual operating expense limits in effect, from time to time may waive and/or reimburse expenses of the Portfolio, or any classes thereof, to such level(s) as the Trust’s officers have determined or may reasonably determine from time to time. Any such voluntary waiver or expense reimbursement may be discontinued by TAM at any time. These amounts are not subject to recapture by TAM.
Additionally, TAM or any of its affiliates may voluntarily waive fees and/or reimburse expenses of one or more classes of the Portfolio to such level(s) as the Trust’s officers may reasonably determine from time to time in an effort to prevent the Portfolio’s yield from falling below zero. Any such voluntary waiver or expense reimbursement is in addition to any contractual expense limitation arrangements in effect from time to time and may be discontinued by TAM or its affiliates at any time. TAM is entitled to reimbursement by the applicable class(es) of the Portfolio of amounts voluntarily waived and/or reimbursed during the previous 36 months so long as the reimbursement does not result in the class’s effective daily yield being negative. Any such reimbursement may result in the class’s expenses exceeding the contractual
|
|
|
| Transamerica Series Trust |
|
Semi-Annual Financial Statements 2024 |
Page 12
Transamerica BlackRock Government Money Market VP
NOTES TO FINANCIAL STATEMENTS (continued)
At June 30, 2024
(unaudited)
6. FEES AND OTHER AFFILIATED TRANSACTIONS (continued)
expense cap for the class. TAM or its affiliates may request that financial intermediaries reduce or waive amounts payable to those intermediaries with respect to services rendered to the Portfolio or its shareholders, and those reductions or waivers may reduce the amounts waived and/or reimbursed by TAM under the contractual and/or voluntary waiver arrangements with respect to the Portfolio. There can be no assurance that the Portfolio will be able to prevent a negative yield.
Voluntarily waived and/or reimbursed expenses related to the maintenance of the yield are included in Expenses waived and/or reimbursed, and amounts recaptured by TAM under the voluntary yield waiver are included in Recapture of previously waived and/or reimbursed fees, in each case included in the Statement of Operations included in this shareholder report. The actual expense ratio of each class of the Portfolio, including any amounts waived and/or reimbursed and any amounts recaptured under the voluntary yield waiver, are shown in the “Ratio and supplemental data” section in the Portfolio’s Financial Highlights in this shareholder report.
For the years ended December 31, 2021, December 31, 2022, December 31, 2023 and the period ended June 30, 2024, the amounts waived by TAM due to the maintenance of the yield are as follows:
|
|
|
|
|
|
|
|
|
|
|
|
|
|
|
|
|
|
|
|
|
| |
|
Amounts Waived |
|
| |
|
2021 |
|
|
2022 |
|
|
2023 |
|
|
2024 |
|
|
Total |
|
| Initial Class |
|
$ |
489,368 |
|
|
$ |
76,738 |
|
|
$ |
— |
|
|
$ |
— |
|
|
$ |
566,106 |
|
| Service Class |
|
|
1,356,271 |
|
|
|
221,781 |
|
|
|
— |
|
|
|
— |
|
|
|
1,578,052 |
|
As of June 30, 2024, the balances available for recapture by TAM due to the maintenance of the yield are as follows:
|
|
|
|
|
|
|
|
|
|
|
|
|
|
|
|
|
|
|
|
|
| |
|
Amounts Available |
|
| |
|
2021 |
|
|
2022 |
|
|
2023 |
|
|
2024 |
|
|
Total |
|
| Initial Class |
|
$ |
489,318 |
|
|
$ |
76,738 |
|
|
$ |
— |
|
|
$ |
— |
|
|
$ |
566,056 |
|
| Service Class |
|
|
1,356,261 |
|
|
|
221,781 |
|
|
|
— |
|
|
|
— |
|
|
|
1,578,042 |
|
For the 36-month period ended June 30, 2024, the amounts waived from financial intermediaries are as follows:
|
|
|
|
|
|
|
|
|
|
|
|
|
|
|
|
|
|
|
| |
|
Amounts Waived |
|
| |
|
2021 (A) |
|
|
2022 (A) |
|
|
2023 (A) |
|
|
2024 (A) |
|
Total |
|
| Service Class |
|
$ |
1,549,979 |
|
|
$ |
1,574,004 |
|
|
$ |
411,092 |
|
|
$ — |
|
$ |
3,535,075 |
|
| |
(A) |
Not subject to recapture. |
For the 36-month period ended June 30, 2024, there are no amounts waived by TAM due to the operating expense limitation.
As of June 30, 2024, there are no amounts available for recapture by TAM due to the operating expense limitation.
Distribution and service fees: TST has a distribution plan (“Distribution Plan”) pursuant to Rule 12b-1 under the 1940 Act. Pursuant to the Distribution Plan, TST entered into a distribution agreement with TCI as the Portfolio’s distributor.
The Distribution Plan requires the Portfolio to pay distribution fees to TCI as compensation for various distribution activities, not as reimbursement for specific expenses. Under the Distribution Plan and distribution agreement, TCI, on behalf of the Portfolio, is authorized to pay various service providers, as direct payment for expenses incurred in connection with distribution of the Portfolio’s shares.
The fee on the Service Class shares is paid to the insurance companies for providing services and account maintenance for the policyholders who invest in the variable insurance products which invest in the Service Class shares. TCI has determined that it will not seek payment for the distribution expenses incurred by the Portfolio with respect to the Initial Class shares before May 1, 2025. Prior to TCI seeking distribution expenses on Initial Class shares, policy and contract owners will be notified in advance. The Portfolio will pay fees relating to Service Class shares. The distribution and service fees are included in Distribution and service fees within the Statement of Operations.
|
|
|
| Transamerica Series Trust |
|
Semi-Annual Financial Statements 2024 |
Page 13
Transamerica BlackRock Government Money Market VP
NOTES TO FINANCIAL STATEMENTS (continued)
At June 30, 2024
(unaudited)
6. FEES AND OTHER AFFILIATED TRANSACTIONS (continued)
The Portfolio is authorized under the Distribution Plan to pay fees to TCI based on daily average net assets of each applicable class up to the following annual rates:
|
|
|
|
|
| Class |
|
Rate |
| Initial Class |
|
|
0.15 |
% |
| Service Class |
|
|
0.25 |
|
Transfer agent costs: TFS provides transfer agency services under an intercompany agreement with TAM. TFS has outsourced the provision of certain sub-transfer agency services to SS&C Global Investor & Distribution Solutions, Inc. (“SS&C GIDS”). The Portfolio does not pay a separate transfer agent fee to TAM or TFS but does pay certain expenses to SS&C GIDS related to applicable sub-transfer agency services. For the period ended June 30, 2024, (i) the expenses paid to SS&C GIDS by the Portfolio are referred to as transfer agent costs and are included within the Statement of Operations and (ii) the expenses payable to SS&C GIDS by the Portfolio are referred to as transfer agent costs within the Statement of Assets and Liabilities.
Brokerage commissions: The Portfolio incurred no brokerage commissions on security transactions placed with affiliates of the investment manager or sub-adviser(s) for the period ended June 30, 2024.
7. FEDERAL INCOME TAXES AND DISTRIBUTIONS TO SHAREHOLDERS
The Portfolio has not made any provision for federal income or excise taxes due to its policy to distribute all of its taxable income and capital gains to its shareholders and otherwise qualify as a regulated investment company under Subchapter M of the Internal Revenue Code. The Portfolio recognizes the tax benefits of uncertain tax positions only where the position is “more likely than not” to be sustained assuming examination by tax authorities. The Portfolio’s tax returns remain subject to examination by the Internal Revenue Service and state tax authorities three years from the date of filing for federal purposes and four years from the date of filing for state purposes. Management has evaluated the Portfolio’s tax provisions taken for all open tax years, and has concluded that no provision for income tax is required in the Portfolio’s financial statements. If applicable, the Portfolio recognizes interest accrued related to unrecognized tax benefits in relation to interest and penalties expense in Other within the Statement of Operations. The Portfolio identifies its major tax jurisdictions as U.S. Federal, the state of Colorado, and foreign jurisdictions where the Portfolio makes significant investments; however, the Portfolio is not aware of any tax positions for which it is reasonably possible that the total amounts of unrecognized tax benefits will change materially in the next twelve months. Distributions are determined in accordance with income tax regulations, which may differ from GAAP.
As of June 30, 2024, the approximate cost for U.S. federal income tax purposes, and the aggregate gross/net unrealized appreciation (depreciation) in the value of investments (including securities sold short and derivatives, if any) are as follows:
|
|
|
|
|
|
|
|
|
|
|
|
|
| Cost |
|
Gross Appreciation |
|
|
Gross (Depreciation) |
|
|
Net Appreciation (Depreciation) |
| $782,017,115 |
|
$ |
— |
|
|
$ |
— |
|
|
$ |
— |
|
Please see TST’s most recent report on Form N-CSR, available at: www.transamerica.com/annuities/prospectus, for additional information. For the most recently filed complete proxy voting records for the Trust please visit: https://www.transamerica.com/sites/default/files/files/e070d/TST%20N-PX%202021.pdf
|
|
|
| Transamerica Series Trust |
|
Semi-Annual Financial Statements 2024 |
Page 14
Transamerica BlackRock Government Money Market VP
MANAGEMENT AND SUB-ADVISORY AGREEMENT — CONTRACT RENEWAL
(unaudited)
At a meeting of the Board of Trustees of Transamerica Series Trust (the “Trustees” or the “Board”) held on June 12-13, 2024, the Board considered the renewal of the management agreement (the “Management Agreement”) between Transamerica Asset Management, Inc. (“TAM”) and Transamerica Series Trust, on behalf of Transamerica BlackRock Government Money Market VP (the “Portfolio”). The Board also considered the renewal of the investment sub-advisory agreement (the “Sub-Advisory Agreement” and together with the Management Agreement, the “Agreements”) for the Portfolio between TAM and BlackRock Investment Management, LLC (the “Sub-Adviser”).
Following its review and consideration, the Board determined that the terms of the Management Agreement and Sub-Advisory Agreement were reasonable and that the renewal of each of the Agreements was in the best interests of the Portfolio and the holders invested in the Portfolio. The Board, including the independent members of the Board (the “Independent Trustees”), unanimously approved the renewal of each of the Agreements through June 30, 2025.
Prior to reaching their decision, the Trustees requested and received from TAM and the Sub-Adviser certain information. They then reviewed such information as they deemed reasonably necessary to evaluate the Agreements, including information they had previously received from TAM and the Sub-Adviser as part of their regular oversight of the Portfolio, and knowledge they gained over time through meeting with TAM and the Sub-Adviser. Among other materials, the Trustees considered comparative fee, expense and performance information prepared by Broadridge Financial Solutions, Inc. (“Broadridge”), an independent provider of mutual fund performance information, as well as fee, expense and profitability information prepared by TAM. To the extent applicable, the Trustees considered information about fees and performance of comparable funds and/or accounts managed by the Sub-Adviser. The Board also considered reductions to the Portfolio’s expense limits, if any, that took effect after the last renewal of the Agreements. In their review, the Trustees also sought to identify instances in which the Portfolio’s performance, fees, total expenses and/or profitability appeared to be outliers within its respective peer group or other comparative metrics and sought to understand the reasons for such comparative positions.
In their deliberations, the Independent Trustees met privately without representatives of TAM or the Sub-Adviser present and were represented throughout the process by their independent legal counsel. In considering the proposed continuation of each of the Agreements, the Trustees evaluated and weighed a number of considerations that they believed to be relevant in light of the legal advice furnished to them by counsel, including independent legal counsel, and made a decision in the exercise of their own business judgment. They based their decisions on the considerations discussed below, among others, although they did not identify any particular consideration or item of information that was controlling of their decisions, and each Trustee may have attributed different weights to the various factors.
Nature, Extent and Quality of the Services Provided
The Board considered the nature, extent and quality of the services provided by TAM and the Sub-Adviser to the Portfolio in the past and the services anticipated to be provided in the future. The Board also considered the investment approach for the Portfolio; the experience, capability and integrity of TAM’s senior management; the financial resources of TAM; TAM’s management oversight process; TAM’s and the Sub-Adviser’s responsiveness to any questions by the Trustees; and the professional qualifications and compensation program of the portfolio management team of the Sub-Adviser. The Trustees noted that they receive, on a quarterly basis, an execution analysis from Capital Institutional Services, Inc. (CAPIS), an independent provider of trade analyses, for the Sub-Adviser and a comparison of trading results against a peer universe of managers.
The Board also considered the continuous and regular investment management and other services provided by TAM, when acting as a manager of managers, for the portion of the management fee it retains from the Portfolio after payment of the sub-advisory fees. The Board noted that the investment management and other services provided by TAM include the design, development and ongoing review and evaluation of the Portfolio and its investment strategy; the selection, oversight and monitoring of one or more investment sub-advisers to perform certain duties with respect to the Portfolio; ongoing portfolio trading oversight and analysis; risk management oversight and analysis; design, development, implementation and ongoing review and evaluation of a process for the valuation of Portfolio investments; design, development, implementation and ongoing review and evaluation of a compliance program for the Portfolio; design, development, implementation and ongoing review and evaluation of a process for the voting of proxies and exercise of rights to consent to corporate action for Portfolio investments; participation in Board meetings and oversight of preparation of materials for the Board, including materials for Board meetings and regular communications with the Board; oversight of preparation of the Portfolio’s prospectus, statement of additional information, shareholder reports and other disclosure materials and regulatory filings for the Portfolio; and ongoing cash management services for the Portfolio. The Board considered that TAM’s investment management services also include the provision of supervisory and administrative services to the Portfolio. The Board also noted that TAM, as part of the services it provides to all Transamerica mutual funds, including the Portfolio, oversees the services provided by the funds’ custodian, transfer agent, independent accountant and legal counsel and supervises the performance of the recordkeeping and holder service functions of the funds.
Investment Performance
In addition, the Board considered the short- and longer-term performance of the Portfolio in light of its investment objective, policies and strategies, including relative performance against a peer universe of comparable mutual funds, as prepared by Broadridge, for various trailing periods ended December 31, 2023. Based on these considerations, the Board determined that TAM and the Sub-Adviser can provide investment and related services that are appropriate in scope and extent in light of the Portfolio’s investment objectives, policies and strategies and operations, the competitive landscape of the investment company business and investor needs. The Board’s
|
|
|
|
|
| Transamerica Series Trust |
|
|
|
Semi-Annual Financial Statements 2024 |
|
|
Page 15 |
|
|
Transamerica BlackRock Government Money Market VP
MANAGEMENT AND SUB-ADVISORY AGREEMENT — CONTRACT RENEWAL (continued)
(unaudited)
conclusions as to the Portfolio’s performance are summarized below. For purposes of its review, the Board generally used the performance of Service Class Shares. In describing the Portfolio’s performance relative to its peer universe, the summary conclusions characterize performance for the relevant periods in relation to whether it was “above,” “below” or “in line with” the peer universe median and do so using quintile rankings prepared by Broadridge. For simplicity, performance is described as “above” the median if the Portfolio’s performance ranked anywhere in the first or second quintiles, as “below” the median if it ranked anywhere in the fourth or fifth quintiles, or “in line with” the median if it ranked anywhere in the third quintile (i.e., even if its precise return was somewhat above or somewhat below the precise median return).
When considering the Portfolio’s performance, the Trustees considered any representations made by TAM regarding the appropriateness of certain peer groups and benchmarks. They recognized that performance reflects a snapshot of a period as of a specific date, and that consideration of performance data for a different period could generate significantly different performance results. The Trustees also recognized that even longer-term performance can be negatively affected by performance over a short-term period when that short-term performance is significantly below the performance of the comparable benchmark or universe of peer funds, and further noted the relatively close spread in performance among the money market funds in the peer universe over certain periods.
The Board noted that the performance of Service Class Shares of the Portfolio was above the median for its peer universe for the past 3-year period, in line with the median for the past 1- and 5-year periods and below the median for the past 10-year period. The Board noted that the Sub-Adviser had commenced sub-advising the Portfolio on November 1, 2018, pursuant to its current investment strategies. The Trustees noted that the Portfolio transitioned from a “prime” money market portfolio to a “government” money market portfolio on May 1, 2016.
Management Fee and Sub-Advisory Fees and Total Expense Ratio
The Board considered the management fee and total expense ratio of the Portfolio, including information provided by Broadridge comparing the management fee and total expense ratio of the Portfolio to the management fees and total expense ratios of comparable investment companies in both a peer group and broader peer universe compiled by Broadridge. The Board’s conclusions as to the Portfolio’s management fee and total expense ratio are summarized below. For purposes of its review, the Board generally used the actual total expenses (i.e., expenses reflecting any waivers and/or reimbursements) of Service Class Shares. In describing the Portfolio’s management fee and total expense ratio relative to its peer group and peer universe, the summary conclusions characterize management fees and total expense ratios for the relevant periods in relation to whether they were “above,” “below” or “in line with” the peer group or peer universe median and do so using quintile rankings prepared by Broadridge. For simplicity, management fees and total expense ratios are described as “above” the median if the Portfolio’s management fee or total expense ratio ranked anywhere in the fourth or fifth quintiles, as “below” the median if it ranked anywhere in the first or second quintiles, or “in line with” the median if it ranked anywhere in the third quintile (i.e., even if its precise management fee or total expense ratio was somewhat above or somewhat below the precise median management fee or total expense ratio).
The Board also considered the fees charged by the Sub-Adviser for sub-advisory services, as well as the portion of the Portfolio’s management fee retained by TAM following payment of the sub-advisory fee and how the portion of the contractual management fee retained by TAM at a specified asset level compared to the portions retained by other investment advisers managing mutual funds with similar investment strategies as calculated by an independent provider of information.
The Board noted that the Portfolio’s contractual management fee and the actual total expenses (i.e., expenses reflecting any waivers and/or reimbursements) of Service Class Shares of the Portfolio were below the medians for its peer group and peer universe. The Trustees also considered that TAM has entered into an expense limitation arrangement with the Portfolio, which may result in TAM waiving fees for the benefit of holders.
On the basis of these considerations, together with the other information it considered, the Board determined that the management and sub-advisory fees to be received by TAM and the Sub-Adviser under the Management Agreement and Sub-Advisory Agreement are reasonable in light of the services provided.
Cost of Services Provided and Level of Profitability
The Board reviewed information provided by TAM about the cost of providing and procuring fund management services, as well as the costs of the provision of administration, transfer agency and other services, to the Portfolio and to Transamerica Series Trust as a whole by TAM and its affiliates. The Board considered the profitability of TAM and its affiliates in providing these services for the Portfolio and Transamerica Series Trust as a whole. The Trustees recognized the competitiveness of the mutual fund industry and the importance of an investment adviser’s long-term profitability, including for maintaining company and management stability and accountability.
The Board also considered the allocation methodology used for calculating the profitability of TAM and its affiliates. The Board noted that the revenue and expense allocation methodology used by TAM to estimate its profitability with respect to its relationship with the Portfolio had been reviewed previously by an independent consultant. The Trustees considered that TAM reported that it had not made material changes to this methodology, and that the methodology had been applied consistently for the Portfolio.
|
|
|
|
|
| Transamerica Series Trust |
|
|
|
Semi-Annual Financial Statements 2024 |
|
|
Page 16 |
|
|
Transamerica BlackRock Government Money Market VP
MANAGEMENT AND SUB-ADVISORY AGREEMENT — CONTRACT RENEWAL (continued)
(unaudited)
With respect to the Sub-Adviser, the Board noted that the sub-advisory fee is the product of arm’s-length negotiation between TAM and the Sub-Adviser, which is not affiliated with TAM, and is paid by TAM and not the Portfolio. As a result, the Board focused on the profitability of TAM and its affiliates with respect to the Portfolio.
Based on this information, the Board determined that the profitability of TAM and its affiliates from their relationships with the Portfolio was not excessive.
Economies of Scale
The Board considered economies of scale with respect to the management of the Portfolio, whether the Portfolio had appropriately benefited from any economies of scale and whether there was the potential for realization of any future economies of scale. The Board also considered the existence of economies of scale with respect to management of the Transamerica mutual funds overall and the extent to which the Portfolio benefited from any economies of scale. The Board recognized that, as the Portfolio’s assets increase, any economies of scale realized by TAM or the Sub-Adviser may not directly correlate with each other or with any economies of scale that might be realized by the Portfolio. The Board considered the Portfolio’s management fee schedule and the existence of breakpoints and also considered the extent to which TAM shared economies of scale, if any, with the Portfolio through undertakings to limit or reimburse Portfolio expenses and to invest in maintaining and developing its capabilities and services. The Board also considered the Sub-Adviser’s sub-advisory fee schedule and the existence of breakpoints, if any, and how such breakpoints relate to any breakpoints in the Portfolio’s management fee schedule. The Trustees concluded that the Portfolio’s fee structure reflected an appropriate sharing of any efficiencies or economies of scale to date and noted that they will have the opportunity to periodically reexamine the appropriateness of the management fee payable to TAM and the fee paid to the Sub-Adviser in light of any economies of scale experienced in the future.
Benefits to TAM, its Affiliates and/or the Sub-Adviser from their Relationships with the Portfolio
The Board considered other benefits derived by TAM, its affiliates, and/or the Sub-Adviser from their relationships with the Portfolio. The Board noted that TAM does not receive benefits from research obtained with commissions paid to broker-dealers for portfolio transactions (commonly referred to as “soft dollars”) as a result of its relationship with the Portfolio.
Other Considerations
The Board noted that TAM has made a substantial commitment to the recruitment and retention of high-quality personnel and maintains the financial, compliance and operational resources reasonably necessary to manage the Portfolio in a professional manner that is consistent with the best interests of the Portfolio and the holders. In this regard, the Board favorably considered the procedures and policies TAM has in place to enforce compliance with applicable laws and regulations and oversee the portfolio management activities of the Sub-Adviser. The Board also noted that TAM has made an entrepreneurial commitment and undertaken certain business risks with respect to the management and success of the Portfolio.
Conclusion
After consideration of the factors described above, as well as other factors, the Trustees, including the Independent Trustees, concluded that the renewal of the Management Agreement and the Sub-Advisory Agreement was in the best interests of the Portfolio and the holders and voted to approve the renewal of the Agreements.
|
|
|
| Transamerica Series Trust |
|
Semi-Annual Financial Statements 2024 |
Page 17
PROXY VOTING POLICIES AND PROCEDURES AND QUARTERLY PORTFOLIO HOLDINGS
(unaudited)
A description of Transamerica Series Trust’s (the “Trust”) proxy voting policies and procedures is available in the Statement of Additional Information of the Portfolios, available without charge upon request by calling 1-800-851-9777 (toll free) or on the Securities and Exchange Commission’s (“SEC”) website at http://www.sec.gov.
In addition, the Portfolio is required to file Form N-PX, with their complete proxy voting records for the most recent 12 months ended June 30th, no later than August 31st of each year. The Form is available without charge: (1) on the Transamerica Funds website at https://www.transamerica.com/sites/default/files/files/e070d/TST%20N-PX%202021.pdf; and (2) on the SEC’s website at http://www.sec.gov.
Each fiscal quarter, the Portfolios, except Transamerica BlackRock Government Money Market VP, will file with the SEC a complete schedule of its monthly portfolio holdings on Form N-PORT. The Portfolios’ holdings as of the end of the third month of every fiscal quarter, as reported on Form N-PORT, will be publicly available on the SEC’s website at http://www.sec.gov within 60 days of the end of the fiscal quarter.
On a monthly basis, Transamerica BlackRock Government Money Market VP will file with the SEC portfolio holdings information on Form N-MFP3. A complete schedule of portfolio holdings is also available at www.transamerica.com.
You may also visit the Trust’s website at www.transamerica.com/annuities/prospectus for this and other information about the Portfolios and the Trust.
Important Notice Regarding Delivery of Shareholder Documents
Every year we provide shareholders informative materials such as the Transamerica Series Trust Annual Report, the Transamerica Series Trust Prospectus, and other required documents that keep you informed regarding your Portfolios. To the extent provided by mail, Transamerica Series Trust will only send one piece per mailing address, a method that saves your Portfolios money by reducing mailing and printing costs. We will continue to do this unless you tell us not to. To elect to receive individual mailings, simply call a Transamerica Customer Service Representative toll free at 1-800-851-9777, 8 a.m. to 7 p.m. Eastern Time, Monday-Friday. Your request will take effect within 30 days.
|
|
|
|
|
| Transamerica Series Trust |
|
|
|
Semi-Annual Financial Statements 2024 |
|
|
Page 18 |
|
|
NOTICE OF PRIVACY POLICY
(unaudited)
Your privacy is very important to us. We want you to understand what information we collect and how we use it. We collect and use “nonpublic personal information” in connection with providing our customers with a broad range of financial products and services as effectively and conveniently as possible. We treat nonpublic personal information in accordance with our Privacy Policy.
What Information We Collect and From Whom We Collect It
We may collect nonpublic personal information about you from the following sources:
| • |
|
Information we receive from you on applications or other forms, such as your name, address, and account number; |
| • |
|
Information about your transactions with us, our affiliates, or others, such as your account balance and purchase/redemption history; and |
| • |
|
Information we receive from non-affiliated third parties, including consumer reporting agencies. |
What Information We Disclose and To Whom We Disclose It
We do not disclose any nonpublic personal information about current or former customers to anyone without their express consent, except as permitted by law. We may disclose the nonpublic personal information we collect, as described above, to persons or companies that perform services on our behalf and to other financial institutions with which we have joint marketing agreements. We will require these companies to protect the confidentiality of your nonpublic personal information and to use it only to perform the services for which we have hired them.
Our Security Procedures
We restrict access to your nonpublic personal information and only allow disclosures to persons and companies as permitted by law to assist in providing products or services to you. We maintain physical, electronic, and procedural safeguards to protect your nonpublic personal information and to safeguard the disposal of certain consumer information.
Contact Us
If you have any questions about our Privacy Policy, please call 1-800-851-9777 on any business day between 8 a.m. and 7 p.m. Eastern Time.
Note: This Privacy Policy applies only to customers that have a direct relationship with us or our affiliates. If you own shares of our portfolios in the name of a third party such as a bank or broker-dealer, its privacy policy may apply to you instead of ours.
|
|
|
|
|
| Transamerica Series Trust |
|
|
|
Semi-Annual Financial Statements 2024 |
|
|
Page 19 |
|
|
PO Box 219945
Kansas City, MO 64121-9945
|
|
|
| Distributor: |
|
Transamerica Capital, Inc. |
|
|
PO Box 219945 |
|
|
Kansas City, MO 64121-9945 |
|
|
|
|
Customer Service: 1-800-851-9777 |
Transamerica Series Trust Semi-Annual Financial Statements
June 30, 2024
1801 California St., Suite 5200
Denver, CO 80202
Distributor: Transamerica Capital, Inc.
Customer Service: 1-800-851-9777
The following pages contain the most recent semi-annual financial statements for the investment options in which you are invested. In compliance with Securities and Exchange Commission regulations, we present these reports on an annual and semi-annual basis with the hope that they will foster greater understanding of the investment options’ holdings, performance, financial data, accounting policies and other issues. This streamlined version provides information only on the investment options in which you are invested.
If you have any questions about these reports, please do not hesitate to contact your financial professional. As always, we thank you for your trust and the opportunity to serve you.
Transamerica BlackRock iShares Active Asset Allocation - Conservative VP
SCHEDULE OF INVESTMENTS
At June 30, 2024
(unaudited)
|
|
|
|
|
|
|
|
|
| |
|
Shares |
|
|
Value |
|
| |
|
|
|
|
| EXCHANGE-TRADED FUNDS - 97.7% |
|
|
|
|
|
|
|
|
| International Equity Funds - 13.3% |
|
|
|
|
|
|
|
|
| iShares Core MSCI EAFE ETF |
|
|
112,152 |
|
|
$ |
8,146,721 |
|
| iShares MSCI EAFE ETF (A) |
|
|
236,311 |
|
|
|
18,510,241 |
|
| iShares MSCI Eurozone ETF (A) |
|
|
48,433 |
|
|
|
2,364,741 |
|
|
|
|
|
|
|
|
|
|
|
|
|
|
|
|
|
|
|
|
29,021,703 |
|
|
|
|
|
|
|
|
|
|
| U.S. Equity Funds - 27.9% |
|
|
|
|
|
|
|
|
| iShares Core S&P 500 ETF |
|
|
95,659 |
|
|
|
52,347,474 |
|
| iShares Russell 2000 ETF (A) |
|
|
42,256 |
|
|
|
8,573,320 |
|
|
|
|
|
|
|
|
|
|
|
|
|
|
|
|
|
|
|
|
60,920,794 |
|
|
|
|
|
|
|
|
|
|
| U.S. Fixed Income Funds - 56.5% |
|
|
|
|
|
|
|
|
| iShares 7-10 Year Treasury Bond ETF |
|
|
225,890 |
|
|
|
21,154,599 |
|
| iShares Core U.S. Aggregate Bond ETF |
|
|
797,654 |
|
|
|
77,428,274 |
|
| iShares iBoxx $ Investment Grade Corporate Bond ETF (A) |
|
|
80,445 |
|
|
|
8,617,268 |
|
| iShares Short Treasury Bond ETF |
|
|
18,208 |
|
|
|
2,011,984 |
|
| iShares U.S. Treasury Bond ETF |
|
|
635,819 |
|
|
|
14,350,435 |
|
|
|
|
|
|
|
|
|
|
|
|
|
|
|
|
|
|
|
|
123,562,560 |
|
|
|
|
|
|
|
|
|
|
| Total Exchange-Traded Funds (Cost $216,836,606) |
|
|
|
|
|
|
213,505,057 |
|
|
|
|
|
|
|
|
|
|
|
|
|
| OTHER INVESTMENT COMPANY - 4.0% |
|
|
|
|
|
|
|
|
| Securities Lending Collateral - 4.0% |
|
|
|
|
|
|
|
|
| State Street Navigator Securities Lending Trust - Government Money Market Portfolio, 5.28% (B) |
|
|
8,730,580 |
|
|
|
8,730,580 |
|
|
|
|
|
|
|
|
|
|
|
|
|
| Total Other Investment Company (Cost $8,730,580) |
|
|
|
|
|
|
8,730,580 |
|
|
|
|
|
|
|
|
|
|
|
|
|
|
|
|
|
|
|
| |
|
Principal |
|
|
Value |
|
| |
|
|
|
|
| REPURCHASE AGREEMENT - 2.0% |
|
|
|
|
|
|
|
|
| Fixed Income Clearing Corp., |
|
|
|
|
|
|
|
|
| 2.50% (B), dated 06/28/2024, to be repurchased at $4,448,272 on 07/01/2024. Collateralized by a U.S. Government Obligation, 3.75%, due 04/15/2026, and with a value of $4,536,397. |
|
$ |
4,447,345 |
|
|
$ |
4,447,345 |
|
|
|
|
|
|
|
|
|
|
|
|
|
| Total Repurchase Agreement (Cost $4,447,345) |
|
|
|
|
|
|
4,447,345 |
|
|
|
|
|
|
|
|
|
|
| Total Investments (Cost $230,014,531) |
|
|
|
|
|
|
226,682,982 |
|
|
|
|
|
|
|
|
|
|
| Net Other Assets (Liabilities) - (3.7)% |
|
|
|
|
|
|
(8,154,568) |
|
|
|
|
|
|
|
|
|
|
|
|
|
| Net Assets - 100.0% |
|
|
|
|
|
$ |
218,528,414 |
|
|
|
|
|
|
|
|
|
|
INVESTMENT VALUATION:
|
|
|
|
|
|
|
|
|
|
|
|
|
|
|
|
|
| Valuation Inputs (C) |
|
|
|
|
|
|
|
|
|
|
|
|
|
|
|
|
|
| |
|
Level 1 - Unadjusted Quoted Prices |
|
|
Level 2 - Other Significant Observable Inputs |
|
|
Level 3 - Significant Unobservable Inputs |
|
|
Value |
|
| |
|
|
|
|
|
|
| ASSETS |
|
|
|
|
|
|
|
|
|
|
|
|
|
|
|
|
| Investments |
|
|
|
|
|
|
|
|
|
|
|
|
|
|
|
|
| Exchange-Traded Funds |
|
$ |
213,505,057 |
|
|
$ |
— |
|
|
$ |
— |
|
|
$ |
213,505,057 |
|
| Other Investment Company |
|
|
8,730,580 |
|
|
|
— |
|
|
|
— |
|
|
|
8,730,580 |
|
| Repurchase Agreement |
|
|
— |
|
|
|
4,447,345 |
|
|
|
— |
|
|
|
4,447,345 |
|
|
|
|
|
|
|
|
|
|
|
|
|
|
|
|
|
|
| Total Investments |
|
$ |
222,235,637 |
|
|
$ |
4,447,345 |
|
|
$ |
— |
|
|
$ |
226,682,982 |
|
|
|
|
|
|
|
|
|
|
|
|
|
|
|
|
|
|
FOOTNOTES TO SCHEDULE OF INVESTMENTS:
| (A) |
All or a portion of the security is on loan. The total value of the securities on loan is $35,353,368, collateralized by cash collateral of $8,730,580 and non-cash collateral, such as U.S. government securities and irrevocable letters of credit, of $27,375,191. The amount on loan indicated may not correspond with the securities on loan identified because a security with pending sales are in the process of recall from the brokers. |
| (B) |
Rate disclosed reflects the yield at June 30, 2024. |
| (C) |
There were no transfers in or out of Level 3 during the period ended June 30, 2024. Please reference the Investment Valuation section of the Notes to Financial Statements for more information regarding investment valuation and pricing inputs. |
|
|
|
|
|
| The Notes to Financial Statements are an integral part of this report. |
| Transamerica Series Trust |
|
|
|
Semi-Annual Financial Statements 2024 |
|
|
Page 1 |
|
|
Transamerica BlackRock iShares Active Asset Allocation - Conservative VP
STATEMENT OF ASSETS AND LIABILITIES
At June 30, 2024
(unaudited)
|
|
|
|
|
|
|
| Assets: |
|
|
|
|
| Unaffiliated investments, at value (cost $225,567,186)
(including securities loaned of $35,353,368) |
|
$ |
222,235,637 |
|
| Repurchase agreement, at value (cost $4,447,345) |
|
|
4,447,345 |
|
| Receivables and other assets: |
|
|
|
|
| Investments sold |
|
|
995,916 |
|
| Net income from securities lending |
|
|
12,753 |
|
| Interest |
|
|
926 |
|
| Prepaid expenses |
|
|
883 |
|
|
|
| Total assets |
|
|
227,693,460 |
|
|
|
| Liabilities: |
|
|
|
|
| Cash collateral received upon return of: |
|
|
|
|
| Securities on loan |
|
|
8,730,580 |
|
| Payables and other liabilities: |
|
|
|
|
| Shares of beneficial interest redeemed |
|
|
273,158 |
|
| Investment management fees |
|
|
75,629 |
|
| Distribution and service fees |
|
|
41,301 |
|
| Transfer agent costs |
|
|
249 |
|
| Trustee and CCO fees |
|
|
698 |
|
| Audit and tax fees |
|
|
9,802 |
|
| Custody fees |
|
|
1,571 |
|
| Legal fees |
|
|
5,022 |
|
| Printing and shareholder reports fees |
|
|
16,718 |
|
| Other accrued expenses |
|
|
10,318 |
|
|
|
| Total liabilities |
|
|
9,165,046 |
|
|
|
| Net assets |
|
$ |
218,528,414 |
|
|
|
| Net assets consist of: |
|
|
|
|
| Capital stock ($0.01 par value) |
|
$ |
235,534 |
|
| Additional paid-in capital |
|
|
238,331,030 |
|
| Total distributable earnings (accumulated losses) |
|
|
(20,038,150 |
) |
|
|
| Net assets |
|
$ |
218,528,414 |
|
|
|
| Net assets by class: |
|
|
|
|
| Initial Class |
|
$ |
4,192,347 |
|
| Service Class |
|
|
214,336,067 |
|
|
|
| Shares outstanding: |
|
|
|
|
| Initial Class |
|
|
448,344 |
|
| Service Class |
|
|
23,105,034 |
|
|
|
| Net asset value and offering price per share: |
|
|
|
|
| Initial Class |
|
$ |
9.35 |
|
| Service Class |
|
|
9.28 |
|
STATEMENT OF OPERATIONS
For the period ended June 30, 2024
(unaudited)
|
|
|
|
|
|
|
| Investment income: |
|
|
|
|
| Dividend income from unaffiliated investments |
|
$ |
2,844,339 |
|
| Interest income from unaffiliated investments |
|
|
18,143 |
|
| Net income from securities lending |
|
|
45,561 |
|
|
|
| Total investment income |
|
|
2,908,043 |
|
|
|
| Expenses: |
|
|
|
|
| Investment management fees |
|
|
546,812 |
|
| Distribution and service fees: |
|
|
|
|
| Service Class |
|
|
268,254 |
|
| Transfer agent costs |
|
|
1,277 |
|
| Trustee and CCO fees |
|
|
5,164 |
|
| Audit and tax fees |
|
|
9,581 |
|
| Custody fees |
|
|
2,053 |
|
| Legal fees |
|
|
9,233 |
|
| Printing and shareholder reports fees |
|
|
15,648 |
|
| Other |
|
|
13,947 |
|
|
|
| Total expenses before waiver and/or reimbursement and recapture |
|
|
871,969 |
|
| Expenses waived and/or reimbursed: |
|
|
|
|
| Initial Class |
|
|
(1,075 |
) |
| Service Class |
|
|
(55,965 |
) |
|
|
| Net expenses |
|
|
814,929 |
|
|
|
| Net investment income (loss) |
|
|
2,093,114 |
|
|
|
| Net realized gain (loss) on: |
|
|
|
|
| Unaffiliated investments |
|
|
1,798,222 |
|
|
|
| Net change in unrealized appreciation (depreciation) on: |
|
|
|
|
| Unaffiliated investments |
|
|
3,777,938 |
|
|
|
| Net realized and change in unrealized gain (loss) |
|
|
5,576,160 |
|
|
|
| Net increase (decrease) in net assets resulting from operations |
|
$ |
7,669,274 |
|
The Notes to Financial Statements are an integral part of this report.
|
|
|
|
|
| Transamerica Series Trust |
|
|
|
Semi-Annual Financial Statements 2024 |
|
|
Page 2 |
|
|
Transamerica BlackRock iShares Active Asset Allocation - Conservative VP
STATEMENT OF CHANGES IN NET ASSETS
For the period and year ended:
|
|
|
|
|
|
|
|
|
| |
|
June 30, 2024 (unaudited) |
|
December 31, 2023 |
|
|
|
| From operations: |
|
|
|
|
|
|
|
|
| Net investment income (loss) |
|
$ |
2,093,114 |
|
|
|
$ 4,846,723 |
|
| Net realized gain (loss) |
|
|
1,798,222 |
|
|
|
(3,204,639 |
) |
| Net change in unrealized appreciation (depreciation) |
|
|
3,777,938 |
|
|
|
20,403,966 |
|
|
|
|
| Net increase (decrease) in net assets resulting from operations |
|
|
7,669,274 |
|
|
|
22,046,050 |
|
|
|
|
| Dividends and/or distributions to shareholders: |
|
|
|
|
|
|
|
|
| Initial Class |
|
|
— |
|
|
|
(71,547 |
) |
| Service Class |
|
|
— |
|
|
|
(3,344,955 |
) |
|
|
|
| Net increase (decrease) in net assets resulting from dividends and/or distributions to shareholders |
|
|
— |
|
|
|
(3,416,502 |
) |
|
|
|
| Capital share transactions: |
|
|
|
|
|
|
|
|
| Proceeds from shares sold:
Initial Class |
|
|
211,690 |
|
|
|
359,485 |
|
| Service Class |
|
|
2,258,279 |
|
|
|
8,228,878 |
|
| |
|
|
2,469,969 |
|
|
|
8,588,363 |
|
| Dividends and/or distributions reinvested:
Initial Class |
|
|
— |
|
|
|
71,547 |
|
| Service Class |
|
|
— |
|
|
|
3,344,955 |
|
| |
|
|
— |
|
|
|
3,416,502 |
|
| Cost of shares redeemed:
Initial Class |
|
|
(366,406 |
) |
|
|
(518,341 |
) |
| Service Class |
|
|
(20,215,325 |
) |
|
|
(40,839,731 |
) |
|
|
|
| |
|
|
(20,581,731 |
) |
|
|
(41,358,072 |
) |
|
|
|
| Net increase (decrease) in net assets resulting from capital share transactions |
|
|
(18,111,762 |
) |
|
|
(29,353,207 |
) |
|
|
|
| Net increase (decrease) in net assets |
|
|
(10,442,488 |
) |
|
|
(10,723,659 |
) |
|
|
|
| Net assets: |
|
|
|
|
|
|
|
|
| Beginning of period/year |
|
|
228,970,902 |
|
|
|
239,694,561 |
|
| End of period/year |
|
$ |
218,528,414 |
|
|
|
$228,970,902 |
|
|
|
|
| Capital share transactions - shares: |
|
|
|
|
|
|
|
|
| Shares issued:
Initial Class |
|
|
23,319 |
|
|
|
41,643 |
|
| Service Class |
|
|
246,869 |
|
|
|
961,354 |
|
| |
|
|
270,188 |
|
|
|
1,002,997 |
|
| Shares reinvested:
Initial Class |
|
|
— |
|
|
|
8,281 |
|
| Service Class |
|
|
— |
|
|
|
389,401 |
|
| |
|
|
— |
|
|
|
397,682 |
|
| Shares redeemed:
Initial Class |
|
|
(39,926 |
) |
|
|
(59,998 |
) |
| Service Class |
|
|
(2,230,274 |
) |
|
|
(4,767,283 |
) |
| |
|
|
(2,270,200 |
) |
|
|
(4,827,281 |
) |
|
|
|
| Net increase (decrease) in shares outstanding: Initial Class |
|
|
(16,607 |
) |
|
|
(10,074 |
) |
| Service Class |
|
|
(1,983,405 |
) |
|
|
(3,416,528 |
) |
|
|
|
| |
|
|
(2,000,012 |
) |
|
|
(3,426,602 |
) |
The Notes to Financial Statements are an integral part of this report.
|
|
|
|
|
| Transamerica Series Trust |
|
|
|
Semi-Annual Financial Statements 2024 |
|
|
Page 3 |
|
|
Transamerica BlackRock iShares Active Asset Allocation - Conservative VP
FINANCIAL HIGHLIGHTS
|
|
|
|
|
|
|
|
|
|
|
|
|
|
|
|
|
|
|
|
|
|
|
|
|
| For a share outstanding during the period and years indicated: |
|
Initial Class |
| |
|
June 30, 2024 (unaudited) |
|
December 31, 2023 |
|
December 31, 2022 |
|
December 31, 2021 |
|
December 31, 2020 |
|
December 31, 2019 |
|
|
|
|
|
|
|
| Net asset value, beginning of period/year |
|
$ |
9.02 |
|
|
$ |
8.33 |
|
|
$ |
11.56 |
|
|
$ |
11.23 |
|
|
$ |
10.89 |
|
|
$ |
10.82 |
|
|
|
|
|
|
|
|
| Investment operations: |
|
|
|
|
|
|
|
|
|
|
|
|
|
|
|
|
|
|
|
|
|
|
|
|
|
|
|
|
|
|
|
| Net investment income (loss)(A) |
|
|
0.10 |
|
|
|
0.20 |
|
|
|
0.15 |
|
|
|
0.15 |
|
|
|
0.14 |
|
|
|
0.23 |
|
|
|
|
|
|
|
|
| Net realized and unrealized gain (loss) |
|
|
0.23 |
|
|
|
0.64 |
|
|
|
(1.84 |
) |
|
|
0.52 |
|
|
|
0.60 |
|
|
|
0.97 |
|
|
|
|
|
|
|
|
| Total investment operations |
|
|
0.33 |
|
|
|
0.84 |
|
|
|
(1.69 |
) |
|
|
0.67 |
|
|
|
0.74 |
|
|
|
1.20 |
|
|
|
|
|
|
|
|
| Dividends and/or distributions to shareholders: |
|
|
|
|
|
|
|
|
|
|
|
|
|
|
|
|
|
|
|
|
|
|
|
|
|
|
|
|
|
|
|
| Net investment income |
|
|
— |
|
|
|
(0.15 |
) |
|
|
(0.17 |
) |
|
|
(0.16 |
) |
|
|
(0.24 |
) |
|
|
(0.26 |
) |
|
|
|
|
|
|
|
| Net realized gains |
|
|
— |
|
|
|
— |
|
|
|
(1.37 |
) |
|
|
(0.18 |
) |
|
|
(0.16 |
) |
|
|
(0.87 |
) |
|
|
|
|
|
|
|
| Total dividends and/or distributions to shareholders |
|
|
— |
|
|
|
(0.15 |
) |
|
|
(1.54 |
) |
|
|
(0.34 |
) |
|
|
(0.40 |
) |
|
|
(1.13 |
) |
|
|
|
|
|
|
|
| Net asset value, end of period/year |
|
$ |
9.35 |
|
|
$ |
9.02 |
|
|
$ |
8.33 |
|
|
$ |
11.56 |
|
|
$ |
11.23 |
|
|
$ |
10.89 |
|
| |
|
|
|
|
|
|
|
|
|
|
|
|
|
|
|
|
|
|
|
|
|
|
|
|
|
|
|
|
|
|
|
| Total return |
|
|
3.66 |
%(B) |
|
|
10.21 |
% |
|
|
(15.06 |
)% |
|
|
5.98 |
% |
|
|
6.99 |
% |
|
|
11.47 |
% |
|
|
|
|
|
|
|
| Ratio and supplemental data: |
|
|
|
|
|
|
|
|
|
|
|
|
|
|
|
|
|
|
|
|
|
|
|
|
|
|
|
|
|
|
|
| Net assets end of period/year (000’s) |
|
$ |
4,192 |
|
|
$ |
4,194 |
|
|
$ |
3,956 |
|
|
$ |
5,046 |
|
|
$ |
4,631 |
|
|
$ |
4,481 |
|
|
|
|
|
|
|
|
| Expenses to average net assets(C) |
|
|
|
|
|
|
|
|
|
|
|
|
|
|
|
|
|
|
|
|
|
|
|
|
|
|
|
|
|
|
|
| Excluding waiver and/or reimbursement and recapture |
|
|
0.55 |
%(D) |
|
|
0.56 |
% |
|
|
0.54 |
% |
|
|
0.58 |
% |
|
|
0.59 |
% |
|
|
0.59 |
% |
|
|
|
|
|
|
|
| Including waiver and/or reimbursement and recapture |
|
|
0.50 |
%(D)(E) |
|
|
0.51 |
%(E) |
|
|
0.49 |
%(E) |
|
|
0.57 |
%(E) |
|
|
0.59 |
% |
|
|
0.59 |
% |
|
|
|
|
|
|
|
| Net investment income (loss) to average net assets |
|
|
2.18 |
%(D) |
|
|
2.34 |
% |
|
|
1.52 |
% |
|
|
1.31 |
% |
|
|
1.31 |
% |
|
|
2.06 |
% |
|
|
|
|
|
|
|
| Portfolio turnover rate |
|
|
35 |
%(B) |
|
|
137 |
% |
|
|
145 |
% |
|
|
146 |
% |
|
|
82 |
% |
|
|
151 |
% |
| (A) |
Calculated based on average number of shares outstanding. |
| (C) |
Does not include expenses of the underlying investments in which the Portfolio invests. |
| (E) |
TAM has contractually agreed, through May 1, 2025, to waive from its management fees an amount equal to the sub-advisory fee waiver by the Portfolio’s sub-adviser. These amounts are not subject to recapture by TAM. |
The Notes to Financial Statements are an integral part of this report.
|
|
|
|
|
| Transamerica Series Trust |
|
|
|
Semi-Annual Financial Statements 2024 |
|
|
Page 4 |
|
|
Transamerica BlackRock iShares Active Asset Allocation - Conservative VP
FINANCIAL HIGHLIGHTS (continued)
|
|
|
|
|
|
|
|
|
|
|
|
|
|
|
|
|
|
|
|
|
|
|
|
|
| For a share outstanding during the period and years indicated: |
|
Service Class |
|
|
|
|
|
|
|
| |
|
June 30, 2024 (unaudited) |
|
December 31, 2023 |
|
December 31, 2022 |
|
December 31, 2021 |
|
December 31, 2020 |
|
December 31, 2019 |
|
|
|
|
|
|
|
| Net asset value, beginning of period/year |
|
$ |
8.96 |
|
|
$ |
8.27 |
|
|
$ |
11.48 |
|
|
$ |
11.15 |
|
|
$ |
10.82 |
|
|
$ |
10.75 |
|
|
|
|
|
|
|
|
| Investment operations: |
|
|
|
|
|
|
|
|
|
|
|
|
|
|
|
|
|
|
|
|
|
|
|
|
|
|
|
|
|
|
|
| Net investment income (loss)(A) |
|
|
0.09 |
|
|
|
0.18 |
|
|
|
0.12 |
|
|
|
0.12 |
|
|
|
0.11 |
|
|
|
0.20 |
|
|
|
|
|
|
|
|
| Net realized and unrealized gain (loss) |
|
|
0.23 |
|
|
|
0.64 |
|
|
|
(1.83 |
) |
|
|
0.52 |
|
|
|
0.59 |
|
|
|
0.97 |
|
|
|
|
|
|
|
|
| Total investment operations |
|
|
0.32 |
|
|
|
0.82 |
|
|
|
(1.71 |
) |
|
|
0.64 |
|
|
|
0.70 |
|
|
|
1.17 |
|
|
|
|
|
|
|
|
| Dividends and/or distributions to shareholders: |
|
|
|
|
|
|
|
|
|
|
|
|
|
|
|
|
|
|
|
|
|
|
|
|
|
|
|
|
|
|
|
| Net investment income |
|
|
— |
|
|
|
(0.13 |
) |
|
|
(0.13 |
) |
|
|
(0.13 |
) |
|
|
(0.21 |
) |
|
|
(0.23 |
) |
|
|
|
|
|
|
|
| Net realized gains |
|
|
— |
|
|
|
— |
|
|
|
(1.37 |
) |
|
|
(0.18 |
) |
|
|
(0.16 |
) |
|
|
(0.87 |
) |
|
|
|
|
|
|
|
| Total dividends and/or distributions to shareholders |
|
|
— |
|
|
|
(0.13 |
) |
|
|
(1.50 |
) |
|
|
(0.31 |
) |
|
|
(0.37 |
) |
|
|
(1.10 |
) |
|
|
|
|
|
|
|
| Net asset value, end of period/year |
|
$ |
9.28 |
|
|
$ |
8.96 |
|
|
$ |
8.27 |
|
|
$ |
11.48 |
|
|
$ |
11.15 |
|
|
$ |
10.82 |
|
| |
|
|
|
|
|
|
|
|
|
|
|
|
|
|
|
|
|
|
|
|
|
|
|
|
|
|
|
|
|
|
|
| Total return |
|
|
3.57 |
%(B) |
|
|
9.96 |
% |
|
|
(15.29 |
)% |
|
|
5.74 |
% |
|
|
6.65 |
% |
|
|
11.23 |
% |
|
|
|
|
|
|
|
| Ratio and supplemental data: |
|
|
|
|
|
|
|
|
|
|
|
|
|
|
|
|
|
|
|
|
|
|
|
|
|
|
|
|
|
|
|
| Net assets end of period/year (000’s) |
|
$ |
214,336 |
|
|
$ |
224,777 |
|
|
$ |
235,739 |
|
|
$ |
319,876 |
|
|
$ |
343,723 |
|
|
$ |
366,838 |
|
|
|
|
|
|
|
|
| Expenses to average net assets(C) |
|
|
|
|
|
|
|
|
|
|
|
|
|
|
|
|
|
|
|
|
|
|
|
|
|
|
|
|
|
|
|
| Excluding waiver and/or reimbursement and recapture |
|
|
0.80 |
%(D) |
|
|
0.81 |
% |
|
|
0.79 |
% |
|
|
0.83 |
% |
|
|
0.84 |
% |
|
|
0.84 |
% |
|
|
|
|
|
|
|
| Including waiver and/or reimbursement and recapture |
|
|
0.75 |
%(D)(E) |
|
|
0.76 |
%(E) |
|
|
0.74 |
%(E) |
|
|
0.82 |
%(E) |
|
|
0.84 |
% |
|
|
0.84 |
% |
|
|
|
|
|
|
|
| Net investment income (loss) to average net assets |
|
|
1.91 |
%(D) |
|
|
2.07 |
% |
|
|
1.26 |
% |
|
|
1.03 |
% |
|
|
1.04 |
% |
|
|
1.80 |
% |
|
|
|
|
|
|
|
| Portfolio turnover rate |
|
|
35 |
%(B) |
|
|
137 |
% |
|
|
145 |
% |
|
|
146 |
% |
|
|
82 |
% |
|
|
151 |
% |
| (A) |
Calculated based on average number of shares outstanding. |
| (C) |
Does not include expenses of the underlying investments in which the Portfolio invests. |
| (E) |
TAM has contractually agreed, through May 1, 2025, to waive from its management fees an amount equal to the sub-advisory fee waiver by the Portfolio’s sub-adviser. These amounts are not subject to recapture by TAM. |
The Notes to Financial Statements are an integral part of this report.
|
|
|
|
|
| Transamerica Series Trust |
|
|
|
Semi-Annual Financial Statements 2024 |
|
|
Page 5 |
|
|
Transamerica BlackRock iShares Active Asset Allocation - Conservative VP
NOTES TO FINANCIAL STATEMENTS
At June 30, 2024
(unaudited)
1. ORGANIZATION
Transamerica Series Trust (“TST”) is an open-end management investment company registered under the Investment Company Act of 1940, as amended (the “1940 Act”). TST applies investment company accounting and reporting guidance. TST serves as a funding vehicle for variable life insurance, variable annuity, and group annuity products. Transamerica BlackRock iShares Active Asset Allocation - Conservative VP (the “Portfolio”) is a series of TST and is classified as diversified under the 1940 Act. The Portfolio currently offers two classes of shares, Initial Class and Service Class.
The only shareholders of the Portfolio are affiliated insurance company separate accounts and/or affiliated asset allocation portfolios. Contract holders of the variable life and annuity contracts are not shareholders of the Portfolio. For ease of reference, shareholders and contract holders are collectively referred to in this report as “shareholders.”
This report must be accompanied or preceded by the Portfolio’s current prospectus, which contains additional information about the Portfolio, including risks, as well as investment objectives and strategies.
Transamerica Asset Management, Inc. (“TAM”) serves as investment manager for the Portfolio pursuant to an investment management agreement. TAM provides continuous and regular investment management services to the Portfolio. TAM supervises the Portfolio’s investments, conducts its investment program and provides supervisory, compliance and administrative services to the Portfolio.
TAM currently acts as a “manager of managers” and has hired sub-advisers to furnish day-to-day investment advice and recommendations. TAM may, in the future, determine to provide all aspects of the day-to-day management of the Portfolio without the use of a sub-adviser. When acting as a manager of managers, TAM provides investment management services that include, without limitation, the design and development of the Portfolio and its investment strategies and the ongoing review and evaluation of those investment strategies including recommending changes in strategy where it believes appropriate or advisable; the selection of one or more sub-advisers for the Portfolio employing a combination of quantitative and qualitative screens, research, analysis and due diligence; negotiation of sub-advisory agreements and fees; oversight and monitoring of sub-advisers and recommending changes to sub-advisers where it believes appropriate or advisable; recommending portfolio combinations and liquidations where it believes appropriate or advisable; selection and oversight of transition managers, as needed; regular supervision of the Portfolio’s investments; regular review and evaluation of sub-adviser performance; daily monitoring of the sub-advisers’ buying and selling of securities for the Portfolio; regular review of holdings; ongoing trade oversight and analysis; regular monitoring to ensure adherence to investment process; regular calls and periodic on-site visits with sub-advisers; portfolio construction and asset allocation when using multiple sub-advisers for the Portfolio; risk management oversight and analysis; oversight of negotiation of investment documentation and agreements; design, development, implementation and regular monitoring of the valuation process; periodic due diligence reviews of pricing vendors and vendor methodology; design, development, implementation and regular monitoring of the compliance process; respond to regulatory inquiries and determine appropriate litigation strategy, as needed; review of proxies voted by sub-advisers; oversight of preparation and review of materials for meetings of the Portfolio’s Board of Trustees (the “Board”), participation in these meetings and preparation of regular communications with the Board; oversight of preparation and review of prospectuses, shareholder reports and other disclosure materials and regulatory filings for the Portfolio; oversight of other service providers to the Portfolio, such as the custodian, the transfer agent, the Portfolio’s independent accounting firm and legal counsel; supervision of the performance of recordkeeping and shareholder relations functions for the Portfolio; and oversight of cash management services. TAM uses a variety of quantitative and qualitative tools to carry out its investment management services. TAM, not the Portfolio, is responsible for paying the sub-adviser(s) for their services, and sub-advisory fees are TAM’s expense.
TAM’s investment management services also include the provision of supervisory and administrative services to the Portfolio. These services include performing certain administrative services for the Portfolio and supervising and overseeing the administrative, clerical, recordkeeping and bookkeeping services provided to the Portfolio by State Street Bank and Trust Company (“State Street”), to whom TAM has outsourced the provision of certain sub-administration services. To the extent agreed upon by TAM and the Portfolio from time to time, TAM’s supervisory and administrative services include, but are not limited to: monitoring and verifying the custodian’s daily calculation of the Net Asset Values (“NAV”); shareholder relations functions; compliance services; valuation services; assisting in due diligence and in the oversight and monitoring of certain activities of sub-advisers and certain aspects of Portfolio investments; assisting with Portfolio combinations and liquidations; oversight of the preparation and filing, and review, of all returns and reports, in connection with federal, state and local taxes; oversight and review of regulatory reporting; supervising and coordinating the Portfolio’s custodian and dividend disbursing agent and monitoring their services to the Portfolio; assisting the Portfolio in preparing reports to shareholders; acting as liaison with the Portfolio’s independent public accountants and providing, upon request, analyses, fiscal year summaries and other audit related services; assisting in the preparation of agendas and supporting documents for and minutes of meetings of trustees and committees of trustees; assisting in the preparation of regular communications with the trustees; and providing personnel and office space, telephones
|
|
|
| Transamerica Series Trust |
|
Semi-Annual Financial Statements 2024 |
Page 6
Transamerica BlackRock iShares Active Asset Allocation - Conservative VP
NOTES TO FINANCIAL STATEMENTS (continued)
At June 30, 2024
(unaudited)
1. ORGANIZATION (continued)
and other office equipment as necessary in order for TAM to perform supervisory and administrative services to the Portfolio. The Portfolio pays certain fees and expenses to State Street for sub-administration services which are not administrative services covered by the management agreement with TAM or paid for through the management fees payable thereunder. For the period ended June 30, 2024, (i) the expenses paid to State Street for sub-administration services by the Portfolio are shown as a part of Other expenses within the Statement of Operations and (ii) the expenses payable to State Street for sub-administration services from the Portfolio are shown as part of Other accrued expenses within the Statement of Assets and Liabilities.
2. SIGNIFICANT ACCOUNTING POLICIES
In preparing the Portfolio’s financial statements in accordance with Generally Accepted Accounting Principles in the United States of America (“GAAP”), estimates or assumptions (which could differ from actual results) may be used that affect reported amounts and disclosures. The following is a summary of significant accounting policies followed by the Portfolio.
Security transactions and investment income: Security transactions are accounted for on the trade date. Security gains and losses are calculated on a first-in, first-out basis. Dividend income, if any, is recorded on the ex-dividend date or, in the case of foreign securities, as soon as the Portfolio is informed of the ex-dividend dates, net of foreign taxes. Non-cash dividends, if any, are recorded on the ex-dividend date at fair value. Interest income, if any, is recorded on the accrual basis from settlement date, net of foreign taxes. Fixed income premiums and discounts are amortized and/or accreted over the lives of the respective securities.
Multiple class operations, income, and expenses: Income, non-class specific expenses, and realized and unrealized gains and losses are allocated to each class daily based upon net assets. Each class bears its own specific expenses in addition to the allocated non-class specific expenses.
Distributions to shareholders: Distributions are recorded on the ex-dividend date and are determined in accordance with federal income tax regulations, which may differ from GAAP.
Indemnification: In the normal course of business, the Portfolio enters into contracts that contain a variety of representations that provide general indemnifications. The Portfolio’s maximum exposure under these arrangements is unknown, as this would involve future claims that may be made against the Portfolio and/or its affiliates that have not yet occurred. However, based on experience, the Portfolio expects the risk of loss to be remote.
3. INVESTMENT VALUATION
TAM has been designated as the Portfolio’s valuation designee pursuant to Rule 2a-5 under the 1940 Act with responsibility for fair valuation subject to oversight by the Portfolio’s Board of Trustees. The net asset value of the Portfolio is computed as of the official close of the New York Stock Exchange (“NYSE”) each day the NYSE is open for business.
TAM utilizes various methods to measure the fair value of its investments on a recurring basis. GAAP establishes a hierarchy that prioritizes inputs to valuation methods. The inputs or methodology used for valuing securities are not necessarily an indication of the risk associated with investing in those securities. The three levels (“Levels”) of inputs of the fair value hierarchy are defined as follows:
Level 1—Unadjusted quoted prices in active markets for identical securities.
Level 2—Inputs, other than quoted prices included in Level 1, which are observable, either directly or indirectly. These inputs may include quoted prices for the identical instrument on an inactive market, prices for similar instruments, interest rates, prepayment speeds, credit risk, yield curves, default rates, and similar data.
Level 3—Unobservable inputs based on the best information available in the circumstances, to the extent observable inputs are not available, which may include TAM’s own assumptions used in determining the fair value of the Portfolio’s investments.
The inputs used to measure fair value may fall into different Levels of the fair value hierarchy. In such cases, for disclosure purposes, the Level in the fair value hierarchy that is assigned to the fair value measurement of a security is determined based on the lowest Level input that is significant to the fair value measurement in its entirety. Certain investments that are measured at fair value using NAV per share, or its equivalent, using the “practical expedient” have not been classified in the fair value Levels. The hierarchy classification of inputs used to value the Portfolio’s investments at June 30, 2024, is disclosed within the Investment Valuation section of the Schedule of Investments.
|
|
|
| Transamerica Series Trust |
|
Semi-Annual Financial Statements 2024 |
Page 7
Transamerica BlackRock iShares Active Asset Allocation - Conservative VP
NOTES TO FINANCIAL STATEMENTS (continued)
At June 30, 2024
(unaudited)
3. INVESTMENT VALUATION (continued)
The availability of observable inputs can vary from security to security and is affected by a wide variety of factors, including, but not limited to, the type of security, whether the security is new and not yet established in the marketplace, the liquidity of markets, and other characteristics particular to the security. To the extent that valuation is based on models or inputs that are less observable or unobservable in the market, the determination of fair value requires more judgment. Accordingly, the degree of judgment exercised in determining fair value is generally greatest for instruments categorized in Level 3. Due to the inherent uncertainty of valuation, the determination of values may differ significantly from values that would have been realized had a ready market for investments existed, and the differences could be material.
Fair value measurements: Descriptions of the valuation techniques applied to the Portfolio’s significant categories of assets and liabilities measured at fair value on a recurring basis are as follows:
Exchange-traded funds (“ETF”): ETFs are stated at the last reported sale price or closing price on the day of valuation taken from the primary exchange where the ETF is principally traded. ETFs are generally categorized in Level 1 of the fair value hierarchy.
Securities lending collateral: Securities lending collateral is invested in a money market fund which is valued at the actively traded NAV and no valuation adjustments are applied. Securities lending collateral is categorized in Level 1 of the fair value hierarchy.
Repurchase agreements: Repurchase agreements are valued at cost, which approximates fair value. To the extent the inputs are observable and timely, the values are generally categorized in Level 2 of the fair value hierarchy.
4. BORROWINGS AND OTHER FINANCING TRANSACTIONS
The Portfolio may engage in borrowing transactions as a means of raising cash to satisfy redemption requests, for other temporary or emergency purposes or, to the extent permitted by its investment policies, to raise additional cash to be invested in other securities or instruments. When the Portfolio invests borrowing proceeds in other securities, the Portfolio will bear the risk that the market value of the securities in which such proceeds are invested goes down and is insufficient to repay the borrowed proceeds. The Portfolio may borrow on a secured or on an unsecured basis. If the Portfolio enters into a secured borrowing arrangement, a portion of the Portfolio’s assets will be used as collateral. The 1940 Act requires the Portfolio to maintain asset coverage of at least 300% of the amount of its borrowings. Asset coverage means the ratio that the value of the Portfolio’s total assets, minus liabilities other than borrowings, bears to the aggregate amount of all borrowings. Although complying with this requirement has the effect of limiting the amount that the Portfolio may borrow, it does not otherwise mitigate the risks of entering into borrowing transactions.
Interfund lending: The Portfolio, along with other funds and portfolios advised by TAM, may participate in an interfund lending program pursuant to exemptive relief granted by the Securities and Exchange Commission on January 18, 2017. This program allows the Portfolio to lend to and borrow from other funds and portfolios advised by TAM. Interfund lending transactions are subject to the conditions of the exemptive relief which places limits on the amount of lending or borrowing a Portfolio may participate in under the program. Interest earned or paid on an interfund lending transaction will be based on the average of certain current market rates. For the period ended June 30, 2024, the Portfolio has not utilized the program.
Repurchase agreements: In a repurchase agreement, the Portfolio purchases a security and simultaneously commits to resell that security to the seller at an agreed-upon price on an agreed-upon date. Securities purchased subject to a repurchase agreement are held at the Portfolio’s custodian, or designated sub-custodian related to tri-party repurchase agreements, and, pursuant to the terms of the repurchase agreement, must be collateralized by securities with an aggregate market value greater than or equal to 100% of the resale price. The Portfolio will bear the risk of value fluctuations until the securities can be sold and may encounter delays and incur costs in liquidating the securities. In the event of bankruptcy or insolvency of the seller, delays and costs may be incurred.
Repurchase agreements are subject to netting agreements, which are agreements between the Portfolio and its counterparties that provide for the net settlement of all transactions and collateral with the Portfolio, through a single payment, in the event of default or termination. Amounts presented within the Schedule of Investments, and as part of Repurchase agreements, at value within the Statement of Assets and Liabilities are shown on a gross basis. The value of the related collateral for each repurchase agreement, as reflected within the Schedule of Investments, exceeds the value of each repurchase agreement at June 30, 2024.
Repurchase agreements at June 30, 2024, if any, are included within the Schedule of Investments and Statement of Assets and Liabilities.
|
|
|
| Transamerica Series Trust |
|
Semi-Annual Financial Statements 2024 |
Page 8
Transamerica BlackRock iShares Active Asset Allocation - Conservative VP
NOTES TO FINANCIAL STATEMENTS (continued)
At June 30, 2024
(unaudited)
4. BORROWINGS AND OTHER FINANCING TRANSACTIONS (continued)
Securities lending: The Portfolio may lend securities to qualified financial institutions, brokers and dealers. State Street serves as securities lending agent to the Portfolio pursuant to a Securities Lending Agreement. Loans of securities are terminable at any time and the borrower, after notice, is required to return borrowed securities within the standard time period for settlement of securities transactions. The lending of securities exposes the Portfolio to risks such as: the borrowers may fail to return the loaned securities or may not be able to provide additional collateral, the Portfolio may experience delays in recovery of the loaned securities or delays in access to collateral, or the Portfolio may experience losses related to the investment collateral. To minimize certain risks, loan counterparties pledge cash, securities issued or guaranteed by the U.S. Government and irrevocable letters of credit issued by banks as collateral. The initial collateral received by the Portfolio is required to have a value of at least 102% of the current value of the loaned securities traded on U.S. exchanges, and a value of at least 105% for all other securities. Typically the lending agent is not permitted to sell, re-pledge or use cash and non-cash collateral it receives. The lending agent has agreed to indemnify the Portfolio in the case of default of any securities borrower.
The Portfolio receives compensation for lending securities from interest or dividends earned on the cash, U.S. Government securities and irrevocable letters of credit held as collateral, less associated fees and expenses. Such income is reflected in Net income from securities lending within the Statement of Operations. Cash collateral received is invested in the State Street Navigator Securities Lending Trust — Government Money Market Portfolio.
The value of loaned securities and related cash and non-cash collateral outstanding at June 30, 2024, if any, are shown on a gross basis within the Schedule of Investments.
The following table reflects a breakdown of transactions accounted for as secured borrowings, the gross obligation by the type, and the remaining contractual maturity of those transactions as of June 30, 2024.
|
|
|
|
|
|
|
|
|
|
|
|
|
|
|
|
|
|
|
|
|
| |
|
Remaining Contractual Maturity of the Agreements |
|
| |
|
Overnight and Continuous |
|
|
Less Than 30 Days |
|
|
Between 30 & 90 Days |
|
|
Greater Than 90 Days |
|
|
Total |
|
| Securities Lending Transactions Exchange-Traded Funds |
|
|
$ 8,730,580 |
|
|
|
$ — |
|
|
|
$ — |
|
|
|
$ — |
|
|
|
$ 8,730,580 |
|
| Total Borrowings |
|
|
$ 8,730,580 |
|
|
|
$ — |
|
|
|
$ — |
|
|
|
$ — |
|
|
|
$ 8,730,580 |
|
| |
|
|
|
|
|
|
|
|
|
|
|
|
|
|
|
|
|
|
|
|
5. RISK FACTORS
Investing in the Portfolio involves certain key risks related to the Portfolio’s trading activity. Please reference the Portfolio’s prospectus for a more complete discussion of the following risk(s), as well as other risks of investing in the Portfolio.
Market risk: The market prices of the Portfolio’s securities or other assets may go up or down, sometimes rapidly or unpredictably, due to factors such as economic events, inflation, changes in interest rates, governmental actions or interventions, actions taken by the U.S. Federal Reserve or foreign central banks, market disruptions caused by tariffs, trade disputes or other factors, political developments, armed conflicts, economic sanctions, cybersecurity events, investor sentiment, the global and domestic effects of widespread or local health, weather or climate events, and other factors that may or may not be related to the issuer of the security or other asset. If the market prices of the Portfolio’s securities and assets fall, the value of your investment in the Portfolio could go down.
Economies and financial markets throughout the world are increasingly interconnected. Events or circumstances in one or more countries or regions could be highly disruptive to, and have profound impacts on, global economies or markets. As a result, whether or not the Portfolio invests in securities of issuers located in or with significant exposure to the countries directly affected, the value and liquidity of the Portfolio’s investments may go down.
Asset allocation risk: The Portfolio’s investment performance is significantly impacted by the Portfolio’s asset allocation and reallocation from time to time. The value of your investment may decrease if the sub-adviser’s judgment about the attractiveness, value or market trends affecting a particular asset class, investment style, technique or strategy, underlying ETF or other issuer is incorrect.
Fixed-income securities risk: Risks of fixed-income securities include credit risk, interest rate risk, counterparty risk, prepayment risk, extension risk, valuation risk, and liquidity risk. The value of fixed-income securities may go up or down, sometimes rapidly and
|
|
|
| Transamerica Series Trust |
|
Semi-Annual Financial Statements 2024 |
Page 9
Transamerica BlackRock iShares Active Asset Allocation - Conservative VP
NOTES TO FINANCIAL STATEMENTS (continued)
At June 30, 2024
(unaudited)
5. RISK FACTORS (continued)
unpredictably, due to general market conditions, such as real or perceived adverse economic or political conditions, tariffs and trade disruptions, inflation, changes in interest rates, lack of liquidity in the bond markets or adverse investor sentiment. In addition, the value of a fixed-income security may decline if the issuer or other obligor of the security fails to pay principal and/or interest, otherwise defaults or has its credit rating downgraded or is perceived to be less creditworthy, or the credit quality or value of any underlying assets declines. If the value of fixed-income securities owned by the Portfolio falls, the value of your investment will go down. The Portfolio may lose its entire investment in the fixed-income securities of an issuer.
6. FEES AND OTHER AFFILIATED TRANSACTIONS
TST serves as a funding vehicle for certain affiliated asset allocation portfolios and certain affiliated separate accounts of Transamerica Life Insurance Company (“TLIC”) and Transamerica Financial Life Insurance Company.
TAM, the Portfolio’s investment manager, is directly owned by TLIC and AUSA Holding, LLC (“AUSA”), both of which are indirect, wholly owned subsidiaries of Aegon Ltd. TLIC is owned by Commonwealth General Corporation (“Commonwealth”). Commonwealth and AUSA are wholly owned by Transamerica Corporation (DE). Transamerica Corporation (DE) is wholly owned by Aegon International B.V., which is wholly owned by Aegon Ltd., a Bermuda exempted company with liability limited by shares (formerly, Aegon NV, a Netherlands corporation) and a publicly traded international insurance group.
Transamerica Fund Services, Inc. (“TFS”) is the Portfolio’s transfer agent. Transamerica Capital, Inc. (“TCI”) is the Portfolio’s distributor/principal underwriter. TAM, TFS and TCI are affiliates of Aegon Ltd.
Certain officers and trustees of the Portfolio may also be officers and/or trustees of TAM, TFS and TCI. No interested trustee who is deemed an interested person due to current or former service with TAM or an affiliate of TAM receives compensation from the Portfolio. The Portfolio does pay non-interested persons (independent trustees), as disclosed in Trustee and CCO fees within the Statement of Operations.
Investment management fees: TAM serves as the Portfolio’s investment manager, performing administration as well as investment advisory services. TAM renders investment advisory, supervisory, and administration services under an investment management agreement and the Portfolio pays a single management fee, which is reflected in Investment management fees within the Statement of Operations.
The Portfolio pays a management fee to TAM based on daily average net assets at the following rates:
|
|
|
|
|
| Breakpoints |
|
Rate |
| First $500 million |
|
|
0.5000 |
% |
| Over $500 million up to $1 billion |
|
|
0.4900 |
|
| Over $1 billion up to $2.5 billion |
|
|
0.4725 |
|
| Over $2.5 billion up to $3.5 billion |
|
|
0.4650 |
|
| Over $3.5 billion up to $4.5 billion |
|
|
0.4525 |
|
| Over $4.5 billion |
|
|
0.4400 |
|
TAM has contractually agreed, through May 1, 2025, to waive from its management fees an amount equal to the sub-advisory fee waiver by the Portfolio’s sub-adviser. These amounts are not subject to recapture by TAM.
TAM has contractually agreed to waive fees and/or reimburse Portfolio expenses to the extent that the total operating expenses excluding, as applicable, acquired fund fees and expenses, interest (including borrowing costs and overdraft charges), taxes, brokerage commissions, dividend and interest expenses on securities sold short, extraordinary expenses and other expenses not incurred in the ordinary course of the Portfolio’s business, exceed the following stated annual operating expense limits to the Portfolio’s daily average net
|
|
|
| Transamerica Series Trust |
|
Semi-Annual Financial Statements 2024 |
Page 10
Transamerica BlackRock iShares Active Asset Allocation - Conservative VP
NOTES TO FINANCIAL STATEMENTS (continued)
At June 30, 2024
(unaudited)
6. FEES AND OTHER AFFILIATED TRANSACTIONS (continued)
assets. To the extent an expense limit changed during the period, the prior limit is also listed below. The expenses waived and/or reimbursed, if any, are included in Expenses waived and/or reimbursed within the Statement of Operations.
|
|
|
|
|
| Class |
|
Operating Expense Limit |
|
Operating Expense Limit Effective Through |
| Initial Class |
|
0.55% |
|
May 1, 2025 |
| Service Class |
|
0.80 |
|
May 1, 2025 |
TAM is permitted to recapture amounts contractually waived and/or reimbursed to a class during any of the 36 months from the date on which TAM waived fees and/or reimbursed expenses for the class. A class may recapture and reimburse TAM only if such amount does not cause, on any particular business day of the Portfolio, the class’s total annual operating expenses (after the recapture is taken into account) to exceed the Operating Expense Limits or any other lower limit then in effect. Amounts recaptured, if any, by TAM for the period ended June 30, 2024 are disclosed in Recapture of previously waived and/or reimbursed fees within the Statement of Operations.
TAM, on a voluntary basis and in addition to the contractual operating expense limits in effect, from time to time may waive and/or reimburse expenses of the Portfolio, or any classes thereof, to such level(s) as the Trust’s officers have determined or may reasonably determine from time to time. Any such voluntary waiver or expense reimbursement may be discontinued by TAM at any time. These amounts are not subject to recapture by TAM.
As of June 30, 2024, there are no amounts available for recapture by TAM.
Distribution and service fees: TST has a distribution plan (“Distribution Plan”) pursuant to Rule 12b-1 under the 1940 Act. Pursuant to the Distribution Plan, TST entered into a distribution agreement with TCI as the Portfolio’s distributor.
The Distribution Plan requires the Portfolio to pay distribution fees to TCI as compensation for various distribution activities, not as reimbursement for specific expenses. Under the Distribution Plan and distribution agreement, TCI, on behalf of the Portfolio, is authorized to pay various service providers, as direct payment for expenses incurred in connection with distribution of the Portfolio’s shares.
The fee on the Service Class shares is paid to the insurance companies for providing services and account maintenance for the policyholders who invest in the variable insurance products which invest in the Service Class shares. TCI has determined that it will not seek payment for the distribution expenses incurred by the Portfolio with respect to the Initial Class shares before May 1, 2025. Prior to TCI seeking distribution expenses on Initial Class shares, policy and contract owners will be notified in advance. The Portfolio will pay fees relating to Service Class shares. The distribution and service fees are included in Distribution and service fees within the Statement of Operations.
The Portfolio is authorized under the Distribution Plan to pay fees to TCI based on daily average net assets of each applicable class up to the following annual rates:
|
|
|
| Class |
|
Rate |
| Initial Class |
|
0.15% |
| Service Class |
|
0.25 |
Transfer agent costs: TFS provides transfer agency services under an intercompany agreement with TAM. TFS has outsourced the provision of certain sub-transfer agency services to SS&C Global Investor & Distribution Solutions, Inc. (“SS&C GIDS”). The Portfolio does not pay a separate transfer agent fee to TAM or TFS but does pay certain expenses to SS&C GIDS related to applicable sub-transfer agency services. For the period ended June 30, 2024, (i) the expenses paid to SS&C GIDS by the Portfolio are referred to as transfer agent costs and are included within the Statement of Operations and (ii) the expenses payable to SS&C GIDS by the Portfolio are referred to as transfer agent costs within the Statement of Assets and Liabilities.
Brokerage commissions: The Portfolio incurred no brokerage commissions on security transactions placed with affiliates of the investment manager or sub-adviser(s) for the period ended June 30, 2024.
|
|
|
| Transamerica Series Trust |
|
Semi-Annual Financial Statements 2024 |
Page 11
Transamerica BlackRock iShares Active Asset Allocation - Conservative VP
NOTES TO FINANCIAL STATEMENTS (continued)
At June 30, 2024
(unaudited)
7. PURCHASES AND SALES OF SECURITIES
For the period ended June 30, 2024, the cost of securities purchased and proceeds from securities sold (excluding short-term securities) are as follows:
|
|
|
|
|
|
|
| |
|
Purchases of Securities |
|
Sales of Securities |
|
|
| |
|
|
|
| |
$ 77,926,203 |
|
$ 99,738,526 |
8. FEDERAL INCOME TAXES AND DISTRIBUTIONS TO SHAREHOLDERS
The Portfolio has not made any provision for federal income or excise taxes due to its policy to distribute all of its taxable income and capital gains to its shareholders and otherwise qualify as a regulated investment company under Subchapter M of the Internal Revenue Code. The Portfolio recognizes the tax benefits of uncertain tax positions only where the position is “more likely than not” to be sustained assuming examination by tax authorities. The Portfolio’s tax returns remain subject to examination by the Internal Revenue Service and state tax authorities three years from the date of filing for federal purposes and four years from the date of filing for state purposes. Management has evaluated the Portfolio’s tax provisions taken for all open tax years, and has concluded that no provision for income tax is required in the Portfolio’s financial statements. If applicable, the Portfolio recognizes interest accrued related to unrecognized tax benefits in relation to interest and penalties expense in Other within the Statement of Operations. The Portfolio identifies its major tax jurisdictions as U.S. Federal, the state of Colorado, and foreign jurisdictions where the Portfolio makes significant investments; however, the Portfolio is not aware of any tax positions for which it is reasonably possible that the total amounts of unrecognized tax benefits will change materially in the next twelve months. Distributions are determined in accordance with income tax regulations, which may differ from GAAP.
As of June 30, 2024, the approximate cost for U.S. federal income tax purposes, and the aggregate gross/net unrealized appreciation (depreciation) in the value of investments (including securities sold short and derivatives, if any) are as follows:
|
|
|
|
|
|
|
|
|
|
|
| |
|
Cost |
|
Gross Appreciation |
|
Gross (Depreciation) |
|
Net Appreciation (Depreciation) |
|
|
| |
$ 230,014,531 |
|
$ 10,410,413 |
|
$ (13,741,962) |
|
$ (3,331,549) |
Please see TST’s most recent report on Form N-CSR, available at: www.transamerica.com/annuities/prospectus, for additional information. For the most recently filed complete proxy voting records for the Trust please visit: https://www.transamerica.com/sites/default/files/files/e070d/TST%20N-PX%202021.pdf
|
|
|
| Transamerica Series Trust |
|
Semi-Annual Financial Statements 2024 |
Page 12
Transamerica BlackRock iShares Active Asset Allocation - Conservative VP
MANAGEMENT AND SUB-ADVISORY AGREEMENT — CONTRACT RENEWAL
(unaudited)
At a meeting of the Board of Trustees of Transamerica Series Trust (the “Trustees” or the “Board”) held on June 12-13, 2024, the Board considered the renewal of the management agreement (the “Management Agreement”) between Transamerica Asset Management, Inc. (“TAM”) and Transamerica Series Trust, on behalf of Transamerica BlackRock iShares Active Asset Allocation – Conservative VP (the “Portfolio”). The Board also considered the renewal of the investment sub-advisory agreement (the “Sub-Advisory Agreement” and together with the Management Agreement, the “Agreements”) for the Portfolio between TAM and BlackRock Investment Management, LLC (the “Sub-Adviser”).
Following its review and consideration, the Board determined that the terms of the Management Agreement and Sub-Advisory Agreement were reasonable and that the renewal of each of the Agreements was in the best interests of the Portfolio and the holders invested in the Portfolio. The Board, including the independent members of the Board (the “Independent Trustees”), unanimously approved the renewal of each of the Agreements through June 30, 2025.
Prior to reaching their decision, the Trustees requested and received from TAM and the Sub-Adviser certain information. They then reviewed such information as they deemed reasonably necessary to evaluate the Agreements, including information they had previously received from TAM and the Sub-Adviser as part of their regular oversight of the Portfolio, and knowledge they gained over time through meeting with TAM and the Sub-Adviser. Among other materials, the Trustees considered comparative fee, expense and performance information prepared by Broadridge Financial Solutions, Inc. (“Broadridge”), an independent provider of mutual fund performance information, as well as fee, expense and profitability information prepared by TAM. In addition, TAM provided the Board with additional supplemental comparative fee, expense and performance information. To the extent applicable, the Trustees considered information about fees and performance of comparable funds and/or accounts managed by the Sub-Adviser. The Board also considered reductions to the Portfolio’s expense limits, if any, that took effect after the last renewal of the Agreements. In their review, the Trustees also sought to identify instances in which the Portfolio’s performance, fees, total expenses and/or profitability appeared to be outliers within its respective peer group or other comparative metrics and sought to understand the reasons for such comparative positions.
In their deliberations, the Independent Trustees met privately without representatives of TAM or the Sub-Adviser present and were represented throughout the process by their independent legal counsel. In considering the proposed continuation of each of the Agreements, the Trustees evaluated and weighed a number of considerations that they believed to be relevant in light of the legal advice furnished to them by counsel, including independent legal counsel, and made a decision in the exercise of their own business judgment. They based their decisions on the considerations discussed below, among others, although they did not identify any particular consideration or item of information that was controlling of their decisions, and each Trustee may have attributed different weights to the various factors.
Nature, Extent and Quality of the Services Provided
The Board considered the nature, extent and quality of the services provided by TAM and the Sub-Adviser to the Portfolio in the past and the services anticipated to be provided in the future. The Board also considered the investment approach for the Portfolio; the experience, capability and integrity of TAM’s senior management; the financial resources of TAM; TAM’s management oversight process; TAM’s and the Sub-Adviser’s responsiveness to any questions by the Trustees; and the professional qualifications and compensation program of the portfolio management team of the Sub-Adviser. The Trustees noted that they receive, on a quarterly basis, an execution analysis from Capital Institutional Services, Inc. (CAPIS), an independent provider of trade analyses, for the Sub-Adviser and a comparison of trading results against a peer universe of managers.
The Board also considered the continuous and regular investment management and other services provided by TAM, when acting as a manager of managers, for the portion of the management fee it retains from the Portfolio after payment of the sub-advisory fees. The Board noted that the investment management and other services provided by TAM include the design, development and ongoing review and evaluation of the Portfolio and its investment strategy; the selection, oversight and monitoring of one or more investment sub-advisers to perform certain duties with respect to the Portfolio; ongoing portfolio trading oversight and analysis; risk management oversight and analysis; design, development, implementation and ongoing review and evaluation of a process for the valuation of Portfolio investments; design, development, implementation and ongoing review and evaluation of a compliance program for the Portfolio; design, development, implementation and ongoing review and evaluation of a process for the voting of proxies and exercise of rights to consent to corporate action for Portfolio investments; participation in Board meetings and oversight of preparation of materials for the Board, including materials for Board meetings and regular communications with the Board; oversight of preparation of the Portfolio’s prospectus, statement of additional information, shareholder reports and other disclosure materials and regulatory filings for the Portfolio; and ongoing cash management services for the Portfolio. The Board considered that TAM’s investment management services also include the provision of supervisory and administrative services to the Portfolio. The Board also noted that TAM, as part of the services it provides to all Transamerica mutual funds, including the Portfolio, oversees the services provided by the funds’ custodian, transfer agent, independent accountant and legal counsel and supervises the performance of the recordkeeping and holder service functions of the funds.
|
|
|
| Transamerica Series Trust |
|
Semi-Annual Financial Statements 2024 |
Page 13
Transamerica BlackRock iShares Active Asset Allocation - Conservative VP
MANAGEMENT AND SUB-ADVISORY AGREEMENT — CONTRACT RENEWAL (continued)
(unaudited)
Investment Performance
In addition, the Board considered the short- and longer-term performance of the Portfolio in light of its investment objective, policies and strategies, including relative performance against (i) a peer universe of comparable mutual funds, as prepared by Broadridge, and (ii) the Portfolio’s benchmarks, in each case for various trailing periods ended December 31, 2023. Based on these considerations, the Board determined that TAM and the Sub-Adviser can provide investment and related services that are appropriate in scope and extent in light of the Portfolio’s investment objectives, policies and strategies and operations, the competitive landscape of the investment company business and investor needs. The Board’s conclusions as to the Portfolio’s performance are summarized below. For purposes of its review, the Board generally used the performance of Service Class Shares. In describing the Portfolio’s performance relative to its peer universe, the summary conclusions characterize performance for the relevant periods in relation to whether it was “above,” “below” or “in line with” the peer universe median and do so using quintile rankings prepared by Broadridge. For simplicity, performance is described as “above” the median if the Portfolio’s performance ranked anywhere in the first or second quintiles, as “below” the median if it ranked anywhere in the fourth or fifth quintiles, or “in line with” the median if it ranked anywhere in the third quintile (i.e., even if its precise return was somewhat above or somewhat below the precise median return).
When considering the Portfolio’s performance, the Trustees considered any representations made by TAM regarding the appropriateness of certain peer groups and benchmarks. They recognized that performance reflects a snapshot of a period as of a specific date, and that consideration of performance data for a different period could generate significantly different performance results. The Trustees also recognized that even longer-term performance can be negatively affected by performance over a short-term period when that short-term performance is significantly below the performance of the comparable benchmark or universe of peer funds.
The Board noted that the performance of Service Class Shares of the Portfolio was in line with the median for its peer universe for the past 1-year period and below the median for the past 3-, 5- and 10-year periods. The Board also noted that the performance of Service Class Shares of the Portfolio was below the benchmark that TAM utilizes to measure performance of the Portfolio for the past 1-, 3-, 5- and 10-year periods. The Board noted that the Sub-Adviser had commenced sub-advising the Portfolio on November 1, 2021 pursuant to its current investment strategies.
Management Fee and Sub-Advisory Fees and Total Expense Ratio
The Board considered the management fee and total expense ratio of the Portfolio, including information provided by Broadridge comparing the management fee and total expense ratio of the Portfolio to the management fees and total expense ratios of comparable investment companies in both a peer group and broader peer universe compiled by Broadridge. The Board’s conclusions as to the Portfolio’s management fee and total expense ratio are summarized below. For purposes of its review, the Board generally used the actual total expenses (i.e., expenses reflecting any waivers and/or reimbursements) of Service Class Shares. In describing the Portfolio’s management fee and total expense ratio relative to its peer group and peer universe, the summary conclusions characterize management fees and total expense ratios for the relevant periods in relation to whether they were “above,” “below” or “in line with” the peer group or peer universe median and do so using quintile rankings prepared by Broadridge. For simplicity, management fees and total expense ratios are described as “above” the median if the Portfolio’s management fee or total expense ratio ranked anywhere in the fourth or fifth quintiles, as “below” the median if it ranked anywhere in the first or second quintiles, or “in line with” the median if it ranked anywhere in the third quintile (i.e., even if its precise management fee or total expense ratio was somewhat above or somewhat below the precise median management fee or total expense ratio).
The Board also considered the fees charged by the Sub-Adviser for sub-advisory services, as well as the portion of the Portfolio’s management fee retained by TAM following payment of the sub-advisory fee and how the portion of the contractual management fee retained by TAM at a specified asset level compared to the portions retained by other investment advisers managing mutual funds with similar investment strategies as calculated by an independent provider of information.
The Board noted that the Portfolio’s contractual management fee was in line with the median for its peer group and above the median for its peer universe and that the actual total expenses (i.e., expenses reflecting any waivers and/or reimbursements) of Service Class Shares of the Portfolio were above the median for its peer group and below the median for its peer universe. The Trustees also considered that TAM has entered into an expense limitation arrangement with the Portfolio, which may result in TAM waiving fees for the benefit of holders.
On the basis of these considerations, together with the other information it considered, the Board determined that the management and sub-advisory fees to be received by TAM and the Sub-Adviser under the Management Agreement and Sub-Advisory Agreement are reasonable in light of the services provided.
Cost of Services Provided and Level of Profitability
The Board reviewed information provided by TAM about the cost of providing and procuring fund management services, as well as the costs of the provision of administration, transfer agency and other services, to the Portfolio and to Transamerica Series Trust as a whole by TAM and its affiliates. The Board considered the profitability of TAM and its affiliates in providing these services for the Portfolio and
|
|
|
| Transamerica Series Trust |
|
Semi-Annual Financial Statements 2024 |
Page 14
Transamerica BlackRock iShares Active Asset Allocation - Conservative VP
MANAGEMENT AND SUB-ADVISORY AGREEMENT — CONTRACT RENEWAL (continued)
(unaudited)
Transamerica Series Trust as a whole. The Trustees recognized the competitiveness of the mutual fund industry and the importance of an investment adviser’s long-term profitability, including for maintaining company and management stability and accountability.
The Board also considered the allocation methodology used for calculating the profitability of TAM and its affiliates. The Board noted that the revenue and expense allocation methodology used by TAM to estimate its profitability with respect to its relationship with the Portfolio had been reviewed previously by an independent consultant. The Trustees considered that TAM reported that it had not made material changes to this methodology, and that the methodology had been applied consistently for the Portfolio.
With respect to the Sub-Adviser, the Board noted that the sub-advisory fee is the product of arm’s-length negotiation between TAM and the Sub-Adviser, which is not affiliated with TAM, and is paid by TAM and not the Portfolio. As a result, the Board focused on the profitability of TAM and its affiliates with respect to the Portfolio.
Based on this information, the Board determined that the profitability of TAM and its affiliates from their relationships with the Portfolio was not excessive.
Economies of Scale
The Board considered economies of scale with respect to the management of the Portfolio, whether the Portfolio had appropriately benefited from any economies of scale and whether there was the potential for realization of any future economies of scale. The Board also considered the existence of economies of scale with respect to management of the Transamerica mutual funds overall and the extent to which the Portfolio benefited from any economies of scale. The Board recognized that, as the Portfolio’s assets increase, any economies of scale realized by TAM or the Sub-Adviser may not directly correlate with each other or with any economies of scale that might be realized by the Portfolio. The Board considered the Portfolio’s management fee schedule and the existence of breakpoints and also considered the extent to which TAM shared economies of scale, if any, with the Portfolio through undertakings to limit or reimburse Portfolio expenses and to invest in maintaining and developing its capabilities and services. The Board also considered the Sub-Adviser’s sub-advisory fee schedule and the existence of breakpoints, if any, and how such breakpoints relate to any breakpoints in the Portfolio’s management fee schedule. The Board considered that the Sub-Adviser’s sub-advisory fees would be based on the combined assets of multiple funds. The Trustees concluded that the Portfolio’s fee structure reflected an appropriate sharing of any efficiencies or economies of scale to date and noted that they will have the opportunity to periodically reexamine the appropriateness of the management fee payable to TAM and the fee paid to the Sub-Adviser in light of any economies of scale experienced in the future.
Benefits to TAM, its Affiliates and/or the Sub-Adviser from their Relationships with the Portfolio
The Board considered other benefits derived by TAM, its affiliates, and/or the Sub-Adviser from their relationships with the Portfolio. The Board noted that TAM does not receive benefits from research obtained with commissions paid to broker-dealers for portfolio transactions (commonly referred to as “soft dollars”) as a result of its relationship with the Portfolio and that TAM believes the use of soft dollars by the Sub-Adviser is generally appropriate and in the best interests of the Portfolio.
Other Considerations
The Board noted that TAM has made a substantial commitment to the recruitment and retention of high-quality personnel and maintains the financial, compliance and operational resources reasonably necessary to manage the Portfolio in a professional manner that is consistent with the best interests of the Portfolio and the holders. In this regard, the Board favorably considered the procedures and policies TAM has in place to enforce compliance with applicable laws and regulations and oversee the portfolio management activities of the Sub-Adviser. The Board also noted that TAM has made an entrepreneurial commitment and undertaken certain business risks with respect to the management and success of the Portfolio.
Conclusion
After consideration of the factors described above, as well as other factors, the Trustees, including the Independent Trustees, concluded that the renewal of the Management Agreement and the Sub-Advisory Agreement was in the best interests of the Portfolio and the holders and voted to approve the renewal of the Agreements.
|
|
|
|
|
| Transamerica Series Trust |
|
|
|
Semi-Annual Financial Statements 2024 |
|
|
Page 15 |
|
|
PROXY VOTING POLICIES AND PROCEDURES AND QUARTERLY PORTFOLIO HOLDINGS
(unaudited)
A description of Transamerica Series Trust’s (the “Trust”) proxy voting policies and procedures is available in the Statement of Additional Information of the Portfolios, available without charge upon request by calling 1-800-851-9777 (toll free) or on the Securities and Exchange Commission’s (“SEC”) website at http://www.sec.gov.
In addition, the Portfolio is required to file Form N-PX, with their complete proxy voting records for the most recent 12 months ended June 30th, no later than August 31st of each year. The Form is available without charge: (1) on the Transamerica Funds website at https://www.transamerica.com/sites/default/files/files/e070d/TST%20N-PX%202021.pdf; and (2) on the SEC’s website at http://www.sec.gov.
Each fiscal quarter, the Portfolios, except Transamerica BlackRock Government Money Market VP, will file with the SEC a complete schedule of its monthly portfolio holdings on Form N-PORT. The Portfolios’ holdings as of the end of the third month of every fiscal quarter, as reported on Form N-PORT, will be publicly available on the SEC’s website at http://www.sec.gov within 60 days of the end of the fiscal quarter.
On a monthly basis, Transamerica BlackRock Government Money Market VP will file with the SEC portfolio holdings information on Form N-MFP3. A complete schedule of portfolio holdings is also available at www.transamerica.com.
You may also visit the Trust’s website at www.transamerica.com/annuities/prospectus for this and other information about the Portfolios and the Trust.
Important Notice Regarding Delivery of Shareholder Documents
Every year we provide shareholders informative materials such as the Transamerica Series Trust Annual Report, the Transamerica Series Trust Prospectus, and other required documents that keep you informed regarding your Portfolios. To the extent provided by mail, Transamerica Series Trust will only send one piece per mailing address, a method that saves your Portfolios money by reducing mailing and printing costs. We will continue to do this unless you tell us not to. To elect to receive individual mailings, simply call a Transamerica Customer Service Representative toll free at 1-800-851-9777, 8 a.m. to 7 p.m. Eastern Time, Monday-Friday. Your request will take effect within 30 days.
|
|
|
| Transamerica Series Trust |
|
Semi-Annual Financial Statements 2024 |
Page 16
NOTICE OF PRIVACY POLICY
(unaudited)
Your privacy is very important to us. We want you to understand what information we collect and how we use it. We collect and use “nonpublic personal information” in connection with providing our customers with a broad range of financial products and services as effectively and conveniently as possible. We treat nonpublic personal information in accordance with our Privacy Policy.
What Information We Collect and From Whom We Collect It
We may collect nonpublic personal information about you from the following sources:
| • |
|
Information we receive from you on applications or other forms, such as your name, address, and account number; |
| • |
|
Information about your transactions with us, our affiliates, or others, such as your account balance and purchase/redemption history; and |
| • |
|
Information we receive from non-affiliated third parties, including consumer reporting agencies. |
What Information We Disclose and To Whom We Disclose It
We do not disclose any nonpublic personal information about current or former customers to anyone without their express consent, except as permitted by law. We may disclose the nonpublic personal information we collect, as described above, to persons or companies that perform services on our behalf and to other financial institutions with which we have joint marketing agreements. We will require these companies to protect the confidentiality of your nonpublic personal information and to use it only to perform the services for which we have hired them.
Our Security Procedures
We restrict access to your nonpublic personal information and only allow disclosures to persons and companies as permitted by law to assist in providing products or services to you. We maintain physical, electronic, and procedural safeguards to protect your nonpublic personal information and to safeguard the disposal of certain consumer information.
Contact Us
If you have any questions about our Privacy Policy, please call 1-800-851-9777 on any business day between 8 a.m. and 7 p.m. Eastern Time.
Note: This Privacy Policy applies only to customers that have a direct relationship with us or our affiliates. If you own shares of our portfolios in the name of a third party such as a bank or broker-dealer, its privacy policy may apply to you instead of ours.
|
|
|
|
|
| Transamerica Series Trust |
|
|
|
Semi-Annual Financial Statements 2024 |
|
|
Page 17 |
|
|
PO Box 219945
Kansas City, MO 64121-9945
|
|
|
| Distributor: |
|
Transamerica Capital, Inc. |
|
|
PO Box 219945 |
|
|
Kansas City, MO 64121-9945 |
|
|
|
|
Customer Service: 1-800-851-9777 |
Transamerica Series Trust Semi-Annual Financial Statements
June 30, 2024
1801 California St., Suite 5200
Denver, CO 80202
Distributor: Transamerica Capital, Inc.
Customer Service: 1-800-851-9777
The following pages contain the most recent semi-annual financial statements for the investment options in which you are invested. In compliance with Securities and Exchange Commission regulations, we present these reports on an annual and semi-annual basis with the hope that they will foster greater understanding of the investment options’ holdings, performance, financial data, accounting policies and other issues. This streamlined version provides information only on the investment options in which you are invested.
If you have any questions about these reports, please do not hesitate to contact your financial professional. As always, we thank you for your trust and the opportunity to serve you.
Transamerica BlackRock iShares Active Asset Allocation - Moderate Growth VP
SCHEDULE OF INVESTMENTS
At June 30, 2024
(unaudited)
|
|
|
|
|
|
|
|
|
| |
|
Shares |
|
|
Value |
|
| |
|
|
|
|
| EXCHANGE-TRADED FUNDS - 97.4% |
|
|
|
|
|
|
|
|
| International Equity Funds - 22.3% |
|
|
|
|
|
|
|
|
| iShares Core MSCI EAFE ETF |
|
|
378,189 |
|
|
$ |
27,471,649 |
|
| iShares MSCI EAFE ETF (A) |
|
|
647,220 |
|
|
|
50,696,743 |
|
| iShares MSCI Eurozone ETF |
|
|
75,964 |
|
|
|
3,708,942 |
|
|
|
|
|
|
|
|
|
|
|
|
|
|
|
|
|
|
|
|
81,877,334 |
|
|
|
|
|
|
|
|
|
|
| U.S. Equity Funds - 53.6% |
|
|
|
|
|
|
|
|
| iShares Core S&P 500 ETF |
|
|
313,799 |
|
|
|
171,720,227 |
|
| iShares Russell 2000 ETF (A) |
|
|
124,132 |
|
|
|
25,185,141 |
|
|
|
|
|
|
|
|
|
|
|
|
|
|
|
|
|
|
|
|
196,905,368 |
|
|
|
|
|
|
|
|
|
|
| U.S. Fixed Income Funds - 21.5% |
|
|
|
|
|
|
|
|
| iShares 7-10 Year Treasury Bond ETF |
|
|
62,632 |
|
|
|
5,865,487 |
|
| iShares Core U.S. Aggregate Bond ETF |
|
|
581,903 |
|
|
|
56,485,324 |
|
| iShares iBoxx $ Investment Grade Corporate Bond ETF (A) |
|
|
54,345 |
|
|
|
5,821,436 |
|
| iShares Short Treasury Bond ETF |
|
|
8,229 |
|
|
|
909,305 |
|
| iShares U.S. Treasury Bond ETF |
|
|
429,149 |
|
|
|
9,685,893 |
|
|
|
|
|
|
|
|
|
|
|
|
|
|
|
|
|
|
|
|
78,767,445 |
|
|
|
|
|
|
|
|
|
|
|
|
|
| Total Exchange-Traded Funds (Cost $304,060,111) |
|
|
|
|
|
|
357,550,147 |
|
|
|
|
|
|
|
|
|
|
|
|
|
| OTHER INVESTMENT COMPANY - 1.6% |
|
|
|
|
|
|
|
|
| Securities Lending Collateral - 1.6% |
|
|
|
|
|
|
|
|
| State Street Navigator Securities Lending Trust - Government Money Market Portfolio, 5.28% (B) |
|
|
5,886,720 |
|
|
|
5,886,720 |
|
|
|
|
|
|
|
|
|
|
|
|
| Total Other Investment Company (Cost $5,886,720) |
|
|
|
5,886,720 |
|
|
|
|
|
|
|
|
|
|
|
|
|
|
|
|
|
|
|
| |
|
Principal |
|
|
Value |
|
| |
|
|
|
|
| REPURCHASE AGREEMENT - 2.3% |
|
|
|
|
|
|
|
|
| Fixed Income Clearing Corp., |
|
|
|
|
|
|
|
|
| 2.50% (B), dated 06/28/2024, to be repurchased at $8,676,541 on 07/01/2024. Collateralized by a U.S. Government Obligation, 3.75%, due 04/15/2026, and with a value of $8,848,315. |
|
$ |
8,674,733 |
|
|
|
$ 8,674,733 |
|
|
|
|
|
|
|
|
|
|
|
|
| Total Repurchase Agreement (Cost $8,674,733) |
|
|
|
8,674,733 |
|
|
|
|
|
|
|
|
|
|
| Total Investments (Cost $318,621,564) |
|
|
|
372,111,600 |
|
|
|
|
|
|
|
|
|
|
| Net Other Assets (Liabilities) - (1.3)% |
|
|
|
(4,922,067) |
|
|
|
|
|
|
|
|
|
|
|
|
| Net Assets - 100.0% |
|
|
$ |
367,189,533 |
|
|
|
|
|
|
|
|
|
|
INVESTMENT VALUATION:
|
|
|
|
|
|
|
|
|
|
|
|
|
|
|
|
|
| |
|
|
|
|
|
|
| Valuation Inputs (C) |
|
|
|
|
|
|
|
|
|
|
|
|
|
|
|
|
|
| |
|
Level 1 - Unadjusted Quoted Prices |
|
|
Level 2 - Other Significant Observable Inputs |
|
|
Level 3 - Significant Unobservable Inputs |
|
|
Value |
|
| |
|
|
|
|
|
|
| ASSETS |
|
|
|
|
|
|
|
|
|
|
|
|
|
|
|
|
| Investments |
|
|
|
|
|
|
|
|
|
|
|
|
|
|
|
|
| Exchange-Traded Funds |
|
$ |
357,550,147 |
|
|
$ |
— |
|
|
$ |
— |
|
|
$ |
357,550,147 |
|
| Other Investment Company |
|
|
5,886,720 |
|
|
|
— |
|
|
|
— |
|
|
|
5,886,720 |
|
| Repurchase Agreement |
|
|
— |
|
|
|
8,674,733 |
|
|
|
— |
|
|
|
8,674,733 |
|
|
|
|
|
|
|
|
|
|
|
|
|
|
|
|
|
|
|
|
|
|
|
| Total Investments |
|
$ |
363,436,867 |
|
|
$ |
8,674,733 |
|
|
$ |
— |
|
|
$ |
372,111,600 |
|
|
|
|
|
|
|
|
|
|
|
|
|
|
|
|
|
|
FOOTNOTES TO SCHEDULE OF INVESTMENTS:
| (A) |
All or a portion of the security is on loan. The total value of the securities on loan is $80,376,251, collateralized by cash collateral of $5,886,720 and non-cash collateral, such as U.S. government securities and irrevocable letters of credit, of $76,181,830. The amount on loan indicated may not correspond with the securities on loan identified because a security with pending sales are in the process of recall from the brokers. |
| (B) |
Rate disclosed reflects the yield at June 30, 2024. |
| (C) |
There were no transfers in or out of Level 3 during the period ended June 30, 2024. Please reference the Investment Valuation section of the Notes to Financial Statements for more information regarding investment valuation and pricing inputs. |
The Notes to Financial Statements are an integral part of this report.
|
|
|
|
|
| Transamerica Series Trust |
|
|
|
Semi-Annual Financial Statements 2024 |
|
|
Page 1 |
|
|
Transamerica BlackRock iShares Active Asset Allocation - Moderate Growth VP
STATEMENT OF ASSETS AND LIABILITIES
At June 30, 2024
(unaudited)
|
|
|
|
|
|
|
| Assets: |
|
|
|
|
| Unaffiliated investments, at value (cost $309,946,831) (including securities loaned of $80,376,251) |
|
$ |
363,436,867 |
|
| Repurchase agreement, at value (cost $8,674,733) |
|
|
8,674,733 |
|
| Receivables and other assets: |
|
|
|
|
| Investments sold |
|
|
3,212,651 |
|
| Net income from securities lending |
|
|
20,585 |
|
| Shares of beneficial interest sold |
|
|
91,349 |
|
| Interest |
|
|
1,807 |
|
| Prepaid expenses |
|
|
1,470 |
|
|
|
| Total assets |
|
|
375,439,462 |
|
|
|
| Liabilities: |
|
|
|
|
| Cash collateral received upon return of: |
|
|
|
|
| Securities on loan |
|
|
5,886,720 |
|
| Payables and other liabilities: |
|
|
|
|
| Investments purchased |
|
|
1,980,966 |
|
| Shares of beneficial interest redeemed |
|
|
127,160 |
|
| Investment management fees |
|
|
126,437 |
|
| Distribution and service fees |
|
|
65,493 |
|
| Transfer agent costs |
|
|
326 |
|
| Trustee and CCO fees |
|
|
980 |
|
| Audit and tax fees |
|
|
10,561 |
|
| Custody fees |
|
|
1,983 |
|
| Legal fees |
|
|
6,934 |
|
| Printing and shareholder reports fees |
|
|
30,573 |
|
| Other accrued expenses |
|
|
11,796 |
|
|
|
| Total liabilities |
|
|
8,249,929 |
|
|
|
| Net assets |
|
$ |
367,189,533 |
|
|
|
| Net assets consist of: |
|
|
|
|
| Capital stock ($0.01 par value) |
|
$ |
330,381 |
|
| Additional paid-in capital |
|
|
370,157,118 |
|
| Total distributable earnings (accumulated losses) |
|
|
(3,297,966 |
) |
|
|
| Net assets |
|
$ |
367,189,533 |
|
|
|
| Net assets by class: |
|
|
|
|
| Initial Class |
|
$ |
25,689,617 |
|
| Service Class |
|
|
341,499,916 |
|
|
|
| Shares outstanding: |
|
|
|
|
| Initial Class |
|
|
2,293,671 |
|
| Service Class |
|
|
30,744,448 |
|
|
|
| Net asset value and offering price per share: |
|
|
|
|
| Initial Class |
|
$ |
11.20 |
|
| Service Class |
|
|
11.11 |
|
STATEMENT OF OPERATIONS
For the period ended June 30, 2024
(unaudited)
|
|
|
|
|
|
|
| Investment income: |
|
|
|
|
| Dividend income from unaffiliated investments |
|
$ |
3,943,434 |
|
| Interest income from unaffiliated investments |
|
|
34,998 |
|
| Net income from securities lending |
|
|
69,744 |
|
|
|
| Total investment income |
|
|
4,048,176 |
|
|
|
| Expenses: |
|
|
|
|
| Investment management fees |
|
|
898,723 |
|
| Distribution and service fees: |
|
|
|
|
| Service Class |
|
|
418,666 |
|
| Transfer agent costs |
|
|
2,028 |
|
| Trustee and CCO fees |
|
|
8,366 |
|
| Audit and tax fees |
|
|
10,232 |
|
| Custody fees |
|
|
2,250 |
|
| Legal fees |
|
|
13,984 |
|
| Printing and shareholder reports fees |
|
|
26,034 |
|
| Other |
|
|
16,524 |
|
|
|
| Total expenses before waiver and/or reimbursement and recapture |
|
|
1,396,807 |
|
| Expenses waived and/or reimbursed: |
|
|
|
|
| Initial Class |
|
|
(6,403 |
) |
| Service Class |
|
|
(87,330 |
) |
|
|
| Net expenses |
|
|
1,303,074 |
|
|
|
| Net investment income (loss) |
|
|
2,745,102 |
|
|
|
| Net realized gain (loss) on: |
|
|
|
|
| Unaffiliated investments |
|
|
6,126,965 |
|
|
|
| Net change in unrealized appreciation (depreciation) on: |
|
|
|
|
| Unaffiliated investments |
|
|
18,977,916 |
|
|
|
| Net realized and change in unrealized gain (loss) |
|
|
25,104,881 |
|
|
|
| Net increase (decrease) in net assets resulting from operations |
|
$ |
27,849,983 |
|
The Notes to Financial Statements are an integral part of this report.
|
|
|
|
|
| Transamerica Series Trust |
|
|
|
Semi-Annual Financial Statements 2024 |
|
|
Page 2 |
|
|
Transamerica BlackRock iShares Active Asset Allocation - Moderate Growth VP
STATEMENT OF CHANGES IN NET ASSETS
For the period and year ended:
|
|
|
|
|
|
|
|
|
|
|
|
|
|
|
|
|
|
|
|
| |
|
June 30, 2024 (unaudited) |
|
December 31, 2023 |
|
|
|
|
|
| From operations: |
|
|
|
|
|
|
|
|
|
|
|
|
|
|
|
|
| Net investment income (loss) |
|
$ |
2,745,102 |
|
|
|
|
|
|
$ |
5,716,360 |
|
|
|
|
|
| Net realized gain (loss) |
|
|
6,126,965 |
|
|
|
|
|
|
|
2,319,411 |
|
|
|
|
|
| Net change in unrealized appreciation (depreciation) |
|
|
18,977,916 |
|
|
|
|
|
|
|
49,485,318 |
|
|
|
|
|
|
|
|
|
|
| Net increase (decrease) in net assets resulting from operations |
|
|
27,849,983 |
|
|
|
|
|
|
|
57,521,089 |
|
|
|
|
|
|
|
|
|
|
| Dividends and/or distributions to shareholders: |
|
|
|
|
|
|
|
|
|
|
|
|
|
|
|
|
| Initial Class |
|
|
— |
|
|
|
|
|
|
|
(387,664 |
) |
|
|
|
|
| Service Class |
|
|
— |
|
|
|
|
|
|
|
(4,543,854 |
) |
|
|
|
|
|
|
|
|
|
| Net increase (decrease) in net assets resulting from dividends and/or distributions to shareholders |
|
|
— |
|
|
|
|
|
|
|
(4,931,518 |
) |
|
|
|
|
|
|
|
|
|
| Capital share transactions: |
|
|
|
|
|
|
|
|
|
|
|
|
|
|
|
|
| Proceeds from shares sold: |
|
|
|
|
|
|
|
|
|
|
|
|
|
|
|
|
| Initial Class |
|
|
635,362 |
|
|
|
|
|
|
|
986,098 |
|
|
|
|
|
| Service Class |
|
|
4,472,217 |
|
|
|
|
|
|
|
8,732,999 |
|
|
|
|
|
|
|
|
|
|
| |
|
|
5,107,579 |
|
|
|
|
|
|
|
9,719,097 |
|
|
|
|
|
| Dividends and/or distributions reinvested: |
|
|
|
|
|
|
|
|
|
|
|
|
|
|
|
|
| Initial Class |
|
|
— |
|
|
|
|
|
|
|
387,664 |
|
|
|
|
|
| Service Class |
|
|
— |
|
|
|
|
|
|
|
4,543,854 |
|
|
|
|
|
| |
|
|
— |
|
|
|
|
|
|
|
4,931,518 |
|
|
|
|
|
| Cost of shares redeemed: |
|
|
|
|
|
|
|
|
|
|
|
|
|
|
|
|
| Initial Class |
|
|
(1,290,859 |
) |
|
|
|
|
|
|
(2,289,253 |
) |
|
|
|
|
| Service Class |
|
|
(28,627,614 |
) |
|
|
|
|
|
|
(44,569,698 |
) |
|
|
|
|
|
|
|
|
|
| |
|
|
(29,918,473 |
) |
|
|
|
|
|
|
(46,858,951 |
) |
|
|
|
|
|
|
|
|
|
| Net increase (decrease) in net assets resulting from capital share transactions |
|
|
(24,810,894 |
) |
|
|
|
|
|
|
(32,208,336 |
) |
|
|
|
|
|
|
|
|
|
| Net increase (decrease) in net assets |
|
|
3,039,089 |
|
|
|
|
|
|
|
20,381,235 |
|
|
|
|
|
|
|
|
|
|
| Net assets: |
|
|
|
|
|
|
|
|
|
|
|
|
|
|
|
|
| Beginning of period/year |
|
|
364,150,444 |
|
|
|
|
|
|
|
343,769,209 |
|
|
|
|
|
| End of period/year |
|
$ |
367,189,533 |
|
|
|
|
|
|
$ |
364,150,444 |
|
|
|
|
|
|
|
|
|
|
| Capital share transactions - shares: |
|
|
|
|
|
|
|
|
|
|
|
|
|
|
|
|
| Shares issued: |
|
|
|
|
|
|
|
|
|
|
|
|
|
|
|
|
| Initial Class |
|
|
59,034 |
|
|
|
|
|
|
|
102,960 |
|
|
|
|
|
| Service Class |
|
|
416,292 |
|
|
|
|
|
|
|
915,238 |
|
|
|
|
|
|
|
|
|
|
| |
|
|
475,326 |
|
|
|
|
|
|
|
1,018,198 |
|
|
|
|
|
| Shares reinvested: |
|
|
|
|
|
|
|
|
|
|
|
|
|
|
|
|
| Initial Class |
|
|
— |
|
|
|
|
|
|
|
39,638 |
|
|
|
|
|
| Service Class |
|
|
— |
|
|
|
|
|
|
|
467,475 |
|
|
|
|
|
|
|
|
|
|
| |
|
|
— |
|
|
|
|
|
|
|
507,113 |
|
|
|
|
|
| Shares redeemed: |
|
|
|
|
|
|
|
|
|
|
|
|
|
|
|
|
| Initial Class |
|
|
(120,052 |
) |
|
|
|
|
|
|
(240,119 |
) |
|
|
|
|
| Service Class |
|
|
(2,685,081 |
) |
|
|
|
|
|
|
(4,675,094 |
) |
|
|
|
|
|
|
|
|
|
| |
|
|
(2,805,133 |
) |
|
|
|
|
|
|
(4,915,213 |
) |
|
|
|
|
|
|
|
|
|
| Net increase (decrease) in shares outstanding: |
|
|
|
|
|
|
|
|
|
|
|
|
|
|
|
|
| Initial Class |
|
|
(61,018 |
) |
|
|
|
|
|
|
(97,521 |
) |
|
|
|
|
| Service Class |
|
|
(2,268,789 |
) |
|
|
|
|
|
|
(3,292,381 |
) |
|
|
|
|
|
|
|
|
|
| |
|
|
(2,329,807 |
) |
|
|
|
|
|
|
(3,389,902 |
) |
|
|
|
|
The Notes to Financial Statements are an integral part of this report.
|
|
|
|
|
| Transamerica Series Trust |
|
|
|
Semi-Annual Financial Statements 2024 |
|
|
Page 3 |
|
|
Transamerica BlackRock iShares Active Asset Allocation - Moderate Growth VP
FINANCIAL HIGHLIGHTS
|
|
|
|
|
|
|
|
|
|
|
|
|
|
|
|
|
|
|
|
|
|
|
|
|
| For a share outstanding during the period and years indicated: |
|
Initial Class |
|
|
|
|
|
|
|
| |
|
June 30, 2024 (unaudited) |
|
December 31, 2023 |
|
December 31, 2022 |
|
December 31, 2021 |
|
December 31, 2020 |
|
December 31, 2019 |
|
|
|
|
|
|
|
| Net asset value, beginning of period/year |
|
$ |
10.36 |
|
|
$ |
8.93 |
|
|
$ |
11.63 |
|
|
$ |
10.86 |
|
|
$ |
11.54 |
|
|
$ |
11.32 |
|
|
|
|
|
|
|
|
| Investment operations: |
|
|
|
|
|
|
|
|
|
|
|
|
|
|
|
|
|
|
|
|
|
|
|
|
|
|
|
|
|
|
|
| Net investment income (loss)(A) |
|
|
0.09 |
|
|
|
0.18 |
|
|
|
0.15 |
|
|
|
0.14 |
|
|
|
0.08 |
|
|
|
0.21 |
|
|
|
|
|
|
|
|
| Net realized and unrealized gain (loss) |
|
|
0.75 |
|
|
|
1.41 |
|
|
|
(2.24 |
) |
|
|
0.72 |
|
|
|
(0.31 |
) |
|
|
1.05 |
|
|
|
|
|
|
|
|
| Total investment operations |
|
|
0.84 |
|
|
|
1.59 |
|
|
|
(2.09 |
) |
|
|
0.86 |
|
|
|
(0.23 |
) |
|
|
1.26 |
|
|
|
|
|
|
|
|
| Dividends and/or distributions to shareholders: |
|
|
|
|
|
|
|
|
|
|
|
|
|
|
|
|
|
|
|
|
|
|
|
|
|
|
|
|
|
|
|
| Net investment income |
|
|
— |
|
|
|
(0.16 |
) |
|
|
(0.16 |
) |
|
|
(0.09 |
) |
|
|
(0.23 |
) |
|
|
(0.24 |
) |
|
|
|
|
|
|
|
| Net realized gains |
|
|
— |
|
|
|
— |
|
|
|
(0.45 |
) |
|
|
— |
|
|
|
(0.22 |
) |
|
|
(0.80 |
) |
|
|
|
|
|
|
|
| Total dividends and/or distributions to shareholders |
|
|
— |
|
|
|
(0.16 |
) |
|
|
(0.61 |
) |
|
|
(0.09 |
) |
|
|
(0.45 |
) |
|
|
(1.04 |
) |
|
|
|
|
|
|
|
| Net asset value, end of period/year |
|
$ |
11.20 |
|
|
$ |
10.36 |
|
|
$ |
8.93 |
|
|
$ |
11.63 |
|
|
$ |
10.86 |
|
|
$ |
11.54 |
|
| |
|
|
|
|
|
|
|
|
|
|
|
|
|
|
|
|
|
|
|
|
|
|
|
|
|
|
|
|
|
|
|
| Total return |
|
|
8.11 |
%(B) |
|
|
17.94 |
% |
|
|
(18.16 |
)% |
|
|
7.94 |
% |
|
|
(1.85 |
)% |
|
|
11.59 |
% |
|
|
|
|
|
|
|
| Ratio and supplemental data: |
|
|
|
|
|
|
|
|
|
|
|
|
|
|
|
|
|
|
|
|
|
|
|
|
|
|
|
|
|
|
|
| Net assets end of period/year (000’s) |
|
$ |
25,690 |
|
|
$ |
24,404 |
|
|
$ |
21,899 |
|
|
$ |
27,300 |
|
|
$ |
26,178 |
|
|
$ |
28,494 |
|
|
|
|
|
|
|
|
| Expenses to average net assets(C) |
|
|
|
|
|
|
|
|
|
|
|
|
|
|
|
|
|
|
|
|
|
|
|
|
|
|
|
|
|
|
|
| Excluding waiver and/or reimbursement and recapture |
|
|
0.54 |
%(D) |
|
|
0.56 |
% |
|
|
0.53 |
% |
|
|
0.58 |
% |
|
|
0.58 |
% |
|
|
0.58 |
% |
|
|
|
|
|
|
|
| Including waiver and/or reimbursement and recapture |
|
|
0.49 |
%(D)(E) |
|
|
0.51 |
%(E) |
|
|
0.48 |
%(E) |
|
|
0.57 |
%(E) |
|
|
0.58 |
% |
|
|
0.58 |
% |
|
|
|
|
|
|
|
| Net investment income (loss) to average net assets |
|
|
1.78 |
%(D) |
|
|
1.87 |
% |
|
|
1.52 |
% |
|
|
1.29 |
% |
|
|
0.79 |
% |
|
|
1.79 |
% |
|
|
|
|
|
|
|
| Portfolio turnover rate |
|
|
15 |
%(B) |
|
|
49 |
% |
|
|
309 |
% |
|
|
268 |
% |
|
|
105 |
% |
|
|
205 |
% |
| (A) |
Calculated based on average number of shares outstanding. |
| (C) |
Does not include expenses of the underlying investments in which the Portfolio invests. |
| (E) |
TAM has contractually agreed, through May 1, 2025, to waive from its management fees an amount equal to the sub-advisory fee waiver by the Portfolio’s sub-adviser. These amounts are not subject to recapture by TAM. |
The Notes to Financial Statements are an integral part of this report.
|
|
|
|
|
| Transamerica Series Trust |
|
|
|
Semi-Annual Financial Statements 2024 |
|
|
Page 4 |
|
|
Transamerica BlackRock iShares Active Asset Allocation - Moderate Growth VP
FINANCIAL HIGHLIGHTS (continued)
|
|
|
|
|
|
|
|
|
|
|
|
|
|
|
|
|
|
|
|
|
|
|
|
|
| For a share outstanding during the period and years indicated: |
|
Service Class |
|
|
|
|
|
|
|
| |
|
June 30, 2024 (unaudited) |
|
December 31, 2023 |
|
December 31, 2022 |
|
December 31, 2021 |
|
December 31, 2020 |
|
December 31, 2019 |
|
|
|
|
|
|
|
| Net asset value, beginning of period/year |
|
$ |
10.29 |
|
|
$ |
8.87 |
|
|
$ |
11.54 |
|
|
$ |
10.78 |
|
|
$ |
11.45 |
|
|
$ |
11.23 |
|
|
|
|
|
|
|
|
| Investment operations: |
|
|
|
|
|
|
|
|
|
|
|
|
|
|
|
|
|
|
|
|
|
|
|
|
|
|
|
|
|
|
|
| Net investment income (loss)(A) |
|
|
0.08 |
|
|
|
0.15 |
|
|
|
0.12 |
|
|
|
0.11 |
|
|
|
0.06 |
|
|
|
0.18 |
|
|
|
|
|
|
|
|
| Net realized and unrealized gain (loss) |
|
|
0.74 |
|
|
|
1.41 |
|
|
|
(2.21 |
) |
|
|
0.71 |
|
|
|
(0.31 |
) |
|
|
1.04 |
|
|
|
|
|
|
|
|
| Total investment operations |
|
|
0.82 |
|
|
|
1.56 |
|
|
|
(2.09 |
) |
|
|
0.82 |
|
|
|
(0.25 |
) |
|
|
1.22 |
|
|
|
|
|
|
|
|
| Dividends and/or distributions to shareholders: |
|
|
|
|
|
|
|
|
|
|
|
|
|
|
|
|
|
|
|
|
|
|
|
|
|
|
|
|
|
|
|
| Net investment income |
|
|
— |
|
|
|
(0.14 |
) |
|
|
(0.13 |
) |
|
|
(0.06 |
) |
|
|
(0.20 |
) |
|
|
(0.20 |
) |
|
|
|
|
|
|
|
| Net realized gains |
|
|
— |
|
|
|
— |
|
|
|
(0.45 |
) |
|
|
— |
|
|
|
(0.22 |
) |
|
|
(0.80 |
) |
|
|
|
|
|
|
|
| Total dividends and/or distributions to shareholders |
|
|
— |
|
|
|
(0.14 |
) |
|
|
(0.58 |
) |
|
|
(0.06 |
) |
|
|
(0.42 |
) |
|
|
(1.00 |
) |
|
|
|
|
|
|
|
| Net asset value, end of period/year |
|
$ |
11.11 |
|
|
$ |
10.29 |
|
|
$ |
8.87 |
|
|
$ |
11.54 |
|
|
$ |
10.78 |
|
|
$ |
11.45 |
|
| |
|
|
|
|
|
|
|
|
|
|
|
|
|
|
|
|
|
|
|
|
|
|
|
|
|
|
|
|
|
|
|
| Total return |
|
|
7.97 |
%(B) |
|
|
17.62 |
% |
|
|
(18.31 |
)% |
|
|
7.62 |
% |
|
|
(2.08 |
)% |
|
|
11.36 |
% |
|
|
|
|
|
|
|
| Ratio and supplemental data: |
|
|
|
|
|
|
|
|
|
|
|
|
|
|
|
|
|
|
|
|
|
|
|
|
|
|
|
|
|
|
|
| Net assets end of period/year (000’s) |
|
$ |
341,500 |
|
|
$ |
339,746 |
|
|
$ |
321,870 |
|
|
$ |
456,616 |
|
|
$ |
489,266 |
|
|
$ |
574,986 |
|
|
|
|
|
|
|
|
| Expenses to average net assets(C) |
|
|
|
|
|
|
|
|
|
|
|
|
|
|
|
|
|
|
|
|
|
|
|
|
|
|
|
|
|
|
|
| Excluding waiver and/or reimbursement and recapture |
|
|
0.79 |
%(D) |
|
|
0.81 |
% |
|
|
0.78 |
% |
|
|
0.83 |
% |
|
|
0.83 |
% |
|
|
0.83 |
% |
|
|
|
|
|
|
|
| Including waiver and/or reimbursement and recapture |
|
|
0.74 |
%(D)(E) |
|
|
0.76 |
%(E) |
|
|
0.73 |
%(E) |
|
|
0.82 |
%(E) |
|
|
0.83 |
% |
|
|
0.83 |
% |
|
|
|
|
|
|
|
| Net investment income (loss) to average net assets |
|
|
1.51 |
%(D) |
|
|
1.61 |
% |
|
|
1.24 |
% |
|
|
1.00 |
% |
|
|
0.53 |
% |
|
|
1.54 |
% |
|
|
|
|
|
|
|
| Portfolio turnover rate |
|
|
15 |
%(B) |
|
|
49 |
% |
|
|
309 |
% |
|
|
268 |
% |
|
|
105 |
% |
|
|
205 |
% |
| (A) |
Calculated based on average number of shares outstanding. |
| (C) |
Does not include expenses of the underlying investments in which the Portfolio invests. |
| (E) |
TAM has contractually agreed, through May 1, 2025, to waive from its management fees an amount equal to the sub-advisory fee waiver by the Portfolio’s sub-adviser. These amounts are not subject to recapture by TAM. |
The Notes to Financial Statements are an integral part of this report.
|
|
|
|
|
| Transamerica Series Trust |
|
|
|
Semi-Annual Financial Statements 2024 |
|
|
Page 5 |
|
|
Transamerica BlackRock iShares Active Asset Allocation - Moderate Growth VP
NOTES TO FINANCIAL STATEMENTS
At June 30, 2024
(unaudited)
1. ORGANIZATION
Transamerica Series Trust (“TST”) is an open-end management investment company registered under the Investment Company Act of 1940, as amended (the “1940 Act”). TST applies investment company accounting and reporting guidance. TST serves as a funding vehicle for variable life insurance, variable annuity, and group annuity products. Transamerica BlackRock iShares Active Asset Allocation - Moderate Growth VP (the “Portfolio”) is a series of TST and is classified as diversified under the 1940 Act. The Portfolio currently offers two classes of shares, Initial Class and Service Class.
The only shareholders of the Portfolio are affiliated insurance company separate accounts and/or affiliated asset allocation portfolios. Contract holders of the variable life and annuity contracts are not shareholders of the Portfolio. For ease of reference, shareholders and contract holders are collectively referred to in this report as “shareholders.”
This report must be accompanied or preceded by the Portfolio’s current prospectus, which contains additional information about the Portfolio, including risks, as well as investment objectives and strategies.
Transamerica Asset Management, Inc. (“TAM”) serves as investment manager for the Portfolio pursuant to an investment management agreement. TAM provides continuous and regular investment management services to the Portfolio. TAM supervises the Portfolio’s investments, conducts its investment program and provides supervisory, compliance and administrative services to the Portfolio.
TAM currently acts as a “manager of managers” and has hired sub-advisers to furnish day-to-day investment advice and recommendations. TAM may, in the future, determine to provide all aspects of the day-to-day management of the Portfolio without the use of a sub-adviser. When acting as a manager of managers, TAM provides investment management services that include, without limitation, the design and development of the Portfolio and its investment strategies and the ongoing review and evaluation of those investment strategies including recommending changes in strategy where it believes appropriate or advisable; the selection of one or more sub-advisers for the Portfolio employing a combination of quantitative and qualitative screens, research, analysis and due diligence; negotiation of sub-advisory agreements and fees; oversight and monitoring of sub-advisers and recommending changes to sub-advisers where it believes appropriate or advisable; recommending portfolio combinations and liquidations where it believes appropriate or advisable; selection and oversight of transition managers, as needed; regular supervision of the Portfolio’s investments; regular review and evaluation of sub-adviser performance; daily monitoring of the sub-advisers’ buying and selling of securities for the Portfolio; regular review of holdings; ongoing trade oversight and analysis; regular monitoring to ensure adherence to investment process; regular calls and periodic on-site visits with sub-advisers; portfolio construction and asset allocation when using multiple sub-advisers for the Portfolio; risk management oversight and analysis; oversight of negotiation of investment documentation and agreements; design, development, implementation and regular monitoring of the valuation process; periodic due diligence reviews of pricing vendors and vendor methodology; design, development, implementation and regular monitoring of the compliance process; respond to regulatory inquiries and determine appropriate litigation strategy, as needed; review of proxies voted by sub-advisers; oversight of preparation and review of materials for meetings of the Portfolio’s Board of Trustees (the “Board”), participation in these meetings and preparation of regular communications with the Board; oversight of preparation and review of prospectuses, shareholder reports and other disclosure materials and regulatory filings for the Portfolio; oversight of other service providers to the Portfolio, such as the custodian, the transfer agent, the Portfolio’s independent accounting firm and legal counsel; supervision of the performance of recordkeeping and shareholder relations functions for the Portfolio; and oversight of cash management services. TAM uses a variety of quantitative and qualitative tools to carry out its investment management services. TAM, not the Portfolio, is responsible for paying the sub-adviser(s) for their services, and sub-advisory fees are TAM’s expense.
TAM’s investment management services also include the provision of supervisory and administrative services to the Portfolio. These services include performing certain administrative services for the Portfolio and supervising and overseeing the administrative, clerical, recordkeeping and bookkeeping services provided to the Portfolio by State Street Bank and Trust Company (“State Street”), to whom TAM has outsourced the provision of certain sub-administration services. To the extent agreed upon by TAM and the Portfolio from time to time, TAM’s supervisory and administrative services include, but are not limited to: monitoring and verifying the custodian’s daily calculation of the Net Asset Values (“NAV”); shareholder relations functions; compliance services; valuation services; assisting in due diligence and in the oversight and monitoring of certain activities of sub-advisers and certain aspects of Portfolio investments; assisting with Portfolio combinations and liquidations; oversight of the preparation and filing, and review, of all returns and reports, in connection with federal, state and local taxes; oversight and review of regulatory reporting; supervising and coordinating the Portfolio’s custodian and dividend disbursing agent and monitoring their services to the Portfolio; assisting the Portfolio in preparing reports to shareholders; acting as liaison with the Portfolio’s independent public accountants and providing, upon request, analyses, fiscal year summaries and other audit related services; assisting in the preparation of agendas and supporting documents for and minutes of meetings of trustees and committees of trustees; assisting in the preparation of regular communications with the trustees; and providing personnel and office space, telephones
|
|
|
| Transamerica Series Trust |
|
Semi-Annual Financial Statements 2024 |
Page 6
Transamerica BlackRock iShares Active Asset Allocation - Moderate Growth VP
NOTES TO FINANCIAL STATEMENTS (continued)
At June 30, 2024
(unaudited)
1. ORGANIZATION (continued)
and other office equipment as necessary in order for TAM to perform supervisory and administrative services to the Portfolio. The Portfolio pays certain fees and expenses to State Street for sub-administration services which are not administrative services covered by the management agreement with TAM or paid for through the management fees payable thereunder. For the period ended June 30, 2024, (i) the expenses paid to State Street for sub-administration services by the Portfolio are shown as a part of Other expenses within the Statement of Operations and (ii) the expenses payable to State Street for sub-administration services from the Portfolio are shown as part of Other accrued expenses within the Statement of Assets and Liabilities.
2. SIGNIFICANT ACCOUNTING POLICIES
In preparing the Portfolio’s financial statements in accordance with Generally Accepted Accounting Principles in the United States of America (“GAAP”), estimates or assumptions (which could differ from actual results) may be used that affect reported amounts and disclosures. The following is a summary of significant accounting policies followed by the Portfolio.
Security transactions and investment income: Security transactions are accounted for on the trade date. Security gains and losses are calculated on a first-in, first-out basis. Interest income, if any, is accrued as earned. Dividend income and capital gain distributions from underlying investments, if any, are recorded on the ex-dividend date. Income or short-term capital gain distributions received from underlying investments, if any, are recorded as Dividend income from investments within the Statement of Operations. Long-term capital gain distributions received from underlying investments, if any, are recorded as Net realized gain (loss) on Capital gain distributions received from investments within the Statement of Operations.
Multiple class operations, income, and expenses: Income, non-class specific expenses, and realized and unrealized gains and losses are allocated to each class daily based upon net assets. Each class bears its own specific expenses in addition to the allocated non-class specific expenses.
Distributions to shareholders: Distributions are recorded on the ex-dividend date and are determined in accordance with federal income tax regulations, which may differ from GAAP.
Indemnification: In the normal course of business, the Portfolio enters into contracts that contain a variety of representations that provide general indemnifications. The Portfolio’s maximum exposure under these arrangements is unknown, as this would involve future claims that may be made against the Portfolio and/or its affiliates that have not yet occurred. However, based on experience, the Portfolio expects the risk of loss to be remote.
3. INVESTMENT VALUATION
TAM has been designated as the Portfolio’s valuation designee pursuant to Rule 2a-5 under the 1940 Act with responsibility for fair valuation subject to oversight by the Portfolio’s Board of Trustees. The net asset value of the Portfolio is computed as of the official close of the New York Stock Exchange (“NYSE”) each day the NYSE is open for business.
TAM utilizes various methods to measure the fair value of its investments on a recurring basis. GAAP establishes a hierarchy that prioritizes inputs to valuation methods. The inputs or methodology used for valuing securities are not necessarily an indication of the risk associated with investing in those securities. The three levels (“Levels”) of inputs of the fair value hierarchy are defined as follows:
Level 1—Unadjusted quoted prices in active markets for identical securities.
Level 2—Inputs, other than quoted prices included in Level 1, which are observable, either directly or indirectly. These inputs may include quoted prices for the identical instrument on an inactive market, prices for similar instruments, interest rates, prepayment speeds, credit risk, yield curves, default rates, and similar data.
Level 3—Unobservable inputs based on the best information available in the circumstances, to the extent observable inputs are not available, which may include TAM’s own assumptions used in determining the fair value of the Portfolio’s investments.
The inputs used to measure fair value may fall into different Levels of the fair value hierarchy. In such cases, for disclosure purposes, the Level in the fair value hierarchy that is assigned to the fair value measurement of a security is determined based on the lowest Level input that is significant to the fair value measurement in its entirety. Certain investments that are measured at fair value using NAV per share, or
|
|
|
| Transamerica Series Trust |
|
Semi-Annual Financial Statements 2024 |
Page 7
Transamerica BlackRock iShares Active Asset Allocation - Moderate Growth VP
NOTES TO FINANCIAL STATEMENTS (continued)
At June 30, 2024
(unaudited)
3. INVESTMENT VALUATION (continued)
its equivalent, using the “practical expedient” have not been classified in the fair value Levels. The hierarchy classification of inputs used to value the Portfolio’s investments at June 30, 2024, is disclosed within the Investment Valuation section of the Schedule of Investments.
The availability of observable inputs can vary from security to security and is affected by a wide variety of factors, including, but not limited to, the type of security, whether the security is new and not yet established in the marketplace, the liquidity of markets, and other characteristics particular to the security. To the extent that valuation is based on models or inputs that are less observable or unobservable in the market, the determination of fair value requires more judgment. Accordingly, the degree of judgment exercised in determining fair value is generally greatest for instruments categorized in Level 3. Due to the inherent uncertainty of valuation, the determination of values may differ significantly from values that would have been realized had a ready market for investments existed, and the differences could be material.
Fair value measurements: Descriptions of the valuation techniques applied to the Portfolio’s significant categories of assets and liabilities measured at fair value on a recurring basis are as follows:
Exchange-traded funds (“ETF”): ETFs are stated at the last reported sale price or closing price on the day of valuation taken from the primary exchange where the ETF is principally traded. ETFs are generally categorized in Level 1 of the fair value hierarchy.
Securities lending collateral: Securities lending collateral is invested in a money market fund which is valued at the actively traded NAV and no valuation adjustments are applied. Securities lending collateral is categorized in Level 1 of the fair value hierarchy.
Repurchase agreements: Repurchase agreements are valued at cost, which approximates fair value. To the extent the inputs are observable and timely, the values are generally categorized in Level 2 of the fair value hierarchy.
4. BORROWINGS AND OTHER FINANCING TRANSACTIONS
The Portfolio may engage in borrowing transactions as a means of raising cash to satisfy redemption requests, for other temporary or emergency purposes or, to the extent permitted by its investment policies, to raise additional cash to be invested in other securities or instruments. When the Portfolio invests borrowing proceeds in other securities, the Portfolio will bear the risk that the market value of the securities in which such proceeds are invested goes down and is insufficient to repay the borrowed proceeds. The Portfolio may borrow on a secured or on an unsecured basis. If the Portfolio enters into a secured borrowing arrangement, a portion of the Portfolio’s assets will be used as collateral. The 1940 Act requires the Portfolio to maintain asset coverage of at least 300% of the amount of its borrowings. Asset coverage means the ratio that the value of the Portfolio’s total assets, minus liabilities other than borrowings, bears to the aggregate amount of all borrowings. Although complying with this requirement has the effect of limiting the amount that the Portfolio may borrow, it does not otherwise mitigate the risks of entering into borrowing transactions.
Interfund lending: The Portfolio, along with other funds and portfolios advised by TAM, may participate in an interfund lending program pursuant to exemptive relief granted by the Securities and Exchange Commission on January 18, 2017. This program allows the Portfolio to lend to and borrow from other funds and portfolios advised by TAM. Interfund lending transactions are subject to the conditions of the exemptive relief which places limits on the amount of lending or borrowing a Portfolio may participate in under the program. Interest earned or paid on an interfund lending transaction will be based on the average of certain current market rates. For the period ended June 30, 2024, the Portfolio has not utilized the program.
Repurchase agreements: In a repurchase agreement, the Portfolio purchases a security and simultaneously commits to resell that security to the seller at an agreed-upon price on an agreed-upon date. Securities purchased subject to a repurchase agreement are held at the Portfolio’s custodian, or designated sub-custodian related to tri-party repurchase agreements, and, pursuant to the terms of the repurchase agreement, must be collateralized by securities with an aggregate market value greater than or equal to 100% of the resale price. The Portfolio will bear the risk of value fluctuations until the securities can be sold and may encounter delays and incur costs in liquidating the securities. In the event of bankruptcy or insolvency of the seller, delays and costs may be incurred.
Repurchase agreements are subject to netting agreements, which are agreements between the Portfolio and its counterparties that provide for the net settlement of all transactions and collateral with the Portfolio, through a single payment, in the event of default or termination. Amounts presented within the Schedule of Investments, and as part of Repurchase agreements, at value within the Statement of Assets and Liabilities are shown on a gross basis. The value of the related collateral for each repurchase agreement, as reflected within the Schedule of Investments, exceeds the value of each repurchase agreement at June 30, 2024.
|
|
|
| Transamerica Series Trust |
|
Semi-Annual Financial Statements 2024 |
Page 8
Transamerica BlackRock iShares Active Asset Allocation - Moderate Growth VP
NOTES TO FINANCIAL STATEMENTS (continued)
At June 30, 2024
(unaudited)
4. BORROWINGS AND OTHER FINANCING TRANSACTIONS (continued)
Repurchase agreements at June 30, 2024, if any, are included within the Schedule of Investments and Statement of Assets and Liabilities.
Securities lending: The Portfolio may lend securities to qualified financial institutions, brokers and dealers. State Street serves as securities lending agent to the Portfolio pursuant to a Securities Lending Agreement. Loans of securities are terminable at any time and the borrower, after notice, is required to return borrowed securities within the standard time period for settlement of securities transactions. The lending of securities exposes the Portfolio to risks such as: the borrowers may fail to return the loaned securities or may not be able to provide additional collateral, the Portfolio may experience delays in recovery of the loaned securities or delays in access to collateral, or the Portfolio may experience losses related to the investment collateral. To minimize certain risks, loan counterparties pledge cash, securities issued or guaranteed by the U.S. Government and irrevocable letters of credit issued by banks as collateral. The initial collateral received by the Portfolio is required to have a value of at least 102% of the current value of the loaned securities traded on U.S. exchanges, and a value of at least 105% for all other securities. Typically the lending agent is not permitted to sell, re-pledge or use cash and non-cash collateral it receives. The lending agent has agreed to indemnify the Portfolio in the case of default of any securities borrower.
The Portfolio receives compensation for lending securities from interest or dividends earned on the cash, U.S. Government securities and irrevocable letters of credit held as collateral, less associated fees and expenses. Such income is reflected in Net income from securities lending within the Statement of Operations. Cash collateral received is invested in the State Street Navigator Securities Lending Trust — Government Money Market Portfolio.
The value of loaned securities and related cash and non-cash collateral outstanding at June 30, 2024, if any, are shown on a gross basis within the Schedule of Investments.
The following table reflects a breakdown of transactions accounted for as secured borrowings, the gross obligation by the type, and the remaining contractual maturity of those transactions as of June 30, 2024.
|
|
|
|
|
|
|
|
|
|
|
|
|
|
|
|
|
|
|
|
|
| |
|
Remaining Contractual Maturity of the Agreements |
|
| |
|
Overnight and Continuous |
|
|
Less Than 30 Days |
|
|
Between 30 & 90 Days |
|
|
Greater Than 90 Days |
|
|
Total |
|
| Securities Lending Transactions
Exchange-Traded Funds |
|
$ |
5,886,720 |
|
|
$ |
— |
|
|
$ |
— |
|
|
$ |
— |
|
|
$ |
5,886,720 |
|
| Total Borrowings |
|
$ |
5,886,720 |
|
|
$ |
— |
|
|
$ |
— |
|
|
$ |
— |
|
|
$ |
5,886,720 |
|
| |
|
|
|
|
|
|
|
|
|
|
|
|
|
|
|
|
|
|
|
|
5. RISK FACTORS
Investing in the Portfolio involves certain key risks related to the Portfolio’s trading activity. Please reference the Portfolio’s prospectus for a more complete discussion of the following risk(s), as well as other risks of investing in the Portfolio.
Market risk: The market prices of the Portfolio’s securities or other assets may go up or down, sometimes rapidly or unpredictably, due to factors such as economic events, inflation, changes in interest rates, governmental actions or interventions, actions taken by the U.S. Federal Reserve or foreign central banks, market disruptions caused by tariffs, trade disputes or other factors, political developments, armed conflicts, economic sanctions, cybersecurity events, investor sentiment, the global and domestic effects of widespread or local health, weather or climate events, and other factors that may or may not be related to the issuer of the security or other asset. If the market prices of the Portfolio’s securities and assets fall, the value of your investment in the Portfolio could go down.
Economies and financial markets throughout the world are increasingly interconnected. Events or circumstances in one or more countries or regions could be highly disruptive to, and have profound impacts on, global economies or markets. As a result, whether or not the Portfolio invests in securities of issuers located in or with significant exposure to the countries directly affected, the value and liquidity of the Portfolio’s investments may go down.
Asset allocation risk: The Portfolio’s investment performance is significantly impacted by the Portfolio’s asset allocation and reallocation from time to time. The value of your investment may decrease if the sub-adviser’s judgment about the attractiveness, value or market trends affecting a particular asset class, investment style, technique or strategy, underlying ETF or other issuer is incorrect.
|
|
|
| Transamerica Series Trust |
|
Semi-Annual Financial Statements 2024 |
Page 9
Transamerica BlackRock iShares Active Asset Allocation - Moderate Growth VP
NOTES TO FINANCIAL STATEMENTS (continued)
At June 30, 2024
(unaudited)
5. RISK FACTORS (continued)
Equity securities risk: Equity securities generally have greater risk of loss than debt securities. Stock markets are volatile and the value of equity securities may go up or down, sometimes rapidly and unpredictably. The market price of an equity security may fluctuate based on overall market conditions, such as real or perceived adverse economic or political conditions or trends, tariffs and trade disruptions, inflation, substantial economic downturn or recession, changes in interest rates, or adverse investor sentiment. The market price of an equity security also may fluctuate based on real or perceived factors affecting a particular industry or industries or the company itself. If the market prices of the equity securities owned by the Portfolio fall, the value of your investment in the Portfolio will decline. The Portfolio may lose its entire investment in the equity securities of an issuer. A change in financial condition or other event affecting a single issuer may adversely impact securities markets as a whole.
6. FEES AND OTHER AFFILIATED TRANSACTIONS
TST serves as a funding vehicle for certain affiliated asset allocation portfolios and certain affiliated separate accounts of Transamerica Life Insurance Company (“TLIC”) and Transamerica Financial Life Insurance Company.
TAM, the Portfolio’s investment manager, is directly owned by TLIC and AUSA Holding, LLC (“AUSA”), both of which are indirect, wholly owned subsidiaries of Aegon Ltd. TLIC is owned by Commonwealth General Corporation (“Commonwealth”). Commonwealth and AUSA are wholly owned by Transamerica Corporation (DE). Transamerica Corporation (DE) is wholly owned by Aegon International B.V., which is wholly owned by Aegon Ltd., a Bermuda exempted company with liability limited by shares (formerly, Aegon NV, a Netherlands corporation) and a publicly traded international insurance group.
Transamerica Fund Services, Inc. (“TFS”) is the Portfolio’s transfer agent. Transamerica Capital, Inc. (“TCI”) is the Portfolio’s distributor/principal underwriter. TAM, TFS and TCI are affiliates of Aegon Ltd.
Certain officers and trustees of the Portfolio may also be officers and/or trustees of TAM, TFS and TCI. No interested trustee who is deemed an interested person due to current or former service with TAM or an affiliate of TAM receives compensation from the Portfolio. The Portfolio does pay non-interested persons (independent trustees), as disclosed in Trustee and CCO fees within the Statement of Operations.
Investment management fees: TAM serves as the Portfolio’s investment manager, performing administration as well as investment advisory services. TAM renders investment advisory, supervisory, and administration services under an investment management agreement and the Portfolio pays a single management fee, which is reflected in Investment management fees within the Statement of Operations.
The Portfolio pays a management fee to TAM based on daily average net assets at the following rates:
|
|
|
|
|
| Breakpoints |
|
Rate |
|
| First $500 million |
|
|
0.5000 |
% |
| Over $500 million up to $1 billion |
|
|
0.4900 |
|
| Over $1 billion up to $2.5 billion |
|
|
0.4725 |
|
| Over $2.5 billion up to $3.5 billion |
|
|
0.4650 |
|
| Over $3.5 billion up to $4.5 billion |
|
|
0.4525 |
|
| Over $4.5 billion |
|
|
0.4400 |
|
TAM has contractually agreed, through May 1, 2025, to waive from its management fees an amount equal to the sub-advisory fee waiver by the Portfolio’s sub-adviser. These amounts are not subject to recapture by TAM.
TAM has contractually agreed to waive fees and/or reimburse Portfolio expenses to the extent that the total operating expenses excluding, as applicable, acquired fund fees and expenses, interest (including borrowing costs and overdraft charges), taxes, brokerage commissions, dividend and interest expenses on securities sold short, extraordinary expenses and other expenses not incurred in the ordinary course of the Portfolio’s business, exceed the following stated annual operating expense limits to the Portfolio’s daily average net
|
|
|
| Transamerica Series Trust |
|
Semi-Annual Financial Statements 2024 |
Page 10
Transamerica BlackRock iShares Active Asset Allocation - Moderate Growth VP
NOTES TO FINANCIAL STATEMENTS (continued)
At June 30, 2024
(unaudited)
6. FEES AND OTHER AFFILIATED TRANSACTIONS (continued)
assets. To the extent an expense limit changed during the period, the prior limit is also listed below. The expenses waived and/or reimbursed, if any, are included in Expenses waived and/or reimbursed within the Statement of Operations.
|
|
|
|
|
|
|
| Class |
|
Operating Expense Limit |
|
Operating Expense Limit Effective Through |
| Initial Class |
|
|
0.55 |
% |
|
May 1, 2025 |
| Service Class |
|
|
0.80 |
|
|
May 1, 2025 |
TAM is permitted to recapture amounts contractually waived and/or reimbursed to a class during any of the 36 months from the date on which TAM waived fees and/or reimbursed expenses for the class. A class may recapture and reimburse TAM only if such amount does not cause, on any particular business day of the Portfolio, the class’s total annual operating expenses (after the recapture is taken into account) to exceed the Operating Expense Limits or any other lower limit then in effect. Amounts recaptured, if any, by TAM for the period ended June 30, 2024 are disclosed in Recapture of previously waived and/or reimbursed fees within the Statement of Operations.
TAM, on a voluntary basis and in addition to the contractual operating expense limits in effect, from time to time may waive and/or reimburse expenses of the Portfolio, or any classes thereof, to such level(s) as the Trust’s officers have determined or may reasonably determine from time to time. Any such voluntary waiver or expense reimbursement may be discontinued by TAM at any time. These amounts are not subject to recapture by TAM.
As of June 30, 2024, there are no amounts available for recapture by TAM.
Distribution and service fees: TST has a distribution plan (“Distribution Plan”) pursuant to Rule 12b-1 under the 1940 Act. Pursuant to the Distribution Plan, TST entered into a distribution agreement with TCI as the Portfolio’s distributor.
The Distribution Plan requires the Portfolio to pay distribution fees to TCI as compensation for various distribution activities, not as reimbursement for specific expenses. Under the Distribution Plan and distribution agreement, TCI, on behalf of the Portfolio, is authorized to pay various service providers, as direct payment for expenses incurred in connection with distribution of the Portfolio’s shares.
The fee on the Service Class shares is paid to the insurance companies for providing services and account maintenance for the policyholders who invest in the variable insurance products which invest in the Service Class shares. TCI has determined that it will not seek payment for the distribution expenses incurred by the Portfolio with respect to the Initial Class shares before May 1, 2025. Prior to TCI seeking distribution expenses on Initial Class shares, policy and contract owners will be notified in advance. The Portfolio will pay fees relating to Service Class shares. The distribution and service fees are included in Distribution and service fees within the Statement of Operations.
The Portfolio is authorized under the Distribution Plan to pay fees to TCI based on daily average net assets of each applicable class up to the following annual rates:
|
|
|
|
|
| Class |
|
Rate |
|
| Initial Class |
|
|
0.15 |
% |
| Service Class |
|
|
0.25 |
|
Transfer agent costs: TFS provides transfer agency services under an intercompany agreement with TAM. TFS has outsourced the provision of certain sub-transfer agency services to SS&C Global Investor & Distribution Solutions, Inc. (“SS&C GIDS”). The Portfolio does not pay a separate transfer agent fee to TAM or TFS but does pay certain expenses to SS&C GIDS related to applicable sub-transfer agency services. For the period ended June 30, 2024, (i) the expenses paid to SS&C GIDS by the Portfolio are referred to as transfer agent costs and are included within the Statement of Operations and (ii) the expenses payable to SS&C GIDS by the Portfolio are referred to as transfer agent costs within the Statement of Assets and Liabilities.
Brokerage commissions: The Portfolio incurred no brokerage commissions on security transactions placed with affiliates of the investment manager or sub-adviser(s) for the period ended June 30, 2024.
|
|
|
| Transamerica Series Trust |
|
Semi-Annual Financial Statements 2024 |
Page 11
Transamerica BlackRock iShares Active Asset Allocation - Moderate Growth VP
NOTES TO FINANCIAL STATEMENTS (continued)
At June 30, 2024
(unaudited)
7. PURCHASES AND SALES OF SECURITIES
For the period ended June 30, 2024, the cost of securities purchased and proceeds from securities sold (excluding short-term securities) are as follows:
|
|
|
|
|
|
|
| |
|
Purchases of Securities |
|
Sales of Securities |
|
|
| |
|
|
|
| |
$ 55,669,107 |
|
$ 87,788,074 |
8. FEDERAL INCOME TAXES AND DISTRIBUTIONS TO SHAREHOLDERS
The Portfolio has not made any provision for federal income or excise taxes due to its policy to distribute all of its taxable income and capital gains to its shareholders and otherwise qualify as a regulated investment company under Subchapter M of the Internal Revenue Code. The Portfolio recognizes the tax benefits of uncertain tax positions only where the position is “more likely than not” to be sustained assuming examination by tax authorities. The Portfolio’s tax returns remain subject to examination by the Internal Revenue Service and state tax authorities three years from the date of filing for federal purposes and four years from the date of filing for state purposes. Management has evaluated the Portfolio’s tax provisions taken for all open tax years, and has concluded that no provision for income tax is required in the Portfolio’s financial statements. If applicable, the Portfolio recognizes interest accrued related to unrecognized tax benefits in relation to interest and penalties expense in Other within the Statement of Operations. The Portfolio identifies its major tax jurisdictions as U.S. Federal, the state of Colorado, and foreign jurisdictions where the Portfolio makes significant investments; however, the Portfolio is not aware of any tax positions for which it is reasonably possible that the total amounts of unrecognized tax benefits will change materially in the next twelve months. Distributions are determined in accordance with income tax regulations, which may differ from GAAP.
As of June 30, 2024, the approximate cost for U.S. federal income tax purposes, and the aggregate gross/net unrealized appreciation (depreciation) in the value of investments (including securities sold short and derivatives, if any) are as follows:
|
|
|
|
|
|
|
| Cost |
|
Gross Appreciation |
|
Gross (Depreciation) |
|
Net Appreciation (Depreciation) |
| $318,621,564 |
|
$ 55,989,993 |
|
$ (2,499,957) |
|
$ 53,490,036 |
Please see TST’s most recent report on Form N-CSR, available at: www.transamerica.com/annuities/prospectus, for additional information. For the most recently filed complete proxy voting records for the Trust please visit: https://www.transamerica.com/sites/default/files/files/e070d/TST%20N-PX%202021.pdf
|
|
|
| Transamerica Series Trust |
|
Semi-Annual Financial Statements 2024 |
Page 12
Transamerica BlackRock iShares Active Asset Allocation - Moderate Growth VP
MANAGEMENT AND SUB-ADVISORY AGREEMENT — CONTRACT RENEWAL
(unaudited)
At a meeting of the Board of Trustees of Transamerica Series Trust (the “Trustees” or the “Board”) held on June 12-13, 2024, the Board considered the renewal of the management agreement (the “Management Agreement”) between Transamerica Asset Management, Inc. (“TAM”) and Transamerica Series Trust, on behalf of Transamerica BlackRock iShares Active Asset Allocation – Moderate Growth VP (the “Portfolio”). The Board also considered the renewal of the investment sub-advisory agreement (the “Sub-Advisory Agreement” and together with the Management Agreement, the “Agreements”) for the Portfolio between TAM and BlackRock Investment Management, LLC (the “Sub-Adviser”).
Following its review and consideration, the Board determined that the terms of the Management Agreement and Sub-Advisory Agreement were reasonable and that the renewal of each of the Agreements was in the best interests of the Portfolio and the holders invested in the Portfolio. The Board, including the independent members of the Board (the “Independent Trustees”), unanimously approved the renewal of each of the Agreements through June 30, 2025.
Prior to reaching their decision, the Trustees requested and received from TAM and the Sub-Adviser certain information. They then reviewed such information as they deemed reasonably necessary to evaluate the Agreements, including information they had previously received from TAM and the Sub-Adviser as part of their regular oversight of the Portfolio, and knowledge they gained over time through meeting with TAM and the Sub-Adviser. Among other materials, the Trustees considered comparative fee, expense and performance information prepared by Broadridge Financial Solutions, Inc. (“Broadridge”), an independent provider of mutual fund performance information, as well as fee, expense and profitability information prepared by TAM. In addition, TAM provided the Board with additional supplemental comparative fee, expense and performance information. To the extent applicable, the Trustees considered information about fees and performance of comparable funds and/or accounts managed by the Sub-Adviser. The Board also considered reductions to the Portfolio’s expense limits, if any, that took effect after the last renewal of the Agreements. In their review, the Trustees also sought to identify instances in which the Portfolio’s performance, fees, total expenses and/or profitability appeared to be outliers within its respective peer group or other comparative metrics and sought to understand the reasons for such comparative positions.
In their deliberations, the Independent Trustees met privately without representatives of TAM or the Sub-Adviser present and were represented throughout the process by their independent legal counsel. In considering the proposed continuation of each of the Agreements, the Trustees evaluated and weighed a number of considerations that they believed to be relevant in light of the legal advice furnished to them by counsel, including independent legal counsel, and made a decision in the exercise of their own business judgment. They based their decisions on the considerations discussed below, among others, although they did not identify any particular consideration or item of information that was controlling of their decisions, and each Trustee may have attributed different weights to the various factors.
Nature, Extent and Quality of the Services Provided
The Board considered the nature, extent and quality of the services provided by TAM and the Sub-Adviser to the Portfolio in the past and the services anticipated to be provided in the future. The Board also considered the investment approach for the Portfolio; the experience, capability and integrity of TAM’s senior management; the financial resources of TAM; TAM’s management oversight process; TAM’s and the Sub-Adviser’s responsiveness to any questions by the Trustees; and the professional qualifications and compensation program of the portfolio management team of the Sub-Adviser. The Trustees noted that they receive, on a quarterly basis, an execution analysis from Capital Institutional Services, Inc. (CAPIS), an independent provider of trade analyses, for the Sub-Adviser and a comparison of trading results against a peer universe of managers.
The Board also considered the continuous and regular investment management and other services provided by TAM, when acting as a manager of managers, for the portion of the management fee it retains from the Portfolio after payment of the sub-advisory fees. The Board noted that the investment management and other services provided by TAM include the design, development and ongoing review and evaluation of the Portfolio and its investment strategy; the selection, oversight and monitoring of one or more investment sub-advisers to perform certain duties with respect to the Portfolio; ongoing portfolio trading oversight and analysis; risk management oversight and analysis; design, development, implementation and ongoing review and evaluation of a process for the valuation of Portfolio investments; design, development, implementation and ongoing review and evaluation of a compliance program for the Portfolio; design, development, implementation and ongoing review and evaluation of a process for the voting of proxies and exercise of rights to consent to corporate action for Portfolio investments; participation in Board meetings and oversight of preparation of materials for the Board, including materials for Board meetings and regular communications with the Board; oversight of preparation of the Portfolio’s prospectus, statement of additional information, shareholder reports and other disclosure materials and regulatory filings for the Portfolio; and ongoing cash management services for the Portfolio. The Board considered that TAM’s investment management services also include the provision of supervisory and administrative services to the Portfolio. The Board also noted that TAM, as part of the services it provides to all Transamerica mutual funds, including the Portfolio, oversees the services provided by the funds’ custodian, transfer agent, independent accountant and legal counsel and supervises the performance of the recordkeeping and holder service functions of the funds.
Investment Performance
|
|
|
|
|
| Transamerica Series Trust |
|
|
|
Semi-Annual Financial Statements 2024 |
|
|
Page 13 |
|
|
Transamerica BlackRock iShares Active Asset Allocation - Moderate Growth VP
MANAGEMENT AND SUB-ADVISORY AGREEMENT — CONTRACT RENEWAL (continued)
(unaudited)
In addition, the Board considered the short- and longer-term performance of the Portfolio in light of its investment objective, policies and strategies, including relative performance against (i) a peer universe of comparable mutual funds, as prepared by Broadridge, and (ii) the Portfolio’s benchmarks, in each case for various trailing periods ended December 31, 2023. Based on these considerations, the Board determined that TAM and the Sub-Adviser can provide investment and related services that are appropriate in scope and extent in light of the Portfolio’s investment objectives, policies and strategies and operations, the competitive landscape of the investment company business and investor needs. The Board’s conclusions as to the Portfolio’s performance are summarized below. For purposes of its review, the Board generally used the performance of Service Class Shares. In describing the Portfolio’s performance relative to its peer universe, the summary conclusions characterize performance for the relevant periods in relation to whether it was “above,” “below” or “in line with” the peer universe median and do so using quintile rankings prepared by Broadridge. For simplicity, performance is described as “above” the median if the Portfolio’s performance ranked anywhere in the first or second quintiles, as “below” the median if it ranked anywhere in the fourth or fifth quintiles, or “in line with” the median if it ranked anywhere in the third quintile (i.e., even if its precise return was somewhat above or somewhat below the precise median return).
When considering the Portfolio’s performance, the Trustees considered any representations made by TAM regarding the appropriateness of certain peer groups and benchmarks. They recognized that performance reflects a snapshot of a period as of a specific date, and that consideration of performance data for a different period could generate significantly different performance results. The Trustees also recognized that even longer-term performance can be negatively affected by performance over a short-term period when that short-term performance is significantly below the performance of the comparable benchmark or universe of peer funds.
The Board noted that the performance of Service Class Shares of the Portfolio was above the median for its peer universe and above the benchmark that TAM utilizes to measure performance of the Portfolio, each for the past 1-year period, and below the median for its peer universe and below the benchmark, each for the past 3-, 5- and 10-year periods. The Board noted that the Sub-Adviser had commenced sub-advising the Portfolio on November 1, 2021 pursuant to its current investment strategies.
Management Fee and Sub-Advisory Fees and Total Expense Ratio
The Board considered the management fee and total expense ratio of the Portfolio, including information provided by Broadridge comparing the management fee and total expense ratio of the Portfolio to the management fees and total expense ratios of comparable investment companies in both a peer group and broader peer universe compiled by Broadridge. The Board’s conclusions as to the Portfolio’s management fee and total expense ratio are summarized below. For purposes of its review, the Board generally used the actual total expenses (i.e., expenses reflecting any waivers and/or reimbursements) of Service Class Shares. In describing the Portfolio’s management fee and total expense ratio relative to its peer group and peer universe, the summary conclusions characterize management fees and total expense ratios for the relevant periods in relation to whether they were “above,” “below” or “in line with” the peer group or peer universe median and do so using quintile rankings prepared by Broadridge. For simplicity, management fees and total expense ratios are described as “above” the median if the Portfolio’s management fee or total expense ratio ranked anywhere in the fourth or fifth quintiles, as “below” the median if it ranked anywhere in the first or second quintiles, or “in line with” the median if it ranked anywhere in the third quintile (i.e., even if its precise management fee or total expense ratio was somewhat above or somewhat below the precise median management fee or total expense ratio).
The Board also considered the fees charged by the Sub-Adviser for sub-advisory services, as well as the portion of the Portfolio’s management fee retained by TAM following payment of the sub-advisory fee and how the portion of the contractual management fee retained by TAM at a specified asset level compared to the portions retained by other investment advisers managing mutual funds with similar investment strategies as calculated by an independent provider of information.
The Board noted that the Portfolio’s contractual management fee was in line with the median for its peer group and above the median for its peer universe and that the actual total expenses (i.e., expenses reflecting any waivers and/or reimbursements) of Service Class Shares of the Portfolio were in line with the median for its peer group and below the median for its peer universe. The Trustees also considered that TAM has entered into an expense limitation arrangement with the Portfolio, which may result in TAM waiving fees for the benefit of holders.
On the basis of these considerations, together with the other information it considered, the Board determined that the management and sub-advisory fees to be received by TAM and the Sub-Adviser under the Management Agreement and Sub-Advisory Agreement are reasonable in light of the services provided.
Cost of Services Provided and Level of Profitability
The Board reviewed information provided by TAM about the cost of providing and procuring fund management services, as well as the costs of the provision of administration, transfer agency and other services, to the Portfolio and to Transamerica Series Trust as a whole by TAM and its affiliates. The Board considered the profitability of TAM and its affiliates in providing these services for the Portfolio and Transamerica Series Trust as a whole. The Trustees recognized the competitiveness of the mutual fund industry and the importance of an investment adviser’s long-term profitability, including for maintaining company and management stability and accountability.
|
|
|
|
|
| Transamerica Series Trust |
|
|
|
Semi-Annual Financial Statements 2024 |
|
|
Page 14 |
|
|
Transamerica BlackRock iShares Active Asset Allocation - Moderate Growth VP
MANAGEMENT AND SUB-ADVISORY AGREEMENT — CONTRACT RENEWAL (continued)
(unaudited)
The Board also considered the allocation methodology used for calculating the profitability of TAM and its affiliates. The Board noted that the revenue and expense allocation methodology used by TAM to estimate its profitability with respect to its relationship with the Portfolio had been reviewed previously by an independent consultant. The Trustees considered that TAM reported that it had not made material changes to this methodology, and that the methodology had been applied consistently for the Portfolio.
With respect to the Sub-Adviser, the Board noted that the sub-advisory fee is the product of arm’s-length negotiation between TAM and the Sub-Adviser, which is not affiliated with TAM, and is paid by TAM and not the Portfolio. As a result, the Board focused on the profitability of TAM and its affiliates with respect to the Portfolio.
Based on this information, the Board determined that the profitability of TAM and its affiliates from their relationships with the Portfolio was not excessive.
Economies of Scale
The Board considered economies of scale with respect to the management of the Portfolio, whether the Portfolio had appropriately benefited from any economies of scale and whether there was the potential for realization of any future economies of scale. The Board also considered the existence of economies of scale with respect to management of the Transamerica mutual funds overall and the extent to which the Portfolio benefited from any economies of scale. The Board recognized that, as the Portfolio’s assets increase, any economies of scale realized by TAM or the Sub-Adviser may not directly correlate with each other or with any economies of scale that might be realized by the Portfolio. The Board considered the Portfolio’s management fee schedule and the existence of breakpoints and also considered the extent to which TAM shared economies of scale, if any, with the Portfolio through undertakings to limit or reimburse Portfolio expenses and to invest in maintaining and developing its capabilities and services. The Board also considered the Sub-Adviser’s sub-advisory fee schedule and the existence of breakpoints, if any, and how such breakpoints relate to any breakpoints in the Portfolio’s management fee schedule. The Board considered that the Sub-Adviser’s sub-advisory fees would be based on the combined assets of multiple funds. The Trustees concluded that the Portfolio’s fee structure reflected an appropriate sharing of any efficiencies or economies of scale to date and noted that they will have the opportunity to periodically reexamine the appropriateness of the management fee payable to TAM and the fee paid to the Sub-Adviser in light of any economies of scale experienced in the future.
Benefits to TAM, its Affiliates and/or the Sub-Adviser from their Relationships with the Portfolio
The Board considered other benefits derived by TAM, its affiliates, and/or the Sub-Adviser from their relationships with the Portfolio. The Board noted that TAM does not receive benefits from research obtained with commissions paid to broker-dealers for portfolio transactions (commonly referred to as “soft dollars”) as a result of its relationship with the Portfolio and that TAM believes the use of soft dollars by the Sub-Adviser is generally appropriate and in the best interests of the Portfolio.
Other Considerations
The Board noted that TAM has made a substantial commitment to the recruitment and retention of high-quality personnel and maintains the financial, compliance and operational resources reasonably necessary to manage the Portfolio in a professional manner that is consistent with the best interests of the Portfolio and the holders. In this regard, the Board favorably considered the procedures and policies TAM has in place to enforce compliance with applicable laws and regulations and oversee the portfolio management activities of the Sub-Adviser. The Board also noted that TAM has made an entrepreneurial commitment and undertaken certain business risks with respect to the management and success of the Portfolio.
Conclusion
After consideration of the factors described above, as well as other factors, the Trustees, including the Independent Trustees, concluded that the renewal of the Management Agreement and the Sub-Advisory Agreement was in the best interests of the Portfolio and the holders and voted to approve the renewal of the Agreements.
|
|
|
|
|
| Transamerica Series Trust |
|
|
|
Semi-Annual Financial Statements 2024 |
|
|
Page 15 |
|
|
PROXY VOTING POLICIES AND PROCEDURES AND QUARTERLY PORTFOLIO HOLDINGS
(unaudited)
A description of Transamerica Series Trust’s (the “Trust”) proxy voting policies and procedures is available in the Statement of Additional Information of the Portfolios, available without charge upon request by calling 1-800-851-9777 (toll free) or on the Securities and Exchange Commission’s (“SEC”) website at http://www.sec.gov.
In addition, the Portfolio is required to file Form N-PX, with their complete proxy voting records for the most recent 12 months ended June 30th, no later than August 31st of each year. The Form is available without charge: (1) on the Transamerica Funds website at https://www.transamerica.com/sites/default/files/files/e070d/TST%20N-PX%202021.pdf; and (2) on the SEC’s website at http://www.sec.gov.
Each fiscal quarter, the Portfolios, except Transamerica BlackRock Government Money Market VP, will file with the SEC a complete schedule of its monthly portfolio holdings on Form N-PORT. The Portfolios’ holdings as of the end of the third month of every fiscal quarter, as reported on Form N-PORT, will be publicly available on the SEC’s website at http://www.sec.gov within 60 days of the end of the fiscal quarter.
On a monthly basis, Transamerica BlackRock Government Money Market VP will file with the SEC portfolio holdings information on Form N-MFP3. A complete schedule of portfolio holdings is also available at www.transamerica.com.
You may also visit the Trust’s website at www.transamerica.com/annuities/prospectus for this and other information about the Portfolios and the Trust.
Important Notice Regarding Delivery of Shareholder Documents
Every year we provide shareholders informative materials such as the Transamerica Series Trust Annual Report, the Transamerica Series Trust Prospectus, and other required documents that keep you informed regarding your Portfolios. To the extent provided by mail, Transamerica Series Trust will only send one piece per mailing address, a method that saves your Portfolios money by reducing mailing and printing costs. We will continue to do this unless you tell us not to. To elect to receive individual mailings, simply call a Transamerica Customer Service Representative toll free at 1-800-851-9777, 8 a.m. to 7 p.m. Eastern Time, Monday-Friday. Your request will take effect within 30 days.
|
|
|
| Transamerica Series Trust |
|
Semi-Annual Financial Statements 2024 |
Page 16
NOTICE OF PRIVACY POLICY
(unaudited)
Your privacy is very important to us. We want you to understand what information we collect and how we use it. We collect and use “nonpublic personal information” in connection with providing our customers with a broad range of financial products and services as effectively and conveniently as possible. We treat nonpublic personal information in accordance with our Privacy Policy.
What Information We Collect and From Whom We Collect It
We may collect nonpublic personal information about you from the following sources:
| • |
|
Information we receive from you on applications or other forms, such as your name, address, and account number; |
| • |
|
Information about your transactions with us, our affiliates, or others, such as your account balance and purchase/redemption history; and |
| • |
|
Information we receive from non-affiliated third parties, including consumer reporting agencies. |
What Information We Disclose and To Whom We Disclose It
We do not disclose any nonpublic personal information about current or former customers to anyone without their express consent, except as permitted by law. We may disclose the nonpublic personal information we collect, as described above, to persons or companies that perform services on our behalf and to other financial institutions with which we have joint marketing agreements. We will require these companies to protect the confidentiality of your nonpublic personal information and to use it only to perform the services for which we have hired them.
Our Security Procedures
We restrict access to your nonpublic personal information and only allow disclosures to persons and companies as permitted by law to assist in providing products or services to you. We maintain physical, electronic, and procedural safeguards to protect your nonpublic personal information and to safeguard the disposal of certain consumer information.
Contact Us
If you have any questions about our Privacy Policy, please call 1-800-851-9777 on any business day between 8 a.m. and 7 p.m. Eastern Time.
Note: This Privacy Policy applies only to customers that have a direct relationship with us or our affiliates. If you own shares of our portfolios in the name of a third party such as a bank or broker-dealer, its privacy policy may apply to you instead of ours.
|
|
|
| Transamerica Series Trust |
|
Semi-Annual Financial Statements 2024 |
Page 17
PO Box 219945
Kansas City, MO 64121-9945
|
|
|
| Distributor: |
|
Transamerica Capital, Inc. |
|
|
PO Box 219945 |
|
|
Kansas City, MO 64121-9945 |
|
|
|
|
Customer Service: 1-800-851-9777 |
Transamerica Series Trust Semi-Annual Financial Statements
June 30, 2024
1801 California St., Suite 5200
Denver, CO 80202
Distributor: Transamerica Capital, Inc.
Customer Service: 1-800-851-9777
The following pages contain the most recent semi-annual financial statements for the investment options in which you are invested. In compliance with Securities and Exchange Commission regulations, we present these reports on an annual and semi-annual basis with the hope that they will foster greater understanding of the investment options’ holdings, performance, financial data, accounting policies and other issues. This streamlined version provides information only on the investment options in which you are invested.
If you have any questions about these reports, please do not hesitate to contact your financial professional. As always, we thank you for your trust and the opportunity to serve you.
Transamerica BlackRock iShares Active Asset Allocation -
Moderate VP
SCHEDULE OF INVESTMENTS
At June 30, 2024
(unaudited)
|
|
|
|
|
|
|
|
|
| |
|
Shares |
|
|
Value |
|
| |
|
|
| EXCHANGE-TRADED FUNDS - 97.5% |
|
| International Equity Funds - 17.4% |
|
| iShares Core MSCI EAFE ETF |
|
|
563,298 |
|
|
$ |
40,917,967 |
|
| iShares MSCI EAFE ETF (A) |
|
|
1,422,786 |
|
|
|
111,446,827 |
|
| iShares MSCI Eurozone ETF (A) |
|
|
192,258 |
|
|
|
9,386,997 |
|
|
|
|
|
|
|
|
|
|
|
|
|
|
|
|
|
|
|
|
161,751,791 |
|
|
|
|
|
|
|
|
|
|
| U.S. Equity Funds - 38.7% |
|
| iShares Core S&P 500 ETF |
|
|
574,942 |
|
|
|
314,625,511 |
|
| iShares Russell 2000 ETF (A) |
|
|
229,760 |
|
|
|
46,616,006 |
|
|
|
|
|
|
|
|
|
|
|
|
|
|
|
|
|
|
|
|
361,241,517 |
|
|
|
|
|
|
|
|
|
|
| U.S. Fixed Income Funds - 41.4% |
|
| iShares 7-10 Year Treasury Bond ETF |
|
|
685,259 |
|
|
|
64,174,505 |
|
| iShares Core U.S. Aggregate Bond ETF |
|
|
2,553,135 |
|
|
|
247,832,815 |
|
| iShares iBoxx $ Investment Grade Corporate Bond ETF (A) |
|
|
247,256 |
|
|
|
26,486,063 |
|
| iShares Short Treasury Bond ETF |
|
|
33,202 |
|
|
|
3,668,821 |
|
| iShares U.S. Treasury Bond ETF |
|
|
1,950,812 |
|
|
|
44,029,827 |
|
|
|
|
|
|
|
|
|
|
|
|
|
|
|
|
|
|
|
|
386,192,031 |
|
|
|
|
|
|
|
|
|
|
| Total Exchange-Traded Funds
(Cost $852,478,018) |
|
|
|
|
|
|
909,185,339 |
|
|
|
|
|
|
|
|
|
|
|
| OTHER INVESTMENT COMPANY - 4.2% |
|
| Securities Lending Collateral - 4.2% |
|
| State Street Navigator Securities Lending Trust - Government Money Market Portfolio, 5.28% (B) |
|
|
38,688,770 |
|
|
|
38,688,770 |
|
|
|
|
|
|
|
|
|
|
| Total Other Investment Company
(Cost $38,688,770) |
|
|
|
38,688,770 |
|
|
|
|
|
|
|
|
|
|
|
|
|
|
|
|
| |
|
Principal |
|
|
Value |
|
| |
|
|
| REPURCHASE AGREEMENT - 2.2% |
|
| Fixed Income Clearing Corp., |
|
|
|
|
|
|
|
|
| 2.50% (B), dated 06/28/2024, to be repurchased at $20,656,814 on 07/01/2024. Collateralized by a U.S. Government Obligation, 4.50%, due 03/31/2026, and with a value of $21,065,568. |
|
$ |
20,652,511 |
|
|
$ |
20,652,511 |
|
|
|
|
|
|
|
|
|
|
|
|
| Total Repurchase Agreement
(Cost $20,652,511) |
|
|
|
20,652,511 |
|
|
|
|
|
|
|
| Total Investments
(Cost $911,819,299) |
|
|
|
968,526,620 |
|
|
|
|
|
|
|
| Net Other Assets (Liabilities) - (3.9)% |
|
|
|
(36,150,673) |
|
|
|
|
|
|
|
|
|
|
|
|
| Net Assets - 100.0% |
|
|
$ |
932,375,947 |
|
|
|
|
|
|
|
INVESTMENT VALUATION:
|
|
|
|
|
|
|
|
|
|
|
|
|
|
|
|
|
| |
|
|
| Valuation Inputs (C) |
|
|
|
|
|
|
| |
|
Level 1 - Unadjusted Quoted Prices |
|
|
Level 2 - Other Significant Observable Inputs |
|
|
Level 3 - Significant Unobservable Inputs |
|
|
Value |
|
| |
|
|
|
|
|
|
| ASSETS |
|
|
|
|
|
|
|
|
|
|
|
|
|
|
|
|
| Investments |
|
|
|
|
|
|
|
|
|
|
|
|
|
|
|
|
| Exchange-Traded Funds |
|
$ |
909,185,339 |
|
|
$ |
— |
|
|
$ |
— |
|
|
$ |
909,185,339 |
|
| Other Investment Company |
|
|
38,688,770 |
|
|
|
— |
|
|
|
— |
|
|
|
38,688,770 |
|
| Repurchase Agreement |
|
|
— |
|
|
|
20,652,511 |
|
|
|
— |
|
|
|
20,652,511 |
|
|
|
|
|
|
|
|
|
|
|
|
|
|
|
|
|
|
|
|
|
|
|
| Total Investments |
|
$ |
947,874,109 |
|
|
$ |
20,652,511 |
|
|
$ |
— |
|
|
$ |
968,526,620 |
|
|
|
|
|
|
|
|
|
|
|
|
|
|
|
|
|
|
FOOTNOTES TO SCHEDULE OF INVESTMENTS:
| (A) |
All or a portion of the security is on loan. The total value of the securities on loan is $83,210,351, collateralized by cash collateral of $38,688,770 and non-cash collateral, such as U.S. government securities and irrevocable letters of credit, of $46,268,019. The amount on loan indicated may not correspond with the securities on loan identified because a security with pending sales are in the process of recall from the brokers. |
| (B) |
Rate disclosed reflects the yield at June 30, 2024. |
| (C) |
There were no transfers in or out of Level 3 during the period ended June 30, 2024. Please reference the Investment Valuation section of the Notes to Financial Statements for more information regarding investment valuation and pricing inputs. |
The Notes to Financial Statements are an integral part of this report.
|
|
|
|
|
| Transamerica Series Trust |
|
|
|
Semi-Annual Financial Statements 2024 |
|
|
Page 1 |
|
|
Transamerica BlackRock iShares Active Asset Allocation -
Moderate VP
STATEMENT OF ASSETS AND LIABILITIES
At June 30, 2024
(unaudited)
|
|
|
|
|
| Assets: |
|
|
|
|
| Unaffiliated investments, at value (cost $891,166,788)
(including securities loaned of $83,210,351) |
|
$ |
947,874,109 |
|
| Repurchase agreement, at value (cost $20,652,511) |
|
|
20,652,511 |
|
| Receivables and other assets: |
|
|
|
|
| Investments sold |
|
|
7,135,576 |
|
| Net income from securities lending |
|
|
43,853 |
|
| Shares of beneficial interest sold |
|
|
602 |
|
| Interest |
|
|
4,303 |
|
| Prepaid expenses |
|
|
3,804 |
|
|
|
| Total assets |
|
|
975,714,758 |
|
|
|
| Liabilities: |
|
|
|
|
| Cash collateral received upon return of: |
|
|
|
|
| Securities on loan |
|
|
38,688,770 |
|
| Payables and other liabilities: |
|
|
|
|
| Investments purchased |
|
|
3,731,128 |
|
| Shares of beneficial interest redeemed |
|
|
326,832 |
|
| Investment management fees |
|
|
318,166 |
|
| Distribution and service fees |
|
|
178,548 |
|
| Transfer agent costs |
|
|
852 |
|
| Trustee and CCO fees |
|
|
2,654 |
|
| Audit and tax fees |
|
|
13,649 |
|
| Custody fees |
|
|
4,973 |
|
| Legal fees |
|
|
18,023 |
|
| Printing and shareholder reports fees |
|
|
35,973 |
|
| Other accrued expenses |
|
|
19,243 |
|
|
|
| Total liabilities |
|
|
43,338,811 |
|
|
|
| Net assets |
|
$ |
932,375,947 |
|
|
|
| Net assets consist of: |
|
|
|
|
| Capital stock ($0.01 par value) |
|
$ |
898,568 |
|
| Additional paid-in capital |
|
|
982,009,370 |
|
| Total distributable earnings (accumulated losses) |
|
|
(50,531,991 |
) |
|
|
| Net assets |
|
$ |
932,375,947 |
|
|
|
| Net assets by class: |
|
|
|
|
| Initial Class |
|
$ |
2,316,203 |
|
| Service Class |
|
|
930,059,744 |
|
|
|
| Shares outstanding: |
|
|
|
|
| Initial Class |
|
|
220,801 |
|
| Service Class |
|
|
89,636,041 |
|
|
|
| Net asset value and offering price per share: |
|
|
|
|
| Initial Class |
|
$ |
10.49 |
|
| Service Class |
|
|
10.38 |
|
STATEMENT OF OPERATIONS
For the period ended June 30, 2024
(unaudited)
|
|
|
|
|
| Investment income: |
|
|
|
|
| Dividend income from unaffiliated investments |
|
$ |
11,163,257 |
|
| Interest income from unaffiliated investments |
|
|
82,615 |
|
| Net income from securities lending |
|
|
172,330 |
|
|
|
| Total investment income |
|
|
11,418,202 |
|
|
|
| Expenses: |
|
|
|
|
| Investment management fees |
|
|
2,285,383 |
|
| Distribution and service fees: |
|
|
|
|
| Service Class |
|
|
1,150,633 |
|
| Transfer agent costs |
|
|
5,236 |
|
| Trustee and CCO fees |
|
|
21,555 |
|
| Audit and tax fees |
|
|
13,513 |
|
| Custody fees |
|
|
4,987 |
|
| Legal fees |
|
|
36,218 |
|
| Printing and shareholder reports fees |
|
|
36,614 |
|
| Other |
|
|
28,367 |
|
|
|
| Total expenses before waiver and/or reimbursement and recapture |
|
|
3,582,506 |
|
| Expenses waived and/or reimbursed: |
|
|
|
|
| Initial Class |
|
|
(591 |
) |
| Service Class |
|
|
(240,034 |
) |
|
|
| Net expenses |
|
|
3,341,881 |
|
|
|
| Net investment income (loss) |
|
|
8,076,321 |
|
|
|
| Net realized gain (loss) on: |
|
|
|
|
| Unaffiliated investments |
|
|
12,356,744 |
|
|
|
| Net change in unrealized appreciation (depreciation) on: |
|
|
|
|
| Unaffiliated investments |
|
|
29,518,367 |
|
|
|
| Net realized and change in unrealized gain (loss) |
|
|
41,875,111 |
|
|
|
| Net increase (decrease) in net assets resulting from operations |
|
$ |
49,951,432 |
|
The Notes to Financial Statements are an integral part of this report.
|
|
|
|
|
| Transamerica Series Trust |
|
|
|
Semi-Annual Financial Statements 2024 |
|
|
Page 2 |
|
|
Transamerica BlackRock iShares Active Asset Allocation -
Moderate VP
STATEMENT OF CHANGES IN NET ASSETS
For the period and year ended:
|
|
|
|
|
|
|
|
|
| |
|
June 30, 2024 (unaudited) |
|
December 31, 2023 |
|
|
|
| From operations: |
|
|
|
|
|
|
|
|
| Net investment income (loss) |
|
$ |
8,076,321 |
|
|
$ |
16,869,160 |
|
| Net realized gain (loss) |
|
|
12,356,744 |
|
|
|
(2,780,280 |
) |
| Net change in unrealized appreciation (depreciation) |
|
|
29,518,367 |
|
|
|
99,437,035 |
|
|
|
|
| Net increase (decrease) in net assets resulting from operations |
|
|
49,951,432 |
|
|
|
113,525,915 |
|
|
|
|
| Dividends and/or distributions to shareholders: |
|
|
|
|
|
|
|
|
| Initial Class |
|
|
— |
|
|
|
(38,656 |
) |
| Service Class |
|
|
— |
|
|
|
(13,454,458 |
) |
|
|
|
| Net increase (decrease) in net assets resulting from dividends and/or distributions to shareholders |
|
|
— |
|
|
|
(13,493,114 |
) |
|
|
|
| Capital share transactions: |
|
|
|
|
|
|
|
|
| Proceeds from shares sold: |
|
|
|
|
|
|
|
|
| Initial Class |
|
|
106,157 |
|
|
|
335,830 |
|
| Service Class |
|
|
2,730,006 |
|
|
|
37,269,309 |
|
|
|
|
| |
|
|
2,836,163 |
|
|
|
37,605,139 |
|
| Dividends and/or distributions reinvested: |
|
|
|
|
|
|
|
|
| Initial Class |
|
|
— |
|
|
|
38,656 |
|
| Service Class |
|
|
— |
|
|
|
13,454,458 |
|
| |
|
|
— |
|
|
|
13,493,114 |
|
| Cost of shares redeemed: |
|
|
|
|
|
|
|
|
| Initial Class |
|
|
(198,269 |
) |
|
|
(371,503 |
) |
| Service Class |
|
|
(66,028,510 |
) |
|
|
(119,288,741 |
) |
|
|
|
| |
|
|
(66,226,779 |
) |
|
|
(119,660,244 |
) |
|
|
|
| Net increase (decrease) in net assets resulting from capital share transactions |
|
|
(63,390,616 |
) |
|
|
(68,561,991 |
) |
|
|
|
| Net increase (decrease) in net assets |
|
|
(13,439,184 |
) |
|
|
31,470,810 |
|
|
|
|
| Net assets: |
|
|
|
|
|
|
|
|
| Beginning of period/year |
|
|
945,815,131 |
|
|
|
914,344,321 |
|
| End of period/year |
|
$ |
932,375,947 |
|
|
$ |
945,815,131 |
|
|
|
|
| Capital share transactions - shares: |
|
|
|
|
|
|
|
|
| Shares issued: |
|
|
|
|
|
|
|
|
| Initial Class |
|
|
10,380 |
|
|
|
36,040 |
|
| Service Class |
|
|
273,060 |
|
|
|
3,881,631 |
|
|
|
|
| |
|
|
283,440 |
|
|
|
3,917,671 |
|
| Shares reinvested: |
|
|
|
|
|
|
|
|
| Initial Class |
|
|
— |
|
|
|
4,099 |
|
| Service Class |
|
|
— |
|
|
|
1,438,979 |
|
|
|
|
| |
|
|
— |
|
|
|
1,443,078 |
|
| Shares redeemed: |
|
|
|
|
|
|
|
|
| Initial Class |
|
|
(19,422 |
) |
|
|
(39,664 |
) |
| Service Class |
|
|
(6,558,326 |
) |
|
|
(12,911,070 |
) |
|
|
|
| |
|
|
(6,577,748 |
) |
|
|
(12,950,734 |
) |
|
|
|
| Net increase (decrease) in shares outstanding: |
|
|
|
|
|
|
|
|
| Initial Class |
|
|
(9,042 |
) |
|
|
475 |
|
| Service Class |
|
|
(6,285,266 |
) |
|
|
(7,590,460 |
) |
|
|
|
| |
|
|
(6,294,308 |
) |
|
|
(7,589,985 |
) |
The Notes to Financial Statements are an integral part of this report.
|
|
|
|
|
| Transamerica Series Trust |
|
|
|
Semi-Annual Financial Statements 2024 |
|
|
Page 3 |
|
|
Transamerica BlackRock iShares Active Asset Allocation -
Moderate VP
FINANCIAL HIGHLIGHTS
|
|
|
|
|
|
|
|
|
|
|
|
|
|
|
|
|
|
|
|
|
|
|
|
|
| For a share outstanding during the period and years indicated: |
|
Initial Class |
|
|
|
|
|
|
|
| |
|
June 30, 2024 (unaudited) |
|
December 31, 2023 |
|
December 31, 2022 |
|
December 31, 2021 |
|
December 31, 2020 |
|
December 31, 2019 |
|
|
|
|
|
|
|
| Net asset value, beginning of period/year |
|
$ |
9.93 |
|
|
$ |
8.90 |
|
|
$ |
12.46 |
|
|
$ |
11.61 |
|
|
$ |
11.67 |
|
|
$ |
11.50 |
|
|
|
|
|
|
|
|
| Investment operations: |
|
|
|
|
|
|
|
|
|
|
|
|
|
|
|
|
|
|
|
|
|
|
|
|
|
|
|
|
|
|
|
| Net investment income (loss)(A) |
|
|
0.10 |
|
|
|
0.20 |
|
|
|
0.16 |
|
|
|
0.16 |
|
|
|
0.12 |
|
|
|
0.23 |
|
|
|
|
|
|
|
|
| Net realized and unrealized gain (loss) |
|
|
0.46 |
|
|
|
1.00 |
|
|
|
(2.21 |
) |
|
|
0.83 |
|
|
|
0.27 |
|
|
|
1.04 |
|
|
|
|
|
|
|
|
| Total investment operations |
|
|
0.56 |
|
|
|
1.20 |
|
|
|
(2.05 |
) |
|
|
0.99 |
|
|
|
0.39 |
|
|
|
1.27 |
|
|
|
|
|
|
|
|
| Dividends and/or distributions to shareholders: |
|
|
|
|
|
|
|
|
|
|
|
|
|
|
|
|
|
|
|
|
|
|
|
|
|
|
|
|
|
|
|
| Net investment income |
|
|
— |
|
|
|
(0.17 |
) |
|
|
(0.18 |
) |
|
|
(0.14 |
) |
|
|
(0.24 |
) |
|
|
(0.26 |
) |
|
|
|
|
|
|
|
| Net realized gains |
|
|
— |
|
|
|
— |
|
|
|
(1.33 |
) |
|
|
— |
|
|
|
(0.21 |
) |
|
|
(0.84 |
) |
|
|
|
|
|
|
|
| Total dividends and/or distributions to shareholders |
|
|
— |
|
|
|
(0.17 |
) |
|
|
(1.51 |
) |
|
|
(0.14 |
) |
|
|
(0.45 |
) |
|
|
(1.10 |
) |
|
|
|
|
|
|
|
| Net asset value, end of period/year |
|
$ |
10.49 |
|
|
$ |
9.93 |
|
|
$ |
8.90 |
|
|
$ |
12.46 |
|
|
$ |
11.61 |
|
|
$ |
11.67 |
|
| |
|
|
|
|
|
|
|
|
|
|
|
|
|
|
|
|
|
|
|
|
|
|
|
|
|
|
|
|
|
|
|
| Total return |
|
|
5.64 |
%(B) |
|
|
13.55 |
% |
|
|
(16.86 |
)% |
|
|
8.52 |
% |
|
|
3.59 |
% |
|
|
11.43 |
% |
|
|
|
|
|
|
|
| Ratio and supplemental data: |
|
|
|
|
|
|
|
|
|
|
|
|
|
|
|
|
|
|
|
|
|
|
|
|
|
|
|
|
|
|
|
| Net assets end of period/year (000’s) |
|
$ |
2,316 |
|
|
$ |
2,283 |
|
|
$ |
2,042 |
|
|
$ |
2,732 |
|
|
$ |
2,496 |
|
|
$ |
2,710 |
|
|
|
|
|
|
|
|
| Expenses to average net assets(C) |
|
|
|
|
|
|
|
|
|
|
|
|
|
|
|
|
|
|
|
|
|
|
|
|
|
|
|
|
|
|
|
| Excluding waiver and/or reimbursement and recapture |
|
|
0.53 |
%(D) |
|
|
0.53 |
% |
|
|
0.52 |
% |
|
|
0.56 |
% |
|
|
0.56 |
% |
|
|
0.56 |
% |
|
|
|
|
|
|
|
| Including waiver and/or reimbursement and recapture |
|
|
0.47 |
%(D)(E) |
|
|
0.48 |
%(E) |
|
|
0.47 |
%(E) |
|
|
0.55 |
%(E) |
|
|
0.56 |
% |
|
|
0.56 |
% |
|
|
|
|
|
|
|
| Net investment income (loss) to average net assets |
|
|
2.00 |
%(D) |
|
|
2.11 |
% |
|
|
1.56 |
% |
|
|
1.32 |
% |
|
|
1.11 |
% |
|
|
1.98 |
% |
|
|
|
|
|
|
|
| Portfolio turnover rate |
|
|
13 |
%(B) |
|
|
81 |
% |
|
|
245 |
% |
|
|
196 |
% |
|
|
99 |
% |
|
|
179 |
% |
| (A) |
Calculated based on average number of shares outstanding. |
| (C) |
Does not include expenses of the underlying investments in which the Portfolio invests. |
| (E) |
TAM has contractually agreed, through May 1, 2025, to waive from its management fees an amount equal to the sub-advisory fee waiver by the Portfolio’s sub-adviser. These amounts are not subject to recapture by TAM. |
The Notes to Financial Statements are an integral part of this report.
|
|
|
|
|
| Transamerica Series Trust |
|
|
|
Semi-Annual Financial Statements 2024 |
|
|
Page 4 |
|
|
Transamerica BlackRock iShares Active Asset Allocation -
Moderate VP
FINANCIAL HIGHLIGHTS (continued)
|
|
|
|
|
|
|
|
|
|
|
|
|
|
|
|
|
|
|
|
|
|
|
|
|
| For a share outstanding during the period and years indicated: |
|
Service Class |
|
|
|
|
|
|
|
| |
|
June 30, 2024 (unaudited) |
|
December 31, 2023 |
|
December 31, 2022 |
|
December 31, 2021 |
|
December 31, 2020 |
|
December 31, 2019 |
|
|
|
|
|
|
|
| Net asset value, beginning of period/year |
|
$ |
9.84 |
|
|
$ |
8.81 |
|
|
$ |
12.35 |
|
|
$ |
11.50 |
|
|
$ |
11.57 |
|
|
$ |
11.41 |
|
|
|
|
|
|
|
|
| Investment operations: |
|
|
|
|
|
|
|
|
|
|
|
|
|
|
|
|
|
|
|
|
|
|
|
|
|
|
|
|
|
|
|
| Net investment income (loss)(A) |
|
|
0.09 |
|
|
|
0.17 |
|
|
|
0.13 |
|
|
|
0.12 |
|
|
|
0.10 |
|
|
|
0.20 |
|
|
|
|
|
|
|
|
| Net realized and unrealized gain (loss) |
|
|
0.45 |
|
|
|
1.00 |
|
|
|
(2.20 |
) |
|
|
0.84 |
|
|
|
0.25 |
|
|
|
1.02 |
|
|
|
|
|
|
|
|
| Total investment operations |
|
|
0.54 |
|
|
|
1.17 |
|
|
|
(2.07 |
) |
|
|
0.96 |
|
|
|
0.35 |
|
|
|
1.22 |
|
|
|
|
|
|
|
|
| Dividends and/or distributions to shareholders: |
|
|
|
|
|
|
|
|
|
|
|
|
|
|
|
|
|
|
|
|
|
|
|
|
|
|
|
|
|
|
|
| Net investment income |
|
|
— |
|
|
|
(0.14 |
) |
|
|
(0.14 |
) |
|
|
(0.11 |
) |
|
|
(0.21 |
) |
|
|
(0.22 |
) |
|
|
|
|
|
|
|
| Net realized gains |
|
|
— |
|
|
|
— |
|
|
|
(1.33 |
) |
|
|
— |
|
|
|
(0.21 |
) |
|
|
(0.84 |
) |
|
|
|
|
|
|
|
| Total dividends and/or distributions to shareholders |
|
|
— |
|
|
|
(0.14 |
) |
|
|
(1.47 |
) |
|
|
(0.11 |
) |
|
|
(0.42 |
) |
|
|
(1.06 |
) |
|
|
|
|
|
|
|
| Net asset value, end of period/year |
|
$ |
10.38 |
|
|
$ |
9.84 |
|
|
$ |
8.81 |
|
|
$ |
12.35 |
|
|
$ |
11.50 |
|
|
$ |
11.57 |
|
| |
|
|
|
|
|
|
|
|
|
|
|
|
|
|
|
|
|
|
|
|
|
|
|
|
|
|
|
|
|
|
|
| Total return |
|
|
5.49 |
%(B) |
|
|
13.37 |
% |
|
|
(17.14 |
)% |
|
|
8.33 |
% |
|
|
3.25 |
% |
|
|
11.13 |
% |
|
|
|
|
|
|
|
| Ratio and supplemental data: |
|
|
|
|
|
|
|
|
|
|
|
|
|
|
|
|
|
|
|
|
|
|
|
|
|
|
|
|
|
|
|
| Net assets end of period/year (000’s) |
|
$ |
930,060 |
|
|
$ |
943,532 |
|
|
$ |
912,302 |
|
|
$ |
1,250,394 |
|
|
$ |
1,319,740 |
|
|
$ |
1,422,002 |
|
|
|
|
|
|
|
|
| Expenses to average net assets(C) |
|
|
|
|
|
|
|
|
|
|
|
|
|
|
|
|
|
|
|
|
|
|
|
|
|
|
|
|
|
|
|
| Excluding waiver and/or reimbursement and recapture |
|
|
0.78 |
%(D) |
|
|
0.78 |
% |
|
|
0.77 |
% |
|
|
0.81 |
% |
|
|
0.81 |
% |
|
|
0.81 |
% |
|
|
|
|
|
|
|
| Including waiver and/or reimbursement and recapture |
|
|
0.72 |
%(D)(E) |
|
|
0.73 |
%(E) |
|
|
0.72 |
%(E) |
|
|
0.80 |
%(E) |
|
|
0.81 |
% |
|
|
0.81 |
% |
|
|
|
|
|
|
|
| Net investment income (loss) to average net assets |
|
|
1.75 |
%(D) |
|
|
1.85 |
% |
|
|
1.31 |
% |
|
|
1.04 |
% |
|
|
0.87 |
% |
|
|
1.72 |
% |
|
|
|
|
|
|
|
| Portfolio turnover rate |
|
|
13 |
%(B) |
|
|
81 |
% |
|
|
245 |
% |
|
|
196 |
% |
|
|
99 |
% |
|
|
179 |
% |
| (A) |
Calculated based on average number of shares outstanding. |
| (C) |
Does not include expenses of the underlying investments in which the Portfolio invests. |
| (E) |
TAM has contractually agreed, through May 1, 2025, to waive from its management fees an amount equal to the sub-advisory fee waiver by the Portfolio’s sub-adviser. These amounts are not subject to recapture by TAM. |
The Notes to Financial Statements are an integral part of this report.
|
|
|
|
|
| Transamerica Series Trust |
|
|
|
Semi-Annual Financial Statements 2024 |
|
|
Page 5 |
|
|
Transamerica BlackRock iShares Active Asset Allocation -
Moderate VP
NOTES TO FINANCIAL STATEMENTS
At June 30, 2024
(unaudited)
1. ORGANIZATION
Transamerica Series Trust (“TST”) is an open-end management investment company registered under the Investment Company Act of 1940, as amended (the “1940 Act”). TST applies investment company accounting and reporting guidance. TST serves as a funding vehicle for variable life insurance, variable annuity, and group annuity products. Transamerica BlackRock iShares Active Asset Allocation - Moderate VP (the “Portfolio”) is a series of TST and is classified as diversified under the 1940 Act. The Portfolio currently offers two classes of shares, Initial Class and Service Class.
The only shareholders of the Portfolio are affiliated insurance company separate accounts and/or affiliated asset allocation portfolios. Contract holders of the variable life and annuity contracts are not shareholders of the Portfolio. For ease of reference, shareholders and contract holders are collectively referred to in this report as “shareholders.”
This report must be accompanied or preceded by the Portfolio’s current prospectus, which contains additional information about the Portfolio, including risks, as well as investment objectives and strategies.
Transamerica Asset Management, Inc. (“TAM”) serves as investment manager for the Portfolio pursuant to an investment management agreement. TAM provides continuous and regular investment management services to the Portfolio. TAM supervises the Portfolio’s investments, conducts its investment program and provides supervisory, compliance and administrative services to the Portfolio.
TAM currently acts as a “manager of managers” and has hired sub-advisers to furnish day-to-day investment advice and recommendations. TAM may, in the future, determine to provide all aspects of the day-to-day management of the Portfolio without the use of a sub-adviser. When acting as a manager of managers, TAM provides investment management services that include, without limitation, the design and development of the Portfolio and its investment strategies and the ongoing review and evaluation of those investment strategies including recommending changes in strategy where it believes appropriate or advisable; the selection of one or more sub-advisers for the Portfolio employing a combination of quantitative and qualitative screens, research, analysis and due diligence; negotiation of sub-advisory agreements and fees; oversight and monitoring of sub-advisers and recommending changes to sub-advisers where it believes appropriate or advisable; recommending portfolio combinations and liquidations where it believes appropriate or advisable; selection and oversight of transition managers, as needed; regular supervision of the Portfolio’s investments; regular review and evaluation of sub-adviser performance; daily monitoring of the sub-advisers’ buying and selling of securities for the Portfolio; regular review of holdings; ongoing trade oversight and analysis; regular monitoring to ensure adherence to investment process; regular calls and periodic on-site visits with sub-advisers; portfolio construction and asset allocation when using multiple sub-advisers for the Portfolio; risk management oversight and analysis; oversight of negotiation of investment documentation and agreements; design, development, implementation and regular monitoring of the valuation process; periodic due diligence reviews of pricing vendors and vendor methodology; design, development, implementation and regular monitoring of the compliance process; respond to regulatory inquiries and determine appropriate litigation strategy, as needed; review of proxies voted by sub-advisers; oversight of preparation and review of materials for meetings of the Portfolio’s Board of Trustees (the “Board”), participation in these meetings and preparation of regular communications with the Board; oversight of preparation and review of prospectuses, shareholder reports and other disclosure materials and regulatory filings for the Portfolio; oversight of other service providers to the Portfolio, such as the custodian, the transfer agent, the Portfolio’s independent accounting firm and legal counsel; supervision of the performance of recordkeeping and shareholder relations functions for the Portfolio; and oversight of cash management services. TAM uses a variety of quantitative and qualitative tools to carry out its investment management services. TAM, not the Portfolio, is responsible for paying the sub-adviser(s) for their services, and sub-advisory fees are TAM’s expense.
TAM’s investment management services also include the provision of supervisory and administrative services to the Portfolio. These services include performing certain administrative services for the Portfolio and supervising and overseeing the administrative, clerical, recordkeeping and bookkeeping services provided to the Portfolio by State Street Bank and Trust Company (“State Street”), to whom TAM has outsourced the provision of certain sub-administration services. To the extent agreed upon by TAM and the Portfolio from time to time, TAM’s supervisory and administrative services include, but are not limited to: monitoring and verifying the custodian’s daily calculation of the Net Asset Values (“NAV”); shareholder relations functions; compliance services; valuation services; assisting in due diligence and in the oversight and monitoring of certain activities of sub-advisers and certain aspects of Portfolio investments; assisting with Portfolio combinations and liquidations; oversight of the preparation and filing, and review, of all returns and reports, in connection with federal, state and local taxes; oversight and review of regulatory reporting; supervising and coordinating the Portfolio’s custodian and dividend disbursing agent and monitoring their services to the Portfolio; assisting the Portfolio in preparing reports to shareholders; acting as liaison with the Portfolio’s independent public accountants and providing, upon request, analyses, fiscal year summaries and other audit related services; assisting in the preparation of agendas and supporting documents for and minutes of meetings of trustees and committees of trustees; assisting in the preparation of regular communications with the trustees; and providing personnel and office space, telephones
|
|
|
| Transamerica Series Trust |
|
Semi-Annual Financial Statements 2024 |
Page 6
Transamerica BlackRock iShares Active Asset Allocation -
Moderate VP
NOTES TO FINANCIAL STATEMENTS (continued)
At June 30, 2024
(unaudited)
1. ORGANIZATION (continued)
and other office equipment as necessary in order for TAM to perform supervisory and administrative services to the Portfolio. The Portfolio pays certain fees and expenses to State Street for sub-administration services which are not administrative services covered by the management agreement with TAM or paid for through the management fees payable thereunder. For the period ended June 30, 2024, (i) the expenses paid to State Street for sub-administration services by the Portfolio are shown as a part of Other expenses within the Statement of Operations and (ii) the expenses payable to State Street for sub-administration services from the Portfolio are shown as part of Other accrued expenses within the Statement of Assets and Liabilities.
2. SIGNIFICANT ACCOUNTING POLICIES
In preparing the Portfolio’s financial statements in accordance with Generally Accepted Accounting Principles in the United States of America (“GAAP”), estimates or assumptions (which could differ from actual results) may be used that affect reported amounts and disclosures. The following is a summary of significant accounting policies followed by the Portfolio.
Security transactions and investment income: Security transactions are accounted for on the trade date. Security gains and losses are calculated on a first-in, first-out basis. Interest income, if any, is accrued as earned. Dividend income and capital gain distributions from underlying investments, if any, are recorded on the ex-dividend date. Income or short-term capital gain distributions received from underlying investments, if any, are recorded as Dividend income from investments within the Statement of Operations. Long-term capital gain distributions received from underlying investments, if any, are recorded as Net realized gain (loss) on Capital gain distributions received from investments within the Statement of Operations.
Multiple class operations, income, and expenses: Income, non-class specific expenses, and realized and unrealized gains and losses are allocated to each class daily based upon net assets. Each class bears its own specific expenses in addition to the allocated non-class specific expenses.
Distributions to shareholders: Distributions are recorded on the ex-dividend date and are determined in accordance with federal income tax regulations, which may differ from GAAP.
Indemnification: In the normal course of business, the Portfolio enters into contracts that contain a variety of representations that provide general indemnifications. The Portfolio’s maximum exposure under these arrangements is unknown, as this would involve future claims that may be made against the Portfolio and/or its affiliates that have not yet occurred. However, based on experience, the Portfolio expects the risk of loss to be remote.
3. INVESTMENT VALUATION
TAM has been designated as the Portfolio’s valuation designee pursuant to Rule 2a-5 under the 1940 Act with responsibility for fair valuation subject to oversight by the Portfolio’s Board of Trustees. The net asset value of the Portfolio is computed as of the official close of the New York Stock Exchange (“NYSE”) each day the NYSE is open for business.
TAM utilizes various methods to measure the fair value of its investments on a recurring basis. GAAP establishes a hierarchy that prioritizes inputs to valuation methods. The inputs or methodology used for valuing securities are not necessarily an indication of the risk associated with investing in those securities. The three levels (“Levels”) of inputs of the fair value hierarchy are defined as follows:
Level 1—Unadjusted quoted prices in active markets for identical securities.
Level 2—Inputs, other than quoted prices included in Level 1, which are observable, either directly or indirectly. These inputs may include quoted prices for the identical instrument on an inactive market, prices for similar instruments, interest rates, prepayment speeds, credit risk, yield curves, default rates, and similar data.
Level 3—Unobservable inputs based on the best information available in the circumstances, to the extent observable inputs are not available, which may include TAM’s own assumptions used in determining the fair value of the Portfolio’s investments.
The inputs used to measure fair value may fall into different Levels of the fair value hierarchy. In such cases, for disclosure purposes, the Level in the fair value hierarchy that is assigned to the fair value measurement of a security is determined based on the lowest Level input that is significant to the fair value measurement in its entirety. Certain investments that are measured at fair value using NAV per share, or
|
|
|
| Transamerica Series Trust |
|
Semi-Annual Financial Statements 2024 |
Page 7
Transamerica BlackRock iShares Active Asset Allocation -
Moderate VP
NOTES TO FINANCIAL STATEMENTS (continued)
At June 30, 2024
(unaudited)
3. INVESTMENT VALUATION (continued)
its equivalent, using the “practical expedient” have not been classified in the fair value Levels. The hierarchy classification of inputs used to value the Portfolio’s investments at June 30, 2024, is disclosed within the Investment Valuation section of the Schedule of Investments.
The availability of observable inputs can vary from security to security and is affected by a wide variety of factors, including, but not limited to, the type of security, whether the security is new and not yet established in the marketplace, the liquidity of markets, and other characteristics particular to the security. To the extent that valuation is based on models or inputs that are less observable or unobservable in the market, the determination of fair value requires more judgment. Accordingly, the degree of judgment exercised in determining fair value is generally greatest for instruments categorized in Level 3. Due to the inherent uncertainty of valuation, the determination of values may differ significantly from values that would have been realized had a ready market for investments existed, and the differences could be material.
Fair value measurements: Descriptions of the valuation techniques applied to the Portfolio’s significant categories of assets and liabilities measured at fair value on a recurring basis are as follows:
Exchange-traded funds (“ETF”): ETFs are stated at the last reported sale price or closing price on the day of valuation taken from the primary exchange where the ETF is principally traded. ETFs are generally categorized in Level 1 of the fair value hierarchy.
Securities lending collateral: Securities lending collateral is invested in a money market fund which is valued at the actively traded NAV and no valuation adjustments are applied. Securities lending collateral is categorized in Level 1 of the fair value hierarchy.
Repurchase agreements: Repurchase agreements are valued at cost, which approximates fair value. To the extent the inputs are observable and timely, the values are generally categorized in Level 2 of the fair value hierarchy.
4. BORROWINGS AND OTHER FINANCING TRANSACTIONS
The Portfolio may engage in borrowing transactions as a means of raising cash to satisfy redemption requests, for other temporary or emergency purposes or, to the extent permitted by its investment policies, to raise additional cash to be invested in other securities or instruments. When the Portfolio invests borrowing proceeds in other securities, the Portfolio will bear the risk that the market value of the securities in which such proceeds are invested goes down and is insufficient to repay the borrowed proceeds. The Portfolio may borrow on a secured or on an unsecured basis. If the Portfolio enters into a secured borrowing arrangement, a portion of the Portfolio’s assets will be used as collateral. The 1940 Act requires the Portfolio to maintain asset coverage of at least 300% of the amount of its borrowings. Asset coverage means the ratio that the value of the Portfolio’s total assets, minus liabilities other than borrowings, bears to the aggregate amount of all borrowings. Although complying with this requirement has the effect of limiting the amount that the Portfolio may borrow, it does not otherwise mitigate the risks of entering into borrowing transactions.
Interfund lending: The Portfolio, along with other funds and portfolios advised by TAM, may participate in an interfund lending program pursuant to exemptive relief granted by the Securities and Exchange Commission on January 18, 2017. This program allows the Portfolio to lend to and borrow from other funds and portfolios advised by TAM. Interfund lending transactions are subject to the conditions of the exemptive relief which places limits on the amount of lending or borrowing a Portfolio may participate in under the program. Interest earned or paid on an interfund lending transaction will be based on the average of certain current market rates. For the period ended June 30, 2024, the Portfolio has not utilized the program.
Repurchase agreements: In a repurchase agreement, the Portfolio purchases a security and simultaneously commits to resell that security to the seller at an agreed-upon price on an agreed-upon date. Securities purchased subject to a repurchase agreement are held at the Portfolio’s custodian, or designated sub-custodian related to tri-party repurchase agreements, and, pursuant to the terms of the repurchase agreement, must be collateralized by securities with an aggregate market value greater than or equal to 100% of the resale price. The Portfolio will bear the risk of value fluctuations until the securities can be sold and may encounter delays and incur costs in liquidating the securities. In the event of bankruptcy or insolvency of the seller, delays and costs may be incurred.
Repurchase agreements are subject to netting agreements, which are agreements between the Portfolio and its counterparties that provide for the net settlement of all transactions and collateral with the Portfolio, through a single payment, in the event of default or termination. Amounts presented within the Schedule of Investments, and as part of Repurchase agreements, at value within the Statement of Assets and Liabilities are shown on a gross basis. The value of the related collateral for each repurchase agreement, as reflected within the Schedule of Investments, exceeds the value of each repurchase agreement at June 30, 2024.
|
|
|
| Transamerica Series Trust |
|
Semi-Annual Financial Statements 2024 |
Page 8
Transamerica BlackRock iShares Active Asset Allocation -
Moderate VP
NOTES TO FINANCIAL STATEMENTS (continued)
At June 30, 2024
(unaudited)
4. BORROWINGS AND OTHER FINANCING TRANSACTIONS (continued)
Repurchase agreements at June 30, 2024, if any, are included within the Schedule of Investments and Statement of Assets and Liabilities.
Securities lending: The Portfolio may lend securities to qualified financial institutions, brokers and dealers. State Street serves as securities lending agent to the Portfolio pursuant to a Securities Lending Agreement. Loans of securities are terminable at any time and the borrower, after notice, is required to return borrowed securities within the standard time period for settlement of securities transactions. The lending of securities exposes the Portfolio to risks such as: the borrowers may fail to return the loaned securities or may not be able to provide additional collateral, the Portfolio may experience delays in recovery of the loaned securities or delays in access to collateral, or the Portfolio may experience losses related to the investment collateral. To minimize certain risks, loan counterparties pledge cash, securities issued or guaranteed by the U.S. Government and irrevocable letters of credit issued by banks as collateral. The initial collateral received by the Portfolio is required to have a value of at least 102% of the current value of the loaned securities traded on U.S. exchanges, and a value of at least 105% for all other securities. Typically the lending agent is not permitted to sell, re-pledge or use cash and non-cash collateral it receives. The lending agent has agreed to indemnify the Portfolio in the case of default of any securities borrower.
The Portfolio receives compensation for lending securities from interest or dividends earned on the cash, U.S. Government securities and irrevocable letters of credit held as collateral, less associated fees and expenses. Such income is reflected in Net income from securities lending within the Statement of Operations. Cash collateral received is invested in the State Street Navigator Securities Lending Trust — Government Money Market Portfolio.
The value of loaned securities and related cash and non-cash collateral outstanding at June 30, 2024, if any, are shown on a gross basis within the Schedule of Investments.
The following table reflects a breakdown of transactions accounted for as secured borrowings, the gross obligation by the type, and the remaining contractual maturity of those transactions as of June 30, 2024.
|
|
|
|
|
|
|
|
|
|
|
|
|
|
|
|
|
|
|
|
|
| |
|
Remaining Contractual Maturity of the Agreements |
|
| |
|
Overnight and Continuous |
|
|
Less Than 30 Days |
|
|
Between 30 & 90 Days |
|
|
Greater Than 90 Days |
|
|
Total |
|
| Securities Lending Transactions Exchange-Traded Funds |
|
|
$ 38,688,770 |
|
|
|
$ — |
|
|
|
$ — |
|
|
|
$ — |
|
|
|
$ 38,688,770 |
|
| Total Borrowings |
|
|
$ 38,688,770 |
|
|
|
$ — |
|
|
|
$ — |
|
|
|
$ — |
|
|
|
$ 38,688,770 |
|
| |
|
|
|
|
|
|
|
|
|
|
|
|
|
|
|
|
|
|
|
|
5. RISK FACTORS
Investing in the Portfolio involves certain key risks related to the Portfolio’s trading activity. Please reference the Portfolio’s prospectus for a more complete discussion of the following risk(s), as well as other risks of investing in the Portfolio.
Market risk: The market prices of the Portfolio’s securities or other assets may go up or down, sometimes rapidly or unpredictably, due to factors such as economic events, inflation, changes in interest rates, governmental actions or interventions, actions taken by the U.S. Federal Reserve or foreign central banks, market disruptions caused by tariffs, trade disputes or other factors, political developments, armed conflicts, economic sanctions, cybersecurity events, investor sentiment, the global and domestic effects of widespread or local health, weather or climate events, and other factors that may or may not be related to the issuer of the security or other asset. If the market prices of the Portfolio’s securities and assets fall, the value of your investment in the Portfolio could go down.
Economies and financial markets throughout the world are increasingly interconnected. Events or circumstances in one or more countries or regions could be highly disruptive to, and have profound impacts on, global economies or markets. As a result, whether or not the Portfolio invests in securities of issuers located in or with significant exposure to the countries directly affected, the value and liquidity of the Portfolio’s investments may go down.
Asset allocation risk: The Portfolio’s investment performance is significantly impacted by the Portfolio’s asset allocation and reallocation from time to time. The value of your investment may decrease if the sub-adviser’s judgment about the attractiveness, value or market trends affecting a particular asset class, investment style, technique or strategy, underlying ETF or other issuer is incorrect.
|
|
|
| Transamerica Series Trust |
|
Semi-Annual Financial Statements 2024 |
Page 9
Transamerica BlackRock iShares Active Asset Allocation -
Moderate VP
NOTES TO FINANCIAL STATEMENTS (continued)
At June 30, 2024
(unaudited)
5. RISK FACTORS (continued)
Equity securities risk: Equity securities generally have greater risk of loss than debt securities. Stock markets are volatile and the value of equity securities may go up or down, sometimes rapidly and unpredictably. The market price of an equity security may fluctuate based on overall market conditions, such as real or perceived adverse economic or political conditions or trends, tariffs and trade disruptions, inflation, substantial economic downturn or recession, changes in interest rates, or adverse investor sentiment. The market price of an equity security also may fluctuate based on real or perceived factors affecting a particular industry or industries or the company itself. If the market prices of the equity securities owned by the Portfolio fall, the value of your investment in the Portfolio will decline. The Portfolio may lose its entire investment in the equity securities of an issuer. A change in financial condition or other event affecting a single issuer may adversely impact securities markets as a whole.
6. FEES AND OTHER AFFILIATED TRANSACTIONS
TST serves as a funding vehicle for certain affiliated asset allocation portfolios and certain affiliated separate accounts of Transamerica Life Insurance Company (“TLIC”) and Transamerica Financial Life Insurance Company.
TAM, the Portfolio’s investment manager, is directly owned by TLIC and AUSA Holding, LLC (“AUSA”), both of which are indirect, wholly owned subsidiaries of Aegon Ltd. TLIC is owned by Commonwealth General Corporation (“Commonwealth”). Commonwealth and AUSA are wholly owned by Transamerica Corporation (DE). Transamerica Corporation (DE) is wholly owned by Aegon International B.V., which is wholly owned by Aegon Ltd., a Bermuda exempted company with liability limited by shares (formerly, Aegon NV, a Netherlands corporation) and a publicly traded international insurance group.
Transamerica Fund Services, Inc. (“TFS”) is the Portfolio’s transfer agent. Transamerica Capital, Inc. (“TCI”) is the Portfolio’s distributor/principal underwriter. TAM, TFS and TCI are affiliates of Aegon Ltd.
Certain officers and trustees of the Portfolio may also be officers and/or trustees of TAM, TFS and TCI. No interested trustee who is deemed an interested person due to current or former service with TAM or an affiliate of TAM receives compensation from the Portfolio. The Portfolio does pay non-interested persons (independent trustees), as disclosed in Trustee and CCO fees within the Statement of Operations.
Investment management fees: TAM serves as the Portfolio’s investment manager, performing administration as well as investment advisory services. TAM renders investment advisory, supervisory, and administration services under an investment management agreement and the Portfolio pays a single management fee, which is reflected in Investment management fees within the Statement of Operations.
The Portfolio pays a management fee to TAM based on daily average net assets at the following rates:
|
|
|
|
|
| Breakpoints |
|
Rate |
| First $500 million |
|
|
0.5000 |
% |
| Over $500 million up to $1 billion |
|
|
0.4900 |
|
| Over $1 billion up to $2.5 billion |
|
|
0.4725 |
|
| Over $2.5 billion up to $3.5 billion |
|
|
0.4650 |
|
| Over $3.5 billion up to $4.5 billion |
|
|
0.4525 |
|
| Over $4.5 billion |
|
|
0.4400 |
|
TAM has contractually agreed, through May 1, 2025, to waive from its management fees an amount equal to the sub-advisory fee waiver by the Portfolio’s sub-adviser. These amounts are not subject to recapture by TAM.
TAM has contractually agreed to waive fees and/or reimburse Portfolio expenses to the extent that the total operating expenses excluding, as applicable, acquired fund fees and expenses, interest (including borrowing costs and overdraft charges), taxes, brokerage commissions, dividend and interest expenses on securities sold short, extraordinary expenses and other expenses not incurred in the ordinary course of the Portfolio’s business, exceed the following stated annual operating expense limits to the Portfolio’s daily average net
|
|
|
| Transamerica Series Trust |
|
Semi-Annual Financial Statements 2024 |
Page 10
Transamerica BlackRock iShares Active Asset Allocation -
Moderate VP
NOTES TO FINANCIAL STATEMENTS (continued)
At June 30, 2024
(unaudited)
6. FEES AND OTHER AFFILIATED TRANSACTIONS (continued)
assets. To the extent an expense limit changed during the period, the prior limit is also listed below. The expenses waived and/or reimbursed, if any, are included in Expenses waived and/or reimbursed within the Statement of Operations.
|
|
|
|
|
| Class |
|
Operating Expense Limit |
|
Operating Expense Limit Effective Through |
| Initial Class |
|
0.55% |
|
May 1, 2025 |
| Service Class |
|
0.80 |
|
May 1, 2025 |
TAM is permitted to recapture amounts contractually waived and/or reimbursed to a class during any of the 36 months from the date on which TAM waived fees and/or reimbursed expenses for the class. A class may recapture and reimburse TAM only if such amount does not cause, on any particular business day of the Portfolio, the class’s total annual operating expenses (after the recapture is taken into account) to exceed the Operating Expense Limits or any other lower limit then in effect. Amounts recaptured, if any, by TAM for the period ended June 30, 2024 are disclosed in Recapture of previously waived and/or reimbursed fees within the Statement of Operations.
TAM, on a voluntary basis and in addition to the contractual operating expense limits in effect, from time to time may waive and/or reimburse expenses of the Portfolio, or any classes thereof, to such level(s) as the Trust’s officers have determined or may reasonably determine from time to time. Any such voluntary waiver or expense reimbursement may be discontinued by TAM at any time. These amounts are not subject to recapture by TAM.
As of June 30, 2024, there are no amounts available for recapture by TAM.
Distribution and service fees: TST has a distribution plan (“Distribution Plan”) pursuant to Rule 12b-1 under the 1940 Act. Pursuant to the Distribution Plan, TST entered into a distribution agreement with TCI as the Portfolio’s distributor.
The Distribution Plan requires the Portfolio to pay distribution fees to TCI as compensation for various distribution activities, not as reimbursement for specific expenses. Under the Distribution Plan and distribution agreement, TCI, on behalf of the Portfolio, is authorized to pay various service providers, as direct payment for expenses incurred in connection with distribution of the Portfolio’s shares.
The fee on the Service Class shares is paid to the insurance companies for providing services and account maintenance for the policyholders who invest in the variable insurance products which invest in the Service Class shares. TCI has determined that it will not seek payment for the distribution expenses incurred by the Portfolio with respect to the Initial Class shares before May 1, 2025. Prior to TCI seeking distribution expenses on Initial Class shares, policy and contract owners will be notified in advance. The Portfolio will pay fees relating to Service Class shares. The distribution and service fees are included in Distribution and service fees within the Statement of Operations.
The Portfolio is authorized under the Distribution Plan to pay fees to TCI based on daily average net assets of each applicable class up to the following annual rates:
|
|
|
|
|
| Class |
|
Rate |
| Initial Class |
|
|
0.15 |
% |
| Service Class |
|
|
0.25 |
|
Transfer agent costs: TFS provides transfer agency services under an intercompany agreement with TAM. TFS has outsourced the provision of certain sub-transfer agency services to SS&C Global Investor & Distribution Solutions, Inc. (“SS&C GIDS”). The Portfolio does not pay a separate transfer agent fee to TAM or TFS but does pay certain expenses to SS&C GIDS related to applicable sub-transfer agency services. For the period ended June 30, 2024, (i) the expenses paid to SS&C GIDS by the Portfolio are referred to as transfer agent costs and are included within the Statement of Operations and (ii) the expenses payable to SS&C GIDS by the Portfolio are referred to as transfer agent costs within the Statement of Assets and Liabilities.
TAM has contractually agreed, through May 1, 2025, to waive from its management fees an amount equal to the sub-advisory fee waiver by the Portfolio’s sub-adviser. These amounts are not subject to recapture by TAM.
|
|
|
| Transamerica Series Trust |
|
Semi-Annual Financial Statements 2024 |
Page 11
Transamerica BlackRock iShares Active Asset Allocation -
Moderate VP
NOTES TO FINANCIAL STATEMENTS (continued)
At June 30, 2024
(unaudited)
6. FEES AND OTHER AFFILIATED TRANSACTIONS (continued)
Brokerage commissions: The Portfolio incurred no brokerage commissions on security transactions placed with affiliates of the investment manager or sub-adviser(s) for the period ended June 30, 2024.
7. PURCHASES AND SALES OF SECURITIES
For the period ended June 30, 2024, the cost of securities purchased and proceeds from securities sold (excluding short-term securities) are as follows:
|
|
|
| Purchases of Securities |
|
Sales of Securities |
|
|
| $ 120,911,545 |
|
$ 191,233,520 |
8. FEDERAL INCOME TAXES AND DISTRIBUTIONS TO SHAREHOLDERS
The Portfolio has not made any provision for federal income or excise taxes due to its policy to distribute all of its taxable income and capital gains to its shareholders and otherwise qualify as a regulated investment company under Subchapter M of the Internal Revenue Code. The Portfolio recognizes the tax benefits of uncertain tax positions only where the position is “more likely than not” to be sustained assuming examination by tax authorities. The Portfolio’s tax returns remain subject to examination by the Internal Revenue Service and state tax authorities three years from the date of filing for federal purposes and four years from the date of filing for state purposes. Management has evaluated the Portfolio’s tax provisions taken for all open tax years, and has concluded that no provision for income tax is required in the Portfolio’s financial statements. If applicable, the Portfolio recognizes interest accrued related to unrecognized tax benefits in relation to interest and penalties expense in Other within the Statement of Operations. The Portfolio identifies its major tax jurisdictions as U.S. Federal, the state of Colorado, and foreign jurisdictions where the Portfolio makes significant investments; however, the Portfolio is not aware of any tax positions for which it is reasonably possible that the total amounts of unrecognized tax benefits will change materially in the next twelve months. Distributions are determined in accordance with income tax regulations, which may differ from GAAP.
As of June 30, 2024, the approximate cost for U.S. federal income tax purposes, and the aggregate gross/net unrealized appreciation (depreciation) in the value of investments (including securities sold short and derivatives, if any) are as follows:
|
|
|
|
|
|
|
| Cost |
|
Gross Appreciation |
|
Gross (Depreciation) |
|
Net Appreciation (Depreciation) |
|
|
|
|
| $ 911,819,299 |
|
$ 90,362,516 |
|
$ (33,655,195) |
|
$ 56,707,321 |
Please see TST’s most recent report on Form N-CSR, available at: www.transamerica.com/annuities/prospectus, for additional information. For the most recently filed complete proxy voting records for the Trust please visit: https://www.transamerica.com/sites/default/files/files/e070d/TST%20N-PX%202021.pdf
|
|
|
| Transamerica Series Trust |
|
Semi-Annual Financial Statements 2024 |
Page 12
Transamerica BlackRock iShares Active Asset Allocation - Moderate VP
MANAGEMENT AND SUB-ADVISORY AGREEMENT — CONTRACT RENEWAL
(unaudited)
At a meeting of the Board of Trustees of Transamerica Series Trust (the “Trustees” or the “Board”) held on June 12-13, 2024, the Board considered the renewal of the management agreement (the “Management Agreement”) between Transamerica Asset Management, Inc. (“TAM”) and Transamerica Series Trust, on behalf of Transamerica BlackRock iShares Active Asset Allocation – Moderate VP (the “Portfolio”). The Board also considered the renewal of the investment sub-advisory agreement (the “Sub-Advisory Agreement” and together with the Management Agreement, the “Agreements”) for the Portfolio between TAM and BlackRock Investment Management, LLC (the “Sub-Adviser”).
Following its review and consideration, the Board determined that the terms of the Management Agreement and Sub-Advisory Agreement were reasonable and that the renewal of each of the Agreements was in the best interests of the Portfolio and the holders invested in the Portfolio. The Board, including the independent members of the Board (the “Independent Trustees”), unanimously approved the renewal of each of the Agreements through June 30, 2025.
Prior to reaching their decision, the Trustees requested and received from TAM and the Sub-Adviser certain information. They then reviewed such information as they deemed reasonably necessary to evaluate the Agreements, including information they had previously received from TAM and the Sub-Adviser as part of their regular oversight of the Portfolio, and knowledge they gained over time through meeting with TAM and the Sub-Adviser. Among other materials, the Trustees considered comparative fee, expense and performance information prepared by Broadridge Financial Solutions, Inc. (“Broadridge”), an independent provider of mutual fund performance information, as well as fee, expense and profitability information prepared by TAM. In addition, TAM provided the Board with additional supplemental comparative fee, expense and performance information. To the extent applicable, the Trustees considered information about fees and performance of comparable funds and/or accounts managed by the Sub-Adviser. The Board also considered reductions to the Portfolio’s expense limits, if any, that took effect after the last renewal of the Agreements. In their review, the Trustees also sought to identify instances in which the Portfolio’s performance, fees, total expenses and/or profitability appeared to be outliers within its respective peer group or other comparative metrics and sought to understand the reasons for such comparative positions.
In their deliberations, the Independent Trustees met privately without representatives of TAM or the Sub-Adviser present and were represented throughout the process by their independent legal counsel. In considering the proposed continuation of each of the Agreements, the Trustees evaluated and weighed a number of considerations that they believed to be relevant in light of the legal advice furnished to them by counsel, including independent legal counsel, and made a decision in the exercise of their own business judgment. They based their decisions on the considerations discussed below, among others, although they did not identify any particular consideration or item of information that was controlling of their decisions, and each Trustee may have attributed different weights to the various factors.
Nature, Extent and Quality of the Services Provided
The Board considered the nature, extent and quality of the services provided by TAM and the Sub-Adviser to the Portfolio in the past and the services anticipated to be provided in the future. The Board also considered the investment approach for the Portfolio; the experience, capability and integrity of TAM’s senior management; the financial resources of TAM; TAM’s management oversight process; TAM’s and the Sub-Adviser’s responsiveness to any questions by the Trustees; and the professional qualifications and compensation program of the portfolio management team of the Sub-Adviser. The Trustees noted that they receive, on a quarterly basis, an execution analysis from Capital Institutional Services, Inc. (CAPIS), an independent provider of trade analyses, for the Sub-Adviser and a comparison of trading results against a peer universe of managers.
The Board also considered the continuous and regular investment management and other services provided by TAM, when acting as a manager of managers, for the portion of the management fee it retains from the Portfolio after payment of the sub-advisory fees. The Board noted that the investment management and other services provided by TAM include the design, development and ongoing review and evaluation of the Portfolio and its investment strategy; the selection, oversight and monitoring of one or more investment sub-advisers to perform certain duties with respect to the Portfolio; ongoing portfolio trading oversight and analysis; risk management oversight and analysis; design, development, implementation and ongoing review and evaluation of a process for the valuation of Portfolio investments; design, development, implementation and ongoing review and evaluation of a compliance program for the Portfolio; design, development, implementation and ongoing review and evaluation of a process for the voting of proxies and exercise of rights to consent to corporate action for Portfolio investments; participation in Board meetings and oversight of preparation of materials for the Board, including materials for Board meetings and regular communications with the Board; oversight of preparation of the Portfolio’s prospectus, statement of additional information, shareholder reports and other disclosure materials and regulatory filings for the Portfolio; and ongoing cash management services for the Portfolio. The Board considered that TAM’s investment management services also include the provision of supervisory and administrative services to the Portfolio. The Board also noted that TAM, as part of the services it provides to all Transamerica mutual funds, including the Portfolio, oversees the services provided by the funds’ custodian, transfer agent, independent accountant and legal counsel and supervises the performance of the recordkeeping and holder service functions of the funds.
Investment Performance
|
|
|
|
|
| Transamerica Series Trust |
|
|
|
Semi-Annual Financial Statements 2024 |
|
|
Page 13 |
|
|
Transamerica BlackRock iShares Active Asset Allocation - Moderate VP
MANAGEMENT AND SUB-ADVISORY AGREEMENT — CONTRACT RENEWAL (continued)
(unaudited)
In addition, the Board considered the short- and longer-term performance of the Portfolio in light of its investment objective, policies and strategies, including relative performance against (i) a peer universe of comparable mutual funds, as prepared by Broadridge, and (ii) the Portfolio’s benchmarks, in each case for various trailing periods ended December 31, 2023. Based on these considerations, the Board determined that TAM and the Sub-Adviser can provide investment and related services that are appropriate in scope and extent in light of the Portfolio’s investment objectives, policies and strategies and operations, the competitive landscape of the investment company business and investor needs. The Board’s conclusions as to the Portfolio’s performance are summarized below. For purposes of its review, the Board generally used the performance of Service Class Shares. In describing the Portfolio’s performance relative to its peer universe, the summary conclusions characterize performance for the relevant periods in relation to whether it was “above,” “below” or “in line with” the peer universe median and do so using quintile rankings prepared by Broadridge. For simplicity, performance is described as “above” the median if the Portfolio’s performance ranked anywhere in the first or second quintiles, as “below” the median if it ranked anywhere in the fourth or fifth quintiles, or “in line with” the median if it ranked anywhere in the third quintile (i.e., even if its precise return was somewhat above or somewhat below the precise median return).
When considering the Portfolio’s performance, the Trustees considered any representations made by TAM regarding the appropriateness of certain peer groups and benchmarks. They recognized that performance reflects a snapshot of a period as of a specific date, and that consideration of performance data for a different period could generate significantly different performance results. The Trustees also recognized that even longer-term performance can be negatively affected by performance over a short-term period when that short-term performance is significantly below the performance of the comparable benchmark or universe of peer funds.
The Board noted that the performance of Service Class Shares of the Portfolio was in line with the median for its peer universe for the past 1-year period and below the median for the past 3-, 5- and 10-year periods. The Board also noted that the performance of Service Class Shares of the Portfolio was below the benchmark that TAM utilizes to measure performance of the Portfolio for the past 1-, 3-, 5- and 10-year periods. The Board noted that the Sub-Adviser had commenced sub-advising the Portfolio on November 1, 2021 pursuant to its current investment strategies.
Management Fee and Sub-Advisory Fees and Total Expense Ratio
The Board considered the management fee and total expense ratio of the Portfolio, including information provided by Broadridge comparing the management fee and total expense ratio of the Portfolio to the management fees and total expense ratios of comparable investment companies in both a peer group and broader peer universe compiled by Broadridge. The Board’s conclusions as to the Portfolio’s management fee and total expense ratio are summarized below. For purposes of its review, the Board generally used the actual total expenses (i.e., expenses reflecting any waivers and/or reimbursements) of Service Class Shares. In describing the Portfolio’s management fee and total expense ratio relative to its peer group and peer universe, the summary conclusions characterize management fees and total expense ratios for the relevant periods in relation to whether they were “above,” “below” or “in line with” the peer group or peer universe median and do so using quintile rankings prepared by Broadridge. For simplicity, management fees and total expense ratios are described as “above” the median if the Portfolio’s management fee or total expense ratio ranked anywhere in the fourth or fifth quintiles, as “below” the median if it ranked anywhere in the first or second quintiles, or “in line with” the median if it ranked anywhere in the third quintile (i.e., even if its precise management fee or total expense ratio was somewhat above or somewhat below the precise median management fee or total expense ratio).
The Board also considered the fees charged by the Sub-Adviser for sub-advisory services, as well as the portion of the Portfolio’s management fee retained by TAM following payment of the sub-advisory fee and how the portion of the contractual management fee retained by TAM at a specified asset level compared to the portions retained by other investment advisers managing mutual funds with similar investment strategies as calculated by an independent provider of information.
The Board noted that the Portfolio’s contractual management fee was in line with the median for its peer group and above the median for its peer universe and that the actual total expenses (i.e., expenses reflecting any waivers and/or reimbursements) of Service Class Shares of the Portfolio were in line with the median for its peer group and below the median for its peer universe. The Trustees also considered that TAM has entered into an expense limitation arrangement with the Portfolio, which may result in TAM waiving fees for the benefit of holders.
On the basis of these considerations, together with the other information it considered, the Board determined that the management and sub-advisory fees to be received by TAM and the Sub-Adviser under the Management Agreement and Sub-Advisory Agreement are reasonable in light of the services provided.
Cost of Services Provided and Level of Profitability
The Board reviewed information provided by TAM about the cost of providing and procuring fund management services, as well as the costs of the provision of administration, transfer agency and other services, to the Portfolio and to Transamerica Series Trust as a whole by TAM and its affiliates. The Board considered the profitability of TAM and its affiliates in providing these services for the Portfolio and Transamerica Series Trust as a whole. The Trustees recognized the competitiveness of the mutual fund industry and the importance of an investment adviser’s long-term profitability, including for maintaining company and management stability and accountability.
|
|
|
|
|
| Transamerica Series Trust |
|
|
|
Semi-Annual Financial Statements 2024 |
|
|
Page 14 |
|
|
Transamerica BlackRock iShares Active Asset Allocation - Moderate VP
MANAGEMENT AND SUB-ADVISORY AGREEMENT — CONTRACT RENEWAL (continued)
(unaudited)
The Board also considered the allocation methodology used for calculating the profitability of TAM and its affiliates. The Board noted that the revenue and expense allocation methodology used by TAM to estimate its profitability with respect to its relationship with the Portfolio had been reviewed previously by an independent consultant. The Trustees considered that TAM reported that it had not made material changes to this methodology, and that the methodology had been applied consistently for the Portfolio.
With respect to the Sub-Adviser, the Board noted that the sub-advisory fee is the product of arm’s-length negotiation between TAM and the Sub-Adviser, which is not affiliated with TAM, and is paid by TAM and not the Portfolio. As a result, the Board focused on the profitability of TAM and its affiliates with respect to the Portfolio.
Based on this information, the Board determined that the profitability of TAM and its affiliates from their relationships with the Portfolio was not excessive.
Economies of Scale
The Board considered economies of scale with respect to the management of the Portfolio, whether the Portfolio had appropriately benefited from any economies of scale and whether there was the potential for realization of any future economies of scale. The Board also considered the existence of economies of scale with respect to management of the Transamerica mutual funds overall and the extent to which the Portfolio benefited from any economies of scale. The Board recognized that, as the Portfolio’s assets increase, any economies of scale realized by TAM or the Sub-Adviser may not directly correlate with each other or with any economies of scale that might be realized by the Portfolio. The Board considered the Portfolio’s management fee schedule and the existence of breakpoints and also considered the extent to which TAM shared economies of scale, if any, with the Portfolio through undertakings to limit or reimburse Portfolio expenses and to invest in maintaining and developing its capabilities and services. The Board also considered the Sub-Adviser’s sub-advisory fee schedule and the existence of breakpoints, if any, and how such breakpoints relate to any breakpoints in the Portfolio’s management fee schedule. The Board considered that the Sub-Adviser’s sub-advisory fees would be based on the combined assets of multiple funds. The Trustees concluded that the Portfolio’s fee structure reflected an appropriate sharing of any efficiencies or economies of scale to date and noted that they will have the opportunity to periodically reexamine the appropriateness of the management fee payable to TAM and the fee paid to the Sub-Adviser in light of any economies of scale experienced in the future.
Benefits to TAM, its Affiliates and/or the Sub-Adviser from their Relationships with the Portfolio
The Board considered other benefits derived by TAM, its affiliates, and/or the Sub-Adviser from their relationships with the Portfolio. The Board noted that TAM does not receive benefits from research obtained with commissions paid to broker-dealers for portfolio transactions (commonly referred to as “soft dollars”) as a result of its relationship with the Portfolio and that TAM believes the use of soft dollars by the Sub-Adviser is generally appropriate and in the best interests of the Portfolio.
Other Considerations
The Board noted that TAM has made a substantial commitment to the recruitment and retention of high-quality personnel and maintains the financial, compliance and operational resources reasonably necessary to manage the Portfolio in a professional manner that is consistent with the best interests of the Portfolio and the holders. In this regard, the Board favorably considered the procedures and policies TAM has in place to enforce compliance with applicable laws and regulations and oversee the portfolio management activities of the Sub-Adviser. The Board also noted that TAM has made an entrepreneurial commitment and undertaken certain business risks with respect to the management and success of the Portfolio.
Conclusion
After consideration of the factors described above, as well as other factors, the Trustees, including the Independent Trustees, concluded that the renewal of the Management Agreement and the Sub-Advisory Agreement was in the best interests of the Portfolio and the holders and voted to approve the renewal of the Agreements.
|
|
|
|
|
| Transamerica Series Trust |
|
|
|
Semi-Annual Financial Statements 2024 |
|
|
Page 15 |
|
|
PROXY VOTING POLICIES AND PROCEDURES AND QUARTERLY PORTFOLIO HOLDINGS
(unaudited)
A description of Transamerica Series Trust’s (the “Trust”) proxy voting policies and procedures is available in the Statement of Additional Information of the Portfolios, available without charge upon request by calling 1-800-851-9777 (toll free) or on the Securities and Exchange Commission’s (“SEC”) website at http://www.sec.gov.
In addition, the Portfolio is required to file Form N-PX, with their complete proxy voting records for the most recent 12 months ended June 30th, no later than August 31st of each year. The Form is available without charge: (1) on the Transamerica Funds website at https://www.transamerica.com/sites/default/files/files/e070d/TST%20N-PX%202021.pdf; and (2) on the SEC’s website at http://www.sec.gov.
Each fiscal quarter, the Portfolios, except Transamerica BlackRock Government Money Market VP, will file with the SEC a complete schedule of its monthly portfolio holdings on Form N-PORT. The Portfolios’ holdings as of the end of the third month of every fiscal quarter, as reported on Form N-PORT, will be publicly available on the SEC’s website at http://www.sec.gov within 60 days of the end of the fiscal quarter.
On a monthly basis, Transamerica BlackRock Government Money Market VP will file with the SEC portfolio holdings information on Form N-MFP3. A complete schedule of portfolio holdings is also available at www.transamerica.com.
You may also visit the Trust’s website at www.transamerica.com/annuities/prospectus for this and other information about the Portfolios and the Trust.
Important Notice Regarding Delivery of Shareholder Documents
Every year we provide shareholders informative materials such as the Transamerica Series Trust Annual Report, the Transamerica Series Trust Prospectus, and other required documents that keep you informed regarding your Portfolios. To the extent provided by mail, Transamerica Series Trust will only send one piece per mailing address, a method that saves your Portfolios money by reducing mailing and printing costs. We will continue to do this unless you tell us not to. To elect to receive individual mailings, simply call a Transamerica Customer Service Representative toll free at 1-800-851-9777, 8 a.m. to 7 p.m. Eastern Time, Monday-Friday. Your request will take effect within 30 days.
|
|
|
| Transamerica Series Trust |
|
Semi-Annual Financial Statements 2024 |
Page 16
NOTICE OF PRIVACY POLICY
(unaudited)
Your privacy is very important to us. We want you to understand what information we collect and how we use it. We collect and use “nonpublic personal information” in connection with providing our customers with a broad range of financial products and services as effectively and conveniently as possible. We treat nonpublic personal information in accordance with our Privacy Policy.
What Information We Collect and From Whom We Collect It
We may collect nonpublic personal information about you from the following sources:
| • |
|
Information we receive from you on applications or other forms, such as your name, address, and account number; |
| • |
|
Information about your transactions with us, our affiliates, or others, such as your account balance and purchase/redemption history; and |
| • |
|
Information we receive from non-affiliated third parties, including consumer reporting agencies. |
What Information We Disclose and To Whom We Disclose It
We do not disclose any nonpublic personal information about current or former customers to anyone without their express consent, except as permitted by law. We may disclose the nonpublic personal information we collect, as described above, to persons or companies that perform services on our behalf and to other financial institutions with which we have joint marketing agreements. We will require these companies to protect the confidentiality of your nonpublic personal information and to use it only to perform the services for which we have hired them.
Our Security Procedures
We restrict access to your nonpublic personal information and only allow disclosures to persons and companies as permitted by law to assist in providing products or services to you. We maintain physical, electronic, and procedural safeguards to protect your nonpublic personal information and to safeguard the disposal of certain consumer information.
Contact Us
If you have any questions about our Privacy Policy, please call 1-800-851-9777 on any business day between 8 a.m. and 7 p.m. Eastern Time.
Note: This Privacy Policy applies only to customers that have a direct relationship with us or our affiliates. If you own shares of our portfolios in the name of a third party such as a bank or broker-dealer, its privacy policy may apply to you instead of ours.
|
|
|
|
|
| Transamerica Series Trust |
|
|
|
Semi-Annual Financial Statements 2024 |
|
|
Page 17 |
|
|
|
|
|
|
| PO Box 219945 |
|
| Kansas City, MO 64121-9945 |
|
|
| Distributor: |
|
Transamerica Capital, Inc. |
|
|
PO Box 219945 |
|
|
Kansas City, MO 64121-9945 |
|
|
|
|
Customer Service: 1-800-851-9777 |
Transamerica Series Trust Semi-Annual Financial Statements
June 30, 2024
1801 California St., Suite 5200
Denver, CO 80202
Distributor: Transamerica Capital, Inc.
Customer Service: 1-800-851-9777
The following pages contain the most recent semi-annual financial statements for the investment options in which you are invested. In compliance with Securities and Exchange Commission regulations, we present these reports on an annual and semi-annual basis with the hope that they will foster greater understanding of the investment options’ holdings, performance, financial data, accounting policies and other issues. This streamlined version provides information only on the investment options in which you are invested.
If you have any questions about these reports, please do not hesitate to contact your financial professional. As always, we thank you for your trust and the opportunity to serve you.
Transamerica BlackRock iShares Dynamic Allocation -
Balanced VP
SCHEDULE OF INVESTMENTS
At June 30, 2024
(unaudited)
|
|
|
|
|
|
|
|
|
| |
|
Shares |
|
|
Value |
|
| |
|
| EXCHANGE-TRADED FUNDS - 97.4% |
|
| International Equity Funds - 14.8% |
|
| iShares Core MSCI EAFE ETF |
|
|
347,442 |
|
|
$ |
25,238,187 |
|
| iShares MSCI EAFE ETF (A) |
|
|
1,024,778 |
|
|
|
80,270,861 |
|
|
|
|
|
|
|
|
|
|
|
|
|
|
|
|
|
|
|
|
105,509,048 |
|
|
|
|
|
|
|
|
|
|
| U.S. Equity Fund - 35.3% |
|
| iShares Core S&P 500 ETF |
|
|
460,262 |
|
|
|
251,869,174 |
|
|
|
|
|
|
|
|
|
|
|
| U.S. Fixed Income Funds - 47.3% |
|
| iShares 7-10 Year Treasury Bond ETF |
|
|
1,282,158 |
|
|
|
120,074,096 |
|
| iShares Core U.S. Aggregate Bond ETF |
|
|
1,383,596 |
|
|
|
134,305,664 |
|
| iShares iBoxx $ Investment Grade Corporate Bond ETF |
|
|
136,835 |
|
|
|
14,657,765 |
|
| iShares Short Treasury Bond ETF |
|
|
398,940 |
|
|
|
44,082,870 |
|
| iShares U.S. Treasury Bond ETF |
|
|
1,080,803 |
|
|
|
24,393,724 |
|
|
|
|
|
|
|
|
|
|
|
|
|
|
|
|
|
|
|
|
337,514,119 |
|
|
|
|
|
|
|
|
|
|
|
|
|
| Total Exchange-Traded Funds
(Cost $640,559,827) |
|
|
|
|
|
|
694,892,341 |
|
|
|
|
|
|
|
|
|
|
|
| OTHER INVESTMENT COMPANY - 0.2% |
|
| Securities Lending Collateral - 0.2% |
|
| State Street Navigator Securities Lending Trust - Government Money Market Portfolio, 5.28% (B) |
|
|
1,600,000 |
|
|
|
1,600,000 |
|
|
|
|
|
|
|
|
|
|
|
|
| Total Other Investment Company
(Cost $1,600,000) |
|
|
|
1,600,000 |
|
|
|
|
|
|
|
|
|
|
|
|
|
|
|
|
| |
|
Principal |
|
|
Value |
|
| |
|
| REPURCHASE AGREEMENT - 1.2% |
|
| Fixed Income Clearing Corp., |
|
|
|
|
|
|
|
|
| 2.50% (B), dated 06/28/2024, to be repurchased at $8,327,042 on 07/01/2024. Collateralized by a U.S. Government Obligation, 3.75%, due 04/15/2026, and with a value of $8,491,896. |
|
$ |
8,325,308 |
|
|
|
$ 8,325,308 |
|
|
|
|
|
|
|
|
|
|
|
|
| Total Repurchase Agreement (Cost $8,325,308) |
|
|
|
8,325,308 |
|
|
|
|
|
|
|
|
|
| Total Investments (Cost $650,485,135) |
|
|
|
704,817,649 |
|
|
|
|
|
|
|
| Net Other Assets (Liabilities) - 1.2% |
|
|
|
8,767,781 |
|
|
|
|
|
|
|
|
|
|
|
|
| Net Assets - 100.0% |
|
|
$ |
713,585,430 |
|
|
|
|
|
|
|
INVESTMENT VALUATION:
Valuation Inputs (C)
|
|
|
|
|
|
|
|
|
|
|
|
|
|
|
|
|
| |
|
Level 1 - Unadjusted Quoted Prices |
|
|
Level 2 - Other Significant Observable Inputs |
|
|
Level 3 - Significant Unobservable Inputs |
|
|
Value |
|
| |
|
|
|
|
|
|
| ASSETS |
|
|
|
|
|
|
|
|
|
|
|
|
|
|
|
|
| Investments |
|
|
|
|
|
|
|
|
|
|
|
|
|
|
|
|
| Exchange-Traded Funds |
|
$ |
694,892,341 |
|
|
$ |
— |
|
|
$ |
— |
|
|
$ |
694,892,341 |
|
| Other Investment Company |
|
|
1,600,000 |
|
|
|
— |
|
|
|
— |
|
|
|
1,600,000 |
|
| Repurchase Agreement |
|
|
— |
|
|
|
8,325,308 |
|
|
|
— |
|
|
|
8,325,308 |
|
|
|
|
|
|
|
|
|
|
|
|
|
|
|
|
|
|
|
|
|
|
|
| Total Investments |
|
$ |
696,492,341 |
|
|
$ |
8,325,308 |
|
|
$ |
— |
|
|
$ |
704,817,649 |
|
|
|
|
|
|
|
|
|
|
|
|
|
|
|
|
|
|
FOOTNOTES TO SCHEDULE OF INVESTMENTS:
| (A) |
All or a portion of the security is on loan. The total value of the securities on loan is $57,371,634, collateralized by cash collateral of $1,600,000 and non-cash collateral, such as U.S. government securities and irrevocable letters of credit, of $56,994,800. The amount on loan indicated may not correspond with the securities on loan identified because a security with pending sales are in the process of recall from the brokers. |
| (B) |
Rate disclosed reflects the yield at June 30, 2024. |
| (C) |
There were no transfers in or out of Level 3 during the period ended June 30, 2024. Please reference the Investment Valuation section of the Notes to Financial Statements for more information regarding investment valuation and pricing inputs. |
The Notes to Financial Statements are an integral part of this report.
|
|
|
|
|
| Transamerica Series Trust |
|
|
|
Semi-Annual Financial Statements 2024 |
|
|
Page 1 |
|
|
Transamerica BlackRock iShares Dynamic Allocation -
Balanced VP
STATEMENT OF ASSETS AND LIABILITIES
At June 30, 2024
(unaudited)
|
|
|
|
|
|
|
| Assets: |
|
|
|
|
| Unaffiliated investments, at value (cost $642,159,827) (including securities loaned of $57,371,634) |
|
$ |
696,492,341 |
|
| Repurchase agreement, at value (cost $8,325,308) |
|
|
8,325,308 |
|
| Receivables and other assets: |
|
|
|
|
| Investments sold |
|
|
10,937,344 |
|
| Net income from securities lending |
|
|
24,051 |
|
| Interest |
|
|
1,734 |
|
| Prepaid expenses |
|
|
2,861 |
|
|
|
| Total assets |
|
|
715,783,639 |
|
|
|
| Liabilities: |
|
|
|
|
| Cash collateral received upon return of: |
|
|
|
|
| Securities on loan |
|
|
1,600,000 |
|
| Payables and other liabilities: |
|
|
|
|
| Shares of beneficial interest redeemed |
|
|
120,789 |
|
| Investment management fees |
|
|
244,866 |
|
| Distribution and service fees |
|
|
137,252 |
|
| Transfer agent costs |
|
|
750 |
|
| Trustee and CCO fees |
|
|
2,130 |
|
| Audit and tax fees |
|
|
11,938 |
|
| Custody fees |
|
|
12,447 |
|
| Legal fees |
|
|
15,712 |
|
| Printing and shareholder reports fees |
|
|
36,286 |
|
| Other accrued expenses |
|
|
16,039 |
|
|
|
| Total liabilities |
|
|
2,198,209 |
|
|
|
| Net assets |
|
$ |
713,585,430 |
|
|
|
| Net assets consist of: |
|
|
|
|
| Capital stock ($0.01 par value) |
|
$ |
642,949 |
|
| Additional paid-in capital |
|
|
724,634,746 |
|
| Total distributable earnings (accumulated losses) |
|
|
(11,692,265 |
) |
|
|
| Net assets |
|
$ |
713,585,430 |
|
|
|
| Shares outstanding |
|
|
64,294,949 |
|
|
|
| Net asset value and offering price per share |
|
$ |
11.10 |
|
STATEMENT OF OPERATIONS
For the period ended June 30, 2024
(unaudited)
|
|
|
|
|
|
|
| Investment income: |
|
|
|
|
| Dividend income from unaffiliated investments |
|
$ |
8,802,944 |
|
| Interest income from unaffiliated investments |
|
|
162,669 |
|
| Net income from securities lending |
|
|
83,443 |
|
|
|
| Total investment income |
|
|
9,049,056 |
|
|
|
| Expenses: |
|
|
|
|
| Investment management fees |
|
|
1,764,406 |
|
| Distribution and service fees |
|
|
887,661 |
|
| Transfer agent costs |
|
|
4,091 |
|
| Trustee and CCO fees |
|
|
16,651 |
|
| Audit and tax fees |
|
|
11,829 |
|
| Custody fees |
|
|
17,752 |
|
| Legal fees |
|
|
29,350 |
|
| Printing and shareholder reports fees |
|
|
33,687 |
|
| Other |
|
|
24,726 |
|
|
|
| Total expenses before waiver and/or reimbursement and recapture |
|
|
2,790,153 |
|
|
|
| Expenses waived and/or reimbursed |
|
|
(185,180 |
) |
|
|
| Net expenses |
|
|
2,604,973 |
|
|
|
| Net investment income (loss) |
|
|
6,444,083 |
|
|
|
| Net realized gain (loss) on: |
|
|
|
|
|
|
| Unaffiliated investments |
|
|
3,982,275 |
|
|
|
| Net change in unrealized appreciation (depreciation) on: |
|
|
|
|
|
|
| Unaffiliated investments |
|
|
27,814,755 |
|
|
|
| Net realized and change in unrealized gain (loss) |
|
|
31,797,030 |
|
|
|
| Net increase (decrease) in net assets resulting from operations |
|
$ |
38,241,113 |
|
The Notes to Financial Statements are an integral part of this report.
|
|
|
|
|
| Transamerica Series Trust |
|
|
|
Semi-Annual Financial Statements 2024 |
|
|
Page 2 |
|
|
Transamerica BlackRock iShares Dynamic Allocation -
Balanced VP
STATEMENT OF CHANGES IN NET ASSETS
For the period and year ended:
|
|
|
|
|
|
|
|
|
|
|
|
|
|
|
|
| |
|
June 30, 2024 (unaudited) |
|
December 31, 2023 |
|
|
|
|
| From operations: |
|
|
|
|
|
|
|
|
|
|
|
|
| Net investment income (loss) |
|
$ |
6,444,083 |
|
|
|
|
|
|
$ |
13,855,383 |
|
| Net realized gain (loss) |
|
|
3,982,275 |
|
|
|
|
|
|
|
(8,900,574 |
) |
| Net change in unrealized appreciation (depreciation) |
|
|
27,814,755 |
|
|
|
|
|
|
|
83,552,316 |
|
|
|
|
|
| Net increase (decrease) in net assets resulting from operations |
|
|
38,241,113 |
|
|
|
|
|
|
|
88,507,125 |
|
|
|
|
|
| Dividends and/or distributions to shareholders: |
|
|
|
|
|
|
|
|
|
|
|
|
|
|
|
|
| Dividends and/or distributions to shareholders |
|
|
— |
|
|
|
|
|
|
|
(10,318,343 |
) |
|
|
|
|
| Net increase (decrease) in net assets resulting from dividends and/or distributions to shareholders |
|
|
— |
|
|
|
|
|
|
|
(10,318,343 |
) |
|
|
|
|
| Capital share transactions: |
|
|
|
|
|
|
|
|
|
|
|
|
| Proceeds from shares sold |
|
|
2,928,851 |
|
|
|
|
|
|
|
5,664,814 |
|
| Dividends and/or distributions reinvested |
|
|
— |
|
|
|
|
|
|
|
10,318,343 |
|
| Cost of shares redeemed |
|
|
(58,763,746 |
) |
|
|
|
|
|
|
(114,520,093 |
) |
|
|
|
|
| Net increase (decrease) in net assets resulting from capital share transactions |
|
|
(55,834,895 |
) |
|
|
|
|
|
|
(98,536,936 |
) |
|
|
|
|
| Net increase (decrease) in net assets |
|
|
(17,593,782 |
) |
|
|
|
|
|
|
(20,348,154 |
) |
|
|
|
|
| Net assets: |
|
|
|
|
|
|
|
|
|
|
|
|
| Beginning of period/year |
|
|
731,179,212 |
|
|
|
|
|
|
|
751,527,366 |
|
| End of period/year |
|
$ |
713,585,430 |
|
|
|
|
|
|
$ |
731,179,212 |
|
|
|
|
|
| Capital share transactions - shares: |
|
|
|
|
|
|
|
|
|
|
|
|
|
|
|
|
| Shares issued |
|
|
271,690 |
|
|
|
|
|
|
|
565,426 |
|
| Shares reinvested |
|
|
— |
|
|
|
|
|
|
|
1,028,748 |
|
| Shares redeemed |
|
|
(5,452,921 |
) |
|
|
|
|
|
|
(11,515,488 |
) |
|
|
|
|
| Net increase (decrease) in shares outstanding |
|
|
(5,181,231 |
) |
|
|
|
|
|
|
(9,921,314 |
) |
The Notes to Financial Statements are an integral part of this report.
|
|
|
|
|
| Transamerica Series Trust |
|
|
|
Semi-Annual Financial Statements 2024 |
|
|
Page 3 |
|
|
Transamerica BlackRock iShares Dynamic Allocation -
Balanced VP
FINANCIAL HIGHLIGHTS
For a share outstanding during the period and
|
|
|
|
|
|
|
|
|
|
|
|
|
|
|
|
|
|
|
|
|
|
|
|
|
| years indicated: |
|
Service Class |
|
|
|
|
|
|
|
| |
|
June 30, 2024 (unaudited) |
|
December 31, 2023 |
|
December 31, 2022 |
|
December 31, 2021 |
|
December 31, 2020 |
|
December 31, 2019 |
|
|
|
|
|
|
|
| Net asset value, beginning of period/year |
|
$ |
10.52 |
|
|
$ |
9.47 |
|
|
$ |
12.34 |
|
|
$ |
12.53 |
|
|
$ |
12.98 |
|
|
$ |
11.66 |
|
|
|
|
|
|
|
|
| Investment operations: |
|
|
|
|
|
|
|
|
|
|
|
|
|
|
|
|
|
|
|
|
|
|
|
|
|
|
|
|
|
|
|
| Net investment income (loss)(A) |
|
|
0.10 |
|
|
|
0.19 |
|
|
|
0.13 |
|
|
|
0.12 |
|
|
|
0.07 |
|
|
|
0.20 |
|
|
|
|
|
|
|
|
| Net realized and unrealized gain (loss) |
|
|
0.48 |
|
|
|
1.00 |
|
|
|
(2.06 |
) |
|
|
1.00 |
|
|
|
(0.15 |
) |
|
|
1.66 |
|
|
|
|
|
|
|
|
| Total investment operations |
|
|
0.58 |
|
|
|
1.19 |
|
|
|
(1.93 |
) |
|
|
1.12 |
|
|
|
(0.08 |
) |
|
|
1.86 |
|
|
|
|
|
|
|
|
| Dividends and/or distributions to shareholders: |
|
|
|
|
|
|
|
|
|
|
|
|
|
|
|
|
|
|
|
|
|
|
|
|
|
|
|
|
|
|
|
| Net investment income |
|
|
— |
|
|
|
(0.14 |
) |
|
|
(0.13 |
) |
|
|
(0.07 |
) |
|
|
(0.21 |
) |
|
|
(0.21 |
) |
|
|
|
|
|
|
|
| Net realized gains |
|
|
— |
|
|
|
— |
|
|
|
(0.81 |
) |
|
|
(1.24 |
) |
|
|
(0.16 |
) |
|
|
(0.33 |
) |
|
|
|
|
|
|
|
| Total dividends and/or distributions to shareholders |
|
|
— |
|
|
|
(0.14 |
) |
|
|
(0.94 |
) |
|
|
(1.31 |
) |
|
|
(0.37 |
) |
|
|
(0.54 |
) |
|
|
|
|
|
|
|
| Net asset value, end of period/year |
|
$ |
11.10 |
|
|
$ |
10.52 |
|
|
$ |
9.47 |
|
|
$ |
12.34 |
|
|
$ |
12.53 |
|
|
$ |
12.98 |
|
| |
|
|
|
|
|
|
|
|
|
|
|
|
|
|
|
|
|
|
|
|
|
|
|
|
|
|
|
|
|
|
|
| Total return |
|
|
5.51 |
%(B) |
|
|
12.66 |
% |
|
|
(15.89 |
)% |
|
|
9.17 |
% |
|
|
(0.55 |
)% |
|
|
16.06 |
% |
|
|
|
|
|
|
|
| Ratio and supplemental data: |
|
|
|
|
|
|
|
|
|
|
|
|
|
|
|
|
|
|
|
|
|
|
|
|
|
|
|
|
|
|
|
| Net assets end of period/year (000’s) |
|
$ |
713,585 |
|
|
$ |
731,179 |
|
|
$ |
751,527 |
|
|
$ |
1,011,184 |
|
|
$ |
1,043,546 |
|
|
$ |
1,134,418 |
|
|
|
|
|
|
|
|
| Expenses to average net assets(C) |
|
|
|
|
|
|
|
|
|
|
|
|
|
|
|
|
|
|
|
|
|
|
|
|
|
|
|
|
|
|
|
| Excluding waiver and/or reimbursement and recapture |
|
|
0.79 |
%(D) |
|
|
0.79 |
% |
|
|
0.77 |
% |
|
|
0.84 |
% |
|
|
0.85 |
% |
|
|
0.84 |
% |
|
|
|
|
|
|
|
| Including waiver and/or reimbursement and recapture |
|
|
0.73 |
%(D)(E) |
|
|
0.74 |
%(E) |
|
|
0.72 |
%(E) |
|
|
0.83 |
%(E) |
|
|
0.85 |
% |
|
|
0.84 |
% |
|
|
|
|
|
|
|
| Net investment income (loss) to average net assets |
|
|
1.81 |
%(D) |
|
|
1.87 |
% |
|
|
1.22 |
% |
|
|
0.95 |
% |
|
|
0.58 |
% |
|
|
1.56 |
% |
|
|
|
|
|
|
|
| Portfolio turnover rate |
|
|
10 |
%(B) |
|
|
63 |
% |
|
|
227 |
% |
|
|
55 |
% |
|
|
127 |
% |
|
|
14 |
% |
| (A) |
Calculated based on average number of shares outstanding. |
| (C) |
Does not include expenses of the underlying investments in which the Portfolio invests. |
| (E) |
TAM has contractually agreed, through May 1, 2025, to waive from its management fees an amount equal to the sub-advisory fee waiver by the Portfolio’s sub-adviser. These amounts are not subject to recapture by TAM. |
The Notes to Financial Statements are an integral part of this report.
|
|
|
|
|
| Transamerica Series Trust |
|
|
|
Semi-Annual Financial Statements 2024 |
|
|
Page 4 |
|
|
Transamerica BlackRock iShares Dynamic Allocation - Balanced VP
NOTES TO FINANCIAL STATEMENTS
At June 30, 2024
(unaudited)
1. ORGANIZATION
Transamerica Series Trust (“TST”) is an open-end management investment company registered under the Investment Company Act of 1940, as amended (the “1940 Act”). TST applies investment company accounting and reporting guidance. TST serves as a funding vehicle for variable life insurance, variable annuity, and group annuity products. Transamerica BlackRock iShares Dynamic Allocation - Balanced VP (the “Portfolio”) is a series of TST and is classified as diversified under the 1940 Act. The Portfolio currently offers one class of shares, Service Class.
The only shareholders of the Portfolio are affiliated insurance company separate accounts and/or affiliated asset allocation portfolios. Contract holders of the variable life and annuity contracts are not shareholders of the Portfolio. For ease of reference, shareholders and contract holders are collectively referred to in this report as “shareholders.”
This report must be accompanied or preceded by the Portfolio’s current prospectus, which contains additional information about the Portfolio, including risks, as well as investment objectives and strategies.
Transamerica Asset Management, Inc. (“TAM”) serves as investment manager for the Portfolio pursuant to an investment management agreement. TAM provides continuous and regular investment management services to the Portfolio. TAM supervises the Portfolio’s investments, conducts its investment program and provides supervisory, compliance and administrative services to the Portfolio.
TAM currently acts as a “manager of managers” and has hired sub-advisers to furnish day-to-day investment advice and recommendations. TAM may, in the future, determine to provide all aspects of the day-to-day management of the Portfolio without the use of a sub-adviser. When acting as a manager of managers, TAM provides investment management services that include, without limitation, the design and development of the Portfolio and its investment strategies and the ongoing review and evaluation of those investment strategies including recommending changes in strategy where it believes appropriate or advisable; the selection of one or more sub-advisers for the Portfolio employing a combination of quantitative and qualitative screens, research, analysis and due diligence; negotiation of sub-advisory agreements and fees; oversight and monitoring of sub-advisers and recommending changes to sub-advisers where it believes appropriate or advisable; recommending portfolio combinations and liquidations where it believes appropriate or advisable; selection and oversight of transition managers, as needed; regular supervision of the Portfolio’s investments; regular review and evaluation of sub-adviser performance; daily monitoring of the sub-advisers’ buying and selling of securities for the Portfolio; regular review of holdings; ongoing trade oversight and analysis; regular monitoring to ensure adherence to investment process; regular calls and periodic on-site visits with sub-advisers; portfolio construction and asset allocation when using multiple sub-advisers for the Portfolio; risk management oversight and analysis; oversight of negotiation of investment documentation and agreements; design, development, implementation and regular monitoring of the valuation process; periodic due diligence reviews of pricing vendors and vendor methodology; design, development, implementation and regular monitoring of the compliance process; respond to regulatory inquiries and determine appropriate litigation strategy, as needed; review of proxies voted by sub-advisers; oversight of preparation and review of materials for meetings of the Portfolio’s Board of Trustees (the “Board”), participation in these meetings and preparation of regular communications with the Board; oversight of preparation and review of prospectuses, shareholder reports and other disclosure materials and regulatory filings for the Portfolio; oversight of other service providers to the Portfolio, such as the custodian, the transfer agent, the Portfolio’s independent accounting firm and legal counsel; supervision of the performance of recordkeeping and shareholder relations functions for the Portfolio; and oversight of cash management services. TAM uses a variety of quantitative and qualitative tools to carry out its investment management services. TAM, not the Portfolio, is responsible for paying the sub-adviser(s) for their services, and sub-advisory fees are TAM’s expense.
TAM’s investment management services also include the provision of supervisory and administrative services to the Portfolio. These services include performing certain administrative services for the Portfolio and supervising and overseeing the administrative, clerical, recordkeeping and bookkeeping services provided to the Portfolio by State Street Bank and Trust Company (“State Street”), to whom TAM has outsourced the provision of certain sub-administration services. To the extent agreed upon by TAM and the Portfolio from time to time, TAM’s supervisory and administrative services include, but are not limited to: monitoring and verifying the custodian’s daily calculation of the Net Asset Values (“NAV”); shareholder relations functions; compliance services; valuation services; assisting in due diligence and in the oversight and monitoring of certain activities of sub-advisers and certain aspects of Portfolio investments; assisting with Portfolio combinations and liquidations; oversight of the preparation and filing, and review, of all returns and reports, in connection with federal, state and local taxes; oversight and review of regulatory reporting; supervising and coordinating the Portfolio’s custodian and dividend disbursing agent and monitoring their services to the Portfolio; assisting the Portfolio in preparing reports to shareholders; acting as liaison with the Portfolio’s independent public accountants and providing, upon request, analyses, fiscal year summaries and other audit related services; assisting in the preparation of agendas and supporting documents for and minutes of meetings of trustees and committees of trustees; assisting in the preparation of regular communications with the trustees; and providing personnel and office space, telephones
|
|
|
|
|
| Transamerica Series Trust |
|
|
|
Semi-Annual Financial Statements 2024 |
|
|
Page 5 |
|
|
Transamerica BlackRock iShares Dynamic Allocation - Balanced VP
NOTES TO FINANCIAL STATEMENTS (continued)
At June 30, 2024
(unaudited)
1. ORGANIZATION (continued)
and other office equipment as necessary in order for TAM to perform supervisory and administrative services to the Portfolio. The Portfolio pays certain fees and expenses to State Street for sub-administration services which are not administrative services covered by the management agreement with TAM or paid for through the management fees payable thereunder. For the period ended June 30, 2024, (i) the expenses paid to State Street for sub-administration services by the Portfolio are shown as a part of Other expenses within the Statement of Operations and (ii) the expenses payable to State Street for sub-administration services from the Portfolio are shown as part of Other accrued expenses within the Statement of Assets and Liabilities.
2. SIGNIFICANT ACCOUNTING POLICIES
In preparing the Portfolio’s financial statements in accordance with Generally Accepted Accounting Principles in the United States of America (“GAAP”), estimates or assumptions (which could differ from actual results) may be used that affect reported amounts and disclosures. The following is a summary of significant accounting policies followed by the Portfolio.
Security transactions and investment income: Security transactions are accounted for on the trade date. Security gains and losses are calculated on a first-in, first-out basis. Interest income, if any, is accrued as earned. Dividend income and capital gain distributions from underlying investments, if any, are recorded on the ex-dividend date. Income or short-term capital gain distributions received from underlying investments, if any, are recorded as Dividend income from investments within the Statement of Operations. Long-term capital gain distributions received from underlying investments, if any, are recorded as Net realized gain (loss) on Capital gain distributions received from investments within the Statement of Operations.
Distributions to shareholders: Distributions are recorded on the ex-dividend date and are determined in accordance with federal income tax regulations, which may differ from GAAP.
Indemnification: In the normal course of business, the Portfolio enters into contracts that contain a variety of representations that provide general indemnifications. The Portfolio’s maximum exposure under these arrangements is unknown, as this would involve future claims that may be made against the Portfolio and/or its affiliates that have not yet occurred. However, based on experience, the Portfolio expects the risk of loss to be remote.
3. INVESTMENT VALUATION
TAM has been designated as the Portfolio’s valuation designee pursuant to Rule 2a-5 under the 1940 Act with responsibility for fair valuation subject to oversight by the Portfolio’s Board of Trustees. The net asset value of the Portfolio is computed as of the official close of the New York Stock Exchange (“NYSE”) each day the NYSE is open for business.
TAM utilizes various methods to measure the fair value of its investments on a recurring basis. GAAP establishes a hierarchy that prioritizes inputs to valuation methods. The inputs or methodology used for valuing securities are not necessarily an indication of the risk associated with investing in those securities. The three levels (“Levels”) of inputs of the fair value hierarchy are defined as follows:
Level 1—Unadjusted quoted prices in active markets for identical securities.
Level 2—Inputs, other than quoted prices included in Level 1, which are observable, either directly or indirectly. These inputs may include quoted prices for the identical instrument on an inactive market, prices for similar instruments, interest rates, prepayment speeds, credit risk, yield curves, default rates, and similar data.
Level 3—Unobservable inputs based on the best information available in the circumstances, to the extent observable inputs are not available, which may include TAM’s own assumptions used in determining the fair value of the Portfolio’s investments.
The inputs used to measure fair value may fall into different Levels of the fair value hierarchy. In such cases, for disclosure purposes, the Level in the fair value hierarchy that is assigned to the fair value measurement of a security is determined based on the lowest Level input that is significant to the fair value measurement in its entirety. Certain investments that are measured at fair value using NAV per share, or its equivalent, using the “practical expedient” have not been classified in the fair value Levels. The hierarchy classification of inputs used to value the Portfolio’s investments at June 30, 2024, is disclosed within the Investment Valuation section of the Schedule of Investments.
The availability of observable inputs can vary from security to security and is affected by a wide variety of factors, including, but not limited to, the type of security, whether the security is new and not yet established in the marketplace, the liquidity of markets, and other
|
|
|
| Transamerica Series Trust |
|
Semi-Annual Financial Statements 2024 |
Page 6
Transamerica BlackRock iShares Dynamic Allocation - Balanced VP
NOTES TO FINANCIAL STATEMENTS (continued)
At June 30, 2024
(unaudited)
3. INVESTMENT VALUATION (continued)
characteristics particular to the security. To the extent that valuation is based on models or inputs that are less observable or unobservable in the market, the determination of fair value requires more judgment. Accordingly, the degree of judgment exercised in determining fair value is generally greatest for instruments categorized in Level 3. Due to the inherent uncertainty of valuation, the determination of values may differ significantly from values that would have been realized had a ready market for investments existed, and the differences could be material.
Fair value measurements: Descriptions of the valuation techniques applied to the Portfolio’s significant categories of assets and liabilities measured at fair value on a recurring basis are as follows:
Exchange-traded funds (“ETF”): ETFs are stated at the last reported sale price or closing price on the day of valuation taken from the primary exchange where the ETF is principally traded. ETFs are generally categorized in Level 1 of the fair value hierarchy.
Securities lending collateral: Securities lending collateral is invested in a money market fund which is valued at the actively traded NAV and no valuation adjustments are applied. Securities lending collateral is categorized in Level 1 of the fair value hierarchy.
Repurchase agreements: Repurchase agreements are valued at cost, which approximates fair value. To the extent the inputs are observable and timely, the values are generally categorized in Level 2 of the fair value hierarchy.
4. BORROWINGS AND OTHER FINANCING TRANSACTIONS
The Portfolio may engage in borrowing transactions as a means of raising cash to satisfy redemption requests, for other temporary or emergency purposes or, to the extent permitted by its investment policies, to raise additional cash to be invested in other securities or instruments. When the Portfolio invests borrowing proceeds in other securities, the Portfolio will bear the risk that the market value of the securities in which such proceeds are invested goes down and is insufficient to repay the borrowed proceeds. The Portfolio may borrow on a secured or on an unsecured basis. If the Portfolio enters into a secured borrowing arrangement, a portion of the Portfolio’s assets will be used as collateral. The 1940 Act requires the Portfolio to maintain asset coverage of at least 300% of the amount of its borrowings. Asset coverage means the ratio that the value of the Portfolio’s total assets, minus liabilities other than borrowings, bears to the aggregate amount of all borrowings. Although complying with this requirement has the effect of limiting the amount that the Portfolio may borrow, it does not otherwise mitigate the risks of entering into borrowing transactions.
Interfund lending: The Portfolio, along with other funds and portfolios advised by TAM, may participate in an interfund lending program pursuant to exemptive relief granted by the Securities and Exchange Commission on January 18, 2017. This program allows the Portfolio to lend to and borrow from other funds and portfolios advised by TAM. Interfund lending transactions are subject to the conditions of the exemptive relief which places limits on the amount of lending or borrowing a Portfolio may participate in under the program. Interest earned or paid on an interfund lending transaction will be based on the average of certain current market rates. For the period ended June 30, 2024, the Portfolio has not utilized the program.
Repurchase agreements: In a repurchase agreement, the Portfolio purchases a security and simultaneously commits to resell that security to the seller at an agreed-upon price on an agreed-upon date. Securities purchased subject to a repurchase agreement are held at the Portfolio’s custodian, or designated sub-custodian related to tri-party repurchase agreements, and, pursuant to the terms of the repurchase agreement, must be collateralized by securities with an aggregate market value greater than or equal to 100% of the resale price. The Portfolio will bear the risk of value fluctuations until the securities can be sold and may encounter delays and incur costs in liquidating the securities. In the event of bankruptcy or insolvency of the seller, delays and costs may be incurred.
Repurchase agreements are subject to netting agreements, which are agreements between the Portfolio and its counterparties that provide for the net settlement of all transactions and collateral with the Portfolio, through a single payment, in the event of default or termination. Amounts presented within the Schedule of Investments, and as part of Repurchase agreements, at value within the Statement of Assets and Liabilities are shown on a gross basis. The value of the related collateral for each repurchase agreement, as reflected within the Schedule of Investments, exceeds the value of each repurchase agreement at June 30, 2024.
Repurchase agreements at June 30, 2024, if any, are included within the Schedule of Investments and Statement of Assets and Liabilities.
Securities lending: The Portfolio may lend securities to qualified financial institutions, brokers and dealers. State Street serves as securities lending agent to the Portfolio pursuant to a Securities Lending Agreement. Loans of securities are terminable at any time and the
|
|
|
| Transamerica Series Trust |
|
Semi-Annual Financial Statements 2024 |
Page 7
Transamerica BlackRock iShares Dynamic Allocation - Balanced VP
NOTES TO FINANCIAL STATEMENTS (continued)
At June 30, 2024
(unaudited)
4. BORROWINGS AND OTHER FINANCING TRANSACTIONS (continued)
borrower, after notice, is required to return borrowed securities within the standard time period for settlement of securities transactions. The lending of securities exposes the Portfolio to risks such as: the borrowers may fail to return the loaned securities or may not be able to provide additional collateral, the Portfolio may experience delays in recovery of the loaned securities or delays in access to collateral, or the Portfolio may experience losses related to the investment collateral. To minimize certain risks, loan counterparties pledge cash, securities issued or guaranteed by the U.S. Government and irrevocable letters of credit issued by banks as collateral. The initial collateral received by the Portfolio is required to have a value of at least 102% of the current value of the loaned securities traded on U.S. exchanges, and a value of at least 105% for all other securities. Typically the lending agent is not permitted to sell, re-pledge or use cash and non-cash collateral it receives. The lending agent has agreed to indemnify the Portfolio in the case of default of any securities borrower.
The Portfolio receives compensation for lending securities from interest or dividends earned on the cash, U.S. Government securities and irrevocable letters of credit held as collateral, less associated fees and expenses. Such income is reflected in Net income from securities lending within the Statement of Operations. Cash collateral received is invested in the State Street Navigator Securities Lending Trust — Government Money Market Portfolio.
The value of loaned securities and related cash and non-cash collateral outstanding at June 30, 2024, if any, are shown on a gross basis within the Schedule of Investments.
The following table reflects a breakdown of transactions accounted for as secured borrowings, the gross obligation by the type, and the remaining contractual maturity of those transactions as of June 30, 2024.
|
|
|
|
|
|
|
|
|
|
|
|
|
|
|
|
|
|
|
|
|
| |
|
Remaining Contractual Maturity of the Agreements |
|
| |
|
Overnight and Continuous |
|
|
Less Than 30 Days |
|
|
Between 30 & 90 Days |
|
|
Greater Than 90 Days |
|
|
Total |
|
| Securities Lending Transactions
Exchange-Traded Funds |
|
$ |
1,600,000 |
|
|
$ |
— |
|
|
$ |
— |
|
|
$ |
— |
|
|
$ |
1,600,000 |
|
| Total Borrowings |
|
$ |
1,600,000 |
|
|
$ |
— |
|
|
$ |
— |
|
|
$ |
— |
|
|
$ |
1,600,000 |
|
| |
|
|
|
|
|
|
|
|
|
|
|
|
|
|
|
|
|
|
|
|
5. RISK FACTORS
Investing in the Portfolio involves certain key risks related to the Portfolio’s trading activity. Please reference the Portfolio’s prospectus for a more complete discussion of the following risk(s), as well as other risks of investing in the Portfolio.
Market risk: The market prices of the Portfolio’s securities or other assets may go up or down, sometimes rapidly or unpredictably, due to factors such as economic events, inflation, changes in interest rates, governmental actions or interventions, actions taken by the U.S. Federal Reserve or foreign central banks, market disruptions caused by tariffs, trade disputes or other factors, political developments, armed conflicts, economic sanctions, cybersecurity events, investor sentiment, the global and domestic effects of widespread or local health, weather or climate events, and other factors that may or may not be related to the issuer of the security or other asset. If the market prices of the Portfolio’s securities and assets fall, the value of your investment in the Portfolio could go down.
Economies and financial markets throughout the world are increasingly interconnected. Events or circumstances in one or more countries or regions could be highly disruptive to, and have profound impacts on, global economies or markets. As a result, whether or not the Portfolio invests in securities of issuers located in or with significant exposure to the countries directly affected, the value and liquidity of the Portfolio’s investments may go down.
Asset allocation risk: The Portfolio’s investment performance is significantly impacted by the Portfolio’s asset allocation and reallocation from time to time. The value of your investment may decrease if the sub-adviser’s judgment about the attractiveness, value or market trends affecting a particular asset class, investment style, technique or strategy, underlying ETF or other issuer is incorrect.
Equity securities risk: Equity securities generally have greater risk of loss than debt securities. Stock markets are volatile and the value of equity securities may go up or down, sometimes rapidly and unpredictably. The market price of an equity security may fluctuate based on overall market conditions, such as real or perceived adverse economic or political conditions or trends, tariffs and trade disruptions, inflation, substantial economic downturn or recession, changes in interest rates, or adverse investor sentiment. The market price of an
|
|
|
| Transamerica Series Trust |
|
Semi-Annual Financial Statements 2024 |
Page 8
Transamerica BlackRock iShares Dynamic Allocation - Balanced VP
NOTES TO FINANCIAL STATEMENTS (continued)
At June 30, 2024
(unaudited)
5. RISK FACTORS (continued)
equity security also may fluctuate based on real or perceived factors affecting a particular industry or industries or the company itself. If the market prices of the equity securities owned by the Portfolio fall, the value of your investment in the Portfolio will decline. The Portfolio may lose its entire investment in the equity securities of an issuer. A change in financial condition or other event affecting a single issuer may adversely impact securities markets as a whole.
6. FEES AND OTHER AFFILIATED TRANSACTIONS
TST serves as a funding vehicle for certain affiliated asset allocation portfolios and certain affiliated separate accounts of Transamerica Life Insurance Company (“TLIC”) and Transamerica Financial Life Insurance Company.
TAM, the Portfolio’s investment manager, is directly owned by TLIC and AUSA Holding, LLC (“AUSA”), both of which are indirect, wholly owned subsidiaries of Aegon Ltd. TLIC is owned by Commonwealth General Corporation (“Commonwealth”). Commonwealth and AUSA are wholly owned by Transamerica Corporation (DE). Transamerica Corporation (DE) is wholly owned by Aegon International B.V., which is wholly owned by Aegon Ltd., a Bermuda exempted company with liability limited by shares (formerly, Aegon NV, a Netherlands corporation) and a publicly traded international insurance group.
Transamerica Fund Services, Inc. (“TFS”) is the Portfolio’s transfer agent. Transamerica Capital, Inc. (“TCI”) is the Portfolio’s distributor/principal underwriter. TAM, TFS and TCI are affiliates of Aegon Ltd.
Certain officers and trustees of the Portfolio may also be officers and/or trustees of TAM, TFS and TCI. No interested trustee who is deemed an interested person due to current or former service with TAM or an affiliate of TAM receives compensation from the Portfolio. The Portfolio does pay non-interested persons (independent trustees), as disclosed in Trustee and CCO fees within the Statement of Operations.
Investment management fees: TAM serves as the Portfolio’s investment manager, performing administration as well as investment advisory services. TAM renders investment advisory, supervisory, and administration services under an investment management agreement and the Portfolio pays a single management fee, which is reflected in Investment management fees within the Statement of Operations.
The Portfolio pays a management fee to TAM based on daily average net assets at the following rates:
|
|
|
|
|
| Breakpoints |
|
Rate |
| First $500 million |
|
|
0.5000 |
% |
| Over $500 million up to $1 billion |
|
|
0.4900 |
|
| Over $1 billion up to $2.5 billion |
|
|
0.4725 |
|
| Over $2.5 billion up to $3.5 billion |
|
|
0.4650 |
|
| Over $3.5 billion up to $4.5 billion |
|
|
0.4525 |
|
| Over $4.5 billion |
|
|
0.4400 |
|
TAM has contractually agreed, through May 1, 2025, to waive from its management fees an amount equal to the sub-advisory fee waiver by the Portfolio’s sub-adviser. These amounts are not subject to recapture by TAM.
TAM has contractually agreed to waive fees and/or reimburse Portfolio expenses to the extent that the total operating expenses excluding, as applicable, acquired fund fees and expenses, interest (including borrowing costs and overdraft charges), taxes, brokerage commissions, dividend and interest expenses on securities sold short, extraordinary expenses and other expenses not incurred in the ordinary course of the Portfolio’s business, exceed the following stated annual operating expense limits to the Portfolio’s daily average net
|
|
|
| Transamerica Series Trust |
|
Semi-Annual Financial Statements 2024 |
Page 9
Transamerica BlackRock iShares Dynamic Allocation - Balanced VP
NOTES TO FINANCIAL STATEMENTS (continued)
At June 30, 2024
(unaudited)
6. FEES AND OTHER AFFILIATED TRANSACTIONS (continued)
assets. To the extent an expense limit changed during the period, the prior limit is also listed below. The expenses waived and/or reimbursed, if any, are included in Expenses waived and/or reimbursed within the Statement of Operations.
|
|
|
|
|
| Class |
|
Operating Expense Limit |
|
Operating Expense Limit Effective Through |
| Service Class |
|
0.80% |
|
May 1, 2025 |
TAM is permitted to recapture amounts contractually waived and/or reimbursed to a class during any of the 36 months from the date on which TAM waived fees and/or reimbursed expenses for the class. A class may recapture and reimburse TAM only if such amount does not cause, on any particular business day of the Portfolio, the class’s total annual operating expenses (after the recapture is taken into account) to exceed the Operating Expense Limits or any other lower limit then in effect. Amounts recaptured, if any, by TAM for the period ended June 30, 2024 are disclosed in Recapture of previously waived and/or reimbursed fees within the Statement of Operations.
TAM, on a voluntary basis and in addition to the contractual operating expense limits in effect, from time to time may waive and/or reimburse expenses of the Portfolio, or any classes thereof, to such level(s) as the Trust’s officers have determined or may reasonably determine from time to time. Any such voluntary waiver or expense reimbursement may be discontinued by TAM at any time. These amounts are not subject to recapture by TAM.
As of June 30, 2024, there are no amounts available for recapture by TAM.
Distribution and service fees: TST has a distribution plan (“Distribution Plan”) pursuant to Rule 12b-1 under the 1940 Act. Pursuant to the Distribution Plan, TST entered into a distribution agreement with TCI as the Portfolio’s distributor.
The Distribution Plan requires the Portfolio to pay distribution fees to TCI as compensation for various distribution activities, not as reimbursement for specific expenses. Under the Distribution Plan and distribution agreement, TCI, on behalf of the Portfolio, is authorized to pay various service providers, as direct payment for expenses incurred in connection with distribution of the Portfolio’s shares.
The fee on the Service Class shares is paid to the insurance companies for providing services and account maintenance for the policyholders who invest in the variable insurance products which invest in the Service Class shares. The distribution and service fees are included in Distribution and service fees within the Statement of Operations.
The Portfolio is authorized under the Distribution Plan to pay fees to TCI based on daily average net assets up to an annual fee of 0.25% of Service Class shares.
Transfer agent costs: TFS provides transfer agency services under an intercompany agreement with TAM. TFS has outsourced the provision of certain sub-transfer agency services to SS&C Global Investor & Distribution Solutions, Inc. (“SS&C GIDS”). The Portfolio does not pay a separate transfer agent fee to TAM or TFS but does pay certain expenses to SS&C GIDS related to applicable sub-transfer agency services. For the period ended June 30, 2024, (i) the expenses paid to SS&C GIDS by the Portfolio are referred to as transfer agent costs and are included within the Statement of Operations and (ii) the expenses payable to SS&C GIDS by the Portfolio are referred to as transfer agent costs within the Statement of Assets and Liabilities.
Brokerage commissions: The Portfolio incurred no brokerage commissions on security transactions placed with affiliates of the investment manager or sub-adviser(s) for the period ended June 30, 2024.
7. PURCHASES AND SALES OF SECURITIES
For the period ended June 30, 2024, the cost of securities purchased and proceeds from securities sold (excluding short-term securities) are as follows:
|
|
|
| Purchases of Securities |
|
Sales of Securities |
| $ 68,012,501 |
|
$ 132,040,720 |
|
|
|
| Transamerica Series Trust |
|
Semi-Annual Financial Statements 2024 |
Page 10
Transamerica BlackRock iShares Dynamic Allocation - Balanced VP
NOTES TO FINANCIAL STATEMENTS (continued)
At June 30, 2024
(unaudited)
8. FEDERAL INCOME TAXES AND DISTRIBUTIONS TO SHAREHOLDERS
The Portfolio has not made any provision for federal income or excise taxes due to its policy to distribute all of its taxable income and capital gains to its shareholders and otherwise qualify as a regulated investment company under Subchapter M of the Internal Revenue Code. The Portfolio recognizes the tax benefits of uncertain tax positions only where the position is “more likely than not” to be sustained assuming examination by tax authorities. The Portfolio’s tax returns remain subject to examination by the Internal Revenue Service and state tax authorities three years from the date of filing for federal purposes and four years from the date of filing for state purposes. Management has evaluated the Portfolio’s tax provisions taken for all open tax years, and has concluded that no provision for income tax is required in the Portfolio’s financial statements. If applicable, the Portfolio recognizes interest accrued related to unrecognized tax benefits in relation to interest and penalties expense in Other within the Statement of Operations. The Portfolio identifies its major tax jurisdictions as U.S. Federal, the state of Colorado, and foreign jurisdictions where the Portfolio makes significant investments; however, the Portfolio is not aware of any tax positions for which it is reasonably possible that the total amounts of unrecognized tax benefits will change materially in the next twelve months. Distributions are determined in accordance with income tax regulations, which may differ from GAAP.
As of June 30, 2024, the approximate cost for U.S. federal income tax purposes, and the aggregate gross/net unrealized appreciation (depreciation) in the value of investments (including securities sold short and derivatives, if any) are as follows:
|
|
|
|
|
|
|
| Cost |
|
Gross Appreciation |
|
Gross (Depreciation) |
|
Net Appreciation (Depreciation) |
|
|
|
|
| $ 650,485,135 |
|
$ 79,680,491 |
|
$ (25,347,977) |
|
$ 54,332,514 |
Please see TST’s most recent report on Form N-CSR, available at: www.transamerica.com/annuities/prospectus, for additional information. For the most recently filed complete proxy voting records for the Trust please visit: https://www.transamerica.com/sites/default/files/files/e070d/TST%20N-PX%202021.pdf
|
|
|
| Transamerica Series Trust |
|
Semi-Annual Financial Statements 2024 |
Page 11
Transamerica BlackRock iShares Dynamic Allocation - Balanced VP
MANAGEMENT AND SUB-ADVISORY AGREEMENT — CONTRACT RENEWAL
(unaudited)
At a meeting of the Board of Trustees of Transamerica Series Trust (the “Trustees” or the “Board”) held on June 12-13, 2024, the Board considered the renewal of the management agreement (the “Management Agreement”) between Transamerica Asset Management, Inc. (“TAM”) and Transamerica Series Trust, on behalf of Transamerica BlackRock iShares Dynamic Allocation – Balanced VP (the “Portfolio”). The Board also considered the renewal of the investment sub-advisory agreement (the “Sub-Advisory Agreement” and together with the Management Agreement, the “Agreements”) for the Portfolio between TAM and BlackRock Investment Management, LLC (the “Sub-Adviser”).
Following its review and consideration, the Board determined that the terms of the Management Agreement and Sub-Advisory Agreement were reasonable and that the renewal of each of the Agreements was in the best interests of the Portfolio and the holders invested in the Portfolio. The Board, including the independent members of the Board (the “Independent Trustees”), unanimously approved the renewal of each of the Agreements through June 30, 2025.
Prior to reaching their decision, the Trustees requested and received from TAM and the Sub-Adviser certain information. They then reviewed such information as they deemed reasonably necessary to evaluate the Agreements, including information they had previously received from TAM and the Sub-Adviser as part of their regular oversight of the Portfolio, and knowledge they gained over time through meeting with TAM and the Sub-Adviser. Among other materials, the Trustees considered comparative fee, expense and performance information prepared by Broadridge Financial Solutions, Inc. (“Broadridge”), an independent provider of mutual fund performance information, as well as fee, expense and profitability information prepared by TAM. In addition, TAM provided the Board with additional supplemental comparative fee, expense and performance information. To the extent applicable, the Trustees considered information about fees and performance of comparable funds and/or accounts managed by the Sub-Adviser. The Board also considered reductions to the Portfolio’s expense limits, if any, that took effect after the last renewal of the Agreements. In their review, the Trustees also sought to identify instances in which the Portfolio’s performance, fees, total expenses and/or profitability appeared to be outliers within its respective peer group or other comparative metrics and sought to understand the reasons for such comparative positions.
In their deliberations, the Independent Trustees met privately without representatives of TAM or the Sub-Adviser present and were represented throughout the process by their independent legal counsel. In considering the proposed continuation of each of the Agreements, the Trustees evaluated and weighed a number of considerations that they believed to be relevant in light of the legal advice furnished to them by counsel, including independent legal counsel, and made a decision in the exercise of their own business judgment. They based their decisions on the considerations discussed below, among others, although they did not identify any particular consideration or item of information that was controlling of their decisions, and each Trustee may have attributed different weights to the various factors.
Nature, Extent and Quality of the Services Provided
The Board considered the nature, extent and quality of the services provided by TAM and the Sub-Adviser to the Portfolio in the past and the services anticipated to be provided in the future. The Board also considered the investment approach for the Portfolio; the experience, capability and integrity of TAM’s senior management; the financial resources of TAM; TAM’s management oversight process; TAM’s and the Sub-Adviser’s responsiveness to any questions by the Trustees; and the professional qualifications and compensation program of the portfolio management team of the Sub-Adviser. The Trustees noted that they receive, on a quarterly basis, an execution analysis from Capital Institutional Services, Inc. (CAPIS), an independent provider of trade analyses, for the Sub-Adviser and a comparison of trading results against a peer universe of managers.
The Board also considered the continuous and regular investment management and other services provided by TAM, when acting as a manager of managers, for the portion of the management fee it retains from the Portfolio after payment of the sub-advisory fees. The Board noted that the investment management and other services provided by TAM include the design, development and ongoing review and evaluation of the Portfolio and its investment strategy; the selection, oversight and monitoring of one or more investment sub-advisers to perform certain duties with respect to the Portfolio; ongoing portfolio trading oversight and analysis; risk management oversight and analysis; design, development, implementation and ongoing review and evaluation of a process for the valuation of Portfolio investments; design, development, implementation and ongoing review and evaluation of a compliance program for the Portfolio; design, development, implementation and ongoing review and evaluation of a process for the voting of proxies and exercise of rights to consent to corporate action for Portfolio investments; participation in Board meetings and oversight of preparation of materials for the Board, including materials for Board meetings and regular communications with the Board; oversight of preparation of the Portfolio’s prospectus, statement of additional information, shareholder reports and other disclosure materials and regulatory filings for the Portfolio; and ongoing cash management services for the Portfolio. The Board considered that TAM’s investment management services also include the provision of supervisory and administrative services to the Portfolio. The Board also noted that TAM, as part of the services it provides to all Transamerica mutual funds, including the Portfolio, oversees the services provided by the funds’ custodian, transfer agent, independent accountant and legal counsel and supervises the performance of the recordkeeping and holder service functions of the funds.
Investment Performance
|
|
|
|
|
| Transamerica Series Trust |
|
|
|
Semi-Annual Financial Statements 2024 |
|
|
Page 12 |
|
|
Transamerica BlackRock iShares Dynamic Allocation - Balanced VP
MANAGEMENT AND SUB-ADVISORY AGREEMENT — CONTRACT RENEWAL (continued)
(unaudited)
In addition, the Board considered the short- and longer-term performance of the Portfolio in light of its investment objective, policies and strategies, including relative performance against (i) a peer universe of comparable mutual funds, as prepared by Broadridge, and (ii) the Portfolio’s benchmarks, in each case for various trailing periods ended December 31, 2023. Based on these considerations, the Board determined that TAM and the Sub-Adviser can provide investment and related services that are appropriate in scope and extent in light of the Portfolio’s investment objectives, policies and strategies and operations, the competitive landscape of the investment company business and investor needs. The Board’s conclusions as to the Portfolio’s performance are summarized below. For purposes of its review, the Board generally used the performance of Service Class Shares. In describing the Portfolio’s performance relative to its peer universe, the summary conclusions characterize performance for the relevant periods in relation to whether it was “above,” “below” or “in line with” the peer universe median and do so using quintile rankings prepared by Broadridge. For simplicity, performance is described as “above” the median if the Portfolio’s performance ranked anywhere in the first or second quintiles, as “below” the median if it ranked anywhere in the fourth or fifth quintiles, or “in line with” the median if it ranked anywhere in the third quintile (i.e., even if its precise return was somewhat above or somewhat below the precise median return).
When considering the Portfolio’s performance, the Trustees considered any representations made by TAM regarding the appropriateness of certain peer groups and benchmarks. They recognized that performance reflects a snapshot of a period as of a specific date, and that consideration of performance data for a different period could generate significantly different performance results. The Trustees also recognized that even longer-term performance can be negatively affected by performance over a short-term period when that short-term performance is significantly below the performance of the comparable benchmark or universe of peer funds.
The Board noted that the performance of Service Class Shares of the Portfolio was below the median for its peer universe and below the benchmark that TAM utilizes to measure performance of the Portfolio, each for the past 1-, 3-, 5- and 10-year periods. The Board noted that the Sub-Adviser had commenced sub-advising the Portfolio on November 1, 2021, pursuant to its current investment strategies and benchmarks.
Management Fee and Sub-Advisory Fees and Total Expense Ratio
The Board considered the management fee and total expense ratio of the Portfolio, including information provided by Broadridge comparing the management fee and total expense ratio of the Portfolio to the management fees and total expense ratios of comparable investment companies in both a peer group and broader peer universe compiled by Broadridge. The Board’s conclusions as to the Portfolio’s management fee and total expense ratio are summarized below. For purposes of its review, the Board generally used the actual total expenses (i.e., expenses reflecting any waivers and/or reimbursements) of Service Class Shares. In describing the Portfolio’s management fee and total expense ratio relative to its peer group and peer universe, the summary conclusions characterize management fees and total expense ratios for the relevant periods in relation to whether they were “above,” “below” or “in line with” the peer group or peer universe median and do so using quintile rankings prepared by Broadridge. For simplicity, management fees and total expense ratios are described as “above” the median if the Portfolio’s management fee or total expense ratio ranked anywhere in the fourth or fifth quintiles, as “below” the median if it ranked anywhere in the first or second quintiles, or “in line with” the median if it ranked anywhere in the third quintile (i.e., even if its precise management fee or total expense ratio was somewhat above or somewhat below the precise median management fee or total expense ratio).
The Board also considered the fees charged by the Sub-Adviser for sub-advisory services, as well as the portion of the Portfolio’s management fee retained by TAM following payment of the sub-advisory fee and how the portion of the contractual management fee retained by TAM at a specified asset level compared to the portions retained by other investment advisers managing mutual funds with similar investment strategies as calculated by an independent provider of information.
The Board noted that the Portfolio’s contractual management fee was in line with the median for its peer group and above the median for its peer universe and that the actual total expenses (i.e., expenses reflecting any waivers and/or reimbursements) of Service Class Shares of the Portfolio were in line with the median for its peer group and below the median for its peer universe. The Trustees also considered that TAM has entered into an expense limitation arrangement with the Portfolio, which may result in TAM waiving fees for the benefit of holders.
On the basis of these considerations, together with the other information it considered, the Board determined that the management and sub-advisory fees to be received by TAM and the Sub-Adviser under the Management Agreement and Sub-Advisory Agreement are reasonable in light of the services provided.
Cost of Services Provided and Level of Profitability
The Board reviewed information provided by TAM about the cost of providing and procuring fund management services, as well as the costs of the provision of administration, transfer agency and other services, to the Portfolio and to Transamerica Series Trust as a whole by TAM and its affiliates. The Board considered the profitability of TAM and its affiliates in providing these services for the Portfolio and Transamerica Series Trust as a whole. The Trustees recognized the competitiveness of the mutual fund industry and the importance of an investment adviser’s long-term profitability, including for maintaining company and management stability and accountability.
|
|
|
|
|
| Transamerica Series Trust |
|
|
|
Semi-Annual Financial Statements 2024 |
|
|
Page 13 |
|
|
Transamerica BlackRock iShares Dynamic Allocation - Balanced VP
MANAGEMENT AND SUB-ADVISORY AGREEMENT — CONTRACT RENEWAL (continued)
(unaudited)
The Board also considered the allocation methodology used for calculating the profitability of TAM and its affiliates. The Board noted that the revenue and expense allocation methodology used by TAM to estimate its profitability with respect to its relationship with the Portfolio had been reviewed previously by an independent consultant. The Trustees considered that TAM reported that it had not made material changes to this methodology, and that the methodology had been applied consistently for the Portfolio.
With respect to the Sub-Adviser, the Board noted that the sub-advisory fee is the product of arm’s-length negotiation between TAM and the Sub-Adviser, which is not affiliated with TAM, and is paid by TAM and not the Portfolio. As a result, the Board focused on the profitability of TAM and its affiliates with respect to the Portfolio.
Based on this information, the Board determined that the profitability of TAM and its affiliates from their relationships with the Portfolio was not excessive.
Economies of Scale
The Board considered economies of scale with respect to the management of the Portfolio, whether the Portfolio had appropriately benefited from any economies of scale and whether there was the potential for realization of any future economies of scale. The Board also considered the existence of economies of scale with respect to management of the Transamerica mutual funds overall and the extent to which the Portfolio benefited from any economies of scale. The Board recognized that, as the Portfolio’s assets increase, any economies of scale realized by TAM or the Sub-Adviser may not directly correlate with each other or with any economies of scale that might be realized by the Portfolio. The Board considered the Portfolio’s management fee schedule and the existence of breakpoints and also considered the extent to which TAM shared economies of scale, if any, with the Portfolio through undertakings to limit or reimburse Portfolio expenses and to invest in maintaining and developing its capabilities and services. The Board also considered the Sub-Adviser’s sub-advisory fee schedule and the existence of breakpoints, if any, and how such breakpoints relate to any breakpoints in the Portfolio’s management fee schedule. The Board considered that the Sub-Adviser’s sub-advisory fees would be based on the combined assets of multiple funds. The Trustees concluded that the Portfolio’s fee structure reflected an appropriate sharing of any efficiencies or economies of scale to date and noted that they will have the opportunity to periodically reexamine the appropriateness of the management fee payable to TAM and the fee paid to the Sub-Adviser in light of any economies of scale experienced in the future.
Benefits to TAM, its Affiliates and/or the Sub-Adviser from their Relationships with the Portfolio
The Board considered other benefits derived by TAM, its affiliates, and/or the Sub-Adviser from their relationships with the Portfolio. The Board noted that TAM does not receive benefits from research obtained with commissions paid to broker-dealers for portfolio transactions (commonly referred to as “soft dollars”) as a result of its relationship with the Portfolio and that TAM believes the use of soft dollars by the Sub-Adviser is generally appropriate and in the best interests of the Portfolio.
Other Considerations
The Board noted that TAM has made a substantial commitment to the recruitment and retention of high-quality personnel and maintains the financial, compliance and operational resources reasonably necessary to manage the Portfolio in a professional manner that is consistent with the best interests of the Portfolio and the holders. In this regard, the Board favorably considered the procedures and policies TAM has in place to enforce compliance with applicable laws and regulations and oversee the portfolio management activities of the Sub-Adviser. The Board also noted that TAM has made an entrepreneurial commitment and undertaken certain business risks with respect to the management and success of the Portfolio.
Conclusion
After consideration of the factors described above, as well as other factors, the Trustees, including the Independent Trustees, concluded that the renewal of the Management Agreement and the Sub-Advisory Agreement was in the best interests of the Portfolio and the holders and voted to approve the renewal of the Agreements.
|
|
|
|
|
| Transamerica Series Trust |
|
|
|
Semi-Annual Financial Statements 2024 |
|
|
Page 14 |
|
|
PROXY VOTING POLICIES AND PROCEDURES AND QUARTERLY PORTFOLIO HOLDINGS
(unaudited)
A description of Transamerica Series Trust’s (the “Trust”) proxy voting policies and procedures is available in the Statement of Additional Information of the Portfolios, available without charge upon request by calling 1-800-851-9777 (toll free) or on the Securities and Exchange Commission’s (“SEC”) website at http://www.sec.gov.
In addition, the Portfolio is required to file Form N-PX, with their complete proxy voting records for the most recent 12 months ended June 30th, no later than August 31st of each year. The Form is available without charge: (1) on the Transamerica Funds website at https://www.transamerica.com/sites/default/files/files/e070d/TST%20N-PX%202021.pdf; and (2) on the SEC’s website at http://www.sec.gov.
Each fiscal quarter, the Portfolios, except Transamerica BlackRock Government Money Market VP, will file with the SEC a complete schedule of its monthly portfolio holdings on Form N-PORT. The Portfolios’ holdings as of the end of the third month of every fiscal quarter, as reported on Form N-PORT, will be publicly available on the SEC’s website at http://www.sec.gov within 60 days of the end of the fiscal quarter.
On a monthly basis, Transamerica BlackRock Government Money Market VP will file with the SEC portfolio holdings information on Form N-MFP3. A complete schedule of portfolio holdings is also available at www.transamerica.com.
You may also visit the Trust’s website at www.transamerica.com/annuities/prospectus for this and other information about the Portfolios and the Trust.
Important Notice Regarding Delivery of Shareholder Documents
Every year we provide shareholders informative materials such as the Transamerica Series Trust Annual Report, the Transamerica Series Trust Prospectus, and other required documents that keep you informed regarding your Portfolios. To the extent provided by mail, Transamerica Series Trust will only send one piece per mailing address, a method that saves your Portfolios money by reducing mailing and printing costs. We will continue to do this unless you tell us not to. To elect to receive individual mailings, simply call a Transamerica Customer Service Representative toll free at 1-800-851-9777, 8 a.m. to 7 p.m. Eastern Time, Monday-Friday. Your request will take effect within 30 days.
|
|
|
| Transamerica Series Trust |
|
Semi-Annual Financial Statements 2024 |
Page 15
NOTICE OF PRIVACY POLICY
(unaudited)
Your privacy is very important to us. We want you to understand what information we collect and how we use it. We collect and use “nonpublic personal information” in connection with providing our customers with a broad range of financial products and services as effectively and conveniently as possible. We treat nonpublic personal information in accordance with our Privacy Policy.
What Information We Collect and From Whom We Collect It
We may collect nonpublic personal information about you from the following sources:
| • |
|
Information we receive from you on applications or other forms, such as your name, address, and account number; |
| • |
|
Information about your transactions with us, our affiliates, or others, such as your account balance and purchase/redemption history; and |
| • |
|
Information we receive from non-affiliated third parties, including consumer reporting agencies. |
What Information We Disclose and To Whom We Disclose It
We do not disclose any nonpublic personal information about current or former customers to anyone without their express consent, except as permitted by law. We may disclose the nonpublic personal information we collect, as described above, to persons or companies that perform services on our behalf and to other financial institutions with which we have joint marketing agreements. We will require these companies to protect the confidentiality of your nonpublic personal information and to use it only to perform the services for which we have hired them.
Our Security Procedures
We restrict access to your nonpublic personal information and only allow disclosures to persons and companies as permitted by law to assist in providing products or services to you. We maintain physical, electronic, and procedural safeguards to protect your nonpublic personal information and to safeguard the disposal of certain consumer information.
Contact Us
If you have any questions about our Privacy Policy, please call 1-800-851-9777 on any business day between 8 a.m. and 7 p.m. Eastern Time.
Note: This Privacy Policy applies only to customers that have a direct relationship with us or our affiliates. If you own shares of our portfolios in the name of a third party such as a bank or broker-dealer, its privacy policy may apply to you instead of ours.
|
|
|
| Transamerica Series Trust |
|
Semi-Annual Financial Statements 2024 |
Page 16
|
|
|
| PO Box 219945 |
| Kansas City, MO 64121-9945 |
|
|
| Distributor: |
|
Transamerica Capital, Inc. |
|
|
PO Box 219945 |
|
|
Kansas City, MO 64121-9945 |
|
|
|
|
Customer Service: 1-800-851-9777 |
Transamerica Series Trust Semi-Annual Financial Statements
June 30, 2024
1801 California St., Suite 5200
Denver, CO 80202
Distributor: Transamerica Capital, Inc.
Customer Service: 1-800-851-9777
The following pages contain the most recent semi-annual financial statements for the investment options in which you are invested. In compliance with Securities and Exchange Commission regulations, we present these reports on an annual and semi-annual basis with the hope that they will foster greater understanding of the investment options’ holdings, performance, financial data, accounting policies and other issues. This streamlined version provides information only on the investment options in which you are invested.
If you have any questions about these reports, please do not hesitate to contact your financial professional. As always, we thank you for your trust and the opportunity to serve you.
Transamerica BlackRock iShares Dynamic Allocation – Moderate Growth VP
SCHEDULE OF INVESTMENTS
At June 30, 2024
(unaudited)
|
|
|
|
|
|
|
|
|
|
|
|
| |
|
Shares |
|
|
Value |
|
| |
|
| EXCHANGE-TRADED FUNDS - 97.6% |
|
| International Equity Funds - 20.0% |
|
| iShares Core MSCI EAFE ETF |
|
|
617,571 |
|
|
$ |
44,860,357 |
|
| iShares MSCI EAFE ETF (A) |
|
|
284,503 |
|
|
|
22,285,120 |
|
|
|
|
|
|
|
|
|
|
|
|
|
|
|
|
|
|
|
|
67,145,477 |
|
|
|
|
|
|
|
|
|
|
| U.S. Equity Fund - 50.4% |
|
| iShares Core S&P 500 ETF |
|
|
308,795 |
|
|
|
168,981,888 |
|
|
|
|
|
|
|
|
|
|
|
| U.S. Fixed Income Funds - 27.2% |
|
| iShares 7-10 Year Treasury Bond ETF |
|
|
272,108 |
|
|
|
25,482,914 |
|
| iShares Core U.S. Aggregate Bond ETF |
|
|
394,907 |
|
|
|
38,333,623 |
|
| iShares iBoxx $ Investment Grade Corporate Bond ETF |
|
|
37,505 |
|
|
|
4,017,536 |
|
| iShares Short Treasury Bond ETF |
|
|
152,370 |
|
|
|
16,836,885 |
|
| iShares U.S. Treasury Bond ETF |
|
|
297,004 |
|
|
|
6,703,380 |
|
|
|
|
|
|
|
|
|
|
|
|
|
|
|
|
|
|
|
|
91,374,338 |
|
|
|
|
|
|
|
|
|
|
|
|
|
| Total Exchange-Traded Funds (Cost $277,570,507) |
|
|
|
|
|
|
327,501,703 |
|
|
|
|
|
|
|
|
|
|
|
|
|
|
|
|
|
|
|
| |
|
Principal |
|
|
Value |
|
| |
|
| REPURCHASE AGREEMENT - 2.2% |
|
| Fixed Income Clearing Corp., |
|
|
|
|
|
|
|
|
| 2.50% (B), dated 06/28/2024, to be repurchased at $7,483,601 on 07/01/2024. Collateralized by a U.S. Government Obligation, 4.50%, due 03/31/2026, and with a value of $7,631,750. |
|
$ |
7,482,042 |
|
|
$ |
7,482,042 |
|
|
|
|
|
|
|
|
|
|
|
|
| Total Repurchase Agreement (Cost $7,482,042) |
|
|
|
7,482,042 |
|
|
|
|
|
|
|
| Total Investments (Cost $285,052,549) |
|
|
|
334,983,745 |
|
|
|
|
|
|
|
| Net Other Assets (Liabilities) - 0.2% |
|
|
|
544,728 |
|
|
|
|
|
|
|
|
|
|
|
|
| Net Assets - 100.0% |
|
|
$ |
335,528,473 |
|
|
|
|
|
|
|
INVESTMENT VALUATION:
Valuation Inputs (C)
|
|
|
|
|
|
|
|
|
|
|
|
|
|
|
|
|
| |
|
Level 1 - Unadjusted Quoted Prices |
|
|
Level 2 - Other Significant Observable Inputs |
|
|
Level 3 - Significant Unobservable Inputs |
|
|
Value |
|
| |
|
|
|
|
|
|
| ASSETS |
|
|
|
|
|
|
|
|
|
|
|
|
|
|
|
|
| Investments |
|
|
|
|
|
|
|
|
|
|
|
|
|
|
|
|
| Exchange-Traded Funds |
|
$ |
327,501,703 |
|
|
$ |
— |
|
|
$ |
— |
|
|
$ |
327,501,703 |
|
| Repurchase Agreement |
|
|
— |
|
|
|
7,482,042 |
|
|
|
— |
|
|
|
7,482,042 |
|
|
|
|
|
|
|
|
|
|
|
|
|
|
|
|
|
|
| Total Investments |
|
$ |
327,501,703 |
|
|
$ |
7,482,042 |
|
|
$ |
— |
|
|
$ |
334,983,745 |
|
|
|
|
|
|
|
|
|
|
|
|
|
|
|
|
|
|
FOOTNOTES TO SCHEDULE OF INVESTMENTS:
| (A) |
All or a portion of the security is on loan. The total value of the securities on loan is $22,062,193, collateralized by non-cash collateral, such as U.S. government securities and irrevocable letters of credit, of $22,532,560. The amount on loan indicated may not correspond with the securities on loan identified because a security with pending sales are in the process of recall from the brokers. |
| (B) |
Rate disclosed reflects the yield at June 30, 2024. |
| (C) |
There were no transfers in or out of Level 3 during the period ended June 30, 2024. Please reference the Investment Valuation section of the Notes to Financial Statements for more information regarding investment valuation and pricing inputs. |
The Notes to Financial Statements are an integral part of this report.
|
|
|
|
|
| Transamerica Series Trust |
|
|
|
Semi-Annual Financial Statements 2024 |
|
|
Page 1 |
|
|
Transamerica BlackRock iShares Dynamic Allocation – Moderate Growth VP
STATEMENT OF ASSETS AND LIABILITIES
At June 30, 2024
(unaudited)
|
|
|
|
|
|
|
| Assets: |
|
|
|
|
|
|
| Unaffiliated investments, at value (cost $277,570,507)
(including securities loaned of $22,062,193) |
|
$ |
327,501,703 |
|
| Repurchase agreement, at value (cost $7,482,042) |
|
|
7,482,042 |
|
| Receivables and other assets: |
|
|
|
|
| Investments sold |
|
|
2,804,982 |
|
| Net income from securities lending |
|
|
6,071 |
|
| Interest |
|
|
1,559 |
|
| Prepaid expenses |
|
|
1,337 |
|
|
|
| Total assets |
|
|
337,797,694 |
|
|
|
| Liabilities: |
|
|
|
|
| Payables and other liabilities: |
|
|
|
|
| Investments purchased |
|
|
1,846,639 |
|
| Shares of beneficial interest redeemed |
|
|
186,602 |
|
| Investment management fees |
|
|
115,615 |
|
| Distribution and service fees |
|
|
64,366 |
|
| Transfer agent costs |
|
|
321 |
|
| Trustee and CCO fees |
|
|
912 |
|
| Audit and tax fees |
|
|
10,871 |
|
| Custody fees |
|
|
7,570 |
|
| Legal fees |
|
|
6,772 |
|
| Printing and shareholder reports fees |
|
|
19,164 |
|
| Other accrued expenses |
|
|
10,389 |
|
|
|
| Total liabilities |
|
|
2,269,221 |
|
| |
|
| Net assets |
|
$ |
335,528,473 |
|
|
|
| Net assets consist of: |
|
|
|
|
| Capital stock ($0.01 par value) |
|
$ |
265,908 |
|
| Additional paid-in capital |
|
|
306,459,325 |
|
| Total distributable earnings (accumulated losses) |
|
|
28,803,240 |
|
| |
|
| Net assets |
|
$ |
335,528,473 |
|
|
|
| Shares outstanding |
|
|
26,590,816 |
|
| |
|
| Net asset value and offering price per share |
|
$ |
12.62 |
|
STATEMENT OF OPERATIONS
For the period ended June 30, 2024
(unaudited)
|
|
|
|
|
|
|
| Investment income: |
|
|
|
|
|
|
| Dividend income from unaffiliated investments |
|
$ |
3,683,050 |
|
| Interest income from unaffiliated investments |
|
|
92,303 |
|
| Net income from securities lending |
|
|
23,981 |
|
|
|
| Total investment income |
|
|
3,799,334 |
|
|
|
| Expenses: |
|
|
|
|
| Investment management fees |
|
|
823,658 |
|
| Distribution and service fees |
|
|
411,829 |
|
| Transfer agent costs |
|
|
1,874 |
|
| Trustee and CCO fees |
|
|
7,678 |
|
| Audit and tax fees |
|
|
10,555 |
|
| Custody fees |
|
|
7,430 |
|
| Legal fees |
|
|
13,161 |
|
| Printing and shareholder reports fees |
|
|
17,638 |
|
| Other |
|
|
16,180 |
|
| |
|
| Total expenses before waiver and/or reimbursement and recapture |
|
|
1,310,003 |
|
| |
|
| Expenses waived and/or reimbursed |
|
|
(85,907 |
) |
|
|
| Net expenses |
|
|
1,224,096 |
|
| |
|
| Net investment income (loss) |
|
|
2,575,238 |
|
|
|
| Net realized gain (loss) on: |
|
|
|
|
| Unaffiliated investments |
|
|
6,548,405 |
|
|
|
| Net change in unrealized appreciation (depreciation) on: |
|
|
|
|
| Unaffiliated investments |
|
|
17,196,524 |
|
| |
|
| Net realized and change in unrealized gain (loss) |
|
|
23,744,929 |
|
| |
|
| Net increase (decrease) in net assets resulting from operations |
|
$ |
26,320,167 |
|
The Notes to Financial Statements are an integral part of this report.
|
|
|
|
|
| Transamerica Series Trust |
|
|
|
Semi-Annual Financial Statements 2024 |
|
|
Page 2 |
|
|
Transamerica BlackRock iShares Dynamic Allocation –
Moderate Growth VP
STATEMENT OF CHANGES IN NET ASSETS
For the period and year ended:
|
|
|
|
|
|
|
|
|
| |
|
June 30, 2024 (unaudited) |
|
December 31, 2023 |
|
|
|
| From operations: |
|
|
|
|
|
|
|
|
| Net investment income (loss) |
|
|
$ 2,575,238 |
|
|
|
$ 5,347,488 |
|
| Net realized gain (loss) |
|
|
6,548,405 |
|
|
|
(3,164,340 |
) |
| Net change in unrealized appreciation (depreciation) |
|
|
17,196,524 |
|
|
|
50,708,455 |
|
|
|
|
| Net increase (decrease) in net assets resulting from operations |
|
|
26,320,167 |
|
|
|
52,891,603 |
|
|
|
|
| Dividends and/or distributions to shareholders: |
|
|
|
|
|
|
|
|
| Dividends and/or distributions to shareholders |
|
|
— |
|
|
|
(4,242,030 |
) |
| |
|
|
| Net increase (decrease) in net assets resulting from dividends and/or distributions to shareholders |
|
|
— |
|
|
|
(4,242,030 |
) |
|
|
|
| Capital share transactions: |
|
|
|
|
|
|
|
|
| Proceeds from shares sold |
|
|
2,289,225 |
|
|
|
5,268,332 |
|
| Dividends and/or distributions reinvested |
|
|
— |
|
|
|
4,242,030 |
|
| Cost of shares redeemed |
|
|
(28,397,394 |
) |
|
|
(50,405,726 |
) |
| |
|
|
| Net increase (decrease) in net assets resulting from capital share transactions |
|
|
(26,108,169 |
) |
|
|
(40,895,364 |
) |
|
|
|
| Net increase (decrease) in net assets |
|
|
211,998 |
|
|
|
7,754,209 |
|
|
|
|
| Net assets: |
|
|
|
|
|
|
|
|
| Beginning of period/year |
|
|
335,316,475 |
|
|
|
327,562,266 |
|
| End of period/year |
|
|
$335,528,473 |
|
|
|
$335,316,475 |
|
|
|
|
| Capital share transactions - shares: |
|
|
|
|
|
|
|
|
| Shares issued |
|
|
188,173 |
|
|
|
482,756 |
|
| Shares reinvested |
|
|
— |
|
|
|
383,894 |
|
| Shares redeemed |
|
|
(2,347,500 |
) |
|
|
(4,652,963 |
) |
| |
|
|
| Net increase (decrease) in shares outstanding |
|
|
(2,159,327 |
) |
|
|
(3,786,313 |
) |
The Notes to Financial Statements are an integral part of this report.
|
|
|
|
|
| Transamerica Series Trust |
|
|
|
Semi-Annual Financial Statements 2024 |
|
|
Page 3 |
|
|
Transamerica BlackRock iShares Dynamic Allocation –
Moderate Growth VP
FINANCIAL HIGHLIGHTS
|
|
|
|
|
|
|
|
|
|
|
|
|
|
|
|
|
|
|
|
|
|
|
|
|
|
|
| For a share outstanding during the period and years indicated: |
|
Service Class |
|
|
|
|
|
|
|
| |
|
June 30, 2024 (unaudited) |
|
December 31, 2023 |
|
December 31, 2022 |
|
December 31, 2021 |
|
December 31, 2020 |
|
December 31, 2019 |
|
|
|
|
|
|
|
| Net asset value, beginning of period/year |
|
$ |
11.66 |
|
|
$ |
10.07 |
|
|
$ |
13.58 |
|
|
$ |
13.04 |
|
|
$ |
13.70 |
|
|
$ |
12.32 |
|
|
|
|
|
|
|
|
| Investment operations: |
|
|
|
|
|
|
|
|
|
|
|
|
|
|
|
|
|
|
|
|
|
|
|
|
|
|
|
|
|
|
|
| Net investment income (loss)(A) |
|
|
0.09 |
|
|
|
0.17 |
|
|
|
0.13 |
|
|
|
0.12 |
|
|
|
0.04 |
|
|
|
0.19 |
|
|
|
|
|
|
|
|
| Net realized and unrealized gain (loss) |
|
|
0.87 |
|
|
|
1.56 |
|
|
|
(2.38 |
) |
|
|
1.72 |
|
|
|
(0.35 |
) |
|
|
1.85 |
|
| |
|
|
|
|
|
|
| Total investment operations |
|
|
0.96 |
|
|
|
1.73 |
|
|
|
(2.25 |
) |
|
|
1.84 |
|
|
|
(0.31 |
) |
|
|
2.04 |
|
|
|
|
|
|
|
|
| Dividends and/or distributions to shareholders: |
|
|
|
|
|
|
|
|
|
|
|
|
|
|
|
|
|
|
|
|
|
|
|
|
|
|
|
|
|
|
|
| Net investment income |
|
|
— |
|
|
|
(0.14 |
) |
|
|
(0.14 |
) |
|
|
(0.04 |
) |
|
|
(0.21 |
) |
|
|
(0.19 |
) |
|
|
|
|
|
|
|
| Net realized gains |
|
|
— |
|
|
|
— |
|
|
|
(1.12 |
) |
|
|
(1.26 |
) |
|
|
(0.14 |
) |
|
|
(0.47 |
) |
| |
|
|
|
|
|
|
| Total dividends and/or distributions to shareholders |
|
|
— |
|
|
|
(0.14 |
) |
|
|
(1.26 |
) |
|
|
(1.30 |
) |
|
|
(0.35 |
) |
|
|
(0.66 |
) |
|
|
|
|
|
|
|
| Net asset value, end of period/year |
|
$ |
12.62 |
|
|
$ |
11.66 |
|
|
$ |
10.07 |
|
|
$ |
13.58 |
|
|
$ |
13.04 |
|
|
$ |
13.70 |
|
| |
|
|
|
|
|
|
|
|
|
|
|
|
|
|
|
|
|
|
|
|
|
|
|
|
|
|
|
|
|
|
|
| Total return |
|
|
8.23 |
%(B) |
|
|
17.28 |
% |
|
|
(16.92 |
)% |
|
|
14.41 |
% |
|
|
(2.17 |
)% |
|
|
16.83 |
% |
|
|
|
|
|
|
|
| Ratio and supplemental data: |
|
|
|
|
|
|
|
|
|
|
|
|
|
|
|
|
|
|
|
|
|
|
|
|
|
|
|
|
|
|
|
| Net assets end of period/year (000’s) |
|
$ |
335,528 |
|
|
$ |
335,316 |
|
|
$ |
327,562 |
|
|
$ |
452,539 |
|
|
$ |
450,524 |
|
|
$ |
504,075 |
|
|
|
|
|
|
|
|
| Expenses to average net assets(C) |
|
|
|
|
|
|
|
|
|
|
|
|
|
|
|
|
|
|
|
|
|
|
|
|
|
|
|
|
|
|
|
| Excluding waiver and/or reimbursement and recapture |
|
|
0.80 |
%(D) |
|
|
0.81 |
% |
|
|
0.78 |
% |
|
|
0.86 |
% |
|
|
0.87 |
% |
|
|
0.86 |
% |
|
|
|
|
|
|
|
| Including waiver and/or reimbursement and recapture |
|
|
0.74 |
%(D)(E) |
|
|
0.75 |
%(E) |
|
|
0.73 |
%(E) |
|
|
0.85 |
%(E) |
|
|
0.87 |
% |
|
|
0.86 |
% |
|
|
|
|
|
|
|
| Net investment income (loss) to average net assets |
|
|
1.56 |
%(D) |
|
|
1.61 |
% |
|
|
1.14 |
% |
|
|
0.92 |
% |
|
|
0.31 |
% |
|
|
1.47 |
% |
|
|
|
|
|
|
|
| Portfolio turnover rate |
|
|
9 |
%(B) |
|
|
32 |
% |
|
|
288 |
% |
|
|
43 |
% |
|
|
173 |
% |
|
|
16 |
% |
| (A) |
Calculated based on average number of shares outstanding. |
| (C) |
Does not include expenses of the underlying investments in which the Portfolio invests. |
| (E) |
TAM has contractually agreed, through May 1, 2025, to waive from its management fees an amount equal to the sub-advisory fee waiver by the Portfolio’s sub-adviser. These amounts are not subject to recapture by TAM. |
The Notes to Financial Statements are an integral part of this report.
|
|
|
|
|
| Transamerica Series Trust |
|
|
|
Semi-Annual Financial Statements 2024 |
|
|
Page 4 |
|
|
Transamerica BlackRock iShares Dynamic Allocation – Moderate Growth VP
NOTES TO FINANCIAL STATEMENTS
At June 30, 2024
(unaudited)
1. ORGANIZATION
Transamerica Series Trust (“TST”) is an open-end management investment company registered under the Investment Company Act of 1940, as amended (the “1940 Act”). TST applies investment company accounting and reporting guidance. TST serves as a funding vehicle for variable life insurance, variable annuity, and group annuity products. Transamerica BlackRock iShares Dynamic Allocation – Moderate Growth VP (the “Portfolio”) is a series of TST and is classified as diversified under the 1940 Act. The Portfolio currently offers one class of shares, Service Class.
The only shareholders of the Portfolio are affiliated insurance company separate accounts and/or affiliated asset allocation portfolios. Contract holders of the variable life and annuity contracts are not shareholders of the Portfolio. For ease of reference, shareholders and contract holders are collectively referred to in this report as “shareholders.”
This report must be accompanied or preceded by the Portfolio’s current prospectus, which contains additional information about the Portfolio, including risks, as well as investment objectives and strategies.
Transamerica Asset Management, Inc. (“TAM”) serves as investment manager for the Portfolio pursuant to an investment management agreement. TAM provides continuous and regular investment management services to the Portfolio. TAM supervises the Portfolio’s investments, conducts its investment program and provides supervisory, compliance and administrative services to the Portfolio.
TAM currently acts as a “manager of managers” and has hired sub-advisers to furnish day-to-day investment advice and recommendations. TAM may, in the future, determine to provide all aspects of the day-to-day management of the Portfolio without the use of a sub-adviser. When acting as a manager of managers, TAM provides investment management services that include, without limitation, the design and development of the Portfolio and its investment strategies and the ongoing review and evaluation of those investment strategies including recommending changes in strategy where it believes appropriate or advisable; the selection of one or more sub-advisers for the Portfolio employing a combination of quantitative and qualitative screens, research, analysis and due diligence; negotiation of sub-advisory agreements and fees; oversight and monitoring of sub-advisers and recommending changes to sub-advisers where it believes appropriate or advisable; recommending portfolio combinations and liquidations where it believes appropriate or advisable; selection and oversight of transition managers, as needed; regular supervision of the Portfolio’s investments; regular review and evaluation of sub-adviser performance; daily monitoring of the sub-advisers’ buying and selling of securities for the Portfolio; regular review of holdings; ongoing trade oversight and analysis; regular monitoring to ensure adherence to investment process; regular calls and periodic on-site visits with sub-advisers; portfolio construction and asset allocation when using multiple sub-advisers for the Portfolio; risk management oversight and analysis; oversight of negotiation of investment documentation and agreements; design, development, implementation and regular monitoring of the valuation process; periodic due diligence reviews of pricing vendors and vendor methodology; design, development, implementation and regular monitoring of the compliance process; respond to regulatory inquiries and determine appropriate litigation strategy, as needed; review of proxies voted by sub-advisers; oversight of preparation and review of materials for meetings of the Portfolio’s Board of Trustees (the “Board”), participation in these meetings and preparation of regular communications with the Board; oversight of preparation and review of prospectuses, shareholder reports and other disclosure materials and regulatory filings for the Portfolio; oversight of other service providers to the Portfolio, such as the custodian, the transfer agent, the Portfolio’s independent accounting firm and legal counsel; supervision of the performance of recordkeeping and shareholder relations functions for the Portfolio; and oversight of cash management services. TAM uses a variety of quantitative and qualitative tools to carry out its investment management services. TAM, not the Portfolio, is responsible for paying the sub-adviser(s) for their services, and sub-advisory fees are TAM’s expense.
TAM’s investment management services also include the provision of supervisory and administrative services to the Portfolio. These services include performing certain administrative services for the Portfolio and supervising and overseeing the administrative, clerical, recordkeeping and bookkeeping services provided to the Portfolio by State Street Bank and Trust Company (“State Street”), to whom TAM has outsourced the provision of certain sub-administration services. To the extent agreed upon by TAM and the Portfolio from time to time, TAM’s supervisory and administrative services include, but are not limited to: monitoring and verifying the custodian’s daily calculation of the Net Asset Values (“NAV”); shareholder relations functions; compliance services; valuation services; assisting in due diligence and in the oversight and monitoring of certain activities of sub-advisers and certain aspects of Portfolio investments; assisting with Portfolio combinations and liquidations; oversight of the preparation and filing, and review, of all returns and reports, in connection with federal, state and local taxes; oversight and review of regulatory reporting; supervising and coordinating the Portfolio’s custodian and dividend disbursing agent and monitoring their services to the Portfolio; assisting the Portfolio in preparing reports to shareholders; acting as liaison with the Portfolio’s independent public accountants and providing, upon request, analyses, fiscal year summaries and other audit related services; assisting in the preparation of agendas and supporting documents for and minutes of meetings of trustees and committees of trustees; assisting in the preparation of regular communications with the trustees; and providing personnel and office space, telephones
|
|
|
|
|
| Transamerica Series Trust |
|
|
|
Semi-Annual Financial Statements 2024 |
|
|
Page 5 |
|
|
Transamerica BlackRock iShares Dynamic Allocation – Moderate Growth VP
NOTES TO FINANCIAL STATEMENTS (continued)
At June 30, 2024
(unaudited)
1. ORGANIZATION (continued)
and other office equipment as necessary in order for TAM to perform supervisory and administrative services to the Portfolio. The Portfolio pays certain fees and expenses to State Street for sub-administration services which are not administrative services covered by the management agreement with TAM or paid for through the management fees payable thereunder. For the period ended June 30, 2024, (i) the expenses paid to State Street for sub-administration services by the Portfolio are shown as a part of Other expenses within the Statement of Operations and (ii) the expenses payable to State Street for sub-administration services from the Portfolio are shown as part of Other accrued expenses within the Statement of Assets and Liabilities.
2. SIGNIFICANT ACCOUNTING POLICIES
In preparing the Portfolio’s financial statements in accordance with Generally Accepted Accounting Principles in the United States of America (“GAAP”), estimates or assumptions (which could differ from actual results) may be used that affect reported amounts and disclosures. The following is a summary of significant accounting policies followed by the Portfolio.
Security transactions and investment income: Security transactions are accounted for on the trade date. Security gains and losses are calculated on a first-in, first-out basis. Interest income, if any, is accrued as earned. Dividend income and capital gain distributions from underlying investments, if any, are recorded on the ex-dividend date. Income or short-term capital gain distributions received from underlying investments, if any, are recorded as Dividend income from investments within the Statement of Operations. Long-term capital gain distributions received from underlying investments, if any, are recorded as Net realized gain (loss) on Capital gain distributions received from investments within the Statement of Operations.
Distributions to shareholders: Distributions are recorded on the ex-dividend date and are determined in accordance with federal income tax regulations, which may differ from GAAP.
Indemnification: In the normal course of business, the Portfolio enters into contracts that contain a variety of representations that provide general indemnifications. The Portfolio’s maximum exposure under these arrangements is unknown, as this would involve future claims that may be made against the Portfolio and/or its affiliates that have not yet occurred. However, based on experience, the Portfolio expects the risk of loss to be remote.
3. INVESTMENT VALUATION
TAM has been designated as the Portfolio’s valuation designee pursuant to Rule 2a-5 under the 1940 Act with responsibility for fair valuation subject to oversight by the Portfolio’s Board of Trustees. The net asset value of the Portfolio is computed as of the official close of the New York Stock Exchange (“NYSE”) each day the NYSE is open for business.
TAM utilizes various methods to measure the fair value of its investments on a recurring basis. GAAP establishes a hierarchy that prioritizes inputs to valuation methods. The inputs or methodology used for valuing securities are not necessarily an indication of the risk associated with investing in those securities. The three levels (“Levels”) of inputs of the fair value hierarchy are defined as follows:
Level 1—Unadjusted quoted prices in active markets for identical securities.
Level 2—Inputs, other than quoted prices included in Level 1, which are observable, either directly or indirectly. These inputs may include quoted prices for the identical instrument on an inactive market, prices for similar instruments, interest rates, prepayment speeds, credit risk, yield curves, default rates, and similar data.
Level 3—Unobservable inputs based on the best information available in the circumstances, to the extent observable inputs are not available, which may include TAM’s own assumptions used in determining the fair value of the Portfolio’s investments.
The inputs used to measure fair value may fall into different Levels of the fair value hierarchy. In such cases, for disclosure purposes, the Level in the fair value hierarchy that is assigned to the fair value measurement of a security is determined based on the lowest Level input that is significant to the fair value measurement in its entirety. Certain investments that are measured at fair value using NAV per share, or its equivalent, using the “practical expedient” have not been classified in the fair value Levels. The hierarchy classification of inputs used to value the Portfolio’s investments at June 30, 2024, is disclosed within the Investment Valuation section of the Schedule of Investments.
The availability of observable inputs can vary from security to security and is affected by a wide variety of factors, including, but not limited to, the type of security, whether the security is new and not yet established in the marketplace, the liquidity of markets, and other
|
|
|
|
|
| Transamerica Series Trust |
|
|
|
Semi-Annual Financial Statements 2024 |
|
|
Page 6 |
|
|
Transamerica BlackRock iShares Dynamic Allocation – Moderate Growth VP
NOTES TO FINANCIAL STATEMENTS (continued)
At June 30, 2024
(unaudited)
3. INVESTMENT VALUATION (continued)
characteristics particular to the security. To the extent that valuation is based on models or inputs that are less observable or unobservable in the market, the determination of fair value requires more judgment. Accordingly, the degree of judgment exercised in determining fair value is generally greatest for instruments categorized in Level 3. Due to the inherent uncertainty of valuation, the determination of values may differ significantly from values that would have been realized had a ready market for investments existed, and the differences could be material.
Fair value measurements: Descriptions of the valuation techniques applied to the Portfolio’s significant categories of assets and liabilities measured at fair value on a recurring basis are as follows:
Exchange-traded funds (“ETF”): ETFs are stated at the last reported sale price or closing price on the day of valuation taken from the primary exchange where the ETF is principally traded. ETFs are generally categorized in Level 1 of the fair value hierarchy.
Repurchase agreements: Repurchase agreements are valued at cost, which approximates fair value. To the extent the inputs are observable and timely, the values are generally categorized in Level 2 of the fair value hierarchy.
4. BORROWINGS AND OTHER FINANCING TRANSACTIONS
The Portfolio may engage in borrowing transactions as a means of raising cash to satisfy redemption requests, for other temporary or emergency purposes or, to the extent permitted by its investment policies, to raise additional cash to be invested in other securities or instruments. When the Portfolio invests borrowing proceeds in other securities, the Portfolio will bear the risk that the market value of the securities in which such proceeds are invested goes down and is insufficient to repay the borrowed proceeds. The Portfolio may borrow on a secured or on an unsecured basis. If the Portfolio enters into a secured borrowing arrangement, a portion of the Portfolio’s assets will be used as collateral. The 1940 Act requires the Portfolio to maintain asset coverage of at least 300% of the amount of its borrowings. Asset coverage means the ratio that the value of the Portfolio’s total assets, minus liabilities other than borrowings, bears to the aggregate amount of all borrowings. Although complying with this requirement has the effect of limiting the amount that the Portfolio may borrow, it does not otherwise mitigate the risks of entering into borrowing transactions.
Interfund lending: The Portfolio, along with other funds and portfolios advised by TAM, may participate in an interfund lending program pursuant to exemptive relief granted by the Securities and Exchange Commission on January 18, 2017. This program allows the Portfolio to lend to and borrow from other funds and portfolios advised by TAM. Interfund lending transactions are subject to the conditions of the exemptive relief which places limits on the amount of lending or borrowing a Portfolio may participate in under the program. Interest earned or paid on an interfund lending transaction will be based on the average of certain current market rates. For the period ended June 30, 2024, the Portfolio has not utilized the program.
Repurchase agreements: In a repurchase agreement, the Portfolio purchases a security and simultaneously commits to resell that security to the seller at an agreed-upon price on an agreed-upon date. Securities purchased subject to a repurchase agreement are held at the Portfolio’s custodian, or designated sub-custodian related to tri-party repurchase agreements, and, pursuant to the terms of the repurchase agreement, must be collateralized by securities with an aggregate market value greater than or equal to 100% of the resale price. The Portfolio will bear the risk of value fluctuations until the securities can be sold and may encounter delays and incur costs in liquidating the securities. In the event of bankruptcy or insolvency of the seller, delays and costs may be incurred.
Repurchase agreements are subject to netting agreements, which are agreements between the Portfolio and its counterparties that provide for the net settlement of all transactions and collateral with the Portfolio, through a single payment, in the event of default or termination. Amounts presented within the Schedule of Investments, and as part of Repurchase agreements, at value within the Statement of Assets and Liabilities are shown on a gross basis. The value of the related collateral for each repurchase agreement, as reflected within the Schedule of Investments, exceeds the value of each repurchase agreement at June 30, 2024.
Repurchase agreements at June 30, 2024, if any, are included within the Schedule of Investments and Statement of Assets and Liabilities.
Securities lending: The Portfolio may lend securities to qualified financial institutions, brokers and dealers. State Street serves as securities lending agent to the Portfolio pursuant to a Securities Lending Agreement. Loans of securities are terminable at any time and the borrower, after notice, is required to return borrowed securities within the standard time period for settlement of securities transactions. The lending of securities exposes the Portfolio to risks such as: the borrowers may fail to return the loaned securities or may not be able to provide additional collateral, the Portfolio may experience delays in recovery of the loaned securities or delays in access to collateral, or
|
|
|
|
|
| Transamerica Series Trust |
|
|
|
Semi-Annual Financial Statements 2024 |
|
|
Page 7 |
|
|
Transamerica BlackRock iShares Dynamic Allocation – Moderate Growth VP
NOTES TO FINANCIAL STATEMENTS (continued)
At June 30, 2024
(unaudited)
4. BORROWINGS AND OTHER FINANCING TRANSACTIONS (continued)
the Portfolio may experience losses related to the investment collateral. To minimize certain risks, loan counterparties pledge cash, securities issued or guaranteed by the U.S. Government and irrevocable letters of credit issued by banks as collateral. The initial collateral received by the Portfolio is required to have a value of at least 102% of the current value of the loaned securities traded on U.S. exchanges, and a value of at least 105% for all other securities. Typically the lending agent is not permitted to sell, re-pledge or use cash and non-cash collateral it receives. The lending agent has agreed to indemnify the Portfolio in the case of default of any securities borrower.
The Portfolio receives compensation for lending securities from interest or dividends earned on the cash, U.S. Government securities and irrevocable letters of credit held as collateral, less associated fees and expenses. Such income is reflected in Net income from securities lending within the Statement of Operations. Cash collateral received is invested in the State Street Navigator Securities Lending Trust — Government Money Market Portfolio.
The value of loaned securities and related cash and non-cash collateral outstanding at June 30, 2024, if any, are shown on a gross basis within the Schedule of Investments.
5. RISK FACTORS
Investing in the Portfolio involves certain key risks related to the Portfolio’s trading activity. Please reference the Portfolio’s prospectus for a more complete discussion of the following risk(s), as well as other risks of investing in the Portfolio.
Market risk: The market prices of the Portfolio’s securities or other assets may go up or down, sometimes rapidly or unpredictably, due to factors such as economic events, inflation, changes in interest rates, governmental actions or interventions, actions taken by the U.S. Federal Reserve or foreign central banks, market disruptions caused by tariffs, trade disputes or other factors, political developments, armed conflicts, economic sanctions, cybersecurity events, investor sentiment, the global and domestic effects of widespread or local health, weather or climate events, and other factors that may or may not be related to the issuer of the security or other asset. If the market prices of the Portfolio’s securities and assets fall, the value of your investment in the Portfolio could go down.
Economies and financial markets throughout the world are increasingly interconnected. Events or circumstances in one or more countries or regions could be highly disruptive to, and have profound impacts on, global economies or markets. As a result, whether or not the Portfolio invests in securities of issuers located in or with significant exposure to the countries directly affected, the value and liquidity of the Portfolio’s investments may go down.
Asset allocation risk: The Portfolio’s investment performance is significantly impacted by the Portfolio’s asset allocation and reallocation from time to time. The value of your investment may decrease if the sub-adviser’s judgment about the attractiveness, value or market trends affecting a particular asset class, investment style, technique or strategy, underlying ETF or other issuer is incorrect.
Equity securities risk: Equity securities generally have greater risk of loss than debt securities. Stock markets are volatile and the value of equity securities may go up or down, sometimes rapidly and unpredictably. The market price of an equity security may fluctuate based on overall market conditions, such as real or perceived adverse economic or political conditions or trends, tariffs and trade disruptions, inflation, substantial economic downturn or recession, changes in interest rates, or adverse investor sentiment. The market price of an equity security also may fluctuate based on real or perceived factors affecting a particular industry or industries or the company itself. If the market prices of the equity securities owned by the Portfolio fall, the value of your investment in the Portfolio will decline. The Portfolio may lose its entire investment in the equity securities of an issuer. A change in financial condition or other event affecting a single issuer may adversely impact securities markets as a whole.
6. FEES AND OTHER AFFILIATED TRANSACTIONS
TST serves as a funding vehicle for certain affiliated asset allocation portfolios and certain affiliated separate accounts of Transamerica Life Insurance Company (“TLIC”) and Transamerica Financial Life Insurance Company.
TAM, the Portfolio’s investment manager, is directly owned by TLIC and AUSA Holding, LLC (“AUSA”), both of which are indirect, wholly owned subsidiaries of Aegon Ltd. TLIC is owned by Commonwealth General Corporation (“Commonwealth”). Commonwealth and AUSA are wholly owned by Transamerica Corporation (DE). Transamerica Corporation (DE) is wholly owned by Aegon International B.V., which is wholly owned by Aegon Ltd., a Bermuda exempted company with liability limited by shares (formerly, Aegon NV, a Netherlands corporation) and a publicly traded international insurance group.
|
|
|
|
|
| Transamerica Series Trust |
|
|
|
Semi-Annual Financial Statements 2024 |
|
|
Page 8 |
|
|
Transamerica BlackRock iShares Dynamic Allocation – Moderate Growth VP
NOTES TO FINANCIAL STATEMENTS (continued)
At June 30, 2024
(unaudited)
6. FEES AND OTHER AFFILIATED TRANSACTIONS (continued)
Transamerica Fund Services, Inc. (“TFS”) is the Portfolio’s transfer agent. Transamerica Capital, Inc. (“TCI”) is the Portfolio’s distributor/principal underwriter. TAM, TFS and TCI are affiliates of Aegon Ltd.
Certain officers and trustees of the Portfolio may also be officers and/or trustees of TAM, TFS and TCI. No interested trustee who is deemed an interested person due to current or former service with TAM or an affiliate of TAM receives compensation from the Portfolio. The Portfolio does pay non-interested persons (independent trustees), as disclosed in Trustee and CCO fees within the Statement of Operations.
Investment management fees: TAM serves as the Portfolio’s investment manager, performing administration as well as investment advisory services. TAM renders investment advisory, supervisory, and administration services under an investment management agreement and the Portfolio pays a single management fee, which is reflected in Investment management fees within the Statement of Operations.
The Portfolio pays a management fee to TAM based on daily average net assets at the following rates:
|
|
|
|
|
| Breakpoints |
|
Rate |
| First $500 million |
|
|
0.5000 |
% |
| Over $500 million up to $1 billion |
|
|
0.4900 |
|
| Over $1 billion up to $2.5 billion |
|
|
0.4725 |
|
| Over $2.5 billion up to $3.5 billion |
|
|
0.4650 |
|
| Over $3.5 billion up to $4.5 billion |
|
|
0.4525 |
|
| Over $4.5 billion |
|
|
0.4400 |
|
TAM has contractually agreed, through May 1, 2025, to waive from its management fees an amount equal to the sub-advisory fee waiver by the Portfolio’s sub-adviser. These amounts are not subject to recapture by TAM.
TAM has contractually agreed to waive fees and/or reimburse Portfolio expenses to the extent that the total operating expenses excluding, as applicable, acquired fund fees and expenses, interest (including borrowing costs and overdraft charges), taxes, brokerage commissions, dividend and interest expenses on securities sold short, extraordinary expenses and other expenses not incurred in the ordinary course of the Portfolio’s business, exceed the following stated annual operating expense limits to the Portfolio’s daily average net assets. To the extent an expense limit changed during the period, the prior limit is also listed below. The expenses waived and/or reimbursed, if any, are included in Expenses waived and/or reimbursed within the Statement of Operations.
|
|
|
|
|
| Class |
|
Operating Expense Limit |
|
Operating Expense Limit Effective Through |
| Service Class |
|
0.80% |
|
May 1, 2025 |
TAM is permitted to recapture amounts contractually waived and/or reimbursed to a class during any of the 36 months from the date on which TAM waived fees and/or reimbursed expenses for the class. A class may recapture and reimburse TAM only if such amount does not cause, on any particular business day of the Portfolio, the class’s total annual operating expenses (after the recapture is taken into account) to exceed the Operating Expense Limits or any other lower limit then in effect. Amounts recaptured, if any, by TAM for the period ended June 30, 2024 are disclosed in Recapture of previously waived and/or reimbursed fees within the Statement of Operations.
TAM, on a voluntary basis and in addition to the contractual operating expense limits in effect, from time to time may waive and/or reimburse expenses of the Portfolio, or any classes thereof, to such level(s) as the Trust’s officers have determined or may reasonably determine from time to time. Any such voluntary waiver or expense reimbursement may be discontinued by TAM at any time. These amounts are not subject to recapture by TAM.
As of June 30, 2024, there are no amounts available for recapture by TAM.
Distribution and service fees: TST has a distribution plan (“Distribution Plan”) pursuant to Rule 12b-1 under the 1940 Act. Pursuant to the Distribution Plan, TST entered into a distribution agreement with TCI as the Portfolio’s distributor.
|
|
|
|
|
| Transamerica Series Trust |
|
|
|
Semi-Annual Financial Statements 2024 |
|
|
Page 9 |
|
|
Transamerica BlackRock iShares Dynamic Allocation – Moderate Growth VP
NOTES TO FINANCIAL STATEMENTS (continued)
At June 30, 2024
(unaudited)
6. FEES AND OTHER AFFILIATED TRANSACTIONS (continued)
The Distribution Plan requires the Portfolio to pay distribution fees to TCI as compensation for various distribution activities, not as reimbursement for specific expenses. Under the Distribution Plan and distribution agreement, TCI, on behalf of the Portfolio, is authorized to pay various service providers, as direct payment for expenses incurred in connection with distribution of the Portfolio’s shares.
The fee on the Service Class shares is paid to the insurance companies for providing services and account maintenance for the policyholders who invest in the variable insurance products which invest in the Service Class shares. The distribution and service fees are included in Distribution and service fees within the Statement of Operations.
The Portfolio is authorized under the Distribution Plan to pay fees to TCI based on daily average net assets up to an annual fee of 0.25% of Service Class shares.
Transfer agent costs: TFS provides transfer agency services under an intercompany agreement with TAM. TFS has outsourced the provision of certain sub-transfer agency services to SS&C Global Investor & Distribution Solutions, Inc. (“SS&C GIDS”). The Portfolio does not pay a separate transfer agent fee to TAM or TFS but does pay certain expenses to SS&C GIDS related to applicable sub-transfer agency services. For the period ended June 30, 2024, (i) the expenses paid to SS&C GIDS by the Portfolio are referred to as transfer agent costs and are included within the Statement of Operations and (ii) the expenses payable to SS&C GIDS by the Portfolio are referred to as transfer agent costs within the Statement of Assets and Liabilities.
Brokerage commissions: The Portfolio incurred no brokerage commissions on security transactions placed with affiliates of the investment manager or sub-adviser(s) for the period ended June 30, 2024.
7. PURCHASES AND SALES OF SECURITIES
For the period ended June 30, 2024, the cost of securities purchased and proceeds from securities sold (excluding short-term securities) are as follows:
|
|
|
|
|
|
|
| |
|
Purchases of Securities |
|
Sales of Securities |
|
|
| |
|
|
|
| |
$ 30,592,059 |
|
$ 54,872,246 |
8. FEDERAL INCOME TAXES AND DISTRIBUTIONS TO SHAREHOLDERS
The Portfolio has not made any provision for federal income or excise taxes due to its policy to distribute all of its taxable income and capital gains to its shareholders and otherwise qualify as a regulated investment company under Subchapter M of the Internal Revenue Code. The Portfolio recognizes the tax benefits of uncertain tax positions only where the position is “more likely than not” to be sustained assuming examination by tax authorities. The Portfolio’s tax returns remain subject to examination by the Internal Revenue Service and state tax authorities three years from the date of filing for federal purposes and four years from the date of filing for state purposes. Management has evaluated the Portfolio’s tax provisions taken for all open tax years, and has concluded that no provision for income tax is required in the Portfolio’s financial statements. If applicable, the Portfolio recognizes interest accrued related to unrecognized tax benefits in relation to interest and penalties expense in Other within the Statement of Operations. The Portfolio identifies its major tax jurisdictions as U.S. Federal, the state of Colorado, and foreign jurisdictions where the Portfolio makes significant investments; however, the Portfolio is not aware of any tax positions for which it is reasonably possible that the total amounts of unrecognized tax benefits will change materially in the next twelve months. Distributions are determined in accordance with income tax regulations, which may differ from GAAP.
As of June 30, 2024, the approximate cost for U.S. federal income tax purposes, and the aggregate gross/net unrealized appreciation (depreciation) in the value of investments (including securities sold short and derivatives, if any) are as follows:
|
|
|
|
|
|
|
| Cost |
|
Gross Appreciation |
|
Gross (Depreciation) |
|
Net Appreciation (Depreciation) |
| $ 285,052,549 |
|
$ 55,584,299 |
|
$ (5,653,103) |
|
$ 49,931,196 |
Please see TST’s most recent report on Form N-CSR, available at: www.transamerica.com/annuities/prospectus, for additional information. For the most recently filed complete proxy voting records for the Trust please visit: https://www.transamerica.com/sites/default/files/files/e070d/TST%20N-PX%202021.pdf
|
|
|
|
|
| Transamerica Series Trust |
|
|
|
Semi-Annual Financial Statements 2024 |
|
|
Page 10 |
|
|
Transamerica BlackRock iShares Dynamic Allocation – Moderate Growth VP
MANAGEMENT AND SUB-ADVISORY AGREEMENT — CONTRACT RENEWAL
(unaudited)
At a meeting of the Board of Trustees of Transamerica Series Trust (the “Trustees” or the “Board”) held on June 12-13, 2024, the Board considered the renewal of the management agreement (the “Management Agreement”) between Transamerica Asset Management, Inc. (“TAM”) and Transamerica Series Trust, on behalf of Transamerica BlackRock iShares Dynamic Allocation – Moderate Growth VP (the “Portfolio”). The Board also considered the renewal of the investment sub-advisory agreement (the “Sub-Advisory Agreement” and together with the Management Agreement, the “Agreements”) for the Portfolio between TAM and BlackRock Investment Management, LLC (the “Sub-Adviser”).
Following its review and consideration, the Board determined that the terms of the Management Agreement and Sub-Advisory Agreement were reasonable and that the renewal of each of the Agreements was in the best interests of the Portfolio and the holders invested in the Portfolio. The Board, including the independent members of the Board (the “Independent Trustees”), unanimously approved the renewal of each of the Agreements through June 30, 2025.
Prior to reaching their decision, the Trustees requested and received from TAM and the Sub-Adviser certain information. They then reviewed such information as they deemed reasonably necessary to evaluate the Agreements, including information they had previously received from TAM and the Sub-Adviser as part of their regular oversight of the Portfolio, and knowledge they gained over time through meeting with TAM and the Sub-Adviser. Among other materials, the Trustees considered comparative fee, expense and performance information prepared by Broadridge Financial Solutions, Inc. (“Broadridge”), an independent provider of mutual fund performance information, as well as fee, expense and profitability information prepared by TAM. In addition, TAM provided the Board with additional supplemental comparative fee, expense and performance information. To the extent applicable, the Trustees considered information about fees and performance of comparable funds and/or accounts managed by the Sub-Adviser. The Board also considered reductions to the Portfolio’s expense limits, if any, that took effect after the last renewal of the Agreements. In their review, the Trustees also sought to identify instances in which the Portfolio’s performance, fees, total expenses and/or profitability appeared to be outliers within its respective peer group or other comparative metrics and sought to understand the reasons for such comparative positions.
In their deliberations, the Independent Trustees met privately without representatives of TAM or the Sub-Adviser present and were represented throughout the process by their independent legal counsel. In considering the proposed continuation of each of the Agreements, the Trustees evaluated and weighed a number of considerations that they believed to be relevant in light of the legal advice furnished to them by counsel, including independent legal counsel, and made a decision in the exercise of their own business judgment. They based their decisions on the considerations discussed below, among others, although they did not identify any particular consideration or item of information that was controlling of their decisions, and each Trustee may have attributed different weights to the various factors.
Nature, Extent and Quality of the Services Provided
The Board considered the nature, extent and quality of the services provided by TAM and the Sub-Adviser to the Portfolio in the past and the services anticipated to be provided in the future. The Board also considered the investment approach for the Portfolio; the experience, capability and integrity of TAM’s senior management; the financial resources of TAM; TAM’s management oversight process; TAM’s and the Sub-Adviser’s responsiveness to any questions by the Trustees; and the professional qualifications and compensation program of the portfolio management team of the Sub-Adviser. The Trustees noted that they receive, on a quarterly basis, an execution analysis from Capital Institutional Services, Inc. (CAPIS), an independent provider of trade analyses, for the Sub-Adviser and a comparison of trading results against a peer universe of managers.
The Board also considered the continuous and regular investment management and other services provided by TAM, when acting as a manager of managers, for the portion of the management fee it retains from the Portfolio after payment of the sub-advisory fees. The Board noted that the investment management and other services provided by TAM include the design, development and ongoing review and evaluation of the Portfolio and its investment strategy; the selection, oversight and monitoring of one or more investment sub-advisers to perform certain duties with respect to the Portfolio; ongoing portfolio trading oversight and analysis; risk management oversight and analysis; design, development, implementation and ongoing review and evaluation of a process for the valuation of Portfolio investments; design, development, implementation and ongoing review and evaluation of a compliance program for the Portfolio; design, development, implementation and ongoing review and evaluation of a process for the voting of proxies and exercise of rights to consent to corporate action for Portfolio investments; participation in Board meetings and oversight of preparation of materials for the Board, including materials for Board meetings and regular communications with the Board; oversight of preparation of the Portfolio’s prospectus, statement of additional information, shareholder reports and other disclosure materials and regulatory filings for the Portfolio; and ongoing cash management services for the Portfolio. The Board considered that TAM’s investment management services also include the provision of supervisory and administrative services to the Portfolio. The Board also noted that TAM, as part of the services it provides to all Transamerica mutual funds, including the Portfolio, oversees the services provided by the funds’ custodian, transfer agent, independent accountant and legal counsel and supervises the performance of the recordkeeping and holder service functions of the funds.
Investment Performance
|
|
|
|
|
| Transamerica Series Trust |
|
|
|
Semi-Annual Financial Statements 2024 |
|
|
Page 11 |
|
|
Transamerica BlackRock iShares Dynamic Allocation – Moderate Growth VP
MANAGEMENT AND SUB-ADVISORY AGREEMENT — CONTRACT RENEWAL (continued)
(unaudited)
In addition, the Board considered the short- and longer-term performance of the Portfolio in light of its investment objective, policies and strategies, including relative performance against (i) a peer universe of comparable mutual funds, as prepared by Broadridge, and (ii) the Portfolio’s benchmarks, in each case for various trailing periods ended December 31, 2023. Based on these considerations, the Board determined that TAM and the Sub-Adviser can provide investment and related services that are appropriate in scope and extent in light of the Portfolio’s investment objectives, policies and strategies and operations, the competitive landscape of the investment company business and investor needs. The Board’s conclusions as to the Portfolio’s performance are summarized below. For purposes of its review, the Board generally used the performance of Service Class Shares. In describing the Portfolio’s performance relative to its peer universe, the summary conclusions characterize performance for the relevant periods in relation to whether it was “above,” “below” or “in line with” the peer universe median and do so using quintile rankings prepared by Broadridge. For simplicity, performance is described as “above” the median if the Portfolio’s performance ranked anywhere in the first or second quintiles, as “below” the median if it ranked anywhere in the fourth or fifth quintiles, or “in line with” the median if it ranked anywhere in the third quintile (i.e., even if its precise return was somewhat above or somewhat below the precise median return).
When considering the Portfolio’s performance, the Trustees considered any representations made by TAM regarding the appropriateness of certain peer groups and benchmarks. They recognized that performance reflects a snapshot of a period as of a specific date, and that consideration of performance data for a different period could generate significantly different performance results. The Trustees also recognized that even longer-term performance can be negatively affected by performance over a short-term period when that short-term performance is significantly below the performance of the comparable benchmark or universe of peer funds.
The Board noted that the performance of Service Class Shares of the Portfolio was above the median for its peer universe for the past 1-year period, in line with the median for the past 3-year period and below the median for the past 5- and 10-year periods. The Board also noted that the performance of Service Class Shares of the Portfolio was below the benchmark that TAM utilizes to measure performance of the Portfolio for the past 1-, 3-, 5- and 10-year periods. The Board noted that the Sub-Adviser had commenced sub-advising the Portfolio on November 1, 2021 pursuant to its current investment strategies and benchmarks.
Management Fee and Sub-Advisory Fees and Total Expense Ratio
The Board considered the management fee and total expense ratio of the Portfolio, including information provided by Broadridge comparing the management fee and total expense ratio of the Portfolio to the management fees and total expense ratios of comparable investment companies in both a peer group and broader peer universe compiled by Broadridge. The Board’s conclusions as to the Portfolio’s management fee and total expense ratio are summarized below. For purposes of its review, the Board generally used the actual total expenses (i.e., expenses reflecting any waivers and/or reimbursements) of Service Class Shares. In describing the Portfolio’s management fee and total expense ratio relative to its peer group and peer universe, the summary conclusions characterize management fees and total expense ratios for the relevant periods in relation to whether they were “above,” “below” or “in line with” the peer group or peer universe median and do so using quintile rankings prepared by Broadridge. For simplicity, management fees and total expense ratios are described as “above” the median if the Portfolio’s management fee or total expense ratio ranked anywhere in the fourth or fifth quintiles, as “below” the median if it ranked anywhere in the first or second quintiles, or “in line with” the median if it ranked anywhere in the third quintile (i.e., even if its precise management fee or total expense ratio was somewhat above or somewhat below the precise median management fee or total expense ratio).
The Board also considered the fees charged by the Sub-Adviser for sub-advisory services, as well as the portion of the Portfolio’s management fee retained by TAM following payment of the sub-advisory fee and how the portion of the contractual management fee retained by TAM at a specified asset level compared to the portions retained by other investment advisers managing mutual funds with similar investment strategies as calculated by an independent provider of information.
The Board noted that the Portfolio’s contractual management fee was in line with the median for its peer group and above the median for its peer universe and that the actual total expenses (i.e., expenses reflecting any waivers and/or reimbursements) of Service Class Shares of the Portfolio were in line with the median for its peer group and below the median for its peer universe. The Trustees also considered that TAM has entered into an expense limitation arrangement with the Portfolio, which may result in TAM waiving fees for the benefit of holders.
On the basis of these considerations, together with the other information it considered, the Board determined that the management and sub-advisory fees to be received by TAM and the Sub-Adviser under the Management Agreement and Sub-Advisory Agreement are reasonable in light of the services provided.
Cost of Services Provided and Level of Profitability
The Board reviewed information provided by TAM about the cost of providing and procuring fund management services, as well as the costs of the provision of administration, transfer agency and other services, to the Portfolio and to Transamerica Series Trust as a whole by TAM and its affiliates. The Board considered the profitability of TAM and its affiliates in providing these services for the Portfolio and Transamerica Series Trust as a whole. The Trustees recognized the competitiveness of the mutual fund industry and the importance of an investment adviser’s long-term profitability, including for maintaining company and management stability and accountability.
|
|
|
|
|
| Transamerica Series Trust |
|
|
|
Semi-Annual Financial Statements 2024 |
|
|
Page 12 |
|
|
Transamerica BlackRock iShares Dynamic Allocation – Moderate Growth VP
MANAGEMENT AND SUB-ADVISORY AGREEMENT — CONTRACT RENEWAL (continued)
(unaudited)
The Board also considered the allocation methodology used for calculating the profitability of TAM and its affiliates. The Board noted that the revenue and expense allocation methodology used by TAM to estimate its profitability with respect to its relationship with the Portfolio had been reviewed previously by an independent consultant. The Trustees considered that TAM reported that it had not made material changes to this methodology, and that the methodology had been applied consistently for the Portfolio.
With respect to the Sub-Adviser, the Board noted that the sub-advisory fee is the product of arm’s-length negotiation between TAM and the Sub-Adviser, which is not affiliated with TAM, and is paid by TAM and not the Portfolio. As a result, the Board focused on the profitability of TAM and its affiliates with respect to the Portfolio.
Based on this information, the Board determined that the profitability of TAM and its affiliates from their relationships with the Portfolio was not excessive.
Economies of Scale
The Board considered economies of scale with respect to the management of the Portfolio, whether the Portfolio had appropriately benefited from any economies of scale and whether there was the potential for realization of any future economies of scale. The Board also considered the existence of economies of scale with respect to management of the Transamerica mutual funds overall and the extent to which the Portfolio benefited from any economies of scale. The Board recognized that, as the Portfolio’s assets increase, any economies of scale realized by TAM or the Sub-Adviser may not directly correlate with each other or with any economies of scale that might be realized by the Portfolio. The Board considered the Portfolio’s management fee schedule and the existence of breakpoints and also considered the extent to which TAM shared economies of scale, if any, with the Portfolio through undertakings to limit or reimburse Portfolio expenses and to invest in maintaining and developing its capabilities and services. The Board also considered the Sub-Adviser’s sub-advisory fee schedule and the existence of breakpoints, if any, and how such breakpoints relate to any breakpoints in the Portfolio’s management fee schedule. The Board considered that the Sub-Adviser’s sub-advisory fees would be based on the combined assets of multiple funds. The Trustees concluded that the Portfolio’s fee structure reflected an appropriate sharing of any efficiencies or economies of scale to date and noted that they will have the opportunity to periodically reexamine the appropriateness of the management fee payable to TAM and the fee paid to the Sub-Adviser in light of any economies of scale experienced in the future.
Benefits to TAM, its Affiliates and/or the Sub-Adviser from their Relationships with the Portfolio
The Board considered other benefits derived by TAM, its affiliates, and/or the Sub-Adviser from their relationships with the Portfolio. The Board noted that TAM does not receive benefits from research obtained with commissions paid to broker-dealers for portfolio transactions (commonly referred to as “soft dollars”) as a result of its relationship with the Portfolio and that TAM believes the use of soft dollars by the Sub-Adviser is generally appropriate and in the best interests of the Portfolio.
Other Considerations
The Board noted that TAM has made a substantial commitment to the recruitment and retention of high-quality personnel and maintains the financial, compliance and operational resources reasonably necessary to manage the Portfolio in a professional manner that is consistent with the best interests of the Portfolio and the holders. In this regard, the Board favorably considered the procedures and policies TAM has in place to enforce compliance with applicable laws and regulations and oversee the portfolio management activities of the Sub-Adviser. The Board also noted that TAM has made an entrepreneurial commitment and undertaken certain business risks with respect to the management and success of the Portfolio.
Conclusion
After consideration of the factors described above, as well as other factors, the Trustees, including the Independent Trustees, concluded that the renewal of the Management Agreement and the Sub-Advisory Agreement was in the best interests of the Portfolio and the holders and voted to approve the renewal of the Agreements.
|
|
|
|
|
| Transamerica Series Trust |
|
|
|
Semi-Annual Financial Statements 2024 |
|
|
Page 13 |
|
|
PROXY VOTING POLICIES AND PROCEDURES AND QUARTERLY PORTFOLIO HOLDINGS
(unaudited)
A description of Transamerica Series Trust’s (the “Trust”) proxy voting policies and procedures is available in the Statement of Additional Information of the Portfolios, available without charge upon request by calling 1-800-851-9777 (toll free) or on the Securities and Exchange Commission’s (“SEC”) website at http://www.sec.gov.
In addition, the Portfolio is required to file Form N-PX, with their complete proxy voting records for the most recent 12 months ended June 30th, no later than August 31st of each year. The Form is available without charge: (1) on the Transamerica Funds website at https://www.transamerica.com/sites/default/files/files/e070d/TST%20N-PX%202021.pdf; and (2) on the SEC’s website at http://www.sec.gov.
Each fiscal quarter, the Portfolios, except Transamerica BlackRock Government Money Market VP, will file with the SEC a complete schedule of its monthly portfolio holdings on Form N-PORT. The Portfolios’ holdings as of the end of the third month of every fiscal quarter, as reported on Form N-PORT, will be publicly available on the SEC’s website at http://www.sec.gov within 60 days of the end of the fiscal quarter.
On a monthly basis, Transamerica BlackRock Government Money Market VP will file with the SEC portfolio holdings information on Form N-MFP3. A complete schedule of portfolio holdings is also available at www.transamerica.com.
You may also visit the Trust’s website at www.transamerica.com/annuities/prospectus for this and other information about the Portfolios and the Trust.
Important Notice Regarding Delivery of Shareholder Documents
Every year we provide shareholders informative materials such as the Transamerica Series Trust Annual Report, the Transamerica Series Trust Prospectus, and other required documents that keep you informed regarding your Portfolios. To the extent provided by mail, Transamerica Series Trust will only send one piece per mailing address, a method that saves your Portfolios money by reducing mailing and printing costs. We will continue to do this unless you tell us not to. To elect to receive individual mailings, simply call a Transamerica Customer Service Representative toll free at 1-800-851-9777, 8 a.m. to 7 p.m. Eastern Time, Monday-Friday. Your request will take effect within 30 days.
|
|
|
| Transamerica Series Trust |
|
Semi-Annual Financial Statements 2024 |
Page 14
NOTICE OF PRIVACY POLICY
(unaudited)
Your privacy is very important to us. We want you to understand what information we collect and how we use it. We collect and use “nonpublic personal information” in connection with providing our customers with a broad range of financial products and services as effectively and conveniently as possible. We treat nonpublic personal information in accordance with our Privacy Policy.
What Information We Collect and From Whom We Collect It
We may collect nonpublic personal information about you from the following sources:
| • |
|
Information we receive from you on applications or other forms, such as your name, address, and account number; |
| • |
|
Information about your transactions with us, our affiliates, or others, such as your account balance and purchase/redemption history; and |
| • |
|
Information we receive from non-affiliated third parties, including consumer reporting agencies. |
What Information We Disclose and To Whom We Disclose It
We do not disclose any nonpublic personal information about current or former customers to anyone without their express consent, except as permitted by law. We may disclose the nonpublic personal information we collect, as described above, to persons or companies that perform services on our behalf and to other financial institutions with which we have joint marketing agreements. We will require these companies to protect the confidentiality of your nonpublic personal information and to use it only to perform the services for which we have hired them.
Our Security Procedures
We restrict access to your nonpublic personal information and only allow disclosures to persons and companies as permitted by law to assist in providing products or services to you. We maintain physical, electronic, and procedural safeguards to protect your nonpublic personal information and to safeguard the disposal of certain consumer information.
Contact Us
If you have any questions about our Privacy Policy, please call 1-800-851-9777 on any business day between 8 a.m. and 7 p.m. Eastern Time.
Note: This Privacy Policy applies only to customers that have a direct relationship with us or our affiliates. If you own shares of our portfolios in the name of a third party such as a bank or broker-dealer, its privacy policy may apply to you instead of ours.
|
|
|
|
|
| Transamerica Series Trust |
|
|
|
Semi-Annual Financial Statements 2024 |
|
|
Page 15 |
|
|
|
|
|
| PO Box 219945 |
| Kansas City, MO 64121-9945 |
|
|
| Distributor: |
|
Transamerica Capital, Inc. |
|
|
PO Box 219945 |
|
|
Kansas City, MO 64121-9945 |
|
|
|
|
Customer Service: 1-800-851-9777 |
Transamerica Series Trust Semi-Annual Financial Statements
June 30, 2024
1801 California St., Suite 5200
Denver, CO 80202
Distributor: Transamerica Capital, Inc.
Customer Service: 1-800-851-9777
The following pages contain the most recent semi-annual financial statements for the investment options in which you are invested. In compliance with Securities and Exchange Commission regulations, we present these reports on an annual and semi-annual basis with the hope that they will foster greater understanding of the investment options’ holdings, performance, financial data, accounting policies and other issues. This streamlined version provides information only on the investment options in which you are invested.
If you have any questions about these reports, please do not hesitate to contact your financial professional. As always, we thank you for your trust and the opportunity to serve you.
Transamerica BlackRock iShares Edge 40 VP
SCHEDULE OF INVESTMENTS
At June 30, 2024
(unaudited)
|
|
|
|
|
|
|
|
|
| |
|
Shares |
|
|
Value |
|
| |
|
|
| EXCHANGE-TRADED FUNDS - 100.1% |
|
| International Equity Funds - 9.9% |
|
| iShares MSCI EAFE Min Vol Factor ETF (A) |
|
|
247,770 |
|
|
$ |
17,184,088 |
|
| iShares MSCI Emerging Markets Min Vol Factor ETF |
|
|
86,775 |
|
|
|
4,964,398 |
|
|
|
|
|
|
|
|
|
|
|
|
|
|
|
|
|
|
|
|
22,148,486 |
|
|
|
|
|
|
|
|
|
|
| U.S. Equity Funds - 31.1% |
|
| iShares MSCI USA Min Vol Factor ETF |
|
|
178,830 |
|
|
|
15,014,567 |
|
| iShares MSCI USA Momentum Factor ETF (A) |
|
|
78,288 |
|
|
|
15,255,982 |
|
| iShares MSCI USA Quality Factor ETF |
|
|
90,117 |
|
|
|
15,388,379 |
|
| iShares MSCI USA Size Factor ETF (A) |
|
|
65,661 |
|
|
|
9,030,357 |
|
| iShares MSCI USA Value Factor ETF (A) |
|
|
139,111 |
|
|
|
14,392,424 |
|
|
|
|
|
|
|
|
|
|
|
|
|
|
|
|
|
|
|
|
69,081,709 |
|
|
|
|
|
|
|
|
|
|
| U.S. Fixed Income Funds - 59.1% |
|
| iShares Broad USD Investment Grade Corporate Bond ETF (A) |
|
|
423,783 |
|
|
|
21,278,145 |
|
| iShares Core U.S. Aggregate Bond ETF |
|
|
1,134,161 |
|
|
|
110,093,008 |
|
|
|
|
|
|
|
|
|
|
|
|
|
|
|
|
|
|
|
|
131,371,153 |
|
|
|
|
|
|
|
|
|
|
|
|
|
| Total Exchange-Traded Funds
(Cost $209,024,337) |
|
|
|
|
|
|
222,601,348 |
|
|
|
|
|
|
|
|
|
|
|
|
|
|
|
|
|
|
|
| |
|
Shares |
|
|
Value |
|
| |
|
|
| OTHER INVESTMENT COMPANY - 9.2% |
|
| Securities Lending Collateral - 9.2% |
|
| State Street Navigator Securities Lending Trust - Government Money Market Portfolio, 5.28% (B) |
|
|
20,534,349 |
|
|
$ |
20,534,349 |
|
|
|
|
|
|
|
|
|
|
|
|
| Total Other Investment Company
(Cost $20,534,349) |
|
|
|
20,534,349 |
|
|
|
|
|
|
|
| Total Investments
(Cost $229,558,686) |
|
|
|
243,135,697 |
|
|
|
|
|
|
|
| Net Other Assets (Liabilities) - (9.3)% |
|
|
|
(20,730,180) |
|
|
|
|
|
|
|
|
|
|
|
|
| Net Assets - 100.0% |
|
|
$ |
222,405,517 |
|
|
|
|
|
|
|
INVESTMENT VALUATION:
Valuation Inputs (C)
|
|
|
|
|
|
|
|
|
|
|
|
|
|
|
|
|
| |
|
Level 1 - Unadjusted Quoted Prices |
|
|
Level 2 - Other Significant Observable Inputs |
|
|
Level 3 - Significant Unobservable Inputs |
|
|
Value |
|
| |
|
|
|
|
|
|
| ASSETS |
|
|
|
|
|
|
|
|
|
|
|
|
|
|
|
|
| Investments |
|
|
|
|
|
|
|
|
|
|
|
|
|
|
|
|
| Exchange-Traded Funds |
|
$ |
222,601,348 |
|
|
$ |
— |
|
|
$ |
— |
|
|
$ |
222,601,348 |
|
| Other Investment Company |
|
|
20,534,349 |
|
|
|
— |
|
|
|
— |
|
|
|
20,534,349 |
|
|
|
|
|
|
|
|
|
|
|
|
|
|
|
|
|
|
| Total Investments |
|
$ |
243,135,697 |
|
|
$ |
— |
|
|
$ |
— |
|
|
$ |
243,135,697 |
|
|
|
|
|
|
|
|
|
|
|
|
|
|
|
|
|
|
FOOTNOTES TO SCHEDULE OF INVESTMENTS:
| (A) |
All or a portion of the security is on loan. The total value of the securities on loan is $29,115,860, collateralized by cash collateral of $20,534,349 and non-cash collateral, such as U.S. government securities and irrevocable letters of credit, of $9,200,250. The amount on loan indicated may not correspond with the securities on loan identified because a security with pending sales are in the process of recall from the brokers. |
| (B) |
Rate disclosed reflects the yield at June 30, 2024. |
| (C) |
There were no transfers in or out of Level 3 during the period ended June 30, 2024. Please reference the Investment Valuation section of the Notes to Financial Statements for more information regarding investment valuation and pricing inputs. |
|
|
|
|
|
| The Notes to Financial Statements are an integral part of this report. |
| Transamerica Series Trust |
|
|
|
Semi-Annual Financial Statements 2024 |
|
|
Page 1 |
|
|
Transamerica BlackRock iShares Edge 40 VP
STATEMENT OF ASSETS AND LIABILITIES
At June 30, 2024
(unaudited)
|
|
|
|
|
|
|
| Assets: |
|
|
|
|
| Unaffiliated investments, at value (cost $229,558,686) (including securities loaned of $29,115,860) |
|
$ |
243,135,697 |
|
| Cash |
|
|
35,066 |
|
| Foreign currency, at value (cost $666) |
|
|
654 |
|
| Receivables and other assets: |
|
|
|
|
| Net income from securities lending |
|
|
10,432 |
|
| Shares of beneficial interest sold |
|
|
1,906 |
|
| Tax reclaims |
|
|
15,377 |
|
| Prepaid expenses |
|
|
897 |
|
|
|
| Total assets |
|
|
243,200,029 |
|
|
|
| Liabilities: |
|
|
|
|
| Cash collateral received upon return of: |
|
|
|
|
| Securities on loan |
|
|
20,534,349 |
|
| Payables and other liabilities: |
|
|
|
|
| Shares of beneficial interest redeemed |
|
|
123,020 |
|
| Investment management fees |
|
|
42,422 |
|
| Distribution and service fees |
|
|
38,904 |
|
| Transfer agent costs |
|
|
242 |
|
| Trustee and CCO fees |
|
|
702 |
|
| Audit and tax fees |
|
|
13,209 |
|
| Custody fees |
|
|
10,473 |
|
| Legal fees |
|
|
5,055 |
|
| Printing and shareholder reports fees |
|
|
17,723 |
|
| Other accrued expenses |
|
|
8,413 |
|
|
|
| Total liabilities |
|
|
20,794,512 |
|
|
|
| Net assets |
|
$ |
222,405,517 |
|
|
|
| Net assets consist of: |
|
|
|
|
| Capital stock ($0.01 par value) |
|
$ |
251,185 |
|
| Additional paid-in capital |
|
|
195,496,887 |
|
| Total distributable earnings (accumulated losses) |
|
|
26,657,445 |
|
|
|
| Net assets |
|
$ |
222,405,517 |
|
|
|
| Net assets by class: |
|
|
|
|
| Initial Class |
|
$ |
20,360,591 |
|
| Service Class |
|
|
202,044,926 |
|
|
|
| Shares outstanding: |
|
|
|
|
| Initial Class |
|
|
2,280,806 |
|
| Service Class |
|
|
22,837,713 |
|
|
|
| Net asset value and offering price per share: |
|
|
|
|
| Initial Class |
|
$ |
8.93 |
|
| Service Class |
|
|
8.85 |
|
STATEMENT OF OPERATIONS
For the period ended June 30, 2024
(unaudited)
|
|
|
|
|
|
|
| Investment income: |
|
|
|
|
| Dividend income from unaffiliated investments |
|
$ |
2,962,323 |
|
| Interest income from unaffiliated investments |
|
|
767 |
|
| Net income from securities lending |
|
|
33,626 |
|
|
|
| Total investment income |
|
|
2,996,716 |
|
|
|
| Expenses: |
|
|
|
|
| Investment management fees |
|
|
334,910 |
|
| Distribution and service fees: |
|
|
|
|
| Service Class |
|
|
254,278 |
|
| Transfer agent costs |
|
|
1,294 |
|
| Trustee and CCO fees |
|
|
5,260 |
|
| Audit and tax fees |
|
|
12,989 |
|
| Custody fees |
|
|
11,699 |
|
| Legal fees |
|
|
9,344 |
|
| Printing and shareholder reports fees |
|
|
16,504 |
|
| Other |
|
|
11,944 |
|
|
|
| Total expenses before waiver and/or reimbursement and recapture |
|
|
658,222 |
|
| Expenses waived and/or reimbursed: |
|
|
|
|
| Initial Class |
|
|
(5,181 |
) |
| Service Class |
|
|
(52,697 |
) |
| Recapture of previously waived and/or reimbursed fees: |
|
|
|
|
| Initial Class |
|
|
4 |
|
| Service Class |
|
|
4 |
|
|
|
| Net expenses |
|
|
600,352 |
|
|
|
| Net investment income (loss) |
|
|
2,396,364 |
|
|
|
| Net realized gain (loss) on: |
|
|
|
|
| Unaffiliated investments |
|
|
2,888,335 |
|
|
|
| Net change in unrealized appreciation (depreciation) on: |
|
|
|
|
| Unaffiliated investments |
|
|
1,879,919 |
|
| Translation of assets and liabilities denominated in foreign currencies |
|
|
(488 |
) |
|
|
| Net change in unrealized appreciation (depreciation) |
|
|
1,879,431 |
|
|
|
| Net realized and change in unrealized gain (loss) |
|
|
4,767,766 |
|
|
|
| Net increase (decrease) in net assets resulting from operations |
|
$ |
7,164,130 |
|
The Notes to Financial Statements are an integral part of this report.
|
|
|
|
|
| Transamerica Series Trust |
|
|
|
Semi-Annual Financial Statements 2024 |
|
|
Page 2 |
|
|
Transamerica BlackRock iShares Edge 40 VP
STATEMENT OF CHANGES IN NET ASSETS
For the period and year ended:
|
|
|
|
|
|
|
|
|
|
|
|
| |
|
June 30, 2024 (unaudited) |
|
December 31, 2023 |
|
|
|
| From operations: |
|
|
|
|
|
|
|
|
| Net investment income (loss) |
|
$ |
2,396,364 |
|
|
$ |
5,480,117 |
|
| Net realized gain (loss) |
|
|
2,888,335 |
|
|
|
2,861,326 |
|
| Net change in unrealized appreciation (depreciation) |
|
|
1,879,431 |
|
|
|
12,052,150 |
|
|
|
|
| Net increase (decrease) in net assets resulting from operations |
|
|
7,164,130 |
|
|
|
20,393,593 |
|
|
|
|
| Dividends and/or distributions to shareholders: |
|
|
|
|
|
|
|
|
| Initial Class |
|
|
— |
|
|
|
(762,305 |
) |
| Service Class |
|
|
— |
|
|
|
(7,677,357 |
) |
|
|
|
| Net increase (decrease) in net assets resulting from dividends and/or distributions to shareholders |
|
|
— |
|
|
|
(8,439,662 |
) |
|
|
|
| Capital share transactions: |
|
|
|
|
|
|
|
|
| Proceeds from shares sold: |
|
|
|
|
|
|
|
|
| Initial Class |
|
|
1,186,287 |
|
|
|
1,039,407 |
|
| Service Class |
|
|
476,198 |
|
|
|
1,234,141 |
|
| |
|
|
1,662,485 |
|
|
|
2,273,548 |
|
| Dividends and/or distributions reinvested: |
|
|
|
|
|
|
|
|
| Initial Class |
|
|
— |
|
|
|
762,305 |
|
| Service Class |
|
|
— |
|
|
|
7,677,357 |
|
| |
|
|
— |
|
|
|
8,439,662 |
|
| Cost of shares redeemed: |
|
|
|
|
|
|
|
|
| Initial Class |
|
|
(1,597,637 |
) |
|
|
(2,621,143 |
) |
| Service Class |
|
|
(16,926,955 |
) |
|
|
(33,856,700 |
) |
|
|
|
| |
|
|
(18,524,592 |
) |
|
|
(36,477,843 |
) |
|
|
|
| Net increase (decrease) in net assets resulting from capital share transactions |
|
|
(16,862,107 |
) |
|
|
(25,764,633 |
) |
|
|
|
| Net increase (decrease) in net assets |
|
|
(9,697,977 |
) |
|
|
(13,810,702 |
) |
|
|
|
| Net assets: |
|
|
|
|
|
|
|
|
| Beginning of period/year |
|
|
232,103,494 |
|
|
|
245,914,196 |
|
| End of period/year |
|
$ |
222,405,517 |
|
|
$ |
232,103,494 |
|
|
|
|
| Capital share transactions - shares: |
|
|
|
|
|
|
|
|
| Shares issued: |
|
|
|
|
|
|
|
|
| Initial Class |
|
|
133,773 |
|
|
|
124,213 |
|
| Service Class |
|
|
54,724 |
|
|
|
149,521 |
|
| |
|
|
188,497 |
|
|
|
273,734 |
|
| Shares reinvested: |
|
|
|
|
|
|
|
|
| Initial Class |
|
|
— |
|
|
|
92,625 |
|
| Service Class |
|
|
— |
|
|
|
939,701 |
|
| |
|
|
— |
|
|
|
1,032,326 |
|
| Shares redeemed: |
|
|
|
|
|
|
|
|
| Initial Class |
|
|
(181,933 |
) |
|
|
(313,381 |
) |
| Service Class |
|
|
(1,948,404 |
) |
|
|
(4,089,827 |
) |
| |
|
|
(2,130,337 |
) |
|
|
(4,403,208 |
) |
| Net increase (decrease) in shares outstanding: |
|
|
|
|
|
|
|
|
| Initial Class |
|
|
(48,160 |
) |
|
|
(96,543 |
) |
| Service Class |
|
|
(1,893,680 |
) |
|
|
(3,000,605 |
) |
| |
|
|
(1,941,840 |
) |
|
|
(3,097,148 |
) |
The Notes to Financial Statements are an integral part of this report.
|
|
|
|
|
| Transamerica Series Trust |
|
|
|
Semi-Annual Financial Statements 2024 |
|
|
Page 3 |
|
|
Transamerica BlackRock iShares Edge 40 VP
FINANCIAL HIGHLIGHTS
|
|
|
|
|
|
|
|
|
|
|
|
|
|
|
|
|
|
|
|
|
|
|
|
|
| For a share outstanding during the period and years indicated: |
|
Initial Class |
|
|
|
|
|
|
|
| |
|
June 30, 2024 (unaudited) |
|
December 31, 2023 |
|
December 31, 2022 |
|
December 31, 2021 |
|
December 31, 2020 |
|
December 31, 2019 |
|
|
|
|
|
|
|
| Net asset value, beginning of period/year |
|
$ |
8.64 |
|
|
$ |
8.21 |
|
|
$ |
10.20 |
|
|
$ |
9.98 |
|
|
$ |
9.39 |
|
|
$ |
9.61 |
|
|
|
|
|
|
|
|
| Investment operations: |
|
|
|
|
|
|
|
|
|
|
|
|
|
|
|
|
|
|
|
|
|
|
|
|
|
|
|
|
|
|
|
| Net investment income (loss)(A) |
|
|
0.10 |
|
|
|
0.21 |
|
|
|
0.18 |
|
|
|
0.15 |
|
|
|
0.17 |
|
|
|
0.24 |
|
|
|
|
|
|
|
|
| Net realized and unrealized gain (loss) |
|
|
0.19 |
|
|
|
0.55 |
|
|
|
(1.62 |
) |
|
|
0.45 |
|
|
|
0.72 |
|
|
|
1.18 |
|
|
|
|
|
|
|
|
| Total investment operations |
|
|
0.29 |
|
|
|
0.76 |
|
|
|
(1.44 |
) |
|
|
0.60 |
|
|
|
0.89 |
|
|
|
1.42 |
|
|
|
|
|
|
|
|
| Dividends and/or distributions to shareholders: |
|
|
|
|
|
|
|
|
|
|
|
|
|
|
|
|
|
|
|
|
|
|
|
|
| Net investment income |
|
|
— |
|
|
|
(0.20 |
) |
|
|
(0.17 |
) |
|
|
(0.18 |
) |
|
|
(0.23 |
) |
|
|
(0.24 |
) |
|
|
|
|
|
|
|
| Net realized gains |
|
|
— |
|
|
|
(0.13 |
) |
|
|
(0.38 |
) |
|
|
(0.20 |
) |
|
|
(0.07 |
) |
|
|
(1.40 |
) |
|
|
|
|
|
|
|
| Total dividends and/or distributions to shareholders |
|
|
— |
|
|
|
(0.33 |
) |
|
|
(0.55 |
) |
|
|
(0.38 |
) |
|
|
(0.30 |
) |
|
|
(1.64 |
) |
|
|
|
|
|
|
|
| Net asset value, end of period/year |
|
$ |
8.93 |
|
|
$ |
8.64 |
|
|
$ |
8.21 |
|
|
$ |
10.20 |
|
|
$ |
9.98 |
|
|
$ |
9.39 |
|
| |
|
|
|
|
|
|
|
|
|
|
|
|
|
|
|
|
|
|
|
|
|
|
|
|
|
|
|
|
|
|
|
| Total return |
|
|
3.36 |
%(B) |
|
|
9.45 |
% |
|
|
(14.24 |
)% |
|
|
6.09 |
% |
|
|
9.65 |
% |
|
|
15.31 |
% |
|
|
|
|
|
|
|
| Ratio and supplemental data: |
|
|
|
|
|
|
|
|
|
|
|
|
|
|
|
|
|
|
|
|
|
|
|
|
|
|
|
|
|
|
|
| Net assets end of period/year (000’s) |
|
$ |
20,361 |
|
|
$ |
20,118 |
|
|
$ |
19,923 |
|
|
$ |
25,371 |
|
|
$ |
27,992 |
|
|
$ |
25,439 |
|
|
|
|
|
|
|
|
| Expenses to average net assets(C) |
|
|
|
|
|
|
|
|
|
|
|
|
|
|
|
|
|
|
|
|
|
|
|
|
|
|
|
|
|
|
|
| Excluding waiver and/or reimbursement and recapture |
|
|
0.36 |
%(D) |
|
|
0.37 |
% |
|
|
0.35 |
% |
|
|
0.34 |
% |
|
|
0.34 |
% |
|
|
0.34 |
% |
|
|
|
|
|
|
|
| Including waiver and/or reimbursement and recapture |
|
|
0.31 |
%(D)(E) |
|
|
0.31 |
%(E) |
|
|
0.30 |
%(E)(F) |
|
|
0.29 |
%(F) |
|
|
0.29 |
%(F) |
|
|
0.30 |
%(F) |
|
|
|
|
|
|
|
| Net investment income (loss) to average net assets |
|
|
2.39 |
%(D) |
|
|
2.56 |
% |
|
|
1.97 |
% |
|
|
1.50 |
% |
|
|
1.84 |
% |
|
|
2.42 |
% |
|
|
|
|
|
|
|
| Portfolio turnover rate |
|
|
3 |
%(B) |
|
|
4 |
% |
|
|
5 |
% |
|
|
6 |
% |
|
|
13 |
% |
|
|
4 |
% |
| (A) |
Calculated based on average number of shares outstanding. |
| (C) |
Does not include expenses of the underlying investments in which the Portfolio invests. |
| (E) |
TAM has contractually agreed, through May 1, 2025, to waive from its management fees an amount equal to the sub-advisory fee waiver by the Portfolio’s sub-adviser. These amounts are not subject to recapture by TAM. |
| (F) |
TAM contractually agreed to waive 0.05% of the average daily net assets from its management fee through May 1, 2022. These amounts are not subject to recapture by TAM. |
The Notes to Financial Statements are an integral part of this report.
|
|
|
|
|
| Transamerica Series Trust |
|
|
|
Semi-Annual Financial Statements 2024 |
|
|
Page 4 |
|
|
Transamerica BlackRock iShares Edge 40 VP
FINANCIAL HIGHLIGHTS (continued)
|
|
|
|
|
|
|
|
|
|
|
|
|
|
|
|
|
|
|
|
|
|
|
|
|
| For a share outstanding during the period and years indicated: |
|
Service Class |
|
|
|
|
|
|
|
| |
|
June 30, 2024 (unaudited) |
|
December 31, 2023 |
|
December 31, 2022 |
|
December 31, 2021 |
|
December 31, 2020 |
|
December 31, 2019 |
|
|
|
|
|
|
|
| Net asset value, beginning of period/year |
|
$ |
8.57 |
|
|
$ |
8.15 |
|
|
$ |
10.12 |
|
|
$ |
9.91 |
|
|
$ |
9.32 |
|
|
$ |
9.54 |
|
|
|
|
|
|
|
|
| Investment operations: |
|
|
|
|
|
|
|
|
|
|
|
|
|
|
|
|
|
|
|
|
|
|
|
|
|
|
|
|
|
|
|
| Net investment income (loss)(A) |
|
|
0.09 |
|
|
|
0.19 |
|
|
|
0.15 |
|
|
|
0.13 |
|
|
|
0.15 |
|
|
|
0.21 |
|
|
|
|
|
|
|
|
| Net realized and unrealized gain (loss) |
|
|
0.19 |
|
|
|
0.53 |
|
|
|
(1.59 |
) |
|
|
0.44 |
|
|
|
0.72 |
|
|
|
1.18 |
|
|
|
|
|
|
|
|
| Total investment operations |
|
|
0.28 |
|
|
|
0.72 |
|
|
|
(1.44 |
) |
|
|
0.57 |
|
|
|
0.87 |
|
|
|
1.39 |
|
|
|
|
|
|
|
|
| Dividends and/or distributions to shareholders: |
|
|
|
|
|
|
|
|
|
|
|
|
|
|
|
|
|
|
|
|
|
|
|
|
|
|
|
|
|
|
|
| Net investment income |
|
|
— |
|
|
|
(0.17 |
) |
|
|
(0.15 |
) |
|
|
(0.16 |
) |
|
|
(0.21 |
) |
|
|
(0.21 |
) |
|
|
|
|
|
|
|
| Net realized gains |
|
|
— |
|
|
|
(0.13 |
) |
|
|
(0.38 |
) |
|
|
(0.20 |
) |
|
|
(0.07 |
) |
|
|
(1.40 |
) |
|
|
|
|
|
|
|
| Total dividends and/or distributions to shareholders |
|
|
— |
|
|
|
(0.30 |
) |
|
|
(0.53 |
) |
|
|
(0.36 |
) |
|
|
(0.28 |
) |
|
|
(1.61 |
) |
|
|
|
|
|
|
|
| Net asset value, end of period/year |
|
$ |
8.85 |
|
|
$ |
8.57 |
|
|
$ |
8.15 |
|
|
$ |
10.12 |
|
|
$ |
9.91 |
|
|
$ |
9.32 |
|
| |
|
|
|
|
|
|
|
|
|
|
|
|
|
|
|
|
|
|
|
|
|
|
|
|
|
|
|
|
|
|
|
| Total return |
|
|
3.27 |
%(B) |
|
|
9.07 |
% |
|
|
(14.44 |
)% |
|
|
5.78 |
% |
|
|
9.45 |
% |
|
|
15.10 |
% |
|
|
|
|
|
|
|
| Ratio and supplemental data: |
|
|
|
|
|
|
|
|
|
|
|
|
|
|
|
|
|
|
|
|
|
|
|
|
|
|
|
|
|
|
|
| Net assets end of period/year (000’s) |
|
$ |
202,045 |
|
|
$ |
211,985 |
|
|
$ |
225,991 |
|
|
$ |
307,762 |
|
|
$ |
322,599 |
|
|
$ |
316,279 |
|
|
|
|
|
|
|
|
| Expenses to average net assets(C) |
|
|
|
|
|
|
|
|
|
|
|
|
|
|
|
|
|
|
|
|
|
|
|
|
|
|
|
|
|
|
|
| Excluding waiver and/or reimbursement and recapture |
|
|
0.61 |
%(D) |
|
|
0.62 |
% |
|
|
0.60 |
% |
|
|
0.59 |
% |
|
|
0.59 |
% |
|
|
0.59 |
% |
|
|
|
|
|
|
|
| Including waiver and/or reimbursement and recapture |
|
|
0.56 |
%(D)(E) |
|
|
0.56 |
%(E) |
|
|
0.55 |
%(E)(F) |
|
|
0.54 |
%(F) |
|
|
0.54 |
%(F) |
|
|
0.55 |
%(F) |
|
|
|
|
|
|
|
| Net investment income (loss) to average net assets |
|
|
2.12 |
%(D) |
|
|
2.30 |
% |
|
|
1.71 |
% |
|
|
1.26 |
% |
|
|
1.58 |
% |
|
|
2.17 |
% |
|
|
|
|
|
|
|
| Portfolio turnover rate |
|
|
3 |
%(B) |
|
|
4 |
% |
|
|
5 |
% |
|
|
6 |
% |
|
|
13 |
% |
|
|
4 |
% |
| (A) |
Calculated based on average number of shares outstanding. |
| (C) |
Does not include expenses of the underlying investments in which the Portfolio invests. |
| (E) |
TAM has contractually agreed, through May 1, 2025, to waive from its management fees an amount equal to the sub-advisory fee waiver by the Portfolio’s sub-adviser. These amounts are not subject to recapture by TAM. |
| (F) |
TAM contractually agreed to waive 0.05% of the average daily net assets from its management fee through May 1, 2022. These amounts are not subject to recapture by TAM. |
The Notes to Financial Statements are an integral part of this report.
|
|
|
|
|
| Transamerica Series Trust |
|
|
|
Semi-Annual Financial Statements 2024 |
|
|
Page 5 |
|
|
Transamerica BlackRock iShares Edge 40 VP
NOTES TO FINANCIAL STATEMENTS
At June 30, 2024
(unaudited)
1. ORGANIZATION
Transamerica Series Trust (“TST”) is an open-end management investment company registered under the Investment Company Act of 1940, as amended (the “1940 Act”). TST applies investment company accounting and reporting guidance. TST serves as a funding vehicle for variable life insurance, variable annuity, and group annuity products. Transamerica BlackRock iShares Edge 40 VP (the “Portfolio”) is a series of TST and is classified as diversified under the 1940 Act. The Portfolio currently offers two classes of shares, Initial Class and Service Class.
The only shareholders of the Portfolio are affiliated insurance company separate accounts and/or affiliated asset allocation portfolios. Contract holders of the variable life and annuity contracts are not shareholders of the Portfolio. For ease of reference, shareholders and contract holders are collectively referred to in this report as “shareholders.”
This report must be accompanied or preceded by the Portfolio’s current prospectus, which contains additional information about the Portfolio, including risks, as well as investment objectives and strategies.
Transamerica Asset Management, Inc. (“TAM”) serves as investment manager for the Portfolio pursuant to an investment management agreement. TAM provides continuous and regular investment management services to the Portfolio. TAM supervises the Portfolio’s investments, conducts its investment program and provides supervisory, compliance and administrative services to the Portfolio.
TAM currently acts as a “manager of managers” and has hired sub-advisers to furnish day-to-day investment advice and recommendations. TAM may, in the future, determine to provide all aspects of the day-to-day management of the Portfolio without the use of a sub-adviser. When acting as a manager of managers, TAM provides investment management services that include, without limitation, the design and development of the Portfolio and its investment strategies and the ongoing review and evaluation of those investment strategies including recommending changes in strategy where it believes appropriate or advisable; the selection of one or more sub-advisers for the Portfolio employing a combination of quantitative and qualitative screens, research, analysis and due diligence; negotiation of sub-advisory agreements and fees; oversight and monitoring of sub-advisers and recommending changes to sub-advisers where it believes appropriate or advisable; recommending portfolio combinations and liquidations where it believes appropriate or advisable; selection and oversight of transition managers, as needed; regular supervision of the Portfolio’s investments; regular review and evaluation of sub-adviser performance; daily monitoring of the sub-advisers’ buying and selling of securities for the Portfolio; regular review of holdings; ongoing trade oversight and analysis; regular monitoring to ensure adherence to investment process; regular calls and periodic on-site visits with sub-advisers; portfolio construction and asset allocation when using multiple sub-advisers for the Portfolio; risk management oversight and analysis; oversight of negotiation of investment documentation and agreements; design, development, implementation and regular monitoring of the valuation process; periodic due diligence reviews of pricing vendors and vendor methodology; design, development, implementation and regular monitoring of the compliance process; respond to regulatory inquiries and determine appropriate litigation strategy, as needed; review of proxies voted by sub-advisers; oversight of preparation and review of materials for meetings of the Portfolio’s Board of Trustees (the “Board”), participation in these meetings and preparation of regular communications with the Board; oversight of preparation and review of prospectuses, shareholder reports and other disclosure materials and regulatory filings for the Portfolio; oversight of other service providers to the Portfolio, such as the custodian, the transfer agent, the Portfolio’s independent accounting firm and legal counsel; supervision of the performance of recordkeeping and shareholder relations functions for the Portfolio; and oversight of cash management services. TAM uses a variety of quantitative and qualitative tools to carry out its investment management services. TAM, not the Portfolio, is responsible for paying the sub-adviser(s) for their services, and sub-advisory fees are TAM’s expense.
TAM’s investment management services also include the provision of supervisory and administrative services to the Portfolio. These services include performing certain administrative services for the Portfolio and supervising and overseeing the administrative, clerical, recordkeeping and bookkeeping services provided to the Portfolio by State Street Bank and Trust Company (“State Street”), to whom TAM has outsourced the provision of certain sub-administration services. To the extent agreed upon by TAM and the Portfolio from time to time, TAM’s supervisory and administrative services include, but are not limited to: monitoring and verifying the custodian’s daily calculation of the Net Asset Values (“NAV”); shareholder relations functions; compliance services; valuation services; assisting in due diligence and in the oversight and monitoring of certain activities of sub-advisers and certain aspects of Portfolio investments; assisting with Portfolio combinations and liquidations; oversight of the preparation and filing, and review, of all returns and reports, in connection with federal, state and local taxes; oversight and review of regulatory reporting; supervising and coordinating the Portfolio’s custodian and dividend disbursing agent and monitoring their services to the Portfolio; assisting the Portfolio in preparing reports to shareholders; acting as liaison with the Portfolio’s independent public accountants and providing, upon request, analyses, fiscal year summaries and other audit related services; assisting in the preparation of agendas and supporting documents for and minutes of meetings of trustees and committees of trustees; assisting in the preparation of regular communications with the trustees; and providing personnel and office space, telephones and other office equipment as necessary in order for TAM to perform supervisory and administrative services to the Portfolio. The Portfolio
|
|
|
| Transamerica Series Trust |
|
Semi-Annual Financial Statements 2024 |
Page 6
Transamerica BlackRock iShares Edge 40 VP
NOTES TO FINANCIAL STATEMENTS (continued)
At June 30, 2024
(unaudited)
1. ORGANIZATION (continued)
pays certain fees and expenses to State Street for sub-administration services which are not administrative services covered by the management agreement with TAM or paid for through the management fees payable thereunder. For the period ended June 30, 2024, (i) the expenses paid to State Street for sub-administration services by the Portfolio are shown as a part of Other expenses within the Statement of Operations and (ii) the expenses payable to State Street for sub-administration services from the Portfolio are shown as part of Other accrued expenses within the Statement of Assets and Liabilities.
2. SIGNIFICANT ACCOUNTING POLICIES
In preparing the Portfolio’s financial statements in accordance with Generally Accepted Accounting Principles in the United States of America (“GAAP”), estimates or assumptions (which could differ from actual results) may be used that affect reported amounts and disclosures. The following is a summary of significant accounting policies followed by the Portfolio.
Foreign currency denominated investments: The accounting records of the Portfolio are maintained in U.S. dollars. Securities and other assets and liabilities denominated in foreign currencies are translated into U.S. dollars based on the closing exchange rate each day. The cost of foreign securities purchased and any realized gains or losses are translated at the prevailing exchange rates in effect on the date of the respective transaction. The Portfolio combines fluctuations from currency exchange rates and fluctuations in value when computing net realized and unrealized gains or losses from investments.
Net foreign currency gains and losses resulting from changes in exchange rates include, foreign currency fluctuations between trade date and settlement date of investment security transactions, gains and losses on forward foreign currency contracts, and the difference between the receivable amounts of interest and dividends recorded in the accounting records in U.S. dollars and the amounts actually received.
Foreign currency denominated assets may involve risks not typically associated with domestic transactions. These risks include revaluation of currencies, adverse fluctuations in foreign currency values, and possible adverse political, social, and economic developments, including those particular to a specific industry, country or region.
Security transactions and investment income: Security transactions are accounted for on the trade date. Security gains and losses are calculated on a first-in, first-out basis. Interest income, if any, is accrued as earned. Dividend income and capital gain distributions from underlying investments, if any, are recorded on the ex-dividend date. Income or short-term capital gain distributions received from underlying investments, if any, are recorded as Dividend income from investments within the Statement of Operations. Long-term capital gain distributions received from underlying investments, if any, are recorded as Net realized gain (loss) on Capital gain distributions received from investments within the Statement of Operations.
Multiple class operations, income, and expenses: Income, non-class specific expenses, and realized and unrealized gains and losses are allocated to each class daily based upon net assets. Each class bears its own specific expenses in addition to the allocated non-class specific expenses.
Distributions to shareholders: Distributions are recorded on the ex-dividend date and are determined in accordance with federal income tax regulations, which may differ from GAAP.
Commission recapture: The sub-adviser(s), to the extent consistent with the best execution and usual commission rate policies and practices, may elect to place security transactions of the Portfolio with broker/dealers with which TST has established a commission recapture program. A commission recapture program is any arrangement under which a broker/dealer applies a portion of the commissions received by such broker/dealer on the security transactions to the Portfolio. In no event will commissions, paid by the Portfolio, be used to pay expenses that would otherwise be borne by any other Portfolios within TST, or by any other party.
There were no commissions recaptured during the period ended June 30, 2024 by the Portfolio.
Indemnification: In the normal course of business, the Portfolio enters into contracts that contain a variety of representations that provide general indemnifications. The Portfolio’s maximum exposure under these arrangements is unknown, as this would involve future claims that may be made against the Portfolio and/or its affiliates that have not yet occurred. However, based on experience, the Portfolio expects the risk of loss to be remote.
|
|
|
| Transamerica Series Trust |
|
Semi-Annual Financial Statements 2024 |
Page 7
Transamerica BlackRock iShares Edge 40 VP
NOTES TO FINANCIAL STATEMENTS (continued)
At June 30, 2024
(unaudited)
3. INVESTMENT VALUATION
TAM has been designated as the Portfolio’s valuation designee pursuant to Rule 2a-5 under the 1940 Act with responsibility for fair valuation subject to oversight by the Portfolio’s Board of Trustees. The net asset value of the Portfolio is computed as of the official close of the New York Stock Exchange (“NYSE”) each day the NYSE is open for business.
TAM utilizes various methods to measure the fair value of its investments on a recurring basis. GAAP establishes a hierarchy that prioritizes inputs to valuation methods. The inputs or methodology used for valuing securities are not necessarily an indication of the risk associated with investing in those securities. The three levels (“Levels”) of inputs of the fair value hierarchy are defined as follows:
Level 1—Unadjusted quoted prices in active markets for identical securities.
Level 2—Inputs, other than quoted prices included in Level 1, which are observable, either directly or indirectly. These inputs may include quoted prices for the identical instrument on an inactive market, prices for similar instruments, interest rates, prepayment speeds, credit risk, yield curves, default rates, and similar data.
Level 3—Unobservable inputs based on the best information available in the circumstances, to the extent observable inputs are not available, which may include TAM’s own assumptions used in determining the fair value of the Portfolio’s investments.
The inputs used to measure fair value may fall into different Levels of the fair value hierarchy. In such cases, for disclosure purposes, the Level in the fair value hierarchy that is assigned to the fair value measurement of a security is determined based on the lowest Level input that is significant to the fair value measurement in its entirety. Certain investments that are measured at fair value using NAV per share, or its equivalent, using the “practical expedient” have not been classified in the fair value Levels. The hierarchy classification of inputs used to value the Portfolio’s investments at June 30, 2024, is disclosed within the Investment Valuation section of the Schedule of Investments.
The availability of observable inputs can vary from security to security and is affected by a wide variety of factors, including, but not limited to, the type of security, whether the security is new and not yet established in the marketplace, the liquidity of markets, and other characteristics particular to the security. To the extent that valuation is based on models or inputs that are less observable or unobservable in the market, the determination of fair value requires more judgment. Accordingly, the degree of judgment exercised in determining fair value is generally greatest for instruments categorized in Level 3. Due to the inherent uncertainty of valuation, the determination of values may differ significantly from values that would have been realized had a ready market for investments existed, and the differences could be material.
Fair value measurements: Descriptions of the valuation techniques applied to the Portfolio’s significant categories of assets and liabilities measured at fair value on a recurring basis are as follows:
Exchange-traded funds (“ETF”): ETFs are stated at the last reported sale price or closing price on the day of valuation taken from the primary exchange where the ETF is principally traded. ETFs are generally categorized in Level 1 of the fair value hierarchy.
Securities lending collateral: Securities lending collateral is invested in a money market fund which is valued at the actively traded NAV and no valuation adjustments are applied. Securities lending collateral is categorized in Level 1 of the fair value hierarchy.
4. BORROWINGS AND OTHER FINANCING TRANSACTIONS
The Portfolio may engage in borrowing transactions as a means of raising cash to satisfy redemption requests, for other temporary or emergency purposes or, to the extent permitted by its investment policies, to raise additional cash to be invested in other securities or instruments. When the Portfolio invests borrowing proceeds in other securities, the Portfolio will bear the risk that the market value of the securities in which such proceeds are invested goes down and is insufficient to repay the borrowed proceeds. The Portfolio may borrow on a secured or on an unsecured basis. If the Portfolio enters into a secured borrowing arrangement, a portion of the Portfolio’s assets will be used as collateral. The 1940 Act requires the Portfolio to maintain asset coverage of at least 300% of the amount of its borrowings. Asset coverage means the ratio that the value of the Portfolio’s total assets, minus liabilities other than borrowings, bears to the aggregate amount of all borrowings. Although complying with this requirement has the effect of limiting the amount that the Portfolio may borrow, it does not otherwise mitigate the risks of entering into borrowing transactions.
Interfund lending: The Portfolio, along with other funds and portfolios advised by TAM, may participate in an interfund lending program pursuant to exemptive relief granted by the Securities and Exchange Commission on January 18, 2017. This program allows the Portfolio to lend to and borrow from other funds and portfolios advised by TAM. Interfund lending transactions are subject to the conditions of the
|
|
|
| Transamerica Series Trust |
|
Semi-Annual Financial Statements 2024 |
Page 8
Transamerica BlackRock iShares Edge 40 VP
NOTES TO FINANCIAL STATEMENTS (continued)
At June 30, 2024
(unaudited)
4. BORROWINGS AND OTHER FINANCING TRANSACTIONS (continued)
exemptive relief which places limits on the amount of lending or borrowing a Portfolio may participate in under the program. Interest earned or paid on an interfund lending transaction will be based on the average of certain current market rates. For the period ended June 30, 2024, the Portfolio has not utilized the program.
Securities lending: The Portfolio may lend securities to qualified financial institutions, brokers and dealers. State Street serves as securities lending agent to the Portfolio pursuant to a Securities Lending Agreement. Loans of securities are terminable at any time and the borrower, after notice, is required to return borrowed securities within the standard time period for settlement of securities transactions. The lending of securities exposes the Portfolio to risks such as: the borrowers may fail to return the loaned securities or may not be able to provide additional collateral, the Portfolio may experience delays in recovery of the loaned securities or delays in access to collateral, or the Portfolio may experience losses related to the investment collateral. To minimize certain risks, loan counterparties pledge cash, securities issued or guaranteed by the U.S. Government and irrevocable letters of credit issued by banks as collateral. The initial collateral received by the Portfolio is required to have a value of at least 102% of the current value of the loaned securities traded on U.S. exchanges, and a value of at least 105% for all other securities. Typically the lending agent is not permitted to sell, re-pledge or use cash and non-cash collateral it receives. The lending agent has agreed to indemnify the Portfolio in the case of default of any securities borrower.
The Portfolio receives compensation for lending securities from interest or dividends earned on the cash, U.S. Government securities and irrevocable letters of credit held as collateral, less associated fees and expenses. Such income is reflected in Net income from securities lending within the Statement of Operations. Cash collateral received is invested in the State Street Navigator Securities Lending Trust — Government Money Market Portfolio.
The value of loaned securities and related cash and non-cash collateral outstanding at June 30, 2024, if any, are shown on a gross basis within the Schedule of Investments.
The following table reflects a breakdown of transactions accounted for as secured borrowings, the gross obligation by the type, and the remaining contractual maturity of those transactions as of June 30, 2024.
|
|
|
|
|
|
|
|
|
|
|
|
|
|
|
|
|
|
|
|
|
| |
|
Remaining Contractual Maturity of the Agreements |
|
| |
|
Overnight and Continuous |
|
|
Less Than 30 Days |
|
|
Between 30 & 90 Days |
|
|
Greater Than 90 Days |
|
|
Total |
|
| Securities Lending Transactions Exchange-Traded Funds |
|
|
$ 20,534,349 |
|
|
|
$ — |
|
|
|
$ — |
|
|
|
$ — |
|
|
|
$ 20,534,349 |
|
| Total Borrowings |
|
|
$ 20,534,349 |
|
|
|
$ — |
|
|
|
$ — |
|
|
|
$ — |
|
|
|
$ 20,534,349 |
|
| |
|
|
|
|
|
|
|
|
|
|
|
|
|
|
|
|
|
|
|
|
5. RISK FACTORS
Investing in the Portfolio involves certain key risks related to the Portfolio’s trading activity. Please reference the Portfolio’s prospectus for a more complete discussion of the following risk(s), as well as other risks of investing in the Portfolio.
Market risk: The market prices of the Portfolio’s securities or other assets may go up or down, sometimes rapidly or unpredictably, due to factors such as economic events, inflation, changes in interest rates, governmental actions or interventions, actions taken by the U.S. Federal Reserve or foreign central banks, market disruptions caused by tariffs, trade disputes or other factors, political developments, armed conflicts, economic sanctions, cybersecurity events, investor sentiment, the global and domestic effects of widespread or local health, weather or climate events, and other factors that may or may not be related to the issuer of the security or other asset. If the market prices of the Portfolio’s securities and assets fall, the value of your investment in the Portfolio could go down.
Economies and financial markets throughout the world are increasingly interconnected. Events or circumstances in one or more countries or regions could be highly disruptive to, and have profound impacts on, global economies or markets. As a result, whether or not the Portfolio invests in securities of issuers located in or with significant exposure to the countries directly affected, the value and liquidity of the Portfolio’s investments may go down.
Asset allocation risk: The Portfolio’s investment performance is significantly impacted by the Portfolio’s asset allocation and reallocation from time to time. The value of your investment may decrease if the sub-adviser’s judgment about the attractiveness, value or market trends affecting a particular asset class, investment style, technique or strategy, underlying ETF or other issuer is incorrect.
|
|
|
| Transamerica Series Trust |
|
Semi-Annual Financial Statements 2024 |
Page 9
Transamerica BlackRock iShares Edge 40 VP
NOTES TO FINANCIAL STATEMENTS (continued)
At June 30, 2024
(unaudited)
5. RISK FACTORS (continued)
Smart beta investing risk: Smart beta strategies seek to capture broad, consistent drivers of return and to out-perform traditional index strategies. These strategies may not work as intended. An underlying ETF pursuing a smart beta strategy may not achieve its objective and may not perform as well as other funds using other asset management strategies.
Underlying exchange-traded funds risk: Because the Portfolio invests its assets in underlying ETFs, its ability to achieve its investment objective depends largely on the performance of the underlying ETFs in which it invests. Investing in underlying ETFs subjects the Portfolio to the risks of investing in the underlying securities or assets held by those ETFs. Each of the underlying ETFs in which the Portfolio may invest has its own investment risks, and those risks can affect the value of the underlying ETFs’ shares and therefore the value of the Portfolio’s investments. There can be no assurance that the investment objective of any underlying ETF will be achieved. To the extent that the Portfolio invests more of its assets in one underlying ETF than in another, the Portfolio will have greater exposure to the risks of that underlying ETF. In addition, the Portfolio will bear a pro rata portion of the operating expenses of the underlying ETFs in which it invests.
6. FEES AND OTHER AFFILIATED TRANSACTIONS
TST serves as a funding vehicle for certain affiliated asset allocation portfolios and certain affiliated separate accounts of Transamerica Life Insurance Company (“TLIC”) and Transamerica Financial Life Insurance Company.
TAM, the Portfolio’s investment manager, is directly owned by TLIC and AUSA Holding, LLC (“AUSA”), both of which are indirect, wholly owned subsidiaries of Aegon Ltd. TLIC is owned by Commonwealth General Corporation (“Commonwealth”). Commonwealth and AUSA are wholly owned by Transamerica Corporation (DE). Transamerica Corporation (DE) is wholly owned by Aegon International B.V., which is wholly owned by Aegon Ltd., a Bermuda exempted company with liability limited by shares (formerly, Aegon NV, a Netherlands corporation) and a publicly traded international insurance group.
Transamerica Fund Services, Inc. (“TFS”) is the Portfolio’s transfer agent. Transamerica Capital, Inc. (“TCI”) is the Portfolio’s distributor/principal underwriter. TAM, TFS and TCI are affiliates of Aegon Ltd.
Certain officers and trustees of the Portfolio may also be officers and/or trustees of TAM, TFS and TCI. No interested trustee who is deemed an interested person due to current or former service with TAM or an affiliate of TAM receives compensation from the Portfolio. The Portfolio does pay non-interested persons (independent trustees), as disclosed in Trustee and CCO fees within the Statement of Operations.
Investment management fees: TAM serves as the Portfolio’s investment manager, performing administration as well as investment advisory services. TAM renders investment advisory, supervisory, and administration services under an investment management agreement and the Portfolio pays a single management fee, which is reflected in Investment management fees within the Statement of Operations.
The Portfolio pays a management fee to TAM based on daily average net assets at the following rates:
|
|
|
|
|
|
|
|
|
| Breakpoints |
|
Rate |
|
|
|
|
| First $1 billion |
|
|
0.30 |
% |
|
|
|
|
| Over $1 billion |
|
|
0.28 |
|
|
|
|
|
TAM has contractually agreed, through May 1, 2025, to waive from its management fees an amount equal to the sub-advisory fee waiver by the Portfolio’s sub-adviser. These amounts are not subject to recapture by TAM.
TAM has contractually agreed to waive fees and/or reimburse Portfolio expenses to the extent that the total operating expenses excluding, as applicable, acquired fund fees and expenses, interest (including borrowing costs and overdraft charges), taxes, brokerage commissions, dividend and interest expenses on securities sold short, extraordinary expenses and other expenses not incurred in the ordinary course of the Portfolio’s business, exceed the following stated annual operating expense limits to the Portfolio’s daily average net
|
|
|
| Transamerica Series Trust |
|
Semi-Annual Financial Statements 2024 |
Page 10
Transamerica BlackRock iShares Edge 40 VP
NOTES TO FINANCIAL STATEMENTS (continued)
At June 30, 2024
(unaudited)
6. FEES AND OTHER AFFILIATED TRANSACTIONS (continued)
assets. To the extent an expense limit changed during the period, the prior limit is also listed below. The expenses waived and/or reimbursed, if any, are included in Expenses waived and/or reimbursed within the Statement of Operations.
|
|
|
|
|
|
|
|
|
|
|
| Class |
|
Operating Expense Limit |
|
Operating Expense Limit Effective Through |
| Initial Class |
|
|
|
0.31 |
% |
|
|
|
May 1, 2025 |
|
| Service Class |
|
|
|
0.56 |
|
|
|
|
May 1, 2025 |
|
TAM is permitted to recapture amounts contractually waived and/or reimbursed to a class during any of the 36 months from the date on which TAM waived fees and/or reimbursed expenses for the class. A class may recapture and reimburse TAM only if such amount does not cause, on any particular business day of the Portfolio, the class’s total annual operating expenses (after the recapture is taken into account) to exceed the Operating Expense Limits or any other lower limit then in effect. Amounts recaptured, if any, by TAM for the period ended June 30, 2024 are disclosed in Recapture of previously waived and/or reimbursed fees within the Statement of Operations.
TAM, on a voluntary basis and in addition to the contractual operating expense limits in effect, from time to time may waive and/or reimburse expenses of the Portfolio, or any classes thereof, to such level(s) as the Trust’s officers have determined or may reasonably determine from time to time. Any such voluntary waiver or expense reimbursement may be discontinued by TAM at any time. These amounts are not subject to recapture by TAM.
For the 36-month period ended June 30, 2024, the balances available for recapture by TAM for the Portfolio are as follows:
|
|
|
|
|
|
|
|
|
|
|
|
|
|
|
|
|
|
|
|
|
|
|
|
|
|
|
|
|
| |
|
Amounts Available |
|
|
|
| |
|
2021 |
|
|
|
|
2022 |
|
|
|
|
2023 |
|
|
|
|
2024 |
|
|
|
|
Total |
|
| Initial Class |
|
$ |
— |
|
|
|
|
$ |
— |
|
|
|
|
$ |
1,918 |
|
|
|
|
$ |
215 |
|
|
|
|
$ |
2,133 |
|
| Service Class |
|
|
— |
|
|
|
|
|
— |
|
|
|
|
|
20,402 |
|
|
|
|
|
1,845 |
|
|
|
|
|
22,247 |
|
Distribution and service fees: TST has a distribution plan (“Distribution Plan”) pursuant to Rule 12b-1 under the 1940 Act. Pursuant to the Distribution Plan, TST entered into a distribution agreement with TCI as the Portfolio’s distributor.
The Distribution Plan requires the Portfolio to pay distribution fees to TCI as compensation for various distribution activities, not as reimbursement for specific expenses. Under the Distribution Plan and distribution agreement, TCI, on behalf of the Portfolio, is authorized to pay various service providers, as direct payment for expenses incurred in connection with distribution of the Portfolio’s shares.
The fee on the Service Class shares is paid to the insurance companies for providing services and account maintenance for the policyholders who invest in the variable insurance products which invest in the Service Class shares. TCI has determined that it will not seek payment for the distribution expenses incurred by the Portfolio with respect to the Initial Class shares before May 1, 2025. Prior to TCI seeking distribution expenses on Initial Class shares, policy and contract owners will be notified in advance. The Portfolio will pay fees relating to Service Class shares. The distribution and service fees are included in Distribution and service fees within the Statement of Operations.
The Portfolio is authorized under the Distribution Plan to pay fees to TCI based on daily average net assets of each applicable class up to the following annual rates:
|
|
|
|
|
|
|
|
|
| Class |
|
Rate |
|
|
|
|
| Initial Class |
|
|
0.15 |
% |
|
|
|
|
| Service Class |
|
|
0.25 |
|
|
|
|
|
Transfer agent costs: TFS provides transfer agency services under an intercompany agreement with TAM. TFS has outsourced the provision of certain sub-transfer agency services to SS&C Global Investor & Distribution Solutions, Inc. (“SS&C GIDS”). The Portfolio does not pay a separate transfer agent fee to TAM or TFS but does pay certain expenses to SS&C GIDS related to applicable sub-transfer
|
|
|
| Transamerica Series Trust |
|
Semi-Annual Financial Statements 2024 |
Page 11
Transamerica BlackRock iShares Edge 40 VP
NOTES TO FINANCIAL STATEMENTS (continued)
At June 30, 2024
(unaudited)
6. FEES AND OTHER AFFILIATED TRANSACTIONS (continued)
agency services. For the period ended June 30, 2024, (i) the expenses paid to SS&C GIDS by the Portfolio are referred to as transfer agent costs and are included within the Statement of Operations and (ii) the expenses payable to SS&C GIDS by the Portfolio are referred to as transfer agent costs within the Statement of Assets and Liabilities.
Brokerage commissions: The Portfolio incurred no brokerage commissions on security transactions placed with affiliates of the investment manager or sub-adviser(s) for the period ended June 30, 2024.
7. PURCHASES AND SALES OF SECURITIES
For the period ended June 30, 2024, the cost of securities purchased and proceeds from securities sold (excluding short-term securities) are as follows:
|
|
|
|
|
|
|
| |
|
Purchases of Securities |
|
Sales of Securities |
|
|
| |
|
|
|
| |
$ 6,712,190 |
|
$ 20,811,282 |
8. FEDERAL INCOME TAXES AND DISTRIBUTIONS TO SHAREHOLDERS
The Portfolio has not made any provision for federal income or excise taxes due to its policy to distribute all of its taxable income and capital gains to its shareholders and otherwise qualify as a regulated investment company under Subchapter M of the Internal Revenue Code. The Portfolio recognizes the tax benefits of uncertain tax positions only where the position is “more likely than not” to be sustained assuming examination by tax authorities. The Portfolio’s tax returns remain subject to examination by the Internal Revenue Service and state tax authorities three years from the date of filing for federal purposes and four years from the date of filing for state purposes. Management has evaluated the Portfolio’s tax provisions taken for all open tax years, and has concluded that no provision for income tax is required in the Portfolio’s financial statements. If applicable, the Portfolio recognizes interest accrued related to unrecognized tax benefits in relation to interest and penalties expense in Other within the Statement of Operations. The Portfolio identifies its major tax jurisdictions as U.S. Federal, the state of Colorado, and foreign jurisdictions where the Portfolio makes significant investments; however, the Portfolio is not aware of any tax positions for which it is reasonably possible that the total amounts of unrecognized tax benefits will change materially in the next twelve months. Distributions are determined in accordance with income tax regulations, which may differ from GAAP.
As of June 30, 2024, the approximate cost for U.S. federal income tax purposes, and the aggregate gross/net unrealized appreciation (depreciation) in the value of investments (including securities sold short and derivatives, if any) are as follows:
|
|
|
|
|
|
|
| Cost |
|
Gross Appreciation |
|
Gross (Depreciation) |
|
Net Appreciation (Depreciation) |
| $ 229,558,686 |
|
$ 26,972,509 |
|
$ (13,395,498) |
|
$ 13,577,011 |
Please see TST’s most recent report on Form N-CSR, available at: www.transamerica.com/annuities/prospectus, for additional information. For the most recently filed complete proxy voting records for the Trust please visit: https://www.transamerica.com/sites/default/files/files/e070d/TST%20N-PX%202021.pdf
|
|
|
| Transamerica Series Trust |
|
Semi-Annual Financial Statements 2024 |
Page 12
Transamerica BlackRock iShares Edge 40 VP
MANAGEMENT AND SUB-ADVISORY AGREEMENT — CONTRACT RENEWAL
(unaudited)
At a meeting of the Board of Trustees of Transamerica Series Trust (the “Trustees” or the “Board”) held on June 12-13, 2024, the Board considered the renewal of the management agreement (the “Management Agreement”) between Transamerica Asset Management, Inc. (“TAM”) and Transamerica Series Trust, on behalf of Transamerica BlackRock iShares Edge 40 VP (the “Portfolio”). The Board also considered the renewal of the investment sub-advisory agreement (the “Sub-Advisory Agreement” and together with the Management Agreement, the “Agreements”) for the Portfolio between TAM and BlackRock Investment Management, LLC (the “Sub-Adviser”).
Following its review and consideration, the Board determined that the terms of the Management Agreement and Sub-Advisory Agreement were reasonable and that the renewal of each of the Agreements was in the best interests of the Portfolio and the holders invested in the Portfolio. The Board, including the independent members of the Board (the “Independent Trustees”), unanimously approved the renewal of each of the Agreements through June 30, 2025.
Prior to reaching their decision, the Trustees requested and received from TAM and the Sub-Adviser certain information. They then reviewed such information as they deemed reasonably necessary to evaluate the Agreements, including information they had previously received from TAM and the Sub-Adviser as part of their regular oversight of the Portfolio, and knowledge they gained over time through meeting with TAM and the Sub-Adviser. Among other materials, the Trustees considered comparative fee, expense and performance information prepared by Broadridge Financial Solutions, Inc. (“Broadridge”), an independent provider of mutual fund performance information, as well as fee, expense and profitability information prepared by TAM. In addition, TAM provided the Board with additional supplemental comparative performance information. To the extent applicable, the Trustees considered information about fees and performance of comparable funds and/or accounts managed by the Sub-Adviser. The Board also considered reductions to the Portfolio’s expense limits, if any, that took effect after the last renewal of the Agreements. In their review, the Trustees also sought to identify instances in which the Portfolio’s performance, fees, total expenses and/or profitability appeared to be outliers within its respective peer group or other comparative metrics and sought to understand the reasons for such comparative positions.
In their deliberations, the Independent Trustees met privately without representatives of TAM or the Sub-Adviser present and were represented throughout the process by their independent legal counsel. In considering the proposed continuation of each of the Agreements, the Trustees evaluated and weighed a number of considerations that they believed to be relevant in light of the legal advice furnished to them by counsel, including independent legal counsel, and made a decision in the exercise of their own business judgment. They based their decisions on the considerations discussed below, among others, although they did not identify any particular consideration or item of information that was controlling of their decisions, and each Trustee may have attributed different weights to the various factors.
Nature, Extent and Quality of the Services Provided
The Board considered the nature, extent and quality of the services provided by TAM and the Sub-Adviser to the Portfolio in the past and the services anticipated to be provided in the future. The Board also considered the investment approach for the Portfolio; the experience, capability and integrity of TAM’s senior management; the financial resources of TAM; TAM’s management oversight process; TAM’s and the Sub-Adviser’s responsiveness to any questions by the Trustees; and the professional qualifications and compensation program of the portfolio management team of the Sub-Adviser. The Trustees noted that they receive, on a quarterly basis, an execution analysis from Capital Institutional Services, Inc. (CAPIS), an independent provider of trade analyses, for the Sub-Adviser and a comparison of trading results against a peer universe of managers.
The Board also considered the continuous and regular investment management and other services provided by TAM, when acting as a manager of managers, for the portion of the management fee it retains from the Portfolio after payment of the sub-advisory fees. The Board noted that the investment management and other services provided by TAM include the design, development and ongoing review and evaluation of the Portfolio and its investment strategy; the selection, oversight and monitoring of one or more investment sub-advisers to perform certain duties with respect to the Portfolio; ongoing portfolio trading oversight and analysis; risk management oversight and analysis; design, development, implementation and ongoing review and evaluation of a process for the valuation of Portfolio investments; design, development, implementation and ongoing review and evaluation of a compliance program for the Portfolio; design, development, implementation and ongoing review and evaluation of a process for the voting of proxies and exercise of rights to consent to corporate action for Portfolio investments; participation in Board meetings and oversight of preparation of materials for the Board, including materials for Board meetings and regular communications with the Board; oversight of preparation of the Portfolio’s prospectus, statement of additional information, shareholder reports and other disclosure materials and regulatory filings for the Portfolio; and ongoing cash management services for the Portfolio. The Board considered that TAM’s investment management services also include the provision of supervisory and administrative services to the Portfolio. The Board also noted that TAM, as part of the services it provides to all Transamerica mutual funds, including the Portfolio, oversees the services provided by the funds’ custodian, transfer agent, independent accountant and legal counsel and supervises the performance of the recordkeeping and holder service functions of the funds.
Investment Performance
In addition, the Board considered the short- and longer-term performance of the Portfolio in light of its investment objective, policies and strategies, including relative performance against (i) a peer universe of comparable mutual funds, as prepared by Broadridge, and (ii) the Portfolio’s benchmarks, in each case for various trailing periods ended December 31, 2023. Based on these considerations, the Board determined that TAM and the Sub-Adviser can provide investment and related services that are appropriate in scope and extent in light of
|
|
|
|
|
| Transamerica Series Trust |
|
|
|
Semi-Annual Financial Statements 2024 |
|
|
Page 13 |
|
|
Transamerica BlackRock iShares Edge 40 VP
MANAGEMENT AND SUB-ADVISORY AGREEMENT — CONTRACT RENEWAL (continued)
(unaudited)
the Portfolio’s investment objectives, policies and strategies and operations, the competitive landscape of the investment company business and investor needs. The Board’s conclusions as to the Portfolio’s performance are summarized below. For purposes of its review, the Board generally used the performance of Service Class Shares. In describing the Portfolio’s performance relative to its peer universe, the summary conclusions characterize performance for the relevant periods in relation to whether it was “above,” “below” or “in line with” the peer universe median and do so using quintile rankings prepared by Broadridge. For simplicity, performance is described as “above” the median if the Portfolio’s performance ranked anywhere in the first or second quintiles, as “below” the median if it ranked anywhere in the fourth or fifth quintiles, or “in line with” the median if it ranked anywhere in the third quintile (i.e., even if its precise return was somewhat above or somewhat below the precise median return).
When considering the Portfolio’s performance, the Trustees considered any representations made by TAM regarding the appropriateness of certain peer groups and benchmarks. They recognized that performance reflects a snapshot of a period as of a specific date, and that consideration of performance data for a different period could generate significantly different performance results. The Trustees also recognized that even longer-term performance can be negatively affected by performance over a short-term period when that short-term performance is significantly below the performance of the comparable benchmark or universe of peer funds.
The Board noted that the performance of Service Class Shares of the Portfolio was in line with the median for its peer universe for the past 5-year period and below the median for the past 1-, 3- and 10-year periods. The Board also noted that the performance of Service Class Shares of the Portfolio was below the benchmark that TAM utilizes to measure performance of the Portfolio for the past 1-, 3-, 5- and 10-year periods. The Board noted that the Sub-Adviser had commenced sub-advising the Portfolio on November 1, 2018 pursuant to its current investment objective, investment strategies and benchmarks.
Management Fee and Sub-Advisory Fees and Total Expense Ratio
The Board considered the management fee and total expense ratio of the Portfolio, including information provided by Broadridge comparing the management fee and total expense ratio of the Portfolio to the management fees and total expense ratios of comparable investment companies in both a peer group and broader peer universe compiled by Broadridge. The Board’s conclusions as to the Portfolio’s management fee and total expense ratio are summarized below. For purposes of its review, the Board generally used the actual total expenses (i.e., expenses reflecting any waivers and/or reimbursements) of Service Class Shares. In describing the Portfolio’s management fee and total expense ratio relative to its peer group and peer universe, the summary conclusions characterize management fees and total expense ratios for the relevant periods in relation to whether they were “above,” “below” or “in line with” the peer group or peer universe median and do so using quintile rankings prepared by Broadridge. For simplicity, management fees and total expense ratios are described as “above” the median if the Portfolio’s management fee or total expense ratio ranked anywhere in the fourth or fifth quintiles, as “below” the median if it ranked anywhere in the first or second quintiles, or “in line with” the median if it ranked anywhere in the third quintile (i.e., even if its precise management fee or total expense ratio was somewhat above or somewhat below the precise median management fee or total expense ratio).
The Board also considered the fees charged by the Sub-Adviser for sub-advisory services, as well as the portion of the Portfolio’s management fee retained by TAM following payment of the sub-advisory fee and how the portion of the contractual management fee retained by TAM at a specified asset level compared to the portions retained by other investment advisers managing mutual funds with similar investment strategies as calculated by an independent provider of information.
The Board noted that the Portfolio’s contractual management fee was above the medians for its peer group and peer universe and that the actual total expenses (i.e., expenses reflecting any waivers and/or reimbursements) of Service Class Shares of the Portfolio were below the medians for its peer group and peer universe. The Trustees also considered that TAM has entered into an expense limitation arrangement with the Portfolio, which may result in TAM waiving fees for the benefit of holders.
On the basis of these considerations, together with the other information it considered, the Board determined that the management and sub-advisory fees to be received by TAM and the Sub-Adviser under the Management Agreement and Sub-Advisory Agreement are reasonable in light of the services provided.
Cost of Services Provided and Level of Profitability
The Board reviewed information provided by TAM about the cost of providing and procuring fund management services, as well as the costs of the provision of administration, transfer agency and other services, to the Portfolio and to Transamerica Series Trust as a whole by TAM and its affiliates. The Board considered the profitability of TAM and its affiliates in providing these services for the Portfolio and Transamerica Series Trust as a whole. The Trustees recognized the competitiveness of the mutual fund industry and the importance of an investment adviser’s long-term profitability, including for maintaining company and management stability and accountability.
The Board also considered the allocation methodology used for calculating the profitability of TAM and its affiliates. The Board noted that the revenue and expense allocation methodology used by TAM to estimate its profitability with respect to its relationship with the Portfolio had been reviewed previously by an independent consultant. The Trustees considered that TAM reported that it had not made material changes to this methodology, and that the methodology had been applied consistently for the Portfolio.
|
|
|
|
|
| Transamerica Series Trust |
|
|
|
Semi-Annual Financial Statements 2024 |
|
|
Page 14 |
|
|
Transamerica BlackRock iShares Edge 40 VP
MANAGEMENT AND SUB-ADVISORY AGREEMENT — CONTRACT RENEWAL (continued)
(unaudited)
With respect to the Sub-Adviser, the Board noted that the sub-advisory fee is the product of arm’s-length negotiation between TAM and the Sub-Adviser, which is not affiliated with TAM, and is paid by TAM and not the Portfolio. As a result, the Board focused on the profitability of TAM and its affiliates with respect to the Portfolio.
Based on this information, the Board determined that the profitability of TAM and its affiliates from their relationships with the Portfolio was not excessive.
Economies of Scale
The Board considered economies of scale with respect to the management of the Portfolio, whether the Portfolio had appropriately benefited from any economies of scale and whether there was the potential for realization of any future economies of scale. The Board also considered the existence of economies of scale with respect to management of the Transamerica mutual funds overall and the extent to which the Portfolio benefited from any economies of scale. The Board recognized that, as the Portfolio’s assets increase, any economies of scale realized by TAM or the Sub-Adviser may not directly correlate with each other or with any economies of scale that might be realized by the Portfolio. The Board considered the Portfolio’s management fee schedule and the existence of breakpoints and also considered the extent to which TAM shared economies of scale, if any, with the Portfolio through undertakings to limit or reimburse Portfolio expenses and to invest in maintaining and developing its capabilities and services. The Board also considered the Sub-Adviser’s sub-advisory fee schedule and the existence of breakpoints, if any, and how such breakpoints relate to any breakpoints in the Portfolio’s management fee schedule. The Trustees concluded that the Portfolio’s fee structure reflected an appropriate sharing of any efficiencies or economies of scale to date and noted that they will have the opportunity to periodically reexamine the appropriateness of the management fee payable to TAM and the fee paid to the Sub-Adviser in light of any economies of scale experienced in the future.
Benefits to TAM, its Affiliates and/or the Sub-Adviser from their Relationships with the Portfolio
The Board considered other benefits derived by TAM, its affiliates, and/or the Sub-Adviser from their relationships with the Portfolio. The Board noted that TAM does not receive benefits from research obtained with commissions paid to broker-dealers for portfolio transactions (commonly referred to as “soft dollars”) as a result of its relationship with the Portfolio.
Other Considerations
The Board noted that TAM has made a substantial commitment to the recruitment and retention of high-quality personnel and maintains the financial, compliance and operational resources reasonably necessary to manage the Portfolio in a professional manner that is consistent with the best interests of the Portfolio and the holders. In this regard, the Board favorably considered the procedures and policies TAM has in place to enforce compliance with applicable laws and regulations and oversee the portfolio management activities of the Sub-Adviser. The Board also noted that TAM has made an entrepreneurial commitment and undertaken certain business risks with respect to the management and success of the Portfolio.
Conclusion
After consideration of the factors described above, as well as other factors, the Trustees, including the Independent Trustees, concluded that the renewal of the Management Agreement and the Sub-Advisory Agreement was in the best interests of the Portfolio and the holders and voted to approve the renewal of the Agreements.
|
|
|
| Transamerica Series Trust |
|
Semi-Annual Financial Statements 2024 |
Page 15
PROXY VOTING POLICIES AND PROCEDURES AND QUARTERLY PORTFOLIO HOLDINGS
(unaudited)
A description of Transamerica Series Trust’s (the “Trust”) proxy voting policies and procedures is available in the Statement of Additional Information of the Portfolios, available without charge upon request by calling 1-800-851-9777 (toll free) or on the Securities and Exchange Commission’s (“SEC”) website at http://www.sec.gov.
In addition, the Portfolio is required to file Form N-PX, with their complete proxy voting records for the most recent 12 months ended June 30th, no later than August 31st of each year. The Form is available without charge: (1) on the Transamerica Funds website at https://www.transamerica.com/sites/default/files/files/e070d/TST%20N-PX%202021.pdf; and (2) on the SEC’s website at http://www.sec.gov.
Each fiscal quarter, the Portfolios, except Transamerica BlackRock Government Money Market VP, will file with the SEC a complete schedule of its monthly portfolio holdings on Form N-PORT. The Portfolios’ holdings as of the end of the third month of every fiscal quarter, as reported on Form N-PORT, will be publicly available on the SEC’s website at http://www.sec.gov within 60 days of the end of the fiscal quarter.
On a monthly basis, Transamerica BlackRock Government Money Market VP will file with the SEC portfolio holdings information on Form N-MFP3. A complete schedule of portfolio holdings is also available at www.transamerica.com.
You may also visit the Trust’s website at www.transamerica.com/annuities/prospectus for this and other information about the Portfolios and the Trust.
Important Notice Regarding Delivery of Shareholder Documents
Every year we provide shareholders informative materials such as the Transamerica Series Trust Annual Report, the Transamerica Series Trust Prospectus, and other required documents that keep you informed regarding your Portfolios. To the extent provided by mail, Transamerica Series Trust will only send one piece per mailing address, a method that saves your Portfolios money by reducing mailing and printing costs. We will continue to do this unless you tell us not to. To elect to receive individual mailings, simply call a Transamerica Customer Service Representative toll free at 1-800-851-9777, 8 a.m. to 7 p.m. Eastern Time, Monday-Friday. Your request will take effect within 30 days.
|
|
|
|
|
| Transamerica Series Trust |
|
|
|
Semi-Annual Financial Statements 2024 |
|
|
Page 16 |
|
|
NOTICE OF PRIVACY POLICY
(unaudited)
Your privacy is very important to us. We want you to understand what information we collect and how we use it. We collect and use “nonpublic personal information” in connection with providing our customers with a broad range of financial products and services as effectively and conveniently as possible. We treat nonpublic personal information in accordance with our Privacy Policy.
What Information We Collect and From Whom We Collect It
We may collect nonpublic personal information about you from the following sources:
| • |
|
Information we receive from you on applications or other forms, such as your name, address, and account number; |
| • |
|
Information about your transactions with us, our affiliates, or others, such as your account balance and purchase/redemption history; and |
| • |
|
Information we receive from non-affiliated third parties, including consumer reporting agencies. |
What Information We Disclose and To Whom We Disclose It
We do not disclose any nonpublic personal information about current or former customers to anyone without their express consent, except as permitted by law. We may disclose the nonpublic personal information we collect, as described above, to persons or companies that perform services on our behalf and to other financial institutions with which we have joint marketing agreements. We will require these companies to protect the confidentiality of your nonpublic personal information and to use it only to perform the services for which we have hired them.
Our Security Procedures
We restrict access to your nonpublic personal information and only allow disclosures to persons and companies as permitted by law to assist in providing products or services to you. We maintain physical, electronic, and procedural safeguards to protect your nonpublic personal information and to safeguard the disposal of certain consumer information.
Contact Us
If you have any questions about our Privacy Policy, please call 1-800-851-9777 on any business day between 8 a.m. and 7 p.m. Eastern Time.
Note: This Privacy Policy applies only to customers that have a direct relationship with us or our affiliates. If you own shares of our portfolios in the name of a third party such as a bank or broker-dealer, its privacy policy may apply to you instead of ours.
|
|
|
|
|
| Transamerica Series Trust |
|
|
|
Semi-Annual Financial Statements 2024 |
|
|
Page 17 |
|
|
|
|
|
| PO Box 219945 |
| Kansas City, MO 64121-9945 |
|
|
| Distributor: |
|
Transamerica Capital, Inc. |
|
|
PO Box 219945 |
|
|
Kansas City, MO 64121-9945 |
|
|
|
|
Customer Service: 1-800-851-9777 |
Transamerica Series Trust Semi-Annual Financial Statements
June 30, 2024
1801 California St., Suite 5200
Denver, CO 80202
Distributor: Transamerica Capital, Inc.
Customer Service: 1-800-851-9777
The following pages contain the most recent semi-annual financial statements for the investment options in which you are invested. In compliance with Securities and Exchange Commission regulations, we present these reports on an annual and semi-annual basis with the hope that they will foster greater understanding of the investment options’ holdings, performance, financial data, accounting policies and other issues. This streamlined version provides information only on the investment options in which you are invested.
If you have any questions about these reports, please do not hesitate to contact your financial professional. As always, we thank you for your trust and the opportunity to serve you.
Transamerica BlackRock iShares Edge 50 VP
SCHEDULE OF INVESTMENTS
At June 30, 2024
(unaudited)
|
|
|
|
|
|
|
|
|
| |
|
Shares |
|
|
Value |
|
| |
|
|
| EXCHANGE-TRADED FUNDS - 99.9% |
|
| International Equity Funds - 12.1% |
|
| iShares MSCI EAFE Min Vol Factor ETF |
|
|
587,389 |
|
|
$ |
40,738,364 |
|
| iShares MSCI Emerging Markets Min Vol Factor ETF |
|
|
197,936 |
|
|
|
11,323,919 |
|
|
|
|
|
|
|
|
|
|
|
|
|
|
|
|
|
|
|
|
52,062,283 |
|
|
|
|
|
|
|
|
|
|
|
| U.S. Equity Funds - 38.5% |
|
| iShares MSCI USA Min Vol Factor ETF |
|
|
427,163 |
|
|
|
35,864,605 |
|
| iShares MSCI USA Momentum Factor ETF |
|
|
187,028 |
|
|
|
36,446,146 |
|
| iShares MSCI USA Quality Factor ETF |
|
|
215,289 |
|
|
|
36,762,750 |
|
| iShares MSCI USA Size Factor ETF |
|
|
156,257 |
|
|
|
21,490,025 |
|
| iShares MSCI USA Value Factor ETF |
|
|
332,741 |
|
|
|
34,425,384 |
|
|
|
|
|
|
|
|
|
|
|
|
|
|
|
|
|
|
|
|
164,988,910 |
|
|
|
|
|
|
|
|
|
|
|
| U.S. Fixed Income Fund - 49.3% |
|
| iShares Core U.S. Aggregate Bond ETF |
|
|
2,180,883 |
|
|
|
211,698,313 |
|
|
|
|
|
|
|
|
|
|
|
|
|
| Total Exchange-Traded Funds
(Cost $407,845,584) |
|
|
|
|
|
|
428,749,506 |
|
|
|
|
|
|
|
|
|
|
|
|
|
|
|
|
|
|
|
| |
|
Principal |
|
|
Value |
|
| |
|
|
| REPURCHASE AGREEMENT - 0.2% |
|
| Fixed Income Clearing Corp., |
|
|
|
|
|
|
|
|
| 2.50% (A), dated 06/28/2024, to be repurchased at $684,171 on 07/01/2024. Collateralized by a U.S. Government Obligation, 4.50%, due 03/31/2026, and with a value of $697,812. |
|
$ |
684,029 |
|
|
|
$ 684,029 |
|
|
|
|
|
|
|
|
|
|
|
|
| Total Repurchase Agreement
(Cost $684,029) |
|
|
|
684,029 |
|
|
|
|
|
|
|
|
|
| Total Investments
(Cost $408,529,613) |
|
|
|
429,433,535 |
|
|
|
|
|
|
|
|
|
| Net Other Assets (Liabilities) - (0.1)% |
|
|
|
(486,792) |
|
|
|
|
|
|
|
|
|
|
|
|
| Net Assets - 100.0% |
|
|
$ |
428,946,743 |
|
|
|
|
|
|
|
INVESTMENT VALUATION:
Valuation Inputs (B)
|
|
|
|
|
|
|
|
|
|
|
|
|
|
|
|
|
| |
|
Level 1 - Unadjusted Quoted Prices |
|
|
Level 2 - Other Significant Observable Inputs |
|
|
Level 3 - Significant Unobservable Inputs |
|
|
Value |
|
| |
|
|
|
|
|
|
| ASSETS |
|
|
|
|
|
|
|
|
|
|
|
|
|
|
|
|
| Investments |
|
|
|
|
|
|
|
|
|
|
|
|
|
|
|
|
| Exchange-Traded Funds |
|
$ |
428,749,506 |
|
|
$ |
— |
|
|
$ |
— |
|
|
$ |
428,749,506 |
|
| Repurchase Agreement |
|
|
— |
|
|
|
684,029 |
|
|
|
— |
|
|
|
684,029 |
|
|
|
|
|
|
|
|
|
|
|
|
|
|
|
|
|
|
| Total Investments |
|
$ |
428,749,506 |
|
|
$ |
684,029 |
|
|
$ |
— |
|
|
$ |
429,433,535 |
|
|
|
|
|
|
|
|
|
|
|
|
|
|
|
|
|
|
FOOTNOTES TO SCHEDULE OF INVESTMENTS:
| (A) |
Rate disclosed reflects the yield at June 30, 2024. |
| (B) |
There were no transfers in or out of Level 3 during the period ended June 30, 2024. Please reference the Investment Valuation section of the Notes to Financial Statements for more information regarding investment valuation and pricing inputs. |
The Notes to Financial Statements are an integral part of this report.
|
|
|
|
|
| Transamerica Series Trust |
|
|
|
Semi-Annual Financial Statements 2024 |
|
|
Page 1 |
|
|
Transamerica BlackRock iShares Edge 50 VP
STATEMENT OF ASSETS AND LIABILITIES
At June 30, 2024
(unaudited)
|
|
|
|
|
|
|
| Assets: |
|
|
|
|
| Unaffiliated investments, at value (cost $407,845,584) |
|
$ |
428,749,506 |
|
| Repurchase agreement, at value (cost $684,029) |
|
|
684,029 |
|
| Receivables and other assets: |
|
|
|
|
| Net income from securities lending |
|
|
4,944 |
|
| Interest |
|
|
143 |
|
| Prepaid expenses |
|
|
1,724 |
|
|
|
| Total assets |
|
|
429,440,346 |
|
|
|
| Liabilities: |
|
|
|
|
| Payables and other liabilities: |
|
|
|
|
| Shares of beneficial interest redeemed |
|
|
281,767 |
|
| Investment management fees |
|
|
82,493 |
|
| Distribution and service fees |
|
|
82,493 |
|
| Transfer agent costs |
|
|
428 |
|
| Trustee and CCO fees |
|
|
1,220 |
|
| Audit and tax fees |
|
|
11,448 |
|
| Custody fees |
|
|
650 |
|
| Legal fees |
|
|
8,960 |
|
| Printing and shareholder reports fees |
|
|
13,084 |
|
| Other accrued expenses |
|
|
11,060 |
|
|
|
| Total liabilities |
|
|
493,603 |
|
|
|
| Net assets |
|
$ |
428,946,743 |
|
|
|
| Net assets consist of: |
|
|
|
|
| Capital stock ($0.01 par value) |
|
$ |
324,409 |
|
| Additional paid-in capital |
|
|
384,675,805 |
|
| Total distributable earnings (accumulated losses) |
|
|
43,946,529 |
|
|
|
| Net assets |
|
$ |
428,946,743 |
|
|
|
| Shares outstanding |
|
|
32,440,924 |
|
|
|
| Net asset value and offering price per share |
|
$ |
13.22 |
|
STATEMENT OF OPERATIONS
For the period ended June 30, 2024
(unaudited)
|
|
|
|
|
|
|
| Investment income: |
|
|
|
|
| Dividend income from unaffiliated investments |
|
$ |
5,269,649 |
|
| Interest income from unaffiliated investments |
|
|
3,057 |
|
| Net income from securities lending |
|
|
28,959 |
|
|
|
| Total investment income |
|
|
5,301,665 |
|
|
|
| Expenses: |
|
|
|
|
| Investment management fees |
|
|
637,453 |
|
| Distribution and service fees |
|
|
531,211 |
|
| Transfer agent costs |
|
|
2,433 |
|
| Trustee and CCO fees |
|
|
9,926 |
|
| Audit and tax fees |
|
|
11,043 |
|
| Custody fees |
|
|
4,118 |
|
| Legal fees |
|
|
17,190 |
|
| Printing and shareholder reports fees |
|
|
12,929 |
|
| Other |
|
|
16,147 |
|
|
|
| Total expenses before waiver and/or reimbursement and recapture |
|
|
1,242,450 |
|
|
|
| Expenses waived and/or reimbursed |
|
|
(106,242 |
) |
|
|
| Net expenses |
|
|
1,136,208 |
|
|
|
| Net investment income (loss) |
|
|
4,165,457 |
|
|
|
| Net realized gain (loss) on: |
|
|
|
|
| Unaffiliated investments |
|
|
5,611,907 |
|
|
|
| Net change in unrealized appreciation (depreciation) on: |
|
|
|
|
| Unaffiliated investments |
|
|
8,039,512 |
|
|
|
| Net realized and change in unrealized gain (loss) |
|
|
13,651,419 |
|
|
|
| Net increase (decrease) in net assets resulting from operations |
|
$ |
17,816,876 |
|
The Notes to Financial Statements are an integral part of this report.
|
|
|
|
|
| Transamerica Series Trust |
|
|
|
Semi-Annual Financial Statements 2024 |
|
|
Page 2 |
|
|
Transamerica BlackRock iShares Edge 50 VP
STATEMENT OF CHANGES IN NET ASSETS
For the period and year ended:
|
|
|
|
|
|
|
|
|
|
|
|
|
|
| |
|
June 30, 2024 (unaudited) |
|
December 31, 2023 |
|
|
|
|
|
| From operations: |
|
|
|
|
|
|
|
|
|
|
| Net investment income (loss) |
|
$ |
4,165,457 |
|
|
|
|
$ |
9,237,503 |
|
| Net realized gain (loss) |
|
|
5,611,907 |
|
|
|
|
|
4,777,428 |
|
| Net change in unrealized appreciation (depreciation) |
|
|
8,039,512 |
|
|
|
|
|
26,022,399 |
|
|
|
|
|
| Net increase (decrease) in net assets resulting from operations |
|
|
17,816,876 |
|
|
|
|
|
40,037,330 |
|
|
|
|
|
| Dividends and/or distributions to shareholders: |
|
|
|
|
|
|
|
|
|
|
| Dividends and/or distributions to shareholders |
|
|
— |
|
|
|
|
|
(10,694,397 |
) |
|
|
|
|
| Net increase (decrease) in net assets resulting from dividends and/or distributions to shareholders |
|
|
— |
|
|
|
|
|
(10,694,397 |
) |
|
|
|
|
| Capital share transactions: |
|
|
|
|
|
|
|
|
|
|
| Proceeds from shares sold |
|
|
2,082,210 |
|
|
|
|
|
3,912,575 |
|
| Dividends and/or distributions reinvested |
|
|
— |
|
|
|
|
|
10,694,397 |
|
| Cost of shares redeemed |
|
|
(27,080,902 |
) |
|
|
|
|
(46,848,057 |
) |
|
|
|
|
| Net increase (decrease) in net assets resulting from capital share transactions |
|
|
(24,998,692 |
) |
|
|
|
|
(32,241,085 |
) |
|
|
|
|
| Net increase (decrease) in net assets |
|
|
(7,181,816 |
) |
|
|
|
|
(2,898,152 |
) |
|
|
|
|
| Net assets: |
|
|
|
|
|
|
|
|
|
|
| Beginning of period/year |
|
|
436,128,559 |
|
|
|
|
|
439,026,711 |
|
| End of period/year |
|
$ |
428,946,743 |
|
|
|
|
$ |
436,128,559 |
|
|
|
|
|
| Capital share transactions - shares: |
|
|
|
|
|
|
|
|
|
|
| Shares issued |
|
|
160,550 |
|
|
|
|
|
316,489 |
|
| Shares reinvested |
|
|
— |
|
|
|
|
|
884,566 |
|
| Shares redeemed |
|
|
(2,093,929 |
) |
|
|
|
|
(3,872,720 |
) |
|
|
|
|
| Net increase (decrease) in shares outstanding |
|
|
(1,933,379 |
) |
|
|
|
|
(2,671,665 |
) |
The Notes to Financial Statements are an integral part of this report.
|
|
|
|
|
| Transamerica Series Trust |
|
|
|
Semi-Annual Financial Statements 2024 |
|
|
Page 3 |
|
|
Transamerica BlackRock iShares Edge 50 VP
FINANCIAL HIGHLIGHTS
|
|
|
|
|
|
|
|
|
|
|
|
|
|
|
|
|
|
|
|
|
|
|
|
|
| For a share outstanding during the period and years indicated: |
|
Service Class |
|
|
|
|
|
|
|
| |
|
June 30, 2024 (unaudited) |
|
December 31, 2023 |
|
December 31, 2022 |
|
December 31, 2021 |
|
December 31, 2020 |
|
December 31, 2019 |
|
|
|
|
|
|
|
| Net asset value, beginning of period/year |
|
$ |
12.69 |
|
|
$ |
11.85 |
|
|
$ |
14.40 |
|
|
$ |
13.70 |
|
|
$ |
12.68 |
|
|
$ |
11.04 |
|
|
|
|
|
|
|
|
| Investment operations: |
|
|
|
|
|
|
|
|
|
|
|
|
|
|
|
|
|
|
|
|
|
|
|
|
|
|
|
|
|
|
|
| Net investment income (loss)(A) |
|
|
0.12 |
|
|
|
0.26 |
|
|
|
0.20 |
|
|
|
0.17 |
|
|
|
0.19 |
|
|
|
0.27 |
|
|
|
|
|
|
|
|
| Net realized and unrealized gain (loss) |
|
|
0.41 |
|
|
|
0.88 |
|
|
|
(2.27 |
) |
|
|
0.89 |
|
|
|
1.03 |
|
|
|
1.50 |
|
|
|
|
|
|
|
|
| Total investment operations |
|
|
0.53 |
|
|
|
1.14 |
|
|
|
(2.07 |
) |
|
|
1.06 |
|
|
|
1.22 |
|
|
|
1.77 |
|
|
|
|
|
|
|
|
| Dividends and/or distributions to shareholders: |
|
|
|
|
|
|
|
|
|
|
|
|
|
|
|
|
|
|
|
|
|
|
|
|
|
|
|
|
|
|
|
| Net investment income |
|
|
— |
|
|
|
(0.21 |
) |
|
|
(0.17 |
) |
|
|
(0.16 |
) |
|
|
(0.16 |
) |
|
|
(0.11 |
) |
|
|
|
|
|
|
|
| Net realized gains |
|
|
— |
|
|
|
(0.09 |
) |
|
|
(0.31 |
) |
|
|
(0.20 |
) |
|
|
(0.04 |
) |
|
|
(0.02 |
) |
|
|
|
|
|
|
|
| Total dividends and/or distributions to shareholders |
|
|
— |
|
|
|
(0.30 |
) |
|
|
(0.48 |
) |
|
|
(0.36 |
) |
|
|
(0.20 |
) |
|
|
(0.13 |
) |
|
|
|
|
|
|
|
| Net asset value, end of period/year |
|
$ |
13.22 |
|
|
$ |
12.69 |
|
|
$ |
11.85 |
|
|
$ |
14.40 |
|
|
$ |
13.70 |
|
|
$ |
12.68 |
|
| |
|
|
|
|
|
|
|
|
|
|
|
|
|
|
|
|
|
|
|
|
|
|
|
|
|
|
|
|
|
|
|
| Total return |
|
|
4.18 |
%(B) |
|
|
9.79 |
% |
|
|
(14.48 |
)% |
|
|
7.74 |
% |
|
|
9.72 |
% |
|
|
16.04 |
% |
|
|
|
|
|
|
|
| Ratio and supplemental data: |
|
|
|
|
|
|
|
|
|
|
|
|
|
|
|
|
|
|
|
|
|
|
|
|
|
|
|
|
|
|
|
| Net assets end of period/year (000’s) |
|
$ |
428,947 |
|
|
$ |
436,129 |
|
|
$ |
439,027 |
|
|
$ |
540,360 |
|
|
$ |
488,968 |
|
|
$ |
328,313 |
|
|
|
|
|
|
|
|
| Expenses to average net assets(C) |
|
|
|
|
|
|
|
|
|
|
|
|
|
|
|
|
|
|
|
|
|
|
|
|
|
|
|
|
|
|
|
| Excluding waiver and/or reimbursement and recapture |
|
|
0.58 |
%(D) |
|
|
0.59 |
% |
|
|
0.58 |
% |
|
|
0.57 |
% |
|
|
0.58 |
% |
|
|
0.58 |
% |
|
|
|
|
|
|
|
| Including waiver and/or reimbursement and recapture |
|
|
0.53 |
%(D)(E) |
|
|
0.54 |
%(E) |
|
|
0.53 |
%(E)(F) |
|
|
0.52 |
%(F) |
|
|
0.53 |
%(F) |
|
|
0.54 |
%(F) |
|
|
|
|
|
|
|
| Net investment income (loss) to average net assets |
|
|
1.96 |
%(D) |
|
|
2.13 |
% |
|
|
1.60 |
% |
|
|
1.19 |
% |
|
|
1.48 |
% |
|
|
2.21 |
% |
|
|
|
|
|
|
|
| Portfolio turnover rate |
|
|
4 |
%(B) |
|
|
5 |
% |
|
|
7 |
% |
|
|
7 |
% |
|
|
11 |
% |
|
|
2 |
% |
| (A) |
Calculated based on average number of shares outstanding. |
| (C) |
Does not include expenses of the underlying investments in which the Portfolio invests. |
| (E) |
TAM has contractually agreed, through May 1, 2025, to waive from its management fees an amount equal to the sub-advisory fee waiver by the Portfolio’s sub-adviser. These amounts are not subject to recapture by TAM. |
| (F) |
TAM contractually agreed to waive 0.05% of the average daily net assets from its management fee through May 1, 2022. These amounts are not subject to recapture by TAM. |
The Notes to Financial Statements are an integral part of this report.
|
|
|
|
|
| Transamerica Series Trust |
|
|
|
Semi-Annual Financial Statements 2024 |
|
|
Page 4 |
|
|
Transamerica BlackRock iShares Edge 50 VP
NOTES TO FINANCIAL STATEMENTS
At June 30, 2024
(unaudited)
1. ORGANIZATION
Transamerica Series Trust (“TST”) is an open-end management investment company registered under the Investment Company Act of 1940, as amended (the “1940 Act”). TST applies investment company accounting and reporting guidance. TST serves as a funding vehicle for variable life insurance, variable annuity, and group annuity products. Transamerica BlackRock iShares Edge 50 VP (the “Portfolio”) is a series of TST and is classified as diversified under the 1940 Act. The Portfolio currently offers one class of shares, Service Class.
The only shareholders of the Portfolio are affiliated insurance company separate accounts and/or affiliated asset allocation portfolios. Contract holders of the variable life and annuity contracts are not shareholders of the Portfolio. For ease of reference, shareholders and contract holders are collectively referred to in this report as “shareholders.”
This report must be accompanied or preceded by the Portfolio’s current prospectus, which contains additional information about the Portfolio, including risks, as well as investment objectives and strategies.
Transamerica Asset Management, Inc. (“TAM”) serves as investment manager for the Portfolio pursuant to an investment management agreement. TAM provides continuous and regular investment management services to the Portfolio. TAM supervises the Portfolio’s investments, conducts its investment program and provides supervisory, compliance and administrative services to the Portfolio.
TAM currently acts as a “manager of managers” and has hired sub-advisers to furnish day-to-day investment advice and recommendations. TAM may, in the future, determine to provide all aspects of the day-to-day management of the Portfolio without the use of a sub-adviser. When acting as a manager of managers, TAM provides investment management services that include, without limitation, the design and development of the Portfolio and its investment strategies and the ongoing review and evaluation of those investment strategies including recommending changes in strategy where it believes appropriate or advisable; the selection of one or more sub-advisers for the Portfolio employing a combination of quantitative and qualitative screens, research, analysis and due diligence; negotiation of sub-advisory agreements and fees; oversight and monitoring of sub-advisers and recommending changes to sub-advisers where it believes appropriate or advisable; recommending portfolio combinations and liquidations where it believes appropriate or advisable; selection and oversight of transition managers, as needed; regular supervision of the Portfolio’s investments; regular review and evaluation of sub-adviser performance; daily monitoring of the sub-advisers’ buying and selling of securities for the Portfolio; regular review of holdings; ongoing trade oversight and analysis; regular monitoring to ensure adherence to investment process; regular calls and periodic on-site visits with sub-advisers; portfolio construction and asset allocation when using multiple sub-advisers for the Portfolio; risk management oversight and analysis; oversight of negotiation of investment documentation and agreements; design, development, implementation and regular monitoring of the valuation process; periodic due diligence reviews of pricing vendors and vendor methodology; design, development, implementation and regular monitoring of the compliance process; respond to regulatory inquiries and determine appropriate litigation strategy, as needed; review of proxies voted by sub-advisers; oversight of preparation and review of materials for meetings of the Portfolio’s Board of Trustees (the “Board”), participation in these meetings and preparation of regular communications with the Board; oversight of preparation and review of prospectuses, shareholder reports and other disclosure materials and regulatory filings for the Portfolio; oversight of other service providers to the Portfolio, such as the custodian, the transfer agent, the Portfolio’s independent accounting firm and legal counsel; supervision of the performance of recordkeeping and shareholder relations functions for the Portfolio; and oversight of cash management services. TAM uses a variety of quantitative and qualitative tools to carry out its investment management services. TAM, not the Portfolio, is responsible for paying the sub-adviser(s) for their services, and sub-advisory fees are TAM’s expense.
TAM’s investment management services also include the provision of supervisory and administrative services to the Portfolio. These services include performing certain administrative services for the Portfolio and supervising and overseeing the administrative, clerical, recordkeeping and bookkeeping services provided to the Portfolio by State Street Bank and Trust Company (“State Street”), to whom TAM has outsourced the provision of certain sub-administration services. To the extent agreed upon by TAM and the Portfolio from time to time, TAM’s supervisory and administrative services include, but are not limited to: monitoring and verifying the custodian’s daily calculation of the Net Asset Values (“NAV”); shareholder relations functions; compliance services; valuation services; assisting in due diligence and in the oversight and monitoring of certain activities of sub-advisers and certain aspects of Portfolio investments; assisting with Portfolio combinations and liquidations; oversight of the preparation and filing, and review, of all returns and reports, in connection with federal, state and local taxes; oversight and review of regulatory reporting; supervising and coordinating the Portfolio’s custodian and dividend disbursing agent and monitoring their services to the Portfolio; assisting the Portfolio in preparing reports to shareholders; acting as liaison with the Portfolio’s independent public accountants and providing, upon request, analyses, fiscal year summaries and other audit related services; assisting in the preparation of agendas and supporting documents for and minutes of meetings of trustees and committees of trustees; assisting in the preparation of regular communications with the trustees; and providing personnel and office space, telephones and other office equipment as necessary in order for TAM to perform supervisory and administrative services to the Portfolio. The Portfolio pays certain fees and expenses to State Street for sub-administration services which are not administrative services covered by the management agreement with TAM or paid for through the management fees payable thereunder. For the period ended June 30, 2024, (i) the expenses paid to State Street for sub-administration services by the Portfolio are shown as a part of Other expenses within the Statement of Operations and (ii) the expenses payable to State Street for sub-administration services from the Portfolio are shown as part of Other accrued expenses within the Statement of Assets and Liabilities.
|
|
|
| Transamerica Series Trust |
|
Semi-Annual Financial Statements 2024 |
Page 5
Transamerica BlackRock iShares Edge 50 VP
NOTES TO FINANCIAL STATEMENTS (continued)
At June 30, 2024
(unaudited)
2. SIGNIFICANT ACCOUNTING POLICIES
In preparing the Portfolio’s financial statements in accordance with Generally Accepted Accounting Principles in the United States of America (“GAAP”), estimates or assumptions (which could differ from actual results) may be used that affect reported amounts and disclosures. The following is a summary of significant accounting policies followed by the Portfolio.
Security transactions and investment income: Security transactions are accounted for on the trade date. Security gains and losses are calculated on a first-in, first-out basis. Interest income, if any, is accrued as earned. Dividend income and capital gain distributions from underlying investments, if any, are recorded on the ex-dividend date. Income or short-term capital gain distributions received from underlying investments, if any, are recorded as Dividend income from investments within the Statement of Operations. Long-term capital gain distributions received from underlying investments, if any, are recorded as Net realized gain (loss) on Capital gain distributions received from investments within the Statement of Operations.
Distributions to shareholders: Distributions are recorded on the ex-dividend date and are determined in accordance with federal income tax regulations, which may differ from GAAP.
Commission recapture: The sub-adviser(s), to the extent consistent with the best execution and usual commission rate policies and practices, may elect to place security transactions of the Portfolio with broker/dealers with which TST has established a commission recapture program. A commission recapture program is any arrangement under which a broker/dealer applies a portion of the commissions received by such broker/dealer on the security transactions to the Portfolio. In no event will commissions, paid by the Portfolio, be used to pay expenses that would otherwise be borne by any other Portfolios within TST, or by any other party.
There were no commissions recaptured during the period ended June 30, 2024 by the Portfolio.
Indemnification: In the normal course of business, the Portfolio enters into contracts that contain a variety of representations that provide general indemnifications. The Portfolio’s maximum exposure under these arrangements is unknown, as this would involve future claims that may be made against the Portfolio and/or its affiliates that have not yet occurred. However, based on experience, the Portfolio expects the risk of loss to be remote.
3. INVESTMENT VALUATION
TAM has been designated as the Portfolio’s valuation designee pursuant to Rule 2a-5 under the 1940 Act with responsibility for fair valuation subject to oversight by the Portfolio’s Board of Trustees. The net asset value of the Portfolio is computed as of the official close of the New York Stock Exchange (“NYSE”) each day the NYSE is open for business.
TAM utilizes various methods to measure the fair value of its investments on a recurring basis. Generally Accepted Accounting Principles in the United States of America establishes a hierarchy that prioritizes inputs to valuation methods. The inputs or methodology used for valuing securities are not necessarily an indication of the risk associated with investing in those securities. The three levels (“Levels”) of inputs of the fair value hierarchy are defined as follows:
Level 1—Unadjusted quoted prices in active markets for identical securities.
Level 2—Inputs, other than quoted prices included in Level 1, which are observable, either directly or indirectly. These inputs may include quoted prices for the identical instrument on an inactive market, prices for similar instruments, interest rates, prepayment speeds, credit risk, yield curves, default rates, and similar data.
Level 3—Unobservable inputs based on the best information available in the circumstances, to the extent observable inputs are not available, which may include TAM’s own assumptions used in determining the fair value of the Portfolio’s investments.
The inputs used to measure fair value may fall into different Levels of the fair value hierarchy. In such cases, for disclosure purposes, the Level in the fair value hierarchy that is assigned to the fair value measurement of a security is determined based on the lowest Level input that is significant to the fair value measurement in its entirety. Certain investments that are measured at fair value using NAV per share, or its equivalent, using the “practical expedient” have not been classified in the fair value Levels. The hierarchy classification of inputs used to value the Portfolio’s investments at June 30, 2024, is disclosed within the Investment Valuation section of the Schedule of Investments.
The availability of observable inputs can vary from security to security and is affected by a wide variety of factors, including, but not limited to, the type of security, whether the security is new and not yet established in the marketplace, the liquidity of markets, and other characteristics particular to the security. To the extent that valuation is based on models or inputs that are less observable or unobservable in the market, the determination of fair value requires more judgment. Accordingly, the degree of judgment exercised in determining fair value is generally greatest for instruments categorized in Level 3. Due to the inherent uncertainty of valuation, the determination of values may differ significantly from values that would have been realized had a ready market for investments existed, and the differences could be material.
|
|
|
| Transamerica Series Trust |
|
Semi-Annual Financial Statements 2024 |
Page 6
Transamerica BlackRock iShares Edge 50 VP
NOTES TO FINANCIAL STATEMENTS (continued)
At June 30, 2024
(unaudited)
3. INVESTMENT VALUATION (continued)
Fair value measurements: Descriptions of the valuation techniques applied to the Portfolio’s significant categories of assets and liabilities measured at fair value on a recurring basis are as follows:
Exchange-traded funds (“ETF”): ETFs are stated at the last reported sale price or closing price on the day of valuation taken from the primary exchange where the ETF is principally traded. ETFs are generally categorized in Level 1 of the fair value hierarchy.
Repurchase agreements: Repurchase agreements are valued at cost, which approximates fair value. To the extent the inputs are observable and timely, the values are generally categorized in Level 2 of the fair value hierarchy.
4. BORROWINGS AND OTHER FINANCING TRANSACTIONS
The Portfolio may engage in borrowing transactions as a means of raising cash to satisfy redemption requests, for other temporary or emergency purposes or, to the extent permitted by its investment policies, to raise additional cash to be invested in other securities or instruments. When the Portfolio invests borrowing proceeds in other securities, the Portfolio will bear the risk that the market value of the securities in which such proceeds are invested goes down and is insufficient to repay the borrowed proceeds. The Portfolio may borrow on a secured or on an unsecured basis. If the Portfolio enters into a secured borrowing arrangement, a portion of the Portfolio’s assets will be used as collateral. The 1940 Act requires the Portfolio to maintain asset coverage of at least 300% of the amount of its borrowings. Asset coverage means the ratio that the value of the Portfolio’s total assets, minus liabilities other than borrowings, bears to the aggregate amount of all borrowings. Although complying with this requirement has the effect of limiting the amount that the Portfolio may borrow, it does not otherwise mitigate the risks of entering into borrowing transactions.
Interfund lending: The Portfolio, along with other funds and portfolios advised by TAM, may participate in an interfund lending program pursuant to exemptive relief granted by the Securities and Exchange Commission on January 18, 2017. This program allows the Portfolio to lend to and borrow from other funds and portfolios advised by TAM. Interfund lending transactions are subject to the conditions of the exemptive relief which places limits on the amount of lending or borrowing a Portfolio may participate in under the program. Interest earned or paid on an interfund lending transaction will be based on the average of certain current market rates. For the period ended June 30, 2024, the Portfolio has not utilized the program.
Repurchase agreements: In a repurchase agreement, the Portfolio purchases a security and simultaneously commits to resell that security to the seller at an agreed-upon price on an agreed-upon date. Securities purchased subject to a repurchase agreement are held at the Portfolio’s custodian, or designated sub-custodian related to tri-party repurchase agreements, and, pursuant to the terms of the repurchase agreement, must be collateralized by securities with an aggregate market value greater than or equal to 100% of the resale price. The Portfolio will bear the risk of value fluctuations until the securities can be sold and may encounter delays and incur costs in liquidating the securities. In the event of bankruptcy or insolvency of the seller, delays and costs may be incurred.
Repurchase agreements are subject to netting agreements, which are agreements between the Portfolio and its counterparties that provide for the net settlement of all transactions and collateral with the Portfolio, through a single payment, in the event of default or termination. Amounts presented within the Schedule of Investments, and as part of Repurchase agreements, at value within the Statement of Assets and Liabilities are shown on a gross basis. The value of the related collateral for each repurchase agreement, as reflected within the Schedule of Investments, exceeds the value of each repurchase agreement at June 30, 2024.
Repurchase agreements at June 30, 2024, if any, are included within the Schedule of Investments and Statement of Assets and Liabilities.
Securities lending: The Portfolio may lend securities to qualified financial institutions, brokers and dealers. State Street serves as securities lending agent to the Portfolio pursuant to a Securities Lending Agreement. Loans of securities are terminable at any time and the borrower, after notice, is required to return borrowed securities within the standard time period for settlement of securities transactions. The lending of securities exposes the Portfolio to risks such as: the borrowers may fail to return the loaned securities or may not be able to provide additional collateral, the Portfolio may experience delays in recovery of the loaned securities or delays in access to collateral, or the Portfolio may experience losses related to the investment collateral. To minimize certain risks, loan counterparties pledge cash, securities issued or guaranteed by the U.S. Government and irrevocable letters of credit issued by banks as collateral. The initial collateral received by the Portfolio is required to have a value of at least 102% of the current value of the loaned securities traded on U.S. exchanges, and a value of at least 105% for all other securities. Typically the lending agent is not permitted to sell, re-pledge or use cash and non-cash collateral it receives. The lending agent has agreed to indemnify the Portfolio in the case of default of any securities borrower.
The Portfolio receives compensation for lending securities from interest or dividends earned on the cash, U.S. Government securities and irrevocable letters of credit held as collateral, less associated fees and expenses. Such income is reflected in Net income from securities lending within the Statement of Operations. Cash collateral received is invested in the State Street Navigator Securities Lending Trust — Government Money Market Portfolio.
|
|
|
| Transamerica Series Trust |
|
Semi-Annual Financial Statements 2024 |
Page 7
Transamerica BlackRock iShares Edge 50 VP
NOTES TO FINANCIAL STATEMENTS (continued)
At June 30, 2024
(unaudited)
4. BORROWINGS AND OTHER FINANCING TRANSACTIONS (continued)
The value of loaned securities and related cash and non-cash collateral outstanding at June 30, 2024, if any, are shown on a gross basis within the Schedule of Investments.
5. RISK FACTORS
Investing in the Portfolio involves certain key risks related to the Portfolio’s trading activity. Please reference the Portfolio’s prospectus for a more complete discussion of the following risk(s), as well as other risks of investing in the Portfolio.
Market risk: The market prices of the Portfolio’s securities or other assets may go up or down, sometimes rapidly or unpredictably, due to factors such as economic events, inflation, changes in interest rates, governmental actions or interventions, actions taken by the U.S. Federal Reserve or foreign central banks, market disruptions caused by tariffs, trade disputes or other factors, political developments, armed conflicts, economic sanctions, cybersecurity events, investor sentiment, the global and domestic effects of widespread or local health, weather or climate events, and other factors that may or may not be related to the issuer of the security or other asset. If the market prices of the Portfolio’s securities and assets fall, the value of your investment in the Portfolio could go down.
Economies and financial markets throughout the world are increasingly interconnected. Events or circumstances in one or more countries or regions could be highly disruptive to, and have profound impacts on, global economies or markets. As a result, whether or not the Portfolio invests in securities of issuers located in or with significant exposure to the countries directly affected, the value and liquidity of the Portfolio’s investments may go down.
Asset allocation risk: The Portfolio’s investment performance is significantly impacted by the Portfolio’s asset allocation and reallocation from time to time. The value of your investment may decrease if the sub-adviser’s judgment about the attractiveness, value or market trends affecting a particular asset class, investment style, technique or strategy, underlying ETF or other issuer is incorrect.
Smart beta investing risk: Smart beta strategies seek to capture broad, consistent drivers of return and to out-perform traditional index strategies. These strategies may not work as intended. An underlying ETF pursuing a smart beta strategy may not achieve its objective and may not perform as well as other funds using other asset management strategies.
Underlying exchange-traded funds risk: Because the Portfolio invests its assets in underlying ETFs, its ability to achieve its investment objective depends largely on the performance of the underlying ETFs in which it invests. Investing in underlying ETFs subjects the Portfolio to the risks of investing in the underlying securities or assets held by those ETFs. Each of the underlying ETFs in which the Portfolio may invest has its own investment risks, and those risks can affect the value of the underlying ETFs’ shares and therefore the value of the Portfolio’s investments. There can be no assurance that the investment objective of any underlying ETF will be achieved. To the extent that the Portfolio invests more of its assets in one underlying ETF than in another, the Portfolio will have greater exposure to the risks of that underlying ETF. In addition, the Portfolio will bear a pro rata portion of the operating expenses of the underlying ETFs in which it invests.
6. FEES AND OTHER AFFILIATED TRANSACTIONS
TST serves as a funding vehicle for certain affiliated asset allocation portfolios and certain affiliated separate accounts of Transamerica Life Insurance Company (“TLIC”) and Transamerica Financial Life Insurance Company.
TAM, the Portfolio’s investment manager, is directly owned by TLIC and AUSA Holding, LLC (“AUSA”), both of which are indirect, wholly owned subsidiaries of Aegon Ltd. TLIC is owned by Commonwealth General Corporation (“Commonwealth”). Commonwealth and AUSA are wholly owned by Transamerica Corporation (DE). Transamerica Corporation (DE) is wholly owned by Aegon International B.V., which is wholly owned by Aegon Ltd., a Bermuda exempted company with liability limited by shares (formerly, Aegon NV, a Netherlands corporation) and a publicly traded international insurance group.
Transamerica Fund Services, Inc. (“TFS”) is the Portfolio’s transfer agent. Transamerica Capital, Inc. (“TCI”) is the Portfolio’s distributor/principal underwriter. TAM, TFS and TCI are affiliates of Aegon Ltd.
Certain officers and trustees of the Portfolio may also be officers and/or trustees of TAM, TFS and TCI. No interested trustee who is deemed an interested person due to current or former service with TAM or an affiliate of TAM receives compensation from the Portfolio. The Portfolio does pay non-interested persons (independent trustees), as disclosed in Trustee and CCO fees within the Statement of Operations.
Investment management fees: TAM serves as the Portfolio’s investment manager, performing administration as well as investment advisory services. TAM renders investment advisory, supervisory, and administration services under an investment management agreement and the Portfolio pays a single management fee, which is reflected in Investment management fees within the Statement of Operations.
|
|
|
| Transamerica Series Trust |
|
Semi-Annual Financial Statements 2024 |
Page 8
Transamerica BlackRock iShares Edge 50 VP
NOTES TO FINANCIAL STATEMENTS (continued)
At June 30, 2024
(unaudited)
6. FEES AND OTHER AFFILIATED TRANSACTIONS (continued)
The Portfolio pays a management fee to TAM based on daily average net assets at the following rates:
|
|
|
| Breakpoints |
|
Rate |
| First $1 billion |
|
0.30% |
| Over $1 billion |
|
0.28 |
TAM has contractually agreed, through May 1, 2025, to waive from its management fees an amount equal to the sub-advisory fee waiver by the Portfolio’s sub-adviser. These amounts are not subject to recapture by TAM.
TAM has contractually agreed to waive fees and/or reimburse Portfolio expenses to the extent that the total operating expenses excluding, as applicable, acquired fund fees and expenses, interest (including borrowing costs and overdraft charges), taxes, brokerage commissions, dividend and interest expenses on securities sold short, extraordinary expenses and other expenses not incurred in the ordinary course of the Portfolio’s business, exceed the following stated annual operating expense limits to the Portfolio’s daily average net assets. To the extent an expense limit changed during the period, the prior limit is also listed below. The expenses waived and/or reimbursed, if any, are included in Expenses waived and/or reimbursed within the Statement of Operations.
|
|
|
|
|
| Class |
|
Operating Expense Limit |
|
Operating Expense Limit Effective Through |
| Service Class |
|
0.56% |
|
May 1, 2025 |
TAM is permitted to recapture amounts contractually waived and/or reimbursed to a class during any of the 36 months from the date on which TAM waived fees and/or reimbursed expenses for the class. A class may recapture and reimburse TAM only if such amount does not cause, on any particular business day of the Portfolio, the class’s total annual operating expenses (after the recapture is taken into account) to exceed the Operating Expense Limits or any other lower limit then in effect. Amounts recaptured, if any, by TAM for the period ended June 30, 2024 are disclosed in Recapture of previously waived and/or reimbursed fees within the Statement of Operations.
TAM, on a voluntary basis and in addition to the contractual operating expense limits in effect, from time to time may waive and/or reimburse expenses of the Portfolio, or any classes thereof, to such level(s) as the Trust’s officers have determined or may reasonably determine from time to time. Any such voluntary waiver or expense reimbursement may be discontinued by TAM at any time. These amounts are not subject to recapture by TAM.
As of June 30, 2024, there are no amounts available for recapture by TAM.
Distribution and service fees: TST has a distribution plan (“Distribution Plan”) pursuant to Rule 12b-1 under the 1940 Act. Pursuant to the Distribution Plan, TST entered into a distribution agreement with TCI as the Portfolio’s distributor.
The Distribution Plan requires the Portfolio to pay distribution fees to TCI as compensation for various distribution activities, not as reimbursement for specific expenses. Under the Distribution Plan and distribution agreement, TCI, on behalf of the Portfolio, is authorized to pay various service providers, as direct payment for expenses incurred in connection with distribution of the Portfolio’s shares.
The fee on the Service Class shares is paid to the insurance companies for providing services and account maintenance for the policyholders who invest in the variable insurance products which invest in the Service Class shares. The distribution and service fees are included in Distribution and service fees within the Statement of Operations.
The Portfolio is authorized under the Distribution Plan to pay fees to TCI based on daily average net assets up to an annual fee of 0.25% of Service Class shares.
Transfer agent costs: TFS provides transfer agency services under an intercompany agreement with TAM. TFS has outsourced the provision of certain sub-transfer agency services to SS&C Global Investor & Distribution Solutions, Inc. (“SS&C GIDS”). The Portfolio does not pay a separate transfer agent fee to TAM or TFS but does pay certain expenses to SS&C GIDS related to applicable sub-transfer agency services. For the period ended June 30, 2024, (i) the expenses paid to SS&C GIDS by the Portfolio are referred to as transfer agent costs and are included within the Statement of Operations and (ii) the expenses payable to SS&C GIDS by the Portfolio are referred to as transfer agent costs within the Statement of Assets and Liabilities.
Brokerage commissions: The Portfolio incurred no brokerage commissions on security transactions placed with affiliates of the investment manager or sub-adviser(s) for the period ended June 30, 2024.
|
|
|
| Transamerica Series Trust |
|
Semi-Annual Financial Statements 2024 |
Page 9
Transamerica BlackRock iShares Edge 50 VP
NOTES TO FINANCIAL STATEMENTS (continued)
At June 30, 2024
(unaudited)
7. PURCHASES AND SALES OF SECURITIES
For the period ended June 30, 2024, the cost of securities purchased and proceeds from securities sold (excluding short-term securities) are as follows:
|
|
|
|
|
|
|
| |
|
Purchases of Securities |
|
Sales of Securities |
|
|
| |
|
|
|
| |
$ 15,489,576 |
|
$ 36,797,478 |
8. FEDERAL INCOME TAXES AND DISTRIBUTIONS TO SHAREHOLDERS
The Portfolio has not made any provision for federal income or excise taxes due to its policy to distribute all of its taxable income and capital gains to its shareholders and otherwise qualify as a regulated investment company under Subchapter M of the Internal Revenue Code. The Portfolio recognizes the tax benefits of uncertain tax positions only where the position is “more likely than not” to be sustained assuming examination by tax authorities. The Portfolio’s tax returns remain subject to examination by the Internal Revenue Service and state tax authorities three years from the date of filing for federal purposes and four years from the date of filing for state purposes. Management has evaluated the Portfolio’s tax provisions taken for all open tax years, and has concluded that no provision for income tax is required in the Portfolio’s financial statements. If applicable, the Portfolio recognizes interest accrued related to unrecognized tax benefits in relation to interest and penalties expense in Other within the Statement of Operations. The Portfolio identifies its major tax jurisdictions as U.S. Federal, the state of Colorado, and foreign jurisdictions where the Portfolio makes significant investments; however, the Portfolio is not aware of any tax positions for which it is reasonably possible that the total amounts of unrecognized tax benefits will change materially in the next twelve months. Distributions are determined in accordance with income tax regulations, which may differ from GAAP.
As of June 30, 2024, the approximate cost for U.S. federal income tax purposes, and the aggregate gross/net unrealized appreciation (depreciation) in the value of investments (including securities sold short and derivatives, if any) are as follows:
|
|
|
|
|
|
|
|
|
|
|
| |
|
Cost |
|
Gross Appreciation |
|
Gross (Depreciation) |
|
Net Appreciation (Depreciation) |
|
|
| |
$ 408,529,613 |
|
$ 52,400,126 |
|
$ (31,496,204) |
|
$ 20,903,922 |
Please see TST’s most recent report on Form N-CSR, available at: www.transamerica.com/annuities/prospectus, for additional information. For the most recently filed complete proxy voting records for the Trust please visit: https://www.transamerica.com/sites/default/files/files/e070d/TST%20N-PX%202021.pdf
|
|
|
| Transamerica Series Trust |
|
Semi-Annual Financial Statements 2024 |
Page 10
Transamerica BlackRock iShares Edge 50 VP
MANAGEMENT AND SUB-ADVISORY AGREEMENT — CONTRACT RENEWAL
(unaudited)
At a meeting of the Board of Trustees of Transamerica Series Trust (the “Trustees” or the “Board”) held on June 12-13, 2024, the Board considered the renewal of the management agreement (the “Management Agreement”) between Transamerica Asset Management, Inc. (“TAM”) and Transamerica Series Trust, on behalf of Transamerica BlackRock iShares Edge 50 VP (the “Portfolio”). The Board also considered the renewal of the investment sub-advisory agreement (the “Sub-Advisory Agreement” and together with the Management Agreement, the “Agreements”) for the Portfolio between TAM and BlackRock Investment Management, LLC (the “Sub-Adviser”).
Following its review and consideration, the Board determined that the terms of the Management Agreement and Sub-Advisory Agreement were reasonable and that the renewal of each of the Agreements was in the best interests of the Portfolio and the holders invested in the Portfolio. The Board, including the independent members of the Board (the “Independent Trustees”), unanimously approved the renewal of each of the Agreements through June 30, 2025.
Prior to reaching their decision, the Trustees requested and received from TAM and the Sub-Adviser certain information. They then reviewed such information as they deemed reasonably necessary to evaluate the Agreements, including information they had previously received from TAM and the Sub-Adviser as part of their regular oversight of the Portfolio, and knowledge they gained over time through meeting with TAM and the Sub-Adviser. Among other materials, the Trustees considered comparative fee, expense and performance information prepared by Broadridge Financial Solutions, Inc. (“Broadridge”), an independent provider of mutual fund performance information, as well as fee, expense and profitability information prepared by TAM. In addition, TAM provided the Board with additional supplemental comparative performance information. To the extent applicable, the Trustees considered information about fees and performance of comparable funds and/or accounts managed by the Sub-Adviser. The Board also considered reductions to the Portfolio’s expense limit, if any, that took effect after the last renewal of the Agreements. In their review, the Trustees also sought to identify instances in which the Portfolio’s performance, fees, total expenses and/or profitability appeared to be outliers within its respective peer group or other comparative metrics and sought to understand the reasons for such comparative positions.
In their deliberations, the Independent Trustees met privately without representatives of TAM or the Sub-Adviser present and were represented throughout the process by their independent legal counsel. In considering the proposed continuation of each of the Agreements, the Trustees evaluated and weighed a number of considerations that they believed to be relevant in light of the legal advice furnished to them by counsel, including independent legal counsel, and made a decision in the exercise of their own business judgment. They based their decisions on the considerations discussed below, among others, although they did not identify any particular consideration or item of information that was controlling of their decisions, and each Trustee may have attributed different weights to the various factors.
Nature, Extent and Quality of the Services Provided
The Board considered the nature, extent and quality of the services provided by TAM and the Sub-Adviser to the Portfolio in the past and the services anticipated to be provided in the future. The Board also considered the investment approach for the Portfolio; the experience, capability and integrity of TAM’s senior management; the financial resources of TAM; TAM’s management oversight process; TAM’s and the Sub-Adviser’s responsiveness to any questions by the Trustees; and the professional qualifications and compensation program of the portfolio management team of the Sub-Adviser. The Trustees noted that they receive, on a quarterly basis, an execution analysis from Capital Institutional Services, Inc. (CAPIS), an independent provider of trade analyses, for the Sub-Adviser and a comparison of trading results against a peer universe of managers.
The Board also considered the continuous and regular investment management and other services provided by TAM, when acting as a manager of managers, for the portion of the management fee it retains from the Portfolio after payment of the sub-advisory fees. The Board noted that the investment management and other services provided by TAM include the design, development and ongoing review and evaluation of the Portfolio and its investment strategy; the selection, oversight and monitoring of one or more investment sub-advisers to perform certain duties with respect to the Portfolio; ongoing portfolio trading oversight and analysis; risk management oversight and analysis; design, development, implementation and ongoing review and evaluation of a process for the valuation of Portfolio investments; design, development, implementation and ongoing review and evaluation of a compliance program for the Portfolio; design, development, implementation and ongoing review and evaluation of a process for the voting of proxies and exercise of rights to consent to corporate action for Portfolio investments; participation in Board meetings and oversight of preparation of materials for the Board, including materials for Board meetings and regular communications with the Board; oversight of preparation of the Portfolio’s prospectus, statement of additional information, shareholder reports and other disclosure materials and regulatory filings for the Portfolio; and ongoing cash management services for the Portfolio. The Board considered that TAM’s investment management services also include the provision of supervisory and administrative services to the Portfolio. The Board also noted that TAM, as part of the services it provides to all Transamerica mutual funds, including the Portfolio, oversees the services provided by the funds’ custodian, transfer agent, independent accountant and legal counsel and supervises the performance of the recordkeeping and holder service functions of the funds.
Investment Performance
In addition, the Board considered the short- and longer-term performance of the Portfolio in light of its investment objective, policies and strategies, including relative performance against (i) a peer universe of comparable mutual funds, as prepared by Broadridge, and (ii) the Portfolio’s benchmarks, in each case for various trailing periods ended December 31, 2023. Based on these considerations, the Board determined that TAM and the Sub-Adviser can provide investment and related services that are appropriate in scope and extent in light of
|
|
|
|
|
| Transamerica Series Trust |
|
|
|
Semi-Annual Financial Statements 2024 |
|
|
Page 11 |
|
|
Transamerica BlackRock iShares Edge 50 VP
MANAGEMENT AND SUB-ADVISORY AGREEMENT — CONTRACT RENEWAL (continued)
(unaudited)
the Portfolio’s investment objectives, policies and strategies and operations, the competitive landscape of the investment company business and investor needs. The Board’s conclusions as to the Portfolio’s performance are summarized below. For purposes of its review, the Board generally used the performance of Service Class Shares. In describing the Portfolio’s performance relative to its peer universe, the summary conclusions characterize performance for the relevant periods in relation to whether it was “above,” “below” or “in line with” the peer universe median and do so using quintile rankings prepared by Broadridge. For simplicity, performance is described as “above” the median if the Portfolio’s performance ranked anywhere in the first or second quintiles, as “below” the median if it ranked anywhere in the fourth or fifth quintiles, or “in line with” the median if it ranked anywhere in the third quintile (i.e., even if its precise return was somewhat above or somewhat below the precise median return).
When considering the Portfolio’s performance, the Trustees considered any representations made by TAM regarding the appropriateness of certain peer groups and benchmarks. They recognized that performance reflects a snapshot of a period as of a specific date, and that consideration of performance data for a different period could generate significantly different performance results. The Trustees also recognized that even longer-term performance can be negatively affected by performance over a short-term period when that short-term performance is significantly below the performance of the comparable benchmark or universe of peer funds.
The Board noted that the performance of Service Class Shares of the Portfolio was below the median for its peer universe and below the benchmark that TAM utilizes to measure performance of the Portfolio, each for the past 1-, 3- and 5-year periods.
Management Fee and Sub-Advisory Fees and Total Expense Ratio
The Board considered the management fee and total expense ratio of the Portfolio, including information provided by Broadridge comparing the management fee and total expense ratio of the Portfolio to the management fees and total expense ratios of comparable investment companies in both a peer group and broader peer universe compiled by Broadridge. The Board’s conclusions as to the Portfolio’s management fee and total expense ratio are summarized below. For purposes of its review, the Board generally used the actual total expenses (i.e., expenses reflecting any waivers and/or reimbursements) of Service Class Shares. In describing the Portfolio’s management fee and total expense ratio relative to its peer group and peer universe, the summary conclusions characterize management fees and total expense ratios for the relevant periods in relation to whether they were “above,” “below” or “in line with” the peer group or peer universe median and do so using quintile rankings prepared by Broadridge. For simplicity, management fees and total expense ratios are described as “above” the median if the Portfolio’s management fee or total expense ratio ranked anywhere in the fourth or fifth quintiles, as “below” the median if it ranked anywhere in the first or second quintiles, or “in line with” the median if it ranked anywhere in the third quintile (i.e., even if its precise management fee or total expense ratio was somewhat above or somewhat below the precise median management fee or total expense ratio).
The Board also considered the fees charged by the Sub-Adviser for sub-advisory services, as well as the portion of the Portfolio’s management fee retained by TAM following payment of the sub-advisory fee and how the portion of the contractual management fee retained by TAM at a specified asset level compared to the portions retained by other investment advisers managing mutual funds with similar investment strategies as calculated by an independent provider of information.
The Board noted that the Portfolio’s contractual management fee was above the medians for its peer group and peer universe and that the actual total expenses (i.e., expenses reflecting any waivers and/or reimbursements) of Service Class Shares of the Portfolio were below the medians for its peer group and peer universe. The Trustees also considered that TAM has entered into an expense limitation arrangement with the Portfolio, which may result in TAM waiving fees for the benefit of holders.
On the basis of these considerations, together with the other information it considered, the Board determined that the management and sub-advisory fees to be received by TAM and the Sub-Adviser under the Management Agreement and Sub-Advisory Agreement are reasonable in light of the services provided.
Cost of Services Provided and Level of Profitability
The Board reviewed information provided by TAM about the cost of providing and procuring fund management services, as well as the costs of the provision of administration, transfer agency and other services, to the Portfolio and to Transamerica Series Trust as a whole by TAM and its affiliates. The Board considered the profitability of TAM and its affiliates in providing these services for the Portfolio and Transamerica Series Trust as a whole. The Trustees recognized the competitiveness of the mutual fund industry and the importance of an investment adviser’s long-term profitability, including for maintaining company and management stability and accountability.
The Board also considered the allocation methodology used for calculating the profitability of TAM and its affiliates. The Board noted that the revenue and expense allocation methodology used by TAM to estimate its profitability with respect to its relationship with the Portfolio had been reviewed previously by an independent consultant. The Trustees considered that TAM reported that it had not made material changes to this methodology, and that the methodology had been applied consistently for the Portfolio.
With respect to the Sub-Adviser, the Board noted that the sub-advisory fee is the product of arm’s-length negotiation between TAM and the Sub-Adviser, which is not affiliated with TAM, and is paid by TAM and not the Portfolio. As a result, the Board focused on the profitability of TAM and its affiliates with respect to the Portfolio.
|
|
|
| Transamerica Series Trust |
|
Semi-Annual Financial Statements 2024 |
Page 12
Transamerica BlackRock iShares Edge 50 VP
MANAGEMENT AND SUB-ADVISORY AGREEMENT — CONTRACT RENEWAL (continued)
(unaudited)
Based on this information, the Board determined that the profitability of TAM and its affiliates from their relationships with the Portfolio was not excessive.
Economies of Scale
The Board considered economies of scale with respect to the management of the Portfolio, whether the Portfolio had appropriately benefited from any economies of scale and whether there was the potential for realization of any future economies of scale. The Board also considered the existence of economies of scale with respect to management of the Transamerica mutual funds overall and the extent to which the Portfolio benefited from any economies of scale. The Board recognized that, as the Portfolio’s assets increase, any economies of scale realized by TAM or the Sub-Adviser may not directly correlate with each other or with any economies of scale that might be realized by the Portfolio. The Board considered the Portfolio’s management fee schedule and the existence of breakpoints and also considered the extent to which TAM shared economies of scale, if any, with the Portfolio through undertakings to limit or reimburse Portfolio expenses and to invest in maintaining and developing its capabilities and services. The Board also considered the Sub-Adviser’s sub-advisory fee schedule and the existence of breakpoints, if any, and how such breakpoints relate to any breakpoints in the Portfolio’s management fee schedule. The Trustees concluded that the Portfolio’s fee structure reflected an appropriate sharing of any efficiencies or economies of scale to date and noted that they will have the opportunity to periodically reexamine the appropriateness of the management fee payable to TAM and the fee paid to the Sub-Adviser in light of any economies of scale experienced in the future.
Benefits to TAM, its Affiliates and/or the Sub-Adviser from their Relationships with the Portfolio
The Board considered other benefits derived by TAM, its affiliates, and/or the Sub-Adviser from their relationships with the Portfolio. The Board noted that TAM does not receive benefits from research obtained with commissions paid to broker-dealers for portfolio transactions (commonly referred to as “soft dollars”) as a result of its relationship with the Portfolio.
Other Considerations
The Board noted that TAM has made a substantial commitment to the recruitment and retention of high-quality personnel and maintains the financial, compliance and operational resources reasonably necessary to manage the Portfolio in a professional manner that is consistent with the best interests of the Portfolio and the holders. In this regard, the Board favorably considered the procedures and policies TAM has in place to enforce compliance with applicable laws and regulations and oversee the portfolio management activities of the Sub-Adviser. The Board also noted that TAM has made an entrepreneurial commitment and undertaken certain business risks with respect to the management and success of the Portfolio.
Conclusion
After consideration of the factors described above, as well as other factors, the Trustees, including the Independent Trustees, concluded that the renewal of the Management Agreement and the Sub-Advisory Agreement was in the best interests of the Portfolio and the holders and voted to approve the renewal of the Agreements.
|
|
|
| Transamerica Series Trust |
|
Semi-Annual Financial Statements 2024 |
Page 13
PROXY VOTING POLICIES AND PROCEDURES AND QUARTERLY PORTFOLIO HOLDINGS
(unaudited)
A description of Transamerica Series Trust’s (the “Trust”) proxy voting policies and procedures is available in the Statement of Additional Information of the Portfolios, available without charge upon request by calling 1-800-851-9777 (toll free) or on the Securities and Exchange Commission’s (“SEC”) website at http://www.sec.gov.
In addition, the Portfolio is required to file Form N-PX, with their complete proxy voting records for the most recent 12 months ended June 30th, no later than August 31st of each year. The Form is available without charge: (1) on the Transamerica Funds website at https://www.transamerica.com/sites/default/files/files/e070d/TST%20N-PX%202021.pdf; and (2) on the SEC’s website at http://www.sec.gov.
Each fiscal quarter, the Portfolios, except Transamerica BlackRock Government Money Market VP, will file with the SEC a complete schedule of its monthly portfolio holdings on Form N-PORT. The Portfolios’ holdings as of the end of the third month of every fiscal quarter, as reported on Form N-PORT, will be publicly available on the SEC’s website at http://www.sec.gov within 60 days of the end of the fiscal quarter.
On a monthly basis, Transamerica BlackRock Government Money Market VP will file with the SEC portfolio holdings information on Form N-MFP3. A complete schedule of portfolio holdings is also available at www.transamerica.com.
You may also visit the Trust’s website at www.transamerica.com/annuities/prospectus for this and other information about the Portfolios and the Trust.
Important Notice Regarding Delivery of Shareholder Documents
Every year we provide shareholders informative materials such as the Transamerica Series Trust Annual Report, the Transamerica Series Trust Prospectus, and other required documents that keep you informed regarding your Portfolios. To the extent provided by mail, Transamerica Series Trust will only send one piece per mailing address, a method that saves your Portfolios money by reducing mailing and printing costs. We will continue to do this unless you tell us not to. To elect to receive individual mailings, simply call a Transamerica Customer Service Representative toll free at 1-800-851-9777, 8 a.m. to 7 p.m. Eastern Time, Monday-Friday. Your request will take effect within 30 days.
|
|
|
| Transamerica Series Trust |
|
Semi-Annual Financial Statements 2024 |
Page 14
NOTICE OF PRIVACY POLICY
(unaudited)
Your privacy is very important to us. We want you to understand what information we collect and how we use it. We collect and use “nonpublic personal information” in connection with providing our customers with a broad range of financial products and services as effectively and conveniently as possible. We treat nonpublic personal information in accordance with our Privacy Policy.
What Information We Collect and From Whom We Collect It
We may collect nonpublic personal information about you from the following sources:
| • |
|
Information we receive from you on applications or other forms, such as your name, address, and account number; |
| • |
|
Information about your transactions with us, our affiliates, or others, such as your account balance and purchase/redemption history; and |
| • |
|
Information we receive from non-affiliated third parties, including consumer reporting agencies. |
What Information We Disclose and To Whom We Disclose It
We do not disclose any nonpublic personal information about current or former customers to anyone without their express consent, except as permitted by law. We may disclose the nonpublic personal information we collect, as described above, to persons or companies that perform services on our behalf and to other financial institutions with which we have joint marketing agreements. We will require these companies to protect the confidentiality of your nonpublic personal information and to use it only to perform the services for which we have hired them.
Our Security Procedures
We restrict access to your nonpublic personal information and only allow disclosures to persons and companies as permitted by law to assist in providing products or services to you. We maintain physical, electronic, and procedural safeguards to protect your nonpublic personal information and to safeguard the disposal of certain consumer information.
Contact Us
If you have any questions about our Privacy Policy, please call 1-800-851-9777 on any business day between 8 a.m. and 7 p.m. Eastern Time.
Note: This Privacy Policy applies only to customers that have a direct relationship with us or our affiliates. If you own shares of our portfolios in the name of a third party such as a bank or broker-dealer, its privacy policy may apply to you instead of ours.
|
|
|
|
|
| Transamerica Series Trust |
|
|
|
Semi-Annual Financial Statements 2024 |
|
|
Page 15 |
|
|
|
|
|
| PO Box 219945 |
| Kansas City, MO 64121-9945 |
|
|
| Distributor: |
|
Transamerica Capital, Inc. |
|
|
PO Box 219945 |
|
|
Kansas City, MO 64121-9945 |
|
|
|
|
Customer Service: 1-800-851-9777 |
Transamerica Series Trust Semi-Annual Financial Statements
June 30, 2024
1801 California St., Suite 5200
Denver, CO 80202
Distributor: Transamerica Capital, Inc.
Customer Service: 1-800-851-9777
The following pages contain the most recent semi-annual financial statements for the investment options in which you are invested. In compliance with Securities and Exchange Commission regulations, we present these reports on an annual and semi-annual basis with the hope that they will foster greater understanding of the investment options’ holdings, performance, financial data, accounting policies and other issues. This streamlined version provides information only on the investment options in which you are invested.
If you have any questions about these reports, please do not hesitate to contact your financial professional. As always, we thank you for your trust and the opportunity to serve you.
Transamerica BlackRock iShares Edge 75 VP
SCHEDULE OF INVESTMENTS
At June 30, 2024
(unaudited)
|
|
|
|
|
|
|
|
|
| |
|
Shares |
|
|
Value |
|
| |
|
|
|
|
| EXCHANGE-TRADED FUNDS - 100.2% |
|
|
|
|
|
|
|
|
| International Equity Funds - 18.5% |
|
|
|
|
|
|
|
|
| iShares MSCI EAFE Min Vol Factor ETF |
|
|
314,819 |
|
|
$ |
21,834,272 |
|
| iShares MSCI Emerging Markets Min Vol Factor ETF |
|
|
105,249 |
|
|
|
6,021,295 |
|
|
|
|
|
|
|
|
|
|
|
|
|
|
|
|
|
|
|
|
27,855,567 |
|
|
|
|
|
|
|
|
|
|
| U.S. Equity Funds - 56.9% |
|
|
|
|
|
|
|
|
| iShares MSCI USA Min Vol Factor ETF |
|
|
223,149 |
|
|
|
18,735,590 |
|
| iShares MSCI USA Momentum Factor ETF (A) |
|
|
95,917 |
|
|
|
18,691,346 |
|
| iShares MSCI USA Quality Factor ETF |
|
|
108,942 |
|
|
|
18,602,936 |
|
| iShares MSCI USA Size Factor ETF (A) |
|
|
81,558 |
|
|
|
11,216,672 |
|
| iShares MSCI USA Value Factor ETF (A) |
|
|
176,557 |
|
|
|
18,266,587 |
|
|
|
|
|
|
|
|
|
|
|
|
|
|
|
|
|
|
|
|
85,513,131 |
|
|
|
|
|
|
|
|
|
|
| U.S. Fixed Income Fund - 24.8% |
|
|
|
|
|
|
|
|
| iShares Core U.S. Aggregate Bond ETF |
|
|
383,341 |
|
|
|
37,210,911 |
|
|
|
|
|
|
|
|
|
|
|
|
|
| Total Exchange-Traded Funds (Cost $131,411,916) |
|
|
|
|
|
|
150,579,609 |
|
|
|
|
|
|
|
|
|
|
|
|
|
|
|
|
|
|
|
| |
|
Shares |
|
|
Value |
|
| |
|
|
| OTHER INVESTMENT COMPANY - 3.9% |
|
| Securities Lending Collateral - 3.9% |
|
| State Street Navigator Securities Lending Trust - Government Money Market Portfolio, 5.28% (B) |
|
|
5,823,388 |
|
|
|
$ 5,823,388 |
|
|
|
|
|
|
|
|
|
|
|
|
| Total Other Investment Company (Cost $5,823,388) |
|
|
|
5,823,388 |
|
|
|
|
|
|
|
|
|
|
| Total Investments (Cost $137,235,304) |
|
|
|
156,402,997 |
|
|
|
|
|
|
|
|
|
|
| Net Other Assets (Liabilities) - (4.1)% |
|
|
|
(6,189,224 |
) |
|
|
|
|
|
|
|
|
|
|
|
| Net Assets - 100.0% |
|
|
$ |
150,213,773 |
|
|
|
|
|
|
|
|
|
|
INVESTMENT VALUATION:
|
|
|
|
|
|
|
|
|
|
|
|
|
|
|
|
|
| Valuation Inputs (C) |
|
|
|
|
|
|
|
|
|
|
|
|
|
|
|
|
|
| |
|
Level 1 - Unadjusted Quoted Prices |
|
|
Level 2 - Other Significant Observable Inputs |
|
|
Level 3 - Significant Unobservable Inputs |
|
|
Value |
|
| |
|
|
|
|
|
|
| ASSETS |
|
|
|
|
|
|
|
|
|
|
|
|
|
|
|
|
| Investments |
|
|
|
|
|
|
|
|
|
|
|
|
|
|
|
|
| Exchange-Traded Funds |
|
$ |
150,579,609 |
|
|
$ |
— |
|
|
$ |
— |
|
|
$ |
150,579,609 |
|
| Other Investment Company |
|
|
5,823,388 |
|
|
|
— |
|
|
|
— |
|
|
|
5,823,388 |
|
|
|
|
|
|
|
|
|
|
|
|
|
|
|
|
|
|
| Total Investments |
|
$ |
156,402,997 |
|
|
$ |
— |
|
|
$ |
— |
|
|
$ |
156,402,997 |
|
|
|
|
|
|
|
|
|
|
|
|
|
|
|
|
|
|
FOOTNOTES TO SCHEDULE OF INVESTMENTS:
| (A) |
All or a portion of the security is on loan. The total value of the securities on loan is $6,002,486, collateralized by cash collateral of $5,823,388 and non-cash collateral, such as U.S. government securities and irrevocable letters of credit, of $306,675. The amount on loan indicated may not correspond with the securities on loan identified because a security with pending sales are in the process of recall from the brokers. |
| (B) |
Rate disclosed reflects the yield at June 30, 2024. |
| (C) |
There were no transfers in or out of Level 3 during the period ended June 30, 2024. Please reference the Investment Valuation section of the Notes to Financial Statements for more information regarding investment valuation and pricing inputs. |
|
|
|
|
|
| The Notes to Financial Statements are an integral part of this report. |
| Transamerica Series Trust |
|
|
|
Semi-Annual Financial Statements 2024 |
|
|
Page 1 |
|
|
Transamerica BlackRock iShares Edge 75 VP
STATEMENT OF ASSETS AND LIABILITIES
At June 30, 2024
(unaudited)
|
|
|
|
|
|
|
| Assets: |
|
|
|
|
| Unaffiliated investments, at value (cost $137,235,304)
(including securities loaned of $6,002,486) |
|
$ |
156,402,997 |
|
| Cash |
|
|
63,305 |
|
| Receivables and other assets: |
|
|
|
|
| Investments sold |
|
|
1,240,991 |
|
| Net income from securities lending |
|
|
7,620 |
|
| Shares of beneficial interest sold |
|
|
808 |
|
| Prepaid expenses |
|
|
601 |
|
|
|
| Total assets |
|
|
157,716,322 |
|
|
|
| Liabilities: |
|
|
|
|
| Cash collateral received upon return of: |
|
|
|
|
| Securities on loan |
|
|
5,823,388 |
|
| Payables and other liabilities: |
|
|
|
|
| Investments purchased |
|
|
1,250,323 |
|
| Shares of beneficial interest redeemed |
|
|
345,143 |
|
| Investment management fees |
|
|
28,848 |
|
| Distribution and service fees |
|
|
28,848 |
|
| Transfer agent costs |
|
|
149 |
|
| Trustee and CCO fees |
|
|
453 |
|
| Audit and tax fees |
|
|
9,703 |
|
| Custody fees |
|
|
846 |
|
| Legal fees |
|
|
3,222 |
|
| Printing and shareholder reports fees |
|
|
4,361 |
|
| Other accrued expenses |
|
|
7,265 |
|
|
|
| Total liabilities |
|
|
7,502,549 |
|
|
|
| Net assets |
|
$ |
150,213,773 |
|
|
|
| Net assets consist of: |
|
|
|
|
| Capital stock ($0.01 par value) |
|
$ |
101,781 |
|
| Additional paid-in capital |
|
|
119,981,727 |
|
| Total distributable earnings (accumulated losses) |
|
|
30,130,265 |
|
|
|
| Net assets |
|
$ |
150,213,773 |
|
|
|
| Shares outstanding |
|
|
10,178,086 |
|
|
|
| Net asset value and offering price per share |
|
$ |
14.76 |
|
STATEMENT OF OPERATIONS
For the period ended June 30, 2024
(unaudited)
|
|
|
|
|
|
|
| Investment income: |
|
|
|
|
| Dividend income from unaffiliated investments |
|
$ |
1,643,207 |
|
| Interest income from unaffiliated investments |
|
|
1,034 |
|
| Net income from securities lending |
|
|
20,761 |
|
|
|
| Total investment income |
|
|
1,665,002 |
|
|
|
| Expenses: |
|
|
|
|
| Investment management fees |
|
|
224,163 |
|
| Distribution and service fees |
|
|
186,802 |
|
| Transfer agent costs |
|
|
854 |
|
| Trustee and CCO fees |
|
|
3,524 |
|
| Audit and tax fees |
|
|
9,558 |
|
| Custody fees |
|
|
2,504 |
|
| Legal fees |
|
|
6,096 |
|
| Printing and shareholder reports fees |
|
|
4,493 |
|
| Other |
|
|
10,226 |
|
|
|
| Total expenses before waiver and/or reimbursement and recapture |
|
|
448,220 |
|
|
|
| Expenses waived and/or reimbursed |
|
|
(37,360 |
) |
|
|
| Net expenses |
|
|
410,860 |
|
|
|
| Net investment income (loss) |
|
|
1,254,142 |
|
|
|
| Net realized gain (loss) on:
Unaffiliated investments |
|
|
3,633,127 |
|
|
|
| Net change in unrealized appreciation (depreciation) on:
Unaffiliated investments |
|
|
5,172,581 |
|
|
|
| Net realized and change in unrealized gain (loss) |
|
|
8,805,708 |
|
|
|
| Net increase (decrease) in net assets resulting from operations |
|
$ |
10,059,850 |
|
The Notes to Financial Statements are an integral part of this report.
|
|
|
|
|
| Transamerica Series Trust |
|
|
|
Semi-Annual Financial Statements 2024 |
|
|
Page 2 |
|
|
Transamerica BlackRock iShares Edge 75 VP
STATEMENT OF CHANGES IN NET ASSETS
For the period and year ended:
|
|
|
|
|
|
|
|
|
| |
|
June 30, 2024 (unaudited) |
|
December 31, 2023 |
|
|
|
| From operations: |
|
|
|
|
|
|
|
|
| Net investment income (loss) |
|
|
$ 1,254,142 |
|
|
|
$ 2,836,849 |
|
| Net realized gain (loss) |
|
|
3,633,127 |
|
|
|
3,733,474 |
|
| Net change in unrealized appreciation (depreciation) |
|
|
5,172,581 |
|
|
|
10,958,144 |
|
|
|
|
| Net increase (decrease) in net assets resulting from operations |
|
|
10,059,850 |
|
|
|
17,528,467 |
|
|
|
|
| Dividends and/or distributions to shareholders: |
|
|
|
|
|
|
|
|
| Dividends and/or distributions to shareholders |
|
|
— |
|
|
|
(7,521,519 |
) |
|
|
|
| Net increase (decrease) in net assets resulting from dividends and/or distributions to shareholders |
|
|
— |
|
|
|
(7,521,519 |
) |
|
|
|
| Capital share transactions: |
|
|
|
|
|
|
|
|
| Proceeds from shares sold |
|
|
2,115,839 |
|
|
|
5,646,883 |
|
| Dividends and/or distributions reinvested |
|
|
— |
|
|
|
7,521,519 |
|
| Cost of shares redeemed |
|
|
(14,058,778 |
) |
|
|
(29,288,424 |
) |
|
|
|
| Net increase (decrease) in net assets resulting from capital share transactions |
|
|
(11,942,939 |
) |
|
|
(16,120,022 |
) |
|
|
|
| Net increase (decrease) in net assets |
|
|
(1,883,089 |
) |
|
|
(6,113,074 |
) |
|
|
|
| Net assets: |
|
|
|
|
|
|
|
|
| Beginning of period/year |
|
|
152,096,862 |
|
|
|
158,209,936 |
|
| End of period/year |
|
|
$150,213,773 |
|
|
|
$152,096,862 |
|
|
|
|
| Capital share transactions - shares: |
|
|
|
|
|
|
|
|
| Shares issued |
|
|
147,022 |
|
|
|
429,776 |
|
| Shares reinvested |
|
|
— |
|
|
|
574,600 |
|
| Shares redeemed |
|
|
(980,119 |
) |
|
|
(2,201,392 |
) |
|
|
|
| Net increase (decrease) in shares outstanding |
|
|
(833,097 |
) |
|
|
(1,197,016 |
) |
The Notes to Financial Statements are an integral part of this report.
|
|
|
|
|
| Transamerica Series Trust |
|
|
|
Semi-Annual Financial Statements 2024 |
|
|
Page 3 |
|
|
Transamerica BlackRock iShares Edge 75 VP
FINANCIAL HIGHLIGHTS
|
|
|
|
|
|
|
|
|
|
|
|
|
|
|
|
|
|
|
|
|
|
|
|
|
| For a share outstanding during the period and years indicated: |
|
Service Class |
|
|
|
|
|
|
|
| |
|
June 30, 2024 (unaudited) |
|
December 31, 2023 |
|
December 31, 2022 |
|
December 31, 2021 |
|
December 31, 2020 |
|
December 31, 2019 |
|
|
|
|
|
|
|
| Net asset value, beginning of period/year |
|
$ |
13.81 |
|
|
$ |
12.96 |
|
|
$ |
16.20 |
|
|
$ |
14.79 |
|
|
$ |
13.66 |
|
|
$ |
11.50 |
|
|
|
|
|
|
|
|
| Investment operations: |
|
|
|
|
|
|
|
|
|
|
|
|
|
|
|
|
|
|
|
|
|
|
|
|
|
|
|
|
|
|
|
| Net investment income (loss)(A) |
|
|
0.12 |
|
|
|
0.24 |
|
|
|
0.21 |
|
|
|
0.18 |
|
|
|
0.18 |
|
|
|
0.27 |
|
|
|
|
|
|
|
|
| Net realized and unrealized gain (loss) |
|
|
0.83 |
|
|
|
1.29 |
|
|
|
(2.62 |
) |
|
|
1.73 |
|
|
|
1.20 |
|
|
|
2.06 |
|
|
|
|
|
|
|
|
| Total investment operations |
|
|
0.95 |
|
|
|
1.53 |
|
|
|
(2.41 |
) |
|
|
1.91 |
|
|
|
1.38 |
|
|
|
2.33 |
|
|
|
|
|
|
|
|
| Dividends and/or distributions to shareholders: |
|
|
|
|
|
|
|
|
|
|
|
|
|
|
|
|
|
|
|
|
|
|
|
|
|
|
|
|
|
|
|
| Net investment income |
|
|
— |
|
|
|
(0.25 |
) |
|
|
(0.20 |
) |
|
|
(0.17 |
) |
|
|
(0.18 |
) |
|
|
(0.12 |
) |
|
|
|
|
|
|
|
| Net realized gains |
|
|
— |
|
|
|
(0.43 |
) |
|
|
(0.63 |
) |
|
|
(0.33 |
) |
|
|
(0.07 |
) |
|
|
(0.05 |
) |
|
|
|
|
|
|
|
| Total dividends and/or distributions to shareholders |
|
|
— |
|
|
|
(0.68 |
) |
|
|
(0.83 |
) |
|
|
(0.50 |
) |
|
|
(0.25 |
) |
|
|
(0.17 |
) |
|
|
|
|
|
|
|
| Net asset value, end of period/year |
|
$ |
14.76 |
|
|
$ |
13.81 |
|
|
$ |
12.96 |
|
|
$ |
16.20 |
|
|
$ |
14.79 |
|
|
$ |
13.66 |
|
| |
|
|
|
|
|
|
|
|
|
|
|
|
|
|
|
|
|
|
|
|
|
|
|
|
|
|
|
|
|
|
|
| Total return |
|
|
6.88 |
%(B) |
|
|
12.09 |
% |
|
|
(15.06 |
)% |
|
|
12.94 |
% |
|
|
10.26 |
% |
|
|
20.28 |
% |
|
|
|
|
|
|
|
| Ratio and supplemental data: |
|
|
|
|
|
|
|
|
|
|
|
|
|
|
|
|
|
|
|
|
|
|
|
|
|
|
|
|
|
|
|
| Net assets end of period/year (000’s) |
|
$ |
150,214 |
|
|
$ |
152,097 |
|
|
$ |
158,210 |
|
|
$ |
218,989 |
|
|
$ |
195,054 |
|
|
$ |
139,315 |
|
|
|
|
|
|
|
|
| Expenses to average net assets(C) |
|
|
|
|
|
|
|
|
|
|
|
|
|
|
|
|
|
|
|
|
|
|
|
|
|
|
|
|
|
|
|
| Excluding waiver and/or reimbursement and recapture |
|
|
0.60 |
%(D) |
|
|
0.60 |
% |
|
|
0.59 |
% |
|
|
0.58 |
% |
|
|
0.59 |
% |
|
|
0.60 |
% |
|
|
|
|
|
|
|
| Including waiver and/or reimbursement and recapture |
|
|
0.55 |
%(D)(E) |
|
|
0.55 |
%(E) |
|
|
0.54 |
%(E)(F) |
|
|
0.53 |
%(F) |
|
|
0.56 |
%(F) |
|
|
0.56 |
%(F) |
|
|
|
|
|
|
|
| Net investment income (loss) to average net assets |
|
|
1.68 |
%(D) |
|
|
1.84 |
% |
|
|
1.50 |
% |
|
|
1.16 |
% |
|
|
1.37 |
% |
|
|
2.11 |
% |
|
|
|
|
|
|
|
| Portfolio turnover rate |
|
|
5 |
%(B) |
|
|
6 |
% |
|
|
8 |
% |
|
|
14 |
% |
|
|
13 |
% |
|
|
4 |
% |
| (A) |
Calculated based on average number of shares outstanding. |
| (C) |
Does not include expenses of the underlying investments in which the Portfolio invests. |
| (E) |
TAM has contractually agreed, through May 1, 2025, to waive from its management fees an amount equal to the sub-advisory fee waiver by the Portfolio’s sub-adviser. These amounts are not subject to recapture by TAM. |
| (F) |
TAM contractually agreed to waive 0.05% of the average daily net assets from its management fee through May 1, 2022. These amounts are not subject to recapture by TAM. |
The Notes to Financial Statements are an integral part of this report.
|
|
|
|
|
| Transamerica Series Trust |
|
|
|
Semi-Annual Financial Statements 2024 |
|
|
Page 4 |
|
|
Transamerica BlackRock iShares Edge 75 VP
NOTES TO FINANCIAL STATEMENTS
At June 30, 2024
(unaudited)
1. ORGANIZATION
Transamerica Series Trust (“TST”) is an open-end management investment company registered under the Investment Company Act of 1940, as amended (the “1940 Act”). TST applies investment company accounting and reporting guidance. TST serves as a funding vehicle for variable life insurance, variable annuity, and group annuity products. Transamerica BlackRock iShares Edge 75 VP (the “Portfolio”) is a series of TST and is classified as diversified under the 1940 Act. The Portfolio currently offers one class of shares, Service Class.
The only shareholders of the Portfolio are affiliated insurance company separate accounts and/or affiliated asset allocation portfolios. Contract holders of the variable life and annuity contracts are not shareholders of the Portfolio. For ease of reference, shareholders and contract holders are collectively referred to in this report as “shareholders.”
This report must be accompanied or preceded by the Portfolio’s current prospectus, which contains additional information about the Portfolio, including risks, as well as investment objectives and strategies.
Transamerica Asset Management, Inc. (“TAM”) serves as investment manager for the Portfolio pursuant to an investment management agreement. TAM provides continuous and regular investment management services to the Portfolio. TAM supervises the Portfolio’s investments, conducts its investment program and provides supervisory, compliance and administrative services to the Portfolio.
TAM currently acts as a “manager of managers” and has hired sub-advisers to furnish day-to-day investment advice and recommendations. TAM may, in the future, determine to provide all aspects of the day-to-day management of the Portfolio without the use of a sub-adviser. When acting as a manager of managers, TAM provides investment management services that include, without limitation, the design and development of the Portfolio and its investment strategies and the ongoing review and evaluation of those investment strategies including recommending changes in strategy where it believes appropriate or advisable; the selection of one or more sub-advisers for the Portfolio employing a combination of quantitative and qualitative screens, research, analysis and due diligence; negotiation of sub-advisory agreements and fees; oversight and monitoring of sub-advisers and recommending changes to sub-advisers where it believes appropriate or advisable; recommending portfolio combinations and liquidations where it believes appropriate or advisable; selection and oversight of transition managers, as needed; regular supervision of the Portfolio’s investments; regular review and evaluation of sub-adviser performance; daily monitoring of the sub-advisers’ buying and selling of securities for the Portfolio; regular review of holdings; ongoing trade oversight and analysis; regular monitoring to ensure adherence to investment process; regular calls and periodic on-site visits with sub-advisers; portfolio construction and asset allocation when using multiple sub-advisers for the Portfolio; risk management oversight and analysis; oversight of negotiation of investment documentation and agreements; design, development, implementation and regular monitoring of the valuation process; periodic due diligence reviews of pricing vendors and vendor methodology; design, development, implementation and regular monitoring of the compliance process; respond to regulatory inquiries and determine appropriate litigation strategy, as needed; review of proxies voted by sub-advisers; oversight of preparation and review of materials for meetings of the Portfolio’s Board of Trustees (the “Board”), participation in these meetings and preparation of regular communications with the Board; oversight of preparation and review of prospectuses, shareholder reports and other disclosure materials and regulatory filings for the Portfolio; oversight of other service providers to the Portfolio, such as the custodian, the transfer agent, the Portfolio’s independent accounting firm and legal counsel; supervision of the performance of recordkeeping and shareholder relations functions for the Portfolio; and oversight of cash management services. TAM uses a variety of quantitative and qualitative tools to carry out its investment management services. TAM, not the Portfolio, is responsible for paying the sub-adviser(s) for their services, and sub-advisory fees are TAM’s expense.
TAM’s investment management services also include the provision of supervisory and administrative services to the Portfolio. These services include performing certain administrative services for the Portfolio and supervising and overseeing the administrative, clerical, recordkeeping and bookkeeping services provided to the Portfolio by State Street Bank and Trust Company (“State Street”), to whom TAM has outsourced the provision of certain sub-administration services. To the extent agreed upon by TAM and the Portfolio from time to time, TAM’s supervisory and administrative services include, but are not limited to: monitoring and verifying the custodian’s daily calculation of the Net Asset Values (“NAV”); shareholder relations functions; compliance services; valuation services; assisting in due diligence and in the oversight and monitoring of certain activities of sub-advisers and certain aspects of Portfolio investments; assisting with Portfolio combinations and liquidations; oversight of the preparation and filing, and review, of all returns and reports, in connection with federal, state and local taxes; oversight and review of regulatory reporting; supervising and coordinating the Portfolio’s custodian and dividend disbursing agent and monitoring their services to the Portfolio; assisting the Portfolio in preparing reports to shareholders; acting as liaison with the Portfolio’s independent public accountants and providing, upon request, analyses, fiscal year summaries and other audit related services; assisting in the preparation of agendas and supporting documents for and minutes of meetings of trustees and committees of trustees; assisting in the preparation of regular communications with the trustees; and providing personnel and office space, telephones and other office equipment as necessary in order for TAM to perform supervisory and administrative services to the Portfolio. The Portfolio pays certain fees and expenses to State Street for sub-administration services which are not administrative services covered by the
|
|
|
| Transamerica Series Trust |
|
Semi-Annual Financial Statements 2024 |
Page 5
Transamerica BlackRock iShares Edge 75 VP
NOTES TO FINANCIAL STATEMENTS (continued)
At June 30, 2024
(unaudited)
1. ORGANIZATION (continued)
management agreement with TAM or paid for through the management fees payable thereunder. For the period ended June 30, 2024, (i) the expenses paid to State Street for sub-administration services by the Portfolio are shown as a part of Other expenses within the Statement of Operations and (ii) the expenses payable to State Street for sub-administration services from the Portfolio are shown as part of Other accrued expenses within the Statement of Assets and Liabilities.
2. SIGNIFICANT ACCOUNTING POLICIES
In preparing the Portfolio’s financial statements in accordance with Generally Accepted Accounting Principles in the United States of America (“GAAP”), estimates or assumptions (which could differ from actual results) may be used that affect reported amounts and disclosures. The following is a summary of significant accounting policies followed by the Portfolio.
Security transactions and investment income: Security transactions are accounted for on the trade date. Security gains and losses are calculated on a first-in, first-out basis. Interest income, if any, is accrued as earned. Dividend income and capital gain distributions from underlying investments, if any, are recorded on the ex-dividend date. Income or short-term capital gain distributions received from underlying investments, if any, are recorded as Dividend income from investments within the Statement of Operations. Long-term capital gain distributions received from underlying investments, if any, are recorded as Net realized gain (loss) on Capital gain distributions received from investments within the Statement of Operations.
Distributions to shareholders: Distributions are recorded on the ex-dividend date and are determined in accordance with federal income tax regulations, which may differ from GAAP.
Commission recapture: The sub-adviser(s), to the extent consistent with the best execution and usual commission rate policies and practices, may elect to place security transactions of the Portfolio with broker/dealers with which TST has established a commission recapture program. A commission recapture program is any arrangement under which a broker/dealer applies a portion of the commissions received by such broker/dealer on the security transactions to the Portfolio. In no event will commissions, paid by the Portfolio, be used to pay expenses that would otherwise be borne by any other Portfolios within TST, or by any other party.
There were no commissions recaptured during the period ended June 30, 2024 by the Portfolio.
Indemnification: In the normal course of business, the Portfolio enters into contracts that contain a variety of representations that provide general indemnifications. The Portfolio’s maximum exposure under these arrangements is unknown, as this would involve future claims that may be made against the Portfolio and/or its affiliates that have not yet occurred. However, based on experience, the Portfolio expects the risk of loss to be remote.
3. INVESTMENT VALUATION
TAM has been designated as the Portfolio’s valuation designee pursuant to Rule 2a-5 under the 1940 Act with responsibility for fair valuation subject to oversight by the Portfolio’s Board of Trustees. The net asset value of the Portfolio is computed as of the official close of the New York Stock Exchange (“NYSE”) each day the NYSE is open for business.
TAM utilizes various methods to measure the fair value of its investments on a recurring basis. GAAP establishes a hierarchy that prioritizes inputs to valuation methods. The inputs or methodology used for valuing securities are not necessarily an indication of the risk associated with investing in those securities. The three levels (“Levels”) of inputs of the fair value hierarchy are defined as follows:
Level 1—Unadjusted quoted prices in active markets for identical securities.
Level 2—Inputs, other than quoted prices included in Level 1, which are observable, either directly or indirectly. These inputs may include quoted prices for the identical instrument on an inactive market, prices for similar instruments, interest rates, prepayment speeds, credit risk, yield curves, default rates, and similar data.
Level 3—Unobservable inputs based on the best information available in the circumstances, to the extent observable inputs are not available, which may include TAM’s own assumptions used in determining the fair value of the Portfolio’s investments.
The inputs used to measure fair value may fall into different Levels of the fair value hierarchy. In such cases, for disclosure purposes, the Level in the fair value hierarchy that is assigned to the fair value measurement of a security is determined based on the lowest Level input that is significant to the fair value measurement in its entirety. Certain investments that are measured at fair value using NAV per share, or
|
|
|
| Transamerica Series Trust |
|
Semi-Annual Financial Statements 2024 |
Page 6
Transamerica BlackRock iShares Edge 75 VP
NOTES TO FINANCIAL STATEMENTS (continued)
At June 30, 2024
(unaudited)
3. INVESTMENT VALUATION (continued)
its equivalent, using the “practical expedient” have not been classified in the fair value Levels. The hierarchy classification of inputs used to value the Portfolio’s investments at June 30, 2024, is disclosed within the Investment Valuation section of the Schedule of Investments.
The availability of observable inputs can vary from security to security and is affected by a wide variety of factors, including, but not limited to, the type of security, whether the security is new and not yet established in the marketplace, the liquidity of markets, and other characteristics particular to the security. To the extent that valuation is based on models or inputs that are less observable or unobservable in the market, the determination of fair value requires more judgment. Accordingly, the degree of judgment exercised in determining fair value is generally greatest for instruments categorized in Level 3. Due to the inherent uncertainty of valuation, the determination of values may differ significantly from values that would have been realized had a ready market for investments existed, and the differences could be material.
Fair value measurements: Descriptions of the valuation techniques applied to the Portfolio’s significant categories of assets and liabilities measured at fair value on a recurring basis are as follows:
Exchange-traded funds (“ETF”): ETFs are stated at the last reported sale price or closing price on the day of valuation taken from the primary exchange where the ETF is principally traded. ETFs are generally categorized in Level 1 of the fair value hierarchy.
Securities lending collateral: Securities lending collateral is invested in a money market fund which is valued at the actively traded NAV and no valuation adjustments are applied. Securities lending collateral is categorized in Level 1 of the fair value hierarchy.
4. BORROWINGS AND OTHER FINANCING TRANSACTIONS
The Portfolio may engage in borrowing transactions as a means of raising cash to satisfy redemption requests, for other temporary or emergency purposes or, to the extent permitted by its investment policies, to raise additional cash to be invested in other securities or instruments. When the Portfolio invests borrowing proceeds in other securities, the Portfolio will bear the risk that the market value of the securities in which such proceeds are invested goes down and is insufficient to repay the borrowed proceeds. The Portfolio may borrow on a secured or on an unsecured basis. If the Portfolio enters into a secured borrowing arrangement, a portion of the Portfolio’s assets will be used as collateral. The 1940 Act requires the Portfolio to maintain asset coverage of at least 300% of the amount of its borrowings. Asset coverage means the ratio that the value of the Portfolio’s total assets, minus liabilities other than borrowings, bears to the aggregate amount of all borrowings. Although complying with this requirement has the effect of limiting the amount that the Portfolio may borrow, it does not otherwise mitigate the risks of entering into borrowing transactions.
Interfund lending: The Portfolio, along with other funds and portfolios advised by TAM, may participate in an interfund lending program pursuant to exemptive relief granted by the Securities and Exchange Commission on January 18, 2017. This program allows the Portfolio to lend to and borrow from other funds and portfolios advised by TAM. Interfund lending transactions are subject to the conditions of the exemptive relief which places limits on the amount of lending or borrowing a Portfolio may participate in under the program. Interest earned or paid on an interfund lending transaction will be based on the average of certain current market rates. For the period ended June 30, 2024, the Portfolio has not utilized the program.
Securities lending: The Portfolio may lend securities to qualified financial institutions, brokers and dealers. State Street serves as securities lending agent to the Portfolio pursuant to a Securities Lending Agreement. Loans of securities are terminable at any time and the borrower, after notice, is required to return borrowed securities within the standard time period for settlement of securities transactions. The lending of securities exposes the Portfolio to risks such as: the borrowers may fail to return the loaned securities or may not be able to provide additional collateral, the Portfolio may experience delays in recovery of the loaned securities or delays in access to collateral, or the Portfolio may experience losses related to the investment collateral. To minimize certain risks, loan counterparties pledge cash, securities issued or guaranteed by the U.S. Government and irrevocable letters of credit issued by banks as collateral. The initial collateral received by the Portfolio is required to have a value of at least 102% of the current value of the loaned securities traded on U.S. exchanges, and a value of at least 105% for all other securities. Typically the lending agent is not permitted to sell, re-pledge or use cash and non-cash collateral it receives. The lending agent has agreed to indemnify the Portfolio in the case of default of any securities borrower.
The Portfolio receives compensation for lending securities from interest or dividends earned on the cash, U.S. Government securities and irrevocable letters of credit held as collateral, less associated fees and expenses. Such income is reflected in Net income from securities lending within the Statement of Operations. Cash collateral received is invested in the State Street Navigator Securities Lending Trust — Government Money Market Portfolio.
|
|
|
| Transamerica Series Trust |
|
Semi-Annual Financial Statements 2024 |
Page 7
Transamerica BlackRock iShares Edge 75 VP
NOTES TO FINANCIAL STATEMENTS (continued)
At June 30, 2024
(unaudited)
4. BORROWINGS AND OTHER FINANCING TRANSACTIONS (continued)
The value of loaned securities and related cash and non-cash collateral outstanding at June 30, 2024, if any, are shown on a gross basis within the Schedule of Investments.
The following table reflects a breakdown of transactions accounted for as secured borrowings, the gross obligation by the type, and the remaining contractual maturity of those transactions as of June 30, 2024.
|
|
|
|
|
|
|
|
|
|
|
|
|
|
|
|
|
|
|
|
|
| |
|
Remaining Contractual Maturity of the Agreements |
|
|
|
|
|
|
|
| |
|
Overnight and Continuous |
|
|
Less Than 30 Days |
|
|
Between 30 & 90 Days |
|
|
Greater Than 90 Days |
|
|
Total |
|
| Securities Lending Transactions
Exchange-Traded Funds |
|
$ |
5,823,388 |
|
|
$ |
— |
|
|
$ |
— |
|
|
$ |
— |
|
|
$ |
5,823,388 |
|
| Total Borrowings |
|
$ |
5,823,388 |
|
|
$ |
— |
|
|
$ |
— |
|
|
$ |
— |
|
|
$ |
5,823,388 |
|
| |
|
|
|
|
|
|
|
|
|
|
|
|
|
|
|
|
|
|
|
|
5. RISK FACTORS
Investing in the Portfolio involves certain key risks related to the Portfolio’s trading activity. Please reference the Portfolio’s prospectus for a more complete discussion of the following risk(s), as well as other risks of investing in the Portfolio.
Market risk: The market prices of the Portfolio’s securities or other assets may go up or down, sometimes rapidly or unpredictably, due to factors such as economic events, inflation, changes in interest rates, governmental actions or interventions, actions taken by the U.S. Federal Reserve or foreign central banks, market disruptions caused by tariffs, trade disputes or other factors, political developments, armed conflicts, economic sanctions, cybersecurity events, investor sentiment, the global and domestic effects of widespread or local health, weather or climate events, and other factors that may or may not be related to the issuer of the security or other asset. If the market prices of the Portfolio’s securities and assets fall, the value of your investment in the Portfolio could go down.
Economies and financial markets throughout the world are increasingly interconnected. Events or circumstances in one or more countries or regions could be highly disruptive to, and have profound impacts on, global economies or markets. As a result, whether or not the Portfolio invests in securities of issuers located in or with significant exposure to the countries directly affected, the value and liquidity of the Portfolio’s investments may go down.
Asset allocation risk: The Portfolio’s investment performance is significantly impacted by the Portfolio’s asset allocation and reallocation from time to time. The value of your investment may decrease if the sub-adviser’s judgment about the attractiveness, value or market trends affecting a particular asset class, investment style, technique or strategy, underlying ETF or other issuer is incorrect.
Smart beta investing risk: Smart beta strategies seek to capture broad, consistent drivers of return and to out-perform traditional index strategies. These strategies may not work as intended. An underlying ETF pursuing a smart beta strategy may not achieve its objective and may not perform as well as other funds using other asset management strategies.
Underlying exchange-traded funds risk: Because the Portfolio invests its assets in underlying ETFs, its ability to achieve its investment objective depends largely on the performance of the underlying ETFs in which it invests. Investing in underlying ETFs subjects the Portfolio to the risks of investing in the underlying securities or assets held by those ETFs. Each of the underlying ETFs in which the Portfolio may invest has its own investment risks, and those risks can affect the value of the underlying ETFs’ shares and therefore the value of the Portfolio’s investments. There can be no assurance that the investment objective of any underlying ETF will be achieved. To the extent that the Portfolio invests more of its assets in one underlying ETF than in another, the Portfolio will have greater exposure to the risks of that underlying ETF. In addition, the Portfolio will bear a pro rata portion of the operating expenses of the underlying ETFs in which it invests.
6. FEES AND OTHER AFFILIATED TRANSACTIONS
TST serves as a funding vehicle for certain affiliated asset allocation portfolios and certain affiliated separate accounts of Transamerica Life Insurance Company (“TLIC”) and Transamerica Financial Life Insurance Company.
TAM, the Portfolio’s investment manager, is directly owned by TLIC and AUSA Holding, LLC (“AUSA”), both of which are indirect, wholly owned subsidiaries of Aegon Ltd. TLIC is owned by Commonwealth General Corporation (“Commonwealth”). Commonwealth and AUSA
|
|
|
| Transamerica Series Trust |
|
Semi-Annual Financial Statements 2024 |
Page 8
Transamerica BlackRock iShares Edge 75 VP
NOTES TO FINANCIAL STATEMENTS (continued)
At June 30, 2024
(unaudited)
6. FEES AND OTHER AFFILIATED TRANSACTIONS (continued)
are wholly owned by Transamerica Corporation (DE). Transamerica Corporation (DE) is wholly owned by Aegon International B.V., which is wholly owned by Aegon Ltd., a Bermuda exempted company with liability limited by shares (formerly, Aegon NV, a Netherlands corporation) and a publicly traded international insurance group.
Transamerica Fund Services, Inc. (“TFS”) is the Portfolio’s transfer agent. Transamerica Capital, Inc. (“TCI”) is the Portfolio’s distributor/principal underwriter. TAM, TFS and TCI are affiliates of Aegon Ltd.
Certain officers and trustees of the Portfolio may also be officers and/or trustees of TAM, TFS and TCI. No interested trustee who is deemed an interested person due to current or former service with TAM or an affiliate of TAM receives compensation from the Portfolio. The Portfolio does pay non-interested persons (independent trustees), as disclosed in Trustee and CCO fees within the Statement of Operations.
Investment management fees: TAM serves as the Portfolio’s investment manager, performing administration as well as investment advisory services. TAM renders investment advisory, supervisory, and administration services under an investment management agreement and the Portfolio pays a single management fee, which is reflected in Investment management fees within the Statement of Operations.
The Portfolio pays a management fee to TAM based on daily average net assets at the following rates:
|
|
|
|
|
| Breakpoints |
|
Rate |
|
| First $1 billion |
|
|
0.30 |
% |
| Over $1 billion |
|
|
0.28 |
|
TAM has contractually agreed, through May 1, 2025, to waive from its management fees an amount equal to the sub-advisory fee waiver by the Portfolio’s sub-adviser. These amounts are not subject to recapture by TAM.
TAM has contractually agreed to waive fees and/or reimburse Portfolio expenses to the extent that the total operating expenses excluding, as applicable, acquired fund fees and expenses, interest (including borrowing costs and overdraft charges), taxes, brokerage commissions, dividend and interest expenses on securities sold short, extraordinary expenses and other expenses not incurred in the ordinary course of the Portfolio’s business, exceed the following stated annual operating expense limits to the Portfolio’s daily average net assets. To the extent an expense limit changed during the period, the prior limit is also listed below. The expenses waived and/or reimbursed, if any, are included in Expenses waived and/or reimbursed within the Statement of Operations.
|
|
|
|
|
| Class |
|
Operating Expense Limit |
|
Operating Expense Limit Effective Through |
| Service Class |
|
0.56% |
|
May 1, 2025 |
TAM is permitted to recapture amounts contractually waived and/or reimbursed to a class during any of the 36 months from the date on which TAM waived fees and/or reimbursed expenses for the class. A class may recapture and reimburse TAM only if such amount does not cause, on any particular business day of the Portfolio, the class’s total annual operating expenses (after the recapture is taken into account) to exceed the Operating Expense Limits or any other lower limit then in effect. Amounts recaptured, if any, by TAM for the period ended June 30, 2024 are disclosed in Recapture of previously waived and/or reimbursed fees within the Statement of Operations.
TAM, on a voluntary basis and in addition to the contractual operating expense limits in effect, from time to time may waive and/or reimburse expenses of the Portfolio, or any classes thereof, to such level(s) as the Trust’s officers have determined or may reasonably determine from time to time. Any such voluntary waiver or expense reimbursement may be discontinued by TAM at any time. These amounts are not subject to recapture by TAM.
As of June 30, 2024, there are no amounts available for recapture by TAM.
Distribution and service fees: TST has a distribution plan (“Distribution Plan”) pursuant to Rule 12b-1 under the 1940 Act. Pursuant to the Distribution Plan, TST entered into a distribution agreement with TCI as the Portfolio’s distributor.
|
|
|
| Transamerica Series Trust |
|
Semi-Annual Financial Statements 2024 |
Page 9
Transamerica BlackRock iShares Edge 75 VP
NOTES TO FINANCIAL STATEMENTS (continued)
At June 30, 2024
(unaudited)
6. FEES AND OTHER AFFILIATED TRANSACTIONS (continued)
The Distribution Plan requires the Portfolio to pay distribution fees to TCI as compensation for various distribution activities, not as reimbursement for specific expenses. Under the Distribution Plan and distribution agreement, TCI, on behalf of the Portfolio, is authorized to pay various service providers, as direct payment for expenses incurred in connection with distribution of the Portfolio’s shares.
The fee on the Service Class shares is paid to the insurance companies for providing services and account maintenance for the policyholders who invest in the variable insurance products which invest in the Service Class shares. The distribution and service fees are included in Distribution and service fees within the Statement of Operations.
The Portfolio is authorized under the Distribution Plan to pay fees to TCI based on daily average net assets up to an annual fee of 0.25% of Service Class shares.
Transfer agent costs: TFS provides transfer agency services under an intercompany agreement with TAM. TFS has outsourced the provision of certain sub-transfer agency services to SS&C Global Investor & Distribution Solutions, Inc. (“SS&C GIDS”). The Portfolio does not pay a separate transfer agent fee to TAM or TFS but does pay certain expenses to SS&C GIDS related to applicable sub-transfer agency services. For the period ended June 30, 2024, (i) the expenses paid to SS&C GIDS by the Portfolio are referred to as transfer agent costs and are included within the Statement of Operations and (ii) the expenses payable to SS&C GIDS by the Portfolio are referred to as transfer agent costs within the Statement of Assets and Liabilities.
Brokerage commissions: The Portfolio incurred no brokerage commissions on security transactions placed with affiliates of the investment manager or sub-adviser(s) for the period ended June 30, 2024.
7. PURCHASES AND SALES OF SECURITIES
For the period ended June 30, 2024, the cost of securities purchased and proceeds from securities sold (excluding short-term securities) are as follows:
|
|
|
|
|
|
|
| |
|
Purchases of Securities |
|
Sales of Securities |
|
|
| |
|
|
|
| |
$ 6,927,070 |
|
$ 17,188,116 |
8. FEDERAL INCOME TAXES AND DISTRIBUTIONS TO SHAREHOLDERS
The Portfolio has not made any provision for federal income or excise taxes due to its policy to distribute all of its taxable income and capital gains to its shareholders and otherwise qualify as a regulated investment company under Subchapter M of the Internal Revenue Code. The Portfolio recognizes the tax benefits of uncertain tax positions only where the position is “more likely than not” to be sustained assuming examination by tax authorities. The Portfolio’s tax returns remain subject to examination by the Internal Revenue Service and state tax authorities three years from the date of filing for federal purposes and four years from the date of filing for state purposes. Management has evaluated the Portfolio’s tax provisions taken for all open tax years, and has concluded that no provision for income tax is required in the Portfolio’s financial statements. If applicable, the Portfolio recognizes interest accrued related to unrecognized tax benefits in relation to interest and penalties expense in Other within the Statement of Operations. The Portfolio identifies its major tax jurisdictions as U.S. Federal, the state of Colorado, and foreign jurisdictions where the Portfolio makes significant investments; however, the Portfolio is not aware of any tax positions for which it is reasonably possible that the total amounts of unrecognized tax benefits will change materially in the next twelve months. Distributions are determined in accordance with income tax regulations, which may differ from GAAP.
As of June 30, 2024, the approximate cost for U.S. federal income tax purposes, and the aggregate gross/net unrealized appreciation (depreciation) in the value of investments (including securities sold short and derivatives, if any) are as follows:
|
|
|
|
|
|
|
|
|
|
|
| |
|
Cost |
|
Gross Appreciation |
|
Gross (Depreciation) |
|
Net Appreciation (Depreciation) |
|
|
| |
$ 137,235,304 |
|
$ 24,585,214 |
|
$ (5,417,521) |
|
$ 19,167,693 |
Please see TST’s most recent report on Form N-CSR, available at: www.transamerica.com/annuities/prospectus, for additional information. For the most recently filed complete proxy voting records for the Trust please visit: https://www.transamerica.com/sites/default/files/files/e070d/TST%20N-PX%202021.pdf
|
|
|
| Transamerica Series Trust |
|
Semi-Annual Financial Statements 2024 |
Page 10
Transamerica BlackRock iShares Edge 75 VP
MANAGEMENT AND SUB-ADVISORY AGREEMENT — CONTRACT RENEWAL
(unaudited)
At a meeting of the Board of Trustees of Transamerica Series Trust (the “Trustees” or the “Board”) held on June 12-13, 2024, the Board considered the renewal of the management agreement (the “Management Agreement”) between Transamerica Asset Management, Inc. (“TAM”) and Transamerica Series Trust, on behalf of Transamerica BlackRock iShares Edge 75 VP (the “Portfolio”). The Board also considered the renewal of the investment sub-advisory agreement (the “Sub-Advisory Agreement” and together with the Management Agreement, the “Agreements”) for the Portfolio between TAM and BlackRock Investment Management, LLC (the “Sub-Adviser”).
Following its review and consideration, the Board determined that the terms of the Management Agreement and Sub-Advisory Agreement were reasonable and that the renewal of each of the Agreements was in the best interests of the Portfolio and the holders invested in the Portfolio. The Board, including the independent members of the Board (the “Independent Trustees”), unanimously approved the renewal of each of the Agreements through June 30, 2025.
Prior to reaching their decision, the Trustees requested and received from TAM and the Sub-Adviser certain information. They then reviewed such information as they deemed reasonably necessary to evaluate the Agreements, including information they had previously received from TAM and the Sub-Adviser as part of their regular oversight of the Portfolio, and knowledge they gained over time through meeting with TAM and the Sub-Adviser. Among other materials, the Trustees considered comparative fee, expense and performance information prepared by Broadridge Financial Solutions, Inc. (“Broadridge”), an independent provider of mutual fund performance information, as well as fee, expense and profitability information prepared by TAM. In addition, TAM provided the Board with additional supplemental comparative performance information. To the extent applicable, the Trustees considered information about fees and performance of comparable funds and/or accounts managed by the Sub-Adviser. The Board also considered reductions to the Portfolio’s expense limit, if any, that took effect after the last renewal of the Agreements. In their review, the Trustees also sought to identify instances in which the Portfolio’s performance, fees, total expenses and/or profitability appeared to be outliers within its respective peer group or other comparative metrics and sought to understand the reasons for such comparative positions.
In their deliberations, the Independent Trustees met privately without representatives of TAM or the Sub-Adviser present and were represented throughout the process by their independent legal counsel. In considering the proposed continuation of each of the Agreements, the Trustees evaluated and weighed a number of considerations that they believed to be relevant in light of the legal advice furnished to them by counsel, including independent legal counsel, and made a decision in the exercise of their own business judgment. They based their decisions on the considerations discussed below, among others, although they did not identify any particular consideration or item of information that was controlling of their decisions, and each Trustee may have attributed different weights to the various factors.
Nature, Extent and Quality of the Services Provided
The Board considered the nature, extent and quality of the services provided by TAM and the Sub-Adviser to the Portfolio in the past and the services anticipated to be provided in the future. The Board also considered the investment approach for the Portfolio; the experience, capability and integrity of TAM’s senior management; the financial resources of TAM; TAM’s management oversight process; TAM’s and the Sub-Adviser’s responsiveness to any questions by the Trustees; and the professional qualifications and compensation program of the portfolio management team of the Sub-Adviser. The Trustees noted that they receive, on a quarterly basis, an execution analysis from Capital Institutional Services, Inc. (CAPIS), an independent provider of trade analyses, for the Sub-Adviser and a comparison of trading results against a peer universe of managers.
The Board also considered the continuous and regular investment management and other services provided by TAM, when acting as a manager of managers, for the portion of the management fee it retains from the Portfolio after payment of the sub-advisory fees. The Board noted that the investment management and other services provided by TAM include the design, development and ongoing review and evaluation of the Portfolio and its investment strategy; the selection, oversight and monitoring of one or more investment sub-advisers to perform certain duties with respect to the Portfolio; ongoing portfolio trading oversight and analysis; risk management oversight and analysis; design, development, implementation and ongoing review and evaluation of a process for the valuation of Portfolio investments; design, development, implementation and ongoing review and evaluation of a compliance program for the Portfolio; design, development, implementation and ongoing review and evaluation of a process for the voting of proxies and exercise of rights to consent to corporate action for Portfolio investments; participation in Board meetings and oversight of preparation of materials for the Board, including materials for Board meetings and regular communications with the Board; oversight of preparation of the Portfolio’s prospectus, statement of additional information, shareholder reports and other disclosure materials and regulatory filings for the Portfolio; and ongoing cash management services for the Portfolio. The Board considered that TAM’s investment management services also include the provision of supervisory and administrative services to the Portfolio. The Board also noted that TAM, as part of the services it provides to all Transamerica mutual funds, including the Portfolio, oversees the services provided by the funds’ custodian, transfer agent, independent accountant and legal counsel and supervises the performance of the recordkeeping and holder service functions of the funds.
Investment Performance
In addition, the Board considered the short- and longer-term performance of the Portfolio in light of its investment objective, policies and strategies, including relative performance against (i) a peer universe of comparable mutual funds, as prepared by Broadridge, and (ii) the Portfolio’s benchmarks, in each case for various trailing periods ended December 31, 2023. Based on these considerations, the Board determined that TAM and the Sub-Adviser can provide investment and related services that are appropriate in scope and extent in light of
|
|
|
|
|
| Transamerica Series Trust |
|
|
|
Semi-Annual Financial Statements 2024 |
|
|
Page 11 |
|
|
Transamerica BlackRock iShares Edge 75 VP
MANAGEMENT AND SUB-ADVISORY AGREEMENT — CONTRACT RENEWAL (continued)
(unaudited)
the Portfolio’s investment objectives, policies and strategies and operations, the competitive landscape of the investment company business and investor needs. The Board’s conclusions as to the Portfolio’s performance are summarized below. For purposes of its review, the Board generally used the performance of Service Class Shares. In describing the Portfolio’s performance relative to its peer universe, the summary conclusions characterize performance for the relevant periods in relation to whether it was “above,” “below” or “in line with” the peer universe median and do so using quintile rankings prepared by Broadridge. For simplicity, performance is described as “above” the median if the Portfolio’s performance ranked anywhere in the first or second quintiles, as “below” the median if it ranked anywhere in the fourth or fifth quintiles, or “in line with” the median if it ranked anywhere in the third quintile (i.e., even if its precise return was somewhat above or somewhat below the precise median return).
When considering the Portfolio’s performance, the Trustees considered any representations made by TAM regarding the appropriateness of certain peer groups and benchmarks. They recognized that performance reflects a snapshot of a period as of a specific date, and that consideration of performance data for a different period could generate significantly different performance results. The Trustees also recognized that even longer-term performance can be negatively affected by performance over a short-term period when that short-term performance is significantly below the performance of the comparable benchmark or universe of peer funds.
The Board noted that the performance of Service Class Shares of the Portfolio was below the median for its peer universe and below the benchmark that TAM utilizes to measure performance of the Portfolio, each for the past 1-, 3- and 5-year periods.
Management Fee and Sub-Advisory Fees and Total Expense Ratio
The Board considered the management fee and total expense ratio of the Portfolio, including information provided by Broadridge comparing the management fee and total expense ratio of the Portfolio to the management fees and total expense ratios of comparable investment companies in both a peer group and broader peer universe compiled by Broadridge. The Board’s conclusions as to the Portfolio’s management fee and total expense ratio are summarized below. For purposes of its review, the Board generally used the actual total expenses (i.e., expenses reflecting any waivers and/or reimbursements) of Service Class Shares. In describing the Portfolio’s management fee and total expense ratio relative to its peer group and peer universe, the summary conclusions characterize management fees and total expense ratios for the relevant periods in relation to whether they were “above,” “below” or “in line with” the peer group or peer universe median and do so using quintile rankings prepared by Broadridge. For simplicity, management fees and total expense ratios are described as “above” the median if the Portfolio’s management fee or total expense ratio ranked anywhere in the fourth or fifth quintiles, as “below” the median if it ranked anywhere in the first or second quintiles, or “in line with” the median if it ranked anywhere in the third quintile (i.e., even if its precise management fee or total expense ratio was somewhat above or somewhat below the precise median management fee or total expense ratio).
The Board also considered the fees charged by the Sub-Adviser for sub-advisory services, as well as the portion of the Portfolio’s management fee retained by TAM following payment of the sub-advisory fee and how the portion of the contractual management fee retained by TAM at a specified asset level compared to the portions retained by other investment advisers managing mutual funds with similar investment strategies as calculated by an independent provider of information.
The Board noted that the Portfolio’s contractual management fee was in line with the median for its peer group and above the median for its peer universe and that the actual total expenses (i.e., expenses reflecting any waivers and/or reimbursements) of Service Class Shares of the Portfolio were below the medians for its peer group and peer universe. The Trustees also considered that TAM has entered into an expense limitation arrangement with the Portfolio, which may result in TAM waiving fees for the benefit of holders.
On the basis of these considerations, together with the other information it considered, the Board determined that the management and sub-advisory fees to be received by TAM and the Sub-Adviser under the Management Agreement and Sub-Advisory Agreement are reasonable in light of the services provided.
Cost of Services Provided and Level of Profitability
The Board reviewed information provided by TAM about the cost of providing and procuring fund management services, as well as the costs of the provision of administration, transfer agency and other services, to the Portfolio and to Transamerica Series Trust as a whole by TAM and its affiliates. The Board considered the profitability of TAM and its affiliates in providing these services for the Portfolio and Transamerica Series Trust as a whole. The Trustees recognized the competitiveness of the mutual fund industry and the importance of an investment adviser’s long-term profitability, including for maintaining company and management stability and accountability.
The Board also considered the allocation methodology used for calculating the profitability of TAM and its affiliates. The Board noted that the revenue and expense allocation methodology used by TAM to estimate its profitability with respect to its relationship with the Portfolio had been reviewed previously by an independent consultant. The Trustees considered that TAM reported that it had not made material changes to this methodology, and that the methodology had been applied consistently for the Portfolio.
With respect to the Sub-Adviser, the Board noted that the sub-advisory fee is the product of arm’s-length negotiation between TAM and the Sub-Adviser, which is not affiliated with TAM, and is paid by TAM and not the Portfolio. As a result, the Board focused on the profitability of TAM and its affiliates with respect to the Portfolio.
|
|
|
|
|
| Transamerica Series Trust |
|
|
|
Semi-Annual Financial Statements 2024 |
|
|
Page 12 |
|
|
Transamerica BlackRock iShares Edge 75 VP
MANAGEMENT AND SUB-ADVISORY AGREEMENT — CONTRACT RENEWAL (continued)
(unaudited)
Based on this information, the Board determined that the profitability of TAM and its affiliates from their relationships with the Portfolio was not excessive.
Economies of Scale
The Board considered economies of scale with respect to the management of the Portfolio, whether the Portfolio had appropriately benefited from any economies of scale and whether there was the potential for realization of any future economies of scale. The Board also considered the existence of economies of scale with respect to management of the Transamerica mutual funds overall and the extent to which the Portfolio benefited from any economies of scale. The Board recognized that, as the Portfolio’s assets increase, any economies of scale realized by TAM or the Sub-Adviser may not directly correlate with each other or with any economies of scale that might be realized by the Portfolio. The Board considered the Portfolio’s management fee schedule and the existence of breakpoints and also considered the extent to which TAM shared economies of scale, if any, with the Portfolio through undertakings to limit or reimburse Portfolio expenses and to invest in maintaining and developing its capabilities and services. The Board also considered the Sub-Adviser’s sub-advisory fee schedule and the existence of breakpoints, if any, and how such breakpoints relate to any breakpoints in the Portfolio’s management fee schedule. The Trustees concluded that the Portfolio’s fee structure reflected an appropriate sharing of any efficiencies or economies of scale to date and noted that they will have the opportunity to periodically reexamine the appropriateness of the management fee payable to TAM and the fee paid to the Sub-Adviser in light of any economies of scale experienced in the future.
Benefits to TAM, its Affiliates and/or the Sub-Adviser from their Relationships with the Portfolio
The Board considered other benefits derived by TAM, its affiliates, and/or the Sub-Adviser from their relationships with the Portfolio. The Board noted that TAM does not receive benefits from research obtained with commissions paid to broker-dealers for portfolio transactions (commonly referred to as “soft dollars”) as a result of its relationship with the Portfolio.
Other Considerations
The Board noted that TAM has made a substantial commitment to the recruitment and retention of high-quality personnel and maintains the financial, compliance and operational resources reasonably necessary to manage the Portfolio in a professional manner that is consistent with the best interests of the Portfolio and the holders. In this regard, the Board favorably considered the procedures and policies TAM has in place to enforce compliance with applicable laws and regulations and oversee the portfolio management activities of the Sub-Adviser. The Board also noted that TAM has made an entrepreneurial commitment and undertaken certain business risks with respect to the management and success of the Portfolio.
Conclusion
After consideration of the factors described above, as well as other factors, the Trustees, including the Independent Trustees, concluded that the renewal of the Management Agreement and the Sub-Advisory Agreement was in the best interests of the Portfolio and the holders and voted to approve the renewal of the Agreements.
|
|
|
|
|
| Transamerica Series Trust |
|
|
|
Semi-Annual Financial Statements 2024 |
|
|
Page 13 |
|
|
PROXY VOTING POLICIES AND PROCEDURES AND QUARTERLY PORTFOLIO HOLDINGS
(unaudited)
A description of Transamerica Series Trust’s (the “Trust”) proxy voting policies and procedures is available in the Statement of Additional Information of the Portfolios, available without charge upon request by calling 1-800-851-9777 (toll free) or on the Securities and Exchange Commission’s (“SEC”) website at http://www.sec.gov.
In addition, the Portfolio is required to file Form N-PX, with their complete proxy voting records for the most recent 12 months ended June 30th, no later than August 31st of each year. The Form is available without charge: (1) on the Transamerica Funds website at https://www.transamerica.com/sites/default/files/files/e070d/TST%20N-PX%202021.pdf; and (2) on the SEC’s website at http://www.sec.gov.
Each fiscal quarter, the Portfolios, except Transamerica BlackRock Government Money Market VP, will file with the SEC a complete schedule of its monthly portfolio holdings on Form N-PORT. The Portfolios’ holdings as of the end of the third month of every fiscal quarter, as reported on Form N-PORT, will be publicly available on the SEC’s website at http://www.sec.gov within 60 days of the end of the fiscal quarter.
On a monthly basis, Transamerica BlackRock Government Money Market VP will file with the SEC portfolio holdings information on Form N-MFP3. A complete schedule of portfolio holdings is also available at www.transamerica.com.
You may also visit the Trust’s website at www.transamerica.com/annuities/prospectus for this and other information about the Portfolios and the Trust.
Important Notice Regarding Delivery of Shareholder Documents
Every year we provide shareholders informative materials such as the Transamerica Series Trust Annual Report, the Transamerica Series Trust Prospectus, and other required documents that keep you informed regarding your Portfolios. To the extent provided by mail, Transamerica Series Trust will only send one piece per mailing address, a method that saves your Portfolios money by reducing mailing and printing costs. We will continue to do this unless you tell us not to. To elect to receive individual mailings, simply call a Transamerica Customer Service Representative toll free at 1-800-851-9777, 8 a.m. to 7 p.m. Eastern Time, Monday-Friday. Your request will take effect within 30 days.
|
|
|
|
|
| Transamerica Series Trust |
|
|
|
Semi-Annual Financial Statements 2024 |
|
|
Page 14 |
|
|
NOTICE OF PRIVACY POLICY
(unaudited)
Your privacy is very important to us. We want you to understand what information we collect and how we use it. We collect and use “nonpublic personal information” in connection with providing our customers with a broad range of financial products and services as effectively and conveniently as possible. We treat nonpublic personal information in accordance with our Privacy Policy.
What Information We Collect and From Whom We Collect It
We may collect nonpublic personal information about you from the following sources:
| • |
|
Information we receive from you on applications or other forms, such as your name, address, and account number; |
| • |
|
Information about your transactions with us, our affiliates, or others, such as your account balance and purchase/redemption history; and |
| • |
|
Information we receive from non-affiliated third parties, including consumer reporting agencies. |
What Information We Disclose and To Whom We Disclose It
We do not disclose any nonpublic personal information about current or former customers to anyone without their express consent, except as permitted by law. We may disclose the nonpublic personal information we collect, as described above, to persons or companies that perform services on our behalf and to other financial institutions with which we have joint marketing agreements. We will require these companies to protect the confidentiality of your nonpublic personal information and to use it only to perform the services for which we have hired them.
Our Security Procedures
We restrict access to your nonpublic personal information and only allow disclosures to persons and companies as permitted by law to assist in providing products or services to you. We maintain physical, electronic, and procedural safeguards to protect your nonpublic personal information and to safeguard the disposal of certain consumer information.
Contact Us
If you have any questions about our Privacy Policy, please call 1-800-851-9777 on any business day between 8 a.m. and 7 p.m. Eastern Time.
Note: This Privacy Policy applies only to customers that have a direct relationship with us or our affiliates. If you own shares of our portfolios in the name of a third party such as a bank or broker-dealer, its privacy policy may apply to you instead of ours.
|
|
|
|
|
| Transamerica Series Trust |
|
|
|
Semi-Annual Financial Statements 2024 |
|
|
Page 15 |
|
|
|
|
|
| PO Box 219945 |
| Kansas City, MO 64121-9945 |
|
|
| Distributor: |
|
Transamerica Capital, Inc. |
|
|
PO Box 219945 |
|
|
Kansas City, MO 64121-9945 |
|
|
|
|
Customer Service: 1-800-851-9777 |
Transamerica Series Trust Semi-Annual Financial Statements
June 30, 2024
1801 California St., Suite 5200
Denver, CO 80202
Distributor: Transamerica Capital, Inc.
Customer Service: 1-800-851-9777
The following pages contain the most recent semi-annual financial statements for the investment options in which you are invested. In compliance with Securities and Exchange Commission regulations, we present these reports on an annual and semi-annual basis with the hope that they will foster greater understanding of the investment options’ holdings, performance, financial data, accounting policies and other issues. This streamlined version provides information only on the investment options in which you are invested.
If you have any questions about these reports, please do not hesitate to contact your financial professional. As always, we thank you for your trust and the opportunity to serve you.
Transamerica BlackRock iShares Edge 100 VP
SCHEDULE OF INVESTMENTS
At June 30, 2024
(unaudited)
|
|
|
|
|
|
|
|
|
| |
|
Shares |
|
|
Value |
|
| |
|
|
|
|
| EXCHANGE-TRADED FUNDS - 99.9% |
|
|
|
|
|
|
|
|
| International Equity Funds - 24.8% |
|
|
|
|
|
|
|
|
| iShares MSCI EAFE Min Vol Factor ETF (A) |
|
|
199,267 |
|
|
$ |
13,820,163 |
|
| iShares MSCI Emerging Markets Min Vol Factor ETF |
|
|
68,143 |
|
|
|
3,898,461 |
|
|
|
|
|
|
|
|
|
|
|
|
|
|
|
|
|
|
|
|
17,718,624 |
|
|
|
|
|
|
|
|
|
|
| U.S. Equity Funds - 75.1% |
|
|
|
|
|
|
|
|
| iShares MSCI USA Min Vol Factor ETF |
|
|
139,025 |
|
|
|
11,672,539 |
|
| iShares MSCI USA Momentum Factor ETF (A) |
|
|
60,381 |
|
|
|
11,766,445 |
|
| iShares MSCI USA Quality Factor ETF |
|
|
68,580 |
|
|
|
11,710,721 |
|
| iShares MSCI USA Size Factor ETF |
|
|
51,027 |
|
|
|
7,017,743 |
|
| iShares MSCI USA Value Factor ETF (A) |
|
|
111,797 |
|
|
|
11,566,518 |
|
|
|
|
|
|
|
|
|
|
|
|
|
|
|
|
|
|
|
|
53,733,966 |
|
|
|
|
|
|
|
|
|
|
| Total Exchange-Traded Funds (Cost $57,655,418) |
|
|
|
|
|
|
71,452,590 |
|
|
|
|
|
|
|
|
|
|
|
|
|
| OTHER INVESTMENT COMPANY - 14.7% |
|
|
|
|
|
|
|
|
| Securities Lending Collateral - 14.7% |
|
|
|
|
|
|
|
|
| State Street Navigator Securities Lending Trust - Government Money Market Portfolio, 5.28% (B) |
|
|
10,548,187 |
|
|
|
10,548,187 |
|
|
|
|
|
|
|
|
|
|
|
|
|
| Total Other Investment Company (Cost $10,548,187) |
|
|
|
|
|
|
10,548,187 |
|
|
|
|
|
|
|
|
|
|
|
|
|
|
|
|
|
|
|
| |
|
Principal |
|
|
Value |
|
| |
|
|
|
|
| REPURCHASE AGREEMENT - 0.2% |
|
|
|
|
|
|
|
|
| Fixed Income Clearing Corp., |
|
|
|
|
|
|
|
|
| 2.50% (B), dated 06/28/2024, to be repurchased at $136,438 on 07/01/2024. Collateralized by a U.S. Government Obligation, 4.50%, due 03/31/2026, and with a value of $139,242. |
|
$ |
136,410 |
|
|
|
$ 136,410 |
|
|
|
|
|
|
|
|
|
|
|
|
|
| Total Repurchase Agreement (Cost $136,410) |
|
|
|
|
|
|
136,410 |
|
|
|
|
|
|
|
|
|
|
| Total Investments (Cost $68,340,015) |
|
|
|
|
|
|
82,137,187 |
|
|
|
|
|
|
|
|
|
|
| Net Other Assets (Liabilities) - (14.8)% |
|
|
|
|
|
|
(10,596,674) |
|
|
|
|
|
|
|
|
|
|
|
|
|
| Net Assets - 100.0% |
|
|
|
|
|
$ |
71,540,513 |
|
|
|
|
|
|
|
|
|
|
INVESTMENT VALUATION:
|
|
|
|
|
|
|
|
|
|
|
|
|
|
|
|
|
| |
|
|
|
|
|
|
| Valuation Inputs (C) |
|
|
|
|
|
|
|
|
|
|
|
|
|
|
|
|
|
| |
|
Level 1 - Unadjusted Quoted Prices |
|
|
Level 2 - Other Significant Observable Inputs |
|
|
Level 3 - Significant Unobservable Inputs |
|
|
Value |
|
| |
|
|
|
|
|
|
| ASSETS |
|
|
|
|
|
|
|
|
|
|
|
|
|
|
|
|
| Investments |
|
|
|
|
|
|
|
|
|
|
|
|
|
|
|
|
| Exchange-Traded Funds |
|
$ |
71,452,590 |
|
|
$ |
— |
|
|
$ |
— |
|
|
$ |
71,452,590 |
|
| Other Investment Company |
|
|
10,548,187 |
|
|
|
— |
|
|
|
— |
|
|
|
10,548,187 |
|
| Repurchase Agreement |
|
|
— |
|
|
|
136,410 |
|
|
|
— |
|
|
|
136,410 |
|
|
|
|
|
|
|
|
|
|
|
|
|
|
|
|
|
|
|
|
|
|
|
| Total Investments |
|
$ |
82,000,777 |
|
|
$ |
136,410 |
|
|
$ |
— |
|
|
$ |
82,137,187 |
|
|
|
|
|
|
|
|
|
|
|
|
|
|
|
|
|
|
FOOTNOTES TO SCHEDULE OF INVESTMENTS:
| (A) |
All or a portion of the security is on loan. The total value of the securities on loan is $10,649,650, collateralized by cash collateral of $10,548,187 and non-cash collateral, such as U.S. government securities and irrevocable letters of credit, of $327,825. The amount on loan indicated may not correspond with the securities on loan identified because a security with pending sales are in the process of recall from the brokers. |
| (B) |
Rate disclosed reflects the yield at June 30, 2024. |
| (C) |
There were no transfers in or out of Level 3 during the period ended June 30, 2024. Please reference the Investment Valuation section of the Notes to Financial Statements for more information regarding investment valuation and pricing inputs. |
The Notes to Financial Statements are an integral part of this report.
|
|
|
|
|
| Transamerica Series Trust |
|
|
|
Semi-Annual Financial Statements 2024 |
|
|
Page 1 |
|
|
Transamerica BlackRock iShares Edge 100 VP
STATEMENT OF ASSETS AND LIABILITIES
At June 30, 2024
(unaudited)
|
|
|
|
|
|
|
| Assets: |
|
|
|
|
|
|
| Unaffiliated investments, at value (cost $68,203,605) (including securities loaned of $10,649,650) |
|
$ |
82,000,777 |
|
| Repurchase agreement, at value (cost $136,410) |
|
|
136,410 |
|
| Receivables and other assets: |
|
|
|
|
| Investments sold |
|
|
489,017 |
|
| Net income from securities lending |
|
|
4,826 |
|
| Shares of beneficial interest sold |
|
|
31 |
|
| Interest |
|
|
28 |
|
| Prepaid expenses |
|
|
283 |
|
|
|
| Total assets |
|
|
82,631,372 |
|
|
|
| Liabilities: |
|
|
|
|
| Cash collateral received upon return of: |
|
|
|
|
| Securities on loan |
|
|
10,548,187 |
|
| Payables and other liabilities: |
|
|
|
|
| Investments purchased |
|
|
494,435 |
|
| Shares of beneficial interest redeemed |
|
|
4,126 |
|
| Investment management fees |
|
|
12,598 |
|
| Distribution and service fees |
|
|
13,670 |
|
| Transfer agent costs |
|
|
48 |
|
| Trustee and CCO fees |
|
|
145 |
|
| Audit and tax fees |
|
|
9,140 |
|
| Custody fees |
|
|
1,054 |
|
| Legal fees |
|
|
1,120 |
|
| Printing and shareholder reports fees |
|
|
1,932 |
|
| Other accrued expenses |
|
|
4,404 |
|
|
|
| Total liabilities |
|
|
11,090,859 |
|
|
|
| Net assets |
|
$ |
71,540,513 |
|
|
|
| Net assets consist of: |
|
|
|
|
| Capital stock ($0.01 par value) |
|
$ |
49,117 |
|
| Additional paid-in capital |
|
|
53,022,954 |
|
| Total distributable earnings (accumulated losses) |
|
|
18,468,442 |
|
|
|
| Net assets |
|
$ |
71,540,513 |
|
|
|
| Shares outstanding |
|
|
4,911,663 |
|
|
|
| Net asset value and offering price per share |
|
$ |
14.57 |
|
STATEMENT OF OPERATIONS
For the period ended June 30, 2024
(unaudited)
|
|
|
|
|
|
|
| Investment income: |
|
|
|
|
| Dividend income from unaffiliated investments |
|
$ |
670,713 |
|
| Interest income from unaffiliated investments |
|
|
1,249 |
|
| Net income from securities lending |
|
|
16,035 |
|
|
|
| Total investment income |
|
|
687,997 |
|
|
|
| Expenses: |
|
|
|
|
| Investment management fees |
|
|
102,422 |
|
| Distribution and service fees |
|
|
85,352 |
|
| Transfer agent costs |
|
|
373 |
|
| Trustee and CCO fees |
|
|
1,562 |
|
| Audit and tax fees |
|
|
9,086 |
|
| Custody fees |
|
|
1,025 |
|
| Legal fees |
|
|
2,456 |
|
| Printing and shareholder reports fees |
|
|
2,223 |
|
| Other |
|
|
7,962 |
|
|
|
| Total expenses before waiver and/or reimbursement and recapture |
|
|
212,461 |
|
|
|
| Expenses waived and/or reimbursed |
|
|
(21,273 |
) |
|
|
| Net expenses |
|
|
191,188 |
|
|
|
| Net investment income (loss) |
|
|
496,809 |
|
|
|
| Net realized gain (loss) on: |
|
|
|
|
| Unaffiliated investments |
|
|
1,849,952 |
|
|
|
| Net change in unrealized appreciation (depreciation) on: |
|
|
|
|
| Unaffiliated investments |
|
|
3,842,046 |
|
|
|
| Net realized and change in unrealized gain (loss) |
|
|
5,691,998 |
|
|
|
| Net increase (decrease) in net assets resulting from operations |
|
$ |
6,188,807 |
|
The Notes to Financial Statements are an integral part of this report.
|
|
|
|
|
| Transamerica Series Trust |
|
|
|
Semi-Annual Financial Statements 2024 |
|
|
Page 2 |
|
|
Transamerica BlackRock iShares Edge 100 VP
STATEMENT OF CHANGES IN NET ASSETS
For the period and year ended:
|
|
|
|
|
|
|
|
|
| |
|
June 30, 2024 (unaudited) |
|
December 31, 2023 |
|
|
|
| From operations: |
|
|
|
|
|
|
|
|
| Net investment income (loss) |
|
$ |
496,809 |
|
|
$ |
990,446 |
|
| Net realized gain (loss) |
|
|
1,849,952 |
|
|
|
1,467,316 |
|
| Net change in unrealized appreciation (depreciation) |
|
|
3,842,046 |
|
|
|
5,999,546 |
|
|
|
|
| Net increase (decrease) in net assets resulting from operations |
|
|
6,188,807 |
|
|
|
8,457,308 |
|
|
|
|
| Dividends and/or distributions to shareholders |
|
|
— |
|
|
|
(10,311,630 |
) |
|
|
|
| Net increase (decrease) in net assets resulting from dividends and/or distributions to shareholders |
|
|
— |
|
|
|
(10,311,630 |
) |
|
|
|
| Capital share transactions: |
|
|
|
|
|
|
|
|
| Proceeds from shares sold |
|
|
3,772,957 |
|
|
|
4,196,081 |
|
| Dividends and/or distributions reinvested |
|
|
— |
|
|
|
10,311,630 |
|
| Cost of shares redeemed |
|
|
(4,646,682 |
) |
|
|
(6,954,331 |
) |
|
|
|
| Net increase (decrease) in net assets resulting from capital share transactions |
|
|
(873,725 |
) |
|
|
7,553,380 |
|
|
|
|
| Net increase (decrease) in net assets |
|
|
5,315,082 |
|
|
|
5,699,058 |
|
|
|
|
| Net assets: |
|
|
|
|
|
|
|
|
| Beginning of period/year |
|
|
66,225,431 |
|
|
|
60,526,373 |
|
|
|
|
| End of period/year |
|
$ |
71,540,513 |
|
|
$ |
66,225,431 |
|
|
|
|
| Capital share transactions - shares: |
|
|
|
|
|
|
|
|
| Shares issued |
|
|
266,543 |
|
|
|
311,048 |
|
| Shares reinvested |
|
|
— |
|
|
|
821,644 |
|
| Shares redeemed |
|
|
(329,642 |
) |
|
|
(505,454 |
) |
|
|
|
| Net increase (decrease) in shares outstanding |
|
|
(63,099 |
) |
|
|
627,238 |
|
FINANCIAL HIGHLIGHTS
|
|
|
|
|
|
|
|
|
|
|
|
|
|
|
|
|
|
|
|
|
|
|
|
|
| For a share outstanding during the period and years indicated: |
|
Service Class |
|
|
|
|
|
|
|
| |
|
June 30, 2024 (unaudited) |
|
December 31, 2023 |
|
December 31, 2022 |
|
December 31, 2021 |
|
December 31, 2020 |
|
December 31, 2019 |
| Net asset value, beginning of period/year |
|
$ |
13.31 |
|
|
$ |
13.92 |
|
|
$ |
17.38 |
|
|
$ |
15.16 |
|
|
$ |
14.30 |
|
|
$ |
12.01 |
|
| Investment operations: |
|
|
|
|
|
|
|
|
|
|
|
|
|
|
|
|
|
|
|
|
|
|
|
|
| Net investment income (loss)(A) |
|
|
0.10 |
|
|
|
0.22 |
|
|
|
0.20 |
|
|
|
0.19 |
|
|
|
0.17 |
|
|
|
0.26 |
|
| Net realized and unrealized gain (loss) |
|
|
1.16 |
|
|
|
1.64 |
|
|
|
(2.93 |
) |
|
|
2.58 |
|
|
|
1.19 |
|
|
|
2.64 |
|
| Total investment operations |
|
|
1.26 |
|
|
|
1.86 |
|
|
|
(2.73 |
) |
|
|
2.77 |
|
|
|
1.36 |
|
|
|
2.90 |
|
| Dividends and/or distributions to shareholders: |
|
|
|
|
|
|
|
|
|
|
|
|
|
|
|
|
|
|
|
|
|
|
|
|
| Net investment income |
|
|
— |
|
|
|
(0.28 |
) |
|
|
(0.18 |
) |
|
|
(0.16 |
) |
|
|
(0.23 |
) |
|
|
(0.21 |
) |
| Net realized gains |
|
|
— |
|
|
|
(2.19 |
) |
|
|
(0.55 |
) |
|
|
(0.39 |
) |
|
|
(0.27 |
) |
|
|
(0.40 |
) |
| Total dividends and/or distributions to shareholders |
|
|
— |
|
|
|
(2.47 |
) |
|
|
(0.73 |
) |
|
|
(0.55 |
) |
|
|
(0.50 |
) |
|
|
(0.61 |
) |
| Net asset value, end of period/year |
|
$ |
14.57 |
|
|
$ |
13.31 |
|
|
$ |
13.92 |
|
|
$ |
17.38 |
|
|
$ |
15.16 |
|
|
$ |
14.30 |
|
| |
|
|
|
|
|
|
|
|
|
|
|
|
|
|
|
|
|
|
|
|
|
|
|
|
| Total return |
|
|
9.47 |
%(B) |
|
|
14.47 |
% |
|
|
(15.76 |
)% |
|
|
18.36 |
% |
|
|
9.88 |
% |
|
|
24.58 |
% |
| Ratio and supplemental data: |
|
|
|
|
|
|
|
|
|
|
|
|
|
|
|
|
|
|
|
|
|
|
|
|
| Net assets end of period/year (000’s) |
|
$ |
71,541 |
|
|
$ |
66,225 |
|
|
$ |
60,526 |
|
|
$ |
105,304 |
|
|
$ |
88,665 |
|
|
$ |
75,243 |
|
| Expenses to average net assets(C) |
|
|
|
|
|
|
|
|
|
|
|
|
|
|
|
|
|
|
|
|
|
|
|
|
| Excluding waiver and/or reimbursement and recapture |
|
|
0.62 |
%(D) |
|
|
0.64 |
% |
|
|
0.61 |
% |
|
|
0.60 |
% |
|
|
0.61 |
% |
|
|
0.61 |
% |
| Including waiver and/or reimbursement and recapture |
|
|
0.56 |
%(D)(E) |
|
|
0.56 |
%(E) |
|
|
0.56 |
%(E)(F) |
|
|
0.56 |
%(F) |
|
|
0.56 |
%(F) |
|
|
0.56 |
%(F) |
| Net investment income (loss) to average net assets |
|
|
1.46 |
%(D) |
|
|
1.61 |
% |
|
|
1.35 |
% |
|
|
1.12 |
% |
|
|
1.27 |
% |
|
|
1.95 |
% |
| Portfolio turnover rate |
|
|
7 |
%(B) |
|
|
8 |
% |
|
|
10 |
% |
|
|
9 |
% |
|
|
13 |
% |
|
|
12 |
% |
| (A) |
Calculated based on average number of shares outstanding. |
| (C) |
Does not include expenses of the underlying investments in which the Portfolio invests. |
| (E) |
TAM has contractually agreed, through May 1, 2025, to waive from its management fees an amount equal to the sub-advisory fee waiver by the Portfolio’s sub-adviser. These amounts are not subject to recapture by TAM. |
| (F) |
TAM contractually agreed to waive 0.05% of the average daily net assets from its management fee through May 1, 2022. These amounts are not subject to recapture by TAM. |
The Notes to Financial Statements are an integral part of this report.
|
|
|
|
|
| Transamerica Series Trust |
|
|
|
Semi-Annual Financial Statements 2024 |
|
|
Page 3 |
|
|
Transamerica BlackRock iShares Edge 100 VP
NOTES TO FINANCIAL STATEMENTS
At June 30, 2024
(unaudited)
1. ORGANIZATION
Transamerica Series Trust (“TST”) is an open-end management investment company registered under the Investment Company Act of 1940, as amended (the “1940 Act”). TST applies investment company accounting and reporting guidance. TST serves as a funding vehicle for variable life insurance, variable annuity, and group annuity products. Transamerica BlackRock iShares Edge 100 VP (the “Portfolio”) is a series of TST and is classified as diversified under the 1940 Act. The Portfolio currently offers one class of shares, Service Class.
The only shareholders of the Portfolio are affiliated insurance company separate accounts and/or affiliated asset allocation portfolios. Contract holders of the variable life and annuity contracts are not shareholders of the Portfolio. For ease of reference, shareholders and contract holders are collectively referred to in this report as “shareholders.”
This report must be accompanied or preceded by the Portfolio’s current prospectus, which contains additional information about the Portfolio, including risks, as well as investment objectives and strategies.
Transamerica Asset Management, Inc. (“TAM”) serves as investment manager for the Portfolio pursuant to an investment management agreement. TAM provides continuous and regular investment management services to the Portfolio. TAM supervises the Portfolio’s investments, conducts its investment program and provides supervisory, compliance and administrative services to the Portfolio.
TAM currently acts as a “manager of managers” and has hired sub-advisers to furnish day-to-day investment advice and recommendations. TAM may, in the future, determine to provide all aspects of the day-to-day management of the Portfolio without the use of a sub-adviser. When acting as a manager of managers, TAM provides investment management services that include, without limitation, the design and development of the Portfolio and its investment strategies and the ongoing review and evaluation of those investment strategies including recommending changes in strategy where it believes appropriate or advisable; the selection of one or more sub-advisers for the Portfolio employing a combination of quantitative and qualitative screens, research, analysis and due diligence; negotiation of sub-advisory agreements and fees; oversight and monitoring of sub-advisers and recommending changes to sub-advisers where it believes appropriate or advisable; recommending portfolio combinations and liquidations where it believes appropriate or advisable; selection and oversight of transition managers, as needed; regular supervision of the Portfolio’s investments; regular review and evaluation of sub-adviser performance; daily monitoring of the sub-advisers’ buying and selling of securities for the Portfolio; regular review of holdings; ongoing trade oversight and analysis; regular monitoring to ensure adherence to investment process; regular calls and periodic on-site visits with sub-advisers; portfolio construction and asset allocation when using multiple sub-advisers for the Portfolio; risk management oversight and analysis; oversight of negotiation of investment documentation and agreements; design, development, implementation and regular monitoring of the valuation process; periodic due diligence reviews of pricing vendors and vendor methodology; design, development, implementation and regular monitoring of the compliance process; respond to regulatory inquiries and determine appropriate litigation strategy, as needed; review of proxies voted by sub-advisers; oversight of preparation and review of materials for meetings of the Portfolio’s Board of Trustees (the “Board”), participation in these meetings and preparation of regular communications with the Board; oversight of preparation and review of prospectuses, shareholder reports and other disclosure materials and regulatory filings for the Portfolio; oversight of other service providers to the Portfolio, such as the custodian, the transfer agent, the Portfolio’s independent accounting firm and legal counsel; supervision of the performance of recordkeeping and shareholder relations functions for the Portfolio; and oversight of cash management services. TAM uses a variety of quantitative and qualitative tools to carry out its investment management services. TAM, not the Portfolio, is responsible for paying the sub-adviser(s) for their services, and sub-advisory fees are TAM’s expense.
TAM’s investment management services also include the provision of supervisory and administrative services to the Portfolio. These services include performing certain administrative services for the Portfolio and supervising and overseeing the administrative, clerical, recordkeeping and bookkeeping services provided to the Portfolio by State Street Bank and Trust Company (“State Street”), to whom TAM has outsourced the provision of certain sub-administration services. To the extent agreed upon by TAM and the Portfolio from time to time, TAM’s supervisory and administrative services include, but are not limited to: monitoring and verifying the custodian’s daily calculation of the Net Asset Values (“NAV”); shareholder relations functions; compliance services; valuation services; assisting in due diligence and in the oversight and monitoring of certain activities of sub-advisers and certain aspects of Portfolio investments; assisting with Portfolio combinations and liquidations; oversight of the preparation and filing, and review, of all returns and reports, in connection with federal, state and local taxes; oversight and review of regulatory reporting; supervising and coordinating the Portfolio’s custodian and dividend disbursing agent and monitoring their services to the Portfolio; assisting the Portfolio in preparing reports to shareholders; acting as liaison with the Portfolio’s independent public accountants and providing, upon request, analyses, fiscal year summaries and other audit related services; assisting in the preparation of agendas and supporting documents for and minutes of meetings of trustees and committees of trustees; assisting in the preparation of regular communications with the trustees; and providing personnel and office space, telephones and other office equipment as necessary in order for TAM to perform supervisory and administrative services to the Portfolio. The Portfolio pays certain fees and expenses to State Street for sub-administration services which are not administrative services covered by the
|
|
|
| Transamerica Series Trust |
|
Semi-Annual Financial Statements 2024 |
Page 4
Transamerica BlackRock iShares Edge 100 VP
NOTES TO FINANCIAL STATEMENTS (continued)
At June 30, 2024
(unaudited)
1. ORGANIZATION (continued)
management agreement with TAM or paid for through the management fees payable thereunder. For the period ended June 30, 2024, (i) the expenses paid to State Street for sub-administration services by the Portfolio are shown as a part of Other expenses within the Statement of Operations and (ii) the expenses payable to State Street for sub-administration services from the Portfolio are shown as part of Other accrued expenses within the Statement of Assets and Liabilities.
2. SIGNIFICANT ACCOUNTING POLICIES
In preparing the Portfolio’s financial statements in accordance with Generally Accepted Accounting Principles in the United States of America (“GAAP”), estimates or assumptions (which could differ from actual results) may be used that affect reported amounts and disclosures. The following is a summary of significant accounting policies followed by the Portfolio.
Security transactions and investment income: Security transactions are accounted for on the trade date. Security gains and losses are calculated on a first-in, first-out basis. Interest income, if any, is accrued as earned. Dividend income and capital gain distributions from underlying investments, if any, are recorded on the ex-dividend date. Income or short-term capital gain distributions received from underlying investments, if any, are recorded as Dividend income from investments within the Statement of Operations. Long-term capital gain distributions received from underlying investments, if any, are recorded as Net realized gain (loss) on Capital gain distributions received from investments within the Statement of Operations.
Distributions to shareholders: Distributions are recorded on the ex-dividend date and are determined in accordance with federal income tax regulations, which may differ from GAAP.
Commission recapture: The sub-adviser(s), to the extent consistent with the best execution and usual commission rate policies and practices, may elect to place security transactions of the Portfolio with broker/dealers with which TST has established a commission recapture program. A commission recapture program is any arrangement under which a broker/dealer applies a portion of the commissions received by such broker/dealer on the security transactions to the Portfolio. In no event will commissions, paid by the Portfolio, be used to pay expenses that would otherwise be borne by any other Portfolios within TST, or by any other party.
There were no commissions recaptured during the period ended June 30, 2024 by the Portfolio.
Indemnification: In the normal course of business, the Portfolio enters into contracts that contain a variety of representations that provide general indemnifications. The Portfolio’s maximum exposure under these arrangements is unknown, as this would involve future claims that may be made against the Portfolio and/or its affiliates that have not yet occurred. However, based on experience, the Portfolio expects the risk of loss to be remote.
3. INVESTMENT VALUATION
TAM has been designated as the Portfolio’s valuation designee pursuant to Rule 2a-5 under the 1940 Act with responsibility for fair valuation subject to oversight by the Portfolio’s Board of Trustees. The net asset value of the Portfolio is computed as of the official close of the New York Stock Exchange (“NYSE”) each day the NYSE is open for business.
TAM utilizes various methods to measure the fair value of its investments on a recurring basis. GAAP establishes a hierarchy that prioritizes inputs to valuation methods. The inputs or methodology used for valuing securities are not necessarily an indication of the risk associated with investing in those securities. The three levels (“Levels”) of inputs of the fair value hierarchy are defined as follows:
Level 1—Unadjusted quoted prices in active markets for identical securities.
Level 2—Inputs, other than quoted prices included in Level 1, which are observable, either directly or indirectly. These inputs may include quoted prices for the identical instrument on an inactive market, prices for similar instruments, interest rates, prepayment speeds, credit risk, yield curves, default rates, and similar data.
Level 3—Unobservable inputs based on the best information available in the circumstances, to the extent observable inputs are not available, which may include TAM’s own assumptions used in determining the fair value of the Portfolio’s investments.
The inputs used to measure fair value may fall into different Levels of the fair value hierarchy. In such cases, for disclosure purposes, the Level in the fair value hierarchy that is assigned to the fair value measurement of a security is determined based on the lowest Level input that is significant to the fair value measurement in its entirety. Certain investments that are measured at fair value using NAV per share, or
|
|
|
| Transamerica Series Trust |
|
Semi-Annual Financial Statements 2024 |
Page 5
Transamerica BlackRock iShares Edge 100 VP
NOTES TO FINANCIAL STATEMENTS (continued)
At June 30, 2024
(unaudited)
3. INVESTMENT VALUATION (continued)
its equivalent, using the “practical expedient” have not been classified in the fair value Levels. The hierarchy classification of inputs used to value the Portfolio’s investments at June 30, 2024, is disclosed within the Investment Valuation section of the Schedule of Investments.
The availability of observable inputs can vary from security to security and is affected by a wide variety of factors, including, but not limited to, the type of security, whether the security is new and not yet established in the marketplace, the liquidity of markets, and other characteristics particular to the security. To the extent that valuation is based on models or inputs that are less observable or unobservable in the market, the determination of fair value requires more judgment. Accordingly, the degree of judgment exercised in determining fair value is generally greatest for instruments categorized in Level 3. Due to the inherent uncertainty of valuation, the determination of values may differ significantly from values that would have been realized had a ready market for investments existed, and the differences could be material.
Fair value measurements: Descriptions of the valuation techniques applied to the Portfolio’s significant categories of assets and liabilities measured at fair value on a recurring basis are as follows:
Exchange-traded funds (“ETF”): ETFs are stated at the last reported sale price or closing price on the day of valuation taken from the primary exchange where the ETF is principally traded. ETFs are generally categorized in Level 1 of the fair value hierarchy.
Securities lending collateral: Securities lending collateral is invested in a money market fund which is valued at the actively traded NAV and no valuation adjustments are applied. Securities lending collateral is categorized in Level 1 of the fair value hierarchy.
Repurchase agreements: Repurchase agreements are valued at cost, which approximates fair value. To the extent the inputs are observable and timely, the values are generally categorized in Level 2 of the fair value hierarchy.
4. BORROWINGS AND OTHER FINANCING TRANSACTIONS
The Portfolio may engage in borrowing transactions as a means of raising cash to satisfy redemption requests, for other temporary or emergency purposes or, to the extent permitted by its investment policies, to raise additional cash to be invested in other securities or instruments. When the Portfolio invests borrowing proceeds in other securities, the Portfolio will bear the risk that the market value of the securities in which such proceeds are invested goes down and is insufficient to repay the borrowed proceeds. The Portfolio may borrow on a secured or on an unsecured basis. If the Portfolio enters into a secured borrowing arrangement, a portion of the Portfolio’s assets will be used as collateral. The 1940 Act requires the Portfolio to maintain asset coverage of at least 300% of the amount of its borrowings. Asset coverage means the ratio that the value of the Portfolio’s total assets, minus liabilities other than borrowings, bears to the aggregate amount of all borrowings. Although complying with this requirement has the effect of limiting the amount that the Portfolio may borrow, it does not otherwise mitigate the risks of entering into borrowing transactions.
Interfund lending: The Portfolio, along with other funds and portfolios advised by TAM, may participate in an interfund lending program pursuant to exemptive relief granted by the Securities and Exchange Commission on January 18, 2017. This program allows the Portfolio to lend to and borrow from other funds and portfolios advised by TAM. Interfund lending transactions are subject to the conditions of the exemptive relief which places limits on the amount of lending or borrowing a Portfolio may participate in under the program. Interest earned or paid on an interfund lending transaction will be based on the average of certain current market rates. For the period ended June 30, 2024, the Portfolio has not utilized the program.
Repurchase agreements: In a repurchase agreement, the Portfolio purchases a security and simultaneously commits to resell that security to the seller at an agreed-upon price on an agreed-upon date. Securities purchased subject to a repurchase agreement are held at the Portfolio’s custodian, or designated sub-custodian related to tri-party repurchase agreements, and, pursuant to the terms of the repurchase agreement, must be collateralized by securities with an aggregate market value greater than or equal to 100% of the resale price. The Portfolio will bear the risk of value fluctuations until the securities can be sold and may encounter delays and incur costs in liquidating the securities. In the event of bankruptcy or insolvency of the seller, delays and costs may be incurred.
Repurchase agreements are subject to netting agreements, which are agreements between the Portfolio and its counterparties that provide for the net settlement of all transactions and collateral with the Portfolio, through a single payment, in the event of default or termination. Amounts presented within the Schedule of Investments, and as part of Repurchase agreements, at value within the Statement of Assets and Liabilities are shown on a gross basis. The value of the related collateral for each repurchase agreement, as reflected within the Schedule of Investments, exceeds the value of each repurchase agreement at June 30, 2024.
|
|
|
| Transamerica Series Trust |
|
Semi-Annual Financial Statements 2024 |
Page 6
Transamerica BlackRock iShares Edge 100 VP
NOTES TO FINANCIAL STATEMENTS (continued)
At June 30, 2024
(unaudited)
4. BORROWINGS AND OTHER FINANCING TRANSACTIONS (continued)
Repurchase agreements at June 30, 2024, if any, are included within the Schedule of Investments and Statement of Assets and Liabilities.
Securities lending: The Portfolio may lend securities to qualified financial institutions, brokers and dealers. State Street serves as securities lending agent to the Portfolio pursuant to a Securities Lending Agreement. Loans of securities are terminable at any time and the borrower, after notice, is required to return borrowed securities within the standard time period for settlement of securities transactions. The lending of securities exposes the Portfolio to risks such as: the borrowers may fail to return the loaned securities or may not be able to provide additional collateral, the Portfolio may experience delays in recovery of the loaned securities or delays in access to collateral, or the Portfolio may experience losses related to the investment collateral. To minimize certain risks, loan counterparties pledge cash, securities issued or guaranteed by the U.S. Government and irrevocable letters of credit issued by banks as collateral. The initial collateral received by the Portfolio is required to have a value of at least 102% of the current value of the loaned securities traded on U.S. exchanges, and a value of at least 105% for all other securities. Typically the lending agent is not permitted to sell, re-pledge or use cash and non-cash collateral it receives. The lending agent has agreed to indemnify the Portfolio in the case of default of any securities borrower.
The Portfolio receives compensation for lending securities from interest or dividends earned on the cash, U.S. Government securities and irrevocable letters of credit held as collateral, less associated fees and expenses. Such income is reflected in Net income from securities lending within the Statement of Operations. Cash collateral received is invested in the State Street Navigator Securities Lending Trust — Government Money Market Portfolio.
The value of loaned securities and related cash and non-cash collateral outstanding at June 30, 2024, if any, are shown on a gross basis within the Schedule of Investments.
The following table reflects a breakdown of transactions accounted for as secured borrowings, the gross obligation by the type, and the remaining contractual maturity of those transactions as of June 30, 2024.
|
|
|
|
|
|
|
|
|
|
|
|
|
|
|
|
|
|
|
|
|
| |
|
Remaining Contractual Maturity of the Agreements |
|
| |
|
Overnight and Continuous |
|
|
Less Than
30 Days |
|
|
Between
30 & 90 Days |
|
|
Greater Than
90 Days |
|
|
Total |
|
| Securities Lending Transactions
Exchange-Traded Funds |
|
$ |
10,548,187 |
|
|
$ |
— |
|
|
$ |
— |
|
|
$ |
— |
|
|
$ |
10,548,187 |
|
| Total Borrowings |
|
$ |
10,548,187 |
|
|
$ |
— |
|
|
$ |
— |
|
|
$ |
— |
|
|
$ |
10,548,187 |
|
| |
|
|
|
|
|
|
|
|
|
|
|
|
|
|
|
|
|
|
|
|
5. RISK FACTORS
Investing in the Portfolio involves certain key risks related to the Portfolio’s trading activity. Please reference the Portfolio’s prospectus for a more complete discussion of the following risk(s), as well as other risks of investing in the Portfolio.
Market risk: The market prices of the Portfolio’s securities or other assets may go up or down, sometimes rapidly or unpredictably, due to factors such as economic events, inflation, changes in interest rates, governmental actions or interventions, actions taken by the U.S. Federal Reserve or foreign central banks, market disruptions caused by tariffs, trade disputes or other factors, political developments, armed conflicts, economic sanctions, cybersecurity events, investor sentiment, the global and domestic effects of widespread or local health, weather or climate events, and other factors that may or may not be related to the issuer of the security or other asset. If the market prices of the Portfolio’s securities and assets fall, the value of your investment in the Portfolio could go down.
Economies and financial markets throughout the world are increasingly interconnected. Events or circumstances in one or more countries or regions could be highly disruptive to, and have profound impacts on, global economies or markets. As a result, whether or not the Portfolio invests in securities of issuers located in or with significant exposure to the countries directly affected, the value and liquidity of the Portfolio’s investments may go down.
Asset allocation risk: The Portfolio’s investment performance is significantly impacted by the Portfolio’s asset allocation and reallocation from time to time. The value of your investment may decrease if the sub-adviser’s judgment about the attractiveness, value or market trends affecting a particular asset class, investment style, technique or strategy, underlying ETF or other issuer is incorrect.
|
|
|
| Transamerica Series Trust |
|
Semi-Annual Financial Statements 2024 |
Page 7
Transamerica BlackRock iShares Edge 100 VP
NOTES TO FINANCIAL STATEMENTS (continued)
At June 30, 2024
(unaudited)
5. RISK FACTORS (continued)
Smart beta investing risk: Smart beta strategies seek to capture broad, consistent drivers of return and to out-perform traditional index strategies. These strategies may not work as intended. An underlying ETF pursuing a smart beta strategy may not achieve its objective and may not perform as well as other funds using other asset management strategies.
Underlying exchange-traded funds risk: Because the Portfolio invests its assets in underlying ETFs, its ability to achieve its investment objective depends largely on the performance of the underlying ETFs in which it invests. Investing in underlying ETFs subjects the Portfolio to the risks of investing in the underlying securities or assets held by those ETFs. Each of the underlying ETFs in which the Portfolio may invest has its own investment risks, and those risks can affect the value of the underlying ETFs’ shares and therefore the value of the Portfolio’s investments. There can be no assurance that the investment objective of any underlying ETF will be achieved. To the extent that the Portfolio invests more of its assets in one underlying ETF than in another, the Portfolio will have greater exposure to the risks of that underlying ETF. In addition, the Portfolio will bear a pro rata portion of the operating expenses of the underlying ETFs in which it invests.
6. FEES AND OTHER AFFILIATED TRANSACTIONS
TST serves as a funding vehicle for certain affiliated asset allocation portfolios and certain affiliated separate accounts of Transamerica Life Insurance Company (“TLIC”) and Transamerica Financial Life Insurance Company.
TAM, the Portfolio’s investment manager, is directly owned by TLIC and AUSA Holding, LLC (“AUSA”), both of which are indirect, wholly owned subsidiaries of Aegon Ltd. TLIC is owned by Commonwealth General Corporation (“Commonwealth”). Commonwealth and AUSA are wholly owned by Transamerica Corporation (DE). Transamerica Corporation (DE) is wholly owned by Aegon International B.V., which is wholly owned by Aegon Ltd., a Bermuda exempted company with liability limited by shares (formerly, Aegon NV, a Netherlands corporation) and a publicly traded international insurance group.
Transamerica Fund Services, Inc. (“TFS”) is the Portfolio’s transfer agent. Transamerica Capital, Inc. (“TCI”) is the Portfolio’s distributor/principal underwriter. TAM, TFS and TCI are affiliates of Aegon Ltd.
Certain officers and trustees of the Portfolio may also be officers and/or trustees of TAM, TFS and TCI. No interested trustee who is deemed an interested person due to current or former service with TAM or an affiliate of TAM receives compensation from the Portfolio. The Portfolio does pay non-interested persons (independent trustees), as disclosed in Trustee and CCO fees within the Statement of Operations.
Investment management fees: TAM serves as the Portfolio’s investment manager, performing administration as well as investment advisory services. TAM renders investment advisory, supervisory, and administration services under an investment management agreement and the Portfolio pays a single management fee, which is reflected in Investment management fees within the Statement of Operations.
The Portfolio pays a management fee to TAM based on daily average net assets at the following rates:
|
|
|
|
|
| Breakpoints |
|
Rate |
|
| First $1 billion |
|
|
0.30 |
% |
| Over $1 billion |
|
|
0.28 |
|
TAM has contractually agreed, through May 1, 2025, to waive from its management fees an amount equal to the sub-advisory fee waiver by the Portfolio’s sub-adviser. These amounts are not subject to recapture by TAM.
TAM has contractually agreed to waive fees and/or reimburse Portfolio expenses to the extent that the total operating expenses excluding, as applicable, acquired fund fees and expenses, interest (including borrowing costs and overdraft charges), taxes, brokerage commissions, dividend and interest expenses on securities sold short, extraordinary expenses and other expenses not incurred in the ordinary course of the Portfolio’s business, exceed the following stated annual operating expense limits to the Portfolio’s daily average net
|
|
|
| Transamerica Series Trust |
|
Semi-Annual Financial Statements 2024 |
Page 8
Transamerica BlackRock iShares Edge 100 VP
NOTES TO FINANCIAL STATEMENTS (continued)
At June 30, 2024
(unaudited)
6. FEES AND OTHER AFFILIATED TRANSACTIONS (continued)
assets. To the extent an expense limit changed during the period, the prior limit is also listed below. The expenses waived and/or reimbursed, if any, are included in Expenses waived and/or reimbursed within the Statement of Operations.
|
|
|
|
|
| Class |
|
Operating Expense Limit |
|
Operating Expense Limit Effective Through |
| Service Class |
|
0.56% |
|
May 1, 2025 |
TAM is permitted to recapture amounts contractually waived and/or reimbursed to a class during any of the 36 months from the date on which TAM waived fees and/or reimbursed expenses for the class. A class may recapture and reimburse TAM only if such amount does not cause, on any particular business day of the Portfolio, the class’s total annual operating expenses (after the recapture is taken into account) to exceed the Operating Expense Limits or any other lower limit then in effect. Amounts recaptured, if any, by TAM for the period ended June 30, 2024 are disclosed in Recapture of previously waived and/or reimbursed fees within the Statement of Operations.
TAM, on a voluntary basis and in addition to the contractual operating expense limits in effect, from time to time may waive and/or reimburse expenses of the Portfolio, or any classes thereof, to such level(s) as the Trust’s officers have determined or may reasonably determine from time to time. Any such voluntary waiver or expense reimbursement may be discontinued by TAM at any time. These amounts are not subject to recapture by TAM.
For the 36-month period ended June 30, 2024, the balances available for recapture by TAM for the Fund are as follows:
|
|
|
|
|
|
|
|
|
|
|
|
|
|
|
|
|
|
|
|
|
| |
|
Amounts Available |
|
|
| |
|
|
|
2021 |
|
|
|
2022 |
|
|
|
2023 |
|
|
|
2024 |
|
|
|
Total |
| Service Class |
|
|
|
$ — |
|
|
|
$ — |
|
|
|
$ 16,271 |
|
|
|
$ 4,203 |
|
|
|
$ 20,474 |
Distribution and service fees: TST has a distribution plan (“Distribution Plan”) pursuant to Rule 12b-1 under the 1940 Act. Pursuant to the Distribution Plan, TST entered into a distribution agreement with TCI as the Portfolio’s distributor.
The Distribution Plan requires the Portfolio to pay distribution fees to TCI as compensation for various distribution activities, not as reimbursement for specific expenses. Under the Distribution Plan and distribution agreement, TCI, on behalf of the Portfolio, is authorized to pay various service providers, as direct payment for expenses incurred in connection with distribution of the Portfolio’s shares.
The fee on the Service Class shares is paid to the insurance companies for providing services and account maintenance for the policyholders who invest in the variable insurance products which invest in the Service Class shares. The distribution and service fees are included in Distribution and service fees within the Statement of Operations.
The Portfolio is authorized under the Distribution Plan to pay fees to TCI based on daily average net assets up to an annual fee of 0.25% of Service Class shares.
Transfer agent costs: TFS provides transfer agency services under an intercompany agreement with TAM. TFS has outsourced the provision of certain sub-transfer agency services to SS&C Global Investor & Distribution Solutions, Inc. (“SS&C GIDS”). The Portfolio does not pay a separate transfer agent fee to TAM or TFS but does pay certain expenses to SS&C GIDS related to applicable sub-transfer agency services. For the period ended June 30, 2024, (i) the expenses paid to SS&C GIDS by the Portfolio are referred to as transfer agent costs and are included within the Statement of Operations and (ii) the expenses payable to SS&C GIDS by the Portfolio are referred to as transfer agent costs within the Statement of Assets and Liabilities.
Brokerage commissions: The Portfolio incurred no brokerage commissions on security transactions placed with affiliates of the investment manager or sub-adviser(s) for the period ended June 30, 2024.
|
|
|
| Transamerica Series Trust |
|
Semi-Annual Financial Statements 2024 |
Page 9
Transamerica BlackRock iShares Edge 100 VP
NOTES TO FINANCIAL STATEMENTS (continued)
At June 30, 2024
(unaudited)
7. PURCHASES AND SALES OF SECURITIES
For the period ended June 30, 2024, the cost of securities purchased and proceeds from securities sold (excluding short-term securities) are as follows:
|
|
|
|
|
|
|
| Purchases of Securities |
|
Sales/Maturities of Securities |
| Long-Term |
|
U.S. Government |
|
Long-Term |
|
U.S. Government |
| $ 5,142,042 |
|
$ — |
|
$ 5,493,829 |
|
$ — |
8. FEDERAL INCOME TAXES AND DISTRIBUTIONS TO SHAREHOLDERS
The Portfolio has not made any provision for federal income or excise taxes due to its policy to distribute all of its taxable income and capital gains to its shareholders and otherwise qualify as a regulated investment company under Subchapter M of the Internal Revenue Code. The Portfolio recognizes the tax benefits of uncertain tax positions only where the position is “more likely than not” to be sustained assuming examination by tax authorities. The Portfolio’s tax returns remain subject to examination by the Internal Revenue Service and state tax authorities three years from the date of filing for federal purposes and four years from the date of filing for state purposes. Management has evaluated the Portfolio’s tax provisions taken for all open tax years, and has concluded that no provision for income tax is required in the Portfolio’s financial statements. If applicable, the Portfolio recognizes interest accrued related to unrecognized tax benefits in relation to interest and penalties expense in Other within the Statement of Operations. The Portfolio identifies its major tax jurisdictions as U.S. Federal, the state of Colorado, and foreign jurisdictions where the Portfolio makes significant investments; however, the Portfolio is not aware of any tax positions for which it is reasonably possible that the total amounts of unrecognized tax benefits will change materially in the next twelve months. Distributions are determined in accordance with income tax regulations, which may differ from GAAP.
As of June 30, 2024, the approximate cost for U.S. federal income tax purposes, and the aggregate gross/net unrealized appreciation (depreciation) in the value of investments (including securities sold short and derivatives, if any) are as follows:
|
|
|
|
|
|
|
| Cost |
|
Gross Appreciation |
|
Gross (Depreciation) |
|
Net Appreciation (Depreciation) |
| $ 68,340,015 |
|
$ 13,992,165 |
|
$ (194,993) |
|
$ 13,797,172 |
Please see TST’s most recent report on Form N-CSR, available at: www.transamerica.com/annuities/prospectus, for additional information. For the most recently filed complete proxy voting records for the Trust please visit: https://www.transamerica.com/sites/default/files/files/e070d/TST%20N-PX%202021.pdf
|
|
|
| Transamerica Series Trust |
|
Semi-Annual Financial Statements 2024 |
Page 10
Transamerica BlackRock iShares Edge 100 VP
MANAGEMENT AND SUB-ADVISORY AGREEMENT — CONTRACT RENEWAL
(unaudited)
At a meeting of the Board of Trustees of Transamerica Series Trust (the “Trustees” or the “Board”) held on June 12-13, 2024, the Board considered the renewal of the management agreement (the “Management Agreement”) between Transamerica Asset Management, Inc. (“TAM”) and Transamerica Series Trust, on behalf of Transamerica BlackRock iShares Edge 100 VP (the “Portfolio”). The Board also considered the renewal of the investment sub-advisory agreement (the “Sub-Advisory Agreement” and together with the Management Agreement, the “Agreements”) for the Portfolio between TAM and BlackRock Investment Management, LLC (the “Sub-Adviser”).
Following its review and consideration, the Board determined that the terms of the Management Agreement and Sub-Advisory Agreement were reasonable and that the renewal of each of the Agreements was in the best interests of the Portfolio and the holders invested in the Portfolio. The Board, including the independent members of the Board (the “Independent Trustees”), unanimously approved the renewal of each of the Agreements through June 30, 2025.
Prior to reaching their decision, the Trustees requested and received from TAM and the Sub-Adviser certain information. They then reviewed such information as they deemed reasonably necessary to evaluate the Agreements, including information they had previously received from TAM and the Sub-Adviser as part of their regular oversight of the Portfolio, and knowledge they gained over time through meeting with TAM and the Sub-Adviser. Among other materials, the Trustees considered comparative fee, expense and performance information prepared by Broadridge Financial Solutions, Inc. (“Broadridge”), an independent provider of mutual fund performance information, as well as fee, expense and profitability information prepared by TAM. In addition, TAM provided the Board with additional supplemental comparative performance information. To the extent applicable, the Trustees considered information about fees and performance of comparable funds and/or accounts managed by the Sub-Adviser. The Board also considered reductions to the Portfolio’s expense limits, if any, that took effect after the last renewal of the Agreements. In their review, the Trustees also sought to identify instances in which the Portfolio’s performance, fees, total expenses and/or profitability appeared to be outliers within its respective peer group or other comparative metrics and sought to understand the reasons for such comparative positions.
In their deliberations, the Independent Trustees met privately without representatives of TAM or the Sub-Adviser present and were represented throughout the process by their independent legal counsel. In considering the proposed continuation of each of the Agreements, the Trustees evaluated and weighed a number of considerations that they believed to be relevant in light of the legal advice furnished to them by counsel, including independent legal counsel, and made a decision in the exercise of their own business judgment. They based their decisions on the considerations discussed below, among others, although they did not identify any particular consideration or item of information that was controlling of their decisions, and each Trustee may have attributed different weights to the various factors.
Nature, Extent and Quality of the Services Provided
The Board considered the nature, extent and quality of the services provided by TAM and the Sub-Adviser to the Portfolio in the past and the services anticipated to be provided in the future. The Board also considered the investment approach for the Portfolio; the experience, capability and integrity of TAM’s senior management; the financial resources of TAM; TAM’s management oversight process; TAM’s and the Sub-Adviser’s responsiveness to any questions by the Trustees; and the professional qualifications and compensation program of the portfolio management team of the Sub-Adviser. The Trustees noted that they receive, on a quarterly basis, an execution analysis from Capital Institutional Services, Inc. (CAPIS), an independent provider of trade analyses, for the Sub-Adviser and a comparison of trading results against a peer universe of managers.
The Board also considered the continuous and regular investment management and other services provided by TAM, when acting as a manager of managers, for the portion of the management fee it retains from the Portfolio after payment of the sub-advisory fees. The Board noted that the investment management and other services provided by TAM include the design, development and ongoing review and evaluation of the Portfolio and its investment strategy; the selection, oversight and monitoring of one or more investment sub-advisers to perform certain duties with respect to the Portfolio; ongoing portfolio trading oversight and analysis; risk management oversight and analysis; design, development, implementation and ongoing review and evaluation of a process for the valuation of Portfolio investments; design, development, implementation and ongoing review and evaluation of a compliance program for the Portfolio; design, development, implementation and ongoing review and evaluation of a process for the voting of proxies and exercise of rights to consent to corporate action for Portfolio investments; participation in Board meetings and oversight of preparation of materials for the Board, including materials for Board meetings and regular communications with the Board; oversight of preparation of the Portfolio’s prospectus, statement of additional information, shareholder reports and other disclosure materials and regulatory filings for the Portfolio; and ongoing cash management services for the Portfolio. The Board considered that TAM’s investment management services also include the provision of supervisory and administrative services to the Portfolio. The Board also noted that TAM, as part of the services it provides to all Transamerica mutual funds, including the Portfolio, oversees the services provided by the funds’ custodian, transfer agent, independent accountant and legal counsel and supervises the performance of the recordkeeping and holder service functions of the funds.
Investment Performance
In addition, the Board considered the short- and longer-term performance of the Portfolio in light of its investment objective, policies and strategies, including relative performance against (i) a peer universe of comparable mutual funds, as prepared by Broadridge, and (ii) the Portfolio’s benchmarks, in each case for various trailing periods ended December 31, 2023. Based on these considerations, the Board determined that TAM and the Sub-Adviser can provide investment and related services that are appropriate in scope and extent in light of
|
|
|
| Transamerica Series Trust |
|
Semi-Annual Financial Statements 2024 |
Page 11
Transamerica BlackRock iShares Edge 100 VP
MANAGEMENT AND SUB-ADVISORY AGREEMENT — CONTRACT RENEWAL (continued)
(unaudited)
the Portfolio’s investment objectives, policies and strategies and operations, the competitive landscape of the investment company business and investor needs. The Board’s conclusions as to the Portfolio’s performance are summarized below. For purposes of its review, the Board generally used the performance of Service Class Shares. In describing the Portfolio’s performance relative to its peer universe, the summary conclusions characterize performance for the relevant periods in relation to whether it was “above,” “below” or “in line with” the peer universe median and do so using quintile rankings prepared by Broadridge. For simplicity, performance is described as “above” the median if the Portfolio’s performance ranked anywhere in the first or second quintiles, as “below” the median if it ranked anywhere in the fourth or fifth quintiles, or “in line with” the median if it ranked anywhere in the third quintile (i.e., even if its precise return was somewhat above or somewhat below the precise median return).
When considering the Portfolio’s performance, the Trustees considered any representations made by TAM regarding the appropriateness of certain peer groups and benchmarks. They recognized that performance reflects a snapshot of a period as of a specific date, and that consideration of performance data for a different period could generate significantly different performance results. The Trustees also recognized that even longer-term performance can be negatively affected by performance over a short-term period when that short-term performance is significantly below the performance of the comparable benchmark or universe of peer funds.
The Board noted that the performance of Service Class Shares of the Portfolio was below the median for its peer universe and below the benchmark that TAM utilizes to measure performance of the Portfolio, each for the past 1-, 3-, 5- and 10-year periods.
Management Fee and Sub-Advisory Fees and Total Expense Ratio
The Board considered the management fee and total expense ratio of the Portfolio, including information provided by Broadridge comparing the management fee and total expense ratio of the Portfolio to the management fees and total expense ratios of comparable investment companies in both a peer group and broader peer universe compiled by Broadridge. The Board’s conclusions as to the Portfolio’s management fee and total expense ratio are summarized below. For purposes of its review, the Board generally used the actual total expenses (i.e., expenses reflecting any waivers and/or reimbursements) of Service Class Shares. In describing the Portfolio’s management fee and total expense ratio relative to its peer group and peer universe, the summary conclusions characterize management fees and total expense ratios for the relevant periods in relation to whether they were “above,” “below” or “in line with” the peer group or peer universe median and do so using quintile rankings prepared by Broadridge. For simplicity, management fees and total expense ratios are described as “above” the median if the Portfolio’s management fee or total expense ratio ranked anywhere in the fourth or fifth quintiles, as “below” the median if it ranked anywhere in the first or second quintiles, or “in line with” the median if it ranked anywhere in the third quintile (i.e., even if its precise management fee or total expense ratio was somewhat above or somewhat below the precise median management fee or total expense ratio).
The Board also considered the fees charged by the Sub-Adviser for sub-advisory services, as well as the portion of the Portfolio’s management fee retained by TAM following payment of the sub-advisory fee and how the portion of the contractual management fee retained by TAM at a specified asset level compared to the portions retained by other investment advisers managing mutual funds with similar investment strategies as calculated by an independent provider of information.
The Board noted that the Portfolio’s contractual management fee was below the medians for its peer group and peer universe and that the actual total expenses (i.e., expenses reflecting any waivers and/or reimbursements) of Service Class Shares of the Portfolio were below the median for its peer group and above the median for its peer universe. The Trustees also considered that TAM has entered into an expense limitation arrangement with the Portfolio, which may result in TAM waiving fees for the benefit of holders.
On the basis of these considerations, together with the other information it considered, the Board determined that the management and sub-advisory fees to be received by TAM and the Sub-Adviser under the Management Agreement and Sub-Advisory Agreement are reasonable in light of the services provided.
Cost of Services Provided and Level of Profitability
The Board reviewed information provided by TAM about the cost of providing and procuring fund management services, as well as the costs of the provision of administration, transfer agency and other services, to the Portfolio and to Transamerica Series Trust as a whole by TAM and its affiliates. The Board considered the profitability of TAM and its affiliates in providing these services for the Portfolio and Transamerica Series Trust as a whole. The Trustees recognized the competitiveness of the mutual fund industry and the importance of an investment adviser’s long-term profitability, including for maintaining company and management stability and accountability.
The Board also considered the allocation methodology used for calculating the profitability of TAM and its affiliates. The Board noted that the revenue and expense allocation methodology used by TAM to estimate its profitability with respect to its relationship with the Portfolio had been reviewed previously by an independent consultant. The Trustees considered that TAM reported that it had not made material changes to this methodology, and that the methodology had been applied consistently for the Portfolio.
With respect to the Sub-Adviser, the Board noted that the sub-advisory fee is the product of arm’s-length negotiation between TAM and the Sub-Adviser, which is not affiliated with TAM, and is paid by TAM and not the Portfolio. As a result, the Board focused on the profitability of TAM and its affiliates with respect to the Portfolio.
|
|
|
| Transamerica Series Trust |
|
Semi-Annual Financial Statements 2024 |
Page 12
Transamerica BlackRock iShares Edge 100 VP
MANAGEMENT AND SUB-ADVISORY AGREEMENT — CONTRACT RENEWAL (continued)
(unaudited)
Based on this information, the Board determined that the profitability of TAM and its affiliates from their relationships with the Portfolio was not excessive.
Economies of Scale
The Board considered economies of scale with respect to the management of the Portfolio, whether the Portfolio had appropriately benefited from any economies of scale and whether there was the potential for realization of any future economies of scale. The Board also considered the existence of economies of scale with respect to management of the Transamerica mutual funds overall and the extent to which the Portfolio benefited from any economies of scale. The Board recognized that, as the Portfolio’s assets increase, any economies of scale realized by TAM or the Sub-Adviser may not directly correlate with each other or with any economies of scale that might be realized by the Portfolio. The Board considered the Portfolio’s management fee schedule and the existence of breakpoints and also considered the extent to which TAM shared economies of scale, if any, with the Portfolio through undertakings to limit or reimburse Portfolio expenses and to invest in maintaining and developing its capabilities and services. The Board also considered the Sub-Adviser’s sub-advisory fee schedule and the existence of breakpoints, if any, and how such breakpoints relate to any breakpoints in the Portfolio’s management fee schedule. The Trustees concluded that the Portfolio’s fee structure reflected an appropriate sharing of any efficiencies or economies of scale to date and noted that they will have the opportunity to periodically reexamine the appropriateness of the management fee payable to TAM and the fee paid to the Sub-Adviser in light of any economies of scale experienced in the future.
Benefits to TAM, its Affiliates and/or the Sub-Adviser from their Relationships with the Portfolio
The Board considered other benefits derived by TAM, its affiliates, and/or the Sub-Adviser from their relationships with the Portfolio. The Board noted that TAM does not receive benefits from research obtained with commissions paid to broker-dealers for portfolio transactions (commonly referred to as “soft dollars”) as a result of its relationship with the Portfolio.
Other Considerations
The Board noted that TAM has made a substantial commitment to the recruitment and retention of high-quality personnel and maintains the financial, compliance and operational resources reasonably necessary to manage the Portfolio in a professional manner that is consistent with the best interests of the Portfolio and the holders. In this regard, the Board favorably considered the procedures and policies TAM has in place to enforce compliance with applicable laws and regulations and oversee the portfolio management activities of the Sub-Adviser. The Board also noted that TAM has made an entrepreneurial commitment and undertaken certain business risks with respect to the management and success of the Portfolio.
Conclusion
After consideration of the factors described above, as well as other factors, the Trustees, including the Independent Trustees, concluded that the renewal of the Management Agreement and the Sub-Advisory Agreement was in the best interests of the Portfolio and the holders and voted to approve the renewal of the Agreements.
|
|
|
| Transamerica Series Trust |
|
Semi-Annual Financial Statements 2024 |
Page 13
PROXY VOTING POLICIES AND PROCEDURES AND QUARTERLY PORTFOLIO HOLDINGS
(unaudited)
A description of Transamerica Series Trust’s (the “Trust”) proxy voting policies and procedures is available in the Statement of Additional Information of the Portfolios, available without charge upon request by calling 1-800-851-9777 (toll free) or on the Securities and Exchange Commission’s (“SEC”) website at http://www.sec.gov.
In addition, the Portfolio is required to file Form N-PX, with their complete proxy voting records for the most recent 12 months ended June 30th, no later than August 31st of each year. The Form is available without charge: (1) on the Transamerica Funds website at https://www.transamerica.com/sites/default/files/files/e070d/TST%20N-PX%202021.pdf; and (2) on the SEC’s website at http://www.sec.gov.
Each fiscal quarter, the Portfolios, except Transamerica BlackRock Government Money Market VP, will file with the SEC a complete schedule of its monthly portfolio holdings on Form N-PORT. The Portfolios’ holdings as of the end of the third month of every fiscal quarter, as reported on Form N-PORT, will be publicly available on the SEC’s website at http://www.sec.gov within 60 days of the end of the fiscal quarter.
On a monthly basis, Transamerica BlackRock Government Money Market VP will file with the SEC portfolio holdings information on Form N-MFP3. A complete schedule of portfolio holdings is also available at www.transamerica.com.
You may also visit the Trust’s website at www.transamerica.com/annuities/prospectus for this and other information about the Portfolios and the Trust.
Important Notice Regarding Delivery of Shareholder Documents
Every year we provide shareholders informative materials such as the Transamerica Series Trust Annual Report, the Transamerica Series Trust Prospectus, and other required documents that keep you informed regarding your Portfolios. To the extent provided by mail, Transamerica Series Trust will only send one piece per mailing address, a method that saves your Portfolios money by reducing mailing and printing costs. We will continue to do this unless you tell us not to. To elect to receive individual mailings, simply call a Transamerica Customer Service Representative toll free at 1-800-851-9777, 8 a.m. to 7 p.m. Eastern Time, Monday-Friday. Your request will take effect within 30 days.
|
|
|
| Transamerica Series Trust |
|
Semi-Annual Financial Statements 2024 |
Page 14
NOTICE OF PRIVACY POLICY
(unaudited)
Your privacy is very important to us. We want you to understand what information we collect and how we use it. We collect and use “nonpublic personal information” in connection with providing our customers with a broad range of financial products and services as effectively and conveniently as possible. We treat nonpublic personal information in accordance with our Privacy Policy.
What Information We Collect and From Whom We Collect It
We may collect nonpublic personal information about you from the following sources:
| • |
|
Information we receive from you on applications or other forms, such as your name, address, and account number; |
| • |
|
Information about your transactions with us, our affiliates, or others, such as your account balance and purchase/redemption history; and |
| • |
|
Information we receive from non-affiliated third parties, including consumer reporting agencies. |
What Information We Disclose and To Whom We Disclose It
We do not disclose any nonpublic personal information about current or former customers to anyone without their express consent, except as permitted by law. We may disclose the nonpublic personal information we collect, as described above, to persons or companies that perform services on our behalf and to other financial institutions with which we have joint marketing agreements. We will require these companies to protect the confidentiality of your nonpublic personal information and to use it only to perform the services for which we have hired them.
Our Security Procedures
We restrict access to your nonpublic personal information and only allow disclosures to persons and companies as permitted by law to assist in providing products or services to you. We maintain physical, electronic, and procedural safeguards to protect your nonpublic personal information and to safeguard the disposal of certain consumer information.
Contact Us
If you have any questions about our Privacy Policy, please call 1-800-851-9777 on any business day between 8 a.m. and 7 p.m. Eastern Time.
Note: This Privacy Policy applies only to customers that have a direct relationship with us or our affiliates. If you own shares of our portfolios in the name of a third party such as a bank or broker-dealer, its privacy policy may apply to you instead of ours.
|
|
|
| Transamerica Series Trust |
|
Semi-Annual Financial Statements 2024 |
Page 15
PO Box 219945
Kansas City, MO 64121-9945
|
|
|
| Distributor: |
|
Transamerica Capital, Inc. |
|
|
PO Box 219945 |
|
|
Kansas City, MO 64121-9945 |
|
|
|
|
Customer Service: 1-800-851-9777 |
Transamerica Series Trust Semi-Annual Financial Statements
June 30, 2024
1801 California St., Suite 5200
Denver, CO 80202
Distributor: Transamerica Capital, Inc.
Customer Service: 1-800-851-9777
The following pages contain the most recent semi-annual financial statements for the investment options in which you are invested. In compliance with Securities and Exchange Commission regulations, we present these reports on an annual and semi-annual basis with the hope that they will foster greater understanding of the investment options’ holdings, performance, financial data, accounting policies and other issues. This streamlined version provides information only on the investment options in which you are invested.
If you have any questions about these reports, please do not hesitate to contact your financial professional. As always, we thank you for your trust and the opportunity to serve you.
Transamerica BlackRock iShares Tactical - Balanced VP
SCHEDULE OF INVESTMENTS
At June 30, 2024
(unaudited)
|
|
|
|
|
|
|
|
|
| |
|
Shares |
|
|
Value |
|
| EXCHANGE-TRADED FUNDS - 98.9% |
|
| International Equity Funds - 15.6% |
|
| iShares Core MSCI EAFE ETF |
|
|
218,415 |
|
|
$ |
15,865,665 |
|
| iShares Core MSCI Emerging Markets ETF |
|
|
138,940 |
|
|
|
7,437,458 |
|
| iShares MSCI Canada ETF |
|
|
104,513 |
|
|
|
3,876,387 |
|
| iShares MSCI EAFE ETF (A) |
|
|
253,981 |
|
|
|
19,894,332 |
|
| iShares MSCI Emerging Markets ETF |
|
|
175,130 |
|
|
|
7,458,787 |
|
|
|
|
|
|
|
|
|
|
|
|
|
|
|
|
|
54,532,629 |
|
|
|
|
|
|
|
|
|
|
| U.S. Equity Funds - 37.9% |
|
| iShares Core S&P 500 ETF |
|
|
146,479 |
|
|
|
80,157,703 |
|
| iShares Core S&P Total U.S. Stock Market ETF |
|
|
441,464 |
|
|
|
52,437,094 |
|
|
|
|
|
|
|
|
|
|
|
|
|
|
|
|
|
132,594,797 |
|
|
|
|
|
|
|
|
|
|
| U.S. Fixed Income Funds - 45.4% |
|
| iShares Broad USD High Yield Corporate Bond ETF |
|
|
287,578 |
|
|
|
10,433,330 |
|
| iShares Broad USD Investment Grade Corporate Bond ETF (A) |
|
|
690,977 |
|
|
|
34,693,955 |
|
| iShares Core U.S. Aggregate Bond ETF |
|
|
658,304 |
|
|
|
63,901,569 |
|
| iShares Short Treasury Bond ETF (A) |
|
|
450,084 |
|
|
|
49,734,282 |
|
|
|
|
|
|
|
|
|
|
|
|
|
|
|
|
|
158,763,136 |
|
|
|
|
|
|
|
|
|
|
| Total Exchange-Traded Funds
(Cost $332,978,913) |
|
|
|
|
|
|
345,890,562 |
|
|
|
|
|
|
|
|
|
|
|
|
|
|
|
|
|
|
|
| |
|
Shares |
|
|
Value |
|
| OTHER INVESTMENT COMPANY - 4.5% |
|
| Securities Lending Collateral - 4.5% |
|
| State Street Navigator Securities Lending Trust - Government Money Market Portfolio, 5.28% (B) |
|
|
15,716,780 |
|
|
$ |
15,716,780 |
|
|
|
|
|
|
|
|
|
|
| Total Other Investment Company
(Cost $15,716,780) |
|
|
|
|
|
|
15,716,780 |
|
|
|
|
|
|
|
|
|
|
|
|
|
| |
|
Principal |
|
|
Value |
|
| REPURCHASE AGREEMENT - 1.2% |
|
| Fixed Income Clearing Corp.,
2.50% (B), dated 06/28/2024, to be repurchased at $4,223,446 on 07/01/2024. Collateralized by a U.S. Government Obligation, 4.50%, due 03/31/2026, and with a value of $4,307,074. |
|
$ |
4,222,567 |
|
|
|
4,222,567 |
|
|
|
|
|
|
|
|
|
|
| Total Repurchase Agreement
(Cost $4,222,567) |
|
|
|
|
|
|
4,222,567 |
|
|
|
|
|
|
|
|
|
|
| Total Investments
(Cost $352,918,260) |
|
|
|
|
|
|
365,829,909 |
|
|
|
|
|
|
|
|
|
|
| Net Other Assets (Liabilities) - (4.6)% |
|
|
|
(16,161,582) |
|
|
|
|
|
|
|
|
|
|
|
|
|
| Net Assets - 100.0% |
|
|
|
|
|
$ |
349,668,327 |
|
|
|
|
|
|
|
|
|
|
INVESTMENT VALUATION:
|
|
|
|
|
|
|
|
|
|
|
|
|
|
|
|
|
| Valuation Inputs (C) |
|
|
|
|
|
|
|
|
|
|
|
|
|
|
|
|
| |
|
Level 1 - Unadjusted Quoted Prices |
|
|
Level 2 - Other Significant Observable Inputs |
|
|
Level 3 - Significant Unobservable Inputs |
|
|
Value |
|
| ASSETS |
|
|
|
|
|
|
|
|
|
|
|
|
|
|
|
|
| Investments |
|
|
|
|
|
|
|
|
|
|
|
|
|
|
|
|
| Exchange-Traded Funds |
|
$ |
345,890,562 |
|
|
$ |
— |
|
|
$ |
— |
|
|
$ |
345,890,562 |
|
| Other Investment Company |
|
|
15,716,780 |
|
|
|
— |
|
|
|
— |
|
|
|
15,716,780 |
|
| Repurchase Agreement |
|
|
— |
|
|
|
4,222,567 |
|
|
|
— |
|
|
|
4,222,567 |
|
|
|
|
|
|
|
|
|
|
|
|
|
|
|
|
|
|
| Total Investments |
|
$ |
361,607,342 |
|
|
$ |
4,222,567 |
|
|
$ |
— |
|
|
$ |
365,829,909 |
|
|
|
|
|
|
|
|
|
|
|
|
|
|
|
|
|
|
FOOTNOTES TO SCHEDULE OF INVESTMENTS:
| (A) |
All or a portion of the security is on loan. The total value of the securities on loan is $15,393,960, collateralized by cash collateral of $15,716,780 and non-cash collateral, such as U.S. government securities and irrevocable letters of credit, of $2,720. The amount on loan indicated may not correspond with the securities on loan identified because a security with pending sales are in the process of recall from the brokers. |
| (B) |
Rate disclosed reflects the yield at June 30, 2024. |
| (C) |
There were no transfers in or out of Level 3 during the period ended June 30, 2024. Please reference the Investment Valuation section of the Notes to Financial Statements for more information regarding investment valuation and pricing inputs. |
|
|
|
| The Notes to Financial Statements are an integral part of this report. |
|
|
| Transamerica Series Trust |
|
Semi-Annual Financial Statements 2024 |
Page 1
Transamerica BlackRock iShares Tactical - Balanced VP
STATEMENT OF ASSETS AND LIABILITIES
At June 30, 2024
(unaudited)
|
|
|
|
|
|
|
| Assets: |
|
|
|
|
| Unaffiliated investments, at value (cost $348,695,693) (including securities loaned of $15,393,960) |
|
$ |
361,607,342 |
|
| Repurchase agreement, at value (cost $4,222,567) |
|
|
4,222,567 |
|
| Cash |
|
|
92 |
|
| Receivables and other assets: |
|
|
|
|
| Net income from securities lending |
|
|
7,493 |
|
| Interest |
|
|
1,770 |
|
| Prepaid expenses |
|
|
1,406 |
|
| Total assets |
|
|
365,840,670 |
|
|
|
| Liabilities: |
|
|
|
|
| Cash collateral received upon return of: |
|
|
|
|
| Securities on loan |
|
|
15,716,780 |
|
| Payables and other liabilities: |
|
|
|
|
| Shares of beneficial interest redeemed |
|
|
159,514 |
|
| Investment management fees |
|
|
120,615 |
|
| Distribution and service fees |
|
|
66,137 |
|
| Transfer agent costs |
|
|
373 |
|
| Trustee and CCO fees |
|
|
1,088 |
|
| Audit and tax fees |
|
|
23,530 |
|
| Custody fees |
|
|
39,817 |
|
| Legal fees |
|
|
9,927 |
|
| Printing and shareholder reports fees |
|
|
22,479 |
|
| Other accrued expenses |
|
|
12,083 |
|
| Total liabilities |
|
|
16,172,343 |
|
| |
|
| Net assets |
|
$ |
349,668,327 |
|
|
|
| Net assets consist of: |
|
|
|
|
| Capital stock ($0.01 par value) |
|
$ |
349,401 |
|
| Additional paid-in capital |
|
|
397,162,815 |
|
| Total distributable earnings (accumulated losses) |
|
|
(47,843,889 |
) |
| |
|
| Net assets |
|
$ |
349,668,327 |
|
|
|
| Net assets by class: |
|
|
|
|
| Initial Class |
|
$ |
5,319,842 |
|
| Service Class |
|
|
344,348,485 |
|
|
|
| Shares outstanding: |
|
|
|
|
| Initial Class |
|
|
520,514 |
|
| Service Class |
|
|
34,419,585 |
|
|
|
| Net asset value and offering price per share: |
|
|
|
|
| Initial Class |
|
$ |
10.22 |
|
| Service Class |
|
|
10.00 |
|
STATEMENT OF OPERATIONS
For the period ended June 30, 2024
(unaudited)
|
|
|
|
|
| Investment income: |
|
|
|
|
| Dividend income from unaffiliated investments |
|
$ |
1,790,834 |
|
| Interest income from unaffiliated investments |
|
|
5,739,880 |
|
| Net income from securities lending |
|
|
12,915 |
|
|
|
| Total investment income |
|
|
7,543,629 |
|
|
|
| Expenses: |
|
|
|
|
| Investment management fees |
|
|
1,236,095 |
|
| Distribution and service fees: |
|
|
|
|
| Service Class |
|
|
430,312 |
|
| Transfer agent costs |
|
|
2,021 |
|
| Trustee and CCO fees |
|
|
8,237 |
|
| Audit and tax fees |
|
|
23,179 |
|
| Custody fees |
|
|
44,319 |
|
| Legal fees |
|
|
28,812 |
|
| Printing and shareholder reports fees |
|
|
21,907 |
|
| Other |
|
|
17,847 |
|
| |
|
| Total expenses before waiver and/or reimbursement and recapture |
|
|
1,812,729 |
|
| |
|
| Expenses waived and/or reimbursed: |
|
|
|
|
| Initial Class |
|
|
(434 |
) |
| Service Class |
|
|
(28,391 |
) |
|
|
| Net expenses |
|
|
1,783,904 |
|
| |
|
| Net investment income (loss) |
|
|
5,759,725 |
|
|
|
| Net realized gain (loss) on: |
|
|
|
|
| Unaffiliated investments |
|
|
(30,440,296 |
) |
| Written options and swaptions |
|
|
57,740 |
|
| Swap agreements |
|
|
3,006,057 |
|
| Futures contracts |
|
|
15,851,297 |
|
| Forward foreign currency contracts |
|
|
185,841 |
|
| Foreign currency transactions |
|
|
(57,752 |
) |
| TBA commitments |
|
|
116,785 |
|
| |
|
| Net realized gain (loss) |
|
|
(11,280,328 |
) |
|
|
| Net change in unrealized appreciation (depreciation) on: |
|
|
|
|
| Unaffiliated investments |
|
|
30,539,338 |
|
| Written options and swaptions |
|
|
(800 |
) |
| Swap agreements |
|
|
(2,072,470 |
) |
| Futures contracts |
|
|
(7,064,561 |
) |
| Forward foreign currency contracts |
|
|
(1,568 |
) |
| Translation of assets and liabilities denominated in foreign currencies |
|
|
7,913 |
|
| TBA commitments |
|
|
53,621 |
|
| |
|
| Net change in unrealized appreciation (depreciation) |
|
|
21,461,473 |
|
|
|
| Net realized and change in unrealized gain (loss) |
|
|
10,181,145 |
|
|
|
| Net increase (decrease) in net assets resulting from operations |
|
$ |
15,940,870 |
|
The Notes to Financial Statements are an integral part of this report.
|
|
|
|
|
| Transamerica Series Trust |
|
|
|
Semi-Annual Financial Statements 2024 |
|
|
Page 2 |
|
|
Transamerica BlackRock iShares Tactical - Balanced VP
STATEMENT OF CHANGES IN NET ASSETS
For the period and year ended:
|
|
|
|
|
|
|
|
|
| |
|
June 30, 2024 (unaudited) |
|
December 31, 2023 |
|
|
|
| From operations: |
|
|
|
|
|
|
|
|
| Net investment income (loss) |
|
|
$ 5,759,725 |
|
|
|
$ 12,471,986 |
|
| Net realized gain (loss) |
|
|
(11,280,328 |
) |
|
|
1,530,420 |
|
| Net change in unrealized appreciation (depreciation) |
|
|
21,461,473 |
|
|
|
23,044,515 |
|
|
|
|
| Net increase (decrease) in net assets resulting from operations |
|
|
15,940,870 |
|
|
|
37,046,921 |
|
|
|
|
| Dividends and/or distributions to shareholders: |
|
|
|
|
|
|
|
|
| Initial Class |
|
|
— |
|
|
|
(66,161 |
) |
| Service Class |
|
|
— |
|
|
|
(3,744,431 |
) |
| |
|
|
| Net increase (decrease) in net assets resulting from dividends and/or distributions to shareholders |
|
|
— |
|
|
|
(3,810,592 |
) |
|
|
|
| Capital share transactions: |
|
|
|
|
|
|
|
|
| Proceeds from shares sold: |
|
|
|
|
|
|
|
|
| Initial Class |
|
|
158,598 |
|
|
|
299,256 |
|
| Service Class |
|
|
242,176 |
|
|
|
1,950,009 |
|
| |
|
|
| |
|
|
400,774 |
|
|
|
2,249,265 |
|
| Dividends and/or distributions reinvested: |
|
|
|
|
|
|
|
|
| Initial Class |
|
|
— |
|
|
|
66,161 |
|
| Service Class |
|
|
— |
|
|
|
3,744,431 |
|
| |
|
|
| |
|
|
— |
|
|
|
3,810,592 |
|
| Cost of shares redeemed: |
|
|
|
|
|
|
|
|
| Initial Class |
|
|
(260,369 |
) |
|
|
(673,344 |
) |
| Service Class |
|
|
(29,646,331 |
) |
|
|
(51,187,082 |
) |
| |
|
|
| |
|
|
(29,906,700 |
) |
|
|
(51,860,426 |
) |
|
|
|
| Net increase (decrease) in net assets resulting from capital share transactions |
|
|
(29,505,926 |
) |
|
|
(45,800,569 |
) |
|
|
|
| Net increase (decrease) in net assets |
|
|
(13,565,056 |
) |
|
|
(12,564,240 |
) |
|
|
|
| Net assets: |
|
|
|
|
|
|
|
|
| Beginning of period/year |
|
|
363,233,383 |
|
|
|
375,797,623 |
|
| End of period/year |
|
|
$349,668,327 |
|
|
|
$363,233,383 |
|
|
|
|
| Capital share transactions - shares: |
|
|
|
|
|
|
|
|
| Shares issued: |
|
|
|
|
|
|
|
|
| Initial Class |
|
|
15,951 |
|
|
|
32,291 |
|
| Service Class |
|
|
24,694 |
|
|
|
215,814 |
|
| |
|
|
| |
|
|
40,645 |
|
|
|
248,105 |
|
| Shares reinvested: |
|
|
|
|
|
|
|
|
| Initial Class |
|
|
— |
|
|
|
7,106 |
|
| Service Class |
|
|
— |
|
|
|
410,124 |
|
| |
|
|
| |
|
|
— |
|
|
|
417,230 |
|
| Shares redeemed: |
|
|
|
|
|
|
|
|
| Initial Class |
|
|
(26,341 |
) |
|
|
(72,463 |
) |
| Service Class |
|
|
(3,043,806 |
) |
|
|
(5,659,039 |
) |
| |
|
|
| |
|
|
(3,070,147 |
) |
|
|
(5,731,502 |
) |
| Net increase (decrease) in shares outstanding: |
|
|
|
|
|
|
|
|
| Initial Class |
|
|
(10,390 |
) |
|
|
(33,066 |
) |
| Service Class |
|
|
(3,019,112 |
) |
|
|
(5,033,101 |
) |
| |
|
|
| |
|
|
(3,029,502 |
) |
|
|
(5,066,167 |
) |
The Notes to Financial Statements are an integral part of this report.
|
|
|
|
|
| Transamerica Series Trust |
|
|
|
Semi-Annual Financial Statements 2024 |
|
|
Page 3 |
|
|
Transamerica BlackRock iShares Tactical - Balanced VP
FINANCIAL HIGHLIGHTS
|
|
|
|
|
|
|
|
|
|
|
|
|
|
|
|
|
|
|
|
|
|
|
|
|
|
|
| For a share outstanding during the period and years indicated: |
|
Initial Class |
| |
|
June 30, 2024 (unaudited) |
|
December 31, 2023 |
|
December 31, 2022 |
|
December 31, 2021 |
|
December 31, 2020 |
|
December 31, 2019 |
|
|
|
|
|
|
|
| Net asset value, beginning of period/year |
|
$ |
9.76 |
|
|
$ |
8.91 |
|
|
$ |
12.31 |
|
|
$ |
12.46 |
|
|
$ |
12.62 |
|
|
$ |
10.57 |
|
| Investment operations: |
|
|
|
|
|
|
|
|
|
|
|
|
|
|
|
|
|
|
|
|
|
|
|
|
| Net investment income (loss)(A) |
|
|
0.17 |
|
|
|
0.34 |
|
|
|
0.15 |
|
|
|
0.08 |
|
|
|
0.03 |
|
|
|
0.23 |
|
| Net realized and unrealized gain (loss) |
|
|
0.29 |
|
|
|
0.63 |
|
|
|
(2.48 |
) |
|
|
0.74 |
|
|
|
1.07 |
|
|
|
1.87 |
|
| |
|
|
|
|
|
|
| Total investment operations |
|
|
0.46 |
|
|
|
0.97 |
|
|
|
(2.33 |
) |
|
|
0.82 |
|
|
|
1.10 |
|
|
|
2.10 |
|
| Dividends and/or distributions to shareholders: |
|
|
|
|
|
|
|
|
|
|
|
|
|
|
|
|
|
|
|
|
|
|
|
|
| Net investment income |
|
|
— |
|
|
|
(0.12 |
) |
|
|
(0.09 |
) |
|
|
— |
|
|
|
(0.45 |
) |
|
|
(0.05 |
) |
| Net realized gains |
|
|
— |
|
|
|
— |
|
|
|
(0.98 |
) |
|
|
(0.97 |
) |
|
|
(0.81 |
) |
|
|
— |
|
| Total dividends and/or distributions to shareholders |
|
|
— |
|
|
|
(0.12 |
) |
|
|
(1.07 |
) |
|
|
(0.97 |
) |
|
|
(1.26 |
) |
|
|
(0.05 |
) |
|
|
|
|
|
|
|
| Net asset value, end of period/year |
|
$ |
10.22 |
|
|
$ |
9.76 |
|
|
$ |
8.91 |
|
|
$ |
12.31 |
|
|
$ |
12.46 |
|
|
$ |
12.62 |
|
| |
|
|
|
|
|
|
|
|
|
|
|
|
|
|
|
|
|
|
|
|
|
|
|
|
|
|
|
|
|
|
|
| Total return |
|
|
4.71 |
%(B) |
|
|
10.99 |
% |
|
|
(19.42 |
)% |
|
|
6.62 |
% |
|
|
9.18 |
% |
|
|
19.90 |
% |
|
|
|
|
|
|
|
| Ratio and supplemental data: |
|
|
|
|
|
|
|
|
|
|
|
|
|
|
|
|
|
|
|
|
|
|
|
|
| Net assets end of period/year (000’s) |
|
$ |
5,320 |
|
|
$ |
5,180 |
|
|
$ |
5,025 |
|
|
$ |
6,616 |
|
|
$ |
6,311 |
|
|
$ |
6,386 |
|
| Expenses to average net assets |
|
|
|
|
|
|
|
|
|
|
|
|
|
|
|
|
|
|
|
|
|
|
|
|
| Excluding waiver and/or reimbursement and recapture |
|
|
0.79 |
%(C) |
|
|
0.89 |
% |
|
|
0.86 |
% |
|
|
0.86 |
% |
|
|
0.86 |
% |
|
|
0.91 |
% |
| Including waiver and/or reimbursement and recapture |
|
|
0.77 |
%(C)(D) |
|
|
0.89 |
% |
|
|
0.86 |
% |
|
|
0.86 |
% |
|
|
0.86 |
% |
|
|
0.91 |
% |
| Net investment income (loss) to average net assets |
|
|
3.54 |
%(C) |
|
|
3.64 |
% |
|
|
1.47 |
% |
|
|
0.60 |
% |
|
|
0.25 |
% |
|
|
1.96 |
% |
| Portfolio turnover rate |
|
|
138 |
%(B) |
|
|
31 |
%(E) |
|
|
33 |
% |
|
|
38 |
%(E) |
|
|
59 |
%(E) |
|
|
50 |
%(E) |
| (A) |
Calculated based on average number of shares outstanding. |
| (D) |
TAM has contractually agreed, through May 1, 2025, to waive from its management fees an amount equal to the sub-advisory fee waiver by the Portfolio’s sub-adviser. These amounts are not subject to recapture by TAM. |
| (E) |
Excludes sale-buyback transactions. |
The Notes to Financial Statements are an integral part of this report.
|
|
|
|
|
| Transamerica Series Trust |
|
|
|
Semi-Annual Financial Statements 2024 |
|
|
Page 4 |
|
|
Transamerica BlackRock iShares Tactical - Balanced VP
FINANCIAL HIGHLIGHTS (continued)
|
|
|
|
|
|
|
|
|
|
|
|
|
|
|
|
|
|
|
|
|
|
|
|
|
|
|
| For a share outstanding during the period and years indicated: |
|
Service Class |
| |
|
June 30, 2024 (unaudited) |
|
December 31, 2023 |
|
December 31, 2022 |
|
December 31, 2021 |
|
December 31, 2020 |
|
December 31, 2019 |
|
|
|
|
|
|
|
| Net asset value, beginning of period/year |
|
$ |
9.56 |
|
|
$ |
8.73 |
|
|
$ |
12.08 |
|
|
$ |
12.27 |
|
|
$ |
12.45 |
|
|
$ |
10.42 |
|
| Investment operations: |
|
|
|
|
|
|
|
|
|
|
|
|
|
|
|
|
|
|
|
|
|
|
|
|
| Net investment income (loss)(A) |
|
|
0.16 |
|
|
|
0.31 |
|
|
|
0.12 |
|
|
|
0.04 |
|
|
|
(0.00 |
)(B) |
|
|
0.20 |
|
| Net realized and unrealized gain (loss) |
|
|
0.28 |
|
|
|
0.62 |
|
|
|
(2.43 |
) |
|
|
0.74 |
|
|
|
1.05 |
|
|
|
1.85 |
|
| |
|
|
|
|
|
|
| Total investment operations |
|
|
0.44 |
|
|
|
0.93 |
|
|
|
(2.31 |
) |
|
|
0.78 |
|
|
|
1.05 |
|
|
|
2.05 |
|
| Dividends and/or distributions to shareholders: |
|
|
|
|
|
|
|
|
|
|
|
|
|
|
|
|
|
|
|
|
|
|
|
|
| Net investment income |
|
|
— |
|
|
|
(0.10 |
) |
|
|
(0.06 |
) |
|
|
— |
|
|
|
(0.42 |
) |
|
|
(0.02 |
) |
| Net realized gains |
|
|
— |
|
|
|
— |
|
|
|
(0.98 |
) |
|
|
(0.97 |
) |
|
|
(0.81 |
) |
|
|
— |
|
| Total dividends and/or distributions to shareholders |
|
|
— |
|
|
|
(0.10 |
) |
|
|
(1.04 |
) |
|
|
(0.97 |
) |
|
|
(1.23 |
) |
|
|
(0.02 |
) |
|
|
|
|
|
|
|
| Net asset value, end of period/year |
|
$ |
10.00 |
|
|
$ |
9.56 |
|
|
$ |
8.73 |
|
|
$ |
12.08 |
|
|
$ |
12.27 |
|
|
$ |
12.45 |
|
| |
|
|
|
|
|
|
|
|
|
|
|
|
|
|
|
|
|
|
|
|
|
|
|
|
|
|
|
|
|
|
|
| Total return |
|
|
4.60 |
%(C) |
|
|
10.66 |
% |
|
|
(19.65 |
)% |
|
|
6.39 |
% |
|
|
8.86 |
% |
|
|
19.68 |
% |
|
|
|
|
|
|
|
| Ratio and supplemental data: |
|
|
|
|
|
|
|
|
|
|
|
|
|
|
|
|
|
|
|
|
|
|
|
|
| Net assets end of period/year (000’s) |
|
$ |
344,348 |
|
|
$ |
358,053 |
|
|
$ |
370,773 |
|
|
$ |
525,408 |
|
|
$ |
573,363 |
|
|
$ |
583,749 |
|
| Expenses to average net assets |
|
|
|
|
|
|
|
|
|
|
|
|
|
|
|
|
|
|
|
|
|
|
|
|
| Excluding waiver and/or reimbursement and recapture |
|
|
1.04 |
%(D) |
|
|
1.14 |
% |
|
|
1.11 |
% |
|
|
1.11 |
% |
|
|
1.11 |
% |
|
|
1.16 |
% |
| Including waiver and/or reimbursement and recapture |
|
|
1.02 |
%(D)(E) |
|
|
1.14 |
% |
|
|
1.11 |
% |
|
|
1.11 |
% |
|
|
1.11 |
% |
|
|
1.16 |
% |
| Net investment income (loss) to average net assets |
|
|
3.29 |
%(D) |
|
|
3.39 |
% |
|
|
1.21 |
% |
|
|
0.36 |
% |
|
|
(0.00 |
)%(F) |
|
|
1.71 |
% |
| Portfolio turnover rate |
|
|
138 |
%(C) |
|
|
31 |
%(G) |
|
|
33 |
% |
|
|
38 |
%(G) |
|
|
59 |
%(G) |
|
|
50 |
%(G) |
| (A) |
Calculated based on average number of shares outstanding. |
| (B) |
Rounds to less than $0.01 or $(0.01). |
| (E) |
TAM has contractually agreed, through May 1, 2025, to waive from its management fees an amount equal to the sub-advisory fee waiver by the Portfolio’s sub-adviser. These amounts are not subject to recapture by TAM. |
| (F) |
Rounds to less than 0.01% or (0.01)%. |
| (G) |
Excludes sale-buyback transactions. |
The Notes to Financial Statements are an integral part of this report.
|
|
|
|
|
| Transamerica Series Trust |
|
|
|
Semi-Annual Financial Statements 2024 |
|
|
Page 5 |
|
|
Transamerica BlackRock iShares Tactical - Balanced VP
NOTES TO FINANCIAL STATEMENTS
At June 30, 2024
(unaudited)
1. ORGANIZATION
Transamerica Series Trust (“TST”) is an open-end management investment company registered under the Investment Company Act of 1940, as amended (the “1940 Act”). TST applies investment company accounting and reporting guidance. TST serves as a funding vehicle for variable life insurance, variable annuity, and group annuity products. Transamerica BlackRock iShares Tactical - Balanced VP (formerly, Transamerica PIMCO Tactical - Balanced VP) (the “Portfolio”) is a series of TST and is classified as diversified under the 1940 Act. The Portfolio currently offers two classes of shares, Initial Class and Service Class.
The only shareholders of the Portfolio are affiliated insurance company separate accounts and/or affiliated asset allocation portfolios. Contract holders of the variable life and annuity contracts are not shareholders of the Portfolio. For ease of reference, shareholders and contract holders are collectively referred to in this report as “shareholders.”
This report must be accompanied or preceded by the Portfolio’s current prospectus, which contains additional information about the Portfolio, including risks, as well as investment objectives and strategies.
Transamerica Asset Management, Inc. (“TAM”) serves as investment manager for the Portfolio pursuant to an investment management agreement. TAM provides continuous and regular investment management services to the Portfolio. TAM supervises the Portfolio’s investments, conducts its investment program and provides supervisory, compliance and administrative services to the Portfolio.
TAM currently acts as a “manager of managers” and has hired sub-advisers to furnish day-to-day investment advice and recommendations. TAM may, in the future, determine to provide all aspects of the day-to-day management of the Portfolio without the use of a sub-adviser. When acting as a manager of managers, TAM provides investment management services that include, without limitation, the design and development of the Portfolio and its investment strategies and the ongoing review and evaluation of those investment strategies including recommending changes in strategy where it believes appropriate or advisable; the selection of one or more sub-advisers for the Portfolio employing a combination of quantitative and qualitative screens, research, analysis and due diligence; negotiation of sub-advisory agreements and fees; oversight and monitoring of sub-advisers and recommending changes to sub-advisers where it believes appropriate or advisable; recommending portfolio combinations and liquidations where it believes appropriate or advisable; selection and oversight of transition managers, as needed; regular supervision of the Portfolio’s investments; regular review and evaluation of sub-adviser performance; daily monitoring of the sub-advisers’ buying and selling of securities for the Portfolio; regular review of holdings; ongoing trade oversight and analysis; regular monitoring to ensure adherence to investment process; regular calls and periodic on-site visits with sub-advisers; portfolio construction and asset allocation when using multiple sub-advisers for the Portfolio; risk management oversight and analysis; oversight of negotiation of investment documentation and agreements; design, development, implementation and regular monitoring of the valuation process; periodic due diligence reviews of pricing vendors and vendor methodology; design, development, implementation and regular monitoring of the compliance process; respond to regulatory inquiries and determine appropriate litigation strategy, as needed; review of proxies voted by sub-advisers; oversight of preparation and review of materials for meetings of the Portfolio’s Board of Trustees (the “Board”), participation in these meetings and preparation of regular communications with the Board; oversight of preparation and review of prospectuses, shareholder reports and other disclosure materials and regulatory filings for the Portfolio; oversight of other service providers to the Portfolio, such as the custodian, the transfer agent, the Portfolio’s independent accounting firm and legal counsel; supervision of the performance of recordkeeping and shareholder relations functions for the Portfolio; and oversight of cash management services. TAM uses a variety of quantitative and qualitative tools to carry out its investment management services. TAM, not the Portfolio, is responsible for paying the sub-adviser(s) for their services, and sub-advisory fees are TAM’s expense.
TAM’s investment management services also include the provision of supervisory and administrative services to the Portfolio. These services include performing certain administrative services for the Portfolio and supervising and overseeing the administrative, clerical, recordkeeping and bookkeeping services provided to the Portfolio by State Street Bank and Trust Company (“State Street”), to whom TAM has outsourced the provision of certain sub-administration services. To the extent agreed upon by TAM and the Portfolio from time to time, TAM’s supervisory and administrative services include, but are not limited to: monitoring and verifying the custodian’s daily calculation of the Net Asset Values (“NAV”); shareholder relations functions; compliance services; valuation services; assisting in due diligence and in the oversight and monitoring of certain activities of sub-advisers and certain aspects of Portfolio investments; assisting with Portfolio combinations and liquidations; oversight of the preparation and filing, and review, of all returns and reports, in connection with federal, state and local taxes; oversight and review of regulatory reporting; supervising and coordinating the Portfolio’s custodian and dividend disbursing agent and monitoring their services to the Portfolio; assisting the Portfolio in preparing reports to shareholders; acting as liaison with the Portfolio’s independent public accountants and providing, upon request, analyses, fiscal year summaries and other audit related services; assisting in the preparation of agendas and supporting documents for and minutes of meetings of trustees and committees of trustees; assisting in the preparation of regular communications with the trustees; and providing personnel and office space, telephones and other office equipment as necessary in order for TAM to perform supervisory and administrative services to the Portfolio. The Portfolio
|
|
|
| Transamerica Series Trust |
|
Semi-Annual Financial Statements 2024 |
Page 6
Transamerica BlackRock iShares Tactical - Balanced VP
NOTES TO FINANCIAL STATEMENTS (continued)
At June 30, 2024
(unaudited)
1. ORGANIZATION (continued)
pays certain fees and expenses to State Street for sub-administration services which are not administrative services covered by the management agreement with TAM or paid for through the management fees payable thereunder. For the period ended June 30, 2024, (i) the expenses paid to State Street for sub-administration services by the Portfolio are shown as a part of Other expenses within the Statement of Operations and (ii) the expenses payable to State Street for sub-administration services from the Portfolio are shown as part of Other accrued expenses within the Statement of Assets and Liabilities.
2. SIGNIFICANT ACCOUNTING POLICIES
In preparing the Portfolio’s financial statements in accordance with Generally Accepted Accounting Principles in the United States of America (“GAAP”), estimates or assumptions (which could differ from actual results) may be used that affect reported amounts and disclosures. The following is a summary of significant accounting policies followed by the Portfolio.
Foreign currency denominated investments: The accounting records of the Portfolio are maintained in U.S. dollars. Securities and other assets and liabilities denominated in foreign currencies are translated into U.S. dollars based on the closing exchange rate each day. The cost of foreign securities purchased and any realized gains or losses are translated at the prevailing exchange rates in effect on the date of the respective transaction. The Portfolio combines fluctuations from currency exchange rates and fluctuations in value when computing net realized and unrealized gains or losses from investments.
Net foreign currency gains and losses resulting from changes in exchange rates include, foreign currency fluctuations between trade date and settlement date of investment security transactions, gains and losses on forward foreign currency contracts, and the difference between the receivable amounts of interest and dividends recorded in the accounting records in U.S. dollars and the amounts actually received.
Foreign currency denominated assets may involve risks not typically associated with domestic transactions. These risks include revaluation of currencies, adverse fluctuations in foreign currency values, and possible adverse political, social, and economic developments, including those particular to a specific industry, country or region.
Security transactions and investment income: Security transactions are accounted for on the trade date. Security gains and losses are calculated on a first-in, first-out basis. Interest income, if any, is accrued as earned. Dividend income and capital gain distributions from underlying investments, if any, are recorded on the ex-dividend date. Income or short-term capital gain distributions received from underlying investments, if any, are recorded as Dividend income from investments within the Statement of Operations. Long-term capital gain distributions received from underlying investments, if any, are recorded as Net realized gain (loss) on Capital gain distributions received from investments within the Statement of Operations.
Multiple class operations, income, and expenses: Income, non-class specific expenses, and realized and unrealized gains and losses are allocated to each class daily based upon net assets. Each class bears its own specific expenses in addition to the allocated non-class specific expenses.
Distributions to shareholders: Distributions are recorded on the ex-dividend date and are determined in accordance with federal income tax regulations, which may differ from GAAP.
Commission recapture: The sub-adviser(s), to the extent consistent with the best execution and usual commission rate policies and practices, may elect to place security transactions of the Portfolio with broker/dealers with which TST has established a commission recapture program. A commission recapture program is any arrangement under which a broker/dealer applies a portion of the commissions received by such broker/dealer on the security transactions to the Portfolio. In no event will commissions, paid by the Portfolio, be used to pay expenses that would otherwise be borne by any other Portfolios within TST, or by any other party.
There were no commissions recaptured during the period ended June 30, 2024 by the Portfolio.
Indemnification: In the normal course of business, the Portfolio enters into contracts that contain a variety of representations that provide general indemnifications. The Portfolio’s maximum exposure under these arrangements is unknown, as this would involve future claims that may be made against the Portfolio and/or its affiliates that have not yet occurred. However, based on experience, the Portfolio expects the risk of loss to be remote.
|
|
|
| Transamerica Series Trust |
|
Semi-Annual Financial Statements 2024 |
Page 7
Transamerica BlackRock iShares Tactical - Balanced VP
NOTES TO FINANCIAL STATEMENTS (continued)
At June 30, 2024
(unaudited)
3. INVESTMENT VALUATION
TAM has been designated as the Portfolio’s valuation designee pursuant to Rule 2a-5 under the 1940 Act with responsibility for fair valuation subject to oversight by the Portfolio’s Board of Trustees. The net asset value of the Portfolio is computed as of the official close of the New York Stock Exchange (“NYSE”) each day the NYSE is open for business.
TAM utilizes various methods to measure the fair value of its investments on a recurring basis. GAAP establishes a hierarchy that prioritizes inputs to valuation methods. The inputs or methodology used for valuing securities are not necessarily an indication of the risk associated with investing in those securities. The three levels (“Levels”) of inputs of the fair value hierarchy are defined as follows:
Level 1—Unadjusted quoted prices in active markets for identical securities.
Level 2—Inputs, other than quoted prices included in Level 1, which are observable, either directly or indirectly. These inputs may include quoted prices for the identical instrument on an inactive market, prices for similar instruments, interest rates, prepayment speeds, credit risk, yield curves, default rates, and similar data.
Level 3—Unobservable inputs based on the best information available in the circumstances, to the extent observable inputs are not available, which may include TAM’s own assumptions used in determining the fair value of the Portfolio’s investments.
The inputs used to measure fair value may fall into different Levels of the fair value hierarchy. In such cases, for disclosure purposes, the Level in the fair value hierarchy that is assigned to the fair value measurement of a security is determined based on the lowest Level input that is significant to the fair value measurement in its entirety. Certain investments that are measured at fair value using NAV per share, or its equivalent, using the “practical expedient” have not been classified in the fair value Levels. The hierarchy classification of inputs used to value the Portfolio’s investments at June 30, 2024, is disclosed within the Investment Valuation section of the Schedule of Investments.
The availability of observable inputs can vary from security to security and is affected by a wide variety of factors, including, but not limited to, the type of security, whether the security is new and not yet established in the marketplace, the liquidity of markets, and other characteristics particular to the security. To the extent that valuation is based on models or inputs that are less observable or unobservable in the market, the determination of fair value requires more judgment. Accordingly, the degree of judgment exercised in determining fair value is generally greatest for instruments categorized in Level 3. Due to the inherent uncertainty of valuation, the determination of values may differ significantly from values that would have been realized had a ready market for investments existed, and the differences could be material.
Fair value measurements: Descriptions of the valuation techniques applied to the Portfolio’s significant categories of assets and liabilities measured at fair value on a recurring basis are as follows:
Exchange-traded funds (“ETF”): ETFs are stated at the last reported sale price or closing price on the day of valuation taken from the primary exchange where the ETF is principally traded. ETFs are generally categorized in Level 1 of the fair value hierarchy.
Securities lending collateral: Securities lending collateral is invested in a money market fund which is valued at the actively traded NAV and no valuation adjustments are applied. Securities lending collateral is categorized in Level 1 of the fair value hierarchy.
Repurchase agreements: Repurchase agreements are valued at cost, which approximates fair value. To the extent the inputs are observable and timely, the values are generally categorized in Level 2 of the fair value hierarchy.
4. BORROWINGS AND OTHER FINANCING TRANSACTIONS
The Portfolio may engage in borrowing transactions as a means of raising cash to satisfy redemption requests, for other temporary or emergency purposes or, to the extent permitted by its investment policies, to raise additional cash to be invested in other securities or instruments. When the Portfolio invests borrowing proceeds in other securities, the Portfolio will bear the risk that the market value of the securities in which such proceeds are invested goes down and is insufficient to repay the borrowed proceeds. The Portfolio may borrow on a secured or on an unsecured basis. If the Portfolio enters into a secured borrowing arrangement, a portion of the Portfolio’s assets will be used as collateral. The 1940 Act requires the Portfolio to maintain asset coverage of at least 300% of the amount of its borrowings. Asset coverage means the ratio that the value of the Portfolio’s total assets, minus liabilities other than borrowings, bears to the aggregate amount of all borrowings. Although complying with this requirement has the effect of limiting the amount that the Portfolio may borrow, it does not otherwise mitigate the risks of entering into borrowing transactions.
|
|
|
| Transamerica Series Trust |
|
Semi-Annual Financial Statements 2024 |
Page 8
Transamerica BlackRock iShares Tactical - Balanced VP
NOTES TO FINANCIAL STATEMENTS (continued)
At June 30, 2024
(unaudited)
4. BORROWINGS AND OTHER FINANCING TRANSACTIONS (continued)
Interfund lending: The Portfolio, along with other funds and portfolios advised by TAM, may participate in an interfund lending program pursuant to exemptive relief granted by the Securities and Exchange Commission on January 18, 2017. This program allows the Portfolio to lend to and borrow from other funds and portfolios advised by TAM. Interfund lending transactions are subject to the conditions of the exemptive relief which places limits on the amount of lending or borrowing a Portfolio may participate in under the program. Interest earned or paid on an interfund lending transaction will be based on the average of certain current market rates. For the period ended June 30, 2024, the Portfolio has not utilized the program.
Repurchase agreements: In a repurchase agreement, the Portfolio purchases a security and simultaneously commits to resell that security to the seller at an agreed-upon price on an agreed-upon date. Securities purchased subject to a repurchase agreement are held at the Portfolio’s custodian, or designated sub-custodian related to tri-party repurchase agreements, and, pursuant to the terms of the repurchase agreement, must be collateralized by securities with an aggregate market value greater than or equal to 100% of the resale price. The Portfolio will bear the risk of value fluctuations until the securities can be sold and may encounter delays and incur costs in liquidating the securities. In the event of bankruptcy or insolvency of the seller, delays and costs may be incurred.
Repurchase agreements are subject to netting agreements, which are agreements between the Portfolio and its counterparties that provide for the net settlement of all transactions and collateral with the Portfolio, through a single payment, in the event of default or termination. Amounts presented within the Schedule of Investments, and as part of Repurchase agreements, at value within the Statement of Assets and Liabilities are shown on a gross basis. The value of the related collateral for each repurchase agreement, as reflected within the Schedule of Investments, exceeds the value of each repurchase agreement at June 30, 2024.
Repurchase agreements at June 30, 2024, if any, are included within the Schedule of Investments and Statement of Assets and Liabilities.
Securities lending: The Portfolio may lend securities to qualified financial institutions, brokers and dealers. State Street serves as securities lending agent to the Portfolio pursuant to a Securities Lending Agreement. Loans of securities are terminable at any time and the borrower, after notice, is required to return borrowed securities within the standard time period for settlement of securities transactions. The lending of securities exposes the Portfolio to risks such as: the borrowers may fail to return the loaned securities or may not be able to provide additional collateral, the Portfolio may experience delays in recovery of the loaned securities or delays in access to collateral, or the Portfolio may experience losses related to the investment collateral. To minimize certain risks, loan counterparties pledge cash, securities issued or guaranteed by the U.S. Government and irrevocable letters of credit issued by banks as collateral. The initial collateral received by the Portfolio is required to have a value of at least 102% of the current value of the loaned securities traded on U.S. exchanges, and a value of at least 105% for all other securities. Typically the lending agent is not permitted to sell, re-pledge or use cash and non-cash collateral it receives. The lending agent has agreed to indemnify the Portfolio in the case of default of any securities borrower.
The Portfolio receives compensation for lending securities from interest or dividends earned on the cash, U.S. Government securities and irrevocable letters of credit held as collateral, less associated fees and expenses. Such income is reflected in Net income from securities lending within the Statement of Operations. Cash collateral received is invested in the State Street Navigator Securities Lending Trust — Government Money Market Portfolio.
The value of loaned securities and related cash and non-cash collateral outstanding at June 30, 2024, if any, are shown on a gross basis within the Schedule of Investments.
The following table reflects a breakdown of transactions accounted for as secured borrowings, the gross obligation by the type, and the remaining contractual maturity of those transactions as of June 30, 2024.
|
|
|
|
|
|
|
|
|
|
|
|
|
|
|
|
|
|
|
|
|
| |
|
Remaining Contractual Maturity of the Agreements |
|
| |
|
Overnight and Continuous |
|
|
Less Than 30 Days |
|
|
Between 30 & 90 Days |
|
|
Greater Than 90 Days |
|
|
Total |
|
| Securities Lending Transactions |
|
|
|
|
|
|
|
|
|
|
|
|
|
|
|
|
|
|
|
|
| Exchange-Traded Funds |
|
$ |
15,716,780 |
|
|
$ |
— |
|
|
$ |
— |
|
|
$ |
— |
|
|
$ |
15,716,780 |
|
| Total Borrowings |
|
$ |
15,716,780 |
|
|
$ |
— |
|
|
$ |
— |
|
|
$ |
— |
|
|
$ |
15,716,780 |
|
| |
|
|
|
|
|
|
|
|
|
|
|
|
|
|
|
|
|
|
|
|
|
|
|
| Transamerica Series Trust |
|
Semi-Annual Financial Statements 2024 |
Page 9
Transamerica BlackRock iShares Tactical - Balanced VP
NOTES TO FINANCIAL STATEMENTS (continued)
At June 30, 2024
(unaudited)
5. RISK EXPOSURES AND THE USE OF DERIVATIVE INSTRUMENTS
The Portfolio’s investment strategies allow the Portfolio to use various types of derivative contracts, including option contracts, swap agreements, futures contracts, and forward foreign currency contracts. Derivatives are investments whose value is primarily derived from underlying assets, indices or reference rates and may be transacted on an exchange or OTC.
Market Risk Factors: In pursuit of the Portfolio’s investment strategies, the Portfolio may seek to use derivatives to increase or decrease its exposure to certain market risks, including:
Interest rate risk: Interest rate risk relates to the fluctuations in the value of fixed income securities due to changes in the prevailing levels of market interest rates.
Foreign exchange rate risk: Foreign exchange rate risk relates to fluctuations in the value of an asset or liability due to changes in the currency exchange rates.
Equity risk: Equity risk relates to the change in value of equity securities as they relate to increases or decreases in the general market.
Credit risk: Credit risk relates to the ability of the issuer of a financial instrument to make further principal or interest payments on an obligation or commitment that it has to the Portfolio.
Commodity risk: Commodity risk relates to the change in value of commodities or commodity indices as they relate to increases or decreases in the commodities market. Commodities are physical assets that have tangible properties. Examples of these types of assets are crude oil, heating oil, metals, livestock, and agricultural products.
The Portfolio is also exposed to additional risks from investing in derivatives, such as liquidity and counterparty credit risk. Liquidity risk is the risk that the Portfolio will be unable to sell or close out the derivative in the open market in a timely manner. Counterparty credit risk is the risk that the counterparty will not be able to fulfill its obligations to the Portfolio. Investing in derivatives may also involve greater risks than investing directly in the underlying assets, such as losses in excess of any initial investment and collateral received. In addition, there may be the risk that the change in value of the derivative contract does not correspond to the change in value of the underlying instrument.
The Portfolio’s exposure to market risk factors and certain other associated risks are summarized by derivative type as follows:
Option contracts: The Portfolio is subject to equity risk, credit risk, interest rate risk, and foreign exchange rate risk in the normal course of pursuing its investment objective. The Portfolio may enter into option contracts to manage exposure to various market fluctuations. The Portfolio may purchase or write call and put options on securities and derivative instruments in which the Portfolio owns or may invest. Options are valued at the average of the bid and ask price established each day at the close of the board of trade or exchange on which they are traded. Options are marked-to-market daily to reflect the current value of the option. The primary risks associated with options are an imperfect correlation between the change in value of the securities held and the prices of the option contracts, the possibility of an illiquid market, and an inability of the counterparty to meet the contract terms. Options can be traded through an exchange or through privately negotiated arrangements with a dealer in an OTC transaction. Options traded on an exchange are generally cleared through a clearinghouse such as the Options Clearing Corp.
Options on exchange-traded funds and/or securities: The Portfolio may purchase or write options on ETFs and/or securities. Purchasing or writing options on ETFs and/or securities gives the Portfolio the right, but not the obligation to buy or sell a specified ETF and/or security as an underlying instrument for the option contract.
Options on indices: The Portfolio may purchase or write options on indices. Purchasing or writing an option on indices gives the Portfolio the right, but not the obligation to buy or sell the cash from the underlying index. The exercise of the option will result in a cash transfer and gain or loss depends on the change in the underlying index.
Options on futures: The Portfolio may purchase or write options on futures. Purchasing or writing options on futures gives the Portfolio the right, but not obligation to buy or sell a position on a futures contract at the specified option exercise price at any time during the period of the option.
Interest rate-capped options: The Portfolio may purchase or write interest rate-capped options. Purchasing or writing interest rate-capped options gives the Portfolio the right, but not the obligation to buy or sell an option which applies a cap to protect the Portfolio from floating rate risk above a certain rate on a given notional exposure. A floor can be used to give downside protection to investments in interest rate-linked products.
|
|
|
| Transamerica Series Trust |
|
Semi-Annual Financial Statements 2024 |
Page 10
Transamerica BlackRock iShares Tactical - Balanced VP
NOTES TO FINANCIAL STATEMENTS (continued)
At June 30, 2024
(unaudited)
5. RISK EXPOSURES AND THE USE OF DERIVATIVE INSTRUMENTS (continued)
Interest rate swaptions: The Portfolio may purchase or write interest rate swaption agreements which are options to enter into a pre-defined swap agreement by some specific date in the future. The writer of the swaption becomes the counterparty to the swap if the buyer exercises. The interest rate swaption agreement will specify whether the buyer of the swaption will be a fixed-rate receiver or a fixed-rate payer upon exercise.
Purchased options: Purchasing call options tends to increase exposure to the underlying instrument. Purchasing put options tends to decrease exposure to the underlying instrument. The Portfolio pays premiums, which are included within the Statement of Assets and Liabilities as an investment and subsequently marked-to-market to reflect the current value of the option. The risk associated with purchasing put and call options is limited to the premium paid. Premiums paid from options which expire are treated as realized losses. Premiums paid for purchasing options which are exercised or closed are added to the amounts paid or offset against the proceeds on the underlying instrument to determine the realized gain or loss.
Written options: Writing call options tends to decrease exposure to the underlying instrument. Writing put options tends to increase exposure to the underlying instrument. When the Portfolio writes a covered call or put option, the premium received is recorded as a liability within the Statement of Assets and Liabilities and is subsequently marked-to-market to reflect the current market value of the option written. Premiums received from written options which expire unexercised are treated as realized gains. Premiums received from writing options which are exercised or closed are added to the proceeds or offset against amounts paid on the underlying instrument to determine the realized gain or loss. In writing an option, the Portfolio bears the market risk of an unfavorable change in the price of the security or currency underlying the written option. Exercise of an option written by the Portfolio could result in the Portfolio selling or buying a security or currency at a price different from the current market value.
Swap agreements: Swap agreements are bilaterally negotiated agreements between the Portfolio and a counterparty to exchange or swap investments, cash flows, assets, foreign currencies, or market-linked returns at specified, future intervals. Swap agreements can be executed in a bilateral privately negotiated arrangement with a dealer in an OTC transaction or executed on a regular market. Certain swaps regardless of the venue of execution are required to be cleared through a clearinghouse (“centrally cleared swap agreements”). Centrally cleared swap agreements listed or traded on a multilateral platform, are valued at the daily settlement price determined by the corresponding exchange. For centrally cleared credit default swap agreements the clearing exchange requires all members to provide applicable levels across complete term levels. Centrally cleared interest rate swap agreements are valued using a pricing model that references the underlying rates including but not limited to the overnight index swap rate and London Interbank Offered Rate (“LIBOR”) forward rate to calculate the daily settlement price. The Portfolio may enter into credit default, cross-currency, interest rate, total return, including contracts for difference (“CFD”), and other forms of swap agreements to manage exposure to credit, currency, interest rate, and commodity risks. In connection with these agreements, securities or cash may be identified as collateral or margin in accordance with the terms of the respective swap agreements to provide assets of value and recourse in the event of default or bankruptcy/insolvency. Centrally cleared swap agreements are marked-to-market daily based upon values from third party vendors, which may include a registered exchange, or quotations from market makers to the extent available and the change in value, if any, is recorded as Variation margin receivable (payable) on centrally cleared swap agreements within the Statement of Assets and Liabilities.
For OTC swap agreements, payments received or made at the beginning of the measurement period are reflected in OTC swap agreements, at value within the Statement of Assets and Liabilities and represent payments made or received upon entering into the swap agreements to compensate for differences between the stated terms of the swap agreement and prevailing market conditions (credit spreads, currency exchange rates, interest rates, and other relevant factors). Additionally, these upfront payments as well as any periodic payments received or paid by the Portfolio, including any liquidation payment received or made at the termination of the swap are recorded as part of Net realized gain (loss) on swap agreements within the Statement of Operations.
Credit default swap agreements: The Portfolio is subject to credit risk in the normal course of pursuing its investment objective. The Portfolio enters into credit default swap agreements to manage its exposure to the market or certain sectors of the market to reduce its risk exposure to defaults of corporate and sovereign issuers, or to create exposure to corporate or sovereign issuers to which it is not otherwise exposed. Credit default swap agreements involve the exchange of a fixed rate premium for protection against the loss in value of an underlying security in the event of a defined credit event, such as payment default or bankruptcy (buy protection).
Under a credit default swap agreement, one party acts as a guarantor by receiving the fixed periodic payment in exchange for the commitment to purchase the underlying security at par if the defined credit event occurs (sell protection). The Portfolio’s maximum risk of loss from counterparty risk, either as the protection seller or as the protection buyer, is the notional amount of the contract. This risk is mitigated by having a master netting arrangement between the Portfolio and the counterparty, and by the posting of collateral.
|
|
|
| Transamerica Series Trust |
|
Semi-Annual Financial Statements 2024 |
Page 11
Transamerica BlackRock iShares Tactical - Balanced VP
NOTES TO FINANCIAL STATEMENTS (continued)
At June 30, 2024
(unaudited)
5. RISK EXPOSURES AND THE USE OF DERIVATIVE INSTRUMENTS (continued)
The Portfolio sells credit default swap agreements, which exposes it to risk of loss from credit risk related events specified in the contracts. Although contract-specific, credit events are generally defined as bankruptcy, failure to pay, restructuring, obligation acceleration, obligation default, or repudiation/moratorium. If a defined credit event had occurred during the period, the swap agreements’ credit-risk-related contingent features would have been triggered, and the Portfolio would have been required to pay the notional amounts for the credit default swap agreements with a sell protection less the value of the contracts’ related reference obligations.
Interest rate swap agreements: The Portfolio is subject to interest rate risk exposure in the normal course of pursuing its investment objective. Because the Portfolio holds fixed rate bonds, the value of these bonds may decrease if interest rates rise. To help hedge against this risk, the Portfolio enters into interest rate swap agreements. Under an interest rate swap agreement, two parties will exchange cash flows based on a notional principal amount. A Portfolio with interest rate agreements can elect to pay a fixed rate and receive a floating rate, or receive a fixed rate and pay a floating rate, on a notional principal amount. The risks of interest rate swap agreements include changes in market conditions which will affect the value of the contract or the cash flows, and the possible inability of the counterparty to fulfill its obligations under the agreement. The Portfolio’s maximum risk of loss from counterparty credit risk is the discounted net value of the cash flows to be received from/paid to the counterparties over the contracts’ remaining lives, to the extent that amount is positive. This risk is mitigated by having a master netting arrangement between the Portfolio and the counterparty, and by the posting of collateral.
Futures contracts: The Portfolio is subject to equity risk, credit risk, commodity risk, interest rate risk and foreign exchange rate risk in the normal course of pursuing its investment objective. The Portfolio uses futures contracts to gain exposure to, or hedge against, changes in the value of equities and commodities, interest rates, or foreign currencies. A futures contract represents a commitment for the future purchase or sale of an asset at a specified price on a specified date. Upon entering into such contracts, the Portfolio is required to deposit with the broker, either in cash or in securities, an initial margin in an amount equal to a certain percentage of the contract amount. Subsequent payments (variation margin) are paid or received by the Portfolio, depending on the daily fluctuations in the value of the contract, and are recorded for financial statement purposes as unrealized gains or losses by the Portfolio. Upon entering into such contracts, the Portfolio bears the risk of equity and commodity prices, interest rates, or exchange rates moving unexpectedly, in which case, the Portfolio may not achieve the anticipated benefits of the futures contracts and may realize losses. With futures, there is minimal counterparty credit risk to the Portfolio since futures are exchange-traded and the exchange’s clearinghouse, as counterparty to all exchange-traded futures, guarantees the futures against default. Futures contracts are generally entered into on a regulated futures exchange and cleared through a clearinghouse associated with the exchange.
Forward foreign currency contracts: The Portfolio is subject to foreign exchange rate risk exposure in the normal course of pursuing its investment objective. The Portfolio may enter into forward foreign currency contracts to hedge against exchange rate risk arising from investments in securities denominated in foreign currencies. Forward foreign currency contracts are marked-to-market daily, with the change in value recorded as an unrealized gain or loss and is shown in Unrealized appreciation (depreciation) on forward foreign currency contracts within the Statement of Assets and Liabilities. When the contracts are settled, a realized gain or loss is incurred and is shown in Net realized gain (loss) on forward foreign currency contracts within the Statement of Operations. Risks may arise from changes in market value of the underlying currencies and from the possible inability of counterparties to meet the terms of their contracts. Forward foreign currency contracts are traded in the OTC inter-bank currency dealer market.
The following is a summary of the location and the effect of derivative investments within the Statement of Operations, categorized by primary market risk exposure as of June 30, 2024.
|
|
|
|
|
|
|
|
|
|
|
|
|
|
|
|
|
|
|
|
|
|
|
|
|
| Realized Gain (Loss) on Derivative Instruments |
|
| Location |
|
Interest Rate Contracts |
|
|
Foreign Exchange Contracts |
|
|
Equity Contracts |
|
|
Credit Contracts |
|
|
Commodity Contracts |
|
|
Total |
|
| Purchased options and swaptions (A) |
|
$ |
— |
|
|
$ |
— |
|
|
$ |
(2,078,740 |
) |
|
$ |
— |
|
|
$ |
— |
|
|
$ |
(2,078,740 |
) |
| Written options and swaptions |
|
|
57,740 |
|
|
|
— |
|
|
|
— |
|
|
|
— |
|
|
|
— |
|
|
|
57,740 |
|
| Swap agreements |
|
|
2,958,191 |
|
|
|
— |
|
|
|
— |
|
|
|
47,866 |
|
|
|
— |
|
|
|
3,006,057 |
|
| Futures contracts |
|
|
1,193,134 |
|
|
|
— |
|
|
|
14,658,163 |
|
|
|
— |
|
|
|
— |
|
|
|
15,851,297 |
|
| Forward foreign currency contracts |
|
|
— |
|
|
|
185,841 |
|
|
|
— |
|
|
|
— |
|
|
|
— |
|
|
|
185,841 |
|
| Total |
|
$ |
4,209,065 |
|
|
$ |
185,841 |
|
|
$ |
12,579,423 |
|
|
$ |
47,866 |
|
|
$ |
— |
|
|
$ |
17,022,195 |
|
| |
|
|
|
|
|
|
|
|
|
|
|
|
|
|
|
|
|
|
|
|
|
|
|
|
|
|
|
| Transamerica Series Trust |
|
Semi-Annual Financial Statements 2024 |
Page 12
Transamerica BlackRock iShares Tactical - Balanced VP
NOTES TO FINANCIAL STATEMENTS (continued)
At June 30, 2024
(unaudited)
5. RISK EXPOSURES AND THE USE OF DERIVATIVE INSTRUMENTS (continued)
|
|
|
|
|
|
|
|
|
|
|
|
|
|
|
|
|
|
|
|
|
|
|
|
|
| Net Change in Unrealized Appreciation (Depreciation) on Derivative Instruments |
|
| Location |
|
Interest Rate Contracts |
|
|
Foreign Exchange Contracts |
|
|
Equity Contracts |
|
|
Credit Contracts |
|
|
Commodity Contracts |
|
|
Total |
|
| Purchased options and swaptions (B) |
|
$ |
— |
|
|
$ |
— |
|
|
$ |
231,329 |
|
|
$ |
— |
|
|
$ |
— |
|
|
$ |
231,329 |
|
| Written options and swaptions |
|
|
(800 |
) |
|
|
— |
|
|
|
— |
|
|
|
— |
|
|
|
— |
|
|
|
(800 |
) |
| Swap agreements |
|
|
(2,042,002 |
) |
|
|
— |
|
|
|
— |
|
|
|
(30,468 |
) |
|
|
— |
|
|
|
(2,072,470 |
) |
| Futures contracts |
|
|
1,082,104 |
|
|
|
— |
|
|
|
(8,146,665 |
) |
|
|
— |
|
|
|
— |
|
|
|
(7,064,561 |
) |
| Forward foreign currency contracts |
|
|
— |
|
|
|
(1,568 |
) |
|
|
— |
|
|
|
— |
|
|
|
— |
|
|
|
(1,568 |
) |
| Total |
|
$ |
(960,698 |
) |
|
$ |
(1,568 |
) |
|
$ |
(7,915,336 |
) |
|
$ |
(30,468 |
) |
|
$ |
— |
|
|
$ |
(8,908,070 |
) |
| |
|
|
|
|
|
|
|
|
|
|
|
|
|
|
|
|
|
|
|
|
|
|
|
|
| (A) |
Included within Net realized gain (loss) on Investments in the Statement of Operations. |
| (B) |
Included within Net change in unrealized appreciation (depreciation) on Investments in the Statement of Operations. |
The following is a summary of the ending monthly average volume on derivative activity during the period ended June 30, 2024.
|
|
|
|
|
| Options: |
|
|
|
|
| Average value of option contracts purchased |
|
$ |
1,303,077 |
|
| Average value of option contracts written |
|
|
(2,795 |
) |
| Average notional value of swaption contracts written |
|
|
(1,992,473 |
) |
| Credit default swaps: |
|
|
|
|
| Average notional value — sell protection |
|
|
996,571 |
|
| Interest rate swaps: |
|
|
|
|
| Average notional value — pays fixed rate |
|
|
10,973,855 |
|
| Average notional value — receives fixed rate |
|
|
7,301,519 |
|
| Futures contracts: |
|
|
|
|
| Average notional value of contracts — long |
|
|
136,375,238 |
|
| Average notional value of contracts — short |
|
|
(29,717,110 |
) |
| Forward foreign currency exchange contracts: |
|
|
|
|
| Average contract amounts purchased — in USD |
|
|
4,542,750 |
|
| Average contract amounts sold — in USD |
|
|
8,340,124 |
|
The Portfolio typically enters into International Swaps and Derivatives Association, Inc. Master Agreements (“ISDA Master Agreements”) or similar master agreements (collectively, “Master Agreements”) with its contract counterparties for certain OTC derivatives in order to, among other things, reduce credit risk to counterparties.
ISDA Master Agreements include provisions for general obligations, representations, collateral and events of default or termination. Under an ISDA Master Agreement, the Portfolio typically may offset with the counterparty certain OTC derivative financial instruments payables and/or receivables with collateral held and/or posted and create one single net payment (close-out netting) in the event of default, termination and/or potential deterioration in the credit quality of the counterparty.
Various Master Agreements govern the terms of certain transactions with counterparties and typically attempt to reduce the counterparty risk associated with such transactions by specifying credit protection mechanisms and providing standardization that improves legal certainty. Cross-termination provisions under Master Agreements typically provide that a default in connection with one transaction between the Portfolio and a counterparty gives the non-defaulting party the right to terminate any other transactions in place with the defaulting party to create one single net payment due to/due from the defaulting party and may be a feature in certain Master Agreements. In the event the Portfolio exercises its right to terminate a Master Agreement after a counterparty experiences a termination event as defined in the Master Agreement, the return of collateral with market value in excess of the Portfolio’s net liability may be delayed or denied.
Collateral requirements: Collateral or margin requirements are set by the broker or exchange clearing house for exchange-traded derivatives (futures contracts, exchange-traded options, and exchange-traded swap agreements) while collateral terms are contract specific for OTC derivatives (forward foreign currency exchange contracts, OTC options, and OTC swap agreements). For OTC
|
|
|
| Transamerica Series Trust |
|
Semi-Annual Financial Statements 2024 |
Page 13
Transamerica BlackRock iShares Tactical - Balanced VP
NOTES TO FINANCIAL STATEMENTS (continued)
At June 30, 2024
(unaudited)
5. RISK EXPOSURES AND THE USE OF DERIVATIVE INSTRUMENTS (continued)
derivatives, under standard derivatives agreements, the Portfolio may be required to pledge collateral on derivatives to a counterparty if the Portfolio is in a net liability position, and receive collateral if in a net positive position. For financial reporting purposes, cash collateral that has been pledged by the Portfolio to cover obligations, if any, is reported in Cash collateral at broker within the Statement of Assets and Liabilities. Cash collateral that has been received by the Portfolio from a counterparty, if any, is reported separately in Cash collateral pledged at custodian and/or broker within the Statement of Assets and Liabilities. Non-cash collateral pledged to the Portfolio, if any, is disclosed within the Schedule of Investments.
Generally, the amount of collateral due from or to a party must exceed a minimum transfer amount threshold before a transfer has been made. Typically a counterparty is not permitted to sell, re-pledge or use cash and non-cash collateral it receives. The Portfolio generally does not use non-cash collateral that it receives but may, absent default or certain other circumstances, be permitted to use cash collateral received. In such cases, interest may be paid pursuant to the collateral arrangement with the counterparty.
To the extent amounts due to the Portfolio from its counterparties are not fully collateralized, contractually or otherwise, the Portfolio bears the risk of loss from counterparty non-performance. Additionally, to the extent the Portfolio has delivered collateral to a counterparty, the Portfolio bears the risk of loss from a counterparty in the event the counterparty fails to return such collateral. Counterparties may immediately terminate derivatives contracts if the Portfolio fails to maintain sufficient asset coverage for its contracts or its net assets decline by stated percentages. Collateral may not be required for all derivative contracts.
6. RISK FACTORS
Investing in the Portfolio involves certain key risks related to the Portfolio’s trading activity. Please reference the Portfolio’s prospectus for a more complete discussion of the following risk(s), as well as other risks of investing in the Portfolio.
Market risk: The market prices of the Portfolio’s securities or other assets may go up or down, sometimes rapidly or unpredictably, due to factors such as economic events, inflation, changes in interest rates, governmental actions or interventions, actions taken by the U.S. Federal Reserve or foreign central banks, market disruptions caused by tariffs, trade disputes or other factors, political developments, armed conflicts, economic sanctions, cybersecurity events, investor sentiment, the global and domestic effects of widespread or local health, weather or climate events, and other factors that may or may not be related to the issuer of the security or other asset. If the market prices of the Portfolio’s securities and assets fall, the value of your investment in the Portfolio could go down.
Economies and financial markets throughout the world are increasingly interconnected. Events or circumstances in one or more countries or regions could be highly disruptive to, and have profound impacts on, global economies or markets. As a result, whether or not the Portfolio invests in securities of issuers located in or with significant exposure to the countries directly affected, the value and liquidity of the Portfolio’s investments may go down.
Equity securities risk: Equity securities generally have greater risk of loss than debt securities. Stock markets are volatile and the value of equity securities may go up or down, sometimes rapidly and unpredictably. The market price of an equity security may fluctuate based on overall market conditions, such as real or perceived adverse economic or political conditions or trends, tariffs and trade disruptions, inflation, substantial economic downturn or recession, changes in interest rates, or adverse investor sentiment. The market price of an equity security also may fluctuate based on real or perceived factors affecting a particular industry or industries or the company itself. If the market prices of the equity securities owned by the Portfolio fall, the value of your investment in the Portfolio will decline. The Portfolio may lose its entire investment in the equity securities of an issuer. A change in financial condition or other event affecting a single issuer may adversely impact securities markets as a whole.
Fixed-income securities risk: Risks of fixed-income securities include credit risk, interest rate risk, counterparty risk, prepayment risk, extension risk, valuation risk, and liquidity risk. The value of fixed-income securities may go up or down, sometimes rapidly and unpredictably, due to general market conditions, such as real or perceived adverse economic or political conditions, tariffs and trade disruptions, inflation, changes in interest rates, lack of liquidity in the bond markets or adverse investor sentiment. In addition, the value of a fixed-income security may decline if the issuer or other obligor of the security fails to pay principal and/or interest, otherwise defaults or has its credit rating downgraded or is perceived to be less creditworthy, or the credit quality or value of any underlying assets declines. If the value of fixed-income securities owned by the Portfolio falls, the value of your investment will go down. The Portfolio may lose its entire investment in the fixed-income securities of an issuer.
|
|
|
| Transamerica Series Trust |
|
Semi-Annual Financial Statements 2024 |
Page 14
Transamerica BlackRock iShares Tactical - Balanced VP
NOTES TO FINANCIAL STATEMENTS (continued)
At June 30, 2024
(unaudited)
7. FEES AND OTHER AFFILIATED TRANSACTIONS
TST serves as a funding vehicle for certain affiliated asset allocation portfolios and certain affiliated separate accounts of Transamerica Life Insurance Company (“TLIC”) and Transamerica Financial Life Insurance Company.
TAM, the Portfolio’s investment manager, is directly owned by TLIC and AUSA Holding, LLC (“AUSA”), both of which are indirect, wholly owned subsidiaries of Aegon Ltd. TLIC is owned by Commonwealth General Corporation (“Commonwealth”). Commonwealth and AUSA are wholly owned by Transamerica Corporation (DE). Transamerica Corporation (DE) is wholly owned by Aegon International B.V., which is wholly owned by Aegon Ltd., a Bermuda exempted company with liability limited by shares (formerly, Aegon NV, a Netherlands corporation) and a publicly traded international insurance group.
Transamerica Fund Services, Inc. (“TFS”) is the Portfolio’s transfer agent. Transamerica Capital, Inc. (“TCI”) is the Portfolio’s distributor/principal underwriter. TAM, TFS and TCI are affiliates of Aegon Ltd.
Certain officers and trustees of the Portfolio may also be officers and/or trustees of TAM, TFS and TCI. No interested trustee who is deemed an interested person due to current or former service with TAM or an affiliate of TAM receives compensation from the Portfolio. The Portfolio does pay non-interested persons (independent trustees), as disclosed in Trustee and CCO fees within the Statement of Operations.
Investment management fees: TAM serves as the Portfolio’s investment manager, performing administration as well as investment advisory services. TAM renders investment advisory, supervisory, and administration services under an investment management agreement and the Portfolio pays a single management fee, which is reflected in Investment management fees within the Statement of Operations.
The Portfolio pays a management fee to TAM based on daily average net assets at the following rates:
|
|
|
|
|
| Breakpoints |
|
Rate |
|
| Effective May 1, 2024 |
|
|
|
|
| First $500 million |
|
|
0.5000 |
% |
| Over $500 million up to $1 billion |
|
|
0.4900 |
|
| Over $1 billion up to $2.5 billion |
|
|
0.4725 |
|
| Over $2.5 billion up to $3.5 billion |
|
|
0.4650 |
|
| Over $3.5 billion up to $4.5 billion |
|
|
0.4525 |
|
| Over $4.5 billion |
|
|
0.4400 |
|
| Prior to May 1, 2024 |
|
|
|
|
| First $250 million |
|
|
0.8100 |
|
| Over $250 million up to $750 million |
|
|
0.8000 |
|
| Over $750 million up to $1.5 billion |
|
|
0.7900 |
|
| Over $1.5 billion |
|
|
0.7600 |
|
TAM has contractually agreed, through May 1, 2025, to waive from its management fees an amount equal to the sub-advisory fee waiver by the Portfolio’s sub-adviser. These amounts are not subject to recapture by TAM.
TAM has contractually agreed to waive fees and/or reimburse Portfolio expenses to the extent that the total operating expenses excluding, as applicable, acquired fund fees and expenses, interest (including borrowing costs and overdraft charges), taxes, brokerage commissions, dividend and interest expenses on securities sold short, extraordinary expenses and other expenses not incurred in the ordinary course of the Portfolio’s business, exceed the following stated annual operating expense limits to the Portfolio’s daily average net
|
|
|
| Transamerica Series Trust |
|
Semi-Annual Financial Statements 2024 |
Page 15
Transamerica BlackRock iShares Tactical - Balanced VP
NOTES TO FINANCIAL STATEMENTS (continued)
At June 30, 2024
(unaudited)
7. FEES AND OTHER AFFILIATED TRANSACTIONS (continued)
assets. To the extent an expense limit changed during the period, the prior limit is also listed below. The expenses waived and/or reimbursed, if any, are included in Expenses waived and/or reimbursed within the Statement of Operations.
|
|
|
|
|
|
|
|
|
|
|
| Class |
|
Operating Expense Limit |
|
Operating Expense Limit Effective Through |
| Effective May 1, 2024 |
|
|
|
|
|
|
|
|
|
|
| Initial Class |
|
|
|
0.63 |
% |
|
|
|
May 1, 2025 |
|
| Service Class |
|
|
|
0.88 |
|
|
|
|
May 1, 2025 |
|
| Prior to May 1, 2024 |
|
|
|
|
|
|
|
|
|
|
| Initial Class |
|
|
|
0.91 |
|
|
|
|
|
|
| Service Class |
|
|
|
1.16 |
|
|
|
|
|
|
TAM is permitted to recapture amounts contractually waived and/or reimbursed to a class during any of the 36 months from the date on which TAM waived fees and/or reimbursed expenses for the class. A class may recapture and reimburse TAM only if such amount does not cause, on any particular business day of the Portfolio, the class’s total annual operating expenses (after the recapture is taken into account) to exceed the Operating Expense Limits or any other lower limit then in effect. Amounts recaptured, if any, by TAM for the period ended June 30, 2024 are disclosed in Recapture of previously waived and/or reimbursed fees within the Statement of Operations.
TAM, on a voluntary basis and in addition to the contractual operating expense limits in effect, from time to time may waive and/or reimburse expenses of the Portfolio, or any classes thereof, to such level(s) as the Trust’s officers have determined or may reasonably determine from time to time. Any such voluntary waiver or expense reimbursement may be discontinued by TAM at any time. These amounts are not subject to recapture by TAM.
As of June 30, 2024, there are no amounts available for recapture by TAM.
Distribution and service fees: TST has a distribution plan (“Distribution Plan”) pursuant to Rule 12b-1 under the 1940 Act. Pursuant to the Distribution Plan, TST entered into a distribution agreement with TCI as the Portfolio’s distributor.
The Distribution Plan requires the Portfolio to pay distribution fees to TCI as compensation for various distribution activities, not as reimbursement for specific expenses. Under the Distribution Plan and distribution agreement, TCI, on behalf of the Portfolio, is authorized to pay various service providers, as direct payment for expenses incurred in connection with distribution of the Portfolio’s shares.
The fee on the Service Class shares is paid to the insurance companies for providing services and account maintenance for the policyholders who invest in the variable insurance products which invest in the Service Class shares. TCI has determined that it will not seek payment for the distribution expenses incurred by the Portfolio with respect to the Initial Class shares before May 1, 2025. Prior to TCI seeking distribution expenses on Initial Class shares, policy and contract owners will be notified in advance. The Portfolio will pay fees relating to Service Class shares. The distribution and service fees are included in Distribution and service fees within the Statement of Operations.
The Portfolio is authorized under the Distribution Plan to pay fees to TCI based on daily average net assets of each applicable class up to the following annual rates:
|
|
|
|
|
| Class |
|
Rate |
|
| Initial Class |
|
|
0.15 |
% |
| Service Class |
|
|
0.25 |
|
Transfer agent costs: TFS provides transfer agency services under an intercompany agreement with TAM. TFS has outsourced the provision of certain sub-transfer agency services to SS&C Global Investor & Distribution Solutions, Inc. (“SS&C GIDS”). The Portfolio does not pay a separate transfer agent fee to TAM or TFS but does pay certain expenses to SS&C GIDS related to applicable sub-transfer agency services. For the period ended June 30, 2024, (i) the expenses paid to SS&C GIDS by the Portfolio are referred to as transfer agent costs and are included within the Statement of Operations and (ii) the expenses payable to SS&C GIDS by the Portfolio are referred to as transfer agent costs within the Statement of Assets and Liabilities.
|
|
|
| Transamerica Series Trust |
|
Semi-Annual Financial Statements 2024 |
Page 16
Transamerica BlackRock iShares Tactical - Balanced VP
NOTES TO FINANCIAL STATEMENTS (continued)
At June 30, 2024
(unaudited)
7. FEES AND OTHER AFFILIATED TRANSACTIONS (continued)
Brokerage commissions: The Portfolio incurred no brokerage commissions on security transactions placed with affiliates of the investment manager or sub-adviser(s) for the period ended June 30, 2024.
8. PURCHASES AND SALES OF SECURITIES
For the period ended June 30, 2024, the cost of securities purchased and proceeds from securities sold (excluding short-term securities) are as follows:
|
|
|
|
|
|
|
| Purchases of Securities |
|
Sales/Maturities of Securities |
| Long-Term |
|
U.S. Government |
|
Long-Term |
|
U.S. Government |
| $ 361,937,349 |
|
$ 116,763,951 |
|
$ 132,068,569 |
|
$ 205,963,117 |
9. FEDERAL INCOME TAXES AND DISTRIBUTIONS TO SHAREHOLDERS
The Portfolio has not made any provision for federal income or excise taxes due to its policy to distribute all of its taxable income and capital gains to its shareholders and otherwise qualify as a regulated investment company under Subchapter M of the Internal Revenue Code. The Portfolio recognizes the tax benefits of uncertain tax positions only where the position is “more likely than not” to be sustained assuming examination by tax authorities. The Portfolio’s tax returns remain subject to examination by the Internal Revenue Service and state tax authorities three years from the date of filing for federal purposes and four years from the date of filing for state purposes. Management has evaluated the Portfolio’s tax provisions taken for all open tax years, and has concluded that no provision for income tax is required in the Portfolio’s financial statements. If applicable, the Portfolio recognizes interest accrued related to unrecognized tax benefits in relation to interest and penalties expense in Other within the Statement of Operations. The Portfolio identifies its major tax jurisdictions as U.S. Federal, the state of Colorado, and foreign jurisdictions where the Portfolio makes significant investments; however, the Portfolio is not aware of any tax positions for which it is reasonably possible that the total amounts of unrecognized tax benefits will change materially in the next twelve months. Distributions are determined in accordance with income tax regulations, which may differ from GAAP.
As of June 30, 2024, the approximate cost for U.S. federal income tax purposes, and the aggregate gross/net unrealized appreciation (depreciation) in the value of investments (including securities sold short and derivatives, if any) are as follows:
|
|
|
|
|
|
|
| Cost |
|
Gross Appreciation |
|
Gross (Depreciation) |
|
Net Appreciation
(Depreciation) |
| $ 352,918,260 |
|
$ 12,911,649 |
|
$ — |
|
$ 12,911,649 |
Please see TST’s most recent report on Form N-CSR, available at: www.transamerica.com/annuities/prospectus, for additional information. For the most recently filed complete proxy voting records for the Trust please visit: https://www.transamerica.com/sites/default/files/files/e070d/TST%20N-PX%202021.pdf
|
|
|
| Transamerica Series Trust |
|
Semi-Annual Financial Statements 2024 |
Page 17
Transamerica BlackRock iShares Tactical - Balanced VP
MANAGEMENT AGREEMENT — CONTRACT RENEWAL
(unaudited)
At a meeting of the Board of Trustees of Transamerica Series Trust (the “Trustees” or the “Board”) held on June 12-13, 2024, the Board considered the renewal of the management agreement (the “Management Agreement”) between Transamerica Asset Management, Inc. (“TAM”) and Transamerica Series Trust, on behalf of Transamerica BlackRock iShares Tactical – Balanced VP (formerly, Transamerica PIMCO Tactical – Balanced VP) (the “Portfolio”).
Following its review and consideration, the Board determined that the terms of the Management Agreement were reasonable and that the renewal of the Management Agreement was in the best interests of the Portfolio and the holders invested in the Portfolio. The Board, including the independent members of the Board (the “Independent Trustees”), unanimously approved the renewal of the Management Agreement through June 30, 2025.
Prior to reaching their decision, the Trustees requested and received from TAM certain information. They then reviewed such information as they deemed reasonably necessary to evaluate the Management Agreement, including information they had previously received from TAM as part of their regular oversight of the Portfolio, and knowledge they gained over time through meeting with TAM. Among other materials, the Trustees considered comparative fee, expense and performance information prepared by Broadridge Financial Solutions, Inc. (“Broadridge”), an independent provider of mutual fund performance information, as well as fee, expense and profitability information prepared by TAM. In addition, TAM provided the Board with additional supplemental comparative performance information. The Board also considered reductions to the Portfolio’s expense limits, if any, that took effect after the last renewal of the Management Agreement. In their review, the Trustees also sought to identify instances in which the Portfolio’s performance, fees, total expenses and/or profitability appeared to be outliers within its respective peer group or other comparative metrics and sought to understand the reasons for such comparative positions.
In their deliberations, the Independent Trustees met privately without representatives of TAM present and were represented throughout the process by their independent legal counsel. In considering the proposed continuation of the Management Agreement, the Trustees evaluated and weighed a number of considerations that they believed to be relevant in light of the legal advice furnished to them by counsel, including independent legal counsel, and made a decision in the exercise of their own business judgment. They based their decisions on the considerations discussed below, among others, although they did not identify any particular consideration or item of information that was controlling of their decisions, and each Trustee may have attributed different weights to the various factors.
Nature, Extent and Quality of the Services Provided
The Board considered the nature, extent and quality of the services provided by TAM to the Portfolio in the past and the services anticipated to be provided in the future. The Board also considered the investment approach for the Portfolio; the experience, capability and integrity of TAM’s senior management; the financial resources of TAM; TAM’s management oversight process; and TAM’s responsiveness to any questions by the Trustees.
The Board also considered the continuous and regular investment management and other services provided by TAM, when acting as a manager of managers, for the portion of the management fee it retains from the Portfolio after payment of the sub-advisory fees. The Board noted that the investment management and other services provided by TAM include the design, development and ongoing review and evaluation of the Portfolio and its investment strategy; the selection, oversight and monitoring of one or more investment sub-advisers to perform certain duties with respect to the Portfolio; ongoing portfolio trading oversight and analysis; risk management oversight and analysis; design, development, implementation and ongoing review and evaluation of a process for the valuation of Portfolio investments; design, development, implementation and ongoing review and evaluation of a compliance program for the Portfolio; design, development, implementation and ongoing review and evaluation of a process for the voting of proxies and exercise of rights to consent to corporate action for Portfolio investments; participation in Board meetings and oversight of preparation of materials for the Board, including materials for Board meetings and regular communications with the Board; oversight of preparation of the Portfolio’s prospectus, statement of additional information, shareholder reports and other disclosure materials and regulatory filings for the Portfolio; and ongoing cash management services for the Portfolio. The Board considered that TAM’s investment management services also include the provision of supervisory and administrative services to the Portfolio. The Board also noted that TAM, as part of the services it provides to all Transamerica mutual funds, including the Portfolio, oversees the services provided by the funds’ custodian, transfer agent, independent accountant and legal counsel and supervises the performance of the recordkeeping and holder service functions of the funds.
Investment Performance
In addition, the Board considered the short- and longer-term performance of the Portfolio in light of its investment objective, policies and strategies, including relative performance against (i) a peer universe of comparable mutual funds, as prepared by Broadridge, and (ii) the Portfolio’s benchmarks, in each case for various trailing periods ended December 31, 2023. Based on these considerations, the Board determined that TAM can provide investment and related services that are appropriate in scope and extent in light of the Portfolio’s investment objectives, policies and strategies and operations, the competitive landscape of the investment company business and investor needs. The Board’s conclusions as to the Portfolio’s performance are summarized below. For purposes of its review, the Board generally used the performance of Service Class Shares. In describing the Portfolio’s performance relative to its peer universe, the summary conclusions characterize performance for the relevant periods in relation to whether it was “above,” “below” or “in line with” the peer universe median and do so using quintile rankings prepared by Broadridge. For simplicity, performance is described as “above” the median if the Portfolio’s performance ranked anywhere in the first or second quintiles, as “below” the median if it ranked anywhere in the
|
|
|
| Transamerica Series Trust |
|
Semi-Annual Financial Statements 2024 |
Page 18
Transamerica BlackRock iShares Tactical - Balanced VP
MANAGEMENT AGREEMENT — CONTRACT RENEWAL (continued)
(unaudited)
fourth or fifth quintiles, or “in line with” the median if it ranked anywhere in the third quintile (i.e., even if its precise return was somewhat above or somewhat below the precise median return).
When considering the Portfolio’s performance, the Trustees considered any representations made by TAM regarding the appropriateness of certain peer groups and benchmarks. They recognized that performance reflects a snapshot of a period as of a specific date, and that consideration of performance data for a different period could generate significantly different performance results. The Trustees also recognized that even longer-term performance can be negatively affected by performance over a short-term period when that short-term performance is significantly below the performance of the comparable benchmark or universe of peer funds.
The Board noted that the performance of Service Class Shares of the Portfolio was below the median for its peer universe and below the benchmark that TAM utilized to measure performance of the Portfolio as of December 31, 2023,1 each for the past 1-, 3-, 5- and 10-year periods. The Trustees discussed the reasons for the underperformance with TAM and TAM agreed to continue to closely monitor and report to the Board on the performance of the Portfolio. The Board noted that the Portfolio’s sub-adviser had commenced sub-advising the Portfolio on May 1, 2024 pursuant to its current investment strategies and benchmarks.
Management Fee and Total Expense Ratio
The Board considered the management fee and total expense ratio of the Portfolio, including information provided by Broadridge comparing the management fee and total expense ratio of the Portfolio to the management fees and total expense ratios of comparable investment companies in both a peer group and broader peer universe compiled by Broadridge. The Board’s conclusions as to the Portfolio’s management fee and total expense ratio are summarized below. For purposes of its review, the Board generally used the actual total expenses (i.e., expenses reflecting any waivers and/or reimbursements) of Service Class Shares. In describing the Portfolio’s management fee and total expense ratio relative to its peer group and peer universe, the summary conclusions characterize management fees and total expense ratios for the relevant periods in relation to whether they were “above,” “below” or “in line with” the peer group or peer universe median and do so using quintile rankings prepared by Broadridge. For simplicity, management fees and total expense ratios are described as “above” the median if the Portfolio’s management fee or total expense ratio ranked anywhere in the fourth or fifth quintiles, as “below” the median if it ranked anywhere in the first or second quintiles, or “in line with” the median if it ranked anywhere in the third quintile (i.e., even if its precise management fee or total expense ratio was somewhat above or somewhat below the precise median management fee or total expense ratio). The Board also considered the fees charged by the Portfolio’s sub-adviser for sub-advisory services, as well as the portion of the Portfolio’s management fee retained by TAM following payment of the sub-advisory fee and how the portion of the contractual management fee retained by TAM at a specified asset level compared to the portions retained by other investment advisers managing mutual funds with similar investment strategies as calculated by an independent provider of information.
The Board noted that the Portfolio’s contractual management fee was below the medians for its peer group and peer universe and that the actual total expenses (i.e., expenses reflecting any waivers and/or reimbursements) of Service Class Shares of the Portfolio were in line with the medians for its peer group and peer universe. The Trustees also considered that TAM has entered into an expense limitation arrangement with the Portfolio, which may result in TAM waiving fees for the benefit of holders.
On the basis of these considerations, together with the other information it considered, the Board determined that the management fee to be received by TAM under the Management Agreement is reasonable in light of the services provided.
Cost of Services Provided and Level of Profitability
The Board reviewed information provided by TAM about the cost of providing and procuring fund management services, as well as the costs of the provision of administration, transfer agency and other services, to the Portfolio and to Transamerica Series Trust as a whole by TAM and its affiliates. The Board considered the profitability of TAM and its affiliates in providing these services for the Portfolio and Transamerica Series Trust as a whole. The Trustees recognized the competitiveness of the mutual fund industry and the importance of an investment adviser’s long-term profitability, including for maintaining company and management stability and accountability.
The Board also considered the allocation methodology used for calculating the profitability of TAM and its affiliates. The Board noted that the revenue and expense allocation methodology used by TAM to estimate its profitability with respect to its relationship with the Portfolio had been reviewed previously by an independent consultant. The Trustees considered that TAM reported that it had not made material changes to this methodology, and that the methodology had been applied consistently for the Portfolio.
Based on this information, the Board determined that the profitability of TAM and its affiliates from their relationships with the Portfolio was not excessive.
1 Effective May 1, 2024, the blended benchmark utilized by TAM to measure the Portfolio’s performance changed in conjunction with a change to the Portfolio’s sub-adviser.
|
|
|
| Transamerica Series Trust |
|
Semi-Annual Financial Statements 2024 |
Page 19
Transamerica BlackRock iShares Tactical - Balanced VP
MANAGEMENT AGREEMENT — CONTRACT RENEWAL (continued)
(unaudited)
Economies of Scale
The Board considered economies of scale with respect to the management of the Portfolio, whether the Portfolio had appropriately benefited from any economies of scale and whether there was the potential for realization of any future economies of scale. The Board also considered the existence of economies of scale with respect to management of the Transamerica mutual funds overall and the extent to which the Portfolio benefited from any economies of scale. The Board recognized that, as the Portfolio’s assets increase, any economies of scale realized by TAM may not directly correlate with any economies of scale that might be realized by the Portfolio. The Board considered the Portfolio’s management fee schedule and the existence of breakpoints and also considered the extent to which TAM shared economies of scale, if any, with the Portfolio through undertakings to limit or reimburse Portfolio expenses and to invest in maintaining and developing its capabilities and services. The Trustees concluded that the Portfolio’s fee structure reflected an appropriate sharing of any efficiencies or economies of scale to date and noted that they will have the opportunity to periodically reexamine the appropriateness of the management fee payable to TAM in light of any economies of scale experienced in the future.
Benefits to TAM and/or its Affiliates from their Relationships with the Portfolio
The Board considered other benefits derived by TAM and/or its affiliates from their relationships with the Portfolio. The Board noted that TAM does not receive benefits from research obtained with commissions paid to broker-dealers for portfolio transactions (commonly referred to as “soft dollars”) as a result of its relationship with the Portfolio.
Other Considerations
The Board noted that TAM has made a substantial commitment to the recruitment and retention of high-quality personnel and maintains the financial, compliance and operational resources reasonably necessary to manage the Portfolio in a professional manner that is consistent with the best interests of the Portfolio and the holders. In this regard, the Board favorably considered the procedures and policies TAM has in place to enforce compliance with applicable laws and regulations and oversee the portfolio management activities of the Portfolio’s sub-adviser. The Board also noted that TAM has made an entrepreneurial commitment and undertaken certain business risks with respect to the management and success of the Portfolio.
Conclusion
After consideration of the factors described above, as well as other factors, the Trustees, including the Independent Trustees, concluded that the renewal of the Management Agreement was in the best interests of the Portfolio and the holders and voted to approve the renewal of the Management Agreement.
|
|
|
| Transamerica Series Trust |
|
Semi-Annual Financial Statements 2024 |
Page 20
PROXY VOTING POLICIES AND PROCEDURES AND QUARTERLY PORTFOLIO HOLDINGS
(unaudited)
A description of Transamerica Series Trust’s (the “Trust”) proxy voting policies and procedures is available in the Statement of Additional Information of the Portfolios, available without charge upon request by calling 1-800-851-9777 (toll free) or on the Securities and Exchange Commission’s (“SEC”) website at http://www.sec.gov.
In addition, the Portfolio is required to file Form N-PX, with their complete proxy voting records for the most recent 12 months ended June 30th, no later than August 31st of each year. The Form is available without charge: (1) on the Transamerica Funds website at https://www.transamerica.com/sites/default/files/files/e070d/TST%20N-PX%202021.pdf; and (2) on the SEC’s website at http://www.sec.gov.
Each fiscal quarter, the Portfolios, except Transamerica BlackRock Government Money Market VP, will file with the SEC a complete schedule of its monthly portfolio holdings on Form N-PORT. The Portfolios’ holdings as of the end of the third month of every fiscal quarter, as reported on Form N-PORT, will be publicly available on the SEC’s website at http://www.sec.gov within 60 days of the end of the fiscal quarter.
On a monthly basis, Transamerica BlackRock Government Money Market VP will file with the SEC portfolio holdings information on Form N-MFP3. A complete schedule of portfolio holdings is also available at www.transamerica.com.
You may also visit the Trust’s website at www.transamerica.com/annuities/prospectus for this and other information about the Portfolios and the Trust.
Important Notice Regarding Delivery of Shareholder Documents
Every year we provide shareholders informative materials such as the Transamerica Series Trust Annual Report, the Transamerica Series Trust Prospectus, and other required documents that keep you informed regarding your Portfolios. To the extent provided by mail, Transamerica Series Trust will only send one piece per mailing address, a method that saves your Portfolios money by reducing mailing and printing costs. We will continue to do this unless you tell us not to. To elect to receive individual mailings, simply call a Transamerica Customer Service Representative toll free at 1-800-851-9777, 8 a.m. to 7 p.m. Eastern Time, Monday-Friday. Your request will take effect within 30 days.
|
|
|
| Transamerica Series Trust |
|
Semi-Annual Financial Statements 2024 |
Page 21
NOTICE OF PRIVACY POLICY
(unaudited)
Your privacy is very important to us. We want you to understand what information we collect and how we use it. We collect and use “nonpublic personal information” in connection with providing our customers with a broad range of financial products and services as effectively and conveniently as possible. We treat nonpublic personal information in accordance with our Privacy Policy.
What Information We Collect and From Whom We Collect It
We may collect nonpublic personal information about you from the following sources:
| • |
|
Information we receive from you on applications or other forms, such as your name, address, and account number; |
| • |
|
Information about your transactions with us, our affiliates, or others, such as your account balance and purchase/redemption history; and |
| • |
|
Information we receive from non-affiliated third parties, including consumer reporting agencies. |
What Information We Disclose and To Whom We Disclose It
We do not disclose any nonpublic personal information about current or former customers to anyone without their express consent, except as permitted by law. We may disclose the nonpublic personal information we collect, as described above, to persons or companies that perform services on our behalf and to other financial institutions with which we have joint marketing agreements. We will require these companies to protect the confidentiality of your nonpublic personal information and to use it only to perform the services for which we have hired them.
Our Security Procedures
We restrict access to your nonpublic personal information and only allow disclosures to persons and companies as permitted by law to assist in providing products or services to you. We maintain physical, electronic, and procedural safeguards to protect your nonpublic personal information and to safeguard the disposal of certain consumer information.
Contact Us
If you have any questions about our Privacy Policy, please call 1-800-851-9777 on any business day between 8 a.m. and 7 p.m. Eastern Time.
Note: This Privacy Policy applies only to customers that have a direct relationship with us or our affiliates. If you own shares of our portfolios in the name of a third party such as a bank or broker-dealer, its privacy policy may apply to you instead of ours.
|
|
|
| Transamerica Series Trust |
|
Semi-Annual Financial Statements 2024 |
Page 22
PO Box 219945
Kansas City, MO 64121-9945
|
|
|
| Distributor: |
|
Transamerica Capital, Inc. |
|
|
PO Box 219945 |
|
|
Kansas City, MO 64121-9945 |
|
|
|
|
Customer Service: 1-800-851-9777 |
Transamerica Series Trust Semi-Annual Financial Statements
June 30, 2024
1801 California St., Suite 5200
Denver, CO 80202
Distributor: Transamerica Capital, Inc.
Customer Service: 1-800-851-9777
|
| The following pages contain the most recent semi-annual financial statements for the investment options in which you are invested. In compliance with Securities and Exchange Commission regulations, we present these reports on an annual and semi-annual basis with the hope that they will foster greater understanding of the investment options’ holdings, performance, financial data, accounting policies and other issues. This streamlined version provides information only on the investment options in which you are invested. |
|
| If you have any questions about these reports, please do not hesitate to contact your financial professional. As always, we thank you for your trust and the opportunity to serve you. |
Transamerica BlackRock iShares Tactical - Conservative VP
SCHEDULE OF INVESTMENTS
At June 30, 2024
(unaudited)
|
|
|
|
|
|
|
|
|
| |
|
Shares |
|
|
Value |
|
| EXCHANGE-TRADED FUNDS - 98.9% |
|
| International Equity Funds - 10.8% |
|
| iShares Core MSCI EAFE ETF |
|
|
74,223 |
|
|
$ |
5,391,559 |
|
| iShares Core MSCI Emerging Markets ETF |
|
|
47,466 |
|
|
|
2,540,855 |
|
| iShares MSCI Canada ETF |
|
|
35,200 |
|
|
|
1,305,568 |
|
| iShares MSCI EAFE ETF (A) |
|
|
93,282 |
|
|
|
7,306,779 |
|
| iShares MSCI Emerging Markets ETF |
|
|
58,139 |
|
|
|
2,476,140 |
|
|
|
|
|
|
|
|
|
|
|
|
|
|
|
|
|
19,020,901 |
|
|
|
|
|
|
|
|
|
|
| U.S. Equity Funds - 27.8% |
|
| iShares Core S&P 500 ETF |
|
|
54,914 |
|
|
|
30,050,588 |
|
| iShares Core S&P Total U.S. Stock Market ETF |
|
|
157,326 |
|
|
|
18,687,183 |
|
|
|
|
|
|
|
|
|
|
|
|
|
|
|
|
|
48,737,771 |
|
|
|
|
|
|
|
|
|
|
| U.S. Fixed Income Funds - 60.3% |
|
| iShares Broad USD High Yield Corporate Bond ETF |
|
|
144,860 |
|
|
|
5,255,521 |
|
| iShares Broad USD Investment Grade Corporate Bond ETF (A) |
|
|
418,378 |
|
|
|
21,006,759 |
|
| iShares Core U.S. Aggregate Bond ETF |
|
|
565,995 |
|
|
|
54,941,135 |
|
| iShares Short Treasury Bond ETF (A) |
|
|
223,085 |
|
|
|
24,650,892 |
|
|
|
|
|
|
|
|
|
|
|
|
|
|
|
|
|
105,854,307 |
|
|
|
|
|
|
|
|
|
|
| Total Exchange-Traded Funds
(Cost $168,175,379) |
|
|
|
|
|
|
173,612,979 |
|
|
|
|
|
|
|
|
|
|
|
|
|
|
|
|
|
|
|
| |
|
Shares |
|
|
Value |
|
| OTHER INVESTMENT COMPANY - 19.9% |
|
| Securities Lending Collateral - 19.9% |
|
| State Street Navigator Securities Lending Trust - Government Money Market Portfolio, 5.28% (B) |
|
|
34,935,565 |
|
|
$ |
34,935,565 |
|
|
|
|
|
|
|
|
|
|
| Total Other Investment Company
(Cost $34,935,565) |
|
|
|
|
|
|
34,935,565 |
|
|
|
|
|
|
|
|
|
|
|
|
|
| |
|
Principal |
|
|
Value |
|
| REPURCHASE AGREEMENT - 1.2% |
|
| Fixed Income Clearing Corp., 2.50% (B), dated 06/28/2024, to be repurchased at $2,206,952 on 07/01/2024. Collateralized by a U.S. Government Obligation, 4.50%, due 03/31/2026, and with a value of $2,250,727. |
|
$ |
2,206,492 |
|
|
|
2,206,492 |
|
|
|
|
|
|
|
|
|
|
| Total Repurchase Agreement
(Cost $2,206,492) |
|
|
|
|
|
|
2,206,492 |
|
|
|
|
|
|
|
|
|
|
| Total Investments
(Cost $205,317,436) |
|
|
|
|
|
|
210,755,036 |
|
|
|
|
|
|
|
|
|
|
| Net Other Assets (Liabilities) - (20.0)% |
|
|
|
(35,138,817) |
|
|
|
|
|
|
|
|
|
|
|
|
|
| Net Assets - 100.0% |
|
|
|
|
|
$ |
175,616,219 |
|
|
|
|
|
|
|
|
|
|
INVESTMENT VALUATION:
|
|
|
|
|
|
|
|
|
|
|
|
|
|
|
|
|
| Valuation Inputs (C) |
|
|
|
|
|
|
|
|
|
|
|
|
|
|
|
|
| |
|
Level 1 - Unadjusted Quoted Prices |
|
|
Level 2 - Other Significant Observable Inputs |
|
|
Level 3 - Significant Unobservable Inputs |
|
|
Value |
|
| ASSETS |
|
|
|
|
|
|
|
|
|
|
|
|
|
|
|
|
| Investments |
|
|
|
|
|
|
|
|
|
|
|
|
|
|
|
|
| Exchange-Traded Funds |
|
$ |
173,612,979 |
|
|
$ |
— |
|
|
$ |
— |
|
|
$ |
173,612,979 |
|
| Other Investment Company |
|
|
34,935,565 |
|
|
|
— |
|
|
|
— |
|
|
|
34,935,565 |
|
| Repurchase Agreement |
|
|
— |
|
|
|
2,206,492 |
|
|
|
— |
|
|
|
2,206,492 |
|
|
|
|
|
|
|
|
|
|
|
|
|
|
|
|
|
|
| Total Investments |
|
$ |
208,548,544 |
|
|
$ |
2,206,492 |
|
|
$ |
— |
|
|
$ |
210,755,036 |
|
|
|
|
|
|
|
|
|
|
|
|
|
|
|
|
|
|
FOOTNOTES TO SCHEDULE OF INVESTMENTS:
| (A) |
All or a portion of the security is on loan. The total value of the securities on loan is $34,228,699, collateralized by cash collateral of $34,935,565 and non-cash collateral, such as U.S. government securities and irrevocable letters of credit, of $1,280. The amount on loan indicated may not correspond with the securities on loan identified because a security with pending sales are in the process of recall from the brokers. |
| (B) |
Rate disclosed reflects the yield at June 30, 2024. |
| (C) |
There were no transfers in or out of Level 3 during the period ended June 30, 2024. Please reference the Investment Valuation section of the Notes to Financial Statements for more information regarding investment valuation and pricing inputs. |
|
|
|
| The Notes to Financial Statements are an integral part of this report. |
|
|
| Transamerica Series Trust |
|
Semi-Annual Financial Statements 2024 |
Page 1
Transamerica BlackRock iShares Tactical - Conservative VP
STATEMENT OF ASSETS AND LIABILITIES
At June 30, 2024
(unaudited)
|
|
|
|
|
|
|
| Assets: |
|
|
|
|
| Unaffiliated investments, at value (cost $203,110,944) (including securities loaned of $34,228,699) |
|
$ |
208,548,544 |
|
| Repurchase agreement, at value (cost $2,206,492) |
|
|
2,206,492 |
|
| Cash |
|
|
75 |
|
| Receivables and other assets: |
|
|
|
|
| Net income from securities lending |
|
|
4,764 |
|
| Shares of beneficial interest sold |
|
|
61 |
|
| Interest |
|
|
460 |
|
| Prepaid expenses |
|
|
699 |
|
| |
|
| Total assets |
|
|
210,761,095 |
|
|
|
| Liabilities: |
|
|
|
|
| Cash collateral received upon return of: |
|
|
|
|
| Securities on loan |
|
|
34,935,565 |
|
| Payables and other liabilities: |
|
|
|
|
| Investments purchased |
|
|
14,314 |
|
| Shares of beneficial interest redeemed |
|
|
18,490 |
|
| Investment management fees |
|
|
60,566 |
|
| Distribution and service fees |
|
|
32,099 |
|
| Transfer agent costs |
|
|
192 |
|
| Trustee and CCO fees |
|
|
562 |
|
| Audit and tax fees |
|
|
22,415 |
|
| Custody fees |
|
|
33,751 |
|
| Legal fees |
|
|
5,066 |
|
| Printing and shareholder reports fees |
|
|
12,508 |
|
| Other accrued expenses |
|
|
9,348 |
|
|
|
| Total liabilities |
|
|
35,144,876 |
|
| |
|
| Net assets |
|
$ |
175,616,219 |
|
|
|
| Net assets consist of: |
|
|
|
|
| Capital stock ($0.01 par value) |
|
$ |
179,833 |
|
| Additional paid-in capital |
|
|
202,694,403 |
|
| Total distributable earnings (accumulated losses) |
|
|
(27,258,017 |
) |
| |
|
| Net assets |
|
$ |
175,616,219 |
|
|
|
| Net assets by class: |
|
|
|
|
| Initial Class |
|
$ |
8,465,451 |
|
| Service Class |
|
|
167,150,768 |
|
|
|
| Shares outstanding: |
|
|
|
|
| Initial Class |
|
|
854,835 |
|
| Service Class |
|
|
17,128,488 |
|
|
|
| Net asset value and offering price per share: |
|
|
|
|
| Initial Class |
|
$ |
9.90 |
|
| Service Class |
|
|
9.76 |
|
STATEMENT OF OPERATIONS
For the period ended June 30, 2024
(unaudited)
|
|
|
|
|
| Investment income: |
|
|
|
|
| Dividend income from unaffiliated investments |
|
$ |
812,173 |
|
| Interest income from unaffiliated investments |
|
|
2,821,828 |
|
| Net income from securities lending |
|
|
7,172 |
|
|
|
| Total investment income |
|
|
3,641,173 |
|
|
|
| Expenses: |
|
|
|
|
| Investment management fees |
|
|
611,836 |
|
| Distribution and service fees: |
|
|
|
|
| Service Class |
|
|
209,356 |
|
| Transfer agent costs |
|
|
1,021 |
|
| Trustee and CCO fees |
|
|
4,146 |
|
| Audit and tax fees |
|
|
22,239 |
|
| Custody fees |
|
|
37,459 |
|
| Legal fees |
|
|
20,568 |
|
| Printing and shareholder reports fees |
|
|
12,176 |
|
| Other |
|
|
14,289 |
|
| |
|
| Total expenses before waiver and/or reimbursement and recapture |
|
|
933,090 |
|
| Expenses waived and/or reimbursed: |
|
|
|
|
| Initial Class |
|
|
(692 |
) |
| Service Class |
|
|
(13,807 |
) |
|
|
| Net expenses |
|
|
918,591 |
|
| |
|
| Net investment income (loss) |
|
|
2,722,582 |
|
|
|
| Net realized gain (loss) on: |
|
|
|
|
| Unaffiliated investments |
|
|
(17,833,573 |
) |
| Written options and swaptions |
|
|
42,457 |
|
| Swap agreements |
|
|
1,952,976 |
|
| Futures contracts |
|
|
4,806,943 |
|
| Forward foreign currency contracts |
|
|
96,555 |
|
| Foreign currency transactions |
|
|
(23,921 |
) |
| TBA commitments |
|
|
82,852 |
|
|
|
| Net realized gain (loss) |
|
|
(10,875,711 |
) |
|
|
| Net change in unrealized appreciation (depreciation) on: |
|
|
|
|
| Unaffiliated investments |
|
|
15,523,694 |
|
| Written options and swaptions |
|
|
3,484 |
|
| Swap agreements |
|
|
(1,405,448 |
) |
| Futures contracts |
|
|
(1,335,727 |
) |
| Forward foreign currency contracts |
|
|
2,540 |
|
| Translation of assets and liabilities denominated in foreign currencies |
|
|
3,094 |
|
| TBA commitments |
|
|
45,316 |
|
| |
|
| Net change in unrealized appreciation (depreciation) |
|
|
12,836,953 |
|
| |
|
| Net realized and change in unrealized gain (loss) |
|
|
1,961,242 |
|
| |
|
| Net increase (decrease) in net assets resulting from operations |
|
$ |
4,683,824 |
|
The Notes to Financial Statements are an integral part of this report.
|
|
|
|
|
| Transamerica Series Trust |
|
|
|
Semi-Annual Financial Statements 2024 |
|
|
Page 2 |
|
|
Transamerica BlackRock iShares Tactical - Conservative VP
STATEMENT OF CHANGES IN NET ASSETS
For the period and year ended:
|
|
|
|
|
|
|
|
|
| |
|
June 30, 2024 (unaudited) |
|
December 31, 2023 |
|
|
|
| From operations: |
|
|
|
|
|
|
|
|
| Net investment income (loss) |
|
|
$ 2,722,582 |
|
|
|
$ 6,303,055 |
|
| Net realized gain (loss) |
|
|
(10,875,711 |
) |
|
|
(2,865,731 |
) |
| Net change in unrealized appreciation (depreciation) |
|
|
12,836,953 |
|
|
|
9,693,341 |
|
|
|
|
| Net increase (decrease) in net assets resulting from operations |
|
|
4,683,824 |
|
|
|
13,130,665 |
|
|
|
|
| Dividends and/or distributions to shareholders: |
|
|
|
|
|
|
|
|
| Initial Class |
|
|
— |
|
|
|
(129,565 |
) |
| Service Class |
|
|
— |
|
|
|
(2,194,346 |
) |
| |
|
|
| Net increase (decrease) in net assets resulting from dividends and/or distributions to shareholders |
|
|
— |
|
|
|
(2,323,911 |
) |
|
|
|
| Capital share transactions: |
|
|
|
|
|
|
|
|
| Proceeds from shares sold: |
|
|
|
|
|
|
|
|
| Initial Class |
|
|
93,855 |
|
|
|
329,659 |
|
| Service Class |
|
|
797,324 |
|
|
|
3,075,003 |
|
| |
|
|
891,179 |
|
|
|
3,404,662 |
|
| Dividends and/or distributions reinvested: |
|
|
|
|
|
|
|
|
| Initial Class |
|
|
— |
|
|
|
129,565 |
|
| Service Class |
|
|
— |
|
|
|
2,194,346 |
|
| |
|
|
— |
|
|
|
2,323,911 |
|
| Cost of shares redeemed: |
|
|
|
|
|
|
|
|
| Initial Class |
|
|
(441,627 |
) |
|
|
(1,152,952 |
) |
| Service Class |
|
|
(13,977,528 |
) |
|
|
(27,361,612 |
) |
| |
|
|
(14,419,155 |
) |
|
|
(28,514,564 |
) |
|
|
|
| Net increase (decrease) in net assets resulting from capital share transactions |
|
|
(13,527,976 |
) |
|
|
(22,785,991 |
) |
|
|
|
| Net increase (decrease) in net assets |
|
|
(8,844,152 |
) |
|
|
(11,979,237 |
) |
|
|
|
| Net assets: |
|
|
|
|
|
|
|
|
| Beginning of period/year |
|
|
184,460,371 |
|
|
|
196,439,608 |
|
| End of period/year |
|
|
$175,616,219 |
|
|
|
$184,460,371 |
|
|
|
|
| Capital share transactions - shares: |
|
|
|
|
|
|
|
|
| Shares issued: |
|
|
|
|
|
|
|
|
| Initial Class |
|
|
9,665 |
|
|
|
35,435 |
|
| Service Class |
|
|
83,288 |
|
|
|
335,684 |
|
| |
|
|
92,953 |
|
|
|
371,119 |
|
| Shares reinvested: |
|
|
|
|
|
|
|
|
| Initial Class |
|
|
— |
|
|
|
13,977 |
|
| Service Class |
|
|
— |
|
|
|
239,819 |
|
| |
|
|
— |
|
|
|
253,796 |
|
| Shares redeemed: |
|
|
|
|
|
|
|
|
| Initial Class |
|
|
(45,674 |
) |
|
|
(124,107 |
) |
| Service Class |
|
|
(1,463,425 |
) |
|
|
(2,985,674 |
) |
| |
|
|
(1,509,099 |
) |
|
|
(3,109,781 |
) |
| Net increase (decrease) in shares outstanding: |
|
|
|
|
|
|
|
|
| Initial Class |
|
|
(36,009 |
) |
|
|
(74,695 |
) |
| Service Class |
|
|
(1,380,137 |
) |
|
|
(2,410,171 |
) |
| |
|
|
(1,416,146 |
) |
|
|
(2,484,866 |
) |
The Notes to Financial Statements are an integral part of this report.
|
|
|
|
|
| Transamerica Series Trust |
|
|
|
Semi-Annual Financial Statements 2024 |
|
|
Page 3 |
|
|
Transamerica BlackRock iShares Tactical - Conservative VP
FINANCIAL HIGHLIGHTS
|
|
|
|
|
|
|
|
|
|
|
|
|
|
|
|
|
|
|
|
|
|
|
|
|
|
|
| For a share outstanding during the period and years indicated: |
|
Initial Class |
| |
|
June 30, 2024 (unaudited) |
|
December 31, 2023 |
|
December 31, 2022 |
|
December 31, 2021 |
|
December 31, 2020 |
|
December 31, 2019 |
|
|
|
|
|
|
|
| Net asset value, beginning of period/year |
|
|
$ 9.63 |
|
|
|
$ 9.09 |
|
|
|
$ 11.84 |
|
|
|
$ 12.47 |
|
|
|
$ 12.32 |
|
|
|
$ 10.49 |
|
| Investment operations: |
|
|
|
|
|
|
|
|
|
|
|
|
|
|
|
|
|
|
|
|
|
|
|
|
| Net investment income (loss)(A) |
|
|
0.16 |
|
|
|
0.33 |
|
|
|
0.17 |
|
|
|
0.13 |
|
|
|
0.20 |
|
|
|
0.24 |
|
| Net realized and unrealized gain (loss) |
|
|
0.11 |
|
|
|
0.35 |
|
|
|
(2.17 |
) |
|
|
0.41 |
|
|
|
1.01 |
|
|
|
1.63 |
|
| |
|
|
|
|
|
|
| Total investment operations |
|
|
0.27 |
|
|
|
0.68 |
|
|
|
(2.00 |
) |
|
|
0.54 |
|
|
|
1.21 |
|
|
|
1.87 |
|
| Dividends and/or distributions to shareholders: |
|
|
|
|
|
|
|
|
|
|
|
|
|
|
|
|
|
|
|
|
|
|
|
|
| Net investment income |
|
|
— |
|
|
|
(0.14 |
) |
|
|
(0.14 |
) |
|
|
(0.16 |
) |
|
|
(0.21 |
) |
|
|
(0.04 |
) |
| Net realized gains |
|
|
— |
|
|
|
— |
|
|
|
(0.61 |
) |
|
|
(1.01 |
) |
|
|
(0.85 |
) |
|
|
— |
|
| Total dividends and/or distributions to shareholders |
|
|
— |
|
|
|
(0.14 |
) |
|
|
(0.75 |
) |
|
|
(1.17 |
) |
|
|
(1.06 |
) |
|
|
(0.04 |
) |
|
|
|
|
|
|
|
| Net asset value, end of period/year |
|
|
$ 9.90 |
|
|
|
$ 9.63 |
|
|
|
$ 9.09 |
|
|
|
$ 11.84 |
|
|
|
$ 12.47 |
|
|
|
$ 12.32 |
|
| |
|
|
|
|
|
|
|
|
|
|
|
|
|
|
|
|
|
|
|
|
|
|
|
|
|
|
|
|
|
|
|
| Total return |
|
|
2.80 |
%(B) |
|
|
7.57 |
% |
|
|
(17.12 |
)% |
|
|
4.43 |
% |
|
|
10.22 |
% |
|
|
17.86 |
% |
|
|
|
|
|
|
|
| Ratio and supplemental data: |
|
|
|
|
|
|
|
|
|
|
|
|
|
|
|
|
|
|
|
|
|
|
|
|
| Net assets end of period/year (000’s) |
|
|
$ 8,465 |
|
|
|
$ 8,580 |
|
|
|
$ 8,782 |
|
|
|
$ 11,199 |
|
|
|
$ 11,569 |
|
|
|
$ 10,796 |
|
| Expenses to average net assets |
|
|
|
|
|
|
|
|
|
|
|
|
|
|
|
|
|
|
|
|
|
|
|
|
| Excluding waiver and/or reimbursement and recapture |
|
|
0.82 |
%(C) |
|
|
0.90 |
%(D) |
|
|
0.87 |
%(D) |
|
|
0.87 |
%(D) |
|
|
0.87 |
%(D) |
|
|
0.92 |
%(D) |
| Including waiver and/or reimbursement and recapture |
|
|
0.81 |
%(C)(E) |
|
|
0.90 |
%(D) |
|
|
0.87 |
%(D) |
|
|
0.87 |
%(D) |
|
|
0.87 |
%(D) |
|
|
0.92 |
%(D) |
| Net investment income (loss) to average net assets |
|
|
3.34 |
%(C) |
|
|
3.58 |
% |
|
|
1.69 |
% |
|
|
1.03 |
% |
|
|
1.61 |
% |
|
|
2.11 |
% |
| Portfolio turnover rate |
|
|
142 |
%(B) |
|
|
28 |
%(F) |
|
|
34 |
%(F) |
|
|
60 |
%(F) |
|
|
65 |
%(F) |
|
|
64 |
%(F) |
| (A) |
Calculated based on average number of shares outstanding. |
| (D) |
Includes interest fee on sale-buyback transactions. |
| (E) |
TAM has contractually agreed, through May 1, 2025, to waive from its management fees an amount equal to the sub-advisory fee waiver by the Portfolio’s sub-adviser. These amounts are not subject to recapture by TAM. |
| (F) |
Excludes sale-buyback transactions. |
The Notes to Financial Statements are an integral part of this report.
|
|
|
|
|
| Transamerica Series Trust |
|
|
|
Semi-Annual Financial Statements 2024 |
|
|
Page 4 |
|
|
Transamerica BlackRock iShares Tactical - Conservative VP
FINANCIAL HIGHLIGHTS (continued)
|
|
|
|
|
|
|
|
|
|
|
|
|
|
|
|
|
|
|
|
|
|
|
|
|
|
|
| For a share outstanding during the period and years indicated: |
|
Service Class |
| |
|
June 30, 2024 (unaudited) |
|
December 31, 2023 |
|
December 31, 2022 |
|
December 31, 2021 |
|
December 31, 2020 |
|
December 31, 2019 |
|
|
|
|
|
|
|
| Net asset value, beginning of period/year |
|
|
$ 9.50 |
|
|
|
$ 8.97 |
|
|
|
$ 11.68 |
|
|
|
$ 12.31 |
|
|
|
$ 12.18 |
|
|
|
$ 10.37 |
|
| Investment operations: |
|
|
|
|
|
|
|
|
|
|
|
|
|
|
|
|
|
|
|
|
|
|
|
|
| Net investment income (loss)(A) |
|
|
0.15 |
|
|
|
0.31 |
|
|
|
0.14 |
|
|
|
0.09 |
|
|
|
0.17 |
|
|
|
0.21 |
|
| Net realized and unrealized gain (loss) |
|
|
0.11 |
|
|
|
0.33 |
|
|
|
(2.13 |
) |
|
|
0.42 |
|
|
|
0.99 |
|
|
|
1.61 |
|
| |
|
|
|
|
|
|
| Total investment operations |
|
|
0.26 |
|
|
|
0.64 |
|
|
|
(1.99 |
) |
|
|
0.51 |
|
|
|
1.16 |
|
|
|
1.82 |
|
| Dividends and/or distributions to shareholders: |
|
|
|
|
|
|
|
|
|
|
|
|
|
|
|
|
|
|
|
|
|
|
|
|
| Net investment income |
|
|
— |
|
|
|
(0.11 |
) |
|
|
(0.11 |
) |
|
|
(0.13 |
) |
|
|
(0.18 |
) |
|
|
(0.01 |
) |
| Net realized gains |
|
|
— |
|
|
|
— |
|
|
|
(0.61 |
) |
|
|
(1.01 |
) |
|
|
(0.85 |
) |
|
|
— |
|
| Total dividends and/or distributions to shareholders |
|
|
— |
|
|
|
(0.11 |
) |
|
|
(0.72 |
) |
|
|
(1.14 |
) |
|
|
(1.03 |
) |
|
|
(0.01 |
) |
|
|
|
|
|
|
|
| Net asset value, end of period/year |
|
|
$ 9.76 |
|
|
|
$ 9.50 |
|
|
|
$ 8.97 |
|
|
|
$ 11.68 |
|
|
|
$ 12.31 |
|
|
|
$ 12.18 |
|
| |
|
|
|
|
|
|
|
|
|
|
|
|
|
|
|
|
|
|
|
|
|
|
|
|
|
|
|
|
|
|
|
| Total return |
|
|
2.74 |
%(B) |
|
|
7.24 |
% |
|
|
(17.29 |
)% |
|
|
4.21 |
% |
|
|
9.89 |
% |
|
|
17.57 |
% |
|
|
|
|
|
|
|
| Ratio and supplemental data: |
|
|
|
|
|
|
|
|
|
|
|
|
|
|
|
|
|
|
|
|
|
|
|
|
| Net assets end of period/year (000’s) |
|
|
$ 167,151 |
|
|
|
$ 175,880 |
|
|
|
$ 187,658 |
|
|
|
$ 261,941 |
|
|
|
$ 306,221 |
|
|
|
$ 284,650 |
|
| Expenses to average net assets |
|
|
|
|
|
|
|
|
|
|
|
|
|
|
|
|
|
|
|
|
|
|
|
|
| Excluding waiver and/or reimbursement and recapture |
|
|
1.07 |
%(C) |
|
|
1.15 |
%(D) |
|
|
1.12 |
%(D) |
|
|
1.12 |
%(D) |
|
|
1.12 |
%(D) |
|
|
1.17 |
%(D) |
| Including waiver and/or reimbursement and recapture |
|
|
1.06 |
%(C)(E) |
|
|
1.15 |
%(D) |
|
|
1.12 |
%(D) |
|
|
1.12 |
%(D) |
|
|
1.12 |
%(D) |
|
|
1.17 |
%(D) |
| Net investment income (loss) to average net assets |
|
|
3.09 |
%(C) |
|
|
3.33 |
% |
|
|
1.42 |
% |
|
|
0.78 |
% |
|
|
1.36 |
% |
|
|
1.86 |
% |
| Portfolio turnover rate |
|
|
142 |
%(B) |
|
|
28 |
%(F) |
|
|
34 |
%(F) |
|
|
60 |
%(F) |
|
|
65 |
%(F) |
|
|
64 |
%(F) |
| (A) |
Calculated based on average number of shares outstanding. |
| (D) |
Includes interest fee on sale-buyback transactions. |
| (E) |
TAM has contractually agreed, through May 1, 2025, to waive from its management fees an amount equal to the sub-advisory fee waiver by the Portfolio’s sub-adviser. These amounts are not subject to recapture by TAM. |
| (F) |
Excludes sale-buyback transactions. |
The Notes to Financial Statements are an integral part of this report.
|
|
|
|
|
| Transamerica Series Trust |
|
|
|
Semi-Annual Financial Statements 2024 |
|
|
Page 5 |
|
|
Transamerica BlackRock iShares Tactical - Conservative VP
NOTES TO FINANCIAL STATEMENTS
At June 30, 2024
(unaudited)
1. ORGANIZATION
Transamerica Series Trust (“TST”) is an open-end management investment company registered under the Investment Company Act of 1940, as amended (the “1940 Act”). TST applies investment company accounting and reporting guidance. TST serves as a funding vehicle for variable life insurance, variable annuity, and group annuity products. Transamerica BlackRock iShares Tactical—Conservative VP (formerly, Transamerica PIMCO Tactical - Conservative VP) (the “Portfolio”) is a series of TST and is classified as diversified under the 1940 Act. The Portfolio currently offers two classes of shares, Initial Class and Service Class.
The only shareholders of the Portfolio are affiliated insurance company separate accounts and/or affiliated asset allocation portfolios. Contract holders of the variable life and annuity contracts are not shareholders of the Portfolio. For ease of reference, shareholders and contract holders are collectively referred to in this report as “shareholders.”
This report must be accompanied or preceded by the Portfolio’s current prospectus, which contains additional information about the Portfolio, including risks, as well as investment objectives and strategies.
Transamerica Asset Management, Inc. (“TAM”) serves as investment manager for the Portfolio pursuant to an investment management agreement. TAM provides continuous and regular investment management services to the Portfolio. TAM supervises the Portfolio’s investments, conducts its investment program and provides supervisory, compliance and administrative services to the Portfolio.
TAM currently acts as a “manager of managers” and has hired sub-advisers to furnish day-to-day investment advice and recommendations. TAM may, in the future, determine to provide all aspects of the day-to-day management of the Portfolio without the use of a sub-adviser. When acting as a manager of managers, TAM provides investment management services that include, without limitation, the design and development of the Portfolio and its investment strategies and the ongoing review and evaluation of those investment strategies including recommending changes in strategy where it believes appropriate or advisable; the selection of one or more sub-advisers for the Portfolio employing a combination of quantitative and qualitative screens, research, analysis and due diligence; negotiation of sub-advisory agreements and fees; oversight and monitoring of sub-advisers and recommending changes to sub-advisers where it believes appropriate or advisable; recommending portfolio combinations and liquidations where it believes appropriate or advisable; selection and oversight of transition managers, as needed; regular supervision of the Portfolio’s investments; regular review and evaluation of sub-adviser performance; daily monitoring of the sub-advisers’ buying and selling of securities for the Portfolio; regular review of holdings; ongoing trade oversight and analysis; regular monitoring to ensure adherence to investment process; regular calls and periodic on-site visits with sub-advisers; portfolio construction and asset allocation when using multiple sub-advisers for the Portfolio; risk management oversight and analysis; oversight of negotiation of investment documentation and agreements; design, development, implementation and regular monitoring of the valuation process; periodic due diligence reviews of pricing vendors and vendor methodology; design, development, implementation and regular monitoring of the compliance process; respond to regulatory inquiries and determine appropriate litigation strategy, as needed; review of proxies voted by sub-advisers; oversight of preparation and review of materials for meetings of the Portfolio’s Board of Trustees (the “Board”), participation in these meetings and preparation of regular communications with the Board; oversight of preparation and review of prospectuses, shareholder reports and other disclosure materials and regulatory filings for the Portfolio; oversight of other service providers to the Portfolio, such as the custodian, the transfer agent, the Portfolio’s independent accounting firm and legal counsel; supervision of the performance of recordkeeping and shareholder relations functions for the Portfolio; and oversight of cash management services. TAM uses a variety of quantitative and qualitative tools to carry out its investment management services. TAM, not the Portfolio, is responsible for paying the sub-adviser(s) for their services, and sub-advisory fees are TAM’s expense.
TAM’s investment management services also include the provision of supervisory and administrative services to the Portfolio. These services include performing certain administrative services for the Portfolio and supervising and overseeing the administrative, clerical, recordkeeping and bookkeeping services provided to the Portfolio by State Street Bank and Trust Company (“State Street”), to whom TAM has outsourced the provision of certain sub-administration services. To the extent agreed upon by TAM and the Portfolio from time to time, TAM’s supervisory and administrative services include, but are not limited to: monitoring and verifying the custodian’s daily calculation of the Net Asset Values (“NAV”); shareholder relations functions; compliance services; valuation services; assisting in due diligence and in the oversight and monitoring of certain activities of sub-advisers and certain aspects of Portfolio investments; assisting with Portfolio combinations and liquidations; oversight of the preparation and filing, and review, of all returns and reports, in connection with federal, state and local taxes; oversight and review of regulatory reporting; supervising and coordinating the Portfolio’s custodian and dividend disbursing agent and monitoring their services to the Portfolio; assisting the Portfolio in preparing reports to shareholders; acting as liaison with the Portfolio’s independent public accountants and providing, upon request, analyses, fiscal year summaries and other audit related services; assisting in the preparation of agendas and supporting documents for and minutes of meetings of trustees and committees of trustees; assisting in the preparation of regular communications with the trustees; and providing personnel and office space, telephones and other office equipment as necessary in order for TAM to perform supervisory and administrative services to the Portfolio. The Portfolio
|
|
|
| Transamerica Series Trust |
|
Semi-Annual Financial Statements 2024 |
Page 6
Transamerica BlackRock iShares Tactical - Conservative VP
NOTES TO FINANCIAL STATEMENTS (continued)
At June 30, 2024
(unaudited)
1. ORGANIZATION (continued)
pays certain fees and expenses to State Street for sub-administration services which are not administrative services covered by the management agreement with TAM or paid for through the management fees payable thereunder. For the period ended June 30, 2024, (i) the expenses paid to State Street for sub-administration services by the Portfolio are shown as a part of Other expenses within the Statement of Operations and (ii) the expenses payable to State Street for sub-administration services from the Portfolio are shown as part of Other accrued expenses within the Statement of Assets and Liabilities.
2. SIGNIFICANT ACCOUNTING POLICIES
In preparing the Portfolio’s financial statements in accordance with Generally Accepted Accounting Principles in the United States of America (“GAAP”), estimates or assumptions (which could differ from actual results) may be used that affect reported amounts and disclosures. The following is a summary of significant accounting policies followed by the Portfolio.
Foreign currency denominated investments: The accounting records of the Portfolio are maintained in U.S. dollars. Securities and other assets and liabilities denominated in foreign currencies are translated into U.S. dollars based on the closing exchange rate each day. The cost of foreign securities purchased and any realized gains or losses are translated at the prevailing exchange rates in effect on the date of the respective transaction. The Portfolio combines fluctuations from currency exchange rates and fluctuations in value when computing net realized and unrealized gains or losses from investments.
Net foreign currency gains and losses resulting from changes in exchange rates include, foreign currency fluctuations between trade date and settlement date of investment security transactions, gains and losses on forward foreign currency contracts, and the difference between the receivable amounts of interest and dividends recorded in the accounting records in U.S. dollars and the amounts actually received.
Foreign currency denominated assets may involve risks not typically associated with domestic transactions. These risks include revaluation of currencies, adverse fluctuations in foreign currency values, and possible adverse political, social, and economic developments, including those particular to a specific industry, country or region.
Security transactions and investment income: Security transactions are accounted for on the trade date. Security gains and losses are calculated on a first-in, first-out basis. Interest income, if any, is accrued as earned. Dividend income and capital gain distributions from underlying investments, if any, are recorded on the ex-dividend date. Income or short-term capital gain distributions received from underlying investments, if any, are recorded as Dividend income from investments within the Statement of Operations. Long-term capital gain distributions received from underlying investments, if any, are recorded as Net realized gain (loss) on Capital gain distributions received from investments within the Statement of Operations.
Multiple class operations, income, and expenses: Income, non-class specific expenses, and realized and unrealized gains and losses are allocated to each class daily based upon net assets. Each class bears its own specific expenses in addition to the allocated non-class specific expenses.
Distributions to shareholders: Distributions are recorded on the ex-dividend date and are determined in accordance with federal income tax regulations, which may differ from GAAP.
Commission recapture: The sub-adviser(s), to the extent consistent with the best execution and usual commission rate policies and practices, may elect to place security transactions of the Portfolio with broker/dealers with which TST has established a commission recapture program. A commission recapture program is any arrangement under which a broker/dealer applies a portion of the commissions received by such broker/dealer on the security transactions to the Portfolio. In no event will commissions, paid by the Portfolio, be used to pay expenses that would otherwise be borne by any other Portfolios within TST, or by any other party.
There were no commissions recaptured during the period ended June 30, 2024 by the Portfolio.
Indemnification: In the normal course of business, the Portfolio enters into contracts that contain a variety of representations that provide general indemnifications. The Portfolio’s maximum exposure under these arrangements is unknown, as this would involve future claims that may be made against the Portfolio and/or its affiliates that have not yet occurred. However, based on experience, the Portfolio expects the risk of loss to be remote.
|
|
|
| Transamerica Series Trust |
|
Semi-Annual Financial Statements 2024 |
Page 7
Transamerica BlackRock iShares Tactical - Conservative VP
NOTES TO FINANCIAL STATEMENTS (continued)
At June 30, 2024
(unaudited)
3. INVESTMENT VALUATION
TAM has been designated as the Portfolio’s valuation designee pursuant to Rule 2a-5 under the 1940 Act with responsibility for fair valuation subject to oversight by the Portfolio’s Board of Trustees. The net asset value of the Portfolio is computed as of the official close of the New York Stock Exchange (“NYSE”) each day the NYSE is open for business.
TAM utilizes various methods to measure the fair value of its investments on a recurring basis. GAAP establishes a hierarchy that prioritizes inputs to valuation methods. The inputs or methodology used for valuing securities are not necessarily an indication of the risk associated with investing in those securities. The three levels (“Levels”) of inputs of the fair value hierarchy are defined as follows:
Level 1—Unadjusted quoted prices in active markets for identical securities.
Level 2—Inputs, other than quoted prices included in Level 1, which are observable, either directly or indirectly. These inputs may include quoted prices for the identical instrument on an inactive market, prices for similar instruments, interest rates, prepayment speeds, credit risk, yield curves, default rates, and similar data.
Level 3—Unobservable inputs based on the best information available in the circumstances, to the extent observable inputs are not available, which may include TAM’s own assumptions used in determining the fair value of the Portfolio’s investments.
The inputs used to measure fair value may fall into different Levels of the fair value hierarchy. In such cases, for disclosure purposes, the Level in the fair value hierarchy that is assigned to the fair value measurement of a security is determined based on the lowest Level input that is significant to the fair value measurement in its entirety. Certain investments that are measured at fair value using NAV per share, or its equivalent, using the “practical expedient” have not been classified in the fair value Levels. The hierarchy classification of inputs used to value the Portfolio’s investments at June 30, 2024, is disclosed within the Investment Valuation section of the Schedule of Investments.
The availability of observable inputs can vary from security to security and is affected by a wide variety of factors, including, but not limited to, the type of security, whether the security is new and not yet established in the marketplace, the liquidity of markets, and other characteristics particular to the security. To the extent that valuation is based on models or inputs that are less observable or unobservable in the market, the determination of fair value requires more judgment. Accordingly, the degree of judgment exercised in determining fair value is generally greatest for instruments categorized in Level 3. Due to the inherent uncertainty of valuation, the determination of values may differ significantly from values that would have been realized had a ready market for investments existed, and the differences could be material.
Fair value measurements: Descriptions of the valuation techniques applied to the Portfolio’s significant categories of assets and liabilities measured at fair value on a recurring basis are as follows:
Exchange-traded funds (“ETF”): ETFs are stated at the last reported sale price or closing price on the day of valuation taken from the primary exchange where the ETF is principally traded. ETFs are generally categorized in Level 1 of the fair value hierarchy.
Securities lending collateral: Securities lending collateral is invested in a money market fund which is valued at the actively traded NAV and no valuation adjustments are applied. Securities lending collateral is categorized in Level 1 of the fair value hierarchy.
Repurchase agreements: Repurchase agreements are valued at cost, which approximates fair value. To the extent the inputs are observable and timely, the values are generally categorized in Level 2 of the fair value hierarchy.
4. BORROWINGS AND OTHER FINANCING TRANSACTIONS
The Portfolio may engage in borrowing transactions as a means of raising cash to satisfy redemption requests, for other temporary or emergency purposes or, to the extent permitted by its investment policies, to raise additional cash to be invested in other securities or instruments. When the Portfolio invests borrowing proceeds in other securities, the Portfolio will bear the risk that the market value of the securities in which such proceeds are invested goes down and is insufficient to repay the borrowed proceeds. The Portfolio may borrow on a secured or on an unsecured basis. If the Portfolio enters into a secured borrowing arrangement, a portion of the Portfolio’s assets will be used as collateral. The 1940 Act requires the Portfolio to maintain asset coverage of at least 300% of the amount of its borrowings. Asset coverage means the ratio that the value of the Portfolio’s total assets, minus liabilities other than borrowings, bears to the aggregate amount of all borrowings. Although complying with this requirement has the effect of limiting the amount that the Portfolio may borrow, it does not otherwise mitigate the risks of entering into borrowing transactions.
|
|
|
| Transamerica Series Trust |
|
Semi-Annual Financial Statements 2024 |
Page 8
Transamerica BlackRock iShares Tactical - Conservative VP
NOTES TO FINANCIAL STATEMENTS (continued)
At June 30, 2024
(unaudited)
4. BORROWINGS AND OTHER FINANCING TRANSACTIONS (continued)
Interfund lending: The Portfolio, along with other funds and portfolios advised by TAM, may participate in an interfund lending program pursuant to exemptive relief granted by the Securities and Exchange Commission on January 18, 2017. This program allows the Portfolio to lend to and borrow from other funds and portfolios advised by TAM. Interfund lending transactions are subject to the conditions of the exemptive relief which places limits on the amount of lending or borrowing a Portfolio may participate in under the program. Interest earned or paid on an interfund lending transaction will be based on the average of certain current market rates. For the period ended June 30, 2024, the Portfolio has not utilized the program.
Repurchase agreements: In a repurchase agreement, the Portfolio purchases a security and simultaneously commits to resell that security to the seller at an agreed-upon price on an agreed-upon date. Securities purchased subject to a repurchase agreement are held at the Portfolio’s custodian, or designated sub-custodian related to tri-party repurchase agreements, and, pursuant to the terms of the repurchase agreement, must be collateralized by securities with an aggregate market value greater than or equal to 100% of the resale price. The Portfolio will bear the risk of value fluctuations until the securities can be sold and may encounter delays and incur costs in liquidating the securities. In the event of bankruptcy or insolvency of the seller, delays and costs may be incurred.
Repurchase agreements are subject to netting agreements, which are agreements between the Portfolio and its counterparties that provide for the net settlement of all transactions and collateral with the Portfolio, through a single payment, in the event of default or termination. Amounts presented within the Schedule of Investments, and as part of Repurchase agreements, at value within the Statement of Assets and Liabilities are shown on a gross basis. The value of the related collateral for each repurchase agreement, as reflected within the Schedule of Investments, exceeds the value of each repurchase agreement at June 30, 2024.
Repurchase agreements at June 30, 2024, if any, are included within the Schedule of Investments and Statement of Assets and Liabilities.
Securities lending: The Portfolio may lend securities to qualified financial institutions, brokers and dealers. State Street serves as securities lending agent to the Portfolio pursuant to a Securities Lending Agreement. Loans of securities are terminable at any time and the borrower, after notice, is required to return borrowed securities within the standard time period for settlement of securities transactions. The lending of securities exposes the Portfolio to risks such as: the borrowers may fail to return the loaned securities or may not be able to provide additional collateral, the Portfolio may experience delays in recovery of the loaned securities or delays in access to collateral, or the Portfolio may experience losses related to the investment collateral. To minimize certain risks, loan counterparties pledge cash, securities issued or guaranteed by the U.S. Government and irrevocable letters of credit issued by banks as collateral. The initial collateral received by the Portfolio is required to have a value of at least 102% of the current value of the loaned securities traded on U.S. exchanges, and a value of at least 105% for all other securities. Typically the lending agent is not permitted to sell, re-pledge or use cash and non-cash collateral it receives. The lending agent has agreed to indemnify the Portfolio in the case of default of any securities borrower.
The Portfolio receives compensation for lending securities from interest or dividends earned on the cash, U.S. Government securities and irrevocable letters of credit held as collateral, less associated fees and expenses. Such income is reflected in Net income from securities lending within the Statement of Operations. Cash collateral received is invested in the State Street Navigator Securities Lending Trust — Government Money Market Portfolio.
The value of loaned securities and related cash and non-cash collateral outstanding at June 30, 2024, if any, are shown on a gross basis within the Schedule of Investments.
The following table reflects a breakdown of transactions accounted for as secured borrowings, the gross obligation by the type, and the remaining contractual maturity of those transactions as of June 30, 2024.
|
|
|
|
|
|
|
|
|
|
|
|
|
|
|
|
|
|
|
|
|
| |
|
Remaining Contractual Maturity of the Agreements |
|
| |
|
Overnight and Continuous |
|
|
Less Than 30 Days |
|
|
Between 30 & 90 Days |
|
|
Greater Than 90 Days |
|
|
Total |
|
| Securities Lending Transactions
Exchange-Traded Funds |
|
$ |
34,935,565 |
|
|
$ |
— |
|
|
$ |
— |
|
|
$ |
— |
|
|
$ |
34,935,565 |
|
| Total Borrowings |
|
$ |
34,935,565 |
|
|
$ |
— |
|
|
$ |
— |
|
|
$ |
— |
|
|
$ |
34,935,565 |
|
| |
|
|
|
|
|
|
|
|
|
|
|
|
|
|
|
|
|
|
|
|
|
|
|
| Transamerica Series Trust |
|
Semi-Annual Financial Statements 2024 |
Page 9
Transamerica BlackRock iShares Tactical - Conservative VP
NOTES TO FINANCIAL STATEMENTS (continued)
At June 30, 2024
(unaudited)
5. RISK EXPOSURES AND THE USE OF DERIVATIVE INSTRUMENTS
The Portfolio’s investment strategies allow the Portfolio to use various types of derivative contracts, including option contracts, swap agreements, futures contracts, and forward foreign currency contracts. Derivatives are investments whose value is primarily derived from underlying assets, indices or reference rates and may be transacted on an exchange or OTC.
Market Risk Factors: In pursuit of the Portfolio’s investment strategies, the Portfolio may seek to use derivatives to increase or decrease its exposure to certain market risks, including:
Interest rate risk: Interest rate risk relates to the fluctuations in the value of fixed income securities due to changes in the prevailing levels of market interest rates.
Foreign exchange rate risk: Foreign exchange rate risk relates to fluctuations in the value of an asset or liability due to changes in the currency exchange rates.
Equity risk: Equity risk relates to the change in value of equity securities as they relate to increases or decreases in the general market.
Credit risk: Credit risk relates to the ability of the issuer of a financial instrument to make further principal or interest payments on an obligation or commitment that it has to the Portfolio.
Commodity risk: Commodity risk relates to the change in value of commodities or commodity indices as they relate to increases or decreases in the commodities market. Commodities are physical assets that have tangible properties. Examples of these types of assets are crude oil, heating oil, metals, livestock, and agricultural products.
The Portfolio is also exposed to additional risks from investing in derivatives, such as liquidity and counterparty credit risk. Liquidity risk is the risk that the Portfolio will be unable to sell or close out the derivative in the open market in a timely manner. Counterparty credit risk is the risk that the counterparty will not be able to fulfill its obligations to the Portfolio. Investing in derivatives may also involve greater risks than investing directly in the underlying assets, such as losses in excess of any initial investment and collateral received. In addition, there may be the risk that the change in value of the derivative contract does not correspond to the change in value of the underlying instrument.
The Portfolio’s exposure to market risk factors and certain other associated risks are summarized by derivative type as follows:
Option contracts: The Portfolio is subject to equity risk, credit risk, interest rate risk, and foreign exchange rate risk in the normal course of pursuing its investment objective. The Portfolio may enter into option contracts to manage exposure to various market fluctuations. The Portfolio may purchase or write call and put options on securities and derivative instruments in which the Portfolio owns or may invest. Options are valued at the average of the bid and ask price established each day at the close of the board of trade or exchange on which they are traded. Options are marked-to-market daily to reflect the current value of the option. The primary risks associated with options are an imperfect correlation between the change in value of the securities held and the prices of the option contracts, the possibility of an illiquid market, and an inability of the counterparty to meet the contract terms. Options can be traded through an exchange or through privately negotiated arrangements with a dealer in an OTC transaction. Options traded on an exchange are generally cleared through a clearinghouse such as the Options Clearing Corp.
Options on exchange-traded funds and/or securities: The Portfolio may purchase or write options on ETFs and/or securities. Purchasing or writing options on ETFs and/or securities gives the Portfolio the right, but not the obligation to buy or sell a specified ETF and/or security as an underlying instrument for the option contract.
Options on indices: The Portfolio may purchase or write options on indices. Purchasing or writing an option on indices gives the Portfolio the right, but not the obligation to buy or sell the cash from the underlying index. The exercise of the option will result in a cash transfer and gain or loss depends on the change in the underlying index.
Options on futures: The Portfolio may purchase or write options on futures. Purchasing or writing options on futures gives the Portfolio the right, but not obligation to buy or sell a position on a futures contract at the specified option exercise price at any time during the period of the option.
Interest rate-capped options: The Portfolio may purchase or write interest rate-capped options. Purchasing or writing interest rate-capped options gives the Portfolio the right, but not the obligation to buy or sell an option which applies a cap to protect the Portfolio from floating rate risk above a certain rate on a given notional exposure. A floor can be used to give downside protection to investments in interest rate-linked products.
|
|
|
| Transamerica Series Trust |
|
Semi-Annual Financial Statements 2024 |
Page 10
Transamerica BlackRock iShares Tactical - Conservative VP
NOTES TO FINANCIAL STATEMENTS (continued)
At June 30, 2024
(unaudited)
5. RISK EXPOSURES AND THE USE OF DERIVATIVE INSTRUMENTS (continued)
Credit default swaptions: The Portfolio may purchase or write credit default swaption agreements which are options to enter into a pre-defined swap agreement by some specific date in the future. Purchasing or writing credit default swaptions gives the Portfolio the right, but not the obligation to buy or sell credit protection on a specific reference with a specific maturity.
Interest rate swaptions: The Portfolio may purchase or write interest rate swaption agreements which are options to enter into a pre-defined swap agreement by some specific date in the future. The writer of the swaption becomes the counterparty to the swap if the buyer exercises. The interest rate swaption agreement will specify whether the buyer of the swaption will be a fixed-rate receiver or a fixed-rate payer upon exercise.
Purchased options: Purchasing call options tends to increase exposure to the underlying instrument. Purchasing put options tends to decrease exposure to the underlying instrument. The Portfolio pays premiums, which are included within the Statement of Assets and Liabilities as an investment and subsequently marked-to-market to reflect the current value of the option. The risk associated with purchasing put and call options is limited to the premium paid. Premiums paid from options which expire are treated as realized losses. Premiums paid for purchasing options which are exercised or closed are added to the amounts paid or offset against the proceeds on the underlying instrument to determine the realized gain or loss.
Written options: Writing call options tends to decrease exposure to the underlying instrument. Writing put options tends to increase exposure to the underlying instrument. When the Portfolio writes a covered call or put option, the premium received is recorded as a liability within the Statement of Assets and Liabilities and is subsequently marked-to-market to reflect the current market value of the option written. Premiums received from written options which expire unexercised are treated as realized gains. Premiums received from writing options which are exercised or closed are added to the proceeds or offset against amounts paid on the underlying instrument to determine the realized gain or loss. In writing an option, the Portfolio bears the market risk of an unfavorable change in the price of the security or currency underlying the written option. Exercise of an option written by the Portfolio could result in the Portfolio selling or buying a security or currency at a price different from the current market value.
Swap agreements: Swap agreements are bilaterally negotiated agreements between the Portfolio and a counterparty to exchange or swap investments, cash flows, assets, foreign currencies, or market-linked returns at specified, future intervals. Swap agreements can be executed in a bilateral privately negotiated arrangement with a dealer in an OTC transaction or executed on a regular market. Certain swaps regardless of the venue of execution are required to be cleared through a clearinghouse (“centrally cleared swap agreements”). Centrally cleared swap agreements listed or traded on a multilateral platform, are valued at the daily settlement price determined by the corresponding exchange. For centrally cleared credit default swap agreements the clearing exchange requires all members to provide applicable levels across complete term levels. Centrally cleared interest rate swap agreements are valued using a pricing model that references the underlying rates including but not limited to the overnight index swap rate and London Interbank Offered Rate (“LIBOR”) forward rate to calculate the daily settlement price. The Portfolio may enter into credit default, cross-currency, interest rate, total return, including contracts for difference (“CFD”), and other forms of swap agreements to manage exposure to credit, currency, interest rate, and commodity risks. In connection with these agreements, securities or cash may be identified as collateral or margin in accordance with the terms of the respective swap agreements to provide assets of value and recourse in the event of default or bankruptcy/insolvency. Centrally cleared swap agreements are marked-to-market daily based upon values from third party vendors, which may include a registered exchange, or quotations from market makers to the extent available and the change in value, if any, is recorded as Variation margin receivable (payable) on centrally cleared swap agreements within the Statement of Assets and Liabilities.
For OTC swap agreements, payments received or made at the beginning of the measurement period are reflected in OTC swap agreements, at value within the Statement of Assets and Liabilities and represent payments made or received upon entering into the swap agreements to compensate for differences between the stated terms of the swap agreement and prevailing market conditions (credit spreads, currency exchange rates, interest rates, and other relevant factors). Additionally, these upfront payments as well as any periodic payments received or paid by the Portfolio, including any liquidation payment received or made at the termination of the swap are recorded as part of Net realized gain (loss) on swap agreements within the Statement of Operations.
Credit default swap agreements: The Portfolio is subject to credit risk in the normal course of pursuing its investment objective. The Portfolio enters into credit default swap agreements to manage its exposure to the market or certain sectors of the market to reduce its risk exposure to defaults of corporate and sovereign issuers, or to create exposure to corporate or sovereign issuers to which it is not otherwise exposed. Credit default swap agreements involve the exchange of a fixed rate premium for protection against the loss in value of an underlying security in the event of a defined credit event, such as payment default or bankruptcy (buy protection).
|
|
|
| Transamerica Series Trust |
|
Semi-Annual Financial Statements 2024 |
Page 11
Transamerica BlackRock iShares Tactical - Conservative VP
NOTES TO FINANCIAL STATEMENTS (continued)
At June 30, 2024
(unaudited)
5. RISK EXPOSURES AND THE USE OF DERIVATIVE INSTRUMENTS (continued)
Under a credit default swap agreement, one party acts as a guarantor by receiving the fixed periodic payment in exchange for the commitment to purchase the underlying security at par if the defined credit event occurs (sell protection). The Portfolio’s maximum risk of loss from counterparty risk, either as the protection seller or as the protection buyer, is the notional amount of the contract. This risk is mitigated by having a master netting arrangement between the Portfolio and the counterparty, and by the posting of collateral.
The Portfolio sells credit default swap agreements, which exposes it to risk of loss from credit risk related events specified in the contracts. Although contract-specific, credit events are generally defined as bankruptcy, failure to pay, restructuring, obligation acceleration, obligation default, or repudiation/moratorium. If a defined credit event had occurred during the period, the swap agreements’ credit-risk-related contingent features would have been triggered, and the Portfolio would have been required to pay the notional amounts for the credit default swap agreements with a sell protection less the value of the contracts’ related reference obligations.
Interest rate swap agreements: The Portfolio is subject to interest rate risk exposure in the normal course of pursuing its investment objective. Because the Portfolio holds fixed rate bonds, the value of these bonds may decrease if interest rates rise. To help hedge against this risk, the Portfolio enters into interest rate swap agreements. Under an interest rate swap agreement, two parties will exchange cash flows based on a notional principal amount. A Portfolio with interest rate agreements can elect to pay a fixed rate and receive a floating rate, or receive a fixed rate and pay a floating rate, on a notional principal amount. The risks of interest rate swap agreements include changes in market conditions which will affect the value of the contract or the cash flows, and the possible inability of the counterparty to fulfill its obligations under the agreement. The Portfolio’s maximum risk of loss from counterparty credit risk is the discounted net value of the cash flows to be received from/paid to the counterparties over the contracts’ remaining lives, to the extent that amount is positive. This risk is mitigated by having a master netting arrangement between the Portfolio and the counterparty, and by the posting of collateral.
Futures contracts: The Portfolio is subject to equity risk, credit risk, commodity risk, interest rate risk and foreign exchange rate risk in the normal course of pursuing its investment objective. The Portfolio uses futures contracts to gain exposure to, or hedge against, changes in the value of equities and commodities, interest rates, or foreign currencies. A futures contract represents a commitment for the future purchase or sale of an asset at a specified price on a specified date. Upon entering into such contracts, the Portfolio is required to deposit with the broker, either in cash or in securities, an initial margin in an amount equal to a certain percentage of the contract amount. Subsequent payments (variation margin) are paid or received by the Portfolio, depending on the daily fluctuations in the value of the contract, and are recorded for financial statement purposes as unrealized gains or losses by the Portfolio. Upon entering into such contracts, the Portfolio bears the risk of equity and commodity prices, interest rates, or exchange rates moving unexpectedly, in which case, the Portfolio may not achieve the anticipated benefits of the futures contracts and may realize losses. With futures, there is minimal counterparty credit risk to the Portfolio since futures are exchange-traded and the exchange’s clearinghouse, as counterparty to all exchange-traded futures, guarantees the futures against default. Futures contracts are generally entered into on a regulated futures exchange and cleared through a clearinghouse associated with the exchange.
Forward foreign currency contracts: The Portfolio is subject to foreign exchange rate risk exposure in the normal course of pursuing its investment objective. The Portfolio may enter into forward foreign currency contracts to hedge against exchange rate risk arising from investments in securities denominated in foreign currencies. Forward foreign currency contracts are marked-to-market daily, with the change in value recorded as an unrealized gain or loss and is shown in Unrealized appreciation (depreciation) on forward foreign currency contracts within the Statement of Assets and Liabilities. When the contracts are settled, a realized gain or loss is incurred and is shown in Net realized gain (loss) on forward foreign currency contracts within the Statement of Operations. Risks may arise from changes in market value of the underlying currencies and from the possible inability of counterparties to meet the terms of their contracts. Forward foreign currency contracts are traded in the OTC inter-bank currency dealer market.
|
|
|
| Transamerica Series Trust |
|
Semi-Annual Financial Statements 2024 |
Page 12
Transamerica BlackRock iShares Tactical - Conservative VP
NOTES TO FINANCIAL STATEMENTS (continued)
At June 30, 2024
(unaudited)
5. RISK EXPOSURES AND THE USE OF DERIVATIVE INSTRUMENTS (continued)
The following is a summary of the location and the effect of derivative investments within the Statement of Operations, categorized by primary market risk exposure as of June 30, 2024.
|
|
|
|
|
|
|
|
|
|
|
|
|
|
|
|
|
|
|
|
|
|
|
|
|
| Realized Gain (Loss) on Derivative Instruments |
|
| Location |
|
Interest Rate Contracts |
|
|
Foreign Exchange Contracts |
|
|
Equity Contracts |
|
|
Credit Contracts |
|
|
Commodity Contracts |
|
|
Total |
|
| Purchased options and swaptions (A) |
|
$ |
— |
|
|
$ |
— |
|
|
$ |
(585,058 |
) |
|
$ |
— |
|
|
$ |
— |
|
|
$ |
(585,058) |
|
| Written options and swaptions |
|
|
42,457 |
|
|
|
— |
|
|
|
— |
|
|
|
— |
|
|
|
— |
|
|
|
42,457 |
|
| Swap agreements |
|
|
1,933,247 |
|
|
|
— |
|
|
|
— |
|
|
|
19,729 |
|
|
|
— |
|
|
|
1,952,976 |
|
| Futures contracts |
|
|
447,237 |
|
|
|
— |
|
|
|
4,359,706 |
|
|
|
— |
|
|
|
— |
|
|
|
4,806,943 |
|
| Forward foreign currency contracts |
|
|
— |
|
|
|
96,555 |
|
|
|
— |
|
|
|
— |
|
|
|
— |
|
|
|
96,555 |
|
| Total |
|
$ |
2,422,941 |
|
|
$ |
96,555 |
|
|
$ |
3,774,648 |
|
|
$ |
19,729 |
|
|
$ |
— |
|
|
$ |
6,313,873 |
|
| |
|
|
|
|
|
|
|
|
|
|
|
|
|
|
|
|
|
|
|
|
|
|
|
|
|
| Net Change in Unrealized Appreciation (Depreciation) on Derivative Instruments |
|
| Location |
|
Interest Rate Contracts |
|
|
Foreign Exchange Contracts |
|
|
Equity Contracts |
|
|
Credit Contracts |
|
|
Commodity Contracts |
|
|
Total |
|
| Purchased options and swaptions (B) |
|
$ |
— |
|
|
$ |
— |
|
|
$ |
63,195 |
|
|
$ |
— |
|
|
$ |
— |
|
|
$ |
63,195 |
|
| Written options and swaptions |
|
|
3,484 |
|
|
|
— |
|
|
|
— |
|
|
|
— |
|
|
|
— |
|
|
|
3,484 |
|
| Swap agreements |
|
|
(1,390,657) |
|
|
|
— |
|
|
|
— |
|
|
|
(14,791) |
|
|
|
— |
|
|
|
(1,405,448) |
|
| Futures contracts |
|
|
964,228 |
|
|
|
— |
|
|
|
(2,299,955 |
) |
|
|
— |
|
|
|
— |
|
|
|
(1,335,727) |
|
| Forward foreign currency contracts |
|
|
— |
|
|
|
2,540 |
|
|
|
— |
|
|
|
— |
|
|
|
— |
|
|
|
2,540 |
|
| Total |
|
$ |
(422,945) |
|
|
$ |
2,540 |
|
|
$ |
(2,236,760 |
) |
|
$ |
(14,791) |
|
|
$ |
— |
|
|
$ |
(2,671,956) |
|
| |
|
|
|
|
|
|
|
|
|
|
|
|
|
|
|
|
|
|
|
|
|
|
|
|
| (A) |
Included within Net realized gain (loss) on Investments in the Statement of Operations. |
| (B) |
Included within Net change in unrealized appreciation (depreciation) on Investments in the Statement of Operations. |
The following is a summary of the ending monthly average volume on derivative activity during the period ended June 30, 2024.
|
|
|
|
|
| Options: |
|
|
|
|
| Average value of option contracts purchased |
|
$ |
440,854 |
|
| Average value of option contracts written |
|
|
(1,834 |
) |
| Average notional value of swaption contracts written |
|
|
(1,728,571 |
) |
| Credit default swaps: |
|
|
|
|
| Average notional value — sell protection |
|
|
514,286 |
|
| Interest rate swaps: |
|
|
|
|
| Average notional value — pays fixed rate |
|
|
7,335,418 |
|
| Average notional value — receives fixed rate |
|
|
5,402,862 |
|
| Futures contracts: |
|
|
|
|
| Average notional value of contracts — long |
|
|
54,842,798 |
|
| Average notional value of contracts — short |
|
|
(19,230,213 |
) |
| Forward foreign currency exchange contracts: |
|
|
|
|
| Average contract amounts purchased — in USD |
|
|
2,671,215 |
|
| Average contract amounts sold — in USD |
|
|
5,314,414 |
|
The Portfolio typically enters into International Swaps and Derivatives Association, Inc. Master Agreements (“ISDA Master Agreements”) or similar master agreements (collectively, “Master Agreements”) with its contract counterparties for certain OTC derivatives in order to, among other things, reduce credit risk to counterparties.
|
|
|
| Transamerica Series Trust |
|
Semi-Annual Financial Statements 2024 |
Page 13
Transamerica BlackRock iShares Tactical - Conservative VP
NOTES TO FINANCIAL STATEMENTS (continued)
At June 30, 2024
(unaudited)
5. RISK EXPOSURES AND THE USE OF DERIVATIVE INSTRUMENTS (continued)
ISDA Master Agreements include provisions for general obligations, representations, collateral and events of default or termination. Under an ISDA Master Agreement, the Portfolio typically may offset with the counterparty certain OTC derivative financial instruments payables and/or receivables with collateral held and/or posted and create one single net payment (close-out netting) in the event of default, termination and/or potential deterioration in the credit quality of the counterparty.
Various Master Agreements govern the terms of certain transactions with counterparties and typically attempt to reduce the counterparty risk associated with such transactions by specifying credit protection mechanisms and providing standardization that improves legal certainty. Cross-termination provisions under Master Agreements typically provide that a default in connection with one transaction between the Portfolio and a counterparty gives the non-defaulting party the right to terminate any other transactions in place with the defaulting party to create one single net payment due to/due from the defaulting party and may be a feature in certain Master Agreements. In the event the Portfolio exercises its right to terminate a Master Agreement after a counterparty experiences a termination event as defined in the Master Agreement, the return of collateral with market value in excess of the Portfolio’s net liability may be delayed or denied.
Collateral requirements: Collateral or margin requirements are set by the broker or exchange clearing house for exchange-traded derivatives (futures contracts, exchange-traded options, and exchange-traded swap agreements) while collateral terms are contract specific for OTC derivatives (forward foreign currency exchange contracts, OTC options, and OTC swap agreements). For OTC derivatives, under standard derivatives agreements, the Portfolio may be required to pledge collateral on derivatives to a counterparty if the Portfolio is in a net liability position, and receive collateral if in a net positive position. For financial reporting purposes, cash collateral that has been pledged by the Portfolio to cover obligations, if any, is reported in Cash collateral at broker within the Statement of Assets and Liabilities. Cash collateral that has been received by the Portfolio from a counterparty, if any, is reported separately in Cash collateral pledged at custodian and/or broker within the Statement of Assets and Liabilities. Non-cash collateral pledged to the Portfolio, if any, is disclosed within the Schedule of Investments.
Generally, the amount of collateral due from or to a party must exceed a minimum transfer amount threshold before a transfer has been made. Typically a counterparty is not permitted to sell, re-pledge or use cash and non-cash collateral it receives. The Portfolio generally does not use non-cash collateral that it receives but may, absent default or certain other circumstances, be permitted to use cash collateral received. In such cases, interest may be paid pursuant to the collateral arrangement with the counterparty.
To the extent amounts due to the Portfolio from its counterparties are not fully collateralized, contractually or otherwise, the Portfolio bears the risk of loss from counterparty non-performance. Additionally, to the extent the Portfolio has delivered collateral to a counterparty, the Portfolio bears the risk of loss from a counterparty in the event the counterparty fails to return such collateral. Counterparties may immediately terminate derivatives contracts if the Portfolio fails to maintain sufficient asset coverage for its contracts or its net assets decline by stated percentages. Collateral may not be required for all derivative contracts.
6. RISK FACTORS
Investing in the Portfolio involves certain key risks related to the Portfolio’s trading activity. Please reference the Portfolio’s prospectus for a more complete discussion of the following risk(s), as well as other risks of investing in the Portfolio.
Market risk: The market prices of the Portfolio’s securities or other assets may go up or down, sometimes rapidly or unpredictably, due to factors such as economic events, inflation, changes in interest rates, governmental actions or interventions, actions taken by the U.S. Federal Reserve or foreign central banks, market disruptions caused by tariffs, trade disputes or other factors, political developments, armed conflicts, economic sanctions, cybersecurity events, investor sentiment, the global and domestic effects of widespread or local health, weather or climate events, and other factors that may or may not be related to the issuer of the security or other asset. If the market prices of the Portfolio’s securities and assets fall, the value of your investment in the Portfolio could go down.
Economies and financial markets throughout the world are increasingly interconnected. Events or circumstances in one or more countries or regions could be highly disruptive to, and have profound impacts on, global economies or markets. As a result, whether or not the Portfolio invests in securities of issuers located in or with significant exposure to the countries directly affected, the value and liquidity of the Portfolio’s investments may go down.
Equity securities risk: Equity securities generally have greater risk of loss than debt securities. Stock markets are volatile and the value of equity securities may go up or down, sometimes rapidly and unpredictably. The market price of an equity security may fluctuate based on overall market conditions, such as real or perceived adverse economic or political conditions or trends, tariffs and trade disruptions, inflation, substantial economic downturn or recession, changes in interest rates, or adverse investor sentiment. The market price of an
|
|
|
| Transamerica Series Trust |
|
Semi-Annual Financial Statements 2024 |
Page 14
Transamerica BlackRock iShares Tactical - Conservative VP
NOTES TO FINANCIAL STATEMENTS (continued)
At June 30, 2024
(unaudited)
6. RISK FACTORS (continued)
equity security also may fluctuate based on real or perceived factors affecting a particular industry or industries or the company itself. If the market prices of the equity securities owned by the Portfolio fall, the value of your investment in the Portfolio will decline. The Portfolio may lose its entire investment in the equity securities of an issuer. A change in financial condition or other event affecting a single issuer may adversely impact securities markets as a whole.
Fixed-income securities risk: Risks of fixed-income securities include credit risk, interest rate risk, counterparty risk, prepayment risk, extension risk, valuation risk, and liquidity risk. The value of fixed-income securities may go up or down, sometimes rapidly and unpredictably, due to general market conditions, such as real or perceived adverse economic or political conditions, tariffs and trade disruptions, inflation, changes in interest rates, lack of liquidity in the bond markets or adverse investor sentiment. In addition, the value of a fixed-income security may decline if the issuer or other obligor of the security fails to pay principal and/or interest, otherwise defaults or has its credit rating downgraded or is perceived to be less creditworthy, or the credit quality or value of any underlying assets declines. If the value of fixed-income securities owned by the Portfolio falls, the value of your investment will go down. The Portfolio may lose its entire investment in the fixed-income securities of an issuer.
7. FEES AND OTHER AFFILIATED TRANSACTIONS
TST serves as a funding vehicle for certain affiliated asset allocation portfolios and certain affiliated separate accounts of Transamerica Life Insurance Company (“TLIC”) and Transamerica Financial Life Insurance Company.
TAM, the Portfolio’s investment manager, is directly owned by TLIC and AUSA Holding, LLC (“AUSA”), both of which are indirect, wholly owned subsidiaries of Aegon Ltd. TLIC is owned by Commonwealth General Corporation (“Commonwealth”). Commonwealth and AUSA are wholly owned by Transamerica Corporation (DE). Transamerica Corporation (DE) is wholly owned by Aegon International B.V., which is wholly owned by Aegon Ltd., a Bermuda exempted company with liability limited by shares (formerly, Aegon NV, a Netherlands corporation) and a publicly traded international insurance group.
Transamerica Fund Services, Inc. (“TFS”) is the Portfolio’s transfer agent. Transamerica Capital, Inc. (“TCI”) is the Portfolio’s distributor/principal underwriter. TAM, TFS and TCI are affiliates of Aegon Ltd.
Certain officers and trustees of the Portfolio may also be officers and/or trustees of TAM, TFS and TCI. No interested trustee who is deemed an interested person due to current or former service with TAM or an affiliate of TAM receives compensation from the Portfolio. The Portfolio does pay non-interested persons (independent trustees), as disclosed in Trustee and CCO fees within the Statement of Operations.
Investment management fees: TAM serves as the Portfolio’s investment manager, performing administration as well as investment advisory services. TAM renders investment advisory, supervisory, and administration services under an investment management agreement and the Portfolio pays a single management fee, which is reflected in Investment management fees within the Statement of Operations.
The Portfolio pays a management fee to TAM based on daily average net assets at the following rates:
|
|
|
|
|
| Breakpoints |
|
Rate |
|
| Effective May 1, 2024 |
|
|
|
|
| First $500 million |
|
|
0.5000 |
% |
| Over $500 million up to $1 billion |
|
|
0.4900 |
|
| Over $1 billion up to $2.5 billion |
|
|
0.4725 |
|
| Over $2.5 billion up to $3.5 billion |
|
|
0.4650 |
|
| Over $3.5 billion up to $4.5 billion |
|
|
0.4525 |
|
| Over $4.5 billion |
|
|
0.4400 |
|
| Prior to May 1, 2024 |
|
|
|
|
| First $750 million |
|
|
0.7900 |
|
| Over $750 million to $1.5 billion |
|
|
0.7800 |
|
| Over $1.5 billion |
|
|
0.7500 |
|
|
|
|
| Transamerica Series Trust |
|
Semi-Annual Financial Statements 2024 |
Page 15
Transamerica BlackRock iShares Tactical - Conservative VP
NOTES TO FINANCIAL STATEMENTS (continued)
At June 30, 2024
(unaudited)
7. FEES AND OTHER AFFILIATED TRANSACTIONS (continued)
TAM has contractually agreed, through May 1, 2025, to waive from its management fees an amount equal to the sub-advisory fee waiver by the Portfolio’s sub-adviser. These amounts are not subject to recapture by TAM.
TAM has contractually agreed to waive fees and/or reimburse Portfolio expenses to the extent that the total operating expenses excluding, as applicable, acquired fund fees and expenses, interest (including borrowing costs and overdraft charges), taxes, brokerage commissions, dividend and interest expenses on securities sold short, extraordinary expenses and other expenses not incurred in the ordinary course of the Portfolio’s business, exceed the following stated annual operating expense limits to the Portfolio’s daily average net assets. To the extent an expense limit changed during the period, the prior limit is also listed below. The expenses waived and/or reimbursed, if any, are included in Expenses waived and/or reimbursed within the Statement of Operations.
|
|
|
|
|
|
|
|
|
| Class |
|
Operating Expense Limit |
|
|
Operating Expense Limit Effective Through |
|
| Effective May 1, 2024 |
|
|
|
|
|
|
|
|
| Initial Class |
|
|
0.63% |
|
|
|
May 1, 2025 |
|
| Service Class |
|
|
0.88 |
|
|
|
May 1, 2025 |
|
| Prior to May 1, 2024 |
|
|
|
|
|
|
|
|
| Initial Class |
|
|
0.92 |
|
|
|
|
|
| Service Class |
|
|
1.17 |
|
|
|
|
|
TAM is permitted to recapture amounts contractually waived and/or reimbursed to a class during any of the 36 months from the date on which TAM waived fees and/or reimbursed expenses for the class. A class may recapture and reimburse TAM only if such amount does not cause, on any particular business day of the Portfolio, the class’s total annual operating expenses (after the recapture is taken into account) to exceed the Operating Expense Limits or any other lower limit then in effect. Amounts recaptured, if any, by TAM for the period ended June 30, 2024 are disclosed in Recapture of previously waived and/or reimbursed fees within the Statement of Operations.
TAM, on a voluntary basis and in addition to the contractual operating expense limits in effect, from time to time may waive and/or reimburse expenses of the Portfolio, or any classes thereof, to such level(s) as the Trust’s officers have determined or may reasonably determine from time to time. Any such voluntary waiver or expense reimbursement may be discontinued by TAM at any time. These amounts are not subject to recapture by TAM.
As of June 30, 2024, there are no amounts available for recapture by TAM.
Distribution and service fees: TST has a distribution plan (“Distribution Plan”) pursuant to Rule 12b-1 under the 1940 Act. Pursuant to the Distribution Plan, TST entered into a distribution agreement with TCI as the Portfolio’s distributor.
The Distribution Plan requires the Portfolio to pay distribution fees to TCI as compensation for various distribution activities, not as reimbursement for specific expenses. Under the Distribution Plan and distribution agreement, TCI, on behalf of the Portfolio, is authorized to pay various service providers, as direct payment for expenses incurred in connection with distribution of the Portfolio’s shares.
The fee on the Service Class shares is paid to the insurance companies for providing services and account maintenance for the policyholders who invest in the variable insurance products which invest in the Service Class shares. TCI has determined that it will not seek payment for the distribution expenses incurred by the Portfolio with respect to the Initial Class shares before May 1, 2025. Prior to TCI seeking distribution expenses on Initial Class shares, policy and contract owners will be notified in advance. The Portfolio will pay fees relating to Service Class shares. The distribution and service fees are included in Distribution and service fees within the Statement of Operations.
The Portfolio is authorized under the Distribution Plan to pay fees to TCI based on daily average net assets of each applicable class up to the following annual rates:
|
|
|
|
|
| Class |
|
Rate |
|
| Initial Class |
|
|
0.15 |
% |
| Service Class |
|
|
0.25 |
|
|
|
|
| Transamerica Series Trust |
|
Semi-Annual Financial Statements 2024 |
Page 16
Transamerica BlackRock iShares Tactical - Conservative VP
NOTES TO FINANCIAL STATEMENTS (continued)
At June 30, 2024
(unaudited)
7. FEES AND OTHER AFFILIATED TRANSACTIONS (continued)
Transfer agent costs: TFS provides transfer agency services under an intercompany agreement with TAM. TFS has outsourced the provision of certain sub-transfer agency services to SS&C Global Investor & Distribution Solutions, Inc. (“SS&C GIDS”). The Portfolio does not pay a separate transfer agent fee to TAM or TFS but does pay certain expenses to SS&C GIDS related to applicable sub-transfer agency services. For the period ended June 30, 2024, (i) the expenses paid to SS&C GIDS by the Portfolio are referred to as transfer agent costs and are included within the Statement of Operations and (ii) the expenses payable to SS&C GIDS by the Portfolio are referred to as transfer agent costs within the Statement of Assets and Liabilities.
Brokerage commissions: The Portfolio incurred no brokerage commissions on security transactions placed with affiliates of the investment manager or sub-adviser(s) for the period ended June 30, 2024.
8. PURCHASES AND SALES OF SECURITIES
For the period ended June 30, 2024, the cost of securities purchased and proceeds from securities sold (excluding short-term securities) are as follows:
|
|
|
|
|
|
|
| Purchases of Securities |
|
Sales/Maturities of Securities |
| Long-Term |
|
U.S. Government |
|
Long-Term |
|
U.S. Government |
| $ 178,468,477 |
|
$ 68,605,876 |
|
$ 76,399,987 |
|
$ 130,476,272 |
9. FEDERAL INCOME TAXES AND DISTRIBUTIONS TO SHAREHOLDERS
The Portfolio has not made any provision for federal income or excise taxes due to its policy to distribute all of its taxable income and capital gains to its shareholders and otherwise qualify as a regulated investment company under Subchapter M of the Internal Revenue Code. The Portfolio recognizes the tax benefits of uncertain tax positions only where the position is “more likely than not” to be sustained assuming examination by tax authorities. The Portfolio’s tax returns remain subject to examination by the Internal Revenue Service and state tax authorities three years from the date of filing for federal purposes and four years from the date of filing for state purposes. Management has evaluated the Portfolio’s tax provisions taken for all open tax years, and has concluded that no provision for income tax is required in the Portfolio’s financial statements. If applicable, the Portfolio recognizes interest accrued related to unrecognized tax benefits in relation to interest and penalties expense in Other within the Statement of Operations. The Portfolio identifies its major tax jurisdictions as U.S. Federal, the state of Colorado, and foreign jurisdictions where the Portfolio makes significant investments; however, the Portfolio is not aware of any tax positions for which it is reasonably possible that the total amounts of unrecognized tax benefits will change materially in the next twelve months. Distributions are determined in accordance with income tax regulations, which may differ from GAAP.
As of June 30, 2024, the approximate cost for U.S. federal income tax purposes, and the aggregate gross/net unrealized appreciation (depreciation) in the value of investments (including securities sold short and derivatives, if any) are as follows:
|
|
|
|
|
|
|
|
|
|
|
| |
|
Cost |
|
Gross Appreciation |
|
Gross (Depreciation) |
|
Net Appreciation (Depreciation) |
|
|
|
|
$ 205,317,436 |
|
$ 5,437,600 |
|
$ — |
|
$ 5,437,600 |
|
|
Please see TST’s most recent report on Form N-CSR, available at: www.transamerica.com/annuities/prospectus, for additional information. For the most recently filed complete proxy voting records for the Trust please visit: https://www.transamerica.com/sites/default/files/files/e070d/TST%20N-PX%202021.pdf
|
|
|
| Transamerica Series Trust |
|
Semi-Annual Financial Statements 2024 |
Page 17
Transamerica BlackRock iShares Tactical - Conservative VP
MANAGEMENT AGREEMENT — CONTRACT RENEWAL
(unaudited)
At a meeting of the Board of Trustees of Transamerica Series Trust (the “Trustees” or the “Board”) held on June 12-13, 2024, the Board considered the renewal of the management agreement (the “Management Agreement”) between Transamerica Asset Management, Inc. (“TAM”) and Transamerica Series Trust, on behalf of Transamerica BlackRock iShares Tactical – Conservative VP (formerly, Transamerica PIMCO Tactical – Conservative VP) (the “Portfolio”).
Following its review and consideration, the Board determined that the terms of the Management Agreement were reasonable and that the renewal of the Management Agreement was in the best interests of the Portfolio and the holders invested in the Portfolio. The Board, including the independent members of the Board (the “Independent Trustees”), unanimously approved the renewal of the Management Agreement through June 30, 2025.
Prior to reaching their decision, the Trustees requested and received from TAM certain information. They then reviewed such information as they deemed reasonably necessary to evaluate the Management Agreement, including information they had previously received from TAM as part of their regular oversight of the Portfolio, and knowledge they gained over time through meeting with TAM. Among other materials, the Trustees considered comparative fee, expense and performance information prepared by Broadridge Financial Solutions, Inc. (“Broadridge”), an independent provider of mutual fund performance information, as well as fee, expense and profitability information prepared by TAM. In addition, TAM provided the Board with additional supplemental comparative performance information. The Board also considered reductions to the Portfolio’s expense limits, if any, that took effect after the last renewal of the Management Agreement. In their review, the Trustees also sought to identify instances in which the Portfolio’s performance, fees, total expenses and/or profitability appeared to be outliers within its respective peer group or other comparative metrics and sought to understand the reasons for such comparative positions.
In their deliberations, the Independent Trustees met privately without representatives of TAM present and were represented throughout the process by their independent legal counsel. In considering the proposed continuation of the Management Agreement, the Trustees evaluated and weighed a number of considerations that they believed to be relevant in light of the legal advice furnished to them by counsel, including independent legal counsel, and made a decision in the exercise of their own business judgment. They based their decisions on the considerations discussed below, among others, although they did not identify any particular consideration or item of information that was controlling of their decisions, and each Trustee may have attributed different weights to the various factors.
Nature, Extent and Quality of the Services Provided
The Board considered the nature, extent and quality of the services provided by TAM to the Portfolio in the past and the services anticipated to be provided in the future. The Board also considered the investment approach for the Portfolio; the experience, capability and integrity of TAM’s senior management; the financial resources of TAM; TAM’s management oversight process; and TAM’s responsiveness to any questions by the Trustees.
The Board also considered the continuous and regular investment management and other services provided by TAM, when acting as a manager of managers, for the portion of the management fee it retains from the Portfolio after payment of the sub-advisory fees. The Board noted that the investment management and other services provided by TAM include the design, development and ongoing review and evaluation of the Portfolio and its investment strategy; the selection, oversight and monitoring of one or more investment sub-advisers to perform certain duties with respect to the Portfolio; ongoing portfolio trading oversight and analysis; risk management oversight and analysis; design, development, implementation and ongoing review and evaluation of a process for the valuation of Portfolio investments; design, development, implementation and ongoing review and evaluation of a compliance program for the Portfolio; design, development, implementation and ongoing review and evaluation of a process for the voting of proxies and exercise of rights to consent to corporate action for Portfolio investments; participation in Board meetings and oversight of preparation of materials for the Board, including materials for Board meetings and regular communications with the Board; oversight of preparation of the Portfolio’s prospectus, statement of additional information, shareholder reports and other disclosure materials and regulatory filings for the Portfolio; and ongoing cash management services for the Portfolio. The Board considered that TAM’s investment management services also include the provision of supervisory and administrative services to the Portfolio. The Board also noted that TAM, as part of the services it provides to all Transamerica mutual funds, including the Portfolio, oversees the services provided by the funds’ custodian, transfer agent, independent accountant and legal counsel and supervises the performance of the recordkeeping and holder service functions of the funds.
Investment Performance
In addition, the Board considered the short- and longer-term performance of the Portfolio in light of its investment objective, policies and strategies, including relative performance against (i) a peer universe of comparable mutual funds, as prepared by Broadridge, and (ii) the Portfolio’s benchmarks, in each case for various trailing periods ended December 31, 2023. Based on these considerations, the Board determined that TAM can provide investment and related services that are appropriate in scope and extent in light of the Portfolio’s investment objectives, policies and strategies and operations, the competitive landscape of the investment company business and investor needs. The Board’s conclusions as to the Portfolio’s performance are summarized below. For purposes of its review, the Board generally used the performance of Service Class Shares. In describing the Portfolio’s performance relative to its peer universe, the summary conclusions characterize performance for the relevant periods in relation to whether it was “above,” “below” or “in line with” the peer universe median and do so using quintile rankings prepared by Broadridge. For simplicity, performance is described as “above” the median if the Portfolio’s performance ranked anywhere in the first or second quintiles, as “below” the median if it ranked anywhere in the
|
|
|
| Transamerica Series Trust |
|
Semi-Annual Financial Statements 2024 |
Page 18
Transamerica BlackRock iShares Tactical - Conservative VP
MANAGEMENT AGREEMENT — CONTRACT RENEWAL (continued)
(unaudited)
fourth or fifth quintiles, or “in line with” the median if it ranked anywhere in the third quintile (i.e., even if its precise return was somewhat above or somewhat below the precise median return).
When considering the Portfolio’s performance, the Trustees considered any representations made by TAM regarding the appropriateness of certain peer groups and benchmarks. They recognized that performance reflects a snapshot of a period as of a specific date, and that consideration of performance data for a different period could generate significantly different performance results. The Trustees also recognized that even longer-term performance can be negatively affected by performance over a short-term period when that short-term performance is significantly below the performance of the comparable benchmark or universe of peer funds.
The Board noted that the performance of Service Class Shares of the Portfolio was below the median for its peer universe and below the benchmark that TAM utilized to measure performance of the Portfolio as of December 31, 2023,1 each for the past 1-, 3-, 5- and 10-year periods. The Trustees discussed the reasons for the underperformance with TAM and TAM agreed to continue to closely monitor and report to the Board on the performance of the Portfolio. The Board noted that the Portfolio’s sub-adviser had commenced sub-advising the Portfolio on May 1, 2024 pursuant to its current investment strategies and benchmarks.
Management Fee and Total Expense Ratio
The Board considered the management fee and total expense ratio of the Portfolio, including information provided by Broadridge comparing the management fee and total expense ratio of the Portfolio to the management fees and total expense ratios of comparable investment companies in both a peer group and broader peer universe compiled by Broadridge. The Board’s conclusions as to the Portfolio’s management fee and total expense ratio are summarized below. For purposes of its review, the Board generally used the actual total expenses (i.e., expenses reflecting any waivers and/or reimbursements) of Service Class Shares. In describing the Portfolio’s management fee and total expense ratio relative to its peer group and peer universe, the summary conclusions characterize management fees and total expense ratios for the relevant periods in relation to whether they were “above,” “below” or “in line with” the peer group or peer universe median and do so using quintile rankings prepared by Broadridge. For simplicity, management fees and total expense ratios are described as “above” the median if the Portfolio’s management fee or total expense ratio ranked anywhere in the fourth or fifth quintiles, as “below” the median if it ranked anywhere in the first or second quintiles, or “in line with” the median if it ranked anywhere in the third quintile (i.e., even if its precise management fee or total expense ratio was somewhat above or somewhat below the precise median management fee or total expense ratio). The Board also considered the fees charged by the Portfolio’s sub-adviser for sub-advisory services, as well as the portion of the Portfolio’s management fee retained by TAM following payment of the sub-advisory fee and how the portion of the contractual management fee retained by TAM at a specified asset level compared to the portions retained by other investment advisers managing mutual funds with similar investment strategies as calculated by an independent provider of information.
The Board noted that the Portfolio’s contractual management fee was below the medians for its peer group and peer universe and that the actual total expenses (i.e., expenses reflecting any waivers and/or reimbursements) of Service Class Shares of the Portfolio were in line with the median for its peer group and above the median for its peer universe. The Trustees also considered that TAM has entered into an expense limitation arrangement with the Portfolio, which may result in TAM waiving fees for the benefit of holders. The Trustees noted that they had previously approved a reduction to the Portfolio’s management fee schedule, which took effect on May 1, 2024 and was not fully reflected in the comparative data.
On the basis of these considerations, together with the other information it considered, the Board determined that the management fee to be received by TAM under the Management Agreement is reasonable in light of the services provided.
Cost of Services Provided and Level of Profitability
The Board reviewed information provided by TAM about the cost of providing and procuring fund management services, as well as the costs of the provision of administration, transfer agency and other services, to the Portfolio and to Transamerica Series Trust as a whole by TAM and its affiliates. The Board considered the profitability of TAM and its affiliates in providing these services for the Portfolio and Transamerica Series Trust as a whole. The Trustees recognized the competitiveness of the mutual fund industry and the importance of an investment adviser’s long-term profitability, including for maintaining company and management stability and accountability.
The Board also considered the allocation methodology used for calculating the profitability of TAM and its affiliates. The Board noted that the revenue and expense allocation methodology used by TAM to estimate its profitability with respect to its relationship with the Portfolio had been reviewed previously by an independent consultant. The Trustees considered that TAM reported that it had not made material changes to this methodology, and that the methodology had been applied consistently for the Portfolio.
Based on this information, the Board determined that the profitability of TAM and its affiliates from their relationships with the Portfolio was not excessive.
1 Effective May 1, 2024, the blended benchmark utilized by TAM to measure the Portfolio’s performance changed in conjunction with a change to the Portfolio’s sub-adviser.
|
|
|
| Transamerica Series Trust |
|
Semi-Annual Financial Statements 2024 |
Page 19
Transamerica BlackRock iShares Tactical - Conservative VP
MANAGEMENT AGREEMENT — CONTRACT RENEWAL (continued)
(unaudited)
Economies of Scale
The Board considered economies of scale with respect to the management of the Portfolio, whether the Portfolio had appropriately benefited from any economies of scale and whether there was the potential for realization of any future economies of scale. The Board also considered the existence of economies of scale with respect to management of the Transamerica mutual funds overall and the extent to which the Portfolio benefited from any economies of scale. The Board recognized that, as the Portfolio’s assets increase, any economies of scale realized by TAM may not directly correlate with any economies of scale that might be realized by the Portfolio. The Board considered the Portfolio’s management fee schedule and the existence of breakpoints and also considered the extent to which TAM shared economies of scale, if any, with the Portfolio through undertakings to limit or reimburse Portfolio expenses and to invest in maintaining and developing its capabilities and services. The Trustees concluded that the Portfolio’s fee structure reflected an appropriate sharing of any efficiencies or economies of scale to date and noted that they will have the opportunity to periodically reexamine the appropriateness of the management fee payable to TAM in light of any economies of scale experienced in the future.
Benefits to TAM and/or its Affiliates from their Relationships with the Portfolio
The Board considered other benefits derived by TAM and/or its affiliates from their relationships with the Portfolio. The Board noted that TAM does not receive benefits from research obtained with commissions paid to broker-dealers for portfolio transactions (commonly referred to as “soft dollars”) as a result of its relationship with the Portfolio.
Other Considerations
The Board noted that TAM has made a substantial commitment to the recruitment and retention of high-quality personnel and maintains the financial, compliance and operational resources reasonably necessary to manage the Portfolio in a professional manner that is consistent with the best interests of the Portfolio and the holders. In this regard, the Board favorably considered the procedures and policies TAM has in place to enforce compliance with applicable laws and regulations and oversee the portfolio management activities of the Portfolio’s sub-adviser. The Board also noted that TAM has made an entrepreneurial commitment and undertaken certain business risks with respect to the management and success of the Portfolio.
Conclusion
After consideration of the factors described above, as well as other factors, the Trustees, including the Independent Trustees, concluded that the renewal of the Management Agreement was in the best interests of the Portfolio and the holders and voted to approve the renewal of the Management Agreement.
|
|
|
| Transamerica Series Trust |
|
Semi-Annual Financial Statements 2024 |
Page 20
PROXY VOTING POLICIES AND PROCEDURES AND QUARTERLY PORTFOLIO HOLDINGS
(unaudited)
A description of Transamerica Series Trust’s (the “Trust”) proxy voting policies and procedures is available in the Statement of Additional Information of the Portfolios, available without charge upon request by calling 1-800-851-9777 (toll free) or on the Securities and Exchange Commission’s (“SEC”) website at http://www.sec.gov.
In addition, the Portfolio is required to file Form N-PX, with their complete proxy voting records for the most recent 12 months ended June 30th, no later than August 31st of each year. The Form is available without charge: (1) on the Transamerica Funds website at https://www.transamerica.com/sites/default/files/files/e070d/TST%20N-PX%202021.pdf; and (2) on the SEC’s website at http://www.sec.gov.
Each fiscal quarter, the Portfolios, except Transamerica BlackRock Government Money Market VP, will file with the SEC a complete schedule of its monthly portfolio holdings on Form N-PORT. The Portfolios’ holdings as of the end of the third month of every fiscal quarter, as reported on Form N-PORT, will be publicly available on the SEC’s website at http://www.sec.gov within 60 days of the end of the fiscal quarter.
On a monthly basis, Transamerica BlackRock Government Money Market VP will file with the SEC portfolio holdings information on Form N-MFP3. A complete schedule of portfolio holdings is also available at www.transamerica.com.
You may also visit the Trust’s website at www.transamerica.com/annuities/prospectus for this and other information about the Portfolios and the Trust.
Important Notice Regarding Delivery of Shareholder Documents
Every year we provide shareholders informative materials such as the Transamerica Series Trust Annual Report, the Transamerica Series Trust Prospectus, and other required documents that keep you informed regarding your Portfolios. To the extent provided by mail, Transamerica Series Trust will only send one piece per mailing address, a method that saves your Portfolios money by reducing mailing and printing costs. We will continue to do this unless you tell us not to. To elect to receive individual mailings, simply call a Transamerica Customer Service Representative toll free at 1-800-851-9777, 8 a.m. to 7 p.m. Eastern Time, Monday-Friday. Your request will take effect within 30 days.
|
|
|
| Transamerica Series Trust |
|
Semi-Annual Financial Statements 2024 |
Page 21
NOTICE OF PRIVACY POLICY
(unaudited)
Your privacy is very important to us. We want you to understand what information we collect and how we use it. We collect and use “nonpublic personal information” in connection with providing our customers with a broad range of financial products and services as effectively and conveniently as possible. We treat nonpublic personal information in accordance with our Privacy Policy.
What Information We Collect and From Whom We Collect It
We may collect nonpublic personal information about you from the following sources:
| • |
|
Information we receive from you on applications or other forms, such as your name, address, and account number; |
| • |
|
Information about your transactions with us, our affiliates, or others, such as your account balance and purchase/redemption history; and |
| • |
|
Information we receive from non-affiliated third parties, including consumer reporting agencies. |
What Information We Disclose and To Whom We Disclose It
We do not disclose any nonpublic personal information about current or former customers to anyone without their express consent, except as permitted by law. We may disclose the nonpublic personal information we collect, as described above, to persons or companies that perform services on our behalf and to other financial institutions with which we have joint marketing agreements. We will require these companies to protect the confidentiality of your nonpublic personal information and to use it only to perform the services for which we have hired them.
Our Security Procedures
We restrict access to your nonpublic personal information and only allow disclosures to persons and companies as permitted by law to assist in providing products or services to you. We maintain physical, electronic, and procedural safeguards to protect your nonpublic personal information and to safeguard the disposal of certain consumer information.
Contact Us
If you have any questions about our Privacy Policy, please call 1-800-851-9777 on any business day between 8 a.m. and 7 p.m. Eastern Time.
Note: This Privacy Policy applies only to customers that have a direct relationship with us or our affiliates. If you own shares of our portfolios in the name of a third party such as a bank or broker-dealer, its privacy policy may apply to you instead of ours.
|
|
|
| Transamerica Series Trust |
|
Semi-Annual Financial Statements 2024 |
Page 22
PO Box 219945
Kansas City, MO 64121-9945
|
|
|
| Distributor: |
|
Transamerica Capital, Inc. |
|
|
PO Box 219945 |
|
|
Kansas City, MO 64121-9945 |
|
|
|
|
Customer Service: 1-800-851-9777 |
Transamerica Series Trust Semi-Annual Financial Statements
June 30, 2024
1801 California St., Suite 5200
Denver, CO 80202
Distributor: Transamerica Capital, Inc.
Customer Service: 1-800-851-9777
|
| The following pages contain the most recent semi-annual financial statements for the investment options in which you are invested. In compliance with Securities and Exchange Commission regulations, we present these reports on an annual and semi-annual basis with the hope that they will foster greater understanding of the investment options’ holdings, performance, financial data, accounting policies and other issues. This streamlined version provides information only on the investment options in which you are invested. |
|
| If you have any questions about these reports, please do not hesitate to contact your financial professional. As always, we thank you for your trust and the opportunity to serve you. |
Transamerica BlackRock iShares Tactical - Growth VP
SCHEDULE OF INVESTMENTS
At June 30, 2024
(unaudited)
|
|
|
|
|
|
|
|
|
| |
|
Shares |
|
|
Value |
|
| EXCHANGE-TRADED FUNDS - 98.9% |
|
| International Equity Funds - 20.5% |
|
| iShares Core MSCI EAFE ETF |
|
|
219,273 |
|
|
$ |
15,927,991 |
|
| iShares Core MSCI Emerging Markets ETF |
|
|
132,558 |
|
|
|
7,095,830 |
|
| iShares MSCI Canada ETF (A) |
|
|
99,710 |
|
|
|
3,698,244 |
|
| iShares MSCI EAFE ETF (A) |
|
|
236,203 |
|
|
|
18,501,781 |
|
| iShares MSCI Emerging Markets ETF |
|
|
167,079 |
|
|
|
7,115,894 |
|
|
|
|
|
|
|
|
|
|
|
|
|
|
|
|
|
52,339,740 |
|
|
|
|
|
|
|
|
|
|
| U.S. Equity Funds - 52.7% |
|
| iShares Core S&P 500 ETF |
|
|
148,786 |
|
|
|
81,420,163 |
|
| iShares Core S&P Total U.S. Stock Market ETF |
|
|
445,942 |
|
|
|
52,968,990 |
|
|
|
|
|
|
|
|
|
|
|
|
|
|
|
|
|
134,389,153 |
|
|
|
|
|
|
|
|
|
|
| U.S. Fixed Income Funds - 25.7% |
|
| iShares Broad USD High Yield Corporate Bond ETF |
|
|
137,052 |
|
|
|
4,972,247 |
|
| iShares Broad USD Investment Grade Corporate Bond ETF |
|
|
401,483 |
|
|
|
20,158,461 |
|
| iShares Core U.S. Aggregate Bond ETF |
|
|
41,847 |
|
|
|
4,062,088 |
|
| iShares Short Treasury Bond ETF (A) |
|
|
328,211 |
|
|
|
36,267,316 |
|
|
|
|
|
|
|
|
|
|
|
|
|
|
|
|
|
65,460,112 |
|
|
|
|
|
|
|
|
|
|
| Total Exchange-Traded Funds
(Cost $240,582,365) |
|
|
|
|
|
|
252,189,005 |
|
|
|
|
|
|
|
|
|
|
|
|
|
|
|
|
|
|
|
| |
|
Shares |
|
|
Value |
|
| OTHER INVESTMENT COMPANY - 7.4% |
|
| Securities Lending Collateral - 7.4% |
|
| State Street Navigator Securities Lending Trust - Government Money Market Portfolio, 5.28% (B) |
|
|
18,855,305 |
|
|
$ |
18,855,305 |
|
|
|
|
|
|
|
|
|
|
| Total Other Investment Company
(Cost $18,855,305) |
|
|
|
|
|
|
18,855,305 |
|
|
|
|
|
|
|
|
|
|
|
|
|
| |
|
Principal |
|
|
Value |
|
| REPURCHASE AGREEMENT - 1.2% |
|
| Fixed Income Clearing Corp.,
2.50% (B), dated 06/28/2024, to be repurchased at $2,937,031 on 07/01/2024. Collateralized by a U.S. Government Obligation, 4.50%, due 03/31/2026, and with a value of $2,995,253. |
|
$ |
2,936,420 |
|
|
|
2,936,420 |
|
|
|
|
|
|
|
|
|
|
| Total Repurchase Agreement
(Cost $2,936,420) |
|
|
|
|
|
|
2,936,420 |
|
|
|
|
|
|
|
|
|
|
| Total Investments
(Cost $262,374,090) |
|
|
|
|
|
|
273,980,730 |
|
|
|
|
|
|
|
|
|
|
| Net Other Assets (Liabilities) - (7.5)% |
|
|
|
(19,095,634 |
) |
|
|
|
|
|
|
|
|
|
|
|
|
| Net Assets - 100.0% |
|
|
|
|
|
$ |
254,885,096 |
|
|
|
|
|
|
|
|
|
|
INVESTMENT VALUATION:
|
|
|
|
|
|
|
|
|
|
|
|
|
|
|
|
|
| Valuation Inputs (C) |
|
|
|
|
|
|
|
|
|
|
|
|
|
|
|
|
| |
|
Level 1 - Unadjusted Quoted Prices |
|
|
Level 2 - Other Significant Observable Inputs |
|
|
Level 3 - Significant Unobservable Inputs |
|
|
Value |
|
| ASSETS |
|
|
|
|
|
|
|
|
|
|
|
|
|
|
|
|
| Investments |
|
|
|
|
|
|
|
|
|
|
|
|
|
|
|
|
| Exchange-Traded Funds |
|
$ |
252,189,005 |
|
|
$ |
— |
|
|
$ |
— |
|
|
$ |
252,189,005 |
|
| Other Investment Company |
|
|
18,855,305 |
|
|
|
— |
|
|
|
— |
|
|
|
18,855,305 |
|
| Repurchase Agreement |
|
|
— |
|
|
|
2,936,420 |
|
|
|
— |
|
|
|
2,936,420 |
|
|
|
|
|
|
|
|
|
|
|
|
|
|
|
|
|
|
| Total Investments |
|
$ |
271,044,310 |
|
|
$ |
2,936,420 |
|
|
$ |
— |
|
|
$ |
273,980,730 |
|
|
|
|
|
|
|
|
|
|
|
|
|
|
|
|
|
|
FOOTNOTES TO SCHEDULE OF INVESTMENTS:
| (A) |
All or a portion of the security is on loan. The total value of the securities on loan is $18,465,973, collateralized by cash collateral of $18,855,305. The amount on loan indicated may not correspond with the securities on loan identified because a security with pending sales are in the process of recall from the brokers. |
| (B) |
Rate disclosed reflects the yield at June 30, 2024. |
| (C) |
There were no transfers in or out of Level 3 during the period ended June 30, 2024. Please reference the Investment Valuation section of the Notes to Financial Statements for more information regarding investment valuation and pricing inputs. |
|
|
|
| The Notes to Financial Statements are an integral part of this report. |
|
|
| Transamerica Series Trust |
|
Semi-Annual Financial Statements 2024 |
Page 1
Transamerica BlackRock iShares Tactical - Growth VP
STATEMENT OF ASSETS AND LIABILITIES
At June 30, 2024
(unaudited)
|
|
|
|
|
|
|
| Assets: |
|
|
|
|
| Unaffiliated investments, at value (cost $259,437,670) (including securities loaned of $18,465,973) |
|
$ |
271,044,310 |
|
| Repurchase agreement, at value (cost $2,936,420) |
|
|
2,936,420 |
|
| Receivables and other assets: |
|
|
|
|
| Net income from securities lending |
|
|
5,396 |
|
| Shares of beneficial interest sold |
|
|
34,177 |
|
| Interest |
|
|
2,805 |
|
| Prepaid expenses |
|
|
1,012 |
|
| |
|
| Total assets |
|
|
274,024,120 |
|
|
|
| Liabilities: |
|
|
|
|
| Cash collateral received upon return of: |
|
|
|
|
| Securities on loan |
|
|
18,855,305 |
|
| Payables and other liabilities: |
|
|
|
|
| Investments purchased |
|
|
2,192 |
|
| Shares of beneficial interest redeemed |
|
|
51,043 |
|
| Investment management fees |
|
|
87,417 |
|
| Distribution and service fees |
|
|
46,428 |
|
| Transfer agent costs |
|
|
251 |
|
| Trustee and CCO fees |
|
|
725 |
|
| Audit and tax fees |
|
|
22,119 |
|
| Custody fees |
|
|
38,097 |
|
| Legal fees |
|
|
6,987 |
|
| Printing and shareholder reports fees |
|
|
18,276 |
|
| Other accrued expenses |
|
|
10,184 |
|
|
|
| Total liabilities |
|
|
19,139,024 |
|
| |
|
| Net assets |
|
$ |
254,885,096 |
|
|
|
| Net assets consist of: |
|
|
|
|
| Capital stock ($0.01 par value) |
|
$ |
248,304 |
|
| Additional paid-in capital |
|
|
270,018,946 |
|
| Total distributable earnings (accumulated losses) |
|
|
(15,382,154 |
) |
| |
|
| Net assets |
|
$ |
254,885,096 |
|
|
|
| Net assets by class: |
|
|
|
|
| Initial Class |
|
$ |
11,735,018 |
|
| Service Class |
|
|
243,150,078 |
|
|
|
| Shares outstanding: |
|
|
|
|
| Initial Class |
|
|
1,105,968 |
|
| Service Class |
|
|
23,724,415 |
|
|
|
| Net asset value and offering price per share: |
|
|
|
|
| Initial Class |
|
$ |
10.61 |
|
| Service Class |
|
|
10.25 |
|
STATEMENT OF OPERATIONS
For the period ended June 30, 2024
(unaudited)
|
|
|
|
|
|
|
| Investment income: |
|
|
|
|
| Dividend income from unaffiliated investments |
|
$ |
1,418,793 |
|
| Interest income from unaffiliated investments |
|
|
4,266,361 |
|
| Net income from securities lending |
|
|
8,000 |
|
|
|
| Total investment income |
|
|
5,693,154 |
|
|
|
| Expenses: |
|
|
|
|
| Investment management fees |
|
|
896,015 |
|
| Distribution and service fees: |
|
|
|
|
| Service Class |
|
|
298,656 |
|
| Transfer agent costs |
|
|
1,432 |
|
| Trustee and CCO fees |
|
|
5,872 |
|
| Audit and tax fees |
|
|
21,873 |
|
| Custody fees |
|
|
40,634 |
|
| Legal fees |
|
|
23,983 |
|
| Printing and shareholder reports fees |
|
|
17,653 |
|
| Other |
|
|
15,481 |
|
| |
|
| Total expenses before waiver and/or reimbursement and recapture |
|
|
1,321,599 |
|
| |
|
| Expenses waived and/or reimbursed: |
|
|
|
|
| Initial Class |
|
|
(958 |
) |
| Service Class |
|
|
(19,849 |
) |
|
|
| Net expenses |
|
|
1,300,792 |
|
| |
|
| Net investment income (loss) |
|
|
4,392,362 |
|
|
|
| Net realized gain (loss) on: |
|
|
|
|
| Unaffiliated investments |
|
|
(14,502,434 |
) |
| Written options and swaptions |
|
|
24,864 |
|
| Swap agreements |
|
|
1,038,710 |
|
| Futures contracts |
|
|
13,397,292 |
|
| Forward foreign currency contracts |
|
|
90,043 |
|
| Foreign currency transactions |
|
|
(24,852 |
) |
| TBA commitments |
|
|
79,990 |
|
| |
|
| Net realized gain (loss) |
|
|
103,613 |
|
|
|
| Net change in unrealized appreciation (depreciation) on: |
|
|
|
|
| Unaffiliated investments |
|
|
19,791,708 |
|
| Written options and swaptions |
|
|
(389 |
) |
| Swap agreements |
|
|
(725,073 |
) |
| Futures contracts |
|
|
(6,916,357 |
) |
| Forward foreign currency contracts |
|
|
780 |
|
| Translation of assets and liabilities denominated in foreign currencies |
|
|
2,114 |
|
| TBA commitments |
|
|
37,893 |
|
| |
|
| Net change in unrealized appreciation (depreciation) |
|
|
12,190,676 |
|
|
|
| Net realized and change in unrealized gain (loss) |
|
|
12,294,289 |
|
|
|
| Net increase (decrease) in net assets resulting from operations |
|
$ |
16,686,651 |
|
The Notes to Financial Statements are an integral part of this report.
|
|
|
|
|
| Transamerica Series Trust |
|
|
|
Semi-Annual Financial Statements 2024 |
|
|
Page 2 |
|
|
Transamerica BlackRock iShares Tactical - Growth VP
STATEMENT OF CHANGES IN NET ASSETS
For the period and year ended:
|
|
|
|
|
|
|
|
|
| |
|
June 30, 2024 (unaudited) |
|
December 31, 2023 |
|
|
|
| From operations: |
|
|
|
|
|
|
|
|
| Net investment income (loss) |
|
|
$ 4,392,362 |
|
|
|
$ 8,973,407 |
|
| Net realized gain (loss) |
|
|
103,613 |
|
|
|
8,274,362 |
|
| Net change in unrealized appreciation (depreciation) |
|
|
12,190,676 |
|
|
|
16,193,462 |
|
|
|
|
| Net increase (decrease) in net assets resulting from operations |
|
|
16,686,651 |
|
|
|
33,441,231 |
|
|
|
|
| Dividends and/or distributions to shareholders: |
|
|
|
|
|
|
|
|
| Initial Class |
|
|
— |
|
|
|
(132,333 |
) |
| Service Class |
|
|
— |
|
|
|
(2,148,655 |
) |
| |
|
|
| Net increase (decrease) in net assets resulting from dividends and/or distributions to shareholders |
|
|
— |
|
|
|
(2,280,988 |
) |
|
|
|
| Capital share transactions: |
|
|
|
|
|
|
|
|
| Proceeds from shares sold: |
|
|
|
|
|
|
|
|
| Initial Class |
|
|
230,282 |
|
|
|
411,246 |
|
| Service Class |
|
|
3,228,127 |
|
|
|
3,607,746 |
|
| |
|
|
| |
|
|
3,458,409 |
|
|
|
4,018,992 |
|
| Dividends and/or distributions reinvested: |
|
|
|
|
|
|
|
|
| Initial Class |
|
|
— |
|
|
|
132,333 |
|
| Service Class |
|
|
— |
|
|
|
2,148,655 |
|
| |
|
|
| |
|
|
— |
|
|
|
2,280,988 |
|
| Cost of shares redeemed: |
|
|
|
|
|
|
|
|
| Initial Class |
|
|
(1,176,622 |
) |
|
|
(1,359,545 |
) |
| Service Class |
|
|
(21,992,143 |
) |
|
|
(38,754,388 |
) |
| |
|
|
|
|
|
(23,168,765 |
) |
|
|
(40,113,933 |
) |
| |
|
|
| Net increase (decrease) in net assets resulting from capital share transactions |
|
|
(19,710,356 |
) |
|
|
(33,813,953 |
) |
|
|
|
| Net increase (decrease) in net assets |
|
|
(3,023,705 |
) |
|
|
(2,653,710 |
) |
|
|
|
| Net assets: |
|
|
|
|
|
|
|
|
| Beginning of period/year |
|
|
257,908,801 |
|
|
|
260,562,511 |
|
| End of period/year |
|
|
$254,885,096 |
|
|
|
$257,908,801 |
|
|
|
|
| Capital share transactions - shares: |
|
|
|
|
|
|
|
|
| Shares issued: |
|
|
|
|
|
|
|
|
| Initial Class |
|
|
22,350 |
|
|
|
44,407 |
|
| Service Class |
|
|
321,660 |
|
|
|
399,284 |
|
| |
|
|
| |
|
|
344,010 |
|
|
|
443,691 |
|
| Shares reinvested: |
|
|
|
|
|
|
|
|
| Initial Class |
|
|
— |
|
|
|
14,048 |
|
| Service Class |
|
|
— |
|
|
|
235,857 |
|
| |
|
|
| |
|
|
— |
|
|
|
249,905 |
|
| Shares redeemed: |
|
|
|
|
|
|
|
|
| Initial Class |
|
|
(114,973 |
) |
|
|
(146,169 |
) |
| Service Class |
|
|
(2,223,552 |
) |
|
|
(4,336,503 |
) |
| |
|
|
| |
|
|
(2,338,525 |
) |
|
|
(4,482,672 |
) |
| Net increase (decrease) in shares outstanding: |
|
|
|
|
|
|
|
|
| Initial Class |
|
|
(92,623 |
) |
|
|
(87,714 |
) |
| Service Class |
|
|
(1,901,892 |
) |
|
|
(3,701,362 |
) |
| |
|
|
| |
|
|
(1,994,515 |
) |
|
|
(3,789,076 |
) |
The Notes to Financial Statements are an integral part of this report.
|
|
|
|
|
| Transamerica Series Trust |
|
|
|
Semi-Annual Financial Statements 2024 |
|
|
Page 3 |
|
|
Transamerica BlackRock iShares Tactical - Growth VP
FINANCIAL HIGHLIGHTS
|
|
|
|
|
|
|
|
|
|
|
|
|
|
|
|
|
|
|
|
|
|
|
|
|
|
|
| For a share outstanding during the period and years indicated: |
|
Initial Class |
| |
|
June 30, 2024 (unaudited) |
|
December 31, 2023 |
|
December 31, 2022 |
|
December 31, 2021 |
|
December 31, 2020 |
|
December 31, 2019 |
|
|
|
|
|
|
|
| Net asset value, beginning of period/year |
|
$ |
9.93 |
|
|
$ |
8.79 |
|
|
$ |
12.30 |
|
|
$ |
12.11 |
|
|
$ |
12.60 |
|
|
$ |
10.34 |
|
| Investment operations: |
|
|
|
|
|
|
|
|
|
|
|
|
|
|
|
|
|
|
|
|
|
|
|
|
| Net investment income (loss)(A) |
|
|
0.19 |
|
|
|
0.35 |
|
|
|
0.11 |
|
|
|
(0.00 |
)(B) |
|
|
0.12 |
|
|
|
0.19 |
|
| Net realized and unrealized gain (loss) |
|
|
0.49 |
|
|
|
0.90 |
|
|
|
(2.23 |
) |
|
|
1.14 |
|
|
|
0.95 |
|
|
|
2.07 |
|
| |
|
|
|
|
|
|
| Total investment operations |
|
|
0.68 |
|
|
|
1.25 |
|
|
|
(2.12 |
) |
|
|
1.14 |
|
|
|
1.07 |
|
|
|
2.26 |
|
| Dividends and/or distributions to shareholders: |
|
|
|
|
|
|
|
|
|
|
|
|
|
|
|
|
|
|
|
|
|
|
|
|
| Net investment income |
|
|
— |
|
|
|
(0.11 |
) |
|
|
— |
|
|
|
— |
|
|
|
(0.52 |
) |
|
|
— |
|
| Net realized gains |
|
|
— |
|
|
|
— |
|
|
|
(1.39 |
) |
|
|
(0.95 |
) |
|
|
(1.04 |
) |
|
|
— |
|
| Total dividends and/or distributions to shareholders |
|
|
— |
|
|
|
(0.11 |
) |
|
|
(1.39 |
) |
|
|
(0.95 |
) |
|
|
(1.56 |
) |
|
|
— |
|
|
|
|
|
|
|
|
| Net asset value, end of period/year |
|
$ |
10.61 |
|
|
$ |
9.93 |
|
|
$ |
8.79 |
|
|
$ |
12.30 |
|
|
$ |
12.11 |
|
|
$ |
12.60 |
|
| |
|
|
|
|
|
|
|
|
|
|
|
|
|
|
|
|
|
|
|
|
|
|
|
|
|
|
|
|
|
|
|
| Total return |
|
|
6.85 |
%(C) |
|
|
14.25 |
% |
|
|
(17.80 |
)% |
|
|
9.51 |
% |
|
|
9.26 |
% |
|
|
21.97 |
% |
|
|
|
|
|
|
|
| Ratio and supplemental data: |
|
|
|
|
|
|
|
|
|
|
|
|
|
|
|
|
|
|
|
|
|
|
|
|
| Net assets end of period/year (000’s) |
|
$ |
11,735 |
|
|
$ |
11,898 |
|
|
$ |
11,305 |
|
|
$ |
13,976 |
|
|
$ |
13,221 |
|
|
$ |
13,002 |
|
| Expenses to average net assets |
|
|
|
|
|
|
|
|
|
|
|
|
|
|
|
|
|
|
|
|
|
|
|
|
| Excluding waiver and/or reimbursement and recapture |
|
|
0.82 |
%(D) |
|
|
0.92 |
% |
|
|
0.88 |
% |
|
|
0.88 |
% |
|
|
0.89 |
% |
|
|
0.92 |
% |
| Including waiver and/or reimbursement and recapture |
|
|
0.80 |
%(D)(E) |
|
|
0.92 |
% |
|
|
0.88 |
% |
|
|
0.88 |
% |
|
|
0.89 |
% |
|
|
0.92 |
% |
| Net investment income (loss) to average net assets |
|
|
3.75 |
%(D) |
|
|
3.73 |
% |
|
|
1.11 |
% |
|
|
(0.00 |
)%(F) |
|
|
0.98 |
% |
|
|
1.67 |
% |
| Portfolio turnover rate |
|
|
126 |
%(C) |
|
|
25 |
%(G) |
|
|
32 |
% |
|
|
38 |
%(G) |
|
|
71 |
%(G) |
|
|
52 |
%(G) |
| (A) |
Calculated based on average number of shares outstanding. |
| (B) |
Rounds to less than $0.01 or $(0.01). |
| (E) |
TAM has contractually agreed, through May 1, 2025, to waive from its management fees an amount equal to the sub-advisory fee waiver by the Portfolio’s sub-adviser. These amounts are not subject to recapture by TAM. |
| (F) |
Rounds to less than 0.01% or (0.01)%. |
| (G) |
Excludes sale-buyback transactions. |
The Notes to Financial Statements are an integral part of this report.
|
|
|
|
|
| Transamerica Series Trust |
|
|
|
Semi-Annual Financial Statements 2024 |
|
|
Page 4 |
|
|
Transamerica BlackRock iShares Tactical - Growth VP
FINANCIAL HIGHLIGHTS (continued)
|
|
|
|
|
|
|
|
|
|
|
|
|
|
|
|
|
|
|
|
|
|
|
|
|
|
|
| For a share outstanding during the period and years indicated: |
|
Service Class |
| |
|
June 30, 2024 (unaudited) |
|
December 31, 2023 |
|
December 31, 2022 |
|
December 31, 2021 |
|
December 31, 2020 |
|
December 31, 2019 |
|
|
|
|
|
|
|
| Net asset value, beginning of period/year |
|
$ |
9.60 |
|
|
$ |
8.50 |
|
|
$ |
11.98 |
|
|
$ |
11.85 |
|
|
$ |
12.35 |
|
|
$ |
10.16 |
|
| Investment operations: |
|
|
|
|
|
|
|
|
|
|
|
|
|
|
|
|
|
|
|
|
|
|
|
|
| Net investment income (loss)(A) |
|
|
0.17 |
|
|
|
0.31 |
|
|
|
0.08 |
|
|
|
(0.03 |
) |
|
|
0.09 |
|
|
|
0.16 |
|
| Net realized and unrealized gain (loss) |
|
|
0.48 |
|
|
|
0.87 |
|
|
|
(2.17 |
) |
|
|
1.11 |
|
|
|
0.94 |
|
|
|
2.03 |
|
| |
|
|
|
|
|
|
| Total investment operations |
|
|
0.65 |
|
|
|
1.18 |
|
|
|
(2.09 |
) |
|
|
1.08 |
|
|
|
1.03 |
|
|
|
2.19 |
|
| Dividends and/or distributions to shareholders: |
|
|
|
|
|
|
|
|
|
|
|
|
|
|
|
|
|
|
|
|
|
|
|
|
| Net investment income |
|
|
— |
|
|
|
(0.08 |
) |
|
|
— |
|
|
|
— |
|
|
|
(0.49 |
) |
|
|
— |
|
| Net realized gains |
|
|
— |
|
|
|
— |
|
|
|
(1.39 |
) |
|
|
(0.95 |
) |
|
|
(1.04 |
) |
|
|
— |
|
| Total dividends and/or distributions to shareholders |
|
|
— |
|
|
|
(0.08 |
) |
|
|
(1.39 |
) |
|
|
(0.95 |
) |
|
|
(1.53 |
) |
|
|
— |
|
|
|
|
|
|
|
|
| Net asset value, end of period/year |
|
$ |
10.25 |
|
|
$ |
9.60 |
|
|
$ |
8.50 |
|
|
$ |
11.98 |
|
|
$ |
11.85 |
|
|
$ |
12.35 |
|
| |
|
|
|
|
|
|
|
|
|
|
|
|
|
|
|
|
|
|
|
|
|
|
|
|
|
|
|
|
|
|
|
| Total return |
|
|
6.77 |
%(B) |
|
|
13.94 |
% |
|
|
(18.03 |
)% |
|
|
9.21 |
% |
|
|
9.09 |
% |
|
|
21.56 |
% |
|
|
|
|
|
|
|
| Ratio and supplemental data: |
|
|
|
|
|
|
|
|
|
|
|
|
|
|
|
|
|
|
|
|
|
|
|
|
| Net assets end of period/year (000’s) |
|
$ |
243,150 |
|
|
$ |
246,011 |
|
|
$ |
249,258 |
|
|
$ |
356,629 |
|
|
$ |
381,949 |
|
|
$ |
383,967 |
|
| Expenses to average net assets |
|
|
|
|
|
|
|
|
|
|
|
|
|
|
|
|
|
|
|
|
|
|
|
|
| Excluding waiver and/or reimbursement and recapture |
|
|
1.07 |
%(C) |
|
|
1.17 |
% |
|
|
1.13 |
% |
|
|
1.13 |
% |
|
|
1.14 |
% |
|
|
1.17 |
% |
| Including waiver and/or reimbursement and recapture |
|
|
1.05 |
%(C)(D) |
|
|
1.17 |
% |
|
|
1.13 |
% |
|
|
1.13 |
% |
|
|
1.14 |
% |
|
|
1.17 |
% |
| Net investment income (loss) to average net assets |
|
|
3.50 |
%(C) |
|
|
3.47 |
% |
|
|
0.82 |
% |
|
|
(0.25 |
)% |
|
|
0.73 |
% |
|
|
1.42 |
% |
| Portfolio turnover rate |
|
|
126 |
%(B) |
|
|
25 |
%(E) |
|
|
32 |
% |
|
|
38 |
%(E) |
|
|
71 |
%(E) |
|
|
52 |
%(E) |
| (A) |
Calculated based on average number of shares outstanding. |
| (D) |
TAM has contractually agreed, through May 1, 2025, to waive from its management fees an amount equal to the sub-advisory fee waiver by the Portfolio’s sub-adviser. These amounts are not subject to recapture by TAM. |
| (E) |
Excludes sale-buyback transactions. |
The Notes to Financial Statements are an integral part of this report.
|
|
|
|
|
| Transamerica Series Trust |
|
|
|
Semi-Annual Financial Statements 2024 |
|
|
Page 5 |
|
|
Transamerica BlackRock iShares Tactical - Growth VP
NOTES TO FINANCIAL STATEMENTS
At June 30, 2024
(unaudited)
1. ORGANIZATION
Transamerica Series Trust (“TST”) is an open-end management investment company registered under the Investment Company Act of 1940, as amended (the “1940 Act”). TST applies investment company accounting and reporting guidance. TST serves as a funding vehicle for variable life insurance, variable annuity, and group annuity products. Transamerica BlackRock iShares Tactical - Growth VP (formerly, Transamerica PIMCO Tactical - Growth VP) (the “Portfolio”) is a series of TST and is classified as diversified under the 1940 Act. The Portfolio currently offers two classes of shares, Initial Class and Service Class.
The only shareholders of the Portfolio are affiliated insurance company separate accounts and/or affiliated asset allocation portfolios. Contract holders of the variable life and annuity contracts are not shareholders of the Portfolio. For ease of reference, shareholders and contract holders are collectively referred to in this report as “shareholders.”
This report must be accompanied or preceded by the Portfolio’s current prospectus, which contains additional information about the Portfolio, including risks, as well as investment objectives and strategies.
Transamerica Asset Management, Inc. (“TAM”) serves as investment manager for the Portfolio pursuant to an investment management agreement. TAM provides continuous and regular investment management services to the Portfolio. TAM supervises the Portfolio’s investments, conducts its investment program and provides supervisory, compliance and administrative services to the Portfolio.
TAM currently acts as a “manager of managers” and has hired sub-advisers to furnish day-to-day investment advice and recommendations. TAM may, in the future, determine to provide all aspects of the day-to-day management of the Portfolio without the use of a sub-adviser. When acting as a manager of managers, TAM provides investment management services that include, without limitation, the design and development of the Portfolio and its investment strategies and the ongoing review and evaluation of those investment strategies including recommending changes in strategy where it believes appropriate or advisable; the selection of one or more sub-advisers for the Portfolio employing a combination of quantitative and qualitative screens, research, analysis and due diligence; negotiation of sub-advisory agreements and fees; oversight and monitoring of sub-advisers and recommending changes to sub-advisers where it believes appropriate or advisable; recommending portfolio combinations and liquidations where it believes appropriate or advisable; selection and oversight of transition managers, as needed; regular supervision of the Portfolio’s investments; regular review and evaluation of sub-adviser performance; daily monitoring of the sub-advisers’ buying and selling of securities for the Portfolio; regular review of holdings; ongoing trade oversight and analysis; regular monitoring to ensure adherence to investment process; regular calls and periodic on-site visits with sub-advisers; portfolio construction and asset allocation when using multiple sub-advisers for the Portfolio; risk management oversight and analysis; oversight of negotiation of investment documentation and agreements; design, development, implementation and regular monitoring of the valuation process; periodic due diligence reviews of pricing vendors and vendor methodology; design, development, implementation and regular monitoring of the compliance process; respond to regulatory inquiries and determine appropriate litigation strategy, as needed; review of proxies voted by sub-advisers; oversight of preparation and review of materials for meetings of the Portfolio’s Board of Trustees (the “Board”), participation in these meetings and preparation of regular communications with the Board; oversight of preparation and review of prospectuses, shareholder reports and other disclosure materials and regulatory filings for the Portfolio; oversight of other service providers to the Portfolio, such as the custodian, the transfer agent, the Portfolio’s independent accounting firm and legal counsel; supervision of the performance of recordkeeping and shareholder relations functions for the Portfolio; and oversight of cash management services. TAM uses a variety of quantitative and qualitative tools to carry out its investment management services. TAM, not the Portfolio, is responsible for paying the sub-adviser(s) for their services, and sub-advisory fees are TAM’s expense.
TAM’s investment management services also include the provision of supervisory and administrative services to the Portfolio. These services include performing certain administrative services for the Portfolio and supervising and overseeing the administrative, clerical, recordkeeping and bookkeeping services provided to the Portfolio by State Street Bank and Trust Company (“State Street”), to whom TAM has outsourced the provision of certain sub-administration services. To the extent agreed upon by TAM and the Portfolio from time to time, TAM’s supervisory and administrative services include, but are not limited to: monitoring and verifying the custodian’s daily calculation of the Net Asset Values (“NAV”); shareholder relations functions; compliance services; valuation services; assisting in due diligence and in the oversight and monitoring of certain activities of sub-advisers and certain aspects of Portfolio investments; assisting with Portfolio combinations and liquidations; oversight of the preparation and filing, and review, of all returns and reports, in connection with federal, state and local taxes; oversight and review of regulatory reporting; supervising and coordinating the Portfolio’s custodian and dividend disbursing agent and monitoring their services to the Portfolio; assisting the Portfolio in preparing reports to shareholders; acting as liaison with the Portfolio’s independent public accountants and providing, upon request, analyses, fiscal year summaries and other audit related services; assisting in the preparation of agendas and supporting documents for and minutes of meetings of trustees and committees of trustees; assisting in the preparation of regular communications with the trustees; and providing personnel and office space, telephones and other office equipment as necessary in order for TAM to perform supervisory and administrative services to the Portfolio. The Portfolio
|
|
|
| Transamerica Series Trust |
|
Semi-Annual Financial Statements 2024 |
Page 6
Transamerica BlackRock iShares Tactical - Growth VP
NOTES TO FINANCIAL STATEMENTS (continued)
At June 30, 2024
(unaudited)
1. ORGANIZATION (continued)
pays certain fees and expenses to State Street for sub-administration services which are not administrative services covered by the management agreement with TAM or paid for through the management fees payable thereunder. For the period ended June 30, 2024, (i) the expenses paid to State Street for sub-administration services by the Portfolio are shown as a part of Other expenses within the Statement of Operations and (ii) the expenses payable to State Street for sub-administration services from the Portfolio are shown as part of Other accrued expenses within the Statement of Assets and Liabilities.
2. SIGNIFICANT ACCOUNTING POLICIES
In preparing the Portfolio’s financial statements in accordance with Generally Accepted Accounting Principles in the United States of America (“GAAP”), estimates or assumptions (which could differ from actual results) may be used that affect reported amounts and disclosures. The following is a summary of significant accounting policies followed by the Portfolio.
Foreign currency denominated investments: The accounting records of the Portfolio are maintained in U.S. dollars. Securities and other assets and liabilities denominated in foreign currencies are translated into U.S. dollars based on the closing exchange rate each day. The cost of foreign securities purchased and any realized gains or losses are translated at the prevailing exchange rates in effect on the date of the respective transaction. The Portfolio combines fluctuations from currency exchange rates and fluctuations in value when computing net realized and unrealized gains or losses from investments.
Net foreign currency gains and losses resulting from changes in exchange rates include, foreign currency fluctuations between trade date and settlement date of investment security transactions, gains and losses on forward foreign currency contracts, and the difference between the receivable amounts of interest and dividends recorded in the accounting records in U.S. dollars and the amounts actually received.
Foreign currency denominated assets may involve risks not typically associated with domestic transactions. These risks include revaluation of currencies, adverse fluctuations in foreign currency values, and possible adverse political, social, and economic developments, including those particular to a specific industry, country or region.
Security transactions and investment income: Security transactions are accounted for on the trade date. Security gains and losses are calculated on a first-in, first-out basis. Interest income, if any, is accrued as earned. Dividend income and capital gain distributions from underlying investments, if any, are recorded on the ex-dividend date. Income or short-term capital gain distributions received from underlying investments, if any, are recorded as Dividend income from investments within the Statement of Operations. Long-term capital gain distributions received from underlying investments, if any, are recorded as Net realized gain (loss) on Capital gain distributions received from investments within the Statement of Operations.
Multiple class operations, income, and expenses: Income, non-class specific expenses, and realized and unrealized gains and losses are allocated to each class daily based upon net assets. Each class bears its own specific expenses in addition to the allocated non-class specific expenses.
Distributions to shareholders: Distributions are recorded on the ex-dividend date and are determined in accordance with federal income tax regulations, which may differ from GAAP.
Commission recapture: The sub-adviser(s), to the extent consistent with the best execution and usual commission rate policies and practices, may elect to place security transactions of the Portfolio with broker/dealers with which TST has established a commission recapture program. A commission recapture program is any arrangement under which a broker/dealer applies a portion of the commissions received by such broker/dealer on the security transactions to the Portfolio. In no event will commissions, paid by the Portfolio, be used to pay expenses that would otherwise be borne by any other Portfolios within TST, or by any other party.
There were no commissions recaptured during the period ended June 30, 2024 by the Portfolio.
Indemnification: In the normal course of business, the Portfolio enters into contracts that contain a variety of representations that provide general indemnifications. The Portfolio’s maximum exposure under these arrangements is unknown, as this would involve future claims that may be made against the Portfolio and/or its affiliates that have not yet occurred. However, based on experience, the Portfolio expects the risk of loss to be remote.
|
|
|
| Transamerica Series Trust |
|
Semi-Annual Financial Statements 2024 |
Page 7
Transamerica BlackRock iShares Tactical - Growth VP
NOTES TO FINANCIAL STATEMENTS (continued)
At June 30, 2024
(unaudited)
3. INVESTMENT VALUATION
TAM has been designated as the Portfolio’s valuation designee pursuant to Rule 2a-5 under the 1940 Act with responsibility for fair valuation subject to oversight by the Portfolio’s Board of Trustees. The net asset value of the Portfolio is computed as of the official close of the New York Stock Exchange (“NYSE”) each day the NYSE is open for business.
TAM utilizes various methods to measure the fair value of its investments on a recurring basis. GAAP establishes a hierarchy that prioritizes inputs to valuation methods. The inputs or methodology used for valuing securities are not necessarily an indication of the risk associated with investing in those securities. The three levels (“Levels”) of inputs of the fair value hierarchy are defined as follows:
Level 1—Unadjusted quoted prices in active markets for identical securities.
Level 2—Inputs, other than quoted prices included in Level 1, which are observable, either directly or indirectly. These inputs may include quoted prices for the identical instrument on an inactive market, prices for similar instruments, interest rates, prepayment speeds, credit risk, yield curves, default rates, and similar data.
Level 3—Unobservable inputs based on the best information available in the circumstances, to the extent observable inputs are not available, which may include TAM’s own assumptions used in determining the fair value of the Portfolio’s investments.
The inputs used to measure fair value may fall into different Levels of the fair value hierarchy. In such cases, for disclosure purposes, the Level in the fair value hierarchy that is assigned to the fair value measurement of a security is determined based on the lowest Level input that is significant to the fair value measurement in its entirety. Certain investments that are measured at fair value using NAV per share, or its equivalent, using the “practical expedient” have not been classified in the fair value Levels. The hierarchy classification of inputs used to value the Portfolio’s investments at June 30, 2024, is disclosed within the Investment Valuation section of the Schedule of Investments.
The availability of observable inputs can vary from security to security and is affected by a wide variety of factors, including, but not limited to, the type of security, whether the security is new and not yet established in the marketplace, the liquidity of markets, and other characteristics particular to the security. To the extent that valuation is based on models or inputs that are less observable or unobservable in the market, the determination of fair value requires more judgment. Accordingly, the degree of judgment exercised in determining fair value is generally greatest for instruments categorized in Level 3. Due to the inherent uncertainty of valuation, the determination of values may differ significantly from values that would have been realized had a ready market for investments existed, and the differences could be material.
Fair value measurements: Descriptions of the valuation techniques applied to the Portfolio’s significant categories of assets and liabilities measured at fair value on a recurring basis are as follows:
Exchange-traded funds (“ETF”): ETFs are stated at the last reported sale price or closing price on the day of valuation taken from the primary exchange where the ETF is principally traded. ETFs are generally categorized in Level 1 of the fair value hierarchy.
Securities lending collateral: Securities lending collateral is invested in a money market fund which is valued at the actively traded NAV and no valuation adjustments are applied. Securities lending collateral is categorized in Level 1 of the fair value hierarchy.
Repurchase agreements: Repurchase agreements are valued at cost, which approximates fair value. To the extent the inputs are observable and timely, the values are generally categorized in Level 2 of the fair value hierarchy.
4. BORROWINGS AND OTHER FINANCING TRANSACTIONS
The Portfolio may engage in borrowing transactions as a means of raising cash to satisfy redemption requests, for other temporary or emergency purposes or, to the extent permitted by its investment policies, to raise additional cash to be invested in other securities or instruments. When the Portfolio invests borrowing proceeds in other securities, the Portfolio will bear the risk that the market value of the securities in which such proceeds are invested goes down and is insufficient to repay the borrowed proceeds. The Portfolio may borrow on a secured or on an unsecured basis. If the Portfolio enters into a secured borrowing arrangement, a portion of the Portfolio’s assets will be used as collateral. The 1940 Act requires the Portfolio to maintain asset coverage of at least 300% of the amount of its borrowings. Asset coverage means the ratio that the value of the Portfolio’s total assets, minus liabilities other than borrowings, bears to the aggregate amount of all borrowings. Although complying with this requirement has the effect of limiting the amount that the Portfolio may borrow, it does not otherwise mitigate the risks of entering into borrowing transactions.
|
|
|
| Transamerica Series Trust |
|
Semi-Annual Financial Statements 2024 |
Page 8
Transamerica BlackRock iShares Tactical - Growth VP
NOTES TO FINANCIAL STATEMENTS (continued)
At June 30, 2024
(unaudited)
4. BORROWINGS AND OTHER FINANCING TRANSACTIONS (continued)
Interfund lending: The Portfolio, along with other funds and portfolios advised by TAM, may participate in an interfund lending program pursuant to exemptive relief granted by the Securities and Exchange Commission on January 18, 2017. This program allows the Portfolio to lend to and borrow from other funds and portfolios advised by TAM. Interfund lending transactions are subject to the conditions of the exemptive relief which places limits on the amount of lending or borrowing a Portfolio may participate in under the program. Interest earned or paid on an interfund lending transaction will be based on the average of certain current market rates. For the period ended June 30, 2024, the Portfolio has not utilized the program.
Repurchase agreements: In a repurchase agreement, the Portfolio purchases a security and simultaneously commits to resell that security to the seller at an agreed-upon price on an agreed-upon date. Securities purchased subject to a repurchase agreement are held at the Portfolio’s custodian, or designated sub-custodian related to tri-party repurchase agreements, and, pursuant to the terms of the repurchase agreement, must be collateralized by securities with an aggregate market value greater than or equal to 100% of the resale price. The Portfolio will bear the risk of value fluctuations until the securities can be sold and may encounter delays and incur costs in liquidating the securities. In the event of bankruptcy or insolvency of the seller, delays and costs may be incurred.
Repurchase agreements are subject to netting agreements, which are agreements between the Portfolio and its counterparties that provide for the net settlement of all transactions and collateral with the Portfolio, through a single payment, in the event of default or termination. Amounts presented within the Schedule of Investments, and as part of Repurchase agreements, at value within the Statement of Assets and Liabilities are shown on a gross basis. The value of the related collateral for each repurchase agreement, as reflected within the Schedule of Investments, exceeds the value of each repurchase agreement at June 30, 2024.
Repurchase agreements at June 30, 2024, if any, are included within the Schedule of Investments and Statement of Assets and Liabilities.
Securities lending: The Portfolio may lend securities to qualified financial institutions, brokers and dealers. State Street serves as securities lending agent to the Portfolio pursuant to a Securities Lending Agreement. Loans of securities are terminable at any time and the borrower, after notice, is required to return borrowed securities within the standard time period for settlement of securities transactions. The lending of securities exposes the Portfolio to risks such as: the borrowers may fail to return the loaned securities or may not be able to provide additional collateral, the Portfolio may experience delays in recovery of the loaned securities or delays in access to collateral, or the Portfolio may experience losses related to the investment collateral. To minimize certain risks, loan counterparties pledge cash, securities issued or guaranteed by the U.S. Government and irrevocable letters of credit issued by banks as collateral. The initial collateral received by the Portfolio is required to have a value of at least 102% of the current value of the loaned securities traded on U.S. exchanges, and a value of at least 105% for all other securities. Typically the lending agent is not permitted to sell, re-pledge or use cash and non-cash collateral it receives. The lending agent has agreed to indemnify the Portfolio in the case of default of any securities borrower.
The Portfolio receives compensation for lending securities from interest or dividends earned on the cash, U.S. Government securities and irrevocable letters of credit held as collateral, less associated fees and expenses. Such income is reflected in Net income from securities lending within the Statement of Operations. Cash collateral received is invested in the State Street Navigator Securities Lending Trust — Government Money Market Portfolio.
The value of loaned securities and related cash and non-cash collateral outstanding at June 30, 2024, if any, are shown on a gross basis within the Schedule of Investments.
The following table reflects a breakdown of transactions accounted for as secured borrowings, the gross obligation by the type, and the remaining contractual maturity of those transactions as of June 30, 2024.
|
|
|
|
|
|
|
|
|
|
|
|
|
|
|
|
|
|
|
|
|
| |
|
Remaining Contractual Maturity of the Agreements |
|
| |
|
Overnight and Continuous |
|
|
Less Than 30 Days |
|
|
Between 30 & 90 Days |
|
|
Greater Than 90 Days |
|
|
Total |
|
| Securities Lending Transactions
Exchange-Traded Funds |
|
$ |
18,855,305 |
|
|
$ |
— |
|
|
$ |
— |
|
|
$ |
— |
|
|
$ |
18,855,305 |
|
| Total Borrowings |
|
$ |
18,855,305 |
|
|
$ |
— |
|
|
$ |
— |
|
|
$ |
— |
|
|
$ |
18,855,305 |
|
| |
|
|
|
|
|
|
|
|
|
|
|
|
|
|
|
|
|
|
|
|
|
|
|
| Transamerica Series Trust |
|
Semi-Annual Financial Statements 2024 |
Page 9
Transamerica BlackRock iShares Tactical - Growth VP
NOTES TO FINANCIAL STATEMENTS (continued)
At June 30, 2024
(unaudited)
5. RISK EXPOSURES AND THE USE OF DERIVATIVE INSTRUMENTS
The Portfolio’s investment strategies allow the Portfolio to use various types of derivative contracts, including option contracts, swap agreements, futures contracts, and forward foreign currency contracts. Derivatives are investments whose value is primarily derived from underlying assets, indices or reference rates and may be transacted on an exchange or OTC.
Market Risk Factors: In pursuit of the Portfolio’s investment strategies, the Portfolio may seek to use derivatives to increase or decrease its exposure to certain market risks, including:
Interest rate risk: Interest rate risk relates to the fluctuations in the value of fixed income securities due to changes in the prevailing levels of market interest rates.
Foreign exchange rate risk: Foreign exchange rate risk relates to fluctuations in the value of an asset or liability due to changes in the currency exchange rates.
Equity risk: Equity risk relates to the change in value of equity securities as they relate to increases or decreases in the general market.
Credit risk: Credit risk relates to the ability of the issuer of a financial instrument to make further principal or interest payments on an obligation or commitment that it has to the Portfolio.
Commodity risk: Commodity risk relates to the change in value of commodities or commodity indices as they relate to increases or decreases in the commodities market. Commodities are physical assets that have tangible properties. Examples of these types of assets are crude oil, heating oil, metals, livestock, and agricultural products.
The Portfolio is also exposed to additional risks from investing in derivatives, such as liquidity and counterparty credit risk. Liquidity risk is the risk that the Portfolio will be unable to sell or close out the derivative in the open market in a timely manner. Counterparty credit risk is the risk that the counterparty will not be able to fulfill its obligations to the Portfolio. Investing in derivatives may also involve greater risks than investing directly in the underlying assets, such as losses in excess of any initial investment and collateral received. In addition, there may be the risk that the change in value of the derivative contract does not correspond to the change in value of the underlying instrument.
The Portfolio’s exposure to market risk factors and certain other associated risks are summarized by derivative type as follows:
Option contracts: The Portfolio is subject to equity risk, credit risk, interest rate risk, and foreign exchange rate risk in the normal course of pursuing its investment objective. The Portfolio may enter into option contracts to manage exposure to various market fluctuations. The Portfolio may purchase or write call and put options on securities and derivative instruments in which the Portfolio owns or may invest. Options are valued at the average of the bid and ask price established each day at the close of the board of trade or exchange on which they are traded. Options are marked-to-market daily to reflect the current value of the option. The primary risks associated with options are an imperfect correlation between the change in value of the securities held and the prices of the option contracts, the possibility of an illiquid market, and an inability of the counterparty to meet the contract terms. Options can be traded through an exchange or through privately negotiated arrangements with a dealer in an OTC transaction. Options traded on an exchange are generally cleared through a clearinghouse such as the Options Clearing Corp.
Options on exchange-traded funds and/or securities: The Portfolio may purchase or write options on ETFs and/or securities. Purchasing or writing options on ETFs and/or securities gives the Portfolio the right, but not the obligation to buy or sell a specified ETF and/or security as an underlying instrument for the option contract.
Options on indices: The Portfolio may purchase or write options on indices. Purchasing or writing an option on indices gives the Portfolio the right, but not the obligation to buy or sell the cash from the underlying index. The exercise of the option will result in a cash transfer and gain or loss depends on the change in the underlying index.
Options on futures: The Portfolio may purchase or write options on futures. Purchasing or writing options on futures gives the Portfolio the right, but not obligation to buy or sell a position on a futures contract at the specified option exercise price at any time during the period of the option.
Interest rate-capped options: The Portfolio may purchase or write interest rate-capped options. Purchasing or writing interest rate-capped options gives the Portfolio the right, but not the obligation to buy or sell an option which applies a cap to protect the Portfolio from floating rate risk above a certain rate on a given notional exposure. A floor can be used to give downside protection to investments in interest rate-linked products.
|
|
|
| Transamerica Series Trust |
|
Semi-Annual Financial Statements 2024 |
Page 10
Transamerica BlackRock iShares Tactical - Growth VP
NOTES TO FINANCIAL STATEMENTS (continued)
At June 30, 2024
(unaudited)
5. RISK EXPOSURES AND THE USE OF DERIVATIVE INSTRUMENTS (continued)
Interest rate swaptions: The Portfolio may purchase or write interest rate swaption agreements which are options to enter into a pre-defined swap agreement by some specific date in the future. The writer of the swaption becomes the counterparty to the swap if the buyer exercises. The interest rate swaption agreement will specify whether the buyer of the swaption will be a fixed-rate receiver or a fixed-rate payer upon exercise.
Purchased options: Purchasing call options tends to increase exposure to the underlying instrument. Purchasing put options tends to decrease exposure to the underlying instrument. The Portfolio pays premiums, which are included within the Statement of Assets and Liabilities as an investment and subsequently marked-to-market to reflect the current value of the option. The risk associated with purchasing put and call options is limited to the premium paid. Premiums paid from options which expire are treated as realized losses. Premiums paid for purchasing options which are exercised or closed are added to the amounts paid or offset against the proceeds on the underlying instrument to determine the realized gain or loss.
Written options: Writing call options tends to decrease exposure to the underlying instrument. Writing put options tends to increase exposure to the underlying instrument. When the Portfolio writes a covered call or put option, the premium received is recorded as a liability within the Statement of Assets and Liabilities and is subsequently marked-to-market to reflect the current market value of the option written. Premiums received from written options which expire unexercised are treated as realized gains. Premiums received from writing options which are exercised or closed are added to the proceeds or offset against amounts paid on the underlying instrument to determine the realized gain or loss. In writing an option, the Portfolio bears the market risk of an unfavorable change in the price of the security or currency underlying the written option. Exercise of an option written by the Portfolio could result in the Portfolio selling or buying a security or currency at a price different from the current market value.
Swap agreements: Swap agreements are bilaterally negotiated agreements between the Portfolio and a counterparty to exchange or swap investments, cash flows, assets, foreign currencies, or market-linked returns at specified, future intervals. Swap agreements can be executed in a bilateral privately negotiated arrangement with a dealer in an OTC transaction or executed on a regular market. Certain swaps regardless of the venue of execution are required to be cleared through a clearinghouse (“centrally cleared swap agreements”). Centrally cleared swap agreements listed or traded on a multilateral platform, are valued at the daily settlement price determined by the corresponding exchange. For centrally cleared credit default swap agreements the clearing exchange requires all members to provide applicable levels across complete term levels. Centrally cleared interest rate swap agreements are valued using a pricing model that references the underlying rates including but not limited to the overnight index swap rate and London Interbank Offered Rate (“LIBOR”) forward rate to calculate the daily settlement price. The Portfolio may enter into credit default, cross-currency, interest rate, total return, including contracts for difference (“CFD”), and other forms of swap agreements to manage exposure to credit, currency, interest rate, and commodity risks. In connection with these agreements, securities or cash may be identified as collateral or margin in accordance with the terms of the respective swap agreements to provide assets of value and recourse in the event of default or bankruptcy/insolvency. Centrally cleared swap agreements are marked-to-market daily based upon values from third party vendors, which may include a registered exchange, or quotations from market makers to the extent available and the change in value, if any, is recorded as Variation margin receivable (payable) on centrally cleared swap agreements within the Statement of Assets and Liabilities.
For OTC swap agreements, payments received or made at the beginning of the measurement period are reflected in OTC swap agreements, at value within the Statement of Assets and Liabilities and represent payments made or received upon entering into the swap agreements to compensate for differences between the stated terms of the swap agreement and prevailing market conditions (credit spreads, currency exchange rates, interest rates, and other relevant factors). Additionally, these upfront payments as well as any periodic payments received or paid by the Portfolio, including any liquidation payment received or made at the termination of the swap are recorded as part of Net realized gain (loss) on swap agreements within the Statement of Operations.
Credit default swap agreements: The Portfolio is subject to credit risk in the normal course of pursuing its investment objective. The Portfolio enters into credit default swap agreements to manage its exposure to the market or certain sectors of the market to reduce its risk exposure to defaults of corporate and sovereign issuers, or to create exposure to corporate or sovereign issuers to which it is not otherwise exposed. Credit default swap agreements involve the exchange of a fixed rate premium for protection against the loss in value of an underlying security in the event of a defined credit event, such as payment default or bankruptcy (buy protection).
Under a credit default swap agreement, one party acts as a guarantor by receiving the fixed periodic payment in exchange for the commitment to purchase the underlying security at par if the defined credit event occurs (sell protection). The Portfolio’s maximum risk of loss from counterparty risk, either as the protection seller or as the protection buyer, is the notional amount of the contract. This risk is mitigated by having a master netting arrangement between the Portfolio and the counterparty, and by the posting of collateral.
|
|
|
| Transamerica Series Trust |
|
Semi-Annual Financial Statements 2024 |
Page 11
Transamerica BlackRock iShares Tactical - Growth VP
NOTES TO FINANCIAL STATEMENTS (continued)
At June 30, 2024
(unaudited)
5. RISK EXPOSURES AND THE USE OF DERIVATIVE INSTRUMENTS (continued)
The Portfolio sells credit default swap agreements, which exposes it to risk of loss from credit risk related events specified in the contracts. Although contract-specific, credit events are generally defined as bankruptcy, failure to pay, restructuring, obligation acceleration, obligation default, or repudiation/moratorium. If a defined credit event had occurred during the period, the swap agreements’ credit-risk-related contingent features would have been triggered, and the Portfolio would have been required to pay the notional amounts for the credit default swap agreements with a sell protection less the value of the contracts’ related reference obligations.
Interest rate swap agreements: The Portfolio is subject to interest rate risk exposure in the normal course of pursuing its investment objective. Because the Portfolio holds fixed rate bonds, the value of these bonds may decrease if interest rates rise. To help hedge against this risk, the Portfolio enters into interest rate swap agreements. Under an interest rate swap agreement, two parties will exchange cash flows based on a notional principal amount. A Portfolio with interest rate agreements can elect to pay a fixed rate and receive a floating rate, or receive a fixed rate and pay a floating rate, on a notional principal amount. The risks of interest rate swap agreements include changes in market conditions which will affect the value of the contract or the cash flows, and the possible inability of the counterparty to fulfill its obligations under the agreement. The Portfolio’s maximum risk of loss from counterparty credit risk is the discounted net value of the cash flows to be received from/paid to the counterparties over the contracts’ remaining lives, to the extent that amount is positive. This risk is mitigated by having a master netting arrangement between the Portfolio and the counterparty, and by the posting of collateral.
Futures contracts: The Portfolio is subject to equity risk, credit risk, commodity risk, interest rate risk and foreign exchange rate risk in the normal course of pursuing its investment objective. The Portfolio uses futures contracts to gain exposure to, or hedge against, changes in the value of equities and commodities, interest rates, or foreign currencies. A futures contract represents a commitment for the future purchase or sale of an asset at a specified price on a specified date. Upon entering into such contracts, the Portfolio is required to deposit with the broker, either in cash or in securities, an initial margin in an amount equal to a certain percentage of the contract amount. Subsequent payments (variation margin) are paid or received by the Portfolio, depending on the daily fluctuations in the value of the contract, and are recorded for financial statement purposes as unrealized gains or losses by the Portfolio. Upon entering into such contracts, the Portfolio bears the risk of equity and commodity prices, interest rates, or exchange rates moving unexpectedly, in which case, the Portfolio may not achieve the anticipated benefits of the futures contracts and may realize losses. With futures, there is minimal counterparty credit risk to the Portfolio since futures are exchange-traded and the exchange’s clearinghouse, as counterparty to all exchange-traded futures, guarantees the futures against default. Futures contracts are generally entered into on a regulated futures exchange and cleared through a clearinghouse associated with the exchange.
Forward foreign currency contracts: The Portfolio is subject to foreign exchange rate risk exposure in the normal course of pursuing its investment objective. The Portfolio may enter into forward foreign currency contracts to hedge against exchange rate risk arising from investments in securities denominated in foreign currencies. Forward foreign currency contracts are marked-to-market daily, with the change in value recorded as an unrealized gain or loss and is shown in Unrealized appreciation (depreciation) on forward foreign currency contracts within the Statement of Assets and Liabilities. When the contracts are settled, a realized gain or loss is incurred and is shown in Net realized gain (loss) on forward foreign currency contracts within the Statement of Operations. Risks may arise from changes in market value of the underlying currencies and from the possible inability of counterparties to meet the terms of their contracts. Forward foreign currency contracts are traded in the OTC inter-bank currency dealer market.
The following is a summary of the location and the effect of derivative investments within the Statement of Operations, categorized by primary market risk exposure as of June 30, 2024.
|
|
|
|
|
|
|
|
|
|
|
|
|
|
|
|
|
|
|
|
|
|
|
|
|
| Realized Gain (Loss) on Derivative Instruments |
|
| Location |
|
Interest Rate Contracts |
|
|
Foreign Exchange Contracts |
|
|
Equity Contracts |
|
|
Credit Contracts |
|
|
Commodity Contracts |
|
|
Total |
|
| Purchased options and swaptions (A) |
|
$ |
— |
|
|
$ |
— |
|
|
$ |
(1,874,571 |
) |
|
$ |
— |
|
|
$ |
— |
|
|
$ |
(1,874,571 |
) |
| Written options and swaptions |
|
|
24,864 |
|
|
|
— |
|
|
|
— |
|
|
|
— |
|
|
|
— |
|
|
|
24,864 |
|
| Swap agreements |
|
|
968,458 |
|
|
|
— |
|
|
|
— |
|
|
|
70,252 |
|
|
|
— |
|
|
|
1,038,710 |
|
| Futures contracts |
|
|
336,594 |
|
|
|
— |
|
|
|
13,060,698 |
|
|
|
— |
|
|
|
— |
|
|
|
13,397,292 |
|
| Forward foreign currency contracts |
|
|
— |
|
|
|
90,043 |
|
|
|
— |
|
|
|
— |
|
|
|
— |
|
|
|
90,043 |
|
| Total |
|
$ |
1,329,916 |
|
|
$ |
90,043 |
|
|
$ |
11,186,127 |
|
|
$ |
70,252 |
|
|
$ |
— |
|
|
$ |
12,676,338 |
|
| |
|
|
|
|
|
|
|
|
|
|
|
|
|
|
|
|
|
|
|
|
|
|
|
|
|
|
|
| Transamerica Series Trust |
|
Semi-Annual Financial Statements 2024 |
Page 12
Transamerica BlackRock iShares Tactical - Growth VP
NOTES TO FINANCIAL STATEMENTS (continued)
At June 30, 2024
(unaudited)
5. RISK EXPOSURES AND THE USE OF DERIVATIVE INSTRUMENTS (continued)
|
|
|
|
|
|
|
|
|
|
|
|
|
|
|
|
|
|
|
|
|
|
|
|
|
| Net Change in Unrealized Appreciation (Depreciation) on Derivative Instruments |
|
| Location |
|
Interest Rate Contracts |
|
|
Foreign Exchange Contracts |
|
|
Equity Contracts |
|
|
Credit Contracts |
|
|
Commodity Contracts |
|
|
Total |
|
| Purchased options and swaptions (B) |
|
$ |
— |
|
|
$ |
— |
|
|
$ |
216,255 |
|
|
$ |
— |
|
|
$ |
— |
|
|
$ |
216,255 |
|
| Written options and swaptions |
|
|
(389 |
) |
|
|
— |
|
|
|
— |
|
|
|
— |
|
|
|
— |
|
|
|
(389 |
) |
| Swap agreements |
|
|
(682,441 |
) |
|
|
— |
|
|
|
— |
|
|
|
(42,632 |
) |
|
|
— |
|
|
|
(725,073 |
) |
| Futures contracts |
|
|
514,808 |
|
|
|
— |
|
|
|
(7,431,165 |
) |
|
|
— |
|
|
|
— |
|
|
|
(6,916,357 |
) |
| Forward foreign currency contracts |
|
|
— |
|
|
|
780 |
|
|
|
— |
|
|
|
— |
|
|
|
— |
|
|
|
780 |
|
| Total |
|
$ |
(168,022 |
) |
|
$ |
780 |
|
|
$ |
(7,214,910 |
) |
|
$ |
(42,632 |
) |
|
$ |
— |
|
|
$ |
(7,424,784 |
) |
| |
|
|
|
|
|
|
|
|
|
|
|
|
|
|
|
|
|
|
|
|
|
|
|
|
| (A) |
Included within Net realized gain (loss) on Investments in the Statement of Operations. |
| (B) |
Included within Net change in unrealized appreciation (depreciation) on Investments in the Statement of Operations. |
The following is a summary of the ending monthly average volume on derivative activity during the period ended June 30, 2024.
|
|
|
|
|
| Options: |
|
|
|
|
| Average value of option contracts purchased |
|
$ |
1,218,165 |
|
| Average value of option contracts written |
|
|
(1,156 |
) |
| Average notional value of swaption contracts written |
|
|
(930,824 |
) |
| Credit default swaps: |
|
|
|
|
| Average notional value — sell protection |
|
|
2,742,857 |
|
| Interest rate swaps: |
|
|
|
|
| Average notional value — pays fixed rate |
|
|
4,537,682 |
|
| Average notional value — receives fixed rate |
|
|
3,031,643 |
|
| Futures contracts: |
|
|
|
|
| Average notional value of contracts — long |
|
|
123,196,071 |
|
| Average notional value of contracts — short |
|
|
(13,096,320 |
) |
| Forward foreign currency exchange contracts: |
|
|
|
|
| Average contract amounts purchased — in USD |
|
|
1,910,815 |
|
| Average contract amounts sold — in USD |
|
|
3,709,590 |
|
The Portfolio typically enters into International Swaps and Derivatives Association, Inc. Master Agreements (“ISDA Master Agreements”) or similar master agreements (collectively, “Master Agreements”) with its contract counterparties for certain OTC derivatives in order to, among other things, reduce credit risk to counterparties.
ISDA Master Agreements include provisions for general obligations, representations, collateral and events of default or termination. Under an ISDA Master Agreement, the Portfolio typically may offset with the counterparty certain OTC derivative financial instruments payables and/or receivables with collateral held and/or posted and create one single net payment (close-out netting) in the event of default, termination and/or potential deterioration in the credit quality of the counterparty.
Various Master Agreements govern the terms of certain transactions with counterparties and typically attempt to reduce the counterparty risk associated with such transactions by specifying credit protection mechanisms and providing standardization that improves legal certainty. Cross-termination provisions under Master Agreements typically provide that a default in connection with one transaction between the Portfolio and a counterparty gives the non-defaulting party the right to terminate any other transactions in place with the defaulting party to create one single net payment due to/due from the defaulting party and may be a feature in certain Master Agreements. In the event the Portfolio exercises its right to terminate a Master Agreement after a counterparty experiences a termination event as defined in the Master Agreement, the return of collateral with market value in excess of the Portfolio’s net liability may be delayed or denied.
Collateral requirements: Collateral or margin requirements are set by the broker or exchange clearing house for exchange-traded derivatives (futures contracts, exchange-traded options, and exchange-traded swap agreements) while collateral terms are contract specific for OTC derivatives (forward foreign currency exchange contracts, OTC options, and OTC swap agreements). For OTC
|
|
|
| Transamerica Series Trust |
|
Semi-Annual Financial Statements 2024 |
Page 13
Transamerica BlackRock iShares Tactical - Growth VP
NOTES TO FINANCIAL STATEMENTS (continued)
At June 30, 2024
(unaudited)
5. RISK EXPOSURES AND THE USE OF DERIVATIVE INSTRUMENTS (continued)
derivatives, under standard derivatives agreements, the Portfolio may be required to pledge collateral on derivatives to a counterparty if the Portfolio is in a net liability position, and receive collateral if in a net positive position. For financial reporting purposes, cash collateral that has been pledged by the Portfolio to cover obligations, if any, is reported in Cash collateral at broker within the Statement of Assets and Liabilities. Cash collateral that has been received by the Portfolio from a counterparty, if any, is reported separately in Cash collateral pledged at custodian and/or broker within the Statement of Assets and Liabilities. Non-cash collateral pledged to the Portfolio, if any, is disclosed within the Schedule of Investments.
Generally, the amount of collateral due from or to a party must exceed a minimum transfer amount threshold before a transfer has been made. Typically a counterparty is not permitted to sell, re-pledge or use cash and non-cash collateral it receives. The Portfolio generally does not use non-cash collateral that it receives but may, absent default or certain other circumstances, be permitted to use cash collateral received. In such cases, interest may be paid pursuant to the collateral arrangement with the counterparty.
To the extent amounts due to the Portfolio from its counterparties are not fully collateralized, contractually or otherwise, the Portfolio bears the risk of loss from counterparty non-performance. Additionally, to the extent the Portfolio has delivered collateral to a counterparty, the Portfolio bears the risk of loss from a counterparty in the event the counterparty fails to return such collateral. Counterparties may immediately terminate derivatives contracts if the Portfolio fails to maintain sufficient asset coverage for its contracts or its net assets decline by stated percentages. Collateral may not be required for all derivative contracts.
6. RISK FACTORS
Investing in the Portfolio involves certain key risks related to the Portfolio’s trading activity. Please reference the Portfolio’s prospectus for a more complete discussion of the following risk(s), as well as other risks of investing in the Portfolio.
Market risk: The market prices of the Portfolio’s securities or other assets may go up or down, sometimes rapidly or unpredictably, due to factors such as economic events, inflation, changes in interest rates, governmental actions or interventions, actions taken by the U.S. Federal Reserve or foreign central banks, market disruptions caused by tariffs, trade disputes or other factors, political developments, armed conflicts, economic sanctions, cybersecurity events, investor sentiment, the global and domestic effects of widespread or local health, weather or climate events, and other factors that may or may not be related to the issuer of the security or other asset. If the market prices of the Portfolio’s securities and assets fall, the value of your investment in the Portfolio could go down.
Economies and financial markets throughout the world are increasingly interconnected. Events or circumstances in one or more countries or regions could be highly disruptive to, and have profound impacts on, global economies or markets. As a result, whether or not the Portfolio invests in securities of issuers located in or with significant exposure to the countries directly affected, the value and liquidity of the Portfolio’s investments may go down.
Equity securities risk: Equity securities generally have greater risk of loss than debt securities. Stock markets are volatile and the value of equity securities may go up or down, sometimes rapidly and unpredictably. The market price of an equity security may fluctuate based on overall market conditions, such as real or perceived adverse economic or political conditions or trends, tariffs and trade disruptions, inflation, substantial economic downturn or recession, changes in interest rates, or adverse investor sentiment. The market price of an equity security also may fluctuate based on real or perceived factors affecting a particular industry or industries or the company itself. If the market prices of the equity securities owned by the Portfolio fall, the value of your investment in the Portfolio will decline. The Portfolio may lose its entire investment in the equity securities of an issuer. A change in financial condition or other event affecting a single issuer may adversely impact securities markets as a whole.
Fixed-income securities risk: Risks of fixed-income securities include credit risk, interest rate risk, counterparty risk, prepayment risk, extension risk, valuation risk, and liquidity risk. The value of fixed-income securities may go up or down, sometimes rapidly and unpredictably, due to general market conditions, such as real or perceived adverse economic or political conditions, tariffs and trade disruptions, inflation, changes in interest rates, lack of liquidity in the bond markets or adverse investor sentiment. In addition, the value of a fixed-income security may decline if the issuer or other obligor of the security fails to pay principal and/or interest, otherwise defaults or has its credit rating downgraded or is perceived to be less creditworthy, or the credit quality or value of any underlying assets declines. If the value of fixed-income securities owned by the Portfolio falls, the value of your investment will go down. The Portfolio may lose its entire investment in the fixed-income securities of an issuer.
|
|
|
| Transamerica Series Trust |
|
Semi-Annual Financial Statements 2024 |
Page 14
Transamerica BlackRock iShares Tactical - Growth VP
NOTES TO FINANCIAL STATEMENTS (continued)
At June 30, 2024
(unaudited)
7. FEES AND OTHER AFFILIATED TRANSACTIONS
TST serves as a funding vehicle for certain affiliated asset allocation portfolios and certain affiliated separate accounts of Transamerica Life Insurance Company (“TLIC”) and Transamerica Financial Life Insurance Company.
TAM, the Portfolio’s investment manager, is directly owned by TLIC and AUSA Holding, LLC (“AUSA”), both of which are indirect, wholly owned subsidiaries of Aegon Ltd. TLIC is owned by Commonwealth General Corporation (“Commonwealth”). Commonwealth and AUSA are wholly owned by Transamerica Corporation (DE). Transamerica Corporation (DE) is wholly owned by Aegon International B.V., which is wholly owned by Aegon Ltd., a Bermuda exempted company with liability limited by shares (formerly, Aegon NV, a Netherlands corporation) and a publicly traded international insurance group.
Transamerica Fund Services, Inc. (“TFS”) is the Portfolio’s transfer agent. Transamerica Capital, Inc. (“TCI”) is the Portfolio’s distributor/principal underwriter. TAM, TFS and TCI are affiliates of Aegon Ltd.
Certain officers and trustees of the Portfolio may also be officers and/or trustees of TAM, TFS and TCI. No interested trustee who is deemed an interested person due to current or former service with TAM or an affiliate of TAM receives compensation from the Portfolio. The Portfolio does pay non-interested persons (independent trustees), as disclosed in Trustee and CCO fees within the Statement of Operations.
Investment management fees: TAM serves as the Portfolio’s investment manager, performing administration as well as investment advisory services. TAM renders investment advisory, supervisory, and administration services under an investment management agreement and the Portfolio pays a single management fee, which is reflected in Investment management fees within the Statement of Operations.
The Portfolio pays a management fee to TAM based on daily average net assets at the following rates:
|
|
|
|
|
| Breakpoints |
|
Rate |
|
| Effective May 1, 2024 |
|
|
|
|
| First $500 million |
|
|
0.5000 |
% |
| Over $500 million up to $1 billion |
|
|
0.4900 |
|
| Over $1 billion up to $2.5 billion |
|
|
0.4725 |
|
| Over $2.5 billion up to $3.5 billion |
|
|
0.4650 |
|
| Over $3.5 billion up to $4.5 billion |
|
|
0.4525 |
|
| Over $4.5 billion |
|
|
0.4400 |
|
| Prior to May 1, 2024 |
|
|
|
|
| First $250 million |
|
|
0.8200 |
|
| Over $250 million up to $750 million |
|
|
0.8100 |
|
| Over $750 million up to $1.5 billion |
|
|
0.7900 |
|
| Over $1.5 billion |
|
|
0.7600 |
|
TAM has contractually agreed, through May 1, 2025, to waive from its management fees an amount equal to the sub-advisory fee waiver by the Portfolio’s sub-adviser. These amounts are not subject to recapture by TAM.
TAM has contractually agreed to waive fees and/or reimburse Portfolio expenses to the extent that the total operating expenses excluding, as applicable, acquired fund fees and expenses, interest (including borrowing costs and overdraft charges), taxes, brokerage commissions, dividend and interest expenses on securities sold short, extraordinary expenses and other expenses not incurred in the ordinary course of the Portfolio’s business, exceed the following stated annual operating expense limits to the Portfolio’s daily average net
|
|
|
| Transamerica Series Trust |
|
Semi-Annual Financial Statements 2024 |
Page 15
Transamerica BlackRock iShares Tactical - Growth VP
NOTES TO FINANCIAL STATEMENTS (continued)
At June 30, 2024
(unaudited)
7. FEES AND OTHER AFFILIATED TRANSACTIONS (continued)
assets. To the extent an expense limit changed during the period, the prior limit is also listed below. The expenses waived and/or reimbursed, if any, are included in Expenses waived and/or reimbursed within the Statement of Operations.
|
|
|
|
|
|
|
|
|
|
|
| Class |
|
Operating Expense Limit |
|
Operating Expense Limit Effective Through |
| Effective May 1, 2024 |
|
|
|
|
|
|
|
|
|
|
| Initial Class |
|
|
|
0.63 |
% |
|
|
|
May 1, 2025 |
|
| Service Class |
|
|
|
0.88 |
|
|
|
|
May 1, 2025 |
|
| Prior to May 1, 2024 |
|
|
|
|
|
|
|
|
|
|
| Initial Class |
|
|
|
0.94 |
|
|
|
|
|
|
| Service Class |
|
|
|
1.19 |
|
|
|
|
|
|
TAM is permitted to recapture amounts contractually waived and/or reimbursed to a class during any of the 36 months from the date on which TAM waived fees and/or reimbursed expenses for the class. A class may recapture and reimburse TAM only if such amount does not cause, on any particular business day of the Portfolio, the class’s total annual operating expenses (after the recapture is taken into account) to exceed the Operating Expense Limits or any other lower limit then in effect. Amounts recaptured, if any, by TAM for the period ended June 30, 2024 are disclosed in Recapture of previously waived and/or reimbursed fees within the Statement of Operations.
TAM, on a voluntary basis and in addition to the contractual operating expense limits in effect, from time to time may waive and/or reimburse expenses of the Portfolio, or any classes thereof, to such level(s) as the Trust’s officers have determined or may reasonably determine from time to time. Any such voluntary waiver or expense reimbursement may be discontinued by TAM at any time. These amounts are not subject to recapture by TAM.
As of June 30, 2024, there are no amounts available for recapture by TAM.
Distribution and service fees: TST has a distribution plan (“Distribution Plan”) pursuant to Rule 12b-1 under the 1940 Act. Pursuant to the Distribution Plan, TST entered into a distribution agreement with TCI as the Portfolio’s distributor.
The Distribution Plan requires the Portfolio to pay distribution fees to TCI as compensation for various distribution activities, not as reimbursement for specific expenses. Under the Distribution Plan and distribution agreement, TCI, on behalf of the Portfolio, is authorized to pay various service providers, as direct payment for expenses incurred in connection with distribution of the Portfolio’s shares.
The fee on the Service Class shares is paid to the insurance companies for providing services and account maintenance for the policyholders who invest in the variable insurance products which invest in the Service Class shares. TCI has determined that it will not seek payment for the distribution expenses incurred by the Portfolio with respect to the Initial Class shares before May 1, 2025. Prior to TCI seeking distribution expenses on Initial Class shares, policy and contract owners will be notified in advance. The Portfolio will pay fees relating to Service Class shares. The distribution and service fees are included in Distribution and service fees within the Statement of Operations.
The Portfolio is authorized under the Distribution Plan to pay fees to TCI based on daily average net assets of each applicable class up to the following annual rates:
|
|
|
|
|
| Class |
|
Rate |
|
| Initial Class |
|
|
0.15 |
% |
| Service Class |
|
|
0.25 |
|
Transfer agent costs: TFS provides transfer agency services under an intercompany agreement with TAM. TFS has outsourced the provision of certain sub-transfer agency services to SS&C Global Investor & Distribution Solutions, Inc. (“SS&C GIDS”). The Portfolio does not pay a separate transfer agent fee to TAM or TFS but does pay certain expenses to SS&C GIDS related to applicable sub-transfer agency services. For the period ended June 30, 2024, (i) the expenses paid to SS&C GIDS by the Portfolio are referred to as transfer agent costs and are included within the Statement of Operations and (ii) the expenses payable to SS&C GIDS by the Portfolio are referred to as transfer agent costs within the Statement of Assets and Liabilities.
|
|
|
| Transamerica Series Trust |
|
Semi-Annual Financial Statements 2024 |
Page 16
Transamerica BlackRock iShares Tactical - Growth VP
NOTES TO FINANCIAL STATEMENTS (continued)
At June 30, 2024
(unaudited)
7. FEES AND OTHER AFFILIATED TRANSACTIONS (continued)
Brokerage commissions: The Portfolio incurred no brokerage commissions on security transactions placed with affiliates of the investment manager or sub-adviser(s) for the period ended June 30, 2024.
8. PURCHASES AND SALES OF SECURITIES
For the period ended June 30, 2024, the cost of securities purchased and proceeds from securities sold (excluding short-term securities) are as follows:
|
|
|
|
|
|
|
| Purchases of Securities |
|
Sales/Maturities of Securities |
| Long-Term |
|
U.S. Government |
|
Long-Term |
|
U.S. Government |
| $ 260,996,304 |
|
$ 68,257,468 |
|
$ 64,698,298 |
|
$ 106,565,177 |
9. FEDERAL INCOME TAXES AND DISTRIBUTIONS TO SHAREHOLDERS
The Portfolio has not made any provision for federal income or excise taxes due to its policy to distribute all of its taxable income and capital gains to its shareholders and otherwise qualify as a regulated investment company under Subchapter M of the Internal Revenue Code. The Portfolio recognizes the tax benefits of uncertain tax positions only where the position is “more likely than not” to be sustained assuming examination by tax authorities. The Portfolio’s tax returns remain subject to examination by the Internal Revenue Service and state tax authorities three years from the date of filing for federal purposes and four years from the date of filing for state purposes. Management has evaluated the Portfolio’s tax provisions taken for all open tax years, and has concluded that no provision for income tax is required in the Portfolio’s financial statements. If applicable, the Portfolio recognizes interest accrued related to unrecognized tax benefits in relation to interest and penalties expense in Other within the Statement of Operations. The Portfolio identifies its major tax jurisdictions as U.S. Federal, the state of Colorado, and foreign jurisdictions where the Portfolio makes significant investments; however, the Portfolio is not aware of any tax positions for which it is reasonably possible that the total amounts of unrecognized tax benefits will change materially in the next twelve months. Distributions are determined in accordance with income tax regulations, which may differ from GAAP.
As of June 30, 2024, the approximate cost for U.S. federal income tax purposes, and the aggregate gross/net unrealized appreciation (depreciation) in the value of investments (including securities sold short and derivatives, if any) are as follows:
|
|
|
|
|
|
|
| Cost |
|
Gross Appreciation |
|
Gross (Depreciation) |
|
Net Appreciation (Depreciation) |
| $ 262,374,090 |
|
$ 11,606,640 |
|
$ — |
|
$ 11,606,640 |
Please see TST’s most recent report on Form N-CSR, available at: www.transamerica.com/annuities/prospectus, for additional information. For the most recently filed complete proxy voting records for the Trust please visit: https://www.transamerica.com/sites/default/files/files/e070d/TST%20N-PX%202021.pdf
|
|
|
| Transamerica Series Trust |
|
Semi-Annual Financial Statements 2024 |
Page 17
Transamerica BlackRock iShares Tactical - Growth VP
MANAGEMENT AGREEMENT — CONTRACT RENEWAL
(unaudited)
At a meeting of the Board of Trustees of Transamerica Series Trust (the “Trustees” or the “Board”) held on June 12-13, 2024, the Board considered the renewal of the management agreement (the “Management Agreement”) between Transamerica Asset Management, Inc. (“TAM”) and Transamerica Series Trust, on behalf of Transamerica BlackRock iShares Tactical – Growth VP (formerly, Transamerica PIMCO Tactical – Growth VP) (the “Portfolio”).
Following its review and consideration, the Board determined that the terms of the Management Agreement were reasonable and that the renewal of the Management Agreement was in the best interests of the Portfolio and the holders invested in the Portfolio. The Board, including the independent members of the Board (the “Independent Trustees”), unanimously approved the renewal of the Management Agreement through June 30, 2025.
Prior to reaching their decision, the Trustees requested and received from TAM certain information. They then reviewed such information as they deemed reasonably necessary to evaluate the Management Agreement, including information they had previously received from TAM as part of their regular oversight of the Portfolio, and knowledge they gained over time through meeting with TAM. Among other materials, the Trustees considered comparative fee, expense and performance information prepared by Broadridge Financial Solutions, Inc. (“Broadridge”), an independent provider of mutual fund performance information, as well as fee, expense and profitability information prepared by TAM. In addition, TAM provided the Board with additional supplemental comparative performance information. The Board also considered reductions to the Portfolio’s expense limits, if any, that took effect after the last renewal of the Management Agreement. In their review, the Trustees also sought to identify instances in which the Portfolio’s performance, fees, total expenses and/or profitability appeared to be outliers within its respective peer group or other comparative metrics and sought to understand the reasons for such comparative positions.
In their deliberations, the Independent Trustees met privately without representatives of TAM present and were represented throughout the process by their independent legal counsel. In considering the proposed continuation of the Management Agreement, the Trustees evaluated and weighed a number of considerations that they believed to be relevant in light of the legal advice furnished to them by counsel, including independent legal counsel, and made a decision in the exercise of their own business judgment. They based their decisions on the considerations discussed below, among others, although they did not identify any particular consideration or item of information that was controlling of their decisions, and each Trustee may have attributed different weights to the various factors.
Nature, Extent and Quality of the Services Provided
The Board considered the nature, extent and quality of the services provided by TAM to the Portfolio in the past and the services anticipated to be provided in the future. The Board also considered the investment approach for the Portfolio; the experience, capability and integrity of TAM’s senior management; the financial resources of TAM; TAM’s management oversight process; and TAM’s responsiveness to any questions by the Trustees.
The Board also considered the continuous and regular investment management and other services provided by TAM, when acting as a manager of managers, for the portion of the management fee it retains from the Portfolio after payment of the sub-advisory fees. The Board noted that the investment management and other services provided by TAM include the design, development and ongoing review and evaluation of the Portfolio and its investment strategy; the selection, oversight and monitoring of one or more investment sub-advisers to perform certain duties with respect to the Portfolio; ongoing portfolio trading oversight and analysis; risk management oversight and analysis; design, development, implementation and ongoing review and evaluation of a process for the valuation of Portfolio investments; design, development, implementation and ongoing review and evaluation of a compliance program for the Portfolio; design, development, implementation and ongoing review and evaluation of a process for the voting of proxies and exercise of rights to consent to corporate action for Portfolio investments; participation in Board meetings and oversight of preparation of materials for the Board, including materials for Board meetings and regular communications with the Board; oversight of preparation of the Portfolio’s prospectus, statement of additional information, shareholder reports and other disclosure materials and regulatory filings for the Portfolio; and ongoing cash management services for the Portfolio. The Board considered that TAM’s investment management services also include the provision of supervisory and administrative services to the Portfolio. The Board also noted that TAM, as part of the services it provides to all Transamerica mutual funds, including the Portfolio, oversees the services provided by the funds’ custodian, transfer agent, independent accountant and legal counsel and supervises the performance of the recordkeeping and holder service functions of the funds.
Investment Performance
In addition, the Board considered the short- and longer-term performance of the Portfolio in light of its investment objective, policies and strategies, including relative performance against (i) a peer universe of comparable mutual funds, as prepared by Broadridge, and (ii) the Portfolio’s benchmarks, in each case for various trailing periods ended December 31, 2023. Based on these considerations, the Board determined that TAM can provide investment and related services that are appropriate in scope and extent in light of the Portfolio’s investment objectives, policies and strategies and operations, the competitive landscape of the investment company business and investor needs. The Board’s conclusions as to the Portfolio’s performance are summarized below. For purposes of its review, the Board generally used the performance of Service Class Shares. In describing the Portfolio’s performance relative to its peer universe, the summary conclusions characterize performance for the relevant periods in relation to whether it was “above,” “below” or “in line with” the peer universe median and do so using quintile rankings prepared by Broadridge. For simplicity, performance is described as “above” the median if the Portfolio’s performance ranked anywhere in the first or second quintiles, as “below” the median if it ranked anywhere in the
|
|
|
| Transamerica Series Trust |
|
Semi-Annual Financial Statements 2024 |
Page 18
Transamerica BlackRock iShares Tactical - Growth VP
MANAGEMENT AGREEMENT — CONTRACT RENEWAL (continued)
(unaudited)
fourth or fifth quintiles, or “in line with” the median if it ranked anywhere in the third quintile (i.e., even if its precise return was somewhat above or somewhat below the precise median return).
When considering the Portfolio’s performance, the Trustees considered any representations made by TAM regarding the appropriateness of certain peer groups and benchmarks. They recognized that performance reflects a snapshot of a period as of a specific date, and that consideration of performance data for a different period could generate significantly different performance results. The Trustees also recognized that even longer-term performance can be negatively affected by performance over a short-term period when that short-term performance is significantly below the performance of the comparable benchmark or universe of peer funds.
The Board noted that the performance of Service Class Shares of the Portfolio was below the median for its peer universe and below the benchmark that TAM utilized to measure performance of the Portfolio as of December 31, 2023,1 each for the past 1-, 3-, 5- and 10-year periods. The Trustees discussed the reasons for the underperformance with TAM and TAM agreed to continue to closely monitor and report to the Board on the performance of the Portfolio. The Board noted that the Portfolio’s sub-adviser had commenced sub-advising the Portfolio on May 1, 2024 pursuant to its current investment strategies and benchmarks.
Management Fee and Total Expense Ratio
The Board considered the management fee and total expense ratio of the Portfolio, including information provided by Broadridge comparing the management fee and total expense ratio of the Portfolio to the management fees and total expense ratios of comparable investment companies in both a peer group and broader peer universe compiled by Broadridge. The Board’s conclusions as to the Portfolio’s management fee and total expense ratio are summarized below. For purposes of its review, the Board generally used the actual total expenses (i.e., expenses reflecting any waivers and/or reimbursements) of Service Class Shares. In describing the Portfolio’s management fee and total expense ratio relative to its peer group and peer universe, the summary conclusions characterize management fees and total expense ratios for the relevant periods in relation to whether they were “above,” “below” or “in line with” the peer group or peer universe median and do so using quintile rankings prepared by Broadridge. For simplicity, management fees and total expense ratios are described as “above” the median if the Portfolio’s management fee or total expense ratio ranked anywhere in the fourth or fifth quintiles, as “below” the median if it ranked anywhere in the first or second quintiles, or “in line with” the median if it ranked anywhere in the third quintile (i.e., even if its precise management fee or total expense ratio was somewhat above or somewhat below the precise median management fee or total expense ratio). The Board also considered the fees charged by the Portfolio’s sub-adviser for sub-advisory services, as well as the portion of the Portfolio’s management fee retained by TAM following payment of the sub-advisory fee and how the portion of the contractual management fee retained by TAM at a specified asset level compared to the portions retained by other investment advisers managing mutual funds with similar investment strategies as calculated by an independent provider of information.
The Board noted that the Portfolio’s contractual management fee was below the medians for its peer group and peer universe and that the actual total expenses (i.e., expenses reflecting any waivers and/or reimbursements) of Service Class Shares of the Portfolio were in line with the median for its peer group and above the median for its peer universe. The Trustees also considered that TAM has entered into an expense limitation arrangement with the Portfolio, which may result in TAM waiving fees for the benefit of holders. The Trustees noted that they had previously approved a reduction to the Portfolio’s management fee schedule, which took effect on May 1, 2024 and was not fully reflected in the comparative data.
On the basis of these considerations, together with the other information it considered, the Board determined that the management fee to be received by TAM under the Management Agreement is reasonable in light of the services provided.
Cost of Services Provided and Level of Profitability
The Board reviewed information provided by TAM about the cost of providing and procuring fund management services, as well as the costs of the provision of administration, transfer agency and other services, to the Portfolio and to Transamerica Series Trust as a whole by TAM and its affiliates. The Board considered the profitability of TAM and its affiliates in providing these services for the Portfolio and Transamerica Series Trust as a whole. The Trustees recognized the competitiveness of the mutual fund industry and the importance of an investment adviser’s long-term profitability, including for maintaining company and management stability and accountability.
The Board also considered the allocation methodology used for calculating the profitability of TAM and its affiliates. The Board noted that the revenue and expense allocation methodology used by TAM to estimate its profitability with respect to its relationship with the Portfolio had been reviewed previously by an independent consultant. The Trustees considered that TAM reported that it had not made material changes to this methodology, and that the methodology had been applied consistently for the Portfolio.
Based on this information, the Board determined that the profitability of TAM and its affiliates from their relationships with the Portfolio was not excessive.
1 Effective May 1, 2024, the blended benchmark utilized by TAM to measure the Portfolio’s performance changed in conjunction with a change to the Portfolio’s sub-adviser.
|
|
|
| Transamerica Series Trust |
|
Semi-Annual Financial Statements 2024 |
Page 19
Transamerica BlackRock iShares Tactical - Growth VP
MANAGEMENT AGREEMENT — CONTRACT RENEWAL (continued)
(unaudited)
Economies of Scale
The Board considered economies of scale with respect to the management of the Portfolio, whether the Portfolio had appropriately benefited from any economies of scale and whether there was the potential for realization of any future economies of scale. The Board also considered the existence of economies of scale with respect to management of the Transamerica mutual funds overall and the extent to which the Portfolio benefited from any economies of scale. The Board recognized that, as the Portfolio’s assets increase, any economies of scale realized by TAM may not directly correlate with any economies of scale that might be realized by the Portfolio. The Board considered the Portfolio’s management fee schedule and the existence of breakpoints and also considered the extent to which TAM shared economies of scale, if any, with the Portfolio through undertakings to limit or reimburse Portfolio expenses and to invest in maintaining and developing its capabilities and services. The Trustees concluded that the Portfolio’s fee structure reflected an appropriate sharing of any efficiencies or economies of scale to date and noted that they will have the opportunity to periodically reexamine the appropriateness of the management fee payable to TAM in light of any economies of scale experienced in the future.
Benefits to TAM and/or its Affiliates from their Relationships with the Portfolio
The Board considered other benefits derived by TAM and/or its affiliates from their relationships with the Portfolio. The Board noted that TAM does not receive benefits from research obtained with commissions paid to broker-dealers for portfolio transactions (commonly referred to as “soft dollars”) as a result of its relationship with the Portfolio.
Other Considerations
The Board noted that TAM has made a substantial commitment to the recruitment and retention of high-quality personnel and maintains the financial, compliance and operational resources reasonably necessary to manage the Portfolio in a professional manner that is consistent with the best interests of the Portfolio and the holders. In this regard, the Board favorably considered the procedures and policies TAM has in place to enforce compliance with applicable laws and regulations and oversee the portfolio management activities of the Portfolio’s sub-adviser. The Board also noted that TAM has made an entrepreneurial commitment and undertaken certain business risks with respect to the management and success of the Portfolio.
Conclusion
After consideration of the factors described above, as well as other factors, the Trustees, including the Independent Trustees, concluded that the renewal of the Management Agreement was in the best interests of the Portfolio and the holders and voted to approve the renewal of the Management Agreement.
|
|
|
| Transamerica Series Trust |
|
Semi-Annual Financial Statements 2024 |
Page 20
PROXY VOTING POLICIES AND PROCEDURES AND QUARTERLY PORTFOLIO HOLDINGS
(unaudited)
A description of Transamerica Series Trust’s (the “Trust”) proxy voting policies and procedures is available in the Statement of Additional Information of the Portfolios, available without charge upon request by calling 1-800-851-9777 (toll free) or on the Securities and Exchange Commission’s (“SEC”) website at http://www.sec.gov.
In addition, the Portfolio is required to file Form N-PX, with their complete proxy voting records for the most recent 12 months ended June 30th, no later than August 31st of each year. The Form is available without charge: (1) on the Transamerica Funds website at https://www.transamerica.com/sites/default/files/files/e070d/TST%20N-PX%202021.pdf; and (2) on the SEC’s website at http://www.sec.gov.
Each fiscal quarter, the Portfolios, except Transamerica BlackRock Government Money Market VP, will file with the SEC a complete schedule of its monthly portfolio holdings on Form N-PORT. The Portfolios’ holdings as of the end of the third month of every fiscal quarter, as reported on Form N-PORT, will be publicly available on the SEC’s website at http://www.sec.gov within 60 days of the end of the fiscal quarter.
On a monthly basis, Transamerica BlackRock Government Money Market VP will file with the SEC portfolio holdings information on Form N-MFP3. A complete schedule of portfolio holdings is also available at www.transamerica.com.
You may also visit the Trust’s website at www.transamerica.com/annuities/prospectus for this and other information about the Portfolios and the Trust.
Important Notice Regarding Delivery of Shareholder Documents
Every year we provide shareholders informative materials such as the Transamerica Series Trust Annual Report, the Transamerica Series Trust Prospectus, and other required documents that keep you informed regarding your Portfolios. To the extent provided by mail, Transamerica Series Trust will only send one piece per mailing address, a method that saves your Portfolios money by reducing mailing and printing costs. We will continue to do this unless you tell us not to. To elect to receive individual mailings, simply call a Transamerica Customer Service Representative toll free at 1-800-851-9777, 8 a.m. to 7 p.m. Eastern Time, Monday-Friday. Your request will take effect within 30 days.
|
|
|
| Transamerica Series Trust |
|
Semi-Annual Financial Statements 2024 |
Page 21
NOTICE OF PRIVACY POLICY
(unaudited)
Your privacy is very important to us. We want you to understand what information we collect and how we use it. We collect and use “nonpublic personal information” in connection with providing our customers with a broad range of financial products and services as effectively and conveniently as possible. We treat nonpublic personal information in accordance with our Privacy Policy.
What Information We Collect and From Whom We Collect It
We may collect nonpublic personal information about you from the following sources:
| • |
|
Information we receive from you on applications or other forms, such as your name, address, and account number; |
| • |
|
Information about your transactions with us, our affiliates, or others, such as your account balance and purchase/redemption history; and |
| • |
|
Information we receive from non-affiliated third parties, including consumer reporting agencies. |
What Information We Disclose and To Whom We Disclose It
We do not disclose any nonpublic personal information about current or former customers to anyone without their express consent, except as permitted by law. We may disclose the nonpublic personal information we collect, as described above, to persons or companies that perform services on our behalf and to other financial institutions with which we have joint marketing agreements. We will require these companies to protect the confidentiality of your nonpublic personal information and to use it only to perform the services for which we have hired them.
Our Security Procedures
We restrict access to your nonpublic personal information and only allow disclosures to persons and companies as permitted by law to assist in providing products or services to you. We maintain physical, electronic, and procedural safeguards to protect your nonpublic personal information and to safeguard the disposal of certain consumer information.
Contact Us
If you have any questions about our Privacy Policy, please call 1-800-851-9777 on any business day between 8 a.m. and 7 p.m. Eastern Time.
Note: This Privacy Policy applies only to customers that have a direct relationship with us or our affiliates. If you own shares of our portfolios in the name of a third party such as a bank or broker-dealer, its privacy policy may apply to you instead of ours.
|
|
|
| Transamerica Series Trust |
|
Semi-Annual Financial Statements 2024 |
Page 22
PO Box 219945
Kansas City, MO 64121-9945
|
|
|
| Distributor: |
|
Transamerica Capital, Inc. |
|
|
PO Box 219945 |
|
|
Kansas City, MO 64121-9945 |
|
|
|
|
Customer Service: 1-800-851-9777 |
Transamerica Series Trust Semi-Annual Financial Statements
June 30, 2024
1801 California St., Suite 5200
Denver, CO 80202
Distributor: Transamerica Capital, Inc.
Customer Service: 1-800-851-9777
|
|
|
|
|
The following pages contain the most recent semi-annual financial statements for the investment options in which you are invested. In compliance with Securities and Exchange Commission regulations, we present these reports on an annual and semi-annual basis with the hope that they will foster greater understanding of the investment options’ holdings, performance, financial data, accounting policies and other issues. This streamlined version provides information only on the investment options in which you are invested. |
|
|
|
|
If you have any questions about these reports, please do not hesitate to contact your financial professional. As always, we thank you for your trust and the opportunity to serve you. |
Transamerica BlackRock Real Estate Securities VP
SCHEDULE OF INVESTMENTS
At June 30, 2024
(unaudited)
|
|
|
|
|
|
|
|
|
| |
|
Shares |
|
|
Value |
|
| COMMON STOCKS - 98.2% |
|
| Australia - 4.4% |
|
| Charter Hall Group, REIT |
|
|
46,276 |
|
|
$ |
345,135 |
|
| Goodman Group, REIT |
|
|
58,888 |
|
|
|
1,365,125 |
|
| Lendlease Corp. Ltd. |
|
|
243,789 |
|
|
|
879,837 |
|
| National Storage, REIT |
|
|
1,408,732 |
|
|
|
2,161,459 |
|
| NEXTDC Ltd. (A) |
|
|
99,048 |
|
|
|
1,164,901 |
|
| Region RE Ltd., REIT |
|
|
908,819 |
|
|
|
1,273,173 |
|
|
|
|
|
|
|
|
|
|
|
|
|
|
|
|
|
7,189,630 |
|
|
|
|
|
|
|
|
|
|
| Belgium - 0.9% |
|
| VGP NV |
|
|
12,487 |
|
|
|
1,390,788 |
|
|
|
|
|
|
|
|
|
|
|
| Canada - 0.7% |
|
| Chase Properties, REIT |
|
|
124,812 |
|
|
|
1,171,438 |
|
|
|
|
|
|
|
|
|
|
|
| France - 1.2% |
|
| Unibail-Rodamco-Westfield, REIT (A) |
|
|
25,198 |
|
|
|
1,983,997 |
|
|
|
|
|
|
|
|
|
|
|
| Germany - 2.3% |
|
| Vonovia SE |
|
|
129,314 |
|
|
|
3,676,880 |
|
|
|
|
|
|
|
|
|
|
|
| Hong Kong - 6.6% |
|
| CK Asset Holdings Ltd. |
|
|
548,500 |
|
|
|
2,054,491 |
|
| Hang Lung Group Ltd. |
|
|
80,000 |
|
|
|
87,079 |
|
| Hang Lung Properties Ltd. |
|
|
172,000 |
|
|
|
146,691 |
|
| Henderson Land Development Co. Ltd. |
|
|
128,000 |
|
|
|
343,396 |
|
| Link, REIT |
|
|
964,219 |
|
|
|
3,747,453 |
|
| Sun Hung Kai Properties Ltd. |
|
|
290,500 |
|
|
|
2,512,889 |
|
| Wharf Holdings Ltd. (B) |
|
|
93,000 |
|
|
|
261,408 |
|
| Wharf Real Estate Investment Co. Ltd. |
|
|
586,000 |
|
|
|
1,553,352 |
|
|
|
|
|
|
|
|
|
|
|
|
|
|
|
|
|
10,706,759 |
|
|
|
|
|
|
|
|
|
|
| Japan - 10.8% |
|
| Daito Trust Construction Co. Ltd. |
|
|
7,100 |
|
|
|
731,888 |
|
| Daiwa House Industry Co. Ltd. |
|
|
63,700 |
|
|
|
1,614,177 |
|
| Daiwa House Investment Corp., REIT |
|
|
711 |
|
|
|
1,086,232 |
|
| Invincible Investment Corp., REIT |
|
|
1,745 |
|
|
|
707,154 |
|
| Japan Airport Terminal Co. Ltd. |
|
|
23,300 |
|
|
|
794,624 |
|
| Japan Hotel Investment Corp., REIT |
|
|
4,007 |
|
|
|
1,935,135 |
|
| Katitas Co. Ltd. |
|
|
98,500 |
|
|
|
1,067,099 |
|
| KDX Realty Investment Corp., REIT |
|
|
1,323 |
|
|
|
1,286,901 |
|
| Mitsubishi Estate Co. Ltd. |
|
|
276,900 |
|
|
|
4,337,050 |
|
| Mitsui Fudosan Logistics Park, Inc., REIT |
|
|
588 |
|
|
|
1,584,300 |
|
| Oriental Land Co. Ltd. |
|
|
14,900 |
|
|
|
415,077 |
|
| ORIX J-REIT, Inc., REIT |
|
|
1,208 |
|
|
|
1,195,311 |
|
| Sumitomo Realty & Development Co. Ltd. |
|
|
15,800 |
|
|
|
463,620 |
|
| Tokyu Fudosan Holdings Corp. |
|
|
59,200 |
|
|
|
394,998 |
|
|
|
|
|
|
|
|
|
|
|
|
|
|
|
|
|
17,613,566 |
|
|
|
|
|
|
|
|
|
|
| Mexico - 0.1% |
|
| Corp. Inmobiliaria Vesta SAB de CV, ADR (B) |
|
|
4,360 |
|
|
|
130,756 |
|
|
|
|
|
|
|
|
|
|
|
| Singapore - 0.8% |
|
| Capitaland Investment Ltd. (B) |
|
|
660,400 |
|
|
|
1,295,475 |
|
|
|
|
|
|
|
|
|
|
|
| Spain - 2.0% |
|
| Cellnex Telecom SA (A)(C) |
|
|
53,222 |
|
|
|
1,731,033 |
|
| Merlin Properties Socimi SA, REIT |
|
|
139,959 |
|
|
|
1,558,847 |
|
|
|
|
|
|
|
|
|
|
|
|
|
|
|
|
|
3,289,880 |
|
|
|
|
|
|
|
|
|
|
|
|
|
|
|
|
|
|
|
| |
|
Shares |
|
|
Value |
|
| COMMON STOCKS (continued) |
|
| Sweden - 1.7% |
|
| Castellum AB (A)(B) |
|
|
121,070 |
|
|
$ |
1,478,107 |
|
| Sagax AB, Class B |
|
|
51,586 |
|
|
|
1,319,948 |
|
|
|
|
|
|
|
|
|
|
|
|
|
|
|
|
|
2,798,055 |
|
|
|
|
|
|
|
|
|
|
| Switzerland - 1.0% |
|
| Swiss Prime Site AG |
|
|
16,253 |
|
|
|
1,541,272 |
|
|
|
|
|
|
|
|
|
|
| United Kingdom - 3.7% |
|
| Big Yellow Group PLC, REIT |
|
|
69,652 |
|
|
|
1,033,672 |
|
| Tritax Big Box PLC, REIT |
|
|
1,399,268 |
|
|
|
2,743,430 |
|
| UNITE Group PLC, REIT |
|
|
200,273 |
|
|
|
2,258,232 |
|
|
|
|
|
|
|
|
|
|
|
|
|
|
|
|
|
6,035,334 |
|
|
|
|
|
|
|
|
|
|
| United States - 62.0% |
|
| Agree Realty Corp., REIT |
|
|
65,566 |
|
|
|
4,061,158 |
|
| Alexandria Real Estate Equities, Inc., REIT |
|
|
6,891 |
|
|
|
806,040 |
|
| AvalonBay Communities, Inc., REIT |
|
|
28,417 |
|
|
|
5,879,193 |
|
| Boston Properties, Inc., REIT |
|
|
28,293 |
|
|
|
1,741,717 |
|
| CareTrust, Inc., REIT |
|
|
64,725 |
|
|
|
1,624,598 |
|
| Cousins Properties, Inc., REIT |
|
|
49,403 |
|
|
|
1,143,680 |
|
| CubeSmart, REIT |
|
|
50,271 |
|
|
|
2,270,741 |
|
| Digital Realty Trust, Inc., REIT |
|
|
17,261 |
|
|
|
2,624,535 |
|
| EastGroup Properties, Inc., REIT |
|
|
8,944 |
|
|
|
1,521,374 |
|
| EPR Properties, REIT |
|
|
63,441 |
|
|
|
2,663,253 |
|
| Equinix, Inc., REIT |
|
|
12,647 |
|
|
|
9,568,720 |
|
| Essential Properties Realty Trust, Inc., REIT |
|
|
93,439 |
|
|
|
2,589,195 |
|
| Extra Space Storage, Inc., REIT |
|
|
34,201 |
|
|
|
5,315,177 |
|
| Federal Realty Investment Trust, REIT |
|
|
25,456 |
|
|
|
2,570,292 |
|
| Healthpeak Properties, Inc., REIT |
|
|
115,264 |
|
|
|
2,259,174 |
|
| Host Hotels & Resorts, Inc., REIT |
|
|
23,028 |
|
|
|
414,043 |
|
| Invitation Homes, Inc., REIT |
|
|
89,979 |
|
|
|
3,229,346 |
|
| Mid-America Apartment Communities, Inc., REIT |
|
|
34,575 |
|
|
|
4,930,741 |
|
| Omega Healthcare Investors, Inc., REIT |
|
|
47,560 |
|
|
|
1,628,930 |
|
| Prologis, Inc., REIT |
|
|
67,165 |
|
|
|
7,543,301 |
|
| Regency Centers Corp., REIT |
|
|
58,289 |
|
|
|
3,625,576 |
|
| Rexford Industrial Realty, Inc., REIT |
|
|
67,243 |
|
|
|
2,998,365 |
|
| Ryman Hospitality Properties, Inc., REIT |
|
|
28,479 |
|
|
|
2,843,913 |
|
| SBA Communications Corp., REIT |
|
|
10,626 |
|
|
|
2,085,884 |
|
| Simon Property Group, Inc., REIT |
|
|
19,538 |
|
|
|
2,965,868 |
|
| SITE Centers Corp., REIT |
|
|
138,857 |
|
|
|
2,013,427 |
|
| SL Green Realty Corp., REIT |
|
|
10,783 |
|
|
|
610,749 |
|
| STAG Industrial, Inc., REIT |
|
|
71,359 |
|
|
|
2,573,206 |
|
| Sun Communities, Inc., REIT |
|
|
29,429 |
|
|
|
3,541,486 |
|
| Ventas, Inc., REIT |
|
|
12,979 |
|
|
|
665,304 |
|
| VICI Properties, Inc., REIT |
|
|
175,236 |
|
|
|
5,018,759 |
|
| Welltower, Inc., REIT |
|
|
71,819 |
|
|
|
7,487,131 |
|
|
|
|
|
|
|
|
|
|
|
|
|
|
|
|
|
100,814,876 |
|
|
|
|
|
|
|
|
|
|
| Total Common Stocks (Cost $161,905,468) |
|
|
|
|
|
|
159,638,706 |
|
|
|
|
|
|
|
|
|
|
The Notes to Financial Statements are an integral part of this report.
|
|
|
|
|
| Transamerica Series Trust |
|
|
|
Semi-Annual Financial Statements 2024 |
|
|
Page 1 |
|
|
Transamerica BlackRock Real Estate Securities VP
SCHEDULE OF INVESTMENTS (continued)
At June 30, 2024
(unaudited)
|
|
|
|
|
|
|
|
|
| |
|
Shares |
|
|
Value |
|
| OTHER INVESTMENT COMPANY - 0.0% (D) |
|
| Securities Lending Collateral - 0.0% (D) |
|
| State Street Navigator Securities Lending Trust - Government Money Market Portfolio, 5.28% (E) |
|
|
900 |
|
|
|
$ 900 |
|
|
|
|
|
|
|
|
|
|
| Total Other Investment Company (Cost $900) |
|
|
|
900 |
|
|
|
|
|
|
|
|
|
|
| |
|
Principal |
|
|
Value |
|
| REPURCHASE AGREEMENT - 1.8% |
|
| Fixed Income Clearing Corp., 2.50% (E), dated 06/28/2024, to be repurchased at $2,954,667 on 07/01/2024. Collateralized by a U.S. Government Obligation, 4.50%, due 03/31/2026, and with a value of $3,013,272. |
|
$ |
2,954,052 |
|
|
|
2,954,052 |
|
|
|
|
|
|
|
| Total Repurchase Agreement (Cost $2,954,052) |
|
|
|
2,954,052 |
|
|
|
|
|
|
|
| Total Investments (Cost $164,860,420) |
|
|
|
162,593,658 |
|
| Net Other Assets (Liabilities) - (0.0)% (D) |
|
|
|
(47,474 |
) |
|
|
|
|
|
|
|
|
| Net Assets - 100.0% |
|
|
$ |
162,546,184 |
|
|
|
|
|
|
|
FORWARD FOREIGN CURRENCY CONTRACTS:
|
|
|
|
|
|
|
|
|
|
|
|
|
|
|
|
|
|
|
|
|
|
|
|
|
|
|
|
|
| Counterparty |
|
Settlement Date |
|
|
Currency Purchased |
|
|
Currency Sold |
|
|
Unrealized Appreciation |
|
|
Unrealized Depreciation |
|
| BNP |
|
|
07/12/2024 |
|
|
|
USD |
|
|
|
205,651 |
|
|
|
AUD |
|
|
|
310,000 |
|
|
$ |
— |
|
|
$ |
(1,216 |
) |
| BNP |
|
|
07/12/2024 |
|
|
|
USD |
|
|
|
204,364 |
|
|
|
CAD |
|
|
|
281,000 |
|
|
|
— |
|
|
|
(1,096 |
) |
| BNP |
|
|
07/12/2024 |
|
|
|
USD |
|
|
|
201,234 |
|
|
|
EUR |
|
|
|
186,000 |
|
|
|
1,924 |
|
|
|
— |
|
| BNP |
|
|
07/12/2024 |
|
|
|
USD |
|
|
|
108,310 |
|
|
|
JPY |
|
|
|
16,876,000 |
|
|
|
3,223 |
|
|
|
— |
|
| BNP |
|
|
07/12/2024 |
|
|
|
GBP |
|
|
|
22,000 |
|
|
|
USD |
|
|
|
27,973 |
|
|
|
— |
|
|
|
(161 |
) |
| BNP |
|
|
07/12/2024 |
|
|
|
HKD |
|
|
|
889,000 |
|
|
|
USD |
|
|
|
113,886 |
|
|
|
—— |
|
|
|
—— |
|
| BNP |
|
|
07/15/2024 |
|
|
|
KRW |
|
|
|
330,082,000 |
|
|
|
USD |
|
|
|
244,998 |
|
|
|
— |
|
|
|
(4,995 |
) |
| BOA |
|
|
07/12/2024 |
|
|
|
USD |
|
|
|
93,510 |
|
|
|
EUR |
|
|
|
87,000 |
|
|
|
285 |
|
|
|
— |
|
| BOA |
|
|
07/12/2024 |
|
|
|
USD |
|
|
|
6,812,550 |
|
|
|
HKD |
|
|
|
53,234,000 |
|
|
|
— |
|
|
|
(7,016 |
) |
| BOA |
|
|
07/12/2024 |
|
|
|
USD |
|
|
|
196,298 |
|
|
|
ILS |
|
|
|
728,000 |
|
|
|
3,473 |
|
|
|
— |
|
| BOA |
|
|
07/12/2024 |
|
|
|
USD |
|
|
|
398,480 |
|
|
|
JPY |
|
|
|
61,714,000 |
|
|
|
14,190 |
|
|
|
— |
|
| BOA |
|
|
07/12/2024 |
|
|
|
EUR |
|
|
|
149,000 |
|
|
|
USD |
|
|
|
162,162 |
|
|
|
— |
|
|
|
(2,499 |
) |
| BOA |
|
|
07/12/2024 |
|
|
|
JPY |
|
|
|
27,830,000 |
|
|
|
USD |
|
|
|
174,920 |
|
|
|
— |
|
|
|
(1,624 |
) |
| CITI |
|
|
07/12/2024 |
|
|
|
USD |
|
|
|
1,281 |
|
|
|
GBP |
|
|
|
1,000 |
|
|
|
16 |
|
|
|
— |
|
| CITI |
|
|
07/12/2024 |
|
|
|
USD |
|
|
|
26,149 |
|
|
|
HKD |
|
|
|
204,000 |
|
|
|
15 |
|
|
|
— |
|
| CITI |
|
|
07/12/2024 |
|
|
|
USD |
|
|
|
248,777 |
|
|
|
JPY |
|
|
|
38,721,000 |
|
|
|
7,663 |
|
|
|
— |
|
| CITI |
|
|
07/12/2024 |
|
|
|
GBP |
|
|
|
33,000 |
|
|
|
USD |
|
|
|
41,336 |
|
|
|
382 |
|
|
|
— |
|
| CITI |
|
|
07/12/2024 |
|
|
|
GBP |
|
|
|
45,000 |
|
|
|
USD |
|
|
|
57,258 |
|
|
|
— |
|
|
|
(370 |
) |
| CITI |
|
|
07/12/2024 |
|
|
|
HKD |
|
|
|
1,985,000 |
|
|
|
USD |
|
|
|
254,790 |
|
|
|
— |
|
|
|
(501 |
) |
| CITI |
|
|
07/12/2024 |
|
|
|
JPY |
|
|
|
20,324,000 |
|
|
|
USD |
|
|
|
130,793 |
|
|
|
— |
|
|
|
(4,236 |
) |
| GSI |
|
|
07/12/2024 |
|
|
|
ILS |
|
|
|
6,180,000 |
|
|
|
USD |
|
|
|
1,654,179 |
|
|
|
— |
|
|
|
(17,279 |
) |
| GSI |
|
|
07/12/2024 |
|
|
|
JPY |
|
|
|
470,792,103 |
|
|
|
USD |
|
|
|
3,113,603 |
|
|
|
— |
|
|
|
(181,997 |
) |
| HSBC |
|
|
07/12/2024 |
|
|
|
USD |
|
|
|
996,615 |
|
|
|
AUD |
|
|
|
1,519,000 |
|
|
|
— |
|
|
|
(17,033 |
) |
| HSBC |
|
|
07/12/2024 |
|
|
|
USD |
|
|
|
68,788 |
|
|
|
AUD |
|
|
|
103,000 |
|
|
|
55 |
|
|
|
— |
|
| HSBC |
|
|
07/12/2024 |
|
|
|
USD |
|
|
|
147,264 |
|
|
|
EUR |
|
|
|
138,000 |
|
|
|
— |
|
|
|
(611 |
) |
| HSBC |
|
|
07/12/2024 |
|
|
|
USD |
|
|
|
7,610 |
|
|
|
EUR |
|
|
|
7,000 |
|
|
|
109 |
|
|
|
— |
|
| HSBC |
|
|
07/12/2024 |
|
|
|
USD |
|
|
|
58,699 |
|
|
|
GBP |
|
|
|
47,000 |
|
|
|
— |
|
|
|
(719 |
) |
| HSBC |
|
|
07/12/2024 |
|
|
|
USD |
|
|
|
313,048 |
|
|
|
HKD |
|
|
|
2,442,000 |
|
|
|
215 |
|
|
|
— |
|
| HSBC |
|
|
07/12/2024 |
|
|
|
USD |
|
|
|
412,905 |
|
|
|
JPY |
|
|
|
64,262,000 |
|
|
|
12,748 |
|
|
|
— |
|
| HSBC |
|
|
07/12/2024 |
|
|
|
USD |
|
|
|
78,993 |
|
|
|
SGD |
|
|
|
106,000 |
|
|
|
777 |
|
|
|
— |
|
The Notes to Financial Statements are an integral part of this report.
|
|
|
|
|
| Transamerica Series Trust |
|
|
|
Semi-Annual Financial Statements 2024 |
|
|
Page 2 |
|
|
Transamerica BlackRock Real Estate Securities VP
SCHEDULE OF INVESTMENTS (continued)
At June 30, 2024
(unaudited)
FORWARD FOREIGN CURRENCY CONTRACTS (continued):
|
|
|
|
|
|
|
|
|
|
|
|
|
|
|
|
|
|
|
|
|
|
|
|
|
|
|
|
|
| Counterparty |
|
Settlement Date |
|
|
Currency Purchased |
|
|
Currency Sold |
|
|
Unrealized Appreciation |
|
|
Unrealized Depreciation |
|
| HSBC |
|
|
07/12/2024 |
|
|
|
AUD |
|
|
|
8,243,000 |
|
|
|
USD |
|
|
|
5,389,240 |
|
|
$ |
111,414 |
|
|
$ |
— |
|
| HSBC |
|
|
07/12/2024 |
|
|
|
CAD |
|
|
|
7,000 |
|
|
|
USD |
|
|
|
5,140 |
|
|
|
— |
|
|
|
(22 |
) |
| HSBC |
|
|
07/12/2024 |
|
|
|
CAD |
|
|
|
8,000 |
|
|
|
USD |
|
|
|
5,832 |
|
|
|
17 |
|
|
|
— |
|
| HSBC |
|
|
07/12/2024 |
|
|
|
EUR |
|
|
|
23,000 |
|
|
|
USD |
|
|
|
25,031 |
|
|
|
— |
|
|
|
(385 |
) |
| HSBC |
|
|
07/12/2024 |
|
|
|
HKD |
|
|
|
174,000 |
|
|
|
USD |
|
|
|
22,289 |
|
|
|
2 |
|
|
|
— |
|
| HSBC |
|
|
07/12/2024 |
|
|
|
HKD |
|
|
|
5,076,000 |
|
|
|
USD |
|
|
|
650,356 |
|
|
|
— |
|
|
|
(93 |
) |
| HSBC |
|
|
07/12/2024 |
|
|
|
NOK |
|
|
|
700,000 |
|
|
|
USD |
|
|
|
64,582 |
|
|
|
1,000 |
|
|
|
— |
|
| HSBC |
|
|
07/12/2024 |
|
|
|
SEK |
|
|
|
1,070,000 |
|
|
|
USD |
|
|
|
99,701 |
|
|
|
1,311 |
|
|
|
— |
|
| JPM |
|
|
07/12/2024 |
|
|
|
USD |
|
|
|
241,177 |
|
|
|
AUD |
|
|
|
371,000 |
|
|
|
— |
|
|
|
(6,395 |
) |
| JPM |
|
|
07/12/2024 |
|
|
|
USD |
|
|
|
27,647 |
|
|
|
CAD |
|
|
|
38,000 |
|
|
|
— |
|
|
|
(138 |
) |
| JPM |
|
|
07/12/2024 |
|
|
|
USD |
|
|
|
430,664 |
|
|
|
JPY |
|
|
|
67,230,000 |
|
|
|
12,025 |
|
|
|
— |
|
| JPM |
|
|
07/12/2024 |
|
|
|
USD |
|
|
|
217,328 |
|
|
|
SGD |
|
|
|
293,000 |
|
|
|
1,125 |
|
|
|
— |
|
| JPM |
|
|
07/12/2024 |
|
|
|
GBP |
|
|
|
327,000 |
|
|
|
USD |
|
|
|
417,504 |
|
|
|
— |
|
|
|
(4,112 |
) |
| JPM |
|
|
07/12/2024 |
|
|
|
HKD |
|
|
|
2,208,000 |
|
|
|
USD |
|
|
|
283,411 |
|
|
|
— |
|
|
|
(554 |
) |
| JPM |
|
|
07/12/2024 |
|
|
|
JPY |
|
|
|
70,747,000 |
|
|
|
USD |
|
|
|
465,527 |
|
|
|
— |
|
|
|
(24,989 |
) |
| JPM |
|
|
07/12/2024 |
|
|
|
NZD |
|
|
|
581,000 |
|
|
|
USD |
|
|
|
347,522 |
|
|
|
6,365 |
|
|
|
— |
|
| NOMI |
|
|
07/12/2024 |
|
|
|
USD |
|
|
|
95,851 |
|
|
|
AUD |
|
|
|
147,000 |
|
|
|
— |
|
|
|
(2,244 |
) |
| NOMI |
|
|
07/12/2024 |
|
|
|
USD |
|
|
|
51,677 |
|
|
|
CHF |
|
|
|
47,000 |
|
|
|
— |
|
|
|
(711 |
) |
| NOMI |
|
|
07/12/2024 |
|
|
|
USD |
|
|
|
1,603,325 |
|
|
|
EUR |
|
|
|
1,491,000 |
|
|
|
5,630 |
|
|
|
— |
|
| NOMI |
|
|
07/12/2024 |
|
|
|
USD |
|
|
|
139,766 |
|
|
|
JPY |
|
|
|
21,782,000 |
|
|
|
4,130 |
|
|
|
— |
|
| NOMI |
|
|
07/12/2024 |
|
|
|
CAD |
|
|
|
1,264,000 |
|
|
|
USD |
|
|
|
923,522 |
|
|
|
682 |
|
|
|
— |
|
| NOMI |
|
|
07/12/2024 |
|
|
|
EUR |
|
|
|
250,000 |
|
|
|
USD |
|
|
|
271,340 |
|
|
|
— |
|
|
|
(3,450 |
) |
| NOMI |
|
|
07/12/2024 |
|
|
|
GBP |
|
|
|
40,000 |
|
|
|
USD |
|
|
|
50,221 |
|
|
|
347 |
|
|
|
— |
|
| SSB |
|
|
07/12/2024 |
|
|
|
USD |
|
|
|
1,220,279 |
|
|
|
AUD |
|
|
|
1,884,000 |
|
|
|
— |
|
|
|
(36,937 |
) |
| SSB |
|
|
07/12/2024 |
|
|
|
USD |
|
|
|
335,104 |
|
|
|
EUR |
|
|
|
311,000 |
|
|
|
1,849 |
|
|
|
— |
|
| SSB |
|
|
07/12/2024 |
|
|
|
USD |
|
|
|
2,502 |
|
|
|
GBP |
|
|
|
2,000 |
|
|
|
— |
|
|
|
(26 |
) |
| SSB |
|
|
07/12/2024 |
|
|
|
USD |
|
|
|
3,819 |
|
|
|
GBP |
|
|
|
3,000 |
|
|
|
26 |
|
|
|
— |
|
| SSB |
|
|
07/12/2024 |
|
|
|
USD |
|
|
|
345,080 |
|
|
|
HKD |
|
|
|
2,691,000 |
|
|
|
348 |
|
|
|
— |
|
| SSB |
|
|
07/12/2024 |
|
|
|
USD |
|
|
|
880,712 |
|
|
|
JPY |
|
|
|
139,036,000 |
|
|
|
14,940 |
|
|
|
— |
|
| SSB |
|
|
07/12/2024 |
|
|
|
GBP |
|
|
|
10,000 |
|
|
|
USD |
|
|
|
12,741 |
|
|
|
— |
|
|
|
(99 |
) |
| SSB |
|
|
07/12/2024 |
|
|
|
HKD |
|
|
|
336,000 |
|
|
|
USD |
|
|
|
43,012 |
|
|
|
31 |
|
|
|
— |
|
| SSB |
|
|
07/12/2024 |
|
|
|
HKD |
|
|
|
2,049,000 |
|
|
|
USD |
|
|
|
262,703 |
|
|
|
— |
|
|
|
(215 |
) |
| SSB |
|
|
07/12/2024 |
|
|
|
JPY |
|
|
|
38,048,000 |
|
|
|
USD |
|
|
|
240,345 |
|
|
|
— |
|
|
|
(3,421 |
) |
| SSB |
|
|
07/12/2024 |
|
|
|
SEK |
|
|
|
1,576,000 |
|
|
|
USD |
|
|
|
146,987 |
|
|
|
1,794 |
|
|
|
— |
|
| SSB |
|
|
07/12/2024 |
|
|
|
SGD |
|
|
|
4,979,000 |
|
|
|
USD |
|
|
|
3,691,658 |
|
|
|
— |
|
|
|
(17,681 |
) |
| UBS |
|
|
07/12/2024 |
|
|
|
USD |
|
|
|
146,358 |
|
|
|
EUR |
|
|
|
137,000 |
|
|
|
— |
|
|
|
(446 |
) |
| UBS |
|
|
07/12/2024 |
|
|
|
USD |
|
|
|
2,521 |
|
|
|
GBP |
|
|
|
2,000 |
|
|
|
— |
|
|
|
(8 |
) |
| UBS |
|
|
07/12/2024 |
|
|
|
USD |
|
|
|
113,288 |
|
|
|
HKD |
|
|
|
884,000 |
|
|
|
43 |
|
|
|
— |
|
| UBS |
|
|
07/12/2024 |
|
|
|
USD |
|
|
|
372,809 |
|
|
|
JPY |
|
|
|
57,599,000 |
|
|
|
14,142 |
|
|
|
— |
|
| UBS |
|
|
07/12/2024 |
|
|
|
CHF |
|
|
|
357,000 |
|
|
|
USD |
|
|
|
395,812 |
|
|
|
2,121 |
|
|
|
— |
|
| UBS |
|
|
07/12/2024 |
|
|
|
EUR |
|
|
|
445,000 |
|
|
|
USD |
|
|
|
479,820 |
|
|
|
— |
|
|
|
(2,976 |
) |
| UBS |
|
|
07/12/2024 |
|
|
|
GBP |
|
|
|
131,000 |
|
|
|
USD |
|
|
|
164,231 |
|
|
|
1,378 |
|
|
|
— |
|
| UBS |
|
|
07/12/2024 |
|
|
|
JPY |
|
|
|
1,948,000 |
|
|
|
USD |
|
|
|
12,499 |
|
|
|
— |
|
|
|
(369 |
) |
|
|
|
|
|
|
|
|
|
|
|
|
|
|
|
|
|
|
|
|
|
|
|
|
|
| Total |
|
|
|
|
|
|
|
|
|
|
|
|
|
|
|
|
|
|
|
|
|
$ |
225,795 |
|
|
$ |
(346,624 |
) |
|
|
|
|
|
|
|
|
|
|
|
|
|
|
|
|
|
|
|
|
|
|
|
|
|
The Notes to Financial Statements are an integral part of this report.
|
|
|
| Transamerica Series Trust |
|
Semi-Annual Financial Statements 2024 |
Page 3
Transamerica BlackRock Real Estate Securities VP
SCHEDULE OF INVESTMENTS (continued)
At June 30, 2024
(unaudited)
INVESTMENT VALUATION:
|
|
|
|
|
|
|
|
|
|
|
|
|
|
|
|
|
| Valuation Inputs (F) |
|
|
|
|
|
|
|
|
|
|
|
|
| |
|
Level 1 - Unadjusted Quoted Prices |
|
|
Level 2 - Other Significant Observable Inputs |
|
|
Level 3 - Significant Unobservable Inputs |
|
|
Value |
|
| ASSETS |
|
|
|
|
|
|
|
|
|
|
|
|
|
|
|
|
| Investments |
|
|
|
|
|
|
|
|
|
|
|
|
|
|
|
|
| Common Stocks |
|
$ |
102,117,070 |
|
|
$ |
57,521,636 |
|
|
$ |
— |
|
|
$ |
159,638,706 |
|
| Other Investment Company |
|
|
900 |
|
|
|
— |
|
|
|
— |
|
|
|
900 |
|
| Repurchase Agreement |
|
|
— |
|
|
|
2,954,052 |
|
|
|
— |
|
|
|
2,954,052 |
|
|
|
|
|
|
|
|
|
|
|
|
|
|
|
|
|
|
| Total Investments |
|
$ |
102,117,970 |
|
|
$ |
60,475,688 |
|
|
$ |
— |
|
|
$ |
162,593,658 |
|
|
|
|
|
|
|
|
|
|
|
|
|
|
|
|
|
|
|
|
|
|
|
| Other Financial Instruments |
|
|
|
|
|
|
|
|
|
|
|
|
|
|
|
|
| Forward Foreign Currency Contracts (G) |
|
$ |
— |
|
|
$ |
225,795 |
|
|
$ |
— |
|
|
$ |
225,795 |
|
|
|
|
|
|
|
|
|
|
|
|
|
|
|
|
|
|
| Total Other Financial Instruments |
|
$ |
— |
|
|
$ |
225,795 |
|
|
$ |
— |
|
|
$ |
225,795 |
|
|
|
|
|
|
|
|
|
|
|
|
|
|
|
|
|
|
|
|
|
|
|
| LIABILITIES |
|
|
|
|
|
|
|
|
|
|
|
|
|
|
|
|
| Other Financial Instruments |
|
|
|
|
|
|
|
|
|
|
|
|
|
|
|
|
| Forward Foreign Currency Contracts (G) |
|
$ |
— |
|
|
$ |
(346,624 |
) |
|
$ |
— |
|
|
$ |
(346,624 |
) |
|
|
|
|
|
|
|
|
|
|
|
|
|
|
|
|
|
| Total Other Financial Instruments |
|
$ |
— |
|
|
$ |
(346,624 |
) |
|
$ |
— |
|
|
$ |
(346,624 |
) |
|
|
|
|
|
|
|
|
|
|
|
|
|
|
|
|
|
FOOTNOTES TO SCHEDULE OF INVESTMENTS:
| (A) |
Non-income producing security. |
| (B) |
All or a portion of the security is on loan. The total value of the securities on loan is $1,500,695, collateralized by cash collateral of $900 and non-cash collateral, such as U.S. government securities and irrevocable letters of credit, of $1,596,982. The amount on loan indicated may not correspond with the securities on loan identified because a security with pending sales are in the process of recall from the brokers. |
| (C) |
Security is exempt from registration pursuant to Rule 144A of the Securities Act of 1933. Security may be resold as transactions exempt from registration, normally to qualified institutional buyers. At June 30, 2024, the total value of 144A securities is $1,731,033, representing 1.1% of the Portfolio’s net assets. |
| (D) |
Percentage rounds to less than 0.1% or (0.1)%. |
| (E) |
Rate disclosed reflects the yield at June 30, 2024. |
| (F) |
There were no transfers in or out of Level 3 during the period ended June 30, 2024. Please reference the Investment Valuation section of the Notes to Financial Statements for more information regarding investment valuation and pricing inputs. |
| (G) |
Derivative instruments are valued at unrealized appreciation (depreciation). |
CURRENCY ABBREVIATION(S):
|
|
|
| AUD |
|
Australian Dollar |
| CAD |
|
Canadian Dollar |
| CHF |
|
Swiss Franc |
| EUR |
|
Euro |
| GBP |
|
British Pound |
| HKD |
|
Hong Kong Dollar |
| ILS |
|
Israel New Shekel |
| JPY |
|
Japanese Yen |
| KRW |
|
South Korean Won |
| NOK |
|
Norwegian Krone |
| NZD |
|
New Zealand Dollar |
| SEK |
|
Swedish Krona |
| SGD |
|
Singapore Dollar |
| USD |
|
United States Dollar |
COUNTERPARTY ABBREVIATION(S):
|
|
|
| BNP |
|
BNP Paribas |
| BOA |
|
Bank of America, N.A. |
| CITI |
|
Citibank, N.A. |
| GSI |
|
Goldman Sachs International |
The Notes to Financial Statements are an integral part of this report.
|
|
|
| Transamerica Series Trust |
|
Semi-Annual Financial Statements 2024 |
Page 4
Transamerica BlackRock Real Estate Securities VP
SCHEDULE OF INVESTMENTS (continued)
At June 30, 2024
(unaudited)
COUNTERPARTY ABBREVIATION(S) (continued):
|
|
|
| HSBC |
|
HSBC Bank USA |
| JPM |
|
JPMorgan Chase Bank, N.A. |
| NOMI |
|
Nomura International PLC |
| SSB |
|
State Street Bank & Trust Co. |
| UBS |
|
UBS AG |
PORTFOLIO ABBREVIATION(S):
|
|
|
| ADR |
|
American Depositary Receipt |
| J-REIT |
|
Japan-Real Estate Investment Trust |
| REIT |
|
Real Estate Investment Trust |
The Notes to Financial Statements are an integral part of this report.
|
|
|
| Transamerica Series Trust |
|
Semi-Annual Financial Statements 2024 |
Page 5
Transamerica BlackRock Real Estate Securities VP
STATEMENT OF ASSETS AND LIABILITIES
At June 30, 2024
(unaudited)
|
|
|
|
|
| Assets: |
|
|
|
|
| Investments, at value (cost $161,906,368) (including securities loaned of $1,500,695) |
|
$ |
159,639,606 |
|
| Repurchase agreement, at value (cost $2,954,052) |
|
|
2,954,052 |
|
| Foreign currency, at value (cost $61,614) |
|
|
61,616 |
|
| Receivables and other assets: |
|
|
|
|
| Investments sold |
|
|
213,611 |
|
| Net income from securities lending |
|
|
418 |
|
| Shares of beneficial interest sold |
|
|
2,272 |
|
| Dividends |
|
|
733,184 |
|
| Interest |
|
|
615 |
|
| Tax reclaims |
|
|
206,422 |
|
| Unrealized appreciation on forward foreign currency contracts |
|
|
225,795 |
|
| Prepaid expenses |
|
|
312 |
|
|
|
| Total assets |
|
|
164,037,903 |
|
|
|
| Liabilities: |
|
|
|
|
| Cash collateral received upon return of: |
|
|
|
|
| Securities on loan |
|
|
900 |
|
| Payables and other liabilities: |
|
|
|
|
| Investments purchased |
|
|
816,822 |
|
| Shares of beneficial interest redeemed |
|
|
92,240 |
|
| Investment management fees |
|
|
94,128 |
|
| Distribution and service fees |
|
|
13,040 |
|
| Transfer agent costs |
|
|
247 |
|
| Trustee and CCO fees |
|
|
647 |
|
| Audit and tax fees |
|
|
16,088 |
|
| Custody fees |
|
|
52,168 |
|
| Legal fees |
|
|
9,905 |
|
| Printing and shareholder reports fees |
|
|
34,214 |
|
| Other accrued expenses |
|
|
14,696 |
|
| Unrealized depreciation on forward foreign currency contracts |
|
|
346,624 |
|
| Total liabilities |
|
|
1,491,719 |
|
| Net assets |
|
$ |
162,546,184 |
|
|
|
| Net assets consist of: |
|
|
|
|
| Capital stock ($0.01 par value) |
|
$ |
168,540 |
|
| Additional paid-in capital |
|
|
424,785,268 |
|
| Total distributable earnings (accumulated losses) |
|
|
(262,407,624 |
) |
| Net assets |
|
$ |
162,546,184 |
|
|
|
| Net assets by class: |
|
|
|
|
| Initial Class |
|
$ |
94,359,880 |
|
| Service Class |
|
|
68,186,304 |
|
|
|
| Shares outstanding: |
|
|
|
|
| Initial Class |
|
|
10,075,032 |
|
| Service Class |
|
|
6,778,981 |
|
|
|
| Net asset value and offering price per share: |
|
|
|
|
| Initial Class |
|
$ |
9.37 |
|
| Service Class |
|
|
10.06 |
|
STATEMENT OF OPERATIONS
For the period ended June 30, 2024
(unaudited)
|
|
|
|
|
| Investment income: |
|
|
|
|
| Dividend income |
|
$ |
3,190,525 |
|
| Interest income |
|
|
51,981 |
|
| Net income from securities lending |
|
|
13,492 |
|
| Withholding taxes on foreign income |
|
|
(96,218 |
) |
|
|
| Total investment income |
|
|
3,159,780 |
|
|
|
| Expenses: |
|
|
|
|
| Investment management fees |
|
|
624,737 |
|
| Distribution and service fees: |
|
|
|
|
| Service Class |
|
|
84,948 |
|
| Transfer agent costs |
|
|
976 |
|
| Trustee and CCO fees |
|
|
3,965 |
|
| Audit and tax fees |
|
|
12,303 |
|
| Custody fees |
|
|
51,145 |
|
| Legal fees |
|
|
11,387 |
|
| Printing and shareholder reports fees |
|
|
31,984 |
|
| Other |
|
|
15,828 |
|
| Total expenses before waiver and/or reimbursement and recapture |
|
|
837,273 |
|
|
|
| Expenses waived and/or reimbursed: |
|
|
|
|
|
|
| Initial Class |
|
|
(12,801 |
) |
|
|
| Service Class |
|
|
(9,206 |
) |
| Net expenses |
|
|
815,266 |
|
| |
|
| Net investment income (loss) |
|
|
2,344,514 |
|
|
|
| Net realized gain (loss) on: |
|
|
|
|
| Investments |
|
|
2,376,105 |
|
| Forward foreign currency contracts |
|
|
(160,373 |
) |
|
|
| Foreign currency transactions |
|
|
51,361 |
|
|
|
| Net realized gain (loss) |
|
|
2,267,093 |
|
|
|
| Net change in unrealized appreciation (depreciation) on: |
|
|
|
|
| Investments |
|
|
(10,518,232 |
) |
| Forward foreign currency contracts |
|
|
(521,823 |
) |
|
|
| Translation of assets and liabilities denominated in foreign currencies |
|
|
(6,119 |
) |
|
|
| Net change in unrealized appreciation (depreciation) |
|
|
(11,046,174 |
) |
|
|
| Net realized and change in unrealized gain (loss) |
|
|
(8,779,081 |
) |
|
|
| Net increase (decrease) in net assets resulting from operations |
|
$ |
(6,434,567 |
) |
The Notes to Financial Statements are an integral part of this report.
|
|
|
|
|
| Transamerica Series Trust |
|
|
|
Semi-Annual Financial Statements 2024 |
Page 6
Transamerica BlackRock Real Estate Securities VP
STATEMENT OF CHANGES IN NET ASSETS
For the period and year ended:
|
|
|
|
|
|
|
|
|
|
|
|
| |
|
June 30, 2024 (unaudited) |
|
December 31, 2023 |
|
|
|
| From operations: |
|
|
|
|
|
|
|
|
| Net investment income (loss) |
|
$ |
2,344,514 |
|
|
$ |
7,100,250 |
|
| Net realized gain (loss) |
|
|
2,267,093 |
|
|
|
(75,201,236 |
) |
| Net change in unrealized appreciation (depreciation) |
|
|
(11,046,174 |
) |
|
|
89,849,260 |
|
|
|
|
| Net increase (decrease) in net assets resulting from operations |
|
|
(6,434,567 |
) |
|
|
21,748,274 |
|
|
|
|
| Dividends and/or distributions to shareholders: |
|
|
|
|
|
|
|
|
| Initial Class |
|
|
— |
|
|
|
(10,636,279 |
) |
| Service Class |
|
|
— |
|
|
|
(3,641,407 |
) |
| |
|
|
| Net increase (decrease) in net assets resulting from dividends and/or distributions to shareholders |
|
|
— |
|
|
|
(14,277,686 |
) |
|
|
|
| Capital share transactions: |
|
|
|
|
|
|
|
|
| Proceeds from shares sold: |
|
|
|
|
|
|
|
|
| Initial Class |
|
|
789,471 |
|
|
|
1,188,832 |
|
| Service Class |
|
|
1,554,138 |
|
|
|
2,463,258 |
|
| |
|
|
| |
|
|
2,343,609 |
|
|
|
3,652,090 |
|
| Dividends and/or distributions reinvested: |
|
|
|
|
|
|
|
|
| Initial Class |
|
|
— |
|
|
|
10,636,279 |
|
| Service Class |
|
|
— |
|
|
|
3,641,407 |
|
| |
|
|
| |
|
|
— |
|
|
|
14,277,686 |
|
| Cost of shares redeemed: |
|
|
|
|
|
|
|
|
| Initial Class |
|
|
(3,554,788 |
) |
|
|
(228,764,240 |
) |
| Service Class |
|
|
(3,921,462 |
) |
|
|
(8,108,168 |
) |
| |
|
|
| |
|
|
(7,476,250 |
) |
|
|
(236,872,408 |
) |
|
|
|
| Net increase (decrease) in net assets resulting from capital share transactions |
|
|
(5,132,641 |
) |
|
|
(218,942,632 |
) |
|
|
|
| Net increase (decrease) in net assets |
|
|
(11,567,208 |
) |
|
|
(211,472,044 |
) |
|
|
|
| Net assets: |
|
|
|
|
|
|
|
|
| Beginning of period/year |
|
|
174,113,392 |
|
|
|
385,585,436 |
|
| End of period/year |
|
$ |
162,546,184 |
|
|
$ |
174,113,392 |
|
|
|
|
| Capital share transactions - shares: |
|
|
|
|
|
|
|
|
| Shares issued: |
|
|
|
|
|
|
|
|
| Initial Class |
|
|
84,325 |
|
|
|
130,827 |
|
| Service Class |
|
|
154,691 |
|
|
|
253,220 |
|
| |
|
|
| |
|
|
239,016 |
|
|
|
384,047 |
|
| Shares reinvested: |
|
|
|
|
|
|
|
|
| Initial Class |
|
|
— |
|
|
|
1,196,432 |
|
| Service Class |
|
|
— |
|
|
|
380,900 |
|
| |
|
|
| |
|
|
— |
|
|
|
1,577,332 |
|
| Shares redeemed: |
|
|
|
|
|
|
|
|
| Initial Class |
|
|
(378,664 |
) |
|
|
(25,546,390 |
) |
| Service Class |
|
|
(388,201 |
) |
|
|
(824,634 |
) |
| |
|
|
| |
|
|
(766,865 |
) |
|
|
(26,371,024 |
) |
| Net increase (decrease) in shares outstanding: |
|
|
|
|
|
|
|
|
| Initial Class |
|
|
(294,339 |
) |
|
|
(24,219,131 |
) |
| Service Class |
|
|
(233,510 |
) |
|
|
(190,514 |
) |
| |
|
|
| |
|
|
(527,849 |
) |
|
|
(24,409,645 |
) |
The Notes to Financial Statements are an integral part of this report.
|
|
|
|
|
| Transamerica Series Trust |
|
|
|
Semi-Annual Financial Statements 2024 |
|
|
Page 7 |
|
|
Transamerica BlackRock Real Estate Securities VP
FINANCIAL HIGHLIGHTS
|
|
|
|
|
|
|
|
|
|
|
|
|
|
|
|
|
|
|
|
|
|
|
|
|
|
|
| For a share outstanding during the period and years indicated: |
|
Initial Class |
|
|
|
|
|
|
|
| |
|
June 30, 2024 (unaudited) |
|
December 31, 2023 |
|
December 31, 2022 |
|
December 31, 2021 |
|
December 31, 2020 |
|
December 31, 2019 |
|
|
|
|
|
|
|
| Net asset value, beginning of period/year |
|
$ |
9.72 |
|
|
$ |
9.12 |
|
|
$ |
13.17 |
|
|
$ |
10.69 |
|
|
$ |
13.40 |
|
|
$ |
10.80 |
|
|
|
|
|
|
|
|
| Investment operations: |
|
|
|
|
|
|
|
|
|
|
|
|
|
|
|
|
|
|
|
|
|
|
|
|
| Net investment income (loss)(A) |
|
|
0.14 |
|
|
|
0.24 |
|
|
|
0.24 |
|
|
|
0.36 |
|
|
|
0.23 |
|
|
|
0.27 |
|
| Net realized and unrealized gain (loss) |
|
|
(0.49 |
) |
|
|
0.92 |
|
|
|
(3.91 |
) |
|
|
2.43 |
|
|
|
(0.53 |
) |
|
|
2.44 |
|
| |
|
|
|
|
|
|
| Total investment operations |
|
|
(0.35 |
) |
|
|
1.16 |
|
|
|
(3.67 |
) |
|
|
2.79 |
|
|
|
(0.30 |
) |
|
|
2.71 |
|
| Dividends and/or distributions to shareholders: |
|
|
|
|
|
|
|
|
|
|
|
|
|
|
|
|
|
|
|
|
|
|
|
|
| Net investment income |
|
|
— |
|
|
|
(0.56 |
) |
|
|
(0.38 |
) |
|
|
(0.31 |
) |
|
|
(1.51 |
) |
|
|
(0.11 |
) |
| Net realized gains |
|
|
— |
|
|
|
— |
|
|
|
— |
|
|
|
— |
|
|
|
(0.90 |
) |
|
|
— |
|
| Total dividends and/or distributions to shareholders |
|
|
— |
|
|
|
(0.56 |
) |
|
|
(0.38 |
) |
|
|
(0.31 |
) |
|
|
(2.41 |
) |
|
|
(0.11 |
) |
|
|
|
|
|
|
|
| Net asset value, end of period/year |
|
$ |
9.37 |
|
|
$ |
9.72 |
|
|
$ |
9.12 |
|
|
$ |
13.17 |
|
|
$ |
10.69 |
|
|
$ |
13.40 |
|
| |
|
|
|
|
|
|
|
|
|
|
|
|
|
|
|
|
|
|
|
|
|
|
|
|
|
|
|
|
|
|
|
| Total return |
|
|
(3.60 |
)%(B) |
|
|
13.33 |
% |
|
|
(28.19 |
)% |
|
|
26.22 |
% |
|
|
(0.31 |
)% |
|
|
25.19 |
% |
|
|
|
|
|
|
|
| Ratio and supplemental data: |
|
|
|
|
|
|
|
|
|
|
|
|
|
|
|
|
|
|
|
|
|
|
|
|
| Net assets end of period/year (000’s) |
|
$ |
94,360 |
|
|
$ |
100,807 |
|
|
$ |
315,322 |
|
|
$ |
965,695 |
|
|
$ |
343,554 |
|
|
$ |
907,719 |
|
| Expenses to average net assets |
|
|
|
|
|
|
|
|
|
|
|
|
|
|
|
|
|
|
|
|
|
|
|
|
| Excluding waiver and/or reimbursement and recapture |
|
|
0.93 |
%(C) |
|
|
0.90 |
% |
|
|
0.78 |
% |
|
|
0.79 |
% |
|
|
0.82 |
% |
|
|
0.78 |
% |
| Including waiver and/or reimbursement and recapture |
|
|
0.90 |
%(C) |
|
|
0.90 |
% |
|
|
0.78 |
% |
|
|
0.79 |
% |
|
|
0.82 |
% |
|
|
0.78 |
% |
| Net investment income (loss) to average net assets |
|
|
2.99 |
%(C) |
|
|
2.55 |
% |
|
|
2.14 |
% |
|
|
2.88 |
% |
|
|
2.03 |
% |
|
|
2.17 |
% |
| Portfolio turnover rate |
|
|
24 |
%(B) |
|
|
60 |
% |
|
|
62 |
% |
|
|
62 |
% |
|
|
107 |
% |
|
|
93 |
% |
| (A) |
Calculated based on average number of shares outstanding. |
The Notes to Financial Statements are an integral part of this report.
|
|
|
|
|
| Transamerica Series Trust |
|
|
|
Semi-Annual Financial Statements 2024 |
|
|
Page 8 |
|
|
Transamerica BlackRock Real Estate Securities VP
FINANCIAL HIGHLIGHTS (continued)
|
|
|
|
|
|
|
|
|
|
|
|
|
|
|
|
|
|
|
|
|
|
|
|
|
|
|
| For a share outstanding during the period and years indicated: |
|
Service Class |
| |
|
June 30, 2024 (unaudited) |
|
December 31, 2023 |
|
December 31, 2022 |
|
December 31, 2021 |
|
December 31, 2020 |
|
December 31, 2019 |
|
|
|
|
|
|
|
| Net asset value, beginning of period/year |
|
$ |
10.45 |
|
|
$ |
9.75 |
|
|
$ |
14.04 |
|
|
$ |
11.39 |
|
|
$ |
14.09 |
|
|
$ |
11.35 |
|
|
|
|
|
|
|
|
| Investment operations: |
|
|
|
|
|
|
|
|
|
|
|
|
|
|
|
|
|
|
|
|
|
|
|
|
| Net investment income (loss)(A) |
|
|
0.14 |
|
|
|
0.19 |
|
|
|
0.21 |
|
|
|
0.28 |
|
|
|
0.21 |
|
|
|
0.24 |
|
| Net realized and unrealized gain (loss) |
|
|
(0.53 |
) |
|
|
1.04 |
|
|
|
(4.16 |
) |
|
|
2.65 |
|
|
|
(0.53 |
) |
|
|
2.58 |
|
| |
|
|
|
|
|
|
| Total investment operations |
|
|
(0.39 |
) |
|
|
1.23 |
|
|
|
(3.95 |
) |
|
|
2.93 |
|
|
|
(0.32 |
) |
|
|
2.82 |
|
|
|
|
|
|
|
|
| Dividends and/or distributions to shareholders: |
|
|
|
|
|
|
|
|
|
|
|
|
|
|
|
|
|
|
|
|
|
|
|
|
| Net investment income |
|
|
— |
|
|
|
(0.53 |
) |
|
|
(0.34 |
) |
|
|
(0.28 |
) |
|
|
(1.48 |
) |
|
|
(0.08 |
) |
| Net realized gains |
|
|
— |
|
|
|
— |
|
|
|
— |
|
|
|
— |
|
|
|
(0.90 |
) |
|
|
— |
|
| Total dividends and/or distributions to shareholders |
|
|
— |
|
|
|
(0.53 |
) |
|
|
(0.34 |
) |
|
|
(0.28 |
) |
|
|
(2.38 |
) |
|
|
(0.08 |
) |
|
|
|
|
|
|
|
| Net asset value, end of period/year |
|
$ |
10.06 |
|
|
$ |
10.45 |
|
|
$ |
9.75 |
|
|
$ |
14.04 |
|
|
$ |
11.39 |
|
|
$ |
14.09 |
|
| |
|
|
|
|
|
|
|
|
|
|
|
|
|
|
|
|
|
|
|
|
|
|
|
|
|
|
|
|
|
|
|
| Total return |
|
|
(3.73 |
)%(B) |
|
|
13.15 |
% |
|
|
(28.38 |
)% |
|
|
25.85 |
% |
|
|
(0.51 |
)% |
|
|
24.88 |
% |
|
|
|
|
|
|
|
| Ratio and supplemental data: |
|
|
|
|
|
|
|
|
|
|
|
|
|
|
|
|
|
|
|
|
|
|
|
|
| Net assets end of period/year (000’s) |
|
$ |
68,186 |
|
|
$ |
73,306 |
|
|
$ |
70,263 |
|
|
$ |
106,586 |
|
|
$ |
91,150 |
|
|
$ |
97,213 |
|
| Expenses to average net assets |
|
|
|
|
|
|
|
|
|
|
|
|
|
|
|
|
|
|
|
|
|
|
|
|
| Excluding waiver and/or reimbursement and recapture |
|
|
1.18 |
%(C) |
|
|
1.15 |
% |
|
|
1.03 |
% |
|
|
1.04 |
% |
|
|
1.06 |
% |
|
|
1.03 |
% |
| Including waiver and/or reimbursement and recapture |
|
|
1.15 |
%(C) |
|
|
1.15 |
% |
|
|
1.03 |
% |
|
|
1.04 |
% |
|
|
1.06 |
% |
|
|
1.03 |
% |
| Net investment income (loss) to average net assets |
|
|
2.74 |
%(C) |
|
|
1.98 |
% |
|
|
1.83 |
% |
|
|
2.16 |
% |
|
|
1.82 |
% |
|
|
1.82 |
% |
| Portfolio turnover rate |
|
|
24 |
%(B) |
|
|
60 |
% |
|
|
62 |
% |
|
|
62 |
% |
|
|
107 |
% |
|
|
93 |
% |
| (A) |
Calculated based on average number of shares outstanding. |
The Notes to Financial Statements are an integral part of this report.
|
|
|
|
|
| Transamerica Series Trust |
|
|
|
Semi-Annual Financial Statements 2024 |
|
|
Page 9 |
|
|
Transamerica BlackRock Real Estate Securities VP
NOTES TO FINANCIAL STATEMENTS
At June 30, 2024
(unaudited)
1. ORGANIZATION
Transamerica Series Trust (“TST”) is an open-end management investment company registered under the Investment Company Act of 1940, as amended (the “1940 Act”). TST applies investment company accounting and reporting guidance. TST serves as a funding vehicle for variable life insurance, variable annuity, and group annuity products. Transamerica BlackRock Real Estate Securities VP (the “Portfolio”) is a series of TST and is classified as diversified under the 1940 Act. The Portfolio currently offers two classes of shares, Initial Class and Service Class.
The only shareholders of the Portfolio are affiliated insurance company separate accounts and/or affiliated asset allocation portfolios. Contract holders of the variable life and annuity contracts are not shareholders of the Portfolio. For ease of reference, shareholders and contract holders are collectively referred to in this report as “shareholders.”
This report must be accompanied or preceded by the Portfolio’s current prospectus, which contains additional information about the Portfolio, including risks, as well as investment objectives and strategies.
Transamerica Asset Management, Inc. (“TAM”) serves as investment manager for the Portfolio pursuant to an investment management agreement. TAM provides continuous and regular investment management services to the Portfolio. TAM supervises the Portfolio’s investments, conducts its investment program and provides supervisory, compliance and administrative services to the Portfolio.
TAM currently acts as a “manager of managers” and has hired sub-advisers to furnish day-to-day investment advice and recommendations. TAM may, in the future, determine to provide all aspects of the day-to-day management of the Portfolio without the use of a sub-adviser. When acting as a manager of managers, TAM provides investment management services that include, without limitation, the design and development of the Portfolio and its investment strategies and the ongoing review and evaluation of those investment strategies including recommending changes in strategy where it believes appropriate or advisable; the selection of one or more sub-advisers for the Portfolio employing a combination of quantitative and qualitative screens, research, analysis and due diligence; negotiation of sub-advisory agreements and fees; oversight and monitoring of sub-advisers and recommending changes to sub-advisers where it believes appropriate or advisable; recommending portfolio combinations and liquidations where it believes appropriate or advisable; selection and oversight of transition managers, as needed; regular supervision of the Portfolio’s investments; regular review and evaluation of sub-adviser performance; daily monitoring of the sub-advisers’ buying and selling of securities for the Portfolio; regular review of holdings; ongoing trade oversight and analysis; regular monitoring to ensure adherence to investment process; regular calls and periodic on-site visits with sub-advisers; portfolio construction and asset allocation when using multiple sub-advisers for the Portfolio; risk management oversight and analysis; oversight of negotiation of investment documentation and agreements; design, development, implementation and regular monitoring of the valuation process; periodic due diligence reviews of pricing vendors and vendor methodology; design, development, implementation and regular monitoring of the compliance process; respond to regulatory inquiries and determine appropriate litigation strategy, as needed; review of proxies voted by sub-advisers; oversight of preparation and review of materials for meetings of the Portfolio’s Board of Trustees (the “Board”), participation in these meetings and preparation of regular communications with the Board; oversight of preparation and review of prospectuses, shareholder reports and other disclosure materials and regulatory filings for the Portfolio; oversight of other service providers to the Portfolio, such as the custodian, the transfer agent, the Portfolio’s independent accounting firm and legal counsel; supervision of the performance of recordkeeping and shareholder relations functions for the Portfolio; and oversight of cash management services. TAM uses a variety of quantitative and qualitative tools to carry out its investment management services. TAM, not the Portfolio, is responsible for paying the sub-adviser(s) for their services, and sub-advisory fees are TAM’s expense.
TAM’s investment management services also include the provision of supervisory and administrative services to the Portfolio. These services include performing certain administrative services for the Portfolio and supervising and overseeing the administrative, clerical, recordkeeping and bookkeeping services provided to the Portfolio by State Street Bank and Trust Company (“State Street”), to whom TAM has outsourced the provision of certain sub-administration services. To the extent agreed upon by TAM and the Portfolio from time to time, TAM’s supervisory and administrative services include, but are not limited to: monitoring and verifying the custodian’s daily calculation of the Net Asset Values (“NAV”); shareholder relations functions; compliance services; valuation services; assisting in due diligence and in the oversight and monitoring of certain activities of sub-advisers and certain aspects of Portfolio investments; assisting with Portfolio combinations and liquidations; oversight of the preparation and filing, and review, of all returns and reports, in connection with federal, state and local taxes; oversight and review of regulatory reporting; supervising and coordinating the Portfolio’s custodian and dividend disbursing agent and monitoring their services to the Portfolio; assisting the Portfolio in preparing reports to shareholders; acting as liaison with the Portfolio’s independent public accountants and providing, upon request, analyses, fiscal year summaries and other audit related services; assisting in the preparation of agendas and supporting documents for and minutes of meetings of trustees and committees of trustees; assisting in the preparation of regular communications with the trustees; and providing personnel and office space, telephones and other office equipment as necessary in order for TAM to perform supervisory and administrative services to the Portfolio. The Portfolio
|
|
|
| Transamerica Series Trust |
|
Semi-Annual Financial Statements 2024 |
Page 10
Transamerica BlackRock Real Estate Securities VP
NOTES TO FINANCIAL STATEMENTS (continued)
At June 30, 2024
(unaudited)
1. ORGANIZATION (continued)
pays certain fees and expenses to State Street for sub-administration services which are not administrative services covered by the management agreement with TAM or paid for through the management fees payable thereunder. For the period ended June 30, 2024, (i) the expenses paid to State Street for sub-administration services by the Portfolio are shown as a part of Other expenses within the Statement of Operations and (ii) the expenses payable to State Street for sub-administration services from the Portfolio are shown as part of Other accrued expenses within the Statement of Assets and Liabilities.
2. SIGNIFICANT ACCOUNTING POLICIES
In preparing the Portfolio’s financial statements in accordance with Generally Accepted Accounting Principles in the United States of America (“GAAP”), estimates or assumptions (which could differ from actual results) may be used that affect reported amounts and disclosures. The following is a summary of significant accounting policies followed by the Portfolio.
Foreign currency denominated investments: The accounting records of the Portfolio are maintained in U.S. dollars. Securities and other assets and liabilities denominated in foreign currencies are translated into U.S. dollars based on the closing exchange rate each day. The cost of foreign securities purchased and any realized gains or losses are translated at the prevailing exchange rates in effect on the date of the respective transaction. The Portfolio combines fluctuations from currency exchange rates and fluctuations in value when computing net realized and unrealized gains or losses from investments.
Net foreign currency gains and losses resulting from changes in exchange rates include, foreign currency fluctuations between trade date and settlement date of investment security transactions, gains and losses on forward foreign currency contracts, and the difference between the receivable amounts of interest and dividends recorded in the accounting records in U.S. dollars and the amounts actually received.
Foreign currency denominated assets may involve risks not typically associated with domestic transactions. These risks include revaluation of currencies, adverse fluctuations in foreign currency values, and possible adverse political, social, and economic developments, including those particular to a specific industry, country or region.
Security transactions and investment income: Security transactions are accounted for on the trade date. Security gains and losses are calculated on a first-in, first-out basis. Dividend income, if any, is recorded on the ex-dividend date or, in the case of foreign securities, as soon as the Portfolio is informed of the ex-dividend dates, net of foreign taxes. Non-cash dividends, if any, are recorded on the ex-dividend date at fair value. Interest income, if any, is recorded on the accrual basis from settlement date, net of foreign taxes. Fixed income premiums and discounts are amortized and/or accreted over the lives of the respective securities.
Multiple class operations, income, and expenses: Income, non-class specific expenses, and realized and unrealized gains and losses are allocated to each class daily based upon net assets. Each class bears its own specific expenses in addition to the allocated non-class specific expenses.
Distributions to shareholders: Distributions are recorded on the ex-dividend date and are determined in accordance with federal income tax regulations, which may differ from GAAP.
Foreign taxes: The Portfolio may be subject to taxes imposed by the countries in which it invests, with respect to its investments in issuers existing or operating in such countries. The Portfolio may also be subject to foreign taxes on income, gains on investments, or currency repatriation, a portion of which may be recoverable. The Portfolio accrues such taxes and recoveries as applicable when the related income or capital gains are earned or unrealized, and based upon the current interpretation of tax rules and regulations that exist in the markets in which the Portfolio invests. Some countries require governmental approval for the repatriation of investment income, capital, or the proceeds of sales earned by foreign investors. In addition, if there is deterioration in a country’s balance of payments or for other reasons, a country may impose temporary restrictions of foreign capital remittances abroad.
Commission recapture: The sub-adviser(s), to the extent consistent with the best execution and usual commission rate policies and practices, may elect to place security transactions of the Portfolio with broker/dealers with which TST has established a commission recapture program. A commission recapture program is any arrangement under which a broker/dealer applies a portion of the commissions received by such broker/dealer on the security transactions to the Portfolio. In no event will commissions, paid by the Portfolio, be used to pay expenses that would otherwise be borne by any other Portfolios within TST, or by any other party.
There were no commissions recaptured during the period ended June 30, 2024 by the Portfolio.
|
|
|
| Transamerica Series Trust |
|
Semi-Annual Financial Statements 2024 |
Page 11
Transamerica BlackRock Real Estate Securities VP
NOTES TO FINANCIAL STATEMENTS (continued)
At June 30, 2024
(unaudited)
2. SIGNIFICANT ACCOUNTING POLICIES (continued)
Indemnification: In the normal course of business, the Portfolio enters into contracts that contain a variety of representations that provide general indemnifications. The Portfolio’s maximum exposure under these arrangements is unknown, as this would involve future claims that may be made against the Portfolio and/or its affiliates that have not yet occurred. However, based on experience, the Portfolio expects the risk of loss to be remote.
3. INVESTMENT VALUATION
TAM has been designated as the Portfolio’s valuation designee pursuant to Rule 2a-5 under the 1940 Act with responsibility for fair valuation subject to oversight by the Portfolio’s Board of Trustees. The net asset value of the Portfolio is computed as of the official close of the New York Stock Exchange (“NYSE”) each day the NYSE is open for business.
TAM utilizes various methods to measure the fair value of its investments on a recurring basis. GAAP establishes a hierarchy that prioritizes inputs to valuation methods. The inputs or methodology used for valuing securities are not necessarily an indication of the risk associated with investing in those securities. The three levels (“Levels”) of inputs of the fair value hierarchy are defined as follows:
Level 1—Unadjusted quoted prices in active markets for identical securities.
Level 2—Inputs, other than quoted prices included in Level 1, which are observable, either directly or indirectly. These inputs may include quoted prices for the identical instrument on an inactive market, prices for similar instruments, interest rates, prepayment speeds, credit risk, yield curves, default rates, and similar data.
Level 3—Unobservable inputs based on the best information available in the circumstances, to the extent observable inputs are not available, which may include TAM’s own assumptions used in determining the fair value of the Portfolio’s investments and derivative instruments.
The inputs used to measure fair value may fall into different Levels of the fair value hierarchy. In such cases, for disclosure purposes, the Level in the fair value hierarchy that is assigned to the fair value measurement of a security is determined based on the lowest Level input that is significant to the fair value measurement in its entirety. Certain investments that are measured at fair value using NAV per share, or its equivalent, using the “practical expedient” have not been classified in the fair value Levels. The hierarchy classification of inputs used to value the Portfolio’s investments at June 30, 2024, is disclosed within the Investment Valuation section of the Schedule of Investments.
The availability of observable inputs can vary from security to security and is affected by a wide variety of factors, including, but not limited to, the type of security, whether the security is new and not yet established in the marketplace, the liquidity of markets, and other characteristics particular to the security. To the extent that valuation is based on models or inputs that are less observable or unobservable in the market, the determination of fair value requires more judgment. Accordingly, the degree of judgment exercised in determining fair value is generally greatest for instruments categorized in Level 3. Due to the inherent uncertainty of valuation, the determination of values may differ significantly from values that would have been realized had a ready market for investments existed, and the differences could be material.
Fair value measurements: Descriptions of the valuation techniques applied to the Portfolio’s significant categories of assets and liabilities measured at fair value on a recurring basis are as follows:
Equity securities: Securities are stated at the last reported sales price or closing price on the day of valuation taken from the primary exchange where the security is principally traded. To the extent these securities are actively traded and valuation adjustments are not applied, they are categorized in Level 1 of the fair value hierarchy. Equities traded on inactive markets or valued by reference to similar instruments are generally categorized in Level 2 or Level 3 if inputs are unobservable.
Foreign equity securities: Securities in which the primary trading market closes at the same time or after the NYSE, are valued based on quotations from the primary market in which they are traded and are categorized in Level 1. Because many foreign securities markets and exchanges close prior to the close of the NYSE, closing prices for foreign securities in those markets or on those exchanges do not reflect the events that occur after that close. Certain foreign securities may be fair valued using a pricing service that considers the correlation of the trading patterns of the foreign security to the intraday trading in the U.S. markets for investments such as American Depositary Receipts, financial futures, or ETFs and the movement of certain indices of securities based on a statistical analysis of their historical relationship; such valuations generally are categorized in Level 2.
|
|
|
| Transamerica Series Trust |
|
Semi-Annual Financial Statements 2024 |
Page 12
Transamerica BlackRock Real Estate Securities VP
NOTES TO FINANCIAL STATEMENTS (continued)
At June 30, 2024
(unaudited)
3. INVESTMENT VALUATION (continued)
Securities lending collateral: Securities lending collateral is invested in a money market fund which is valued at the actively traded NAV and no valuation adjustments are applied. Securities lending collateral is categorized in Level 1 of the fair value hierarchy.
Repurchase agreements: Repurchase agreements are valued at cost, which approximates fair value. To the extent the inputs are observable and timely, the values are generally categorized in Level 2 of the fair value hierarchy.
Derivative instruments: Centrally cleared or listed derivatives that are actively traded are valued based on quoted prices from the exchange and are categorized in Level 1 of the fair value hierarchy. Over-the-counter (“OTC”) derivative contracts include forward, swap, swaption, and option contracts related to interest rates, foreign currencies, credit standing of reference entities, equity prices, or commodity prices. Depending on the product and the terms of the transaction, the fair value of the OTC derivative products are modeled taking into account the counterparties’ creditworthiness and using a series of techniques, including simulation models. Many pricing models do not entail material subjectivity because the methodologies employed do not necessitate significant judgments and the pricing inputs are observed from actively quoted markets, as is the case of interest rate swap and option contracts. The majority of OTC derivative products valued by the Portfolio using pricing models fall into this category and are categorized within Level 2 of the fair value hierarchy or Level 3 if inputs are unobservable.
4. SECURITIES AND OTHER INVESTMENTS
Real estate investment trusts (“REITs”): REITs are pooled investment vehicles which invest primarily in income producing real estate, or real estate related loans or interests. Distributions received by REITs are classified at management’s estimate of the dividend income, return of capital and capital gains. Estimates are based on information available at year-end, which includes the previous fiscal year’s classification. The actual amounts of dividend income, return of capital, and capital gains are only determined by each REIT after the fiscal year end and may differ from the estimated amounts. Upon notification from the REITs, some of the distributions received may be re-classified and recorded as a return of capital or capital gains. There are certain additional risks involved in investing in REITs. These include, but are not limited to, economic conditions, changes in zoning laws, real estate values, property taxes, and interest rates.
REITs held at June 30, 2024, if any, are identified within the Schedule of Investments.
5. BORROWINGS AND OTHER FINANCING TRANSACTIONS
The Portfolio may engage in borrowing transactions as a means of raising cash to satisfy redemption requests, for other temporary or emergency purposes or, to the extent permitted by its investment policies, to raise additional cash to be invested in other securities or instruments. When the Portfolio invests borrowing proceeds in other securities, the Portfolio will bear the risk that the market value of the securities in which such proceeds are invested goes down and is insufficient to repay the borrowed proceeds. The Portfolio may borrow on a secured or on an unsecured basis. If the Portfolio enters into a secured borrowing arrangement, a portion of the Portfolio’s assets will be used as collateral. The 1940 Act requires the Portfolio to maintain asset coverage of at least 300% of the amount of its borrowings. Asset coverage means the ratio that the value of the Portfolio’s total assets, minus liabilities other than borrowings, bears to the aggregate amount of all borrowings. Although complying with this requirement has the effect of limiting the amount that the Portfolio may borrow, it does not otherwise mitigate the risks of entering into borrowing transactions.
Interfund lending: The Portfolio, along with other funds and portfolios advised by TAM, may participate in an interfund lending program pursuant to exemptive relief granted by the Securities and Exchange Commission on January 18, 2017. This program allows the Portfolio to lend to and borrow from other funds and portfolios advised by TAM. Interfund lending transactions are subject to the conditions of the exemptive relief which places limits on the amount of lending or borrowing a Portfolio may participate in under the program. Interest earned or paid on an interfund lending transaction will be based on the average of certain current market rates. For the period ended June 30, 2024, the Portfolio has not utilized the program.
Repurchase agreements: In a repurchase agreement, the Portfolio purchases a security and simultaneously commits to resell that security to the seller at an agreed-upon price on an agreed-upon date. Securities purchased subject to a repurchase agreement are held at the Portfolio’s custodian, or designated sub-custodian related to tri-party repurchase agreements, and, pursuant to the terms of the repurchase agreement, must be collateralized by securities with an aggregate market value greater than or equal to 100% of the resale price. The Portfolio will bear the risk of value fluctuations until the securities can be sold and may encounter delays and incur costs in liquidating the securities. In the event of bankruptcy or insolvency of the seller, delays and costs may be incurred.
|
|
|
| Transamerica Series Trust |
|
Semi-Annual Financial Statements 2024 |
Page 13
Transamerica BlackRock Real Estate Securities VP
NOTES TO FINANCIAL STATEMENTS (continued)
At June 30, 2024
(unaudited)
5. BORROWINGS AND OTHER FINANCING TRANSACTIONS (continued)
Repurchase agreements are subject to netting agreements, which are agreements between the Portfolio and its counterparties that provide for the net settlement of all transactions and collateral with the Portfolio, through a single payment, in the event of default or termination. Amounts presented within the Schedule of Investments, and as part of Repurchase agreements, at value within the Statement of Assets and Liabilities are shown on a gross basis. The value of the related collateral for each repurchase agreement, as reflected within the Schedule of Investments, exceeds the value of each repurchase agreement at June 30, 2024.
Repurchase agreements at June 30, 2024, if any, are included within the Schedule of Investments and Statement of Assets and Liabilities.
Securities lending: The Portfolio may lend securities to qualified financial institutions, brokers and dealers. State Street serves as securities lending agent to the Portfolio pursuant to a Securities Lending Agreement. Loans of securities are terminable at any time and the borrower, after notice, is required to return borrowed securities within the standard time period for settlement of securities transactions. The lending of securities exposes the Portfolio to risks such as: the borrowers may fail to return the loaned securities or may not be able to provide additional collateral, the Portfolio may experience delays in recovery of the loaned securities or delays in access to collateral, or the Portfolio may experience losses related to the investment collateral. To minimize certain risks, loan counterparties pledge cash, securities issued or guaranteed by the U.S. Government and irrevocable letters of credit issued by banks as collateral. The initial collateral received by the Portfolio is required to have a value of at least 102% of the current value of the loaned securities traded on U.S. exchanges, and a value of at least 105% for all other securities. Typically the lending agent is not permitted to sell, re-pledge or use cash and non-cash collateral it receives. The lending agent has agreed to indemnify the Portfolio in the case of default of any securities borrower.
The Portfolio receives compensation for lending securities from interest or dividends earned on the cash, U.S. Government securities and irrevocable letters of credit held as collateral, less associated fees and expenses. Such income is reflected in Net income from securities lending within the Statement of Operations. Cash collateral received is invested in the State Street Navigator Securities Lending Trust — Government Money Market Portfolio.
The value of loaned securities and related cash and non-cash collateral outstanding at June 30, 2024, if any, are shown on a gross basis within the Schedule of Investments.
The following table reflects a breakdown of transactions accounted for as secured borrowings, the gross obligation by the type, and the remaining contractual maturity of those transactions as of June 30, 2024.
|
|
|
|
|
|
|
|
|
|
|
|
|
|
|
|
|
|
|
|
|
| |
|
Remaining Contractual Maturity of the Agreements |
|
| |
|
Overnight and Continuous |
|
|
Less Than 30 Days |
|
|
Between 30 & 90 Days |
|
|
Greater Than 90 Days |
|
|
Total |
|
| Securities Lending Transactions |
|
|
|
|
|
|
|
|
|
|
|
|
|
|
|
|
|
|
|
|
| Common Stocks |
|
$ |
900 |
|
|
$ |
— |
|
|
$ |
— |
|
|
$ |
— |
|
|
$ |
900 |
|
| Total Borrowings |
|
$ |
900 |
|
|
$ |
— |
|
|
$ |
— |
|
|
$ |
— |
|
|
$ |
900 |
|
| |
|
|
|
|
|
|
|
|
|
|
|
|
|
|
|
|
|
|
|
|
6. RISK EXPOSURES AND THE USE OF DERIVATIVE INSTRUMENTS
The Portfolio’s investment strategies allow the Portfolio to use various types of derivative contracts, including option contracts, swap agreements, futures contracts, and forward foreign currency contracts. Derivatives are investments whose value is primarily derived from underlying assets, indices or reference rates and may be transacted on an exchange or OTC.
Market Risk Factors: In pursuit of the Portfolio’s investment strategies, the Portfolio may seek to use derivatives to increase or decrease its exposure to certain market risks, including:
Interest rate risk: Interest rate risk relates to the fluctuations in the value of fixed income securities due to changes in the prevailing levels of market interest rates.
Foreign exchange rate risk: Foreign exchange rate risk relates to fluctuations in the value of an asset or liability due to changes in the currency exchange rates.
Equity risk: Equity risk relates to the change in value of equity securities as they relate to increases or decreases in the general market.
|
|
|
| Transamerica Series Trust |
|
Semi-Annual Financial Statements 2024 |
Page 14
Transamerica BlackRock Real Estate Securities VP
NOTES TO FINANCIAL STATEMENTS (continued)
At June 30, 2024
(unaudited)
6. RISK EXPOSURES AND THE USE OF DERIVATIVE INSTRUMENTS (continued)
Credit risk: Credit risk relates to the ability of the issuer of a financial instrument to make further principal or interest payments on an obligation or commitment that it has to the Portfolio.
Commodity risk: Commodity risk relates to the change in value of commodities or commodity indices as they relate to increases or decreases in the commodities market. Commodities are physical assets that have tangible properties. Examples of these types of assets are crude oil, heating oil, metals, livestock, and agricultural products.
The Portfolio is also exposed to additional risks from investing in derivatives, such as liquidity and counterparty credit risk. Liquidity risk is the risk that the Portfolio will be unable to sell or close out the derivative in the open market in a timely manner. Counterparty credit risk is the risk that the counterparty will not be able to fulfill its obligations to the Portfolio. Investing in derivatives may also involve greater risks than investing directly in the underlying assets, such as losses in excess of any initial investment and collateral received. In addition, there may be the risk that the change in value of the derivative contract does not correspond to the change in value of the underlying instrument.
The Portfolio’s exposure to market risk factors and certain other associated risks are summarized by derivative type as follows:
Forward foreign currency contracts: The Portfolio is subject to foreign exchange rate risk exposure in the normal course of pursuing its investment objective. The Portfolio may enter into forward foreign currency contracts to hedge against exchange rate risk arising from investments in securities denominated in foreign currencies. Forward foreign currency contracts are marked-to-market daily, with the change in value recorded as an unrealized gain or loss and is shown in Unrealized appreciation (depreciation) on forward foreign currency contracts within the Statement of Assets and Liabilities. When the contracts are settled, a realized gain or loss is incurred and is shown in Net realized gain (loss) on forward foreign currency contracts within the Statement of Operations. Risks may arise from changes in market value of the underlying currencies and from the possible inability of counterparties to meet the terms of their contracts. Forward foreign currency contracts are traded in the OTC inter-bank currency dealer market.
Open forward foreign currency contracts at June 30, 2024 are listed within the Schedule of Investments.
The following is a summary of the location and the Portfolio’s fair values of derivative investments disclosed within the Statement of Assets and Liabilities, categorized by primary market risk exposure as of June 30, 2024.
|
|
|
|
|
|
|
|
|
|
|
|
|
|
|
|
|
|
|
|
|
|
|
|
|
|
| Asset Derivatives |
|
| Location |
|
Interest Rate Contracts |
|
|
Foreign Exchange Contracts |
|
|
Equity Contracts |
|
|
Credit Contracts |
|
|
Commodity Contracts |
|
|
Total |
|
| Forward foreign currency contracts: |
|
|
|
|
|
|
|
|
|
|
|
|
|
|
|
|
|
|
|
|
|
|
|
|
| Unrealized appreciation on forward foreign currency contracts |
|
$ |
— |
|
|
$ |
225,795 |
|
|
$ |
— |
|
|
$ |
— |
|
|
$ |
— |
|
|
$ |
225,795 |
|
| Total |
|
$ |
— |
|
|
$ |
225,795 |
|
|
$ |
— |
|
|
$ |
— |
|
|
$ |
— |
|
|
$ |
225,795 |
|
| |
|
|
|
|
|
|
|
|
|
|
|
|
|
|
|
|
|
|
|
|
|
|
|
|
|
| Liability Derivatives |
|
| Location |
|
Interest Rate Contracts |
|
|
Foreign Exchange Contracts |
|
|
Equity Contracts |
|
|
Credit Contracts |
|
|
Commodity Contracts |
|
|
Total |
|
| Forward foreign currency contracts: |
|
|
|
|
|
|
|
|
|
|
|
|
|
|
|
|
|
|
|
|
|
|
|
|
| Unrealized depreciation on forward foreign currency contracts |
|
$ |
— |
|
|
$ |
(346,624 |
) |
|
$ |
— |
|
|
$ |
— |
|
|
$ |
— |
|
|
$ |
(346,624 |
) |
| Total |
|
$ |
— |
|
|
$ |
(346,624 |
) |
|
$ |
— |
|
|
$ |
— |
|
|
$ |
— |
|
|
$ |
(346,624 |
) |
| |
|
|
|
|
|
|
|
|
|
|
|
|
|
|
|
|
|
|
|
|
|
|
|
|
|
|
|
| Transamerica Series Trust |
|
Semi-Annual Financial Statements 2024 |
Page 15
Transamerica BlackRock Real Estate Securities VP
NOTES TO FINANCIAL STATEMENTS (continued)
At June 30, 2024
(unaudited)
6. RISK EXPOSURES AND THE USE OF DERIVATIVE INSTRUMENTS (continued)
The following is a summary of the location and the effect of derivative investments within the Statement of Operations, categorized by primary market risk exposure as of June 30, 2024.
|
|
|
|
|
|
|
|
|
|
|
|
|
|
|
|
|
|
|
|
|
|
|
|
|
| Realized Gain (Loss) on Derivative Instruments |
|
| Location |
|
Interest Rate Contracts |
|
|
Foreign Exchange Contracts |
|
|
Equity Contracts |
|
|
Credit Contracts |
|
|
Commodity Contracts |
|
|
Total |
|
| Forward foreign currency contracts |
|
$ |
— |
|
|
$ |
(160,373 |
) |
|
$ |
— |
|
|
$ |
— |
|
|
$ |
— |
|
|
$ |
(160,373 |
) |
| Total |
|
$ |
— |
|
|
$ |
(160,373 |
) |
|
$ |
— |
|
|
$ |
— |
|
|
$ |
— |
|
|
$ |
(160,373 |
) |
| |
|
|
|
|
|
|
|
|
|
|
|
|
|
|
|
|
|
|
|
|
|
|
|
|
|
| Net Change in Unrealized Appreciation (Depreciation) on Derivative Instruments |
|
| Location |
|
Interest Rate Contracts |
|
|
Foreign Exchange Contracts |
|
|
Equity Contracts |
|
|
Credit Contracts |
|
|
Commodity Contracts |
|
|
Total |
|
| Forward foreign currency contracts |
|
$ |
— |
|
|
$ |
(521,823 |
) |
|
$ |
— |
|
|
$ |
— |
|
|
$ |
— |
|
|
$ |
(521,823 |
) |
| Total |
|
$ |
— |
|
|
$ |
(521,823 |
) |
|
$ |
— |
|
|
$ |
— |
|
|
$ |
— |
|
|
$ |
(521,823 |
) |
| |
|
|
|
|
|
|
|
|
|
|
|
|
|
|
|
|
|
|
|
|
|
|
|
|
The following is a summary of the ending monthly average volume on derivative activity during the period ended June 30, 2024.
|
|
|
|
|
| Forward foreign currency exchange contracts: |
|
|
|
|
| Average contract amounts purchased — in USD |
|
$ |
21,452,093 |
|
| Average contract amounts sold — in USD |
|
|
17,690,079 |
|
The Portfolio typically enters into International Swaps and Derivatives Association, Inc. Master Agreements (“ISDA Master Agreements”) or similar master agreements (collectively, “Master Agreements”) with its contract counterparties for certain OTC derivatives in order to, among other things, reduce credit risk to counterparties.
ISDA Master Agreements include provisions for general obligations, representations, collateral and events of default or termination. Under an ISDA Master Agreement, the Portfolio typically may offset with the counterparty certain OTC derivative financial instruments payables and/or receivables with collateral held and/or posted and create one single net payment (close-out netting) in the event of default, termination and/or potential deterioration in the credit quality of the counterparty.
Various Master Agreements govern the terms of certain transactions with counterparties and typically attempt to reduce the counterparty risk associated with such transactions by specifying credit protection mechanisms and providing standardization that improves legal certainty. Cross-termination provisions under Master Agreements typically provide that a default in connection with one transaction between the Portfolio and a counterparty gives the non-defaulting party the right to terminate any other transactions in place with the defaulting party to create one single net payment due to/due from the defaulting party and may be a feature in certain Master Agreements. In the event the Portfolio exercises its right to terminate a Master Agreement after a counterparty experiences a termination event as defined in the Master Agreement, the return of collateral with market value in excess of the Portfolio’s net liability may be delayed or denied.
Collateral requirements: Collateral or margin requirements are set by the broker or exchange clearing house for exchange-traded derivatives (futures contracts, exchange-traded options, and exchange-traded swap agreements) while collateral terms are contract specific for OTC derivatives (forward foreign currency exchange contracts, OTC options, and OTC swap agreements). For OTC derivatives, under standard derivatives agreements, the Portfolio may be required to pledge collateral on derivatives to a counterparty if the Portfoliois in a net liability position, and receive collateral if in a net positive position. For financial reporting purposes, cash collateral that has been pledged by the Portfolio to cover obligations, if any, is reported in Cash collateral at broker within the Statement of Assets and Liabilities. Cash collateral that has been received by the Portfolio from a counterparty, if any, is reported separately in Cash collateral pledged at custodian and/or broker within the Statement of Assets and Liabilities. Non-cash collateral pledged to the Portfolio, if any, is disclosed within the Schedule of Investments.
|
|
|
| Transamerica Series Trust |
|
Semi-Annual Financial Statements 2024 |
Page 16
Transamerica BlackRock Real Estate Securities VP
NOTES TO FINANCIAL STATEMENTS (continued)
At June 30, 2024
(unaudited)
6. RISK EXPOSURES AND THE USE OF DERIVATIVE INSTRUMENTS (continued)
Generally, the amount of collateral due from or to a party must exceed a minimum transfer amount threshold before a transfer has been made. Typically a counterparty is not permitted to sell, re-pledge or use cash and non-cash collateral it receives. The Portfolio generally does not use non-cash collateral that it receives but may, absent default or certain other circumstances, be permitted to use cash collateral received. In such cases, interest may be paid pursuant to the collateral arrangement with the counterparty.
To the extent amounts due to the Portfolio from its counterparties are not fully collateralized, contractually or otherwise, the Portfolio bears the risk of loss from counterparty non-performance. Additionally, to the extent the Portfolio has delivered collateral to a counterparty, the Portfolio bears the risk of loss from a counterparty in the event the counterparty fails to return such collateral. Counterparties may immediately terminate derivatives contracts if the Portfolio fails to maintain sufficient asset coverage for its contracts or its net assets decline by stated percentages. Collateral may not be required for all derivative contracts.
The following is a summary of the Portfolio OTC derivative assets and liabilities by counterparty net of amounts available for offset under a master netting agreement and net of the related collateral received/pledged by the Portfolio as of June 30, 2024. For financial reporting purposes, the Portfolio does not offset assets and liabilities that are subject to a master netting agreement or similar arrangement on the Statement of Assets and Liabilities. See the Repurchase agreement section within the notes for offsetting and collateral information pertaining to repurchase agreements that are subject to master netting agreements.
|
|
|
|
|
|
|
|
|
|
|
|
|
|
|
|
|
|
|
|
|
|
|
|
|
|
|
|
|
|
|
|
|
| |
|
Gross Amounts of Assets Presented within Statement of Assets and Liabilities (A) |
|
|
Gross Amounts Not Offset
within Statement
of Assets and Liabilities |
|
|
Gross Amounts of Liabilities Presented within Statement of Assets and Liabilities (A) |
|
|
Gross Amounts Not Offset
within Statement
of Assets and Liabilities |
|
| Counterparty |
|
Financial Instruments |
|
|
Collateral Received (B) |
|
|
Net Receivable |
|
|
Financial Instruments |
|
|
Collateral Pledged (B) |
|
|
Net Payable |
|
| |
|
Assets |
|
|
Liabilities |
|
| Bank of America, N.A. |
|
$ |
17,948 |
|
|
$ |
(11,139 |
) |
|
$ |
— |
|
|
$ |
6,809 |
|
|
$ |
11,139 |
|
|
$ |
(11,139 |
) |
|
$ |
— |
|
|
$ |
— |
|
| BNP Paribas |
|
|
5,147 |
|
|
|
(5,147 |
) |
|
|
— |
|
|
|
— |
|
|
|
7,468 |
|
|
|
(5,147 |
) |
|
|
— |
|
|
|
2,321 |
|
| Citibank, N.A. |
|
|
8,076 |
|
|
|
(5,107 |
) |
|
|
— |
|
|
|
2,969 |
|
|
|
5,107 |
|
|
|
(5,107 |
) |
|
|
— |
|
|
|
— |
|
| Goldman Sachs International |
|
|
— |
|
|
|
— |
|
|
|
— |
|
|
|
— |
|
|
|
199,276 |
|
|
|
— |
|
|
|
— |
|
|
|
199,276 |
|
| HSBC Bank USA |
|
|
127,648 |
|
|
|
(18,863 |
) |
|
|
— |
|
|
|
108,785 |
|
|
|
18,863 |
|
|
|
(18,863 |
) |
|
|
— |
|
|
|
— |
|
| JPMorgan Chase Bank, N.A. |
|
|
19,515 |
|
|
|
(19,515 |
) |
|
|
— |
|
|
|
— |
|
|
|
36,188 |
|
|
|
(19,515 |
) |
|
|
— |
|
|
|
16,673 |
|
| Nomura International PLC |
|
|
10,789 |
|
|
|
(6,405 |
) |
|
|
— |
|
|
|
4,384 |
|
|
|
6,405 |
|
|
|
(6,405 |
) |
|
|
— |
|
|
|
— |
|
| State Street Bank & Trust Co. |
|
|
18,988 |
|
|
|
(18,988 |
) |
|
|
— |
|
|
|
— |
|
|
|
58,379 |
|
|
|
(18,988 |
) |
|
|
— |
|
|
|
39,391 |
|
| UBS AG |
|
|
17,684 |
|
|
|
(3,799 |
) |
|
|
— |
|
|
|
13,885 |
|
|
|
3,799 |
|
|
|
(3,799 |
) |
|
|
— |
|
|
|
— |
|
| Total |
|
$ |
225,795 |
|
|
$ |
(88,963 |
) |
|
$ |
— |
|
|
$ |
136,832 |
|
|
$ |
346,624 |
|
|
$ |
(88,963 |
) |
|
$ |
— |
|
|
$ |
257,661 |
|
| |
|
|
|
|
|
|
|
|
|
|
|
|
|
|
|
|
|
|
|
|
|
|
|
|
|
|
|
|
|
|
|
|
| (A) |
Absent an event of default or early termination, OTC derivative assets and liabilities are presented gross and not offset within the Statement of Assets and Liabilities. |
| (B) |
In some instances, the actual collateral received and/or pledged may be more than the amount shown due to overcollateralization. |
7. RISK FACTORS
Investing in the Portfolio involves certain key risks related to the Portfolio’s trading activity. Please reference the Portfolio’s prospectus for a more complete discussion of the following risk(s), as well as other risks of investing in the Portfolio.
Market risk: The market prices of the Portfolio’s securities or other assets may go up or down, sometimes rapidly or unpredictably, due to factors such as economic events, inflation, changes in interest rates, governmental actions or interventions, actions taken by the U.S. Federal Reserve or foreign central banks, market disruptions caused by tariffs, trade disputes or other factors, political developments, armed conflicts, economic sanctions, cybersecurity events, investor sentiment, the global and domestic effects of widespread or local health, weather or climate events, and other factors that may or may not be related to the issuer of the security or other asset. If the market prices of the Portfolio’s securities and assets fall, the value of your investment in the Portfolio could go down.
Economies and financial markets throughout the world are increasingly interconnected. Events or circumstances in one or more countries or regions could be highly disruptive to, and have profound impacts on, global economies or markets. As a result, whether or not the Portfolio invests in securities of issuers located in or with significant exposure to the countries directly affected, the value and liquidity of the Portfolio’s investments may go down.
|
|
|
| Transamerica Series Trust |
|
Semi-Annual Financial Statements 2024 |
Page 17
Transamerica BlackRock Real Estate Securities VP
NOTES TO FINANCIAL STATEMENTS (continued)
At June 30, 2024
(unaudited)
7. RISK FACTORS (continued)
Real estate securities risk: Investments in the real estate industry are subject to risks associated with direct investment in real estate. These risks include declines in the value of real estate, adverse general and local economic conditions, increased competition, overbuilding and changes in laws and regulations affecting real estate, operating expenses, property taxes and interest rates. If the Portfolio’s real estate-related investments are concentrated in one geographic area or one property type, the Portfolio will also be subject to the risks associated with that one area or property type. The value of the Portfolio’s real estate-related securities will not necessarily track the value of the underlying investments of the issuers of such securities.
Real estate investment trusts (“REITs”) risk: Investing in real estate investment trusts (“REITs”) involves unique risks. When the Portfolio invests in REITs, it is subject to risks generally associated with investing in real estate. A REIT’s performance depends on the types and locations of the properties it owns, how well it manages those properties and cash flow. REITs may have limited financial resources, may trade less frequently and in limited volume, may engage in dilutive offerings, and may be subject to more abrupt or erratic price movements than the overall securities markets. In addition to its own expenses, the Portfolio will indirectly bear its proportionate share of any management and other expenses paid by REITs in which it invests. U.S. REITs are subject to a number of highly technical tax-related rules and requirements; and a U.S. REIT’s failure to qualify for the favorable U.S. federal income tax treatment generally available to U.S. REITs could result in corporate-level taxation, significantly reducing the return on an investment to the Portfolio.
8. FEES AND OTHER AFFILIATED TRANSACTIONS
TST serves as a funding vehicle for certain affiliated asset allocation portfolios and certain affiliated separate accounts of Transamerica Life Insurance Company (“TLIC”) and Transamerica Financial Life Insurance Company.
TAM, the Portfolio’s investment manager, is directly owned by TLIC and AUSA Holding, LLC (“AUSA”), both of which are indirect, wholly owned subsidiaries of Aegon Ltd. TLIC is owned by Commonwealth General Corporation (“Commonwealth”). Commonwealth and AUSA are wholly owned by Transamerica Corporation (DE). Transamerica Corporation (DE) is wholly owned by Aegon International B.V., which is wholly owned by Aegon Ltd., a Bermuda exempted company with liability limited by shares (formerly, Aegon NV, a Netherlands corporation) and a publicly traded international insurance group.
Transamerica Fund Services, Inc. (“TFS”) is the Portfolio’s transfer agent. Transamerica Capital, Inc. (“TCI”) is the Portfolio’s distributor/principal underwriter. TAM, TFS and TCI are affiliates of Aegon Ltd.
Certain officers and trustees of the Portfolio may also be officers and/or trustees of TAM, TFS and TCI. No interested trustee who is deemed an interested person due to current or former service with TAM or an affiliate of TAM receives compensation from the Portfolio. The Portfolio does pay non-interested persons (independent trustees), as disclosed in Trustee and CCO fees within the Statement of Operations.
Investment management fees: TAM serves as the Portfolio’s investment manager, performing administration as well as investment advisory services. TAM renders investment advisory, supervisory, and administration services under an investment management agreement and the Portfolio pays a single management fee, which is reflected in Investment management fees within the Statement of Operations.
The Portfolio pays a management fee to TAM based on daily average net assets at the following rates:
|
|
|
|
|
| Breakpoints |
|
Rate |
|
| First $250 million |
|
|
0.77 |
% |
| Over $250 million up to $500 million |
|
|
0.75 |
|
| Over $500 million up to $750 million |
|
|
0.70 |
|
| Over $750 million |
|
|
0.68 |
|
TAM has contractually agreed to waive fees and/or reimburse Portfolio expenses to the extent that the total operating expenses excluding, as applicable, acquired fund fees and expenses, interest (including borrowing costs and overdraft charges), taxes, brokerage commissions, dividend and interest expenses on securities sold short, extraordinary expenses and other expenses not incurred in the ordinary course of the Portfolio’s business, exceed the following stated annual operating expense limits to the Portfolio’s daily average net
|
|
|
| Transamerica Series Trust |
|
Semi-Annual Financial Statements 2024 |
Page 18
Transamerica BlackRock Real Estate Securities VP
NOTES TO FINANCIAL STATEMENTS (continued)
At June 30, 2024
(unaudited)
8. FEES AND OTHER AFFILIATED TRANSACTIONS (continued)
assets. To the extent an expense limit changed during the period, the prior limit is also listed below. The expenses waived and/or reimbursed, if any, are included in Expenses waived and/or reimbursed within the Statement of Operations.
|
|
|
|
|
| Class |
|
Operating Expense Limit |
|
Operating Expense Limit Effective Through |
| Initial Class |
|
0.90% |
|
May 1, 2025 |
| Service Class |
|
1.15 |
|
May 1, 2025 |
TAM is permitted to recapture amounts contractually waived and/or reimbursed to a class during any of the 36 months from the date on which TAM waived fees and/or reimbursed expenses for the class. A class may recapture and reimburse TAM only if such amount does not cause, on any particular business day of the Portfolio, the class’s total annual operating expenses (after the recapture is taken into account) to exceed the Operating Expense Limits or any other lower limit then in effect. Amounts recaptured, if any, by TAM for the period ended June 30, 2024 are disclosed in Recapture of previously waived and/or reimbursed fees within the Statement of Operations.
TAM, on a voluntary basis and in addition to the contractual operating expense limits in effect, from time to time may waive and/or reimburse expenses of the Portfolio, or any classes thereof, to such level(s) as the Trust’s officers have determined or may reasonably determine from time to time. Any such voluntary waiver or expense reimbursement may be discontinued by TAM at any time. These amounts are not subject to recapture by TAM.
As of June 30, 2024, there are no amounts available for recapture by TAM.
Distribution and service fees: TST has a distribution plan (“Distribution Plan”) pursuant to Rule 12b-1 under the 1940 Act. Pursuant to the Distribution Plan, TST entered into a distribution agreement with TCI as the Portfolio’s distributor.
The Distribution Plan requires the Portfolio to pay distribution fees to TCI as compensation for various distribution activities, not as reimbursement for specific expenses. Under the Distribution Plan and distribution agreement, TCI, on behalf of the Portfolio, is authorized to pay various service providers, as direct payment for expenses incurred in connection with distribution of the Portfolio’s shares.
The fee on the Service Class shares is paid to the insurance companies for providing services and account maintenance for the policyholders who invest in the variable insurance products which invest in the Service Class shares. TCI has determined that it will not seek payment for the distribution expenses incurred by the Portfolio with respect to the Initial Class shares before May 1, 2025. Prior to TCI seeking distribution expenses on Initial Class shares, policy and contract owners will be notified in advance. The Portfolio will pay fees relating to Service Class shares. The distribution and service fees are included in Distribution and service fees within the Statement of Operations.
The Portfolio is authorized under the Distribution Plan to pay fees to TCI based on daily average net assets of each applicable class up to the following annual rates:
|
|
|
|
|
|
|
|
|
| Class |
|
Rate |
|
|
|
|
| Initial Class |
|
|
0.15 |
% |
|
|
|
|
| Service Class |
|
|
0.25 |
|
|
|
|
|
Transfer agent costs: TFS provides transfer agency services under an intercompany agreement with TAM. TFS has outsourced the provision of certain sub-transfer agency services to SS&C Global Investor & Distribution Solutions, Inc. (“SS&C GIDS”). The Portfolio does not pay a separate transfer agent fee to TAM or TFS but does pay certain expenses to SS&C GIDS related to applicable sub-transfer agency services. For the period ended June 30, 2024, (i) the expenses paid to SS&C GIDS by the Portfolio are referred to as transfer agent costs and are included within the Statement of Operations and (ii) the expenses payable to SS&C GIDS by the Portfolio are referred to as transfer agent costs within the Statement of Assets and Liabilities.
Brokerage commissions: The Portfolio incurred no brokerage commissions on security transactions placed with affiliates of the investment manager or sub-adviser(s) for the period ended June 30, 2024.
|
|
|
| Transamerica Series Trust |
|
Semi-Annual Financial Statements 2024 |
Page 19
Transamerica BlackRock Real Estate Securities VP
NOTES TO FINANCIAL STATEMENTS (continued)
At June 30, 2024
(unaudited)
9. PURCHASES AND SALES OF SECURITIES
For the period ended June 30, 2024, the cost of securities purchased and proceeds from securities sold (excluding short-term securities) are as follows:
|
|
|
|
|
|
|
| Purchases of Securities |
|
Sales/Maturities of Securities |
| Long-Term |
|
U.S. Government |
|
Long-Term |
|
U.S. Government |
| $ 39,338,885 |
|
$ — |
|
$ 41,923,908 |
|
$ — |
10. FEDERAL INCOME TAXES AND DISTRIBUTIONS TO SHAREHOLDERS
The Portfolio has not made any provision for federal income or excise taxes due to its policy to distribute all of its taxable income and capital gains to its shareholders and otherwise qualify as a regulated investment company under Subchapter M of the Internal Revenue Code. The Portfolio recognizes the tax benefits of uncertain tax positions only where the position is “more likely than not” to be sustained assuming examination by tax authorities. The Portfolio’s tax returns remain subject to examination by the Internal Revenue Service and state tax authorities three years from the date of filing for federal purposes and four years from the date of filing for state purposes. Management has evaluated the Portfolio’s tax provisions taken for all open tax years, and has concluded that no provision for income tax is required in the Portfolio’s financial statements. If applicable, the Portfolio recognizes interest accrued related to unrecognized tax benefits in relation to interest and penalties expense in Other within the Statement of Operations. The Portfolio identifies its major tax jurisdictions as U.S. Federal, the state of Colorado, and foreign jurisdictions where the Portfolio makes significant investments; however, the Portfolio is not aware of any tax positions for which it is reasonably possible that the total amounts of unrecognized tax benefits will change materially in the next twelve months. Distributions are determined in accordance with income tax regulations, which may differ from GAAP.
As of June 30, 2024, the approximate cost for U.S. federal income tax purposes, and the aggregate gross/net unrealized appreciation (depreciation) in the value of investments (including securities sold short and derivatives, if any) are as follows:
|
|
|
|
|
|
|
|
|
|
|
| |
|
Cost |
|
Gross Appreciation |
|
Gross (Depreciation) |
|
Net Appreciation (Depreciation) |
|
|
|
|
$ 164,860,420 |
|
$ 10,113,215 |
|
$ (12,500,806) |
|
$ (2,387,591) |
|
|
11. NEW ACCOUNTING PRONOUNCEMENT
In June 2022, the Financial Accounting Standards Board issued Accounting Standards Update No. 2022-03 (“ASU 2022-03”), “Fair Value Measurement of Equity Securities Subject to Contractual Sale Restrictions” (“Topic 820”). ASU 2022-03 clarifies the guidance in Topic 820, related to the measurement of the fair value of an equity security subject to contractual sale restrictions, where it eliminates the need to apply a discount to fair value of these securities, and introduces disclosure requirements related to such equity securities. The guidance is effective for fiscal years, and interim periods within those fiscal years, beginning after December 15, 2023, and allows for early adoption. Management is currently evaluating the implications, if any, of the additional requirements and their impact on the Portfolio’s financial statements.
Please see TST’s most recent report on Form N-CSR, available at: www.transamerica.com/annuities/prospectus, for additional information. For the most recently filed complete proxy voting records for the Trust please visit: https://www.transamerica.com/sites/default/files/files/e070d/TST%20N-PX%202021.pdf
|
|
|
| Transamerica Series Trust |
|
Semi-Annual Financial Statements 2024 |
Page 20
Transamerica BlackRock Real Estate Securities VP
MANAGEMENT, SUB-ADVISORY AND SUB-SUB-ADVISORY AGREEMENTS — CONTRACT RENEWAL
(unaudited)
At a meeting of the Board of Trustees of Transamerica Series Trust (the “Trustees” or the “Board”) held on June 12-13, 2024, the Board considered the renewal of the management agreement (the “Management Agreement”) between Transamerica Asset Management, Inc. (“TAM”) and Transamerica Series Trust, on behalf of Transamerica BlackRock Real Estate Securities VP (the “Portfolio”). The Board also considered the renewal of the investment sub-advisory agreement (the “Sub-Advisory Agreement”) for the Portfolio between TAM and BlackRock Investment Management, LLC (the “Sub-Adviser”) and the renewal of the investment sub-sub-advisory agreements (the “Sub-Sub-Advisory Agreements” and together with the Sub-Advisory Agreement and the Management Agreement, the “Agreements”) with respect to the Portfolio between the Sub-Adviser and each of BlackRock International Limited and BlackRock (Singapore) Limited (each a “Sub-Sub-Adviser” and collectively the “Sub-Sub-Advisers”).
Following its review and consideration, the Board determined that the terms of the Management Agreement, the Sub-Advisory Agreement and each Sub-Sub-Advisory Agreement were reasonable and that the renewal of each of the Agreements was in the best interests of the Portfolio and the holders invested in the Portfolio. The Board, including the independent members of the Board (the “Independent Trustees”), unanimously approved the renewal of each of the Agreements through June 30, 2025.
Prior to reaching their decision, the Trustees requested and received from TAM, the Sub-Adviser and each Sub-Sub-Adviser certain information. They then reviewed such information as they deemed reasonably necessary to evaluate the Agreements, including information they had previously received from TAM, the Sub-Adviser and each Sub-Sub-Adviser as part of their regular oversight of the Portfolio, and knowledge they gained over time through meeting with TAM, the Sub-Adviser and each Sub-Sub-Adviser. Among other materials, the Trustees considered comparative fee, expense and performance information prepared by Broadridge Financial Solutions, Inc. (“Broadridge”), an independent provider of mutual fund performance information, as well as fee, expense and profitability information prepared by TAM. To the extent applicable, the Trustees considered information about fees and performance of comparable funds and/or accounts managed by the Sub-Adviser and each Sub-Sub-Adviser. The Board also considered reductions to the Portfolio’s expense limits, if any, that took effect after the last renewal of the Management Agreement. In their review, the Trustees also sought to identify instances in which the Portfolio’s performance, fees, total expenses and/or profitability appeared to be outliers within its respective peer group or other comparative metrics and sought to understand the reasons for such comparative positions.
In their deliberations, the Independent Trustees met privately without representatives of TAM, the Sub-Adviser or the Sub-Sub-Advisers present and were represented throughout the process by their independent legal counsel. In considering the proposed continuation of each of the Agreements, the Trustees evaluated and weighed a number of considerations that they believed to be relevant in light of the legal advice furnished to them by counsel, including independent legal counsel, and made a decision in the exercise of their own business judgment. They based their decisions on the considerations discussed below, among others, although they did not identify any particular consideration or item of information that was controlling of their decisions, and each Trustee may have attributed different weights to the various factors.
Nature, Extent and Quality of the Services Provided
The Board considered the nature, extent and quality of the services provided by TAM, the Sub-Adviser and each Sub-Sub-Adviser to the Portfolio in the past and the services anticipated to be provided in the future. The Board also considered the investment approach for the Portfolio; the experience, capability and integrity of TAM’s senior management; the financial resources of TAM; TAM’s management oversight process; TAM’s, the Sub-Adviser’s and each Sub-Sub-Adviser’s responsiveness to any questions by the Trustees; and the professional qualifications and compensation program of the portfolio management teams of the Sub-Adviser and each Sub-Sub-Adviser. The Trustees noted that they receive, on a quarterly basis, an execution analysis from Capital Institutional Services, Inc. (CAPIS), an independent provider of trade analyses, for the Sub-Adviser and a comparison of trading results against a peer universe of managers.
The Board also considered the continuous and regular investment management and other services provided by TAM, when acting as a manager of managers, for the portion of the management fee it retains from the Portfolio after payment of the sub-advisory fees. The Board noted that the investment management and other services provided by TAM include the design, development and ongoing review and evaluation of the Portfolio and its investment strategy; the selection, oversight and monitoring of one or more investment sub-advisers to perform certain duties with respect to the Portfolio; ongoing portfolio trading oversight and analysis; risk management oversight and analysis; design, development, implementation and ongoing review and evaluation of a process for the valuation of Portfolio investments; design, development, implementation and ongoing review and evaluation of a compliance program for the Portfolio; design, development, implementation and ongoing review and evaluation of a process for the voting of proxies and exercise of rights to consent to corporate action for Portfolio investments; participation in Board meetings and oversight of preparation of materials for the Board, including materials for Board meetings and regular communications with the Board; oversight of preparation of the Portfolio’s prospectus, statement of additional information, shareholder reports and other disclosure materials and regulatory filings for the Portfolio; and ongoing cash management services for the Portfolio. The Board considered that TAM’s investment management services also include the provision of supervisory and administrative services to the Portfolio. The Board also noted that TAM, as part of the services it provides to all Transamerica mutual funds, including the Portfolio, oversees the services provided by the funds’ custodian, transfer agent, independent accountant and legal counsel and supervises the performance of the recordkeeping and holder service functions of the funds.
Investment Performance
|
|
|
| Transamerica Series Trust |
|
Semi-Annual Financial Statements 2024 |
Page 21
Transamerica BlackRock Real Estate Securities VP
MANAGEMENT, SUB-ADVISORY AND SUB-SUB-ADVISORY AGREEMENTS — CONTRACT RENEWAL (continued)
(unaudited)
In addition, the Board considered the short- and longer-term performance of the Portfolio in light of its investment objective, policies and strategies, including relative performance against (i) a peer universe of comparable mutual funds, as prepared by Broadridge, and (ii) the Portfolio’s benchmarks, in each case for various trailing periods ended December 31, 2023. Based on these considerations, the Board determined that TAM, the Sub-Adviser and each Sub-Sub-Adviser can provide investment and related services that are appropriate in scope and extent in light of the Portfolio’s investment objectives, policies and strategies and operations, the competitive landscape of the investment company business and investor needs. The Board’s conclusions as to the Portfolio’s performance are summarized below. For purposes of its review, the Board generally used the performance of Service Class Shares. In describing the Portfolio’s performance relative to its peer universe, the summary conclusions characterize performance for the relevant periods in relation to whether it was “above,” “below” or “in line with” the peer universe median and do so using quintile rankings prepared by Broadridge. For simplicity, performance is described as “above” the median if the Portfolio’s performance ranked anywhere in the first or second quintiles, as “below” the median if it ranked anywhere in the fourth or fifth quintiles, or “in line with” the median if it ranked anywhere in the third quintile (i.e., even if its precise return was somewhat above or somewhat below the precise median return).
When considering the Portfolio’s performance, the Trustees considered any representations made by TAM regarding the appropriateness of certain peer groups and benchmarks. They recognized that performance reflects a snapshot of a period as of a specific date, and that consideration of performance data for a different period could generate significantly different performance results. The Trustees also recognized that even longer-term performance can be negatively affected by performance over a short-term period when that short-term performance is significantly below the performance of the comparable benchmark or universe of peer funds.
The Board noted that the performance of Service Class Shares of the Portfolio was above the median for its peer universe for the past 1-year period, in line with the median for the past 5-year period and below the median for the past 3- and 10-year periods. The Board also noted that the performance of Service Class Shares of the Portfolio was above the benchmark that TAM utilizes to measure performance of the Portfolio for the past 1- and 5-year periods and below the benchmark for the past 3- and 10-year periods. The Board noted that the Sub-Adviser had commenced sub-advising the Portfolio on November 1, 2018 pursuant to its current investment objective, investment strategies and benchmarks. The Trustees also noted recent changes in the portfolio management team at the Sub-Adviser. The Trustees noted that TAM intends to monitor and report to the Board on the portfolio manager transition and performance going forward.
Management Fee and Sub-Advisory Fees and Total Expense Ratio
The Board considered the management fee and total expense ratio of the Portfolio, including information provided by Broadridge comparing the management fee and total expense ratio of the Portfolio to the management fees and total expense ratios of comparable investment companies in both a peer group and broader peer universe compiled by Broadridge. The Board’s conclusions as to the Portfolio’s management fee and total expense ratio are summarized below. For purposes of its review, the Board generally used the actual total expenses (i.e., expenses reflecting any waivers and/or reimbursements) of Service Class Shares. In describing the Portfolio’s management fee and total expense ratio relative to its peer group and peer universe, the summary conclusions characterize management fees and total expense ratios for the relevant periods in relation to whether they were “above,” “below” or “in line with” the peer group or peer universe median and do so using quintile rankings prepared by Broadridge. For simplicity, management fees and total expense ratios are described as “above” the median if the Portfolio’s management fee or total expense ratio ranked anywhere in the fourth or fifth quintiles, as “below” the median if it ranked anywhere in the first or second quintiles, or “in line with” the median if it ranked anywhere in the third quintile (i.e., even if its precise management fee or total expense ratio was somewhat above or somewhat below the precise median management fee or total expense ratio).
The Board also considered the fees charged by the Sub-Adviser for sub-advisory services and the Sub-Sub-Advisers for sub-sub-advisory services, noting that TAM pays sub-advisory fees to the Sub-Adviser and that the sub-sub-advisory fees payable to the Sub-Sub-Advisers are paid by the Sub-Adviser and not the Portfolio or TAM. The Board also considered the portion of the Portfolio’s management fee retained by TAM following payment of the sub-advisory fee and how the portion of the contractual management fee retained by TAM at a specified asset level compared to the portions retained by other investment advisers managing mutual funds with similar investment strategies as calculated by an independent provider of information.
The Board noted that the Portfolio’s contractual management fee and the actual total expenses (i.e., expenses reflecting any waivers and/or reimbursements) of Service Class Shares of the Portfolio were in line with the medians for its peer group and peer universe. The Trustees also considered that TAM has entered into an expense limitation arrangement with the Portfolio, which may result in TAM waiving fees for the benefit of holders.
On the basis of these considerations, together with the other information it considered, the Board determined that the management, sub-advisory and sub-sub-advisory fees to be received by TAM, the Sub-Adviser and the Sub-Sub-Advisers under the Management Agreement, the Sub-Advisory Agreement and each Sub-Sub-Advisory Agreement are reasonable in light of the services provided.
Cost of Services Provided and Level of Profitability
The Board reviewed information provided by TAM about the cost of providing and procuring fund management services, as well as the costs of the provision of administration, transfer agency and other services, to the Portfolio and to Transamerica Series Trust as a whole by TAM and its affiliates. The Board considered the profitability of TAM and its affiliates in providing these services for the Portfolio and
|
|
|
| Transamerica Series Trust |
|
Semi-Annual Financial Statements 2024 |
Page 22
Transamerica BlackRock Real Estate Securities VP
MANAGEMENT, SUB-ADVISORY AND SUB-SUB-ADVISORY AGREEMENTS — CONTRACT RENEWAL (continued)
(unaudited)
Transamerica Series Trust as a whole. The Trustees recognized the competitiveness of the mutual fund industry and the importance of an investment adviser’s long-term profitability, including for maintaining company and management stability and accountability.
The Board also considered the allocation methodology used for calculating the profitability of TAM and its affiliates. The Board noted that the revenue and expense allocation methodology used by TAM to estimate its profitability with respect to its relationship with the Portfolio had been reviewed previously by an independent consultant. The Trustees considered that TAM reported that it had not made material changes to this methodology, and that the methodology had been applied consistently for the Portfolio.
With respect to the Sub-Adviser, the Board noted that the sub-advisory fee is the product of arm’s-length negotiation between TAM and the Sub-Adviser, which is not affiliated with TAM, and is paid by TAM and not the Portfolio. As a result, the Board focused on the profitability of TAM and its affiliates with respect to the Portfolio.
Based on this information, the Board determined that the profitability of TAM and its affiliates from their relationships with the Portfolio was not excessive.
Economies of Scale
The Board considered economies of scale with respect to the management of the Portfolio, whether the Portfolio had appropriately benefited from any economies of scale and whether there was the potential for realization of any future economies of scale. The Board also considered the existence of economies of scale with respect to management of the Transamerica mutual funds overall and the extent to which the Portfolio benefited from any economies of scale. The Board recognized that, as the Portfolio’s assets increase, any economies of scale realized by TAM, the Sub-Adviser or a Sub-Sub-Adviser may not directly correlate with each other or with any economies of scale that might be realized by the Portfolio. The Board considered the Portfolio’s management fee schedule and the existence of breakpoints and also considered the extent to which TAM shared economies of scale, if any, with the Portfolio through undertakings to limit or reimburse Portfolio expenses and to invest in maintaining and developing its capabilities and services. The Board also considered the Sub-Adviser’s sub-advisory fee schedule and each Sub-Sub-Adviser’s sub-sub-advisory fee schedule and the existence of breakpoints, if any, and how such breakpoints relate to any breakpoints in the Portfolio’s management fee schedule. The Trustees concluded that the Portfolio’s fee structure reflected an appropriate sharing of any efficiencies or economies of scale to date and noted that they will have the opportunity to periodically reexamine the appropriateness of the management fee payable to TAM and the fees paid to the Sub-Adviser and the Sub-Sub-Advisers in light of any economies of scale experienced in the future.
Benefits to TAM, its Affiliates, the Sub-Adviser and/or the Sub-Sub-Advisers from their Relationships with the Portfolio
The Board considered other benefits derived by TAM, its affiliates, the Sub-Adviser and/or the Sub-Sub-Advisers from their relationships with the Portfolio. The Board noted that TAM does not receive benefits from research obtained with commissions paid to broker-dealers for portfolio transactions (commonly referred to as “soft dollars”) as a result of its relationship with the Portfolio and that TAM believes the use of soft dollars by the Sub-Adviser is generally appropriate and in the best interests of the Portfolio.
Other Considerations
The Board noted that TAM has made a substantial commitment to the recruitment and retention of high-quality personnel and maintains the financial, compliance and operational resources reasonably necessary to manage the Portfolio in a professional manner that is consistent with the best interests of the Portfolio and the holders. In this regard, the Board favorably considered the procedures and policies TAM has in place to enforce compliance with applicable laws and regulations and oversee the portfolio management activities of the Sub-Adviser and the Sub-Sub-Advisers. The Board also noted that TAM has made an entrepreneurial commitment and undertaken certain business risks with respect to the management and success of the Portfolio.
Conclusion
After consideration of the factors described above, as well as other factors, the Trustees, including the Independent Trustees, concluded that the renewal of the Management Agreement, the Sub-Advisory Agreement and each Sub-Sub-Advisory Agreement was in the best interests of the Portfolio and the holders and voted to approve the renewal of the Agreements.
|
|
|
| Transamerica Series Trust |
|
Semi-Annual Financial Statements 2024 |
Page 23
PROXY VOTING POLICIES AND PROCEDURES AND QUARTERLY PORTFOLIO HOLDINGS
(unaudited)
A description of Transamerica Series Trust’s (the “Trust”) proxy voting policies and procedures is available in the Statement of Additional Information of the Portfolios, available without charge upon request by calling 1-800-851-9777 (toll free) or on the Securities and Exchange Commission’s (“SEC”) website at http://www.sec.gov.
In addition, the Portfolio is required to file Form N-PX, with their complete proxy voting records for the most recent 12 months ended June 30th, no later than August 31st of each year. The Form is available without charge: (1) on the Transamerica Funds website at https://www.transamerica.com/sites/default/files/files/e070d/TST%20N-PX%202021.pdf; and (2) on the SEC’s website at http://www.sec.gov.
Each fiscal quarter, the Portfolios, except Transamerica BlackRock Government Money Market VP, will file with the SEC a complete schedule of its monthly portfolio holdings on Form N-PORT. The Portfolios’ holdings as of the end of the third month of every fiscal quarter, as reported on Form N-PORT, will be publicly available on the SEC’s website at http://www.sec.gov within 60 days of the end of the fiscal quarter.
On a monthly basis, Transamerica BlackRock Government Money Market VP will file with the SEC portfolio holdings information on Form N-MFP3. A complete schedule of portfolio holdings is also available at www.transamerica.com.
You may also visit the Trust’s website at www.transamerica.com/annuities/prospectus for this and other information about the Portfolios and the Trust.
Important Notice Regarding Delivery of Shareholder Documents
Every year we provide shareholders informative materials such as the Transamerica Series Trust Annual Report, the Transamerica Series Trust Prospectus, and other required documents that keep you informed regarding your Portfolios. To the extent provided by mail, Transamerica Series Trust will only send one piece per mailing address, a method that saves your Portfolios money by reducing mailing and printing costs. We will continue to do this unless you tell us not to. To elect to receive individual mailings, simply call a Transamerica Customer Service Representative toll free at 1-800-851-9777, 8 a.m. to 7 p.m. Eastern Time, Monday-Friday. Your request will take effect within 30 days.
|
|
|
| Transamerica Series Trust |
|
Semi-Annual Financial Statements 2024 |
Page 24
NOTICE OF PRIVACY POLICY
(unaudited)
Your privacy is very important to us. We want you to understand what information we collect and how we use it. We collect and use “nonpublic personal information” in connection with providing our customers with a broad range of financial products and services as effectively and conveniently as possible. We treat nonpublic personal information in accordance with our Privacy Policy.
What Information We Collect and From Whom We Collect It
We may collect nonpublic personal information about you from the following sources:
| • |
|
Information we receive from you on applications or other forms, such as your name, address, and account number; |
| • |
|
Information about your transactions with us, our affiliates, or others, such as your account balance and purchase/redemption history; and |
| • |
|
Information we receive from non-affiliated third parties, including consumer reporting agencies. |
What Information We Disclose and To Whom We Disclose It
We do not disclose any nonpublic personal information about current or former customers to anyone without their express consent, except as permitted by law. We may disclose the nonpublic personal information we collect, as described above, to persons or companies that perform services on our behalf and to other financial institutions with which we have joint marketing agreements. We will require these companies to protect the confidentiality of your nonpublic personal information and to use it only to perform the services for which we have hired them.
Our Security Procedures
We restrict access to your nonpublic personal information and only allow disclosures to persons and companies as permitted by law to assist in providing products or services to you. We maintain physical, electronic, and procedural safeguards to protect your nonpublic personal information and to safeguard the disposal of certain consumer information.
Contact Us
If you have any questions about our Privacy Policy, please call 1-800-851-9777 on any business day between 8 a.m. and 7 p.m. Eastern Time.
Note: This Privacy Policy applies only to customers that have a direct relationship with us or our affiliates. If you own shares of our portfolios in the name of a third party such as a bank or broker-dealer, its privacy policy may apply to you instead of ours.
|
|
|
| Transamerica Series Trust |
|
Semi-Annual Financial Statements 2024 |
Page 25
PO Box 219945
Kansas City, MO 64121-9945
|
|
|
| Distributor: |
|
Transamerica Capital, Inc. |
|
|
PO Box 219945 |
|
|
Kansas City, MO 64121-9945 |
|
|
|
|
Customer Service: 1-800-851-9777 |
Transamerica Series Trust Semi-Annual Financial Statements
June 30, 2024
1801 California St., Suite 5200
Denver, CO 80202
Distributor: Transamerica Capital, Inc.
Customer Service: 1-800-851-9777
The following pages contain the most recent semi-annual financial statements for the investment options in which you are invested. In compliance with Securities and Exchange Commission regulations, we present these reports on an annual and semi-annual basis with the hope that they will foster greater understanding of the investment options’ holdings, performance, financial data, accounting policies and other issues. This streamlined version provides information only on the investment options in which you are invested.
If you have any questions about these reports, please do not hesitate to contact your financial professional. As always, we thank you for your trust and the opportunity to serve you.
Transamerica BlackRock Tactical Allocation VP
SCHEDULE OF INVESTMENTS
At June 30, 2024
(unaudited)
|
|
|
|
|
|
|
|
|
| |
|
Shares |
|
|
Value |
|
| INVESTMENT COMPANIES - 91.3% |
|
| International Alternative Fund - 0.0% (A) |
|
| Transamerica Global Allocation Liquidating Trust (B)(C)(D)(E) |
|
|
13,521 |
|
|
$ |
16,252 |
|
|
|
|
|
|
|
|
|
|
| International Equity Funds - 15.8% |
|
| Transamerica International Focus VP (C) |
|
|
7,099,129 |
|
|
|
64,673,069 |
|
| Transamerica Morgan Stanley Capital Growth VP (C) |
|
|
3,710,436 |
|
|
|
20,667,128 |
|
| Transamerica TSW International Equity VP (C) |
|
|
3,731,554 |
|
|
|
55,674,789 |
|
|
|
|
|
|
|
|
|
|
|
|
|
|
|
|
|
141,014,986 |
|
|
|
|
|
|
|
|
|
|
| U.S. Equity Funds - 52.6% |
|
| Transamerica JPMorgan Enhanced Index VP (C) |
|
|
10,753,937 |
|
|
|
298,529,290 |
|
| Transamerica Large Cap Value (C) |
|
|
5,217,353 |
|
|
|
73,095,120 |
|
| Transamerica Small Cap Growth (C) |
|
|
2,062,920 |
|
|
|
13,924,714 |
|
| Transamerica Small Cap Value (C) |
|
|
2,219,974 |
|
|
|
12,631,650 |
|
| Transamerica WMC US Growth VP (C) |
|
|
1,707,481 |
|
|
|
72,875,275 |
|
|
|
|
|
|
|
|
|
|
|
|
|
|
|
|
|
471,056,049 |
|
|
|
|
|
|
|
|
|
|
| U.S. Fixed Income Funds - 22.9% |
|
| Transamerica Aegon Core Bond VP (C) |
|
|
6,470,936 |
|
|
|
70,727,331 |
|
| Transamerica Bond (C) |
|
|
8,829,651 |
|
|
|
70,372,315 |
|
| Transamerica Short-Term Bond (C) |
|
|
6,536,555 |
|
|
|
63,600,679 |
|
|
|
|
|
|
|
|
|
|
|
|
|
|
|
|
|
204,700,325 |
|
|
|
|
|
|
|
|
|
|
| Total Investment Companies
(Cost $721,390,791) |
|
|
|
|
|
|
816,787,612 |
|
|
|
|
|
|
|
|
|
|
| EXCHANGE-TRADED FUNDS - 7.2% |
|
| U.S. Equity Funds - 2.9% |
|
| SPDR S&P 500 ETF Trust |
|
|
28,277 |
|
|
|
15,388,909 |
|
| Vanguard Value ETF (F) |
|
|
65,894 |
|
|
|
10,570,057 |
|
|
|
|
|
|
|
|
|
|
|
|
|
|
|
|
|
25,958,966 |
|
|
|
|
|
|
|
|
|
|
|
|
|
|
|
|
|
|
|
| |
|
Shares |
|
|
Value |
|
| EXCHANGE-TRADED FUNDS (continued) |
|
| U.S. Fixed Income Fund - 4.3% |
|
| Vanguard Total Bond Market ETF |
|
|
536,688 |
|
|
$ |
38,668,370 |
|
|
|
|
|
|
|
|
|
|
| Total Exchange-Traded Funds
(Cost $62,057,968) |
|
|
|
|
|
|
64,627,336 |
|
|
|
|
|
|
|
|
|
|
| OTHER INVESTMENT COMPANY - 0.0% (A) |
|
| Securities Lending Collateral - 0.0% (A) |
|
| State Street Navigator Securities Lending Trust - Government Money Market Portfolio, 5.28% (G) |
|
|
409,375 |
|
|
|
409,375 |
|
|
|
|
|
|
|
|
|
|
| Total Other Investment Company
(Cost $409,375) |
|
|
|
|
|
|
409,375 |
|
|
|
|
|
|
|
|
|
|
|
|
|
| |
|
Principal |
|
|
Value |
|
| REPURCHASE AGREEMENT - 0.3% |
|
| Fixed Income Clearing Corp., 2.50% (G), dated 06/28/2024, to be repurchased at $2,384,929 on 07/01/2024. Collateralized by a U.S. Government Obligation, 4.50%, due 03/31/2026, and with a value of $2,432,288. |
|
$ |
2,384,433 |
|
|
|
2,384,433 |
|
|
|
|
|
|
|
|
|
|
| Total Repurchase Agreement
(Cost $2,384,433) |
|
|
|
|
|
|
2,384,433 |
|
|
|
|
|
|
|
|
|
|
| Total Investments
(Cost $786,242,567) |
|
|
|
|
|
|
884,208,756 |
|
|
|
|
|
|
|
|
|
|
| Net Other Assets (Liabilities) - 1.2% |
|
|
|
|
|
|
10,290,833 |
|
|
|
|
|
|
|
|
|
|
|
|
|
| Net Assets - 100.0% |
|
|
|
|
|
$ |
894,499,589 |
|
|
|
|
|
|
|
INVESTMENT VALUATION:
|
|
|
|
|
|
|
|
|
|
|
|
|
|
|
|
|
| Valuation Inputs (H) |
|
|
|
|
|
|
|
|
|
|
|
|
|
|
|
|
| |
|
Level 1 - Unadjusted Quoted Prices |
|
|
Level 2 - Other Significant Observable Inputs |
|
|
Level 3 - Significant Unobservable Inputs |
|
|
Value |
|
| ASSETS |
|
|
|
|
|
|
|
|
|
|
|
|
|
|
|
|
| Investments |
|
|
|
|
|
|
|
|
|
|
|
|
|
|
|
|
| Investment Companies |
|
$ |
816,771,360 |
|
|
$ |
— |
|
|
$ |
— |
|
|
$ |
816,771,360 |
|
| Exchange-Traded Funds |
|
|
64,627,336 |
|
|
|
— |
|
|
|
— |
|
|
|
64,627,336 |
|
| Other Investment Company |
|
|
409,375 |
|
|
|
— |
|
|
|
— |
|
|
|
409,375 |
|
| Repurchase Agreement |
|
|
— |
|
|
|
2,384,433 |
|
|
|
— |
|
|
|
2,384,433 |
|
|
|
|
|
|
|
|
|
|
|
|
|
|
|
|
|
|
| Total |
|
$ |
881,808,071 |
|
|
$ |
2,384,433 |
|
|
$ |
— |
|
|
$ |
884,192,504 |
|
|
|
|
|
|
|
|
|
|
|
|
|
|
|
|
|
|
| Investment Companies Measured at Net Asset Value (D) |
|
|
|
|
|
|
|
|
|
|
|
|
|
|
16,252 |
|
|
|
|
|
|
|
|
|
|
|
|
|
|
|
|
|
|
| Total Investments |
|
|
|
|
|
|
|
|
|
|
|
|
|
$ |
884,208,756 |
|
|
|
|
|
|
|
|
|
|
|
|
|
|
|
|
|
|
FOOTNOTES TO SCHEDULE OF INVESTMENTS:
| (A) |
Percentage rounds to less than 0.1% or (0.1)%. |
| (B) |
Non-income producing security. |
|
|
|
| The Notes to Financial Statements are an integral part of this report. |
|
|
| Transamerica Series Trust |
|
Semi-Annual Financial Statements 2024 |
Page 1
Transamerica BlackRock Tactical Allocation VP
SCHEDULE OF INVESTMENTS (continued)
At June 30, 2024
(unaudited)
FOOTNOTES TO SCHEDULE OF INVESTMENTS (continued):
| (C) |
Affiliated investment in the Class I2 shares of funds within Transamerica Funds and/or affiliated investment in the Initial Class shares of funds within Transamerica Series Trust. The Portfolio’s transactions and earnings from these underlying funds are as follows: |
|
|
|
|
|
|
|
|
|
|
|
|
|
|
|
|
|
|
|
|
|
|
|
|
|
|
|
|
|
|
|
|
|
|
|
|
|
| Affiliated Investments |
|
Value December 31, 2023 |
|
|
Purchases at Cost |
|
|
Proceeds from Sales |
|
|
Net Realized Gain (Loss) |
|
|
Net Change in
Unrealized
Appreciation
(Depreciation) |
|
|
Value June 30, 2024 |
|
|
Shares as of
June 30,
2024 |
|
|
Dividend Income |
|
|
Net Capital Gain Distributions |
|
| Transamerica Aegon Core Bond VP |
|
$ |
160,336,297 |
|
|
$ |
26,800,000 |
|
|
$ |
(114,000,000 |
) |
|
$ |
(2,803,963 |
) |
|
$ |
394,997 |
|
|
$ |
70,727,331 |
|
|
|
6,470,936 |
|
|
$ |
— |
|
|
$ |
— |
|
| Transamerica Bond |
|
|
158,957,680 |
|
|
|
29,096,604 |
|
|
|
(113,500,000 |
) |
|
|
(4,753,759 |
) |
|
|
571,790 |
|
|
|
70,372,315 |
|
|
|
8,829,651 |
|
|
|
2,296,604 |
|
|
|
— |
|
| Transamerica Global Allocation Liquidating Trust |
|
|
16,809 |
|
|
|
— |
|
|
|
— |
|
|
|
— |
|
|
|
(557 |
) |
|
|
16,252 |
|
|
|
13,521 |
|
|
|
— |
|
|
|
— |
|
| Transamerica International Focus VP |
|
|
56,306,320 |
|
|
|
17,000,000 |
|
|
|
(11,800,000 |
) |
|
|
3,298,893 |
|
|
|
(132,144 |
) |
|
|
64,673,069 |
|
|
|
7,099,129 |
|
|
|
— |
|
|
|
— |
|
| Transamerica JPMorgan Enhanced Index VP |
|
|
270,559,111 |
|
|
|
71,000,000 |
|
|
|
(86,600,000 |
) |
|
|
13,238,002 |
|
|
|
30,332,177 |
|
|
|
298,529,290 |
|
|
|
10,753,937 |
|
|
|
— |
|
|
|
— |
|
| Transamerica Large Cap Value |
|
|
66,808,728 |
|
|
|
17,964,475 |
|
|
|
(19,000,000 |
) |
|
|
— |
|
|
|
7,321,917 |
|
|
|
73,095,120 |
|
|
|
5,217,353 |
|
|
|
464,475 |
|
|
|
— |
|
| Transamerica Morgan Stanley Capital Growth VP |
|
|
18,137,609 |
|
|
|
2,600,000 |
|
|
|
— |
|
|
|
— |
|
|
|
(70,481 |
) |
|
|
20,667,128 |
|
|
|
3,710,436 |
|
|
|
— |
|
|
|
— |
|
| Transamerica Short-Term Bond |
|
|
10,015,696 |
|
|
|
53,528,432 |
|
|
|
— |
|
|
|
— |
|
|
|
56,551 |
|
|
|
63,600,679 |
|
|
|
6,536,555 |
|
|
|
728,432 |
|
|
|
— |
|
| Transamerica Small Cap Growth |
|
|
12,023,153 |
|
|
|
1,700,000 |
|
|
|
— |
|
|
|
— |
|
|
|
201,561 |
|
|
|
13,924,714 |
|
|
|
2,062,920 |
|
|
|
— |
|
|
|
— |
|
| Transamerica Small Cap Value |
|
|
12,476,252 |
|
|
|
— |
|
|
|
— |
|
|
|
— |
|
|
|
155,398 |
|
|
|
12,631,650 |
|
|
|
2,219,974 |
|
|
|
— |
|
|
|
— |
|
| Transamerica TSW International Equity VP |
|
|
54,779,361 |
|
|
|
7,600,000 |
|
|
|
(8,900,000 |
) |
|
|
1,617,488 |
|
|
|
577,940 |
|
|
|
55,674,789 |
|
|
|
3,731,554 |
|
|
|
— |
|
|
|
— |
|
| Transamerica WMC US Growth VP |
|
|
61,001,722 |
|
|
|
16,800,000 |
|
|
|
(17,000,000 |
) |
|
|
(260,145 |
) |
|
|
12,333,698 |
|
|
|
72,875,275 |
|
|
|
1,707,481 |
|
|
|
— |
|
|
|
— |
|
|
|
|
|
|
| Total |
|
$ |
881,418,738 |
|
|
$ |
244,089,511 |
|
|
$ |
(370,800,000 |
) |
|
$ |
10,336,516 |
|
|
$ |
51,742,847 |
|
|
$ |
816,787,612 |
|
|
|
58,353,447 |
|
|
$ |
3,489,511 |
|
|
$ |
— |
|
|
|
|
|
|
| (D) |
Certain investments are measured at fair value using the net asset value per share, or its equivalent, practical expedient and have not been classified in the fair value levels. The fair value amount presented is intended to permit reconciliation to the Total Investments amount presented within the Schedule of Investments. |
| (E) |
Restricted security. At June 30, 2024, the total value of such securities held by the Portfolio is as follows: |
|
|
|
|
|
|
|
|
|
|
|
|
|
|
|
|
|
| Investments |
|
Description |
|
Acquisition Date |
|
|
Acquisition Cost |
|
|
Value |
|
|
Value as Percentage of Net Assets |
| Investment Companies |
|
Transamerica Global Allocation Liquidating Trust |
|
|
07/31/2014 |
|
|
$ |
139,107 |
|
|
$ |
16,252 |
|
|
0.0%(A) |
| (F) |
All or a portion of the security is on loan. The total value of the securities on loan is $401,025, collateralized by cash collateral of $409,375. The amount on loan indicated may not correspond with the securities on loan identified because a security with pending sales are in the process of recall from the brokers. |
| (G) |
Rate disclosed reflects the yield at June 30, 2024. |
| (H) |
There were no transfers in or out of Level 3 during the period ended June 30, 2024. Please reference the Investment Valuation section of the Notes to Financial Statements for more information regarding investment valuation and pricing inputs. |
The Notes to Financial Statements are an integral part of this report.
|
|
|
| Transamerica Series Trust |
|
Semi-Annual Financial Statements 2024 |
Page 2
Transamerica BlackRock Tactical Allocation VP
STATEMENT OF ASSETS AND LIABILITIES
At June 30, 2024
(unaudited)
|
|
|
|
|
|
|
| Assets: |
|
|
|
|
| Affiliated investments, at value (cost $721,390,791) |
|
$ |
816,787,612 |
|
| Unaffiliated investments, at value (cost $62,467,343) (including securities loaned of $401,025) |
|
|
65,036,711 |
|
| Repurchase agreement, at value (cost $2,384,433) |
|
|
2,384,433 |
|
| Receivables and other assets: |
|
|
|
|
| Investments sold |
|
|
11,625,706 |
|
| Net income from securities lending |
|
|
1,947 |
|
| Shares of beneficial interest sold |
|
|
34 |
|
| Dividends from affiliated investments |
|
|
470,847 |
|
| Dividends from unaffiliated investments |
|
|
162,614 |
|
| Interest |
|
|
497 |
|
| Prepaid expenses |
|
|
3,601 |
|
| Total assets |
|
|
896,474,002 |
|
|
|
| Liabilities: |
|
|
|
|
| Cash collateral received upon return of: |
|
|
|
|
| Securities on loan |
|
|
409,375 |
|
| Payables and other liabilities: |
|
|
|
|
| Investments purchased |
|
|
470,846 |
|
| Shares of beneficial interest redeemed |
|
|
726,455 |
|
| Investment management fees |
|
|
89,272 |
|
| Distribution and service fees |
|
|
166,564 |
|
| Transfer agent costs |
|
|
910 |
|
| Trustee and CCO fees |
|
|
2,680 |
|
| Audit and tax fees |
|
|
14,761 |
|
| Custody fees |
|
|
4,951 |
|
| Legal fees |
|
|
19,168 |
|
| Printing and shareholder reports fees |
|
|
52,503 |
|
| Other accrued expenses |
|
|
16,928 |
|
| Total liabilities |
|
|
1,974,413 |
|
| |
|
| Net assets |
|
$ |
894,499,589 |
|
|
|
| Net assets consist of: |
|
|
|
|
| Capital stock ($0.01 par value) |
|
$ |
645,714 |
|
| Additional paid-in capital |
|
|
869,372,486 |
|
| Total distributable earnings (accumulated losses) |
|
|
24,481,389 |
|
| |
|
| Net assets |
|
$ |
894,499,589 |
|
|
|
| Net assets by class: |
|
|
|
|
| Initial Class |
|
$ |
26,764,453 |
|
| Service Class |
|
|
867,735,136 |
|
|
|
| Shares outstanding: |
|
|
|
|
| Initial Class |
|
|
4,738,075 |
|
| Service Class |
|
|
59,833,366 |
|
|
|
| Net asset value and offering price per share: |
|
|
|
|
| Initial Class |
|
$ |
5.65 |
|
| Service Class |
|
|
14.50 |
|
STATEMENT OF OPERATIONS
For the period ended June 30, 2024
(unaudited)
|
|
|
|
|
| Investment income: |
|
|
|
|
| Dividend income from affiliated investments |
|
$ |
3,489,511 |
|
| Dividend income from unaffiliated investments |
|
|
667,053 |
|
| Interest income from unaffiliated investments |
|
|
40,311 |
|
| Net income from securities lending |
|
|
9,380 |
|
|
|
| Total investment income |
|
|
4,206,255 |
|
|
|
| Expenses: |
|
|
|
|
| Investment management fees |
|
|
580,018 |
|
| Distribution and service fees: |
|
|
|
|
| Service Class |
|
|
1,083,167 |
|
| Transfer agent costs |
|
|
5,120 |
|
| Trustee and CCO fees |
|
|
20,929 |
|
| Audit and tax fees |
|
|
14,585 |
|
| Custody fees |
|
|
4,839 |
|
| Legal fees |
|
|
36,452 |
|
| Printing and shareholder reports fees |
|
|
48,465 |
|
| Other |
|
|
28,037 |
|
| |
|
| Total expenses |
|
|
1,821,612 |
|
| |
|
| Net investment income (loss) |
|
|
2,384,643 |
|
|
|
| Net realized gain (loss) on: |
|
|
|
|
| Affiliated investments |
|
|
10,336,516 |
|
| Unaffiliated investments |
|
|
2,553,897 |
|
| |
|
| Net realized gain (loss) |
|
|
12,890,413 |
|
|
|
| Net change in unrealized appreciation (depreciation) on: |
|
|
|
|
| Affiliated investments |
|
|
51,742,847 |
|
| Unaffiliated investments |
|
|
1,641,006 |
|
|
|
| Net change in unrealized appreciation (depreciation) |
|
|
53,383,853 |
|
|
|
| Net realized and change in unrealized gain (loss) |
|
|
66,274,266 |
|
|
|
| Net increase (decrease) in net assets resulting from operations |
|
$ |
68,658,909 |
|
The Notes to Financial Statements are an integral part of this report.
|
|
|
|
|
| Transamerica Series Trust |
|
|
|
Semi-Annual Financial Statements 2024 |
|
|
Page 3 |
|
|
Transamerica BlackRock Tactical Allocation VP
STATEMENT OF CHANGES IN NET ASSETS
For the period and year ended:
|
|
|
|
|
|
|
|
|
| |
|
June 30, 2024 (unaudited) |
|
|
December 31, 2023 |
|
|
|
|
| From operations: |
|
|
|
|
|
|
|
|
| Net investment income (loss) |
|
$ |
2,384,643 |
|
|
$ |
14,274,794 |
|
| Net realized gain (loss) |
|
|
12,890,413 |
|
|
|
(73,482,150 |
) |
| Net change in unrealized appreciation (depreciation) |
|
|
53,383,853 |
|
|
|
186,915,493 |
|
|
|
|
| Net increase (decrease) in net assets resulting from operations |
|
|
68,658,909 |
|
|
|
127,708,137 |
|
|
|
|
| Dividends and/or distributions to shareholders: |
|
|
|
|
|
|
|
|
| Initial Class |
|
|
— |
|
|
|
(3,784,261 |
) |
| Service Class |
|
|
— |
|
|
|
(54,516,846 |
) |
| |
|
|
| Net increase (decrease) in net assets resulting from dividends and/or distributions to shareholders |
|
|
— |
|
|
|
(58,301,107 |
) |
|
|
|
| Capital share transactions: |
|
|
|
|
|
|
|
|
| Proceeds from shares sold: |
|
|
|
|
|
|
|
|
| Initial Class |
|
|
311,430 |
|
|
|
790,301 |
|
| Service Class |
|
|
1,617,004 |
|
|
|
5,287,906 |
|
| |
|
|
1,928,434 |
|
|
|
6,078,207 |
|
| Dividends and/or distributions reinvested: |
|
|
|
|
|
|
|
|
| Initial Class |
|
|
— |
|
|
|
3,784,261 |
|
| Service Class |
|
|
— |
|
|
|
54,516,846 |
|
| |
|
|
— |
|
|
|
58,301,107 |
|
| Cost of shares redeemed: |
|
|
|
|
|
|
|
|
| Initial Class |
|
|
(1,547,041 |
) |
|
|
(2,634,141 |
) |
| Service Class |
|
|
(92,320,405 |
) |
|
|
(146,987,289 |
) |
| |
|
|
(93,867,446 |
) |
|
|
(149,621,430 |
) |
|
|
|
| Net increase (decrease) in net assets resulting from capital share transactions |
|
|
(91,939,012 |
) |
|
|
(85,242,116 |
) |
|
|
|
| Net increase (decrease) in net assets |
|
|
(23,280,103 |
) |
|
|
(15,835,086 |
) |
|
|
|
| Net assets: |
|
|
|
|
|
|
|
|
| Beginning of period/year |
|
|
917,779,692 |
|
|
|
933,614,778 |
|
| End of period/year |
|
$ |
894,499,589 |
|
|
$ |
917,779,692 |
|
|
|
|
| Capital share transactions - shares: |
|
|
|
|
|
|
|
|
| Shares issued: |
|
|
|
|
|
|
|
|
| Initial Class |
|
|
57,161 |
|
|
|
148,025 |
|
| Service Class |
|
|
114,358 |
|
|
|
411,668 |
|
| |
|
|
171,519 |
|
|
|
559,693 |
|
| Shares reinvested: |
|
|
|
|
|
|
|
|
| Initial Class |
|
|
— |
|
|
|
766,045 |
|
| Service Class |
|
|
— |
|
|
|
4,292,665 |
|
| |
|
|
— |
|
|
|
5,058,710 |
|
| Shares redeemed: |
|
|
|
|
|
|
|
|
| Initial Class |
|
|
(285,850 |
) |
|
|
(498,623 |
) |
| Service Class |
|
|
(6,610,296 |
) |
|
|
(11,357,406 |
) |
| |
|
|
(6,896,146 |
) |
|
|
(11,856,029 |
) |
| Net increase (decrease) in shares outstanding: |
|
|
|
|
|
|
|
|
| Initial Class |
|
|
(228,689 |
) |
|
|
415,447 |
|
| Service Class |
|
|
(6,495,938 |
) |
|
|
(6,653,073 |
) |
| |
|
|
(6,724,627 |
) |
|
|
(6,237,626 |
) |
The Notes to Financial Statements are an integral part of this report.
|
|
|
|
|
| Transamerica Series Trust |
|
|
|
Semi-Annual Financial Statements 2024 |
|
|
Page 4 |
|
|
Transamerica BlackRock Tactical Allocation VP
FINANCIAL HIGHLIGHTS
|
|
|
|
|
|
|
|
|
|
|
|
|
|
|
|
|
|
|
|
|
|
|
|
|
|
|
| For a share outstanding during the period and years indicated: |
|
Initial Class |
| |
|
June 30, 2024 (unaudited) |
|
December 31, 2023 |
|
December 31, 2022 |
|
December 31, 2021 |
|
December 31, 2020 |
|
December 31, 2019 |
|
|
|
|
|
|
|
| Net asset value, beginning of period/year |
|
$ |
5.23 |
|
|
$ |
5.33 |
|
|
$ |
8.50 |
|
|
$ |
8.87 |
|
|
$ |
8.99 |
|
|
$ |
8.68 |
|
| Investment operations: |
|
|
|
|
|
|
|
|
|
|
|
|
|
|
|
|
|
|
|
|
|
|
|
|
| Net investment income (loss)(A) |
|
|
0.02 |
|
|
|
0.10 |
|
|
|
0.17 |
|
|
|
0.29 |
|
|
|
0.25 |
|
|
|
0.17 |
|
| Net realized and unrealized gain (loss) |
|
|
0.40 |
|
|
|
0.66 |
|
|
|
(1.47 |
) |
|
|
0.40 |
|
|
|
0.87 |
|
|
|
1.29 |
|
| |
|
|
|
|
|
|
| Total investment operations |
|
|
0.42 |
|
|
|
0.76 |
|
|
|
(1.30 |
) |
|
|
0.69 |
|
|
|
1.12 |
|
|
|
1.46 |
|
| Dividends and/or distributions to shareholders: |
|
|
|
|
|
|
|
|
|
|
|
|
|
|
|
|
|
|
|
|
|
|
|
|
| Net investment income |
|
|
— |
|
|
|
(0.37 |
) |
|
|
(0.60 |
) |
|
|
(0.48 |
) |
|
|
(0.33 |
) |
|
|
(0.40 |
) |
| Net realized gains |
|
|
— |
|
|
|
(0.49 |
) |
|
|
(1.27 |
) |
|
|
(0.58 |
) |
|
|
(0.91 |
) |
|
|
(0.75 |
) |
| Total dividends and/or distributions to shareholders |
|
|
— |
|
|
|
(0.86 |
) |
|
|
(1.87 |
) |
|
|
(1.06 |
) |
|
|
(1.24 |
) |
|
|
(1.15 |
) |
|
|
|
|
|
|
|
| Net asset value, end of period/year |
|
$ |
5.65 |
|
|
$ |
5.23 |
|
|
$ |
5.33 |
|
|
$ |
8.50 |
|
|
$ |
8.87 |
|
|
$ |
8.99 |
|
| |
|
|
|
|
|
|
|
|
|
|
|
|
|
|
|
|
|
|
|
|
|
|
|
|
|
|
|
|
|
|
|
| Total return |
|
|
8.03 |
%(B) |
|
|
15.31 |
% |
|
|
(16.06 |
)% |
|
|
7.91 |
% |
|
|
13.40 |
% |
|
|
17.43 |
% |
|
|
|
|
|
|
|
| Ratio and supplemental data: |
|
|
|
|
|
|
|
|
|
|
|
|
|
|
|
|
|
|
|
|
|
|
|
|
| Net assets end of period/year (000’s) |
|
$ |
26,764 |
|
|
$ |
25,978 |
|
|
$ |
24,280 |
|
|
$ |
29,319 |
|
|
$ |
28,518 |
|
|
$ |
26,400 |
|
| Expenses to average net assets(C) |
|
|
0.17 |
%(D) |
|
|
0.17 |
% |
|
|
0.15 |
% |
|
|
0.15 |
% |
|
|
0.15 |
% |
|
|
0.15 |
% |
| Net investment income (loss) to average net assets |
|
|
0.78 |
%(D) |
|
|
1.81 |
% |
|
|
2.52 |
% |
|
|
3.22 |
% |
|
|
2.83 |
% |
|
|
1.91 |
% |
| Portfolio turnover rate |
|
|
38 |
%(B) |
|
|
91 |
% |
|
|
42 |
% |
|
|
33 |
% |
|
|
67 |
% |
|
|
36 |
% |
| (A) |
Calculated based on average number of shares outstanding. |
| (C) |
Does not include expenses of the underlying investments in which the Portfolio invests. |
|
|
|
|
|
|
|
|
|
|
|
|
|
|
|
|
|
|
|
|
|
|
|
|
|
|
|
| For a share outstanding during the period and years indicated: |
|
Service Class |
| |
|
June 30, 2024 (unaudited) |
|
December 31, 2023 |
|
December 31, 2022 |
|
December 31, 2021 |
|
December 31, 2020 |
|
December 31, 2019 |
|
|
|
|
|
|
|
| Net asset value, beginning of period/year |
|
$ |
13.45 |
|
|
$ |
12.46 |
|
|
$ |
16.97 |
|
|
$ |
16.72 |
|
|
$ |
15.90 |
|
|
$ |
14.57 |
|
| Investment operations: |
|
|
|
|
|
|
|
|
|
|
|
|
|
|
|
|
|
|
|
|
|
|
|
|
| Net investment income (loss)(A) |
|
|
0.04 |
|
|
|
0.20 |
|
|
|
0.32 |
|
|
|
0.50 |
|
|
|
0.40 |
|
|
|
0.26 |
|
| Net realized and unrealized gain (loss) |
|
|
1.01 |
|
|
|
1.61 |
|
|
|
(3.01 |
) |
|
|
0.76 |
|
|
|
1.62 |
|
|
|
2.17 |
|
| |
|
|
|
|
|
|
| Total investment operations |
|
|
1.05 |
|
|
|
1.81 |
|
|
|
(2.69 |
) |
|
|
1.26 |
|
|
|
2.02 |
|
|
|
2.43 |
|
| Dividends and/or distributions to shareholders: |
|
|
|
|
|
|
|
|
|
|
|
|
|
|
|
|
|
|
|
|
|
|
|
|
| Net investment income |
|
|
— |
|
|
|
(0.33 |
) |
|
|
(0.55 |
) |
|
|
(0.43 |
) |
|
|
(0.29 |
) |
|
|
(0.35 |
) |
| Net realized gains |
|
|
— |
|
|
|
(0.49 |
) |
|
|
(1.27 |
) |
|
|
(0.58 |
) |
|
|
(0.91 |
) |
|
|
(0.75 |
) |
| Total dividends and/or distributions to shareholders |
|
|
— |
|
|
|
(0.82 |
) |
|
|
(1.82 |
) |
|
|
(1.01 |
) |
|
|
(1.20 |
) |
|
|
(1.10 |
) |
|
|
|
|
|
|
|
| Net asset value, end of period/year |
|
$ |
14.50 |
|
|
$ |
13.45 |
|
|
$ |
12.46 |
|
|
$ |
16.97 |
|
|
$ |
16.72 |
|
|
$ |
15.90 |
|
| |
|
|
|
|
|
|
|
|
|
|
|
|
|
|
|
|
|
|
|
|
|
|
|
|
|
|
|
|
|
|
|
| Total return |
|
|
7.81 |
%(B) |
|
|
14.88 |
% |
|
|
(16.21 |
)% |
|
|
7.63 |
% |
|
|
13.19 |
% |
|
|
17.05 |
% |
|
|
|
|
|
|
|
| Ratio and supplemental data: |
|
|
|
|
|
|
|
|
|
|
|
|
|
|
|
|
|
|
|
|
|
|
|
|
| Net assets end of period/year (000’s) |
|
$ |
867,736 |
|
|
$ |
891,802 |
|
|
$ |
909,335 |
|
|
$ |
1,253,039 |
|
|
$ |
1,348,851 |
|
|
$ |
1,363,259 |
|
| Expenses to average net assets(C) |
|
|
0.42 |
%(D) |
|
|
0.42 |
% |
|
|
0.40 |
% |
|
|
0.40 |
% |
|
|
0.40 |
% |
|
|
0.40 |
% |
| Net investment income (loss) to average net assets |
|
|
0.53 |
%(D) |
|
|
1.54 |
% |
|
|
2.23 |
% |
|
|
2.92 |
% |
|
|
2.53 |
% |
|
|
1.65 |
% |
| Portfolio turnover rate |
|
|
38 |
%(B) |
|
|
91 |
% |
|
|
42 |
% |
|
|
33 |
% |
|
|
67 |
% |
|
|
36 |
% |
| (A) |
Calculated based on average number of shares outstanding. |
| (C) |
Does not include expenses of the underlying investments in which the Portfolio invests. |
The Notes to Financial Statements are an integral part of this report.
|
|
|
|
|
| Transamerica Series Trust |
|
|
|
Semi-Annual Financial Statements 2024 |
|
|
Page 5 |
|
|
Transamerica BlackRock Tactical Allocation VP
NOTES TO FINANCIAL STATEMENTS
At June 30, 2024
(unaudited)
1. ORGANIZATION
Transamerica Series Trust (“TST”) is an open-end management investment company registered under the Investment Company Act of 1940, as amended (the “1940 Act”). TST applies investment company accounting and reporting guidance. TST serves as a funding vehicle for variable life insurance, variable annuity, and group annuity products. Transamerica BlackRock Tactical Allocation VP (the “Portfolio”) is a series of TST and is classified as diversified under the 1940 Act. The Portfolio currently offers two classes of shares, Initial Class and Service Class.
The only shareholders of the Portfolio are affiliated insurance company separate accounts and/or affiliated asset allocation portfolios. Contract holders of the variable life and annuity contracts are not shareholders of the Portfolio. For ease of reference, shareholders and contract holders are collectively referred to in this report as “shareholders.”
This report must be accompanied or preceded by the Portfolio’s current prospectus, which contains additional information about the Portfolio, including risks, as well as investment objectives and strategies.
Transamerica Asset Management, Inc. (“TAM”) serves as investment manager for the Portfolio pursuant to an investment management agreement. TAM provides continuous and regular investment management services to the Portfolio. TAM supervises the Portfolio’s investments, conducts its investment program and provides supervisory, compliance and administrative services to the Portfolio.
TAM currently acts as a “manager of managers” and has hired sub-advisers to furnish day-to-day investment advice and recommendations. TAM may, in the future, determine to provide all aspects of the day-to-day management of the Portfolio without the use of a sub-adviser. When acting as a manager of managers, TAM provides investment management services that include, without limitation, the design and development of the Portfolio and its investment strategies and the ongoing review and evaluation of those investment strategies including recommending changes in strategy where it believes appropriate or advisable; the selection of one or more sub-advisers for the Portfolio employing a combination of quantitative and qualitative screens, research, analysis and due diligence; negotiation of sub-advisory agreements and fees; oversight and monitoring of sub-advisers and recommending changes to sub-advisers where it believes appropriate or advisable; recommending portfolio combinations and liquidations where it believes appropriate or advisable; selection and oversight of transition managers, as needed; regular supervision of the Portfolio’s investments; regular review and evaluation of sub-adviser performance; daily monitoring of the sub-advisers’ buying and selling of securities for the Portfolio; regular review of holdings; ongoing trade oversight and analysis; regular monitoring to ensure adherence to investment process; regular calls and periodic on-site visits with sub-advisers; portfolio construction and asset allocation when using multiple sub-advisers for the Portfolio; risk management oversight and analysis; oversight of negotiation of investment documentation and agreements; design, development, implementation and regular monitoring of the valuation process; periodic due diligence reviews of pricing vendors and vendor methodology; design, development, implementation and regular monitoring of the compliance process; respond to regulatory inquiries and determine appropriate litigation strategy, as needed; review of proxies voted by sub-advisers; oversight of preparation and review of materials for meetings of the Portfolio’s Board of Trustees (the “Board”), participation in these meetings and preparation of regular communications with the Board; oversight of preparation and review of prospectuses, shareholder reports and other disclosure materials and regulatory filings for the Portfolio; oversight of other service providers to the Portfolio, such as the custodian, the transfer agent, the Portfolio’s independent accounting firm and legal counsel; supervision of the performance of recordkeeping and shareholder relations functions for the Portfolio; and oversight of cash management services. TAM uses a variety of quantitative and qualitative tools to carry out its investment management services. TAM, not the Portfolio, is responsible for paying the sub-adviser(s) for their services, and sub-advisory fees are TAM’s expense.
TAM’s investment management services also include the provision of supervisory and administrative services to the Portfolio. These services include performing certain administrative services for the Portfolio and supervising and overseeing the administrative, clerical, recordkeeping and bookkeeping services provided to the Portfolio by State Street Bank and Trust Company (“State Street”), to whom TAM has outsourced the provision of certain sub-administration services. To the extent agreed upon by TAM and the Portfolio from time to time, TAM’s supervisory and administrative services include, but are not limited to: monitoring and verifying the custodian’s daily calculation of the Net Asset Values (“NAV”); shareholder relations functions; compliance services; valuation services; assisting in due diligence and in the oversight and monitoring of certain activities of sub-advisers and certain aspects of Portfolio investments; assisting with Portfolio combinations and liquidations; oversight of the preparation and filing, and review, of all returns and reports, in connection with federal, state and local taxes; oversight and review of regulatory reporting; supervising and coordinating the Portfolio’s custodian and dividend disbursing agent and monitoring their services to the Portfolio; assisting the Portfolio in preparing reports to shareholders; acting as liaison with the Portfolio’s independent public accountants and providing, upon request, analyses, fiscal year summaries and other audit related services; assisting in the preparation of agendas and supporting documents for and minutes of meetings of trustees and committees of trustees; assisting in the preparation of regular communications with the trustees; and providing personnel and office space, telephones and other office equipment as necessary in order for TAM to perform supervisory and administrative services to the Portfolio. The Portfolio
|
|
|
| Transamerica Series Trust |
|
Semi-Annual Financial Statements 2024 |
Page 6
Transamerica BlackRock Tactical Allocation VP
NOTES TO FINANCIAL STATEMENTS (continued)
At June 30, 2024
(unaudited)
1. ORGANIZATION (continued)
pays certain fees and expenses to State Street for sub-administration services which are not administrative services covered by the management agreement with TAM or paid for through the management fees payable thereunder. For the period ended June 30, 2024, (i) the expenses paid to State Street for sub-administration services by the Portfolio are shown as a part of Other expenses within the Statement of Operations and (ii) the expenses payable to State Street for sub-administration services from the Portfolio are shown as part of Other accrued expenses within the Statement of Assets and Liabilities.
2. SIGNIFICANT ACCOUNTING POLICIES
In preparing the Portfolio’s financial statements in accordance with Generally Accepted Accounting Principles in the United States of America (“GAAP”), estimates or assumptions (which could differ from actual results) may be used that affect reported amounts and disclosures. The following is a summary of significant accounting policies followed by the Portfolio.
Security transactions and investment income: Security transactions are accounted for on the trade date. Security gains and losses are calculated on a first-in, first-out basis. Interest income, if any, is accrued as earned. Dividend income and capital gain distributions from underlying investments, if any, are recorded on the ex-dividend date. Income or short-term capital gain distributions received from underlying investments, if any, are recorded as Dividend income from investments within the Statement of Operations. Long-term capital gain distributions received from underlying investments, if any, are recorded as Net realized gain (loss) on Capital gain distributions received from investments within the Statement of Operations.
Multiple class operations, income, and expenses: Income, non-class specific expenses, and realized and unrealized gains and losses are allocated to each class daily based upon net assets. Each class bears its own specific expenses in addition to the allocated non-class specific expenses.
Distributions to shareholders: Distributions are recorded on the ex-dividend date and are determined in accordance with federal income tax regulations, which may differ from GAAP.
Indemnification: In the normal course of business, the Portfolio enters into contracts that contain a variety of representations that provide general indemnifications. The Portfolio’s maximum exposure under these arrangements is unknown, as this would involve future claims that may be made against the Portfolio and/or its affiliates that have not yet occurred. However, based on experience, the Portfolio expects the risk of loss to be remote.
3. INVESTMENT VALUATION
TAM has been designated as the Portfolio’s valuation designee pursuant to Rule 2a-5 under the 1940 Act with responsibility for fair valuation subject to oversight by the Portfolio’s Board of Trustees. The net asset value of the Portfolio is computed as of the official close of the New York Stock Exchange (“NYSE”) each day the NYSE is open for business.
TAM utilizes various methods to measure the fair value of its investments on a recurring basis. GAAP establishes a hierarchy that prioritizes inputs to valuation methods. The inputs or methodology used for valuing securities are not necessarily an indication of the risk associated with investing in those securities. The three levels (“Levels”) of inputs of the fair value hierarchy are defined as follows:
Level 1—Unadjusted quoted prices in active markets for identical securities.
Level 2—Inputs, other than quoted prices included in Level 1, which are observable, either directly or indirectly. These inputs may include quoted prices for the identical instrument on an inactive market, prices for similar instruments, interest rates, prepayment speeds, credit risk, yield curves, default rates, and similar data.
Level 3—Unobservable inputs based on the best information available in the circumstances, to the extent observable inputs are not available, which may include TAM’s own assumptions used in determining the fair value of the Portfolio’s investments.
The inputs used to measure fair value may fall into different Levels of the fair value hierarchy. In such cases, for disclosure purposes, the Level in the fair value hierarchy that is assigned to the fair value measurement of a security is determined based on the lowest Level input that is significant to the fair value measurement in its entirety. Certain investments that are measured at fair value using NAV per share, or its equivalent, using the “practical expedient” have not been classified in the fair value Levels. The hierarchy classification of inputs used to value the Portfolio’s investments at June 30, 2024, is disclosed within the Investment Valuation section of the Schedule of Investments.
|
|
|
| Transamerica Series Trust |
|
Semi-Annual Financial Statements 2024 |
Page 7
Transamerica BlackRock Tactical Allocation VP
NOTES TO FINANCIAL STATEMENTS (continued)
At June 30, 2024
(unaudited)
3. INVESTMENT VALUATION (continued)
The availability of observable inputs can vary from security to security and is affected by a wide variety of factors, including, but not limited to, the type of security, whether the security is new and not yet established in the marketplace, the liquidity of markets, and other characteristics particular to the security. To the extent that valuation is based on models or inputs that are less observable or unobservable in the market, the determination of fair value requires more judgment. Accordingly, the degree of judgment exercised in determining fair value is generally greatest for instruments categorized in Level 3. Due to the inherent uncertainty of valuation, the determination of values may differ significantly from values that would have been realized had a ready market for investments existed, and the differences could be material.
Fair value measurements: Descriptions of the valuation techniques applied to the Portfolio’s significant categories of assets and liabilities measured at fair value on a recurring basis are as follows:
Exchange-traded funds (“ETF”): ETFs are stated at the last reported sale price or closing price on the day of valuation taken from the primary exchange where the ETF is principally traded. ETFs are generally categorized in Level 1 of the fair value hierarchy.
Investment companies: Certain investment companies are valued at the NAV as the practical expedient. These investment companies are not included within the fair value hierarchy. Certain other investment companies are valued at the actively traded NAV and no valuation adjustments are applied. These investment companies are categorized in Level 1 of the fair value hierarchy.
Repurchase agreements: Repurchase agreements are valued at cost, which approximates fair value. To the extent the inputs are observable and timely, the values are generally categorized in Level 2 of the fair value hierarchy.
Restricted securities: Restricted securities for which quotations are not readily available are valued at fair value. Restricted securities issued by publicly traded companies are generally valued at a discount to similar publicly traded securities. Restricted securities issued by nonpublic entities may be valued by reference to comparable public entities and/or fundamental data relating to the issuer. Depending on the relative significance of observable valuation inputs, these instruments may be classified in either Level 2 or Level 3 of the fair value hierarchy.
4. SECURITIES AND OTHER INVESTMENTS
Restricted securities: The Portfolio may invest in unregulated restricted securities. Restricted securities are subject to legal or contractual restrictions on resale. Restricted securities generally may be resold in transactions exempt from registration under the Securities Act of 1933.
Restricted securities held at June 30, 2024, if any, are identified within the Schedule of Investments.
5. BORROWINGS AND OTHER FINANCING TRANSACTIONS
The Portfolio may engage in borrowing transactions as a means of raising cash to satisfy redemption requests, for other temporary or emergency purposes or, to the extent permitted by its investment policies, to raise additional cash to be invested in other securities or instruments. When the Portfolio invests borrowing proceeds in other securities, the Portfolio will bear the risk that the market value of the securities in which such proceeds are invested goes down and is insufficient to repay the borrowed proceeds. The Portfolio may borrow on a secured or on an unsecured basis. If the Portfolio enters into a secured borrowing arrangement, a portion of the Portfolio’s assets will be used as collateral. The 1940 Act requires the Portfolio to maintain asset coverage of at least 300% of the amount of its borrowings. Asset coverage means the ratio that the value of the Portfolio’s total assets, minus liabilities other than borrowings, bears to the aggregate amount of all borrowings. Although complying with this requirement has the effect of limiting the amount that the Portfolio may borrow, it does not otherwise mitigate the risks of entering into borrowing transactions.
Interfund lending: The Portfolio, along with other funds and portfolios advised by TAM, may participate in an interfund lending program pursuant to exemptive relief granted by the Securities and Exchange Commission on January 18, 2017. This program allows the Portfolio to lend to and borrow from other funds and portfolios advised by TAM. Interfund lending transactions are subject to the conditions of the exemptive relief which places limits on the amount of lending or borrowing a Portfolio may participate in under the program. Interest earned or paid on an interfund lending transaction will be based on the average of certain current market rates. For the period ended June 30, 2024, the Portfolio has not utilized the program.
Repurchase agreements: In a repurchase agreement, the Portfolio purchases a security and simultaneously commits to resell that security to the seller at an agreed-upon price on an agreed-upon date. Securities purchased subject to a repurchase agreement are held
|
|
|
| Transamerica Series Trust |
|
Semi-Annual Financial Statements 2024 |
Page 8
Transamerica BlackRock Tactical Allocation VP
NOTES TO FINANCIAL STATEMENTS (continued)
At June 30, 2024
(unaudited)
5. BORROWINGS AND OTHER FINANCING TRANSACTIONS (continued)
at the Portfolio’s custodian, or designated sub-custodian related to tri-party repurchase agreements, and, pursuant to the terms of the repurchase agreement, must be collateralized by securities with an aggregate market value greater than or equal to 100% of the resale price. The Portfolio will bear the risk of value fluctuations until the securities can be sold and may encounter delays and incur costs in liquidating the securities. In the event of bankruptcy or insolvency of the seller, delays and costs may be incurred.
Repurchase agreements are subject to netting agreements, which are agreements between the Portfolio and its counterparties that provide for the net settlement of all transactions and collateral with the Portfolio, through a single payment, in the event of default or termination. Amounts presented within the Schedule of Investments, and as part of Repurchase agreements, at value within the Statement of Assets and Liabilities are shown on a gross basis. The value of the related collateral for each repurchase agreement, as reflected within the Schedule of Investments, exceeds the value of each repurchase agreement at June 30, 2024.
Repurchase agreements at June 30, 2024, if any, are included within the Schedule of Investments and Statement of Assets and Liabilities.
Securities lending: The Portfolio may lend securities to qualified financial institutions, brokers and dealers. State Street serves as securities lending agent to the Portfolio pursuant to a Securities Lending Agreement. Loans of securities are terminable at any time and the borrower, after notice, is required to return borrowed securities within the standard time period for settlement of securities transactions. The lending of securities exposes the Portfolio to risks such as: the borrowers may fail to return the loaned securities or may not be able to provide additional collateral, the Portfolio may experience delays in recovery of the loaned securities or delays in access to collateral, or the Portfolio may experience losses related to the investment collateral. To minimize certain risks, loan counterparties pledge cash, securities issued or guaranteed by the U.S. Government and irrevocable letters of credit issued by banks as collateral. The initial collateral received by the Portfolio is required to have a value of at least 102% of the current value of the loaned securities traded on U.S. exchanges, and a value of at least 105% for all other securities. Typically the lending agent is not permitted to sell, re-pledge or use cash and non-cash collateral it receives. The lending agent has agreed to indemnify the Portfolio in the case of default of any securities borrower.
The Portfolio receives compensation for lending securities from interest or dividends earned on the cash, U.S. Government securities and irrevocable letters of credit held as collateral, less associated fees and expenses. Such income is reflected in Net income from securities lending within the Statement of Operations. Cash collateral received is invested in the State Street Navigator Securities Lending Trust — Government Money Market Portfolio.
The value of loaned securities and related cash and non-cash collateral outstanding at June 30, 2024, if any, are shown on a gross basis within the Schedule of Investments.
|
|
|
|
|
|
|
|
|
|
|
|
|
|
|
|
|
|
|
|
|
| |
|
Remaining Contractual Maturity of the Agreements |
|
| |
|
Overnight and Continuous |
|
|
Less Than 30 Days |
|
|
Between 30 & 90 Days |
|
|
Greater Than 90 Days |
|
|
Total |
|
| Securities Lending Transactions
Exchange-Traded Funds |
|
$ |
409,375 |
|
|
$ |
— |
|
|
$ |
— |
|
|
$ |
— |
|
|
$ |
409,375 |
|
| Total Borrowings |
|
$ |
409,375 |
|
|
$ |
— |
|
|
$ |
— |
|
|
$ |
— |
|
|
$ |
409,375 |
|
| |
|
|
|
|
|
|
|
|
|
|
|
|
|
|
|
|
|
|
|
|
6. RISK FACTORS
Investing in the Portfolio involves certain key risks related to the Portfolio’s trading activity. Please reference the Portfolio’s prospectus for a more complete discussion of the following risk(s), as well as other risks of investing in the Portfolio.
Market risk: The market prices of the Portfolio’s securities or other assets may go up or down, sometimes rapidly or unpredictably, due to factors such as economic events, inflation, changes in interest rates, governmental actions or interventions, actions taken by the U.S. Federal Reserve or foreign central banks, market disruptions caused by tariffs, trade disputes or other factors, political developments, armed conflicts, economic sanctions, cybersecurity events, investor sentiment, the global and domestic effects of widespread or local health, weather or climate events, and other factors that may or may not be related to the issuer of the security or other asset. If the market prices of the Portfolio’s securities and assets fall, the value of your investment in the Portfolio could go down.
|
|
|
| Transamerica Series Trust |
|
Semi-Annual Financial Statements 2024 |
Page 9
Transamerica BlackRock Tactical Allocation VP
NOTES TO FINANCIAL STATEMENTS (continued)
At June 30, 2024
(unaudited)
6. RISK FACTORS (continued)
Economies and financial markets throughout the world are increasingly interconnected. Events or circumstances in one or more countries or regions could be highly disruptive to, and have profound impacts on, global economies or markets. As a result, whether or not the Portfolio invests in securities of issuers located in or with significant exposure to the countries directly affected, the value and liquidity of the Portfolio’s investments may go down.
Asset allocation risk: The Portfolio’s investment performance is significantly impacted by the Portfolio’s asset allocation and reallocation from time to time. The value of your investment may decrease if the sub-adviser’s judgment about the attractiveness, value or market trends affecting a particular asset class, investment style, technique or strategy, underlying portfolio or other issuer is incorrect.
Model and data risk: If quantitative models, algorithms or calculations (whether proprietary and developed by the sub-adviser or supplied by third parties) (“Models”) or information or data supplied by third parties (“Data”) prove to be incorrect or incomplete, any decisions made, in whole or part, in reliance thereon expose the Portfolio to additional risks. Models can be predictive in nature. The use of predictive Models has inherent risks. The success of relying on or otherwise using Models depends on a number of factors, including the validity, accuracy and completeness of the Model’s development, implementation and maintenance, the Model’s assumptions, factors, algorithms and methodologies, and the accuracy and reliability of the supplied historical or other Data. Models rely on, among other things, correct and complete Data inputs. If incorrect Data is entered into even a well-founded Model, the resulting information will be incorrect. However, even if Data is input correctly, Model prices may differ substantially from market prices, especially for securities with complex characteristics. Investments selected with the use of Models may perform differently than expected as a result of the design of the Model, inputs into the Model or other factors. There also can be no assurance that the use of Models will result in effective investment decisions for the Portfolio.
7. FEES AND OTHER AFFILIATED TRANSACTIONS
TST serves as a funding vehicle for certain affiliated asset allocation portfolios and certain affiliated separate accounts of Transamerica Life Insurance Company (“TLIC”) and Transamerica Financial Life Insurance Company.
TAM, the Portfolio’s investment manager, is directly owned by TLIC and AUSA Holding, LLC (“AUSA”), both of which are indirect, wholly owned subsidiaries of Aegon Ltd. TLIC is owned by Commonwealth General Corporation (“Commonwealth”). Commonwealth and AUSA are wholly owned by Transamerica Corporation (DE). Transamerica Corporation (DE) is wholly owned by Aegon International B.V., which is wholly owned by Aegon Ltd., a Bermuda exempted company with liability limited by shares (formerly, Aegon NV, a Netherlands corporation) and a publicly traded international insurance group.
Transamerica Fund Services, Inc. (“TFS”) is the Portfolio’s transfer agent. Transamerica Capital, Inc. (“TCI”) is the Portfolio’s distributor/principal underwriter. TAM, TFS and TCI are affiliates of Aegon Ltd.
Certain officers and trustees of the Portfolio may also be officers and/or trustees of TAM, TFS and TCI. No interested trustee who is deemed an interested person due to current or former service with TAM or an affiliate of TAM receives compensation from the Portfolio. The Portfolio does pay non-interested persons (independent trustees), as disclosed in Trustee and CCO fees within the Statement of Operations.
Investment management fees: TAM serves as the Portfolio’s investment manager, performing administration as well as investment advisory services. TAM renders investment advisory, supervisory, and administration services under an investment management agreement and the Portfolio pays a single management fee, which is reflected in Investment management fees within the Statement of Operations.
The Portfolio pays a management fee to TAM based on daily average net assets at the following rates:
|
|
|
|
|
| Breakpoints |
|
Rate |
|
| First $1 billion |
|
|
0.130 |
% |
| Over $1 billion up to $2 billion |
|
|
0.110 |
|
| Over $2 billion up to $3 billion |
|
|
0.105 |
|
| Over $3 billion |
|
|
0.100 |
|
TAM has contractually agreed to waive fees and/or reimburse Portfolio expenses to the extent that the total operating expenses excluding, as applicable, acquired fund fees and expenses, interest (including borrowing costs and overdraft charges), taxes, brokerage
|
|
|
| Transamerica Series Trust |
|
Semi-Annual Financial Statements 2024 |
Page 10
Transamerica BlackRock Tactical Allocation VP
NOTES TO FINANCIAL STATEMENTS (continued)
At June 30, 2024
(unaudited)
7. FEES AND OTHER AFFILIATED TRANSACTIONS (continued)
commissions, dividend and interest expenses on securities sold short, extraordinary expenses and other expenses not incurred in the ordinary course of the Portfolio’s business, exceed the following stated annual operating expense limits to the Portfolio’s daily average net assets. To the extent an expense limit changed during the period, the prior limit is also listed below. The expenses waived and/or reimbursed, if any, are included in Expenses waived and/or reimbursed within the Statement of Operations.
|
|
|
|
|
| Class |
|
Operating Expense Limit |
|
Operating Expense Limit Effective Through |
| Initial Class |
|
0.21% |
|
May 1, 2025 |
| Service Class |
|
0.46 |
|
May 1, 2025 |
TAM is permitted to recapture amounts contractually waived and/or reimbursed to a class during any of the 36 months from the date on which TAM waived fees and/or reimbursed expenses for the class. A class may recapture and reimburse TAM only if such amount does not cause, on any particular business day of the Portfolio, the class’s total annual operating expenses (after the recapture is taken into account) to exceed the Operating Expense Limits or any other lower limit then in effect. Amounts recaptured, if any, by TAM for the period ended June 30, 2024 are disclosed in Recapture of previously waived and/or reimbursed fees within the Statement of Operations.
TAM, on a voluntary basis and in addition to the contractual operating expense limits in effect, from time to time may waive and/or reimburse expenses of the Portfolio, or any classes thereof, to such level(s) as the Trust’s officers have determined or may reasonably determine from time to time. Any such voluntary waiver or expense reimbursement may be discontinued by TAM at any time. These amounts are not subject to recapture by TAM.
As of June 30, 2024, there are no amounts available for recapture by TAM.
Distribution and service fees: TST has a distribution plan (“Distribution Plan”) pursuant to Rule 12b-1 under the 1940 Act. Pursuant to the Distribution Plan, TST entered into a distribution agreement with TCI as the Portfolio’s distributor.
The Distribution Plan requires the Portfolio to pay distribution fees to TCI as compensation for various distribution activities, not as reimbursement for specific expenses. Under the Distribution Plan and distribution agreement, TCI, on behalf of the Portfolio, is authorized to pay various service providers, as direct payment for expenses incurred in connection with distribution of the Portfolio’s shares.
The fee on the Service Class shares is paid to the insurance companies for providing services and account maintenance for the policyholders who invest in the variable insurance products which invest in the Service Class shares. TCI has determined that it will not seek payment for the distribution expenses incurred by the Portfolio with respect to the Initial Class shares before May 1, 2025. Prior to TCI seeking distribution expenses on Initial Class shares, policy and contract owners will be notified in advance. The Portfolio will pay fees relating to Service Class shares. The distribution and service fees are included in Distribution and service fees within the Statement of Operations.
The Portfolio is authorized under the Distribution Plan to pay fees to TCI based on daily average net assets of each applicable class up to the following annual rates:
|
|
|
|
|
| Class |
|
Rate |
|
| Initial Class |
|
|
0.15 |
% |
| Service Class |
|
|
0.25 |
|
Transfer agent costs: TFS provides transfer agency services under an intercompany agreement with TAM. TFS has outsourced the provision of certain sub-transfer agency services to SS&C Global Investor & Distribution Solutions, Inc. (“SS&C GIDS”). The Portfolio does not pay a separate transfer agent fee to TAM or TFS but does pay certain expenses to SS&C GIDS related to applicable sub-transfer agency services. For the period ended June 30, 2024, (i) the expenses paid to SS&C GIDS by the Portfolio are referred to as transfer agent costs and are included within the Statement of Operations and (ii) the expenses payable to SS&C GIDS by the Portfolio are referred to as transfer agent costs within the Statement of Assets and Liabilities.
Brokerage commissions: The Portfolio incurred no brokerage commissions on security transactions placed with affiliates of the investment manager or sub-adviser(s) for the period ended June 30, 2024.
|
|
|
| Transamerica Series Trust |
|
Semi-Annual Financial Statements 2024 |
Page 11
Transamerica BlackRock Tactical Allocation VP
NOTES TO FINANCIAL STATEMENTS (continued)
At June 30, 2024
(unaudited)
8. PURCHASES AND SALES OF SECURITIES
For the period ended June 30, 2024, the cost of securities purchased and proceeds from securities sold (excluding short-term securities) are as follows:
|
|
|
|
|
| Purchases of Securities |
|
|
|
Sales of Securities |
| $ 346,069,226 |
|
|
|
$ 444,261,181 |
9. FEDERAL INCOME TAXES AND DISTRIBUTIONS TO SHAREHOLDERS
The Portfolio has not made any provision for federal income or excise taxes due to its policy to distribute all of its taxable income and capital gains to its shareholders and otherwise qualify as a regulated investment company under Subchapter M of the Internal Revenue Code. The Portfolio recognizes the tax benefits of uncertain tax positions only where the position is “more likely than not” to be sustained assuming examination by tax authorities. The Portfolio’s tax returns remain subject to examination by the Internal Revenue Service and state tax authorities three years from the date of filing for federal purposes and four years from the date of filing for state purposes. Management has evaluated the Portfolio’s tax provisions taken for all open tax years, and has concluded that no provision for income tax is required in the Portfolio’s financial statements. If applicable, the Portfolio recognizes interest accrued related to unrecognized tax benefits in relation to interest and penalties expense in Other within the Statement of Operations. The Portfolio identifies its major tax jurisdictions as U.S. Federal, the state of Colorado, and foreign jurisdictions where the Portfolio makes significant investments; however, the Portfolio is not aware of any tax positions for which it is reasonably possible that the total amounts of unrecognized tax benefits will change materially in the next twelve months. Distributions are determined in accordance with income tax regulations, which may differ from GAAP.
As of June 30, 2024, the approximate cost for U.S. federal income tax purposes, and the aggregate gross/net unrealized appreciation (depreciation) in the value of investments (including securities sold short and derivatives, if any) are as follows:
|
|
|
|
|
|
|
| Cost |
|
Gross Appreciation |
|
Gross (Depreciation) |
|
Net Appreciation (Depreciation) |
| $ 786,242,567 |
|
$ 98,818,042 |
|
$ (851,853) |
|
$ 97,966,189 |
Please see TST’s most recent report on Form N-CSR, available at: www.transamerica.com/annuities/prospectus, for additional information. For the most recently filed complete proxy voting records for the Trust please visit: https://www.transamerica.com/sites/default/files/files/e070d/TST%20N-PX%202021.pdf
|
|
|
| Transamerica Series Trust |
|
Semi-Annual Financial Statements 2024 |
Page 12
Transamerica BlackRock Tactical Allocation VP
MANAGEMENT AND SUB-ADVISORY AGREEMENT — CONTRACT RENEWAL
(unaudited)
At a meeting of the Board of Trustees of Transamerica Series Trust (the “Trustees” or the “Board”) held on June 12-13, 2024, the Board considered the renewal of the management agreement (the “Management Agreement”) between Transamerica Asset Management, Inc. (“TAM”) and Transamerica Series Trust, on behalf of Transamerica BlackRock Tactical Allocation VP (the “Portfolio”). The Board also considered the renewal of the investment sub-advisory agreement (the “Sub-Advisory Agreement” and together with the Management Agreement, the “Agreements”) for the Portfolio between TAM and BlackRock Investment Management, LLC (the “Sub-Adviser”).
Following its review and consideration, the Board determined that the terms of the Management Agreement and Sub-Advisory Agreement were reasonable and that the renewal of each of the Agreements was in the best interests of the Portfolio and the holders invested in the Portfolio. The Board, including the independent members of the Board (the “Independent Trustees”), unanimously approved the renewal of each of the Agreements through June 30, 2025.
Prior to reaching their decision, the Trustees requested and received from TAM and the Sub-Adviser certain information. They then reviewed such information as they deemed reasonably necessary to evaluate the Agreements, including information they had previously received from TAM and the Sub-Adviser as part of their regular oversight of the Portfolio, and knowledge they gained over time through meeting with TAM and the Sub-Adviser. Among other materials, the Trustees considered comparative fee, expense and performance information prepared by Broadridge Financial Solutions, Inc. (“Broadridge”), an independent provider of mutual fund performance information, as well as fee, expense and profitability information prepared by TAM. In addition, TAM provided the Board with additional supplemental comparative fee, expense and performance information. To the extent applicable, the Trustees considered information about fees and performance of comparable funds and/or accounts managed by the Sub-Adviser. The Board also considered reductions to the Portfolio’s expense limits, if any, that took effect after the last renewal of the Agreements. In their review, the Trustees also sought to identify instances in which the Portfolio’s performance, fees, total expenses and/or profitability appeared to be outliers within its respective peer group or other comparative metrics and sought to understand the reasons for such comparative positions.
In their deliberations, the Independent Trustees met privately without representatives of TAM or the Sub-Adviser present and were represented throughout the process by their independent legal counsel. In considering the proposed continuation of each of the Agreements, the Trustees evaluated and weighed a number of considerations that they believed to be relevant in light of the legal advice furnished to them by counsel, including independent legal counsel, and made a decision in the exercise of their own business judgment. They based their decisions on the considerations discussed below, among others, although they did not identify any particular consideration or item of information that was controlling of their decisions, and each Trustee may have attributed different weights to the various factors.
Nature, Extent and Quality of the Services Provided
The Board considered the nature, extent and quality of the services provided by TAM and the Sub-Adviser to the Portfolio in the past and the services anticipated to be provided in the future. The Board also considered the investment approach for the Portfolio; the experience, capability and integrity of TAM’s senior management; the financial resources of TAM; TAM’s management oversight process; TAM’s and the Sub-Adviser’s responsiveness to any questions by the Trustees; and the professional qualifications and compensation program of the portfolio management team of the Sub-Adviser. The Trustees noted that they receive, on a quarterly basis, an execution analysis from Capital Institutional Services, Inc. (CAPIS), an independent provider of trade analyses, for the Sub-Adviser and a comparison of trading results against a peer universe of managers.
The Board also considered the continuous and regular investment management and other services provided by TAM, when acting as a manager of managers, for the portion of the management fee it retains from the Portfolio after payment of the sub-advisory fees. The Board noted that the investment management and other services provided by TAM include the design, development and ongoing review and evaluation of the Portfolio and its investment strategy; the selection, oversight and monitoring of one or more investment sub-advisers to perform certain duties with respect to the Portfolio; ongoing portfolio trading oversight and analysis; risk management oversight and analysis; design, development, implementation and ongoing review and evaluation of a process for the valuation of Portfolio investments; design, development, implementation and ongoing review and evaluation of a compliance program for the Portfolio; design, development, implementation and ongoing review and evaluation of a process for the voting of proxies and exercise of rights to consent to corporate action for Portfolio investments; participation in Board meetings and oversight of preparation of materials for the Board, including materials for Board meetings and regular communications with the Board; oversight of preparation of the Portfolio’s prospectus, statement of additional information, shareholder reports and other disclosure materials and regulatory filings for the Portfolio; and ongoing cash management services for the Portfolio. The Board considered that TAM’s investment management services also include the provision of supervisory and administrative services to the Portfolio. The Board also noted that TAM, as part of the services it provides to all Transamerica mutual funds, including the Portfolio, oversees the services provided by the funds’ custodian, transfer agent, independent accountant and legal counsel and supervises the performance of the recordkeeping and holder service functions of the funds.
Investment Performance
In addition, the Board considered the short- and longer-term performance of the Portfolio in light of its investment objective, policies and strategies, including relative performance against (i) a peer universe of comparable mutual funds, as prepared by Broadridge, and (ii) the Portfolio’s benchmarks, in each case for various trailing periods ended December 31, 2023. Based on these considerations, the Board determined that TAM and the Sub-Adviser can provide investment and related services that are appropriate in scope and extent in light of
|
|
|
| Transamerica Series Trust |
|
Semi-Annual Financial Statements 2024 |
Page 13
Transamerica BlackRock Tactical Allocation VP
MANAGEMENT AND SUB-ADVISORY AGREEMENT — CONTRACT RENEWAL (continued)
(unaudited)
the Portfolio’s investment objectives, policies and strategies and operations, the competitive landscape of the investment company business and investor needs. The Board’s conclusions as to the Portfolio’s performance are summarized below. For purposes of its review, the Board generally used the performance of Service Class Shares. In describing the Portfolio’s performance relative to its peer universe, the summary conclusions characterize performance for the relevant periods in relation to whether it was “above,” “below” or “in line with” the peer universe median and do so using quintile rankings prepared by Broadridge. For simplicity, performance is described as “above” the median if the Portfolio’s performance ranked anywhere in the first or second quintiles, as “below” the median if it ranked anywhere in the fourth or fifth quintiles, or “in line with” the median if it ranked anywhere in the third quintile (i.e., even if its precise return was somewhat above or somewhat below the precise median return).
When considering the Portfolio’s performance, the Trustees considered any representations made by TAM regarding the appropriateness of certain peer groups and benchmarks. They recognized that performance reflects a snapshot of a period as of a specific date, and that consideration of performance data for a different period could generate significantly different performance results. The Trustees also recognized that even longer-term performance can be negatively affected by performance over a short-term period when that short-term performance is significantly below the performance of the comparable benchmark or universe of peer funds.
The Board noted that the performance of Service Class Shares of the Portfolio was above the median for its peer universe for the past 1-year period, in line with the median for the past 5- and 10-year periods and below the median for the past 3-year period. The Board also noted that the performance of Service Class Shares of the Portfolio was below the benchmark that TAM utilizes to measure performance of the Portfolio for the past 1-, 3-, 5- and 10-year periods.
Management Fee and Sub-Advisory Fees and Total Expense Ratio
The Board considered the management fee and total expense ratio of the Portfolio, including information provided by Broadridge comparing the management fee and total expense ratio of the Portfolio to the management fees and total expense ratios of comparable investment companies in both a peer group and broader peer universe compiled by Broadridge. The Board’s conclusions as to the Portfolio’s management fee and total expense ratio are summarized below. For purposes of its review, the Board generally used the actual total expenses (i.e., expenses reflecting any waivers and/or reimbursements) of Service Class Shares. In describing the Portfolio’s management fee and total expense ratio relative to its peer group and peer universe, the summary conclusions characterize management fees and total expense ratios for the relevant periods in relation to whether they were “above,” “below” or “in line with” the peer group or peer universe median and do so using quintile rankings prepared by Broadridge. For simplicity, management fees and total expense ratios are described as “above” the median if the Portfolio’s management fee or total expense ratio ranked anywhere in the fourth or fifth quintiles, as “below” the median if it ranked anywhere in the first or second quintiles, or “in line with” the median if it ranked anywhere in the third quintile (i.e., even if its precise management fee or total expense ratio was somewhat above or somewhat below the precise median management fee or total expense ratio).
The Board also considered the fees charged by the Sub-Adviser for sub-advisory services, as well as the portion of the Portfolio’s management fee retained by TAM following payment of the sub-advisory fee and how the portion of the contractual management fee retained by TAM at a specified asset level compared to the portions retained by other investment advisers managing mutual funds with similar investment strategies as calculated by an independent provider of information.
The Board noted that the Portfolio’s contractual management fee was below the medians for its peer group and peer universe and that the actual total expenses (i.e., expenses reflecting any waivers and/or reimbursements) of Service Class Shares of the Portfolio were in line with the median for its peer group and above the median for its peer universe. The Trustees also considered that TAM has entered into an expense limitation arrangement with the Portfolio, which may result in TAM waiving fees for the benefit of holders.
On the basis of these considerations, together with the other information it considered, the Board determined that the management and sub-advisory fees to be received by TAM and the Sub-Adviser under the Management Agreement and Sub-Advisory Agreement are reasonable in light of the services provided.
Cost of Services Provided and Level of Profitability
The Board reviewed information provided by TAM about the cost of providing and procuring fund management services, as well as the costs of the provision of administration, transfer agency and other services, to the Portfolio and to Transamerica Series Trust as a whole by TAM and its affiliates. The Board considered the profitability of TAM and its affiliates in providing these services for the Portfolio and Transamerica Series Trust as a whole. The Trustees recognized the competitiveness of the mutual fund industry and the importance of an investment adviser’s long-term profitability, including for maintaining company and management stability and accountability.
The Board also considered the allocation methodology used for calculating the profitability of TAM and its affiliates. The Board noted that the revenue and expense allocation methodology used by TAM to estimate its profitability with respect to its relationship with the Portfolio had been reviewed previously by an independent consultant. The Trustees considered that TAM reported that it had not made material changes to this methodology, and that the methodology had been applied consistently for the Portfolio.
|
|
|
| Transamerica Series Trust |
|
Semi-Annual Financial Statements 2024 |
Page 14
Transamerica BlackRock Tactical Allocation VP
MANAGEMENT AND SUB-ADVISORY AGREEMENT — CONTRACT RENEWAL (continued)
(unaudited)
With respect to the Sub-Adviser, the Board noted that the sub-advisory fee is the product of arm’s-length negotiation between TAM and the Sub-Adviser, which is not affiliated with TAM, and is paid by TAM and not the Portfolio. As a result, the Board focused on the profitability of TAM and its affiliates with respect to the Portfolio.
Based on this information, the Board determined that the profitability of TAM and its affiliates from their relationships with the Portfolio was not excessive.
Economies of Scale
The Board considered economies of scale with respect to the management of the Portfolio, whether the Portfolio had appropriately benefited from any economies of scale and whether there was the potential for realization of any future economies of scale. The Board also considered the existence of economies of scale with respect to management of the Transamerica mutual funds overall and the extent to which the Portfolio benefited from any economies of scale. The Board recognized that, as the Portfolio’s assets increase, any economies of scale realized by TAM or the Sub-Adviser may not directly correlate with each other or with any economies of scale that might be realized by the Portfolio. The Board considered the Portfolio’s management fee schedule and the existence of breakpoints and also considered the extent to which TAM shared economies of scale, if any, with the Portfolio through undertakings to limit or reimburse Portfolio expenses and to invest in maintaining and developing its capabilities and services. The Board also considered the Sub-Adviser’s sub-advisory fee schedule and the existence of breakpoints, if any, and how such breakpoints relate to any breakpoints in the Portfolio’s management fee schedule. The Trustees concluded that the Portfolio’s fee structure reflected an appropriate sharing of any efficiencies or economies of scale to date and noted that they will have the opportunity to periodically reexamine the appropriateness of the management fee payable to TAM and the fee paid to the Sub-Adviser in light of any economies of scale experienced in the future.
Benefits to TAM, its Affiliates and/or the Sub-Adviser from their Relationships with the Portfolio
The Board considered other benefits derived by TAM, its affiliates, and/or the Sub-Adviser from their relationships with the Portfolio. The Board noted that TAM does not receive benefits from research obtained with commissions paid to broker-dealers for portfolio transactions (commonly referred to as “soft dollars”) as a result of its relationship with the Portfolio and that TAM believes the use of soft dollars by the Sub-Adviser is generally appropriate and in the best interests of the Portfolio.
Other Considerations
The Board noted that TAM has made a substantial commitment to the recruitment and retention of high-quality personnel and maintains the financial, compliance and operational resources reasonably necessary to manage the Portfolio in a professional manner that is consistent with the best interests of the Portfolio and the holders. In this regard, the Board favorably considered the procedures and policies TAM has in place to enforce compliance with applicable laws and regulations and oversee the portfolio management activities of the Sub-Adviser. The Board also noted that TAM has made an entrepreneurial commitment and undertaken certain business risks with respect to the management and success of the Portfolio.
Conclusion
After consideration of the factors described above, as well as other factors, the Trustees, including the Independent Trustees, concluded that the renewal of the Management Agreement and the Sub-Advisory Agreement was in the best interests of the Portfolio and the holders and voted to approve the renewal of the Agreements.
|
|
|
| Transamerica Series Trust |
|
Semi-Annual Financial Statements 2024 |
Page 15
PROXY VOTING POLICIES AND PROCEDURES AND QUARTERLY PORTFOLIO HOLDINGS
(unaudited)
A description of Transamerica Series Trust’s (the “Trust”) proxy voting policies and procedures is available in the Statement of Additional Information of the Portfolios, available without charge upon request by calling 1-800-851-9777 (toll free) or on the Securities and Exchange Commission’s (“SEC”) website at http://www.sec.gov.
In addition, the Portfolio is required to file Form N-PX, with their complete proxy voting records for the most recent 12 months ended June 30th, no later than August 31st of each year. The Form is available without charge: (1) on the Transamerica Funds website at https://www.transamerica.com/sites/default/files/files/e070d/TST%20N-PX%202021.pdf; and (2) on the SEC’s website at http://www.sec.gov.
Each fiscal quarter, the Portfolios, except Transamerica BlackRock Government Money Market VP, will file with the SEC a complete schedule of its monthly portfolio holdings on Form N-PORT. The Portfolios’ holdings as of the end of the third month of every fiscal quarter, as reported on Form N-PORT, will be publicly available on the SEC’s website at http://www.sec.gov within 60 days of the end of the fiscal quarter.
On a monthly basis, Transamerica BlackRock Government Money Market VP will file with the SEC portfolio holdings information on Form N-MFP3. A complete schedule of portfolio holdings is also available at www.transamerica.com.
You may also visit the Trust’s website at www.transamerica.com/annuities/prospectus for this and other information about the Portfolios and the Trust.
Important Notice Regarding Delivery of Shareholder Documents
Every year we provide shareholders informative materials such as the Transamerica Series Trust Annual Report, the Transamerica Series Trust Prospectus, and other required documents that keep you informed regarding your Portfolios. To the extent provided by mail, Transamerica Series Trust will only send one piece per mailing address, a method that saves your Portfolios money by reducing mailing and printing costs. We will continue to do this unless you tell us not to. To elect to receive individual mailings, simply call a Transamerica Customer Service Representative toll free at 1-800-851-9777, 8 a.m. to 7 p.m. Eastern Time, Monday-Friday. Your request will take effect within 30 days.
|
|
|
| Transamerica Series Trust |
|
Semi-Annual Financial Statements 2024 |
Page 16
NOTICE OF PRIVACY POLICY
(unaudited)
Your privacy is very important to us. We want you to understand what information we collect and how we use it. We collect and use “nonpublic personal information” in connection with providing our customers with a broad range of financial products and services as effectively and conveniently as possible. We treat nonpublic personal information in accordance with our Privacy Policy.
What Information We Collect and From Whom We Collect It
We may collect nonpublic personal information about you from the following sources:
| • |
|
Information we receive from you on applications or other forms, such as your name, address, and account number; |
| • |
|
Information about your transactions with us, our affiliates, or others, such as your account balance and purchase/redemption history; and |
| • |
|
Information we receive from non-affiliated third parties, including consumer reporting agencies. |
What Information We Disclose and To Whom We Disclose It
We do not disclose any nonpublic personal information about current or former customers to anyone without their express consent, except as permitted by law. We may disclose the nonpublic personal information we collect, as described above, to persons or companies that perform services on our behalf and to other financial institutions with which we have joint marketing agreements. We will require these companies to protect the confidentiality of your nonpublic personal information and to use it only to perform the services for which we have hired them.
Our Security Procedures
We restrict access to your nonpublic personal information and only allow disclosures to persons and companies as permitted by law to assist in providing products or services to you. We maintain physical, electronic, and procedural safeguards to protect your nonpublic personal information and to safeguard the disposal of certain consumer information.
Contact Us
If you have any questions about our Privacy Policy, please call 1-800-851-9777 on any business day between 8 a.m. and 7 p.m. Eastern Time.
Note: This Privacy Policy applies only to customers that have a direct relationship with us or our affiliates. If you own shares of our portfolios in the name of a third party such as a bank or broker-dealer, its privacy policy may apply to you instead of ours.
|
|
|
| Transamerica Series Trust |
|
Semi-Annual Financial Statements 2024 |
Page 17
PO Box 219945
Kansas City, MO 64121-9945
|
|
|
| Distributor: |
|
Transamerica Capital, Inc. |
|
|
PO Box 219945 |
|
|
Kansas City, MO 64121-9945 |
|
|
|
|
Customer Service: 1-800-851-9777 |
Transamerica Series Trust Semi-Annual Financial Statements
June 30, 2024
1801 California St., Suite 5200
Denver, CO 80202
Distributor: Transamerica Capital, Inc.
Customer Service: 1-800-851-9777
The following pages contain the most recent semi-annual financial statements for the investment options in which you are invested. In compliance with Securities and Exchange Commission regulations, we present these reports on an annual and semi-annual basis with the hope that they will foster greater understanding of the investment options’ holdings, performance, financial data, accounting policies and other issues. This streamlined version provides information only on the investment options in which you are invested.
If you have any questions about these reports, please do not hesitate to contact your financial professional. As always, we thank you for your trust and the opportunity to serve you.
Transamerica Goldman Sachs 70/30 Allocation VP
SCHEDULE OF INVESTMENTS
At June 30, 2024
(unaudited)
|
|
|
|
|
|
|
|
|
| |
|
Shares |
|
|
Value |
|
| INVESTMENT COMPANIES - 99.7% |
|
| International Equity Funds - 20.7% |
|
| Transamerica Emerging Markets Opportunities (A) |
|
|
23,640 |
|
|
$ |
188,174 |
|
| Transamerica International Equity (A) |
|
|
31,605 |
|
|
|
659,916 |
|
| Transamerica International Small Cap Value (A) |
|
|
6,004 |
|
|
|
89,887 |
|
| Transamerica International Stock (A) |
|
|
56,526 |
|
|
|
689,048 |
|
|
|
|
|
|
|
|
|
|
|
|
|
|
|
|
|
1,627,025 |
|
|
|
|
|
|
|
|
|
|
| U.S. Equity Funds - 49.5% |
|
| Transamerica Aegon Sustainable Equity Income VP (A) |
|
|
8,121 |
|
|
|
161,118 |
|
| Transamerica Large Cap Value (A) |
|
|
116,371 |
|
|
|
1,630,354 |
|
| Transamerica Small Cap Growth (A) |
|
|
12,435 |
|
|
|
83,938 |
|
| Transamerica Small Cap Value (A) |
|
|
16,776 |
|
|
|
95,459 |
|
| Transamerica WMC US Growth VP (A) |
|
|
45,137 |
|
|
|
1,926,447 |
|
|
|
|
|
|
|
|
|
|
|
|
|
|
|
|
|
3,897,316 |
|
|
|
|
|
|
|
|
|
|
|
|
|
|
|
|
|
|
|
| |
|
Shares |
|
|
Value |
|
| INVESTMENT COMPANIES (continued) |
|
| U.S. Fixed Income Funds - 29.5% |
|
| Transamerica Bond (A) |
|
|
68,474 |
|
|
$ |
545,737 |
|
| Transamerica Core Bond (A) |
|
|
147,956 |
|
|
|
1,259,100 |
|
| Transamerica High Yield Bond (A) |
|
|
20,810 |
|
|
|
166,897 |
|
| Transamerica Long Credit (A) |
|
|
20,754 |
|
|
|
196,541 |
|
| Transamerica Pinebridge Inflation Opportunities VP (A) |
|
|
15,628 |
|
|
|
153,000 |
|
|
|
|
|
|
|
|
|
|
|
|
|
|
|
|
|
2,321,275 |
|
|
|
|
|
|
|
|
|
|
| Total Investment Companies
(Cost $7,506,209) |
|
|
|
|
|
|
7,845,616 |
|
|
|
|
|
|
|
|
|
|
| Total Investments
(Cost $7,506,209) |
|
|
|
|
|
|
7,845,616 |
|
|
|
|
|
|
|
|
|
|
| Net Other Assets (Liabilities) - 0.3% |
|
|
|
27,014 |
|
|
|
|
|
|
|
|
|
|
|
|
|
| Net Assets - 100.0% |
|
|
|
|
|
$ |
7,872,630 |
|
|
|
|
|
|
|
|
|
|
INVESTMENT VALUATION:
|
|
|
|
|
|
|
|
|
|
|
|
|
|
|
|
|
| Valuation Inputs (B) |
|
|
|
|
|
|
|
|
|
|
|
|
|
|
|
|
| |
|
Level 1 - Unadjusted Quoted Prices |
|
|
Level 2 - Other Significant Observable Inputs |
|
|
Level 3 - Significant Unobservable Inputs |
|
|
Value |
|
| ASSETS |
|
|
|
|
|
|
|
|
|
|
|
|
|
|
|
|
| Investments |
|
|
|
|
|
|
|
|
|
|
|
|
|
|
|
|
| Investment Companies |
|
$ |
7,845,616 |
|
|
$ |
— |
|
|
$ |
— |
|
|
$ |
7,845,616 |
|
|
|
|
|
|
|
|
|
|
|
|
|
|
|
|
|
|
| Total Investments |
|
$ |
7,845,616 |
|
|
$ |
— |
|
|
$ |
— |
|
|
$ |
7,845,616 |
|
|
|
|
|
|
|
|
|
|
|
|
|
|
|
|
|
|
FOOTNOTES TO SCHEDULE OF INVESTMENTS:
| (A) |
Affiliated investment in the Class I2 shares of funds within Transamerica Funds and/or affiliated investment in the Initial Class shares of funds within Transamerica Series Trust. Affiliated interest income, dividends income, realized and unrealized gains (losses), if any, are broken out within the Statement of Operations. |
| (B) |
There were no transfers in or out of Level 3 during the period ended June 30, 2024. Please reference the Investment Valuation section of the Notes to Financial Statements for more information regarding investment valuation and pricing inputs. |
|
|
|
| The Notes to Financial Statements are an integral part of this report. |
|
|
| Transamerica Series Trust |
|
Semi-Annual Financial Statements 2024 |
Page 1
Transamerica Goldman Sachs 70/30 Allocation VP
STATEMENT OF ASSETS AND LIABILITIES
At June 30, 2024
(unaudited)
|
|
|
|
|
|
|
| Assets: |
|
|
|
|
| Affiliated investments, at value (cost $7,506,209) |
|
$ |
7,845,616 |
|
| Cash |
|
|
45,138 |
|
| Receivables and other assets: |
|
|
|
|
| Dividends from affiliated investments |
|
|
7,940 |
|
| Due from investment manager |
|
|
2,195 |
|
| Prepaid expenses |
|
|
30 |
|
| Total assets |
|
|
7,900,919 |
|
|
|
| Liabilities: |
|
|
|
|
| Payables and other liabilities: |
|
|
|
|
| Affiliated investments purchased |
|
|
7,940 |
|
| Shares of beneficial interest redeemed |
|
|
194 |
|
| Distribution and service fees |
|
|
1,507 |
|
| Trustee and CCO fees |
|
|
18 |
|
| Audit and tax fees |
|
|
12,019 |
|
| Custody fees |
|
|
1,662 |
|
| Legal fees |
|
|
49 |
|
| Printing and shareholder reports fees |
|
|
169 |
|
| Other accrued expenses |
|
|
4,731 |
|
| Total liabilities |
|
|
28,289 |
|
| |
|
| Net assets |
|
$ |
7,872,630 |
|
|
|
| Net assets consist of: |
|
|
|
|
| Capital stock ($0.01 par value) |
|
$ |
6,084 |
|
| Additional paid-in capital |
|
|
7,251,138 |
|
| Total distributable earnings (accumulated losses) |
|
|
615,408 |
|
| |
|
| Net assets |
|
$ |
7,872,630 |
|
| |
|
| Shares outstanding |
|
|
608,387 |
|
| |
|
| Net asset value and offering price per share |
|
$ |
12.94 |
|
STATEMENT OF OPERATIONS
For the period ended June 30, 2024
(unaudited)
|
|
|
|
|
| Investment income: |
|
|
|
|
| Dividend income from affiliated investments |
|
$ |
55,093 |
|
| Interest income from unaffiliated investments |
|
|
223 |
|
|
|
| Total investment income |
|
|
55,316 |
|
|
|
| Expenses: |
|
|
|
|
| Investment management fees |
|
|
3,675 |
|
| Distribution and service fees |
|
|
8,834 |
|
| Transfer agent costs |
|
|
35 |
|
| Trustee and CCO fees |
|
|
168 |
|
| Audit and tax fees |
|
|
12,015 |
|
| Custody fees |
|
|
1,665 |
|
| Legal fees |
|
|
195 |
|
| Printing and shareholder reports fees |
|
|
627 |
|
| Index fees |
|
|
5,022 |
|
| Filing fees |
|
|
4,538 |
|
| Other |
|
|
93 |
|
| Total expenses before waiver and/or reimbursement and recapture |
|
|
36,867 |
|
| |
|
| Expenses waived and/or reimbursed |
|
|
(18,492 |
) |
|
|
| Net expenses |
|
|
18,375 |
|
| |
|
| Net investment income (loss) |
|
|
36,941 |
|
|
|
| Net realized gain (loss) on: |
|
|
|
|
| Affiliated investments |
|
|
27,386 |
|
|
|
| Net change in unrealized appreciation (depreciation) on: |
|
|
|
|
| Affiliated investments |
|
|
478,453 |
|
| |
|
| Net realized and change in unrealized gain (loss) |
|
|
505,839 |
|
|
|
| Net increase (decrease) in net assets resulting from operations |
|
$ |
542,780 |
|
The Notes to Financial Statements are an integral part of this report.
|
|
|
|
|
| Transamerica Series Trust |
|
|
|
Semi-Annual Financial Statements 2024 |
|
|
Page 2 |
|
|
Transamerica Goldman Sachs 70/30 Allocation VP
STATEMENT OF CHANGES IN NET ASSETS
For the period and year ended:
|
|
|
|
|
|
|
|
|
| |
|
June 30, 2024 (unaudited) |
|
December 31, 2023 |
|
|
|
| From operations: |
|
|
|
|
|
|
|
|
| Net investment income (loss) |
|
|
$ 36,941 |
|
|
|
$ 100,297 |
|
| Net realized gain (loss) |
|
|
27,386 |
|
|
|
125,878 |
|
| Net change in unrealized appreciation (depreciation) |
|
|
478,453 |
|
|
|
521,322 |
|
|
|
|
| Net increase (decrease) in net assets resulting from operations |
|
|
542,780 |
|
|
|
747,497 |
|
|
|
|
| Dividends and/or distributions to shareholders: |
|
|
|
|
|
|
|
|
| Dividends and/or distributions to shareholders |
|
|
— |
|
|
|
(161,144 |
) |
| |
|
|
| Net increase (decrease) in net assets resulting from dividends and/or distributions to shareholders |
|
|
— |
|
|
|
(161,144 |
) |
|
|
|
| Capital share transactions: |
|
|
|
|
|
|
|
|
| Proceeds from shares sold |
|
|
1,267,188 |
|
|
|
1,618,485 |
|
| Dividends and/or distributions reinvested |
|
|
— |
|
|
|
161,144 |
|
| Cost of shares redeemed |
|
|
(164,211 |
) |
|
|
(195,071 |
) |
|
|
|
| Net increase (decrease) in net assets resulting from capital share transactions |
|
|
1,102,977 |
|
|
|
1,584,558 |
|
|
|
|
| Net increase (decrease) in net assets |
|
|
1,645,757 |
|
|
|
2,170,911 |
|
|
|
|
| Net assets: |
|
|
|
|
|
|
|
|
| Beginning of period/year |
|
|
6,226,873 |
|
|
|
4,055,962 |
|
| End of period/year |
|
|
$7,872,630 |
|
|
|
$6,226,873 |
|
|
|
|
| Capital share transactions - shares: |
|
|
|
|
|
|
|
|
| Shares issued |
|
|
102,438 |
|
|
|
142,680 |
|
| Shares reinvested |
|
|
— |
|
|
|
14,210 |
|
| Shares redeemed |
|
|
(13,020 |
) |
|
|
(17,576 |
) |
|
|
|
| Net increase (decrease) in shares outstanding |
|
|
89,418 |
|
|
|
139,314 |
|
The Notes to Financial Statements are an integral part of this report.
|
|
|
|
|
| Transamerica Series Trust |
|
|
|
Semi-Annual Financial Statements 2024 |
|
|
Page 3 |
|
|
Transamerica Goldman Sachs 70/30 Allocation VP
FINANCIAL HIGHLIGHTS
|
|
|
|
|
|
|
|
|
|
|
|
|
|
|
|
|
|
|
|
|
|
|
| For a share outstanding during the period and years indicated: |
|
Service Class |
| |
|
June 30, 2024 (unaudited) |
|
December 31, 2023 |
|
December 31, 2022 |
|
December 31, 2021 |
|
December 31, 2020(A) |
|
|
|
|
|
|
| Net asset value, beginning of period/year |
|
$ |
12.00 |
|
|
$ |
10.68 |
|
|
$ |
14.04 |
|
|
$ |
12.69 |
|
|
$ |
10.00 |
|
| Investment operations: |
|
|
|
|
|
|
|
|
|
|
|
|
|
|
|
|
|
|
|
|
| Net investment income (loss)(B) |
|
|
0.06 |
|
|
|
0.24 |
|
|
|
0.21 |
|
|
|
0.38 |
|
|
|
0.19 |
|
| Net realized and unrealized gain (loss) |
|
|
0.88 |
|
|
|
1.48 |
|
|
|
(2.60 |
) |
|
|
1.28 |
|
|
|
2.50 |
|
| |
|
|
|
|
|
| Total investment operations |
|
|
0.94 |
|
|
|
1.72 |
|
|
|
(2.39 |
) |
|
|
1.66 |
|
|
|
2.69 |
|
| |
|
|
|
|
|
| Contributions from Investment Manager |
|
|
— |
|
|
|
— |
|
|
|
— |
|
|
|
0.03 |
|
|
|
— |
|
| Dividends and/or distributions to shareholders: |
|
|
|
|
|
|
|
|
|
|
|
|
|
|
|
|
|
|
|
|
| Net investment income |
|
|
— |
|
|
|
(0.19 |
) |
|
|
(0.23 |
) |
|
|
(0.12 |
) |
|
|
— |
|
| Net realized gains |
|
|
— |
|
|
|
(0.21 |
) |
|
|
(0.74 |
) |
|
|
(0.22 |
) |
|
|
— |
|
| Total dividends and/or distributions to shareholders |
|
|
— |
|
|
|
(0.40 |
) |
|
|
(0.97 |
) |
|
|
(0.34 |
) |
|
|
— |
|
|
|
|
|
|
|
| Net asset value, end of period/year |
|
$ |
12.94 |
|
|
$ |
12.00 |
|
|
$ |
10.68 |
|
|
$ |
14.04 |
|
|
$ |
12.69 |
|
|
|
|
|
|
|
| |
|
|
|
|
|
|
|
|
|
|
|
|
|
|
|
|
|
|
|
|
|
|
|
|
|
|
| Total return |
|
|
7.83 |
%(C) |
|
|
16.25 |
% |
|
|
(17.10 |
)% |
|
|
13.33 |
%(D) |
|
|
26.90 |
%(C) |
|
|
|
|
|
|
| Ratio and supplemental data: |
|
|
|
|
|
|
|
|
|
|
|
|
|
|
|
|
|
|
|
|
| Net assets end of period/year (000’s) |
|
$ |
7,873 |
|
|
$ |
6,227 |
|
|
$ |
4,056 |
|
|
$ |
3,807 |
|
|
$ |
1,289 |
|
| Expenses to average net assets(E) |
|
|
|
|
|
|
|
|
|
|
|
|
|
|
|
|
|
|
|
|
| Excluding waiver and/or reimbursement and recapture |
|
|
1.04 |
%(F) |
|
|
1.42 |
% |
|
|
1.66 |
% |
|
|
1.72 |
% |
|
|
6.01 |
%(F) |
| Including waiver and/or reimbursement and recapture |
|
|
0.52 |
%(F)(G) |
|
|
0.52 |
%(G) |
|
|
0.51 |
%(G) |
|
|
0.50 |
%(G) |
|
|
1.15 |
%(F) |
| Net investment income (loss) to average net assets |
|
|
1.05 |
%(F) |
|
|
2.10 |
% |
|
|
1.79 |
% |
|
|
2.78 |
% |
|
|
2.54 |
%(F) |
| Portfolio turnover rate |
|
|
12 |
%(C) |
|
|
7 |
% |
|
|
24 |
% |
|
|
23 |
% |
|
|
4 |
%(C) |
| (A) |
Commenced operations on May 1, 2020. |
| (B) |
Calculated based on average number of shares outstanding. |
| (D) |
Total return includes the contribution from investment manager. If the investment manager had not made the contribution, total return would have decreased by 0.24%. |
| (E) |
Does not include expenses of the underlying investments in which the Portfolio invests. |
| (G) |
Ratio excludes acquired fund fees and expenses, which are indirect expenses incurred by the Portfolio through its investments in Underlying Funds. If the expenses incurred by the Underlying Funds were included in these ratios they would have increased by 0.63% (annualized), 0.63%, 0.64% and 0.65%, for the period ended June 30, 2024 and the years ended December 31, 2023, December 31, 2022 and December 31, 2021, respectively. |
The Notes to Financial Statements are an integral part of this report.
|
|
|
|
|
| Transamerica Series Trust |
|
|
|
Semi-Annual Financial Statements 2024 |
|
|
Page 4 |
|
|
Transamerica Goldman Sachs 70/30 Allocation VP
NOTES TO FINANCIAL STATEMENTS
At June 30, 2024
(unaudited)
1. ORGANIZATION
Transamerica Series Trust (“TST”) is an open-end management investment company registered under the Investment Company Act of 1940, as amended (the “1940 Act”). TST applies investment company accounting and reporting guidance. TST serves as a funding vehicle for variable life insurance, variable annuity, and group annuity products. Transamerica Goldman Sachs 70/30 Allocation VP (the “Portfolio”) is a series of TST and is classified as diversified under the 1940 Act. The Portfolio currently offers one class of shares, Service Class.
The only shareholders of the Portfolio are affiliated insurance company separate accounts and/or affiliated asset allocation portfolios. Contract holders of the variable life and annuity contracts are not shareholders of the Portfolio. For ease of reference, shareholders and contract holders are collectively referred to in this report as “shareholders.”
This report must be accompanied or preceded by the Portfolio’s current prospectus, which contains additional information about the Portfolio, including risks, as well as investment objectives and strategies.
Transamerica Asset Management, Inc. (“TAM”) serves as investment manager for the Portfolio pursuant to an investment management agreement. TAM provides continuous and regular investment management services to the Portfolio. TAM supervises the Portfolio’s investments, conducts its investment program and provides supervisory, compliance and administrative services to the Portfolio.
TAM currently acts as a “manager of managers” and has hired sub-advisers to furnish day-to-day investment advice and recommendations. TAM may, in the future, determine to provide all aspects of the day-to-day management of the Portfolio without the use of a sub-adviser. When acting as a manager of managers, TAM provides investment management services that include, without limitation, the design and development of the Portfolio and its investment strategies and the ongoing review and evaluation of those investment strategies including recommending changes in strategy where it believes appropriate or advisable; the selection of one or more sub-advisers for the Portfolio employing a combination of quantitative and qualitative screens, research, analysis and due diligence; negotiation of sub-advisory agreements and fees; oversight and monitoring of sub-advisers and recommending changes to sub-advisers where it believes appropriate or advisable; recommending portfolio combinations and liquidations where it believes appropriate or advisable; selection and oversight of transition managers, as needed; regular supervision of the Portfolio’s investments; regular review and evaluation of sub-adviser performance; daily monitoring of the sub-advisers’ buying and selling of securities for the Portfolio; regular review of holdings; ongoing trade oversight and analysis; regular monitoring to ensure adherence to investment process; regular calls and periodic on-site visits with sub-advisers; portfolio construction and asset allocation when using multiple sub-advisers for the Portfolio; risk management oversight and analysis; oversight of negotiation of investment documentation and agreements; design, development, implementation and regular monitoring of the valuation process; periodic due diligence reviews of pricing vendors and vendor methodology; design, development, implementation and regular monitoring of the compliance process; respond to regulatory inquiries and determine appropriate litigation strategy, as needed; review of proxies voted by sub-advisers; oversight of preparation and review of materials for meetings of the Portfolio’s Board of Trustees (the “Board”), participation in these meetings and preparation of regular communications with the Board; oversight of preparation and review of prospectuses, shareholder reports and other disclosure materials and regulatory filings for the Portfolio; oversight of other service providers to the Portfolio, such as the custodian, the transfer agent, the Portfolio’s independent accounting firm and legal counsel; supervision of the performance of recordkeeping and shareholder relations functions for the Portfolio; and oversight of cash management services. TAM uses a variety of quantitative and qualitative tools to carry out its investment management services. TAM, not the Portfolio, is responsible for paying the sub-adviser(s) for their services, and sub-advisory fees are TAM’s expense.
TAM’s investment management services also include the provision of supervisory and administrative services to the Portfolio. These services include performing certain administrative services for the Portfolio and supervising and overseeing the administrative, clerical, recordkeeping and bookkeeping services provided to the Portfolio by State Street Bank and Trust Company (“State Street”), to whom TAM has outsourced the provision of certain sub-administration services. To the extent agreed upon by TAM and the Portfolio from time to time, TAM’s supervisory and administrative services include, but are not limited to: monitoring and verifying the custodian’s daily calculation of the Net Asset Values (“NAV”); shareholder relations functions; compliance services; valuation services; assisting in due diligence and in the oversight and monitoring of certain activities of sub-advisers and certain aspects of Portfolio investments; assisting with Portfolio combinations and liquidations; oversight of the preparation and filing, and review, of all returns and reports, in connection with federal, state and local taxes; oversight and review of regulatory reporting; supervising and coordinating the Portfolio’s custodian and dividend disbursing agent and monitoring their services to the Portfolio; assisting the Portfolio in preparing reports to shareholders; acting as liaison with the Portfolio’s independent public accountants and providing, upon request, analyses, fiscal year summaries and other audit related services; assisting in the preparation of agendas and supporting documents for and minutes of meetings of trustees and committees of trustees; assisting in the preparation of regular communications with the trustees; and providing personnel and office space, telephones and other office equipment as necessary in order for TAM to perform supervisory and administrative services to the Portfolio. The Portfolio pays certain fees and expenses to State Street for sub-administration services which are not administrative services covered by the
|
|
|
| Transamerica Series Trust |
|
Semi-Annual Financial Statements 2024 |
Page 5
Transamerica Goldman Sachs 70/30 Allocation VP
NOTES TO FINANCIAL STATEMENTS (continued)
At June 30, 2024
(unaudited)
1. ORGANIZATION (continued)
management agreement with TAM or paid for through the management fees payable thereunder. For the period ended June 30, 2024, (i) the expenses paid to State Street for sub-administration services by the Portfolio are shown as a part of Other expenses within the Statement of Operations and (ii) the expenses payable to State Street for sub-administration services from the Portfolio are shown as part of Other accrued expenses within the Statement of Assets and Liabilities.
2. SIGNIFICANT ACCOUNTING POLICIES
In preparing the Portfolio’s financial statements in accordance with Generally Accepted Accounting Principles in the United States of America (“GAAP”), estimates or assumptions (which could differ from actual results) may be used that affect reported amounts and disclosures. The following is a summary of significant accounting policies followed by the Portfolio.
Security transactions and investment income: Security transactions are accounted for on the trade date. Security gains and losses are calculated on a first-in, first-out basis. Interest income, if any, is accrued as earned. Dividend income and capital gain distributions from underlying investments, if any, are recorded on the ex-dividend date. Income or short-term capital gain distributions received from underlying investments, if any, are recorded as Dividend income from investments within the Statement of Operations. Long-term capital gain distributions received from underlying investments, if any, are recorded as Net realized gain (loss) on Capital gain distributions received from investments within the Statement of Operations.
Distributions to shareholders: Distributions are recorded on the ex-dividend date and are determined in accordance with federal income tax regulations, which may differ from GAAP.
Indemnification: In the normal course of business, the Portfolio enters into contracts that contain a variety of representations that provide general indemnifications. The Portfolio’s maximum exposure under these arrangements is unknown, as this would involve future claims that may be made against the Portfolio and/or its affiliates that have not yet occurred. However, based on experience, the Portfolio expects the risk of loss to be remote.
3. INVESTMENT VALUATION
TAM has been designated as the Portfolio’s valuation designee pursuant to Rule 2a-5 under the 1940 Act with responsibility for fair valuation subject to oversight by the Portfolio’s Board of Trustees. The net asset value of the Portfolio is computed as of the official close of the New York Stock Exchange (“NYSE”) each day the NYSE is open for business.
TAM utilizes various methods to measure the fair value of its investments on a recurring basis. GAAP establishes a hierarchy that prioritizes inputs to valuation methods. The inputs or methodology used for valuing securities are not necessarily an indication of the risk associated with investing in those securities. The three levels (“Levels”) of inputs of the fair value hierarchy are defined as follows:
Level 1—Unadjusted quoted prices in active markets for identical securities.
Level 2—Inputs, other than quoted prices included in Level 1, which are observable, either directly or indirectly. These inputs may include quoted prices for the identical instrument on an inactive market, prices for similar instruments, interest rates, prepayment speeds, credit risk, yield curves, default rates, and similar data.
Level 3—Unobservable inputs based on the best information available in the circumstances, to the extent observable inputs are not available, which may include TAM’s own assumptions used in determining the fair value of the Portfolio’s investments.
The inputs used to measure fair value may fall into different Levels of the fair value hierarchy. In such cases, for disclosure purposes, the Level in the fair value hierarchy that is assigned to the fair value measurement of a security is determined based on the lowest Level input that is significant to the fair value measurement in its entirety. Certain investments that are measured at fair value using NAV per share, or its equivalent, using the “practical expedient” have not been classified in the fair value Levels. The hierarchy classification of inputs used to value the Portfolio’s investments at June 30, 2024, is disclosed within the Investment Valuation section of the Schedule of Investments.
The availability of observable inputs can vary from security to security and is affected by a wide variety of factors, including, but not limited to, the type of security, whether the security is new and not yet established in the marketplace, the liquidity of markets, and other characteristics particular to the security. To the extent that valuation is based on models or inputs that are less observable or unobservable in the market, the determination of fair value requires more judgment. Accordingly, the degree of judgment exercised in determining fair
|
|
|
| Transamerica Series Trust |
|
Semi-Annual Financial Statements 2024 |
Page 6
Transamerica Goldman Sachs 70/30 Allocation VP
NOTES TO FINANCIAL STATEMENTS (continued)
At June 30, 2024
(unaudited)
3. INVESTMENT VALUATION (continued)
value is generally greatest for instruments categorized in Level 3. Due to the inherent uncertainty of valuation, the determination of values may differ significantly from values that would have been realized had a ready market for investments existed, and the differences could be material.
Fair value measurements: Descriptions of the valuation techniques applied to the Portfolio’s significant categories of assets and liabilities measured at fair value on a recurring basis are as follows:
Investment companies: Certain investment companies are valued at the NAV as the practical expedient. These investment companies are not included within the fair value hierarchy. Certain other investment companies are valued at the actively traded NAV and no valuation adjustments are applied. These investment companies are categorized in Level 1 of the fair value hierarchy.
4. BORROWINGS AND OTHER FINANCING TRANSACTIONS
The Portfolio may engage in borrowing transactions as a means of raising cash to satisfy redemption requests, for other temporary or emergency purposes or, to the extent permitted by its investment policies, to raise additional cash to be invested in other securities or instruments. When the Portfolio invests borrowing proceeds in other securities, the Portfolio will bear the risk that the market value of the securities in which such proceeds are invested goes down and is insufficient to repay the borrowed proceeds. The Portfolio may borrow on a secured or on an unsecured basis. If the Portfolio enters into a secured borrowing arrangement, a portion of the Portfolio’s assets will be used as collateral. The 1940 Act requires the Portfolio to maintain asset coverage of at least 300% of the amount of its borrowings. Asset coverage means the ratio that the value of the Portfolio’s total assets, minus liabilities other than borrowings, bears to the aggregate amount of all borrowings. Although complying with this requirement has the effect of limiting the amount that the Portfolio may borrow, it does not otherwise mitigate the risks of entering into borrowing transactions.
Interfund lending: The Portfolio, along with other funds and portfolios advised by TAM, may participate in an interfund lending program pursuant to exemptive relief granted by the Securities and Exchange Commission on January 18, 2017. This program allows the Portfolio to lend to and borrow from other funds and portfolios advised by TAM. Interfund lending transactions are subject to the conditions of the exemptive relief which places limits on the amount of lending or borrowing a Portfolio may participate in under the program. Interest earned or paid on an interfund lending transaction will be based on the average of certain current market rates. For the period ended June 30, 2024, the Portfolio has not utilized the program.
5. RISK FACTORS
Investing in the Portfolio involves certain key risks related to the Portfolio’s trading activity. Please reference the Portfolio’s prospectus for a more complete discussion of the following risk(s), as well as other risks of investing in the Portfolio.
Market risk: The market prices of the Portfolio’s securities or other assets may go up or down, sometimes rapidly or unpredictably, due to factors such as economic events, inflation, changes in interest rates, governmental actions or interventions, actions taken by the U.S. Federal Reserve or foreign central banks, market disruptions caused by tariffs, trade disputes or other factors, political developments, armed conflicts, economic sanctions, cybersecurity events, investor sentiment, the global and domestic effects of widespread or local health, weather or climate events, and other factors that may or may not be related to the issuer of the security or other asset. If the market prices of the Portfolio’s securities and assets fall, the value of your investment in the Portfolio could go down.
Economies and financial markets throughout the world are increasingly interconnected. Events or circumstances in one or more countries or regions could be highly disruptive to, and have profound impacts on, global economies or markets. As a result, whether or not the Portfolio invests in securities of issuers located in or with significant exposure to the countries directly affected, the value and liquidity of the Portfolio’s investments may go down.
Asset allocation risk: The Portfolio’s investment performance is significantly impacted by the Portfolio’s asset allocation and reallocation from time to time. The value of your investment may decrease if the sub-adviser’s judgment about the attractiveness, value or market trends affecting a particular asset class, investment style, technique or strategy, underlying portfolio or other issuer is incorrect.
Asset class variation risk: The underlying portfolios invest principally in the securities constituting their asset class (i.e., equity or fixed-income) or underlying index components. However, an underlying portfolio may vary the percentage of its assets in these securities (subject to any applicable regulatory requirements). Depending upon the percentage of securities in a particular asset class held by the
|
|
|
| Transamerica Series Trust |
|
Semi-Annual Financial Statements 2024 |
Page 7
Transamerica Goldman Sachs 70/30 Allocation VP
NOTES TO FINANCIAL STATEMENTS (continued)
At June 30, 2024
(unaudited)
5. RISK FACTORS (continued)
underlying portfolios at any given time, and the percentage of the Portfolio’s assets invested in various underlying portfolios, the Portfolio’s actual exposure to the securities in a particular asset class may vary substantially from its target allocation for that asset class, and this in turn may adversely affect the Portfolio’s performance.
6. FEES AND OTHER AFFILIATED TRANSACTIONS
TST serves as a funding vehicle for certain affiliated asset allocation portfolios and certain affiliated separate accounts of Transamerica Life Insurance Company (“TLIC”) and Transamerica Financial Life Insurance Company.
TAM, the Portfolio’s investment manager, is directly owned by TLIC and AUSA Holding, LLC (“AUSA”), both of which are indirect, wholly owned subsidiaries of Aegon Ltd. TLIC is owned by Commonwealth General Corporation (“Commonwealth”). Commonwealth and AUSA are wholly owned by Transamerica Corporation (DE). Transamerica Corporation (DE) is wholly owned by Aegon International B.V., which is wholly owned by Aegon Ltd., a Bermuda exempted company with liability limited by shares (formerly, Aegon NV, a Netherlands corporation) and a publicly traded international insurance group.
Transamerica Fund Services, Inc. (“TFS”) is the Portfolio’s transfer agent. Transamerica Capital, Inc. (“TCI”) is the Portfolio’s distributor/principal underwriter. TAM, TFS and TCI are affiliates of Aegon Ltd.
Certain officers and trustees of the Portfolio may also be officers and/or trustees of TAM, TFS and TCI. No interested trustee who is deemed an interested person due to current or former service with TAM or an affiliate of TAM receives compensation from the Portfolio. The Portfolio does pay non-interested persons (independent trustees), as disclosed in Trustee and CCO fees within the Statement of Operations.
Investment management fees: TAM serves as the Portfolio’s investment manager, performing administration as well as investment advisory services. TAM renders investment advisory, supervisory, and administration services under an investment management agreement and the Portfolio pays a single management fee, which is reflected in Investment management fees within the Statement of Operations.
The Portfolio pays a management fee to TAM based on daily average net assets at the following rates:
|
|
|
|
|
| Breakpoints |
|
Rate |
|
| First $1 billion |
|
|
0.1040 |
% |
| Over $1 billion up to $3 billion |
|
|
0.0975 |
|
| Over $3 billion up to $5 billion |
|
|
0.0925 |
|
| Over $5 billion up to $7 billion |
|
|
0.0850 |
|
| Over $7 billion up to $9 billion |
|
|
0.0800 |
|
| Over $9 billion |
|
|
0.0725 |
|
TAM has contractually agreed to waive fees and/or reimburse Portfolio expenses to the extent that the total operating expenses, including the pro rata share of expenses incurred through the Portfolio’s investment in the underlying Funds, but excluding, as applicable, interest (including borrowing costs and overdraft charges), taxes, brokerage commissions, dividend and interest expenses on securities sold short, extraordinary expenses and other expenses not incurred in the ordinary course of the Portfolio’s business, exceed the following stated annual operating expense limits to the Portfolio’s daily average net assets. To the extent an expense limit changed during the period, the prior limit is also listed below. The expenses waived and/or reimbursed, if any, are included in Expenses waived and/or reimbursed within the Statement of Operations.
|
|
|
|
|
|
|
|
|
|
|
| Class |
|
Operating Expense Limit |
|
Operating Expense Limit Effective Through |
| Service Class |
|
|
|
1.15 |
% |
|
|
|
May 1, 2025 |
|
TAM is permitted to recapture amounts contractually waived and/or reimbursed to a class during any of the 36 months from the date on which TAM waived fees and/or reimbursed expenses for the class. A class may recapture and reimburse TAM only if such amount does not cause, on any particular business day of the Portfolio, the class’s total annual operating expenses (after the recapture is taken into
|
|
|
| Transamerica Series Trust |
|
Semi-Annual Financial Statements 2024 |
Page 8
Transamerica Goldman Sachs 70/30 Allocation VP
NOTES TO FINANCIAL STATEMENTS (continued)
At June 30, 2024
(unaudited)
6. FEES AND OTHER AFFILIATED TRANSACTIONS (continued)
account) to exceed the Operating Expense Limits or any other lower limit then in effect. Amounts recaptured, if any, by TAM for the period ended June 30, 2024 are disclosed in Recapture of previously waived and/or reimbursed fees within the Statement of Operations.
TAM, on a voluntary basis and in addition to the contractual operating expense limits in effect, from time to time may waive and/or reimburse expenses of the Portfolio, or any classes thereof, to such level(s) as the Trust’s officers have determined or may reasonably determine from time to time. Any such voluntary waiver or expense reimbursement may be discontinued by TAM at any time. These amounts are not subject to recapture by TAM.
For the 36-month period ended June 30, 2024, the balances available for recapture by TAM for the Portfolio are as follows:
|
|
|
|
|
|
|
|
|
|
|
|
|
|
|
|
|
|
|
|
|
| |
|
Amounts Available |
|
|
|
|
| |
|
2021 (A) |
|
|
2022 |
|
|
2023 |
|
|
2024 |
|
|
Total |
|
| Service Class |
|
|
$ 21,040 |
|
|
|
$ 45,282 |
|
|
|
$ 42,806 |
|
|
|
$ 18,492 |
|
|
|
$ 127,620 |
|
(A) For the six-month period of July 1, 2021 through December 31, 2021.
Distribution and service fees: TST has a distribution plan (“Distribution Plan”) pursuant to Rule 12b-1 under the 1940 Act. Pursuant to the Distribution Plan, TST entered into a distribution agreement with TCI as the Portfolio’s distributor.
The Distribution Plan requires the Portfolio to pay distribution fees to TCI as compensation for various distribution activities, not as reimbursement for specific expenses. Under the Distribution Plan and distribution agreement, TCI, on behalf of the Portfolio, is authorized to pay various service providers, as direct payment for expenses incurred in connection with distribution of the Portfolio’s shares.
The fee on the Service Class shares is paid to the insurance companies for providing services and account maintenance for the policyholders who invest in the variable insurance products which invest in the Service Class shares. The distribution and service fees are included in Distribution and service fees within the Statement of Operations.
The Portfolio is authorized under the Distribution Plan to pay fees to TCI based on daily average net assets up to an annual fee of 0.25% of Service Class shares.
Transfer agent costs: TFS provides transfer agency services under an intercompany agreement with TAM. TFS has outsourced the provision of certain sub-transfer agency services to SS&C Global Investor & Distribution Solutions, Inc. (“SS&C GIDS”). The Portfolio does not pay a separate transfer agent fee to TAM or TFS but does pay certain expenses to SS&C GIDS related to applicable sub-transfer agency services. For the period ended June 30, 2024, (i) the expenses paid to SS&C GIDS by the Portfolio are referred to as transfer agent costs and are included within the Statement of Operations and (ii) the expenses payable to SS&C GIDS by the Portfolio are referred to as transfer agent costs within the Statement of Assets and Liabilities.
Brokerage commissions: The Portfolio incurred no brokerage commissions on security transactions placed with affiliates of the investment manager or sub-adviser(s) for the period ended June 30, 2024.
7. PURCHASES AND SALES OF SECURITIES
For the period ended June 30, 2024, the cost of securities purchased and proceeds from securities sold (excluding short-term securities) are as follows:
|
|
|
| Purchases of Securities |
|
Sales of Securities |
| $ 1,995,093 |
|
$ 830,000 |
8. FEDERAL INCOME TAXES AND DISTRIBUTIONS TO SHAREHOLDERS
The Portfolio has not made any provision for federal income or excise taxes due to its policy to distribute all of its taxable income and capital gains to its shareholders and otherwise qualify as a regulated investment company under Subchapter M of the Internal Revenue Code. The Portfolio recognizes the tax benefits of uncertain tax positions only where the position is “more likely than not” to be sustained assuming examination by tax authorities. The Portfolio’s tax returns remain subject to examination by the Internal Revenue Service and
|
|
|
| Transamerica Series Trust |
|
Semi-Annual Financial Statements 2024 |
Page 9
Transamerica Goldman Sachs 70/30 Allocation VP
NOTES TO FINANCIAL STATEMENTS (continued)
At June 30, 2024
(unaudited)
8. FEDERAL INCOME TAXES AND DISTRIBUTIONS TO SHAREHOLDERS (continued)
state tax authorities three years from the date of filing for federal purposes and four years from the date of filing for state purposes. Management has evaluated the Portfolio’s tax provisions taken for all open tax years, and has concluded that no provision for income tax is required in the Portfolio’s financial statements. If applicable, the Portfolio recognizes interest accrued related to unrecognized tax benefits in relation to interest and penalties expense in Other within the Statement of Operations. The Portfolio identifies its major tax jurisdictions as U.S. Federal, the state of Colorado, and foreign jurisdictions where the Portfolio makes significant investments; however, the Portfolio is not aware of any tax positions for which it is reasonably possible that the total amounts of unrecognized tax benefits will change materially in the next twelve months. Distributions are determined in accordance with income tax regulations, which may differ from GAAP.
As of June 30, 2024, the approximate cost for U.S. federal income tax purposes, and the aggregate gross/net unrealized appreciation (depreciation) in the value of investments (including securities sold short and derivatives, if any) are as follows:
|
|
|
|
|
|
|
| Cost |
|
Gross Appreciation |
|
Gross (Depreciation) |
|
Net Appreciation (Depreciation) |
| $ 7,506,209 |
|
$ 451,795 |
|
$ (112,388) |
|
$ 339,407 |
Please see TST’s most recent report on Form N-CSR, available at: www.transamerica.com/annuities/prospectus, for additional information. For the most recently filed complete proxy voting records for the Trust please visit: https://www.transamerica.com/sites/default/files/files/e070d/TST%20N-PX%202021.pdf
|
|
|
| Transamerica Series Trust |
|
Semi-Annual Financial Statements 2024 |
Page 10
Transamerica Goldman Sachs 70/30 Allocation VP
MANAGEMENT AND SUB-ADVISORY AGREEMENT — CONTRACT RENEWAL
(unaudited)
At a meeting of the Board of Trustees of Transamerica Series Trust (the “Trustees” or the “Board”) held on June 12-13, 2024, the Board considered the renewal of the management agreement (the “Management Agreement”) between Transamerica Asset Management, Inc. (“TAM”) and Transamerica Series Trust, on behalf of Transamerica Goldman Sachs 70/30 Allocation VP (the “Portfolio”). The Board also considered the renewal of the investment sub-advisory agreement (the “Sub-Advisory Agreement” and together with the Management Agreement, the “Agreements”) for the Portfolio between TAM and Goldman Sachs Asset Management, L.P. (the “Sub-Adviser”).
Following its review and consideration, the Board determined that the terms of the Management Agreement and Sub-Advisory Agreement were reasonable and that the renewal of each of the Agreements was in the best interests of the Portfolio and the holders invested in the Portfolio. The Board, including the independent members of the Board (the “Independent Trustees”), unanimously approved the renewal of each of the Agreements through June 30, 2025.
Prior to reaching their decision, the Trustees requested and received from TAM and the Sub-Adviser certain information. They then reviewed such information as they deemed reasonably necessary to evaluate the Agreements, including information they had previously received from TAM and the Sub-Adviser as part of their regular oversight of the Portfolio, and knowledge they gained over time through meeting with TAM and the Sub-Adviser. Among other materials, the Trustees considered comparative fee, expense and performance information prepared by Broadridge Financial Solutions, Inc. (“Broadridge”), an independent provider of mutual fund performance information, as well as fee, expense and profitability information prepared by TAM. In addition, TAM provided the Board with additional supplemental comparative fee, expense and performance information. To the extent applicable, the Trustees considered information about fees and performance of comparable funds and/or accounts managed by the Sub-Adviser. The Board also considered reductions to the Portfolio’s expense limit, if any, that took effect after the last renewal of the Agreements. In their review, the Trustees also sought to identify instances in which the Portfolio’s performance, fees, total expenses and/or profitability appeared to be outliers within its respective peer group or other comparative metrics and sought to understand the reasons for such comparative positions.
In their deliberations, the Independent Trustees met privately without representatives of TAM or the Sub-Adviser present and were represented throughout the process by their independent legal counsel. In considering the proposed continuation of each of the Agreements, the Trustees evaluated and weighed a number of considerations that they believed to be relevant in light of the legal advice furnished to them by counsel, including independent legal counsel, and made a decision in the exercise of their own business judgment. They based their decisions on the considerations discussed below, among others, although they did not identify any particular consideration or item of information that was controlling of their decisions, and each Trustee may have attributed different weights to the various factors.
Nature, Extent and Quality of the Services Provided
The Board considered the nature, extent and quality of the services provided by TAM and the Sub-Adviser to the Portfolio in the past and the services anticipated to be provided in the future. The Board also considered the investment approach for the Portfolio; the experience, capability and integrity of TAM’s senior management; the financial resources of TAM; TAM’s management oversight process; TAM’s and the Sub-Adviser’s responsiveness to any questions by the Trustees; and the professional qualifications and compensation program of the portfolio management team of the Sub-Adviser.
The Board also considered the continuous and regular investment management and other services provided by TAM, when acting as a manager of managers, for the portion of the management fee it retains from the Portfolio after payment of the sub-advisory fees. The Board noted that the investment management and other services provided by TAM include the design, development and ongoing review and evaluation of the Portfolio and its investment strategy; the selection, oversight and monitoring of one or more investment sub-advisers to perform certain duties with respect to the Portfolio; ongoing portfolio trading oversight and analysis; risk management oversight and analysis; design, development, implementation and ongoing review and evaluation of a process for the valuation of Portfolio investments; design, development, implementation and ongoing review and evaluation of a compliance program for the Portfolio; design, development, implementation and ongoing review and evaluation of a process for the voting of proxies and exercise of rights to consent to corporate action for Portfolio investments; participation in Board meetings and oversight of preparation of materials for the Board, including materials for Board meetings and regular communications with the Board; oversight of preparation of the Portfolio’s prospectus, statement of additional information, shareholder reports and other disclosure materials and regulatory filings for the Portfolio; and ongoing cash management services for the Portfolio. The Board considered that TAM’s investment management services also include the provision of supervisory and administrative services to the Portfolio. The Board also noted that TAM, as part of the services it provides to all Transamerica mutual funds, including the Portfolio, oversees the services provided by the funds’ custodian, transfer agent, independent accountant and legal counsel and supervises the performance of the recordkeeping and holder service functions of the funds.
Investment Performance
In addition, the Board considered the short- and longer-term performance of the Portfolio in light of its investment objective, policies and strategies, including relative performance against (i) a peer universe of comparable mutual funds, as prepared by Broadridge, and (ii) the Portfolio’s benchmarks, in each case for various trailing periods ended December 31, 2023. Based on these considerations, the Board determined that TAM and the Sub-Adviser can provide investment and related services that are appropriate in scope and extent in light of the Portfolio’s investment objectives, policies and strategies and operations, the competitive landscape of the investment company business and investor needs. The Board’s conclusions as to the Portfolio’s performance are summarized below. For purposes of its review,
|
|
|
| Transamerica Series Trust |
|
Semi-Annual Financial Statements 2024 |
Page 11
Transamerica Goldman Sachs 70/30 Allocation VP
MANAGEMENT AND SUB-ADVISORY AGREEMENT — CONTRACT RENEWAL (continued)
(unaudited)
the Board generally used the performance of Service Class Shares. In describing the Portfolio’s performance relative to its peer universe, the summary conclusions characterize performance for the relevant periods in relation to whether it was “above,” “below” or “in line with” the peer universe median and do so using quintile rankings prepared by Broadridge. For simplicity, performance is described as “above” the median if the Portfolio’s performance ranked anywhere in the first or second quintiles, as “below” the median if it ranked anywhere in the fourth or fifth quintiles, or “in line with” the median if it ranked anywhere in the third quintile (i.e., even if its precise return was somewhat above or somewhat below the precise median return).
When considering the Portfolio’s performance, the Trustees considered any representations made by TAM regarding the appropriateness of certain peer groups and benchmarks. They recognized that performance reflects a snapshot of a period as of a specific date, and that consideration of performance data for a different period could generate significantly different performance results. The Trustees also recognized that even longer-term performance can be negatively affected by performance over a short-term period when that short-term performance is significantly below the performance of the comparable benchmark or universe of peer funds.
The Board noted that the performance of Service Class Shares of the Portfolio was above the median for its peer universe for the past 1-year period and below the median for the past 3-year period. The Board also noted that the performance of Service Class Shares of the Portfolio was below the benchmark that TAM utilizes to measure performance of the Portfolio for the past 1- and 3-year periods.
Management Fee and Sub-Advisory Fees and Total Expense Ratio
The Board considered the management fee and total expense ratio of the Portfolio, including information provided by Broadridge comparing the management fee and total expense ratio of the Portfolio to the management fees and total expense ratios of comparable investment companies in both a peer group and broader peer universe compiled by Broadridge. The Board’s conclusions as to the Portfolio’s management fee and total expense ratio are summarized below. For purposes of its review, the Board generally used the actual total expenses (i.e., expenses reflecting any waivers and/or reimbursements) of Service Class Shares. In describing the Portfolio’s management fee and total expense ratio relative to its peer group and peer universe, the summary conclusions characterize management fees and total expense ratios for the relevant periods in relation to whether they were “above,” “below” or “in line with” the peer group or peer universe median and do so using quintile rankings prepared by Broadridge. For simplicity, management fees and total expense ratios are described as “above” the median if the Portfolio’s management fee or total expense ratio ranked anywhere in the fourth or fifth quintiles, as “below” the median if it ranked anywhere in the first or second quintiles, or “in line with” the median if it ranked anywhere in the third quintile (i.e., even if its precise management fee or total expense ratio was somewhat above or somewhat below the precise median management fee or total expense ratio).
The Board also considered the fees charged by the Sub-Adviser for sub-advisory services, as well as the portion of the Portfolio’s management fee retained by TAM following payment of the sub-advisory fee and how the portion of the contractual management fee retained by TAM at a specified asset level compared to the portions retained by other investment advisers managing mutual funds with similar investment strategies as calculated by an independent provider of information.
The Board noted that the Portfolio’s contractual management fee was below the medians for its peer group and peer universe and that the actual total expenses (i.e., expenses reflecting any waivers and/or reimbursements) of Service Class Shares of the Portfolio were above the medians for its peer group and peer universe. The Trustees also considered that TAM has entered into an expense limitation arrangement with the Portfolio, which may result in TAM waiving fees for the benefit of holders.
On the basis of these considerations, together with the other information it considered, the Board determined that the management and sub-advisory fees to be received by TAM and the Sub-Adviser under the Management Agreement and Sub-Advisory Agreement are reasonable in light of the services provided.
Cost of Services Provided and Level of Profitability
The Board reviewed information provided by TAM about the cost of providing and procuring fund management services, as well as the costs of the provision of administration, transfer agency and other services, to the Portfolio and to Transamerica Series Trust as a whole by TAM and its affiliates. The Board considered the profitability of TAM and its affiliates in providing these services for the Portfolio and Transamerica Series Trust as a whole. The Trustees recognized the competitiveness of the mutual fund industry and the importance of an investment adviser’s long-term profitability, including for maintaining company and management stability and accountability.
The Board also considered the allocation methodology used for calculating the profitability of TAM and its affiliates. The Board noted that the revenue and expense allocation methodology used by TAM to estimate its profitability with respect to its relationship with the Portfolio had been reviewed previously by an independent consultant. The Trustees considered that TAM reported that it had not made material changes to this methodology, and that the methodology had been applied consistently for the Portfolio.
With respect to the Sub-Adviser, the Board noted that the sub-advisory fee is the product of arm’s-length negotiation between TAM and the Sub-Adviser, which is not affiliated with TAM, and is paid by TAM and not the Portfolio. As a result, the Board focused on the profitability of TAM and its affiliates with respect to the Portfolio.
|
|
|
| Transamerica Series Trust |
|
Semi-Annual Financial Statements 2024 |
Page 12
Transamerica Goldman Sachs 70/30 Allocation VP
MANAGEMENT AND SUB-ADVISORY AGREEMENT — CONTRACT RENEWAL (continued)
(unaudited)
Based on this information, the Board determined that the profitability of TAM and its affiliates from their relationships with the Portfolio was not excessive.
Economies of Scale
The Board considered economies of scale with respect to the management of the Portfolio, whether the Portfolio had appropriately benefited from any economies of scale and whether there was the potential for realization of any future economies of scale. The Board also considered the existence of economies of scale with respect to management of the Transamerica mutual funds overall and the extent to which the Portfolio benefited from any economies of scale. The Board recognized that, as the Portfolio’s assets increase, any economies of scale realized by TAM or the Sub-Adviser may not directly correlate with each other or with any economies of scale that might be realized by the Portfolio. The Board considered the Portfolio’s management fee schedule and the existence of breakpoints and also considered the extent to which TAM shared economies of scale, if any, with the Portfolio through undertakings to limit or reimburse Portfolio expenses and to invest in maintaining and developing its capabilities and services. The Board also considered the Sub-Adviser’s sub-advisory fee schedule and the existence of breakpoints, if any, and how such breakpoints relate to any breakpoints in the Portfolio’s management fee schedule. The Board considered that the Sub-Adviser’s sub-advisory fees would be based on the combined assets of multiple funds. The Trustees concluded that the Portfolio’s fee structure reflected an appropriate sharing of any efficiencies or economies of scale to date and noted that they will have the opportunity to periodically reexamine the appropriateness of the management fee payable to TAM and the fee paid to the Sub-Adviser in light of any economies of scale experienced in the future.
Benefits to TAM, its Affiliates and/or the Sub-Adviser from their Relationships with the Portfolio
The Board considered other benefits derived by TAM, its affiliates, and/or the Sub-Adviser from their relationships with the Portfolio. The Board noted that TAM does not receive benefits from research obtained with commissions paid to broker-dealers for portfolio transactions (commonly referred to as “soft dollars”) as a result of its relationship with the Portfolio.
Other Considerations
The Board noted that TAM has made a substantial commitment to the recruitment and retention of high-quality personnel and maintains the financial, compliance and operational resources reasonably necessary to manage the Portfolio in a professional manner that is consistent with the best interests of the Portfolio and the holders. In this regard, the Board favorably considered the procedures and policies TAM has in place to enforce compliance with applicable laws and regulations and oversee the portfolio management activities of the Sub-Adviser. The Board also noted that TAM has made an entrepreneurial commitment and undertaken certain business risks with respect to the management and success of the Portfolio.
Conclusion
After consideration of the factors described above, as well as other factors, the Trustees, including the Independent Trustees, concluded that the renewal of the Management Agreement and the Sub-Advisory Agreement was in the best interests of the Portfolio and the holders and voted to approve the renewal of the Agreements.
|
|
|
| Transamerica Series Trust |
|
Semi-Annual Financial Statements 2024 |
Page 13
PROXY VOTING POLICIES AND PROCEDURES AND QUARTERLY PORTFOLIO HOLDINGS
(unaudited)
A description of Transamerica Series Trust’s (the “Trust”) proxy voting policies and procedures is available in the Statement of Additional Information of the Portfolios, available without charge upon request by calling 1-800-851-9777 (toll free) or on the Securities and Exchange Commission’s (“SEC”) website at http://www.sec.gov.
In addition, the Portfolio is required to file Form N-PX, with their complete proxy voting records for the most recent 12 months ended June 30th, no later than August 31st of each year. The Form is available without charge: (1) on the Transamerica Funds website at https://www.transamerica.com/sites/default/files/files/e070d/TST%20N-PX%202021.pdf; and (2) on the SEC’s website at http://www.sec.gov.
Each fiscal quarter, the Portfolios, except Transamerica BlackRock Government Money Market VP, will file with the SEC a complete schedule of its monthly portfolio holdings on Form N-PORT. The Portfolios’ holdings as of the end of the third month of every fiscal quarter, as reported on Form N-PORT, will be publicly available on the SEC’s website at http://www.sec.gov within 60 days of the end of the fiscal quarter.
On a monthly basis, Transamerica BlackRock Government Money Market VP will file with the SEC portfolio holdings information on Form N-MFP3. A complete schedule of portfolio holdings is also available at www.transamerica.com.
You may also visit the Trust’s website at www.transamerica.com/annuities/prospectus for this and other information about the Portfolios and the Trust.
Important Notice Regarding Delivery of Shareholder Documents
Every year we provide shareholders informative materials such as the Transamerica Series Trust Annual Report, the Transamerica Series Trust Prospectus, and other required documents that keep you informed regarding your Portfolios. To the extent provided by mail, Transamerica Series Trust will only send one piece per mailing address, a method that saves your Portfolios money by reducing mailing and printing costs. We will continue to do this unless you tell us not to. To elect to receive individual mailings, simply call a Transamerica Customer Service Representative toll free at 1-800-851-9777, 8 a.m. to 7 p.m. Eastern Time, Monday-Friday. Your request will take effect within 30 days.
|
|
|
| Transamerica Series Trust |
|
Semi-Annual Financial Statements 2024 |
Page 14
NOTICE OF PRIVACY POLICY
(unaudited)
Your privacy is very important to us. We want you to understand what information we collect and how we use it. We collect and use “nonpublic personal information” in connection with providing our customers with a broad range of financial products and services as effectively and conveniently as possible. We treat nonpublic personal information in accordance with our Privacy Policy.
What Information We Collect and From Whom We Collect It
We may collect nonpublic personal information about you from the following sources:
| • |
|
Information we receive from you on applications or other forms, such as your name, address, and account number; |
| • |
|
Information about your transactions with us, our affiliates, or others, such as your account balance and purchase/redemption history; and |
| • |
|
Information we receive from non-affiliated third parties, including consumer reporting agencies. |
What Information We Disclose and To Whom We Disclose It
We do not disclose any nonpublic personal information about current or former customers to anyone without their express consent, except as permitted by law. We may disclose the nonpublic personal information we collect, as described above, to persons or companies that perform services on our behalf and to other financial institutions with which we have joint marketing agreements. We will require these companies to protect the confidentiality of your nonpublic personal information and to use it only to perform the services for which we have hired them.
Our Security Procedures
We restrict access to your nonpublic personal information and only allow disclosures to persons and companies as permitted by law to assist in providing products or services to you. We maintain physical, electronic, and procedural safeguards to protect your nonpublic personal information and to safeguard the disposal of certain consumer information.
Contact Us
If you have any questions about our Privacy Policy, please call 1-800-851-9777 on any business day between 8 a.m. and 7 p.m. Eastern Time.
Note: This Privacy Policy applies only to customers that have a direct relationship with us or our affiliates. If you own shares of our portfolios in the name of a third party such as a bank or broker-dealer, its privacy policy may apply to you instead of ours.
|
|
|
| Transamerica Series Trust |
|
Semi-Annual Financial Statements 2024 |
Page 15
PO Box 219945
Kansas City, MO 64121-9945
|
|
|
| Distributor: |
|
Transamerica Capital, Inc. |
|
|
PO Box 219945 |
|
|
Kansas City, MO 64121-9945 |
|
|
|
|
Customer Service: 1-800-851-9777 |
Transamerica Series Trust Semi-Annual Financial Statements
June 30, 2024
1801 California St., Suite 5200
Denver, CO 80202
Distributor: Transamerica Capital, Inc.
Customer Service: 1-800-851-9777
|
| The following pages contain the most recent semi-annual financial statements for the investment options in which you are invested. In compliance with Securities and Exchange Commission regulations, we present these reports on an annual and semi-annual basis with the hope that they will foster greater understanding of the investment options’ holdings, performance, financial data, accounting policies and other issues. This streamlined version provides information only on the investment options in which you are invested. |
|
| If you have any questions about these reports, please do not hesitate to contact your financial professional. As always, we thank you for your trust and the opportunity to serve you. |
Transamerica Goldman Sachs Managed Risk - Balanced ETF VP
SCHEDULE OF INVESTMENTS
At June 30, 2024
(unaudited)
|
|
|
|
|
|
|
|
|
| |
|
Shares |
|
|
Value |
|
| EXCHANGE-TRADED FUNDS - 99.6% |
|
| International Equity Funds - 15.6% |
|
| iShares Core MSCI EAFE ETF |
|
|
1,804,570 |
|
|
$ |
131,083,965 |
|
| iShares Core MSCI Emerging Markets ETF |
|
|
3,782,931 |
|
|
|
202,500,296 |
|
| iShares MSCI EAFE ETF (A) |
|
|
866,986 |
|
|
|
67,911,013 |
|
| iShares MSCI EAFE Small-Cap ETF (A) |
|
|
253,984 |
|
|
|
15,655,574 |
|
| Vanguard FTSE Developed Markets ETF |
|
|
4,069,497 |
|
|
|
201,114,542 |
|
|
|
|
|
|
|
|
|
|
|
|
|
|
|
|
|
618,265,390 |
|
|
|
|
|
|
|
|
|
|
| U.S. Equity Funds - 36.2% |
|
| iShares Core S&P 500 ETF |
|
|
822,200 |
|
|
|
449,932,506 |
|
| iShares Core S&P Mid-Cap ETF |
|
|
863,169 |
|
|
|
50,512,650 |
|
| iShares Russell 2000 ETF (A) |
|
|
339,714 |
|
|
|
68,924,573 |
|
| SPDR S&P 500 ETF Trust |
|
|
379,843 |
|
|
|
206,718,157 |
|
| Vanguard S&P 500 ETF |
|
|
1,310,658 |
|
|
|
655,499,386 |
|
|
|
|
|
|
|
|
|
|
|
|
|
|
|
|
|
1,431,587,272 |
|
|
|
|
|
|
|
|
|
|
| U.S. Fixed Income Funds - 47.8% |
|
| iShares Core U.S. Aggregate Bond ETF |
|
|
6,880,541 |
|
|
|
667,894,115 |
|
| Vanguard Intermediate-Term Corporate Bond ETF (A) |
|
|
6,956,164 |
|
|
|
556,006,188 |
|
| Vanguard Total Bond Market ETF |
|
|
9,287,955 |
|
|
|
669,197,158 |
|
|
|
|
|
|
|
|
|
|
|
|
|
|
|
|
|
1,893,097,461 |
|
|
|
|
|
|
|
|
|
|
| Total Exchange-Traded Funds
(Cost $3,695,544,993) |
|
|
|
|
|
|
3,942,950,123 |
|
|
|
|
|
|
|
|
|
|
|
|
|
|
|
|
|
|
|
| |
|
Shares |
|
|
Value |
|
| OTHER INVESTMENT COMPANY - 6.1% |
|
| Securities Lending Collateral - 6.1% |
|
| State Street Navigator Securities Lending Trust - Government Money Market Portfolio, 5.28% (B) |
|
|
241,681,646 |
|
|
$ |
241,681,646 |
|
|
|
|
|
|
|
|
|
|
| Total Other Investment Company
(Cost $241,681,646) |
|
|
|
241,681,646 |
|
|
|
|
|
|
|
|
|
|
|
|
|
| |
|
Principal |
|
|
Value |
|
| REPURCHASE AGREEMENT - 0.4% |
|
| Fixed Income Clearing Corp.,
2.50% (B), dated 06/28/2024, to be repurchased at $16,439,991 on 07/01/2024. Collateralized by a U.S. Government Obligation, 3.75%, due 04/15/2026, and with a value of $16,765,358. |
|
$ |
16,436,567 |
|
|
|
16,436,567 |
|
|
|
|
|
|
|
|
|
|
| Total Repurchase Agreement
(Cost $16,436,567) |
|
|
|
|
|
|
16,436,567 |
|
|
|
|
|
|
|
|
|
|
| Total Investments
(Cost $3,953,663,206) |
|
|
|
|
|
|
4,201,068,336 |
|
|
|
|
|
|
|
|
|
|
| Net Other Assets (Liabilities) - (6.1)% |
|
|
|
(241,915,439 |
) |
|
|
|
|
|
|
|
|
|
|
|
|
| Net Assets - 100.0% |
|
|
|
|
|
$ |
3,959,152,897 |
|
|
|
|
|
|
|
|
|
|
INVESTMENT VALUATION:
|
|
|
|
|
|
|
|
|
|
|
|
|
|
|
|
|
| Valuation Inputs (C) |
|
|
|
|
|
|
|
|
|
|
|
|
|
|
|
|
| |
|
Level 1 - Unadjusted Quoted Prices |
|
|
Level 2 - Other Significant Observable Inputs |
|
|
Level 3 - Significant Unobservable Inputs |
|
|
Value |
|
| ASSETS |
|
|
|
|
|
|
|
|
|
|
|
|
|
|
|
|
| Investments |
|
|
|
|
|
|
|
|
|
|
|
|
|
|
|
|
| Exchange-Traded Funds |
|
$ |
3,942,950,123 |
|
|
$ |
— |
|
|
$ |
— |
|
|
$ |
3,942,950,123 |
|
| Other Investment Company |
|
|
241,681,646 |
|
|
|
— |
|
|
|
— |
|
|
|
241,681,646 |
|
| Repurchase Agreement |
|
|
— |
|
|
|
16,436,567 |
|
|
|
— |
|
|
|
16,436,567 |
|
|
|
|
|
|
|
|
|
|
|
|
|
|
|
|
|
|
| Total Investments |
|
$ |
4,184,631,769 |
|
|
$ |
16,436,567 |
|
|
$ |
— |
|
|
$ |
4,201,068,336 |
|
|
|
|
|
|
|
|
|
|
|
|
|
|
|
|
|
|
FOOTNOTES TO SCHEDULE OF INVESTMENTS:
| (A) |
All or a portion of the security is on loan. The total value of the securities on loan is $356,553,031, collateralized by cash collateral of $241,681,646 and non-cash collateral, such as U.S. government securities and irrevocable letters of credit, of $122,725,529. The amount on loan indicated may not correspond with the securities on loan identified because a security with pending sales are in the process of recall from the brokers. |
| (B) |
Rate disclosed reflects the yield at June 30, 2024. |
| (C) |
There were no transfers in or out of Level 3 during the period ended June 30, 2024. Please reference the Investment Valuation section of the Notes to Financial Statements for more information regarding investment valuation and pricing inputs. |
|
|
|
| The Notes to Financial Statements are an integral part of this report. |
|
|
| Transamerica Series Trust |
|
Semi-Annual Financial Statements 2024 |
Page 1
Transamerica Goldman Sachs Managed Risk - Balanced ETF VP
STATEMENT OF ASSETS AND LIABILITIES
At June 30, 2024
(unaudited)
|
|
|
|
|
| Assets: |
|
|
|
|
| Unaffiliated investments, at value (cost $3,937,226,639) (including securities loaned of $356,553,031) |
|
$ |
4,184,631,769 |
|
| Repurchase agreement, at value (cost $16,436,567) |
|
|
16,436,567 |
|
| Receivables and other assets: |
|
|
|
|
| Net income from securities lending |
|
|
98,896 |
|
| Dividends from unaffiliated investments |
|
|
3,005,712 |
|
| Interest |
|
|
3,424 |
|
| Prepaid expenses |
|
|
15,992 |
|
| |
|
| Total assets |
|
|
4,204,192,360 |
|
|
|
| Liabilities: |
|
|
|
|
| Cash collateral received upon return of: |
|
|
|
|
| Securities on loan |
|
|
241,681,646 |
|
| Payables and other liabilities: |
|
|
|
|
| Shares of beneficial interest redeemed |
|
|
1,329,852 |
|
| Investment management fees |
|
|
917,132 |
|
| Distribution and service fees |
|
|
759,517 |
|
| Transfer agent costs |
|
|
4,218 |
|
| Trustee and CCO fees |
|
|
12,140 |
|
| Audit and tax fees |
|
|
31,746 |
|
| Custody fees |
|
|
20,422 |
|
| Legal fees |
|
|
86,154 |
|
| Printing and shareholder reports fees |
|
|
112,565 |
|
| Other accrued expenses |
|
|
84,071 |
|
|
|
| Total liabilities |
|
|
245,039,463 |
|
| |
|
| Net assets |
|
$ |
3,959,152,897 |
|
|
|
| Net assets consist of: |
|
|
|
|
| Capital stock ($0.01 par value) |
|
$ |
3,311,014 |
|
| Additional paid-in capital |
|
|
3,512,338,677 |
|
| Total distributable earnings (accumulated losses) |
|
|
443,503,206 |
|
| |
|
| Net assets |
|
$ |
3,959,152,897 |
|
|
|
| Net assets by class: |
|
|
|
|
| Initial Class |
|
$ |
4,919,938 |
|
| Service Class |
|
|
3,954,232,959 |
|
|
|
| Shares outstanding: |
|
|
|
|
| Initial Class |
|
|
404,592 |
|
| Service Class |
|
|
330,696,841 |
|
|
|
| Net asset value and offering price per share: |
|
|
|
|
| Initial Class |
|
$ |
12.16 |
|
| Service Class |
|
|
11.96 |
|
STATEMENT OF OPERATIONS
For the period ended June 30, 2024
(unaudited)
|
|
|
|
|
|
|
| Investment income: |
|
|
|
|
| Dividend income from unaffiliated investments |
|
$ |
48,540,839 |
|
| Interest income from unaffiliated investments |
|
|
173,700 |
|
| Net income from securities lending |
|
|
240,946 |
|
|
|
| Total investment income |
|
|
48,955,485 |
|
|
|
| Expenses: |
|
|
|
|
| Investment management fees |
|
|
5,951,769 |
|
| Distribution and service fees: |
|
|
|
|
| Service Class |
|
|
4,929,289 |
|
| Transfer agent costs |
|
|
22,819 |
|
| Trustee and CCO fees |
|
|
92,846 |
|
| Audit and tax fees |
|
|
30,747 |
|
| Custody fees |
|
|
20,085 |
|
| Legal fees |
|
|
162,760 |
|
| Printing and shareholder reports fees |
|
|
106,317 |
|
| Other |
|
|
112,547 |
|
| |
|
| Total expenses |
|
|
11,429,179 |
|
| |
|
| Net investment income (loss) |
|
|
37,526,306 |
|
|
|
| Net realized gain (loss) on: |
|
|
|
|
| Unaffiliated investments |
|
|
44,886,844 |
|
|
|
| Net change in unrealized appreciation (depreciation) on: |
|
|
|
|
| Unaffiliated investments |
|
|
117,143,186 |
|
| |
|
| Net realized and change in unrealized gain (loss) |
|
|
162,030,030 |
|
| |
|
| Net increase (decrease) in net assets resulting from operations |
|
$ |
199,556,336 |
|
The Notes to Financial Statements are an integral part of this report.
|
|
|
|
|
| Transamerica Series Trust |
|
|
|
Semi-Annual Financial Statements 2024 |
|
|
Page 2 |
|
|
Transamerica Goldman Sachs Managed Risk - Balanced ETF VP
STATEMENT OF CHANGES IN NET ASSETS
For the period and year ended:
|
|
|
|
|
|
|
|
|
| |
|
June 30, 2024 (unaudited) |
|
December 31, 2023 |
|
|
|
| From operations: |
|
|
|
|
|
|
|
|
| Net investment income (loss) |
|
|
$ 37,526,306 |
|
|
|
$ 86,478,342 |
|
| Net realized gain (loss) |
|
|
44,886,844 |
|
|
|
47,260,421 |
|
| Net change in unrealized appreciation (depreciation) |
|
|
117,143,186 |
|
|
|
374,269,445 |
|
|
|
|
| Net increase (decrease) in net assets resulting from operations |
|
|
199,556,336 |
|
|
|
508,008,208 |
|
|
|
|
| Dividends and/or distributions to shareholders: |
|
|
|
|
|
|
|
|
| Initial Class |
|
|
— |
|
|
|
(412,407 |
) |
| Service Class |
|
|
— |
|
|
|
(339,280,996 |
) |
| |
|
|
| Net increase (decrease) in net assets resulting from dividends and/or distributions to shareholders |
|
|
— |
|
|
|
(339,693,403 |
) |
|
|
|
| Capital share transactions: |
|
|
|
|
|
|
|
|
| Proceeds from shares sold: |
|
|
|
|
|
|
|
|
| Initial Class |
|
|
84,023 |
|
|
|
655,507 |
|
| Service Class |
|
|
2,782,606 |
|
|
|
9,027,078 |
|
| |
|
|
| |
|
|
2,866,629 |
|
|
|
9,682,585 |
|
| Dividends and/or distributions reinvested: |
|
|
|
|
|
|
|
|
| Initial Class |
|
|
— |
|
|
|
412,407 |
|
| Service Class |
|
|
— |
|
|
|
339,280,996 |
|
| |
|
|
| |
|
|
— |
|
|
|
339,693,403 |
|
| Cost of shares redeemed: |
|
|
|
|
|
|
|
|
| Initial Class |
|
|
(379,606 |
) |
|
|
(583,485 |
) |
| Service Class |
|
|
(342,772,535 |
) |
|
|
(569,272,165 |
) |
| |
|
|
|
|
|
(343,152,141 |
) |
|
|
(569,855,650 |
) |
| |
|
|
| Net increase (decrease) in net assets resulting from capital share transactions |
|
|
(340,285,512 |
) |
|
|
(220,479,662 |
) |
|
|
|
| Net increase (decrease) in net assets |
|
|
(140,729,176 |
) |
|
|
(52,164,857 |
) |
|
|
|
| Net assets: |
|
|
|
|
|
|
|
|
| Beginning of period/year |
|
|
4,099,882,073 |
|
|
|
4,152,046,930 |
|
| End of period/year |
|
|
$3,959,152,897 |
|
|
|
$4,099,882,073 |
|
|
|
|
| Capital share transactions - shares: |
|
|
|
|
|
|
|
|
| Shares issued: |
|
|
|
|
|
|
|
|
| Initial Class |
|
|
7,040 |
|
|
|
57,335 |
|
| Service Class |
|
|
237,336 |
|
|
|
805,394 |
|
| |
|
|
| |
|
|
244,376 |
|
|
|
862,729 |
|
| Shares reinvested: |
|
|
|
|
|
|
|
|
| Initial Class |
|
|
— |
|
|
|
37,594 |
|
| Service Class |
|
|
— |
|
|
|
31,385,846 |
|
| |
|
|
| |
|
|
— |
|
|
|
31,423,440 |
|
| Shares redeemed: |
|
|
|
|
|
|
|
|
| Initial Class |
|
|
(32,579 |
) |
|
|
(52,091 |
) |
| Service Class |
|
|
(29,532,013 |
) |
|
|
(50,802,064 |
) |
| |
|
|
| |
|
|
(29,564,592 |
) |
|
|
(50,854,155 |
) |
| Net increase (decrease) in shares outstanding: |
|
|
|
|
|
|
|
|
| Initial Class |
|
|
(25,539 |
) |
|
|
42,838 |
|
| Service Class |
|
|
(29,294,677 |
) |
|
|
(18,610,824 |
) |
| |
|
|
| |
|
|
(29,320,216 |
) |
|
|
(18,567,986 |
) |
The Notes to Financial Statements are an integral part of this report.
|
|
|
|
|
| Transamerica Series Trust |
|
|
|
Semi-Annual Financial Statements 2024 |
|
|
Page 3 |
|
|
Transamerica Goldman Sachs Managed Risk - Balanced ETF VP
FINANCIAL HIGHLIGHTS
|
|
|
|
|
|
|
|
|
|
|
|
|
|
|
|
|
|
|
|
|
|
|
|
|
|
|
| For a share outstanding during the period and years indicated: |
|
Initial Class |
| |
|
June 30, 2024 (unaudited) |
|
December 31, 2023 |
|
December 31, 2022 |
|
December 31, 2021 |
|
December 31, 2020 |
|
December 31, 2019 |
|
|
|
|
|
|
|
| Net asset value, beginning of period/year |
|
$ |
11.55 |
|
|
$ |
11.12 |
|
|
$ |
13.53 |
|
|
$ |
13.10 |
|
|
$ |
13.00 |
|
|
$ |
11.78 |
|
| Investment operations: |
|
|
|
|
|
|
|
|
|
|
|
|
|
|
|
|
|
|
|
|
|
|
|
|
| Net investment income (loss)(A) |
|
|
0.13 |
|
|
|
0.27 |
|
|
|
0.20 |
|
|
|
0.20 |
|
|
|
0.17 |
|
|
|
0.29 |
|
| Net realized and unrealized gain (loss) |
|
|
0.48 |
|
|
|
1.17 |
|
|
|
(2.09 |
) |
|
|
1.05 |
|
|
|
0.39 |
|
|
|
1.54 |
|
| |
|
|
|
|
|
|
| Total investment operations |
|
|
0.61 |
|
|
|
1.44 |
|
|
|
(1.89 |
) |
|
|
1.25 |
|
|
|
0.56 |
|
|
|
1.83 |
|
| Dividends and/or distributions to shareholders: |
|
|
|
|
|
|
|
|
|
|
|
|
|
|
|
|
|
|
|
|
|
|
|
|
| Net investment income |
|
|
— |
|
|
|
(0.21 |
) |
|
|
(0.22 |
) |
|
|
(0.19 |
) |
|
|
(0.30 |
) |
|
|
(0.28 |
) |
| Net realized gains |
|
|
— |
|
|
|
(0.80 |
) |
|
|
(0.30 |
) |
|
|
(0.63 |
) |
|
|
(0.16 |
) |
|
|
(0.33 |
) |
| Total dividends and/or distributions to shareholders |
|
|
— |
|
|
|
(1.01 |
) |
|
|
(0.52 |
) |
|
|
(0.82 |
) |
|
|
(0.46 |
) |
|
|
(0.61 |
) |
|
|
|
|
|
|
|
| Net asset value, end of period/year |
|
$ |
12.16 |
|
|
$ |
11.55 |
|
|
$ |
11.12 |
|
|
$ |
13.53 |
|
|
$ |
13.10 |
|
|
$ |
13.00 |
|
| |
|
|
|
|
|
|
|
|
|
|
|
|
|
|
|
|
|
|
|
|
|
|
|
|
|
|
|
|
|
|
|
| Total return |
|
|
5.28 |
%(B) |
|
|
13.41 |
% |
|
|
(14.07 |
)% |
|
|
9.65 |
% |
|
|
4.48 |
% |
|
|
15.92 |
% |
|
|
|
|
|
|
|
| Ratio and supplemental data: |
|
|
|
|
|
|
|
|
|
|
|
|
|
|
|
|
|
|
|
|
|
|
|
|
| Net assets end of period/year (000’s) |
|
$ |
4,920 |
|
|
$ |
4,970 |
|
|
$ |
4,306 |
|
|
$ |
3,985 |
|
|
$ |
3,583 |
|
|
$ |
3,910 |
|
| Expenses to average net assets(C) |
|
|
|
|
|
|
|
|
|
|
|
|
|
|
|
|
|
|
|
|
|
|
|
|
| Excluding waiver and/or reimbursement and recapture |
|
|
0.33 |
%(D) |
|
|
0.33 |
% |
|
|
0.32 |
% |
|
|
0.32 |
% |
|
|
0.32 |
% |
|
|
0.32 |
% |
| Including waiver and/or reimbursement and recapture |
|
|
0.33 |
%(D) |
|
|
0.33 |
% |
|
|
0.32 |
%(E) |
|
|
0.32 |
%(E) |
|
|
0.32 |
%(E) |
|
|
0.32 |
%(E) |
| Net investment income (loss) to average net assets |
|
|
2.17 |
%(D) |
|
|
2.40 |
% |
|
|
1.66 |
% |
|
|
1.47 |
% |
|
|
1.38 |
% |
|
|
2.31 |
% |
| Portfolio turnover rate |
|
|
11 |
%(B) |
|
|
26 |
% |
|
|
158 |
% |
|
|
13 |
% |
|
|
91 |
% |
|
|
22 |
% |
| (A) |
Calculated based on average number of shares outstanding. |
| (C) |
Does not include expenses of the underlying investments in which the Portfolio invests. |
| (E) |
Waiver and/or reimbursement rounds to less than 0.01%. |
The Notes to Financial Statements are an integral part of this report.
|
|
|
|
|
| Transamerica Series Trust |
|
|
|
Semi-Annual Financial Statements 2024 |
|
|
Page 4 |
|
|
Transamerica Goldman Sachs Managed Risk - Balanced ETF VP
FINANCIAL HIGHLIGHTS (continued)
|
|
|
|
|
|
|
|
|
|
|
|
|
|
|
|
|
|
|
|
|
|
|
|
|
|
|
| For a share outstanding during the period and years indicated: |
|
Service Class |
| |
|
June 30, 2024 (unaudited) |
|
December 31, 2023 |
|
December 31, 2022 |
|
December 31, 2021 |
|
December 31, 2020 |
|
December 31, 2019 |
|
|
|
|
|
|
|
| Net asset value, beginning of period/year |
|
$ |
11.38 |
|
|
$ |
10.96 |
|
|
$ |
13.33 |
|
|
$ |
12.92 |
|
|
$ |
12.83 |
|
|
$ |
11.63 |
|
| Investment operations: |
|
|
|
|
|
|
|
|
|
|
|
|
|
|
|
|
|
|
|
|
|
|
|
|
| Net investment income (loss)(A) |
|
|
0.11 |
|
|
|
0.24 |
|
|
|
0.15 |
|
|
|
0.16 |
|
|
|
0.14 |
|
|
|
0.24 |
|
| Net realized and unrealized gain (loss) |
|
|
0.47 |
|
|
|
1.15 |
|
|
|
(2.04 |
) |
|
|
1.04 |
|
|
|
0.37 |
|
|
|
1.54 |
|
| |
|
|
|
|
|
|
| Total investment operations |
|
|
0.58 |
|
|
|
1.39 |
|
|
|
(1.89 |
) |
|
|
1.20 |
|
|
|
0.51 |
|
|
|
1.78 |
|
| Dividends and/or distributions to shareholders: |
|
|
|
|
|
|
|
|
|
|
|
|
|
|
|
|
|
|
|
|
|
|
|
|
| Net investment income |
|
|
— |
|
|
|
(0.17 |
) |
|
|
(0.18 |
) |
|
|
(0.16 |
) |
|
|
(0.26 |
) |
|
|
(0.25 |
) |
| Net realized gains |
|
|
— |
|
|
|
(0.80 |
) |
|
|
(0.30 |
) |
|
|
(0.63 |
) |
|
|
(0.16 |
) |
|
|
(0.33 |
) |
| Total dividends and/or distributions to shareholders |
|
|
— |
|
|
|
(0.97 |
) |
|
|
(0.48 |
) |
|
|
(0.79 |
) |
|
|
(0.42 |
) |
|
|
(0.58 |
) |
|
|
|
|
|
|
|
| Net asset value, end of period/year |
|
$ |
11.96 |
|
|
$ |
11.38 |
|
|
$ |
10.96 |
|
|
$ |
13.33 |
|
|
$ |
12.92 |
|
|
$ |
12.83 |
|
| |
|
|
|
|
|
|
|
|
|
|
|
|
|
|
|
|
|
|
|
|
|
|
|
|
|
|
|
|
|
|
|
| Total return |
|
|
5.10 |
%(B) |
|
|
13.20 |
% |
|
|
(14.26 |
)% |
|
|
9.35 |
% |
|
|
4.19 |
% |
|
|
15.65 |
% |
|
|
|
|
|
|
|
| Ratio and supplemental data: |
|
|
|
|
|
|
|
|
|
|
|
|
|
|
|
|
|
|
|
|
|
|
|
|
| Net assets end of period/year (000’s) |
|
$ |
3,954,233 |
|
|
$ |
4,094,912 |
|
|
$ |
4,147,741 |
|
|
$ |
5,491,585 |
|
|
$ |
5,707,849 |
|
|
$ |
6,035,492 |
|
| Expenses to average net assets(C) |
|
|
|
|
|
|
|
|
|
|
|
|
|
|
|
|
|
|
|
|
|
|
|
|
| Excluding waiver and/or reimbursement and recapture |
|
|
0.58 |
%(D) |
|
|
0.58 |
% |
|
|
0.57 |
% |
|
|
0.57 |
% |
|
|
0.57 |
% |
|
|
0.57 |
% |
| Including waiver and/or reimbursement and recapture |
|
|
0.58 |
%(D) |
|
|
0.58 |
% |
|
|
0.57 |
%(E) |
|
|
0.57 |
%(E) |
|
|
0.57 |
%(E) |
|
|
0.57 |
%(E) |
| Net investment income (loss) to average net assets |
|
|
1.90 |
%(D) |
|
|
2.10 |
% |
|
|
1.32 |
% |
|
|
1.21 |
% |
|
|
1.14 |
% |
|
|
1.97 |
% |
| Portfolio turnover rate |
|
|
11 |
%(B) |
|
|
26 |
% |
|
|
158 |
% |
|
|
13 |
% |
|
|
91 |
% |
|
|
22 |
% |
| (A) |
Calculated based on average number of shares outstanding. |
| (C) |
Does not include expenses of the underlying investments in which the Portfolio invests. |
| (E) |
Waiver and/or reimbursement rounds to less than 0.01%. |
The Notes to Financial Statements are an integral part of this report.
|
|
|
|
|
| Transamerica Series Trust |
|
|
|
Semi-Annual Financial Statements 2024 |
|
|
Page 5 |
|
|
Transamerica Goldman Sachs Managed Risk - Balanced ETF VP
NOTES TO FINANCIAL STATEMENTS
At June 30, 2024
(unaudited)
1. ORGANIZATION
Transamerica Series Trust (“TST”) is an open-end management investment company registered under the Investment Company Act of 1940, as amended (the “1940 Act”). TST applies investment company accounting and reporting guidance. TST serves as a funding vehicle for variable life insurance, variable annuity, and group annuity products. Transamerica Goldman Sachs Managed Risk - Balanced ETF VP (the “Portfolio”) is a series of TST and is classified as diversified under the 1940 Act. The Portfolio currently offers two classes of shares, Initial Class and Service Class.
The only shareholders of the Portfolio are affiliated insurance company separate accounts and/or affiliated asset allocation portfolios. Contract holders of the variable life and annuity contracts are not shareholders of the Portfolio. For ease of reference, shareholders and contract holders are collectively referred to in this report as “shareholders.”
This report must be accompanied or preceded by the Portfolio’s current prospectus, which contains additional information about the Portfolio, including risks, as well as investment objectives and strategies.
Transamerica Asset Management, Inc. (“TAM”) serves as investment manager for the Portfolio pursuant to an investment management agreement. TAM provides continuous and regular investment management services to the Portfolio. TAM supervises the Portfolio’s investments, conducts its investment program and provides supervisory, compliance and administrative services to the Portfolio.
TAM currently acts as a “manager of managers” and has hired sub-advisers to furnish day-to-day investment advice and recommendations. TAM may, in the future, determine to provide all aspects of the day-to-day management of the Portfolio without the use of a sub-adviser. When acting as a manager of managers, TAM provides investment management services that include, without limitation, the design and development of the Portfolio and its investment strategies and the ongoing review and evaluation of those investment strategies including recommending changes in strategy where it believes appropriate or advisable; the selection of one or more sub-advisers for the Portfolio employing a combination of quantitative and qualitative screens, research, analysis and due diligence; negotiation of sub-advisory agreements and fees; oversight and monitoring of sub-advisers and recommending changes to sub-advisers where it believes appropriate or advisable; recommending portfolio combinations and liquidations where it believes appropriate or advisable; selection and oversight of transition managers, as needed; regular supervision of the Portfolio’s investments; regular review and evaluation of sub-adviser performance; daily monitoring of the sub-advisers’ buying and selling of securities for the Portfolio; regular review of holdings; ongoing trade oversight and analysis; regular monitoring to ensure adherence to investment process; regular calls and periodic on-site visits with sub-advisers; portfolio construction and asset allocation when using multiple sub-advisers for the Portfolio; risk management oversight and analysis; oversight of negotiation of investment documentation and agreements; design, development, implementation and regular monitoring of the valuation process; periodic due diligence reviews of pricing vendors and vendor methodology; design, development, implementation and regular monitoring of the compliance process; respond to regulatory inquiries and determine appropriate litigation strategy, as needed; review of proxies voted by sub-advisers; oversight of preparation and review of materials for meetings of the Portfolio’s Board of Trustees (the “Board”), participation in these meetings and preparation of regular communications with the Board; oversight of preparation and review of prospectuses, shareholder reports and other disclosure materials and regulatory filings for the Portfolio; oversight of other service providers to the Portfolio, such as the custodian, the transfer agent, the Portfolio’s independent accounting firm and legal counsel; supervision of the performance of recordkeeping and shareholder relations functions for the Portfolio; and oversight of cash management services. TAM uses a variety of quantitative and qualitative tools to carry out its investment management services. TAM, not the Portfolio, is responsible for paying the sub-adviser(s) for their services, and sub-advisory fees are TAM’s expense.
TAM’s investment management services also include the provision of supervisory and administrative services to the Portfolio. These services include performing certain administrative services for the Portfolio and supervising and overseeing the administrative, clerical, recordkeeping and bookkeeping services provided to the Portfolio by State Street Bank and Trust Company (“State Street”), to whom TAM has outsourced the provision of certain sub-administration services. To the extent agreed upon by TAM and the Portfolio from time to time, TAM’s supervisory and administrative services include, but are not limited to: monitoring and verifying the custodian’s daily calculation of the Net Asset Values (“NAV”); shareholder relations functions; compliance services; valuation services; assisting in due diligence and in the oversight and monitoring of certain activities of sub-advisers and certain aspects of Portfolio investments; assisting with Portfolio combinations and liquidations; oversight of the preparation and filing, and review, of all returns and reports, in connection with federal, state and local taxes; oversight and review of regulatory reporting; supervising and coordinating the Portfolio’s custodian and dividend disbursing agent and monitoring their services to the Portfolio; assisting the Portfolio in preparing reports to shareholders; acting as liaison with the Portfolio’s independent public accountants and providing, upon request, analyses, fiscal year summaries and other audit related services; assisting in the preparation of agendas and supporting documents for and minutes of meetings of trustees and committees of trustees; assisting in the preparation of regular communications with the trustees; and providing personnel and office space, telephones and other office equipment as necessary in order for TAM to perform supervisory and administrative services to the Portfolio. The Portfolio
|
|
|
| Transamerica Series Trust |
|
Semi-Annual Financial Statements 2024 |
Page 6
Transamerica Goldman Sachs Managed Risk - Balanced ETF VP
NOTES TO FINANCIAL STATEMENTS (continued)
At June 30, 2024
(unaudited)
1. ORGANIZATION (continued)
pays certain fees and expenses to State Street for sub-administration services which are not administrative services covered by the management agreement with TAM or paid for through the management fees payable thereunder. For the period ended June 30, 2024, (i) the expenses paid to State Street for sub-administration services by the Portfolio are shown as a part of Other expenses within the Statement of Operations and (ii) the expenses payable to State Street for sub-administration services from the Portfolio are shown as part of Other accrued expenses within the Statement of Assets and Liabilities.
2. SIGNIFICANT ACCOUNTING POLICIES
In preparing the Portfolio’s financial statements in accordance with Generally Accepted Accounting Principles in the United States of America (“GAAP”), estimates or assumptions (which could differ from actual results) may be used that affect reported amounts and disclosures. The following is a summary of significant accounting policies followed by the Portfolio.
Security transactions and investment income: Security transactions are accounted for on the trade date. Security gains and losses are calculated on a first-in, first-out basis. Interest income, if any, is accrued as earned. Dividend income and capital gain distributions from underlying investments, if any, are recorded on the ex-dividend date. Income or short-term capital gain distributions received from underlying investments, if any, are recorded as Dividend income from investments within the Statement of Operations. Long-term capital gain distributions received from underlying investments, if any, are recorded as Net realized gain (loss) on Capital gain distributions received from investments within the Statement of Operations.
Multiple class operations, income, and expenses: Income, non-class specific expenses, and realized and unrealized gains and losses are allocated to each class daily based upon net assets. Each class bears its own specific expenses in addition to the allocated non-class specific expenses.
Distributions to shareholders: Distributions are recorded on the ex-dividend date and are determined in accordance with federal income tax regulations, which may differ from GAAP.
Indemnification: In the normal course of business, the Portfolio enters into contracts that contain a variety of representations that provide general indemnifications. The Portfolio’s maximum exposure under these arrangements is unknown, as this would involve future claims that may be made against the Portfolio and/or its affiliates that have not yet occurred. However, based on experience, the Portfolio expects the risk of loss to be remote.
3. INVESTMENT VALUATION
TAM has been designated as the Portfolio’s valuation designee pursuant to Rule 2a-5 under the 1940 Act with responsibility for fair valuation subject to oversight by the Portfolio’s Board of Trustees. The net asset value of the Portfolio is computed as of the official close of the New York Stock Exchange (“NYSE”) each day the NYSE is open for business.
TAM utilizes various methods to measure the fair value of its investments on a recurring basis. GAAP establishes a hierarchy that prioritizes inputs to valuation methods. The inputs or methodology used for valuing securities are not necessarily an indication of the risk associated with investing in those securities. The three levels (“Levels”) of inputs of the fair value hierarchy are defined as follows:
Level 1—Unadjusted quoted prices in active markets for identical securities.
Level 2—Inputs, other than quoted prices included in Level 1, which are observable, either directly or indirectly. These inputs may include quoted prices for the identical instrument on an inactive market, prices for similar instruments, interest rates, prepayment speeds, credit risk, yield curves, default rates, and similar data.
Level 3—Unobservable inputs based on the best information available in the circumstances, to the extent observable inputs are not available, which may include TAM’s own assumptions used in determining the fair value of the Portfolio’s investments.
The inputs used to measure fair value may fall into different Levels of the fair value hierarchy. In such cases, for disclosure purposes, the Level in the fair value hierarchy that is assigned to the fair value measurement of a security is determined based on the lowest Level input that is significant to the fair value measurement in its entirety. Certain investments that are measured at fair value using NAV per share, or its equivalent, using the “practical expedient” have not been classified in the fair value Levels. The hierarchy classification of inputs used to value the Portfolio’s investments at June 30, 2024, is disclosed within the Investment Valuation section of the Schedule of Investments.
|
|
|
| Transamerica Series Trust |
|
Semi-Annual Financial Statements 2024 |
Page 7
Transamerica Goldman Sachs Managed Risk - Balanced ETF VP
NOTES TO FINANCIAL STATEMENTS (continued)
At June 30, 2024
(unaudited)
3. INVESTMENT VALUATION (continued)
The availability of observable inputs can vary from security to security and is affected by a wide variety of factors, including, but not limited to, the type of security, whether the security is new and not yet established in the marketplace, the liquidity of markets, and other characteristics particular to the security. To the extent that valuation is based on models or inputs that are less observable or unobservable in the market, the determination of fair value requires more judgment. Accordingly, the degree of judgment exercised in determining fair value is generally greatest for instruments categorized in Level 3. Due to the inherent uncertainty of valuation, the determination of values may differ significantly from values that would have been realized had a ready market for investments existed, and the differences could be material.
Fair value measurements: Descriptions of the valuation techniques applied to the Portfolio’s significant categories of assets and liabilities measured at fair value on a recurring basis are as follows:
Exchange-traded funds (“ETF”): ETFs are stated at the last reported sale price or closing price on the day of valuation taken from the primary exchange where the ETF is principally traded. ETFs are generally categorized in Level 1 of the fair value hierarchy.
Securities lending collateral: Securities lending collateral is invested in a money market fund which is valued at the actively traded NAV and no valuation adjustments are applied. Securities lending collateral is categorized in Level 1 of the fair value hierarchy.
Repurchase agreements: Repurchase agreements are valued at cost, which approximates fair value. To the extent the inputs are observable and timely, the values are generally categorized in Level 2 of the fair value hierarchy.
4. BORROWINGS AND OTHER FINANCING TRANSACTIONS
The Portfolio may engage in borrowing transactions as a means of raising cash to satisfy redemption requests, for other temporary or emergency purposes or, to the extent permitted by its investment policies, to raise additional cash to be invested in other securities or instruments. When the Portfolio invests borrowing proceeds in other securities, the Portfolio will bear the risk that the market value of the securities in which such proceeds are invested goes down and is insufficient to repay the borrowed proceeds. The Portfolio may borrow on a secured or on an unsecured basis. If the Portfolio enters into a secured borrowing arrangement, a portion of the Portfolio’s assets will be used as collateral. The 1940 Act requires the Portfolio to maintain asset coverage of at least 300% of the amount of its borrowings. Asset coverage means the ratio that the value of the Portfolio’s total assets, minus liabilities other than borrowings, bears to the aggregate amount of all borrowings. Although complying with this requirement has the effect of limiting the amount that the Portfolio may borrow, it does not otherwise mitigate the risks of entering into borrowing transactions.
Interfund lending: The Portfolio, along with other funds and portfolios advised by TAM, may participate in an interfund lending program pursuant to exemptive relief granted by the Securities and Exchange Commission on January 18, 2017. This program allows the Portfolio to lend to and borrow from other funds and portfolios advised by TAM. Interfund lending transactions are subject to the conditions of the exemptive relief which places limits on the amount of lending or borrowing a Portfolio may participate in under the program. Interest earned or paid on an interfund lending transaction will be based on the average of certain current market rates. For the period ended June 30, 2024, the Portfolio has not utilized the program.
Repurchase agreements: In a repurchase agreement, the Portfolio purchases a security and simultaneously commits to resell that security to the seller at an agreed-upon price on an agreed-upon date. Securities purchased subject to a repurchase agreement are held at the Portfolio’s custodian, or designated sub-custodian related to tri-party repurchase agreements, and, pursuant to the terms of the repurchase agreement, must be collateralized by securities with an aggregate market value greater than or equal to 100% of the resale price. The Portfolio will bear the risk of value fluctuations until the securities can be sold and may encounter delays and incur costs in liquidating the securities. In the event of bankruptcy or insolvency of the seller, delays and costs may be incurred.
Repurchase agreements are subject to netting agreements, which are agreements between the Portfolio and its counterparties that provide for the net settlement of all transactions and collateral with the Portfolio, through a single payment, in the event of default or termination. Amounts presented within the Schedule of Investments, and as part of Repurchase agreements, at value within the Statement of Assets and Liabilities are shown on a gross basis. The value of the related collateral for each repurchase agreement, as reflected within the Schedule of Investments, exceeds the value of each repurchase agreement at June 30, 2024.
Repurchase agreements at June 30, 2024, if any, are included within the Schedule of Investments and Statement of Assets and Liabilities.
|
|
|
| Transamerica Series Trust |
|
Semi-Annual Financial Statements 2024 |
Page 8
Transamerica Goldman Sachs Managed Risk - Balanced ETF VP
NOTES TO FINANCIAL STATEMENTS (continued)
At June 30, 2024
(unaudited)
4. BORROWINGS AND OTHER FINANCING TRANSACTIONS (continued)
Securities lending: The Portfolio may lend securities to qualified financial institutions, brokers and dealers. State Street serves as securities lending agent to the Portfolio pursuant to a Securities Lending Agreement. Loans of securities are terminable at any time and the borrower, after notice, is required to return borrowed securities within the standard time period for settlement of securities transactions. The lending of securities exposes the Portfolio to risks such as: the borrowers may fail to return the loaned securities or may not be able to provide additional collateral, the Portfolio may experience delays in recovery of the loaned securities or delays in access to collateral, or the Portfolio may experience losses related to the investment collateral. To minimize certain risks, loan counterparties pledge cash, securities issued or guaranteed by the U.S. Government and irrevocable letters of credit issued by banks as collateral. The initial collateral received by the Portfolio is required to have a value of at least 102% of the current value of the loaned securities traded on U.S. exchanges, and a value of at least 105% for all other securities. Typically the lending agent is not permitted to sell, re-pledge or use cash and non-cash collateral it receives. The lending agent has agreed to indemnify the Portfolio in the case of default of any securities borrower.
The Portfolio receives compensation for lending securities from interest or dividends earned on the cash, U.S. Government securities and irrevocable letters of credit held as collateral, less associated fees and expenses. Such income is reflected in Net income from securities lending within the Statement of Operations. Cash collateral received is invested in the State Street Navigator Securities Lending Trust — Government Money Market Portfolio.
The value of loaned securities and related cash and non-cash collateral outstanding at June 30, 2024, if any, are shown on a gross basis within the Schedule of Investments.
The following table reflects a breakdown of transactions accounted for as secured borrowings, the gross obligation by the type, and the remaining contractual maturity of those transactions as of June 30, 2024.
|
|
|
|
|
|
|
|
|
|
|
|
|
|
|
|
|
|
|
|
|
| |
|
Remaining Contractual Maturity of the Agreements |
|
| |
|
Overnight and Continuous |
|
|
Less Than 30 Days |
|
|
Between 30 & 90 Days |
|
|
Greater Than 90 Days |
|
|
Total |
|
| Securities Lending Transactions |
|
|
|
|
|
|
|
|
|
|
|
|
|
|
|
|
|
|
|
|
| Exchange-Traded Funds |
|
$ |
241,681,646 |
|
|
$ |
— |
|
|
$ |
— |
|
|
$ |
— |
|
|
$ |
241,681,646 |
|
| Total Borrowings |
|
$ |
241,681,646 |
|
|
$ |
— |
|
|
$ |
— |
|
|
$ |
— |
|
|
$ |
241,681,646 |
|
| |
|
|
|
|
|
|
|
|
|
|
|
|
|
|
|
|
|
|
|
|
5. RISK FACTORS
Investing in the Portfolio involves certain key risks related to the Portfolio’s trading activity. Please reference the Portfolio’s prospectus for a more complete discussion of the following risk(s), as well as other risks of investing in the Portfolio.
Market risk: The market prices of the Portfolio’s securities or other assets may go up or down, sometimes rapidly or unpredictably, due to factors such as economic events, inflation, changes in interest rates, governmental actions or interventions, actions taken by the U.S. Federal Reserve or foreign central banks, market disruptions caused by tariffs, trade disputes or other factors, political developments, armed conflicts, economic sanctions, cybersecurity events, investor sentiment, the global and domestic effects of widespread or local health, weather or climate events, and other factors that may or may not be related to the issuer of the security or other asset. If the market prices of the Portfolio’s securities and assets fall, the value of your investment in the Portfolio could go down.
Economies and financial markets throughout the world are increasingly interconnected. Events or circumstances in one or more countries or regions could be highly disruptive to, and have profound impacts on, global economies or markets. As a result, whether or not the Portfolio invests in securities of issuers located in or with significant exposure to the countries directly affected, the value and liquidity of the Portfolio’s investments may go down.
Managed risk strategy risk: The Portfolio employs a managed risk strategy. The strategy attempts to stabilize the volatility of the Portfolio around a target volatility level and manage downside exposure during periods of significant market declines but may not work as intended. Because market conditions change, sometimes rapidly and unpredictably, the success of the strategy also will be subject to the sub-adviser’s ability to implement the strategy in a timely and efficient manner. The strategy may result in periods of underperformance and may fail to protect against market declines. The strategy may limit the Portfolio’s ability to participate in up markets, may cause the Portfolio to underperform its benchmark in up markets, may increase transaction costs at the Portfolio and/or underlying portfolio level and may result in substantial losses if it does not work as intended. For example, if the Portfolio has reduced its equity exposure to avoid losses in
|
|
|
| Transamerica Series Trust |
|
Semi-Annual Financial Statements 2024 |
Page 9
Transamerica Goldman Sachs Managed Risk - Balanced ETF VP
NOTES TO FINANCIAL STATEMENTS (continued)
At June 30, 2024
(unaudited)
5. RISK FACTORS (continued)
certain market conditions, and the market rises sharply and quickly, there may be a delay in increasing the Portfolio’s equity exposure, causing the Portfolio to forgo gains from the market rebound. Managing the Portfolio pursuant to the strategy may result in the Portfolio not achieving its stated asset mix goal due to unforeseen or unanticipated market conditions. The strategy also serves to reduce the risk to the Transamerica insurance companies that provide guaranteed benefits under certain variable contracts from equity market volatility and to facilitate their provision of those guaranteed benefits. The strategy also may have the effect of limiting the amount of guaranteed benefits. The Portfolio’s performance may be lower than similar portfolios that are not subject to a managed risk strategy.
Model and data risk: If quantitative models, algorithms or calculations (whether proprietary and developed by the sub-adviser or supplied by third parties) (“Models”) or information or data supplied by third parties (“Data”) prove to be incorrect or incomplete, any decisions made, in whole or part, in reliance thereon expose the Portfolio to additional risks. Models can be predictive in nature. The use of predictive Models has inherent risks. The success of relying on or otherwise using Models depends on a number of factors, including the validity, accuracy and completeness of the Model’s development, implementation and maintenance, the Model’s assumptions, factors, algorithms and methodologies, and the accuracy and reliability of the supplied historical or other Data. Models rely on, among other things, correct and complete Data inputs. If incorrect Data is entered into even a well-founded Model, the resulting information will be incorrect. However, even if Data is input correctly, Model prices may differ substantially from market prices, especially for securities with complex characteristics. Investments selected with the use of Models may perform differently than expected as a result of the design of the Model, inputs into the Model or other factors. There also can be no assurance that the use of Models will result in effective investment decisions for the Portfolio.
6. FEES AND OTHER AFFILIATED TRANSACTIONS
TST serves as a funding vehicle for certain affiliated asset allocation portfolios and certain affiliated separate accounts of Transamerica Life Insurance Company (“TLIC”) and Transamerica Financial Life Insurance Company.
TAM, the Portfolio’s investment manager, is directly owned by TLIC and AUSA Holding, LLC (“AUSA”), both of which are indirect, wholly owned subsidiaries of Aegon Ltd. TLIC is owned by Commonwealth General Corporation (“Commonwealth”). Commonwealth and AUSA are wholly owned by Transamerica Corporation (DE). Transamerica Corporation (DE) is wholly owned by Aegon International B.V., which is wholly owned by Aegon Ltd., a Bermuda exempted company with liability limited by shares (formerly, Aegon NV, a Netherlands corporation) and a publicly traded international insurance group.
Transamerica Fund Services, Inc. (“TFS”) is the Portfolio’s transfer agent. Transamerica Capital, Inc. (“TCI”) is the Portfolio’s distributor/principal underwriter. TAM, TFS and TCI are affiliates of Aegon Ltd.
Certain officers and trustees of the Portfolio may also be officers and/or trustees of TAM, TFS and TCI. No interested trustee who is deemed an interested person due to current or former service with TAM or an affiliate of TAM receives compensation from the Portfolio. The Portfolio does pay non-interested persons (independent trustees), as disclosed in Trustee and CCO fees within the Statement of Operations.
Investment management fees: TAM serves as the Portfolio’s investment manager, performing administration as well as investment advisory services. TAM renders investment advisory, supervisory, and administration services under an investment management agreement and the Portfolio pays a single management fee, which is reflected in Investment management fees within the Statement of Operations.
The Portfolio pays a management fee to TAM based on daily average net assets at the following rates:
|
|
|
|
|
| Breakpoints |
|
Rate |
|
| First $50 million |
|
|
0.3400 |
% |
| Over $50 million up to $250 million |
|
|
0.3200 |
|
| Over $250 million up to $5 billion |
|
|
0.3000 |
|
| Over $5 billion up to $7 billion |
|
|
0.2900 |
|
| Over $7 billion up to $9 billon |
|
|
0.2875 |
|
| Over $9 billion |
|
|
0.2800 |
|
|
|
|
| Transamerica Series Trust |
|
Semi-Annual Financial Statements 2024 |
Page 10
Transamerica Goldman Sachs Managed Risk - Balanced ETF VP
NOTES TO FINANCIAL STATEMENTS (continued)
At June 30, 2024
(unaudited)
6. FEES AND OTHER AFFILIATED TRANSACTIONS (continued)
TAM has contractually agreed to waive fees and/or reimburse Portfolio expenses to the extent that the total operating expenses excluding, as applicable, acquired fund fees and expenses, interest (including borrowing costs and overdraft charges), taxes, brokerage commissions, dividend and interest expenses on securities sold short, extraordinary expenses and other expenses not incurred in the ordinary course of the Portfolio’s business, exceed the following stated annual operating expense limits to the Portfolio’s daily average net assets. To the extent an expense limit changed during the period, the prior limit is also listed below. The expenses waived and/or reimbursed, if any, are included in Expenses waived and/or reimbursed within the Statement of Operations.
|
|
|
|
|
|
|
|
|
|
|
| Class |
|
Operating Expense Limit |
|
Operating Expense Limit Effective Through |
| Initial Class |
|
|
|
0.37 |
% |
|
|
|
May 1, 2025 |
|
| Service Class |
|
|
|
0.62 |
|
|
|
|
May 1, 2025 |
|
TAM is permitted to recapture amounts contractually waived and/or reimbursed to a class during any of the 36 months from the date on which TAM waived fees and/or reimbursed expenses for the class. A class may recapture and reimburse TAM only if such amount does not cause, on any particular business day of the Portfolio, the class’s total annual operating expenses (after the recapture is taken into account) to exceed the Operating Expense Limits or any other lower limit then in effect. Amounts recaptured, if any, by TAM for the period ended June 30, 2024 are disclosed in Recapture of previously waived and/or reimbursed fees within the Statement of Operations.
TAM, on a voluntary basis and in addition to the contractual operating expense limits in effect, from time to time may waive and/or reimburse expenses of the Portfolio, or any classes thereof, to such level(s) as the Trust’s officers have determined or may reasonably determine from time to time. Any such voluntary waiver or expense reimbursement may be discontinued by TAM at any time. These amounts are not subject to recapture by TAM.
As of June 30, 2024, there are no amounts available for recapture by TAM.
Distribution and service fees: TST has a distribution plan (“Distribution Plan”) pursuant to Rule 12b-1 under the 1940 Act. Pursuant to the Distribution Plan, TST entered into a distribution agreement with TCI as the Portfolio’s distributor.
The Distribution Plan requires the Portfolio to pay distribution fees to TCI as compensation for various distribution activities, not as reimbursement for specific expenses. Under the Distribution Plan and distribution agreement, TCI, on behalf of the Portfolio, is authorized to pay various service providers, as direct payment for expenses incurred in connection with distribution of the Portfolio’s shares.
The fee on the Service Class shares is paid to the insurance companies for providing services and account maintenance for the policyholders who invest in the variable insurance products which invest in the Service Class shares. TCI has determined that it will not seek payment for the distribution expenses incurred by the Portfolio with respect to the Initial Class shares before May 1, 2025. Prior to TCI seeking distribution expenses on Initial Class shares, policy and contract owners will be notified in advance. The Portfolio will pay fees relating to Service Class shares. The distribution and service fees are included in Distribution and service fees within the Statement of Operations.
The Portfolio is authorized under the Distribution Plan to pay fees to TCI based on daily average net assets of each applicable class up to the following annual rates:
|
|
|
|
|
| Class |
|
Rate |
|
| Initial Class |
|
|
0.15 |
% |
| Service Class |
|
|
0.25 |
|
Transfer agent costs: TFS provides transfer agency services under an intercompany agreement with TAM. TFS has outsourced the provision of certain sub-transfer agency services to SS&C Global Investor & Distribution Solutions, Inc. (“SS&C GIDS”). The Portfolio does not pay a separate transfer agent fee to TAM or TFS but does pay certain expenses to SS&C GIDS related to applicable sub-transfer agency services. For the period ended June 30, 2024, (i) the expenses paid to SS&C GIDS by the Portfolio are referred to as transfer agent costs and are included within the Statement of Operations and (ii) the expenses payable to SS&C GIDS by the Portfolio are referred to as transfer agent costs within the Statement of Assets and Liabilities.
|
|
|
| Transamerica Series Trust |
|
Semi-Annual Financial Statements 2024 |
Page 11
Transamerica Goldman Sachs Managed Risk - Balanced ETF VP
NOTES TO FINANCIAL STATEMENTS (continued)
At June 30, 2024
(unaudited)
6. FEES AND OTHER AFFILIATED TRANSACTIONS (continued)
Brokerage commissions: The Portfolio incurred no brokerage commissions on security transactions placed with affiliates of the investment manager or sub-adviser(s) for the period ended June 30, 2024.
7. PURCHASES AND SALES OF SECURITIES
For the period ended June 30, 2024, the cost of securities purchased and proceeds from securities sold (excluding short-term securities) are as follows:
|
|
|
|
|
| Purchases of Securities |
|
|
|
Sales of Securities |
| $ 426,721,398 |
|
|
|
$ 721,812,665 |
8. FEDERAL INCOME TAXES AND DISTRIBUTIONS TO SHAREHOLDERS
The Portfolio has not made any provision for federal income or excise taxes due to its policy to distribute all of its taxable income and capital gains to its shareholders and otherwise qualify as a regulated investment company under Subchapter M of the Internal Revenue Code. The Portfolio recognizes the tax benefits of uncertain tax positions only where the position is “more likely than not” to be sustained assuming examination by tax authorities. The Portfolio’s tax returns remain subject to examination by the Internal Revenue Service and state tax authorities three years from the date of filing for federal purposes and four years from the date of filing for state purposes. Management has evaluated the Portfolio’s tax provisions taken for all open tax years, and has concluded that no provision for income tax is required in the Portfolio’s financial statements. If applicable, the Portfolio recognizes interest accrued related to unrecognized tax benefits in relation to interest and penalties expense in Other within the Statement of Operations. The Portfolio identifies its major tax jurisdictions as U.S. Federal, the state of Colorado, and foreign jurisdictions where the Portfolio makes significant investments; however, the Portfolio is not aware of any tax positions for which it is reasonably possible that the total amounts of unrecognized tax benefits will change materially in the next twelve months. Distributions are determined in accordance with income tax regulations, which may differ from GAAP.
As of June 30, 2024, the approximate cost for U.S. federal income tax purposes, and the aggregate gross/net unrealized appreciation (depreciation) in the value of investments (including securities sold short and derivatives, if any) are as follows:
|
|
|
|
|
|
|
| Cost |
|
Gross Appreciation |
|
Gross (Depreciation) |
|
Net Appreciation (Depreciation) |
| $ 3,953,663,206 |
|
$ 446,108,675 |
|
$ (198,703,545) |
|
$ 247,405,130 |
Please see TST’s most recent report on Form N-CSR, available at: www.transamerica.com/annuities/prospectus, for additional information. For the most recently filed complete proxy voting records for the Trust please visit: https://www.transamerica.com/sites/default/files/files/e070d/TST%20N-PX%202021.pdf
|
|
|
| Transamerica Series Trust |
|
Semi-Annual Financial Statements 2024 |
Page 12
Transamerica Goldman Sachs Managed Risk - Balanced ETF VP
MANAGEMENT AND SUB-ADVISORY AGREEMENT — CONTRACT RENEWAL
(unaudited)
At a meeting of the Board of Trustees of Transamerica Series Trust (the “Trustees” or the “Board”) held on June 12-13, 2024, the Board considered the renewal of the management agreement (the “Management Agreement”) between Transamerica Asset Management, Inc. (“TAM”) and Transamerica Series Trust, on behalf of Transamerica Goldman Sachs Managed Risk – Balanced ETF VP (the “Portfolio”). The Board also considered the renewal of the investment sub-advisory agreement (the “Sub-Advisory Agreement” and together with the Management Agreement, the “Agreements”) for the Portfolio between TAM and Goldman Sachs Asset Management, L.P. (the “Sub-Adviser”).
Following its review and consideration, the Board determined that the terms of the Management Agreement and Sub-Advisory Agreement were reasonable and that the renewal of each of the Agreements was in the best interests of the Portfolio and the holders invested in the Portfolio. The Board, including the independent members of the Board (the “Independent Trustees”), unanimously approved the renewal of each of the Agreements through June 30, 2025.
Prior to reaching their decision, the Trustees requested and received from TAM and the Sub-Adviser certain information. They then reviewed such information as they deemed reasonably necessary to evaluate the Agreements, including information they had previously received from TAM and the Sub-Adviser as part of their regular oversight of the Portfolio, and knowledge they gained over time through meeting with TAM and the Sub-Adviser. Among other materials, the Trustees considered comparative fee, expense and performance information prepared by Broadridge Financial Solutions, Inc. (“Broadridge”), an independent provider of mutual fund performance information, as well as fee, expense and profitability information prepared by TAM. In addition, TAM provided the Board with additional supplemental comparative fee, expense and performance information. To the extent applicable, the Trustees considered information about fees and performance of comparable funds and/or accounts managed by the Sub-Adviser. The Board also considered reductions to the Portfolio’s expense limits, if any, that took effect after the last renewal of the Agreements. In their review, the Trustees also sought to identify instances in which the Portfolio’s performance, fees, total expenses and/or profitability appeared to be outliers within its respective peer group or other comparative metrics and sought to understand the reasons for such comparative positions.
In their deliberations, the Independent Trustees met privately without representatives of TAM or the Sub-Adviser present and were represented throughout the process by their independent legal counsel. In considering the proposed continuation of each of the Agreements, the Trustees evaluated and weighed a number of considerations that they believed to be relevant in light of the legal advice furnished to them by counsel, including independent legal counsel, and made a decision in the exercise of their own business judgment. They based their decisions on the considerations discussed below, among others, although they did not identify any particular consideration or item of information that was controlling of their decisions, and each Trustee may have attributed different weights to the various factors.
Nature, Extent and Quality of the Services Provided
The Board considered the nature, extent and quality of the services provided by TAM and the Sub-Adviser to the Portfolio in the past and the services anticipated to be provided in the future. The Board also considered the investment approach for the Portfolio; the experience, capability and integrity of TAM’s senior management; the financial resources of TAM; TAM’s management oversight process; TAM’s and the Sub-Adviser’s responsiveness to any questions by the Trustees; and the professional qualifications and compensation program of the portfolio management team of the Sub-Adviser. The Trustees noted that they receive, on a quarterly basis, an execution analysis from Capital Institutional Services, Inc. (CAPIS), an independent provider of trade analyses, for the Sub-Adviser and a comparison of trading results against a peer universe of managers.
The Board also considered the continuous and regular investment management and other services provided by TAM, when acting as a manager of managers, for the portion of the management fee it retains from the Portfolio after payment of the sub-advisory fees. The Board noted that the investment management and other services provided by TAM include the design, development and ongoing review and evaluation of the Portfolio and its investment strategy; the selection, oversight and monitoring of one or more investment sub-advisers to perform certain duties with respect to the Portfolio; ongoing portfolio trading oversight and analysis; risk management oversight and analysis; design, development, implementation and ongoing review and evaluation of a process for the valuation of Portfolio investments; design, development, implementation and ongoing review and evaluation of a compliance program for the Portfolio; design, development, implementation and ongoing review and evaluation of a process for the voting of proxies and exercise of rights to consent to corporate action for Portfolio investments; participation in Board meetings and oversight of preparation of materials for the Board, including materials for Board meetings and regular communications with the Board; oversight of preparation of the Portfolio’s prospectus, statement of additional information, shareholder reports and other disclosure materials and regulatory filings for the Portfolio; and ongoing cash management services for the Portfolio. The Board considered that TAM’s investment management services also include the provision of supervisory and administrative services to the Portfolio. The Board also noted that TAM, as part of the services it provides to all Transamerica mutual funds, including the Portfolio, oversees the services provided by the funds’ custodian, transfer agent, independent accountant and legal counsel and supervises the performance of the recordkeeping and holder service functions of the funds.
Investment Performance
In addition, the Board considered the short- and longer-term performance of the Portfolio in light of its investment objective, policies and strategies, including relative performance against (i) a peer universe of comparable mutual funds, as prepared by Broadridge, and (ii) the Portfolio’s benchmarks, in each case for various trailing periods ended December 31, 2023. Based on these considerations, the Board
|
|
|
| Transamerica Series Trust |
|
Semi-Annual Financial Statements 2024 |
Page 13
Transamerica Goldman Sachs Managed Risk - Balanced ETF VP
MANAGEMENT AND SUB-ADVISORY AGREEMENT — CONTRACT RENEWAL (continued)
(unaudited)
determined that TAM and the Sub-Adviser can provide investment and related services that are appropriate in scope and extent in light of the Portfolio’s investment objectives, policies and strategies and operations, the competitive landscape of the investment company business and investor needs. The Board’s conclusions as to the Portfolio’s performance are summarized below. For purposes of its review, the Board generally used the performance of Service Class Shares. In describing the Portfolio’s performance relative to its peer universe, the summary conclusions characterize performance for the relevant periods in relation to whether it was “above,” “below” or “in line with” the peer universe median and do so using quintile rankings prepared by Broadridge. For simplicity, performance is described as “above” the median if the Portfolio’s performance ranked anywhere in the first or second quintiles, as “below” the median if it ranked anywhere in the fourth or fifth quintiles, or “in line with” the median if it ranked anywhere in the third quintile (i.e., even if its precise return was somewhat above or somewhat below the precise median return).
When considering the Portfolio’s performance, the Trustees considered any representations made by TAM regarding the appropriateness of certain peer groups and benchmarks. They recognized that performance reflects a snapshot of a period as of a specific date, and that consideration of performance data for a different period could generate significantly different performance results. The Trustees also recognized that even longer-term performance can be negatively affected by performance over a short-term period when that short-term performance is significantly below the performance of the comparable benchmark or universe of peer funds.
The Board noted that the performance of Service Class Shares of the Portfolio was in line with the median for its peer universe for the past 1- and 3-year periods and below the median for the past 5- and 10-year periods. The Board also noted that the performance of Service Class Shares of the Portfolio was above the benchmark that TAM utilizes to measure performance of the Portfolio for the past 3-year period and below the benchmark for the past 1-, 5- and 10-year periods. The Board noted that the Sub-Adviser had commenced sub-advising the Portfolio on November 1, 2022 pursuant to its current investment strategies. The Trustees also noted recent changes in the portfolio management team at the Sub-Adviser. The Trustees noted that TAM intends to monitor and report to the Board on the portfolio manager transition and performance going forward.
Management Fee and Sub-Advisory Fees and Total Expense Ratio
The Board considered the management fee and total expense ratio of the Portfolio, including information provided by Broadridge comparing the management fee and total expense ratio of the Portfolio to the management fees and total expense ratios of comparable investment companies in both a peer group and broader peer universe compiled by Broadridge. The Board’s conclusions as to the Portfolio’s management fee and total expense ratio are summarized below. For purposes of its review, the Board generally used the actual total expenses (i.e., expenses reflecting any waivers and/or reimbursements) of Service Class Shares. In describing the Portfolio’s management fee and total expense ratio relative to its peer group and peer universe, the summary conclusions characterize management fees and total expense ratios for the relevant periods in relation to whether they were “above,” “below” or “in line with” the peer group or peer universe median and do so using quintile rankings prepared by Broadridge. For simplicity, management fees and total expense ratios are described as “above” the median if the Portfolio’s management fee or total expense ratio ranked anywhere in the fourth or fifth quintiles, as “below” the median if it ranked anywhere in the first or second quintiles, or “in line with” the median if it ranked anywhere in the third quintile (i.e., even if its precise management fee or total expense ratio was somewhat above or somewhat below the precise median management fee or total expense ratio).
The Board also considered the fees charged by the Sub-Adviser for sub-advisory services, as well as the portion of the Portfolio’s management fee retained by TAM following payment of the sub-advisory fee and how the portion of the contractual management fee retained by TAM at a specified asset level compared to the portions retained by other investment advisers managing mutual funds with similar investment strategies as calculated by an independent provider of information.
The Board noted that the Portfolio’s contractual management fee was in line with the medians for its peer group and peer universe and that the actual total expenses (i.e., expenses reflecting any waivers and/or reimbursements) of Service Class Shares of the Portfolio were below the medians for its peer group and peer universe. The Trustees also considered that TAM has entered into an expense limitation arrangement with the Portfolio, which may result in TAM waiving fees for the benefit of holders.
On the basis of these considerations, together with the other information it considered, the Board determined that the management and sub-advisory fees to be received by TAM and the Sub-Adviser under the Management Agreement and Sub-Advisory Agreement are reasonable in light of the services provided.
Cost of Services Provided and Level of Profitability
The Board reviewed information provided by TAM about the cost of providing and procuring fund management services, as well as the costs of the provision of administration, transfer agency and other services, to the Portfolio and to Transamerica Series Trust as a whole by TAM and its affiliates. The Board considered the profitability of TAM and its affiliates in providing these services for the Portfolio and Transamerica Series Trust as a whole. The Trustees recognized the competitiveness of the mutual fund industry and the importance of an investment adviser’s long-term profitability, including for maintaining company and management stability and accountability.
The Board also considered the allocation methodology used for calculating the profitability of TAM and its affiliates. The Board noted that the revenue and expense allocation methodology used by TAM to estimate its profitability with respect to its relationship with the Portfolio
|
|
|
| Transamerica Series Trust |
|
Semi-Annual Financial Statements 2024 |
Page 14
Transamerica Goldman Sachs Managed Risk - Balanced ETF VP
MANAGEMENT AND SUB-ADVISORY AGREEMENT — CONTRACT RENEWAL (continued)
(unaudited)
had been reviewed previously by an independent consultant. The Trustees considered that TAM reported that it had not made material changes to this methodology, and that the methodology had been applied consistently for the Portfolio.
With respect to the Sub-Adviser, the Board noted that the sub-advisory fee is the product of arm’s-length negotiation between TAM and the Sub-Adviser, which is not affiliated with TAM, and is paid by TAM and not the Portfolio. As a result, the Board focused on the profitability of TAM and its affiliates with respect to the Portfolio.
Based on this information, the Board determined that the profitability of TAM and its affiliates from their relationships with the Portfolio was not excessive.
Economies of Scale
The Board considered economies of scale with respect to the management of the Portfolio, whether the Portfolio had appropriately benefited from any economies of scale and whether there was the potential for realization of any future economies of scale. The Board also considered the existence of economies of scale with respect to management of the Transamerica mutual funds overall and the extent to which the Portfolio benefited from any economies of scale. The Board recognized that, as the Portfolio’s assets increase, any economies of scale realized by TAM or the Sub-Adviser may not directly correlate with each other or with any economies of scale that might be realized by the Portfolio. The Board considered the Portfolio’s management fee schedule and the existence of breakpoints and also considered the extent to which TAM shared economies of scale, if any, with the Portfolio through undertakings to limit or reimburse Portfolio expenses and to invest in maintaining and developing its capabilities and services. The Board also considered the Sub-Adviser’s sub-advisory fee schedule and the existence of breakpoints, if any, and how such breakpoints relate to any breakpoints in the Portfolio’s management fee schedule. The Board considered that the Sub-Adviser’s sub-advisory fees would be based on the combined assets of multiple funds. The Trustees concluded that the Portfolio’s fee structure reflected an appropriate sharing of any efficiencies or economies of scale to date and noted that they will have the opportunity to periodically reexamine the appropriateness of the management fee payable to TAM and the fee paid to the Sub-Adviser in light of any economies of scale experienced in the future.
Benefits to TAM, its Affiliates and/or the Sub-Adviser from their Relationships with the Portfolio
The Board considered other benefits derived by TAM, its affiliates, and/or the Sub-Adviser from their relationships with the Portfolio. The Board noted that TAM does not receive benefits from research obtained with commissions paid to broker-dealers for portfolio transactions (commonly referred to as “soft dollars”) as a result of its relationship with the Portfolio.
Other Considerations
The Board noted that TAM has made a substantial commitment to the recruitment and retention of high-quality personnel and maintains the financial, compliance and operational resources reasonably necessary to manage the Portfolio in a professional manner that is consistent with the best interests of the Portfolio and the holders. In this regard, the Board favorably considered the procedures and policies TAM has in place to enforce compliance with applicable laws and regulations and oversee the portfolio management activities of the Sub-Adviser. The Board also noted that TAM has made an entrepreneurial commitment and undertaken certain business risks with respect to the management and success of the Portfolio.
Conclusion
After consideration of the factors described above, as well as other factors, the Trustees, including the Independent Trustees, concluded that the renewal of the Management Agreement and the Sub-Advisory Agreement was in the best interests of the Portfolio and the holders and voted to approve the renewal of the Agreements.
|
|
|
| Transamerica Series Trust |
|
Semi-Annual Financial Statements 2024 |
Page 15
PROXY VOTING POLICIES AND PROCEDURES AND QUARTERLY PORTFOLIO HOLDINGS
(unaudited)
A description of Transamerica Series Trust’s (the “Trust”) proxy voting policies and procedures is available in the Statement of Additional Information of the Portfolios, available without charge upon request by calling 1-800-851-9777 (toll free) or on the Securities and Exchange Commission’s (“SEC”) website at http://www.sec.gov.
In addition, the Portfolio is required to file Form N-PX, with their complete proxy voting records for the most recent 12 months ended June 30th, no later than August 31st of each year. The Form is available without charge: (1) on the Transamerica Funds website at https://www.transamerica.com/sites/default/files/files/e070d/TST%20N-PX%202021.pdf; and (2) on the SEC’s website at http://www.sec.gov.
Each fiscal quarter, the Portfolios, except Transamerica BlackRock Government Money Market VP, will file with the SEC a complete schedule of its monthly portfolio holdings on Form N-PORT. The Portfolios’ holdings as of the end of the third month of every fiscal quarter, as reported on Form N-PORT, will be publicly available on the SEC’s website at http://www.sec.gov within 60 days of the end of the fiscal quarter.
On a monthly basis, Transamerica BlackRock Government Money Market VP will file with the SEC portfolio holdings information on Form N-MFP3. A complete schedule of portfolio holdings is also available at www.transamerica.com.
You may also visit the Trust’s website at www.transamerica.com/annuities/prospectus for this and other information about the Portfolios and the Trust.
Important Notice Regarding Delivery of Shareholder Documents
Every year we provide shareholders informative materials such as the Transamerica Series Trust Annual Report, the Transamerica Series Trust Prospectus, and other required documents that keep you informed regarding your Portfolios. To the extent provided by mail, Transamerica Series Trust will only send one piece per mailing address, a method that saves your Portfolios money by reducing mailing and printing costs. We will continue to do this unless you tell us not to. To elect to receive individual mailings, simply call a Transamerica Customer Service Representative toll free at 1-800-851-9777, 8 a.m. to 7 p.m. Eastern Time, Monday-Friday. Your request will take effect within 30 days.
|
|
|
| Transamerica Series Trust |
|
Semi-Annual Financial Statements 2024 |
Page 16
NOTICE OF PRIVACY POLICY
(unaudited)
Your privacy is very important to us. We want you to understand what information we collect and how we use it. We collect and use “nonpublic personal information” in connection with providing our customers with a broad range of financial products and services as effectively and conveniently as possible. We treat nonpublic personal information in accordance with our Privacy Policy.
What Information We Collect and From Whom We Collect It
We may collect nonpublic personal information about you from the following sources:
| • |
|
Information we receive from you on applications or other forms, such as your name, address, and account number; |
| • |
|
Information about your transactions with us, our affiliates, or others, such as your account balance and purchase/redemption history; and |
| • |
|
Information we receive from non-affiliated third parties, including consumer reporting agencies. |
What Information We Disclose and To Whom We Disclose It
We do not disclose any nonpublic personal information about current or former customers to anyone without their express consent, except as permitted by law. We may disclose the nonpublic personal information we collect, as described above, to persons or companies that perform services on our behalf and to other financial institutions with which we have joint marketing agreements. We will require these companies to protect the confidentiality of your nonpublic personal information and to use it only to perform the services for which we have hired them.
Our Security Procedures
We restrict access to your nonpublic personal information and only allow disclosures to persons and companies as permitted by law to assist in providing products or services to you. We maintain physical, electronic, and procedural safeguards to protect your nonpublic personal information and to safeguard the disposal of certain consumer information.
Contact Us
If you have any questions about our Privacy Policy, please call 1-800-851-9777 on any business day between 8 a.m. and 7 p.m. Eastern Time.
Note: This Privacy Policy applies only to customers that have a direct relationship with us or our affiliates. If you own shares of our portfolios in the name of a third party such as a bank or broker-dealer, its privacy policy may apply to you instead of ours.
|
|
|
| Transamerica Series Trust |
|
Semi-Annual Financial Statements 2024 |
Page 17
PO Box 219945
Kansas City, MO 64121-9945
|
|
|
| Distributor: |
|
Transamerica Capital, Inc. |
|
|
PO Box 219945 |
|
|
Kansas City, MO 64121-9945 |
|
|
|
|
Customer Service: 1-800-851-9777 |
Transamerica Series Trust Semi-Annual Financial Statements
June 30, 2024
1801 California St., Suite 5200
Denver, CO 80202
Distributor: Transamerica Capital, Inc.
Customer Service: 1-800-851-9777
The following pages contain the most recent semi-annual financial statements for the investment options in which you are invested. In compliance with Securities and Exchange Commission regulations, we present these reports on an annual and semi-annual basis with the hope that they will foster greater understanding of the investment options’ holdings, performance, financial data, accounting policies and other issues. This streamlined version provides information only on the investment options in which you are invested.
If you have any questions about these reports, please do not hesitate to contact your financial professional. As always, we thank you for your trust and the opportunity to serve you.
Transamerica Goldman Sachs Managed Risk -
Conservative ETF VP
SCHEDULE OF INVESTMENTS
At June 30, 2024
(unaudited)
|
|
|
|
|
|
|
|
|
| |
|
Shares |
|
|
Value |
|
| EXCHANGE-TRADED FUNDS - 99.6% |
|
| International Equity Funds - 9.7% |
|
| iShares Core MSCI EAFE ETF |
|
|
129,728 |
|
|
$ |
9,423,442 |
|
| iShares Core MSCI Emerging Markets ETF |
|
|
256,584 |
|
|
|
13,734,942 |
|
| iShares MSCI EAFE ETF (A) |
|
|
114,568 |
|
|
|
8,974,111 |
|
| iShares MSCI EAFE Small-Cap ETF |
|
|
26,727 |
|
|
|
1,647,452 |
|
| Vanguard FTSE Developed Markets ETF |
|
|
171,403 |
|
|
|
8,470,736 |
|
|
|
|
|
|
|
|
|
|
|
|
|
|
|
|
|
42,250,683 |
|
|
|
|
|
|
|
|
|
|
| U.S. Equity Funds - 26.5% |
|
| iShares Core S&P 500 ETF |
|
|
63,899 |
|
|
|
34,967,450 |
|
| iShares Core S&P Mid-Cap ETF |
|
|
67,947 |
|
|
|
3,976,258 |
|
| iShares Russell 2000 ETF (A) |
|
|
26,879 |
|
|
|
5,453,480 |
|
| SPDR S&P 500 ETF Trust |
|
|
64,916 |
|
|
|
35,328,586 |
|
| Vanguard S&P 500 ETF |
|
|
72,019 |
|
|
|
36,018,863 |
|
|
|
|
|
|
|
|
|
|
|
|
|
|
|
|
|
115,744,637 |
|
|
|
|
|
|
|
|
|
|
| U.S. Fixed Income Funds - 63.4% |
|
| iShares Core U.S. Aggregate Bond ETF |
|
|
797,533 |
|
|
|
77,416,528 |
|
| Schwab U.S. Aggregate Bond ETF (A) |
|
|
1,691,700 |
|
|
|
77,107,686 |
|
| Vanguard Intermediate-Term Corporate Bond ETF (A) |
|
|
560,486 |
|
|
|
44,799,646 |
|
| Vanguard Total Bond Market ETF |
|
|
1,069,114 |
|
|
|
77,029,664 |
|
|
|
|
|
|
|
|
|
|
|
|
|
|
|
|
|
276,353,524 |
|
|
|
|
|
|
|
|
|
|
| Total Exchange-Traded Funds
(Cost $441,775,722) |
|
|
|
|
|
|
434,348,844 |
|
|
|
|
|
|
|
|
|
|
|
|
|
|
|
|
|
|
|
| |
|
Shares |
|
|
Value |
|
| OTHER INVESTMENT COMPANY - 9.0% |
|
| Securities Lending Collateral - 9.0% |
|
| State Street Navigator Securities Lending Trust - Government Money Market Portfolio, 5.28% (B) |
|
|
38,950,209 |
|
|
$ |
38,950,209 |
|
|
|
|
|
|
|
|
|
|
| Total Other Investment Company
(Cost $38,950,209) |
|
|
|
|
|
|
38,950,209 |
|
|
|
|
|
|
|
|
|
|
|
|
|
| |
|
Principal |
|
|
Value |
|
| REPURCHASE AGREEMENT - 0.4% |
|
| Fixed Income Clearing Corp., 2.50% (B), dated 06/28/2024, to be repurchased at $1,792,037 on 07/01/2024. Collateralized by a U.S. Government Obligation, 4.50%, due 03/31/2026, and with a value of $1,827,649. |
|
$ |
1,791,664 |
|
|
|
1,791,664 |
|
|
|
|
|
|
|
|
|
|
| Total Repurchase Agreement
(Cost $1,791,664) |
|
|
|
|
|
|
1,791,664 |
|
|
|
|
|
|
|
|
|
|
| Total Investments
(Cost $482,517,595) |
|
|
|
|
|
|
475,090,717 |
|
|
|
|
|
|
|
|
|
|
| Net Other Assets (Liabilities) - (9.0)% |
|
|
|
(39,193,926) |
|
|
|
|
|
|
|
|
|
|
|
|
|
| Net Assets - 100.0% |
|
|
|
|
|
$ |
435,896,791 |
|
|
|
|
|
|
|
|
|
|
INVESTMENT VALUATION:
|
|
|
|
|
|
|
|
|
|
|
|
|
|
|
|
|
| Valuation Inputs (C) |
|
|
|
|
|
|
|
|
|
|
|
|
|
|
|
|
| |
|
Level 1 - Unadjusted Quoted Prices |
|
|
Level 2 - Other Significant Observable Inputs |
|
|
Level 3 - Significant Unobservable Inputs |
|
|
Value |
|
| ASSETS |
|
|
|
|
|
|
|
|
|
|
|
|
|
|
|
|
| Investments |
|
|
|
|
|
|
|
|
|
|
|
|
|
|
|
|
| Exchange-Traded Funds |
|
$ |
434,348,844 |
|
|
$ |
— |
|
|
$ |
— |
|
|
$ |
434,348,844 |
|
| Other Investment Company |
|
|
38,950,209 |
|
|
|
— |
|
|
|
— |
|
|
|
38,950,209 |
|
| Repurchase Agreement |
|
|
— |
|
|
|
1,791,664 |
|
|
|
— |
|
|
|
1,791,664 |
|
|
|
|
|
|
|
|
|
|
|
|
|
|
|
|
|
|
| Total Investments |
|
$ |
473,299,053 |
|
|
$ |
1,791,664 |
|
|
$ |
— |
|
|
$ |
475,090,717 |
|
|
|
|
|
|
|
|
|
|
|
|
|
|
|
|
|
|
FOOTNOTES TO SCHEDULE OF INVESTMENTS:
| (A) |
All or a portion of the security is on loan. The total value of the securities on loan is $44,721,925, collateralized by cash collateral of $38,950,209 and non-cash collateral, such as U.S. government securities and irrevocable letters of credit, of $6,762,940. The amount on loan indicated may not correspond with the securities on loan identified because a security with pending sales are in the process of recall from the brokers. |
| (B) |
Rate disclosed reflects the yield at June 30, 2024. |
| (C) |
There were no transfers in or out of Level 3 during the period ended June 30, 2024. Please reference the Investment Valuation section of the Notes to Financial Statements for more information regarding investment valuation and pricing inputs. |
|
|
|
| The Notes to Financial Statements are an integral part of this report. |
|
|
| Transamerica Series Trust |
|
Semi-Annual Financial Statements 2024 |
Page 1
Transamerica Goldman Sachs Managed Risk -
Conservative ETF VP
STATEMENT OF ASSETS AND LIABILITIES
At June 30, 2024
(unaudited)
|
|
|
|
|
|
|
| Assets: |
|
|
|
|
| Unaffiliated investments, at value (cost $480,725,931) (including securities loaned of $44,721,925) |
|
$ |
473,299,053 |
|
| Repurchase agreement, at value (cost $1,791,664) |
|
|
1,791,664 |
|
| Receivables and other assets: |
|
|
|
|
| Net income from securities lending |
|
|
6,078 |
|
| Dividends from unaffiliated investments |
|
|
242,635 |
|
| Interest |
|
|
373 |
|
| Prepaid expenses |
|
|
1,767 |
|
| Total assets |
|
|
475,341,570 |
|
|
|
| Liabilities: |
|
|
|
|
| Cash collateral received upon return of: |
|
|
|
|
| Securities on loan |
|
|
38,950,209 |
|
| Payables and other liabilities: |
|
|
|
|
| Shares of beneficial interest redeemed |
|
|
242,631 |
|
| Investment management fees |
|
|
105,190 |
|
| Distribution and service fees |
|
|
83,830 |
|
| Transfer agent costs |
|
|
509 |
|
| Trustee and CCO fees |
|
|
1,437 |
|
| Audit and tax fees |
|
|
10,701 |
|
| Custody fees |
|
|
3,471 |
|
| Legal fees |
|
|
10,292 |
|
| Printing and shareholder reports fees |
|
|
21,839 |
|
| Other accrued expenses |
|
|
14,670 |
|
| Total liabilities |
|
|
39,444,779 |
|
| |
|
| Net assets |
|
$ |
435,896,791 |
|
|
|
| Net assets consist of: |
|
|
|
|
| Capital stock ($0.01 par value) |
|
$ |
374,464 |
|
| Additional paid-in capital |
|
|
418,860,361 |
|
| Total distributable earnings (accumulated losses) |
|
|
16,661,966 |
|
| |
|
| Net assets |
|
$ |
435,896,791 |
|
|
|
| Net assets by class: |
|
|
|
|
| Initial Class |
|
$ |
17,472 |
|
| Service Class |
|
|
435,879,319 |
|
|
|
| Shares outstanding: |
|
|
|
|
| Initial Class |
|
|
1,484 |
|
| Service Class |
|
|
37,444,895 |
|
|
|
| Net asset value and offering price per share: |
|
|
|
|
| Initial Class |
|
$ |
11.77 |
|
| Service Class |
|
|
11.64 |
|
STATEMENT OF OPERATIONS
For the period ended June 30, 2024
(unaudited)
|
|
|
|
|
| Investment income: |
|
|
|
|
| Dividend income from unaffiliated investments |
|
$ |
5,790,416 |
|
| Interest income from unaffiliated investments |
|
|
19,548 |
|
| Net income from securities lending |
|
|
33,077 |
|
|
|
| Total investment income |
|
|
5,843,041 |
|
|
|
| Expenses: |
|
|
|
|
| Investment management fees |
|
|
687,544 |
|
| Distribution and service fees: |
|
|
|
|
| Service Class |
|
|
548,342 |
|
| Transfer agent costs |
|
|
2,570 |
|
| Trustee and CCO fees |
|
|
10,378 |
|
| Audit and tax fees |
|
|
10,252 |
|
| Custody fees |
|
|
3,776 |
|
| Legal fees |
|
|
18,718 |
|
| Printing and shareholder reports fees |
|
|
20,291 |
|
| Other |
|
|
16,288 |
|
|
|
| Total expenses |
|
|
1,318,159 |
|
| |
|
| Net investment income (loss) |
|
|
4,524,882 |
|
|
|
| Net realized gain (loss) on: |
|
|
|
|
| Unaffiliated investments |
|
|
(627,356 |
) |
|
|
| Net change in unrealized appreciation (depreciation) on: |
|
|
|
|
| Unaffiliated investments |
|
|
10,840,018 |
|
|
|
| Net realized and change in unrealized gain (loss) |
|
|
10,212,662 |
|
|
|
| Net increase (decrease) in net assets resulting from operations |
|
$ |
14,737,544 |
|
The Notes to Financial Statements are an integral part of this report.
|
|
|
|
|
| Transamerica Series Trust |
|
|
|
Semi-Annual Financial Statements 2024 |
|
|
Page 2 |
|
|
Transamerica Goldman Sachs Managed Risk -
Conservative ETF VP
STATEMENT OF CHANGES IN NET ASSETS
For the period and year ended:
|
|
|
|
|
|
|
|
|
| |
|
June 30, 2024 (unaudited) |
|
December 31, 2023 |
|
|
|
| From operations: |
|
|
|
|
|
|
|
|
| Net investment income (loss) |
|
$ |
4,524,882 |
|
|
$ |
10,688,375 |
|
| Net realized gain (loss) |
|
|
(627,356 |
) |
|
|
11,659,382 |
|
| Net change in unrealized appreciation (depreciation) |
|
|
10,840,018 |
|
|
|
24,955,042 |
|
|
|
|
| Net increase (decrease) in net assets resulting from operations |
|
|
14,737,544 |
|
|
|
47,302,799 |
|
|
|
|
| Dividends and/or distributions to shareholders: |
|
|
|
|
|
|
|
|
| Initial Class |
|
|
— |
|
|
|
(1,383 |
) |
| Service Class |
|
|
— |
|
|
|
(30,474,870 |
) |
| |
|
|
| Net increase (decrease) in net assets resulting from dividends and/or distributions to shareholders |
|
|
— |
|
|
|
(30,476,253 |
) |
|
|
|
| Capital share transactions: |
|
|
|
|
|
|
|
|
| Proceeds from shares sold: |
|
|
|
|
|
|
|
|
| Initial Class |
|
|
770 |
|
|
|
1,311 |
|
| Service Class |
|
|
655,980 |
|
|
|
5,880,950 |
|
| |
|
|
| |
|
|
656,750 |
|
|
|
5,882,261 |
|
| Dividends and/or distributions reinvested: |
|
|
|
|
|
|
|
|
| Initial Class |
|
|
— |
|
|
|
1,383 |
|
| Service Class |
|
|
— |
|
|
|
30,474,870 |
|
| |
|
|
| |
|
|
— |
|
|
|
30,476,253 |
|
| Cost of shares redeemed: |
|
|
|
|
|
|
|
|
| Initial Class |
|
|
(5,772 |
) |
|
|
(333 |
) |
| Service Class |
|
|
(41,939,281 |
) |
|
|
(80,108,323 |
) |
| |
|
|
| |
|
|
(41,945,053 |
) |
|
|
(80,108,656 |
) |
|
|
|
| Net increase (decrease) in net assets resulting from capital share transactions |
|
|
(41,288,303 |
) |
|
|
(43,750,142 |
) |
|
|
|
| Net increase (decrease) in net assets |
|
|
(26,550,759 |
) |
|
|
(26,923,596 |
) |
|
|
|
| Net assets: |
|
|
|
|
|
|
|
|
| Beginning of period/year |
|
|
462,447,550 |
|
|
|
489,371,146 |
|
| End of period/year |
|
$ |
435,896,791 |
|
|
$ |
462,447,550 |
|
|
|
|
| Capital share transactions - shares: |
|
|
|
|
|
|
|
|
| Shares issued: |
|
|
|
|
|
|
|
|
| Initial Class |
|
|
66 |
|
|
|
118 |
|
| Service Class |
|
|
57,521 |
|
|
|
533,497 |
|
| |
|
|
| |
|
|
57,587 |
|
|
|
533,615 |
|
| Shares reinvested: |
|
|
|
|
|
|
|
|
| Initial Class |
|
|
— |
|
|
|
127 |
|
| Service Class |
|
|
— |
|
|
|
2,834,872 |
|
| |
|
|
| |
|
|
— |
|
|
|
2,834,999 |
|
| Shares redeemed: |
|
|
|
|
|
|
|
|
| Initial Class |
|
|
(511 |
) |
|
|
(30 |
) |
| Service Class |
|
|
(3,691,955 |
) |
|
|
(7,241,827 |
) |
| |
|
|
| |
|
|
(3,692,466 |
) |
|
|
(7,241,857 |
) |
| Net increase (decrease) in shares outstanding: |
|
|
|
|
|
|
|
|
| Initial Class |
|
|
(445 |
) |
|
|
215 |
|
| Service Class |
|
|
(3,634,434 |
) |
|
|
(3,873,458 |
) |
| |
|
|
| |
|
|
(3,634,879 |
) |
|
|
(3,873,243 |
) |
The Notes to Financial Statements are an integral part of this report.
|
|
|
|
|
| Transamerica Series Trust |
|
|
|
Semi-Annual Financial Statements 2024 |
|
|
Page 341 |
|
|
Transamerica Goldman Sachs Managed Risk -
Conservative ETF VP
FINANCIAL HIGHLIGHTS
|
|
|
|
|
|
|
|
|
|
|
|
|
|
|
|
|
|
|
|
|
|
|
|
|
|
|
| For a share outstanding during the period and years indicated: |
|
Initial Class |
| |
|
June 30, 2024 (unaudited) |
|
December 31, 2023 |
|
December 31, 2022 |
|
December 31, 2021 |
|
December 31, 2020 |
|
December 31, 2019 |
|
|
|
|
|
|
|
| Net asset value, beginning of period/year |
|
$ |
11.37 |
|
|
$ |
10.99 |
|
|
$ |
12.89 |
|
|
$ |
12.92 |
|
|
$ |
12.63 |
|
|
$ |
12.10 |
|
| Investment operations: |
|
|
|
|
|
|
|
|
|
|
|
|
|
|
|
|
|
|
|
|
|
|
|
|
| Net investment income (loss)(A) |
|
|
0.13 |
|
|
|
0.29 |
|
|
|
0.21 |
|
|
|
0.20 |
|
|
|
0.22 |
|
|
|
0.29 |
|
| Net realized and unrealized gain (loss) |
|
|
0.27 |
|
|
|
0.87 |
|
|
|
(1.70 |
) |
|
|
0.19 |
|
|
|
0.43 |
|
|
|
1.18 |
|
| |
|
|
|
|
|
|
| Total investment operations |
|
|
0.40 |
|
|
|
1.16 |
|
|
|
(1.49 |
) |
|
|
0.39 |
|
|
|
0.65 |
|
|
|
1.47 |
|
| Dividends and/or distributions to shareholders: |
|
|
|
|
|
|
|
|
|
|
|
|
|
|
|
|
|
|
|
|
|
|
|
|
| Net investment income |
|
|
— |
|
|
|
(0.24 |
) |
|
|
(0.23 |
) |
|
|
(0.24 |
) |
|
|
(0.32 |
) |
|
|
(0.30 |
) |
| Net realized gains |
|
|
— |
|
|
|
(0.54 |
) |
|
|
(0.18 |
) |
|
|
(0.18 |
) |
|
|
(0.04 |
) |
|
|
(0.64 |
) |
| Total dividends and/or distributions to shareholders |
|
|
— |
|
|
|
(0.78 |
) |
|
|
(0.41 |
) |
|
|
(0.42 |
) |
|
|
(0.36 |
) |
|
|
(0.94 |
) |
|
|
|
|
|
|
|
| Net asset value, end of period/year |
|
$ |
11.77 |
|
|
$ |
11.37 |
|
|
$ |
10.99 |
|
|
$ |
12.89 |
|
|
$ |
12.92 |
|
|
$ |
12.63 |
|
| |
|
|
|
|
|
|
|
|
|
|
|
|
|
|
|
|
|
|
|
|
|
|
|
|
|
|
|
|
|
|
|
| Total return |
|
|
3.52 |
%(B) |
|
|
10.91 |
% |
|
|
(11.66 |
)% |
|
|
3.00 |
% |
|
|
5.23 |
% |
|
|
12.38 |
% |
|
|
|
|
|
|
|
| Ratio and supplemental data: |
|
|
|
|
|
|
|
|
|
|
|
|
|
|
|
|
|
|
|
|
|
|
|
|
| Net assets end of period/year (000’s) |
|
$ |
17 |
|
|
$ |
22 |
|
|
$ |
19 |
|
|
$ |
20 |
|
|
$ |
18 |
|
|
$ |
17 |
|
| Expenses to average net assets(C) |
|
|
|
|
|
|
|
|
|
|
|
|
|
|
|
|
|
|
|
|
|
|
|
|
| Excluding waiver and/or reimbursement and recapture |
|
|
0.35 |
%(D) |
|
|
0.35 |
% |
|
|
0.34 |
% |
|
|
0.33 |
% |
|
|
0.33 |
% |
|
|
0.33 |
% |
| Including waiver and/or reimbursement and recapture |
|
|
0.35 |
%(D) |
|
|
0.35 |
% |
|
|
0.34 |
% |
|
|
0.33 |
% |
|
|
0.33 |
% |
|
|
0.33 |
% |
| Net investment income (loss) to average net assets |
|
|
2.23 |
%(D) |
|
|
2.56 |
% |
|
|
1.82 |
% |
|
|
1.55 |
% |
|
|
1.75 |
% |
|
|
2.33 |
% |
| Portfolio turnover rate |
|
|
7 |
%(B) |
|
|
141 |
% |
|
|
93 |
% |
|
|
1 |
% |
|
|
80 |
% |
|
|
2 |
% |
| (A) |
Calculated based on average number of shares outstanding. |
| (C) |
Does not include expenses of the underlying investments in which the Portfolio invests. |
|
|
|
|
|
|
|
|
|
|
|
|
|
|
|
|
|
|
|
|
|
|
|
|
|
|
|
| For a share outstanding during the period and years indicated: |
|
Service Class |
| |
|
June 30, 2024 (unaudited) |
|
December 31, 2023 |
|
December 31, 2022 |
|
December 31, 2021 |
|
December 31, 2020 |
|
December 31, 2019 |
|
|
|
|
|
|
|
| Net asset value, beginning of period/year |
|
$ |
11.26 |
|
|
$ |
10.89 |
|
|
$ |
12.76 |
|
|
$ |
12.80 |
|
|
$ |
12.51 |
|
|
$ |
11.98 |
|
| Investment operations: |
|
|
|
|
|
|
|
|
|
|
|
|
|
|
|
|
|
|
|
|
|
|
|
|
| Net investment income (loss)(A) |
|
|
0.12 |
|
|
|
0.25 |
|
|
|
0.18 |
|
|
|
0.16 |
|
|
|
0.19 |
|
|
|
0.26 |
|
| Net realized and unrealized gain (loss) |
|
|
0.26 |
|
|
|
0.86 |
|
|
|
(1.68 |
) |
|
|
0.18 |
|
|
|
0.42 |
|
|
|
1.18 |
|
| |
|
|
|
|
|
|
| Total investment operations |
|
|
0.38 |
|
|
|
1.11 |
|
|
|
(1.50 |
) |
|
|
0.34 |
|
|
|
0.61 |
|
|
|
1.44 |
|
| Dividends and/or distributions to shareholders: |
|
|
|
|
|
|
|
|
|
|
|
|
|
|
|
|
|
|
|
|
|
|
|
|
| Net investment income |
|
|
— |
|
|
|
(0.20 |
) |
|
|
(0.19 |
) |
|
|
(0.20 |
) |
|
|
(0.28 |
) |
|
|
(0.27 |
) |
| Net realized gains |
|
|
— |
|
|
|
(0.54 |
) |
|
|
(0.18 |
) |
|
|
(0.18 |
) |
|
|
(0.04 |
) |
|
|
(0.64 |
) |
| Total dividends and/or distributions to shareholders |
|
|
— |
|
|
|
(0.74 |
) |
|
|
(0.37 |
) |
|
|
(0.38 |
) |
|
|
(0.32 |
) |
|
|
(0.91 |
) |
|
|
|
|
|
|
|
| Net asset value, end of period/year |
|
$ |
11.64 |
|
|
$ |
11.26 |
|
|
$ |
10.89 |
|
|
$ |
12.76 |
|
|
$ |
12.80 |
|
|
$ |
12.51 |
|
| |
|
|
|
|
|
|
|
|
|
|
|
|
|
|
|
|
|
|
|
|
|
|
|
|
|
|
|
|
|
|
|
| Total return |
|
|
3.37 |
%(B) |
|
|
10.59 |
% |
|
|
(11.83 |
)% |
|
|
2.76 |
% |
|
|
4.91 |
% |
|
|
12.19 |
% |
|
|
|
|
|
|
|
| Ratio and supplemental data: |
|
|
|
|
|
|
|
|
|
|
|
|
|
|
|
|
|
|
|
|
|
|
|
|
| Net assets end of period/year (000’s) |
|
$ |
435,880 |
|
|
$ |
462,426 |
|
|
$ |
489,352 |
|
|
$ |
643,486 |
|
|
$ |
704,005 |
|
|
$ |
748,077 |
|
| Expenses to average net assets(C) |
|
|
|
|
|
|
|
|
|
|
|
|
|
|
|
|
|
|
|
|
|
|
|
|
| Excluding waiver and/or reimbursement and recapture |
|
|
0.60 |
%(D) |
|
|
0.60 |
% |
|
|
0.59 |
% |
|
|
0.58 |
% |
|
|
0.58 |
% |
|
|
0.58 |
% |
| Including waiver and/or reimbursement and recapture |
|
|
0.60 |
%(D) |
|
|
0.60 |
% |
|
|
0.59 |
%(E) |
|
|
0.58 |
%(E) |
|
|
0.58 |
%(E) |
|
|
0.58 |
%(E) |
| Net investment income (loss) to average net assets |
|
|
2.06 |
%(D) |
|
|
2.26 |
% |
|
|
1.53 |
% |
|
|
1.28 |
% |
|
|
1.49 |
% |
|
|
2.06 |
% |
| Portfolio turnover rate |
|
|
7 |
%(B) |
|
|
141 |
% |
|
|
93 |
% |
|
|
1 |
% |
|
|
80 |
% |
|
|
2 |
% |
| (A) |
Calculated based on average number of shares outstanding. |
| (C) |
Does not include expenses of the underlying investments in which the Portfolio invests. |
| (E) |
Waiver and/or reimbursement rounds to less than 0.01%. |
The Notes to Financial Statements are an integral part of this report.
|
|
|
|
|
| Transamerica Series Trust |
|
|
|
Semi-Annual Financial Statements 2024 |
|
|
Page 4 |
|
|
Transamerica Goldman Sachs Managed Risk -
Conservative ETF VP
NOTES TO FINANCIAL STATEMENTS
At June 30, 2024
(unaudited)
1. ORGANIZATION
Transamerica Series Trust (“TST”) is an open-end management investment company registered under the Investment Company Act of 1940, as amended (the “1940 Act”). TST applies investment company accounting and reporting guidance. TST serves as a funding vehicle for variable life insurance, variable annuity, and group annuity products. Transamerica Goldman Sachs Managed Risk - Conservative ETF VP (the “Portfolio”) is a series of TST and is classified as diversified under the 1940 Act. The Portfolio currently offers two classes of shares, Initial Class and Service Class.
The only shareholders of the Portfolio are affiliated insurance company separate accounts and/or affiliated asset allocation portfolios. Contract holders of the variable life and annuity contracts are not shareholders of the Portfolio. For ease of reference, shareholders and contract holders are collectively referred to in this report as “shareholders.”
This report must be accompanied or preceded by the Portfolio’s current prospectus, which contains additional information about the Portfolio, including risks, as well as investment objectives and strategies.
Transamerica Asset Management, Inc. (“TAM”) serves as investment manager for the Portfolio pursuant to an investment management agreement. TAM provides continuous and regular investment management services to the Portfolio. TAM supervises the Portfolio’s investments, conducts its investment program and provides supervisory, compliance and administrative services to the Portfolio.
TAM currently acts as a “manager of managers” and has hired sub-advisers to furnish day-to-day investment advice and recommendations. TAM may, in the future, determine to provide all aspects of the day-to-day management of the Portfolio without the use of a sub-adviser. When acting as a manager of managers, TAM provides investment management services that include, without limitation, the design and development of the Portfolio and its investment strategies and the ongoing review and evaluation of those investment strategies including recommending changes in strategy where it believes appropriate or advisable; the selection of one or more sub-advisers for the Portfolio employing a combination of quantitative and qualitative screens, research, analysis and due diligence; negotiation of sub-advisory agreements and fees; oversight and monitoring of sub-advisers and recommending changes to sub-advisers where it believes appropriate or advisable; recommending portfolio combinations and liquidations where it believes appropriate or advisable; selection and oversight of transition managers, as needed; regular supervision of the Portfolio’s investments; regular review and evaluation of sub-adviser performance; daily monitoring of the sub-advisers’ buying and selling of securities for the Portfolio; regular review of holdings; ongoing trade oversight and analysis; regular monitoring to ensure adherence to investment process; regular calls and periodic on-site visits with sub-advisers; portfolio construction and asset allocation when using multiple sub-advisers for the Portfolio; risk management oversight and analysis; oversight of negotiation of investment documentation and agreements; design, development, implementation and regular monitoring of the valuation process; periodic due diligence reviews of pricing vendors and vendor methodology; design, development, implementation and regular monitoring of the compliance process; respond to regulatory inquiries and determine appropriate litigation strategy, as needed; review of proxies voted by sub-advisers; oversight of preparation and review of materials for meetings of the Portfolio’s Board of Trustees (the “Board”), participation in these meetings and preparation of regular communications with the Board; oversight of preparation and review of prospectuses, shareholder reports and other disclosure materials and regulatory filings for the Portfolio; oversight of other service providers to the Portfolio, such as the custodian, the transfer agent, the Portfolio’s independent accounting firm and legal counsel; supervision of the performance of recordkeeping and shareholder relations functions for the Portfolio; and oversight of cash management services. TAM uses a variety of quantitative and qualitative tools to carry out its investment management services. TAM, not the Portfolio, is responsible for paying the sub-adviser(s) for their services, and sub-advisory fees are TAM’s expense.
TAM’s investment management services also include the provision of supervisory and administrative services to the Portfolio. These services include performing certain administrative services for the Portfolio and supervising and overseeing the administrative, clerical, recordkeeping and bookkeeping services provided to the Portfolio by State Street Bank and Trust Company (“State Street”), to whom TAM has outsourced the provision of certain sub-administration services. To the extent agreed upon by TAM and the Portfolio from time to time, TAM’s supervisory and administrative services include, but are not limited to: monitoring and verifying the custodian’s daily calculation of the Net Asset Values (“NAV”); shareholder relations functions; compliance services; valuation services; assisting in due diligence and in the oversight and monitoring of certain activities of sub-advisers and certain aspects of Portfolio investments; assisting with Portfolio combinations and liquidations; oversight of the preparation and filing, and review, of all returns and reports, in connection with federal, state and local taxes; oversight and review of regulatory reporting; supervising and coordinating the Portfolio’s custodian and dividend disbursing agent and monitoring their services to the Portfolio; assisting the Portfolio in preparing reports to shareholders; acting as liaison with the Portfolio’s independent public accountants and providing, upon request, analyses, fiscal year summaries and other audit related services; assisting in the preparation of agendas and supporting documents for and minutes of meetings of trustees and committees of trustees; assisting in the preparation of regular communications with the trustees; and providing personnel and office space, telephones
|
|
|
|
|
| Transamerica Series Trust |
|
|
|
Semi-Annual Financial Statements 2024 |
|
|
Page 5 |
|
|
Transamerica Goldman Sachs Managed Risk -
Conservative ETF VP
NOTES TO FINANCIAL STATEMENTS (continued)
At June 30, 2024
(unaudited)
1. ORGANIZATION (continued)
and other office equipment as necessary in order for TAM to perform supervisory and administrative services to the Portfolio. The Portfolio pays certain fees and expenses to State Street for sub-administration services which are not administrative services covered by the management agreement with TAM or paid for through the management fees payable thereunder. For the period ended June 30, 2024, (i) the expenses paid to State Street for sub-administration services by the Portfolio are shown as a part of Other expenses within the Statement of Operations and (ii) the expenses payable to State Street for sub-administration services from the Portfolio are shown as part of Other accrued expenses within the Statement of Assets and Liabilities.
2. SIGNIFICANT ACCOUNTING POLICIES
In preparing the Portfolio’s financial statements in accordance with Generally Accepted Accounting Principles in the United States of America (“GAAP”), estimates or assumptions (which could differ from actual results) may be used that affect reported amounts and disclosures. The following is a summary of significant accounting policies followed by the Portfolio.
Security transactions and investment income: Security transactions are accounted for on the trade date. Security gains and losses are calculated on a first-in, first-out basis. Interest income, if any, is accrued as earned. Dividend income and capital gain distributions from underlying investments, if any, are recorded on the ex-dividend date. Income or short-term capital gain distributions received from underlying investments, if any, are recorded as Dividend income from investments within the Statement of Operations. Long-term capital gain distributions received from underlying investments, if any, are recorded as Net realized gain (loss) on Capital gain distributions received from investments within the Statement of Operations.
Multiple class operations, income, and expenses: Income, non-class specific expenses, and realized and unrealized gains and losses are allocated to each class daily based upon net assets. Each class bears its own specific expenses in addition to the allocated non-class specific expenses.
Distributions to shareholders: Distributions are recorded on the ex-dividend date and are determined in accordance with federal income tax regulations, which may differ from GAAP.
Indemnification: In the normal course of business, the Portfolio enters into contracts that contain a variety of representations that provide general indemnifications. The Portfolio’s maximum exposure under these arrangements is unknown, as this would involve future claims that may be made against the Portfolio and/or its affiliates that have not yet occurred. However, based on experience, the Portfolio expects the risk of loss to be remote.
3. INVESTMENT VALUATION
TAM has been designated as the Portfolio’s valuation designee pursuant to Rule 2a-5 under the 1940 Act with responsibility for fair valuation subject to oversight by the Portfolio’s Board of Trustees. The net asset value of the Portfolio is computed as of the official close of the New York Stock Exchange (“NYSE”) each day the NYSE is open for business.
TAM utilizes various methods to measure the fair value of its investments on a recurring basis. GAAP establishes a hierarchy that prioritizes inputs to valuation methods. The inputs or methodology used for valuing securities are not necessarily an indication of the risk associated with investing in those securities. The three levels (“Levels”) of inputs of the fair value hierarchy are defined as follows:
Level 1—Unadjusted quoted prices in active markets for identical securities.
Level 2—Inputs, other than quoted prices included in Level 1, which are observable, either directly or indirectly. These inputs may include quoted prices for the identical instrument on an inactive market, prices for similar instruments, interest rates, prepayment speeds, credit risk, yield curves, default rates, and similar data.
Level 3—Unobservable inputs based on the best information available in the circumstances, to the extent observable inputs are not available, which may include TAM’s own assumptions used in determining the fair value of the Portfolio’s investments.
The inputs used to measure fair value may fall into different Levels of the fair value hierarchy. In such cases, for disclosure purposes, the Level in the fair value hierarchy that is assigned to the fair value measurement of a security is determined based on the lowest Level input that is significant to the fair value measurement in its entirety. Certain investments that are measured at fair value using NAV per share, or
|
|
|
|
|
| Transamerica Series Trust |
|
|
|
Semi-Annual Financial Statements 2024 |
|
|
Page 6 |
|
|
Transamerica Goldman Sachs Managed Risk -
Conservative ETF VP
NOTES TO FINANCIAL STATEMENTS (continued)
At June 30, 2024
(unaudited)
3. INVESTMENT VALUATION (continued)
its equivalent, using the “practical expedient” have not been classified in the fair value Levels. The hierarchy classification of inputs used to value the Portfolio’s investments at June 30, 2024, is disclosed within the Investment Valuation section of the Schedule of Investments.
The availability of observable inputs can vary from security to security and is affected by a wide variety of factors, including, but not limited to, the type of security, whether the security is new and not yet established in the marketplace, the liquidity of markets, and other characteristics particular to the security. To the extent that valuation is based on models or inputs that are less observable or unobservable in the market, the determination of fair value requires more judgment. Accordingly, the degree of judgment exercised in determining fair value is generally greatest for instruments categorized in Level 3. Due to the inherent uncertainty of valuation, the determination of values may differ significantly from values that would have been realized had a ready market for investments existed, and the differences could be material.
Fair value measurements: Descriptions of the valuation techniques applied to the Portfolio’s significant categories of assets and liabilities measured at fair value on a recurring basis are as follows:
Exchange-traded funds (“ETF”): ETFs are stated at the last reported sale price or closing price on the day of valuation taken from the primary exchange where the ETF is principally traded. ETFs are generally categorized in Level 1 of the fair value hierarchy.
Securities lending collateral: Securities lending collateral is invested in a money market fund which is valued at the actively traded NAV and no valuation adjustments are applied. Securities lending collateral is categorized in Level 1 of the fair value hierarchy.
Repurchase agreements: Repurchase agreements are valued at cost, which approximates fair value. To the extent the inputs are observable and timely, the values are generally categorized in Level 2 of the fair value hierarchy.
4. BORROWINGS AND OTHER FINANCING TRANSACTIONS
The Portfolio may engage in borrowing transactions as a means of raising cash to satisfy redemption requests, for other temporary or emergency purposes or, to the extent permitted by its investment policies, to raise additional cash to be invested in other securities or instruments. When the Portfolio invests borrowing proceeds in other securities, the Portfolio will bear the risk that the market value of the securities in which such proceeds are invested goes down and is insufficient to repay the borrowed proceeds. The Portfolio may borrow on a secured or on an unsecured basis. If the Portfolio enters into a secured borrowing arrangement, a portion of the Portfolio’s assets will be used as collateral. The 1940 Act requires the Portfolio to maintain asset coverage of at least 300% of the amount of its borrowings. Asset coverage means the ratio that the value of the Portfolio’s total assets, minus liabilities other than borrowings, bears to the aggregate amount of all borrowings. Although complying with this requirement has the effect of limiting the amount that the Portfolio may borrow, it does not otherwise mitigate the risks of entering into borrowing transactions.
Interfund lending: The Portfolio, along with other funds and portfolios advised by TAM, may participate in an interfund lending program pursuant to exemptive relief granted by the Securities and Exchange Commission on January 18, 2017. This program allows the Portfolio to lend to and borrow from other funds and portfolios advised by TAM. Interfund lending transactions are subject to the conditions of the exemptive relief which places limits on the amount of lending or borrowing a Portfolio may participate in under the program. Interest earned or paid on an interfund lending transaction will be based on the average of certain current market rates. For the period ended June 30, 2024, the Portfolio has not utilized the program.
Repurchase agreements: In a repurchase agreement, the Portfolio purchases a security and simultaneously commits to resell that security to the seller at an agreed-upon price on an agreed-upon date. Securities purchased subject to a repurchase agreement are held at the Portfolio’s custodian, or designated sub-custodian related to tri-party repurchase agreements, and, pursuant to the terms of the repurchase agreement, must be collateralized by securities with an aggregate market value greater than or equal to 100% of the resale price. The Portfolio will bear the risk of value fluctuations until the securities can be sold and may encounter delays and incur costs in liquidating the securities. In the event of bankruptcy or insolvency of the seller, delays and costs may be incurred.
Repurchase agreements are subject to netting agreements, which are agreements between the Portfolio and its counterparties that provide for the net settlement of all transactions and collateral with the Portfolio, through a single payment, in the event of default or termination. Amounts presented within the Schedule of Investments, and as part of Repurchase agreements, at value within the Statement of Assets and Liabilities are shown on a gross basis. The value of the related collateral for each repurchase agreement, as reflected within the Schedule of Investments, exceeds the value of each repurchase agreement at June 30, 2024.
|
|
|
|
|
| Transamerica Series Trust |
|
|
|
Semi-Annual Financial Statements 2024 |
|
|
Page 7 |
|
|
Transamerica Goldman Sachs Managed Risk -
Conservative ETF VP
NOTES TO FINANCIAL STATEMENTS (continued)
At June 30, 2024
(unaudited)
4. BORROWINGS AND OTHER FINANCING TRANSACTIONS (continued)
Repurchase agreements at June 30, 2024, if any, are included within the Schedule of Investments and Statement of Assets and Liabilities.
Securities lending: The Portfolio may lend securities to qualified financial institutions, brokers and dealers. State Street serves as securities lending agent to the Portfolio pursuant to a Securities Lending Agreement. Loans of securities are terminable at any time and the borrower, after notice, is required to return borrowed securities within the standard time period for settlement of securities transactions. The lending of securities exposes the Portfolio to risks such as: the borrowers may fail to return the loaned securities or may not be able to provide additional collateral, the Portfolio may experience delays in recovery of the loaned securities or delays in access to collateral, or the Portfolio may experience losses related to the investment collateral. To minimize certain risks, loan counterparties pledge cash, securities issued or guaranteed by the U.S. Government and irrevocable letters of credit issued by banks as collateral. The initial collateral received by the Portfolio is required to have a value of at least 102% of the current value of the loaned securities traded on U.S. exchanges, and a value of at least 105% for all other securities. Typically the lending agent is not permitted to sell, re-pledge or use cash and non-cash collateral it receives. The lending agent has agreed to indemnify the Portfolio in the case of default of any securities borrower.
The Portfolio receives compensation for lending securities from interest or dividends earned on the cash, U.S. Government securities and irrevocable letters of credit held as collateral, less associated fees and expenses. Such income is reflected in Net income from securities lending within the Statement of Operations. Cash collateral received is invested in the State Street Navigator Securities Lending Trust — Government Money Market Portfolio.
The value of loaned securities and related cash and non-cash collateral outstanding at June 30, 2024, if any, are shown on a gross basis within the Schedule of Investments.
The following table reflects a breakdown of transactions accounted for as secured borrowings, the gross obligation by the type, and the remaining contractual maturity of those transactions as of June 30, 2024.
|
|
|
|
|
|
|
|
|
|
|
|
|
|
|
|
|
|
|
|
|
| |
|
Remaining Contractual Maturity of the Agreements |
|
| |
|
Overnight and Continuous |
|
|
Less Than 30 Days |
|
|
Between 30 & 90 Days |
|
|
Greater Than 90 Days |
|
|
Total |
|
|
|
|
|
|
|
| Securities Lending Transactions
Exchange-Traded Funds |
|
$ |
38,950,209 |
|
|
$ |
— |
|
|
$ |
— |
|
|
$ |
— |
|
|
$ |
38,950,209 |
|
| |
|
| Total Borrowings |
|
$ |
38,950,209 |
|
|
$ |
— |
|
|
$ |
— |
|
|
$ |
— |
|
|
$ |
38,950,209 |
|
| |
|
5. RISK FACTORS
Investing in the Portfolio involves certain key risks related to the Portfolio’s trading activity. Please reference the Portfolio’s prospectus for a more complete discussion of the following risk(s), as well as other risks of investing in the Portfolio.
Market risk: The market prices of the Portfolio’s securities or other assets may go up or down, sometimes rapidly or unpredictably, due to factors such as economic events, inflation, changes in interest rates, governmental actions or interventions, actions taken by the U.S. Federal Reserve or foreign central banks, market disruptions caused by tariffs, trade disputes or other factors, political developments, armed conflicts, economic sanctions, cybersecurity events, investor sentiment, the global and domestic effects of widespread or local health, weather or climate events, and other factors that may or may not be related to the issuer of the security or other asset. If the market prices of the Portfolio’s securities and assets fall, the value of your investment in the Portfolio could go down.
Economies and financial markets throughout the world are increasingly interconnected. Events or circumstances in one or more countries or regions could be highly disruptive to, and have profound impacts on, global economies or markets. As a result, whether or not the Portfolio invests in securities of issuers located in or with significant exposure to the countries directly affected, the value and liquidity of the Portfolio’s investments may go down.
Managed risk strategy risk: The Portfolio employs a managed risk strategy. The strategy attempts to stabilize the volatility of the Portfolio around a target volatility level and manage downside exposure during periods of significant market declines but may not work as intended. Because market conditions change, sometimes rapidly and unpredictably, the success of the strategy also will be subject to the sub-adviser’s ability to implement the strategy in a timely and efficient manner. The strategy may result in periods of underperformance and
|
|
|
|
|
| Transamerica Series Trust |
|
|
|
Semi-Annual Financial Statements 2024 |
|
|
Page 8 |
|
|
Transamerica Goldman Sachs Managed Risk -
Conservative ETF VP
NOTES TO FINANCIAL STATEMENTS (continued)
At June 30, 2024
(unaudited)
5. RISK FACTORS (continued)
may fail to protect against market declines. The strategy may limit the Portfolio’s ability to participate in up markets, may cause the Portfolio to underperform its benchmark in up markets, may increase transaction costs at the Portfolio and/or underlying portfolio level and may result in substantial losses if it does not work as intended. For example, if the Portfolio has reduced its equity exposure to avoid losses in certain market conditions, and the market rises sharply and quickly, there may be a delay in increasing the Portfolio’s equity exposure, causing the Portfolio to forgo gains from the market rebound. Managing the Portfolio pursuant to the strategy may result in the Portfolio not achieving its stated asset mix goal due to unforeseen or unanticipated market conditions. The strategy also serves to reduce the risk to the Transamerica insurance companies that provide guaranteed benefits under certain variable contracts from equity market volatility and to facilitate their provision of those guaranteed benefits. The strategy also may have the effect of limiting the amount of guaranteed benefits. The Portfolio’s performance may be lower than similar portfolios that are not subject to a managed risk strategy.
Model and data risk: If quantitative models, algorithms or calculations (whether proprietary and developed by the sub-adviser or supplied by third parties) (“Models”) or information or data supplied by third parties (“Data”) prove to be incorrect or incomplete, any decisions made, in whole or part, in reliance thereon expose the Portfolio to additional risks. Models can be predictive in nature. The use of predictive Models has inherent risks. The success of relying on or otherwise using Models depends on a number of factors, including the validity, accuracy and completeness of the Model’s development, implementation and maintenance, the Model’s assumptions, factors, algorithms and methodologies, and the accuracy and reliability of the supplied historical or other Data. Models rely on, among other things, correct and complete Data inputs. If incorrect Data is entered into even a well-founded Model, the resulting information will be incorrect. However, even if Data is input correctly, Model prices may differ substantially from market prices, especially for securities with complex characteristics. Investments selected with the use of Models may perform differently than expected as a result of the design of the Model, inputs into the Model or other factors. There also can be no assurance that the use of Models will result in effective investment decisions for the Portfolio.
6. FEES AND OTHER AFFILIATED TRANSACTIONS
TST serves as a funding vehicle for certain affiliated asset allocation portfolios and certain affiliated separate accounts of Transamerica Life Insurance Company (“TLIC”) and Transamerica Financial Life Insurance Company.
TAM, the Portfolio’s investment manager, is directly owned by TLIC and AUSA Holding, LLC (“AUSA”), both of which are indirect, wholly owned subsidiaries of Aegon Ltd. TLIC is owned by Commonwealth General Corporation (“Commonwealth”). Commonwealth and AUSA are wholly owned by Transamerica Corporation (DE). Transamerica Corporation (DE) is wholly owned by Aegon International B.V., which is wholly owned by Aegon Ltd., a Bermuda exempted company with liability limited by shares (formerly, Aegon NV, a Netherlands corporation) and a publicly traded international insurance group.
Transamerica Fund Services, Inc. (“TFS”) is the Portfolio’s transfer agent. Transamerica Capital, Inc. (“TCI”) is the Portfolio’s distributor/principal underwriter. TAM, TFS and TCI are affiliates of Aegon Ltd.
Certain officers and trustees of the Portfolio may also be officers and/or trustees of TAM, TFS and TCI. No interested trustee who is deemed an interested person due to current or former service with TAM or an affiliate of TAM receives compensation from the Portfolio. The Portfolio does pay non-interested persons (independent trustees), as disclosed in Trustee and CCO fees within the Statement of Operations.
Investment management fees: TAM serves as the Portfolio’s investment manager, performing administration as well as investment advisory services. TAM renders investment advisory, supervisory, and administration services under an investment management agreement and the Portfolio pays a single management fee, which is reflected in Investment management fees within the Statement of Operations.
|
|
|
|
|
| Transamerica Series Trust |
|
|
|
Semi-Annual Financial Statements 2024 |
|
|
Page 9 |
|
|
Transamerica Goldman Sachs Managed Risk -
Conservative ETF VP
NOTES TO FINANCIAL STATEMENTS (continued)
At June 30, 2024
(unaudited)
6. FEES AND OTHER AFFILIATED TRANSACTIONS (continued)
The Portfolio pays a management fee to TAM based on daily average net assets at the following rates:
|
|
|
|
|
| Breakpoints |
|
Rate |
|
|
| First $50 million |
|
|
0.3400% |
|
| Over $50 million up to $250 million |
|
|
0.3200 |
|
| Over $250 million up to $5 billion |
|
|
0.3000 |
|
| Over $5 billion up to $7 billion |
|
|
0.2900 |
|
| Over $7 billion up to $9 billion |
|
|
0.2875 |
|
| Over $9 billion |
|
|
0.2800 |
|
TAM has contractually agreed to waive fees and/or reimburse Portfolio expenses to the extent that the total operating expenses excluding, as applicable, acquired fund fees and expenses, interest (including borrowing costs and overdraft charges), taxes, brokerage commissions, dividend and interest expenses on securities sold short, extraordinary expenses and other expenses not incurred in the ordinary course of the Portfolio’s business, exceed the following stated annual operating expense limits to the Portfolio’s daily average net assets. To the extent an expense limit changed during the period, the prior limit is also listed below. The expenses waived and/or reimbursed, if any, are included in Expenses waived and/or reimbursed within the Statement of Operations.
|
|
|
|
|
|
|
|
|
|
|
| Class |
|
Operating Expense Limit |
|
Operating Expense Limit Effective Through |
| Initial Class |
|
|
|
0.37 |
% |
|
|
|
May 1, 2025 |
|
| Service Class |
|
|
|
0.62 |
|
|
|
|
May 1, 2025 |
|
TAM is permitted to recapture amounts contractually waived and/or reimbursed to a class during any of the 36 months from the date on which TAM waived fees and/or reimbursed expenses for the class. A class may recapture and reimburse TAM only if such amount does not cause, on any particular business day of the Portfolio, the class’s total annual operating expenses (after the recapture is taken into account) to exceed the Operating Expense Limits or any other lower limit then in effect. Amounts recaptured, if any, by TAM for the period ended June 30, 2024 are disclosed in Recapture of previously waived and/or reimbursed fees within the Statement of Operations.
TAM, on a voluntary basis and in addition to the contractual operating expense limits in effect, from time to time may waive and/or reimburse expenses of the Portfolio, or any classes thereof, to such level(s) as the Trust’s officers have determined or may reasonably determine from time to time. Any such voluntary waiver or expense reimbursement may be discontinued by TAM at any time. These amounts are not subject to recapture by TAM.
As of June 30, 2024, there are no amounts available for recapture by TAM.
Distribution and service fees: TST has a distribution plan (“Distribution Plan”) pursuant to Rule 12b-1 under the 1940 Act. Pursuant to the Distribution Plan, TST entered into a distribution agreement with TCI as the Portfolio’s distributor.
The Distribution Plan requires the Portfolio to pay distribution fees to TCI as compensation for various distribution activities, not as reimbursement for specific expenses. Under the Distribution Plan and distribution agreement, TCI, on behalf of the Portfolio, is authorized to pay various service providers, as direct payment for expenses incurred in connection with distribution of the Portfolio’s shares.
The fee on the Service Class shares is paid to the insurance companies for providing services and account maintenance for the policyholders who invest in the variable insurance products which invest in the Service Class shares. TCI has determined that it will not seek payment for the distribution expenses incurred by the Portfolio with respect to the Initial Class shares before May 1, 2025. Prior to TCI seeking distribution expenses on Initial Class shares, policy and contract owners will be notified in advance. The Portfolio will pay fees relating to Service Class shares. The distribution and service fees are included in Distribution and service fees within the Statement of Operations.
|
|
|
|
|
| Transamerica Series Trust |
|
|
|
Semi-Annual Financial Statements 2024 |
|
|
Page 10 |
|
|
Transamerica Goldman Sachs Managed Risk -
Conservative ETF VP
NOTES TO FINANCIAL STATEMENTS (continued)
At June 30, 2024
(unaudited)
6. FEES AND OTHER AFFILIATED TRANSACTIONS (continued)
The Portfolio is authorized under the Distribution Plan to pay fees to TCI based on daily average net assets of each applicable class up to the following annual rates:
|
|
|
|
|
| Class |
|
Rate |
| Initial Class |
|
|
0.15% |
|
| Service Class |
|
|
0.25 |
|
Transfer agent costs: TFS provides transfer agency services under an intercompany agreement with TAM. TFS has outsourced the provision of certain sub-transfer agency services to SS&C Global Investor & Distribution Solutions, Inc. (“SS&C GIDS”). The Portfolio does not pay a separate transfer agent fee to TAM or TFS but does pay certain expenses to SS&C GIDS related to applicable sub-transfer agency services. For the period ended June 30, 2024, (i) the expenses paid to SS&C GIDS by the Portfolio are referred to as transfer agent costs and are included within the Statement of Operations and (ii) the expenses payable to SS&C GIDS by the Portfolio are referred to as transfer agent costs within the Statement of Assets and Liabilities.
Brokerage commissions: The Portfolio incurred no brokerage commissions on security transactions placed with affiliates of the investment manager or sub-adviser(s) for the period ended June 30, 2024.
7. PURCHASES AND SALES OF SECURITIES
For the period ended June 30, 2024, the cost of securities purchased and proceeds from securities sold (excluding short-term securities) are as follows:
|
|
|
| Purchases of Securities |
|
Sales of Securities |
| $ 31,688,414 |
|
$ 67,160,901 |
8. FEDERAL INCOME TAXES AND DISTRIBUTIONS TO SHAREHOLDERS
The Portfolio has not made any provision for federal income or excise taxes due to its policy to distribute all of its taxable income and capital gains to its shareholders and otherwise qualify as a regulated investment company under Subchapter M of the Internal Revenue Code. The Portfolio recognizes the tax benefits of uncertain tax positions only where the position is “more likely than not” to be sustained assuming examination by tax authorities. The Portfolio’s tax returns remain subject to examination by the Internal Revenue Service and state tax authorities three years from the date of filing for federal purposes and four years from the date of filing for state purposes. Management has evaluated the Portfolio’s tax provisions taken for all open tax years, and has concluded that no provision for income tax is required in the Portfolio’s financial statements. If applicable, the Portfolio recognizes interest accrued related to unrecognized tax benefits in relation to interest and penalties expense in Other within the Statement of Operations. The Portfolio identifies its major tax jurisdictions as U.S. Federal, the state of Colorado, and foreign jurisdictions where the Portfolio makes significant investments; however, the Portfolio is not aware of any tax positions for which it is reasonably possible that the total amounts of unrecognized tax benefits will change materially in the next twelve months. Distributions are determined in accordance with income tax regulations, which may differ from GAAP.
As of June 30, 2024, the approximate cost for U.S. federal income tax purposes, and the aggregate gross/net unrealized appreciation (depreciation) in the value of investments (including securities sold short and derivatives, if any) are as follows:
|
|
|
|
|
|
|
| Cost |
|
Gross Appreciation |
|
Gross (Depreciation) |
|
Net Appreciation (Depreciation) |
|
|
|
|
| $ 482,517,595 |
|
$ 24,400,171 |
|
$ (31,827,049) |
|
$ (7,426,878) |
Please see TST’s most recent report on Form N-CSR, available at: www.transamerica.com/annuities/prospectus, for additional information. For the most recently filed complete proxy voting records for the Trust please visit: https://www.transamerica.com/sites/default/files/files/e070d/TST%20N-PX%202021.pdf
|
|
|
|
|
| Transamerica Series Trust |
|
|
|
Semi-Annual Financial Statements 2024 |
|
|
Page 11 |
|
|
Transamerica Goldman Sachs Managed Risk -
Conservative ETF VP
MANAGEMENT AND SUB-ADVISORY AGREEMENT — CONTRACT RENEWAL
(unaudited)
At a meeting of the Board of Trustees of Transamerica Series Trust (the “Trustees” or the “Board”) held on June 12-13, 2024, the Board considered the renewal of the management agreement (the “Management Agreement”) between Transamerica Asset Management, Inc. (“TAM”) and Transamerica Series Trust, on behalf of Transamerica Goldman Sachs Managed Risk – Conservative ETF VP (the “Portfolio”). The Board also considered the renewal of the investment sub-advisory agreement (the “Sub-Advisory Agreement” and together with the Management Agreement, the “Agreements”) for the Portfolio between TAM and Goldman Sachs Asset Management, L.P. (the “Sub-Adviser”).
Following its review and consideration, the Board determined that the terms of the Management Agreement and Sub-Advisory Agreement were reasonable and that the renewal of each of the Agreements was in the best interests of the Portfolio and the holders invested in the Portfolio. The Board, including the independent members of the Board (the “Independent Trustees”), unanimously approved the renewal of each of the Agreements through June 30, 2025.
Prior to reaching their decision, the Trustees requested and received from TAM and the Sub-Adviser certain information. They then reviewed such information as they deemed reasonably necessary to evaluate the Agreements, including information they had previously received from TAM and the Sub-Adviser as part of their regular oversight of the Portfolio, and knowledge they gained over time through meeting with TAM and the Sub-Adviser. Among other materials, the Trustees considered comparative fee, expense and performance information prepared by Broadridge Financial Solutions, Inc. (“Broadridge”), an independent provider of mutual fund performance information, as well as fee, expense and profitability information prepared by TAM. In addition, TAM provided the Board with additional supplemental comparative fee, expense and performance information. To the extent applicable, the Trustees considered information about fees and performance of comparable funds and/or accounts managed by the Sub-Adviser. The Board also considered reductions to the Portfolio’s expense limits, if any, that took effect after the last renewal of the Agreements. In their review, the Trustees also sought to identify instances in which the Portfolio’s performance, fees, total expenses and/or profitability appeared to be outliers within its respective peer group or other comparative metrics and sought to understand the reasons for such comparative positions.
In their deliberations, the Independent Trustees met privately without representatives of TAM or the Sub-Adviser present and were represented throughout the process by their independent legal counsel. In considering the proposed continuation of each of the Agreements, the Trustees evaluated and weighed a number of considerations that they believed to be relevant in light of the legal advice furnished to them by counsel, including independent legal counsel, and made a decision in the exercise of their own business judgment. They based their decisions on the considerations discussed below, among others, although they did not identify any particular consideration or item of information that was controlling of their decisions, and each Trustee may have attributed different weights to the various factors.
Nature, Extent and Quality of the Services Provided
The Board considered the nature, extent and quality of the services provided by TAM and the Sub-Adviser to the Portfolio in the past and the services anticipated to be provided in the future. The Board also considered the investment approach for the Portfolio; the experience, capability and integrity of TAM’s senior management; the financial resources of TAM; TAM’s management oversight process; TAM’s and the Sub-Adviser’s responsiveness to any questions by the Trustees; and the professional qualifications and compensation program of the portfolio management team of the Sub-Adviser. The Trustees noted that they receive, on a quarterly basis, an execution analysis from Capital Institutional Services, Inc. (CAPIS), an independent provider of trade analyses, for the Sub-Adviser and a comparison of trading results against a peer universe of managers.
The Board also considered the continuous and regular investment management and other services provided by TAM, when acting as a manager of managers, for the portion of the management fee it retains from the Portfolio after payment of the sub-advisory fees. The Board noted that the investment management and other services provided by TAM include the design, development and ongoing review and evaluation of the Portfolio and its investment strategy; the selection, oversight and monitoring of one or more investment sub-advisers to perform certain duties with respect to the Portfolio; ongoing portfolio trading oversight and analysis; risk management oversight and analysis; design, development, implementation and ongoing review and evaluation of a process for the valuation of Portfolio investments; design, development, implementation and ongoing review and evaluation of a compliance program for the Portfolio; design, development, implementation and ongoing review and evaluation of a process for the voting of proxies and exercise of rights to consent to corporate action for Portfolio investments; participation in Board meetings and oversight of preparation of materials for the Board, including materials for Board meetings and regular communications with the Board; oversight of preparation of the Portfolio’s prospectus, statement of additional information, shareholder reports and other disclosure materials and regulatory filings for the Portfolio; and ongoing cash management services for the Portfolio. The Board considered that TAM’s investment management services also include the provision of supervisory and administrative services to the Portfolio. The Board also noted that TAM, as part of the services it provides to all Transamerica mutual funds, including the Portfolio, oversees the services provided by the funds’ custodian, transfer agent, independent accountant and legal counsel and supervises the performance of the recordkeeping and holder service functions of the funds.
Investment Performance
|
|
|
|
|
| Transamerica Series Trust |
|
|
|
Semi-Annual Financial Statements 2024 |
|
|
Page 12 |
|
|
Transamerica Goldman Sachs Managed Risk -
Conservative ETF VP
MANAGEMENT AND SUB-ADVISORY AGREEMENT — CONTRACT RENEWAL (continued)
(unaudited)
In addition, the Board considered the short- and longer-term performance of the Portfolio in light of its investment objective, policies and strategies, including relative performance against (i) a peer universe of comparable mutual funds, as prepared by Broadridge, and (ii) the Portfolio’s benchmarks, in each case for various trailing periods ended December 31, 2023. Based on these considerations, the Board determined that TAM and the Sub-Adviser can provide investment and related services that are appropriate in scope and extent in light of the Portfolio’s investment objectives, policies and strategies and operations, the competitive landscape of the investment company business and investor needs. The Board’s conclusions as to the Portfolio’s performance are summarized below. For purposes of its review, the Board generally used the performance of Service Class Shares. In describing the Portfolio’s performance relative to its peer universe, the summary conclusions characterize performance for the relevant periods in relation to whether it was “above,” “below” or “in line with” the peer universe median and do so using quintile rankings prepared by Broadridge. For simplicity, performance is described as “above” the median if the Portfolio’s performance ranked anywhere in the first or second quintiles, as “below” the median if it ranked anywhere in the fourth or fifth quintiles, or “in line with” the median if it ranked anywhere in the third quintile (i.e., even if its precise return was somewhat above or somewhat below the precise median return).
When considering the Portfolio’s performance, the Trustees considered any representations made by TAM regarding the appropriateness of certain peer groups and benchmarks. They recognized that performance reflects a snapshot of a period as of a specific date, and that consideration of performance data for a different period could generate significantly different performance results. The Trustees also recognized that even longer-term performance can be negatively affected by performance over a short-term period when that short-term performance is significantly below the performance of the comparable benchmark or universe of peer funds.
The Board noted that the performance of Service Class Shares of the Portfolio was above the median for its peer universe for the past 1-year period, in line with the median for the past 3-year period and below the median for the past 5- and 10-year periods. The Board also noted that the performance of Service Class Shares of the Portfolio was below the benchmark that TAM utilizes to measure performance of the Portfolio for the past 1-, 3-, 5- and 10-year periods. The Board noted that the Sub-Adviser had commenced sub-advising the Portfolio on November 1, 2022 pursuant to its current investment strategies. The Trustees also noted recent changes in the portfolio management team at the Sub-Adviser. The Trustees noted that TAM intends to monitor and report to the Board on the portfolio manager transition and performance going forward.
Management Fee and Sub-Advisory Fees and Total Expense Ratio
The Board considered the management fee and total expense ratio of the Portfolio, including information provided by Broadridge comparing the management fee and total expense ratio of the Portfolio to the management fees and total expense ratios of comparable investment companies in both a peer group and broader peer universe compiled by Broadridge. The Board’s conclusions as to the Portfolio’s management fee and total expense ratio are summarized below. For purposes of its review, the Board generally used the actual total expenses (i.e., expenses reflecting any waivers and/or reimbursements) of Service Class Shares. In describing the Portfolio’s management fee and total expense ratio relative to its peer group and peer universe, the summary conclusions characterize management fees and total expense ratios for the relevant periods in relation to whether they were “above,” “below” or “in line with” the peer group or peer universe median and do so using quintile rankings prepared by Broadridge. For simplicity, management fees and total expense ratios are described as “above” the median if the Portfolio’s management fee or total expense ratio ranked anywhere in the fourth or fifth quintiles, as “below” the median if it ranked anywhere in the first or second quintiles, or “in line with” the median if it ranked anywhere in the third quintile (i.e., even if its precise management fee or total expense ratio was somewhat above or somewhat below the precise median management fee or total expense ratio).
The Board also considered the fees charged by the Sub-Adviser for sub-advisory services, as well as the portion of the Portfolio’s management fee retained by TAM following payment of the sub-advisory fee and how the portion of the contractual management fee retained by TAM at a specified asset level compared to the portions retained by other investment advisers managing mutual funds with similar investment strategies as calculated by an independent provider of information.
The Board noted that the Portfolio’s contractual management fee was in line with the median for its peer group and above the median for its peer universe and that the actual total expenses (i.e., expenses reflecting any waivers and/or reimbursements) of Service Class Shares of the Portfolio were below the medians for its peer group and peer universe. The Trustees also considered that TAM has entered into an expense limitation arrangement with the Portfolio, which may result in TAM waiving fees for the benefit of holders.
On the basis of these considerations, together with the other information it considered, the Board determined that the management and sub-advisory fees to be received by TAM and the Sub-Adviser under the Management Agreement and Sub-Advisory Agreement are reasonable in light of the services provided.
Cost of Services Provided and Level of Profitability
The Board reviewed information provided by TAM about the cost of providing and procuring fund management services, as well as the costs of the provision of administration, transfer agency and other services, to the Portfolio and to Transamerica Series Trust as a whole by TAM and its affiliates. The Board considered the profitability of TAM and its affiliates in providing these services for the Portfolio and
|
|
|
|
|
| Transamerica Series Trust |
|
|
|
Semi-Annual Financial Statements 2024 |
|
|
Page 13 |
|
|
Transamerica Goldman Sachs Managed Risk -
Conservative ETF VP
MANAGEMENT AND SUB-ADVISORY AGREEMENT — CONTRACT RENEWAL (continued)
(unaudited)
Transamerica Series Trust as a whole. The Trustees recognized the competitiveness of the mutual fund industry and the importance of an investment adviser’s long-term profitability, including for maintaining company and management stability and accountability.
The Board also considered the allocation methodology used for calculating the profitability of TAM and its affiliates. The Board noted that the revenue and expense allocation methodology used by TAM to estimate its profitability with respect to its relationship with the Portfolio had been reviewed previously by an independent consultant. The Trustees considered that TAM reported that it had not made material changes to this methodology, and that the methodology had been applied consistently for the Portfolio.
With respect to the Sub-Adviser, the Board noted that the sub-advisory fee is the product of arm’s-length negotiation between TAM and the Sub-Adviser, which is not affiliated with TAM, and is paid by TAM and not the Portfolio. As a result, the Board focused on the profitability of TAM and its affiliates with respect to the Portfolio.
Based on this information, the Board determined that the profitability of TAM and its affiliates from their relationships with the Portfolio was not excessive.
Economies of Scale
The Board considered economies of scale with respect to the management of the Portfolio, whether the Portfolio had appropriately benefited from any economies of scale and whether there was the potential for realization of any future economies of scale. The Board also considered the existence of economies of scale with respect to management of the Transamerica mutual funds overall and the extent to which the Portfolio benefited from any economies of scale. The Board recognized that, as the Portfolio’s assets increase, any economies of scale realized by TAM or the Sub-Adviser may not directly correlate with each other or with any economies of scale that might be realized by the Portfolio. The Board considered the Portfolio’s management fee schedule and the existence of breakpoints and also considered the extent to which TAM shared economies of scale, if any, with the Portfolio through undertakings to limit or reimburse Portfolio expenses and to invest in maintaining and developing its capabilities and services. The Board also considered the Sub-Adviser’s sub-advisory fee schedule and the existence of breakpoints, if any, and how such breakpoints relate to any breakpoints in the Portfolio’s management fee schedule. The Board considered that the Sub-Adviser’s sub-advisory fees would be based on the combined assets of multiple funds. The Trustees concluded that the Portfolio’s fee structure reflected an appropriate sharing of any efficiencies or economies of scale to date and noted that they will have the opportunity to periodically reexamine the appropriateness of the management fee payable to TAM and the fee paid to the Sub-Adviser in light of any economies of scale experienced in the future.
Benefits to TAM, its Affiliates and/or the Sub-Adviser from their Relationships with the Portfolio
The Board considered other benefits derived by TAM, its affiliates, and/or the Sub-Adviser from their relationships with the Portfolio. The Board noted that TAM does not receive benefits from research obtained with commissions paid to broker-dealers for portfolio transactions (commonly referred to as “soft dollars”) as a result of its relationship with the Portfolio.
Other Considerations
The Board noted that TAM has made a substantial commitment to the recruitment and retention of high-quality personnel and maintains the financial, compliance and operational resources reasonably necessary to manage the Portfolio in a professional manner that is consistent with the best interests of the Portfolio and the holders. In this regard, the Board favorably considered the procedures and policies TAM has in place to enforce compliance with applicable laws and regulations and oversee the portfolio management activities of the Sub-Adviser. The Board also noted that TAM has made an entrepreneurial commitment and undertaken certain business risks with respect to the management and success of the Portfolio.
Conclusion
After consideration of the factors described above, as well as other factors, the Trustees, including the Independent Trustees, concluded that the renewal of the Management Agreement and the Sub-Advisory Agreement was in the best interests of the Portfolio and the holders and voted to approve the renewal of the Agreements.
|
|
|
|
|
| Transamerica Series Trust |
|
|
|
Semi-Annual Financial Statements 2024 |
|
|
Page 14 |
|
|
PROXY VOTING POLICIES AND PROCEDURES AND QUARTERLY PORTFOLIO HOLDINGS
(unaudited)
A description of Transamerica Series Trust’s (the “Trust”) proxy voting policies and procedures is available in the Statement of Additional Information of the Portfolios, available without charge upon request by calling 1-800-851-9777 (toll free) or on the Securities and Exchange Commission’s (“SEC”) website at http://www.sec.gov.
In addition, the Portfolio is required to file Form N-PX, with their complete proxy voting records for the most recent 12 months ended June 30th, no later than August 31st of each year. The Form is available without charge: (1) on the Transamerica Funds website at https://www.transamerica.com/sites/default/files/files/e070d/TST%20N-PX%202021.pdf; and (2) on the SEC’s website at http://www.sec.gov.
Each fiscal quarter, the Portfolios, except Transamerica BlackRock Government Money Market VP, will file with the SEC a complete schedule of its monthly portfolio holdings on Form N-PORT. The Portfolios’ holdings as of the end of the third month of every fiscal quarter, as reported on Form N-PORT, will be publicly available on the SEC’s website at http://www.sec.gov within 60 days of the end of the fiscal quarter.
On a monthly basis, Transamerica BlackRock Government Money Market VP will file with the SEC portfolio holdings information on Form N-MFP3. A complete schedule of portfolio holdings is also available at www.transamerica.com.
You may also visit the Trust’s website at www.transamerica.com/annuities/prospectus for this and other information about the Portfolios and the Trust.
Important Notice Regarding Delivery of Shareholder Documents
Every year we provide shareholders informative materials such as the Transamerica Series Trust Annual Report, the Transamerica Series Trust Prospectus, and other required documents that keep you informed regarding your Portfolios. To the extent provided by mail, Transamerica Series Trust will only send one piece per mailing address, a method that saves your Portfolios money by reducing mailing and printing costs. We will continue to do this unless you tell us not to. To elect to receive individual mailings, simply call a Transamerica Customer Service Representative toll free at 1-800-851-9777, 8 a.m. to 7 p.m. Eastern Time, Monday-Friday. Your request will take effect within 30 days.
|
|
|
|
|
| Transamerica Series Trust |
|
|
|
Semi-Annual Financial Statements 2024 |
|
|
Page 15 |
|
|
NOTICE OF PRIVACY POLICY
(unaudited)
Your privacy is very important to us. We want you to understand what information we collect and how we use it. We collect and use “nonpublic personal information” in connection with providing our customers with a broad range of financial products and services as effectively and conveniently as possible. We treat nonpublic personal information in accordance with our Privacy Policy.
What Information We Collect and From Whom We Collect It
We may collect nonpublic personal information about you from the following sources:
| • |
|
Information we receive from you on applications or other forms, such as your name, address, and account number; |
| • |
|
Information about your transactions with us, our affiliates, or others, such as your account balance and purchase/redemption history; and |
| • |
|
Information we receive from non-affiliated third parties, including consumer reporting agencies. |
What Information We Disclose and To Whom We Disclose It
We do not disclose any nonpublic personal information about current or former customers to anyone without their express consent, except as permitted by law. We may disclose the nonpublic personal information we collect, as described above, to persons or companies that perform services on our behalf and to other financial institutions with which we have joint marketing agreements. We will require these companies to protect the confidentiality of your nonpublic personal information and to use it only to perform the services for which we have hired them.
Our Security Procedures
We restrict access to your nonpublic personal information and only allow disclosures to persons and companies as permitted by law to assist in providing products or services to you. We maintain physical, electronic, and procedural safeguards to protect your nonpublic personal information and to safeguard the disposal of certain consumer information.
Contact Us
If you have any questions about our Privacy Policy, please call 1-800-851-9777 on any business day between 8 a.m. and 7 p.m. Eastern Time.
Note: This Privacy Policy applies only to customers that have a direct relationship with us or our affiliates. If you own shares of our portfolios in the name of a third party such as a bank or broker-dealer, its privacy policy may apply to you instead of ours.
|
|
|
|
|
| Transamerica Series Trust |
|
|
|
Semi-Annual Financial Statements 2024 |
|
|
Page 16 |
|
|
PO Box 219945
Kansas City, MO 64121-9945
|
|
|
| Distributor: |
|
Transamerica Capital, Inc. |
|
|
PO Box 219945 |
|
|
Kansas City, MO 64121-9945 |
|
|
|
|
Customer Service: 1-800-851-9777 |
Transamerica Series Trust Semi-Annual Financial Statements
June 30, 2024
1801 California St., Suite 5200
Denver, CO 80202
Distributor: Transamerica Capital, Inc.
Customer Service: 1-800-851-9777
|
| The following pages contain the most recent semi-annual financial statements for the investment options in which you are invested. In compliance with Securities and Exchange Commission regulations, we present these reports on an annual and semi-annual basis with the hope that they will foster greater understanding of the investment options’ holdings, performance, financial data, accounting policies and other issues. This streamlined version provides information only on the investment options in which you are invested. If you have any questions about these reports, please do not hesitate to contact your financial professional. As always, we thank you for your trust and the opportunity to serve you. |
Transamerica Goldman Sachs Managed Risk - Growth ETF VP
SCHEDULE OF INVESTMENTS
At June 30, 2024
(unaudited)
|
|
|
|
|
|
|
|
|
| |
|
Shares |
|
|
Value |
|
| |
|
| EXCHANGE-TRADED FUNDS - 99.6% |
|
|
|
|
|
|
|
|
| International Equity Funds - 24.0% |
|
|
|
|
|
|
|
|
| iShares Core MSCI EAFE ETF |
|
|
1,442,605 |
|
|
$ |
104,790,827 |
|
| iShares Core MSCI Emerging Markets ETF |
|
|
2,515,918 |
|
|
|
134,677,091 |
|
| iShares MSCI EAFE ETF (A) |
|
|
1,360,145 |
|
|
|
106,540,158 |
|
| iShares MSCI EAFE Small-Cap ETF |
|
|
203,138 |
|
|
|
12,521,426 |
|
| Vanguard FTSE Developed Markets ETF |
|
|
2,104,098 |
|
|
|
103,984,523 |
|
|
|
|
|
|
|
|
|
|
|
|
|
|
|
|
|
|
|
|
462,514,025 |
|
|
|
|
|
|
|
|
|
|
| U.S. Equity Funds - 54.5% |
|
|
|
|
|
|
|
|
| iShares Core S&P 500 ETF |
|
|
632,907 |
|
|
|
346,345,697 |
|
| iShares Core S&P Mid-Cap ETF |
|
|
1,158,434 |
|
|
|
67,791,558 |
|
| iShares Russell 2000 ETF (A) |
|
|
260,248 |
|
|
|
52,801,717 |
|
| SPDR S&P 500 ETF Trust |
|
|
382,328 |
|
|
|
208,070,544 |
|
| Vanguard S&P 500 ETF |
|
|
748,884 |
|
|
|
374,539,355 |
|
|
|
|
|
|
|
|
|
|
|
|
|
|
|
|
|
|
|
|
1,049,548,871 |
|
|
|
|
|
|
|
|
|
|
| U.S. Fixed Income Funds - 21.1% |
|
|
|
|
|
|
|
|
| iShares Core U.S. Aggregate Bond ETF |
|
|
1,497,036 |
|
|
|
145,317,285 |
|
| Vanguard Intermediate-Term Corporate Bond ETF (A) |
|
|
1,439,727 |
|
|
|
115,077,379 |
|
| Vanguard Total Bond Market ETF |
|
|
2,029,839 |
|
|
|
146,249,900 |
|
|
|
|
|
|
|
|
|
|
|
|
|
|
|
|
|
|
|
|
406,644,564 |
|
|
|
|
|
|
|
|
|
|
| Total Exchange-Traded Funds
(Cost $1,630,457,510) |
|
|
|
|
|
|
1,918,707,460 |
|
|
|
|
|
|
|
|
|
|
|
|
|
|
|
|
|
|
|
| |
|
Shares |
|
|
Value |
|
| |
|
| OTHER INVESTMENT COMPANY - 5.4% |
|
|
|
|
|
| Securities Lending Collateral - 5.4% |
|
|
|
|
|
| State Street Navigator Securities Lending Trust - Government Money Market Portfolio, 5.28% (B) |
|
|
104,030,943 |
|
|
$ |
104,030,943 |
|
|
|
|
|
|
|
|
|
|
| Total Other Investment Company
(Cost $104,030,943) |
|
|
|
|
|
|
104,030,943 |
|
|
|
|
|
|
|
|
|
|
|
|
|
| |
|
Principal |
|
|
Value |
|
| |
|
| REPURCHASE AGREEMENT - 0.4% |
|
|
|
|
|
| Fixed Income Clearing Corp., 2.50% (B), dated 06/28/2024, to be repurchased at $7,660,541 on 07/01/2024. Collateralized by a U.S. Government Obligation, 3.75%, due 04/15/2026, and with a value of $7,812,215. |
|
$ |
7,658,946 |
|
|
|
7,658,946 |
|
|
|
|
|
|
|
|
|
|
| Total Repurchase Agreement
(Cost $7,658,946) |
|
|
|
7,658,946 |
|
|
|
|
|
|
|
|
|
|
| Total Investments
(Cost $1,742,147,399) |
|
|
|
2,030,397,349 |
|
|
|
|
|
|
|
|
|
|
| Net Other Assets (Liabilities) - (5.4)% |
|
|
|
(104,425,207 |
) |
|
|
|
|
|
|
|
|
|
|
|
| Net Assets - 100.0% |
|
|
$ |
1,925,972,142 |
|
|
|
|
|
|
|
|
|
|
INVESTMENT VALUATION:
|
|
|
|
|
|
|
|
|
|
|
|
|
|
|
|
|
| Valuation Inputs (C) |
|
|
|
|
|
|
|
|
|
|
|
|
| |
|
Level 1 - Unadjusted Quoted Prices |
|
|
Level 2 - Other Significant Observable Inputs |
|
|
Level 3 - Significant Unobservable Inputs |
|
|
Value |
|
| |
|
| ASSETS |
|
|
|
|
|
|
|
|
|
|
|
|
|
|
|
|
| Investments |
|
|
|
|
|
|
|
|
|
|
|
|
|
|
|
|
| Exchange-Traded Funds |
|
$ |
1,918,707,460 |
|
|
$ |
— |
|
|
$ |
— |
|
|
$ |
1,918,707,460 |
|
| Other Investment Company |
|
|
104,030,943 |
|
|
|
— |
|
|
|
— |
|
|
|
104,030,943 |
|
| Repurchase Agreement |
|
|
— |
|
|
|
7,658,946 |
|
|
|
— |
|
|
|
7,658,946 |
|
|
|
|
|
|
|
|
|
|
|
|
|
|
|
|
|
|
| Total Investments |
|
$ |
2,022,738,403 |
|
|
$ |
7,658,946 |
|
|
$ |
— |
|
|
$ |
2,030,397,349 |
|
|
|
|
|
|
|
|
|
|
|
|
|
|
|
|
|
|
FOOTNOTES TO SCHEDULE OF INVESTMENTS:
| (A) |
All or a portion of the security is on loan. The total value of the securities on loan is $121,939,483, collateralized by cash collateral of $104,030,943 and non-cash collateral, such as U.S. government securities and irrevocable letters of credit, of $20,484,099. The amount on loan indicated may not correspond with the securities on loan identified because a security with pending sales are in the process of recall from the brokers. |
| (B) |
Rate disclosed reflects the yield at June 30, 2024. |
| (C) |
There were no transfers in or out of Level 3 during the period ended June 30, 2024. Please reference the Investment Valuation section of the Notes to Financial Statements for more information regarding investment valuation and pricing inputs. |
|
|
|
|
|
| The Notes to Financial Statements are an integral part of this report. Transamerica Series Trust |
|
|
|
Semi-Annual Financial Statements 2024 |
|
|
Page 1 |
|
|
Transamerica Goldman Sachs Managed Risk - Growth ETF VP
|
|
|
| STATEMENT OF ASSETS AND LIABILITIES At June 30, 2024 (unaudited) |
|
STATEMENT OF OPERATIONS For the period ended June 30, 2024 (unaudited) |
|
|
|
|
|
| Assets: |
|
|
|
|
| Unaffiliated investments, at value (cost $1,734,488,453) (including securities loaned of $121,939,483) |
|
$ |
2,022,738,403 |
|
| Repurchase agreement, at value (cost $7,658,946) |
|
|
7,658,946 |
|
| Receivables and other assets: |
|
|
|
|
| Net income from securities lending |
|
|
39,983 |
|
| Shares of beneficial interest sold |
|
|
78 |
|
| Dividends from unaffiliated investments |
|
|
2,008,159 |
|
| Interest |
|
|
1,595 |
|
| Prepaid expenses |
|
|
7,671 |
|
|
|
| Total assets |
|
|
2,032,454,835 |
|
|
|
| Liabilities: |
|
|
|
|
| Cash collateral received upon return of: |
|
|
|
|
| Securities on loan |
|
|
104,030,943 |
|
| Payables and other liabilities: |
|
|
|
|
| Shares of beneficial interest redeemed |
|
|
1,460,129 |
|
| Investment management fees |
|
|
448,132 |
|
| Distribution and service fees |
|
|
368,601 |
|
| Transfer agent costs |
|
|
1,864 |
|
| Trustee and CCO fees |
|
|
5,469 |
|
| Audit and tax fees |
|
|
18,951 |
|
| Custody fees |
|
|
10,003 |
|
| Legal fees |
|
|
39,411 |
|
| Printing and shareholder reports fees |
|
|
56,058 |
|
| Other accrued expenses |
|
|
43,132 |
|
|
|
| Total liabilities |
|
|
106,482,693 |
|
|
|
| Net assets |
|
$ |
1,925,972,142 |
|
|
|
| Net assets consist of: |
|
|
|
|
| Capital stock ($0.01 par value) |
|
$ |
1,716,517 |
|
| Additional paid-in capital |
|
|
1,536,691,086 |
|
| Total distributable earnings (accumulated losses) |
|
|
387,564,539 |
|
|
|
| Net assets |
|
$ |
1,925,972,142 |
|
|
|
| Net assets by class: |
|
|
|
|
| Initial Class |
|
$ |
5,338,913 |
|
| Service Class |
|
|
1,920,633,229 |
|
|
|
| Shares outstanding: |
|
|
|
|
| Initial Class |
|
|
465,560 |
|
| Service Class |
|
|
171,186,122 |
|
|
|
| Net asset value and offering price per share: |
|
|
|
|
| Initial Class |
|
$ |
11.47 |
|
| Service Class |
|
|
11.22 |
|
|
|
|
|
|
| Investment income: |
|
|
|
|
| Dividend income from unaffiliated investments |
|
$ |
19,793,910 |
|
| Interest income from unaffiliated investments |
|
|
81,677 |
|
| Net income from securities lending |
|
|
131,709 |
|
| Total investment income |
|
|
20,007,296 |
|
|
|
| Expenses: |
|
|
|
|
| Investment management fees |
|
|
2,880,277 |
|
| Distribution and service fees: |
|
|
|
|
| Service Class |
|
|
2,369,302 |
|
| Transfer agent costs |
|
|
10,831 |
|
| Trustee and CCO fees |
|
|
44,483 |
|
| Audit and tax fees |
|
|
18,491 |
|
| Custody fees |
|
|
9,776 |
|
| Legal fees |
|
|
76,349 |
|
| Printing and shareholder reports fees |
|
|
52,379 |
|
| Other |
|
|
55,910 |
|
|
|
| Total expenses |
|
|
5,517,798 |
|
|
|
| Net investment income (loss) |
|
|
14,489,498 |
|
|
|
| Net realized gain (loss) on: |
|
|
|
|
| Unaffiliated investments |
|
|
44,388,412 |
|
|
|
| Net change in unrealized appreciation (depreciation) on: |
|
|
|
|
| Unaffiliated investments |
|
|
94,085,249 |
|
|
|
| Net realized and change in unrealized gain (loss) |
|
|
138,473,661 |
|
|
|
| Net increase (decrease) in net assets resulting from operations |
|
$ |
152,963,159 |
|
|
|
|
|
|
| The Notes to Financial Statements are an integral part of this report. Transamerica Series Trust |
|
|
|
Semi-Annual Financial Statements 2024 |
|
|
Page 2 |
|
|
Transamerica Goldman Sachs Managed Risk - Growth ETF VP
STATEMENT OF CHANGES IN NET ASSETS
For the period and year ended:
|
|
|
|
|
|
|
|
|
| |
|
June 30, 2024 (unaudited) |
|
|
December 31, 2023 |
|
|
|
|
| From operations: |
|
|
|
|
|
|
|
|
| Net investment income (loss) |
|
$ |
14,489,498 |
|
|
$ |
34,425,084 |
|
| Net realized gain (loss) |
|
|
44,388,412 |
|
|
|
22,275,496 |
|
| Net change in unrealized appreciation (depreciation) |
|
|
94,085,249 |
|
|
|
257,620,595 |
|
|
|
|
| Net increase (decrease) in net assets resulting from operations |
|
|
152,963,159 |
|
|
|
314,321,175 |
|
|
|
|
| Dividends and/or distributions to shareholders: |
|
|
|
|
|
|
|
|
| Initial Class |
|
|
— |
|
|
|
(196,177 |
) |
| Service Class |
|
|
— |
|
|
|
(77,458,858 |
) |
|
|
|
| Net increase (decrease) in net assets resulting from dividends and/or distributions to shareholders |
|
|
— |
|
|
|
(77,655,035 |
) |
|
|
|
| Capital share transactions: |
|
|
|
|
|
|
|
|
| Proceeds from shares sold: |
|
|
|
|
|
|
|
|
| Initial Class |
|
|
137,529 |
|
|
|
795,997 |
|
| Service Class |
|
|
4,292,141 |
|
|
|
6,617,621 |
|
| |
|
|
4,429,670 |
|
|
|
7,413,618 |
|
| Dividends and/or distributions reinvested: |
|
|
|
|
|
|
|
|
| Initial Class |
|
|
— |
|
|
|
196,177 |
|
| Service Class |
|
|
— |
|
|
|
77,458,858 |
|
| |
|
|
— |
|
|
|
77,655,035 |
|
| Cost of shares redeemed: |
|
|
|
|
|
|
|
|
| Initial Class |
|
|
(195,306 |
) |
|
|
(408,718 |
) |
| Service Class |
|
|
(177,043,296 |
) |
|
|
(283,484,693 |
) |
|
|
|
| |
|
|
(177,238,602 |
) |
|
|
(283,893,411 |
) |
|
|
|
| Net increase (decrease) in net assets resulting from capital share transactions |
|
|
(172,808,932 |
) |
|
|
(198,824,758 |
) |
|
|
|
| Net increase (decrease) in net assets |
|
|
(19,845,773 |
) |
|
|
37,841,382 |
|
|
|
|
| Net assets: |
|
|
|
|
|
|
|
|
| Beginning of period/year |
|
|
1,945,817,915 |
|
|
|
1,907,976,533 |
|
| End of period/year |
|
$ |
1,925,972,142 |
|
|
$ |
1,945,817,915 |
|
|
|
|
| Capital share transactions - shares: |
|
|
|
|
|
|
|
|
| Shares issued: |
|
|
|
|
|
|
|
|
| Initial Class |
|
|
12,578 |
|
|
|
77,077 |
|
| Service Class |
|
|
401,210 |
|
|
|
675,199 |
|
| |
|
|
413,788 |
|
|
|
752,276 |
|
| Shares reinvested: |
|
|
|
|
|
|
|
|
| Initial Class |
|
|
— |
|
|
|
19,618 |
|
| Service Class |
|
|
— |
|
|
|
7,903,965 |
|
| |
|
|
— |
|
|
|
7,923,583 |
|
| Shares redeemed: |
|
|
|
|
|
|
|
|
| Initial Class |
|
|
(17,858 |
) |
|
|
(41,375 |
) |
| Service Class |
|
|
(16,472,102 |
) |
|
|
(29,015,207 |
) |
| |
|
|
(16,489,960 |
) |
|
|
(29,056,582 |
) |
|
|
|
| Net increase (decrease) in shares outstanding: |
|
|
|
|
|
|
|
|
| Initial Class |
|
|
(5,280 |
) |
|
|
55,320 |
|
| Service Class |
|
|
(16,070,892 |
) |
|
|
(20,436,043 |
) |
| |
|
|
(16,076,172 |
) |
|
|
(20,380,723 |
) |
The Notes to Financial Statements are an integral part of this report.
|
|
|
|
|
| Transamerica Series Trust |
|
|
|
Semi-Annual Financial Statements 2024 |
|
|
Page 3 |
|
|
Transamerica Goldman Sachs Managed Risk - Growth ETF VP
FINANCIAL HIGHLIGHTS
|
|
|
|
|
|
|
|
|
|
|
|
|
|
|
|
|
|
|
|
|
|
|
|
|
| For a share outstanding during the period and years indicated: |
|
Initial Class |
|
|
|
|
|
|
|
| |
|
June 30, 2024 (unaudited) |
|
December 31, 2023 |
|
December 31, 2022 |
|
December 31, 2021 |
|
December 31, 2020 |
|
December 31, 2019 |
|
|
|
|
|
|
|
| Net asset value, beginning of period/year |
|
$ |
10.58 |
|
|
$ |
9.35 |
|
|
$ |
11.81 |
|
|
$ |
10.96 |
|
|
$ |
11.04 |
|
|
$ |
10.33 |
|
|
|
|
|
|
|
|
| Investment operations: |
|
|
|
|
|
|
|
|
|
|
|
|
|
|
|
|
|
|
|
|
|
|
|
|
|
|
|
|
|
|
|
| Net investment income (loss)(A) |
|
|
0.10 |
|
|
|
0.21 |
|
|
|
0.16 |
|
|
|
0.16 |
|
|
|
0.12 |
|
|
|
0.23 |
|
|
|
|
|
|
|
|
| Net realized and unrealized gain (loss) |
|
|
0.79 |
|
|
|
1.45 |
|
|
|
(1.83 |
) |
|
|
1.38 |
|
|
|
0.34 |
|
|
|
1.70 |
|
|
|
|
|
|
|
|
| Total investment operations |
|
|
0.89 |
|
|
|
1.66 |
|
|
|
(1.67 |
) |
|
|
1.54 |
|
|
|
0.46 |
|
|
|
1.93 |
|
|
|
|
|
|
|
|
| Dividends and/or distributions to shareholders: |
|
|
|
|
|
|
|
|
|
|
|
|
|
|
|
|
|
|
|
|
|
|
|
|
|
|
|
|
|
|
|
| Net investment income |
|
|
— |
|
|
|
(0.17 |
) |
|
|
(0.18 |
) |
|
|
(0.13 |
) |
|
|
(0.25 |
) |
|
|
(0.23 |
) |
|
|
|
|
|
|
|
| Net realized gains |
|
|
— |
|
|
|
(0.26 |
) |
|
|
(0.61 |
) |
|
|
(0.56 |
) |
|
|
(0.29 |
) |
|
|
(0.99 |
) |
|
|
|
|
|
|
|
| Total dividends and/or distributions to shareholders |
|
|
— |
|
|
|
(0.43 |
) |
|
|
(0.79 |
) |
|
|
(0.69 |
) |
|
|
(0.54 |
) |
|
|
(1.22 |
) |
|
|
|
|
|
|
|
| Net asset value, end of period/year |
|
$ |
11.47 |
|
|
$ |
10.58 |
|
|
$ |
9.35 |
|
|
$ |
11.81 |
|
|
$ |
10.96 |
|
|
$ |
11.04 |
|
| |
|
|
|
|
|
|
|
|
|
|
|
|
|
|
|
|
|
|
|
|
|
|
|
|
|
|
|
|
|
|
|
| Total return |
|
|
8.41 |
%(B) |
|
|
18.08 |
% |
|
|
(14.32 |
)% |
|
|
14.25 |
% |
|
|
4.52 |
% |
|
|
19.74 |
% |
|
|
|
|
|
|
|
| Ratio and supplemental data: |
|
|
|
|
|
|
|
|
|
|
|
|
|
|
|
|
|
|
|
|
|
|
|
|
|
|
|
|
|
|
|
| Net assets end of period/year (000’s) |
|
$ |
5,339 |
|
|
$ |
4,982 |
|
|
$ |
3,886 |
|
|
$ |
4,709 |
|
|
$ |
4,122 |
|
|
$ |
4,658 |
|
|
|
|
|
|
|
|
| Expenses to average net assets(C) |
|
|
|
|
|
|
|
|
|
|
|
|
|
|
|
|
|
|
|
|
|
|
|
|
|
|
|
|
|
|
|
| Excluding waiver and/or reimbursement and recapture |
|
|
0.33 |
%(D) |
|
|
0.34 |
% |
|
|
0.33 |
% |
|
|
0.32 |
% |
|
|
0.32 |
% |
|
|
0.32 |
% |
|
|
|
|
|
|
|
| Including waiver and/or reimbursement and recapture |
|
|
0.33 |
%(D) |
|
|
0.34 |
% |
|
|
0.33 |
%(E) |
|
|
0.32 |
%(E) |
|
|
0.32 |
%(E) |
|
|
0.32 |
%(E) |
|
|
|
|
|
|
|
| Net investment income (loss) to average net assets |
|
|
1.81 |
%(D) |
|
|
2.10 |
% |
|
|
1.58 |
% |
|
|
1.41 |
% |
|
|
1.15 |
% |
|
|
2.15 |
% |
|
|
|
|
|
|
|
| Portfolio turnover rate |
|
|
8 |
%(B) |
|
|
3 |
% |
|
|
197 |
% |
|
|
29 |
% |
|
|
201 |
% |
|
|
59 |
% |
| (A) |
Calculated based on average number of shares outstanding. |
| (C) |
Does not include expenses of the underlying investments in which the Portfolio invests. |
| (E) |
Waiver and/or reimbursement rounds to less than 0.01%. |
|
|
|
|
|
|
|
|
|
|
|
|
|
|
|
|
|
|
|
|
|
|
|
|
|
| For a share outstanding during the period and years indicated: |
|
Service Class |
|
|
|
|
|
|
|
| |
|
June 30, 2024 (unaudited) |
|
December 31, 2023 |
|
December 31, 2022 |
|
December 31, 2021 |
|
December 31, 2020 |
|
December 31, 2019 |
|
|
|
|
|
|
|
| Net asset value, beginning of period/year |
|
$ |
10.36 |
|
|
$ |
9.17 |
|
|
$ |
11.59 |
|
|
$ |
10.76 |
|
|
$ |
10.85 |
|
|
$ |
10.17 |
|
|
|
|
|
|
|
|
| Investment operations: |
|
|
|
|
|
|
|
|
|
|
|
|
|
|
|
|
|
|
|
|
|
|
|
|
|
|
|
|
|
|
|
| Net investment income (loss)(A) |
|
|
0.08 |
|
|
|
0.17 |
|
|
|
0.13 |
|
|
|
0.13 |
|
|
|
0.09 |
|
|
|
0.20 |
|
|
|
|
|
|
|
|
| Net realized and unrealized gain (loss) |
|
|
0.78 |
|
|
|
1.42 |
|
|
|
(1.79 |
) |
|
|
1.36 |
|
|
|
0.33 |
|
|
|
1.67 |
|
|
|
|
|
|
|
|
| Total investment operations |
|
|
0.86 |
|
|
|
1.59 |
|
|
|
(1.66 |
) |
|
|
1.49 |
|
|
|
0.42 |
|
|
|
1.87 |
|
|
|
|
|
|
|
|
| Dividends and/or distributions to shareholders: |
|
|
|
|
|
|
|
|
|
|
|
|
|
|
|
|
|
|
|
|
|
|
|
|
|
|
|
|
|
|
|
| Net investment income |
|
|
— |
|
|
|
(0.14 |
) |
|
|
(0.15 |
) |
|
|
(0.10 |
) |
|
|
(0.22 |
) |
|
|
(0.20 |
) |
|
|
|
|
|
|
|
| Net realized gains |
|
|
— |
|
|
|
(0.26 |
) |
|
|
(0.61 |
) |
|
|
(0.56 |
) |
|
|
(0.29 |
) |
|
|
(0.99 |
) |
|
|
|
|
|
|
|
| Total dividends and/or distributions to shareholders |
|
|
— |
|
|
|
(0.40 |
) |
|
|
(0.76 |
) |
|
|
(0.66 |
) |
|
|
(0.51 |
) |
|
|
(1.19 |
) |
|
|
|
|
|
|
|
| Net asset value, end of period/year |
|
$ |
11.22 |
|
|
$ |
10.36 |
|
|
$ |
9.17 |
|
|
$ |
11.59 |
|
|
$ |
10.76 |
|
|
$ |
10.85 |
|
| |
|
|
|
|
|
|
|
|
|
|
|
|
|
|
|
|
|
|
|
|
|
|
|
|
|
|
|
|
|
|
|
| Total return |
|
|
8.30 |
%(B) |
|
|
17.68 |
% |
|
|
(14.52 |
)% |
|
|
14.05 |
% |
|
|
4.22 |
% |
|
|
19.41 |
% |
|
|
|
|
|
|
|
| Ratio and supplemental data: |
|
|
|
|
|
|
|
|
|
|
|
|
|
|
|
|
|
|
|
|
|
|
|
|
|
|
|
|
|
|
|
| Net assets end of period/year (000’s) |
|
$ |
1,920,633 |
|
|
$ |
1,940,836 |
|
|
$ |
1,904,091 |
|
|
$ |
2,547,419 |
|
|
$ |
2,606,524 |
|
|
$ |
2,845,470 |
|
|
|
|
|
|
|
|
| Expenses to average net assets(C) |
|
|
|
|
|
|
|
|
|
|
|
|
|
|
|
|
|
|
|
|
|
|
|
|
|
|
|
|
|
|
|
| Excluding waiver and/or reimbursement and recapture |
|
|
0.58 |
%(D) |
|
|
0.58 |
% |
|
|
0.58 |
% |
|
|
0.57 |
% |
|
|
0.57 |
% |
|
|
0.57 |
% |
|
|
|
|
|
|
|
| Including waiver and/or reimbursement and recapture |
|
|
0.58 |
%(D) |
|
|
0.58 |
% |
|
|
0.58 |
%(E) |
|
|
0.57 |
%(E) |
|
|
0.57 |
%(E) |
|
|
0.57 |
%(E) |
|
|
|
|
|
|
|
| Net investment income (loss) to average net assets |
|
|
1.52 |
%(D) |
|
|
1.79 |
% |
|
|
1.30 |
% |
|
|
1.12 |
% |
|
|
0.90 |
% |
|
|
1.86 |
% |
|
|
|
|
|
|
|
| Portfolio turnover rate |
|
|
8 |
%(B) |
|
|
3 |
% |
|
|
197 |
% |
|
|
29 |
% |
|
|
201 |
% |
|
|
59 |
% |
| (A) |
Calculated based on average number of shares outstanding. |
| (C) |
Does not include expenses of the underlying investments in which the Portfolio invests. |
| (E) |
Waiver and/or reimbursement rounds to less than 0.01%. |
The Notes to Financial Statements are an integral part of this report.
|
|
|
|
|
| Transamerica Series Trust |
|
|
|
Semi-Annual Financial Statements 2024 |
|
|
Page 4 |
|
|
Transamerica Goldman Sachs Managed Risk - Growth ETF VP
NOTES TO FINANCIAL STATEMENTS
At June 30, 2024
(unaudited)
1. ORGANIZATION
Transamerica Series Trust (“TST”) is an open-end management investment company registered under the Investment Company Act of 1940, as amended (the “1940 Act”). TST applies investment company accounting and reporting guidance. TST serves as a funding vehicle for variable life insurance, variable annuity, and group annuity products. Transamerica Goldman Sachs Managed Risk - Growth ETF VP (the “Portfolio”) is a series of TST and is classified as diversified under the 1940 Act. The Portfolio currently offers two classes of shares, Initial Class and Service Class.
The only shareholders of the Portfolio are affiliated insurance company separate accounts and/or affiliated asset allocation portfolios. Contract holders of the variable life and annuity contracts are not shareholders of the Portfolio. For ease of reference, shareholders and contract holders are collectively referred to in this report as “shareholders.”
This report must be accompanied or preceded by the Portfolio’s current prospectus, which contains additional information about the Portfolio, including risks, as well as investment objectives and strategies.
Transamerica Asset Management, Inc. (“TAM”) serves as investment manager for the Portfolio pursuant to an investment management agreement. TAM provides continuous and regular investment management services to the Portfolio. TAM supervises the Portfolio’s investments, conducts its investment program and provides supervisory, compliance and administrative services to the Portfolio.
TAM currently acts as a “manager of managers” and has hired sub-advisers to furnish day-to-day investment advice and recommendations. TAM may, in the future, determine to provide all aspects of the day-to-day management of the Portfolio without the use of a sub-adviser. When acting as a manager of managers, TAM provides investment management services that include, without limitation, the design and development of the Portfolio and its investment strategies and the ongoing review and evaluation of those investment strategies including recommending changes in strategy where it believes appropriate or advisable; the selection of one or more sub-advisers for the Portfolio employing a combination of quantitative and qualitative screens, research, analysis and due diligence; negotiation of sub-advisory agreements and fees; oversight and monitoring of sub-advisers and recommending changes to sub-advisers where it believes appropriate or advisable; recommending portfolio combinations and liquidations where it believes appropriate or advisable; selection and oversight of transition managers, as needed; regular supervision of the Portfolio’s investments; regular review and evaluation of sub-adviser performance; daily monitoring of the sub-advisers’ buying and selling of securities for the Portfolio; regular review of holdings; ongoing trade oversight and analysis; regular monitoring to ensure adherence to investment process; regular calls and periodic on-site visits with sub-advisers; portfolio construction and asset allocation when using multiple sub-advisers for the Portfolio; risk management oversight and analysis; oversight of negotiation of investment documentation and agreements; design, development, implementation and regular monitoring of the valuation process; periodic due diligence reviews of pricing vendors and vendor methodology; design, development, implementation and regular monitoring of the compliance process; respond to regulatory inquiries and determine appropriate litigation strategy, as needed; review of proxies voted by sub-advisers; oversight of preparation and review of materials for meetings of the Portfolio’s Board of Trustees (the “Board”), participation in these meetings and preparation of regular communications with the Board; oversight of preparation and review of prospectuses, shareholder reports and other disclosure materials and regulatory filings for the Portfolio; oversight of other service providers to the Portfolio, such as the custodian, the transfer agent, the Portfolio’s independent accounting firm and legal counsel; supervision of the performance of recordkeeping and shareholder relations functions for the Portfolio; and oversight of cash management services. TAM uses a variety of quantitative and qualitative tools to carry out its investment management services. TAM, not the Portfolio, is responsible for paying the sub-adviser(s) for their services, and sub-advisory fees are TAM’s expense.
TAM’s investment management services also include the provision of supervisory and administrative services to the Portfolio. These services include performing certain administrative services for the Portfolio and supervising and overseeing the administrative, clerical, recordkeeping and bookkeeping services provided to the Portfolio by State Street Bank and Trust Company (“State Street”), to whom TAM has outsourced the provision of certain sub-administration services. To the extent agreed upon by TAM and the Portfolio from time to time, TAM’s supervisory and administrative services include, but are not limited to: monitoring and verifying the custodian’s daily calculation of the Net Asset Values (“NAV”); shareholder relations functions; compliance services; valuation services; assisting in due diligence and in the oversight and monitoring of certain activities of sub-advisers and certain aspects of Portfolio investments; assisting with Portfolio combinations and liquidations; oversight of the preparation and filing, and review, of all returns and reports, in connection with federal, state and local taxes; oversight and review of regulatory reporting; supervising and coordinating the Portfolio’s custodian and dividend disbursing agent and monitoring their services to the Portfolio; assisting the Portfolio in preparing reports to shareholders; acting as liaison with the Portfolio’s independent public accountants and providing, upon request, analyses, fiscal year summaries and other audit related services; assisting in the preparation of agendas and supporting documents for and minutes of meetings of trustees and committees of trustees; assisting in the preparation of regular communications with the trustees; and providing personnel and office space, telephones and other office equipment as necessary in order for TAM to perform supervisory and administrative services to the Portfolio. The Portfolio
|
|
|
|
|
| Transamerica Series Trust |
|
|
|
Semi-Annual Financial Statements 2024 |
|
|
Page 5 |
|
|
Transamerica Goldman Sachs Managed Risk - Growth ETF VP
NOTES TO FINANCIAL STATEMENTS (continued)
At June 30, 2024
(unaudited)
1. ORGANIZATION (continued)
pays certain fees and expenses to State Street for sub-administration services which are not administrative services covered by the management agreement with TAM or paid for through the management fees payable thereunder. For the period ended June 30, 2024, (i) the expenses paid to State Street for sub-administration services by the Portfolio are shown as a part of Other expenses within the Statement of Operations and (ii) the expenses payable to State Street for sub-administration services from the Portfolio are shown as part of Other accrued expenses within the Statement of Assets and Liabilities.
2. SIGNIFICANT ACCOUNTING POLICIES
In preparing the Portfolio’s financial statements in accordance with Generally Accepted Accounting Principles in the United States of America (“GAAP”), estimates or assumptions (which could differ from actual results) may be used that affect reported amounts and disclosures. The following is a summary of significant accounting policies followed by the Portfolio.
Security transactions and investment income: Security transactions are accounted for on the trade date. Security gains and losses are calculated on a first-in, first-out basis. Interest income, if any, is accrued as earned. Dividend income and capital gain distributions from underlying investments, if any, are recorded on the ex-dividend date. Income or short-term capital gain distributions received from underlying investments, if any, are recorded as Dividend income from investments within the Statement of Operations. Long-term capital gain distributions received from underlying investments, if any, are recorded as Net realized gain (loss) on Capital gain distributions received from investments within the Statement of Operations.
Multiple class operations, income, and expenses: Income, non-class specific expenses, and realized and unrealized gains and losses are allocated to each class daily based upon net assets. Each class bears its own specific expenses in addition to the allocated non-class specific expenses.
Distributions to shareholders: Distributions are recorded on the ex-dividend date and are determined in accordance with federal income tax regulations, which may differ from GAAP.
Indemnification: In the normal course of business, the Portfolio enters into contracts that contain a variety of representations that provide general indemnifications. The Portfolio’s maximum exposure under these arrangements is unknown, as this would involve future claims that may be made against the Portfolio and/or its affiliates that have not yet occurred. However, based on experience, the Portfolio expects the risk of loss to be remote.
3. INVESTMENT VALUATION
TAM has been designated as the Portfolio’s valuation designee pursuant to Rule 2a-5 under the 1940 Act with responsibility for fair valuation subject to oversight by the Portfolio’s Board of Trustees. The net asset value of the Portfolio is computed as of the official close of the New York Stock Exchange (“NYSE”) each day the NYSE is open for business.
TAM utilizes various methods to measure the fair value of its investments on a recurring basis. GAAP establishes a hierarchy that prioritizes inputs to valuation methods. The inputs or methodology used for valuing securities are not necessarily an indication of the risk associated with investing in those securities. The three levels (“Levels”) of inputs of the fair value hierarchy are defined as follows:
Level 1—Unadjusted quoted prices in active markets for identical securities.
Level 2—Inputs, other than quoted prices included in Level 1, which are observable, either directly or indirectly. These inputs may include quoted prices for the identical instrument on an inactive market, prices for similar instruments, interest rates, prepayment speeds, credit risk, yield curves, default rates, and similar data.
Level 3—Unobservable inputs based on the best information available in the circumstances, to the extent observable inputs are not available, which may include TAM’s own assumptions used in determining the fair value of the Portfolio’s investments.
The inputs used to measure fair value may fall into different Levels of the fair value hierarchy. In such cases, for disclosure purposes, the Level in the fair value hierarchy that is assigned to the fair value measurement of a security is determined based on the lowest Level input that is significant to the fair value measurement in its entirety. Certain investments that are measured at fair value using NAV per share, or its equivalent, using the “practical expedient” have not been classified in the fair value Levels. The hierarchy classification of inputs used to value the Portfolio’s investments at June 30, 2024, is disclosed within the Investment Valuation section of the Schedule of Investments.
|
|
|
|
|
| Transamerica Series Trust |
|
|
|
Semi-Annual Financial Statements 2024 |
|
|
Page 6 |
|
|
Transamerica Goldman Sachs Managed Risk - Growth ETF VP
NOTES TO FINANCIAL STATEMENTS (continued)
At June 30, 2024
(unaudited)
3. INVESTMENT VALUATION (continued)
The availability of observable inputs can vary from security to security and is affected by a wide variety of factors, including, but not limited to, the type of security, whether the security is new and not yet established in the marketplace, the liquidity of markets, and other characteristics particular to the security. To the extent that valuation is based on models or inputs that are less observable or unobservable in the market, the determination of fair value requires more judgment. Accordingly, the degree of judgment exercised in determining fair value is generally greatest for instruments categorized in Level 3. Due to the inherent uncertainty of valuation, the determination of values may differ significantly from values that would have been realized had a ready market for investments existed, and the differences could be material.
Fair value measurements: Descriptions of the valuation techniques applied to the Portfolio’s significant categories of assets and liabilities measured at fair value on a recurring basis are as follows:
Exchange-traded funds (“ETF”): ETFs are stated at the last reported sale price or closing price on the day of valuation taken from the primary exchange where the ETF is principally traded. ETFs are generally categorized in Level 1 of the fair value hierarchy.
Securities lending collateral: Securities lending collateral is invested in a money market fund which is valued at the actively traded NAV and no valuation adjustments are applied. Securities lending collateral is categorized in Level 1 of the fair value hierarchy.
Repurchase agreements: Repurchase agreements are valued at cost, which approximates fair value. To the extent the inputs are observable and timely, the values are generally categorized in Level 2 of the fair value hierarchy.
4. BORROWINGS AND OTHER FINANCING TRANSACTIONS
The Portfolio may engage in borrowing transactions as a means of raising cash to satisfy redemption requests, for other temporary or emergency purposes or, to the extent permitted by its investment policies, to raise additional cash to be invested in other securities or instruments. When the Portfolio invests borrowing proceeds in other securities, the Portfolio will bear the risk that the market value of the securities in which such proceeds are invested goes down and is insufficient to repay the borrowed proceeds. The Portfolio may borrow on a secured or on an unsecured basis. If the Portfolio enters into a secured borrowing arrangement, a portion of the Portfolio’s assets will be used as collateral. The 1940 Act requires the Portfolio to maintain asset coverage of at least 300% of the amount of its borrowings. Asset coverage means the ratio that the value of the Portfolio’s total assets, minus liabilities other than borrowings, bears to the aggregate amount of all borrowings. Although complying with this requirement has the effect of limiting the amount that the Portfolio may borrow, it does not otherwise mitigate the risks of entering into borrowing transactions.
Interfund lending: The Portfolio, along with other funds and portfolios advised by TAM, may participate in an interfund lending program pursuant to exemptive relief granted by the Securities and Exchange Commission on January 18, 2017. This program allows the Portfolio to lend to and borrow from other funds and portfolios advised by TAM. Interfund lending transactions are subject to the conditions of the exemptive relief which places limits on the amount of lending or borrowing a Portfolio may participate in under the program. Interest earned or paid on an interfund lending transaction will be based on the average of certain current market rates. For the period ended June 30, 2024, the Portfolio has not utilized the program.
Repurchase agreements: In a repurchase agreement, the Portfolio purchases a security and simultaneously commits to resell that security to the seller at an agreed-upon price on an agreed-upon date. Securities purchased subject to a repurchase agreement are held at the Portfolio’s custodian, or designated sub-custodian related to tri-party repurchase agreements, and, pursuant to the terms of the repurchase agreement, must be collateralized by securities with an aggregate market value greater than or equal to 100% of the resale price. The Portfolio will bear the risk of value fluctuations until the securities can be sold and may encounter delays and incur costs in liquidating the securities. In the event of bankruptcy or insolvency of the seller, delays and costs may be incurred.
Repurchase agreements are subject to netting agreements, which are agreements between the Portfolio and its counterparties that provide for the net settlement of all transactions and collateral with the Portfolio, through a single payment, in the event of default or termination. Amounts presented within the Schedule of Investments, and as part of Repurchase agreements, at value within the Statement of Assets and Liabilities are shown on a gross basis. The value of the related collateral for each repurchase agreement, as reflected within the Schedule of Investments, exceeds the value of each repurchase agreement at June 30, 2024.
Repurchase agreements at June 30, 2024, if any, are included within the Schedule of Investments and Statement of Assets and Liabilities.
|
|
|
|
|
| Transamerica Series Trust |
|
|
|
Semi-Annual Financial Statements 2024 |
|
|
Page 7 |
|
|
Transamerica Goldman Sachs Managed Risk - Growth ETF VP
NOTES TO FINANCIAL STATEMENTS (continued)
At June 30, 2024
(unaudited)
4. BORROWINGS AND OTHER FINANCING TRANSACTIONS (continued)
Securities lending: The Portfolio may lend securities to qualified financial institutions, brokers and dealers. State Street serves as securities lending agent to the Portfolio pursuant to a Securities Lending Agreement. Loans of securities are terminable at any time and the borrower, after notice, is required to return borrowed securities within the standard time period for settlement of securities transactions. The lending of securities exposes the Portfolio to risks such as: the borrowers may fail to return the loaned securities or may not be able to provide additional collateral, the Portfolio may experience delays in recovery of the loaned securities or delays in access to collateral, or the Portfolio may experience losses related to the investment collateral. To minimize certain risks, loan counterparties pledge cash, securities issued or guaranteed by the U.S. Government and irrevocable letters of credit issued by banks as collateral. The initial collateral received by the Portfolio is required to have a value of at least 102% of the current value of the loaned securities traded on U.S. exchanges, and a value of at least 105% for all other securities. Typically the lending agent is not permitted to sell, re-pledge or use cash and non-cash collateral it receives. The lending agent has agreed to indemnify the Portfolio in the case of default of any securities borrower.
The Portfolio receives compensation for lending securities from interest or dividends earned on the cash, U.S. Government securities and irrevocable letters of credit held as collateral, less associated fees and expenses. Such income is reflected in Net income from securities lending within the Statement of Operations. Cash collateral received is invested in the State Street Navigator Securities Lending Trust — Government Money Market Portfolio.
The value of loaned securities and related cash and non-cash collateral outstanding at June 30, 2024, if any, are shown on a gross basis within the Schedule of Investments.
The following table reflects a breakdown of transactions accounted for as secured borrowings, the gross obligation by the type, and the remaining contractual maturity of those transactions as of June 30, 2024.
|
|
|
|
|
|
|
|
|
|
|
|
|
|
|
|
|
|
|
|
|
| |
|
Remaining Contractual Maturity of the Agreements |
|
| |
|
Overnight and Continuous |
|
|
Less Than 30 Days |
|
|
Between 30 & 90 Days |
|
|
Greater Than 90 Days |
|
|
Total |
|
|
|
|
|
|
|
| Securities Lending Transactions
Exchange-Traded Funds |
|
|
$ 104,030,943 |
|
|
$ |
— |
|
|
$ |
— |
|
|
$ |
— |
|
|
$ |
104,030,943 |
|
| |
|
| Total Borrowings |
|
|
$ 104,030,943 |
|
|
$ |
— |
|
|
$ |
— |
|
|
$ |
— |
|
|
$ |
104,030,943 |
|
| |
|
5. RISK FACTORS
Investing in the Portfolio involves certain key risks related to the Portfolio’s trading activity. Please reference the Portfolio’s prospectus for a more complete discussion of the following risk(s), as well as other risks of investing in the Portfolio.
Market risk: The market prices of the Portfolio’s securities or other assets may go up or down, sometimes rapidly or unpredictably, due to factors such as economic events, inflation, changes in interest rates, governmental actions or interventions, actions taken by the U.S. Federal Reserve or foreign central banks, market disruptions caused by tariffs, trade disputes or other factors, political developments, armed conflicts, economic sanctions, cybersecurity events, investor sentiment, the global and domestic effects of widespread or local health, weather or climate events, and other factors that may or may not be related to the issuer of the security or other asset. If the market prices of the Portfolio’s securities and assets fall, the value of your investment in the Portfolio could go down.
Economies and financial markets throughout the world are increasingly interconnected. Events or circumstances in one or more countries or regions could be highly disruptive to, and have profound impacts on, global economies or markets. As a result, whether or not the Portfolio invests in securities of issuers located in or with significant exposure to the countries directly affected, the value and liquidity of the Portfolio’s investments may go down.
Managed risk strategy risk: The Portfolio employs a managed risk strategy. The strategy attempts to stabilize the volatility of the Portfolio around a target volatility level and manage downside exposure during periods of significant market declines but may not work as intended. Because market conditions change, sometimes rapidly and unpredictably, the success of the strategy also will be subject to the sub-adviser’s ability to implement the strategy in a timely and efficient manner. The strategy may result in periods of underperformance and may fail to protect against market declines. The strategy may limit the Portfolio’s ability to participate in up markets, may cause the Portfolio to underperform its benchmark in up markets, may increase transaction costs at the Portfolio and/or underlying portfolio level and may result in substantial losses if it does not work as intended. For example, if the Portfolio has reduced its equity exposure to avoid losses in
|
|
|
|
|
| Transamerica Series Trust |
|
|
|
Semi-Annual Financial Statements 2024 |
|
|
Page 8 |
|
|
Transamerica Goldman Sachs Managed Risk - Growth ETF VP
NOTES TO FINANCIAL STATEMENTS (continued)
At June 30, 2024
(unaudited)
5. RISK FACTORS (continued)
certain market conditions, and the market rises sharply and quickly, there may be a delay in increasing the Portfolio’s equity exposure, causing the Portfolio to forgo gains from the market rebound. Managing the Portfolio pursuant to the strategy may result in the Portfolio not achieving its stated asset mix goal due to unforeseen or unanticipated market conditions. The strategy also serves to reduce the risk to the Transamerica insurance companies that provide guaranteed benefits under certain variable contracts from equity market volatility and to facilitate their provision of those guaranteed benefits. The strategy also may have the effect of limiting the amount of guaranteed benefits. The Portfolio’s performance may be lower than similar portfolios that are not subject to a managed risk strategy.
Model and data risk: If quantitative models, algorithms or calculations (whether proprietary and developed by the sub-adviser or supplied by third parties) (“Models”) or information or data supplied by third parties (“Data”) prove to be incorrect or incomplete, any decisions made, in whole or part, in reliance thereon expose the Portfolio to additional risks. Models can be predictive in nature. The use of predictive Models has inherent risks. The success of relying on or otherwise using Models depends on a number of factors, including the validity, accuracy and completeness of the Model’s development, implementation and maintenance, the Model’s assumptions, factors, algorithms and methodologies, and the accuracy and reliability of the supplied historical or other Data. Models rely on, among other things, correct and complete Data inputs. If incorrect Data is entered into even a well-founded Model, the resulting information will be incorrect. However, even if Data is input correctly, Model prices may differ substantially from market prices, especially for securities with complex characteristics. Investments selected with the use of Models may perform differently than expected as a result of the design of the Model, inputs into the Model or other factors. There also can be no assurance that the use of Models will result in effective investment decisions for the Portfolio.
6. FEES AND OTHER AFFILIATED TRANSACTIONS
TST serves as a funding vehicle for certain affiliated asset allocation portfolios and certain affiliated separate accounts of Transamerica Life Insurance Company (“TLIC”) and Transamerica Financial Life Insurance Company.
TAM, the Portfolio’s investment manager, is directly owned by TLIC and AUSA Holding, LLC (“AUSA”), both of which are indirect, wholly owned subsidiaries of Aegon Ltd. TLIC is owned by Commonwealth General Corporation (“Commonwealth”). Commonwealth and AUSA are wholly owned by Transamerica Corporation (DE). Transamerica Corporation (DE) is wholly owned by Aegon International B.V., which is wholly owned by Aegon Ltd., a Bermuda exempted company with liability limited by shares (formerly, Aegon NV, a Netherlands corporation) and a publicly traded international insurance group.
Transamerica Fund Services, Inc. (“TFS”) is the Portfolio’s transfer agent. Transamerica Capital, Inc. (“TCI”) is the Portfolio’s distributor/principal underwriter. TAM, TFS and TCI are affiliates of Aegon Ltd.
Certain officers and trustees of the Portfolio may also be officers and/or trustees of TAM, TFS and TCI. No interested trustee who is deemed an interested person due to current or former service with TAM or an affiliate of TAM receives compensation from the Portfolio. The Portfolio does pay non-interested persons (independent trustees), as disclosed in Trustee and CCO fees within the Statement of Operations.
Investment management fees: TAM serves as the Portfolio’s investment manager, performing administration as well as investment advisory services. TAM renders investment advisory, supervisory, and administration services under an investment management agreement and the Portfolio pays a single management fee, which is reflected in Investment management fees within the Statement of Operations.
The Portfolio pays a management fee to TAM based on daily average net assets at the following rates:
|
|
|
|
|
| Breakpoints |
|
Rate |
|
|
| First $50 million |
|
|
0.3400% |
|
| Over $50 million up to $250 million |
|
|
0.3200 |
|
| Over $250 million up to $5 billion |
|
|
0.3000 |
|
| Over $5 billion up to $7 billion |
|
|
0.2900 |
|
| Over $7 billion up to $9 billion |
|
|
0.2875 |
|
| Over $9 billion |
|
|
0.2800 |
|
|
|
|
|
|
| Transamerica Series Trust |
|
|
|
Semi-Annual Financial Statements 2024 |
|
|
Page 9 |
|
|
Transamerica Goldman Sachs Managed Risk - Growth ETF VP
NOTES TO FINANCIAL STATEMENTS (continued)
At June 30, 2024
(unaudited)
6. FEES AND OTHER AFFILIATED TRANSACTIONS (continued)
TAM has contractually agreed to waive fees and/or reimburse Portfolio expenses to the extent that the total operating expenses excluding, as applicable, acquired fund fees and expenses, interest (including borrowing costs and overdraft charges), taxes, brokerage commissions, dividend and interest expenses on securities sold short, extraordinary expenses and other expenses not incurred in the ordinary course of the Portfolio’s business, exceed the following stated annual operating expense limits to the Portfolio’s daily average net assets. To the extent an expense limit changed during the period, the prior limit is also listed below. The expenses waived and/or reimbursed, if any, are included in Expenses waived and/or reimbursed within the Statement of Operations.
|
|
|
|
|
|
|
|
|
|
|
| Class |
|
Operating Expense Limit |
|
Operating Expense Limit Effective Through |
|
|
|
| Initial Class |
|
|
|
0.37 |
% |
|
|
|
May 1, 2025 |
|
| Service Class |
|
|
|
0.62 |
|
|
|
|
May 1, 2025 |
|
TAM is permitted to recapture amounts contractually waived and/or reimbursed to a class during any of the 36 months from the date on which TAM waived fees and/or reimbursed expenses for the class. A class may recapture and reimburse TAM only if such amount does not cause, on any particular business day of the Portfolio, the class’s total annual operating expenses (after the recapture is taken into account) to exceed the Operating Expense Limits or any other lower limit then in effect. Amounts recaptured, if any, by TAM for the period ended June 30, 2024 are disclosed in Recapture of previously waived and/or reimbursed fees within the Statement of Operations.
TAM, on a voluntary basis and in addition to the contractual operating expense limits in effect, from time to time may waive and/or reimburse expenses of the Portfolio, or any classes thereof, to such level(s) as the Trust’s officers have determined or may reasonably determine from time to time. Any such voluntary waiver or expense reimbursement may be discontinued by TAM at any time. These amounts are not subject to recapture by TAM.
As of June 30, 2024, there are no amounts available for recapture by TAM.
Distribution and service fees: TST has a distribution plan (“Distribution Plan”) pursuant to Rule 12b-1 under the 1940 Act. Pursuant to the Distribution Plan, TST entered into a distribution agreement with TCI as the Portfolio’s distributor.
The Distribution Plan requires the Portfolio to pay distribution fees to TCI as compensation for various distribution activities, not as reimbursement for specific expenses. Under the Distribution Plan and distribution agreement, TCI, on behalf of the Portfolio, is authorized to pay various service providers, as direct payment for expenses incurred in connection with distribution of the Portfolio’s shares.
The fee on the Service Class shares is paid to the insurance companies for providing services and account maintenance for the policyholders who invest in the variable insurance products which invest in the Service Class shares. TCI has determined that it will not seek payment for the distribution expenses incurred by the Portfolio with respect to the Initial Class shares before May 1, 2025. Prior to TCI seeking distribution expenses on Initial Class shares, policy and contract owners will be notified in advance. The Portfolio will pay fees relating to Service Class shares. The distribution and service fees are included in Distribution and service fees within the Statement of Operations.
The Portfolio is authorized under the Distribution Plan to pay fees to TCI based on daily average net assets of each applicable class up to the following annual rates:
|
|
|
|
|
| Class |
|
Rate |
| Initial Class |
|
|
0.15% |
|
| Service Class |
|
|
0.25 |
|
Transfer agent costs: TFS provides transfer agency services under an intercompany agreement with TAM. TFS has outsourced the provision of certain sub-transfer agency services to SS&C Global Investor & Distribution Solutions, Inc. (“SS&C GIDS”). The Portfolio does not pay a separate transfer agent fee to TAM or TFS but does pay certain expenses to SS&C GIDS related to applicable sub-transfer agency services. For the period ended June 30, 2024, (i) the expenses paid to SS&C GIDS by the Portfolio are referred to as transfer agent costs and are included within the Statement of Operations and (ii) the expenses payable to SS&C GIDS by the Portfolio are referred to as transfer agent costs within the Statement of Assets and Liabilities.
|
|
|
|
|
| Transamerica Series Trust |
|
|
|
Semi-Annual Financial Statements 2024 |
|
|
Page 10 |
|
|
Transamerica Goldman Sachs Managed Risk - Growth ETF VP
NOTES TO FINANCIAL STATEMENTS (continued)
At June 30, 2024
(unaudited)
6. FEES AND OTHER AFFILIATED TRANSACTIONS (continued)
Brokerage commissions: The Portfolio incurred no brokerage commissions on security transactions placed with affiliates of the investment manager or sub-adviser(s) for the period ended June 30, 2024.
7. PURCHASES AND SALES OF SECURITIES
For the period ended June 30, 2024, the cost of securities purchased and proceeds from securities sold (excluding short-term securities) are as follows:
|
|
|
| Purchases of Securities |
|
Sales of Securities |
|
|
| $ 165,536,443 |
|
$ 318,461,747 |
8. FEDERAL INCOME TAXES AND DISTRIBUTIONS TO SHAREHOLDERS
The Portfolio has not made any provision for federal income or excise taxes due to its policy to distribute all of its taxable income and capital gains to its shareholders and otherwise qualify as a regulated investment company under Subchapter M of the Internal Revenue Code. The Portfolio recognizes the tax benefits of uncertain tax positions only where the position is “more likely than not” to be sustained assuming examination by tax authorities. The Portfolio’s tax returns remain subject to examination by the Internal Revenue Service and state tax authorities three years from the date of filing for federal purposes and four years from the date of filing for state purposes. Management has evaluated the Portfolio’s tax provisions taken for all open tax years, and has concluded that no provision for income tax is required in the Portfolio’s financial statements. If applicable, the Portfolio recognizes interest accrued related to unrecognized tax benefits in relation to interest and penalties expense in Other within the Statement of Operations. The Portfolio identifies its major tax jurisdictions as U.S. Federal, the state of Colorado, and foreign jurisdictions where the Portfolio makes significant investments; however, the Portfolio is not aware of any tax positions for which it is reasonably possible that the total amounts of unrecognized tax benefits will change materially in the next twelve months. Distributions are determined in accordance with income tax regulations, which may differ from GAAP.
As of June 30, 2024, the approximate cost for U.S. federal income tax purposes, and the aggregate gross/net unrealized appreciation (depreciation) in the value of investments (including securities sold short and derivatives, if any) are as follows:
|
|
|
|
|
|
|
| Cost |
|
Gross Appreciation |
|
Gross (Depreciation) |
|
Net Appreciation (Depreciation) |
|
|
|
|
| $ 1,742,147,399 |
|
$ 328,444,727 |
|
$ (40,194,777) |
|
$ 288,249,950 |
Please see TST’s most recent report on Form N-CSR, available at: www.transamerica.com/annuities/prospectus, for additional information. For the most recently filed complete proxy voting records for the Trust please visit: https://www.transamerica.com/sites/default/files/files/e070d/TST%20N-PX%202021.pdf
|
|
|
|
|
| Transamerica Series Trust |
|
|
|
Semi-Annual Financial Statements 2024 |
|
|
Page 11 |
|
|
Transamerica Goldman Sachs Managed Risk - Growth ETF VP
MANAGEMENT AND SUB-ADVISORY AGREEMENT — CONTRACT RENEWAL
(unaudited)
At a meeting of the Board of Trustees of Transamerica Series Trust (the “Trustees” or the “Board”) held on June 12-13, 2024, the Board considered the renewal of the management agreement (the “Management Agreement”) between Transamerica Asset Management, Inc. (“TAM”) and Transamerica Series Trust, on behalf of Transamerica Goldman Sachs Managed Risk – Growth ETF VP (the “Portfolio”). The Board also considered the renewal of the investment sub-advisory agreement (the “Sub-Advisory Agreement” and together with the Management Agreement, the “Agreements”) for the Portfolio between TAM and Goldman Sachs Asset Management, L.P. (the “Sub-Adviser”).
Following its review and consideration, the Board determined that the terms of the Management Agreement and Sub-Advisory Agreement were reasonable and that the renewal of each of the Agreements was in the best interests of the Portfolio and the holders invested in the Portfolio. The Board, including the independent members of the Board (the “Independent Trustees”), unanimously approved the renewal of each of the Agreements through June 30, 2025.
Prior to reaching their decision, the Trustees requested and received from TAM and the Sub-Adviser certain information. They then reviewed such information as they deemed reasonably necessary to evaluate the Agreements, including information they had previously received from TAM and the Sub-Adviser as part of their regular oversight of the Portfolio, and knowledge they gained over time through meeting with TAM and the Sub-Adviser. Among other materials, the Trustees considered comparative fee, expense and performance information prepared by Broadridge Financial Solutions, Inc. (“Broadridge”), an independent provider of mutual fund performance information, as well as fee, expense and profitability information prepared by TAM. In addition, TAM provided the Board with additional supplemental comparative fee, expense and performance information. To the extent applicable, the Trustees considered information about fees and performance of comparable funds and/or accounts managed by the Sub-Adviser. The Board also considered reductions to the Portfolio’s expense limits, if any, that took effect after the last renewal of the Agreements. In their review, the Trustees also sought to identify instances in which the Portfolio’s performance, fees, total expenses and/or profitability appeared to be outliers within its respective peer group or other comparative metrics and sought to understand the reasons for such comparative positions.
In their deliberations, the Independent Trustees met privately without representatives of TAM or the Sub-Adviser present and were represented throughout the process by their independent legal counsel. In considering the proposed continuation of each of the Agreements, the Trustees evaluated and weighed a number of considerations that they believed to be relevant in light of the legal advice furnished to them by counsel, including independent legal counsel, and made a decision in the exercise of their own business judgment. They based their decisions on the considerations discussed below, among others, although they did not identify any particular consideration or item of information that was controlling of their decisions, and each Trustee may have attributed different weights to the various factors.
Nature, Extent and Quality of the Services Provided
The Board considered the nature, extent and quality of the services provided by TAM and the Sub-Adviser to the Portfolio in the past and the services anticipated to be provided in the future. The Board also considered the investment approach for the Portfolio; the experience, capability and integrity of TAM’s senior management; the financial resources of TAM; TAM’s management oversight process; TAM’s and the Sub-Adviser’s responsiveness to any questions by the Trustees; and the professional qualifications and compensation program of the portfolio management team of the Sub-Adviser. The Trustees noted that they receive, on a quarterly basis, an execution analysis from Capital Institutional Services, Inc. (CAPIS), an independent provider of trade analyses, for the Sub-Adviser and a comparison of trading results against a peer universe of managers.
The Board also considered the continuous and regular investment management and other services provided by TAM, when acting as a manager of managers, for the portion of the management fee it retains from the Portfolio after payment of the sub-advisory fees. The Board noted that the investment management and other services provided by TAM include the design, development and ongoing review and evaluation of the Portfolio and its investment strategy; the selection, oversight and monitoring of one or more investment sub-advisers to perform certain duties with respect to the Portfolio; ongoing portfolio trading oversight and analysis; risk management oversight and analysis; design, development, implementation and ongoing review and evaluation of a process for the valuation of Portfolio investments; design, development, implementation and ongoing review and evaluation of a compliance program for the Portfolio; design, development, implementation and ongoing review and evaluation of a process for the voting of proxies and exercise of rights to consent to corporate action for Portfolio investments; participation in Board meetings and oversight of preparation of materials for the Board, including materials for Board meetings and regular communications with the Board; oversight of preparation of the Portfolio’s prospectus, statement of additional information, shareholder reports and other disclosure materials and regulatory filings for the Portfolio; and ongoing cash management services for the Portfolio. The Board considered that TAM’s investment management services also include the provision of supervisory and administrative services to the Portfolio. The Board also noted that TAM, as part of the services it provides to all Transamerica mutual funds, including the Portfolio, oversees the services provided by the funds’ custodian, transfer agent, independent accountant and legal counsel and supervises the performance of the recordkeeping and holder service functions of the funds.
Investment Performance
In addition, the Board considered the short- and longer-term performance of the Portfolio in light of its investment objective, policies and strategies, including relative performance against (i) a peer universe of comparable mutual funds, as prepared by Broadridge, and (ii) the Portfolio’s benchmarks, in each case for various trailing periods ended December 31, 2023. Based on these considerations, the Board
|
|
|
|
|
| Transamerica Series Trust |
|
|
|
Semi-Annual Financial Statements 2024 |
|
|
Page 12 |
|
|
Transamerica Goldman Sachs Managed Risk - Growth ETF VP
MANAGEMENT AND SUB-ADVISORY AGREEMENT — CONTRACT RENEWAL (continued)
(unaudited)
determined that TAM and the Sub-Adviser can provide investment and related services that are appropriate in scope and extent in light of the Portfolio’s investment objectives, policies and strategies and operations, the competitive landscape of the investment company business and investor needs. The Board’s conclusions as to the Portfolio’s performance are summarized below. For purposes of its review, the Board generally used the performance of Service Class Shares. In describing the Portfolio’s performance relative to its peer universe, the summary conclusions characterize performance for the relevant periods in relation to whether it was “above,” “below” or “in line with” the peer universe median and do so using quintile rankings prepared by Broadridge. For simplicity, performance is described as “above” the median if the Portfolio’s performance ranked anywhere in the first or second quintiles, as “below” the median if it ranked anywhere in the fourth or fifth quintiles, or “in line with” the median if it ranked anywhere in the third quintile (i.e., even if its precise return was somewhat above or somewhat below the precise median return).
When considering the Portfolio’s performance, the Trustees considered any representations made by TAM regarding the appropriateness of certain peer groups and benchmarks. They recognized that performance reflects a snapshot of a period as of a specific date, and that consideration of performance data for a different period could generate significantly different performance results. The Trustees also recognized that even longer-term performance can be negatively affected by performance over a short-term period when that short-term performance is significantly below the performance of the comparable benchmark or universe of peer funds.
The Board noted that the performance of Service Class Shares of the Portfolio was above the median for its peer universe for the past 1- and 3-year periods and below the median for the past 5- and 10-year periods. The Board also noted that the performance of Service Class Shares of the Portfolio was above the benchmark that TAM utilizes to measure performance of the Portfolio for the past 3-year period and below the benchmark for the past 1-, 5- and 10-year periods. The Board noted that the Sub-Adviser had commenced sub-advising the Portfolio on November 1, 2022 pursuant to its current investment strategies. The Trustees also noted recent changes in the portfolio management team at the Sub-Adviser. The Trustees noted that TAM intends to monitor and report to the Board on the portfolio manager transition and performance going forward.
Management Fee and Sub-Advisory Fees and Total Expense Ratio
The Board considered the management fee and total expense ratio of the Portfolio, including information provided by Broadridge comparing the management fee and total expense ratio of the Portfolio to the management fees and total expense ratios of comparable investment companies in both a peer group and broader peer universe compiled by Broadridge. The Board’s conclusions as to the Portfolio’s management fee and total expense ratio are summarized below. For purposes of its review, the Board generally used the actual total expenses (i.e., expenses reflecting any waivers and/or reimbursements) of Service Class Shares. In describing the Portfolio’s management fee and total expense ratio relative to its peer group and peer universe, the summary conclusions characterize management fees and total expense ratios for the relevant periods in relation to whether they were “above,” “below” or “in line with” the peer group or peer universe median and do so using quintile rankings prepared by Broadridge. For simplicity, management fees and total expense ratios are described as “above” the median if the Portfolio’s management fee or total expense ratio ranked anywhere in the fourth or fifth quintiles, as “below” the median if it ranked anywhere in the first or second quintiles, or “in line with” the median if it ranked anywhere in the third quintile (i.e., even if its precise management fee or total expense ratio was somewhat above or somewhat below the precise median management fee or total expense ratio).
The Board also considered the fees charged by the Sub-Adviser for sub-advisory services, as well as the portion of the Portfolio’s management fee retained by TAM following payment of the sub-advisory fee and how the portion of the contractual management fee retained by TAM at a specified asset level compared to the portions retained by other investment advisers managing mutual funds with similar investment strategies as calculated by an independent provider of information.
The Board noted that the Portfolio’s contractual management fee was in line with the median for its peer group and above the median for its peer universe and that the actual total expenses (i.e., expenses reflecting any waivers and/or reimbursements) of Service Class Shares of the Portfolio were below the medians for its peer group and peer universe. The Trustees also considered that TAM has entered into an expense limitation arrangement with the Portfolio, which may result in TAM waiving fees for the benefit of holders.
On the basis of these considerations, together with the other information it considered, the Board determined that the management and sub-advisory fees to be received by TAM and the Sub-Adviser under the Management Agreement and Sub-Advisory Agreement are reasonable in light of the services provided.
Cost of Services Provided and Level of Profitability
The Board reviewed information provided by TAM about the cost of providing and procuring fund management services, as well as the costs of the provision of administration, transfer agency and other services, to the Portfolio and to Transamerica Series Trust as a whole by TAM and its affiliates. The Board considered the profitability of TAM and its affiliates in providing these services for the Portfolio and Transamerica Series Trust as a whole. The Trustees recognized the competitiveness of the mutual fund industry and the importance of an investment adviser’s long-term profitability, including for maintaining company and management stability and accountability.
The Board also considered the allocation methodology used for calculating the profitability of TAM and its affiliates. The Board noted that the revenue and expense allocation methodology used by TAM to estimate its profitability with respect to its relationship with the Portfolio
|
|
|
|
|
| Transamerica Series Trust |
|
|
|
Semi-Annual Financial Statements 2024 |
|
|
Page 13 |
|
|
Transamerica Goldman Sachs Managed Risk - Growth ETF VP
MANAGEMENT AND SUB-ADVISORY AGREEMENT — CONTRACT RENEWAL (continued)
(unaudited)
had been reviewed previously by an independent consultant. The Trustees considered that TAM reported that it had not made material changes to this methodology, and that the methodology had been applied consistently for the Portfolio.
With respect to the Sub-Adviser, the Board noted that the sub-advisory fee is the product of arm’s-length negotiation between TAM and the Sub-Adviser, which is not affiliated with TAM, and is paid by TAM and not the Portfolio. As a result, the Board focused on the profitability of TAM and its affiliates with respect to the Portfolio.
Based on this information, the Board determined that the profitability of TAM and its affiliates from their relationships with the Portfolio was not excessive.
Economies of Scale
The Board considered economies of scale with respect to the management of the Portfolio, whether the Portfolio had appropriately benefited from any economies of scale and whether there was the potential for realization of any future economies of scale. The Board also considered the existence of economies of scale with respect to management of the Transamerica mutual funds overall and the extent to which the Portfolio benefited from any economies of scale. The Board recognized that, as the Portfolio’s assets increase, any economies of scale realized by TAM or the Sub-Adviser may not directly correlate with each other or with any economies of scale that might be realized by the Portfolio. The Board considered the Portfolio’s management fee schedule and the existence of breakpoints and also considered the extent to which TAM shared economies of scale, if any, with the Portfolio through undertakings to limit or reimburse Portfolio expenses and to invest in maintaining and developing its capabilities and services. The Board also considered the Sub-Adviser’s sub-advisory fee schedule and the existence of breakpoints, if any, and how such breakpoints relate to any breakpoints in the Portfolio’s management fee schedule. The Board considered that the Sub-Adviser’s sub-advisory fees would be based on the combined assets of multiple funds. The Trustees concluded that the Portfolio’s fee structure reflected an appropriate sharing of any efficiencies or economies of scale to date and noted that they will have the opportunity to periodically reexamine the appropriateness of the management fee payable to TAM and the fee paid to the Sub-Adviser in light of any economies of scale experienced in the future.
Benefits to TAM, its Affiliates and/or the Sub-Adviser from their Relationships with the Portfolio
The Board considered other benefits derived by TAM, its affiliates, and/or the Sub-Adviser from their relationships with the Portfolio. The Board noted that TAM does not receive benefits from research obtained with commissions paid to broker-dealers for portfolio transactions (commonly referred to as “soft dollars”) as a result of its relationship with the Portfolio.
Other Considerations
The Board noted that TAM has made a substantial commitment to the recruitment and retention of high-quality personnel and maintains the financial, compliance and operational resources reasonably necessary to manage the Portfolio in a professional manner that is consistent with the best interests of the Portfolio and the holders. In this regard, the Board favorably considered the procedures and policies TAM has in place to enforce compliance with applicable laws and regulations and oversee the portfolio management activities of the Sub-Adviser. The Board also noted that TAM has made an entrepreneurial commitment and undertaken certain business risks with respect to the management and success of the Portfolio.
Conclusion
After consideration of the factors described above, as well as other factors, the Trustees, including the Independent Trustees, concluded that the renewal of the Management Agreement and the Sub-Advisory Agreement was in the best interests of the Portfolio and the holders and voted to approve the renewal of the Agreements.
|
|
|
|
|
| Transamerica Series Trust |
|
|
|
Semi-Annual Financial Statements 2024 |
|
|
Page 14 |
|
|
PROXY VOTING POLICIES AND PROCEDURES AND QUARTERLY PORTFOLIO HOLDINGS
(unaudited)
A description of Transamerica Series Trust’s (the “Trust”) proxy voting policies and procedures is available in the Statement of Additional Information of the Portfolios, available without charge upon request by calling 1-800-851-9777 (toll free) or on the Securities and Exchange Commission’s (“SEC”) website at http://www.sec.gov.
In addition, the Portfolio is required to file Form N-PX, with their complete proxy voting records for the most recent 12 months ended June 30th, no later than August 31st of each year. The Form is available without charge: (1) on the Transamerica Funds website at https://www.transamerica.com/sites/default/files/files/e070d/TST%20N-PX%202021.pdf; and (2) on the SEC’s website at http://www.sec.gov.
Each fiscal quarter, the Portfolios, except Transamerica BlackRock Government Money Market VP, will file with the SEC a complete schedule of its monthly portfolio holdings on Form N-PORT. The Portfolios’ holdings as of the end of the third month of every fiscal quarter, as reported on Form N-PORT, will be publicly available on the SEC’s website at http://www.sec.gov within 60 days of the end of the fiscal quarter.
On a monthly basis, Transamerica BlackRock Government Money Market VP will file with the SEC portfolio holdings information on Form N-MFP3. A complete schedule of portfolio holdings is also available at www.transamerica.com.
You may also visit the Trust’s website at www.transamerica.com/annuities/prospectus for this and other information about the Portfolios and the Trust.
Important Notice Regarding Delivery of Shareholder Documents
Every year we provide shareholders informative materials such as the Transamerica Series Trust Annual Report, the Transamerica Series Trust Prospectus, and other required documents that keep you informed regarding your Portfolios. To the extent provided by mail, Transamerica Series Trust will only send one piece per mailing address, a method that saves your Portfolios money by reducing mailing and printing costs. We will continue to do this unless you tell us not to. To elect to receive individual mailings, simply call a Transamerica Customer Service Representative toll free at 1-800-851-9777, 8 a.m. to 7 p.m. Eastern Time, Monday-Friday. Your request will take effect within 30 days.
|
|
|
|
|
| Transamerica Series Trust |
|
|
|
Semi-Annual Financial Statements 2024 |
|
|
Page 15 |
|
|
NOTICE OF PRIVACY POLICY
(unaudited)
Your privacy is very important to us. We want you to understand what information we collect and how we use it. We collect and use “nonpublic personal information” in connection with providing our customers with a broad range of financial products and services as effectively and conveniently as possible. We treat nonpublic personal information in accordance with our Privacy Policy.
What Information We Collect and From Whom We Collect It
We may collect nonpublic personal information about you from the following sources:
| • |
|
Information we receive from you on applications or other forms, such as your name, address, and account number; |
| • |
|
Information about your transactions with us, our affiliates, or others, such as your account balance and purchase/redemption history; and |
| • |
|
Information we receive from non-affiliated third parties, including consumer reporting agencies. |
What Information We Disclose and To Whom We Disclose It
We do not disclose any nonpublic personal information about current or former customers to anyone without their express consent, except as permitted by law. We may disclose the nonpublic personal information we collect, as described above, to persons or companies that perform services on our behalf and to other financial institutions with which we have joint marketing agreements. We will require these companies to protect the confidentiality of your nonpublic personal information and to use it only to perform the services for which we have hired them.
Our Security Procedures
We restrict access to your nonpublic personal information and only allow disclosures to persons and companies as permitted by law to assist in providing products or services to you. We maintain physical, electronic, and procedural safeguards to protect your nonpublic personal information and to safeguard the disposal of certain consumer information.
Contact Us
If you have any questions about our Privacy Policy, please call 1-800-851-9777 on any business day between 8 a.m. and 7 p.m. Eastern Time.
Note: This Privacy Policy applies only to customers that have a direct relationship with us or our affiliates. If you own shares of our portfolios in the name of a third party such as a bank or broker-dealer, its privacy policy may apply to you instead of ours.
|
|
|
|
|
| Transamerica Series Trust |
|
|
|
Semi-Annual Financial Statements 2024 |
|
|
Page 16 |
|
|
PO Box 219945
Kansas City, MO 64121-9945
|
|
|
| Distributor: |
|
Transamerica Capital, Inc. |
|
|
PO Box 219945 |
|
|
Kansas City, MO 64121-9945 |
|
|
|
|
Customer Service: 1-800-851-9777 |
Transamerica Series Trust Semi-Annual Financial Statements
June 30, 2024
1801 California St., Suite 5200
Denver, CO 80202
Distributor: Transamerica Capital, Inc.
Customer Service: 1-800-851-9777
The following pages contain the most recent semi-annual financial statements for the investment options in which you are invested. In compliance with Securities and Exchange Commission regulations, we present these reports on an annual and semi-annual basis with the hope that they will foster greater understanding of the investment options’ holdings, performance, financial data, accounting policies and other issues. This streamlined version provides information only on the investment options in which you are invested.
If you have any questions about these reports, please do not hesitate to contact your financial professional. As always, we thank you for your trust and the opportunity to serve you.
Transamerica Great Lakes Advisors Large Cap Value VP
SCHEDULE OF INVESTMENTS
At June 30, 2024
(unaudited)
|
|
|
|
|
|
|
|
|
| |
|
Shares |
|
|
Value |
|
| |
|
|
|
|
| COMMON STOCKS - 97.1% |
|
|
|
|
|
|
|
|
| Aerospace & Defense - 3.8% |
|
|
|
|
|
|
|
|
| RTX Corp. |
|
|
15,183 |
|
|
$ |
1,524,221 |
|
| Textron, Inc. |
|
|
10,803 |
|
|
|
927,546 |
|
|
|
|
|
|
|
|
|
|
|
|
|
|
|
|
|
|
|
|
2,451,767 |
|
|
|
|
|
|
|
|
|
|
|
|
|
| Automobiles - 1.7% |
|
|
|
|
|
|
|
|
| General Motors Co. |
|
|
23,627 |
|
|
|
1,097,710 |
|
|
|
|
|
|
|
|
|
|
|
|
|
| Banks - 9.9% |
|
|
|
|
|
|
|
|
| Bank of America Corp. |
|
|
34,909 |
|
|
|
1,388,331 |
|
| JPMorgan Chase & Co. |
|
|
14,185 |
|
|
|
2,869,058 |
|
| Wells Fargo & Co. |
|
|
37,369 |
|
|
|
2,219,345 |
|
|
|
|
|
|
|
|
|
|
|
|
|
|
|
|
|
|
|
|
6,476,734 |
|
|
|
|
|
|
|
|
|
|
|
|
|
| Beverages - 2.2% |
|
|
|
|
|
|
|
|
| PepsiCo, Inc. |
|
|
8,809 |
|
|
|
1,452,868 |
|
|
|
|
|
|
|
|
|
|
|
|
|
| Biotechnology - 5.0% |
|
|
|
|
|
|
|
|
| AbbVie, Inc. |
|
|
10,260 |
|
|
|
1,759,795 |
|
| Amgen, Inc. |
|
|
4,803 |
|
|
|
1,500,698 |
|
|
|
|
|
|
|
|
|
|
|
|
|
|
|
|
|
|
|
|
3,260,493 |
|
|
|
|
|
|
|
|
|
|
|
|
|
| Capital Markets - 4.9% |
|
|
|
|
|
|
|
|
| BlackRock, Inc. |
|
|
2,205 |
|
|
|
1,736,041 |
|
| Intercontinental Exchange, Inc. |
|
|
10,552 |
|
|
|
1,444,463 |
|
|
|
|
|
|
|
|
|
|
|
|
|
|
|
|
|
|
|
|
3,180,504 |
|
|
|
|
|
|
|
|
|
|
|
|
|
| Chemicals - 2.1% |
|
|
|
|
|
|
|
|
| Air Products & Chemicals, Inc. |
|
|
5,178 |
|
|
|
1,336,183 |
|
|
|
|
|
|
|
|
|
|
|
|
|
| Communications Equipment - 2.1% |
|
|
|
|
|
|
|
|
| Motorola Solutions, Inc. |
|
|
3,482 |
|
|
|
1,344,226 |
|
|
|
|
|
|
|
|
|
|
|
|
|
| Construction & Engineering - 2.3% |
|
|
|
|
|
|
|
|
| Quanta Services, Inc. |
|
|
5,849 |
|
|
|
1,486,172 |
|
|
|
|
|
|
|
|
|
|
|
|
|
| Construction Materials - 2.0% |
|
|
|
|
|
|
|
|
| Martin Marietta Materials, Inc. |
|
|
2,456 |
|
|
|
1,330,661 |
|
|
|
|
|
|
|
|
|
|
|
| Consumer Staples Distribution & Retail - 1.7% |
|
| Target Corp. |
|
|
7,507 |
|
|
|
1,111,336 |
|
|
|
|
|
|
|
|
|
|
|
|
|
| Electric Utilities - 2.3% |
|
|
|
|
|
|
|
|
| Duke Energy Corp. |
|
|
14,901 |
|
|
|
1,493,527 |
|
|
|
|
|
|
|
|
|
|
|
|
|
| Energy Equipment & Services - 1.9% |
|
|
|
|
|
|
|
|
| Schlumberger NV |
|
|
26,099 |
|
|
|
1,231,351 |
|
|
|
|
|
|
|
|
|
|
|
|
|
| Entertainment - 2.4% |
|
|
|
|
|
|
|
|
| Walt Disney Co. |
|
|
15,716 |
|
|
|
1,560,442 |
|
|
|
|
|
|
|
|
|
|
|
|
|
| Food Products - 2.6% |
|
|
|
|
|
|
|
|
| Mondelez International, Inc., Class A |
|
|
13,677 |
|
|
|
895,023 |
|
| Tyson Foods, Inc., Class A |
|
|
13,929 |
|
|
|
795,903 |
|
|
|
|
|
|
|
|
|
|
|
|
|
|
|
|
|
|
|
|
1,690,926 |
|
|
|
|
|
|
|
|
|
|
|
|
|
| Ground Transportation - 1.9% |
|
|
|
|
|
|
|
|
| CSX Corp. |
|
|
36,212 |
|
|
|
1,211,291 |
|
|
|
|
|
|
|
|
|
|
|
|
|
|
|
|
|
|
|
| |
|
Shares |
|
|
Value |
|
| |
|
|
| COMMON STOCKS (continued) |
|
| Health Care Equipment & Supplies - 5.1% |
|
| Abbott Laboratories |
|
|
14,506 |
|
|
$ |
1,507,319 |
|
| Boston Scientific Corp. (A) |
|
|
23,338 |
|
|
|
1,797,259 |
|
|
|
|
|
|
|
|
|
|
|
|
|
|
|
|
|
|
|
|
3,304,578 |
|
|
|
|
|
|
|
|
|
|
|
|
|
| Health Care Providers & Services - 5.0% |
|
|
|
|
|
|
|
|
| Cencora, Inc. |
|
|
6,327 |
|
|
|
1,425,473 |
|
| UnitedHealth Group, Inc. |
|
|
3,550 |
|
|
|
1,807,873 |
|
|
|
|
|
|
|
|
|
|
|
|
|
|
|
|
|
|
|
|
3,233,346 |
|
|
|
|
|
|
|
|
|
|
|
|
|
| Industrial REITs - 1.6% |
|
|
|
|
|
|
|
|
| Prologis, Inc. |
|
|
9,557 |
|
|
|
1,073,347 |
|
|
|
|
|
|
|
|
|
|
|
|
|
| Insurance - 2.9% |
|
|
|
|
|
|
|
|
| Hartford Financial Services Group, Inc. |
|
|
18,826 |
|
|
|
1,892,766 |
|
|
|
|
|
|
|
|
|
|
|
|
|
| Interactive Media & Services - 4.0% |
|
|
|
|
|
|
|
|
| Alphabet, Inc., Class A |
|
|
6,546 |
|
|
|
1,192,354 |
|
| Meta Platforms, Inc., Class A |
|
|
2,756 |
|
|
|
1,389,630 |
|
|
|
|
|
|
|
|
|
|
|
|
|
|
|
|
|
|
|
|
2,581,984 |
|
|
|
|
|
|
|
|
|
|
|
|
|
| Life Sciences Tools & Services - 2.3% |
|
|
|
|
|
|
|
|
| Thermo Fisher Scientific, Inc. |
|
|
2,765 |
|
|
|
1,529,045 |
|
|
|
|
|
|
|
|
|
|
|
|
|
| Machinery - 4.7% |
|
|
|
|
|
|
|
|
| Caterpillar, Inc. |
|
|
4,443 |
|
|
|
1,479,963 |
|
| Parker-Hannifin Corp. |
|
|
3,159 |
|
|
|
1,597,854 |
|
|
|
|
|
|
|
|
|
|
|
|
|
|
|
|
|
|
|
|
3,077,817 |
|
|
|
|
|
|
|
|
|
|
|
|
|
| Media - 1.5% |
|
|
|
|
|
|
|
|
| Fox Corp., Class A |
|
|
27,977 |
|
|
|
961,569 |
|
|
|
|
|
|
|
|
|
|
|
|
|
| Metals & Mining - 1.5% |
|
|
|
|
|
|
|
|
| Freeport-McMoRan, Inc. |
|
|
20,577 |
|
|
|
1,000,042 |
|
|
|
|
|
|
|
|
|
|
|
|
|
| Oil, Gas & Consumable Fuels - 6.8% |
|
|
|
|
|
|
|
|
| ConocoPhillips |
|
|
14,286 |
|
|
|
1,634,033 |
|
| Exxon Mobil Corp. |
|
|
24,128 |
|
|
|
2,777,615 |
|
|
|
|
|
|
|
|
|
|
|
|
|
|
|
|
|
|
|
|
4,411,648 |
|
|
|
|
|
|
|
|
|
|
|
|
|
| Passenger Airlines - 1.5% |
|
|
|
|
|
|
|
|
| Delta Air Lines, Inc. |
|
|
19,949 |
|
|
|
946,381 |
|
|
|
|
|
|
|
|
|
|
|
|
|
| Pharmaceuticals - 2.0% |
|
|
|
|
|
|
|
|
| Merck & Co., Inc. |
|
|
10,783 |
|
|
|
1,334,935 |
|
|
|
|
|
|
|
|
|
|
|
| Semiconductors & Semiconductor Equipment - 3.8% |
|
| Broadcom, Inc. |
|
|
632 |
|
|
|
1,014,695 |
|
| Micron Technology, Inc. |
|
|
11,177 |
|
|
|
1,470,111 |
|
|
|
|
|
|
|
|
|
|
|
|
|
|
|
|
|
|
|
|
2,484,806 |
|
|
|
|
|
|
|
|
|
|
|
|
|
| Software - 1.9% |
|
|
|
|
|
|
|
|
| Microsoft Corp. |
|
|
2,729 |
|
|
|
1,219,727 |
|
|
|
|
|
|
|
|
|
|
|
|
|
| Specialized REITs - 1.9% |
|
|
|
|
|
|
|
|
| American Tower Corp. |
|
|
6,363 |
|
|
|
1,236,840 |
|
|
|
|
|
|
|
|
|
|
|
|
|
| Specialty Retail - 1.8% |
|
|
|
|
|
|
|
|
| Lowe’s Cos., Inc. |
|
|
5,376 |
|
|
|
1,185,193 |
|
|
|
|
|
|
|
|
|
|
| Total Common Stocks
(Cost $52,548,654) |
|
|
|
|
|
|
63,190,215 |
|
|
|
|
|
|
|
|
|
|
The Notes to Financial Statements are an integral part of this report.
|
|
|
|
|
| Transamerica Series Trust |
|
|
|
Semi-Annual Financial Statements 2024 |
|
|
Page 1 |
|
|
Transamerica Great Lakes Advisors Large Cap Value VP
SCHEDULE OF INVESTMENTS (continued)
At June 30, 2024
(unaudited)
|
|
|
|
|
|
|
|
|
| |
|
Principal |
|
|
Value |
|
| |
|
| REPURCHASE AGREEMENT - 2.6% |
|
| Fixed Income Clearing Corp., 2.50% (B), dated 06/28/2024, to be repurchased at $1,717,394 on 07/01/2024. Collateralized by a U.S. Government Obligation, 4.50%, due 03/31/2026, and with a value of $1,751,504. |
|
$ |
1,717,037 |
|
|
$ |
1,717,037 |
|
|
|
|
|
|
|
|
|
|
| Total Repurchase Agreement
(Cost $1,717,037) |
|
|
|
1,717,037 |
|
|
|
|
|
|
|
|
|
|
| Total Investments
(Cost $54,265,691) |
|
|
|
64,907,252 |
|
|
|
|
|
|
|
|
|
|
| Net Other Assets (Liabilities) - 0.3% |
|
|
|
171,828 |
|
|
|
|
|
|
|
|
|
|
|
|
| Net Assets - 100.0% |
|
|
$ |
65,079,080 |
|
|
|
|
|
|
|
|
|
|
INVESTMENT VALUATION:
|
|
|
|
|
|
|
|
|
|
|
|
|
|
|
|
|
| |
|
|
|
|
|
|
| Valuation Inputs (C) |
|
|
|
|
|
|
|
|
|
|
|
|
|
|
|
|
| |
|
Level 1 - Unadjusted Quoted Prices |
|
|
Level 2 - Other Significant Observable Inputs |
|
|
Level 3 - Significant Unobservable Inputs |
|
|
Value |
|
| |
|
| ASSETS |
|
|
|
|
|
|
|
|
|
|
|
|
|
|
|
|
| Investments |
|
|
|
|
|
|
|
|
|
|
|
|
|
|
|
|
| Common Stocks |
|
$ |
63,190,215 |
|
|
$ |
— |
|
|
$ |
— |
|
|
$ |
63,190,215 |
|
| Repurchase Agreement |
|
|
— |
|
|
|
1,717,037 |
|
|
|
— |
|
|
|
1,717,037 |
|
|
|
|
|
|
|
|
|
|
|
|
|
|
|
|
|
|
| Total Investments |
|
$ |
63,190,215 |
|
|
$ |
1,717,037 |
|
|
$ |
— |
|
|
$ |
64,907,252 |
|
|
|
|
|
|
|
|
|
|
|
|
|
|
|
|
|
|
FOOTNOTES TO SCHEDULE OF INVESTMENTS:
| (A) |
Non-income producing security. |
| (B) |
Rate disclosed reflects the yield at June 30, 2024. |
| (C) |
There were no transfers in or out of Level 3 during the period ended June 30, 2024. Please reference the Investment Valuation section of the Notes to Financial Statements for more information regarding investment valuation and pricing inputs. |
PORTFOLIO ABBREVIATION(S):
REIT Real Estate Investment Trust
The Notes to Financial Statements are an integral part of this report.
|
|
|
|
|
| Transamerica Series Trust |
|
|
|
Semi-Annual Financial Statements 2024 |
|
|
Page 2 |
|
|
Transamerica Great Lakes Advisors Large Cap Value VP
STATEMENT OF ASSETS AND LIABILITIES
At June 30, 2024
(unaudited)
|
|
|
|
|
|
|
| Assets: |
|
|
|
|
| Investments, at value (cost $52,548,654) |
|
$ |
63,190,215 |
|
| Repurchase agreement, at value (cost $1,717,037) |
|
|
1,717,037 |
|
| Receivables and other assets: |
|
|
|
|
| Shares of beneficial interest sold |
|
|
189,915 |
|
| Dividends |
|
|
44,891 |
|
| Interest |
|
|
358 |
|
| Prepaid expenses |
|
|
249 |
|
|
|
| Total assets |
|
|
65,142,665 |
|
|
|
| Liabilities: |
|
|
|
|
| Payables and other liabilities: |
|
|
|
|
| Shares of beneficial interest redeemed |
|
|
115 |
|
| Investment management fees |
|
|
29,612 |
|
| Distribution and service fees |
|
|
12,463 |
|
| Transfer agent costs |
|
|
38 |
|
| Trustee and CCO fees |
|
|
114 |
|
| Audit and tax fees |
|
|
10,988 |
|
| Custody fees |
|
|
2,650 |
|
| Legal fees |
|
|
1,029 |
|
| Printing and shareholder reports fees |
|
|
2,285 |
|
| Other accrued expenses |
|
|
4,291 |
|
|
|
| Total liabilities |
|
|
63,585 |
|
|
|
| Net assets |
|
$ |
65,079,080 |
|
|
|
| Net assets consist of: |
|
|
|
|
| Capital stock ($0.01 par value) |
|
$ |
48,389 |
|
| Additional paid-in capital |
|
|
50,606,289 |
|
| Total distributable earnings (accumulated losses) |
|
|
14,424,402 |
|
|
|
| Net assets |
|
$ |
65,079,080 |
|
|
|
| Shares outstanding |
|
|
4,838,897 |
|
|
|
| Net asset value and offering price per share |
|
$ |
13.45 |
|
STATEMENT OF OPERATIONS
For the period ended June 30, 2024
(unaudited)
|
|
|
|
|
|
|
| Investment income: |
|
|
|
|
| Dividend income |
|
$ |
563,102 |
|
| Interest income |
|
|
16,078 |
|
|
|
| Total investment income |
|
|
579,180 |
|
|
|
| Expenses: |
|
|
|
|
| Investment management fees |
|
|
183,741 |
|
| Distribution and service fees |
|
|
77,332 |
|
| Transfer agent costs |
|
|
334 |
|
| Trustee and CCO fees |
|
|
1,393 |
|
| Audit and tax fees |
|
|
10,937 |
|
| Custody fees |
|
|
2,990 |
|
| Legal fees |
|
|
2,225 |
|
| Printing and shareholder reports fees |
|
|
3,053 |
|
| Other |
|
|
9,053 |
|
|
|
| Total expenses |
|
|
291,058 |
|
|
|
| Net investment income (loss) |
|
|
288,122 |
|
|
|
| Net realized gain (loss) on: |
|
|
|
|
| Investments |
|
|
230,442 |
|
|
|
| Net change in unrealized appreciation (depreciation) on: |
|
|
|
|
| Investments |
|
|
5,775,542 |
|
|
|
| Net realized and change in unrealized gain (loss) |
|
|
6,005,984 |
|
|
|
| Net increase (decrease) in net assets resulting from operations |
|
$ |
6,294,106 |
|
The Notes to Financial Statements are an integral part of this report.
|
|
|
|
|
| Transamerica Series Trust |
|
|
|
Semi-Annual Financial Statements 2024 |
|
|
Page 3 |
|
|
Transamerica Great Lakes Advisors Large Cap Value VP
STATEMENT OF CHANGES IN NET ASSETS
For the period and year ended:
|
|
|
|
|
|
|
|
|
|
|
|
| |
|
June 30, 2024 (unaudited) |
|
December 31, 2023 |
|
|
|
| From operations: |
|
|
|
|
|
|
|
|
| Net investment income (loss) |
|
$ |
288,122 |
|
|
$ |
592,866 |
|
| Net realized gain (loss) |
|
|
230,442 |
|
|
|
2,808,677 |
|
| Net change in unrealized appreciation (depreciation) |
|
|
5,775,542 |
|
|
|
3,358,416 |
|
|
|
|
| Net increase (decrease) in net assets resulting from operations |
|
|
6,294,106 |
|
|
|
6,759,959 |
|
|
|
|
| Dividends and/or distributions to shareholders: |
|
|
|
|
|
|
|
|
| Dividends and/or distributions to shareholders |
|
|
— |
|
|
|
(3,122,688 |
) |
|
|
|
| Net increase (decrease) in net assets resulting from dividends and/or distributions to shareholders |
|
|
— |
|
|
|
(3,122,688 |
) |
|
|
|
| Capital share transactions: |
|
|
|
|
|
|
|
|
| Proceeds from shares sold |
|
|
4,946,052 |
|
|
|
7,712,840 |
|
| Dividends and/or distributions reinvested |
|
|
— |
|
|
|
3,122,688 |
|
| Cost of shares redeemed |
|
|
(4,569,298 |
) |
|
|
(11,046,968 |
) |
|
|
|
| Net increase (decrease) in net assets resulting from capital share transactions |
|
|
376,754 |
|
|
|
(211,440 |
) |
|
|
|
| Net increase (decrease) in net assets |
|
|
6,670,860 |
|
|
|
3,425,831 |
|
|
|
|
| Net assets: |
|
|
|
|
|
|
|
|
| Beginning of period/year |
|
|
58,408,220 |
|
|
|
54,982,389 |
|
| End of period/year |
|
$ |
65,079,080 |
|
|
$ |
58,408,220 |
|
|
|
|
| Capital share transactions - shares: |
|
|
|
|
|
|
|
|
| Shares issued |
|
|
379,578 |
|
|
|
666,025 |
|
| Shares reinvested |
|
|
— |
|
|
|
272,724 |
|
| Shares redeemed |
|
|
(349,562 |
) |
|
|
(948,548 |
) |
|
|
|
| Net increase (decrease) in shares outstanding |
|
|
30,016 |
|
|
|
(9,799 |
) |
FINANCIAL HIGHLIGHTS
|
|
|
|
|
|
|
|
|
|
|
|
|
|
|
|
|
|
|
|
|
|
|
|
|
| For a share outstanding during the period and years indicated: |
|
Service Class |
|
|
|
|
|
|
|
| |
|
June 30, 2024 (unaudited) |
|
December 31, 2023 |
|
December 31, 2022 |
|
December 31, 2021 |
|
December 31, 2020 |
|
December 31, 2019 |
| Net asset value, beginning of period/year |
|
$ |
12.15 |
|
|
$ |
11.41 |
|
|
$ |
12.80 |
|
|
$ |
10.14 |
|
|
$ |
10.49 |
|
|
$ |
9.02 |
|
|
|
|
|
|
|
|
| Investment operations: |
|
|
|
|
|
|
|
|
|
|
|
|
|
|
|
|
|
|
|
|
|
|
|
|
| Net investment income (loss)(A) |
|
|
0.06 |
|
|
|
0.12 |
|
|
|
0.11 |
|
|
|
0.04 |
|
|
|
0.16 |
|
|
|
0.16 |
|
| Net realized and unrealized gain (loss) |
|
|
1.24 |
|
|
|
1.30 |
|
|
|
(1.06 |
) |
|
|
3.04 |
|
|
|
(0.27 |
)(B) |
|
|
1.37 |
|
|
|
|
|
|
|
|
| Total investment operations |
|
|
1.30 |
|
|
|
1.42 |
|
|
|
(0.95 |
) |
|
|
3.08 |
|
|
|
(0.11 |
) |
|
|
1.53 |
|
|
|
|
|
|
|
|
| Dividends and/or distributions to shareholders: |
|
|
|
|
|
|
|
|
|
|
|
|
|
|
|
|
|
|
|
|
|
|
|
|
| Net investment income |
|
|
— |
|
|
|
(0.11 |
) |
|
|
(0.03 |
) |
|
|
(0.09 |
) |
|
|
(0.06 |
) |
|
|
(0.03 |
) |
| Net realized gains |
|
|
— |
|
|
|
(0.57 |
) |
|
|
(0.41 |
) |
|
|
(0.33 |
) |
|
|
(0.18 |
) |
|
|
(0.03 |
) |
|
|
|
|
|
|
|
| Total dividends and/or distributions to shareholders |
|
|
— |
|
|
|
(0.68 |
) |
|
|
(0.44 |
) |
|
|
(0.42 |
) |
|
|
(0.24 |
) |
|
|
(0.06 |
) |
|
|
|
|
|
|
|
| Net asset value, end of period/year |
|
$ |
13.45 |
|
|
$ |
12.15 |
|
|
$ |
11.41 |
|
|
$ |
12.80 |
|
|
$ |
10.14 |
|
|
$ |
10.49 |
|
| |
|
|
|
|
|
|
|
|
|
|
|
|
|
|
|
|
|
|
|
|
|
|
|
|
|
|
|
|
|
|
|
| Total return |
|
|
10.70 |
%(C) |
|
|
12.78 |
% |
|
|
(7.38 |
)% |
|
|
30.56 |
% |
|
|
(0.61 |
)% |
|
|
17.00 |
% |
|
|
|
|
|
|
|
| Ratio and supplemental data: |
|
|
|
|
|
|
|
|
|
|
|
|
|
|
|
|
|
|
|
|
|
|
|
|
| Net assets end of period/year (000’s) |
|
$ |
65,079 |
|
|
$ |
58,408 |
|
|
$ |
54,982 |
|
|
$ |
46,827 |
|
|
$ |
25,810 |
|
|
$ |
12,878 |
|
| Expenses to average net assets |
|
|
|
|
|
|
|
|
|
|
|
|
|
|
|
|
|
|
|
|
|
|
|
|
| Excluding waiver and/or reimbursement and recapture |
|
|
0.94 |
%(D) |
|
|
0.97 |
% |
|
|
0.94 |
% |
|
|
0.99 |
% |
|
|
1.23 |
% |
|
|
1.49 |
% |
| Including waiver and/or reimbursement and recapture |
|
|
0.94 |
%(D) |
|
|
0.97 |
% |
|
|
0.94 |
% |
|
|
1.17 |
% |
|
|
1.20 |
% |
|
|
1.20 |
% |
| Net investment income (loss) to average net assets |
|
|
0.93 |
%(D) |
|
|
1.06 |
% |
|
|
0.93 |
% |
|
|
0.38 |
% |
|
|
1.81 |
% |
|
|
1.59 |
% |
|
|
|
|
|
|
|
| Portfolio turnover rate |
|
|
11 |
%(C) |
|
|
21 |
% |
|
|
29 |
% |
|
|
30 |
% |
|
|
288 |
% |
|
|
144 |
% |
| (A) |
Calculated based on average number of shares outstanding. |
| (B) |
The amount of net realized and unrealized gain/(loss) per share does not correspond with the amounts reported within the Statement of Changes due to the timing of purchases and redemptions of Portfolio shares and fluctuating market values during the period. |
The Notes to Financial Statements are an integral part of this report.
|
|
|
|
|
| Transamerica Series Trust |
|
|
|
Semi-Annual Financial Statements 2024 |
|
|
Page 4 |
|
|
Transamerica Great Lakes Advisors Large Cap Value VP
NOTES TO FINANCIAL STATEMENTS
At June 30, 2024
(unaudited)
1. ORGANIZATION
Transamerica Series Trust (“TST”) is an open-end management investment company registered under the Investment Company Act of 1940, as amended (the “1940 Act”). TST applies investment company accounting and reporting guidance. TST serves as a funding vehicle for variable life insurance, variable annuity, and group annuity products. Transamerica Great Lakes Advisors Large Cap Value VP (the “Portfolio”) is a series of TST and is classified as diversified under the 1940 Act. The Portfolio currently offers one class of shares, Service Class.
The only shareholders of the Portfolio are affiliated insurance company separate accounts and/or affiliated asset allocation portfolios. Contract holders of the variable life and annuity contracts are not shareholders of the Portfolio. For ease of reference, shareholders and contract holders are collectively referred to in this report as “shareholders.”
This report must be accompanied or preceded by the Portfolio’s current prospectus, which contains additional information about the Portfolio, including risks, as well as investment objectives and strategies.
Transamerica Asset Management, Inc. (“TAM”) serves as investment manager for the Portfolio pursuant to an investment management agreement. TAM provides continuous and regular investment management services to the Portfolio. TAM supervises the Portfolio’s investments, conducts its investment program and provides supervisory, compliance and administrative services to the Portfolio.
TAM currently acts as a “manager of managers” and has hired sub-advisers to furnish day-to-day investment advice and recommendations. TAM may, in the future, determine to provide all aspects of the day-to-day management of the Portfolio without the use of a sub-adviser. When acting as a manager of managers, TAM provides investment management services that include, without limitation, the design and development of the Portfolio and its investment strategies and the ongoing review and evaluation of those investment strategies including recommending changes in strategy where it believes appropriate or advisable; the selection of one or more sub-advisers for the Portfolio employing a combination of quantitative and qualitative screens, research, analysis and due diligence; negotiation of sub-advisory agreements and fees; oversight and monitoring of sub-advisers and recommending changes to sub-advisers where it believes appropriate or advisable; recommending portfolio combinations and liquidations where it believes appropriate or advisable; selection and oversight of transition managers, as needed; regular supervision of the Portfolio’s investments; regular review and evaluation of sub-adviser performance; daily monitoring of the sub-advisers’ buying and selling of securities for the Portfolio; regular review of holdings; ongoing trade oversight and analysis; regular monitoring to ensure adherence to investment process; regular calls and periodic on-site visits with sub-advisers; portfolio construction and asset allocation when using multiple sub-advisers for the Portfolio; risk management oversight and analysis; oversight of negotiation of investment documentation and agreements; design, development, implementation and regular monitoring of the valuation process; periodic due diligence reviews of pricing vendors and vendor methodology; design, development, implementation and regular monitoring of the compliance process; respond to regulatory inquiries and determine appropriate litigation strategy, as needed; review of proxies voted by sub-advisers; oversight of preparation and review of materials for meetings of the Portfolio’s Board of Trustees (the “Board”), participation in these meetings and preparation of regular communications with the Board; oversight of preparation and review of prospectuses, shareholder reports and other disclosure materials and regulatory filings for the Portfolio; oversight of other service providers to the Portfolio, such as the custodian, the transfer agent, the Portfolio’s independent accounting firm and legal counsel; supervision of the performance of recordkeeping and shareholder relations functions for the Portfolio; and oversight of cash management services. TAM uses a variety of quantitative and qualitative tools to carry out its investment management services. TAM, not the Portfolio, is responsible for paying the sub-adviser(s) for their services, and sub-advisory fees are TAM’s expense.
TAM’s investment management services also include the provision of supervisory and administrative services to the Portfolio. These services include performing certain administrative services for the Portfolio and supervising and overseeing the administrative, clerical, recordkeeping and bookkeeping services provided to the Portfolio by State Street Bank and Trust Company (“State Street”), to whom TAM has outsourced the provision of certain sub-administration services. To the extent agreed upon by TAM and the Portfolio from time to time, TAM’s supervisory and administrative services include, but are not limited to: monitoring and verifying the custodian’s daily calculation of the Net Asset Values (“NAV”); shareholder relations functions; compliance services; valuation services; assisting in due diligence and in the oversight and monitoring of certain activities of sub-advisers and certain aspects of Portfolio investments; assisting with Portfolio combinations and liquidations; oversight of the preparation and filing, and review, of all returns and reports, in connection with federal, state and local taxes; oversight and review of regulatory reporting; supervising and coordinating the Portfolio’s custodian and dividend disbursing agent and monitoring their services to the Portfolio; assisting the Portfolio in preparing reports to shareholders; acting as liaison with the Portfolio’s independent public accountants and providing, upon request, analyses, fiscal year summaries and other audit related services; assisting in the preparation of agendas and supporting documents for and minutes of meetings of trustees and committees of trustees; assisting in the preparation of regular communications with the trustees; and providing personnel and office space, telephones and other office equipment as necessary in order for TAM to perform supervisory and administrative services to the Portfolio. The Portfolio
|
|
|
|
|
| Transamerica Series Trust |
|
|
|
Semi-Annual Financial Statements 2024 |
|
|
Page 5 |
|
|
Transamerica Great Lakes Advisors Large Cap Value VP
NOTES TO FINANCIAL STATEMENTS (continued)
At June 30, 2024
(unaudited)
1. ORGANIZATION (continued)
pays certain fees and expenses to State Street for sub-administration services which are not administrative services covered by the management agreement with TAM or paid for through the management fees payable thereunder. For the period ended June 30, 2024, (i) the expenses paid to State Street for sub-administration services by the Portfolio are shown as a part of Other expenses within the Statement of Operations and (ii) the expenses payable to State Street for sub-administration services from the Portfolio are shown as part of Other accrued expenses within the Statement of Assets and Liabilities.
2. SIGNIFICANT ACCOUNTING POLICIES
In preparing the Portfolio’s financial statements in accordance with Generally Accepted Accounting Principles in the United States of America (“GAAP”), estimates or assumptions (which could differ from actual results) may be used that affect reported amounts and disclosures. The following is a summary of significant accounting policies followed by the Portfolio.
Security transactions and investment income: Security transactions are accounted for on the trade date. Security gains and losses are calculated on a first-in, first-out basis. Dividend income, if any, is recorded on the ex-dividend date or, in the case of foreign securities, as soon as the Portfolio is informed of the ex-dividend dates, net of foreign taxes. Non-cash dividends, if any, are recorded on the ex-dividend date at fair value. Interest income, if any, is recorded on the accrual basis from settlement date, net of foreign taxes. Fixed income premiums and discounts are amortized and/or accreted over the lives of the respective securities.
Distributions to shareholders: Distributions are recorded on the ex-dividend date and are determined in accordance with federal income tax regulations, which may differ from GAAP.
Commission recapture: The sub-adviser(s), to the extent consistent with the best execution and usual commission rate policies and practices, may elect to place security transactions of the Portfolio with broker/dealers with which TST has established a commission recapture program. A commission recapture program is any arrangement under which a broker/dealer applies a portion of the commissions received by such broker/dealer on the security transactions to the Portfolio. In no event will commissions, paid by the Portfolio, be used to pay expenses that would otherwise be borne by any other Portfolios within TST, or by any other party.
Commissions recaptured are included within Net realized gain (loss) within the Statement of Operations. For the period ended June 30, 2024, commissions recaptured are $490.
Indemnification: In the normal course of business, the Portfolio enters into contracts that contain a variety of representations that provide general indemnifications. The Portfolio’s maximum exposure under these arrangements is unknown, as this would involve future claims that may be made against the Portfolio and/or its affiliates that have not yet occurred. However, based on experience, the Portfolio expects the risk of loss to be remote.
3. INVESTMENT VALUATION
TAM has been designated as the Portfolio’s valuation designee pursuant to Rule 2a-5 under the 1940 Act with responsibility for fair valuation subject to oversight by the Portfolio’s Board of Trustees. The net asset value of the Portfolio is computed as of the official close of the New York Stock Exchange (“NYSE”) each day the NYSE is open for business.
TAM utilizes various methods to measure the fair value of its investments on a recurring basis. GAAP establishes a hierarchy that prioritizes inputs to valuation methods. The inputs or methodology used for valuing securities are not necessarily an indication of the risk associated with investing in those securities. The three levels (“Levels”) of inputs of the fair value hierarchy are defined as follows:
Level 1—Unadjusted quoted prices in active markets for identical securities.
Level 2—Inputs, other than quoted prices included in Level 1, which are observable, either directly or indirectly. These inputs may include quoted prices for the identical instrument on an inactive market, prices for similar instruments, interest rates, prepayment speeds, credit risk, yield curves, default rates, and similar data.
Level 3—Unobservable inputs based on the best information available in the circumstances, to the extent observable inputs are not available, which may include TAM’s own assumptions used in determining the fair value of the Portfolio’s investments.
The inputs used to measure fair value may fall into different Levels of the fair value hierarchy. In such cases, for disclosure purposes, the Level in the fair value hierarchy that is assigned to the fair value measurement of a security is determined based on the lowest Level input
|
|
|
|
|
| Transamerica Series Trust |
|
|
|
Semi-Annual Financial Statements 2024 |
|
|
Page 6 |
|
|
Transamerica Great Lakes Advisors Large Cap Value VP
NOTES TO FINANCIAL STATEMENTS (continued)
At June 30, 2024
(unaudited)
3. INVESTMENT VALUATION (continued)
that is significant to the fair value measurement in its entirety. Certain investments that are measured at fair value using NAV per share, or its equivalent, using the “practical expedient” have not been classified in the fair value Levels. The hierarchy classification of inputs used to value the Portfolio’s investments at June 30, 2024, is disclosed within the Investment Valuation section of the Schedule of Investments.
The availability of observable inputs can vary from security to security and is affected by a wide variety of factors, including, but not limited to, the type of security, whether the security is new and not yet established in the marketplace, the liquidity of markets, and other characteristics particular to the security. To the extent that valuation is based on models or inputs that are less observable or unobservable in the market, the determination of fair value requires more judgment. Accordingly, the degree of judgment exercised in determining fair value is generally greatest for instruments categorized in Level 3. Due to the inherent uncertainty of valuation, the determination of values may differ significantly from values that would have been realized had a ready market for investments existed, and the differences could be material.
Fair value measurements: Descriptions of the valuation techniques applied to the Portfolio’s significant categories of assets and liabilities measured at fair value on a recurring basis are as follows:
Equity securities: Securities are stated at the last reported sales price or closing price on the day of valuation taken from the primary exchange where the security is principally traded. To the extent these securities are actively traded and valuation adjustments are not applied, they are categorized in Level 1 of the fair value hierarchy. Equities traded on inactive markets or valued by reference to similar instruments are generally categorized in Level 2 or Level 3 if inputs are unobservable.
Foreign equity securities: Securities in which the primary trading market closes at the same time or after the NYSE, are valued based on quotations from the primary market in which they are traded and are categorized in Level 1. Because many foreign securities markets and exchanges close prior to the close of the NYSE, closing prices for foreign securities in those markets or on those exchanges do not reflect the events that occur after that close. Certain foreign securities may be fair valued using a pricing service that considers the correlation of the trading patterns of the foreign security to the intraday trading in the U.S. markets for investments such as American Depositary Receipts, financial futures, or ETFs and the movement of certain indices of securities based on a statistical analysis of their historical relationship; such valuations generally are categorized in Level 2.
Repurchase agreements: Repurchase agreements are valued at cost, which approximates fair value. To the extent the inputs are observable and timely, the values are generally categorized in Level 2 of the fair value hierarchy.
4. SECURITIES AND OTHER INVESTMENTS
Real estate investment trusts (“REITs”): REITs are pooled investment vehicles which invest primarily in income producing real estate, or real estate related loans or interests. Distributions received by REITs are classified at management’s estimate of the dividend income, return of capital and capital gains. Estimates are based on information available at year-end, which includes the previous fiscal year’s classification. The actual amounts of dividend income, return of capital, and capital gains are only determined by each REIT after the fiscal year end and may differ from the estimated amounts. Upon notification from the REITs, some of the distributions received may be re-classified and recorded as a return of capital or capital gains. There are certain additional risks involved in investing in REITs. These include, but are not limited to, economic conditions, changes in zoning laws, real estate values, property taxes, and interest rates.
REITs held at June 30, 2024, if any, are identified within the Schedule of Investments.
5. BORROWINGS AND OTHER FINANCING TRANSACTIONS
The Portfolio may engage in borrowing transactions as a means of raising cash to satisfy redemption requests, for other temporary or emergency purposes or, to the extent permitted by its investment policies, to raise additional cash to be invested in other securities or instruments. When the Portfolio invests borrowing proceeds in other securities, the Portfolio will bear the risk that the market value of the securities in which such proceeds are invested goes down and is insufficient to repay the borrowed proceeds. The Portfolio may borrow on a secured or on an unsecured basis. If the Portfolio enters into a secured borrowing arrangement, a portion of the Portfolio’s assets will be used as collateral. The 1940 Act requires the Portfolio to maintain asset coverage of at least 300% of the amount of its borrowings. Asset coverage means the ratio that the value of the Portfolio’s total assets, minus liabilities other than borrowings, bears to the aggregate amount of all borrowings. Although complying with this requirement has the effect of limiting the amount that the Portfolio may borrow, it does not otherwise mitigate the risks of entering into borrowing transactions.
|
|
|
|
|
| Transamerica Series Trust |
|
|
|
Semi-Annual Financial Statements 2024 |
|
|
Page 7 |
|
|
Transamerica Great Lakes Advisors Large Cap Value VP
NOTES TO FINANCIAL STATEMENTS (continued)
At June 30, 2024
(unaudited)
5. BORROWINGS AND OTHER FINANCING TRANSACTIONS (continued)
Interfund lending: The Portfolio, along with other funds and portfolios advised by TAM, may participate in an interfund lending program pursuant to exemptive relief granted by the Securities and Exchange Commission on January 18, 2017. This program allows the Portfolio to lend to and borrow from other funds and portfolios advised by TAM. Interfund lending transactions are subject to the conditions of the exemptive relief which places limits on the amount of lending or borrowing a Portfolio may participate in under the program. Interest earned or paid on an interfund lending transaction will be based on the average of certain current market rates. For the period ended June 30, 2024, the Portfolio has not utilized the program.
Repurchase agreements: In a repurchase agreement, the Portfolio purchases a security and simultaneously commits to resell that security to the seller at an agreed-upon price on an agreed-upon date. Securities purchased subject to a repurchase agreement are held at the Portfolio’s custodian, or designated sub-custodian related to tri-party repurchase agreements, and, pursuant to the terms of the repurchase agreement, must be collateralized by securities with an aggregate market value greater than or equal to 100% of the resale price. The Portfolio will bear the risk of value fluctuations until the securities can be sold and may encounter delays and incur costs in liquidating the securities. In the event of bankruptcy or insolvency of the seller, delays and costs may be incurred.
Repurchase agreements are subject to netting agreements, which are agreements between the Portfolio and its counterparties that provide for the net settlement of all transactions and collateral with the Portfolio, through a single payment, in the event of default or termination. Amounts presented within the Schedule of Investments, and as part of Repurchase agreements, at value within the Statement of Assets and Liabilities are shown on a gross basis. The value of the related collateral for each repurchase agreement, as reflected within the Schedule of Investments, exceeds the value of each repurchase agreement at June 30, 2024.
Repurchase agreements at June 30, 2024, if any, are included within the Schedule of Investments and Statement of Assets and Liabilities.
6. RISK FACTORS
Investing in the Portfolio involves certain key risks related to the Portfolio’s trading activity. Please reference the Portfolio’s prospectus for a more complete discussion of the following risk(s), as well as other risks of investing in the Portfolio.
Market risk: The market prices of the Portfolio’s securities or other assets may go up or down, sometimes rapidly or unpredictably, due to factors such as economic events, inflation, changes in interest rates, governmental actions or interventions, actions taken by the U.S. Federal Reserve or foreign central banks, market disruptions caused by tariffs, trade disputes or other factors, political developments, armed conflicts, economic sanctions, cybersecurity events, investor sentiment, the global and domestic effects of widespread or local health, weather or climate events, and other factors that may or may not be related to the issuer of the security or other asset. If the market prices of the Portfolio’s securities and assets fall, the value of your investment in the Portfolio could go down.
Economies and financial markets throughout the world are increasingly interconnected. Events or circumstances in one or more countries or regions could be highly disruptive to, and have profound impacts on, global economies or markets. As a result, whether or not the Portfolio invests in securities of issuers located in or with significant exposure to the countries directly affected, the value and liquidity of the Portfolio’s investments may go down.
Equity securities risk: Equity securities generally have greater risk of loss than debt securities. Stock markets are volatile and the value of equity securities may go up or down, sometimes rapidly and unpredictably. The market price of an equity security may fluctuate based on overall market conditions, such as real or perceived adverse economic or political conditions or trends, tariffs and trade disruptions, inflation, substantial economic downturn or recession, changes in interest rates, or adverse investor sentiment. The market price of an equity security also may fluctuate based on real or perceived factors affecting a particular industry or industries or the company itself. If the market prices of the equity securities owned by the Portfolio fall, the value of your investment in the Portfolio will decline. The Portfolio may lose its entire investment in the equity securities of an issuer. A change in financial condition or other event affecting a single issuer may adversely impact securities markets as a whole.
Large capitalization companies risk: The Portfolio’s investments in larger, more established companies may underperform other segments of the market because they may be less responsive to competitive challenges and opportunities and unable to attain high growth rates during periods of economic expansion.
Real estate investment trusts (“REITs”) risk: Investing in real estate investment trusts (“REITs”) involves unique risks. When the Portfolio invests in REITs, it is subject to risks generally associated with investing in real estate. A REIT’s performance depends on the types and locations of the properties it owns, how well it manages those properties and cash flow. REITs may have limited financial
|
|
|
|
|
| Transamerica Series Trust |
|
|
|
Semi-Annual Financial Statements 2024 |
|
|
Page 8 |
|
|
Transamerica Great Lakes Advisors Large Cap Value VP
NOTES TO FINANCIAL STATEMENTS (continued)
At June 30, 2024
(unaudited)
6. RISK FACTORS (continued)
resources, may trade less frequently and in limited volume, may engage in dilutive offerings, and may be subject to more abrupt or erratic price movements than the overall securities markets. In addition to its own expenses, the Portfolio will indirectly bear its proportionate share of any management and other expenses paid by REITs in which it invests. U.S. REITs are subject to a number of highly technical tax-related rules and requirements; and a U.S. REIT’s failure to qualify for the favorable U.S. federal income tax treatment generally available to U.S. REITs could result in corporate-level taxation, significantly reducing the return on an investment to the Portfolio.
7. FEES AND OTHER AFFILIATED TRANSACTIONS
TST serves as a funding vehicle for certain affiliated asset allocation portfolios and certain affiliated separate accounts of Transamerica Life Insurance Company (“TLIC”) and Transamerica Financial Life Insurance Company.
TAM, the Portfolio’s investment manager, is directly owned by TLIC and AUSA Holding, LLC (“AUSA”), both of which are indirect, wholly owned subsidiaries of Aegon Ltd. TLIC is owned by Commonwealth General Corporation (“Commonwealth”). Commonwealth and AUSA are wholly owned by Transamerica Corporation (DE). Transamerica Corporation (DE) is wholly owned by Aegon International B.V., which is wholly owned by Aegon Ltd., a Bermuda exempted company with liability limited by shares (formerly, Aegon NV, a Netherlands corporation) and a publicly traded international insurance group.
Transamerica Fund Services, Inc. (“TFS”) is the Portfolio’s transfer agent. Transamerica Capital, Inc. (“TCI”) is the Portfolio’s distributor/principal underwriter. TAM, TFS and TCI are affiliates of Aegon Ltd.
Certain officers and trustees of the Portfolio may also be officers and/or trustees of TAM, TFS and TCI. No interested trustee who is deemed an interested person due to current or former service with TAM or an affiliate of TAM receives compensation from the Portfolio. The Portfolio does pay non-interested persons (independent trustees), as disclosed in Trustee and CCO fees within the Statement of Operations.
Investment management fees: TAM serves as the Portfolio’s investment manager, performing administration as well as investment advisory services. TAM renders investment advisory, supervisory, and administration services under an investment management agreement and the Portfolio pays a single management fee, which is reflected in Investment management fees within the Statement of Operations.
The Portfolio pays a management fee to TAM based on daily average net assets at the following rates:
|
|
|
|
|
| Breakpoints |
|
Rate |
|
|
| First $1 billion |
|
|
0.594% |
|
| Over $1 billion up to $2 billion |
|
|
0.580 |
|
| Over $2 billion up to $3 billion |
|
|
0.560 |
|
| Over $3 billion |
|
|
0.540 |
|
TAM has contractually agreed to waive fees and/or reimburse Portfolio expenses to the extent that the total operating expenses excluding, as applicable, acquired fund fees and expenses, interest (including borrowing costs and overdraft charges), taxes, brokerage commissions, dividend and interest expenses on securities sold short, extraordinary expenses and other expenses not incurred in the ordinary course of the Portfolio’s business, exceed the following stated annual operating expense limits to the Portfolio’s daily average net assets. To the extent an expense limit changed during the period, the prior limit is also listed below. The expenses waived and/or reimbursed, if any, are included in Expenses waived and/or reimbursed within the Statement of Operations.
|
|
|
|
|
|
|
|
|
|
|
| Class |
|
Operating Expense Limit |
|
Operating Expense Limit Effective Through |
|
|
|
| Effective May 1, 2024
Service Class |
|
|
|
1.01 |
% |
|
|
|
May 1, 2025 |
|
| Prior to May 1, 2024
Service Class |
|
|
|
1.04 |
|
|
|
|
|
|
|
|
|
|
|
| Transamerica Series Trust |
|
|
|
Semi-Annual Financial Statements 2024 |
|
|
Page 9 |
|
|
Transamerica Great Lakes Advisors Large Cap Value VP
NOTES TO FINANCIAL STATEMENTS (continued)
At June 30, 2024
(unaudited)
7. FEES AND OTHER AFFILIATED TRANSACTIONS (continued)
TAM is permitted to recapture amounts contractually waived and/or reimbursed to a class during any of the 36 months from the date on which TAM waived fees and/or reimbursed expenses for the class. A class may recapture and reimburse TAM only if such amount does not cause, on any particular business day of the Portfolio, the class’s total annual operating expenses (after the recapture is taken into account) to exceed the Operating Expense Limits or any other lower limit then in effect. Amounts recaptured, if any, by TAM for the period ended June 30, 2024 are disclosed in Recapture of previously waived and/or reimbursed fees within the Statement of Operations.
TAM, on a voluntary basis and in addition to the contractual operating expense limits in effect, from time to time may waive and/or reimburse expenses of the Portfolio, or any classes thereof, to such level(s) as the Trust’s officers have determined or may reasonably determine from time to time. Any such voluntary waiver or expense reimbursement may be discontinued by TAM at any time. These amounts are not subject to recapture by TAM.
As of June 30, 2024, there are no amounts available for recapture by TAM.
Distribution and service fees: TST has a distribution plan (“Distribution Plan”) pursuant to Rule 12b-1 under the 1940 Act. Pursuant to the Distribution Plan, TST entered into a distribution agreement with TCI as the Portfolio’s distributor.
The Distribution Plan requires the Portfolio to pay distribution fees to TCI as compensation for various distribution activities, not as reimbursement for specific expenses. Under the Distribution Plan and distribution agreement, TCI, on behalf of the Portfolio, is authorized to pay various service providers, as direct payment for expenses incurred in connection with distribution of the Portfolio’s shares.
The fee on the Service Class shares is paid to the insurance companies for providing services and account maintenance for the policyholders who invest in the variable insurance products which invest in the Service Class shares. The distribution and service fees are included in Distribution and service fees within the Statement of Operations.
The Portfolio is authorized under the Distribution Plan to pay fees to TCI based on daily average net assets up to an annual fee of 0.25% of Service Class shares.
Transfer agent costs: TFS provides transfer agency services under an intercompany agreement with TAM. TFS has outsourced the provision of certain sub-transfer agency services to SS&C Global Investor & Distribution Solutions, Inc. (“SS&C GIDS”). The Portfolio does not pay a separate transfer agent fee to TAM or TFS but does pay certain expenses to SS&C GIDS related to applicable sub-transfer agency services. For the period ended June 30, 2024, (i) the expenses paid to SS&C GIDS by the Portfolio are referred to as transfer agent costs and are included within the Statement of Operations and (ii) the expenses payable to SS&C GIDS by the Portfolio are referred to as transfer agent costs within the Statement of Assets and Liabilities.
Brokerage commissions: The Portfolio incurred no brokerage commissions on security transactions placed with affiliates of the investment manager or sub-adviser(s) for the period ended June 30, 2024.
8. PURCHASES AND SALES OF SECURITIES
For the period ended June 30, 2024, the cost of securities purchased and proceeds from securities sold (excluding short-term securities) are as follows:
|
|
|
|
|
|
|
| Purchases of Securities |
|
Sales/Maturities of Securities |
| Long-Term |
|
U.S. Government |
|
Long-Term |
|
U.S. Government |
| |
| $ 6,678,307 |
|
$ — |
|
$ 6,937,067 |
|
$ — |
9. FEDERAL INCOME TAXES AND DISTRIBUTIONS TO SHAREHOLDERS
The Portfolio has not made any provision for federal income or excise taxes due to its policy to distribute all of its taxable income and capital gains to its shareholders and otherwise qualify as a regulated investment company under Subchapter M of the Internal Revenue Code. The Portfolio recognizes the tax benefits of uncertain tax positions only where the position is “more likely than not” to be sustained assuming examination by tax authorities. The Portfolio’s tax returns remain subject to examination by the Internal Revenue Service and state tax authorities three years from the date of filing for federal purposes and four years from the date of filing for state purposes. Management has evaluated the Portfolio’s tax provisions taken for all open tax years, and has concluded that no provision for income tax is required in the Portfolio’s financial statements. If applicable, the Portfolio recognizes interest accrued related to unrecognized tax
|
|
|
|
|
| Transamerica Series Trust |
|
|
|
Semi-Annual Financial Statements 2024 |
|
|
Page 10 |
|
|
Transamerica Great Lakes Advisors Large Cap Value VP
NOTES TO FINANCIAL STATEMENTS (continued)
At June 30, 2024
(unaudited)
9. FEDERAL INCOME TAXES AND DISTRIBUTIONS TO SHAREHOLDERS (continued)
benefits in relation to interest and penalties expense in Other within the Statement of Operations. The Portfolio identifies its major tax jurisdictions as U.S. Federal, the state of Colorado, and foreign jurisdictions where the Portfolio makes significant investments; however, the Portfolio is not aware of any tax positions for which it is reasonably possible that the total amounts of unrecognized tax benefits will change materially in the next twelve months. Distributions are determined in accordance with income tax regulations, which may differ from GAAP.
As of June 30, 2024, the approximate cost for U.S. federal income tax purposes, and the aggregate gross/net unrealized appreciation (depreciation) in the value of investments (including securities sold short and derivatives, if any) are as follows:
|
|
|
|
|
|
|
| Cost |
|
Gross Appreciation |
|
Gross (Depreciation) |
|
Net Appreciation (Depreciation) |
|
|
|
|
| $ 54,265,691 |
|
$ 12,042,595 |
|
$ (1,401,034) |
|
$ 10,641,561 |
10. NEW ACCOUNTING PRONOUNCEMENT
In June 2022, the Financial Accounting Standards Board issued Accounting Standards Update No. 2022-03 (“ASU 2022-03”), “Fair Value Measurement of Equity Securities Subject to Contractual Sale Restrictions” (“Topic 820”). ASU 2022-03 clarifies the guidance in Topic 820, related to the measurement of the fair value of an equity security subject to contractual sale restrictions, where it eliminates the need to apply a discount to fair value of these securities, and introduces disclosure requirements related to such equity securities. The guidance is effective for fiscal years, and interim periods within those fiscal years, beginning after December 15, 2023, and allows for early adoption. Management is currently evaluating the implications, if any, of the additional requirements and their impact on the Portfolio’s financial statements.
Please see TST’s most recent report on Form N-CSR, available at: www.transamerica.com/annuities/prospectus, for additional information. For the most recently filed complete proxy voting records for the Trust please visit: https://www.transamerica.com/sites/default/files/files/e070d/TST%20N-PX%202021.pdf
|
|
|
|
|
| Transamerica Series Trust |
|
|
|
Semi-Annual Financial Statements 2024 |
|
|
Page 11 |
|
|
Transamerica Great Lakes Advisors Large Cap Value VP
MANAGEMENT AND SUB-ADVISORY AGREEMENT — CONTRACT RENEWAL
(unaudited)
At a meeting of the Board of Trustees of Transamerica Series Trust (the “Trustees” or the “Board”) held on June 12-13, 2024, the Board considered the renewal of the management agreement (the “Management Agreement”) between Transamerica Asset Management, Inc. (“TAM”) and Transamerica Series Trust, on behalf of Great Lakes Advisors Large Cap Value VP (the “Portfolio”). The Board also considered the renewal of the investment sub-advisory agreement (the “Sub-Advisory Agreement” and together with the Management Agreement, the “Agreements”) for the Portfolio between TAM and Great Lakes Advisors, LLC (the “Sub-Adviser”).
Following its review and consideration, the Board determined that the terms of the Management Agreement and Sub-Advisory Agreement were reasonable and that the renewal of each of the Agreements was in the best interests of the Portfolio and the holders invested in the Portfolio. The Board, including the independent members of the Board (the “Independent Trustees”), unanimously approved the renewal of each of the Agreements through June 30, 2025.
Prior to reaching their decision, the Trustees requested and received from TAM and the Sub-Adviser certain information. They then reviewed such information as they deemed reasonably necessary to evaluate the Agreements, including information they had previously received from TAM and the Sub-Adviser as part of their regular oversight of the Portfolio, and knowledge they gained over time through meeting with TAM and the Sub-Adviser. Among other materials, the Trustees considered comparative fee, expense and performance information prepared by Broadridge Financial Solutions, Inc. (“Broadridge”), an independent provider of mutual fund performance information, as well as fee, expense and profitability information prepared by TAM. To the extent applicable, the Trustees considered information about fees and performance of comparable funds and/or accounts managed by the Sub-Adviser. The Board also considered reductions to the Portfolio’s expense limits, if any, that took effect after the last renewal of the Agreements. In their review, the Trustees also sought to identify instances in which the Portfolio’s performance, fees, total expenses and/or profitability appeared to be outliers within its respective peer group or other comparative metrics and sought to understand the reasons for such comparative positions.
In their deliberations, the Independent Trustees met privately without representatives of TAM or the Sub-Adviser present and were represented throughout the process by their independent legal counsel. In considering the proposed continuation of each of the Agreements, the Trustees evaluated and weighed a number of considerations that they believed to be relevant in light of the legal advice furnished to them by counsel, including independent legal counsel, and made a decision in the exercise of their own business judgment. They based their decisions on the considerations discussed below, among others, although they did not identify any particular consideration or item of information that was controlling of their decisions, and each Trustee may have attributed different weights to the various factors.
Nature, Extent and Quality of the Services Provided
The Board considered the nature, extent and quality of the services provided by TAM and the Sub-Adviser to the Portfolio in the past and the services anticipated to be provided in the future. The Board also considered the investment approach for the Portfolio; the experience, capability and integrity of TAM’s senior management; the financial resources of TAM; TAM’s management oversight process; TAM’s and the Sub-Adviser’s responsiveness to any questions by the Trustees; and the professional qualifications and compensation program of the portfolio management team of the Sub-Adviser. The Trustees noted that they receive, on a quarterly basis, an execution analysis from Capital Institutional Services, Inc. (CAPIS), an independent provider of trade analyses, for the Sub-Adviser and a comparison of trading results against a peer universe of managers.
The Board also considered the continuous and regular investment management and other services provided by TAM, when acting as a manager of managers, for the portion of the management fee it retains from the Portfolio after payment of the sub-advisory fees. The Board noted that the investment management and other services provided by TAM include the design, development and ongoing review and evaluation of the Portfolio and its investment strategy; the selection, oversight and monitoring of one or more investment sub-advisers to perform certain duties with respect to the Portfolio; ongoing portfolio trading oversight and analysis; risk management oversight and analysis; design, development, implementation and ongoing review and evaluation of a process for the valuation of Portfolio investments; design, development, implementation and ongoing review and evaluation of a compliance program for the Portfolio; design, development, implementation and ongoing review and evaluation of a process for the voting of proxies and exercise of rights to consent to corporate action for Portfolio investments; participation in Board meetings and oversight of preparation of materials for the Board, including materials for Board meetings and regular communications with the Board; oversight of preparation of the Portfolio’s prospectus, statement of additional information, shareholder reports and other disclosure materials and regulatory filings for the Portfolio; and ongoing cash management services for the Portfolio. The Board considered that TAM’s investment management services also include the provision of supervisory and administrative services to the Portfolio. The Board also noted that TAM, as part of the services it provides to all Transamerica mutual funds, including the Portfolio, oversees the services provided by the funds’ custodian, transfer agent, independent accountant and legal counsel and supervises the performance of the recordkeeping and holder service functions of the funds.
Investment Performance
In addition, the Board considered the short- and longer-term performance of the Portfolio in light of its investment objective, policies and strategies, including relative performance against (i) a peer universe of comparable mutual funds, as prepared by Broadridge, and (ii) the Portfolio’s benchmarks, in each case for various trailing periods ended December 31, 2023. Based on these considerations, the Board determined that TAM and the Sub-Adviser can provide investment and related services that are appropriate in scope and extent in light of the Portfolio’s investment objectives, policies and strategies and operations, the competitive landscape of the investment company
|
|
|
|
|
| Transamerica Series Trust |
|
|
|
Semi-Annual Financial Statements 2024 |
|
|
Page 12 |
|
|
Transamerica Great Lakes Advisors Large Cap Value VP
MANAGEMENT AND SUB-ADVISORY AGREEMENT — CONTRACT RENEWAL (continued)
(unaudited)
business and investor needs. The Board’s conclusions as to the Portfolio’s performance are summarized below. For purposes of its review, the Board generally used the performance of Service Class Shares. In describing the Portfolio’s performance relative to its peer universe, the summary conclusions characterize performance for the relevant periods in relation to whether it was “above,” “below” or “in line with” the peer universe median and do so using quintile rankings prepared by Broadridge. For simplicity, performance is described as “above” the median if the Portfolio’s performance ranked anywhere in the first or second quintiles, as “below” the median if it ranked anywhere in the fourth or fifth quintiles, or “in line with” the median if it ranked anywhere in the third quintile (i.e., even if its precise return was somewhat above or somewhat below the precise median return).
When considering the Portfolio’s performance, the Trustees considered any representations made by TAM regarding the appropriateness of certain peer groups and benchmarks. They recognized that performance reflects a snapshot of a period as of a specific date, and that consideration of performance data for a different period could generate significantly different performance results. The Trustees also recognized that even longer-term performance can be negatively affected by performance over a short-term period when that short-term performance is significantly below the performance of the comparable benchmark or universe of peer funds.
The Board noted that the performance of Service Class Shares of the Portfolio was above the median for its peer universe for the past 3-year period, in line with the median for the past 1-year period and below the median for the past 5-year period. The Board also noted that the performance of Service Class Shares of the Portfolio was above the benchmark that TAM utilizes to measure performance of the Portfolio for the past 1- and 3-year periods and below the benchmark for the past 5-year period. The Board noted that the Sub-Adviser had commenced sub-advising the Portfolio on December 1, 2020 pursuant to its current investment strategies. The Trustees also noted recent organizational changes involving the Sub-Adviser’s acquisition of Rothschild & Co Asset Management US Inc. The Trustees noted that TAM intends to monitor and report to the Board on the organizational transition and performance going forward.
Management Fee and Sub-Advisory Fees and Total Expense Ratio
The Board considered the management fee and total expense ratio of the Portfolio, including information provided by Broadridge comparing the management fee and total expense ratio of the Portfolio to the management fees and total expense ratios of comparable investment companies in both a peer group and broader peer universe compiled by Broadridge. The Board’s conclusions as to the Portfolio’s management fee and total expense ratio are summarized below. For purposes of its review, the Board generally used the actual total expenses (i.e., expenses reflecting any waivers and/or reimbursements) of Service Class Shares. In describing the Portfolio’s management fee and total expense ratio relative to its peer group and peer universe, the summary conclusions characterize management fees and total expense ratios for the relevant periods in relation to whether they were “above,” “below” or “in line with” the peer group or peer universe median and do so using quintile rankings prepared by Broadridge. For simplicity, management fees and total expense ratios are described as “above” the median if the Portfolio’s management fee or total expense ratio ranked anywhere in the fourth or fifth quintiles, as “below” the median if it ranked anywhere in the first or second quintiles, or “in line with” the median if it ranked anywhere in the third quintile (i.e., even if its precise management fee or total expense ratio was somewhat above or somewhat below the precise median management fee or total expense ratio).
The Board also considered the fees charged by the Sub-Adviser for sub-advisory services, as well as the portion of the Portfolio’s management fee retained by TAM following payment of the sub-advisory fee and how the portion of the contractual management fee retained by TAM at a specified asset level compared to the portions retained by other investment advisers managing mutual funds with similar investment strategies as calculated by an independent provider of information.
The Board noted that the Portfolio’s contractual management fee was below the medians for its peer group and peer universe and that the actual total expenses (i.e., expenses reflecting any waivers and/or reimbursements) of Service Class Shares of the Portfolio were in line with the median for its peer group and above the median for its peer universe. The Trustees also considered that TAM has entered into an expense limitation arrangement with the Portfolio, which may result in TAM waiving fees for the benefit of holders.
On the basis of these considerations, together with the other information it considered, the Board determined that the management and sub-advisory fees to be received by TAM and the Sub-Adviser under the Management Agreement and Sub-Advisory Agreement are reasonable in light of the services provided.
Cost of Services Provided and Level of Profitability
The Board reviewed information provided by TAM about the cost of providing and procuring fund management services, as well as the costs of the provision of administration, transfer agency and other services, to the Portfolio and to Transamerica Series Trust as a whole by TAM and its affiliates. The Board considered the profitability of TAM and its affiliates in providing these services for the Portfolio and Transamerica Series Trust as a whole. The Trustees recognized the competitiveness of the mutual fund industry and the importance of an investment adviser’s long-term profitability, including for maintaining company and management stability and accountability.
The Board also considered the allocation methodology used for calculating the profitability of TAM and its affiliates. The Board noted that the revenue and expense allocation methodology used by TAM to estimate its profitability with respect to its relationship with the Portfolio had been reviewed previously by an independent consultant. The Trustees considered that TAM reported that it had not made material changes to this methodology, and that the methodology had been applied consistently for the Portfolio.
|
|
|
|
|
| Transamerica Series Trust |
|
|
|
Semi-Annual Financial Statements 2024 |
|
|
Page 13 |
|
|
Transamerica Great Lakes Advisors Large Cap Value VP
MANAGEMENT AND SUB-ADVISORY AGREEMENT — CONTRACT RENEWAL (continued)
(unaudited)
With respect to the Sub-Adviser, the Board noted that the sub-advisory fee is the product of arm’s-length negotiation between TAM and the Sub-Adviser, which is not affiliated with TAM, and is paid by TAM and not the Portfolio. As a result, the Board focused on the profitability of TAM and its affiliates with respect to the Portfolio.
Based on this information, the Board determined that the profitability of TAM and its affiliates from their relationships with the Portfolio was not excessive.
Economies of Scale
The Board considered economies of scale with respect to the management of the Portfolio, whether the Portfolio had appropriately benefited from any economies of scale and whether there was the potential for realization of any future economies of scale. The Board also considered the existence of economies of scale with respect to management of the Transamerica mutual funds overall and the extent to which the Portfolio benefited from any economies of scale. The Board recognized that, as the Portfolio’s assets increase, any economies of scale realized by TAM or the Sub-Adviser may not directly correlate with each other or with any economies of scale that might be realized by the Portfolio. The Board considered the Portfolio’s management fee schedule and the existence of breakpoints and also considered the extent to which TAM shared economies of scale, if any, with the Portfolio through undertakings to limit or reimburse Portfolio expenses and to invest in maintaining and developing its capabilities and services. The Board also considered the Sub-Adviser’s sub-advisory fee schedule and the existence of breakpoints, if any, and how such breakpoints relate to any breakpoints in the Portfolio’s management fee schedule. The Board considered that the Sub-Adviser’s sub-advisory fees would be based on the combined assets of multiple funds. The Trustees concluded that the Portfolio’s fee structure reflected an appropriate sharing of any efficiencies or economies of scale to date and noted that they will have the opportunity to periodically reexamine the appropriateness of the management fee payable to TAM and the fee paid to the Sub-Adviser in light of any economies of scale experienced in the future.
Benefits to TAM, its Affiliates and/or the Sub-Adviser from their Relationships with the Portfolio
The Board considered other benefits derived by TAM, its affiliates, and/or the Sub-Adviser from their relationships with the Portfolio. The Board noted that TAM does not receive benefits from research obtained with commissions paid to broker-dealers for portfolio transactions (commonly referred to as “soft dollars”) as a result of its relationship with the Portfolio and that TAM believes the use of soft dollars by the Sub-Adviser is generally appropriate and in the best interests of the Portfolio. The Board also noted that the Sub-Adviser participates in a brokerage program pursuant to which a portion of brokerage commissions paid by the Portfolio is recaptured for the benefit of the Portfolio and the holders, thus limiting the amount of soft dollar arrangements the Sub-Adviser may engage in with respect to the Portfolio’s brokerage transactions.
Other Considerations
The Board noted that TAM has made a substantial commitment to the recruitment and retention of high-quality personnel and maintains the financial, compliance and operational resources reasonably necessary to manage the Portfolio in a professional manner that is consistent with the best interests of the Portfolio and the holders. In this regard, the Board favorably considered the procedures and policies TAM has in place to enforce compliance with applicable laws and regulations and oversee the portfolio management activities of the Sub-Adviser. The Board also noted that TAM has made an entrepreneurial commitment and undertaken certain business risks with respect to the management and success of the Portfolio.
Conclusion
After consideration of the factors described above, as well as other factors, the Trustees, including the Independent Trustees, concluded that the renewal of the Management Agreement and the Sub-Advisory Agreement was in the best interests of the Portfolio and the holders and voted to approve the renewal of the Agreements.
|
|
|
|
|
| Transamerica Series Trust |
|
|
|
Semi-Annual Financial Statements 2024 |
|
|
Page 14 |
|
|
PROXY VOTING POLICIES AND PROCEDURES AND QUARTERLY PORTFOLIO HOLDINGS
(unaudited)
A description of Transamerica Series Trust’s (the “Trust”) proxy voting policies and procedures is available in the Statement of Additional Information of the Portfolios, available without charge upon request by calling 1-800-851-9777 (toll free) or on the Securities and Exchange Commission’s (“SEC”) website at http://www.sec.gov.
In addition, the Portfolio is required to file Form N-PX, with their complete proxy voting records for the most recent 12 months ended June 30th, no later than August 31st of each year. The Form is available without charge: (1) on the Transamerica Funds website at https://www.transamerica.com/sites/default/files/files/e070d/TST%20N-PX%202021.pdf; and (2) on the SEC’s website at http://www.sec.gov.
Each fiscal quarter, the Portfolios, except Transamerica BlackRock Government Money Market VP, will file with the SEC a complete schedule of its monthly portfolio holdings on Form N-PORT. The Portfolios’ holdings as of the end of the third month of every fiscal quarter, as reported on Form N-PORT, will be publicly available on the SEC’s website at http://www.sec.gov within 60 days of the end of the fiscal quarter.
On a monthly basis, Transamerica BlackRock Government Money Market VP will file with the SEC portfolio holdings information on Form N-MFP3. A complete schedule of portfolio holdings is also available at www.transamerica.com.
You may also visit the Trust’s website at www.transamerica.com/annuities/prospectus for this and other information about the Portfolios and the Trust.
Important Notice Regarding Delivery of Shareholder Documents
Every year we provide shareholders informative materials such as the Transamerica Series Trust Annual Report, the Transamerica Series Trust Prospectus, and other required documents that keep you informed regarding your Portfolios. To the extent provided by mail, Transamerica Series Trust will only send one piece per mailing address, a method that saves your Portfolios money by reducing mailing and printing costs. We will continue to do this unless you tell us not to. To elect to receive individual mailings, simply call a Transamerica Customer Service Representative toll free at 1-800-851-9777, 8 a.m. to 7 p.m. Eastern Time, Monday-Friday. Your request will take effect within 30 days.
|
|
|
|
|
| Transamerica Series Trust |
|
|
|
Semi-Annual Financial Statements 2024 |
|
|
Page 15 |
|
|
NOTICE OF PRIVACY POLICY
(unaudited)
Your privacy is very important to us. We want you to understand what information we collect and how we use it. We collect and use “nonpublic personal information” in connection with providing our customers with a broad range of financial products and services as effectively and conveniently as possible. We treat nonpublic personal information in accordance with our Privacy Policy.
What Information We Collect and From Whom We Collect It
We may collect nonpublic personal information about you from the following sources:
| • |
|
Information we receive from you on applications or other forms, such as your name, address, and account number; |
| • |
|
Information about your transactions with us, our affiliates, or others, such as your account balance and purchase/redemption history; and |
| • |
|
Information we receive from non-affiliated third parties, including consumer reporting agencies. |
What Information We Disclose and To Whom We Disclose It
We do not disclose any nonpublic personal information about current or former customers to anyone without their express consent, except as permitted by law. We may disclose the nonpublic personal information we collect, as described above, to persons or companies that perform services on our behalf and to other financial institutions with which we have joint marketing agreements. We will require these companies to protect the confidentiality of your nonpublic personal information and to use it only to perform the services for which we have hired them.
Our Security Procedures
We restrict access to your nonpublic personal information and only allow disclosures to persons and companies as permitted by law to assist in providing products or services to you. We maintain physical, electronic, and procedural safeguards to protect your nonpublic personal information and to safeguard the disposal of certain consumer information.
Contact Us
If you have any questions about our Privacy Policy, please call 1-800-851-9777 on any business day between 8 a.m. and 7 p.m. Eastern Time.
Note: This Privacy Policy applies only to customers that have a direct relationship with us or our affiliates. If you own shares of our portfolios in the name of a third party such as a bank or broker-dealer, its privacy policy may apply to you instead of ours.
|
|
|
|
|
| Transamerica Series Trust |
|
|
|
Semi-Annual Financial Statements 2024 |
|
|
Page 16 |
|
|
PO Box 219945
Kansas City, MO 64121-9945
|
|
|
| Distributor: |
|
Transamerica Capital, Inc. |
|
|
PO Box 219945 |
|
|
Kansas City, MO 64121-9945 |
|
|
|
|
Customer Service: 1-800-851-9777 |
Transamerica Series Trust Semi-Annual Financial Statements
June 30, 2024
1801 California St., Suite 5200
Denver, CO 80202
Distributor: Transamerica Capital, Inc.
Customer Service: 1-800-851-9777
|
| The following pages contain the most recent semi-annual financial statements for the investment options in which you are invested. In compliance with Securities and Exchange Commission regulations, we present these reports on an annual and semi-annual basis with the hope that they will foster greater understanding of the investment options’ holdings, performance, financial data, accounting policies and other issues. This streamlined version provides information only on the investment options in which you are invested. |
|
| If you have any questions about these reports, please do not hesitate to contact your financial professional. As always, we thank you for your trust and the opportunity to serve you. |
Transamerica International Focus VP
SCHEDULE OF INVESTMENTS
At June 30, 2024
(unaudited)
|
|
|
|
|
|
|
|
|
| |
|
Shares |
|
|
Value |
|
| |
|
|
|
|
| COMMON STOCKS - 97.5% |
|
|
|
|
|
|
|
|
| Australia - 5.9% |
|
|
|
|
|
|
|
|
| Computershare Ltd. |
|
|
307,783 |
|
|
$ |
5,408,181 |
|
| National Australia Bank Ltd. |
|
|
375,356 |
|
|
|
9,071,990 |
|
| QBE Insurance Group Ltd. |
|
|
632,838 |
|
|
|
7,341,469 |
|
|
|
|
|
|
|
|
|
|
|
|
|
|
|
|
|
|
|
|
21,821,640 |
|
|
|
|
|
|
|
|
|
|
|
|
|
| Austria - 2.2% |
|
|
|
|
|
|
|
|
| Erste Group Bank AG |
|
|
170,574 |
|
|
|
8,081,600 |
|
|
|
|
|
|
|
|
|
|
|
|
|
| China - 2.5% |
|
|
|
|
|
|
|
|
| ANTA Sports Products Ltd. |
|
|
577,281 |
|
|
|
5,544,346 |
|
| Zijin Mining Group Co. Ltd., Class H |
|
|
1,798,925 |
|
|
|
3,796,401 |
|
|
|
|
|
|
|
|
|
|
|
|
|
|
|
|
|
|
|
|
9,340,747 |
|
|
|
|
|
|
|
|
|
|
|
|
|
| Denmark - 4.3% |
|
|
|
|
|
|
|
|
| Novo Nordisk AS, Class B |
|
|
108,799 |
|
|
|
15,710,776 |
|
|
|
|
|
|
|
|
|
|
|
|
|
| Finland - 1.3% |
|
|
|
|
|
|
|
|
| Metso OYJ (A) |
|
|
464,948 |
|
|
|
4,921,602 |
|
|
|
|
|
|
|
|
|
|
|
|
|
| France - 11.5% |
|
|
|
|
|
|
|
|
| Hermes International SCA |
|
|
2,335 |
|
|
|
5,351,433 |
|
| LVMH Moet Hennessy Louis Vuitton SE |
|
|
12,909 |
|
|
|
9,865,448 |
|
| Sanofi SA |
|
|
99,870 |
|
|
|
9,619,607 |
|
| TotalEnergies SE |
|
|
141,622 |
|
|
|
9,453,600 |
|
| Vinci SA |
|
|
76,766 |
|
|
|
8,088,074 |
|
|
|
|
|
|
|
|
|
|
|
|
|
|
|
|
|
|
|
|
42,378,162 |
|
|
|
|
|
|
|
|
|
|
|
|
|
| Germany - 3.2% |
|
|
|
|
|
|
|
|
| Bayerische Motoren Werke AG |
|
|
52,258 |
|
|
|
4,946,251 |
|
| Merck KGaA |
|
|
41,953 |
|
|
|
6,952,853 |
|
|
|
|
|
|
|
|
|
|
|
|
|
|
|
|
|
|
|
|
11,899,104 |
|
|
|
|
|
|
|
|
|
|
|
|
|
| India - 1.8% |
|
|
|
|
|
|
|
|
| ICICI Bank Ltd., ADR |
|
|
233,419 |
|
|
|
6,724,801 |
|
|
|
|
|
|
|
|
|
|
|
|
|
| Ireland - 7.0% |
|
|
|
|
|
|
|
|
| CRH PLC |
|
|
88,050 |
|
|
|
6,562,481 |
|
| ICON PLC (B) |
|
|
18,752 |
|
|
|
5,878,190 |
|
| Kingspan Group PLC |
|
|
65,909 |
|
|
|
5,611,529 |
|
| Smurfit Kappa Group PLC |
|
|
172,060 |
|
|
|
7,665,538 |
|
|
|
|
|
|
|
|
|
|
|
|
|
|
|
|
|
|
|
|
25,717,738 |
|
|
|
|
|
|
|
|
|
|
|
|
|
| Italy - 2.3% |
|
|
|
|
|
|
|
|
| Prysmian SpA |
|
|
139,190 |
|
|
|
8,618,973 |
|
|
|
|
|
|
|
|
|
|
|
|
|
| Japan - 21.2% |
|
|
|
|
|
|
|
|
| Asahi Group Holdings Ltd. |
|
|
178,498 |
|
|
|
6,296,079 |
|
| Hoya Corp. |
|
|
59,600 |
|
|
|
6,929,070 |
|
| ITOCHU Corp. |
|
|
212,454 |
|
|
|
10,371,146 |
|
| Mitsubishi Corp. |
|
|
395,652 |
|
|
|
7,741,392 |
|
| Nitto Denko Corp. |
|
|
85,200 |
|
|
|
6,730,636 |
|
| Pan Pacific International Holdings Corp. |
|
|
332,956 |
|
|
|
7,789,461 |
|
| Shin-Etsu Chemical Co. Ltd. |
|
|
185,500 |
|
|
|
7,192,175 |
|
| Tokio Marine Holdings, Inc. |
|
|
241,800 |
|
|
|
9,024,855 |
|
| Tokyo Electron Ltd. |
|
|
45,803 |
|
|
|
9,935,513 |
|
| Toyota Motor Corp. |
|
|
304,100 |
|
|
|
6,218,466 |
|
|
|
|
|
|
|
|
|
|
|
|
|
|
|
|
|
|
|
|
78,228,793 |
|
|
|
|
|
|
|
|
|
|
|
|
|
|
|
|
|
|
|
| |
|
Shares |
|
|
Value |
|
| |
|
|
| COMMON STOCKS (continued) |
|
| Mexico - 1.5% |
|
| Grupo Financiero Banorte SAB de CV, Class O |
|
|
728,751 |
|
|
$ |
5,671,471 |
|
|
|
|
|
|
|
|
|
|
|
|
|
| Netherlands - 6.5% |
|
|
|
|
|
|
|
|
| ASML Holding NV |
|
|
14,242 |
|
|
|
14,706,438 |
|
| Wolters Kluwer NV |
|
|
56,069 |
|
|
|
9,295,294 |
|
|
|
|
|
|
|
|
|
|
|
|
|
|
|
|
|
|
|
|
24,001,732 |
|
|
|
|
|
|
|
|
|
|
|
|
|
| Norway - 2.2% |
|
|
|
|
|
|
|
|
| DNB Bank ASA |
|
|
411,219 |
|
|
|
8,076,484 |
|
|
|
|
|
|
|
|
|
|
|
|
|
| Republic of Korea - 1.9% |
|
|
|
|
|
|
|
|
| Samsung Electronics Co. Ltd. |
|
|
117,063 |
|
|
|
6,931,082 |
|
|
|
|
|
|
|
|
|
|
|
|
|
| Singapore - 2.2% |
|
|
|
|
|
|
|
|
| DBS Group Holdings Ltd. |
|
|
312,104 |
|
|
|
8,237,613 |
|
|
|
|
|
|
|
|
|
|
|
|
|
| Sweden - 2.5% |
|
|
|
|
|
|
|
|
| Atlas Copco AB, A Shares |
|
|
494,485 |
|
|
|
9,293,463 |
|
|
|
|
|
|
|
|
|
|
|
|
|
| Switzerland - 2.2% |
|
|
|
|
|
|
|
|
| Coca-Cola HBC AG |
|
|
241,072 |
|
|
|
8,221,858 |
|
|
|
|
|
|
|
|
|
|
|
|
|
| Taiwan - 1.7% |
|
|
|
|
|
|
|
|
| Taiwan Semiconductor Manufacturing Co. Ltd., ADR |
|
|
35,585 |
|
|
|
6,185,029 |
|
|
|
|
|
|
|
|
|
|
|
|
|
| United Kingdom - 13.6% |
|
|
|
|
|
|
|
|
| Associated British Foods PLC |
|
|
262,421 |
|
|
|
8,206,907 |
|
| BAE Systems PLC |
|
|
551,350 |
|
|
|
9,199,888 |
|
| Compass Group PLC |
|
|
286,368 |
|
|
|
7,819,149 |
|
| InterContinental Hotels Group PLC |
|
|
75,389 |
|
|
|
7,934,611 |
|
| Legal & General Group PLC |
|
|
2,478,215 |
|
|
|
7,111,252 |
|
| Shell PLC |
|
|
284,447 |
|
|
|
10,190,194 |
|
|
|
|
|
|
|
|
|
|
|
|
|
|
|
|
|
|
|
|
50,462,001 |
|
|
|
|
|
|
|
|
|
|
|
|
|
| Total Common Stocks
(Cost $312,723,332) |
|
|
|
|
|
|
360,524,669 |
|
|
|
|
|
|
|
|
|
|
|
|
|
| |
|
Principal |
|
|
Value |
|
| |
|
|
| REPURCHASE AGREEMENT - 1.5% |
|
| Fixed Income Clearing Corp., 2.50% (C), dated 06/28/2024, to be repurchased at $5,542,772 on 07/01/2024. Collateralized by a U.S. Government Obligation, 4.50%, due 03/31/2026, and with a value of $5,652,515. |
|
$ |
5,541,617 |
|
|
|
5,541,617 |
|
|
|
|
|
|
|
|
|
|
|
|
| Total Repurchase Agreement
(Cost $5,541,617) |
|
|
|
5,541,617 |
|
|
|
|
|
|
|
|
|
|
| Total Investments
(Cost $318,264,949) |
|
|
|
366,066,286 |
|
| Net Other Assets (Liabilities) - 1.0% |
|
|
|
3,638,892 |
|
|
|
|
|
|
|
|
|
|
|
|
| Net Assets - 100.0% |
|
|
$ |
369,705,178 |
|
|
|
|
|
|
|
|
|
|
The Notes to Financial Statements are an integral part of this report.
|
|
|
|
|
| Transamerica Series Trust |
|
|
|
Semi-Annual Financial Statements 2024 |
|
|
Page 1 |
|
|
Transamerica International Focus VP
SCHEDULE OF INVESTMENTS (continued)
At June 30, 2024
(unaudited)
INVESTMENT VALUATION:
Valuation Inputs (D)
|
|
|
|
|
|
|
|
|
|
|
|
|
|
|
|
|
| |
|
Level 1 - Unadjusted Quoted Prices |
|
|
Level 2 - Other Significant Observable Inputs |
|
|
Level 3 - Significant Unobservable Inputs |
|
|
Value |
|
| |
|
|
|
|
|
|
| ASSETS |
|
|
|
|
|
|
|
|
|
|
|
|
|
|
|
|
| Investments |
|
|
|
|
|
|
|
|
|
|
|
|
|
|
|
|
| Common Stocks |
|
$ |
24,459,491 |
|
|
$ |
336,065,178 |
|
|
$ |
— |
|
|
$ |
360,524,669 |
|
| Repurchase Agreement |
|
|
— |
|
|
|
5,541,617 |
|
|
|
— |
|
|
|
5,541,617 |
|
|
|
|
|
|
|
|
|
|
|
|
|
|
|
|
|
|
|
|
|
|
|
| Total Investments |
|
$ |
24,459,491 |
|
|
$ |
341,606,795 |
|
|
$ |
— |
|
|
$ |
366,066,286 |
|
|
|
|
|
|
|
|
|
|
|
|
|
|
|
|
|
|
FOOTNOTES TO SCHEDULE OF INVESTMENTS:
| (A) |
All or a portion of the security is on loan. The total value of the securities on loan is $108,689, collateralized by non-cash collateral, such as U.S. government securities and irrevocable letters of credit, of $114,466. The amount on loan indicated may not correspond with the securities on loan identified because a security with pending sales are in the process of recall from the brokers. |
| (B) |
Non-income producing security. |
| (C) |
Rate disclosed reflects the yield at June 30, 2024. |
| (D) |
There were no transfers in or out of Level 3 during the period ended June 30, 2024. Please reference the Investment Valuation section of the Notes to Financial Statements for more information regarding investment valuation and pricing inputs. |
PORTFOLIO ABBREVIATION(S):
ADR American Depositary Receipt
The Notes to Financial Statements are an integral part of this report.
|
|
|
|
|
| Transamerica Series Trust |
|
|
|
Semi-Annual Financial Statements 2024 |
|
|
Page 2 |
|
|
Transamerica International Focus VP
STATEMENT OF ASSETS AND LIABILITIES
At June 30, 2024
(unaudited)
|
|
|
|
|
|
|
| Assets: |
|
|
|
|
| Investments, at value (cost $312,723,332) (including securities loaned of $108,689) |
|
$ |
360,524,669 |
|
| Repurchase agreement, at value (cost $5,541,617) |
|
|
5,541,617 |
|
| Foreign currency, at value (cost $1,696,292) |
|
|
1,689,850 |
|
| Receivables and other assets: |
|
|
|
|
| Net income from securities lending |
|
|
734 |
|
| Shares of beneficial interest sold |
|
|
204,868 |
|
| Dividends |
|
|
927,136 |
|
| Interest |
|
|
1,154 |
|
| Tax reclaims |
|
|
1,229,000 |
|
| Prepaid expenses |
|
|
1,425 |
|
| |
|
| Total assets |
|
|
370,120,453 |
|
|
|
| Liabilities: |
|
|
|
|
| Payables and other liabilities: |
|
|
|
|
| Shares of beneficial interest redeemed |
|
|
71,049 |
|
| Investment management fees |
|
|
221,475 |
|
| Distribution and service fees |
|
|
18,957 |
|
| Transfer agent costs |
|
|
312 |
|
| Trustee and CCO fees |
|
|
986 |
|
| Audit and tax fees |
|
|
16,821 |
|
| Custody fees |
|
|
34,268 |
|
| Legal fees |
|
|
7,258 |
|
| Printing and shareholder reports fees |
|
|
36,000 |
|
| Other accrued expenses |
|
|
8,149 |
|
|
|
| Total liabilities |
|
|
415,275 |
|
| |
|
| Net assets |
|
$ |
369,705,178 |
|
|
|
| Net assets consist of: |
|
|
|
|
| Capital stock ($0.01 par value) |
|
$ |
408,745 |
|
| Additional paid-in capital |
|
|
292,772,934 |
|
| Total distributable earnings (accumulated losses) |
|
|
76,523,499 |
|
| |
|
| Net assets |
|
$ |
369,705,178 |
|
|
|
| Net assets by class: |
|
|
|
|
| Initial Class |
|
$ |
272,137,253 |
|
| Service Class |
|
|
97,567,925 |
|
|
|
| Shares outstanding: |
|
|
|
|
| Initial Class |
|
|
29,881,602 |
|
| Service Class |
|
|
10,992,945 |
|
|
|
| Net asset value and offering price per share: |
|
|
|
|
| Initial Class |
|
$ |
9.11 |
|
| Service Class |
|
|
8.88 |
|
STATEMENT OF OPERATIONS
For the period ended June 30, 2024
(unaudited)
|
|
|
|
|
|
|
| Investment income: |
|
|
|
|
| Dividend income |
|
$ |
7,401,059 |
|
| Interest income |
|
|
71,206 |
|
| Net income from securities lending |
|
|
16,646 |
|
| Withholding taxes on foreign income |
|
|
(743,713 |
) |
|
|
| Total investment income |
|
|
6,745,198 |
|
|
|
| Expenses: |
|
|
|
|
| Investment management fees |
|
|
1,424,155 |
|
| Distribution and service fees: |
|
|
|
|
| Service Class |
|
|
122,192 |
|
| Transfer agent costs |
|
|
2,061 |
|
| Trustee and CCO fees |
|
|
8,604 |
|
| Audit and tax fees |
|
|
13,528 |
|
| Custody fees |
|
|
35,058 |
|
| Legal fees |
|
|
14,312 |
|
| Printing and shareholder reports fees |
|
|
34,568 |
|
| Other |
|
|
14,649 |
|
| Total expenses before waiver and/or reimbursement and recapture |
|
|
1,669,127 |
|
| Expenses waived and/or reimbursed: |
|
|
|
|
| Service Class |
|
|
(144 |
) |
| Recapture of previously waived and/or reimbursed fees: |
|
|
|
|
| Service Class |
|
|
144 |
|
|
|
| Net expenses |
|
|
1,669,127 |
|
|
|
| Net investment income (loss) |
|
|
5,076,071 |
|
|
|
| Net realized gain (loss) on: |
|
|
|
|
| Investments |
|
|
7,945,761 |
|
| Foreign currency transactions |
|
|
(395,969 |
) |
|
|
| Net realized gain (loss) |
|
|
7,549,792 |
|
|
|
| Net change in unrealized appreciation (depreciation) on: |
|
|
|
|
| Investments |
|
|
5,977,579 |
|
| Translation of assets and liabilities denominated in foreign currencies |
|
|
(51,639 |
) |
|
|
| Net change in unrealized appreciation (depreciation) |
|
|
5,925,940 |
|
|
|
| Net realized and change in unrealized gain (loss) |
|
|
13,475,732 |
|
|
|
| Net increase (decrease) in net assets resulting from operations |
|
$ |
18,551,803 |
|
The Notes to Financial Statements are an integral part of this report.
|
|
|
|
|
| Transamerica Series Trust |
|
|
|
Semi-Annual Financial Statements 2024 |
|
|
Page 3 |
|
|
Transamerica International Focus VP
STATEMENT OF CHANGES IN NET ASSETS
For the period and year ended:
|
|
|
|
|
|
|
|
|
| |
|
June 30, 2024 (unaudited) |
|
December 31, 2023 |
|
|
|
| From operations: |
|
|
|
|
|
|
|
|
| Net investment income (loss) |
|
|
$ 5,076,071 |
|
|
|
$ 8,072,117 |
|
| Net realized gain (loss) |
|
|
7,549,792 |
|
|
|
16,022,011 |
|
| Net change in unrealized appreciation (depreciation) |
|
|
5,925,940 |
|
|
|
18,776,399 |
|
|
|
|
| Net increase (decrease) in net assets resulting from operations |
|
|
18,551,803 |
|
|
|
42,870,527 |
|
|
|
|
| Dividends and/or distributions to shareholders: |
|
|
|
|
|
|
|
|
| Initial Class |
|
|
— |
|
|
|
(5,228,746 |
) |
| Service Class |
|
|
— |
|
|
|
(1,711,160 |
) |
|
|
|
| Net increase (decrease) in net assets resulting from dividends and/or distributions to shareholders |
|
|
— |
|
|
|
(6,939,906 |
) |
|
|
|
| Capital share transactions: |
|
|
|
|
|
|
|
|
| Proceeds from shares sold: |
|
|
|
|
|
|
|
|
| Initial Class |
|
|
19,997,407 |
|
|
|
23,434,385 |
|
| Service Class |
|
|
1,860,040 |
|
|
|
2,171,642 |
|
| |
|
|
21,857,447 |
|
|
|
25,606,027 |
|
| Dividends and/or distributions reinvested: |
|
|
|
|
|
|
|
|
| Initial Class |
|
|
— |
|
|
|
5,228,746 |
|
| Service Class |
|
|
— |
|
|
|
1,711,160 |
|
| |
|
|
— |
|
|
|
6,939,906 |
|
| Cost of shares redeemed: |
|
|
|
|
|
|
|
|
| Initial Class |
|
|
(26,658,177 |
) |
|
|
(52,154,535 |
) |
| Service Class |
|
|
(6,709,514 |
) |
|
|
(14,522,815 |
) |
| |
|
|
(33,367,691 |
) |
|
|
(66,677,350 |
) |
| |
|
|
| Net increase (decrease) in net assets resulting from capital share transactions |
|
|
(11,510,244 |
) |
|
|
(34,131,417 |
) |
| |
|
|
| Net increase (decrease) in net assets |
|
|
7,041,559 |
|
|
|
1,799,204 |
|
|
|
|
| Net assets: |
|
|
|
|
|
|
|
|
| Beginning of period/year |
|
|
362,663,619 |
|
|
|
360,864,415 |
|
| End of period/year |
|
|
$369,705,178 |
|
|
|
$ 362,663,619 |
|
|
|
|
| Capital share transactions - shares: |
|
|
|
|
|
|
|
|
| Shares issued: |
|
|
|
|
|
|
|
|
| Initial Class |
|
|
2,219,813 |
|
|
|
2,856,754 |
|
| Service Class |
|
|
211,382 |
|
|
|
268,563 |
|
| |
|
|
2,431,195 |
|
|
|
3,125,317 |
|
| Shares reinvested: |
|
|
|
|
|
|
|
|
| Initial Class |
|
|
— |
|
|
|
628,455 |
|
| Service Class |
|
|
— |
|
|
|
210,475 |
|
| |
|
|
— |
|
|
|
838,930 |
|
| Shares redeemed: |
|
|
|
|
|
|
|
|
| Initial Class |
|
|
(2,918,644 |
) |
|
|
(6,277,042 |
) |
| Service Class |
|
|
(758,025 |
) |
|
|
(1,802,895 |
) |
| |
|
|
(3,676,669 |
) |
|
|
(8,079,937 |
) |
| Net increase (decrease) in shares outstanding: |
|
|
|
|
|
|
|
|
| Initial Class |
|
|
(698,831 |
) |
|
|
(2,791,833 |
) |
| Service Class |
|
|
(546,643 |
) |
|
|
(1,323,857 |
) |
| |
|
|
(1,245,474 |
) |
|
|
(4,115,690 |
) |
The Notes to Financial Statements are an integral part of this report.
|
|
|
|
|
| Transamerica Series Trust |
|
|
|
Semi-Annual Financial Statements 2024 |
|
|
Page 4 |
|
|
Transamerica International Focus VP
FINANCIAL HIGHLIGHTS
|
|
|
|
|
|
|
|
|
|
|
|
|
|
|
|
|
|
|
|
|
|
|
|
|
|
|
| For a share outstanding during the period and years indicated: |
|
Initial Class |
|
|
|
|
|
|
|
| |
|
June 30, 2024 (unaudited) |
|
December 31, 2023 |
|
December 31, 2022 |
|
December 31, 2021 |
|
December 31, 2020 |
|
December 31, 2019 |
|
|
|
|
|
|
|
| Net asset value, beginning of period/year |
|
|
$ 8.67 |
|
|
|
$ 7.86 |
|
|
|
$ 10.77 |
|
|
|
$ 9.84 |
|
|
|
$ 8.32 |
|
|
|
$ 8.01 |
|
|
|
|
|
|
|
|
| Investment operations: |
|
|
|
|
|
|
|
|
|
|
|
|
|
|
|
|
|
|
|
|
|
|
|
|
| Net investment income (loss)(A) |
|
|
0.13 |
|
|
|
0.19 |
|
|
|
0.19 |
|
|
|
0.18 |
|
|
|
0.12 |
|
|
|
0.18 |
|
| Net realized and unrealized gain (loss) |
|
|
0.31 |
|
|
|
0.79 |
|
|
|
(2.36 |
) |
|
|
0.88 |
|
|
|
1.59 |
|
|
|
1.81 |
|
| |
|
|
|
|
|
|
| Total investment operations |
|
|
0.44 |
|
|
|
0.98 |
|
|
|
(2.17 |
) |
|
|
1.06 |
|
|
|
1.71 |
|
|
|
1.99 |
|
|
|
|
|
|
|
|
| Dividends and/or distributions to shareholders: |
|
|
|
|
|
|
|
|
|
|
|
|
|
|
|
|
|
|
|
|
|
|
|
|
| Net investment income |
|
|
— |
|
|
|
(0.17 |
) |
|
|
(0.27 |
) |
|
|
(0.13 |
) |
|
|
(0.19 |
) |
|
|
(0.15 |
) |
| Net realized gains |
|
|
— |
|
|
|
— |
|
|
|
(0.47 |
) |
|
|
— |
|
|
|
— |
|
|
|
(1.53 |
) |
| |
|
|
|
|
|
|
| Total dividends and/or distributions to shareholders |
|
|
— |
|
|
|
(0.17 |
) |
|
|
(0.74 |
) |
|
|
(0.13 |
) |
|
|
(0.19 |
) |
|
|
(1.68 |
) |
|
|
|
|
|
|
|
| Net asset value, end of period/year |
|
|
$ 9.11 |
|
|
|
$ 8.67 |
|
|
|
$ 7.86 |
|
|
|
$ 10.77 |
|
|
|
$ 9.84 |
|
|
|
$ 8.32 |
|
| |
|
|
|
|
|
|
|
|
|
|
|
|
| |
|
|
|
|
|
|
| Total return |
|
|
5.08 |
%(B) |
|
|
12.53 |
% |
|
|
(20.04 |
)% |
|
|
10.82 |
% |
|
|
20.90 |
% |
|
|
27.68 |
% |
|
|
|
|
|
|
|
| Ratio and supplemental data: |
|
|
|
|
|
|
|
|
|
|
|
|
|
|
|
|
|
|
|
|
|
|
|
|
| Net assets end of period/year (000’s) |
|
|
$ 272,137 |
|
|
|
$ 265,064 |
|
|
|
$ 262,221 |
|
|
|
$ 357,374 |
|
|
|
$ 383,396 |
|
|
|
$ 365,486 |
|
| Expenses to average net assets |
|
|
|
|
|
|
|
|
|
|
|
|
|
|
|
|
|
|
|
|
|
|
|
|
| Excluding waiver and/or reimbursement and recapture |
|
|
0.84 |
%(C) |
|
|
0.85 |
% |
|
|
0.82 |
% |
|
|
0.83 |
% |
|
|
0.82 |
% |
|
|
0.82 |
% |
| Including waiver and/or reimbursement and recapture |
|
|
0.84 |
%(C) |
|
|
0.85 |
% |
|
|
0.82 |
% |
|
|
0.83 |
% |
|
|
0.82 |
% |
|
|
0.82 |
% |
| Net investment income (loss) to average net assets |
|
|
2.82 |
%(C) |
|
|
2.28 |
% |
|
|
2.23 |
% |
|
|
1.71 |
% |
|
|
1.46 |
% |
|
|
2.10 |
% |
| Portfolio turnover rate |
|
|
37 |
%(B) |
|
|
39 |
% |
|
|
36 |
% |
|
|
20 |
% |
|
|
30 |
% |
|
|
26 |
% |
| (A) |
Calculated based on average number of shares outstanding. |
|
|
|
|
|
|
|
|
|
|
|
|
|
|
|
|
|
|
|
|
|
|
|
|
|
|
|
| For a share outstanding during the period and years indicated: |
|
Service Class |
|
|
|
|
|
|
|
| |
|
June 30, 2024 (unaudited) |
|
December 31, 2023 |
|
December 31, 2022 |
|
December 31, 2021 |
|
December 31, 2020 |
|
December 31, 2019 |
|
|
|
|
|
|
|
| Net asset value, beginning of period/year |
|
|
$ 8.46 |
|
|
|
$ 7.67 |
|
|
|
$ 10.53 |
|
|
|
$ 9.62 |
|
|
|
$ 8.14 |
|
|
|
$ 7.86 |
|
|
|
|
|
|
|
|
| Investment operations: |
|
|
|
|
|
|
|
|
|
|
|
|
|
|
|
|
|
|
|
|
|
|
|
|
| Net investment income (loss)(A) |
|
|
0.11 |
|
|
|
0.17 |
|
|
|
0.17 |
|
|
|
0.15 |
|
|
|
0.09 |
|
|
|
0.15 |
|
| Net realized and unrealized gain (loss) |
|
|
0.31 |
|
|
|
0.77 |
|
|
|
(2.32 |
) |
|
|
0.87 |
|
|
|
1.56 |
|
|
|
1.78 |
|
| |
|
|
|
|
|
|
| Total investment operations |
|
|
0.42 |
|
|
|
0.94 |
|
|
|
(2.15 |
) |
|
|
1.02 |
|
|
|
1.65 |
|
|
|
1.93 |
|
|
|
|
|
|
|
|
| Dividends and/or distributions to shareholders: |
|
|
|
|
|
|
|
|
|
|
|
|
|
|
|
|
|
|
|
|
|
|
|
|
| Net investment income |
|
|
— |
|
|
|
(0.15 |
) |
|
|
(0.24 |
) |
|
|
(0.11 |
) |
|
|
(0.17 |
) |
|
|
(0.12 |
) |
| Net realized gains |
|
|
— |
|
|
|
— |
|
|
|
(0.47 |
) |
|
|
— |
|
|
|
— |
|
|
|
(1.53 |
) |
| |
|
|
|
|
|
|
| Total dividends and/or distributions to shareholders |
|
|
— |
|
|
|
(0.15 |
) |
|
|
(0.71 |
) |
|
|
(0.11 |
) |
|
|
(0.17 |
) |
|
|
(1.65 |
) |
|
|
|
|
|
|
|
| Net asset value, end of period/year |
|
|
$ 8.88 |
|
|
|
$ 8.46 |
|
|
|
$ 7.67 |
|
|
|
$ 10.53 |
|
|
|
$ 9.62 |
|
|
|
$ 8.14 |
|
| |
|
|
|
|
|
|
|
|
|
|
|
|
| |
|
|
|
|
|
|
| Total return |
|
|
4.96 |
%(B) |
|
|
12.27 |
% |
|
|
(20.29 |
)% |
|
|
10.63 |
% |
|
|
20.58 |
% |
|
|
27.40 |
% |
| Ratio and supplemental data: |
|
|
|
|
|
|
|
|
|
|
|
|
|
|
|
|
|
|
|
|
|
|
|
|
| Net assets end of period/year (000’s) |
|
|
$ 97,568 |
|
|
|
$ 97,600 |
|
|
|
$ 98,643 |
|
|
|
$ 137,574 |
|
|
|
$ 129,234 |
|
|
|
$ 114,566 |
|
| Expenses to average net assets |
|
|
|
|
|
|
|
|
|
|
|
|
|
|
|
|
|
|
|
|
|
|
|
|
| Excluding waiver and/or reimbursement and recapture |
|
|
1.09 |
%(C) |
|
|
1.10 |
% |
|
|
1.07 |
% |
|
|
1.08 |
% |
|
|
1.07 |
% |
|
|
1.07 |
% |
| Including waiver and/or reimbursement and recapture |
|
|
1.09 |
%(C)(D) |
|
|
1.10 |
% |
|
|
1.07 |
% |
|
|
1.08 |
% |
|
|
1.07 |
% |
|
|
1.07 |
% |
| Net investment income (loss) to average net assets |
|
|
2.53 |
%(C) |
|
|
2.08 |
% |
|
|
1.98 |
% |
|
|
1.45 |
% |
|
|
1.18 |
% |
|
|
1.83 |
% |
| Portfolio turnover rate |
|
|
37 |
%(B) |
|
|
39 |
% |
|
|
36 |
% |
|
|
20 |
% |
|
|
30 |
% |
|
|
26 |
% |
| (A) |
Calculated based on average number of shares outstanding. |
| (D) |
Waiver and/or reimbursement rounds to less than 0.01%. |
The Notes to Financial Statements are an integral part of this report.
|
|
|
|
|
| Transamerica Series Trust |
|
|
|
Semi-Annual Financial Statements 2024 |
|
|
Page 5 |
|
|
Transamerica International Focus VP
NOTES TO FINANCIAL STATEMENTS
At June 30, 2024
(unaudited)
1. ORGANIZATION
Transamerica Series Trust (“TST”) is an open-end management investment company registered under the Investment Company Act of 1940, as amended (the “1940 Act”). TST applies investment company accounting and reporting guidance. TST serves as a funding vehicle for variable life insurance, variable annuity, and group annuity products. Transamerica International Focus VP (the “Portfolio”) is a series of TST and is classified as diversified under the 1940 Act. The Portfolio currently offers two classes of shares, Initial Class and Service Class.
The only shareholders of the Portfolio are affiliated insurance company separate accounts and/or affiliated asset allocation portfolios. Contract holders of the variable life and annuity contracts are not shareholders of the Portfolio. For ease of reference, shareholders and contract holders are collectively referred to in this report as “shareholders.”
This report must be accompanied or preceded by the Portfolio’s current prospectus, which contains additional information about the Portfolio, including risks, as well as investment objectives and strategies.
Transamerica Asset Management, Inc. (“TAM”) serves as investment manager for the Portfolio pursuant to an investment management agreement. TAM provides continuous and regular investment management services to the Portfolio. TAM supervises the Portfolio’s investments, conducts its investment program and provides supervisory, compliance and administrative services to the Portfolio.
TAM currently acts as a “manager of managers” and has hired sub-advisers to furnish day-to-day investment advice and recommendations. TAM may, in the future, determine to provide all aspects of the day-to-day management of the Portfolio without the use of a sub-adviser. When acting as a manager of managers, TAM provides investment management services that include, without limitation, the design and development of the Portfolio and its investment strategies and the ongoing review and evaluation of those investment strategies including recommending changes in strategy where it believes appropriate or advisable; the selection of one or more sub-advisers for the Portfolio employing a combination of quantitative and qualitative screens, research, analysis and due diligence; negotiation of sub-advisory agreements and fees; oversight and monitoring of sub-advisers and recommending changes to sub-advisers where it believes appropriate or advisable; recommending portfolio combinations and liquidations where it believes appropriate or advisable; selection and oversight of transition managers, as needed; regular supervision of the Portfolio’s investments; regular review and evaluation of sub-adviser performance; daily monitoring of the sub-advisers’ buying and selling of securities for the Portfolio; regular review of holdings; ongoing trade oversight and analysis; regular monitoring to ensure adherence to investment process; regular calls and periodic on-site visits with sub-advisers; portfolio construction and asset allocation when using multiple sub-advisers for the Portfolio; risk management oversight and analysis; oversight of negotiation of investment documentation and agreements; design, development, implementation and regular monitoring of the valuation process; periodic due diligence reviews of pricing vendors and vendor methodology; design, development, implementation and regular monitoring of the compliance process; respond to regulatory inquiries and determine appropriate litigation strategy, as needed; review of proxies voted by sub-advisers; oversight of preparation and review of materials for meetings of the Portfolio’s Board of Trustees (the “Board”), participation in these meetings and preparation of regular communications with the Board; oversight of preparation and review of prospectuses, shareholder reports and other disclosure materials and regulatory filings for the Portfolio; oversight of other service providers to the Portfolio, such as the custodian, the transfer agent, the Portfolio’s independent accounting firm and legal counsel; supervision of the performance of recordkeeping and shareholder relations functions for the Portfolio; and oversight of cash management services. TAM uses a variety of quantitative and qualitative tools to carry out its investment management services. TAM, not the Portfolio, is responsible for paying the sub-adviser(s) for their services, and sub-advisory fees are TAM’s expense.
TAM’s investment management services also include the provision of supervisory and administrative services to the Portfolio. These services include performing certain administrative services for the Portfolio and supervising and overseeing the administrative, clerical, recordkeeping and bookkeeping services provided to the Portfolio by State Street Bank and Trust Company (“State Street”), to whom TAM has outsourced the provision of certain sub-administration services. To the extent agreed upon by TAM and the Portfolio from time to time, TAM’s supervisory and administrative services include, but are not limited to: monitoring and verifying the custodian’s daily calculation of the Net Asset Values (“NAV”); shareholder relations functions; compliance services; valuation services; assisting in due diligence and in the oversight and monitoring of certain activities of sub-advisers and certain aspects of Portfolio investments; assisting with Portfolio combinations and liquidations; oversight of the preparation and filing, and review, of all returns and reports, in connection with federal, state and local taxes; oversight and review of regulatory reporting; supervising and coordinating the Portfolio’s custodian and dividend disbursing agent and monitoring their services to the Portfolio; assisting the Portfolio in preparing reports to shareholders; acting as liaison with the Portfolio’s independent public accountants and providing, upon request, analyses, fiscal year summaries and other audit related services; assisting in the preparation of agendas and supporting documents for and minutes of meetings of trustees and committees of trustees; assisting in the preparation of regular communications with the trustees; and providing personnel and office space, telephones and other office equipment as necessary in order for TAM to perform supervisory and administrative services to the Portfolio. The Portfolio pays certain fees and expenses to State Street for sub-administration services which are not administrative services covered by the
|
|
|
|
|
| Transamerica Series Trust |
|
|
|
Semi-Annual Financial Statements 2024 |
|
|
Page 6 |
|
|
Transamerica International Focus VP
NOTES TO FINANCIAL STATEMENTS (continued)
At June 30, 2024
(unaudited)
1. ORGANIZATION (continued)
management agreement with TAM or paid for through the management fees payable thereunder. For the period ended June 30, 2024, (i) the expenses paid to State Street for sub-administration services by the Portfolio are shown as a part of Other expenses within the Statement of Operations and (ii) the expenses payable to State Street for sub-administration services from the Portfolio are shown as part of Other accrued expenses within the Statement of Assets and Liabilities.
2. SIGNIFICANT ACCOUNTING POLICIES
In preparing the Portfolio’s financial statements in accordance with Generally Accepted Accounting Principles in the United States of America (“GAAP”), estimates or assumptions (which could differ from actual results) may be used that affect reported amounts and disclosures. The following is a summary of significant accounting policies followed by the Portfolio.
Foreign currency denominated investments: The accounting records of the Portfolio are maintained in U.S. dollars. Securities and other assets and liabilities denominated in foreign currencies are translated into U.S. dollars based on the closing exchange rate each day. The cost of foreign securities purchased and any realized gains or losses are translated at the prevailing exchange rates in effect on the date of the respective transaction. The Portfolio combines fluctuations from currency exchange rates and fluctuations in value when computing net realized and unrealized gains or losses from investments.
Net foreign currency gains and losses resulting from changes in exchange rates include, foreign currency fluctuations between trade date and settlement date of investment security transactions, gains and losses on forward foreign currency contracts, and the difference between the receivable amounts of interest and dividends recorded in the accounting records in U.S. dollars and the amounts actually received.
Foreign currency denominated assets may involve risks not typically associated with domestic transactions. These risks include revaluation of currencies, adverse fluctuations in foreign currency values, and possible adverse political, social, and economic developments, including those particular to a specific industry, country or region.
Security transactions and investment income: Security transactions are accounted for on the trade date. Security gains and losses are calculated on a first-in, first-out basis. Dividend income, if any, is recorded on the ex-dividend date or, in the case of foreign securities, as soon as the Portfolio is informed of the ex-dividend dates, net of foreign taxes. Non-cash dividends, if any, are recorded on the ex-dividend date at fair value. Interest income, if any, is recorded on the accrual basis from settlement date, net of foreign taxes. Fixed income premiums and discounts are amortized and/or accreted over the lives of the respective securities.
Multiple class operations, income, and expenses: Income, non-class specific expenses, and realized and unrealized gains and losses are allocated to each class daily based upon net assets. Each class bears its own specific expenses in addition to the allocated non-class specific expenses.
Distributions to shareholders: Distributions are recorded on the ex-dividend date and are determined in accordance with federal income tax regulations, which may differ from GAAP.
Foreign taxes: The Portfolio may be subject to taxes imposed by the countries in which it invests, with respect to its investments in issuers existing or operating in such countries. The Portfolio may also be subject to foreign taxes on income, gains on investments, or currency repatriation, a portion of which may be recoverable. The Portfolio accrues such taxes and recoveries as applicable when the related income or capital gains are earned or unrealized, and based upon the current interpretation of tax rules and regulations that exist in the markets in which the Portfolio invests. Some countries require governmental approval for the repatriation of investment income, capital, or the proceeds of sales earned by foreign investors. In addition, if there is deterioration in a country’s balance of payments or for other reasons, a country may impose temporary restrictions of foreign capital remittances abroad.
Commission recapture: The sub-adviser(s), to the extent consistent with the best execution and usual commission rate policies and practices, may elect to place security transactions of the Portfolio with broker/dealers with which TST has established a commission recapture program. A commission recapture program is any arrangement under which a broker/dealer applies a portion of the commissions received by such broker/dealer on the security transactions to the Portfolio. In no event will commissions, paid by the Portfolio, be used to pay expenses that would otherwise be borne by any other Portfolios within TST, or by any other party.
There were no commissions recaptured during the period ended June 30, 2024 by the Portfolio.
|
|
|
|
|
| Transamerica Series Trust |
|
|
|
Semi-Annual Financial Statements 2024 |
|
|
Page 7 |
|
|
Transamerica International Focus VP
NOTES TO FINANCIAL STATEMENTS (continued)
At June 30, 2024
(unaudited)
2. SIGNIFICANT ACCOUNTING POLICIES (continued)
Indemnification: In the normal course of business, the Portfolio enters into contracts that contain a variety of representations that provide general indemnifications. The Portfolio’s maximum exposure under these arrangements is unknown, as this would involve future claims that may be made against the Portfolio and/or its affiliates that have not yet occurred. However, based on experience, the Portfolio expects the risk of loss to be remote.
3. INVESTMENT VALUATION
TAM has been designated as the Portfolio’s valuation designee pursuant to Rule 2a-5 under the 1940 Act with responsibility for fair valuation subject to oversight by the Portfolio’s Board of Trustees. The net asset value of the Portfolio is computed as of the official close of the New York Stock Exchange (“NYSE”) each day the NYSE is open for business.
TAM utilizes various methods to measure the fair value of its investments on a recurring basis. GAAP establishes a hierarchy that prioritizes inputs to valuation methods. The inputs or methodology used for valuing securities are not necessarily an indication of the risk associated with investing in those securities. The three levels (“Levels”) of inputs of the fair value hierarchy are defined as follows:
Level 1—Unadjusted quoted prices in active markets for identical securities.
Level 2—Inputs, other than quoted prices included in Level 1, which are observable, either directly or indirectly. These inputs may include quoted prices for the identical instrument on an inactive market, prices for similar instruments, interest rates, prepayment speeds, credit risk, yield curves, default rates, and similar data.
Level 3—Unobservable inputs based on the best information available in the circumstances, to the extent observable inputs are not available, which may include TAM’s own assumptions used in determining the fair value of the Portfolio’s investments.
The inputs used to measure fair value may fall into different Levels of the fair value hierarchy. In such cases, for disclosure purposes, the Level in the fair value hierarchy that is assigned to the fair value measurement of a security is determined based on the lowest Level input that is significant to the fair value measurement in its entirety. Certain investments that are measured at fair value using NAV per share, or its equivalent, using the “practical expedient” have not been classified in the fair value Levels. The hierarchy classification of inputs used to value the Portfolio’s investments at June 30, 2024, is disclosed within the Investment Valuation section of the Schedule of Investments.
The availability of observable inputs can vary from security to security and is affected by a wide variety of factors, including, but not limited to, the type of security, whether the security is new and not yet established in the marketplace, the liquidity of markets, and other characteristics particular to the security. To the extent that valuation is based on models or inputs that are less observable or unobservable in the market, the determination of fair value requires more judgment. Accordingly, the degree of judgment exercised in determining fair value is generally greatest for instruments categorized in Level 3. Due to the inherent uncertainty of valuation, the determination of values may differ significantly from values that would have been realized had a ready market for investments existed, and the differences could be material.
Fair value measurements: Descriptions of the valuation techniques applied to the Portfolio’s significant categories of assets and liabilities measured at fair value on a recurring basis are as follows:
Equity securities: Securities are stated at the last reported sales price or closing price on the day of valuation taken from the primary exchange where the security is principally traded. To the extent these securities are actively traded and valuation adjustments are not applied, they are categorized in Level 1 of the fair value hierarchy. Equities traded on inactive markets or valued by reference to similar instruments are generally categorized in Level 2 or Level 3 if inputs are unobservable.
Foreign equity securities: Securities in which the primary trading market closes at the same time or after the NYSE, are valued based on quotations from the primary market in which they are traded and are categorized in Level 1. Because many foreign securities markets and exchanges close prior to the close of the NYSE, closing prices for foreign securities in those markets or on those exchanges do not reflect the events that occur after that close. Certain foreign securities may be fair valued using a pricing service that considers the correlation of the trading patterns of the foreign security to the intraday trading in the U.S. markets for investments such as American Depositary Receipts, financial futures, or ETFs and the movement of certain indices of securities based on a statistical analysis of their historical relationship; such valuations generally are categorized in Level 2.
Repurchase agreements: Repurchase agreements are valued at cost, which approximates fair value. To the extent the inputs are observable and timely, the values are generally categorized in Level 2 of the fair value hierarchy.
|
|
|
|
|
| Transamerica Series Trust |
|
|
|
Semi-Annual Financial Statements 2024 |
|
|
Page 8 |
|
|
Transamerica International Focus VP
NOTES TO FINANCIAL STATEMENTS (continued)
At June 30, 2024
(unaudited)
4. BORROWINGS AND OTHER FINANCING TRANSACTIONS
The Portfolio may engage in borrowing transactions as a means of raising cash to satisfy redemption requests, for other temporary or emergency purposes or, to the extent permitted by its investment policies, to raise additional cash to be invested in other securities or instruments. When the Portfolio invests borrowing proceeds in other securities, the Portfolio will bear the risk that the market value of the securities in which such proceeds are invested goes down and is insufficient to repay the borrowed proceeds. The Portfolio may borrow on a secured or on an unsecured basis. If the Portfolio enters into a secured borrowing arrangement, a portion of the Portfolio’s assets will be used as collateral. The 1940 Act requires the Portfolio to maintain asset coverage of at least 300% of the amount of its borrowings. Asset coverage means the ratio that the value of the Portfolio’s total assets, minus liabilities other than borrowings, bears to the aggregate amount of all borrowings. Although complying with this requirement has the effect of limiting the amount that the Portfolio may borrow, it does not otherwise mitigate the risks of entering into borrowing transactions.
Interfund lending: The Portfolio, along with other funds and portfolios advised by TAM, may participate in an interfund lending program pursuant to exemptive relief granted by the Securities and Exchange Commission on January 18, 2017. This program allows the Portfolio to lend to and borrow from other funds and portfolios advised by TAM. Interfund lending transactions are subject to the conditions of the exemptive relief which places limits on the amount of lending or borrowing a Portfolio may participate in under the program. Interest earned or paid on an interfund lending transaction will be based on the average of certain current market rates. For the period ended June 30, 2024, the Portfolio has not utilized the program.
Repurchase agreements: In a repurchase agreement, the Portfolio purchases a security and simultaneously commits to resell that security to the seller at an agreed-upon price on an agreed-upon date. Securities purchased subject to a repurchase agreement are held at the Portfolio’s custodian, or designated sub-custodian related to tri-party repurchase agreements, and, pursuant to the terms of the repurchase agreement, must be collateralized by securities with an aggregate market value greater than or equal to 100% of the resale price. The Portfolio will bear the risk of value fluctuations until the securities can be sold and may encounter delays and incur costs in liquidating the securities. In the event of bankruptcy or insolvency of the seller, delays and costs may be incurred.
Repurchase agreements are subject to netting agreements, which are agreements between the Portfolio and its counterparties that provide for the net settlement of all transactions and collateral with the Portfolio, through a single payment, in the event of default or termination. Amounts presented within the Schedule of Investments, and as part of Repurchase agreements, at value within the Statement of Assets and Liabilities are shown on a gross basis. The value of the related collateral for each repurchase agreement, as reflected within the Schedule of Investments, exceeds the value of each repurchase agreement at June 30, 2024.
Repurchase agreements at June 30, 2024, if any, are included within the Schedule of Investments and Statement of Assets and Liabilities.
Securities lending: The Portfolio may lend securities to qualified financial institutions, brokers and dealers. State Street serves as securities lending agent to the Portfolio pursuant to a Securities Lending Agreement. Loans of securities are terminable at any time and the borrower, after notice, is required to return borrowed securities within the standard time period for settlement of securities transactions. The lending of securities exposes the Portfolio to risks such as: the borrowers may fail to return the loaned securities or may not be able to provide additional collateral, the Portfolio may experience delays in recovery of the loaned securities or delays in access to collateral, or the Portfolio may experience losses related to the investment collateral. To minimize certain risks, loan counterparties pledge cash, securities issued or guaranteed by the U.S. Government and irrevocable letters of credit issued by banks as collateral. The initial collateral received by the Portfolio is required to have a value of at least 102% of the current value of the loaned securities traded on U.S. exchanges, and a value of at least 105% for all other securities. Typically the lending agent is not permitted to sell, re-pledge or use cash and non-cash collateral it receives. The lending agent has agreed to indemnify the Portfolio in the case of default of any securities borrower.
The Portfolio receives compensation for lending securities from interest or dividends earned on the cash, U.S. Government securities and irrevocable letters of credit held as collateral, less associated fees and expenses. Such income is reflected in Net income from securities lending within the Statement of Operations. Cash collateral received is invested in the State Street Navigator Securities Lending Trust — Government Money Market Portfolio.
The value of loaned securities and related cash and non-cash collateral outstanding at June 30, 2024, if any, are shown on a gross basis within the Schedule of Investments.
5. RISK FACTORS
Investing in the Portfolio involves certain key risks related to the Portfolio’s trading activity. Please reference the Portfolio’s prospectus for a more complete discussion of the following risk(s), as well as other risks of investing in the Portfolio.
|
|
|
|
|
| Transamerica Series Trust |
|
|
|
Semi-Annual Financial Statements 2024 |
|
|
Page 9 |
|
|
Transamerica International Focus VP
NOTES TO FINANCIAL STATEMENTS (continued)
At June 30, 2024
(unaudited)
5. RISK FACTORS (continued)
Market risk: The market prices of the Portfolio’s securities or other assets may go up or down, sometimes rapidly or unpredictably, due to factors such as economic events, inflation, changes in interest rates, governmental actions or interventions, actions taken by the U.S. Federal Reserve or foreign central banks, market disruptions caused by tariffs, trade disputes or other factors, political developments, armed conflicts, economic sanctions, cybersecurity events, investor sentiment, the global and domestic effects of widespread or local health, weather or climate events, and other factors that may or may not be related to the issuer of the security or other asset. If the market prices of the Portfolio’s securities and assets fall, the value of your investment in the Portfolio could go down.
Economies and financial markets throughout the world are increasingly interconnected. Events or circumstances in one or more countries or regions could be highly disruptive to, and have profound impacts on, global economies or markets. As a result, whether or not the Portfolio invests in securities of issuers located in or with significant exposure to the countries directly affected, the value and liquidity of the Portfolio’s investments may go down.
Foreign investments risk: Investing in securities of foreign issuers or issuers with significant exposure to foreign markets involves additional risks. Foreign markets can be less liquid, less regulated, less transparent and more volatile than U.S. markets. The value of the Portfolio’s foreign investments may decline, sometimes rapidly or unpredictably, because of factors affecting the particular issuer as well as foreign markets and issuers generally, such as unfavorable government actions, including nationalization, expropriation or confiscatory taxation, reduction of government or central bank support, tariffs and trade disruptions, sanctions, political or financial instability, social unrest or other adverse economic or political developments. Foreign investments may also be subject to different accounting practices and different regulatory, legal, auditing, financial reporting and recordkeeping standards and practices, and may be more difficult to value than investments in U.S. issuers. Certain foreign clearance and settlement procedures may result in an inability to execute transactions or delays in settlement.
Growth stocks risk: Returns on growth stocks may not move in tandem with returns on other categories of stocks or the market as a whole. Growth stocks typically are particularly sensitive to market movements and may involve larger price swings because their market prices tend to reflect future expectations. When it appears those expectations may not be met, the prices of growth stocks typically fall. Growth stocks may also be more volatile because they often do not pay dividends. The values of growth stocks tend to go down when interest rates rise because the rise in interest rates reduces the current value of future cash flows. Growth stocks as a group may be out of favor and underperform the overall equity market for a long period of time, for example, while the market favors “value” stocks.
6. FEES AND OTHER AFFILIATED TRANSACTIONS
TST serves as a funding vehicle for certain affiliated asset allocation portfolios and certain affiliated separate accounts of Transamerica Life Insurance Company (“TLIC”) and Transamerica Financial Life Insurance Company.
TAM, the Portfolio’s investment manager, is directly owned by TLIC and AUSA Holding, LLC (“AUSA”), both of which are indirect, wholly owned subsidiaries of Aegon Ltd. TLIC is owned by Commonwealth General Corporation (“Commonwealth”). Commonwealth and AUSA are wholly owned by Transamerica Corporation (DE). Transamerica Corporation (DE) is wholly owned by Aegon International B.V., which is wholly owned by Aegon Ltd., a Bermuda exempted company with liability limited by shares (formerly, Aegon NV, a Netherlands corporation) and a publicly traded international insurance group.
Transamerica Fund Services, Inc. (“TFS”) is the Portfolio’s transfer agent. Transamerica Capital, Inc. (“TCI”) is the Portfolio’s distributor/principal underwriter. TAM, TFS and TCI are affiliates of Aegon Ltd.
Certain officers and trustees of the Portfolio may also be officers and/or trustees of TAM, TFS and TCI. No interested trustee who is deemed an interested person due to current or former service with TAM or an affiliate of TAM receives compensation from the Portfolio. The Portfolio does pay non-interested persons (independent trustees), as disclosed in Trustee and CCO fees within the Statement of Operations.
Investment management fees: TAM serves as the Portfolio’s investment manager, performing administration as well as investment advisory services. TAM renders investment advisory, supervisory, and administration services under an investment management agreement and the Portfolio pays a single management fee, which is reflected in Investment management fees within the Statement of Operations.
|
|
|
|
|
| Transamerica Series Trust |
|
|
|
Semi-Annual Financial Statements 2024 |
|
|
Page 10 |
|
|
Transamerica International Focus VP
NOTES TO FINANCIAL STATEMENTS (continued)
At June 30, 2024
(unaudited)
6. FEES AND OTHER AFFILIATED TRANSACTIONS (continued)
The Portfolio pays a management fee to TAM based on daily average net assets at the following rates:
|
|
|
|
|
| Breakpoints |
|
Rate |
|
|
| First $500 million |
|
|
0.770 |
% |
| Over $500 million up to $1 billion |
|
|
0.760 |
|
| Over $1 billion up to $2 billion |
|
|
0.710 |
|
| Over $2 billion up to $3 billion |
|
|
0.695 |
|
| Over $3 billion |
|
|
0.680 |
|
TAM has contractually agreed to waive fees and/or reimburse Portfolio expenses to the extent that the total operating expenses excluding, as applicable, acquired fund fees and expenses, interest (including borrowing costs and overdraft charges), taxes, brokerage commissions, dividend and interest expenses on securities sold short, extraordinary expenses and other expenses not incurred in the ordinary course of the Portfolio’s business, exceed the following stated annual operating expense limits to the Portfolio’s daily average net assets. To the extent an expense limit changed during the period, the prior limit is also listed below. The expenses waived and/or reimbursed, if any, are included in Expenses waived and/or reimbursed within the Statement of Operations.
|
|
|
|
|
|
|
|
| Class |
|
Operating Expense Limit |
|
Operating Expense Limit Effective Through |
|
|
|
| Initial Class |
|
0.88% |
|
May 1, 2025 |
| Service Class |
|
1.13 |
|
May 1, 2025 |
TAM is permitted to recapture amounts contractually waived and/or reimbursed to a class during any of the 36 months from the date on which TAM waived fees and/or reimbursed expenses for the class. A class may recapture and reimburse TAM only if such amount does not cause, on any particular business day of the Portfolio, the class’s total annual operating expenses (after the recapture is taken into account) to exceed the Operating Expense Limits or any other lower limit then in effect. Amounts recaptured, if any, by TAM for the period ended June 30, 2024 are disclosed in Recapture of previously waived and/or reimbursed fees within the Statement of Operations.
TAM, on a voluntary basis and in addition to the contractual operating expense limits in effect, from time to time may waive and/or reimburse expenses of the Portfolio, or any classes thereof, to such level(s) as the Trust’s officers have determined or may reasonably determine from time to time. Any such voluntary waiver or expense reimbursement may be discontinued by TAM at any time. These amounts are not subject to recapture by TAM.
As of June 30, 2024, there are no amounts available for recapture by TAM.
Distribution and service fees: TST has a distribution plan (“Distribution Plan”) pursuant to Rule 12b-1 under the 1940 Act. Pursuant to the Distribution Plan, TST entered into a distribution agreement with TCI as the Portfolio’s distributor.
The Distribution Plan requires the Portfolio to pay distribution fees to TCI as compensation for various distribution activities, not as reimbursement for specific expenses. Under the Distribution Plan and distribution agreement, TCI, on behalf of the Portfolio, is authorized to pay various service providers, as direct payment for expenses incurred in connection with distribution of the Portfolio’s shares.
The fee on the Service Class shares is paid to the insurance companies for providing services and account maintenance for the policyholders who invest in the variable insurance products which invest in the Service Class shares. TCI has determined that it will not seek payment for the distribution expenses incurred by the Portfolio with respect to the Initial Class shares before May 1, 2025. Prior to TCI seeking distribution expenses on Initial Class shares, policy and contract owners will be notified in advance. The Portfolio will pay fees relating to Service Class shares. The distribution and service fees are included in Distribution and service fees within the Statement of Operations.
|
|
|
|
|
| Transamerica Series Trust |
|
|
|
Semi-Annual Financial Statements 2024 |
|
|
Page 11 |
|
|
Transamerica International Focus VP
NOTES TO FINANCIAL STATEMENTS (continued)
At June 30, 2024
(unaudited)
6. FEES AND OTHER AFFILIATED TRANSACTIONS (continued)
The Portfolio is authorized under the Distribution Plan to pay fees to TCI based on daily average net assets of each applicable class up to the following annual rates:
|
|
|
|
|
| Class |
|
Rate |
|
|
| Initial Class |
|
|
0.15 |
% |
| Service Class |
|
|
0.25 |
|
Transfer agent costs: TFS provides transfer agency services under an intercompany agreement with TAM. TFS has outsourced the provision of certain sub-transfer agency services to SS&C Global Investor & Distribution Solutions, Inc. (“SS&C GIDS”). The Portfolio does not pay a separate transfer agent fee to TAM or TFS but does pay certain expenses to SS&C GIDS related to applicable sub-transfer agency services. For the period ended June 30, 2024, (i) the expenses paid to SS&C GIDS by the Portfolio are referred to as transfer agent costs and are included within the Statement of Operations and (ii) the expenses payable to SS&C GIDS by the Portfolio are referred to as transfer agent costs within the Statement of Assets and Liabilities.
Brokerage commissions: The Portfolio incurred no brokerage commissions on security transactions placed with affiliates of the investment manager or sub-adviser(s) for the period ended June 30, 2024.
7. PURCHASES AND SALES OF SECURITIES
For the period ended June 30, 2024, the cost of securities purchased and proceeds from securities sold (excluding short-term securities) are as follows:
|
|
|
|
|
|
|
| Purchases of Securities |
|
Sales/Maturities of Securities |
| Long-Term |
|
U.S. Government |
|
Long-Term |
|
U.S. Government |
| $ 132,710,252 |
|
$ — |
|
$ 139,402,566 |
|
$ — |
8. FEDERAL INCOME TAXES AND DISTRIBUTIONS TO SHAREHOLDERS
The Portfolio has not made any provision for federal income or excise taxes due to its policy to distribute all of its taxable income and capital gains to its shareholders and otherwise qualify as a regulated investment company under Subchapter M of the Internal Revenue Code. The Portfolio recognizes the tax benefits of uncertain tax positions only where the position is “more likely than not” to be sustained assuming examination by tax authorities. The Portfolio’s tax returns remain subject to examination by the Internal Revenue Service and state tax authorities three years from the date of filing for federal purposes and four years from the date of filing for state purposes. Management has evaluated the Portfolio’s tax provisions taken for all open tax years, and has concluded that no provision for income tax is required in the Portfolio’s financial statements. If applicable, the Portfolio recognizes interest accrued related to unrecognized tax benefits in relation to interest and penalties expense in Other within the Statement of Operations. The Portfolio identifies its major tax jurisdictions as U.S. Federal, the state of Colorado, and foreign jurisdictions where the Portfolio makes significant investments; however, the Portfolio is not aware of any tax positions for which it is reasonably possible that the total amounts of unrecognized tax benefits will change materially in the next twelve months. Distributions are determined in accordance with income tax regulations, which may differ from GAAP.
As of June 30, 2024, the approximate cost for U.S. federal income tax purposes, and the aggregate gross/net unrealized appreciation (depreciation) in the value of investments (including securities sold short and derivatives, if any) are as follows:
|
|
|
|
|
|
|
| Cost |
|
Gross Appreciation |
|
Gross (Depreciation) |
|
Net Appreciation (Depreciation) |
| |
| $ 318,264,949 |
|
$ 56,007,230 |
|
$ (8,205,893) |
|
$ 47,801,337 |
9. NEW ACCOUNTING PRONOUNCEMENT
In June 2022, the Financial Accounting Standards Board issued Accounting Standards Update No. 2022-03 (“ASU 2022-03”), “Fair Value Measurement of Equity Securities Subject to Contractual Sale Restrictions” (“Topic 820”). ASU 2022-03 clarifies the guidance in Topic 820, related to the measurement of the fair value of an equity security subject to contractual sale restrictions, where it eliminates the need to
|
|
|
|
|
| Transamerica Series Trust |
|
|
|
Semi-Annual Financial Statements 2024 |
|
|
Page 12 |
|
|
Transamerica International Focus VP
NOTES TO FINANCIAL STATEMENTS (continued)
At June 30, 2024
(unaudited)
9. NEW ACCOUNTING PRONOUNCEMENT (continued)
apply a discount to fair value of these securities, and introduces disclosure requirements related to such equity securities. The guidance is effective for fiscal years, and interim periods within those fiscal years, beginning after December 15, 2023, and allows for early adoption. Management is currently evaluating the implications, if any, of the additional requirements and their impact on the Portfolio’s financial statements.
Please see TST’s most recent report on Form N-CSR, available at: www.transamerica.com/annuities/prospectus, for additional information. For the most recently filed complete proxy voting records for the Trust please visit: https://www.transamerica.com/sites/default/files/files/e070d/TST%20N-PX%202021.pdf
|
|
|
|
|
| Transamerica Series Trust |
|
|
|
Semi-Annual Financial Statements 2024 |
|
|
Page 13 |
|
|
Transamerica International Focus VP
MANAGEMENT AND SUB-ADVISORY AGREEMENT — CONTRACT RENEWAL
(unaudited)
At a meeting of the Board of Trustees of Transamerica Series Trust (the “Trustees” or the “Board”) held on June 12-13, 2024, the Board considered the renewal of the management agreement (the “Management Agreement”) between Transamerica Asset Management, Inc. (“TAM”) and Transamerica Series Trust, on behalf of Transamerica International Focus VP (the “Portfolio”). The Board also considered the renewal of the investment sub-advisory agreement (the “Sub-Advisory Agreement” and together with the Management Agreement, the “Agreements”) for the Portfolio between TAM and Epoch Investment Partners, Inc. (the “Sub-Adviser”).
Following its review and consideration, the Board determined that the terms of the Management Agreement and Sub-Advisory Agreement were reasonable and that the renewal of each of the Agreements was in the best interests of the Portfolio and the holders invested in the Portfolio. The Board, including the independent members of the Board (the “Independent Trustees”), unanimously approved the renewal of each of the Agreements through June 30, 2025.
Prior to reaching their decision, the Trustees requested and received from TAM and the Sub-Adviser certain information. They then reviewed such information as they deemed reasonably necessary to evaluate the Agreements, including information they had previously received from TAM and the Sub-Adviser as part of their regular oversight of the Portfolio, and knowledge they gained over time through meeting with TAM and the Sub-Adviser. Among other materials, the Trustees considered comparative fee, expense and performance information prepared by Broadridge Financial Solutions, Inc. (“Broadridge”), an independent provider of mutual fund performance information, as well as fee, expense and profitability information prepared by TAM. In addition, TAM provided the Board with additional supplemental comparative performance information. To the extent applicable, the Trustees considered information about fees and performance of comparable funds and/or accounts managed by the Sub-Adviser. The Board also considered reductions to the Portfolio’s expense limits, if any, that took effect after the last renewal of the Agreements. In their review, the Trustees also sought to identify instances in which the Portfolio’s performance, fees, total expenses and/or profitability appeared to be outliers within its respective peer group or other comparative metrics and sought to understand the reasons for such comparative positions.
In their deliberations, the Independent Trustees met privately without representatives of TAM or the Sub-Adviser present and were represented throughout the process by their independent legal counsel. In considering the proposed continuation of each of the Agreements, the Trustees evaluated and weighed a number of considerations that they believed to be relevant in light of the legal advice furnished to them by counsel, including independent legal counsel, and made a decision in the exercise of their own business judgment. They based their decisions on the considerations discussed below, among others, although they did not identify any particular consideration or item of information that was controlling of their decisions, and each Trustee may have attributed different weights to the various factors.
Nature, Extent and Quality of the Services Provided
The Board considered the nature, extent and quality of the services provided by TAM and the Sub-Adviser to the Portfolio in the past and the services anticipated to be provided in the future. The Board also considered the investment approach for the Portfolio; the experience, capability and integrity of TAM’s senior management; the financial resources of TAM; TAM’s management oversight process; TAM’s and the Sub-Adviser’s responsiveness to any questions by the Trustees; and the professional qualifications and compensation program of the portfolio management team of the Sub-Adviser. The Trustees noted that they receive, on a quarterly basis, an execution analysis from Capital Institutional Services, Inc. (CAPIS), an independent provider of trade analyses, for the Sub-Adviser and a comparison of trading results against a peer universe of managers.
The Board also considered the continuous and regular investment management and other services provided by TAM, when acting as a manager of managers, for the portion of the management fee it retains from the Portfolio after payment of the sub-advisory fees. The Board noted that the investment management and other services provided by TAM include the design, development and ongoing review and evaluation of the Portfolio and its investment strategy; the selection, oversight and monitoring of one or more investment sub-advisers to perform certain duties with respect to the Portfolio; ongoing portfolio trading oversight and analysis; risk management oversight and analysis; design, development, implementation and ongoing review and evaluation of a process for the valuation of Portfolio investments; design, development, implementation and ongoing review and evaluation of a compliance program for the Portfolio; design, development, implementation and ongoing review and evaluation of a process for the voting of proxies and exercise of rights to consent to corporate action for Portfolio investments; participation in Board meetings and oversight of preparation of materials for the Board, including materials for Board meetings and regular communications with the Board; oversight of preparation of the Portfolio’s prospectus, statement of additional information, shareholder reports and other disclosure materials and regulatory filings for the Portfolio; and ongoing cash management services for the Portfolio. The Board considered that TAM’s investment management services also include the provision of supervisory and administrative services to the Portfolio. The Board also noted that TAM, as part of the services it provides to all Transamerica mutual funds, including the Portfolio, oversees the services provided by the funds’ custodian, transfer agent, independent accountant and legal counsel and supervises the performance of the recordkeeping and holder service functions of the funds.
Investment Performance
In addition, the Board considered the short- and longer-term performance of the Portfolio in light of its investment objective, policies and strategies, including relative performance against (i) a peer universe of comparable mutual funds, as prepared by Broadridge, and (ii) the Portfolio’s benchmark, in each case for various trailing periods ended December 31, 2023. Based on these considerations, the Board determined that TAM and the Sub-Adviser can provide investment and related services that are appropriate in scope and extent in light of
|
|
|
|
|
| Transamerica Series Trust |
|
|
|
Semi-Annual Financial Statements 2024 |
|
|
Page 14 |
|
|
Transamerica International Focus VP
MANAGEMENT AND SUB-ADVISORY AGREEMENT — CONTRACT RENEWAL (continued)
(unaudited)
the Portfolio’s investment objectives, policies and strategies and operations, the competitive landscape of the investment company business and investor needs. The Board’s conclusions as to the Portfolio’s performance are summarized below. For purposes of its review, the Board generally used the performance of Service Class Shares. In describing the Portfolio’s performance relative to its peer universe, the summary conclusions characterize performance for the relevant periods in relation to whether it was “above,” “below” or “in line with” the peer universe median and do so using quintile rankings prepared by Broadridge. For simplicity, performance is described as “above” the median if the Portfolio’s performance ranked anywhere in the first or second quintiles, as “below” the median if it ranked anywhere in the fourth or fifth quintiles, or “in line with” the median if it ranked anywhere in the third quintile (i.e., even if its precise return was somewhat above or somewhat below the precise median return).
When considering the Portfolio’s performance, the Trustees considered any representations made by TAM regarding the appropriateness of certain peer groups and benchmarks. They recognized that performance reflects a snapshot of a period as of a specific date, and that consideration of performance data for a different period could generate significantly different performance results. The Trustees also recognized that even longer-term performance can be negatively affected by performance over a short-term period when that short-term performance is significantly below the performance of the comparable benchmark or universe of peer funds.
The Board noted that the performance of Service Class Shares of the Portfolio was above the median for its peer universe for the past 5- and 10-year periods and below the median for the past 1- and 3-year periods. The Board also noted that the performance of Service Class Shares of the Portfolio was above the benchmark that TAM utilizes to measure performance of the Portfolio for the past 5-year period and below the benchmark for the past 1-, 3- and 10-year periods. The Board noted that the Sub-Adviser had commenced sub-advising the Portfolio on May 1, 2018 pursuant to its current investment objective and investment strategies. The Trustees also noted recent changes in the portfolio management team at the Sub-Adviser. The Trustees noted that TAM intends to monitor and report to the Board on the portfolio manager transition and performance going forward. The Trustees observed that the performance of the Portfolio had improved during the first quarter of 2024.
Management Fee and Sub-Advisory Fees and Total Expense Ratio
The Board considered the management fee and total expense ratio of the Portfolio, including information provided by Broadridge comparing the management fee and total expense ratio of the Portfolio to the management fees and total expense ratios of comparable investment companies in both a peer group and broader peer universe compiled by Broadridge. The Board’s conclusions as to the Portfolio’s management fee and total expense ratio are summarized below. For purposes of its review, the Board generally used the actual total expenses (i.e., expenses reflecting any waivers and/or reimbursements) of Service Class Shares. In describing the Portfolio’s management fee and total expense ratio relative to its peer group and peer universe, the summary conclusions characterize management fees and total expense ratios for the relevant periods in relation to whether they were “above,” “below” or “in line with” the peer group or peer universe median and do so using quintile rankings prepared by Broadridge. For simplicity, management fees and total expense ratios are described as “above” the median if the Portfolio’s management fee or total expense ratio ranked anywhere in the fourth or fifth quintiles, as “below” the median if it ranked anywhere in the first or second quintiles, or “in line with” the median if it ranked anywhere in the third quintile (i.e., even if its precise management fee or total expense ratio was somewhat above or somewhat below the precise median management fee or total expense ratio).
The Board also considered the fees charged by the Sub-Adviser for sub-advisory services, as well as the portion of the Portfolio’s management fee retained by TAM following payment of the sub-advisory fee and how the portion of the contractual management fee retained by TAM at a specified asset level compared to the portions retained by other investment advisers managing mutual funds with similar investment strategies as calculated by an independent provider of information.
The Board noted that the Portfolio’s contractual management fee was below the medians for its peer group and peer universe and that the actual total expenses (i.e., expenses reflecting any waivers and/or reimbursements) of Service Class Shares of the Portfolio were in line with the median for its peer group and above the median for its peer universe. The Trustees also considered that TAM has entered into an expense limitation arrangement with the Portfolio, which may result in TAM waiving fees for the benefit of holders.
On the basis of these considerations, together with the other information it considered, the Board determined that the management and sub-advisory fees to be received by TAM and the Sub-Adviser under the Management Agreement and Sub-Advisory Agreement are reasonable in light of the services provided.
Cost of Services Provided and Level of Profitability
The Board reviewed information provided by TAM about the cost of providing and procuring fund management services, as well as the costs of the provision of administration, transfer agency and other services, to the Portfolio and to Transamerica Series Trust as a whole by TAM and its affiliates. The Board considered the profitability of TAM and its affiliates in providing these services for the Portfolio and Transamerica Series Trust as a whole. The Trustees recognized the competitiveness of the mutual fund industry and the importance of an investment adviser’s long-term profitability, including for maintaining company and management stability and accountability.
The Board also considered the allocation methodology used for calculating the profitability of TAM and its affiliates. The Board noted that the revenue and expense allocation methodology used by TAM to estimate its profitability with respect to its relationship with the Portfolio
|
|
|
|
|
| Transamerica Series Trust |
|
|
|
Semi-Annual Financial Statements 2024 |
|
|
Page 15 |
|
|
Transamerica International Focus VP
MANAGEMENT AND SUB-ADVISORY AGREEMENT — CONTRACT RENEWAL (continued)
(unaudited)
had been reviewed previously by an independent consultant. The Trustees considered that TAM reported that it had not made material changes to this methodology, and that the methodology had been applied consistently for the Portfolio.
With respect to the Sub-Adviser, the Board noted that the sub-advisory fee is the product of arm’s-length negotiation between TAM and the Sub-Adviser, which is not affiliated with TAM, and is paid by TAM and not the Portfolio. As a result, the Board focused on the profitability of TAM and its affiliates with respect to the Portfolio.
Based on this information, the Board determined that the profitability of TAM and its affiliates from their relationships with the Portfolio was not excessive.
Economies of Scale
The Board considered economies of scale with respect to the management of the Portfolio, whether the Portfolio had appropriately benefited from any economies of scale and whether there was the potential for realization of any future economies of scale. The Board also considered the existence of economies of scale with respect to management of the Transamerica mutual funds overall and the extent to which the Portfolio benefited from any economies of scale. The Board recognized that, as the Portfolio’s assets increase, any economies of scale realized by TAM or the Sub-Adviser may not directly correlate with each other or with any economies of scale that might be realized by the Portfolio. The Board considered the Portfolio’s management fee schedule and the existence of breakpoints and also considered the extent to which TAM shared economies of scale, if any, with the Portfolio through undertakings to limit or reimburse Portfolio expenses and to invest in maintaining and developing its capabilities and services. The Board also considered the Sub-Adviser’s sub-advisory fee schedule and the existence of breakpoints, if any, and how such breakpoints relate to any breakpoints in the Portfolio’s management fee schedule. The Board considered that the Sub-Adviser’s sub-advisory fees would be based on the combined assets of multiple funds. The Trustees concluded that the Portfolio’s fee structure reflected an appropriate sharing of any efficiencies or economies of scale to date and noted that they will have the opportunity to periodically reexamine the appropriateness of the management fee payable to TAM and the fee paid to the Sub-Adviser in light of any economies of scale experienced in the future.
Benefits to TAM, its Affiliates and/or the Sub-Adviser from their Relationships with the Portfolio
The Board considered other benefits derived by TAM, its affiliates, and/or the Sub-Adviser from their relationships with the Portfolio. The Board noted that TAM does not receive benefits from research obtained with commissions paid to broker-dealers for portfolio transactions (commonly referred to as “soft dollars”) as a result of its relationship with the Portfolio.
Other Considerations
The Board noted that TAM has made a substantial commitment to the recruitment and retention of high-quality personnel and maintains the financial, compliance and operational resources reasonably necessary to manage the Portfolio in a professional manner that is consistent with the best interests of the Portfolio and the holders. In this regard, the Board favorably considered the procedures and policies TAM has in place to enforce compliance with applicable laws and regulations and oversee the portfolio management activities of the Sub-Adviser. The Board also noted that TAM has made an entrepreneurial commitment and undertaken certain business risks with respect to the management and success of the Portfolio.
Conclusion
After consideration of the factors described above, as well as other factors, the Trustees, including the Independent Trustees, concluded that the renewal of the Management Agreement and the Sub-Advisory Agreement was in the best interests of the Portfolio and the holders and voted to approve the renewal of the Agreements.
|
|
|
|
|
| Transamerica Series Trust |
|
|
|
Semi-Annual Financial Statements 2024 |
|
|
Page 16 |
|
|
Transamerica International Focus VP
RESULTS OF SHAREHOLDER MEETING
(unaudited)
Rule 30e-1 under the Investment Company Act of 1940, as amended, titled “Reports to Stockholders of Management Companies,” requires regulated investment companies to report on all subject matters put to the vote of shareholders and to provide final results. Accordingly, the Board of Trustees of the Portfolio solicited a vote by the shareholders for the following item:
A special meeting of holders of Transamerica International Focus VP was held on April 29, 2024. The results of Proposal 1 and Proposal 2 were as follows:
Proposal 1: To approve a new sub-advisory agreement for Transamerica International Focus VP. Holders of the Portfolio are being asked to ratify and approve a new sub-advisory agreement with Epoch Investment Partners, Inc.
|
|
|
| Proposal |
|
Number of Shares |
| For |
|
41,067,917 |
| Against |
|
515,415 |
| Withheld |
|
666,463 |
Proposal 2: To approve the Portfolio’s use of the manager of managers exemptive order, which will allow TAM, the Portfolio’s investment manager, to enter into and materially amend sub-advisory agreements with respect to the Portfolio in the future without Holder approval, subject to prior approval by the Portfolio’s Board of Trustees.
|
|
|
| Proposal |
|
Number of Shares |
| For |
|
40,716,042 |
| Against |
|
752,888 |
| Withheld |
|
780,865 |
|
|
|
|
|
| Transamerica Series Trust |
|
|
|
Semi-Annual Financial Statements 2024 |
|
|
Page 17 |
|
|
PROXY VOTING POLICIES AND PROCEDURES AND QUARTERLY PORTFOLIO HOLDINGS
(unaudited)
A description of Transamerica Series Trust’s (the “Trust”) proxy voting policies and procedures is available in the Statement of Additional Information of the Portfolios, available without charge upon request by calling 1-800-851-9777 (toll free) or on the Securities and Exchange Commission’s (“SEC”) website at http://www.sec.gov.
In addition, the Portfolio is required to file Form N-PX, with their complete proxy voting records for the most recent 12 months ended June 30th, no later than August 31st of each year. The Form is available without charge: (1) on the Transamerica Funds website at https://www.transamerica.com/sites/default/files/files/e070d/TST%20N-PX%202021.pdf; and (2) on the SEC’s website at http://www.sec.gov.
Each fiscal quarter, the Portfolios, except Transamerica BlackRock Government Money Market VP, will file with the SEC a complete schedule of its monthly portfolio holdings on Form N-PORT. The Portfolios’ holdings as of the end of the third month of every fiscal quarter, as reported on Form N-PORT, will be publicly available on the SEC’s website at http://www.sec.gov within 60 days of the end of the fiscal quarter.
On a monthly basis, Transamerica BlackRock Government Money Market VP will file with the SEC portfolio holdings information on Form N-MFP3. A complete schedule of portfolio holdings is also available at www.transamerica.com.
You may also visit the Trust’s website at www.transamerica.com/annuities/prospectus for this and other information about the Portfolios and the Trust.
Important Notice Regarding Delivery of Shareholder Documents
Every year we provide shareholders informative materials such as the Transamerica Series Trust Annual Report, the Transamerica Series Trust Prospectus, and other required documents that keep you informed regarding your Portfolios. To the extent provided by mail, Transamerica Series Trust will only send one piece per mailing address, a method that saves your Portfolios money by reducing mailing and printing costs. We will continue to do this unless you tell us not to. To elect to receive individual mailings, simply call a Transamerica Customer Service Representative toll free at 1-800-851-9777, 8 a.m. to 7 p.m. Eastern Time, Monday-Friday. Your request will take effect within 30 days.
|
|
|
|
|
| Transamerica Series Trust |
|
|
|
Semi-Annual Financial Statements 2024 |
|
|
Page 18 |
|
|
NOTICE OF PRIVACY POLICY
(unaudited)
Your privacy is very important to us. We want you to understand what information we collect and how we use it. We collect and use “nonpublic personal information” in connection with providing our customers with a broad range of financial products and services as effectively and conveniently as possible. We treat nonpublic personal information in accordance with our Privacy Policy.
What Information We Collect and From Whom We Collect It
We may collect nonpublic personal information about you from the following sources:
| • |
|
Information we receive from you on applications or other forms, such as your name, address, and account number; |
| • |
|
Information about your transactions with us, our affiliates, or others, such as your account balance and purchase/redemption history; and |
| • |
|
Information we receive from non-affiliated third parties, including consumer reporting agencies. |
What Information We Disclose and To Whom We Disclose It
We do not disclose any nonpublic personal information about current or former customers to anyone without their express consent, except as permitted by law. We may disclose the nonpublic personal information we collect, as described above, to persons or companies that perform services on our behalf and to other financial institutions with which we have joint marketing agreements. We will require these companies to protect the confidentiality of your nonpublic personal information and to use it only to perform the services for which we have hired them.
Our Security Procedures
We restrict access to your nonpublic personal information and only allow disclosures to persons and companies as permitted by law to assist in providing products or services to you. We maintain physical, electronic, and procedural safeguards to protect your nonpublic personal information and to safeguard the disposal of certain consumer information.
Contact Us
If you have any questions about our Privacy Policy, please call 1-800-851-9777 on any business day between 8 a.m. and 7 p.m. Eastern Time.
Note: This Privacy Policy applies only to customers that have a direct relationship with us or our affiliates. If you own shares of our portfolios in the name of a third party such as a bank or broker-dealer, its privacy policy may apply to you instead of ours.
|
|
|
|
|
| Transamerica Series Trust |
|
|
|
Semi-Annual Financial Statements 2024 |
|
|
Page 19 |
|
|
PO Box 219945
Kansas City, MO 64121-9945
|
|
|
| Distributor: |
|
Transamerica Capital, Inc. |
|
|
PO Box 219945 |
|
|
Kansas City, MO 64121-9945 |
|
|
|
|
Customer Service: 1-800-851-9777 |
Transamerica Series Trust Semi-Annual Financial Statements
June 30, 2024
1801 California St., Suite 5200
Denver, CO 80202
Distributor: Transamerica Capital, Inc.
Customer Service: 1-800-851-9777
|
| The following pages contain the most recent semi-annual financial statements for the investment options in which you are invested. In compliance with Securities and Exchange Commission regulations, we present these reports on an annual and semi-annual basis with the hope that they will foster greater understanding of the investment options’ holdings, performance, financial data, accounting policies and other issues. This streamlined version provides information only on the investment options in which you are invested. If you have any questions about these reports, please do not hesitate to contact your financial professional. As always, we thank you for your trust and the opportunity to serve you. |
Transamerica Janus Balanced VP
SCHEDULE OF INVESTMENTS
At June 30, 2024
(unaudited)
|
|
|
|
|
|
|
|
|
| |
|
Shares |
|
|
Value |
|
| |
|
|
|
|
| COMMON STOCKS - 60.1% |
|
|
|
|
|
|
|
|
| Aerospace & Defense - 0.5% |
|
|
|
|
|
|
|
|
| General Dynamics Corp. |
|
|
14,440 |
|
|
$ |
4,189,622 |
|
| General Electric Co. |
|
|
3,620 |
|
|
|
575,471 |
|
|
|
|
|
|
|
|
|
|
|
|
|
|
|
|
|
|
|
|
4,765,093 |
|
|
|
|
|
|
|
|
|
|
|
|
|
| Banks - 1.2% |
|
|
|
|
|
|
|
|
| JPMorgan Chase & Co. |
|
|
58,773 |
|
|
|
11,887,427 |
|
|
|
|
|
|
|
|
|
|
|
|
|
| Beverages - 1.0% |
|
|
|
|
|
|
|
|
| Constellation Brands, Inc., Class A |
|
|
17,627 |
|
|
|
4,535,074 |
|
| Monster Beverage Corp. (A) |
|
|
94,684 |
|
|
|
4,729,466 |
|
|
|
|
|
|
|
|
|
|
|
|
|
|
|
|
|
|
|
|
9,264,540 |
|
|
|
|
|
|
|
|
|
|
|
|
|
| Biotechnology - 1.8% |
|
|
|
|
|
|
|
|
| AbbVie, Inc. |
|
|
35,682 |
|
|
|
6,120,177 |
|
| Amgen, Inc. |
|
|
18,564 |
|
|
|
5,800,322 |
|
| Vertex Pharmaceuticals, Inc. (A) |
|
|
10,580 |
|
|
|
4,959,057 |
|
|
|
|
|
|
|
|
|
|
|
|
|
|
|
|
|
|
|
|
16,879,556 |
|
|
|
|
|
|
|
|
|
|
|
|
|
| Broadline Retail - 2.4% |
|
|
|
|
|
|
|
|
| Amazon.com, Inc. (A) |
|
|
120,496 |
|
|
|
23,285,852 |
|
|
|
|
|
|
|
|
|
|
|
|
|
| Building Products - 0.6% |
|
|
|
|
|
|
|
|
| Trane Technologies PLC |
|
|
16,184 |
|
|
|
5,323,403 |
|
|
|
|
|
|
|
|
|
|
|
|
|
| Capital Markets - 1.9% |
|
|
|
|
|
|
|
|
| Charles Schwab Corp. |
|
|
54,191 |
|
|
|
3,993,335 |
|
| CME Group, Inc. |
|
|
23,723 |
|
|
|
4,663,942 |
|
| Moody’s Corp. |
|
|
4,202 |
|
|
|
1,768,748 |
|
| Morgan Stanley |
|
|
76,890 |
|
|
|
7,472,939 |
|
|
|
|
|
|
|
|
|
|
|
|
|
|
|
|
|
|
|
|
17,898,964 |
|
|
|
|
|
|
|
|
|
|
|
|
|
| Chemicals - 0.4% |
|
|
|
|
|
|
|
|
| Corteva, Inc. |
|
|
74,447 |
|
|
|
4,015,671 |
|
|
|
|
|
|
|
|
|
|
|
|
|
| Communications Equipment - 0.3% |
|
|
|
|
|
|
|
|
| Motorola Solutions, Inc. |
|
|
6,780 |
|
|
|
2,617,419 |
|
|
|
|
|
|
|
|
|
|
|
|
|
| Consumer Finance - 1.4% |
|
|
|
|
|
|
|
|
| American Express Co. |
|
|
58,784 |
|
|
|
13,611,435 |
|
|
|
|
|
|
|
|
|
|
|
| Consumer Staples Distribution & Retail - 1.3% |
|
| Costco Wholesale Corp. |
|
|
9,351 |
|
|
|
7,948,256 |
|
| Sysco Corp. |
|
|
63,553 |
|
|
|
4,537,049 |
|
|
|
|
|
|
|
|
|
|
|
|
|
|
|
|
|
|
|
|
12,485,305 |
|
|
|
|
|
|
|
|
|
|
|
|
|
| Energy Equipment & Services - 0.4% |
|
|
|
|
|
|
|
|
| Schlumberger NV |
|
|
72,129 |
|
|
|
3,403,046 |
|
|
|
|
|
|
|
|
|
|
|
|
|
| Entertainment - 0.7% |
|
|
|
|
|
|
|
|
| Netflix, Inc. (A) |
|
|
6,848 |
|
|
|
4,621,578 |
|
| Walt Disney Co. |
|
|
24,080 |
|
|
|
2,390,903 |
|
|
|
|
|
|
|
|
|
|
|
|
|
|
|
|
|
|
|
|
7,012,481 |
|
|
|
|
|
|
|
|
|
|
|
|
|
| Financial Services - 2.0% |
|
|
|
|
|
|
|
|
| Mastercard, Inc., Class A |
|
|
44,372 |
|
|
|
19,575,152 |
|
|
|
|
|
|
|
|
|
|
|
|
|
| Food Products - 0.3% |
|
|
|
|
|
|
|
|
| Hershey Co. |
|
|
17,514 |
|
|
|
3,219,599 |
|
|
|
|
|
|
|
|
|
|
|
|
|
| Ground Transportation - 0.3% |
|
|
|
|
|
|
|
|
| Uber Technologies, Inc. (A) |
|
|
41,075 |
|
|
|
2,985,331 |
|
|
|
|
|
|
|
|
|
|
|
|
|
|
|
|
|
|
|
| |
|
Shares |
|
|
Value |
|
| |
|
|
| COMMON STOCKS (continued) |
|
| Health Care Equipment & Supplies - 1.6% |
|
| Abbott Laboratories |
|
|
59,122 |
|
|
$ |
6,143,367 |
|
| Edwards Lifesciences Corp. (A) |
|
|
44,380 |
|
|
|
4,099,381 |
|
| Stryker Corp. |
|
|
14,830 |
|
|
|
5,045,907 |
|
|
|
|
|
|
|
|
|
|
|
|
|
|
|
|
|
|
|
|
15,288,655 |
|
|
|
|
|
|
|
|
|
|
|
| Health Care Providers & Services - 1.9% |
|
| HCA Healthcare, Inc. |
|
|
9,377 |
|
|
|
3,012,643 |
|
| UnitedHealth Group, Inc. |
|
|
30,870 |
|
|
|
15,720,856 |
|
|
|
|
|
|
|
|
|
|
|
|
|
|
|
|
|
|
|
|
18,733,499 |
|
|
|
|
|
|
|
|
|
|
|
| Hotels, Restaurants & Leisure - 3.4% |
|
| Booking Holdings, Inc. |
|
|
2,196 |
|
|
|
8,699,454 |
|
| Chipotle Mexican Grill, Inc. (A) |
|
|
72,566 |
|
|
|
4,546,260 |
|
| Hilton Worldwide Holdings, Inc. |
|
|
48,874 |
|
|
|
10,664,307 |
|
| McDonald’s Corp. |
|
|
34,971 |
|
|
|
8,912,009 |
|
|
|
|
|
|
|
|
|
|
|
|
|
|
|
|
|
|
|
|
32,822,030 |
|
|
|
|
|
|
|
|
|
|
|
|
|
| Household Products - 0.7% |
|
|
|
|
|
|
|
|
| Procter & Gamble Co. |
|
|
39,479 |
|
|
|
6,510,877 |
|
|
|
|
|
|
|
|
|
|
|
| Industrial Conglomerates - 0.8% |
|
| Honeywell International, Inc. |
|
|
37,331 |
|
|
|
7,971,662 |
|
|
|
|
|
|
|
|
|
|
|
|
|
| Insurance - 1.9% |
|
|
|
|
|
|
|
|
| Marsh & McLennan Cos., Inc. |
|
|
21,507 |
|
|
|
4,531,955 |
|
| Progressive Corp. |
|
|
65,195 |
|
|
|
13,541,654 |
|
|
|
|
|
|
|
|
|
|
|
|
|
|
|
|
|
|
|
|
18,073,609 |
|
|
|
|
|
|
|
|
|
|
|
| Interactive Media & Services - 5.1% |
|
| Alphabet, Inc., Class C |
|
|
158,306 |
|
|
|
29,036,486 |
|
| Meta Platforms, Inc., Class A |
|
|
39,916 |
|
|
|
20,126,446 |
|
|
|
|
|
|
|
|
|
|
|
|
|
|
|
|
|
|
|
|
49,162,932 |
|
|
|
|
|
|
|
|
|
|
|
|
|
| IT Services - 0.7% |
|
|
|
|
|
|
|
|
| Accenture PLC, Class A |
|
|
22,588 |
|
|
|
6,853,425 |
|
|
|
|
|
|
|
|
|
|
|
| Life Sciences Tools & Services - 0.8% |
|
| Danaher Corp. |
|
|
9,999 |
|
|
|
2,498,250 |
|
| Thermo Fisher Scientific, Inc. |
|
|
9,158 |
|
|
|
5,064,374 |
|
|
|
|
|
|
|
|
|
|
|
|
|
|
|
|
|
|
|
|
7,562,624 |
|
|
|
|
|
|
|
|
|
|
|
|
|
| Machinery - 0.8% |
|
|
|
|
|
|
|
|
| Deere & Co. |
|
|
20,025 |
|
|
|
7,481,941 |
|
|
|
|
|
|
|
|
|
|
|
| Oil, Gas & Consumable Fuels - 1.2% |
|
| Chevron Corp. |
|
|
35,638 |
|
|
|
5,574,496 |
|
| ConocoPhillips |
|
|
56,224 |
|
|
|
6,430,901 |
|
|
|
|
|
|
|
|
|
|
|
|
|
|
|
|
|
|
|
|
12,005,397 |
|
|
|
|
|
|
|
|
|
|
|
|
|
| Pharmaceuticals - 2.2% |
|
|
|
|
|
|
|
|
| Eli Lilly & Co. |
|
|
13,354 |
|
|
|
12,090,444 |
|
| Merck & Co., Inc. |
|
|
49,146 |
|
|
|
6,084,275 |
|
| Zoetis, Inc. |
|
|
18,047 |
|
|
|
3,128,628 |
|
|
|
|
|
|
|
|
|
|
|
|
|
|
|
|
|
|
|
|
21,303,347 |
|
|
|
|
|
|
|
|
|
|
|
| Professional Services - 0.6% |
|
| Automatic Data Processing, Inc. |
|
|
25,579 |
|
|
|
6,105,452 |
|
|
|
|
|
|
|
|
|
|
|
| Semiconductors & Semiconductor Equipment - 8.7% |
|
| Broadcom, Inc. |
|
|
2,393 |
|
|
|
3,842,033 |
|
The Notes to Financial Statements are an integral part of this report.
|
|
|
|
|
| Transamerica Series Trust |
|
|
|
Semi-Annual Financial Statements 2024 |
|
|
Page 1 |
|
|
Transamerica Janus Balanced VP
SCHEDULE OF INVESTMENTS (continued)
At June 30, 2024
(unaudited)
|
|
|
|
|
|
|
|
|
| |
|
Shares |
|
|
Value |
|
| |
|
|
| COMMON STOCKS (continued) |
|
| Semiconductors & Semiconductor Equipment (continued) |
|
| KLA Corp. |
|
|
9,798 |
|
|
$ |
8,078,549 |
|
| Lam Research Corp. |
|
|
14,466 |
|
|
|
15,404,120 |
|
| NVIDIA Corp. |
|
|
394,680 |
|
|
|
48,758,767 |
|
| Texas Instruments, Inc. |
|
|
35,856 |
|
|
|
6,975,068 |
|
|
|
|
|
|
|
|
|
|
|
|
|
|
|
|
|
|
|
|
83,058,537 |
|
|
|
|
|
|
|
|
|
|
|
|
|
| Software - 8.0% |
|
|
|
|
|
|
|
|
| Adobe, Inc. (A) |
|
|
6,376 |
|
|
|
3,542,123 |
|
| Cadence Design Systems, Inc. (A) |
|
|
8,318 |
|
|
|
2,559,864 |
|
| Intuit, Inc. |
|
|
7,724 |
|
|
|
5,076,290 |
|
| Microsoft Corp. |
|
|
126,821 |
|
|
|
56,682,646 |
|
| Oracle Corp. |
|
|
41,879 |
|
|
|
5,913,315 |
|
| ServiceNow, Inc. (A) |
|
|
3,234 |
|
|
|
2,544,091 |
|
|
|
|
|
|
|
|
|
|
|
|
|
|
|
|
|
|
|
|
76,318,329 |
|
|
|
|
|
|
|
|
|
|
|
|
|
| Specialty Retail - 1.4% |
|
|
|
|
|
|
|
|
| Home Depot, Inc. |
|
|
18,308 |
|
|
|
6,302,346 |
|
| TJX Cos., Inc. |
|
|
61,162 |
|
|
|
6,733,936 |
|
|
|
|
|
|
|
|
|
|
|
|
|
|
|
|
|
|
|
|
13,036,282 |
|
|
|
|
|
|
|
|
|
|
|
| Technology Hardware, Storage & Peripherals - 3.2% |
|
| Apple, Inc. |
|
|
144,379 |
|
|
|
30,409,105 |
|
|
|
|
|
|
|
|
|
|
|
| Textiles, Apparel & Luxury Goods - 0.6% |
|
| NIKE, Inc., Class B |
|
|
74,352 |
|
|
|
5,603,910 |
|
|
|
|
|
|
|
|
|
|
| Total Common Stocks
(Cost $339,390,638) |
|
|
|
|
|
|
576,531,887 |
|
|
|
|
|
|
|
|
|
|
|
|
|
| |
|
Principal |
|
|
Value |
|
| |
|
|
| CORPORATE DEBT SECURITIES - 13.4% |
|
| Aerospace & Defense - 0.6% |
|
| BAE Systems PLC |
|
|
|
|
|
|
|
|
| 5.13%, 03/26/2029 (B) |
|
$ |
386,000 |
|
|
|
384,522 |
|
| 5.25%, 03/26/2031 (B) |
|
|
200,000 |
|
|
|
199,644 |
|
| 5.30%, 03/26/2034 (B) |
|
|
562,000 |
|
|
|
557,986 |
|
| Boeing Co. |
|
|
|
|
|
|
|
|
| 6.30%, 05/01/2029 (B) |
|
|
313,000 |
|
|
|
317,592 |
|
| 6.39%, 05/01/2031 (B) |
|
|
784,000 |
|
|
|
799,135 |
|
| 6.53%, 05/01/2034 (B) |
|
|
755,000 |
|
|
|
774,458 |
|
| 6.86%, 05/01/2054 (B) |
|
|
331,000 |
|
|
|
341,250 |
|
| 7.01%, 05/01/2064 (B) |
|
|
161,000 |
|
|
|
165,657 |
|
| Bombardier, Inc. |
|
|
|
|
|
|
|
|
| 7.00%, 06/01/2032 (B) |
|
|
762,000 |
|
|
|
772,435 |
|
| TransDigm, Inc. |
|
|
|
|
|
|
|
|
| 6.38%, 03/01/2029 (B) |
|
|
253,000 |
|
|
|
254,275 |
|
| 6.63%, 03/01/2032 (B) |
|
|
1,140,000 |
|
|
|
1,151,514 |
|
|
|
|
|
|
|
|
|
|
|
|
|
|
|
|
|
|
|
|
5,718,468 |
|
|
|
|
|
|
|
|
|
|
|
|
|
| Automobile Components - 0.1% |
|
|
|
|
|
|
|
|
| ZF North America Capital, Inc. |
|
|
|
|
|
|
|
|
| 6.75%, 04/23/2030 (B) |
|
|
763,000 |
|
|
|
777,124 |
|
| 6.88%, 04/23/2032 (B) |
|
|
413,000 |
|
|
|
426,952 |
|
|
|
|
|
|
|
|
|
|
|
|
|
|
|
|
|
|
|
|
1,204,076 |
|
|
|
|
|
|
|
|
|
|
|
|
|
|
|
|
|
|
|
| |
|
Principal |
|
|
Value |
|
| |
|
|
| CORPORATE DEBT SECURITIES (continued) |
|
| Automobiles - 0.3% |
|
| Ford Motor Credit Co. LLC |
|
|
|
|
|
|
|
|
| 5.80%, 03/08/2029 |
|
$ |
830,000 |
|
|
$ |
827,285 |
|
| 6.13%, 03/08/2034 |
|
|
645,000 |
|
|
|
639,262 |
|
| 7.12%, 11/07/2033 |
|
|
474,000 |
|
|
|
502,044 |
|
| 7.20%, 06/10/2030 |
|
|
231,000 |
|
|
|
243,164 |
|
| 7.35%, 03/06/2030 |
|
|
234,000 |
|
|
|
247,813 |
|
| General Motors Financial Co., Inc. |
|
|
|
|
|
|
|
|
| 5.95%, 04/04/2034 |
|
|
724,000 |
|
|
|
725,952 |
|
|
|
|
|
|
|
|
|
|
|
|
|
|
|
|
|
|
|
|
3,185,520 |
|
|
|
|
|
|
|
|
|
|
|
|
|
| Banks - 2.9% |
|
|
|
|
|
|
|
|
| Bank of America Corp. |
|
|
|
|
|
|
|
|
| Fixed until 09/15/2033, 5.87% (C), 09/15/2034 |
|
|
799,000 |
|
|
|
823,445 |
|
| Fixed until 11/10/2027, 6.20% (C), 11/10/2028 |
|
|
1,219,000 |
|
|
|
1,255,328 |
|
| Fixed until 09/05/2024, 6.25% (C), 09/05/2024 (D) |
|
|
993,000 |
|
|
|
988,884 |
|
| Bank of Montreal |
|
|
|
|
|
|
|
|
| Fixed until 01/10/2032, 3.09% (C), 01/10/2037 |
|
|
1,059,000 |
|
|
|
865,641 |
|
| Bank of New York Mellon Corp. |
|
|
|
|
|
|
|
|
| Fixed until 04/26/2026, 4.95% (C), 04/26/2027 |
|
|
541,000 |
|
|
|
537,637 |
|
| Fixed until 10/25/2033, 6.47% (C), 10/25/2034 |
|
|
904,000 |
|
|
|
976,822 |
|
| BNP Paribas SA |
|
|
|
|
|
|
|
|
| Fixed until 01/20/2027, 2.59% (C), 01/20/2028 (B) |
|
|
616,000 |
|
|
|
572,689 |
|
| Fixed until 01/09/2029, 5.18% (C), 01/09/2030 (B) |
|
|
616,000 |
|
|
|
609,870 |
|
| Citigroup, Inc. |
|
|
|
|
|
|
|
|
| Fixed until 01/10/2027, 3.89% (C), 01/10/2028 |
|
|
1,369,000 |
|
|
|
1,321,681 |
|
| Fixed until 02/13/2034, 5.83% (C), 02/13/2035 |
|
|
2,098,000 |
|
|
|
2,083,032 |
|
| Fixed until 05/15/2025, 5.95% (C), 05/15/2025 (D) |
|
|
496,000 |
|
|
|
493,067 |
|
| 3-Month Term SOFR + 3.68%, 9.01% (C), 08/15/2024 (D) |
|
|
109,000 |
|
|
|
108,883 |
|
| Fifth Third Bancorp |
|
|
|
|
|
|
|
|
| Fixed until 01/29/2031, 5.63% (C), 01/29/2032 |
|
|
241,000 |
|
|
|
239,128 |
|
| JPMorgan Chase & Co. |
|
|
|
|
|
|
|
|
| Fixed until 08/01/2024, 5.00% (C), 08/01/2024 (D) |
|
|
392,000 |
|
|
|
390,890 |
|
| Fixed until 01/23/2029, 5.01% (C), 01/23/2030 |
|
|
414,000 |
|
|
|
411,077 |
|
| Fixed until 01/23/2027, 5.04% (C), 01/23/2028 |
|
|
522,000 |
|
|
|
519,281 |
|
| Fixed until 07/24/2028, 5.30% (C), 07/24/2029 |
|
|
912,000 |
|
|
|
915,526 |
|
| Fixed until 10/23/2028, 6.09% (C), 10/23/2029 |
|
|
917,000 |
|
|
|
947,961 |
|
| Fixed until 10/23/2033, 6.25% (C), 10/23/2034 |
|
|
786,000 |
|
|
|
835,075 |
|
The Notes to Financial Statements are an integral part of this report.
|
|
|
|
|
| Transamerica Series Trust |
|
|
|
Semi-Annual Financial Statements 2024 |
|
|
Page 2 |
|
|
Transamerica Janus Balanced VP
SCHEDULE OF INVESTMENTS (continued)
At June 30, 2024
(unaudited)
|
|
|
|
|
|
|
|
|
| |
|
Principal |
|
|
Value |
|
| |
|
|
| CORPORATE DEBT SECURITIES (continued) |
|
| Banks (continued) |
|
| Morgan Stanley |
|
|
|
|
|
|
|
|
| Fixed until 05/04/2026, 1.59% (C), 05/04/2027 |
|
$ |
632,000 |
|
|
$ |
589,177 |
|
| Fixed until 04/28/2025, 2.19% (C), 04/28/2026 |
|
|
990,000 |
|
|
|
961,800 |
|
| Fixed until 01/21/2032, 2.94% (C), 01/21/2033 |
|
|
676,000 |
|
|
|
575,561 |
|
| Fixed until 01/24/2028, 3.77% (C), 01/24/2029 |
|
|
90,000 |
|
|
|
85,723 |
|
| 4.35%, 09/08/2026 |
|
|
79,000 |
|
|
|
77,266 |
|
| Fixed until 04/20/2028, 5.16% (C), 04/20/2029 |
|
|
850,000 |
|
|
|
847,991 |
|
| Fixed until 07/21/2033, 5.42% (C), 07/21/2034 |
|
|
774,000 |
|
|
|
771,540 |
|
| National Australia Bank Ltd. |
|
|
|
|
|
|
|
|
| 2.99%, 05/21/2031 (B) |
|
|
1,103,000 |
|
|
|
929,502 |
|
| Nordea Bank Abp |
|
|
|
|
|
|
|
|
| 5.38%, 09/22/2027 (B) |
|
|
1,253,000 |
|
|
|
1,259,495 |
|
| PNC Financial Services Group, Inc. |
|
|
|
|
|
|
|
|
| Fixed until 10/20/2033, 6.88% (C), 10/20/2034 |
|
|
950,000 |
|
|
|
1,036,864 |
|
| Sumitomo Mitsui Financial Group, Inc. |
|
|
|
|
|
|
|
|
| 5.85%, 07/13/2030 |
|
|
358,000 |
|
|
|
367,745 |
|
| Truist Financial Corp. |
|
|
|
|
|
|
|
|
| Fixed until 01/24/2029, 5.44% (C), 01/24/2030 |
|
|
381,000 |
|
|
|
380,098 |
|
| Fixed until 01/24/2034, 5.71% (C), 01/24/2035 |
|
|
313,000 |
|
|
|
312,246 |
|
| Fixed until 06/08/2026, 6.05% (C), 06/08/2027 |
|
|
517,000 |
|
|
|
520,643 |
|
| UBS Group AG |
|
|
|
|
|
|
|
|
| Fixed until 02/08/2029, 5.43% (C), 02/08/2030 (B) |
|
|
708,000 |
|
|
|
706,973 |
|
| Fixed until 02/08/2034, 5.70% (C), 02/08/2035 (B) |
|
|
598,000 |
|
|
|
598,721 |
|
| US Bancorp |
|
|
|
|
|
|
|
|
| Fixed until 11/03/2031, 2.49% (C), 11/03/2036 |
|
|
857,000 |
|
|
|
675,846 |
|
| Fixed until 01/23/2029, 5.38% (C), 01/23/2030 |
|
|
799,000 |
|
|
|
801,535 |
|
| Fixed until 01/23/2034, 5.68% (C), 01/23/2035 |
|
|
573,000 |
|
|
|
576,371 |
|
| Wells Fargo & Co. |
|
|
|
|
|
|
|
|
| Fixed until 01/22/2029, 5.20% (C), 01/23/2030 |
|
|
1,134,000 |
|
|
|
1,130,078 |
|
|
|
|
|
|
|
|
|
|
|
|
|
|
|
|
|
|
|
|
28,101,092 |
|
|
|
|
|
|
|
|
|
|
|
| Biotechnology - 0.1% |
|
| Illumina, Inc. |
|
|
|
|
|
|
|
|
| 5.80%, 12/12/2025 |
|
|
483,000 |
|
|
|
483,580 |
|
| Royalty Pharma PLC |
|
|
|
|
|
|
|
|
| 3.55%, 09/02/2050 |
|
|
782,000 |
|
|
|
527,805 |
|
|
|
|
|
|
|
|
|
|
|
|
|
|
|
|
|
|
|
|
1,011,385 |
|
|
|
|
|
|
|
|
|
|
|
|
|
|
|
|
|
|
|
| |
|
Principal |
|
|
Value |
|
| |
|
|
| CORPORATE DEBT SECURITIES (continued) |
|
| Building Products - 0.2% |
|
| Home Depot, Inc. |
|
|
|
|
|
|
|
|
| 4.75%, 06/25/2029 (E) |
|
$ |
352,000 |
|
|
$ |
350,150 |
|
| 4.85%, 06/25/2031 |
|
|
435,000 |
|
|
|
432,016 |
|
| 4.95%, 06/25/2034 |
|
|
348,000 |
|
|
|
345,154 |
|
| 5.30%, 06/25/2054 |
|
|
347,000 |
|
|
|
340,491 |
|
|
|
|
|
|
|
|
|
|
|
|
|
|
|
|
|
|
|
|
1,467,811 |
|
|
|
|
|
|
|
|
|
|
|
| Capital Markets - 0.7% |
|
| Blackstone Private Credit Fund |
|
|
|
|
|
|
|
|
| 7.30%, 11/27/2028 (B) |
|
|
604,000 |
|
|
|
626,201 |
|
| Blue Owl Credit Income Corp. |
|
|
|
|
|
|
|
|
| 4.70%, 02/08/2027 |
|
|
113,000 |
|
|
|
107,545 |
|
| 7.75%, 09/16/2027 |
|
|
678,000 |
|
|
|
696,757 |
|
| 7.95%, 06/13/2028 |
|
|
371,000 |
|
|
|
383,850 |
|
| Blue Owl Finance LLC |
|
|
|
|
|
|
|
|
| 6.25%, 04/18/2034 (B) |
|
|
1,556,000 |
|
|
|
1,563,319 |
|
| Jane Street Group/JSG Finance, Inc. |
|
|
|
|
|
|
|
|
| 7.13%, 04/30/2031 (B) |
|
|
1,682,000 |
|
|
|
1,722,186 |
|
| LPL Holdings, Inc. |
|
|
|
|
|
|
|
|
| 6.00%, 05/20/2034 |
|
|
787,000 |
|
|
|
787,513 |
|
| 6.75%, 11/17/2028 |
|
|
1,261,000 |
|
|
|
1,323,353 |
|
|
|
|
|
|
|
|
|
|
|
|
|
|
|
|
|
|
|
|
7,210,724 |
|
|
|
|
|
|
|
|
|
|
|
| Chemicals - 0.3% |
|
| Celanese US Holdings LLC |
|
|
|
|
|
|
|
|
| 6.33%, 07/15/2029 |
|
|
382,000 |
|
|
|
393,120 |
|
| 6.35%, 11/15/2028 |
|
|
386,000 |
|
|
|
396,814 |
|
| 6.55%, 11/15/2030 |
|
|
967,000 |
|
|
|
1,011,306 |
|
| 6.70%, 11/15/2033 |
|
|
943,000 |
|
|
|
992,792 |
|
|
|
|
|
|
|
|
|
|
|
|
|
|
|
|
|
|
|
|
2,794,032 |
|
|
|
|
|
|
|
|
|
|
|
| Consumer Finance - 0.3% |
|
| Capital One Financial Corp. |
|
|
|
|
|
|
|
|
| Fixed until 02/01/2029, 5.70% (C), 02/01/2030 (E) |
|
|
214,000 |
|
|
|
215,144 |
|
| Fixed until 06/08/2028, 6.31% (C), 06/08/2029 |
|
|
388,000 |
|
|
|
397,179 |
|
| Fixed until 10/30/2030, 7.62% (C), 10/30/2031 |
|
|
864,000 |
|
|
|
951,827 |
|
| Discover Financial Services |
|
|
|
|
|
|
|
|
| Fixed until 11/02/2033, 7.96% (C), 11/02/2034 |
|
|
1,157,000 |
|
|
|
1,303,551 |
|
|
|
|
|
|
|
|
|
|
|
|
|
|
|
|
|
|
|
|
2,867,701 |
|
|
|
|
|
|
|
|
|
|
|
| Consumer Staples Distribution & Retail - 0.1% |
|
| Albertsons Cos., Inc./Safeway, Inc./New Albertsons LP |
|
|
|
|
|
|
|
|
| 6.50%, 02/15/2028 (B) |
|
|
592,000 |
|
|
|
595,557 |
|
|
|
|
|
|
|
|
|
|
|
| Containers & Packaging - 0.1% |
|
| Berry Global, Inc. |
|
|
|
|
|
|
|
|
| 5.80%, 06/15/2031 (B) |
|
|
1,309,000 |
|
|
|
1,308,639 |
|
|
|
|
|
|
|
|
|
|
|
| Distributors - 0.2% |
|
| LKQ Corp. |
|
|
|
|
|
|
|
|
| 5.75%, 06/15/2028 |
|
|
854,000 |
|
|
|
862,692 |
|
| 6.25%, 06/15/2033 |
|
|
802,000 |
|
|
|
823,734 |
|
|
|
|
|
|
|
|
|
|
|
|
|
|
|
|
|
|
|
|
1,686,426 |
|
|
|
|
|
|
|
|
|
|
The Notes to Financial Statements are an integral part of this report.
|
|
|
|
|
| Transamerica Series Trust |
|
|
|
Semi-Annual Financial Statements 2024 |
|
|
Page 3 |
|
|
Transamerica Janus Balanced VP
SCHEDULE OF INVESTMENTS (continued)
At June 30, 2024
(unaudited)
|
|
|
|
|
|
|
|
|
| |
|
Principal |
|
|
Value |
|
| |
|
|
| CORPORATE DEBT SECURITIES (continued) |
|
| Diversified REITs - 0.0% (F) |
|
| GLP Capital LP/GLP Financing II, Inc. |
|
|
|
|
|
|
|
|
| REIT, 5.30%, 01/15/2029 |
|
$ |
73,000 |
|
|
$ |
71,955 |
|
| REIT, 5.38%, 04/15/2026 |
|
|
333,000 |
|
|
|
330,328 |
|
|
|
|
|
|
|
|
|
|
|
|
|
|
|
|
|
|
|
|
402,283 |
|
|
|
|
|
|
|
|
|
|
|
| Diversified Telecommunication Services - 0.0% (F) |
|
| AT&T, Inc. |
|
|
|
|
|
|
|
|
| 3.65%, 09/15/2059 |
|
|
109,000 |
|
|
|
73,573 |
|
|
|
|
|
|
|
|
|
|
|
| Electric Utilities - 1.0% |
|
| American Electric Power Co., Inc. |
|
|
|
|
|
|
|
|
| 5.63%, 03/01/2033 |
|
|
893,000 |
|
|
|
891,364 |
|
| Duke Energy Corp. |
|
|
|
|
|
|
|
|
| 4.30%, 03/15/2028 |
|
|
643,000 |
|
|
|
624,107 |
|
| 5.45%, 06/15/2034 |
|
|
1,332,000 |
|
|
|
1,319,307 |
|
| Duquesne Light Holdings, Inc. |
|
|
|
|
|
|
|
|
| 2.78%, 01/07/2032 (B) |
|
|
642,000 |
|
|
|
521,962 |
|
| Electricite de France SA |
|
|
|
|
|
|
|
|
| 5.70%, 05/23/2028 (B) |
|
|
421,000 |
|
|
|
425,445 |
|
| 6.25%, 05/23/2033 (B) |
|
|
583,000 |
|
|
|
604,194 |
|
| Exelon Corp. |
|
|
|
|
|
|
|
|
| 5.45%, 03/15/2034 |
|
|
679,000 |
|
|
|
675,568 |
|
| Georgia Power Co. |
|
|
|
|
|
|
|
|
| 4.65%, 05/16/2028 |
|
|
450,000 |
|
|
|
443,287 |
|
| 4.95%, 05/17/2033 |
|
|
713,000 |
|
|
|
696,595 |
|
| 5.25%, 03/15/2034 |
|
|
599,000 |
|
|
|
598,334 |
|
| National Grid PLC |
|
|
|
|
|
|
|
|
| 5.60%, 06/12/2028 |
|
|
320,000 |
|
|
|
323,243 |
|
| 5.81%, 06/12/2033 |
|
|
672,000 |
|
|
|
676,456 |
|
| Southern Co. |
|
|
|
|
|
|
|
|
| 5.70%, 03/15/2034 |
|
|
645,000 |
|
|
|
657,076 |
|
| Xcel Energy, Inc. |
|
|
|
|
|
|
|
|
| 5.45%, 08/15/2033 |
|
|
1,551,000 |
|
|
|
1,525,488 |
|
|
|
|
|
|
|
|
|
|
|
|
|
|
|
|
|
|
|
|
9,982,426 |
|
|
|
|
|
|
|
|
|
|
|
| Electrical Equipment - 0.1% |
|
| WESCO Distribution, Inc. |
|
|
|
|
|
|
|
|
| 6.38%, 03/15/2029 (B) |
|
|
483,000 |
|
|
|
484,776 |
|
| 6.63%, 03/15/2032 (B) |
|
|
611,000 |
|
|
|
617,580 |
|
|
|
|
|
|
|
|
|
|
|
|
|
|
|
|
|
|
|
|
1,102,356 |
|
|
|
|
|
|
|
|
|
|
|
| Electronic Equipment, Instruments & Components - 0.2% |
|
| Trimble, Inc. |
|
|
|
|
|
|
|
|
| 4.90%, 06/15/2028 |
|
|
314,000 |
|
|
|
309,953 |
|
| 6.10%, 03/15/2033 |
|
|
1,129,000 |
|
|
|
1,171,136 |
|
|
|
|
|
|
|
|
|
|
|
|
|
|
|
|
|
|
|
|
1,481,089 |
|
|
|
|
|
|
|
|
|
|
|
| Financial Services - 0.3% |
|
| AerCap Ireland Capital DAC/AerCap Global Aviation Trust |
|
|
|
|
|
|
|
|
| 4.63%, 10/15/2027 |
|
|
414,000 |
|
|
|
403,446 |
|
| Intercontinental Exchange, Inc. |
|
|
|
|
|
|
|
|
| 5.25%, 06/15/2031 |
|
|
1,003,000 |
|
|
|
1,008,661 |
|
| Nasdaq, Inc. |
|
|
|
|
|
|
|
|
| 5.55%, 02/15/2034 |
|
|
1,295,000 |
|
|
|
1,298,798 |
|
|
|
|
|
|
|
|
|
|
|
|
|
|
|
|
|
|
|
|
2,710,905 |
|
|
|
|
|
|
|
|
|
|
|
|
|
|
|
|
|
|
|
| |
|
Principal |
|
|
Value |
|
| |
|
|
| CORPORATE DEBT SECURITIES (continued) |
|
| Food Products - 0.5% |
|
| JBS USA Holding LUX SARL/JBS USA Food Co./JBS LUX Co. SARL |
|
|
|
|
|
|
|
|
| 3.00%, 05/15/2032 |
|
$ |
695,000 |
|
|
$ |
571,157 |
|
| 3.63%, 01/15/2032 |
|
|
500,000 |
|
|
|
431,723 |
|
| 5.50%, 01/15/2030 |
|
|
375,000 |
|
|
|
369,217 |
|
| Nestle Capital Corp. |
|
|
|
|
|
|
|
|
| 4.75%, 03/12/2031(B) |
|
|
1,229,000 |
|
|
|
1,214,549 |
|
| 4.88%, 03/12/2034(B) |
|
|
1,374,000 |
|
|
|
1,358,704 |
|
| Pilgrim’s Pride Corp. |
|
|
|
|
|
|
|
|
| 6.25%, 07/01/2033 |
|
|
953,000 |
|
|
|
971,059 |
|
|
|
|
|
|
|
|
|
|
|
|
|
|
|
|
|
|
|
|
4,916,409 |
|
|
|
|
|
|
|
|
|
|
|
| Health Care Equipment & Supplies - 0.5% |
|
| Smith & Nephew PLC |
|
|
|
|
|
|
|
|
| 5.40%, 03/20/2034 |
|
|
1,211,000 |
|
|
|
1,194,850 |
|
| Solventum Corp. |
|
|
|
|
|
|
|
|
| 5.45%, 03/13/2031(B) |
|
|
1,292,000 |
|
|
|
1,277,687 |
|
| 5.60%, 03/23/2034(B) |
|
|
1,703,000 |
|
|
|
1,675,449 |
|
| 6.00%, 05/15/2064(B) |
|
|
597,000 |
|
|
|
569,025 |
|
|
|
|
|
|
|
|
|
|
|
|
|
|
|
|
|
|
|
|
4,717,011 |
|
|
|
|
|
|
|
|
|
|
|
| Health Care Providers & Services - 1.3% |
|
| Centene Corp. |
|
|
|
|
|
|
|
|
| 2.45%, 07/15/2028 |
|
|
919,000 |
|
|
|
815,847 |
|
| 3.00%, 10/15/2030 |
|
|
491,000 |
|
|
|
419,800 |
|
| 4.25%, 12/15/2027 |
|
|
2,255,000 |
|
|
|
2,153,889 |
|
| HCA, Inc. |
|
|
|
|
|
|
|
|
| 3.63%, 03/15/2032 |
|
|
450,000 |
|
|
|
397,106 |
|
| 5.20%, 06/01/2028 |
|
|
233,000 |
|
|
|
232,210 |
|
| 5.38%, 09/01/2026 |
|
|
187,000 |
|
|
|
186,528 |
|
| 5.45%, 04/01/2031 |
|
|
430,000 |
|
|
|
430,164 |
|
| 5.50%, 06/01/2033 |
|
|
747,000 |
|
|
|
742,273 |
|
| 5.60%, 04/01/2034 |
|
|
690,000 |
|
|
|
687,173 |
|
| 5.63%, 09/01/2028 |
|
|
264,000 |
|
|
|
266,542 |
|
| 5.88%, 02/01/2029 |
|
|
408,000 |
|
|
|
415,590 |
|
| Health Care Service Corp. A Mutual Legal Reserve Co. |
|
|
|
|
|
|
|
|
| 2.20%, 06/01/2030(B) |
|
|
510,000 |
|
|
|
431,171 |
|
| 5.20%, 06/15/2029(B) |
|
|
575,000 |
|
|
|
572,914 |
|
| 5.45%, 06/15/2034(B) |
|
|
1,297,000 |
|
|
|
1,284,662 |
|
| 5.88%, 06/15/2054(B) |
|
|
1,067,000 |
|
|
|
1,053,487 |
|
| Humana, Inc. |
|
|
|
|
|
|
|
|
| 5.38%, 04/15/2031 |
|
|
850,000 |
|
|
|
846,231 |
|
| 5.75%, 04/15/2054 |
|
|
563,000 |
|
|
|
545,382 |
|
| 5.88%, 03/01/2033 |
|
|
220,000 |
|
|
|
224,196 |
|
| 5.95%, 03/15/2034 |
|
|
367,000 |
|
|
|
376,224 |
|
| Universal Health Services, Inc. |
|
|
|
|
|
|
|
|
| 2.65%, 10/15/2030 |
|
|
163,000 |
|
|
|
139,285 |
|
|
|
|
|
|
|
|
|
|
|
|
|
|
|
|
|
|
|
|
12,220,674 |
|
|
|
|
|
|
|
|
|
|
|
|
|
| Insurance - 0.6% |
|
|
|
|
|
|
|
|
| Aon North America, Inc. |
|
|
|
|
|
|
|
|
| 5.30%, 03/01/2031 |
|
|
941,000 |
|
|
|
939,425 |
|
| 5.45%, 03/01/2034 |
|
|
1,926,000 |
|
|
|
1,921,490 |
|
| Arthur J Gallagher & Co. |
|
|
|
|
|
|
|
|
| 5.45%, 07/15/2034 |
|
|
823,000 |
|
|
|
817,978 |
|
| 6.50%, 02/15/2034 |
|
|
427,000 |
|
|
|
452,735 |
|
The Notes to Financial Statements are an integral part of this report.
|
|
|
|
|
| Transamerica Series Trust |
|
|
|
Semi-Annual Financial Statements 2024 |
|
|
Page 4 |
|
|
Transamerica Janus Balanced VP
SCHEDULE OF INVESTMENTS (continued)
At June 30, 2024
(unaudited)
|
|
|
|
|
|
|
|
|
| |
|
Principal |
|
|
Value |
|
| |
|
|
| CORPORATE DEBT SECURITIES (continued) |
|
| Insurance (continued) |
|
| Athene Global Funding |
|
|
|
|
|
|
|
|
| 2.65%, 10/04/2031 (B) |
|
$ |
712,000 |
|
|
$ |
586,191 |
|
| 2.72%, 01/07/2029 (B) |
|
|
800,000 |
|
|
|
710,259 |
|
| Brown & Brown, Inc. |
|
|
|
|
|
|
|
|
| 4.95%, 03/17/2052 |
|
|
845,000 |
|
|
|
722,413 |
|
|
|
|
|
|
|
|
|
|
|
|
|
|
|
|
|
|
|
|
6,150,491 |
|
|
|
|
|
|
|
|
|
|
|
|
|
| IT Services - 0.2% |
|
|
|
|
|
|
|
|
| Booz Allen Hamilton, Inc. |
|
|
|
|
|
|
|
|
| 5.95%, 08/04/2033 |
|
|
932,000 |
|
|
|
961,635 |
|
| Leidos, Inc. |
|
|
|
|
|
|
|
|
| 2.30%, 02/15/2031 |
|
|
170,000 |
|
|
|
140,272 |
|
| 5.75%, 03/15/2033 |
|
|
558,000 |
|
|
|
563,881 |
|
|
|
|
|
|
|
|
|
|
|
|
|
|
|
|
|
|
|
|
1,665,788 |
|
|
|
|
|
|
|
|
|
|
|
|
|
| Machinery - 0.1% |
|
|
|
|
|
|
|
|
| Regal Rexnord Corp. |
|
|
|
|
|
|
|
|
| 6.05%, 04/15/2028 |
|
|
693,000 |
|
|
|
701,618 |
|
|
|
|
|
|
|
|
|
|
|
|
|
| Media - 0.2% |
|
|
|
|
|
|
|
|
| Charter Communications Operating LLC/Charter Communications Operating Capital |
|
|
|
|
|
|
|
|
| 6.65%, 02/01/2034 |
|
|
1,852,000 |
|
|
|
1,874,590 |
|
|
|
|
|
|
|
|
|
|
|
| Oil, Gas & Consumable Fuels - 0.8% |
|
| Cheniere Energy, Inc. |
|
|
|
|
|
|
|
|
| 5.65%, 04/15/2034 (B) |
|
|
888,000 |
|
|
|
888,705 |
|
| Columbia Pipelines Operating Co. LLC |
|
|
|
|
|
|
|
|
| 5.93%, 08/15/2030 (B) |
|
|
212,000 |
|
|
|
216,743 |
|
| 6.04%, 11/15/2033 (B) |
|
|
510,000 |
|
|
|
522,133 |
|
| 6.50%, 08/15/2043 (B) |
|
|
103,000 |
|
|
|
107,639 |
|
| 6.54%, 11/15/2053 (B) |
|
|
532,000 |
|
|
|
563,275 |
|
| DT Midstream, Inc. |
|
|
|
|
|
|
|
|
| 4.30%, 04/15/2032 (B) |
|
|
114,000 |
|
|
|
103,122 |
|
| 4.38%, 06/15/2031 (B) |
|
|
635,000 |
|
|
|
578,251 |
|
| Energy Transfer LP |
|
|
|
|
|
|
|
|
| 4.95%, 06/15/2028 |
|
|
78,000 |
|
|
|
77,005 |
|
| 5.55%, 02/15/2028 |
|
|
603,000 |
|
|
|
607,904 |
|
| EQT Corp. |
|
|
|
|
|
|
|
|
| 5.70%, 04/01/2028 |
|
|
318,000 |
|
|
|
321,110 |
|
| Hess Midstream Operations LP |
|
|
|
|
|
|
|
|
| 5.13%, 06/15/2028 (B) |
|
|
460,000 |
|
|
|
445,422 |
|
| Occidental Petroleum Corp. |
|
|
|
|
|
|
|
|
| 6.13%, 01/01/2031 |
|
|
534,000 |
|
|
|
546,335 |
|
| 6.63%, 09/01/2030 |
|
|
296,000 |
|
|
|
310,421 |
|
| 8.88%, 07/15/2030 |
|
|
420,000 |
|
|
|
483,856 |
|
| Sunoco LP |
|
|
|
|
|
|
|
|
| 7.00%, 05/01/2029 (B) |
|
|
908,000 |
|
|
|
931,635 |
|
| 7.25%, 05/01/2032 (B) |
|
|
512,000 |
|
|
|
529,529 |
|
| Viper Energy, Inc. |
|
|
|
|
|
|
|
|
| 7.38%, 11/01/2031 (B) |
|
|
835,000 |
|
|
|
864,784 |
|
|
|
|
|
|
|
|
|
|
|
|
|
|
|
|
|
|
|
|
8,097,869 |
|
|
|
|
|
|
|
|
|
|
|
| Personal Care Products - 0.1% |
|
| Haleon US Capital LLC |
|
|
|
|
|
|
|
|
| 3.38%, 03/24/2027 |
|
|
554,000 |
|
|
|
528,666 |
|
|
|
|
|
|
|
|
|
|
|
|
|
|
|
|
|
|
|
| |
|
Principal |
|
|
Value |
|
| |
|
|
| CORPORATE DEBT SECURITIES (continued) |
|
| Pharmaceuticals - 0.2% |
|
| AbbVie, Inc. |
|
|
|
|
|
|
|
|
| 5.40%, 03/15/2054 |
|
$ |
337,000 |
|
|
$ |
335,135 |
|
| Organon & Co./Organon Foreign Debt Co- Issuer BV |
|
|
|
|
|
|
|
|
| 6.75%, 05/15/2034 (B) |
|
|
653,000 |
|
|
|
652,016 |
|
| 7.88%, 05/15/2034 (B) |
|
|
869,000 |
|
|
|
892,889 |
|
|
|
|
|
|
|
|
|
|
|
|
|
|
|
|
|
|
|
|
1,880,040 |
|
|
|
|
|
|
|
|
|
|
|
| Professional Services - 0.1% |
|
| Global Payments, Inc. |
|
|
|
|
|
|
|
|
| 2.15%, 01/15/2027 |
|
|
570,000 |
|
|
|
528,088 |
|
|
|
|
|
|
|
|
|
|
|
| Real Estate Management & Development - 0.3% |
|
| CBRE Services, Inc. |
|
|
|
|
|
|
|
|
| 5.95%, 08/15/2034 (E) |
|
|
2,100,000 |
|
|
|
2,130,130 |
|
| CoStar Group, Inc. |
|
|
|
|
|
|
|
|
| 2.80%, 07/15/2030 (B) |
|
|
497,000 |
|
|
|
420,691 |
|
|
|
|
|
|
|
|
|
|
|
|
|
|
|
|
|
|
|
|
2,550,821 |
|
|
|
|
|
|
|
|
|
|
|
| Residential REITs - 0.1% |
|
| Sun Communities Operating LP |
|
|
|
|
|
|
|
|
| 2.70%, 07/15/2031 |
|
|
898,000 |
|
|
|
743,594 |
|
|
|
|
|
|
|
|
|
|
|
| Semiconductors & Semiconductor Equipment - 0.4% |
|
| Foundry JV Holdco LLC |
|
|
|
|
|
|
|
|
| 5.88%, 01/25/2034 (B) |
|
|
2,099,000 |
|
|
|
2,084,718 |
|
| 5.90%, 01/25/2030 (B) |
|
|
321,000 |
|
|
|
325,801 |
|
| 6.15%, 01/25/2032 (B) |
|
|
892,000 |
|
|
|
910,538 |
|
| Marvell Technology, Inc. |
|
|
|
|
|
|
|
|
| 4.88%, 06/22/2028 |
|
|
378,000 |
|
|
|
372,743 |
|
| 5.75%, 02/15/2029 |
|
|
391,000 |
|
|
|
399,449 |
|
|
|
|
|
|
|
|
|
|
|
|
|
|
|
|
|
|
|
|
4,093,249 |
|
|
|
|
|
|
|
|
|
|
|
| Software - 0.3% |
|
| Constellation Software, Inc. |
|
|
|
|
|
|
|
|
| 5.16%, 02/16/2029 (B) |
|
|
256,000 |
|
|
|
256,070 |
|
| 5.46%, 02/16/2034 (B) |
|
|
744,000 |
|
|
|
745,560 |
|
| MSCI, Inc. |
|
|
|
|
|
|
|
|
| 3.63%, 09/01/2030 (B) |
|
|
992,000 |
|
|
|
890,615 |
|
| 3.88%, 02/15/2031 (B) |
|
|
962,000 |
|
|
|
866,321 |
|
| 4.00%, 11/15/2029 (B)(E) |
|
|
184,000 |
|
|
|
171,956 |
|
|
|
|
|
|
|
|
|
|
|
|
|
|
|
|
|
|
|
|
2,930,522 |
|
|
|
|
|
|
|
|
|
|
|
| Specialized REITs - 0.1% |
|
| American Tower Trust #1 |
|
|
|
|
|
|
|
|
| REIT, 5.49%, 03/15/2053 (B) |
|
|
1,406,000 |
|
|
|
1,411,947 |
|
|
|
|
|
|
|
|
|
|
|
| Wireless Telecommunication Services - 0.1% |
|
| T-Mobile USA, Inc. |
|
|
|
|
|
|
|
|
| 4.85%, 01/15/2029 |
|
|
591,000 |
|
|
|
583,952 |
|
| 5.15%, 04/15/2034 |
|
|
506,000 |
|
|
|
498,436 |
|
|
|
|
|
|
|
|
|
|
|
|
|
|
|
|
|
|
|
|
1,082,388 |
|
|
|
|
|
|
|
|
|
|
| Total Corporate Debt Securities
(Cost $130,711,851) |
|
|
|
|
|
|
128,997,828 |
|
|
|
|
|
|
|
|
|
|
The Notes to Financial Statements are an integral part of this report.
|
|
|
|
|
| Transamerica Series Trust |
|
|
|
Semi-Annual Financial Statements 2024 |
|
|
Page 5 |
|
|
Transamerica Janus Balanced VP
SCHEDULE OF INVESTMENTS (continued)
At June 30, 2024
(unaudited)
|
|
|
|
|
|
|
|
|
| |
|
Principal |
|
|
Value |
|
| |
|
|
| U.S. GOVERNMENT AGENCY OBLIGATIONS - 10.8% |
|
| Federal Home Loan Mortgage Corp. |
|
|
|
|
|
|
|
|
| 2.50%, 12/01/2033 - 05/01/2052 |
|
$ |
9,303,135 |
|
|
$ |
7,881,288 |
|
| 3.00%, 05/01/2031 - 03/01/2052 |
|
|
1,416,838 |
|
|
|
1,301,267 |
|
| 3.50%, 07/01/2046 - 06/01/2052 |
|
|
824,490 |
|
|
|
744,438 |
|
| 4.00%, 03/01/2047 - 11/01/2050 |
|
|
1,706,239 |
|
|
|
1,587,274 |
|
| 4.50%, 03/01/2048 - 03/01/2052 |
|
|
1,599,850 |
|
|
|
1,523,415 |
|
| 5.00%, 09/01/2048 - 09/01/2053 |
|
|
4,202,532 |
|
|
|
4,122,642 |
|
| 5.50%, 09/01/2052 - 04/01/2054 |
|
|
1,846,913 |
|
|
|
1,847,284 |
|
| 6.00%, 04/01/2040 - 04/01/2054 |
|
|
4,601,806 |
|
|
|
4,671,041 |
|
| 6.50%, 11/01/2053 |
|
|
680,422 |
|
|
|
702,382 |
|
| Federal Home Loan Mortgage Corp. STACR REMICS Trust |
|
|
|
|
|
|
|
|
| 1-Month SOFR Average + 0.85%, 6.19% (C), 11/25/2041 (B) |
|
|
301,585 |
|
|
|
301,538 |
|
| 1-Month SOFR Average + 0.95%, 6.29% (C), 12/25/2041 (B) |
|
|
719,117 |
|
|
|
718,083 |
|
| 1-Month SOFR Average + 1.20%, 6.54% (C), 05/25/2044 (B) |
|
|
537,242 |
|
|
|
538,086 |
|
| 1-Month SOFR Average + 1.30%, 6.64% (C), 02/25/2042 (B) |
|
|
122,755 |
|
|
|
123,327 |
|
| 1-Month SOFR Average + 1.50%, 6.84% (C), 10/25/2041 (B) |
|
|
192,864 |
|
|
|
193,822 |
|
| 1-Month SOFR Average + 1.85%, 7.19% (C), 11/25/2043 (B) |
|
|
378,855 |
|
|
|
383,919 |
|
| 1-Month SOFR Average + 2.00%, 7.34% (C), 04/25/2042 - 06/25/2043 (B) |
|
|
181,402 |
|
|
|
183,778 |
|
| 1-Month SOFR Average + 2.10%, 7.44% (C), 09/25/2041 - 03/25/2042 (B) |
|
|
443,305 |
|
|
|
447,365 |
|
| 1-Month SOFR Average + 2.10%, 7.44% (C), 04/25/2043 (B) |
|
|
229,613 |
|
|
|
234,973 |
|
| 1-Month SOFR Average + 2.30%, 7.64% (C), 08/25/2042 (B) |
|
|
213,829 |
|
|
|
219,144 |
|
| 1-Month SOFR Average + 2.35%, 7.69% (C), 12/25/2041 (B) |
|
|
258,132 |
|
|
|
261,311 |
|
| Federal National Mortgage Association |
|
|
|
|
|
|
|
|
| 2.00%, 07/01/2051 |
|
|
221,134 |
|
|
|
174,269 |
|
| 2.50%, 11/01/2034 - 03/01/2062 |
|
|
18,448,811 |
|
|
|
15,333,408 |
|
| 3.00%, 10/01/2034 - 06/01/2057 |
|
|
5,647,336 |
|
|
|
4,877,135 |
|
| 3.50%, 08/01/2047 - 08/01/2056 |
|
|
6,097,547 |
|
|
|
5,481,640 |
|
| 4.00%, 05/01/2045 - 05/01/2052 |
|
|
7,541,950 |
|
|
|
6,998,900 |
|
| 4.50%, 11/01/2042 - 08/01/2053 |
|
|
3,187,140 |
|
|
|
3,029,367 |
|
| 5.00%, 07/01/2044 - 12/01/2053 |
|
|
2,259,850 |
|
|
|
2,219,520 |
|
| 5.50%, 06/01/2053 - 03/01/2054 |
|
|
4,169,699 |
|
|
|
4,156,907 |
|
| 6.00%, 02/01/2037 - 05/01/2054 |
|
|
2,652,875 |
|
|
|
2,706,484 |
|
| Federal National Mortgage Association Connecticut Avenue Securities Trust |
|
|
|
|
|
|
|
|
| 1-Month SOFR Average + 1.05%, 6.39% (C), 01/25/2044 (B) |
|
|
393,968 |
|
|
|
394,272 |
|
| 1-Month SOFR Average + 1.10%, 6.42% (C), 05/25/2044 (B) |
|
|
377,026 |
|
|
|
377,269 |
|
| 1-Month SOFR Average + 1.50%, 6.84% (C), 10/25/2043 (B) |
|
|
416,251 |
|
|
|
418,876 |
|
| 1-Month SOFR Average + 1.65%, 6.99% (C), 12/25/2041 (B) |
|
|
464,000 |
|
|
|
467,188 |
|
| 1-Month SOFR Average + 1.70%, 7.04% (C), 07/25/2043 (B) |
|
|
454,454 |
|
|
|
458,637 |
|
| 1-Month SOFR Average + 1.90%, 7.24% (C), 04/25/2042 (B) |
|
|
316,087 |
|
|
|
318,839 |
|
| 1-Month SOFR Average + 1.95%, 7.29% (C), 09/25/2043 (B) |
|
|
205,337 |
|
|
|
206,870 |
|
|
|
|
|
|
|
|
|
|
| |
|
Principal |
|
|
Value |
|
| |
|
|
| U.S. GOVERNMENT AGENCY OBLIGATIONS (continued) |
|
| Federal National Mortgage Association Connecticut Avenue Securities Trust (continued) |
|
|
|
|
|
|
|
|
| 1-Month SOFR Average + 2.00%, 7.34% (C), 11/25/2041 (B) |
|
$ |
1,446,000 |
|
|
$ |
1,456,919 |
|
| 1-Month SOFR Average + 2.10%, 7.44% (C), 03/25/2042 (B) |
|
|
340,927 |
|
|
|
346,668 |
|
| 1-Month SOFR Average + 2.30%, 7.64% (C), 05/25/2043 (B) |
|
|
521,756 |
|
|
|
536,131 |
|
| 1-Month SOFR Average + 2.50%, 7.84% (C), 09/25/2042 (B) |
|
|
635,656 |
|
|
|
648,251 |
|
| 1-Month SOFR Average + 2.50%, 7.84% (C), 04/25/2043 (B) |
|
|
401,686 |
|
|
|
411,038 |
|
| 1-Month SOFR Average + 3.00%, 8.34% (C), 01/25/2042 - 04/25/2042 (B) |
|
|
903,000 |
|
|
|
930,251 |
|
| Federal National Mortgage Association REMICS |
|
|
|
|
|
|
|
|
| 3.00%, 05/25/2048 - 11/25/2049 |
|
|
953,100 |
|
|
|
830,491 |
|
| Government National Mortgage Association |
|
|
|
|
|
|
|
|
| 2.50%, 03/20/2051 - 01/20/2052 |
|
|
3,312,672 |
|
|
|
2,773,627 |
|
| 2.50%, 07/20/2054 (G) |
|
|
2,612,575 |
|
|
|
2,201,933 |
|
| 3.00%, 11/20/2046 - 08/20/2051 |
|
|
5,232,319 |
|
|
|
4,589,283 |
|
| 3.50%, 05/20/2049 |
|
|
1,647,313 |
|
|
|
1,498,734 |
|
| 4.00%, 01/15/2045 - 05/20/2048 |
|
|
1,264,062 |
|
|
|
1,188,419 |
|
| 4.00%, 07/20/2054 (G) |
|
|
1,437,751 |
|
|
|
1,331,245 |
|
| 4.50%, 08/15/2046 - 05/20/2048 |
|
|
659,876 |
|
|
|
637,682 |
|
| 4.50%, 07/20/2054 (G) |
|
|
801,906 |
|
|
|
763,307 |
|
| 5.00%, 08/20/2048 |
|
|
166,023 |
|
|
|
164,033 |
|
| 5.00%, 07/20/2054 (G) |
|
|
729,984 |
|
|
|
711,727 |
|
| Seasoned Loans Structured Transaction Trust |
|
|
|
|
|
|
|
|
| 4.75% (C), 09/25/2060 (B) |
|
|
170,525 |
|
|
|
163,476 |
|
| Uniform Mortgage-Backed Security, TBA |
|
|
|
|
|
|
|
|
| 3.00%, 07/01/2054 (G) |
|
|
983,245 |
|
|
|
838,058 |
|
| 4.00%, 07/01/2054 (G) |
|
|
729,000 |
|
|
|
668,163 |
|
| 4.50%, 07/01/2054 (G) |
|
|
760,000 |
|
|
|
717,672 |
|
| 5.00%, 07/01/2054 (G) |
|
|
1,905,000 |
|
|
|
1,844,272 |
|
| 5.50%, 07/01/2054 (G) |
|
|
2,028,000 |
|
|
|
2,002,507 |
|
| 6.00%, 07/01/2054 (G) |
|
|
316,209 |
|
|
|
317,399 |
|
|
|
|
|
|
|
|
|
|
|
|
| Total U.S. Government Agency Obligations
(Cost $107,097,863) |
|
|
|
103,177,244 |
|
|
|
|
|
|
|
|
|
|
|
| MORTGAGE-BACKED SECURITIES - 5.5% |
|
| 280 Park Avenue Mortgage Trust |
|
|
|
|
|
|
|
|
| Series 2017-280P, Class A, 1-Month Term SOFR + 1.18%, 6.51% (C), 09/15/2034 (B) |
|
|
592,515 |
|
|
|
573,911 |
|
| A&D Mortgage Trust |
|
|
|
|
|
|
|
|
| Series 2023-NQM2, Class A1, 6.13% (C), 05/25/2068 (B) |
|
|
568,694 |
|
|
|
567,482 |
|
| Angel Oak Mortgage Trust |
|
|
|
|
|
|
|
|
| Series 2019-5, Class A1, 2.59% (C), 10/25/2049 (B) |
|
|
48,151 |
|
|
|
46,584 |
|
| Series 2019-6, Class A1, 2.62% (C), 11/25/2059 (B) |
|
|
47,065 |
|
|
|
45,593 |
|
| Series 2020-3, Class A2, 2.41% (C), 04/25/2065 (B) |
|
|
123,729 |
|
|
|
114,817 |
|
| Series 2024-3, Class A1, 4.80% (C), 11/26/2068 (B) |
|
|
171,134 |
|
|
|
166,408 |
|
The Notes to Financial Statements are an integral part of this report.
|
|
|
|
|
| Transamerica Series Trust |
|
|
|
Semi-Annual Financial Statements 2024 |
|
|
Page 6 |
|
|
Transamerica Janus Balanced VP
SCHEDULE OF INVESTMENTS (continued)
At June 30, 2024
(unaudited)
|
|
|
|
|
|
|
|
|
| |
|
Principal |
|
|
Value |
|
| |
|
|
| MORTGAGE-BACKED SECURITIES (continued) |
|
| Angel Oak Mortgage Trust (continued) |
|
|
|
|
|
|
|
|
| Series 2024-5, Class A1, 4.95% (C), 07/25/2068 (B) |
|
$ |
974,800 |
|
|
$ |
949,191 |
|
| Series 2024-6, Class A1, 4.65% (C), 11/25/2067 (B) |
|
|
1,034,000 |
|
|
|
996,269 |
|
| BAMLL Re-REMICS Trust |
|
|
|
|
|
|
|
|
| Series 2024-FRR2, Class E, 1.27% (C), 07/27/2050 (B) |
|
|
328,000 |
|
|
|
237,259 |
|
| Series 2024-FRR3, Class C, 0.66% (C), 01/27/2050 (B) |
|
|
250,000 |
|
|
|
210,199 |
|
| Series 2024-FRR3, Class D, 0.59% (C), 01/27/2050 (B) |
|
|
240,199 |
|
|
|
195,819 |
|
| Series 2024-FRR3, Class E, 0.51% (C), 01/27/2050 (B) |
|
|
380,014 |
|
|
|
301,404 |
|
| Bayview MSR Opportunity Master Fund Trust |
|
|
|
|
|
|
|
|
| Series 2021-5, Class AF, 1-Month SOFR Average + 0.85%, 5.00% (C), 11/25/2051 (B) |
|
|
638,341 |
|
|
|
589,962 |
|
| Series 2022-2, Class A1, 3.00% (C), 12/25/2051 (B) |
|
|
946,616 |
|
|
|
784,213 |
|
| BBCMS Trust |
|
|
|
|
|
|
|
|
| Series 2015-SRCH, Class A2, 4.20%, 08/10/2035 (B) |
|
|
715,000 |
|
|
|
661,493 |
|
| BPR Trust |
|
|
|
|
|
|
|
|
| Series 2022-OANA, Class A, 1-Month Term SOFR + 1.9%, 7.23% (C), 04/15/2037 (B) |
|
|
891,000 |
|
|
|
891,000 |
|
| Series 2023-BRK2, Class A, 7.15% (C), 10/05/2038 (B) |
|
|
831,000 |
|
|
|
862,060 |
|
| BX Commercial Mortgage Trust |
|
|
|
|
|
|
|
|
| Series 2020-VKNG, Class A, 1-Month Term SOFR + 1.04%, 6.37% (C), 10/15/2037 (B) |
|
|
128,627 |
|
|
|
127,903 |
|
| Series 2021-VINO, Class A, 1-Month Term SOFR + 0.77%, 6.10% (C), 05/15/2038 (B) |
|
|
134,097 |
|
|
|
132,421 |
|
| Series 2021-VOLT, Class B, 1-Month Term SOFR + 1.06%, 6.39% (C), 09/15/2036 (B) |
|
|
733,000 |
|
|
|
722,272 |
|
| Series 2021-VOLT, Class D, 1-Month Term SOFR + 1.76%, 7.09% (C), 09/15/2036 (B) |
|
|
770,000 |
|
|
|
758,251 |
|
| BX Trust |
|
|
|
|
|
|
|
|
| Class A2, 1-Month Term SOFR + 0.75%, 6.08% (C), 04/15/2039 (B) |
|
|
664,629 |
|
|
|
651,755 |
|
| Series 2019-MMP, Class C, 1-Month Term SOFR + 1.49%, 6.82% (C), 08/15/2036 (B) |
|
|
183,084 |
|
|
|
177,472 |
|
| Series 2019-OC11, Class B, 3.61%, 12/09/2041 (B) |
|
|
242,000 |
|
|
|
215,403 |
|
| Series 2019-OC11, Class C, 3.86%, 12/09/2041 (B) |
|
|
481,000 |
|
|
|
427,587 |
|
| Series 2021-LBA, Class AJV, 1-Month Term SOFR + 0.91%, 6.24% (C), 02/15/2036 (B) |
|
|
820,000 |
|
|
|
809,494 |
|
|
|
|
|
|
|
|
|
|
| |
|
Principal |
|
|
Value |
|
| |
|
|
| MORTGAGE-BACKED SECURITIES (continued) |
|
| BX Trust (continued) |
|
|
|
|
|
|
|
|
| Series 2021-LBA, Class AV, 1-Month Term SOFR + 0.91%, 6.24% (C), 02/15/2036 (B) |
|
$ |
737,035 |
|
|
$ |
728,282 |
|
| Series 2024-VLT4, Class A, 1-Month Term SOFR + 1.49%, 6.81% (C), 07/15/2029 (B) |
|
|
939,765 |
|
|
|
938,586 |
|
| BXP Trust |
|
|
|
|
|
|
|
|
| Series 2017-GM, Class A, 3.38%, 06/13/2039 (B) |
|
|
324,000 |
|
|
|
301,111 |
|
| CENT Trust |
|
|
|
|
|
|
|
|
| Series 2023-CITY, Class A, 1-Month Term SOFR + 2.62%, 7.95% (C), 09/15/2038 (B) |
|
|
849,000 |
|
|
|
853,245 |
|
| Chase Mortgage Finance Corp. |
|
|
|
|
|
|
|
|
| Series 2021-CL1, Class M1, 1-Month SOFR Average + 1.20%, 6.54% (C), 02/25/2050 (B) |
|
|
652,344 |
|
|
|
629,407 |
|
| Cold Storage Trust |
|
|
|
|
|
|
|
|
| Series 2020-ICE5, Class A, 1-Month Term SOFR + 1.01%, 6.34% (C), 11/15/2037 (B) |
|
|
1,316,224 |
|
|
|
1,311,289 |
|
| Series 2020-ICE5, Class B, 1-Month Term SOFR + 1.41%, 6.74% (C), 11/15/2037 (B) |
|
|
585,862 |
|
|
|
583,671 |
|
| Series 2020-ICE5, Class C, 1-Month Term SOFR + 1.76%, 7.09% (C), 11/15/2037 (B) |
|
|
587,828 |
|
|
|
585,624 |
|
| COLT Mortgage Loan Trust |
|
|
|
|
|
|
|
|
| Series 2020-3, Class A1, 1.51% (C), 04/27/2065 (B) |
|
|
37,207 |
|
|
|
35,267 |
|
| COMM Mortgage Trust |
|
|
|
|
|
|
|
|
| Series 2024-WCL1, Class A, 1-Month Term SOFR + 1.84%, 7.14% (C), 06/15/2041 (B) |
|
|
951,334 |
|
|
|
946,772 |
|
| Connecticut Avenue Securities Trust |
|
|
|
|
|
|
|
|
| Series 2024-R03, Class 2M1, 1-Month SOFR Average + 1.15%, 6.49% (C), 03/25/2044 (B) |
|
|
248,495 |
|
|
|
248,949 |
|
| CRSO Trust |
|
|
|
|
|
|
|
|
| 7.12% (C), 07/10/2040 |
|
|
1,274,000 |
|
|
|
1,319,485 |
|
| DATA Mortgage Trust |
|
|
|
|
|
|
|
|
| Series 2024-CTR2, Class A, 5.48% (C), 05/10/2046 (B) |
|
|
263,256 |
|
|
|
258,884 |
|
| DC Commercial Mortgage Trust |
|
|
|
|
|
|
|
|
| Series 2023-DC, Class A, 6.31%, 09/12/2040 (B) |
|
|
708,000 |
|
|
|
726,086 |
|
| Extended Stay America Trust |
|
|
|
|
|
|
|
|
| Series 2021-ESH, Class A, 1-Month Term SOFR + 1.19%, 6.52% (C), 07/15/2038 (B) |
|
|
389,444 |
|
|
|
387,983 |
|
| Flagstar Mortgage Trust |
|
|
|
|
|
|
|
|
| Series 2021-13IN, Class A2, 3.00% (C), 12/30/2051 (B) |
|
|
1,260,313 |
|
|
|
1,044,091 |
|
| FREMF Mortgage Trust, Interest Only STRIPS |
|
|
|
|
|
|
|
|
| Series 2017-K729, Class X2A, 0.10%, 11/25/2049 (B) |
|
|
3,141,870 |
|
|
|
338 |
|
| Series 2017-K729, Class X2B, 0.10%, 11/25/2049 (B) |
|
|
1,055,535 |
|
|
|
431 |
|
The Notes to Financial Statements are an integral part of this report.
|
|
|
|
|
| Transamerica Series Trust |
|
|
|
Semi-Annual Financial Statements 2024 |
|
|
Page 7 |
|
|
Transamerica Janus Balanced VP
SCHEDULE OF INVESTMENTS (continued)
At June 30, 2024
(unaudited)
|
|
|
|
|
|
|
|
|
| |
|
Principal |
|
|
Value |
|
| |
|
|
| MORTGAGE-BACKED SECURITIES (continued) |
|
| FREMF Mortgage Trust, Principal Only STRIPS |
|
|
|
|
|
|
|
|
| Series 2017-K729, Class D, Zero coupon, 11/25/2049 (B) |
|
$ |
419,478 |
|
|
$ |
401,127 |
|
| GCAT Trust |
|
|
|
|
|
|
|
|
| Series 2022-INV1, Class A1, 3.00% (C), 12/25/2051 (B) |
|
|
1,677,141 |
|
|
|
1,395,697 |
|
| Series 2023-INV1, Class A1, 6.00% (C), 08/25/2053 (B) |
|
|
851,683 |
|
|
|
846,493 |
|
| Series 2024-INV1, Class 2A2, 6.50% (C), 01/25/2054 (B) |
|
|
939,634 |
|
|
|
946,608 |
|
| GWT Trust |
|
|
|
|
|
|
|
|
| Series 2024-WLF2, Class A, 1-Month Term SOFR + 1.69%, 7.02% (C), 05/15/2041 (B) |
|
|
1,141,000 |
|
|
|
1,140,287 |
|
| Homeward Opportunities Fund Trust |
|
|
|
|
|
|
|
|
| Series 2024-RTL1, Class A1, 7.12%, 07/25/2029 (B) |
|
|
920,000 |
|
|
|
919,717 |
|
| Hudsons Bay Simon JV Trust |
|
|
|
|
|
|
|
|
| Series 2015-HB10, Class A10, 4.15%, 08/05/2034 (B) |
|
|
321,959 |
|
|
|
300,990 |
|
| Series 2015-HB7, Class A7, 3.91%, 08/05/2034 (B) |
|
|
171,561 |
|
|
|
169,152 |
|
| Imperial Fund Mortgage Trust |
|
|
|
|
|
|
|
|
| Series 2023-NQM1, Class A1, 5.94% (C), 02/25/2068 (B) |
|
|
400,917 |
|
|
|
397,514 |
|
| JPMorgan Chase Commercial Mortgage Securities Trust |
|
|
|
|
|
|
|
|
| Series 2020-ACE, Class A, 3.29%, 01/10/2037 (B) |
|
|
845,000 |
|
|
|
829,267 |
|
| Series 2020-ACE, Class B, 3.64%, 01/10/2037 (B) |
|
|
580,000 |
|
|
|
565,385 |
|
| LBA Trust |
|
|
|
|
|
|
|
|
| Series 2024-BOLT, Class A, 1-Month Term SOFR + 1.59%, 6.92% (C), 06/15/2026 (B) |
|
|
752,511 |
|
|
|
748,984 |
|
| LHOME Mortgage Trust |
|
|
|
|
|
|
|
|
| Series 2024-RTL2, Class A1, 7.13% (C), 03/25/2029 (B) |
|
|
249,645 |
|
|
|
250,776 |
|
| Series 2024-RTL3, Class A1, 6.90%, 05/25/2029 (B) |
|
|
311,653 |
|
|
|
311,873 |
|
| Life Mortgage Trust |
|
|
|
|
|
|
|
|
| Series 2021-BMR, Class A, 1-Month Term SOFR + 0.81%, 6.14% (C), 03/15/2038 (B) |
|
|
1,278,844 |
|
|
|
1,255,692 |
|
| Series 2021-BMR, Class C, 1-Month Term SOFR + 1.21%, 6.54% (C), 03/15/2038 (B) |
|
|
740,177 |
|
|
|
720,769 |
|
| Series 2022-BMR2, Class A1, 1-Month Term SOFR + 1.30%, 6.62% (C), 05/15/2039 (B) |
|
|
886,000 |
|
|
|
870,218 |
|
| Series 2022-BMR2, Class B, 1-Month Term SOFR + 1.79%, 7.12% (C), 05/15/2039 (B) |
|
|
257,000 |
|
|
|
250,255 |
|
| Med Trust |
|
|
|
|
|
|
|
|
| Series 2021-MDLN, Class A, 1-Month Term SOFR + 1.06%, 6.39% (C), 11/15/2038 (B) |
|
|
197,054 |
|
|
|
196,623 |
|
| Series 2021-MDLN, Class E, 1-Month Term SOFR + 3.26%, 8.59% (C), 11/15/2038 (B) |
|
|
967,357 |
|
|
|
966,753 |
|
|
|
|
|
|
|
|
|
|
| |
|
Principal |
|
|
Value |
|
| |
|
|
| MORTGAGE-BACKED SECURITIES (continued) |
|
| Mello Mortgage Capital Acceptance |
|
|
|
|
|
|
|
|
| Series 2021-INV2, Class A11, 1-Month SOFR Average + 0.95%, 5.00% (C), 08/25/2051 (B) |
|
$ |
477,843 |
|
|
$ |
442,514 |
|
| Series 2021-INV3, Class A11, 1-Month SOFR Average + 0.95%, 5.00% (C), 10/25/2051 (B) |
|
|
583,541 |
|
|
|
538,864 |
|
| Series 2022-INV1, Class A2, 3.00% (C), 03/25/2052 (B) |
|
|
566,018 |
|
|
|
468,911 |
|
| Series 2024-SD1, Class A1, 4.00% (C), 04/25/2054 (B) |
|
|
363,005 |
|
|
|
345,468 |
|
| MHC Commercial Mortgage Trust |
|
|
|
|
|
|
|
|
| Series 2021-MHC, Class A, 1-Month Term SOFR + 0.92%, 6.24% (C), 04/15/2038 (B) |
|
|
1,128,360 |
|
|
|
1,119,202 |
|
| Series 2021-MHC, Class C, 1-Month Term SOFR + 1.47%, 6.79% (C), 04/15/2038 (B) |
|
|
636,935 |
|
|
|
630,593 |
|
| MIC Trust |
|
|
|
|
|
|
|
|
| Series 2023-MIC, Class A, 8.73% (C), 12/05/2038 (B) |
|
|
584,328 |
|
|
|
627,740 |
|
| NCMF Trust |
|
|
|
|
|
|
|
|
| Series 2022-MFP, Class A, 1-Month Term SOFR + 1.74%, 7.07% (C), 03/15/2039 (B) |
|
|
400,000 |
|
|
|
397,783 |
|
| New Residential Mortgage Loan Trust |
|
|
|
|
|
|
|
|
| Series 2018-2A, Class A1, 4.50% (C), 02/25/2058 (B) |
|
|
90,969 |
|
|
|
87,559 |
|
| NRTH Mortgage Trust |
|
|
|
|
|
|
|
|
| Series 2024-PARK, Class A, 1-Month Term SOFR + 1.64%, 6.97% (C), 03/15/2041 (B) |
|
|
1,390,000 |
|
|
|
1,386,525 |
|
| OBX Trust |
|
|
|
|
|
|
|
|
| Series 2022-INV1, Class A1, 3.00% (C), 12/25/2051 (B) |
|
|
1,254,574 |
|
|
|
1,039,337 |
|
| Series 2022-INV1, Class A18, 3.00% (C), 12/25/2051 (B) |
|
|
532,650 |
|
|
|
435,914 |
|
| Oceanview Mortgage Trust |
|
|
|
|
|
|
|
|
| Series 2022-1, Class A1, 3.00% (C), 12/25/2051 (B) |
|
|
334,693 |
|
|
|
277,272 |
|
| OPEN Trust |
|
|
|
|
|
|
|
|
| Series 2023-AIR, Class C, 1-Month Term SOFR + 5.24%, 10.56% (C), 10/15/2028 (B) |
|
|
186,837 |
|
|
|
187,304 |
|
| PRPM LLC |
|
|
|
|
|
|
|
|
| Series 2020-4, Class A1, 5.61% (C), 10/25/2025 (B) |
|
|
395,267 |
|
|
|
394,998 |
|
| Series 2024-RCF2, Class A1, 3.75% (C), 03/25/2054 (B) |
|
|
237,537 |
|
|
|
226,695 |
|
| RCKT Mortgage Trust |
|
|
|
|
|
|
|
|
| Series 2021-3, Class A21, 1-Month SOFR Average + 0.80%, 5.00% (C), 07/25/2051 (B) |
|
|
420,887 |
|
|
|
387,962 |
|
| Series 2023-CES1, Class A1A, 6.52% (C), 06/25/2043 (B) |
|
|
446,516 |
|
|
|
447,669 |
|
| Series 2023-CES2, Class A1A, 6.81% (C), 09/25/2043 (B) |
|
|
691,499 |
|
|
|
696,678 |
|
| Series 2024-CES3, Class A1A, 6.59% (C), 05/25/2044 (B) |
|
|
524,751 |
|
|
|
529,612 |
|
The Notes to Financial Statements are an integral part of this report.
|
|
|
|
|
| Transamerica Series Trust |
|
|
|
Semi-Annual Financial Statements 2024 |
|
|
Page 8 |
|
|
Transamerica Janus Balanced VP
SCHEDULE OF INVESTMENTS (continued)
At June 30, 2024
(unaudited)
|
|
|
|
|
|
|
|
|
| |
|
Principal |
|
|
Value |
|
| |
|
|
| MORTGAGE-BACKED SECURITIES (continued) |
|
| Saluda Grade Alternative Mortgage Trust |
|
|
|
|
|
|
|
|
| Series 2024-CES1, Class A1, 6.31% (C), 03/25/2054 (B) |
|
$ |
366,177 |
|
|
$ |
365,810 |
|
| Series 2024-FIG5, Class A, 6.26% (C), 04/25/2054 (B) |
|
|
438,588 |
|
|
|
441,553 |
|
| Series 2024-RTL6, Class A1, 7.44% (C), 07/25/2030 (B) |
|
|
775,000 |
|
|
|
774,724 |
|
| Sequoia Mortgage Trust |
|
|
|
|
|
|
|
|
| Series 2013-5, Class A1, 2.50% (C), 05/25/2043 (B) |
|
|
98,250 |
|
|
|
82,804 |
|
| Series 2020-2, Class A19, 3.50% (C), 03/25/2050 (B) |
|
|
46,109 |
|
|
|
39,805 |
|
| SMRT Commercial Mortgage Trust |
|
|
|
|
|
|
|
|
| Series 2022-MINI, Class A, 1-Month Term SOFR + 1.00%, 6.33% (C), 01/15/2039 (B) |
|
|
451,000 |
|
|
|
445,338 |
|
| SREIT Trust |
|
|
|
|
|
|
|
|
| Series 2021-MFP, Class A, 1-Month Term SOFR + 0.85%, 6.17% (C), 11/15/2038 (B) |
|
|
95,686 |
|
|
|
94,790 |
|
| Towd Point Mortgage Trust |
|
|
|
|
|
|
|
|
| Series 2023-CES1, Class A1A, 6.75% (C), 07/25/2063 (B) |
|
|
1,057 |
|
|
|
1,063 |
|
| TYSN Mortgage Trust |
|
|
|
|
|
|
|
|
| Series 2023-CRNR, Class A, 6.80% (C), 12/10/2033 (B) |
|
|
924,755 |
|
|
|
954,637 |
|
| UWM Mortgage Trust |
|
|
|
|
|
|
|
|
| Series 2021-INV1, Class A9, 1-Month SOFR Average + 0.90%, 5.00% (C), 08/25/2051 (B) |
|
|
570,128 |
|
|
|
527,947 |
|
| VASA Trust |
|
|
|
|
|
|
|
|
| Series 2021-VASA, Class A, 1-Month Term SOFR + 1.01%, 6.34% (C), 07/15/2039 (B) |
|
|
425,000 |
|
|
|
392,877 |
|
| VMC Finance LLC |
|
|
|
|
|
|
|
|
| Series 2021-HT1, Class A, 1-Month Term SOFR + 1.76%, 7.10% (C), 01/18/2037 (B) |
|
|
272,943 |
|
|
|
267,480 |
|
| WB Commercial Mortgage Trust |
|
|
|
|
|
|
|
|
| Series 2024-HQ, Class A, 6.13% (C), 03/15/2040 (B) |
|
|
654,000 |
|
|
|
653,533 |
|
| Wells Fargo Commercial Mortgage Trust |
|
|
|
|
|
|
|
|
| Series 2021-SAVE, Class A, 1-Month Term SOFR + 1.26%, 6.59% (C), 02/15/2040 (B) |
|
|
183,247 |
|
|
|
181,874 |
|
|
|
|
|
|
|
|
|
|
| Total Mortgage-Backed Securities
(Cost $53,941,857) |
|
|
|
|
|
|
52,492,738 |
|
|
|
|
|
|
|
|
|
|
|
|
| U.S. GOVERNMENT OBLIGATIONS - 5.3% |
|
|
|
|
|
| U.S. Treasury - 5.3% |
|
|
|
|
|
|
|
|
| U.S. Treasury Bonds |
|
|
|
|
|
|
|
|
| 4.25%, 02/15/2054 |
|
|
20,126,100 |
|
|
|
19,283,320 |
|
| 4.63%, 05/15/2044 (E) |
|
|
21,666,000 |
|
|
|
21,716,780 |
|
| 4.75%, 11/15/2053 |
|
|
7,036,100 |
|
|
|
7,318,643 |
|
| U.S. Treasury Notes |
|
|
|
|
|
|
|
|
| 4.38%, 05/15/2034 |
|
|
2,087,900 |
|
|
|
2,093,120 |
|
|
|
|
|
|
|
|
|
|
| Total U.S. Government Obligations
(Cost $49,600,103) |
|
|
|
|
|
|
50,411,863 |
|
|
|
|
|
|
|
|
|
|
|
|
|
|
|
|
|
|
|
| |
|
Principal |
|
|
Value |
|
| |
|
|
|
|
| ASSET-BACKED SECURITIES - 4.3% |
|
|
|
|
|
|
|
|
| ACC Auto Trust |
|
|
|
|
|
|
|
|
| Series 2022-A, Class A, 4.58%, 07/15/2026 (B) |
|
$ |
22,658 |
|
|
$ |
22,616 |
|
| Aqua Finance Trust |
|
|
|
|
|
|
|
|
| Series 2021-A, Class A, 1.54%, 07/17/2046 (B) |
|
|
159,169 |
|
|
|
142,716 |
|
| ARES LX CLO Ltd. |
|
|
|
|
|
|
|
|
| Series 2021-60A, Class A, 3-Month Term SOFR + 1.38%, 6.71% (C), 07/18/2034 (B) |
|
|
250,000 |
|
|
|
250,412 |
|
| Ares XXXIX CLO Ltd. |
|
|
|
|
|
|
|
|
| Series 2016-39A, Class AR3, 3-Month Term SOFR + 1.42%, 6.75% (C), 07/18/2037 (B) |
|
|
767,128 |
|
|
|
768,938 |
|
| Arivo Acceptance Auto Loan Receivables Trust |
|
|
|
|
|
|
|
|
| Series 2022-1A, Class A, 3.93%, 05/15/2028 (B) |
|
|
102,634 |
|
|
|
101,331 |
|
| Ballyrock CLO 14 Ltd. |
|
|
|
|
|
|
|
|
| Series 2020-14A, Class A1AR, 3-Month EURIBOR + 1.38%, 1.00% (C), 07/20/2037 (B)(G) |
|
|
1,233,102 |
|
|
|
1,233,102 |
|
| Series 2020-14A, Class A1BR, 3-Month EURIBOR + 1.58%, 1.00% (C), 07/20/2037 (B)(G) |
|
|
250,000 |
|
|
|
250,000 |
|
| Benefit Street Partners CLO XV Ltd. |
|
|
|
|
|
|
|
|
| Series 2018-15A, Class A1R, 3-Month Term SOFR + 1.39%, 6.74% (C), 07/15/2037 (B)(G) |
|
|
743,000 |
|
|
|
743,000 |
|
| CBAM Ltd. |
|
|
|
|
|
|
|
|
| Series 2019-11RA, Class A1, 3-Month Term SOFR + 1.44%, 6.77% (C), 01/20/2035 (B) |
|
|
1,210,000 |
|
|
|
1,210,471 |
|
| Series 2019-11RA, Class B, 3-Month Term SOFR + 2.01%, 7.34% (C), 01/20/2035 (B) |
|
|
308,466 |
|
|
|
308,758 |
|
| CF Hippolyta Issuer LLC |
|
|
|
|
|
|
|
|
| Series 2020-1, Class A1, 1.69%, 07/15/2060 (B) |
|
|
440,947 |
|
|
|
417,847 |
|
| Series 2020-1, Class B1, 2.28%, 07/15/2060 (B) |
|
|
89,945 |
|
|
|
84,035 |
|
| Series 2021-1A, Class A1, 1.53%, 03/15/2061 (B) |
|
|
778,462 |
|
|
|
713,032 |
|
| Series 2021-1A, Class B1, 1.98%, 03/15/2061 (B) |
|
|
294,044 |
|
|
|
262,506 |
|
| Series 2022-1A, Class A1, 5.97%, 08/15/2062 (B) |
|
|
725,133 |
|
|
|
714,133 |
|
| Series 2022-1A, Class A2, 6.11%, 08/15/2062 (B) |
|
|
2,064,677 |
|
|
|
2,026,501 |
|
| CIFC Funding Ltd. |
|
|
|
|
|
|
|
|
| 3-Month EURIBOR + 1.38%, 1.00% (C), 07/17/2037 (B) |
|
|
1,352,000 |
|
|
|
1,352,000 |
|
| Series 2021-7A, Class A1, 3-Month Term SOFR + 1.39%, 6.72% (C), 01/23/2035 (B) |
|
|
375,000 |
|
|
|
375,168 |
|
| Series 2021-7A, Class B, 3-Month Term SOFR + 1.86%, 7.19% (C), 01/23/2035 (B) |
|
|
250,874 |
|
|
|
251,124 |
|
The Notes to Financial Statements are an integral part of this report.
|
|
|
|
|
| Transamerica Series Trust |
|
|
|
Semi-Annual Financial Statements 2024 |
|
|
Page 9 |
|
|
Transamerica Janus Balanced VP
SCHEDULE OF INVESTMENTS (continued)
At June 30, 2024
(unaudited)
|
|
|
|
|
|
|
|
|
| |
|
Principal |
|
|
Value |
|
| |
|
|
| ASSET-BACKED SECURITIES (continued) |
|
| CIM Trust |
|
|
|
|
|
|
|
|
| Series 2021-NR1, Class A1, 5.57% (C), 07/25/2055 (B) |
|
$ |
200,673 |
|
|
$ |
198,911 |
|
| Series 2021-NR4, Class A1, 2.82% (C), 10/25/2061 (B) |
|
|
145,512 |
|
|
|
143,237 |
|
| CP EF Asset Securitization I LLC |
|
|
|
|
|
|
|
|
| Series 2022-1A, Class A, 5.96%, 04/15/2030 (B) |
|
|
111,175 |
|
|
|
110,801 |
|
| CP EF Asset Securitization II LLC |
|
|
|
|
|
|
|
|
| Series 2023-1A, Class A, 7.48%, 03/15/2032 (B) |
|
|
358,115 |
|
|
|
360,969 |
|
| CRB Securitization Trust |
|
|
|
|
|
|
|
|
| Series 2023-1, Class A, 6.96%, 10/20/2033 (B) |
|
|
132,888 |
|
|
|
133,741 |
|
| CyrusOne Data Centers Issuer I LLC |
|
|
|
|
|
|
|
|
| Series 2023-2A, Class A2, 5.56%, 11/20/2048 (B) |
|
|
872,000 |
|
|
|
852,019 |
|
| Series 2024-1A, Class A2, 4.76%, 03/22/2049 (B) |
|
|
372,724 |
|
|
|
349,704 |
|
| Series 2024-3A, Class A2, 4.65%, 05/20/2049 (B) |
|
|
1,339,000 |
|
|
|
1,212,914 |
|
| Diamond Infrastructure Funding LLC |
|
|
|
|
|
|
|
|
| Series 2021-1A, Class A, 1.76%, 04/15/2049 (B) |
|
|
821,000 |
|
|
|
740,771 |
|
| Domino’s Pizza Master Issuer LLC |
|
|
|
|
|
|
|
|
| Series 2018-1A, Class A2I, 4.12%, 07/25/2048 (B) |
|
|
747,577 |
|
|
|
729,618 |
|
| Elmwood CLO II Ltd. |
|
|
|
|
|
|
|
|
| Series 2019-2A, Class AR, 3-Month Term SOFR + 1.41%, 6.74% (C), 04/20/2034 (B) |
|
|
339,000 |
|
|
|
339,596 |
|
| Elmwood CLO VI Ltd. |
|
|
|
|
|
|
|
|
| Series 2020-3A, Class ARR, 3-Month Term SOFR + 1.38%, 1.00% (C), 07/18/2037 (B)(G) |
|
|
1,485,000 |
|
|
|
1,485,000 |
|
| Exeter Automobile Receivables Trust |
|
|
|
|
|
|
|
|
| Series 2021-1A, Class D, 1.08%, 11/16/2026 |
|
|
355,854 |
|
|
|
348,602 |
|
| FIGRE Trust |
|
|
|
|
|
|
|
|
| Series 2024-HE1, Class A, 6.17% (C), 03/25/2054 (B) |
|
|
452,176 |
|
|
|
452,259 |
|
| Series 2024-HE2, Class A, 6.38% (C), 05/25/2054 (B) |
|
|
390,177 |
|
|
|
393,519 |
|
| Gracie Point International Funding LLC |
|
|
|
|
|
|
|
|
| Series 2024-1A, Class A, 3-Month SOFR Average + 1.70%, 7.05% (C), 03/01/2028 (B) |
|
|
287,000 |
|
|
|
288,125 |
|
| HPS Loan Management Ltd. |
|
|
|
|
|
|
|
|
| Series 2021-16A, Class B, 3-Month Term SOFR + 1.96%, 7.29% (C), 01/23/2035 (B) |
|
|
250,000 |
|
|
|
250,000 |
|
| JPMorgan Chase Bank NA - CACLN |
|
|
|
|
|
|
|
|
| Series 2021-1, Class B, 0.88%, 09/25/2028 (B) |
|
|
6,853 |
|
|
|
6,824 |
|
| Series 2021-2, Class B, 0.89%, 12/26/2028 (B) |
|
|
47,367 |
|
|
|
46,840 |
|
| LAD Auto Receivables Trust |
|
|
|
|
|
|
|
|
| Series 2021-1A, Class A, 1.30%, 08/17/2026 (B) |
|
|
17,416 |
|
|
|
17,362 |
|
| Series 2022-1A, Class A, 5.21%, 06/15/2027 (B) |
|
|
309,660 |
|
|
|
308,633 |
|
|
|
|
|
|
|
|
|
|
| |
|
Principal |
|
|
Value |
|
| |
|
|
| ASSET-BACKED SECURITIES (continued) |
|
| Lendbuzz Securitization Trust |
|
|
|
|
|
|
|
|
| Series 2022-1A, Class A, 4.22%, 05/17/2027 (B) |
|
$ |
299,657 |
|
|
$ |
295,438 |
|
| Series 2023-1A, Class A2, 6.92%, 08/15/2028 (B) |
|
|
233,043 |
|
|
|
234,884 |
|
| Libra Solutions LLC |
|
|
|
|
|
|
|
|
| Series 2022-2A, Class A, 6.85%, 10/15/2034 (B) |
|
|
74,368 |
|
|
|
74,247 |
|
| Logan CLO II Ltd. |
|
|
|
|
|
|
|
|
| Series 2021-2A, Class A, 3-Month Term SOFR + 1.41%, 6.74% (C), 01/20/2035 (B) |
|
|
582,571 |
|
|
|
582,890 |
|
| M&T Equipment Notes |
|
|
|
|
|
|
|
|
| Series 2023-1A, Class A2, 6.09%, 07/15/2030 (B) |
|
|
252,843 |
|
|
|
252,942 |
|
| Series 2023-1A, Class A3, 5.74%, 07/15/2030 (B) |
|
|
207,000 |
|
|
|
207,026 |
|
| Marlette Funding Trust |
|
|
|
|
|
|
|
|
| Series 2023-2A, Class B, 6.54%, 06/15/2033 (B) |
|
|
224,000 |
|
|
|
224,527 |
|
| Mercury Financial Credit Card Master Trust |
|
|
|
|
|
|
|
|
| Series 2023-1A, Class A, 8.04%, 09/20/2027 (B) |
|
|
718,000 |
|
|
|
723,051 |
|
| New Economy Assets Phase 1 Sponsor LLC |
|
|
|
|
|
|
|
|
| Series 2021-1, Class B1, 2.41%, 10/20/2061 (B) |
|
|
353,000 |
|
|
|
304,236 |
|
| NRZ Excess Spread-Collateralized Notes |
|
|
|
|
|
|
|
|
| Series 2020-PLS1, Class A, 3.84%, 12/25/2025 (B) |
|
|
124,123 |
|
|
|
119,763 |
|
| Series 2021-FHT1, Class A, 3.10%, 07/25/2026 (B) |
|
|
223,589 |
|
|
|
210,349 |
|
| Oak Street Investment Grade Net Lease Fund |
|
|
|
|
|
|
|
|
| Series 2020-1A, Class A1, 1.85%, 11/20/2050 (B) |
|
|
655,908 |
|
|
|
615,757 |
|
| Octagon Investment Partners 48 Ltd. |
|
|
|
|
|
|
|
|
| Series 2020-3A, Class AR, 3-Month Term SOFR + 1.41%, 6.74% (C), 10/20/2034 (B) |
|
|
351,000 |
|
|
|
351,270 |
|
| Pagaya AI Debt Trust |
|
|
|
|
|
|
|
|
| Series 2022-1, Class A, 2.03%, 10/15/2029 (B) |
|
|
32,297 |
|
|
|
32,149 |
|
| PRET LLC |
|
|
|
|
|
|
|
|
| Series 2023-RN1, Class A1, 8.23% (C), 09/25/2053 (B) |
|
|
893,975 |
|
|
|
903,986 |
|
| PRPM LLC |
|
|
|
|
|
|
|
|
| Series 2021-10, Class A1, 2.49% (C), 10/25/2026 (B) |
|
|
556,131 |
|
|
|
550,482 |
|
| Series 2021-9, Class A1, 2.36% (C), 10/25/2026 (B) |
|
|
475,617 |
|
|
|
468,184 |
|
| Series 2022-2, Class A1, 5.00% (C), 03/25/2027 (B) |
|
|
901,944 |
|
|
|
892,512 |
|
| Rad CLO 21 Ltd. |
|
|
|
|
|
|
|
|
| Series 2023-21A, Class A, 3-Month Term SOFR + 1.59%, 6.91% (C), 01/25/2033 (B) |
|
|
521,477 |
|
|
|
524,912 |
|
The Notes to Financial Statements are an integral part of this report.
|
|
|
|
|
| Transamerica Series Trust |
|
|
|
Semi-Annual Financial Statements 2024 |
|
|
Page 10 |
|
|
Transamerica Janus Balanced VP
SCHEDULE OF INVESTMENTS (continued)
At June 30, 2024
(unaudited)
|
|
|
|
|
|
|
|
|
| |
|
Principal |
|
|
Value |
|
| |
|
|
| ASSET-BACKED SECURITIES (continued) |
|
| RCKT Mortgage Trust |
|
|
|
|
|
|
|
|
| Series 2023-CES3, Class A1A, 7.11% (C), 11/25/2043 (B) |
|
$ |
1,245,856 |
|
|
$ |
1,263,467 |
|
| Series 2024-CES1, Class A1A, 6.03% (C), 02/25/2044 (B) |
|
|
548,087 |
|
|
|
548,570 |
|
| Series 2024-CES2, Class A1A, 6.14% (C), 04/25/2044 (B) |
|
|
1,766,503 |
|
|
|
1,764,853 |
|
| Regatta XI Funding Ltd. |
|
|
|
|
|
|
|
|
| Series 2018-1A, Class AR, 3-Month Term SOFR + 1.40%, 1.00% (C), 07/17/2037 (B)(G) |
|
|
1,358,910 |
|
|
|
1,358,910 |
|
| Regatta XXIII Funding Ltd. |
|
|
|
|
|
|
|
|
| Series 2021-4A, Class A1, 3-Month Term SOFR + 1.41%, 6.74% (C), 01/20/2035 (B) |
|
|
952,000 |
|
|
|
953,001 |
|
| Series 2021-4A, Class B, 3-Month Term SOFR + 1.96%, 7.29% (C), 01/20/2035 (B) |
|
|
264,465 |
|
|
|
264,765 |
|
| RR 21 Ltd. |
|
|
|
|
|
|
|
|
| Series 2022-21A, Class A1AR, 3-Month Term SOFR + 1.40%, 1.00% (C), 07/15/2039 (B)(G) |
|
|
767,128 |
|
|
|
767,128 |
|
| Saluda Grade Alternative Mortgage Trust |
|
|
|
|
|
|
|
|
| Series 2023-FIG3, Class A, 7.07% (C), 08/25/2053 (B) |
|
|
1,087,392 |
|
|
|
1,113,848 |
|
| Series 2023-FIG4, Class A, 6.72% (C), 11/25/2053 (B) |
|
|
585,841 |
|
|
|
593,264 |
|
| Santander Bank Auto Credit-Linked Notes |
|
|
|
|
|
|
|
|
| Series 2021-1A, Class B, 1.83%, 12/15/2031 (B) |
|
|
29,185 |
|
|
|
28,941 |
|
| Series 2022-A, Class B, 5.28%, 05/15/2032 (B) |
|
|
238,570 |
|
|
|
237,325 |
|
| Series 2022-B, Class A2, 5.59%, 08/16/2032 (B) |
|
|
109,995 |
|
|
|
110,058 |
|
| Taco Bell Funding LLC |
|
|
|
|
|
|
|
|
| Series 2021-1A, Class A23, 2.54%, 08/25/2051 (B) |
|
|
451,840 |
|
|
|
370,021 |
|
| THL Credit Wind River CLO Ltd. |
|
|
|
|
|
|
|
|
| Series 2019-1A, Class AR, 3-Month Term SOFR + 1.42%, 6.75% (C), 07/20/2034 (B) |
|
|
314,000 |
|
|
|
314,409 |
|
| Upstart Securitization Trust |
|
|
|
|
|
|
|
|
| Series 2022-1, Class A, 3.12%, 03/20/2032 (B) |
|
|
98,064 |
|
|
|
97,603 |
|
| Series 2022-2, Class A, 4.37%, 05/20/2032 (B) |
|
|
4,174 |
|
|
|
4,170 |
|
| Vantage Data Centers Issuer LLC |
|
|
|
|
|
|
|
|
| Series 2020-1A, Class A2, 1.65%, 09/15/2045 (B) |
|
|
925,000 |
|
|
|
876,045 |
|
| Series 2021-1A, Class A2, 2.17%, 10/15/2046 (B) |
|
|
1,953,558 |
|
|
|
1,794,986 |
|
| Vantage Data Centers LLC |
|
|
|
|
|
|
|
|
| Series 2020-2A, Class A2, 1.99%, 09/15/2045 (B) |
|
|
596,000 |
|
|
|
529,391 |
|
|
|
|
|
|
|
|
|
|
| |
|
Principal |
|
|
Value |
|
| |
|
|
| ASSET-BACKED SECURITIES (continued) |
|
| VCAT LLC |
|
|
|
|
|
|
|
|
| Series 2021-NPL1, Class A1, 5.29% (C), 12/26/2050 (B) |
|
$ |
54,908 |
|
|
$ |
54,629 |
|
| Wendy’s Funding LLC |
|
|
|
|
|
|
|
|
| Series 2021-1A, Class A2II, 2.78%, 06/15/2051 (B) |
|
|
357,929 |
|
|
|
298,949 |
|
| Westgate Resorts LLC |
|
|
|
|
|
|
|
|
| Series 2022-1A, Class A, 1.79%, 08/20/2036 (B) |
|
|
114,907 |
|
|
|
110,336 |
|
|
|
|
|
|
|
|
|
|
| Total Asset-Backed Securities
(Cost $41,258,741) |
|
|
|
41,020,409 |
|
|
|
|
|
|
|
|
|
|
|
|
|
| LOAN ASSIGNMENT - 0.1% |
|
|
|
|
|
|
|
|
| Ground Transportation - 0.1% |
|
|
|
|
|
|
|
|
| Genesee & Wyoming, Inc. Term Loan B, 3-Month Term SOFR + 2.00%, 7.33% (C), 04/10/2031 |
|
|
1,385,620 |
|
|
|
1,383,902 |
|
|
|
|
|
|
|
|
|
|
| Total Loan Assignment
(Cost $1,383,896) |
|
|
|
|
|
|
1,383,902 |
|
|
|
|
|
|
|
|
|
|
|
|
|
| |
|
Shares |
|
|
Value |
|
| |
|
|
|
| OTHER INVESTMENT COMPANY - 2.6% |
|
|
|
|
|
| Securities Lending Collateral - 2.6% |
|
|
|
|
|
| State Street Navigator Securities Lending Trust - Government Money Market Portfolio, 5.28% (H) |
|
|
24,891,828 |
|
|
|
24,891,828 |
|
|
|
|
|
|
|
|
|
|
| Total Other Investment Company
(Cost $24,891,828) |
|
|
|
24,891,828 |
|
|
|
|
|
|
|
|
|
|
|
|
|
| |
|
Principal |
|
|
Value |
|
| |
|
|
|
| REPURCHASE AGREEMENT - 2.0% |
|
|
|
|
|
| Fixed Income Clearing Corp., 2.50% (H), dated 06/28/2024, to be repurchased at $19,745,391 on 07/01/2024. Collateralized by a U.S. Government Obligation, 4.50%, due 03/31/2026, and with a value of $20,136,275. |
|
$ |
19,741,279 |
|
|
|
19,741,279 |
|
|
|
|
|
|
|
|
|
|
| Total Repurchase Agreement
(Cost $19,741,279) |
|
|
|
19,741,279 |
|
|
|
|
|
|
|
|
|
|
| Total Investments
(Cost $768,018,056) |
|
|
|
998,648,978 |
|
|
|
|
|
|
|
|
|
|
| Net Other Assets (Liabilities) - (4.1)% |
|
|
|
(39,655,161 |
) |
|
|
|
|
|
|
|
|
|
|
|
| Net Assets - 100.0% |
|
|
$ |
958,993,817 |
|
|
|
|
|
|
|
|
|
|
The Notes to Financial Statements are an integral part of this report.
|
|
|
|
|
| Transamerica Series Trust |
|
|
|
Semi-Annual Financial Statements 2024 |
|
|
Page 11 |
|
|
Transamerica Janus Balanced VP
SCHEDULE OF INVESTMENTS (continued)
At June 30, 2024
(unaudited)
INVESTMENT VALUATION:
Valuation Inputs (I)
|
|
|
|
|
|
|
|
|
|
|
|
|
|
|
|
|
| |
|
Level 1 - Unadjusted Quoted Prices |
|
|
Level 2 - Other Significant Observable Inputs |
|
|
Level 3 - Significant Unobservable Inputs |
|
|
Value |
|
| |
|
| ASSETS |
|
|
|
|
|
|
|
|
|
|
|
|
|
|
|
|
| Investments |
|
|
|
|
|
|
|
|
|
|
|
|
|
|
|
|
| Common Stocks |
|
$ |
576,531,887 |
|
|
$ |
— |
|
|
$ |
— |
|
|
$ |
576,531,887 |
|
| Corporate Debt Securities |
|
|
— |
|
|
|
128,997,828 |
|
|
|
— |
|
|
|
128,997,828 |
|
| U.S. Government Agency Obligations |
|
|
— |
|
|
|
103,177,244 |
|
|
|
— |
|
|
|
103,177,244 |
|
| Mortgage-Backed Securities |
|
|
— |
|
|
|
52,492,738 |
|
|
|
— |
|
|
|
52,492,738 |
|
| U.S. Government Obligations |
|
|
— |
|
|
|
50,411,863 |
|
|
|
— |
|
|
|
50,411,863 |
|
| Asset-Backed Securities |
|
|
— |
|
|
|
41,020,409 |
|
|
|
— |
|
|
|
41,020,409 |
|
| Loan Assignment |
|
|
— |
|
|
|
1,383,902 |
|
|
|
— |
|
|
|
1,383,902 |
|
| Other Investment Company |
|
|
24,891,828 |
|
|
|
— |
|
|
|
— |
|
|
|
24,891,828 |
|
| Repurchase Agreement |
|
|
— |
|
|
|
19,741,279 |
|
|
|
— |
|
|
|
19,741,279 |
|
|
|
|
|
|
|
|
|
|
|
|
|
|
|
|
|
|
|
|
|
|
|
| Total Investments |
|
$ |
601,423,715 |
|
|
$ |
397,225,263 |
|
|
$ |
— |
|
|
$ |
998,648,978 |
|
|
|
|
|
|
|
|
|
|
|
|
|
|
|
|
|
|
FOOTNOTES TO SCHEDULE OF INVESTMENTS:
| (A) |
Non-income producing security. |
| (B) |
Security is exempt from registration pursuant to Rule 144A of the Securities Act of 1933. Security may be resold as transactions exempt from registration, normally to qualified institutional buyers. At June 30, 2024, the total value of 144A securities is $148,769,202, representing 15.5% of the Portfolio’s net assets. |
| (C) |
Floating or variable rate security. The rate disclosed is as of June 30, 2024. For securities based on a published reference rate and spread, the reference rate and spread are indicated within the description. Variable rate securities with a floor or ceiling feature are disclosed at the inherent rate, where applicable. Certain variable rate securities are not based on a published reference rate and spread, but are determined by the issuer or agent and are based on current market conditions; these securities do not indicate a reference rate and spread in the description. |
| (D) |
Perpetual maturity. The date displayed is the next call date. |
| (E) |
All or a portion of the security is on loan. The total value of the securities on loan is $24,382,910, collateralized by cash collateral of $24,891,828. The amount on loan indicated may not correspond with the securities on loan identified because a security with pending sales are in the process of recall from the brokers. |
| (F) |
Percentage rounds to less than 0.1% or (0.1)%. |
| (G) |
When-issued, delayed-delivery and/or forward commitment (including TBAs) security. Security to be settled and delivered after June 30, 2024. Security may display a coupon rate of 0.00%, as the rate is to be determined at time of settlement. |
| (H) |
Rate disclosed reflects the yield at June 30, 2024. |
| (I) |
There were no transfers in or out of Level 3 during the period ended June 30, 2024. Please reference the Investment Valuation section of the Notes to Financial Statements for more information regarding investment valuation and pricing inputs. |
PORTFOLIO ABBREVIATION(S):
|
|
|
| CLO |
|
Collateralized Loan Obligation |
| EURIBOR |
|
Euro Interbank Offer Rate |
| REIT |
|
Real Estate Investment Trust |
| SOFR |
|
Secured Overnight Financing Rate |
| STACR |
|
Structured Agency Credit Risk |
| STRIPS |
|
Separate Trading of Registered Interest and Principal of Securities |
| TBA |
|
To Be Announced |
The Notes to Financial Statements are an integral part of this report.
|
|
|
|
|
| Transamerica Series Trust |
|
|
|
Semi-Annual Financial Statements 2024 |
|
|
Page 12 |
|
|
Transamerica Janus Balanced VP
|
|
|
| STATEMENT OF ASSETS AND LIABILITIES At June 30, 2024 (unaudited) |
|
STATEMENT OF OPERATIONS For the period ended June 30, 2024 (unaudited) |
|
|
|
|
|
| Assets: |
|
|
|
|
| Investments, at value (cost $748,276,777) (including securities loaned of $24,382,910) |
|
$ |
978,907,699 |
|
| Repurchase agreement, at value (cost $19,741,279) |
|
|
19,741,279 |
|
| Cash |
|
|
505,124 |
|
| Receivables and other assets: |
|
|
|
|
| Investments sold |
|
|
3,235,406 |
|
| When-issued, delayed-delivery, forward and TBA commitments sold |
|
|
691,629 |
|
| Net income from securities lending |
|
|
9,697 |
|
| Shares of beneficial interest sold |
|
|
145,439 |
|
| Dividends |
|
|
212,965 |
|
| Interest |
|
|
2,879,836 |
|
| Prepaid expenses |
|
|
3,867 |
|
| |
|
| Total assets |
|
|
1,006,332,941 |
|
|
|
| Liabilities: |
|
|
|
|
| Cash collateral received upon return of: |
|
|
|
|
| Securities on loan |
|
|
24,891,828 |
|
| Payables and other liabilities: |
|
|
|
|
| Investments purchased |
|
|
3,351,249 |
|
| When-issued, delayed-delivery, forward and TBA commitments purchased |
|
|
17,470,739 |
|
| Shares of beneficial interest redeemed |
|
|
772,800 |
|
| Investment management fees |
|
|
505,153 |
|
| Distribution and service fees |
|
|
180,970 |
|
| Transfer agent costs |
|
|
919 |
|
| Trustee and CCO fees |
|
|
2,564 |
|
| Audit and tax fees |
|
|
21,657 |
|
| Custody fees |
|
|
66,439 |
|
| Legal fees |
|
|
18,918 |
|
| Printing and shareholder reports fees |
|
|
39,599 |
|
| Other accrued expenses |
|
|
16,289 |
|
|
|
| Total liabilities |
|
|
47,339,124 |
|
| |
|
| Net assets |
|
$ |
958,993,817 |
|
|
|
| Net assets consist of: |
|
|
|
|
| Capital stock ($0.01 par value) |
|
$ |
547,226 |
|
| Additional paid-in capital |
|
|
641,933,165 |
|
| Total distributable earnings (accumulated losses) |
|
|
316,513,426 |
|
| |
|
| Net assets |
|
$ |
958,993,817 |
|
|
|
| Net assets by class: |
|
|
|
|
| Initial Class |
|
$ |
15,981,546 |
|
| Service Class |
|
|
943,012,271 |
|
|
|
| Shares outstanding: |
|
|
|
|
| Initial Class |
|
|
893,169 |
|
| Service Class |
|
|
53,829,420 |
|
|
|
| Net asset value and offering price per share: |
|
|
|
|
| Initial Class |
|
$ |
17.89 |
|
| Service Class |
|
|
17.52 |
|
|
|
|
|
|
| Investment income: |
|
|
|
|
| Dividend income |
|
$ |
3,296,483 |
|
| Interest income |
|
|
9,267,280 |
|
| Net income from securities lending |
|
|
39,819 |
|
|
|
| Total investment income |
|
|
12,603,582 |
|
|
|
| Expenses: |
|
|
|
|
| Investment management fees |
|
|
3,229,967 |
|
| Distribution and service fees: |
|
|
|
|
| Service Class |
|
|
1,157,261 |
|
| Transfer agent costs |
|
|
5,349 |
|
| Trustee and CCO fees |
|
|
21,896 |
|
| Audit and tax fees |
|
|
21,469 |
|
| Custody fees |
|
|
66,255 |
|
| Legal fees |
|
|
37,297 |
|
| Printing and shareholder reports fees |
|
|
37,780 |
|
| Other |
|
|
25,108 |
|
|
|
| Total expenses |
|
|
4,602,382 |
|
|
|
| Net investment income (loss) |
|
|
8,001,200 |
|
|
|
| Net realized gain (loss) on: |
|
|
|
|
| Investments |
|
|
41,337,337 |
|
|
|
| Net change in unrealized appreciation (depreciation) on: |
|
|
|
|
| Investments |
|
|
41,983,299 |
|
|
|
| Net realized and change in unrealized gain (loss) |
|
|
83,320,636 |
|
|
|
| Net increase (decrease) in net assets resulting from operations |
|
$ |
91,321,836 |
|
The Notes to Financial Statements are an integral part of this report.
|
|
|
|
|
| Transamerica Series Trust |
|
|
|
Semi-Annual Financial Statements 2024 |
|
|
Page 13 |
|
|
Transamerica Janus Balanced VP
STATEMENT OF CHANGES IN NET ASSETS
For the period and year ended:
|
|
|
|
|
|
|
|
|
|
|
|
| |
|
June 30, 2024 (unaudited) |
|
|
December 31, 2023 |
|
|
|
| From operations: |
|
|
|
|
|
|
|
|
| Net investment income (loss) |
|
$ |
8,001,200 |
|
|
$ |
15,929,430 |
|
| Net realized gain (loss) |
|
|
41,337,337 |
|
|
|
22,992,166 |
|
| Net change in unrealized appreciation (depreciation) |
|
|
41,983,299 |
|
|
|
92,656,198 |
|
|
|
|
| Net increase (decrease) in net assets resulting from operations |
|
|
91,321,836 |
|
|
|
131,577,794 |
|
|
|
|
| Dividends and/or distributions to shareholders: |
|
|
|
|
|
|
|
|
| Initial Class |
|
|
— |
|
|
|
(597,794 |
) |
| Service Class |
|
|
— |
|
|
|
(37,387,192 |
) |
|
|
|
| Net increase (decrease) in net assets resulting from dividends and/or distributions to shareholders |
|
|
— |
|
|
|
(37,984,986 |
) |
|
|
|
| Capital share transactions: |
|
|
|
|
|
|
|
|
| Proceeds from shares sold: |
|
|
|
|
|
|
|
|
| Initial Class |
|
|
526,760 |
|
|
|
1,491,830 |
|
| Service Class |
|
|
11,486,647 |
|
|
|
16,789,925 |
|
| |
|
|
12,013,407 |
|
|
|
18,281,755 |
|
| Dividends and/or distributions reinvested: |
|
|
|
|
|
|
|
|
| Initial Class |
|
|
— |
|
|
|
597,794 |
|
| Service Class |
|
|
— |
|
|
|
37,387,192 |
|
|
|
|
| |
|
|
— |
|
|
|
37,984,986 |
|
| Cost of shares redeemed: |
|
|
|
|
|
|
|
|
| Initial Class |
|
|
(760,997 |
) |
|
|
(1,241,005 |
) |
| Service Class |
|
|
(92,186,322 |
) |
|
|
(131,976,078 |
) |
|
|
|
| |
|
|
(92,947,319 |
) |
|
|
(133,217,083 |
) |
|
|
|
| Net increase (decrease) in net assets resulting from capital share transactions |
|
|
(80,933,912 |
) |
|
|
(76,950,342 |
) |
|
|
|
| Net increase (decrease) in net assets |
|
|
10,387,924 |
|
|
|
16,642,466 |
|
|
|
|
| Net assets: |
|
|
|
|
|
|
|
|
| Beginning of period/year |
|
|
948,605,893 |
|
|
|
931,963,427 |
|
| End of period/year |
|
$ |
958,993,817 |
|
|
$ |
948,605,893 |
|
|
|
|
| Capital share transactions - shares: |
|
|
|
|
|
|
|
|
| Shares issued: |
|
|
|
|
|
|
|
|
| Initial Class |
|
|
30,805 |
|
|
|
95,295 |
|
| Service Class |
|
|
688,893 |
|
|
|
1,115,587 |
|
|
|
|
| |
|
|
719,698 |
|
|
|
1,210,882 |
|
| Shares reinvested: |
|
|
|
|
|
|
|
|
| Initial Class |
|
|
— |
|
|
|
38,642 |
|
| Service Class |
|
|
— |
|
|
|
2,464,548 |
|
|
|
|
| |
|
|
— |
|
|
|
2,503,190 |
|
| Shares redeemed: |
|
|
|
|
|
|
|
|
| Initial Class |
|
|
(44,551 |
) |
|
|
(79,955 |
) |
| Service Class |
|
|
(5,505,943 |
) |
|
|
(8,706,533 |
) |
|
|
|
| |
|
|
(5,550,494 |
) |
|
|
(8,786,488 |
) |
|
|
|
| Net increase (decrease) in shares outstanding: |
|
|
|
|
|
|
|
|
| Initial Class |
|
|
(13,746 |
) |
|
|
53,982 |
|
| Service Class |
|
|
(4,817,050 |
) |
|
|
(5,126,398 |
) |
|
|
|
| |
|
|
(4,830,796 |
) |
|
|
(5,072,416 |
) |
The Notes to Financial Statements are an integral part of this report.
|
|
|
|
|
| Transamerica Series Trust |
|
|
|
Semi-Annual Financial Statements 2024 |
|
|
Page 14 |
|
|
Transamerica Janus Balanced VP
FINANCIAL HIGHLIGHTS
|
|
|
|
|
|
|
|
|
|
|
|
|
|
|
|
|
|
|
|
|
|
|
|
|
| For a share outstanding during the period and years indicated: |
|
Initial Class |
|
|
|
|
|
|
|
| |
|
June 30, 2024 (unaudited) |
|
December 31, 2023 |
|
December 31, 2022 |
|
December 31, 2021 |
|
December 31, 2020 |
|
December 31, 2019 |
| Net asset value, beginning of period/year |
|
$ |
16.24 |
|
|
$ |
14.70 |
|
|
$ |
20.24 |
|
|
$ |
18.48 |
|
|
$ |
17.08 |
|
|
$ |
14.87 |
|
|
|
|
|
|
|
|
| Investment operations: |
|
|
|
|
|
|
|
|
|
|
|
|
|
|
|
|
|
|
|
|
|
|
|
|
| Net investment income (loss)(A) |
|
|
0.16 |
|
|
|
0.30 |
|
|
|
0.21 |
|
|
|
0.17 |
|
|
|
0.24 |
|
|
|
0.29 |
|
| Net realized and unrealized gain (loss) |
|
|
1.49 |
|
|
|
1.92 |
|
|
|
(3.46 |
) |
|
|
2.70 |
|
|
|
2.18 |
|
|
|
2.93 |
|
|
|
|
|
|
|
|
| Total investment operations |
|
|
1.65 |
|
|
|
2.22 |
|
|
|
(3.25 |
) |
|
|
2.87 |
|
|
|
2.42 |
|
|
|
3.22 |
|
| Dividends and/or distributions to shareholders: |
|
|
|
|
|
|
|
|
|
|
|
|
|
|
|
|
|
|
|
|
|
|
|
|
| Net investment income |
|
|
— |
|
|
|
(0.22 |
) |
|
|
(0.20 |
) |
|
|
(0.27 |
) |
|
|
(0.30 |
) |
|
|
(0.27 |
) |
| Net realized gains |
|
|
— |
|
|
|
(0.46 |
) |
|
|
(2.09 |
) |
|
|
(0.84 |
) |
|
|
(0.72 |
) |
|
|
(0.74 |
) |
|
|
|
|
|
|
|
| Total dividends and/or distributions to shareholders |
|
|
— |
|
|
|
(0.68 |
) |
|
|
(2.29 |
) |
|
|
(1.11 |
) |
|
|
(1.02 |
) |
|
|
(1.01 |
) |
|
|
|
|
|
|
|
| Net asset value, end of period/year |
|
$ |
17.89 |
|
|
$ |
16.24 |
|
|
$ |
14.70 |
|
|
$ |
20.24 |
|
|
$ |
18.48 |
|
|
$ |
17.08 |
|
| |
|
|
|
|
|
|
|
|
|
|
|
|
|
|
|
|
|
|
|
|
|
|
|
|
|
|
|
|
|
|
|
| Total return |
|
|
10.16 |
%(B) |
|
|
15.24 |
% |
|
|
(16.51 |
)% |
|
|
15.71 |
% |
|
|
14.59 |
% |
|
|
22.08 |
% |
|
|
|
|
|
|
|
| Ratio and supplemental data: |
|
|
|
|
|
|
|
|
|
|
|
|
|
|
|
|
|
|
|
|
|
|
|
|
| Net assets end of period/year (000’s) |
|
$ |
15,982 |
|
|
$ |
14,732 |
|
|
$ |
12,537 |
|
|
$ |
15,647 |
|
|
$ |
14,443 |
|
|
$ |
13,443 |
|
| Expenses to average net assets |
|
|
0.73 |
%(C) |
|
|
0.74 |
% |
|
|
0.74 |
% |
|
|
0.75 |
% |
|
|
0.76 |
% |
|
|
0.76 |
% |
| Net investment income (loss) to average net assets |
|
|
1.95 |
%(C) |
|
|
1.95 |
% |
|
|
1.24 |
% |
|
|
0.86 |
% |
|
|
1.41 |
% |
|
|
1.80 |
% |
| Portfolio turnover rate |
|
|
31 |
%(B) |
|
|
80 |
% |
|
|
90 |
% |
|
|
65 |
% |
|
|
86 |
% |
|
|
87 |
% |
| (A) |
Calculated based on average number of shares outstanding. |
|
|
|
|
|
|
|
|
|
|
|
|
|
|
|
|
|
|
|
|
|
|
|
|
|
| For a share outstanding during the period and years indicated: |
|
Service Class |
|
|
|
|
|
|
|
| |
|
June 30, 2024 (unaudited) |
|
December 31, 2023 |
|
December 31, 2022 |
|
December 31, 2021 |
|
December 31, 2020 |
|
December 31, 2019 |
|
|
|
|
|
|
|
| Net asset value, beginning of period/year |
|
$ |
15.92 |
|
|
$ |
14.42 |
|
|
$ |
19.89 |
|
|
$ |
18.18 |
|
|
$ |
16.82 |
|
|
$ |
14.66 |
|
|
|
|
|
|
|
|
| Investment operations: |
|
|
|
|
|
|
|
|
|
|
|
|
|
|
|
|
|
|
|
|
|
|
|
|
| Net investment income (loss)(A) |
|
|
0.14 |
|
|
|
0.26 |
|
|
|
0.16 |
|
|
|
0.12 |
|
|
|
0.19 |
|
|
|
0.25 |
|
| Net realized and unrealized gain (loss) |
|
|
1.46 |
|
|
|
1.88 |
|
|
|
(3.39 |
) |
|
|
2.65 |
|
|
|
2.15 |
|
|
|
2.88 |
|
|
|
|
|
|
|
|
| Total investment operations |
|
|
1.60 |
|
|
|
2.14 |
|
|
|
(3.23 |
) |
|
|
2.77 |
|
|
|
2.34 |
|
|
|
3.13 |
|
| Dividends and/or distributions to shareholders: |
|
|
|
|
|
|
|
|
|
|
|
|
|
|
|
|
|
|
|
|
|
|
|
|
| Net investment income |
|
|
— |
|
|
|
(0.18 |
) |
|
|
(0.15 |
) |
|
|
(0.22 |
) |
|
|
(0.26 |
) |
|
|
(0.23 |
) |
| Net realized gains |
|
|
— |
|
|
|
(0.46 |
) |
|
|
(2.09 |
) |
|
|
(0.84 |
) |
|
|
(0.72 |
) |
|
|
(0.74 |
) |
|
|
|
|
|
|
|
| Total dividends and/or distributions to shareholders |
|
|
— |
|
|
|
(0.64 |
) |
|
|
(2.24 |
) |
|
|
(1.06 |
) |
|
|
(0.98 |
) |
|
|
(0.97 |
) |
|
|
|
|
|
|
|
| Net asset value, end of period/year |
|
$ |
17.52 |
|
|
$ |
15.92 |
|
|
$ |
14.42 |
|
|
$ |
19.89 |
|
|
$ |
18.18 |
|
|
$ |
16.82 |
|
| |
|
|
|
|
|
|
|
|
|
|
|
|
|
|
|
|
|
|
|
|
|
|
|
|
|
|
|
|
|
|
|
| Total return |
|
|
10.05 |
%(B) |
|
|
15.01 |
% |
|
|
(16.77 |
)% |
|
|
15.44 |
% |
|
|
14.31 |
% |
|
|
21.77 |
% |
|
|
|
|
|
|
|
| Ratio and supplemental data: |
|
|
|
|
|
|
|
|
|
|
|
|
|
|
|
|
|
|
|
|
|
|
|
|
| Net assets end of period/year (000’s) |
|
$ |
943,012 |
|
|
$ |
933,874 |
|
|
$ |
919,426 |
|
|
$ |
1,264,435 |
|
|
$ |
1,207,852 |
|
|
$ |
1,111,765 |
|
| Expenses to average net assets |
|
|
0.98 |
%(C) |
|
|
0.99 |
% |
|
|
0.99 |
% |
|
|
1.00 |
% |
|
|
1.01 |
% |
|
|
1.01 |
% |
| Net investment income (loss) to average net assets |
|
|
1.70 |
%(C) |
|
|
1.69 |
% |
|
|
0.98 |
% |
|
|
0.61 |
% |
|
|
1.16 |
% |
|
|
1.56 |
% |
| Portfolio turnover rate |
|
|
31 |
%(B) |
|
|
80 |
% |
|
|
90 |
% |
|
|
65 |
% |
|
|
86 |
% |
|
|
87 |
% |
| (A) |
Calculated based on average number of shares outstanding. |
The Notes to Financial Statements are an integral part of this report.
|
|
|
|
|
| Transamerica Series Trust |
|
|
|
Semi-Annual Financial Statements 2024 |
|
|
Page 15 |
|
|
Transamerica Janus Balanced VP
NOTES TO FINANCIAL STATEMENTS
At June 30, 2024
(unaudited)
1. ORGANIZATION
Transamerica Series Trust (“TST”) is an open-end management investment company registered under the Investment Company Act of 1940, as amended (the “1940 Act”). TST applies investment company accounting and reporting guidance. TST serves as a funding vehicle for variable life insurance, variable annuity, and group annuity products. Transamerica Janus Balanced VP (the “Portfolio”) is a series of TST and is classified as diversified under the 1940 Act. The Portfolio currently offers two classes of shares, Initial Class and Service Class.
The only shareholders of the Portfolio are affiliated insurance company separate accounts and/or affiliated asset allocation portfolios. Contract holders of the variable life and annuity contracts are not shareholders of the Portfolio. For ease of reference, shareholders and contract holders are collectively referred to in this report as “shareholders.”
This report must be accompanied or preceded by the Portfolio’s current prospectus, which contains additional information about the Portfolio, including risks, as well as investment objectives and strategies.
Transamerica Asset Management, Inc. (“TAM”) serves as investment manager for the Portfolio pursuant to an investment management agreement. TAM provides continuous and regular investment management services to the Portfolio. TAM supervises the Portfolio’s investments, conducts its investment program and provides supervisory, compliance and administrative services to the Portfolio.
TAM currently acts as a “manager of managers” and has hired sub-advisers to furnish day-to-day investment advice and recommendations. TAM may, in the future, determine to provide all aspects of the day-to-day management of the Portfolio without the use of a sub-adviser. When acting as a manager of managers, TAM provides investment management services that include, without limitation, the design and development of the Portfolio and its investment strategies and the ongoing review and evaluation of those investment strategies including recommending changes in strategy where it believes appropriate or advisable; the selection of one or more sub-advisers for the Portfolio employing a combination of quantitative and qualitative screens, research, analysis and due diligence; negotiation of sub-advisory agreements and fees; oversight and monitoring of sub-advisers and recommending changes to sub-advisers where it believes appropriate or advisable; recommending portfolio combinations and liquidations where it believes appropriate or advisable; selection and oversight of transition managers, as needed; regular supervision of the Portfolio’s investments; regular review and evaluation of sub-adviser performance; daily monitoring of the sub-advisers’ buying and selling of securities for the Portfolio; regular review of holdings; ongoing trade oversight and analysis; regular monitoring to ensure adherence to investment process; regular calls and periodic on-site visits with sub-advisers; portfolio construction and asset allocation when using multiple sub-advisers for the Portfolio; risk management oversight and analysis; oversight of negotiation of investment documentation and agreements; design, development, implementation and regular monitoring of the valuation process; periodic due diligence reviews of pricing vendors and vendor methodology; design, development, implementation and regular monitoring of the compliance process; respond to regulatory inquiries and determine appropriate litigation strategy, as needed; review of proxies voted by sub-advisers; oversight of preparation and review of materials for meetings of the Portfolio’s Board of Trustees (the “Board”), participation in these meetings and preparation of regular communications with the Board; oversight of preparation and review of prospectuses, shareholder reports and other disclosure materials and regulatory filings for the Portfolio; oversight of other service providers to the Portfolio, such as the custodian, the transfer agent, the Portfolio’s independent accounting firm and legal counsel; supervision of the performance of recordkeeping and shareholder relations functions for the Portfolio; and oversight of cash management services. TAM uses a variety of quantitative and qualitative tools to carry out its investment management services. TAM, not the Portfolio, is responsible for paying the sub-adviser(s) for their services, and sub-advisory fees are TAM’s expense.
TAM’s investment management services also include the provision of supervisory and administrative services to the Portfolio. These services include performing certain administrative services for the Portfolio and supervising and overseeing the administrative, clerical, recordkeeping and bookkeeping services provided to the Portfolio by State Street Bank and Trust Company (“State Street”), to whom TAM has outsourced the provision of certain sub-administration services. To the extent agreed upon by TAM and the Portfolio from time to time, TAM’s supervisory and administrative services include, but are not limited to: monitoring and verifying the custodian’s daily calculation of the Net Asset Values (“NAV”); shareholder relations functions; compliance services; valuation services; assisting in due diligence and in the oversight and monitoring of certain activities of sub-advisers and certain aspects of Portfolio investments; assisting with Portfolio combinations and liquidations; oversight of the preparation and filing, and review, of all returns and reports, in connection with federal, state and local taxes; oversight and review of regulatory reporting; supervising and coordinating the Portfolio’s custodian and dividend disbursing agent and monitoring their services to the Portfolio; assisting the Portfolio in preparing reports to shareholders; acting as liaison with the Portfolio’s independent public accountants and providing, upon request, analyses, fiscal year summaries and other audit related services; assisting in the preparation of agendas and supporting documents for and minutes of meetings of trustees and committees of trustees; assisting in the preparation of regular communications with the trustees; and providing personnel and office space, telephones and other office equipment as necessary in order for TAM to perform supervisory and administrative services to the Portfolio. The Portfolio pays certain fees and expenses to State Street for sub-administration services which are not administrative services covered by the
|
|
|
|
|
| Transamerica Series Trust |
|
|
|
Semi-Annual Financial Statements 2024 |
|
|
Page 16 |
|
|
Transamerica Janus Balanced VP
NOTES TO FINANCIAL STATEMENTS (continued)
At June 30, 2024
(unaudited)
1. ORGANIZATION (continued)
management agreement with TAM or paid for through the management fees payable thereunder. For the period ended June 30, 2024, (i) the expenses paid to State Street for sub-administration services by the Portfolio are shown as a part of Other expenses within the Statement of Operations and (ii) the expenses payable to State Street for sub-administration services from the Portfolio are shown as part of Other accrued expenses within the Statement of Assets and Liabilities.
2. SIGNIFICANT ACCOUNTING POLICIES
In preparing the Portfolio’s financial statements in accordance with Generally Accepted Accounting Principles in the United States of America (“GAAP”), estimates or assumptions (which could differ from actual results) may be used that affect reported amounts and disclosures. The following is a summary of significant accounting policies followed by the Portfolio.
Security transactions and investment income: Security transactions are accounted for on the trade date. Security gains and losses are calculated on a first-in, first-out basis. Dividend income, if any, is recorded on the ex-dividend date or, in the case of foreign securities, as soon as the Portfolio is informed of the ex-dividend dates, net of foreign taxes. Non-cash dividends, if any, are recorded on the ex-dividend date at fair value. Interest income, if any, is recorded on the accrual basis from settlement date, net of foreign taxes. Fixed income premiums and discounts are amortized and/or accreted over the lives of the respective securities.
Multiple class operations, income, and expenses: Income, non-class specific expenses, and realized and unrealized gains and losses are allocated to each class daily based upon net assets. Each class bears its own specific expenses in addition to the allocated non-class specific expenses.
Distributions to shareholders: Distributions are recorded on the ex-dividend date and are determined in accordance with federal income tax regulations, which may differ from GAAP.
Commission recapture: The sub-adviser(s), to the extent consistent with the best execution and usual commission rate policies and practices, may elect to place security transactions of the Portfolio with broker/dealers with which TST has established a commission recapture program. A commission recapture program is any arrangement under which a broker/dealer applies a portion of the commissions received by such broker/dealer on the security transactions to the Portfolio. In no event will commissions, paid by the Portfolio, be used to pay expenses that would otherwise be borne by any other Portfolios within TST, or by any other party.
Commissions recaptured are included within Net realized gain (loss) within the Statement of Operations. For the period ended June 30, 2024, commissions recaptured are $8.
Indemnification: In the normal course of business, the Portfolio enters into contracts that contain a variety of representations that provide general indemnifications. The Portfolio’s maximum exposure under these arrangements is unknown, as this would involve future claims that may be made against the Portfolio and/or its affiliates that have not yet occurred. However, based on experience, the Portfolio expects the risk of loss to be remote.
3. INVESTMENT VALUATION
TAM has been designated as the Portfolio’s valuation designee pursuant to Rule 2a-5 under the 1940 Act with responsibility for fair valuation subject to oversight by the Portfolio’s Board of Trustees. The net asset value of the Portfolio is computed as of the official close of the New York Stock Exchange (“NYSE”) each day the NYSE is open for business.
TAM utilizes various methods to measure the fair value of its investments on a recurring basis. GAAP establishes a hierarchy that prioritizes inputs to valuation methods. The inputs or methodology used for valuing securities are not necessarily an indication of the risk associated with investing in those securities. The three levels (“Levels”) of inputs of the fair value hierarchy are defined as follows:
Level 1—Unadjusted quoted prices in active markets for identical securities.
Level 2—Inputs, other than quoted prices included in Level 1, which are observable, either directly or indirectly. These inputs may include quoted prices for the identical instrument on an inactive market, prices for similar instruments, interest rates, prepayment speeds, credit risk, yield curves, default rates, and similar data.
|
|
|
|
|
| Transamerica Series Trust |
|
|
|
Semi-Annual Financial Statements 2024 |
|
|
Page 17 |
|
|
Transamerica Janus Balanced VP
NOTES TO FINANCIAL STATEMENTS (continued)
At June 30, 2024
(unaudited)
3. INVESTMENT VALUATION (continued)
Level 3—Unobservable inputs based on the best information available in the circumstances, to the extent observable inputs are not available, which may include TAM’s own assumptions used in determining the fair value of the Portfolio’s investments and derivative instruments.
The inputs used to measure fair value may fall into different Levels of the fair value hierarchy. In such cases, for disclosure purposes, the Level in the fair value hierarchy that is assigned to the fair value measurement of a security is determined based on the lowest Level input that is significant to the fair value measurement in its entirety. Certain investments that are measured at fair value using NAV per share, or its equivalent, using the “practical expedient” have not been classified in the fair value Levels. The hierarchy classification of inputs used to value the Portfolio’s investments at June 30, 2024, is disclosed within the Investment Valuation section of the Schedule of Investments.
The availability of observable inputs can vary from security to security and is affected by a wide variety of factors, including, but not limited to, the type of security, whether the security is new and not yet established in the marketplace, the liquidity of markets, and other characteristics particular to the security. To the extent that valuation is based on models or inputs that are less observable or unobservable in the market, the determination of fair value requires more judgment. Accordingly, the degree of judgment exercised in determining fair value is generally greatest for instruments categorized in Level 3. Due to the inherent uncertainty of valuation, the determination of values may differ significantly from values that would have been realized had a ready market for investments existed, and the differences could be material.
Fair value measurements: Descriptions of the valuation techniques applied to the Portfolio’s significant categories of assets and liabilities measured at fair value on a recurring basis are as follows:
Asset-backed securities: The fair value of asset-backed securities is estimated based on models that consider the estimated cash flows of each tranche of the entity, establish a benchmark yield, and develop an estimated tranche specific spread to the benchmark yield based on the unique attributes of the tranche. To the extent the inputs are observable and timely, the values would generally be categorized in Level 2 of the fair value hierarchy; otherwise they would be categorized in Level 3.
Corporate debt securities: The fair value of corporate debt securities is estimated using various techniques, which consider recently executed transactions in securities of the issuer or comparable issuers, market price quotations (where observable), bond spreads, fundamental data relating to the issuer, and credit default swap spreads adjusted for any basis difference between cash and derivative instruments. While most corporate debt securities are categorized in Level 2 of the fair value hierarchy, in instances where lower relative weight is placed on transaction prices, quotations, or similar observable inputs, they are categorized in Level 3.
Equity securities: Securities are stated at the last reported sales price or closing price on the day of valuation taken from the primary exchange where the security is principally traded. To the extent these securities are actively traded and valuation adjustments are not applied, they are categorized in Level 1 of the fair value hierarchy. Equities traded on inactive markets or valued by reference to similar instruments are generally categorized in Level 2 or Level 3 if inputs are unobservable.
Foreign equity securities: Securities in which the primary trading market closes at the same time or after the NYSE, are valued based on quotations from the primary market in which they are traded and are categorized in Level 1. Because many foreign securities markets and exchanges close prior to the close of the NYSE, closing prices for foreign securities in those markets or on those exchanges do not reflect the events that occur after that close. Certain foreign securities may be fair valued using a pricing service that considers the correlation of the trading patterns of the foreign security to the intraday trading in the U.S. markets for investments such as American Depositary Receipts, financial futures, or ETFs and the movement of certain indices of securities based on a statistical analysis of their historical relationship; such valuations generally are categorized in Level 2.
Loan assignments: Loan assignments are normally valued using an income approach, which projects future cash flows and converts those future cash flows to a present value using a discount rate. The resulting present value reflects the likely fair value of the loan. To the extent the inputs are observable and timely, the values would generally be categorized in Level 2 of the fair value hierarchy; otherwise are categorized in Level 3.
Mortgage-backed securities: The fair value of mortgage-backed securities is estimated based on models that consider issuer type, coupon, cash flows, mortgage prepayment projection tables and adjustable rate mortgage evaluations that incorporate index data, periodic life caps and the next coupon reset date. To the extent the inputs are observable and timely, the values would generally be categorized in Level 2 of the fair value hierarchy; otherwise they are categorized in Level 3.
|
|
|
|
|
| Transamerica Series Trust |
|
|
|
Semi-Annual Financial Statements 2024 |
|
|
Page 18 |
|
|
Transamerica Janus Balanced VP
NOTES TO FINANCIAL STATEMENTS (continued)
At June 30, 2024
(unaudited)
3. INVESTMENT VALUATION (continued)
U.S. government agency obligations: U.S. government agency obligations are comprised of two main categories consisting of agency issued debt and mortgage pass-throughs. Generally, agency issued debt securities are valued in a manner similar to U.S. government obligations. Mortgage pass-throughs include to be announced (“TBA”) securities and mortgage pass-through certificates. Generally, TBA securities and mortgage pass-throughs are valued using dealer quotations. Depending on market activity levels and whether quotations or other observable data are used, these securities are typically categorized in Level 2 of the fair value hierarchy; otherwise they would be categorized in Level 3.
U.S. government obligations: U.S. government obligations are normally valued using a model that incorporates market observable data such as reported sales of similar securities, broker quotes, yields, bids, offers, and reference data. Certain securities are valued by principally using dealer quotations. U.S. government obligations generally are categorized in Level 2 of the fair value hierarchy, or Level 3 if inputs are unobservable.
Securities lending collateral: Securities lending collateral is invested in a money market fund which is valued at the actively traded NAV and no valuation adjustments are applied. Securities lending collateral is categorized in Level 1 of the fair value hierarchy.
Repurchase agreements: Repurchase agreements are valued at cost, which approximates fair value. To the extent the inputs are observable and timely, the values are generally categorized in Level 2 of the fair value hierarchy.
4. SECURITIES AND OTHER INVESTMENTS
Real estate investment trusts (“REITs”): REITs are pooled investment vehicles which invest primarily in income producing real estate, or real estate related loans or interests. Distributions received by REITs are classified at management’s estimate of the dividend income, return of capital and capital gains. Estimates are based on information available at year-end, which includes the previous fiscal year’s classification. The actual amounts of dividend income, return of capital, and capital gains are only determined by each REIT after the fiscal year end and may differ from the estimated amounts. Upon notification from the REITs, some of the distributions received may be re-classified and recorded as a return of capital or capital gains. There are certain additional risks involved in investing in REITs. These include, but are not limited to, economic conditions, changes in zoning laws, real estate values, property taxes, and interest rates.
REITs held at June 30, 2024, if any, are identified within the Schedule of Investments.
When-issued, delayed-delivery, forward, and to be announced (“TBA”) commitment transactions: The Portfolio may purchase or sell securities on a when-issued, delayed-delivery, forward and TBA commitment basis. When-issued and forward commitment transactions are made conditionally because a security, although authorized, has not yet been issued in the market. Settlement of such transactions normally occurs within a month or more after the purchase or sale commitment is made. The Portfolio engages in when-issued and forward commitment transactions to obtain an advantageous price and yield at the time of the transaction. The Portfolio engages in when-issued and forward commitment transactions for the purpose of acquiring securities, but may enter into a separate agreement to sell the securities before the settlement date. Since the value of securities purchased may fluctuate prior to settlement, the Portfolio may be required to pay more at settlement than the security is worth. In addition, the Portfolio is not entitled to any of the interest earned prior to settlement.
Delayed-delivery transactions involve a commitment by the Portfolio to purchase or sell securities for a predetermined price or yield, with payment and delivery taking place beyond the customary settlement period. When delayed-delivery transactions are outstanding, the Portfolio will segregate with its custodian either cash, U.S. government securities, or other liquid assets at least equal to the value or purchase commitments until payment is made. When purchasing a security on a delayed-delivery basis, the Portfolio assumes the rights and risks of ownership of the security, including the risk of price and yield fluctuations. These transactions also involve a risk to the Portfolio if the other party to the transaction defaults on its obligation to make payment or delivery, and the Portfolio is delayed or prevented from completing the transaction. The Portfolio may dispose of or renegotiate a delayed-delivery transaction after it is entered into, which may result in a realized gain or loss. When the Portfolio sells a security on a delayed-delivery basis, the Portfolio does not participate in future gains and losses on the security.
TBA commitments are entered into to purchase or sell securities for a fixed price at a future date, typically not to exceed 45 days. TBAs are considered securities in themselves, and involve a risk of loss if the value of the security to be purchased declines, or the value of the security sold increases, prior to settlement date, in addition to the risk of decline in the value of a Portfolio’s other assets. Unsettled TBA commitments are valued at the current value of the underlying securities. TBA collateral requirements are typically calculated by netting the mark-to-market amount for each transaction and comparing that amount to the value of the collateral currently pledged by a Portfolio
|
|
|
|
|
| Transamerica Series Trust |
|
|
|
Semi-Annual Financial Statements 2024 |
|
|
Page 19 |
|
|
Transamerica Janus Balanced VP
NOTES TO FINANCIAL STATEMENTS (continued)
At June 30, 2024
(unaudited)
4. SECURITIES AND OTHER INVESTMENTS (continued)
and the counterparty. Cash collateral that has been pledged to cover the obligations of a Portfolio and cash collateral received from the counterparty, if any, is reported separately in the Statement of Assets and Liabilities as Cash collateral pledged at broker for TBA commitments or Cash collateral at broker for TBA commitments, respectively. Non-cash collateral pledged by a Portfolio, if any, is disclosed within the Schedule of Investments. Typically, a Portfolio is permitted to sell, re-pledge or use the collateral it receives; however, the counterparty is not permitted. To the extent amounts due to a Portfolio are not fully collateralized, contractually or otherwise, a Portfolio bears the risk of loss from counterparty non-performance.
When-issued, delayed-delivery, forward and TBA commitment transactions held at June 30, 2024, if any, are identified within the Schedule of Investments. Open trades, if any, are reflected as When-issued, delayed-delivery, forward and TBA commitments purchased or sold within the Statement of Assets and Liabilities.
5. BORROWINGS AND OTHER FINANCING TRANSACTIONS
The Portfolio may engage in borrowing transactions as a means of raising cash to satisfy redemption requests, for other temporary or emergency purposes or, to the extent permitted by its investment policies, to raise additional cash to be invested in other securities or instruments. When the Portfolio invests borrowing proceeds in other securities, the Portfolio will bear the risk that the market value of the securities in which such proceeds are invested goes down and is insufficient to repay the borrowed proceeds. The Portfolio may borrow on a secured or on an unsecured basis. If the Portfolio enters into a secured borrowing arrangement, a portion of the Portfolio’s assets will be used as collateral. The 1940 Act requires the Portfolio to maintain asset coverage of at least 300% of the amount of its borrowings. Asset coverage means the ratio that the value of the Portfolio’s total assets, minus liabilities other than borrowings, bears to the aggregate amount of all borrowings. Although complying with this requirement has the effect of limiting the amount that the Portfolio may borrow, it does not otherwise mitigate the risks of entering into borrowing transactions.
Interfund lending: The Portfolio, along with other funds and portfolios advised by TAM, may participate in an interfund lending program pursuant to exemptive relief granted by the Securities and Exchange Commission on January 18, 2017. This program allows the Portfolio to lend to and borrow from other funds and portfolios advised by TAM. Interfund lending transactions are subject to the conditions of the exemptive relief which places limits on the amount of lending or borrowing a Portfolio may participate in under the program. Interest earned or paid on an interfund lending transaction will be based on the average of certain current market rates. For the period ended June 30, 2024, the Portfolio has not utilized the program.
Repurchase agreements: In a repurchase agreement, the Portfolio purchases a security and simultaneously commits to resell that security to the seller at an agreed-upon price on an agreed-upon date. Securities purchased subject to a repurchase agreement are held at the Portfolio’s custodian, or designated sub-custodian related to tri-party repurchase agreements, and, pursuant to the terms of the repurchase agreement, must be collateralized by securities with an aggregate market value greater than or equal to 100% of the resale price. The Portfolio will bear the risk of value fluctuations until the securities can be sold and may encounter delays and incur costs in liquidating the securities. In the event of bankruptcy or insolvency of the seller, delays and costs may be incurred.
Repurchase agreements are subject to netting agreements, which are agreements between the Portfolio and its counterparties that provide for the net settlement of all transactions and collateral with the Portfolio, through a single payment, in the event of default or termination. Amounts presented within the Schedule of Investments, and as part of Repurchase agreements, at value within the Statement of Assets and Liabilities are shown on a gross basis. The value of the related collateral for each repurchase agreement, as reflected within the Schedule of Investments, exceeds the value of each repurchase agreement at June 30, 2024.
Repurchase agreements at June 30, 2024, if any, are included within the Schedule of Investments and Statement of Assets and Liabilities.
Securities lending: The Portfolio may lend securities to qualified financial institutions, brokers and dealers. State Street serves as securities lending agent to the Portfolio pursuant to a Securities Lending Agreement. Loans of securities are terminable at any time and the borrower, after notice, is required to return borrowed securities within the standard time period for settlement of securities transactions. The lending of securities exposes the Portfolio to risks such as: the borrowers may fail to return the loaned securities or may not be able to provide additional collateral, the Portfolio may experience delays in recovery of the loaned securities or delays in access to collateral, or the Portfolio may experience losses related to the investment collateral. To minimize certain risks, loan counterparties pledge cash, securities issued or guaranteed by the U.S. Government and irrevocable letters of credit issued by banks as collateral. The initial collateral received by the Portfolio is required to have a value of at least 102% of the current value of the loaned securities traded on U.S. exchanges, and a value of at least 105% for all other securities. Typically the lending agent is not permitted to sell, re-pledge or use cash and non-cash collateral it receives. The lending agent has agreed to indemnify the Portfolio in the case of default of any securities borrower.
|
|
|
|
|
| Transamerica Series Trust |
|
|
|
Semi-Annual Financial Statements 2024 |
|
|
Page 20 |
|
|
Transamerica Janus Balanced VP
NOTES TO FINANCIAL STATEMENTS (continued)
At June 30, 2024
(unaudited)
5. BORROWINGS AND OTHER FINANCING TRANSACTIONS (continued)
The Portfolio receives compensation for lending securities from interest or dividends earned on the cash, U.S. Government securities and irrevocable letters of credit held as collateral, less associated fees and expenses. Such income is reflected in Net income from securities lending within the Statement of Operations. Cash collateral received is invested in the State Street Navigator Securities Lending Trust — Government Money Market Portfolio.
The value of loaned securities and related cash and non-cash collateral outstanding at June 30, 2024, if any, are shown on a gross basis within the Schedule of Investments.
The following table reflects a breakdown of transactions accounted for as secured borrowings, the gross obligation by the type, and the remaining contractual maturity of those transactions as of June 30, 2024.
|
|
|
|
|
|
|
|
|
|
|
|
|
|
|
|
|
|
|
|
|
| |
|
Remaining Contractual Maturity of the Agreements |
|
| |
|
Overnight and Continuous |
|
|
Less Than 30 Days |
|
|
Between 30 & 90 Days |
|
|
Greater Than 90 Days |
|
|
Total |
|
|
|
|
|
|
|
| Securities Lending Transactions |
|
|
|
|
|
|
|
|
|
|
|
|
|
|
|
|
|
|
|
|
| Corporate Debt Securities |
|
$ |
2,865,236 |
|
|
$ |
— |
|
|
$ |
— |
|
|
$ |
— |
|
|
$ |
2,865,236 |
|
|
|
|
|
|
|
| U.S. Government Obligations |
|
|
22,026,592 |
|
|
|
— |
|
|
|
— |
|
|
|
— |
|
|
|
22,026,592 |
|
|
|
|
|
|
|
| Total Securities Lending Transactions |
|
$ |
24,891,828 |
|
|
$ |
— |
|
|
$ |
— |
|
|
$ |
— |
|
|
$ |
24,891,828 |
|
|
|
|
|
|
|
| Total Borrowings |
|
$ |
24,891,828 |
|
|
$ |
— |
|
|
$ |
— |
|
|
$ |
— |
|
|
$ |
24,891,828 |
|
| |
|
|
|
|
|
|
|
|
|
|
|
|
|
|
|
|
|
|
|
|
6. RISK FACTORS
Investing in the Portfolio involves certain key risks related to the Portfolio’s trading activity. Please reference the Portfolio’s prospectus for a more complete discussion of the following risk(s), as well as other risks of investing in the Portfolio.
Market risk: The market prices of the Portfolio’s securities or other assets may go up or down, sometimes rapidly or unpredictably, due to factors such as economic events, inflation, changes in interest rates, governmental actions or interventions, actions taken by the U.S. Federal Reserve or foreign central banks, market disruptions caused by tariffs, trade disputes or other factors, political developments, armed conflicts, economic sanctions, cybersecurity events, investor sentiment, the global and domestic effects of widespread or local health, weather or climate events, and other factors that may or may not be related to the issuer of the security or other asset. If the market prices of the Portfolio’s securities and assets fall, the value of your investment in the Portfolio could go down.
Economies and financial markets throughout the world are increasingly interconnected. Events or circumstances in one or more countries or regions could be highly disruptive to, and have profound impacts on, global economies or markets. As a result, whether or not the Portfolio invests in securities of issuers located in or with significant exposure to the countries directly affected, the value and liquidity of the Portfolio’s investments may go down.
Asset class allocation risk: The Portfolio’s investment performance is significantly impacted by the Portfolio’s asset class allocation and reallocation from time to time. The value of your investment may decrease if the sub-adviser’s judgment about the attractiveness, value or market trends affecting a particular asset class is incorrect. The Portfolio’s balance between equity and debt securities limits its potential for capital appreciation relative to an all-stock fund and contributes to greater volatility relative to an all-bond fund.
Equity securities risk: Equity securities generally have greater risk of loss than debt securities. Stock markets are volatile and the value of equity securities may go up or down, sometimes rapidly and unpredictably. The market price of an equity security may fluctuate based on overall market conditions, such as real or perceived adverse economic or political conditions or trends, tariffs and trade disruptions, inflation, substantial economic downturn or recession, changes in interest rates, or adverse investor sentiment. The market price of an equity security also may fluctuate based on real or perceived factors affecting a particular industry or industries or the company itself. If the market prices of the equity securities owned by the Portfolio fall, the value of your investment in the Portfolio will decline. The Portfolio may lose its entire investment in the equity securities of an issuer. A change in financial condition or other event affecting a single issuer may adversely impact securities markets as a whole.
Real estate investment trusts (“REITs”) risk: Investing in real estate investment trusts (“REITs”) involves unique risks. When the Portfolio invests in REITs, it is subject to risks generally associated with investing in real estate. A REIT’s performance depends on the
|
|
|
|
|
| Transamerica Series Trust |
|
|
|
Semi-Annual Financial Statements 2024 |
|
|
Page 21 |
|
|
Transamerica Janus Balanced VP
NOTES TO FINANCIAL STATEMENTS (continued)
At June 30, 2024
(unaudited)
6. RISK FACTORS (continued)
types and locations of the properties it owns, how well it manages those properties and cash flow. REITs may have limited financial resources, may trade less frequently and in limited volume, may engage in dilutive offerings, and may be subject to more abrupt or erratic price movements than the overall securities markets. In addition to its own expenses, the Portfolio will indirectly bear its proportionate share of any management and other expenses paid by REITs in which it invests. U.S. REITs are subject to a number of highly technical tax-related rules and requirements; and a U.S. REIT’s failure to qualify for the favorable U.S. federal income tax treatment generally available to U.S. REITs could result in corporate-level taxation, significantly reducing the return on an investment to the Portfolio.
7. FEES AND OTHER AFFILIATED TRANSACTIONS
TST serves as a funding vehicle for certain affiliated asset allocation portfolios and certain affiliated separate accounts of Transamerica Life Insurance Company (“TLIC”) and Transamerica Financial Life Insurance Company.
TAM, the Portfolio’s investment manager, is directly owned by TLIC and AUSA Holding, LLC (“AUSA”), both of which are indirect, wholly owned subsidiaries of Aegon Ltd. TLIC is owned by Commonwealth General Corporation (“Commonwealth”). Commonwealth and AUSA are wholly owned by Transamerica Corporation (DE). Transamerica Corporation (DE) is wholly owned by Aegon International B.V., which is wholly owned by Aegon Ltd., a Bermuda exempted company with liability limited by shares (formerly, Aegon NV, a Netherlands corporation) and a publicly traded international insurance group.
Transamerica Fund Services, Inc. (“TFS”) is the Portfolio’s transfer agent. Transamerica Capital, Inc. (“TCI”) is the Portfolio’s distributor/principal underwriter. TAM, TFS and TCI are affiliates of Aegon Ltd.
Certain officers and trustees of the Portfolio may also be officers and/or trustees of TAM, TFS and TCI. No interested trustee who is deemed an interested person due to current or former service with TAM or an affiliate of TAM receives compensation from the Portfolio. The Portfolio does pay non-interested persons (independent trustees), as disclosed in Trustee and CCO fees within the Statement of Operations.
Investment management fees: TAM serves as the Portfolio’s investment manager, performing administration as well as investment advisory services. TAM renders investment advisory, supervisory, and administration services under an investment management agreement and the Portfolio pays a single management fee, which is reflected in Investment management fees within the Statement of Operations.
The Portfolio pays a management fee to TAM based on daily average net assets at the following rates:
|
|
|
|
|
| Breakpoints |
|
Rate |
|
|
|
| First $250 million |
|
|
0.735 |
% |
| Over $250 million up to $500 million |
|
|
0.705 |
|
| Over $500 million up to $1 billion |
|
|
0.650 |
|
| Over $1 billion |
|
|
0.630 |
|
TAM has contractually agreed to waive fees and/or reimburse Portfolio expenses to the extent that the total operating expenses excluding, as applicable, acquired fund fees and expenses, interest (including borrowing costs and overdraft charges), taxes, brokerage commissions, dividend and interest expenses on securities sold short, extraordinary expenses and other expenses not incurred in the ordinary course of the Portfolio’s business, exceed the following stated annual operating expense limits to the Portfolio’s daily average net
|
|
|
|
|
| Transamerica Series Trust |
|
|
|
Semi-Annual Financial Statements 2024 |
|
|
Page 22 |
|
|
Transamerica Janus Balanced VP
NOTES TO FINANCIAL STATEMENTS (continued)
At June 30, 2024
(unaudited)
7. FEES AND OTHER AFFILIATED TRANSACTIONS (continued)
assets. To the extent an expense limit changed during the period, the prior limit is also listed below. The expenses waived and/or reimbursed, if any, are included in Expenses waived and/or reimbursed within the Statement of Operations.
|
|
|
|
|
|
|
|
|
| Class |
|
Operating Expense Limit |
|
|
Operating Expense Limit Effective Through |
|
|
|
|
| Effective May 1, 2024 |
|
|
|
|
|
|
|
|
| Initial Class |
|
|
0.79% |
|
|
|
May 1, 2025 |
|
| Service Class |
|
|
1.04 |
|
|
|
May 1, 2025 |
|
| Prior to May 1, 2024 |
|
|
|
|
|
|
|
|
| Initial Class |
|
|
0.81 |
|
|
|
|
|
| Service Class |
|
|
1.05 |
|
|
|
|
|
TAM is permitted to recapture amounts contractually waived and/or reimbursed to a class during any of the 36 months from the date on which TAM waived fees and/or reimbursed expenses for the class. A class may recapture and reimburse TAM only if such amount does not cause, on any particular business day of the Portfolio, the class’s total annual operating expenses (after the recapture is taken into account) to exceed the Operating Expense Limits or any other lower limit then in effect. Amounts recaptured, if any, by TAM for the period ended June 30, 2024 are disclosed in Recapture of previously waived and/or reimbursed fees within the Statement of Operations.
TAM, on a voluntary basis and in addition to the contractual operating expense limits in effect, from time to time may waive and/or reimburse expenses of the Portfolio, or any classes thereof, to such level(s) as the Trust’s officers have determined or may reasonably determine from time to time. Any such voluntary waiver or expense reimbursement may be discontinued by TAM at any time. These amounts are not subject to recapture by TAM.
As of June 30, 2024, there are no amounts available for recapture by TAM.
Distribution and service fees: TST has a distribution plan (“Distribution Plan”) pursuant to Rule 12b-1 under the 1940 Act. Pursuant to the Distribution Plan, TST entered into a distribution agreement with TCI as the Portfolio’s distributor.
The Distribution Plan requires the Portfolio to pay distribution fees to TCI as compensation for various distribution activities, not as reimbursement for specific expenses. Under the Distribution Plan and distribution agreement, TCI, on behalf of the Portfolio, is authorized to pay various service providers, as direct payment for expenses incurred in connection with distribution of the Portfolio’s shares.
The fee on the Service Class shares is paid to the insurance companies for providing services and account maintenance for the policyholders who invest in the variable insurance products which invest in the Service Class shares. TCI has determined that it will not seek payment for the distribution expenses incurred by the Portfolio with respect to the Initial Class shares before May 1, 2025. Prior to TCI seeking distribution expenses on Initial Class shares, policy and contract owners will be notified in advance. The Portfolio will pay fees relating to Service Class shares. The distribution and service fees are included in Distribution and service fees within the Statement of Operations.
The Portfolio is authorized under the Distribution Plan to pay fees to TCI based on daily average net assets of each applicable class up to the following annual rates:
|
|
|
|
|
| Class |
|
Rate |
|
|
|
| Initial Class |
|
|
0.15 |
% |
| Service Class |
|
|
0.25 |
|
Transfer agent costs: TFS provides transfer agency services under an intercompany agreement with TAM. TFS has outsourced the provision of certain sub-transfer agency services to SS&C Global Investor & Distribution Solutions, Inc. (“SS&C GIDS”). The Portfolio does not pay a separate transfer agent fee to TAM or TFS but does pay certain expenses to SS&C GIDS related to applicable sub-transfer agency services. For the period ended June 30, 2024, (i) the expenses paid to SS&C GIDS by the Portfolio are referred to as transfer agent costs and are included within the Statement of Operations and (ii) the expenses payable to SS&C GIDS by the Portfolio are referred to as transfer agent costs within the Statement of Assets and Liabilities.
|
|
|
|
|
| Transamerica Series Trust |
|
|
|
Semi-Annual Financial Statements 2024 |
|
|
Page 23 |
|
|
Transamerica Janus Balanced VP
NOTES TO FINANCIAL STATEMENTS (continued)
At June 30, 2024
(unaudited)
7. FEES AND OTHER AFFILIATED TRANSACTIONS (continued)
Brokerage commissions: The Portfolio incurred no brokerage commissions on security transactions placed with affiliates of the investment manager or sub-adviser(s) for the period ended June 30, 2024.
8. PURCHASES AND SALES OF SECURITIES
For the period ended June 30, 2024, the cost of securities purchased and proceeds from securities sold (excluding short-term securities) are as follows:
|
|
|
|
|
|
|
|
|
|
|
|
|
| Purchases of Securities |
|
|
Sales/Maturities of Securities |
|
| Long-Term |
|
U.S. Government |
|
|
Long-Term |
|
|
U.S. Government |
|
| |
|
$ 145,297,097
|
|
|
$ 143,776,901
|
|
|
$
|
173,890,497
|
|
|
$
|
174,314,441
|
|
9. FEDERAL INCOME TAXES AND DISTRIBUTIONS TO SHAREHOLDERS
The Portfolio has not made any provision for federal income or excise taxes due to its policy to distribute all of its taxable income and capital gains to its shareholders and otherwise qualify as a regulated investment company under Subchapter M of the Internal Revenue Code. The Portfolio recognizes the tax benefits of uncertain tax positions only where the position is “more likely than not” to be sustained assuming examination by tax authorities. The Portfolio’s tax returns remain subject to examination by the Internal Revenue Service and state tax authorities three years from the date of filing for federal purposes and four years from the date of filing for state purposes. Management has evaluated the Portfolio’s tax provisions taken for all open tax years, and has concluded that no provision for income tax is required in the Portfolio’s financial statements. If applicable, the Portfolio recognizes interest accrued related to unrecognized tax benefits in relation to interest and penalties expense in Other within the Statement of Operations. The Portfolio identifies its major tax jurisdictions as U.S. Federal, the state of Colorado, and foreign jurisdictions where the Portfolio makes significant investments; however, the Portfolio is not aware of any tax positions for which it is reasonably possible that the total amounts of unrecognized tax benefits will change materially in the next twelve months. Distributions are determined in accordance with income tax regulations, which may differ from GAAP.
As of June 30, 2024, the approximate cost for U.S. federal income tax purposes, and the aggregate gross/net unrealized appreciation (depreciation) in the value of investments (including securities sold short and derivatives, if any) are as follows:
|
|
|
|
|
|
|
| Cost |
|
Gross Appreciation |
|
Gross (Depreciation) |
|
Net Appreciation (Depreciation) |
|
|
|
|
| $ 768,018,056 |
|
$ 244,896,165 |
|
$ (14,265,243) |
|
$ 230,630,922 |
10. NEW ACCOUNTING PRONOUNCEMENT
In June 2022, the Financial Accounting Standards Board issued Accounting Standards Update No. 2022-03 (“ASU 2022-03”), “Fair Value Measurement of Equity Securities Subject to Contractual Sale Restrictions” (“Topic 820”). ASU 2022-03 clarifies the guidance in Topic 820, related to the measurement of the fair value of an equity security subject to contractual sale restrictions, where it eliminates the need to apply a discount to fair value of these securities, and introduces disclosure requirements related to such equity securities. The guidance is effective for fiscal years, and interim periods within those fiscal years, beginning after December 15, 2023, and allows for early adoption. Management is currently evaluating the implications, if any, of the additional requirements and their impact on the Portfolio’s financial statements.
Please see TST’s most recent report on Form N-CSR, available at: www.transamerica.com/annuities/prospectus, for additional information. For the most recently filed complete proxy voting records for the Trust please visit: https://www.transamerica.com/sites/default/files/files/e070d/TST%20N-PX%202021.pdf
|
|
|
|
|
| Transamerica Series Trust |
|
|
|
Semi-Annual Financial Statements 2024 |
|
|
Page 24 |
|
|
Transamerica Janus Balanced VP
MANAGEMENT AND SUB-ADVISORY AGREEMENT — CONTRACT RENEWAL
(unaudited)
At a meeting of the Board of Trustees of Transamerica Series Trust (the “Trustees” or the “Board”) held on June 12-13, 2024, the Board considered the renewal of the management agreement (the “Management Agreement”) between Transamerica Asset Management, Inc. (“TAM”) and Transamerica Series Trust, on behalf of Transamerica Janus Balanced VP (the “Portfolio”). The Board also considered the renewal of the investment sub-advisory agreement (the “Sub-Advisory Agreement” and together with the Management Agreement, the “Agreements”) for the Portfolio between TAM and Janus Henderson Investors US LLC (the “Sub-Adviser”).
Following its review and consideration, the Board determined that the terms of the Management Agreement and Sub-Advisory Agreement were reasonable and that the renewal of each of the Agreements was in the best interests of the Portfolio and the holders invested in the Portfolio. The Board, including the independent members of the Board (the “Independent Trustees”), unanimously approved the renewal of each of the Agreements through June 30, 2025.
Prior to reaching their decision, the Trustees requested and received from TAM and the Sub-Adviser certain information. They then reviewed such information as they deemed reasonably necessary to evaluate the Agreements, including information they had previously received from TAM and the Sub-Adviser as part of their regular oversight of the Portfolio, and knowledge they gained over time through meeting with TAM and the Sub-Adviser. Among other materials, the Trustees considered comparative fee, expense and performance information prepared by Broadridge Financial Solutions, Inc. (“Broadridge”), an independent provider of mutual fund performance information, as well as fee, expense and profitability information prepared by TAM. To the extent applicable, the Trustees considered information about fees and performance of comparable funds and/or accounts managed by the Sub-Adviser. The Board also considered reductions to the Portfolio’s expense limits, if any, that took effect after the last renewal of the Agreements. In their review, the Trustees also sought to identify instances in which the Portfolio’s performance, fees, total expenses and/or profitability appeared to be outliers within its respective peer group or other comparative metrics and sought to understand the reasons for such comparative positions.
In their deliberations, the Independent Trustees met privately without representatives of TAM or the Sub-Adviser present and were represented throughout the process by their independent legal counsel. In considering the proposed continuation of each of the Agreements, the Trustees evaluated and weighed a number of considerations that they believed to be relevant in light of the legal advice furnished to them by counsel, including independent legal counsel, and made a decision in the exercise of their own business judgment. They based their decisions on the considerations discussed below, among others, although they did not identify any particular consideration or item of information that was controlling of their decisions, and each Trustee may have attributed different weights to the various factors.
Nature, Extent and Quality of the Services Provided
The Board considered the nature, extent and quality of the services provided by TAM and the Sub-Adviser to the Portfolio in the past and the services anticipated to be provided in the future. The Board also considered the investment approach for the Portfolio; the experience, capability and integrity of TAM’s senior management; the financial resources of TAM; TAM’s management oversight process; TAM’s and the Sub-Adviser’s responsiveness to any questions by the Trustees; and the professional qualifications and compensation program of the portfolio management team of the Sub-Adviser. The Trustees noted that they receive, on a quarterly basis, an execution analysis from Capital Institutional Services, Inc. (CAPIS), an independent provider of trade analyses, for the Sub-Adviser and a comparison of trading results against a peer universe of managers.
The Board also considered the continuous and regular investment management and other services provided by TAM, when acting as a manager of managers, for the portion of the management fee it retains from the Portfolio after payment of the sub-advisory fees. The Board noted that the investment management and other services provided by TAM include the design, development and ongoing review and evaluation of the Portfolio and its investment strategy; the selection, oversight and monitoring of one or more investment sub-advisers to perform certain duties with respect to the Portfolio; ongoing portfolio trading oversight and analysis; risk management oversight and analysis; design, development, implementation and ongoing review and evaluation of a process for the valuation of Portfolio investments; design, development, implementation and ongoing review and evaluation of a compliance program for the Portfolio; design, development, implementation and ongoing review and evaluation of a process for the voting of proxies and exercise of rights to consent to corporate action for Portfolio investments; participation in Board meetings and oversight of preparation of materials for the Board, including materials for Board meetings and regular communications with the Board; oversight of preparation of the Portfolio’s prospectus, statement of additional information, shareholder reports and other disclosure materials and regulatory filings for the Portfolio; and ongoing cash management services for the Portfolio. The Board considered that TAM’s investment management services also include the provision of supervisory and administrative services to the Portfolio. The Board also noted that TAM, as part of the services it provides to all Transamerica mutual funds, including the Portfolio, oversees the services provided by the funds’ custodian, transfer agent, independent accountant and legal counsel and supervises the performance of the recordkeeping and holder service functions of the funds.
Investment Performance
In addition, the Board considered the short- and longer-term performance of the Portfolio in light of its investment objective, policies and strategies, including relative performance against (i) a peer universe of comparable mutual funds, as prepared by Broadridge, and (ii) the Portfolio’s benchmarks, in each case for various trailing periods ended December 31, 2023. Based on these considerations, the Board determined that TAM and the Sub-Adviser can provide investment and related services that are appropriate in scope and extent in light of the Portfolio’s investment objectives, policies and strategies and operations, the competitive landscape of the investment company
|
|
|
|
|
| Transamerica Series Trust |
|
|
|
Semi-Annual Financial Statements 2024 |
|
|
Page 25 |
|
|
Transamerica Janus Balanced VP
MANAGEMENT AND SUB-ADVISORY AGREEMENT — CONTRACT RENEWAL (continued)
(unaudited)
business and investor needs. The Board’s conclusions as to the Portfolio’s performance are summarized below. For purposes of its review, the Board generally used the performance of Service Class Shares. In describing the Portfolio’s performance relative to its peer universe, the summary conclusions characterize performance for the relevant periods in relation to whether it was “above,” “below” or “in line with” the peer universe median and do so using quintile rankings prepared by Broadridge. For simplicity, performance is described as “above” the median if the Portfolio’s performance ranked anywhere in the first or second quintiles, as “below” the median if it ranked anywhere in the fourth or fifth quintiles, or “in line with” the median if it ranked anywhere in the third quintile (i.e., even if its precise return was somewhat above or somewhat below the precise median return).
When considering the Portfolio’s performance, the Trustees considered any representations made by TAM regarding the appropriateness of certain peer groups and benchmarks. They recognized that performance reflects a snapshot of a period as of a specific date, and that consideration of performance data for a different period could generate significantly different performance results. The Trustees also recognized that even longer-term performance can be negatively affected by performance over a short-term period when that short-term performance is significantly below the performance of the comparable benchmark or universe of peer funds.
The Board noted that the performance of Service Class Shares of the Portfolio was above the median for its peer universe for the past 1-, 3-, 5- and 10-year periods. The Board also noted that the performance of Service Class Shares of the Portfolio was below the benchmark that TAM utilizes to measure performance of the Portfolio for the past 1-, 3-, 5- and 10-year periods.
Management Fee and Sub-Advisory Fees and Total Expense Ratio
The Board considered the management fee and total expense ratio of the Portfolio, including information provided by Broadridge comparing the management fee and total expense ratio of the Portfolio to the management fees and total expense ratios of comparable investment companies in both a peer group and broader peer universe compiled by Broadridge. The Board’s conclusions as to the Portfolio’s management fee and total expense ratio are summarized below. For purposes of its review, the Board generally used the actual total expenses (i.e., expenses reflecting any waivers and/or reimbursements) of Service Class Shares. In describing the Portfolio’s management fee and total expense ratio relative to its peer group and peer universe, the summary conclusions characterize management fees and total expense ratios for the relevant periods in relation to whether they were “above,” “below” or “in line with” the peer group or peer universe median and do so using quintile rankings prepared by Broadridge. For simplicity, management fees and total expense ratios are described as “above” the median if the Portfolio’s management fee or total expense ratio ranked anywhere in the fourth or fifth quintiles, as “below” the median if it ranked anywhere in the first or second quintiles, or “in line with” the median if it ranked anywhere in the third quintile (i.e., even if its precise management fee or total expense ratio was somewhat above or somewhat below the precise median management fee or total expense ratio).
The Board also considered the fees charged by the Sub-Adviser for sub-advisory services, as well as the portion of the Portfolio’s management fee retained by TAM following payment of the sub-advisory fee and how the portion of the contractual management fee retained by TAM at a specified asset level compared to the portions retained by other investment advisers managing mutual funds with similar investment strategies as calculated by an independent provider of information.
The Board noted that the Portfolio’s contractual management fee and the actual total expenses (i.e., expenses reflecting any waivers and/or reimbursements) of Service Class Shares of the Portfolio were above the medians for its peer group and peer universe. The Trustees also considered that TAM has entered into an expense limitation arrangement with the Portfolio, which may result in TAM waiving fees for the benefit of holders.
On the basis of these considerations, together with the other information it considered, the Board determined that the management and sub-advisory fees to be received by TAM and the Sub-Adviser under the Management Agreement and Sub-Advisory Agreement are reasonable in light of the services provided.
Cost of Services Provided and Level of Profitability
The Board reviewed information provided by TAM about the cost of providing and procuring fund management services, as well as the costs of the provision of administration, transfer agency and other services, to the Portfolio and to Transamerica Series Trust as a whole by TAM and its affiliates. The Board considered the profitability of TAM and its affiliates in providing these services for the Portfolio and Transamerica Series Trust as a whole. The Trustees recognized the competitiveness of the mutual fund industry and the importance of an investment adviser’s long-term profitability, including for maintaining company and management stability and accountability.
The Board also considered the allocation methodology used for calculating the profitability of TAM and its affiliates. The Board noted that the revenue and expense allocation methodology used by TAM to estimate its profitability with respect to its relationship with the Portfolio had been reviewed previously by an independent consultant. The Trustees considered that TAM reported that it had not made material changes to this methodology, and that the methodology had been applied consistently for the Portfolio.
With respect to the Sub-Adviser, the Board noted that the sub-advisory fee is the product of arm’s-length negotiation between TAM and the Sub-Adviser, which is not affiliated with TAM, and is paid by TAM and not the Portfolio. As a result, the Board focused on the profitability of TAM and its affiliates with respect to the Portfolio.
|
|
|
|
|
| Transamerica Series Trust |
|
|
|
Semi-Annual Financial Statements 2024 |
|
|
Page 26 |
|
|
Transamerica Janus Balanced VP
MANAGEMENT AND SUB-ADVISORY AGREEMENT — CONTRACT RENEWAL (continued)
(unaudited)
Based on this information, the Board determined that the profitability of TAM and its affiliates from their relationships with the Portfolio was not excessive.
Economies of Scale
The Board considered economies of scale with respect to the management of the Portfolio, whether the Portfolio had appropriately benefited from any economies of scale and whether there was the potential for realization of any future economies of scale. The Board also considered the existence of economies of scale with respect to management of the Transamerica mutual funds overall and the extent to which the Portfolio benefited from any economies of scale. The Board recognized that, as the Portfolio’s assets increase, any economies of scale realized by TAM or the Sub-Adviser may not directly correlate with each other or with any economies of scale that might be realized by the Portfolio. The Board considered the Portfolio’s management fee schedule and the existence of breakpoints and also considered the extent to which TAM shared economies of scale, if any, with the Portfolio through undertakings to limit or reimburse Portfolio expenses and to invest in maintaining and developing its capabilities and services. The Board also considered the Sub-Adviser’s sub-advisory fee schedule and the existence of breakpoints, if any, and how such breakpoints relate to any breakpoints in the Portfolio’s management fee schedule. The Trustees concluded that the Portfolio’s fee structure reflected an appropriate sharing of any efficiencies or economies of scale to date and noted that they will have the opportunity to periodically reexamine the appropriateness of the management fee payable to TAM and the fee paid to the Sub-Adviser in light of any economies of scale experienced in the future.
Benefits to TAM, its Affiliates and/or the Sub-Adviser from their Relationships with the Portfolio
The Board considered other benefits derived by TAM, its affiliates, and/or the Sub-Adviser from their relationships with the Portfolio. The Board noted that TAM does not receive benefits from research obtained with commissions paid to broker-dealers for portfolio transactions (commonly referred to as “soft dollars”) as a result of its relationship with the Portfolio and that TAM believes the use of soft dollars by the Sub-Adviser is generally appropriate and in the best interests of the Portfolio. The Board also noted that the Sub-Adviser participates in a brokerage program pursuant to which a portion of brokerage commissions paid by the Portfolio is recaptured for the benefit of the Portfolio and the holders, thus limiting the amount of soft dollar arrangements the Sub-Adviser may engage in with respect to the Portfolio’s brokerage transactions.
Other Considerations
The Board noted that TAM has made a substantial commitment to the recruitment and retention of high-quality personnel and maintains the financial, compliance and operational resources reasonably necessary to manage the Portfolio in a professional manner that is consistent with the best interests of the Portfolio and the holders. In this regard, the Board favorably considered the procedures and policies TAM has in place to enforce compliance with applicable laws and regulations and oversee the portfolio management activities of the Sub-Adviser. The Board also noted that TAM has made an entrepreneurial commitment and undertaken certain business risks with respect to the management and success of the Portfolio.
Conclusion
After consideration of the factors described above, as well as other factors, the Trustees, including the Independent Trustees, concluded that the renewal of the Management Agreement and the Sub-Advisory Agreement was in the best interests of the Portfolio and the holders and voted to approve the renewal of the Agreements.
|
|
|
|
|
| Transamerica Series Trust |
|
|
|
Semi-Annual Financial Statements 2024 |
|
|
Page 27 |
|
|
PROXY VOTING POLICIES AND PROCEDURES AND QUARTERLY PORTFOLIO HOLDINGS
(unaudited)
A description of Transamerica Series Trust’s (the “Trust”) proxy voting policies and procedures is available in the Statement of Additional Information of the Portfolios, available without charge upon request by calling 1-800-851-9777 (toll free) or on the Securities and Exchange Commission’s (“SEC”) website at http://www.sec.gov.
In addition, the Portfolio is required to file Form N-PX, with their complete proxy voting records for the most recent 12 months ended June 30th, no later than August 31st of each year. The Form is available without charge: (1) on the Transamerica Funds website at https://www.transamerica.com/sites/default/files/files/e070d/TST%20N-PX%202021.pdf; and (2) on the SEC’s website at http://www.sec.gov.
Each fiscal quarter, the Portfolios, except Transamerica BlackRock Government Money Market VP, will file with the SEC a complete schedule of its monthly portfolio holdings on Form N-PORT. The Portfolios’ holdings as of the end of the third month of every fiscal quarter, as reported on Form N-PORT, will be publicly available on the SEC’s website at http://www.sec.gov within 60 days of the end of the fiscal quarter.
On a monthly basis, Transamerica BlackRock Government Money Market VP will file with the SEC portfolio holdings information on Form N-MFP3. A complete schedule of portfolio holdings is also available at www.transamerica.com.
You may also visit the Trust’s website at www.transamerica.com/annuities/prospectus for this and other information about the Portfolios and the Trust.
Important Notice Regarding Delivery of Shareholder Documents
Every year we provide shareholders informative materials such as the Transamerica Series Trust Annual Report, the Transamerica Series Trust Prospectus, and other required documents that keep you informed regarding your Portfolios. To the extent provided by mail, Transamerica Series Trust will only send one piece per mailing address, a method that saves your Portfolios money by reducing mailing and printing costs. We will continue to do this unless you tell us not to. To elect to receive individual mailings, simply call a Transamerica Customer Service Representative toll free at 1-800-851-9777, 8 a.m. to 7 p.m. Eastern Time, Monday-Friday. Your request will take effect within 30 days.
|
|
|
|
|
| Transamerica Series Trust |
|
|
|
Semi-Annual Financial Statements 2024 |
|
|
Page 28 |
|
|
NOTICE OF PRIVACY POLICY
(unaudited)
Your privacy is very important to us. We want you to understand what information we collect and how we use it. We collect and use “nonpublic personal information” in connection with providing our customers with a broad range of financial products and services as effectively and conveniently as possible. We treat nonpublic personal information in accordance with our Privacy Policy.
What Information We Collect and From Whom We Collect It
We may collect nonpublic personal information about you from the following sources:
| • |
|
Information we receive from you on applications or other forms, such as your name, address, and account number; |
| • |
|
Information about your transactions with us, our affiliates, or others, such as your account balance and purchase/redemption history; and |
| • |
|
Information we receive from non-affiliated third parties, including consumer reporting agencies. |
What Information We Disclose and To Whom We Disclose It
We do not disclose any nonpublic personal information about current or former customers to anyone without their express consent, except as permitted by law. We may disclose the nonpublic personal information we collect, as described above, to persons or companies that perform services on our behalf and to other financial institutions with which we have joint marketing agreements. We will require these companies to protect the confidentiality of your nonpublic personal information and to use it only to perform the services for which we have hired them.
Our Security Procedures
We restrict access to your nonpublic personal information and only allow disclosures to persons and companies as permitted by law to assist in providing products or services to you. We maintain physical, electronic, and procedural safeguards to protect your nonpublic personal information and to safeguard the disposal of certain consumer information.
Contact Us
If you have any questions about our Privacy Policy, please call 1-800-851-9777 on any business day between 8 a.m. and 7 p.m. Eastern Time.
Note: This Privacy Policy applies only to customers that have a direct relationship with us or our affiliates. If you own shares of our portfolios in the name of a third party such as a bank or broker-dealer, its privacy policy may apply to you instead of ours.
|
|
|
|
|
| Transamerica Series Trust |
|
|
|
Semi-Annual Financial Statements 2024 |
|
|
Page 29 |
|
|
PO Box 219945
Kansas City, MO 64121-9945
|
|
|
| Distributor: |
|
Transamerica Capital, Inc. |
|
|
PO Box 219945 |
|
|
Kansas City, MO 64121-9945 |
|
|
|
|
Customer Service: 1-800-851-9777 |
Transamerica Series Trust Semi-Annual Financial Statements
June 30, 2024
1801 California St., Suite 5200
Denver, CO 80202
Distributor: Transamerica Capital, Inc.
Customer Service: 1-800-851-9777
|
| The following pages contain the most recent semi-annual financial statements for the investment options in which you are invested. In compliance with Securities and Exchange Commission regulations, we present these reports on an annual and semi-annual basis with the hope that they will foster greater understanding of the investment options’ holdings, performance, financial data, accounting policies and other issues. This streamlined version provides information only on the investment options in which you are invested. If you have any questions about these reports, please do not hesitate to contact your financial professional. As always, we thank you for your trust and the opportunity to serve you. |
Transamerica Janus Mid-Cap Growth VP
SCHEDULE OF INVESTMENTS
At June 30, 2024
(unaudited)
|
|
|
|
|
|
|
|
|
| |
|
Shares |
|
|
Value |
|
| |
|
|
|
|
| COMMON STOCKS - 99.0% |
|
|
|
|
|
|
|
|
|
|
|
| Aerospace & Defense - 1.7% |
|
|
|
|
|
|
|
|
| L3 Harris Technologies, Inc. |
|
|
65,525 |
|
|
$ |
14,715,605 |
|
|
|
|
|
|
|
|
|
|
|
|
|
| Biotechnology - 2.8% |
|
|
|
|
|
|
|
|
| Argenx SE, ADR (A) |
|
|
16,133 |
|
|
|
6,937,835 |
|
| Ascendis Pharma AS, ADR (A) |
|
|
43,932 |
|
|
|
5,991,446 |
|
| GRAIL, Inc. (A) |
|
|
1 |
|
|
|
13 |
|
| Sarepta Therapeutics, Inc. (A) |
|
|
39,392 |
|
|
|
6,223,936 |
|
| Vaxcyte, Inc. (A) |
|
|
78,829 |
|
|
|
5,952,378 |
|
|
|
|
|
|
|
|
|
|
|
|
|
|
|
|
|
|
|
|
25,105,608 |
|
|
|
|
|
|
|
|
|
|
|
|
|
| Capital Markets - 3.0% |
|
|
|
|
|
|
|
|
| Cboe Global Markets, Inc. |
|
|
28,064 |
|
|
|
4,772,564 |
|
| Charles Schwab Corp. |
|
|
108,618 |
|
|
|
8,004,060 |
|
| LPL Financial Holdings, Inc. |
|
|
47,600 |
|
|
|
13,294,680 |
|
|
|
|
|
|
|
|
|
|
|
|
|
|
|
|
|
|
|
|
26,071,304 |
|
|
|
|
|
|
|
|
|
|
|
|
|
| Chemicals - 1.3% |
|
|
|
|
|
|
|
|
| Corteva, Inc. |
|
|
208,193 |
|
|
|
11,229,930 |
|
|
|
|
|
|
|
|
|
|
|
|
|
| Commercial Services & Supplies - 5.1% |
|
|
|
|
|
|
|
|
| Cimpress PLC (A) |
|
|
81,767 |
|
|
|
7,163,607 |
|
| Clean Harbors, Inc. (A) |
|
|
38,993 |
|
|
|
8,818,267 |
|
| RB Global, Inc. |
|
|
112,975 |
|
|
|
8,626,771 |
|
| Rentokil Initial PLC (B) |
|
|
845,487 |
|
|
|
11,589,229 |
|
| Veralto Corp. |
|
|
96,061 |
|
|
|
9,170,943 |
|
|
|
|
|
|
|
|
|
|
|
|
|
|
|
|
|
|
|
|
45,368,817 |
|
|
|
|
|
|
|
|
|
|
|
| Construction & Engineering - 0.8% |
|
| API Group Corp. (A) |
|
|
196,435 |
|
|
|
7,391,849 |
|
|
|
|
|
|
|
|
|
|
|
| Consumer Staples Distribution & Retail - 0.6% |
|
| Dollar Tree, Inc. (A) |
|
|
54,251 |
|
|
|
5,792,379 |
|
|
|
|
|
|
|
|
|
|
|
|
|
| Electric Utilities - 1.9% |
|
|
|
|
|
|
|
|
| Alliant Energy Corp. |
|
|
322,782 |
|
|
|
16,429,604 |
|
|
|
|
|
|
|
|
|
|
|
|
|
| Electrical Equipment - 1.7% |
|
|
|
|
|
|
|
|
| Sensata Technologies Holding PLC |
|
|
402,973 |
|
|
|
15,067,160 |
|
|
|
|
|
|
|
|
|
|
|
| Electronic Equipment, Instruments & Components - 4.9% |
|
| Flex Ltd. (A) |
|
|
659,840 |
|
|
|
19,458,682 |
|
| TE Connectivity Ltd. |
|
|
40,612 |
|
|
|
6,109,263 |
|
| Teledyne Technologies, Inc. (A) |
|
|
45,396 |
|
|
|
17,612,740 |
|
|
|
|
|
|
|
|
|
|
|
|
|
|
|
|
|
|
|
|
43,180,685 |
|
|
|
|
|
|
|
|
|
|
|
|
|
| Entertainment - 2.2% |
|
|
|
|
|
|
|
|
| Liberty Media Corp. - Liberty Formula One, Class C (A) |
|
|
238,852 |
|
|
|
17,159,128 |
|
| Liberty Media Corp. - Liberty Formula One, Class A (A) |
|
|
30,533 |
|
|
|
1,961,134 |
|
|
|
|
|
|
|
|
|
|
|
|
|
|
|
|
|
19,120,262 |
|
|
|
|
|
|
|
|
|
|
|
|
|
| Financial Services - 4.1% |
|
|
|
|
|
|
|
|
| Fidelity National Information Services, Inc. |
|
|
111,387 |
|
|
|
8,394,124 |
|
| Global Payments, Inc. |
|
|
57,019 |
|
|
|
5,513,737 |
|
| WEX, Inc. (A) |
|
|
126,120 |
|
|
|
22,340,897 |
|
|
|
|
|
|
|
|
|
|
|
|
|
|
|
|
|
|
|
|
36,248,758 |
|
|
|
|
|
|
|
|
|
|
|
|
|
|
|
|
|
|
|
| |
|
Shares |
|
|
Value |
|
| |
|
|
| COMMON STOCKS (continued) |
|
|
| Ground Transportation - 3.3% |
|
| JB Hunt Transport Services, Inc. |
|
|
110,509 |
|
|
$ |
17,681,440 |
|
| TFI International, Inc. (B) |
|
|
79,806 |
|
|
|
11,584,639 |
|
|
|
|
|
|
|
|
|
|
|
|
|
|
|
|
|
|
|
|
29,266,079 |
|
|
|
|
|
|
|
|
|
|
|
|
|
| Health Care Equipment & Supplies - 9.6% |
|
|
|
|
|
|
|
|
| Boston Scientific Corp. (A) |
|
|
442,351 |
|
|
|
34,065,451 |
|
| Cooper Cos., Inc. |
|
|
86,733 |
|
|
|
7,571,791 |
|
| Dentsply Sirona, Inc. |
|
|
201,970 |
|
|
|
5,031,073 |
|
| ICU Medical, Inc. (A) |
|
|
58,422 |
|
|
|
6,937,612 |
|
| STERIS PLC |
|
|
31,745 |
|
|
|
6,969,297 |
|
| Teleflex, Inc. |
|
|
114,485 |
|
|
|
24,079,630 |
|
|
|
|
|
|
|
|
|
|
|
|
|
|
|
|
|
|
|
|
84,654,854 |
|
|
|
|
|
|
|
|
|
|
|
|
|
| Hotels, Restaurants & Leisure - 2.5% |
|
|
|
|
|
|
|
|
| Aramark |
|
|
359,641 |
|
|
|
12,234,987 |
|
| DoorDash, Inc., Class A (A) |
|
|
50,403 |
|
|
|
5,482,838 |
|
| Entain PLC |
|
|
523,365 |
|
|
|
4,167,988 |
|
|
|
|
|
|
|
|
|
|
|
|
|
|
|
|
|
|
|
|
21,885,813 |
|
|
|
|
|
|
|
|
|
|
|
|
|
| Insurance - 5.8% |
|
|
|
|
|
|
|
|
| Intact Financial Corp. |
|
|
150,423 |
|
|
|
25,070,683 |
|
| Ryan Specialty Holdings, Inc. |
|
|
103,195 |
|
|
|
5,976,023 |
|
| W.R. Berkley Corp. |
|
|
251,048 |
|
|
|
19,727,352 |
|
|
|
|
|
|
|
|
|
|
|
|
|
|
|
|
|
|
|
|
50,774,058 |
|
|
|
|
|
|
|
|
|
|
|
|
|
| Interactive Media & Services - 0.4% |
|
|
|
|
|
|
|
|
| Ziff Davis, Inc. (A) |
|
|
57,548 |
|
|
|
3,168,017 |
|
|
|
|
|
|
|
|
|
|
|
|
|
| IT Services - 5.9% |
|
|
|
|
|
|
|
|
| Amdocs Ltd. |
|
|
217,943 |
|
|
|
17,200,062 |
|
| GoDaddy, Inc., Class A (A) |
|
|
250,393 |
|
|
|
34,982,406 |
|
|
|
|
|
|
|
|
|
|
|
|
|
|
|
|
|
|
|
|
52,182,468 |
|
|
|
|
|
|
|
|
|
|
|
|
|
| Life Sciences Tools & Services - 4.8% |
|
|
|
|
|
|
|
|
| Avantor, Inc. (A) |
|
|
487,562 |
|
|
|
10,336,314 |
|
| Illumina, Inc. (A) |
|
|
33,362 |
|
|
|
3,482,325 |
|
| Revvity, Inc. |
|
|
187,324 |
|
|
|
19,642,795 |
|
| Waters Corp. (A) |
|
|
30,781 |
|
|
|
8,930,184 |
|
|
|
|
|
|
|
|
|
|
|
|
|
|
|
|
|
|
|
|
42,391,618 |
|
|
|
|
|
|
|
|
|
|
|
|
|
| Machinery - 4.6% |
|
|
|
|
|
|
|
|
| Fortive Corp. |
|
|
176,302 |
|
|
|
13,063,978 |
|
| Ingersoll Rand, Inc. |
|
|
132,289 |
|
|
|
12,017,133 |
|
| Westinghouse Air Brake Technologies Corp. |
|
|
96,391 |
|
|
|
15,234,598 |
|
|
|
|
|
|
|
|
|
|
|
|
|
|
|
|
|
|
|
|
40,315,709 |
|
|
|
|
|
|
|
|
|
|
|
|
|
| Multi-Utilities - 2.3% |
|
|
|
|
|
|
|
|
| Ameren Corp. |
|
|
146,724 |
|
|
|
10,433,544 |
|
| DTE Energy Co. |
|
|
88,541 |
|
|
|
9,828,936 |
|
|
|
|
|
|
|
|
|
|
|
|
|
|
|
|
|
|
|
|
20,262,480 |
|
|
|
|
|
|
|
|
|
|
|
|
|
| Passenger Airlines - 1.2% |
|
|
|
|
|
|
|
|
| Ryanair Holdings PLC, ADR |
|
|
91,372 |
|
|
|
10,639,356 |
|
|
|
|
|
|
|
|
|
|
|
|
|
| Pharmaceuticals - 0.4% |
|
|
|
|
|
|
|
|
| Catalent, Inc. (A) |
|
|
62,335 |
|
|
|
3,505,097 |
|
|
|
|
|
|
|
|
|
|
|
|
|
| Professional Services - 6.3% |
|
|
|
|
|
|
|
|
| Broadridge Financial Solutions, Inc., ADR |
|
|
78,686 |
|
|
|
15,501,142 |
|
| Dayforce, Inc. (A) |
|
|
168,285 |
|
|
|
8,346,936 |
|
The Notes to Financial Statements are an integral part of this report.
|
|
|
|
|
| Transamerica Series Trust |
|
|
|
Semi-Annual Financial Statements 2024 |
|
|
Page 1 |
|
|
Transamerica Janus Mid-Cap Growth VP
SCHEDULE OF INVESTMENTS (continued)
At June 30, 2024
(unaudited)
|
|
|
|
|
|
|
|
|
| |
|
Shares |
|
|
Value |
|
| |
|
|
| COMMON STOCKS (continued) |
|
| Professional Services (continued) |
|
| SS&C Technologies Holdings, Inc. |
|
|
366,644 |
|
|
$ |
22,977,580 |
|
| TransUnion |
|
|
90,167 |
|
|
|
6,686,785 |
|
| UL Solutions, Inc., Class A |
|
|
44,639 |
|
|
|
1,883,319 |
|
|
|
|
|
|
|
|
|
|
|
|
|
|
|
|
|
|
|
|
55,395,762 |
|
|
|
|
|
|
|
|
|
|
|
| Semiconductors & Semiconductor Equipment - 7.6% |
|
| KLA Corp. |
|
|
12,871 |
|
|
|
10,612,268 |
|
| Lam Research Corp. |
|
|
5,540 |
|
|
|
5,899,269 |
|
| Microchip Technology, Inc. |
|
|
103,248 |
|
|
|
9,447,192 |
|
| NXP Semiconductors NV |
|
|
83,522 |
|
|
|
22,474,935 |
|
| ON Semiconductor Corp. (A) |
|
|
267,178 |
|
|
|
18,315,052 |
|
|
|
|
|
|
|
|
|
|
|
|
|
|
|
|
|
|
|
|
66,748,716 |
|
|
|
|
|
|
|
|
|
|
|
|
|
| Software - 6.9% |
|
|
|
|
|
|
|
|
| AppLovin Corp., Class A (A) |
|
|
54,962 |
|
|
|
4,573,937 |
|
| Constellation Software, Inc. |
|
|
15,653 |
|
|
|
45,102,334 |
|
| Dynatrace, Inc. (A) |
|
|
103,124 |
|
|
|
4,613,768 |
|
| Nice Ltd., ADR (A)(B) |
|
|
19,001 |
|
|
|
3,267,602 |
|
| Topicus.com, Inc. |
|
|
40,691 |
|
|
|
3,480,024 |
|
|
|
|
|
|
|
|
|
|
|
|
|
|
|
|
|
|
|
|
61,037,665 |
|
|
|
|
|
|
|
|
|
|
|
|
|
| Specialized REITs - 1.4% |
|
|
|
|
|
|
|
|
| Lamar Advertising Co., Class A |
|
|
102,544 |
|
|
|
12,257,084 |
|
|
|
|
|
|
|
|
|
|
|
|
|
| Specialty Retail - 2.7% |
|
|
|
|
|
|
|
|
| Burlington Stores, Inc. (A) |
|
|
32,171 |
|
|
|
7,721,040 |
|
| CarMax, Inc. (A) |
|
|
158,228 |
|
|
|
11,604,442 |
|
| Wayfair, Inc., Class A (A)(B) |
|
|
79,414 |
|
|
|
4,187,500 |
|
|
|
|
|
|
|
|
|
|
|
|
|
|
|
|
|
|
|
|
23,512,982 |
|
|
|
|
|
|
|
|
|
|
|
|
|
| Textiles, Apparel & Luxury Goods - 1.2% |
|
|
|
|
|
|
|
|
| Gildan Activewear, Inc. (B) |
|
|
286,317 |
|
|
|
10,857,141 |
|
|
|
|
|
|
|
|
|
|
|
|
|
| Trading Companies & Distributors - 2.0% |
|
|
|
|
|
|
|
|
| Ferguson PLC |
|
|
89,627 |
|
|
|
17,356,269 |
|
|
|
|
|
|
|
|
|
|
| Total Common Stocks
(Cost $736,664,173) |
|
|
|
|
|
|
871,933,129 |
|
|
|
|
|
|
|
|
|
|
|
|
|
|
|
|
|
|
|
| |
|
Shares |
|
|
Value |
|
| |
|
|
|
|
| WARRANT - 0.0% (C) |
|
|
|
|
|
|
|
|
| Software - 0.0% (C) |
|
|
|
|
|
|
|
|
| Constellation Software, Inc., (A)(D)(E) Exercise Price CAD 0, Expiration Date 03/31/2040 |
|
|
18,616 |
|
|
|
$ 1 |
|
|
|
|
|
|
|
|
|
|
| Total Warrant
(Cost $0) |
|
|
|
|
|
|
1 |
|
|
|
|
|
|
|
|
|
|
|
| OTHER INVESTMENT COMPANY - 2.6% |
|
| Securities Lending Collateral - 2.6% |
|
|
|
|
|
|
|
|
| State Street Navigator Securities Lending Trust - Government Money Market Portfolio, 5.28% (F) |
|
|
22,888,584 |
|
|
|
22,888,584 |
|
|
|
|
|
|
|
|
|
|
|
|
| Total Other Investment Company
(Cost $22,888,584) |
|
|
|
22,888,584 |
|
|
|
|
|
|
|
|
|
|
|
|
|
|
|
|
|
|
|
| |
|
Principal |
|
|
Value |
|
| |
|
|
| REPURCHASE AGREEMENT - 1.3% |
|
| Fixed Income Clearing Corp., 2.50% (F), dated 06/28/2024, to be repurchased at $11,347,191 on 07/01/2024. Collateralized by a U.S. Government Obligation, 4.50%, due 03/31/2026, and with a value of $11,571,835. |
|
$ |
11,344,828 |
|
|
|
11,344,828 |
|
|
|
|
|
|
|
|
|
|
|
|
| Total Repurchase Agreement
(Cost $11,344,828) |
|
|
|
11,344,828 |
|
|
|
|
|
|
|
|
|
|
|
|
| Total Investments
(Cost $770,897,585) |
|
|
|
906,166,542 |
|
|
|
|
|
|
|
|
|
|
|
|
| Net Other Assets (Liabilities) - (2.9)% |
|
|
|
(25,356,512 |
) |
|
|
|
|
|
|
|
|
|
|
|
| Net Assets - 100.0% |
|
|
$ |
880,810,030 |
|
|
|
|
|
|
|
|
|
|
INVESTMENT VALUATION:
|
|
|
|
|
|
|
|
|
|
|
|
|
|
|
|
|
|
|
|
|
|
| Valuation Inputs (G) |
|
|
|
|
|
|
|
|
|
|
|
|
| |
|
Level 1 - Unadjusted Quoted Prices |
|
|
Level 2 - Other Significant Observable Inputs |
|
|
Level 3 - Significant Unobservable Inputs (H) |
|
|
Value |
|
| |
|
| ASSETS |
|
|
|
|
|
|
|
|
|
|
|
|
|
|
|
|
| Investments |
|
|
|
|
|
|
|
|
|
|
|
|
|
|
|
|
| Common Stocks |
|
$ |
864,465,993 |
|
|
$ |
7,467,136 |
|
|
$ |
— |
|
|
$ |
871,933,129 |
|
| Warrant |
|
|
— |
|
|
|
— |
|
|
|
1 |
|
|
|
1 |
|
| Other Investment Company |
|
|
22,888,584 |
|
|
|
— |
|
|
|
— |
|
|
|
22,888,584 |
|
| Repurchase Agreement |
|
|
— |
|
|
|
11,344,828 |
|
|
|
— |
|
|
|
11,344,828 |
|
|
|
|
|
|
|
|
|
|
|
|
|
|
|
|
|
|
|
|
|
|
|
| Total Investments |
|
$ |
887,354,577 |
|
|
$ |
18,811,964 |
|
|
$ |
1 |
|
|
$ |
906,166,542 |
|
|
|
|
|
|
|
|
|
|
|
|
|
|
|
|
|
|
The Notes to Financial Statements are an integral part of this report.
|
|
|
|
|
| Transamerica Series Trust |
|
|
|
Semi-Annual Financial Statements 2024 |
|
|
Page 2 |
|
|
Transamerica Janus Mid-Cap Growth VP
SCHEDULE OF INVESTMENTS (continued)
At June 30, 2024
(unaudited)
FOOTNOTES TO SCHEDULE OF INVESTMENTS:
| (A) |
Non-income producing security. |
| (B) |
All or a portion of the security is on loan. The total value of the securities on loan is $26,853,576, collateralized by cash collateral of $22,888,584 and non-cash collateral, such as U.S. government securities and irrevocable letters of credit, of $4,536,737. The amount on loan indicated may not correspond with the securities on loan identified because a security with pending sales are in the process of recall from the brokers. |
| (C) |
Percentage rounds to less than 0.1% or (0.1)%. |
| (D) |
Security is Level 3 of the fair value hierarchy. |
| (E) |
Fair valued as determined in good faith in accordance with TAM’s procedures. At June 30, 2024, the total value of the securities is $1, representing less than 0.1% of the Portfolio’s net assets. |
| (F) |
Rate disclosed reflects the yield at June 30, 2024. |
| (G) |
There were no transfers in or out of Level 3 during the period ended June 30, 2024. Please reference the Investment Valuation section of the Notes to Financial Statements for more information regarding investment valuation and pricing inputs. |
| (H) |
Level 3 securities were not considered significant to the Portfolio. |
CURRENCY ABBREVIATION(S):
PORTFOLIO ABBREVIATION(S):
|
|
|
| ADR |
|
American Depositary Receipt |
| REIT |
|
Real Estate Investment Trust |
The Notes to Financial Statements are an integral part of this report.
|
|
|
|
|
| Transamerica Series Trust |
|
|
|
Semi-Annual Financial Statements 2024 |
|
|
Page 3 |
|
|
Transamerica Janus Mid-Cap Growth VP
STATEMENT OF ASSETS AND LIABILITIES
At June 30, 2024
(unaudited)
|
|
|
|
|
|
|
| Assets: |
|
|
|
|
| Investments, at value (cost $759,552,757) (including securities loaned of $26,853,576) |
|
$ |
894,821,714 |
|
| Repurchase agreement, at value (cost $11,344,828) |
|
|
11,344,828 |
|
| Foreign currency, at value (cost $115,462) |
|
|
115,538 |
|
| Receivables and other assets: |
|
|
|
|
| Investments sold |
|
|
443,562 |
|
| Net income from securities lending |
|
|
4,054 |
|
| Shares of beneficial interest sold |
|
|
16,914 |
|
| Dividends |
|
|
621,550 |
|
| Interest |
|
|
2,364 |
|
| Prepaid expenses |
|
|
4,090 |
|
|
|
| Total assets |
|
|
907,374,614 |
|
|
|
| Liabilities: |
|
|
|
|
| Cash collateral received upon return of: |
|
|
|
|
| Securities on loan |
|
|
22,888,584 |
|
| Payables and other liabilities: |
|
|
|
|
| Investments purchased |
|
|
2,344,001 |
|
| Shares of beneficial interest redeemed |
|
|
393,628 |
|
| Due to custodian |
|
|
128,280 |
|
| Investment management fees |
|
|
546,243 |
|
| Distribution and service fees |
|
|
41,429 |
|
| Transfer agent costs |
|
|
1,061 |
|
| Trustee and CCO fees |
|
|
3,416 |
|
| Audit and tax fees |
|
|
15,159 |
|
| Custody fees |
|
|
41,017 |
|
| Legal fees |
|
|
19,165 |
|
| Printing and shareholder reports fees |
|
|
125,632 |
|
| Other accrued expenses |
|
|
16,969 |
|
|
|
| Total liabilities |
|
|
26,564,584 |
|
|
|
| Net assets |
|
$ |
880,810,030 |
|
|
|
| Net assets consist of: |
|
|
|
|
| Capital stock ($0.01 par value) |
|
$ |
280,989 |
|
| Additional paid-in capital |
|
|
618,240,225 |
|
|
|
| Total distributable earnings (accumulated losses) |
|
|
262,288,816 |
|
|
|
| Net assets |
|
$ |
880,810,030 |
|
|
|
| Net assets by class: |
|
|
|
|
| Initial Class |
|
$ |
664,460,532 |
|
| Service Class |
|
|
216,349,498 |
|
|
|
| Shares outstanding: |
|
|
|
|
| Initial Class |
|
|
20,684,146 |
|
| Service Class |
|
|
7,414,752 |
|
|
|
| Net asset value and offering price per share: |
|
|
|
|
| Initial Class |
|
$ |
32.12 |
|
| Service Class |
|
|
29.18 |
|
STATEMENT OF OPERATIONS
For the period ended June 30, 2024
(unaudited)
|
|
|
|
|
|
|
| Investment income: |
|
|
|
|
| Dividend income |
|
$ |
4,306,036 |
|
| Interest income |
|
|
231,913 |
|
| Net income from securities lending |
|
|
26,253 |
|
| Withholding taxes on foreign income |
|
|
(121,358 |
) |
|
|
| Total investment income |
|
|
4,442,844 |
|
|
|
| Expenses: |
|
|
|
|
| Investment management fees |
|
|
3,711,775 |
|
| Distribution and service fees: |
|
|
|
|
| Service Class |
|
|
268,373 |
|
| Transfer agent costs |
|
|
5,547 |
|
| Trustee and CCO fees |
|
|
22,315 |
|
| Audit and tax fees |
|
|
14,895 |
|
| Custody fees |
|
|
41,018 |
|
| Legal fees |
|
|
38,435 |
|
| Printing and shareholder reports fees |
|
|
120,638 |
|
| Other |
|
|
28,259 |
|
|
|
| Total expenses |
|
|
4,251,255 |
|
|
|
| Net investment income (loss) |
|
|
191,589 |
|
|
|
| Net realized gain (loss) on: |
|
|
|
|
| Investments |
|
|
71,968,751 |
|
| Foreign currency transactions |
|
|
1,152 |
|
|
|
| Net realized gain (loss) |
|
|
71,969,903 |
|
|
|
| Net change in unrealized appreciation (depreciation) on: |
|
|
|
|
| Investments |
|
|
(21,198,258 |
) |
| Translation of assets and liabilities denominated in foreign currencies |
|
|
350 |
|
|
|
| Net change in unrealized appreciation (depreciation) |
|
|
(21,197,908 |
) |
|
|
| Net realized and change in unrealized gain (loss) |
|
|
50,771,995 |
|
|
|
| Net increase (decrease) in net assets resulting from operations |
|
$ |
50,963,584 |
|
The Notes to Financial Statements are an integral part of this report.
|
|
|
|
|
| Transamerica Series Trust |
|
|
|
Semi-Annual Financial Statements 2024 |
|
|
Page 4 |
|
|
Transamerica Janus Mid-Cap Growth VP
STATEMENT OF CHANGES IN NET ASSETS
For the period and year ended:
|
|
|
|
|
|
|
|
|
|
|
|
| |
|
June 30, 2024 (unaudited) |
|
|
December 31, 2023 |
|
|
|
| From operations: |
|
|
|
|
|
|
|
|
| Net investment income (loss) |
|
$ |
191,589 |
|
|
$ |
909,433 |
|
| Net realized gain (loss) |
|
|
71,969,903 |
|
|
|
54,985,972 |
|
| Net change in unrealized appreciation (depreciation) |
|
|
(21,197,908 |
) |
|
|
95,139,479 |
|
|
|
|
| Net increase (decrease) in net assets resulting from operations |
|
|
50,963,584 |
|
|
|
151,034,884 |
|
|
|
|
| Dividends and/or distributions to shareholders: |
|
|
|
|
|
|
|
|
| Initial Class |
|
|
— |
|
|
|
(133,285,810 |
) |
| Service Class |
|
|
— |
|
|
|
(37,893,515 |
) |
|
|
|
| Net increase (decrease) in net assets resulting from dividends and/or distributions to shareholders |
|
|
— |
|
|
|
(171,179,325 |
) |
|
|
|
| Capital share transactions: |
|
|
|
|
|
|
|
|
| Proceeds from shares sold: |
|
|
|
|
|
|
|
|
| Initial Class |
|
|
3,793,749 |
|
|
|
46,620,393 |
|
| Service Class |
|
|
6,490,204 |
|
|
|
10,067,230 |
|
| |
|
|
10,283,953 |
|
|
|
56,687,623 |
|
| Dividends and/or distributions reinvested: |
|
|
|
|
|
|
|
|
| Initial Class |
|
|
— |
|
|
|
133,285,810 |
|
| Service Class |
|
|
— |
|
|
|
37,893,515 |
|
|
|
|
| |
|
|
— |
|
|
|
171,179,325 |
|
| Cost of shares redeemed: |
|
|
|
|
|
|
|
|
| Initial Class |
|
|
(183,433,354 |
) |
|
|
(77,814,501 |
) |
| Service Class |
|
|
(14,090,028 |
) |
|
|
(24,962,824 |
) |
|
|
|
| |
|
|
(197,523,382 |
) |
|
|
(102,777,325 |
) |
|
|
|
| Net increase (decrease) in net assets resulting from capital share transactions |
|
|
(187,239,429 |
) |
|
|
125,089,623 |
|
|
|
|
| Net increase (decrease) in net assets |
|
|
(136,275,845 |
) |
|
|
104,945,182 |
|
|
|
|
| Net assets: |
|
|
|
|
|
|
|
|
| Beginning of period/year |
|
|
1,017,085,875 |
|
|
|
912,140,693 |
|
| End of period/year |
|
$ |
880,810,030 |
|
|
$ |
1,017,085,875 |
|
|
|
|
| Capital share transactions - shares: |
|
|
|
|
|
|
|
|
| Shares issued: |
|
|
|
|
|
|
|
|
| Initial Class |
|
|
118,718 |
|
|
|
1,356,878 |
|
| Service Class |
|
|
223,675 |
|
|
|
344,014 |
|
|
|
|
| |
|
|
342,393 |
|
|
|
1,700,892 |
|
| Shares reinvested: |
|
|
|
|
|
|
|
|
| Initial Class |
|
|
— |
|
|
|
4,580,268 |
|
| Service Class |
|
|
— |
|
|
|
1,431,024 |
|
|
|
|
| |
|
|
— |
|
|
|
6,011,292 |
|
| Shares redeemed: |
|
|
|
|
|
|
|
|
| Initial Class |
|
|
(5,765,752 |
) |
|
|
(2,365,869 |
) |
| Service Class |
|
|
(486,068 |
) |
|
|
(835,710 |
) |
|
|
|
| |
|
|
(6,251,820 |
) |
|
|
(3,201,579 |
) |
| Net increase (decrease) in shares outstanding: |
|
|
|
|
|
|
|
|
| Initial Class |
|
|
(5,647,034 |
) |
|
|
3,571,277 |
|
| Service Class |
|
|
(262,393 |
) |
|
|
939,328 |
|
|
|
|
| |
|
|
(5,909,427 |
) |
|
|
4,510,605 |
|
The Notes to Financial Statements are an integral part of this report.
|
|
|
|
|
| Transamerica Series Trust |
|
|
|
Semi-Annual Financial Statements 2024 |
|
|
Page 5 |
|
|
Transamerica Janus Mid-Cap Growth VP
FINANCIAL HIGHLIGHTS
|
|
|
|
|
|
|
|
|
|
|
|
|
|
|
|
|
|
|
|
|
|
|
|
|
| For a share outstanding during the period and years indicated: |
|
Initial Class |
|
|
|
|
|
|
|
| |
|
June 30, 2024 (unaudited) |
|
December 31, 2023 |
|
December 31, 2022 |
|
December 31, 2021 |
|
December 31, 2020 |
|
December 31, 2019 |
| Net asset value, beginning of period/year |
|
$ |
30.53 |
|
|
$ |
31.45 |
|
|
$ |
44.53 |
|
|
$ |
43.28 |
|
|
$ |
39.58 |
|
|
$ |
30.58 |
|
|
|
|
|
|
|
|
| Investment operations: |
|
|
|
|
|
|
|
|
|
|
|
|
|
|
|
|
|
|
|
|
|
|
|
|
| Net investment income (loss)(A) |
|
|
0.01 |
|
|
|
0.05 |
|
|
|
(0.00 |
)(B) |
|
|
(0.01 |
) |
|
|
0.02 |
|
|
|
0.03 |
|
| Net realized and unrealized gain (loss) |
|
|
1.58 |
|
|
|
5.02 |
|
|
|
(7.20 |
) |
|
|
7.25 |
|
|
|
6.95 |
|
|
|
11.04 |
|
|
|
|
|
|
|
|
| Total investment operations |
|
|
1.59 |
|
|
|
5.07 |
|
|
|
(7.20 |
) |
|
|
7.24 |
|
|
|
6.97 |
|
|
|
11.07 |
|
|
|
|
|
|
|
|
| Dividends and/or distributions to shareholders: |
|
|
|
|
|
|
|
|
|
|
|
|
|
|
|
|
|
|
|
|
|
|
|
|
| Net investment income |
|
|
— |
|
|
|
— |
|
|
|
— |
|
|
|
(0.13 |
) |
|
|
(0.09 |
) |
|
|
(0.03 |
) |
| Net realized gains |
|
|
— |
|
|
|
(5.99 |
) |
|
|
(5.88 |
) |
|
|
(5.86 |
) |
|
|
(3.18 |
) |
|
|
(2.04 |
) |
|
|
|
|
|
|
|
| Total dividends and/or distributions to shareholders |
|
|
— |
|
|
|
(5.99 |
) |
|
|
(5.88 |
) |
|
|
(5.99 |
) |
|
|
(3.27 |
) |
|
|
(2.07 |
) |
|
|
|
|
|
|
|
| Net asset value, end of period/year |
|
$ |
32.12 |
|
|
$ |
30.53 |
|
|
$ |
31.45 |
|
|
$ |
44.53 |
|
|
$ |
43.28 |
|
|
$ |
39.58 |
|
| |
|
|
|
|
|
|
|
|
|
|
|
|
|
|
|
|
|
|
|
|
|
|
|
|
|
|
|
|
|
|
|
| Total return |
|
|
5.21 |
%(C) |
|
|
17.04 |
% |
|
|
(16.72 |
)% |
|
|
17.30 |
% |
|
|
19.20 |
% |
|
|
36.71 |
% |
|
|
|
|
|
|
|
| Ratio and supplemental data: |
|
|
|
|
|
|
|
|
|
|
|
|
|
|
|
|
|
|
|
|
|
|
|
|
| Net assets end of period/year (000’s) |
|
$ |
664,461 |
|
|
$ |
803,925 |
|
|
$ |
715,712 |
|
|
$ |
1,160,263 |
|
|
$ |
870,326 |
|
|
$ |
983,244 |
|
| Expenses to average net assets |
|
|
0.85 |
%(D) |
|
|
0.86 |
% |
|
|
0.81 |
% |
|
|
0.82 |
% |
|
|
0.83 |
% |
|
|
0.83 |
% |
| Net investment income (loss) to average net assets |
|
|
0.09 |
%(D) |
|
|
0.15 |
% |
|
|
(0.00 |
)%(E) |
|
|
(0.03 |
)% |
|
|
0.06 |
% |
|
|
0.09 |
% |
| Portfolio turnover rate |
|
|
6 |
%(C) |
|
|
14 |
% |
|
|
17 |
% |
|
|
25 |
% |
|
|
15 |
% |
|
|
10 |
% |
| (A) |
Calculated based on average number of shares outstanding. |
| (B) |
Rounds to less than $0.01 or $(0.01). |
| (E) |
Rounds to less than 0.01% or (0.01)%. |
|
|
|
|
|
|
|
|
|
|
|
|
|
|
|
|
|
|
|
|
|
|
|
|
|
| For a share outstanding during the period and years indicated: |
|
Service Class |
|
|
|
|
|
|
|
| |
|
June 30, 2024 (unaudited) |
|
December 31, 2023 |
|
December 31, 2022 |
|
December 31, 2021 |
|
December 31, 2020 |
|
December 31, 2019 |
|
|
|
|
|
|
|
| Net asset value, beginning of period/year |
|
$ |
27.77 |
|
|
$ |
29.15 |
|
|
$ |
41.87 |
|
|
$ |
41.04 |
|
|
$ |
37.71 |
|
|
$ |
29.27 |
|
|
|
|
|
|
|
|
| Investment operations: |
|
|
|
|
|
|
|
|
|
|
|
|
|
|
|
|
|
|
|
|
|
|
|
|
| Net investment income (loss)(A) |
|
|
(0.02 |
) |
|
|
(0.03 |
) |
|
|
(0.08 |
) |
|
|
(0.07 |
) |
|
|
(0.07 |
) |
|
|
(0.06 |
) |
| Net realized and unrealized gain (loss) |
|
|
1.43 |
|
|
|
4.64 |
|
|
|
(6.76 |
) |
|
|
6.80 |
|
|
|
6.59 |
|
|
|
10.54 |
|
|
|
|
|
|
|
|
| Total investment operations |
|
|
1.41 |
|
|
|
4.61 |
|
|
|
(6.84 |
) |
|
|
6.73 |
|
|
|
6.52 |
|
|
|
10.48 |
|
|
|
|
|
|
|
|
| Dividends and/or distributions to shareholders: |
|
|
|
|
|
|
|
|
|
|
|
|
|
|
|
|
|
|
|
|
|
|
|
|
| Net investment income |
|
|
— |
|
|
|
— |
|
|
|
— |
|
|
|
(0.04 |
) |
|
|
(0.01 |
) |
|
|
— |
|
| Net realized gains |
|
|
— |
|
|
|
(5.99 |
) |
|
|
(5.88 |
) |
|
|
(5.86 |
) |
|
|
(3.18 |
) |
|
|
(2.04 |
) |
|
|
|
|
|
|
|
| Total dividends and/or distributions to shareholders |
|
|
— |
|
|
|
(5.99 |
) |
|
|
(5.88 |
) |
|
|
(5.90 |
) |
|
|
(3.19 |
) |
|
|
(2.04 |
) |
|
|
|
|
|
|
|
| Net asset value, end of period/year |
|
$ |
29.18 |
|
|
$ |
27.77 |
|
|
$ |
29.15 |
|
|
$ |
41.87 |
|
|
$ |
41.04 |
|
|
$ |
37.71 |
|
| |
|
|
|
|
|
|
|
|
|
|
|
|
|
|
|
|
|
|
|
|
|
|
|
|
|
|
|
|
|
|
|
| Total return |
|
|
5.08 |
%(B) |
|
|
16.80 |
% |
|
|
(16.93 |
)% |
|
|
16.99 |
% |
|
|
18.93 |
% |
|
|
36.33 |
% |
|
|
|
|
|
|
|
| Ratio and supplemental data: |
|
|
|
|
|
|
|
|
|
|
|
|
|
|
|
|
|
|
|
|
|
|
|
|
| Net assets end of period/year (000’s) |
|
$ |
216,349 |
|
|
$ |
213,161 |
|
|
$ |
196,429 |
|
|
$ |
271,568 |
|
|
$ |
247,889 |
|
|
$ |
196,136 |
|
| Expenses to average net assets |
|
|
1.10 |
%(C) |
|
|
1.11 |
% |
|
|
1.06 |
% |
|
|
1.07 |
% |
|
|
1.08 |
% |
|
|
1.08 |
% |
| Net investment income (loss) to average net assets |
|
|
(0.14 |
)%(C) |
|
|
(0.10 |
)% |
|
|
(0.24 |
)% |
|
|
(0.16 |
)% |
|
|
(0.20 |
)% |
|
|
(0.16 |
)% |
| Portfolio turnover rate |
|
|
6 |
%(B) |
|
|
14 |
% |
|
|
17 |
% |
|
|
25 |
% |
|
|
15 |
% |
|
|
10 |
% |
| (A) |
Calculated based on average number of shares outstanding. |
The Notes to Financial Statements are an integral part of this report.
|
|
|
|
|
| Transamerica Series Trust |
|
|
|
Semi-Annual Financial Statements 2024 |
|
|
Page 6 |
|
|
Transamerica Janus Mid-Cap Growth VP
NOTES TO FINANCIAL STATEMENTS
At June 30, 2024
(unaudited)
1. ORGANIZATION
Transamerica Series Trust (“TST”) is an open-end management investment company registered under the Investment Company Act of 1940, as amended (the “1940 Act”). TST applies investment company accounting and reporting guidance. TST serves as a funding vehicle for variable life insurance, variable annuity, and group annuity products. Transamerica Janus Mid-Cap Growth VP (the “Portfolio”) is a series of TST and is classified as diversified under the 1940 Act. The Portfolio currently offers two classes of shares, Initial Class and Service Class.
The only shareholders of the Portfolio are affiliated insurance company separate accounts and/or affiliated asset allocation portfolios. Contract holders of the variable life and annuity contracts are not shareholders of the Portfolio. For ease of reference, shareholders and contract holders are collectively referred to in this report as “shareholders.”
This report must be accompanied or preceded by the Portfolio’s current prospectus, which contains additional information about the Portfolio, including risks, as well as investment objectives and strategies.
Transamerica Asset Management, Inc. (“TAM”) serves as investment manager for the Portfolio pursuant to an investment management agreement. TAM provides continuous and regular investment management services to the Portfolio. TAM supervises the Portfolio’s investments, conducts its investment program and provides supervisory, compliance and administrative services to the Portfolio.
TAM currently acts as a “manager of managers” and has hired sub-advisers to furnish day-to-day investment advice and recommendations. TAM may, in the future, determine to provide all aspects of the day-to-day management of the Portfolio without the use of a sub-adviser. When acting as a manager of managers, TAM provides investment management services that include, without limitation, the design and development of the Portfolio and its investment strategies and the ongoing review and evaluation of those investment strategies including recommending changes in strategy where it believes appropriate or advisable; the selection of one or more sub-advisers for the Portfolio employing a combination of quantitative and qualitative screens, research, analysis and due diligence; negotiation of sub-advisory agreements and fees; oversight and monitoring of sub-advisers and recommending changes to sub-advisers where it believes appropriate or advisable; recommending portfolio combinations and liquidations where it believes appropriate or advisable; selection and oversight of transition managers, as needed; regular supervision of the Portfolio’s investments; regular review and evaluation of sub-adviser performance; daily monitoring of the sub-advisers’ buying and selling of securities for the Portfolio; regular review of holdings; ongoing trade oversight and analysis; regular monitoring to ensure adherence to investment process; regular calls and periodic on-site visits with sub-advisers; portfolio construction and asset allocation when using multiple sub-advisers for the Portfolio; risk management oversight and analysis; oversight of negotiation of investment documentation and agreements; design, development, implementation and regular monitoring of the valuation process; periodic due diligence reviews of pricing vendors and vendor methodology; design, development, implementation and regular monitoring of the compliance process; respond to regulatory inquiries and determine appropriate litigation strategy, as needed; review of proxies voted by sub-advisers; oversight of preparation and review of materials for meetings of the Portfolio’s Board of Trustees (the “Board”), participation in these meetings and preparation of regular communications with the Board; oversight of preparation and review of prospectuses, shareholder reports and other disclosure materials and regulatory filings for the Portfolio; oversight of other service providers to the Portfolio, such as the custodian, the transfer agent, the Portfolio’s independent accounting firm and legal counsel; supervision of the performance of recordkeeping and shareholder relations functions for the Portfolio; and oversight of cash management services. TAM uses a variety of quantitative and qualitative tools to carry out its investment management services. TAM, not the Portfolio, is responsible for paying the sub-adviser(s) for their services, and sub-advisory fees are TAM’s expense.
TAM’s investment management services also include the provision of supervisory and administrative services to the Portfolio. These services include performing certain administrative services for the Portfolio and supervising and overseeing the administrative, clerical, recordkeeping and bookkeeping services provided to the Portfolio by State Street Bank and Trust Company (“State Street”), to whom TAM has outsourced the provision of certain sub-administration services. To the extent agreed upon by TAM and the Portfolio from time to time, TAM’s supervisory and administrative services include, but are not limited to: monitoring and verifying the custodian’s daily calculation of the Net Asset Values (“NAV”); shareholder relations functions; compliance services; valuation services; assisting in due diligence and in the oversight and monitoring of certain activities of sub-advisers and certain aspects of Portfolio investments; assisting with Portfolio combinations and liquidations; oversight of the preparation and filing, and review, of all returns and reports, in connection with federal, state and local taxes; oversight and review of regulatory reporting; supervising and coordinating the Portfolio’s custodian and dividend disbursing agent and monitoring their services to the Portfolio; assisting the Portfolio in preparing reports to shareholders; acting as liaison with the Portfolio’s independent public accountants and providing, upon request, analyses, fiscal year summaries and other audit related services; assisting in the preparation of agendas and supporting documents for and minutes of meetings of trustees and committees of trustees; assisting in the preparation of regular communications with the trustees; and providing personnel and office space, telephones and other office equipment as necessary in order for TAM to perform supervisory and administrative services to the Portfolio. The Portfolio
|
|
|
|
|
| Transamerica Series Trust |
|
|
|
Semi-Annual Financial Statements 2024 |
|
|
Page 7 |
|
|
Transamerica Janus Mid-Cap Growth VP
NOTES TO FINANCIAL STATEMENTS (continued)
At June 30, 2024
(unaudited)
1. ORGANIZATION (continued)
pays certain fees and expenses to State Street for sub-administration services which are not administrative services covered by the management agreement with TAM or paid for through the management fees payable thereunder. For the period ended June 30, 2024, (i) the expenses paid to State Street for sub-administration services by the Portfolio are shown as a part of Other expenses within the Statement of Operations and (ii) the expenses payable to State Street for sub-administration services from the Portfolio are shown as part of Other accrued expenses within the Statement of Assets and Liabilities.
2. SIGNIFICANT ACCOUNTING POLICIES
In preparing the Portfolio’s financial statements in accordance with Generally Accepted Accounting Principles in the United States of America (“GAAP”), estimates or assumptions (which could differ from actual results) may be used that affect reported amounts and disclosures. The following is a summary of significant accounting policies followed by the Portfolio.
Foreign currency denominated investments: The accounting records of the Portfolio are maintained in U.S. dollars. Securities and other assets and liabilities denominated in foreign currencies are translated into U.S. dollars based on the closing exchange rate each day. The cost of foreign securities purchased and any realized gains or losses are translated at the prevailing exchange rates in effect on the date of the respective transaction. The Portfolio combines fluctuations from currency exchange rates and fluctuations in value when computing net realized and unrealized gains or losses from investments.
Net foreign currency gains and losses resulting from changes in exchange rates include, foreign currency fluctuations between trade date and settlement date of investment security transactions, gains and losses on forward foreign currency contracts, and the difference between the receivable amounts of interest and dividends recorded in the accounting records in U.S. dollars and the amounts actually received.
Foreign currency denominated assets may involve risks not typically associated with domestic transactions. These risks include revaluation of currencies, adverse fluctuations in foreign currency values, and possible adverse political, social, and economic developments, including those particular to a specific industry, country or region.
Security transactions and investment income: Security transactions are accounted for on the trade date. Security gains and losses are calculated on a first-in, first-out basis. Dividend income, if any, is recorded on the ex-dividend date or, in the case of foreign securities, as soon as the Portfolio is informed of the ex-dividend dates, net of foreign taxes. Non-cash dividends, if any, are recorded on the ex-dividend date at fair value. Interest income, if any, is recorded on the accrual basis from settlement date, net of foreign taxes. Fixed income premiums and discounts are amortized and/or accreted over the lives of the respective securities.
Multiple class operations, income, and expenses: Income, non-class specific expenses, and realized and unrealized gains and losses are allocated to each class daily based upon net assets. Each class bears its own specific expenses in addition to the allocated non-class specific expenses.
Distributions to shareholders: Distributions are recorded on the ex-dividend date and are determined in accordance with federal income tax regulations, which may differ from GAAP.
Foreign taxes: The Portfolio may be subject to taxes imposed by the countries in which it invests, with respect to its investments in issuers existing or operating in such countries. The Portfolio may also be subject to foreign taxes on income, gains on investments, or currency repatriation, a portion of which may be recoverable. The Portfolio accrues such taxes and recoveries as applicable when the related income or capital gains are earned or unrealized, and based upon the current interpretation of tax rules and regulations that exist in the markets in which the Portfolio invests. Some countries require governmental approval for the repatriation of investment income, capital, or the proceeds of sales earned by foreign investors. In addition, if there is deterioration in a country’s balance of payments or for other reasons, a country may impose temporary restrictions of foreign capital remittances abroad.
Cash overdraft: The Portfolio may have cash overdraft balances. A fee is incurred on these overdrafts, calculated by multiplying the overdraft by a rate based on the Federal Funds Rate.
Payables, if any, are reflected as Due to custodian within the Statement of Assets and Liabilities. Expenses, if any, from U.S. cash overdrafts are reflected in Custody fees within the Statement of Operations. Expenses, if any, from foreign cash overdrafts are reflected in Other expenses within the Statement of Operations.
|
|
|
|
|
| Transamerica Series Trust |
|
|
|
Semi-Annual Financial Statements 2024 |
|
|
Page 8 |
|
|
Transamerica Janus Mid-Cap Growth VP
NOTES TO FINANCIAL STATEMENTS (continued)
At June 30, 2024
(unaudited)
2. SIGNIFICANT ACCOUNTING POLICIES (continued)
Commission recapture: The sub-adviser(s), to the extent consistent with the best execution and usual commission rate policies and practices, may elect to place security transactions of the Portfolio with broker/dealers with which TST has established a commission recapture program. A commission recapture program is any arrangement under which a broker/dealer applies a portion of the commissions received by such broker/dealer on the security transactions to the Portfolio. In no event will commissions, paid by the Portfolio, be used to pay expenses that would otherwise be borne by any other Portfolios within TST, or by any other party.
There were no commissions recaptured during the period ended June 30, 2024 by the Portfolio.
Indemnification: In the normal course of business, the Portfolio enters into contracts that contain a variety of representations that provide general indemnifications. The Portfolio’s maximum exposure under these arrangements is unknown, as this would involve future claims that may be made against the Portfolio and/or its affiliates that have not yet occurred. However, based on experience, the Portfolio expects the risk of loss to be remote.
3. INVESTMENT VALUATION
TAM has been designated as the Portfolio’s valuation designee pursuant to Rule 2a-5 under the 1940 Act with responsibility for fair valuation subject to oversight by the Portfolio’s Board of Trustees. The net asset value of the Portfolio is computed as of the official close of the New York Stock Exchange (“NYSE”) each day the NYSE is open for business.
TAM utilizes various methods to measure the fair value of its investments on a recurring basis. GAAP establishes a hierarchy that prioritizes inputs to valuation methods. The inputs or methodology used for valuing securities are not necessarily an indication of the risk associated with investing in those securities. The three levels (“Levels”) of inputs of the fair value hierarchy are defined as follows:
Level 1—Unadjusted quoted prices in active markets for identical securities.
Level 2—Inputs, other than quoted prices included in Level 1, which are observable, either directly or indirectly. These inputs may include quoted prices for the identical instrument on an inactive market, prices for similar instruments, interest rates, prepayment speeds, credit risk, yield curves, default rates, and similar data.
Level 3—Unobservable inputs based on the best information available in the circumstances, to the extent observable inputs are not available, which may include TAM’s own assumptions used in determining the fair value of the Portfolio’s investments.
The inputs used to measure fair value may fall into different Levels of the fair value hierarchy. In such cases, for disclosure purposes, the Level in the fair value hierarchy that is assigned to the fair value measurement of a security is determined based on the lowest Level input that is significant to the fair value measurement in its entirety. Certain investments that are measured at fair value using NAV per share, or its equivalent, using the “practical expedient” have not been classified in the fair value Levels. The hierarchy classification of inputs used to value the Portfolio’s investments at June 30, 2024, is disclosed within the Investment Valuation section of the Schedule of Investments.
The availability of observable inputs can vary from security to security and is affected by a wide variety of factors, including, but not limited to, the type of security, whether the security is new and not yet established in the marketplace, the liquidity of markets, and other characteristics particular to the security. To the extent that valuation is based on models or inputs that are less observable or unobservable in the market, the determination of fair value requires more judgment. Accordingly, the degree of judgment exercised in determining fair value is generally greatest for instruments categorized in Level 3. Due to the inherent uncertainty of valuation, the determination of values may differ significantly from values that would have been realized had a ready market for investments existed, and the differences could be material.
Fair value measurements: Descriptions of the valuation techniques applied to the Portfolio’s significant categories of assets and liabilities measured at fair value on a recurring basis are as follows:
Equity securities: Securities are stated at the last reported sales price or closing price on the day of valuation taken from the primary exchange where the security is principally traded. To the extent these securities are actively traded and valuation adjustments are not applied, they are categorized in Level 1 of the fair value hierarchy. Equities traded on inactive markets or valued by reference to similar instruments are generally categorized in Level 2 or Level 3 if inputs are unobservable.
Foreign equity securities: Securities in which the primary trading market closes at the same time or after the NYSE, are valued based on quotations from the primary market in which they are traded and are categorized in Level 1. Because many foreign securities markets and
|
|
|
|
|
| Transamerica Series Trust |
|
|
|
Semi-Annual Financial Statements 2024 |
|
|
Page 9 |
|
|
Transamerica Janus Mid-Cap Growth VP
NOTES TO FINANCIAL STATEMENTS (continued)
At June 30, 2024
(unaudited)
3. INVESTMENT VALUATION (continued)
exchanges close prior to the close of the NYSE, closing prices for foreign securities in those markets or on those exchanges do not reflect the events that occur after that close. Certain foreign securities may be fair valued using a pricing service that considers the correlation of the trading patterns of the foreign security to the intraday trading in the U.S. markets for investments such as American Depositary Receipts, financial futures, or ETFs and the movement of certain indices of securities based on a statistical analysis of their historical relationship; such valuations generally are categorized in Level 2.
Warrants: Warrants may be priced intrinsically using a model that incorporates the subscription or strike price, the daily market price for the underlying security, and a subscription ratio. If the inputs are unavailable, or if the subscription or strike price is higher than the market price, then the warrants are priced at zero. Warrants are generally categorized in Level 2 of the fair value hierarchy, or Level 3 if inputs are unobservable.
Securities lending collateral: Securities lending collateral is invested in a money market fund which is valued at the actively traded NAV and no valuation adjustments are applied. Securities lending collateral is categorized in Level 1 of the fair value hierarchy.
Repurchase agreements: Repurchase agreements are valued at cost, which approximates fair value. To the extent the inputs are observable and timely, the values are generally categorized in Level 2 of the fair value hierarchy.
4. SECURITIES AND OTHER INVESTMENTS
Real estate investment trusts (“REITs”): REITs are pooled investment vehicles which invest primarily in income producing real estate, or real estate related loans or interests. Distributions received by REITs are classified at management’s estimate of the dividend income, return of capital and capital gains. Estimates are based on information available at year-end, which includes the previous fiscal year’s classification. The actual amounts of dividend income, return of capital, and capital gains are only determined by each REIT after the fiscal year end and may differ from the estimated amounts. Upon notification from the REITs, some of the distributions received may be re-classified and recorded as a return of capital or capital gains. There are certain additional risks involved in investing in REITs. These include, but are not limited to, economic conditions, changes in zoning laws, real estate values, property taxes, and interest rates.
REITs held at June 30, 2024, if any, are identified within the Schedule of Investments.
5. BORROWINGS AND OTHER FINANCING TRANSACTIONS
The Portfolio may engage in borrowing transactions as a means of raising cash to satisfy redemption requests, for other temporary or emergency purposes or, to the extent permitted by its investment policies, to raise additional cash to be invested in other securities or instruments. When the Portfolio invests borrowing proceeds in other securities, the Portfolio will bear the risk that the market value of the securities in which such proceeds are invested goes down and is insufficient to repay the borrowed proceeds. The Portfolio may borrow on a secured or on an unsecured basis. If the Portfolio enters into a secured borrowing arrangement, a portion of the Portfolio’s assets will be used as collateral. The 1940 Act requires the Portfolio to maintain asset coverage of at least 300% of the amount of its borrowings. Asset coverage means the ratio that the value of the Portfolio’s total assets, minus liabilities other than borrowings, bears to the aggregate amount of all borrowings. Although complying with this requirement has the effect of limiting the amount that the Portfolio may borrow, it does not otherwise mitigate the risks of entering into borrowing transactions.
Interfund lending: The Portfolio, along with other funds and portfolios advised by TAM, may participate in an interfund lending program pursuant to exemptive relief granted by the Securities and Exchange Commission on January 18, 2017. This program allows the Portfolio to lend to and borrow from other funds and portfolios advised by TAM. Interfund lending transactions are subject to the conditions of the exemptive relief which places limits on the amount of lending or borrowing a Portfolio may participate in under the program. Interest earned or paid on an interfund lending transaction will be based on the average of certain current market rates. For the period ended June 30, 2024, the Portfolio has not utilized the program.
Repurchase agreements: In a repurchase agreement, the Portfolio purchases a security and simultaneously commits to resell that security to the seller at an agreed-upon price on an agreed-upon date. Securities purchased subject to a repurchase agreement are held at the Portfolio’s custodian, or designated sub-custodian related to tri-party repurchase agreements, and, pursuant to the terms of the repurchase agreement, must be collateralized by securities with an aggregate market value greater than or equal to 100% of the resale price. The Portfolio will bear the risk of value fluctuations until the securities can be sold and may encounter delays and incur costs in liquidating the securities. In the event of bankruptcy or insolvency of the seller, delays and costs may be incurred.
|
|
|
|
|
| Transamerica Series Trust |
|
|
|
Semi-Annual Financial Statements 2024 |
|
|
Page 10 |
|
|
Transamerica Janus Mid-Cap Growth VP
NOTES TO FINANCIAL STATEMENTS (continued)
At June 30, 2024
(unaudited)
5. BORROWINGS AND OTHER FINANCING TRANSACTIONS (continued)
Repurchase agreements are subject to netting agreements, which are agreements between the Portfolio and its counterparties that provide for the net settlement of all transactions and collateral with the Portfolio, through a single payment, in the event of default or termination. Amounts presented within the Schedule of Investments, and as part of Repurchase agreements, at value within the Statement of Assets and Liabilities are shown on a gross basis. The value of the related collateral for each repurchase agreement, as reflected within the Schedule of Investments, exceeds the value of each repurchase agreement at June 30, 2024.
Repurchase agreements at June 30, 2024, if any, are included within the Schedule of Investments and Statement of Assets and Liabilities.
Securities lending: The Portfolio may lend securities to qualified financial institutions, brokers and dealers. State Street serves as securities lending agent to the Portfolio pursuant to a Securities Lending Agreement. Loans of securities are terminable at any time and the borrower, after notice, is required to return borrowed securities within the standard time period for settlement of securities transactions. The lending of securities exposes the Portfolio to risks such as: the borrowers may fail to return the loaned securities or may not be able to provide additional collateral, the Portfolio may experience delays in recovery of the loaned securities or delays in access to collateral, or the Portfolio may experience losses related to the investment collateral. To minimize certain risks, loan counterparties pledge cash, securities issued or guaranteed by the U.S. Government and irrevocable letters of credit issued by banks as collateral. The initial collateral received by the Portfolio is required to have a value of at least 102% of the current value of the loaned securities traded on U.S. exchanges, and a value of at least 105% for all other securities. Typically the lending agent is not permitted to sell, re-pledge or use cash and non-cash collateral it receives. The lending agent has agreed to indemnify the Portfolio in the case of default of any securities borrower.
The Portfolio receives compensation for lending securities from interest or dividends earned on the cash, U.S. Government securities and irrevocable letters of credit held as collateral, less associated fees and expenses. Such income is reflected in Net income from securities lending within the Statement of Operations. Cash collateral received is invested in the State Street Navigator Securities Lending Trust — Government Money Market Portfolio.
The value of loaned securities and related cash and non-cash collateral outstanding at June 30, 2024, if any, are shown on a gross basis within the Schedule of Investments.
The following table reflects a breakdown of transactions accounted for as secured borrowings, the gross obligation by the type, and the remaining contractual maturity of those transactions as of June 30, 2024.
|
|
|
|
|
|
|
|
|
|
|
|
|
|
|
|
|
|
|
|
|
| |
|
Remaining Contractual Maturity of the Agreements |
|
|
|
|
|
|
|
| |
|
Overnight and Continuous |
|
|
Less Than 30 Days |
|
|
Between 30 & 90 Days |
|
|
Greater Than 90 Days |
|
|
Total |
|
|
|
|
|
|
|
| Securities Lending Transactions |
|
|
|
|
|
|
|
|
|
|
|
|
|
|
|
|
|
|
|
|
| Common Stocks |
|
$ |
22,888,584 |
|
|
$ |
— |
|
|
$ |
— |
|
|
$ |
— |
|
|
$ |
22,888,584 |
|
|
|
|
|
|
|
| Total Borrowings |
|
$ |
22,888,584 |
|
|
$ |
— |
|
|
$ |
— |
|
|
$ |
— |
|
|
$ |
22,888,584 |
|
| |
|
|
|
|
|
|
|
|
|
|
|
|
|
|
|
|
|
|
|
|
6. RISK FACTORS
Investing in the Portfolio involves certain key risks related to the Portfolio’s trading activity. Please reference the Portfolio’s prospectus for a more complete discussion of the following risk(s), as well as other risks of investing in the Portfolio.
Market risk: The market prices of the Portfolio’s securities or other assets may go up or down, sometimes rapidly or unpredictably, due to factors such as economic events, inflation, changes in interest rates, governmental actions or interventions, actions taken by the U.S. Federal Reserve or foreign central banks, market disruptions caused by tariffs, trade disputes or other factors, political developments, armed conflicts, economic sanctions, cybersecurity events, investor sentiment, the global and domestic effects of widespread or local health, weather or climate events, and other factors that may or may not be related to the issuer of the security or other asset. If the market prices of the Portfolio’s securities and assets fall, the value of your investment in the Portfolio could go down.
Economies and financial markets throughout the world are increasingly interconnected. Events or circumstances in one or more countries or regions could be highly disruptive to, and have profound impacts on, global economies or markets. As a result, whether or not the Portfolio invests in securities of issuers located in or with significant exposure to the countries directly affected, the value and liquidity of the Portfolio’s investments may go down.
|
|
|
|
|
| Transamerica Series Trust |
|
|
|
Semi-Annual Financial Statements 2024 |
|
|
Page 11 |
|
|
Transamerica Janus Mid-Cap Growth VP
NOTES TO FINANCIAL STATEMENTS (continued)
At June 30, 2024
(unaudited)
6. RISK FACTORS (continued)
Growth stocks risk: Returns on growth stocks may not move in tandem with returns on other categories of stocks or the market as a whole. Growth stocks typically are particularly sensitive to market movements and may involve larger price swings because their market prices tend to reflect future expectations. When it appears those expectations may not be met, the prices of growth stocks typically fall. Growth stocks may also be more volatile because they often do not pay dividends. The values of growth stocks tend to go down when interest rates rise because the rise in interest rates reduces the current value of future cash flows. Growth stocks as a group may be out of favor and underperform the overall equity market for a long period of time, for example, while the market favors “value” stocks.
Medium capitalization companies risk: The Portfolio will be exposed to additional risks as a result of its investments in the securities of medium capitalization companies. Investing in medium capitalization companies involves greater risk than is customarily associated with more established companies. The prices of securities of medium capitalization companies generally are more volatile and are more likely to be adversely affected by changes in earnings results and investor expectations or poor economic or market conditions. Securities of medium capitalization companies may underperform larger capitalization companies, may be harder to sell at times and at prices the Portfolio managers believe appropriate and may offer greater potential for losses.
Real estate investment trusts (“REITs”) risk: Investing in real estate investment trusts (“REITs”) involves unique risks. When the Portfolio invests in REITs, it is subject to risks generally associated with investing in real estate. A REIT’s performance depends on the types and locations of the properties it owns, how well it manages those properties and cash flow. REITs may have limited financial resources, may trade less frequently and in limited volume, may engage in dilutive offerings, and may be subject to more abrupt or erratic price movements than the overall securities markets. In addition to its own expenses, the Portfolio will indirectly bear its proportionate share of any management and other expenses paid by REITs in which it invests. U.S. REITs are subject to a number of highly technical tax-related rules and requirements; and a U.S. REIT’s failure to qualify for the favorable U.S. federal income tax treatment generally available to U.S. REITs could result in corporate-level taxation, significantly reducing the return on an investment to the Portfolio.
7. FEES AND OTHER AFFILIATED TRANSACTIONS
TST serves as a funding vehicle for certain affiliated asset allocation portfolios and certain affiliated separate accounts of Transamerica Life Insurance Company (“TLIC”) and Transamerica Financial Life Insurance Company.
TAM, the Portfolio’s investment manager, is directly owned by TLIC and AUSA Holding, LLC (“AUSA”), both of which are indirect, wholly owned subsidiaries of Aegon Ltd. TLIC is owned by Commonwealth General Corporation (“Commonwealth”). Commonwealth and AUSA are wholly owned by Transamerica Corporation (DE). Transamerica Corporation (DE) is wholly owned by Aegon International B.V., which is wholly owned by Aegon Ltd., a Bermuda exempted company with liability limited by shares (formerly, Aegon NV, a Netherlands corporation) and a publicly traded international insurance group.
Transamerica Fund Services, Inc. (“TFS”) is the Portfolio’s transfer agent. Transamerica Capital, Inc. (“TCI”) is the Portfolio’s distributor/principal underwriter. TAM, TFS and TCI are affiliates of Aegon Ltd.
Certain officers and trustees of the Portfolio may also be officers and/or trustees of TAM, TFS and TCI. No interested trustee who is deemed an interested person due to current or former service with TAM or an affiliate of TAM receives compensation from the Portfolio. The Portfolio does pay non-interested persons (independent trustees), as disclosed in Trustee and CCO fees within the Statement of Operations.
Investment management fees: TAM serves as the Portfolio’s investment manager, performing administration as well as investment advisory services. TAM renders investment advisory, supervisory, and administration services under an investment management agreement and the Portfolio pays a single management fee, which is reflected in Investment management fees within the Statement of Operations.
The Portfolio pays a management fee to TAM based on daily average net assets at the following rates:
|
|
|
|
|
| Breakpoints |
|
Rate |
|
|
|
| First $500 million |
|
|
0.805 |
% |
| Over $500 million up to $1 billion |
|
|
0.770 |
|
| Over $1 billion |
|
|
0.750 |
|
|
|
|
|
|
| Transamerica Series Trust |
|
|
|
Semi-Annual Financial Statements 2024 |
|
|
Page 12 |
|
|
Transamerica Janus Mid-Cap Growth VP
NOTES TO FINANCIAL STATEMENTS (continued)
At June 30, 2024
(unaudited)
7. FEES AND OTHER AFFILIATED TRANSACTIONS (continued)
TAM has contractually agreed to waive fees and/or reimburse Portfolio expenses to the extent that the total operating expenses excluding, as applicable, acquired fund fees and expenses, interest (including borrowing costs and overdraft charges), taxes, brokerage commissions, dividend and interest expenses on securities sold short, extraordinary expenses and other expenses not incurred in the ordinary course of the Portfolio’s business, exceed the following stated annual operating expense limits to the Portfolio’s daily average net assets. To the extent an expense limit changed during the period, the prior limit is also listed below. The expenses waived and/or reimbursed, if any, are included in Expenses waived and/or reimbursed within the Statement of Operations.
|
|
|
|
|
| Class |
|
Operating Expense Limit |
|
Operating Expense Limit Effective Through |
|
|
|
| Initial Class |
|
0.88% |
|
May 1, 2025 |
| Service Class |
|
1.13 |
|
May 1, 2025 |
TAM is permitted to recapture amounts contractually waived and/or reimbursed to a class during any of the 36 months from the date on which TAM waived fees and/or reimbursed expenses for the class. A class may recapture and reimburse TAM only if such amount does not cause, on any particular business day of the Portfolio, the class’s total annual operating expenses (after the recapture is taken into account) to exceed the Operating Expense Limits or any other lower limit then in effect. Amounts recaptured, if any, by TAM for the period ended June 30, 2024 are disclosed in Recapture of previously waived and/or reimbursed fees within the Statement of Operations.
TAM, on a voluntary basis and in addition to the contractual operating expense limits in effect, from time to time may waive and/or reimburse expenses of the Portfolio, or any classes thereof, to such level(s) as the Trust’s officers have determined or may reasonably determine from time to time. Any such voluntary waiver or expense reimbursement may be discontinued by TAM at any time. These amounts are not subject to recapture by TAM.
As of June 30, 2024, there are no amounts available for recapture by TAM.
Distribution and service fees: TST has a distribution plan (“Distribution Plan”) pursuant to Rule 12b-1 under the 1940 Act. Pursuant to the Distribution Plan, TST entered into a distribution agreement with TCI as the Portfolio’s distributor.
The Distribution Plan requires the Portfolio to pay distribution fees to TCI as compensation for various distribution activities, not as reimbursement for specific expenses. Under the Distribution Plan and distribution agreement, TCI, on behalf of the Portfolio, is authorized to pay various service providers, as direct payment for expenses incurred in connection with distribution of the Portfolio’s shares.
The fee on the Service Class shares is paid to the insurance companies for providing services and account maintenance for the policyholders who invest in the variable insurance products which invest in the Service Class shares. TCI has determined that it will not seek payment for the distribution expenses incurred by the Portfolio with respect to the Initial Class shares before May 1, 2025. Prior to TCI seeking distribution expenses on Initial Class shares, policy and contract owners will be notified in advance. The Portfolio will pay fees relating to Service Class shares. The distribution and service fees are included in Distribution and service fees within the Statement of Operations.
The Portfolio is authorized under the Distribution Plan to pay fees to TCI based on daily average net assets of each applicable class up to the following annual rates:
|
|
|
|
|
| Class |
|
Rate |
|
|
| Initial Class |
|
|
0.15 |
% |
| Service Class |
|
|
0.25 |
|
Transfer agent costs: TFS provides transfer agency services under an intercompany agreement with TAM. TFS has outsourced the provision of certain sub-transfer agency services to SS&C Global Investor & Distribution Solutions, Inc. (“SS&C GIDS”). The Portfolio does not pay a separate transfer agent fee to TAM or TFS but does pay certain expenses to SS&C GIDS related to applicable sub-transfer agency services. For the period ended June 30, 2024, (i) the expenses paid to SS&C GIDS by the Portfolio are referred to as transfer agent costs and are included within the Statement of Operations and (ii) the expenses payable to SS&C GIDS by the Portfolio are referred to as transfer agent costs within the Statement of Assets and Liabilities.
|
|
|
|
|
| Transamerica Series Trust |
|
|
|
Semi-Annual Financial Statements 2024 |
|
|
Page 13 |
|
|
Transamerica Janus Mid-Cap Growth VP
NOTES TO FINANCIAL STATEMENTS (continued)
At June 30, 2024
(unaudited)
7. FEES AND OTHER AFFILIATED TRANSACTIONS (continued)
Brokerage commissions: The Portfolio incurred no brokerage commissions on security transactions placed with affiliates of the investment manager or sub-adviser(s) for the period ended June 30, 2024.
8. PURCHASES AND SALES OF SECURITIES
For the period ended June 30, 2024, the cost of securities purchased and proceeds from securities sold (excluding short-term securities) are as follows:
|
|
|
|
|
|
|
| Purchases of Securities |
|
Sales/Maturities of Securities |
| Long-Term |
|
U.S. Government |
|
Long-Term |
|
U.S. Government |
| $ 58,593,639 |
|
$ — |
|
$ 234,596,933 |
|
$ — |
9. FEDERAL INCOME TAXES AND DISTRIBUTIONS TO SHAREHOLDERS
The Portfolio has not made any provision for federal income or excise taxes due to its policy to distribute all of its taxable income and capital gains to its shareholders and otherwise qualify as a regulated investment company under Subchapter M of the Internal Revenue Code. The Portfolio recognizes the tax benefits of uncertain tax positions only where the position is “more likely than not” to be sustained assuming examination by tax authorities. The Portfolio’s tax returns remain subject to examination by the Internal Revenue Service and state tax authorities three years from the date of filing for federal purposes and four years from the date of filing for state purposes. Management has evaluated the Portfolio’s tax provisions taken for all open tax years, and has concluded that no provision for income tax is required in the Portfolio’s financial statements. If applicable, the Portfolio recognizes interest accrued related to unrecognized tax benefits in relation to interest and penalties expense in Other within the Statement of Operations. The Portfolio identifies its major tax jurisdictions as U.S. Federal, the state of Colorado, and foreign jurisdictions where the Portfolio makes significant investments; however, the Portfolio is not aware of any tax positions for which it is reasonably possible that the total amounts of unrecognized tax benefits will change materially in the next twelve months. Distributions are determined in accordance with income tax regulations, which may differ from GAAP.
As of June 30, 2024, the approximate cost for U.S. federal income tax purposes, and the aggregate gross/net unrealized appreciation (depreciation) in the value of investments (including securities sold short and derivatives, if any) are as follows:
|
|
|
|
|
|
|
| Cost |
|
Gross Appreciation |
|
Gross (Depreciation) |
|
Net Appreciation (Depreciation) |
|
|
|
|
| $ 770,897,585 |
|
$ 207,631,467 |
|
$ (72,362,510) |
|
$ 135,268,957 |
10. NEW ACCOUNTING PRONOUNCEMENT
In June 2022, the Financial Accounting Standards Board issued Accounting Standards Update No. 2022-03 (“ASU 2022-03”), “Fair Value Measurement of Equity Securities Subject to Contractual Sale Restrictions” (“Topic 820”). ASU 2022-03 clarifies the guidance in Topic 820, related to the measurement of the fair value of an equity security subject to contractual sale restrictions, where it eliminates the need to apply a discount to fair value of these securities, and introduces disclosure requirements related to such equity securities. The guidance is effective for fiscal years, and interim periods within those fiscal years, beginning after December 15, 2023, and allows for early adoption. Management is currently evaluating the implications, if any, of the additional requirements and their impact on the Portfolio’s financial statements.
Please see TST’s most recent report on Form N-CSR, available at: www.transamerica.com/annuities/prospectus, for additional information. For the most recently filed complete proxy voting records for the Trust please visit: https://www.transamerica.com/sites/default/files/files/e070d/TST%20N-PX%202021.pdf
|
|
|
|
|
| Transamerica Series Trust |
|
|
|
Semi-Annual Financial Statements 2024 |
|
|
Page 14 |
|
|
Transamerica Janus Mid-Cap Growth VP
MANAGEMENT AND SUB-ADVISORY AGREEMENT — CONTRACT RENEWAL
(unaudited)
At a meeting of the Board of Trustees of Transamerica Series Trust (the “Trustees” or the “Board”) held on June 12-13, 2024, the Board considered the renewal of the management agreement (the “Management Agreement”) between Transamerica Asset Management, Inc. (“TAM”) and Transamerica Series Trust, on behalf of Transamerica Janus Mid-Cap Growth VP (the “Portfolio”). The Board also considered the renewal of the investment sub-advisory agreement (the “Sub-Advisory Agreement” and together with the Management Agreement, the “Agreements”) for the Portfolio between TAM and Janus Henderson Investors US LLC (the “Sub-Adviser”).
Following its review and consideration, the Board determined that the terms of the Management Agreement and Sub-Advisory Agreement were reasonable and that the renewal of each of the Agreements was in the best interests of the Portfolio and the holders invested in the Portfolio. The Board, including the independent members of the Board (the “Independent Trustees”), unanimously approved the renewal of each of the Agreements through June 30, 2025.
Prior to reaching their decision, the Trustees requested and received from TAM and the Sub-Adviser certain information. They then reviewed such information as they deemed reasonably necessary to evaluate the Agreements, including information they had previously received from TAM and the Sub-Adviser as part of their regular oversight of the Portfolio, and knowledge they gained over time through meeting with TAM and the Sub-Adviser. Among other materials, the Trustees considered comparative fee, expense and performance information prepared by Broadridge Financial Solutions, Inc. (“Broadridge”), an independent provider of mutual fund performance information, as well as fee, expense and profitability information prepared by TAM. In addition, TAM provided the Board with additional supplemental comparative performance information. To the extent applicable, the Trustees considered information about fees and performance of comparable funds and/or accounts managed by the Sub-Adviser. The Board also considered reductions to the Portfolio’s expense limits, if any, that took effect after the last renewal of the Agreements. In their review, the Trustees also sought to identify instances in which the Portfolio’s performance, fees, total expenses and/or profitability appeared to be outliers within its respective peer group or other comparative metrics and sought to understand the reasons for such comparative positions.
In their deliberations, the Independent Trustees met privately without representatives of TAM or the Sub-Adviser present and were represented throughout the process by their independent legal counsel. In considering the proposed continuation of each of the Agreements, the Trustees evaluated and weighed a number of considerations that they believed to be relevant in light of the legal advice furnished to them by counsel, including independent legal counsel, and made a decision in the exercise of their own business judgment. They based their decisions on the considerations discussed below, among others, although they did not identify any particular consideration or item of information that was controlling of their decisions, and each Trustee may have attributed different weights to the various factors.
Nature, Extent and Quality of the Services Provided
The Board considered the nature, extent and quality of the services provided by TAM and the Sub-Adviser to the Portfolio in the past and the services anticipated to be provided in the future. The Board also considered the investment approach for the Portfolio; the experience, capability and integrity of TAM’s senior management; the financial resources of TAM; TAM’s management oversight process; TAM’s and the Sub-Adviser’s responsiveness to any questions by the Trustees; and the professional qualifications and compensation program of the portfolio management team of the Sub-Adviser. The Trustees noted that they receive, on a quarterly basis, an execution analysis from Capital Institutional Services, Inc. (CAPIS), an independent provider of trade analyses, for the Sub-Adviser and a comparison of trading results against a peer universe of managers.
The Board also considered the continuous and regular investment management and other services provided by TAM, when acting as a manager of managers, for the portion of the management fee it retains from the Portfolio after payment of the sub-advisory fees. The Board noted that the investment management and other services provided by TAM include the design, development and ongoing review and evaluation of the Portfolio and its investment strategy; the selection, oversight and monitoring of one or more investment sub-advisers to perform certain duties with respect to the Portfolio; ongoing portfolio trading oversight and analysis; risk management oversight and analysis; design, development, implementation and ongoing review and evaluation of a process for the valuation of Portfolio investments; design, development, implementation and ongoing review and evaluation of a compliance program for the Portfolio; design, development, implementation and ongoing review and evaluation of a process for the voting of proxies and exercise of rights to consent to corporate action for Portfolio investments; participation in Board meetings and oversight of preparation of materials for the Board, including materials for Board meetings and regular communications with the Board; oversight of preparation of the Portfolio’s prospectus, statement of additional information, shareholder reports and other disclosure materials and regulatory filings for the Portfolio; and ongoing cash management services for the Portfolio. The Board considered that TAM’s investment management services also include the provision of supervisory and administrative services to the Portfolio. The Board also noted that TAM, as part of the services it provides to all Transamerica mutual funds, including the Portfolio, oversees the services provided by the funds’ custodian, transfer agent, independent accountant and legal counsel and supervises the performance of the recordkeeping and holder service functions of the funds.
Investment Performance
In addition, the Board considered the short- and longer-term performance of the Portfolio in light of its investment objective, policies and strategies, including relative performance against (i) a peer universe of comparable mutual funds, as prepared by Broadridge, and (ii) the Portfolio’s benchmarks, in each case for various trailing periods ended December 31, 2023. Based on these considerations, the Board determined that TAM and the Sub-Adviser can provide investment and related services that are appropriate in scope and extent in light of
|
|
|
|
|
| Transamerica Series Trust |
|
|
|
Semi-Annual Financial Statements 2024 |
|
|
Page 15 |
|
|
Transamerica Janus Mid-Cap Growth VP
MANAGEMENT AND SUB-ADVISORY AGREEMENT — CONTRACT RENEWAL (continued)
(unaudited)
the Portfolio’s investment objectives, policies and strategies and operations, the competitive landscape of the investment company business and investor needs. The Board’s conclusions as to the Portfolio’s performance are summarized below. For purposes of its review, the Board generally used the performance of Service Class Shares. In describing the Portfolio’s performance relative to its peer universe, the summary conclusions characterize performance for the relevant periods in relation to whether it was “above,” “below” or “in line with” the peer universe median and do so using quintile rankings prepared by Broadridge. For simplicity, performance is described as “above” the median if the Portfolio’s performance ranked anywhere in the first or second quintiles, as “below” the median if it ranked anywhere in the fourth or fifth quintiles, or “in line with” the median if it ranked anywhere in the third quintile (i.e., even if its precise return was somewhat above or somewhat below the precise median return).
When considering the Portfolio’s performance, the Trustees considered any representations made by TAM regarding the appropriateness of certain peer groups and benchmarks. They recognized that performance reflects a snapshot of a period as of a specific date, and that consideration of performance data for a different period could generate significantly different performance results. The Trustees also recognized that even longer-term performance can be negatively affected by performance over a short-term period when that short-term performance is significantly below the performance of the comparable benchmark or universe of peer funds.
The Board noted that the performance of Service Class Shares of the Portfolio was above the median for its peer universe for the past 3-year period, in line with the median for the past 5-year period and below the median for the past 1- and 10-year periods. The Board also noted that the performance of Service Class Shares of the Portfolio was above the benchmark that TAM utilizes to measure performance of the Portfolio for the past 3-year period and below the benchmark for the past 1-, 5- and 10-year periods. The Board noted that the Sub-Adviser had commenced sub-advising the Portfolio on May 1, 2016 pursuant to its current investment objective and investment strategies.
Management Fee and Sub-Advisory Fees and Total Expense Ratio
The Board considered the management fee and total expense ratio of the Portfolio, including information provided by Broadridge comparing the management fee and total expense ratio of the Portfolio to the management fees and total expense ratios of comparable investment companies in both a peer group and broader peer universe compiled by Broadridge. The Board’s conclusions as to the Portfolio’s management fee and total expense ratio are summarized below. For purposes of its review, the Board generally used the actual total expenses (i.e., expenses reflecting any waivers and/or reimbursements) of Service Class Shares. In describing the Portfolio’s management fee and total expense ratio relative to its peer group and peer universe, the summary conclusions characterize management fees and total expense ratios for the relevant periods in relation to whether they were “above,” “below” or “in line with” the peer group or peer universe median and do so using quintile rankings prepared by Broadridge. For simplicity, management fees and total expense ratios are described as “above” the median if the Portfolio’s management fee or total expense ratio ranked anywhere in the fourth or fifth quintiles, as “below” the median if it ranked anywhere in the first or second quintiles, or “in line with” the median if it ranked anywhere in the third quintile (i.e., even if its precise management fee or total expense ratio was somewhat above or somewhat below the precise median management fee or total expense ratio).
The Board also considered the fees charged by the Sub-Adviser for sub-advisory services, as well as the portion of the Portfolio’s management fee retained by TAM following payment of the sub-advisory fee and how the portion of the contractual management fee retained by TAM at a specified asset level compared to the portions retained by other investment advisers managing mutual funds with similar investment strategies as calculated by an independent provider of information.
The Board noted that the Portfolio’s contractual management fee was above the median for its peer group and in line with the median for its peer universe and that the actual total expenses (i.e., expenses reflecting any waivers and/or reimbursements) of Service Class Shares of the Portfolio were above the medians for its peer group and peer universe. The Trustees also considered that TAM has entered into an expense limitation arrangement with the Portfolio, which may result in TAM waiving fees for the benefit of holders.
On the basis of these considerations, together with the other information it considered, the Board determined that the management and sub-advisory fees to be received by TAM and the Sub-Adviser under the Management Agreement and Sub-Advisory Agreement are reasonable in light of the services provided.
Cost of Services Provided and Level of Profitability
The Board reviewed information provided by TAM about the cost of providing and procuring fund management services, as well as the costs of the provision of administration, transfer agency and other services, to the Portfolio and to Transamerica Series Trust as a whole by TAM and its affiliates. The Board considered the profitability of TAM and its affiliates in providing these services for the Portfolio and Transamerica Series Trust as a whole. The Trustees recognized the competitiveness of the mutual fund industry and the importance of an investment adviser’s long-term profitability, including for maintaining company and management stability and accountability.
The Board also considered the allocation methodology used for calculating the profitability of TAM and its affiliates. The Board noted that the revenue and expense allocation methodology used by TAM to estimate its profitability with respect to its relationship with the Portfolio had been reviewed previously by an independent consultant. The Trustees considered that TAM reported that it had not made material changes to this methodology, and that the methodology had been applied consistently for the Portfolio.
|
|
|
|
|
| Transamerica Series Trust |
|
|
|
Semi-Annual Financial Statements 2024 |
|
|
Page 16 |
|
|
Transamerica Janus Mid-Cap Growth VP
MANAGEMENT AND SUB-ADVISORY AGREEMENT — CONTRACT RENEWAL (continued)
(unaudited)
With respect to the Sub-Adviser, the Board noted that the sub-advisory fee is the product of arm’s-length negotiation between TAM and the Sub-Adviser, which is not affiliated with TAM, and is paid by TAM and not the Portfolio. As a result, the Board focused on the profitability of TAM and its affiliates with respect to the Portfolio.
Based on this information, the Board determined that the profitability of TAM and its affiliates from their relationships with the Portfolio was not excessive.
Economies of Scale
The Board considered economies of scale with respect to the management of the Portfolio, whether the Portfolio had appropriately benefited from any economies of scale and whether there was the potential for realization of any future economies of scale. The Board also considered the existence of economies of scale with respect to management of the Transamerica mutual funds overall and the extent to which the Portfolio benefited from any economies of scale. The Board recognized that, as the Portfolio’s assets increase, any economies of scale realized by TAM or the Sub-Adviser may not directly correlate with each other or with any economies of scale that might be realized by the Portfolio. The Board considered the Portfolio’s management fee schedule and the existence of breakpoints and also considered the extent to which TAM shared economies of scale, if any, with the Portfolio through undertakings to limit or reimburse Portfolio expenses and to invest in maintaining and developing its capabilities and services. The Board also considered the Sub-Adviser’s sub-advisory fee schedule and the existence of breakpoints, if any, and how such breakpoints relate to any breakpoints in the Portfolio’s management fee schedule. The Trustees concluded that the Portfolio’s fee structure reflected an appropriate sharing of any efficiencies or economies of scale to date and noted that they will have the opportunity to periodically reexamine the appropriateness of the management fee payable to TAM and the fee paid to the Sub-Adviser in light of any economies of scale experienced in the future.
Benefits to TAM, its Affiliates and/or the Sub-Adviser from their Relationships with the Portfolio
The Board considered other benefits derived by TAM, its affiliates, and/or the Sub-Adviser from their relationships with the Portfolio. The Board noted that TAM does not receive benefits from research obtained with commissions paid to broker-dealers for portfolio transactions (commonly referred to as “soft dollars”) as a result of its relationship with the Portfolio and that TAM believes the use of soft dollars by the Sub-Adviser is generally appropriate and in the best interests of the Portfolio. The Board also noted that the Sub-Adviser participates in a brokerage program pursuant to which a portion of brokerage commissions paid by the Portfolio is recaptured for the benefit of the Portfolio and the holders, thus limiting the amount of soft dollar arrangements the Sub-Adviser may engage in with respect to the Portfolio’s brokerage transactions.
Other Considerations
The Board noted that TAM has made a substantial commitment to the recruitment and retention of high-quality personnel and maintains the financial, compliance and operational resources reasonably necessary to manage the Portfolio in a professional manner that is consistent with the best interests of the Portfolio and the holders. In this regard, the Board favorably considered the procedures and policies TAM has in place to enforce compliance with applicable laws and regulations and oversee the portfolio management activities of the Sub-Adviser. The Board also noted that TAM has made an entrepreneurial commitment and undertaken certain business risks with respect to the management and success of the Portfolio.
Conclusion
After consideration of the factors described above, as well as other factors, the Trustees, including the Independent Trustees, concluded that the renewal of the Management Agreement and the Sub-Advisory Agreement was in the best interests of the Portfolio and the holders and voted to approve the renewal of the Agreements.
|
|
|
|
|
| Transamerica Series Trust |
|
|
|
Semi-Annual Financial Statements 2024 |
|
|
Page 17 |
|
|
PROXY VOTING POLICIES AND PROCEDURES AND QUARTERLY PORTFOLIO HOLDINGS
(unaudited)
A description of Transamerica Series Trust’s (the “Trust”) proxy voting policies and procedures is available in the Statement of Additional Information of the Portfolios, available without charge upon request by calling 1-800-851-9777 (toll free) or on the Securities and Exchange Commission’s (“SEC”) website at http://www.sec.gov.
In addition, the Portfolio is required to file Form N-PX, with their complete proxy voting records for the most recent 12 months ended June 30th, no later than August 31st of each year. The Form is available without charge: (1) on the Transamerica Funds website at https://www.transamerica.com/sites/default/files/files/e070d/TST%20N-PX%202021.pdf; and (2) on the SEC’s website at http://www.sec.gov.
Each fiscal quarter, the Portfolios, except Transamerica BlackRock Government Money Market VP, will file with the SEC a complete schedule of its monthly portfolio holdings on Form N-PORT. The Portfolios’ holdings as of the end of the third month of every fiscal quarter, as reported on Form N-PORT, will be publicly available on the SEC’s website at http://www.sec.gov within 60 days of the end of the fiscal quarter.
On a monthly basis, Transamerica BlackRock Government Money Market VP will file with the SEC portfolio holdings information on Form N-MFP3. A complete schedule of portfolio holdings is also available at www.transamerica.com.
You may also visit the Trust’s website at www.transamerica.com/annuities/prospectus for this and other information about the Portfolios and the Trust.
Important Notice Regarding Delivery of Shareholder Documents
Every year we provide shareholders informative materials such as the Transamerica Series Trust Annual Report, the Transamerica Series Trust Prospectus, and other required documents that keep you informed regarding your Portfolios. To the extent provided by mail, Transamerica Series Trust will only send one piece per mailing address, a method that saves your Portfolios money by reducing mailing and printing costs. We will continue to do this unless you tell us not to. To elect to receive individual mailings, simply call a Transamerica Customer Service Representative toll free at 1-800-851-9777, 8 a.m. to 7 p.m. Eastern Time, Monday-Friday. Your request will take effect within 30 days.
|
|
|
|
|
| Transamerica Series Trust |
|
|
|
Semi-Annual Financial Statements 2024 |
|
|
Page 18 |
|
|
NOTICE OF PRIVACY POLICY
(unaudited)
Your privacy is very important to us. We want you to understand what information we collect and how we use it. We collect and use “nonpublic personal information” in connection with providing our customers with a broad range of financial products and services as effectively and conveniently as possible. We treat nonpublic personal information in accordance with our Privacy Policy.
What Information We Collect and From Whom We Collect It
We may collect nonpublic personal information about you from the following sources:
| • |
|
Information we receive from you on applications or other forms, such as your name, address, and account number; |
| • |
|
Information about your transactions with us, our affiliates, or others, such as your account balance and purchase/redemption history; and |
| • |
|
Information we receive from non-affiliated third parties, including consumer reporting agencies. |
What Information We Disclose and To Whom We Disclose It
We do not disclose any nonpublic personal information about current or former customers to anyone without their express consent, except as permitted by law. We may disclose the nonpublic personal information we collect, as described above, to persons or companies that perform services on our behalf and to other financial institutions with which we have joint marketing agreements. We will require these companies to protect the confidentiality of your nonpublic personal information and to use it only to perform the services for which we have hired them.
Our Security Procedures
We restrict access to your nonpublic personal information and only allow disclosures to persons and companies as permitted by law to assist in providing products or services to you. We maintain physical, electronic, and procedural safeguards to protect your nonpublic personal information and to safeguard the disposal of certain consumer information.
Contact Us
If you have any questions about our Privacy Policy, please call 1-800-851-9777 on any business day between 8 a.m. and 7 p.m. Eastern Time.
Note: This Privacy Policy applies only to customers that have a direct relationship with us or our affiliates. If you own shares of our portfolios in the name of a third party such as a bank or broker-dealer, its privacy policy may apply to you instead of ours.
|
|
|
|
|
| Transamerica Series Trust |
|
|
|
Semi-Annual Financial Statements 2024 |
|
|
Page 19 |
|
|
PO Box 219945
Kansas City, MO 64121-9945
|
|
|
| Distributor: |
|
Transamerica Capital, Inc. |
|
|
PO Box 219945 |
|
|
Kansas City, MO 64121-9945 |
|
|
|
|
Customer Service: 1-800-851-9777 |
Transamerica Series Trust Semi-Annual Financial Statements
June 30, 2024
1801 California St., Suite 5200
Denver, CO 80202
Distributor: Transamerica Capital, Inc.
Customer Service: 1-800-851-9777
|
| The following pages contain the most recent semi-annual financial statements for the investment options in which you are invested. In compliance with Securities and Exchange Commission regulations, we present these reports on an annual and semi-annual basis with the hope that they will foster greater understanding of the investment options’ holdings, performance, financial data, accounting policies and other issues. This streamlined version provides information only on the investment options in which you are invested. If you have any questions about these reports, please do not hesitate to contact your financial professional. As always, we thank you for your trust and the opportunity to serve you. |
Transamerica JPMorgan Asset Allocation - Conservative VP
SCHEDULE OF INVESTMENTS
At June 30, 2024
(unaudited)
|
|
|
|
|
|
|
|
|
| |
|
Shares |
|
|
Value |
|
| |
|
|
|
| INVESTMENT COMPANIES - 97.9% |
|
|
|
|
|
| International Alternative Fund - 1.1% |
|
|
|
|
|
|
|
|
| Transamerica Unconstrained Bond (A) |
|
|
981,249 |
|
|
$ |
8,585,927 |
|
|
|
|
|
|
|
|
|
|
| International Equity Funds - 6.7% |
|
|
|
|
|
|
|
|
| Transamerica BlackRock Real Estate Securities VP (A) |
|
|
233,093 |
|
|
|
2,184,085 |
|
| Transamerica Emerging Markets Opportunities (A) |
|
|
1,431,895 |
|
|
|
11,397,886 |
|
| Transamerica International Equity (A) |
|
|
439,600 |
|
|
|
9,178,845 |
|
| Transamerica International Focus (A) |
|
|
2,094,523 |
|
|
|
17,342,650 |
|
| Transamerica International Small Cap Value (A) |
|
|
949,788 |
|
|
|
14,218,318 |
|
|
|
|
|
|
|
|
|
|
|
|
|
|
|
|
|
|
|
|
54,321,784 |
|
|
|
|
|
|
|
|
|
|
| International Mixed Allocation Fund - 23.1% |
|
|
|
|
|
| Transamerica Aegon Bond VP (A) |
|
|
19,428,388 |
|
|
|
188,066,796 |
|
|
|
|
|
|
|
|
|
|
| U.S. Equity Funds - 25.4% |
|
|
|
|
|
|
|
|
| Transamerica Janus Mid-Cap Growth VP (A) |
|
|
2,897 |
|
|
|
93,048 |
|
| Transamerica JPMorgan Enhanced Index VP (A) |
|
|
1,267,658 |
|
|
|
35,190,197 |
|
| Transamerica Large Cap Value (A) |
|
|
3,614,533 |
|
|
|
50,639,610 |
|
| Transamerica Mid Cap Growth (A)(B) |
|
|
209,687 |
|
|
|
1,937,505 |
|
| Transamerica Mid Cap Value Opportunities (A) |
|
|
859 |
|
|
|
9,437 |
|
| Transamerica Small Cap Value (A) |
|
|
54,629 |
|
|
|
310,840 |
|
| Transamerica T. Rowe Price Small Cap VP (A) |
|
|
19,070 |
|
|
|
233,613 |
|
| Transamerica WMC US Growth VP (A) |
|
|
2,757,257 |
|
|
|
117,679,714 |
|
|
|
|
|
|
|
|
|
|
|
|
|
|
|
|
|
|
|
|
206,093,964 |
|
|
|
|
|
|
|
|
|
|
| U.S. Fixed Income Funds - 41.6% |
|
|
|
|
|
|
|
|
| Transamerica Core Bond (A) |
|
|
25,929,255 |
|
|
|
220,657,956 |
|
|
|
|
|
|
|
|
|
|
| |
|
Shares |
|
|
Value |
|
| |
|
|
| INVESTMENT COMPANIES (continued) |
|
| U.S. Fixed Income Funds (continued) |
|
| Transamerica Floating Rate (A) |
|
|
947,689 |
|
|
$ |
8,567,107 |
|
| Transamerica High Yield Bond (A) |
|
|
8,244,513 |
|
|
|
66,120,997 |
|
| Transamerica Long Credit (A) |
|
|
4,512,542 |
|
|
|
42,733,776 |
|
|
|
|
|
|
|
|
|
|
|
|
|
|
|
|
|
|
|
|
338,079,836 |
|
|
|
|
|
|
|
|
|
|
| Total Investment Companies
(Cost $786,316,017) |
|
|
|
|
|
|
795,148,307 |
|
|
|
|
|
|
|
|
|
|
|
|
|
| |
|
Principal |
|
|
Value |
|
| |
|
|
|
| U.S. GOVERNMENT OBLIGATION - 1.4% |
|
|
|
|
|
| U.S. Treasury - 1.4% |
|
|
|
|
|
|
|
|
| U.S. Treasury Notes |
|
|
|
|
|
|
|
|
| 4.13%, 01/31/2025 (C) |
|
$ |
11,359,400 |
|
|
|
11,280,417 |
|
|
|
|
|
|
|
|
|
|
| Total U.S. Government Obligation
(Cost $11,298,548) |
|
|
|
|
|
|
11,280,417 |
|
|
|
|
|
|
|
|
|
|
|
|
| REPURCHASE AGREEMENT - 0.7% |
|
|
|
|
|
| Fixed Income Clearing Corp., 2.50% (D), dated 06/28/2024, to be repurchased at $6,058,315 on 07/01/2024. Collateralized by a U.S. Government Obligation, 4.50%, due 03/31/2026, and with a value of $6,178,340. |
|
|
6,057,053 |
|
|
|
6,057,053 |
|
|
|
|
|
|
|
|
|
|
| Total Repurchase Agreement
(Cost $6,057,053) |
|
|
|
6,057,053 |
|
|
|
|
|
|
|
|
|
|
| Total Investments
(Cost $803,671,618) |
|
|
|
812,485,777 |
|
|
|
|
|
|
|
|
|
|
| Net Other Assets (Liabilities) - (0.0)% (E) |
|
|
|
(228,097) |
|
|
|
|
|
|
|
|
|
|
|
|
| Net Assets - 100.0% |
|
|
$ |
812,257,680 |
|
|
|
|
|
|
|
|
|
|
FUTURES CONTRACTS:
|
|
|
|
|
|
|
|
|
|
|
|
|
|
|
|
|
|
|
|
|
|
|
| Long Futures Contracts |
|
| Description |
|
Number of Contracts |
|
Expiration Date |
|
|
Notional Amount |
|
|
Value |
|
|
Unrealized Appreciation |
|
|
Unrealized Depreciation |
| 5-Year U.S. Treasury Notes |
|
571 |
|
|
09/30/2024 |
|
|
$ |
60,460,227 |
|
|
$ |
60,856,109 |
|
|
$ |
395,882 |
|
|
$ |
— |
|
| 10-Year Canada Government Bonds |
|
371 |
|
|
09/18/2024 |
|
|
|
32,357,404 |
|
|
|
32,561,653 |
|
|
|
204,249 |
|
|
|
— |
|
| E-Mini Russell 2000® Index |
|
97 |
|
|
09/20/2024 |
|
|
|
9,843,664 |
|
|
|
10,015,250 |
|
|
|
171,586 |
|
|
|
— |
|
| Euro-BTP Italy Government Bonds |
|
351 |
|
|
09/06/2024 |
|
|
|
43,958,556 |
|
|
|
43,337,928 |
|
|
|
— |
|
|
|
(620,628 |
) |
| MSCI EAFE Mini Index |
|
170 |
|
|
09/20/2024 |
|
|
|
19,721,202 |
|
|
|
19,917,200 |
|
|
|
195,998 |
|
|
|
— |
|
| MSCI Emerging Markets Index |
|
666 |
|
|
09/20/2024 |
|
|
|
36,175,355 |
|
|
|
36,237,060 |
|
|
|
61,705 |
|
|
|
— |
|
| S&P 500® E-Mini Index |
|
111 |
|
|
09/20/2024 |
|
|
|
30,539,389 |
|
|
|
30,644,325 |
|
|
|
104,936 |
|
|
|
— |
|
| S&P/TSX 60 Index |
|
32 |
|
|
09/19/2024 |
|
|
|
6,071,456 |
|
|
|
6,130,770 |
|
|
|
59,314 |
|
|
|
— |
|
| U.K. Gilt |
|
214 |
|
|
09/26/2024 |
|
|
|
26,214,761 |
|
|
|
26,394,371 |
|
|
|
179,610 |
|
|
|
— |
|
| Total |
|
|
$ |
1,373,280 |
|
|
$ |
|
(620,628) |
|
|
|
|
|
|
|
|
|
|
|
|
|
|
|
|
|
|
|
|
|
|
|
|
|
|
|
|
|
|
|
|
|
| Short Futures Contracts |
|
| Description |
|
Number of Contracts |
|
Expiration Date |
|
|
Notional Amount |
|
|
Value |
|
|
Unrealized Appreciation |
|
|
Unrealized Depreciation |
| 2-Year U.S. Treasury Notes |
|
(357) |
|
|
09/30/2024 |
|
|
$ |
(72,718,530 |
) |
|
$ |
(72,906,094 |
) |
|
$ |
— |
|
|
$ |
(187,564 |
) |
| 10-Year U.S. Treasury Notes |
|
(390) |
|
|
09/19/2024 |
|
|
|
(42,640,196 |
) |
|
|
(42,893,906 |
) |
|
|
— |
|
|
|
(253,710 |
) |
| 10-Year U.S. Treasury Ultra Notes |
|
(273) |
|
|
09/19/2024 |
|
|
|
(30,699,130 |
) |
|
|
(30,994,031 |
) |
|
|
— |
|
|
|
(294,901 |
) |
| CAD Currency |
|
(252) |
|
|
09/17/2024 |
|
|
|
(18,405,826 |
) |
|
|
(18,446,400 |
) |
|
|
— |
|
|
|
(40,574 |
) |
| EURO STOXX 50® Index |
|
(251) |
|
|
09/20/2024 |
|
|
|
(13,117,340 |
) |
|
|
(13,241,510 |
) |
|
|
— |
|
|
|
(124,170 |
) |
| German Euro Bund |
|
(246) |
|
|
09/06/2024 |
|
|
|
(34,320,906 |
) |
|
|
(34,675,791 |
) |
|
|
— |
|
|
|
(354,885 |
) |
The Notes to Financial Statements are an integral part of this report.
|
|
|
|
|
| Transamerica Series Trust |
|
|
|
Semi-Annual Financial Statements 2024 |
|
|
Page 1 |
|
|
Transamerica JPMorgan Asset Allocation - Conservative VP
SCHEDULE OF INVESTMENTS (continued)
At June 30, 2024
(unaudited)
|
|
|
|
|
|
|
|
|
|
|
|
|
|
|
|
|
|
|
|
|
|
|
|
|
|
|
|
|
|
|
| FUTURES CONTRACTS (continued): |
|
| Short Futures Contracts (continued) |
| Description |
|
Number of Contracts |
|
Expiration Date |
|
Notional Amount |
|
Value |
|
Unrealized Appreciation |
|
Unrealized Depreciation |
| JPY Currency |
|
|
|
(202 |
) |
|
|
|
09/16/2024 |
|
|
|
|
$(16,286,373 |
) |
|
|
|
$(15,888,562 |
) |
|
|
$ |
397,811 |
|
|
|
$ |
— |
|
| TOPIX Index |
|
|
|
(14 |
) |
|
|
|
09/12/2024 |
|
|
|
|
(2,362,450 |
) |
|
|
|
(2,445,584 |
) |
|
|
|
— |
|
|
|
|
(83,134) |
|
| U.S. Treasury Ultra Bonds |
|
|
|
(62 |
) |
|
|
|
09/19/2024 |
|
|
|
|
(7,685,442 |
) |
|
|
|
(7,771,313 |
) |
|
|
|
— |
|
|
|
|
(85,871) |
|
|
|
|
|
|
|
|
|
|
|
|
|
|
|
|
|
|
|
|
|
|
|
|
|
|
|
| Total |
|
|
|
|
|
|
|
|
|
|
|
|
|
|
|
|
|
|
|
|
|
|
$ |
397,811 |
|
|
|
$ |
(1,424,809) |
|
|
|
|
|
|
|
|
|
|
|
|
|
|
|
|
|
|
|
|
|
|
|
|
|
|
|
| Total Futures Contracts |
|
|
|
|
|
|
|
|
|
|
|
|
|
|
|
|
|
|
|
|
|
|
$ |
1,771,091 |
|
|
|
$ |
(2,045,437) |
|
|
|
|
|
|
|
|
|
|
|
|
|
|
|
|
|
|
|
|
|
|
|
|
|
|
|
INVESTMENT VALUATION:
|
|
|
|
|
|
|
|
|
|
|
|
|
|
|
|
|
| Valuation Inputs (F) |
|
|
|
|
|
|
|
|
|
|
|
|
| |
|
Level 1 - Unadjusted Quoted Prices |
|
|
Level 2 - Other Significant Observable Inputs |
|
|
Level 3 - Significant Unobservable Inputs |
|
|
Value |
|
| ASSETS |
|
|
|
|
|
|
|
|
|
|
|
|
|
|
|
|
| Investments |
|
|
|
|
|
|
|
|
|
|
|
|
|
|
|
|
| Investment Companies |
|
$ |
795,148,307 |
|
|
$ |
— |
|
|
$ |
— |
|
|
$ |
795,148,307 |
|
| U.S. Government Obligation |
|
|
— |
|
|
|
11,280,417 |
|
|
|
— |
|
|
|
11,280,417 |
|
| Repurchase Agreement |
|
|
— |
|
|
|
6,057,053 |
|
|
|
— |
|
|
|
6,057,053 |
|
|
|
|
|
|
|
|
|
|
|
|
|
|
|
|
|
|
| Total Investments |
|
$ |
795,148,307 |
|
|
$ |
17,337,470 |
|
|
$ |
— |
|
|
$ |
812,485,777 |
|
|
|
|
|
|
|
|
|
|
|
|
|
|
|
|
|
|
| Other Financial Instruments |
|
|
|
|
|
|
|
|
|
|
|
|
|
|
|
|
| Futures Contracts (G) |
|
$ |
1,771,091 |
|
|
$ |
— |
|
|
$ |
— |
|
|
$ |
1,771,091 |
|
|
|
|
|
|
|
|
|
|
|
|
|
|
|
|
|
|
| Total Other Financial Instruments |
|
$ |
1,771,091 |
|
|
$ |
— |
|
|
$ |
— |
|
|
$ |
1,771,091 |
|
|
|
|
|
|
|
|
|
|
|
|
|
|
|
|
|
|
| LIABILITIES |
|
|
|
|
|
|
|
|
|
|
|
|
|
|
|
|
| Other Financial Instruments |
|
|
|
|
|
|
|
|
|
|
|
|
|
|
|
|
| Futures Contracts (G) |
|
$ |
(2,045,437 |
) |
|
$ |
— |
|
|
$ |
— |
|
|
$ |
(2,045,437 |
) |
|
|
|
|
|
|
|
|
|
|
|
|
|
|
|
|
|
| Total Other Financial Instruments |
|
$ |
(2,045,437 |
) |
|
$ |
— |
|
|
$ |
— |
|
|
$ |
(2,045,437 |
) |
|
|
|
|
|
|
|
|
|
|
|
|
|
|
|
|
|
FOOTNOTES TO SCHEDULE OF INVESTMENTS:
| (A) |
Affiliated investment in the Class I2 shares of funds within Transamerica Funds and/or affiliated investment in the Initial Class shares of funds within Transamerica Series Trust. The Portfolio’s transactions and earnings from these underlying funds are as follows: |
|
|
|
|
|
|
|
|
|
|
|
|
|
|
|
|
|
|
|
|
|
|
|
|
|
|
|
|
|
|
|
|
|
|
|
|
|
| Affiliated Investments |
|
Value December 31, 2023 |
|
|
Purchases at Cost |
|
|
Proceeds from Sales |
|
|
Net Realized Gain
(Loss) |
|
|
Net Change in Unrealized Appreciation (Depreciation) |
|
|
Value June 30, 2024 |
|
|
Shares as of June 30, 2024 |
|
|
Dividend Income |
|
|
Net Capital Gain Distributions |
|
|
|
|
|
|
|
|
|
|
|
| Transamerica Aegon Bond VP |
|
|
$188,066,796 |
|
|
|
$— |
|
|
|
$— |
|
|
|
$— |
|
|
|
$— |
|
|
|
$188,066,796 |
|
|
|
19,428,388 |
|
|
|
$— |
|
|
|
$— |
|
|
|
|
|
|
|
|
|
|
|
| Transamerica BlackRock Real Estate Securities VP |
|
|
2,265,667 |
|
|
|
— |
|
|
|
— |
|
|
|
— |
|
|
|
(81,582 |
) |
|
|
2,184,085 |
|
|
|
233,093 |
|
|
|
— |
|
|
|
— |
|
|
|
|
|
|
|
|
|
|
|
| Transamerica Core Bond |
|
|
269,436,871 |
|
|
|
5,254,491 |
|
|
|
(47,556,908 |
) |
|
|
(10,490,525 |
) |
|
|
4,014,027 |
|
|
|
220,657,956 |
|
|
|
25,929,255 |
|
|
|
5,254,491 |
|
|
|
— |
|
|
|
|
|
|
|
|
|
|
|
| Transamerica Emerging Markets Opportunities |
|
|
10,624,663 |
|
|
|
— |
|
|
|
— |
|
|
|
— |
|
|
|
773,223 |
|
|
|
11,397,886 |
|
|
|
1,431,895 |
|
|
|
— |
|
|
|
— |
|
|
|
|
|
|
|
|
|
|
|
| Transamerica Floating Rate |
|
|
8,236,632 |
|
|
|
348,972 |
|
|
|
— |
|
|
|
— |
|
|
|
(18,497 |
) |
|
|
8,567,107 |
|
|
|
947,689 |
|
|
|
348,972 |
|
|
|
— |
|
|
|
|
|
|
|
|
|
|
|
| Transamerica High Yield Bond |
|
|
67,270,065 |
|
|
|
2,107,519 |
|
|
|
(2,524,438 |
) |
|
|
27,073 |
|
|
|
(759,222 |
) |
|
|
66,120,997 |
|
|
|
8,244,513 |
|
|
|
2,107,518 |
|
|
|
— |
|
|
|
|
|
|
|
|
|
|
|
| Transamerica International Equity |
|
|
10,972,697 |
|
|
|
— |
|
|
|
(2,072,246 |
) |
|
|
354,218 |
|
|
|
(75,824 |
) |
|
|
9,178,845 |
|
|
|
439,600 |
|
|
|
— |
|
|
|
— |
|
|
|
|
|
|
|
|
|
|
|
| Transamerica International Focus |
|
|
15,696,962 |
|
|
|
12,561,960 |
|
|
|
(11,082,834 |
) |
|
|
415,516 |
|
|
|
(248,954 |
) |
|
|
17,342,650 |
|
|
|
2,094,523 |
|
|
|
— |
|
|
|
— |
|
|
|
|
|
|
|
|
|
|
|
| Transamerica International Small Cap Value |
|
|
13,429,994 |
|
|
|
— |
|
|
|
— |
|
|
|
— |
|
|
|
788,324 |
|
|
|
14,218,318 |
|
|
|
949,788 |
|
|
|
— |
|
|
|
— |
|
|
|
|
|
|
|
|
|
|
|
| Transamerica Janus Mid- Cap Growth VP |
|
|
12,311,291 |
|
|
|
— |
|
|
|
(12,733,466 |
) |
|
|
(1,647,824 |
) |
|
|
2,163,047 |
|
|
|
93,048 |
|
|
|
2,897 |
|
|
|
— |
|
|
|
— |
|
|
|
|
|
|
|
|
|
|
|
| Transamerica JPMorgan Enhanced Index VP |
|
|
27,132,089 |
|
|
|
3,692,900 |
|
|
|
— |
|
|
|
— |
|
|
|
4,365,208 |
|
|
|
35,190,197 |
|
|
|
1,267,658 |
|
|
|
— |
|
|
|
— |
|
The Notes to Financial Statements are an integral part of this report.
|
|
|
|
|
| Transamerica Series Trust |
|
|
|
Semi-Annual Financial Statements 2024 |
|
|
Page 2 |
|
|
Transamerica JPMorgan Asset Allocation - Conservative VP
SCHEDULE OF INVESTMENTS (continued)
At June 30, 2024
(unaudited)
FOOTNOTES TO SCHEDULE OF INVESTMENTS (continued):
|
|
|
|
|
|
|
|
|
|
|
|
|
|
|
|
|
|
|
|
|
|
|
|
|
|
|
|
|
|
|
|
|
|
|
|
|
| Affiliated Investments |
|
Value December 31, 2023 |
|
|
Purchases at Cost |
|
|
Proceeds from Sales |
|
|
Net Realized Gain (Loss) |
|
|
Net Change in Unrealized Appreciation (Depreciation) |
|
|
Value June 30, 2024 |
|
|
Shares as of June 30, 2024 |
|
|
Dividend Income |
|
|
Net Capital Gain Distributions |
|
|
|
|
|
|
|
|
|
|
| Transamerica Large Cap Value |
|
|
$57,850,139 |
|
|
|
$301,552 |
|
|
|
$(12,556,080 |
) |
|
|
$656,859 |
|
|
|
$4,387,140 |
|
|
|
$50,639,610 |
|
|
|
3,614,533 |
|
|
|
$301,552 |
|
|
|
$— |
|
|
|
|
|
|
|
|
|
|
|
| Transamerica Long Credit |
|
|
35,498,303 |
|
|
|
9,488,577 |
|
|
|
— |
|
|
|
— |
|
|
|
(2,253,104 |
) |
|
|
42,733,776 |
|
|
|
4,512,542 |
|
|
|
1,072,664 |
|
|
|
— |
|
|
|
|
|
|
|
|
|
|
|
| Transamerica Mid Cap Growth |
|
|
16,447,839 |
|
|
|
— |
|
|
|
(15,082,375 |
) |
|
|
(2,260,661 |
) |
|
|
2,832,702 |
|
|
|
1,937,505 |
|
|
|
209,687 |
|
|
|
— |
|
|
|
— |
|
|
|
|
|
|
|
|
|
|
|
| Transamerica Mid Cap Value Opportunities |
|
|
4,788,747 |
|
|
|
— |
|
|
|
(4,840,774 |
) |
|
|
91,458 |
|
|
|
(29,994 |
) |
|
|
9,437 |
|
|
|
859 |
|
|
|
— |
|
|
|
— |
|
|
|
|
|
|
|
|
|
|
|
| Transamerica Small Cap Value |
|
|
307,016 |
|
|
|
— |
|
|
|
— |
|
|
|
— |
|
|
|
3,824 |
|
|
|
310,840 |
|
|
|
54,629 |
|
|
|
— |
|
|
|
— |
|
|
|
|
|
|
|
|
|
|
|
| Transamerica T. Rowe Price Small Cap VP |
|
|
217,212 |
|
|
|
— |
|
|
|
— |
|
|
|
— |
|
|
|
16,401 |
|
|
|
233,613 |
|
|
|
19,070 |
|
|
|
— |
|
|
|
— |
|
|
|
|
|
|
|
|
|
|
|
| Transamerica TSW Mid Cap Value Opportunities VP |
|
|
2,202,168 |
|
|
|
— |
|
|
|
(2,268,316 |
) |
|
|
11,449 |
|
|
|
54,699 |
|
|
|
— |
|
|
|
— |
|
|
|
— |
|
|
|
— |
|
|
|
|
|
|
|
|
|
|
|
| Transamerica Unconstrained Bond |
|
|
25,792,394 |
|
|
|
709,993 |
|
|
|
(17,589,104 |
) |
|
|
65,304 |
|
|
|
(392,660 |
) |
|
|
8,585,927 |
|
|
|
981,249 |
|
|
|
709,993 |
|
|
|
— |
|
|
|
|
|
|
|
|
|
|
|
| Transamerica WMC US Growth VP |
|
|
72,248,316 |
|
|
|
28,936,031 |
|
|
|
— |
|
|
|
— |
|
|
|
16,495,367 |
|
|
|
117,679,714 |
|
|
|
2,757,257 |
|
|
|
— |
|
|
|
— |
|
|
|
|
|
|
|
|
|
|
|
|
|
|
|
|
| Total |
|
|
$840,795,861 |
|
|
|
$63,401,995 |
|
|
|
$(128,306,541 |
) |
|
|
$(12,777,133 |
) |
|
|
$32,034,125 |
|
|
|
$795,148,307 |
|
|
|
73,119,125 |
|
|
|
$9,795,190 |
|
|
|
$— |
|
|
|
|
|
|
| (B) |
Non-income producing security. |
| (C) |
All or a portion of the security has been segregated by the custodian as collateral to cover margin requirements for open futures contracts. The total value of the securities is $11,280,417. |
| (D) |
Rate disclosed reflects the yield at June 30, 2024. |
| (E) |
Percentage rounds to less than 0.1% or (0.1)%. |
| (F) |
There were no transfers in or out of Level 3 during the period ended June 30, 2024. Please reference the Investment Valuation section of the Notes to Financial Statements for more information regarding investment valuation and pricing inputs. |
| (G) |
Derivative instruments are valued at unrealized appreciation (depreciation). |
CURRENCY ABBREVIATION(S):
|
|
|
| CAD |
|
Canadian Dollar |
| JPY |
|
Japanese Yen |
PORTFOLIO ABBREVIATION(S):
|
|
|
| BTP |
|
Buoni del Tesoro Poliennali (Italian Treasury Bonds) |
| EAFE |
|
Europe, Australasia and Far East |
| STOXX |
|
Deutsche Börse Group & SIX Group Index |
| TOPIX |
|
Tokyo Price Index |
| TSX |
|
Toronto Stock Exchange |
The Notes to Financial Statements are an integral part of this report.
|
|
|
|
|
| Transamerica Series Trust |
|
|
|
Semi-Annual Financial Statements 2024 |
|
|
Page 3 |
|
|
Transamerica JPMorgan Asset Allocation - Conservative VP
|
|
|
| STATEMENT OF ASSETS AND LIABILITIES At June 30, 2024 (unaudited) |
|
STATEMENT OF OPERATIONS For the period ended June 30, 2024 (unaudited) |
|
|
|
|
|
|
|
| Assets: |
|
|
|
|
| Affiliated investments, at value (cost $786,316,017) |
|
$ |
795,148,307 |
|
| Unaffiliated investments, at value (cost $11,298,548) |
|
|
11,280,417 |
|
| Repurchase agreement, at value (cost $6,057,053) |
|
|
6,057,053 |
|
| Receivables and other assets: |
|
|
|
|
| Investments sold |
|
|
909,400 |
|
| Shares of beneficial interest sold |
|
|
170 |
|
| Dividends from affiliated investments |
|
|
1,383,627 |
|
| Interest |
|
|
194,356 |
|
| Variation margin receivable on futures contracts |
|
|
53,331 |
|
| Prepaid expenses |
|
|
3,244 |
|
|
|
| Total assets |
|
|
815,029,905 |
|
|
|
| Liabilities: |
|
|
|
|
| Payables and other liabilities: |
|
|
|
|
| Investments purchased |
|
|
2,293,027 |
|
| Shares of beneficial interest redeemed |
|
|
150,926 |
|
| Due to custodian |
|
|
20,341 |
|
| Investment management fees |
|
|
76,585 |
|
| Distribution and service fees |
|
|
125,214 |
|
| Transfer agent costs |
|
|
918 |
|
| Trustee and CCO fees |
|
|
2,587 |
|
| Audit and tax fees |
|
|
15,173 |
|
| Custody fees |
|
|
13,042 |
|
| Legal fees |
|
|
19,223 |
|
| Printing and shareholder reports fees |
|
|
38,181 |
|
| Other accrued expenses |
|
|
17,008 |
|
| |
|
| Total liabilities |
|
|
2,772,225 |
|
|
|
| Net assets |
|
$ |
812,257,680 |
|
|
|
| Net assets consist of: |
|
|
|
|
| Capital stock ($0.01 par value) |
|
$ |
925,573 |
|
| Additional paid-in capital |
|
|
892,762,232 |
|
| Total distributable earnings (accumulated losses) |
|
|
(81,430,125 |
) |
| |
|
| Net assets |
|
$ |
812,257,680 |
|
|
|
| Net assets by class: |
|
|
|
|
| Initial Class |
|
$ |
161,597,294 |
|
| Service Class |
|
|
650,660,386 |
|
|
|
| Shares outstanding: |
|
|
|
|
| Initial Class |
|
|
18,178,929 |
|
| Service Class |
|
|
74,378,374 |
|
|
|
| Net asset value and offering price per share: |
|
|
|
|
| Initial Class |
|
$ |
8.89 |
|
|
|
| Service Class |
|
|
8.75 |
|
|
|
|
|
|
|
|
| Investment income: |
|
|
|
|
| Dividend income from affiliated investments |
|
$ |
9,795,190 |
|
| Interest income from unaffiliated investments |
|
|
319,032 |
|
|
|
| Total investment income |
|
|
10,114,222 |
|
|
|
| Expenses: |
|
|
|
|
| Investment management fees |
|
|
499,247 |
|
| Distribution and service fees: |
|
|
|
|
| Service Class |
|
|
819,167 |
|
| Transfer agent costs |
|
|
4,750 |
|
| Trustee and CCO fees |
|
|
19,255 |
|
| Audit and tax fees |
|
|
15,032 |
|
| Custody fees |
|
|
14,577 |
|
| Legal fees |
|
|
34,763 |
|
| Printing and shareholder reports fees |
|
|
35,907 |
|
| Other |
|
|
31,051 |
|
| |
|
| Total expenses |
|
|
1,473,749 |
|
|
|
| Net investment income (loss) |
|
|
8,640,473 |
|
|
|
| Net realized gain (loss) on: |
|
|
|
|
| Affiliated investments |
|
|
(12,777,133 |
) |
| Unaffiliated investments |
|
|
26,442 |
|
| Futures contracts |
|
|
3,212,826 |
|
| |
|
| Net realized gain (loss) |
|
|
(9,537,865 |
) |
|
|
| Net change in unrealized appreciation (depreciation) on: |
|
|
|
|
| Affiliated investments |
|
|
32,034,125 |
|
| Unaffiliated investments |
|
|
(20,585 |
) |
| Futures contracts |
|
|
(6,515,778 |
) |
| Translation of assets and liabilities denominated in foreign currencies |
|
|
(8,328 |
) |
| |
|
| Net change in unrealized appreciation (depreciation) |
|
|
25,489,434 |
|
|
|
| Net realized and change in unrealized gain (loss) |
|
|
15,951,569 |
|
|
|
| Net increase (decrease) in net assets resulting from operations |
|
$ |
24,592,042 |
|
The Notes to Financial Statements are an integral part of this report.
|
|
|
|
|
| Transamerica Series Trust |
|
|
|
Semi-Annual Financial Statements 2024 |
|
|
Page 4 |
|
|
Transamerica JPMorgan Asset Allocation - Conservative VP
STATEMENT OF CHANGES IN NET ASSETS
For the period and year ended:
|
|
|
|
|
|
|
|
|
| |
|
June 30, 2024 (unaudited) |
|
|
December 31,
2023 |
|
|
|
|
| From operations: |
|
|
|
|
|
|
|
|
| Net investment income (loss) |
|
|
$ 8,640,473 |
|
|
|
$ 19,375,168 |
|
| Net realized gain (loss) |
|
|
(9,537,865 |
) |
|
|
(61,997,294 |
) |
| Net change in unrealized appreciation (depreciation) |
|
|
25,489,434 |
|
|
|
99,103,822 |
|
| |
|
|
| Net increase (decrease) in net assets resulting from operations |
|
|
24,592,042 |
|
|
|
56,481,696 |
|
|
|
|
| Dividends and/or distributions to shareholders: |
|
|
|
|
|
|
|
|
| Initial Class |
|
|
— |
|
|
|
(3,796,460 |
) |
| Service Class |
|
|
— |
|
|
|
(14,048,881 |
) |
| |
|
|
| Net increase (decrease) in net assets resulting from dividends and/or distributions to shareholders |
|
|
— |
|
|
|
(17,845,341 |
) |
|
|
|
| Capital share transactions: |
|
|
|
|
|
|
|
|
| Proceeds from shares sold: |
|
|
|
|
|
|
|
|
| Initial Class |
|
|
6,006,759 |
|
|
|
10,776,146 |
|
| Service Class |
|
|
3,208,671 |
|
|
|
7,397,039 |
|
| |
|
|
9,215,430 |
|
|
|
18,173,185 |
|
| Dividends and/or distributions reinvested: |
|
|
|
|
|
|
|
|
| Initial Class |
|
|
— |
|
|
|
3,796,460 |
|
| Service Class |
|
|
— |
|
|
|
14,048,881 |
|
| |
|
|
— |
|
|
|
17,845,341 |
|
| Cost of shares redeemed: |
|
|
|
|
|
|
|
|
| Initial Class |
|
|
(14,417,572 |
) |
|
|
(26,700,322 |
) |
| Service Class |
|
|
(60,951,765 |
) |
|
|
(121,888,463 |
) |
| |
|
|
(75,369,337 |
) |
|
|
(148,588,785 |
) |
|
|
|
| Net increase (decrease) in net assets resulting from capital share transactions |
|
|
(66,153,907 |
) |
|
|
(112,570,259 |
) |
|
|
|
| Net increase (decrease) in net assets |
|
|
(41,561,865 |
) |
|
|
(73,933,904 |
) |
|
|
|
| Net assets: |
|
|
|
|
|
|
|
|
| Beginning of period/year |
|
|
853,819,545 |
|
|
|
927,753,449 |
|
| End of period/year |
|
|
$812,257,680 |
|
|
|
$ 853,819,545 |
|
|
|
|
| Capital share transactions - shares: |
|
|
|
|
|
|
|
|
| Shares issued: |
|
|
|
|
|
|
|
|
| Initial Class |
|
|
691,715 |
|
|
|
1,288,927 |
|
| Service Class |
|
|
373,832 |
|
|
|
891,637 |
|
| |
|
|
1,065,547 |
|
|
|
2,180,564 |
|
| Shares reinvested: |
|
|
|
|
|
|
|
|
| Initial Class |
|
|
— |
|
|
|
462,419 |
|
| Service Class |
|
|
— |
|
|
|
1,734,430 |
|
| |
|
|
— |
|
|
|
2,196,849 |
|
| Shares redeemed: |
|
|
|
|
|
|
|
|
| Initial Class |
|
|
(1,653,626 |
) |
|
|
(3,229,698 |
) |
| Service Class |
|
|
(7,110,514 |
) |
|
|
(14,923,969 |
) |
| |
|
|
(8,764,140 |
) |
|
|
(18,153,667 |
) |
| Net increase (decrease) in shares outstanding: |
|
|
|
|
|
|
|
|
| Initial Class |
|
|
(961,911 |
) |
|
|
(1,478,352 |
) |
| Service Class |
|
|
(6,736,682 |
) |
|
|
(12,297,902 |
) |
| |
|
|
(7,698,593 |
) |
|
|
(13,776,254 |
) |
The Notes to Financial Statements are an integral part of this report.
|
|
|
|
|
| Transamerica Series Trust |
|
|
|
Semi-Annual Financial Statements 2024 |
|
|
Page 5 |
|
|
Transamerica JPMorgan Asset Allocation - Conservative VP
FINANCIAL HIGHLIGHTS
|
|
|
|
|
|
|
|
|
|
|
|
|
|
|
|
|
|
|
|
|
|
|
|
|
| For a share outstanding during the period and years indicated: |
|
Initial Class |
|
|
|
|
|
|
|
|
| |
|
June 30, 2024 (unaudited) |
|
|
December 31, 2023 |
|
|
December 31, 2022 |
|
|
December 31, 2021 |
|
|
December 31, 2020 |
|
|
December 31, 2019 |
|
|
|
|
|
|
|
|
| Net asset value, beginning of period/year |
|
$ |
8.62 |
|
|
$ |
8.24 |
|
|
$ |
11.50 |
|
|
$ |
11.30 |
|
|
$ |
10.66 |
|
|
$ |
9.97 |
|
|
|
|
|
|
|
|
| Investment operations: |
|
|
|
|
|
|
|
|
|
|
|
|
|
|
|
|
|
|
|
|
|
|
|
|
|
|
|
|
|
|
|
| Net investment income (loss)(A) |
|
|
0.10 |
|
|
|
0.20 |
|
|
|
0.20 |
|
|
|
0.50 |
|
|
|
0.27 |
|
|
|
0.25 |
|
|
|
|
|
|
|
|
| Net realized and unrealized gain (loss) |
|
|
0.17 |
|
|
|
0.37 |
|
|
|
(1.93 |
) |
|
|
0.16 |
|
|
|
0.91 |
|
|
|
1.12 |
|
|
|
|
|
|
|
|
| Total investment operations |
|
|
0.27 |
|
|
|
0.57 |
|
|
|
(1.73 |
) |
|
|
0.66 |
|
|
|
1.18 |
|
|
|
1.37 |
|
|
|
|
|
|
|
|
| Dividends and/or distributions to shareholders: |
|
|
|
|
|
|
|
|
|
|
|
|
|
|
|
|
|
|
|
|
|
|
|
|
|
|
|
|
|
|
|
| Net investment income |
|
|
— |
|
|
|
(0.19 |
) |
|
|
(0.58 |
) |
|
|
(0.28 |
) |
|
|
(0.27 |
) |
|
|
(0.28 |
) |
|
|
|
|
|
|
|
| Net realized gains |
|
|
— |
|
|
|
— |
|
|
|
(0.95 |
) |
|
|
(0.18 |
) |
|
|
(0.27 |
) |
|
|
(0.40 |
) |
|
|
|
|
|
|
|
| Total dividends and/or distributions to shareholders |
|
|
— |
|
|
|
(0.19 |
) |
|
|
(1.53 |
) |
|
|
(0.46 |
) |
|
|
(0.54 |
) |
|
|
(0.68 |
) |
|
|
|
|
|
|
|
| Net asset value, end of period/year |
|
$ |
8.89 |
|
|
$ |
8.62 |
|
|
$ |
8.24 |
|
|
$ |
11.50 |
|
|
$ |
11.30 |
|
|
$ |
10.66 |
|
| |
|
|
|
|
|
|
|
|
|
|
|
|
|
|
|
|
|
|
|
|
|
|
|
|
|
|
|
|
|
|
|
| Total return |
|
|
3.13 |
%(B) |
|
|
7.05 |
% |
|
|
(15.35 |
)% |
|
|
5.90 |
% |
|
|
11.47 |
% |
|
|
13.90 |
% |
|
|
|
|
|
|
|
| Ratio and supplemental data: |
|
|
|
|
|
|
|
|
|
|
|
|
|
|
|
|
|
|
|
|
|
|
|
|
|
|
|
|
|
|
|
| Net assets end of period/year (000’s) |
|
$ |
161,597 |
|
|
$ |
164,970 |
|
|
$ |
169,834 |
|
|
$ |
227,524 |
|
|
$ |
252,776 |
|
|
$ |
239,261 |
|
|
|
|
|
|
|
|
| Expenses to average net assets(C) |
|
|
0.16 |
%(D) |
|
|
0.16 |
% |
|
|
0.15 |
% |
|
|
0.15 |
% |
|
|
0.15 |
% |
|
|
0.15 |
% |
|
|
|
|
|
|
|
| Net investment income (loss) to average net assets |
|
|
2.32 |
%(D) |
|
|
2.42 |
% |
|
|
2.06 |
% |
|
|
4.36 |
% |
|
|
2.52 |
% |
|
|
2.39 |
% |
|
|
|
|
|
|
|
| Portfolio turnover rate |
|
|
7 |
%(B) |
|
|
40 |
% |
|
|
24 |
% |
|
|
25 |
% |
|
|
30 |
% |
|
|
9 |
% |
| (A) |
Calculated based on average number of shares outstanding. |
| (C) |
Does not include expenses of the underlying investments in which the Portfolio invests. |
|
|
|
|
|
|
|
|
|
|
|
|
|
|
|
|
|
|
|
|
|
|
|
|
|
| For a share outstanding during the period and years indicated: |
|
Service Class |
|
|
|
|
|
|
|
|
| |
|
June 30, 2024 (unaudited) |
|
|
December 31, 2023 |
|
|
December 31, 2022 |
|
|
December 31, 2021 |
|
|
December 31, 2020 |
|
|
December 31, 2019 |
|
|
|
|
|
|
|
|
| Net asset value, beginning of period/year |
|
$ |
8.49 |
|
|
$ |
8.11 |
|
|
$ |
11.34 |
|
|
$ |
11.15 |
|
|
$ |
10.52 |
|
|
$ |
9.85 |
|
|
|
|
|
|
|
|
| Investment operations: |
|
|
|
|
|
|
|
|
|
|
|
|
|
|
|
|
|
|
|
|
|
|
|
|
|
|
|
|
|
|
|
| Net investment income (loss)(A) |
|
|
0.09 |
|
|
|
0.18 |
|
|
|
0.17 |
|
|
|
0.47 |
|
|
|
0.23 |
|
|
|
0.22 |
|
|
|
|
|
|
|
|
| Net realized and unrealized gain (loss) |
|
|
0.17 |
|
|
|
0.37 |
|
|
|
(1.91 |
) |
|
|
0.16 |
|
|
|
0.91 |
|
|
|
1.10 |
|
|
|
|
|
|
|
|
| Total investment operations |
|
|
0.26 |
|
|
|
0.55 |
|
|
|
(1.74 |
) |
|
|
0.63 |
|
|
|
1.14 |
|
|
|
1.32 |
|
|
|
|
|
|
|
|
| Dividends and/or distributions to shareholders: |
|
|
|
|
|
|
|
|
|
|
|
|
|
|
|
|
|
|
|
|
|
|
|
|
|
|
|
|
|
|
|
| Net investment income |
|
|
— |
|
|
|
(0.17 |
) |
|
|
(0.54 |
) |
|
|
(0.26 |
) |
|
|
(0.24 |
) |
|
|
(0.25 |
) |
|
|
|
|
|
|
|
| Net realized gains |
|
|
— |
|
|
|
— |
|
|
|
(0.95 |
) |
|
|
(0.18 |
) |
|
|
(0.27 |
) |
|
|
(0.40 |
) |
|
|
|
|
|
|
|
| Total dividends and/or distributions to shareholders |
|
|
— |
|
|
|
(0.17 |
) |
|
|
(1.49 |
) |
|
|
(0.44 |
) |
|
|
(0.51 |
) |
|
|
(0.65 |
) |
|
|
|
|
|
|
|
| Net asset value, end of period/year |
|
$ |
8.75 |
|
|
$ |
8.49 |
|
|
$ |
8.11 |
|
|
$ |
11.34 |
|
|
$ |
11.15 |
|
|
$ |
10.52 |
|
| |
|
|
|
|
|
|
|
|
|
|
|
|
|
|
|
|
|
|
|
|
|
|
|
|
|
|
|
|
|
|
|
| Total return |
|
|
3.06 |
%(B) |
|
|
6.83 |
% |
|
|
(15.61 |
)% |
|
|
5.63 |
% |
|
|
11.25 |
% |
|
|
13.55 |
% |
|
|
|
|
|
|
|
| Ratio and supplemental data: |
|
|
|
|
|
|
|
|
|
|
|
|
|
|
|
|
|
|
|
|
|
|
|
|
|
|
|
|
|
|
|
| Net assets end of period/year (000’s) |
|
$ |
650,661 |
|
|
$ |
688,850 |
|
|
$ |
757,919 |
|
|
$ |
1,039,178 |
|
|
$ |
1,106,102 |
|
|
$ |
1,119,128 |
|
|
|
|
|
|
|
|
| Expenses to average net assets(C) |
|
|
0.41 |
%(D) |
|
|
0.41 |
% |
|
|
0.40 |
% |
|
|
0.40 |
% |
|
|
0.40 |
% |
|
|
0.40 |
% |
|
|
|
|
|
|
|
| Net investment income (loss) to average net assets |
|
|
2.07 |
%(D) |
|
|
2.15 |
% |
|
|
1.80 |
% |
|
|
4.14 |
% |
|
|
2.25 |
% |
|
|
2.13 |
% |
|
|
|
|
|
|
|
| Portfolio turnover rate |
|
|
7 |
%(B) |
|
|
40 |
% |
|
|
24 |
% |
|
|
25 |
% |
|
|
30 |
% |
|
|
9 |
% |
| (A) |
Calculated based on average number of shares outstanding. |
| (C) |
Does not include expenses of the underlying investments in which the Portfolio invests. |
The Notes to Financial Statements are an integral part of this report.
|
|
|
|
|
| Transamerica Series Trust |
|
|
|
Semi-Annual Financial Statements 2024 |
|
|
Page 6 |
|
|
Transamerica JPMorgan Asset Allocation - Conservative VP
NOTES TO FINANCIAL STATEMENTS
At June 30, 2024
(unaudited)
1. ORGANIZATION
Transamerica Series Trust (“TST”) is an open-end management investment company registered under the Investment Company Act of 1940, as amended (the “1940 Act”). TST applies investment company accounting and reporting guidance. TST serves as a funding vehicle for variable life insurance, variable annuity, and group annuity products. Transamerica JPMorgan Asset Allocation - Conservative VP (the “Portfolio”) is a series of TST and is classified as diversified under the 1940 Act. The Portfolio currently offers two classes of shares, Initial Class and Service Class.
The only shareholders of the Portfolio are affiliated insurance company separate accounts and/or affiliated asset allocation portfolios. Contract holders of the variable life and annuity contracts are not shareholders of the Portfolio. For ease of reference, shareholders and contract holders are collectively referred to in this report as “shareholders.”
This report must be accompanied or preceded by the Portfolio’s current prospectus, which contains additional information about the Portfolio, including risks, as well as investment objectives and strategies.
Transamerica Asset Management, Inc. (“TAM”) serves as investment manager for the Portfolio pursuant to an investment management agreement. TAM provides continuous and regular investment management services to the Portfolio. TAM supervises the Portfolio’s investments, conducts its investment program and provides supervisory, compliance and administrative services to the Portfolio.
TAM currently acts as a “manager of managers” and has hired sub-advisers to furnish day-to-day investment advice and recommendations. TAM may, in the future, determine to provide all aspects of the day-to-day management of the Portfolio without the use of a sub-adviser. When acting as a manager of managers, TAM provides investment management services that include, without limitation, the design and development of the Portfolio and its investment strategies and the ongoing review and evaluation of those investment strategies including recommending changes in strategy where it believes appropriate or advisable; the selection of one or more sub-advisers for the Portfolio employing a combination of quantitative and qualitative screens, research, analysis and due diligence; negotiation of sub-advisory agreements and fees; oversight and monitoring of sub-advisers and recommending changes to sub-advisers where it believes appropriate or advisable; recommending portfolio combinations and liquidations where it believes appropriate or advisable; selection and oversight of transition managers, as needed; regular supervision of the Portfolio’s investments; regular review and evaluation of sub-adviser performance; daily monitoring of the sub-advisers’ buying and selling of securities for the Portfolio; regular review of holdings; ongoing trade oversight and analysis; regular monitoring to ensure adherence to investment process; regular calls and periodic on-site visits with sub-advisers; portfolio construction and asset allocation when using multiple sub-advisers for the Portfolio; risk management oversight and analysis; oversight of negotiation of investment documentation and agreements; design, development, implementation and regular monitoring of the valuation process; periodic due diligence reviews of pricing vendors and vendor methodology; design, development, implementation and regular monitoring of the compliance process; respond to regulatory inquiries and determine appropriate litigation strategy, as needed; review of proxies voted by sub-advisers; oversight of preparation and review of materials for meetings of the Portfolio’s Board of Trustees (the “Board”), participation in these meetings and preparation of regular communications with the Board; oversight of preparation and review of prospectuses, shareholder reports and other disclosure materials and regulatory filings for the Portfolio; oversight of other service providers to the Portfolio, such as the custodian, the transfer agent, the Portfolio’s independent accounting firm and legal counsel; supervision of the performance of recordkeeping and shareholder relations functions for the Portfolio; and oversight of cash management services. TAM uses a variety of quantitative and qualitative tools to carry out its investment management services. TAM, not the Portfolio, is responsible for paying the sub-adviser(s) for their services, and sub-advisory fees are TAM’s expense.
TAM’s investment management services also include the provision of supervisory and administrative services to the Portfolio. These services include performing certain administrative services for the Portfolio and supervising and overseeing the administrative, clerical, recordkeeping and bookkeeping services provided to the Portfolio by State Street Bank and Trust Company (“State Street”), to whom TAM has outsourced the provision of certain sub-administration services. To the extent agreed upon by TAM and the Portfolio from time to time, TAM’s supervisory and administrative services include, but are not limited to: monitoring and verifying the custodian’s daily calculation of the Net Asset Values (“NAV”); shareholder relations functions; compliance services; valuation services; assisting in due diligence and in the oversight and monitoring of certain activities of sub-advisers and certain aspects of Portfolio investments; assisting with Portfolio combinations and liquidations; oversight of the preparation and filing, and review, of all returns and reports, in connection with federal, state and local taxes; oversight and review of regulatory reporting; supervising and coordinating the Portfolio’s custodian and dividend disbursing agent and monitoring their services to the Portfolio; assisting the Portfolio in preparing reports to shareholders; acting as liaison with the Portfolio’s independent public accountants and providing, upon request, analyses, fiscal year summaries and other audit related services; assisting in the preparation of agendas and supporting documents for and minutes of meetings of trustees and committees of trustees; assisting in the preparation of regular communications with the trustees; and providing personnel and office space, telephones and other office equipment as necessary in order for TAM to perform supervisory and administrative services to the Portfolio. The Portfolio
|
|
|
|
|
| Transamerica Series Trust |
|
|
|
Semi-Annual Financial Statements 2024 |
|
|
Page 7 |
|
|
Transamerica JPMorgan Asset Allocation - Conservative VP
NOTES TO FINANCIAL STATEMENTS (continued)
At June 30, 2024
(unaudited)
1. ORGANIZATION (continued)
pays certain fees and expenses to State Street for sub-administration services which are not administrative services covered by the management agreement with TAM or paid for through the management fees payable thereunder. For the period ended June 30, 2024, (i) the expenses paid to State Street for sub-administration services by the Portfolio are shown as a part of Other expenses within the Statement of Operations and (ii) the expenses payable to State Street for sub-administration services from the Portfolio are shown as part of Other accrued expenses within the Statement of Assets and Liabilities.
2. SIGNIFICANT ACCOUNTING POLICIES
In preparing the Portfolio’s financial statements in accordance with Generally Accepted Accounting Principles in the United States of America (“GAAP”), estimates or assumptions (which could differ from actual results) may be used that affect reported amounts and disclosures. The following is a summary of significant accounting policies followed by the Portfolio.
Foreign currency denominated investments: The accounting records of the Portfolio are maintained in U.S. dollars. Securities and other assets and liabilities denominated in foreign currencies are translated into U.S. dollars based on the closing exchange rate each day. The cost of foreign securities purchased and any realized gains or losses are translated at the prevailing exchange rates in effect on the date of the respective transaction. The Portfolio combines fluctuations from currency exchange rates and fluctuations in value when computing net realized and unrealized gains or losses from investments.
Net foreign currency gains and losses resulting from changes in exchange rates include, foreign currency fluctuations between trade date and settlement date of investment security transactions, gains and losses on forward foreign currency contracts, and the difference between the receivable amounts of interest and dividends recorded in the accounting records in U.S. dollars and the amounts actually received.
Foreign currency denominated assets may involve risks not typically associated with domestic transactions. These risks include revaluation of currencies, adverse fluctuations in foreign currency values, and possible adverse political, social, and economic developments, including those particular to a specific industry, country or region.
Security transactions and investment income: Security transactions are accounted for on the trade date. Security gains and losses are calculated on a first-in, first-out basis. Interest income, if any, is accrued as earned. Dividend income and capital gain distributions from underlying investments, if any, are recorded on the ex-dividend date. Income or short-term capital gain distributions received from underlying investments, if any, are recorded as Dividend income from investments within the Statement of Operations. Long-term capital gain distributions received from underlying investments, if any, are recorded as Net realized gain (loss) on Capital gain distributions received from investments within the Statement of Operations.
Multiple class operations, income, and expenses: Income, non-class specific expenses, and realized and unrealized gains and losses are allocated to each class daily based upon net assets. Each class bears its own specific expenses in addition to the allocated non-class specific expenses.
Distributions to shareholders: Distributions are recorded on the ex-dividend date and are determined in accordance with federal income tax regulations, which may differ from GAAP.
Cash overdraft: The Portfolio may have cash overdraft balances. A fee is incurred on these overdrafts, calculated by multiplying the overdraft by a rate based on the Federal Funds Rate.
Payables, if any, are reflected as Due to custodian within the Statement of Assets and Liabilities. Expenses, if any, from U.S. cash overdrafts are reflected in Custody fees within the Statement of Operations. Expenses, if any, from foreign cash overdrafts are reflected in Other expenses within the Statement of Operations.
Indemnification: In the normal course of business, the Portfolio enters into contracts that contain a variety of representations that provide general indemnifications. The Portfolio’s maximum exposure under these arrangements is unknown, as this would involve future claims that may be made against the Portfolio and/or its affiliates that have not yet occurred. However, based on experience, the Portfolio expects the risk of loss to be remote.
|
|
|
|
|
| Transamerica Series Trust |
|
|
|
Semi-Annual Financial Statements 2024 |
|
|
Page 8 |
|
|
Transamerica JPMorgan Asset Allocation - Conservative VP
NOTES TO FINANCIAL STATEMENTS (continued)
At June 30, 2024
(unaudited)
3. INVESTMENT VALUATION
TAM has been designated as the Portfolio’s valuation designee pursuant to Rule 2a-5 under the 1940 Act with responsibility for fair valuation subject to oversight by the Portfolio’s Board of Trustees. The net asset value of the Portfolio is computed as of the official close of the New York Stock Exchange (“NYSE”) each day the NYSE is open for business.
TAM utilizes various methods to measure the fair value of its investments on a recurring basis. GAAP establishes a hierarchy that prioritizes inputs to valuation methods. The inputs or methodology used for valuing securities are not necessarily an indication of the risk associated with investing in those securities. The three levels (“Levels”) of inputs of the fair value hierarchy are defined as follows:
Level 1—Unadjusted quoted prices in active markets for identical securities.
Level 2—Inputs, other than quoted prices included in Level 1, which are observable, either directly or indirectly. These inputs may include quoted prices for the identical instrument on an inactive market, prices for similar instruments, interest rates, prepayment speeds, credit risk, yield curves, default rates, and similar data.
Level 3—Unobservable inputs based on the best information available in the circumstances, to the extent observable inputs are not available, which may include TAM’s own assumptions used in determining the fair value of the Portfolio’s investments and derivative instruments.
The inputs used to measure fair value may fall into different Levels of the fair value hierarchy. In such cases, for disclosure purposes, the Level in the fair value hierarchy that is assigned to the fair value measurement of a security is determined based on the lowest Level input that is significant to the fair value measurement in its entirety. Certain investments that are measured at fair value using NAV per share, or its equivalent, using the “practical expedient” have not been classified in the fair value Levels. The hierarchy classification of inputs used to value the Portfolio’s investments at June 30, 2024, is disclosed within the Investment Valuation section of the Schedule of Investments.
The availability of observable inputs can vary from security to security and is affected by a wide variety of factors, including, but not limited to, the type of security, whether the security is new and not yet established in the marketplace, the liquidity of markets, and other characteristics particular to the security. To the extent that valuation is based on models or inputs that are less observable or unobservable in the market, the determination of fair value requires more judgment. Accordingly, the degree of judgment exercised in determining fair value is generally greatest for instruments categorized in Level 3. Due to the inherent uncertainty of valuation, the determination of values may differ significantly from values that would have been realized had a ready market for investments existed, and the differences could be material.
Fair value measurements: Descriptions of the valuation techniques applied to the Portfolio’s significant categories of assets and liabilities measured at fair value on a recurring basis are as follows:
Investment companies: Certain investment companies are valued at the NAV as the practical expedient. These investment companies are not included within the fair value hierarchy. Certain other investment companies are valued at the actively traded NAV and no valuation adjustments are applied. These investment companies are categorized in Level 1 of the fair value hierarchy.
U.S. government obligations: U.S. government obligations are normally valued using a model that incorporates market observable data such as reported sales of similar securities, broker quotes, yields, bids, offers, and reference data. Certain securities are valued by principally using dealer quotations. U.S. government obligations generally are categorized in Level 2 of the fair value hierarchy, or Level 3 if inputs are unobservable.
Repurchase agreements: Repurchase agreements are valued at cost, which approximates fair value. To the extent the inputs are observable and timely, the values are generally categorized in Level 2 of the fair value hierarchy.
Derivative instruments: Centrally cleared or listed derivatives that are actively traded are valued based on quoted prices from the exchange and are categorized in Level 1 of the fair value hierarchy. Over-the-counter (“OTC”) derivative contracts include forward, swap, swaption, and option contracts related to interest rates, foreign currencies, credit standing of reference entities, equity prices, or commodity prices. Depending on the product and the terms of the transaction, the fair value of the OTC derivative products are modeled taking into account the counterparties’ creditworthiness and using a series of techniques, including simulation models. Many pricing models do not entail material subjectivity because the methodologies employed do not necessitate significant judgments and the pricing inputs are observed
|
|
|
|
|
| Transamerica Series Trust |
|
|
|
Semi-Annual Financial Statements 2024 |
|
|
Page 9 |
|
|
Transamerica JPMorgan Asset Allocation - Conservative VP
NOTES TO FINANCIAL STATEMENTS (continued)
At June 30, 2024
(unaudited)
3. INVESTMENT VALUATION (continued)
from actively quoted markets, as is the case of interest rate swap and option contracts. The majority of OTC derivative products valued by the Portfolio using pricing models fall into this category and are categorized within Level 2 of the fair value hierarchy or Level 3 if inputs are unobservable.
4. BORROWINGS AND OTHER FINANCING TRANSACTIONS
The Portfolio may engage in borrowing transactions as a means of raising cash to satisfy redemption requests, for other temporary or emergency purposes or, to the extent permitted by its investment policies, to raise additional cash to be invested in other securities or instruments. When the Portfolio invests borrowing proceeds in other securities, the Portfolio will bear the risk that the market value of the securities in which such proceeds are invested goes down and is insufficient to repay the borrowed proceeds. The Portfolio may borrow on a secured or on an unsecured basis. If the Portfolio enters into a secured borrowing arrangement, a portion of the Portfolio’s assets will be used as collateral. The 1940 Act requires the Portfolio to maintain asset coverage of at least 300% of the amount of its borrowings. Asset coverage means the ratio that the value of the Portfolio’s total assets, minus liabilities other than borrowings, bears to the aggregate amount of all borrowings. Although complying with this requirement has the effect of limiting the amount that the Portfolio may borrow, it does not otherwise mitigate the risks of entering into borrowing transactions.
Interfund lending: The Portfolio, along with other funds and portfolios advised by TAM, may participate in an interfund lending program pursuant to exemptive relief granted by the Securities and Exchange Commission on January 18, 2017. This program allows the Portfolio to lend to and borrow from other funds and portfolios advised by TAM. Interfund lending transactions are subject to the conditions of the exemptive relief which places limits on the amount of lending or borrowing a Portfolio may participate in under the program. Interest earned or paid on an interfund lending transaction will be based on the average of certain current market rates. For the period ended June 30, 2024, the Portfolio has not utilized the program.
Repurchase agreements: In a repurchase agreement, the Portfolio purchases a security and simultaneously commits to resell that security to the seller at an agreed-upon price on an agreed-upon date. Securities purchased subject to a repurchase agreement are held at the Portfolio’s custodian, or designated sub-custodian related to tri-party repurchase agreements, and, pursuant to the terms of the repurchase agreement, must be collateralized by securities with an aggregate market value greater than or equal to 100% of the resale price. The Portfolio will bear the risk of value fluctuations until the securities can be sold and may encounter delays and incur costs in liquidating the securities. In the event of bankruptcy or insolvency of the seller, delays and costs may be incurred.
Repurchase agreements are subject to netting agreements, which are agreements between the Portfolio and its counterparties that provide for the net settlement of all transactions and collateral with the Portfolio, through a single payment, in the event of default or termination. Amounts presented within the Schedule of Investments, and as part of Repurchase agreements, at value within the Statement of Assets and Liabilities are shown on a gross basis. The value of the related collateral for each repurchase agreement, as reflected within the Schedule of Investments, exceeds the value of each repurchase agreement at June 30, 2024.
Repurchase agreements at June 30, 2024, if any, are included within the Schedule of Investments and Statement of Assets and Liabilities.
5. RISK EXPOSURES AND THE USE OF DERIVATIVE INSTRUMENTS
The Portfolio’s investment strategies allow the Portfolio to use various types of derivative contracts, including option contracts, swap agreements, futures contracts, and forward foreign currency contracts. Derivatives are investments whose value is primarily derived from underlying assets, indices or reference rates and may be transacted on an exchange or OTC.
Market Risk Factors: In pursuit of the Portfolio’s investment strategies, the Portfolio may seek to use derivatives to increase or decrease its exposure to certain market risks, including:
Interest rate risk: Interest rate risk relates to the fluctuations in the value of fixed income securities due to changes in the prevailing levels of market interest rates.
Foreign exchange rate risk: Foreign exchange rate risk relates to fluctuations in the value of an asset or liability due to changes in the currency exchange rates.
Equity risk: Equity risk relates to the change in value of equity securities as they relate to increases or decreases in the general market.
|
|
|
|
|
| Transamerica Series Trust |
|
|
|
Semi-Annual Financial Statements 2024 |
|
|
Page 10 |
|
|
Transamerica JPMorgan Asset Allocation - Conservative VP
NOTES TO FINANCIAL STATEMENTS (continued)
At June 30, 2024
(unaudited)
5. RISK EXPOSURES AND THE USE OF DERIVATIVE INSTRUMENTS (continued)
Credit risk: Credit risk relates to the ability of the issuer of a financial instrument to make further principal or interest payments on an obligation or commitment that it has to the Portfolio.
Commodity risk: Commodity risk relates to the change in value of commodities or commodity indices as they relate to increases or decreases in the commodities market. Commodities are physical assets that have tangible properties. Examples of these types of assets are crude oil, heating oil, metals, livestock, and agricultural products.
The Portfolio is also exposed to additional risks from investing in derivatives, such as liquidity and counterparty credit risk. Liquidity risk is the risk that the Portfolio will be unable to sell or close out the derivative in the open market in a timely manner. Counterparty credit risk is the risk that the counterparty will not be able to fulfill its obligations to the Portfolio. Investing in derivatives may also involve greater risks than investing directly in the underlying assets, such as losses in excess of any initial investment and collateral received. In addition, there may be the risk that the change in value of the derivative contract does not correspond to the change in value of the underlying instrument.
The Portfolio’s exposure to market risk factors and certain other associated risks are summarized by derivative type as follows:
Futures contracts: The Portfolio is subject to equity risk, credit risk, commodity risk, interest rate risk and foreign exchange rate risk in the normal course of pursuing its investment objective. The Portfolio uses futures contracts to gain exposure to, or hedge against, changes in the value of equities and commodities, interest rates, or foreign currencies. A futures contract represents a commitment for the future purchase or sale of an asset at a specified price on a specified date. Upon entering into such contracts, the Portfolio is required to deposit with the broker, either in cash or in securities, an initial margin in an amount equal to a certain percentage of the contract amount. Subsequent payments (variation margin) are paid or received by the Portfolio, depending on the daily fluctuations in the value of the contract, and are recorded for financial statement purposes as unrealized gains or losses by the Portfolio. Upon entering into such contracts, the Portfolio bears the risk of equity and commodity prices, interest rates, or exchange rates moving unexpectedly, in which case, the Portfolio may not achieve the anticipated benefits of the futures contracts and may realize losses. With futures, there is minimal counterparty credit risk to the Portfolio since futures are exchange-traded and the exchange’s clearinghouse, as counterparty to all exchange-traded futures, guarantees the futures against default. Futures contracts are generally entered into on a regulated futures exchange and cleared through a clearinghouse associated with the exchange.
Open futures contracts at June 30, 2024 are listed within the Schedule of Investments. Variation margin, if applicable, is shown in Variation margin receivable or payable on futures contracts within the Statement of Assets and Liabilities.
The following is a summary of the location and the Portfolio’s fair values of derivative investments disclosed within the Statement of Assets and Liabilities, categorized by primary market risk exposure as of June 30, 2024.
|
|
|
|
|
|
|
|
|
|
|
|
|
|
|
|
|
|
|
|
|
|
|
|
|
| Asset Derivatives |
|
| Location |
|
Interest Rate Contracts |
|
|
Foreign Exchange Contracts |
|
|
Equity Contracts |
|
|
Credit Contracts |
|
|
Commodity Contracts |
|
|
Total |
|
|
|
|
|
|
|
|
| Futures contracts: |
|
|
|
|
|
|
|
|
|
|
|
|
|
|
|
|
|
|
|
|
|
|
|
|
| Total distributable earnings (accumulated losses) (A)(B) |
|
$ |
779,741 |
|
|
$ |
397,811 |
|
|
$ |
593,539 |
|
|
$ |
— |
|
|
$ |
— |
|
|
$ |
1,771,091 |
|
| |
|
|
|
|
|
|
|
|
| Total |
|
$ |
779,741 |
|
|
$ |
397,811 |
|
|
$ |
593,539 |
|
|
$ |
— |
|
|
$ |
— |
|
|
$ |
1,771,091 |
|
| |
|
|
|
|
|
|
| Transamerica Series Trust |
|
|
|
Semi-Annual Financial Statements 2024 |
|
|
Page 11 |
|
|
Transamerica JPMorgan Asset Allocation - Conservative VP
NOTES TO FINANCIAL STATEMENTS (continued)
At June 30, 2024
(unaudited)
5. RISK EXPOSURES AND THE USE OF DERIVATIVE INSTRUMENTS (continued)
|
|
|
|
|
|
|
|
|
|
|
|
|
|
|
|
|
|
|
|
|
|
|
|
|
| Liability Derivatives |
|
| Location |
|
Interest Rate Contracts |
|
|
Foreign Exchange Contracts |
|
|
Equity Contracts |
|
|
Credit Contracts |
|
|
Commodity Contracts |
|
|
Total |
|
|
|
|
|
|
|
| Futures contracts: |
|
|
|
|
|
|
|
|
|
|
|
|
|
|
|
|
|
|
|
|
|
|
|
|
| Total distributable earnings (accumulated losses) (A)(B) |
|
$ |
(1,797,559 |
) |
|
$ |
(40,574 |
) |
|
$ |
(207,304 |
) |
|
$ |
— |
|
|
$ |
— |
|
|
$ |
(2,045,437 |
) |
|
|
|
|
|
|
|
| Total |
|
$ |
(1,797,559 |
) |
|
$ |
(40,574 |
) |
|
$ |
(207,304 |
) |
|
$ |
— |
|
|
$ |
— |
|
|
$ |
(2,045,437 |
) |
| |
|
| (A) |
May include exchange-traded derivatives which are not subject to a master netting arrangement, or another similar arrangement. |
| (B) |
Included within unrealized appreciation (depreciation) on futures contracts as reported in the Schedule of Investments. Only current day’s variation margin is reported within the Statement of Assets and Liabilities. |
The following is a summary of the location and the effect of derivative investments within the Statement of Operations, categorized by primary market risk exposure as of June 30, 2024.
|
|
|
|
|
|
|
|
|
|
|
|
|
|
|
|
|
|
|
|
|
|
|
|
|
| Realized Gain (Loss) on Derivative Instruments |
|
| Location |
|
Interest Rate Contracts |
|
|
Foreign Exchange Contracts |
|
|
Equity Contracts |
|
|
Credit Contracts |
|
|
Commodity Contracts |
|
|
Total |
|
|
|
|
|
|
|
| Futures contracts |
|
$ |
(6,622,375 |
) |
|
$ |
(1,151,453 |
) |
|
$ |
10,986,654 |
|
|
$ |
— |
|
|
$ |
— |
|
|
$ |
3,212,826 |
|
|
|
|
|
|
|
|
| Total |
|
$ |
(6,622,375 |
) |
|
$ |
(1,151,453 |
) |
|
$ |
10,986,654 |
|
|
$ |
— |
|
|
$ |
— |
|
|
$ |
3,212,826 |
|
| |
|
|
| Net Change in Unrealized Appreciation (Depreciation) on Derivative Instruments |
|
| Location |
|
Interest Rate Contracts |
|
|
Foreign Exchange Contracts |
|
|
Equity Contracts |
|
|
Credit Contracts |
|
|
Commodity Contracts |
|
|
Total |
|
|
|
|
|
|
|
| Futures contracts |
|
$ |
(1,479,905 |
) |
|
$ |
(162,489 |
) |
|
$ |
(4,873,384 |
) |
|
$ |
— |
|
|
$ |
— |
|
|
$ |
(6,515,778 |
) |
|
|
|
|
|
|
|
| Total |
|
$ |
(1,479,905 |
) |
|
$ |
(162,489 |
) |
|
$ |
(4,873,384 |
) |
|
$ |
— |
|
|
$ |
— |
|
|
$ |
(6,515,778 |
) |
| |
|
The following is a summary of the ending monthly average volume on derivative activity during the period ended June 30, 2024.
|
|
|
|
|
| Futures contracts: |
|
|
|
|
| Average notional value of contracts — long |
|
$ |
303,138,378 |
|
| Average notional value of contracts — short |
|
|
(124,822,373 |
) |
Collateral requirements: Collateral or margin requirements are set by the broker or exchange clearing house for exchange-traded derivatives (futures contracts, exchange-traded options, and exchange-traded swap agreements) while collateral terms are contract specific for OTC derivatives (forward foreign currency exchange contracts, OTC options, and OTC swap agreements). For OTC derivatives, under standard derivatives agreements, the Portfolio may be required to pledge collateral on derivatives to a counterparty if the Portfolio is in a net liability position, and receive collateral if in a net positive position. For financial reporting purposes, cash collateral that has been pledged by the Portfolio to cover obligations, if any, is reported in Cash collateral at broker within the Statement of Assets and Liabilities. Cash collateral that has been received by the Portfolio from a counterparty, if any, is reported separately in Cash collateral pledged at custodian and/or broker within the Statement of Assets and Liabilities. Non-cash collateral pledged to the Portfolio, if any, is disclosed within the Schedule of Investments.
Generally, the amount of collateral due from or to a party must exceed a minimum transfer amount threshold before a transfer has been made. Typically a counterparty is not permitted to sell, re-pledge or use cash and non-cash collateral it receives. The Portfolio generally
|
|
|
|
|
| Transamerica Series Trust |
|
|
|
Semi-Annual Financial Statements 2024 |
|
|
Page 12 |
|
|
Transamerica JPMorgan Asset Allocation - Conservative VP
NOTES TO FINANCIAL STATEMENTS (continued)
At June 30, 2024
(unaudited)
5. RISK EXPOSURES AND THE USE OF DERIVATIVE INSTRUMENTS (continued)
does not use non-cash collateral that it receives but may, absent default or certain other circumstances, be permitted to use cash collateral received. In such cases, interest may be paid pursuant to the collateral arrangement with the counterparty.
To the extent amounts due to the Portfolio from its counterparties are not fully collateralized, contractually or otherwise, the Portfolio bears the risk of loss from counterparty non-performance. Additionally, to the extent the Portfolio has delivered collateral to a counterparty, the Portfolio bears the risk of loss from a counterparty in the event the counterparty fails to return such collateral. Counterparties may immediately terminate derivatives contracts if the Portfolio fails to maintain sufficient asset coverage for its contracts or its net assets decline by stated percentages. Collateral may not be required for all derivative contracts.
6. RISK FACTORS
Investing in the Portfolio involves certain key risks related to the Portfolio’s trading activity. Please reference the Portfolio’s prospectus for a more complete discussion of the following risk(s), as well as other risks of investing in the Portfolio.
Market risk: The market prices of the Portfolio’s securities or other assets may go up or down, sometimes rapidly or unpredictably, due to factors such as economic events, inflation, changes in interest rates, governmental actions or interventions, actions taken by the U.S. Federal Reserve or foreign central banks, market disruptions caused by tariffs, trade disputes or other factors, political developments, armed conflicts, economic sanctions, cybersecurity events, investor sentiment, the global and domestic effects of widespread or local health, weather or climate events, and other factors that may or may not be related to the issuer of the security or other asset. If the market prices of the Portfolio’s securities and assets fall, the value of your investment in the Portfolio could go down.
Economies and financial markets throughout the world are increasingly interconnected. Events or circumstances in one or more countries or regions could be highly disruptive to, and have profound impacts on, global economies or markets. As a result, whether or not the Portfolio invests in securities of issuers located in or with significant exposure to the countries directly affected, the value and liquidity of the Portfolio’s investments may go down.
Asset allocation risk: The Portfolio’s investment performance is significantly impacted by the Portfolio’s asset allocation and reallocation from time to time. The value of your investment may decrease if the sub-adviser’s judgment about the attractiveness, value or market trends affecting a particular asset class, investment style, technique or strategy, underlying portfolio or other issuer is incorrect.
Fixed-income securities risk: Risks of fixed-income securities include credit risk, interest rate risk, counterparty risk, prepayment risk, extension risk, valuation risk, and liquidity risk. The value of fixed-income securities may go up or down, sometimes rapidly and unpredictably, due to general market conditions, such as real or perceived adverse economic or political conditions, tariffs and trade disruptions, inflation, changes in interest rates, lack of liquidity in the bond markets or adverse investor sentiment. In addition, the value of a fixed-income security may decline if the issuer or other obligor of the security fails to pay principal and/or interest, otherwise defaults or has its credit rating downgraded or is perceived to be less creditworthy, or the credit quality or value of any underlying assets declines. If the value of fixed-income securities owned by the Portfolio falls, the value of your investment will go down. The Portfolio may lose its entire investment in the fixed-income securities of an issuer.
Risk management framework risk: The Portfolio is subject to a multi-factor risk management framework that is intended to reduce equity exposure under certain market conditions. This framework may impose a maximum equity exposure limit for the Portfolio in response to individual asset class momentum signals and a portfolio level volatility signal. The framework is intended to improve the Portfolio’s absolute and risk-adjusted returns but may not work as intended. The framework may result in the Portfolionot achieving its stated asset mix goal or may cause the Portfolio to underperform, possibly significantly. Because market conditions change, sometimes rapidly and unpredictably, the success of the framework also will be subject to the sub-adviser’s ability to implement the framework in a timely and efficient manner. The framework may result in periods of underperformance, may fail to protect against market declines, may limit the Portfolio’s ability to participate in up markets, may cause the Portfolio to underperform its benchmark in rising markets, may increase transaction costs at the Portfolio and/or underlying portfolio level and may result in substantial losses if it does not work as intended. For example, if the Portfolio has reduced its equity exposure to avoid losses in certain market conditions, and the market rises sharply and quickly, there may be a delay in increasing the Portfolio’s equity exposure, causing the Portfolio to forgo gains from the market rebound. The framework incorporates quantitative models and signals. If those models or signals prove to be flawed or for other reasons do not produce the desired results, any decisions made in reliance thereon may expose the Portfolio to additional risks and losses. The use of models has inherent risks, and the success of relying on or otherwise using a model depends, among other things, on the accuracy and completeness of the model’s development, implementation and maintenance; on the model’s assumptions and methodologies; and on the accuracy and reliability of the inputs and output of the model. The framework also serves to reduce the risk to the Transamerica insurance
|
|
|
|
|
| Transamerica Series Trust |
|
|
|
Semi-Annual Financial Statements 2024 |
|
|
Page 13 |
|
|
Transamerica JPMorgan Asset Allocation - Conservative VP
NOTES TO FINANCIAL STATEMENTS (continued)
At June 30, 2024
(unaudited)
6. RISK FACTORS (continued)
companies that provide guaranteed benefits under certain variable contracts from equity market volatility and to facilitate their provision of those guaranteed benefits. The framework also may have the effect of limiting the amount of guaranteed benefits. The Portfolio’s performance may be lower than similar portfolios that are not subject to a risk management framework. The use of derivatives in connection with the framework may expose the Portfolio to different and potentially greater risks than if it had only invested in underlying portfolios.
7. FEES AND OTHER AFFILIATED TRANSACTIONS
TST serves as a funding vehicle for certain affiliated asset allocation portfolios and certain affiliated separate accounts of Transamerica Life Insurance Company (“TLIC”) and Transamerica Financial Life Insurance Company.
TAM, the Portfolio’s investment manager, is directly owned by TLIC and AUSA Holding, LLC (“AUSA”), both of which are indirect, wholly owned subsidiaries of Aegon Ltd. TLIC is owned by Commonwealth General Corporation (“Commonwealth”). Commonwealth and AUSA are wholly owned by Transamerica Corporation (DE). Transamerica Corporation (DE) is wholly owned by Aegon International B.V., which is wholly owned by Aegon Ltd., a Bermuda exempted company with liability limited by shares (formerly, Aegon NV, a Netherlands corporation) and a publicly traded international insurance group.
Transamerica Fund Services, Inc. (“TFS”) is the Portfolio’s transfer agent. Transamerica Capital, Inc. (“TCI”) is the Portfolio’s distributor/principal underwriter. TAM, TFS and TCI are affiliates of Aegon Ltd.
Certain officers and trustees of the Portfolio may also be officers and/or trustees of TAM, TFS and TCI. No interested trustee who is deemed an interested person due to current or former service with TAM or an affiliate of TAM receives compensation from the Portfolio. The Portfolio does pay non-interested persons (independent trustees), as disclosed in Trustee and CCO fees within the Statement of Operations.
Investment management fees: TAM serves as the Portfolio’s investment manager, performing administration as well as investment advisory services. TAM renders investment advisory, supervisory, and administration services under an investment management agreement and the Portfolio pays a single management fee, which is reflected in Investment management fees within the Statement of Operations.
The Portfolio pays a management fee to TAM based on daily average net assets at the following rates:
|
|
|
|
|
| Breakpoints |
|
Rate |
|
|
|
| First $10 billion |
|
|
0.1225% |
|
| Over $10 billion |
|
|
0.1025 |
|
TAM has contractually agreed to waive fees and/or reimburse Portfolio expenses to the extent that the total operating expenses excluding, as applicable, acquired fund fees and expenses, interest (including borrowing costs and overdraft charges), taxes, brokerage commissions, dividend and interest expenses on securities sold short, extraordinary expenses and other expenses not incurred in the ordinary course of the Portfolio’s business, exceed the following stated annual operating expense limits to the Portfolio’s daily average net assets. To the extent an expense limit changed during the period, the prior limit is also listed below. The expenses waived and/or reimbursed, if any, are included in Expenses waived and/or reimbursed within the Statement of Operations.
|
|
|
|
|
| Class |
|
Operating Expense Limit |
|
Operating Expense Limit Effective Through |
|
|
|
| Initial Class |
|
0.20% |
|
May 1, 2025 |
| Service Class |
|
0.45 |
|
May 1, 2025 |
TAM is permitted to recapture amounts contractually waived and/or reimbursed to a class during any of the 36 months from the date on which TAM waived fees and/or reimbursed expenses for the class. A class may recapture and reimburse TAM only if such amount does not cause, on any particular business day of the Portfolio, the class’s total annual operating expenses (after the recapture is taken into account) to exceed the Operating Expense Limits or any other lower limit then in effect. Amounts recaptured, if any, by TAM for the period ended June 30, 2024 are disclosed in Recapture of previously waived and/or reimbursed fees within the Statement of Operations.
|
|
|
|
|
| Transamerica Series Trust |
|
|
|
Semi-Annual Financial Statements 2024 |
|
|
Page 14 |
|
|
Transamerica JPMorgan Asset Allocation - Conservative VP
NOTES TO FINANCIAL STATEMENTS (continued)
At June 30, 2024
(unaudited)
7. FEES AND OTHER AFFILIATED TRANSACTIONS (continued)
TAM, on a voluntary basis and in addition to the contractual operating expense limits in effect, from time to time may waive and/or reimburse expenses of the Portfolio, or any classes thereof, to such level(s) as the Trust’s officers have determined or may reasonably determine from time to time. Any such voluntary waiver or expense reimbursement may be discontinued by TAM at any time. These amounts are not subject to recapture by TAM.
As of June 30, 2024, there are no amounts available for recapture by TAM.
Distribution and service fees: TST has a distribution plan (“Distribution Plan”) pursuant to Rule 12b-1 under the 1940 Act. Pursuant to the Distribution Plan, TST entered into a distribution agreement with TCI as the Portfolio’s distributor.
The Distribution Plan requires the Portfolio to pay distribution fees to TCI as compensation for various distribution activities, not as reimbursement for specific expenses. Under the Distribution Plan and distribution agreement, TCI, on behalf of the Portfolio, is authorized to pay various service providers, as direct payment for expenses incurred in connection with distribution of the Portfolio’s shares.
The fee on the Service Class shares is paid to the insurance companies for providing services and account maintenance for the policyholders who invest in the variable insurance products which invest in the Service Class shares. TCI has determined that it will not seek payment for the distribution expenses incurred by the Portfolio with respect to the Initial Class shares before May 1, 2025. Prior to TCI seeking distribution expenses on Initial Class shares, policy and contract owners will be notified in advance. The Portfolio will pay fees relating to Service Class shares. The distribution and service fees are included in Distribution and service fees within the Statement of Operations.
The Portfolio is authorized under the Distribution Plan to pay fees to TCI based on daily average net assets of each applicable class up to the following annual rates:
|
|
|
|
|
| Class |
|
Rate |
|
| Initial Class |
|
|
0.15% |
|
| Service Class |
|
|
0.25 |
|
Transfer agent costs: TFS provides transfer agency services under an intercompany agreement with TAM. TFS has outsourced the provision of certain sub-transfer agency services to SS&C Global Investor & Distribution Solutions, Inc. (“SS&C GIDS”). The Portfolio does not pay a separate transfer agent fee to TAM or TFS but does pay certain expenses to SS&C GIDS related to applicable sub-transfer agency services. For the period ended June 30, 2024, (i) the expenses paid to SS&C GIDS by the Portfolio are referred to as transfer agent costs and are included within the Statement of Operations and (ii) the expenses payable to SS&C GIDS by the Portfolio are referred to as transfer agent costs within the Statement of Assets and Liabilities.
Brokerage commissions: The Portfolio incurred no brokerage commissions on security transactions placed with affiliates of the investment manager or sub-adviser(s) for the period ended June 30, 2024.
8. PURCHASES AND SALES OF SECURITIES
For the period ended June 30, 2024, the cost of securities purchased and proceeds from securities sold (excluding short-term securities) are as follows:
|
|
|
|
|
|
|
| Purchases of Securities |
|
Sales/Maturities of Securities |
| Long-Term |
|
U.S. Government |
|
Long-Term |
|
U.S. Government |
| |
| $ 53,606,804 |
|
$ 6,001,855 |
|
$ 128,345,636 |
|
$ 4,031,437 |
9. FEDERAL INCOME TAXES AND DISTRIBUTIONS TO SHAREHOLDERS
The Portfolio has not made any provision for federal income or excise taxes due to its policy to distribute all of its taxable income and capital gains to its shareholders and otherwise qualify as a regulated investment company under Subchapter M of the Internal Revenue Code. The Portfolio recognizes the tax benefits of uncertain tax positions only where the position is “more likely than not” to be sustained assuming examination by tax authorities. The Portfolio’s tax returns remain subject to examination by the Internal Revenue Service and state tax authorities three years from the date of filing for federal purposes and four years from the date of filing for state purposes.
|
|
|
|
|
| Transamerica Series Trust |
|
|
|
Semi-Annual Financial Statements 2024 |
|
|
Page 15 |
|
|
Transamerica JPMorgan Asset Allocation - Conservative VP
NOTES TO FINANCIAL STATEMENTS (continued)
At June 30, 2024
(unaudited)
9. FEDERAL INCOME TAXES AND DISTRIBUTIONS TO SHAREHOLDERS (continued)
Management has evaluated the Portfolio’s tax provisions taken for all open tax years, and has concluded that no provision for income tax is required in the Portfolio’s financial statements. If applicable, the Portfolio recognizes interest accrued related to unrecognized tax benefits in relation to interest and penalties expense in Other within the Statement of Operations. The Portfolio identifies its major tax jurisdictions as U.S. Federal, the state of Colorado, and foreign jurisdictions where the Portfolio makes significant investments; however, the Portfolio is not aware of any tax positions for which it is reasonably possible that the total amounts of unrecognized tax benefits will change materially in the next twelve months. Distributions are determined in accordance with income tax regulations, which may differ from GAAP.
As of June 30, 2024, the approximate cost for U.S. federal income tax purposes, and the aggregate gross/net unrealized appreciation (depreciation) in the value of investments (including securities sold short and derivatives, if any) are as follows:
|
|
|
|
|
|
|
| Cost |
|
Gross Appreciation |
|
Gross (Depreciation) |
|
Net Appreciation (Depreciation) |
|
|
|
|
| $ 803,671,618 |
|
$ 33,813,682 |
|
$ (25,273,869) |
|
$ 8,539,813 |
Please see TST’s most recent report on Form N-CSR, available at: www.transamerica.com/annuities/prospectus, for additional information. For the most recently filed complete proxy voting records for the Trust please visit: https://www.transamerica.com/sites/default/files/files/e070d/TST%20N-PX%202021.pdf
|
|
|
|
|
| Transamerica Series Trust |
|
|
|
Semi-Annual Financial Statements 2024 |
|
|
Page 16 |
|
|
Transamerica JPMorgan Asset Allocation - Conservative VP
MANAGEMENT AND SUB-ADVISORY AGREEMENT — CONTRACT RENEWAL
(unaudited)
At a meeting of the Board of Trustees of Transamerica Series Trust (the “Trustees” or the “Board”) held on June 12-13, 2024, the Board considered the renewal of the management agreement (the “Management Agreement”) between Transamerica Asset Management, Inc. (“TAM”) and Transamerica Series Trust, on behalf of Transamerica JPMorgan Asset Allocation – Conservative VP (the “Portfolio”). The Board also considered the renewal of the investment sub-advisory agreement (the “Sub-Advisory Agreement” and together with the Management Agreement, the “Agreements”) for the Portfolio between TAM and J.P. Morgan Investment Management, Inc. (the “Sub-Adviser”).
Following its review and consideration, the Board determined that the terms of the Management Agreement and Sub-Advisory Agreement were reasonable and that the renewal of each of the Agreements was in the best interests of the Portfolio and the holders invested in the Portfolio. The Board, including the independent members of the Board (the “Independent Trustees”), unanimously approved the renewal of each of the Agreements through June 30, 2025.
Prior to reaching their decision, the Trustees requested and received from TAM and the Sub-Adviser certain information. They then reviewed such information as they deemed reasonably necessary to evaluate the Agreements, including information they had previously received from TAM and the Sub-Adviser as part of their regular oversight of the Portfolio, and knowledge they gained over time through meeting with TAM and the Sub-Adviser. Among other materials, the Trustees considered comparative fee, expense and performance information prepared by Broadridge Financial Solutions, Inc. (“Broadridge”), an independent provider of mutual fund performance information, as well as fee, expense and profitability information prepared by TAM. In addition, TAM provided the Board with additional supplemental comparative performance information. To the extent applicable, the Trustees considered information about fees and performance of comparable funds and/or accounts managed by the Sub-Adviser. The Board also considered reductions to the Portfolio’s expense limits, if any, that took effect after the last renewal of the Agreements. In their review, the Trustees also sought to identify instances in which the Portfolio’s performance, fees, total expenses and/or profitability appeared to be outliers within its respective peer group or other comparative metrics and sought to understand the reasons for such comparative positions.
In their deliberations, the Independent Trustees met privately without representatives of TAM or the Sub-Adviser present and were represented throughout the process by their independent legal counsel. In considering the proposed continuation of each of the Agreements, the Trustees evaluated and weighed a number of considerations that they believed to be relevant in light of the legal advice furnished to them by counsel, including independent legal counsel, and made a decision in the exercise of their own business judgment. They based their decisions on the considerations discussed below, among others, although they did not identify any particular consideration or item of information that was controlling of their decisions, and each Trustee may have attributed different weights to the various factors.
Nature, Extent and Quality of the Services Provided
The Board considered the nature, extent and quality of the services provided by TAM and the Sub-Adviser to the Portfolio in the past and the services anticipated to be provided in the future. The Board also considered the investment approach for the Portfolio; the experience, capability and integrity of TAM’s senior management; the financial resources of TAM; TAM’s management oversight process; TAM’s and the Sub-Adviser’s responsiveness to any questions by the Trustees; and the professional qualifications and compensation program of the portfolio management team of the Sub-Adviser. The Trustees noted that they receive, on a quarterly basis, an execution analysis from Capital Institutional Services, Inc. (CAPIS), an independent provider of trade analyses, for the Sub-Adviser and a comparison of trading results against a peer universe of managers.
The Board also considered the continuous and regular investment management and other services provided by TAM, when acting as a manager of managers, for the portion of the management fee it retains from the Portfolio after payment of the sub-advisory fees. The Board noted that the investment management and other services provided by TAM include the design, development and ongoing review and evaluation of the Portfolio and its investment strategy; the selection, oversight and monitoring of one or more investment sub-advisers to perform certain duties with respect to the Portfolio; ongoing portfolio trading oversight and analysis; risk management oversight and analysis; design, development, implementation and ongoing review and evaluation of a process for the valuation of Portfolio investments; design, development, implementation and ongoing review and evaluation of a compliance program for the Portfolio; design, development, implementation and ongoing review and evaluation of a process for the voting of proxies and exercise of rights to consent to corporate action for Portfolio investments; participation in Board meetings and oversight of preparation of materials for the Board, including materials for Board meetings and regular communications with the Board; oversight of preparation of the Portfolio’s prospectus, statement of additional information, shareholder reports and other disclosure materials and regulatory filings for the Portfolio; and ongoing cash management services for the Portfolio. The Board considered that TAM’s investment management services also include the provision of supervisory and administrative services to the Portfolio. The Board also noted that TAM, as part of the services it provides to all Transamerica mutual funds, including the Portfolio, oversees the services provided by the funds’ custodian, transfer agent, independent accountant and legal counsel and supervises the performance of the recordkeeping and holder service functions of the funds.
Investment Performance
In addition, the Board considered the short- and longer-term performance of the Portfolio in light of its investment objective, policies and strategies, including relative performance against (i) a peer universe of comparable mutual funds, as prepared by Broadridge, and (ii) the Portfolio’s benchmarks, in each case for various trailing periods ended December 31, 2023. Based on these considerations, the Board
|
|
|
|
|
| Transamerica Series Trust |
|
|
|
Semi-Annual Financial Statements 2024 |
|
|
Page 17 |
|
|
Transamerica JPMorgan Asset Allocation - Conservative VP
MANAGEMENT AND SUB-ADVISORY AGREEMENT — CONTRACT RENEWAL (continued)
(unaudited)
determined that TAM and the Sub-Adviser can provide investment and related services that are appropriate in scope and extent in light of the Portfolio’s investment objectives, policies and strategies and operations, the competitive landscape of the investment company business and investor needs. The Board’s conclusions as to the Portfolio’s performance are summarized below. For purposes of its review, the Board generally used the performance of Service Class Shares. In describing the Portfolio’s performance relative to its peer universe, the summary conclusions characterize performance for the relevant periods in relation to whether it was “above,” “below” or “in line with” the peer universe median and do so using quintile rankings prepared by Broadridge. For simplicity, performance is described as “above” the median if the Portfolio’s performance ranked anywhere in the first or second quintiles, as “below” the median if it ranked anywhere in the fourth or fifth quintiles, or “in line with” the median if it ranked anywhere in the third quintile (i.e., even if its precise return was somewhat above or somewhat below the precise median return).
When considering the Portfolio’s performance, the Trustees considered any representations made by TAM regarding the appropriateness of certain peer groups and benchmarks. They recognized that performance reflects a snapshot of a period as of a specific date, and that consideration of performance data for a different period could generate significantly different performance results. The Trustees also recognized that even longer-term performance can be negatively affected by performance over a short-term period when that short-term performance is significantly below the performance of the comparable benchmark or universe of peer funds.
The Board noted that the performance of Service Class Shares of the Portfolio was below the median for its peer universe for the past 1-, 3-, 5- and 10-year periods. The Board also noted that the performance of Service Class Shares of the Portfolio was above the benchmark that TAM utilizes to measure performance of the Portfolio for the past 1-, 3-, 5- and 10-year periods. The Trustees discussed the reasons for the underperformance with TAM and TAM agreed to continue to closely monitor and report to the Board on the performance of the Portfolio. The Board noted that the Sub-Adviser had commenced sub-advising the Portfolio on July 1, 2016 pursuant to its current investment strategies.
Management Fee and Sub-Advisory Fees and Total Expense Ratio
The Board considered the management fee and total expense ratio of the Portfolio, including information provided by Broadridge comparing the management fee and total expense ratio of the Portfolio to the management fees and total expense ratios of comparable investment companies in both a peer group and broader peer universe compiled by Broadridge. The Board’s conclusions as to the Portfolio’s management fee and total expense ratio are summarized below. For purposes of its review, the Board generally used the actual total expenses (i.e., expenses reflecting any waivers and/or reimbursements) of Service Class Shares. In describing the Portfolio’s management fee and total expense ratio relative to its peer group and peer universe, the summary conclusions characterize management fees and total expense ratios for the relevant periods in relation to whether they were “above,” “below” or “in line with” the peer group or peer universe median and do so using quintile rankings prepared by Broadridge. For simplicity, management fees and total expense ratios are described as “above” the median if the Portfolio’s management fee or total expense ratio ranked anywhere in the fourth or fifth quintiles, as “below” the median if it ranked anywhere in the first or second quintiles, or “in line with” the median if it ranked anywhere in the third quintile (i.e., even if its precise management fee or total expense ratio was somewhat above or somewhat below the precise median management fee or total expense ratio).
The Board also considered the fees charged by the Sub-Adviser for sub-advisory services, as well as the portion of the Portfolio’s management fee retained by TAM following payment of the sub-advisory fee and how the portion of the contractual management fee retained by TAM at a specified asset level compared to the portions retained by other investment advisers managing mutual funds with similar investment strategies as calculated by an independent provider of information.
The Board noted that the Portfolio’s contractual management fee was below the medians for its peer group and peer universe and that the actual total expenses (i.e., expenses reflecting any waivers and/or reimbursements) of Service Class Shares of the Portfolio were above the medians for its peer group and peer universe. The Trustees also considered that TAM has entered into an expense limitation arrangement with the Portfolio, which may result in TAM waiving fees for the benefit of holders.
On the basis of these considerations, together with the other information it considered, the Board determined that the management and sub-advisory fees to be received by TAM and the Sub-Adviser under the Management Agreement and Sub-Advisory Agreement are reasonable in light of the services provided.
Cost of Services Provided and Level of Profitability
The Board reviewed information provided by TAM about the cost of providing and procuring fund management services, as well as the costs of the provision of administration, transfer agency and other services, to the Portfolio and to Transamerica Series Trust as a whole by TAM and its affiliates. The Board considered the profitability of TAM and its affiliates in providing these services for the Portfolio and Transamerica Series Trust as a whole. The Trustees recognized the competitiveness of the mutual fund industry and the importance of an investment adviser’s long-term profitability, including for maintaining company and management stability and accountability.
The Board also considered the allocation methodology used for calculating the profitability of TAM and its affiliates. The Board noted that the revenue and expense allocation methodology used by TAM to estimate its profitability with respect to its relationship with the Portfolio
|
|
|
|
|
| Transamerica Series Trust |
|
|
|
Semi-Annual Financial Statements 2024 |
|
|
Page 18 |
|
|
Transamerica JPMorgan Asset Allocation - Conservative VP
MANAGEMENT AND SUB-ADVISORY AGREEMENT — CONTRACT RENEWAL (continued)
(unaudited)
had been reviewed previously by an independent consultant. The Trustees considered that TAM reported that it had not made material changes to this methodology, and that the methodology had been applied consistently for the Portfolio.
With respect to the Sub-Adviser, the Board noted that the sub-advisory fee is the product of arm’s-length negotiation between TAM and the Sub-Adviser, which is not affiliated with TAM, and is paid by TAM and not the Portfolio. As a result, the Board focused on the profitability of TAM and its affiliates with respect to the Portfolio.
Based on this information, the Board determined that the profitability of TAM and its affiliates from their relationships with the Portfolio was not excessive.
Economies of Scale
The Board considered economies of scale with respect to the management of the Portfolio, whether the Portfolio had appropriately benefited from any economies of scale and whether there was the potential for realization of any future economies of scale. The Board also considered the existence of economies of scale with respect to management of the Transamerica mutual funds overall and the extent to which the Portfolio benefited from any economies of scale. The Board recognized that, as the Portfolio’s assets increase, any economies of scale realized by TAM or the Sub-Adviser may not directly correlate with each other or with any economies of scale that might be realized by the Portfolio. The Board considered the Portfolio’s management fee schedule and the existence of breakpoints and also considered the extent to which TAM shared economies of scale, if any, with the Portfolio through undertakings to limit or reimburse Portfolio expenses and to invest in maintaining and developing its capabilities and services. The Board also considered the Sub-Adviser’s sub-advisory fee schedule and the existence of breakpoints, if any, and how such breakpoints relate to any breakpoints in the Portfolio’s management fee schedule. The Board considered that the Sub-Adviser’s sub-advisory fees would be based on the combined assets of multiple funds. The Trustees concluded that the Portfolio’s fee structure reflected an appropriate sharing of any efficiencies or economies of scale to date and noted that they will have the opportunity to periodically reexamine the appropriateness of the management fee payable to TAM and the fee paid to the Sub-Adviser in light of any economies of scale experienced in the future.
Benefits to TAM, its Affiliates and/or the Sub-Adviser from their Relationships with the Portfolio
The Board considered other benefits derived by TAM, its affiliates, and/or the Sub-Adviser from their relationships with the Portfolio. The Board noted that TAM does not receive benefits from research obtained with commissions paid to broker-dealers for portfolio transactions (commonly referred to as “soft dollars”) as a result of its relationship with the Portfolio.
Other Considerations
The Board noted that TAM has made a substantial commitment to the recruitment and retention of high-quality personnel and maintains the financial, compliance and operational resources reasonably necessary to manage the Portfolio in a professional manner that is consistent with the best interests of the Portfolio and the holders. In this regard, the Board favorably considered the procedures and policies TAM has in place to enforce compliance with applicable laws and regulations and oversee the portfolio management activities of the Sub-Adviser. The Board also noted that TAM has made an entrepreneurial commitment and undertaken certain business risks with respect to the management and success of the Portfolio.
Conclusion
After consideration of the factors described above, as well as other factors, the Trustees, including the Independent Trustees, concluded that the renewal of the Management Agreement and the Sub-Advisory Agreement was in the best interests of the Portfolio and the holders and voted to approve the renewal of the Agreements.
|
|
|
|
|
| Transamerica Series Trust |
|
|
|
Semi-Annual Financial Statements 2024 |
|
|
Page 19 |
|
|
PROXY VOTING POLICIES AND PROCEDURES AND QUARTERLY PORTFOLIO HOLDINGS
(unaudited)
A description of Transamerica Series Trust’s (the “Trust”) proxy voting policies and procedures is available in the Statement of Additional Information of the Portfolios, available without charge upon request by calling 1-800-851-9777 (toll free) or on the Securities and Exchange Commission’s (“SEC”) website at http://www.sec.gov.
In addition, the Portfolio is required to file Form N-PX, with their complete proxy voting records for the most recent 12 months ended June 30th, no later than August 31st of each year. The Form is available without charge: (1) on the Transamerica Funds website at https://www.transamerica.com/sites/default/files/files/e070d/TST%20N-PX%202021.pdf; and (2) on the SEC’s website at http://www.sec.gov.
Each fiscal quarter, the Portfolios, except Transamerica BlackRock Government Money Market VP, will file with the SEC a complete schedule of its monthly portfolio holdings on Form N-PORT. The Portfolios’ holdings as of the end of the third month of every fiscal quarter, as reported on Form N-PORT, will be publicly available on the SEC’s website at http://www.sec.gov within 60 days of the end of the fiscal quarter.
On a monthly basis, Transamerica BlackRock Government Money Market VP will file with the SEC portfolio holdings information on Form N-MFP3. A complete schedule of portfolio holdings is also available at www.transamerica.com.
You may also visit the Trust’s website at www.transamerica.com/annuities/prospectus for this and other information about the Portfolios and the Trust.
Important Notice Regarding Delivery of Shareholder Documents
Every year we provide shareholders informative materials such as the Transamerica Series Trust Annual Report, the Transamerica Series Trust Prospectus, and other required documents that keep you informed regarding your Portfolios. To the extent provided by mail, Transamerica Series Trust will only send one piece per mailing address, a method that saves your Portfolios money by reducing mailing and printing costs. We will continue to do this unless you tell us not to. To elect to receive individual mailings, simply call a Transamerica Customer Service Representative toll free at 1-800-851-9777, 8 a.m. to 7 p.m. Eastern Time, Monday-Friday. Your request will take effect within 30 days.
|
|
|
|
|
| Transamerica Series Trust |
|
|
|
Semi-Annual Financial Statements 2024 |
|
|
Page 20 |
|
|
NOTICE OF PRIVACY POLICY
(unaudited)
Your privacy is very important to us. We want you to understand what information we collect and how we use it. We collect and use “nonpublic personal information” in connection with providing our customers with a broad range of financial products and services as effectively and conveniently as possible. We treat nonpublic personal information in accordance with our Privacy Policy.
What Information We Collect and From Whom We Collect It
We may collect nonpublic personal information about you from the following sources:
| • |
|
Information we receive from you on applications or other forms, such as your name, address, and account number; |
| • |
|
Information about your transactions with us, our affiliates, or others, such as your account balance and purchase/redemption history; and |
| • |
|
Information we receive from non-affiliated third parties, including consumer reporting agencies. |
What Information We Disclose and To Whom We Disclose It
We do not disclose any nonpublic personal information about current or former customers to anyone without their express consent, except as permitted by law. We may disclose the nonpublic personal information we collect, as described above, to persons or companies that perform services on our behalf and to other financial institutions with which we have joint marketing agreements. We will require these companies to protect the confidentiality of your nonpublic personal information and to use it only to perform the services for which we have hired them.
Our Security Procedures
We restrict access to your nonpublic personal information and only allow disclosures to persons and companies as permitted by law to assist in providing products or services to you. We maintain physical, electronic, and procedural safeguards to protect your nonpublic personal information and to safeguard the disposal of certain consumer information.
Contact Us
If you have any questions about our Privacy Policy, please call 1-800-851-9777 on any business day between 8 a.m. and 7 p.m. Eastern Time.
Note: This Privacy Policy applies only to customers that have a direct relationship with us or our affiliates. If you own shares of our portfolios in the name of a third party such as a bank or broker-dealer, its privacy policy may apply to you instead of ours.
|
|
|
|
|
| Transamerica Series Trust |
|
|
|
Semi-Annual Financial Statements 2024 |
|
|
Page 21 |
|
|
PO Box 219945
Kansas City, MO 64121-9945
|
|
|
| Distributor: |
|
Transamerica Capital, Inc. |
|
|
PO Box 219945 |
|
|
Kansas City, MO 64121-9945 |
|
|
|
|
Customer Service: 1-800-851-9777 |
Transamerica Series Trust Semi-Annual Financial Statements
June 30, 2024
1801 California St., Suite 5200
Denver, CO 80202
Distributor: Transamerica Capital, Inc.
Customer Service: 1-800-851-9777
The following pages contain the most recent semi-annual financial statements for the investment options in which you are invested. In compliance with Securities and Exchange Commission regulations, we present these reports on an annual and semi-annual basis with the hope that they will foster greater understanding of the investment options’ holdings, performance, financial data, accounting policies and other issues. This streamlined version provides information only on the investment options in which you are invested.
If you have any questions about these reports, please do not hesitate to contact your financial professional. As always, we thank you for your trust and the opportunity to serve you.
Transamerica JPMorgan Asset Allocation - Growth VP
SCHEDULE OF INVESTMENTS
At June 30, 2024
(unaudited)
|
|
|
|
|
|
|
|
|
| |
|
Shares |
|
|
Value |
|
| |
|
|
|
|
| INVESTMENT COMPANIES - 98.0% |
|
|
|
|
|
|
|
|
| International Equity Funds - 15.1% |
|
|
|
|
|
|
|
|
| Transamerica BlackRock Real Estate Securities VP (A) |
|
|
258,238 |
|
|
$ |
2,419,691 |
|
| Transamerica Emerging Markets Opportunities (A) |
|
|
3,607,946 |
|
|
|
28,719,256 |
|
| Transamerica International Equity (A) |
|
|
1,982,895 |
|
|
|
41,402,850 |
|
| Transamerica International Focus (A) |
|
|
6,053,908 |
|
|
|
50,126,357 |
|
| Transamerica International Small Cap Value (A) |
|
|
2,378,584 |
|
|
|
35,607,399 |
|
|
|
|
|
|
|
|
|
|
|
|
|
|
|
|
|
|
|
|
158,275,553 |
|
|
|
|
|
|
|
|
|
|
| U.S. Equity Funds - 73.6% |
|
|
|
|
|
|
|
|
| Transamerica Janus Mid-Cap Growth VP (A) |
|
|
245,555 |
|
|
|
7,887,222 |
|
| Transamerica JPMorgan Enhanced Index VP (A) |
|
|
14,958,325 |
|
|
|
415,243,090 |
|
| Transamerica Large Cap Value (A) |
|
|
8,567,943 |
|
|
|
120,036,887 |
|
| Transamerica Mid Cap Growth (A)(B) |
|
|
1,338,662 |
|
|
|
12,369,239 |
|
| Transamerica Mid Cap Value Opportunities (A) |
|
|
708,957 |
|
|
|
7,791,432 |
|
| Transamerica Small Cap Value (A) |
|
|
940,350 |
|
|
|
5,350,590 |
|
| Transamerica T. Rowe Price Small Cap VP (A) |
|
|
430,550 |
|
|
|
5,274,240 |
|
| Transamerica WMC US Growth VP (A) |
|
|
4,632,166 |
|
|
|
197,700,857 |
|
|
|
|
|
|
|
|
|
|
|
|
|
|
|
|
|
|
|
|
771,653,557 |
|
|
|
|
|
|
|
|
|
|
| U.S. Fixed Income Funds - 9.3% |
|
|
|
|
|
|
|
|
| Transamerica Aegon High Yield Bond VP (A) |
|
|
9,972,200 |
|
|
|
69,506,235 |
|
| Transamerica Floating Rate (A) |
|
|
3,137,881 |
|
|
|
28,366,443 |
|
|
|
|
|
|
|
|
|
|
|
|
|
|
|
|
|
|
|
|
97,872,678 |
|
|
|
|
|
|
|
|
|
|
| Total Investment Companies
(Cost $923,768,998) |
|
|
|
|
|
|
1,027,801,788 |
|
|
|
|
|
|
|
|
|
|
|
|
|
|
|
|
|
|
|
| |
|
Principal |
|
|
Value |
|
| |
|
|
|
| U.S. GOVERNMENT OBLIGATION - 1.0% |
|
|
|
|
|
| U.S. Treasury - 1.0% |
|
|
|
|
|
|
|
|
| U.S. Treasury Notes |
|
|
|
|
|
|
|
|
| 4.13%, 01/31/2025 (C) |
|
$ |
10,607,600 |
|
|
$ |
10,533,844 |
|
|
|
|
|
|
|
|
|
|
| Total U.S. Government Obligation
(Cost $10,560,579) |
|
|
|
|
|
|
10,533,844 |
|
|
|
|
|
|
|
|
|
|
|
|
|
| REPURCHASE AGREEMENT - 0.8% |
|
|
|
|
|
|
|
|
| Fixed Income Clearing Corp., 2.50% (D), dated 06/28/2024, to be repurchased at $8,456,431 on 07/01/2024. Collateralized by a U.S. Government Obligation, 3.75%, due 04/15/2026, and with a value of $8,623,944. |
|
|
8,454,670 |
|
|
|
8,454,670 |
|
|
|
|
|
|
|
|
|
|
| Total Repurchase Agreement
(Cost $8,454,670) |
|
|
|
8,454,670 |
|
|
|
|
|
|
|
|
|
|
| Total Investments
(Cost $942,784,247) |
|
|
|
1,046,790,302 |
|
|
|
|
|
|
|
|
|
|
| Net Other Assets (Liabilities) - 0.2% |
|
|
|
1,575,331 |
|
|
|
|
|
|
|
|
|
|
|
|
| Net Assets - 100.0% |
|
|
$ |
1,048,365,633 |
|
|
|
|
|
|
|
|
|
|
FUTURES CONTRACTS:
|
|
|
|
|
|
|
|
|
|
|
|
|
|
|
|
|
|
|
|
|
|
|
| |
|
| Long Futures Contracts |
|
| |
|
| Description |
|
Number of Contracts |
|
Expiration Date |
|
|
Notional Amount |
|
|
Value |
|
|
Unrealized Appreciation |
|
|
Unrealized Depreciation |
| |
|
| E-Mini Russell 2000® Index |
|
154 |
|
|
09/20/2024 |
|
|
|
$15,628,086 |
|
|
|
$15,900,500 |
|
|
$ |
272,414 |
|
|
$ |
— |
|
| MSCI EAFE Mini Index |
|
690 |
|
|
09/20/2024 |
|
|
|
80,044,878 |
|
|
|
80,840,400 |
|
|
|
795,522 |
|
|
|
— |
|
| MSCI Emerging Markets Index |
|
1,545 |
|
|
09/20/2024 |
|
|
|
83,963,716 |
|
|
|
84,063,450 |
|
|
|
99,734 |
|
|
|
— |
|
| S&P 500® E-Mini Index |
|
55 |
|
|
09/20/2024 |
|
|
|
15,192,260 |
|
|
|
15,184,125 |
|
|
|
— |
|
|
|
(8,135) |
|
| S&P/TSX 60 Index |
|
120 |
|
|
09/19/2024 |
|
|
|
22,767,963 |
|
|
|
22,990,388 |
|
|
|
222,425 |
|
|
|
— |
|
|
|
|
|
|
|
|
|
|
|
|
|
|
|
|
|
|
|
|
| Total |
|
|
$ |
1,390,095 |
|
|
$ |
(8,135) |
|
|
|
|
|
|
|
|
|
|
|
|
|
|
|
|
|
|
|
|
|
| Short Futures Contracts |
|
| |
|
| Description |
|
Number of Contracts |
|
Expiration Date |
|
|
Notional Amount |
|
|
Value |
|
|
Unrealized Appreciation |
|
|
Unrealized Depreciation |
| |
|
| 5-Year U.S. Treasury Notes |
|
(537) |
|
|
09/30/2024 |
|
|
$ |
(56,870,582 |
) |
|
$ |
(57,232,453 |
) |
|
$ |
— |
|
|
$ |
(361,871) |
|
| EURO STOXX 50® Index |
|
(309) |
|
|
09/20/2024 |
|
|
|
(16,148,440 |
) |
|
|
(16,301,301 |
) |
|
|
— |
|
|
|
(152,861) |
|
| JPY Currency |
|
(191) |
|
|
09/16/2024 |
|
|
|
(15,399,491 |
) |
|
|
(15,023,344 |
) |
|
|
376,147 |
|
|
|
— |
|
| TOPIX Index |
|
(17) |
|
|
09/12/2024 |
|
|
|
(2,864,083 |
) |
|
|
(2,969,638 |
) |
|
|
— |
|
|
|
(105,555) |
|
|
|
|
|
|
|
|
|
|
|
|
|
|
|
|
|
|
|
|
| Total |
|
|
$ |
376,147 |
|
|
$ |
(620,287) |
|
|
|
|
|
|
|
|
|
|
|
|
|
|
|
|
|
|
|
|
| Total Futures Contracts |
|
|
$ |
1,766,242 |
|
|
$ |
(628,422) |
|
|
|
|
|
|
|
|
|
|
|
|
|
|
|
|
|
|
|
|
The Notes to Financial Statements are an integral part of this report.
|
|
|
|
|
| Transamerica Series Trust |
|
|
|
Semi-Annual Financial Statements 2024 |
|
|
Page 1 |
|
|
Transamerica JPMorgan Asset Allocation - Growth VP
SCHEDULE OF INVESTMENTS (continued)
At June 30, 2024
(unaudited)
INVESTMENT VALUATION:
|
|
|
|
|
|
|
|
|
|
|
|
|
|
|
|
|
| Valuation Inputs (E) |
|
|
|
|
|
|
|
|
|
|
|
|
| |
|
Level 1 - Unadjusted Quoted Prices |
|
|
Level 2 - Other Significant Observable Inputs |
|
|
Level 3 - Significant Unobservable Inputs |
|
|
Value |
|
| |
|
|
|
|
|
|
| ASSETS |
|
|
|
|
|
|
|
|
|
|
|
|
|
|
|
|
| Investments |
|
|
|
|
|
|
|
|
|
|
|
|
|
|
|
|
| Investment Companies |
|
$ |
1,027,801,788 |
|
|
$ |
— |
|
|
$ |
— |
|
|
$ |
1,027,801,788 |
|
| U.S. Government Obligation |
|
|
— |
|
|
|
10,533,844 |
|
|
|
— |
|
|
|
10,533,844 |
|
| Repurchase Agreement |
|
|
— |
|
|
|
8,454,670 |
|
|
|
— |
|
|
|
8,454,670 |
|
|
|
|
|
|
|
|
|
|
|
|
|
|
|
|
|
|
|
|
|
|
|
| Total Investments |
|
$ |
1,027,801,788 |
|
|
$ |
18,988,514 |
|
|
$ |
— |
|
|
$ |
1,046,790,302 |
|
|
|
|
|
|
|
|
|
|
|
|
|
|
|
|
|
|
|
|
|
|
|
| Other Financial Instruments |
|
|
|
|
|
|
|
|
|
|
|
|
|
|
|
|
| Futures Contracts (F) |
|
$ |
1,766,242 |
|
|
$ |
— |
|
|
$ |
— |
|
|
$ |
1,766,242 |
|
|
|
|
|
|
|
|
|
|
|
|
|
|
|
|
|
|
|
|
|
|
|
| Total Other Financial Instruments |
|
$ |
1,766,242 |
|
|
$ |
— |
|
|
$ |
— |
|
|
$ |
1,766,242 |
|
|
|
|
|
|
|
|
|
|
|
|
|
|
|
|
|
|
|
|
|
|
|
| LIABILITIES |
|
|
|
|
|
|
|
|
|
|
|
|
|
|
|
|
| Other Financial Instruments |
|
|
|
|
|
|
|
|
|
|
|
|
|
|
|
|
| Futures Contracts (F) |
|
$ |
(628,422 |
) |
|
$ |
— |
|
|
$ |
— |
|
|
$ |
(628,422 |
) |
|
|
|
|
|
|
|
|
|
|
|
|
|
|
|
|
|
|
|
|
|
|
| Total Other Financial Instruments |
|
$ |
(628,422 |
) |
|
$ |
— |
|
|
$ |
— |
|
|
$ |
(628,422 |
) |
|
|
|
|
|
|
|
|
|
|
|
|
|
|
|
|
|
FOOTNOTES TO SCHEDULE OF INVESTMENTS:
| (A) |
Affiliated investment in the Class I2 shares of funds within Transamerica Funds and/or affiliated investment in the Initial Class shares of funds within Transamerica Series Trust. The Portfolio’s transactions and earnings from these underlying funds are as follows: |
|
|
|
|
|
|
|
|
|
|
|
|
|
|
|
|
|
|
|
|
|
|
|
|
|
|
|
|
|
|
|
|
|
|
|
|
|
| Affiliated Investments |
|
Value December 31, 2023 |
|
|
Purchases at Cost |
|
|
Proceeds from Sales |
|
|
Net Realized Gain (Loss) |
|
|
Net Change in Unrealized Appreciation (Depreciation) |
|
|
Value June 30, 2024 |
|
|
Shares as of June 30, 2024 |
|
|
Dividend Income |
|
|
Net Capital Gain Distributions |
|
|
|
|
|
|
|
|
|
|
|
| Transamerica Aegon High Yield Bond VP |
|
|
$68,209,849 |
|
|
|
$— |
|
|
|
$— |
|
|
|
$— |
|
|
|
$1,296,386 |
|
|
|
$69,506,235 |
|
|
|
9,972,200 |
|
|
|
$— |
|
|
|
$— |
|
| Transamerica BlackRock Real Estate Securities VP |
|
|
2,510,074 |
|
|
|
— |
|
|
|
— |
|
|
|
— |
|
|
|
(90,383 |
) |
|
|
2,419,691 |
|
|
|
258,238 |
|
|
|
— |
|
|
|
— |
|
| Transamerica Emerging Markets Opportunities |
|
|
26,770,965 |
|
|
|
— |
|
|
|
— |
|
|
|
— |
|
|
|
1,948,291 |
|
|
|
28,719,256 |
|
|
|
3,607,946 |
|
|
|
— |
|
|
|
— |
|
| Transamerica Floating Rate |
|
|
27,272,211 |
|
|
|
1,155,476 |
|
|
|
— |
|
|
|
— |
|
|
|
(61,244 |
) |
|
|
28,366,443 |
|
|
|
3,137,881 |
|
|
|
1,155,309 |
|
|
|
— |
|
| Transamerica International Equity |
|
|
40,034,653 |
|
|
|
— |
|
|
|
— |
|
|
|
— |
|
|
|
1,368,197 |
|
|
|
41,402,850 |
|
|
|
1,982,895 |
|
|
|
— |
|
|
|
— |
|
| Transamerica International Focus |
|
|
57,246,967 |
|
|
|
18,636,320 |
|
|
|
(27,037,070 |
) |
|
|
1,633,857 |
|
|
|
(353,717 |
) |
|
|
50,126,357 |
|
|
|
6,053,908 |
|
|
|
— |
|
|
|
— |
|
| Transamerica International Small Cap Value |
|
|
33,633,174 |
|
|
|
— |
|
|
|
— |
|
|
|
— |
|
|
|
1,974,225 |
|
|
|
35,607,399 |
|
|
|
2,378,584 |
|
|
|
— |
|
|
|
— |
|
| Transamerica Janus Mid-Cap Growth VP |
|
|
21,705,456 |
|
|
|
— |
|
|
|
(14,801,971 |
) |
|
|
(5,228,450 |
) |
|
|
6,212,187 |
|
|
|
7,887,222 |
|
|
|
245,555 |
|
|
|
— |
|
|
|
— |
|
| Transamerica JPMorgan Enhanced Index VP |
|
|
321,988,968 |
|
|
|
59,550,405 |
|
|
|
(20,276,120 |
) |
|
|
4,267,068 |
|
|
|
49,712,769 |
|
|
|
415,243,090 |
|
|
|
14,958,325 |
|
|
|
— |
|
|
|
— |
|
| Transamerica Large Cap Value |
|
|
119,906,141 |
|
|
|
3,727,445 |
|
|
|
(14,905,860 |
) |
|
|
3,322,985 |
|
|
|
7,986,176 |
|
|
|
120,036,887 |
|
|
|
8,567,943 |
|
|
|
714,803 |
|
|
|
— |
|
| Transamerica Mid Cap Growth |
|
|
32,604,379 |
|
|
|
— |
|
|
|
(21,239,625 |
) |
|
|
(5,427,117 |
) |
|
|
6,431,602 |
|
|
|
12,369,239 |
|
|
|
1,338,662 |
|
|
|
— |
|
|
|
— |
|
| Transamerica Mid Cap Value Opportunities |
|
|
19,065,600 |
|
|
|
— |
|
|
|
(11,483,600 |
) |
|
|
199,697 |
|
|
|
9,735 |
|
|
|
7,791,432 |
|
|
|
708,957 |
|
|
|
— |
|
|
|
— |
|
| Transamerica Small Cap Value |
|
|
10,760,012 |
|
|
|
— |
|
|
|
(5,368,157 |
) |
|
|
(277,706 |
) |
|
|
236,441 |
|
|
|
5,350,590 |
|
|
|
940,350 |
|
|
|
— |
|
|
|
— |
|
| Transamerica T. Rowe Price Small Cap VP |
|
|
20,441,633 |
|
|
|
— |
|
|
|
(16,207,233 |
) |
|
|
(3,433,745 |
) |
|
|
4,473,585 |
|
|
|
5,274,240 |
|
|
|
430,550 |
|
|
|
— |
|
|
|
— |
|
The Notes to Financial Statements are an integral part of this report.
|
|
|
|
|
| Transamerica Series Trust |
|
|
|
Semi-Annual Financial Statements 2024 |
|
|
Page 2 |
|
|
Transamerica JPMorgan Asset Allocation - Growth VP
SCHEDULE OF INVESTMENTS (continued)
At June 30, 2024
(unaudited)
FOOTNOTES TO SCHEDULE OF INVESTMENTS (continued):
|
|
|
|
|
|
|
|
|
|
|
|
|
|
|
|
|
|
|
|
|
|
|
|
|
|
|
|
|
|
|
|
|
|
|
|
|
| Affiliated Investments |
|
Value December 31, 2023 |
|
|
Purchases at Cost |
|
|
Proceeds from Sales |
|
|
Net Realized Gain (Loss) |
|
|
Net Change in Unrealized Appreciation (Depreciation) |
|
|
Value June 30, 2024 |
|
|
Shares as of June 30, 2024 |
|
|
Dividend Income |
|
|
Net Capital Gain Distributions |
|
|
|
|
|
|
|
|
|
|
|
| Transamerica TSW Mid Cap Value Opportunities VP |
|
|
$11,795,284 |
|
|
|
$— |
|
|
|
$(12,112,614 |
) |
|
|
$(1,641,743 |
) |
|
|
$1,959,073 |
|
|
|
$— |
|
|
|
— |
|
|
|
$— |
|
|
|
$— |
|
| Transamerica WMC US Growth VP |
|
|
138,704,885 |
|
|
|
29,765,166 |
|
|
|
— |
|
|
|
— |
|
|
|
29,230,806 |
|
|
|
197,700,857 |
|
|
|
4,632,166 |
|
|
|
— |
|
|
|
— |
|
|
|
|
|
|
| Total |
|
|
$952,650,251 |
|
|
|
$112,834,812 |
|
|
|
$(143,432,250 |
) |
|
|
$(6,585,154 |
) |
|
|
$112,334,129 |
|
|
|
$1,027,801,788 |
|
|
|
59,214,160 |
|
|
|
$1,870,112 |
|
|
|
$— |
|
|
|
|
|
|
| (B) |
Non-income producing security. |
| (C) |
All or a portion of the security has been segregated by the custodian as collateral to cover margin requirements for open futures contracts. The total value of the securities is $10,533,844. |
| (D) |
Rate disclosed reflects the yield at June 30, 2024. |
| (E) |
There were no transfers in or out of Level 3 during the period ended June 30, 2024. Please reference the Investment Valuation section of the Notes to Financial Statements for more information regarding investment valuation and pricing inputs. |
| (F) |
Derivative instruments are valued at unrealized appreciation (depreciation). |
CURRENCY ABBREVIATION(S):
PORTFOLIO ABBREVIATION(S):
|
|
|
| EAFE |
|
Europe, Australasia and Far East |
| STOXX |
|
Deutsche Börse Group & SIX Group Index |
| TOPIX |
|
Tokyo Price Index |
| TSX |
|
Toronto Stock Exchange |
The Notes to Financial Statements are an integral part of this report.
|
|
|
|
|
| Transamerica Series Trust |
|
|
|
Semi-Annual Financial Statements 2024 |
|
|
Page 3 |
|
|
Transamerica JPMorgan Asset Allocation - Growth VP
STATEMENT OF ASSETS AND LIABILITIES
At June 30, 2024
(unaudited)
|
|
|
|
|
| Assets: |
|
|
|
|
| Affiliated investments, at value (cost $923,768,998) |
|
$ |
1,027,801,788 |
|
| Unaffiliated investments, at value (cost $10,560,579) |
|
|
10,533,844 |
|
| Repurchase agreement, at value (cost $8,454,670) |
|
|
8,454,670 |
|
| Receivables and other assets: |
|
|
|
|
| Investments sold |
|
|
2,235,900 |
|
| Shares of beneficial interest sold |
|
|
1,443 |
|
| Dividends from affiliated investments |
|
|
181,068 |
|
| Interest |
|
|
182,076 |
|
| Variation margin receivable on futures contracts |
|
|
1,915,264 |
|
| Prepaid expenses |
|
|
4,120 |
|
|
|
| Total assets |
|
|
1,051,310,173 |
|
|
|
| Liabilities: |
|
|
|
|
| Foreign currency overdraft, at value (cost $0) |
|
|
2,506 |
|
| Payables and other liabilities: |
|
|
|
|
| Investments purchased |
|
|
2,416,969 |
|
| Shares of beneficial interest redeemed |
|
|
259,276 |
|
| Due to custodian |
|
|
345 |
|
| Investment management fees |
|
|
98,028 |
|
| Distribution and service fees |
|
|
56,744 |
|
| Transfer agent costs |
|
|
730 |
|
| Trustee and CCO fees |
|
|
2,217 |
|
| Audit and tax fees |
|
|
15,652 |
|
| Custody fees |
|
|
12,150 |
|
| Legal fees |
|
|
16,717 |
|
| Printing and shareholder reports fees |
|
|
45,243 |
|
| Other accrued expenses |
|
|
17,963 |
|
|
|
| Total liabilities |
|
|
2,944,540 |
|
|
|
| Net assets |
|
$ |
1,048,365,633 |
|
|
|
| Net assets consist of: |
|
|
|
|
| Capital stock ($0.01 par value) |
|
$ |
912,368 |
|
| Additional paid-in capital |
|
|
919,985,905 |
|
| Total distributable earnings (accumulated losses) |
|
|
127,467,360 |
|
|
|
| Net assets |
|
$ |
1,048,365,633 |
|
|
|
| Net assets by class: |
|
|
|
|
| Initial Class |
|
$ |
751,718,179 |
|
| Service Class |
|
|
296,647,454 |
|
|
|
| Shares outstanding: |
|
|
|
|
| Initial Class |
|
|
65,089,628 |
|
| Service Class |
|
|
26,147,126 |
|
|
|
| Net asset value and offering price per share: |
|
|
|
|
| Initial Class |
|
$ |
11.55 |
|
| Service Class |
|
|
11.35 |
|
STATEMENT OF OPERATIONS
For the period ended June 30, 2024
(unaudited)
|
|
|
|
|
| Investment income: |
|
|
|
|
| Dividend income from affiliated investments |
|
$ |
1,870,112 |
|
| Interest income from unaffiliated investments |
|
|
504,620 |
|
| Total investment income |
|
|
2,374,732 |
|
|
|
| Expenses: |
|
|
|
|
| Investment management fees |
|
|
614,845 |
|
| Distribution and service fees: |
|
|
|
|
| Service Class |
|
|
356,429 |
|
| Transfer agent costs |
|
|
5,501 |
|
| Trustee and CCO fees |
|
|
23,003 |
|
| Audit and tax fees |
|
|
15,485 |
|
| Custody fees |
|
|
15,211 |
|
| Legal fees |
|
|
36,592 |
|
| Printing and shareholder reports fees |
|
|
43,701 |
|
| Other |
|
|
31,458 |
|
|
|
| Total expenses |
|
|
1,142,225 |
|
|
|
| Net investment income (loss) |
|
|
1,232,507 |
|
|
|
| Net realized gain (loss) on: |
|
|
|
|
| Affiliated investments |
|
|
(6,585,154 |
) |
| Unaffiliated investments |
|
|
(17,555 |
) |
| Futures contracts |
|
|
12,884,136 |
|
|
|
| Net realized gain (loss) |
|
|
6,281,427 |
|
|
|
| Net change in unrealized appreciation (depreciation) on: |
|
|
|
|
| Affiliated investments |
|
|
112,334,129 |
|
| Unaffiliated investments |
|
|
(28,639 |
) |
| Futures contracts |
|
|
(10,032,184 |
) |
| Translation of assets and liabilities denominated in foreign currencies |
|
|
(51,972 |
) |
|
|
| Net change in unrealized appreciation (depreciation) |
|
|
102,221,334 |
|
|
|
| Net realized and change in unrealized gain (loss) |
|
|
108,502,761 |
|
|
|
| Net increase (decrease) in net assets resulting from operations |
|
$ |
109,735,268 |
|
The Notes to Financial Statements are an integral part of this report.
|
|
|
|
|
| Transamerica Series Trust |
|
|
|
Semi-Annual Financial Statements 2024 |
|
|
Page 4 |
|
|
Transamerica JPMorgan Asset Allocation - Growth VP
STATEMENT OF CHANGES IN NET ASSETS
For the period and year ended:
|
|
|
|
|
|
|
|
|
| |
|
June 30, 2024 (unaudited) |
|
|
December 31, 2023 |
|
|
|
| From operations: |
|
|
|
|
|
|
|
|
| Net investment income (loss) |
|
$ |
1,232,507 |
|
|
$ |
13,319,876 |
|
| Net realized gain (loss) |
|
|
6,281,427 |
|
|
|
6,789,148 |
|
| Net change in unrealized appreciation (depreciation) |
|
|
102,221,334 |
|
|
|
150,578,722 |
|
|
|
|
| Net increase (decrease) in net assets resulting from operations |
|
|
109,735,268 |
|
|
|
170,687,746 |
|
|
|
|
| Dividends and/or distributions to shareholders: |
|
|
|
|
|
|
|
|
| Initial Class |
|
|
— |
|
|
|
(20,562,006 |
) |
| Service Class |
|
|
— |
|
|
|
(7,608,639 |
) |
|
|
|
| Net increase (decrease) in net assets resulting from dividends and/or distributions to shareholders |
|
|
— |
|
|
|
(28,170,645 |
) |
|
|
|
| Capital share transactions: |
|
|
|
|
|
|
|
|
| Proceeds from shares sold: |
|
|
|
|
|
|
|
|
| Initial Class |
|
|
4,666,093 |
|
|
|
8,340,738 |
|
| Service Class |
|
|
9,248,363 |
|
|
|
10,898,218 |
|
| |
|
|
13,914,456 |
|
|
|
19,238,956 |
|
| Dividends and/or distributions reinvested: |
|
|
|
|
|
|
|
|
| Initial Class |
|
|
— |
|
|
|
20,562,006 |
|
| Service Class |
|
|
— |
|
|
|
7,608,639 |
|
| |
|
|
— |
|
|
|
28,170,645 |
|
| Cost of shares redeemed: |
|
|
|
|
|
|
|
|
| Initial Class |
|
|
(36,158,380 |
) |
|
|
(51,424,779 |
) |
| Service Class |
|
|
(21,437,075 |
) |
|
|
(31,178,385 |
) |
|
|
|
| |
|
|
(57,595,455 |
) |
|
|
(82,603,164 |
) |
|
|
|
| Net increase (decrease) in net assets resulting from capital share transactions |
|
|
(43,680,999 |
) |
|
|
(35,193,563 |
) |
|
|
|
| Net increase (decrease) in net assets |
|
|
66,054,269 |
|
|
|
107,323,538 |
|
|
|
|
| Net assets: |
|
|
|
|
|
|
|
|
| Beginning of period/year |
|
|
982,311,364 |
|
|
|
874,987,826 |
|
| End of period/year |
|
$ |
1,048,365,633 |
|
|
$ |
982,311,364 |
|
|
|
|
| Capital share transactions - shares: |
|
|
|
|
|
|
|
|
| Shares issued: |
|
|
|
|
|
|
|
|
| Initial Class |
|
|
431,799 |
|
|
|
883,176 |
|
| Service Class |
|
|
852,884 |
|
|
|
1,160,121 |
|
| |
|
|
1,284,683 |
|
|
|
2,043,297 |
|
| Shares reinvested: |
|
|
|
|
|
|
|
|
| Initial Class |
|
|
— |
|
|
|
2,128,572 |
|
| Service Class |
|
|
— |
|
|
|
800,067 |
|
| |
|
|
— |
|
|
|
2,928,639 |
|
| Shares redeemed: |
|
|
|
|
|
|
|
|
| Initial Class |
|
|
(3,303,114 |
) |
|
|
(5,403,905 |
) |
| Service Class |
|
|
(1,969,626 |
) |
|
|
(3,350,694 |
) |
| |
|
|
(5,272,740 |
) |
|
|
(8,754,599 |
) |
| Net increase (decrease) in shares outstanding: |
|
|
|
|
|
|
|
|
| Initial Class |
|
|
(2,871,315 |
) |
|
|
(2,392,157 |
) |
| Service Class |
|
|
(1,116,742 |
) |
|
|
(1,390,506 |
) |
| |
|
|
(3,988,057 |
) |
|
|
(3,782,663 |
) |
The Notes to Financial Statements are an integral part of this report.
|
|
|
|
|
| Transamerica Series Trust |
|
|
|
Semi-Annual Financial Statements 2024 |
|
|
Page 5 |
|
|
Transamerica JPMorgan Asset Allocation - Growth VP
FINANCIAL HIGHLIGHTS
|
|
|
|
|
|
|
|
|
|
|
|
|
|
|
|
|
|
|
|
|
|
|
|
|
| For a share outstanding during the period and years indicated: |
|
Initial Class |
|
|
|
|
|
|
|
| |
|
June 30, 2024 (unaudited) |
|
December 31, 2023 |
|
December 31, 2022 |
|
December 31, 2021 |
|
December 31, 2020 |
|
December 31, 2019 |
|
|
|
|
|
|
|
| Net asset value, beginning of period/year |
|
$ |
10.36 |
|
|
$ |
8.88 |
|
|
$ |
15.70 |
|
|
$ |
14.19 |
|
|
$ |
12.54 |
|
|
$ |
11.19 |
|
|
|
|
|
|
|
|
| Investment operations: |
|
|
|
|
|
|
|
|
|
|
|
|
|
|
|
|
|
|
|
|
|
|
|
|
| Net investment income (loss)(A) |
|
|
0.02 |
|
|
|
0.15 |
|
|
|
0.19 |
|
|
|
0.73 |
|
|
|
0.26 |
|
|
|
0.21 |
|
| Net realized and unrealized gain (loss) |
|
|
1.17 |
|
|
|
1.64 |
|
|
|
(3.59 |
) |
|
|
2.03 |
|
|
|
2.61 |
|
|
|
2.54 |
|
| Total investment operations |
|
|
1.19 |
|
|
|
1.79 |
|
|
|
(3.40 |
) |
|
|
2.76 |
|
|
|
2.87 |
|
|
|
2.75 |
|
|
|
|
|
|
|
|
| Dividends and/or distributions to shareholders: |
|
|
|
|
|
|
|
|
|
|
|
|
|
|
|
|
|
|
|
|
|
|
|
|
| Net investment income |
|
|
— |
|
|
|
(0.17 |
) |
|
|
(0.79 |
) |
|
|
(0.27 |
) |
|
|
(0.21 |
) |
|
|
(0.22 |
) |
| Net realized gains |
|
|
— |
|
|
|
(0.14 |
) |
|
|
(2.63 |
) |
|
|
(0.98 |
) |
|
|
(1.01 |
) |
|
|
(1.18 |
) |
| Total dividends and/or distributions to shareholders |
|
|
— |
|
|
|
(0.31 |
) |
|
|
(3.42 |
) |
|
|
(1.25 |
) |
|
|
(1.22 |
) |
|
|
(1.40 |
) |
|
|
|
|
|
|
|
| Net asset value, end of period/year |
|
$ |
11.55 |
|
|
$ |
10.36 |
|
|
$ |
8.88 |
|
|
$ |
15.70 |
|
|
$ |
14.19 |
|
|
$ |
12.54 |
|
| |
|
|
|
|
|
|
|
|
| Total return |
|
|
11.49 |
%(B) |
|
|
20.34 |
% |
|
|
(22.57 |
)% |
|
|
19.64 |
% |
|
|
24.74 |
% |
|
|
26.05 |
% |
|
|
|
|
|
|
|
| Ratio and supplemental data: |
|
|
|
|
|
|
|
|
|
|
|
|
|
|
|
|
|
|
|
|
|
|
|
|
|
|
|
|
|
|
|
| Net assets end of period/year (000’s) |
|
$ |
751,719 |
|
|
$ |
704,377 |
|
|
$ |
624,660 |
|
|
$ |
862,525 |
|
|
$ |
830,510 |
|
|
$ |
721,535 |
|
| Expenses to average net assets(C) |
|
|
|
|
|
|
|
|
|
|
|
|
|
|
|
|
|
|
|
|
|
|
|
|
| Excluding waiver and/or reimbursement and recapture |
|
|
0.16 |
%(D) |
|
|
0.17 |
% |
|
|
0.15 |
% |
|
|
0.15 |
% |
|
|
0.16 |
% |
|
|
0.15 |
% |
| Including waiver and/or reimbursement and recapture |
|
|
0.16 |
%(D) |
|
|
0.17 |
%(E) |
|
|
0.15 |
% |
|
|
0.15 |
% |
|
|
0.16 |
% |
|
|
0.15 |
% |
| Net investment income (loss) to average net assets |
|
|
0.32 |
%(D) |
|
|
1.52 |
% |
|
|
1.64 |
% |
|
|
4.68 |
% |
|
|
2.17 |
% |
|
|
1.74 |
% |
| Portfolio turnover rate |
|
|
12 |
%(B) |
|
|
45 |
% |
|
|
13 |
% |
|
|
22 |
% |
|
|
49 |
% |
|
|
12 |
% |
| (A) |
Calculated based on average number of shares outstanding. |
| (C) |
Does not include expenses of the underlying investments in which the Portfolio invests. |
| (E) |
Waiver and/or reimbursement rounds to less than 0.01%. |
|
|
|
|
|
|
|
|
|
|
|
|
|
|
|
|
|
|
|
|
|
|
|
|
|
| For a share outstanding during the period and years indicated: |
|
Service Class |
|
|
|
|
|
|
|
| |
|
June 30, 2024 (unaudited) |
|
December 31, 2023 |
|
December 31, 2022 |
|
December 31, 2021 |
|
December 31, 2020 |
|
December 31, 2019 |
|
|
|
|
|
|
|
| Net asset value, beginning of period/year |
|
$ |
10.19 |
|
|
$ |
8.74 |
|
|
$ |
15.50 |
|
|
$ |
14.03 |
|
|
$ |
12.42 |
|
|
$ |
11.09 |
|
|
|
|
|
|
|
|
| Investment operations: |
|
|
|
|
|
|
|
|
|
|
|
|
|
|
|
|
|
|
|
|
|
|
|
|
| Net investment income (loss)(A) |
|
|
— |
(B) |
|
|
0.12 |
|
|
|
0.16 |
|
|
|
0.69 |
|
|
|
0.23 |
|
|
|
0.18 |
|
| Net realized and unrealized gain (loss) |
|
|
1.16 |
|
|
|
1.61 |
|
|
|
(3.55 |
) |
|
|
2.00 |
|
|
|
2.58 |
|
|
|
2.52 |
|
| Total investment operations |
|
|
1.16 |
|
|
|
1.73 |
|
|
|
(3.39 |
) |
|
|
2.69 |
|
|
|
2.81 |
|
|
|
2.70 |
|
|
|
|
|
|
|
|
| Dividends and/or distributions to shareholders: |
|
|
|
|
|
|
|
|
|
|
|
|
|
|
|
|
|
|
|
|
|
|
|
|
| Net investment income |
|
|
— |
|
|
|
(0.14 |
) |
|
|
(0.74 |
) |
|
|
(0.24 |
) |
|
|
(0.19 |
) |
|
|
(0.19 |
) |
| Net realized gains |
|
|
— |
|
|
|
(0.14 |
) |
|
|
(2.63 |
) |
|
|
(0.98 |
) |
|
|
(1.01 |
) |
|
|
(1.18 |
) |
| Total dividends and/or distributions to shareholders |
|
|
— |
|
|
|
(0.28 |
) |
|
|
(3.37 |
) |
|
|
(1.22 |
) |
|
|
(1.20 |
) |
|
|
(1.37 |
) |
|
|
|
|
|
|
|
| Net asset value, end of period/year |
|
$ |
11.35 |
|
|
$ |
10.19 |
|
|
$ |
8.74 |
|
|
$ |
15.50 |
|
|
$ |
14.03 |
|
|
$ |
12.42 |
|
| |
|
|
|
|
|
|
|
|
| Total return |
|
|
11.38 |
%(C) |
|
|
20.00 |
% |
|
|
(22.74 |
)% |
|
|
19.35 |
% |
|
|
24.36 |
% |
|
|
25.86 |
% |
|
|
|
|
|
|
|
| Ratio and supplemental data: |
|
|
|
|
|
|
|
|
|
|
|
|
|
|
|
|
|
|
|
|
|
|
|
|
|
|
|
|
|
|
|
| Net assets end of period/year (000’s) |
|
$ |
296,647 |
|
|
$ |
277,934 |
|
|
$ |
250,328 |
|
|
$ |
353,737 |
|
|
$ |
330,772 |
|
|
$ |
284,695 |
|
| Expenses to average net assets(D) |
|
|
|
|
|
|
|
|
|
|
|
|
|
|
|
|
|
|
|
|
|
|
|
|
| Excluding waiver and/or reimbursement and recapture |
|
|
0.41 |
%(E) |
|
|
0.42 |
% |
|
|
0.40 |
% |
|
|
0.40 |
% |
|
|
0.41 |
% |
|
|
0.40 |
% |
| Including waiver and/or reimbursement and recapture |
|
|
0.41 |
%(E) |
|
|
0.42 |
%(F) |
|
|
0.40 |
% |
|
|
0.40 |
% |
|
|
0.41 |
% |
|
|
0.40 |
% |
| Net investment income (loss) to average net assets |
|
|
0.07 |
%(E) |
|
|
1.27 |
% |
|
|
1.38 |
% |
|
|
4.49 |
% |
|
|
1.93 |
% |
|
|
1.50 |
% |
| Portfolio turnover rate |
|
|
12 |
%(C) |
|
|
45 |
% |
|
|
13 |
% |
|
|
22 |
% |
|
|
49 |
% |
|
|
12 |
% |
| (A) |
Calculated based on average number of shares outstanding. |
| (B) |
Rounds to less than $0.01 or $(0.01). |
| (D) |
Does not include expenses of the underlying investments in which the Portfolio invests. |
| (F) |
Waiver and/or reimbursement rounds to less than 0.01%. |
The Notes to Financial Statements are an integral part of this report.
|
|
|
|
|
| Transamerica Series Trust |
|
|
|
Semi-Annual Financial Statements 2024 |
|
|
Page 6 |
|
|
Transamerica JPMorgan Asset Allocation - Growth VP
NOTES TO FINANCIAL STATEMENTS
At June 30, 2024
(unaudited)
1. ORGANIZATION
Transamerica Series Trust (“TST”) is an open-end management investment company registered under the Investment Company Act of 1940, as amended (the “1940 Act”). TST applies investment company accounting and reporting guidance. TST serves as a funding vehicle for variable life insurance, variable annuity, and group annuity products. Transamerica JPMorgan Asset Allocation - Growth VP (the “Portfolio”) is a series of TST and is classified as diversified under the 1940 Act. The Portfolio currently offers two classes of shares, Initial Class and Service Class.
The only shareholders of the Portfolio are affiliated insurance company separate accounts and/or affiliated asset allocation portfolios. Contract holders of the variable life and annuity contracts are not shareholders of the Portfolio. For ease of reference, shareholders and contract holders are collectively referred to in this report as “shareholders.”
This report must be accompanied or preceded by the Portfolio’s current prospectus, which contains additional information about the Portfolio, including risks, as well as investment objectives and strategies.
Transamerica Asset Management, Inc. (“TAM”) serves as investment manager for the Portfolio pursuant to an investment management agreement. TAM provides continuous and regular investment management services to the Portfolio. TAM supervises the Portfolio’s investments, conducts its investment program and provides supervisory, compliance and administrative services to the Portfolio.
TAM currently acts as a “manager of managers” and has hired sub-advisers to furnish day-to-day investment advice and recommendations. TAM may, in the future, determine to provide all aspects of the day-to-day management of the Portfolio without the use of a sub-adviser. When acting as a manager of managers, TAM provides investment management services that include, without limitation, the design and development of the Portfolio and its investment strategies and the ongoing review and evaluation of those investment strategies including recommending changes in strategy where it believes appropriate or advisable; the selection of one or more sub-advisers for the Portfolio employing a combination of quantitative and qualitative screens, research, analysis and due diligence; negotiation of sub-advisory agreements and fees; oversight and monitoring of sub-advisers and recommending changes to sub-advisers where it believes appropriate or advisable; recommending portfolio combinations and liquidations where it believes appropriate or advisable; selection and oversight of transition managers, as needed; regular supervision of the Portfolio’s investments; regular review and evaluation of sub-adviser performance; daily monitoring of the sub-advisers’ buying and selling of securities for the Portfolio; regular review of holdings; ongoing trade oversight and analysis; regular monitoring to ensure adherence to investment process; regular calls and periodic on-site visits with sub-advisers; portfolio construction and asset allocation when using multiple sub-advisers for the Portfolio; risk management oversight and analysis; oversight of negotiation of investment documentation and agreements; design, development, implementation and regular monitoring of the valuation process; periodic due diligence reviews of pricing vendors and vendor methodology; design, development, implementation and regular monitoring of the compliance process; respond to regulatory inquiries and determine appropriate litigation strategy, as needed; review of proxies voted by sub-advisers; oversight of preparation and review of materials for meetings of the Portfolio’s Board of Trustees (the “Board”), participation in these meetings and preparation of regular communications with the Board; oversight of preparation and review of prospectuses, shareholder reports and other disclosure materials and regulatory filings for the Portfolio; oversight of other service providers to the Portfolio, such as the custodian, the transfer agent, the Portfolio’s independent accounting firm and legal counsel; supervision of the performance of recordkeeping and shareholder relations functions for the Portfolio; and oversight of cash management services. TAM uses a variety of quantitative and qualitative tools to carry out its investment management services. TAM, not the Portfolio, is responsible for paying the sub-adviser(s) for their services, and sub-advisory fees are TAM’s expense.
TAM’s investment management services also include the provision of supervisory and administrative services to the Portfolio. These services include performing certain administrative services for the Portfolio and supervising and overseeing the administrative, clerical, recordkeeping and bookkeeping services provided to the Portfolio by State Street Bank and Trust Company (“State Street”), to whom TAM has outsourced the provision of certain sub-administration services. To the extent agreed upon by TAM and the Portfolio from time to time, TAM’s supervisory and administrative services include, but are not limited to: monitoring and verifying the custodian’s daily calculation of the Net Asset Values (“NAV”); shareholder relations functions; compliance services; valuation services; assisting in due diligence and in the oversight and monitoring of certain activities of sub-advisers and certain aspects of Portfolio investments; assisting with Portfolio combinations and liquidations; oversight of the preparation and filing, and review, of all returns and reports, in connection with federal, state and local taxes; oversight and review of regulatory reporting; supervising and coordinating the Portfolio’s custodian and dividend disbursing agent and monitoring their services to the Portfolio; assisting the Portfolio in preparing reports to shareholders; acting as liaison with the Portfolio’s independent public accountants and providing, upon request, analyses, fiscal year summaries and other audit related services; assisting in the preparation of agendas and supporting documents for and minutes of meetings of trustees and committees of trustees; assisting in the preparation of regular communications with the trustees; and providing personnel and office space, telephones and other office equipment as necessary in order for TAM to perform supervisory and administrative services to the Portfolio. The Portfolio pays certain fees and expenses to State Street for sub-administration services which are not administrative services covered by the management agreement with TAM or paid for through the management fees payable thereunder. For the period ended June 30, 2024, (i) the expenses paid to State Street for sub-administration services by the Portfolio are shown as a part of Other expenses within the Statement of Operations and (ii) the expenses payable to State Street for sub-administration services from the Portfolio are shown as part of Other accrued expenses within the Statement of Assets and Liabilities.
|
|
|
|
|
| Transamerica Series Trust |
|
|
|
Semi-Annual Financial Statements 2024 |
|
|
Page 7 |
|
|
Transamerica JPMorgan Asset Allocation - Growth VP
NOTES TO FINANCIAL STATEMENTS (continued)
At June 30, 2024
(unaudited)
2. SIGNIFICANT ACCOUNTING POLICIES
In preparing the Portfolio’s financial statements in accordance with Generally Accepted Accounting Principles in the United States of America (“GAAP”), estimates or assumptions (which could differ from actual results) may be used that affect reported amounts and disclosures. The following is a summary of significant accounting policies followed by the Portfolio.
Foreign currency denominated investments: The accounting records of the Portfolio are maintained in U.S. dollars. Securities and other assets and liabilities denominated in foreign currencies are translated into U.S. dollars based on the closing exchange rate each day. The cost of foreign securities purchased and any realized gains or losses are translated at the prevailing exchange rates in effect on the date of the respective transaction. The Portfolio combines fluctuations from currency exchange rates and fluctuations in value when computing net realized and unrealized gains or losses from investments.
Net foreign currency gains and losses resulting from changes in exchange rates include, foreign currency fluctuations between trade date and settlement date of investment security transactions, gains and losses on forward foreign currency contracts, and the difference between the receivable amounts of interest and dividends recorded in the accounting records in U.S. dollars and the amounts actually received.
Foreign currency denominated assets may involve risks not typically associated with domestic transactions. These risks include revaluation of currencies, adverse fluctuations in foreign currency values, and possible adverse political, social, and economic developments, including those particular to a specific industry, country or region.
Security transactions and investment income: Security transactions are accounted for on the trade date. Security gains and losses are calculated on a first-in, first-out basis. Interest income, if any, is accrued as earned. Dividend income and capital gain distributions from underlying investments, if any, are recorded on the ex-dividend date. Income or short-term capital gain distributions received from underlying investments, if any, are recorded as Dividend income from investments within the Statement of Operations. Long-term capital gain distributions received from underlying investments, if any, are recorded as Net realized gain (loss) on Capital gain distributions received from investments within the Statement of Operations.
Multiple class operations, income, and expenses: Income, non-class specific expenses, and realized and unrealized gains and losses are allocated to each class daily based upon net assets. Each class bears its own specific expenses in addition to the allocated non-class specific expenses.
Distributions to shareholders: Distributions are recorded on the ex-dividend date and are determined in accordance with federal income tax regulations, which may differ from GAAP.
Cash overdraft: The Portfolio may have cash overdraft balances. A fee is incurred on these overdrafts, calculated by multiplying the overdraft by a rate based on the Federal Funds Rate.
Payables, if any, are reflected as Due to custodian within the Statement of Assets and Liabilities. Expenses, if any, from U.S. cash overdrafts are reflected in Custody fees within the Statement of Operations. Expenses, if any, from foreign cash overdrafts are reflected in Other expenses within the Statement of Operations.
Indemnification: In the normal course of business, the Portfolio enters into contracts that contain a variety of representations that provide general indemnifications. The Portfolio’s maximum exposure under these arrangements is unknown, as this would involve future claims that may be made against the Portfolio and/or its affiliates that have not yet occurred. However, based on experience, the Portfolio expects the risk of loss to be remote.
3. INVESTMENT VALUATION
TAM has been designated as the Portfolio’s valuation designee pursuant to Rule 2a-5 under the 1940 Act with responsibility for fair valuation subject to oversight by the Portfolio’s Board of Trustees. The net asset value of the Portfolio is computed as of the official close of the New York Stock Exchange (“NYSE”) each day the NYSE is open for business.
TAM utilizes various methods to measure the fair value of its investments on a recurring basis. GAAP establishes a hierarchy that prioritizes inputs to valuation methods. The inputs or methodology used for valuing securities are not necessarily an indication of the risk associated with investing in those securities. The three levels (“Levels”) of inputs of the fair value hierarchy are defined as follows:
Level 1—Unadjusted quoted prices in active markets for identical securities.
Level 2—Inputs, other than quoted prices included in Level 1, which are observable, either directly or indirectly. These inputs may include quoted prices for the identical instrument on an inactive market, prices for similar instruments, interest rates, prepayment speeds, credit risk, yield curves, default rates, and similar data.
Level 3—Unobservable inputs based on the best information available in the circumstances, to the extent observable inputs are not available, which may include TAM’s own assumptions used in determining the fair value of the Portfolio’s investments and derivative instruments.
The inputs used to measure fair value may fall into different Levels of the fair value hierarchy. In such cases, for disclosure purposes, the Level in the fair value hierarchy that is assigned to the fair value measurement of a security is determined based on the lowest Level input that is significant to the fair value measurement in its entirety. Certain investments that are measured at fair value using NAV per share, or
|
|
|
|
|
| Transamerica Series Trust |
|
|
|
Semi-Annual Financial Statements 2024 |
|
|
Page 8 |
|
|
Transamerica JPMorgan Asset Allocation - Growth VP
NOTES TO FINANCIAL STATEMENTS (continued)
At June 30, 2024
(unaudited)
3. INVESTMENT VALUATION (continued)
its equivalent, using the “practical expedient” have not been classified in the fair value Levels. The hierarchy classification of inputs used to value the Portfolio’s investments at June 30, 2024, is disclosed within the Investment Valuation section of the Schedule of Investments.
The availability of observable inputs can vary from security to security and is affected by a wide variety of factors, including, but not limited to, the type of security, whether the security is new and not yet established in the marketplace, the liquidity of markets, and other characteristics particular to the security. To the extent that valuation is based on models or inputs that are less observable or unobservable in the market, the determination of fair value requires more judgment. Accordingly, the degree of judgment exercised in determining fair value is generally greatest for instruments categorized in Level 3. Due to the inherent uncertainty of valuation, the determination of values may differ significantly from values that would have been realized had a ready market for investments existed, and the differences could be material.
Fair value measurements: Descriptions of the valuation techniques applied to the Portfolio’s significant categories of assets and liabilities measured at fair value on a recurring basis are as follows:
Investment companies: Certain investment companies are valued at the NAV as the practical expedient. These investment companies are not included within the fair value hierarchy. Certain other investment companies are valued at the actively traded NAV and no valuation adjustments are applied. These investment companies are categorized in Level 1 of the fair value hierarchy.
U.S. government obligations: U.S. government obligations are normally valued using a model that incorporates market observable data such as reported sales of similar securities, broker quotes, yields, bids, offers, and reference data. Certain securities are valued by principally using dealer quotations. U.S. government obligations generally are categorized in Level 2 of the fair value hierarchy, or Level 3 if inputs are unobservable.
Repurchase agreements: Repurchase agreements are valued at cost, which approximates fair value. To the extent the inputs are observable and timely, the values are generally categorized in Level 2 of the fair value hierarchy.
Derivative instruments: Centrally cleared or listed derivatives that are actively traded are valued based on quoted prices from the exchange and are categorized in Level 1 of the fair value hierarchy. Over-the-counter (“OTC”) derivative contracts include forward, swap, swaption, and option contracts related to interest rates, foreign currencies, credit standing of reference entities, equity prices, or commodity prices. Depending on the product and the terms of the transaction, the fair value of the OTC derivative products are modeled taking into account the counterparties’ creditworthiness and using a series of techniques, including simulation models. Many pricing models do not entail material subjectivity because the methodologies employed do not necessitate significant judgments and the pricing inputs are observed from actively quoted markets, as is the case of interest rate swap and option contracts. The majority of OTC derivative products valued by the Portfolio using pricing models fall into this category and are categorized within Level 2 of the fair value hierarchy or Level 3 if inputs are unobservable.
4. BORROWINGS AND OTHER FINANCING TRANSACTIONS
The Portfolio may engage in borrowing transactions as a means of raising cash to satisfy redemption requests, for other temporary or emergency purposes or, to the extent permitted by its investment policies, to raise additional cash to be invested in other securities or instruments. When the Portfolio invests borrowing proceeds in other securities, the Portfolio will bear the risk that the market value of the securities in which such proceeds are invested goes down and is insufficient to repay the borrowed proceeds. The Portfolio may borrow on a secured or on an unsecured basis. If the Portfolio enters into a secured borrowing arrangement, a portion of the Portfolio’s assets will be used as collateral. The 1940 Act requires the Portfolio to maintain asset coverage of at least 300% of the amount of its borrowings. Asset coverage means the ratio that the value of the Portfolio’s total assets, minus liabilities other than borrowings, bears to the aggregate amount of all borrowings. Although complying with this requirement has the effect of limiting the amount that the Portfolio may borrow, it does not otherwise mitigate the risks of entering into borrowing transactions.
Interfund lending: The Portfolio, along with other funds and portfolios advised by TAM, may participate in an interfund lending program pursuant to exemptive relief granted by the Securities and Exchange Commission on January 18, 2017. This program allows the Portfolio to lend to and borrow from other funds and portfolios advised by TAM. Interfund lending transactions are subject to the conditions of the exemptive relief which places limits on the amount of lending or borrowing a Portfolio may participate in under the program. Interest earned or paid on an interfund lending transaction will be based on the average of certain current market rates. For the period ended June 30, 2024, the Portfolio has not utilized the program.
Repurchase agreements: In a repurchase agreement, the Portfolio purchases a security and simultaneously commits to resell that security to the seller at an agreed-upon price on an agreed-upon date. Securities purchased subject to a repurchase agreement are held at the Portfolio’s custodian, or designated sub-custodian related to tri-party repurchase agreements, and, pursuant to the terms of the repurchase agreement, must be collateralized by securities with an aggregate market value greater than or equal to 100% of the resale price. The Portfolio will bear the risk of value fluctuations until the securities can be sold and may encounter delays and incur costs in liquidating the securities. In the event of bankruptcy or insolvency of the seller, delays and costs may be incurred.
Repurchase agreements are subject to netting agreements, which are agreements between the Portfolio and its counterparties that provide for the net settlement of all transactions and collateral with the Portfolio, through a single payment, in the event of default or termination. Amounts presented within the Schedule of Investments, and as part of Repurchase agreements, at value within the Statement
|
|
|
|
|
| Transamerica Series Trust |
|
|
|
Semi-Annual Financial Statements 2024 |
|
|
Page 9 |
|
|
Transamerica JPMorgan Asset Allocation - Growth VP
NOTES TO FINANCIAL STATEMENTS (continued)
At June 30, 2024
(unaudited)
4. BORROWINGS AND OTHER FINANCING TRANSACTIONS (continued)
of Assets and Liabilities are shown on a gross basis. The value of the related collateral for each repurchase agreement, as reflected within the Schedule of Investments, exceeds the value of each repurchase agreement at June 30, 2024.
Repurchase agreements at June 30, 2024, if any, are included within the Schedule of Investments and Statement of Assets and Liabilities.
5. RISK EXPOSURES AND THE USE OF DERIVATIVE INSTRUMENTS
The Portfolio’s investment strategies allow the Portfolio to use various types of derivative contracts, including option contracts, swap agreements, futures contracts, and forward foreign currency contracts. Derivatives are investments whose value is primarily derived from underlying assets, indices or reference rates and may be transacted on an exchange or OTC.
Market Risk Factors: In pursuit of the Portfolio’s investment strategies, the Portfolio may seek to use derivatives to increase or decrease its exposure to certain market risks, including:
Interest rate risk: Interest rate risk relates to the fluctuations in the value of fixed income securities due to changes in the prevailing levels of market interest rates.
Foreign exchange rate risk: Foreign exchange rate risk relates to fluctuations in the value of an asset or liability due to changes in the currency exchange rates.
Equity risk: Equity risk relates to the change in value of equity securities as they relate to increases or decreases in the general market.
Credit risk: Credit risk relates to the ability of the issuer of a financial instrument to make further principal or interest payments on an obligation or commitment that it has to the Portfolio.
Commodity risk: Commodity risk relates to the change in value of commodities or commodity indices as they relate to increases or decreases in the commodities market. Commodities are physical assets that have tangible properties. Examples of these types of assets are crude oil, heating oil, metals, livestock, and agricultural products.
The Portfolio is also exposed to additional risks from investing in derivatives, such as liquidity and counterparty credit risk. Liquidity risk is the risk that the Portfolio will be unable to sell or close out the derivative in the open market in a timely manner. Counterparty credit risk is the risk that the counterparty will not be able to fulfill its obligations to the Portfolio. Investing in derivatives may also involve greater risks than investing directly in the underlying assets, such as losses in excess of any initial investment and collateral received. In addition, there may be the risk that the change in value of the derivative contract does not correspond to the change in value of the underlying instrument.
The Portfolio’s exposure to market risk factors and certain other associated risks are summarized by derivative type as follows:
Futures contracts: The Portfolio is subject to equity risk, credit risk, commodity risk, interest rate risk and foreign exchange rate risk in the normal course of pursuing its investment objective. The Portfolio uses futures contracts to gain exposure to, or hedge against, changes in the value of equities and commodities, interest rates, or foreign currencies. A futures contract represents a commitment for the future purchase or sale of an asset at a specified price on a specified date. Upon entering into such contracts, the Portfolio is required to deposit with the broker, either in cash or in securities, an initial margin in an amount equal to a certain percentage of the contract amount. Subsequent payments (variation margin) are paid or received by the Portfolio, depending on the daily fluctuations in the value of the contract, and are recorded for financial statement purposes as unrealized gains or losses by the Portfolio. Upon entering into such contracts, the Portfolio bears the risk of equity and commodity prices, interest rates, or exchange rates moving unexpectedly, in which case, the Portfolio may not achieve the anticipated benefits of the futures contracts and may realize losses. With futures, there is minimal counterparty credit risk to the Portfolio since futures are exchange-traded and the exchange’s clearinghouse, as counterparty to all exchange-traded futures, guarantees the futures against default. Futures contracts are generally entered into on a regulated futures exchange and cleared through a clearinghouse associated with the exchange.
Open futures contracts at June 30, 2024 are listed within the Schedule of Investments. Variation margin, if applicable, is shown in Variation margin receivable or payable on futures contracts within the Statement of Assets and Liabilities.
The following is a summary of the location and the Portfolio’s fair values of derivative investments disclosed within the Statement of Assets and Liabilities, categorized by primary market risk exposure as of June 30, 2024.
|
|
|
|
|
|
|
|
|
|
|
|
|
|
|
|
|
|
|
|
|
|
|
|
|
| Asset Derivatives |
|
| |
|
| Location |
|
Interest Rate Contracts |
|
|
Foreign Exchange Contracts |
|
|
Equity Contracts |
|
|
Credit Contracts |
|
|
Commodity Contracts |
|
|
Total |
|
| |
|
| Futures contracts: |
|
|
|
|
|
|
|
|
|
|
|
|
|
|
|
|
|
|
|
|
|
|
|
|
| Total distributable earnings (accumulated losses) (A)(B) |
|
|
$ — |
|
|
|
$ 376,147 |
|
|
|
$ 1,390,095 |
|
|
|
$ — |
|
|
|
$ — |
|
|
|
$ 1,766,242 |
|
| |
|
| Total |
|
|
$ — |
|
|
|
$ 376,147 |
|
|
|
$ 1,390,095 |
|
|
|
$ — |
|
|
|
$ — |
|
|
|
$ 1,766,242 |
|
| |
|
|
|
|
|
|
| Transamerica Series Trust |
|
|
|
Semi-Annual Financial Statements 2024 |
|
|
Page 10 |
|
|
Transamerica JPMorgan Asset Allocation - Growth VP
NOTES TO FINANCIAL STATEMENTS (continued)
At June 30, 2024
(unaudited)
5. RISK EXPOSURES AND THE USE OF DERIVATIVE INSTRUMENTS (continued)
|
|
|
|
|
|
|
|
|
|
|
|
|
|
|
|
|
|
|
|
|
|
|
|
|
| Liability Derivatives |
|
| |
|
| Location |
|
Interest Rate Contracts |
|
|
Foreign Exchange Contracts |
|
|
Equity Contracts |
|
|
Credit Contracts |
|
|
Commodity Contracts |
|
|
Total |
|
| |
|
| Futures contracts: |
|
|
|
|
|
|
|
|
|
|
|
|
|
|
|
|
|
|
|
|
|
|
|
|
| Total distributable earnings (accumulated losses) (A)(B) |
|
|
$ (361,871) |
|
|
|
$ — |
|
|
|
$ (266,551) |
|
|
|
$ — |
|
|
|
$ — |
|
|
|
$ (628,422) |
|
| |
|
| Total |
|
|
$ (361,871) |
|
|
|
$ — |
|
|
|
$ (266,551) |
|
|
|
$ — |
|
|
|
$ — |
|
|
|
$ (628,422) |
|
| |
|
| (A) |
May include exchange-traded derivatives which are not subject to a master netting arrangement, or another similar arrangement. |
| (B) |
Included within unrealized appreciation (depreciation) on futures contracts as reported in the Schedule of Investments. Only current day’s variation margin is reported within the Statement of Assets and Liabilities. |
The following is a summary of the location and the effect of derivative investments within the Statement of Operations, categorized by primary market risk exposure as of June 30, 2024.
|
|
|
|
|
|
|
|
|
|
|
|
|
| Realized Gain (Loss) on Derivative Instruments |
| |
| Location |
|
Interest Rate Contracts |
|
Foreign Exchange Contracts |
|
Equity Contracts |
|
Credit Contracts |
|
Commodity Contracts |
|
Total |
| |
| Futures contracts |
|
$ (253,256) |
|
$ (1,855,533) |
|
$ 14,992,925 |
|
$ — |
|
$ — |
|
$ 12,884,136 |
| |
| Total |
|
$ (253,256) |
|
$ (1,855,533) |
|
$ 14,992,925 |
|
$ — |
|
$ — |
|
$ 12,884,136 |
| |
|
| Net Change in Unrealized Appreciation (Depreciation) on Derivative Instruments |
| |
| Location |
|
Interest Rate Contracts |
|
Foreign Exchange Contracts |
|
Equity Contracts |
|
Credit Contracts |
|
Commodity Contracts |
|
Total |
| |
| Futures contracts |
|
$ (361,871) |
|
$ (503,140) |
|
$ (9,167,173) |
|
$ — |
|
$ — |
|
$ (10,032,184) |
| |
| Total |
|
$ (361,871) |
|
$ (503,140) |
|
$ (9,167,173) |
|
$ — |
|
$ — |
|
$ (10,032,184) |
| |
The following is a summary of the ending monthly average volume on derivative activity during the period ended June 30, 2024.
|
|
|
|
|
| Futures contracts: |
|
|
|
| Average notional value of contracts — long |
|
$ |
253,397,066 |
|
| Average notional value of contracts — short |
|
|
(53,254,142 |
) |
Collateral requirements: Collateral or margin requirements are set by the broker or exchange clearing house for exchange-traded derivatives (futures contracts, exchange-traded options, and exchange-traded swap agreements) while collateral terms are contract specific for OTC derivatives (forward foreign currency exchange contracts, OTC options, and OTC swap agreements). For OTC derivatives, under standard derivatives agreements, the Portfolio may be required to pledge collateral on derivatives to a counterparty if the Portfolio is in a net liability position, and receive collateral if in a net positive position. For financial reporting purposes, cash collateral that has been pledged by the Portfolio to cover obligations, if any, is reported in Cash collateral at broker within the Statement of Assets and Liabilities. Cash collateral that has been received by the Portfolio from a counterparty, if any, is reported separately in Cash collateral pledged at custodian and/or broker within the Statement of Assets and Liabilities. Non-cash collateral pledged to the Portfolio, if any, is disclosed within the Schedule of Investments.
Generally, the amount of collateral due from or to a party must exceed a minimum transfer amount threshold before a transfer has been made. Typically a counterparty is not permitted to sell, re-pledge or use cash and non-cash collateral it receives. The Portfolio generally does not use non-cash collateral that it receives but may, absent default or certain other circumstances, be permitted to use cash collateral received. In such cases, interest may be paid pursuant to the collateral arrangement with the counterparty.
To the extent amounts due to the Portfolio from its counterparties are not fully collateralized, contractually or otherwise, the Portfolio bears the risk of loss from counterparty non-performance. Additionally, to the extent the Portfolio has delivered collateral to a counterparty, the Portfolio bears the risk of loss from a counterparty in the event the counterparty fails to return such collateral. Counterparties may immediately terminate derivatives contracts if the Portfolio fails to maintain sufficient asset coverage for its contracts or its net assets decline by stated percentages. Collateral may not be required for all derivative contracts.
6. RISK FACTORS
Investing in the Portfolio involves certain key risks related to the Portfolio’s trading activity. Please reference the Portfolio’s prospectus for a more complete discussion of the following risk(s), as well as other risks of investing in the Portfolio.
|
|
|
|
|
| Transamerica Series Trust |
|
|
|
Semi-Annual Financial Statements 2024 |
|
|
Page 11 |
|
|
Transamerica JPMorgan Asset Allocation - Growth VP
NOTES TO FINANCIAL STATEMENTS (continued)
At June 30, 2024
(unaudited)
6. RISK FACTORS (continued)
Market risk: The market prices of the Portfolio’s securities or other assets may go up or down, sometimes rapidly or unpredictably, due to factors such as economic events, inflation, changes in interest rates, governmental actions or interventions, actions taken by the U.S. Federal Reserve or foreign central banks, market disruptions caused by tariffs, trade disputes or other factors, political developments, armed conflicts, economic sanctions, cybersecurity events, investor sentiment, the global and domestic effects of widespread or local health, weather or climate events, and other factors that may or may not be related to the issuer of the security or other asset. If the market prices of the Portfolio’s securities and assets fall, the value of your investment in the Portfolio could go down.
Economies and financial markets throughout the world are increasingly interconnected. Events or circumstances in one or more countries or regions could be highly disruptive to, and have profound impacts on, global economies or markets. As a result, whether or not the Portfolio invests in securities of issuers located in or with significant exposure to the countries directly affected, the value and liquidity of the Portfolio’s investments may go down.
Asset allocation risk: The Portfolio’s investment performance is significantly impacted by the Portfolio’s asset allocation and reallocation from time to time. The value of your investment may decrease if the sub-adviser’s judgment about the attractiveness, value or market trends affecting a particular asset class, investment style, technique or strategy, underlying ETF or other issuer is incorrect.
Equity securities risk: Equity securities generally have greater risk of loss than debt securities. Stock markets are volatile and the value of equity securities may go up or down, sometimes rapidly and unpredictably. The market price of an equity security may fluctuate based on overall market conditions, such as real or perceived adverse economic or political conditions or trends, tariffs and trade disruptions, inflation, substantial economic downturn or recession, changes in interest rates, or adverse investor sentiment. The market price of an equity security also may fluctuate based on real or perceived factors affecting a particular industry or industries or the company itself. If the market prices of the equity securities owned by the Portfolio fall, the value of your investment in the Portfolio will decline. The Portfolio may lose its entire investment in the equity securities of an issuer. A change in financial condition or other event affecting a single issuer may adversely impact securities markets as a whole.
7. FEES AND OTHER AFFILIATED TRANSACTIONS
TST serves as a funding vehicle for certain affiliated asset allocation portfolios and certain affiliated separate accounts of Transamerica Life Insurance Company (“TLIC”) and Transamerica Financial Life Insurance Company.
TAM, the Portfolio’s investment manager, is directly owned by TLIC and AUSA Holding, LLC (“AUSA”), both of which are indirect, wholly owned subsidiaries of Aegon Ltd. TLIC is owned by Commonwealth General Corporation (“Commonwealth”). Commonwealth and AUSA are wholly owned by Transamerica Corporation (DE). Transamerica Corporation (DE) is wholly owned by Aegon International B.V., which is wholly owned by Aegon Ltd., a Bermuda exempted company with liability limited by shares (formerly, Aegon NV, a Netherlands corporation) and a publicly traded international insurance group.
Transamerica Fund Services, Inc. (“TFS”) is the Portfolio’s transfer agent. Transamerica Capital, Inc. (“TCI”) is the Portfolio’s distributor/principal underwriter. TAM, TFS and TCI are affiliates of Aegon Ltd.
Certain officers and trustees of the Portfolio may also be officers and/or trustees of TAM, TFS and TCI. No interested trustee who is deemed an interested person due to current or former service with TAM or an affiliate of TAM receives compensation from the Portfolio. The Portfolio does pay non-interested persons (independent trustees), as disclosed in Trustee and CCO fees within the Statement of Operations.
Investment management fees: TAM serves as the Portfolio’s investment manager, performing administration as well as investment advisory services. TAM renders investment advisory, supervisory, and administration services under an investment management agreement and the Portfolio pays a single management fee, which is reflected in Investment management fees within the Statement of Operations.
The Portfolio pays a management fee to TAM based on daily average net assets at the following rates:
|
|
|
| Breakpoints |
|
Rate |
| First $10 billion |
|
0.1225% |
| Over $10 billion |
|
0.1025 |
TAM has contractually agreed to waive fees and/or reimburse Portfolio expenses to the extent that the total operating expenses excluding, as applicable, acquired fund fees and expenses, interest (including borrowing costs and overdraft charges), taxes, brokerage commissions, dividend and interest expenses on securities sold short, extraordinary expenses and other expenses not incurred in the ordinary course of the Portfolio’s business, exceed the following stated annual operating expense limits to the Portfolio’s daily average net
|
|
|
|
|
| Transamerica Series Trust |
|
|
|
Semi-Annual Financial Statements 2024 |
|
|
Page 12 |
|
|
Transamerica JPMorgan Asset Allocation - Growth VP
NOTES TO FINANCIAL STATEMENTS (continued)
At June 30, 2024
(unaudited)
7. FEES AND OTHER AFFILIATED TRANSACTIONS (continued)
assets. To the extent an expense limit changed during the period, the prior limit is also listed below. The expenses waived and/or reimbursed, if any, are included in Expenses waived and/or reimbursed within the Statement of Operations.
|
|
|
|
|
| Class |
|
Operating Expense Limit |
|
Operating Expense Limit Effective Through |
| Initial Class |
|
0.20% |
|
May 1, 2025 |
| Service Class |
|
0.45 |
|
May 1, 2025 |
TAM is permitted to recapture amounts contractually waived and/or reimbursed to a class during any of the 36 months from the date on which TAM waived fees and/or reimbursed expenses for the class. A class may recapture and reimburse TAM only if such amount does not cause, on any particular business day of the Portfolio, the class’s total annual operating expenses (after the recapture is taken into account) to exceed the Operating Expense Limits or any other lower limit then in effect. Amounts recaptured, if any, by TAM for the period ended June 30, 2024 are disclosed in Recapture of previously waived and/or reimbursed fees within the Statement of Operations.
TAM, on a voluntary basis and in addition to the contractual operating expense limits in effect, from time to time may waive and/or reimburse expenses of the Portfolio, or any classes thereof, to such level(s) as the Trust’s officers have determined or may reasonably determine from time to time. Any such voluntary waiver or expense reimbursement may be discontinued by TAM at any time. These amounts are not subject to recapture by TAM.
As of June 30, 2024, there are no amounts available for recapture by TAM.
Distribution and service fees: TST has a distribution plan (“Distribution Plan”) pursuant to Rule 12b-1 under the 1940 Act. Pursuant to the Distribution Plan, TST entered into a distribution agreement with TCI as the Portfolio’s distributor.
The Distribution Plan requires the Portfolio to pay distribution fees to TCI as compensation for various distribution activities, not as reimbursement for specific expenses. Under the Distribution Plan and distribution agreement, TCI, on behalf of the Portfolio, is authorized to pay various service providers, as direct payment for expenses incurred in connection with distribution of the Portfolio’s shares.
The fee on the Service Class shares is paid to the insurance companies for providing services and account maintenance for the policyholders who invest in the variable insurance products which invest in the Service Class shares. TCI has determined that it will not seek payment for the distribution expenses incurred by the Portfolio with respect to the Initial Class shares before May 1, 2025. Prior to TCI seeking distribution expenses on Initial Class shares, policy and contract owners will be notified in advance. The Portfolio will pay fees relating to Service Class shares. The distribution and service fees are included in Distribution and service fees within the Statement of Operations.
The Portfolio is authorized under the Distribution Plan to pay fees to TCI based on daily average net assets of each applicable class up to the following annual rates:
|
|
|
| Class |
|
Rate |
| Initial Class |
|
0.15% |
| Service Class |
|
0.25 |
Transfer agent costs: TFS provides transfer agency services under an intercompany agreement with TAM. TFS has outsourced the provision of certain sub-transfer agency services to SS&C Global Investor & Distribution Solutions, Inc. (“SS&C GIDS”). The Portfolio does not pay a separate transfer agent fee to TAM or TFS but does pay certain expenses to SS&C GIDS related to applicable sub-transfer agency services. For the period ended June 30, 2024, (i) the expenses paid to SS&C GIDS by the Portfolio are referred to as transfer agent costs and are included within the Statement of Operations and (ii) the expenses payable to SS&C GIDS by the Portfolio are referred to as transfer agent costs within the Statement of Assets and Liabilities.
Brokerage commissions: The Portfolio incurred no brokerage commissions on security transactions placed with affiliates of the investment manager or sub-adviser(s) for the period ended June 30, 2024.
8. PURCHASES AND SALES OF SECURITIES
For the period ended June 30, 2024, the cost of securities purchased and proceeds from securities sold (excluding short-term securities) are as follows:
|
|
|
|
|
|
|
| Purchases of Securities |
|
Sales/Maturities of Securities |
| Long-Term |
|
U.S. Government |
|
Long-Term |
|
U.S. Government |
| |
| $ 110,964,534 |
|
$ 9,647,777 |
|
$ 143,432,250 |
|
$ 5,404,706 |
9. FEDERAL INCOME TAXES AND DISTRIBUTIONS TO SHAREHOLDERS
The Portfolio has not made any provision for federal income or excise taxes due to its policy to distribute all of its taxable income and capital gains to its shareholders and otherwise qualify as a regulated investment company under Subchapter M of the Internal Revenue
|
|
|
|
|
| Transamerica Series Trust |
|
|
|
Semi-Annual Financial Statements 2024 |
|
|
Page 13 |
|
|
Transamerica JPMorgan Asset Allocation - Growth VP
NOTES TO FINANCIAL STATEMENTS (continued)
At June 30, 2024
(unaudited)
9. FEDERAL INCOME TAXES AND DISTRIBUTIONS TO SHAREHOLDERS (continued)
Code. The Portfolio recognizes the tax benefits of uncertain tax positions only where the position is “more likely than not” to be sustained assuming examination by tax authorities. The Portfolio’s tax returns remain subject to examination by the Internal Revenue Service and state tax authorities three years from the date of filing for federal purposes and four years from the date of filing for state purposes. Management has evaluated the Portfolio’s tax provisions taken for all open tax years, and has concluded that no provision for income tax is required in the Portfolio’s financial statements. If applicable, the Portfolio recognizes interest accrued related to unrecognized tax benefits in relation to interest and penalties expense in Other within the Statement of Operations. The Portfolio identifies its major tax jurisdictions as U.S. Federal, the state of Colorado, and foreign jurisdictions where the Portfolio makes significant investments; however, the Portfolio is not aware of any tax positions for which it is reasonably possible that the total amounts of unrecognized tax benefits will change materially in the next twelve months. Distributions are determined in accordance with income tax regulations, which may differ from GAAP.
As of June 30, 2024, the approximate cost for U.S. federal income tax purposes, and the aggregate gross/net unrealized appreciation (depreciation) in the value of investments (including securities sold short and derivatives, if any) are as follows:
|
|
|
|
|
|
|
| Cost |
|
Gross Appreciation |
|
Gross (Depreciation) |
|
Net Appreciation (Depreciation) |
| $ 942,784,247 |
|
$ 117,471,653 |
|
$ (12,327,778) |
|
$ 105,143,875 |
Please see TST’s most recent report on Form N-CSR, available at: www.transamerica.com/annuities/prospectus, for additional information. For the most recently filed complete proxy voting records for the Trust please visit: https://www.transamerica.com/sites/default/files/files/e070d/TST%20N-PX%202021.pdf
|
|
|
|
|
| Transamerica Series Trust |
|
|
|
Semi-Annual Financial Statements 2024 |
|
|
Page 14 |
|
|
Transamerica JPMorgan Asset Allocation - Growth VP
MANAGEMENT AND SUB-ADVISORY AGREEMENT — CONTRACT RENEWAL
(unaudited)
At a meeting of the Board of Trustees of Transamerica Series Trust (the “Trustees” or the “Board”) held on June 12-13, 2024, the Board considered the renewal of the management agreement (the “Management Agreement”) between Transamerica Asset Management, Inc. (“TAM”) and Transamerica Series Trust, on behalf of Transamerica JPMorgan Asset Allocation – Growth VP (the “Portfolio”). The Board also considered the renewal of the investment sub-advisory agreement (the “Sub-Advisory Agreement” and together with the Management Agreement, the “Agreements”) for the Portfolio between TAM and J.P. Morgan Investment Management, Inc. (the “Sub-Adviser”).
Following its review and consideration, the Board determined that the terms of the Management Agreement and Sub-Advisory Agreement were reasonable and that the renewal of each of the Agreements was in the best interests of the Portfolio and the holders invested in the Portfolio. The Board, including the independent members of the Board (the “Independent Trustees”), unanimously approved the renewal of each of the Agreements through June 30, 2025.
Prior to reaching their decision, the Trustees requested and received from TAM and the Sub-Adviser certain information. They then reviewed such information as they deemed reasonably necessary to evaluate the Agreements, including information they had previously received from TAM and the Sub-Adviser as part of their regular oversight of the Portfolio, and knowledge they gained over time through meeting with TAM and the Sub-Adviser. Among other materials, the Trustees considered comparative fee, expense and performance information prepared by Broadridge Financial Solutions, Inc. (“Broadridge”), an independent provider of mutual fund performance information, as well as fee, expense and profitability information prepared by TAM. In addition, TAM provided the Board with additional supplemental comparative performance information. To the extent applicable, the Trustees considered information about fees and performance of comparable funds and/or accounts managed by the Sub-Adviser. The Board also considered reductions to the Portfolio’s expense limits, if any, that took effect after the last renewal of the Agreements. In their review, the Trustees also sought to identify instances in which the Portfolio’s performance, fees, total expenses and/or profitability appeared to be outliers within its respective peer group or other comparative metrics and sought to understand the reasons for such comparative positions.
In their deliberations, the Independent Trustees met privately without representatives of TAM or the Sub-Adviser present and were represented throughout the process by their independent legal counsel. In considering the proposed continuation of each of the Agreements, the Trustees evaluated and weighed a number of considerations that they believed to be relevant in light of the legal advice furnished to them by counsel, including independent legal counsel, and made a decision in the exercise of their own business judgment. They based their decisions on the considerations discussed below, among others, although they did not identify any particular consideration or item of information that was controlling of their decisions, and each Trustee may have attributed different weights to the various factors.
Nature, Extent and Quality of the Services Provided
The Board considered the nature, extent and quality of the services provided by TAM and the Sub-Adviser to the Portfolio in the past and the services anticipated to be provided in the future. The Board also considered the investment approach for the Portfolio; the experience, capability and integrity of TAM’s senior management; the financial resources of TAM; TAM’s management oversight process; TAM’s and the Sub-Adviser’s responsiveness to any questions by the Trustees; and the professional qualifications and compensation program of the portfolio management team of the Sub-Adviser. The Trustees noted that they receive, on a quarterly basis, an execution analysis from Capital Institutional Services, Inc. (CAPIS), an independent provider of trade analyses, for the Sub-Adviser and a comparison of trading results against a peer universe of managers.
The Board also considered the continuous and regular investment management and other services provided by TAM, when acting as a manager of managers, for the portion of the management fee it retains from the Portfolio after payment of the sub-advisory fees. The Board noted that the investment management and other services provided by TAM include the design, development and ongoing review and evaluation of the Portfolio and its investment strategy; the selection, oversight and monitoring of one or more investment sub-advisers to perform certain duties with respect to the Portfolio; ongoing portfolio trading oversight and analysis; risk management oversight and analysis; design, development, implementation and ongoing review and evaluation of a process for the valuation of Portfolio investments; design, development, implementation and ongoing review and evaluation of a compliance program for the Portfolio; design, development, implementation and ongoing review and evaluation of a process for the voting of proxies and exercise of rights to consent to corporate action for Portfolio investments; participation in Board meetings and oversight of preparation of materials for the Board, including materials for Board meetings and regular communications with the Board; oversight of preparation of the Portfolio’s prospectus, statement of additional information, shareholder reports and other disclosure materials and regulatory filings for the Portfolio; and ongoing cash management services for the Portfolio. The Board considered that TAM’s investment management services also include the provision of supervisory and administrative services to the Portfolio. The Board also noted that TAM, as part of the services it provides to all Transamerica mutual funds, including the Portfolio, oversees the services provided by the funds’ custodian, transfer agent, independent accountant and legal counsel and supervises the performance of the recordkeeping and holder service functions of the funds.
Investment Performance
In addition, the Board considered the short- and longer-term performance of the Portfolio in light of its investment objective, policies and strategies, including relative performance against (i) a peer universe of comparable mutual funds, as prepared by Broadridge, and (ii) the Portfolio’s benchmark, in each case for various trailing periods ended December 31, 2023. Based on these considerations, the Board determined that TAM and the Sub-Adviser can provide investment and related services that are appropriate in scope and extent in light of
|
|
|
|
|
| Transamerica Series Trust |
|
|
|
Semi-Annual Financial Statements 2024 |
|
|
Page 15 |
|
|
Transamerica JPMorgan Asset Allocation - Growth VP
MANAGEMENT AND SUB-ADVISORY AGREEMENT — CONTRACT RENEWAL (continued)
(unaudited)
the Portfolio’s investment objectives, policies and strategies and operations, the competitive landscape of the investment company business and investor needs. The Board’s conclusions as to the Portfolio’s performance are summarized below. For purposes of its review, the Board generally used the performance of Service Class Shares. In describing the Portfolio’s performance relative to its peer universe, the summary conclusions characterize performance for the relevant periods in relation to whether it was “above,” “below” or “in line with” the peer universe median and do so using quintile rankings prepared by Broadridge. For simplicity, performance is described as “above” the median if the Portfolio’s performance ranked anywhere in the first or second quintiles, as “below” the median if it ranked anywhere in the fourth or fifth quintiles, or “in line with” the median if it ranked anywhere in the third quintile (i.e., even if its precise return was somewhat above or somewhat below the precise median return).
When considering the Portfolio’s performance, the Trustees considered any representations made by TAM regarding the appropriateness of certain peer groups and benchmarks. They recognized that performance reflects a snapshot of a period as of a specific date, and that consideration of performance data for a different period could generate significantly different performance results. The Trustees also recognized that even longer-term performance can be negatively affected by performance over a short-term period when that short-term performance is significantly below the performance of the comparable benchmark or universe of peer funds.
The Board noted that the performance of Service Class Shares of the Portfolio was above the median for its peer universe for the past 1-, 5- and 10-year periods and below the median for the past 3-year period. The Board also noted that the performance of Service Class Shares of the Portfolio was below the benchmark that TAM utilizes to measure performance of the Portfolio for the past 1-, 3-, 5- and 10-year periods. The Trustees discussed the reasons for the underperformance with TAM and TAM agreed to continue to closely monitor and report to the Board on the performance of the Portfolio. The Board noted that the Sub-Adviser had commenced sub-advising the Portfolio on July 1, 2016 pursuant to its current investment strategies. The Trustees observed that the performance of the Portfolio had improved during the first quarter of 2024.
Management Fee and Sub-Advisory Fees and Total Expense Ratio
The Board considered the management fee and total expense ratio of the Portfolio, including information provided by Broadridge comparing the management fee and total expense ratio of the Portfolio to the management fees and total expense ratios of comparable investment companies in both a peer group and broader peer universe compiled by Broadridge. The Board’s conclusions as to the Portfolio’s management fee and total expense ratio are summarized below. For purposes of its review, the Board generally used the actual total expenses (i.e., expenses reflecting any waivers and/or reimbursements) of Service Class Shares. In describing the Portfolio’s management fee and total expense ratio relative to its peer group and peer universe, the summary conclusions characterize management fees and total expense ratios for the relevant periods in relation to whether they were “above,” “below” or “in line with” the peer group or peer universe median and do so using quintile rankings prepared by Broadridge. For simplicity, management fees and total expense ratios are described as “above” the median if the Portfolio’s management fee or total expense ratio ranked anywhere in the fourth or fifth quintiles, as “below” the median if it ranked anywhere in the first or second quintiles, or “in line with” the median if it ranked anywhere in the third quintile (i.e., even if its precise management fee or total expense ratio was somewhat above or somewhat below the precise median management fee or total expense ratio).
The Board also considered the fees charged by the Sub-Adviser for sub-advisory services, as well as the portion of the Portfolio’s management fee retained by TAM following payment of the sub-advisory fee and how the portion of the contractual management fee retained by TAM at a specified asset level compared to the portions retained by other investment advisers managing mutual funds with similar investment strategies as calculated by an independent provider of information.
The Board noted that the Portfolio’s contractual management fee was below the medians for its peer group and peer universe and that the actual total expenses (i.e., expenses reflecting any waivers and/or reimbursements) of Service Class Shares of the Portfolio were above the medians for its peer group and peer universe. The Trustees also considered that TAM has entered into an expense limitation arrangement with the Portfolio, which may result in TAM waiving fees for the benefit of holders.
On the basis of these considerations, together with the other information it considered, the Board determined that the management and sub-advisory fees to be received by TAM and the Sub-Adviser under the Management Agreement and Sub-Advisory Agreement are reasonable in light of the services provided.
Cost of Services Provided and Level of Profitability
The Board reviewed information provided by TAM about the cost of providing and procuring fund management services, as well as the costs of the provision of administration, transfer agency and other services, to the Portfolio and to Transamerica Series Trust as a whole by TAM and its affiliates. The Board considered the profitability of TAM and its affiliates in providing these services for the Portfolio and Transamerica Series Trust as a whole. The Trustees recognized the competitiveness of the mutual fund industry and the importance of an investment adviser’s long-term profitability, including for maintaining company and management stability and accountability.
With respect to the Sub-Adviser, the Board noted that the sub-advisory fee is the product of arm’s-length negotiation between TAM and the Sub-Adviser, which is not affiliated with TAM, and is paid by TAM and not the Portfolio. As a result, the Board focused on the profitability of TAM and its affiliates with respect to the Portfolio.
|
|
|
|
|
| Transamerica Series Trust |
|
|
|
Semi-Annual Financial Statements 2024 |
|
|
Page 16 |
|
|
Transamerica JPMorgan Asset Allocation - Growth VP
MANAGEMENT AND SUB-ADVISORY AGREEMENT — CONTRACT RENEWAL (continued)
(unaudited)
Based on this information, the Board determined that the profitability of TAM and its affiliates from their relationships with the Portfolio was not excessive.
Economies of Scale
The Board considered economies of scale with respect to the management of the Portfolio, whether the Portfolio had appropriately benefited from any economies of scale and whether there was the potential for realization of any future economies of scale. The Board also considered the existence of economies of scale with respect to management of the Transamerica mutual funds overall and the extent to which the Portfolio benefited from any economies of scale. The Board recognized that, as the Portfolio’s assets increase, any economies of scale realized by TAM or the Sub-Adviser may not directly correlate with each other or with any economies of scale that might be realized by the Portfolio. The Board considered the Portfolio’s management fee schedule and the existence of breakpoints and also considered the extent to which TAM shared economies of scale, if any, with the Portfolio through undertakings to limit or reimburse Portfolio expenses and to invest in maintaining and developing its capabilities and services. The Board also considered the Sub-Adviser’s sub-advisory fee schedule and the existence of breakpoints, if any, and how such breakpoints relate to any breakpoints in the Portfolio’s management fee schedule. The Board considered that the Sub-Adviser’s sub-advisory fees would be based on the combined assets of multiple funds. The Trustees concluded that the Portfolio’s fee structure reflected an appropriate sharing of any efficiencies or economies of scale to date and noted that they will have the opportunity to periodically reexamine the appropriateness of the management fee payable to TAM and the fee paid to the Sub-Adviser in light of any economies of scale experienced in the future.
Benefits to TAM, its Affiliates and/or the Sub-Adviser from their Relationships with the Portfolio
The Board considered other benefits derived by TAM, its affiliates, and/or the Sub-Adviser from their relationships with the Portfolio. The Board noted that TAM does not receive benefits from research obtained with commissions paid to broker-dealers for portfolio transactions (commonly referred to as “soft dollars”) as a result of its relationship with the Portfolio.
Other Considerations
The Board noted that TAM has made a substantial commitment to the recruitment and retention of high-quality personnel and maintains the financial, compliance and operational resources reasonably necessary to manage the Portfolio in a professional manner that is consistent with the best interests of the Portfolio and the holders. In this regard, the Board favorably considered the procedures and policies TAM has in place to enforce compliance with applicable laws and regulations and oversee the portfolio management activities of the Sub-Adviser. The Board also noted that TAM has made an entrepreneurial commitment and undertaken certain business risks with respect to the management and success of the Portfolio.
Conclusion
After consideration of the factors described above, as well as other factors, the Trustees, including the Independent Trustees, concluded that the renewal of the Management Agreement and the Sub-Advisory Agreement was in the best interests of the Portfolio and the holders and voted to approve the renewal of the Agreements.
|
|
|
|
|
| Transamerica Series Trust |
|
|
|
Semi-Annual Financial Statements 2024 |
|
|
Page 17 |
|
|
PROXY VOTING POLICIES AND PROCEDURES AND QUARTERLY PORTFOLIO HOLDINGS
(unaudited)
A description of Transamerica Series Trust’s (the “Trust”) proxy voting policies and procedures is available in the Statement of Additional Information of the Portfolios, available without charge upon request by calling 1-800-851-9777 (toll free) or on the Securities and Exchange Commission’s (“SEC”) website at http://www.sec.gov.
In addition, the Portfolio is required to file Form N-PX, with their complete proxy voting records for the most recent 12 months ended June 30th, no later than August 31st of each year. The Form is available without charge: (1) on the Transamerica Funds website at https://www.transamerica.com/sites/default/files/files/e070d/TST%20N-PX%202021.pdf; and (2) on the SEC’s website at http://www.sec.gov.
Each fiscal quarter, the Portfolios, except Transamerica BlackRock Government Money Market VP, will file with the SEC a complete schedule of its monthly portfolio holdings on Form N-PORT. The Portfolios’ holdings as of the end of the third month of every fiscal quarter, as reported on Form N-PORT, will be publicly available on the SEC’s website at http://www.sec.gov within 60 days of the end of the fiscal quarter.
On a monthly basis, Transamerica BlackRock Government Money Market VP will file with the SEC portfolio holdings information on Form N-MFP3. A complete schedule of portfolio holdings is also available at www.transamerica.com.
You may also visit the Trust’s website at www.transamerica.com/annuities/prospectus for this and other information about the Portfolios and the Trust.
Important Notice Regarding Delivery of Shareholder Documents
Every year we provide shareholders informative materials such as the Transamerica Series Trust Annual Report, the Transamerica Series Trust Prospectus, and other required documents that keep you informed regarding your Portfolios. To the extent provided by mail, Transamerica Series Trust will only send one piece per mailing address, a method that saves your Portfolios money by reducing mailing and printing costs. We will continue to do this unless you tell us not to. To elect to receive individual mailings, simply call a Transamerica Customer Service Representative toll free at 1-800-851-9777, 8 a.m. to 7 p.m. Eastern Time, Monday-Friday. Your request will take effect within 30 days.
|
|
|
|
|
| Transamerica Series Trust |
|
|
|
Semi-Annual Financial Statements 2024 |
|
|
Page 18 |
|
|
NOTICE OF PRIVACY POLICY
(unaudited)
Your privacy is very important to us. We want you to understand what information we collect and how we use it. We collect and use “nonpublic personal information” in connection with providing our customers with a broad range of financial products and services as effectively and conveniently as possible. We treat nonpublic personal information in accordance with our Privacy Policy.
What Information We Collect and From Whom We Collect It
We may collect nonpublic personal information about you from the following sources:
| • |
|
Information we receive from you on applications or other forms, such as your name, address, and account number; |
| • |
|
Information about your transactions with us, our affiliates, or others, such as your account balance and purchase/redemption history; and |
| • |
|
Information we receive from non-affiliated third parties, including consumer reporting agencies. |
What Information We Disclose and To Whom We Disclose It
We do not disclose any nonpublic personal information about current or former customers to anyone without their express consent, except as permitted by law. We may disclose the nonpublic personal information we collect, as described above, to persons or companies that perform services on our behalf and to other financial institutions with which we have joint marketing agreements. We will require these companies to protect the confidentiality of your nonpublic personal information and to use it only to perform the services for which we have hired them.
Our Security Procedures
We restrict access to your nonpublic personal information and only allow disclosures to persons and companies as permitted by law to assist in providing products or services to you. We maintain physical, electronic, and procedural safeguards to protect your nonpublic personal information and to safeguard the disposal of certain consumer information.
Contact Us
If you have any questions about our Privacy Policy, please call 1-800-851-9777 on any business day between 8 a.m. and 7 p.m. Eastern Time.
Note: This Privacy Policy applies only to customers that have a direct relationship with us or our affiliates. If you own shares of our portfolios in the name of a third party such as a bank or broker-dealer, its privacy policy may apply to you instead of ours.
|
|
|
|
|
| Transamerica Series Trust |
|
|
|
Semi-Annual Financial Statements 2024 |
|
|
Page 19 |
|
|
PO Box 219945
Kansas City, MO 64121-9945
|
|
|
| Distributor: |
|
Transamerica Capital, Inc. |
|
|
PO Box 219945 |
|
|
Kansas City, MO 64121-9945 |
|
|
|
|
Customer Service: 1-800-851-9777 |
Transamerica Series Trust Semi-Annual Financial Statements
June 30, 2024
1801 California St., Suite 5200
Denver, CO 80202
Distributor: Transamerica Capital, Inc.
Customer Service: 1-800-851-9777
|
| The following pages contain the most recent semi-annual financial statements for the investment options in which you are invested. In compliance with Securities and Exchange Commission regulations, we present these reports on an annual and semi-annual basis with the hope that they will foster greater understanding of the investment options’ holdings, performance, financial data, accounting policies and other issues. This streamlined version provides information only on the investment options in which you are invested. |
|
| If you have any questions about these reports, please do not hesitate to contact your financial professional. As always, we thank you for your trust and the opportunity to serve you. |
Transamerica JPMorgan Asset Allocation - Moderate Growth VP
SCHEDULE OF INVESTMENTS
At June 30, 2024
(unaudited)
|
|
|
|
|
|
|
|
|
| |
|
Shares |
|
|
Value |
|
| |
|
|
|
|
| INVESTMENT COMPANIES - 98.3% |
|
|
|
|
|
|
|
|
| International Alternative Funds - 1.0% |
|
|
|
|
|
|
|
|
| Transamerica Global Allocation Liquidating Trust (A)(B)(C)(D) |
|
|
11,961 |
|
|
|
$ 14,377 |
|
| Transamerica Unconstrained Bond (B) |
|
|
4,076,651 |
|
|
|
35,670,699 |
|
|
|
|
|
|
|
|
|
|
|
|
|
|
|
|
|
|
|
|
35,685,076 |
|
|
|
|
|
|
|
|
|
|
|
|
|
| International Equity Funds - 13.8% |
|
|
|
|
|
|
|
|
| Transamerica BlackRock Real Estate Securities VP (B) |
|
|
936,498 |
|
|
|
8,774,988 |
|
| Transamerica Emerging Markets Opportunities (B) |
|
|
13,538,361 |
|
|
|
107,765,353 |
|
| Transamerica International Equity (B) |
|
|
5,642,974 |
|
|
|
117,825,290 |
|
| Transamerica International Focus (B) |
|
|
15,940,860 |
|
|
|
131,990,320 |
|
| Transamerica International Small Cap Value (B) |
|
|
7,322,383 |
|
|
|
109,616,075 |
|
|
|
|
|
|
|
|
|
|
|
|
|
|
|
|
|
|
|
|
475,972,026 |
|
|
|
|
|
|
|
|
|
|
|
| International Mixed Allocation Fund - 14.7% |
|
| Transamerica Aegon Bond VP (B) |
|
|
52,202,517 |
|
|
|
505,320,367 |
|
|
|
|
|
|
|
|
|
|
|
|
|
| U.S. Equity Funds - 52.7% |
|
|
|
|
|
|
|
|
| Transamerica Janus Mid-Cap Growth VP (B) |
|
|
543,805 |
|
|
|
17,467,006 |
|
| Transamerica JPMorgan Enhanced Index VP (B) |
|
|
37,805,553 |
|
|
|
1,049,482,159 |
|
| Transamerica Large Cap Value (B) |
|
|
15,620,384 |
|
|
|
218,841,584 |
|
| Transamerica Mid Cap Growth (A)(B) |
|
|
3,363,491 |
|
|
|
31,078,656 |
|
| Transamerica Mid Cap Value Opportunities (B) |
|
|
1,556,489 |
|
|
|
17,105,810 |
|
| Transamerica Small Cap Value (B) |
|
|
1,520,267 |
|
|
|
8,650,320 |
|
| Transamerica T. Rowe Price Small Cap VP (B) |
|
|
717,102 |
|
|
|
8,784,500 |
|
| Transamerica WMC US Growth VP (B) |
|
|
10,802,791 |
|
|
|
461,063,112 |
|
|
|
|
|
|
|
|
|
|
|
|
|
|
|
|
|
|
|
|
1,812,473,147 |
|
|
|
|
|
|
|
|
|
|
|
|
|
| U.S. Fixed Income Funds - 16.1% |
|
|
|
|
|
|
|
|
| Transamerica Core Bond (B) |
|
|
4,617,591 |
|
|
|
39,295,698 |
|
|
|
|
|
|
|
|
|
|
| |
|
Shares |
|
|
Value |
|
| |
|
|
| INVESTMENT COMPANIES (continued) |
|
| U.S. Fixed Income Funds (continued) |
|
| Transamerica Floating Rate (B) |
|
|
3,820,757 |
|
|
|
$ 34,539,648 |
|
| Transamerica High Yield Bond (B) |
|
|
38,164,322 |
|
|
|
306,077,861 |
|
| Transamerica Long Credit (B) |
|
|
18,266,882 |
|
|
|
172,987,376 |
|
|
|
|
|
|
|
|
|
|
|
|
|
|
|
|
|
552,900,583 |
|
|
|
|
|
|
|
|
|
|
|
|
|
| Total Investment Companies
(Cost $3,131,272,678) |
|
|
|
|
|
|
3,382,351,199 |
|
|
|
|
|
|
|
|
|
|
|
|
|
| |
|
Principal |
|
|
Value |
|
| |
|
|
| U.S. GOVERNMENT OBLIGATION - 1.3% |
|
| U.S. Treasury - 1.3% |
|
|
|
|
|
|
|
|
| U.S. Treasury Notes
4.13%, 01/31/2025 (E) |
|
|
$ 44,644,700 |
|
|
|
44,334,280 |
|
|
|
|
|
|
|
|
|
|
|
|
|
| Total U.S. Government Obligation
(Cost $44,394,334) |
|
|
|
|
|
|
44,334,280 |
|
|
|
|
|
|
|
|
|
|
|
| REPURCHASE AGREEMENT - 0.3% |
|
| Fixed Income Clearing Corp., 2.50% (F), dated 06/28/2024, to be repurchased at $11,295,810 on 07/01/2024. Collateralized by a U.S. Government Obligation, 3.75%, due 04/15/2026, and with a value of $11,519,506. |
|
|
11,293,457 |
|
|
|
11,293,457 |
|
|
|
|
|
|
|
|
|
|
|
|
| Total Repurchase Agreement
(Cost $11,293,457) |
|
|
|
11,293,457 |
|
|
|
|
|
|
|
|
|
|
| Total Investments
(Cost $3,186,960,469) |
|
|
|
3,437,978,936 |
|
|
|
|
|
|
|
|
|
|
| Net Other Assets (Liabilities) - 0.1% |
|
|
|
2,799,907 |
|
|
|
|
|
|
|
|
|
|
|
|
| Net Assets - 100.0% |
|
|
|
$ 3,440,778,843 |
|
|
|
|
|
|
|
|
|
|
FUTURES CONTRACTS:
|
|
|
|
|
|
|
|
|
|
|
|
|
|
|
|
|
|
|
|
|
|
|
|
|
|
| Long Futures Contracts |
|
| Description |
|
Number of Contracts |
|
|
Expiration Date |
|
|
Notional Amount |
|
|
Value |
|
|
Unrealized Appreciation |
|
|
Unrealized Depreciation |
| 5-Year U.S. Treasury Notes |
|
|
2,179 |
|
|
|
09/30/2024 |
|
|
|
$230,723,006 |
|
|
|
$232,233,735 |
|
|
|
$ 1,510,729 |
|
|
|
$ — |
|
| 10-Year Canada Government Bonds |
|
|
1,555 |
|
|
|
09/18/2024 |
|
|
|
135,621,993 |
|
|
|
136,478,089 |
|
|
|
856,096 |
|
|
|
— |
|
| E-Mini Russell 2000® Index |
|
|
499 |
|
|
|
09/20/2024 |
|
|
|
50,639,060 |
|
|
|
51,521,750 |
|
|
|
882,690 |
|
|
|
— |
|
| Euro-BTP Italy Government Bonds |
|
|
1,474 |
|
|
|
09/06/2024 |
|
|
|
184,600,888 |
|
|
|
181,994,603 |
|
|
|
— |
|
|
|
(2,606,285 |
) |
| MSCI EAFE Mini Index |
|
|
1,260 |
|
|
|
09/20/2024 |
|
|
|
146,168,908 |
|
|
|
147,621,600 |
|
|
|
1,452,692 |
|
|
|
— |
|
| MSCI Emerging Markets Index |
|
|
3,618 |
|
|
|
09/20/2024 |
|
|
|
196,502,997 |
|
|
|
196,855,380 |
|
|
|
352,383 |
|
|
|
— |
|
| S&P 500® E-Mini Index |
|
|
80 |
|
|
|
09/20/2024 |
|
|
|
22,010,370 |
|
|
|
22,086,000 |
|
|
|
75,630 |
|
|
|
— |
|
| S&P/TSX 60 Index |
|
|
282 |
|
|
|
09/19/2024 |
|
|
|
53,504,714 |
|
|
|
54,027,411 |
|
|
|
522,697 |
|
|
|
— |
|
| U.K. Gilt |
|
|
908 |
|
|
|
09/26/2024 |
|
|
|
111,228,988 |
|
|
|
111,991,071 |
|
|
|
762,083 |
|
|
|
— |
|
| Total |
|
|
|
$ 6,415,000 |
|
|
|
$ (2,606,285 |
) |
|
|
|
|
|
|
|
|
|
|
|
| Short Futures Contracts |
|
| Description |
|
Number of Contracts |
|
|
Expiration Date |
|
|
Notional Amount |
|
|
Value |
|
|
Unrealized Appreciation |
|
|
Unrealized Depreciation |
| 2-Year U.S. Treasury Notes |
|
|
(1,496) |
|
|
|
09/30/2024 |
|
|
|
$(304,725,269 |
) |
|
|
$(305,511,250 |
) |
|
|
$ — |
|
|
|
$(785,981 |
) |
| 10-Year U.S. Treasury Notes |
|
|
(1,754) |
|
|
|
09/19/2024 |
|
|
|
(191,771,550 |
) |
|
|
(192,912,594 |
) |
|
|
— |
|
|
|
(1,141,044 |
) |
| 10-Year U.S. Treasury Ultra Notes |
|
|
(1,143) |
|
|
|
09/19/2024 |
|
|
|
(128,531,522 |
) |
|
|
(129,766,219 |
) |
|
|
— |
|
|
|
(1,234,697 |
) |
The Notes to Financial Statements are an integral part of this report.
|
|
|
|
|
| Transamerica Series Trust |
|
|
|
Semi-Annual Financial Statements 2024 |
|
|
Page 1 |
|
|
Transamerica JPMorgan Asset Allocation - Moderate Growth VP
SCHEDULE OF INVESTMENTS (continued)
At June 30, 2024
(unaudited)
FUTURES CONTRACTS (continued):
|
|
|
|
|
|
|
|
|
|
|
|
|
|
|
|
|
|
|
|
|
|
|
| Short Futures Contracts (continued) |
|
| Description |
|
Number of Contracts |
|
|
Expiration Date |
|
Notional Amount |
|
|
Value |
|
|
Unrealized Appreciation |
|
|
Unrealized Depreciation |
|
| CAD Currency |
|
|
(651) |
|
|
09/17/2024 |
|
$ |
(47,546,523 |
) |
|
$ |
(47,653,200 |
) |
|
$ |
— |
|
|
$ |
(106,677 |
) |
| EURO STOXX 50® Index |
|
|
(1,177) |
|
|
09/20/2024 |
|
|
(61,510,420 |
) |
|
|
(62,092,659 |
) |
|
|
— |
|
|
|
(582,239 |
) |
| German Euro Bund |
|
|
(1,047) |
|
|
09/06/2024 |
|
|
(146,073,426 |
) |
|
|
(147,583,550 |
) |
|
|
— |
|
|
|
(1,510,124 |
) |
| JPY Currency |
|
|
(851) |
|
|
09/16/2024 |
|
|
(68,612,395 |
) |
|
|
(66,936,469 |
) |
|
|
1,675,926 |
|
|
|
— |
|
| TOPIX Index |
|
|
(76) |
|
|
09/12/2024 |
|
|
(12,827,416 |
) |
|
|
(13,276,027 |
) |
|
|
— |
|
|
|
(448,611 |
) |
| U.S. Treasury Ultra Bonds |
|
|
(257) |
|
|
09/19/2024 |
|
|
(31,857,396 |
) |
|
|
(32,213,344 |
) |
|
|
— |
|
|
|
(355,948 |
) |
| Total |
|
|
$ |
1,675,926 |
|
|
$ |
(6,165,321 |
) |
| Total Futures Contracts |
|
|
$ |
8,090,926 |
|
|
$ |
(8,771,606 |
) |
|
|
|
|
|
|
|
|
|
|
INVESTMENT VALUATION:
Valuation Inputs (G)
|
|
|
|
|
|
|
|
|
|
|
|
|
|
|
|
|
| |
|
Level 1 - Unadjusted Quoted Prices |
|
|
Level 2 - Other Significant Observable Inputs |
|
|
Level 3 - Significant Unobservable Inputs |
|
|
Value |
|
| |
|
|
|
|
|
|
| ASSETS |
|
|
|
|
|
|
|
|
|
|
|
|
|
|
|
|
| Investments |
|
|
|
|
|
|
|
|
|
|
|
|
|
|
|
|
| Investment Companies |
|
$ |
3,382,336,822 |
|
|
$ |
— |
|
|
$ |
— |
|
|
$ |
3,382,336,822 |
|
| U.S. Government Obligation |
|
|
— |
|
|
|
44,334,280 |
|
|
|
— |
|
|
|
44,334,280 |
|
| Repurchase Agreement |
|
|
— |
|
|
|
11,293,457 |
|
|
|
— |
|
|
|
11,293,457 |
|
|
|
|
|
|
|
|
|
|
|
|
|
|
|
|
|
|
|
|
|
|
|
| Total |
|
$ |
3,382,336,822 |
|
|
$ |
55,627,737 |
|
|
$ |
— |
|
|
$ |
3,437,964,559 |
|
|
|
|
|
|
|
|
|
|
|
|
|
|
|
|
|
|
| Investment Companies Measured at Net Asset Value (C) |
|
|
|
|
|
|
|
|
|
|
|
|
|
|
14,377 |
|
|
|
|
|
|
|
|
|
|
|
|
|
|
|
|
|
|
| Total Investments |
|
|
|
|
|
|
|
|
|
|
|
|
|
$ |
3,437,978,936 |
|
|
|
|
|
|
|
|
|
|
|
|
|
|
|
|
|
|
|
|
|
|
|
| Other Financial Instruments |
|
|
|
|
|
|
|
|
|
|
|
|
|
|
|
|
| Futures Contracts (H) |
|
$ |
8,090,926 |
|
|
$ |
— |
|
|
$ |
— |
|
|
$ |
8,090,926 |
|
|
|
|
|
|
|
|
|
|
|
|
|
|
|
|
|
|
|
|
|
|
|
| Total Other Financial Instruments |
|
$ |
8,090,926 |
|
|
$ |
— |
|
|
$ |
— |
|
|
$ |
8,090,926 |
|
|
|
|
|
|
|
|
|
|
|
|
|
|
|
|
|
|
|
|
|
|
|
| LIABILITIES |
|
|
|
|
|
|
|
|
|
|
|
|
|
|
|
|
| Other Financial Instruments |
|
|
|
|
|
|
|
|
|
|
|
|
|
|
|
|
| Futures Contracts (H) |
|
$ |
(8,771,606 |
) |
|
$ |
— |
|
|
$ |
— |
|
|
$ |
(8,771,606 |
) |
|
|
|
|
|
|
|
|
|
|
|
|
|
|
|
|
|
|
|
|
|
|
| Total Other Financial Instruments |
|
$ |
(8,771,606 |
) |
|
$ |
— |
|
|
$ |
— |
|
|
$ |
(8,771,606 |
) |
|
|
|
|
|
|
|
|
|
|
|
|
|
|
|
|
|
FOOTNOTES TO SCHEDULE OF INVESTMENTS:
| (A) |
Non-income producing security. |
| (B) |
Affiliated investment in the Class I2 shares of funds within Transamerica Funds, and a liquidating trust of a former Transamerica Fund and/or affiliated investment in the Initial Class shares of funds within Transamerica Series Trust. The Portfolio’s transactions and earnings from these underlying funds are as follows: |
|
|
|
|
|
|
|
|
|
|
|
|
|
|
|
|
|
|
|
|
|
|
|
|
|
|
|
|
|
|
|
|
|
|
|
|
|
| Affiliated Investments |
|
Value December 31, 2023 |
|
|
Purchases at Cost |
|
|
Proceeds from Sales |
|
|
Net Realized Gain (Loss) |
|
|
Net Change in Unrealized Appreciation (Depreciation) |
|
|
Value June 30, 2024 |
|
|
Shares as of June 30, 2024 |
|
|
Dividend Income |
|
|
Net Capital Gain Distributions |
|
| Transamerica Aegon Bond VP |
|
|
$585,742,430 |
|
|
|
$— |
|
|
|
$(79,278,640 |
) |
|
|
$(7,214,527 |
) |
|
|
$6,071,104 |
|
|
|
$505,320,367 |
|
|
|
52,202,517 |
|
|
|
$— |
|
|
|
$— |
|
| Transamerica BlackRock Real Estate Securities VP |
|
|
9,102,763 |
|
|
|
— |
|
|
|
— |
|
|
|
— |
|
|
|
(327,775 |
) |
|
|
8,774,988 |
|
|
|
936,498 |
|
|
|
— |
|
|
|
— |
|
| Transamerica Core Bond |
|
|
75,917,197 |
|
|
|
1,181,953 |
|
|
|
(35,657,032 |
) |
|
|
(3,804,144 |
) |
|
|
1,657,724 |
|
|
|
39,295,698 |
|
|
|
4,617,591 |
|
|
|
1,181,953 |
|
|
|
— |
|
| Transamerica Emerging Markets Opportunities |
|
|
100,454,638 |
|
|
|
— |
|
|
|
— |
|
|
|
— |
|
|
|
7,310,715 |
|
|
|
107,765,353 |
|
|
|
13,538,361 |
|
|
|
— |
|
|
|
— |
|
| Transamerica Floating Rate |
|
|
33,207,285 |
|
|
|
1,406,935 |
|
|
|
— |
|
|
|
— |
|
|
|
(74,572 |
) |
|
|
34,539,648 |
|
|
|
3,820,757 |
|
|
|
1,406,935 |
|
|
|
— |
|
| Transamerica Global Allocation Liquidating Trust |
|
|
14,870 |
|
|
|
— |
|
|
|
— |
|
|
|
— |
|
|
|
(493 |
) |
|
|
14,377 |
|
|
|
11,961 |
|
|
|
— |
|
|
|
— |
|
| Transamerica High Yield Bond |
|
|
299,830,247 |
|
|
|
9,579,809 |
|
|
|
— |
|
|
|
— |
|
|
|
(3,332,195 |
) |
|
|
306,077,861 |
|
|
|
38,164,322 |
|
|
|
9,579,809 |
|
|
|
— |
|
The Notes to Financial Statements are an integral part of this report.
|
|
|
|
|
| Transamerica Series Trust |
|
|
|
Semi-Annual Financial Statements 2024 |
|
|
Page 2 |
|
|
Transamerica JPMorgan Asset Allocation - Moderate Growth VP
SCHEDULE OF INVESTMENTS (continued)
At June 30, 2024
(unaudited)
FOOTNOTES TO SCHEDULE OF INVESTMENTS (continued):
|
|
|
|
|
|
|
|
|
|
|
|
|
|
|
|
|
|
|
|
|
|
|
|
|
|
|
|
|
|
|
|
|
|
|
|
|
| Affiliated Investments |
|
Value December 31, 2023 |
|
Purchases at Cost |
|
|
Proceeds from Sales |
|
|
Net Realized Gain (Loss) |
|
|
Net Change in Unrealized Appreciation (Depreciation) |
|
|
Value June 30, 2024 |
|
|
Shares as of June 30, 2024 |
|
|
Dividend Income |
|
|
Net Capital Gain Distributions |
|
|
|
|
|
|
|
|
|
|
|
| Transamerica International Equity |
|
|
$122,615,488 |
|
|
|
$— |
|
|
|
$(8,580,625 |
) |
|
|
$1,161,288 |
|
|
|
$2,629,139 |
|
|
|
$117,825,290 |
|
|
|
5,642,974 |
|
|
|
$— |
|
|
|
$— |
|
|
|
|
|
|
|
|
|
|
|
| Transamerica International Focus |
|
|
144,716,839 |
|
|
|
57,384,100 |
|
|
|
(73,111,680 |
) |
|
|
3,133,814 |
|
|
|
(132,753 |
) |
|
|
131,990,320 |
|
|
|
15,940,860 |
|
|
|
— |
|
|
|
— |
|
|
|
|
|
|
|
|
|
|
|
| Transamerica International Small Cap Value |
|
|
103,538,497 |
|
|
|
— |
|
|
|
— |
|
|
|
— |
|
|
|
6,077,578 |
|
|
|
109,616,075 |
|
|
|
7,322,383 |
|
|
|
— |
|
|
|
— |
|
|
|
|
|
|
|
|
|
|
|
| Transamerica Janus Mid- Cap Growth VP |
|
|
76,766,973 |
|
|
|
— |
|
|
|
(62,662,025 |
) |
|
|
(18,991,129 |
) |
|
|
22,353,187 |
|
|
|
17,467,006 |
|
|
|
543,805 |
|
|
|
— |
|
|
|
— |
|
|
|
|
|
|
|
|
|
|
|
| Transamerica JPMorgan Enhanced Index VP |
|
|
883,225,820 |
|
|
|
71,097,294 |
|
|
|
(43,379,617 |
) |
|
|
8,782,004 |
|
|
|
129,756,658 |
|
|
|
1,049,482,159 |
|
|
|
37,805,553 |
|
|
|
— |
|
|
|
— |
|
|
|
|
|
|
|
|
|
|
|
| Transamerica Large Cap Value |
|
|
221,249,467 |
|
|
|
29,070,971 |
|
|
|
(51,821,460 |
) |
|
|
12,886,379 |
|
|
|
7,456,227 |
|
|
|
218,841,584 |
|
|
|
15,620,384 |
|
|
|
1,303,171 |
|
|
|
— |
|
|
|
|
|
|
|
|
|
|
|
| Transamerica Long Credit |
|
|
143,393,341 |
|
|
|
38,710,095 |
|
|
|
— |
|
|
|
— |
|
|
|
(9,116,060 |
) |
|
|
172,987,376 |
|
|
|
18,266,882 |
|
|
|
4,341,660 |
|
|
|
— |
|
|
|
|
|
|
|
|
|
|
|
| Transamerica Mid Cap Growth |
|
|
97,240,116 |
|
|
|
— |
|
|
|
(68,941,474 |
) |
|
|
(13,825,962 |
) |
|
|
16,605,976 |
|
|
|
31,078,656 |
|
|
|
3,363,491 |
|
|
|
— |
|
|
|
— |
|
|
|
|
|
|
|
|
|
|
|
| Transamerica Mid Cap Value Opportunities |
|
|
47,322,522 |
|
|
|
— |
|
|
|
(30,746,700 |
) |
|
|
1,472,648 |
|
|
|
(942,660 |
) |
|
|
17,105,810 |
|
|
|
1,556,489 |
|
|
|
— |
|
|
|
— |
|
|
|
|
|
|
|
|
|
|
|
| Transamerica Small Cap Value |
|
|
29,529,929 |
|
|
|
— |
|
|
|
(20,311,843 |
) |
|
|
(1,561,006 |
) |
|
|
993,240 |
|
|
|
8,650,320 |
|
|
|
1,520,267 |
|
|
|
— |
|
|
|
— |
|
|
|
|
|
|
|
|
|
|
|
| Transamerica T. Rowe Price Small Cap VP |
|
|
41,007,637 |
|
|
|
— |
|
|
|
(34,010,311 |
) |
|
|
2,963,222 |
|
|
|
(1,176,048 |
) |
|
|
8,784,500 |
|
|
|
717,102 |
|
|
|
— |
|
|
|
— |
|
|
|
|
|
|
|
|
|
|
|
| Transamerica TSW Mid Cap Value Opportunities VP |
|
|
37,338,861 |
|
|
|
— |
|
|
|
(38,435,453 |
) |
|
|
(3,873,159 |
) |
|
|
4,969,751 |
|
|
|
— |
|
|
|
— |
|
|
|
— |
|
|
|
— |
|
|
|
|
|
|
|
|
|
|
|
| Transamerica Unconstrained Bond |
|
|
103,959,125 |
|
|
|
3,034,073 |
|
|
|
(69,998,916 |
) |
|
|
259,311 |
|
|
|
(1,582,894 |
) |
|
|
35,670,699 |
|
|
|
4,076,651 |
|
|
|
2,872,641 |
|
|
|
— |
|
|
|
|
|
|
|
|
|
|
|
| Transamerica WMC US Growth VP |
|
|
273,908,240 |
|
|
|
123,329,758 |
|
|
|
— |
|
|
|
— |
|
|
|
63,825,114 |
|
|
|
461,063,112 |
|
|
|
10,802,791 |
|
|
|
— |
|
|
|
— |
|
|
|
|
|
|
| Total |
|
|
$3,430,082,285 |
|
|
|
$334,794,988 |
|
|
|
$(616,935,776) |
|
|
|
$(18,611,261) |
|
|
|
$253,020,963 |
|
|
|
$3,382,351,199 |
|
|
|
236,471,639 |
|
|
|
$20,686,169 |
|
|
|
$— |
|
|
|
|
|
|
| (C) |
Certain investments are measured at fair value using the net asset value per share, or its equivalent, practical expedient and have not been classified in the fair value levels. The fair value amount presented is intended to permit reconciliation to the Total Investments amount presented within the Schedule of Investments. |
| (D) |
Restricted security. At June 30, 2024, the total value of such securities held by the Portfolio is as follows: |
|
|
|
|
|
|
|
|
|
|
|
| Investments |
|
Description |
|
Acquisition Date |
|
Acquisition Cost |
|
Value |
|
Value as Percentage of Net Assets |
| Investment Companies |
|
Transamerica Global
Allocation Liquidating Trust |
|
07/31/2014 |
|
$123,058 |
|
$14,377 |
|
0.0%(I) |
| (E) |
All or a portion of the security has been segregated by the custodian as collateral to cover margin requirements for open futures contracts. The total value of the securities is $44,334,280. |
| (F) |
Rate disclosed reflects the yield at June 30, 2024. |
| (G) |
There were no transfers in or out of Level 3 during the period ended June 30, 2024. Please reference the Investment Valuation section of the Notes to Financial Statements for more information regarding investment valuation and pricing inputs. |
| (H) |
Derivative instruments are valued at unrealized appreciation (depreciation). |
| (I) |
Percentage rounds to less than 0.1% or (0.1)%. |
CURRENCY ABBREVIATION(S):
|
|
|
| CAD |
|
Canadian Dollar |
| JPY |
|
Japanese Yen |
PORTFOLIO ABBREVIATION(S):
|
|
|
| BTP |
|
Buoni del Tesoro Poliennali (Italian Treasury Bonds) |
| EAFE |
|
Europe, Australasia and Far East |
| STOXX |
|
Deutsche Börse Group & SIX Group Index |
| TOPIX |
|
Tokyo Price Index |
| TSX |
|
Toronto Stock Exchange |
The Notes to Financial Statements are an integral part of this report.
|
|
|
|
|
| Transamerica Series Trust |
|
|
|
Semi-Annual Financial Statements 2024 |
|
|
Page 3 |
|
|
Transamerica JPMorgan Asset Allocation - Moderate Growth VP
STATEMENT OF ASSETS AND LIABILITIES
At June 30, 2024
(unaudited)
|
|
|
|
|
|
|
| Assets: |
|
|
|
|
|
|
| Affiliated investments, at value (cost $3,131,272,678) |
|
$ |
3,382,351,199 |
|
| Unaffiliated investments, at value (cost $44,394,334) |
|
|
44,334,280 |
|
| Repurchase agreement, at value (cost $11,293,457) |
|
|
11,293,457 |
|
| Cash |
|
|
919,380 |
|
| Receivables and other assets: |
|
|
|
|
| Investments sold |
|
|
6,865,100 |
|
| Shares of beneficial interest sold |
|
|
75,884 |
|
| Dividends from affiliated investments |
|
|
2,831,696 |
|
| Interest |
|
|
761,252 |
|
| Variation margin receivable on futures contracts |
|
|
3,430,185 |
|
| Prepaid expenses |
|
|
13,643 |
|
|
|
| Total assets |
|
|
3,452,876,076 |
|
|
|
| Liabilities: |
|
|
|
|
|
|
| Payables and other liabilities: |
|
|
|
|
| Investments purchased |
|
|
9,696,796 |
|
| Shares of beneficial interest redeemed |
|
|
1,254,597 |
|
| Investment management fees |
|
|
323,746 |
|
| Distribution and service fees |
|
|
500,883 |
|
| Transfer agent costs |
|
|
3,312 |
|
| Trustee and CCO fees |
|
|
9,699 |
|
| Audit and tax fees |
|
|
32,838 |
|
| Custody fees |
|
|
29,653 |
|
| Legal fees |
|
|
72,544 |
|
| Printing and shareholder reports fees |
|
|
114,341 |
|
| Other accrued expenses |
|
|
58,824 |
|
|
|
| Total liabilities |
|
|
12,097,233 |
|
|
|
| Net assets |
|
$ |
3,440,778,843 |
|
|
|
| Net assets consist of: |
|
|
|
|
|
|
| Capital stock ($0.01 par value) |
|
$ |
3,246,494 |
|
| Additional paid-in capital |
|
|
3,313,981,338 |
|
| Total distributable earnings (accumulated losses) |
|
|
123,551,011 |
|
|
|
| Net assets |
|
$ |
3,440,778,843 |
|
|
|
| Net assets by class: |
|
|
|
|
|
|
| Initial Class |
|
$ |
834,763,701 |
|
| Service Class |
|
|
2,606,015,142 |
|
|
|
| Shares outstanding: |
|
|
|
|
|
|
| Initial Class |
|
|
77,362,326 |
|
| Service Class |
|
|
247,287,121 |
|
|
|
| Net asset value and offering price per share: |
|
|
|
|
|
|
| Initial Class |
|
$ |
10.79 |
|
| Service Class |
|
|
10.54 |
|
STATEMENT OF OPERATIONS
For the period ended June 30, 2024
(unaudited)
|
|
|
|
|
|
|
| Investment income: |
|
|
|
|
|
|
| Dividend income from affiliated investments |
|
$ |
20,686,169 |
|
| Interest income from unaffiliated investments |
|
|
1,396,076 |
|
|
|
| Total investment income |
|
|
22,082,245 |
|
|
|
| Expenses: |
|
|
|
|
| Investment management fees |
|
|
2,086,739 |
|
| Distribution and service fees: |
|
|
|
|
| Service Class |
|
|
3,242,122 |
|
| Transfer agent costs |
|
|
19,406 |
|
| Trustee and CCO fees |
|
|
79,635 |
|
| Audit and tax fees |
|
|
31,985 |
|
| Custody fees |
|
|
30,454 |
|
| Legal fees |
|
|
138,175 |
|
| Printing and shareholder reports fees |
|
|
107,669 |
|
| Other |
|
|
94,372 |
|
|
|
| Total expenses |
|
|
5,830,557 |
|
|
|
| Net investment income (loss) |
|
|
16,251,688 |
|
|
|
| Net realized gain (loss) on: |
|
|
|
|
|
|
| Affiliated investments |
|
|
(18,611,261 |
) |
| Unaffiliated investments |
|
|
85,113 |
|
| Futures contracts |
|
|
10,341,267 |
|
|
|
| Net realized gain (loss) |
|
|
(8,184,881 |
) |
|
|
| Net change in unrealized appreciation (depreciation) on: |
|
|
|
|
|
|
| Affiliated investments |
|
|
253,020,963 |
|
| Unaffiliated investments |
|
|
(71,314 |
) |
| Futures contracts |
|
|
(29,051,714 |
) |
| Translation of assets and liabilities denominated in foreign currencies |
|
|
(75,296 |
) |
|
|
| Net change in unrealized appreciation (depreciation) |
|
|
223,822,639 |
|
|
|
| Net realized and change in unrealized gain (loss) |
|
|
215,637,758 |
|
|
|
| Net increase (decrease) in net assets resulting from operations |
|
$ |
231,889,446 |
|
The Notes to Financial Statements are an integral part of this report.
|
|
|
|
|
| Transamerica Series Trust |
|
|
|
Semi-Annual Financial Statements 2024 |
|
|
Page 4 |
|
|
Transamerica JPMorgan Asset Allocation - Moderate Growth VP
STATEMENT OF CHANGES IN NET ASSETS
For the period and year ended:
|
|
|
|
|
|
|
|
|
| |
|
June 30, 2024 (unaudited) |
|
December 31, 2023 |
|
|
|
| From operations: |
|
|
|
|
|
|
|
|
|
|
|
| Net investment income (loss) |
|
$ |
16,251,688 |
|
|
$ |
53,118,609 |
|
|
|
|
| Net realized gain (loss) |
|
|
(8,184,881 |
) |
|
|
(127,418,661 |
) |
|
|
|
| Net change in unrealized appreciation (depreciation) |
|
|
223,822,639 |
|
|
|
466,568,618 |
|
|
|
|
| Net increase (decrease) in net assets resulting from operations |
|
|
231,889,446 |
|
|
|
392,268,566 |
|
|
|
|
| Dividends and/or distributions to shareholders: |
|
|
|
|
|
|
|
|
|
|
|
| Initial Class |
|
|
— |
|
|
|
(50,577,204 |
) |
|
|
|
| Service Class |
|
|
— |
|
|
|
(165,608,804 |
) |
|
|
|
| Net increase (decrease) in net assets resulting from dividends and/or distributions to shareholders |
|
|
— |
|
|
|
(216,186,008 |
) |
|
|
|
| Capital share transactions: |
|
|
|
|
|
|
|
|
|
|
|
| Proceeds from shares sold: |
|
|
|
|
|
|
|
|
|
|
|
| Initial Class |
|
|
6,497,085 |
|
|
|
13,961,596 |
|
|
|
|
| Service Class |
|
|
4,874,223 |
|
|
|
4,555,497 |
|
|
|
|
| |
|
|
11,371,308 |
|
|
|
18,517,093 |
|
|
|
|
| Dividends and/or distributions reinvested: |
|
|
|
|
|
|
|
|
|
|
|
| Initial Class |
|
|
— |
|
|
|
50,577,204 |
|
|
|
|
| Service Class |
|
|
— |
|
|
|
165,608,804 |
|
|
|
|
| |
|
|
— |
|
|
|
216,186,008 |
|
|
|
|
| Cost of shares redeemed: |
|
|
|
|
|
|
|
|
|
|
|
| Initial Class |
|
|
(46,810,794 |
) |
|
|
(83,579,658 |
) |
|
|
|
| Service Class |
|
|
(237,475,977 |
) |
|
|
(421,630,057 |
) |
|
|
|
| |
|
|
(284,286,771 |
) |
|
|
(505,209,715 |
) |
|
|
|
| Net increase (decrease) in net assets resulting from capital share transactions |
|
|
(272,915,463 |
) |
|
|
(270,506,614 |
) |
|
|
|
| Net increase (decrease) in net assets |
|
|
(41,026,017 |
) |
|
|
(94,424,056 |
) |
|
|
|
| Net assets: |
|
|
|
|
|
|
|
|
|
|
|
| Beginning of period/year |
|
|
3,481,804,860 |
|
|
|
3,576,228,916 |
|
|
|
|
| End of period/year |
|
$ |
3,440,778,843 |
|
|
$ |
3,481,804,860 |
|
|
|
|
| Capital share transactions - shares: |
|
|
|
|
|
|
|
|
|
|
|
| Shares issued: |
|
|
|
|
|
|
|
|
|
|
|
| Initial Class |
|
|
626,727 |
|
|
|
1,443,771 |
|
|
|
|
| Service Class |
|
|
475,395 |
|
|
|
477,162 |
|
|
|
|
| |
|
|
1,102,122 |
|
|
|
1,920,933 |
|
|
|
|
| Shares reinvested: |
|
|
|
|
|
|
|
|
|
|
|
| Initial Class |
|
|
— |
|
|
|
5,296,042 |
|
|
|
|
| Service Class |
|
|
— |
|
|
|
17,712,172 |
|
|
|
|
| |
|
|
— |
|
|
|
23,008,214 |
|
|
|
|
| Shares redeemed: |
|
|
|
|
|
|
|
|
|
|
|
| Initial Class |
|
|
(4,492,584 |
) |
|
|
(8,547,764 |
) |
|
|
|
| Service Class |
|
|
(23,296,838 |
) |
|
|
(44,103,038 |
) |
|
|
|
| |
|
|
(27,789,422 |
) |
|
|
(52,650,802 |
) |
|
|
|
| Net increase (decrease) in shares outstanding: |
|
|
|
|
|
|
|
|
|
|
|
| Initial Class |
|
|
(3,865,857 |
) |
|
|
(1,807,951 |
) |
|
|
|
| Service Class |
|
|
(22,821,443 |
) |
|
|
(25,913,704 |
) |
|
|
|
| |
|
|
(26,687,300 |
) |
|
|
(27,721,655 |
) |
The Notes to Financial Statements are an integral part of this report.
|
|
|
|
|
| Transamerica Series Trust |
|
|
|
Semi-Annual Financial Statements 2024 |
|
|
Page 5 |
|
|
Transamerica JPMorgan Asset Allocation - Moderate Growth VP
FINANCIAL HIGHLIGHTS
|
|
|
|
|
|
|
|
|
|
|
|
|
|
|
|
|
|
|
|
|
|
|
|
|
| For a share outstanding during the period and years indicated: |
|
Initial Class |
|
|
|
|
|
|
|
| |
|
June 30, 2024 (unaudited) |
|
December 31, 2023 |
|
December 31, 2022 |
|
December 31, 2021 |
|
December 31, 2020 |
|
December 31, 2019 |
|
|
|
|
|
|
|
| Net asset value, beginning of period/year |
|
$ |
10.08 |
|
|
$ |
9.59 |
|
|
$ |
14.47 |
|
|
$ |
13.30 |
|
|
$ |
12.44 |
|
|
$ |
11.61 |
|
|
|
|
|
|
|
|
| Investment operations: |
|
|
|
|
|
|
|
|
|
|
|
|
|
|
|
|
|
|
|
|
|
|
|
|
|
|
|
|
|
|
|
| Net investment income (loss)(A) |
|
|
0.06 |
|
|
|
0.17 |
|
|
|
0.22 |
|
|
|
0.61 |
|
|
|
0.29 |
|
|
|
0.24 |
|
|
|
|
|
|
|
|
| Net realized and unrealized gain (loss) |
|
|
0.65 |
|
|
|
0.96 |
|
|
|
(2.68 |
) |
|
|
1.23 |
|
|
|
1.46 |
|
|
|
1.96 |
|
|
|
|
|
|
|
|
| Total investment operations |
|
|
0.71 |
|
|
|
1.13 |
|
|
|
(2.46 |
) |
|
|
1.84 |
|
|
|
1.75 |
|
|
|
2.20 |
|
|
|
|
|
|
|
|
| Dividends and/or distributions to shareholders: |
|
|
|
|
|
|
|
|
|
|
|
|
|
|
|
|
|
|
|
|
|
|
|
|
|
|
|
|
|
|
|
| Net investment income |
|
|
— |
|
|
|
(0.20 |
) |
|
|
(0.68 |
) |
|
|
(0.31 |
) |
|
|
(0.25 |
) |
|
|
(0.28 |
) |
|
|
|
|
|
|
|
| Net realized gains |
|
|
— |
|
|
|
(0.44 |
) |
|
|
(1.74 |
) |
|
|
(0.36 |
) |
|
|
(0.64 |
) |
|
|
(1.09 |
) |
|
|
|
|
|
|
|
| Total dividends and/or distributions to shareholders |
|
|
— |
|
|
|
(0.64 |
) |
|
|
(2.42 |
) |
|
|
(0.67 |
) |
|
|
(0.89 |
) |
|
|
(1.37 |
) |
|
|
|
|
|
|
|
| Net asset value, end of period/year |
|
$ |
10.79 |
|
|
$ |
10.08 |
|
|
$ |
9.59 |
|
|
$ |
14.47 |
|
|
$ |
13.30 |
|
|
$ |
12.44 |
|
|
|
|
|
|
|
|
| |
|
|
|
|
|
|
|
|
|
|
|
|
|
|
|
|
|
|
|
|
|
|
|
|
|
|
|
|
|
|
|
| Total return |
|
|
7.04 |
%(B) |
|
|
12.21 |
% |
|
|
(17.35 |
)% |
|
|
13.95 |
% |
|
|
15.07 |
% |
|
|
20.01 |
% |
|
|
|
|
|
|
|
| Ratio and supplemental data: |
|
|
|
|
|
|
|
|
|
|
|
|
|
|
|
|
|
|
|
|
|
|
|
|
|
|
|
|
|
|
|
| Net assets end of period/year (000’s) |
|
$ |
834,764 |
|
|
$ |
818,927 |
|
|
$ |
796,606 |
|
|
$ |
1,048,517 |
|
|
$ |
1,066,427 |
|
|
$ |
998,736 |
|
|
|
|
|
|
|
|
| Expenses to average net assets(C) |
|
|
0.15 |
%(D) |
|
|
0.16 |
% |
|
|
0.15 |
% |
|
|
0.15 |
% |
|
|
0.15 |
% |
|
|
0.14 |
% |
|
|
|
|
|
|
|
| Net investment income (loss) to average net assets |
|
|
1.14 |
%(D) |
|
|
1.73 |
% |
|
|
1.91 |
% |
|
|
4.26 |
% |
|
|
2.44 |
% |
|
|
1.99 |
% |
|
|
|
|
|
|
|
| Portfolio turnover rate |
|
|
10 |
%(B) |
|
|
36 |
% |
|
|
10 |
% |
|
|
21 |
% |
|
|
28 |
% |
|
|
10 |
% |
| (A) |
Calculated based on average number of shares outstanding. |
| (C) |
Does not include expenses of the underlying investments in which the Portfolio invests. |
|
|
|
|
|
|
|
|
|
|
|
|
|
|
|
|
|
|
|
|
|
|
|
|
|
| For a share outstanding during the period and years indicated: |
|
Service Class |
|
|
|
|
|
|
|
| |
|
June 30, 2024 (unaudited) |
|
December 31, 2023 |
|
December 31, 2022 |
|
December 31, 2021 |
|
December 31, 2020 |
|
December 31, 2019 |
|
|
|
|
|
|
|
| Net asset value, beginning of period/year |
|
$ |
9.86 |
|
|
$ |
9.39 |
|
|
$ |
14.21 |
|
|
$ |
13.07 |
|
|
$ |
12.25 |
|
|
$ |
11.44 |
|
|
|
|
|
|
|
|
| Investment operations: |
|
|
|
|
|
|
|
|
|
|
|
|
|
|
|
|
|
|
|
|
|
|
|
|
|
|
|
|
|
|
|
| Net investment income (loss)(A) |
|
|
0.04 |
|
|
|
0.14 |
|
|
|
0.19 |
|
|
|
0.57 |
|
|
|
0.26 |
|
|
|
0.21 |
|
|
|
|
|
|
|
|
| Net realized and unrealized gain (loss) |
|
|
0.64 |
|
|
|
0.94 |
|
|
|
(2.63 |
) |
|
|
1.21 |
|
|
|
1.42 |
|
|
|
1.94 |
|
|
|
|
|
|
|
|
| Total investment operations |
|
|
0.68 |
|
|
|
1.08 |
|
|
|
(2.44 |
) |
|
|
1.78 |
|
|
|
1.68 |
|
|
|
2.15 |
|
|
|
|
|
|
|
|
| Dividends and/or distributions to shareholders: |
|
|
|
|
|
|
|
|
|
|
|
|
|
|
|
|
|
|
|
|
|
|
|
|
|
|
|
|
|
|
|
| Net investment income |
|
|
— |
|
|
|
(0.17 |
) |
|
|
(0.64 |
) |
|
|
(0.28 |
) |
|
|
(0.22 |
) |
|
|
(0.25 |
) |
|
|
|
|
|
|
|
| Net realized gains |
|
|
— |
|
|
|
(0.44 |
) |
|
|
(1.74 |
) |
|
|
(0.36 |
) |
|
|
(0.64 |
) |
|
|
(1.09 |
) |
|
|
|
|
|
|
|
| Total dividends and/or distributions to shareholders |
|
|
— |
|
|
|
(0.61 |
) |
|
|
(2.38 |
) |
|
|
(0.64 |
) |
|
|
(0.86 |
) |
|
|
(1.34 |
) |
|
|
|
|
|
|
|
| Net asset value, end of period/year |
|
$ |
10.54 |
|
|
$ |
9.86 |
|
|
$ |
9.39 |
|
|
$ |
14.21 |
|
|
$ |
13.07 |
|
|
$ |
12.25 |
|
|
|
|
|
|
|
|
| |
|
|
|
|
|
|
|
|
|
|
|
|
|
|
|
|
|
|
|
|
|
|
|
|
|
|
|
|
|
|
|
| Total return |
|
|
6.90 |
%(B) |
|
|
11.93 |
% |
|
|
(17.53 |
)% |
|
|
13.70 |
% |
|
|
14.66 |
% |
|
|
19.79 |
% |
|
|
|
|
|
|
|
| Ratio and supplemental data: |
|
|
|
|
|
|
|
|
|
|
|
|
|
|
|
|
|
|
|
|
|
|
|
|
|
|
|
|
|
|
|
| Net assets end of period/year (000’s) |
|
$ |
2,606,015 |
|
|
$ |
2,662,878 |
|
|
$ |
2,779,623 |
|
|
$ |
3,834,114 |
|
|
$ |
3,859,311 |
|
|
$ |
3,804,109 |
|
|
|
|
|
|
|
|
| Expenses to average net assets(C) |
|
|
0.40 |
%(D) |
|
|
0.41 |
% |
|
|
0.40 |
% |
|
|
0.40 |
% |
|
|
0.40 |
% |
|
|
0.39 |
% |
|
|
|
|
|
|
|
| Net investment income (loss) to average net assets |
|
|
0.89 |
%(D) |
|
|
1.46 |
% |
|
|
1.64 |
% |
|
|
4.05 |
% |
|
|
2.17 |
% |
|
|
1.72 |
% |
|
|
|
|
|
|
|
| Portfolio turnover rate |
|
|
10 |
%(B) |
|
|
36 |
% |
|
|
10 |
% |
|
|
21 |
% |
|
|
28 |
% |
|
|
10 |
% |
| (A) |
Calculated based on average number of shares outstanding. |
| (C) |
Does not include expenses of the underlying investments in which the Portfolio invests. |
The Notes to Financial Statements are an integral part of this report.
|
|
|
|
|
| Transamerica Series Trust |
|
|
|
Semi-Annual Financial Statements 2024 |
|
|
Page 6 |
|
|
Transamerica JPMorgan Asset Allocation - Moderate Growth VP
NOTES TO FINANCIAL STATEMENTS
At June 30, 2024
(unaudited)
1. ORGANIZATION
Transamerica Series Trust (“TST”) is an open-end management investment company registered under the Investment Company Act of 1940, as amended (the “1940 Act”). TST applies investment company accounting and reporting guidance. TST serves as a funding vehicle for variable life insurance, variable annuity, and group annuity products. Transamerica JPMorgan Asset Allocation - Moderate Growth VP (the “Portfolio”) is a series of TST and is classified as diversified under the 1940 Act. The Portfolio currently offers two classes of shares, Initial Class and Service Class.
The only shareholders of the Portfolio are affiliated insurance company separate accounts and/or affiliated asset allocation portfolios. Contract holders of the variable life and annuity contracts are not shareholders of the Portfolio. For ease of reference, shareholders and contract holders are collectively referred to in this report as “shareholders.”
This report must be accompanied or preceded by the Portfolio’s current prospectus, which contains additional information about the Portfolio, including risks, as well as investment objectives and strategies.
Transamerica Asset Management, Inc. (“TAM”) serves as investment manager for the Portfolio pursuant to an investment management agreement. TAM provides continuous and regular investment management services to the Portfolio. TAM supervises the Portfolio’s investments, conducts its investment program and provides supervisory, compliance and administrative services to the Portfolio.
TAM currently acts as a “manager of managers” and has hired sub-advisers to furnish day-to-day investment advice and recommendations. TAM may, in the future, determine to provide all aspects of the day-to-day management of the Portfolio without the use of a sub-adviser. When acting as a manager of managers, TAM provides investment management services that include, without limitation, the design and development of the Portfolio and its investment strategies and the ongoing review and evaluation of those investment strategies including recommending changes in strategy where it believes appropriate or advisable; the selection of one or more sub-advisers for the Portfolio employing a combination of quantitative and qualitative screens, research, analysis and due diligence; negotiation of sub-advisory agreements and fees; oversight and monitoring of sub-advisers and recommending changes to sub-advisers where it believes appropriate or advisable; recommending portfolio combinations and liquidations where it believes appropriate or advisable; selection and oversight of transition managers, as needed; regular supervision of the Portfolio’s investments; regular review and evaluation of sub-adviser performance; daily monitoring of the sub-advisers’ buying and selling of securities for the Portfolio; regular review of holdings; ongoing trade oversight and analysis; regular monitoring to ensure adherence to investment process; regular calls and periodic on-site visits with sub-advisers; portfolio construction and asset allocation when using multiple sub-advisers for the Portfolio; risk management oversight and analysis; oversight of negotiation of investment documentation and agreements; design, development, implementation and regular monitoring of the valuation process; periodic due diligence reviews of pricing vendors and vendor methodology; design, development, implementation and regular monitoring of the compliance process; respond to regulatory inquiries and determine appropriate litigation strategy, as needed; review of proxies voted by sub-advisers; oversight of preparation and review of materials for meetings of the Portfolio’s Board of Trustees (the “Board”), participation in these meetings and preparation of regular communications with the Board; oversight of preparation and review of prospectuses, shareholder reports and other disclosure materials and regulatory filings for the Portfolio; oversight of other service providers to the Portfolio, such as the custodian, the transfer agent, the Portfolio’s independent accounting firm and legal counsel; supervision of the performance of recordkeeping and shareholder relations functions for the Portfolio; and oversight of cash management services. TAM uses a variety of quantitative and qualitative tools to carry out its investment management services. TAM, not the Portfolio, is responsible for paying the sub-adviser(s) for their services, and sub-advisory fees are TAM’s expense.
TAM’s investment management services also include the provision of supervisory and administrative services to the Portfolio. These services include performing certain administrative services for the Portfolio and supervising and overseeing the administrative, clerical, recordkeeping and bookkeeping services provided to the Portfolio by State Street Bank and Trust Company (“State Street”), to whom TAM has outsourced the provision of certain sub-administration services. To the extent agreed upon by TAM and the Portfolio from time to time, TAM’s supervisory and administrative services include, but are not limited to: monitoring and verifying the custodian’s daily calculation of the Net Asset Values (“NAV”); shareholder relations functions; compliance services; valuation services; assisting in due diligence and in the oversight and monitoring of certain activities of sub-advisers and certain aspects of Portfolio investments; assisting with Portfolio combinations and liquidations; oversight of the preparation and filing, and review, of all returns and reports, in connection with federal, state and local taxes; oversight and review of regulatory reporting; supervising and coordinating the Portfolio’s custodian and dividend disbursing agent and monitoring their services to the Portfolio; assisting the Portfolio in preparing reports to shareholders; acting as liaison with the Portfolio’s independent public accountants and providing, upon request, analyses, fiscal year summaries and other audit related services; assisting in the preparation of agendas and supporting documents for and minutes of meetings of trustees and committees of trustees; assisting in the preparation of regular communications with the trustees; and providing personnel and office space, telephones and other office equipment as necessary in order for TAM to perform supervisory and administrative services to the Portfolio. The Portfolio
|
|
|
|
|
| Transamerica Series Trust |
|
|
|
Semi-Annual Financial Statements 2024 |
|
|
Page 7 |
|
|
Transamerica JPMorgan Asset Allocation - Moderate Growth VP
NOTES TO FINANCIAL STATEMENTS (continued)
At June 30, 2024
(unaudited)
1. ORGANIZATION (continued)
pays certain fees and expenses to State Street for sub-administration services which are not administrative services covered by the management agreement with TAM or paid for through the management fees payable thereunder. For the period ended June 30, 2024, (i) the expenses paid to State Street for sub-administration services by the Portfolio are shown as a part of Other expenses within the Statement of Operations and (ii) the expenses payable to State Street for sub-administration services from the Portfolio are shown as part of Other accrued expenses within the Statement of Assets and Liabilities.
2. SIGNIFICANT ACCOUNTING POLICIES
In preparing the Portfolio’s financial statements in accordance with Generally Accepted Accounting Principles in the United States of America (“GAAP”), estimates or assumptions (which could differ from actual results) may be used that affect reported amounts and disclosures. The following is a summary of significant accounting policies followed by the Portfolio.
Foreign currency denominated investments: The accounting records of the Portfolio are maintained in U.S. dollars. Securities and other assets and liabilities denominated in foreign currencies are translated into U.S. dollars based on the closing exchange rate each day. The cost of foreign securities purchased and any realized gains or losses are translated at the prevailing exchange rates in effect on the date of the respective transaction. The Portfolio combines fluctuations from currency exchange rates and fluctuations in value when computing net realized and unrealized gains or losses from investments.
Net foreign currency gains and losses resulting from changes in exchange rates include, foreign currency fluctuations between trade date and settlement date of investment security transactions, gains and losses on forward foreign currency contracts, and the difference between the receivable amounts of interest and dividends recorded in the accounting records in U.S. dollars and the amounts actually received.
Foreign currency denominated assets may involve risks not typically associated with domestic transactions. These risks include revaluation of currencies, adverse fluctuations in foreign currency values, and possible adverse political, social, and economic developments, including those particular to a specific industry, country or region.
Security transactions and investment income: Security transactions are accounted for on the trade date. Security gains and losses are calculated on a first-in, first-out basis. Interest income, if any, is accrued as earned. Dividend income and capital gain distributions from underlying investments, if any, are recorded on the ex-dividend date. Income or short-term capital gain distributions received from underlying investments, if any, are recorded as Dividend income from investments within the Statement of Operations. Long-term capital gain distributions received from underlying investments, if any, are recorded as Net realized gain (loss) on Capital gain distributions received from investments within the Statement of Operations.
Multiple class operations, income, and expenses: Income, non-class specific expenses, and realized and unrealized gains and losses are allocated to each class daily based upon net assets. Each class bears its own specific expenses in addition to the allocated non-class specific expenses.
Distributions to shareholders: Distributions are recorded on the ex-dividend date and are determined in accordance with federal income tax regulations, which may differ from GAAP.
Indemnification: In the normal course of business, the Portfolio enters into contracts that contain a variety of representations that provide general indemnifications. The Portfolio’s maximum exposure under these arrangements is unknown, as this would involve future claims that may be made against the Portfolio and/or its affiliates that have not yet occurred. However, based on experience, the Portfolio expects the risk of loss to be remote.
3. INVESTMENT VALUATION
TAM has been designated as the Portfolio’s valuation designee pursuant to Rule 2a-5 under the 1940 Act with responsibility for fair valuation subject to oversight by the Portfolio’s Board of Trustees. The net asset value of the Portfolio is computed as of the official close of the New York Stock Exchange (“NYSE”) each day the NYSE is open for business.
TAM utilizes various methods to measure the fair value of its investments on a recurring basis. GAAP establishes a hierarchy that prioritizes inputs to valuation methods. The inputs or methodology used for valuing securities are not necessarily an indication of the risk associated with investing in those securities. The three levels (“Levels”) of inputs of the fair value hierarchy are defined as follows:
|
|
|
|
|
| Transamerica Series Trust |
|
|
|
Semi-Annual Financial Statements 2024 |
|
|
Page 8 |
|
|
Transamerica JPMorgan Asset Allocation - Moderate Growth VP
NOTES TO FINANCIAL STATEMENTS (continued)
At June 30, 2024
(unaudited)
3. INVESTMENT VALUATION (continued)
Level 1—Unadjusted quoted prices in active markets for identical securities.
Level 2—Inputs, other than quoted prices included in Level 1, which are observable, either directly or indirectly. These inputs may include quoted prices for the identical instrument on an inactive market, prices for similar instruments, interest rates, prepayment speeds, credit risk, yield curves, default rates, and similar data.
Level 3—Unobservable inputs based on the best information available in the circumstances, to the extent observable inputs are not available, which may include TAM’s own assumptions used in determining the fair value of the Portfolio’s investments and derivative instruments.
The inputs used to measure fair value may fall into different Levels of the fair value hierarchy. In such cases, for disclosure purposes, the Level in the fair value hierarchy that is assigned to the fair value measurement of a security is determined based on the lowest Level input that is significant to the fair value measurement in its entirety. Certain investments that are measured at fair value using NAV per share, or its equivalent, using the “practical expedient” have not been classified in the fair value Levels. The hierarchy classification of inputs used to value the Portfolio’s investments at June 30, 2024, is disclosed within the Investment Valuation section of the Schedule of Investments.
The availability of observable inputs can vary from security to security and is affected by a wide variety of factors, including, but not limited to, the type of security, whether the security is new and not yet established in the marketplace, the liquidity of markets, and other characteristics particular to the security. To the extent that valuation is based on models or inputs that are less observable or unobservable in the market, the determination of fair value requires more judgment. Accordingly, the degree of judgment exercised in determining fair value is generally greatest for instruments categorized in Level 3. Due to the inherent uncertainty of valuation, the determination of values may differ significantly from values that would have been realized had a ready market for investments existed, and the differences could be material.
Fair value measurements: Descriptions of the valuation techniques applied to the Portfolio’s significant categories of assets and liabilities measured at fair value on a recurring basis are as follows:
Investment companies: Certain investment companies are valued at the NAV as the practical expedient. These investment companies are not included within the fair value hierarchy. Certain other investment companies are valued at the actively traded NAV and no valuation adjustments are applied. These investment companies are categorized in Level 1 of the fair value hierarchy.
U.S. government obligations: U.S. government obligations are normally valued using a model that incorporates market observable data such as reported sales of similar securities, broker quotes, yields, bids, offers, and reference data. Certain securities are valued by principally using dealer quotations. U.S. government obligations generally are categorized in Level 2 of the fair value hierarchy, or Level 3 if inputs are unobservable.
Repurchase agreements: Repurchase agreements are valued at cost, which approximates fair value. To the extent the inputs are observable and timely, the values are generally categorized in Level 2 of the fair value hierarchy.
Restricted securities: Restricted securities for which quotations are not readily available are valued at fair value. Restricted securities issued by publicly traded companies are generally valued at a discount to similar publicly traded securities. Restricted securities issued by nonpublic entities may be valued by reference to comparable public entities and/or fundamental data relating to the issuer. Depending on the relative significance of observable valuation inputs, these instruments may be classified in either Level 2 or Level 3 of the fair value hierarchy.
Derivative instruments: Centrally cleared or listed derivatives that are actively traded are valued based on quoted prices from the exchange and are categorized in Level 1 of the fair value hierarchy. Over-the-counter (“OTC”) derivative contracts include forward, swap, swaption, and option contracts related to interest rates, foreign currencies, credit standing of reference entities, equity prices, or commodity prices. Depending on the product and the terms of the transaction, the fair value of the OTC derivative products are modeled taking into account the counterparties’ creditworthiness and using a series of techniques, including simulation models. Many pricing models do not entail material subjectivity because the methodologies employed do not necessitate significant judgments and the pricing inputs are observed from actively quoted markets, as is the case of interest rate swap and option contracts. The majority of OTC derivative products valued by the Portfolio using pricing models fall into this category and are categorized within Level 2 of the fair value hierarchy or Level 3 if inputs are unobservable.
|
|
|
|
|
| Transamerica Series Trust |
|
|
|
Semi-Annual Financial Statements 2024 |
|
|
Page 9 |
|
|
Transamerica JPMorgan Asset Allocation - Moderate Growth VP
NOTES TO FINANCIAL STATEMENTS (continued)
At June 30, 2024
(unaudited)
4. SECURITIES AND OTHER INVESTMENTS
Restricted securities: The Portfolio may invest in unregulated restricted securities. Restricted securities are subject to legal or contractual restrictions on resale. Restricted securities generally may be resold in transactions exempt from registration under the Securities Act of 1933.
Restricted securities held at June 30, 2024, if any, are identified within the Schedule of Investments.
5. BORROWINGS AND OTHER FINANCING TRANSACTIONS
The Portfolio may engage in borrowing transactions as a means of raising cash to satisfy redemption requests, for other temporary or emergency purposes or, to the extent permitted by its investment policies, to raise additional cash to be invested in other securities or instruments. When the Portfolio invests borrowing proceeds in other securities, the Portfolio will bear the risk that the market value of the securities in which such proceeds are invested goes down and is insufficient to repay the borrowed proceeds. The Portfolio may borrow on a secured or on an unsecured basis. If the Portfolio enters into a secured borrowing arrangement, a portion of the Portfolio’s assets will be used as collateral. The 1940 Act requires the Portfolio to maintain asset coverage of at least 300% of the amount of its borrowings. Asset coverage means the ratio that the value of the Portfolio’s total assets, minus liabilities other than borrowings, bears to the aggregate amount of all borrowings. Although complying with this requirement has the effect of limiting the amount that the Portfolio may borrow, it does not otherwise mitigate the risks of entering into borrowing transactions.
Interfund lending: The Portfolio, along with other funds and portfolios advised by TAM, may participate in an interfund lending program pursuant to exemptive relief granted by the Securities and Exchange Commission on January 18, 2017. This program allows the Portfolio to lend to and borrow from other funds and portfolios advised by TAM. Interfund lending transactions are subject to the conditions of the exemptive relief which places limits on the amount of lending or borrowing a Portfolio may participate in under the program. Interest earned or paid on an interfund lending transaction will be based on the average of certain current market rates. For the period ended June 30, 2024, the Portfolio has not utilized the program.
Repurchase agreements: In a repurchase agreement, the Portfolio purchases a security and simultaneously commits to resell that security to the seller at an agreed-upon price on an agreed-upon date. Securities purchased subject to a repurchase agreement are held at the Portfolio’s custodian, or designated sub-custodian related to tri-party repurchase agreements, and, pursuant to the terms of the repurchase agreement, must be collateralized by securities with an aggregate market value greater than or equal to 100% of the resale price. The Portfolio will bear the risk of value fluctuations until the securities can be sold and may encounter delays and incur costs in liquidating the securities. In the event of bankruptcy or insolvency of the seller, delays and costs may be incurred.
Repurchase agreements are subject to netting agreements, which are agreements between the Portfolio and its counterparties that provide for the net settlement of all transactions and collateral with the Portfolio, through a single payment, in the event of default or termination. Amounts presented within the Schedule of Investments, and as part of Repurchase agreements, at value within the Statement of Assets and Liabilities are shown on a gross basis. The value of the related collateral for each repurchase agreement, as reflected within the Schedule of Investments, exceeds the value of each repurchase agreement at June 30, 2024.
Repurchase agreements at June 30, 2024, if any, are included within the Schedule of Investments and Statement of Assets and Liabilities.
6. RISK EXPOSURES AND THE USE OF DERIVATIVE INSTRUMENTS
The Portfolio’s investment strategies allow the Portfolio to use various types of derivative contracts, including option contracts, swap agreements, futures contracts, and forward foreign currency contracts. Derivatives are investments whose value is primarily derived from underlying assets, indices or reference rates and may be transacted on an exchange or OTC.
Market Risk Factors: In pursuit of the Portfolio’s investment strategies, the Portfolio may seek to use derivatives to increase or decrease its exposure to certain market risks, including:
Interest rate risk: Interest rate risk relates to the fluctuations in the value of fixed income securities due to changes in the prevailing levels of market interest rates.
Foreign exchange rate risk: Foreign exchange rate risk relates to fluctuations in the value of an asset or liability due to changes in the currency exchange rates.
Equity risk: Equity risk relates to the change in value of equity securities as they relate to increases or decreases in the general market.
|
|
|
|
|
| Transamerica Series Trust |
|
|
|
Semi-Annual Financial Statements 2024 |
|
|
Page 10 |
|
|
Transamerica JPMorgan Asset Allocation - Moderate Growth VP
NOTES TO FINANCIAL STATEMENTS (continued)
At June 30, 2024
(unaudited)
6. RISK EXPOSURES AND THE USE OF DERIVATIVE INSTRUMENTS (continued)
Credit risk: Credit risk relates to the ability of the issuer of a financial instrument to make further principal or interest payments on an obligation or commitment that it has to the Portfolio.
Commodity risk: Commodity risk relates to the change in value of commodities or commodity indices as they relate to increases or decreases in the commodities market. Commodities are physical assets that have tangible properties. Examples of these types of assets are crude oil, heating oil, metals, livestock, and agricultural products.
The Portfolio is also exposed to additional risks from investing in derivatives, such as liquidity and counterparty credit risk. Liquidity risk is the risk that the Portfolio will be unable to sell or close out the derivative in the open market in a timely manner. Counterparty credit risk is the risk that the counterparty will not be able to fulfill its obligations to the Portfolio. Investing in derivatives may also involve greater risks than investing directly in the underlying assets, such as losses in excess of any initial investment and collateral received. In addition, there may be the risk that the change in value of the derivative contract does not correspond to the change in value of the underlying instrument.
The Portfolio’s exposure to market risk factors and certain other associated risks are summarized by derivative type as follows:
Futures contracts: The Portfolio is subject to equity risk, credit risk, commodity risk, interest rate risk and foreign exchange rate risk in the normal course of pursuing its investment objective. The Portfolio uses futures contracts to gain exposure to, or hedge against, changes in the value of equities and commodities, interest rates, or foreign currencies. A futures contract represents a commitment for the future purchase or sale of an asset at a specified price on a specified date. Upon entering into such contracts, the Portfolio is required to deposit with the broker, either in cash or in securities, an initial margin in an amount equal to a certain percentage of the contract amount. Subsequent payments (variation margin) are paid or received by the Portfolio, depending on the daily fluctuations in the value of the contract, and are recorded for financial statement purposes as unrealized gains or losses by the Portfolio. Upon entering into such contracts, the Portfolio bears the risk of equity and commodity prices, interest rates, or exchange rates moving unexpectedly, in which case, the Portfolio may not achieve the anticipated benefits of the futures contracts and may realize losses. With futures, there is minimal counterparty credit risk to the Portfolio since futures are exchange-traded and the exchange’s clearinghouse, as counterparty to all exchange-traded futures, guarantees the futures against default. Futures contracts are generally entered into on a regulated futures exchange and cleared through a clearinghouse associated with the exchange.
Open futures contracts at June 30, 2024 are listed within the Schedule of Investments. Variation margin, if applicable, is shown in Variation margin receivable or payable on futures contracts within the Statement of Assets and Liabilities.
The following is a summary of the location and the Portfolio’s fair values of derivative investments disclosed within the Statement of Assets and Liabilities, categorized by primary market risk exposure as of June 30, 2024.
|
|
|
|
|
|
|
|
|
|
|
|
|
|
|
|
|
|
|
|
|
|
|
|
|
| Asset Derivatives |
|
|
|
|
|
|
|
|
| Location |
|
Interest Rate Contracts |
|
|
Foreign Exchange Contracts |
|
|
Equity Contracts |
|
|
Credit Contracts |
|
|
Commodity Contracts |
|
|
Total |
|
|
|
|
|
|
|
|
| Futures contracts: |
|
|
|
|
|
|
|
|
|
|
|
|
|
|
|
|
|
|
|
|
|
|
|
|
| Total distributable earnings
(accumulated losses) (A)(B) |
|
$ |
3,128,908 |
|
|
$ |
1,675,926 |
|
|
$ |
3,286,092 |
|
|
$ |
— |
|
|
$ |
— |
|
|
$ |
8,090,926 |
|
| |
|
|
|
|
|
|
| Total |
|
$ |
3,128,908 |
|
|
$ |
1,675,926 |
|
|
$ |
3,286,092 |
|
|
$ |
— |
|
|
$ |
— |
|
|
$ |
8,090,926 |
|
| |
|
|
|
|
|
|
|
|
|
|
|
|
|
|
|
|
|
|
|
|
|
|
|
|
|
|
|
|
|
| Transamerica Series Trust |
|
|
|
Semi-Annual Financial Statements 2024 |
|
|
Page 11 |
|
|
Transamerica JPMorgan Asset Allocation - Moderate Growth VP
NOTES TO FINANCIAL STATEMENTS (continued)
At June 30, 2024
(unaudited)
6. RISK EXPOSURES AND THE USE OF DERIVATIVE INSTRUMENTS (continued)
|
|
|
|
|
|
|
|
|
|
|
|
|
|
|
|
|
|
|
|
|
|
|
|
|
| Liability Derivatives |
|
|
|
|
|
|
|
|
| Location |
|
Interest Rate Contracts |
|
|
Foreign Exchange Contracts |
|
|
Equity Contracts |
|
|
Credit Contracts |
|
|
Commodity Contracts |
|
|
Total |
|
|
|
|
|
|
|
|
| Futures contracts: |
|
|
|
|
|
|
|
|
|
|
|
|
|
|
|
|
|
|
|
|
|
|
|
|
| Total distributable earnings (accumulated losses) (A)(B) |
|
$ |
(6,123,955) |
|
|
$ |
(106,677) |
|
|
$ |
(2,540,974) |
|
|
$ |
— |
|
|
$ |
— |
|
|
$ |
(8,771,606) |
|
| |
|
|
|
|
|
|
| Total |
|
$ |
(6,123,955) |
|
|
$ |
(106,677) |
|
|
$ |
(2,540,974) |
|
|
$ |
— |
|
|
$ |
— |
|
|
$ |
(8,771,606) |
|
| |
|
|
|
|
|
|
|
|
|
|
|
|
|
|
|
|
|
|
|
|
|
|
|
|
| (A) |
May include exchange-traded derivatives which are not subject to a master netting arrangement, or another similar arrangement. |
| (B) |
Included within unrealized appreciation (depreciation) on futures contracts as reported in the Schedule of Investments. Only current day’s variation margin is reported within the Statement of Assets and Liabilities. |
The following is a summary of the location and the effect of derivative investments within the Statement of Operations, categorized by primary market risk exposure as of June 30, 2024.
|
|
|
|
|
|
|
|
|
|
|
|
|
|
|
|
|
|
|
|
|
|
|
|
|
| Realized Gain (Loss) on Derivative Instruments |
|
|
|
|
|
|
|
|
| Location |
|
Interest Rate Contracts |
|
|
Foreign Exchange Contracts |
|
|
Equity Contracts |
|
|
Credit Contracts |
|
|
Commodity Contracts |
|
|
Total |
|
|
|
|
|
|
|
|
| Futures contracts |
|
$ |
(25,727,402) |
|
|
$ |
(5,069,491) |
|
|
$ |
41,138,160 |
|
|
$ |
— |
|
|
$ |
— |
|
|
$ |
10,341,267 |
|
| |
|
|
|
|
|
|
| Total |
|
$ |
(25,727,402) |
|
|
$ |
(5,069,491) |
|
|
$ |
41,138,160 |
|
|
$ |
— |
|
|
$ |
— |
|
|
$ |
10,341,267 |
|
| |
|
|
|
|
|
|
|
|
|
|
|
|
|
|
|
|
|
|
|
|
|
|
|
|
|
|
|
|
|
|
|
|
|
|
|
|
|
|
|
|
|
|
|
|
|
|
|
|
|
| Net Change in Unrealized Appreciation (Depreciation) on Derivative Instruments |
|
|
|
|
|
|
|
|
| Location |
|
Interest Rate Contracts |
|
|
Foreign Exchange Contracts |
|
|
Equity Contracts |
|
|
Credit Contracts |
|
|
Commodity Contracts |
|
|
Total |
|
|
|
|
|
|
|
|
| Futures contracts |
|
$ |
(4,503,772) |
|
|
$ |
(1,152,982) |
|
|
$ |
(23,394,960) |
|
|
$ |
— |
|
|
$ |
— |
|
|
$ |
(29,051,714) |
|
| |
|
|
|
|
|
|
| Total |
|
$ |
(4,503,772) |
|
|
$ |
(1,152,982) |
|
|
$ |
(23,394,960) |
|
|
$ |
— |
|
|
$ |
— |
|
|
$ |
(29,051,714) |
|
| |
|
|
|
|
|
|
|
|
|
|
|
|
|
|
|
|
|
|
|
|
|
|
|
|
The following is a summary of the ending monthly average volume on derivative activity during the period ended June 30, 2024.
|
|
|
|
|
| Futures contracts: |
|
|
|
|
| Average notional value of contracts — long |
|
$ |
1,317,591,227 |
|
| Average notional value of contracts — short |
|
|
(544,594,453 |
) |
Collateral requirements: Collateral or margin requirements are set by the broker or exchange clearing house for exchange-traded derivatives (futures contracts, exchange-traded options, and exchange-traded swap agreements) while collateral terms are contract specific for OTC derivatives (forward foreign currency exchange contracts, OTC options, and OTC swap agreements). For OTC derivatives, under standard derivatives agreements, the Portfolio may be required to pledge collateral on derivatives to a counterparty if the Portfolio is in a net liability position, and receive collateral if in a net positive position. For financial reporting purposes, cash collateral that has been pledged by the Portfolio to cover obligations, if any, is reported in Cash collateral at broker within the Statement of Assets and Liabilities. Cash collateral that has been received by the Portfolio from a counterparty, if any, is reported separately in Cash collateral pledged at custodian and/or broker within the Statement of Assets and Liabilities. Non-cash collateral pledged to the Portfolio, if any, is disclosed within the Schedule of Investments.
Generally, the amount of collateral due from or to a party must exceed a minimum transfer amount threshold before a transfer has been made. Typically a counterparty is not permitted to sell, re-pledge or use cash and non-cash collateral it receives. The Portfolio generally
|
|
|
|
|
| Transamerica Series Trust |
|
|
|
Semi-Annual Financial Statements 2024 |
|
|
Page 12 |
|
|
Transamerica JPMorgan Asset Allocation - Moderate Growth VP
NOTES TO FINANCIAL STATEMENTS (continued)
At June 30, 2024
(unaudited)
6. RISK EXPOSURES AND THE USE OF DERIVATIVE INSTRUMENTS (continued)
does not use non-cash collateral that it receives but may, absent default or certain other circumstances, be permitted to use cash collateral received. In such cases, interest may be paid pursuant to the collateral arrangement with the counterparty.
To the extent amounts due to the Portfolio from its counterparties are not fully collateralized, contractually or otherwise, the Portfolio bears the risk of loss from counterparty non-performance. Additionally, to the extent the Portfolio has delivered collateral to a counterparty, the Portfolio bears the risk of loss from a counterparty in the event the counterparty fails to return such collateral. Counterparties may immediately terminate derivatives contracts if the Portfolio fails to maintain sufficient asset coverage for its contracts or its net assets decline by stated percentages. Collateral may not be required for all derivative contracts.
7. RISK FACTORS
Investing in the Portfolio involves certain key risks related to the Portfolio’s trading activity. Please reference the Portfolio’s prospectus for a more complete discussion of the following risk(s), as well as other risks of investing in the Portfolio.
Market risk: The market prices of the Portfolio’s securities or other assets may go up or down, sometimes rapidly or unpredictably, due to factors such as economic events, inflation, changes in interest rates, governmental actions or interventions, actions taken by the U.S. Federal Reserve or foreign central banks, market disruptions caused by tariffs, trade disputes or other factors, political developments, armed conflicts, economic sanctions, cybersecurity events, investor sentiment, the global and domestic effects of widespread or local health, weather or climate events, and other factors that may or may not be related to the issuer of the security or other asset. If the market prices of the Portfolio’s securities and assets fall, the value of your investment in the Portfolio could go down.
Economies and financial markets throughout the world are increasingly interconnected. Events or circumstances in one or more countries or regions could be highly disruptive to, and have profound impacts on, global economies or markets. As a result, whether or not the Portfolio invests in securities of issuers located in or with significant exposure to the countries directly affected, the value and liquidity of the Portfolio’s investments may go down.
Asset allocation risk: The Portfolio’s investment performance is significantly impacted by the Portfolio’s asset allocation and reallocation from time to time. The value of your investment may decrease if the sub-adviser’s judgment about the attractiveness, value or market trends affecting a particular asset class, investment style, technique or strategy, underlying portfolio or other issuer is incorrect.
Equity securities risk: Equity securities generally have greater risk of loss than debt securities. Stock markets are volatile and the value of equity securities may go up or down, sometimes rapidly and unpredictably. The market price of an equity security may fluctuate based on overall market conditions, such as real or perceived adverse economic or political conditions or trends, tariffs and trade disruptions, inflation, substantial economic downturn or recession, changes in interest rates, or adverse investor sentiment. The market price of an equity security also may fluctuate based on real or perceived factors affecting a particular industry or industries or the company itself. If the market prices of the equity securities owned by the Portfolio fall, the value of your investment in the Portfolio will decline. The Portfolio may lose its entire investment in the equity securities of an issuer. A change in financial condition or other event affecting a single issuer may adversely impact securities markets as a whole.
Risk management framework risk: The Portfolio is subject to a multi-factor risk management framework that is intended to reduce equity exposure under certain market conditions. This framework may impose a maximum equity exposure limit for the Portfolio in response to individual asset class momentum signals and a portfolio level volatility signal. The framework is intended to improve the Portfolio’s absolute and risk-adjusted returns but may not work as intended. The framework may result in the Portfolionot achieving its stated asset mix goal or may cause the Portfolio to underperform, possibly significantly. Because market conditions change, sometimes rapidly and unpredictably, the success of the framework also will be subject to the sub-adviser’s ability to implement the framework in a timely and efficient manner. The framework may result in periods of underperformance, may fail to protect against market declines, may limit the Portfolio’s ability to participate in up markets, may cause the Portfolio to underperform its benchmark in rising markets, may increase transaction costs at the Portfolio and/or underlying portfolio level and may result in substantial losses if it does not work as intended. For example, if the Portfolio has reduced its equity exposure to avoid losses in certain market conditions, and the market rises sharply and quickly, there may be a delay in increasing the Portfolio’s equity exposure, causing the Portfolio to forgo gains from the market rebound. The framework incorporates quantitative models and signals. If those models or signals prove to be flawed or for other reasons do not produce the desired results, any decisions made in reliance thereon may expose the Portfolio to additional risks and losses. The use of models has inherent risks, and the success of relying on or otherwise using a model depends, among other things, on the accuracy and completeness of the model’s development, implementation and maintenance; on the model’s assumptions and methodologies; and on the accuracy and reliability of the inputs and output of the model. The framework also serves to reduce the risk to the Transamerica insurance
|
|
|
|
|
| Transamerica Series Trust |
|
|
|
Semi-Annual Financial Statements 2024 |
|
|
Page 13 |
|
|
Transamerica JPMorgan Asset Allocation - Moderate Growth VP
NOTES TO FINANCIAL STATEMENTS (continued)
At June 30, 2024
(unaudited)
7. RISK FACTORS (continued)
companies that provide guaranteed benefits under certain variable contracts from equity market volatility and to facilitate their provision of those guaranteed benefits. The framework also may have the effect of limiting the amount of guaranteed benefits. The Portfolio’s performance may be lower than similar portfolios that are not subject to a risk management framework. The use of derivatives in connection with the framework may expose the Portfolio to different and potentially greater risks than if it had only invested in underlying portfolios.
8. FEES AND OTHER AFFILIATED TRANSACTIONS
TST serves as a funding vehicle for certain affiliated asset allocation portfolios and certain affiliated separate accounts of Transamerica Life Insurance Company (“TLIC”) and Transamerica Financial Life Insurance Company.
TAM, the Portfolio’s investment manager, is directly owned by TLIC and AUSA Holding, LLC (“AUSA”), both of which are indirect, wholly owned subsidiaries of Aegon Ltd. TLIC is owned by Commonwealth General Corporation (“Commonwealth”). Commonwealth and AUSA are wholly owned by Transamerica Corporation (DE). Transamerica Corporation (DE) is wholly owned by Aegon International B.V., which is wholly owned by Aegon Ltd., a Bermuda exempted company with liability limited by shares (formerly, Aegon NV, a Netherlands corporation) and a publicly traded international insurance group.
Transamerica Fund Services, Inc. (“TFS”) is the Portfolio’s transfer agent. Transamerica Capital, Inc. (“TCI”) is the Portfolio’s distributor/principal underwriter. TAM, TFS and TCI are affiliates of Aegon Ltd.
Certain officers and trustees of the Portfolio may also be officers and/or trustees of TAM, TFS and TCI. No interested trustee who is deemed an interested person due to current or former service with TAM or an affiliate of TAM receives compensation from the Portfolio. The Portfolio does pay non-interested persons (independent trustees), as disclosed in Trustee and CCO fees within the Statement of Operations.
Investment management fees: TAM serves as the Portfolio’s investment manager, performing administration as well as investment advisory services. TAM renders investment advisory, supervisory, and administration services under an investment management agreement and the Portfolio pays a single management fee, which is reflected in Investment management fees within the Statement of Operations.
The Portfolio pays a management fee to TAM based on daily average net assets at the following rates:
|
|
|
|
|
| Breakpoints |
|
Rate |
|
|
|
| First $10 billion |
|
|
0.1225 |
% |
| Over $10 billion |
|
|
0.1025 |
|
TAM has contractually agreed to waive fees and/or reimburse Portfolio expenses to the extent that the total operating expenses excluding, as applicable, acquired fund fees and expenses, interest (including borrowing costs and overdraft charges), taxes, brokerage commissions, dividend and interest expenses on securities sold short, extraordinary expenses and other expenses not incurred in the ordinary course of the Portfolio’s business, exceed the following stated annual operating expense limits to the Portfolio’s daily average net assets. To the extent an expense limit changed during the period, the prior limit is also listed below. The expenses waived and/or reimbursed, if any, are included in Expenses waived and/or reimbursed within the Statement of Operations.
|
|
|
|
|
| Class |
|
Operating Expense Limit |
|
Operating Expense Limit Effective Through |
|
|
|
| Initial Class |
|
0.20% |
|
May 1, 2025 |
| Service Class |
|
0.45 |
|
May 1, 2025 |
TAM is permitted to recapture amounts contractually waived and/or reimbursed to a class during any of the 36 months from the date on which TAM waived fees and/or reimbursed expenses for the class. A class may recapture and reimburse TAM only if such amount does not cause, on any particular business day of the Portfolio, the class’s total annual operating expenses (after the recapture is taken into account) to exceed the Operating Expense Limits or any other lower limit then in effect. Amounts recaptured, if any, by TAM for the period ended June 30, 2024 are disclosed in Recapture of previously waived and/or reimbursed fees within the Statement of Operations.
|
|
|
|
|
| Transamerica Series Trust |
|
|
|
Semi-Annual Financial Statements 2024 |
|
|
Page 14 |
|
|
Transamerica JPMorgan Asset Allocation - Moderate Growth VP
NOTES TO FINANCIAL STATEMENTS (continued)
At June 30, 2024
(unaudited)
8. FEES AND OTHER AFFILIATED TRANSACTIONS (continued)
TAM, on a voluntary basis and in addition to the contractual operating expense limits in effect, from time to time may waive and/or reimburse expenses of the Portfolio, or any classes thereof, to such level(s) as the Trust’s officers have determined or may reasonably determine from time to time. Any such voluntary waiver or expense reimbursement may be discontinued by TAM at any time. These amounts are not subject to recapture by TAM.
As of June 30, 2024, there are no amounts available for recapture by TAM.
Distribution and service fees: TST has a distribution plan (“Distribution Plan”) pursuant to Rule 12b-1 under the 1940 Act. Pursuant to the Distribution Plan, TST entered into a distribution agreement with TCI as the Portfolio’s distributor.
The Distribution Plan requires the Portfolio to pay distribution fees to TCI as compensation for various distribution activities, not as reimbursement for specific expenses. Under the Distribution Plan and distribution agreement, TCI, on behalf of the Portfolio, is authorized to pay various service providers, as direct payment for expenses incurred in connection with distribution of the Portfolio’s shares.
The fee on the Service Class shares is paid to the insurance companies for providing services and account maintenance for the policyholders who invest in the variable insurance products which invest in the Service Class shares. TCI has determined that it will not seek payment for the distribution expenses incurred by the Portfolio with respect to the Initial Class shares before May 1, 2025. Prior to TCI seeking distribution expenses on Initial Class shares, policy and contract owners will be notified in advance. The Portfolio will pay fees relating to Service Class shares. The distribution and service fees are included in Distribution and service fees within the Statement of Operations.
The Portfolio is authorized under the Distribution Plan to pay fees to TCI based on daily average net assets of each applicable class up to the following annual rates:
|
|
|
|
|
| Class |
|
Rate |
|
|
|
| Initial Class |
|
|
0.15 |
% |
| Service Class |
|
|
0.25 |
|
Transfer agent costs: TFS provides transfer agency services under an intercompany agreement with TAM. TFS has outsourced the provision of certain sub-transfer agency services to SS&C Global Investor & Distribution Solutions, Inc. (“SS&C GIDS”). The Portfolio does not pay a separate transfer agent fee to TAM or TFS but does pay certain expenses to SS&C GIDS related to applicable sub-transfer agency services. For the period ended June 30, 2024, (i) the expenses paid to SS&C GIDS by the Portfolio are referred to as transfer agent costs and are included within the Statement of Operations and (ii) the expenses payable to SS&C GIDS by the Portfolio are referred to as transfer agent costs within the Statement of Assets and Liabilities.
Brokerage commissions: The Portfolio incurred no brokerage commissions on security transactions placed with affiliates of the investment manager or sub-adviser(s) for the period ended June 30, 2024.
9. PURCHASES AND SALES OF SECURITIES
For the period ended June 30, 2024, the cost of securities purchased and proceeds from securities sold (excluding short-term securities) are as follows:
|
|
|
|
|
|
|
| Purchases of Securities |
|
Sales/Maturities of Securities |
| Long-Term |
|
U.S. Government |
|
Long-Term |
|
U.S. Government |
|
|
|
|
| $ 313,947,388 |
|
$ 24,946,946 |
|
$ 616,935,776 |
|
$ 29,202,414 |
10. FEDERAL INCOME TAXES AND DISTRIBUTIONS TO SHAREHOLDERS
The Portfolio has not made any provision for federal income or excise taxes due to its policy to distribute all of its taxable income and capital gains to its shareholders and otherwise qualify as a regulated investment company under Subchapter M of the Internal Revenue Code. The Portfolio recognizes the tax benefits of uncertain tax positions only where the position is “more likely than not” to be sustained assuming examination by tax authorities. The Portfolio’s tax returns remain subject to examination by the Internal Revenue Service and state tax authorities three years from the date of filing for federal purposes and four years from the date of filing for state purposes.
|
|
|
|
|
| Transamerica Series Trust |
|
|
|
Semi-Annual Financial Statements 2024 |
|
|
Page 15 |
|
|
Transamerica JPMorgan Asset Allocation - Moderate Growth VP
NOTES TO FINANCIAL STATEMENTS (continued)
At June 30, 2024
(unaudited)
10. FEDERAL INCOME TAXES AND DISTRIBUTIONS TO SHAREHOLDERS (continued)
Management has evaluated the Portfolio’s tax provisions taken for all open tax years, and has concluded that no provision for income tax is required in the Portfolio’s financial statements. If applicable, the Portfolio recognizes interest accrued related to unrecognized tax benefits in relation to interest and penalties expense in Other within the Statement of Operations. The Portfolio identifies its major tax jurisdictions as U.S. Federal, the state of Colorado, and foreign jurisdictions where the Portfolio makes significant investments; however, the Portfolio is not aware of any tax positions for which it is reasonably possible that the total amounts of unrecognized tax benefits will change materially in the next twelve months. Distributions are determined in accordance with income tax regulations, which may differ from GAAP.
As of June 30, 2024, the approximate cost for U.S. federal income tax purposes, and the aggregate gross/net unrealized appreciation (depreciation) in the value of investments (including securities sold short and derivatives, if any) are as follows:
|
|
|
|
|
|
|
| Cost |
|
Gross Appreciation |
|
Gross (Depreciation) |
|
Net Appreciation (Depreciation) |
|
|
|
|
| $ 3,186,960,469 |
|
$ 296,999,614 |
|
$ (46,661,827) |
|
$ 250,337,787 |
Please see TST’s most recent report on Form N-CSR, available at: www.transamerica.com/annuities/prospectus, for additional information. For the most recently filed complete proxy voting records for the Trust please visit: https://www.transamerica.com/sites/default/files/files/e070d/TST%20N-PX%202021.pdf
|
|
|
|
|
| Transamerica Series Trust |
|
|
|
Semi-Annual Financial Statements 2024 |
|
|
Page 16 |
|
|
Transamerica JPMorgan Asset Allocation - Moderate Growth VP
MANAGEMENT AND SUB-ADVISORY AGREEMENT — CONTRACT RENEWAL
(unaudited)
At a meeting of the Board of Trustees of Transamerica Series Trust (the “Trustees” or the “Board”) held on June 12-13, 2024, the Board considered the renewal of the management agreement (the “Management Agreement”) between Transamerica Asset Management, Inc. (“TAM”) and Transamerica Series Trust, on behalf of Transamerica JPMorgan Asset Allocation – Moderate Growth VP (the “Portfolio”). The Board also considered the renewal of the investment sub-advisory agreement (the “Sub-Advisory Agreement” and together with the Management Agreement, the “Agreements”) for the Portfolio between TAM and J.P. Morgan Investment Management, Inc. (the “Sub-Adviser”).
Following its review and consideration, the Board determined that the terms of the Management Agreement and Sub-Advisory Agreement were reasonable and that the renewal of each of the Agreements was in the best interests of the Portfolio and the holders invested in the Portfolio. The Board, including the independent members of the Board (the “Independent Trustees”), unanimously approved the renewal of each of the Agreements through June 30, 2025.
Prior to reaching their decision, the Trustees requested and received from TAM and the Sub-Adviser certain information. They then reviewed such information as they deemed reasonably necessary to evaluate the Agreements, including information they had previously received from TAM and the Sub-Adviser as part of their regular oversight of the Portfolio, and knowledge they gained over time through meeting with TAM and the Sub-Adviser. Among other materials, the Trustees considered comparative fee, expense and performance information prepared by Broadridge Financial Solutions, Inc. (“Broadridge”), an independent provider of mutual fund performance information, as well as fee, expense and profitability information prepared by TAM. In addition, TAM provided the Board with additional supplemental comparative performance information. To the extent applicable, the Trustees considered information about fees and performance of comparable funds and/or accounts managed by the Sub-Adviser. The Board also considered reductions to the Portfolio’s expense limits, if any, that took effect after the last renewal of the Agreements. In their review, the Trustees also sought to identify instances in which the Portfolio’s performance, fees, total expenses and/or profitability appeared to be outliers within its respective peer group or other comparative metrics and sought to understand the reasons for such comparative positions.
In their deliberations, the Independent Trustees met privately without representatives of TAM or the Sub-Adviser present and were represented throughout the process by their independent legal counsel. In considering the proposed continuation of each of the Agreements, the Trustees evaluated and weighed a number of considerations that they believed to be relevant in light of the legal advice furnished to them by counsel, including independent legal counsel, and made a decision in the exercise of their own business judgment. They based their decisions on the considerations discussed below, among others, although they did not identify any particular consideration or item of information that was controlling of their decisions, and each Trustee may have attributed different weights to the various factors.
Nature, Extent and Quality of the Services Provided
The Board considered the nature, extent and quality of the services provided by TAM and the Sub-Adviser to the Portfolio in the past and the services anticipated to be provided in the future. The Board also considered the investment approach for the Portfolio; the experience, capability and integrity of TAM’s senior management; the financial resources of TAM; TAM’s management oversight process; TAM’s and the Sub-Adviser’s responsiveness to any questions by the Trustees; and the professional qualifications and compensation program of the portfolio management team of the Sub-Adviser. The Trustees noted that they receive, on a quarterly basis, an execution analysis from Capital Institutional Services, Inc. (CAPIS), an independent provider of trade analyses, for the Sub-Adviser and a comparison of trading results against a peer universe of managers.
The Board also considered the continuous and regular investment management and other services provided by TAM, when acting as a manager of managers, for the portion of the management fee it retains from the Portfolio after payment of the sub-advisory fees. The Board noted that the investment management and other services provided by TAM include the design, development and ongoing review and evaluation of the Portfolio and its investment strategy; the selection, oversight and monitoring of one or more investment sub-advisers to perform certain duties with respect to the Portfolio; ongoing portfolio trading oversight and analysis; risk management oversight and analysis; design, development, implementation and ongoing review and evaluation of a process for the valuation of Portfolio investments; design, development, implementation and ongoing review and evaluation of a compliance program for the Portfolio; design, development, implementation and ongoing review and evaluation of a process for the voting of proxies and exercise of rights to consent to corporate action for Portfolio investments; participation in Board meetings and oversight of preparation of materials for the Board, including materials for Board meetings and regular communications with the Board; oversight of preparation of the Portfolio’s prospectus, statement of additional information, shareholder reports and other disclosure materials and regulatory filings for the Portfolio; and ongoing cash management services for the Portfolio. The Board considered that TAM’s investment management services also include the provision of supervisory and administrative services to the Portfolio. The Board also noted that TAM, as part of the services it provides to all Transamerica mutual funds, including the Portfolio, oversees the services provided by the funds’ custodian, transfer agent, independent accountant and legal counsel and supervises the performance of the recordkeeping and holder service functions of the funds.
Investment Performance
In addition, the Board considered the short- and longer-term performance of the Portfolio in light of its investment objective, policies and strategies, including relative performance against (i) a peer universe of comparable mutual funds, as prepared by Broadridge, and (ii) the Portfolio’s benchmarks, in each case for various trailing periods ended December 31, 2023. Based on these considerations, the Board
|
|
|
|
|
| Transamerica Series Trust |
|
|
|
Semi-Annual Financial Statements 2024 |
|
|
Page 17 |
|
|
Transamerica JPMorgan Asset Allocation - Moderate Growth VP
MANAGEMENT AND SUB-ADVISORY AGREEMENT — CONTRACT RENEWAL (continued)
(unaudited)
determined that TAM and the Sub-Adviser can provide investment and related services that are appropriate in scope and extent in light of the Portfolio’s investment objectives, policies and strategies and operations, the competitive landscape of the investment company business and investor needs. The Board’s conclusions as to the Portfolio’s performance are summarized below. For purposes of its review, the Board generally used the performance of Service Class Shares. In describing the Portfolio’s performance relative to its peer universe, the summary conclusions characterize performance for the relevant periods in relation to whether it was “above,” “below” or “in line with” the peer universe median and do so using quintile rankings prepared by Broadridge. For simplicity, performance is described as “above” the median if the Portfolio’s performance ranked anywhere in the first or second quintiles, as “below” the median if it ranked anywhere in the fourth or fifth quintiles, or “in line with” the median if it ranked anywhere in the third quintile (i.e., even if its precise return was somewhat above or somewhat below the precise median return).
When considering the Portfolio’s performance, the Trustees considered any representations made by TAM regarding the appropriateness of certain peer groups and benchmarks. They recognized that performance reflects a snapshot of a period as of a specific date, and that consideration of performance data for a different period could generate significantly different performance results. The Trustees also recognized that even longer-term performance can be negatively affected by performance over a short-term period when that short-term performance is significantly below the performance of the comparable benchmark or universe of peer funds.
The Board noted that the performance of Service Class Shares of the Portfolio was below the median for its peer universe and below the benchmark that TAM utilizes to measure performance of the Portfolio, each for the past 1-, 3-, 5- and 10-year periods. The Trustees discussed the reasons for the underperformance with TAM and TAM agreed to continue to closely monitor and report to the Board on the performance of the Portfolio. The Board noted that the Sub-Adviser had commenced sub-advising the Portfolio on July 1, 2016 pursuant to its current investment strategies.
Management Fee and Sub-Advisory Fees and Total Expense Ratio
The Board considered the management fee and total expense ratio of the Portfolio, including information provided by Broadridge comparing the management fee and total expense ratio of the Portfolio to the management fees and total expense ratios of comparable investment companies in both a peer group and broader peer universe compiled by Broadridge. The Board’s conclusions as to the Portfolio’s management fee and total expense ratio are summarized below. For purposes of its review, the Board generally used the actual total expenses (i.e., expenses reflecting any waivers and/or reimbursements) of Service Class Shares. In describing the Portfolio’s management fee and total expense ratio relative to its peer group and peer universe, the summary conclusions characterize management fees and total expense ratios for the relevant periods in relation to whether they were “above,” “below” or “in line with” the peer group or peer universe median and do so using quintile rankings prepared by Broadridge. For simplicity, management fees and total expense ratios are described as “above” the median if the Portfolio’s management fee or total expense ratio ranked anywhere in the fourth or fifth quintiles, as “below” the median if it ranked anywhere in the first or second quintiles, or “in line with” the median if it ranked anywhere in the third quintile (i.e., even if its precise management fee or total expense ratio was somewhat above or somewhat below the precise median management fee or total expense ratio).
The Board also considered the fees charged by the Sub-Adviser for sub-advisory services, as well as the portion of the Portfolio’s management fee retained by TAM following payment of the sub-advisory fee and how the portion of the contractual management fee retained by TAM at a specified asset level compared to the portions retained by other investment advisers managing mutual funds with similar investment strategies as calculated by an independent provider of information.
The Board noted that the Portfolio’s contractual management fee was below the medians for its peer group and peer universe and that the actual total expenses (i.e., expenses reflecting any waivers and/or reimbursements) of Service Class Shares of the Portfolio were above the medians for its peer group and peer universe. The Trustees also considered that TAM has entered into an expense limitation arrangement with the Portfolio, which may result in TAM waiving fees for the benefit of holders.
On the basis of these considerations, together with the other information it considered, the Board determined that the management and sub-advisory fees to be received by TAM and the Sub-Adviser under the Management Agreement and Sub-Advisory Agreement are reasonable in light of the services provided.
Cost of Services Provided and Level of Profitability
The Board reviewed information provided by TAM about the cost of providing and procuring fund management services, as well as the costs of the provision of administration, transfer agency and other services, to the Portfolio and to Transamerica Series Trust as a whole by TAM and its affiliates. The Board considered the profitability of TAM and its affiliates in providing these services for the Portfolio and Transamerica Series Trust as a whole. The Trustees recognized the competitiveness of the mutual fund industry and the importance of an investment adviser’s long-term profitability, including for maintaining company and management stability and accountability.
The Board also considered the allocation methodology used for calculating the profitability of TAM and its affiliates. The Board noted that the revenue and expense allocation methodology used by TAM to estimate its profitability with respect to its relationship with the Portfolio had been reviewed previously by an independent consultant. The Trustees considered that TAM reported that it had not made material changes to this methodology, and that the methodology had been applied consistently for the Portfolio.
|
|
|
|
|
| Transamerica Series Trust |
|
|
|
Semi-Annual Financial Statements 2024 |
|
|
Page 18 |
|
|
Transamerica JPMorgan Asset Allocation - Moderate Growth VP
MANAGEMENT AND SUB-ADVISORY AGREEMENT — CONTRACT RENEWAL (continued)
(unaudited)
With respect to the Sub-Adviser, the Board noted that the sub-advisory fee is the product of arm’s-length negotiation between TAM and the Sub-Adviser, which is not affiliated with TAM, and is paid by TAM and not the Portfolio. As a result, the Board focused on the profitability of TAM and its affiliates with respect to the Portfolio.
Based on this information, the Board determined that the profitability of TAM and its affiliates from their relationships with the Portfolio was not excessive.
Economies of Scale
The Board considered economies of scale with respect to the management of the Portfolio, whether the Portfolio had appropriately benefited from any economies of scale and whether there was the potential for realization of any future economies of scale. The Board also considered the existence of economies of scale with respect to management of the Transamerica mutual funds overall and the extent to which the Portfolio benefited from any economies of scale. The Board recognized that, as the Portfolio’s assets increase, any economies of scale realized by TAM or the Sub-Adviser may not directly correlate with each other or with any economies of scale that might be realized by the Portfolio. The Board considered the Portfolio’s management fee schedule and the existence of breakpoints and also considered the extent to which TAM shared economies of scale, if any, with the Portfolio through undertakings to limit or reimburse Portfolio expenses and to invest in maintaining and developing its capabilities and services. The Board also considered the Sub-Adviser’s sub-advisory fee schedule and the existence of breakpoints, if any, and how such breakpoints relate to any breakpoints in the Portfolio’s management fee schedule. The Board considered that the Sub-Adviser’s sub-advisory fees would be based on the combined assets of multiple funds. The Trustees concluded that the Portfolio’s fee structure reflected an appropriate sharing of any efficiencies or economies of scale to date and noted that they will have the opportunity to periodically reexamine the appropriateness of the management fee payable to TAM and the fee paid to the Sub-Adviser in light of any economies of scale experienced in the future.
Benefits to TAM, its Affiliates and/or the Sub-Adviser from their Relationships with the Portfolio
The Board considered other benefits derived by TAM, its affiliates, and/or the Sub-Adviser from their relationships with the Portfolio. The Board noted that TAM does not receive benefits from research obtained with commissions paid to broker-dealers for portfolio transactions (commonly referred to as “soft dollars”) as a result of its relationship with the Portfolio.
Other Considerations
The Board noted that TAM has made a substantial commitment to the recruitment and retention of high-quality personnel and maintains the financial, compliance and operational resources reasonably necessary to manage the Portfolio in a professional manner that is consistent with the best interests of the Portfolio and the holders. In this regard, the Board favorably considered the procedures and policies TAM has in place to enforce compliance with applicable laws and regulations and oversee the portfolio management activities of the Sub-Adviser. The Board also noted that TAM has made an entrepreneurial commitment and undertaken certain business risks with respect to the management and success of the Portfolio.
Conclusion
After consideration of the factors described above, as well as other factors, the Trustees, including the Independent Trustees, concluded that the renewal of the Management Agreement and the Sub-Advisory Agreement was in the best interests of the Portfolio and the holders and voted to approve the renewal of the Agreements.
|
|
|
|
|
| Transamerica Series Trust |
|
|
|
Semi-Annual Financial Statements 2024 |
|
|
Page 19 |
|
|
PROXY VOTING POLICIES AND PROCEDURES AND QUARTERLY PORTFOLIO HOLDINGS
(unaudited)
A description of Transamerica Series Trust’s (the “Trust”) proxy voting policies and procedures is available in the Statement of Additional Information of the Portfolios, available without charge upon request by calling 1-800-851-9777 (toll free) or on the Securities and Exchange Commission’s (“SEC”) website at http://www.sec.gov.
In addition, the Portfolio is required to file Form N-PX, with their complete proxy voting records for the most recent 12 months ended June 30th, no later than August 31st of each year. The Form is available without charge: (1) on the Transamerica Funds website at https://www.transamerica.com/sites/default/files/files/e070d/TST%20N-PX%202021.pdf; and (2) on the SEC’s website at http://www.sec.gov.
Each fiscal quarter, the Portfolios, except Transamerica BlackRock Government Money Market VP, will file with the SEC a complete schedule of its monthly portfolio holdings on Form N-PORT. The Portfolios’ holdings as of the end of the third month of every fiscal quarter, as reported on Form N-PORT, will be publicly available on the SEC’s website at http://www.sec.gov within 60 days of the end of the fiscal quarter.
On a monthly basis, Transamerica BlackRock Government Money Market VP will file with the SEC portfolio holdings information on Form N-MFP3. A complete schedule of portfolio holdings is also available at www.transamerica.com.
You may also visit the Trust’s website at www.transamerica.com/annuities/prospectus for this and other information about the Portfolios and the Trust.
Important Notice Regarding Delivery of Shareholder Documents
Every year we provide shareholders informative materials such as the Transamerica Series Trust Annual Report, the Transamerica Series Trust Prospectus, and other required documents that keep you informed regarding your Portfolios. To the extent provided by mail, Transamerica Series Trust will only send one piece per mailing address, a method that saves your Portfolios money by reducing mailing and printing costs. We will continue to do this unless you tell us not to. To elect to receive individual mailings, simply call a Transamerica Customer Service Representative toll free at 1-800-851-9777, 8 a.m. to 7 p.m. Eastern Time, Monday-Friday. Your request will take effect within 30 days.
|
|
|
|
|
| Transamerica Series Trust |
|
|
|
Semi-Annual Financial Statements 2024 |
|
|
Page 20 |
|
|
NOTICE OF PRIVACY POLICY
(unaudited)
Your privacy is very important to us. We want you to understand what information we collect and how we use it. We collect and use “nonpublic personal information” in connection with providing our customers with a broad range of financial products and services as effectively and conveniently as possible. We treat nonpublic personal information in accordance with our Privacy Policy.
What Information We Collect and From Whom We Collect It
We may collect nonpublic personal information about you from the following sources:
| • |
|
Information we receive from you on applications or other forms, such as your name, address, and account number; |
| • |
|
Information about your transactions with us, our affiliates, or others, such as your account balance and purchase/redemption history; and |
| • |
|
Information we receive from non-affiliated third parties, including consumer reporting agencies. |
What Information We Disclose and To Whom We Disclose It
We do not disclose any nonpublic personal information about current or former customers to anyone without their express consent, except as permitted by law. We may disclose the nonpublic personal information we collect, as described above, to persons or companies that perform services on our behalf and to other financial institutions with which we have joint marketing agreements. We will require these companies to protect the confidentiality of your nonpublic personal information and to use it only to perform the services for which we have hired them.
Our Security Procedures
We restrict access to your nonpublic personal information and only allow disclosures to persons and companies as permitted by law to assist in providing products or services to you. We maintain physical, electronic, and procedural safeguards to protect your nonpublic personal information and to safeguard the disposal of certain consumer information.
Contact Us
If you have any questions about our Privacy Policy, please call 1-800-851-9777 on any business day between 8 a.m. and 7 p.m. Eastern Time.
Note: This Privacy Policy applies only to customers that have a direct relationship with us or our affiliates. If you own shares of our portfolios in the name of a third party such as a bank or broker-dealer, its privacy policy may apply to you instead of ours.
|
|
|
|
|
| Transamerica Series Trust |
|
|
|
Semi-Annual Financial Statements 2024 |
|
|
Page 21 |
|
|
PO Box 219945
Kansas City, MO 64121-9945
|
|
|
| Distributor: |
|
Transamerica Capital, Inc. PO Box 219945 Kansas City, MO 64121-9945 Customer Service: 1-800-851-9777 |
Transamerica Series Trust Semi-Annual Financial Statements
June 30, 2024
1801 California St., Suite 5200
Denver, CO 80202
Distributor: Transamerica Capital, Inc.
Customer Service: 1-800-851-9777
|
| The following pages contain the most recent semi-annual financial statements for the investment options in which you are invested. In compliance with Securities and Exchange Commission regulations, we present these reports on an annual and semi-annual basis with the hope that they will foster greater understanding of the investment options’ holdings, performance, financial data, accounting policies and other issues. This streamlined version provides information only on the investment options in which you are invested. |
| If you have any questions about these reports, please do not hesitate to contact your financial professional. As always, we thank you for your trust and the opportunity to serve you. |
Transamerica JPMorgan Asset Allocation - Moderate VP
SCHEDULE OF INVESTMENTS
At June 30, 2024
(unaudited)
|
|
|
|
|
|
|
|
|
| |
|
Shares |
|
|
Value |
|
| |
|
|
|
|
| INVESTMENT COMPANIES - 98.4% |
|
|
|
|
|
|
|
|
| International Alternative Funds - 1.1% |
|
|
|
|
|
|
|
|
| Transamerica Global Allocation Liquidating Trust (A)(B)(C)(D) |
|
|
6,235 |
|
|
|
$ 7,495 |
|
| Transamerica Unconstrained Bond (B) |
|
|
6,023,254 |
|
|
|
52,703,474 |
|
|
|
|
|
|
|
|
|
|
|
|
|
|
|
|
|
|
|
|
52,710,969 |
|
|
|
|
|
|
|
|
|
|
|
|
|
| International Equity Funds - 10.1% |
|
|
|
|
|
|
|
|
| Transamerica BlackRock Real Estate Securities VP (B) |
|
|
1,388,445 |
|
|
|
13,009,729 |
|
| Transamerica Emerging Markets Opportunities (B) |
|
|
16,304,704 |
|
|
|
129,785,446 |
|
| Transamerica International Equity (B) |
|
|
5,075,828 |
|
|
|
105,983,279 |
|
| Transamerica International Focus (B) |
|
|
17,290,903 |
|
|
|
143,168,675 |
|
| Transamerica International Small Cap Value (B) |
|
|
7,942,092 |
|
|
|
118,893,122 |
|
|
|
|
|
|
|
|
|
|
|
|
|
|
|
|
|
|
|
|
510,840,251 |
|
|
|
|
|
|
|
|
|
|
|
| International Mixed Allocation Fund - 18.4% |
|
| Transamerica Aegon Bond VP (B) |
|
|
95,985,174 |
|
|
|
929,136,484 |
|
|
|
|
|
|
|
|
|
|
|
|
|
| U.S. Equity Funds - 38.3% |
|
|
|
|
|
|
|
|
| Transamerica Janus Mid-Cap Growth VP (B) |
|
|
399,866 |
|
|
|
12,843,694 |
|
| Transamerica JPMorgan Enhanced Index VP (B) |
|
|
32,183,123 |
|
|
|
893,403,492 |
|
| Transamerica Large Cap Value (B) |
|
|
21,071,436 |
|
|
|
295,210,825 |
|
| Transamerica Mid Cap Growth (A)(B) |
|
|
2,569,020 |
|
|
|
23,737,744 |
|
| Transamerica Mid Cap Value
Opportunities (B) |
|
|
1,164,339 |
|
|
|
12,796,083 |
|
| Transamerica Small Cap Value (B) |
|
|
28,949 |
|
|
|
164,721 |
|
| Transamerica T. Rowe Price Small Cap
VP (B) |
|
|
51,966 |
|
|
|
636,581 |
|
| Transamerica WMC US Growth VP (B) |
|
|
16,295,602 |
|
|
|
695,496,281 |
|
|
|
|
|
|
|
|
|
|
|
|
|
|
|
|
|
|
|
|
1,934,289,421 |
|
|
|
|
|
|
|
|
|
|
|
|
|
| U.S. Fixed Income Funds - 30.5% |
|
|
|
|
|
|
|
|
| Transamerica Core Bond (B) |
|
|
93,462,119 |
|
|
|
795,362,632 |
|
|
|
|
|
|
|
|
|
|
| |
|
Shares |
|
|
Value |
|
| |
|
|
| INVESTMENT COMPANIES (continued) |
|
| U.S. Fixed Income Funds (continued) |
|
| Transamerica Floating Rate (B) |
|
|
5,669,219 |
|
|
|
$ 51,249,738 |
|
| Transamerica High Yield Bond (B) |
|
|
54,205,903 |
|
|
|
434,731,346 |
|
| Transamerica Long Credit (B) |
|
|
27,168,200 |
|
|
|
257,282,857 |
|
|
|
|
|
|
|
|
|
|
|
|
|
|
|
|
|
|
|
|
1,538,626,573 |
|
|
|
|
|
|
|
|
|
|
|
|
|
| Total Investment Companies
(Cost $4,718,128,762) |
|
|
|
|
|
|
4,965,603,698 |
|
|
|
|
|
|
|
|
|
|
|
|
|
| |
|
Principal |
|
|
Value |
|
|
| U.S. GOVERNMENT OBLIGATION - 1.2% |
|
| U.S. Treasury - 1.2% |
|
|
|
|
|
|
|
|
| U.S. Treasury Notes |
|
|
|
|
|
|
|
|
| 4.13%, 01/31/2025 (E) |
|
$ |
60,669,200 |
|
|
|
60,247,359 |
|
|
|
|
|
|
|
|
|
|
|
|
|
| Total U.S. Government Obligation
(Cost $60,327,675) |
|
|
|
|
|
|
60,247,359 |
|
|
|
|
|
|
|
|
|
|
|
| REPURCHASE AGREEMENT - 0.4% |
|
| Fixed Income Clearing Corp., 2.50% (F), dated 06/28/2024, to be repurchased at $20,687,797 on 07/01/2024. Collateralized by a U.S. Government Obligation, 3.75%, due 04/15/2026, and with a value of $21,097,328. |
|
|
20,683,488 |
|
|
|
20,683,488 |
|
|
|
|
|
|
|
|
|
|
|
|
| Total Repurchase Agreement
(Cost $20,683,488) |
|
|
|
20,683,488 |
|
|
|
|
|
|
|
|
|
|
| Total Investments
(Cost $4,799,139,925) |
|
|
|
5,046,534,545 |
|
|
|
|
|
|
|
|
|
|
| Net Other Assets (Liabilities) - 0.0% (G) |
|
|
|
1,564,371 |
|
|
|
|
|
|
|
|
|
|
|
|
| Net Assets - 100.0% |
|
|
$ |
5,048,098,916 |
|
|
|
|
|
|
|
|
|
|
|
|
|
|
|
|
|
|
|
|
|
|
|
|
|
|
|
|
|
|
|
|
|
|
|
| FUTURES CONTRACTS: |
|
|
|
|
|
|
|
|
|
|
|
|
|
|
|
|
|
| Long Futures Contracts |
|
| Description |
|
Number of Contracts |
|
|
Expiration Date |
|
|
Notional Amount |
|
|
Value |
|
|
Unrealized Appreciation |
|
|
Unrealized Depreciation |
| 5-Year U.S. Treasury Notes |
|
|
3,547 |
|
|
|
09/30/2024 |
|
|
|
$375,573,428 |
|
|
|
$378,032,609 |
|
|
$ |
2,459,181 |
|
|
$ |
— |
|
| 10-Year Canada Government Bonds |
|
|
2,295 |
|
|
|
09/18/2024 |
|
|
|
200,162,368 |
|
|
|
201,425,862 |
|
|
|
1,263,494 |
|
|
|
— |
|
| E-Mini Russell 2000® Index |
|
|
873 |
|
|
|
09/20/2024 |
|
|
|
88,592,985 |
|
|
|
90,137,250 |
|
|
|
1,544,265 |
|
|
|
— |
|
| Euro-BTP Italy Government Bonds |
|
|
2,174 |
|
|
|
09/06/2024 |
|
|
|
272,267,523 |
|
|
|
268,423,518 |
|
|
|
— |
|
|
|
(3,844,005 |
) |
| MSCI EAFE Mini Index |
|
|
1,510 |
|
|
|
09/20/2024 |
|
|
|
175,170,676 |
|
|
|
176,911,600 |
|
|
|
1,740,924 |
|
|
|
— |
|
| MSCI Emerging Markets Index |
|
|
4,453 |
|
|
|
09/20/2024 |
|
|
|
241,864,585 |
|
|
|
242,287,730 |
|
|
|
423,145 |
|
|
|
— |
|
| S&P 500® E-Mini Index |
|
|
55 |
|
|
|
09/20/2024 |
|
|
|
15,132,130 |
|
|
|
15,184,125 |
|
|
|
51,995 |
|
|
|
— |
|
| S&P/TSX 60 Index |
|
|
297 |
|
|
|
09/19/2024 |
|
|
|
56,350,710 |
|
|
|
56,901,210 |
|
|
|
550,500 |
|
|
|
— |
|
| U.K. Gilt |
|
|
1,332 |
|
|
|
09/26/2024 |
|
|
|
163,168,514 |
|
|
|
164,286,460 |
|
|
|
1,117,946 |
|
|
|
— |
|
| Total |
|
|
$ |
9,151,450 |
|
|
$ |
(3,844,005 |
) |
|
|
|
|
|
|
|
|
|
|
| Short Futures Contracts |
|
| Description |
|
Number of Contracts |
|
|
Expiration Date |
|
|
Notional Amount |
|
|
Value |
|
|
Unrealized Appreciation |
|
|
Unrealized Depreciation |
| 2-Year U.S. Treasury Notes |
|
|
(2,210) |
|
|
|
09/30/2024 |
|
|
$ |
(450,162,330 |
) |
|
|
$(451,323,437 |
) |
|
$ |
— |
|
|
$ |
(1,161,107 |
) |
| 10-Year U.S. Treasury Notes |
|
|
(2,576) |
|
|
|
09/19/2024 |
|
|
|
(281,643,964 |
) |
|
|
(283,319,750 |
) |
|
|
— |
|
|
|
(1,675,786 |
) |
| 10-Year U.S. Treasury Ultra Notes |
|
|
(1,464) |
|
|
|
09/19/2024 |
|
|
|
(164,628,301 |
) |
|
|
(166,209,750 |
) |
|
|
— |
|
|
|
(1,581,449 |
) |
|
|
|
|
|
| The Notes to Financial Statements are an integral part of this report. |
| Transamerica Series Trust |
|
|
|
Semi-Annual Financial Statements 2024 |
|
|
Page 1 |
|
|
Transamerica JPMorgan Asset Allocation - Moderate VP
SCHEDULE OF INVESTMENTS (continued)
At June 30, 2024
(unaudited)
|
|
|
|
|
|
|
|
|
|
|
|
|
|
|
|
|
|
|
|
|
|
|
|
|
| FUTURES CONTRACTS (continued): |
|
| Short Futures Contracts (continued) |
|
| Description |
|
Number of Contracts |
|
|
Expiration Date |
|
|
Notional Amount |
|
|
Value |
|
|
Unrealized Appreciation |
|
Unrealized Depreciation |
| CAD Currency |
|
|
(1,290) |
|
|
|
09/17/2024 |
|
|
$ |
(94,219,294 |
) |
|
$ |
(94,428,000 |
) |
|
$ |
— |
|
|
$ |
(208,706 |
) |
| EURO STOXX 50® Index |
|
|
(1,652) |
|
|
|
09/20/2024 |
|
|
|
(86,334,089 |
) |
|
|
(87,151,293 |
) |
|
|
— |
|
|
|
(817,204 |
) |
| German Euro Bund |
|
|
(1,535) |
|
|
|
09/06/2024 |
|
|
|
(214,186,516 |
) |
|
|
(216,371,299 |
) |
|
|
— |
|
|
|
(2,184,783 |
) |
| JPY Currency |
|
|
(1,249) |
|
|
|
09/16/2024 |
|
|
|
(100,701,387 |
) |
|
|
(98,241,656 |
) |
|
|
2,459,731 |
|
|
|
— |
|
| TOPIX Index |
|
|
(99) |
|
|
|
09/12/2024 |
|
|
|
(16,721,041 |
) |
|
|
(17,293,772 |
) |
|
|
— |
|
|
|
(572,731 |
) |
| U.S. Treasury Ultra Bonds |
|
|
(287) |
|
|
|
09/19/2024 |
|
|
|
(35,576,158 |
) |
|
|
(35,973,657 |
) |
|
|
— |
|
|
|
(397,499 |
) |
|
|
|
|
|
|
|
|
|
|
|
|
|
|
|
|
|
|
|
|
|
| Total |
|
|
$ |
2,459,731 |
|
|
$ |
(8,599,265 |
) |
|
|
|
|
|
|
|
|
|
|
|
|
|
|
|
|
|
|
|
|
|
| Total Futures Contracts |
|
|
$ |
11,611,181 |
|
|
$ |
(12,443,270 |
) |
|
|
|
|
|
|
|
|
|
|
|
|
|
|
|
|
|
|
|
|
|
INVESTMENT VALUATION:
Valuation Inputs (H)
|
|
|
|
|
|
|
|
|
|
|
|
|
|
|
|
|
| |
|
Level 1 - Unadjusted Quoted Prices |
|
|
Level 2 - Other Significant Observable Inputs |
|
|
Level 3 - Significant Unobservable Inputs |
|
|
Value |
|
| |
|
| ASSETS |
|
|
|
|
|
|
|
|
|
|
|
|
|
|
|
|
| Investments |
|
|
|
|
|
|
|
|
|
|
|
|
|
|
|
|
| Investment Companies |
|
$ |
4,965,596,203 |
|
|
$ |
— |
|
|
$ |
— |
|
|
$ |
4,965,596,203 |
|
| U.S. Government Obligation |
|
|
— |
|
|
|
60,247,359 |
|
|
|
— |
|
|
|
60,247,359 |
|
| Repurchase Agreement |
|
|
— |
|
|
|
20,683,488 |
|
|
|
— |
|
|
|
20,683,488 |
|
|
|
|
|
|
|
|
|
|
|
|
|
|
|
|
|
|
|
|
|
|
|
| Total |
|
$ |
4,965,596,203 |
|
|
$ |
80,930,847 |
|
|
$ |
— |
|
|
$ |
5,046,527,050 |
|
|
|
|
|
|
|
|
|
|
|
|
|
|
|
|
|
|
| Investment Companies Measured at Net Asset Value (C) |
|
|
|
|
|
|
|
|
|
|
|
|
|
|
7,495 |
|
|
|
|
|
|
|
|
|
|
|
|
|
|
|
|
|
|
| Total Investments |
|
|
|
|
|
|
|
|
|
|
|
|
|
$ |
5,046,534,545 |
|
|
|
|
|
|
|
|
|
|
|
|
|
|
|
|
|
|
|
|
|
|
|
| Other Financial Instruments |
|
|
|
|
|
|
|
|
|
|
|
|
|
|
|
|
| Futures Contracts (I) |
|
$ |
11,611,181 |
|
|
$ |
— |
|
|
$ |
— |
|
|
$ |
11,611,181 |
|
|
|
|
|
|
|
|
|
|
|
|
|
|
|
|
|
|
|
|
|
|
|
| Total Other Financial Instruments |
|
$ |
11,611,181 |
|
|
$ |
— |
|
|
$ |
— |
|
|
$ |
11,611,181 |
|
|
|
|
|
|
|
|
|
|
|
|
|
|
|
|
|
|
|
|
|
|
|
| LIABILITIES |
|
|
|
|
|
|
|
|
|
|
|
|
|
|
|
|
| Other Financial Instruments |
|
|
|
|
|
|
|
|
|
|
|
|
|
|
|
|
| Futures Contracts (I) |
|
$ |
(12,443,270 |
) |
|
$ |
— |
|
|
$ |
— |
|
|
$ |
(12,443,270 |
) |
|
|
|
|
|
|
|
|
|
|
|
|
|
|
|
|
|
|
|
|
|
|
| Total Other Financial Instruments |
|
$ |
(12,443,270 |
) |
|
$ |
— |
|
|
$ |
— |
|
|
$ |
(12,443,270 |
) |
|
|
|
|
|
|
|
|
|
|
|
|
|
|
|
|
|
FOOTNOTES TO SCHEDULE OF INVESTMENTS:
| (A) |
Non-income producing security. |
| (B) |
Affiliated investment in the Class I2 shares of funds within Transamerica Funds, and a liquidating trust of a former Transamerica Fund and/or affiliated investment in the Initial Class shares of funds within Transamerica Series Trust. The Portfolio’s transactions and earnings from these underlying funds are as follows: |
|
|
|
|
|
|
|
|
|
|
|
|
|
|
|
|
|
|
|
|
|
|
|
|
|
|
|
|
|
|
|
|
|
|
|
|
|
| Affiliated Investments |
|
Value December 31, 2023 |
|
|
Purchases at Cost |
|
|
Proceeds from Sales |
|
|
Net Realized Gain (Loss) |
|
|
Net Change in Unrealized Appreciation (Depreciation) |
|
|
Value June 30, 2024 |
|
|
Shares as of June 30, 2024 |
|
|
Dividend Income |
|
|
Net Capital Gain Distributions |
|
| Transamerica Aegon Bond VP |
|
|
$996,287,876 |
|
|
|
$— |
|
|
|
$(65,948,993 |
) |
|
|
$(12,831,449 |
) |
|
|
$11,629,050 |
|
|
|
$929,136,484 |
|
|
|
95,985,174 |
|
|
|
$— |
|
|
|
$— |
|
|
|
|
|
|
|
|
|
|
|
| Transamerica BlackRock Real Estate Securities VP |
|
|
13,495,684 |
|
|
|
— |
|
|
|
— |
|
|
|
— |
|
|
|
(485,955 |
) |
|
|
13,009,729 |
|
|
|
1,388,445 |
|
|
|
— |
|
|
|
— |
|
|
|
|
|
|
|
|
|
|
|
| Transamerica Core Bond |
|
|
910,433,971 |
|
|
|
18,677,605 |
|
|
|
(111,245,971 |
) |
|
|
(25,189,251 |
) |
|
|
2,686,278 |
|
|
|
795,362,632 |
|
|
|
93,462,119 |
|
|
|
18,677,605 |
|
|
|
— |
|
|
|
|
|
|
|
|
|
|
|
| Transamerica Emerging Markets Opportunities |
|
|
120,980,906 |
|
|
|
— |
|
|
|
— |
|
|
|
— |
|
|
|
8,804,540 |
|
|
|
129,785,446 |
|
|
|
16,304,704 |
|
|
|
— |
|
|
|
— |
|
|
|
|
|
|
|
|
|
|
|
| Transamerica Floating Rate |
|
|
49,272,785 |
|
|
|
2,087,603 |
|
|
|
— |
|
|
|
— |
|
|
|
(110,650 |
) |
|
|
51,249,738 |
|
|
|
5,669,219 |
|
|
|
2,087,603 |
|
|
|
— |
|
|
|
|
|
|
|
|
|
|
|
| Transamerica Global Allocation Liquidating Trust |
|
|
7,752 |
|
|
|
— |
|
|
|
— |
|
|
|
— |
|
|
|
(257 |
) |
|
|
7,495 |
|
|
|
6,235 |
|
|
|
— |
|
|
|
— |
|
|
|
|
|
|
|
|
|
|
|
| Transamerica High Yield Bond |
|
|
425,857,676 |
|
|
|
13,606,483 |
|
|
|
— |
|
|
|
— |
|
|
|
(4,732,813 |
) |
|
|
434,731,346 |
|
|
|
54,205,903 |
|
|
|
13,606,483 |
|
|
|
— |
|
|
|
|
|
|
| The Notes to Financial Statements are an integral part of this report. |
| Transamerica Series Trust |
|
|
|
Semi-Annual Financial Statements 2024 |
|
|
Page 2 |
|
|
Transamerica JPMorgan Asset Allocation - Moderate VP
SCHEDULE OF INVESTMENTS (continued)
At June 30, 2024
(unaudited)
FOOTNOTES TO SCHEDULE OF INVESTMENTS (continued):
|
|
|
|
|
|
|
|
|
|
|
|
|
|
|
|
|
|
|
|
|
|
|
|
|
|
|
|
|
|
|
|
|
|
|
|
|
| Affiliated Investments |
|
Value December 31, 2023 |
|
Purchases at Cost |
|
|
Proceeds from Sales |
|
|
Net Realized Gain (Loss) |
|
|
Net Change in Unrealized Appreciation (Depreciation) |
|
|
Value June 30, 2024 |
|
|
Shares as of June 30, 2024 |
|
|
Dividend Income |
|
|
Net Capital Gain Distributions |
|
| Transamerica International Equity |
|
|
$117,873,642 |
|
|
|
$— |
|
|
|
$(15,209,710 |
) |
|
|
$633,059 |
|
|
|
$2,686,288 |
|
|
|
$105,983,279 |
|
|
|
5,075,828 |
|
|
|
$— |
|
|
|
$— |
|
|
|
|
|
|
|
|
|
|
|
| Transamerica International Focus |
|
|
160,181,347 |
|
|
|
86,417,620 |
|
|
|
(105,329,237 |
) |
|
|
4,514,768 |
|
|
|
(2,615,823 |
) |
|
|
143,168,675 |
|
|
|
17,290,903 |
|
|
|
— |
|
|
|
— |
|
|
|
|
|
|
|
|
|
|
|
| Transamerica International Small Cap Value |
|
|
112,301,185 |
|
|
|
— |
|
|
|
— |
|
|
|
— |
|
|
|
6,591,937 |
|
|
|
118,893,122 |
|
|
|
7,942,092 |
|
|
|
— |
|
|
|
— |
|
|
|
|
|
|
|
|
|
|
|
| Transamerica Janus Mid-Cap Growth VP |
|
|
71,479,084 |
|
|
|
— |
|
|
|
(61,796,708 |
) |
|
|
(13,664,110 |
) |
|
|
16,825,428 |
|
|
|
12,843,694 |
|
|
|
399,866 |
|
|
|
— |
|
|
|
— |
|
|
|
|
|
|
|
|
|
|
|
| Transamerica JPMorgan Enhanced Index VP |
|
|
734,013,948 |
|
|
|
61,196,664 |
|
|
|
(17,786,645 |
) |
|
|
4,581,064 |
|
|
|
111,398,461 |
|
|
|
893,403,492 |
|
|
|
32,183,123 |
|
|
|
— |
|
|
|
— |
|
|
|
|
|
|
|
|
|
|
|
| Transamerica Large Cap Value |
|
|
340,552,408 |
|
|
|
1,757,940 |
|
|
|
(76,616,020 |
) |
|
|
9,976,084 |
|
|
|
19,540,413 |
|
|
|
295,210,825 |
|
|
|
21,071,436 |
|
|
|
1,757,940 |
|
|
|
— |
|
|
|
|
|
|
|
|
|
|
|
| Transamerica Long Credit |
|
|
187,598,192 |
|
|
|
82,858,254 |
|
|
|
— |
|
|
|
— |
|
|
|
(13,173,589 |
) |
|
|
257,282,857 |
|
|
|
27,168,200 |
|
|
|
6,414,265 |
|
|
|
— |
|
|
|
|
|
|
|
|
|
|
|
| Transamerica Mid Cap Growth |
|
|
143,753,432 |
|
|
|
— |
|
|
|
(124,936,526 |
) |
|
|
(31,800,789 |
) |
|
|
36,721,627 |
|
|
|
23,737,744 |
|
|
|
2,569,020 |
|
|
|
— |
|
|
|
— |
|
|
|
|
|
|
|
|
|
|
|
| Transamerica Mid Cap Value Opportunities |
|
|
69,940,925 |
|
|
|
— |
|
|
|
(57,872,848 |
) |
|
|
1,498,585 |
|
|
|
(770,579 |
) |
|
|
12,796,083 |
|
|
|
1,164,339 |
|
|
|
— |
|
|
|
— |
|
|
|
|
|
|
|
|
|
|
|
| Transamerica Small Cap Value |
|
|
15,331,914 |
|
|
|
— |
|
|
|
(14,681,829 |
) |
|
|
203,684 |
|
|
|
(689,048 |
) |
|
|
164,721 |
|
|
|
28,949 |
|
|
|
— |
|
|
|
— |
|
|
|
|
|
|
|
|
|
|
|
| Transamerica T. Rowe Price Small Cap VP |
|
|
15,204,551 |
|
|
|
— |
|
|
|
(14,907,736 |
) |
|
|
997,594 |
|
|
|
(657,828 |
) |
|
|
636,581 |
|
|
|
51,966 |
|
|
|
— |
|
|
|
— |
|
|
|
|
|
|
|
|
|
|
|
| Transamerica TSW Mid Cap Value Opportunities VP |
|
|
12,921,278 |
|
|
|
— |
|
|
|
(13,309,027 |
) |
|
|
66,804 |
|
|
|
320,945 |
|
|
|
— |
|
|
|
— |
|
|
|
— |
|
|
|
— |
|
|
|
|
|
|
|
|
|
|
|
| Transamerica Unconstrained Bond |
|
|
154,266,694 |
|
|
|
4,260,408 |
|
|
|
(103,863,470 |
) |
|
|
385,636 |
|
|
|
(2,345,794 |
) |
|
|
52,703,474 |
|
|
|
6,023,254 |
|
|
|
4,260,408 |
|
|
|
— |
|
|
|
|
|
|
|
|
|
|
|
| Transamerica WMC US Growth VP |
|
|
420,660,137 |
|
|
|
177,906,115 |
|
|
|
— |
|
|
|
— |
|
|
|
96,930,029 |
|
|
|
695,496,281 |
|
|
|
16,295,602 |
|
|
|
— |
|
|
|
— |
|
|
|
|
|
|
|
|
|
|
|
|
|
|
|
|
| Total |
|
|
$5,072,415,387 |
|
|
|
$448,768,692 |
|
|
|
$(783,504,720 |
) |
|
|
$(60,628,321 |
) |
|
|
$288,552,660 |
|
|
|
$4,965,603,698 |
|
|
|
404,286,377 |
|
|
|
$46,804,304 |
|
|
|
$— |
|
|
|
|
|
|
| (C) |
Certain investments are measured at fair value using the net asset value per share, or its equivalent, practical expedient and have not been classified in the fair value levels. The fair value amount presented is intended to permit reconciliation to the Total Investments amount presented within the Schedule of Investments. |
| (D) |
Restricted security. At June 30, 2024, the total value of such securities held by the Portfolio is as follows: |
|
|
|
|
|
|
|
|
|
|
|
| Investments |
|
Description |
|
Acquisition Date |
|
Acquisition Cost |
|
Value |
|
Value as Percentage of Net Assets |
| Investment Companies |
|
Transamerica Global
Allocation Liquidating Trust |
|
07/31/2014 |
|
$64,152 |
|
$7,495 |
|
0.0%(G) |
| (E) |
All or a portion of the security has been segregated by the custodian as collateral to cover margin requirements for open futures contracts. The total value of the securities is $60,247,360. |
| (F) |
Rate disclosed reflects the yield at June 30, 2024. |
| (G) |
Percentage rounds to less than 0.1% or (0.1)%. |
| (H) |
There were no transfers in or out of Level 3 during the period ended June 30, 2024. Please reference the Investment Valuation section of the Notes to Financial Statements for more information regarding investment valuation and pricing inputs. |
| (I) |
Derivative instruments are valued at unrealized appreciation (depreciation). |
CURRENCY ABBREVIATION(S):
|
|
|
| CAD |
|
Canadian Dollar |
| JPY |
|
Japanese Yen |
PORTFOLIO ABBREVIATION(S):
|
|
|
| BTP |
|
Buoni del Tesoro Poliennali (Italian Treasury Bonds) |
| EAFE |
|
Europe, Australasia and Far East |
| STOXX |
|
Deutsche Börse Group & SIX Group Index |
| TOPIX |
|
Tokyo Price Index |
| TSX |
|
Toronto Stock Exchange |
|
|
|
|
|
| The Notes to Financial Statements are an integral part of this report. |
| Transamerica Series Trust |
|
|
|
Semi-Annual Financial Statements 2024 |
|
|
Page 3 |
|
|
Transamerica JPMorgan Asset Allocation - Moderate VP
STATEMENT OF ASSETS AND LIABILITIES
At June 30, 2024
(unaudited)
|
|
|
|
|
|
|
| Assets: |
|
|
|
|
| Affiliated investments, at value (cost $4,718,128,762) |
|
$ |
4,965,603,698 |
|
| Unaffiliated investments, at value (cost $60,327,675) |
|
|
60,247,359 |
|
| Repurchase agreement, at value (cost $20,683,488) |
|
|
20,683,488 |
|
| Receivables and other assets: |
|
|
|
|
| Investments sold |
|
|
11,589,600 |
|
| Dividends from affiliated investments |
|
|
6,645,788 |
|
| Interest |
|
|
1,035,602 |
|
| Variation margin receivable on futures contracts |
|
|
3,718,692 |
|
| Prepaid expenses |
|
|
20,183 |
|
|
|
| Total assets |
|
|
5,069,544,410 |
|
|
|
| Liabilities: |
|
|
|
|
| Payables and other liabilities: |
|
|
|
|
| Investments purchased |
|
|
18,235,388 |
|
| Shares of beneficial interest redeemed |
|
|
1,404,688 |
|
| Due to custodian |
|
|
2,051 |
|
| Investment management fees |
|
|
475,256 |
|
| Distribution and service fees |
|
|
893,220 |
|
| Transfer agent costs |
|
|
5,053 |
|
| Trustee and CCO fees |
|
|
14,652 |
|
| Audit and tax fees |
|
|
43,650 |
|
| Custody fees |
|
|
36,753 |
|
| Legal fees |
|
|
108,647 |
|
| Printing and shareholder reports fees |
|
|
140,505 |
|
| Other accrued expenses |
|
|
85,631 |
|
|
|
| Total liabilities |
|
|
21,445,494 |
|
|
|
| Net assets |
|
$ |
5,048,098,916 |
|
|
|
| Net assets consist of: |
|
|
|
|
| Capital stock ($0.01 par value) |
|
$ |
4,788,002 |
|
| Additional paid-in capital |
|
|
4,998,892,902 |
|
| Total distributable earnings (accumulated losses) |
|
|
44,418,012 |
|
|
|
| Net assets |
|
$ |
5,048,098,916 |
|
|
|
| Net assets by class: |
|
|
|
|
| Initial Class |
|
$ |
401,214,238 |
|
| Service Class |
|
|
4,646,884,678 |
|
|
|
| Shares outstanding: |
|
|
|
|
| Initial Class |
|
|
37,334,491 |
|
| Service Class |
|
|
441,465,707 |
|
|
|
| Net asset value and offering price per share: |
|
|
|
|
| Initial Class |
|
$ |
10.75 |
|
| Service Class |
|
|
10.53 |
|
STATEMENT OF OPERATIONS
For the period ended June 30, 2024
(unaudited)
|
|
|
|
|
|
|
| Investment income: |
|
|
|
|
| Dividend income from affiliated investments |
|
$ |
46,804,304 |
|
| Interest income from unaffiliated investments |
|
|
1,901,637 |
|
|
|
| Total investment income |
|
|
48,705,941 |
|
|
|
| Expenses: |
|
|
|
|
| Investment management fees |
|
|
3,073,218 |
|
| Distribution and service fees: |
|
|
|
|
| Service Class |
|
|
5,779,587 |
|
| Transfer agent costs |
|
|
28,745 |
|
| Trustee and CCO fees |
|
|
117,507 |
|
| Audit and tax fees |
|
|
42,453 |
|
| Custody fees |
|
|
40,378 |
|
| Legal fees |
|
|
205,353 |
|
| Printing and shareholder reports fees |
|
|
132,947 |
|
| Other |
|
|
155,088 |
|
|
|
| Total expenses |
|
|
9,575,276 |
|
|
|
| Net investment income (loss) |
|
|
39,130,665 |
|
|
|
| Net realized gain (loss) on: |
|
|
|
|
| Affiliated investments |
|
|
(60,628,321 |
) |
| Unaffiliated investments |
|
|
138,648 |
|
| Futures contracts |
|
|
4,269,608 |
|
|
|
| Net realized gain (loss) |
|
|
(56,220,065 |
) |
|
|
| Net change in unrealized appreciation (depreciation) on: |
|
|
|
|
| Affiliated investments |
|
|
288,552,660 |
|
| Unaffiliated investments |
|
|
(102,165 |
) |
| Futures contracts |
|
|
(37,814,936 |
) |
| Translation of assets and liabilities denominated in foreign currencies |
|
|
(146,238 |
) |
|
|
| Net change in unrealized appreciation (depreciation) |
|
|
250,489,321 |
|
|
|
| Net realized and change in unrealized gain (loss) |
|
|
194,269,256 |
|
|
|
| Net increase (decrease) in net assets resulting from operations |
|
$ |
233,399,921 |
|
The Notes to Financial Statements are an integral part of this report.
|
|
|
|
|
| Transamerica Series Trust |
|
|
|
Semi-Annual Financial Statements 2024 |
|
|
Page 4 |
|
|
Transamerica JPMorgan Asset Allocation - Moderate VP
STATEMENT OF CHANGES IN NET ASSETS
For the period and year ended:
|
|
|
|
|
|
|
|
|
| |
|
June 30, 2024 (unaudited) |
|
December 31, 2023 |
|
|
|
| From operations: |
|
|
|
|
|
|
|
|
|
|
|
| Net investment income (loss) |
|
$ |
39,130,665 |
|
|
$ |
95,447,304 |
|
|
|
|
| Net realized gain (loss) |
|
|
(56,220,065 |
) |
|
|
(190,514,018 |
) |
|
|
|
| Net change in unrealized appreciation (depreciation) |
|
|
250,489,321 |
|
|
|
530,392,474 |
|
|
|
|
| Net increase (decrease) in net assets resulting from operations |
|
|
233,399,921 |
|
|
|
435,325,760 |
|
|
|
|
| Dividends and/or distributions to shareholders: |
|
|
|
|
|
|
|
|
|
|
|
| Initial Class |
|
|
— |
|
|
|
(11,210,803 |
) |
|
|
|
| Service Class |
|
|
— |
|
|
|
(124,099,260 |
) |
|
|
|
| Net increase (decrease) in net assets resulting from dividends and/or distributions to shareholders |
|
|
— |
|
|
|
(135,310,063 |
) |
|
|
|
| Capital share transactions: |
|
|
|
|
|
|
|
|
|
|
|
| Proceeds from shares sold: |
|
|
|
|
|
|
|
|
|
|
|
| Initial Class |
|
|
10,643,458 |
|
|
|
14,743,970 |
|
|
|
|
| Service Class |
|
|
1,812,289 |
|
|
|
4,978,478 |
|
|
|
|
| |
|
|
12,455,747 |
|
|
|
19,722,448 |
|
|
|
|
| Dividends and/or distributions reinvested: |
|
|
|
|
|
|
|
|
|
|
|
| Initial Class |
|
|
— |
|
|
|
11,210,803 |
|
|
|
|
| Service Class |
|
|
— |
|
|
|
124,099,260 |
|
|
|
|
| |
|
|
— |
|
|
|
135,310,063 |
|
|
|
|
| Cost of shares redeemed: |
|
|
|
|
|
|
|
|
|
|
|
| Initial Class |
|
|
(29,682,765 |
) |
|
|
(49,783,449 |
) |
|
|
|
| Service Class |
|
|
(330,780,656 |
) |
|
|
(583,886,715 |
) |
|
|
|
| |
|
|
(360,463,421 |
) |
|
|
(633,670,164 |
) |
|
|
|
| Net increase (decrease) in net assets resulting from capital share transactions |
|
|
(348,007,674 |
) |
|
|
(478,637,653 |
) |
|
|
|
| Net increase (decrease) in net assets |
|
|
(114,607,753 |
) |
|
|
(178,621,956 |
) |
|
|
|
| Net assets: |
|
|
|
|
|
|
|
|
|
|
|
| Beginning of period/year |
|
|
5,162,706,669 |
|
|
|
5,341,328,625 |
|
|
|
|
| End of period/year |
|
$ |
5,048,098,916 |
|
|
|
$5,162,706,669 |
|
|
|
|
| Capital share transactions - shares: |
|
|
|
|
|
|
|
|
|
|
|
| Shares issued: |
|
|
|
|
|
|
|
|
|
|
|
| Initial Class |
|
|
1,018,639 |
|
|
|
1,487,632 |
|
|
|
|
| Service Class |
|
|
174,727 |
|
|
|
520,883 |
|
|
|
|
| |
|
|
1,193,366 |
|
|
|
2,008,515 |
|
|
|
|
| Shares reinvested: |
|
|
|
|
|
|
|
|
|
|
|
| Initial Class |
|
|
— |
|
|
|
1,149,826 |
|
|
|
|
| Service Class |
|
|
— |
|
|
|
12,967,530 |
|
|
|
|
| |
|
|
— |
|
|
|
14,117,356 |
|
|
|
|
| Shares redeemed: |
|
|
|
|
|
|
|
|
|
|
|
| Initial Class |
|
|
(2,837,172 |
) |
|
|
(5,065,927 |
) |
|
|
|
| Service Class |
|
|
(32,219,197 |
) |
|
|
(60,600,327 |
) |
|
|
|
| |
|
|
(35,056,369 |
) |
|
|
(65,666,254 |
) |
|
|
|
| Net increase (decrease) in shares outstanding: |
|
|
|
|
|
|
|
|
|
|
|
| Initial Class |
|
|
(1,818,533 |
) |
|
|
(2,428,469 |
) |
|
|
|
| Service Class |
|
|
(32,044,470 |
) |
|
|
(47,111,914 |
) |
|
|
|
| |
|
|
(33,863,003 |
) |
|
|
(49,540,383 |
) |
The Notes to Financial Statements are an integral part of this report.
|
|
|
|
|
| Transamerica Series Trust |
|
|
|
Semi-Annual Financial Statements 2024 |
|
|
Page 5 |
|
|
Transamerica JPMorgan Asset Allocation - Moderate VP
FINANCIAL HIGHLIGHTS
|
|
|
|
|
|
|
|
|
|
|
|
|
|
|
|
|
|
|
|
|
|
|
|
|
| For a share outstanding during the period and years indicated: |
|
Initial Class |
|
|
|
|
|
|
|
| |
|
June 30, 2024 (unaudited) |
|
December 31, 2023 |
|
December 31, 2022 |
|
December 31, 2021 |
|
December 31, 2020 |
|
December 31, 2019 |
|
|
|
|
|
|
|
| Net asset value, beginning of period/year |
|
$ |
10.25 |
|
|
$ |
9.67 |
|
|
$ |
13.66 |
|
|
$ |
12.83 |
|
|
$ |
12.02 |
|
|
$ |
11.18 |
|
|
|
|
|
|
|
|
| Investment operations: |
|
|
|
|
|
|
|
|
|
|
|
|
|
|
|
|
|
|
|
|
|
|
|
|
|
|
|
|
|
|
|
| Net investment income (loss)(A) |
|
|
0.09 |
|
|
|
0.20 |
|
|
|
0.23 |
|
|
|
0.56 |
|
|
|
0.25 |
|
|
|
0.26 |
|
|
|
|
|
|
|
|
| Net realized and unrealized gain (loss) |
|
|
0.41 |
|
|
|
0.67 |
|
|
|
(2.39 |
) |
|
|
0.62 |
|
|
|
1.20 |
|
|
|
1.54 |
|
|
|
|
|
|
|
|
| Total investment operations |
|
|
0.50 |
|
|
|
0.87 |
|
|
|
(2.16 |
) |
|
|
1.18 |
|
|
|
1.45 |
|
|
|
1.80 |
|
|
|
|
|
|
|
|
| Dividends and/or distributions to shareholders: |
|
|
|
|
|
|
|
|
|
|
|
|
|
|
|
|
|
|
|
|
|
|
|
|
|
|
|
|
|
|
|
| Net investment income |
|
|
— |
|
|
|
(0.21 |
) |
|
|
(0.64 |
) |
|
|
(0.26 |
) |
|
|
(0.27 |
) |
|
|
(0.27 |
) |
|
|
|
|
|
|
|
| Net realized gains |
|
|
— |
|
|
|
(0.08 |
) |
|
|
(1.19 |
) |
|
|
(0.09 |
) |
|
|
(0.37 |
) |
|
|
(0.69 |
) |
|
|
|
|
|
|
|
| Total dividends and/or distributions to shareholders |
|
|
— |
|
|
|
(0.29 |
) |
|
|
(1.83 |
) |
|
|
(0.35 |
) |
|
|
(0.64 |
) |
|
|
(0.96 |
) |
|
|
|
|
|
|
|
| Net asset value, end of period/year |
|
$ |
10.75 |
|
|
$ |
10.25 |
|
|
$ |
9.67 |
|
|
$ |
13.66 |
|
|
$ |
12.83 |
|
|
$ |
12.02 |
|
|
|
|
|
|
|
|
| |
|
|
|
|
|
|
|
|
|
|
|
|
|
|
|
|
|
|
|
|
|
|
|
|
|
|
|
|
|
|
|
| Total return |
|
|
4.88 |
%(B) |
|
|
9.10 |
% |
|
|
(16.08 |
)% |
|
|
9.18 |
% |
|
|
12.60 |
% |
|
|
16.42 |
% |
|
|
|
|
|
|
|
| Ratio and supplemental data: |
|
|
|
|
|
|
|
|
|
|
|
|
|
|
|
|
|
|
|
|
|
|
|
|
|
|
|
|
|
|
|
| Net assets end of period/year (000’s) |
|
$ |
401,214 |
|
|
$ |
401,446 |
|
|
$ |
402,196 |
|
|
$ |
539,029 |
|
|
$ |
593,022 |
|
|
$ |
575,923 |
|
|
|
|
|
|
|
|
| Expenses to average net assets(C) |
|
|
0.15 |
%(D) |
|
|
0.15 |
% |
|
|
0.15 |
% |
|
|
0.14 |
% |
|
|
0.15 |
% |
|
|
0.14 |
% |
|
|
|
|
|
|
|
| Net investment income (loss) to average net assets |
|
|
1.79 |
%(D) |
|
|
2.08 |
% |
|
|
1.99 |
% |
|
|
4.19 |
% |
|
|
2.12 |
% |
|
|
2.19 |
% |
|
|
|
|
|
|
|
| Portfolio turnover rate |
|
|
9 |
%(B) |
|
|
36 |
% |
|
|
18 |
% |
|
|
18 |
% |
|
|
27 |
% |
|
|
11 |
% |
| (A) |
Calculated based on average number of shares outstanding. |
| (C) |
Does not include expenses of the underlying investments in which the Portfolio invests. |
|
|
|
|
|
|
|
|
|
|
|
|
|
|
|
|
|
|
|
|
|
|
|
|
|
| For a share outstanding during the period and years indicated: |
|
Service Class |
|
|
|
|
|
|
|
| |
|
June 30, 2024 (unaudited) |
|
December 31, 2023 |
|
December 31, 2022 |
|
December 31, 2021 |
|
December 31, 2020 |
|
December 31, 2019 |
|
|
|
|
|
|
|
| Net asset value, beginning of period/year |
|
$ |
10.06 |
|
|
$ |
9.49 |
|
|
$ |
13.43 |
|
|
$ |
12.62 |
|
|
$ |
11.83 |
|
|
$ |
11.03 |
|
|
|
|
|
|
|
|
| Investment operations: |
|
|
|
|
|
|
|
|
|
|
|
|
|
|
|
|
|
|
|
|
|
|
|
|
|
|
|
|
|
|
|
| Net investment income (loss)(A) |
|
|
0.08 |
|
|
|
0.18 |
|
|
|
0.19 |
|
|
|
0.54 |
|
|
|
0.22 |
|
|
|
0.23 |
|
|
|
|
|
|
|
|
| Net realized and unrealized gain (loss) |
|
|
0.39 |
|
|
|
0.65 |
|
|
|
(2.33 |
) |
|
|
0.59 |
|
|
|
1.18 |
|
|
|
1.50 |
|
|
|
|
|
|
|
|
| Total investment operations |
|
|
0.47 |
|
|
|
0.83 |
|
|
|
(2.14 |
) |
|
|
1.13 |
|
|
|
1.40 |
|
|
|
1.73 |
|
|
|
|
|
|
|
|
| Dividends and/or distributions to shareholders: |
|
|
|
|
|
|
|
|
|
|
|
|
|
|
|
|
|
|
|
|
|
|
|
|
|
|
|
|
|
|
|
| Net investment income |
|
|
— |
|
|
|
(0.18 |
) |
|
|
(0.61 |
) |
|
|
(0.23 |
) |
|
|
(0.24 |
) |
|
|
(0.24 |
) |
|
|
|
|
|
|
|
| Net realized gains |
|
|
— |
|
|
|
(0.08 |
) |
|
|
(1.19 |
) |
|
|
(0.09 |
) |
|
|
(0.37 |
) |
|
|
(0.69 |
) |
|
|
|
|
|
|
|
| Total dividends and/or distributions to shareholders |
|
|
— |
|
|
|
(0.26 |
) |
|
|
(1.80 |
) |
|
|
(0.32 |
) |
|
|
(0.61 |
) |
|
|
(0.93 |
) |
|
|
|
|
|
|
|
| Net asset value, end of period/year |
|
$ |
10.53 |
|
|
$ |
10.06 |
|
|
$ |
9.49 |
|
|
$ |
13.43 |
|
|
$ |
12.62 |
|
|
$ |
11.83 |
|
|
|
|
|
|
|
|
| |
|
|
|
|
|
|
|
|
|
|
|
|
|
|
|
|
|
|
|
|
|
|
|
|
|
|
|
|
|
|
|
| Total return |
|
|
4.67 |
%(B) |
|
|
8.86 |
% |
|
|
(16.25 |
)% |
|
|
8.93 |
% |
|
|
12.28 |
% |
|
|
16.18 |
% |
|
|
|
|
|
|
|
| Ratio and supplemental data: |
|
|
|
|
|
|
|
|
|
|
|
|
|
|
|
|
|
|
|
|
|
|
|
|
|
|
|
|
|
|
|
| Net assets end of period/year (000’s) |
|
$ |
4,646,885 |
|
|
$ |
4,761,261 |
|
|
$ |
4,939,133 |
|
|
$ |
6,584,121 |
|
|
$ |
6,639,121 |
|
|
$ |
6,148,828 |
|
|
|
|
|
|
|
|
| Expenses to average net assets(C) |
|
|
0.40 |
%(D) |
|
|
0.40 |
% |
|
|
0.40 |
% |
|
|
0.39 |
% |
|
|
0.40 |
% |
|
|
0.39 |
% |
|
|
|
|
|
|
|
| Net investment income (loss) to average net assets |
|
|
1.54 |
%(D) |
|
|
1.82 |
% |
|
|
1.74 |
% |
|
|
4.07 |
% |
|
|
1.89 |
% |
|
|
1.97 |
% |
|
|
|
|
|
|
|
| Portfolio turnover rate |
|
|
9 |
%(B) |
|
|
36 |
% |
|
|
18 |
% |
|
|
18 |
% |
|
|
27 |
% |
|
|
11 |
% |
| (A) |
Calculated based on average number of shares outstanding. |
| (C) |
Does not include expenses of the underlying investments in which the Portfolio invests. |
The Notes to Financial Statements are an integral part of this report.
|
|
|
|
|
| Transamerica Series Trust |
|
|
|
Semi-Annual Financial Statements 2024 |
|
|
Page 6 |
|
|
Transamerica JPMorgan Asset Allocation - Moderate VP
NOTES TO FINANCIAL STATEMENTS
At June 30, 2024
(unaudited)
1. ORGANIZATION
Transamerica Series Trust (“TST”) is an open-end management investment company registered under the Investment Company Act of 1940, as amended (the “1940 Act”). TST applies investment company accounting and reporting guidance. TST serves as a funding vehicle for variable life insurance, variable annuity, and group annuity products. Transamerica JPMorgan Asset Allocation - Moderate VP (the “Portfolio”) is a series of TST and is classified as diversified under the 1940 Act. The Portfolio currently offers two classes of shares, Initial Class and Service Class.
The only shareholders of the Portfolio are affiliated insurance company separate accounts and/or affiliated asset allocation portfolios. Contract holders of the variable life and annuity contracts are not shareholders of the Portfolio. For ease of reference, shareholders and contract holders are collectively referred to in this report as “shareholders.”
This report must be accompanied or preceded by the Portfolio’s current prospectus, which contains additional information about the Portfolio, including risks, as well as investment objectives and strategies.
Transamerica Asset Management, Inc. (“TAM”) serves as investment manager for the Portfolio pursuant to an investment management agreement. TAM provides continuous and regular investment management services to the Portfolio. TAM supervises the Portfolio’s investments, conducts its investment program and provides supervisory, compliance and administrative services to the Portfolio.
TAM currently acts as a “manager of managers” and has hired sub-advisers to furnish day-to-day investment advice and recommendations. TAM may, in the future, determine to provide all aspects of the day-to-day management of the Portfolio without the use of a sub-adviser. When acting as a manager of managers, TAM provides investment management services that include, without limitation, the design and development of the Portfolio and its investment strategies and the ongoing review and evaluation of those investment strategies including recommending changes in strategy where it believes appropriate or advisable; the selection of one or more sub-advisers for the Portfolio employing a combination of quantitative and qualitative screens, research, analysis and due diligence; negotiation of sub-advisory agreements and fees; oversight and monitoring of sub-advisers and recommending changes to sub-advisers where it believes appropriate or advisable; recommending portfolio combinations and liquidations where it believes appropriate or advisable; selection and oversight of transition managers, as needed; regular supervision of the Portfolio’s investments; regular review and evaluation of sub-adviser performance; daily monitoring of the sub-advisers’ buying and selling of securities for the Portfolio; regular review of holdings; ongoing trade oversight and analysis; regular monitoring to ensure adherence to investment process; regular calls and periodic on-site visits with sub-advisers; portfolio construction and asset allocation when using multiple sub-advisers for the Portfolio; risk management oversight and analysis; oversight of negotiation of investment documentation and agreements; design, development, implementation and regular monitoring of the valuation process; periodic due diligence reviews of pricing vendors and vendor methodology; design, development, implementation and regular monitoring of the compliance process; respond to regulatory inquiries and determine appropriate litigation strategy, as needed; review of proxies voted by sub-advisers; oversight of preparation and review of materials for meetings of the Portfolio’s Board of Trustees (the “Board”), participation in these meetings and preparation of regular communications with the Board; oversight of preparation and review of prospectuses, shareholder reports and other disclosure materials and regulatory filings for the Portfolio; oversight of other service providers to the Portfolio, such as the custodian, the transfer agent, the Portfolio’s independent accounting firm and legal counsel; supervision of the performance of recordkeeping and shareholder relations functions for the Portfolio; and oversight of cash management services. TAM uses a variety of quantitative and qualitative tools to carry out its investment management services. TAM, not the Portfolio, is responsible for paying the sub-adviser(s) for their services, and sub-advisory fees are TAM’s expense.
TAM’s investment management services also include the provision of supervisory and administrative services to the Portfolio. These services include performing certain administrative services for the Portfolio and supervising and overseeing the administrative, clerical, recordkeeping and bookkeeping services provided to the Portfolio by State Street Bank and Trust Company (“State Street”), to whom TAM has outsourced the provision of certain sub-administration services. To the extent agreed upon by TAM and the Portfolio from time to time, TAM’s supervisory and administrative services include, but are not limited to: monitoring and verifying the custodian’s daily calculation of the Net Asset Values (“NAV”); shareholder relations functions; compliance services; valuation services; assisting in due diligence and in the oversight and monitoring of certain activities of sub-advisers and certain aspects of Portfolio investments; assisting with Portfolio combinations and liquidations; oversight of the preparation and filing, and review, of all returns and reports, in connection with federal, state and local taxes; oversight and review of regulatory reporting; supervising and coordinating the Portfolio’s custodian and dividend disbursing agent and monitoring their services to the Portfolio; assisting the Portfolio in preparing reports to shareholders; acting as liaison with the Portfolio’s independent public accountants and providing, upon request, analyses, fiscal year summaries and other audit related services; assisting in the preparation of agendas and supporting documents for and minutes of meetings of trustees and committees of trustees; assisting in the preparation of regular communications with the trustees; and providing personnel and office space, telephones and other office equipment as necessary in order for TAM to perform supervisory and administrative services to the Portfolio. The Portfolio
|
|
|
|
|
| Transamerica Series Trust |
|
|
|
Semi-Annual Financial Statements 2024 |
|
|
Page 7 |
|
|
Transamerica JPMorgan Asset Allocation - Moderate VP
NOTES TO FINANCIAL STATEMENTS (continued)
At June 30, 2024
(unaudited)
1. ORGANIZATION (continued)
pays certain fees and expenses to State Street for sub-administration services which are not administrative services covered by the management agreement with TAM or paid for through the management fees payable thereunder. For the period ended June 30, 2024, (i) the expenses paid to State Street for sub-administration services by the Portfolio are shown as a part of Other expenses within the Statement of Operations and (ii) the expenses payable to State Street for sub-administration services from the Portfolio are shown as part of Other accrued expenses within the Statement of Assets and Liabilities.
2. SIGNIFICANT ACCOUNTING POLICIES
In preparing the Portfolio’s financial statements in accordance with Generally Accepted Accounting Principles in the United States of America (“GAAP”), estimates or assumptions (which could differ from actual results) may be used that affect reported amounts and disclosures. The following is a summary of significant accounting policies followed by the Portfolio.
Foreign currency denominated investments: The accounting records of the Portfolio are maintained in U.S. dollars. Securities and other assets and liabilities denominated in foreign currencies are translated into U.S. dollars based on the closing exchange rate each day. The cost of foreign securities purchased and any realized gains or losses are translated at the prevailing exchange rates in effect on the date of the respective transaction. The Portfolio combines fluctuations from currency exchange rates and fluctuations in value when computing net realized and unrealized gains or losses from investments.
Net foreign currency gains and losses resulting from changes in exchange rates include, foreign currency fluctuations between trade date and settlement date of investment security transactions, gains and losses on forward foreign currency contracts, and the difference between the receivable amounts of interest and dividends recorded in the accounting records in U.S. dollars and the amounts actually received.
Foreign currency denominated assets may involve risks not typically associated with domestic transactions. These risks include revaluation of currencies, adverse fluctuations in foreign currency values, and possible adverse political, social, and economic developments, including those particular to a specific industry, country or region.
Security transactions and investment income: Security transactions are accounted for on the trade date. Security gains and losses are calculated on a first-in, first-out basis. Interest income, if any, is accrued as earned. Dividend income and capital gain distributions from underlying investments, if any, are recorded on the ex-dividend date. Income or short-term capital gain distributions received from underlying investments, if any, are recorded as Dividend income from investments within the Statement of Operations. Long-term capital gain distributions received from underlying investments, if any, are recorded as Net realized gain (loss) on Capital gain distributions received from investments within the Statement of Operations.
Multiple class operations, income, and expenses: Income, non-class specific expenses, and realized and unrealized gains and losses are allocated to each class daily based upon net assets. Each class bears its own specific expenses in addition to the allocated non-class specific expenses.
Distributions to shareholders: Distributions are recorded on the ex-dividend date and are determined in accordance with federal income tax regulations, which may differ from GAAP.
Cash overdraft: The Portfolio may have cash overdraft balances. A fee is incurred on these overdrafts, calculated by multiplying the overdraft by a rate based on the Federal Funds Rate.
Payables, if any, are reflected as Due to custodian within the Statement of Assets and Liabilities. Expenses, if any, from U.S. cash overdrafts are reflected in Custody fees within the Statement of Operations. Expenses, if any, from foreign cash overdrafts are reflected in Other expenses within the Statement of Operations.
Indemnification: In the normal course of business, the Portfolio enters into contracts that contain a variety of representations that provide general indemnifications. The Portfolio’s maximum exposure under these arrangements is unknown, as this would involve future claims that may be made against the Portfolio and/or its affiliates that have not yet occurred. However, based on experience, the Portfolio expects the risk of loss to be remote.
|
|
|
|
|
| Transamerica Series Trust |
|
|
|
Semi-Annual Financial Statements 2024 |
|
|
Page 8 |
|
|
Transamerica JPMorgan Asset Allocation - Moderate VP
NOTES TO FINANCIAL STATEMENTS (continued)
At June 30, 2024
(unaudited)
3. INVESTMENT VALUATION
TAM has been designated as the Portfolio’s valuation designee pursuant to Rule 2a-5 under the 1940 Act with responsibility for fair valuation subject to oversight by the Portfolio’s Board of Trustees. The net asset value of the Portfolio is computed as of the official close of the New York Stock Exchange (“NYSE”) each day the NYSE is open for business.
TAM utilizes various methods to measure the fair value of its investments on a recurring basis. GAAP establishes a hierarchy that prioritizes inputs to valuation methods. The inputs or methodology used for valuing securities are not necessarily an indication of the risk associated with investing in those securities. The three levels (“Levels”) of inputs of the fair value hierarchy are defined as follows:
Level 1—Unadjusted quoted prices in active markets for identical securities.
Level 2—Inputs, other than quoted prices included in Level 1, which are observable, either directly or indirectly. These inputs may include quoted prices for the identical instrument on an inactive market, prices for similar instruments, interest rates, prepayment speeds, credit risk, yield curves, default rates, and similar data.
Level 3—Unobservable inputs based on the best information available in the circumstances, to the extent observable inputs are not available, which may include TAM’s own assumptions used in determining the fair value of the Portfolio’s investments and derivative instruments.
The inputs used to measure fair value may fall into different Levels of the fair value hierarchy. In such cases, for disclosure purposes, the Level in the fair value hierarchy that is assigned to the fair value measurement of a security is determined based on the lowest Level input that is significant to the fair value measurement in its entirety. Certain investments that are measured at fair value using NAV per share, or its equivalent, using the “practical expedient” have not been classified in the fair value Levels. The hierarchy classification of inputs used to value the Portfolio’s investments at June 30, 2024, is disclosed within the Investment Valuation section of the Schedule of Investments.
The availability of observable inputs can vary from security to security and is affected by a wide variety of factors, including, but not limited to, the type of security, whether the security is new and not yet established in the marketplace, the liquidity of markets, and other characteristics particular to the security. To the extent that valuation is based on models or inputs that are less observable or unobservable in the market, the determination of fair value requires more judgment. Accordingly, the degree of judgment exercised in determining fair value is generally greatest for instruments categorized in Level 3. Due to the inherent uncertainty of valuation, the determination of values may differ significantly from values that would have been realized had a ready market for investments existed, and the differences could be material.
Fair value measurements: Descriptions of the valuation techniques applied to the Portfolio’s significant categories of assets and liabilities measured at fair value on a recurring basis are as follows:
Investment companies: Certain investment companies are valued at the NAV as the practical expedient. These investment companies are not included within the fair value hierarchy. Certain other investment companies are valued at the actively traded NAV and no valuation adjustments are applied. These investment companies are categorized in Level 1 of the fair value hierarchy.
U.S. government obligations: U.S. government obligations are normally valued using a model that incorporates market observable data such as reported sales of similar securities, broker quotes, yields, bids, offers, and reference data. Certain securities are valued by principally using dealer quotations. U.S. government obligations generally are categorized in Level 2 of the fair value hierarchy, or Level 3 if inputs are unobservable.
Repurchase agreements: Repurchase agreements are valued at cost, which approximates fair value. To the extent the inputs are observable and timely, the values are generally categorized in Level 2 of the fair value hierarchy.
Restricted securities: Restricted securities for which quotations are not readily available are valued at fair value. Restricted securities issued by publicly traded companies are generally valued at a discount to similar publicly traded securities. Restricted securities issued by nonpublic entities may be valued by reference to comparable public entities and/or fundamental data relating to the issuer. Depending on the relative significance of observable valuation inputs, these instruments may be classified in either Level 2 or Level 3 of the fair value hierarchy.
Derivative instruments: Centrally cleared or listed derivatives that are actively traded are valued based on quoted prices from the exchange and are categorized in Level 1 of the fair value hierarchy. Over-the-counter (“OTC”) derivative contracts include forward, swap, swaption,
|
|
|
|
|
| Transamerica Series Trust |
|
|
|
Semi-Annual Financial Statements 2024 |
|
|
Page 9 |
|
|
Transamerica JPMorgan Asset Allocation - Moderate VP
NOTES TO FINANCIAL STATEMENTS (continued)
At June 30, 2024
(unaudited)
3. INVESTMENT VALUATION (continued)
and option contracts related to interest rates, foreign currencies, credit standing of reference entities, equity prices, or commodity prices. Depending on the product and the terms of the transaction, the fair value of the OTC derivative products are modeled taking into account the counterparties’ creditworthiness and using a series of techniques, including simulation models. Many pricing models do not entail material subjectivity because the methodologies employed do not necessitate significant judgments and the pricing inputs are observed from actively quoted markets, as is the case of interest rate swap and option contracts. The majority of OTC derivative products valued by the Portfolio using pricing models fall into this category and are categorized within Level 2 of the fair value hierarchy or Level 3 if inputs are unobservable.
4. SECURITIES AND OTHER INVESTMENTS
Restricted securities: The Portfolio may invest in unregulated restricted securities. Restricted securities are subject to legal or contractual restrictions on resale. Restricted securities generally may be resold in transactions exempt from registration under the Securities Act of 1933.
Restricted securities held at June 30, 2024, if any, are identified within the Schedule of Investments.
5. BORROWINGS AND OTHER FINANCING TRANSACTIONS
The Portfolio may engage in borrowing transactions as a means of raising cash to satisfy redemption requests, for other temporary or emergency purposes or, to the extent permitted by its investment policies, to raise additional cash to be invested in other securities or instruments. When the Portfolio invests borrowing proceeds in other securities, the Portfolio will bear the risk that the market value of the securities in which such proceeds are invested goes down and is insufficient to repay the borrowed proceeds. The Portfolio may borrow on a secured or on an unsecured basis. If the Portfolio enters into a secured borrowing arrangement, a portion of the Portfolio’s assets will be used as collateral. The 1940 Act requires the Portfolio to maintain asset coverage of at least 300% of the amount of its borrowings. Asset coverage means the ratio that the value of the Portfolio’s total assets, minus liabilities other than borrowings, bears to the aggregate amount of all borrowings. Although complying with this requirement has the effect of limiting the amount that the Portfolio may borrow, it does not otherwise mitigate the risks of entering into borrowing transactions.
Interfund lending: The Portfolio, along with other funds and portfolios advised by TAM, may participate in an interfund lending program pursuant to exemptive relief granted by the Securities and Exchange Commission on January 18, 2017. This program allows the Portfolio to lend to and borrow from other funds and portfolios advised by TAM. Interfund lending transactions are subject to the conditions of the exemptive relief which places limits on the amount of lending or borrowing a Portfolio may participate in under the program. Interest earned or paid on an interfund lending transaction will be based on the average of certain current market rates. For the period ended June 30, 2024, the Portfolio has not utilized the program.
Repurchase agreements: In a repurchase agreement, the Portfolio purchases a security and simultaneously commits to resell that security to the seller at an agreed-upon price on an agreed-upon date. Securities purchased subject to a repurchase agreement are held at the Portfolio’s custodian, or designated sub-custodian related to tri-party repurchase agreements, and, pursuant to the terms of the repurchase agreement, must be collateralized by securities with an aggregate market value greater than or equal to 100% of the resale price. The Portfolio will bear the risk of value fluctuations until the securities can be sold and may encounter delays and incur costs in liquidating the securities. In the event of bankruptcy or insolvency of the seller, delays and costs may be incurred.
Repurchase agreements are subject to netting agreements, which are agreements between the Portfolio and its counterparties that provide for the net settlement of all transactions and collateral with the Portfolio, through a single payment, in the event of default or termination. Amounts presented within the Schedule of Investments, and as part of Repurchase agreements, at value within the Statement of Assets and Liabilities are shown on a gross basis. The value of the related collateral for each repurchase agreement, as reflected within the Schedule of Investments, exceeds the value of each repurchase agreement at June 30, 2024.
Repurchase agreements at June 30, 2024, if any, are included within the Schedule of Investments and Statement of Assets and Liabilities.
6. RISK EXPOSURES AND THE USE OF DERIVATIVE INSTRUMENTS
The Portfolio’s investment strategies allow the Portfolio to use various types of derivative contracts, including option contracts, swap agreements, futures contracts, and forward foreign currency contracts. Derivatives are investments whose value is primarily derived from underlying assets, indices or reference rates and may be transacted on an exchange or OTC.
|
|
|
|
|
| Transamerica Series Trust |
|
|
|
Semi-Annual Financial Statements 2024 |
|
|
Page 10 |
|
|
Transamerica JPMorgan Asset Allocation - Moderate VP
NOTES TO FINANCIAL STATEMENTS (continued)
At June 30, 2024
(unaudited)
6. RISK EXPOSURES AND THE USE OF DERIVATIVE INSTRUMENTS (continued)
Market Risk Factors: In pursuit of the Portfolio’s investment strategies, the Portfolio may seek to use derivatives to increase or decrease its exposure to certain market risks, including:
Interest rate risk: Interest rate risk relates to the fluctuations in the value of fixed income securities due to changes in the prevailing levels of market interest rates.
Foreign exchange rate risk: Foreign exchange rate risk relates to fluctuations in the value of an asset or liability due to changes in the currency exchange rates.
Equity risk: Equity risk relates to the change in value of equity securities as they relate to increases or decreases in the general market.
Credit risk: Credit risk relates to the ability of the issuer of a financial instrument to make further principal or interest payments on an obligation or commitment that it has to the Portfolio.
Commodity risk: Commodity risk relates to the change in value of commodities or commodity indices as they relate to increases or decreases in the commodities market. Commodities are physical assets that have tangible properties. Examples of these types of assets are crude oil, heating oil, metals, livestock, and agricultural products.
The Portfolio is also exposed to additional risks from investing in derivatives, such as liquidity and counterparty credit risk. Liquidity risk is the risk that the Portfolio will be unable to sell or close out the derivative in the open market in a timely manner. Counterparty credit risk is the risk that the counterparty will not be able to fulfill its obligations to the Portfolio. Investing in derivatives may also involve greater risks than investing directly in the underlying assets, such as losses in excess of any initial investment and collateral received. In addition, there may be the risk that the change in value of the derivative contract does not correspond to the change in value of the underlying instrument.
The Portfolio’s exposure to market risk factors and certain other associated risks are summarized by derivative type as follows:
Futures contracts: The Portfolio is subject to equity risk, credit risk, commodity risk, interest rate risk and foreign exchange rate risk in the normal course of pursuing its investment objective. The Portfolio uses futures contracts to gain exposure to, or hedge against, changes in the value of equities and commodities, interest rates, or foreign currencies. A futures contract represents a commitment for the future purchase or sale of an asset at a specified price on a specified date. Upon entering into such contracts, the Portfolio is required to deposit with the broker, either in cash or in securities, an initial margin in an amount equal to a certain percentage of the contract amount. Subsequent payments (variation margin) are paid or received by the Portfolio, depending on the daily fluctuations in the value of the contract, and are recorded for financial statement purposes as unrealized gains or losses by the Portfolio. Upon entering into such contracts, the Portfolio bears the risk of equity and commodity prices, interest rates, or exchange rates moving unexpectedly, in which case, the Portfolio may not achieve the anticipated benefits of the futures contracts and may realize losses. With futures, there is minimal counterparty credit risk to the Portfolio since futures are exchange-traded and the exchange’s clearinghouse, as counterparty to all exchange-traded futures, guarantees the futures against default. Futures contracts are generally entered into on a regulated futures exchange and cleared through a clearinghouse associated with the exchange.
Open futures contracts at June 30, 2024 are listed within the Schedule of Investments. Variation margin, if applicable, is shown in Variation margin receivable or payable on futures contracts within the Statement of Assets and Liabilities.
The following is a summary of the location and the Portfolio’s fair values of derivative investments disclosed within the Statement of Assets and Liabilities, categorized by primary market risk exposure as of June 30, 2024.
|
|
|
|
|
|
|
|
|
|
|
|
|
|
|
|
|
|
|
|
|
|
|
|
|
| Asset Derivatives |
|
|
|
|
|
|
|
|
| Location |
|
Interest Rate Contracts |
|
|
Foreign Exchange Contracts |
|
|
Equity Contracts |
|
|
Credit Contracts |
|
Commodity Contracts |
|
Total |
|
|
|
|
|
|
|
| Futures contracts: |
|
|
|
|
|
|
|
|
|
|
|
|
|
|
|
|
|
|
|
|
|
|
|
|
| Total distributable earnings (accumulated losses) (A)(B) |
|
$ |
4,840,621 |
|
|
$ |
2,459,731 |
|
|
$ |
4,310,829 |
|
|
$ |
— |
|
|
$ |
— |
|
|
$ |
11,611,181 |
|
| Total |
|
$ |
4,840,621 |
|
|
$ |
2,459,731 |
|
|
$ |
4,310,829 |
|
|
$ |
— |
|
|
$ |
— |
|
|
$ |
11,611,181 |
|
| |
|
|
|
|
|
|
|
|
|
|
|
|
|
|
|
|
|
|
|
|
|
|
|
|
|
|
|
|
|
| Transamerica Series Trust |
|
|
|
Semi-Annual Financial Statements 2024 |
|
|
Page 11 |
|
|
Transamerica JPMorgan Asset Allocation - Moderate VP
NOTES TO FINANCIAL STATEMENTS (continued)
At June 30, 2024
(unaudited)
6. RISK EXPOSURES AND THE USE OF DERIVATIVE INSTRUMENTS (continued)
|
|
|
|
|
|
|
|
|
|
|
|
|
|
|
|
|
|
|
|
|
|
|
|
|
| Liability Derivatives |
|
|
|
|
|
|
|
|
| Location |
|
Interest Rate Contracts |
|
|
Foreign Exchange Contracts |
|
|
Equity Contracts |
|
|
Credit Contracts |
|
Commodity Contracts |
|
Total |
|
|
|
|
|
|
|
| Futures contracts: |
|
|
|
|
|
|
|
|
|
|
|
|
|
|
|
|
|
|
|
|
|
|
|
|
| Total distributable earnings (accumulated losses) (A)(B) |
|
$ |
(10,844,629 |
) |
|
$ |
(208,706 |
) |
|
$ |
(1,389,935 |
) |
|
$ |
— |
|
|
$ |
— |
|
|
$ |
(12,443,270 |
) |
| Total |
|
$ |
(10,844,629 |
) |
|
$ |
(208,706 |
) |
|
$ |
(1,389,935 |
) |
|
$ |
— |
|
|
$ |
— |
|
|
$ |
(12,443,270 |
) |
| |
|
|
|
|
|
|
|
|
|
|
|
|
|
|
|
|
|
|
|
|
|
|
|
|
| (A) |
May include exchange-traded derivatives which are not subject to a master netting arrangement, or another similar arrangement. |
| (B) |
Included within unrealized appreciation (depreciation) on futures contracts as reported in the Schedule of Investments. Only current day’s variation margin is reported within the Statement of Assets and Liabilities. |
The following is a summary of the location and the effect of derivative investments within the Statement of Operations, categorized by primary market risk exposure as of June 30, 2024.
|
|
|
|
|
|
|
|
|
|
|
|
|
|
|
|
|
|
|
|
|
|
|
|
|
| Realized Gain (Loss) on Derivative Instruments |
|
|
|
|
|
|
|
|
| Location |
|
Interest Rate Contracts |
|
|
Foreign Exchange Contracts |
|
|
Equity Contracts |
|
|
Credit Contracts |
|
Commodity Contracts |
|
Total |
| Futures contracts |
|
$ |
(37,549,541 |
) |
|
$ |
(7,133,836 |
) |
|
$ |
48,952,985 |
|
|
$ |
— |
|
|
$ |
— |
|
|
$ |
4,269,608 |
|
| Total |
|
$ |
(37,549,541 |
) |
|
$ |
(7,133,836 |
) |
|
$ |
48,952,985 |
|
|
$ |
— |
|
|
$ |
— |
|
|
$ |
4,269,608 |
|
| |
|
|
|
|
|
|
|
|
|
|
|
|
|
|
|
|
|
|
|
|
|
|
|
|
|
|
|
|
|
|
|
|
|
|
|
|
|
|
|
|
|
|
|
|
|
|
|
|
|
| Net Change in Unrealized Appreciation (Depreciation) on Derivative Instruments |
|
| Location |
|
Interest Rate Contracts |
|
|
Foreign Exchange Contracts |
|
|
Equity Contracts |
|
|
Credit Contracts |
|
Commodity Contracts |
|
Total |
| Futures contracts |
|
$ |
(12,013,850 |
) |
|
$ |
(1,252,648 |
) |
|
$ |
(24,548,438 |
) |
|
$ |
— |
|
|
$ |
— |
|
|
$ |
(37,814,936 |
) |
| Total |
|
$ |
(12,013,850 |
) |
|
$ |
(1,252,648 |
) |
|
$ |
(24,548,438 |
) |
|
$ |
— |
|
|
$ |
— |
|
|
$ |
(37,814,936 |
) |
| |
|
|
|
|
|
|
|
|
|
|
|
|
|
|
|
|
|
|
|
|
|
|
|
|
The following is a summary of the ending monthly average volume on derivative activity during the period ended June 30, 2024.
|
|
|
|
|
| Futures contracts: |
|
|
|
|
| Average notional value of contracts — long |
|
$ |
1,817,145,301 |
|
| Average notional value of contracts — short |
|
|
(759,501,387 |
) |
Collateral requirements: Collateral or margin requirements are set by the broker or exchange clearing house for exchange-traded derivatives (futures contracts, exchange-traded options, and exchange-traded swap agreements) while collateral terms are contract specific for OTC derivatives (forward foreign currency exchange contracts, OTC options, and OTC swap agreements). For OTC derivatives, under standard derivatives agreements, the Portfolio may be required to pledge collateral on derivatives to a counterparty if the Portfolio is in a net liability position, and receive collateral if in a net positive position. For financial reporting purposes, cash collateral that has been pledged by the Portfolio to cover obligations, if any, is reported in Cash collateral at broker within the Statement of Assets and Liabilities. Cash collateral that has been received by the Portfolio from a counterparty, if any, is reported separately in Cash collateral pledged at custodian and/or broker within the Statement of Assets and Liabilities. Non-cash collateral pledged to the Portfolio, if any, is disclosed within the Schedule of Investments.
Generally, the amount of collateral due from or to a party must exceed a minimum transfer amount threshold before a transfer has been made. Typically a counterparty is not permitted to sell, re-pledge or use cash and non-cash collateral it receives. The Portfolio generally
|
|
|
|
|
| Transamerica Series Trust |
|
|
|
Semi-Annual Financial Statements 2024 |
|
|
Page 12 |
|
|
Transamerica JPMorgan Asset Allocation - Moderate VP
NOTES TO FINANCIAL STATEMENTS (continued)
At June 30, 2024
(unaudited)
6. RISK EXPOSURES AND THE USE OF DERIVATIVE INSTRUMENTS (continued)
does not use non-cash collateral that it receives but may, absent default or certain other circumstances, be permitted to use cash collateral received. In such cases, interest may be paid pursuant to the collateral arrangement with the counterparty.
To the extent amounts due to the Portfolio from its counterparties are not fully collateralized, contractually or otherwise, the Portfolio bears the risk of loss from counterparty non-performance. Additionally, to the extent the Portfolio has delivered collateral to a counterparty, the Portfolio bears the risk of loss from a counterparty in the event the counterparty fails to return such collateral. Counterparties may immediately terminate derivatives contracts if the Portfolio fails to maintain sufficient asset coverage for its contracts or its net assets decline by stated percentages. Collateral may not be required for all derivative contracts.
7. RISK FACTORS
Investing in the Portfolio involves certain key risks related to the Portfolio’s trading activity. Please reference the Portfolio’s prospectus for a more complete discussion of the following risk(s), as well as other risks of investing in the Portfolio.
Market risk: The market prices of the Portfolio’s securities or other assets may go up or down, sometimes rapidly or unpredictably, due to factors such as economic events, inflation, changes in interest rates, governmental actions or interventions, actions taken by the U.S. Federal Reserve or foreign central banks, market disruptions caused by tariffs, trade disputes or other factors, political developments, armed conflicts, economic sanctions, cybersecurity events, investor sentiment, the global and domestic effects of widespread or local health, weather or climate events, and other factors that may or may not be related to the issuer of the security or other asset. If the market prices of the Portfolio’s securities and assets fall, the value of your investment in the Portfolio could go down.
Economies and financial markets throughout the world are increasingly interconnected. Events or circumstances in one or more countries or regions could be highly disruptive to, and have profound impacts on, global economies or markets. As a result, whether or not the Portfolio invests in securities of issuers located in or with significant exposure to the countries directly affected, the value and liquidity of the Portfolio’s investments may go down.
Asset allocation risk: The Portfolio’s investment performance is significantly impacted by the Portfolio’s asset allocation and reallocation from time to time. The value of your investment may decrease if the sub-adviser’s judgment about the attractiveness, value or market trends affecting a particular asset class, investment style, technique or strategy, underlying fund or other issuer is incorrect.
Equity securities risk: Equity securities generally have greater risk of loss than debt securities. Stock markets are volatile and the value of equity securities may go up or down, sometimes rapidly and unpredictably. The market price of an equity security may fluctuate based on overall market conditions, such as real or perceived adverse economic or political conditions or trends, tariffs and trade disruptions, inflation, substantial economic downturn or recession, changes in interest rates, or adverse investor sentiment. The market price of an equity security also may fluctuate based on real or perceived factors affecting a particular industry or industries or the company itself. If the market prices of the equity securities owned by the Portfolio fall, the value of your investment in the Portfolio will decline. The Portfolio may lose its entire investment in the equity securities of an issuer. A change in financial condition or other event affecting a single issuer may adversely impact securities markets as a whole.
Risk management framework risk: The Portfolio is subject to a multi-factor risk management framework that is intended to reduce equity exposure under certain market conditions. This framework may impose a maximum equity exposure limit for the Portfolio in response to individual asset class momentum signals and a portfolio level volatility signal. The framework is intended to improve the Portfolio’s absolute and risk-adjusted returns but may not work as intended. The framework may result in the Portfolionot achieving its stated asset mix goal or may cause the Portfolio to underperform, possibly significantly. Because market conditions change, sometimes rapidly and unpredictably, the success of the framework also will be subject to the sub-adviser’s ability to implement the framework in a timely and efficient manner. The framework may result in periods of underperformance, may fail to protect against market declines, may limit the Portfolio’s ability to participate in up markets, may cause the Portfolio to underperform its benchmark in rising markets, may increase transaction costs at the Portfolio and/or underlying portfolio level and may result in substantial losses if it does not work as intended. For example, if the Portfolio has reduced its equity exposure to avoid losses in certain market conditions, and the market rises sharply and quickly, there may be a delay in increasing the Portfolio’s equity exposure, causing the Portfolio to forgo gains from the market rebound. The framework incorporates quantitative models and signals. If those models or signals prove to be flawed or for other reasons do not produce the desired results, any decisions made in reliance thereon may expose the Portfolio to additional risks and losses. The use of models has inherent risks, and the success of relying on or otherwise using a model depends, among other things, on the accuracy and completeness of the model’s development, implementation and maintenance; on the model’s assumptions and methodologies; and on the accuracy and reliability of the inputs and output of the model. The framework also serves to reduce the risk to the Transamerica insurance
|
|
|
|
|
| Transamerica Series Trust |
|
|
|
Semi-Annual Financial Statements 2024 |
|
|
Page 13 |
|
|
Transamerica JPMorgan Asset Allocation - Moderate VP
NOTES TO FINANCIAL STATEMENTS (continued)
At June 30, 2024
(unaudited)
7. RISK FACTORS (continued)
companies that provide guaranteed benefits under certain variable contracts from equity market volatility and to facilitate their provision of those guaranteed benefits. The framework also may have the effect of limiting the amount of guaranteed benefits. The Portfolio’s performance may be lower than similar portfolios that are not subject to a risk management framework. The use of derivatives in connection with the framework may expose the Portfolio to different and potentially greater risks than if it had only invested in underlying portfolios.
8. FEES AND OTHER AFFILIATED TRANSACTIONS
TST serves as a funding vehicle for certain affiliated asset allocation portfolios and certain affiliated separate accounts of Transamerica Life Insurance Company (“TLIC”) and Transamerica Financial Life Insurance Company.
TAM, the Portfolio’s investment manager, is directly owned by TLIC and AUSA Holding, LLC (“AUSA”), both of which are indirect, wholly owned subsidiaries of Aegon Ltd. TLIC is owned by Commonwealth General Corporation (“Commonwealth”). Commonwealth and AUSA are wholly owned by Transamerica Corporation (DE). Transamerica Corporation (DE) is wholly owned by Aegon International B.V., which is wholly owned by Aegon Ltd., a Bermuda exempted company with liability limited by shares (formerly, Aegon NV, a Netherlands corporation) and a publicly traded international insurance group.
Transamerica Fund Services, Inc. (“TFS”) is the Portfolio’s transfer agent. Transamerica Capital, Inc. (“TCI”) is the Portfolio’s distributor/principal underwriter. TAM, TFS and TCI are affiliates of Aegon Ltd.
Certain officers and trustees of the Portfolio may also be officers and/or trustees of TAM, TFS and TCI. No interested trustee who is deemed an interested person due to current or former service with TAM or an affiliate of TAM receives compensation from the Portfolio. The Portfolio does pay non-interested persons (independent trustees), as disclosed in Trustee and CCO fees within the Statement of Operations.
Investment management fees: TAM serves as the Portfolio’s investment manager, performing administration as well as investment advisory services. TAM renders investment advisory, supervisory, and administration services under an investment management agreement and the Portfolio pays a single management fee, which is reflected in Investment management fees within the Statement of Operations.
The Portfolio pays a management fee to TAM based on daily average net assets at the following rates:
|
|
|
|
|
| Breakpoints |
|
Rate |
|
|
| First $10 billion |
|
|
0.1225 |
% |
| Over $10 billion |
|
|
0.1025 |
|
TAM has contractually agreed to waive fees and/or reimburse Portfolio expenses to the extent that the total operating expenses excluding, as applicable, acquired fund fees and expenses, interest (including borrowing costs and overdraft charges), taxes, brokerage commissions, dividend and interest expenses on securities sold short, extraordinary expenses and other expenses not incurred in the ordinary course of the Portfolio’s business, exceed the following stated annual operating expense limits to the Portfolio’s daily average net assets. To the extent an expense limit changed during the period, the prior limit is also listed below. The expenses waived and/or reimbursed, if any, are included in Expenses waived and/or reimbursed within the Statement of Operations.
|
|
|
|
|
|
|
| Class |
|
Operating Expense Limit |
|
Operating Expense Limit Effective Through |
|
|
|
| Initial Class |
|
|
0.20 |
% |
|
May 1, 2025 |
| Service Class |
|
|
0.45 |
|
|
May 1, 2025 |
TAM is permitted to recapture amounts contractually waived and/or reimbursed to a class during any of the 36 months from the date on which TAM waived fees and/or reimbursed expenses for the class. A class may recapture and reimburse TAM only if such amount does not cause, on any particular business day of the Portfolio, the class’s total annual operating expenses (after the recapture is taken into account) to exceed the Operating Expense Limits or any other lower limit then in effect. Amounts recaptured, if any, by TAM for the period ended June 30, 2024 are disclosed in Recapture of previously waived and/or reimbursed fees within the Statement of Operations.
|
|
|
|
|
| Transamerica Series Trust |
|
|
|
Semi-Annual Financial Statements 2024 |
|
|
Page 14 |
|
|
Transamerica JPMorgan Asset Allocation - Moderate VP
NOTES TO FINANCIAL STATEMENTS (continued)
At June 30, 2024
(unaudited)
8. FEES AND OTHER AFFILIATED TRANSACTIONS (continued)
TAM, on a voluntary basis and in addition to the contractual operating expense limits in effect, from time to time may waive and/or reimburse expenses of the Portfolio, or any classes thereof, to such level(s) as the Trust’s officers have determined or may reasonably determine from time to time. Any such voluntary waiver or expense reimbursement may be discontinued by TAM at any time. These amounts are not subject to recapture by TAM.
As of June 30, 2024, there are no amounts available for recapture by TAM.
Distribution and service fees: TST has a distribution plan (“Distribution Plan”) pursuant to Rule 12b-1 under the 1940 Act. Pursuant to the Distribution Plan, TST entered into a distribution agreement with TCI as the Portfolio’s distributor.
The Distribution Plan requires the Portfolio to pay distribution fees to TCI as compensation for various distribution activities, not as reimbursement for specific expenses. Under the Distribution Plan and distribution agreement, TCI, on behalf of the Portfolio, is authorized to pay various service providers, as direct payment for expenses incurred in connection with distribution of the Portfolio’s shares.
The fee on the Service Class shares is paid to the insurance companies for providing services and account maintenance for the policyholders who invest in the variable insurance products which invest in the Service Class shares. TCI has determined that it will not seek payment for the distribution expenses incurred by the Portfolio with respect to the Initial Class shares before May 1, 2025. Prior to TCI seeking distribution expenses on Initial Class shares, policy and contract owners will be notified in advance. The Portfolio will pay fees relating to Service Class shares. The distribution and service fees are included in Distribution and service fees within the Statement of Operations.
The Portfolio is authorized under the Distribution Plan to pay fees to TCI based on daily average net assets of each applicable class up to the following annual rates:
|
|
|
|
|
| Class |
|
Rate |
|
|
| Initial Class |
|
|
0.15 |
% |
| Service Class |
|
|
0.25 |
|
Transfer agent costs: TFS provides transfer agency services under an intercompany agreement with TAM. TFS has outsourced the provision of certain sub-transfer agency services to SS&C Global Investor & Distribution Solutions, Inc. (“SS&C GIDS”). The Portfolio does not pay a separate transfer agent fee to TAM or TFS but does pay certain expenses to SS&C GIDS related to applicable sub-transfer agency services. For the period ended June 30, 2024, (i) the expenses paid to SS&C GIDS by the Portfolio are referred to as transfer agent costs and are included within the Statement of Operations and (ii) the expenses payable to SS&C GIDS by the Portfolio are referred to as transfer agent costs within the Statement of Assets and Liabilities.
Brokerage commissions: The Portfolio incurred no brokerage commissions on security transactions placed with affiliates of the investment manager or sub-adviser(s) for the period ended June 30, 2024.
9. PURCHASES AND SALES OF SECURITIES
For the period ended June 30, 2024, the cost of securities purchased and proceeds from securities sold (excluding short-term securities) are as follows:
|
|
|
|
|
|
|
|
|
|
|
| Purchases of Securities |
|
|
|
Sales/Maturities of Securities |
|
|
|
|
|
| Long-Term |
|
U.S. Government |
|
|
|
Long-Term |
|
|
U.S. Government |
| $ 401,964,388 |
|
$ 33,392,203 |
|
|
|
$ |
783,740,404 |
|
|
$ 31,709,690 |
10. FEDERAL INCOME TAXES AND DISTRIBUTIONS TO SHAREHOLDERS
The Portfolio has not made any provision for federal income or excise taxes due to its policy to distribute all of its taxable income and capital gains to its shareholders and otherwise qualify as a regulated investment company under Subchapter M of the Internal Revenue Code. The Portfolio recognizes the tax benefits of uncertain tax positions only where the position is “more likely than not” to be sustained assuming examination by tax authorities. The Portfolio’s tax returns remain subject to examination by the Internal Revenue Service and state tax authorities three years from the date of filing for federal purposes and four years from the date of filing for state purposes.
|
|
|
|
|
| Transamerica Series Trust |
|
|
|
Semi-Annual Financial Statements 2024 |
|
|
Page 15 |
|
|
Transamerica JPMorgan Asset Allocation - Moderate VP
NOTES TO FINANCIAL STATEMENTS (continued)
At June 30, 2024
(unaudited)
10. FEDERAL INCOME TAXES AND DISTRIBUTIONS TO SHAREHOLDERS (continued)
Management has evaluated the Portfolio’s tax provisions taken for all open tax years, and has concluded that no provision for income tax is required in the Portfolio’s financial statements. If applicable, the Portfolio recognizes interest accrued related to unrecognized tax benefits in relation to interest and penalties expense in Other within the Statement of Operations. The Portfolio identifies its major tax jurisdictions as U.S. Federal, the state of Colorado, and foreign jurisdictions where the Portfolio makes significant investments; however, the Portfolio is not aware of any tax positions for which it is reasonably possible that the total amounts of unrecognized tax benefits will change materially in the next twelve months. Distributions are determined in accordance with income tax regulations, which may differ from GAAP.
As of June 30, 2024, the approximate cost for U.S. federal income tax purposes, and the aggregate gross/net unrealized appreciation (depreciation) in the value of investments (including securities sold short and derivatives, if any) are as follows:
|
|
|
|
|
|
|
| Cost |
|
Gross Appreciation |
|
Gross (Depreciation) |
|
Net Appreciation (Depreciation) |
|
|
|
|
| $ 4,799,139,925 |
|
$ 373,477,852 |
|
$ (126,915,321) |
|
$ 246,562,531 |
Please see TST’s most recent report on Form N-CSR, available at: www.transamerica.com/annuities/prospectus, for additional information. For the most recently filed complete proxy voting records for the Trust please visit: https://www.transamerica.com/sites/default/files/files/e070d/TST%20N-PX%202021.pdf
|
|
|
|
|
| Transamerica Series Trust |
|
|
|
Semi-Annual Financial Statements 2024 |
|
|
Page 16 |
|
|
Transamerica JPMorgan Asset Allocation - Moderate VP
MANAGEMENT AND SUB-ADVISORY AGREEMENT — CONTRACT RENEWAL
(unaudited)
At a meeting of the Board of Trustees of Transamerica Series Trust (the “Trustees” or the “Board”) held on June 12-13, 2024, the Board considered the renewal of the management agreement (the “Management Agreement”) between Transamerica Asset Management, Inc. (“TAM”) and Transamerica Series Trust, on behalf of JPMorgan Asset Allocation – Moderate VP (the “Portfolio”). The Board also considered the renewal of the investment sub-advisory agreement (the “Sub-Advisory Agreement” and together with the Management Agreement, the “Agreements”) for the Portfolio between TAM and J.P. Morgan Investment Management, Inc. (the “Sub-Adviser”).
Following its review and consideration, the Board determined that the terms of the Management Agreement and Sub-Advisory Agreement were reasonable and that the renewal of each of the Agreements was in the best interests of the Portfolio and the holders invested in the Portfolio. The Board, including the independent members of the Board (the “Independent Trustees”), unanimously approved the renewal of each of the Agreements through June 30, 2025.
Prior to reaching their decision, the Trustees requested and received from TAM and the Sub-Adviser certain information. They then reviewed such information as they deemed reasonably necessary to evaluate the Agreements, including information they had previously received from TAM and the Sub-Adviser as part of their regular oversight of the Portfolio, and knowledge they gained over time through meeting with TAM and the Sub-Adviser. Among other materials, the Trustees considered comparative fee, expense and performance information prepared by Broadridge Financial Solutions, Inc. (“Broadridge”), an independent provider of mutual fund performance information, as well as fee, expense and profitability information prepared by TAM. In addition, TAM provided the Board with additional supplemental comparative performance information. To the extent applicable, the Trustees considered information about fees and performance of comparable funds and/or accounts managed by the Sub-Adviser. The Board also considered reductions to the Portfolio’s expense limits, if any, that took effect after the last renewal of the Agreements. In their review, the Trustees also sought to identify instances in which the Portfolio’s performance, fees, total expenses and/or profitability appeared to be outliers within its respective peer group or other comparative metrics and sought to understand the reasons for such comparative positions.
In their deliberations, the Independent Trustees met privately without representatives of TAM or the Sub-Adviser present and were represented throughout the process by their independent legal counsel. In considering the proposed continuation of each of the Agreements, the Trustees evaluated and weighed a number of considerations that they believed to be relevant in light of the legal advice furnished to them by counsel, including independent legal counsel, and made a decision in the exercise of their own business judgment. They based their decisions on the considerations discussed below, among others, although they did not identify any particular consideration or item of information that was controlling of their decisions, and each Trustee may have attributed different weights to the various factors.
Nature, Extent and Quality of the Services Provided
The Board considered the nature, extent and quality of the services provided by TAM and the Sub-Adviser to the Portfolio in the past and the services anticipated to be provided in the future. The Board also considered the investment approach for the Portfolio; the experience, capability and integrity of TAM’s senior management; the financial resources of TAM; TAM’s management oversight process; TAM’s and the Sub-Adviser’s responsiveness to any questions by the Trustees; and the professional qualifications and compensation program of the portfolio management team of the Sub-Adviser. The Trustees noted that they receive, on a quarterly basis, an execution analysis from Capital Institutional Services, Inc. (CAPIS), an independent provider of trade analyses, for the Sub-Adviser and a comparison of trading results against a peer universe of managers.
The Board also considered the continuous and regular investment management and other services provided by TAM, when acting as a manager of managers, for the portion of the management fee it retains from the Portfolio after payment of the sub-advisory fees. The Board noted that the investment management and other services provided by TAM include the design, development and ongoing review and evaluation of the Portfolio and its investment strategy; the selection, oversight and monitoring of one or more investment sub-advisers to perform certain duties with respect to the Portfolio; ongoing portfolio trading oversight and analysis; risk management oversight and analysis; design, development, implementation and ongoing review and evaluation of a process for the valuation of Portfolio investments; design, development, implementation and ongoing review and evaluation of a compliance program for the Portfolio; design, development, implementation and ongoing review and evaluation of a process for the voting of proxies and exercise of rights to consent to corporate action for Portfolio investments; participation in Board meetings and oversight of preparation of materials for the Board, including materials for Board meetings and regular communications with the Board; oversight of preparation of the Portfolio’s prospectus, statement of additional information, shareholder reports and other disclosure materials and regulatory filings for the Portfolio; and ongoing cash management services for the Portfolio. The Board considered that TAM’s investment management services also include the provision of supervisory and administrative services to the Portfolio. The Board also noted that TAM, as part of the services it provides to all Transamerica mutual funds, including the Portfolio, oversees the services provided by the funds’ custodian, transfer agent, independent accountant and legal counsel and supervises the performance of the recordkeeping and holder service functions of the funds.
Investment Performance
In addition, the Board considered the short- and longer-term performance of the Portfolio in light of its investment objective, policies and strategies, including relative performance against (i) a peer universe of comparable mutual funds, as prepared by Broadridge, and (ii) the Portfolio’s benchmarks, in each case for various trailing periods ended December 31, 2023. Based on these considerations, the Board determined that TAM and the Sub-Adviser can provide investment and related services that are appropriate in scope and extent in light of
|
|
|
|
|
| Transamerica Series Trust |
|
|
|
Semi-Annual Financial Statements 2024 |
|
|
Page 17 |
|
|
Transamerica JPMorgan Asset Allocation - Moderate VP
MANAGEMENT AND SUB-ADVISORY AGREEMENT — CONTRACT RENEWAL (continued)
(unaudited)
the Portfolio’s investment objectives, policies and strategies and operations, the competitive landscape of the investment company business and investor needs. The Board’s conclusions as to the Portfolio’s performance are summarized below. For purposes of its review, the Board generally used the performance of Service Class Shares. In describing the Portfolio’s performance relative to its peer universe, the summary conclusions characterize performance for the relevant periods in relation to whether it was “above,” “below” or “in line with” the peer universe median and do so using quintile rankings prepared by Broadridge. For simplicity, performance is described as “above” the median if the Portfolio’s performance ranked anywhere in the first or second quintiles, as “below” the median if it ranked anywhere in the fourth or fifth quintiles, or “in line with” the median if it ranked anywhere in the third quintile (i.e., even if its precise return was somewhat above or somewhat below the precise median return).
When considering the Portfolio’s performance, the Trustees considered any representations made by TAM regarding the appropriateness of certain peer groups and benchmarks. They recognized that performance reflects a snapshot of a period as of a specific date, and that consideration of performance data for a different period could generate significantly different performance results. The Trustees also recognized that even longer-term performance can be negatively affected by performance over a short-term period when that short-term performance is significantly below the performance of the comparable benchmark or universe of peer funds.
The Board noted that the performance of Service Class Shares of the Portfolio was below the median for its peer universe and below the benchmark that TAM utilizes to measure performance of the Portfolio, each for the past 1-, 3-, 5- and 10-year periods. The Trustees discussed the reasons for the underperformance with TAM and TAM agreed to continue to closely monitor and report to the Board on the performance of the Portfolio. The Board noted that the Sub-Adviser had commenced sub-advising the Portfolio on July 1, 2016 pursuant to its current investment strategies.
Management Fee and Sub-Advisory Fees and Total Expense Ratio
The Board considered the management fee and total expense ratio of the Portfolio, including information provided by Broadridge comparing the management fee and total expense ratio of the Portfolio to the management fees and total expense ratios of comparable investment companies in both a peer group and broader peer universe compiled by Broadridge. The Board’s conclusions as to the Portfolio’s management fee and total expense ratio are summarized below. For purposes of its review, the Board generally used the actual total expenses (i.e., expenses reflecting any waivers and/or reimbursements) of Service Class Shares. In describing the Portfolio’s management fee and total expense ratio relative to its peer group and peer universe, the summary conclusions characterize management fees and total expense ratios for the relevant periods in relation to whether they were “above,” “below” or “in line with” the peer group or peer universe median and do so using quintile rankings prepared by Broadridge. For simplicity, management fees and total expense ratios are described as “above” the median if the Portfolio’s management fee or total expense ratio ranked anywhere in the fourth or fifth quintiles, as “below” the median if it ranked anywhere in the first or second quintiles, or “in line with” the median if it ranked anywhere in the third quintile (i.e., even if its precise management fee or total expense ratio was somewhat above or somewhat below the precise median management fee or total expense ratio).
The Board also considered the fees charged by the Sub-Adviser for sub-advisory services, as well as the portion of the Portfolio’s management fee retained by TAM following payment of the sub-advisory fee and how the portion of the contractual management fee retained by TAM at a specified asset level compared to the portions retained by other investment advisers managing mutual funds with similar investment strategies as calculated by an independent provider of information.
The Board noted that the Portfolio’s contractual management fee was below the medians for its peer group and peer universe and that the actual total expenses (i.e., expenses reflecting any waivers and/or reimbursements) of Service Class Shares of the Portfolio were above the medians for its peer group and peer universe. The Trustees also considered that TAM has entered into an expense limitation arrangement with the Portfolio, which may result in TAM waiving fees for the benefit of holders.
On the basis of these considerations, together with the other information it considered, the Board determined that the management and sub-advisory fees to be received by TAM and the Sub-Adviser under the Management Agreement and Sub-Advisory Agreement are reasonable in light of the services provided.
Cost of Services Provided and Level of Profitability
The Board reviewed information provided by TAM about the cost of providing and procuring fund management services, as well as the costs of the provision of administration, transfer agency and other services, to the Portfolio and to Transamerica Series Trust as a whole by TAM and its affiliates. The Board considered the profitability of TAM and its affiliates in providing these services for the Portfolio and Transamerica Series Trust as a whole. The Trustees recognized the competitiveness of the mutual fund industry and the importance of an investment adviser’s long-term profitability, including for maintaining company and management stability and accountability.
The Board also considered the allocation methodology used for calculating the profitability of TAM and its affiliates. The Board noted that the revenue and expense allocation methodology used by TAM to estimate its profitability with respect to its relationship with the Portfolio had been reviewed previously by an independent consultant. The Trustees considered that TAM reported that it had not made material changes to this methodology, and that the methodology had been applied consistently for the Portfolio.
|
|
|
|
|
| Transamerica Series Trust |
|
|
|
Semi-Annual Financial Statements 2024 |
|
|
Page 18 |
|
|
Transamerica JPMorgan Asset Allocation - Moderate VP
MANAGEMENT AND SUB-ADVISORY AGREEMENT — CONTRACT RENEWAL (continued)
(unaudited)
With respect to the Sub-Adviser, the Board noted that the sub-advisory fee is the product of arm’s-length negotiation between TAM and the Sub-Adviser, which is not affiliated with TAM, and is paid by TAM and not the Portfolio. As a result, the Board focused on the profitability of TAM and its affiliates with respect to the Portfolio.
Based on this information, the Board determined that the profitability of TAM and its affiliates from their relationships with the Portfolio was not excessive.
Economies of Scale
The Board considered economies of scale with respect to the management of the Portfolio, whether the Portfolio had appropriately benefited from any economies of scale and whether there was the potential for realization of any future economies of scale. The Board also considered the existence of economies of scale with respect to management of the Transamerica mutual funds overall and the extent to which the Portfolio benefited from any economies of scale. The Board recognized that, as the Portfolio’s assets increase, any economies of scale realized by TAM or the Sub-Adviser may not directly correlate with each other or with any economies of scale that might be realized by the Portfolio. The Board considered the Portfolio’s management fee schedule and the existence of breakpoints and also considered the extent to which TAM shared economies of scale, if any, with the Portfolio through undertakings to limit or reimburse Portfolio expenses and to invest in maintaining and developing its capabilities and services. The Board also considered the Sub-Adviser’s sub-advisory fee schedule and the existence of breakpoints, if any, and how such breakpoints relate to any breakpoints in the Portfolio’s management fee schedule. The Board considered that the Sub-Adviser’s sub-advisory fees would be based on the combined assets of multiple funds. The Trustees concluded that the Portfolio’s fee structure reflected an appropriate sharing of any efficiencies or economies of scale to date and noted that they will have the opportunity to periodically reexamine the appropriateness of the management fee payable to TAM and the fee paid to the Sub-Adviser in light of any economies of scale experienced in the future.
Benefits to TAM, its Affiliates and/or the Sub-Adviser from their Relationships with the Portfolio
The Board considered other benefits derived by TAM, its affiliates, and/or the Sub-Adviser from their relationships with the Portfolio. The Board noted that TAM does not receive benefits from research obtained with commissions paid to broker-dealers for portfolio transactions (commonly referred to as “soft dollars”) as a result of its relationship with the Portfolio.
Other Considerations
The Board noted that TAM has made a substantial commitment to the recruitment and retention of high-quality personnel and maintains the financial, compliance and operational resources reasonably necessary to manage the Portfolio in a professional manner that is consistent with the best interests of the Portfolio and the holders. In this regard, the Board favorably considered the procedures and policies TAM has in place to enforce compliance with applicable laws and regulations and oversee the portfolio management activities of the Sub-Adviser. The Board also noted that TAM has made an entrepreneurial commitment and undertaken certain business risks with respect to the management and success of the Portfolio.
Conclusion
After consideration of the factors described above, as well as other factors, the Trustees, including the Independent Trustees, concluded that the renewal of the Management Agreement and the Sub-Advisory Agreement was in the best interests of the Portfolio and the holders and voted to approve the renewal of the Agreements.
|
|
|
|
|
| Transamerica Series Trust |
|
|
|
Semi-Annual Financial Statements 2024 |
|
|
Page 19 |
|
|
PROXY VOTING POLICIES AND PROCEDURES AND QUARTERLY PORTFOLIO HOLDINGS
(unaudited)
A description of Transamerica Series Trust’s (the “Trust”) proxy voting policies and procedures is available in the Statement of Additional Information of the Portfolios, available without charge upon request by calling 1-800-851-9777 (toll free) or on the Securities and Exchange Commission’s (“SEC”) website at http://www.sec.gov.
In addition, the Portfolio is required to file Form N-PX, with their complete proxy voting records for the most recent 12 months ended June 30th, no later than August 31st of each year. The Form is available without charge: (1) on the Transamerica Funds website at https://www.transamerica.com/sites/default/files/files/e070d/TST%20N-PX%202021.pdf; and (2) on the SEC’s website at http://www.sec.gov.
Each fiscal quarter, the Portfolios, except Transamerica BlackRock Government Money Market VP, will file with the SEC a complete schedule of its monthly portfolio holdings on Form N-PORT. The Portfolios’ holdings as of the end of the third month of every fiscal quarter, as reported on Form N-PORT, will be publicly available on the SEC’s website at http://www.sec.gov within 60 days of the end of the fiscal quarter.
On a monthly basis, Transamerica BlackRock Government Money Market VP will file with the SEC portfolio holdings information on Form N-MFP3. A complete schedule of portfolio holdings is also available at www.transamerica.com.
You may also visit the Trust’s website at www.transamerica.com/annuities/prospectus for this and other information about the Portfolios and the Trust.
Important Notice Regarding Delivery of Shareholder Documents
Every year we provide shareholders informative materials such as the Transamerica Series Trust Annual Report, the Transamerica Series Trust Prospectus, and other required documents that keep you informed regarding your Portfolios. To the extent provided by mail, Transamerica Series Trust will only send one piece per mailing address, a method that saves your Portfolios money by reducing mailing and printing costs. We will continue to do this unless you tell us not to. To elect to receive individual mailings, simply call a Transamerica Customer Service Representative toll free at 1-800-851-9777, 8 a.m. to 7 p.m. Eastern Time, Monday-Friday. Your request will take effect within 30 days.
|
|
|
|
|
| Transamerica Series Trust |
|
|
|
Semi-Annual Financial Statements 2024 |
|
|
Page 20 |
|
|
NOTICE OF PRIVACY POLICY
(unaudited)
Your privacy is very important to us. We want you to understand what information we collect and how we use it. We collect and use “nonpublic personal information” in connection with providing our customers with a broad range of financial products and services as effectively and conveniently as possible. We treat nonpublic personal information in accordance with our Privacy Policy.
What Information We Collect and From Whom We Collect It
We may collect nonpublic personal information about you from the following sources:
| • |
|
Information we receive from you on applications or other forms, such as your name, address, and account number; |
| • |
|
Information about your transactions with us, our affiliates, or others, such as your account balance and purchase/redemption history; and |
| • |
|
Information we receive from non-affiliated third parties, including consumer reporting agencies. |
What Information We Disclose and To Whom We Disclose It
We do not disclose any nonpublic personal information about current or former customers to anyone without their express consent, except as permitted by law. We may disclose the nonpublic personal information we collect, as described above, to persons or companies that perform services on our behalf and to other financial institutions with which we have joint marketing agreements. We will require these companies to protect the confidentiality of your nonpublic personal information and to use it only to perform the services for which we have hired them.
Our Security Procedures
We restrict access to your nonpublic personal information and only allow disclosures to persons and companies as permitted by law to assist in providing products or services to you. We maintain physical, electronic, and procedural safeguards to protect your nonpublic personal information and to safeguard the disposal of certain consumer information.
Contact Us
If you have any questions about our Privacy Policy, please call 1-800-851-9777 on any business day between 8 a.m. and 7 p.m. Eastern Time.
Note: This Privacy Policy applies only to customers that have a direct relationship with us or our affiliates. If you own shares of our portfolios in the name of a third party such as a bank or broker-dealer, its privacy policy may apply to you instead of ours.
|
|
|
|
|
| Transamerica Series Trust |
|
|
|
Semi-Annual Financial Statements 2024 |
|
|
Page 21 |
|
|
PO Box 219945
Kansas City, MO 64121-9945
|
|
|
| Distributor: |
|
Transamerica Capital, Inc. |
|
|
PO Box 219945 |
|
|
Kansas City, MO 64121-9945 |
|
|
|
|
Customer Service: 1-800-851-9777 |
Transamerica Series Trust Semi-Annual Financial Statements
June 30, 2024
1801 California St., Suite 5200
Denver, CO 80202
Distributor: Transamerica Capital, Inc.
Customer Service: 1-800-851-9777
|
| The following pages contain the most recent semi-annual financial statements for the investment options in which you are invested. In compliance with Securities and Exchange Commission regulations, we present these reports on an annual and semi-annual basis with the hope that they will foster greater understanding of the investment options’ holdings, performance, financial data, accounting policies and other issues. This streamlined version provides information only on the investment options in which you are invested. |
|
| If you have any questions about these reports, please do not hesitate to contact your financial professional. As always, we thank you for your trust and the opportunity to serve you. |
Transamerica JPMorgan Enhanced Index VP
SCHEDULE OF INVESTMENTS
At June 30, 2024
(unaudited)
|
|
|
|
|
|
|
|
|
| |
|
Shares |
|
|
Value |
|
| |
|
|
|
|
| COMMON STOCKS - 97.2% |
|
|
|
|
|
|
|
|
| Aerospace & Defense - 1.1% |
|
|
|
|
|
|
|
|
| Howmet Aerospace, Inc. |
|
|
174,502 |
|
|
$ |
13,546,590 |
|
| Northrop Grumman Corp. |
|
|
9,733 |
|
|
|
4,243,101 |
|
| RTX Corp. |
|
|
37,324 |
|
|
|
3,746,956 |
|
| Textron, Inc. |
|
|
120,697 |
|
|
|
10,363,045 |
|
| TransDigm Group, Inc. |
|
|
4,300 |
|
|
|
5,493,723 |
|
|
|
|
|
|
|
|
|
|
|
|
|
|
|
|
|
|
|
|
37,393,415 |
|
|
|
|
|
|
|
|
|
|
|
|
|
| Air Freight & Logistics - 0.9% |
|
|
|
|
|
|
|
|
| FedEx Corp. |
|
|
38,593 |
|
|
|
11,571,725 |
|
| United Parcel Service, Inc., Class B |
|
|
138,193 |
|
|
|
18,911,712 |
|
|
|
|
|
|
|
|
|
|
|
|
|
|
|
|
|
|
|
|
30,483,437 |
|
|
|
|
|
|
|
|
|
|
|
|
|
| Automobile Components - 0.1% |
|
|
|
|
|
|
|
|
| Aptiv PLC (A) |
|
|
60,919 |
|
|
|
4,289,916 |
|
|
|
|
|
|
|
|
|
|
|
|
|
| Automobiles - 1.0% |
|
|
|
|
|
|
|
|
| Tesla, Inc. (A) |
|
|
159,323 |
|
|
|
31,526,835 |
|
|
|
|
|
|
|
|
|
|
|
|
|
| Banks - 3.3% |
|
|
|
|
|
|
|
|
| Bank of America Corp. |
|
|
919,040 |
|
|
|
36,550,221 |
|
| Citigroup, Inc. |
|
|
63,730 |
|
|
|
4,044,306 |
|
| Fifth Third Bancorp |
|
|
345,249 |
|
|
|
12,598,136 |
|
| Truist Financial Corp. |
|
|
412,274 |
|
|
|
16,016,845 |
|
| US Bancorp |
|
|
267,201 |
|
|
|
10,607,880 |
|
| Wells Fargo & Co. |
|
|
476,160 |
|
|
|
28,279,142 |
|
|
|
|
|
|
|
|
|
|
|
|
|
|
|
|
|
|
|
|
108,096,530 |
|
|
|
|
|
|
|
|
|
|
|
|
|
| Beverages - 1.8% |
|
|
|
|
|
|
|
|
| Coca-Cola Co. |
|
|
487,051 |
|
|
|
31,000,796 |
|
| Monster Beverage Corp. (A) |
|
|
178,481 |
|
|
|
8,915,126 |
|
| PepsiCo, Inc. |
|
|
117,787 |
|
|
|
19,426,610 |
|
|
|
|
|
|
|
|
|
|
|
|
|
|
|
|
|
59,342,532 |
|
|
|
|
|
|
|
|
|
|
|
|
|
| Biotechnology - 2.7% |
|
|
|
|
|
|
|
|
| AbbVie, Inc. |
|
|
218,350 |
|
|
|
37,451,392 |
|
| Biogen, Inc. (A) |
|
|
24,667 |
|
|
|
5,718,304 |
|
| BioMarin Pharmaceutical, Inc. (A) |
|
|
15,940 |
|
|
|
1,312,340 |
|
| Neurocrine Biosciences, Inc. (A) |
|
|
21,005 |
|
|
|
2,891,759 |
|
| Regeneron Pharmaceuticals, Inc. (A) |
|
|
19,275 |
|
|
|
20,258,603 |
|
| Sarepta Therapeutics, Inc. (A) |
|
|
10,210 |
|
|
|
1,613,180 |
|
| Vertex Pharmaceuticals, Inc. (A) |
|
|
42,231 |
|
|
|
19,794,514 |
|
|
|
|
|
|
|
|
|
|
|
|
|
|
|
|
|
|
|
|
89,040,092 |
|
|
|
|
|
|
|
|
|
|
|
|
|
| Broadline Retail - 4.3% |
|
|
|
|
|
|
|
|
| Amazon.com, Inc. (A) |
|
|
722,203 |
|
|
|
139,565,730 |
|
|
|
|
|
|
|
|
|
|
|
|
|
| Building Products - 1.4% |
|
|
|
|
|
|
|
|
| Carrier Global Corp. |
|
|
208,942 |
|
|
|
13,180,061 |
|
| Masco Corp. |
|
|
105,992 |
|
|
|
7,066,487 |
|
| Trane Technologies PLC |
|
|
80,072 |
|
|
|
26,338,083 |
|
|
|
|
|
|
|
|
|
|
|
|
|
|
|
|
|
|
|
|
46,584,631 |
|
|
|
|
|
|
|
|
|
|
|
|
|
| Capital Markets - 2.3% |
|
|
|
|
|
|
|
|
| Ameriprise Financial, Inc. |
|
|
9,020 |
|
|
|
3,853,254 |
|
| Charles Schwab Corp. |
|
|
169,607 |
|
|
|
12,498,340 |
|
| CME Group, Inc. |
|
|
78,725 |
|
|
|
15,477,335 |
|
| Goldman Sachs Group, Inc. |
|
|
42,265 |
|
|
|
19,117,305 |
|
|
|
|
|
|
|
|
|
|
| |
|
Shares |
|
|
Value |
|
| |
|
|
| COMMON STOCKS (continued) |
|
| Capital Markets (continued) |
|
| Intercontinental Exchange, Inc. |
|
|
92,845 |
|
|
$ |
12,709,552 |
|
| State Street Corp. |
|
|
149,758 |
|
|
|
11,082,092 |
|
|
|
|
|
|
|
|
|
|
|
|
|
|
|
|
|
|
|
|
74,737,878 |
|
|
|
|
|
|
|
|
|
|
|
|
|
| Chemicals - 1.7% |
|
|
|
|
|
|
|
|
| Dow, Inc. |
|
|
265,183 |
|
|
|
14,067,958 |
|
| Eastman Chemical Co. |
|
|
31,579 |
|
|
|
3,093,795 |
|
| Linde PLC |
|
|
62,042 |
|
|
|
27,224,650 |
|
| LyondellBasell Industries NV, Class A |
|
|
82,651 |
|
|
|
7,906,395 |
|
| PPG Industries, Inc. |
|
|
33,072 |
|
|
|
4,163,434 |
|
|
|
|
|
|
|
|
|
|
|
|
|
|
|
|
|
|
|
|
56,456,232 |
|
|
|
|
|
|
|
|
|
|
|
| Commercial Services & Supplies - 0.1% |
|
| Cintas Corp. |
|
|
5,950 |
|
|
|
4,166,547 |
|
|
|
|
|
|
|
|
|
|
|
|
|
| Communications Equipment - 0.1% |
|
|
|
|
|
|
|
|
| Motorola Solutions, Inc. |
|
|
11,574 |
|
|
|
4,468,143 |
|
|
|
|
|
|
|
|
|
|
|
|
|
| Construction Materials - 0.1% |
|
|
|
|
|
|
|
|
| Martin Marietta Materials, Inc. |
|
|
7,668 |
|
|
|
4,154,522 |
|
|
|
|
|
|
|
|
|
|
|
| Consumer Staples Distribution & Retail - 0.8% |
|
| Costco Wholesale Corp. |
|
|
32,274 |
|
|
|
27,432,577 |
|
|
|
|
|
|
|
|
|
|
|
|
|
| Distributors - 0.1% |
|
|
|
|
|
|
|
|
| LKQ Corp. |
|
|
47,831 |
|
|
|
1,989,291 |
|
|
|
|
|
|
|
|
|
|
|
|
|
| Electric Utilities - 2.0% |
|
|
|
|
|
|
|
|
| NextEra Energy, Inc. |
|
|
310,158 |
|
|
|
21,962,288 |
|
| NRG Energy, Inc. |
|
|
15,859 |
|
|
|
1,234,782 |
|
| PG&E Corp. |
|
|
855,998 |
|
|
|
14,945,725 |
|
| Southern Co. |
|
|
338,287 |
|
|
|
26,240,922 |
|
|
|
|
|
|
|
|
|
|
|
|
|
|
|
|
|
|
|
|
64,383,717 |
|
|
|
|
|
|
|
|
|
|
|
|
|
| Electrical Equipment - 0.6% |
|
|
|
|
|
|
|
|
| AMETEK, Inc. |
|
|
11,851 |
|
|
|
1,975,680 |
|
| Eaton Corp. PLC |
|
|
57,197 |
|
|
|
17,934,120 |
|
|
|
|
|
|
|
|
|
|
|
|
|
|
|
|
|
|
|
|
19,909,800 |
|
|
|
|
|
|
|
|
|
|
|
| Electronic Equipment, Instruments & Components - 0.2% |
|
| Corning, Inc. |
|
|
67,748 |
|
|
|
2,632,010 |
|
| TE Connectivity Ltd. |
|
|
21,256 |
|
|
|
3,197,540 |
|
|
|
|
|
|
|
|
|
|
|
|
|
|
|
|
|
|
|
|
5,829,550 |
|
|
|
|
|
|
|
|
|
|
|
| Energy Equipment & Services - 0.1% |
|
| Baker Hughes Co. |
|
|
121,168 |
|
|
|
4,261,479 |
|
|
|
|
|
|
|
|
|
|
|
|
|
| Entertainment - 0.3% |
|
|
|
|
|
|
|
|
| Netflix, Inc. (A) |
|
|
10,527 |
|
|
|
7,104,462 |
|
| Warner Music Group Corp., Class A |
|
|
118,620 |
|
|
|
3,635,703 |
|
|
|
|
|
|
|
|
|
|
|
|
|
|
|
|
|
|
|
|
10,740,165 |
|
|
|
|
|
|
|
|
|
|
|
|
|
| Financial Services - 4.5% |
|
|
|
|
|
|
|
|
| Berkshire Hathaway, Inc., Class B (A) |
|
|
102,705 |
|
|
|
41,780,394 |
|
| Block, Inc. (A) |
|
|
33,013 |
|
|
|
2,129,009 |
|
| Corpay, Inc. (A) |
|
|
40,254 |
|
|
|
10,724,068 |
|
| Fidelity National Information Services, Inc. |
|
|
128,970 |
|
|
|
9,719,179 |
|
| Mastercard, Inc., Class A |
|
|
108,141 |
|
|
|
47,707,484 |
|
| Visa, Inc., Class A |
|
|
134,356 |
|
|
|
35,264,419 |
|
|
|
|
|
|
|
|
|
|
|
|
|
|
|
|
|
|
|
|
147,324,553 |
|
|
|
|
|
|
|
|
|
|
The Notes to Financial Statements are an integral part of this report.
|
|
|
|
|
| Transamerica Series Trust |
|
|
|
Semi-Annual Financial Statements 2024 |
|
|
Page 1 |
|
|
Transamerica JPMorgan Enhanced Index VP
SCHEDULE OF INVESTMENTS (continued)
At June 30, 2024
(unaudited)
|
|
|
|
|
|
|
|
|
| |
|
Shares |
|
|
Value |
|
| |
|
|
| COMMON STOCKS (continued) |
|
| Food Products - 0.8% |
|
| Mondelez International, Inc., Class A |
|
|
373,617 |
|
|
$ |
24,449,497 |
|
|
|
|
|
|
|
|
|
|
|
|
|
| Ground Transportation - 1.2% |
|
|
|
|
|
|
|
|
| CSX Corp. |
|
|
337,522 |
|
|
|
11,290,111 |
|
| Uber Technologies, Inc. (A) |
|
|
272,924 |
|
|
|
19,836,116 |
|
| Union Pacific Corp. |
|
|
32,724 |
|
|
|
7,404,132 |
|
|
|
|
|
|
|
|
|
|
|
|
|
|
|
|
|
|
|
|
38,530,359 |
|
|
|
|
|
|
|
|
|
|
|
| Health Care Equipment & Supplies - 2.0% |
|
| Baxter International, Inc. |
|
|
59,200 |
|
|
|
1,980,240 |
|
| Becton Dickinson & Co. |
|
|
16,227 |
|
|
|
3,792,412 |
|
| Boston Scientific Corp. (A) |
|
|
221,238 |
|
|
|
17,037,539 |
|
| Dexcom, Inc. (A) |
|
|
26,424 |
|
|
|
2,995,953 |
|
| Medtronic PLC |
|
|
180,997 |
|
|
|
14,246,274 |
|
| Stryker Corp. |
|
|
70,009 |
|
|
|
23,820,562 |
|
|
|
|
|
|
|
|
|
|
|
|
|
|
|
|
|
|
|
|
63,872,980 |
|
|
|
|
|
|
|
|
|
|
|
| Health Care Providers & Services - 2.4% |
|
| Elevance Health, Inc. |
|
|
26,850 |
|
|
|
14,548,941 |
|
| HCA Healthcare, Inc. |
|
|
11,072 |
|
|
|
3,557,212 |
|
| Humana, Inc. |
|
|
20,860 |
|
|
|
7,794,339 |
|
| McKesson Corp. |
|
|
9,007 |
|
|
|
5,260,448 |
|
| UnitedHealth Group, Inc. |
|
|
94,007 |
|
|
|
47,874,005 |
|
|
|
|
|
|
|
|
|
|
|
|
|
|
|
|
|
|
|
|
79,034,945 |
|
|
|
|
|
|
|
|
|
|
|
|
|
| Health Care REITs - 0.6% |
|
|
|
|
|
|
|
|
| Ventas, Inc. |
|
|
210,496 |
|
|
|
10,790,025 |
|
| Welltower, Inc. |
|
|
68,133 |
|
|
|
7,102,865 |
|
|
|
|
|
|
|
|
|
|
|
|
|
|
|
|
|
|
|
|
17,892,890 |
|
|
|
|
|
|
|
|
|
|
|
| Hotels, Restaurants & Leisure - 2.9% |
|
| Booking Holdings, Inc. |
|
|
5,193 |
|
|
|
20,572,069 |
|
| Chipotle Mexican Grill, Inc. (A) |
|
|
257,400 |
|
|
|
16,126,110 |
|
| Expedia Group, Inc. (A) |
|
|
61,297 |
|
|
|
7,722,809 |
|
| Hilton Worldwide Holdings, Inc. |
|
|
40,359 |
|
|
|
8,806,334 |
|
| McDonald’s Corp. |
|
|
55,802 |
|
|
|
14,220,582 |
|
| Royal Caribbean Cruises Ltd. (A) |
|
|
72,619 |
|
|
|
11,577,647 |
|
| Yum! Brands, Inc. |
|
|
112,987 |
|
|
|
14,966,258 |
|
|
|
|
|
|
|
|
|
|
|
|
|
|
|
|
|
|
|
|
93,991,809 |
|
|
|
|
|
|
|
|
|
|
|
|
|
| Household Durables - 0.2% |
|
|
|
|
|
|
|
|
| Lennar Corp., Class A |
|
|
27,745 |
|
|
|
4,158,143 |
|
| Toll Brothers, Inc. |
|
|
29,170 |
|
|
|
3,359,801 |
|
|
|
|
|
|
|
|
|
|
|
|
|
|
|
|
|
|
|
|
7,517,944 |
|
|
|
|
|
|
|
|
|
|
|
| Household Products - 0.5% |
|
| Church & Dwight Co., Inc. |
|
|
35,215 |
|
|
|
3,651,091 |
|
| Procter & Gamble Co. |
|
|
77,475 |
|
|
|
12,777,177 |
|
|
|
|
|
|
|
|
|
|
|
|
|
|
|
|
|
|
|
|
16,428,268 |
|
|
|
|
|
|
|
|
|
|
|
| Independent Power & Renewable Electricity Producers - 0.1% |
|
| Vistra Corp. |
|
|
23,483 |
|
|
|
2,019,068 |
|
|
|
|
|
|
|
|
|
|
|
|
|
| Industrial Conglomerates - 1.0% |
|
|
|
|
|
|
|
|
| Honeywell International, Inc. |
|
|
149,431 |
|
|
|
31,909,496 |
|
|
|
|
|
|
|
|
|
|
|
|
|
| Industrial REITs - 0.6% |
|
|
|
|
|
|
|
|
| Prologis, Inc. |
|
|
160,768 |
|
|
|
18,055,854 |
|
|
|
|
|
|
|
|
|
|
|
|
|
|
|
|
|
|
|
| |
|
Shares |
|
|
Value |
|
| |
|
|
| COMMON STOCKS (continued) |
|
| Insurance - 2.0% |
|
| Aflac, Inc. |
|
|
102,802 |
|
|
$ |
9,181,247 |
|
| Aon PLC, Class A |
|
|
10,675 |
|
|
|
3,133,967 |
|
| MetLife, Inc. |
|
|
123,292 |
|
|
|
8,653,865 |
|
| Principal Financial Group, Inc. |
|
|
79,348 |
|
|
|
6,224,851 |
|
| Progressive Corp. |
|
|
95,619 |
|
|
|
19,861,022 |
|
| Travelers Cos., Inc. |
|
|
85,062 |
|
|
|
17,296,507 |
|
|
|
|
|
|
|
|
|
|
|
|
|
|
|
|
|
|
|
|
64,351,459 |
|
|
|
|
|
|
|
|
|
|
|
|
|
| Interactive Media & Services - 6.8% |
|
|
|
|
|
|
|
|
| Alphabet, Inc., Class A |
|
|
413,179 |
|
|
|
75,260,555 |
|
| Alphabet, Inc., Class C |
|
|
306,733 |
|
|
|
56,260,967 |
|
| Meta Platforms, Inc., Class A |
|
|
176,467 |
|
|
|
88,978,190 |
|
|
|
|
|
|
|
|
|
|
|
|
|
|
|
|
|
|
|
|
220,499,712 |
|
|
|
|
|
|
|
|
|
|
|
|
|
| IT Services - 0.9% |
|
|
|
|
|
|
|
|
| Accenture PLC, Class A |
|
|
53,164 |
|
|
|
16,130,489 |
|
| Cognizant Technology Solutions Corp., Class A |
|
|
190,883 |
|
|
|
12,980,044 |
|
|
|
|
|
|
|
|
|
|
|
|
|
|
|
|
|
|
|
|
29,110,533 |
|
|
|
|
|
|
|
|
|
|
|
| Life Sciences Tools & Services - 1.3% |
|
| Danaher Corp. |
|
|
70,344 |
|
|
|
17,575,448 |
|
| Thermo Fisher Scientific, Inc. |
|
|
47,429 |
|
|
|
26,228,237 |
|
|
|
|
|
|
|
|
|
|
|
|
|
|
|
|
|
|
|
|
43,803,685 |
|
|
|
|
|
|
|
|
|
|
|
|
|
| Machinery - 1.4% |
|
|
|
|
|
|
|
|
| Deere & Co. |
|
|
60,149 |
|
|
|
22,473,471 |
|
| Ingersoll Rand, Inc. |
|
|
58,480 |
|
|
|
5,312,323 |
|
| Otis Worldwide Corp. |
|
|
170,858 |
|
|
|
16,446,791 |
|
|
|
|
|
|
|
|
|
|
|
|
|
|
|
|
|
|
|
|
44,232,585 |
|
|
|
|
|
|
|
|
|
|
|
|
|
| Media - 1.0% |
|
|
|
|
|
|
|
|
| Charter Communications, Inc., Class A (A) |
|
|
21,321 |
|
|
|
6,374,126 |
|
| Comcast Corp., Class A |
|
|
577,142 |
|
|
|
22,600,881 |
|
| Liberty Media Corp. - Liberty SiriusXM, Class A (A) |
|
|
103,539 |
|
|
|
2,293,389 |
|
|
|
|
|
|
|
|
|
|
|
|
|
|
|
|
|
|
|
|
31,268,396 |
|
|
|
|
|
|
|
|
|
|
|
|
|
| Metals & Mining - 0.1% |
|
|
|
|
|
|
|
|
| Nucor Corp. |
|
|
24,994 |
|
|
|
3,951,052 |
|
|
|
|
|
|
|
|
|
|
|
|
|
| Multi-Utilities - 0.2% |
|
|
|
|
|
|
|
|
| CMS Energy Corp. |
|
|
112,832 |
|
|
|
6,716,889 |
|
|
|
|
|
|
|
|
|
|
|
| Oil, Gas & Consumable Fuels - 3.5% |
|
| Chevron Corp. |
|
|
35,188 |
|
|
|
5,504,107 |
|
| ConocoPhillips |
|
|
177,651 |
|
|
|
20,319,721 |
|
| Diamondback Energy, Inc. |
|
|
69,803 |
|
|
|
13,973,863 |
|
| EOG Resources, Inc. |
|
|
154,246 |
|
|
|
19,414,944 |
|
| Exxon Mobil Corp. |
|
|
470,552 |
|
|
|
54,169,946 |
|
|
|
|
|
|
|
|
|
|
|
|
|
|
|
|
|
|
|
|
113,382,581 |
|
|
|
|
|
|
|
|
|
|
|
|
|
| Passenger Airlines - 0.1% |
|
|
|
|
|
|
|
|
| Delta Air Lines, Inc. |
|
|
99,237 |
|
|
|
4,707,803 |
|
|
|
|
|
|
|
|
|
|
|
|
|
| Personal Care Products - 0.3% |
|
|
|
|
|
|
|
|
| Estee Lauder Cos., Inc., Class A |
|
|
27,333 |
|
|
|
2,908,231 |
|
| Kenvue, Inc. |
|
|
343,505 |
|
|
|
6,244,921 |
|
|
|
|
|
|
|
|
|
|
|
|
|
|
|
|
|
|
|
|
9,153,152 |
|
|
|
|
|
|
|
|
|
|
The Notes to Financial Statements are an integral part of this report.
|
|
|
|
|
| Transamerica Series Trust |
|
|
|
Semi-Annual Financial Statements 2024 |
|
|
Page 2 |
|
|
Transamerica JPMorgan Enhanced Index VP
SCHEDULE OF INVESTMENTS (continued)
At June 30, 2024
(unaudited)
|
|
|
|
|
|
|
|
|
| |
|
Shares |
|
|
Value |
|
| |
|
|
| COMMON STOCKS (continued) |
|
| Pharmaceuticals - 3.0% |
|
| Bristol-Myers Squibb Co. |
|
|
396,372 |
|
|
$ |
16,461,329 |
|
| Eli Lilly & Co. |
|
|
49,169 |
|
|
|
44,516,629 |
|
| Johnson & Johnson |
|
|
123,074 |
|
|
|
17,988,496 |
|
| Merck & Co., Inc. |
|
|
148,201 |
|
|
|
18,347,284 |
|
|
|
|
|
|
|
|
|
|
|
|
|
|
|
|
|
|
|
|
97,313,738 |
|
|
|
|
|
|
|
|
|
|
|
|
|
| Professional Services - 0.3% |
|
|
|
|
|
|
|
|
| Leidos Holdings, Inc. |
|
|
71,724 |
|
|
|
10,463,097 |
|
|
|
|
|
|
|
|
|
|
|
|
|
| Residential REITs - 0.2% |
|
|
|
|
|
|
|
|
| Equity LifeStyle Properties, Inc. |
|
|
103,011 |
|
|
|
6,709,106 |
|
|
|
|
|
|
|
|
|
|
|
| Semiconductors & Semiconductor Equipment - 12.1% |
|
| Advanced Micro Devices, Inc. (A) |
|
|
146,468 |
|
|
|
23,758,574 |
|
| Analog Devices, Inc. |
|
|
117,432 |
|
|
|
26,805,028 |
|
| Broadcom, Inc. |
|
|
18,614 |
|
|
|
29,885,335 |
|
| Lam Research Corp. |
|
|
9,887 |
|
|
|
10,528,172 |
|
| Micron Technology, Inc. |
|
|
145,821 |
|
|
|
19,179,836 |
|
| NVIDIA Corp. |
|
|
1,821,335 |
|
|
|
225,007,726 |
|
| NXP Semiconductors NV |
|
|
104,264 |
|
|
|
28,056,400 |
|
| Qorvo, Inc. (A) |
|
|
27,265 |
|
|
|
3,163,831 |
|
| Texas Instruments, Inc. |
|
|
149,824 |
|
|
|
29,145,263 |
|
|
|
|
|
|
|
|
|
|
|
|
|
|
|
|
|
|
|
|
395,530,165 |
|
|
|
|
|
|
|
|
|
|
|
|
|
| Software - 10.5% |
|
|
|
|
|
|
|
|
| Adobe, Inc. (A) |
|
|
10,453 |
|
|
|
5,807,060 |
|
| Cadence Design Systems, Inc. (A) |
|
|
18,836 |
|
|
|
5,796,779 |
|
| Intuit, Inc. |
|
|
34,224 |
|
|
|
22,492,355 |
|
| Microsoft Corp. |
|
|
568,629 |
|
|
|
254,148,732 |
|
| Salesforce, Inc. |
|
|
103,683 |
|
|
|
26,656,899 |
|
| ServiceNow, Inc. (A) |
|
|
36,048 |
|
|
|
28,357,880 |
|
|
|
|
|
|
|
|
|
|
|
|
|
|
|
|
|
|
|
|
343,259,705 |
|
|
|
|
|
|
|
|
|
|
|
|
|
| Specialized REITs - 0.6% |
|
|
|
|
|
|
|
|
| Digital Realty Trust, Inc. |
|
|
75,825 |
|
|
|
11,529,191 |
|
| SBA Communications Corp. |
|
|
47,948 |
|
|
|
9,412,193 |
|
|
|
|
|
|
|
|
|
|
|
|
|
|
|
|
|
|
|
|
20,941,384 |
|
|
|
|
|
|
|
|
|
|
|
|
|
| Specialty Retail - 2.7% |
|
|
|
|
|
|
|
|
| AutoNation, Inc. (A) |
|
|
4,165 |
|
|
|
663,818 |
|
| AutoZone, Inc. (A) |
|
|
7,779 |
|
|
|
23,057,734 |
|
| Best Buy Co., Inc. |
|
|
81,614 |
|
|
|
6,879,244 |
|
| Burlington Stores, Inc. (A) |
|
|
30,739 |
|
|
|
7,377,360 |
|
|
|
|
|
|
|
|
|
|
| |
|
Shares |
|
|
Value |
|
| |
|
|
| COMMON STOCKS (continued) |
|
| Specialty Retail (continued) |
|
| Lowe’s Cos., Inc. |
|
|
133,163 |
|
|
$ |
29,357,115 |
|
| O’Reilly Automotive, Inc.(A) |
|
|
4,791 |
|
|
|
5,059,583 |
|
| Ross Stores, Inc. |
|
|
73,856 |
|
|
|
10,732,754 |
|
| TJX Cos., Inc. |
|
|
36,425 |
|
|
|
4,010,393 |
|
|
|
|
|
|
|
|
|
|
|
|
|
|
|
|
|
|
|
|
87,138,001 |
|
|
|
|
|
|
|
|
|
|
|
| Technology Hardware, Storage & Peripherals - 7.5% |
|
| Apple, Inc. |
|
|
1,041,968 |
|
|
|
219,459,300 |
|
| Hewlett Packard Enterprise Co. |
|
|
321,523 |
|
|
|
6,806,642 |
|
| Seagate Technology Holdings PLC |
|
|
153,830 |
|
|
|
15,886,024 |
|
| Western Digital Corp.(A) |
|
|
39,553 |
|
|
|
2,996,931 |
|
|
|
|
|
|
|
|
|
|
|
|
|
|
|
|
|
|
|
|
245,148,897 |
|
|
|
|
|
|
|
|
|
|
|
|
|
| Tobacco - 0.4% |
|
|
|
|
|
|
|
|
| Altria Group, Inc. |
|
|
93,832 |
|
|
|
4,274,047 |
|
| Philip Morris International, Inc. |
|
|
84,784 |
|
|
|
8,591,163 |
|
|
|
|
|
|
|
|
|
|
|
|
|
|
|
|
|
|
|
|
12,865,210 |
|
|
|
|
|
|
|
|
|
|
|
| Trading Companies & Distributors - 0.2% |
|
| United Rentals, Inc. |
|
|
9,233 |
|
|
|
5,971,258 |
|
|
|
|
|
|
|
|
|
|
|
| Wireless Telecommunication Services - 0.3% |
|
| T-Mobile US, Inc. |
|
|
58,546 |
|
|
|
10,314,634 |
|
|
|
|
|
|
|
|
|
|
|
|
|
| Total Common Stocks
(Cost $2,268,859,614) |
|
|
|
|
|
|
3,172,713,724 |
|
|
|
|
|
|
|
|
|
|
|
|
|
|
|
|
Principal |
|
|
|
Value |
|
| |
|
|
| REPURCHASE AGREEMENT - 2.0% |
|
| Fixed Income Clearing Corp.,
2.50% (B), dated 06/28/2024, to be repurchased at $66,786,487 on 07/01/2024. Collateralized by a U.S. Government Obligation, 4.50%, due 03/31/2026, and with a value of $68,108,114. |
|
$ |
66,772,576 |
|
|
|
66,772,576 |
|
|
|
|
|
|
|
|
|
|
|
|
| Total Repurchase Agreement
(Cost $66,772,576) |
|
|
|
66,772,576 |
|
|
|
|
|
|
|
|
|
|
|
|
| Total Investments
(Cost $2,335,632,190) |
|
|
|
3,239,486,300 |
|
|
|
|
|
|
|
|
|
|
| Net Other Assets (Liabilities) - 0.8% |
|
|
|
25,561,173 |
|
|
|
|
|
|
|
|
|
|
|
|
| Net Assets - 100.0% |
|
|
$ |
3,265,047,473 |
|
|
|
|
|
|
|
|
|
|
FUTURES CONTRACTS:
|
|
|
|
|
|
|
|
|
|
|
|
|
|
| Long Futures Contracts |
| Description |
|
Number of Contracts |
|
Expiration Date |
|
Notional Amount |
|
Value |
|
Unrealized Appreciation |
|
Unrealized Depreciation |
| S&P 500® E-Mini Index |
|
322 |
|
09/20/2024 |
|
$88,880,196 |
|
$88,896,150 |
|
$15,954 |
|
$— |
The Notes to Financial Statements are an integral part of this report.
|
|
|
|
|
| Transamerica Series Trust |
|
|
|
Semi-Annual Financial Statements 2024 |
|
|
Page 3 |
|
|
Transamerica JPMorgan Enhanced Index VP
SCHEDULE OF INVESTMENTS (continued)
At June 30, 2024
(unaudited)
|
|
|
|
|
|
|
|
|
|
|
|
|
|
|
|
|
| INVESTMENT VALUATION: |
|
| |
|
|
| Valuation Inputs (C) |
|
|
|
|
|
|
| |
|
Level 1 - Unadjusted Quoted Prices |
|
|
Level 2 - Other Significant Observable Inputs |
|
|
Level 3 - Significant Unobservable Inputs |
|
|
Value |
|
| |
|
|
|
|
|
|
| ASSETS |
|
|
|
|
|
|
|
|
|
|
|
|
|
|
|
|
| Investments |
|
|
|
|
|
|
|
|
|
|
|
|
|
|
|
|
| Common Stocks |
|
$ |
3,172,713,724 |
|
|
$ |
— |
|
|
$ |
— |
|
|
$ |
3,172,713,724 |
|
| Repurchase Agreement |
|
|
— |
|
|
|
66,772,576 |
|
|
|
— |
|
|
|
66,772,576 |
|
|
|
|
|
|
|
|
|
|
|
|
|
|
|
|
|
|
|
|
|
|
|
| Total Investments |
|
$ |
3,172,713,724 |
|
|
$ |
66,772,576 |
|
|
$ |
— |
|
|
$ |
3,239,486,300 |
|
|
|
|
|
|
|
|
|
|
|
|
|
|
|
|
|
|
|
|
|
|
|
| Other Financial Instruments |
|
|
|
|
|
|
|
|
|
|
|
|
|
|
|
|
| Futures Contracts (D) |
|
$ |
15,954 |
|
|
$ |
— |
|
|
$ |
— |
|
|
$ |
15,954 |
|
|
|
|
|
|
|
|
|
|
|
|
|
|
|
|
|
|
|
|
|
|
|
| Total Other Financial Instruments |
|
$ |
15,954 |
|
|
$ |
— |
|
|
$ |
— |
|
|
$ |
15,954 |
|
|
|
|
|
|
|
|
|
|
|
|
|
|
|
|
|
|
FOOTNOTES TO SCHEDULE OF INVESTMENTS:
| (A) |
Non-income producing security. |
| (B) |
Rate disclosed reflects the yield at June 30, 2024. |
| (C) |
There were no transfers in or out of Level 3 during the period ended June 30, 2024. Please reference the Investment Valuation section of the Notes to Financial Statements for more information regarding investment valuation and pricing inputs. |
| (D) |
Derivative instruments are valued at unrealized appreciation (depreciation). |
PORTFOLIO ABBREVIATION(S):
REIT Real Estate Investment Trust
The Notes to Financial Statements are an integral part of this report.
|
|
|
|
|
| Transamerica Series Trust |
|
|
|
Semi-Annual Financial Statements 2024 |
|
|
Page 4 |
|
|
Transamerica JPMorgan Enhanced Index VP
|
|
|
| STATEMENT OF ASSETS AND LIABILITIES At June 30, 2024 (unaudited) |
|
STATEMENT OF OPERATIONS For the period ended June 30, 2024 (unaudited) |
|
|
|
|
|
|
|
| Assets: |
|
|
|
|
| Investments, at value (cost $2,268,859,614) |
|
$ |
3,172,713,724 |
|
| Repurchase agreement, at value (cost $66,772,576) |
|
|
66,772,576 |
|
| Cash collateral pledged at broker for: |
|
|
|
|
| Futures contracts |
|
|
2,877,000 |
|
| Receivables and other assets: |
|
|
|
|
| Investments sold |
|
|
2,236,227 |
|
| Shares of beneficial interest sold |
|
|
23,011,927 |
|
| Dividends |
|
|
1,858,293 |
|
| Interest |
|
|
13,911 |
|
| Prepaid expenses |
|
|
11,472 |
|
|
|
| Total assets |
|
|
3,269,495,130 |
|
|
|
| Liabilities: |
|
|
|
|
| Payables and other liabilities: |
|
|
|
|
| Investments purchased |
|
|
2,244,551 |
|
| Shares of beneficial interest redeemed |
|
|
291,606 |
|
| Investment management fees |
|
|
1,382,492 |
|
| Distribution and service fees |
|
|
28,532 |
|
| Transfer agent costs |
|
|
1,376 |
|
| Trustee and CCO fees |
|
|
3,801 |
|
| Audit and tax fees |
|
|
22,957 |
|
| Custody fees |
|
|
72,776 |
|
| Legal fees |
|
|
35,129 |
|
| Printing and shareholder reports fees |
|
|
17,931 |
|
| Other accrued expenses |
|
|
45,701 |
|
| Variation margin payable on futures contracts |
|
|
300,805 |
|
|
|
| Total liabilities |
|
|
4,447,657 |
|
|
|
| Net assets |
|
$ |
3,265,047,473 |
|
|
|
| Net assets consist of: |
|
|
|
|
| Capital stock ($0.01 par value) |
|
$ |
1,176,748 |
|
| Additional paid-in capital |
|
|
2,088,743,331 |
|
| Total distributable earnings (accumulated losses) |
|
|
1,175,127,394 |
|
|
|
| Net assets |
|
$ |
3,265,047,473 |
|
|
|
| Net assets by class: |
|
|
|
|
| Initial Class |
|
$ |
3,112,473,284 |
|
| Service Class |
|
|
152,574,189 |
|
|
|
| Shares outstanding: |
|
|
|
|
| Initial Class |
|
|
112,135,329 |
|
| Service Class |
|
|
5,539,519 |
|
|
|
| Net asset value and offering price per share: |
|
|
|
|
| Initial Class |
|
$ |
27.76 |
|
| Service Class |
|
|
27.54 |
|
|
|
|
|
|
|
|
| Investment income: |
|
|
|
|
| Dividend income |
|
$ |
18,551,987 |
|
| Interest income |
|
|
690,510 |
|
| Withholding taxes on foreign income |
|
|
(30,222 |
) |
|
|
| Total investment income |
|
|
19,212,275 |
|
|
|
| Expenses: |
|
|
|
|
| Investment management fees |
|
|
8,129,983 |
|
| Distribution and service fees: |
|
|
|
|
| Service Class |
|
|
173,727 |
|
| Transfer agent costs |
|
|
14,601 |
|
| Trustee and CCO fees |
|
|
62,368 |
|
| Audit and tax fees |
|
|
22,530 |
|
| Custody fees |
|
|
74,690 |
|
| Legal fees |
|
|
90,849 |
|
| Printing and shareholder reports fees |
|
|
20,088 |
|
| Other |
|
|
69,424 |
|
|
|
| Total expenses |
|
|
8,658,260 |
|
|
|
| Net investment income (loss) |
|
|
10,554,015 |
|
|
|
| Net realized gain (loss) on: |
|
|
|
|
| Investments |
|
|
137,587,051 |
|
| Futures contracts |
|
|
5,113,884 |
|
|
|
| Net realized gain (loss) |
|
|
142,700,935 |
|
|
|
| Net change in unrealized appreciation (depreciation) on: |
|
|
|
|
| Investments |
|
|
269,883,024 |
|
| Futures contracts |
|
|
(1,251,411 |
) |
|
|
| Net change in unrealized appreciation (depreciation) |
|
|
268,631,613 |
|
|
|
| Net realized and change in unrealized gain (loss) |
|
|
411,332,548 |
|
|
|
| Net increase (decrease) in net assets resulting from operations |
|
$ |
421,886,563 |
|
The Notes to Financial Statements are an integral part of this report.
|
|
|
|
|
| Transamerica Series Trust |
|
|
|
Semi-Annual Financial Statements 2024 |
|
|
Page 5 |
|
|
Transamerica JPMorgan Enhanced Index VP
STATEMENT OF CHANGES IN NET ASSETS
For the period and year ended:
|
|
|
|
|
|
|
|
|
| |
|
June 30, 2024 (unaudited) |
|
|
December 31, 2023 |
| From operations: |
|
|
|
|
|
|
|
|
| Net investment income (loss) |
|
$ |
10,554,015 |
|
|
|
$ 20,806,808 |
|
| Net realized gain (loss) |
|
|
142,700,935 |
|
|
|
102,669,416 |
|
| Net change in unrealized appreciation (depreciation) |
|
|
268,631,613 |
|
|
|
440,357,390 |
|
|
|
|
| Net increase (decrease) in net assets resulting from operations |
|
|
421,886,563 |
|
|
|
563,833,614 |
|
|
|
|
| Dividends and/or distributions to shareholders: |
|
|
|
|
|
|
|
|
| Initial Class |
|
|
— |
|
|
|
(118,041,478 |
) |
| Service Class |
|
|
— |
|
|
|
(6,321,597 |
) |
|
|
|
| Net increase (decrease) in net assets resulting from dividends and/or distributions to shareholders |
|
|
— |
|
|
|
(124,363,075 |
) |
|
|
|
| Capital share transactions: |
|
|
|
|
|
|
|
|
| Proceeds from shares sold: |
|
|
|
|
|
|
|
|
| Initial Class |
|
|
447,381,128 |
|
|
|
250,909,778 |
|
| Service Class |
|
|
13,511,168 |
|
|
|
21,863,507 |
|
| |
|
|
460,892,296 |
|
|
|
272,773,285 |
|
| Dividends and/or distributions reinvested: |
|
|
|
|
|
|
|
|
| Initial Class |
|
|
— |
|
|
|
118,041,478 |
|
| Service Class |
|
|
— |
|
|
|
6,321,597 |
|
| |
|
|
— |
|
|
|
124,363,075 |
|
| Cost of shares redeemed: |
|
|
|
|
|
|
|
|
| Initial Class |
|
|
(184,136,297 |
) |
|
|
(191,870,792 |
) |
| Service Class |
|
|
(14,535,006 |
) |
|
|
(18,470,301 |
) |
|
|
|
| |
|
|
(198,671,303 |
) |
|
|
(210,341,093 |
) |
|
|
|
| Net increase (decrease) in net assets resulting from capital share transactions |
|
|
262,220,993 |
|
|
|
186,795,267 |
|
|
|
|
| Net increase (decrease) in net assets |
|
|
684,107,556 |
|
|
|
626,265,806 |
|
|
|
|
| Net assets: |
|
|
|
|
|
|
|
|
| Beginning of period/year |
|
|
2,580,939,917 |
|
|
|
1,954,674,111 |
|
| End of period/year |
|
$ |
3,265,047,473 |
|
|
|
$2,580,939,917 |
|
|
|
|
| Capital share transactions - shares: |
|
|
|
|
|
|
|
|
| Shares issued: |
|
|
|
|
|
|
|
|
| Initial Class |
|
|
16,988,826 |
|
|
|
11,661,753 |
|
| Service Class |
|
|
521,640 |
|
|
|
988,649 |
|
| |
|
|
17,510,466 |
|
|
|
12,650,402 |
|
| Shares reinvested: |
|
|
|
|
|
|
|
|
| Initial Class |
|
|
— |
|
|
|
5,265,008 |
|
| Service Class |
|
|
— |
|
|
|
283,607 |
|
| |
|
|
— |
|
|
|
5,548,615 |
|
| Shares redeemed: |
|
|
|
|
|
|
|
|
| Initial Class |
|
|
(7,234,853 |
) |
|
|
(8,289,282 |
) |
| Service Class |
|
|
(566,137 |
) |
|
|
(864,337 |
) |
| |
|
|
(7,800,990 |
) |
|
|
(9,153,619 |
) |
|
|
|
| Net increase (decrease) in shares outstanding: |
|
|
|
|
|
|
|
|
| Initial Class |
|
|
9,753,973 |
|
|
|
8,637,479 |
|
| Service Class |
|
|
(44,497 |
) |
|
|
407,919 |
|
| |
|
|
9,709,476 |
|
|
|
9,045,398 |
|
The Notes to Financial Statements are an integral part of this report.
|
|
|
|
|
| Transamerica Series Trust |
|
|
|
Semi-Annual Financial Statements 2024 |
|
|
Page 6 |
|
|
Transamerica JPMorgan Enhanced Index VP
FINANCIAL HIGHLIGHTS
|
|
|
|
|
|
|
|
|
|
|
|
|
|
|
|
|
|
|
|
|
|
|
|
|
| For a share outstanding during the period and years indicated: |
|
Initial Class |
|
|
|
|
|
|
|
| |
|
June 30, 2024 (unaudited) |
|
December 31, 2023 |
|
December 31, 2022 |
|
December 31, 2021 |
|
December 31, 2020 |
|
December 31, 2019 |
|
|
|
|
|
|
|
| Net asset value, beginning of period/year |
|
$ |
23.91 |
|
|
$ |
19.77 |
|
|
$ |
27.67 |
|
|
$ |
24.07 |
|
|
$ |
22.01 |
|
|
$ |
19.30 |
|
|
|
|
|
|
|
|
| Investment operations: |
|
|
|
|
|
|
|
|
|
|
|
|
|
|
|
|
|
|
|
|
|
|
|
|
|
|
|
|
|
|
|
| Net investment income (loss)(A) |
|
|
0.10 |
|
|
|
0.20 |
|
|
|
0.21 |
|
|
|
0.18 |
|
|
|
0.22 |
|
|
|
0.23 |
|
|
|
|
|
|
|
|
| Net realized and unrealized gain (loss) |
|
|
3.75 |
|
|
|
5.18 |
|
|
|
(5.08 |
) |
|
|
6.83 |
|
|
|
3.98 |
|
|
|
5.41 |
|
|
|
|
|
|
|
|
| Total investment operations |
|
|
3.85 |
|
|
|
5.38 |
|
|
|
(4.87 |
) |
|
|
7.01 |
|
|
|
4.20 |
|
|
|
5.64 |
|
|
|
|
|
|
|
|
| Dividends and/or distributions to shareholders: |
|
|
|
|
|
|
|
|
|
|
|
|
|
|
|
|
|
|
|
|
|
|
|
|
|
|
|
|
|
|
|
| Net investment income |
|
|
— |
|
|
|
(0.18 |
) |
|
|
(0.16 |
) |
|
|
(0.22 |
) |
|
|
(0.33 |
) |
|
|
(0.27 |
) |
|
|
|
|
|
|
|
| Net realized gains |
|
|
— |
|
|
|
(1.06 |
) |
|
|
(2.87 |
) |
|
|
(3.19 |
) |
|
|
(1.81 |
) |
|
|
(2.66 |
) |
|
|
|
|
|
|
|
| Total dividends and/or distributions to shareholders |
|
|
— |
|
|
|
(1.24 |
) |
|
|
(3.03 |
) |
|
|
(3.41 |
) |
|
|
(2.14 |
) |
|
|
(2.93 |
) |
|
|
|
|
|
|
|
| Net asset value, end of period/year |
|
$ |
27.76 |
|
|
$ |
23.91 |
|
|
$ |
19.77 |
|
|
$ |
27.67 |
|
|
$ |
24.07 |
|
|
$ |
22.01 |
|
| |
|
|
|
|
|
|
|
|
|
|
|
|
|
|
|
|
|
|
|
|
|
|
|
|
|
|
|
|
|
|
|
| Total return |
|
|
16.10 |
%(B) |
|
|
27.66 |
% |
|
|
(18.35 |
)% |
|
|
30.12 |
% |
|
|
20.16 |
% |
|
|
31.03 |
% |
|
|
|
|
|
|
|
| Ratio and supplemental data: |
|
|
|
|
|
|
|
|
|
|
|
|
|
|
|
|
|
|
|
|
|
|
|
|
|
|
|
|
|
|
|
| Net assets end of period/year (000’s) |
|
$ |
3,112,473 |
|
|
$ |
2,448,269 |
|
|
$ |
1,852,968 |
|
|
$ |
2,105,664 |
|
|
$ |
1,529,426 |
|
|
$ |
2,060,400 |
|
|
|
|
|
|
|
|
| Expenses to average net assets |
|
|
0.61 |
%(C) |
|
|
0.62 |
% |
|
|
0.62 |
% |
|
|
0.62 |
% |
|
|
0.65 |
% |
|
|
0.69 |
% |
|
|
|
|
|
|
|
| Net investment income (loss) to average net assets |
|
|
0.77 |
%(C) |
|
|
0.93 |
% |
|
|
0.91 |
% |
|
|
0.68 |
% |
|
|
1.03 |
% |
|
|
1.08 |
% |
|
|
|
|
|
|
|
| Portfolio turnover rate |
|
|
20 |
%(B) |
|
|
30 |
% |
|
|
33 |
% |
|
|
40 |
% |
|
|
45 |
% |
|
|
39 |
% |
| (A) |
Calculated based on average number of shares outstanding. |
|
|
|
|
|
|
|
|
|
|
|
|
|
|
|
|
|
|
|
|
|
|
|
|
|
| For a share outstanding during the period and years indicated: |
|
Service Class |
|
|
|
|
|
|
|
| |
|
June 30, 2024 (unaudited) |
|
December 31, 2023 |
|
December 31, 2022 |
|
December 31, 2021 |
|
December 31, 2020 |
|
December 31, 2019 |
|
|
|
|
|
|
|
| Net asset value, beginning of period/year |
|
$ |
23.76 |
|
|
$ |
19.65 |
|
|
$ |
27.51 |
|
|
$ |
23.96 |
|
|
$ |
21.93 |
|
|
$ |
19.24 |
|
|
|
|
|
|
|
|
| Investment operations: |
|
|
|
|
|
|
|
|
|
|
|
|
|
|
|
|
|
|
|
|
|
|
|
|
|
|
|
|
|
|
|
| Net investment income (loss)(A) |
|
|
0.06 |
|
|
|
0.15 |
|
|
|
0.15 |
|
|
|
0.11 |
|
|
|
0.17 |
|
|
|
0.18 |
|
|
|
|
|
|
|
|
| Net realized and unrealized gain (loss) |
|
|
3.72 |
|
|
|
5.15 |
|
|
|
(5.04 |
) |
|
|
6.79 |
|
|
|
3.95 |
|
|
|
5.39 |
|
|
|
|
|
|
|
|
| Total investment operations |
|
|
3.78 |
|
|
|
5.30 |
|
|
|
(4.89 |
) |
|
|
6.90 |
|
|
|
4.12 |
|
|
|
5.57 |
|
|
|
|
|
|
|
|
| Dividends and/or distributions to shareholders: |
|
|
|
|
|
|
|
|
|
|
|
|
|
|
|
|
|
|
|
|
|
|
|
|
|
|
|
|
|
|
|
| Net investment income |
|
|
— |
|
|
|
(0.13 |
) |
|
|
(0.10 |
) |
|
|
(0.16 |
) |
|
|
(0.28 |
) |
|
|
(0.22 |
) |
|
|
|
|
|
|
|
| Net realized gains |
|
|
— |
|
|
|
(1.06 |
) |
|
|
(2.87 |
) |
|
|
(3.19 |
) |
|
|
(1.81 |
) |
|
|
(2.66 |
) |
|
|
|
|
|
|
|
| Total dividends and/or distributions to shareholders |
|
|
— |
|
|
|
(1.19 |
) |
|
|
(2.97 |
) |
|
|
(3.35 |
) |
|
|
(2.09 |
) |
|
|
(2.88 |
) |
|
|
|
|
|
|
|
| Net asset value, end of period/year |
|
$ |
27.54 |
|
|
$ |
23.76 |
|
|
$ |
19.65 |
|
|
$ |
27.51 |
|
|
$ |
23.96 |
|
|
$ |
21.93 |
|
| |
|
|
|
|
|
|
|
|
|
|
|
|
|
|
|
|
|
|
|
|
|
|
|
|
|
|
|
|
|
|
|
| Total return |
|
|
15.91 |
%(B) |
|
|
27.39 |
% |
|
|
(18.55 |
)% |
|
|
29.79 |
% |
|
|
19.86 |
% |
|
|
30.69 |
% |
|
|
|
|
|
|
|
| Ratio and supplemental data: |
|
|
|
|
|
|
|
|
|
|
|
|
|
|
|
|
|
|
|
|
|
|
|
|
|
|
|
|
|
|
|
| Net assets end of period/year (000’s) |
|
$ |
152,574 |
|
|
$ |
132,671 |
|
|
$ |
101,706 |
|
|
$ |
135,501 |
|
|
$ |
114,372 |
|
|
$ |
92,928 |
|
|
|
|
|
|
|
|
| Expenses to average net assets |
|
|
0.86 |
%(C) |
|
|
0.87 |
% |
|
|
0.87 |
% |
|
|
0.87 |
% |
|
|
0.90 |
% |
|
|
0.94 |
% |
|
|
|
|
|
|
|
| Net investment income (loss) to average net assets |
|
|
0.51 |
%(C) |
|
|
0.68 |
% |
|
|
0.65 |
% |
|
|
0.43 |
% |
|
|
0.77 |
% |
|
|
0.83 |
% |
|
|
|
|
|
|
|
| Portfolio turnover rate |
|
|
20 |
%(B) |
|
|
30 |
% |
|
|
33 |
% |
|
|
40 |
% |
|
|
45 |
% |
|
|
39 |
% |
| (A) |
Calculated based on average number of shares outstanding. |
The Notes to Financial Statements are an integral part of this report.
|
|
|
|
|
| Transamerica Series Trust |
|
|
|
Semi-Annual Financial Statements 2024 |
|
|
Page 7 |
|
|
Transamerica JPMorgan Enhanced Index VP
NOTES TO FINANCIAL STATEMENTS
At June 30, 2024
(unaudited)
1. ORGANIZATION
Transamerica Series Trust (“TST”) is an open-end management investment company registered under the Investment Company Act of 1940, as amended (the “1940 Act”). TST applies investment company accounting and reporting guidance. TST serves as a funding vehicle for variable life insurance, variable annuity, and group annuity products. Transamerica JPMorgan Enhanced Index VP (the “Portfolio”) is a series of TST and is classified as diversified under the 1940 Act. The Portfolio currently offers two classes of shares, Initial Class and Service Class.
The only shareholders of the Portfolio are affiliated insurance company separate accounts and/or affiliated asset allocation portfolios. Contract holders of the variable life and annuity contracts are not shareholders of the Portfolio. For ease of reference, shareholders and contract holders are collectively referred to in this report as “shareholders.”
This report must be accompanied or preceded by the Portfolio’s current prospectus, which contains additional information about the Portfolio, including risks, as well as investment objectives and strategies.
Transamerica Asset Management, Inc. (“TAM”) serves as investment manager for the Portfolio pursuant to an investment management agreement. TAM provides continuous and regular investment management services to the Portfolio. TAM supervises the Portfolio’s investments, conducts its investment program and provides supervisory, compliance and administrative services to the Portfolio.
TAM currently acts as a “manager of managers” and has hired sub-advisers to furnish day-to-day investment advice and recommendations. TAM may, in the future, determine to provide all aspects of the day-to-day management of the Portfolio without the use of a sub-adviser. When acting as a manager of managers, TAM provides investment management services that include, without limitation, the design and development of the Portfolio and its investment strategies and the ongoing review and evaluation of those investment strategies including recommending changes in strategy where it believes appropriate or advisable; the selection of one or more sub-advisers for the Portfolio employing a combination of quantitative and qualitative screens, research, analysis and due diligence; negotiation of sub-advisory agreements and fees; oversight and monitoring of sub-advisers and recommending changes to sub-advisers where it believes appropriate or advisable; recommending portfolio combinations and liquidations where it believes appropriate or advisable; selection and oversight of transition managers, as needed; regular supervision of the Portfolio’s investments; regular review and evaluation of sub-adviser performance; daily monitoring of the sub-advisers’ buying and selling of securities for the Portfolio; regular review of holdings; ongoing trade oversight and analysis; regular monitoring to ensure adherence to investment process; regular calls and periodic on-site visits with sub-advisers; portfolio construction and asset allocation when using multiple sub-advisers for the Portfolio; risk management oversight and analysis; oversight of negotiation of investment documentation and agreements; design, development, implementation and regular monitoring of the valuation process; periodic due diligence reviews of pricing vendors and vendor methodology; design, development, implementation and regular monitoring of the compliance process; respond to regulatory inquiries and determine appropriate litigation strategy, as needed; review of proxies voted by sub-advisers; oversight of preparation and review of materials for meetings of the Portfolio’s Board of Trustees (the “Board”), participation in these meetings and preparation of regular communications with the Board; oversight of preparation and review of prospectuses, shareholder reports and other disclosure materials and regulatory filings for the Portfolio; oversight of other service providers to the Portfolio, such as the custodian, the transfer agent, the Portfolio’s independent accounting firm and legal counsel; supervision of the performance of recordkeeping and shareholder relations functions for the Portfolio; and oversight of cash management services. TAM uses a variety of quantitative and qualitative tools to carry out its investment management services. TAM, not the Portfolio, is responsible for paying the sub-adviser(s) for their services, and sub-advisory fees are TAM’s expense.
TAM’s investment management services also include the provision of supervisory and administrative services to the Portfolio. These services include performing certain administrative services for the Portfolio and supervising and overseeing the administrative, clerical, recordkeeping and bookkeeping services provided to the Portfolio by State Street Bank and Trust Company (“State Street”), to whom TAM has outsourced the provision of certain sub-administration services. To the extent agreed upon by TAM and the Portfolio from time to time, TAM’s supervisory and administrative services include, but are not limited to: monitoring and verifying the custodian’s daily calculation of the Net Asset Values (“NAV”); shareholder relations functions; compliance services; valuation services; assisting in due diligence and in the oversight and monitoring of certain activities of sub-advisers and certain aspects of Portfolio investments; assisting with Portfolio combinations and liquidations; oversight of the preparation and filing, and review, of all returns and reports, in connection with federal, state and local taxes; oversight and review of regulatory reporting; supervising and coordinating the Portfolio’s custodian and dividend disbursing agent and monitoring their services to the Portfolio; assisting the Portfolio in preparing reports to shareholders; acting as liaison with the Portfolio’s independent public accountants and providing, upon request, analyses, fiscal year summaries and other audit related services; assisting in the preparation of agendas and supporting documents for and minutes of meetings of trustees and committees of trustees; assisting in the preparation of regular communications with the trustees; and providing personnel and office space, telephones and other office equipment as necessary in order for TAM to perform supervisory and administrative services to the Portfolio. The Portfolio
|
|
|
|
|
| Transamerica Series Trust |
|
|
|
Semi-Annual Financial Statements 2024 |
|
|
Page 8 |
|
|
Transamerica JPMorgan Enhanced Index VP
NOTES TO FINANCIAL STATEMENTS (continued)
At June 30, 2024
(unaudited)
1. ORGANIZATION (continued)
pays certain fees and expenses to State Street for sub-administration services which are not administrative services covered by the management agreement with TAM or paid for through the management fees payable thereunder. For the period ended June 30, 2024, (i) the expenses paid to State Street for sub-administration services by the Portfolio are shown as a part of Other expenses within the Statement of Operations and (ii) the expenses payable to State Street for sub-administration services from the Portfolio are shown as part of Other accrued expenses within the Statement of Assets and Liabilities.
2. SIGNIFICANT ACCOUNTING POLICIES
In preparing the Portfolio’s financial statements in accordance with Generally Accepted Accounting Principles in the United States of America (“GAAP”), estimates or assumptions (which could differ from actual results) may be used that affect reported amounts and disclosures. The following is a summary of significant accounting policies followed by the Portfolio.
Security transactions and investment income: Security transactions are accounted for on the trade date. Security gains and losses are calculated on a first-in, first-out basis. Dividend income, if any, is recorded on the ex-dividend date or, in the case of foreign securities, as soon as the Portfolio is informed of the ex-dividend dates, net of foreign taxes. Non-cash dividends, if any, are recorded on the ex-dividend date at fair value. Interest income, if any, is recorded on the accrual basis from settlement date, net of foreign taxes. Fixed income premiums and discounts are amortized and/or accreted over the lives of the respective securities.
Multiple class operations, income, and expenses: Income, non-class specific expenses, and realized and unrealized gains and losses are allocated to each class daily based upon net assets. Each class bears its own specific expenses in addition to the allocated non-class specific expenses.
Distributions to shareholders: Distributions are recorded on the ex-dividend date and are determined in accordance with federal income tax regulations, which may differ from GAAP.
Foreign taxes: The Portfolio may be subject to taxes imposed by the countries in which it invests, with respect to its investments in issuers existing or operating in such countries. The Portfolio may also be subject to foreign taxes on income, gains on investments, or currency repatriation, a portion of which may be recoverable. The Portfolio accrues such taxes and recoveries as applicable when the related income or capital gains are earned or unrealized, and based upon the current interpretation of tax rules and regulations that exist in the markets in which the Portfolio invests. Some countries require governmental approval for the repatriation of investment income, capital, or the proceeds of sales earned by foreign investors. In addition, if there is deterioration in a country’s balance of payments or for other reasons, a country may impose temporary restrictions of foreign capital remittances abroad.
Commission recapture: The sub-adviser(s), to the extent consistent with the best execution and usual commission rate policies and practices, may elect to place security transactions of the Portfolio with broker/dealers with which TST has established a commission recapture program. A commission recapture program is any arrangement under which a broker/dealer applies a portion of the commissions received by such broker/dealer on the security transactions to the Portfolio. In no event will commissions, paid by the Portfolio, be used to pay expenses that would otherwise be borne by any other Portfolios within TST, or by any other party.
Commissions recaptured are included within Net realized gain (loss) within the Statement of Operations. For the period ended June 30, 2024, commissions recaptured are $10,339.
Indemnification: In the normal course of business, the Portfolio enters into contracts that contain a variety of representations that provide general indemnifications. The Portfolio’s maximum exposure under these arrangements is unknown, as this would involve future claims that may be made against the Portfolio and/or its affiliates that have not yet occurred. However, based on experience, the Portfolio expects the risk of loss to be remote.
3. INVESTMENT VALUATION
TAM has been designated as the Portfolio’s valuation designee pursuant to Rule 2a-5 under the 1940 Act with responsibility for fair valuation subject to oversight by the Portfolio’s Board of Trustees. The net asset value of the Portfolio is computed as of the official close of the New York Stock Exchange (“NYSE”) each day the NYSE is open for business.
TAM utilizes various methods to measure the fair value of its investments on a recurring basis. GAAP establishes a hierarchy that prioritizes inputs to valuation methods. The inputs or methodology used for valuing securities are not necessarily an indication of the risk associated with investing in those securities. The three levels (“Levels”) of inputs of the fair value hierarchy are defined as follows:
|
|
|
|
|
| Transamerica Series Trust |
|
|
|
Semi-Annual Financial Statements 2024 |
|
|
Page 9 |
|
|
Transamerica JPMorgan Enhanced Index VP
NOTES TO FINANCIAL STATEMENTS (continued)
At June 30, 2024
(unaudited)
3. INVESTMENT VALUATION (continued)
Level 1—Unadjusted quoted prices in active markets for identical securities.
Level 2—Inputs, other than quoted prices included in Level 1, which are observable, either directly or indirectly. These inputs may include quoted prices for the identical instrument on an inactive market, prices for similar instruments, interest rates, prepayment speeds, credit risk, yield curves, default rates, and similar data.
Level 3—Unobservable inputs based on the best information available in the circumstances, to the extent observable inputs are not available, which may include TAM’s own assumptions used in determining the fair value of the Portfolio’s investments and derivative instruments.
The inputs used to measure fair value may fall into different Levels of the fair value hierarchy. In such cases, for disclosure purposes, the Level in the fair value hierarchy that is assigned to the fair value measurement of a security is determined based on the lowest Level input that is significant to the fair value measurement in its entirety. Certain investments that are measured at fair value using NAV per share, or its equivalent, using the “practical expedient” have not been classified in the fair value Levels. The hierarchy classification of inputs used to value the Portfolio’s investments at June 30, 2024, is disclosed within the Investment Valuation section of the Schedule of Investments.
The availability of observable inputs can vary from security to security and is affected by a wide variety of factors, including, but not limited to, the type of security, whether the security is new and not yet established in the marketplace, the liquidity of markets, and other characteristics particular to the security. To the extent that valuation is based on models or inputs that are less observable or unobservable in the market, the determination of fair value requires more judgment. Accordingly, the degree of judgment exercised in determining fair value is generally greatest for instruments categorized in Level 3. Due to the inherent uncertainty of valuation, the determination of values may differ significantly from values that would have been realized had a ready market for investments existed, and the differences could be material.
Fair value measurements: Descriptions of the valuation techniques applied to the Portfolio’s significant categories of assets and liabilities measured at fair value on a recurring basis are as follows:
Equity securities: Securities are stated at the last reported sales price or closing price on the day of valuation taken from the primary exchange where the security is principally traded. To the extent these securities are actively traded and valuation adjustments are not applied, they are categorized in Level 1 of the fair value hierarchy. Equities traded on inactive markets or valued by reference to similar instruments are generally categorized in Level 2 or Level 3 if inputs are unobservable.
Foreign equity securities: Securities in which the primary trading market closes at the same time or after the NYSE, are valued based on quotations from the primary market in which they are traded and are categorized in Level 1. Because many foreign securities markets and exchanges close prior to the close of the NYSE, closing prices for foreign securities in those markets or on those exchanges do not reflect the events that occur after that close. Certain foreign securities may be fair valued using a pricing service that considers the correlation of the trading patterns of the foreign security to the intraday trading in the U.S. markets for investments such as American Depositary Receipts, financial futures, or ETFs and the movement of certain indices of securities based on a statistical analysis of their historical relationship; such valuations generally are categorized in Level 2.
Repurchase agreements: Repurchase agreements are valued at cost, which approximates fair value. To the extent the inputs are observable and timely, the values are generally categorized in Level 2 of the fair value hierarchy.
Derivative instruments: Centrally cleared or listed derivatives that are actively traded are valued based on quoted prices from the exchange and are categorized in Level 1 of the fair value hierarchy. Over-the-counter (“OTC”) derivative contracts include forward, swap, swaption, and option contracts related to interest rates, foreign currencies, credit standing of reference entities, equity prices, or commodity prices. Depending on the product and the terms of the transaction, the fair value of the OTC derivative products are modeled taking into account the counterparties’ creditworthiness and using a series of techniques, including simulation models. Many pricing models do not entail material subjectivity because the methodologies employed do not necessitate significant judgments and the pricing inputs are observed from actively quoted markets, as is the case of interest rate swap and option contracts. The majority of OTC derivative products valued by the Portfolio using pricing models fall into this category and are categorized within Level 2 of the fair value hierarchy or Level 3 if inputs are unobservable.
|
|
|
|
|
| Transamerica Series Trust |
|
|
|
Semi-Annual Financial Statements 2024 |
|
|
Page 10 |
|
|
Transamerica JPMorgan Enhanced Index VP
NOTES TO FINANCIAL STATEMENTS (continued)
At June 30, 2024
(unaudited)
4. SECURITIES AND OTHER INVESTMENTS
Real estate investment trusts (“REITs”): REITs are pooled investment vehicles which invest primarily in income producing real estate, or real estate related loans or interests. Distributions received by REITs are classified at management’s estimate of the dividend income, return of capital and capital gains. Estimates are based on information available at year-end, which includes the previous fiscal year’s classification. The actual amounts of dividend income, return of capital, and capital gains are only determined by each REIT after the fiscal year end and may differ from the estimated amounts. Upon notification from the REITs, some of the distributions received may be re-classified and recorded as a return of capital or capital gains. There are certain additional risks involved in investing in REITs. These include, but are not limited to, economic conditions, changes in zoning laws, real estate values, property taxes, and interest rates.
REITs held at June 30, 2024, if any, are identified within the Schedule of Investments.
5. BORROWINGS AND OTHER FINANCING TRANSACTIONS
The Portfolio may engage in borrowing transactions as a means of raising cash to satisfy redemption requests, for other temporary or emergency purposes or, to the extent permitted by its investment policies, to raise additional cash to be invested in other securities or instruments. When the Portfolio invests borrowing proceeds in other securities, the Portfolio will bear the risk that the market value of the securities in which such proceeds are invested goes down and is insufficient to repay the borrowed proceeds. The Portfolio may borrow on a secured or on an unsecured basis. If the Portfolio enters into a secured borrowing arrangement, a portion of the Portfolio’s assets will be used as collateral. The 1940 Act requires the Portfolio to maintain asset coverage of at least 300% of the amount of its borrowings. Asset coverage means the ratio that the value of the Portfolio’s total assets, minus liabilities other than borrowings, bears to the aggregate amount of all borrowings. Although complying with this requirement has the effect of limiting the amount that the Portfolio may borrow, it does not otherwise mitigate the risks of entering into borrowing transactions.
Interfund lending: The Portfolio, along with other funds and portfolios advised by TAM, may participate in an interfund lending program pursuant to exemptive relief granted by the Securities and Exchange Commission on January 18, 2017. This program allows the Portfolio to lend to and borrow from other funds and portfolios advised by TAM. Interfund lending transactions are subject to the conditions of the exemptive relief which places limits on the amount of lending or borrowing a Portfolio may participate in under the program. Interest earned or paid on an interfund lending transaction will be based on the average of certain current market rates. For the period ended June 30, 2024, the Portfolio has not utilized the program.
Repurchase agreements: In a repurchase agreement, the Portfolio purchases a security and simultaneously commits to resell that security to the seller at an agreed-upon price on an agreed-upon date. Securities purchased subject to a repurchase agreement are held at the Portfolio’s custodian, or designated sub-custodian related to tri-party repurchase agreements, and, pursuant to the terms of the repurchase agreement, must be collateralized by securities with an aggregate market value greater than or equal to 100% of the resale price. The Portfolio will bear the risk of value fluctuations until the securities can be sold and may encounter delays and incur costs in liquidating the securities. In the event of bankruptcy or insolvency of the seller, delays and costs may be incurred.
Repurchase agreements are subject to netting agreements, which are agreements between the Portfolio and its counterparties that provide for the net settlement of all transactions and collateral with the Portfolio, through a single payment, in the event of default or termination. Amounts presented within the Schedule of Investments, and as part of Repurchase agreements, at value within the Statement of Assets and Liabilities are shown on a gross basis. The value of the related collateral for each repurchase agreement, as reflected within the Schedule of Investments, exceeds the value of each repurchase agreement at June 30, 2024.
Repurchase agreements at June 30, 2024, if any, are included within the Schedule of Investments and Statement of Assets and Liabilities.
6. RISK EXPOSURES AND THE USE OF DERIVATIVE INSTRUMENTS
The Portfolio’s investment strategies allow the Portfolio to use various types of derivative contracts, including option contracts, swap agreements, futures contracts, and forward foreign currency contracts. Derivatives are investments whose value is primarily derived from underlying assets, indices or reference rates and may be transacted on an exchange or OTC.
Market Risk Factors: In pursuit of the Portfolio’s investment strategies, the Portfolio may seek to use derivatives to increase or decrease its exposure to certain market risks, including:
Interest rate risk: Interest rate risk relates to the fluctuations in the value of fixed income securities due to changes in the prevailing levels of market interest rates.
|
|
|
|
|
| Transamerica Series Trust |
|
|
|
Semi-Annual Financial Statements 2024 |
|
|
Page 11 |
|
|
Transamerica JPMorgan Enhanced Index VP
NOTES TO FINANCIAL STATEMENTS (continued)
At June 30, 2024
(unaudited)
6. RISK EXPOSURES AND THE USE OF DERIVATIVE INSTRUMENTS (continued)
Foreign exchange rate risk: Foreign exchange rate risk relates to fluctuations in the value of an asset or liability due to changes in the currency exchange rates.
Equity risk: Equity risk relates to the change in value of equity securities as they relate to increases or decreases in the general market.
Credit risk: Credit risk relates to the ability of the issuer of a financial instrument to make further principal or interest payments on an obligation or commitment that it has to the Portfolio.
Commodity risk: Commodity risk relates to the change in value of commodities or commodity indices as they relate to increases or decreases in the commodities market. Commodities are physical assets that have tangible properties. Examples of these types of assets are crude oil, heating oil, metals, livestock, and agricultural products.
The Portfolio is also exposed to additional risks from investing in derivatives, such as liquidity and counterparty credit risk. Liquidity risk is the risk that the Portfolio will be unable to sell or close out the derivative in the open market in a timely manner. Counterparty credit risk is the risk that the counterparty will not be able to fulfill its obligations to the Portfolio. Investing in derivatives may also involve greater risks than investing directly in the underlying assets, such as losses in excess of any initial investment and collateral received. In addition, there may be the risk that the change in value of the derivative contract does not correspond to the change in value of the underlying instrument.
The Portfolio’s exposure to market risk factors and certain other associated risks are summarized by derivative type as follows:
Futures contracts: The Portfolio is subject to equity risk, credit risk, commodity risk, interest rate risk and foreign exchange rate risk in the normal course of pursuing its investment objective. The Portfolio uses futures contracts to gain exposure to, or hedge against, changes in the value of equities and commodities, interest rates, or foreign currencies. A futures contract represents a commitment for the future purchase or sale of an asset at a specified price on a specified date. Upon entering into such contracts, the Portfolio is required to deposit with the broker, either in cash or in securities, an initial margin in an amount equal to a certain percentage of the contract amount. Subsequent payments (variation margin) are paid or received by the Portfolio, depending on the daily fluctuations in the value of the contract, and are recorded for financial statement purposes as unrealized gains or losses by the Portfolio. Upon entering into such contracts, the Portfolio bears the risk of equity and commodity prices, interest rates, or exchange rates moving unexpectedly, in which case, the Portfolio may not achieve the anticipated benefits of the futures contracts and may realize losses. With futures, there is minimal counterparty credit risk to the Portfolio since futures are exchange-traded and the exchange’s clearinghouse, as counterparty to all exchange-traded futures, guarantees the futures against default. Futures contracts are generally entered into on a regulated futures exchange and cleared through a clearinghouse associated with the exchange.
Open futures contracts at June 30, 2024 are listed within the Schedule of Investments. Variation margin, if applicable, is shown in Variation margin receivable or payable on futures contracts within the Statement of Assets and Liabilities.
The following is a summary of the location and the Portfolio’s fair values of derivative investments disclosed within the Statement of Assets and Liabilities, categorized by primary market risk exposure as of June 30, 2024.
|
|
|
|
|
|
|
|
|
|
|
|
|
|
|
|
|
|
|
|
|
|
|
|
|
| Asset Derivatives |
| Location |
|
Interest Rate Contracts |
|
|
Foreign Exchange Contracts |
|
|
Equity Contracts |
|
|
Credit Contracts |
|
|
Commodity Contracts |
|
|
Total |
|
| Futures contracts: |
|
|
|
|
|
|
|
|
|
|
|
|
|
|
|
|
|
|
|
|
|
|
|
|
| Total distributable earnings (accumulated losses) (A)(B) |
|
$ |
— |
|
|
$ |
— |
|
|
$ |
15,954 |
|
|
$ |
— |
|
|
$ |
— |
|
|
$ |
15,954 |
|
| |
|
| Total |
|
$ |
— |
|
|
$ |
— |
|
|
$ |
15,954 |
|
|
$ |
— |
|
|
$ |
— |
|
|
$ |
15,954 |
|
| |
|
| (A) |
May include exchange-traded derivatives which are not subject to a master netting arrangement, or another similar arrangement. |
| (B) |
Included within unrealized appreciation (depreciation) on futures contracts as reported in the Schedule of Investments. Only current day’s variation margin is reported within the Statement of Assets and Liabilities. |
|
|
|
|
|
| Transamerica Series Trust |
|
|
|
Semi-Annual Financial Statements 2024 |
|
|
Page 12 |
|
|
Transamerica JPMorgan Enhanced Index VP
NOTES TO FINANCIAL STATEMENTS (continued)
At June 30, 2024
(unaudited)
6. RISK EXPOSURES AND THE USE OF DERIVATIVE INSTRUMENTS (continued)
The following is a summary of the location and the effect of derivative investments within the Statement of Operations, categorized by primary market risk exposure as of June 30, 2024.
|
|
|
|
|
|
|
|
|
|
|
|
|
|
|
|
|
|
|
|
|
|
|
|
|
| Realized Gain (Loss) on Derivative Instruments |
| Location |
|
Interest Rate Contracts |
|
|
Foreign Exchange Contracts |
|
|
Equity Contracts |
|
|
Credit Contracts |
|
|
Commodity Contracts |
|
|
Total |
|
| Futures contracts |
|
$ |
— |
|
|
$ |
— |
|
|
$ |
5,113,884 |
|
|
$ |
— |
|
|
$ |
— |
|
|
$ |
5,113,884 |
|
| |
|
| Total |
|
$ |
— |
|
|
$ |
— |
|
|
$ |
5,113,884 |
|
|
$ |
— |
|
|
$ |
— |
|
|
$ |
5,113,884 |
|
| |
|
|
|
|
|
|
|
|
|
|
|
|
|
|
|
|
|
|
|
|
|
|
|
|
|
|
| Net Change in Unrealized Appreciation (Depreciation) on Derivative Instruments |
| Location |
|
Interest Rate Contracts |
|
|
Foreign Exchange Contracts |
|
|
Equity Contracts |
|
|
Credit Contracts |
|
|
Commodity Contracts |
|
|
Total |
| Futures contracts |
|
$ |
— |
|
|
$ |
— |
|
|
$ |
(1,251,411 |
) |
|
$ |
— |
|
|
$ |
— |
|
|
$ |
(1,251,411 |
) |
| |
|
| Total |
|
$ |
— |
|
|
$ |
— |
|
|
$ |
(1,251,411 |
) |
|
$ |
— |
|
|
$ |
— |
|
|
$ |
(1,251,411 |
) |
| |
|
The following is a summary of the ending monthly average volume on derivative activity during the period ended June 30, 2024.
|
|
|
|
|
| Futures contracts: |
|
|
|
|
| Average notional value of contracts — long |
|
$ |
61,686,537 |
|
7. RISK FACTORS
Investing in the Portfolio involves certain key risks related to the Portfolio’s trading activity. Please reference the Portfolio’s prospectus for a more complete discussion of the following risk(s), as well as other risks of investing in the Portfolio.
Market risk: The market prices of the Portfolio’s securities or other assets may go up or down, sometimes rapidly or unpredictably, due to factors such as economic events, inflation, changes in interest rates, governmental actions or interventions, actions taken by the U.S. Federal Reserve or foreign central banks, market disruptions caused by tariffs, trade disputes or other factors, political developments, armed conflicts, economic sanctions, cybersecurity events, investor sentiment, the global and domestic effects of widespread or local health, weather or climate events, and other factors that may or may not be related to the issuer of the security or other asset. If the market prices of the Portfolio’s securities and assets fall, the value of your investment in the Portfolio could go down.
Economies and financial markets throughout the world are increasingly interconnected. Events or circumstances in one or more countries or regions could be highly disruptive to, and have profound impacts on, global economies or markets. As a result, whether or not the Portfolio invests in securities of issuers located in or with significant exposure to the countries directly affected, the value and liquidity of the Portfolio’s investments may go down.
Equity securities risk: Equity securities generally have greater risk of loss than debt securities. Stock markets are volatile and the value of equity securities may go up or down, sometimes rapidly and unpredictably. The market price of an equity security may fluctuate based on overall market conditions, such as real or perceived adverse economic or political conditions or trends, tariffs and trade disruptions, inflation, substantial economic downturn or recession, changes in interest rates, or adverse investor sentiment. The market price of an equity security also may fluctuate based on real or perceived factors affecting a particular industry or industries or the company itself. If the market prices of the equity securities owned by the Portfolio fall, the value of your investment in the Portfolio will decline. The Portfolio may lose its entire investment in the equity securities of an issuer. A change in financial condition or other event affecting a single issuer may adversely impact securities markets as a whole.
Large capitalization companies risk: The Portfolio’s investments in larger, more established companies may underperform other segments of the market because they may be less responsive to competitive challenges and opportunities and unable to attain high growth rates during periods of economic expansion.
|
|
|
|
|
| Transamerica Series Trust |
|
|
|
Semi-Annual Financial Statements 2024 |
|
|
Page 13 |
|
|
Transamerica JPMorgan Enhanced Index VP
NOTES TO FINANCIAL STATEMENTS (continued)
At June 30, 2024
(unaudited)
7. RISK FACTORS (continued)
Real estate investment trusts (“REITs”) risk: Investing in real estate investment trusts (“REITs”) involves unique risks. When the Portfolio invests in REITs, it is subject to risks generally associated with investing in real estate. A REIT’s performance depends on the types and locations of the properties it owns, how well it manages those properties and cash flow. REITs may have limited financial resources, may trade less frequently and in limited volume, may engage in dilutive offerings, and may be subject to more abrupt or erratic price movements than the overall securities markets. In addition to its own expenses, the Portfolio will indirectly bear its proportionate share of any management and other expenses paid by REITs in which it invests. U.S. REITs are subject to a number of highly technical tax-related rules and requirements; and a U.S. REIT’s failure to qualify for the favorable U.S. federal income tax treatment generally available to U.S. REITs could result in corporate-level taxation, significantly reducing the return on an investment to the Portfolio.
8. FEES AND OTHER AFFILIATED TRANSACTIONS
TST serves as a funding vehicle for certain affiliated asset allocation portfolios and certain affiliated separate accounts of Transamerica Life Insurance Company (“TLIC”) and Transamerica Financial Life Insurance Company.
TAM, the Portfolio’s investment manager, is directly owned by TLIC and AUSA Holding, LLC (“AUSA”), both of which are indirect, wholly owned subsidiaries of Aegon Ltd. TLIC is owned by Commonwealth General Corporation (“Commonwealth”). Commonwealth and AUSA are wholly owned by Transamerica Corporation (DE). Transamerica Corporation (DE) is wholly owned by Aegon International B.V., which is wholly owned by Aegon Ltd., a Bermuda exempted company with liability limited by shares (formerly, Aegon NV, a Netherlands corporation) and a publicly traded international insurance group.
Transamerica Fund Services, Inc. (“TFS”) is the Portfolio’s transfer agent. Transamerica Capital, Inc. (“TCI”) is the Portfolio’s distributor/principal underwriter. TAM, TFS and TCI are affiliates of Aegon Ltd.
Certain officers and trustees of the Portfolio may also be officers and/or trustees of TAM, TFS and TCI. No interested trustee who is deemed an interested person due to current or former service with TAM or an affiliate of TAM receives compensation from the Portfolio. The Portfolio does pay non-interested persons (independent trustees), as disclosed in Trustee and CCO fees within the Statement of Operations.
Investment management fees: TAM serves as the Portfolio’s investment manager, performing administration as well as investment advisory services. TAM renders investment advisory, supervisory, and administration services under an investment management agreement and the Portfolio pays a single management fee, which is reflected in Investment management fees within the Statement of Operations.
The Portfolio pays a management fee to TAM based on daily average net assets at the following rates:
|
|
|
|
|
| Breakpoints |
|
Rate |
|
| First $1 billion |
|
|
0.60 |
% |
| Over $1 billion up to $2 billion |
|
|
0.59 |
|
| Over $2 billion up to $3 billion |
|
|
0.56 |
|
| Over $3 billion up to $4 billion |
|
|
0.52 |
|
| Over $4 billion |
|
|
0.46 |
|
TAM has contractually agreed to waive fees and/or reimburse Portfolio expenses to the extent that the total operating expenses excluding, as applicable, acquired fund fees and expenses, interest (including borrowing costs and overdraft charges), taxes, brokerage commissions, dividend and interest expenses on securities sold short, extraordinary expenses and other expenses not incurred in the ordinary course of the Portfolio’s business, exceed the following stated annual operating expense limits to the Portfolio’s daily average net
|
|
|
|
|
| Transamerica Series Trust |
|
|
|
Semi-Annual Financial Statements 2024 |
|
|
Page 14 |
|
|
Transamerica JPMorgan Enhanced Index VP
NOTES TO FINANCIAL STATEMENTS (continued)
At June 30, 2024
(unaudited)
8. FEES AND OTHER AFFILIATED TRANSACTIONS (continued)
assets. To the extent an expense limit changed during the period, the prior limit is also listed below. The expenses waived and/or reimbursed, if any, are included in Expenses waived and/or reimbursed within the Statement of Operations.
|
|
|
|
|
| Class |
|
Operating Expense Limit |
|
Operating Expense Limit Effective Through |
|
|
|
| Initial Class |
|
0.67% |
|
May 1, 2026 |
| Service Class |
|
0.92 |
|
May 1, 2026 |
TAM is permitted to recapture amounts contractually waived and/or reimbursed to a class during any of the 36 months from the date on which TAM waived fees and/or reimbursed expenses for the class. A class may recapture and reimburse TAM only if such amount does not cause, on any particular business day of the Portfolio, the class’s total annual operating expenses (after the recapture is taken into account) to exceed the Operating Expense Limits or any other lower limit then in effect. Amounts recaptured, if any, by TAM for the period ended June 30, 2024 are disclosed in Recapture of previously waived and/or reimbursed fees within the Statement of Operations.
TAM, on a voluntary basis and in addition to the contractual operating expense limits in effect, from time to time may waive and/or reimburse expenses of the Portfolio, or any classes thereof, to such level(s) as the Trust’s officers have determined or may reasonably determine from time to time. Any such voluntary waiver or expense reimbursement may be discontinued by TAM at any time. These amounts are not subject to recapture by TAM.
As of June 30, 2024, there are no amounts available for recapture by TAM.
Distribution and service fees: TST has a distribution plan (“Distribution Plan”) pursuant to Rule 12b-1 under the 1940 Act. Pursuant to the Distribution Plan, TST entered into a distribution agreement with TCI as the Portfolio’s distributor.
The Distribution Plan requires the Portfolio to pay distribution fees to TCI as compensation for various distribution activities, not as reimbursement for specific expenses. Under the Distribution Plan and distribution agreement, TCI, on behalf of the Portfolio, is authorized to pay various service providers, as direct payment for expenses incurred in connection with distribution of the Portfolio’s shares.
The fee on the Service Class shares is paid to the insurance companies for providing services and account maintenance for the policyholders who invest in the variable insurance products which invest in the Service Class shares. TCI has determined that it will not seek payment for the distribution expenses incurred by the Portfolio with respect to the Initial Class shares before May 1, 2025. Prior to TCI seeking distribution expenses on Initial Class shares, policy and contract owners will be notified in advance. The Portfolio will pay fees relating to Service Class shares. The distribution and service fees are included in Distribution and service fees within the Statement of Operations.
The Portfolio is authorized under the Distribution Plan to pay fees to TCI based on daily average net assets of each applicable class up to the following annual rates:
|
|
|
|
|
| Class |
|
Rate |
|
|
| Initial Class |
|
|
0.15 |
% |
| Service Class |
|
|
0.25 |
|
Transfer agent costs: TFS provides transfer agency services under an intercompany agreement with TAM. TFS has outsourced the provision of certain sub-transfer agency services to SS&C Global Investor & Distribution Solutions, Inc. (“SS&C GIDS”). The Portfolio does not pay a separate transfer agent fee to TAM or TFS but does pay certain expenses to SS&C GIDS related to applicable sub-transfer agency services. For the period ended June 30, 2024, (i) the expenses paid to SS&C GIDS by the Portfolio are referred to as transfer agent costs and are included within the Statement of Operations and (ii) the expenses payable to SS&C GIDS by the Portfolio are referred to as transfer agent costs within the Statement of Assets and Liabilities.
Brokerage commissions: The Portfolio incurred no brokerage commissions on security transactions placed with affiliates of the investment manager or sub-adviser(s) for the period ended June 30, 2024.
|
|
|
|
|
| Transamerica Series Trust |
|
|
|
Semi-Annual Financial Statements 2024 |
|
|
Page 15 |
|
|
Transamerica JPMorgan Enhanced Index VP
NOTES TO FINANCIAL STATEMENTS (continued)
At June 30, 2024
(unaudited)
9. PURCHASES AND SALES OF SECURITIES
For the period ended June 30, 2024, the cost of securities purchased and proceeds from securities sold (excluding short-term securities) are as follows:
|
|
|
|
|
|
|
| Purchases of Securities |
|
Sales/Maturities of Securities |
| Long-Term |
|
U.S. Government |
|
Long-Term |
|
U.S. Government |
|
|
|
|
| $ 783,229,023 |
|
$ — |
|
$ 559,106,084 |
|
$ — |
10. FEDERAL INCOME TAXES AND DISTRIBUTIONS TO SHAREHOLDERS
The Portfolio has not made any provision for federal income or excise taxes due to its policy to distribute all of its taxable income and capital gains to its shareholders and otherwise qualify as a regulated investment company under Subchapter M of the Internal Revenue Code. The Portfolio recognizes the tax benefits of uncertain tax positions only where the position is “more likely than not” to be sustained assuming examination by tax authorities. The Portfolio’s tax returns remain subject to examination by the Internal Revenue Service and state tax authorities three years from the date of filing for federal purposes and four years from the date of filing for state purposes. Management has evaluated the Portfolio’s tax provisions taken for all open tax years, and has concluded that no provision for income tax is required in the Portfolio’s financial statements. If applicable, the Portfolio recognizes interest accrued related to unrecognized tax benefits in relation to interest and penalties expense in Other within the Statement of Operations. The Portfolio identifies its major tax jurisdictions as U.S. Federal, the state of Colorado, and foreign jurisdictions where the Portfolio makes significant investments; however, the Portfolio is not aware of any tax positions for which it is reasonably possible that the total amounts of unrecognized tax benefits will change materially in the next twelve months. Distributions are determined in accordance with income tax regulations, which may differ from GAAP.
As of June 30, 2024, the approximate cost for U.S. federal income tax purposes, and the aggregate gross/net unrealized appreciation (depreciation) in the value of investments (including securities sold short and derivatives, if any) are as follows:
|
|
|
|
|
|
|
| Cost |
|
Gross Appreciation |
|
Gross (Depreciation) |
|
Net Appreciation (Depreciation) |
|
|
|
|
| $ 2,335,632,190 |
|
$ 955,737,385 |
|
$ (51,867,321) |
|
$ 903,870,064 |
11. NEW ACCOUNTING PRONOUNCEMENT
In June 2022, the Financial Accounting Standards Board issued Accounting Standards Update No. 2022-03 (“ASU 2022-03”), “Fair Value Measurement of Equity Securities Subject to Contractual Sale Restrictions” (“Topic 820”). ASU 2022-03 clarifies the guidance in Topic 820, related to the measurement of the fair value of an equity security subject to contractual sale restrictions, where it eliminates the need to apply a discount to fair value of these securities, and introduces disclosure requirements related to such equity securities. The guidance is effective for fiscal years, and interim periods within those fiscal years, beginning after December 15, 2023, and allows for early adoption. Management is currently evaluating the implications, if any, of the additional requirements and their impact on the Portfolio’s financial statements.
Please see TST’s most recent report on Form N-CSR, available at: www.transamerica.com/annuities/prospectus, for additional information. For the most recently filed complete proxy voting records for the Trust please visit: https://www.transamerica.com/sites/default/files/files/e070d/TST%20N-PX%202021.pdf
|
|
|
|
|
| Transamerica Series Trust |
|
|
|
Semi-Annual Financial Statements 2024 |
|
|
Page 16 |
|
|
Transamerica JPMorgan Enhanced Index VP
MANAGEMENT AND SUB-ADVISORY AGREEMENT — CONTRACT RENEWAL
(unaudited)
At a meeting of the Board of Trustees of Transamerica Series Trust (the “Trustees” or the “Board”) held on June 12-13, 2024, the Board considered the renewal of the management agreement (the “Management Agreement”) between Transamerica Asset Management, Inc. (“TAM”) and Transamerica Series Trust, on behalf of Transamerica JPMorgan Enhanced Index VP (the “Portfolio”). The Board also considered the renewal of the investment sub-advisory agreement (the “Sub-Advisory Agreement” and together with the Management Agreement, the “Agreements”) for the Portfolio between TAM and J.P. Morgan Investment Management, Inc. (the “Sub-Adviser”).
Following its review and consideration, the Board determined that the terms of the Management Agreement and Sub-Advisory Agreement were reasonable and that the renewal of each of the Agreements was in the best interests of the Portfolio and the holders invested in the Portfolio. The Board, including the independent members of the Board (the “Independent Trustees”), unanimously approved the renewal of each of the Agreements through June 30, 2025.
Prior to reaching their decision, the Trustees requested and received from TAM and the Sub-Adviser certain information. They then reviewed such information as they deemed reasonably necessary to evaluate the Agreements, including information they had previously received from TAM and the Sub-Adviser as part of their regular oversight of the Portfolio, and knowledge they gained over time through meeting with TAM and the Sub-Adviser. Among other materials, the Trustees considered comparative fee, expense and performance information prepared by Broadridge Financial Solutions, Inc. (“Broadridge”), an independent provider of mutual fund performance information, as well as fee, expense and profitability information prepared by TAM. To the extent applicable, the Trustees considered information about fees and performance of comparable funds and/or accounts managed by the Sub-Adviser. The Board also considered reductions to the Portfolio’s expense limits, if any, that took effect after the last renewal of the Agreements. In their review, the Trustees also sought to identify instances in which the Portfolio’s performance, fees, total expenses and/or profitability appeared to be outliers within its respective peer group or other comparative metrics and sought to understand the reasons for such comparative positions.
In their deliberations, the Independent Trustees met privately without representatives of TAM or the Sub-Adviser present and were represented throughout the process by their independent legal counsel. In considering the proposed continuation of each of the Agreements, the Trustees evaluated and weighed a number of considerations that they believed to be relevant in light of the legal advice furnished to them by counsel, including independent legal counsel, and made a decision in the exercise of their own business judgment. They based their decisions on the considerations discussed below, among others, although they did not identify any particular consideration or item of information that was controlling of their decisions, and each Trustee may have attributed different weights to the various factors.
Nature, Extent and Quality of the Services Provided
The Board considered the nature, extent and quality of the services provided by TAM and the Sub-Adviser to the Portfolio in the past and the services anticipated to be provided in the future. The Board also considered the investment approach for the Portfolio; the experience, capability and integrity of TAM’s senior management; the financial resources of TAM; TAM’s management oversight process; TAM’s and the Sub-Adviser’s responsiveness to any questions by the Trustees; and the professional qualifications and compensation program of the portfolio management team of the Sub-Adviser. The Trustees noted that they receive, on a quarterly basis, an execution analysis from Capital Institutional Services, Inc. (CAPIS), an independent provider of trade analyses, for the Sub-Adviser and a comparison of trading results against a peer universe of managers.
The Board also considered the continuous and regular investment management and other services provided by TAM, when acting as a manager of managers, for the portion of the management fee it retains from the Portfolio after payment of the sub-advisory fees. The Board noted that the investment management and other services provided by TAM include the design, development and ongoing review and evaluation of the Portfolio and its investment strategy; the selection, oversight and monitoring of one or more investment sub-advisers to perform certain duties with respect to the Portfolio; ongoing portfolio trading oversight and analysis; risk management oversight and analysis; design, development, implementation and ongoing review and evaluation of a process for the valuation of Portfolio investments; design, development, implementation and ongoing review and evaluation of a compliance program for the Portfolio; design, development, implementation and ongoing review and evaluation of a process for the voting of proxies and exercise of rights to consent to corporate action for Portfolio investments; participation in Board meetings and oversight of preparation of materials for the Board, including materials for Board meetings and regular communications with the Board; oversight of preparation of the Portfolio’s prospectus, statement of additional information, shareholder reports and other disclosure materials and regulatory filings for the Portfolio; and ongoing cash management services for the Portfolio. The Board considered that TAM’s investment management services also include the provision of supervisory and administrative services to the Portfolio. The Board also noted that TAM, as part of the services it provides to all Transamerica mutual funds, including the Portfolio, oversees the services provided by the funds’ custodian, transfer agent, independent accountant and legal counsel and supervises the performance of the recordkeeping and holder service functions of the funds.
Investment Performance
In addition, the Board considered the short- and longer-term performance of the Portfolio in light of its investment objective, policies and strategies, including relative performance against (i) a peer universe of comparable mutual funds, as prepared by Broadridge, and (ii) the Portfolio’s benchmark, in each case for various trailing periods ended December 31, 2023. Based on these considerations, the Board determined that TAM and the Sub-Adviser can provide investment and related services that are appropriate in scope and extent in light of the Portfolio’s investment objectives, policies and strategies and operations, the competitive landscape of the investment company
|
|
|
|
|
| Transamerica Series Trust |
|
|
|
Semi-Annual Financial Statements 2024 |
|
|
Page 17 |
|
|
Transamerica JPMorgan Enhanced Index VP
MANAGEMENT AND SUB-ADVISORY AGREEMENT — CONTRACT RENEWAL (continued)
(unaudited)
business and investor needs. The Board’s conclusions as to the Portfolio’s performance are summarized below. For purposes of its review, the Board generally used the performance of Service Class Shares. In describing the Portfolio’s performance relative to its peer universe, the summary conclusions characterize performance for the relevant periods in relation to whether it was “above,” “below” or “in line with” the peer universe median and do so using quintile rankings prepared by Broadridge. For simplicity, performance is described as “above” the median if the Portfolio’s performance ranked anywhere in the first or second quintiles, as “below” the median if it ranked anywhere in the fourth or fifth quintiles, or “in line with” the median if it ranked anywhere in the third quintile (i.e., even if its precise return was somewhat above or somewhat below the precise median return).
When considering the Portfolio’s performance, the Trustees considered any representations made by TAM regarding the appropriateness of certain peer groups and benchmarks. They recognized that performance reflects a snapshot of a period as of a specific date, and that consideration of performance data for a different period could generate significantly different performance results. The Trustees also recognized that even longer-term performance can be negatively affected by performance over a short-term period when that short-term performance is significantly below the performance of the comparable benchmark or universe of peer funds.
The Board noted that the performance of Service Class Shares of the Portfolio was above the median for its peer universe for the past 1-, 3-, 5- and 10-year periods. The Board also noted that the performance of Service Class Shares of the Portfolio was above the benchmark that TAM utilizes to measure performance of the Portfolio for the past 1-, 3- and 5-year periods and below the benchmark for the past 10-year period.
Management Fee and Sub-Advisory Fees and Total Expense Ratio
The Board considered the management fee and total expense ratio of the Portfolio, including information provided by Broadridge comparing the management fee and total expense ratio of the Portfolio to the management fees and total expense ratios of comparable investment companies in both a peer group and broader peer universe compiled by Broadridge. The Board’s conclusions as to the Portfolio’s management fee and total expense ratio are summarized below. For purposes of its review, the Board generally used the actual total expenses (i.e., expenses reflecting any waivers and/or reimbursements) of Service Class Shares. In describing the Portfolio’s management fee and total expense ratio relative to its peer group and peer universe, the summary conclusions characterize management fees and total expense ratios for the relevant periods in relation to whether they were “above,” “below” or “in line with” the peer group or peer universe median and do so using quintile rankings prepared by Broadridge. For simplicity, management fees and total expense ratios are described as “above” the median if the Portfolio’s management fee or total expense ratio ranked anywhere in the fourth or fifth quintiles, as “below” the median if it ranked anywhere in the first or second quintiles, or “in line with” the median if it ranked anywhere in the third quintile (i.e., even if its precise management fee or total expense ratio was somewhat above or somewhat below the precise median management fee or total expense ratio).
The Board also considered the fees charged by the Sub-Adviser for sub-advisory services, as well as the portion of the Portfolio’s management fee retained by TAM following payment of the sub-advisory fee and how the portion of the contractual management fee retained by TAM at a specified asset level compared to the portions retained by other investment advisers managing mutual funds with similar investment strategies as calculated by an independent provider of information.
The Board noted that the Portfolio’s contractual management fee was in line with the median for its peer group and above the median for its peer universe and that the actual total expenses (i.e., expenses reflecting any waivers and/or reimbursements) of Service Class Shares of the Portfolio were below the median for its peer group and in line with the median for its peer universe. The Trustees also considered that TAM has entered into an expense limitation arrangement with the Portfolio, which may result in TAM waiving fees for the benefit of holders.
On the basis of these considerations, together with the other information it considered, the Board determined that the management and sub-advisory fees to be received by TAM and the Sub-Adviser under the Management Agreement and Sub-Advisory Agreement are reasonable in light of the services provided.
Cost of Services Provided and Level of Profitability
The Board reviewed information provided by TAM about the cost of providing and procuring fund management services, as well as the costs of the provision of administration, transfer agency and other services, to the Portfolio and to Transamerica Series Trust as a whole by TAM and its affiliates. The Board considered the profitability of TAM and its affiliates in providing these services for the Portfolio and Transamerica Series Trust as a whole. The Trustees recognized the competitiveness of the mutual fund industry and the importance of an investment adviser’s long-term profitability, including for maintaining company and management stability and accountability.
The Board also considered the allocation methodology used for calculating the profitability of TAM and its affiliates. The Board noted that the revenue and expense allocation methodology used by TAM to estimate its profitability with respect to its relationship with the Portfolio had been reviewed previously by an independent consultant. The Trustees considered that TAM reported that it had not made material changes to this methodology, and that the methodology had been applied consistently for the Portfolio.
|
|
|
|
|
| Transamerica Series Trust |
|
|
|
Semi-Annual Financial Statements 2024 |
|
|
Page 18 |
|
|
Transamerica JPMorgan Enhanced Index VP
MANAGEMENT AND SUB-ADVISORY AGREEMENT — CONTRACT RENEWAL (continued)
(unaudited)
With respect to the Sub-Adviser, the Board noted that the sub-advisory fee is the product of arm’s-length negotiation between TAM and the Sub-Adviser, which is not affiliated with TAM, and is paid by TAM and not the Portfolio. As a result, the Board focused on the profitability of TAM and its affiliates with respect to the Portfolio.
Based on this information, the Board determined that the profitability of TAM and its affiliates from their relationships with the Portfolio was not excessive.
Economies of Scale
The Board considered economies of scale with respect to the management of the Portfolio, whether the Portfolio had appropriately benefited from any economies of scale and whether there was the potential for realization of any future economies of scale. The Board also considered the existence of economies of scale with respect to management of the Transamerica mutual funds overall and the extent to which the Portfolio benefited from any economies of scale. The Board recognized that, as the Portfolio’s assets increase, any economies of scale realized by TAM or the Sub-Adviser may not directly correlate with each other or with any economies of scale that might be realized by the Portfolio. The Board considered the Portfolio’s management fee schedule and the existence of breakpoints and also considered the extent to which TAM shared economies of scale, if any, with the Portfolio through undertakings to limit or reimburse Portfolio expenses and to invest in maintaining and developing its capabilities and services. The Board also considered the Sub-Adviser’s sub-advisory fee schedule and the existence of breakpoints, if any, and how such breakpoints relate to any breakpoints in the Portfolio’s management fee schedule. The Board considered that the Sub-Adviser’s sub-advisory fees would be based on the combined assets of multiple funds. The Trustees concluded that the Portfolio’s fee structure reflected an appropriate sharing of any efficiencies or economies of scale to date and noted that they will have the opportunity to periodically reexamine the appropriateness of the management fee payable to TAM and the fee paid to the Sub-Adviser in light of any economies of scale experienced in the future.
Benefits to TAM, its Affiliates and/or the Sub-Adviser from their Relationships with the Portfolio
The Board considered other benefits derived by TAM, its affiliates, and/or the Sub-Adviser from their relationships with the Portfolio. The Board noted that TAM does not receive benefits from research obtained with commissions paid to broker-dealers for portfolio transactions (commonly referred to as “soft dollars”) as a result of its relationship with the Portfolio and that TAM believes the use of soft dollars by the Sub-Adviser is generally appropriate and in the best interests of the Portfolio. The Board also noted that the Sub-Adviser participates in a brokerage program pursuant to which a portion of brokerage commissions paid by the Portfolio is recaptured for the benefit of the Portfolio and the holders, thus limiting the amount of soft dollar arrangements the Sub-Adviser may engage in with respect to the Portfolio’s brokerage transactions.
Other Considerations
The Board noted that TAM has made a substantial commitment to the recruitment and retention of high-quality personnel and maintains the financial, compliance and operational resources reasonably necessary to manage the Portfolio in a professional manner that is consistent with the best interests of the Portfolio and the holders. In this regard, the Board favorably considered the procedures and policies TAM has in place to enforce compliance with applicable laws and regulations and oversee the portfolio management activities of the Sub-Adviser. The Board also noted that TAM has made an entrepreneurial commitment and undertaken certain business risks with respect to the management and success of the Portfolio.
Conclusion
After consideration of the factors described above, as well as other factors, the Trustees, including the Independent Trustees, concluded that the renewal of the Management Agreement and the Sub-Advisory Agreement was in the best interests of the Portfolio and the holders and voted to approve the renewal of the Agreements.
|
|
|
|
|
| Transamerica Series Trust |
|
|
|
Semi-Annual Financial Statements 2024 |
|
|
Page 19 |
|
|
PROXY VOTING POLICIES AND PROCEDURES AND QUARTERLY PORTFOLIO HOLDINGS
(unaudited)
A description of Transamerica Series Trust’s (the “Trust”) proxy voting policies and procedures is available in the Statement of Additional Information of the Portfolios, available without charge upon request by calling 1-800-851-9777 (toll free) or on the Securities and Exchange Commission’s (“SEC”) website at http://www.sec.gov.
In addition, the Portfolio is required to file Form N-PX, with their complete proxy voting records for the most recent 12 months ended June 30th, no later than August 31st of each year. The Form is available without charge: (1) on the Transamerica Funds website at https://www.transamerica.com/sites/default/files/files/e070d/TST%20N-PX%202021.pdf; and (2) on the SEC’s website at http://www.sec.gov.
Each fiscal quarter, the Portfolios, except Transamerica BlackRock Government Money Market VP, will file with the SEC a complete schedule of its monthly portfolio holdings on Form N-PORT. The Portfolios’ holdings as of the end of the third month of every fiscal quarter, as reported on Form N-PORT, will be publicly available on the SEC’s website at http://www.sec.gov within 60 days of the end of the fiscal quarter.
On a monthly basis, Transamerica BlackRock Government Money Market VP will file with the SEC portfolio holdings information on Form N-MFP3. A complete schedule of portfolio holdings is also available at www.transamerica.com.
You may also visit the Trust’s website at www.transamerica.com/annuities/prospectus for this and other information about the Portfolios and the Trust.
Important Notice Regarding Delivery of Shareholder Documents
Every year we provide shareholders informative materials such as the Transamerica Series Trust Annual Report, the Transamerica Series Trust Prospectus, and other required documents that keep you informed regarding your Portfolios. To the extent provided by mail, Transamerica Series Trust will only send one piece per mailing address, a method that saves your Portfolios money by reducing mailing and printing costs. We will continue to do this unless you tell us not to. To elect to receive individual mailings, simply call a Transamerica Customer Service Representative toll free at 1-800-851-9777, 8 a.m. to 7 p.m. Eastern Time, Monday-Friday. Your request will take effect within 30 days.
|
|
|
|
|
| Transamerica Series Trust |
|
|
|
Semi-Annual Financial Statements 2024 |
|
|
Page 20 |
|
|
NOTICE OF PRIVACY POLICY
(unaudited)
Your privacy is very important to us. We want you to understand what information we collect and how we use it. We collect and use “nonpublic personal information” in connection with providing our customers with a broad range of financial products and services as effectively and conveniently as possible. We treat nonpublic personal information in accordance with our Privacy Policy.
What Information We Collect and From Whom We Collect It
We may collect nonpublic personal information about you from the following sources:
| • |
|
Information we receive from you on applications or other forms, such as your name, address, and account number; |
| • |
|
Information about your transactions with us, our affiliates, or others, such as your account balance and purchase/redemption history; and |
| • |
|
Information we receive from non-affiliated third parties, including consumer reporting agencies. |
What Information We Disclose and To Whom We Disclose It
We do not disclose any nonpublic personal information about current or former customers to anyone without their express consent, except as permitted by law. We may disclose the nonpublic personal information we collect, as described above, to persons or companies that perform services on our behalf and to other financial institutions with which we have joint marketing agreements. We will require these companies to protect the confidentiality of your nonpublic personal information and to use it only to perform the services for which we have hired them.
Our Security Procedures
We restrict access to your nonpublic personal information and only allow disclosures to persons and companies as permitted by law to assist in providing products or services to you. We maintain physical, electronic, and procedural safeguards to protect your nonpublic personal information and to safeguard the disposal of certain consumer information.
Contact Us
If you have any questions about our Privacy Policy, please call 1-800-851-9777 on any business day between 8 a.m. and 7 p.m. Eastern Time.
Note: This Privacy Policy applies only to customers that have a direct relationship with us or our affiliates. If you own shares of our portfolios in the name of a third party such as a bank or broker-dealer, its privacy policy may apply to you instead of ours.
|
|
|
|
|
| Transamerica Series Trust |
|
|
|
Semi-Annual Financial Statements 2024 |
|
|
Page 21 |
|
|
PO Box 219945
Kansas City, MO 64121-9945
|
|
|
| Distributor: |
|
Transamerica Capital, Inc. PO Box 219945 Kansas City, MO 64121-9945 Customer Service: 1-800-851-9777 |
Transamerica Series Trust Semi-Annual Financial Statements
June 30, 2024
1801 California St., Suite 5200
Denver, CO 80202
Distributor: Transamerica Capital, Inc.
Customer Service: 1-800-851-9777
|
| The following pages contain the most recent semi-annual financial statements for the investment options in which you are invested. In compliance with Securities and Exchange Commission regulations, we present these reports on an annual and semi-annual basis with the hope that they will foster greater understanding of the investment options’ holdings, performance, financial data, accounting policies and other issues. This streamlined version provides information only on the investment options in which you are invested. |
| If you have any questions about these reports, please do not hesitate to contact your financial professional. As always, we thank you for your trust and the opportunity to serve you. |
Transamerica JPMorgan International Moderate Growth VP
SCHEDULE OF INVESTMENTS
At June 30, 2024
(unaudited)
|
|
|
|
|
|
|
|
|
| |
|
Shares |
|
|
Value |
|
| |
|
|
|
|
| INVESTMENT COMPANIES - 97.2% |
|
|
|
|
|
|
|
|
| International Alternative Fund - 1.1% |
|
|
|
|
|
|
|
|
| Transamerica Unconstrained Bond (A) |
|
|
474,595 |
|
|
$ |
4,152,706 |
|
|
|
|
|
|
|
|
|
|
|
|
|
| International Equity Funds - 53.6% |
|
|
|
|
|
|
|
|
| Transamerica BlackRock Real Estate Securities VP (A) |
|
|
110,148 |
|
|
|
1,032,091 |
|
| Transamerica Emerging Markets Opportunities (A) |
|
|
5,656 |
|
|
|
45,019 |
|
| Transamerica International Equity (A) |
|
|
3,413,075 |
|
|
|
71,265,003 |
|
| Transamerica International Focus (A) |
|
|
9,732,366 |
|
|
|
80,583,987 |
|
| Transamerica International Small Cap Value (A) |
|
|
3,667,237 |
|
|
|
54,898,545 |
|
|
|
|
|
|
|
|
|
|
|
|
|
|
|
|
|
|
|
|
207,824,645 |
|
|
|
|
|
|
|
|
|
|
|
| International Mixed Allocation Fund - 14.1% |
|
| Transamerica Aegon Bond VP (A) |
|
|
5,662,889 |
|
|
|
54,816,768 |
|
|
|
|
|
|
|
|
|
|
|
|
|
| U.S. Equity Funds - 11.5% |
|
|
|
|
|
|
|
|
| Transamerica Large Cap Value (A) |
|
|
6,041 |
|
|
|
84,636 |
|
| Transamerica WMC US Growth VP (A) |
|
|
1,047,452 |
|
|
|
44,705,228 |
|
|
|
|
|
|
|
|
|
|
|
|
|
|
|
|
|
|
|
|
44,789,864 |
|
|
|
|
|
|
|
|
|
|
|
|
|
| U.S. Fixed Income Funds - 16.9% |
|
|
|
|
|
|
|
|
| Transamerica Core Bond (A) |
|
|
595,659 |
|
|
|
5,069,060 |
|
| Transamerica Floating Rate (A) |
|
|
447,112 |
|
|
|
4,041,891 |
|
| Transamerica High Yield Bond (A) |
|
|
4,480,987 |
|
|
|
35,937,513 |
|
| Transamerica Long Credit (A) |
|
|
2,146,909 |
|
|
|
20,331,234 |
|
|
|
|
|
|
|
|
|
|
|
|
|
|
|
|
|
|
|
|
65,379,698 |
|
|
|
|
|
|
|
|
|
|
|
|
|
| Total Investment Companies
(Cost $346,448,731) |
|
|
|
|
|
|
376,963,681 |
|
|
|
|
|
|
|
|
|
|
|
|
|
|
|
|
|
|
|
| |
|
Principal |
|
|
Value |
|
| |
|
|
| U.S. GOVERNMENT OBLIGATION - 2.1% |
|
| U.S. Treasury - 2.1% |
|
|
|
|
|
|
|
|
| U.S. Treasury Notes |
|
|
|
|
|
|
|
|
| 4.13%, 01/31/2025 (B) |
|
$ |
8,085,900 |
|
|
$ |
8,029,678 |
|
|
|
|
|
|
|
|
|
|
|
|
|
| Total U.S. Government Obligation
(Cost $8,045,051) |
|
|
|
|
|
|
8,029,678 |
|
|
|
|
|
|
|
|
|
|
|
| REPURCHASE AGREEMENT - 0.7% |
|
| Fixed Income Clearing Corp., 2.50% (C), dated 06/28/2024, to be repurchased at $2,728,966 on 07/01/2024. Collateralized by a U.S. Government Obligation, 4.50%, due 03/31/2026, and with a value of $2,783,026. |
|
|
2,728,398 |
|
|
|
2,728,398 |
|
|
|
|
|
|
|
|
|
|
|
|
| Total Repurchase Agreement
(Cost $2,728,398) |
|
|
|
2,728,398 |
|
|
|
|
|
|
|
|
|
|
| Total Investments
(Cost $357,222,180) |
|
|
|
387,721,757 |
|
|
|
|
|
|
|
|
|
|
| Net Other Assets (Liabilities) - (0.0)% (D) |
|
|
|
(80,414 |
) |
|
|
|
|
|
|
|
|
|
|
|
| Net Assets - 100.0% |
|
|
$ |
387,641,343 |
|
|
|
|
|
|
|
|
|
|
FUTURES CONTRACTS:
|
|
|
|
|
|
|
|
|
|
|
|
|
|
|
|
|
|
|
|
|
|
|
|
|
| Long Futures Contracts |
|
| Description |
|
Number of Contracts |
|
|
Expiration Date |
|
|
Notional Amount |
|
|
Value |
|
|
Unrealized Appreciation |
|
Unrealized Depreciation |
| 5-Year U.S. Treasury Notes |
|
|
253 |
|
|
|
09/30/2024 |
|
|
|
$26,788,858 |
|
|
|
$26,964,266 |
|
|
$ |
175,408 |
|
|
$ |
— |
|
| 10-Year Canada Government Bonds |
|
|
89 |
|
|
|
09/18/2024 |
|
|
|
7,762,291 |
|
|
|
7,811,286 |
|
|
|
48,995 |
|
|
|
— |
|
| CAD Currency |
|
|
181 |
|
|
|
09/17/2024 |
|
|
|
13,193,721 |
|
|
|
13,249,200 |
|
|
|
55,479 |
|
|
|
— |
|
| Euro-BTP Italy Government Bonds |
|
|
171 |
|
|
|
09/06/2024 |
|
|
|
21,415,707 |
|
|
|
21,113,349 |
|
|
|
— |
|
|
|
(302,358 |
) |
| MSCI EAFE Mini Index |
|
|
420 |
|
|
|
09/20/2024 |
|
|
|
48,742,214 |
|
|
|
49,207,200 |
|
|
|
464,986 |
|
|
|
— |
|
| MSCI Emerging Markets Index |
|
|
221 |
|
|
|
09/20/2024 |
|
|
|
12,006,590 |
|
|
|
12,024,610 |
|
|
|
18,020 |
|
|
|
— |
|
| S&P/TSX 60 Index |
|
|
154 |
|
|
|
09/19/2024 |
|
|
|
29,218,887 |
|
|
|
29,504,331 |
|
|
|
285,444 |
|
|
|
— |
|
| U.K. Gilt |
|
|
105 |
|
|
|
09/26/2024 |
|
|
|
12,862,389 |
|
|
|
12,950,509 |
|
|
|
88,120 |
|
|
|
— |
|
|
|
|
|
|
|
|
|
|
|
|
|
|
|
|
|
|
|
|
|
|
| Total |
|
|
$ |
1,136,452 |
|
|
$ |
(302,358 |
) |
|
|
|
|
|
|
|
|
|
|
|
|
|
|
|
|
|
|
|
|
|
|
| Short Futures Contracts |
|
| Description |
|
Number of Contracts |
|
|
Expiration Date |
|
|
Notional Amount |
|
|
Value |
|
|
Unrealized Appreciation |
|
Unrealized Depreciation |
| 2-Year U.S. Treasury Notes |
|
|
(173) |
|
|
|
09/30/2024 |
|
|
$ |
(35,238,952 |
) |
|
$ |
(35,329,844 |
) |
|
$ |
— |
|
|
$ |
(90,892 |
) |
| 10-Year U.S. Treasury Notes |
|
|
(80) |
|
|
|
09/19/2024 |
|
|
|
(8,746,707 |
) |
|
|
(8,798,750 |
) |
|
|
— |
|
|
|
(52,043 |
) |
| 10-Year U.S. Treasury Ultra Notes |
|
|
(132) |
|
|
|
09/19/2024 |
|
|
|
(14,843,535 |
) |
|
|
(14,986,125 |
) |
|
|
— |
|
|
|
(142,590 |
) |
| EURO STOXX 50® Index |
|
|
(200) |
|
|
|
09/20/2024 |
|
|
|
(10,452,070 |
) |
|
|
(10,551,004 |
) |
|
|
— |
|
|
|
(98,934 |
) |
| German Euro Bund |
|
|
(119) |
|
|
|
09/06/2024 |
|
|
|
(16,599,505 |
) |
|
|
(16,774,061 |
) |
|
|
— |
|
|
|
(174,556 |
) |
| JPY Currency |
|
|
(146) |
|
|
|
09/16/2024 |
|
|
|
(11,757,119 |
) |
|
|
(11,483,812 |
) |
|
|
273,307 |
|
|
|
— |
|
| S&P 500® E-Mini Index |
|
|
(100) |
|
|
|
09/20/2024 |
|
|
|
(27,512,287 |
) |
|
|
(27,607,500 |
) |
|
|
— |
|
|
|
(95,213 |
) |
| S&P/ASX 200 Index |
|
|
(12) |
|
|
|
09/19/2024 |
|
|
|
(1,549,192 |
) |
|
|
(1,555,410 |
) |
|
|
— |
|
|
|
(6,218 |
) |
|
|
|
|
|
| The Notes to Financial Statements are an integral part of this report. |
| Transamerica Series Trust |
|
|
|
Semi-Annual Financial Statements 2024 |
|
|
Page 1 |
|
|
Transamerica JPMorgan International Moderate Growth VP
SCHEDULE OF INVESTMENTS (continued)
At June 30, 2024
(unaudited)
FUTURES CONTRACTS (continued):
|
|
|
|
|
|
|
|
|
|
|
|
|
|
|
|
|
|
|
|
|
|
|
|
|
| Short Futures Contracts (continued) |
|
| Description |
|
Number of Contracts |
|
|
Expiration Date |
|
|
Notional Amount |
|
|
Value |
|
|
Unrealized Appreciation |
|
|
Unrealized Depreciation |
| TOPIX Index |
|
|
(19) |
|
|
|
09/12/2024 |
|
|
$ |
(3,204,803 |
) |
|
$ |
(3,319,007 |
) |
|
$ |
— |
|
|
$ |
(114,204 |
) |
| U.S. Treasury Ultra Bonds |
|
|
(32) |
|
|
|
09/19/2024 |
|
|
|
(3,966,679 |
) |
|
|
(4,011,000 |
) |
|
|
— |
|
|
|
(44,321 |
) |
|
|
|
|
|
|
|
|
|
|
|
|
|
|
|
|
|
|
|
|
|
| Total |
|
|
$ |
273,307 |
|
|
$ |
(818,971 |
) |
|
|
|
|
|
|
|
|
|
|
|
|
|
|
|
|
|
|
|
|
|
| Total Futures Contracts |
|
|
$ |
1,409,759 |
|
|
$ |
(1,121,329 |
) |
|
|
|
|
|
|
|
|
|
|
|
|
|
|
|
|
|
|
|
|
|
INVESTMENT VALUATION:
|
|
|
|
|
|
|
|
|
|
|
|
|
|
|
|
|
| Valuation Inputs (E) |
|
|
|
|
|
|
|
|
|
|
|
|
| |
|
Level 1 - Unadjusted Quoted Prices |
|
|
Level 2 - Other Significant Observable Inputs |
|
|
Level 3 - Significant Unobservable Inputs |
|
|
Value |
|
| |
|
|
|
|
|
|
| ASSETS |
|
|
|
|
|
|
|
|
|
|
|
|
|
|
|
|
| Investments |
|
|
|
|
|
|
|
|
|
|
|
|
|
|
|
|
| Investment Companies |
|
$ |
376,963,681 |
|
|
$ |
— |
|
|
$ |
— |
|
|
$ |
376,963,681 |
|
| U.S. Government Obligation |
|
|
— |
|
|
|
8,029,678 |
|
|
|
— |
|
|
|
8,029,678 |
|
| Repurchase Agreement |
|
|
— |
|
|
|
2,728,398 |
|
|
|
— |
|
|
|
2,728,398 |
|
|
|
|
|
|
|
|
|
|
|
|
|
|
|
|
|
|
|
|
|
|
|
| Total Investments |
|
$ |
376,963,681 |
|
|
$ |
10,758,076 |
|
|
$ |
— |
|
|
$ |
387,721,757 |
|
|
|
|
|
|
|
|
|
|
|
|
|
|
|
|
|
|
|
|
|
|
|
| Other Financial Instruments |
|
|
|
|
|
|
|
|
|
|
|
|
|
|
|
|
| Futures Contracts (F) |
|
$ |
1,409,759 |
|
|
$ |
— |
|
|
$ |
— |
|
|
$ |
1,409,759 |
|
|
|
|
|
|
|
|
|
|
|
|
|
|
|
|
|
|
|
|
|
|
|
| Total Other Financial Instruments |
|
$ |
1,409,759 |
|
|
$ |
— |
|
|
$ |
— |
|
|
$ |
1,409,759 |
|
|
|
|
|
|
|
|
|
|
|
|
|
|
|
|
|
|
|
|
|
|
|
| LIABILITIES |
|
|
|
|
|
|
|
|
|
|
|
|
|
|
|
|
| Other Financial Instruments |
|
|
|
|
|
|
|
|
|
|
|
|
|
|
|
|
| Futures Contracts (F) |
|
$ |
(1,121,329 |
) |
|
$ |
— |
|
|
$ |
— |
|
|
$ |
(1,121,329 |
) |
|
|
|
|
|
|
|
|
|
|
|
|
|
|
|
|
|
|
|
|
|
|
| Total Other Financial Instruments |
|
$ |
(1,121,329 |
) |
|
$ |
— |
|
|
$ |
— |
|
|
$ |
(1,121,329 |
) |
|
|
|
|
|
|
|
|
|
|
|
|
|
|
|
|
|
FOOTNOTES TO SCHEDULE OF INVESTMENTS:
| (A) |
Affiliated investment in the Class I2 shares of funds within Transamerica Funds and/or affiliated investment in the Initial Class shares of funds within Transamerica Series Trust. The Portfolio’s transactions and earnings from these underlying funds are as follows: |
|
|
|
|
|
|
|
|
|
|
|
|
|
|
|
|
|
|
|
|
|
|
|
|
|
|
|
|
|
|
|
|
|
|
|
|
|
| Affiliated Investments |
|
Value December 31, 2023 |
|
|
Purchases at Cost |
|
|
Proceeds from Sales |
|
|
Net Realized Gain (Loss) |
|
|
Net Change in Unrealized Appreciation (Depreciation) |
|
|
Value June 30, 2024 |
|
|
Shares as of June 30, 2024 |
|
|
Dividend Income |
|
|
Net Capital Gain Distributions |
|
| Transamerica Aegon Bond VP |
|
|
$70,771,688 |
|
|
|
$— |
|
|
|
$(15,739,411 |
) |
|
|
$(361,311 |
) |
|
|
$145,802 |
|
|
|
$54,816,768 |
|
|
|
5,662,889 |
|
|
|
$— |
|
|
|
$— |
|
|
|
|
|
|
|
|
|
|
|
| Transamerica BlackRock Real Estate Securities VP |
|
|
1,070,643 |
|
|
|
— |
|
|
|
— |
|
|
|
— |
|
|
|
(38,552 |
) |
|
|
1,032,091 |
|
|
|
110,148 |
|
|
|
— |
|
|
|
— |
|
|
|
|
|
|
|
|
|
|
|
| Transamerica Core Bond |
|
|
8,766,973 |
|
|
|
156,680 |
|
|
|
(3,586,694 |
) |
|
|
(558,822 |
) |
|
|
290,923 |
|
|
|
5,069,060 |
|
|
|
595,659 |
|
|
|
156,680 |
|
|
|
— |
|
|
|
|
|
|
|
|
|
|
|
| Transamerica Emerging Markets Opportunities |
|
|
41,965 |
|
|
|
— |
|
|
|
— |
|
|
|
— |
|
|
|
3,054 |
|
|
|
45,019 |
|
|
|
5,656 |
|
|
|
— |
|
|
|
— |
|
|
|
|
|
|
|
|
|
|
|
| Transamerica Floating Rate |
|
|
3,885,976 |
|
|
|
164,642 |
|
|
|
— |
|
|
|
— |
|
|
|
(8,727 |
) |
|
|
4,041,891 |
|
|
|
447,112 |
|
|
|
164,642 |
|
|
|
— |
|
|
|
|
|
|
|
|
|
|
|
| Transamerica High Yield Bond |
|
|
35,203,962 |
|
|
|
1,124,794 |
|
|
|
— |
|
|
|
— |
|
|
|
(391,243 |
) |
|
|
35,937,513 |
|
|
|
4,480,987 |
|
|
|
1,124,794 |
|
|
|
— |
|
|
|
|
|
|
|
|
|
|
|
| Transamerica International Equity |
|
|
69,530,527 |
|
|
|
12,919,150 |
|
|
|
(14,023,700 |
) |
|
|
2,451,358 |
|
|
|
387,668 |
|
|
|
71,265,003 |
|
|
|
3,413,075 |
|
|
|
— |
|
|
|
— |
|
|
|
|
|
|
|
|
|
|
|
| Transamerica International Focus |
|
|
107,339,265 |
|
|
|
12,238,324 |
|
|
|
(41,631,446 |
) |
|
|
359,818 |
|
|
|
2,278,026 |
|
|
|
80,583,987 |
|
|
|
9,732,366 |
|
|
|
— |
|
|
|
— |
|
|
|
|
|
|
|
|
|
|
|
| Transamerica International Small Cap Value |
|
|
48,111,816 |
|
|
|
3,715,291 |
|
|
|
— |
|
|
|
— |
|
|
|
3,071,438 |
|
|
|
54,898,545 |
|
|
|
3,667,237 |
|
|
|
— |
|
|
|
— |
|
|
|
|
|
|
|
|
|
|
|
| Transamerica Large Cap Value |
|
|
5,981,973 |
|
|
|
504 |
|
|
|
(6,105,223 |
) |
|
|
(169,522 |
) |
|
|
376,904 |
|
|
|
84,636 |
|
|
|
6,041 |
|
|
|
504 |
|
|
|
— |
|
|
|
|
|
|
|
|
|
|
|
| Transamerica Long Credit |
|
|
16,856,261 |
|
|
|
4,546,433 |
|
|
|
— |
|
|
|
— |
|
|
|
(1,071,460 |
) |
|
|
20,331,234 |
|
|
|
2,146,909 |
|
|
|
510,281 |
|
|
|
— |
|
|
|
|
|
|
| The Notes to Financial Statements are an integral part of this report. |
| Transamerica Series Trust |
|
|
|
Semi-Annual Financial Statements 2024 |
|
|
Page 2 |
|
|
Transamerica JPMorgan International Moderate Growth VP
SCHEDULE OF INVESTMENTS (continued)
At June 30, 2024
(unaudited)
FOOTNOTES TO SCHEDULE OF INVESTMENTS (continued):
|
|
|
|
|
|
|
|
|
|
|
|
|
|
|
|
|
|
|
|
|
|
|
|
|
|
|
|
|
|
|
|
|
|
|
|
|
| Affiliated Investments |
|
Value December 31, 2023 |
|
Purchases at Cost |
|
|
Proceeds from Sales |
|
|
Net Realized Gain (Loss) |
|
|
Net Change in Unrealized Appreciation (Depreciation) |
|
|
Value June 30, 2024 |
|
|
Shares as of June 30, 2024 |
|
|
Dividend Income |
|
|
Net Capital Gain Distributions |
|
| Transamerica Unconstrained Bond |
|
|
$12,225,701 |
|
|
|
$356,402 |
|
|
|
$(8,273,728 |
) |
|
|
$30,650 |
|
|
|
$(186,319 |
) |
|
|
$4,152,706 |
|
|
|
474,595 |
|
|
|
$337,392 |
|
|
|
$— |
|
|
|
|
|
|
|
|
|
|
|
| Transamerica WMC US Growth VP |
|
|
20,242,874 |
|
|
|
17,832,756 |
|
|
|
— |
|
|
|
— |
|
|
|
6,629,598 |
|
|
|
44,705,228 |
|
|
|
1,047,452 |
|
|
|
— |
|
|
|
— |
|
|
|
|
|
|
|
|
|
|
|
|
|
|
|
|
| Total |
|
|
$400,029,624 |
|
|
|
$53,054,976 |
|
|
|
$(89,360,202 |
) |
|
|
$1,752,171 |
|
|
|
$11,487,112 |
|
|
|
$376,963,681 |
|
|
|
31,790,126 |
|
|
|
$2,294,293 |
|
|
|
$— |
|
|
|
|
|
|
| (B) |
All or a portion of the security has been segregated by the custodian as collateral to cover margin requirements for open futures contracts. The total value of the securities is $8,029,678. |
| (C) |
Rate disclosed reflects the yield at June 30, 2024. |
| (D) |
Percentage rounds to less than 0.1% or (0.1)%. |
| (E) |
There were no transfers in or out of Level 3 during the period ended June 30, 2024. Please reference the Investment Valuation section of the Notes to Financial Statements for more information regarding investment valuation and pricing inputs. |
| (F) |
Derivative instruments are valued at unrealized appreciation (depreciation). |
CURRENCY ABBREVIATION(S):
|
|
|
| CAD |
|
Canadian Dollar |
| JPY |
|
Japanese Yen |
PORTFOLIO ABBREVIATION(S):
|
|
|
| BTP |
|
Buoni del Tesoro Poliennali (Italian Treasury Bonds) |
| EAFE |
|
Europe, Australasia and Far East |
| STOXX |
|
Deutsche Börse Group & SIX Group Index |
| TOPIX |
|
Tokyo Price Index |
| TSX |
|
Toronto Stock Exchange |
|
|
|
|
|
| The Notes to Financial Statements are an integral part of this report. |
| Transamerica Series Trust |
|
|
|
Semi-Annual Financial Statements 2024 |
|
|
Page 3 |
|
|
Transamerica JPMorgan International Moderate Growth VP
|
|
|
| STATEMENT OF ASSETS AND LIABILITIES At June 30, 2024 (unaudited) |
|
STATEMENT OF OPERATIONS For the period ended June 30, 2024 (unaudited) |
|
|
|
|
|
|
|
| Assets: |
|
|
|
|
| Affiliated investments, at value (cost $346,448,731) |
|
$ |
376,963,681 |
|
| Unaffiliated investments, at value (cost $8,045,051) |
|
|
8,029,678 |
|
| Repurchase agreement, at value (cost $2,728,398) |
|
|
2,728,398 |
|
| Receivables and other assets: |
|
|
|
|
| Shares of beneficial interest sold |
|
|
829 |
|
| Dividends from affiliated investments |
|
|
333,800 |
|
| Interest |
|
|
138,017 |
|
| Variation margin receivable on futures contracts |
|
|
428,169 |
|
| Prepaid expenses |
|
|
1,548 |
|
|
|
| Total assets |
|
|
388,624,120 |
|
|
|
| Liabilities: |
|
|
|
|
| Payables and other liabilities: |
|
|
|
|
| Investments purchased |
|
|
333,800 |
|
| Shares of beneficial interest redeemed |
|
|
463,235 |
|
| Due to custodian |
|
|
91 |
|
| Investment management fees |
|
|
36,845 |
|
| Distribution and service fees |
|
|
72,211 |
|
| Transfer agent costs |
|
|
405 |
|
| Trustee and CCO fees |
|
|
1,230 |
|
| Audit and tax fees |
|
|
12,549 |
|
| Custody fees |
|
|
9,058 |
|
| Legal fees |
|
|
9,148 |
|
| Printing and shareholder reports fees |
|
|
33,943 |
|
| Other accrued expenses |
|
|
10,262 |
|
|
|
| Total liabilities |
|
|
982,777 |
|
|
|
| Net assets |
|
$ |
387,641,343 |
|
|
|
| Net assets consist of: |
|
|
|
|
| Capital stock ($0.01 par value) |
|
$ |
418,116 |
|
| Additional paid-in capital |
|
|
371,320,673 |
|
| Total distributable earnings (accumulated losses) |
|
|
15,902,554 |
|
|
|
| Net assets |
|
$ |
387,641,343 |
|
|
|
| Net assets by class: |
|
|
|
|
| Initial Class |
|
$ |
15,404,988 |
|
| Service Class |
|
|
372,236,355 |
|
|
|
| Shares outstanding: |
|
|
|
|
| Initial Class |
|
|
1,641,844 |
|
| Service Class |
|
|
40,169,722 |
|
|
|
| Net asset value and offering price per share: |
|
|
|
|
| Initial Class |
|
$ |
9.38 |
|
| Service Class |
|
|
9.27 |
|
|
|
|
|
|
|
|
| Investment income: |
|
|
|
|
| Dividend income from affiliated investments |
|
$ |
2,294,293 |
|
| Interest income from unaffiliated investments |
|
|
220,153 |
|
| Total investment income |
|
|
2,514,446 |
|
|
|
| Expenses: |
|
|
|
|
| Investment management fees |
|
|
241,580 |
|
| Distribution and service fees: |
|
|
|
|
| Service Class |
|
|
474,303 |
|
| Transfer agent costs |
|
|
2,271 |
|
| Trustee and CCO fees |
|
|
9,297 |
|
| Audit and tax fees |
|
|
12,148 |
|
| Custody fees |
|
|
8,981 |
|
| Legal fees |
|
|
16,636 |
|
| Printing and shareholder reports fees |
|
|
31,655 |
|
| Other |
|
|
13,975 |
|
|
|
| Total expenses |
|
|
810,846 |
|
|
|
| Net investment income (loss) |
|
|
1,703,600 |
|
|
|
| Net realized gain (loss) on: |
|
|
|
|
| Affiliated investments |
|
|
1,752,171 |
|
| Unaffiliated investments |
|
|
9,271 |
|
| Futures contracts |
|
|
(2,096,331 |
) |
|
|
| Net realized gain (loss) |
|
|
(334,889 |
) |
|
|
| Net change in unrealized appreciation (depreciation) on: |
|
|
|
|
| Affiliated investments |
|
|
11,487,112 |
|
| Unaffiliated investments |
|
|
(14,683 |
) |
| Futures contracts |
|
|
(3,355,060 |
) |
| Translation of assets and liabilities denominated in foreign currencies |
|
|
(17,942 |
) |
|
|
| Net change in unrealized appreciation (depreciation) |
|
|
8,099,427 |
|
|
|
| Net realized and change in unrealized gain (loss) |
|
|
7,764,538 |
|
|
|
| Net increase (decrease) in net assets resulting from operations |
|
$ |
9,468,138 |
|
The Notes to Financial Statements are an integral part of this report.
|
|
|
|
|
| Transamerica Series Trust |
|
|
|
Semi-Annual Financial Statements 2024 |
|
|
Page 4 |
|
|
Transamerica JPMorgan International Moderate Growth VP
STATEMENT OF CHANGES IN NET ASSETS
For the period and year ended:
|
|
|
|
|
|
|
|
|
| |
|
June 30, 2024 (unaudited) |
|
|
December 31, 2023 |
| From operations: |
|
|
|
|
|
|
|
|
| Net investment income (loss) |
|
$ |
1,703,600 |
|
|
|
$ 10,412,159 |
|
| Net realized gain (loss) |
|
|
(334,889 |
) |
|
|
(13,120,610 |
) |
| Net change in unrealized appreciation (depreciation) |
|
|
8,099,427 |
|
|
|
37,873,370 |
|
|
|
|
| Net increase (decrease) in net assets resulting from operations |
|
|
9,468,138 |
|
|
|
35,164,919 |
|
|
|
|
| Dividends and/or distributions to shareholders: |
|
|
|
|
|
|
|
|
| Initial Class |
|
|
— |
|
|
|
(237,046 |
) |
| Service Class |
|
|
— |
|
|
|
(5,383,997 |
) |
|
|
|
| Net increase (decrease) in net assets resulting from dividends and/or distributions to shareholders |
|
|
— |
|
|
|
(5,621,043 |
) |
|
|
|
| Capital share transactions: |
|
|
|
|
|
|
|
|
| Proceeds from shares sold: |
|
|
|
|
|
|
|
|
| Initial Class |
|
|
897,811 |
|
|
|
670,485 |
|
| Service Class |
|
|
1,000,400 |
|
|
|
1,883,911 |
|
| |
|
|
1,898,211 |
|
|
|
2,554,396 |
|
| Dividends and/or distributions reinvested: |
|
|
|
|
|
|
|
|
| Initial Class |
|
|
— |
|
|
|
237,046 |
|
| Service Class |
|
|
— |
|
|
|
5,383,997 |
|
| |
|
|
— |
|
|
|
5,621,043 |
|
| Cost of shares redeemed: |
|
|
|
|
|
|
|
|
| Initial Class |
|
|
(723,347 |
) |
|
|
(1,514,800 |
) |
| Service Class |
|
|
(33,616,134 |
) |
|
|
(63,055,106 |
) |
|
|
|
| |
|
|
(34,339,481 |
) |
|
|
(64,569,906 |
) |
|
|
|
| Net increase (decrease) in net assets resulting from capital share transactions |
|
|
(32,441,270 |
) |
|
|
(56,394,467 |
) |
|
|
|
| Net increase (decrease) in net assets |
|
|
(22,973,132 |
) |
|
|
(26,850,591 |
) |
|
|
|
| Net assets: |
|
|
|
|
|
|
|
|
| Beginning of period/year |
|
|
410,614,475 |
|
|
|
437,465,066 |
|
| End of period/year |
|
$ |
387,641,343 |
|
|
|
$410,614,475 |
|
|
|
|
| Capital share transactions - shares: |
|
|
|
|
|
|
|
|
| Shares issued: |
|
|
|
|
|
|
|
|
| Initial Class |
|
|
96,756 |
|
|
|
75,522 |
|
| Service Class |
|
|
108,478 |
|
|
|
214,283 |
|
| |
|
|
205,234 |
|
|
|
289,805 |
|
| Shares reinvested: |
|
|
|
|
|
|
|
|
| Initial Class |
|
|
— |
|
|
|
27,215 |
|
| Service Class |
|
|
— |
|
|
|
624,594 |
|
| |
|
|
— |
|
|
|
651,809 |
|
| Shares redeemed: |
|
|
|
|
|
|
|
|
| Initial Class |
|
|
(77,934 |
) |
|
|
(172,636 |
) |
| Service Class |
|
|
(3,654,019 |
) |
|
|
(7,275,558 |
) |
| |
|
|
(3,731,953 |
) |
|
|
(7,448,194 |
) |
| Net increase (decrease) in shares outstanding: |
|
|
|
|
|
|
|
|
| Initial Class |
|
|
18,822 |
|
|
|
(69,899 |
) |
| Service Class |
|
|
(3,545,541 |
) |
|
|
(6,436,681 |
) |
| |
|
|
(3,526,719 |
) |
|
|
(6,506,580 |
) |
The Notes to Financial Statements are an integral part of this report.
|
|
|
|
|
| Transamerica Series Trust |
|
|
|
Semi-Annual Financial Statements 2024 |
|
|
Page 5 |
|
|
Transamerica JPMorgan International Moderate Growth VP
FINANCIAL HIGHLIGHTS
|
|
|
|
|
|
|
|
|
|
|
|
|
|
|
|
|
|
|
|
|
|
|
|
|
| For a share outstanding during the period and years indicated: |
|
Initial Class |
|
|
|
|
|
|
|
|
| |
|
June 30, 2024 (unaudited) |
|
|
December 31, 2023 |
|
|
December 31, 2022 |
|
|
December 31, 2021 |
|
|
December 31, 2020 |
|
|
December 31, 2019 |
|
|
|
|
|
|
|
|
| Net asset value, beginning of period/year |
|
$ |
9.16 |
|
|
$ |
8.53 |
|
|
$ |
12.01 |
|
|
$ |
11.16 |
|
|
$ |
9.98 |
|
|
$ |
9.48 |
|
|
|
|
|
|
|
|
| Investment operations: |
|
|
|
|
|
|
|
|
|
|
|
|
|
|
|
|
|
|
|
|
|
|
|
|
| Net investment income (loss)(A) |
|
|
0.05 |
|
|
|
0.25 |
|
|
|
0.15 |
|
|
|
0.47 |
|
|
|
0.16 |
|
|
|
0.24 |
|
| Net realized and unrealized gain (loss) |
|
|
0.17 |
|
|
|
0.52 |
|
|
|
(2.23 |
) |
|
|
0.56 |
|
|
|
1.29 |
|
|
|
1.34 |
|
| Total investment operations |
|
|
0.22 |
|
|
|
0.77 |
|
|
|
(2.08 |
) |
|
|
1.03 |
|
|
|
1.45 |
|
|
|
1.58 |
|
|
|
|
|
|
|
|
| Dividends and/or distributions to shareholders: |
|
|
|
|
|
|
|
|
|
|
|
|
|
|
|
|
|
|
|
|
|
|
|
|
| Net investment income |
|
|
— |
|
|
|
(0.14 |
) |
|
|
(0.53 |
) |
|
|
(0.18 |
) |
|
|
(0.27 |
) |
|
|
(0.24 |
) |
| Net realized gains |
|
|
— |
|
|
|
— |
|
|
|
(0.87 |
) |
|
|
— |
|
|
|
(0.00 |
)(B) |
|
|
(0.84 |
) |
| Total dividends and/or distributions to shareholders |
|
|
— |
|
|
|
(0.14 |
) |
|
|
(1.40 |
) |
|
|
(0.18 |
) |
|
|
(0.27 |
) |
|
|
(1.08 |
) |
| Net asset value, end of period/year |
|
$ |
9.38 |
|
|
$ |
9.16 |
|
|
$ |
8.53 |
|
|
$ |
12.01 |
|
|
$ |
11.16 |
|
|
$ |
9.98 |
|
| |
|
|
|
|
|
|
|
|
|
|
|
|
|
|
|
|
|
|
| Total return |
|
|
2.40 |
%(C) |
|
|
9.16 |
% |
|
|
(17.28 |
)% |
|
|
9.25 |
% |
|
|
14.90 |
% |
|
|
17.77 |
% |
|
|
|
|
|
|
|
| Ratio and supplemental data: |
|
|
|
|
|
|
|
|
|
|
|
|
|
|
|
|
|
|
|
|
|
|
|
|
| Net assets end of period/year (000’s) |
|
$ |
15,405 |
|
|
$ |
14,859 |
|
|
$ |
14,445 |
|
|
$ |
18,219 |
|
|
$ |
16,919 |
|
|
$ |
15,762 |
|
| Expenses to average net assets(D) |
|
|
0.17 |
%(E) |
|
|
0.18 |
% |
|
|
0.16 |
% |
|
|
0.16 |
% |
|
|
0.16 |
% |
|
|
0.16 |
% |
| Net investment income (loss) to average net assets |
|
|
1.10 |
%(E) |
|
|
2.79 |
% |
|
|
1.58 |
% |
|
|
3.99 |
% |
|
|
1.69 |
% |
|
|
2.43 |
% |
| Portfolio turnover rate |
|
|
14 |
%(C) |
|
|
35 |
% |
|
|
11 |
% |
|
|
19 |
% |
|
|
19 |
% |
|
|
17 |
% |
| (A) |
Calculated based on average number of shares outstanding. |
| (B) |
Rounds to less than $0.01 or $(0.01). |
| (D) |
Does not include expenses of the underlying investments in which the Portfolio invests. |
|
|
|
|
|
|
|
|
|
|
|
|
|
|
|
|
|
|
|
|
|
|
|
|
|
| For a share outstanding during the period and years indicated: |
|
Service Class |
|
|
|
|
|
|
|
|
| |
|
June 30, 2024 (unaudited) |
|
|
December 31, 2023 |
|
|
December 31, 2022 |
|
|
December 31, 2021 |
|
|
December 31, 2020 |
|
|
December 31, 2019 |
|
|
|
|
|
|
|
|
| Net asset value, beginning of period/year |
|
$ |
9.05 |
|
|
$ |
8.43 |
|
|
$ |
11.88 |
|
|
$ |
11.05 |
|
|
$ |
9.88 |
|
|
$ |
9.38 |
|
|
|
|
|
|
|
|
| Investment operations: |
|
|
|
|
|
|
|
|
|
|
|
|
|
|
|
|
|
|
|
|
|
|
|
|
| Net investment income (loss)(A) |
|
|
0.04 |
|
|
|
0.21 |
|
|
|
0.13 |
|
|
|
0.42 |
|
|
|
0.13 |
|
|
|
0.21 |
|
| Net realized and unrealized gain (loss) |
|
|
0.18 |
|
|
|
0.53 |
|
|
|
(2.21 |
) |
|
|
0.56 |
|
|
|
1.28 |
|
|
|
1.34 |
|
| Total investment operations |
|
|
0.22 |
|
|
|
0.74 |
|
|
|
(2.08 |
) |
|
|
0.98 |
|
|
|
1.41 |
|
|
|
1.55 |
|
|
|
|
|
|
|
|
| Dividends and/or distributions to shareholders: |
|
|
|
|
|
|
|
|
|
|
|
|
|
|
|
|
|
|
|
|
|
|
|
|
| Net investment income |
|
|
— |
|
|
|
(0.12 |
) |
|
|
(0.50 |
) |
|
|
(0.15 |
) |
|
|
(0.24 |
) |
|
|
(0.21 |
) |
| Net realized gains |
|
|
— |
|
|
|
— |
|
|
|
(0.87 |
) |
|
|
— |
|
|
|
(0.00 |
)(B) |
|
|
(0.84 |
) |
| Total dividends and/or distributions to shareholders |
|
|
— |
|
|
|
(0.12 |
) |
|
|
(1.37 |
) |
|
|
(0.15 |
) |
|
|
(0.24 |
) |
|
|
(1.05 |
) |
| Net asset value, end of period/year |
|
$ |
9.27 |
|
|
$ |
9.05 |
|
|
$ |
8.43 |
|
|
$ |
11.88 |
|
|
$ |
11.05 |
|
|
$ |
9.88 |
|
| |
|
|
|
|
|
|
|
|
|
|
|
|
|
|
|
|
|
|
| Total return |
|
|
2.43 |
%(C) |
|
|
8.70 |
% |
|
|
(17.42 |
)% |
|
|
9.01 |
% |
|
|
14.54 |
% |
|
|
17.61 |
% |
|
|
|
|
|
|
|
| Ratio and supplemental data: |
|
|
|
|
|
|
|
|
|
|
|
|
|
|
|
|
|
|
|
|
|
|
|
|
| Net assets end of period/year (000’s) |
|
$ |
372,236 |
|
|
$ |
395,755 |
|
|
$ |
423,020 |
|
|
$ |
590,096 |
|
|
$ |
624,241 |
|
|
$ |
624,312 |
|
| Expenses to average net assets(D) |
|
|
0.42 |
%(E) |
|
|
0.43 |
% |
|
|
0.41 |
% |
|
|
0.41 |
% |
|
|
0.41 |
% |
|
|
0.41 |
% |
| Net investment income (loss) to average net assets |
|
|
0.85 |
%(E) |
|
|
2.46 |
% |
|
|
1.29 |
% |
|
|
3.60 |
% |
|
|
1.42 |
% |
|
|
2.15 |
% |
| Portfolio turnover rate |
|
|
14 |
%(C) |
|
|
35 |
% |
|
|
11 |
% |
|
|
19 |
% |
|
|
19 |
% |
|
|
17 |
% |
| (A) |
Calculated based on average number of shares outstanding. |
| (B) |
Rounds to less than $0.01 or $(0.01). |
| (D) |
Does not include expenses of the underlying investments in which the Portfolio invests. |
The Notes to Financial Statements are an integral part of this report.
|
|
|
|
|
| Transamerica Series Trust |
|
|
|
Semi-Annual Financial Statements 2024 |
|
|
Page 6 |
|
|
Transamerica JPMorgan International Moderate Growth VP
NOTES TO FINANCIAL STATEMENTS
At June 30, 2024
(unaudited)
1. ORGANIZATION
Transamerica Series Trust (“TST”) is an open-end management investment company registered under the Investment Company Act of 1940, as amended (the “1940 Act”). TST applies investment company accounting and reporting guidance. TST serves as a funding vehicle for variable life insurance, variable annuity, and group annuity products. Transamerica JPMorgan International Moderate Growth VP (the “Portfolio”) is a series of TST and is classified as diversified under the 1940 Act. The Portfolio currently offers two classes of shares, Initial Class and Service Class.
The only shareholders of the Portfolio are affiliated insurance company separate accounts and/or affiliated asset allocation portfolios. Contract holders of the variable life and annuity contracts are not shareholders of the Portfolio. For ease of reference, shareholders and contract holders are collectively referred to in this report as “shareholders.”
This report must be accompanied or preceded by the Portfolio’s current prospectus, which contains additional information about the Portfolio, including risks, as well as investment objectives and strategies.
Transamerica Asset Management, Inc. (“TAM”) serves as investment manager for the Portfolio pursuant to an investment management agreement. TAM provides continuous and regular investment management services to the Portfolio. TAM supervises the Portfolio’s investments, conducts its investment program and provides supervisory, compliance and administrative services to the Portfolio.
TAM currently acts as a “manager of managers” and has hired sub-advisers to furnish day-to-day investment advice and recommendations. TAM may, in the future, determine to provide all aspects of the day-to-day management of the Portfolio without the use of a sub-adviser. When acting as a manager of managers, TAM provides investment management services that include, without limitation, the design and development of the Portfolio and its investment strategies and the ongoing review and evaluation of those investment strategies including recommending changes in strategy where it believes appropriate or advisable; the selection of one or more sub-advisers for the Portfolio employing a combination of quantitative and qualitative screens, research, analysis and due diligence; negotiation of sub-advisory agreements and fees; oversight and monitoring of sub-advisers and recommending changes to sub-advisers where it believes appropriate or advisable; recommending portfolio combinations and liquidations where it believes appropriate or advisable; selection and oversight of transition managers, as needed; regular supervision of the Portfolio’s investments; regular review and evaluation of sub-adviser performance; daily monitoring of the sub-advisers’ buying and selling of securities for the Portfolio; regular review of holdings; ongoing trade oversight and analysis; regular monitoring to ensure adherence to investment process; regular calls and periodic on-site visits with sub-advisers; portfolio construction and asset allocation when using multiple sub-advisers for the Portfolio; risk management oversight and analysis; oversight of negotiation of investment documentation and agreements; design, development, implementation and regular monitoring of the valuation process; periodic due diligence reviews of pricing vendors and vendor methodology; design, development, implementation and regular monitoring of the compliance process; respond to regulatory inquiries and determine appropriate litigation strategy, as needed; review of proxies voted by sub-advisers; oversight of preparation and review of materials for meetings of the Portfolio’s Board of Trustees (the “Board”), participation in these meetings and preparation of regular communications with the Board; oversight of preparation and review of prospectuses, shareholder reports and other disclosure materials and regulatory filings for the Portfolio; oversight of other service providers to the Portfolio, such as the custodian, the transfer agent, the Portfolio’s independent accounting firm and legal counsel; supervision of the performance of recordkeeping and shareholder relations functions for the Portfolio; and oversight of cash management services. TAM uses a variety of quantitative and qualitative tools to carry out its investment management services. TAM, not the Portfolio, is responsible for paying the sub-adviser(s) for their services, and sub-advisory fees are TAM’s expense.
TAM’s investment management services also include the provision of supervisory and administrative services to the Portfolio. These services include performing certain administrative services for the Portfolio and supervising and overseeing the administrative, clerical, recordkeeping and bookkeeping services provided to the Portfolio by State Street Bank and Trust Company (“State Street”), to whom TAM has outsourced the provision of certain sub-administration services. To the extent agreed upon by TAM and the Portfolio from time to time, TAM’s supervisory and administrative services include, but are not limited to: monitoring and verifying the custodian’s daily calculation of the Net Asset Values (“NAV”); shareholder relations functions; compliance services; valuation services; assisting in due diligence and in the oversight and monitoring of certain activities of sub-advisers and certain aspects of Portfolio investments; assisting with Portfolio combinations and liquidations; oversight of the preparation and filing, and review, of all returns and reports, in connection with federal, state and local taxes; oversight and review of regulatory reporting; supervising and coordinating the Portfolio’s custodian and dividend disbursing agent and monitoring their services to the Portfolio; assisting the Portfolio in preparing reports to shareholders; acting as liaison with the Portfolio’s independent public accountants and providing, upon request, analyses, fiscal year summaries and other audit related services; assisting in the preparation of agendas and supporting documents for and minutes of meetings of trustees and committees of trustees; assisting in the preparation of regular communications with the trustees; and providing personnel and office space, telephones and other office equipment as necessary in order for TAM to perform supervisory and administrative services to the Portfolio. The Portfolio
|
|
|
|
|
| Transamerica Series Trust |
|
|
|
Semi-Annual Financial Statements 2024 |
|
|
Page 7 |
|
|
Transamerica JPMorgan International Moderate Growth VP
NOTES TO FINANCIAL STATEMENTS (continued)
At June 30, 2024
(unaudited)
1. ORGANIZATION (continued)
pays certain fees and expenses to State Street for sub-administration services which are not administrative services covered by the management agreement with TAM or paid for through the management fees payable thereunder. For the period ended June 30, 2024, (i) the expenses paid to State Street for sub-administration services by the Portfolio are shown as a part of Other expenses within the Statement of Operations and (ii) the expenses payable to State Street for sub-administration services from the Portfolio are shown as part of Other accrued expenses within the Statement of Assets and Liabilities.
2. SIGNIFICANT ACCOUNTING POLICIES
In preparing the Portfolio’s financial statements in accordance with Generally Accepted Accounting Principles in the United States of America (“GAAP”), estimates or assumptions (which could differ from actual results) may be used that affect reported amounts and disclosures. The following is a summary of significant accounting policies followed by the Portfolio.
Foreign currency denominated investments: The accounting records of the Portfolio are maintained in U.S. dollars. Securities and other assets and liabilities denominated in foreign currencies are translated into U.S. dollars based on the closing exchange rate each day. The cost of foreign securities purchased and any realized gains or losses are translated at the prevailing exchange rates in effect on the date of the respective transaction. The Portfolio combines fluctuations from currency exchange rates and fluctuations in value when computing net realized and unrealized gains or losses from investments.
Net foreign currency gains and losses resulting from changes in exchange rates include, foreign currency fluctuations between trade date and settlement date of investment security transactions, gains and losses on forward foreign currency contracts, and the difference between the receivable amounts of interest and dividends recorded in the accounting records in U.S. dollars and the amounts actually received.
Foreign currency denominated assets may involve risks not typically associated with domestic transactions. These risks include revaluation of currencies, adverse fluctuations in foreign currency values, and possible adverse political, social, and economic developments, including those particular to a specific industry, country or region.
Security transactions and investment income: Security transactions are accounted for on the trade date. Security gains and losses are calculated on a first-in, first-out basis. Interest income, if any, is accrued as earned. Dividend income and capital gain distributions from underlying investments, if any, are recorded on the ex-dividend date. Income or short-term capital gain distributions received from underlying investments, if any, are recorded as Dividend income from investments within the Statement of Operations. Long-term capital gain distributions received from underlying investments, if any, are recorded as Net realized gain (loss) on Capital gain distributions received from investments within the Statement of Operations.
Multiple class operations, income, and expenses: Income, non-class specific expenses, and realized and unrealized gains and losses are allocated to each class daily based upon net assets. Each class bears its own specific expenses in addition to the allocated non-class specific expenses.
Distributions to shareholders: Distributions are recorded on the ex-dividend date and are determined in accordance with federal income tax regulations, which may differ from GAAP.
Cash overdraft: The Portfolio may have cash overdraft balances. A fee is incurred on these overdrafts, calculated by multiplying the overdraft by a rate based on the Federal Funds Rate.
Payables, if any, are reflected as Due to custodian within the Statement of Assets and Liabilities. Expenses, if any, from U.S. cash overdrafts are reflected in Custody fees within the Statement of Operations. Expenses, if any, from foreign cash overdrafts are reflected in Other expenses within the Statement of Operations.
Commission recapture: The sub-adviser(s), to the extent consistent with the best execution and usual commission rate policies and practices, may elect to place security transactions of the Portfolio with broker/dealers with which TST has established a commission recapture program. A commission recapture program is any arrangement under which a broker/dealer applies a portion of the commissions received by such broker/dealer on the security transactions to the Portfolio. In no event will commissions, paid by the Portfolio, be used to pay expenses that would otherwise be borne by any other Portfolios within TST, or by any other party.
There were no commissions recaptured during the period ended June 30, 2024 by the Portfolio.
|
|
|
|
|
| Transamerica Series Trust |
|
|
|
Semi-Annual Financial Statements 2024 |
|
|
Page 8 |
|
|
Transamerica JPMorgan International Moderate Growth VP
NOTES TO FINANCIAL STATEMENTS (continued)
At June 30, 2024
(unaudited)
2. SIGNIFICANT ACCOUNTING POLICIES (continued)
Indemnification: In the normal course of business, the Portfolio enters into contracts that contain a variety of representations that provide general indemnifications. The Portfolio’s maximum exposure under these arrangements is unknown, as this would involve future claims that may be made against the Portfolio and/or its affiliates that have not yet occurred. However, based on experience, the Portfolio expects the risk of loss to be remote.
3. INVESTMENT VALUATION
TAM has been designated as the Portfolio’s valuation designee pursuant to Rule 2a-5 under the 1940 Act with responsibility for fair valuation subject to oversight by the Portfolio’s Board of Trustees. The net asset value of the Portfolio is computed as of the official close of the New York Stock Exchange (“NYSE”) each day the NYSE is open for business.
TAM utilizes various methods to measure the fair value of its investments on a recurring basis. GAAP establishes a hierarchy that prioritizes inputs to valuation methods. The inputs or methodology used for valuing securities are not necessarily an indication of the risk associated with investing in those securities. The three levels (“Levels”) of inputs of the fair value hierarchy are defined as follows:
Level 1—Unadjusted quoted prices in active markets for identical securities.
Level 2—Inputs, other than quoted prices included in Level 1, which are observable, either directly or indirectly. These inputs may include quoted prices for the identical instrument on an inactive market, prices for similar instruments, interest rates, prepayment speeds, credit risk, yield curves, default rates, and similar data.
Level 3—Unobservable inputs based on the best information available in the circumstances, to the extent observable inputs are not available, which may include TAM’s own assumptions used in determining the fair value of the Portfolio’s investments and derivative instruments.
The inputs used to measure fair value may fall into different Levels of the fair value hierarchy. In such cases, for disclosure purposes, the Level in the fair value hierarchy that is assigned to the fair value measurement of a security is determined based on the lowest Level input that is significant to the fair value measurement in its entirety. Certain investments that are measured at fair value using NAV per share, or its equivalent, using the “practical expedient” have not been classified in the fair value Levels. The hierarchy classification of inputs used to value the Portfolio’s investments at June 30, 2024, is disclosed within the Investment Valuation section of the Schedule of Investments.
The availability of observable inputs can vary from security to security and is affected by a wide variety of factors, including, but not limited to, the type of security, whether the security is new and not yet established in the marketplace, the liquidity of markets, and other characteristics particular to the security. To the extent that valuation is based on models or inputs that are less observable or unobservable in the market, the determination of fair value requires more judgment. Accordingly, the degree of judgment exercised in determining fair value is generally greatest for instruments categorized in Level 3. Due to the inherent uncertainty of valuation, the determination of values may differ significantly from values that would have been realized had a ready market for investments existed, and the differences could be material.
Fair value measurements: Descriptions of the valuation techniques applied to the Portfolio’s significant categories of assets and liabilities measured at fair value on a recurring basis are as follows:
Investment companies: Certain investment companies are valued at the NAV as the practical expedient. These investment companies are not included within the fair value hierarchy. Certain other investment companies are valued at the actively traded NAV and no valuation adjustments are applied. These investment companies are categorized in Level 1 of the fair value hierarchy.
U.S. government obligations: U.S. government obligations are normally valued using a model that incorporates market observable data such as reported sales of similar securities, broker quotes, yields, bids, offers, and reference data. Certain securities are valued by principally using dealer quotations. U.S. government obligations generally are categorized in Level 2 of the fair value hierarchy, or Level 3 if inputs are unobservable.
Repurchase agreements: Repurchase agreements are valued at cost, which approximates fair value. To the extent the inputs are observable and timely, the values are generally categorized in Level 2 of the fair value hierarchy.
Derivative instruments: Centrally cleared or listed derivatives that are actively traded are valued based on quoted prices from the exchange and are categorized in Level 1 of the fair value hierarchy. Over-the-counter (“OTC”) derivative contracts include forward, swap, swaption,
|
|
|
|
|
| Transamerica Series Trust |
|
|
|
Semi-Annual Financial Statements 2024 |
|
|
Page 9 |
|
|
Transamerica JPMorgan International Moderate Growth VP
NOTES TO FINANCIAL STATEMENTS (continued)
At June 30, 2024
(unaudited)
3. INVESTMENT VALUATION (continued)
and option contracts related to interest rates, foreign currencies, credit standing of reference entities, equity prices, or commodity prices. Depending on the product and the terms of the transaction, the fair value of the OTC derivative products are modeled taking into account the counterparties’ creditworthiness and using a series of techniques, including simulation models. Many pricing models do not entail material subjectivity because the methodologies employed do not necessitate significant judgments and the pricing inputs are observed from actively quoted markets, as is the case of interest rate swap and option contracts. The majority of OTC derivative products valued by the Portfolio using pricing models fall into this category and are categorized within Level 2 of the fair value hierarchy or Level 3 if inputs are unobservable.
4. BORROWINGS AND OTHER FINANCING TRANSACTIONS
The Portfolio may engage in borrowing transactions as a means of raising cash to satisfy redemption requests, for other temporary or emergency purposes or, to the extent permitted by its investment policies, to raise additional cash to be invested in other securities or instruments. When the Portfolio invests borrowing proceeds in other securities, the Portfolio will bear the risk that the market value of the securities in which such proceeds are invested goes down and is insufficient to repay the borrowed proceeds. The Portfolio may borrow on a secured or on an unsecured basis. If the Portfolio enters into a secured borrowing arrangement, a portion of the Portfolio’s assets will be used as collateral. The 1940 Act requires the Portfolio to maintain asset coverage of at least 300% of the amount of its borrowings. Asset coverage means the ratio that the value of the Portfolio’s total assets, minus liabilities other than borrowings, bears to the aggregate amount of all borrowings. Although complying with this requirement has the effect of limiting the amount that the Portfolio may borrow, it does not otherwise mitigate the risks of entering into borrowing transactions.
Interfund lending: The Portfolio, along with other funds and portfolios advised by TAM, may participate in an interfund lending program pursuant to exemptive relief granted by the Securities and Exchange Commission on January 18, 2017. This program allows the Portfolio to lend to and borrow from other funds and portfolios advised by TAM. Interfund lending transactions are subject to the conditions of the exemptive relief which places limits on the amount of lending or borrowing a Portfolio may participate in under the program. Interest earned or paid on an interfund lending transaction will be based on the average of certain current market rates. For the period ended June 30, 2024, the Portfolio has not utilized the program.
Repurchase agreements: In a repurchase agreement, the Portfolio purchases a security and simultaneously commits to resell that security to the seller at an agreed-upon price on an agreed-upon date. Securities purchased subject to a repurchase agreement are held at the Portfolio’s custodian, or designated sub-custodian related to tri-party repurchase agreements, and, pursuant to the terms of the repurchase agreement, must be collateralized by securities with an aggregate market value greater than or equal to 100% of the resale price. The Portfolio will bear the risk of value fluctuations until the securities can be sold and may encounter delays and incur costs in liquidating the securities. In the event of bankruptcy or insolvency of the seller, delays and costs may be incurred.
Repurchase agreements are subject to netting agreements, which are agreements between the Portfolio and its counterparties that provide for the net settlement of all transactions and collateral with the Portfolio, through a single payment, in the event of default or termination. Amounts presented within the Schedule of Investments, and as part of Repurchase agreements, at value within the Statement of Assets and Liabilities are shown on a gross basis. The value of the related collateral for each repurchase agreement, as reflected within the Schedule of Investments, exceeds the value of each repurchase agreement at June 30, 2024.
Repurchase agreements at June 30, 2024, if any, are included within the Schedule of Investments and Statement of Assets and Liabilities.
5. RISK EXPOSURES AND THE USE OF DERIVATIVE INSTRUMENTS
The Portfolio’s investment strategies allow the Portfolio to use various types of derivative contracts, including option contracts, swap agreements, futures contracts, and forward foreign currency contracts. Derivatives are investments whose value is primarily derived from underlying assets, indices or reference rates and may be transacted on an exchange or OTC.
Market Risk Factors: In pursuit of the Portfolio’s investment strategies, the Portfolio may seek to use derivatives to increase or decrease its exposure to certain market risks, including:
Interest rate risk: Interest rate risk relates to the fluctuations in the value of fixed income securities due to changes in the prevailing levels of market interest rates.
Foreign exchange rate risk: Foreign exchange rate risk relates to fluctuations in the value of an asset or liability due to changes in the currency exchange rates.
|
|
|
|
|
| Transamerica Series Trust |
|
|
|
Semi-Annual Financial Statements 2024 |
|
|
Page 10 |
|
|
Transamerica JPMorgan International Moderate Growth VP
NOTES TO FINANCIAL STATEMENTS (continued)
At June 30, 2024
(unaudited)
5. RISK EXPOSURES AND THE USE OF DERIVATIVE INSTRUMENTS (continued)
Equity risk: Equity risk relates to the change in value of equity securities as they relate to increases or decreases in the general market.
Credit risk: Credit risk relates to the ability of the issuer of a financial instrument to make further principal or interest payments on an obligation or commitment that it has to the Portfolio.
Commodity risk: Commodity risk relates to the change in value of commodities or commodity indices as they relate to increases or decreases in the commodities market. Commodities are physical assets that have tangible properties. Examples of these types of assets are crude oil, heating oil, metals, livestock, and agricultural products.
The Portfolio is also exposed to additional risks from investing in derivatives, such as liquidity and counterparty credit risk. Liquidity risk is the risk that the Portfolio will be unable to sell or close out the derivative in the open market in a timely manner. Counterparty credit risk is the risk that the counterparty will not be able to fulfill its obligations to the Portfolio. Investing in derivatives may also involve greater risks than investing directly in the underlying assets, such as losses in excess of any initial investment and collateral received. In addition, there may be the risk that the change in value of the derivative contract does not correspond to the change in value of the underlying instrument.
The Portfolio’s exposure to market risk factors and certain other associated risks are summarized by derivative type as follows:
Futures contracts: The Portfolio is subject to equity risk, credit risk, commodity risk, interest rate risk and foreign exchange rate risk in the normal course of pursuing its investment objective. The Portfolio uses futures contracts to gain exposure to, or hedge against, changes in the value of equities and commodities, interest rates, or foreign currencies. A futures contract represents a commitment for the future purchase or sale of an asset at a specified price on a specified date. Upon entering into such contracts, the Portfolio is required to deposit with the broker, either in cash or in securities, an initial margin in an amount equal to a certain percentage of the contract amount. Subsequent payments (variation margin) are paid or received by the Portfolio, depending on the daily fluctuations in the value of the contract, and are recorded for financial statement purposes as unrealized gains or losses by the Portfolio. Upon entering into such contracts, the Portfolio bears the risk of equity and commodity prices, interest rates, or exchange rates moving unexpectedly, in which case, the Portfolio may not achieve the anticipated benefits of the futures contracts and may realize losses. With futures, there is minimal counterparty credit risk to the Portfolio since futures are exchange-traded and the exchange’s clearinghouse, as counterparty to all exchange-traded futures, guarantees the futures against default. Futures contracts are generally entered into on a regulated futures exchange and cleared through a clearinghouse associated with the exchange.
Open futures contracts at June 30, 2024 are listed within the Schedule of Investments. Variation margin, if applicable, is shown in Variation margin receivable or payable on futures contracts within the Statement of Assets and Liabilities.
The following is a summary of the location and the Portfolio’s fair values of derivative investments disclosed within the Statement of Assets and Liabilities, categorized by primary market risk exposure as of June 30, 2024.
|
|
|
|
|
|
|
|
|
|
|
|
|
|
|
|
|
|
|
|
|
|
|
|
|
| Asset Derivatives |
| Location |
|
Interest Rate Contracts |
|
|
Foreign Exchange Contracts |
|
|
Equity Contracts |
|
|
Credit Contracts |
|
|
Commodity Contracts |
|
|
Total |
|
| Futures contracts: |
|
|
|
|
|
|
|
|
|
|
|
|
|
|
|
|
|
|
|
|
|
|
|
|
| Total distributable earnings (accumulated losses) (A)(B) |
|
$ |
312,523 |
|
|
$ |
328,786 |
|
|
$ |
768,450 |
|
|
$ |
— |
|
|
$ |
— |
|
|
$ |
1,409,759 |
|
| |
|
| Total |
|
$ |
312,523 |
|
|
$ |
328,786 |
|
|
$ |
768,450 |
|
|
$ |
— |
|
|
$ |
— |
|
|
$ |
1,409,759 |
|
| |
|
|
|
|
|
|
| Transamerica Series Trust |
|
|
|
Semi-Annual Financial Statements 2024 |
|
|
Page 11 |
|
|
Transamerica JPMorgan International Moderate Growth VP
NOTES TO FINANCIAL STATEMENTS (continued)
At June 30, 2024
(unaudited)
5. RISK EXPOSURES AND THE USE OF DERIVATIVE INSTRUMENTS (continued)
|
|
|
|
|
|
|
|
|
|
|
|
|
|
|
|
|
|
|
|
|
|
|
|
|
| Liability Derivatives |
| Location |
|
Interest Rate Contracts |
|
|
Foreign Exchange Contracts |
|
|
Equity Contracts |
|
|
Credit Contracts |
|
|
Commodity Contracts |
|
|
Total |
| Futures contracts: |
|
|
|
|
|
|
|
|
|
|
|
|
|
|
|
|
|
|
|
|
|
|
|
|
| Total distributable earnings (accumulated losses) (A)(B) |
|
$ |
(806,760 |
) |
|
$ |
— |
|
|
$ |
(314,569 |
) |
|
$ |
— |
|
|
$ |
— |
|
|
$ |
(1,121,329 |
) |
| |
|
| Total |
|
$ |
(806,760 |
) |
|
$ |
— |
|
|
$ |
(314,569 |
) |
|
$ |
— |
|
|
$ |
— |
|
|
$ |
(1,121,329 |
) |
| |
|
| (A) |
May include exchange-traded derivatives which are not subject to a master netting arrangement, or another similar arrangement. |
| (B) |
Included within unrealized appreciation (depreciation) on futures contracts as reported in the Schedule of Investments. Only current day’s variation margin is reported within the Statement of Assets and Liabilities. |
The following is a summary of the location and the effect of derivative investments within the Statement of Operations, categorized by primary market risk exposure as of June 30, 2024.
|
|
|
|
|
|
|
|
|
|
|
|
|
|
|
|
|
|
|
|
|
|
|
|
|
| Realized Gain (Loss) on Derivative Instruments |
| Location |
|
Interest Rate Contracts |
|
|
Foreign Exchange Contracts |
|
|
Equity Contracts |
|
|
Credit Contracts |
|
|
Commodity Contracts |
|
|
Total |
| Futures contracts |
|
$ |
(2,940,995 |
) |
|
$ |
(1,166,384 |
) |
|
$ |
2,011,048 |
|
|
$ |
— |
|
|
$ |
— |
|
|
$ |
(2,096,331 |
) |
| |
|
| Total |
|
$ |
(2,940,995 |
) |
|
$ |
(1,166,384 |
) |
|
$ |
2,011,048 |
|
|
$ |
— |
|
|
$ |
— |
|
|
$ |
(2,096,331 |
) |
| |
|
|
| Net Change in Unrealized Appreciation (Depreciation) on Derivative Instruments |
| Location |
|
Interest Rate Contracts |
|
|
Foreign Exchange Contracts |
|
|
Equity Contracts |
|
|
Credit Contracts |
|
|
Commodity Contracts |
|
|
Total |
| Futures contracts |
|
$ |
(625,892 |
) |
|
$ |
(653,877 |
) |
|
$ |
(2,075,291 |
) |
|
$ |
— |
|
|
$ |
— |
|
|
$ |
(3,355,060 |
) |
| |
|
| Total |
|
$ |
(625,892 |
) |
|
$ |
(653,877 |
) |
|
$ |
(2,075,291 |
) |
|
$ |
— |
|
|
$ |
— |
|
|
$ |
(3,355,060 |
) |
| |
|
The following is a summary of the ending monthly average volume on derivative activity during the period ended June 30, 2024.
|
|
|
|
|
| Futures contracts: |
|
|
|
|
| Average notional value of contracts — long |
|
$ |
195,568,332 |
|
| Average notional value of contracts — short |
|
|
(78,515,169 |
) |
Collateral requirements: Collateral or margin requirements are set by the broker or exchange clearing house for exchange-traded derivatives (futures contracts, exchange-traded options, and exchange-traded swap agreements) while collateral terms are contract specific for OTC derivatives (forward foreign currency exchange contracts, OTC options, and OTC swap agreements). For OTC derivatives, under standard derivatives agreements, the Portfolio may be required to pledge collateral on derivatives to a counterparty if the Portfolio is in a net liability position, and receive collateral if in a net positive position. For financial reporting purposes, cash collateral that has been pledged by the Portfolio to cover obligations, if any, is reported in Cash collateral at broker within the Statement of Assets and Liabilities. Cash collateral that has been received by the Portfolio from a counterparty, if any, is reported separately in Cash collateral pledged at custodian and/or broker within the Statement of Assets and Liabilities. Non-cash collateral pledged to the Portfolio, if any, is disclosed within the Schedule of Investments.
Generally, the amount of collateral due from or to a party must exceed a minimum transfer amount threshold before a transfer has been made. Typically a counterparty is not permitted to sell, re-pledge or use cash and non-cash collateral it receives. The Portfolio generally
|
|
|
|
|
| Transamerica Series Trust |
|
|
|
Semi-Annual Financial Statements 2024 |
|
|
Page 12 |
|
|
Transamerica JPMorgan International Moderate Growth VP
NOTES TO FINANCIAL STATEMENTS (continued)
At June 30, 2024
(unaudited)
5. RISK EXPOSURES AND THE USE OF DERIVATIVE INSTRUMENTS (continued)
does not use non-cash collateral that it receives but may, absent default or certain other circumstances, be permitted to use cash collateral received. In such cases, interest may be paid pursuant to the collateral arrangement with the counterparty.
To the extent amounts due to the Portfolio from its counterparties are not fully collateralized, contractually or otherwise, the Portfolio bears the risk of loss from counterparty non-performance. Additionally, to the extent the Portfolio has delivered collateral to a counterparty, the Portfolio bears the risk of loss from a counterparty in the event the counterparty fails to return such collateral. Counterparties may immediately terminate derivatives contracts if the Portfolio fails to maintain sufficient asset coverage for its contracts or its net assets decline by stated percentages. Collateral may not be required for all derivative contracts.
6. RISK FACTORS
Investing in the Portfolio involves certain key risks related to the Portfolio’s trading activity. Please reference the Portfolio’s prospectus for a more complete discussion of the following risk(s), as well as other risks of investing in the Portfolio.
Market risk: The market prices of the Portfolio’s securities or other assets may go up or down, sometimes rapidly or unpredictably, due to factors such as economic events, inflation, changes in interest rates, governmental actions or interventions, actions taken by the U.S. Federal Reserve or foreign central banks, market disruptions caused by tariffs, trade disputes or other factors, political developments, armed conflicts, economic sanctions, cybersecurity events, investor sentiment, the global and domestic effects of widespread or local health, weather or climate events, and other factors that may or may not be related to the issuer of the security or other asset. If the market prices of the Portfolio’s securities and assets fall, the value of your investment in the Portfolio could go down.
Economies and financial markets throughout the world are increasingly interconnected. Events or circumstances in one or more countries or regions could be highly disruptive to, and have profound impacts on, global economies or markets. As a result, whether or not the Portfolio invests in securities of issuers located in or with significant exposure to the countries directly affected, the value and liquidity of the Portfolio’s investments may go down.
Asset allocation risk: The Portfolio’s investment performance is significantly impacted by the Portfolio’s asset allocation and reallocation from time to time. The value of your investment may decrease if the Investment Manager’s judgment about the attractiveness,value or market trends affecting a particular asset class, investment style, technique or strategy, underlying portfolio or other issuer is incorrect.
Foreign investments risk: Investing in securities of foreign issuers or issuers with significant exposure to foreign markets involves additional risks. Foreign markets can be less liquid, less regulated, less transparent and more volatile than U.S. markets. The value of the Portfolio’s foreign investments may decline, sometimes rapidly or unpredictably, because of factors affecting the particular issuer as well as foreign markets and issuers generally, such as unfavorable government actions, including nationalization, expropriation or confiscatory taxation, reduction of government or central bank support, tariffs and trade disruptions, sanctions, political or financial instability, social unrest or other adverse economic or political developments. Foreign investments may also be subject to different accounting practices and different regulatory, legal, auditing, financial reporting and recordkeeping standards and practices, and may be more difficult to value than investments in U.S. issuers. Certain foreign clearance and settlement procedures may result in an inability to execute transactions or delays in settlement.
Risk management framework risk: The Portfolio is subject to a multi-factor risk management framework that is intended to reduce equity exposure under certain market conditions. This framework may impose a maximum equity exposure limit for the Portfolio in response to individual asset class momentum signals and a portfolio level volatility signal. The framework is intended to improve the Portfolio’s absolute and risk-adjusted returns but may not work as intended. The framework may result in the Portfolionot achieving its stated asset mix goal or may cause the Portfolio to underperform, possibly significantly. Because market conditions change, sometimes rapidly and unpredictably, the success of the framework also will be subject to the sub-adviser’s ability to implement the framework in a timely and efficient manner. The framework may result in periods of underperformance, may fail to protect against market declines, may limit the Portfolio’s ability to participate in up markets, may cause the Portfolio to underperform its benchmark in rising markets, may increase transaction costs at the Portfolio and/or underlying portfolio level and may result in substantial losses if it does not work as intended. For example, if the Portfolio has reduced its equity exposure to avoid losses in certain market conditions, and the market rises sharply and quickly, there may be a delay in increasing the Portfolio’s equity exposure, causing the Portfolio to forgo gains from the market rebound. The framework incorporates quantitative models and signals. If those models or signals prove to be flawed or for other reasons do not produce the desired results, any decisions made in reliance thereon may expose the Portfolio to additional risks and losses. The use of models has inherent risks, and the success of relying on or otherwise using a model depends, among other things, on the accuracy and completeness of the model’s development, implementation and maintenance; on the model’s assumptions and methodologies; and on the
|
|
|
|
|
| Transamerica Series Trust |
|
|
|
Semi-Annual Financial Statements 2024 |
|
|
Page 13 |
|
|
Transamerica JPMorgan International Moderate Growth VP
NOTES TO FINANCIAL STATEMENTS (continued)
At June 30, 2024
(unaudited)
6. RISK FACTORS (continued)
accuracy and reliability of the inputs and output of the model. The framework also serves to reduce the risk to the Transamerica insurance companies that provide guaranteed benefits under certain variable contracts from equity market volatility and to facilitate their provision of those guaranteed benefits. The framework also may have the effect of limiting the amount of guaranteed benefits. The Portfolio’s performance may be lower than similar portfolios that are not subject to a risk management framework. The use of derivatives in connection with the framework may expose the Portfolio to different and potentially greater risks than if it had only invested in underlying portfolios.
7. FEES AND OTHER AFFILIATED TRANSACTIONS
TST serves as a funding vehicle for certain affiliated asset allocation portfolios and certain affiliated separate accounts of Transamerica Life Insurance Company (“TLIC”) and Transamerica Financial Life Insurance Company.
TAM, the Portfolio’s investment manager, is directly owned by TLIC and AUSA Holding, LLC (“AUSA”), both of which are indirect, wholly owned subsidiaries of Aegon Ltd. TLIC is owned by Commonwealth General Corporation (“Commonwealth”). Commonwealth and AUSA are wholly owned by Transamerica Corporation (DE). Transamerica Corporation (DE) is wholly owned by Aegon International B.V., which is wholly owned by Aegon Ltd., a Bermuda exempted company with liability limited by shares (formerly, Aegon NV, a Netherlands corporation) and a publicly traded international insurance group.
Transamerica Fund Services, Inc. (“TFS”) is the Portfolio’s transfer agent. Transamerica Capital, Inc. (“TCI”) is the Portfolio’s distributor/principal underwriter. TAM, TFS and TCI are affiliates of Aegon Ltd.
Certain officers and trustees of the Portfolio may also be officers and/or trustees of TAM, TFS and TCI. No interested trustee who is deemed an interested person due to current or former service with TAM or an affiliate of TAM receives compensation from the Portfolio. The Portfolio does pay non-interested persons (independent trustees), as disclosed in Trustee and CCO fees within the Statement of Operations.
Investment management fees: TAM serves as the Portfolio’s investment manager, performing administration as well as investment advisory services. TAM renders investment advisory, supervisory, and administration services under an investment management agreement and the Portfolio pays a single management fee, which is reflected in Investment management fees within the Statement of Operations.
The Portfolio pays a management fee to TAM based on daily average net assets at the following rates:
|
|
|
|
|
| Breakpoints |
|
Rate |
|
|
|
| First $10 billion |
|
|
0.1225 |
% |
| Over $10 billion |
|
|
0.1025 |
|
TAM has contractually agreed to waive fees and/or reimburse Portfolio expenses to the extent that the total operating expenses excluding, as applicable, acquired fund fees and expenses, interest (including borrowing costs and overdraft charges), taxes, brokerage commissions, dividend and interest expenses on securities sold short, extraordinary expenses and other expenses not incurred in the ordinary course of the Portfolio’s business, exceed the following stated annual operating expense limits to the Portfolio’s daily average net assets. To the extent an expense limit changed during the period, the prior limit is also listed below. The expenses waived and/or reimbursed, if any, are included in Expenses waived and/or reimbursed within the Statement of Operations.
|
|
|
|
|
|
|
| Class |
|
Operating Expense Limit |
|
Operating Expense Limit Effective Through |
|
|
|
| Initial Class |
|
|
0.21 |
% |
|
May 1, 2025 |
| Service Class |
|
|
0.46 |
|
|
May 1, 2025 |
TAM is permitted to recapture amounts contractually waived and/or reimbursed to a class during any of the 36 months from the date on which TAM waived fees and/or reimbursed expenses for the class. A class may recapture and reimburse TAM only if such amount does not cause, on any particular business day of the Portfolio, the class’s total annual operating expenses (after the recapture is taken into
|
|
|
|
|
| Transamerica Series Trust |
|
|
|
Semi-Annual Financial Statements 2024 |
|
|
Page 14 |
|
|
Transamerica JPMorgan International Moderate Growth VP
NOTES TO FINANCIAL STATEMENTS (continued)
At June 30, 2024
(unaudited)
7. FEES AND OTHER AFFILIATED TRANSACTIONS (continued)
account) to exceed the Operating Expense Limits or any other lower limit then in effect. Amounts recaptured, if any, by TAM for the period ended June 30, 2024 are disclosed in Recapture of previously waived and/or reimbursed fees within the Statement of Operations.
TAM, on a voluntary basis and in addition to the contractual operating expense limits in effect, from time to time may waive and/or reimburse expenses of the Portfolio, or any classes thereof, to such level(s) as the Trust’s officers have determined or may reasonably determine from time to time. Any such voluntary waiver or expense reimbursement may be discontinued by TAM at any time. These amounts are not subject to recapture by TAM.
As of June 30, 2024, there are no amounts available for recapture by TAM.
Distribution and service fees: TST has a distribution plan (“Distribution Plan”) pursuant to Rule 12b-1 under the 1940 Act. Pursuant to the Distribution Plan, TST entered into a distribution agreement with TCI as the Portfolio’s distributor.
The Distribution Plan requires the Portfolio to pay distribution fees to TCI as compensation for various distribution activities, not as reimbursement for specific expenses. Under the Distribution Plan and distribution agreement, TCI, on behalf of the Portfolio, is authorized to pay various service providers, as direct payment for expenses incurred in connection with distribution of the Portfolio’s shares.
The fee on the Service Class shares is paid to the insurance companies for providing services and account maintenance for the policyholders who invest in the variable insurance products which invest in the Service Class shares. TCI has determined that it will not seek payment for the distribution expenses incurred by the Portfolio with respect to the Initial Class shares before May 1, 2025. Prior to TCI seeking distribution expenses on Initial Class shares, policy and contract owners will be notified in advance. The Portfolio will pay fees relating to Service Class shares. The distribution and service fees are included in Distribution and service fees within the Statement of Operations.
The Portfolio is authorized under the Distribution Plan to pay fees to TCI based on daily average net assets of each applicable class up to the following annual rates:
|
|
|
|
|
| Class |
|
Rate |
|
|
|
| Initial Class |
|
|
0.15 |
% |
| Service Class |
|
|
0.25 |
|
Transfer agent costs: TFS provides transfer agency services under an intercompany agreement with TAM. TFS has outsourced the provision of certain sub-transfer agency services to SS&C Global Investor & Distribution Solutions, Inc. (“SS&C GIDS”). The Portfolio does not pay a separate transfer agent fee to TAM or TFS but does pay certain expenses to SS&C GIDS related to applicable sub-transfer agency services. For the period ended June 30, 2024, (i) the expenses paid to SS&C GIDS by the Portfolio are referred to as transfer agent costs and are included within the Statement of Operations and (ii) the expenses payable to SS&C GIDS by the Portfolio are referred to as transfer agent costs within the Statement of Assets and Liabilities.
Brokerage commissions: The Portfolio incurred no brokerage commissions on security transactions placed with affiliates of the investment manager or sub-adviser(s) for the period ended June 30, 2024.
8. PURCHASES AND SALES OF SECURITIES
For the period ended June 30, 2024, the cost of securities purchased and proceeds from securities sold (excluding short-term securities) are as follows:
|
|
|
|
|
|
|
| Purchases of Securities |
|
Sales/Maturities of Securities |
|
|
|
|
| Long-Term |
|
U.S. Government |
|
Long-Term |
|
U.S. Government |
|
|
|
|
| $ 50,741,674 |
|
$ 5,826,550 |
|
$ 89,360,202 |
|
$ 3,589,407 |
9. FEDERAL INCOME TAXES AND DISTRIBUTIONS TO SHAREHOLDERS
The Portfolio has not made any provision for federal income or excise taxes due to its policy to distribute all of its taxable income and capital gains to its shareholders and otherwise qualify as a regulated investment company under Subchapter M of the Internal Revenue
|
|
|
|
|
| Transamerica Series Trust |
|
|
|
Semi-Annual Financial Statements 2024 |
|
|
Page 15 |
|
|
Transamerica JPMorgan International Moderate Growth VP
NOTES TO FINANCIAL STATEMENTS (continued)
At June 30, 2024
(unaudited)
9. FEDERAL INCOME TAXES AND DISTRIBUTIONS TO SHAREHOLDERS (continued)
Code. The Portfolio recognizes the tax benefits of uncertain tax positions only where the position is “more likely than not” to be sustained assuming examination by tax authorities. The Portfolio’s tax returns remain subject to examination by the Internal Revenue Service and state tax authorities three years from the date of filing for federal purposes and four years from the date of filing for state purposes. Management has evaluated the Portfolio’s tax provisions taken for all open tax years, and has concluded that no provision for income tax is required in the Portfolio’s financial statements. If applicable, the Portfolio recognizes interest accrued related to unrecognized tax benefits in relation to interest and penalties expense in Other within the Statement of Operations. The Portfolio identifies its major tax jurisdictions as U.S. Federal, the state of Colorado, and foreign jurisdictions where the Portfolio makes significant investments; however, the Portfolio is not aware of any tax positions for which it is reasonably possible that the total amounts of unrecognized tax benefits will change materially in the next twelve months. Distributions are determined in accordance with income tax regulations, which may differ from GAAP.
As of June 30, 2024, the approximate cost for U.S. federal income tax purposes, and the aggregate gross/net unrealized appreciation (depreciation) in the value of investments (including securities sold short and derivatives, if any) are as follows:
|
|
|
|
|
|
|
| Cost |
|
Gross Appreciation |
|
Gross (Depreciation) |
|
Net Appreciation (Depreciation) |
|
|
|
|
| $ 357,222,180 |
|
$ 33,024,379 |
|
$ (2,236,372) |
|
$ 30,788,007 |
Please see TST’s most recent report on Form N-CSR, available at: www.transamerica.com/annuities/prospectus, for additional information. For the most recently filed complete proxy voting records for the Trust please visit: https://www.transamerica.com/sites/default/files/files/e070d/TST%20N-PX%202021.pdf
|
|
|
|
|
| Transamerica Series Trust |
|
|
|
Semi-Annual Financial Statements 2024 |
|
|
Page 16 |
|
|
Transamerica JPMorgan International Moderate Growth VP
MANAGEMENT AND SUB-ADVISORY AGREEMENT — CONTRACT RENEWAL
(unaudited)
At a meeting of the Board of Trustees of Transamerica Series Trust (the “Trustees” or the “Board”) held on June 12-13, 2024, the Board considered the renewal of the management agreement (the “Management Agreement”) between Transamerica Asset Management, Inc. (“TAM”) and Transamerica Series Trust, on behalf of Transamerica JPMorgan International Moderate Growth VP (the “Portfolio”). The Board also considered the renewal of the investment sub-advisory agreement (the “Sub-Advisory Agreement” and together with the Management Agreement, the “Agreements”) for the Portfolio between TAM and J.P. Morgan Investment Management, Inc. (the “Sub-Adviser”).
Following its review and consideration, the Board determined that the terms of the Management Agreement and Sub-Advisory Agreement were reasonable and that the renewal of each of the Agreements was in the best interests of the Portfolio and the holders invested in the Portfolio. The Board, including the independent members of the Board (the “Independent Trustees”), unanimously approved the renewal of each of the Agreements through June 30, 2025.
Prior to reaching their decision, the Trustees requested and received from TAM and the Sub-Adviser certain information. They then reviewed such information as they deemed reasonably necessary to evaluate the Agreements, including information they had previously received from TAM and the Sub-Adviser as part of their regular oversight of the Portfolio, and knowledge they gained over time through meeting with TAM and the Sub-Adviser. Among other materials, the Trustees considered comparative fee, expense and performance information prepared by Broadridge Financial Solutions, Inc. (“Broadridge”), an independent provider of mutual fund performance information, as well as fee, expense and profitability information prepared by TAM. In addition, TAM provided the Board with additional supplemental comparative fee, expense and performance information. To the extent applicable, the Trustees considered information about fees and performance of comparable funds and/or accounts managed by the Sub-Adviser. The Board also considered reductions to the Portfolio’s expense limits, if any, that took effect after the last renewal of the Agreements. In their review, the Trustees also sought to identify instances in which the Portfolio’s performance, fees, total expenses and/or profitability appeared to be outliers within its respective peer group or other comparative metrics and sought to understand the reasons for such comparative positions.
In their deliberations, the Independent Trustees met privately without representatives of TAM or the Sub-Adviser present and were represented throughout the process by their independent legal counsel. In considering the proposed continuation of each of the Agreements, the Trustees evaluated and weighed a number of considerations that they believed to be relevant in light of the legal advice furnished to them by counsel, including independent legal counsel, and made a decision in the exercise of their own business judgment. They based their decisions on the considerations discussed below, among others, although they did not identify any particular consideration or item of information that was controlling of their decisions, and each Trustee may have attributed different weights to the various factors.
Nature, Extent and Quality of the Services Provided
The Board considered the nature, extent and quality of the services provided by TAM and the Sub-Adviser to the Portfolio in the past and the services anticipated to be provided in the future. The Board also considered the investment approach for the Portfolio; the experience, capability and integrity of TAM’s senior management; the financial resources of TAM; TAM’s management oversight process; TAM’s and the Sub-Adviser’s responsiveness to any questions by the Trustees; and the professional qualifications and compensation program of the portfolio management team of the Sub-Adviser. The Trustees noted that they receive, on a quarterly basis, an execution analysis from Capital Institutional Services, Inc. (CAPIS), an independent provider of trade analyses, for the Sub-Adviser and a comparison of trading results against a peer universe of managers.
The Board also considered the continuous and regular investment management and other services provided by TAM, when acting as a manager of managers, for the portion of the management fee it retains from the Portfolio after payment of the sub-advisory fees. The Board noted that the investment management and other services provided by TAM include the design, development and ongoing review and evaluation of the Portfolio and its investment strategy; the selection, oversight and monitoring of one or more investment sub-advisers to perform certain duties with respect to the Portfolio; ongoing portfolio trading oversight and analysis; risk management oversight and analysis; design, development, implementation and ongoing review and evaluation of a process for the valuation of Portfolio investments; design, development, implementation and ongoing review and evaluation of a compliance program for the Portfolio; design, development, implementation and ongoing review and evaluation of a process for the voting of proxies and exercise of rights to consent to corporate action for Portfolio investments; participation in Board meetings and oversight of preparation of materials for the Board, including materials for Board meetings and regular communications with the Board; oversight of preparation of the Portfolio’s prospectus, statement of additional information, shareholder reports and other disclosure materials and regulatory filings for the Portfolio; and ongoing cash management services for the Portfolio. The Board considered that TAM’s investment management services also include the provision of supervisory and administrative services to the Portfolio. The Board also noted that TAM, as part of the services it provides to all Transamerica mutual funds, including the Portfolio, oversees the services provided by the funds’ custodian, transfer agent, independent accountant and legal counsel and supervises the performance of the recordkeeping and holder service functions of the funds.
Investment Performance
In addition, the Board considered the short- and longer-term performance of the Portfolio in light of its investment objective, policies and strategies, including relative performance against (i) a peer universe of comparable mutual funds, as prepared by Broadridge, and (ii) the Portfolio’s benchmarks, in each case for various trailing periods ended December 31, 2023. Based on these considerations, the Board
|
|
|
|
|
| Transamerica Series Trust |
|
|
|
Semi-Annual Financial Statements 2024 |
|
|
Page 17 |
|
|
Transamerica JPMorgan International Moderate Growth VP
MANAGEMENT AND SUB-ADVISORY AGREEMENT — CONTRACT RENEWAL (continued)
(unaudited)
determined that TAM and the Sub-Adviser can provide investment and related services that are appropriate in scope and extent in light of the Portfolio’s investment objectives, policies and strategies and operations, the competitive landscape of the investment company business and investor needs. The Board’s conclusions as to the Portfolio’s performance are summarized below. For purposes of its review, the Board generally used the performance of Service Class Shares. In describing the Portfolio’s performance relative to its peer universe, the summary conclusions characterize performance for the relevant periods in relation to whether it was “above,” “below” or “in line with” the peer universe median and do so using quintile rankings prepared by Broadridge. For simplicity, performance is described as “above” the median if the Portfolio’s performance ranked anywhere in the first or second quintiles, as “below” the median if it ranked anywhere in the fourth or fifth quintiles, or “in line with” the median if it ranked anywhere in the third quintile (i.e., even if its precise return was somewhat above or somewhat below the precise median return).
When considering the Portfolio’s performance, the Trustees considered any representations made by TAM regarding the appropriateness of certain peer groups and benchmarks. They recognized that performance reflects a snapshot of a period as of a specific date, and that consideration of performance data for a different period could generate significantly different performance results. The Trustees also recognized that even longer-term performance can be negatively affected by performance over a short-term period when that short-term performance is significantly below the performance of the comparable benchmark or universe of peer funds.
The Board noted that the performance of Service Class Shares of the Portfolio was below the median for its peer universe and below the benchmark that TAM utilizes to measure performance of the Portfolio, each for the past 1-, 3-, 5- and 10-year periods. The Trustees discussed the reasons for the underperformance with TAM and TAM agreed to continue to closely monitor and report to the Board on the performance of the Portfolio. The Board noted that the Sub-Adviser had commenced sub-advising the Portfolio on July 1, 2016 pursuant to its current investment strategies.
Management Fee and Sub-Advisory Fees and Total Expense Ratio
The Board considered the management fee and total expense ratio of the Portfolio, including information provided by Broadridge comparing the management fee and total expense ratio of the Portfolio to the management fees and total expense ratios of comparable investment companies in both a peer group and broader peer universe compiled by Broadridge. The Board’s conclusions as to the Portfolio’s management fee and total expense ratio are summarized below. For purposes of its review, the Board generally used the actual total expenses (i.e., expenses reflecting any waivers and/or reimbursements) of Service Class Shares. In describing the Portfolio’s management fee and total expense ratio relative to its peer group and peer universe, the summary conclusions characterize management fees and total expense ratios for the relevant periods in relation to whether they were “above,” “below” or “in line with” the peer group or peer universe median and do so using quintile rankings prepared by Broadridge. For simplicity, management fees and total expense ratios are described as “above” the median if the Portfolio’s management fee or total expense ratio ranked anywhere in the fourth or fifth quintiles, as “below” the median if it ranked anywhere in the first or second quintiles, or “in line with” the median if it ranked anywhere in the third quintile (i.e., even if its precise management fee or total expense ratio was somewhat above or somewhat below the precise median management fee or total expense ratio).
The Board also considered the fees charged by the Sub-Adviser for sub-advisory services, as well as the portion of the Portfolio’s management fee retained by TAM following payment of the sub-advisory fee and how the portion of the contractual management fee retained by TAM at a specified asset level compared to the portions retained by other investment advisers managing mutual funds with similar investment strategies as calculated by an independent provider of information.
The Board noted that the Portfolio’s contractual management fee was below the medians for its peer group and peer universe and that the actual total expenses (i.e., expenses reflecting any waivers and/or reimbursements) of Service Class Shares of the Portfolio were above the medians for its peer group and peer universe. The Trustees also considered that TAM has entered into an expense limitation arrangement with the Portfolio, which may result in TAM waiving fees for the benefit of holders.
On the basis of these considerations, together with the other information it considered, the Board determined that the management and sub-advisory fees to be received by TAM and the Sub-Adviser under the Management Agreement and Sub-Advisory Agreement are reasonable in light of the services provided.
Cost of Services Provided and Level of Profitability
The Board reviewed information provided by TAM about the cost of providing and procuring fund management services, as well as the costs of the provision of administration, transfer agency and other services, to the Portfolio and to Transamerica Series Trust as a whole by TAM and its affiliates. The Board considered the profitability of TAM and its affiliates in providing these services for the Portfolio and Transamerica Series Trust as a whole. The Trustees recognized the competitiveness of the mutual fund industry and the importance of an investment adviser’s long-term profitability, including for maintaining company and management stability and accountability.
The Board also considered the allocation methodology used for calculating the profitability of TAM and its affiliates. The Board noted that the revenue and expense allocation methodology used by TAM to estimate its profitability with respect to its relationship with the Portfolio had been reviewed previously by an independent consultant. The Trustees considered that TAM reported that it had not made material changes to this methodology, and that the methodology had been applied consistently for the Portfolio.
|
|
|
|
|
| Transamerica Series Trust |
|
|
|
Semi-Annual Financial Statements 2024 |
|
|
Page 18 |
|
|
Transamerica JPMorgan International Moderate Growth VP
MANAGEMENT AND SUB-ADVISORY AGREEMENT — CONTRACT RENEWAL (continued)
(unaudited)
With respect to the Sub-Adviser, the Board noted that the sub-advisory fee is the product of arm’s-length negotiation between TAM and the Sub-Adviser, which is not affiliated with TAM, and is paid by TAM and not the Portfolio. As a result, the Board focused on the profitability of TAM and its affiliates with respect to the Portfolio.
Based on this information, the Board determined that the profitability of TAM and its affiliates from their relationships with the Portfolio was not excessive.
Economies of Scale
The Board considered economies of scale with respect to the management of the Portfolio, whether the Portfolio had appropriately benefited from any economies of scale and whether there was the potential for realization of any future economies of scale. The Board also considered the existence of economies of scale with respect to management of the Transamerica mutual funds overall and the extent to which the Portfolio benefited from any economies of scale. The Board recognized that, as the Portfolio’s assets increase, any economies of scale realized by TAM or the Sub-Adviser may not directly correlate with each other or with any economies of scale that might be realized by the Portfolio. The Board considered the Portfolio’s management fee schedule and the existence of breakpoints and also considered the extent to which TAM shared economies of scale, if any, with the Portfolio through undertakings to limit or reimburse Portfolio expenses and to invest in maintaining and developing its capabilities and services. The Board also considered the Sub-Adviser’s sub-advisory fee schedule and the existence of breakpoints, if any, and how such breakpoints relate to any breakpoints in the Portfolio’s management fee schedule. The Board considered that the Sub-Adviser’s sub-advisory fees would be based on the combined assets of multiple funds. The Trustees concluded that the Portfolio’s fee structure reflected an appropriate sharing of any efficiencies or economies of scale to date and noted that they will have the opportunity to periodically reexamine the appropriateness of the management fee payable to TAM and the fee paid to the Sub-Adviser in light of any economies of scale experienced in the future.
Benefits to TAM, its Affiliates and/or the Sub-Adviser from their Relationships with the Portfolio
The Board considered other benefits derived by TAM, its affiliates, and/or the Sub-Adviser from their relationships with the Portfolio. The Board noted that TAM does not receive benefits from research obtained with commissions paid to broker-dealers for portfolio transactions (commonly referred to as “soft dollars”) as a result of its relationship with the Portfolio.
Other Considerations
The Board noted that TAM has made a substantial commitment to the recruitment and retention of high-quality personnel and maintains the financial, compliance and operational resources reasonably necessary to manage the Portfolio in a professional manner that is consistent with the best interests of the Portfolio and the holders. In this regard, the Board favorably considered the procedures and policies TAM has in place to enforce compliance with applicable laws and regulations and oversee the portfolio management activities of the Sub-Adviser. The Board also noted that TAM has made an entrepreneurial commitment and undertaken certain business risks with respect to the management and success of the Portfolio.
Conclusion
After consideration of the factors described above, as well as other factors, the Trustees, including the Independent Trustees, concluded that the renewal of the Management Agreement and the Sub-Advisory Agreement was in the best interests of the Portfolio and the holders and voted to approve the renewal of the Agreements.
|
|
|
|
|
| Transamerica Series Trust |
|
|
|
Semi-Annual Financial Statements 2024 |
|
|
Page 19 |
|
|
PROXY VOTING POLICIES AND PROCEDURES AND QUARTERLY PORTFOLIO HOLDINGS
(unaudited)
A description of Transamerica Series Trust’s (the “Trust”) proxy voting policies and procedures is available in the Statement of Additional Information of the Portfolios, available without charge upon request by calling 1-800-851-9777 (toll free) or on the Securities and Exchange Commission’s (“SEC”) website at http://www.sec.gov.
In addition, the Portfolio is required to file Form N-PX, with their complete proxy voting records for the most recent 12 months ended June 30th, no later than August 31st of each year. The Form is available without charge: (1) on the Transamerica Funds website at https://www.transamerica.com/sites/default/files/files/e070d/TST%20N-PX%202021.pdf; and (2) on the SEC’s website at http://www.sec.gov.
Each fiscal quarter, the Portfolios, except Transamerica BlackRock Government Money Market VP, will file with the SEC a complete schedule of its monthly portfolio holdings on Form N-PORT. The Portfolios’ holdings as of the end of the third month of every fiscal quarter, as reported on Form N-PORT, will be publicly available on the SEC’s website at http://www.sec.gov within 60 days of the end of the fiscal quarter.
On a monthly basis, Transamerica BlackRock Government Money Market VP will file with the SEC portfolio holdings information on Form N-MFP3. A complete schedule of portfolio holdings is also available at www.transamerica.com.
You may also visit the Trust’s website at www.transamerica.com/annuities/prospectus for this and other information about the Portfolios and the Trust.
Important Notice Regarding Delivery of Shareholder Documents
Every year we provide shareholders informative materials such as the Transamerica Series Trust Annual Report, the Transamerica Series Trust Prospectus, and other required documents that keep you informed regarding your Portfolios. To the extent provided by mail, Transamerica Series Trust will only send one piece per mailing address, a method that saves your Portfolios money by reducing mailing and printing costs. We will continue to do this unless you tell us not to. To elect to receive individual mailings, simply call a Transamerica Customer Service Representative toll free at 1-800-851-9777, 8 a.m. to 7 p.m. Eastern Time, Monday-Friday. Your request will take effect within 30 days.
|
|
|
|
|
| Transamerica Series Trust |
|
|
|
Semi-Annual Financial Statements 2024 |
|
|
Page 20 |
|
|
NOTICE OF PRIVACY POLICY
(unaudited)
Your privacy is very important to us. We want you to understand what information we collect and how we use it. We collect and use “nonpublic personal information” in connection with providing our customers with a broad range of financial products and services as effectively and conveniently as possible. We treat nonpublic personal information in accordance with our Privacy Policy.
What Information We Collect and From Whom We Collect It
We may collect nonpublic personal information about you from the following sources:
| • |
|
Information we receive from you on applications or other forms, such as your name, address, and account number; |
| • |
|
Information about your transactions with us, our affiliates, or others, such as your account balance and purchase/redemption history; and |
| • |
|
Information we receive from non-affiliated third parties, including consumer reporting agencies. |
What Information We Disclose and To Whom We Disclose It
We do not disclose any nonpublic personal information about current or former customers to anyone without their express consent, except as permitted by law. We may disclose the nonpublic personal information we collect, as described above, to persons or companies that perform services on our behalf and to other financial institutions with which we have joint marketing agreements. We will require these companies to protect the confidentiality of your nonpublic personal information and to use it only to perform the services for which we have hired them.
Our Security Procedures
We restrict access to your nonpublic personal information and only allow disclosures to persons and companies as permitted by law to assist in providing products or services to you. We maintain physical, electronic, and procedural safeguards to protect your nonpublic personal information and to safeguard the disposal of certain consumer information.
Contact Us
If you have any questions about our Privacy Policy, please call 1-800-851-9777 on any business day between 8 a.m. and 7 p.m. Eastern Time.
Note: This Privacy Policy applies only to customers that have a direct relationship with us or our affiliates. If you own shares of our portfolios in the name of a third party such as a bank or broker-dealer, its privacy policy may apply to you instead of ours.
|
|
|
|
|
| Transamerica Series Trust |
|
|
|
Semi-Annual Financial Statements 2024 |
|
|
Page 21 |
|
|
PO Box 219945
Kansas City, MO 64121-9945
|
|
|
| Distributor: |
|
Transamerica Capital, Inc. PO Box 219945 Kansas City, MO 64121-9945 Customer Service: 1-800-851-9777 |
Transamerica Series Trust Semi-Annual Financial Statements
June 30, 2024
1801 California St., Suite 5200
Denver, CO 80202
Distributor: Transamerica Capital, Inc.
Customer Service: 1-800-851-9777
|
|
|
| |
|
The following pages contain the most recent semi-annual financial statements for the investment options in which you are invested. In compliance with Securities and Exchange Commission regulations, we present these reports on an annual and semi-annual basis with the hope that they will foster greater understanding of the investment options’ holdings, performance, financial data, accounting policies and other issues. This streamlined version provides information only on the investment options in which you are invested. If you have any questions about these reports, please do not hesitate to contact your financial professional. As always, we thank you for your trust and the opportunity to serve you. |
Transamerica JPMorgan Tactical Allocation VP
SCHEDULE OF INVESTMENTS
At June 30, 2024
(unaudited)
|
|
|
|
|
|
|
|
|
| |
|
Shares |
|
|
Value |
|
| |
|
|
|
|
| COMMON STOCKS - 30.2% |
|
|
|
|
|
|
|
|
| Australia - 0.2% |
|
|
|
|
|
|
|
|
| BHP Group Ltd. |
|
|
35,420 |
|
|
$ |
1,008,472 |
|
| Goodman Group, REIT |
|
|
12,398 |
|
|
|
287,407 |
|
| Rio Tinto Ltd. |
|
|
3,267 |
|
|
|
259,350 |
|
|
|
|
|
|
|
|
|
|
|
|
|
|
|
|
|
|
|
|
1,555,229 |
|
|
|
|
|
|
|
|
|
|
| Austria - 0.0% (A) |
|
|
|
|
|
|
|
|
| Erste Group Bank AG |
|
|
7,988 |
|
|
|
378,462 |
|
|
|
|
|
|
|
|
|
|
|
|
|
| Belgium - 0.1% |
|
|
|
|
|
|
|
|
| KBC Group NV |
|
|
8,704 |
|
|
|
614,290 |
|
|
|
|
|
|
|
|
|
|
|
|
|
| Bermuda - 0.0% (A) |
|
|
|
|
|
|
|
|
| Arch Capital Group Ltd. (B) |
|
|
2,382 |
|
|
|
240,320 |
|
|
|
|
|
|
|
|
|
|
|
|
|
| Denmark - 0.4% |
|
|
|
|
|
|
|
|
| Carlsberg AS, Class B |
|
|
4,894 |
|
|
|
587,232 |
|
| Novo Nordisk AS, Class B |
|
|
26,276 |
|
|
|
3,794,303 |
|
|
|
|
|
|
|
|
|
|
|
|
|
|
|
|
|
|
|
|
4,381,535 |
|
|
|
|
|
|
|
|
|
|
| Finland - 0.1% |
|
|
|
|
|
|
|
|
| Nordea Bank Abp |
|
|
50,191 |
|
|
|
597,454 |
|
|
|
|
|
|
|
|
|
|
|
|
|
| France - 1.6% |
|
|
|
|
|
|
|
|
| Air Liquide SA |
|
|
4,536 |
|
|
|
783,471 |
|
| Airbus SE |
|
|
7,408 |
|
|
|
1,017,564 |
|
| Capgemini SE |
|
|
2,009 |
|
|
|
399,541 |
|
| Cie Generale des Etablissements Michelin SCA |
|
|
21,077 |
|
|
|
815,090 |
|
| Dassault Systemes SE |
|
|
12,827 |
|
|
|
484,919 |
|
| Legrand SA |
|
|
18,501 |
|
|
|
1,835,537 |
|
| L’Oreal SA |
|
|
1,256 |
|
|
|
551,564 |
|
| LVMH Moet Hennessy Louis Vuitton SE |
|
|
5,353 |
|
|
|
4,090,925 |
|
| Pernod Ricard SA |
|
|
2,806 |
|
|
|
380,744 |
|
| Safran SA |
|
|
9,048 |
|
|
|
1,912,798 |
|
| Sanofi SA |
|
|
6,734 |
|
|
|
648,627 |
|
| TotalEnergies SE |
|
|
10,324 |
|
|
|
689,151 |
|
| Vinci SA |
|
|
21,970 |
|
|
|
2,314,762 |
|
|
|
|
|
|
|
|
|
|
|
|
|
|
|
|
|
|
|
|
15,924,693 |
|
|
|
|
|
|
|
|
|
|
| Germany - 0.6% |
|
|
|
|
|
|
|
|
| Allianz SE |
|
|
2,233 |
|
|
|
620,577 |
|
| Deutsche Boerse AG |
|
|
3,409 |
|
|
|
697,681 |
|
| Deutsche Telekom AG |
|
|
27,369 |
|
|
|
688,219 |
|
| Infineon Technologies AG |
|
|
11,752 |
|
|
|
431,756 |
|
| Muenchener Rueckversicherungs-Gesellschaft AG |
|
|
6,904 |
|
|
|
3,452,924 |
|
| SAP SE |
|
|
1,866 |
|
|
|
378,736 |
|
|
|
|
|
|
|
|
|
|
|
|
|
|
|
|
|
|
|
|
6,269,893 |
|
|
|
|
|
|
|
|
|
|
| Hong Kong - 0.2% |
|
|
|
|
|
|
|
|
| AIA Group Ltd. |
|
|
155,000 |
|
|
|
1,051,984 |
|
| Hong Kong Exchanges & Clearing Ltd. |
|
|
20,900 |
|
|
|
669,631 |
|
| Techtronic Industries Co. Ltd. |
|
|
33,500 |
|
|
|
382,659 |
|
|
|
|
|
|
|
|
|
|
|
|
|
|
|
|
|
|
|
|
2,104,274 |
|
|
|
|
|
|
|
|
|
|
| India - 0.1% |
|
|
|
|
|
|
|
|
| HDFC Bank Ltd., ADR |
|
|
8,340 |
|
|
|
536,512 |
|
|
|
|
|
|
|
|
|
|
|
|
|
|
|
|
|
|
|
| |
|
Shares |
|
|
Value |
|
| |
|
|
| COMMON STOCKS (continued) |
|
| Ireland - 0.1% |
|
| Medtronic PLC |
|
|
3,156 |
|
|
$ |
248,409 |
|
| Trane Technologies PLC |
|
|
2,914 |
|
|
|
958,502 |
|
|
|
|
|
|
|
|
|
|
|
|
|
|
|
|
|
|
|
|
1,206,911 |
|
|
|
|
|
|
|
|
|
|
| Italy - 0.1% |
|
|
|
|
|
|
|
|
| UniCredit SpA |
|
|
23,061 |
|
|
|
854,646 |
|
|
|
|
|
|
|
|
|
|
|
|
|
| Japan - 1.5% |
|
|
|
|
|
|
|
|
| Bridgestone Corp. (C) |
|
|
11,400 |
|
|
|
447,951 |
|
| Daikin Industries Ltd. |
|
|
4,800 |
|
|
|
667,388 |
|
| Hitachi Ltd. |
|
|
49,000 |
|
|
|
1,096,706 |
|
| Hoya Corp. |
|
|
5,200 |
|
|
|
604,550 |
|
| ITOCHU Corp. |
|
|
20,900 |
|
|
|
1,020,254 |
|
| Keyence Corp. |
|
|
1,900 |
|
|
|
833,147 |
|
| Mitsubishi UFJ Financial Group, Inc. |
|
|
51,800 |
|
|
|
556,667 |
|
| Mitsui Fudosan Co. Ltd. |
|
|
58,900 |
|
|
|
537,601 |
|
| Nippon Telegraph & Telephone Corp. |
|
|
413,500 |
|
|
|
390,138 |
|
| Recruit Holdings Co. Ltd. |
|
|
12,800 |
|
|
|
684,751 |
|
| Shimano, Inc. |
|
|
3,300 |
|
|
|
509,593 |
|
| Shin-Etsu Chemical Co. Ltd. |
|
|
102,000 |
|
|
|
3,954,727 |
|
| Sony Group Corp. |
|
|
13,100 |
|
|
|
1,110,597 |
|
| Terumo Corp. |
|
|
38,500 |
|
|
|
634,847 |
|
| Tokio Marine Holdings, Inc. |
|
|
39,700 |
|
|
|
1,481,748 |
|
|
|
|
|
|
|
|
|
|
|
|
|
|
|
|
|
|
|
|
14,530,665 |
|
|
|
|
|
|
|
|
|
|
| Mexico - 0.1% |
|
|
|
|
|
|
|
|
| Wal-Mart de Mexico SAB de CV |
|
|
215,594 |
|
|
|
736,402 |
|
|
|
|
|
|
|
|
|
|
|
|
|
| Netherlands - 0.5% |
|
|
|
|
|
|
|
|
| ASML Holding NV |
|
|
1,723 |
|
|
|
1,779,188 |
|
| Heineken NV |
|
|
18,308 |
|
|
|
1,770,509 |
|
| Koninklijke KPN NV |
|
|
197,241 |
|
|
|
756,222 |
|
| NXP Semiconductors NV |
|
|
1,444 |
|
|
|
388,566 |
|
| Stellantis NV |
|
|
20,434 |
|
|
|
404,194 |
|
|
|
|
|
|
|
|
|
|
|
|
|
|
|
|
|
|
|
|
5,098,679 |
|
|
|
|
|
|
|
|
|
|
| Republic of Korea - 0.3% |
|
|
|
|
|
|
|
|
| Samsung Electronics Co. Ltd. |
|
|
14,495 |
|
|
|
858,222 |
|
| Samsung Electronics Co. Ltd., GDR (D) |
|
|
441 |
|
|
|
652,680 |
|
| SK Hynix, Inc. |
|
|
10,282 |
|
|
|
1,766,577 |
|
|
|
|
|
|
|
|
|
|
|
|
|
|
|
|
|
|
|
|
3,277,479 |
|
|
|
|
|
|
|
|
|
|
| Singapore - 0.2% |
|
|
|
|
|
|
|
|
| DBS Group Holdings Ltd. |
|
|
58,980 |
|
|
|
1,556,707 |
|
|
|
|
|
|
|
|
|
|
|
|
|
| Spain - 0.1% |
|
|
|
|
|
|
|
|
| Banco Santander SA |
|
|
117,686 |
|
|
|
545,798 |
|
| Industria de Diseno Textil SA |
|
|
15,725 |
|
|
|
780,735 |
|
|
|
|
|
|
|
|
|
|
|
|
|
|
|
|
|
|
|
|
1,326,533 |
|
|
|
|
|
|
|
|
|
|
| Sweden - 0.2% |
|
|
|
|
|
|
|
|
| Atlas Copco AB, A Shares |
|
|
34,678 |
|
|
|
651,746 |
|
| Sandvik AB |
|
|
16,842 |
|
|
|
337,508 |
|
| Volvo AB, B Shares |
|
|
31,861 |
|
|
|
814,937 |
|
|
|
|
|
|
|
|
|
|
|
|
|
|
|
|
|
|
|
|
1,804,191 |
|
|
|
|
|
|
|
|
|
|
| Switzerland - 0.7% |
|
|
|
|
|
|
|
|
| Chubb Ltd. |
|
|
1,623 |
|
|
|
413,995 |
|
| Cie Financiere Richemont SA, Class A |
|
|
4,317 |
|
|
|
673,893 |
|
The Notes to Financial Statements are an integral part of this report.
|
|
|
|
|
| Transamerica Series Trust |
|
|
|
Semi-Annual Financial Statements 2024 |
|
|
Page 1 |
|
|
Transamerica JPMorgan Tactical Allocation VP
SCHEDULE OF INVESTMENTS (continued)
At June 30, 2024
(unaudited)
|
|
|
|
|
|
|
|
|
| |
|
Shares |
|
|
Value |
|
| |
|
|
| COMMON STOCKS (continued) |
|
| Switzerland (continued) |
|
| Garmin Ltd. |
|
|
2,653 |
|
|
$ |
432,227 |
|
| Nestle SA |
|
|
44,284 |
|
|
|
4,520,817 |
|
| UBS Group AG |
|
|
28,558 |
|
|
|
840,736 |
|
|
|
|
|
|
|
|
|
|
|
|
|
|
|
|
|
|
|
|
6,881,668 |
|
|
|
|
|
|
|
|
|
|
| Taiwan - 0.5% |
|
|
|
|
|
|
|
|
| Taiwan Semiconductor Manufacturing Co. Ltd. |
|
|
71,000 |
|
|
|
2,114,144 |
|
| Taiwan Semiconductor Manufacturing Co. Ltd., ADR |
|
|
16,188 |
|
|
|
2,813,636 |
|
|
|
|
|
|
|
|
|
|
|
|
|
|
|
|
|
|
|
|
4,927,780 |
|
|
|
|
|
|
|
|
|
|
| United Kingdom - 1.7% |
|
|
|
|
|
|
|
|
| 3i Group PLC |
|
|
27,579 |
|
|
|
1,068,887 |
|
| AstraZeneca PLC |
|
|
17,579 |
|
|
|
2,745,701 |
|
| BP PLC |
|
|
336,203 |
|
|
|
2,019,572 |
|
| Diageo PLC |
|
|
34,008 |
|
|
|
1,070,223 |
|
| Ferguson PLC |
|
|
1,547 |
|
|
|
297,930 |
|
| InterContinental Hotels Group PLC |
|
|
6,769 |
|
|
|
712,430 |
|
| Lloyds Banking Group PLC |
|
|
1,123,193 |
|
|
|
777,214 |
|
| London Stock Exchange Group PLC |
|
|
5,624 |
|
|
|
668,274 |
|
| Next PLC |
|
|
4,364 |
|
|
|
498,474 |
|
| RELX PLC |
|
|
41,468 |
|
|
|
1,907,727 |
|
| Rio Tinto PLC |
|
|
7,611 |
|
|
|
500,391 |
|
| Shell PLC |
|
|
81,364 |
|
|
|
2,914,831 |
|
| SSE PLC |
|
|
51,644 |
|
|
|
1,168,242 |
|
| TechnipFMC PLC |
|
|
25,340 |
|
|
|
662,641 |
|
|
|
|
|
|
|
|
|
|
|
|
|
|
|
|
|
|
|
|
17,012,537 |
|
|
|
|
|
|
|
|
|
|
| United States - 20.9% |
|
|
|
|
|
|
|
|
| AbbVie, Inc. |
|
|
14,732 |
|
|
|
2,526,833 |
|
| Advanced Micro Devices, Inc. (B) |
|
|
13,028 |
|
|
|
2,113,272 |
|
| Air Lease Corp. |
|
|
4,187 |
|
|
|
199,008 |
|
| Albertsons Cos., Inc., Class A |
|
|
14,664 |
|
|
|
289,614 |
|
| Alnylam Pharmaceuticals, Inc. (B) |
|
|
1,257 |
|
|
|
305,451 |
|
| Alphabet, Inc., Class C |
|
|
17,660 |
|
|
|
3,239,197 |
|
| Amazon.com, Inc. (B) |
|
|
57,862 |
|
|
|
11,181,831 |
|
| American Express Co. |
|
|
2,519 |
|
|
|
583,274 |
|
| American Homes 4 Rent, Class A, REIT |
|
|
11,327 |
|
|
|
420,911 |
|
| AMETEK, Inc. |
|
|
3,137 |
|
|
|
522,969 |
|
| Analog Devices, Inc. |
|
|
3,955 |
|
|
|
902,768 |
|
| Apple Hospitality, Inc., REIT |
|
|
15,393 |
|
|
|
223,814 |
|
| Apple, Inc. |
|
|
52,037 |
|
|
|
10,960,033 |
|
| Arista Networks, Inc. (B) |
|
|
1,341 |
|
|
|
469,994 |
|
| AutoZone, Inc. (B) |
|
|
546 |
|
|
|
1,618,399 |
|
| Axalta Coating Systems Ltd. (B) |
|
|
10,909 |
|
|
|
372,761 |
|
| Bank of America Corp. |
|
|
77,197 |
|
|
|
3,070,125 |
|
| Bath & Body Works, Inc. |
|
|
9,456 |
|
|
|
369,257 |
|
| Berkshire Hathaway, Inc., Class B (B) |
|
|
4,473 |
|
|
|
1,819,616 |
|
| Best Buy Co., Inc. |
|
|
3,196 |
|
|
|
269,391 |
|
| Blackstone, Inc. |
|
|
4,912 |
|
|
|
608,106 |
|
| Booking Holdings, Inc. |
|
|
267 |
|
|
|
1,057,720 |
|
| Booz Allen Hamilton Holding Corp. |
|
|
3,035 |
|
|
|
467,087 |
|
| Bristol-Myers Squibb Co. |
|
|
13,769 |
|
|
|
571,827 |
|
| Brixmor Property Group, Inc., REIT |
|
|
17,447 |
|
|
|
402,851 |
|
| Broadcom, Inc. |
|
|
1,238 |
|
|
|
1,987,646 |
|
| Capital One Financial Corp. |
|
|
10,039 |
|
|
|
1,389,900 |
|
|
|
|
|
|
|
|
|
|
| |
|
Shares |
|
|
Value |
|
| |
|
|
| COMMON STOCKS (continued) |
|
| United States (continued) |
|
| Carlisle Cos., Inc. |
|
|
1,354 |
|
|
$ |
548,654 |
|
| Carter’s, Inc. |
|
|
6,361 |
|
|
|
394,191 |
|
| CBRE Group, Inc., Class A (B) |
|
|
2,991 |
|
|
|
266,528 |
|
| CDW Corp. |
|
|
960 |
|
|
|
214,886 |
|
| Cencora, Inc. |
|
|
3,240 |
|
|
|
729,972 |
|
| Charles Schwab Corp. |
|
|
13,506 |
|
|
|
995,257 |
|
| Chevron Corp. |
|
|
13,141 |
|
|
|
2,055,515 |
|
| Cigna Group |
|
|
1,140 |
|
|
|
376,850 |
|
| Cisco Systems, Inc. |
|
|
4,808 |
|
|
|
228,428 |
|
| Citizens Financial Group, Inc. |
|
|
11,597 |
|
|
|
417,840 |
|
| CME Group, Inc. |
|
|
4,521 |
|
|
|
888,829 |
|
| CNA Financial Corp. |
|
|
6,155 |
|
|
|
283,561 |
|
| Coca-Cola Co. |
|
|
30,584 |
|
|
|
1,946,672 |
|
| Columbia Sportswear Co. |
|
|
2,542 |
|
|
|
201,021 |
|
| Confluent, Inc., Class A (B) |
|
|
10,370 |
|
|
|
306,226 |
|
| ConocoPhillips |
|
|
9,326 |
|
|
|
1,066,708 |
|
| Constellation Brands, Inc., Class A |
|
|
1,652 |
|
|
|
425,027 |
|
| Cooper Cos., Inc. |
|
|
4,340 |
|
|
|
378,882 |
|
| Copart, Inc. (B) |
|
|
9,290 |
|
|
|
503,146 |
|
| Corpay, Inc. (B) |
|
|
1,151 |
|
|
|
306,638 |
|
| Coterra Energy, Inc. |
|
|
9,618 |
|
|
|
256,512 |
|
| Crowdstrike Holdings, Inc., Class A (B) |
|
|
1,609 |
|
|
|
616,553 |
|
| CVS Health Corp. |
|
|
6,917 |
|
|
|
408,518 |
|
| Deere & Co. |
|
|
1,903 |
|
|
|
711,018 |
|
| Dick’s Sporting Goods, Inc. |
|
|
1,938 |
|
|
|
416,379 |
|
| Digital Realty Trust, Inc., REIT |
|
|
7,359 |
|
|
|
1,118,936 |
|
| Dominion Energy, Inc. |
|
|
16,500 |
|
|
|
808,500 |
|
| Domino’s Pizza, Inc. |
|
|
573 |
|
|
|
295,857 |
|
| DoorDash, Inc., Class A (B) |
|
|
4,096 |
|
|
|
445,563 |
|
| Dover Corp. |
|
|
3,234 |
|
|
|
583,575 |
|
| EastGroup Properties, Inc., REIT |
|
|
1,097 |
|
|
|
186,600 |
|
| Eaton Corp. PLC |
|
|
806 |
|
|
|
252,721 |
|
| Edison International |
|
|
4,418 |
|
|
|
317,257 |
|
| elf Beauty, Inc. (B) |
|
|
2,277 |
|
|
|
479,809 |
|
| Eli Lilly & Co. |
|
|
2,118 |
|
|
|
1,917,595 |
|
| Energizer Holdings, Inc. |
|
|
6,211 |
|
|
|
183,473 |
|
| Entegris, Inc. |
|
|
4,009 |
|
|
|
542,819 |
|
| Entergy Corp. |
|
|
1,642 |
|
|
|
175,694 |
|
| EOG Resources, Inc. |
|
|
9,326 |
|
|
|
1,173,864 |
|
| Expedia Group, Inc. (B) |
|
|
4,575 |
|
|
|
576,404 |
|
| Exxon Mobil Corp. |
|
|
20,657 |
|
|
|
2,378,034 |
|
| Federal Realty Investment Trust, REIT |
|
|
3,656 |
|
|
|
369,146 |
|
| FedEx Corp. |
|
|
2,476 |
|
|
|
742,404 |
|
| Fidelity National Information Services, Inc. |
|
|
13,297 |
|
|
|
1,002,062 |
|
| Fifth Third Bancorp |
|
|
4,813 |
|
|
|
175,626 |
|
| First Citizens BancShares, Inc., Class A |
|
|
349 |
|
|
|
587,580 |
|
| Fiserv, Inc. (B) |
|
|
6,645 |
|
|
|
990,371 |
|
| Fortune Brands Innovations, Inc. |
|
|
5,176 |
|
|
|
336,129 |
|
| General Dynamics Corp. |
|
|
1,890 |
|
|
|
548,365 |
|
| Graphic Packaging Holding Co. |
|
|
16,057 |
|
|
|
420,854 |
|
| HCA Healthcare, Inc. |
|
|
2,134 |
|
|
|
685,612 |
|
| Henry Schein, Inc. (B) |
|
|
6,961 |
|
|
|
446,200 |
|
| Hilton Worldwide Holdings, Inc. |
|
|
2,939 |
|
|
|
641,290 |
|
| Home Depot, Inc. |
|
|
796 |
|
|
|
274,015 |
|
| Honeywell International, Inc. |
|
|
10,863 |
|
|
|
2,319,685 |
|
| Hubbell, Inc. |
|
|
983 |
|
|
|
359,267 |
|
The Notes to Financial Statements are an integral part of this report.
|
|
|
|
|
| Transamerica Series Trust |
|
|
|
Semi-Annual Financial Statements 2024 |
|
|
Page 2 |
|
|
Transamerica JPMorgan Tactical Allocation VP
SCHEDULE OF INVESTMENTS (continued)
At June 30, 2024
(unaudited)
|
|
|
|
|
|
|
|
|
| |
|
Shares |
|
|
Value |
|
| |
|
|
| COMMON STOCKS (continued) |
|
| United States (continued) |
|
| HubSpot, Inc. (B) |
|
|
826 |
|
|
$ |
487,167 |
|
| IAC, Inc. (B) |
|
|
8,898 |
|
|
|
416,871 |
|
| Ingersoll Rand, Inc. |
|
|
6,140 |
|
|
|
557,758 |
|
| Interactive Brokers Group, Inc., Class A |
|
|
4,122 |
|
|
|
505,357 |
|
| International Business Machines Corp. |
|
|
1,849 |
|
|
|
319,785 |
|
| Intuit, Inc. |
|
|
1,515 |
|
|
|
995,673 |
|
| Intuitive Surgical, Inc. (B) |
|
|
1,909 |
|
|
|
849,219 |
|
| ITT, Inc. |
|
|
3,337 |
|
|
|
431,074 |
|
| Johnson & Johnson |
|
|
13,109 |
|
|
|
1,916,011 |
|
| Kenvue, Inc. |
|
|
10,848 |
|
|
|
197,217 |
|
| Keurig Dr. Pepper, Inc. |
|
|
17,362 |
|
|
|
579,891 |
|
| Kimco Realty Corp., REIT |
|
|
24,587 |
|
|
|
478,463 |
|
| Kinder Morgan, Inc. |
|
|
33,594 |
|
|
|
667,513 |
|
| KKR & Co., Inc. |
|
|
4,688 |
|
|
|
493,365 |
|
| Kraft Heinz Co. |
|
|
11,656 |
|
|
|
375,556 |
|
| Labcorp Holdings, Inc. |
|
|
2,255 |
|
|
|
458,915 |
|
| Lam Research Corp. |
|
|
846 |
|
|
|
900,863 |
|
| Lamar Advertising Co., Class A, REIT |
|
|
3,752 |
|
|
|
448,477 |
|
| Liberty Broadband Corp., Class C (B) |
|
|
3,378 |
|
|
|
185,182 |
|
| Liberty Media Corp. - Liberty Live,
Class C (B) |
|
|
3,281 |
|
|
|
125,564 |
|
| Liberty Media Corp. - Liberty SiriusXM,
Class C (B) |
|
|
11,180 |
|
|
|
247,749 |
|
| Loews Corp. |
|
|
14,060 |
|
|
|
1,050,844 |
|
| Lowe’s Cos., Inc. |
|
|
2,997 |
|
|
|
660,719 |
|
| M&T Bank Corp. |
|
|
8,045 |
|
|
|
1,217,691 |
|
| Martin Marietta Materials, Inc. |
|
|
872 |
|
|
|
472,450 |
|
| Mastercard, Inc., Class A |
|
|
13,346 |
|
|
|
5,887,721 |
|
| McDonald’s Corp. |
|
|
1,392 |
|
|
|
354,737 |
|
| McKesson Corp. |
|
|
627 |
|
|
|
366,193 |
|
| Merck & Co., Inc. |
|
|
3,551 |
|
|
|
439,614 |
|
| Meta Platforms, Inc., Class A |
|
|
16,018 |
|
|
|
8,076,596 |
|
| Mettler-Toledo International, Inc. (B) |
|
|
116 |
|
|
|
162,120 |
|
| MGIC Investment Corp. |
|
|
19,304 |
|
|
|
416,001 |
|
| Micron Technology, Inc. |
|
|
10,213 |
|
|
|
1,343,316 |
|
| Microsoft Corp. |
|
|
35,456 |
|
|
|
15,847,059 |
|
| Mid-America Apartment Communities, Inc., REIT |
|
|
4,818 |
|
|
|
687,095 |
|
| Middleby Corp. (B) |
|
|
1,114 |
|
|
|
136,588 |
|
| Mohawk Industries, Inc. (B) |
|
|
3,930 |
|
|
|
446,409 |
|
| Mondelez International, Inc., Class A |
|
|
11,030 |
|
|
|
721,803 |
|
| MongoDB, Inc. (B) |
|
|
852 |
|
|
|
212,966 |
|
| Moody’s Corp. |
|
|
1,452 |
|
|
|
611,190 |
|
| Morgan Stanley |
|
|
9,360 |
|
|
|
909,698 |
|
| Murphy USA, Inc. |
|
|
722 |
|
|
|
338,950 |
|
| Natera, Inc. (B) |
|
|
5,832 |
|
|
|
631,547 |
|
| Netflix, Inc. (B) |
|
|
1,273 |
|
|
|
859,122 |
|
| Newell Brands, Inc. |
|
|
22,339 |
|
|
|
143,193 |
|
| Nexstar Media Group, Inc. |
|
|
1,622 |
|
|
|
269,268 |
|
| NextEra Energy, Inc. |
|
|
27,884 |
|
|
|
1,974,466 |
|
| Northern Trust Corp. |
|
|
5,306 |
|
|
|
445,598 |
|
| Northrop Grumman Corp. |
|
|
568 |
|
|
|
247,620 |
|
| NVIDIA Corp. |
|
|
105,367 |
|
|
|
13,017,039 |
|
| Oracle Corp. |
|
|
3,559 |
|
|
|
502,531 |
|
| O’Reilly Automotive, Inc. (B) |
|
|
993 |
|
|
|
1,048,668 |
|
| Otis Worldwide Corp. |
|
|
16,948 |
|
|
|
1,631,414 |
|
| Packaging Corp. of America |
|
|
3,242 |
|
|
|
591,860 |
|
|
|
|
|
|
|
|
|
|
| |
|
Shares |
|
|
Value |
|
| |
|
|
| COMMON STOCKS (continued) |
|
| United States (continued) |
|
| Palo Alto Networks, Inc. (B) |
|
|
2,287 |
|
|
$ |
775,316 |
|
| PG&E Corp. |
|
|
25,959 |
|
|
|
453,244 |
|
| Philip Morris International, Inc. |
|
|
4,938 |
|
|
|
500,368 |
|
| Phillips 66 |
|
|
4,602 |
|
|
|
649,664 |
|
| PNC Financial Services Group, Inc. |
|
|
3,953 |
|
|
|
614,612 |
|
| Pool Corp. |
|
|
505 |
|
|
|
155,202 |
|
| Post Holdings, Inc. (B) |
|
|
4,600 |
|
|
|
479,136 |
|
| Procter & Gamble Co. |
|
|
4,082 |
|
|
|
673,203 |
|
| Progressive Corp. |
|
|
4,429 |
|
|
|
919,948 |
|
| Prologis, Inc., REIT |
|
|
12,164 |
|
|
|
1,366,139 |
|
| Public Service Enterprise Group, Inc. |
|
|
16,640 |
|
|
|
1,226,368 |
|
| Public Storage, REIT |
|
|
2,685 |
|
|
|
772,340 |
|
| Quanta Services, Inc. |
|
|
2,582 |
|
|
|
656,060 |
|
| Ralph Lauren Corp. |
|
|
793 |
|
|
|
138,823 |
|
| Rayonier, Inc., REIT |
|
|
7,855 |
|
|
|
228,502 |
|
| Regency Centers Corp., REIT |
|
|
7,580 |
|
|
|
471,476 |
|
| Regeneron Pharmaceuticals, Inc. (B) |
|
|
3,731 |
|
|
|
3,921,393 |
|
| Regions Financial Corp. |
|
|
25,759 |
|
|
|
516,210 |
|
| Ross Stores, Inc. |
|
|
8,602 |
|
|
|
1,250,043 |
|
| Royalty Pharma PLC, Class A |
|
|
7,741 |
|
|
|
204,130 |
|
| RTX Corp. |
|
|
5,985 |
|
|
|
600,834 |
|
| Saia, Inc. (B) |
|
|
927 |
|
|
|
439,667 |
|
| Salesforce, Inc. |
|
|
3,614 |
|
|
|
929,159 |
|
| Silgan Holdings, Inc. |
|
|
4,369 |
|
|
|
184,940 |
|
| Snowflake, Inc., Class A (B) |
|
|
2,057 |
|
|
|
277,880 |
|
| Southern Co. |
|
|
31,469 |
|
|
|
2,441,050 |
|
| State Street Corp. |
|
|
7,957 |
|
|
|
588,818 |
|
| Stryker Corp. |
|
|
4,118 |
|
|
|
1,401,149 |
|
| Synopsys, Inc. (B) |
|
|
916 |
|
|
|
545,075 |
|
| Take-Two Interactive Software, Inc. (B) |
|
|
2,731 |
|
|
|
424,643 |
|
| TD SYNNEX Corp. |
|
|
3,729 |
|
|
|
430,327 |
|
| Teradyne, Inc. |
|
|
3,506 |
|
|
|
519,905 |
|
| Tesla, Inc. (B) |
|
|
2,669 |
|
|
|
528,142 |
|
| Texas Instruments, Inc. |
|
|
3,423 |
|
|
|
665,876 |
|
| Texas Roadhouse, Inc. |
|
|
1,024 |
|
|
|
175,831 |
|
| Thermo Fisher Scientific, Inc. |
|
|
1,127 |
|
|
|
623,231 |
|
| Timken Co. |
|
|
3,204 |
|
|
|
256,737 |
|
| TJX Cos., Inc. |
|
|
17,595 |
|
|
|
1,937,209 |
|
| T-Mobile US, Inc. |
|
|
1,663 |
|
|
|
292,987 |
|
| Trade Desk, Inc., Class A (B) |
|
|
6,784 |
|
|
|
662,593 |
|
| Travelers Cos., Inc. |
|
|
3,974 |
|
|
|
808,073 |
|
| Uber Technologies, Inc. (B) |
|
|
43,966 |
|
|
|
3,195,449 |
|
| Union Pacific Corp. |
|
|
2,137 |
|
|
|
483,518 |
|
| United Parcel Service, Inc., Class B |
|
|
1,023 |
|
|
|
139,998 |
|
| UnitedHealth Group, Inc. |
|
|
6,529 |
|
|
|
3,324,959 |
|
| Verizon Communications, Inc. |
|
|
7,984 |
|
|
|
329,260 |
|
| Vertex Pharmaceuticals, Inc. (B) |
|
|
506 |
|
|
|
237,172 |
|
| Vertiv Holdings Co. |
|
|
4,077 |
|
|
|
352,946 |
|
| W.R. Berkley Corp. |
|
|
3,666 |
|
|
|
288,074 |
|
| Wells Fargo & Co. |
|
|
43,577 |
|
|
|
2,588,038 |
|
| Welltower, Inc., REIT |
|
|
13,489 |
|
|
|
1,406,228 |
|
| Westrock Co. |
|
|
6,621 |
|
|
|
332,771 |
|
| Weyerhaeuser Co., REIT |
|
|
21,011 |
|
|
|
596,502 |
|
| Williams Cos., Inc. |
|
|
16,985 |
|
|
|
721,862 |
|
| Xcel Energy, Inc. |
|
|
4,891 |
|
|
|
261,228 |
|
The Notes to Financial Statements are an integral part of this report.
|
|
|
|
|
| Transamerica Series Trust |
|
|
|
Semi-Annual Financial Statements 2024 |
|
|
Page 3 |
|
|
Transamerica JPMorgan Tactical Allocation VP
SCHEDULE OF INVESTMENTS (continued)
At June 30, 2024
(unaudited)
|
|
|
|
|
|
|
|
|
| |
|
Shares |
|
|
Value |
|
| |
|
|
| COMMON STOCKS (continued) |
|
| United States (continued) |
|
| Yum! Brands, Inc. |
|
|
14,061 |
|
|
$ |
1,862,520 |
|
| Zimmer Biomet Holdings, Inc. |
|
|
2,747 |
|
|
|
298,132 |
|
|
|
|
|
|
|
|
|
|
|
|
|
|
|
|
|
|
|
|
204,707,489 |
|
|
|
|
|
|
|
|
|
|
|
|
|
| Total Common Stocks
(Cost $245,964,367) |
|
|
|
|
|
|
296,524,349 |
|
|
|
|
|
|
|
|
|
|
|
|
|
| |
|
Principal |
|
|
Value |
|
| |
|
|
| U.S. GOVERNMENT AGENCY OBLIGATIONS - 21.8% |
|
| COOF Securitization Trust Ltd., Interest Only STRIPS |
|
|
|
|
|
|
|
|
| 2.90% (E), 06/25/2040 (F) |
|
|
$ 43,918 |
|
|
|
3,007 |
|
| Federal Farm Credit Banks Funding Corp. |
|
|
|
|
|
|
|
|
| 2.10%, 02/25/2036 |
|
|
1,525,000 |
|
|
|
1,149,791 |
|
| 2.35%, 03/10/2036 |
|
|
2,660,000 |
|
|
|
2,056,742 |
|
| 2.50%, 04/14/2036 |
|
|
4,647,000 |
|
|
|
3,649,000 |
|
| Federal Home Loan Banks |
|
|
|
|
|
|
|
|
| 1.93%, 02/11/2036 |
|
|
3,000,000 |
|
|
|
2,215,971 |
|
| 2.09%, 02/22/2036 |
|
|
4,510,000 |
|
|
|
3,416,182 |
|
| Federal Home Loan Mortgage Corp. |
|
|
|
|
|
|
|
|
| 2.50%, 07/01/2050 - 05/01/2052 |
|
|
35,991,305 |
|
|
|
30,018,626 |
|
| 3.00%, 06/01/2052 - 08/01/2052 |
|
|
5,511,197 |
|
|
|
4,766,370 |
|
| 3.50%, 01/01/2032 - 04/01/2052 |
|
|
4,625,998 |
|
|
|
4,183,437 |
|
| 4.00%, 08/01/2047 |
|
|
$ 3,099,367 |
|
|
|
2,900,452 |
|
| 5.00%, 07/01/2052 - 01/01/2053 |
|
|
5,595,570 |
|
|
|
5,427,302 |
|
| 6.00%, 06/01/2053 - 11/01/2053 |
|
|
14,378,610 |
|
|
|
14,577,060 |
|
| 1-Year CMT + 2.25%, 6.36% (E), 02/01/2036 |
|
|
$ 8,000 |
|
|
|
8,130 |
|
| 1-Year RFUCC Treasury + 1.84%, 6.42% (E), 07/01/2040 |
|
|
15,413 |
|
|
|
15,863 |
|
| 6.50%, 09/01/2037 - 11/01/2037 |
|
|
3,011 |
|
|
|
3,034 |
|
| 1-Year CMT + 2.43%, 6.94% (E), 12/01/2031 |
|
|
$ 8,355 |
|
|
|
8,412 |
|
| Federal Home Loan Mortgage Corp. REMICS |
|
|
|
|
|
|
|
|
| (4.44) * 1-Month SOFR Average + 23.93%, 0.23% (E), 06/15/2035 |
|
|
28,625 |
|
|
|
25,803 |
|
| 2.50%, 12/25/2047 |
|
|
3,258,825 |
|
|
|
2,822,229 |
|
| 5.00%, 06/15/2025 |
|
|
1,480 |
|
|
|
1,472 |
|
| (3.62) * 1-Month SOFR Average + 26.80%, |
|
|
|
|
|
|
|
|
| 5.50% (E), 05/15/2041 |
|
|
38,066 |
|
|
|
37,046 |
|
| 5.65% (E), 10/15/2038 |
|
|
$ 8,457 |
|
|
|
8,609 |
|
| Federal Home Loan Mortgage Corp. REMICS, Interest Only STRIPS |
|
|
|
|
|
|
|
|
| (1.00) * 1-Month SOFR Average + 6.26%, 0.92% (E), 10/15/2037 |
|
|
116,265 |
|
|
|
10,636 |
|
| Federal Home Loan Mortgage Corp. REMICS, Principal Only STRIPS |
|
|
|
|
|
|
|
|
| 09/15/2032 - 01/15/2040 |
|
|
78,045 |
|
|
|
64,199 |
|
| Federal National Mortgage Association |
|
|
|
|
|
|
|
|
| 1.59%, 11/25/2028 |
|
|
$ 272,490 |
|
|
|
242,579 |
|
| 2.00%, 04/01/2052 |
|
|
1,142,713 |
|
|
|
904,355 |
|
| 2.50%, 08/01/2050 - 05/01/2052 |
|
|
18,944,667 |
|
|
|
15,776,180 |
|
| 3.00%, 07/01/2050 - 07/01/2060 |
|
|
41,680,340 |
|
|
|
35,862,010 |
|
| 3.50%, 08/01/2032 - 10/01/2050 |
|
|
5,495,821 |
|
|
|
4,965,974 |
|
| 4.00%, 11/01/2050 |
|
|
$ 397,351 |
|
|
|
370,770 |
|
|
|
|
|
|
|
|
|
|
| |
|
Principal |
|
|
Value |
|
| |
|
|
| U.S. GOVERNMENT AGENCY OBLIGATIONS (continued) |
|
| Federal National Mortgage Association (continued) |
|
|
|
|
|
|
|
|
| 4.50%, 09/01/2040 |
|
|
$ 72,211 |
|
|
$ |
70,258 |
|
| 5.00%, 07/01/2052 |
|
|
3,976,632 |
|
|
|
3,859,529 |
|
| 5.50%, 07/01/2025 - 01/01/2059 |
|
|
5,666,846 |
|
|
|
5,652,204 |
|
| 6.00%, 07/01/2027 - 01/01/2053 |
|
|
7,233,096 |
|
|
|
7,287,426 |
|
| 6.50%, 11/01/2053 |
|
|
$ 3,192,561 |
|
|
|
3,266,999 |
|
| 7.00%, 11/01/2037 |
|
|
9,057 |
|
|
|
9,137 |
|
| Federal National Mortgage Association REMICS |
|
|
|
|
|
|
|
|
| 2.50%, 09/25/2048 |
|
|
4,228,401 |
|
|
|
3,669,527 |
|
| 5.00%, 10/25/2025 - 01/25/2046 |
|
|
1,352,139 |
|
|
|
1,329,992 |
|
| Federal National Mortgage Association REMICS, Interest Only STRIPS |
|
|
|
|
|
|
|
|
| (1.00) * 1-Month SOFR Average + 6.42%, 1.08% (E), 01/25/2041 |
|
|
$ 109,773 |
|
|
|
13,575 |
|
| (1.00) * 1-Month SOFR Average + 6.49%, 1.15% (E), 08/25/2035 - 06/25/2036 |
|
|
99,329 |
|
|
|
8,504 |
|
| (1.00) * 1-Month SOFR Average + 6.59%, 1.25% (E), 03/25/2036 |
|
|
$ 107,219 |
|
|
|
9,160 |
|
| Federal National Mortgage Association REMICS, Principal Only STRIPS |
|
|
|
|
|
|
|
|
| 12/25/2034 - 12/25/2043 |
|
|
417,937 |
|
|
|
316,509 |
|
| Federal National Mortgage Association, Interest Only STRIPS |
|
|
|
|
|
|
|
|
| 2.03% (E), 11/25/2033 |
|
|
$ 2,937,875 |
|
|
|
217,423 |
|
| 2.06% (E), 07/25/2030 |
|
|
2,432,230 |
|
|
|
164,199 |
|
| 2.10% (E), 11/25/2028 |
|
|
1,783,891 |
|
|
|
100,189 |
|
| Federal National Mortgage Association, Principal Only STRIPS |
|
|
|
|
|
|
|
|
| 08/25/2032 |
|
|
6,811 |
|
|
|
6,052 |
|
| FREMF Mortgage Trust |
|
|
|
|
|
|
|
|
| 3.79% (E), 04/25/2028 (F) |
|
|
1,441,000 |
|
|
|
1,312,003 |
|
| Government National Mortgage Association |
|
|
|
|
|
|
|
|
| 2.00%, 04/20/2052 |
|
|
6,794,498 |
|
|
|
5,512,603 |
|
| 3.00%, 08/20/2051 - 01/20/2052 |
|
|
20,076,772 |
|
|
|
17,541,265 |
|
| 4.50%, 08/20/2052 |
|
|
$ 9,499,702 |
|
|
|
9,065,521 |
|
| 5.00%, 08/20/2052 - 09/20/2052 |
|
|
3,368,231 |
|
|
|
3,288,020 |
|
| 5.50%, 11/20/2052 - 04/20/2053 |
|
|
11,108,156 |
|
|
|
11,045,925 |
|
| 6.50%, 02/20/2054 - 05/20/2054 |
|
|
2,207,780 |
|
|
|
2,241,650 |
|
| Government National Mortgage Association REMICS |
|
|
|
|
|
|
|
|
| 1.65%, 01/20/2063 - 04/20/2063 |
|
|
6,109 |
|
|
|
5,644 |
|
| 4.00% (E), 11/16/2042 |
|
|
$ 63,355 |
|
|
|
59,409 |
|
| (3.50) * 1-Month Term SOFR + 22.87%, 4.19% (E), 04/20/2037 |
|
|
14,946 |
|
|
|
15,898 |
|
| 5.00%, 04/20/2041 |
|
|
289,340 |
|
|
|
285,814 |
|
| 5.14% (E), 07/20/2060 |
|
|
366 |
|
|
|
375 |
|
| 1-Month Term SOFR + 0.56%, 5.50% (E), 03/20/2060 - 05/20/2062 |
|
|
3,500 |
|
|
|
3,459 |
|
| 1-Month Term SOFR + 0.66%, 5.99% (E), 04/20/2062 - 07/20/2062 |
|
|
903 |
|
|
|
899 |
|
| 1-Month Term SOFR + 0.76%, 6.09% (E), 05/20/2061 |
|
|
$ 1,012 |
|
|
|
1,006 |
|
| 1-Month Term SOFR + 1.11%, 6.44% (E), 12/20/2066 |
|
|
199,719 |
|
|
|
200,126 |
|
The Notes to Financial Statements are an integral part of this report.
|
|
|
|
|
| Transamerica Series Trust |
|
|
|
Semi-Annual Financial Statements 2024 |
|
|
Page 4 |
|
|
Transamerica JPMorgan Tactical Allocation VP
SCHEDULE OF INVESTMENTS (continued)
At June 30, 2024
(unaudited)
|
|
|
|
|
|
|
|
|
| |
|
Principal |
|
|
Value |
|
| |
|
|
| U.S. GOVERNMENT AGENCY OBLIGATIONS (continued) |
|
| Government National Mortgage Association REMICS, Interest Only STRIPS |
|
|
|
|
|
|
|
|
| (1.00) * 1-Month Term SOFR + 6.49%, 1.15% (E), 05/20/2041 |
|
$ |
31,746 |
|
|
|
$ 1,709 |
|
| 1.20% (E), 06/20/2067 |
|
|
1,373,032 |
|
|
|
42,314 |
|
| 7.50%, 04/20/2031 |
|
|
385 |
|
|
|
22 |
|
| Government National Mortgage Association REMICS, Principal Only STRIPS |
|
|
|
|
|
|
|
|
| 01/20/2038 |
|
|
4,859 |
|
|
|
4,431 |
|
| KGS-Alpha SBA COOF Trust, Interest Only STRIPS |
|
|
|
|
|
|
|
|
| 0.87% (E), 08/25/2038 (F) |
|
|
147,524 |
|
|
|
2,412 |
|
| 1.79% (E), 03/25/2039 (F) |
|
|
141,599 |
|
|
|
4,122 |
|
| 3.30% (E), 04/25/2040 (F) |
|
|
45,467 |
|
|
|
2,006 |
|
| Resolution Funding Corp., Principal Only STRIPS |
|
|
|
|
|
|
|
|
| 04/15/2030 |
|
|
400,000 |
|
|
|
305,869 |
|
| Tennessee Valley Authority |
|
|
|
|
|
|
|
|
| 4.25%, 09/15/2065 (C) |
|
|
264,000 |
|
|
|
227,033 |
|
| 4.63%, 09/15/2060 (C) |
|
|
155,000 |
|
|
|
144,315 |
|
| 5.88%, 04/01/2036 |
|
|
874,000 |
|
|
|
963,510 |
|
| Tennessee Valley Authority, Interest Only STRIPS |
|
|
|
|
|
|
|
|
| 07/15/2028 |
|
|
1,000,000 |
|
|
|
829,687 |
|
|
|
|
|
|
|
|
|
|
|
|
| Total U.S. Government Agency Obligations
(Cost $225,316,155) |
|
|
|
214,578,971 |
|
|
|
|
|
|
|
|
|
|
|
|
| CORPORATE DEBT SECURITIES - 21.2% |
|
|
|
|
|
| Australia - 0.2% |
|
|
|
|
|
|
|
|
| BHP Billiton Finance USA Ltd. |
|
|
|
|
|
|
|
|
| 5.25%, 09/08/2030 - 09/08/2033 |
|
|
565,000 |
|
|
|
570,231 |
|
| Commonwealth Bank of Australia |
|
|
|
|
|
|
|
|
| 3.78%, 03/14/2032 (F) |
|
|
375,000 |
|
|
|
328,925 |
|
| National Australia Bank Ltd. |
|
|
|
|
|
|
|
|
| 2.33%, 08/21/2030 (F) |
|
|
415,000 |
|
|
|
343,537 |
|
| Santos Finance Ltd. |
|
|
|
|
|
|
|
|
| 3.65%, 04/29/2031 (F) |
|
|
314,000 |
|
|
|
274,563 |
|
| 6.88%, 09/19/2033 (F) |
|
|
320,000 |
|
|
|
338,725 |
|
|
|
|
|
|
|
|
|
|
|
|
|
|
|
|
|
|
|
|
1,855,981 |
|
|
|
|
|
|
|
|
|
|
| Brazil - 0.0% (A) |
|
|
|
|
|
|
|
|
| Vale Overseas Ltd. |
|
|
|
|
|
|
|
|
| 6.13%, 06/12/2033 |
|
|
211,000 |
|
|
|
212,639 |
|
| 6.40%, 06/28/2054 (C) |
|
|
223,000 |
|
|
|
220,368 |
|
|
|
|
|
|
|
|
|
|
|
|
|
|
|
|
|
|
|
|
433,007 |
|
|
|
|
|
|
|
|
|
|
| Canada - 0.5% |
|
|
|
|
|
|
|
|
| Air Canada Pass-Through Trust |
|
|
|
|
|
|
|
|
| 3.75%, 06/15/2029 (F) |
|
|
668,282 |
|
|
|
627,902 |
|
| Bank of Nova Scotia |
|
|
|
|
|
|
|
|
| 5.45%, 08/01/2029 |
|
|
442,000 |
|
|
|
446,713 |
|
| Barrick Gold Corp. |
|
|
|
|
|
|
|
|
| 6.45%, 10/15/2035 |
|
|
62,000 |
|
|
|
66,651 |
|
| Canadian Imperial Bank of Commerce |
|
|
|
|
|
|
|
|
| 5.26%, 04/08/2029 |
|
|
335,000 |
|
|
|
334,617 |
|
|
|
|
|
|
|
|
|
|
| |
|
Principal |
|
|
Value |
|
| |
|
|
| CORPORATE DEBT SECURITIES (continued) |
|
| Canada (continued) |
|
| Canadian Pacific Railway Co. |
|
|
|
|
|
|
|
|
| 2.05%, 03/05/2030 |
|
$ |
395,000 |
|
|
|
$ 337,233 |
|
| 4.70%, 05/01/2048 |
|
|
254,000 |
|
|
|
220,906 |
|
| Enbridge, Inc. |
|
|
|
|
|
|
|
|
| 5.30%, 04/05/2029 |
|
|
303,000 |
|
|
|
303,649 |
|
| Fixed until 10/15/2028, 8.25% (E), 01/15/2084 |
|
|
408,000 |
|
|
|
425,121 |
|
| Federation des Caisses Desjardins du Quebec |
|
|
|
|
|
|
|
|
| 5.70%, 03/14/2028 (F) |
|
|
330,000 |
|
|
|
333,956 |
|
| Fortis, Inc. |
|
|
|
|
|
|
|
|
| 3.06%, 10/04/2026 |
|
|
648,000 |
|
|
|
614,824 |
|
| Kinross Gold Corp. |
|
|
|
|
|
|
|
|
| 6.25%, 07/15/2033 |
|
|
157,000 |
|
|
|
164,409 |
|
| Manulife Financial Corp. |
|
|
|
|
|
|
|
|
| Fixed until 02/24/2027,4.06% (E), 02/24/2032 |
|
|
203,000 |
|
|
|
194,445 |
|
| Nutrien Ltd. |
|
|
|
|
|
|
|
|
| 5.20%, 06/21/2027 |
|
|
375,000 |
|
|
|
374,624 |
|
| Rogers Communications, Inc. |
|
|
|
|
|
|
|
|
| 3.80%, 03/15/2032 |
|
|
323,000 |
|
|
|
289,078 |
|
| Teck Resources Ltd. |
|
|
|
|
|
|
|
|
| 5.20%, 03/01/2042 |
|
|
127,000 |
|
|
|
113,958 |
|
| TransCanada PipeLines Ltd. |
|
|
|
|
|
|
|
|
| 6.10%, 06/01/2040 |
|
|
94,000 |
|
|
|
95,881 |
|
| Transcanada Trust |
|
|
|
|
|
|
|
|
| Fixed until 08/15/2026, 5.88% (E), 08/15/2076 |
|
|
200,000 |
|
|
|
195,786 |
|
|
|
|
|
|
|
|
|
|
|
|
|
|
|
|
|
|
|
|
5,139,753 |
|
|
|
|
|
|
|
|
|
|
| Cayman Islands - 0.3% |
|
|
|
|
|
|
|
|
| Avolon Holdings Funding Ltd. |
|
|
|
|
|
|
|
|
| 2.13%, 02/21/2026 (F) |
|
|
236,000 |
|
|
|
221,843 |
|
| 2.75%, 02/21/2028 (F) |
|
|
767,000 |
|
|
|
689,451 |
|
| 2.88%, 02/15/2025 (F) |
|
|
349,000 |
|
|
|
341,897 |
|
| 3.25%, 02/15/2027 (F) |
|
|
95,000 |
|
|
|
88,921 |
|
| 4.25%, 04/15/2026 (F) |
|
|
349,000 |
|
|
|
339,013 |
|
| 4.38%, 05/01/2026 (F) |
|
|
333,000 |
|
|
|
323,902 |
|
| 5.50%, 01/15/2026 (F) |
|
|
150,000 |
|
|
|
148,805 |
|
| 5.75%, 11/15/2029 (F) |
|
|
630,000 |
|
|
|
626,066 |
|
| 6.38%, 05/04/2028 (F) |
|
|
339,000 |
|
|
|
344,395 |
|
|
|
|
|
|
|
|
|
|
|
|
|
|
|
|
|
|
|
|
3,124,293 |
|
|
|
|
|
|
|
|
|
|
| Chile - 0.1% |
|
|
|
|
|
|
|
|
| Corp. Nacional del Cobre de Chile
6.44%, 01/26/2036 (F) |
|
|
627,000 |
|
|
|
647,550 |
|
|
|
|
|
|
|
|
|
|
|
|
|
| Denmark - 0.0% (A) |
|
|
|
|
|
|
|
|
| Danske Bank AS |
|
|
|
|
|
|
|
|
| Fixed until 04/01/2027, 4.30% (E), 04/01/2028 (F) |
|
|
225,000 |
|
|
|
217,835 |
|
| Fixed until 03/01/2029, 5.71% (E), 03/01/2030 (F) |
|
|
200,000 |
|
|
|
200,677 |
|
|
|
|
|
|
|
|
|
|
|
|
|
|
|
|
|
|
|
|
418,512 |
|
|
|
|
|
|
|
|
|
|
The Notes to Financial Statements are an integral part of this report.
|
|
|
|
|
| Transamerica Series Trust |
|
|
|
Semi-Annual Financial Statements 2024 |
|
|
Page 5 |
|
|
Transamerica JPMorgan Tactical Allocation VP
SCHEDULE OF INVESTMENTS (continued)
At June 30, 2024
(unaudited)
|
|
|
|
|
|
|
|
|
| |
|
Principal |
|
|
Value |
|
| |
|
|
| CORPORATE DEBT SECURITIES (continued) |
|
| Finland - 0.0% (A) |
|
| Nordea Bank Abp |
|
|
|
|
|
|
|
|
| Fixed until 09/13/2028, 4.63% (E), 09/13/2033 (F) |
|
$ |
270,000 |
|
|
|
$ 256,147 |
|
|
|
|
|
|
|
|
|
|
|
|
|
| France - 0.6% |
|
|
|
|
|
|
|
|
| BNP Paribas SA |
|
|
|
|
|
|
|
|
| Fixed until 06/12/2028, 5.34% (E), 06/12/2029 (F) |
|
|
820,000 |
|
|
|
819,699 |
|
| Fixed until 08/16/2029 (F)(G), 7.75% (E) |
|
|
300,000 |
|
|
|
302,634 |
|
| BPCE SA |
|
|
|
|
|
|
|
|
| Fixed until 10/06/2025, 1.65% (E), 10/06/2026 (F) |
|
|
935,000 |
|
|
|
884,673 |
|
| Fixed until 10/19/2031, 3.12% (E), 10/19/2032 (F) |
|
|
250,000 |
|
|
|
203,825 |
|
| Fixed until 01/18/2026, 5.98% (E), 01/18/2027 (F) |
|
|
250,000 |
|
|
|
250,153 |
|
| Fixed until 10/19/2033, 7.00% (E), 10/19/2034 (F) |
|
|
285,000 |
|
|
|
305,257 |
|
| Credit Agricole SA |
|
|
|
|
|
|
|
|
| Fixed until 01/10/2034, 6.25% (E), 01/10/2035 (F) |
|
|
435,000 |
|
|
|
438,415 |
|
| Engie SA |
|
|
|
|
|
|
|
|
| 5.25%, 04/10/2029 (F) |
|
|
240,000 |
|
|
|
239,262 |
|
| 5.63%, 04/10/2034 (F) |
|
|
205,000 |
|
|
|
203,673 |
|
| 5.88%, 04/10/2054 (F) |
|
|
200,000 |
|
|
|
193,474 |
|
| Societe Generale SA |
|
|
|
|
|
|
|
|
| Fixed until 06/09/2026, 1.79% (E), 06/09/2027 (F) |
|
|
700,000 |
|
|
|
645,689 |
|
| Fixed until 01/19/2027, 2.80% (E), 01/19/2028 (F) |
|
|
409,000 |
|
|
|
377,434 |
|
| Fixed until 01/19/2034, 6.07% (E), 01/19/2035 (F) |
|
|
215,000 |
|
|
|
213,238 |
|
| TotalEnergies Capital International SA |
|
|
|
|
|
|
|
|
| 2.99%, 06/29/2041 |
|
|
484,000 |
|
|
|
353,621 |
|
| TotalEnergies Capital SA |
|
|
|
|
|
|
|
|
| 5.49%, 04/05/2054 |
|
|
329,000 |
|
|
|
326,046 |
|
| 5.64%, 04/05/2064 |
|
|
170,000 |
|
|
|
169,348 |
|
|
|
|
|
|
|
|
|
|
|
|
|
|
|
|
|
|
|
|
5,926,441 |
|
|
|
|
|
|
|
|
|
|
| Germany - 0.2% |
|
|
|
|
|
|
|
|
| Deutsche Bank AG |
|
|
|
|
|
|
|
|
| Fixed until 11/24/2025, 2.13% (E), 11/24/2026 |
|
|
450,000 |
|
|
|
427,063 |
|
| Fixed until 11/16/2026, 2.31% (E), 11/16/2027 |
|
|
460,000 |
|
|
|
424,686 |
|
| Fixed until 11/20/2028, 6.82% (E), 11/20/2029 |
|
|
555,000 |
|
|
|
577,500 |
|
| Fixed until 07/13/2026, 7.15% (E), 07/13/2027 |
|
|
460,000 |
|
|
|
471,169 |
|
|
|
|
|
|
|
|
|
|
|
|
|
|
|
|
|
|
|
|
1,900,418 |
|
|
|
|
|
|
|
|
|
|
| Ireland - 0.3% |
|
|
|
|
|
|
|
|
| AerCap Ireland Capital DAC/AerCap Global Aviation Trust |
|
|
|
|
|
|
|
|
| 2.45%, 10/29/2026 |
|
|
584,000 |
|
|
|
544,821 |
|
| 3.00%, 10/29/2028 |
|
|
840,000 |
|
|
|
763,759 |
|
| 6.10%, 01/15/2027 |
|
|
255,000 |
|
|
|
258,804 |
|
|
|
|
|
|
|
|
|
|
| |
|
Principal |
|
|
Value |
|
| |
|
|
| CORPORATE DEBT SECURITIES (continued) |
|
| Ireland (continued) |
|
| AIB Group PLC |
|
|
|
|
|
|
|
|
| Fixed until 03/28/2034, 5.87% (E), 03/28/2035 (F) |
|
$ |
200,000 |
|
|
|
$ 199,151 |
|
| Bank of Ireland Group PLC |
|
|
|
|
|
|
|
|
| Fixed until 03/20/2029, 5.60% (E), 03/20/2030 (F) |
|
|
435,000 |
|
|
|
432,769 |
|
| SMBC Aviation Capital Finance DAC |
|
|
|
|
|
|
|
|
| 5.55%, 04/03/2034 (F) |
|
|
310,000 |
|
|
|
303,873 |
|
| Smurfit Kappa Treasury ULC |
|
|
|
|
|
|
|
|
| 5.44%, 04/03/2034 (F) |
|
|
270,000 |
|
|
|
267,557 |
|
|
|
|
|
|
|
|
|
|
|
|
|
|
|
|
|
|
|
|
2,770,734 |
|
|
|
|
|
|
|
|
|
|
| Italy - 0.3% |
|
|
|
|
|
|
|
|
| Eni SpA |
|
|
|
|
|
|
|
|
| 5.70%, 10/01/2040 (F) |
|
|
405,000 |
|
|
|
390,006 |
|
| 5.95%, 05/15/2054 (F) |
|
|
200,000 |
|
|
|
197,474 |
|
| Intesa Sanpaolo SpA |
|
|
|
|
|
|
|
|
| Fixed until 06/01/2041, 4.95% (E), 06/01/2042 (F) |
|
|
310,000 |
|
|
|
232,301 |
|
| 6.63%, 06/20/2033 (F) |
|
|
730,000 |
|
|
|
754,588 |
|
| 7.20%, 11/28/2033 (F) |
|
|
375,000 |
|
|
|
401,671 |
|
| UniCredit SpA |
|
|
|
|
|
|
|
|
| Fixed until 06/03/2026, 1.98% (E), 06/03/2027 (F) |
|
|
480,000 |
|
|
|
447,505 |
|
|
|
|
|
|
|
|
|
|
|
|
|
|
|
|
|
|
|
|
2,423,545 |
|
|
|
|
|
|
|
|
|
|
| Japan - 0.1% |
|
|
|
|
|
|
|
|
| Takeda Pharmaceutical Co. Ltd. |
|
|
|
|
|
|
|
|
| 5.30%, 07/05/2034 (H) |
|
|
500,000 |
|
|
|
497,482 |
|
| 5.65%, 07/05/2044 |
|
|
200,000 |
|
|
|
197,139 |
|
| 5.65%, 07/05/2054 (H) |
|
|
200,000 |
|
|
|
196,783 |
|
| 5.80%, 07/05/2064 (H) |
|
|
200,000 |
|
|
|
196,259 |
|
|
|
|
|
|
|
|
|
|
|
|
|
|
|
|
|
|
|
|
1,087,663 |
|
|
|
|
|
|
|
|
|
|
| Jersey, Channel Islands - 0.0% (A) |
|
|
|
|
|
|
|
|
| Galaxy Pipeline Assets Bidco Ltd. |
|
|
|
|
|
|
|
|
| 2.94%, 09/30/2040 (F) |
|
|
274,734 |
|
|
|
220,008 |
|
|
|
|
|
|
|
|
|
|
|
|
|
| Mexico - 0.1% |
|
|
|
|
|
|
|
|
| Coca-Cola Femsa SAB de CV |
|
|
|
|
|
|
|
|
| 1.85%, 09/01/2032 |
|
|
200,000 |
|
|
|
155,237 |
|
| Mexico City Airport Trust |
|
|
|
|
|
|
|
|
| 5.50%, 07/31/2047 (F) |
|
|
200,000 |
|
|
|
165,757 |
|
| Petroleos Mexicanos |
|
|
|
|
|
|
|
|
| 6.50%, 03/13/2027 |
|
|
250,000 |
|
|
|
238,127 |
|
|
|
|
|
|
|
|
|
|
|
|
|
|
|
|
|
|
|
|
559,121 |
|
|
|
|
|
|
|
|
|
|
| Netherlands - 0.3% |
|
|
|
|
|
|
|
|
| ABN AMRO Bank NV |
|
|
|
|
|
|
|
|
| Fixed until 09/18/2026, 6.34% (E), 09/18/2027 (F) |
|
|
300,000 |
|
|
|
303,949 |
|
| Braskem Netherlands Finance BV |
|
|
|
|
|
|
|
|
| 7.25%, 02/13/2033 (C)(F) |
|
|
248,000 |
|
|
|
233,852 |
|
| Cooperatieve Rabobank UA |
|
|
|
|
|
|
|
|
| 3.75%, 07/21/2026 |
|
|
960,000 |
|
|
|
924,095 |
|
| ENEL Finance International NV |
|
|
|
|
|
|
|
|
| 1.88%, 07/12/2028 (F) |
|
|
200,000 |
|
|
|
176,188 |
|
| 2.25%, 07/12/2031 (F) |
|
|
200,000 |
|
|
|
163,417 |
|
The Notes to Financial Statements are an integral part of this report.
|
|
|
|
|
| Transamerica Series Trust |
|
|
|
Semi-Annual Financial Statements 2024 |
|
|
Page 6 |
|
|
Transamerica JPMorgan Tactical Allocation VP
SCHEDULE OF INVESTMENTS (continued)
At June 30, 2024
(unaudited)
|
|
|
|
|
|
|
|
|
| |
|
Principal |
|
|
Value |
|
| |
|
|
| CORPORATE DEBT SECURITIES (continued) |
|
| Netherlands (continued) |
|
| ENEL Finance International NV (continued) |
|
|
|
|
|
|
|
|
| 3.50%, 04/06/2028 (F) |
|
$ |
200,000 |
|
|
|
$ 187,206 |
|
| 5.13%, 06/26/2029 (F) |
|
|
355,000 |
|
|
|
349,713 |
|
| 5.50%, 06/26/2034 (F) |
|
|
570,000 |
|
|
|
556,605 |
|
|
|
|
|
|
|
|
|
|
|
|
|
|
|
|
|
|
|
|
2,895,025 |
|
|
|
|
|
|
|
|
|
|
| Norway - 0.1% |
|
|
|
|
|
|
|
|
| Aker BP ASA |
|
|
|
|
|
|
|
|
| 3.10%, 07/15/2031 (F) |
|
|
383,000 |
|
|
|
326,350 |
|
| 6.00%, 06/13/2033 (F) |
|
|
380,000 |
|
|
|
384,580 |
|
|
|
|
|
|
|
|
|
|
|
|
|
|
|
|
|
|
|
|
710,930 |
|
|
|
|
|
|
|
|
|
|
| Panama - 0.0% (A) |
|
|
|
|
|
|
|
|
| Banco Nacional de Panama |
|
|
|
|
|
|
|
|
| 2.50%, 08/11/2030 (F) |
|
|
300,000 |
|
|
|
230,713 |
|
|
|
|
|
|
|
|
|
|
|
|
|
| Saudi Arabia - 0.0%(A) |
|
|
|
|
|
|
|
|
| Saudi Arabian Oil Co. |
|
|
|
|
|
|
|
|
| 1.63%, 11/24/2025 (F) |
|
|
200,000 |
|
|
|
189,408 |
|
|
|
|
|
|
|
|
|
|
|
|
|
| Singapore - 0.2% |
|
|
|
|
|
|
|
|
| IBM International Capital Pte. Ltd. |
|
|
|
|
|
|
|
|
| 4.75%, 02/05/2031 |
|
|
295,000 |
|
|
|
289,276 |
|
| 5.30%, 02/05/2054 |
|
|
200,000 |
|
|
|
188,009 |
|
| Pepsico Singapore Financing I Pte. Ltd. |
|
|
|
|
|
|
|
|
| 4.70%, 02/16/2034 |
|
|
384,000 |
|
|
|
375,332 |
|
| Pfizer Investment Enterprises Pte. Ltd. |
|
|
|
|
|
|
|
|
| 4.75%, 05/19/2033 |
|
|
391,000 |
|
|
|
381,691 |
|
| 5.30%, 05/19/2053 |
|
|
54,000 |
|
|
|
52,375 |
|
| 5.34%, 05/19/2063 |
|
|
857,000 |
|
|
|
814,309 |
|
|
|
|
|
|
|
|
|
|
|
|
|
|
|
|
|
|
|
|
2,100,992 |
|
|
|
|
|
|
|
|
|
|
| Spain - 0.3% |
|
|
|
|
|
|
|
|
| Banco Bilbao Vizcaya Argentaria SA |
|
|
|
|
|
|
|
|
| Fixed until 03/19/2029 (G), 9.38% (E) |
|
|
400,000 |
|
|
|
425,726 |
|
| Banco Santander SA |
|
|
|
|
|
|
|
|
| Fixed until 09/14/2026, 1.72% (E), 09/14/2027 |
|
|
600,000 |
|
|
|
550,152 |
|
| 6.94%, 11/07/2033 |
|
|
400,000 |
|
|
|
437,671 |
|
| Fixed until 11/21/2028 (G), 9.63% (E) |
|
|
600,000 |
|
|
|
642,567 |
|
| Fixed until 05/21/2033 (G), 9.63% (E) |
|
|
400,000 |
|
|
|
443,456 |
|
| CaixaBank SA |
|
|
|
|
|
|
|
|
| Fixed until 06/15/2034, 6.04% (E), 06/15/2035 (F) |
|
|
200,000 |
|
|
|
201,001 |
|
| Fixed until 09/13/2026, 6.68% (E), 09/13/2027 (F) |
|
|
395,000 |
|
|
|
402,533 |
|
| Fixed until 09/13/2033, 6.84% (E), 09/13/2034 (F) |
|
|
245,000 |
|
|
|
259,203 |
|
|
|
|
|
|
|
|
|
|
|
|
|
|
|
|
|
|
|
|
3,362,309 |
|
|
|
|
|
|
|
|
|
|
| Sweden - 0.1% |
|
|
|
|
|
|
|
|
| Svenska Handelsbanken AB |
|
|
|
|
|
|
|
|
| 5.50%, 06/15/2028 (F) |
|
|
480,000 |
|
|
|
483,305 |
|
|
|
|
|
|
|
|
|
|
|
|
|
|
|
|
|
|
|
| |
|
Principal |
|
|
Value |
|
| |
|
|
| CORPORATE DEBT SECURITIES (continued) |
|
| Switzerland - 0.2% |
|
| UBS AG |
|
|
|
|
|
|
|
|
| 7.50%, 02/15/2028 |
|
$ |
825,000 |
|
|
|
$ 883,119 |
|
| UBS Group AG |
|
|
|
|
|
|
|
|
| Fixed until 02/08/2034, 5.70% (E), 02/08/2035 (F) |
|
|
325,000 |
|
|
|
325,392 |
|
| Fixed until 11/13/2028 (F)(G), 9.25% (E) |
|
|
200,000 |
|
|
|
215,188 |
|
| Fixed until 11/13/2033 (F)(G), 9.25% (E) |
|
|
200,000 |
|
|
|
223,982 |
|
|
|
|
|
|
|
|
|
|
|
|
|
|
|
|
|
|
|
|
1,647,681 |
|
|
|
|
|
|
|
|
|
|
| United Kingdom - 1.1% |
|
|
|
|
|
|
|
|
| Anglo American Capital PLC |
|
|
|
|
|
|
|
|
| 4.00%, 09/11/2027 (F) |
|
|
250,000 |
|
|
|
239,544 |
|
| AstraZeneca PLC |
|
|
|
|
|
|
|
|
| 6.45%, 09/15/2037 |
|
|
85,000 |
|
|
|
94,926 |
|
| Barclays PLC |
|
|
|
|
|
|
|
|
| Fixed until 05/09/2026, 5.83% (E), 05/09/2027 |
|
|
643,000 |
|
|
|
644,025 |
|
| Fixed until 09/13/2028, 6.49% (E), 09/13/2029 |
|
|
385,000 |
|
|
|
398,713 |
|
| HSBC Holdings PLC |
|
|
|
|
|
|
|
|
| Fixed until 08/17/2028, 2.21% (E), 08/17/2029 |
|
|
830,000 |
|
|
|
729,987 |
|
| Fixed until 05/17/2027, 5.60% (E), 05/17/2028 |
|
|
410,000 |
|
|
|
411,494 |
|
| Fixed until 05/17/2031, 5.73% (E), 05/17/2032 |
|
|
205,000 |
|
|
|
205,712 |
|
| Fixed until 08/14/2026, 5.89% (E), 08/14/2027 |
|
|
580,000 |
|
|
|
584,329 |
|
| Fixed until 11/03/2027, 7.39% (E), 11/03/2028 |
|
|
485,000 |
|
|
|
513,024 |
|
| Imperial Brands Finance PLC |
|
|
|
|
|
|
|
|
| 3.50%, 07/26/2026 (F) |
|
|
612,000 |
|
|
|
587,655 |
|
| 5.50%, 02/01/2030 (F)(H) |
|
|
895,000 |
|
|
|
887,240 |
|
| 5.88%, 07/01/2034 (F)(H) |
|
|
765,000 |
|
|
|
751,391 |
|
| Nationwide Building Society |
|
|
|
|
|
|
|
|
| Fixed until 10/18/2026, 6.56% (E), 10/18/2027 (F) |
|
|
695,000 |
|
|
|
709,091 |
|
| NatWest Group PLC |
|
|
|
|
|
|
|
|
| Fixed until 03/01/2034, 5.78% (E), 03/01/2035 |
|
|
590,000 |
|
|
|
593,283 |
|
| Fixed until 12/29/2025 (G), 6.00% (E) |
|
|
370,000 |
|
|
|
361,913 |
|
| Fixed until 11/10/2033 (G), 8.13% (E) |
|
|
200,000 |
|
|
|
202,028 |
|
| NatWest Markets PLC |
|
|
|
|
|
|
|
|
| 5.41%, 05/17/2029 (F) |
|
|
400,000 |
|
|
|
401,476 |
|
| 5.42%, 05/17/2027 (F) |
|
|
300,000 |
|
|
|
299,870 |
|
| Santander UK Group Holdings PLC |
|
|
|
|
|
|
|
|
| Fixed until 11/21/2025, 6.83% (E), 11/21/2026 |
|
|
885,000 |
|
|
|
896,791 |
|
| Standard Chartered PLC |
|
|
|
|
|
|
|
|
| Fixed until 02/08/2029, 7.02% (E), 02/08/2030 (F) |
|
|
915,000 |
|
|
|
967,066 |
|
| Vodafone Group PLC |
|
|
|
|
|
|
|
|
| 5.75%, 06/28/2054 |
|
|
110,000 |
|
|
|
107,053 |
|
|
|
|
|
|
|
|
|
|
|
|
|
|
|
|
|
|
|
|
10,586,611 |
|
|
|
|
|
|
|
|
|
|
The Notes to Financial Statements are an integral part of this report.
|
|
|
|
|
| Transamerica Series Trust |
|
|
|
Semi-Annual Financial Statements 2024 |
|
|
Page 7 |
|
|
Transamerica JPMorgan Tactical Allocation VP
SCHEDULE OF INVESTMENTS (continued)
At June 30, 2024
(unaudited)
|
|
|
|
|
|
|
|
|
| |
|
Principal |
|
|
Value |
|
| |
|
|
| CORPORATE DEBT SECURITIES (continued) |
|
| United States - 16.2% |
|
| 7-Eleven, Inc. |
|
|
|
|
|
|
|
|
| 2.50%, 02/10/2041 (F) |
|
$ |
195,000 |
|
|
$ |
127,787 |
|
| 2.80%, 02/10/2051 (F) |
|
|
232,000 |
|
|
|
139,126 |
|
| AbbVie, Inc. |
|
|
|
|
|
|
|
|
| 4.05%, 11/21/2039 |
|
|
930,000 |
|
|
|
810,298 |
|
| 4.25%, 11/21/2049 |
|
|
109,000 |
|
|
|
91,240 |
|
| 4.40%, 11/06/2042 |
|
|
161,000 |
|
|
|
141,925 |
|
| 4.50%, 05/14/2035 |
|
|
140,000 |
|
|
|
132,352 |
|
| 4.63%, 10/01/2042 |
|
|
432,000 |
|
|
|
390,793 |
|
| 4.80%, 03/15/2029 |
|
|
308,000 |
|
|
|
306,908 |
|
| 5.35%, 03/15/2044 |
|
|
160,000 |
|
|
|
158,761 |
|
| 5.40%, 03/15/2054 |
|
|
81,000 |
|
|
|
80,552 |
|
| 5.50%, 03/15/2064 |
|
|
62,000 |
|
|
|
61,579 |
|
| AES Corp. |
|
|
|
|
|
|
|
|
| 3.30%, 07/15/2025 (F) |
|
|
172,000 |
|
|
|
167,679 |
|
| 5.45%, 06/01/2028 |
|
|
625,000 |
|
|
|
624,070 |
|
| Aetna, Inc. |
|
|
|
|
|
|
|
|
| 3.88%, 08/15/2047 |
|
|
151,000 |
|
|
|
110,129 |
|
| 4.13%, 11/15/2042 |
|
|
234,000 |
|
|
|
184,624 |
|
| 6.75%, 12/15/2037 |
|
|
201,000 |
|
|
|
214,878 |
|
| Air Products & Chemicals, Inc. |
|
|
|
|
|
|
|
|
| 4.85%, 02/08/2034 |
|
|
620,000 |
|
|
|
609,592 |
|
| Albemarle Corp. |
|
|
|
|
|
|
|
|
| 4.65%, 06/01/2027 |
|
|
44,000 |
|
|
|
43,298 |
|
| Albertsons Cos., Inc./Safeway, Inc./New Albertsons LP |
|
|
|
|
|
|
|
|
| 4.88%, 02/15/2030 (F) |
|
|
516,000 |
|
|
|
487,825 |
|
| 5.88%, 02/15/2028 (F) |
|
|
79,000 |
|
|
|
78,079 |
|
| Alliant Energy Finance LLC |
|
|
|
|
|
|
|
|
| 1.40%, 03/15/2026 (F) |
|
|
68,000 |
|
|
|
62,914 |
|
| 5.95%, 03/30/2029 (F) |
|
|
515,000 |
|
|
|
527,451 |
|
| Altria Group, Inc. |
|
|
|
|
|
|
|
|
| 3.40%, 02/04/2041 |
|
|
472,000 |
|
|
|
341,640 |
|
| 6.88%, 11/01/2033 |
|
|
343,000 |
|
|
|
371,283 |
|
| Amazon.com, Inc. |
|
|
|
|
|
|
|
|
| 2.50%, 06/03/2050 |
|
|
127,000 |
|
|
|
78,152 |
|
| 2.70%, 06/03/2060 |
|
|
129,000 |
|
|
|
76,435 |
|
| 3.10%, 05/12/2051 |
|
|
178,000 |
|
|
|
123,070 |
|
| 3.88%, 08/22/2037 |
|
|
591,000 |
|
|
|
523,367 |
|
| American Airlines Pass-Through Trust |
|
|
|
|
|
|
|
|
| 3.38%, 11/01/2028 |
|
|
155,079 |
|
|
|
146,417 |
|
| 3.95%, 01/11/2032 |
|
|
39,790 |
|
|
|
36,759 |
|
| 4.10%, 07/15/2029 |
|
|
194,858 |
|
|
|
182,605 |
|
| American Tower Corp. |
|
|
|
|
|
|
|
|
| 5.20%, 02/15/2029 |
|
|
406,000 |
|
|
|
404,392 |
|
| American Water Capital Corp. |
|
|
|
|
|
|
|
|
| 5.45%, 03/01/2054 |
|
|
294,000 |
|
|
|
285,032 |
|
| Amgen, Inc. |
|
|
|
|
|
|
|
|
| 2.45%, 02/21/2030 |
|
|
576,000 |
|
|
|
502,707 |
|
| 4.20%, 02/22/2052 |
|
|
364,000 |
|
|
|
289,435 |
|
| Amphenol Corp. |
|
|
|
|
|
|
|
|
| 5.25%, 04/05/2034 |
|
|
321,000 |
|
|
|
320,666 |
|
| Anheuser-Busch Cos. LLC/Anheuser-Busch InBev Worldwide, Inc. |
|
|
|
|
|
|
|
|
| 4.70%, 02/01/2036 |
|
|
802,000 |
|
|
|
766,498 |
|
|
|
|
|
|
|
|
|
|
| |
|
Principal |
|
|
Value |
|
| |
|
|
| CORPORATE DEBT SECURITIES (continued) |
|
| United States (continued) |
|
| Anheuser-Busch InBev Finance, Inc. |
|
|
|
|
|
|
|
|
| 4.70%, 02/01/2036 |
|
$ |
173,000 |
|
|
$ |
165,342 |
|
| Anheuser-Busch InBev Worldwide, Inc. |
|
|
|
|
|
|
|
|
| 4.35%, 06/01/2040 |
|
|
147,000 |
|
|
|
130,041 |
|
| 4.38%, 04/15/2038 |
|
|
276,000 |
|
|
|
251,944 |
|
| Antero Resources Corp. |
|
|
|
|
|
|
|
|
| 5.38%, 03/01/2030 (F) |
|
|
295,000 |
|
|
|
285,543 |
|
| Apple, Inc. |
|
|
|
|
|
|
|
|
| 2.70%, 08/05/2051 |
|
|
500,000 |
|
|
|
319,533 |
|
| 2.80%, 02/08/2061 |
|
|
54,000 |
|
|
|
33,368 |
|
| Applied Materials, Inc. |
|
|
|
|
|
|
|
|
| 4.80%, 06/15/2029 |
|
|
150,000 |
|
|
|
149,886 |
|
| AT&T, Inc. |
|
|
|
|
|
|
|
|
| 2.55%, 12/01/2033 |
|
|
910,000 |
|
|
|
725,164 |
|
| 3.50%, 09/15/2053 |
|
|
89,000 |
|
|
|
60,752 |
|
| 3.55%, 09/15/2055 |
|
|
348,000 |
|
|
|
235,982 |
|
| 3.65%, 09/15/2059 |
|
|
346,000 |
|
|
|
233,544 |
|
| 3.80%, 12/01/2057 |
|
|
158,000 |
|
|
|
110,830 |
|
| 5.40%, 02/15/2034 |
|
|
130,000 |
|
|
|
130,251 |
|
| AutoZone, Inc. |
|
|
|
|
|
|
|
|
| 5.40%, 07/15/2034 |
|
|
355,000 |
|
|
|
351,912 |
|
| Bank of America Corp. |
|
|
|
|
|
|
|
|
| Fixed until 07/23/2030, 1.90% (E), 07/23/2031 |
|
|
225,000 |
|
|
|
185,496 |
|
| Fixed until 10/24/2030, 1.92% (E), 10/24/2031 |
|
|
225,000 |
|
|
|
184,171 |
|
| Fixed until 06/19/2040, 2.68% (E), 06/19/2041 |
|
|
70,000 |
|
|
|
49,104 |
|
| Fixed until 10/22/2029, 2.88% (E), 10/22/2030 |
|
|
1,146,000 |
|
|
|
1,020,882 |
|
| Fixed until 12/20/2027, 3.42% (E), 12/20/2028 |
|
|
1,117,000 |
|
|
|
1,050,453 |
|
| Fixed until 07/21/2027, 3.59% (E), 07/21/2028 |
|
|
172,000 |
|
|
|
163,771 |
|
| Fixed until 04/24/2027, 3.71% (E), 04/24/2028 |
|
|
605,000 |
|
|
|
579,544 |
|
| Fixed until 01/20/2027, 3.82% (E), 01/20/2028 |
|
|
1,539,000 |
|
|
|
1,484,111 |
|
| Fixed until 02/07/2029, 3.97% (E), 02/07/2030 |
|
|
602,000 |
|
|
|
570,507 |
|
| Fixed until 04/27/2027, 4.38% (E), 04/27/2028 |
|
|
191,000 |
|
|
|
186,433 |
|
| Fixed until 04/25/2028, 5.20% (E), 04/25/2029 |
|
|
736,000 |
|
|
|
735,186 |
|
| Fixed until 01/23/2034, 5.47% (E), 01/23/2035 |
|
|
616,000 |
|
|
|
616,917 |
|
| Fixed until 09/15/2028, 5.82% (E), 09/15/2029 |
|
|
1,322,000 |
|
|
|
1,350,288 |
|
| BAT Capital Corp. |
|
|
|
|
|
|
|
|
| 4.39%, 08/15/2037 |
|
|
419,000 |
|
|
|
354,494 |
|
| 4.54%, 08/15/2047 |
|
|
291,000 |
|
|
|
224,784 |
|
| 5.83%, 02/20/2031 |
|
|
486,000 |
|
|
|
492,857 |
|
| 6.00%, 02/20/2034 |
|
|
173,000 |
|
|
|
175,375 |
|
| 7.08%, 08/02/2043 |
|
|
410,000 |
|
|
|
433,967 |
|
| Baxter International, Inc. |
|
|
|
|
|
|
|
|
| 2.54%, 02/01/2032 (C) |
|
|
1,787,000 |
|
|
|
1,468,383 |
|
| Berkshire Hathaway Energy Co. |
|
|
|
|
|
|
|
|
| 4.60%, 05/01/2053 |
|
|
65,000 |
|
|
|
54,261 |
|
The Notes to Financial Statements are an integral part of this report.
|
|
|
|
|
| Transamerica Series Trust |
|
|
|
Semi-Annual Financial Statements 2024 |
|
|
Page 8 |
|
|
Transamerica JPMorgan Tactical Allocation VP
SCHEDULE OF INVESTMENTS (continued)
At June 30, 2024
(unaudited)
|
|
|
|
|
|
|
|
|
| |
|
Principal |
|
|
Value |
|
| |
|
|
| CORPORATE DEBT SECURITIES (continued) |
|
| United States (continued) |
|
| Berkshire Hathaway Finance Corp. |
|
|
|
|
|
|
|
|
| 3.85%, 03/15/2052 |
|
|
$ 68,000 |
|
|
$ |
52,841 |
|
| Berry Global, Inc. |
|
|
|
|
|
|
|
|
| 5.65%, 01/15/2034 (F) |
|
|
740,000 |
|
|
|
724,300 |
|
| 5.80%, 06/15/2031 (F) |
|
|
545,000 |
|
|
|
544,850 |
|
| Bimbo Bakeries USA, Inc. |
|
|
|
|
|
|
|
|
| 4.00%, 05/17/2051 (F) |
|
|
200,000 |
|
|
|
151,553 |
|
| 5.38%, 01/09/2036 (F) |
|
|
640,000 |
|
|
|
624,604 |
|
| 6.05%, 01/15/2029 (F) |
|
|
219,000 |
|
|
|
225,226 |
|
| Biogen, Inc. |
|
|
|
|
|
|
|
|
| 2.25%, 05/01/2030 |
|
|
1,120,000 |
|
|
|
954,158 |
|
| Boeing Co. |
|
|
|
|
|
|
|
|
| 2.95%, 02/01/2030 |
|
|
232,000 |
|
|
|
198,770 |
|
| 3.25%, 02/01/2035 |
|
|
63,000 |
|
|
|
48,198 |
|
| 3.60%, 05/01/2034 |
|
|
201,000 |
|
|
|
162,130 |
|
| 3.63%, 02/01/2031 |
|
|
186,000 |
|
|
|
163,053 |
|
| 3.95%, 08/01/2059 |
|
|
492,000 |
|
|
|
315,195 |
|
| 5.15%, 05/01/2030 |
|
|
205,000 |
|
|
|
197,027 |
|
| 5.81%, 05/01/2050 |
|
|
404,000 |
|
|
|
365,773 |
|
| 6.53%, 05/01/2034 (F) |
|
|
49,000 |
|
|
|
50,263 |
|
| 6.86%, 05/01/2054 (F) |
|
|
277,000 |
|
|
|
285,578 |
|
| 7.01%, 05/01/2064 (F) |
|
|
134,000 |
|
|
|
137,876 |
|
| Bristol-Myers Squibb Co. |
|
|
|
|
|
|
|
|
| 2.35%, 11/13/2040 |
|
|
61,000 |
|
|
|
40,643 |
|
| 3.70%, 03/15/2052 |
|
|
290,000 |
|
|
|
213,779 |
|
| 3.90%, 03/15/2062 |
|
|
161,000 |
|
|
|
116,582 |
|
| 4.90%, 02/22/2029 |
|
|
232,000 |
|
|
|
231,668 |
|
| 5.10%, 02/22/2031 |
|
|
98,000 |
|
|
|
98,476 |
|
| 5.20%, 02/22/2034 |
|
|
87,000 |
|
|
|
86,987 |
|
| 5.55%, 02/22/2054 |
|
|
349,000 |
|
|
|
345,931 |
|
| 5.65%, 02/22/2064 |
|
|
263,000 |
|
|
|
258,165 |
|
| 6.25%, 11/15/2053 |
|
|
275,000 |
|
|
|
296,822 |
|
| 6.40%, 11/15/2063 |
|
|
125,000 |
|
|
|
136,512 |
|
| Broadcom, Inc. |
|
|
|
|
|
|
|
|
| 3.14%, 11/15/2035 (F) |
|
|
619,000 |
|
|
|
496,963 |
|
| 3.42%, 04/15/2033 (F) |
|
|
593,000 |
|
|
|
512,107 |
|
| Burlington Northern Santa Fe LLC |
|
|
|
|
|
|
|
|
| 3.90%, 08/01/2046 |
|
|
217,000 |
|
|
|
172,078 |
|
| 4.15%, 04/01/2045 |
|
|
55,000 |
|
|
|
45,711 |
|
| 4.38%, 09/01/2042 |
|
|
55,000 |
|
|
|
48,006 |
|
| 5.20%, 04/15/2054 |
|
|
213,000 |
|
|
|
205,362 |
|
| 5.50%, 03/15/2055 |
|
|
175,000 |
|
|
|
176,474 |
|
| Cardinal Health, Inc. |
|
|
|
|
|
|
|
|
| 5.45%, 02/15/2034 |
|
|
223,000 |
|
|
|
222,424 |
|
| Celanese US Holdings LLC |
|
|
|
|
|
|
|
|
| 6.35%, 11/15/2028 |
|
|
203,000 |
|
|
|
208,687 |
|
| Cencora, Inc. |
|
|
|
|
|
|
|
|
| 2.70%, 03/15/2031 |
|
|
1,001,000 |
|
|
|
855,930 |
|
| 2.80%, 05/15/2030 |
|
|
90,000 |
|
|
|
79,450 |
|
| 5.13%, 02/15/2034 |
|
|
79,000 |
|
|
|
77,726 |
|
| CenterPoint Energy Resources Corp. |
|
|
|
|
|
|
|
|
| 5.40%, 07/01/2034 |
|
|
450,000 |
|
|
|
446,495 |
|
| CenterPoint Energy, Inc. |
|
|
|
|
|
|
|
|
| 2.95%, 03/01/2030 |
|
|
120,000 |
|
|
|
106,273 |
|
| 5.40%, 06/01/2029 |
|
|
420,000 |
|
|
|
421,766 |
|
|
|
|
|
|
|
|
|
|
| |
|
Principal |
|
|
Value |
|
| |
|
|
| CORPORATE DEBT SECURITIES (continued) |
|
| United States (continued) |
|
| CF Industries, Inc. |
|
|
|
|
|
|
|
|
| 4.95%, 06/01/2043 |
|
$ |
209,000 |
|
|
$ |
183,039 |
|
| Charter Communications Operating LLC/Charter Communications Operating Capital |
|
|
|
|
|
|
|
|
| 2.25%, 01/15/2029 |
|
|
89,000 |
|
|
|
76,117 |
|
| 2.80%, 04/01/2031 |
|
|
278,000 |
|
|
|
227,629 |
|
| 3.50%, 06/01/2041 - 03/01/2042 |
|
|
818,000 |
|
|
|
550,475 |
|
| 3.70%, 04/01/2051 |
|
|
761,000 |
|
|
|
465,037 |
|
| 6.38%, 10/23/2035 |
|
|
70,000 |
|
|
|
68,400 |
|
| 6.55%, 06/01/2034 |
|
|
180,000 |
|
|
|
180,562 |
|
| Cheniere Corpus Christi Holdings LLC |
|
|
|
|
|
|
|
|
| 3.70%, 11/15/2029 |
|
|
214,000 |
|
|
|
197,905 |
|
| Cheniere Energy Partners LP |
|
|
|
|
|
|
|
|
| 3.25%, 01/31/2032 |
|
|
396,000 |
|
|
|
337,946 |
|
| 4.50%, 10/01/2029 |
|
|
603,000 |
|
|
|
574,461 |
|
| Cheniere Energy, Inc. |
|
|
|
|
|
|
|
|
| 4.63%, 10/15/2028 |
|
|
309,000 |
|
|
|
299,876 |
|
| Chesapeake Energy Corp. |
|
|
|
|
|
|
|
|
| 5.88%, 02/01/2029 (F) |
|
|
348,000 |
|
|
|
344,503 |
|
| 6.75%, 04/15/2029 (F) |
|
|
531,000 |
|
|
|
532,044 |
|
| Cisco Systems, Inc. |
|
|
|
|
|
|
|
|
| 5.30%, 02/26/2054 |
|
|
125,000 |
|
|
|
123,135 |
|
| Citigroup, Inc. |
|
|
|
|
|
|
|
|
| Fixed until 05/01/2031, 2.56% (E), 05/01/2032 |
|
|
277,000 |
|
|
|
231,214 |
|
| Fixed until 11/05/2029, 2.98% (E), 11/05/2030 |
|
|
541,000 |
|
|
|
482,188 |
|
| Fixed until 10/27/2027, 3.52% (E), 10/27/2028 |
|
|
1,288,000 |
|
|
|
1,217,712 |
|
| Fixed until 07/24/2027, 3.67% (E), 07/24/2028 |
|
|
715,000 |
|
|
|
681,688 |
|
| Fixed until 12/10/2025 (G), 4.00% (E) |
|
|
433,000 |
|
|
|
414,699 |
|
| Fixed until 04/23/2028, 4.08% (E), 04/23/2029 |
|
|
250,000 |
|
|
|
239,789 |
|
| Fixed until 06/11/2034, 5.45% (E), 06/11/2035 |
|
|
265,000 |
|
|
|
263,500 |
|
| Fixed until 02/13/2034, 5.83% (E), 02/13/2035 |
|
|
1,035,000 |
|
|
|
1,027,616 |
|
| Fixed until 05/25/2033, 6.17% (E), 05/25/2034 |
|
|
195,000 |
|
|
|
198,582 |
|
| Fixed until 08/15/2029 (G), 7.13% (E) |
|
|
585,000 |
|
|
|
583,587 |
|
| Coca-Cola Co. |
|
|
|
|
|
|
|
|
| 5.30%, 05/13/2054 |
|
|
170,000 |
|
|
|
169,861 |
|
| Columbia Pipelines Operating Co. LLC |
|
|
|
|
|
|
|
|
| 5.93%, 08/15/2030 (F) |
|
|
125,000 |
|
|
|
127,796 |
|
| 6.04%, 11/15/2033 (F) |
|
|
418,000 |
|
|
|
427,944 |
|
| Comcast Corp. |
|
|
|
|
|
|
|
|
| 2.65%, 02/01/2030 |
|
|
187,000 |
|
|
|
165,703 |
|
| 2.80%, 01/15/2051 |
|
|
91,000 |
|
|
|
56,544 |
|
| 2.89%, 11/01/2051 |
|
|
915,000 |
|
|
|
574,013 |
|
| 2.94%, 11/01/2056 |
|
|
842,000 |
|
|
|
511,004 |
|
| 3.20%, 07/15/2036 |
|
|
409,000 |
|
|
|
331,357 |
|
| 3.75%, 04/01/2040 |
|
|
174,000 |
|
|
|
142,081 |
|
| 5.30%, 06/01/2034 (C) |
|
|
245,000 |
|
|
|
246,128 |
|
The Notes to Financial Statements are an integral part of this report.
|
|
|
|
|
| Transamerica Series Trust |
|
|
|
Semi-Annual Financial Statements 2024 |
|
|
Page 9 |
|
|
Transamerica JPMorgan Tactical Allocation VP
SCHEDULE OF INVESTMENTS (continued)
At June 30, 2024
(unaudited)
|
|
|
|
|
|
|
|
|
| |
|
Principal |
|
|
Value |
|
| |
|
|
| CORPORATE DEBT SECURITIES (continued) |
|
| United States (continued) |
|
| Commonwealth Edison Co. |
|
|
|
|
|
|
|
|
| 3.65%, 06/15/2046 |
|
$ |
119,000 |
|
|
$ |
88,846 |
|
| 4.70%, 01/15/2044 |
|
|
91,000 |
|
|
|
81,301 |
|
| ConocoPhillips Co. |
|
|
|
|
|
|
|
|
| 5.70%, 09/15/2063 |
|
|
207,000 |
|
|
|
207,143 |
|
| Consolidated Edison Co. of New York, Inc. |
|
|
|
|
|
|
|
|
| 5.70%, 05/15/2054 |
|
|
317,000 |
|
|
|
317,937 |
|
| Constellation Brands, Inc. |
|
|
|
|
|
|
|
|
| 3.15%, 08/01/2029 |
|
|
87,000 |
|
|
|
78,959 |
|
| Constellation Energy Generation LLC |
|
|
|
|
|
|
|
|
| 5.60%, 06/15/2042 |
|
|
125,000 |
|
|
|
120,924 |
|
| 5.75%, 03/15/2054 |
|
|
172,000 |
|
|
|
167,553 |
|
| 6.50%, 10/01/2053 |
|
|
338,000 |
|
|
|
360,561 |
|
| Continental Resources, Inc. |
|
|
|
|
|
|
|
|
| 2.27%, 11/15/2026 (F) |
|
|
250,000 |
|
|
|
232,086 |
|
| COPT Defense Properties LP |
|
|
|
|
|
|
|
|
| 2.00%, 01/15/2029 |
|
|
147,000 |
|
|
|
124,716 |
|
| 2.75%, 04/15/2031 |
|
|
311,000 |
|
|
|
257,632 |
|
| Cox Communications, Inc. |
|
|
|
|
|
|
|
|
| 4.80%, 02/01/2035 (F) |
|
|
161,000 |
|
|
|
145,872 |
|
| Crown Castle, Inc. |
|
|
|
|
|
|
|
|
| 3.65%, 09/01/2027 |
|
|
544,000 |
|
|
|
517,156 |
|
| 5.00%, 01/11/2028 |
|
|
165,000 |
|
|
|
163,062 |
|
| 5.60%, 06/01/2029 |
|
|
397,000 |
|
|
|
400,623 |
|
| CSX Corp. |
|
|
|
|
|
|
|
|
| 2.50%, 05/15/2051 |
|
|
361,000 |
|
|
|
214,287 |
|
| CVS Health Corp. |
|
|
|
|
|
|
|
|
| 2.70%, 08/21/2040 |
|
|
576,000 |
|
|
|
384,290 |
|
| 3.25%, 08/15/2029 |
|
|
147,000 |
|
|
|
133,512 |
|
| 4.78%, 03/25/2038 |
|
|
178,000 |
|
|
|
159,343 |
|
| 5.70%, 06/01/2034 (C) |
|
|
401,000 |
|
|
|
400,632 |
|
| 5.88%, 06/01/2053 |
|
|
366,000 |
|
|
|
352,138 |
|
| CVS Pass-Through Trust |
|
|
|
|
|
|
|
|
| 6.20%, 10/10/2025 (F) |
|
|
16,734 |
|
|
|
16,707 |
|
| Danaher Corp. |
|
|
|
|
|
|
|
|
| 2.80%, 12/10/2051 |
|
|
149,000 |
|
|
|
94,654 |
|
| Darden Restaurants, Inc. |
|
|
|
|
|
|
|
|
| 6.30%, 10/10/2033 (C) |
|
|
303,000 |
|
|
|
313,119 |
|
| Dell International LLC/EMC Corp. |
|
|
|
|
|
|
|
|
| 3.38%, 12/15/2041 |
|
|
125,000 |
|
|
|
91,816 |
|
| Diamondback Energy, Inc. |
|
|
|
|
|
|
|
|
| 5.40%, 04/18/2034 |
|
|
119,000 |
|
|
|
117,960 |
|
| 5.75%, 04/18/2054 |
|
|
92,000 |
|
|
|
89,576 |
|
| 6.25%, 03/15/2033 |
|
|
156,000 |
|
|
|
163,697 |
|
| Discovery Communications LLC |
|
|
|
|
|
|
|
|
| 3.63%, 05/15/2030 |
|
|
56,000 |
|
|
|
49,299 |
|
| Dominion Energy, Inc. |
|
|
|
|
|
|
|
|
| Fixed until 01/15/2027 (G), 4.35% (E) |
|
|
350,000 |
|
|
|
328,294 |
|
| Fixed until 11/03/2029, 6.88% (E), 02/01/2055 |
|
|
150,000 |
|
|
|
153,418 |
|
| Fixed until 03/03/2034, 7.00% (E), 06/01/2054 |
|
|
100,000 |
|
|
|
104,042 |
|
| Dow Chemical Co. |
|
|
|
|
|
|
|
|
| 4.38%, 11/15/2042 |
|
|
170,000 |
|
|
|
140,667 |
|
| 4.80%, 05/15/2049 |
|
|
232,000 |
|
|
|
198,859 |
|
|
|
|
|
|
|
|
|
|
| |
|
Principal |
|
|
Value |
|
| |
|
|
| CORPORATE DEBT SECURITIES (continued) |
|
| United States (continued) |
|
| DTE Energy Co. |
|
|
|
|
|
|
|
|
| 5.85%, 06/01/2034 |
|
$ |
343,000 |
|
|
$ |
348,719 |
|
| Duke Energy Carolinas LLC |
|
|
|
|
|
|
|
|
| 4.00%, 09/30/2042 |
|
|
152,000 |
|
|
|
122,866 |
|
| Duke Energy Corp. |
|
|
|
|
|
|
|
|
| 5.80%, 06/15/2054 |
|
|
310,000 |
|
|
|
302,730 |
|
| Duke Energy Florida LLC |
|
|
|
|
|
|
|
|
| 1.75%, 06/15/2030 |
|
|
181,000 |
|
|
|
150,278 |
|
| Duke Energy Indiana LLC |
|
|
|
|
|
|
|
|
| 2.75%, 04/01/2050 |
|
|
178,000 |
|
|
|
108,349 |
|
| 3.75%, 05/15/2046 |
|
|
158,000 |
|
|
|
120,282 |
|
| 5.25%, 03/01/2034 |
|
|
495,000 |
|
|
|
494,082 |
|
| 5.40%, 04/01/2053 |
|
|
45,000 |
|
|
|
42,679 |
|
| Duke Energy Ohio, Inc. |
|
|
|
|
|
|
|
|
| 5.25%, 04/01/2033 |
|
|
87,000 |
|
|
|
86,406 |
|
| 5.55%, 03/15/2054 |
|
|
167,000 |
|
|
|
161,663 |
|
| 5.65%, 04/01/2053 |
|
|
31,000 |
|
|
|
30,089 |
|
| Duke Energy Progress LLC |
|
|
|
|
|
|
|
|
| 2.90%, 08/15/2051 |
|
|
227,000 |
|
|
|
141,455 |
|
| 5.25%, 03/15/2033 |
|
|
166,000 |
|
|
|
165,826 |
|
| Duquesne Light Holdings, Inc. |
|
|
|
|
|
|
|
|
| 3.62%, 08/01/2027 (F) |
|
|
335,000 |
|
|
|
315,020 |
|
| Eastman Chemical Co. |
|
|
|
|
|
|
|
|
| 5.75%, 03/08/2033 |
|
|
254,000 |
|
|
|
256,664 |
|
| Edison International |
|
|
|
|
|
|
|
|
| Fixed until 12/15/2026 (G), 5.00% (E) |
|
|
350,000 |
|
|
|
332,928 |
|
| 5.45%, 06/15/2029 |
|
|
350,000 |
|
|
|
349,958 |
|
| Electronic Arts, Inc. |
|
|
|
|
|
|
|
|
| 1.85%, 02/15/2031 |
|
|
423,000 |
|
|
|
346,156 |
|
| 2.95%, 02/15/2051 |
|
|
128,000 |
|
|
|
83,378 |
|
| Elevance Health, Inc. |
|
|
|
|
|
|
|
|
| 2.88%, 09/15/2029 |
|
|
153,000 |
|
|
|
137,814 |
|
| 4.63%, 05/15/2042 |
|
|
118,000 |
|
|
|
104,263 |
|
| 4.65%, 01/15/2043 |
|
|
103,000 |
|
|
|
91,210 |
|
| 6.10%, 10/15/2052 |
|
|
130,000 |
|
|
|
136,965 |
|
| Emera US Finance LP |
|
|
|
|
|
|
|
|
| 2.64%, 06/15/2031 |
|
|
266,000 |
|
|
|
219,955 |
|
| 4.75%, 06/15/2046 |
|
|
188,000 |
|
|
|
155,233 |
|
| Energy Transfer LP |
|
|
|
|
|
|
|
|
| 5.63%, 05/01/2027 (F) |
|
|
754,000 |
|
|
|
750,824 |
|
| 5.75%, 02/15/2033 |
|
|
175,000 |
|
|
|
176,835 |
|
| 6.00%, 02/01/2029 (F) |
|
|
1,134,000 |
|
|
|
1,141,949 |
|
| 6.40%, 12/01/2030 |
|
|
321,000 |
|
|
|
337,546 |
|
| 6.55%, 12/01/2033 |
|
|
91,000 |
|
|
|
96,431 |
|
| Fixed until 05/15/2030 (G), 7.13% (E) |
|
|
140,000 |
|
|
|
138,649 |
|
| 7.38%, 02/01/2031 (F) |
|
|
187,000 |
|
|
|
195,176 |
|
| EnLink Midstream LLC |
|
|
|
|
|
|
|
|
| 5.38%, 06/01/2029 |
|
|
346,000 |
|
|
|
338,769 |
|
| 5.63%, 01/15/2028 (F) |
|
|
205,000 |
|
|
|
203,826 |
|
| 6.50%, 09/01/2030 (F) |
|
|
219,000 |
|
|
|
224,261 |
|
| Entergy Arkansas LLC |
|
|
|
|
|
|
|
|
| 4.95%, 12/15/2044 |
|
|
61,000 |
|
|
|
53,061 |
|
| 5.75%, 06/01/2054 |
|
|
80,000 |
|
|
|
79,788 |
|
The Notes to Financial Statements are an integral part of this report.
|
|
|
|
|
| Transamerica Series Trust |
|
|
|
Semi-Annual Financial Statements 2024 |
|
|
Page 10 |
|
|
Transamerica JPMorgan Tactical Allocation VP
SCHEDULE OF INVESTMENTS (continued)
At June 30, 2024
(unaudited)
|
|
|
|
|
|
|
|
|
| |
|
Principal |
|
|
Value |
|
| |
|
| CORPORATE DEBT SECURITIES (continued) |
|
| United States (continued) |
|
| Entergy Corp. |
|
|
|
|
|
|
|
|
| Fixed until 09/01/2029, 7.13% (E), 12/01/2054 |
|
$ |
360,000 |
|
|
$ |
356,872 |
|
| Entergy Louisiana LLC |
|
|
|
|
|
|
|
|
| 1.60%, 12/15/2030 |
|
|
172,000 |
|
|
|
138,599 |
|
| 2.90%, 03/15/2051 |
|
|
331,000 |
|
|
|
201,675 |
|
| 5.70%, 03/15/2054 |
|
|
129,000 |
|
|
|
127,546 |
|
| Entergy Mississippi LLC |
|
|
|
|
|
|
|
|
| 3.50%, 06/01/2051 |
|
|
46,000 |
|
|
|
32,131 |
|
| Entergy Texas, Inc. |
|
|
|
|
|
|
|
|
| 3.45%, 12/01/2027 |
|
|
35,000 |
|
|
|
32,932 |
|
| Enterprise Products Operating LLC |
|
|
|
|
|
|
|
|
| 6.65%, 10/15/2034 |
|
|
228,000 |
|
|
|
250,531 |
|
| EQM Midstream Partners LP |
|
|
|
|
|
|
|
|
| 4.75%, 01/15/2031 (F) |
|
|
210,000 |
|
|
|
196,379 |
|
| 6.38%, 04/01/2029 (F) |
|
|
325,000 |
|
|
|
328,278 |
|
| EQT Corp. |
|
|
|
|
|
|
|
|
| 3.13%, 05/15/2026 (F) |
|
|
125,000 |
|
|
|
119,449 |
|
| Equinix Europe 2 Financing Corp. LLC |
|
|
|
|
|
|
|
|
| 5.50%, 06/15/2034 |
|
|
415,000 |
|
|
|
415,481 |
|
| Equitable Holdings, Inc. |
|
|
|
|
|
|
|
|
| 4.57%, 02/15/2029(F) |
|
|
152,000 |
|
|
|
146,211 |
|
| Essex Portfolio LP |
|
|
|
|
|
|
|
|
| 1.70%, 03/01/2028 |
|
|
290,000 |
|
|
|
254,621 |
|
| 2.65%, 03/15/2032 |
|
|
128,000 |
|
|
|
106,123 |
|
| 5.50%, 04/01/2034 |
|
|
98,000 |
|
|
|
97,318 |
|
| Evergy Metro, Inc. |
|
|
|
|
|
|
|
|
| 2.25%, 06/01/2030 |
|
|
149,000 |
|
|
|
126,830 |
|
| Evergy Missouri West, Inc. |
|
|
|
|
|
|
|
|
| 5.65%, 06/01/2034(F) |
|
|
275,000 |
|
|
|
276,964 |
|
| Exelon Corp. |
|
|
|
|
|
|
|
|
| 5.60%, 03/15/2053 |
|
|
145,000 |
|
|
|
140,063 |
|
| Extra Space Storage LP |
|
|
|
|
|
|
|
|
| 5.50%, 07/01/2030 |
|
|
429,000 |
|
|
|
432,549 |
|
| 5.90%, 01/15/2031 |
|
|
339,000 |
|
|
|
346,666 |
|
| Exxon Mobil Corp. |
|
|
|
|
|
|
|
|
| 3.00%, 08/16/2039 |
|
|
302,000 |
|
|
|
230,356 |
|
| FedEx Corp. |
|
|
|
|
|
|
|
|
| 3.25%, 05/15/2041 |
|
|
140,000 |
|
|
|
103,214 |
|
| Fells Point Funding Trust |
|
|
|
|
|
|
|
|
| 3.05%, 01/31/2027 (F) |
|
|
1,229,000 |
|
|
|
1,157,073 |
|
| Fifth Third Bancorp |
|
|
|
|
|
|
|
|
| Fixed until 04/25/2032, 4.34%(E), 04/25/2033 |
|
|
149,000 |
|
|
|
135,999 |
|
| Fixed until 01/29/2031, 5.63% (E), 01/29/2032 |
|
|
98,000 |
|
|
|
97,239 |
|
| FirstEnergy Corp. |
|
|
|
|
|
|
|
|
| 2.65%, 03/01/2030 |
|
|
311,000 |
|
|
|
270,355 |
|
| FirstEnergy Transmission LLC |
|
|
|
|
|
|
|
|
| 2.87%, 09/15/2028 (F) |
|
|
415,000 |
|
|
|
379,237 |
|
| 4.55%, 04/01/2049 (F) |
|
|
688,000 |
|
|
|
571,599 |
|
| Ford Motor Co. |
|
|
|
|
|
|
|
|
| 3.25%, 02/12/2032 |
|
|
837,000 |
|
|
|
692,678 |
|
| Ford Motor Credit Co. LLC |
|
|
|
|
|
|
|
|
| 4.95%, 05/28/2027 |
|
|
230,000 |
|
|
|
224,513 |
|
| 5.85%, 05/17/2027 |
|
|
200,000 |
|
|
|
200,046 |
|
| 6.05%, 03/05/2031 |
|
|
410,000 |
|
|
|
410,859 |
|
|
|
|
|
|
|
|
|
|
| |
|
Principal |
|
|
Value |
|
| |
|
| CORPORATE DEBT SECURITIES (continued) |
|
| United States (continued) |
|
| Freeport-McMoRan, Inc. |
|
|
|
|
|
|
|
|
| 4.13%, 03/01/2028 |
|
$ |
126,000 |
|
|
$ |
120,715 |
|
| 4.63%, 08/01/2030 (C) |
|
|
54,000 |
|
|
|
51,977 |
|
| GE Capital Funding LLC |
|
|
|
|
|
|
|
|
| 4.55%, 05/15/2032 |
|
|
200,000 |
|
|
|
191,250 |
|
| General Motors Co. |
|
|
|
|
|
|
|
|
| 5.15%, 04/01/2038 |
|
|
98,000 |
|
|
|
90,377 |
|
| 5.95%, 04/01/2049 |
|
|
125,000 |
|
|
|
121,946 |
|
| General Motors Financial Co., Inc. |
|
|
|
|
|
|
|
|
| 5.75%, 02/08/2031 |
|
|
223,000 |
|
|
|
223,757 |
|
| 5.95%, 04/04/2034 |
|
|
138,000 |
|
|
|
138,372 |
|
| 6.10%, 01/07/2034 |
|
|
143,000 |
|
|
|
144,820 |
|
| Gilead Sciences, Inc. |
|
|
|
|
|
|
|
|
| 2.60%, 10/01/2040 |
|
|
365,000 |
|
|
|
252,553 |
|
| 4.60%, 09/01/2035 |
|
|
338,000 |
|
|
|
320,035 |
|
| 5.25%, 10/15/2033 |
|
|
578,000 |
|
|
|
583,273 |
|
| 5.55%, 10/15/2053 |
|
|
207,000 |
|
|
|
207,816 |
|
| Glencore Funding LLC |
|
|
|
|
|
|
|
|
| 5.63%, 04/04/2034 (F) |
|
|
886,000 |
|
|
|
874,003 |
|
| 5.89%, 04/04/2054 (F) |
|
|
98,000 |
|
|
|
94,710 |
|
| 6.38%, 10/06/2030 (F) |
|
|
303,000 |
|
|
|
316,049 |
|
| Global Payments, Inc. |
|
|
|
|
|
|
|
|
| 3.20%, 08/15/2029 |
|
|
1,025,000 |
|
|
|
921,486 |
|
| Goldman Sachs Group, Inc. |
|
|
|
|
|
|
|
|
| Fixed until 03/09/2026, 1.43% (E), 03/09/2027 |
|
|
754,000 |
|
|
|
703,551 |
|
| Fixed until 09/10/2026, 1.54% (E), 09/10/2027 |
|
|
975,000 |
|
|
|
895,477 |
|
| Fixed until 10/21/2026, 1.95% (E), 10/21/2027 |
|
|
456,000 |
|
|
|
421,104 |
|
| Fixed until 10/31/2037, 4.02% (E), 10/31/2038 |
|
|
273,000 |
|
|
|
232,781 |
|
| Fixed until 04/25/2034, 5.85% (E), 04/25/2035 |
|
|
558,000 |
|
|
|
572,757 |
|
| Fixed until 10/24/2028, 6.48% (E), 10/24/2029 |
|
|
1,561,000 |
|
|
|
1,630,662 |
|
| Fixed until 05/10/2029 (G), 7.50% (E) |
|
|
517,000 |
|
|
|
531,737 |
|
| Hasbro, Inc. |
|
|
|
|
|
|
|
|
| 6.05%, 05/14/2034 |
|
|
280,000 |
|
|
|
279,927 |
|
| HCA, Inc. |
|
|
|
|
|
|
|
|
| 2.38%, 07/15/2031 |
|
|
286,000 |
|
|
|
235,210 |
|
| 4.50%, 02/15/2027 |
|
|
540,000 |
|
|
|
527,739 |
|
| 4.63%, 03/15/2052 |
|
|
257,000 |
|
|
|
208,875 |
|
| 5.20%, 06/01/2028 |
|
|
357,000 |
|
|
|
355,790 |
|
| 5.25%, 06/15/2049 |
|
|
161,000 |
|
|
|
144,211 |
|
| 5.50%, 06/15/2047 |
|
|
72,000 |
|
|
|
66,786 |
|
| 5.63%, 09/01/2028 |
|
|
215,000 |
|
|
|
217,070 |
|
| 5.90%, 06/01/2053 |
|
|
161,000 |
|
|
|
157,597 |
|
| 6.00%, 04/01/2054 |
|
|
305,000 |
|
|
|
302,187 |
|
| Hess Corp. |
|
|
|
|
|
|
|
|
| 5.60%, 02/15/2041 |
|
|
352,000 |
|
|
|
352,074 |
|
| 6.00%, 01/15/2040 |
|
|
342,000 |
|
|
|
354,655 |
|
| Hess Midstream Operations LP |
|
|
|
|
|
|
|
|
| 4.25%, 02/15/2030 (F) |
|
|
103,000 |
|
|
|
94,527 |
|
| 5.50%, 10/15/2030 (F) |
|
|
241,000 |
|
|
|
232,767 |
|
The Notes to Financial Statements are an integral part of this report.
|
|
|
|
|
| Transamerica Series Trust |
|
|
|
Semi-Annual Financial Statements 2024 |
|
|
Page 11 |
|
|
Transamerica JPMorgan Tactical Allocation VP
SCHEDULE OF INVESTMENTS (continued)
At June 30, 2024
(unaudited)
|
|
|
|
|
|
|
|
|
| |
|
Principal |
|
|
Value |
|
| |
|
| CORPORATE DEBT SECURITIES (continued) |
|
| United States (continued) |
|
| Home Depot, Inc. |
|
|
|
|
|
|
|
|
| 2.38%, 03/15/2051 |
|
$ |
452,000 |
|
|
$ |
261,009 |
|
| 3.30%, 04/15/2040 |
|
|
112,000 |
|
|
|
87,571 |
|
| 3.35%, 04/15/2050 |
|
|
98,000 |
|
|
|
70,020 |
|
| 4.85%, 06/25/2031 |
|
|
255,000 |
|
|
|
253,251 |
|
| 4.95%, 06/25/2034 |
|
|
250,000 |
|
|
|
247,955 |
|
| 5.30%, 06/25/2054 |
|
|
80,000 |
|
|
|
78,499 |
|
| Huntington Bancshares, Inc. |
|
|
|
|
|
|
|
|
| Fixed until 02/02/2034, 5.71% (E), 02/02/2035 |
|
|
93,000 |
|
|
|
91,734 |
|
| Fixed until 08/21/2028, 6.21% (E), 08/21/2029 |
|
|
256,000 |
|
|
|
261,496 |
|
| Hyundai Capital America |
|
|
|
|
|
|
|
|
| 5.30%, 06/24/2029 (F) |
|
|
195,000 |
|
|
|
194,070 |
|
| Ingersoll Rand, Inc. |
|
|
|
|
|
|
|
|
| 5.31%, 06/15/2031 |
|
|
196,000 |
|
|
|
197,186 |
|
| Intel Corp. |
|
|
|
|
|
|
|
|
| 3.05%, 08/12/2051 |
|
|
89,000 |
|
|
|
56,778 |
|
| 3.25%, 11/15/2049 |
|
|
220,000 |
|
|
|
148,360 |
|
| 3.73%, 12/08/2047 |
|
|
78,000 |
|
|
|
57,587 |
|
| Intercontinental Exchange, Inc. |
|
|
|
|
|
|
|
|
| 4.00%, 09/15/2027 |
|
|
382,000 |
|
|
|
369,037 |
|
| Intuit, Inc. |
|
|
|
|
|
|
|
|
| 5.20%, 09/15/2033 |
|
|
204,000 |
|
|
|
205,217 |
|
| ITC Holdings Corp. |
|
|
|
|
|
|
|
|
| 2.95%, 05/14/2030 (F) |
|
|
1,105,000 |
|
|
|
973,705 |
|
| 5.40%, 06/01/2033 (F) |
|
|
171,000 |
|
|
|
168,866 |
|
| 5.65%, 05/09/2034 (F) |
|
|
170,000 |
|
|
|
170,369 |
|
| JBS USA Holding LUX SARL/JBS USA Food Co./JBS LUX Co. SARL |
|
|
|
|
|
|
|
|
| 3.00%, 05/15/2032 |
|
|
115,000 |
|
|
|
94,508 |
|
| 4.38%, 02/02/2052 |
|
|
47,000 |
|
|
|
35,144 |
|
| 5.50%, 01/15/2030 |
|
|
260,000 |
|
|
|
255,991 |
|
| 6.75%, 03/15/2034 (F) |
|
|
115,000 |
|
|
|
121,912 |
|
| 7.25%, 11/15/2053 (F) |
|
|
426,000 |
|
|
|
466,172 |
|
| JetBlue Pass-Through Trust |
|
|
|
|
|
|
|
|
| 2.75%, 11/15/2033 |
|
|
139,519 |
|
|
|
120,442 |
|
| 8.00%, 11/15/2027 |
|
|
162,530 |
|
|
|
166,073 |
|
| John Deere Capital Corp. |
|
|
|
|
|
|
|
|
| 4.85%, 06/11/2029 |
|
|
475,000 |
|
|
|
473,967 |
|
| Kenvue, Inc. |
|
|
|
|
|
|
|
|
| 5.20%, 03/22/2063 |
|
|
37,000 |
|
|
|
35,136 |
|
| Keurig Dr Pepper, Inc. |
|
|
|
|
|
|
|
|
| 5.30%, 03/15/2034 |
|
|
294,000 |
|
|
|
293,173 |
|
| KeyBank NA |
|
|
|
|
|
|
|
|
| 3.90%, 04/13/2029 (C) |
|
|
590,000 |
|
|
|
531,220 |
|
| KeyCorp |
|
|
|
|
|
|
|
|
| Fixed until 06/01/2032, 4.79% (E), 06/01/2033 |
|
|
186,000 |
|
|
|
170,064 |
|
| Fixed until 03/06/2034, 6.40% (E), 03/06/2035 |
|
|
134,000 |
|
|
|
136,121 |
|
| Kimco Realty OP LLC |
|
|
|
|
|
|
|
|
| 6.40%, 03/01/2034 |
|
|
393,000 |
|
|
|
416,308 |
|
| Kinder Morgan Energy Partners LP |
|
|
|
|
|
|
|
|
| 5.00%, 08/15/2042 |
|
|
291,000 |
|
|
|
255,699 |
|
| Kinetik Holdings LP |
|
|
|
|
|
|
|
|
| 5.88%, 06/15/2030 (F) |
|
|
468,000 |
|
|
|
461,174 |
|
|
|
|
|
|
|
|
|
|
| |
|
Principal |
|
|
Value |
|
| |
|
| CORPORATE DEBT SECURITIES (continued) |
|
| United States (continued) |
|
| KLA Corp. |
|
|
|
|
|
|
|
|
| 4.70%, 02/01/2034 |
|
$ |
292,000 |
|
|
$ |
284,308 |
|
| Kroger Co. |
|
|
|
|
|
|
|
|
| 4.45%, 02/01/2047 |
|
|
80,000 |
|
|
|
66,259 |
|
| L3Harris Technologies, Inc. |
|
|
|
|
|
|
|
|
| 4.40%, 06/15/2028 |
|
|
528,000 |
|
|
|
512,995 |
|
| 5.35%, 06/01/2034 |
|
|
602,000 |
|
|
|
598,817 |
|
| Leidos, Inc. |
|
|
|
|
|
|
|
|
| 2.30%, 02/15/2031 |
|
|
649,000 |
|
|
|
535,511 |
|
| 5.75%, 03/15/2033 |
|
|
216,000 |
|
|
|
218,276 |
|
| Lowe’s Cos., Inc. |
|
|
|
|
|
|
|
|
| 5.63%, 04/15/2053 |
|
|
315,000 |
|
|
|
306,607 |
|
| LYB International Finance III LLC |
|
|
|
|
|
|
|
|
| 3.63%, 04/01/2051 |
|
|
241,000 |
|
|
|
166,509 |
|
| Marathon Oil Corp. |
|
|
|
|
|
|
|
|
| 5.70%, 04/01/2034 |
|
|
473,000 |
|
|
|
482,530 |
|
| Marriott International, Inc. |
|
|
|
|
|
|
|
|
| 5.55%, 10/15/2028 |
|
|
457,000 |
|
|
|
463,441 |
|
| Marvell Technology, Inc. |
|
|
|
|
|
|
|
|
| 2.95%, 04/15/2031 |
|
|
339,000 |
|
|
|
292,900 |
|
| 5.75%, 02/15/2029 |
|
|
485,000 |
|
|
|
495,480 |
|
| 5.95%, 09/15/2033 |
|
|
729,000 |
|
|
|
754,310 |
|
| Massachusetts Electric Co. |
|
|
|
|
|
|
|
|
| 1.73%, 11/24/2030 (F) |
|
|
332,000 |
|
|
|
263,965 |
|
| McDonald’s Corp. |
|
|
|
|
|
|
|
|
| 3.70%, 02/15/2042 |
|
|
266,000 |
|
|
|
208,777 |
|
| 5.45%, 08/14/2053 |
|
|
323,000 |
|
|
|
313,671 |
|
| MDC Holdings, Inc. |
|
|
|
|
|
|
|
|
| 3.85%, 01/15/2030 |
|
|
135,000 |
|
|
|
128,524 |
|
| 6.00%, 01/15/2043 |
|
|
236,000 |
|
|
|
249,074 |
|
| Merck & Co., Inc. |
|
|
|
|
|
|
|
|
| 5.15%, 05/17/2063 |
|
|
103,000 |
|
|
|
98,441 |
|
| Met Tower Global Funding |
|
|
|
|
|
|
|
|
| 5.25%, 04/12/2029 (F) |
|
|
430,000 |
|
|
|
432,406 |
|
| Meta Platforms, Inc. |
|
|
|
|
|
|
|
|
| 4.45%, 08/15/2052 |
|
|
352,000 |
|
|
|
304,972 |
|
| 5.60%, 05/15/2053 |
|
|
160,000 |
|
|
|
164,220 |
|
| 5.75%, 05/15/2063 |
|
|
128,000 |
|
|
|
132,332 |
|
| Metropolitan Life Global Funding I |
|
|
|
|
|
|
|
|
| 2.95%, 04/09/2030 (F) |
|
|
230,000 |
|
|
|
204,816 |
|
| 5.05%, 01/08/2034 (F) |
|
|
310,000 |
|
|
|
304,990 |
|
| 5.15%, 03/28/2033 (F) |
|
|
545,000 |
|
|
|
538,521 |
|
| Microsoft Corp. |
|
|
|
|
|
|
|
|
| 2.50%, 09/15/2050 |
|
|
466,000 |
|
|
|
295,235 |
|
| Mid-Atlantic Interstate Transmission LLC |
|
|
|
|
|
|
|
|
| 4.10%, 05/15/2028 (F) |
|
|
34,000 |
|
|
|
32,679 |
|
| Mohawk Industries, Inc. |
|
|
|
|
|
|
|
|
| 5.85%, 09/18/2028 |
|
|
123,000 |
|
|
|
125,543 |
|
| Monongahela Power Co. |
|
|
|
|
|
|
|
|
| 3.55%, 05/15/2027 (F) |
|
|
39,000 |
|
|
|
37,196 |
|
| 5.85%, 02/15/2034 (F) |
|
|
220,000 |
|
|
|
224,375 |
|
| Morgan Stanley |
|
|
|
|
|
|
|
|
| Fixed until 07/20/2026, 1.51% (E), 07/20/2027 |
|
|
567,000 |
|
|
|
524,205 |
|
| Fixed until 05/04/2026, 1.59% (E), 05/04/2027 |
|
|
929,000 |
|
|
|
866,053 |
|
The Notes to Financial Statements are an integral part of this report.
|
|
|
|
|
| Transamerica Series Trust |
|
|
|
Semi-Annual Financial Statements 2024 |
|
|
Page 12 |
|
|
Transamerica JPMorgan Tactical Allocation VP
SCHEDULE OF INVESTMENTS (continued)
At June 30, 2024
(unaudited)
|
|
|
|
|
|
|
|
|
| |
|
Principal |
|
|
Value |
|
| |
|
| CORPORATE DEBT SECURITIES (continued) |
|
| United States (continued) |
|
| Morgan Stanley(continued) |
|
|
|
|
|
|
|
|
| Fixed until 02/13/2031, 1.79% (E), 02/13/2032 |
|
$ |
412,000 |
|
|
$ |
331,195 |
|
| Fixed until 04/28/2031, 1.93% (E), 04/28/2032 |
|
|
203,000 |
|
|
|
163,380 |
|
| Fixed until 09/16/2031, 2.48% (E), 09/16/2036 |
|
|
790,000 |
|
|
|
625,846 |
|
| Fixed until 10/20/2031, 2.51% (E), 10/20/2032 |
|
|
86,000 |
|
|
|
71,210 |
|
| Fixed until 01/22/2030, 2.70% (E), 01/22/2031 |
|
|
483,000 |
|
|
|
423,688 |
|
| Fixed until 01/24/2028, 3.77% (E), 01/24/2029 |
|
|
208,000 |
|
|
|
198,115 |
|
| Fixed until 01/16/2029, 5.17% (E), 01/16/2030 |
|
|
321,000 |
|
|
|
320,381 |
|
| Fixed until 07/20/2028, 5.45% (E), 07/20/2029 |
|
|
91,000 |
|
|
|
91,602 |
|
| Fixed until 04/18/2029, 5.66% (E), 04/18/2030 |
|
|
455,000 |
|
|
|
462,977 |
|
| Fixed until 04/19/2034, 5.83% (E), 04/19/2035 |
|
|
134,000 |
|
|
|
137,652 |
|
| Fixed until 02/07/2034, 5.94% (E), 02/07/2039 |
|
|
321,000 |
|
|
|
318,282 |
|
| Fixed until 01/19/2033, 5.95% (E), 01/19/2038 |
|
|
411,000 |
|
|
|
409,347 |
|
| Morgan Stanley Bank NA |
|
|
|
|
|
|
|
|
| Fixed until 05/26/2027, 5.50% (E), 05/26/2028 |
|
|
815,000 |
|
|
|
820,726 |
|
| MPLX LP |
|
|
|
|
|
|
|
|
| 5.50%, 06/01/2034 |
|
|
770,000 |
|
|
|
759,956 |
|
| 5.65%, 03/01/2053 |
|
|
70,000 |
|
|
|
66,177 |
|
| Netflix, Inc. |
|
|
|
|
|
|
|
|
| 5.38%, 11/15/2029 (F) |
|
|
124,000 |
|
|
|
125,293 |
|
| New York & Presbyterian Hospital |
|
|
|
|
|
|
|
|
| 2.26%, 08/01/2040 |
|
|
282,000 |
|
|
|
191,057 |
|
| New York Life Global Funding |
|
|
|
|
|
|
|
|
| 1.20%, 08/07/2030 (F) |
|
|
241,000 |
|
|
|
193,138 |
|
| 1.85%, 08/01/2031 (F) |
|
|
227,000 |
|
|
|
183,699 |
|
| New York Life Insurance Co. |
|
|
|
|
|
|
|
|
| 3.75%, 05/15/2050 (F) |
|
|
87,000 |
|
|
|
65,318 |
|
| 4.45%, 05/15/2069 (F) |
|
|
103,000 |
|
|
|
83,342 |
|
| Newmont Corp./Newcrest Finance Pty. Ltd. |
|
|
|
|
|
|
|
|
| 4.20%, 05/13/2050 (F) |
|
|
250,000 |
|
|
|
204,511 |
|
| NextEra Energy Capital Holdings, Inc. |
|
|
|
|
|
|
|
|
| 4.90%, 03/15/2029 |
|
|
441,000 |
|
|
|
436,525 |
|
| Fixed until 03/15/2034, 6.75%(E), 06/15/2054 |
|
|
210,000 |
|
|
|
211,343 |
|
| NGPL PipeCo LLC |
|
|
|
|
|
|
|
|
| 4.88%, 08/15/2027 (F) |
|
|
384,000 |
|
|
|
375,599 |
|
| Niagara Mohawk Power Corp. |
|
|
|
|
|
|
|
|
| 4.28%, 12/15/2028 (F) |
|
|
266,000 |
|
|
|
254,534 |
|
| NiSource, Inc. |
|
|
|
|
|
|
|
|
| 5.35%, 04/01/2034 |
|
|
368,000 |
|
|
|
361,672 |
|
| 5.80%, 02/01/2042 |
|
|
43,000 |
|
|
|
41,970 |
|
| Fixed until 08/30/2029, 6.95%(E), 11/30/2054 |
|
|
210,000 |
|
|
|
211,049 |
|
| NNN REIT, Inc. |
|
|
|
|
|
|
|
|
| 3.00%, 04/15/2052 |
|
|
103,000 |
|
|
|
64,531 |
|
|
|
|
|
|
|
|
|
|
| |
|
Principal |
|
|
Value |
|
| |
|
| CORPORATE DEBT SECURITIES (continued) |
|
| United States (continued) |
|
| NNN REIT, Inc.(continued) |
|
|
|
|
|
|
|
|
| 3.50%, 10/15/2027 |
|
$ |
55,000 |
|
|
$ |
52,168 |
|
| 5.50%, 06/15/2034 |
|
|
100,000 |
|
|
|
99,260 |
|
| 5.60%, 10/15/2033 |
|
|
125,000 |
|
|
|
124,624 |
|
| Norfolk Southern Corp. |
|
|
|
|
|
|
|
|
| 3.05%, 05/15/2050 |
|
|
213,000 |
|
|
|
139,229 |
|
| 3.95%, 10/01/2042 |
|
|
91,000 |
|
|
|
73,231 |
|
| 5.95%, 03/15/2064 |
|
|
161,000 |
|
|
|
164,853 |
|
| Northern Natural Gas Co. |
|
|
|
|
|
|
|
|
| 3.40%, 10/16/2051 (F) |
|
|
113,000 |
|
|
|
75,436 |
|
| 4.30%, 01/15/2049 (F) |
|
|
70,000 |
|
|
|
56,397 |
|
| Northwestern Mutual Life Insurance Co. |
|
|
|
|
|
|
|
|
| 3.85%, 09/30/2047 (F) |
|
|
220,000 |
|
|
|
167,384 |
|
| 6.06%, 03/30/2040 (F) |
|
|
282,000 |
|
|
|
293,969 |
|
| NRG Energy, Inc. |
|
|
|
|
|
|
|
|
| 4.45%, 06/15/2029 (F) |
|
|
429,000 |
|
|
|
405,121 |
|
| 7.00%, 03/15/2033 (F) |
|
|
242,000 |
|
|
|
255,469 |
|
| Occidental Petroleum Corp. |
|
|
|
|
|
|
|
|
| 3.50%, 08/15/2029 |
|
|
370,000 |
|
|
|
336,306 |
|
| 4.63%, 06/15/2045 |
|
|
191,000 |
|
|
|
151,330 |
|
| 6.20%, 03/15/2040 |
|
|
263,000 |
|
|
|
263,588 |
|
| Ohio Power Co. |
|
|
|
|
|
|
|
|
| 2.90%, 10/01/2051 |
|
|
213,000 |
|
|
|
130,971 |
|
| OhioHealth Corp. |
|
|
|
|
|
|
|
|
| 2.30%, 11/15/2031 |
|
|
401,000 |
|
|
|
334,942 |
|
| Oracle Corp. |
|
|
|
|
|
|
|
|
| 2.30%, 03/25/2028 |
|
|
294,000 |
|
|
|
265,955 |
|
| 3.60%, 04/01/2040 - 04/01/2050 |
|
|
545,000 |
|
|
|
398,397 |
|
| 3.85%, 07/15/2036 |
|
|
94,000 |
|
|
|
79,436 |
|
| 3.95%, 03/25/2051 |
|
|
185,000 |
|
|
|
137,565 |
|
| Ovintiv, Inc. |
|
|
|
|
|
|
|
|
| 6.25%, 07/15/2033 |
|
|
155,000 |
|
|
|
160,071 |
|
| 6.50%, 02/01/2038 |
|
|
62,000 |
|
|
|
63,899 |
|
| Pacific Gas & Electric Co. |
|
|
|
|
|
|
|
|
| 4.40%, 03/01/2032 |
|
|
116,000 |
|
|
|
106,293 |
|
| 4.45%, 04/15/2042 |
|
|
323,000 |
|
|
|
257,030 |
|
| 4.50%, 07/01/2040 |
|
|
222,559 |
|
|
|
183,914 |
|
| 4.55%, 07/01/2030 |
|
|
199,030 |
|
|
|
188,762 |
|
| 4.60%, 06/15/2043 |
|
|
331,000 |
|
|
|
269,871 |
|
| 5.55%, 05/15/2029 |
|
|
316,000 |
|
|
|
316,928 |
|
| 5.80%, 05/15/2034 |
|
|
294,000 |
|
|
|
292,689 |
|
| 6.10%, 01/15/2029 |
|
|
134,000 |
|
|
|
137,206 |
|
| 6.15%, 01/15/2033 |
|
|
100,000 |
|
|
|
101,772 |
|
| 6.95%, 03/15/2034 |
|
|
361,000 |
|
|
|
389,279 |
|
| PacifiCorp |
|
|
|
|
|
|
|
|
| 2.90%, 06/15/2052 |
|
|
94,000 |
|
|
|
55,714 |
|
| Paramount Global |
|
|
|
|
|
|
|
|
| 4.85%, 07/01/2042 |
|
|
55,000 |
|
|
|
39,534 |
|
| PECO Energy Co. |
|
|
|
|
|
|
|
|
| 2.80%, 06/15/2050 |
|
|
260,000 |
|
|
|
163,302 |
|
| Pernod Ricard International Finance LLC |
|
|
|
|
|
|
|
|
| 1.63%, 04/01/2031 (F) |
|
|
270,000 |
|
|
|
215,602 |
|
| Philip Morris International, Inc. |
|
|
|
|
|
|
|
|
| 3.88%, 08/21/2042 |
|
|
245,000 |
|
|
|
191,415 |
|
| 5.13%, 02/13/2031 |
|
|
348,000 |
|
|
|
344,196 |
|
| 5.25%, 02/13/2034 |
|
|
839,000 |
|
|
|
824,668 |
|
The Notes to Financial Statements are an integral part of this report.
|
|
|
|
|
| Transamerica Series Trust |
|
|
|
Semi-Annual Financial Statements 2024 |
|
|
Page 13 |
|
|
Transamerica JPMorgan Tactical Allocation VP
SCHEDULE OF INVESTMENTS (continued)
At June 30, 2024
(unaudited)
|
|
|
|
|
|
|
|
|
| |
|
Principal |
|
|
Value |
|
| |
|
| CORPORATE DEBT SECURITIES (continued) |
|
| United States (continued) |
|
| Phillips 66 Co. |
|
|
|
|
|
|
|
|
| 3.15%, 12/15/2029 |
|
$ |
677,000 |
|
|
$ |
612,948 |
|
| Piedmont Healthcare, Inc. |
|
|
|
|
|
|
|
|
| 2.04%, 01/01/2032 |
|
|
535,000 |
|
|
|
432,501 |
|
| Pioneer Natural Resources Co. |
|
|
|
|
|
|
|
|
| 2.15%, 01/15/2031 |
|
|
755,000 |
|
|
|
634,907 |
|
| PNC Financial Services Group, Inc. |
|
|
|
|
|
|
|
|
| Fixed until 09/15/2026 (G), 3.40% (E) |
|
|
241,000 |
|
|
|
216,248 |
|
| Fixed until 01/22/2034, 5.68% (E), 01/22/2035 |
|
|
210,000 |
|
|
|
211,574 |
|
| Fixed until 10/20/2033, 6.88% (E), 10/20/2034 |
|
|
187,000 |
|
|
|
204,098 |
|
| Prologis LP |
|
|
|
|
|
|
|
|
| 2.13%, 10/15/2050 |
|
|
91,000 |
|
|
|
48,626 |
|
| 5.13%, 01/15/2034 |
|
|
205,000 |
|
|
|
202,984 |
|
| Prudential Financial, Inc. |
|
|
|
|
|
|
|
|
| Fixed until 12/15/2033, 6.50% (E), 03/15/2054 |
|
|
181,000 |
|
|
|
182,898 |
|
| Public Service Co. of Colorado |
|
|
|
|
|
|
|
|
| 2.70%, 01/15/2051 |
|
|
129,000 |
|
|
|
76,626 |
|
| 4.30%, 03/15/2044 |
|
|
183,000 |
|
|
|
149,287 |
|
| 4.50%, 06/01/2052 |
|
|
120,000 |
|
|
|
97,942 |
|
| Public Service Electric & Gas Co. |
|
|
|
|
|
|
|
|
| 2.70%, 05/01/2050 |
|
|
155,000 |
|
|
|
97,886 |
|
| Public Service Enterprise Group, Inc. |
|
|
|
|
|
|
|
|
| 5.85%, 11/15/2027 |
|
|
546,000 |
|
|
|
555,435 |
|
| Puget Energy, Inc. |
|
|
|
|
|
|
|
|
| 2.38%, 06/15/2028 |
|
|
134,000 |
|
|
|
119,662 |
|
| Puget Sound Energy, Inc. |
|
|
|
|
|
|
|
|
| 5.69%, 06/15/2054 |
|
|
216,000 |
|
|
|
214,776 |
|
| Regal Rexnord Corp. |
|
|
|
|
|
|
|
|
| 6.05%, 04/15/2028 |
|
|
355,000 |
|
|
|
359,414 |
|
| 6.40%, 04/15/2033 |
|
|
147,000 |
|
|
|
150,659 |
|
| Regency Centers LP |
|
|
|
|
|
|
|
|
| 2.95%, 09/15/2029 |
|
|
193,000 |
|
|
|
173,370 |
|
| 3.70%, 06/15/2030 |
|
|
241,000 |
|
|
|
222,162 |
|
| Roche Holdings, Inc. |
|
|
|
|
|
|
|
|
| 4.99%, 03/08/2034 (F) |
|
|
200,000 |
|
|
|
198,738 |
|
| 5.49%, 11/13/2030 (F) |
|
|
550,000 |
|
|
|
566,407 |
|
| RTX Corp. |
|
|
|
|
|
|
|
|
| 2.38%, 03/15/2032 |
|
|
880,000 |
|
|
|
722,831 |
|
| 3.13%, 07/01/2050 |
|
|
107,000 |
|
|
|
70,676 |
|
| 6.40%, 03/15/2054 |
|
|
285,000 |
|
|
|
312,420 |
|
| RWE Finance US LLC |
|
|
|
|
|
|
|
|
| 5.88%, 04/16/2034 (F) |
|
|
150,000 |
|
|
|
150,477 |
|
| S&P Global, Inc. |
|
|
|
|
|
|
|
|
| 2.30%, 08/15/2060 |
|
|
182,000 |
|
|
|
93,102 |
|
| San Diego Gas & Electric Co. |
|
|
|
|
|
|
|
|
| 2.95%, 08/15/2051 |
|
|
217,000 |
|
|
|
141,395 |
|
| 3.32%, 04/15/2050 |
|
|
78,000 |
|
|
|
53,348 |
|
| 4.30%, 04/01/2042 |
|
|
45,000 |
|
|
|
38,229 |
|
| 4.95%, 08/15/2028 |
|
|
250,000 |
|
|
|
248,970 |
|
| 5.35%, 04/01/2053 |
|
|
150,000 |
|
|
|
142,502 |
|
| Sempra |
|
|
|
|
|
|
|
|
| Fixed until 07/01/2029, 6.88% (E), 10/01/2054 |
|
|
210,000 |
|
|
|
208,738 |
|
|
|
|
|
|
|
|
|
|
| |
|
Principal |
|
|
Value |
|
| |
|
| CORPORATE DEBT SECURITIES (continued) |
|
| United States (continued) |
|
| Sherwin-Williams Co. |
|
|
|
|
|
|
|
|
| 2.95%, 08/15/2029 |
|
$ |
151,000 |
|
|
$ |
136,188 |
|
| Smithfield Foods, Inc. |
|
|
|
|
|
|
|
|
| 3.00%, 10/15/2030 (F) |
|
|
707,000 |
|
|
|
600,798 |
|
| Solventum Corp. |
|
|
|
|
|
|
|
|
| 5.40%, 03/01/2029 (F) |
|
|
857,000 |
|
|
|
854,917 |
|
| Southern California Edison Co. |
|
|
|
|
|
|
|
|
| 2.95%, 02/01/2051 |
|
|
196,000 |
|
|
|
122,238 |
|
| 3.60%, 02/01/2045 |
|
|
162,000 |
|
|
|
118,808 |
|
| 3.65%, 03/01/2028 |
|
|
183,000 |
|
|
|
173,548 |
|
| 5.20%, 06/01/2034 |
|
|
388,000 |
|
|
|
379,613 |
|
| 5.70%, 03/01/2053 |
|
|
83,000 |
|
|
|
80,813 |
|
| 5.88%, 12/01/2053 |
|
|
266,000 |
|
|
|
266,502 |
|
| Southern Co. Gas Capital Corp. |
|
|
|
|
|
|
|
|
| 1.75%, 01/15/2031 |
|
|
116,000 |
|
|
|
94,014 |
|
| 3.15%, 09/30/2051 |
|
|
279,000 |
|
|
|
176,571 |
|
| 5.15%, 09/15/2032 |
|
|
763,000 |
|
|
|
759,621 |
|
| 5.75%, 09/15/2033 |
|
|
133,000 |
|
|
|
136,526 |
|
| Southern Power Co. |
|
|
|
|
|
|
|
|
| 5.15%, 09/15/2041 |
|
|
326,000 |
|
|
|
302,709 |
|
| 5.25%, 07/15/2043 |
|
|
308,000 |
|
|
|
286,292 |
|
| Southwestern Electric Power Co. |
|
|
|
|
|
|
|
|
| 3.90%, 04/01/2045 |
|
|
85,000 |
|
|
|
63,571 |
|
| Southwestern Energy Co. |
|
|
|
|
|
|
|
|
| 4.75%, 02/01/2032 |
|
|
632,000 |
|
|
|
581,088 |
|
| 5.38%, 02/01/2029 |
|
|
48,000 |
|
|
|
46,661 |
|
| Sprint Capital Corp. |
|
|
|
|
|
|
|
|
| 6.88%, 11/15/2028 |
|
|
324,000 |
|
|
|
343,491 |
|
| State Street Corp. |
|
|
|
|
|
|
|
|
| Fixed until 03/15/2029(G), 6.70% (E) |
|
|
175,000 |
|
|
|
176,078 |
|
| Take-Two Interactive Software, Inc. |
|
|
|
|
|
|
|
|
| 4.95%, 03/28/2028 |
|
|
65,000 |
|
|
|
64,427 |
|
| 5.40%, 06/12/2029 |
|
|
60,000 |
|
|
|
60,384 |
|
| 5.60%, 06/12/2034 |
|
|
500,000 |
|
|
|
499,881 |
|
| Teachers Insurance & Annuity Association of America |
|
|
|
|
|
|
|
|
| Fixed until 09/15/2024, 4.38% (E), 09/15/2054 (F) |
|
|
70,000 |
|
|
|
69,686 |
|
| 6.85%, 12/16/2039 (F) |
|
|
604,000 |
|
|
|
675,602 |
|
| Tennessee Gas Pipeline Co. LLC |
|
|
|
|
|
|
|
|
| 2.90%, 03/01/2030 (F) |
|
|
80,000 |
|
|
|
69,957 |
|
| Texas Instruments, Inc. |
|
|
|
|
|
|
|
|
| 5.00%, 03/14/2053 |
|
|
160,000 |
|
|
|
150,597 |
|
| 5.15%, 02/08/2054 |
|
|
205,000 |
|
|
|
197,315 |
|
| Time Warner Cable Enterprises LLC |
|
|
|
|
|
|
|
|
| 8.38%, 07/15/2033 |
|
|
183,000 |
|
|
|
202,436 |
|
| Time Warner Cable LLC |
|
|
|
|
|
|
|
|
| 4.50%, 09/15/2042 |
|
|
78,000 |
|
|
|
57,283 |
|
| 5.88%, 11/15/2040 |
|
|
78,000 |
|
|
|
67,897 |
|
| 6.55%, 05/01/2037 |
|
|
55,000 |
|
|
|
52,209 |
|
| T-Mobile USA, Inc. |
|
|
|
|
|
|
|
|
| 2.63%, 02/15/2029 |
|
|
1,144,000 |
|
|
|
1,024,628 |
|
| 3.38%, 04/15/2029 |
|
|
526,000 |
|
|
|
485,919 |
|
| 3.50%, 04/15/2031 |
|
|
233,000 |
|
|
|
209,777 |
|
| 3.88%, 04/15/2030 |
|
|
477,000 |
|
|
|
446,195 |
|
The Notes to Financial Statements are an integral part of this report.
|
|
|
|
|
| Transamerica Series Trust |
|
|
|
Semi-Annual Financial Statements 2024 |
|
|
Page 14 |
|
|
Transamerica JPMorgan Tactical Allocation VP
SCHEDULE OF INVESTMENTS (continued)
At June 30, 2024
(unaudited)
|
|
|
|
|
|
|
|
|
| |
|
Principal |
|
|
Value |
|
| |
|
| CORPORATE DEBT SECURITIES (continued) |
|
| United States (continued) |
|
| Toll Brothers Finance Corp. |
|
|
|
|
|
|
|
|
| 3.80%, 11/01/2029 |
|
$ |
199,000 |
|
|
$ |
184,186 |
|
| 4.35%, 02/15/2028 |
|
|
263,000 |
|
|
|
254,027 |
|
| Truist Financial Corp. |
|
|
|
|
|
|
|
|
| Fixed until 01/26/2033, 5.12% (E), 01/26/2034 |
|
|
653,000 |
|
|
|
626,365 |
|
| Fixed until 01/24/2034, 5.71% (E), 01/24/2035 |
|
|
67,000 |
|
|
|
66,839 |
|
| Fixed until 10/28/2032, 6.12% (E), 10/28/2033 |
|
|
58,000 |
|
|
|
59,412 |
|
| Trustees of Boston University |
|
|
|
|
|
|
|
|
| 3.17%, 10/01/2050 |
|
|
339,000 |
|
|
|
238,918 |
|
| Tucson Electric Power Co. |
|
|
|
|
|
|
|
|
| 1.50%, 08/01/2030 |
|
|
116,000 |
|
|
|
94,245 |
|
| UDR, Inc. |
|
|
|
|
|
|
|
|
| 4.40%, 01/26/2029 |
|
|
375,000 |
|
|
|
361,722 |
|
| Union Electric Co. |
|
|
|
|
|
|
|
|
| 3.90%, 04/01/2052 |
|
|
71,000 |
|
|
|
54,631 |
|
| 5.20%, 04/01/2034 |
|
|
366,000 |
|
|
|
364,110 |
|
| 5.25%, 01/15/2054 |
|
|
174,000 |
|
|
|
163,240 |
|
| 5.45%, 03/15/2053 |
|
|
58,000 |
|
|
|
56,103 |
|
| Union Pacific Corp. |
|
|
|
|
|
|
|
|
| 3.55%, 08/15/2039 |
|
|
386,000 |
|
|
|
315,529 |
|
| United Airlines Pass-Through Trust |
|
|
|
|
|
|
|
|
| 2.88%, 04/07/2030 |
|
|
408,528 |
|
|
|
372,402 |
|
| 3.75%, 03/03/2028 |
|
|
135,227 |
|
|
|
130,484 |
|
| UnitedHealth Group, Inc. |
|
|
|
|
|
|
|
|
| 2.75%, 05/15/2040 |
|
|
161,000 |
|
|
|
116,121 |
|
| 3.05%, 05/15/2041 |
|
|
104,000 |
|
|
|
77,049 |
|
| 3.25%, 05/15/2051 |
|
|
193,000 |
|
|
|
133,321 |
|
| 3.50%, 08/15/2039 |
|
|
529,000 |
|
|
|
428,906 |
|
| 5.38%, 04/15/2054 |
|
|
110,000 |
|
|
|
107,462 |
|
| University of Miami |
|
|
|
|
|
|
|
|
| 4.06%, 04/01/2052 |
|
|
328,000 |
|
|
|
265,468 |
|
| US Bancorp |
|
|
|
|
|
|
|
|
| Fixed until 01/23/2034, 5.68% (E), 01/23/2035 |
|
|
174,000 |
|
|
|
175,024 |
|
| Fixed until 06/10/2033, 5.84% (E), 06/12/2034 |
|
|
285,000 |
|
|
|
289,399 |
|
| US Cellular Corp. |
|
|
|
|
|
|
|
|
| 6.70%, 12/15/2033 |
|
|
329,000 |
|
|
|
349,158 |
|
| Ventas Realty LP |
|
|
|
|
|
|
|
|
| 3.00%, 01/15/2030 |
|
|
586,000 |
|
|
|
517,750 |
|
| 4.00%, 03/01/2028 |
|
|
67,000 |
|
|
|
63,937 |
|
| 4.75%, 11/15/2030 |
|
|
324,000 |
|
|
|
311,213 |
|
| 5.63%, 07/01/2034 |
|
|
430,000 |
|
|
|
427,117 |
|
| Veralto Corp. |
|
|
|
|
|
|
|
|
| 5.35%, 09/18/2028 (F) |
|
|
308,000 |
|
|
|
309,377 |
|
| 5.45%, 09/18/2033 (F) |
|
|
343,000 |
|
|
|
343,002 |
|
| Verizon Communications, Inc. |
|
|
|
|
|
|
|
|
| 1.68%, 10/30/2030 |
|
|
412,000 |
|
|
|
335,076 |
|
| 1.75%, 01/20/2031 |
|
|
1,378,000 |
|
|
|
1,116,895 |
|
| 2.36%, 03/15/2032 |
|
|
639,000 |
|
|
|
523,417 |
|
| 2.99%, 10/30/2056 |
|
|
105,000 |
|
|
|
64,714 |
|
| 4.02%, 12/03/2029 |
|
|
374,000 |
|
|
|
353,874 |
|
|
|
|
|
|
|
|
|
|
| |
|
Principal |
|
|
Value |
|
| |
|
| CORPORATE DEBT SECURITIES (continued) |
|
| United States (continued) |
|
| Virginia Electric & Power Co. |
|
|
|
|
|
|
|
|
| 2.45%, 12/15/2050 |
|
$ |
497,000 |
|
|
$ |
280,133 |
|
| 5.70%, 08/15/2053 |
|
|
145,000 |
|
|
|
144,863 |
|
| Vistra Operations Co. LLC |
|
|
|
|
|
|
|
|
| 4.30%, 07/15/2029 (F) |
|
|
352,000 |
|
|
|
332,765 |
|
| 6.00%, 04/15/2034 (F) |
|
|
297,000 |
|
|
|
298,351 |
|
| 6.95%, 10/15/2033 (F) |
|
|
330,000 |
|
|
|
353,279 |
|
| VMware LLC |
|
|
|
|
|
|
|
|
| 4.70%, 05/15/2030 |
|
|
653,000 |
|
|
|
632,172 |
|
| Walt Disney Co. |
|
|
|
|
|
|
|
|
| 3.50%, 05/13/2040 |
|
|
202,000 |
|
|
|
161,755 |
|
| Warnermedia Holdings, Inc. |
|
|
|
|
|
|
|
|
| 4.05%, 03/15/2029 |
|
|
575,000 |
|
|
|
531,319 |
|
| 4.28%, 03/15/2032 |
|
|
892,000 |
|
|
|
779,666 |
|
| 5.05%, 03/15/2042 |
|
|
610,000 |
|
|
|
497,945 |
|
| 5.14%, 03/15/2052 |
|
|
187,000 |
|
|
|
146,302 |
|
| Wells Fargo & Co. |
|
|
|
|
|
|
|
|
| Fixed until 06/02/2027, 2.39% (E), 06/02/2028 |
|
|
395,000 |
|
|
|
363,946 |
|
| Fixed until 03/24/2027, 3.53% (E), 03/24/2028 |
|
|
566,000 |
|
|
|
540,007 |
|
| Fixed until 05/22/2027, 3.58% (E), 05/22/2028 |
|
|
132,000 |
|
|
|
125,746 |
|
| Fixed until 03/15/2026 (G), 3.90% (E) |
|
|
216,000 |
|
|
|
206,682 |
|
| Fixed until 07/25/2027, 4.81% (E), 07/25/2028 |
|
|
373,000 |
|
|
|
367,901 |
|
| Fixed until 04/24/2033, 5.39% (E), 04/24/2034 |
|
|
487,000 |
|
|
|
482,366 |
|
| Fixed until 01/23/2034, 5.50% (E), 01/23/2035 |
|
|
366,000 |
|
|
|
365,877 |
|
| Fixed until 07/25/2033, 5.56% (E), 07/25/2034 |
|
|
630,000 |
|
|
|
630,851 |
|
| Fixed until 07/25/2028, 5.57% (E), 07/25/2029 |
|
|
476,000 |
|
|
|
480,567 |
|
| Fixed until 04/22/2027, 5.71% (E), 04/22/2028 |
|
|
509,000 |
|
|
|
513,545 |
|
| 4.40%, 06/14/2046 |
|
|
155,000 |
|
|
|
125,566 |
|
| 4.65%, 11/04/2044 |
|
|
100,000 |
|
|
|
84,813 |
|
| Welltower OP LLC |
|
|
|
|
|
|
|
|
| 3.10%, 01/15/2030 |
|
|
362,000 |
|
|
|
324,637 |
|
| 4.13%, 03/15/2029 |
|
|
200,000 |
|
|
|
191,259 |
|
| Western Midstream Operating LP |
|
|
|
|
|
|
|
|
| 5.25%, 02/01/2050 |
|
|
178,000 |
|
|
|
156,342 |
|
| Westlake Corp. |
|
|
|
|
|
|
|
|
| 3.13%, 08/15/2051 |
|
|
93,000 |
|
|
|
58,921 |
|
| Williams Cos., Inc. |
|
|
|
|
|
|
|
|
| 5.30%, 08/15/2028 |
|
|
657,000 |
|
|
|
659,355 |
|
| WP Carey, Inc. |
|
|
|
|
|
|
|
|
| 2.40%, 02/01/2031 |
|
|
395,000 |
|
|
|
328,190 |
|
| 2.45%, 02/01/2032 |
|
|
281,000 |
|
|
|
228,269 |
|
| 3.85%, 07/15/2029 |
|
|
299,000 |
|
|
|
279,417 |
|
| Xilinx, Inc. |
|
|
|
|
|
|
|
|
| 2.38%, 06/01/2030 |
|
|
283,000 |
|
|
|
245,134 |
|
The Notes to Financial Statements are an integral part of this report.
|
|
|
|
|
| Transamerica Series Trust |
|
|
|
Semi-Annual Financial Statements 2024 |
|
|
Page 15 |
|
|
Transamerica JPMorgan Tactical Allocation VP
SCHEDULE OF INVESTMENTS (continued)
At June 30, 2024
(unaudited)
|
|
|
|
|
|
|
|
|
| |
|
Principal |
|
|
Value |
|
| |
|
| CORPORATE DEBT SECURITIES (continued) |
|
| United States (continued) |
|
| Zoetis, Inc. |
|
|
|
|
|
|
|
|
| 2.00%, 05/15/2030 |
|
$ |
424,000 |
|
|
|
$ 357,614 |
|
| 4.70%, 02/01/2043 |
|
|
119,000 |
|
|
|
106,349 |
|
|
|
|
|
|
|
|
|
|
|
|
|
|
|
|
|
|
|
|
159,049,830 |
|
|
|
|
|
|
|
|
|
|
|
|
|
| Total Corporate Debt Securities
(Cost $217,103,358) |
|
|
|
|
|
|
208,019,977 |
|
|
|
|
|
|
|
|
|
|
|
| U.S. GOVERNMENT OBLIGATIONS - 18.8% |
|
| U.S. Treasury - 18.8% |
|
|
|
|
|
|
|
|
| U.S. Treasury Bonds |
|
|
|
|
|
|
|
|
| 1.13%, 05/15/2040 |
|
|
300 |
|
|
|
185 |
|
| 1.88%, 02/15/2051 - 11/15/2051 |
|
|
1,790,100 |
|
|
|
1,052,060 |
|
| 2.00%, 08/15/2051 |
|
|
25,000 |
|
|
|
15,125 |
|
| 2.25%, 02/15/2052 |
|
|
1,686,600 |
|
|
|
1,081,796 |
|
| 2.38%, 05/15/2051 |
|
|
2,253,600 |
|
|
|
1,494,154 |
|
| 2.88%, 05/15/2043 - 05/15/2052 |
|
|
2,165,000 |
|
|
|
1,649,796 |
|
| 3.00%, 08/15/2052 |
|
|
763,900 |
|
|
|
578,445 |
|
| 3.13%, 02/15/2043 |
|
|
2,500,000 |
|
|
|
2,033,301 |
|
| 3.63%, 08/15/2043 - 05/15/2053 |
|
|
1,050,200 |
|
|
|
916,008 |
|
| 3.75%, 08/15/2041 |
|
|
2,100,000 |
|
|
|
1,904,355 |
|
| 3.88%, 08/15/2040 - 05/15/2043 |
|
|
2,935,000 |
|
|
|
2,689,885 |
|
| 4.00%, 11/15/2052 |
|
|
862,300 |
|
|
|
790,318 |
|
| 4.25%, 02/15/2054 |
|
|
9,984,000 |
|
|
|
9,565,920 |
|
| 4.38%, 05/15/2040 |
|
|
250,000 |
|
|
|
247,578 |
|
| 4.50%, 02/15/2044 |
|
|
11,270,000 |
|
|
|
11,104,472 |
|
| 4.63%, 02/15/2040 |
|
|
270,000 |
|
|
|
275,337 |
|
| U.S. Treasury Bonds, Principal Only STRIPS |
|
|
|
|
|
|
|
|
| Zero Coupon, 08/15/2026 - 11/15/2040 |
|
|
3,952,000 |
|
|
|
2,419,687 |
|
| U.S. Treasury Notes |
|
|
|
|
|
|
|
|
| 0.38%, 01/31/2026 |
|
|
130,000 |
|
|
|
121,159 |
|
| 0.75%, 04/30/2026 |
|
|
330,000 |
|
|
|
306,913 |
|
| 1.13%, 10/31/2026 |
|
|
39,680,000 |
|
|
|
36,621,850 |
|
| 1.25%, 04/30/2028 - 06/30/2028 |
|
|
3,835,000 |
|
|
|
3,396,520 |
|
| 1.38%, 10/31/2028 |
|
|
34,110,000 |
|
|
|
30,094,080 |
|
| 1.63%, 02/15/2026 - 08/15/2029 |
|
|
949,400 |
|
|
|
884,522 |
|
| 1.75%, 12/31/2026 |
|
|
130,000 |
|
|
|
121,332 |
|
| 2.00%, 11/15/2026 |
|
|
245,000 |
|
|
|
230,578 |
|
| 2.25%, 11/15/2025 - 02/15/2027 |
|
|
237,000 |
|
|
|
224,583 |
|
| 2.50%, 02/28/2026 - 03/31/2027 |
|
|
2,441,000 |
|
|
|
2,316,302 |
|
| 2.63%, 05/31/2027 |
|
|
26,587,000 |
|
|
|
25,218,185 |
|
| 2.88%, 05/15/2028 |
|
|
355,000 |
|
|
|
335,544 |
|
| 4.13%, 01/31/2025 (I) |
|
|
11,008,700 |
|
|
|
10,932,155 |
|
| 4.13%, 09/30/2027 |
|
|
2,480,000 |
|
|
|
2,452,681 |
|
| 4.38%, 05/15/2034 |
|
|
1,700,000 |
|
|
|
1,704,250 |
|
| 4.63%, 04/30/2029 - 04/30/2031 |
|
|
19,080,000 |
|
|
|
19,341,973 |
|
| 4.88%, 04/30/2026 |
|
|
12,230,000 |
|
|
|
12,248,154 |
|
|
|
|
|
|
|
|
|
|
|
|
|
|
|
|
|
|
|
|
184,369,203 |
|
|
|
|
|
|
|
|
|
|
|
| U.S. Treasury Inflation-Protected Securities - 0.0%(A) |
|
| U.S. Treasury Inflation-Protected Indexed Bonds |
|
|
|
|
|
|
|
|
| 2.50%, 01/15/2029 |
|
|
73,011 |
|
|
|
74,310 |
|
|
|
|
|
|
|
|
|
|
|
|
|
|
|
|
|
|
|
|
74,310 |
|
|
|
|
|
|
|
|
|
|
|
|
|
| Total U.S. Government Obligations
(Cost $197,035,646) |
|
|
|
|
|
|
184,443,513 |
|
|
|
|
|
|
|
|
|
|
|
|
|
|
|
|
|
|
|
| |
|
Shares |
|
|
Value |
|
| |
|
|
|
|
| INVESTMENT COMPANY - 4.7% |
|
|
|
|
|
|
|
|
| United States - 4.7% |
|
|
|
|
|
|
|
|
| JPMorgan High Yield Fund |
|
|
7,289,750 |
|
|
|
$ 46,508,606 |
|
|
|
|
|
|
|
|
|
|
|
|
|
| Total Investment Company
(Cost $46,841,642) |
|
|
|
|
|
|
46,508,606 |
|
|
|
|
|
|
|
|
|
|
|
|
|
| |
|
Principal |
|
|
Value |
|
| |
|
|
| MORTGAGE-BACKED SECURITIES - 0.4% |
|
| Cayman Islands - 0.2% |
|
|
|
|
|
|
|
|
| LFT CRE Ltd. |
|
|
|
|
|
|
|
|
| Series 2021-FL1, Class C, 1-Month Term SOFR + 2.06%,
7.39% (E), 06/15/2039(F) |
|
$ |
1,420,000 |
|
|
|
1,382,104 |
|
|
|
|
|
|
|
|
|
|
|
|
|
| United States - 0.2% |
|
|
|
|
|
|
|
|
| LB-UBS Commercial Mortgage Trust |
|
|
|
|
|
|
|
|
| Series 2006-C6, Class AJ, 5.45% (E), 09/15/2039 |
|
|
269,797 |
|
|
|
103,077 |
|
| MRCD Mortgage Trust |
|
|
|
|
|
|
|
|
| Series 2019-PARK, Class A, 2.72%, 12/15/2036 (F) |
|
|
1,230,000 |
|
|
|
1,064,073 |
|
| SDR Commercial Mortgage Trust |
|
|
|
|
|
|
|
|
| Series 2024-DSNY, Class B, 1-Month Term SOFR + 1.74%,
7.07% (E), 05/15/2039 (F) |
|
|
246,000 |
|
|
|
244,770 |
|
| SREIT Trust |
|
|
|
|
|
|
|
|
| Series 2021-MFP, Class A, 1-Month Term SOFR + 0.85%,
6.17% (E), 11/15/2038 (F) |
|
|
842,039 |
|
|
|
834,150 |
|
| Wachovia Bank Commercial Mortgage Trust, Interest Only STRIPS |
|
|
|
|
|
|
|
|
| Series 2006-C24, Class XC, Zero Coupon (E), 03/15/2045 (F)(J) |
|
|
27,700 |
|
|
|
0 |
|
|
|
|
|
|
|
|
|
|
|
|
|
|
|
|
|
|
|
|
2,246,070 |
|
|
|
|
|
|
|
|
|
|
|
|
|
| Total Mortgage-Backed Securities
(Cost $4,010,292) |
|
|
|
|
|
|
3,628,174 |
|
|
|
|
|
|
|
|
|
|
|
|
|
| ASSET-BACKED SECURITIES - 0.3% |
|
|
|
|
|
|
|
|
| United States - 0.3% |
|
|
|
|
|
|
|
|
| American Homes 4 Rent Trust Series 2015-SFR1, Class A, 3.47%, 04/17/2052 (F) |
|
|
206,281 |
|
|
|
202,424 |
|
| CoreVest American Finance Ltd. Series 2019-3, Class A, 2.71%, 10/15/2052 (F) |
|
|
397,897 |
|
|
|
391,434 |
|
| Goodgreen Trust Series 2017, Class R1, 5.00%, 10/20/2051 (F) |
|
|
757 |
|
|
|
734 |
|
| NRZ Excess Spread-Collateralized Notes |
|
|
|
|
|
|
|
|
| Series 2021-FHT1, Class A, 3.10%, 07/25/2026 (F) |
|
|
889,007 |
|
|
|
836,364 |
|
| Series 2021-FNT2, Class A, 3.23%, 05/25/2026 (F) |
|
|
510,741 |
|
|
|
483,285 |
|
| P4 SFR Holdco LLC Series 2019-STL, Class A, 7.25%, 10/11/2026 |
|
|
1,000,000 |
|
|
|
950,000 |
|
| SART Series 2018-1, 4.75%, 06/15/2025 |
|
|
35,928 |
|
|
|
35,859 |
|
|
|
|
|
|
|
|
|
|
|
|
| Total Asset-Backed Securities
(Cost $3,043,929) |
|
|
|
2,900,100 |
|
|
|
|
|
|
|
|
|
|
The Notes to Financial Statements are an integral part of this report.
|
|
|
|
|
| Transamerica Series Trust |
|
|
|
Semi-Annual Financial Statements 2024 |
|
|
Page 16 |
|
|
Transamerica JPMorgan Tactical Allocation VP
SCHEDULE OF INVESTMENTS (continued)
At June 30, 2024
(unaudited)
|
|
|
|
|
|
|
|
|
| |
|
Principal |
|
|
Value |
|
| |
|
|
| FOREIGN GOVERNMENT OBLIGATIONS - 0.3% |
|
| Israel - 0.1% |
|
|
|
|
|
|
|
|
| Israel Government AID Bonds |
|
|
|
|
|
|
|
|
| Zero Coupon, 08/15/2025 |
|
$ |
1,000,000 |
|
|
$ |
945,653 |
|
|
|
|
|
|
|
|
|
|
|
|
|
| Mexico - 0.2% |
|
|
|
|
|
|
|
|
| Mexico Government International Bonds |
|
|
|
|
|
|
|
|
| 3.50%, 02/12/2034 |
|
|
417,000 |
|
|
|
338,910 |
|
| 3.77%, 05/24/2061 |
|
|
205,000 |
|
|
|
125,281 |
|
| 4.28%, 08/14/2041 |
|
|
200,000 |
|
|
|
154,934 |
|
| 4.50%, 01/31/2050 |
|
|
265,000 |
|
|
|
198,951 |
|
| 4.75%, 03/08/2044 |
|
|
232,000 |
|
|
|
185,857 |
|
| 6.00%, 05/07/2036 |
|
|
247,000 |
|
|
|
240,561 |
|
| 6.34%, 05/04/2053 |
|
|
350,000 |
|
|
|
330,192 |
|
|
|
|
|
|
|
|
|
|
|
|
|
|
|
|
|
|
|
|
1,574,686 |
|
|
|
|
|
|
|
|
|
|
|
|
|
| Panama - 0.0% (A) |
|
|
|
|
|
|
|
|
| Panama Government International Bonds |
|
|
|
|
|
|
|
|
| 4.50%, 04/16/2050 |
|
|
200,000 |
|
|
|
134,398 |
|
|
|
|
|
|
|
|
|
|
|
|
|
| Saudi Arabia - 0.0% (A) |
|
|
|
|
|
|
|
|
| Saudi Government International Bonds |
|
|
|
|
|
|
|
|
| 2.25%, 02/02/2033(F) |
|
|
200,000 |
|
|
|
159,695 |
|
|
|
|
|
|
|
|
|
|
|
|
|
| Total Foreign Government Obligations
(Cost $3,303,760) |
|
|
|
|
|
|
2,814,432 |
|
|
|
|
|
|
|
|
|
|
|
| SHORT-TERM U.S. GOVERNMENT OBLIGATIONS - 0.2% |
|
| U.S. Treasury Bills |
|
|
|
|
|
|
|
|
| 4.85% (K), 07/11/2024 (I) |
|
|
903,000 |
|
|
|
901,687 |
|
| 5.30% (K), 09/24/2024 (I) |
|
|
548,600 |
|
|
|
541,849 |
|
|
|
|
|
|
|
|
|
|
|
|
| Total Short-Term U.S. Government Obligations
(Cost $1,443,109) |
|
|
|
1,443,536 |
|
|
|
|
|
|
|
|
|
|
|
|
|
|
|
|
|
|
|
| |
|
Shares |
|
|
Value |
|
| |
|
|
| OTHER INVESTMENT COMPANY - 0.2% |
|
| Securities Lending Collateral - 0.2% |
|
|
|
|
|
|
|
|
| State Street Navigator Securities Lending Trust - Government Money Market Portfolio, 5.28% (K) |
|
|
2,385,273 |
|
|
$ |
2,385,273 |
|
|
|
|
|
|
|
|
|
|
|
|
| Total Other Investment Company
(Cost $2,385,273) |
|
|
|
2,385,273 |
|
|
|
|
|
|
|
|
|
|
|
|
|
| |
|
Principal |
|
|
Value |
|
| |
|
|
| REPURCHASE AGREEMENT - 2.0% |
|
| Fixed Income Clearing Corp., 2.50%(K), dated 06/28/2024, to be repurchased at $19,514,615 on 07/01/2024. Collateralized by U.S. Government Obligations, 3.75% - 4.50%, due 03/31/2026 - 04/15/2026, and with a total value of $19,901,071. |
|
$ |
19,510,551 |
|
|
|
19,510,551 |
|
|
|
|
|
|
|
|
|
|
|
|
| Total Repurchase Agreement
(Cost $19,510,551) |
|
|
|
19,510,551 |
|
|
|
|
|
|
|
|
|
|
| Total Investments
(Cost $965,958,082) |
|
|
|
982,757,482 |
|
| Net Other Assets (Liabilities) - (0.1)% |
|
|
|
(795,034 |
) |
|
|
|
|
|
|
|
|
|
| Net Assets - 100.0% |
|
|
$ |
981,962,448 |
|
|
|
|
|
|
|
|
|
|
FUTURES CONTRACTS:
|
|
|
|
|
|
|
|
|
|
|
|
|
|
|
|
|
|
|
|
|
|
|
|
|
| Long Futures Contracts |
|
| Description |
|
Number of Contracts |
|
Expiration Date |
|
|
Notional Amount |
|
|
Value |
|
|
Unrealized Appreciation |
|
Unrealized Depreciation |
| 2-Year U.S. Treasury Notes |
|
|
284 |
|
|
|
09/30/2024 |
|
|
$ |
57,919,837 |
|
|
$ |
57,998,125 |
|
|
$ |
78,288 |
|
|
$ |
— |
|
| 10-Year U.S. Treasury Notes |
|
|
722 |
|
|
|
09/19/2024 |
|
|
|
78,883,170 |
|
|
|
79,408,719 |
|
|
|
525,549 |
|
|
|
— |
|
| 30-Year U.S. Treasury Bonds |
|
|
90 |
|
|
|
09/19/2024 |
|
|
|
10,508,186 |
|
|
|
10,648,125 |
|
|
|
139,939 |
|
|
|
— |
|
| AUD Currency |
|
|
223 |
|
|
|
09/16/2024 |
|
|
|
14,936,122 |
|
|
|
14,903,090 |
|
|
|
— |
|
|
|
(33,032 |
) |
| EURO STOXX 50® Index |
|
|
182 |
|
|
|
09/20/2024 |
|
|
|
9,727,723 |
|
|
|
9,601,414 |
|
|
|
— |
|
|
|
(126,309 |
) |
| Euro-BTP Italy Government Bonds |
|
|
273 |
|
|
|
09/06/2024 |
|
|
|
34,189,988 |
|
|
|
33,707,277 |
|
|
|
— |
|
|
|
(482,711 |
) |
| FTSE 100 Index |
|
|
95 |
|
|
|
09/20/2024 |
|
|
|
9,854,628 |
|
|
|
9,861,745 |
|
|
|
7,117 |
|
|
|
— |
|
| TOPIX Index |
|
|
56 |
|
|
|
09/12/2024 |
|
|
|
9,662,515 |
|
|
|
9,782,336 |
|
|
|
119,821 |
|
|
|
— |
|
| U.S. Treasury Ultra Bonds |
|
|
34 |
|
|
|
09/19/2024 |
|
|
|
4,223,762 |
|
|
|
4,261,688 |
|
|
|
37,926 |
|
|
|
— |
|
| Total |
|
|
$ |
908,640 |
|
|
$ |
(642,052 |
) |
|
|
|
|
|
|
|
|
|
|
|
| Short Futures Contracts |
|
| Description |
|
Number of Contracts |
|
Expiration Date |
|
|
Notional Amount |
|
|
Value |
|
|
Unrealized Appreciation |
|
Unrealized Depreciation |
| 5-Year U.S. Treasury Notes |
|
|
(200 |
) |
|
|
09/30/2024 |
|
|
$ |
(21,217,062 |
) |
|
$ |
(21,315,625 |
) |
|
$ |
— |
|
|
$ |
(98,563 |
) |
| 10-Year U.S. Treasury Ultra Notes |
|
|
(231 |
) |
|
|
09/19/2024 |
|
|
|
(26,097,573 |
) |
|
|
(26,225,719 |
) |
|
|
— |
|
|
|
(128,146 |
) |
| CAD Currency |
|
|
(273 |
) |
|
|
09/17/2024 |
|
|
|
(19,975,983 |
) |
|
|
(19,983,600 |
) |
|
|
— |
|
|
|
(7,617 |
) |
| CHF Currency |
|
|
(107 |
) |
|
|
09/16/2024 |
|
|
|
(15,184,318 |
) |
|
|
(15,024,138 |
) |
|
|
160,180 |
|
|
|
— |
|
| German Euro Bund |
|
|
(216 |
) |
|
|
09/06/2024 |
|
|
|
(30,228,335 |
) |
|
|
(30,447,036 |
) |
|
|
— |
|
|
|
(218,701 |
) |
| MSCI EAFE Index |
|
|
(136 |
) |
|
|
09/20/2024 |
|
|
|
(16,039,169 |
) |
|
|
(15,933,760 |
) |
|
|
105,409 |
|
|
|
— |
|
|
|
|
|
|
| The Notes to Financial Statements are an integral part of this report. |
| Transamerica Series Trust |
|
|
|
Semi-Annual Financial Statements 2024 |
|
|
Page 17 |
|
|
Transamerica JPMorgan Tactical Allocation VP
SCHEDULE OF INVESTMENTS (continued)
At June 30, 2024
(unaudited)
FUTURES CONTRACTS (continued):
|
|
|
|
|
|
|
|
|
|
|
|
|
|
|
|
|
|
|
|
|
|
|
|
|
| Short Futures Contracts (continued) |
|
| Description |
|
Number of Contracts |
|
|
Expiration Date |
|
|
Notional Amount |
|
|
Value |
|
|
Unrealized Appreciation |
|
|
Unrealized Depreciation |
| MSCI Emerging Markets Index |
|
|
(1) |
|
|
|
09/20/2024 |
|
|
$ |
(54,460 |
) |
|
$ |
(54,410 |
) |
|
$ |
50 |
|
|
$ |
— |
|
| S&P 500® E-Mini Index |
|
|
(44) |
|
|
|
09/20/2024 |
|
|
|
(12,083,076 |
) |
|
|
(12,147,300 |
) |
|
|
— |
|
|
|
(64,224 |
) |
| S&P/ASX 200 Index |
|
|
(114) |
|
|
|
09/19/2024 |
|
|
|
(14,698,311 |
) |
|
|
(14,776,395 |
) |
|
|
— |
|
|
|
(78,084 |
) |
| Total |
|
|
$ |
265,639 |
|
|
$ |
(595,335 |
) |
| Total Futures Contracts |
|
|
$ |
1,174,279 |
|
|
$ |
(1,237,387 |
) |
|
|
|
|
|
|
|
|
|
|
INVESTMENT VALUATION:
|
|
|
|
|
|
|
|
|
|
|
|
|
|
|
|
|
| Valuation Inputs(L) |
|
|
|
|
|
|
|
|
|
|
|
|
| |
|
Level 1 - Unadjusted Quoted Prices |
|
|
Level 2 - Other Significant Observable Inputs |
|
|
Level 3 - Significant Unobservable Inputs |
|
|
Value |
|
| ASSETS |
|
|
|
|
|
|
|
|
|
|
|
|
|
|
|
|
| Investments |
|
|
|
|
|
|
|
|
|
|
|
|
|
|
|
|
| Common Stocks |
|
$ |
212,791,379 |
|
|
$ |
83,732,970 |
|
|
$ |
— |
|
|
$ |
296,524,349 |
|
| U.S. Government Agency Obligations |
|
|
— |
|
|
|
214,578,971 |
|
|
|
— |
|
|
|
214,578,971 |
|
| Corporate Debt Securities |
|
|
— |
|
|
|
208,019,977 |
|
|
|
— |
|
|
|
208,019,977 |
|
| U.S. Government Obligations |
|
|
— |
|
|
|
184,443,513 |
|
|
|
— |
|
|
|
184,443,513 |
|
| Investment Company |
|
|
46,508,606 |
|
|
|
— |
|
|
|
— |
|
|
|
46,508,606 |
|
| Mortgage-Backed Securities |
|
|
— |
|
|
|
3,628,174 |
|
|
|
— |
|
|
|
3,628,174 |
|
| Asset-Backed Securities |
|
|
— |
|
|
|
2,900,100 |
|
|
|
— |
|
|
|
2,900,100 |
|
| Foreign Government Obligations |
|
|
— |
|
|
|
2,814,432 |
|
|
|
— |
|
|
|
2,814,432 |
|
| Short-Term U.S. Government Obligations |
|
|
— |
|
|
|
1,443,536 |
|
|
|
— |
|
|
|
1,443,536 |
|
| Other Investment Company |
|
|
2,385,273 |
|
|
|
— |
|
|
|
— |
|
|
|
2,385,273 |
|
| Repurchase Agreement |
|
|
— |
|
|
|
19,510,551 |
|
|
|
— |
|
|
|
19,510,551 |
|
|
|
|
|
|
|
|
|
|
|
|
|
|
|
|
|
|
| Total Investments |
|
$ |
261,685,258 |
|
|
$ |
721,072,224 |
|
|
$ |
— |
|
|
$ |
982,757,482 |
|
|
|
|
|
|
|
|
|
|
|
|
|
|
|
|
|
|
| Other Financial Instruments |
|
|
|
|
|
|
|
|
|
|
|
|
|
|
|
|
| Futures Contracts (M) |
|
$ |
1,174,279 |
|
|
$ |
— |
|
|
$ |
— |
|
|
$ |
1,174,279 |
|
|
|
|
|
|
|
|
|
|
|
|
|
|
|
|
|
|
| Total Other Financial Instruments |
|
$ |
1,174,279 |
|
|
$ |
— |
|
|
$ |
— |
|
|
$ |
1,174,279 |
|
|
|
|
|
|
|
|
|
|
|
|
|
|
|
|
|
|
|
|
|
|
|
| LIABILITIES |
|
|
|
|
|
|
|
|
|
|
|
|
|
|
|
|
| Other Financial Instruments |
|
|
|
|
|
|
|
|
|
|
|
|
|
|
|
|
| Futures Contracts (M) |
|
$ |
(1,237,387 |
) |
|
$ |
— |
|
|
$ |
— |
|
|
$ |
(1,237,387 |
) |
|
|
|
|
|
|
|
|
|
|
|
|
|
|
|
|
|
| Total Other Financial Instruments |
|
$ |
(1,237,387 |
) |
|
$ |
— |
|
|
$ |
— |
|
|
$ |
(1,237,387 |
) |
|
|
|
|
|
|
|
|
|
|
|
|
|
|
|
|
|
FOOTNOTES TO SCHEDULE OF INVESTMENTS:
| (A) |
Percentage rounds to less than 0.1% or (0.1)%. |
| (B) |
Non-income producing security. |
| (C) |
All or a portion of the security is on loan. The total value of the securities on loan is $3,572,812, collateralized by cash collateral of $2,385,273 and non-cash collateral, such as U.S. government securities and irrevocable letters of credit, of $1,276,283. The amount on loan indicated may not correspond with the securities on loan identified because a security with pending sales are in the process of recall from the brokers. |
| (D) |
Security exempt from registration under Regulation S of the Securities Act of 1933, which exempts from registration securities offered and sold outside the United States. Security may not be offered or sold in the United States except pursuant to an exemption from, or in a transaction not subject to, the registration requirements of the Securities Act of 1933. At June 30, 2024, the total value of the Regulation S securities is $652,680, representing 0.1% of the Portfolio’s net assets. |
| (E) |
Floating or variable rate security. The rate disclosed is as of June 30, 2024. For securities based on a published reference rate and spread, the reference rate and spread are indicated within the description. Variable rate securities with a floor or ceiling feature are disclosed at the inherent rate, where applicable. Certain variable rate securities are not based on a published reference rate and spread, but are determined by the issuer or agent and are based on current market conditions; these securities do not indicate a reference rate and spread in the description. |
| (F) |
Security is exempt from registration pursuant to Rule 144A of the Securities Act of 1933. Security may be resold as transactions exempt from registration, normally to qualified institutional buyers. At June 30, 2024, the total value of 144A securities is $60,211,059, representing 6.1% of the Portfolio’s net assets. |
| (G) |
Perpetual maturity. The date displayed is the next call date. |
|
|
|
|
|
| The Notes to Financial Statements are an integral part of this report. |
| Transamerica Series Trust |
|
|
|
Semi-Annual Financial Statements 2024 |
|
|
Page 18 |
|
|
Transamerica JPMorgan Tactical Allocation VP
SCHEDULE OF INVESTMENTS (continued)
At June 30, 2024
(unaudited)
FOOTNOTES TO SCHEDULE OF INVESTMENTS (continued):
| (H) |
When-issued, delayed-delivery and/or forward commitment (including TBAs) security. Security to be settled and delivered after June 30, 2024. Security may display a coupon rate of 0.00%, as the rate is to be determined at time of settlement. |
| (I) |
All or a portion of the security has been segregated by the custodian as collateral to cover margin requirements for open futures contracts. The total value of the securities is $12,375,691. |
| (J) |
Rounds to less than $1 or $(1). |
| (K) |
Rate disclosed reflects the yield at June 30, 2024. |
| (L) |
There were no transfers in or out of Level 3 during the period ended June 30, 2024. Please reference the Investment Valuation section of the Notes to Financial Statements for more information regarding investment valuation and pricing inputs. |
| (M) |
Derivative instruments are valued at unrealized appreciation (depreciation). |
CURRENCY ABBREVIATION(S):
|
|
|
| AUD |
|
Australian Dollar |
| CAD |
|
Canadian Dollar |
| CHF |
|
Swiss Franc |
PORTFOLIO ABBREVIATION(S):
|
|
|
| ADR |
|
American Depositary Receipt |
| BTP |
|
Buoni del Tesoro Poliennali (Italian Treasury Bonds) |
| CMT |
|
Constant Maturity Treasury |
| EAFE |
|
Europe, Australasia and Far East |
| FTSE |
|
Financial Times Stock Exchange |
| GDR |
|
Global Depositary Receipt |
| REIT |
|
Real Estate Investment Trust |
| RFUCC |
|
Refinitiv USD IBOR Consumer Cash Fallbacks |
| SDR |
|
Swedish Depositary Receipt |
| SOFR |
|
Secured Overnight Financing Rate |
| STOXX |
|
Deutsche Börse Group & SIX Group Index |
| STRIPS |
|
Separate Trading of Registered Interest and Principal of Securities |
| TOPIX |
|
Tokyo Price Index |
|
|
|
|
|
| The Notes to Financial Statements are an integral part of this report. |
| Transamerica Series Trust |
|
|
|
Semi-Annual Financial Statements 2024 |
|
|
Page 19 |
|
|
Transamerica JPMorgan Tactical Allocation VP
STATEMENT OF ASSETS AND LIABILITIES
At June 30, 2024
(unaudited)
|
|
|
|
|
|
|
| Assets: |
|
|
|
|
| Investments, at value (cost $946,447,531) (including securities loaned of $3,572,812) |
|
$ |
963,246,931 |
|
| Repurchase agreement, at value (cost $19,510,551) |
|
|
19,510,551 |
|
| Cash |
|
|
7,349 |
|
| Foreign currency, at value (cost $72,937) |
|
|
67,498 |
|
| Receivables and other assets: |
|
|
|
|
| Investments sold |
|
|
263,605 |
|
| Net income from securities lending |
|
|
1,176 |
|
| Shares of beneficial interest sold |
|
|
11 |
|
| Dividends |
|
|
136,596 |
|
| Interest |
|
|
4,591,074 |
|
| Tax reclaims |
|
|
379,266 |
|
| Variation margin receivable on futures contracts |
|
|
506,495 |
|
| Prepaid expenses |
|
|
3,967 |
|
| Litigation |
|
|
33 |
|
|
|
| Total assets |
|
|
988,714,552 |
|
|
|
| Liabilities: |
|
|
|
|
| Cash collateral received upon return of: |
|
|
|
|
| Securities on loan |
|
|
2,385,273 |
|
| Payables and other liabilities: |
|
|
|
|
| Investments purchased |
|
|
496,644 |
|
| When-issued, delayed-delivery, forward and TBA commitments purchased |
|
|
2,548,570 |
|
| Shares of beneficial interest redeemed |
|
|
333,984 |
|
| Investment management fees |
|
|
537,372 |
|
| Distribution and service fees |
|
|
177,145 |
|
| Transfer agent costs |
|
|
1,121 |
|
| Trustee and CCO fees |
|
|
3,129 |
|
| Audit and tax fees |
|
|
35,190 |
|
| Custody fees |
|
|
115,173 |
|
| Legal fees |
|
|
22,763 |
|
| Printing and shareholder reports fees |
|
|
73,858 |
|
| Other accrued expenses |
|
|
21,882 |
|
|
|
| Total liabilities |
|
|
6,752,104 |
|
|
|
| Net assets |
|
$ |
981,962,448 |
|
|
|
| Net assets consist of: |
|
|
|
|
| Capital stock ($0.01 par value) |
|
$ |
733,653 |
|
| Additional paid-in capital |
|
|
1,049,544,223 |
|
| Total distributable earnings (accumulated losses) |
|
|
(68,315,428 |
) |
|
|
| Net assets |
|
$ |
981,962,448 |
|
|
|
| Net assets by class: |
|
|
|
|
| Initial Class |
|
$ |
60,572,030 |
|
| Service Class |
|
|
921,390,418 |
|
|
|
| Shares outstanding: |
|
|
|
|
| Initial Class |
|
|
4,824,515 |
|
| Service Class |
|
|
68,540,764 |
|
|
|
| Net asset value and offering price per share: |
|
|
|
|
| Initial Class |
|
$ |
12.56 |
|
| Service Class |
|
|
13.44 |
|
STATEMENT OF OPERATIONS
For the period ended June 30, 2024
(unaudited)
|
|
|
|
|
|
|
| Investment income: |
|
|
|
|
| Dividend income |
|
$ |
4,507,974 |
|
| Interest income |
|
|
13,293,140 |
|
| Net income from securities lending |
|
|
22,991 |
|
| Withholding taxes on foreign income |
|
|
(230,474 |
) |
|
|
| Total investment income |
|
|
17,593,631 |
|
|
|
| Expenses: |
|
|
|
|
| Investment management fees |
|
|
3,499,313 |
|
| Distribution and service fees: |
|
|
|
|
| Service Class |
|
|
1,154,982 |
|
| Transfer agent costs |
|
|
5,751 |
|
| Trustee and CCO fees |
|
|
23,244 |
|
| Audit and tax fees |
|
|
31,596 |
|
| Custody fees |
|
|
115,788 |
|
| Legal fees |
|
|
41,694 |
|
| Printing and shareholder reports fees |
|
|
68,657 |
|
| Other |
|
|
37,051 |
|
|
|
| Total expenses |
|
|
4,978,076 |
|
|
|
| Net investment income (loss) |
|
|
12,615,555 |
|
|
|
| Net realized gain (loss) on: |
|
|
|
|
| Investments |
|
|
13,315,367 |
|
| Futures contracts |
|
|
(3,692,437 |
) |
| Foreign currency transactions |
|
|
6,693 |
|
|
|
| Net realized gain (loss) |
|
|
9,629,623 |
|
|
|
| Net change in unrealized appreciation (depreciation) on: |
|
|
|
|
| Investments |
|
|
10,132,753 |
|
| Futures contracts |
|
|
(12,460,416 |
) |
|
|
| Translation of assets and liabilities denominated in foreign currencies |
|
|
(67,229 |
) |
|
|
| Net change in unrealized appreciation (depreciation) |
|
|
(2,394,892 |
) |
|
|
| Net realized and change in unrealized gain (loss) |
|
|
7,234,731 |
|
|
|
| Net increase (decrease) in net assets resulting from operations |
|
$ |
19,850,286 |
|
The Notes to Financial Statements are an integral part of this report.
|
|
|
|
|
| Transamerica Series Trust |
|
|
|
Semi-Annual Financial Statements 2024 |
|
|
Page 20 |
|
|
Transamerica JPMorgan Tactical Allocation VP
STATEMENT OF CHANGES IN NET ASSETS
For the period and year ended:
|
|
|
|
|
|
|
|
|
|
|
| |
|
June 30, 2024 (unaudited) |
|
December 31, 2023 |
|
|
|
| From operations: |
|
|
|
|
|
|
|
|
|
|
| Net investment income (loss) |
|
|
$ |
12,615,555 |
|
|
|
$ |
22,479,266 |
|
| Net realized gain (loss) |
|
|
|
9,629,623 |
|
|
|
|
(45,003,969 |
) |
| Net change in unrealized appreciation (depreciation) |
|
|
|
(2,394,892 |
) |
|
|
|
107,575,295 |
|
|
|
|
| Net increase (decrease) in net assets resulting from operations |
|
|
|
19,850,286 |
|
|
|
|
85,050,592 |
|
|
|
|
| Dividends and/or distributions to shareholders: |
|
|
|
|
|
|
|
|
|
|
| Initial Class |
|
|
|
— |
|
|
|
|
(1,224,228 |
) |
| Service Class |
|
|
|
— |
|
|
|
|
(15,088,367 |
) |
|
|
|
| Net increase (decrease) in net assets resulting from dividends and/or distributions to shareholders |
|
|
|
— |
|
|
|
|
(16,312,595 |
) |
|
|
|
| Capital share transactions: |
|
|
|
|
|
|
|
|
|
|
| Proceeds from shares sold: |
|
|
|
|
|
|
|
|
|
|
| Initial Class |
|
|
|
2,098,569 |
|
|
|
|
3,022,075 |
|
| Service Class |
|
|
|
1,068,141 |
|
|
|
|
4,063,982 |
|
| |
|
|
|
3,166,710 |
|
|
|
|
7,086,057 |
|
| Dividends and/or distributions reinvested: |
|
|
|
|
|
|
|
|
|
|
| Initial Class |
|
|
|
— |
|
|
|
|
1,224,228 |
|
| Service Class |
|
|
|
— |
|
|
|
|
15,088,367 |
|
| |
|
|
|
— |
|
|
|
|
16,312,595 |
|
| Cost of shares redeemed: |
|
|
|
|
|
|
|
|
|
|
| Initial Class |
|
|
|
(4,592,233 |
) |
|
|
|
(10,001,480 |
) |
| Service Class |
|
|
|
(69,640,588 |
) |
|
|
|
(137,598,649 |
) |
| |
|
|
|
(74,232,821 |
) |
|
|
|
(147,600,129 |
) |
|
|
|
| Net increase (decrease) in net assets resulting from capital share transactions |
|
|
|
(71,066,111 |
) |
|
|
|
(124,201,477 |
) |
|
|
|
| Net increase (decrease) in net assets |
|
|
|
(51,215,825 |
) |
|
|
|
(55,463,480 |
) |
|
|
|
| Net assets: |
|
|
|
|
|
|
|
|
|
|
| Beginning of period/year |
|
|
|
1,033,178,273 |
|
|
|
|
1,088,641,753 |
|
| End of period/year |
|
|
$ |
981,962,448 |
|
|
|
$ |
1,033,178,273 |
|
|
|
|
| Capital share transactions - shares: |
|
|
|
|
|
|
|
|
|
|
| Shares issued: |
|
|
|
|
|
|
|
|
|
|
| Initial Class |
|
|
|
171,782 |
|
|
|
|
256,849 |
|
| Service Class |
|
|
|
81,158 |
|
|
|
|
320,506 |
|
| |
|
|
|
252,940 |
|
|
|
|
577,355 |
|
| Shares reinvested: |
|
|
|
|
|
|
|
|
|
|
| Initial Class |
|
|
|
— |
|
|
|
|
105,446 |
|
| Service Class |
|
|
|
— |
|
|
|
|
1,211,917 |
|
| |
|
|
|
— |
|
|
|
|
1,317,363 |
|
| Shares redeemed: |
|
|
|
|
|
|
|
|
|
|
| Initial Class |
|
|
|
(371,506 |
) |
|
|
|
(859,670 |
) |
| Service Class |
|
|
|
(5,277,866 |
) |
|
|
|
(10,934,112 |
) |
| |
|
|
|
(5,649,372 |
) |
|
|
|
(11,793,782 |
) |
| Net increase (decrease) in shares outstanding: |
|
|
|
|
|
|
|
|
|
|
| Initial Class |
|
|
|
(199,724 |
) |
|
|
|
(497,375 |
) |
|
|
|
| Service Class |
|
|
|
(5,196,708 |
) |
|
|
|
(9,401,689 |
) |
| |
|
|
|
(5,396,432 |
) |
|
|
|
(9,899,064 |
) |
The Notes to Financial Statements are an integral part of this report.
|
|
|
|
|
| Transamerica Series Trust |
|
|
|
Semi-Annual Financial Statements 2024 |
|
|
Page 21 |
|
|
Transamerica JPMorgan Tactical Allocation VP
FINANCIAL HIGHLIGHTS
|
|
|
|
|
|
|
|
|
|
|
|
|
|
|
|
|
|
|
|
|
|
|
|
|
|
|
|
|
|
|
For a share outstanding during the period and
years indicated: |
|
Initial Class |
|
|
|
|
|
|
|
| |
|
June 30, 2024 (unaudited) |
|
December 31, 2023 |
|
December 31, 2022 |
|
December 31, 2021 |
|
December 31, 2020 |
|
December 31, 2019 |
|
|
|
|
|
|
|
| Net asset value, beginning of period/year |
|
|
$ |
12.29 |
|
|
|
$ |
11.52 |
|
|
|
$ |
15.60 |
|
|
|
$ |
16.13 |
|
|
|
$ |
15.08 |
|
|
|
$ |
13.96 |
|
|
|
|
|
|
|
|
| Investment operations: |
|
|
|
|
|
|
|
|
|
|
|
|
|
|
|
|
|
|
|
|
|
|
|
|
|
|
|
|
|
|
| Net investment income (loss)(A) |
|
|
|
0.17 |
|
|
|
|
0.28 |
|
|
|
|
0.20 |
|
|
|
|
0.22 |
|
|
|
|
0.27 |
|
|
|
|
0.33 |
|
| Net realized and unrealized gain (loss) |
|
|
|
0.10 |
|
|
|
|
0.72 |
|
|
|
|
(2.46 |
) |
|
|
|
0.57 |
|
|
|
|
1.55 |
|
|
|
|
1.36 |
|
|
|
|
|
|
|
|
| Total investment operations |
|
|
|
0.27 |
|
|
|
|
1.00 |
|
|
|
|
(2.26 |
) |
|
|
|
0.79 |
|
|
|
|
1.82 |
|
|
|
|
1.69 |
|
|
|
|
|
|
|
|
| Dividends and/or distributions to shareholders: |
|
|
|
|
|
|
|
|
|
|
|
|
|
|
|
|
|
|
|
|
|
|
|
|
|
|
|
|
|
|
| Net investment income |
|
|
|
— |
|
|
|
|
(0.23 |
) |
|
|
|
(0.27 |
) |
|
|
|
(0.31 |
) |
|
|
|
(0.38 |
) |
|
|
|
(0.37 |
) |
| Net realized gains |
|
|
|
— |
|
|
|
|
— |
|
|
|
|
(1.55 |
) |
|
|
|
(1.01 |
) |
|
|
|
(0.39 |
) |
|
|
|
(0.20 |
) |
| Total dividends and/or distributions to shareholders |
|
|
|
— |
|
|
|
|
(0.23 |
) |
|
|
|
(1.82 |
) |
|
|
|
(1.32 |
) |
|
|
|
(0.77 |
) |
|
|
|
(0.57 |
) |
|
|
|
|
|
|
|
| Net asset value, end of period/year |
|
|
$ |
12.56 |
|
|
|
$ |
12.29 |
|
|
|
$ |
11.52 |
|
|
|
$ |
15.60 |
|
|
|
$ |
16.13 |
|
|
|
$ |
15.08 |
|
| |
|
|
|
|
|
|
|
|
| Total return |
|
|
|
2.20 |
%(B) |
|
|
|
8.90 |
% |
|
|
|
(14.80 |
)% |
|
|
|
4.91 |
% |
|
|
|
12.36 |
% |
|
|
|
12.18 |
% |
|
|
|
|
|
|
|
| Ratio and supplemental data: |
|
|
|
|
|
|
|
|
|
|
|
|
|
|
|
|
|
|
|
|
|
|
|
|
|
|
|
|
|
|
| Net assets end of period/year (000’s) |
|
|
$ |
60,572 |
|
|
|
$ |
61,743 |
|
|
|
$ |
63,613 |
|
|
|
$ |
81,871 |
|
|
|
$ |
83,030 |
|
|
|
$ |
79,367 |
|
| Expenses to average net assets(C) |
|
|
|
0.78 |
%(D) |
|
|
|
0.77 |
% |
|
|
|
0.75 |
% |
|
|
|
0.77 |
% |
|
|
|
0.78 |
% |
|
|
|
0.77 |
% |
| Net investment income (loss) to average net assets |
|
|
|
2.80 |
%(D) |
|
|
|
2.37 |
% |
|
|
|
1.52 |
% |
|
|
|
1.39 |
% |
|
|
|
1.77 |
% |
|
|
|
2.20 |
% |
| Portfolio turnover rate |
|
|
|
38 |
%(B) |
|
|
|
65 |
% |
|
|
|
106 |
% |
|
|
|
83 |
% |
|
|
|
73 |
% |
|
|
|
45 |
% |
| (A) |
Calculated based on average number of shares outstanding. |
| (C) |
Does not include expenses of the underlying investments in which the Portfolio invests. |
|
|
|
|
|
|
|
|
|
|
|
|
|
|
|
|
|
|
|
|
|
|
|
|
|
|
|
|
|
|
|
| For a share outstanding during the period and years indicated: |
|
Service Class |
|
|
|
|
|
|
|
| |
|
June 30, 2024 (unaudited) |
|
December 31, 2023 |
|
December 31, 2022 |
|
December 31, 2021 |
|
December 31, 2020 |
|
December 31, 2019 |
|
|
|
|
|
|
|
| Net asset value, beginning of period/year |
|
|
$ |
13.17 |
|
|
|
$ |
12.33 |
|
|
|
$ |
16.54 |
|
|
|
$ |
17.03 |
|
|
|
$ |
15.88 |
|
|
|
$ |
14.67 |
|
|
|
|
|
|
|
|
| Investment operations: |
|
|
|
|
|
|
|
|
|
|
|
|
|
|
|
|
|
|
|
|
|
|
|
|
|
|
|
|
|
|
| Net investment income (loss)(A) |
|
|
|
0.17 |
|
|
|
|
0.27 |
|
|
|
|
0.18 |
|
|
|
|
0.19 |
|
|
|
|
0.25 |
|
|
|
|
0.30 |
|
| Net realized and unrealized gain (loss) |
|
|
|
0.10 |
|
|
|
|
0.76 |
|
|
|
|
(2.61 |
) |
|
|
|
0.59 |
|
|
|
|
1.63 |
|
|
|
|
1.44 |
|
|
|
|
|
|
|
|
| Total investment operations |
|
|
|
0.27 |
|
|
|
|
1.03 |
|
|
|
|
(2.43 |
) |
|
|
|
0.78 |
|
|
|
|
1.88 |
|
|
|
|
1.74 |
|
|
|
|
|
|
|
|
| Dividends and/or distributions to shareholders: |
|
|
|
|
|
|
|
|
|
|
|
|
|
|
|
|
|
|
|
|
|
|
|
|
|
|
|
|
|
|
| Net investment income |
|
|
|
— |
|
|
|
|
(0.19 |
) |
|
|
|
(0.23 |
) |
|
|
|
(0.26 |
) |
|
|
|
(0.34 |
) |
|
|
|
(0.33 |
) |
| Net realized gains |
|
|
|
— |
|
|
|
|
— |
|
|
|
|
(1.55 |
) |
|
|
|
(1.01 |
) |
|
|
|
(0.39 |
) |
|
|
|
(0.20 |
) |
| Total dividends and/or distributions to shareholders |
|
|
|
— |
|
|
|
|
(0.19 |
) |
|
|
|
(1.78 |
) |
|
|
|
(1.27 |
) |
|
|
|
(0.73 |
) |
|
|
|
(0.53 |
) |
|
|
|
|
|
|
|
| Net asset value, end of period/year |
|
|
$ |
13.44 |
|
|
|
$ |
13.17 |
|
|
|
$ |
12.33 |
|
|
|
$ |
16.54 |
|
|
|
$ |
17.03 |
|
|
|
$ |
15.88 |
|
| |
|
|
|
|
|
|
|
|
| Total return |
|
|
|
2.05 |
%(B) |
|
|
|
8.57 |
% |
|
|
|
(15.03 |
)% |
|
|
|
4.63 |
% |
|
|
|
12.10 |
% |
|
|
|
11.91 |
% |
|
|
|
|
|
|
|
| Ratio and supplemental data: |
|
|
|
|
|
|
|
|
|
|
|
|
|
|
|
|
|
|
|
|
|
|
|
|
|
|
|
|
|
|
| Net assets end of period/year (000’s) |
|
|
$ |
921,390 |
|
|
|
$ |
971,435 |
|
|
|
$ |
1,025,029 |
|
|
|
$ |
1,354,922 |
|
|
|
$ |
1,392,332 |
|
|
|
$ |
1,308,451 |
|
| Expenses to average net assets(C) |
|
|
|
1.03 |
%(D) |
|
|
|
1.01 |
% |
|
|
|
1.00 |
% |
|
|
|
1.02 |
% |
|
|
|
1.03 |
% |
|
|
|
1.02 |
% |
| Net investment income (loss) to average net assets |
|
|
|
2.55 |
%(D) |
|
|
|
2.12 |
% |
|
|
|
1.26 |
% |
|
|
|
1.14 |
% |
|
|
|
1.52 |
% |
|
|
|
1.95 |
% |
| Portfolio turnover rate |
|
|
|
38 |
%(B) |
|
|
|
65 |
% |
|
|
|
106 |
% |
|
|
|
83 |
% |
|
|
|
73 |
% |
|
|
|
45 |
% |
| (A) |
Calculated based on average number of shares outstanding. |
| (C) |
Does not include expenses of the underlying investments in which the Portfolio invests. |
The Notes to Financial Statements are an integral part of this report.
|
|
|
|
|
| Transamerica Series Trust |
|
|
|
Semi-Annual Financial Statements 2024 |
|
|
Page 22 |
|
|
Transamerica JPMorgan Tactical Allocation VP
NOTES TO FINANCIAL STATEMENTS
At June 30, 2024
(unaudited)
1. ORGANIZATION
Transamerica Series Trust (“TST”) is an open-end management investment company registered under the Investment Company Act of 1940, as amended (the “1940 Act”). TST applies investment company accounting and reporting guidance. TST serves as a funding vehicle for variable life insurance, variable annuity, and group annuity products. Transamerica JPMorgan Tactical Allocation VP (the “Portfolio”) is a series of TST and is classified as diversified under the 1940 Act. The Portfolio currently offers two classes of shares, Initial Class and Service Class.
The only shareholders of the Portfolio are affiliated insurance company separate accounts and/or affiliated asset allocation portfolios. Contract holders of the variable life and annuity contracts are not shareholders of the Portfolio. For ease of reference, shareholders and contract holders are collectively referred to in this report as “shareholders.”
This report must be accompanied or preceded by the Portfolio’s current prospectus, which contains additional information about the Portfolio, including risks, as well as investment objectives and strategies.
Transamerica Asset Management, Inc. (“TAM”) serves as investment manager for the Portfolio pursuant to an investment management agreement. TAM provides continuous and regular investment management services to the Portfolio. TAM supervises the Portfolio’s investments, conducts its investment program and provides supervisory, compliance and administrative services to the Portfolio.
TAM currently acts as a “manager of managers” and has hired sub-advisers to furnish day-to-day investment advice and recommendations. TAM may, in the future, determine to provide all aspects of the day-to-day management of the Portfolio without the use of a sub-adviser. When acting as a manager of managers, TAM provides investment management services that include, without limitation, the design and development of the Portfolio and its investment strategies and the ongoing review and evaluation of those investment strategies including recommending changes in strategy where it believes appropriate or advisable; the selection of one or more sub-advisers for the Portfolio employing a combination of quantitative and qualitative screens, research, analysis and due diligence; negotiation of sub-advisory agreements and fees; oversight and monitoring of sub-advisers and recommending changes to sub-advisers where it believes appropriate or advisable; recommending portfolio combinations and liquidations where it believes appropriate or advisable; selection and oversight of transition managers, as needed; regular supervision of the Portfolio’s investments; regular review and evaluation of sub-adviser performance; daily monitoring of the sub-advisers’ buying and selling of securities for the Portfolio; regular review of holdings; ongoing trade oversight and analysis; regular monitoring to ensure adherence to investment process; regular calls and periodic on-site visits with sub-advisers; portfolio construction and asset allocation when using multiple sub-advisers for the Portfolio; risk management oversight and analysis; oversight of negotiation of investment documentation and agreements; design, development, implementation and regular monitoring of the valuation process; periodic due diligence reviews of pricing vendors and vendor methodology; design, development, implementation and regular monitoring of the compliance process; respond to regulatory inquiries and determine appropriate litigation strategy, as needed; review of proxies voted by sub-advisers; oversight of preparation and review of materials for meetings of the Portfolio’s Board of Trustees (the “Board”), participation in these meetings and preparation of regular communications with the Board; oversight of preparation and review of prospectuses, shareholder reports and other disclosure materials and regulatory filings for the Portfolio; oversight of other service providers to the Portfolio, such as the custodian, the transfer agent, the Portfolio’s independent accounting firm and legal counsel; supervision of the performance of recordkeeping and shareholder relations functions for the Portfolio; and oversight of cash management services. TAM uses a variety of quantitative and qualitative tools to carry out its investment management services. TAM, not the Portfolio, is responsible for paying the sub-adviser(s) for their services, and sub-advisory fees are TAM’s expense.
TAM’s investment management services also include the provision of supervisory and administrative services to the Portfolio. These services include performing certain administrative services for the Portfolio and supervising and overseeing the administrative, clerical, recordkeeping and bookkeeping services provided to the Portfolio by State Street Bank and Trust Company (“State Street”), to whom TAM has outsourced the provision of certain sub-administration services. To the extent agreed upon by TAM and the Portfolio from time to time, TAM’s supervisory and administrative services include, but are not limited to: monitoring and verifying the custodian’s daily calculation of the Net Asset Values (“NAV”); shareholder relations functions; compliance services; valuation services; assisting in due diligence and in the oversight and monitoring of certain activities of sub-advisers and certain aspects of Portfolio investments; assisting with Portfolio combinations and liquidations; oversight of the preparation and filing, and review, of all returns and reports, in connection with federal, state and local taxes; oversight and review of regulatory reporting; supervising and coordinating the Portfolio’s custodian and dividend disbursing agent and monitoring their services to the Portfolio; assisting the Portfolio in preparing reports to shareholders; acting as liaison with the Portfolio’s independent public accountants and providing, upon request, analyses, fiscal year summaries and other audit related services; assisting in the preparation of agendas and supporting documents for and minutes of meetings of trustees and committees of trustees; assisting in the preparation of regular communications with the trustees; and providing personnel and office space, telephones and other office equipment as necessary in order for TAM to perform supervisory and administrative services to the Portfolio. The Portfolio
|
|
|
|
|
| Transamerica Series Trust |
|
|
|
Semi-Annual Financial Statements 2024 |
|
|
Page 23 |
|
|
Transamerica JPMorgan Tactical Allocation VP
NOTES TO FINANCIAL STATEMENTS (continued)
At June 30, 2024
(unaudited)
1. ORGANIZATION (continued)
pays certain fees and expenses to State Street for sub-administration services which are not administrative services covered by the management agreement with TAM or paid for through the management fees payable thereunder. For the period ended June 30, 2024, (i) the expenses paid to State Street for sub-administration services by the Portfolio are shown as a part of Other expenses within the Statement of Operations and (ii) the expenses payable to State Street for sub-administration services from the Portfolio are shown as part of Other accrued expenses within the Statement of Assets and Liabilities.
2. SIGNIFICANT ACCOUNTING POLICIES
In preparing the Portfolio’s financial statements in accordance with Generally Accepted Accounting Principles in the United States of America (“GAAP”), estimates or assumptions (which could differ from actual results) may be used that affect reported amounts and disclosures. The following is a summary of significant accounting policies followed by the Portfolio.
Foreign currency denominated investments: The accounting records of the Portfolio are maintained in U.S. dollars. Securities and other assets and liabilities denominated in foreign currencies are translated into U.S. dollars based on the closing exchange rate each day. The cost of foreign securities purchased and any realized gains or losses are translated at the prevailing exchange rates in effect on the date of the respective transaction. The Portfolio combines fluctuations from currency exchange rates and fluctuations in value when computing net realized and unrealized gains or losses from investments.
Net foreign currency gains and losses resulting from changes in exchange rates include, foreign currency fluctuations between trade date and settlement date of investment security transactions, gains and losses on forward foreign currency contracts, and the difference between the receivable amounts of interest and dividends recorded in the accounting records in U.S. dollars and the amounts actually received.
Foreign currency denominated assets may involve risks not typically associated with domestic transactions. These risks include revaluation of currencies, adverse fluctuations in foreign currency values, and possible adverse political, social, and economic developments, including those particular to a specific industry, country or region.
Security transactions and investment income: Security transactions are accounted for on the trade date. Security gains and losses are calculated on a first-in, first-out basis. Dividend income, if any, is recorded on the ex-dividend date or, in the case of foreign securities, as soon as the Portfolio is informed of the ex-dividend dates, net of foreign taxes. Non-cash dividends, if any, are recorded on the ex-dividend date at fair value. Interest income, if any, is recorded on the accrual basis from settlement date, net of foreign taxes. Fixed income premiums and discounts are amortized and/or accreted over the lives of the respective securities.
Multiple class operations, income, and expenses: Income, non-class specific expenses, and realized and unrealized gains and losses are allocated to each class daily based upon net assets. Each class bears its own specific expenses in addition to the allocated non-class specific expenses.
Distributions to shareholders: Distributions are recorded on the ex-dividend date and are determined in accordance with federal income tax regulations, which may differ from GAAP.
Foreign taxes: The Portfolio may be subject to taxes imposed by the countries in which it invests, with respect to its investments in issuers existing or operating in such countries. The Portfolio may also be subject to foreign taxes on income, gains on investments, or currency repatriation, a portion of which may be recoverable. The Portfolio accrues such taxes and recoveries as applicable when the related income or capital gains are earned or unrealized, and based upon the current interpretation of tax rules and regulations that exist in the markets in which the Portfolio invests. Some countries require governmental approval for the repatriation of investment income, capital, or the proceeds of sales earned by foreign investors. In addition, if there is deterioration in a country’s balance of payments or for other reasons, a country may impose temporary restrictions of foreign capital remittances abroad.
Commission recapture: The sub-adviser(s), to the extent consistent with the best execution and usual commission rate policies and practices, may elect to place security transactions of the Portfolio with broker/dealers with which TST has established a commission recapture program. A commission recapture program is any arrangement under which a broker/dealer applies a portion of the commissions received by such broker/dealer on the security transactions to the Portfolio. In no event will commissions, paid by the Portfolio, be used to pay expenses that would otherwise be borne by any other Portfolios within TST, or by any other party.
There were no commissions recaptured during the period ended June 30, 2024 by the Portfolio.
|
|
|
|
|
| Transamerica Series Trust |
|
|
|
Semi-Annual Financial Statements 2024 |
|
|
Page 24 |
|
|
Transamerica JPMorgan Tactical Allocation VP
NOTES TO FINANCIAL STATEMENTS (continued)
At June 30, 2024
(unaudited)
2. SIGNIFICANT ACCOUNTING POLICIES (continued)
Indemnification: In the normal course of business, the Portfolio enters into contracts that contain a variety of representations that provide general indemnifications. The Portfolio’s maximum exposure under these arrangements is unknown, as this would involve future claims that may be made against the Portfolio and/or its affiliates that have not yet occurred. However, based on experience, the Portfolio expects the risk of loss to be remote.
3. INVESTMENT VALUATION
TAM has been designated as the Portfolio’s valuation designee pursuant to Rule 2a-5 under the 1940 Act with responsibility for fair valuation subject to oversight by the Portfolio’s Board of Trustees. The net asset value of the Portfolio is computed as of the official close of the New York Stock Exchange (“NYSE”) each day the NYSE is open for business.
TAM utilizes various methods to measure the fair value of its investments on a recurring basis. GAAP establishes a hierarchy that prioritizes inputs to valuation methods. The inputs or methodology used for valuing securities are not necessarily an indication of the risk associated with investing in those securities. The three levels (“Levels”) of inputs of the fair value hierarchy are defined as follows:
Level 1—Unadjusted quoted prices in active markets for identical securities.
Level 2—Inputs, other than quoted prices included in Level 1, which are observable, either directly or indirectly. These inputs may include quoted prices for the identical instrument on an inactive market, prices for similar instruments, interest rates, prepayment speeds, credit risk, yield curves, default rates, and similar data.
Level 3—Unobservable inputs based on the best information available in the circumstances, to the extent observable inputs are not available, which may include TAM’s own assumptions used in determining the fair value of the Portfolio’s investments and derivative instruments.
The inputs used to measure fair value may fall into different Levels of the fair value hierarchy. In such cases, for disclosure purposes, the Level in the fair value hierarchy that is assigned to the fair value measurement of a security is determined based on the lowest Level input that is significant to the fair value measurement in its entirety. Certain investments that are measured at fair value using NAV per share, or its equivalent, using the “practical expedient” have not been classified in the fair value Levels. The hierarchy classification of inputs used to value the Portfolio’s investments at June 30, 2024, is disclosed within the Investment Valuation section of the Schedule of Investments.
The availability of observable inputs can vary from security to security and is affected by a wide variety of factors, including, but not limited to, the type of security, whether the security is new and not yet established in the marketplace, the liquidity of markets, and other characteristics particular to the security. To the extent that valuation is based on models or inputs that are less observable or unobservable in the market, the determination of fair value requires more judgment. Accordingly, the degree of judgment exercised in determining fair value is generally greatest for instruments categorized in Level 3. Due to the inherent uncertainty of valuation, the determination of values may differ significantly from values that would have been realized had a ready market for investments existed, and the differences could be material.
Fair value measurements: Descriptions of the valuation techniques applied to the Portfolio’s significant categories of assets and liabilities measured at fair value on a recurring basis are as follows:
Asset-backed securities: The fair value of asset-backed securities is estimated based on models that consider the estimated cash flows of each tranche of the entity, establish a benchmark yield, and develop an estimated tranche specific spread to the benchmark yield based on the unique attributes of the tranche. To the extent the inputs are observable and timely, the values would generally be categorized in Level 2 of the fair value hierarchy; otherwise they would be categorized in Level 3.
Corporate debt securities: The fair value of corporate debt securities is estimated using various techniques, which consider recently executed transactions in securities of the issuer or comparable issuers, market price quotations (where observable), bond spreads, fundamental data relating to the issuer, and credit default swap spreads adjusted for any basis difference between cash and derivative instruments. While most corporate debt securities are categorized in Level 2 of the fair value hierarchy, in instances where lower relative weight is placed on transaction prices, quotations, or similar observable inputs, they are categorized in Level 3.
Equity securities: Securities are stated at the last reported sales price or closing price on the day of valuation taken from the primary exchange where the security is principally traded. To the extent these securities are actively traded and valuation adjustments are not
|
|
|
|
|
| Transamerica Series Trust |
|
|
|
Semi-Annual Financial Statements 2024 |
|
|
Page 25 |
|
|
Transamerica JPMorgan Tactical Allocation VP
NOTES TO FINANCIAL STATEMENTS (continued)
At June 30, 2024
(unaudited)
3. INVESTMENT VALUATION (continued)
applied, they are categorized in Level 1 of the fair value hierarchy. Equities traded on inactive markets or valued by reference to similar instruments are generally categorized in Level 2 or Level 3 if inputs are unobservable.
Foreign equity securities: Securities in which the primary trading market closes at the same time or after the NYSE, are valued based on quotations from the primary market in which they are traded and are categorized in Level 1. Because many foreign securities markets and exchanges close prior to the close of the NYSE, closing prices for foreign securities in those markets or on those exchanges do not reflect the events that occur after that close. Certain foreign securities may be fair valued using a pricing service that considers the correlation of the trading patterns of the foreign security to the intraday trading in the U.S. markets for investments such as American Depositary Receipts, financial futures, or ETFs and the movement of certain indices of securities based on a statistical analysis of their historical relationship; such valuations generally are categorized in Level 2.
Foreign government obligations: Foreign government obligations are normally valued using a model that incorporates market observable data such as reported sales of similar securities, broker quotes, yields, bids, offers, and reference data. Certain securities are valued by principally using dealer quotations. Foreign government obligations generally are categorized in Level 2 of the fair value hierarchy, or Level 3 if inputs are unobservable.
Investment companies: Certain investment companies are valued at the NAV as the practical expedient. These investment companies are not included within the fair value hierarchy. Certain other investment companies are valued at the actively traded NAV and no valuation adjustments are applied. These investment companies are categorized in Level 1 of the fair value hierarchy.
Mortgage-backed securities: The fair value of mortgage-backed securities is estimated based on models that consider issuer type, coupon, cash flows, mortgage prepayment projection tables and adjustable rate mortgage evaluations that incorporate index data, periodic life caps and the next coupon reset date. To the extent the inputs are observable and timely, the values would generally be categorized in Level 2 of the fair value hierarchy; otherwise they are categorized in Level 3.
U.S. government agency obligations: U.S. government agency obligations are comprised of two main categories consisting of agency issued debt and mortgage pass-throughs. Generally, agency issued debt securities are valued in a manner similar to U.S. government obligations. Mortgage pass-throughs include to be announced (“TBA”) securities and mortgage pass-through certificates. Generally, TBA securities and mortgage pass-throughs are valued using dealer quotations. Depending on market activity levels and whether quotations or other observable data are used, these securities are typically categorized in Level 2 of the fair value hierarchy; otherwise they would be categorized in Level 3.
U.S. government obligations: U.S. government obligations are normally valued using a model that incorporates market observable data such as reported sales of similar securities, broker quotes, yields, bids, offers, and reference data. Certain securities are valued by principally using dealer quotations. U.S. government obligations generally are categorized in Level 2 of the fair value hierarchy, or Level 3 if inputs are unobservable.
Short-term notes: The Portfolio normally values short-term government and U.S. government agency securities using a model that incorporates market observable data such as reported sales of similar securities, broker quotes, yields, bids, offers and reference data. Certain securities are valued by principally using dealer quotations. Short-term government and U.S. government agency securities generally are categorized in Level 2 of the fair value hierarchy, or Level 3 if inputs are unobservable.
Securities lending collateral: Securities lending collateral is invested in a money market fund which is valued at the actively traded NAV and no valuation adjustments are applied. Securities lending collateral is categorized in Level 1 of the fair value hierarchy.
Repurchase agreements: Repurchase agreements are valued at cost, which approximates fair value. To the extent the inputs are observable and timely, the values are generally categorized in Level 2 of the fair value hierarchy.
Derivative instruments: Centrally cleared or listed derivatives that are actively traded are valued based on quoted prices from the exchange and are categorized in Level 1 of the fair value hierarchy. Over-the-counter (“OTC”) derivative contracts include forward, swap, swaption, and option contracts related to interest rates, foreign currencies, credit standing of reference entities, equity prices, or commodity prices. Depending on the product and the terms of the transaction, the fair value of the OTC derivative products are modeled taking into account the counterparties’ creditworthiness and using a series of techniques, including simulation models. Many pricing models do not entail material subjectivity because the methodologies employed do not necessitate significant judgments and the pricing inputs are observed
|
|
|
|
|
| Transamerica Series Trust |
|
|
|
Semi-Annual Financial Statements 2024 |
|
|
Page 26 |
|
|
Transamerica JPMorgan Tactical Allocation VP
NOTES TO FINANCIAL STATEMENTS (continued)
At June 30, 2024
(unaudited)
3. INVESTMENT VALUATION (continued)
from actively quoted markets, as is the case of interest rate swap and option contracts. The majority of OTC derivative products valued by the Portfolio using pricing models fall into this category and are categorized within Level 2 of the fair value hierarchy or Level 3 if inputs are unobservable.
4. SECURITIES AND OTHER INVESTMENTS
Real estate investment trusts (“REITs”): REITs are pooled investment vehicles which invest primarily in income producing real estate, or real estate related loans or interests. Distributions received by REITs are classified at management’s estimate of the dividend income, return of capital and capital gains. Estimates are based on information available at year-end, which includes the previous fiscal year’s classification. The actual amounts of dividend income, return of capital, and capital gains are only determined by each REIT after the fiscal year end and may differ from the estimated amounts. Upon notification from the REITs, some of the distributions received may be re-classified and recorded as a return of capital or capital gains. There are certain additional risks involved in investing in REITs. These include, but are not limited to, economic conditions, changes in zoning laws, real estate values, property taxes, and interest rates.
REITs held at June 30, 2024, if any, are identified within the Schedule of Investments.
Treasury inflation-protected securities (“TIPS”): The Portfolio may invest in TIPS, which are fixed income securities whose principal value is periodically adjusted according to the rate of inflation/deflation. If the index measuring inflation/deflation rises or falls, the principal value of TIPS will be adjusted upward or downward, and consequently the interest payable on these securities (calculated with respect to a larger or smaller principal amount) will be increased or reduced, respectively. Repayment of the original bond principal upon maturity (as adjusted for inflation) is guaranteed in the case of U.S. Treasury inflation-indexed bonds and notes. For bonds and notes that do not provide a similar guarantee, the adjusted principal value of the bond repaid at maturity may be less than the original principal.
TIPS held at June 30, 2024, if any, are included within the Schedule of Investments. The adjustments, if any, to principal due to inflation/deflation are reflected as increases/decreases to Interest income within the Statement of Operations, with a corresponding adjustment to Investments, at cost within the Statement of Assets and Liabilities.
When-issued, delayed-delivery, forward, and to be announced (“TBA”) commitment transactions: The Portfolio may purchase or sell securities on a when-issued, delayed-delivery, forward and TBA commitment basis. When-issued and forward commitment transactions are made conditionally because a security, although authorized, has not yet been issued in the market. Settlement of such transactions normally occurs within a month or more after the purchase or sale commitment is made. The Portfolio engages in when-issued and forward commitment transactions to obtain an advantageous price and yield at the time of the transaction. The Portfolio engages in when-issued and forward commitment transactions for the purpose of acquiring securities, but may enter into a separate agreement to sell the securities before the settlement date. Since the value of securities purchased may fluctuate prior to settlement, the Portfolio may be required to pay more at settlement than the security is worth. In addition, the Portfolio is not entitled to any of the interest earned prior to settlement.
Delayed-delivery transactions involve a commitment by the Portfolio to purchase or sell securities for a predetermined price or yield, with payment and delivery taking place beyond the customary settlement period. When delayed-delivery transactions are outstanding, the Portfolio will segregate with its custodian either cash, U.S. government securities, or other liquid assets at least equal to the value or purchase commitments until payment is made. When purchasing a security on a delayed-delivery basis, the Portfolio assumes the rights and risks of ownership of the security, including the risk of price and yield fluctuations. These transactions also involve a risk to the Portfolio if the other party to the transaction defaults on its obligation to make payment or delivery, and the Portfolio is delayed or prevented from completing the transaction. The Portfolio may dispose of or renegotiate a delayed-delivery transaction after it is entered into, which may result in a realized gain or loss. When the Portfolio sells a security on a delayed-delivery basis, the Portfolio does not participate in future gains and losses on the security.
TBA commitments are entered into to purchase or sell securities for a fixed price at a future date, typically not to exceed 45 days. TBAs are considered securities in themselves, and involve a risk of loss if the value of the security to be purchased declines, or the value of the security sold increases, prior to settlement date, in addition to the risk of decline in the value of a Portfolio’s other assets. Unsettled TBA commitments are valued at the current value of the underlying securities. TBA collateral requirements are typically calculated by netting the mark-to-market amount for each transaction and comparing that amount to the value of the collateral currently pledged by a Portfolio and the counterparty. Cash collateral that has been pledged to cover the obligations of a Portfolio and cash collateral received from the counterparty, if any, is reported separately in the Statement of Assets and Liabilities as Cash collateral pledged at broker for TBA commitments or Cash collateral at broker for TBA commitments, respectively. Non-cash collateral pledged by a Portfolio, if any, is
|
|
|
|
|
| Transamerica Series Trust |
|
|
|
Semi-Annual Financial Statements 2024 |
|
|
Page 27 |
|
|
Transamerica JPMorgan Tactical Allocation VP
NOTES TO FINANCIAL STATEMENTS (continued)
At June 30, 2024
(unaudited)
4. SECURITIES AND OTHER INVESTMENTS (continued)
disclosed within the Schedule of Investments. Typically, a Portfolio is permitted to sell, re-pledge or use the collateral it receives; however, the counterparty is not permitted. To the extent amounts due to a Portfolio are not fully collateralized, contractually or otherwise, a Portfolio bears the risk of loss from counterparty non-performance.
When-issued, delayed-delivery, forward and TBA commitment transactions held at June 30, 2024, if any, are identified within the Schedule of Investments. Open trades, if any, are reflected as When-issued, delayed-delivery, forward and TBA commitments purchased or sold within the Statement of Assets and Liabilities.
5. BORROWINGS AND OTHER FINANCING TRANSACTIONS
The Portfolio may engage in borrowing transactions as a means of raising cash to satisfy redemption requests, for other temporary or emergency purposes or, to the extent permitted by its investment policies, to raise additional cash to be invested in other securities or instruments. When the Portfolio invests borrowing proceeds in other securities, the Portfolio will bear the risk that the market value of the securities in which such proceeds are invested goes down and is insufficient to repay the borrowed proceeds. The Portfolio may borrow on a secured or on an unsecured basis. If the Portfolio enters into a secured borrowing arrangement, a portion of the Portfolio’s assets will be used as collateral. The 1940 Act requires the Portfolio to maintain asset coverage of at least 300% of the amount of its borrowings. Asset coverage means the ratio that the value of the Portfolio’s total assets, minus liabilities other than borrowings, bears to the aggregate amount of all borrowings. Although complying with this requirement has the effect of limiting the amount that the Portfolio may borrow, it does not otherwise mitigate the risks of entering into borrowing transactions.
Interfund lending: The Portfolio, along with other funds and portfolios advised by TAM, may participate in an interfund lending program pursuant to exemptive relief granted by the Securities and Exchange Commission on January 18, 2017. This program allows the Portfolio to lend to and borrow from other funds and portfolios advised by TAM. Interfund lending transactions are subject to the conditions of the exemptive relief which places limits on the amount of lending or borrowing a Portfolio may participate in under the program. Interest earned or paid on an interfund lending transaction will be based on the average of certain current market rates. For the period ended June 30, 2024, the Portfolio has not utilized the program.
Repurchase agreements: In a repurchase agreement, the Portfolio purchases a security and simultaneously commits to resell that security to the seller at an agreed-upon price on an agreed-upon date. Securities purchased subject to a repurchase agreement are held at the Portfolio’s custodian, or designated sub-custodian related to tri-party repurchase agreements, and, pursuant to the terms of the repurchase agreement, must be collateralized by securities with an aggregate market value greater than or equal to 100% of the resale price. The Portfolio will bear the risk of value fluctuations until the securities can be sold and may encounter delays and incur costs in liquidating the securities. In the event of bankruptcy or insolvency of the seller, delays and costs may be incurred.
Repurchase agreements are subject to netting agreements, which are agreements between the Portfolio and its counterparties that provide for the net settlement of all transactions and collateral with the Portfolio, through a single payment, in the event of default or termination. Amounts presented within the Schedule of Investments, and as part of Repurchase agreements, at value within the Statement of Assets and Liabilities are shown on a gross basis. The value of the related collateral for each repurchase agreement, as reflected within the Schedule of Investments, exceeds the value of each repurchase agreement at June 30, 2024.
Repurchase agreements at June 30, 2024, if any, are included within the Schedule of Investments and Statement of Assets and Liabilities.
Securities lending: The Portfolio may lend securities to qualified financial institutions, brokers and dealers. State Street serves as securities lending agent to the Portfolio pursuant to a Securities Lending Agreement. Loans of securities are terminable at any time and the borrower, after notice, is required to return borrowed securities within the standard time period for settlement of securities transactions. The lending of securities exposes the Portfolio to risks such as: the borrowers may fail to return the loaned securities or may not be able to provide additional collateral, the Portfolio may experience delays in recovery of the loaned securities or delays in access to collateral, or the Portfolio may experience losses related to the investment collateral. To minimize certain risks, loan counterparties pledge cash, securities issued or guaranteed by the U.S. Government and irrevocable letters of credit issued by banks as collateral. The initial collateral received by the Portfolio is required to have a value of at least 102% of the current value of the loaned securities traded on U.S. exchanges, and a value of at least 105% for all other securities. Typically the lending agent is not permitted to sell, re-pledge or use cash and non-cash collateral it receives. The lending agent has agreed to indemnify the Portfolio in the case of default of any securities borrower.
|
|
|
|
|
| Transamerica Series Trust |
|
|
|
Semi-Annual Financial Statements 2024 |
|
|
Page 28 |
|
|
Transamerica JPMorgan Tactical Allocation VP
NOTES TO FINANCIAL STATEMENTS (continued)
At June 30, 2024
(unaudited)
5. BORROWINGS AND OTHER FINANCING TRANSACTIONS (continued)
The Portfolio receives compensation for lending securities from interest or dividends earned on the cash, U.S. Government securities and irrevocable letters of credit held as collateral, less associated fees and expenses. Such income is reflected in Net income from securities lending within the Statement of Operations. Cash collateral received is invested in the State Street Navigator Securities Lending Trust — Government Money Market Portfolio.
The value of loaned securities and related cash and non-cash collateral outstanding at June 30, 2024, if any, are shown on a gross basis within the Schedule of Investments.
The following table reflects a breakdown of transactions accounted for as secured borrowings, the gross obligation by the type, and the remaining contractual maturity of those transactions as of June 30, 2024.
|
|
|
|
|
|
|
|
|
|
|
|
|
|
|
|
|
|
|
|
|
| |
|
Remaining Contractual Maturity of the Agreements |
|
|
|
|
|
| |
|
Overnight and Continuous |
|
Less Than 30 Days |
|
Between 30 & 90 Days |
|
Greater Than 90 Days |
|
Total |
|
|
|
|
|
|
| Securities Lending Transactions |
|
|
|
|
|
|
|
|
|
|
|
|
|
|
|
|
|
|
|
|
| Common Stocks |
|
$ |
451,682 |
|
|
$ |
— |
|
|
$ |
— |
|
|
$ |
— |
|
|
$ |
451,682 |
|
| Corporate Debt Securities |
|
|
1,554,483 |
|
|
|
— |
|
|
|
— |
|
|
|
— |
|
|
|
1,554,483 |
|
| U.S. Government Agency Obligations |
|
|
379,108 |
|
|
|
— |
|
|
|
— |
|
|
|
— |
|
|
|
379,108 |
|
| |
|
|
|
|
|
| Total Securities Lending Transactions |
|
$ |
2,385,273 |
|
|
$ |
— |
|
|
$ |
— |
|
|
$ |
— |
|
|
$ |
2,385,273 |
|
| Total Borrowings |
|
$ |
2,385,273 |
|
|
$ |
— |
|
|
$ |
— |
|
|
$ |
— |
|
|
$ |
2,385,273 |
|
| |
|
|
|
|
|
|
|
|
|
|
|
|
|
|
|
|
|
|
|
|
6. RISK EXPOSURES AND THE USE OF DERIVATIVE INSTRUMENTS
The Portfolio’s investment strategies allow the Portfolio to use various types of derivative contracts, including option contracts, swap agreements, futures contracts, and forward foreign currency contracts. Derivatives are investments whose value is primarily derived from underlying assets, indices or reference rates and may be transacted on an exchange or OTC.
Market Risk Factors: In pursuit of the Portfolio’s investment strategies, the Portfolio may seek to use derivatives to increase or decrease its exposure to certain market risks, including:
Interest rate risk: Interest rate risk relates to the fluctuations in the value of fixed income securities due to changes in the prevailing levels of market interest rates.
Foreign exchange rate risk: Foreign exchange rate risk relates to fluctuations in the value of an asset or liability due to changes in the currency exchange rates.
Equity risk: Equity risk relates to the change in value of equity securities as they relate to increases or decreases in the general market.
Credit risk: Credit risk relates to the ability of the issuer of a financial instrument to make further principal or interest payments on an obligation or commitment that it has to the Portfolio.
Commodity risk: Commodity risk relates to the change in value of commodities or commodity indices as they relate to increases or decreases in the commodities market. Commodities are physical assets that have tangible properties. Examples of these types of assets are crude oil, heating oil, metals, livestock, and agricultural products.
The Portfolio is also exposed to additional risks from investing in derivatives, such as liquidity and counterparty credit risk. Liquidity risk is the risk that the Portfolio will be unable to sell or close out the derivative in the open market in a timely manner. Counterparty credit risk is the risk that the counterparty will not be able to fulfill its obligations to the Portfolio. Investing in derivatives may also involve greater risks than investing directly in the underlying assets, such as losses in excess of any initial investment and collateral received. In addition, there may be the risk that the change in value of the derivative contract does not correspond to the change in value of the underlying instrument.
The Portfolio’s exposure to market risk factors and certain other associated risks are summarized by derivative type as follows:
|
|
|
|
|
| Transamerica Series Trust |
|
|
|
Semi-Annual Financial Statements 2024 |
|
|
Page 29 |
|
|
Transamerica JPMorgan Tactical Allocation VP
NOTES TO FINANCIAL STATEMENTS (continued)
At June 30, 2024
(unaudited)
6. RISK EXPOSURES AND THE USE OF DERIVATIVE INSTRUMENTS (continued)
Futures contracts: The Portfolio is subject to equity risk, credit risk, commodity risk, interest rate risk and foreign exchange rate risk in the normal course of pursuing its investment objective. The Portfolio uses futures contracts to gain exposure to, or hedge against, changes in the value of equities and commodities, interest rates, or foreign currencies. A futures contract represents a commitment for the future purchase or sale of an asset at a specified price on a specified date. Upon entering into such contracts, the Portfolio is required to deposit with the broker, either in cash or in securities, an initial margin in an amount equal to a certain percentage of the contract amount. Subsequent payments (variation margin) are paid or received by the Portfolio, depending on the daily fluctuations in the value of the contract, and are recorded for financial statement purposes as unrealized gains or losses by the Portfolio. Upon entering into such contracts, the Portfolio bears the risk of equity and commodity prices, interest rates, or exchange rates moving unexpectedly, in which case, the Portfolio may not achieve the anticipated benefits of the futures contracts and may realize losses. With futures, there is minimal counterparty credit risk to the Portfolio since futures are exchange-traded and the exchange’s clearinghouse, as counterparty to all exchange-traded futures, guarantees the futures against default. Futures contracts are generally entered into on a regulated futures exchange and cleared through a clearinghouse associated with the exchange.
Open futures contracts at June 30, 2024 are listed within the Schedule of Investments. Variation margin, if applicable, is shown in Variation margin receivable or payable on futures contracts within the Statement of Assets and Liabilities.
The following is a summary of the location and the Portfolio’s fair values of derivative investments disclosed within the Statement of Assets and Liabilities, categorized by primary market risk exposure as of June 30, 2024.
|
|
|
|
|
|
|
|
|
|
|
|
|
|
|
|
|
|
|
|
|
|
|
|
|
| Asset Derivatives |
|
| Location |
|
Interest Rate Contracts |
|
Foreign Exchange Contracts |
|
Equity Contracts |
|
Credit Contracts |
|
|
Commodity Contracts |
|
|
Total |
|
|
|
|
|
|
|
|
| Futures contracts: |
|
|
|
|
|
|
|
|
|
|
|
|
|
|
|
|
|
|
|
|
|
|
|
|
| Total distributable earnings (accumulated losses) (A)(B) |
|
$ |
781,701 |
|
|
$ |
160,181 |
|
|
$ |
232,397 |
|
|
$ |
— |
|
|
$ |
— |
|
|
$ |
1,174,279 |
|
| |
|
|
|
|
|
|
| Total |
|
$ |
781,701 |
|
|
$ |
160,181 |
|
|
$ |
232,397 |
|
|
$ |
— |
|
|
$ |
— |
|
|
$ |
1,174,279 |
|
| |
|
|
|
|
|
|
|
|
|
|
|
|
|
|
|
|
|
|
|
|
|
|
|
|
|
|
|
|
|
|
|
|
|
|
|
|
|
|
|
|
|
|
|
|
|
|
|
|
|
| Liability Derivatives |
|
| Location |
|
Interest Rate Contracts |
|
Foreign Exchange Contracts |
|
Equity Contracts |
|
Credit Contracts |
|
|
Commodity Contracts |
|
|
Total |
|
|
|
|
|
|
|
|
| Futures contracts: |
|
|
|
|
|
|
|
|
|
|
|
|
|
|
|
|
|
|
|
|
|
|
|
|
| Total distributable earnings (accumulated losses) (A)(B) |
|
$ |
(928,122 |
) |
|
$ |
(40,648 |
) |
|
$ |
(268,617 |
) |
|
$ |
— |
|
|
$ |
— |
|
|
$ |
(1,237,387 |
) |
| |
|
|
|
|
|
|
| Total |
|
$ |
(928,122 |
) |
|
$ |
(40,648 |
) |
|
$ |
(268,617 |
) |
|
$ |
— |
|
|
$ |
— |
|
|
$ |
(1,237,387 |
) |
| |
|
|
|
|
|
|
|
|
|
|
|
|
|
|
|
|
|
|
|
|
|
|
|
|
| (A) |
May include exchange-traded derivatives which are not subject to a master netting arrangement, or another similar arrangement. |
| (B) |
Included within unrealized appreciation (depreciation) on futures contracts as reported in the Schedule of Investments. Only current day’s variation margin is reported within the Statement of Assets and Liabilities. |
The following is a summary of the location and the effect of derivative investments within the Statement of Operations, categorized by primary market risk exposure as of June 30, 2024.
|
|
|
|
|
|
|
|
|
|
|
|
|
|
|
|
|
|
|
|
|
|
|
|
|
| Realized Gain (Loss) on Derivative Instruments |
|
| Location |
|
Interest Rate Contracts |
|
Foreign Exchange Contracts |
|
Equity Contracts |
|
Credit Contracts |
|
|
Commodity Contracts |
|
|
Total |
|
|
|
|
|
|
|
|
| Futures contracts |
|
$ |
(1,133,114 |
) |
|
$ |
(766,442 |
) |
|
$ |
(1,792,881 |
) |
|
$ |
— |
|
|
$ |
— |
|
|
$ |
(3,692,437 |
) |
| |
|
|
|
|
|
|
| Total |
|
$ |
(1,133,114 |
) |
|
$ |
(766,442 |
) |
|
$ |
(1,792,881 |
) |
|
$ |
— |
|
|
$ |
— |
|
|
$ |
(3,692,437 |
) |
| |
|
|
|
|
|
|
|
|
|
|
|
|
|
|
|
|
|
|
|
|
|
|
|
|
|
|
|
|
|
| Transamerica Series Trust |
|
|
|
Semi-Annual Financial Statements 2024 |
|
|
Page 30 |
|
|
Transamerica JPMorgan Tactical Allocation VP
NOTES TO FINANCIAL STATEMENTS (continued)
At June 30, 2024
(unaudited)
6. RISK EXPOSURES AND THE USE OF DERIVATIVE INSTRUMENTS (continued)
|
|
|
|
|
|
|
|
|
|
|
|
|
|
|
|
|
|
|
|
|
|
|
|
|
| Net Change in Unrealized Appreciation (Depreciation) on Derivative Instruments |
|
| Location |
|
Interest Rate Contracts |
|
Foreign Exchange Contracts |
|
Equity Contracts |
|
Credit Contracts |
|
|
Commodity Contracts |
|
|
Total |
|
|
|
|
|
|
|
|
| Futures contracts |
|
$ |
(10,904,988 |
) |
|
$ |
(43,119 |
) |
|
$ |
(1,512,309 |
) |
|
$ |
— |
|
|
$ |
— |
|
|
$ |
(12,460,416 |
) |
| |
|
|
|
|
|
|
| Total |
|
$ |
(10,904,988 |
) |
|
$ |
(43,119 |
) |
|
$ |
(1,512,309 |
) |
|
$ |
— |
|
|
$ |
— |
|
|
$ |
(12,460,416 |
) |
| |
|
|
|
|
|
|
|
|
|
|
|
|
|
|
|
|
|
|
|
|
|
|
|
|
The following is a summary of the ending monthly average volume on derivative activity during the period ended June 30, 2024.
|
|
|
|
|
| Futures contracts: |
|
|
|
|
| Average notional value of contracts — long |
|
$ |
315,767,686 |
|
| Average notional value of contracts — short |
|
|
(154,426,074 |
) |
Collateral requirements: Collateral or margin requirements are set by the broker or exchange clearing house for exchange-traded derivatives (futures contracts, exchange-traded options, and exchange-traded swap agreements) while collateral terms are contract specific for OTC derivatives (forward foreign currency exchange contracts, OTC options, and OTC swap agreements). For OTC derivatives, under standard derivatives agreements, the Portfolio may be required to pledge collateral on derivatives to a counterparty if the Portfolio is in a net liability position, and receive collateral if in a net positive position. For financial reporting purposes, cash collateral that has been pledged by the Portfolio to cover obligations, if any, is reported in Cash collateral at broker within the Statement of Assets and Liabilities. Cash collateral that has been received by the Portfolio from a counterparty, if any, is reported separately in Cash collateral pledged at custodian and/or broker within the Statement of Assets and Liabilities. Non-cash collateral pledged to the Portfolio, if any, is disclosed within the Schedule of Investments.
Generally, the amount of collateral due from or to a party must exceed a minimum transfer amount threshold before a transfer has been made. Typically a counterparty is not permitted to sell, re-pledge or use cash and non-cash collateral it receives. The Portfolio generally does not use non-cash collateral that it receives but may, absent default or certain other circumstances, be permitted to use cash collateral received. In such cases, interest may be paid pursuant to the collateral arrangement with the counterparty.
To the extent amounts due to the Portfolio from its counterparties are not fully collateralized, contractually or otherwise, the Portfolio bears the risk of loss from counterparty non-performance. Additionally, to the extent the Portfolio has delivered collateral to a counterparty, the Portfolio bears the risk of loss from a counterparty in the event the counterparty fails to return such collateral. Counterparties may immediately terminate derivatives contracts if the Portfolio fails to maintain sufficient asset coverage for its contracts or its net assets decline by stated percentages. Collateral may not be required for all derivative contracts.
7. RISK FACTORS
Investing in the Portfolio involves certain key risks related to the Portfolio’s trading activity. Please reference the Portfolio’s prospectus for a more complete discussion of the following risk(s), as well as other risks of investing in the Portfolio.
Market risk: The market prices of the Portfolio’s securities or other assets may go up or down, sometimes rapidly or unpredictably, due to factors such as economic events, inflation, changes in interest rates, governmental actions or interventions, actions taken by the U.S. Federal Reserve or foreign central banks, market disruptions caused by tariffs, trade disputes or other factors, political developments, armed conflicts, economic sanctions, cybersecurity events, investor sentiment, the global and domestic effects of widespread or local health, weather or climate events, and other factors that may or may not be related to the issuer of the security or other asset. If the market prices of the Portfolio’s securities and assets fall, the value of your investment in the Portfolio could go down.
Economies and financial markets throughout the world are increasingly interconnected. Events or circumstances in one or more countries or regions could be highly disruptive to, and have profound impacts on, global economies or markets. As a result, whether or not the Portfolio invests in securities of issuers located in or with significant exposure to the countries directly affected, the value and liquidity of the Portfolio’s investments may go down.
|
|
|
|
|
| Transamerica Series Trust |
|
|
|
Semi-Annual Financial Statements 2024 |
|
|
Page 31 |
|
|
Transamerica JPMorgan Tactical Allocation VP
NOTES TO FINANCIAL STATEMENTS (continued)
At June 30, 2024
(unaudited)
7. RISK FACTORS (continued)
Equity securities risk: Equity securities generally have greater risk of loss than debt securities. Stock markets are volatile and the value of equity securities may go up or down, sometimes rapidly and unpredictably. The market price of an equity security may fluctuate based on overall market conditions, such as real or perceived adverse economic or political conditions or trends, tariffs and trade disruptions, inflation, substantial economic downturn or recession, changes in interest rates, or adverse investor sentiment. The market price of an equity security also may fluctuate based on real or perceived factors affecting a particular industry or industries or the company itself. If the market prices of the equity securities owned by the Portfolio fall, the value of your investment in the Portfolio will decline. The Portfolio may lose its entire investment in the equity securities of an issuer. A change in financial condition or other event affecting a single issuer may adversely impact securities markets as a whole.
Fixed-income securities risk: Risks of fixed-income securities include credit risk, interest rate risk, counterparty risk, prepayment risk, extension risk, valuation risk, and liquidity risk. The value of fixed-income securities may go up or down, sometimes rapidly and unpredictably, due to general market conditions, such as real or perceived adverse economic or political conditions, tariffs and trade disruptions, inflation, changes in interest rates, lack of liquidity in the bond markets or adverse investor sentiment. In addition, the value of a fixed-income security may decline if the issuer or other obligor of the security fails to pay principal and/or interest, otherwise defaults or has its credit rating downgraded or is perceived to be less creditworthy, or the credit quality or value of any underlying assets declines. If the value of fixed-income securities owned by the Portfolio falls, the value of your investment will go down. The Portfolio may lose its entire investment in the fixed-income securities of an issuer.
Real estate investment trusts (“REITs”) risk: Investing in real estate investment trusts (“REITs”) involves unique risks. When the Portfolio invests in REITs, it is subject to risks generally associated with investing in real estate. A REIT’s performance depends on the types and locations of the properties it owns, how well it manages those properties and cash flow. REITs may have limited financial resources, may trade less frequently and in limited volume, may engage in dilutive offerings, and may be subject to more abrupt or erratic price movements than the overall securities markets. In addition to its own expenses, the Portfolio will indirectly bear its proportionate share of any management and other expenses paid by REITs in which it invests. U.S. REITs are subject to a number of highly technical tax-related rules and requirements; and a U.S. REIT’s failure to qualify for the favorable U.S. federal income tax treatment generally available to U.S. REITs could result in corporate-level taxation, significantly reducing the return on an investment to the Portfolio.
8. FEES AND OTHER AFFILIATED TRANSACTIONS
TST serves as a funding vehicle for certain affiliated asset allocation portfolios and certain affiliated separate accounts of Transamerica Life Insurance Company (“TLIC”) and Transamerica Financial Life Insurance Company.
TAM, the Portfolio’s investment manager, is directly owned by TLIC and AUSA Holding, LLC (“AUSA”), both of which are indirect, wholly owned subsidiaries of Aegon Ltd. TLIC is owned by Commonwealth General Corporation (“Commonwealth”). Commonwealth and AUSA are wholly owned by Transamerica Corporation (DE). Transamerica Corporation (DE) is wholly owned by Aegon International B.V., which is wholly owned by Aegon Ltd., a Bermuda exempted company with liability limited by shares (formerly, Aegon NV, a Netherlands corporation) and a publicly traded international insurance group.
Transamerica Fund Services, Inc. (“TFS”) is the Portfolio’s transfer agent. Transamerica Capital, Inc. (“TCI”) is the Portfolio’s distributor/principal underwriter. TAM, TFS and TCI are affiliates of Aegon Ltd.
Certain officers and trustees of the Portfolio may also be officers and/or trustees of TAM, TFS and TCI. No interested trustee who is deemed an interested person due to current or former service with TAM or an affiliate of TAM receives compensation from the Portfolio. The Portfolio does pay non-interested persons (independent trustees), as disclosed in Trustee and CCO fees within the Statement of Operations.
Investment management fees: TAM serves as the Portfolio’s investment manager, performing administration as well as investment advisory services. TAM renders investment advisory, supervisory, and administration services under an investment management agreement and the Portfolio pays a single management fee, which is reflected in Investment management fees within the Statement of Operations.
|
|
|
|
|
| Transamerica Series Trust |
|
|
|
Semi-Annual Financial Statements 2024 |
|
|
Page 32 |
|
|
Transamerica JPMorgan Tactical Allocation VP
NOTES TO FINANCIAL STATEMENTS (continued)
At June 30, 2024
(unaudited)
8. FEES AND OTHER AFFILIATED TRANSACTIONS (continued)
The Portfolio pays a management fee to TAM based on daily average net assets at the following rates:
|
|
|
|
|
| Breakpoints |
|
Rate |
|
|
|
| First $500 million |
|
|
0.730 |
% |
| Over $500 million up to $750 million |
|
|
0.705 |
|
| Over $750 million up to $1.5 billion |
|
|
0.680 |
|
| Over $1.5 billion up to $2.5 billion |
|
|
0.670 |
|
| Over $2.5 billion |
|
|
0.650 |
|
TAM has contractually agreed to waive fees and/or reimburse Portfolio expenses to the extent that the total operating expenses excluding, as applicable, acquired fund fees and expenses, interest (including borrowing costs and overdraft charges), taxes, brokerage commissions, dividend and interest expenses on securities sold short, extraordinary expenses and other expenses not incurred in the ordinary course of the Portfolio’s business, exceed the following stated annual operating expense limits to the Portfolio’s daily average net assets. To the extent an expense limit changed during the period, the prior limit is also listed below. The expenses waived and/or reimbursed, if any, are included in Expenses waived and/or reimbursed within the Statement of Operations.
|
|
|
|
|
|
|
|
|
| Class |
|
Operating Expense Limit |
|
Operating Expense Limit Effective Through |
|
|
|
|
| Effective May 1, 2024 |
|
|
|
|
|
|
|
|
| Initial Class |
|
|
0.81 |
% |
|
|
May 1, 2025 |
|
| Service Class |
|
|
1.06 |
|
|
|
May 1, 2025 |
|
| Prior to May 1, 2024 |
|
|
|
|
|
|
|
|
| Initial Class |
|
|
0.82 |
|
|
|
|
|
| Service Class |
|
|
1.07 |
|
|
|
|
|
TAM is permitted to recapture amounts contractually waived and/or reimbursed to a class during any of the 36 months from the date on which TAM waived fees and/or reimbursed expenses for the class. A class may recapture and reimburse TAM only if such amount does not cause, on any particular business day of the Portfolio, the class’s total annual operating expenses (after the recapture is taken into account) to exceed the Operating Expense Limits or any other lower limit then in effect. Amounts recaptured, if any, by TAM for the period ended June 30, 2024 are disclosed in Recapture of previously waived and/or reimbursed fees within the Statement of Operations.
TAM, on a voluntary basis and in addition to the contractual operating expense limits in effect, from time to time may waive and/or reimburse expenses of the Portfolio, or any classes thereof, to such level(s) as the Trust’s officers have determined or may reasonably determine from time to time. Any such voluntary waiver or expense reimbursement may be discontinued by TAM at any time. These amounts are not subject to recapture by TAM.
As of June 30, 2024, there are no amounts available for recapture by TAM.
Distribution and service fees: TST has a distribution plan (“Distribution Plan”) pursuant to Rule 12b-1 under the 1940 Act. Pursuant to the Distribution Plan, TST entered into a distribution agreement with TCI as the Portfolio’s distributor.
The Distribution Plan requires the Portfolio to pay distribution fees to TCI as compensation for various distribution activities, not as reimbursement for specific expenses. Under the Distribution Plan and distribution agreement, TCI, on behalf of the Portfolio, is authorized to pay various service providers, as direct payment for expenses incurred in connection with distribution of the Portfolio’s shares.
The fee on the Service Class shares is paid to the insurance companies for providing services and account maintenance for the policyholders who invest in the variable insurance products which invest in the Service Class shares. TCI has determined that it will not seek payment for the distribution expenses incurred by the Portfolio with respect to the Initial Class shares before May 1, 2025. Prior to TCI seeking distribution expenses on Initial Class shares, policy and contract owners will be notified in advance. The Portfolio will pay fees relating to Service Class shares. The distribution and service fees are included in Distribution and service fees within the Statement of Operations.
|
|
|
|
|
| Transamerica Series Trust |
|
|
|
Semi-Annual Financial Statements 2024 |
|
|
Page 33 |
|
|
Transamerica JPMorgan Tactical Allocation VP
NOTES TO FINANCIAL STATEMENTS (continued)
At June 30, 2024
(unaudited)
8. FEES AND OTHER AFFILIATED TRANSACTIONS (continued)
The Portfolio is authorized under the Distribution Plan to pay fees to TCI based on daily average net assets of each applicable class up to the following annual rates:
|
|
|
|
|
| Class |
|
Rate |
|
|
|
| Initial Class |
|
|
0.15 |
% |
| Service Class |
|
|
0.25 |
|
Transfer agent costs: TFS provides transfer agency services under an intercompany agreement with TAM. TFS has outsourced the provision of certain sub-transfer agency services to SS&C Global Investor & Distribution Solutions, Inc. (“SS&C GIDS”). The Portfolio does not pay a separate transfer agent fee to TAM or TFS but does pay certain expenses to SS&C GIDS related to applicable sub-transfer agency services. For the period ended June 30, 2024, (i) the expenses paid to SS&C GIDS by the Portfolio are referred to as transfer agent costs and are included within the Statement of Operations and (ii) the expenses payable to SS&C GIDS by the Portfolio are referred to as transfer agent costs within the Statement of Assets and Liabilities.
Brokerage commissions: The Portfolio incurred no brokerage commissions on security transactions placed with affiliates of the investment manager or sub-adviser(s) for the period ended June 30, 2024.
9. PURCHASES AND SALES OF SECURITIES
For the period ended June 30, 2024, the cost of securities purchased and proceeds from securities sold (excluding short-term securities) are as follows:
|
|
|
|
|
|
|
|
|
| Purchases of Securities |
|
|
|
Sales/Maturities of Securities |
| Long-Term |
|
U.S. Government |
|
|
|
Long-Term |
|
U.S. Government |
|
|
|
|
|
| $ 232,807,611 |
|
$ 134,789,944 |
|
|
|
$ 259,483,531 |
|
$ 161,129,555 |
10. FEDERAL INCOME TAXES AND DISTRIBUTIONS TO SHAREHOLDERS
The Portfolio has not made any provision for federal income or excise taxes due to its policy to distribute all of its taxable income and capital gains to its shareholders and otherwise qualify as a regulated investment company under Subchapter M of the Internal Revenue Code. The Portfolio recognizes the tax benefits of uncertain tax positions only where the position is “more likely than not” to be sustained assuming examination by tax authorities. The Portfolio’s tax returns remain subject to examination by the Internal Revenue Service and state tax authorities three years from the date of filing for federal purposes and four years from the date of filing for state purposes. Management has evaluated the Portfolio’s tax provisions taken for all open tax years, and has concluded that no provision for income tax is required in the Portfolio’s financial statements. If applicable, the Portfolio recognizes interest accrued related to unrecognized tax benefits in relation to interest and penalties expense in Other within the Statement of Operations. The Portfolio identifies its major tax jurisdictions as U.S. Federal, the state of Colorado, and foreign jurisdictions where the Portfolio makes significant investments; however, the Portfolio is not aware of any tax positions for which it is reasonably possible that the total amounts of unrecognized tax benefits will change materially in the next twelve months. Distributions are determined in accordance with income tax regulations, which may differ from GAAP.
As of June 30, 2024, the approximate cost for U.S. federal income tax purposes, and the aggregate gross/net unrealized appreciation (depreciation) in the value of investments (including securities sold short and derivatives, if any) are as follows:
|
|
|
|
|
|
|
| Cost |
|
Gross Appreciation |
|
Gross (Depreciation) |
|
Net Appreciation (Depreciation) |
|
|
|
|
| $ 965,958,082 |
|
$ 61,228,710 |
|
$ (44,492,418) |
|
$ 16,736,292 |
11. NEW ACCOUNTING PRONOUNCEMENT
In June 2022, the Financial Accounting Standards Board issued Accounting Standards Update No. 2022-03 (“ASU 2022-03”), “Fair Value Measurement of Equity Securities Subject to Contractual Sale Restrictions” (“Topic 820”). ASU 2022-03 clarifies the guidance in Topic 820, related to the measurement of the fair value of an equity security subject to contractual sale restrictions, where it eliminates the need to
|
|
|
|
|
| Transamerica Series Trust |
|
|
|
Semi-Annual Financial Statements 2024 |
|
|
Page 34 |
|
|
Transamerica JPMorgan Tactical Allocation VP
NOTES TO FINANCIAL STATEMENTS (continued)
At June 30, 2024
(unaudited)
11. NEW ACCOUNTING PRONOUNCEMENT (continued)
apply a discount to fair value of these securities, and introduces disclosure requirements related to such equity securities. The guidance is effective for fiscal years, and interim periods within those fiscal years, beginning after December 15, 2023, and allows for early adoption. Management is currently evaluating the implications, if any, of the additional requirements and their impact on the Portfolio’s financial statements.
Please see TST’s most recent report on Form N-CSR, available at: www.transamerica.com/annuities/prospectus, for additional information. For the most recently filed complete proxy voting records for the Trust please visit: https://www.transamerica.com/sites/default/files/files/e070d/TST%20N-PX%202021.pdf
|
|
|
|
|
| Transamerica Series Trust |
|
|
|
Semi-Annual Financial Statements 2024 |
|
|
Page 35 |
|
|
Transamerica JPMorgan Tactical Allocation VP
MANAGEMENT AND SUB-ADVISORY AGREEMENT — CONTRACT RENEWAL
(unaudited)
At a meeting of the Board of Trustees of Transamerica Series Trust (the “Trustees” or the “Board”) held on June 12-13, 2024, the Board considered the renewal of the management agreement (the “Management Agreement”) between Transamerica Asset Management, Inc. (“TAM”) and Transamerica Series Trust, on behalf of Transamerica JPMorgan Tactical Allocation VP (the “Portfolio”). The Board also considered the renewal of the investment sub-advisory agreement (the “Sub-Advisory Agreement” and together with the Management Agreement, the “Agreements”) for the Portfolio between TAM and J.P. Morgan Investment Management, Inc. (the “Sub-Adviser”).
Following its review and consideration, the Board determined that the terms of the Management Agreement and Sub-Advisory Agreement were reasonable and that the renewal of each of the Agreements was in the best interests of the Portfolio and the holders invested in the Portfolio. The Board, including the independent members of the Board (the “Independent Trustees”), unanimously approved the renewal of each of the Agreements through June 30, 2025.
Prior to reaching their decision, the Trustees requested and received from TAM and the Sub-Adviser certain information. They then reviewed such information as they deemed reasonably necessary to evaluate the Agreements, including information they had previously received from TAM and the Sub-Adviser as part of their regular oversight of the Portfolio, and knowledge they gained over time through meeting with TAM and the Sub-Adviser. Among other materials, the Trustees considered comparative fee, expense and performance information prepared by Broadridge Financial Solutions, Inc. (“Broadridge”), an independent provider of mutual fund performance information, as well as fee, expense and profitability information prepared by TAM. In addition, TAM provided the Board with additional supplemental comparative performance information. To the extent applicable, the Trustees considered information about fees and performance of comparable funds and/or accounts managed by the Sub-Adviser. The Board also considered reductions to the Portfolio’s expense limits, if any, that took effect after the last renewal of the Agreements. In their review, the Trustees also sought to identify instances in which the Portfolio’s performance, fees, total expenses and/or profitability appeared to be outliers within its respective peer group or other comparative metrics and sought to understand the reasons for such comparative positions.
In their deliberations, the Independent Trustees met privately without representatives of TAM or the Sub-Adviser present and were represented throughout the process by their independent legal counsel. In considering the proposed continuation of each of the Agreements, the Trustees evaluated and weighed a number of considerations that they believed to be relevant in light of the legal advice furnished to them by counsel, including independent legal counsel, and made a decision in the exercise of their own business judgment. They based their decisions on the considerations discussed below, among others, although they did not identify any particular consideration or item of information that was controlling of their decisions, and each Trustee may have attributed different weights to the various factors.
Nature, Extent and Quality of the Services Provided
The Board considered the nature, extent and quality of the services provided by TAM and the Sub-Adviser to the Portfolio in the past and the services anticipated to be provided in the future. The Board also considered the investment approach for the Portfolio; the experience, capability and integrity of TAM’s senior management; the financial resources of TAM; TAM’s management oversight process; TAM’s and the Sub-Adviser’s responsiveness to any questions by the Trustees; and the professional qualifications and compensation program of the portfolio management team of the Sub-Adviser. The Trustees noted that they receive, on a quarterly basis, an execution analysis from Capital Institutional Services, Inc. (CAPIS), an independent provider of trade analyses, for the Sub-Adviser and a comparison of trading results against a peer universe of managers.
The Board also considered the continuous and regular investment management and other services provided by TAM, when acting as a manager of managers, for the portion of the management fee it retains from the Portfolio after payment of the sub-advisory fees. The Board noted that the investment management and other services provided by TAM include the design, development and ongoing review and evaluation of the Portfolio and its investment strategy; the selection, oversight and monitoring of one or more investment sub-advisers to perform certain duties with respect to the Portfolio; ongoing portfolio trading oversight and analysis; risk management oversight and analysis; design, development, implementation and ongoing review and evaluation of a process for the valuation of Portfolio investments; design, development, implementation and ongoing review and evaluation of a compliance program for the Portfolio; design, development, implementation and ongoing review and evaluation of a process for the voting of proxies and exercise of rights to consent to corporate action for Portfolio investments; participation in Board meetings and oversight of preparation of materials for the Board, including materials for Board meetings and regular communications with the Board; oversight of preparation of the Portfolio’s prospectus, statement of additional information, shareholder reports and other disclosure materials and regulatory filings for the Portfolio; and ongoing cash management services for the Portfolio. The Board considered that TAM’s investment management services also include the provision of supervisory and administrative services to the Portfolio. The Board also noted that TAM, as part of the services it provides to all Transamerica mutual funds, including the Portfolio, oversees the services provided by the funds’ custodian, transfer agent, independent accountant and legal counsel and supervises the performance of the recordkeeping and holder service functions of the funds.
Investment Performance
In addition, the Board considered the short- and longer-term performance of the Portfolio in light of its investment objective, policies and strategies, including relative performance against (i) a peer universe of comparable mutual funds, as prepared by Broadridge, and (ii) the Portfolio’s benchmarks, in each case for various trailing periods ended December 31, 2023. Based on these considerations, the Board determined that TAM and the Sub-Adviser can provide investment and related services that are appropriate in scope and extent in light of
|
|
|
|
|
| Transamerica Series Trust |
|
|
|
Semi-Annual Financial Statements 2024 |
|
|
Page 36 |
|
|
Transamerica JPMorgan Tactical Allocation VP
MANAGEMENT AND SUB-ADVISORY AGREEMENT — CONTRACT RENEWAL (continued)
(unaudited)
the Portfolio’s investment objectives, policies and strategies and operations, the competitive landscape of the investment company business and investor needs. The Board’s conclusions as to the Portfolio’s performance are summarized below. For purposes of its review, the Board generally used the performance of Service Class Shares. In describing the Portfolio’s performance relative to its peer universe, the summary conclusions characterize performance for the relevant periods in relation to whether it was “above,” “below” or “in line with” the peer universe median and do so using quintile rankings prepared by Broadridge. For simplicity, performance is described as “above” the median if the Portfolio’s performance ranked anywhere in the first or second quintiles, as “below” the median if it ranked anywhere in the fourth or fifth quintiles, or “in line with” the median if it ranked anywhere in the third quintile (i.e., even if its precise return was somewhat above or somewhat below the precise median return).
When considering the Portfolio’s performance, the Trustees considered any representations made by TAM regarding the appropriateness of certain peer groups and benchmarks. They recognized that performance reflects a snapshot of a period as of a specific date, and that consideration of performance data for a different period could generate significantly different performance results. The Trustees also recognized that even longer-term performance can be negatively affected by performance over a short-term period when that short-term performance is significantly below the performance of the comparable benchmark or universe of peer funds.
The Board noted that the performance of Service Class Shares of the Portfolio was below the median for its peer universe and below the benchmark that TAM utilizes to measure performance of the Portfolio, each for the past 1-, 3-, 5- and 10-year periods.
Management Fee and Sub-Advisory Fees and Total Expense Ratio
The Board considered the management fee and total expense ratio of the Portfolio, including information provided by Broadridge comparing the management fee and total expense ratio of the Portfolio to the management fees and total expense ratios of comparable investment companies in both a peer group and broader peer universe compiled by Broadridge. The Board’s conclusions as to the Portfolio’s management fee and total expense ratio are summarized below. For purposes of its review, the Board generally used the actual total expenses (i.e., expenses reflecting any waivers and/or reimbursements) of Service Class Shares. In describing the Portfolio’s management fee and total expense ratio relative to its peer group and peer universe, the summary conclusions characterize management fees and total expense ratios for the relevant periods in relation to whether they were “above,” “below” or “in line with” the peer group or peer universe median and do so using quintile rankings prepared by Broadridge. For simplicity, management fees and total expense ratios are described as “above” the median if the Portfolio’s management fee or total expense ratio ranked anywhere in the fourth or fifth quintiles, as “below” the median if it ranked anywhere in the first or second quintiles, or “in line with” the median if it ranked anywhere in the third quintile (i.e., even if its precise management fee or total expense ratio was somewhat above or somewhat below the precise median management fee or total expense ratio).
The Board also considered the fees charged by the Sub-Adviser for sub-advisory services, as well as the portion of the Portfolio’s management fee retained by TAM following payment of the sub-advisory fee and how the portion of the contractual management fee retained by TAM at a specified asset level compared to the portions retained by other investment advisers managing mutual funds with similar investment strategies as calculated by an independent provider of information.
The Board noted that the Portfolio’s contractual management fee and the actual total expenses (i.e., expenses reflecting any waivers and/or reimbursements) of Service Class Shares of the Portfolio were above the medians for its peer group and peer universe. The Trustees also considered that TAM has entered into an expense limitation arrangement with the Portfolio, which may result in TAM waiving fees for the benefit of holders.
On the basis of these considerations, together with the other information it considered, the Board determined that the management and sub-advisory fees to be received by TAM and the Sub-Adviser under the Management Agreement and Sub-Advisory Agreement are reasonable in light of the services provided.
Cost of Services Provided and Level of Profitability
The Board reviewed information provided by TAM about the cost of providing and procuring fund management services, as well as the costs of the provision of administration, transfer agency and other services, to the Portfolio and to Transamerica Series Trust as a whole by TAM and its affiliates. The Board considered the profitability of TAM and its affiliates in providing these services for the Portfolio and Transamerica Series Trust as a whole. The Trustees recognized the competitiveness of the mutual fund industry and the importance of an investment adviser’s long-term profitability, including for maintaining company and management stability and accountability.
The Board also considered the allocation methodology used for calculating the profitability of TAM and its affiliates. The Board noted that the revenue and expense allocation methodology used by TAM to estimate its profitability with respect to its relationship with the Portfolio had been reviewed previously by an independent consultant. The Trustees considered that TAM reported that it had not made material changes to this methodology, and that the methodology had been applied consistently for the Portfolio.
With respect to the Sub-Adviser, the Board noted that the sub-advisory fee is the product of arm’s-length negotiation between TAM and the Sub-Adviser, which is not affiliated with TAM, and is paid by TAM and not the Portfolio. As a result, the Board focused on the profitability of TAM and its affiliates with respect to the Portfolio.
|
|
|
|
|
| Transamerica Series Trust |
|
|
|
Semi-Annual Financial Statements 2024 |
|
|
Page 37 |
|
|
Transamerica JPMorgan Tactical Allocation VP
MANAGEMENT AND SUB-ADVISORY AGREEMENT — CONTRACT RENEWAL (continued)
(unaudited)
Based on this information, the Board determined that the profitability of TAM and its affiliates from their relationships with the Portfolio was not excessive.
Economies of Scale
The Board considered economies of scale with respect to the management of the Portfolio, whether the Portfolio had appropriately benefited from any economies of scale and whether there was the potential for realization of any future economies of scale. The Board also considered the existence of economies of scale with respect to management of the Transamerica mutual funds overall and the extent to which the Portfolio benefited from any economies of scale. The Board recognized that, as the Portfolio’s assets increase, any economies of scale realized by TAM or the Sub-Adviser may not directly correlate with each other or with any economies of scale that might be realized by the Portfolio. The Board considered the Portfolio’s management fee schedule and the existence of breakpoints and also considered the extent to which TAM shared economies of scale, if any, with the Portfolio through undertakings to limit or reimburse Portfolio expenses and to invest in maintaining and developing its capabilities and services. The Board also considered the Sub-Adviser’s sub-advisory fee schedule and the existence of breakpoints, if any, and how such breakpoints relate to any breakpoints in the Portfolio’s management fee schedule. The Trustees concluded that the Portfolio’s fee structure reflected an appropriate sharing of any efficiencies or economies of scale to date and noted that they will have the opportunity to periodically reexamine the appropriateness of the management fee payable to TAM and the fee paid to the Sub-Adviser in light of any economies of scale experienced in the future.
Benefits to TAM, its Affiliates and/or the Sub-Adviser from their Relationships with the Portfolio
The Board considered other benefits derived by TAM, its affiliates, and/or the Sub-Adviser from their relationships with the Portfolio. The Board noted that TAM does not receive benefits from research obtained with commissions paid to broker-dealers for portfolio transactions (commonly referred to as “soft dollars”) as a result of its relationship with the Portfolio and that TAM believes the use of soft dollars by the Sub-Adviser is generally appropriate and in the best interests of the Portfolio. The Board also noted that the Sub-Adviser participates in a brokerage program pursuant to which a portion of brokerage commissions paid by the Portfolio is recaptured for the benefit of the Portfolio and the holders, thus limiting the amount of soft dollar arrangements the Sub-Adviser may engage in with respect to the Portfolio’s brokerage transactions.
Other Considerations
The Board noted that TAM has made a substantial commitment to the recruitment and retention of high-quality personnel and maintains the financial, compliance and operational resources reasonably necessary to manage the Portfolio in a professional manner that is consistent with the best interests of the Portfolio and the holders. In this regard, the Board favorably considered the procedures and policies TAM has in place to enforce compliance with applicable laws and regulations and oversee the portfolio management activities of the Sub-Adviser. The Board also noted that TAM has made an entrepreneurial commitment and undertaken certain business risks with respect to the management and success of the Portfolio.
Conclusion
After consideration of the factors described above, as well as other factors, the Trustees, including the Independent Trustees, concluded that the renewal of the Management Agreement and the Sub-Advisory Agreement was in the best interests of the Portfolio and the holders and voted to approve the renewal of the Agreements.
|
|
|
|
|
| Transamerica Series Trust |
|
|
|
Semi-Annual Financial Statements 2024 |
|
|
Page 38 |
|
|
PROXY VOTING POLICIES AND PROCEDURES AND QUARTERLY PORTFOLIO HOLDINGS
(unaudited)
A description of Transamerica Series Trust’s (the “Trust”) proxy voting policies and procedures is available in the Statement of Additional Information of the Portfolios, available without charge upon request by calling 1-800-851-9777 (toll free) or on the Securities and Exchange Commission’s (“SEC”) website at http://www.sec.gov.
In addition, the Portfolio is required to file Form N-PX, with their complete proxy voting records for the most recent 12 months ended June 30th, no later than August 31st of each year. The Form is available without charge: (1) on the Transamerica Funds website at https://www.transamerica.com/sites/default/files/files/e070d/TST%20N-PX%202021.pdf; and (2) on the SEC’s website at http://www.sec.gov.
Each fiscal quarter, the Portfolios, except Transamerica BlackRock Government Money Market VP, will file with the SEC a complete schedule of its monthly portfolio holdings on Form N-PORT. The Portfolios’ holdings as of the end of the third month of every fiscal quarter, as reported on Form N-PORT, will be publicly available on the SEC’s website at http://www.sec.gov within 60 days of the end of the fiscal quarter.
On a monthly basis, Transamerica BlackRock Government Money Market VP will file with the SEC portfolio holdings information on Form N-MFP3. A complete schedule of portfolio holdings is also available at www.transamerica.com.
You may also visit the Trust’s website at www.transamerica.com/annuities/prospectus for this and other information about the Portfolios and the Trust.
Important Notice Regarding Delivery of Shareholder Documents
Every year we provide shareholders informative materials such as the Transamerica Series Trust Annual Report, the Transamerica Series Trust Prospectus, and other required documents that keep you informed regarding your Portfolios. To the extent provided by mail, Transamerica Series Trust will only send one piece per mailing address, a method that saves your Portfolios money by reducing mailing and printing costs. We will continue to do this unless you tell us not to. To elect to receive individual mailings, simply call a Transamerica Customer Service Representative toll free at 1-800-851-9777, 8 a.m. to 7 p.m. Eastern Time, Monday-Friday. Your request will take effect within 30 days.
|
|
|
|
|
| Transamerica Series Trust |
|
|
|
Semi-Annual Financial Statements 2024 |
|
|
Page 39 |
|
|
NOTICE OF PRIVACY POLICY
(unaudited)
Your privacy is very important to us. We want you to understand what information we collect and how we use it. We collect and use “nonpublic personal information” in connection with providing our customers with a broad range of financial products and services as effectively and conveniently as possible. We treat nonpublic personal information in accordance with our Privacy Policy.
What Information We Collect and From Whom We Collect It
We may collect nonpublic personal information about you from the following sources:
| • |
|
Information we receive from you on applications or other forms, such as your name, address, and account number; |
| • |
|
Information about your transactions with us, our affiliates, or others, such as your account balance and purchase/redemption history; and |
| • |
|
Information we receive from non-affiliated third parties, including consumer reporting agencies. |
What Information We Disclose and To Whom We Disclose It
We do not disclose any nonpublic personal information about current or former customers to anyone without their express consent, except as permitted by law. We may disclose the nonpublic personal information we collect, as described above, to persons or companies that perform services on our behalf and to other financial institutions with which we have joint marketing agreements. We will require these companies to protect the confidentiality of your nonpublic personal information and to use it only to perform the services for which we have hired them.
Our Security Procedures
We restrict access to your nonpublic personal information and only allow disclosures to persons and companies as permitted by law to assist in providing products or services to you. We maintain physical, electronic, and procedural safeguards to protect your nonpublic personal information and to safeguard the disposal of certain consumer information.
Contact Us
If you have any questions about our Privacy Policy, please call 1-800-851-9777 on any business day between 8 a.m. and 7 p.m. Eastern Time.
Note: This Privacy Policy applies only to customers that have a direct relationship with us or our affiliates. If you own shares of our portfolios in the name of a third party such as a bank or broker-dealer, its privacy policy may apply to you instead of ours.
|
|
|
|
|
| Transamerica Series Trust |
|
|
|
Semi-Annual Financial Statements 2024 |
|
|
Page 40 |
|
|
PO Box 219945
Kansas City, MO 64121-9945
|
|
|
| Distributor: |
|
Transamerica Capital, Inc. PO Box 219945 Kansas City, MO 64121-9945 Customer Service: 1-800-851-9777 |
Transamerica Series Trust Semi-Annual Financial Statements
June 30, 2024
1801 California St., Suite 5200
Denver, CO 80202
Distributor: Transamerica Capital, Inc.
Customer Service: 1-800-851-9777
The following pages contain the most recent semi-annual financial statements for the investment options in which you are invested. In compliance with Securities and Exchange Commission regulations, we present these reports on an annual and semi-annual basis with the hope that they will foster greater understanding of the investment options’ holdings, performance, financial data, accounting policies and other issues. This streamlined version provides information only on the investment options in which you are invested.
If you have any questions about these reports, please do not hesitate to contact your financial professional. As always, we thank you for your trust and the opportunity to serve you.
Transamerica Madison Diversified Income VP
SCHEDULE OF INVESTMENTS
At June 30, 2024
(unaudited)
|
|
|
|
|
|
|
|
|
| |
|
Shares |
|
|
Value |
|
| |
|
|
|
|
| COMMON STOCKS - 39.0% |
|
|
|
|
|
|
|
|
| Banks - 3.3% |
|
|
|
|
|
|
|
|
| Bank of America Corp. |
|
|
31,500 |
|
|
$ |
1,252,755 |
|
| JPMorgan Chase & Co. |
|
|
7,150 |
|
|
|
1,446,159 |
|
| US Bancorp |
|
|
31,600 |
|
|
|
1,254,520 |
|
|
|
|
|
|
|
|
|
|
|
|
|
|
|
|
|
|
|
|
3,953,434 |
|
|
|
|
|
|
|
|
|
|
|
|
|
| Beverages - 1.1% |
|
|
|
|
|
|
|
|
| PepsiCo, Inc. |
|
|
7,600 |
|
|
|
1,253,468 |
|
|
|
|
|
|
|
|
|
|
|
|
|
| Biotechnology - 1.1% |
|
|
|
|
|
|
|
|
| AbbVie, Inc. |
|
|
7,300 |
|
|
|
1,252,096 |
|
|
|
|
|
|
|
|
|
|
|
|
|
| Capital Markets - 4.7% |
|
|
|
|
|
|
|
|
| BlackRock, Inc. |
|
|
1,925 |
|
|
|
1,515,591 |
|
| CME Group, Inc. |
|
|
8,025 |
|
|
|
1,577,715 |
|
| Morgan Stanley |
|
|
19,000 |
|
|
|
1,846,610 |
|
| Northern Trust Corp. |
|
|
7,900 |
|
|
|
663,442 |
|
|
|
|
|
|
|
|
|
|
|
|
|
|
|
|
|
|
|
|
5,603,358 |
|
|
|
|
|
|
|
|
|
|
|
|
|
| Chemicals - 0.8% |
|
|
|
|
|
|
|
|
| Air Products & Chemicals, Inc. |
|
|
3,650 |
|
|
|
941,883 |
|
|
|
|
|
|
|
|
|
|
|
|
|
| Electric Utilities - 1.6% |
|
|
|
|
|
|
|
|
| NextEra Energy, Inc. |
|
|
27,700 |
|
|
|
1,961,437 |
|
|
|
|
|
|
|
|
|
|
|
|
|
| Food Products - 0.8% |
|
|
|
|
|
|
|
|
| Hershey Co. |
|
|
5,100 |
|
|
|
937,533 |
|
|
|
|
|
|
|
|
|
|
|
|
|
| Ground Transportation - 1.1% |
|
|
|
|
|
|
|
|
| Union Pacific Corp. |
|
|
6,000 |
|
|
|
1,357,560 |
|
|
|
|
|
|
|
|
|
|
|
| Health Care Equipment & Supplies - 2.3% |
|
| Abbott Laboratories |
|
|
10,400 |
|
|
|
1,080,664 |
|
| Medtronic PLC |
|
|
21,850 |
|
|
|
1,719,813 |
|
|
|
|
|
|
|
|
|
|
|
|
|
|
|
|
|
|
|
|
2,800,477 |
|
|
|
|
|
|
|
|
|
|
|
|
|
| Hotels, Restaurants & Leisure - 1.0% |
|
|
|
|
|
|
|
|
| McDonald’s Corp. |
|
|
2,500 |
|
|
|
637,100 |
|
| Starbucks Corp. |
|
|
7,513 |
|
|
|
584,887 |
|
|
|
|
|
|
|
|
|
|
|
|
|
|
|
|
|
|
|
|
1,221,987 |
|
|
|
|
|
|
|
|
|
|
|
|
|
| Household Products - 1.6% |
|
|
|
|
|
|
|
|
| Colgate-Palmolive Co. |
|
|
11,050 |
|
|
|
1,072,292 |
|
| Procter & Gamble Co. |
|
|
5,050 |
|
|
|
832,846 |
|
|
|
|
|
|
|
|
|
|
|
|
|
|
|
|
|
|
|
|
1,905,138 |
|
|
|
|
|
|
|
|
|
|
|
|
|
| Industrial Conglomerates - 1.5% |
|
|
|
|
|
|
|
|
| Honeywell International, Inc. |
|
|
8,375 |
|
|
|
1,788,397 |
|
|
|
|
|
|
|
|
|
|
|
|
|
| IT Services - 0.4% |
|
|
|
|
|
|
|
|
| Accenture PLC, Class A |
|
|
1,575 |
|
|
|
477,871 |
|
|
|
|
|
|
|
|
|
|
|
|
|
| Machinery - 1.2% |
|
|
|
|
|
|
|
|
| Caterpillar, Inc. |
|
|
1,525 |
|
|
|
507,978 |
|
| Cummins, Inc. |
|
|
3,125 |
|
|
|
865,406 |
|
|
|
|
|
|
|
|
|
|
|
|
|
|
|
|
|
|
|
|
1,373,384 |
|
|
|
|
|
|
|
|
|
|
|
|
|
| Media - 1.4% |
|
|
|
|
|
|
|
|
| Comcast Corp., Class A |
|
|
42,200 |
|
|
|
1,652,552 |
|
|
|
|
|
|
|
|
|
|
|
|
|
| Oil, Gas & Consumable Fuels - 4.4% |
|
|
|
|
|
|
|
|
| Chevron Corp. |
|
|
9,600 |
|
|
|
1,501,632 |
|
|
|
|
|
|
|
|
|
|
| |
|
Shares |
|
|
Value |
|
| |
|
|
|
|
| COMMON STOCKS (continued) |
|
|
|
|
|
|
|
|
| Oil, Gas & Consumable Fuels (continued) |
|
| ConocoPhillips |
|
|
8,700 |
|
|
$ |
995,106 |
|
| EOG Resources, Inc. |
|
|
13,350 |
|
|
|
1,680,364 |
|
| Exxon Mobil Corp. |
|
|
9,600 |
|
|
|
1,105,152 |
|
|
|
|
|
|
|
|
|
|
|
|
|
|
|
|
|
|
|
|
5,282,254 |
|
|
|
|
|
|
|
|
|
|
|
|
|
| Pharmaceuticals - 1.2% |
|
|
|
|
|
|
|
|
| Johnson & Johnson |
|
|
9,675 |
|
|
|
1,414,098 |
|
|
|
|
|
|
|
|
|
|
|
|
|
| Professional Services - 2.2% |
|
|
|
|
|
|
|
|
| Automatic Data Processing, Inc. |
|
|
7,700 |
|
|
|
1,837,913 |
|
| Paychex, Inc. |
|
|
6,775 |
|
|
|
803,244 |
|
|
|
|
|
|
|
|
|
|
|
|
|
|
|
|
|
|
|
|
2,641,157 |
|
|
|
|
|
|
|
|
|
|
|
| Semiconductors & Semiconductor Equipment - 2.1% |
|
| Analog Devices, Inc. |
|
|
3,400 |
|
|
|
776,084 |
|
| Texas Instruments, Inc. |
|
|
9,175 |
|
|
|
1,784,813 |
|
|
|
|
|
|
|
|
|
|
|
|
|
|
|
|
|
|
|
|
2,560,897 |
|
|
|
|
|
|
|
|
|
|
|
|
|
| Specialized REITs - 1.1% |
|
|
|
|
|
|
|
|
| American Tower Corp. |
|
|
7,050 |
|
|
|
1,370,379 |
|
|
|
|
|
|
|
|
|
|
|
|
|
| Specialty Retail - 2.6% |
|
|
|
|
|
|
|
|
| Home Depot, Inc. |
|
|
5,025 |
|
|
|
1,729,806 |
|
| Lowe’s Cos., Inc. |
|
|
6,200 |
|
|
|
1,366,852 |
|
|
|
|
|
|
|
|
|
|
|
|
|
|
|
|
|
|
|
|
3,096,658 |
|
|
|
|
|
|
|
|
|
|
|
|
|
| Trading Companies & Distributors - 1.5% |
|
|
|
|
|
|
|
|
| Fastenal Co. |
|
|
27,600 |
|
|
|
1,734,383 |
|
|
|
|
|
|
|
|
|
|
|
|
|
| Total Common Stocks
(Cost $42,005,335) |
|
|
|
|
|
|
46,580,401 |
|
|
|
|
|
|
|
|
|
|
|
|
|
| |
|
Principal |
|
|
Value |
|
| |
|
| U.S. GOVERNMENT AGENCY OBLIGATIONS - 23.2% |
|
| Federal Home Loan Banks |
|
|
|
|
|
|
|
|
| 6.05%, 11/21/2031 |
|
$ |
200,000 |
|
|
|
199,645 |
|
| Federal Home Loan Mortgage Corp. |
|
|
|
|
|
|
|
|
| 2.00%, 03/01/2041 - 12/01/2051 |
|
|
1,595,685 |
|
|
|
1,318,964 |
|
| 2.50%, 02/01/2032 - 01/01/2052 |
|
|
2,506,637 |
|
|
|
2,129,714 |
|
| 3.00%, 09/01/2042 - 08/01/2052 |
|
|
1,793,678 |
|
|
|
1,565,838 |
|
| 3.50%, 11/01/2040 - 05/01/2052 |
|
|
1,936,689 |
|
|
|
1,739,899 |
|
| 4.00%, 04/01/2033 - 03/01/2047 |
|
|
163,573 |
|
|
|
156,860 |
|
| 4.50%, 02/01/2025 - 12/01/2052 |
|
|
470,082 |
|
|
|
452,384 |
|
| 5.00%, 11/01/2052 - 02/01/2053 |
|
|
2,093,512 |
|
|
|
2,029,884 |
|
| 5.50%, 01/01/2037 - 02/01/2054 |
|
|
1,530,211 |
|
|
|
1,518,708 |
|
| 6.00%, 09/01/2053 |
|
|
651,527 |
|
|
|
656,332 |
|
| Federal Home Loan Mortgage Corp. Multifamily Structured Pass-Through Certificates |
|
|
|
|
|
|
|
|
| 2.98%, 11/25/2025 |
|
|
177,651 |
|
|
|
174,751 |
|
| 3.12%, 06/25/2027 |
|
|
750,000 |
|
|
|
713,627 |
|
| 3.35%, 01/25/2028 |
|
|
400,000 |
|
|
|
380,497 |
|
| Federal Home Loan Mortgage Corp. REMICS |
|
|
|
|
|
|
|
|
| 5.00%, 07/15/2036 |
|
|
69,742 |
|
|
|
69,902 |
|
| Federal Home Loan Mortgage Corp. STACR REMICS Trust |
|
|
|
|
|
|
|
|
| 1-Month SOFR Average + 0.75%, 6.09% (A), 10/25/2033 (B) |
|
|
16,106 |
|
|
|
16,101 |
|
The Notes to Financial Statements are an integral part of this report.
|
|
|
|
|
| Transamerica Series Trust |
|
|
|
Semi-Annual Financial Statements 2024 |
|
|
Page 1 |
|
|
Transamerica Madison Diversified Income VP
SCHEDULE OF INVESTMENTS (continued)
At June 30, 2024
(unaudited)
|
|
|
|
|
|
|
|
|
| |
|
Principal |
|
|
Value |
|
| |
|
|
| U.S. GOVERNMENT AGENCY OBLIGATIONS (continued) |
|
| Federal National Mortgage Association |
|
|
|
|
|
|
|
|
| 2.50%, 06/01/2031 - 04/01/2052 |
|
$ |
3,367,725 |
|
|
|
$ 2,894,165 |
|
| 3.00%, 12/01/2028 - 01/01/2049 |
|
|
2,115,502 |
|
|
|
1,903,725 |
|
| 3.10% (A), 07/25/2024 |
|
|
21,035 |
|
|
|
20,952 |
|
| 3.20% (A), 11/25/2027 |
|
|
423,697 |
|
|
|
404,097 |
|
| 3.50%, 12/01/2031 - 08/01/2052 |
|
|
2,314,742 |
|
|
|
2,086,900 |
|
| 4.00%, 02/01/2035 - 05/01/2052 |
|
|
2,977,850 |
|
|
|
2,756,433 |
|
| 4.50%, 05/01/2038 - 07/01/2053 |
|
|
2,060,390 |
|
|
|
1,974,991 |
|
| 5.00%, 10/01/2052 - 12/01/2052 |
|
|
1,307,937 |
|
|
|
1,269,263 |
|
| 5.50%, 10/01/2052 - 05/01/2054 |
|
|
1,027,454 |
|
|
|
1,016,845 |
|
| Federal National Mortgage Association REMICS |
|
|
|
|
|
|
|
|
| 1.38%, 09/25/2027 |
|
|
201,618 |
|
|
|
191,337 |
|
| 3.50%, 04/25/2031 |
|
|
102,175 |
|
|
|
98,404 |
|
| Government National Mortgage Association |
|
|
|
|
|
|
|
|
| 3.50%, 12/15/2042 |
|
|
30,941 |
|
|
|
28,514 |
|
| 4.00%, 12/15/2039 |
|
|
3,946 |
|
|
|
3,719 |
|
| 4.50%, 08/15/2040 |
|
|
1,593 |
|
|
|
1,549 |
|
|
|
|
|
|
|
|
|
|
|
|
| Total U.S. Government Agency Obligations
(Cost $29,769,683) |
|
|
|
27,774,000 |
|
|
|
|
|
|
|
|
|
|
|
| CORPORATE DEBT SECURITIES - 18.2% |
|
| Aerospace & Defense - 0.2% |
|
| BAE Systems PLC |
|
|
|
|
|
|
|
|
| 5.30%, 03/26/2034 (B) |
|
|
250,000 |
|
|
|
248,214 |
|
|
|
|
|
|
|
|
|
|
|
|
|
| Banks - 4.4% |
|
|
|
|
|
|
|
|
| Bank of America Corp. |
|
|
|
|
|
|
|
|
| Fixed until 06/14/2028, 2.09% (A), 06/14/2029 |
|
|
300,000 |
|
|
|
266,237 |
|
| Fixed until 03/08/2032, 3.85% (A), 03/08/2037 |
|
|
250,000 |
|
|
|
219,485 |
|
| Citigroup, Inc. |
|
|
|
|
|
|
|
|
| Fixed until 05/24/2032, 4.91% (A), 05/24/2033 |
|
|
200,000 |
|
|
|
192,394 |
|
| Fifth Third Bancorp |
|
|
|
|
|
|
|
|
| 2.55%, 05/05/2027 |
|
|
225,000 |
|
|
|
208,433 |
|
| Fixed until 04/25/2032, 4.34% (A), 04/25/2033 |
|
|
200,000 |
|
|
|
182,549 |
|
| Fixed until 07/27/2028, 6.34% (A), 07/27/2029 |
|
|
100,000 |
|
|
|
102,555 |
|
| Goldman Sachs Group, Inc. |
|
|
|
|
|
|
|
|
| Fixed until 10/21/2026, 1.95%(A), 10/21/2027 |
|
|
500,000 |
|
|
|
461,737 |
|
| Huntington Bancshares, Inc. |
|
|
|
|
|
|
|
|
| Fixed until 08/15/2031, 2.49% (A), 08/15/2036 |
|
|
300,000 |
|
|
|
228,211 |
|
| JPMorgan Chase & Co. |
|
|
|
|
|
|
|
|
| Fixed until 01/23/2034, 5.34% (A), 01/23/2035 |
|
|
250,000 |
|
|
|
249,025 |
|
| Mitsubishi UFJ Financial Group, Inc. |
|
|
|
|
|
|
|
|
| Fixed until 02/22/2030, 5.48% (A), 02/22/2031 |
|
|
250,000 |
|
|
|
252,673 |
|
| Morgan Stanley |
|
|
|
|
|
|
|
|
| Fixed until 01/18/2034, 5.47% (A), 01/18/2035 |
|
|
250,000 |
|
|
|
249,832 |
|
| Fixed until 01/19/2033, 5.95% (A), 01/19/2038 |
|
|
100,000 |
|
|
|
99,598 |
|
|
|
|
|
|
|
|
|
|
| |
|
Principal |
|
|
Value |
|
| |
|
|
| CORPORATE DEBT SECURITIES (continued) |
|
| Banks (continued) |
|
| PNC Bank NA |
|
|
|
|
|
|
|
|
| 2.70%, 10/22/2029 |
|
$ |
125,000 |
|
|
|
$ 109,103 |
|
| PNC Financial Services Group, Inc. |
|
|
|
|
|
|
|
|
| Fixed until 10/20/2033, 6.88% (A), 10/20/2034 |
|
|
250,000 |
|
|
|
272,859 |
|
| Regions Financial Corp. |
|
|
|
|
|
|
|
|
| 1.80%, 08/12/2028 |
|
|
250,000 |
|
|
|
216,041 |
|
| Royal Bank of Canada |
|
|
|
|
|
|
|
|
| 5.15%, 02/01/2034 |
|
|
175,000 |
|
|
|
174,023 |
|
| State Street Corp. |
|
|
|
|
|
|
|
|
| Fixed until 11/01/2029, 3.03% (A), 11/01/2034 |
|
|
125,000 |
|
|
|
110,753 |
|
| Toronto-Dominion Bank |
|
|
|
|
|
|
|
|
| 4.46%, 06/08/2032 |
|
|
250,000 |
|
|
|
236,014 |
|
| Truist Financial Corp. |
|
|
|
|
|
|
|
|
| Fixed until 01/26/2033, 5.12% (A), 01/26/2034 |
|
|
200,000 |
|
|
|
191,842 |
|
| Fixed until 06/08/2033, 5.87% (A), 06/08/2034 |
|
|
300,000 |
|
|
|
302,839 |
|
| UBS Group AG |
|
|
|
|
|
|
|
|
| Fixed until 08/05/2026, 4.70% (A), 08/05/2027 (B) |
|
|
200,000 |
|
|
|
196,341 |
|
| US Bancorp |
|
|
|
|
|
|
|
|
| Fixed until 02/01/2033, 4.84% (A), 02/01/2034 |
|
|
225,000 |
|
|
|
213,703 |
|
| Fixed until 01/23/2029, 5.38% (A), 01/23/2030 |
|
|
125,000 |
|
|
|
125,397 |
|
| Wells Fargo & Co. |
|
|
|
|
|
|
|
|
| Fixed until 01/22/2029, 5.20% (A), 01/23/2030 |
|
|
125,000 |
|
|
|
124,568 |
|
| Fixed until 07/25/2028, 5.57% (A), 07/25/2029 |
|
|
250,000 |
|
|
|
252,399 |
|
|
|
|
|
|
|
|
|
|
|
|
|
|
|
|
|
|
|
|
5,238,611 |
|
|
|
|
|
|
|
|
|
|
|
|
|
| Beverages - 0.1% |
|
|
|
|
|
|
|
|
| Keurig Dr. Pepper, Inc. |
|
|
|
|
|
|
|
|
| 3.80%, 05/01/2050 |
|
|
200,000 |
|
|
|
149,626 |
|
|
|
|
|
|
|
|
|
|
|
|
|
| Biotechnology - 0.2% |
|
|
|
|
|
|
|
|
| Amgen, Inc. |
|
|
|
|
|
|
|
|
| 5.65%, 03/02/2053 |
|
|
75,000 |
|
|
|
74,264 |
|
|
|
|
|
|
|
|
|
|
| Royalty Pharma PLC |
|
|
|
|
|
|
|
|
| 2.20%, 09/02/2030 |
|
|
200,000 |
|
|
|
166,817 |
|
|
|
|
|
|
|
|
|
|
|
|
|
|
|
|
|
|
|
|
241,081 |
|
|
|
|
|
|
|
|
|
|
|
|
|
| Building Products - 0.4% |
|
|
|
|
|
|
|
|
| Carrier Global Corp. |
|
|
|
|
|
|
|
|
| 3.58%, 04/05/2050 |
|
|
100,000 |
|
|
|
72,998 |
|
| 6.20%, 03/15/2054 |
|
|
200,000 |
|
|
|
215,325 |
|
| Lowe’s Cos., Inc. |
|
|
|
|
|
|
|
|
| 3.00%, 10/15/2050 |
|
|
300,000 |
|
|
|
188,905 |
|
|
|
|
|
|
|
|
|
|
|
|
|
|
|
|
|
|
|
|
477,228 |
|
|
|
|
|
|
|
|
|
|
|
|
|
| Capital Markets - 0.6% |
|
|
|
|
|
|
|
|
| Goldman Sachs BDC, Inc. |
|
|
|
|
|
|
|
|
| 2.88%, 01/15/2026 |
|
|
200,000 |
|
|
|
190,923 |
|
| Jefferies Financial Group, Inc. |
|
|
|
|
|
|
|
|
| 2.63%, 10/15/2031 |
|
|
250,000 |
|
|
|
202,047 |
|
| 6.20%, 04/14/2034 |
|
|
200,000 |
|
|
|
202,656 |
|
The Notes to Financial Statements are an integral part of this report.
|
|
|
|
|
| Transamerica Series Trust |
|
|
|
Semi-Annual Financial Statements 2024 |
|
|
Page 2 |
|
|
Transamerica Madison Diversified Income VP
SCHEDULE OF INVESTMENTS (continued)
At June 30, 2024
(unaudited)
|
|
|
|
|
|
|
|
|
| |
|
Principal |
|
|
Value |
|
| |
|
|
| CORPORATE DEBT SECURITIES (continued) |
|
| Capital Markets (continued) |
|
| KKR Group Finance Co. VIII LLC |
|
|
|
|
|
|
|
|
| 3.50%, 08/25/2050 (B) |
|
$ |
250,000 |
|
|
|
$ 173,361 |
|
|
|
|
|
|
|
|
|
|
|
|
|
|
|
|
|
|
|
|
768,987 |
|
|
|
|
|
|
|
|
|
|
|
|
|
| Chemicals - 0.3% |
|
|
|
|
|
|
|
|
| LYB International Finance III LLC |
|
|
|
|
|
|
|
|
| 3.63%, 04/01/2051 |
|
|
200,000 |
|
|
|
138,182 |
|
| Nutrien Ltd. |
|
|
|
|
|
|
|
|
| 5.80%, 03/27/2053 |
|
|
250,000 |
|
|
|
247,958 |
|
|
|
|
|
|
|
|
|
|
|
|
|
|
|
|
|
|
|
|
386,140 |
|
|
|
|
|
|
|
|
|
|
|
|
|
| Commercial Services & Supplies - 0.4% |
|
|
|
|
|
|
|
|
| Quanta Services, Inc. |
|
|
|
|
|
|
|
|
| 2.90%, 10/01/2030 |
|
|
300,000 |
|
|
|
264,569 |
|
| Textron, Inc. |
|
|
|
|
|
|
|
|
| 2.45%, 03/15/2031 |
|
|
250,000 |
|
|
|
209,808 |
|
|
|
|
|
|
|
|
|
|
|
|
|
|
|
|
|
|
|
|
474,377 |
|
|
|
|
|
|
|
|
|
|
|
|
|
| Construction Materials - 0.2% |
|
|
|
|
|
|
|
|
| Vulcan Materials Co. |
|
|
|
|
|
|
|
|
| 3.50%, 06/01/2030 |
|
|
275,000 |
|
|
|
251,163 |
|
|
|
|
|
|
|
|
|
|
|
|
|
| Consumer Finance - 0.8% |
|
|
|
|
|
|
|
|
| American Express Co. |
|
|
|
|
|
|
|
|
| Fixed until 10/30/2030, 6.49% (A), 10/30/2031 |
|
|
250,000 |
|
|
|
266,719 |
|
| Capital One Financial Corp. |
|
|
|
|
|
|
|
|
| Fixed until 05/10/2027, 4.93% (A), 05/10/2028 |
|
|
200,000 |
|
|
|
197,196 |
|
| Fixed until 06/08/2028, 6.31% (A), 06/08/2029 |
|
|
200,000 |
|
|
|
204,731 |
|
| Synchrony Financial |
|
|
|
|
|
|
|
|
| 3.70%, 08/04/2026 |
|
|
100,000 |
|
|
|
95,422 |
|
| Western Union Co. |
|
|
|
|
|
|
|
|
| 2.85%, 01/10/2025 |
|
|
150,000 |
|
|
|
147,552 |
|
|
|
|
|
|
|
|
|
|
|
|
|
|
|
|
|
|
|
|
911,620 |
|
|
|
|
|
|
|
|
|
|
|
| Consumer Staples Distribution & Retail - 0.1% |
|
| 7-Eleven, Inc. |
|
|
|
|
|
|
|
|
| 2.50%, 02/10/2041 (B) |
|
|
250,000 |
|
|
|
163,830 |
|
|
|
|
|
|
|
|
|
|
|
|
|
| Containers & Packaging - 0.1% |
|
|
|
|
|
|
|
|
| WRKCo, Inc. |
|
|
|
|
|
|
|
|
| 3.90%, 06/01/2028 |
|
|
125,000 |
|
|
|
118,994 |
|
|
|
|
|
|
|
|
|
|
|
|
|
| Diversified REITs - 0.1% |
|
|
|
|
|
|
|
|
| GLP Capital LP/GLP Financing II, Inc. |
|
|
|
|
|
|
|
|
| 3.25%, 01/15/2032 |
|
|
200,000 |
|
|
|
168,130 |
|
|
|
|
|
|
|
|
|
|
|
| Diversified Telecommunication Services - 0.3% |
|
| AT&T, Inc. |
|
|
|
|
|
|
|
|
| 2.25%, 02/01/2032 |
|
|
300,000 |
|
|
|
243,861 |
|
| 4.75%, 05/15/2046 |
|
|
75,000 |
|
|
|
65,124 |
|
|
|
|
|
|
|
|
|
|
|
|
|
|
|
|
|
|
|
|
308,985 |
|
|
|
|
|
|
|
|
|
|
|
|
|
| Electric Utilities - 1.1% |
|
|
|
|
|
|
|
|
| Berkshire Hathaway Energy Co. |
|
|
|
|
|
|
|
|
| 1.65%, 05/15/2031 |
|
|
200,000 |
|
|
|
159,395 |
|
|
|
|
|
|
|
|
|
|
| |
|
Principal |
|
|
Value |
|
| |
|
|
| CORPORATE DEBT SECURITIES (continued) |
|
| Electric Utilities (continued) |
|
| DTE Electric Co. |
|
|
|
|
|
|
|
|
| 5.40%, 04/01/2053 (C) |
|
$ |
250,000 |
|
|
|
$ 245,068 |
|
| Duke Energy Corp. |
|
|
|
|
|
|
|
|
| 3.75%, 09/01/2046 |
|
|
250,000 |
|
|
|
182,772 |
|
| Interstate Power & Light Co. |
|
|
|
|
|
|
|
|
| 3.50%, 09/30/2049 |
|
|
225,000 |
|
|
|
158,451 |
|
| NextEra Energy Capital Holdings, Inc. |
|
|
|
|
|
|
|
|
| 1.90%, 06/15/2028 |
|
|
400,000 |
|
|
|
353,851 |
|
| PECO Energy Co. |
|
|
|
|
|
|
|
|
| 3.05%, 03/15/2051 |
|
|
250,000 |
|
|
|
163,433 |
|
|
|
|
|
|
|
|
|
|
|
|
|
|
|
|
|
|
|
|
1,262,970 |
|
|
|
|
|
|
|
|
|
|
|
| Electronic Equipment, Instruments & Components - 0.2% |
|
| Vontier Corp. |
|
|
|
|
|
|
|
|
| 1.80%, 04/01/2026 |
|
|
200,000 |
|
|
|
186,960 |
|
|
|
|
|
|
|
|
|
|
|
|
|
| Energy Equipment & Services - 0.2% |
|
|
|
|
|
|
|
|
| Schlumberger Holdings Corp. |
|
|
|
|
|
|
|
|
| 3.90%, 05/17/2028 (B) |
|
|
292,000 |
|
|
|
278,948 |
|
|
|
|
|
|
|
|
|
|
|
|
|
| Financial Services - 1.0% |
|
|
|
|
|
|
|
|
| AerCap Ireland Capital DAC/AerCap Global Aviation Trust |
|
|
|
|
|
|
|
|
| 1.75%, 01/30/2026 |
|
|
350,000 |
|
|
|
329,700 |
|
| 4.63%, 10/15/2027 |
|
|
250,000 |
|
|
|
243,627 |
|
| Air Lease Corp. |
|
|
|
|
|
|
|
|
| 2.88%, 01/15/2026 |
|
|
250,000 |
|
|
|
239,850 |
|
| Avolon Holdings Funding Ltd. |
|
|
|
|
|
|
|
|
| 2.13%, 02/21/2026 (B) |
|
|
350,000 |
|
|
|
329,005 |
|
|
|
|
|
|
|
|
|
|
|
|
|
|
|
|
|
|
|
|
1,142,182 |
|
|
|
|
|
|
|
|
|
|
|
|
|
| Food Products - 0.2% |
|
|
|
|
|
|
|
|
| J M Smucker Co. |
|
|
|
|
|
|
|
|
| 6.20%, 11/15/2033 (C) |
|
|
250,000 |
|
|
|
262,892 |
|
|
|
|
|
|
|
|
|
|
|
| Health Care Providers & Services - 0.8% |
|
| Cigna Group |
|
|
|
|
|
|
|
|
| 4.38%, 10/15/2028 |
|
|
50,000 |
|
|
|
48,577 |
|
| 4.90%, 12/15/2048 |
|
|
100,000 |
|
|
|
88,161 |
|
| CVS Health Corp. |
|
|
|
|
|
|
|
|
| 5.13%, 07/20/2045 |
|
|
250,000 |
|
|
|
221,016 |
|
| Health Care Service Corp. A Mutual Legal Reserve Co. |
|
|
|
|
|
|
|
|
| 2.20%, 06/01/2030 (B) |
|
|
350,000 |
|
|
|
295,901 |
|
| Humana, Inc. |
|
|
|
|
|
|
|
|
| 5.38%, 04/15/2031 |
|
|
150,000 |
|
|
|
149,335 |
|
| UnitedHealth Group, Inc. |
|
|
|
|
|
|
|
|
| 3.70%, 08/15/2049 |
|
|
250,000 |
|
|
|
188,996 |
|
|
|
|
|
|
|
|
|
|
|
|
|
|
|
|
|
|
|
|
991,986 |
|
|
|
|
|
|
|
|
|
|
|
|
|
| Health Care REITs - 0.3% |
|
|
|
|
|
|
|
|
| Healthpeak OP LLC |
|
|
|
|
|
|
|
|
| 3.25%, 07/15/2026 |
|
|
150,000 |
|
|
|
143,659 |
|
| Omega Healthcare Investors, Inc. |
|
|
|
|
|
|
|
|
| 3.38%, 02/01/2031 |
|
|
225,000 |
|
|
|
192,477 |
|
|
|
|
|
|
|
|
|
|
|
|
|
|
|
|
|
|
|
|
336,136 |
|
|
|
|
|
|
|
|
|
|
The Notes to Financial Statements are an integral part of this report.
|
|
|
|
|
| Transamerica Series Trust |
|
|
|
Semi-Annual Financial Statements 2024 |
|
|
Page 3 |
|
|
Transamerica Madison Diversified Income VP
SCHEDULE OF INVESTMENTS (continued)
At June 30, 2024
(unaudited)
|
|
|
|
|
|
|
|
|
| |
|
Principal |
|
|
Value |
|
| |
|
|
| CORPORATE DEBT SECURITIES (continued) |
|
| Health Care Technology - 0.2% |
|
| GE HealthCare Technologies, Inc. |
|
|
|
|
|
|
|
|
| 5.60%, 11/15/2025 |
|
$ |
250,000 |
|
|
|
$ 250,081 |
|
|
|
|
|
|
|
|
|
|
|
|
|
| Insurance - 1.3% |
|
|
|
|
|
|
|
|
| Aflac, Inc. |
|
|
|
|
|
|
|
|
| 4.75%, 01/15/2049 |
|
|
250,000 |
|
|
|
221,424 |
|
| American International Group, Inc. |
|
|
|
|
|
|
|
|
| 4.75%, 04/01/2048 |
|
|
100,000 |
|
|
|
88,587 |
|
| Athene Holding Ltd. |
|
|
|
|
|
|
|
|
| 6.25%, 04/01/2054 |
|
|
125,000 |
|
|
|
125,702 |
|
| Belrose Funding Trust |
|
|
|
|
|
|
|
|
| 2.33%, 08/15/2030 (B) |
|
|
250,000 |
|
|
|
203,798 |
|
| Berkshire Hathaway Finance Corp. |
|
|
|
|
|
|
|
|
| 3.85%, 03/15/2052 |
|
|
200,000 |
|
|
|
155,415 |
|
| Empower Finance 2020 LP |
|
|
|
|
|
|
|
|
| 3.08%, 09/17/2051 (B) |
|
|
350,000 |
|
|
|
224,602 |
|
| Five Corners Funding Trust II |
|
|
|
|
|
|
|
|
| 2.85%, 05/15/2030 (B) |
|
|
250,000 |
|
|
|
220,286 |
|
| Liberty Mutual Group, Inc. |
|
|
|
|
|
|
|
|
| 3.95%, 05/15/2060 (B) |
|
|
100,000 |
|
|
|
68,678 |
|
| Old Republic International Corp. |
|
|
|
|
|
|
|
|
| 3.85%, 06/11/2051 |
|
|
250,000 |
|
|
|
177,217 |
|
| Teachers Insurance & Annuity Association of America |
|
|
|
|
|
|
|
|
| 3.30%, 05/15/2050 (B) |
|
|
200,000 |
|
|
|
133,685 |
|
|
|
|
|
|
|
|
|
|
|
|
|
|
|
|
|
|
|
|
1,619,394 |
|
|
|
|
|
|
|
|
|
|
|
| Oil, Gas & Consumable Fuels - 2.6% |
|
| Diamondback Energy, Inc. |
|
|
|
|
|
|
|
|
| 5.40%, 04/18/2034 |
|
|
295,000 |
|
|
|
292,423 |
|
| Eastern Gas Transmission & Storage, Inc. |
|
|
|
|
|
|
|
|
| 3.00%, 11/15/2029 |
|
|
250,000 |
|
|
|
224,424 |
|
| Enbridge, Inc. |
|
|
|
|
|
|
|
|
| 5.70%, 03/08/2033 |
|
|
125,000 |
|
|
|
126,212 |
|
| Energy Transfer LP |
|
|
|
|
|
|
|
|
| 5.25%, 04/15/2029 |
|
|
100,000 |
|
|
|
99,634 |
|
| 6.55%, 12/01/2033 |
|
|
250,000 |
|
|
|
264,920 |
|
| Exxon Mobil Corp. |
|
|
|
|
|
|
|
|
| 4.11%, 03/01/2046 |
|
|
225,000 |
|
|
|
186,398 |
|
| Kinder Morgan, Inc. |
|
|
|
|
|
|
|
|
| 5.55%, 06/01/2045 |
|
|
350,000 |
|
|
|
327,771 |
|
| Marathon Petroleum Corp. |
|
|
|
|
|
|
|
|
| 3.80%, 04/01/2028 |
|
|
175,000 |
|
|
|
166,834 |
|
| 4.70%, 05/01/2025 |
|
|
200,000 |
|
|
|
198,345 |
|
| MPLX LP |
|
|
|
|
|
|
|
|
| 2.65%, 08/15/2030 |
|
|
400,000 |
|
|
|
345,225 |
|
| Phillips 66 |
|
|
|
|
|
|
|
|
| 4.65%, 11/15/2034 |
|
|
100,000 |
|
|
|
93,247 |
|
| Valero Energy Corp. |
|
|
|
|
|
|
|
|
| 4.00%, 06/01/2052 |
|
|
100,000 |
|
|
|
73,672 |
|
| 6.63%, 06/15/2037 |
|
|
250,000 |
|
|
|
267,087 |
|
| Valero Energy Partners LP |
|
|
|
|
|
|
|
|
| 4.50%, 03/15/2028 |
|
|
400,000 |
|
|
|
390,146 |
|
|
|
|
|
|
|
|
|
|
|
|
|
|
|
|
|
|
|
|
3,056,338 |
|
|
|
|
|
|
|
|
|
|
|
|
|
|
|
|
|
|
|
| |
|
Principal |
|
|
Value |
|
| |
|
|
| CORPORATE DEBT SECURITIES (continued) |
|
| Passenger Airlines - 0.2% |
|
| Delta Air Lines, Inc./SkyMiles IP Ltd. |
|
|
|
|
|
|
|
|
| 4.75%, 10/20/2028 (B) |
|
$ |
250,000 |
|
|
|
$ 243,585 |
|
|
|
|
|
|
|
|
|
|
|
|
|
| Pharmaceuticals - 0.4% |
|
|
|
|
|
|
|
|
| Pfizer Investment Enterprises Pte. Ltd. |
|
|
|
|
|
|
|
|
| 5.30%, 05/19/2053 |
|
|
450,000 |
|
|
|
436,457 |
|
|
|
|
|
|
|
|
|
|
|
|
|
| Retail REITs - 0.2% |
|
|
|
|
|
|
|
|
| Realty Income Corp. |
|
|
|
|
|
|
|
|
| 4.85%, 03/15/2030 |
|
|
200,000 |
|
|
|
196,169 |
|
|
|
|
|
|
|
|
|
|
|
| Semiconductors & Semiconductor Equipment - 0.2% |
|
| Broadcom, Inc. |
|
|
|
|
|
|
|
|
| 3.19%, 11/15/2036 (B) |
|
|
9,000 |
|
|
|
7,139 |
|
| Intel Corp. |
|
|
|
|
|
|
|
|
| 3.73%, 12/08/2047 |
|
|
400,000 |
|
|
|
295,317 |
|
|
|
|
|
|
|
|
|
|
|
|
|
|
|
|
|
|
|
|
302,456 |
|
|
|
|
|
|
|
|
|
|
|
|
|
| Software - 0.6% |
|
|
|
|
|
|
|
|
| Fiserv, Inc. |
|
|
|
|
|
|
|
|
| 3.50%, 07/01/2029 |
|
|
200,000 |
|
|
|
185,047 |
|
| Intuit, Inc. |
|
|
|
|
|
|
|
|
| 5.20%, 09/15/2033 |
|
|
100,000 |
|
|
|
100,596 |
|
| Oracle Corp. |
|
|
|
|
|
|
|
|
| 3.95%, 03/25/2051 |
|
|
250,000 |
|
|
|
185,899 |
|
| VMware LLC |
|
|
|
|
|
|
|
|
| 2.20%, 08/15/2031 |
|
|
250,000 |
|
|
|
203,501 |
|
|
|
|
|
|
|
|
|
|
|
|
|
|
|
|
|
|
|
|
675,043 |
|
|
|
|
|
|
|
|
|
|
|
|
|
| Specialized REITs - 0.1% |
|
|
|
|
|
|
|
|
| Weyerhaeuser Co. |
|
|
|
|
|
|
|
|
| 3.38%, 03/09/2033 |
|
|
200,000 |
|
|
|
171,659 |
|
|
|
|
|
|
|
|
|
|
|
|
|
| Specialty Retail - 0.1% |
|
|
|
|
|
|
|
|
| Tractor Supply Co. |
|
|
|
|
|
|
|
|
| 5.25%, 05/15/2033 |
|
|
100,000 |
|
|
|
99,297 |
|
|
|
|
|
|
|
|
|
|
|
| Technology Hardware, Storage & Peripherals - 0.3% |
|
| Dell International LLC/EMC Corp. |
|
|
|
|
|
|
|
|
| 3.45%, 12/15/2051 |
|
|
250,000 |
|
|
|
170,260 |
|
| 8.35%, 07/15/2046 |
|
|
19,000 |
|
|
|
24,128 |
|
| HP, Inc. |
|
|
|
|
|
|
|
|
| 2.65%, 06/17/2031 |
|
|
250,000 |
|
|
|
212,193 |
|
|
|
|
|
|
|
|
|
|
|
|
|
|
|
|
|
|
|
|
406,581 |
|
|
|
|
|
|
|
|
|
|
|
|
|
| Total Corporate Debt Securities
(Cost $24,254,960) |
|
|
|
|
|
|
21,826,120 |
|
|
|
|
|
|
|
|
|
|
|
| U.S. GOVERNMENT OBLIGATIONS - 12.7% |
|
| U.S. Treasury - 12.7% |
|
|
|
|
|
|
|
|
| U.S. Treasury Bonds |
|
|
|
|
|
|
|
|
| 2.00%, 02/15/2050 |
|
|
700,000 |
|
|
|
428,012 |
|
| 2.50%, 02/15/2045 |
|
|
750,000 |
|
|
|
537,686 |
|
| 2.75%, 08/15/2042 - 11/15/2042 |
|
|
1,800,000 |
|
|
|
1,388,594 |
|
| 3.00%, 05/15/2047 |
|
|
750,000 |
|
|
|
576,943 |
|
| 3.75%, 08/15/2041 |
|
|
250,000 |
|
|
|
226,709 |
|
| 4.13%, 08/15/2053 |
|
|
975,000 |
|
|
|
913,605 |
|
| 4.38%, 05/15/2041 |
|
|
500,000 |
|
|
|
492,285 |
|
The Notes to Financial Statements are an integral part of this report.
|
|
|
|
|
| Transamerica Series Trust |
|
|
|
Semi-Annual Financial Statements 2024 |
|
|
Page 4 |
|
|
Transamerica Madison Diversified Income VP
SCHEDULE OF INVESTMENTS (continued)
At June 30, 2024
(unaudited)
|
|
|
|
|
|
|
|
|
| |
|
Principal |
|
|
Value |
|
| |
|
|
| U.S. GOVERNMENT OBLIGATIONS (continued) |
|
| U.S. Treasury (continued) |
|
| U.S. Treasury Notes |
|
|
|
|
|
|
|
|
| 2.00%, 08/15/2025 |
|
$ |
1,000,000 |
|
|
|
$ 966,953 |
|
| 2.38%, 05/15/2027 |
|
|
1,250,000 |
|
|
|
1,177,539 |
|
| 2.63%, 02/15/2029 |
|
|
2,500,000 |
|
|
|
2,318,750 |
|
| 2.88%, 05/15/2028 |
|
|
2,250,000 |
|
|
|
2,126,689 |
|
| 3.88%, 11/30/2029 |
|
|
1,000,000 |
|
|
|
977,383 |
|
| 4.00%, 02/29/2028 - 02/15/2034 |
|
|
2,065,000 |
|
|
|
2,026,139 |
|
| 4.13%, 11/15/2032 |
|
|
250,000 |
|
|
|
246,201 |
|
| 4.63%, 09/30/2028 |
|
|
800,000 |
|
|
|
807,188 |
|
|
|
|
|
|
|
|
|
|
|
|
|
| Total U.S. Government Obligations
(Cost $16,878,156) |
|
|
|
|
|
|
15,210,676 |
|
|
|
|
|
|
|
|
|
|
|
| MORTGAGE-BACKED SECURITIES - 3.0% |
|
| Bunker Hill Loan Depositary Trust |
|
|
|
|
|
|
|
|
| Series 2020-1, Class A1, 1.72% (A), 02/25/2055 (B) |
|
|
71,631 |
|
|
|
68,666 |
|
| CIM Trust |
|
|
|
|
|
|
|
|
| Series 2021-J2, Class A4, 2.50% (A), 04/25/2051 (B) |
|
|
268,876 |
|
|
|
233,643 |
|
| FREMF Mortgage Trust |
|
|
|
|
|
|
|
|
| Series 2014-K41, Class B, 3.97% (A), 11/25/2047 (B) |
|
|
180,000 |
|
|
|
178,283 |
|
| Series 2015-K44, Class B, 3.84%(A), 01/25/2048 (B) |
|
|
410,000 |
|
|
|
403,953 |
|
| Series 2020-K106, Class B, 3.68% (A), 03/25/2053 (B) |
|
|
250,000 |
|
|
|
226,430 |
|
| GCAT Trust |
|
|
|
|
|
|
|
|
| Series 2021-NQM1, Class A1, 0.87% (A), 01/25/2066 (B) |
|
|
138,538 |
|
|
|
116,950 |
|
| GS Mortgage-Backed Securities Corp. Trust |
|
|
|
|
|
|
|
|
| Series 2020-PJ6, Class A2, 2.50% (A), 05/25/2051 (B) |
|
|
154,778 |
|
|
|
124,356 |
|
| JP Morgan Mortgage Trust |
|
|
|
|
|
|
|
|
| Series 2024-5, Class A4, 6.00% (A), 11/25/2054 (B) |
|
|
250,000 |
|
|
|
249,427 |
|
| JPMorgan Mortgage Trust |
|
|
|
|
|
|
|
|
| Series 2021-1, Class A3, 2.50% (A), 06/25/2051 (B) |
|
|
447,802 |
|
|
|
358,312 |
|
| Series 2021-3, Class A3, 2.50% (A), 07/25/2051(B) |
|
|
207,221 |
|
|
|
165,058 |
|
| Series 2021-6, Class A4, 2.50% (A), 10/25/2051 (B) |
|
|
548,903 |
|
|
|
474,208 |
|
| JPMorgan Wealth Management |
|
|
|
|
|
|
|
|
| Series 2020-ATR1, Class A3, 3.00% (A), 02/25/2050 (B) |
|
|
103,081 |
|
|
|
87,844 |
|
| PSMC Trust |
|
|
|
|
|
|
|
|
| Series 2021-1, Class A11, 2.50% (A), 03/25/2051 (B) |
|
|
320,648 |
|
|
|
277,519 |
|
| RCKT Mortgage Trust |
|
|
|
|
|
|
|
|
| Series 2021-6, Class A5, 2.50% (A), 12/25/2051 (B) |
|
|
321,381 |
|
|
|
275,914 |
|
| Sequoia Mortgage Trust |
|
|
|
|
|
|
|
|
| Series 2013-7, Class A2, 3.00% (A), 06/25/2043 |
|
|
197,428 |
|
|
|
171,078 |
|
|
|
|
|
|
|
|
|
|
| |
|
Principal |
|
|
Value |
|
| |
|
|
| MORTGAGE-BACKED SECURITIES (continued) |
|
| Wells Fargo Mortgage-Backed Securities Trust |
|
|
|
|
|
|
|
|
| Series 2021-INV2, Class A2, 2.50% (A), 09/25/2051 (B) |
|
$ |
197,904 |
|
|
|
$ 157,612 |
|
|
|
|
|
|
|
|
|
|
|
|
|
| Total Mortgage-Backed Securities
(Cost $4,120,298) |
|
|
|
|
|
|
3,569,253 |
|
|
|
|
|
|
|
|
|
|
|
| ASSET-BACKED SECURITIES - 2.7% |
|
| Carmax Auto Owner Trust |
|
|
|
|
|
|
|
|
| Series 2022-3, Class A4, 4.06%, 02/15/2028 |
|
|
203,000 |
|
|
|
198,369 |
|
| Chesapeake Funding II LLC |
|
|
|
|
|
|
|
|
| Series 2023-1A, Class A1, 5.65%, 05/15/2035 (B) |
|
|
355,537 |
|
|
|
355,392 |
|
| CNH Equipment Trust |
|
|
|
|
|
|
|
|
| Series 2023-A, Class A3, 4.81%, 08/15/2028 |
|
|
500,000 |
|
|
|
495,884 |
|
| Dell Equipment Finance Trust |
|
|
|
|
|
|
|
|
| Series 2023-2, Class A2, 5.84%, 01/22/2029 (B) |
|
|
133,392 |
|
|
|
133,439 |
|
| Enterprise Fleet Financing LLC |
|
|
|
|
|
|
|
|
| Series 2022-4, Class A2, 5.76%, 10/22/2029 (B) |
|
|
233,975 |
|
|
|
234,143 |
|
| Series 2023-1, Class A2, 5.51%, 01/22/2029 (B) |
|
|
185,390 |
|
|
|
185,064 |
|
| Hertz Vehicle Financing III LLC |
|
|
|
|
|
|
|
|
| Series 2022-1A, Class A, 1.99%, 06/25/2026 (B) |
|
|
250,000 |
|
|
|
242,853 |
|
| Hertz Vehicle Financing LLC |
|
|
|
|
|
|
|
|
| Series 2021-1A, Class A, 1.21%, 12/26/2025 (B) |
|
|
250,000 |
|
|
|
246,688 |
|
| Honda Auto Receivables Owner Trust |
|
|
|
|
|
|
|
|
| Series 2021-3, Class A3, 0.41%, 11/18/2025 |
|
|
185,734 |
|
|
|
182,974 |
|
| JPMorgan Chase Bank NA - CACLN |
|
|
|
|
|
|
|
|
| Series 2021-1, Class B, 0.88%, 09/25/2028 (B) |
|
|
8,081 |
|
|
|
8,047 |
|
| Series 2021-2, Class B, 0.89%, 12/26/2028 (B) |
|
|
30,798 |
|
|
|
30,455 |
|
| Series 2021-3, Class C, 0.86%, 02/26/2029 (B) |
|
|
54,547 |
|
|
|
53,286 |
|
| LAD Auto Receivables Trust |
|
|
|
|
|
|
|
|
| Series 2023-2A, Class A2, 5.93%, 06/15/2027 (B) |
|
|
120,713 |
|
|
|
120,828 |
|
| Santander Revolving Auto Loan Trust |
|
|
|
|
|
|
|
|
| Series 2019-A, Class C, 3.00%, 01/26/2032 (B) |
|
|
350,000 |
|
|
|
344,904 |
|
| Towd Point HE Trust |
|
|
|
|
|
|
|
|
| Series 2021-HE1, Class A1, 0.92% (A), 02/25/2063 (B) |
|
|
80,409 |
|
|
|
77,127 |
|
| Towd Point Mortgage Trust |
|
|
|
|
|
|
|
|
| Series 2024-CES1, Class A1A, 5.85% (A), 01/25/2064 (B) |
|
|
279,010 |
|
|
|
278,111 |
|
|
|
|
|
|
|
|
|
|
|
|
| Total Asset-Backed Securities
(Cost $3,202,066) |
|
|
|
3,187,564 |
|
|
|
|
|
|
|
|
|
|
The Notes to Financial Statements are an integral part of this report.
|
|
|
|
|
| Transamerica Series Trust |
|
|
|
Semi-Annual Financial Statements 2024 |
|
|
Page 5 |
|
|
Transamerica Madison Diversified Income VP
SCHEDULE OF INVESTMENTS (continued)
At June 30, 2024
(unaudited)
|
|
|
|
|
|
|
|
|
| |
|
Principal |
|
|
Value |
|
| |
|
|
| MUNICIPAL GOVERNMENT OBLIGATIONS - 0.2% |
|
| Massachusetts - 0.0%(D) |
|
|
|
|
|
|
|
|
| University of Massachusetts Building Authority, Revenue Bonds,
6.57%, 05/01/2039 |
|
|
$ 35,000 |
|
|
|
$ 35,024 |
|
|
|
|
|
|
|
|
|
|
|
|
|
| Oregon - 0.2% |
|
|
|
|
|
|
|
|
| Hillsboro School District No. 1J, General Obligation Limited, 4.36%, 06/30/2034 |
|
|
200,000 |
|
|
|
192,305 |
|
|
|
|
|
|
|
|
|
|
|
|
| Total Municipal Government Obligations
(Cost $236,503) |
|
|
|
227,329 |
|
|
|
|
|
|
|
|
|
|
|
|
|
|
|
|
|
|
|
| |
|
Shares |
|
|
Value |
|
| |
|
|
| OTHER INVESTMENT COMPANY - 0.2% |
|
| Securities Lending Collateral - 0.2% |
|
|
|
|
|
|
|
|
| State Street Navigator Securities Lending Trust - Government Money Market Portfolio, 5.28% (E) |
|
|
267,378 |
|
|
|
267,378 |
|
|
|
|
|
|
|
|
|
|
|
|
| Total Other Investment Company
(Cost $267,378) |
|
|
|
267,378 |
|
|
|
|
|
|
|
|
|
|
|
|
|
|
|
|
|
|
|
| |
|
Principal |
|
|
Value |
|
| |
|
|
| REPURCHASE AGREEMENT - 0.7% |
|
| Fixed Income Clearing Corp., 2.50%(E), dated 06/28/2024, to be repurchased at $825,527 on 07/01/2024. Collateralized by a U.S. Government Obligation, 3.75%, due 04/15/2026, and with a value of $841,865. |
|
|
$ 825,355 |
|
|
|
$ 825,355 |
|
|
|
|
|
|
|
|
|
|
|
|
| Total Repurchase Agreement
(Cost $825,355) |
|
|
|
825,355 |
|
|
|
|
|
|
|
|
|
|
| Total Investments
(Cost $121,559,734) |
|
|
|
119,468,076 |
|
|
|
|
|
|
|
|
|
|
| Net Other Assets (Liabilities) - 0.1% |
|
|
|
81,898 |
|
|
|
|
|
|
|
|
|
|
|
|
| Net Assets - 100.0% |
|
|
|
$ 119,549,974 |
|
|
|
|
|
|
|
|
|
|
INVESTMENT VALUATION:
Valuation Inputs (F)
|
|
|
|
|
|
|
|
|
|
|
|
|
|
|
|
|
|
|
|
|
| |
|
Level 1 - Unadjusted Quoted Prices |
|
Level 2 - Other Significant Observable Inputs |
|
Level 3 - Significant Unobservable Inputs |
|
Value |
|
|
|
|
|
| ASSETS |
|
|
|
|
|
|
|
|
|
|
|
|
|
|
|
|
|
|
|
|
| Investments |
|
|
|
|
|
|
|
|
|
|
|
|
|
|
|
|
|
|
|
|
| Common Stocks |
|
|
$ |
46,580,401 |
|
|
|
$ |
— |
|
|
|
$ |
— |
|
|
|
$ |
46,580,401 |
|
| U.S. Government Agency Obligations |
|
|
|
— |
|
|
|
|
27,774,000 |
|
|
|
|
— |
|
|
|
|
27,774,000 |
|
| Corporate Debt Securities |
|
|
|
— |
|
|
|
|
21,826,120 |
|
|
|
|
— |
|
|
|
|
21,826,120 |
|
| U.S. Government Obligations |
|
|
|
— |
|
|
|
|
15,210,676 |
|
|
|
|
— |
|
|
|
|
15,210,676 |
|
| Mortgage-Backed Securities |
|
|
|
— |
|
|
|
|
3,569,253 |
|
|
|
|
— |
|
|
|
|
3,569,253 |
|
| Asset-Backed Securities |
|
|
|
— |
|
|
|
|
3,187,564 |
|
|
|
|
— |
|
|
|
|
3,187,564 |
|
| Municipal Government Obligations |
|
|
|
— |
|
|
|
|
227,329 |
|
|
|
|
— |
|
|
|
|
227,329 |
|
| Other Investment Company |
|
|
|
267,378 |
|
|
|
|
— |
|
|
|
|
— |
|
|
|
|
267,378 |
|
| Repurchase Agreement |
|
|
|
— |
|
|
|
|
825,355 |
|
|
|
|
— |
|
|
|
|
825,355 |
|
|
|
|
|
|
|
|
|
|
|
|
|
|
|
|
|
|
|
|
|
|
| Total Investments |
|
|
$ |
46,847,779 |
|
|
|
$ |
72,620,297 |
|
|
|
$ |
— |
|
|
|
$ |
119,468,076 |
|
|
|
|
|
|
|
|
|
|
|
|
|
|
|
|
|
|
|
|
|
|
FOOTNOTES TO SCHEDULE OF INVESTMENTS:
| (A) |
Floating or variable rate security. The rate disclosed is as of June 30, 2024. For securities based on a published reference rate and spread, the reference rate and spread are indicated within the description. Variable rate securities with a floor or ceiling feature are disclosed at the inherent rate, where applicable. Certain variable rate securities are not based on a published reference rate and spread, but are determined by the issuer or agent and are based on current market conditions; these securities do not indicate a reference rate and spread in the description. |
| (B) |
Security is exempt from registration pursuant to Rule 144A of the Securities Act of 1933. Security may be resold as transactions exempt from registration, normally to qualified institutional buyers. At June 30, 2024, the total value of 144A securities is $8,511,986, representing 7.1% of the Portfolio’s net assets. |
| (C) |
All or a portion of the security is on loan. The total value of the securities on loan is $506,917, collateralized by cash collateral of $267,378 and non-cash collateral, such as U.S. government securities and irrevocable letters of credit, of $250,705. The amount on loan indicated may not correspond with the securities on loan identified because a security with pending sales are in the process of recall from the brokers. |
| (D) |
Percentage rounds to less than 0.1% or (0.1)%. |
| (E) |
Rate disclosed reflects the yield at June 30, 2024. |
| (F) |
There were no transfers in or out of Level 3 during the period ended June 30, 2024. Please reference the Investment Valuation section of the Notes to Financial Statements for more information regarding investment valuation and pricing inputs. |
|
|
|
|
|
| The Notes to Financial Statements are an integral part of this report. |
| Transamerica Series Trust |
|
|
|
Semi-Annual Financial Statements 2024 |
|
|
Page 6 |
|
|
Transamerica Madison Diversified Income VP
SCHEDULE OF INVESTMENTS (continued)
At June 30, 2024
(unaudited)
PORTFOLIO ABBREVIATION(S):
|
|
|
| REIT |
|
Real Estate Investment Trust |
| SOFR |
|
Secured Overnight Financing Rate |
| STACR |
|
Structured Agency Credit Risk |
|
|
|
|
|
| The Notes to Financial Statements are an integral part of this report. |
| Transamerica Series Trust |
|
|
|
Semi-Annual Financial Statements 2024 |
|
|
Page 7 |
|
|
Transamerica Madison Diversified Income VP
STATEMENT OF ASSETS AND LIABILITIES
At June 30, 2024
(unaudited)
|
|
|
|
|
|
|
| Assets: |
|
|
|
|
| Investments, at value (cost $120,734,379) (including securities loaned of $506,917) |
|
$ |
118,642,721 |
|
| Repurchase agreement, at value (cost $825,355) |
|
|
825,355 |
|
| Receivables and other assets: |
|
|
|
|
| Net income from securities lending |
|
|
118 |
|
| Dividends |
|
|
59,355 |
|
| Interest |
|
|
473,503 |
|
| Prepaid expenses |
|
|
478 |
|
|
|
| Total assets |
|
|
120,001,530 |
|
|
|
| Liabilities: |
|
|
|
|
| Cash collateral received upon return of: |
|
|
|
|
| Securities on loan |
|
|
267,378 |
|
| Payables and other liabilities: |
|
|
|
|
| Shares of beneficial interest redeemed |
|
|
45,689 |
|
| Investment management fees |
|
|
67,220 |
|
| Distribution and service fees |
|
|
23,021 |
|
| Transfer agent costs |
|
|
147 |
|
| Trustee and CCO fees |
|
|
421 |
|
| Audit and tax fees |
|
|
16,938 |
|
| Custody fees |
|
|
18,203 |
|
| Legal fees |
|
|
822 |
|
| Printing and shareholder reports fees |
|
|
6,278 |
|
| Other accrued expenses |
|
|
5,439 |
|
|
|
| Total liabilities |
|
|
451,556 |
|
|
|
| Net assets |
|
$ |
119,549,974 |
|
|
|
| Net assets consist of: |
|
|
|
|
| Capital stock ($0.01 par value) |
|
$ |
109,654 |
|
| Additional paid-in capital |
|
|
120,754,079 |
|
| Total distributable earnings (accumulated losses) |
|
|
(1,313,759 |
) |
|
|
| Net assets |
|
$ |
119,549,974 |
|
|
|
| Shares outstanding |
|
|
10,965,396 |
|
|
|
| Net asset value and offering price per share |
|
$ |
10.90 |
|
STATEMENT OF OPERATIONS
For the period ended June 30, 2024
(unaudited)
|
|
|
|
|
|
|
| Investment income: |
|
|
|
|
| Dividend income |
|
$ |
630,235 |
|
| Interest income |
|
|
1,432,413 |
|
| Net income from securities lending |
|
|
3,875 |
|
| Total investment income |
|
|
2,066,523 |
|
|
|
| Expenses: |
|
|
|
|
| Investment management fees |
|
|
442,154 |
|
| Distribution and service fees |
|
|
151,422 |
|
| Transfer agent costs |
|
|
716 |
|
| Trustee and CCO fees |
|
|
2,879 |
|
| Audit and tax fees |
|
|
16,810 |
|
| Custody fees |
|
|
18,041 |
|
| Legal fees |
|
|
5,342 |
|
| Printing and shareholder reports fees |
|
|
6,224 |
|
| Other |
|
|
11,105 |
|
|
|
| Total expenses |
|
|
654,693 |
|
|
|
| Net investment income (loss) |
|
|
1,411,830 |
|
|
|
| Net realized gain (loss) on: |
|
|
|
|
| Investments |
|
|
(1,412,731 |
) |
|
|
| Net change in unrealized appreciation (depreciation) on: |
|
|
|
|
| Investments |
|
|
(965,928 |
) |
|
|
| Net realized and change in unrealized gain (loss) |
|
|
(2,378,659 |
) |
|
|
| Net increase (decrease) in net assets resulting from operations |
|
$ |
(966,829 |
) |
The Notes to Financial Statements are an integral part of this report.
|
|
|
|
|
| Transamerica Series Trust |
|
|
|
Semi-Annual Financial Statements 2024 |
|
|
Page 8 |
|
|
Transamerica Madison Diversified Income VP
STATEMENT OF CHANGES IN NET ASSETS
For the period and year ended:
|
|
|
|
|
|
|
|
|
| |
|
June 30, 2024 (unaudited) |
|
December 31, 2023 |
|
|
|
| From operations: |
|
|
|
|
|
|
|
|
| Net investment income (loss) |
|
|
$ 1,411,830 |
|
|
|
$ 2,947,847 |
|
| Net realized gain (loss) |
|
|
(1,412,731 |
) |
|
|
(2,095,938 |
) |
| Net change in unrealized appreciation (depreciation) |
|
|
(965,928 |
) |
|
|
4,036,821 |
|
|
|
|
| Net increase (decrease) in net assets resulting from operations |
|
|
(966,829 |
) |
|
|
4,888,730 |
|
|
|
|
| Dividends and/or distributions to shareholders: |
|
|
|
|
|
|
|
|
| Dividends and/or distributions to shareholders |
|
|
— |
|
|
|
(8,554,749 |
) |
|
|
|
| Net increase (decrease) in net assets resulting from dividends and/or distributions to shareholders |
|
|
— |
|
|
|
(8,554,749 |
) |
|
|
|
| Capital share transactions: |
|
|
|
|
|
|
|
|
| Proceeds from shares sold |
|
|
1,288,963 |
|
|
|
3,138,211 |
|
| Dividends and/or distributions reinvested |
|
|
— |
|
|
|
8,554,749 |
|
| Cost of shares redeemed |
|
|
(10,318,462 |
) |
|
|
(21,920,983 |
) |
|
|
|
| Net increase (decrease) in net assets resulting from capital share transactions |
|
|
(9,029,499 |
) |
|
|
(10,228,023 |
) |
|
|
|
| Net increase (decrease) in net assets |
|
|
(9,996,328 |
) |
|
|
(13,894,042 |
) |
|
|
|
| Net assets: |
|
|
|
|
|
|
|
|
| Beginning of period/year |
|
|
129,546,302 |
|
|
|
143,440,344 |
|
| End of period/year |
|
|
$119,549,974 |
|
|
|
$129,546,302 |
|
|
|
|
| Capital share transactions - shares: |
|
|
|
|
|
|
|
|
| Shares issued |
|
|
118,702 |
|
|
|
280,895 |
|
| Shares reinvested |
|
|
— |
|
|
|
804,774 |
|
| Shares redeemed |
|
|
(948,932 |
) |
|
|
(1,994,046 |
) |
|
|
|
| Net increase (decrease) in shares outstanding |
|
|
(830,230 |
) |
|
|
(908,377 |
) |
FINANCIAL HIGHLIGHTS
|
|
|
|
|
|
|
|
|
|
|
|
|
|
|
|
|
|
|
|
|
|
|
|
|
| For a share outstanding during the period and years indicated: |
|
Service Class |
|
|
|
|
|
|
|
| |
|
June 30, 2024 (unaudited) |
|
December 31, 2023 |
|
December 31, 2022 |
|
December 31, 2021 |
|
December 31, 2020 |
|
December 31, 2019 |
| Net asset value, beginning of period/year |
|
$ |
10.98 |
|
|
$ |
11.29 |
|
|
$ |
15.03 |
|
|
$ |
14.34 |
|
|
$ |
13.84 |
|
|
$ |
12.54 |
|
|
|
|
|
|
|
|
| Investment operations: |
|
|
|
|
|
|
|
|
|
|
|
|
|
|
|
|
|
|
|
|
|
|
|
|
|
|
|
|
|
|
|
| Net investment income (loss)(A) |
|
|
0.12 |
|
|
|
0.24 |
|
|
|
0.22 |
|
|
|
0.18 |
|
|
|
0.21 |
|
|
|
0.21 |
|
|
|
|
|
|
|
|
| Net realized and unrealized gain (loss) |
|
|
(0.20 |
) |
|
|
0.19 |
|
|
|
(1.74 |
) |
|
|
0.94 |
|
|
|
0.86 |
|
|
|
1.65 |
|
|
|
|
|
|
|
|
| Total investment operations |
|
|
(0.08 |
) |
|
|
0.43 |
|
|
|
(1.52 |
) |
|
|
1.12 |
|
|
|
1.07 |
|
|
|
1.86 |
|
|
|
|
|
|
|
|
| Dividends and/or distributions to shareholders: |
|
|
|
|
|
|
|
|
|
|
|
|
|
|
|
|
|
|
|
|
|
|
|
|
|
|
|
|
|
|
|
| Net investment income |
|
|
— |
|
|
|
(0.23 |
) |
|
|
(0.23 |
) |
|
|
(0.24 |
) |
|
|
(0.23 |
) |
|
|
(0.21 |
) |
|
|
|
|
|
|
|
| Net realized gains |
|
|
— |
|
|
|
(0.51 |
) |
|
|
(1.99 |
) |
|
|
(0.19 |
) |
|
|
(0.34 |
) |
|
|
(0.35 |
) |
|
|
|
|
|
|
|
| Total dividends and/or distributions to shareholders |
|
|
— |
|
|
|
(0.74 |
) |
|
|
(2.22 |
) |
|
|
(0.43 |
) |
|
|
(0.57 |
) |
|
|
(0.56 |
) |
|
|
|
|
|
|
|
| Net asset value, end of period/year |
|
$ |
10.90 |
|
|
$ |
10.98 |
|
|
$ |
11.29 |
|
|
$ |
15.03 |
|
|
$ |
14.34 |
|
|
$ |
13.84 |
|
| |
|
|
|
|
|
|
|
|
|
|
|
|
|
|
|
|
|
|
|
|
|
|
|
|
|
|
|
|
|
|
|
| Total return |
|
|
(0.73 |
)%(B) |
|
|
3.97 |
% |
|
|
(10.38 |
)% |
|
|
7.87 |
% |
|
|
7.95 |
% |
|
|
14.94 |
% |
|
|
|
|
|
|
|
| Ratio and supplemental data: |
|
|
|
|
|
|
|
|
|
|
|
|
|
|
|
|
|
|
|
|
|
|
|
|
|
|
|
|
|
|
|
| Net assets end of period/year (000’s) |
|
$ |
119,550 |
|
|
$ |
129,546 |
|
|
$ |
143,440 |
|
|
$ |
176,032 |
|
|
$ |
210,086 |
|
|
$ |
185,147 |
|
|
|
|
|
|
|
|
| Expenses to average net assets |
|
|
1.08 |
%(C) |
|
|
1.08 |
% |
|
|
1.06 |
% |
|
|
1.05 |
% |
|
|
1.04 |
% |
|
|
1.05 |
% |
|
|
|
|
|
|
|
| Net investment income (loss) to average net assets |
|
|
2.33 |
%(C) |
|
|
2.19 |
% |
|
|
1.69 |
% |
|
|
1.21 |
% |
|
|
1.55 |
% |
|
|
1.58 |
% |
|
|
|
|
|
|
|
| Portfolio turnover rate |
|
|
12 |
%(B) |
|
|
31 |
% |
|
|
32 |
% |
|
|
33 |
% |
|
|
40 |
% |
|
|
25 |
% |
| (A) |
Calculated based on average number of shares outstanding. |
The Notes to Financial Statements are an integral part of this report.
|
|
|
|
|
| Transamerica Series Trust |
|
|
|
Semi-Annual Financial Statements 2024 |
|
|
Page 9 |
|
|
Transamerica Madison Diversified Income VP
NOTES TO FINANCIAL STATEMENTS
At June 30, 2024
(unaudited)
1. ORGANIZATION
Transamerica Series Trust (“TST”) is an open-end management investment company registered under the Investment Company Act of 1940, as amended (the “1940 Act”). TST applies investment company accounting and reporting guidance. TST serves as a funding vehicle for variable life insurance, variable annuity, and group annuity products. Transamerica Madison Diversified Income VP (the “Portfolio”) is a series of TST and is classified as diversified under the 1940 Act. The Portfolio currently offers one class of shares, Service Class.
The only shareholders of the Portfolio are affiliated insurance company separate accounts and/or affiliated asset allocation portfolios. Contract holders of the variable life and annuity contracts are not shareholders of the Portfolio. For ease of reference, shareholders and contract holders are collectively referred to in this report as “shareholders.”
This report must be accompanied or preceded by the Portfolio’s current prospectus, which contains additional information about the Portfolio, including risks, as well as investment objectives and strategies.
Transamerica Asset Management, Inc. (“TAM”) serves as investment manager for the Portfolio pursuant to an investment management agreement. TAM provides continuous and regular investment management services to the Portfolio. TAM supervises the Portfolio’s investments, conducts its investment program and provides supervisory, compliance and administrative services to the Portfolio.
TAM currently acts as a “manager of managers” and has hired sub-advisers to furnish day-to-day investment advice and recommendations. TAM may, in the future, determine to provide all aspects of the day-to-day management of the Portfolio without the use of a sub-adviser. When acting as a manager of managers, TAM provides investment management services that include, without limitation, the design and development of the Portfolio and its investment strategies and the ongoing review and evaluation of those investment strategies including recommending changes in strategy where it believes appropriate or advisable; the selection of one or more sub-advisers for the Portfolio employing a combination of quantitative and qualitative screens, research, analysis and due diligence; negotiation of sub-advisory agreements and fees; oversight and monitoring of sub-advisers and recommending changes to sub-advisers where it believes appropriate or advisable; recommending portfolio combinations and liquidations where it believes appropriate or advisable; selection and oversight of transition managers, as needed; regular supervision of the Portfolio’s investments; regular review and evaluation of sub-adviser performance; daily monitoring of the sub-advisers’ buying and selling of securities for the Portfolio; regular review of holdings; ongoing trade oversight and analysis; regular monitoring to ensure adherence to investment process; regular calls and periodic on-site visits with sub-advisers; portfolio construction and asset allocation when using multiple sub-advisers for the Portfolio; risk management oversight and analysis; oversight of negotiation of investment documentation and agreements; design, development, implementation and regular monitoring of the valuation process; periodic due diligence reviews of pricing vendors and vendor methodology; design, development, implementation and regular monitoring of the compliance process; respond to regulatory inquiries and determine appropriate litigation strategy, as needed; review of proxies voted by sub-advisers; oversight of preparation and review of materials for meetings of the Portfolio’s Board of Trustees (the “Board”), participation in these meetings and preparation of regular communications with the Board; oversight of preparation and review of prospectuses, shareholder reports and other disclosure materials and regulatory filings for the Portfolio; oversight of other service providers to the Portfolio, such as the custodian, the transfer agent, the Portfolio’s independent accounting firm and legal counsel; supervision of the performance of recordkeeping and shareholder relations functions for the Portfolio; and oversight of cash management services. TAM uses a variety of quantitative and qualitative tools to carry out its investment management services. TAM, not the Portfolio, is responsible for paying the sub-adviser(s) for their services, and sub-advisory fees are TAM’s expense.
TAM’s investment management services also include the provision of supervisory and administrative services to the Portfolio. These services include performing certain administrative services for the Portfolio and supervising and overseeing the administrative, clerical, recordkeeping and bookkeeping services provided to the Portfolio by State Street Bank and Trust Company (“State Street”), to whom TAM has outsourced the provision of certain sub-administration services. To the extent agreed upon by TAM and the Portfolio from time to time, TAM’s supervisory and administrative services include, but are not limited to: monitoring and verifying the custodian’s daily calculation of the Net Asset Values (“NAV”); shareholder relations functions; compliance services; valuation services; assisting in due diligence and in the oversight and monitoring of certain activities of sub-advisers and certain aspects of Portfolio investments; assisting with Portfolio combinations and liquidations; oversight of the preparation and filing, and review, of all returns and reports, in connection with federal, state and local taxes; oversight and review of regulatory reporting; supervising and coordinating the Portfolio’s custodian and dividend disbursing agent and monitoring their services to the Portfolio; assisting the Portfolio in preparing reports to shareholders; acting as liaison with the Portfolio’s independent public accountants and providing, upon request, analyses, fiscal year summaries and other audit related services; assisting in the preparation of agendas and supporting documents for and minutes of meetings of trustees and committees of trustees; assisting in the preparation of regular communications with the trustees; and providing personnel and office space, telephones and other office equipment as necessary in order for TAM to perform supervisory and administrative services to the Portfolio. The Portfolio pays certain fees and expenses to State Street for sub-administration services which are not administrative services covered by the
|
|
|
|
|
| Transamerica Series Trust |
|
|
|
Semi-Annual Financial Statements 2024 |
|
|
Page 10 |
|
|
Transamerica Madison Diversified Income VP
NOTES TO FINANCIAL STATEMENTS (continued)
At June 30, 2024
(unaudited)
1. ORGANIZATION (continued)
management agreement with TAM or paid for through the management fees payable thereunder. For the period ended June 30, 2024, (i) the expenses paid to State Street for sub-administration services by the Portfolio are shown as a part of Other expenses within the Statement of Operations and (ii) the expenses payable to State Street for sub-administration services from the Portfolio are shown as part of Other accrued expenses within the Statement of Assets and Liabilities.
2. SIGNIFICANT ACCOUNTING POLICIES
In preparing the Portfolio’s financial statements in accordance with Generally Accepted Accounting Principles in the United States of America (“GAAP”), estimates or assumptions (which could differ from actual results) may be used that affect reported amounts and disclosures. The following is a summary of significant accounting policies followed by the Portfolio.
Security transactions and investment income: Security transactions are accounted for on the trade date. Security gains and losses are calculated on a first-in, first-out basis. Dividend income, if any, is recorded on the ex-dividend date or, in the case of foreign securities, as soon as the Portfolio is informed of the ex-dividend dates, net of foreign taxes. Non-cash dividends, if any, are recorded on the ex-dividend date at fair value. Interest income, if any, is recorded on the accrual basis from settlement date, net of foreign taxes. Fixed income premiums and discounts are amortized and/or accreted over the lives of the respective securities.
Distributions to shareholders: Distributions are recorded on the ex-dividend date and are determined in accordance with federal income tax regulations, which may differ from GAAP.
Commission recapture: The sub-adviser(s), to the extent consistent with the best execution and usual commission rate policies and practices, may elect to place security transactions of the Portfolio with broker/dealers with which TST has established a commission recapture program. A commission recapture program is any arrangement under which a broker/dealer applies a portion of the commissions received by such broker/dealer on the security transactions to the Portfolio. In no event will commissions, paid by the Portfolio, be used to pay expenses that would otherwise be borne by any other Portfolios within TST, or by any other party.
Commissions recaptured are included within Net realized gain (loss) within the Statement of Operations. For the period ended June 30, 2024, commissions recaptured are $6,423.
Indemnification: In the normal course of business, the Portfolio enters into contracts that contain a variety of representations that provide general indemnifications. The Portfolio’s maximum exposure under these arrangements is unknown, as this would involve future claims that may be made against the Portfolio and/or its affiliates that have not yet occurred. However, based on experience, the Portfolio expects the risk of loss to be remote.
3. INVESTMENT VALUATION
TAM has been designated as the Portfolio’s valuation designee pursuant to Rule 2a-5 under the 1940 Act with responsibility for fair valuation subject to oversight by the Portfolio’s Board of Trustees. The net asset value of the Portfolio is computed as of the official close of the New York Stock Exchange (“NYSE”) each day the NYSE is open for business.
TAM utilizes various methods to measure the fair value of its investments on a recurring basis. GAAP establishes a hierarchy that prioritizes inputs to valuation methods. The inputs or methodology used for valuing securities are not necessarily an indication of the risk associated with investing in those securities. The three levels (“Levels”) of inputs of the fair value hierarchy are defined as follows:
Level 1—Unadjusted quoted prices in active markets for identical securities.
Level 2—Inputs, other than quoted prices included in Level 1, which are observable, either directly or indirectly. These inputs may include quoted prices for the identical instrument on an inactive market, prices for similar instruments, interest rates, prepayment speeds, credit risk, yield curves, default rates, and similar data.
Level 3—Unobservable inputs based on the best information available in the circumstances, to the extent observable inputs are not available, which may include TAM’s own assumptions used in determining the fair value of the Portfolio’s investments.
The inputs used to measure fair value may fall into different Levels of the fair value hierarchy. In such cases, for disclosure purposes, the Level in the fair value hierarchy that is assigned to the fair value measurement of a security is determined based on the lowest Level input that is significant to the fair value measurement in its entirety. Certain investments that are measured at fair value using NAV per share, or
|
|
|
|
|
| Transamerica Series Trust |
|
|
|
Semi-Annual Financial Statements 2024 |
|
|
Page 11 |
|
|
Transamerica Madison Diversified Income VP
NOTES TO FINANCIAL STATEMENTS (continued)
At June 30, 2024
(unaudited)
3. INVESTMENT VALUATION (continued)
its equivalent, using the “practical expedient” have not been classified in the fair value Levels. The hierarchy classification of inputs used to value the Portfolio’s investments at June 30, 2024, is disclosed within the Investment Valuation section of the Schedule of Investments.
The availability of observable inputs can vary from security to security and is affected by a wide variety of factors, including, but not limited to, the type of security, whether the security is new and not yet established in the marketplace, the liquidity of markets, and other characteristics particular to the security. To the extent that valuation is based on models or inputs that are less observable or unobservable in the market, the determination of fair value requires more judgment. Accordingly, the degree of judgment exercised in determining fair value is generally greatest for instruments categorized in Level 3. Due to the inherent uncertainty of valuation, the determination of values may differ significantly from values that would have been realized had a ready market for investments existed, and the differences could be material.
Fair value measurements: Descriptions of the valuation techniques applied to the Portfolio’s significant categories of assets and liabilities measured at fair value on a recurring basis are as follows:
Asset-backed securities: The fair value of asset-backed securities is estimated based on models that consider the estimated cash flows of each tranche of the entity, establish a benchmark yield, and develop an estimated tranche specific spread to the benchmark yield based on the unique attributes of the tranche. To the extent the inputs are observable and timely, the values would generally be categorized in Level 2 of the fair value hierarchy; otherwise they would be categorized in Level 3.
Corporate debt securities: The fair value of corporate debt securities is estimated using various techniques, which consider recently executed transactions in securities of the issuer or comparable issuers, market price quotations (where observable), bond spreads, fundamental data relating to the issuer, and credit default swap spreads adjusted for any basis difference between cash and derivative instruments. While most corporate debt securities are categorized in Level 2 of the fair value hierarchy, in instances where lower relative weight is placed on transaction prices, quotations, or similar observable inputs, they are categorized in Level 3.
Equity securities: Securities are stated at the last reported sales price or closing price on the day of valuation taken from the primary exchange where the security is principally traded. To the extent these securities are actively traded and valuation adjustments are not applied, they are categorized in Level 1 of the fair value hierarchy. Equities traded on inactive markets or valued by reference to similar instruments are generally categorized in Level 2 or Level 3 if inputs are unobservable.
Foreign equity securities: Securities in which the primary trading market closes at the same time or after the NYSE, are valued based on quotations from the primary market in which they are traded and are categorized in Level 1. Because many foreign securities markets and exchanges close prior to the close of the NYSE, closing prices for foreign securities in those markets or on those exchanges do not reflect the events that occur after that close. Certain foreign securities may be fair valued using a pricing service that considers the correlation of the trading patterns of the foreign security to the intraday trading in the U.S. markets for investments such as American Depositary Receipts, financial futures, or ETFs and the movement of certain indices of securities based on a statistical analysis of their historical relationship; such valuations generally are categorized in Level 2.
Mortgage-backed securities: The fair value of mortgage-backed securities is estimated based on models that consider issuer type, coupon, cash flows, mortgage prepayment projection tables and adjustable rate mortgage evaluations that incorporate index data, periodic life caps and the next coupon reset date. To the extent the inputs are observable and timely, the values would generally be categorized in Level 2 of the fair value hierarchy; otherwise they are categorized in Level 3.
Municipal government obligations: The fair value of municipal government obligations and variable rate notes is estimated based on models that consider, among other factors, information received from market makers and broker-dealers, current trades, bid-want lists, offerings, market movements, the liquidity of the bond, state of issuance, benchmark yield curves, and bond or note insurance. To the extent the inputs are observable and timely, the values would generally be categorized in Level 2 of the fair value hierarchy; otherwise they are categorized in Level 3.
U.S. government agency obligations: U.S. government agency obligations are comprised of two main categories consisting of agency issued debt and mortgage pass-throughs. Generally, agency issued debt securities are valued in a manner similar to U.S. government obligations. Mortgage pass-throughs include to be announced (“TBA”) securities and mortgage pass-through certificates. Generally, TBA securities and mortgage pass-throughs are valued using dealer quotations. Depending on market activity levels and whether quotations or other observable data are used, these securities are typically categorized in Level 2 of the fair value hierarchy; otherwise they would be categorized in Level 3.
|
|
|
|
|
| Transamerica Series Trust |
|
|
|
Semi-Annual Financial Statements 2024 |
|
|
Page 12 |
|
|
Transamerica Madison Diversified Income VP
NOTES TO FINANCIAL STATEMENTS (continued)
At June 30, 2024
(unaudited)
3. INVESTMENT VALUATION (continued)
U.S. government obligations: U.S. government obligations are normally valued using a model that incorporates market observable data such as reported sales of similar securities, broker quotes, yields, bids, offers, and reference data. Certain securities are valued by principally using dealer quotations. U.S. government obligations generally are categorized in Level 2 of the fair value hierarchy, or Level 3 if inputs are unobservable.
Securities lending collateral: Securities lending collateral is invested in a money market fund which is valued at the actively traded NAV and no valuation adjustments are applied. Securities lending collateral is categorized in Level 1 of the fair value hierarchy.
Repurchase agreements: Repurchase agreements are valued at cost, which approximates fair value. To the extent the inputs are observable and timely, the values are generally categorized in Level 2 of the fair value hierarchy.
4. SECURITIES AND OTHER INVESTMENTS
Real estate investment trusts (“REITs”): REITs are pooled investment vehicles which invest primarily in income producing real estate, or real estate related loans or interests. Distributions received by REITs are classified at management’s estimate of the dividend income, return of capital and capital gains. Estimates are based on information available at year-end, which includes the previous fiscal year’s classification. The actual amounts of dividend income, return of capital, and capital gains are only determined by each REIT after the fiscal year end and may differ from the estimated amounts. Upon notification from the REITs, some of the distributions received may be re-classified and recorded as a return of capital or capital gains. There are certain additional risks involved in investing in REITs. These include, but are not limited to, economic conditions, changes in zoning laws, real estate values, property taxes, and interest rates.
REITs held at June 30, 2024, if any, are identified within the Schedule of Investments.
5. BORROWINGS AND OTHER FINANCING TRANSACTIONS
The Portfolio may engage in borrowing transactions as a means of raising cash to satisfy redemption requests, for other temporary or emergency purposes or, to the extent permitted by its investment policies, to raise additional cash to be invested in other securities or instruments. When the Portfolio invests borrowing proceeds in other securities, the Portfolio will bear the risk that the market value of the securities in which such proceeds are invested goes down and is insufficient to repay the borrowed proceeds. The Portfolio may borrow on a secured or on an unsecured basis. If the Portfolio enters into a secured borrowing arrangement, a portion of the Portfolio’s assets will be used as collateral. The 1940 Act requires the Portfolio to maintain asset coverage of at least 300% of the amount of its borrowings. Asset coverage means the ratio that the value of the Portfolio’s total assets, minus liabilities other than borrowings, bears to the aggregate amount of all borrowings. Although complying with this requirement has the effect of limiting the amount that the Portfolio may borrow, it does not otherwise mitigate the risks of entering into borrowing transactions.
Interfund lending: The Portfolio, along with other funds and portfolios advised by TAM, may participate in an interfund lending program pursuant to exemptive relief granted by the Securities and Exchange Commission on January 18, 2017. This program allows the Portfolio to lend to and borrow from other funds and portfolios advised by TAM. Interfund lending transactions are subject to the conditions of the exemptive relief which places limits on the amount of lending or borrowing a Portfolio may participate in under the program. Interest earned or paid on an interfund lending transaction will be based on the average of certain current market rates. For the period ended June 30, 2024, the Portfolio has not utilized the program.
Repurchase agreements: In a repurchase agreement, the Portfolio purchases a security and simultaneously commits to resell that security to the seller at an agreed-upon price on an agreed-upon date. Securities purchased subject to a repurchase agreement are held at the Portfolio’s custodian, or designated sub-custodian related to tri-party repurchase agreements, and, pursuant to the terms of the repurchase agreement, must be collateralized by securities with an aggregate market value greater than or equal to 100% of the resale price. The Portfolio will bear the risk of value fluctuations until the securities can be sold and may encounter delays and incur costs in liquidating the securities. In the event of bankruptcy or insolvency of the seller, delays and costs may be incurred.
Repurchase agreements are subject to netting agreements, which are agreements between the Portfolio and its counterparties that provide for the net settlement of all transactions and collateral with the Portfolio, through a single payment, in the event of default or termination. Amounts presented within the Schedule of Investments, and as part of Repurchase agreements, at value within the Statement of Assets and Liabilities are shown on a gross basis. The value of the related collateral for each repurchase agreement, as reflected within the Schedule of Investments, exceeds the value of each repurchase agreement at June 30, 2024.
Repurchase agreements at June 30, 2024, if any, are included within the Schedule of Investments and Statement of Assets and Liabilities.
|
|
|
|
|
| Transamerica Series Trust |
|
|
|
Semi-Annual Financial Statements 2024 |
|
|
Page 13 |
|
|
Transamerica Madison Diversified Income VP
NOTES TO FINANCIAL STATEMENTS (continued)
At June 30, 2024
(unaudited)
5. BORROWINGS AND OTHER FINANCING TRANSACTIONS (continued)
Securities lending: The Portfolio may lend securities to qualified financial institutions, brokers and dealers. State Street serves as securities lending agent to the Portfolio pursuant to a Securities Lending Agreement. Loans of securities are terminable at any time and the borrower, after notice, is required to return borrowed securities within the standard time period for settlement of securities transactions. The lending of securities exposes the Portfolio to risks such as: the borrowers may fail to return the loaned securities or may not be able to provide additional collateral, the Portfolio may experience delays in recovery of the loaned securities or delays in access to collateral, or the Portfolio may experience losses related to the investment collateral. To minimize certain risks, loan counterparties pledge cash, securities issued or guaranteed by the U.S. Government and irrevocable letters of credit issued by banks as collateral. The initial collateral received by the Portfolio is required to have a value of at least 102% of the current value of the loaned securities traded on U.S. exchanges, and a value of at least 105% for all other securities. Typically the lending agent is not permitted to sell, re-pledge or use cash and non-cash collateral it receives. The lending agent has agreed to indemnify the Portfolio in the case of default of any securities borrower.
The Portfolio receives compensation for lending securities from interest or dividends earned on the cash, U.S. Government securities and irrevocable letters of credit held as collateral, less associated fees and expenses. Such income is reflected in Net income from securities lending within the Statement of Operations. Cash collateral received is invested in the State Street Navigator Securities Lending Trust — Government Money Market Portfolio.
The value of loaned securities and related cash and non-cash collateral outstanding at June 30, 2024, if any, are shown on a gross basis within the Schedule of Investments.
The following table reflects a breakdown of transactions accounted for as secured borrowings, the gross obligation by the type, and the remaining contractual maturity of those transactions as of June 30, 2024.
|
|
|
|
|
|
|
|
|
|
|
|
|
|
|
|
|
|
|
|
|
| |
|
Remaining Contractual Maturity of the Agreements |
|
|
|
|
|
|
|
| |
|
Overnight and Continuous |
|
|
Less Than 30 Days |
|
|
Between 30 & 90 Days |
|
|
Greater Than 90 Days |
|
|
Total |
| Securities Lending Transactions |
|
|
|
|
|
|
|
|
|
|
|
|
|
|
|
|
|
|
|
|
| Corporate Debt Securities |
|
$ |
267,378 |
|
|
$ |
— |
|
|
$ |
— |
|
|
$ |
— |
|
|
$ |
267,378 |
|
| |
|
| Total Borrowings |
|
$ |
267,378 |
|
|
$ |
— |
|
|
$ |
— |
|
|
$ |
— |
|
|
$ |
267,378 |
|
| |
|
6. RISK FACTORS
Investing in the Portfolio involves certain key risks related to the Portfolio’s trading activity. Please reference the Portfolio’s prospectus for a more complete discussion of the following risk(s), as well as other risks of investing in the Portfolio.
Market risk: The market prices of the Portfolio’s securities or other assets may go up or down, sometimes rapidly or unpredictably, due to factors such as economic events, inflation, changes in interest rates, governmental actions or interventions, actions taken by the U.S. Federal Reserve or foreign central banks, market disruptions caused by tariffs, trade disputes or other factors, political developments, armed conflicts, economic sanctions, cybersecurity events, investor sentiment, the global and domestic effects of widespread or local health, weather or climate events, and other factors that may or may not be related to the issuer of the security or other asset. If the market prices of the Portfolio’s securities and assets fall, the value of your investment in the Portfolio could go down.
Economies and financial markets throughout the world are increasingly interconnected. Events or circumstances in one or more countries or regions could be highly disruptive to, and have profound impacts on, global economies or markets. As a result, whether or not the Portfolio invests in securities of issuers located in or with significant exposure to the countries directly affected, the value and liquidity of the Portfolio’s investments may go down.
Dividend paying stock risk: There can be no assurance that the issuers of the stocks held by the Portfolio will pay dividends in the future or that, if dividends are paid, they will not decrease. The Portfolio’s emphasis on dividend paying stocks could cause the Portfolio’s share price and total return to fluctuate more than, or cause the Portfolio to underperform, similar Portfolios that invest without consideration of an issuer’s track record of paying dividends or ability to pay dividends in the future. Dividend-paying stocks tend to go through cycles of over- or under-performing the stock market in general.
|
|
|
|
|
| Transamerica Series Trust |
|
|
|
Semi-Annual Financial Statements 2024 |
|
|
Page 14 |
|
|
Transamerica Madison Diversified Income VP
NOTES TO FINANCIAL STATEMENTS (continued)
At June 30, 2024
(unaudited)
6. RISK FACTORS (continued)
Fixed-income securities risk: Risks of fixed-income securities include credit risk, interest rate risk, counterparty risk, prepayment risk, extension risk, valuation risk, and liquidity risk. The value of fixed-income securities may go up or down, sometimes rapidly and unpredictably, due to general market conditions, such as real or perceived adverse economic or political conditions, tariffs and trade disruptions, inflation, changes in interest rates, lack of liquidity in the bond markets or adverse investor sentiment. In addition, the value of a fixed-income security may decline if the issuer or other obligor of the security fails to pay principal and/or interest, otherwise defaults or has its credit rating downgraded or is perceived to be less creditworthy, or the credit quality or value of any underlying assets declines. If the value of fixed-income securities owned by the Portfolio falls, the value of your investment will go down. The Portfolio may lose its entire investment in the fixed-income securities of an issuer.
Real estate investment trusts (“REITs”) risk: Investing in real estate investment trusts (“REITs”) involves unique risks. When the Portfolio invests in REITs, it is subject to risks generally associated with investing in real estate. A REIT’s performance depends on the types and locations of the properties it owns, how well it manages those properties and cash flow. REITs may have limited financial resources, may trade less frequently and in limited volume, may engage in dilutive offerings, and may be subject to more abrupt or erratic price movements than the overall securities markets. In addition to its own expenses, the Portfolio will indirectly bear its proportionate share of any management and other expenses paid by REITs in which it invests. U.S. REITs are subject to a number of highly technical tax-related rules and requirements; and a U.S. REIT’s failure to qualify for the favorable U.S. federal income tax treatment generally available to U.S. REITs could result in corporate-level taxation, significantly reducing the return on an investment to the Portfolio.
7. FEES AND OTHER AFFILIATED TRANSACTIONS
TST serves as a funding vehicle for certain affiliated asset allocation portfolios and certain affiliated separate accounts of Transamerica Life Insurance Company (“TLIC”) and Transamerica Financial Life Insurance Company.
TAM, the Portfolio’s investment manager, is directly owned by TLIC and AUSA Holding, LLC (“AUSA”), both of which are indirect, wholly owned subsidiaries of Aegon Ltd. TLIC is owned by Commonwealth General Corporation (“Commonwealth”). Commonwealth and AUSA are wholly owned by Transamerica Corporation (DE). Transamerica Corporation (DE) is wholly owned by Aegon International B.V., which is wholly owned by Aegon Ltd., a Bermuda exempted company with liability limited by shares (formerly, Aegon NV, a Netherlands corporation) and a publicly traded international insurance group.
Transamerica Fund Services, Inc. (“TFS”) is the Portfolio’s transfer agent. Transamerica Capital, Inc. (“TCI”) is the Portfolio’s distributor/principal underwriter. TAM, TFS and TCI are affiliates of Aegon Ltd.
Certain officers and trustees of the Portfolio may also be officers and/or trustees of TAM, TFS and TCI. No interested trustee who is deemed an interested person due to current or former service with TAM or an affiliate of TAM receives compensation from the Portfolio. The Portfolio does pay non-interested persons (independent trustees), as disclosed in Trustee and CCO fees within the Statement of Operations.
Investment management fees: TAM serves as the Portfolio’s investment manager, performing administration as well as investment advisory services. TAM renders investment advisory, supervisory, and administration services under an investment management agreement and the Portfolio pays a single management fee, which is reflected in Investment management fees within the Statement of Operations.
The Portfolio pays a management fee to TAM based on daily average net assets at the following rates:
|
|
|
|
|
| Breakpoints |
|
Rate |
|
|
| First $500 million |
|
|
0.73 |
% |
| Over $500 million up to $1 billion |
|
|
0.70 |
|
| Over $1 billion |
|
|
0.68 |
|
TAM has contractually agreed to waive fees and/or reimburse Portfolio expenses to the extent that the total operating expenses excluding, as applicable, acquired fund fees and expenses, interest (including borrowing costs and overdraft charges), taxes, brokerage commissions, dividend and interest expenses on securities sold short, extraordinary expenses and other expenses not incurred in the ordinary course of the Portfolio’s business, exceed the following stated annual operating expense limits to the Portfolio’s daily average net
|
|
|
|
|
| Transamerica Series Trust |
|
|
|
Semi-Annual Financial Statements 2024 |
|
|
Page 15 |
|
|
Transamerica Madison Diversified Income VP
NOTES TO FINANCIAL STATEMENTS (continued)
At June 30, 2024
(unaudited)
7. FEES AND OTHER AFFILIATED TRANSACTIONS (continued)
assets. To the extent an expense limit changed during the period, the prior limit is also listed below. The expenses waived and/or reimbursed, if any, are included in Expenses waived and/or reimbursed within the Statement of Operations.
|
|
|
|
|
|
|
| Class |
|
Operating Expense Limit |
|
Operating Expense Limit Effective Through |
| Service Class |
|
|
1.09 |
% |
|
May 1, 2025 |
TAM is permitted to recapture amounts contractually waived and/or reimbursed to a class during any of the 36 months from the date on which TAM waived fees and/or reimbursed expenses for the class. A class may recapture and reimburse TAM only if such amount does not cause, on any particular business day of the Portfolio, the class’s total annual operating expenses (after the recapture is taken into account) to exceed the Operating Expense Limits or any other lower limit then in effect. Amounts recaptured, if any, by TAM for the period ended June 30, 2024 are disclosed in Recapture of previously waived and/or reimbursed fees within the Statement of Operations.
TAM, on a voluntary basis and in addition to the contractual operating expense limits in effect, from time to time may waive and/or reimburse expenses of the Portfolio, or any classes thereof, to such level(s) as the Trust’s officers have determined or may reasonably determine from time to time. Any such voluntary waiver or expense reimbursement may be discontinued by TAM at any time. These amounts are not subject to recapture by TAM.
As of June 30, 2024, there are no amounts available for recapture by TAM.
Distribution and service fees: TST has a distribution plan (“Distribution Plan”) pursuant to Rule 12b-1 under the 1940 Act. Pursuant to the Distribution Plan, TST entered into a distribution agreement with TCI as the Portfolio’s distributor.
The Distribution Plan requires the Portfolio to pay distribution fees to TCI as compensation for various distribution activities, not as reimbursement for specific expenses. Under the Distribution Plan and distribution agreement, TCI, on behalf of the Portfolio, is authorized to pay various service providers, as direct payment for expenses incurred in connection with distribution of the Portfolio’s shares.
The fee on the Service Class shares is paid to the insurance companies for providing services and account maintenance for the policyholders who invest in the variable insurance products which invest in the Service Class shares. The distribution and service fees are included in Distribution and service fees within the Statement of Operations.
The Portfolio is authorized under the Distribution Plan to pay fees to TCI based on daily average net assets up to an annual fee of 0.25% of Service Class shares.
Transfer agent costs: TFS provides transfer agency services under an intercompany agreement with TAM. TFS has outsourced the provision of certain sub-transfer agency services to SS&C Global Investor & Distribution Solutions, Inc. (“SS&C GIDS”). The Portfolio does not pay a separate transfer agent fee to TAM or TFS but does pay certain expenses to SS&C GIDS related to applicable sub-transfer agency services. For the period ended June 30, 2024, (i) the expenses paid to SS&C GIDS by the Portfolio are referred to as transfer agent costs and are included within the Statement of Operations and (ii) the expenses payable to SS&C GIDS by the Portfolio are referred to as transfer agent costs within the Statement of Assets and Liabilities.
Brokerage commissions: The Portfolio incurred no brokerage commissions on security transactions placed with affiliates of the investment manager or sub-adviser(s) for the period ended June 30, 2024.
8. PURCHASES AND SALES OF SECURITIES
For the period ended June 30, 2024, the cost of securities purchased and proceeds from securities sold (excluding short-term securities) are as follows:
|
|
|
|
|
|
|
|
|
|
|
| Purchases of Securities |
|
|
|
Sales/Maturities of Securities |
|
|
|
|
|
| Long-Term |
|
U.S. Government |
|
|
|
Long-Term |
|
|
U.S. Government |
| $ 11,675,137 |
|
$ 3,326,677 |
|
|
|
$ |
18,807,571 |
|
|
$ 3,504,038 |
|
|
|
|
|
| Transamerica Series Trust |
|
|
|
Semi-Annual Financial Statements 2024 |
|
|
Page 16 |
|
|
Transamerica Madison Diversified Income VP
NOTES TO FINANCIAL STATEMENTS (continued)
At June 30, 2024
(unaudited)
9. FEDERAL INCOME TAXES AND DISTRIBUTIONS TO SHAREHOLDERS
The Portfolio has not made any provision for federal income or excise taxes due to its policy to distribute all of its taxable income and capital gains to its shareholders and otherwise qualify as a regulated investment company under Subchapter M of the Internal Revenue Code. The Portfolio recognizes the tax benefits of uncertain tax positions only where the position is “more likely than not” to be sustained assuming examination by tax authorities. The Portfolio’s tax returns remain subject to examination by the Internal Revenue Service and state tax authorities three years from the date of filing for federal purposes and four years from the date of filing for state purposes. Management has evaluated the Portfolio’s tax provisions taken for all open tax years, and has concluded that no provision for income tax is required in the Portfolio’s financial statements. If applicable, the Portfolio recognizes interest accrued related to unrecognized tax benefits in relation to interest and penalties expense in Other within the Statement of Operations. The Portfolio identifies its major tax jurisdictions as U.S. Federal, the state of Colorado, and foreign jurisdictions where the Portfolio makes significant investments; however, the Portfolio is not aware of any tax positions for which it is reasonably possible that the total amounts of unrecognized tax benefits will change materially in the next twelve months. Distributions are determined in accordance with income tax regulations, which may differ from GAAP.
As of June 30, 2024, the approximate cost for U.S. federal income tax purposes, and the aggregate gross/net unrealized appreciation (depreciation) in the value of investments (including securities sold short and derivatives, if any) are as follows:
|
|
|
|
|
|
|
| Cost |
|
Gross Appreciation |
|
Gross (Depreciation) |
|
Net Appreciation (Depreciation) |
| $ 121,559,734 |
|
$ 6,477,650 |
|
$ (8,569,308) |
|
$ (2,091,658) |
10. NEW ACCOUNTING PRONOUNCEMENT
In June 2022, the Financial Accounting Standards Board issued Accounting Standards Update No. 2022-03 (“ASU 2022-03”), “Fair Value Measurement of Equity Securities Subject to Contractual Sale Restrictions” (“Topic 820”). ASU 2022-03 clarifies the guidance in Topic 820, related to the measurement of the fair value of an equity security subject to contractual sale restrictions, where it eliminates the need to apply a discount to fair value of these securities, and introduces disclosure requirements related to such equity securities. The guidance is effective for fiscal years, and interim periods within those fiscal years, beginning after December 15, 2023, and allows for early adoption. Management is currently evaluating the implications, if any, of the additional requirements and their impact on the Portfolio’s financial statements.
Please see TST’s most recent report on Form N-CSR, available at: www.transamerica.com/annuities/prospectus, for additional information. For the most recently filed complete proxy voting records for the Trust please visit: https://www.transamerica.com/sites/default/files/files/e070d/TST%20N-PX%202021.pdf
|
|
|
|
|
| Transamerica Series Trust |
|
|
|
Semi-Annual Financial Statements 2024 |
|
|
Page 17 |
|
|
Transamerica Madison Diversified Income VP
MANAGEMENT AND SUB-ADVISORY AGREEMENT — CONTRACT RENEWAL
(unaudited)
At a meeting of the Board of Trustees of Transamerica Series Trust (the “Trustees” or the “Board”) held on June 12-13, 2024, the Board considered the renewal of the management agreement (the “Management Agreement”) between Transamerica Asset Management, Inc. (“TAM”) and Transamerica Series Trust, on behalf of Transamerica Madison Diversified Income VP (the “Portfolio”). The Board also considered the renewal of the investment sub-advisory agreement (the “Sub-Advisory Agreement” and together with the Management Agreement, the “Agreements”) for the Portfolio between TAM and Madison Asset Management, LLC (the “Sub-Adviser”).
Following its review and consideration, the Board determined that the terms of the Management Agreement and Sub-Advisory Agreement were reasonable and that the renewal of each of the Agreements was in the best interests of the Portfolio and the holders invested in the Portfolio. The Board, including the independent members of the Board (the “Independent Trustees”), unanimously approved the renewal of each of the Agreements through June 30, 2025.
Prior to reaching their decision, the Trustees requested and received from TAM and the Sub-Adviser certain information. They then reviewed such information as they deemed reasonably necessary to evaluate the Agreements, including information they had previously received from TAM and the Sub-Adviser as part of their regular oversight of the Portfolio, and knowledge they gained over time through meeting with TAM and the Sub-Adviser. Among other materials, the Trustees considered comparative fee, expense and performance information prepared by Broadridge Financial Solutions, Inc. (“Broadridge”), an independent provider of mutual fund performance information, as well as fee, expense and profitability information prepared by TAM. In addition, TAM provided the Board with additional supplemental comparative performance information. To the extent applicable, the Trustees considered information about fees and performance of comparable funds and/or accounts managed by the Sub-Adviser. The Board also considered reductions to the Portfolio’s expense limits, if any, that took effect after the last renewal of the Agreements. In their review, the Trustees also sought to identify instances in which the Portfolio’s performance, fees, total expenses and/or profitability appeared to be outliers within its respective peer group or other comparative metrics and sought to understand the reasons for such comparative positions.
In their deliberations, the Independent Trustees met privately without representatives of TAM or the Sub-Adviser present and were represented throughout the process by their independent legal counsel. In considering the proposed continuation of each of the Agreements, the Trustees evaluated and weighed a number of considerations that they believed to be relevant in light of the legal advice furnished to them by counsel, including independent legal counsel, and made a decision in the exercise of their own business judgment. They based their decisions on the considerations discussed below, among others, although they did not identify any particular consideration or item of information that was controlling of their decisions, and each Trustee may have attributed different weights to the various factors.
Nature, Extent and Quality of the Services Provided
The Board considered the nature, extent and quality of the services provided by TAM and the Sub-Adviser to the Portfolio in the past and the services anticipated to be provided in the future. The Board also considered the investment approach for the Portfolio; the experience, capability and integrity of TAM’s senior management; the financial resources of TAM; TAM’s management oversight process; TAM’s and the Sub-Adviser’s responsiveness to any questions by the Trustees; and the professional qualifications and compensation program of the portfolio management team of the Sub-Adviser. The Trustees noted that they receive, on a quarterly basis, an execution analysis from Capital Institutional Services, Inc. (CAPIS), an independent provider of trade analyses, for the Sub-Adviser and a comparison of trading results against a peer universe of managers.
The Board also considered the continuous and regular investment management and other services provided by TAM, when acting as a manager of managers, for the portion of the management fee it retains from the Portfolio after payment of the sub-advisory fees. The Board noted that the investment management and other services provided by TAM include the design, development and ongoing review and evaluation of the Portfolio and its investment strategy; the selection, oversight and monitoring of one or more investment sub-advisers to perform certain duties with respect to the Portfolio; ongoing portfolio trading oversight and analysis; risk management oversight and analysis; design, development, implementation and ongoing review and evaluation of a process for the valuation of Portfolio investments; design, development, implementation and ongoing review and evaluation of a compliance program for the Portfolio; design, development, implementation and ongoing review and evaluation of a process for the voting of proxies and exercise of rights to consent to corporate action for Portfolio investments; participation in Board meetings and oversight of preparation of materials for the Board, including materials for Board meetings and regular communications with the Board; oversight of preparation of the Portfolio’s prospectus, statement of additional information, shareholder reports and other disclosure materials and regulatory filings for the Portfolio; and ongoing cash management services for the Portfolio. The Board considered that TAM’s investment management services also include the provision of supervisory and administrative services to the Portfolio. The Board also noted that TAM, as part of the services it provides to all Transamerica mutual funds, including the Portfolio, oversees the services provided by the funds’ custodian, transfer agent, independent accountant and legal counsel and supervises the performance of the recordkeeping and holder service functions of the funds.
Investment Performance
In addition, the Board considered the short- and longer-term performance of the Portfolio in light of its investment objective, policies and strategies, including relative performance against (i) a peer universe of comparable mutual funds, as prepared by Broadridge, and (ii) the Portfolio’s benchmarks, in each case for various trailing periods ended December 31, 2023. Based on these considerations, the Board determined that TAM and the Sub-Adviser can provide investment and related services that are appropriate in scope and extent in light of
|
|
|
|
|
| Transamerica Series Trust |
|
|
|
Semi-Annual Financial Statements 2024 |
|
|
Page 18 |
|
|
Transamerica Madison Diversified Income VP
MANAGEMENT AND SUB-ADVISORY AGREEMENT — CONTRACT RENEWAL (continued)
(unaudited)
the Portfolio’s investment objectives, policies and strategies and operations, the competitive landscape of the investment company business and investor needs. The Board’s conclusions as to the Portfolio’s performance are summarized below. For purposes of its review, the Board generally used the performance of Service Class Shares. In describing the Portfolio’s performance relative to its peer universe, the summary conclusions characterize performance for the relevant periods in relation to whether it was “above,” “below” or “in line with” the peer universe median and do so using quintile rankings prepared by Broadridge. For simplicity, performance is described as “above” the median if the Portfolio’s performance ranked anywhere in the first or second quintiles, as “below” the median if it ranked anywhere in the fourth or fifth quintiles, or “in line with” the median if it ranked anywhere in the third quintile (i.e., even if its precise return was somewhat above or somewhat below the precise median return).
When considering the Portfolio’s performance, the Trustees considered any representations made by TAM regarding the appropriateness of certain peer groups and benchmarks. They recognized that performance reflects a snapshot of a period as of a specific date, and that consideration of performance data for a different period could generate significantly different performance results. The Trustees also recognized that even longer-term performance can be negatively affected by performance over a short-term period when that short-term performance is significantly below the performance of the comparable benchmark or universe of peer funds.
The Board noted that the performance of Service Class Shares of the Portfolio was above the median for its peer universe for the past 10-year period, in line with the median for the past 3- and 5-year periods and below the median for the past 1-year period. The Board also noted that the performance of Service Class Shares of the Portfolio was below the benchmark that TAM utilizes to measure performance of the Portfolio for the past 1-, 3-, 5- and 10-year periods.
Management Fee and Sub-Advisory Fees and Total Expense Ratio
The Board considered the management fee and total expense ratio of the Portfolio, including information provided by Broadridge comparing the management fee and total expense ratio of the Portfolio to the management fees and total expense ratios of comparable investment companies in both a peer group and broader peer universe compiled by Broadridge. The Board’s conclusions as to the Portfolio’s management fee and total expense ratio are summarized below. For purposes of its review, the Board generally used the actual total expenses (i.e., expenses reflecting any waivers and/or reimbursements) of Service Class Shares. In describing the Portfolio’s management fee and total expense ratio relative to its peer group and peer universe, the summary conclusions characterize management fees and total expense ratios for the relevant periods in relation to whether they were “above,” “below” or “in line with” the peer group or peer universe median and do so using quintile rankings prepared by Broadridge. For simplicity, management fees and total expense ratios are described as “above” the median if the Portfolio’s management fee or total expense ratio ranked anywhere in the fourth or fifth quintiles, as “below” the median if it ranked anywhere in the first or second quintiles, or “in line with” the median if it ranked anywhere in the third quintile (i.e., even if its precise management fee or total expense ratio was somewhat above or somewhat below the precise median management fee or total expense ratio).
The Board also considered the fees charged by the Sub-Adviser for sub-advisory services, as well as the portion of the Portfolio’s management fee retained by TAM following payment of the sub-advisory fee and how the portion of the contractual management fee retained by TAM at a specified asset level compared to the portions retained by other investment advisers managing mutual funds with similar investment strategies as calculated by an independent provider of information.
The Board noted that the Portfolio’s contractual management fee was below the median for its peer group and above the median for its peer universe and that the actual total expenses (i.e., expenses reflecting any waivers and/or reimbursements) of Service Class Shares of the Portfolio were above the medians for its peer group and peer universe. The Trustees also considered that TAM has entered into an expense limitation arrangement with the Portfolio, which may result in TAM waiving fees for the benefit of holders.
On the basis of these considerations, together with the other information it considered, the Board determined that the management and sub-advisory fees to be received by TAM and the Sub-Adviser under the Management Agreement and Sub-Advisory Agreement are reasonable in light of the services provided.
Cost of Services Provided and Level of Profitability
The Board reviewed information provided by TAM about the cost of providing and procuring fund management services, as well as the costs of the provision of administration, transfer agency and other services, to the Portfolio and to Transamerica Series Trust as a whole by TAM and its affiliates. The Board considered the profitability of TAM and its affiliates in providing these services for the Portfolio and Transamerica Series Trust as a whole. The Trustees recognized the competitiveness of the mutual fund industry and the importance of an investment adviser’s long-term profitability, including for maintaining company and management stability and accountability.
The Board also considered the allocation methodology used for calculating the profitability of TAM and its affiliates. The Board noted that the revenue and expense allocation methodology used by TAM to estimate its profitability with respect to its relationship with the Portfolio had been reviewed previously by an independent consultant. The Trustees considered that TAM reported that it had not made material changes to this methodology, and that the methodology had been applied consistently for the Portfolio.
|
|
|
|
|
| Transamerica Series Trust |
|
|
|
Semi-Annual Financial Statements 2024 |
|
|
Page 19 |
|
|
Transamerica Madison Diversified Income VP
MANAGEMENT AND SUB-ADVISORY AGREEMENT — CONTRACT RENEWAL (continued)
(unaudited)
With respect to the Sub-Adviser, the Board noted that the sub-advisory fee is the product of arm’s-length negotiation between TAM and the Sub-Adviser, which is not affiliated with TAM, and is paid by TAM and not the Portfolio. As a result, the Board focused on the profitability of TAM and its affiliates with respect to the Portfolio.
Based on this information, the Board determined that the profitability of TAM and its affiliates from their relationships with the Portfolio was not excessive.
Economies of Scale
The Board considered economies of scale with respect to the management of the Portfolio, whether the Portfolio had appropriately benefited from any economies of scale and whether there was the potential for realization of any future economies of scale. The Board also considered the existence of economies of scale with respect to management of the Transamerica mutual funds overall and the extent to which the Portfolio benefited from any economies of scale. The Board recognized that, as the Portfolio’s assets increase, any economies of scale realized by TAM or the Sub-Adviser may not directly correlate with each other or with any economies of scale that might be realized by the Portfolio. The Board considered the Portfolio’s management fee schedule and the existence of breakpoints and also considered the extent to which TAM shared economies of scale, if any, with the Portfolio through undertakings to limit or reimburse Portfolio expenses and to invest in maintaining and developing its capabilities and services. The Board also considered the Sub-Adviser’s sub-advisory fee schedule and the existence of breakpoints, if any, and how such breakpoints relate to any breakpoints in the Portfolio’s management fee schedule. The Trustees concluded that the Portfolio’s fee structure reflected an appropriate sharing of any efficiencies or economies of scale to date and noted that they will have the opportunity to periodically reexamine the appropriateness of the management fee payable to TAM and the fee paid to the Sub-Adviser in light of any economies of scale experienced in the future.
Benefits to TAM, its Affiliates and/or the Sub-Adviser from their Relationships with the Portfolio
The Board considered other benefits derived by TAM, its affiliates, and/or the Sub-Adviser from their relationships with the Portfolio. The Board noted that TAM does not receive benefits from research obtained with commissions paid to broker-dealers for portfolio transactions (commonly referred to as “soft dollars”) as a result of its relationship with the Portfolio and that TAM believes the use of soft dollars by the Sub-Adviser is generally appropriate and in the best interests of the Portfolio. The Board also noted that the Sub-Adviser participates in a brokerage program pursuant to which a portion of brokerage commissions paid by the Portfolio is recaptured for the benefit of the Portfolio and the holders, thus limiting the amount of soft dollar arrangements the Sub-Adviser may engage in with respect to the Portfolio’s brokerage transactions.
Other Considerations
The Board noted that TAM has made a substantial commitment to the recruitment and retention of high-quality personnel and maintains the financial, compliance and operational resources reasonably necessary to manage the Portfolio in a professional manner that is consistent with the best interests of the Portfolio and the holders. In this regard, the Board favorably considered the procedures and policies TAM has in place to enforce compliance with applicable laws and regulations and oversee the portfolio management activities of the Sub-Adviser. The Board also noted that TAM has made an entrepreneurial commitment and undertaken certain business risks with respect to the management and success of the Portfolio.
Conclusion
After consideration of the factors described above, as well as other factors, the Trustees, including the Independent Trustees, concluded that the renewal of the Management Agreement and the Sub-Advisory Agreement was in the best interests of the Portfolio and the holders and voted to approve the renewal of the Agreements.
|
|
|
|
|
| Transamerica Series Trust |
|
|
|
Semi-Annual Financial Statements 2024 |
|
|
Page 20 |
|
|
PROXY VOTING POLICIES AND PROCEDURES AND QUARTERLY PORTFOLIO HOLDINGS
(unaudited)
A description of Transamerica Series Trust’s (the “Trust”) proxy voting policies and procedures is available in the Statement of Additional Information of the Portfolios, available without charge upon request by calling 1-800-851-9777 (toll free) or on the Securities and Exchange Commission’s (“SEC”) website at http://www.sec.gov.
In addition, the Portfolio is required to file Form N-PX, with their complete proxy voting records for the most recent 12 months ended June 30th, no later than August 31st of each year. The Form is available without charge: (1) on the Transamerica Funds website at https://www.transamerica.com/sites/default/files/files/e070d/TST%20N-PX%202021.pdf; and (2) on the SEC’s website at http://www.sec.gov.
Each fiscal quarter, the Portfolios, except Transamerica BlackRock Government Money Market VP, will file with the SEC a complete schedule of its monthly portfolio holdings on Form N-PORT. The Portfolios’ holdings as of the end of the third month of every fiscal quarter, as reported on Form N-PORT, will be publicly available on the SEC’s website at http://www.sec.gov within 60 days of the end of the fiscal quarter.
On a monthly basis, Transamerica BlackRock Government Money Market VP will file with the SEC portfolio holdings information on Form N-MFP3. A complete schedule of portfolio holdings is also available at www.transamerica.com.
You may also visit the Trust’s website at www.transamerica.com/annuities/prospectus for this and other information about the Portfolios and the Trust.
Important Notice Regarding Delivery of Shareholder Documents
Every year we provide shareholders informative materials such as the Transamerica Series Trust Annual Report, the Transamerica Series Trust Prospectus, and other required documents that keep you informed regarding your Portfolios. To the extent provided by mail, Transamerica Series Trust will only send one piece per mailing address, a method that saves your Portfolios money by reducing mailing and printing costs. We will continue to do this unless you tell us not to. To elect to receive individual mailings, simply call a Transamerica Customer Service Representative toll free at 1-800-851-9777, 8 a.m. to 7 p.m. Eastern Time, Monday-Friday. Your request will take effect within 30 days.
|
|
|
|
|
| Transamerica Series Trust |
|
|
|
Semi-Annual Financial Statements 2024 |
|
|
Page 21 |
|
|
NOTICE OF PRIVACY POLICY
(unaudited)
Your privacy is very important to us. We want you to understand what information we collect and how we use it. We collect and use “nonpublic personal information” in connection with providing our customers with a broad range of financial products and services as effectively and conveniently as possible. We treat nonpublic personal information in accordance with our Privacy Policy.
What Information We Collect and From Whom We Collect It
We may collect nonpublic personal information about you from the following sources:
| • |
|
Information we receive from you on applications or other forms, such as your name, address, and account number; |
| • |
|
Information about your transactions with us, our affiliates, or others, such as your account balance and purchase/redemption history; and |
| • |
|
Information we receive from non-affiliated third parties, including consumer reporting agencies. |
What Information We Disclose and To Whom We Disclose It
We do not disclose any nonpublic personal information about current or former customers to anyone without their express consent, except as permitted by law. We may disclose the nonpublic personal information we collect, as described above, to persons or companies that perform services on our behalf and to other financial institutions with which we have joint marketing agreements. We will require these companies to protect the confidentiality of your nonpublic personal information and to use it only to perform the services for which we have hired them.
Our Security Procedures
We restrict access to your nonpublic personal information and only allow disclosures to persons and companies as permitted by law to assist in providing products or services to you. We maintain physical, electronic, and procedural safeguards to protect your nonpublic personal information and to safeguard the disposal of certain consumer information.
Contact Us
If you have any questions about our Privacy Policy, please call 1-800-851-9777 on any business day between 8 a.m. and 7 p.m. Eastern Time.
Note: This Privacy Policy applies only to customers that have a direct relationship with us or our affiliates. If you own shares of our portfolios in the name of a third party such as a bank or broker-dealer, its privacy policy may apply to you instead of ours.
|
|
|
|
|
| Transamerica Series Trust |
|
|
|
Semi-Annual Financial Statements 2024 |
|
|
Page 22 |
|
|
PO Box 219945
Kansas City, MO 64121-9945
|
|
|
| Distributor: |
|
Transamerica Capital, Inc. PO Box 219945 Kansas City, MO 64121-9945 Customer Service: 1-800-851-9777 |
Transamerica Series Trust Semi-Annual Financial Statements
June 30, 2024
1801 California St., Suite 5200
Denver, CO 80202
Distributor: Transamerica Capital, Inc.
Customer Service: 1-800-851-9777
The following pages contain the most recent semi-annual financial statements for the investment options in which you are invested. In compliance with Securities and Exchange Commission regulations, we present these reports on an annual and semi-annual basis with the hope that they will foster greater understanding of the investment options’ holdings, performance, financial data, accounting policies and other issues. This streamlined version provides information only on the investment options in which you are invested.
If you have any questions about these reports, please do not hesitate to contact your financial professional. As always, we thank you for your trust and the opportunity to serve you.
Transamerica Market Participation Strategy VP
SCHEDULE OF INVESTMENTS
At June 30, 2024
(unaudited)
|
|
|
|
|
|
|
|
|
| |
|
Principal |
|
|
Value |
|
| |
|
|
| U.S. GOVERNMENT OBLIGATIONS - 22.9% |
|
| U.S. Treasury - 22.9% |
|
|
|
|
|
|
|
|
| U.S. Treasury Bonds, Principal Only STRIPS |
|
|
|
|
|
|
|
|
| Zero Coupon, 02/15/2027 |
|
$ |
18,000,000 |
|
|
$ |
16,026,067 |
|
| U.S. Treasury Notes |
|
|
|
|
|
|
|
|
| 1.63%, 10/31/2026 |
|
|
62,000,000 |
|
|
|
57,902,188 |
|
|
|
|
|
|
|
|
|
|
|
|
|
| Total U.S. Government Obligations
(Cost $80,081,004) |
|
|
|
|
|
|
73,928,255 |
|
|
|
|
|
|
|
|
|
|
|
| U.S. GOVERNMENT AGENCY OBLIGATIONS - 19.8% |
|
| Federal Home Loan Banks |
|
|
|
|
|
|
|
|
| 3.25%, 11/16/2028 (A) |
|
|
29,000,000 |
|
|
|
27,686,939 |
|
| Federal Home Loan Mortgage Corp. |
|
|
|
|
|
|
|
|
| 1.50%, 02/12/2025 |
|
|
5,000,000 |
|
|
|
4,884,957 |
|
| Federal National Mortgage Association |
|
|
|
|
|
|
|
|
| 0.63%, 04/22/2025 (A) |
|
|
25,000,000 |
|
|
|
24,106,455 |
|
| 6.25%, 05/15/2029 (A) |
|
|
6,500,000 |
|
|
|
7,027,961 |
|
|
|
|
|
|
|
|
|
|
|
|
| Total U.S. Government Agency Obligations
(Cost $68,243,171) |
|
|
|
63,706,312 |
|
|
|
|
|
|
|
|
|
|
|
| FOREIGN GOVERNMENT OBLIGATIONS - 9.1% |
|
|
|
|
| Supranational - 9.1% |
|
|
|
|
|
|
|
|
| European Investment Bank |
|
|
|
|
|
|
|
|
| 3.88%, 03/15/2028 |
|
|
7,000,000 |
|
|
|
6,844,509 |
|
| Inter-American Development Bank |
|
|
|
|
|
|
|
|
| 4.00%, 01/12/2028 |
|
|
7,000,000 |
|
|
|
6,874,238 |
|
| International Bank for Reconstruction & Development |
|
|
|
|
|
|
|
|
| 0.88%, 07/15/2026 |
|
|
17,000,000 |
|
|
|
15,732,196 |
|
|
|
|
|
|
|
|
|
|
|
|
|
|
|
|
|
|
|
|
29,450,943 |
|
|
|
|
|
|
|
|
|
|
|
|
|
| Total Foreign Government Obligations
(Cost $30,941,731) |
|
|
|
|
|
|
29,450,943 |
|
|
|
|
|
|
|
|
|
|
|
| SHORT-TERM U.S. GOVERNMENT OBLIGATIONS - 24.5% |
|
| U.S. Treasury Bills |
|
|
|
|
|
|
|
|
| 5.31% (B), 08/01/2024 |
|
|
35,000,000 |
|
|
|
34,842,373 |
|
| 5.38% (B), 10/15/2024 |
|
|
45,000,000 |
|
|
|
44,309,675 |
|
|
|
|
|
|
|
|
|
|
|
|
| Total Short-Term U.S. Government Obligations
(Cost $79,126,535) |
|
|
|
79,152,048 |
|
|
|
|
|
|
|
|
|
|
|
|
|
|
|
|
|
|
|
| |
|
Shares |
|
|
Value |
|
| |
|
|
| OTHER INVESTMENT COMPANY - 9.5% |
|
| Securities Lending Collateral - 9.5% |
|
| State Street Navigator Securities Lending Trust - Government Money Market Portfolio, 5.28% (B) |
|
|
30,691,453 |
|
|
$ |
30,691,453 |
|
|
|
|
|
|
|
|
|
|
|
|
| Total Other Investment Company
(Cost $30,691,453) |
|
|
|
30,691,453 |
|
|
|
|
|
|
|
|
|
|
|
|
|
| |
|
Principal |
|
|
Value |
|
| |
|
| REPURCHASE AGREEMENT - 4.1% |
|
| Fixed Income Clearing Corp., 2.50% (B), dated 06/28/2024, to be repurchased at $13,209,408 on 07/01/2024. Collateralized by a U.S. Government Obligation, 3.75%, due 04/15/2026, and with a value of $13,470,812. |
|
$ |
13,206,657 |
|
|
|
13,206,657 |
|
|
|
|
|
|
|
|
|
|
|
|
| Total Repurchase Agreement
(Cost $13,206,657) |
|
|
|
13,206,657 |
|
|
|
|
|
|
|
|
|
|
|
|
| Total Investments Excluding Options Purchased
(Cost $302,290,551) |
|
|
|
290,135,668 |
|
|
|
|
|
|
|
|
|
|
|
|
| Total Options Purchased - 19.6%
(Cost $48,438,195) |
|
|
|
63,313,468 |
|
|
|
|
|
|
|
|
|
|
|
|
| Total Investments
(Cost $350,728,746) |
|
|
|
353,449,136 |
|
| Net Other Assets (Liabilities) - (9.5)% |
|
|
|
(30,618,892 |
) |
|
|
|
|
|
|
|
|
|
|
|
| Net Assets - 100.0% |
|
|
$ |
322,830,244 |
|
|
|
|
|
|
|
|
|
|
OVER-THE-COUNTER OPTIONS PURCHASED:
|
|
|
|
|
|
|
|
|
|
|
|
|
|
|
|
|
|
|
|
|
|
|
|
|
|
|
|
|
|
|
|
|
|
|
|
|
|
|
|
|
|
|
|
|
| Description |
|
Counterparty |
|
|
Exercise Price |
|
|
Expiration Date |
|
|
Notional Amount |
|
|
Number of Contracts |
|
|
Premiums Paid |
|
|
Value |
|
| Call – S&P 500® Index |
|
|
MSC |
|
|
|
USD |
|
|
|
4,510.00 |
|
|
|
02/28/2029 |
|
|
|
USD |
|
|
|
120,130,560 |
|
|
|
220 |
|
|
$ |
25,828,110 |
|
|
$ |
40,673,208 |
|
| Call – S&P 500® Index |
|
|
UBS |
|
|
|
USD |
|
|
|
5,450.00 |
|
|
|
06/11/2029 |
|
|
|
USD |
|
|
|
92,828,160 |
|
|
|
170 |
|
|
|
22,610,085 |
|
|
|
22,640,260 |
|
|
|
|
|
|
|
|
|
|
|
|
|
|
|
|
|
|
|
|
|
|
|
|
|
|
|
|
|
|
|
|
|
|
| Total |
|
|
|
|
|
|
|
|
|
|
|
|
|
|
|
|
|
|
|
|
|
|
|
|
|
|
|
|
|
$ |
48,438,195 |
|
|
$ |
63,313,468 |
|
|
|
|
|
|
|
|
|
|
|
|
|
|
|
|
|
|
|
|
|
|
|
|
|
|
|
|
|
|
|
|
|
|
FUTURES CONTRACTS:
|
|
|
|
|
|
|
|
|
|
|
|
|
|
|
|
|
|
|
|
|
|
|
|
| Long Futures Contracts |
|
| Description |
|
Number of Contracts |
|
|
Expiration Date |
|
Notional Amount |
|
|
Value |
|
|
Unrealized Appreciation |
|
|
Unrealized Depreciation |
|
| 2-Year U.S. Treasury Notes |
|
|
40 |
|
|
09/30/2024 |
|
$ |
8,155,379 |
|
|
$ |
8,168,750 |
|
|
|
$ 13,371 |
|
|
$ |
— |
|
| 5-Year U.S. Treasury Notes |
|
|
279 |
|
|
09/30/2024 |
|
|
29,607,154 |
|
|
|
29,735,297 |
|
|
|
128,143 |
|
|
|
— |
|
| 10-Year U.S. Treasury Notes |
|
|
130 |
|
|
09/19/2024 |
|
|
14,213,886 |
|
|
|
14,297,969 |
|
|
|
84,083 |
|
|
|
— |
|
|
|
|
|
|
| The Notes to Financial Statements are an integral part of this report. Transamerica Series Trust Semi-Annual Financial Statements 2024 |
|
|
Page 1 |
|
|
Transamerica Market Participation Strategy VP
SCHEDULE OF INVESTMENTS (continued)
At June 30, 2024
(unaudited)
FUTURES CONTRACTS (continued):
|
|
|
|
|
|
|
|
|
|
|
|
|
|
|
|
|
|
|
|
|
| Long Futures Contracts (continued) |
|
| Description |
|
Number of Contracts |
|
Expiration Date |
|
Notional Amount |
|
|
Value |
|
|
Unrealized Appreciation |
|
Unrealized Depreciation |
| 30-Year U.S. Treasury Bonds |
|
63 |
|
09/19/2024 |
|
$ |
7,396,693 |
|
|
$ |
7,453,687 |
|
|
$ |
56,994 |
|
|
$ |
— |
|
| S&P 500® E-Mini Index |
|
59 |
|
09/20/2024 |
|
|
16,394,527 |
|
|
|
16,288,425 |
|
|
|
— |
|
|
|
(106,102 |
) |
| U.S. Treasury Ultra Bonds |
|
50 |
|
09/19/2024 |
|
|
6,379,771 |
|
|
|
6,267,188 |
|
|
|
— |
|
|
|
(112,583 |
) |
|
|
|
|
|
|
|
|
|
|
|
|
|
|
|
|
|
| Total Futures Contracts |
|
|
$ |
282,591 |
|
|
$ |
(218,685 |
) |
|
|
|
|
|
|
|
|
|
|
|
|
|
|
|
|
|
INVESTMENT VALUATION:
Valuation Inputs (C)
|
|
|
|
|
|
|
|
|
|
|
|
|
|
|
|
|
| |
|
Level 1 - Unadjusted Quoted Prices |
|
|
Level 2 - Other Significant Observable Inputs |
|
|
Level 3 - Significant Unobservable Inputs |
|
|
Value |
|
| |
|
| ASSETS |
|
|
|
|
|
|
|
|
|
|
|
|
|
|
|
|
| Investments |
|
|
|
|
|
|
|
|
|
|
|
|
|
|
|
|
| U.S. Government Obligations |
|
$ |
— |
|
|
$ |
73,928,255 |
|
|
$ |
— |
|
|
$ |
73,928,255 |
|
| U.S. Government Agency Obligations |
|
|
— |
|
|
|
63,706,312 |
|
|
|
— |
|
|
|
63,706,312 |
|
| Foreign Government Obligations |
|
|
— |
|
|
|
29,450,943 |
|
|
|
— |
|
|
|
29,450,943 |
|
| Short-Term U.S. Government Obligations |
|
|
— |
|
|
|
79,152,048 |
|
|
|
— |
|
|
|
79,152,048 |
|
| Other Investment Company |
|
|
30,691,453 |
|
|
|
— |
|
|
|
— |
|
|
|
30,691,453 |
|
| Repurchase Agreement |
|
|
— |
|
|
|
13,206,657 |
|
|
|
— |
|
|
|
13,206,657 |
|
| Over-the-Counter Options Purchased |
|
|
— |
|
|
|
63,313,468 |
|
|
|
— |
|
|
|
63,313,468 |
|
|
|
|
|
|
|
|
|
|
|
|
|
|
|
|
|
|
|
|
|
|
|
| Total Investments |
|
$ |
30,691,453 |
|
|
$ |
322,757,683 |
|
|
$ |
— |
|
|
$ |
353,449,136 |
|
|
|
|
|
|
|
|
|
|
|
|
|
|
|
|
|
|
|
|
|
|
|
| Other Financial Instruments |
|
|
|
|
|
|
|
|
|
|
|
|
|
|
|
|
| Futures Contracts (D) |
|
$ |
282,591 |
|
|
$ |
— |
|
|
$ |
— |
|
|
$ |
282,591 |
|
|
|
|
|
|
|
|
|
|
|
|
|
|
|
|
|
|
|
|
|
|
|
| Total Other Financial Instruments |
|
$ |
282,591 |
|
|
$ |
— |
|
|
$ |
— |
|
|
$ |
282,591 |
|
|
|
|
|
|
|
|
|
|
|
|
|
|
|
|
|
|
|
|
|
|
|
| LIABILITIES |
|
|
|
|
|
|
|
|
|
|
|
|
|
|
|
|
| Other Financial Instruments |
|
|
|
|
|
|
|
|
|
|
|
|
|
|
|
|
| Futures Contracts (D) |
|
$ |
(218,685 |
) |
|
$ |
— |
|
|
$ |
— |
|
|
$ |
(218,685 |
) |
|
|
|
|
|
|
|
|
|
|
|
|
|
|
|
|
|
|
|
|
|
|
| Total Other Financial Instruments |
|
$ |
(218,685 |
) |
|
$ |
— |
|
|
$ |
— |
|
|
$ |
(218,685 |
) |
|
|
|
|
|
|
|
|
|
|
|
|
|
|
|
|
|
| FOOTNOTES |
TO SCHEDULE OF INVESTMENTS: |
| (A) |
All or a portion of the security is on loan. The total value of the securities on loan is $30,090,484, collateralized by cash collateral of $30,691,453. The amount on loan indicated may not correspond with the securities on loan identified because a security with pending sales are in the process of recall from the brokers. |
| (B) |
Rate disclosed reflects the yield at June 30, 2024. |
| (C) |
There were no transfers in or out of Level 3 during the period ended June 30, 2024. Please reference the Investment Valuation section of the Notes to Financial Statements for more information regarding investment valuation and pricing inputs. |
| (D) |
Derivative instruments are valued at unrealized appreciation (depreciation). |
COUNTERPARTY ABBREVIATION(S):
|
|
|
| MSC |
|
Morgan Stanley & Co. |
| UBS |
|
UBS AG |
PORTFOLIO ABBREVIATION(S):
|
|
|
| STRIPS |
|
Separate Trading of Registered Interest and Principal of Securities |
|
|
|
|
|
| The Notes to Financial Statements are an integral part of this report. |
| Transamerica Series Trust |
|
|
|
Semi-Annual Financial Statements 2024 |
|
|
Page 2 |
|
|
Transamerica Market Participation Strategy VP
|
|
|
| STATEMENT OF ASSETS AND LIABILITIES At June 30, 2024 (unaudited) |
|
STATEMENT OF OPERATIONS For the period ended June 30, 2024 (unaudited) |
|
|
|
|
|
|
|
| Assets: |
|
|
|
|
| Investments, at value (cost $337,522,089) (including securities loaned of $30,090,484) |
|
$ |
340,242,479 |
|
| Repurchase agreement, at value (cost $13,206,657) |
|
|
13,206,657 |
|
| Receivables and other assets: |
|
|
|
|
| Net income from securities lending |
|
|
6,304 |
|
| Interest |
|
|
662,882 |
|
| Prepaid expenses |
|
|
1,289 |
|
|
|
| Total assets |
|
|
354,119,611 |
|
|
|
| Liabilities: |
|
|
|
|
| Cash collateral received upon return of: |
|
|
|
|
| Securities on loan |
|
|
30,691,453 |
|
| Payables and other liabilities: |
|
|
|
|
| Shares of beneficial interest redeemed |
|
|
24,533 |
|
| Investment management fees |
|
|
168,480 |
|
| Distribution and service fees |
|
|
61,941 |
|
| Transfer agent costs |
|
|
332 |
|
| Trustee and CCO fees |
|
|
935 |
|
| Audit and tax fees |
|
|
13,102 |
|
| Custody fees |
|
|
11,755 |
|
| Legal fees |
|
|
6,902 |
|
| Printing and shareholder reports fees |
|
|
17,490 |
|
| Other accrued expenses |
|
|
8,357 |
|
| Variation margin payable on futures contracts |
|
|
284,087 |
|
|
|
| Total liabilities |
|
|
31,289,367 |
|
|
|
| Net assets |
|
$ |
322,830,244 |
|
|
|
| Net assets consist of: |
|
|
|
|
| Capital stock ($0.01 par value) |
|
$ |
296,850 |
|
| Additional paid-in capital |
|
|
302,256,389 |
|
| Total distributable earnings (accumulated losses) |
|
|
20,277,005 |
|
|
|
| Net assets |
|
$ |
322,830,244 |
|
|
|
| Shares outstanding |
|
|
29,685,031 |
|
|
|
| Net asset value and offering price per share |
|
$ |
10.88 |
|
|
|
|
|
|
|
|
| Investment income: |
|
|
|
|
| Interest income |
|
$ |
3,462,669 |
|
| Net income from securities lending |
|
|
37,680 |
|
|
|
| Total investment income |
|
|
3,500,349 |
|
|
|
| Expenses: |
|
|
|
|
|
|
| Investment management fees |
|
|
1,087,408 |
|
| Distribution and service fees |
|
|
399,782 |
|
| Transfer agent costs |
|
|
1,834 |
|
| Trustee and CCO fees |
|
|
7,478 |
|
| Audit and tax fees |
|
|
12,781 |
|
| Custody fees |
|
|
12,173 |
|
| Legal fees |
|
|
13,041 |
|
| Printing and shareholder reports fees |
|
|
16,336 |
|
| Other |
|
|
14,129 |
|
|
|
| Total expenses |
|
|
1,564,962 |
|
|
|
| Net investment income (loss) |
|
|
1,935,387 |
|
|
|
| Net realized gain (loss) on: |
|
|
|
|
| Investments |
|
|
21,645,807 |
|
| Futures contracts |
|
|
(533,668 |
) |
|
|
| Net realized gain (loss) |
|
|
21,112,139 |
|
|
|
| Net change in unrealized appreciation (depreciation) on: |
|
|
|
|
| Investments |
|
|
6,204,310 |
|
| Futures contracts |
|
|
(1,872,344 |
) |
|
|
| Net change in unrealized appreciation (depreciation) |
|
|
4,331,966 |
|
|
|
| Net realized and change in unrealized gain (loss) |
|
|
25,444,105 |
|
|
|
| Net increase (decrease) in net assets resulting from operations |
|
$ |
27,379,492 |
|
The Notes to Financial Statements are an integral part of this report.
|
|
|
|
|
| Transamerica Series Trust |
|
|
|
Semi-Annual Financial Statements 2024 |
|
|
Page 3 |
|
|
Transamerica Market Participation Strategy VP
STATEMENT OF CHANGES IN NET ASSETS
For the period and year ended:
|
|
|
|
|
|
|
|
|
| |
|
June 30, 2024 (unaudited) |
|
|
December 31, 2023 |
|
|
|
|
| From operations: |
|
|
|
|
|
|
|
|
| Net investment income (loss) |
|
$ |
1,935,387 |
|
|
$ |
4,807,096 |
|
| Net realized gain (loss) |
|
|
21,112,139 |
|
|
|
2,234,011 |
|
| Net change in unrealized appreciation (depreciation) |
|
|
4,331,966 |
|
|
|
28,469,566 |
|
|
|
|
| Net increase (decrease) in net assets resulting from operations |
|
|
27,379,492 |
|
|
|
35,510,673 |
|
|
|
|
| Dividends and/or distributions to shareholders: |
|
|
|
|
|
|
|
|
| Dividends and/or distributions to shareholders |
|
|
— |
|
|
|
(1,315,462 |
) |
|
|
|
| Net increase (decrease) in net assets resulting from dividends and/or distributions to shareholders |
|
|
— |
|
|
|
(1,315,462 |
) |
|
|
|
| Capital share transactions: |
|
|
|
|
|
|
|
|
| Proceeds from shares sold |
|
|
2,684,785 |
|
|
|
3,273,031 |
|
| Dividends and/or distributions reinvested |
|
|
— |
|
|
|
1,315,462 |
|
| Cost of shares redeemed |
|
|
(32,145,945 |
) |
|
|
(50,237,006 |
) |
|
|
|
| Net increase (decrease) in net assets resulting from capital share transactions |
|
|
(29,461,160 |
) |
|
|
(45,648,513 |
) |
|
|
|
| Net increase (decrease) in net assets |
|
|
(2,081,668 |
) |
|
|
(11,453,302 |
) |
|
|
|
| Net assets: |
|
|
|
|
|
|
|
|
| Beginning of period/year |
|
|
324,911,912 |
|
|
|
336,365,214 |
|
| End of period/year |
|
$ |
322,830,244 |
|
|
$ |
324,911,912 |
|
|
|
|
| Capital share transactions - shares: |
|
|
|
|
|
|
|
|
|
|
|
| Shares issued |
|
|
258,495 |
|
|
|
346,743 |
|
| Shares reinvested |
|
|
— |
|
|
|
136,742 |
|
| Shares redeemed |
|
|
(3,080,277 |
) |
|
|
(5,335,148 |
) |
|
|
|
| Net increase (decrease) in shares outstanding |
|
|
(2,821,782 |
) |
|
|
(4,851,663 |
) |
The Notes to Financial Statements are an integral part of this report.
|
|
|
|
|
| Transamerica Series Trust |
|
|
|
Semi-Annual Financial Statements 2024 |
|
|
Page 4 |
|
|
Transamerica Market Participation Strategy VP
FINANCIAL HIGHLIGHTS
|
|
|
|
|
|
|
|
|
|
|
|
|
|
|
|
|
|
|
|
|
|
|
|
|
| For a share outstanding during the period and years indicated: |
|
Service Class |
|
|
|
|
|
|
|
|
| |
|
June 30, 2024 (unaudited) |
|
|
December 31, 2023 |
|
|
December 31, 2022 |
|
|
December 31, 2021 |
|
|
December 31, 2020 |
|
|
December 31, 2019 |
|
|
|
|
|
|
|
|
| Net asset value, beginning of period/year |
|
$ |
10.00 |
|
|
$ |
9.00 |
|
|
$ |
14.11 |
|
|
$ |
13.78 |
|
|
$ |
11.70 |
|
|
$ |
11.73 |
|
|
|
|
|
|
|
|
| Investment operations: |
|
|
|
|
|
|
|
|
|
|
|
|
|
|
|
|
|
|
|
|
|
|
|
|
| Net investment income (loss)(A) |
|
|
0.06 |
|
|
|
0.14 |
|
|
|
0.04 |
|
|
|
0.01 |
|
|
|
0.07 |
|
|
|
0.12 |
|
| Net realized and unrealized gain (loss) |
|
|
0.82 |
|
|
|
0.90 |
|
|
|
(2.07 |
) |
|
|
1.92 |
|
|
|
2.29 |
|
|
|
1.93 |
|
|
|
|
|
|
|
|
| Total investment operations |
|
|
0.88 |
|
|
|
1.04 |
|
|
|
(2.03 |
) |
|
|
1.93 |
|
|
|
2.36 |
|
|
|
2.05 |
|
|
|
|
|
|
|
|
| Dividends and/or distributions to shareholders: |
|
|
|
|
|
|
|
|
|
|
|
|
|
|
|
|
|
|
|
|
|
|
|
|
| Net investment income |
|
|
— |
|
|
|
(0.04 |
) |
|
|
(0.00 |
)(B) |
|
|
(0.07 |
) |
|
|
(0.13 |
) |
|
|
(0.12 |
) |
| Net realized gains |
|
|
— |
|
|
|
— |
|
|
|
(3.08 |
) |
|
|
(1.53 |
) |
|
|
(0.15 |
) |
|
|
(1.96 |
) |
|
|
|
|
|
|
|
| Total dividends and/or distributions to shareholders |
|
|
— |
|
|
|
(0.04 |
) |
|
|
(3.08 |
) |
|
|
(1.60 |
) |
|
|
(0.28 |
) |
|
|
(2.08 |
) |
|
|
|
|
|
|
|
| Net asset value, end of period/year |
|
$ |
10.88 |
|
|
$ |
10.00 |
|
|
$ |
9.00 |
|
|
$ |
14.11 |
|
|
$ |
13.78 |
|
|
$ |
11.70 |
|
| |
|
|
|
|
|
|
|
|
|
|
|
|
|
|
|
|
|
|
|
|
|
|
|
|
|
| Total return |
|
|
8.80 |
%(C) |
|
|
11.55 |
% |
|
|
(15.30 |
)% |
|
|
14.45 |
% |
|
|
20.33 |
% |
|
|
18.58 |
% |
|
|
|
|
|
|
|
| Ratio and supplemental data: |
|
|
|
|
|
|
|
|
|
|
|
|
|
|
|
|
|
|
|
|
|
|
|
|
| Net assets end of period/year (000’s) |
|
$ |
322,830 |
|
|
$ |
324,912 |
|
|
$ |
336,365 |
|
|
$ |
460,349 |
|
|
$ |
467,693 |
|
|
$ |
427,339 |
|
| Expenses to average net assets |
|
|
0.98 |
%(D) |
|
|
0.98 |
% |
|
|
0.97 |
% |
|
|
0.96 |
% |
|
|
0.97 |
% |
|
|
0.97 |
% |
| Net investment income (loss) to average net assets |
|
|
1.21 |
%(D) |
|
|
1.46 |
% |
|
|
0.35 |
% |
|
|
0.04 |
% |
|
|
0.52 |
% |
|
|
1.02 |
% |
| Portfolio turnover rate |
|
|
10 |
%(C) |
|
|
16 |
% |
|
|
3 |
% |
|
|
72 |
% |
|
|
51 |
% |
|
|
32 |
% |
| (A) |
Calculated based on average number of shares outstanding. |
| (B) |
Rounds to less than $0.01 or $(0.01). |
The Notes to Financial Statements are an integral part of this report.
|
|
|
|
|
| Transamerica Series Trust |
|
|
|
Semi-Annual Financial Statements 2024 |
|
|
Page 5 |
|
|
Transamerica Market Participation Strategy VP
NOTES TO FINANCIAL STATEMENTS
At June 30, 2024
(unaudited)
1. ORGANIZATION
Transamerica Series Trust (“TST”) is an open-end management investment company registered under the Investment Company Act of 1940, as amended (the “1940 Act”). TST applies investment company accounting and reporting guidance. TST serves as a funding vehicle for variable life insurance, variable annuity, and group annuity products. Transamerica Market Participation Strategy VP (the “Portfolio”) is a series of TST and is classified as non-diversified under the 1940 Act. The Portfolio currently offers one class of shares, Service Class.
The only shareholders of the Portfolio are affiliated insurance company separate accounts and/or affiliated asset allocation portfolios. Contract holders of the variable life and annuity contracts are not shareholders of the Portfolio. For ease of reference, shareholders and contract holders are collectively referred to in this report as “shareholders.”
This report must be accompanied or preceded by the Portfolio’s current prospectus, which contains additional information about the Portfolio, including risks, as well as investment objectives and strategies.
Transamerica Asset Management, Inc. (“TAM”) serves as investment manager for the Portfolio pursuant to an investment management agreement. TAM provides continuous and regular investment management services to the Portfolio. TAM supervises the Portfolio’s investments, conducts its investment program and provides supervisory, compliance and administrative services to the Portfolio.
TAM currently acts as a “manager of managers” and has hired sub-advisers to furnish day-to-day investment advice and recommendations. TAM may, in the future, determine to provide all aspects of the day-to-day management of the Portfolio without the use of a sub-adviser. When acting as a manager of managers, TAM provides investment management services that include, without limitation, the design and development of the Portfolio and its investment strategies and the ongoing review and evaluation of those investment strategies including recommending changes in strategy where it believes appropriate or advisable; the selection of one or more sub-advisers for the Portfolio employing a combination of quantitative and qualitative screens, research, analysis and due diligence; negotiation of sub-advisory agreements and fees; oversight and monitoring of sub-advisers and recommending changes to sub-advisers where it believes appropriate or advisable; recommending portfolio combinations and liquidations where it believes appropriate or advisable; selection and oversight of transition managers, as needed; regular supervision of the Portfolio’s investments; regular review and evaluation of sub-adviser performance; daily monitoring of the sub-advisers’ buying and selling of securities for the Portfolio; regular review of holdings; ongoing trade oversight and analysis; regular monitoring to ensure adherence to investment process; regular calls and periodic on-site visits with sub-advisers; portfolio construction and asset allocation when using multiple sub-advisers for the Portfolio; risk management oversight and analysis; oversight of negotiation of investment documentation and agreements; design, development, implementation and regular monitoring of the valuation process; periodic due diligence reviews of pricing vendors and vendor methodology; design, development, implementation and regular monitoring of the compliance process; respond to regulatory inquiries and determine appropriate litigation strategy, as needed; review of proxies voted by sub-advisers; oversight of preparation and review of materials for meetings of the Portfolio’s Board of Trustees (the “Board”), participation in these meetings and preparation of regular communications with the Board; oversight of preparation and review of prospectuses, shareholder reports and other disclosure materials and regulatory filings for the Portfolio; oversight of other service providers to the Portfolio, such as the custodian, the transfer agent, the Portfolio’s independent accounting firm and legal counsel; supervision of the performance of recordkeeping and shareholder relations functions for the Portfolio; and oversight of cash management services. TAM uses a variety of quantitative and qualitative tools to carry out its investment management services. TAM, not the Portfolio, is responsible for paying the sub-adviser(s) for their services, and sub-advisory fees are TAM’s expense.
TAM’s investment management services also include the provision of supervisory and administrative services to the Portfolio. These services include performing certain administrative services for the Portfolio and supervising and overseeing the administrative, clerical, recordkeeping and bookkeeping services provided to the Portfolio by State Street Bank and Trust Company (“State Street”), to whom TAM has outsourced the provision of certain sub-administration services. To the extent agreed upon by TAM and the Portfolio from time to time, TAM’s supervisory and administrative services include, but are not limited to: monitoring and verifying the custodian’s daily calculation of the Net Asset Values (“NAV”); shareholder relations functions; compliance services; valuation services; assisting in due diligence and in the oversight and monitoring of certain activities of sub-advisers and certain aspects of Portfolio investments; assisting with Portfolio combinations and liquidations; oversight of the preparation and filing, and review, of all returns and reports, in connection with federal, state and local taxes; oversight and review of regulatory reporting; supervising and coordinating the Portfolio’s custodian and dividend disbursing agent and monitoring their services to the Portfolio; assisting the Portfolio in preparing reports to shareholders; acting as liaison with the Portfolio’s independent public accountants and providing, upon request, analyses, fiscal year summaries and other audit related services; assisting in the preparation of agendas and supporting documents for and minutes of meetings of trustees and committees of trustees; assisting in the preparation of regular communications with the trustees; and providing personnel and office space, telephones and other office equipment as necessary in order for TAM to perform supervisory and administrative services to the Portfolio. The Portfolio pays certain fees and expenses to State Street for sub-administration services which are not administrative services covered by the
|
|
|
|
|
| Transamerica Series Trust |
|
|
|
Semi-Annual Financial Statements 2024 |
|
|
Page 6 |
|
|
Transamerica Market Participation Strategy VP
NOTES TO FINANCIAL STATEMENTS (continued)
At June 30, 2024
(unaudited)
1. ORGANIZATION (continued)
management agreement with TAM or paid for through the management fees payable thereunder. For the period ended June 30, 2024, (i) the expenses paid to State Street for sub-administration services by the Portfolio are shown as a part of Other expenses within the Statement of Operations and (ii) the expenses payable to State Street for sub-administration services from the Portfolio are shown as part of Other accrued expenses within the Statement of Assets and Liabilities.
2. SIGNIFICANT ACCOUNTING POLICIES
In preparing the Portfolio’s financial statements in accordance with Generally Accepted Accounting Principles in the United States of America (“GAAP”), estimates or assumptions (which could differ from actual results) may be used that affect reported amounts and disclosures. The following is a summary of significant accounting policies followed by the Portfolio.
Security transactions and investment income: Security transactions are accounted for on the trade date. Security gains and losses are calculated on a first-in, first-out basis. Dividend income, if any, is recorded on the ex-dividend date or, in the case of foreign securities, as soon as the Portfolio is informed of the ex-dividend dates, net of foreign taxes. Non-cash dividends, if any, are recorded on the ex-dividend date at fair value. Interest income, if any, is recorded on the accrual basis from settlement date, net of foreign taxes. Fixed income premiums and discounts are amortized and/or accreted over the lives of the respective securities.
Distributions to shareholders: Distributions are recorded on the ex-dividend date and are determined in accordance with federal income tax regulations, which may differ from GAAP.
Commission recapture: The sub-adviser(s), to the extent consistent with the best execution and usual commission rate policies and practices, may elect to place security transactions of the Portfolio with broker/dealers with which TST has established a commission recapture program. A commission recapture program is any arrangement under which a broker/dealer applies a portion of the commissions received by such broker/dealer on the security transactions to the Portfolio. In no event will commissions, paid by the Portfolio, be used to pay expenses that would otherwise be borne by any other Portfolios within TST, or by any other party.
There were no commissions recaptured during the period ended June 30, 2024 by the Portfolio.
Indemnification: In the normal course of business, the Portfolio enters into contracts that contain a variety of representations that provide general indemnifications. The Portfolio’s maximum exposure under these arrangements is unknown, as this would involve future claims that may be made against the Portfolio and/or its affiliates that have not yet occurred. However, based on experience, the Portfolio expects the risk of loss to be remote.
3. INVESTMENT VALUATION
TAM has been designated as the Portfolio’s valuation designee pursuant to Rule 2a-5 under the 1940 Act with responsibility for fair valuation subject to oversight by the Portfolio’s Board of Trustees. The net asset value of the Portfolio is computed as of the official close of the New York Stock Exchange (“NYSE”) each day the NYSE is open for business.
TAM utilizes various methods to measure the fair value of its investments on a recurring basis. GAAP establishes a hierarchy that prioritizes inputs to valuation methods. The inputs or methodology used for valuing securities are not necessarily an indication of the risk associated with investing in those securities. The three levels (“Levels”) of inputs of the fair value hierarchy are defined as follows:
Level 1—Unadjusted quoted prices in active markets for identical securities.
Level 2—Inputs, other than quoted prices included in Level 1, which are observable, either directly or indirectly. These inputs may include quoted prices for the identical instrument on an inactive market, prices for similar instruments, interest rates, prepayment speeds, credit risk, yield curves, default rates, and similar data.
Level 3—Unobservable inputs based on the best information available in the circumstances, to the extent observable inputs are not available, which may include TAM’s own assumptions used in determining the fair value of the Portfolio’s investments and derivative instruments.
The inputs used to measure fair value may fall into different Levels of the fair value hierarchy. In such cases, for disclosure purposes, the Level in the fair value hierarchy that is assigned to the fair value measurement of a security is determined based on the lowest Level input that is significant to the fair value measurement in its entirety. Certain investments that are measured at fair value using NAV per share, or
|
|
|
|
|
| Transamerica Series Trust |
|
|
|
Semi-Annual Financial Statements 2024 |
|
|
Page 7 |
|
|
Transamerica Market Participation Strategy VP
NOTES TO FINANCIAL STATEMENTS (continued)
At June 30, 2024
(unaudited)
3. INVESTMENT VALUATION (continued)
its equivalent, using the “practical expedient” have not been classified in the fair value Levels. The hierarchy classification of inputs used to value the Portfolio’s investments at June 30, 2024, is disclosed within the Investment Valuation section of the Schedule of Investments.
The availability of observable inputs can vary from security to security and is affected by a wide variety of factors, including, but not limited to, the type of security, whether the security is new and not yet established in the marketplace, the liquidity of markets, and other characteristics particular to the security. To the extent that valuation is based on models or inputs that are less observable or unobservable in the market, the determination of fair value requires more judgment. Accordingly, the degree of judgment exercised in determining fair value is generally greatest for instruments categorized in Level 3. Due to the inherent uncertainty of valuation, the determination of values may differ significantly from values that would have been realized had a ready market for investments existed, and the differences could be material.
Fair value measurements: Descriptions of the valuation techniques applied to the Portfolio’s significant categories of assets and liabilities measured at fair value on a recurring basis are as follows:
Foreign government obligations: Foreign government obligations are normally valued using a model that incorporates market observable data such as reported sales of similar securities, broker quotes, yields, bids, offers, and reference data. Certain securities are valued by principally using dealer quotations. Foreign government obligations generally are categorized in Level 2 of the fair value hierarchy, or Level 3 if inputs are unobservable.
U.S. government agency obligations: U.S. government agency obligations are comprised of two main categories consisting of agency issued debt and mortgage pass-throughs. Generally, agency issued debt securities are valued in a manner similar to U.S. government obligations. Mortgage pass-throughs include to be announced (“TBA”) securities and mortgage pass-through certificates. Generally, TBA securities and mortgage pass-throughs are valued using dealer quotations. Depending on market activity levels and whether quotations or other observable data are used, these securities are typically categorized in Level 2 of the fair value hierarchy; otherwise they would be categorized in Level 3.
U.S. government obligations: U.S. government obligations are normally valued using a model that incorporates market observable data such as reported sales of similar securities, broker quotes, yields, bids, offers, and reference data. Certain securities are valued by principally using dealer quotations. U.S. government obligations generally are categorized in Level 2 of the fair value hierarchy, or Level 3 if inputs are unobservable.
Short-term notes: The Portfolio normally values short-term government and U.S. government agency securities using a model that incorporates market observable data such as reported sales of similar securities, broker quotes, yields, bids, offers and reference data. Certain securities are valued by principally using dealer quotations. Short-term government and U.S. government agency securities generally are categorized in Level 2 of the fair value hierarchy, or Level 3 if inputs are unobservable.
Securities lending collateral: Securities lending collateral is invested in a money market fund which is valued at the actively traded NAV and no valuation adjustments are applied. Securities lending collateral is categorized in Level 1 of the fair value hierarchy.
Repurchase agreements: Repurchase agreements are valued at cost, which approximates fair value. To the extent the inputs are observable and timely, the values are generally categorized in Level 2 of the fair value hierarchy.
Derivative instruments: Centrally cleared or listed derivatives that are actively traded are valued based on quoted prices from the exchange and are categorized in Level 1 of the fair value hierarchy. Over-the-counter (“OTC”) derivative contracts include forward, swap, swaption, and option contracts related to interest rates, foreign currencies, credit standing of reference entities, equity prices, or commodity prices. Depending on the product and the terms of the transaction, the fair value of the OTC derivative products are modeled taking into account the counterparties’ creditworthiness and using a series of techniques, including simulation models. Many pricing models do not entail material subjectivity because the methodologies employed do not necessitate significant judgments and the pricing inputs are observed from actively quoted markets, as is the case of interest rate swap and option contracts. The majority of OTC derivative products valued by the Portfolio using pricing models fall into this category and are categorized within Level 2 of the fair value hierarchy or Level 3 if inputs are unobservable.
|
|
|
|
|
| Transamerica Series Trust |
|
|
|
Semi-Annual Financial Statements 2024 |
|
|
Page 8 |
|
|
Transamerica Market Participation Strategy VP
NOTES TO FINANCIAL STATEMENTS (continued)
At June 30, 2024
(unaudited)
4. BORROWINGS AND OTHER FINANCING TRANSACTIONS
The Portfolio may engage in borrowing transactions as a means of raising cash to satisfy redemption requests, for other temporary or emergency purposes or, to the extent permitted by its investment policies, to raise additional cash to be invested in other securities or instruments. When the Portfolio invests borrowing proceeds in other securities, the Portfolio will bear the risk that the market value of the securities in which such proceeds are invested goes down and is insufficient to repay the borrowed proceeds. The Portfolio may borrow on a secured or on an unsecured basis. If the Portfolio enters into a secured borrowing arrangement, a portion of the Portfolio’s assets will be used as collateral. The 1940 Act requires the Portfolio to maintain asset coverage of at least 300% of the amount of its borrowings. Asset coverage means the ratio that the value of the Portfolio’s total assets, minus liabilities other than borrowings, bears to the aggregate amount of all borrowings. Although complying with this requirement has the effect of limiting the amount that the Portfolio may borrow, it does not otherwise mitigate the risks of entering into borrowing transactions.
Interfund lending: The Portfolio, along with other funds and portfolios advised by TAM, may participate in an interfund lending program pursuant to exemptive relief granted by the Securities and Exchange Commission on January 18, 2017. This program allows the Portfolio to lend to and borrow from other funds and portfolios advised by TAM. Interfund lending transactions are subject to the conditions of the exemptive relief which places limits on the amount of lending or borrowing a Portfolio may participate in under the program. Interest earned or paid on an interfund lending transaction will be based on the average of certain current market rates. For the period ended June 30, 2024, the Portfolio has not utilized the program.
Repurchase agreements: In a repurchase agreement, the Portfolio purchases a security and simultaneously commits to resell that security to the seller at an agreed-upon price on an agreed-upon date. Securities purchased subject to a repurchase agreement are held at the Portfolio’s custodian, or designated sub-custodian related to tri-party repurchase agreements, and, pursuant to the terms of the repurchase agreement, must be collateralized by securities with an aggregate market value greater than or equal to 100% of the resale price. The Portfolio will bear the risk of value fluctuations until the securities can be sold and may encounter delays and incur costs in liquidating the securities. In the event of bankruptcy or insolvency of the seller, delays and costs may be incurred.
Repurchase agreements are subject to netting agreements, which are agreements between the Portfolio and its counterparties that provide for the net settlement of all transactions and collateral with the Portfolio, through a single payment, in the event of default or termination. Amounts presented within the Schedule of Investments, and as part of Repurchase agreements, at value within the Statement of Assets and Liabilities are shown on a gross basis. The value of the related collateral for each repurchase agreement, as reflected within the Schedule of Investments, exceeds the value of each repurchase agreement at June 30, 2024.
Repurchase agreements at June 30, 2024, if any, are included within the Schedule of Investments and Statement of Assets and Liabilities.
Securities lending: The Portfolio may lend securities to qualified financial institutions, brokers and dealers. State Street serves as securities lending agent to the Portfolio pursuant to a Securities Lending Agreement. Loans of securities are terminable at any time and the borrower, after notice, is required to return borrowed securities within the standard time period for settlement of securities transactions. The lending of securities exposes the Portfolio to risks such as: the borrowers may fail to return the loaned securities or may not be able to provide additional collateral, the Portfolio may experience delays in recovery of the loaned securities or delays in access to collateral, or the Portfolio may experience losses related to the investment collateral. To minimize certain risks, loan counterparties pledge cash, securities issued or guaranteed by the U.S. Government and irrevocable letters of credit issued by banks as collateral. The initial collateral received by the Portfolio is required to have a value of at least 102% of the current value of the loaned securities traded on U.S. exchanges, and a value of at least 105% for all other securities. Typically the lending agent is not permitted to sell, re-pledge or use cash and non-cash collateral it receives. The lending agent has agreed to indemnify the Portfolio in the case of default of any securities borrower.
The Portfolio receives compensation for lending securities from interest or dividends earned on the cash, U.S. Government securities and irrevocable letters of credit held as collateral, less associated fees and expenses. Such income is reflected in Net income from securities lending within the Statement of Operations. Cash collateral received is invested in the State Street Navigator Securities Lending Trust — Government Money Market Portfolio.
The value of loaned securities and related cash and non-cash collateral outstanding at June 30, 2024, if any, are shown on a gross basis within the Schedule of Investments.
|
|
|
|
|
| Transamerica Series Trust |
|
|
|
Semi-Annual Financial Statements 2024 |
|
|
Page 9 |
|
|
Transamerica Market Participation Strategy VP
NOTES TO FINANCIAL STATEMENTS (continued)
At June 30, 2024
(unaudited)
4. BORROWINGS AND OTHER FINANCING TRANSACTIONS (continued)
The following table reflects a breakdown of transactions accounted for as secured borrowings, the gross obligation by the type, and the remaining contractual maturity of those transactions as of June 30, 2024.
|
|
|
|
|
|
|
|
|
|
|
|
|
|
|
|
|
|
|
|
|
| |
|
Remaining Contractual Maturity of the Agreements |
|
|
|
|
|
| |
|
Overnight and Continuous |
|
Less Than 30 Days |
|
|
Between 30 & 90 Days |
|
|
Greater Than 90 Days |
|
|
Total |
| Securities Lending Transactions |
|
|
|
|
|
|
|
|
|
|
|
|
|
|
|
|
|
|
|
|
| U.S. Government Agency Obligations |
|
$ |
30,691,453 |
|
|
$ |
— |
|
|
$ |
— |
|
|
$ |
— |
|
|
$ |
30,691,453 |
|
| Total Borrowings |
|
$ |
30,691,453 |
|
|
$ |
— |
|
|
$ |
— |
|
|
$ |
— |
|
|
$ |
30,691,453 |
|
| |
|
|
|
|
|
|
|
|
|
|
|
|
|
|
|
|
|
|
|
|
5. RISK EXPOSURES AND THE USE OF DERIVATIVE INSTRUMENTS
The Portfolio’s investment strategies allow the Portfolio to use various types of derivative contracts, including option contracts, swap agreements, futures contracts, and forward foreign currency contracts. Derivatives are investments whose value is primarily derived from underlying assets, indices or reference rates and may be transacted on an exchange or OTC.
Market Risk Factors: In pursuit of the Portfolio’s investment strategies, the Portfolio may seek to use derivatives to increase or decrease its exposure to certain market risks, including:
Interest rate risk: Interest rate risk relates to the fluctuations in the value of fixed income securities due to changes in the prevailing levels of market interest rates.
Foreign exchange rate risk: Foreign exchange rate risk relates to fluctuations in the value of an asset or liability due to changes in the currency exchange rates.
Equity risk: Equity risk relates to the change in value of equity securities as they relate to increases or decreases in the general market.
Credit risk: Credit risk relates to the ability of the issuer of a financial instrument to make further principal or interest payments on an obligation or commitment that it has to the Portfolio.
Commodity risk: Commodity risk relates to the change in value of commodities or commodity indices as they relate to increases or decreases in the commodities market. Commodities are physical assets that have tangible properties. Examples of these types of assets are crude oil, heating oil, metals, livestock, and agricultural products.
The Portfolio is also exposed to additional risks from investing in derivatives, such as liquidity and counterparty credit risk. Liquidity risk is the risk that the Portfolio will be unable to sell or close out the derivative in the open market in a timely manner. Counterparty credit risk is the risk that the counterparty will not be able to fulfill its obligations to the Portfolio. Investing in derivatives may also involve greater risks than investing directly in the underlying assets, such as losses in excess of any initial investment and collateral received. In addition, there may be the risk that the change in value of the derivative contract does not correspond to the change in value of the underlying instrument.
The Portfolio’s exposure to market risk factors and certain other associated risks are summarized by derivative type as follows:
Option contracts: The Portfolio is subject to equity risk, credit risk, interest rate risk, and foreign exchange rate risk in the normal course of pursuing its investment objective. The Portfolio may enter into option contracts to manage exposure to various market fluctuations. The Portfolio may purchase or write call and put options on securities and derivative instruments in which the Portfolio owns or may invest. Options are valued at the average of the bid and ask price established each day at the close of the board of trade or exchange on which they are traded. Options are marked-to-market daily to reflect the current value of the option. The primary risks associated with options are an imperfect correlation between the change in value of the securities held and the prices of the option contracts, the possibility of an illiquid market, and an inability of the counterparty to meet the contract terms. Options can be traded through an exchange or through privately negotiated arrangements with a dealer in an OTC transaction. Options traded on an exchange are generally cleared through a clearinghouse such as the Options Clearing Corp.
|
|
|
|
|
| Transamerica Series Trust |
|
|
|
Semi-Annual Financial Statements 2024 |
|
|
Page 10 |
|
|
Transamerica Market Participation Strategy VP
NOTES TO FINANCIAL STATEMENTS (continued)
At June 30, 2024
(unaudited)
5. RISK EXPOSURES AND THE USE OF DERIVATIVE INSTRUMENTS (continued)
Options on indices: The Portfolio may purchase or write options on indices. Purchasing or writing an option on indices gives the Portfolio the right, but not the obligation to buy or sell the cash from the underlying index. The exercise of the option will result in a cash transfer and gain or loss depends on the change in the underlying index.
Purchased options: Purchasing call options tends to increase exposure to the underlying instrument. Purchasing put options tends to decrease exposure to the underlying instrument. The Portfolio pays premiums, which are included within the Statement of Assets and Liabilities as an investment and subsequently marked-to-market to reflect the current value of the option. The risk associated with purchasing put and call options is limited to the premium paid. Premiums paid from options which expire are treated as realized losses. Premiums paid for purchasing options which are exercised or closed are added to the amounts paid or offset against the proceeds on the underlying instrument to determine the realized gain or loss.
Open option contracts at June 30, 2024, are included within the Schedule of Investments. The value of purchased option contracts, as applicable, is shown in Investments, at value within the Statement of Assets and Liabilities. The value of written option contracts, as applicable, is shown in Written options and swaptions, at value within the Statement of Assets and Liabilities.
Futures contracts: The Portfolio is subject to equity risk, credit risk, commodity risk, interest rate risk and foreign exchange rate risk in the normal course of pursuing its investment objective. The Portfolio uses futures contracts to gain exposure to, or hedge against, changes in the value of equities and commodities, interest rates, or foreign currencies. A futures contract represents a commitment for the future purchase or sale of an asset at a specified price on a specified date. Upon entering into such contracts, the Portfolio is required to deposit with the broker, either in cash or in securities, an initial margin in an amount equal to a certain percentage of the contract amount. Subsequent payments (variation margin) are paid or received by the Portfolio, depending on the daily fluctuations in the value of the contract, and are recorded for financial statement purposes as unrealized gains or losses by the Portfolio. Upon entering into such contracts, the Portfolio bears the risk of equity and commodity prices, interest rates, or exchange rates moving unexpectedly, in which case, the Portfolio may not achieve the anticipated benefits of the futures contracts and may realize losses. With futures, there is minimal counterparty credit risk to the Portfolio since futures are exchange-traded and the exchange’s clearinghouse, as counterparty to all exchange-traded futures, guarantees the futures against default. Futures contracts are generally entered into on a regulated futures exchange and cleared through a clearinghouse associated with the exchange.
Open futures contracts at June 30, 2024 are listed within the Schedule of Investments. Variation margin, if applicable, is shown in Variation margin receivable or payable on futures contracts within the Statement of Assets and Liabilities.
The following is a summary of the location and the Portfolio’s fair values of derivative investments disclosed within the Statement of Assets and Liabilities, categorized by primary market risk exposure as of June 30, 2024.
|
|
|
|
|
|
|
|
|
|
|
|
|
|
|
|
|
|
|
|
|
|
|
|
|
| Asset Derivatives |
|
| Location |
|
Interest Rate Contracts |
|
|
Foreign Exchange Contracts |
|
|
Equity Contracts |
|
|
Credit Contracts |
|
|
Commodity Contracts |
|
|
Total |
| Purchased options and swaptions: Investments, at value (A) |
|
$ |
— |
|
|
$ |
— |
|
|
$ |
63,313,468 |
|
|
$ |
— |
|
|
$ |
— |
|
|
$ |
63,313,468 |
|
| Futures contracts: |
|
|
|
|
|
|
|
|
|
|
|
|
|
|
|
|
|
|
|
|
|
|
|
|
| Total distributable earnings (accumulated losses) (A)(B) |
|
|
282,591 |
|
|
|
— |
|
|
|
— |
|
|
|
— |
|
|
|
— |
|
|
|
282,591 |
|
| Total |
|
$ |
282,591 |
|
|
$ |
— |
|
|
$ |
63,313,468 |
|
|
$ |
— |
|
|
$ |
— |
|
|
$ |
63,596,059 |
|
| |
|
|
|
|
|
|
|
|
|
|
|
|
|
|
|
|
|
|
|
|
|
|
|
|
|
|
|
|
|
| Transamerica Series Trust |
|
|
|
Semi-Annual Financial Statements 2024 |
|
|
Page 11 |
|
|
Transamerica Market Participation Strategy VP
NOTES TO FINANCIAL STATEMENTS (continued)
At June 30, 2024
(unaudited)
5. RISK EXPOSURES AND THE USE OF DERIVATIVE INSTRUMENTS (continued)
|
|
|
|
|
|
|
|
|
|
|
|
|
|
|
|
|
|
|
|
|
|
|
|
|
| Liability Derivatives |
|
| Location |
|
Interest Rate Contracts |
|
Foreign Exchange Contracts |
|
|
Equity Contracts |
|
Credit Contracts |
|
|
Commodity Contracts |
|
|
Total |
|
|
|
|
|
|
|
|
| Futures contracts: |
|
|
|
|
|
|
|
|
|
|
|
|
|
|
|
|
|
|
|
|
|
|
|
|
| Total distributable earnings (accumulated losses) (A)(B) |
|
$ |
(112,583 |
) |
|
$ |
— |
|
|
$ |
(106,102 |
) |
|
$ |
— |
|
|
$ |
— |
|
|
$ |
(218,685 |
) |
| |
|
|
|
|
|
|
| Total |
|
$ |
(112,583 |
) |
|
$ |
— |
|
|
$ |
(106,102 |
) |
|
$ |
— |
|
|
$ |
— |
|
|
$ |
(218,685 |
) |
| |
|
|
|
|
|
|
|
|
|
|
|
|
|
|
|
|
|
|
|
|
|
|
|
|
| (A) |
May include exchange-traded derivatives which are not subject to a master netting arrangement, or another similar arrangement. |
| (B) |
Included within unrealized appreciation (depreciation) on futures contracts as reported in the Schedule of Investments. Only current day’s variation margin is reported within the Statement of Assets and Liabilities. |
The following is a summary of the location and the effect of derivative investments within the Statement of Operations, categorized by primary market risk exposure as of June 30, 2024.
|
|
|
|
|
|
|
|
|
|
|
|
|
|
|
|
|
|
|
|
|
|
|
|
|
| Realized Gain (Loss) on Derivative Instruments |
|
| Location |
|
Interest Rate Contracts |
|
Foreign Exchange Contracts |
|
|
Equity Contracts |
|
Credit Contracts |
|
|
Commodity Contracts |
|
|
Total |
|
|
|
|
|
|
|
|
| Purchased options and swaptions (A) |
|
$ |
— |
|
|
$ |
— |
|
|
$ |
21,910,221 |
|
|
$ |
— |
|
|
$ |
— |
|
|
$ |
21,910,221 |
|
| Futures contracts |
|
|
(1,078,012 |
) |
|
|
— |
|
|
|
544,344 |
|
|
|
— |
|
|
|
— |
|
|
|
(533,668 |
) |
| |
|
|
|
|
|
|
| Total |
|
$ |
(1,078,012 |
) |
|
$ |
— |
|
|
$ |
22,454,565 |
|
|
$ |
— |
|
|
$ |
— |
|
|
$ |
21,376,553 |
|
| |
|
|
|
|
|
|
|
|
|
|
|
|
|
|
|
|
|
|
|
|
|
|
|
|
|
|
|
|
|
|
|
|
|
|
|
|
|
|
|
|
|
|
|
|
|
|
|
|
|
| Net Change in Unrealized Appreciation (Depreciation) on Derivative Instruments |
|
| Location |
|
Interest Rate Contracts |
|
Foreign Exchange Contracts |
|
|
Equity Contracts |
|
Credit Contracts |
|
|
Commodity Contracts |
|
|
Total |
|
|
|
|
|
|
|
|
| Purchased options and swaptions (B) |
|
$ |
— |
|
|
$ |
— |
|
|
$ |
6,378,591 |
|
|
$ |
— |
|
|
$ |
— |
|
|
$ |
6,378,591 |
|
| Futures contracts |
|
|
(1,230,619 |
) |
|
|
— |
|
|
|
(641,725 |
) |
|
|
— |
|
|
|
— |
|
|
|
(1,872,344 |
) |
| |
|
|
|
|
|
|
| Total |
|
$ |
(1,230,619 |
) |
|
$ |
— |
|
|
$ |
5,736,866 |
|
|
$ |
— |
|
|
$ |
— |
|
|
$ |
4,506,247 |
|
| |
|
|
|
|
|
|
|
|
|
|
|
|
|
|
|
|
|
|
|
|
|
|
|
|
| (A) |
Included within Net realized gain (loss) on Investments in the Statement of Operations. |
| (B) |
Included within Net change in unrealized appreciation (depreciation) on Investments in the Statement of Operations. |
The following is a summary of the ending monthly average volume on derivative activity during the period ended June 30, 2024.
|
|
|
|
|
| Options: |
|
|
|
|
| Average value of option contracts purchased |
|
$ |
67,851,210 |
|
| Futures contracts: |
|
|
|
|
| Average notional value of contracts — long |
|
|
83,634,420 |
|
| Average notional value of contracts — short |
|
|
(1,072,254 |
) |
Collateral requirements: Collateral or margin requirements are set by the broker or exchange clearing house for exchange-traded derivatives (futures contracts, exchange-traded options, and exchange-traded swap agreements) while collateral terms are contract specific for OTC derivatives (forward foreign currency exchange contracts, OTC options, and OTC swap agreements). For OTC derivatives, under standard derivatives agreements, the Portfolio may be required to pledge collateral on derivatives to a counterparty if the Portfolio is in a net liability position, and receive collateral if in a net positive position. For financial reporting purposes, cash collateral that has been pledged by the Portfolio to cover obligations, if any, is reported in Cash collateral at broker within the Statement of Assets and
|
|
|
|
|
| Transamerica Series Trust |
|
|
|
Semi-Annual Financial Statements 2024 |
|
|
Page 12 |
|
|
Transamerica Market Participation Strategy VP
NOTES TO FINANCIAL STATEMENTS (continued)
At June 30, 2024
(unaudited)
5. RISK EXPOSURES AND THE USE OF DERIVATIVE INSTRUMENTS (continued)
Liabilities. Cash collateral that has been received by the Portfolio from a counterparty, if any, is reported separately in Cash collateral pledged at custodian and/or broker within the Statement of Assets and Liabilities. Non-cash collateral pledged to the Portfolio, if any, is disclosed within the Schedule of Investments.
Generally, the amount of collateral due from or to a party must exceed a minimum transfer amount threshold before a transfer has been made. Typically a counterparty is not permitted to sell, re-pledge or use cash and non-cash collateral it receives. The Portfolio generally does not use non-cash collateral that it receives but may, absent default or certain other circumstances, be permitted to use cash collateral received. In such cases, interest may be paid pursuant to the collateral arrangement with the counterparty.
To the extent amounts due to the Portfolio from its counterparties are not fully collateralized, contractually or otherwise, the Portfolio bears the risk of loss from counterparty non-performance. Additionally, to the extent the Portfolio has delivered collateral to a counterparty, the Portfolio bears the risk of loss from a counterparty in the event the counterparty fails to return such collateral. Counterparties may immediately terminate derivatives contracts if the Portfolio fails to maintain sufficient asset coverage for its contracts or its net assets decline by stated percentages. Collateral may not be required for all derivative contracts.
6. RISK FACTORS
Investing in the Portfolio involves certain key risks related to the Portfolio’s trading activity. Please reference the Portfolio’s prospectus for a more complete discussion of the following risk(s), as well as other risks of investing in the Portfolio.
Market risk: The market prices of the Portfolio’s securities or other assets may go up or down, sometimes rapidly or unpredictably, due to factors such as economic events, inflation, changes in interest rates, governmental actions or interventions, actions taken by the U.S. Federal Reserve or foreign central banks, market disruptions caused by tariffs, trade disputes or other factors, political developments, armed conflicts, economic sanctions, cybersecurity events, investor sentiment, the global and domestic effects of widespread or local health, weather or climate events, and other factors that may or may not be related to the issuer of the security or other asset. If the market prices of the Portfolio’s securities and assets fall, the value of your investment in the Portfolio could go down.
Economies and financial markets throughout the world are increasingly interconnected. Events or circumstances in one or more countries or regions could be highly disruptive to, and have profound impacts on, global economies or markets. As a result, whether or not the Portfolio invests in securities of issuers located in or with significant exposure to the countries directly affected, the value and liquidity of the Portfolio’s investments may go down.
Asset class allocation risk: The Portfolio’s investment performance is significantly impacted by the Portfolio’s asset class allocation and reallocation from time to time. The value of your investment may decrease if the sub-adviser’s judgment about the attractiveness, value or market trends affecting a particular asset class is incorrect.
Non-diversification risk: As a “non-diversified” Portfolio, the Portfolio may invest a larger percentage of its assets in a smaller number of issuers than a diversified fund. Investing in a smaller number of issuers will make the Portfolio more susceptible to the risks associated with investing in those issuers.
Tactical asset allocation risk: Tactical asset allocation is an investment strategy that actively adjusts a portfolio’s asset allocation. The Portfolio’s tactical asset management discipline may not work as intended. The Portfolio may not achieve its objective and may not perform as well as other funds using other asset management styles, including those based on fundamental analysis (a method of evaluating a security that entails attempting to measure its intrinsic value by examining related economic, financial and other factors) or strategic asset allocation (a strategy that involves periodically rebalancing the Portfolio in order to maintain a long-term goal for asset allocation).The sub-adviser’s evaluations and assumptions in selecting investments may be incorrect in view of actual market conditions, and may result in owning securities that underperform other securities.
7. FEES AND OTHER AFFILIATED TRANSACTIONS
TST serves as a funding vehicle for certain affiliated asset allocation portfolios and certain affiliated separate accounts of Transamerica Life Insurance Company (“TLIC”) and Transamerica Financial Life Insurance Company.
TAM, the Portfolio’s investment manager, is directly owned by TLIC and AUSA Holding, LLC (“AUSA”), both of which are indirect, wholly owned subsidiaries of Aegon Ltd. TLIC is owned by Commonwealth General Corporation (“Commonwealth”). Commonwealth and AUSA
|
|
|
|
|
| Transamerica Series Trust |
|
|
|
Semi-Annual Financial Statements 2024 |
|
|
Page 13 |
|
|
Transamerica Market Participation Strategy VP
NOTES TO FINANCIAL STATEMENTS (continued)
At June 30, 2024
(unaudited)
7. FEES AND OTHER AFFILIATED TRANSACTIONS (continued)
are wholly owned by Transamerica Corporation (DE). Transamerica Corporation (DE) is wholly owned by Aegon International B.V., which is wholly owned by Aegon Ltd., a Bermuda exempted company with liability limited by shares (formerly, Aegon NV, a Netherlands corporation) and a publicly traded international insurance group.
Transamerica Fund Services, Inc. (“TFS”) is the Portfolio’s transfer agent. Transamerica Capital, Inc. (“TCI”) is the Portfolio’s distributor/principal underwriter. TAM, TFS and TCI are affiliates of Aegon Ltd.
Certain officers and trustees of the Portfolio may also be officers and/or trustees of TAM, TFS and TCI. No interested trustee who is deemed an interested person due to current or former service with TAM or an affiliate of TAM receives compensation from the Portfolio. The Portfolio does pay non-interested persons (independent trustees), as disclosed in Trustee and CCO fees within the Statement of Operations.
Investment management fees: TAM serves as the Portfolio’s investment manager, performing administration as well as investment advisory services. TAM renders investment advisory, supervisory, and administration services under an investment management agreement and the Portfolio pays a single management fee, which is reflected in Investment management fees within the Statement of Operations.
The Portfolio pays a management fee to TAM based on daily average net assets at the following rates:
|
|
|
|
|
| Breakpoints |
|
Rate |
|
|
|
| First $500 million |
|
|
0.68 |
% |
| Over $500 million up to $1 billion |
|
|
0.65 |
|
| Over $1 billion up to $1.5 billion |
|
|
0.62 |
|
| Over $1.5 billion |
|
|
0.60 |
|
TAM has contractually agreed to waive fees and/or reimburse Portfolio expenses to the extent that the total operating expenses excluding, as applicable, acquired fund fees and expenses, interest (including borrowing costs and overdraft charges), taxes, brokerage commissions, dividend and interest expenses on securities sold short, extraordinary expenses and other expenses not incurred in the ordinary course of the Portfolio’s business, exceed the following stated annual operating expense limits to the Portfolio’s daily average net assets. To the extent an expense limit changed during the period, the prior limit is also listed below. The expenses waived and/or reimbursed, if any, are included in Expenses waived and/or reimbursed within the Statement of Operations.
|
|
|
|
|
|
|
| Class |
|
Operating Expense Limit |
|
Operating Expense Limit Effective Through |
|
|
|
| Service Class |
|
|
1.07 |
% |
|
May 1, 2025 |
TAM is permitted to recapture amounts contractually waived and/or reimbursed to a class during any of the 36 months from the date on which TAM waived fees and/or reimbursed expenses for the class. A class may recapture and reimburse TAM only if such amount does not cause, on any particular business day of the Portfolio, the class’s total annual operating expenses (after the recapture is taken into account) to exceed the Operating Expense Limits or any other lower limit then in effect. Amounts recaptured, if any, by TAM for the period ended June 30, 2024 are disclosed in Recapture of previously waived and/or reimbursed fees within the Statement of Operations.
TAM, on a voluntary basis and in addition to the contractual operating expense limits in effect, from time to time may waive and/or reimburse expenses of the Portfolio, or any classes thereof, to such level(s) as the Trust’s officers have determined or may reasonably determine from time to time. Any such voluntary waiver or expense reimbursement may be discontinued by TAM at any time. These amounts are not subject to recapture by TAM.
As of June 30, 2024, there are no amounts available for recapture by TAM.
Distribution and service fees: TST has a distribution plan (“Distribution Plan”) pursuant to Rule 12b-1 under the 1940 Act. Pursuant to the Distribution Plan, TST entered into a distribution agreement with TCI as the Portfolio’s distributor.
|
|
|
|
|
| Transamerica Series Trust |
|
|
|
Semi-Annual Financial Statements 2024 |
|
|
Page 14 |
|
|
Transamerica Market Participation Strategy VP
NOTES TO FINANCIAL STATEMENTS (continued)
At June 30, 2024
(unaudited)
7. FEES AND OTHER AFFILIATED TRANSACTIONS (continued)
The Distribution Plan requires the Portfolio to pay distribution fees to TCI as compensation for various distribution activities, not as reimbursement for specific expenses. Under the Distribution Plan and distribution agreement, TCI, on behalf of the Portfolio, is authorized to pay various service providers, as direct payment for expenses incurred in connection with distribution of the Portfolio’s shares.
The fee on the Service Class shares is paid to the insurance companies for providing services and account maintenance for the policyholders who invest in the variable insurance products which invest in the Service Class shares. The distribution and service fees are included in Distribution and service fees within the Statement of Operations.
The Portfolio is authorized under the Distribution Plan to pay fees to TCI based on daily average net assets up to an annual fee of 0.25% of Service Class shares.
Transfer agent costs: TFS provides transfer agency services under an intercompany agreement with TAM. TFS has outsourced the provision of certain sub-transfer agency services to SS&C Global Investor & Distribution Solutions, Inc. (“SS&C GIDS”). The Portfolio does not pay a separate transfer agent fee to TAM or TFS but does pay certain expenses to SS&C GIDS related to applicable sub-transfer agency services. For the period ended June 30, 2024, (i) the expenses paid to SS&C GIDS by the Portfolio are referred to as transfer agent costs and are included within the Statement of Operations and (ii) the expenses payable to SS&C GIDS by the Portfolio are referred to as transfer agent costs within the Statement of Assets and Liabilities.
Brokerage commissions: The Portfolio incurred no brokerage commissions on security transactions placed with affiliates of the investment manager or sub-adviser(s) for the period ended June 30, 2024.
8. PURCHASES AND SALES OF SECURITIES
For the period ended June 30, 2024, the cost of securities purchased and proceeds from securities sold (excluding short-term securities) are as follows:
|
|
|
|
|
|
|
|
|
|
|
| Purchases of Securities |
|
|
|
Sales/Maturities of Securities |
| Long-Term |
|
U.S. Government |
|
|
|
Long-Term |
|
|
U.S. Government |
|
|
|
|
|
| $ 22,610,085 |
|
$ — |
|
|
|
|
$ 44,279,865 |
|
|
$ 4,237,813 |
9. FEDERAL INCOME TAXES AND DISTRIBUTIONS TO SHAREHOLDERS
The Portfolio has not made any provision for federal income or excise taxes due to its policy to distribute all of its taxable income and capital gains to its shareholders and otherwise qualify as a regulated investment company under Subchapter M of the Internal Revenue Code. The Portfolio recognizes the tax benefits of uncertain tax positions only where the position is “more likely than not” to be sustained assuming examination by tax authorities. The Portfolio’s tax returns remain subject to examination by the Internal Revenue Service and state tax authorities three years from the date of filing for federal purposes and four years from the date of filing for state purposes. Management has evaluated the Portfolio’s tax provisions taken for all open tax years, and has concluded that no provision for income tax is required in the Portfolio’s financial statements. If applicable, the Portfolio recognizes interest accrued related to unrecognized tax benefits in relation to interest and penalties expense in Other within the Statement of Operations. The Portfolio identifies its major tax jurisdictions as U.S. Federal, the state of Colorado, and foreign jurisdictions where the Portfolio makes significant investments; however, the Portfolio is not aware of any tax positions for which it is reasonably possible that the total amounts of unrecognized tax benefits will change materially in the next twelve months. Distributions are determined in accordance with income tax regulations, which may differ from GAAP.
As of June 30, 2024, the approximate cost for U.S. federal income tax purposes, and the aggregate gross/net unrealized appreciation (depreciation) in the value of investments (including securities sold short and derivatives, if any) are as follows:
|
|
|
|
|
|
|
| Cost |
|
Gross Appreciation |
|
Gross (Depreciation) |
|
Net Appreciation (Depreciation) |
|
|
|
|
| $ 350,728,746 |
|
$ 15,183,377 |
|
$ (12,399,081) |
|
$ 2,784,296 |
Please see TST’s most recent report on Form N-CSR, available at: www.transamerica.com/annuities/prospectus, for additional information. For the most recently filed complete proxy voting records for the Trust please visit: https://www.transamerica.com/sites/default/files/files/e070d/TST%20N-PX%202021.pdf
|
|
|
|
|
| Transamerica Series Trust |
|
|
|
Semi-Annual Financial Statements 2024 |
|
|
Page 15 |
|
|
Transamerica Market Participation Strategy VP
MANAGEMENT AND SUB-ADVISORY AGREEMENT — CONTRACT RENEWAL
(unaudited)
At a meeting of the Board of Trustees of Transamerica Series Trust (the “Trustees” or the “Board”) held on June 12-13, 2024, the Board considered the renewal of the management agreement (the “Management Agreement”) between Transamerica Asset Management, Inc. (“TAM”) and Transamerica Series Trust, on behalf of Transamerica Market Participation Strategy VP (the “Portfolio”). The Board also considered the renewal of the investment sub-advisory agreement (the “Sub-Advisory Agreement” and together with the Management Agreement, the “Agreements”) for the Portfolio between TAM and PGIM Quantitative Solutions LLC (the “Sub-Adviser”).
Following its review and consideration, the Board determined that the terms of the Management Agreement and Sub-Advisory Agreement were reasonable and that the renewal of each of the Agreements was in the best interests of the Portfolio and the holders invested in the Portfolio. The Board, including the independent members of the Board (the “Independent Trustees”), unanimously approved the renewal of each of the Agreements through June 30, 2025.
Prior to reaching their decision, the Trustees requested and received from TAM and the Sub-Adviser certain information. They then reviewed such information as they deemed reasonably necessary to evaluate the Agreements, including information they had previously received from TAM and the Sub-Adviser as part of their regular oversight of the Portfolio, and knowledge they gained over time through meeting with TAM and the Sub-Adviser. Among other materials, the Trustees considered comparative fee, expense and performance information prepared by Broadridge Financial Solutions, Inc. (“Broadridge”), an independent provider of mutual fund performance information, as well as fee, expense and profitability information prepared by TAM. In addition, TAM provided the Board with additional supplemental comparative fee, expense and performance information. To the extent applicable, the Trustees considered information about fees and performance of comparable funds and/or accounts managed by the Sub-Adviser. The Board also considered reductions to the Portfolio’s expense limits, if any, that took effect after the last renewal of the Agreements. In their review, the Trustees also sought to identify instances in which the Portfolio’s performance, fees, total expenses and/or profitability appeared to be outliers within its respective peer group or other comparative metrics and sought to understand the reasons for such comparative positions.
In their deliberations, the Independent Trustees met privately without representatives of TAM or the Sub-Adviser present and were represented throughout the process by their independent legal counsel. In considering the proposed continuation of each of the Agreements, the Trustees evaluated and weighed a number of considerations that they believed to be relevant in light of the legal advice furnished to them by counsel, including independent legal counsel, and made a decision in the exercise of their own business judgment. They based their decisions on the considerations discussed below, among others, although they did not identify any particular consideration or item of information that was controlling of their decisions, and each Trustee may have attributed different weights to the various factors.
Nature, Extent and Quality of the Services Provided
The Board considered the nature, extent and quality of the services provided by TAM and the Sub-Adviser to the Portfolio in the past and the services anticipated to be provided in the future. The Board also considered the investment approach for the Portfolio; the experience, capability and integrity of TAM’s senior management; the financial resources of TAM; TAM’s management oversight process; TAM’s and the Sub-Adviser’s responsiveness to any questions by the Trustees; and the professional qualifications and compensation program of the portfolio management team of the Sub-Adviser. The Trustees noted that they receive, on a quarterly basis, an execution analysis from Capital Institutional Services, Inc. (CAPIS), an independent provider of trade analyses, for the Sub-Adviser and a comparison of trading results against a peer universe of managers.
The Board also considered the continuous and regular investment management and other services provided by TAM, when acting as a manager of managers, for the portion of the management fee it retains from the Portfolio after payment of the sub-advisory fees. The Board noted that the investment management and other services provided by TAM include the design, development and ongoing review and evaluation of the Portfolio and its investment strategy; the selection, oversight and monitoring of one or more investment sub-advisers to perform certain duties with respect to the Portfolio; ongoing portfolio trading oversight and analysis; risk management oversight and analysis; design, development, implementation and ongoing review and evaluation of a process for the valuation of Portfolio investments; design, development, implementation and ongoing review and evaluation of a compliance program for the Portfolio; design, development, implementation and ongoing review and evaluation of a process for the voting of proxies and exercise of rights to consent to corporate action for Portfolio investments; participation in Board meetings and oversight of preparation of materials for the Board, including materials for Board meetings and regular communications with the Board; oversight of preparation of the Portfolio’s prospectus, statement of additional information, shareholder reports and other disclosure materials and regulatory filings for the Portfolio; and ongoing cash management services for the Portfolio. The Board considered that TAM’s investment management services also include the provision of supervisory and administrative services to the Portfolio. The Board also noted that TAM, as part of the services it provides to all Transamerica mutual funds, including the Portfolio, oversees the services provided by the funds’ custodian, transfer agent, independent accountant and legal counsel and supervises the performance of the recordkeeping and holder service functions of the funds.
Investment Performance
In addition, the Board considered the short- and longer-term performance of the Portfolio in light of its investment objective, policies and strategies, including relative performance against (i) a peer universe of comparable mutual funds, as prepared by Broadridge, and (ii) the Portfolio’s benchmarks, in each case for various trailing periods ended December 31, 2023. Based on these considerations, the Board determined that TAM and the Sub-Adviser can provide investment and related services that are appropriate in scope and extent in light of
|
|
|
|
|
| Transamerica Series Trust |
|
|
|
Semi-Annual Financial Statements 2024 |
|
|
Page 16 |
|
|
Transamerica Market Participation Strategy VP
MANAGEMENT AND SUB-ADVISORY AGREEMENT — CONTRACT RENEWAL (continued)
(unaudited)
the Portfolio’s investment objectives, policies and strategies and operations, the competitive landscape of the investment company business and investor needs. The Board’s conclusions as to the Portfolio’s performance are summarized below. For purposes of its review, the Board generally used the performance of Service Class Shares. In describing the Portfolio’s performance relative to its peer universe, the summary conclusions characterize performance for the relevant periods in relation to whether it was “above,” “below” or “in line with” the peer universe median and do so using quintile rankings prepared by Broadridge. For simplicity, performance is described as “above” the median if the Portfolio’s performance ranked anywhere in the first or second quintiles, as “below” the median if it ranked anywhere in the fourth or fifth quintiles, or “in line with” the median if it ranked anywhere in the third quintile (i.e., even if its precise return was somewhat above or somewhat below the precise median return).
When considering the Portfolio’s performance, the Trustees considered any representations made by TAM regarding the appropriateness of certain peer groups and benchmarks. They recognized that performance reflects a snapshot of a period as of a specific date, and that consideration of performance data for a different period could generate significantly different performance results. The Trustees also recognized that even longer-term performance can be negatively affected by performance over a short-term period when that short-term performance is significantly below the performance of the comparable benchmark or universe of peer funds.
The Board noted that the performance of Service Class Shares of the Portfolio was above the median for its peer universe for the past 3-, 5-, and 10-year periods and below the median for the past 1-year period. The Board also noted that the performance of Service Class Shares of the Portfolio was above the benchmark that TAM utilizes to measure performance of the Portfolio for the past 5-year period and below the benchmark for the past 1-, 3-, and 10-year periods.
Management Fee and Sub-Advisory Fees and Total Expense Ratio
The Board considered the management fee and total expense ratio of the Portfolio, including information provided by Broadridge comparing the management fee and total expense ratio of the Portfolio to the management fees and total expense ratios of comparable investment companies in both a peer group and broader peer universe compiled by Broadridge. The Board’s conclusions as to the Portfolio’s management fee and total expense ratio are summarized below. For purposes of its review, the Board generally used the actual total expenses (i.e., expenses reflecting any waivers and/or reimbursements) of Service Class Shares. In describing the Portfolio’s management fee and total expense ratio relative to its peer group and peer universe, the summary conclusions characterize management fees and total expense ratios for the relevant periods in relation to whether they were “above,” “below” or “in line with” the peer group or peer universe median and do so using quintile rankings prepared by Broadridge. For simplicity, management fees and total expense ratios are described as “above” the median if the Portfolio’s management fee or total expense ratio ranked anywhere in the fourth or fifth quintiles, as “below” the median if it ranked anywhere in the first or second quintiles, or “in line with” the median if it ranked anywhere in the third quintile (i.e., even if its precise management fee or total expense ratio was somewhat above or somewhat below the precise median management fee or total expense ratio).
The Board also considered the fees charged by the Sub-Adviser for sub-advisory services, as well as the portion of the Portfolio’s management fee retained by TAM following payment of the sub-advisory fee and how the portion of the contractual management fee retained by TAM at a specified asset level compared to the portions retained by other investment advisers managing mutual funds with similar investment strategies as calculated by an independent provider of information.
The Board noted that the Portfolio’s contractual management fee and the actual total expenses (i.e., expenses reflecting any waivers and/or reimbursements) of Service Class Shares of the Portfolio were above the medians for its peer group and peer universe. The Trustees also considered that TAM has entered into an expense limitation arrangement with the Portfolio, which may result in TAM waiving fees for the benefit of holders.
On the basis of these considerations, together with the other information it considered, the Board determined that the management and sub-advisory fees to be received by TAM and the Sub-Adviser under the Management Agreement and Sub-Advisory Agreement are reasonable in light of the services provided.
Cost of Services Provided and Level of Profitability
The Board reviewed information provided by TAM about the cost of providing and procuring fund management services, as well as the costs of the provision of administration, transfer agency and other services, to the Portfolio and to Transamerica Series Trust as a whole by TAM and its affiliates. The Board considered the profitability of TAM and its affiliates in providing these services for the Portfolio and Transamerica Series Trust as a whole. The Trustees recognized the competitiveness of the mutual fund industry and the importance of an investment adviser’s long-term profitability, including for maintaining company and management stability and accountability.
The Board also considered the allocation methodology used for calculating the profitability of TAM and its affiliates. The Board noted that the revenue and expense allocation methodology used by TAM to estimate its profitability with respect to its relationship with the Portfolio had been reviewed previously by an independent consultant. The Trustees considered that TAM reported that it had not made material changes to this methodology, and that the methodology had been applied consistently for the Portfolio.
|
|
|
|
|
| Transamerica Series Trust |
|
|
|
Semi-Annual Financial Statements 2024 |
|
|
Page 17 |
|
|
Transamerica Market Participation Strategy VP
MANAGEMENT AND SUB-ADVISORY AGREEMENT — CONTRACT RENEWAL (continued)
(unaudited)
With respect to the Sub-Adviser, the Board noted that the sub-advisory fee is the product of arm’s-length negotiation between TAM and the Sub-Adviser, which is not affiliated with TAM, and is paid by TAM and not the Portfolio. As a result, the Board focused on the profitability of TAM and its affiliates with respect to the Portfolio.
Based on this information, the Board determined that the profitability of TAM and its affiliates from their relationships with the Portfolio was not excessive.
Economies of Scale
The Board considered economies of scale with respect to the management of the Portfolio, whether the Portfolio had appropriately benefited from any economies of scale and whether there was the potential for realization of any future economies of scale. The Board also considered the existence of economies of scale with respect to management of the Transamerica mutual funds overall and the extent to which the Portfolio benefited from any economies of scale. The Board recognized that, as the Portfolio’s assets increase, any economies of scale realized by TAM or the Sub-Adviser may not directly correlate with each other or with any economies of scale that might be realized by the Portfolio. The Board considered the Portfolio’s management fee schedule and the existence of breakpoints and also considered the extent to which TAM shared economies of scale, if any, with the Portfolio through undertakings to limit or reimburse Portfolio expenses and to invest in maintaining and developing its capabilities and services. The Board also considered the Sub-Adviser’s sub-advisory fee schedule and the existence of breakpoints, if any, and how such breakpoints relate to any breakpoints in the Portfolio’s management fee schedule. The Trustees concluded that the Portfolio’s fee structure reflected an appropriate sharing of any efficiencies or economies of scale to date and noted that they will have the opportunity to periodically reexamine the appropriateness of the management fee payable to TAM and the fee paid to the Sub-Adviser in light of any economies of scale experienced in the future.
Benefits to TAM, its Affiliates and/or the Sub-Adviser from their Relationships with the Portfolio
The Board considered other benefits derived by TAM, its affiliates, and/or the Sub-Adviser from their relationships with the Portfolio. The Board noted that TAM does not receive benefits from research obtained with commissions paid to broker-dealers for portfolio transactions (commonly referred to as “soft dollars”) as a result of its relationship with the Portfolio.
Other Considerations
The Board noted that TAM has made a substantial commitment to the recruitment and retention of high-quality personnel and maintains the financial, compliance and operational resources reasonably necessary to manage the Portfolio in a professional manner that is consistent with the best interests of the Portfolio and the holders. In this regard, the Board favorably considered the procedures and policies TAM has in place to enforce compliance with applicable laws and regulations and oversee the portfolio management activities of the Sub-Adviser. The Board also noted that TAM has made an entrepreneurial commitment and undertaken certain business risks with respect to the management and success of the Portfolio.
Conclusion
After consideration of the factors described above, as well as other factors, the Trustees, including the Independent Trustees, concluded that the renewal of the Management Agreement and the Sub-Advisory Agreement was in the best interests of the Portfolio and the holders and voted to approve the renewal of the Agreements.
|
|
|
|
|
| Transamerica Series Trust |
|
|
|
Semi-Annual Financial Statements 2024 |
|
|
Page 18 |
|
|
PROXY VOTING POLICIES AND PROCEDURES AND QUARTERLY PORTFOLIO HOLDINGS
(unaudited)
A description of Transamerica Series Trust’s (the “Trust”) proxy voting policies and procedures is available in the Statement of Additional Information of the Portfolios, available without charge upon request by calling 1-800-851-9777 (toll free) or on the Securities and Exchange Commission’s (“SEC”) website at http://www.sec.gov.
In addition, the Portfolio is required to file Form N-PX, with their complete proxy voting records for the most recent 12 months ended June 30th, no later than August 31st of each year. The Form is available without charge: (1) on the Transamerica Funds website at https://www.transamerica.com/sites/default/files/files/e070d/TST%20N-PX%202021.pdf; and (2) on the SEC’s website at http://www.sec.gov.
Each fiscal quarter, the Portfolios, except Transamerica BlackRock Government Money Market VP, will file with the SEC a complete schedule of its monthly portfolio holdings on Form N-PORT. The Portfolios’ holdings as of the end of the third month of every fiscal quarter, as reported on Form N-PORT, will be publicly available on the SEC’s website at http://www.sec.gov within 60 days of the end of the fiscal quarter.
On a monthly basis, Transamerica BlackRock Government Money Market VP will file with the SEC portfolio holdings information on Form N-MFP3. A complete schedule of portfolio holdings is also available at www.transamerica.com.
You may also visit the Trust’s website at www.transamerica.com/annuities/prospectus for this and other information about the Portfolios and the Trust.
Important Notice Regarding Delivery of Shareholder Documents
Every year we provide shareholders informative materials such as the Transamerica Series Trust Annual Report, the Transamerica Series Trust Prospectus, and other required documents that keep you informed regarding your Portfolios. To the extent provided by mail, Transamerica Series Trust will only send one piece per mailing address, a method that saves your Portfolios money by reducing mailing and printing costs. We will continue to do this unless you tell us not to. To elect to receive individual mailings, simply call a Transamerica Customer Service Representative toll free at 1-800-851-9777, 8 a.m. to 7 p.m. Eastern Time, Monday-Friday. Your request will take effect within 30 days.
|
|
|
|
|
| Transamerica Series Trust |
|
|
|
Semi-Annual Financial Statements 2024 |
|
|
Page 19 |
|
|
NOTICE OF PRIVACY POLICY
(unaudited)
Your privacy is very important to us. We want you to understand what information we collect and how we use it. We collect and use “nonpublic personal information” in connection with providing our customers with a broad range of financial products and services as effectively and conveniently as possible. We treat nonpublic personal information in accordance with our Privacy Policy.
What Information We Collect and From Whom We Collect It
We may collect nonpublic personal information about you from the following sources:
| • |
|
Information we receive from you on applications or other forms, such as your name, address, and account number; |
| • |
|
Information about your transactions with us, our affiliates, or others, such as your account balance and purchase/redemption history; and |
| • |
|
Information we receive from non-affiliated third parties, including consumer reporting agencies. |
What Information We Disclose and To Whom We Disclose It
We do not disclose any nonpublic personal information about current or former customers to anyone without their express consent, except as permitted by law. We may disclose the nonpublic personal information we collect, as described above, to persons or companies that perform services on our behalf and to other financial institutions with which we have joint marketing agreements. We will require these companies to protect the confidentiality of your nonpublic personal information and to use it only to perform the services for which we have hired them.
Our Security Procedures
We restrict access to your nonpublic personal information and only allow disclosures to persons and companies as permitted by law to assist in providing products or services to you. We maintain physical, electronic, and procedural safeguards to protect your nonpublic personal information and to safeguard the disposal of certain consumer information.
Contact Us
If you have any questions about our Privacy Policy, please call 1-800-851-9777 on any business day between 8 a.m. and 7 p.m. Eastern Time.
Note: This Privacy Policy applies only to customers that have a direct relationship with us or our affiliates. If you own shares of our portfolios in the name of a third party such as a bank or broker-dealer, its privacy policy may apply to you instead of ours.
|
|
|
|
|
| Transamerica Series Trust |
|
|
|
Semi-Annual Financial Statements 2024 |
|
|
Page 20 |
|
|
PO Box 219945
Kansas City, MO 64121-9945
|
|
|
| Distributor: |
|
Transamerica Capital, Inc. PO Box 219945 Kansas City, MO 64121-9945 Customer Service: 1-800-851-9777 |
Transamerica Series Trust Semi-Annual Financial Statements
June 30, 2024
1801 California St., Suite 5200
Denver, CO 80202
Distributor: Transamerica Capital, Inc.
Customer Service: 1-800-851-9777
The following pages contain the most recent semi-annual financial statements for the investment options in which you are invested. In compliance with Securities and Exchange Commission regulations, we present these reports on an annual and semi-annual basis with the hope that they will foster greater understanding of the investment options’ holdings, performance, financial data, accounting policies and other issues. This streamlined version provides information only on the investment options in which you are invested.
If you have any questions about these reports, please do not hesitate to contact your financial professional. As always, we thank you for your trust and the opportunity to serve you.
Transamerica Morgan Stanley Capital Growth VP
SCHEDULE OF INVESTMENTS
At June 30, 2024
(unaudited)
|
|
|
|
|
|
|
|
|
| |
|
Shares |
|
|
Value |
|
| COMMON STOCKS - 93.6% |
|
| Automobiles - 5.8% |
|
| Rivian Automotive, Inc., Class A (A)(B) |
|
|
21,855 |
|
|
$ |
293,294 |
|
| Tesla, Inc. (A) |
|
|
36,420 |
|
|
|
7,206,790 |
|
|
|
|
|
|
|
|
|
|
|
|
|
|
|
|
|
|
|
|
7,500,084 |
|
|
|
|
|
|
|
|
|
|
|
| Biotechnology - 1.3% |
|
| ProKidney Corp. (A)(B) |
|
|
104,554 |
|
|
|
257,203 |
|
| Roivant Sciences Ltd. (A) |
|
|
134,334 |
|
|
|
1,419,910 |
|
|
|
|
|
|
|
|
|
|
|
|
|
|
|
|
|
|
|
|
1,677,113 |
|
|
|
|
|
|
|
|
|
|
|
| Broadline Retail - 5.5% |
|
| Global-e Online Ltd. (A) |
|
|
85,384 |
|
|
|
3,096,877 |
|
| MercadoLibre, Inc. (A) |
|
|
2,427 |
|
|
|
3,988,532 |
|
|
|
|
|
|
|
|
|
|
|
|
|
|
|
|
|
|
|
|
7,085,409 |
|
|
|
|
|
|
|
|
|
|
|
| Capital Markets - 4.4% |
|
| Coinbase Global, Inc., Class A (A) |
|
|
8,425 |
|
|
|
1,872,288 |
|
| Intercontinental Exchange, Inc. |
|
|
28,114 |
|
|
|
3,848,525 |
|
|
|
|
|
|
|
|
|
|
|
|
|
|
|
|
|
|
|
|
5,720,813 |
|
|
|
|
|
|
|
|
|
|
|
| Entertainment - 4.9% |
|
| ROBLOX Corp., Class A (A) |
|
|
171,001 |
|
|
|
6,362,947 |
|
|
|
|
|
|
|
|
|
|
|
| Financial Services - 8.3% |
|
| Adyen NV (A)(C) |
|
|
3,868 |
|
|
|
4,611,360 |
|
| Affirm Holdings, Inc. (A) |
|
|
201,620 |
|
|
|
6,090,940 |
|
|
|
|
|
|
|
|
|
|
|
|
|
|
|
|
|
|
|
|
10,702,300 |
|
|
|
|
|
|
|
|
|
|
|
| Ground Transportation - 3.7% |
|
| Uber Technologies, Inc. (A) |
|
|
66,824 |
|
|
|
4,856,768 |
|
|
|
|
|
|
|
|
|
|
|
| Health Care Providers & Services - 1.6% |
|
| agilon health, Inc. (A)(B) |
|
|
318,600 |
|
|
|
2,083,644 |
|
|
|
|
|
|
|
|
|
|
|
| Health Care Technology - 0.7% |
|
| Doximity, Inc., Class A (A) |
|
|
31,536 |
|
|
|
882,062 |
|
|
|
|
|
|
|
|
|
|
|
| Hotels, Restaurants & Leisure - 11.6% |
|
| Airbnb, Inc., Class A (A) |
|
|
40,364 |
|
|
|
6,120,393 |
|
| DoorDash, Inc., Class A (A) |
|
|
81,912 |
|
|
|
8,910,388 |
|
|
|
|
|
|
|
|
|
|
|
|
|
|
|
|
|
15,030,781 |
|
|
|
|
|
|
|
|
|
|
|
| IT Services - 18.7% |
|
| Cloudflare, Inc., Class A (A) |
|
|
124,740 |
|
|
|
10,332,214 |
|
| Shopify, Inc., Class A (A) |
|
|
115,992 |
|
|
|
7,661,272 |
|
| Snowflake, Inc., Class A (A) |
|
|
46,231 |
|
|
|
6,245,346 |
|
|
|
|
|
|
|
|
|
|
|
|
|
|
|
|
|
|
|
|
24,238,832 |
|
|
|
|
|
|
|
|
|
|
|
| Leisure Products - 0.4% |
|
| Peloton Interactive, Inc., Class A (A)(B) |
|
|
134,886 |
|
|
|
455,915 |
|
|
|
|
|
|
|
|
|
|
|
| Life Sciences Tools & Services - 0.3% |
|
| 10X Genomics, Inc., Class A (A) |
|
|
20,233 |
|
|
|
393,532 |
|
|
|
|
|
|
|
|
|
|
|
|
|
|
|
|
|
|
|
| |
|
Shares |
|
|
Value |
|
| COMMON STOCKS (continued) |
|
| Media - 7.9% |
|
| Trade Desk, Inc., Class A (A) |
|
|
104,701 |
|
|
$ |
10,226,147 |
|
|
|
|
|
|
|
|
|
|
|
| Pharmaceuticals - 4.6% |
|
| Royalty Pharma PLC, Class A |
|
|
226,655 |
|
|
|
5,976,892 |
|
|
|
|
|
|
|
|
|
|
|
| Software - 8.0% |
|
| Aurora Innovation, Inc. (A)(B) |
|
|
495,756 |
|
|
|
1,373,244 |
|
| Bill Holdings, Inc. (A) |
|
|
37,732 |
|
|
|
1,985,458 |
|
| MicroStrategy, Inc., Class A (A)(B) |
|
|
3,053 |
|
|
|
4,205,446 |
|
| Samsara, Inc., Class A (A) |
|
|
82,828 |
|
|
|
2,791,304 |
|
|
|
|
|
|
|
|
|
|
|
|
|
|
|
|
|
|
|
|
10,355,452 |
|
|
|
|
|
|
|
|
|
|
|
| Specialized REITs - 1.9% |
|
| American Tower Corp. |
|
|
12,978 |
|
|
|
2,522,664 |
|
|
|
|
|
|
|
|
|
|
|
| Specialty Retail - 4.0% |
|
| Carvana Co. (A) |
|
|
40,697 |
|
|
|
5,238,518 |
|
|
|
|
|
|
|
|
|
|
|
|
|
| Total Common Stocks
(Cost $119,481,193) |
|
|
|
|
|
|
121,309,873 |
|
|
|
|
|
|
|
|
|
|
|
| OTHER INVESTMENT COMPANY - 3.7% |
|
| Securities Lending Collateral - 3.7% |
|
| State Street Navigator Securities Lending Trust - Government Money Market Portfolio, 5.28% (D) |
|
|
4,855,649 |
|
|
|
4,855,649 |
|
|
|
|
|
|
|
|
|
|
|
|
| Total Other Investment Company
(Cost $4,855,649) |
|
|
|
4,855,649 |
|
|
|
|
|
|
|
|
|
|
| |
|
Principal |
|
|
Value |
|
| REPURCHASE AGREEMENT - 6.6% |
|
| Fixed Income Clearing Corp.,
2.50% (D), dated 06/28/2024, to be repurchased at $8,541,660 on 07/01/2024. Collateralized by a U.S. Government Obligation, 3.75%, due 04/15/2026, and with a value of $8,710,785. |
|
$ |
8,539,881 |
|
|
|
8,539,881 |
|
|
|
|
|
|
|
|
|
|
| Total Repurchase Agreement
(Cost $8,539,881) |
|
|
|
8,539,881 |
|
|
|
|
|
|
|
|
|
| Total Investments Excluding Options Purchased
(Cost $132,876,723) |
|
|
|
134,705,403 |
|
|
|
|
|
|
|
|
|
| Total Options Purchased - 0.1%
(Cost $266,430) |
|
|
|
124,086 |
|
|
|
|
|
|
|
|
|
| Total Investments
(Cost $133,143,153) |
|
|
|
134,829,489 |
|
|
|
| Net Other Assets (Liabilities) - (4.0)% |
|
|
|
(5,221,190 |
) |
|
|
|
|
|
|
|
|
|
|
|
| Net Assets - 100.0% |
|
|
$ |
129,608,299 |
|
|
|
|
|
|
|
|
|
|
|
|
| The Notes to Financial Statements are an integral part of this report. |
|
|
|
Semi-Annual Financial Statements 2024 |
| Transamerica Series Trust |
|
|
|
|
|
|
Page 1 |
|
|
Transamerica Morgan Stanley Capital Growth VP
SCHEDULE OF INVESTMENTS (continued)
At June 30, 2024
(unaudited)
OVER-THE-COUNTER FOREIGN EXCHANGE OPTIONS PURCHASED:
|
|
|
|
|
|
|
|
|
|
|
|
|
|
|
|
|
|
|
|
|
|
|
|
|
|
|
|
|
|
|
| |
|
|
|
|
|
|
| Description |
|
Counterparty |
|
Exercise Price |
|
|
Expiration Date |
|
|
Notional Amount/ Number of Contracts |
|
|
Premiums Paid |
|
|
Value |
|
| Put – USD vs. CNH |
|
GSI |
|
|
USD |
|
|
|
7.68 |
|
|
|
01/06/2025 |
|
|
|
USD |
|
|
|
33,141,518 |
|
|
$ |
125,401 |
|
|
$ |
54,120 |
|
| Put – USD vs. CNH |
|
JPM |
|
|
USD |
|
|
|
7.78 |
|
|
|
03/25/2025 |
|
|
|
USD |
|
|
|
33,222,362 |
|
|
|
141,029 |
|
|
|
69,966 |
|
|
|
|
|
|
|
|
|
|
|
|
|
|
|
|
|
|
|
|
|
|
|
|
|
|
|
|
| Total |
|
|
$ |
266,430 |
|
|
$ |
124,086 |
|
|
|
|
|
|
|
INVESTMENT VALUATION:
|
|
|
|
|
|
|
|
|
|
|
|
|
|
|
|
|
| |
|
|
|
|
| Valuation Inputs (E) |
|
|
|
|
|
|
|
|
|
|
|
|
|
|
|
|
|
| |
|
Level 1 - Unadjusted Quoted Prices |
|
|
Level 2 - Other Significant Observable Inputs |
|
|
Level 3 - Significant Unobservable Inputs |
|
|
Value |
|
| ASSETS |
|
|
|
|
|
|
|
|
|
|
|
|
|
|
|
|
| Investments |
|
|
|
|
|
|
|
|
|
|
|
|
|
|
|
|
| Common Stocks |
|
$ |
116,698,513 |
|
|
$ |
4,611,360 |
|
|
$ |
— |
|
|
$ |
121,309,873 |
|
| Other Investment Company |
|
|
4,855,649 |
|
|
|
— |
|
|
|
— |
|
|
|
4,855,649 |
|
| Repurchase Agreement |
|
|
— |
|
|
|
8,539,881 |
|
|
|
— |
|
|
|
8,539,881 |
|
| Over-the-Counter Foreign Exchange Options Purchased |
|
|
— |
|
|
|
124,086 |
|
|
|
— |
|
|
|
124,086 |
|
|
|
|
|
|
|
|
|
|
|
|
|
|
|
|
|
|
| Total Investments |
|
$ |
121,554,162 |
|
|
$ |
13,275,327 |
|
|
$ |
— |
|
|
$ |
134,829,489 |
|
|
|
|
|
|
|
|
|
|
|
|
|
|
|
|
|
|
FOOTNOTES TO SCHEDULE OF INVESTMENTS:
| (A) |
Non-income producing security. |
| (B) |
All or a portion of the security is on loan. The total value of the securities on loan is $7,562,917, collateralized by cash collateral of $4,855,649 and non-cash collateral, such as U.S. government securities and irrevocable letters of credit, of $2,991,804. The amount on loan indicated may not correspond with the securities on loan identified because a security with pending sales are in the process of recall from the brokers. |
| (C) |
Security is exempt from registration pursuant to Rule 144A of the Securities Act of 1933. Security may be resold as transactions exempt from registration, normally to qualified institutional buyers. At June 30, 2024, the total value of 144A securities is $4,611,360, representing 3.6% of the Portfolio’s net assets. |
| (D) |
Rate disclosed reflects the yield at June 30, 2024. |
| (E) |
There were no transfers in or out of Level 3 during the period ended June 30, 2024. Please reference the Investment Valuation section of the Notes to Financial Statements for more information regarding investment valuation and pricing inputs. |
CURRENCY ABBREVIATION(S):
|
|
|
| CNH |
|
Chinese Yuan Renminbi (offshore) |
| USD |
|
United States Dollar |
COUNTERPARTY ABBREVIATION(S):
|
|
|
| GSI |
|
Goldman Sachs International |
| JPM |
|
JPMorgan Chase Bank, N.A. |
PORTFOLIO ABBREVIATION(S):
|
|
|
| REIT |
|
Real Estate Investment Trust |
|
|
|
|
|
| The Notes to Financial Statements are an integral part of this report. |
|
|
|
Semi-Annual Financial Statements 2024 |
| Transamerica Series Trust |
|
|
|
|
|
|
Page 2 |
|
|
Transamerica Morgan Stanley Capital Growth VP
STATEMENT OF ASSETS AND LIABILITIES
At June 30, 2024
(unaudited)
|
|
|
|
|
| Assets: |
|
|
|
|
| Investments, at value (cost $124,603,272) (including securities loaned of $7,562,917) |
|
$ |
126,289,608 |
|
| Repurchase agreement, at value (cost $8,539,881) |
|
|
8,539,881 |
|
| Foreign currency, at value (cost $1,608) |
|
|
1,607 |
|
| Receivables and other assets: |
|
|
|
|
| Investments sold |
|
|
99,941 |
|
| Net income from securities lending |
|
|
6,115 |
|
| Dividends |
|
|
21,024 |
|
| Interest |
|
|
1,779 |
|
| Prepaid expenses |
|
|
551 |
|
|
|
| Total assets |
|
|
134,960,506 |
|
|
|
| Liabilities: |
|
|
|
|
| Cash collateral received upon return of: |
|
|
|
|
| Securities on loan |
|
|
4,855,649 |
|
| Cash collateral at broker for: |
|
|
|
|
| OTC derivatives (A) |
|
|
200,000 |
|
| Payables and other liabilities: |
|
|
|
|
| Shares of beneficial interest redeemed |
|
|
107,707 |
|
| Investment management fees |
|
|
88,508 |
|
| Transfer agent costs |
|
|
104 |
|
| Trustee and CCO fees |
|
|
613 |
|
| Audit and tax fees |
|
|
12,706 |
|
| Custody fees |
|
|
8,286 |
|
| Legal fees |
|
|
12,817 |
|
| Printing and shareholder reports fees |
|
|
59,208 |
|
| Other accrued expenses |
|
|
6,609 |
|
|
|
| Total liabilities |
|
|
5,352,207 |
|
|
|
| Net assets |
|
$ |
129,608,299 |
|
|
|
| Net assets consist of: |
|
|
|
|
| Capital stock ($0.01 par value) |
|
$ |
232,644 |
|
| Additional paid-in capital |
|
|
940,730,708 |
|
| Total distributable earnings (accumulated losses) |
|
|
(811,355,053 |
) |
|
|
| Net assets |
|
$ |
129,608,299 |
|
|
|
| Shares outstanding |
|
|
23,264,354 |
|
|
|
| Net asset value and offering price per share |
|
$ |
5.57 |
|
| (A) |
OTC derivatives may include swaps, options and/or swaptions and forward foreign currency contracts. |
STATEMENT OF OPERATIONS
For the period ended June 30, 2024
(unaudited)
|
|
|
|
|
| Investment income: |
|
|
|
|
| Dividend income |
|
$ |
122,253 |
|
| Interest income |
|
|
99,982 |
|
| Net income from securities lending |
|
|
21,634 |
|
|
|
| Total investment income |
|
|
243,869 |
|
|
|
| Expenses: |
|
|
|
|
| Investment management fees |
|
|
441,709 |
|
| Transfer agent costs |
|
|
727 |
|
| Trustee and CCO fees |
|
|
3,324 |
|
| Audit and tax fees |
|
|
12,589 |
|
| Custody fees |
|
|
6,802 |
|
| Legal fees |
|
|
12,354 |
|
| Printing and shareholder reports fees |
|
|
19,292 |
|
| Other |
|
|
11,829 |
|
| Total expenses before waiver and/or reimbursement and recapture |
|
|
508,626 |
|
| Expenses waived and/or reimbursed: |
|
|
|
|
| Initial Class |
|
|
(42,938 |
) |
| Recapture of previously waived and/or reimbursed fees: |
|
|
|
|
| Initial Class |
|
|
26,179 |
|
|
|
| Net expenses |
|
|
491,867 |
|
|
|
| Net investment income (loss) |
|
|
(247,998 |
) |
|
|
| Net realized gain (loss) on: |
|
|
|
|
| Investments |
|
|
10,995,048 |
|
| Foreign currency transactions |
|
|
316 |
|
| Net realized gain (loss) |
|
|
10,995,364 |
|
|
|
| Net change in unrealized appreciation (depreciation) on: |
|
|
|
|
| Investments |
|
|
(10,571,318 |
) |
| Translation of assets and liabilities denominated in foreign currencies |
|
|
(133 |
) |
|
|
| Net change in unrealized appreciation (depreciation) |
|
|
(10,571,451 |
) |
|
|
| Net realized and change in unrealized gain (loss) |
|
|
423,913 |
|
|
|
| Net increase (decrease) in net assets resulting from operations |
|
$ |
175,915 |
|
|
|
|
|
|
| The Notes to Financial Statements are an integral part of this report. |
|
|
|
Semi-Annual Financial Statements 2024 |
| Transamerica Series Trust |
|
|
|
|
|
|
Page 3 |
|
|
Transamerica Morgan Stanley Capital Growth VP
STATEMENT OF CHANGES IN NET ASSETS
For the period and year ended:
|
|
|
|
|
|
|
|
|
| |
|
June 30, 2024 (unaudited) |
|
December 31, 2023 |
|
|
|
| From operations: |
|
|
|
|
|
|
|
|
| Net investment income (loss) |
|
$ |
(247,998 |
) |
|
$ |
(1,706,486 |
) |
| Net realized gain (loss) |
|
|
10,995,364 |
|
|
|
(483,923,894 |
) |
| Net change in unrealized appreciation (depreciation) |
|
|
(10,571,451 |
) |
|
|
592,836,635 |
|
|
|
|
| Net increase (decrease) in net assets resulting from operations |
|
|
175,915 |
|
|
|
107,206,255 |
|
|
|
|
| Capital share transactions: |
|
|
|
|
|
|
|
|
| Proceeds from shares sold: |
|
|
|
|
|
|
|
|
| Initial Class |
|
|
2,897,944 |
|
|
|
10,985,798 |
|
|
|
|
| Service Class (A) |
|
|
— |
|
|
|
13,755,075 |
|
|
|
|
| |
|
|
2,897,944 |
|
|
|
24,740,873 |
|
| Cost of shares redeemed: |
|
|
|
|
|
|
|
|
| Initial Class |
|
|
(7,725,616 |
) |
|
|
(271,294,639 |
) |
|
|
|
| Service Class (A) |
|
|
— |
|
|
|
(443,639,180 |
) |
|
|
|
|
|
|
(7,725,616 |
) |
|
|
(714,933,819 |
) |
| |
|
|
| Net increase (decrease) in net assets resulting from capital share transactions |
|
|
(4,827,672 |
) |
|
|
(690,192,946 |
) |
|
|
|
| Net increase (decrease) in net assets |
|
|
(4,651,757 |
) |
|
|
(582,986,691 |
) |
|
|
|
| Net assets: |
|
|
|
|
|
|
|
|
| Beginning of period/year |
|
|
134,260,056 |
|
|
|
717,246,747 |
|
| End of period/year |
|
$ |
129,608,299 |
|
|
$ |
134,260,056 |
|
|
|
|
| Capital share transactions - shares: |
|
|
|
|
|
|
|
|
| Shares issued: |
|
|
|
|
|
|
|
|
| Initial Class |
|
|
501,584 |
|
|
|
2,430,621 |
|
|
|
|
| Service Class (A) |
|
|
— |
|
|
|
3,875,718 |
|
|
|
|
| |
|
|
501,584 |
|
|
|
6,306,339 |
|
| Shares redeemed: |
|
|
|
|
|
|
|
|
| Initial Class |
|
|
(1,389,934 |
) |
|
|
(64,603,491 |
) |
|
|
|
| Service Class (A) |
|
|
— |
|
|
|
(129,187,634 |
) |
|
|
|
| |
|
|
(1,389,934 |
) |
|
|
(193,791,125 |
) |
| Net increase (decrease) in shares outstanding: |
|
|
|
|
|
|
|
|
| Initial Class |
|
|
(888,350 |
) |
|
|
(62,172,870 |
) |
|
|
|
| Service Class (A) |
|
|
— |
|
|
|
(125,311,916 |
) |
|
|
|
| |
|
|
(888,350 |
) |
|
|
(187,484,786 |
) |
| (A) |
Service class shares were liquidated on September 22, 2023. |
|
|
|
|
|
| The Notes to Financial Statements are an integral part of this report. |
|
|
| Transamerica Series Trust |
|
|
|
Semi-Annual Financial Statements 2024 |
|
|
Page 4 |
|
|
Transamerica Morgan Stanley Capital Growth VP
FINANCIAL HIGHLIGHTS
|
|
|
|
|
|
|
|
|
|
|
|
|
|
|
|
|
|
|
|
|
|
|
|
|
|
|
| For a share outstanding during the period and years indicated: |
|
Initial Class |
| |
|
June 30, 2024 (unaudited) |
|
December 31, 2023 |
|
December 31, 2022 |
|
December 31, 2021 |
|
December 31, 2020 |
|
December 31, 2019 |
|
|
|
|
|
|
|
| Net asset value, beginning of period/year |
|
$ |
5.56 |
|
|
$ |
3.79 |
|
|
$ |
29.23 |
|
|
$ |
38.86 |
|
|
$ |
18.46 |
|
|
$ |
16.20 |
|
| Investment operations: |
|
|
|
|
|
|
|
|
|
|
|
|
|
|
|
|
|
|
|
|
|
|
|
|
| Net investment income (loss)(A) |
|
|
(0.01 |
) |
|
|
(0.02 |
) |
|
|
(0.06 |
) |
|
|
(0.25 |
) |
|
|
(0.19 |
) |
|
|
(0.13 |
) |
| Net realized and unrealized gain (loss) |
|
|
0.02 |
|
|
|
1.79 |
|
|
|
(15.27 |
) |
|
|
1.48 |
|
|
|
21.70 |
|
|
|
4.00 |
|
| |
|
|
|
|
|
|
| Total investment operations |
|
|
0.01 |
|
|
|
1.77 |
|
|
|
(15.33 |
) |
|
|
1.23 |
|
|
|
21.51 |
|
|
|
3.87 |
|
|
|
|
|
|
|
|
| Dividends and/or distributions to shareholders: |
|
|
|
|
|
|
|
|
|
|
|
|
|
|
|
|
|
|
|
|
|
|
|
|
| Net realized gains |
|
|
— |
|
|
|
— |
|
|
|
(10.11 |
) |
|
|
(10.86 |
) |
|
|
(1.11 |
) |
|
|
(1.61 |
) |
| |
|
|
|
|
|
|
| Net asset value, end of period/year |
|
$ |
5.57 |
|
|
$ |
5.56 |
|
|
$ |
3.79 |
|
|
$ |
29.23 |
|
|
$ |
38.86 |
|
|
$ |
18.46 |
|
| |
|
|
|
|
|
|
|
|
|
|
|
|
|
|
|
|
|
|
|
|
|
|
|
|
|
|
|
|
|
|
|
| Total return |
|
|
0.18 |
%(B) |
|
|
46.70 |
% |
|
|
(59.84 |
)% |
|
|
(0.53 |
)% |
|
|
117.87 |
% |
|
|
23.74 |
% |
|
|
|
|
|
|
|
| Ratio and supplemental data: |
|
|
|
|
|
|
|
|
|
|
|
|
|
|
|
|
|
|
|
|
|
|
|
|
| Net assets end of period/year (000’s) |
|
$ |
129,608 |
|
|
$ |
134,260 |
|
|
$ |
326,844 |
|
|
$ |
1,621,984 |
|
|
$ |
2,000,396 |
|
|
$ |
1,316,457 |
|
| Expenses to average net assets |
|
|
|
|
|
|
|
|
|
|
|
|
|
|
|
|
|
|
|
|
|
|
|
|
| Excluding waiver and/or reimbursement and recapture |
|
|
0.79 |
%(C) |
|
|
0.85 |
% |
|
|
0.76 |
% |
|
|
0.72 |
% |
|
|
0.73 |
% |
|
|
0.82 |
% |
| Including waiver and/or reimbursement and recapture |
|
|
0.76 |
%(C) |
|
|
0.76 |
% |
|
|
0.76 |
%(D) |
|
|
0.72 |
% |
|
|
0.73 |
% |
|
|
0.82 |
% |
| Net investment income (loss) to average net assets |
|
|
(0.38 |
)%(C) |
|
|
(0.34 |
)% |
|
|
(0.56 |
)% |
|
|
(0.66 |
)% |
|
|
(0.70 |
)% |
|
|
(0.68 |
)% |
| Portfolio turnover rate |
|
|
19 |
%(B) |
|
|
28 |
% |
|
|
37 |
% |
|
|
59 |
% |
|
|
52 |
% |
|
|
209 |
% |
| (A) |
Calculated based on average number of shares outstanding. |
| (D) |
Waiver and/or reimbursement rounds to less than 0.01%. |
|
|
|
|
|
| The Notes to Financial Statements are an integral part of this report. |
|
|
| Transamerica Series Trust |
|
|
|
Semi-Annual Financial Statements 2024 |
|
|
Page 5 |
|
|
Transamerica Morgan Stanley Capital Growth VP
NOTES TO FINANCIAL STATEMENTS
At June 30, 2024
(unaudited)
1. ORGANIZATION
Transamerica Series Trust (“TST”) is an open-end management investment company registered under the Investment Company Act of 1940, as amended (the “1940 Act”). TST applies investment company accounting and reporting guidance. TST serves as a funding vehicle for variable life insurance, variable annuity, and group annuity products. Transamerica Morgan Stanley Capital Growth VP (the “Portfolio”) is a series of TST and is classified as diversified under the 1940 Act. The Portfolio currently offers one class of shares, Initial Class.
The only shareholders of the Portfolio are affiliated insurance company separate accounts and/or affiliated asset allocation portfolios. Contract holders of the variable life and annuity contracts are not shareholders of the Portfolio. For ease of reference, shareholders and contract holders are collectively referred to in this report as “shareholders.”
This report must be accompanied or preceded by the Portfolio’s current prospectus, which contains additional information about the Portfolio, including risks, as well as investment objectives and strategies.
Transamerica Asset Management, Inc. (“TAM”) serves as investment manager for the Portfolio pursuant to an investment management agreement. TAM provides continuous and regular investment management services to the Portfolio. TAM supervises the Portfolio’s investments, conducts its investment program and provides supervisory, compliance and administrative services to the Portfolio.
TAM currently acts as a “manager of managers” and has hired sub-advisers to furnish day-to-day investment advice and recommendations. TAM may, in the future, determine to provide all aspects of the day-to-day management of the Portfolio without the use of a sub-adviser. When acting as a manager of managers, TAM provides investment management services that include, without limitation, the design and development of the Portfolio and its investment strategies and the ongoing review and evaluation of those investment strategies including recommending changes in strategy where it believes appropriate or advisable; the selection of one or more sub-advisers for the Portfolio employing a combination of quantitative and qualitative screens, research, analysis and due diligence; negotiation of sub-advisory agreements and fees; oversight and monitoring of sub-advisers and recommending changes to sub-advisers where it believes appropriate or advisable; recommending portfolio combinations and liquidations where it believes appropriate or advisable; selection and oversight of transition managers, as needed; regular supervision of the Portfolio’s investments; regular review and evaluation of sub-adviser performance; daily monitoring of the sub-advisers’ buying and selling of securities for the Portfolio; regular review of holdings; ongoing trade oversight and analysis; regular monitoring to ensure adherence to investment process; regular calls and periodic on-site visits with sub-advisers; portfolio construction and asset allocation when using multiple sub-advisers for the Portfolio; risk management oversight and analysis; oversight of negotiation of investment documentation and agreements; design, development, implementation and regular monitoring of the valuation process; periodic due diligence reviews of pricing vendors and vendor methodology; design, development, implementation and regular monitoring of the compliance process; respond to regulatory inquiries and determine appropriate litigation strategy, as needed; review of proxies voted by sub-advisers; oversight of preparation and review of materials for meetings of the Portfolio’s Board of Trustees (the “Board”), participation in these meetings and preparation of regular communications with the Board; oversight of preparation and review of prospectuses, shareholder reports and other disclosure materials and regulatory filings for the Portfolio; oversight of other service providers to the Portfolio, such as the custodian, the transfer agent, the Portfolio’s independent accounting firm and legal counsel; supervision of the performance of recordkeeping and shareholder relations functions for the Portfolio; and oversight of cash management services. TAM uses a variety of quantitative and qualitative tools to carry out its investment management services. TAM, not the Portfolio, is responsible for paying the sub-adviser(s) for their services, and sub-advisory fees are TAM’s expense.
TAM’s investment management services also include the provision of supervisory and administrative services to the Portfolio. These services include performing certain administrative services for the Portfolio and supervising and overseeing the administrative, clerical, recordkeeping and bookkeeping services provided to the Portfolio by State Street Bank and Trust Company (“State Street”), to whom TAM has outsourced the provision of certain sub-administration services. To the extent agreed upon by TAM and the Portfolio from time to time, TAM’s supervisory and administrative services include, but are not limited to: monitoring and verifying the custodian’s daily calculation of the Net Asset Values (“NAV”); shareholder relations functions; compliance services; valuation services; assisting in due diligence and in the oversight and monitoring of certain activities of sub-advisers and certain aspects of Portfolio investments; assisting with Portfolio combinations and liquidations; oversight of the preparation and filing, and review, of all returns and reports, in connection with federal, state and local taxes; oversight and review of regulatory reporting; supervising and coordinating the Portfolio’s custodian and dividend disbursing agent and monitoring their services to the Portfolio; assisting the Portfolio in preparing reports to shareholders; acting as liaison with the Portfolio’s independent public accountants and providing, upon request, analyses, fiscal year summaries and other audit related services; assisting in the preparation of agendas and supporting documents for and minutes of meetings of trustees and committees of trustees; assisting in the preparation of regular communications with the trustees; and providing personnel and office space, telephones and other office equipment as necessary in order for TAM to perform supervisory and administrative services to the Portfolio. The Portfolio pays certain fees and expenses to State Street for sub-administration services which are not administrative services covered by the
|
|
|
|
|
| Transamerica Series Trust |
|
|
|
Semi-Annual Financial Statements 2024 |
|
|
Page 6 |
|
|
Transamerica Morgan Stanley Capital Growth VP
NOTES TO FINANCIAL STATEMENTS (continued)
At June 30, 2024
(unaudited)
1. ORGANIZATION (continued)
management agreement with TAM or paid for through the management fees payable thereunder. For the period ended June 30, 2024, (i) the expenses paid to State Street for sub-administration services by the Portfolio are shown as a part of Other expenses within the Statement of Operations and (ii) the expenses payable to State Street for sub-administration services from the Portfolio are shown as part of Other accrued expenses within the Statement of Assets and Liabilities.
2. SIGNIFICANT ACCOUNTING POLICIES
In preparing the Portfolio’s financial statements in accordance with Generally Accepted Accounting Principles in the United States of America (“GAAP”), estimates or assumptions (which could differ from actual results) may be used that affect reported amounts and disclosures. The following is a summary of significant accounting policies followed by the Portfolio.
Foreign currency denominated investments: The accounting records of the Portfolio are maintained in U.S. dollars. Securities and other assets and liabilities denominated in foreign currencies are translated into U.S. dollars based on the closing exchange rate each day. The cost of foreign securities purchased and any realized gains or losses are translated at the prevailing exchange rates in effect on the date of the respective transaction. The Portfolio combines fluctuations from currency exchange rates and fluctuations in value when computing net realized and unrealized gains or losses from investments.
Net foreign currency gains and losses resulting from changes in exchange rates include, foreign currency fluctuations between trade date and settlement date of investment security transactions, gains and losses on forward foreign currency contracts, and the difference between the receivable amounts of interest and dividends recorded in the accounting records in U.S. dollars and the amounts actually received.
Foreign currency denominated assets may involve risks not typically associated with domestic transactions. These risks include revaluation of currencies, adverse fluctuations in foreign currency values, and possible adverse political, social, and economic developments, including those particular to a specific industry, country or region.
Security transactions and investment income: Security transactions are accounted for on the trade date. Security gains and losses are calculated on a first-in, first-out basis. Dividend income, if any, is recorded on the ex-dividend date or, in the case of foreign securities, as soon as the Portfolio is informed of the ex-dividend dates, net of foreign taxes. Non-cash dividends, if any, are recorded on the ex-dividend date at fair value. Interest income, if any, is recorded on the accrual basis from settlement date, net of foreign taxes. Fixed income premiums and discounts are amortized and/or accreted over the lives of the respective securities.
Multiple class operations, income, and expenses: Income, non-class specific expenses, and realized and unrealized gains and losses are allocated to each class daily based upon net assets. Each class bears its own specific expenses in addition to the allocated non-class specific expenses.
Foreign taxes: The Portfolio may be subject to taxes imposed by the countries in which it invests, with respect to its investments in issuers existing or operating in such countries. The Portfolio may also be subject to foreign taxes on income, gains on investments, or currency repatriation, a portion of which may be recoverable. The Portfolio accrues such taxes and recoveries as applicable when the related income or capital gains are earned or unrealized, and based upon the current interpretation of tax rules and regulations that exist in the markets in which the Portfolio invests. Some countries require governmental approval for the repatriation of investment income, capital, or the proceeds of sales earned by foreign investors. In addition, if there is deterioration in a country’s balance of payments or for other reasons, a country may impose temporary restrictions of foreign capital remittances abroad.
Distributions to shareholders: Distributions are recorded on the ex-dividend date and are determined in accordance with federal income tax regulations, which may differ from GAAP.
Commission recapture: The sub-adviser(s), to the extent consistent with the best execution and usual commission rate policies and practices, may elect to place security transactions of the Portfolio with broker/dealers with which TST has established a commission recapture program. A commission recapture program is any arrangement under which a broker/dealer applies a portion of the commissions received by such broker/dealer on the security transactions to the Portfolio. In no event will commissions, paid by the Portfolio, be used to pay expenses that would otherwise be borne by any other Portfolios within TST, or by any other party.
There were no commissions recaptured during the period ended June 30, 2024 by the Portfolio.
|
|
|
|
|
| Transamerica Series Trust |
|
|
|
Semi-Annual Financial Statements 2024 |
|
|
Page 7 |
|
|
Transamerica Morgan Stanley Capital Growth VP
NOTES TO FINANCIAL STATEMENTS (continued)
At June 30, 2024
(unaudited)
2. SIGNIFICANT ACCOUNTING POLICIES (continued)
Indemnification: In the normal course of business, the Portfolio enters into contracts that contain a variety of representations that provide general indemnifications. The Portfolio’s maximum exposure under these arrangements is unknown, as this would involve future claims that may be made against the Portfolio and/or its affiliates that have not yet occurred. However, based on experience, the Portfolio expects the risk of loss to be remote.
3. INVESTMENT VALUATION
TAM has been designated as the Portfolio’s valuation designee pursuant to Rule 2a-5 under the 1940 Act with responsibility for fair valuation subject to oversight by the Portfolio’s Board of Trustees. The net asset value of the Portfolio is computed as of the official close of the New York Stock Exchange (“NYSE”) each day the NYSE is open for business.
TAM utilizes various methods to measure the fair value of its investments on a recurring basis. GAAP establishes a hierarchy that prioritizes inputs to valuation methods. The inputs or methodology used for valuing securities are not necessarily an indication of the risk associated with investing in those securities. The three levels (“Levels”) of inputs of the fair value hierarchy are defined as follows:
Level 1—Unadjusted quoted prices in active markets for identical securities.
Level 2—Inputs, other than quoted prices included in Level 1, which are observable, either directly or indirectly. These inputs may include quoted prices for the identical instrument on an inactive market, prices for similar instruments, interest rates, prepayment speeds, credit risk, yield curves, default rates, and similar data.
Level 3—Unobservable inputs based on the best information available in the circumstances, to the extent observable inputs are not available, which may include TAM’s own assumptions used in determining the fair value of the Portfolio’s investments and derivative instruments.
The inputs used to measure fair value may fall into different Levels of the fair value hierarchy. In such cases, for disclosure purposes, the Level in the fair value hierarchy that is assigned to the fair value measurement of a security is determined based on the lowest Level input that is significant to the fair value measurement in its entirety. Certain investments that are measured at fair value using NAV per share, or its equivalent, using the “practical expedient” have not been classified in the fair value Levels. The hierarchy classification of inputs used to value the Portfolio’s investments at June 30, 2024, is disclosed within the Investment Valuation section of the Schedule of Investments.
The availability of observable inputs can vary from security to security and is affected by a wide variety of factors, including, but not limited to, the type of security, whether the security is new and not yet established in the marketplace, the liquidity of markets, and other characteristics particular to the security. To the extent that valuation is based on models or inputs that are less observable or unobservable in the market, the determination of fair value requires more judgment. Accordingly, the degree of judgment exercised in determining fair value is generally greatest for instruments categorized in Level 3. Due to the inherent uncertainty of valuation, the determination of values may differ significantly from values that would have been realized had a ready market for investments existed, and the differences could be material.
Fair value measurements: Descriptions of the valuation techniques applied to the Portfolio’s significant categories of assets and liabilities measured at fair value on a recurring basis are as follows:
Equity securities: Securities are stated at the last reported sales price or closing price on the day of valuation taken from the primary exchange where the security is principally traded. To the extent these securities are actively traded and valuation adjustments are not applied, they are categorized in Level 1 of the fair value hierarchy. Equities traded on inactive markets or valued by reference to similar instruments are generally categorized in Level 2 or Level 3 if inputs are unobservable.
Foreign equity securities: Securities in which the primary trading market closes at the same time or after the NYSE, are valued based on quotations from the primary market in which they are traded and are categorized in Level 1. Because many foreign securities markets and exchanges close prior to the close of the NYSE, closing prices for foreign securities in those markets or on those exchanges do not reflect the events that occur after that close. Certain foreign securities may be fair valued using a pricing service that considers the correlation of the trading patterns of the foreign security to the intraday trading in the U.S. markets for investments such as American Depositary Receipts, financial futures, or ETFs and the movement of certain indices of securities based on a statistical analysis of their historical relationship; such valuations generally are categorized in Level 2.
|
|
|
|
|
| Transamerica Series Trust |
|
|
|
Semi-Annual Financial Statements 2024 |
|
|
Page 8 |
|
|
Transamerica Morgan Stanley Capital Growth VP
NOTES TO FINANCIAL STATEMENTS (continued)
At June 30, 2024
(unaudited)
3. INVESTMENT VALUATION (continued)
Securities lending collateral: Securities lending collateral is invested in a money market fund which is valued at the actively traded NAV and no valuation adjustments are applied. Securities lending collateral is categorized in Level 1 of the fair value hierarchy.
Repurchase agreements: Repurchase agreements are valued at cost, which approximates fair value. To the extent the inputs are observable and timely, the values are generally categorized in Level 2 of the fair value hierarchy.
Derivative instruments: Centrally cleared or listed derivatives that are actively traded are valued based on quoted prices from the exchange and are categorized in Level 1 of the fair value hierarchy. Over-the-counter (“OTC”) derivative contracts include forward, swap, swaption, and option contracts related to interest rates, foreign currencies, credit standing of reference entities, equity prices, or commodity prices. Depending on the product and the terms of the transaction, the fair value of the OTC derivative products are modeled taking into account the counterparties’ creditworthiness and using a series of techniques, including simulation models. Many pricing models do not entail material subjectivity because the methodologies employed do not necessitate significant judgments and the pricing inputs are observed from actively quoted markets, as is the case of interest rate swap and option contracts. The majority of OTC derivative products valued by the Portfolio using pricing models fall into this category and are categorized within Level 2 of the fair value hierarchy or Level 3 if inputs are unobservable.
4. BORROWINGS AND OTHER FINANCING TRANSACTIONS
The Portfolio may engage in borrowing transactions as a means of raising cash to satisfy redemption requests, for other temporary or emergency purposes or, to the extent permitted by its investment policies, to raise additional cash to be invested in other securities or instruments. When the Portfolio invests borrowing proceeds in other securities, the Portfolio will bear the risk that the market value of the securities in which such proceeds are invested goes down and is insufficient to repay the borrowed proceeds. The Portfolio may borrow on a secured or on an unsecured basis. If the Portfolio enters into a secured borrowing arrangement, a portion of the Portfolio’s assets will be used as collateral. The 1940 Act requires the Portfolio to maintain asset coverage of at least 300% of the amount of its borrowings. Asset coverage means the ratio that the value of the Portfolio’s total assets, minus liabilities other than borrowings, bears to the aggregate amount of all borrowings. Although complying with this requirement has the effect of limiting the amount that the Portfolio may borrow, it does not otherwise mitigate the risks of entering into borrowing transactions.
Interfund lending: The Portfolio, along with other funds and portfolios advised by TAM, may participate in an interfund lending program pursuant to exemptive relief granted by the Securities and Exchange Commission on January 18, 2017. This program allows the Portfolio to lend to and borrow from other funds and portfolios advised by TAM. Interfund lending transactions are subject to the conditions of the exemptive relief which places limits on the amount of lending or borrowing a Portfolio may participate in under the program. Interest earned or paid on an interfund lending transaction will be based on the average of certain current market rates. For the period ended June 30, 2024, the Portfolio has not utilized the program.
Repurchase agreements: In a repurchase agreement, the Portfolio purchases a security and simultaneously commits to resell that security to the seller at an agreed-upon price on an agreed-upon date. Securities purchased subject to a repurchase agreement are held at the Portfolio’s custodian, or designated sub-custodian related to tri-party repurchase agreements, and, pursuant to the terms of the repurchase agreement, must be collateralized by securities with an aggregate market value greater than or equal to 100% of the resale price. The Portfolio will bear the risk of value fluctuations until the securities can be sold and may encounter delays and incur costs in liquidating the securities. In the event of bankruptcy or insolvency of the seller, delays and costs may be incurred.
Repurchase agreements are subject to netting agreements, which are agreements between the Portfolio and its counterparties that provide for the net settlement of all transactions and collateral with the Portfolio, through a single payment, in the event of default or termination. Amounts presented within the Schedule of Investments, and as part of Repurchase agreements, at value within the Statement of Assets and Liabilities are shown on a gross basis. The value of the related collateral for each repurchase agreement, as reflected within the Schedule of Investments, exceeds the value of each repurchase agreement at June 30, 2024.
Repurchase agreements at June 30, 2024, if any, are included within the Schedule of Investments and Statement of Assets and Liabilities.
Securities lending: The Portfolio may lend securities to qualified financial institutions, brokers and dealers. State Street serves as securities lending agent to the Portfolio pursuant to a Securities Lending Agreement. Loans of securities are terminable at any time and the borrower, after notice, is required to return borrowed securities within the standard time period for settlement of securities transactions. The lending of securities exposes the Portfolio to risks such as: the borrowers may fail to return the loaned securities or may not be able to provide additional collateral, the Portfolio may experience delays in recovery of the loaned securities or delays in access to collateral, or
|
|
|
|
|
| Transamerica Series Trust |
|
|
|
Semi-Annual Financial Statements 2024 |
|
|
Page 9 |
|
|
Transamerica Morgan Stanley Capital Growth VP
NOTES TO FINANCIAL STATEMENTS (continued)
At June 30, 2024
(unaudited)
4. BORROWINGS AND OTHER FINANCING TRANSACTIONS (continued)
the Portfolio may experience losses related to the investment collateral. To minimize certain risks, loan counterparties pledge cash, securities issued or guaranteed by the U.S. Government and irrevocable letters of credit issued by banks as collateral. The initial collateral received by the Portfolio is required to have a value of at least 102% of the current value of the loaned securities traded on U.S. exchanges, and a value of at least 105% for all other securities. Typically the lending agent is not permitted to sell, re-pledge or use cash and non-cash collateral it receives. The lending agent has agreed to indemnify the Portfolio in the case of default of any securities borrower.
The Portfolio receives compensation for lending securities from interest or dividends earned on the cash, U.S. Government securities and irrevocable letters of credit held as collateral, less associated fees and expenses. Such income is reflected in Net income from securities lending within the Statement of Operations. Cash collateral received is invested in the State Street Navigator Securities Lending Trust — Government Money Market Portfolio.
The value of loaned securities and related cash and non-cash collateral outstanding at June 30, 2024, if any, are shown on a gross basis within the Schedule of Investments.
The following table reflects a breakdown of transactions accounted for as secured borrowings, the gross obligation by the type, and the remaining contractual maturity of those transactions as of June 30, 2024.
|
|
|
|
|
|
|
|
|
|
|
|
|
|
|
|
|
|
|
|
|
| |
|
Remaining Contractual Maturity of the Agreements |
|
| |
|
Overnight and Continuous |
|
|
Less Than 30 Days |
|
|
Between 30 & 90 Days |
|
|
Greater Than 90 Days |
|
|
Total |
|
| Securities Lending Transactions
Common Stocks |
|
$ |
4,855,649 |
|
|
$ |
— |
|
|
$ |
— |
|
|
$ |
— |
|
|
$ |
4,855,649 |
|
| Total Borrowings |
|
$ |
4,855,649 |
|
|
$ |
— |
|
|
$ |
— |
|
|
$ |
— |
|
|
$ |
4,855,649 |
|
| |
|
5. RISK EXPOSURES AND THE USE OF DERIVATIVE INSTRUMENTS
The Portfolio’s investment strategies allow the Portfolio to use various types of derivative contracts, including option contracts, swap agreements, futures contracts, and forward foreign currency contracts. Derivatives are investments whose value is primarily derived from underlying assets, indices or reference rates and may be transacted on an exchange or OTC.
Market Risk Factors: In pursuit of the Portfolio’s investment strategies, the Portfolio may seek to use derivatives to increase or decrease its exposure to certain market risks, including:
Interest rate risk: Interest rate risk relates to the fluctuations in the value of fixed income securities due to changes in the prevailing levels of market interest rates.
Foreign exchange rate risk: Foreign exchange rate risk relates to fluctuations in the value of an asset or liability due to changes in the currency exchange rates.
Equity risk: Equity risk relates to the change in value of equity securities as they relate to increases or decreases in the general market.
Credit risk: Credit risk relates to the ability of the issuer of a financial instrument to make further principal or interest payments on an obligation or commitment that it has to the Portfolio.
Commodity risk: Commodity risk relates to the change in value of commodities or commodity indices as they relate to increases or decreases in the commodities market. Commodities are physical assets that have tangible properties. Examples of these types of assets are crude oil, heating oil, metals, livestock, and agricultural products.
The Portfolio is also exposed to additional risks from investing in derivatives, such as liquidity and counterparty credit risk. Liquidity risk is the risk that the Portfolio will be unable to sell or close out the derivative in the open market in a timely manner. Counterparty credit risk is the risk that the counterparty will not be able to fulfill its obligations to the Portfolio. Investing in derivatives may also involve greater risks than investing directly in the underlying assets, such as losses in excess of any initial investment and collateral received. In addition, there may be the risk that the change in value of the derivative contract does not correspond to the change in value of the underlying instrument.
|
|
|
|
|
| Transamerica Series Trust |
|
|
|
Semi-Annual Financial Statements 2024 |
|
|
Page 10 |
|
|
Transamerica Morgan Stanley Capital Growth VP
NOTES TO FINANCIAL STATEMENTS (continued)
At June 30, 2024
(unaudited)
5. RISK EXPOSURES AND THE USE OF DERIVATIVE INSTRUMENTS (continued)
The Portfolio’s exposure to market risk factors and certain other associated risks are summarized by derivative type as follows:
Option contracts: The Portfolio is subject to equity risk, credit risk, interest rate risk, and foreign exchange rate risk in the normal course of pursuing its investment objective. The Portfolio may enter into option contracts to manage exposure to various market fluctuations. The Portfolio may purchase or write call and put options on securities and derivative instruments in which the Portfolio owns or may invest. Options are valued at the average of the bid and ask price established each day at the close of the board of trade or exchange on which they are traded. Options are marked-to-market daily to reflect the current value of the option. The primary risks associated with options are an imperfect correlation between the change in value of the securities held and the prices of the option contracts, the possibility of an illiquid market, and an inability of the counterparty to meet the contract terms. Options can be traded through an exchange or through privately negotiated arrangements with a dealer in an OTC transaction. Options traded on an exchange are generally cleared through a clearinghouse such as the Options Clearing Corp.
Purchased options: Purchasing call options tends to increase exposure to the underlying instrument. Purchasing put options tends to decrease exposure to the underlying instrument. The Portfolio pays premiums, which are included within the Statement of Assets and Liabilities as an investment and subsequently marked-to-market to reflect the current value of the option. The risk associated with purchasing put and call options is limited to the premium paid. Premiums paid from options which expire are treated as realized losses. Premiums paid for purchasing options which are exercised or closed are added to the amounts paid or offset against the proceeds on the underlying instrument to determine the realized gain or loss.
Options on foreign currency: The Portfolio may purchase or write foreign currency options. Purchasing or writing options on foreign currency gives the Portfolio the right, but not the obligation to buy or sell the currency and will specify the amount of currency and a rate of exchange that may be exercised by a specified date.
Open option contracts at June 30, 2024, are included within the Schedule of Investments.
The following is a summary of the location and the Portfolio’s fair values of derivative investments disclosed within the Statement of Assets and Liabilities, categorized by primary market risk exposure as of June 30, 2024.
|
|
|
|
|
|
|
|
|
|
|
|
|
|
|
|
|
|
|
|
|
|
|
|
|
|
|
|
|
|
|
| Asset Derivatives |
| Location |
|
Interest Rate Contracts |
|
Foreign Exchange Contracts |
|
Equity Contracts |
|
Credit Contracts |
|
Commodity Contracts |
|
Total |
| Purchased options and swaptions: |
|
|
|
|
|
|
|
|
|
|
|
|
|
|
|
|
|
|
|
|
|
|
|
|
|
|
|
|
|
|
| Investments, at value (A) |
|
|
$ |
— |
|
|
|
$ |
124,086 |
|
|
|
$ |
— |
|
|
|
$ |
— |
|
|
|
$ |
— |
|
|
|
$ |
124,086 |
|
| Total |
|
|
$ |
— |
|
|
|
$ |
124,086 |
|
|
|
$ |
— |
|
|
|
$ |
— |
|
|
|
$ |
— |
|
|
|
$ |
124,086 |
|
| |
|
| (A) |
May include exchange-traded derivatives which are not subject to a master netting arrangement, or another similar arrangement. |
The following is a summary of the location and the effect of derivative investments within the Statement of Operations, categorized by primary market risk exposure as of June 30, 2024.
|
|
|
|
|
|
|
|
|
|
|
|
|
|
|
|
|
|
|
|
|
|
|
|
|
|
|
|
|
|
|
| Realized Gain (Loss) on Derivative Instruments |
| Location |
|
Interest Rate Contracts |
|
Foreign Exchange Contracts |
|
Equity Contracts |
|
Credit Contracts |
|
Commodity Contracts |
|
Total |
| Purchased options and swaptions (A) |
|
|
$ |
— |
|
|
|
$ |
(748,862 |
) |
|
|
$ |
— |
|
|
|
$ |
— |
|
|
|
$ |
— |
|
|
|
$ |
(748,862) |
|
| Total |
|
|
$ |
— |
|
|
|
$ |
(748,862 |
) |
|
|
$ |
— |
|
|
|
$ |
— |
|
|
|
$ |
— |
|
|
|
$ |
(748,862) |
|
| |
|
|
|
|
|
|
| Transamerica Series Trust |
|
|
|
Semi-Annual Financial Statements 2024 |
|
|
Page 11 |
|
|
Transamerica Morgan Stanley Capital Growth VP
NOTES TO FINANCIAL STATEMENTS (continued)
At June 30, 2024
(unaudited)
5. RISK EXPOSURES AND THE USE OF DERIVATIVE INSTRUMENTS (continued)
|
|
|
|
|
|
|
|
|
|
|
|
|
|
|
|
|
|
|
|
|
|
|
|
|
|
|
|
|
|
|
| Net Change in Unrealized Appreciation (Depreciation) on Derivative Instruments |
| Location |
|
Interest Rate Contracts |
|
Foreign Exchange Contracts |
|
Equity Contracts |
|
Credit Contracts |
|
Commodity Contracts |
|
Total |
| Purchased options and swaptions (B) |
|
|
$ |
— |
|
|
|
$ |
592,200 |
|
|
|
$ |
— |
|
|
|
$ |
— |
|
|
|
$ |
— |
|
|
|
$ |
592,200 |
|
| Total |
|
|
$ |
— |
|
|
|
$ |
592,200 |
|
|
|
$ |
— |
|
|
|
$ |
— |
|
|
|
$ |
— |
|
|
|
$ |
592,200 |
|
| |
|
| (A) |
Included within Net realized gain (loss) on Investments in the Statement of Operations. |
| (B) |
Included within Net change in unrealized appreciation (depreciation) on Investments in the Statement of Operations. |
The following is a summary of the ending monthly average volume on derivative activity during the period ended June 30, 2024.
|
|
|
|
|
| Options: |
|
|
|
|
| Average value of option contracts purchased |
|
$ |
130,710 |
|
The Portfolio typically enters into International Swaps and Derivatives Association, Inc. Master Agreements (“ISDA Master Agreements”) or similar master agreements (collectively, “Master Agreements”) with its contract counterparties for certain OTC derivatives in order to, among other things, reduce credit risk to counterparties.
ISDA Master Agreements include provisions for general obligations, representations, collateral and events of default or termination. Under an ISDA Master Agreement, the Portfolio typically may offset with the counterparty certain OTC derivative financial instruments payables and/or receivables with collateral held and/or posted and create one single net payment (close-out netting) in the event of default, termination and/or potential deterioration in the credit quality of the counterparty.
Various Master Agreements govern the terms of certain transactions with counterparties and typically attempt to reduce the counterparty risk associated with such transactions by specifying credit protection mechanisms and providing standardization that improves legal certainty. Cross-termination provisions under Master Agreements typically provide that a default in connection with one transaction between the Portfolio and a counterparty gives the non-defaulting party the right to terminate any other transactions in place with the defaulting party to create one single net payment due to/due from the defaulting party and may be a feature in certain Master Agreements. In the event the Portfolio exercises its right to terminate a Master Agreement after a counterparty experiences a termination event as defined in the Master Agreement, the return of collateral with market value in excess of the Portfolio’s net liability may be delayed or denied.
Collateral requirements: Collateral or margin requirements are set by the broker or exchange clearing house for exchange-traded derivatives (futures contracts, exchange-traded options, and exchange-traded swap agreements) while collateral terms are contract specific for OTC derivatives (forward foreign currency exchange contracts, OTC options, and OTC swap agreements). For OTC derivatives, under standard derivatives agreements, the Portfolio may be required to pledge collateral on derivatives to a counterparty if the Portfoliois in a net liability position, and receive collateral if in a net positive position. For financial reporting purposes, cash collateral that has been pledged by the Portfolio to cover obligations, if any, is reported in Cash collateral at broker within the Statement of Assets and Liabilities. Cash collateral that has been received by the Portfolio from a counterparty, if any, is reported separately in Cash collateral pledged at custodian and/or broker within the Statement of Assets and Liabilities. Non-cash collateral pledged to the Portfolio, if any, is disclosed within the Schedule of Investments.
Generally, the amount of collateral due from or to a party must exceed a minimum transfer amount threshold before a transfer has been made. Typically a counterparty is not permitted to sell, re-pledge or use cash and non-cash collateral it receives. The Portfolio generally does not use non-cash collateral that it receives but may, absent default or certain other circumstances, be permitted to use cash collateral received. In such cases, interest may be paid pursuant to the collateral arrangement with the counterparty.
To the extent amounts due to the Portfolio from its counterparties are not fully collateralized, contractually or otherwise, the Portfolio bears the risk of loss from counterparty non-performance. Additionally, to the extent the Portfolio has delivered collateral to a counterparty, the Portfolio bears the risk of loss from a counterparty in the event the counterparty fails to return such collateral. Counterparties may immediately terminate derivatives contracts if the Portfolio fails to maintain sufficient asset coverage for its contracts or its net assets decline by stated percentages. Collateral may not be required for all derivative contracts.
|
|
|
|
|
| Transamerica Series Trust |
|
|
|
Semi-Annual Financial Statements 2024 |
|
|
Page 12 |
|
|
Transamerica Morgan Stanley Capital Growth VP
NOTES TO FINANCIAL STATEMENTS (continued)
At June 30, 2024
(unaudited)
5. RISK EXPOSURES AND THE USE OF DERIVATIVE INSTRUMENTS (continued)
The following is a summary of the Portfolio OTC derivative assets and liabilities by counterparty net of amounts available for offset under a master netting agreement and net of the related collateral received/pledged by the Portfolio as of June 30, 2024. For financial reporting purposes, the Portfolio does not offset assets and liabilities that are subject to a master netting agreement or similar arrangement on the Statement of Assets and Liabilities. See the Repurchase agreement section within the notes for offsetting and collateral information pertaining to repurchase agreements that are subject to master netting agreements.
|
|
|
|
|
|
|
|
|
|
|
|
|
|
|
|
|
|
|
|
|
|
|
|
|
|
|
|
|
|
|
|
|
|
|
|
|
|
|
|
|
| |
|
Gross Amounts of Assets Presented within Statement of Assets and Liabilities (A) |
|
Gross Amounts Not Offset within Statement of Assets and Liabilities |
|
Gross Amounts of Liabilities Presented within Statement of Assets and Liabilities (A) |
|
Gross Amounts Not Offset within Statement of Assets and Liabilities |
| Counterparty |
|
Financial Instruments |
|
Collateral Received (B) |
|
Net Receivable |
|
Financial Instruments |
|
Collateral Pledged (B) |
|
Net Payable |
| |
|
Assets |
|
Liabilities |
| Goldman Sachs & Co. |
|
|
$ |
54,120 |
|
|
|
$ |
— |
|
|
|
$ |
— |
|
|
|
$ |
54,120 |
|
|
|
$ |
— |
|
|
|
$ |
— |
|
|
|
$ |
— |
|
|
|
$ |
— |
|
| JPMorgan Chase Bank, N.A. |
|
|
|
69,966 |
|
|
|
|
— |
|
|
|
|
(69,966 |
) |
|
|
|
— |
|
|
|
|
— |
|
|
|
|
— |
|
|
|
|
— |
|
|
|
|
— |
|
| Total |
|
|
$ |
124,086 |
|
|
|
$ |
— |
|
|
|
$ |
(69,966 |
) |
|
|
$ |
54,120 |
|
|
|
$ |
— |
|
|
|
$ |
— |
|
|
|
$ |
— |
|
|
|
$ |
— |
|
| |
|
| (A) |
Absent an event of default or early termination, OTC derivative assets and liabilities are presented gross and not offset within the Statement of Assets and Liabilities. |
| (B) |
In some instances, the actual collateral received and/or pledged may be more than the amount shown due to overcollateralization. |
6. RISK FACTORS
Investing in the Portfolio involves certain key risks related to the Portfolio’s trading activity. Please reference the Portfolio’s prospectus for a more complete discussion of the following risk(s), as well as other risks of investing in the Portfolio.
Market risk: The market prices of the Portfolio’s securities or other assets may go up or down, sometimes rapidly or unpredictably, due to factors such as economic events, inflation, changes in interest rates, governmental actions or interventions, actions taken by the U.S. Federal Reserve or foreign central banks, market disruptions caused by tariffs, trade disputes or other factors, political developments, armed conflicts, economic sanctions, cybersecurity events, investor sentiment, the global and domestic effects of widespread or local health, weather or climate events, and other factors that may or may not be related to the issuer of the security or other asset. If the market prices of the Portfolio’s securities and assets fall, the value of your investment in the Portfolio could go down.
Economies and financial markets throughout the world are increasingly interconnected. Events or circumstances in one or more countries or regions could be highly disruptive to, and have profound impacts on, global economies or markets. As a result, whether or not the Portfolio invests in securities of issuers located in or with significant exposure to the countries directly affected, the value and liquidity of the Portfolio’s investments may go down.
Foreign investments risk: Investing in securities of foreign issuers or issuers with significant exposure to foreign markets involves additional risks. Foreign markets can be less liquid, less regulated, less transparent and more volatile than U.S. markets. The value of the Portfolio’s foreign investments may decline, sometimes rapidly or unpredictably, because of factors affecting the particular issuer as well as foreign markets and issuers generally, such as unfavorable government actions, including nationalization, expropriation or confiscatory taxation, reduction of government or central bank support, tariffs and trade disruptions, sanctions, political or financial instability, social unrest or other adverse economic or political developments. Foreign investments may also be subject to different accounting practices and different regulatory, legal, auditing, financial reporting and recordkeeping standards and practices, and may be more difficult to value than investments in U.S. issuers. Certain foreign clearance and settlement procedures may result in an inability to execute transactions or delays in settlement.
Growth stocks risk: Returns on growth stocks may not move in tandem with returns on other categories of stocks or the market as a whole. Growth stocks typically are particularly sensitive to market movements and may involve larger price swings because their market prices tend to reflect future expectations. When it appears those expectations may not be met, the prices of growth stocks typically fall. Growth stocks may also be more volatile because they often do not pay dividends. The values of growth stocks tend to go down when interest rates rise because the rise in interest rates reduces the current value of future cash flows. Growth stocks as a group may be out of favor and underperform the overall equity market for a long period of time, for example, while the market favors “value” stocks.
|
|
|
|
|
| Transamerica Series Trust |
|
|
|
Semi-Annual Financial Statements 2024 |
|
|
Page 13 |
|
|
Transamerica Morgan Stanley Capital Growth VP
NOTES TO FINANCIAL STATEMENTS (continued)
At June 30, 2024
(unaudited)
7. FEES AND OTHER AFFILIATED TRANSACTIONS
TST serves as a funding vehicle for certain affiliated asset allocation portfolios and certain affiliated separate accounts of Transamerica Life Insurance Company (“TLIC”) and Transamerica Financial Life Insurance Company.
TAM, the Portfolio’s investment manager, is directly owned by TLIC and AUSA Holding, LLC (“AUSA”), both of which are indirect, wholly owned subsidiaries of Aegon Ltd. TLIC is owned by Commonwealth General Corporation (“Commonwealth”). Commonwealth and AUSA are wholly owned by Transamerica Corporation (DE). Transamerica Corporation (DE) is wholly owned by Aegon International B.V., which is wholly owned by Aegon Ltd., a Bermuda exempted company with liability limited by shares (formerly, Aegon NV, a Netherlands corporation) and a publicly traded international insurance group.
Transamerica Fund Services, Inc. (“TFS”) is the Portfolio’s transfer agent. Transamerica Capital, Inc. (“TCI”) is the Portfolio’s distributor/principal underwriter. TAM, TFS and TCI are affiliates of Aegon Ltd.
Certain officers and trustees of the Portfolio may also be officers and/or trustees of TAM, TFS and TCI. No interested trustee who is deemed an interested person due to current or former service with TAM or an affiliate of TAM receives compensation from the Portfolio. The Portfolio does pay non-interested persons (independent trustees), as disclosed in Trustee and CCO fees within the Statement of Operations.
Investment management fees: TAM serves as the Portfolio’s investment manager, performing administration as well as investment advisory services. TAM renders investment advisory, supervisory, and administration services under an investment management agreement and the Portfolio pays a single management fee, which is reflected in Investment management fees within the Statement of Operations.
The Portfolio pays a management fee to TAM based on daily average net assets at the following rates:
|
|
|
|
|
| Breakpoints |
|
|
Rate |
|
| First $1.5 billion |
|
|
0.6825% |
|
| Over $1.5 billion up to $3 billion |
|
|
0.6415 |
|
| Over $3 billion up to $4 billion |
|
|
0.5900 |
|
| Over $4 billion up to $5 billion |
|
|
0.5750 |
|
| Over $5 billion |
|
|
0.5500 |
|
TAM has contractually agreed to waive fees and/or reimburse Portfolio expenses to the extent that the total operating expenses excluding, as applicable, acquired fund fees and expenses, interest (including borrowing costs and overdraft charges), taxes, brokerage commissions, dividend and interest expenses on securities sold short, extraordinary expenses and other expenses not incurred in the ordinary course of the Portfolio’s business, exceed the following stated annual operating expense limits to the Portfolio’s daily average net assets. To the extent an expense limit changed during the period, the prior limit is also listed below. The expenses waived and/or reimbursed, if any, are included in Expenses waived and/or reimbursed within the Statement of Operations.
|
|
|
|
|
| Class |
|
Operating Expense Limit |
|
Operating Expense Limit Effective Through |
| Initial Class |
|
0.76% |
|
May 1, 2025 |
TAM is permitted to recapture amounts contractually waived and/or reimbursed to a class during any of the 36 months from the date on which TAM waived fees and/or reimbursed expenses for the class. A class may recapture and reimburse TAM only if such amount does not cause, on any particular business day of the Portfolio, the class’s total annual operating expenses (after the recapture is taken into account) to exceed the Operating Expense Limits or any other lower limit then in effect. Amounts recaptured, if any, by TAM for the period ended June 30, 2024 are disclosed in Recapture of previously waived and/or reimbursed fees within the Statement of Operations.
TAM, on a voluntary basis and in addition to the contractual operating expense limits in effect, from time to time may waive and/or reimburse expenses of the Portfolio, or any classes thereof, to such level(s) as the Trust’s officers have determined or may reasonably determine from time to time. Any such voluntary waiver or expense reimbursement may be discontinued by TAM at any time. These amounts are not subject to recapture by TAM.
|
|
|
|
|
| Transamerica Series Trust |
|
|
|
Semi-Annual Financial Statements 2024 |
|
|
Page 14 |
|
|
Transamerica Morgan Stanley Capital Growth VP
NOTES TO FINANCIAL STATEMENTS (continued)
At June 30, 2024
(unaudited)
7. FEES AND OTHER AFFILIATED TRANSACTIONS (continued)
For the 36-month period ended June 30, 2024, the balances available for recapture by TAM for the Portfolio are as follows:
|
|
|
|
|
|
|
|
|
|
|
|
|
|
|
|
|
|
|
|
|
| |
|
Amounts Available |
|
|
|
|
| |
|
2021 |
|
|
2022 |
|
|
2023 |
|
|
2024 |
|
|
Total |
|
| Initial Class |
|
$ |
— |
|
|
$ |
— |
|
|
$ |
165,122 |
|
|
$ |
42,938 |
|
|
$ |
208,060 |
|
Distribution and service fees: TST has a distribution plan (“Distribution Plan”) pursuant to Rule 12b-1 under the 1940 Act. Pursuant to the Distribution Plan, TST entered into a distribution agreement with TCI as the Portfolio’s distributor.
The Distribution Plan requires the Portfolio to pay distribution fees to TCI as compensation for various distribution activities, not as reimbursement for specific expenses. Under the Distribution Plan and distribution agreement, TCI, on behalf of the Portfolio, is authorized to pay various service providers, as direct payment for expenses incurred in connection with distribution of the Portfolio’s shares.
TCI has determined that it will not seek payment for the distribution expenses incurred by the Portfolio with respect to the Initial Class shares before May 1, 2025. Prior to TCI seeking distribution expenses on Initial Class shares, policy and contract owners will be notified in advance. The distribution and service fees are included in Distribution and service fees within the Statement of Operations.
The Portfolio is authorized under the Distribution Plan to pay fees to TCI based on daily average net assets up to an annual fee of 0.15% of Initial Class shares.
Transfer agent costs: TFS provides transfer agency services under an intercompany agreement with TAM. TFS has outsourced the provision of certain sub-transfer agency services to SS&C Global Investor & Distribution Solutions, Inc. (“SS&C GIDS”). The Portfolio does not pay a separate transfer agent fee to TAM or TFS but does pay certain expenses to SS&C GIDS related to applicable sub-transfer agency services. For the period ended June 30, 2024, (i) the expenses paid to SS&C GIDS by the Portfolio are referred to as transfer agent costs and are included within the Statement of Operations and (ii) the expenses payable to SS&C GIDS by the Portfolio are referred to as transfer agent costs within the Statement of Assets and Liabilities.
Brokerage commissions: The Portfolio incurred no brokerage commissions on security transactions placed with affiliates of the investment manager or sub-adviser(s) for the period ended June 30, 2024.
8. PURCHASES AND SALES OF SECURITIES
For the period ended June 30, 2024, the cost of securities purchased and proceeds from securities sold (excluding short-term securities) are as follows:
|
|
|
|
|
|
|
|
|
| Purchases of Securities |
|
|
|
Sales/Maturities of Securities |
| Long-Term |
|
U.S. Government |
|
|
|
Long-Term |
|
U.S. Government |
| $ 23,352,475 |
|
$ — |
|
|
|
$ 29,334,707 |
|
$ — |
9. FEDERAL INCOME TAXES AND DISTRIBUTIONS TO SHAREHOLDERS
The Portfolio has not made any provision for federal income or excise taxes due to its policy to distribute all of its taxable income and capital gains to its shareholders and otherwise qualify as a regulated investment company under Subchapter M of the Internal Revenue Code. The Portfolio recognizes the tax benefits of uncertain tax positions only where the position is “more likely than not” to be sustained assuming examination by tax authorities. The Portfolio’s tax returns remain subject to examination by the Internal Revenue Service and state tax authorities three years from the date of filing for federal purposes and four years from the date of filing for state purposes. Management has evaluated the Portfolio’s tax provisions taken for all open tax years, and has concluded that no provision for income tax is required in the Portfolio’s financial statements. If applicable, the Portfolio recognizes interest accrued related to unrecognized tax benefits in relation to interest and penalties expense in Other within the Statement of Operations. The Portfolio identifies its major tax jurisdictions as U.S. Federal, the state of Colorado, and foreign jurisdictions where the Portfolio makes significant investments; however, the Portfolio is not aware of any tax positions for which it is reasonably possible that the total amounts of unrecognized tax benefits will change materially in the next twelve months. Distributions are determined in accordance with income tax regulations, which may differ from GAAP.
|
|
|
|
|
| Transamerica Series Trust |
|
|
|
Semi-Annual Financial Statements 2024 |
|
|
Page 15 |
|
|
Transamerica Morgan Stanley Capital Growth VP
NOTES TO FINANCIAL STATEMENTS (continued)
At June 30, 2024
(unaudited)
9. FEDERAL INCOME TAXES AND DISTRIBUTIONS TO SHAREHOLDERS (continued)
As of June 30, 2024, the approximate cost for U.S. federal income tax purposes, and the aggregate gross/net unrealized appreciation (depreciation) in the value of investments (including securities sold short and derivatives, if any) are as follows:
|
|
|
|
|
|
|
| Cost |
|
Gross Appreciation |
|
Gross (Depreciation) |
|
Net Appreciation (Depreciation) |
| $ 133,143,153 |
|
$ 23,289,292 |
|
$ (21,602,956) |
|
$ 1,686,336 |
10. NEW ACCOUNTING PRONOUNCEMENT
In June 2022, the Financial Accounting Standards Board issued Accounting Standards Update No. 2022-03 (“ASU 2022-03”), “Fair Value Measurement of Equity Securities Subject to Contractual Sale Restrictions” (“Topic 820”). ASU 2022-03 clarifies the guidance in Topic 820, related to the measurement of the fair value of an equity security subject to contractual sale restrictions, where it eliminates the need to apply a discount to fair value of these securities, and introduces disclosure requirements related to such equity securities. The guidance is effective for fiscal years, and interim periods within those fiscal years, beginning after December 15, 2023, and allows for early adoption. Management is currently evaluating the implications, if any, of the additional requirements and their impact on the Portfolio’s financial statements.
Please see TST’s most recent report on Form N-CSR, available at: www.transamerica.com/annuities/prospectus, for additional information. For the most recently filed complete proxy voting records for the Trust please visit: https://www.transamerica.com/sites/default/files/files/e070d/TST%20N-PX%202021.pdf
|
|
|
|
|
| Transamerica Series Trust |
|
|
|
Semi-Annual Financial Statements 2024 |
|
|
Page 16 |
|
|
Transamerica Morgan Stanley Capital Growth VP
MANAGEMENT AND SUB-ADVISORY AGREEMENT — CONTRACT RENEWAL
(unaudited)
At a meeting of the Board of Trustees of Transamerica Series Trust (the “Trustees” or the “Board”) held on June 12-13, 2024, the Board considered the renewal of the management agreement (the “Management Agreement”) between Transamerica Asset Management, Inc. (“TAM”) and Transamerica Series Trust, on behalf of Transamerica Morgan Stanley Capital Growth VP (the “Portfolio”). The Board also considered the renewal of the investment sub-advisory agreement (the “Sub-Advisory Agreement” and together with the Management Agreement, the “Agreements”) for the Portfolio between TAM and Morgan Stanley Investment Management, Inc. (the “Sub-Adviser”).
Following its review and consideration, the Board determined that the terms of the Management Agreement and Sub-Advisory Agreement were reasonable and that the renewal of each of the Agreements was in the best interests of the Portfolio and the holders invested in the Portfolio. The Board, including the independent members of the Board (the “Independent Trustees”), unanimously approved the renewal of each of the Agreements through June 30, 2025.
Prior to reaching their decision, the Trustees requested and received from TAM and the Sub-Adviser certain information. They then reviewed such information as they deemed reasonably necessary to evaluate the Agreements, including information they had previously received from TAM and the Sub-Adviser as part of their regular oversight of the Portfolio, and knowledge they gained over time through meeting with TAM and the Sub-Adviser. Among other materials, the Trustees considered comparative fee, expense and performance information prepared by Broadridge Financial Solutions, Inc. (“Broadridge”), an independent provider of mutual fund performance information, as well as fee, expense and profitability information prepared by TAM. In addition, TAM provided the Board with additional supplemental comparative fee, expense and performance information. To the extent applicable, the Trustees considered information about fees and performance of comparable funds and/or accounts managed by the Sub-Adviser. The Board also considered reductions to the Portfolio’s expense limit, if any, that took effect after the last renewal of the Agreements. In their review, the Trustees also sought to identify instances in which the Portfolio’s performance, fees, total expenses and/or profitability appeared to be outliers within its respective peer group or other comparative metrics and sought to understand the reasons for such comparative positions.
In their deliberations, the Independent Trustees met privately without representatives of TAM or the Sub-Adviser present and were represented throughout the process by their independent legal counsel. In considering the proposed continuation of each of the Agreements, the Trustees evaluated and weighed a number of considerations that they believed to be relevant in light of the legal advice furnished to them by counsel, including independent legal counsel, and made a decision in the exercise of their own business judgment. They based their decisions on the considerations discussed below, among others, although they did not identify any particular consideration or item of information that was controlling of their decisions, and each Trustee may have attributed different weights to the various factors.
Nature, Extent and Quality of the Services Provided
The Board considered the nature, extent and quality of the services provided by TAM and the Sub-Adviser to the Portfolio in the past and the services anticipated to be provided in the future. The Board also considered the investment approach for the Portfolio; the experience, capability and integrity of TAM’s senior management; the financial resources of TAM; TAM’s management oversight process; TAM’s and the Sub-Adviser’s responsiveness to any questions by the Trustees; and the professional qualifications and compensation program of the portfolio management team of the Sub-Adviser. The Trustees noted that they receive, on a quarterly basis, an execution analysis from Capital Institutional Services, Inc. (CAPIS), an independent provider of trade analyses, for the Sub-Adviser and a comparison of trading results against a peer universe of managers.
The Board also considered the continuous and regular investment management and other services provided by TAM, when acting as a manager of managers, for the portion of the management fee it retains from the Portfolio after payment of the sub-advisory fees. The Board noted that the investment management and other services provided by TAM include the design, development and ongoing review and evaluation of the Portfolio and its investment strategy; the selection, oversight and monitoring of one or more investment sub-advisers to perform certain duties with respect to the Portfolio; ongoing portfolio trading oversight and analysis; risk management oversight and analysis; design, development, implementation and ongoing review and evaluation of a process for the valuation of Portfolio investments; design, development, implementation and ongoing review and evaluation of a compliance program for the Portfolio; design, development, implementation and ongoing review and evaluation of a process for the voting of proxies and exercise of rights to consent to corporate action for Portfolio investments; participation in Board meetings and oversight of preparation of materials for the Board, including materials for Board meetings and regular communications with the Board; oversight of preparation of the Portfolio’s prospectus, statement of additional information, shareholder reports and other disclosure materials and regulatory filings for the Portfolio; and ongoing cash management services for the Portfolio. The Board considered that TAM’s investment management services also include the provision of supervisory and administrative services to the Portfolio. The Board also noted that TAM, as part of the services it provides to all Transamerica mutual funds, including the Portfolio, oversees the services provided by the funds’ custodian, transfer agent, independent accountant and legal counsel and supervises the performance of the recordkeeping and holder service functions of the funds.
Investment Performance
In addition, the Board considered the short- and longer-term performance of the Portfolio in light of its investment objective, policies and strategies, including relative performance against (i) a peer universe of comparable mutual funds, as prepared by Broadridge, and (ii) the Portfolio’s benchmarks, in each case for various trailing periods ended December 31, 2023. Based on these considerations, the Board determined that TAM and the Sub-Adviser can provide investment and related services that are appropriate in scope and extent in light of
|
|
|
| Transamerica Series Trust |
|
Semi-Annual Financial Statements 2024 |
Page 17
Transamerica Morgan Stanley Capital Growth VP
MANAGEMENT AND SUB-ADVISORY AGREEMENT — CONTRACT RENEWAL (continued)
(unaudited)
the Portfolio’s investment objectives, policies and strategies and operations, the competitive landscape of the investment company business and investor needs. The Board’s conclusions as to the Portfolio’s performance are summarized below. For purposes of its review, the Board generally used the performance of Initial Class Shares. In describing the Portfolio’s performance relative to its peer universe, the summary conclusions characterize performance for the relevant periods in relation to whether it was “above,” “below” or “in line with” the peer universe median and do so using quintile rankings prepared by Broadridge. For simplicity, performance is described as “above” the median if the Portfolio’s performance ranked anywhere in the first or second quintiles, as “below” the median if it ranked anywhere in the fourth or fifth quintiles, or “in line with” the median if it ranked anywhere in the third quintile (i.e., even if its precise return was somewhat above or somewhat below the precise median return).
When considering the Portfolio’s performance, the Trustees considered any representations made by TAM regarding the appropriateness of certain peer groups and benchmarks. They recognized that performance reflects a snapshot of a period as of a specific date, and that consideration of performance data for a different period could generate significantly different performance results. The Trustees also recognized that even longer-term performance can be negatively affected by performance over a short-term period when that short-term performance is significantly below the performance of the comparable benchmark or universe of peer funds.
The Board noted that the performance of Initial Class Shares of the Portfolio was above the median for its peer universe for the past 1-year period, in line with the median for the past 10-year period and below the median for the past 3- and 5-year periods. The Board also noted that the performance of Initial Class Shares of the Portfolio was above the benchmark that TAM utilizes to measure performance of the Portfolio for the past 1-year period and below the benchmark for the past 3-, 5- and 10-year periods. The Board also noted that the Service Class Shares of the Portfolio had been terminated in September 2023.
Management Fee and Sub-Advisory Fees and Total Expense Ratio
The Board considered the management fee and total expense ratio of the Portfolio, including information provided by Broadridge comparing the management fee and total expense ratio of the Portfolio to the management fees and total expense ratios of comparable investment companies in both a peer group and broader peer universe compiled by Broadridge. The Board’s conclusions as to the Portfolio’s management fee and total expense ratio are summarized below. For purposes of its review, the Board generally used the actual total expenses (i.e., expenses reflecting any waivers and/or reimbursements) of Initial Class Shares. In describing the Portfolio’s management fee and total expense ratio relative to its peer group and peer universe, the summary conclusions characterize management fees and total expense ratios for the relevant periods in relation to whether they were “above,” “below” or “in line with” the peer group or peer universe median and do so using quintile rankings prepared by Broadridge. For simplicity, management fees and total expense ratios are described as “above” the median if the Portfolio’s management fee or total expense ratio ranked anywhere in the fourth or fifth quintiles, as “below” the median if it ranked anywhere in the first or second quintiles, or “in line with” the median if it ranked anywhere in the third quintile (i.e., even if its precise management fee or total expense ratio was somewhat above or somewhat below the precise median management fee or total expense ratio).
The Board also considered the fees charged by the Sub-Adviser for sub-advisory services, as well as the portion of the Portfolio’s management fee retained by TAM following payment of the sub-advisory fee and how the portion of the contractual management fee retained by TAM at a specified asset level compared to the portions retained by other investment advisers managing mutual funds with similar investment strategies as calculated by an independent provider of information.
The Board noted that the Portfolio’s contractual management fee was below the median for its peer group and in line with the median for its peer universe and that the actual total expenses (i.e., expenses reflecting any waivers and/or reimbursements) of Initial Class Shares of the Portfolio were below the medians for its peer group and peer universe. The Trustees also considered that TAM has entered into an expense limitation arrangement with the Portfolio, which may result in TAM waiving fees for the benefit of holders. The Trustees noted that they had previously approved a reduction to the Portfolio’s management fee schedule, which took effect on November 1, 2023 and was not fully reflected in the comparative data.
On the basis of these considerations, together with the other information it considered, the Board determined that the management and sub-advisory fees to be received by TAM and the Sub-Adviser under the Management Agreement and Sub-Advisory Agreement are reasonable in light of the services provided.
Cost of Services Provided and Level of Profitability
The Board reviewed information provided by TAM about the cost of providing and procuring fund management services, as well as the costs of the provision of administration, transfer agency and other services, to the Portfolio and to Transamerica Series Trust as a whole by TAM and its affiliates. The Board considered the profitability of TAM and its affiliates in providing these services for the Portfolio and Transamerica Series Trust as a whole. The Trustees recognized the competitiveness of the mutual fund industry and the importance of an investment adviser’s long-term profitability, including for maintaining company and management stability and accountability.
The Board also considered the allocation methodology used for calculating the profitability of TAM and its affiliates. The Board noted that the revenue and expense allocation methodology used by TAM to estimate its profitability with respect to its relationship with the Portfolio
|
|
|
| Transamerica Series Trust |
|
Semi-Annual Financial Statements 2024 |
Page 18
Transamerica Morgan Stanley Capital Growth VP
MANAGEMENT AND SUB-ADVISORY AGREEMENT — CONTRACT RENEWAL (continued)
(unaudited)
had been reviewed previously by an independent consultant. The Trustees considered that TAM reported that it had not made material changes to this methodology, and that the methodology had been applied consistently for the Portfolio.
With respect to the Sub-Adviser, the Board noted that the sub-advisory fee is the product of arm’s-length negotiation between TAM and the Sub-Adviser, which is not affiliated with TAM, and is paid by TAM and not the Portfolio. As a result, the Board focused on the profitability of TAM and its affiliates with respect to the Portfolio.
Based on this information, the Board determined that the profitability of TAM and its affiliates from their relationships with the Portfolio was not excessive.
Economies of Scale
The Board considered economies of scale with respect to the management of the Portfolio, whether the Portfolio had appropriately benefited from any economies of scale and whether there was the potential for realization of any future economies of scale. The Board also considered the existence of economies of scale with respect to management of the Transamerica mutual funds overall and the extent to which the Portfolio benefited from any economies of scale. The Board recognized that, as the Portfolio’s assets increase, any economies of scale realized by TAM or the Sub-Adviser may not directly correlate with each other or with any economies of scale that might be realized by the Portfolio. The Board considered the Portfolio’s management fee schedule and the existence of breakpoints and also considered the extent to which TAM shared economies of scale, if any, with the Portfolio through undertakings to limit or reimburse Portfolio expenses and to invest in maintaining and developing its capabilities and services. The Board also considered the Sub-Adviser’s sub-advisory fee schedule and the existence of breakpoints, if any, and how such breakpoints relate to any breakpoints in the Portfolio’s management fee schedule. The Board considered that the Sub-Adviser’s sub-advisory fees would be based on the combined assets of multiple funds. The Trustees concluded that the Portfolio’s fee structure reflected an appropriate sharing of any efficiencies or economies of scale to date and noted that they will have the opportunity to periodically reexamine the appropriateness of the management fee payable to TAM and the fee paid to the Sub-Adviser in light of any economies of scale experienced in the future.
Benefits to TAM, its Affiliates and/or the Sub-Adviser from their Relationships with the Portfolio
The Board considered other benefits derived by TAM, its affiliates, and/or the Sub-Adviser from their relationships with the Portfolio. The Board noted that TAM does not receive benefits from research obtained with commissions paid to broker-dealers for portfolio transactions (commonly referred to as “soft dollars”) as a result of its relationship with the Portfolio and that TAM believes the use of soft dollars by the Sub-Adviser is generally appropriate and in the best interests of the Portfolio.
Other Considerations
The Board noted that TAM has made a substantial commitment to the recruitment and retention of high-quality personnel and maintains the financial, compliance and operational resources reasonably necessary to manage the Portfolio in a professional manner that is consistent with the best interests of the Portfolio and the holders. In this regard, the Board favorably considered the procedures and policies TAM has in place to enforce compliance with applicable laws and regulations and oversee the portfolio management activities of the Sub-Adviser. The Board also noted that TAM has made an entrepreneurial commitment and undertaken certain business risks with respect to the management and success of the Portfolio.
Conclusion
After consideration of the factors described above, as well as other factors, the Trustees, including the Independent Trustees, concluded that the renewal of the Management Agreement and the Sub-Advisory Agreement was in the best interests of the Portfolio and the holders and voted to approve the renewal of the Agreements.
|
|
|
| Transamerica Series Trust |
|
Semi-Annual Financial Statements 2024 |
Page 19
PROXY VOTING POLICIES AND PROCEDURES AND QUARTERLY PORTFOLIO HOLDINGS
(unaudited)
A description of Transamerica Series Trust’s (the “Trust”) proxy voting policies and procedures is available in the Statement of Additional Information of the Portfolios, available without charge upon request by calling 1-800-851-9777 (toll free) or on the Securities and Exchange Commission’s (“SEC”) website at http://www.sec.gov.
In addition, the Portfolio is required to file Form N-PX, with their complete proxy voting records for the most recent 12 months ended June 30th, no later than August 31st of each year. The Form is available without charge: (1) on the Transamerica Funds website at https://www.transamerica.com/sites/default/files/files/e070d/TST%20N-PX%202021.pdf; and (2) on the SEC’s website at http://www.sec.gov.
Each fiscal quarter, the Portfolios, except Transamerica BlackRock Government Money Market VP, will file with the SEC a complete schedule of its monthly portfolio holdings on Form N-PORT. The Portfolios’ holdings as of the end of the third month of every fiscal quarter, as reported on Form N-PORT, will be publicly available on the SEC’s website at http://www.sec.gov within 60 days of the end of the fiscal quarter.
On a monthly basis, Transamerica BlackRock Government Money Market VP will file with the SEC portfolio holdings information on Form N-MFP3. A complete schedule of portfolio holdings is also available at www.transamerica.com.
You may also visit the Trust’s website at www.transamerica.com/annuities/prospectus for this and other information about the Portfolios and the Trust.
Important Notice Regarding Delivery of Shareholder Documents
Every year we provide shareholders informative materials such as the Transamerica Series Trust Annual Report, the Transamerica Series Trust Prospectus, and other required documents that keep you informed regarding your Portfolios. To the extent provided by mail, Transamerica Series Trust will only send one piece per mailing address, a method that saves your Portfolios money by reducing mailing and printing costs. We will continue to do this unless you tell us not to. To elect to receive individual mailings, simply call a Transamerica Customer Service Representative toll free at 1-800-851-9777, 8 a.m. to 7 p.m. Eastern Time, Monday-Friday. Your request will take effect within 30 days.
|
|
|
| Transamerica Series Trust |
|
Semi-Annual Financial Statements 2024 |
Page 20
NOTICE OF PRIVACY POLICY
(unaudited)
Your privacy is very important to us. We want you to understand what information we collect and how we use it. We collect and use “nonpublic personal information” in connection with providing our customers with a broad range of financial products and services as effectively and conveniently as possible. We treat nonpublic personal information in accordance with our Privacy Policy.
What Information We Collect and From Whom We Collect It
We may collect nonpublic personal information about you from the following sources:
| • |
|
Information we receive from you on applications or other forms, such as your name, address, and account number; |
| • |
|
Information about your transactions with us, our affiliates, or others, such as your account balance and purchase/redemption history; and |
| • |
|
Information we receive from non-affiliated third parties, including consumer reporting agencies. |
What Information We Disclose and To Whom We Disclose It
We do not disclose any nonpublic personal information about current or former customers to anyone without their express consent, except as permitted by law. We may disclose the nonpublic personal information we collect, as described above, to persons or companies that perform services on our behalf and to other financial institutions with which we have joint marketing agreements. We will require these companies to protect the confidentiality of your nonpublic personal information and to use it only to perform the services for which we have hired them.
Our Security Procedures
We restrict access to your nonpublic personal information and only allow disclosures to persons and companies as permitted by law to assist in providing products or services to you. We maintain physical, electronic, and procedural safeguards to protect your nonpublic personal information and to safeguard the disposal of certain consumer information.
Contact Us
If you have any questions about our Privacy Policy, please call 1-800-851-9777 on any business day between 8 a.m. and 7 p.m. Eastern Time.
Note: This Privacy Policy applies only to customers that have a direct relationship with us or our affiliates. If you own shares of our portfolios in the name of a third party such as a bank or broker-dealer, its privacy policy may apply to you instead of ours.
|
|
|
|
|
| Transamerica Series Trust |
|
|
|
Semi-Annual Financial Statements 2024 |
|
|
Page 21 |
|
|
PO Box 219945
Kansas City, MO 64121-9945
Distributor: Transamerica Capital, Inc.
PO Box 219945
Kansas City, MO 64121-9945
Customer Service: 1-800-851-9777
Transamerica Series Trust Semi-Annual Financial Statements
June 30, 2024
1801 California St., Suite 5200
Denver, CO 80202
Distributor: Transamerica Capital, Inc.
Customer Service: 1-800-851-9777
|
| The following pages contain the most recent semi-annual financial statements for the investment options in which you are invested. In compliance with Securities and Exchange Commission regulations, we present these reports on an annual and semi-annual basis with the hope that they will foster greater understanding of the investment options’ holdings, performance, financial data, accounting policies and other issues. This streamlined version provides information only on the investment options in which you are invested. |
|
| If you have any questions about these reports, please do not hesitate to contact your financial professional. As always, we thank you for your trust and the opportunity to serve you. |
Transamerica Morgan Stanley Global Allocation Managed Risk - Balanced VP
SCHEDULE OF INVESTMENTS
At June 30, 2024
(unaudited)
|
|
|
|
|
|
|
| |
|
Shares |
|
|
Value |
|
|
|
| INVESTMENT COMPANY - 97.7% |
|
|
|
|
|
|
| International Mixed Allocation Fund - 97.7% |
|
|
|
|
|
|
| Transamerica Morgan Stanley Global Allocation VP (A) |
|
|
36,204,095 |
|
|
$ 207,811,506 |
|
|
|
|
|
|
|
|
|
|
| Total Investment Company
(Cost $262,493,831) |
|
|
|
|
|
207,811,506 |
|
|
|
|
|
|
|
|
|
|
| |
|
Principal |
|
|
Value |
|
|
|
| REPURCHASE AGREEMENT - 2.4% |
|
|
|
|
|
|
| Fixed Income Clearing Corp.,
2.50% (B), dated 06/28/2024, to be repurchased at $5,175,568 on 07/01/2024. Collateralized by a U.S. Government Obligation, 3.75%, due 04/15/2026, and with a value of $5,278,162. |
|
$ |
5,174,490 |
|
|
5,174,490 |
|
|
|
|
|
|
|
|
|
|
| Total Repurchase Agreement
(Cost $5,174,490) |
|
|
|
|
|
5,174,490 |
|
|
|
|
|
|
|
|
|
|
| Total Investments
(Cost $267,668,321) |
|
|
|
|
|
212,985,996 |
|
|
|
|
|
|
|
| Net Other Assets (Liabilities) - (0.1)% |
|
|
|
|
|
(134,737) |
|
|
|
|
|
|
|
|
|
|
| Net Assets - 100.0% |
|
|
|
|
|
$ 212,851,259 |
|
|
|
|
|
|
|
INVESTMENT VALUATION:
Valuation Inputs (c)
|
|
|
|
|
|
|
|
|
|
|
|
|
|
|
| |
|
Level 1 - Unadjusted Quoted Prices |
|
|
Level 2 - Other Significant Observable Inputs |
|
|
Level 3 - Significant Unobservable Inputs |
|
|
Value |
| |
|
|
|
|
|
| ASSETS |
|
|
|
|
|
|
|
|
|
|
|
|
|
|
| Investments |
|
|
|
|
|
|
|
|
|
|
|
|
|
|
| Investment Company |
|
$ |
207,811,506 |
|
|
$ |
— |
|
|
$ |
— |
|
|
$ 207,811,506 |
| Repurchase Agreement |
|
|
— |
|
|
|
5,174,490 |
|
|
|
— |
|
|
5,174,490 |
|
|
|
|
|
|
|
|
|
|
|
|
|
|
|
|
|
|
|
|
| Total Investments |
|
$ |
207,811,506 |
|
|
$ |
5,174,490 |
|
|
$ |
— |
|
|
$ 212,985,996 |
|
|
|
|
|
|
|
|
|
|
|
|
|
|
|
FOOTNOTES TO SCHEDULE OF INVESTMENTS:
| (A) |
Affiliated investment in the Class I2 shares of funds within Transamerica Funds and/or affiliated investment in the Initial Class shares of funds within Transamerica Series Trust. The Portfolio’s transactions and earnings from these underlying funds are as follows: |
|
|
|
|
|
|
|
|
|
|
|
|
|
|
|
|
|
|
|
|
|
|
|
|
|
|
|
|
|
|
|
|
|
|
|
|
|
| Affiliated Investments |
|
Value December 31, 2023 |
|
|
Purchases at Cost |
|
|
Proceeds from Sales |
|
|
Net Realized Gain (Loss) |
|
|
Net Change in Unrealized Appreciation (Depreciation) |
|
|
Value June 30, 2024 |
|
|
Shares as of June 30, 2024 |
|
|
Dividend Income |
|
|
Net Capital Gain Distributions |
|
| |
|
| Transamerica Morgan Stanley Global Allocation VP |
|
|
$215,461,357 |
|
|
|
$— |
|
|
|
$(16,562,833) |
|
|
|
$(8,514,885) |
|
|
|
$17,427,867 |
|
|
|
$207,811,506 |
|
|
|
36,204,095 |
|
|
|
$— |
|
|
|
$— |
|
| (B) |
Rate disclosed reflects the yield at June 30, 2024. |
| (C) |
There were no transfers in or out of Level 3 during the period ended June 30, 2024. Please reference the Investment Valuation section of the Notes to Financial Statements for more information regarding investment valuation and pricing inputs. |
The Notes to Financial Statements are an integral part of this report.
|
|
|
|
|
| Transamerica Series Trust |
|
|
|
Semi-Annual Financial Statements 2024 |
|
|
Page 1 |
|
|
Transamerica Morgan Stanley Global Allocation Managed Risk - Balanced VP
STATEMENT OF ASSETS AND LIABILITIES
At June 30, 2024
(unaudited)
|
|
|
|
|
|
|
| Assets: |
|
|
|
|
| Affiliated investments, at value (cost $262,493,831) |
|
$ |
207,811,506 |
|
| Repurchase agreement, at value (cost $5,174,490) |
|
|
5,174,490 |
|
| Receivables and other assets: |
|
|
|
|
| Interest |
|
|
1,078 |
|
| Prepaid expenses |
|
|
856 |
|
| Other assets |
|
|
146 |
|
| |
|
| Total assets |
|
|
212,988,076 |
|
|
|
| Liabilities: |
|
|
|
|
| Payables and other liabilities: |
|
|
|
|
| Shares of beneficial interest redeemed |
|
|
22,320 |
|
| Investment management fees |
|
|
27,302 |
|
| Distribution and service fees |
|
|
40,872 |
|
| Transfer agent costs |
|
|
224 |
|
| Trustee and CCO fees |
|
|
647 |
|
| Audit and tax fees |
|
|
11,476 |
|
| Custody fees |
|
|
10,345 |
|
| Legal fees |
|
|
4,612 |
|
| Printing and shareholder reports fees |
|
|
11,204 |
|
| Other accrued expenses |
|
|
7,815 |
|
| |
|
| Total liabilities |
|
|
136,817 |
|
| |
|
| Net assets |
|
$ |
212,851,259 |
|
|
|
| Net assets consist of: |
|
|
|
|
| Capital stock ($0.01 par value) |
|
$ |
315,123 |
|
| Additional paid-in capital |
|
|
290,850,921 |
|
| Total distributable earnings (accumulated losses) |
|
|
(78,314,785 |
) |
| |
|
| Net assets |
|
$ |
212,851,259 |
|
|
|
| Shares outstanding |
|
|
31,512,322 |
|
| |
|
| Net asset value and offering price per share |
|
$ |
6.75 |
|
STATEMENT OF OPERATIONS
For the period ended June 30, 2024
(unaudited)
|
|
|
|
|
| Investment income: |
|
|
|
|
| Interest income from unaffiliated investments |
|
$ |
72,234 |
|
|
|
| Total investment income |
|
|
72,234 |
|
|
|
| Expenses: |
|
|
|
|
| Investment management fees |
|
|
211,942 |
|
| Distribution and service fees |
|
|
264,927 |
|
| Transfer agent costs |
|
|
1,224 |
|
| Trustee and CCO fees |
|
|
4,975 |
|
| Audit and tax fees |
|
|
11,270 |
|
| Custody fees |
|
|
9,360 |
|
| Legal fees |
|
|
8,710 |
|
| Printing and shareholder reports fees |
|
|
10,796 |
|
| Other |
|
|
11,330 |
|
| |
|
| Total expenses before waiver and/or reimbursement and recapture |
|
|
534,534 |
|
| |
|
| Expenses waived and/or reimbursed |
|
|
(36,471 |
) |
|
|
| Net expenses |
|
|
498,063 |
|
| |
|
| Net investment income (loss) |
|
|
(425,829 |
) |
|
|
| Net realized gain (loss) on: |
|
|
|
|
| Affiliated investments |
|
|
(8,514,885 |
) |
| Futures contracts |
|
|
(903,584 |
) |
|
|
| Net realized gain (loss) |
|
|
(9,418,469 |
) |
|
|
| Net change in unrealized appreciation (depreciation) on: |
|
|
|
|
| Affiliated investments |
|
|
17,427,867 |
|
| Translation of assets and liabilities denominated in foreign currencies |
|
|
(388 |
) |
|
|
| Net change in unrealized appreciation (depreciation) |
|
|
17,427,479 |
|
| |
|
| Net realized and change in unrealized gain (loss) |
|
|
8,009,010 |
|
| |
|
| Net increase (decrease) in net assets resulting from operations |
|
$ |
7,583,181 |
|
The Notes to Financial Statements are an integral part of this report.
|
|
|
|
|
| Transamerica Series Trust |
|
|
|
Semi-Annual Financial Statements 2024 |
|
|
Page 2 |
|
|
Transamerica Morgan Stanley Global Allocation Managed Risk - Balanced VP
STATEMENT OF CHANGES IN NET ASSETS
For the period and year ended:
|
|
|
|
|
|
|
|
|
| |
|
June 30, 2024 (unaudited) |
|
December 31, 2023 |
|
|
|
| From operations: |
|
|
|
|
|
|
|
|
| Net investment income (loss) |
|
|
$ (425,829 |
) |
|
|
$ (781,189 |
) |
| Net realized gain (loss) |
|
|
(9,418,469 |
) |
|
|
1,227,433 |
|
| Net change in unrealized appreciation (depreciation) |
|
|
17,427,479 |
|
|
|
18,244,709 |
|
|
|
|
| Net increase (decrease) in net assets resulting from operations |
|
|
7,583,181 |
|
|
|
18,690,953 |
|
|
|
|
| Dividends and/or distributions to shareholders: |
|
|
|
|
|
|
|
|
| Dividends and/or distributions to shareholders |
|
|
— |
|
|
|
(41,471,268 |
) |
| |
|
|
| Net increase (decrease) in net assets resulting from dividends and/or distributions to shareholders |
|
|
— |
|
|
|
(41,471,268 |
) |
|
|
|
| Capital share transactions: |
|
|
|
|
|
|
|
|
| Proceeds from shares sold |
|
|
623,024 |
|
|
|
1,812,734 |
|
| Dividends and/or distributions reinvested |
|
|
— |
|
|
|
41,471,268 |
|
| Cost of shares redeemed |
|
|
(15,550,106 |
) |
|
|
(26,495,603 |
) |
| |
|
|
| Net increase (decrease) in net assets resulting from capital share transactions |
|
|
(14,927,082 |
) |
|
|
16,788,399 |
|
|
|
|
| Net increase (decrease) in net assets |
|
|
(7,343,901 |
) |
|
|
(5,991,916 |
) |
|
|
|
| Net assets: |
|
|
|
|
|
|
|
|
| Beginning of period/year |
|
|
220,195,160 |
|
|
|
226,187,076 |
|
| End of period/year |
|
|
$212,851,259 |
|
|
|
$220,195,160 |
|
|
|
|
| Capital share transactions - shares: |
|
|
|
|
|
|
|
|
| Shares issued |
|
|
94,897 |
|
|
|
259,420 |
|
| Shares reinvested |
|
|
— |
|
|
|
6,667,406 |
|
| Shares redeemed |
|
|
(2,359,214 |
) |
|
|
(3,785,009 |
) |
| |
|
|
| Net increase (decrease) in shares outstanding |
|
|
(2,264,317 |
) |
|
|
3,141,817 |
|
The Notes to Financial Statements are an integral part of this report.
|
|
|
|
|
| Transamerica Series Trust |
|
|
|
Semi-Annual Financial Statements 2024 |
|
|
Page 3 |
|
|
Transamerica Morgan Stanley Global Allocation Managed Risk - Balanced VP
FINANCIAL HIGHLIGHTS
|
|
|
|
|
|
|
|
|
|
|
|
|
|
|
|
|
|
|
|
|
|
|
|
|
|
|
| For a share outstanding during the period and years indicated: |
|
Service Class |
| |
|
June 30, 2024 (unaudited) |
|
December 31, 2023 |
|
December 31, 2022 |
|
December 31, 2021 |
|
December 31, 2020 |
|
December 31, 2019 |
|
|
|
|
|
|
|
| Net asset value, beginning of period/year |
|
|
$ 6.52 |
|
|
|
$ 7.38 |
|
|
|
$ 10.45 |
|
|
|
$ 10.28 |
|
|
|
$ 10.03 |
|
|
|
$ 9.01 |
|
| Investment operations: |
|
|
|
|
|
|
|
|
|
|
|
|
|
|
|
|
|
|
|
|
|
|
|
|
| Net investment income (loss)(A) |
|
|
(0.01 |
) |
|
|
(0.03 |
) |
|
|
1.43 |
|
|
|
1.32 |
|
|
|
0.54 |
|
|
|
0.13 |
|
| Net realized and unrealized gain (loss) |
|
|
0.24 |
|
|
|
0.62 |
|
|
|
(3.09 |
) |
|
|
(0.59 |
) |
|
|
0.09 |
|
|
|
1.18 |
|
| |
|
|
|
|
|
|
| Total investment operations |
|
|
0.23 |
|
|
|
0.59 |
|
|
|
(1.66 |
) |
|
|
0.73 |
|
|
|
0.63 |
|
|
|
1.31 |
|
| Dividends and/or distributions to shareholders: |
|
|
|
|
|
|
|
|
|
|
|
|
|
|
|
|
|
|
|
|
|
|
|
|
| Net investment income |
|
|
— |
|
|
|
(1.45 |
) |
|
|
(1.41 |
) |
|
|
(0.56 |
) |
|
|
(0.13 |
) |
|
|
(0.29 |
) |
| Net realized gains |
|
|
— |
|
|
|
— |
|
|
|
— |
|
|
|
— |
|
|
|
(0.25 |
) |
|
|
— |
|
| Total dividends and/or distributions to shareholders |
|
|
— |
|
|
|
(1.45 |
) |
|
|
(1.41 |
) |
|
|
(0.56 |
) |
|
|
(0.38 |
) |
|
|
(0.29 |
) |
|
|
|
|
|
|
|
| Net asset value, end of period/year |
|
|
$ 6.75 |
|
|
|
$ 6.52 |
|
|
|
$ 7.38 |
|
|
|
$ 10.45 |
|
|
|
$ 10.28 |
|
|
|
$ 10.03 |
|
| |
|
|
|
|
|
|
|
|
|
|
|
|
|
|
|
|
|
|
|
|
|
|
|
|
|
|
|
|
|
|
|
| Total return |
|
|
3.53 |
%(B) |
|
|
9.00 |
% |
|
|
(16.23 |
)% |
|
|
7.18 |
% |
|
|
6.49 |
% |
|
|
14.71 |
% |
|
|
|
|
|
|
|
| Ratio and supplemental data: |
|
|
|
|
|
|
|
|
|
|
|
|
|
|
|
|
|
|
|
|
|
|
|
|
| Net assets end of period/year (000’s) |
|
|
$ 212,851 |
|
|
|
$ 220,195 |
|
|
|
$ 226,187 |
|
|
|
$ 300,295 |
|
|
|
$ 299,061 |
|
|
|
$ 286,813 |
|
| Expenses to average net assets(C) |
|
|
|
|
|
|
|
|
|
|
|
|
|
|
|
|
|
|
|
|
|
|
|
|
| Excluding waiver and/or reimbursement and recapture |
|
|
0.50 |
%(D) |
|
|
0.51 |
% |
|
|
0.50 |
% |
|
|
0.48 |
% |
|
|
0.53 |
% |
|
|
0.56 |
% |
| Including waiver and/or reimbursement and recapture |
|
|
0.47 |
%(D) |
|
|
0.47 |
% |
|
|
0.47 |
% |
|
|
0.47 |
% |
|
|
0.51 |
% |
|
|
0.57 |
% |
| Net investment income (loss) to average net assets |
|
|
(0.40 |
)%(D) |
|
|
(0.35 |
)% |
|
|
16.41 |
% |
|
|
12.45 |
% |
|
|
5.60 |
% |
|
|
1.41 |
% |
| Portfolio turnover rate |
|
|
— |
%(B) |
|
|
2 |
% |
|
|
2 |
% |
|
|
— |
% |
|
|
5 |
% |
|
|
— |
% |
| (A) |
Calculated based on average number of shares outstanding. |
| (C) |
Does not include expenses of the underlying investments in which the Portfolio invests. |
The Notes to Financial Statements are an integral part of this report.
|
|
|
|
|
| Transamerica Series Trust |
|
|
|
Semi-Annual Financial Statements 2024 |
|
|
Page 4 |
|
|
Transamerica Morgan Stanley Global Allocation Managed Risk - Balanced VP
NOTES TO FINANCIAL STATEMENTS
At June 30, 2024
(unaudited)
1. ORGANIZATION
Transamerica Series Trust (“TST”) is an open-end management investment company registered under the Investment Company Act of 1940, as amended (the “1940 Act”). TST applies investment company accounting and reporting guidance. TST serves as a funding vehicle for variable life insurance, variable annuity, and group annuity products. Transamerica Morgan Stanley Global Allocation Managed Risk - Balanced VP (the “Portfolio”) is a series of TST and is classified as non-diversified under the 1940 Act. The Portfolio currently offers one class of shares, Service Class.
The only shareholders of the Portfolio are affiliated insurance company separate accounts and/or affiliated asset allocation portfolios. Contract holders of the variable life and annuity contracts are not shareholders of the Portfolio. For ease of reference, shareholders and contract holders are collectively referred to in this report as “shareholders.”
This report must be accompanied or preceded by the Portfolio’s current prospectus, which contains additional information about the Portfolio, including risks, as well as investment objectives and strategies.
Transamerica Asset Management, Inc. (“TAM”) serves as investment manager for the Portfolio pursuant to an investment management agreement. TAM provides continuous and regular investment management services to the Portfolio. TAM supervises the Portfolio’s investments, conducts its investment program and provides supervisory, compliance and administrative services to the Portfolio.
TAM currently acts as a “manager of managers” and has hired sub-advisers to furnish day-to-day investment advice and recommendations. TAM may, in the future, determine to provide all aspects of the day-to-day management of the Portfolio without the use of a sub-adviser. When acting as a manager of managers, TAM provides investment management services that include, without limitation, the design and development of the Portfolio and its investment strategies and the ongoing review and evaluation of those investment strategies including recommending changes in strategy where it believes appropriate or advisable; the selection of one or more sub-advisers for the Portfolio employing a combination of quantitative and qualitative screens, research, analysis and due diligence; negotiation of sub-advisory agreements and fees; oversight and monitoring of sub-advisers and recommending changes to sub-advisers where it believes appropriate or advisable; recommending portfolio combinations and liquidations where it believes appropriate or advisable; selection and oversight of transition managers, as needed; regular supervision of the Portfolio’s investments; regular review and evaluation of sub-adviser performance; daily monitoring of the sub-advisers’ buying and selling of securities for the Portfolio; regular review of holdings; ongoing trade oversight and analysis; regular monitoring to ensure adherence to investment process; regular calls and periodic on-site visits with sub-advisers; portfolio construction and asset allocation when using multiple sub-advisers for the Portfolio; risk management oversight and analysis; oversight of negotiation of investment documentation and agreements; design, development, implementation and regular monitoring of the valuation process; periodic due diligence reviews of pricing vendors and vendor methodology; design, development, implementation and regular monitoring of the compliance process; respond to regulatory inquiries and determine appropriate litigation strategy, as needed; review of proxies voted by sub-advisers; oversight of preparation and review of materials for meetings of the Portfolio’s Board of Trustees (the “Board”), participation in these meetings and preparation of regular communications with the Board; oversight of preparation and review of prospectuses, shareholder reports and other disclosure materials and regulatory filings for the Portfolio; oversight of other service providers to the Portfolio, such as the custodian, the transfer agent, the Portfolio’s independent accounting firm and legal counsel; supervision of the performance of recordkeeping and shareholder relations functions for the Portfolio; and oversight of cash management services. TAM uses a variety of quantitative and qualitative tools to carry out its investment management services. TAM, not the Portfolio, is responsible for paying the sub-adviser(s) for their services, and sub-advisory fees are TAM’s expense.
TAM’s investment management services also include the provision of supervisory and administrative services to the Portfolio. These services include performing certain administrative services for the Portfolio and supervising and overseeing the administrative, clerical, recordkeeping and bookkeeping services provided to the Portfolio by State Street Bank and Trust Company (“State Street”), to whom TAM has outsourced the provision of certain sub-administration services. To the extent agreed upon by TAM and the Portfolio from time to time, TAM’s supervisory and administrative services include, but are not limited to: monitoring and verifying the custodian’s daily calculation of the Net Asset Values (“NAV”); shareholder relations functions; compliance services; valuation services; assisting in due diligence and in the oversight and monitoring of certain activities of sub-advisers and certain aspects of Portfolio investments; assisting with Portfolio combinations and liquidations; oversight of the preparation and filing, and review, of all returns and reports, in connection with federal, state and local taxes; oversight and review of regulatory reporting; supervising and coordinating the Portfolio’s custodian and dividend disbursing agent and monitoring their services to the Portfolio; assisting the Portfolio in preparing reports to shareholders; acting as liaison with the Portfolio’s independent public accountants and providing, upon request, analyses, fiscal year summaries and other audit related services; assisting in the preparation of agendas and supporting documents for and minutes of meetings of trustees and committees of
|
|
|
|
|
| Transamerica Series Trust |
|
|
|
Semi-Annual Financial Statements 2024 |
|
|
Page 5 |
|
|
Transamerica Morgan Stanley Global Allocation Managed Risk - Balanced VP
NOTES TO FINANCIAL STATEMENTS (continued)
At June 30, 2024
(unaudited)
1. ORGANIZATION (continued)
trustees; assisting in the preparation of regular communications with the trustees; and providing personnel and office space, telephones and other office equipment as necessary in order for TAM to perform supervisory and administrative services to the Portfolio. The Portfolio pays certain fees and expenses to State Street for sub-administration services which are not administrative services covered by the management agreement with TAM or paid for through the management fees payable thereunder. For the period ended June 30, 2024, (i) the expenses paid to State Street for sub-administration services by the Portfolio are shown as a part of Other expenses within the Statement of Operations and (ii) the expenses payable to State Street for sub-administration services from the Portfolio are shown as part of Other accrued expenses within the Statement of Assets and Liabilities.
2. SIGNIFICANT ACCOUNTING POLICIES
In preparing the Portfolio’s financial statements in accordance with Generally Accepted Accounting Principles in the United States of America (“GAAP”), estimates or assumptions (which could differ from actual results) may be used that affect reported amounts and disclosures. The following is a summary of significant accounting policies followed by the Portfolio.
Foreign currency denominated investments: The accounting records of the Portfolio are maintained in U.S. dollars. Securities and other assets and liabilities denominated in foreign currencies are translated into U.S. dollars based on the closing exchange rate each day. The cost of foreign securities purchased and any realized gains or losses are translated at the prevailing exchange rates in effect on the date of the respective transaction. The Portfolio combines fluctuations from currency exchange rates and fluctuations in value when computing net realized and unrealized gains or losses from investments.
Net foreign currency gains and losses resulting from changes in exchange rates include, foreign currency fluctuations between trade date and settlement date of investment security transactions, gains and losses on forward foreign currency contracts, and the difference between the receivable amounts of interest and dividends recorded in the accounting records in U.S. dollars and the amounts actually received.
Foreign currency denominated assets may involve risks not typically associated with domestic transactions. These risks include revaluation of currencies, adverse fluctuations in foreign currency values, and possible adverse political, social, and economic developments, including those particular to a specific industry, country or region.
Security transactions and investment income: Security transactions are accounted for on the trade date. Security gains and losses are calculated on a first-in, first-out basis. Interest income, if any, is accrued as earned. Dividend income and capital gain distributions from underlying investments, if any, are recorded on the ex-dividend date. Income or short-term capital gain distributions received from underlying investments, if any, are recorded as Dividend income from investments within the Statement of Operations. Long-term capital gain distributions received from underlying investments, if any, are recorded as Net realized gain (loss) on Capital gain distributions received from investments within the Statement of Operations.
Distributions to shareholders: Distributions are recorded on the ex-dividend date and are determined in accordance with federal income tax regulations, which may differ from GAAP.
Indemnification: In the normal course of business, the Portfolio enters into contracts that contain a variety of representations that provide general indemnifications. The Portfolio’s maximum exposure under these arrangements is unknown, as this would involve future claims that may be made against the Portfolio and/or its affiliates that have not yet occurred. However, based on experience, the Portfolio expects the risk of loss to be remote.
3. INVESTMENT VALUATION
TAM has been designated as the Portfolio’s valuation designee pursuant to Rule 2a-5 under the 1940 Act with responsibility for fair valuation subject to oversight by the Portfolio’s Board of Trustees. The net asset value of the Portfolio is computed as of the official close of the New York Stock Exchange (“NYSE”) each day the NYSE is open for business.
TAM utilizes various methods to measure the fair value of its investments on a recurring basis. GAAP establishes a hierarchy that prioritizes inputs to valuation methods. The inputs or methodology used for valuing securities are not necessarily an indication of the risk associated with investing in those securities. The three levels (“Levels”) of inputs of the fair value hierarchy are defined as follows:
|
|
|
|
|
| Transamerica Series Trust |
|
|
|
Semi-Annual Financial Statements 2024 |
|
|
Page 6 |
|
|
Transamerica Morgan Stanley Global Allocation Managed Risk - Balanced VP
NOTES TO FINANCIAL STATEMENTS (continued)
At June 30, 2024
(unaudited)
3. INVESTMENT VALUATION (continued)
Level 1—Unadjusted quoted prices in active markets for identical securities.
Level 2—Inputs, other than quoted prices included in Level 1, which are observable, either directly or indirectly. These inputs may include quoted prices for the identical instrument on an inactive market, prices for similar instruments, interest rates, prepayment speeds, credit risk, yield curves, default rates, and similar data.
Level 3—Unobservable inputs based on the best information available in the circumstances, to the extent observable inputs are not available, which may include TAM’s own assumptions used in determining the fair value of the Portfolio’s investments.
The inputs used to measure fair value may fall into different Levels of the fair value hierarchy. In such cases, for disclosure purposes, the Level in the fair value hierarchy that is assigned to the fair value measurement of a security is determined based on the lowest Level input that is significant to the fair value measurement in its entirety. Certain investments that are measured at fair value using NAV per share, or its equivalent, using the “practical expedient” have not been classified in the fair value Levels. The hierarchy classification of inputs used to value the Portfolio’s investments at June 30, 2024, is disclosed within the Investment Valuation section of the Schedule of Investments.
The availability of observable inputs can vary from security to security and is affected by a wide variety of factors, including, but not limited to, the type of security, whether the security is new and not yet established in the marketplace, the liquidity of markets, and other characteristics particular to the security. To the extent that valuation is based on models or inputs that are less observable or unobservable in the market, the determination of fair value requires more judgment. Accordingly, the degree of judgment exercised in determining fair value is generally greatest for instruments categorized in Level 3. Due to the inherent uncertainty of valuation, the determination of values may differ significantly from values that would have been realized had a ready market for investments existed, and the differences could be material.
Fair value measurements: Descriptions of the valuation techniques applied to the Portfolio’s significant categories of assets and liabilities measured at fair value on a recurring basis are as follows:
Investment companies: Certain investment companies are valued at the NAV as the practical expedient. These investment companies are not included within the fair value hierarchy. Certain other investment companies are valued at the actively traded NAV and no valuation adjustments are applied. These investment companies are categorized in Level 1 of the fair value hierarchy.
Repurchase agreements: Repurchase agreements are valued at cost, which approximates fair value. To the extent the inputs are observable and timely, the values are generally categorized in Level 2 of the fair value hierarchy.
4. BORROWINGS AND OTHER FINANCING TRANSACTIONS
The Portfolio may engage in borrowing transactions as a means of raising cash to satisfy redemption requests, for other temporary or emergency purposes or, to the extent permitted by its investment policies, to raise additional cash to be invested in other securities or instruments. When the Portfolio invests borrowing proceeds in other securities, the Portfolio will bear the risk that the market value of the securities in which such proceeds are invested goes down and is insufficient to repay the borrowed proceeds. The Portfolio may borrow on a secured or on an unsecured basis. If the Portfolio enters into a secured borrowing arrangement, a portion of the Portfolio’s assets will be used as collateral. The 1940 Act requires the Portfolio to maintain asset coverage of at least 300% of the amount of its borrowings. Asset coverage means the ratio that the value of the Portfolio’s total assets, minus liabilities other than borrowings, bears to the aggregate amount of all borrowings. Although complying with this requirement has the effect of limiting the amount that the Portfolio may borrow, it does not otherwise mitigate the risks of entering into borrowing transactions.
Interfund lending: The Portfolio, along with other funds and portfolios advised by TAM, may participate in an interfund lending program pursuant to exemptive relief granted by the Securities and Exchange Commission on January 18, 2017. This program allows the Portfolio to lend to and borrow from other funds and portfolios advised by TAM. Interfund lending transactions are subject to the conditions of the exemptive relief which places limits on the amount of lending or borrowing a Portfolio may participate in under the program. Interest earned or paid on an interfund lending transaction will be based on the average of certain current market rates. For the period ended June 30, 2024, the Portfolio has not utilized the program.
|
|
|
|
|
| Transamerica Series Trust |
|
|
|
Semi-Annual Financial Statements 2024 |
|
|
Page 7 |
|
|
Transamerica Morgan Stanley Global Allocation Managed Risk - Balanced VP
NOTES TO FINANCIAL STATEMENTS (continued)
At June 30, 2024
(unaudited)
4. BORROWINGS AND OTHER FINANCING TRANSACTIONS (continued)
Repurchase agreements: In a repurchase agreement, the Portfolio purchases a security and simultaneously commits to resell that security to the seller at an agreed-upon price on an agreed-upon date. Securities purchased subject to a repurchase agreement are held at the Portfolio’s custodian, or designated sub-custodian related to tri-party repurchase agreements, and, pursuant to the terms of the repurchase agreement, must be collateralized by securities with an aggregate market value greater than or equal to 100% of the resale price. The Portfolio will bear the risk of value fluctuations until the securities can be sold and may encounter delays and incur costs in liquidating the securities. In the event of bankruptcy or insolvency of the seller, delays and costs may be incurred.
Repurchase agreements are subject to netting agreements, which are agreements between the Portfolio and its counterparties that provide for the net settlement of all transactions and collateral with the Portfolio, through a single payment, in the event of default or termination. Amounts presented within the Schedule of Investments, and as part of Repurchase agreements, at value within the Statement of Assets and Liabilities are shown on a gross basis. The value of the related collateral for each repurchase agreement, as reflected within the Schedule of Investments, exceeds the value of each repurchase agreement at June 30, 2024.
Repurchase agreements at June 30, 2024, if any, are included within the Schedule of Investments and Statement of Assets and Liabilities.
5. RISK EXPOSURES AND THE USE OF DERIVATIVE INSTRUMENTS
The Portfolio’s investment strategies allow the Portfolio to use various types of derivative contracts, including option contracts, swap agreements, futures contracts, and forward foreign currency contracts. Derivatives are investments whose value is primarily derived from underlying assets, indices or reference rates and may be transacted on an exchange or OTC.
Market Risk Factors: In pursuit of the Portfolio’s investment strategies, the Portfolio may seek to use derivatives to increase or decrease its exposure to certain market risks, including:
Interest rate risk: Interest rate risk relates to the fluctuations in the value of fixed income securities due to changes in the prevailing levels of market interest rates.
Foreign exchange rate risk: Foreign exchange rate risk relates to fluctuations in the value of an asset or liability due to changes in the currency exchange rates.
Equity risk: Equity risk relates to the change in value of equity securities as they relate to increases or decreases in the general market.
Credit risk: Credit risk relates to the ability of the issuer of a financial instrument to make further principal or interest payments on an obligation or commitment that it has to the Portfolio.
Commodity risk: Commodity risk relates to the change in value of commodities or commodity indices as they relate to increases or decreases in the commodities market. Commodities are physical assets that have tangible properties. Examples of these types of assets are crude oil, heating oil, metals, livestock, and agricultural products.
The Portfolio is also exposed to additional risks from investing in derivatives, such as liquidity and counterparty credit risk. Liquidity risk is the risk that the Portfolio will be unable to sell or close out the derivative in the open market in a timely manner. Counterparty credit risk is the risk that the counterparty will not be able to fulfill its obligations to the Portfolio. Investing in derivatives may also involve greater risks than investing directly in the underlying assets, such as losses in excess of any initial investment and collateral received. In addition, there may be the risk that the change in value of the derivative contract does not correspond to the change in value of the underlying instrument.
The Portfolio’s exposure to market risk factors and certain other associated risks are summarized by derivative type as follows:
Futures contracts: The Portfolio is subject to equity risk, credit risk, commodity risk, interest rate risk and foreign exchange rate risk in the normal course of pursuing its investment objective. The Portfolio uses futures contracts to gain exposure to, or hedge against, changes in the value of equities and commodities, interest rates, or foreign currencies. A futures contract represents a commitment for the future purchase or sale of an asset at a specified price on a specified date. Upon entering into such contracts, the Portfolio is required to deposit with the broker, either in cash or in securities, an initial margin in an amount equal to a certain percentage of the contract amount. Subsequent payments (variation margin) are paid or received by the Portfolio, depending on the daily fluctuations in the value of the
|
|
|
|
|
| Transamerica Series Trust |
|
|
|
Semi-Annual Financial Statements 2024 |
|
|
Page 8 |
|
|
Transamerica Morgan Stanley Global Allocation Managed Risk - Balanced VP
NOTES TO FINANCIAL STATEMENTS (continued)
At June 30, 2024
(unaudited)
5. RISK EXPOSURES AND THE USE OF DERIVATIVE INSTRUMENTS (continued)
contract, and are recorded for financial statement purposes as unrealized gains or losses by the Portfolio. Upon entering into such contracts, the Portfolio bears the risk of equity and commodity prices, interest rates, or exchange rates moving unexpectedly, in which case, the Portfolio may not achieve the anticipated benefits of the futures contracts and may realize losses. With futures, there is minimal counterparty credit risk to the Portfolio since futures are exchange-traded and the exchange’s clearinghouse, as counterparty to all exchange-traded futures, guarantees the futures against default. Futures contracts are generally entered into on a regulated futures exchange and cleared through a clearinghouse associated with the exchange.
The following is a summary of the location and the effect of derivative investments within the Statement of Operations, categorized by primary market risk exposure as of June 30, 2024.
|
|
|
|
|
|
|
|
|
|
|
|
|
|
|
|
|
|
|
|
|
|
|
|
|
| Realized Gain (Loss) on Derivative Instruments |
|
| Location |
|
Interest Rate Contracts |
|
|
Foreign Exchange Contracts |
|
|
Equity Contracts |
|
|
Credit Contracts |
|
|
Commodity Contracts |
|
|
Total |
|
| Futures contracts |
|
$ |
— |
|
|
$ |
4,269 |
|
|
$ |
(907,853) |
|
|
$ |
— |
|
|
$ |
— |
|
|
$ |
(903,584) |
|
| Total |
|
$ |
— |
|
|
$ |
4,269 |
|
|
$ |
(907,853) |
|
|
$ |
— |
|
|
$ |
— |
|
|
$ |
(903,584) |
|
| |
|
The following is a summary of the ending monthly average volume on derivative activity during the period ended June 30, 2024.
|
|
|
|
|
| Futures contracts: |
|
|
|
|
| Average notional value of contracts — short |
|
$ |
(1,035,703 |
) |
Collateral requirements: Collateral or margin requirements are set by the broker or exchange clearing house for exchange-traded derivatives (futures contracts, exchange-traded options, and exchange-traded swap agreements) while collateral terms are contract specific for OTC derivatives (forward foreign currency exchange contracts, OTC options, and OTC swap agreements). For OTC derivatives, under standard derivatives agreements, the Portfolio may be required to pledge collateral on derivatives to a counterparty if the Portfolio is in a net liability position, and receive collateral if in a net positive position. For financial reporting purposes, cash collateral that has been pledged by the Portfolio to cover obligations, if any, is reported in Cash collateral at broker within the Statement of Assets and Liabilities. Cash collateral that has been received by the Portfolio from a counterparty, if any, is reported separately in Cash collateral pledged at custodian and/or broker within the Statement of Assets and Liabilities. Non-cash collateral pledged to the Portfolio, if any, is disclosed within the Schedule of Investments.
Generally, the amount of collateral due from or to a party must exceed a minimum transfer amount threshold before a transfer has been made. Typically a counterparty is not permitted to sell, re-pledge or use cash and non-cash collateral it receives. The Portfolio generally does not use non-cash collateral that it receives but may, absent default or certain other circumstances, be permitted to use cash collateral received. In such cases, interest may be paid pursuant to the collateral arrangement with the counterparty.
To the extent amounts due to the Portfolio from its counterparties are not fully collateralized, contractually or otherwise, the Portfolio bears the risk of loss from counterparty non-performance. Additionally, to the extent the Portfolio has delivered collateral to a counterparty, the Portfolio bears the risk of loss from a counterparty in the event the counterparty fails to return such collateral. Counterparties may immediately terminate derivatives contracts if the Portfolio fails to maintain sufficient asset coverage for its contracts or its net assets decline by stated percentages. Collateral may not be required for all derivative contracts.
6. RISK FACTORS
Investing in the Portfolio involves certain key risks related to the Portfolio’s trading activity. Please reference the Portfolio’s prospectus for a more complete discussion of the following risk(s), as well as other risks of investing in the Portfolio.
Market risk: The market prices of the Portfolio’s securities or other assets may go up or down, sometimes rapidly or unpredictably, due to factors such as economic events, inflation, changes in interest rates, governmental actions or interventions, actions taken by the U.S. Federal Reserve or foreign central banks, market disruptions caused by tariffs, trade disputes or other factors, political developments,
|
|
|
|
|
| Transamerica Series Trust |
|
|
|
Semi-Annual Financial Statements 2024 |
|
|
Page 9 |
|
|
Transamerica Morgan Stanley Global Allocation Managed Risk - Balanced VP
NOTES TO FINANCIAL STATEMENTS (continued)
At June 30, 2024
(unaudited)
6. RISK FACTORS (continued)
armed conflicts, economic sanctions, cybersecurity events, investor sentiment, the global and domestic effects of widespread or local health, weather or climate events, and other factors that may or may not be related to the issuer of the security or other asset. If the market prices of the Portfolio’s securities and assets fall, the value of your investment in the Portfolio could go down.
Economies and financial markets throughout the world are increasingly interconnected. Events or circumstances in one or more countries or regions could be highly disruptive to, and have profound impacts on, global economies or markets. As a result, whether or not the Portfolio invests in securities of issuers located in or with significant exposure to the countries directly affected, the value and liquidity of the Portfolio’s investments may go down.
Asset allocation risk: The Portfolio’s investment performance is significantly impacted by the Portfolio’s and Underlying Portfolio’s asset allocation and reallocation from time to time. These actions may be unsuccessful in maximizing return and/or avoiding investment losses.
Managed risk strategy risk: The Portfolio employs a managed risk strategy. The strategy attempts to stabilize the volatility of the Portfolio around a target volatility level and manage downside exposure during periods of significant market declines but may not work as intended. Because market conditions change, sometimes rapidly and unpredictably, the success of the strategy also will be subject to the sub-adviser’s ability to implement the strategy in a timely and efficient manner. The strategy may result in periods of underperformance and may fail to protect against market declines. The strategy may limit the Portfolio’s ability to participate in up markets, may cause the Portfolio to underperform its benchmark in up markets, may increase transaction costs at the Portfolio and/or underlying portfolio level and may result in substantial losses if it does not work as intended. For example, if the Portfolio has reduced its equity exposure to avoid losses in certain market conditions, and the market rises sharply and quickly, there may be a delay in increasing the Portfolio’s equity exposure, causing the Portfolio to forgo gains from the market rebound. Managing the Portfolio pursuant to the strategy may result in the Portfolio not achieving its stated asset mix goal due to unforeseen or unanticipated market conditions. The strategy also serves to reduce the risk to the Transamerica insurance companies that provide guaranteed benefits under certain variable contracts from equity market volatility and to facilitate their provision of those guaranteed benefits. The strategy also may have the effect of limiting the amount of guaranteed benefits. The Portfolio’s performance may be lower than similar portfolios that are not subject to a managed risk strategy.
Non-diversification risk: As a “non-diversified” Portfolio, the Portfolio may invest a larger percentage of its assets in a smaller number of issuers than a diversified fund. Investing in a smaller number of issuers will make the Portfolio more susceptible to the risks associated with investing in those issuers.
7. INVESTMENT CONCENTRATION
Throughout the period, the Portfolio can have investments that account for a significant percentage of the Portfolio’s total assets. As of June 30, 2024, the most recent financial statements are included within this report for the following investments:
|
|
|
| Investment |
|
Percentage of Total Assets |
| Transamerica Morgan Stanley Global Allocation VP |
|
97.57% |
8. FEES AND OTHER AFFILIATED TRANSACTIONS
TST serves as a funding vehicle for certain affiliated asset allocation portfolios and certain affiliated separate accounts of Transamerica Life Insurance Company (“TLIC”) and Transamerica Financial Life Insurance Company.
TAM, the Portfolio’s investment manager, is directly owned by TLIC and AUSA Holding, LLC (“AUSA”), both of which are indirect, wholly owned subsidiaries of Aegon Ltd. TLIC is owned by Commonwealth General Corporation (“Commonwealth”). Commonwealth and AUSA are wholly owned by Transamerica Corporation (DE). Transamerica Corporation (DE) is wholly owned by Aegon International B.V., which is wholly owned by Aegon Ltd., a Bermuda exempted company with liability limited by shares (formerly, Aegon NV, a Netherlands corporation) and a publicly traded international insurance group.
Transamerica Fund Services, Inc. (“TFS”) is the Portfolio’s transfer agent. Transamerica Capital, Inc. (“TCI”) is the Portfolio’s distributor/principal underwriter. TAM, TFS and TCI are affiliates of Aegon Ltd.
|
|
|
|
|
| Transamerica Series Trust |
|
|
|
Semi-Annual Financial Statements 2024 |
|
|
Page 10 |
|
|
Transamerica Morgan Stanley Global Allocation Managed Risk - Balanced VP
NOTES TO FINANCIAL STATEMENTS (continued)
At June 30, 2024
(unaudited)
8. FEES AND OTHER AFFILIATED TRANSACTIONS (continued)
Certain officers and trustees of the Portfolio may also be officers and/or trustees of TAM, TFS and TCI. No interested trustee who is deemed an interested person due to current or former service with TAM or an affiliate of TAM receives compensation from the Portfolio. The Portfolio does pay non-interested persons (independent trustees), as disclosed in Trustee and CCO fees within the Statement of Operations.
Investment management fees: TAM serves as the Portfolio’s investment manager, performing administration as well as investment advisory services. TAM renders investment advisory, supervisory, and administration services under an investment management agreement and the Portfolio pays a single management fee, which is reflected in Investment management fees within the Statement of Operations.
The Portfolio pays a management fee to TAM based on daily average net assets at the following rates:
|
|
|
|
|
| Breakpoints |
|
Rate |
|
| First $2 billion |
|
|
0.20 |
% |
| Over $2 billion up to $4 billion |
|
|
0.19 |
|
| Over $4 billion up to $6 billion |
|
|
0.18 |
|
| Over $6 billion up to $8 billion |
|
|
0.17 |
|
| Over $8 billion up to $10 billion |
|
|
0.16 |
|
| Over $10 billion |
|
|
0.15 |
|
TAM has contractually agreed to waive fees and/or reimburse Portfolio expenses to the extent that the total operating expenses excluding, as applicable, acquired fund fees and expenses, interest (including borrowing costs and overdraft charges), taxes, brokerage commissions, dividend and interest expenses on securities sold short, extraordinary expenses and other expenses not incurred in the ordinary course of the Portfolio’s business, exceed the following stated annual operating expense limits to the Portfolio’s daily average net assets. To the extent an expense limit changed during the period, the prior limit is also listed below. The expenses waived and/or reimbursed, if any, are included in Expenses waived and/or reimbursed within the Statement of Operations.
|
|
|
|
|
| Class |
|
Operating Expense Limit |
|
Operating Expense Limit Effective Through |
| Service Class |
|
0.47% |
|
May 1, 2025 |
TAM is permitted to recapture amounts contractually waived and/or reimbursed to a class during any of the 36 months from the date on which TAM waived fees and/or reimbursed expenses for the class. A class may recapture and reimburse TAM only if such amount does not cause, on any particular business day of the Portfolio, the class’s total annual operating expenses (after the recapture is taken into account) to exceed the Operating Expense Limits or any other lower limit then in effect. Amounts recaptured, if any, by TAM for the period ended June 30, 2024 are disclosed in Recapture of previously waived and/or reimbursed fees within the Statement of Operations.
TAM, on a voluntary basis and in addition to the contractual operating expense limits in effect, from time to time may waive and/or reimburse expenses of the Portfolio, or any classes thereof, to such level(s) as the Trust’s officers have determined or may reasonably determine from time to time. Any such voluntary waiver or expense reimbursement may be discontinued by TAM at any time. These amounts are not subject to recapture by TAM.
For the 36-month period ended June 30, 2024, the balances available for recapture by TAM for the Portfolio are as follows:
|
|
|
|
|
|
|
|
|
|
|
| |
|
Amounts Available |
|
|
| |
|
2021 (A) |
|
2022 |
|
2023 |
|
2024 |
|
Total |
| Service Class |
|
$ 25,555 |
|
$ 85,960 |
|
$ 101,556 |
|
$ 36,471 |
|
$ 249,542 |
|
| (A) For the six-month period of July 1, 2021 through December 31, 2021. |
|
|
|
|
|
| Transamerica Series Trust |
|
|
|
Semi-Annual Financial Statements 2024 |
|
|
Page 11 |
|
|
Transamerica Morgan Stanley Global Allocation Managed Risk - Balanced VP
NOTES TO FINANCIAL STATEMENTS (continued)
At June 30, 2024
(unaudited)
8. FEES AND OTHER AFFILIATED TRANSACTIONS (continued)
Distribution and service fees: TST has a distribution plan (“Distribution Plan”) pursuant to Rule 12b-1 under the 1940 Act. Pursuant to the Distribution Plan, TST entered into a distribution agreement with TCI as the Portfolio’s distributor.
The Distribution Plan requires the Portfolio to pay distribution fees to TCI as compensation for various distribution activities, not as reimbursement for specific expenses. Under the Distribution Plan and distribution agreement, TCI, on behalf of the Portfolio, is authorized to pay various service providers, as direct payment for expenses incurred in connection with distribution of the Portfolio’s shares.
The fee on the Service Class shares is paid to the insurance companies for providing services and account maintenance for the policyholders who invest in the variable insurance products which invest in the Service Class shares. The distribution and service fees are included in Distribution and service fees within the Statement of Operations.
The Portfolio is authorized under the Distribution Plan to pay fees to TCI based on daily average net assets up to an annual fee of 0.25% of Service Class shares.
Transfer agent costs: TFS provides transfer agency services under an intercompany agreement with TAM. TFS has outsourced the provision of certain sub-transfer agency services to SS&C Global Investor & Distribution Solutions, Inc. (“SS&C GIDS”). The Portfolio does not pay a separate transfer agent fee to TAM or TFS but does pay certain expenses to SS&C GIDS related to applicable sub-transfer agency services. For the period ended June 30, 2024, (i) the expenses paid to SS&C GIDS by the Portfolio are referred to as transfer agent costs and are included within the Statement of Operations and (ii) the expenses payable to SS&C GIDS by the Portfolio are referred to as transfer agent costs within the Statement of Assets and Liabilities.
Brokerage commissions: The Portfolio incurred no brokerage commissions on security transactions placed with affiliates of the investment manager or sub-adviser(s) for the period ended June 30, 2024.
9. PURCHASES AND SALES OF SECURITIES
For the period ended June 30, 2024, the cost of securities purchased and proceeds from securities sold (excluding short-term securities) are as follows:
|
|
|
|
|
|
|
| |
|
Purchases of Securities |
|
Sales of Securities |
|
|
|
|
$ — |
|
$ 16,562,833 |
|
|
10. FEDERAL INCOME TAXES AND DISTRIBUTIONS TO SHAREHOLDERS
The Portfolio has not made any provision for federal income or excise taxes due to its policy to distribute all of its taxable income and capital gains to its shareholders and otherwise qualify as a regulated investment company under Subchapter M of the Internal Revenue Code. The Portfolio recognizes the tax benefits of uncertain tax positions only where the position is “more likely than not” to be sustained assuming examination by tax authorities. The Portfolio’s tax returns remain subject to examination by the Internal Revenue Service and state tax authorities three years from the date of filing for federal purposes and four years from the date of filing for state purposes. Management has evaluated the Portfolio’s tax provisions taken for all open tax years, and has concluded that no provision for income tax is required in the Portfolio’s financial statements. If applicable, the Portfolio recognizes interest accrued related to unrecognized tax benefits in relation to interest and penalties expense in Other within the Statement of Operations. The Portfolio identifies its major tax jurisdictions as U.S. Federal, the state of Colorado, and foreign jurisdictions where the Portfolio makes significant investments; however, the Portfolio is not aware of any tax positions for which it is reasonably possible that the total amounts of unrecognized tax benefits will change materially in the next twelve months. Distributions are determined in accordance with income tax regulations, which may differ from GAAP.
|
|
|
|
|
| Transamerica Series Trust |
|
|
|
Semi-Annual Financial Statements 2024 |
|
|
Page 12 |
|
|
Transamerica Morgan Stanley Global Allocation Managed Risk - Balanced VP
NOTES TO FINANCIAL STATEMENTS (continued)
At June 30, 2024
(unaudited)
10. FEDERAL INCOME TAXES AND DISTRIBUTIONS TO SHAREHOLDERS (continued)
As of June 30, 2024, the approximate cost for U.S. federal income tax purposes, and the aggregate gross/net unrealized appreciation (depreciation) in the value of investments (including securities sold short and derivatives, if any) are as follows:
|
|
|
|
|
|
|
| Cost |
|
Gross Appreciation |
|
Gross (Depreciation) |
|
Net Appreciation (Depreciation) |
| $ 267,668,321 |
|
$ — |
|
$ (54,682,325) |
|
$ (54,682,325) |
Please see TST’s most recent report on Form N-CSR, available at: www.transamerica.com/annuities/prospectus, for additional information. For the most recently filed complete proxy voting records for the Trust please visit: https://www.transamerica.com/sites/default/files/files/e070d/TST%20N-PX%202021.pdf
|
|
|
|
|
| Transamerica Series Trust |
|
|
|
Semi-Annual Financial Statements 2024 |
|
|
Page 13 |
|
|
Transamerica Morgan Stanley Global Allocation Managed Risk - Balanced VP
MANAGEMENT AND SUB-ADVISORY AGREEMENT — CONTRACT RENEWAL
(unaudited)
At a meeting of the Board of Trustees of Transamerica Series Trust (the “Trustees” or the “Board”) held on June 12-13, 2024, the Board considered the renewal of the management agreement (the “Management Agreement”) between Transamerica Asset Management, Inc. (“TAM”) and Transamerica Series Trust, on behalf of Transamerica Morgan Stanley Global Allocation Managed Risk – Balanced VP (the “Portfolio”). The Board also considered the renewal of the investment sub-advisory agreement (the “Sub-Advisory Agreement” and together with the Management Agreement, the “Agreements”) for the Portfolio between TAM and Milliman Financial Risk Management LLC (the “Sub-Adviser”).
Following its review and consideration, the Board determined that the terms of the Management Agreement and Sub-Advisory Agreement were reasonable and that the renewal of each of the Agreements was in the best interests of the Portfolio and the holders invested in the Portfolio. The Board, including the independent members of the Board (the “Independent Trustees”), unanimously approved the renewal of each of the Agreements through June 30, 2025.
Prior to reaching their decision, the Trustees requested and received from TAM and the Sub-Adviser certain information. They then reviewed such information as they deemed reasonably necessary to evaluate the Agreements, including information they had previously received from TAM and the Sub-Adviser as part of their regular oversight of the Portfolio, and knowledge they gained over time through meeting with TAM and the Sub-Adviser. Among other materials, the Trustees considered comparative fee, expense and performance information prepared by Broadridge Financial Solutions, Inc. (“Broadridge”), an independent provider of mutual fund performance information, as well as fee, expense and profitability information prepared by TAM. In addition, TAM provided the Board with additional supplemental comparative fee, expense and performance information. To the extent applicable, the Trustees considered information about fees and performance of comparable funds and/or accounts managed by the Sub-Adviser. The Board also considered reductions to the Portfolio’s expense limits, if any, that took effect after the last renewal of the Agreements. In their review, the Trustees also sought to identify instances in which the Portfolio’s performance, fees, total expenses and/or profitability appeared to be outliers within its respective peer group or other comparative metrics and sought to understand the reasons for such comparative positions.
In their deliberations, the Independent Trustees met privately without representatives of TAM or the Sub-Adviser present and were represented throughout the process by their independent legal counsel. In considering the proposed continuation of each of the Agreements, the Trustees evaluated and weighed a number of considerations that they believed to be relevant in light of the legal advice furnished to them by counsel, including independent legal counsel, and made a decision in the exercise of their own business judgment. They based their decisions on the considerations discussed below, among others, although they did not identify any particular consideration or item of information that was controlling of their decisions, and each Trustee may have attributed different weights to the various factors.
Nature, Extent and Quality of the Services Provided
The Board considered the nature, extent and quality of the services provided by TAM and the Sub-Adviser to the Portfolio in the past and the services anticipated to be provided in the future. The Board also considered the investment approach for the Portfolio; the experience, capability and integrity of TAM’s senior management; the financial resources of TAM; TAM’s management oversight process; TAM’s and the Sub-Adviser’s responsiveness to any questions by the Trustees; and the professional qualifications and compensation program of the portfolio management team of the Sub-Adviser.
The Board also considered the continuous and regular investment management and other services provided by TAM, when acting as a manager of managers, for the portion of the management fee it retains from the Portfolio after payment of the sub-advisory fees. The Board noted that the investment management and other services provided by TAM include the design, development and ongoing review and evaluation of the Portfolio and its investment strategy; the selection, oversight and monitoring of one or more investment sub-advisers to perform certain duties with respect to the Portfolio; ongoing portfolio trading oversight and analysis; risk management oversight and analysis; design, development, implementation and ongoing review and evaluation of a process for the valuation of Portfolio investments; design, development, implementation and ongoing review and evaluation of a compliance program for the Portfolio; design, development, implementation and ongoing review and evaluation of a process for the voting of proxies and exercise of rights to consent to corporate action for Portfolio investments; participation in Board meetings and oversight of preparation of materials for the Board, including materials for Board meetings and regular communications with the Board; oversight of preparation of the Portfolio’s prospectus, statement of additional information, shareholder reports and other disclosure materials and regulatory filings for the Portfolio; and ongoing cash management services for the Portfolio. The Board considered that TAM’s investment management services also include the provision of supervisory and administrative services to the Portfolio. The Board also noted that TAM, as part of the services it provides to all Transamerica mutual funds, including the Portfolio, oversees the services provided by the funds’ custodian, transfer agent, independent accountant and legal counsel and supervises the performance of the recordkeeping and holder service functions of the funds.
Investment Performance
In addition, the Board considered the short- and longer-term performance of the Portfolio in light of its investment objective, policies and strategies, including relative performance against (i) a peer universe of comparable mutual funds, as prepared by Broadridge, and (ii) the Portfolio’s benchmarks, in each case for various trailing periods ended December 31, 2023. Based on these considerations, the Board
|
|
|
|
|
| Transamerica Series Trust |
|
|
|
Semi-Annual Financial Statements 2024 |
|
|
Page 14 |
|
|
Transamerica Morgan Stanley Global Allocation Managed Risk - Balanced VP
MANAGEMENT AND SUB-ADVISORY AGREEMENT — CONTRACT RENEWAL (continued)
(unaudited)
determined that TAM and the Sub-Adviser can provide investment and related services that are appropriate in scope and extent in light of the Portfolio’s investment objectives, policies and strategies and operations, the competitive landscape of the investment company business and investor needs. The Board’s conclusions as to the Portfolio’s performance are summarized below. For purposes of its review, the Board generally used the performance of Service Class Shares. In describing the Portfolio’s performance relative to its peer universe, the summary conclusions characterize performance for the relevant periods in relation to whether it was “above,” “below” or “in line with” the peer universe median and do so using quintile rankings prepared by Broadridge. For simplicity, performance is described as “above” the median if the Portfolio’s performance ranked anywhere in the first or second quintiles, as “below” the median if it ranked anywhere in the fourth or fifth quintiles, or “in line with” the median if it ranked anywhere in the third quintile (i.e., even if its precise return was somewhat above or somewhat below the precise median return).
When considering the Portfolio’s performance, the Trustees considered any representations made by TAM regarding the appropriateness of certain peer groups and benchmarks. They recognized that performance reflects a snapshot of a period as of a specific date, and that consideration of performance data for a different period could generate significantly different performance results. The Trustees also recognized that even longer-term performance can be negatively affected by performance over a short-term period when that short-term performance is significantly below the performance of the comparable benchmark or universe of peer funds.
The Board noted that the performance of Service Class Shares of the Portfolio was below the median for its peer universe and below the benchmark that TAM utilizes to measure performance of the Portfolio, each for the past 1-, 3-, and 5-year periods. The Board noted that the Sub-Adviser had commenced sub-advising the Portfolio on April 30, 2020 pursuant to its current investment objective and investment strategies.
Management Fee and Sub-Advisory Fees and Total Expense Ratio
The Board considered the management fee and total expense ratio of the Portfolio, including information provided by Broadridge comparing the management fee and total expense ratio of the Portfolio to the management fees and total expense ratios of comparable investment companies in both a peer group and broader peer universe compiled by Broadridge. The Board’s conclusions as to the Portfolio’s management fee and total expense ratio are summarized below. For purposes of its review, the Board generally used the actual total expenses (i.e., expenses reflecting any waivers and/or reimbursements) of Service Class Shares. In describing the Portfolio’s management fee and total expense ratio relative to its peer group and peer universe, the summary conclusions characterize management fees and total expense ratios for the relevant periods in relation to whether they were “above,” “below” or “in line with” the peer group or peer universe median and do so using quintile rankings prepared by Broadridge. For simplicity, management fees and total expense ratios are described as “above” the median if the Portfolio’s management fee or total expense ratio ranked anywhere in the fourth or fifth quintiles, as “below” the median if it ranked anywhere in the first or second quintiles, or “in line with” the median if it ranked anywhere in the third quintile (i.e., even if its precise management fee or total expense ratio was somewhat above or somewhat below the precise median management fee or total expense ratio).
The Board also considered the fees charged by the Sub-Adviser for sub-advisory services, as well as the portion of the Portfolio’s management fee retained by TAM following payment of the sub-advisory fee and how the portion of the contractual management fee retained by TAM at a specified asset level compared to the portions retained by other investment advisers managing mutual funds with similar investment strategies as calculated by an independent provider of information.
The Board noted that the Portfolio’s contractual management fee was below the medians for its peer group and peer universe and that the actual total expenses (i.e., expenses reflecting any waivers and/or reimbursements) of Service Class Shares of the Portfolio were above the medians for its peer group and peer universe. The Trustees also considered that TAM has entered into an expense limitation arrangement with the Portfolio, which may result in TAM waiving fees for the benefit of holders.
On the basis of these considerations, together with the other information it considered, the Board determined that the management and sub-advisory fees to be received by TAM and the Sub-Adviser under the Management Agreement and Sub-Advisory Agreement are reasonable in light of the services provided.
Cost of Services Provided and Level of Profitability
The Board reviewed information provided by TAM about the cost of providing and procuring fund management services, as well as the costs of the provision of administration, transfer agency and other services, to the Portfolio and to Transamerica Series Trust as a whole by TAM and its affiliates. The Board considered the profitability of TAM and its affiliates in providing these services for the Portfolio and Transamerica Series Trust as a whole. The Trustees recognized the competitiveness of the mutual fund industry and the importance of an investment adviser’s long-term profitability, including for maintaining company and management stability and accountability.
The Board also considered the allocation methodology used for calculating the profitability of TAM and its affiliates. The Board noted that the revenue and expense allocation methodology used by TAM to estimate its profitability with respect to its relationship with the Portfolio had been reviewed previously by an independent consultant. The Trustees considered that TAM reported that it had not made material changes to this methodology, and that the methodology had been applied consistently for the Portfolio.
|
|
|
|
|
| Transamerica Series Trust |
|
|
|
Semi-Annual Financial Statements 2024 |
|
|
Page 15 |
|
|
Transamerica Morgan Stanley Global Allocation Managed Risk - Balanced VP
MANAGEMENT AND SUB-ADVISORY AGREEMENT — CONTRACT RENEWAL (continued)
(unaudited)
With respect to the Sub-Adviser, the Board noted that the sub-advisory fee is the product of arm’s-length negotiation between TAM and the Sub-Adviser, which is not affiliated with TAM, and is paid by TAM and not the Portfolio. As a result, the Board focused on the profitability of TAM and its affiliates with respect to the Portfolio.
Based on this information, the Board determined that the profitability of TAM and its affiliates from their relationships with the Portfolio was not excessive.
Economies of Scale
The Board considered economies of scale with respect to the management of the Portfolio, whether the Portfolio had appropriately benefited from any economies of scale and whether there was the potential for realization of any future economies of scale. The Board also considered the existence of economies of scale with respect to management of the Transamerica mutual funds overall and the extent to which the Portfolio benefited from any economies of scale. The Board recognized that, as the Portfolio’s assets increase, any economies of scale realized by TAM or the Sub-Adviser may not directly correlate with each other or with any economies of scale that might be realized by the Portfolio. The Board considered the Portfolio’s management fee schedule and the existence of breakpoints and also considered the extent to which TAM shared economies of scale, if any, with the Portfolio through undertakings to limit or reimburse Portfolio expenses and to invest in maintaining and developing its capabilities and services. The Board also considered the Sub-Adviser’s sub-advisory fee schedule and the existence of breakpoints, if any, and how such breakpoints relate to any breakpoints in the Portfolio’s management fee schedule. The Board considered that the Sub-Adviser’s sub-advisory fees would be based on the combined assets of multiple funds. The Trustees concluded that the Portfolio’s fee structure reflected an appropriate sharing of any efficiencies or economies of scale to date and noted that they will have the opportunity to periodically reexamine the appropriateness of the management fee payable to TAM and the fee paid to the Sub-Adviser in light of any economies of scale experienced in the future.
Benefits to TAM, its Affiliates and/or the Sub-Adviser from their Relationships with the Portfolio
The Board considered other benefits derived by TAM, its affiliates, and/or the Sub-Adviser from their relationships with the Portfolio. The Board noted that TAM does not receive benefits from research obtained with commissions paid to broker-dealers for portfolio transactions (commonly referred to as “soft dollars”) as a result of its relationship with the Portfolio.
Other Considerations
The Board noted that TAM has made a substantial commitment to the recruitment and retention of high-quality personnel and maintains the financial, compliance and operational resources reasonably necessary to manage the Portfolio in a professional manner that is consistent with the best interests of the Portfolio and the holders. In this regard, the Board favorably considered the procedures and policies TAM has in place to enforce compliance with applicable laws and regulations and oversee the portfolio management activities of the Sub-Adviser. The Board also noted that TAM has made an entrepreneurial commitment and undertaken certain business risks with respect to the management and success of the Portfolio.
Conclusion
After consideration of the factors described above, as well as other factors, the Trustees, including the Independent Trustees, concluded that the renewal of the Management Agreement and the Sub-Advisory Agreement was in the best interests of the Portfolio and the holders and voted to approve the renewal of the Agreements.
|
|
|
|
|
| Transamerica Series Trust |
|
|
|
Semi-Annual Financial Statements 2024 |
|
|
Page 16 |
|
|
PROXY VOTING POLICIES AND PROCEDURES AND QUARTERLY PORTFOLIO HOLDINGS
(unaudited)
A description of Transamerica Series Trust’s (the “Trust”) proxy voting policies and procedures is available in the Statement of Additional Information of the Portfolios, available without charge upon request by calling 1-800-851-9777 (toll free) or on the Securities and Exchange Commission’s (“SEC”) website at http://www.sec.gov.
In addition, the Portfolio is required to file Form N-PX, with their complete proxy voting records for the most recent 12 months ended June 30th, no later than August 31st of each year. The Form is available without charge: (1) on the Transamerica Funds website at https://www.transamerica.com/sites/default/files/files/e070d/TST%20N-PX%202021.pdf; and (2) on the SEC’s website at http://www.sec.gov.
Each fiscal quarter, the Portfolios, except Transamerica BlackRock Government Money Market VP, will file with the SEC a complete schedule of its monthly portfolio holdings on Form N-PORT. The Portfolios’ holdings as of the end of the third month of every fiscal quarter, as reported on Form N-PORT, will be publicly available on the SEC’s website at http://www.sec.gov within 60 days of the end of the fiscal quarter.
On a monthly basis, Transamerica BlackRock Government Money Market VP will file with the SEC portfolio holdings information on Form N-MFP3. A complete schedule of portfolio holdings is also available at www.transamerica.com.
You may also visit the Trust’s website at www.transamerica.com/annuities/prospectus for this and other information about the Portfolios and the Trust.
Important Notice Regarding Delivery of Shareholder Documents
Every year we provide shareholders informative materials such as the Transamerica Series Trust Annual Report, the Transamerica Series Trust Prospectus, and other required documents that keep you informed regarding your Portfolios. To the extent provided by mail, Transamerica Series Trust will only send one piece per mailing address, a method that saves your Portfolios money by reducing mailing and printing costs. We will continue to do this unless you tell us not to. To elect to receive individual mailings, simply call a Transamerica Customer Service Representative toll free at 1-800-851-9777, 8 a.m. to 7 p.m. Eastern Time, Monday-Friday. Your request will take effect within 30 days.
|
|
|
|
|
| Transamerica Series Trust |
|
|
|
Semi-Annual Financial Statements 2024 |
|
|
Page 17 |
|
|
NOTICE OF PRIVACY POLICY
(unaudited)
Your privacy is very important to us. We want you to understand what information we collect and how we use it. We collect and use “nonpublic personal information” in connection with providing our customers with a broad range of financial products and services as effectively and conveniently as possible. We treat nonpublic personal information in accordance with our Privacy Policy.
What Information We Collect and From Whom We Collect It
We may collect nonpublic personal information about you from the following sources:
| • |
|
Information we receive from you on applications or other forms, such as your name, address, and account number; |
| • |
|
Information about your transactions with us, our affiliates, or others, such as your account balance and purchase/redemption history; and |
| • |
|
Information we receive from non-affiliated third parties, including consumer reporting agencies. |
What Information We Disclose and To Whom We Disclose It
We do not disclose any nonpublic personal information about current or former customers to anyone without their express consent, except as permitted by law. We may disclose the nonpublic personal information we collect, as described above, to persons or companies that perform services on our behalf and to other financial institutions with which we have joint marketing agreements. We will require these companies to protect the confidentiality of your nonpublic personal information and to use it only to perform the services for which we have hired them.
Our Security Procedures
We restrict access to your nonpublic personal information and only allow disclosures to persons and companies as permitted by law to assist in providing products or services to you. We maintain physical, electronic, and procedural safeguards to protect your nonpublic personal information and to safeguard the disposal of certain consumer information.
Contact Us
If you have any questions about our Privacy Policy, please call 1-800-851-9777 on any business day between 8 a.m. and 7 p.m. Eastern Time.
Note: This Privacy Policy applies only to customers that have a direct relationship with us or our affiliates. If you own shares of our portfolios in the name of a third party such as a bank or broker-dealer, its privacy policy may apply to you instead of ours.
|
|
|
|
|
| Transamerica Series Trust |
|
|
|
Semi-Annual Financial Statements 2024 |
|
|
Page 18 |
|
|
|
|
|
| PO Box 219945 |
| Kansas City, MO 64121-9945 |
|
|
| Distributor: |
|
Transamerica Capital, Inc. PO Box 219945 Kansas City, MO 64121-9945 |
|
|
|
|
Customer Service: 1-800-851-9777 |
Transamerica Series Trust Semi-Annual Financial Statements
June 30, 2024
1801 California St., Suite 5200
Denver, CO 80202
Distributor: Transamerica Capital, Inc.
Customer Service: 1-800-851-9777
The following pages contain the most recent semi-annual financial statements for the investment options in which you are invested. In compliance with Securities and Exchange Commission regulations, we present these reports on an annual and semi-annual basis with the hope that they will foster greater understanding of the investment options’ holdings, performance, financial data, accounting policies and other issues. This streamlined version provides information only on the investment options in which you are invested.
If you have any questions about these reports, please do not hesitate to contact your financial professional. As always, we thank you for your trust and the opportunity to serve you.
Transamerica Morgan Stanley Global Allocation VP
CONSOLIDATED SCHEDULE OF INVESTMENTS
At June 30, 2024
(unaudited)
|
|
|
|
|
|
|
|
|
| |
|
Shares |
|
|
Value |
|
| COMMON STOCKS - 27.9% |
|
| Australia - 1.0% |
|
| Ampol Ltd. |
|
|
1,982 |
|
|
|
$ 42,760 |
|
| ANZ Group Holdings Ltd. |
|
|
24,817 |
|
|
|
467,525 |
|
| APA Group |
|
|
10,496 |
|
|
|
55,945 |
|
| Aristocrat Leisure Ltd. |
|
|
4,676 |
|
|
|
155,219 |
|
| ASX Ltd. |
|
|
1,596 |
|
|
|
63,881 |
|
| Aurizon Holdings Ltd. |
|
|
14,872 |
|
|
|
36,212 |
|
| BHP Group Ltd. |
|
|
41,770 |
|
|
|
1,189,268 |
|
| BlueScope Steel Ltd. |
|
|
3,696 |
|
|
|
50,372 |
|
| Brambles Ltd. |
|
|
11,289 |
|
|
|
109,424 |
|
| CAR Group Ltd. |
|
|
2,941 |
|
|
|
69,158 |
|
| Cochlear Ltd. |
|
|
537 |
|
|
|
118,987 |
|
| Coles Group Ltd. |
|
|
10,948 |
|
|
|
124,377 |
|
| Commonwealth Bank of Australia |
|
|
13,768 |
|
|
|
1,169,938 |
|
| Computershare Ltd. |
|
|
4,348 |
|
|
|
76,400 |
|
| CSL Ltd. |
|
|
3,961 |
|
|
|
780,058 |
|
| Dexus, REIT |
|
|
8,667 |
|
|
|
37,466 |
|
| Endeavour Group Ltd. |
|
|
12,387 |
|
|
|
41,730 |
|
| Fortescue Ltd. |
|
|
14,126 |
|
|
|
201,756 |
|
| Goodman Group, REIT |
|
|
14,241 |
|
|
|
330,131 |
|
| GPT Group, REIT |
|
|
15,387 |
|
|
|
41,059 |
|
| Insurance Australia Group Ltd. |
|
|
19,682 |
|
|
|
93,747 |
|
| Lottery Corp. Ltd. |
|
|
18,253 |
|
|
|
61,735 |
|
| Macquarie Group Ltd. |
|
|
2,968 |
|
|
|
405,276 |
|
| Medibank Pvt Ltd. |
|
|
22,375 |
|
|
|
55,675 |
|
| Mineral Resources Ltd. |
|
|
1,461 |
|
|
|
52,552 |
|
| Mirvac Group, REIT |
|
|
33,077 |
|
|
|
41,263 |
|
| National Australia Bank Ltd. |
|
|
25,522 |
|
|
|
616,842 |
|
| Northern Star Resources Ltd. |
|
|
9,572 |
|
|
|
83,011 |
|
| Orica Ltd. |
|
|
3,929 |
|
|
|
46,838 |
|
| Origin Energy Ltd. |
|
|
14,205 |
|
|
|
102,911 |
|
| Pilbara Minerals Ltd. (A) |
|
|
23,357 |
|
|
|
47,835 |
|
| Pro Medicus Ltd. |
|
|
467 |
|
|
|
44,631 |
|
| Qantas Airways Ltd. (B) |
|
|
6,555 |
|
|
|
25,581 |
|
| QBE Insurance Group Ltd. |
|
|
12,608 |
|
|
|
146,264 |
|
| Quintis Australia Pty. Ltd. (C)(D)(E) |
|
|
1,725,383 |
|
|
|
1 |
|
| Ramsay Health Care Ltd. |
|
|
1,523 |
|
|
|
48,219 |
|
| REA Group Ltd. (A) |
|
|
430 |
|
|
|
56,412 |
|
| Reece Ltd. |
|
|
1,834 |
|
|
|
30,795 |
|
| Rio Tinto Ltd. |
|
|
3,065 |
|
|
|
243,315 |
|
| Santos Ltd. |
|
|
26,955 |
|
|
|
137,740 |
|
| Scentre Group, REIT |
|
|
42,305 |
|
|
|
88,052 |
|
| SEEK Ltd. |
|
|
2,962 |
|
|
|
42,206 |
|
| Seven Group Holdings Ltd. |
|
|
1,601 |
|
|
|
40,243 |
|
| Sonic Healthcare Ltd. |
|
|
3,814 |
|
|
|
66,916 |
|
| South32 Ltd. |
|
|
37,812 |
|
|
|
92,321 |
|
| Stockland, REIT |
|
|
19,678 |
|
|
|
54,740 |
|
| Suncorp Group Ltd. |
|
|
10,475 |
|
|
|
121,659 |
|
| Telstra Group Ltd. |
|
|
33,400 |
|
|
|
80,658 |
|
| Transurban Group |
|
|
25,001 |
|
|
|
206,809 |
|
| Treasury Wine Estates Ltd. |
|
|
6,741 |
|
|
|
55,942 |
|
| Vicinity Ltd., REIT |
|
|
31,777 |
|
|
|
39,217 |
|
| Washington H Soul Pattinson & Co. Ltd. |
|
|
1,937 |
|
|
|
42,409 |
|
| Wesfarmers Ltd. |
|
|
9,490 |
|
|
|
412,640 |
|
| Westpac Banking Corp. |
|
|
28,467 |
|
|
|
517,107 |
|
| WiseTech Global Ltd. |
|
|
1,350 |
|
|
|
90,329 |
|
|
|
|
|
|
|
|
|
|
| |
|
Shares |
|
|
Value |
|
| COMMON STOCKS (continued) |
|
| Australia (continued) |
|
| Woodside Energy Group Ltd. |
|
|
15,827 |
|
|
$ |
297,847 |
|
| Woolworths Group Ltd. |
|
|
10,039 |
|
|
|
226,292 |
|
|
|
|
|
|
|
|
|
|
|
|
|
|
|
|
|
|
|
|
9,977,696 |
|
|
|
|
|
|
|
|
|
|
| Austria - 0.1% |
|
| Erste Group Bank AG |
|
|
8,393 |
|
|
|
397,651 |
|
| OMV AG |
|
|
960 |
|
|
|
41,803 |
|
| Verbund AG |
|
|
457 |
|
|
|
36,046 |
|
| voestalpine AG |
|
|
694 |
|
|
|
18,744 |
|
|
|
|
|
|
|
|
|
|
|
|
|
|
|
|
|
|
|
|
494,244 |
|
|
|
|
|
|
|
|
|
|
| Belgium - 0.1% |
|
| Ageas SA |
|
|
1,318 |
|
|
|
60,243 |
|
| Anheuser-Busch InBev SA |
|
|
7,233 |
|
|
|
419,224 |
|
| D’ieteren Group |
|
|
177 |
|
|
|
37,552 |
|
| Elia Group SA |
|
|
243 |
|
|
|
22,758 |
|
| Groupe Bruxelles Lambert NV |
|
|
112 |
|
|
|
7,994 |
|
| Groupe Bruxelles Lambert NV (D) |
|
|
614 |
|
|
|
43,856 |
|
| KBC Group NV |
|
|
6,576 |
|
|
|
464,105 |
|
| Lotus Bakeries NV |
|
|
3 |
|
|
|
30,940 |
|
| Sofina SA |
|
|
127 |
|
|
|
28,997 |
|
| Syensqo SA |
|
|
608 |
|
|
|
54,416 |
|
| UCB SA |
|
|
1,049 |
|
|
|
155,819 |
|
| Umicore SA (A) |
|
|
1,648 |
|
|
|
24,762 |
|
| Warehouses De Pauw CVA, REIT |
|
|
1,443 |
|
|
|
39,098 |
|
|
|
|
|
|
|
|
|
|
|
|
|
|
|
|
|
|
|
|
1,389,764 |
|
|
|
|
|
|
|
|
|
|
| Bermuda - 0.0% (F) |
|
| Arch Capital Group Ltd. (B) |
|
|
1,101 |
|
|
|
111,080 |
|
| Everest Group Ltd. |
|
|
127 |
|
|
|
48,389 |
|
|
|
|
|
|
|
|
|
|
|
|
|
|
|
|
|
|
|
|
159,469 |
|
|
|
|
|
|
|
|
|
|
| Canada - 1.6% |
|
| Agnico Eagle Mines Ltd. |
|
|
4,127 |
|
|
|
269,935 |
|
| Air Canada (B) |
|
|
1,455 |
|
|
|
19,038 |
|
| Alimentation Couche-Tard, Inc. |
|
|
6,308 |
|
|
|
353,982 |
|
| AltaGas Ltd. |
|
|
2,419 |
|
|
|
54,655 |
|
| ARC Resources Ltd. (A) |
|
|
4,854 |
|
|
|
86,610 |
|
| Bank of Montreal |
|
|
6,010 |
|
|
|
504,461 |
|
| Bank of Nova Scotia (A) |
|
|
10,025 |
|
|
|
458,583 |
|
| Barrick Gold Corp. |
|
|
14,534 |
|
|
|
242,437 |
|
| BCE, Inc. |
|
|
600 |
|
|
|
19,433 |
|
| Brookfield Asset Management Ltd., Class A |
|
|
2,902 |
|
|
|
110,476 |
|
| Brookfield Corp. |
|
|
11,134 |
|
|
|
463,086 |
|
| BRP, Inc. (A) |
|
|
295 |
|
|
|
18,900 |
|
| CAE, Inc. (B) |
|
|
2,625 |
|
|
|
48,756 |
|
| Cameco Corp. |
|
|
3,606 |
|
|
|
177,420 |
|
| Canadian Apartment Properties, REIT |
|
|
671 |
|
|
|
21,802 |
|
| Canadian Imperial Bank of Commerce (A) |
|
|
7,696 |
|
|
|
365,940 |
|
| Canadian National Railway Co. |
|
|
4,477 |
|
|
|
529,039 |
|
| Canadian Natural Resources Ltd. |
|
|
17,450 |
|
|
|
621,570 |
|
| Canadian Pacific Kansas City Ltd. |
|
|
7,627 |
|
|
|
600,660 |
|
| Canadian Tire Corp. Ltd., Class A |
|
|
427 |
|
|
|
42,368 |
|
| Canadian Utilities Ltd., Class A |
|
|
1,093 |
|
|
|
23,609 |
|
| CCL Industries, Inc., Class B |
|
|
1,227 |
|
|
|
64,523 |
|
| Cenovus Energy, Inc. |
|
|
11,450 |
|
|
|
225,058 |
|
| CGI, Inc. (B) |
|
|
1,706 |
|
|
|
170,282 |
|
The Notes to Financial Statements are an integral part of this report.
|
|
|
|
|
| Transamerica Series Trust |
|
|
|
Semi-Annual Financial Statements 2024 |
|
|
Page 1 |
|
|
Transamerica Morgan Stanley Global Allocation VP
CONSOLIDATED SCHEDULE OF INVESTMENTS (continued)
At June 30, 2024
(unaudited)
|
|
|
|
|
|
|
|
|
| |
|
Shares |
|
|
Value |
|
| COMMON STOCKS (continued) |
|
| Canada (continued) |
|
| Constellation Software, Inc. |
|
|
165 |
|
|
|
$ 475,429 |
|
| Descartes Systems Group, Inc. (B) |
|
|
706 |
|
|
|
68,404 |
|
| Dollarama, Inc. |
|
|
2,282 |
|
|
|
208,358 |
|
| Element Fleet Management Corp. |
|
|
3,201 |
|
|
|
58,238 |
|
| Emera, Inc. |
|
|
2,343 |
|
|
|
78,183 |
|
| Empire Co. Ltd., Class A |
|
|
1,134 |
|
|
|
28,987 |
|
| Enbridge, Inc. |
|
|
17,557 |
|
|
|
624,611 |
|
| Fairfax Financial Holdings Ltd. |
|
|
173 |
|
|
|
196,809 |
|
| First Quantum Minerals Ltd. |
|
|
5,803 |
|
|
|
76,225 |
|
| FirstService Corp. (A) |
|
|
336 |
|
|
|
51,135 |
|
| Fortis, Inc. |
|
|
4,046 |
|
|
|
157,250 |
|
| Franco-Nevada Corp. |
|
|
1,579 |
|
|
|
187,211 |
|
| George Weston Ltd. |
|
|
490 |
|
|
|
70,485 |
|
| GFL Environmental, Inc. |
|
|
1,818 |
|
|
|
70,804 |
|
| Gildan Activewear, Inc. |
|
|
1,255 |
|
|
|
47,602 |
|
| Great-West Lifeco, Inc. (A) |
|
|
2,313 |
|
|
|
67,477 |
|
| Hydro One Ltd. (G) |
|
|
2,701 |
|
|
|
78,678 |
|
| iA Financial Corp., Inc. |
|
|
811 |
|
|
|
50,929 |
|
| IGM Financial, Inc. |
|
|
690 |
|
|
|
19,050 |
|
| Imperial Oil Ltd. |
|
|
1,523 |
|
|
|
103,845 |
|
| Intact Financial Corp. |
|
|
1,460 |
|
|
|
243,335 |
|
| Ivanhoe Mines Ltd., Class A (A)(B) |
|
|
5,145 |
|
|
|
66,379 |
|
| Keyera Corp. |
|
|
1,891 |
|
|
|
52,374 |
|
| Kinross Gold Corp. |
|
|
10,176 |
|
|
|
84,723 |
|
| Loblaw Cos. Ltd. |
|
|
1,277 |
|
|
|
148,138 |
|
| Lululemon Athletica, Inc. (B) |
|
|
337 |
|
|
|
100,662 |
|
| Lundin Mining Corp. |
|
|
5,296 |
|
|
|
58,958 |
|
| Magna International, Inc. |
|
|
2,232 |
|
|
|
93,551 |
|
| Manulife Financial Corp. |
|
|
14,695 |
|
|
|
391,315 |
|
| MEG Energy Corp. (B) |
|
|
2,215 |
|
|
|
47,391 |
|
| Metro, Inc. |
|
|
1,861 |
|
|
|
103,099 |
|
| National Bank of Canada |
|
|
2,825 |
|
|
|
224,071 |
|
| Northland Power, Inc. (A) |
|
|
2,098 |
|
|
|
36,070 |
|
| Nutrien Ltd. (A) |
|
|
4,075 |
|
|
|
207,466 |
|
| Onex Corp. |
|
|
544 |
|
|
|
36,989 |
|
| Open Text Corp. |
|
|
2,262 |
|
|
|
67,924 |
|
| Pan American Silver Corp. |
|
|
3,041 |
|
|
|
60,440 |
|
| Parkland Corp. (A) |
|
|
1,153 |
|
|
|
32,322 |
|
| Pembina Pipeline Corp. |
|
|
4,752 |
|
|
|
176,318 |
|
| Power Corp. of Canada (A) |
|
|
4,627 |
|
|
|
128,591 |
|
| Quebecor, Inc., Class B |
|
|
1,256 |
|
|
|
26,505 |
|
| Restaurant Brands International, Inc. (A) |
|
|
2,489 |
|
|
|
175,388 |
|
| RioCan, REIT |
|
|
1,207 |
|
|
|
14,831 |
|
| Rogers Communications, Inc., Class B |
|
|
2,951 |
|
|
|
109,148 |
|
| Royal Bank of Canada |
|
|
11,517 |
|
|
|
1,226,162 |
|
| Saputo, Inc. |
|
|
2,072 |
|
|
|
46,527 |
|
| Shopify, Inc., Class A (B) |
|
|
10,099 |
|
|
|
667,410 |
|
| Stantec, Inc. |
|
|
943 |
|
|
|
78,946 |
|
| Sun Life Financial, Inc. |
|
|
4,785 |
|
|
|
234,624 |
|
| Suncor Energy, Inc. |
|
|
10,494 |
|
|
|
400,031 |
|
| TC Energy Corp. (A) |
|
|
8,531 |
|
|
|
323,393 |
|
| Teck Resources Ltd., Class B |
|
|
3,724 |
|
|
|
178,462 |
|
| TELUS Corp. |
|
|
4,031 |
|
|
|
61,023 |
|
| TFI International, Inc. (A) |
|
|
659 |
|
|
|
95,686 |
|
| Thomson Reuters Corp. |
|
|
1,311 |
|
|
|
220,993 |
|
| TMX Group Ltd. |
|
|
2,296 |
|
|
|
63,910 |
|
|
|
|
|
|
|
|
|
|
| |
|
Shares |
|
|
Value |
|
| COMMON STOCKS (continued) |
|
| Canada (continued) |
|
| Toromont Industries Ltd. |
|
|
685 |
|
|
|
$ 60,651 |
|
| Toronto-Dominion Bank |
|
|
14,521 |
|
|
|
798,201 |
|
| Tourmaline Oil Corp. |
|
|
2,715 |
|
|
|
123,143 |
|
| Waste Connections, Inc. |
|
|
756 |
|
|
|
132,572 |
|
| West Fraser Timber Co. Ltd. |
|
|
463 |
|
|
|
35,560 |
|
| Wheaton Precious Metals Corp. |
|
|
3,745 |
|
|
|
196,359 |
|
| WSP Global, Inc. |
|
|
1,029 |
|
|
|
160,234 |
|
|
|
|
|
|
|
|
|
|
|
|
|
|
|
|
|
|
|
|
16,002,208 |
|
|
|
|
|
|
|
|
|
|
| Chile - 0.0% (F) |
|
| Antofagasta PLC |
|
|
3,255 |
|
|
|
86,819 |
|
|
|
|
|
|
|
|
|
|
| Denmark - 0.5% |
|
| AP Moller - Maersk AS, Class A |
|
|
25 |
|
|
|
42,433 |
|
| AP Moller - Maersk AS, Class B |
|
|
36 |
|
|
|
62,577 |
|
| Carlsberg AS, Class B |
|
|
783 |
|
|
|
93,952 |
|
| Coloplast AS, Class B |
|
|
1,021 |
|
|
|
122,657 |
|
| Danske Bank AS |
|
|
5,509 |
|
|
|
164,149 |
|
| Demant AS (B) |
|
|
799 |
|
|
|
34,581 |
|
| DSV AS |
|
|
1,380 |
|
|
|
211,442 |
|
| Genmab AS (B) |
|
|
537 |
|
|
|
134,561 |
|
| Novo Nordisk AS, Class B |
|
|
26,505 |
|
|
|
3,827,371 |
|
| Novonesis (Novozymes) B, Class B |
|
|
3,028 |
|
|
|
185,274 |
|
| Orsted AS (B)(G) |
|
|
1,520 |
|
|
|
80,890 |
|
| Pandora AS |
|
|
661 |
|
|
|
99,759 |
|
| Rockwool AS, B Shares |
|
|
75 |
|
|
|
30,436 |
|
| Tryg AS |
|
|
2,809 |
|
|
|
61,392 |
|
| Vestas Wind Systems AS (B) |
|
|
8,053 |
|
|
|
186,468 |
|
|
|
|
|
|
|
|
|
|
|
|
|
|
|
|
|
|
|
|
5,337,942 |
|
|
|
|
|
|
|
|
|
|
| Finland - 0.2% |
|
| Elisa OYJ |
|
|
1,195 |
|
|
|
54,826 |
|
| Fortum OYJ |
|
|
3,793 |
|
|
|
55,448 |
|
| Kesko OYJ, B Shares |
|
|
2,250 |
|
|
|
39,494 |
|
| Kone OYJ, Class B |
|
|
2,802 |
|
|
|
138,307 |
|
| Metso OYJ |
|
|
5,119 |
|
|
|
54,186 |
|
| Neste OYJ |
|
|
3,556 |
|
|
|
63,313 |
|
| Nokia OYJ |
|
|
42,819 |
|
|
|
163,182 |
|
| Nordea Bank Abp |
|
|
83,875 |
|
|
|
998,416 |
|
| Orion OYJ, Class B |
|
|
896 |
|
|
|
38,248 |
|
| Sampo OYJ, A Shares |
|
|
3,763 |
|
|
|
161,602 |
|
| Stora Enso OYJ, R Shares |
|
|
4,880 |
|
|
|
66,661 |
|
| UPM-Kymmene OYJ |
|
|
4,545 |
|
|
|
158,777 |
|
| Wartsila OYJ Abp |
|
|
4,149 |
|
|
|
79,981 |
|
|
|
|
|
|
|
|
|
|
|
|
|
|
|
|
|
|
|
|
2,072,441 |
|
|
|
|
|
|
|
|
|
|
| France - 1.7% |
|
| Accor SA |
|
|
1,569 |
|
|
|
64,356 |
|
| Aeroports de Paris SA |
|
|
279 |
|
|
|
33,943 |
|
| Air Liquide SA |
|
|
4,685 |
|
|
|
809,207 |
|
| Airbus SE |
|
|
4,834 |
|
|
|
663,999 |
|
| Alstom SA |
|
|
2,833 |
|
|
|
47,634 |
|
| Amundi SA (G) |
|
|
499 |
|
|
|
32,198 |
|
| Arkema SA |
|
|
483 |
|
|
|
41,976 |
|
| AXA SA |
|
|
14,749 |
|
|
|
482,867 |
|
| BioMerieux |
|
|
334 |
|
|
|
31,746 |
|
| BNP Paribas SA |
|
|
27,149 |
|
|
|
1,730,849 |
|
The Notes to Financial Statements are an integral part of this report.
|
|
|
|
|
| Transamerica Series Trust |
|
|
|
Semi-Annual Financial Statements 2024 |
|
|
Page 2 |
|
|
Transamerica Morgan Stanley Global Allocation VP
CONSOLIDATED SCHEDULE OF INVESTMENTS (continued)
At June 30, 2024
(unaudited)
|
|
|
|
|
|
|
|
|
| |
|
Shares |
|
|
Value |
|
| COMMON STOCKS (continued) |
|
| France (continued) |
|
| Bollore SE |
|
|
5,798 |
|
|
|
$ 34,027 |
|
| Bouygues SA |
|
|
1,538 |
|
|
|
49,364 |
|
| Bureau Veritas SA (A) |
|
|
2,575 |
|
|
|
71,314 |
|
| Capgemini SE |
|
|
1,265 |
|
|
|
251,578 |
|
| Carrefour SA (A) |
|
|
4,623 |
|
|
|
65,353 |
|
| Cie de Saint-Gobain SA |
|
|
3,703 |
|
|
|
287,991 |
|
| Cie Generale des Etablissements Michelin SCA |
|
|
5,481 |
|
|
|
211,961 |
|
| Covivio SA, REIT |
|
|
410 |
|
|
|
19,487 |
|
| Credit Agricole SA |
|
|
27,773 |
|
|
|
378,932 |
|
| Danone SA |
|
|
5,226 |
|
|
|
319,465 |
|
| Dassault Aviation SA |
|
|
161 |
|
|
|
29,243 |
|
| Dassault Systemes SE |
|
|
5,450 |
|
|
|
206,035 |
|
| Edenred SE |
|
|
1,995 |
|
|
|
84,201 |
|
| Eiffage SA |
|
|
597 |
|
|
|
54,831 |
|
| Engie SA |
|
|
14,930 |
|
|
|
213,217 |
|
| EssilorLuxottica SA |
|
|
2,411 |
|
|
|
519,511 |
|
| Eurazeo SE |
|
|
369 |
|
|
|
29,382 |
|
| Gecina SA, REIT |
|
|
371 |
|
|
|
34,150 |
|
| Getlink SE |
|
|
2,482 |
|
|
|
41,068 |
|
| Hermes International SCA |
|
|
256 |
|
|
|
586,710 |
|
| Ipsen SA |
|
|
302 |
|
|
|
37,032 |
|
| Kering SA |
|
|
602 |
|
|
|
218,235 |
|
| Klepierre SA, REIT |
|
|
1,748 |
|
|
|
46,763 |
|
| La Francaise des Jeux SAEM (G) |
|
|
857 |
|
|
|
29,186 |
|
| Legrand SA |
|
|
2,136 |
|
|
|
211,919 |
|
| L’Oreal SA |
|
|
1,963 |
|
|
|
862,038 |
|
| LVMH Moet Hennessy Louis Vuitton SE |
|
|
2,233 |
|
|
|
1,706,526 |
|
| Orange SA |
|
|
15,285 |
|
|
|
153,120 |
|
| Pernod Ricard SA |
|
|
1,644 |
|
|
|
223,074 |
|
| Publicis Groupe SA (A) |
|
|
1,845 |
|
|
|
196,365 |
|
| Remy Cointreau SA |
|
|
183 |
|
|
|
15,267 |
|
| Renault SA |
|
|
1,551 |
|
|
|
79,464 |
|
| Rexel SA |
|
|
1,809 |
|
|
|
46,806 |
|
| Safran SA |
|
|
2,747 |
|
|
|
580,731 |
|
| Sanofi SA |
|
|
9,075 |
|
|
|
874,116 |
|
| Sartorius Stedim Biotech |
|
|
240 |
|
|
|
39,403 |
|
| Schneider Electric SE |
|
|
4,410 |
|
|
|
1,059,345 |
|
| SEB SA |
|
|
203 |
|
|
|
20,784 |
|
| Societe Generale SA |
|
|
19,072 |
|
|
|
447,720 |
|
| Sodexo SA |
|
|
717 |
|
|
|
64,501 |
|
| Teleperformance SE |
|
|
436 |
|
|
|
45,918 |
|
| Thales SA |
|
|
768 |
|
|
|
122,962 |
|
| TotalEnergies SE |
|
|
17,461 |
|
|
|
1,165,563 |
|
| Unibail-Rodamco-Westfield, REIT (B) |
|
|
956 |
|
|
|
75,272 |
|
| Veolia Environnement SA |
|
|
5,600 |
|
|
|
167,445 |
|
| Vinci SA |
|
|
4,061 |
|
|
|
427,867 |
|
| Vivendi SE |
|
|
5,853 |
|
|
|
61,153 |
|
|
|
|
|
|
|
|
|
|
|
|
|
|
|
|
|
|
|
|
16,405,170 |
|
|
|
|
|
|
|
|
|
|
| Germany - 1.1% |
|
| adidas AG |
|
|
1,314 |
|
|
|
313,812 |
|
| Allianz SE |
|
|
3,179 |
|
|
|
883,481 |
|
| BASF SE |
|
|
7,136 |
|
|
|
345,317 |
|
| Bayer AG |
|
|
7,837 |
|
|
|
221,408 |
|
| Bayerische Motoren Werke AG |
|
|
2,506 |
|
|
|
237,194 |
|
| Bechtle AG |
|
|
665 |
|
|
|
31,293 |
|
|
|
|
|
|
|
|
|
|
| |
|
Shares |
|
|
Value |
|
| COMMON STOCKS (continued) |
|
| Germany (continued) |
|
| Beiersdorf AG |
|
|
818 |
|
|
|
$ 119,623 |
|
| Brenntag SE |
|
|
1,044 |
|
|
|
70,394 |
|
| Carl Zeiss Meditec AG |
|
|
323 |
|
|
|
22,709 |
|
| Commerzbank AG |
|
|
27,518 |
|
|
|
418,038 |
|
| Continental AG |
|
|
886 |
|
|
|
50,195 |
|
| Covestro AG (B)(G) |
|
|
1,434 |
|
|
|
84,159 |
|
| CTS Eventim AG & Co. KGaA |
|
|
509 |
|
|
|
42,464 |
|
| Daimler Truck Holding AG |
|
|
4,301 |
|
|
|
171,211 |
|
| Delivery Hero SE (B)(G) |
|
|
1,533 |
|
|
|
36,365 |
|
| Deutsche Bank AG |
|
|
15,157 |
|
|
|
241,993 |
|
| Deutsche Boerse AG |
|
|
1,541 |
|
|
|
315,379 |
|
| Deutsche Lufthansa AG |
|
|
4,765 |
|
|
|
29,139 |
|
| Deutsche Post AG |
|
|
7,982 |
|
|
|
323,041 |
|
| Deutsche Telekom AG |
|
|
26,132 |
|
|
|
657,113 |
|
| E.ON SE |
|
|
18,385 |
|
|
|
241,294 |
|
| Evonik Industries AG |
|
|
2,070 |
|
|
|
42,231 |
|
| Fresenius Medical Care AG |
|
|
1,637 |
|
|
|
62,693 |
|
| Fresenius SE & Co. KGaA (B) |
|
|
3,425 |
|
|
|
102,264 |
|
| GEA Group AG |
|
|
1,249 |
|
|
|
52,033 |
|
| Hannover Rueck SE |
|
|
491 |
|
|
|
124,466 |
|
| Heidelberg Materials AG |
|
|
1,099 |
|
|
|
113,955 |
|
| Henkel AG & Co. KGaA |
|
|
840 |
|
|
|
66,076 |
|
| Infineon Technologies AG |
|
|
10,519 |
|
|
|
386,457 |
|
| Knorr-Bremse AG |
|
|
581 |
|
|
|
44,364 |
|
| LEG Immobilien SE |
|
|
599 |
|
|
|
48,921 |
|
| Mercedes-Benz Group AG |
|
|
6,369 |
|
|
|
440,424 |
|
| Merck KGaA |
|
|
1,060 |
|
|
|
175,673 |
|
| MTU Aero Engines AG |
|
|
439 |
|
|
|
112,271 |
|
| Muenchener Rueckversicherungs-Gesellschaft AG |
|
|
1,108 |
|
|
|
554,148 |
|
| Nemetschek SE |
|
|
474 |
|
|
|
46,626 |
|
| Puma SE |
|
|
841 |
|
|
|
38,612 |
|
| Rational AG |
|
|
40 |
|
|
|
33,307 |
|
| Rheinmetall AG |
|
|
346 |
|
|
|
176,270 |
|
| RWE AG |
|
|
5,151 |
|
|
|
176,251 |
|
| SAP SE |
|
|
8,627 |
|
|
|
1,750,992 |
|
| Scout24 SE (G) |
|
|
611 |
|
|
|
46,590 |
|
| Siemens AG |
|
|
6,109 |
|
|
|
1,136,552 |
|
| Siemens Healthineers AG (G) |
|
|
2,291 |
|
|
|
132,001 |
|
| Symrise AG |
|
|
1,070 |
|
|
|
130,978 |
|
| Talanx AG |
|
|
525 |
|
|
|
41,916 |
|
| Volkswagen AG |
|
|
234 |
|
|
|
28,093 |
|
| Vonovia SE |
|
|
5,898 |
|
|
|
167,702 |
|
| Zalando SE (B)(G) |
|
|
1,951 |
|
|
|
45,738 |
|
|
|
|
|
|
|
|
|
|
|
|
|
|
|
|
|
|
|
|
11,133,226 |
|
|
|
|
|
|
|
|
|
|
| Hong Kong - 0.3% |
|
| AIA Group Ltd. |
|
|
93,850 |
|
|
|
636,960 |
|
| BOC Hong Kong Holdings Ltd. |
|
|
30,837 |
|
|
|
94,971 |
|
| CK Asset Holdings Ltd. |
|
|
15,958 |
|
|
|
59,773 |
|
| CK Hutchison Holdings Ltd. |
|
|
22,128 |
|
|
|
105,978 |
|
| CK Infrastructure Holdings Ltd. |
|
|
5,191 |
|
|
|
29,315 |
|
| CLP Holdings Ltd. |
|
|
13,639 |
|
|
|
110,208 |
|
| Futu Holdings Ltd., ADR (B) |
|
|
455 |
|
|
|
29,850 |
|
| Galaxy Entertainment Group Ltd. |
|
|
18,511 |
|
|
|
86,285 |
|
| Hang Seng Bank Ltd. |
|
|
6,303 |
|
|
|
81,037 |
|
| Henderson Land Development Co. Ltd. |
|
|
11,885 |
|
|
|
31,885 |
|
The Notes to Financial Statements are an integral part of this report.
|
|
|
|
|
| Transamerica Series Trust |
|
|
|
Semi-Annual Financial Statements 2024 |
|
|
Page 3 |
|
|
Transamerica Morgan Stanley Global Allocation VP
CONSOLIDATED SCHEDULE OF INVESTMENTS (continued)
At June 30, 2024
(unaudited)
|
|
|
|
|
|
|
|
|
| |
|
Shares |
|
|
Value |
|
| COMMON STOCKS (continued) |
|
| Hong Kong (continued) |
|
| HKT Trust & HKT Ltd. |
|
|
31,595 |
|
|
|
$ 35,442 |
|
| Hong Kong & China Gas Co. Ltd. |
|
|
91,321 |
|
|
|
69,464 |
|
| Hong Kong Exchanges & Clearing Ltd. |
|
|
9,980 |
|
|
|
319,757 |
|
| Hongkong Land Holdings Ltd. |
|
|
9,296 |
|
|
|
30,026 |
|
| Jardine Matheson Holdings Ltd. |
|
|
1,320 |
|
|
|
46,702 |
|
| Link, REIT |
|
|
21,294 |
|
|
|
82,759 |
|
| MTR Corp. Ltd. |
|
|
12,899 |
|
|
|
40,717 |
|
| Power Assets Holdings Ltd. |
|
|
11,344 |
|
|
|
61,375 |
|
| Prudential PLC |
|
|
21,696 |
|
|
|
197,028 |
|
| Sino Land Co. Ltd. |
|
|
32,502 |
|
|
|
33,505 |
|
| SITC International Holdings Co. Ltd. |
|
|
11,080 |
|
|
|
30,080 |
|
| Sun Hung Kai Properties Ltd. |
|
|
12,128 |
|
|
|
104,910 |
|
| Swire Pacific Ltd., Class A |
|
|
3,429 |
|
|
|
30,298 |
|
| Swire Properties Ltd. |
|
|
9,741 |
|
|
|
15,518 |
|
| Techtronic Industries Co. Ltd. |
|
|
11,332 |
|
|
|
129,441 |
|
| WH Group Ltd. (G) |
|
|
67,220 |
|
|
|
44,245 |
|
| Wharf Holdings Ltd. (A) |
|
|
8,856 |
|
|
|
24,893 |
|
| Wharf Real Estate Investment Co. Ltd. |
|
|
13,892 |
|
|
|
36,824 |
|
|
|
|
|
|
|
|
|
|
|
|
|
|
|
|
|
|
|
|
2,599,246 |
|
|
|
|
|
|
|
|
|
|
| Ireland - 0.3% |
|
| Accenture PLC, Class A |
|
|
1,844 |
|
|
|
559,488 |
|
| AerCap Holdings NV |
|
|
1,704 |
|
|
|
158,813 |
|
| AIB Group PLC |
|
|
42,927 |
|
|
|
226,921 |
|
| Allegion PLC |
|
|
253 |
|
|
|
29,892 |
|
| Aptiv PLC (B) |
|
|
795 |
|
|
|
55,984 |
|
| Bank of Ireland Group PLC |
|
|
27,832 |
|
|
|
291,152 |
|
| DCC PLC |
|
|
829 |
|
|
|
58,056 |
|
| Experian PLC |
|
|
7,694 |
|
|
|
358,500 |
|
| Flutter Entertainment PLC (B) |
|
|
1,527 |
|
|
|
279,215 |
|
| James Hardie Industries PLC, CDI (B) |
|
|
3,513 |
|
|
|
110,848 |
|
| Kerry Group PLC, Class A |
|
|
1,347 |
|
|
|
109,130 |
|
| Kingspan Group PLC |
|
|
1,350 |
|
|
|
114,940 |
|
| Medtronic PLC |
|
|
3,916 |
|
|
|
308,228 |
|
| Smurfit Kappa Group PLC |
|
|
2,303 |
|
|
|
102,602 |
|
| Trane Technologies PLC |
|
|
662 |
|
|
|
217,752 |
|
|
|
|
|
|
|
|
|
|
|
|
|
|
|
|
|
|
|
|
2,981,521 |
|
|
|
|
|
|
|
|
|
|
| Israel - 0.1% |
|
| Azrieli Group Ltd. |
|
|
356 |
|
|
|
20,799 |
|
| Bank Hapoalim BM |
|
|
10,398 |
|
|
|
91,831 |
|
| Bank Leumi Le-Israel BM |
|
|
12,470 |
|
|
|
101,650 |
|
| Check Point Software Technologies Ltd. (B) |
|
|
756 |
|
|
|
124,740 |
|
| CyberArk Software Ltd. (B) |
|
|
354 |
|
|
|
96,791 |
|
| Elbit Systems Ltd. |
|
|
222 |
|
|
|
38,631 |
|
| Global-e Online Ltd. (B) |
|
|
835 |
|
|
|
30,286 |
|
| ICL Group Ltd. |
|
|
6,450 |
|
|
|
27,737 |
|
| Israel Discount Bank Ltd., Class A |
|
|
10,169 |
|
|
|
50,748 |
|
| Mizrahi Tefahot Bank Ltd. |
|
|
1,274 |
|
|
|
43,203 |
|
| Monday.com Ltd. (B) |
|
|
307 |
|
|
|
73,913 |
|
| Nice Ltd. (B) |
|
|
501 |
|
|
|
86,190 |
|
| Teva Pharmaceutical Industries Ltd., ADR (B) |
|
|
9,379 |
|
|
|
152,409 |
|
| Wix.com Ltd. (B) |
|
|
443 |
|
|
|
70,468 |
|
|
|
|
|
|
|
|
|
|
|
|
|
|
|
|
|
|
|
|
1,009,396 |
|
|
|
|
|
|
|
|
|
|
| Italy - 0.6% |
|
| Amplifon SpA |
|
|
1,014 |
|
|
|
36,097 |
|
|
|
|
|
|
|
|
|
|
| |
|
Shares |
|
|
Value |
|
| COMMON STOCKS (continued) |
|
| Italy (continued) |
|
| Assicurazioni Generali SpA |
|
|
8,314 |
|
|
|
$ 207,371 |
|
| Banco BPM SpA |
|
|
32,177 |
|
|
|
207,242 |
|
| Davide Campari-Milano NV |
|
|
5,087 |
|
|
|
48,073 |
|
| DiaSorin SpA |
|
|
186 |
|
|
|
18,537 |
|
| Enel SpA |
|
|
67,124 |
|
|
|
466,831 |
|
| Eni SpA |
|
|
17,476 |
|
|
|
268,648 |
|
| Ferrari NV |
|
|
1,027 |
|
|
|
418,719 |
|
| FinecoBank Banca Fineco SpA |
|
|
16,047 |
|
|
|
239,223 |
|
| Infrastrutture Wireless Italiane SpA (G) |
|
|
2,763 |
|
|
|
28,851 |
|
| Intesa Sanpaolo SpA |
|
|
398,799 |
|
|
|
1,482,443 |
|
| Leonardo SpA |
|
|
3,362 |
|
|
|
78,060 |
|
| Mediobanca Banca di Credito Finanziario SpA |
|
|
14,121 |
|
|
|
207,032 |
|
| Moncler SpA |
|
|
1,793 |
|
|
|
109,567 |
|
| Nexi SpA (B)(G) |
|
|
4,885 |
|
|
|
29,789 |
|
| Poste Italiane SpA (G) |
|
|
3,959 |
|
|
|
50,434 |
|
| Prysmian SpA |
|
|
2,141 |
|
|
|
132,576 |
|
| Recordati Industria Chimica e Farmaceutica SpA |
|
|
860 |
|
|
|
44,854 |
|
| Snam SpA (A) |
|
|
17,273 |
|
|
|
76,417 |
|
| Telecom Italia SpA (B) |
|
|
82,293 |
|
|
|
19,697 |
|
| Terna - Rete Elettrica Nazionale (A) |
|
|
11,937 |
|
|
|
92,274 |
|
| UniCredit SpA |
|
|
40,965 |
|
|
|
1,518,173 |
|
|
|
|
|
|
|
|
|
|
|
|
|
|
|
|
|
|
|
|
5,780,908 |
|
|
|
|
|
|
|
|
|
|
| Jordan - 0.0% (F) |
|
| Hikma Pharmaceuticals PLC |
|
|
1,394 |
|
|
|
33,322 |
|
|
|
|
|
|
|
|
|
|
|
| Luxembourg - 0.0% (F) |
|
| ArcelorMittal SA |
|
|
3,774 |
|
|
|
86,373 |
|
| Eurofins Scientific SE (A) |
|
|
1,365 |
|
|
|
68,049 |
|
| Tenaris SA |
|
|
3,871 |
|
|
|
59,490 |
|
|
|
|
|
|
|
|
|
|
|
|
|
|
|
|
|
|
|
|
213,912 |
|
|
|
|
|
|
|
|
|
|
| Macau - 0.0% (F) |
|
| Sands China Ltd. (B) |
|
|
20,289 |
|
|
|
42,298 |
|
|
|
|
|
|
|
|
|
|
|
| Netherlands - 1.0% |
|
| ABN AMRO Bank NV (G) |
|
|
12,156 |
|
|
|
199,834 |
|
| Adyen NV (B)(G) |
|
|
178 |
|
|
|
212,208 |
|
| Akzo Nobel NV |
|
|
1,408 |
|
|
|
85,618 |
|
| Argenx SE (B) |
|
|
464 |
|
|
|
203,042 |
|
| ASM International NV |
|
|
390 |
|
|
|
297,298 |
|
| ASML Holding NV |
|
|
3,307 |
|
|
|
3,414,843 |
|
| BE Semiconductor Industries NV |
|
|
647 |
|
|
|
108,197 |
|
| DSM BV (B)(C)(D) |
|
|
1,957 |
|
|
|
201,202 |
|
| Euronext NV (G) |
|
|
657 |
|
|
|
60,863 |
|
| EXOR NV |
|
|
2,069 |
|
|
|
216,483 |
|
| Ferrovial SE |
|
|
4,165 |
|
|
|
161,738 |
|
| Heineken Holding NV |
|
|
1,083 |
|
|
|
85,422 |
|
| Heineken NV |
|
|
2,404 |
|
|
|
232,483 |
|
| IMCD NV |
|
|
467 |
|
|
|
64,667 |
|
| ING Groep NV, Series N |
|
|
92,342 |
|
|
|
1,578,541 |
|
| JDE Peet’s NV |
|
|
1,000 |
|
|
|
19,920 |
|
| Koninklijke Ahold Delhaize NV |
|
|
7,787 |
|
|
|
230,087 |
|
| Koninklijke KPN NV |
|
|
32,588 |
|
|
|
124,942 |
|
| Koninklijke Philips NV (B) |
|
|
6,676 |
|
|
|
168,661 |
|
| NN Group NV |
|
|
2,216 |
|
|
|
103,117 |
|
The Notes to Financial Statements are an integral part of this report.
|
|
|
|
|
| Transamerica Series Trust |
|
|
|
Semi-Annual Financial Statements 2024 |
|
|
Page 4 |
|
|
Transamerica Morgan Stanley Global Allocation VP
CONSOLIDATED SCHEDULE OF INVESTMENTS (continued)
At June 30, 2024
(unaudited)
|
|
|
|
|
|
|
|
|
| |
|
Shares |
|
|
Value |
|
| COMMON STOCKS (continued) |
|
| Netherlands (continued) |
|
| NXP Semiconductors NV |
|
|
761 |
|
|
|
$ 204,778 |
|
| OCI NV |
|
|
871 |
|
|
|
21,258 |
|
| Prosus NV |
|
|
11,683 |
|
|
|
416,146 |
|
| Qiagen NV (B) |
|
|
1,821 |
|
|
|
75,180 |
|
| Randstad NV |
|
|
895 |
|
|
|
40,573 |
|
| Stellantis NV |
|
|
17,972 |
|
|
|
355,494 |
|
| Universal Music Group NV |
|
|
6,760 |
|
|
|
201,117 |
|
| Wolters Kluwer NV |
|
|
2,049 |
|
|
|
339,690 |
|
|
|
|
|
|
|
|
|
|
|
|
|
|
|
|
|
|
|
|
9,423,402 |
|
|
|
|
|
|
|
|
|
|
| New Zealand - 0.0% (F) |
|
| Auckland International Airport Ltd. |
|
|
9,208 |
|
|
|
42,794 |
|
| Fisher & Paykel Healthcare Corp. Ltd. |
|
|
4,064 |
|
|
|
74,384 |
|
| Mercury Ltd. |
|
|
4,812 |
|
|
|
19,242 |
|
| Meridian Energy Ltd. |
|
|
8,770 |
|
|
|
33,600 |
|
| Spark New Zealand Ltd. |
|
|
12,642 |
|
|
|
32,033 |
|
| Xero Ltd. (B) |
|
|
1,194 |
|
|
|
108,645 |
|
|
|
|
|
|
|
|
|
|
|
|
|
|
|
|
|
|
|
|
310,698 |
|
|
|
|
|
|
|
|
|
|
| Norway - 0.1% |
|
| Aker BP ASA |
|
|
2,569 |
|
|
|
65,494 |
|
| DNB Bank ASA |
|
|
6,860 |
|
|
|
134,733 |
|
| Equinor ASA |
|
|
7,305 |
|
|
|
207,957 |
|
| Gjensidige Forsikring ASA |
|
|
1,636 |
|
|
|
29,236 |
|
| Kongsberg Gruppen ASA |
|
|
725 |
|
|
|
59,076 |
|
| Mowi ASA |
|
|
3,810 |
|
|
|
63,411 |
|
| Norsk Hydro ASA |
|
|
10,607 |
|
|
|
66,064 |
|
| Orkla ASA |
|
|
5,724 |
|
|
|
46,507 |
|
| Salmar ASA |
|
|
542 |
|
|
|
28,529 |
|
| Telenor ASA |
|
|
5,127 |
|
|
|
58,439 |
|
| Yara International ASA |
|
|
1,327 |
|
|
|
38,230 |
|
|
|
|
|
|
|
|
|
|
|
|
|
|
|
|
|
|
|
|
797,676 |
|
|
|
|
|
|
|
|
|
|
| Poland - 0.0% (F) |
|
| InPost SA (B) |
|
|
1,667 |
|
|
|
29,386 |
|
|
|
|
|
|
|
|
|
|
|
| Portugal - 0.0% (F) |
|
| EDP - Energias de Portugal SA |
|
|
29,438 |
|
|
|
110,312 |
|
| Galp Energia SGPS SA |
|
|
4,325 |
|
|
|
91,340 |
|
| Jeronimo Martins SGPS SA |
|
|
2,623 |
|
|
|
51,266 |
|
|
|
|
|
|
|
|
|
|
|
|
|
|
|
|
|
|
|
|
252,918 |
|
|
|
|
|
|
|
|
|
|
| Republic of South Africa - 0.7% |
|
| Absa Group Ltd. |
|
|
149,302 |
|
|
|
1,300,276 |
|
| Capitec Bank Holdings Ltd. |
|
|
15,300 |
|
|
|
2,210,853 |
|
| Nedbank Group Ltd. |
|
|
77,193 |
|
|
|
1,087,904 |
|
| Standard Bank Group Ltd. |
|
|
235,574 |
|
|
|
2,729,583 |
|
|
|
|
|
|
|
|
|
|
|
|
|
|
|
|
|
|
|
|
7,328,616 |
|
|
|
|
|
|
|
|
|
|
| Russian Federation - 0.0% |
|
| Evraz PLC (B)(C)(D)(H) |
|
|
6,267 |
|
|
|
0 |
|
|
|
|
|
|
|
|
|
|
|
| Singapore - 0.2% |
|
| CapitaLand Ascendas, REIT |
|
|
29,944 |
|
|
|
56,531 |
|
| CapitaLand Integrated Commercial Trust, REIT |
|
|
43,128 |
|
|
|
62,974 |
|
| Capitaland Investment Ltd. |
|
|
21,021 |
|
|
|
41,236 |
|
| DBS Group Holdings Ltd. |
|
|
15,998 |
|
|
|
422,248 |
|
|
|
|
|
|
|
|
|
|
| |
|
Shares |
|
|
Value |
|
| COMMON STOCKS (continued) |
|
| Singapore (continued) |
|
| Genting Singapore Ltd. |
|
|
49,237 |
|
|
|
$ 31,409 |
|
| Grab Holdings Ltd., Class A (B) |
|
|
16,949 |
|
|
|
60,169 |
|
| Keppel Ltd. |
|
|
11,688 |
|
|
|
55,768 |
|
| Oversea-Chinese Banking Corp. Ltd. |
|
|
26,972 |
|
|
|
287,025 |
|
| Sea Ltd., ADR (B) |
|
|
2,924 |
|
|
|
208,832 |
|
| Sembcorp Industries Ltd. |
|
|
7,267 |
|
|
|
25,777 |
|
| Singapore Airlines Ltd. (A) |
|
|
11,967 |
|
|
|
60,894 |
|
| Singapore Exchange Ltd. |
|
|
6,872 |
|
|
|
48,043 |
|
| Singapore Technologies Engineering Ltd. |
|
|
12,384 |
|
|
|
39,545 |
|
| Singapore Telecommunications Ltd. |
|
|
66,219 |
|
|
|
134,294 |
|
| United Overseas Bank Ltd. |
|
|
10,175 |
|
|
|
235,091 |
|
| Wilmar International Ltd. |
|
|
15,366 |
|
|
|
35,129 |
|
|
|
|
|
|
|
|
|
|
|
|
|
|
|
|
|
|
|
|
1,804,965 |
|
|
|
|
|
|
|
|
|
|
| Spain - 0.6% |
|
| Acciona SA (A) |
|
|
198 |
|
|
|
23,389 |
|
| ACS Actividades de Construccion y Servicios SA (A) |
|
|
1,615 |
|
|
|
69,668 |
|
| Aena SME SA (G) |
|
|
615 |
|
|
|
123,823 |
|
| Amadeus IT Group SA |
|
|
3,658 |
|
|
|
243,436 |
|
| Banco Bilbao Vizcaya Argentaria SA |
|
|
154,030 |
|
|
|
1,542,692 |
|
| Banco de Sabadell SA |
|
|
43,727 |
|
|
|
84,316 |
|
| Banco Santander SA |
|
|
417,314 |
|
|
|
1,935,398 |
|
| CaixaBank SA |
|
|
104,634 |
|
|
|
553,902 |
|
| Cellnex Telecom SA (B)(G) |
|
|
3,983 |
|
|
|
129,546 |
|
| EDP Renovaveis SA |
|
|
2,927 |
|
|
|
40,907 |
|
| Endesa SA (A) |
|
|
2,572 |
|
|
|
48,300 |
|
| Grifols SA (B) |
|
|
2,401 |
|
|
|
20,211 |
|
| Iberdrola SA |
|
|
46,950 |
|
|
|
609,156 |
|
| Industria de Diseno Textil SA |
|
|
8,901 |
|
|
|
441,928 |
|
| Redeia Corp. SA (A) |
|
|
3,313 |
|
|
|
57,904 |
|
| Repsol SA (A) |
|
|
9,871 |
|
|
|
155,769 |
|
| Telefonica SA |
|
|
37,614 |
|
|
|
159,520 |
|
|
|
|
|
|
|
|
|
|
|
|
|
|
|
|
|
|
|
|
6,239,865 |
|
|
|
|
|
|
|
|
|
|
| Sweden - 0.4% |
|
| Alfa Laval AB |
|
|
2,341 |
|
|
|
102,506 |
|
| Assa Abloy AB, Class B |
|
|
8,203 |
|
|
|
231,873 |
|
| Atlas Copco AB, A Shares |
|
|
21,632 |
|
|
|
406,557 |
|
| Atlas Copco AB, B Shares |
|
|
12,567 |
|
|
|
202,929 |
|
| Beijer Ref AB (A) |
|
|
2,924 |
|
|
|
45,106 |
|
| Boliden AB |
|
|
2,234 |
|
|
|
71,474 |
|
| Epiroc AB, Class A |
|
|
5,419 |
|
|
|
108,135 |
|
| Epiroc AB, Class B |
|
|
3,199 |
|
|
|
58,493 |
|
| EQT AB |
|
|
2,969 |
|
|
|
87,734 |
|
| Essity AB, Class B |
|
|
4,966 |
|
|
|
127,160 |
|
| Evolution AB (G) |
|
|
1,470 |
|
|
|
153,116 |
|
| Fastighets AB Balder, B Shares (B) |
|
|
5,407 |
|
|
|
37,047 |
|
| Getinge AB, B Shares |
|
|
1,848 |
|
|
|
31,393 |
|
| H&M Hennes & Mauritz AB, B Shares (A) |
|
|
4,742 |
|
|
|
75,007 |
|
| Hexagon AB, B Shares |
|
|
17,104 |
|
|
|
193,084 |
|
| Holmen AB, B Shares |
|
|
630 |
|
|
|
24,798 |
|
| Husqvarna AB, B Shares |
|
|
2,864 |
|
|
|
22,952 |
|
| Industrivarden AB, A Shares |
|
|
1,017 |
|
|
|
34,600 |
|
| Industrivarden AB, C Shares |
|
|
1,289 |
|
|
|
43,490 |
|
| Indutrade AB |
|
|
2,250 |
|
|
|
57,656 |
|
| Investment AB Latour, B Shares |
|
|
1,240 |
|
|
|
33,483 |
|
The Notes to Financial Statements are an integral part of this report.
|
|
|
|
|
| Transamerica Series Trust |
|
|
|
Semi-Annual Financial Statements 2024 |
|
|
Page 5 |
|
|
Transamerica Morgan Stanley Global Allocation VP
CONSOLIDATED SCHEDULE OF INVESTMENTS (continued)
At June 30, 2024
(unaudited)
|
|
|
|
|
|
|
|
|
| |
|
Shares |
|
|
Value |
|
| COMMON STOCKS (continued) |
|
| Sweden (continued) |
|
| Investor AB, B Shares |
|
|
14,167 |
|
|
|
$ 387,892 |
|
| L E Lundbergforetagen AB, B Shares |
|
|
621 |
|
|
|
30,701 |
|
| Lifco AB, B Shares |
|
|
1,898 |
|
|
|
52,110 |
|
| Nibe Industrier AB, B Shares |
|
|
12,730 |
|
|
|
53,975 |
|
| Saab AB, Class B |
|
|
2,594 |
|
|
|
62,409 |
|
| Sagax AB, Class B |
|
|
1,783 |
|
|
|
45,622 |
|
| Sandvik AB |
|
|
8,734 |
|
|
|
175,026 |
|
| Securitas AB, B Shares |
|
|
4,016 |
|
|
|
39,861 |
|
| Skandinaviska Enskilda Banken AB, Class A |
|
|
13,042 |
|
|
|
192,572 |
|
| Skanska AB, B Shares |
|
|
2,795 |
|
|
|
50,315 |
|
| SKF AB, B Shares |
|
|
2,798 |
|
|
|
56,176 |
|
| Svenska Cellulosa AB SCA, Class B |
|
|
4,967 |
|
|
|
73,364 |
|
| Svenska Handelsbanken AB, A Shares |
|
|
11,914 |
|
|
|
113,475 |
|
| Swedbank AB, A Shares |
|
|
6,897 |
|
|
|
141,922 |
|
| Swedish Orphan Biovitrum AB (B) |
|
|
1,601 |
|
|
|
42,838 |
|
| Tele2 AB, B Shares |
|
|
4,385 |
|
|
|
44,144 |
|
| Telefonaktiebolaget LM Ericsson, B Shares |
|
|
22,228 |
|
|
|
137,994 |
|
| Telia Co. AB |
|
|
19,047 |
|
|
|
51,090 |
|
| Trelleborg AB, B Shares |
|
|
1,749 |
|
|
|
68,052 |
|
| Volvo AB, A Shares |
|
|
1,641 |
|
|
|
42,794 |
|
| Volvo AB, B Shares |
|
|
12,884 |
|
|
|
329,545 |
|
| Volvo Car AB, B Shares (A)(B) |
|
|
5,767 |
|
|
|
17,839 |
|
|
|
|
|
|
|
|
|
|
|
|
|
|
|
|
|
|
|
|
4,358,309 |
|
|
|
|
|
|
|
|
|
|
| Switzerland - 1.5% |
|
| ABB Ltd. |
|
|
13,035 |
|
|
|
724,255 |
|
| Adecco Group AG |
|
|
1,370 |
|
|
|
45,471 |
|
| Alcon, Inc. |
|
|
4,091 |
|
|
|
365,274 |
|
| Avolta AG |
|
|
746 |
|
|
|
28,978 |
|
| Bachem Holding AG (A) |
|
|
279 |
|
|
|
25,604 |
|
| Baloise Holding AG |
|
|
381 |
|
|
|
67,087 |
|
| Banque Cantonale Vaudoise |
|
|
248 |
|
|
|
26,320 |
|
| Barry Callebaut AG |
|
|
29 |
|
|
|
47,255 |
|
| BKW AG |
|
|
173 |
|
|
|
27,593 |
|
| Chocoladefabriken Lindt & Spruengli AG |
|
|
9 |
|
|
|
208,937 |
|
| Chubb Ltd. |
|
|
1,190 |
|
|
|
303,545 |
|
| Cie Financiere Richemont SA, Class A |
|
|
4,396 |
|
|
|
686,225 |
|
| Clariant AG |
|
|
1,752 |
|
|
|
27,573 |
|
| Coca-Cola HBC AG |
|
|
1,822 |
|
|
|
62,140 |
|
| DSM-Firmenich AG |
|
|
1,516 |
|
|
|
171,448 |
|
| EMS-Chemie Holding AG |
|
|
58 |
|
|
|
47,545 |
|
| Garmin Ltd. |
|
|
449 |
|
|
|
73,151 |
|
| Geberit AG |
|
|
272 |
|
|
|
160,696 |
|
| Givaudan SA |
|
|
76 |
|
|
|
360,354 |
|
| Glencore PLC |
|
|
86,358 |
|
|
|
492,444 |
|
| Helvetia Holding AG |
|
|
309 |
|
|
|
41,787 |
|
| Holcim AG |
|
|
4,260 |
|
|
|
377,518 |
|
| Julius Baer Group Ltd. |
|
|
1,675 |
|
|
|
93,589 |
|
| Kuehne & Nagel International AG |
|
|
396 |
|
|
|
113,892 |
|
| Logitech International SA |
|
|
1,278 |
|
|
|
123,639 |
|
| Lonza Group AG |
|
|
612 |
|
|
|
334,047 |
|
| Nestle SA |
|
|
21,766 |
|
|
|
2,222,024 |
|
| Novartis AG |
|
|
15,962 |
|
|
|
1,708,571 |
|
| Partners Group Holding AG |
|
|
185 |
|
|
|
237,620 |
|
| Roche Holding AG |
|
|
6,032 |
|
|
|
1,682,176 |
|
| Sandoz Group AG |
|
|
3,377 |
|
|
|
122,308 |
|
|
|
|
|
|
|
|
|
|
| |
|
Shares |
|
|
Value |
|
| COMMON STOCKS (continued) |
|
| Switzerland (continued) |
|
| Schindler Holding AG |
|
|
528 |
|
|
|
$ 132,311 |
|
| SGS SA |
|
|
1,251 |
|
|
|
111,392 |
|
| Siemens Energy AG (B) |
|
|
4,695 |
|
|
|
122,233 |
|
| SIG Group AG |
|
|
2,485 |
|
|
|
45,499 |
|
| Sika AG |
|
|
1,252 |
|
|
|
358,411 |
|
| Sonova Holding AG |
|
|
420 |
|
|
|
129,770 |
|
| STMicroelectronics NV |
|
|
5,513 |
|
|
|
217,657 |
|
| Straumann Holding AG |
|
|
913 |
|
|
|
113,102 |
|
| Swatch Group AG |
|
|
660 |
|
|
|
65,173 |
|
| Swiss Life Holding AG |
|
|
243 |
|
|
|
178,670 |
|
| Swiss Prime Site AG |
|
|
632 |
|
|
|
59,933 |
|
| Swiss Re AG |
|
|
2,489 |
|
|
|
308,891 |
|
| Swisscom AG |
|
|
212 |
|
|
|
119,279 |
|
| Temenos AG |
|
|
522 |
|
|
|
36,022 |
|
| UBS Group AG |
|
|
26,649 |
|
|
|
784,536 |
|
| VAT Group AG (G) |
|
|
221 |
|
|
|
125,302 |
|
| Zurich Insurance Group AG |
|
|
1,198 |
|
|
|
638,836 |
|
|
|
|
|
|
|
|
|
|
|
|
|
|
|
|
|
|
|
|
14,556,083 |
|
|
|
|
|
|
|
|
|
|
| United Arab Emirates - 0.0% |
|
| NMC Health PLC (B)(C)(D)(H) |
|
|
77,617 |
|
|
|
0 |
|
|
|
|
|
|
|
|
|
|
|
| United Kingdom - 2.0% |
|
| 3i Group PLC |
|
|
8,174 |
|
|
|
316,802 |
|
| Admiral Group PLC |
|
|
2,188 |
|
|
|
72,327 |
|
| Amcor PLC |
|
|
4,251 |
|
|
|
41,575 |
|
| Anglo American PLC |
|
|
10,632 |
|
|
|
336,266 |
|
| Ashtead Group PLC |
|
|
3,608 |
|
|
|
240,905 |
|
| Associated British Foods PLC |
|
|
2,779 |
|
|
|
86,910 |
|
| AstraZeneca PLC |
|
|
13,051 |
|
|
|
2,038,463 |
|
| Atlassian Corp., Class A (B) |
|
|
460 |
|
|
|
81,365 |
|
| Auto Trader Group PLC (G) |
|
|
7,568 |
|
|
|
76,648 |
|
| Aviva PLC |
|
|
22,609 |
|
|
|
136,212 |
|
| BAE Systems PLC |
|
|
25,303 |
|
|
|
422,209 |
|
| Barclays PLC |
|
|
124,984 |
|
|
|
330,046 |
|
| Barratt Developments PLC |
|
|
8,160 |
|
|
|
48,708 |
|
| Berkeley Group Holdings PLC |
|
|
901 |
|
|
|
52,255 |
|
| BP PLC |
|
|
141,120 |
|
|
|
847,708 |
|
| British American Tobacco PLC |
|
|
16,621 |
|
|
|
510,557 |
|
| BT Group PLC (A) |
|
|
53,562 |
|
|
|
95,028 |
|
| Bunzl PLC |
|
|
2,812 |
|
|
|
106,995 |
|
| Burberry Group PLC |
|
|
2,945 |
|
|
|
32,678 |
|
| Centrica PLC |
|
|
44,739 |
|
|
|
76,292 |
|
| CNH Industrial NV |
|
|
2,524 |
|
|
|
25,568 |
|
| Coca-Cola Europacific Partners PLC |
|
|
1,718 |
|
|
|
125,191 |
|
| Compass Group PLC |
|
|
14,259 |
|
|
|
389,336 |
|
| Croda International PLC |
|
|
1,107 |
|
|
|
55,247 |
|
| Diageo PLC |
|
|
18,692 |
|
|
|
588,233 |
|
| Endeavour Mining PLC |
|
|
1,544 |
|
|
|
32,907 |
|
| Entain PLC |
|
|
5,304 |
|
|
|
42,240 |
|
| Ferguson PLC |
|
|
597 |
|
|
|
115,609 |
|
| G4S Ltd. (B)(C)(D) |
|
|
27,853 |
|
|
|
86,262 |
|
| GSK PLC |
|
|
34,593 |
|
|
|
668,835 |
|
| Haleon PLC |
|
|
57,754 |
|
|
|
235,520 |
|
| Halma PLC |
|
|
3,161 |
|
|
|
108,127 |
|
| Hargreaves Lansdown PLC |
|
|
2,988 |
|
|
|
42,757 |
|
| HSBC Holdings PLC |
|
|
156,576 |
|
|
|
1,353,627 |
|
The Notes to Financial Statements are an integral part of this report.
|
|
|
|
|
| Transamerica Series Trust |
|
|
|
Semi-Annual Financial Statements 2024 |
|
|
Page 6 |
|
|
Transamerica Morgan Stanley Global Allocation VP
CONSOLIDATED SCHEDULE OF INVESTMENTS (continued)
At June 30, 2024
(unaudited)
|
|
|
|
|
|
|
|
|
| |
|
Shares |
|
|
Value |
|
| COMMON STOCKS (continued) |
|
| United Kingdom (continued) |
|
| Imperial Brands PLC |
|
|
6,799 |
|
|
|
$ 173,955 |
|
| Informa PLC |
|
|
11,326 |
|
|
|
122,527 |
|
| InterContinental Hotels Group PLC |
|
|
1,361 |
|
|
|
143,244 |
|
| Intertek Group PLC |
|
|
1,354 |
|
|
|
82,054 |
|
| J Sainsbury PLC |
|
|
14,027 |
|
|
|
45,215 |
|
| JD Sports Fashion PLC |
|
|
21,042 |
|
|
|
31,786 |
|
| Kingfisher PLC |
|
|
15,739 |
|
|
|
49,500 |
|
| Land Securities Group PLC, REIT |
|
|
5,911 |
|
|
|
46,290 |
|
| Legal & General Group PLC |
|
|
50,157 |
|
|
|
143,926 |
|
| Lloyds Banking Group PLC |
|
|
529,320 |
|
|
|
366,273 |
|
| London Stock Exchange Group PLC |
|
|
3,822 |
|
|
|
454,150 |
|
| M&G PLC |
|
|
18,789 |
|
|
|
48,452 |
|
| Melrose Industries PLC |
|
|
10,939 |
|
|
|
76,524 |
|
| Mondi PLC |
|
|
3,724 |
|
|
|
71,483 |
|
| National Grid PLC |
|
|
40,714 |
|
|
|
454,244 |
|
| NatWest Group PLC |
|
|
54,210 |
|
|
|
213,667 |
|
| Next PLC |
|
|
1,005 |
|
|
|
114,795 |
|
| Pearson PLC |
|
|
5,135 |
|
|
|
64,314 |
|
| Pentair PLC |
|
|
483 |
|
|
|
37,032 |
|
| Persimmon PLC |
|
|
2,665 |
|
|
|
45,546 |
|
| Phoenix Group Holdings PLC |
|
|
5,783 |
|
|
|
38,123 |
|
| Reckitt Benckiser Group PLC |
|
|
5,899 |
|
|
|
319,305 |
|
| RELX PLC |
|
|
15,722 |
|
|
|
723,221 |
|
| Rentokil Initial PLC |
|
|
21,109 |
|
|
|
123,066 |
|
| Rio Tinto PLC |
|
|
9,497 |
|
|
|
624,388 |
|
| Rolls-Royce Holdings PLC (B) |
|
|
70,025 |
|
|
|
404,353 |
|
| Sage Group PLC |
|
|
8,492 |
|
|
|
116,848 |
|
| Schroders PLC |
|
|
6,729 |
|
|
|
30,945 |
|
| Segro PLC, REIT |
|
|
10,594 |
|
|
|
120,286 |
|
| Severn Trent PLC |
|
|
2,268 |
|
|
|
68,234 |
|
| Shell PLC |
|
|
53,595 |
|
|
|
1,920,018 |
|
| Smith & Nephew PLC |
|
|
7,398 |
|
|
|
91,704 |
|
| Smiths Group PLC |
|
|
2,890 |
|
|
|
62,288 |
|
| Spirax Group PLC |
|
|
616 |
|
|
|
66,032 |
|
| SSE PLC |
|
|
9,164 |
|
|
|
207,299 |
|
| Standard Chartered PLC |
|
|
18,313 |
|
|
|
165,750 |
|
| Taylor Wimpey PLC |
|
|
29,576 |
|
|
|
53,146 |
|
| Tesco PLC |
|
|
58,883 |
|
|
|
227,768 |
|
| Unilever PLC |
|
|
21,098 |
|
|
|
1,158,810 |
|
| United Utilities Group PLC |
|
|
5,759 |
|
|
|
71,533 |
|
| Vodafone Group PLC |
|
|
191,988 |
|
|
|
169,302 |
|
| Whitbread PLC |
|
|
1,537 |
|
|
|
57,802 |
|
| Willis Towers Watson PLC |
|
|
300 |
|
|
|
78,642 |
|
| Wise PLC, Class A (B) |
|
|
5,253 |
|
|
|
45,254 |
|
| WPP PLC |
|
|
8,858 |
|
|
|
81,114 |
|
|
|
|
|
|
|
|
|
|
|
|
|
|
|
|
|
|
|
|
19,629,616 |
|
|
|
|
|
|
|
|
|
|
| United States - 13.8% |
|
| 3M Co. |
|
|
1,620 |
|
|
|
165,548 |
|
| A.O. Smith Corp. |
|
|
354 |
|
|
|
28,950 |
|
| Abbott Laboratories |
|
|
5,120 |
|
|
|
532,019 |
|
| AbbVie, Inc. |
|
|
5,150 |
|
|
|
883,328 |
|
| ABIOMED, Inc. (B)(C)(D) |
|
|
56 |
|
|
|
57 |
|
| Adobe, Inc. (B) |
|
|
1,322 |
|
|
|
734,424 |
|
| Advanced Micro Devices, Inc. (B) |
|
|
4,811 |
|
|
|
780,392 |
|
| AECOM |
|
|
394 |
|
|
|
34,727 |
|
|
|
|
|
|
|
|
|
|
| |
|
Shares |
|
|
Value |
|
| COMMON STOCKS (continued) |
|
| United States (continued) |
|
| AES Corp. |
|
|
2,038 |
|
|
|
$ 35,808 |
|
| Aflac, Inc. |
|
|
1,590 |
|
|
|
142,003 |
|
| Agilent Technologies, Inc. |
|
|
847 |
|
|
|
109,797 |
|
| Air Products & Chemicals, Inc. |
|
|
658 |
|
|
|
169,797 |
|
| Airbnb, Inc., Class A (B) |
|
|
1,314 |
|
|
|
199,242 |
|
| Akamai Technologies, Inc. (B) |
|
|
443 |
|
|
|
39,905 |
|
| Albemarle Corp. |
|
|
350 |
|
|
|
33,432 |
|
| Albertsons Cos., Inc., Class A |
|
|
1,005 |
|
|
|
19,849 |
|
| Alexandria Real Estate Equities, Inc., REIT |
|
|
461 |
|
|
|
53,923 |
|
| Align Technology, Inc. (B) |
|
|
211 |
|
|
|
50,942 |
|
| Alliant Energy Corp. |
|
|
751 |
|
|
|
38,226 |
|
| Allstate Corp. |
|
|
766 |
|
|
|
122,300 |
|
| Ally Financial, Inc. |
|
|
791 |
|
|
|
31,379 |
|
| Alnylam Pharmaceuticals, Inc. (B) |
|
|
281 |
|
|
|
68,283 |
|
| Alphabet, Inc., Class A |
|
|
17,393 |
|
|
|
3,168,135 |
|
| Alphabet, Inc., Class C |
|
|
14,997 |
|
|
|
2,750,750 |
|
| Altria Group, Inc. |
|
|
5,019 |
|
|
|
228,615 |
|
| Amazon.com, Inc. (B) |
|
|
27,507 |
|
|
|
5,315,728 |
|
| Ameren Corp. |
|
|
779 |
|
|
|
55,395 |
|
| American Electric Power Co., Inc. |
|
|
1,538 |
|
|
|
134,944 |
|
| American Express Co. |
|
|
1,679 |
|
|
|
388,772 |
|
| American Financial Group, Inc. |
|
|
209 |
|
|
|
25,711 |
|
| American Homes 4 Rent, Class A, REIT |
|
|
958 |
|
|
|
35,599 |
|
| American International Group, Inc. |
|
|
1,961 |
|
|
|
145,585 |
|
| American Tower Corp., REIT |
|
|
1,367 |
|
|
|
265,717 |
|
| American Water Works Co., Inc. |
|
|
566 |
|
|
|
73,105 |
|
| Ameriprise Financial, Inc. |
|
|
293 |
|
|
|
125,167 |
|
| AMETEK, Inc. |
|
|
672 |
|
|
|
112,029 |
|
| Amgen, Inc. |
|
|
1,561 |
|
|
|
487,734 |
|
| Amphenol Corp., Class A |
|
|
3,574 |
|
|
|
240,780 |
|
| Analog Devices, Inc. |
|
|
1,468 |
|
|
|
335,086 |
|
| Annaly Capital Management, Inc., REIT |
|
|
1,465 |
|
|
|
27,923 |
|
| ANSYS, Inc. (B) |
|
|
258 |
|
|
|
82,947 |
|
| Aon PLC, Class A |
|
|
586 |
|
|
|
172,038 |
|
| APA Corp. |
|
|
1,066 |
|
|
|
31,383 |
|
| Apollo Global Management, Inc. |
|
|
1,166 |
|
|
|
137,670 |
|
| Apple, Inc. |
|
|
42,902 |
|
|
|
9,036,019 |
|
| Applied Materials, Inc. |
|
|
2,488 |
|
|
|
587,143 |
|
| AppLovin Corp., Class A (B) |
|
|
539 |
|
|
|
44,856 |
|
| Archer-Daniels-Midland Co. |
|
|
1,474 |
|
|
|
89,103 |
|
| Ares Management Corp., Class A |
|
|
524 |
|
|
|
69,839 |
|
| Arista Networks, Inc. (B) |
|
|
801 |
|
|
|
280,734 |
|
| Arthur J Gallagher & Co. |
|
|
640 |
|
|
|
165,958 |
|
| Aspen Technology, Inc. (B) |
|
|
84 |
|
|
|
16,685 |
|
| Assurant, Inc. |
|
|
152 |
|
|
|
25,270 |
|
| AT&T, Inc. |
|
|
20,868 |
|
|
|
398,787 |
|
| Atmos Energy Corp. |
|
|
441 |
|
|
|
51,443 |
|
| Autodesk, Inc. (B) |
|
|
634 |
|
|
|
156,883 |
|
| Automatic Data Processing, Inc. |
|
|
1,205 |
|
|
|
287,621 |
|
| AutoZone, Inc. (B) |
|
|
51 |
|
|
|
151,169 |
|
| AvalonBay Communities, Inc., REIT |
|
|
415 |
|
|
|
85,859 |
|
| Avantor, Inc. (B) |
|
|
1,961 |
|
|
|
41,573 |
|
| Avery Dennison Corp. |
|
|
234 |
|
|
|
51,164 |
|
| Axon Enterprise, Inc. (B) |
|
|
210 |
|
|
|
61,790 |
|
| Baker Hughes Co. |
|
|
2,889 |
|
|
|
101,606 |
|
| Ball Corp. |
|
|
916 |
|
|
|
54,978 |
|
The Notes to Financial Statements are an integral part of this report.
|
|
|
|
|
| Transamerica Series Trust |
|
|
|
Semi-Annual Financial Statements 2024 |
|
|
Page 7 |
|
|
Transamerica Morgan Stanley Global Allocation VP
CONSOLIDATED SCHEDULE OF INVESTMENTS (continued)
At June 30, 2024
(unaudited)
|
|
|
|
|
|
|
|
|
| |
|
Shares |
|
|
Value |
|
| COMMON STOCKS (continued) |
|
| United States (continued) |
|
| Bank of America Corp. |
|
|
20,589 |
|
|
|
$ 818,825 |
|
| Bank of New York Mellon Corp. |
|
|
2,198 |
|
|
|
131,638 |
|
| Bath & Body Works, Inc. |
|
|
630 |
|
|
|
24,602 |
|
| Baxter International, Inc. |
|
|
1,508 |
|
|
|
50,443 |
|
| Becton Dickinson & Co. |
|
|
856 |
|
|
|
200,056 |
|
| Bentley Systems, Inc., Class B |
|
|
470 |
|
|
|
23,199 |
|
| Berkshire Hathaway, Inc., Class B (B) |
|
|
3,826 |
|
|
|
1,556,417 |
|
| Best Buy Co., Inc. |
|
|
573 |
|
|
|
48,298 |
|
| Biogen, Inc. (B) |
|
|
425 |
|
|
|
98,524 |
|
| BioMarin Pharmaceutical, Inc. (B) |
|
|
552 |
|
|
|
45,446 |
|
| Bio-Rad Laboratories, Inc., Class A (B) |
|
|
59 |
|
|
|
16,113 |
|
| Bio-Techne Corp. |
|
|
459 |
|
|
|
32,887 |
|
| BlackRock, Inc. |
|
|
434 |
|
|
|
341,697 |
|
| Blackstone, Inc. |
|
|
2,079 |
|
|
|
257,380 |
|
| Block, Inc. (B) |
|
|
1,599 |
|
|
|
103,120 |
|
| Boeing Co. (B) |
|
|
1,693 |
|
|
|
308,143 |
|
| Booking Holdings, Inc. |
|
|
100 |
|
|
|
396,150 |
|
| Booz Allen Hamilton Holding Corp. |
|
|
376 |
|
|
|
57,866 |
|
| Boston Properties, Inc., REIT |
|
|
435 |
|
|
|
26,779 |
|
| Boston Scientific Corp. (B) |
|
|
4,349 |
|
|
|
334,917 |
|
| Bristol-Myers Squibb Co. |
|
|
5,963 |
|
|
|
247,643 |
|
| Broadcom, Inc. |
|
|
1,321 |
|
|
|
2,120,905 |
|
| Broadridge Financial Solutions, Inc., ADR |
|
|
345 |
|
|
|
67,965 |
|
| Brookfield Renewable Corp., Class A |
|
|
1,103 |
|
|
|
31,251 |
|
| Brown & Brown, Inc. |
|
|
714 |
|
|
|
63,839 |
|
| Brown-Forman Corp., Class B |
|
|
539 |
|
|
|
23,279 |
|
| Builders FirstSource, Inc. (B) |
|
|
359 |
|
|
|
49,689 |
|
| Bunge Global SA |
|
|
416 |
|
|
|
44,416 |
|
| Burlington Stores, Inc. (B) |
|
|
188 |
|
|
|
45,120 |
|
| Cadence Design Systems, Inc. (B) |
|
|
819 |
|
|
|
252,047 |
|
| Caesars Entertainment, Inc. (B) |
|
|
638 |
|
|
|
25,354 |
|
| Camden Property Trust, REIT |
|
|
311 |
|
|
|
33,933 |
|
| Campbell Soup Co. |
|
|
561 |
|
|
|
25,352 |
|
| Capital One Financial Corp. |
|
|
1,112 |
|
|
|
153,956 |
|
| Cardinal Health, Inc. |
|
|
711 |
|
|
|
69,906 |
|
| Carlisle Cos., Inc. |
|
|
139 |
|
|
|
56,324 |
|
| Carlyle Group, Inc. |
|
|
685 |
|
|
|
27,503 |
|
| CarMax, Inc. (B) |
|
|
460 |
|
|
|
33,736 |
|
| Carnival Corp. (B) |
|
|
2,945 |
|
|
|
55,130 |
|
| Carrier Global Corp. |
|
|
2,316 |
|
|
|
146,093 |
|
| Catalent, Inc. (B) |
|
|
532 |
|
|
|
29,914 |
|
| Caterpillar, Inc. |
|
|
1,454 |
|
|
|
484,327 |
|
| Cboe Global Markets, Inc. |
|
|
315 |
|
|
|
53,569 |
|
| CBRE Group, Inc., Class A (B) |
|
|
904 |
|
|
|
80,555 |
|
| CDW Corp. |
|
|
396 |
|
|
|
88,641 |
|
| Celanese Corp. |
|
|
326 |
|
|
|
43,974 |
|
| Celsius Holdings, Inc. (B) |
|
|
457 |
|
|
|
26,090 |
|
| Cencora, Inc. |
|
|
522 |
|
|
|
117,607 |
|
| Centene Corp. (B) |
|
|
1,562 |
|
|
|
103,561 |
|
| CenterPoint Energy, Inc. |
|
|
1,851 |
|
|
|
57,344 |
|
| CF Industries Holdings, Inc. |
|
|
540 |
|
|
|
40,025 |
|
| CH Robinson Worldwide, Inc. |
|
|
335 |
|
|
|
29,520 |
|
| Charles River Laboratories International, Inc. (B) |
|
|
151 |
|
|
|
31,194 |
|
| Charles Schwab Corp. |
|
|
4,392 |
|
|
|
323,646 |
|
| Charter Communications, Inc., Class A (B) |
|
|
275 |
|
|
|
82,214 |
|
|
|
|
|
|
|
|
|
|
| |
|
Shares |
|
|
Value |
|
| COMMON STOCKS (continued) |
|
| United States (continued) |
|
| Cheniere Energy, Inc. |
|
|
673 |
|
|
|
$ 117,661 |
|
| Chesapeake Energy Corp. |
|
|
320 |
|
|
|
26,301 |
|
| Chevron Corp. |
|
|
5,090 |
|
|
|
796,178 |
|
| Chipotle Mexican Grill, Inc. (B) |
|
|
4,100 |
|
|
|
256,865 |
|
| Chord Energy Corp. |
|
|
179 |
|
|
|
30,015 |
|
| Church & Dwight Co., Inc. |
|
|
724 |
|
|
|
75,064 |
|
| Cigna Group |
|
|
825 |
|
|
|
272,720 |
|
| Cincinnati Financial Corp. |
|
|
456 |
|
|
|
53,854 |
|
| Cintas Corp. |
|
|
269 |
|
|
|
188,370 |
|
| Cisco Systems, Inc. |
|
|
11,851 |
|
|
|
563,041 |
|
| Citigroup, Inc. |
|
|
5,561 |
|
|
|
352,901 |
|
| Citizens Financial Group, Inc. |
|
|
1,327 |
|
|
|
47,812 |
|
| Cleveland-Cliffs, Inc. (B) |
|
|
1,471 |
|
|
|
22,639 |
|
| Clorox Co. |
|
|
366 |
|
|
|
49,948 |
|
| Cloudflare, Inc., Class A (B) |
|
|
876 |
|
|
|
72,559 |
|
| CME Group, Inc. |
|
|
1,052 |
|
|
|
206,823 |
|
| CMS Energy Corp. |
|
|
870 |
|
|
|
51,791 |
|
| Coca-Cola Co. |
|
|
11,903 |
|
|
|
757,626 |
|
| Cognizant Technology Solutions Corp., Class A |
|
|
1,455 |
|
|
|
98,940 |
|
| Coinbase Global, Inc., Class A (B) |
|
|
569 |
|
|
|
126,449 |
|
| Colgate-Palmolive Co. |
|
|
2,278 |
|
|
|
221,057 |
|
| Comcast Corp., Class A |
|
|
11,657 |
|
|
|
456,488 |
|
| Conagra Brands, Inc. |
|
|
1,384 |
|
|
|
39,333 |
|
| Confluent, Inc., Class A (B) |
|
|
592 |
|
|
|
17,482 |
|
| ConocoPhillips |
|
|
3,395 |
|
|
|
388,320 |
|
| Consolidated Edison, Inc. |
|
|
1,008 |
|
|
|
90,135 |
|
| Constellation Brands, Inc., Class A |
|
|
482 |
|
|
|
124,009 |
|
| Constellation Energy Corp. |
|
|
923 |
|
|
|
184,849 |
|
| Cooper Cos., Inc. |
|
|
589 |
|
|
|
51,420 |
|
| Copart, Inc. (B) |
|
|
2,539 |
|
|
|
137,512 |
|
| Corebridge Financial, Inc. |
|
|
729 |
|
|
|
21,228 |
|
| Corning, Inc. |
|
|
2,386 |
|
|
|
92,696 |
|
| Corpay, Inc. (B) |
|
|
199 |
|
|
|
53,016 |
|
| Corteva, Inc. |
|
|
2,054 |
|
|
|
110,793 |
|
| CoStar Group, Inc. (B) |
|
|
1,204 |
|
|
|
89,265 |
|
| Costco Wholesale Corp. |
|
|
1,314 |
|
|
|
1,116,887 |
|
| Coterra Energy, Inc. |
|
|
2,164 |
|
|
|
57,714 |
|
| CRH PLC |
|
|
2,031 |
|
|
|
152,284 |
|
| Crowdstrike Holdings, Inc., Class A (B) |
|
|
678 |
|
|
|
259,803 |
|
| Crown Castle, Inc., REIT |
|
|
1,271 |
|
|
|
124,177 |
|
| Crown Holdings, Inc. |
|
|
349 |
|
|
|
25,962 |
|
| CSX Corp. |
|
|
5,754 |
|
|
|
192,471 |
|
| Cummins, Inc. |
|
|
393 |
|
|
|
108,834 |
|
| CVS Health Corp. |
|
|
3,688 |
|
|
|
217,813 |
|
| D.R. Horton, Inc. |
|
|
868 |
|
|
|
122,327 |
|
| Danaher Corp. |
|
|
2,057 |
|
|
|
513,941 |
|
| Darden Restaurants, Inc. |
|
|
352 |
|
|
|
53,265 |
|
| Datadog, Inc., Class A (B) |
|
|
807 |
|
|
|
104,660 |
|
| DaVita, Inc. (B) |
|
|
157 |
|
|
|
21,755 |
|
| Dayforce, Inc. (B) |
|
|
434 |
|
|
|
21,526 |
|
| Deckers Outdoor Corp. (B) |
|
|
75 |
|
|
|
72,596 |
|
| Deere & Co. |
|
|
771 |
|
|
|
288,069 |
|
| Dell Technologies, Inc., Class C |
|
|
800 |
|
|
|
110,328 |
|
| Delta Air Lines, Inc. |
|
|
470 |
|
|
|
22,297 |
|
| Devon Energy Corp. |
|
|
1,836 |
|
|
|
87,026 |
|
The Notes to Financial Statements are an integral part of this report.
|
|
|
|
|
| Transamerica Series Trust |
|
|
|
Semi-Annual Financial Statements 2024 |
|
|
Page 8 |
|
|
Transamerica Morgan Stanley Global Allocation VP
CONSOLIDATED SCHEDULE OF INVESTMENTS (continued)
At June 30, 2024
(unaudited)
|
|
|
|
|
|
|
|
|
| |
|
Shares |
|
|
Value |
|
| COMMON STOCKS (continued) |
|
| United States (continued) |
|
| Dexcom, Inc. (B) |
|
|
1,184 |
|
|
|
$ 134,242 |
|
| Diamondback Energy, Inc. |
|
|
490 |
|
|
|
98,093 |
|
| Dick’s Sporting Goods, Inc. |
|
|
174 |
|
|
|
37,384 |
|
| Digital Realty Trust, Inc., REIT |
|
|
910 |
|
|
|
138,366 |
|
| Discover Financial Services |
|
|
735 |
|
|
|
96,145 |
|
| DocuSign, Inc. (B) |
|
|
606 |
|
|
|
32,421 |
|
| Dollar General Corp. |
|
|
640 |
|
|
|
84,627 |
|
| Dollar Tree, Inc. (B) |
|
|
607 |
|
|
|
64,809 |
|
| Dominion Energy, Inc. |
|
|
2,454 |
|
|
|
120,246 |
|
| Domino’s Pizza, Inc. |
|
|
102 |
|
|
|
52,666 |
|
| DoorDash, Inc., Class A (B) |
|
|
842 |
|
|
|
91,593 |
|
| Dover Corp. |
|
|
401 |
|
|
|
72,360 |
|
| Dow, Inc. |
|
|
2,059 |
|
|
|
109,230 |
|
| DraftKings, Inc., Class A (B) |
|
|
1,293 |
|
|
|
49,354 |
|
| DTE Energy Co. |
|
|
603 |
|
|
|
66,939 |
|
| Duke Energy Corp. |
|
|
2,243 |
|
|
|
224,816 |
|
| DuPont de Nemours, Inc. |
|
|
1,219 |
|
|
|
98,117 |
|
| Dynatrace, Inc. (B) |
|
|
793 |
|
|
|
35,479 |
|
| Eastman Chemical Co. |
|
|
341 |
|
|
|
33,408 |
|
| Eaton Corp. PLC |
|
|
1,169 |
|
|
|
366,540 |
|
| eBay, Inc. |
|
|
1,507 |
|
|
|
80,956 |
|
| Ecolab, Inc. |
|
|
760 |
|
|
|
180,880 |
|
| Edison International |
|
|
1,122 |
|
|
|
80,571 |
|
| Edwards Lifesciences Corp. (B) |
|
|
1,771 |
|
|
|
163,587 |
|
| Electronic Arts, Inc. |
|
|
739 |
|
|
|
102,965 |
|
| Elevance Health, Inc. |
|
|
680 |
|
|
|
368,465 |
|
| Eli Lilly & Co. |
|
|
2,370 |
|
|
|
2,145,751 |
|
| EMCOR Group, Inc. |
|
|
141 |
|
|
|
51,476 |
|
| Emerson Electric Co. |
|
|
1,669 |
|
|
|
183,857 |
|
| Enphase Energy, Inc. (B) |
|
|
401 |
|
|
|
39,984 |
|
| Entegris, Inc. |
|
|
451 |
|
|
|
61,065 |
|
| Entergy Corp. |
|
|
618 |
|
|
|
66,126 |
|
| EOG Resources, Inc. |
|
|
1,687 |
|
|
|
212,343 |
|
| EPAM Systems, Inc. (B) |
|
|
169 |
|
|
|
31,791 |
|
| EQT Corp. |
|
|
1,203 |
|
|
|
44,487 |
|
| Equifax, Inc. |
|
|
366 |
|
|
|
88,740 |
|
| Equinix, Inc., REIT |
|
|
279 |
|
|
|
211,091 |
|
| Equitable Holdings, Inc. |
|
|
958 |
|
|
|
39,144 |
|
| Equity LifeStyle Properties, Inc., REIT |
|
|
516 |
|
|
|
33,607 |
|
| Equity Residential, REIT |
|
|
995 |
|
|
|
68,993 |
|
| Erie Indemnity Co., Class A |
|
|
74 |
|
|
|
26,818 |
|
| Essential Utilities, Inc. |
|
|
754 |
|
|
|
28,147 |
|
| Essex Property Trust, Inc., REIT |
|
|
188 |
|
|
|
51,174 |
|
| Estee Lauder Cos., Inc., Class A |
|
|
678 |
|
|
|
72,139 |
|
| Etsy, Inc. (B) |
|
|
352 |
|
|
|
20,761 |
|
| Evergy, Inc. |
|
|
669 |
|
|
|
35,437 |
|
| Eversource Energy |
|
|
1,019 |
|
|
|
57,788 |
|
| Exact Sciences Corp. (B) |
|
|
550 |
|
|
|
23,238 |
|
| Exelon Corp. |
|
|
2,930 |
|
|
|
101,407 |
|
| Expedia Group, Inc. (B) |
|
|
388 |
|
|
|
48,884 |
|
| Expeditors International of Washington, Inc. |
|
|
418 |
|
|
|
52,162 |
|
| Extra Space Storage, Inc., REIT |
|
|
621 |
|
|
|
96,510 |
|
| Exxon Mobil Corp. |
|
|
12,993 |
|
|
|
1,495,754 |
|
| F5, Inc. (B) |
|
|
173 |
|
|
|
29,796 |
|
| FactSet Research Systems, Inc. |
|
|
111 |
|
|
|
45,318 |
|
| Fair Isaac Corp. (B) |
|
|
74 |
|
|
|
110,161 |
|
|
|
|
|
|
|
|
|
|
| |
|
Shares |
|
|
Value |
|
| COMMON STOCKS (continued) |
|
| United States (continued) |
|
| Fastenal Co. |
|
|
1,685 |
|
|
|
$ 105,885 |
|
| FedEx Corp. |
|
|
685 |
|
|
|
205,390 |
|
| Fidelity National Financial, Inc. |
|
|
762 |
|
|
|
37,658 |
|
| Fidelity National Information Services, Inc. |
|
|
1,683 |
|
|
|
126,831 |
|
| Fifth Third Bancorp |
|
|
1,980 |
|
|
|
72,250 |
|
| First Citizens BancShares, Inc., Class A |
|
|
30 |
|
|
|
50,508 |
|
| First Republic Bank (B) |
|
|
870 |
|
|
|
17 |
|
| First Solar, Inc. (B) |
|
|
294 |
|
|
|
66,285 |
|
| FirstEnergy Corp. |
|
|
1,599 |
|
|
|
61,194 |
|
| Fiserv, Inc. (B) |
|
|
1,723 |
|
|
|
256,796 |
|
| Ford Motor Co. |
|
|
11,242 |
|
|
|
140,975 |
|
| Fortinet, Inc. (B) |
|
|
1,906 |
|
|
|
114,875 |
|
| Fortive Corp. |
|
|
1,022 |
|
|
|
75,730 |
|
| Fortune Brands Innovations, Inc. |
|
|
367 |
|
|
|
23,833 |
|
| Fox Corp., Class A |
|
|
707 |
|
|
|
24,300 |
|
| Fox Corp., Class B |
|
|
417 |
|
|
|
13,352 |
|
| Franklin Resources, Inc. |
|
|
842 |
|
|
|
18,819 |
|
| Freeport-McMoRan, Inc. |
|
|
4,147 |
|
|
|
201,544 |
|
| Gaming & Leisure Properties, Inc., REIT |
|
|
791 |
|
|
|
35,761 |
|
| Gartner, Inc. (B) |
|
|
231 |
|
|
|
103,733 |
|
| GE HealthCare Technologies, Inc. |
|
|
1,278 |
|
|
|
99,582 |
|
| GE Vernova, Inc. (B) |
|
|
800 |
|
|
|
137,208 |
|
| Gen Digital, Inc. |
|
|
1,692 |
|
|
|
42,266 |
|
| General Dynamics Corp. |
|
|
680 |
|
|
|
197,295 |
|
| General Electric Co. |
|
|
3,255 |
|
|
|
517,447 |
|
| General Mills, Inc. |
|
|
1,638 |
|
|
|
103,620 |
|
| General Motors Co. |
|
|
3,362 |
|
|
|
156,199 |
|
| Genuine Parts Co. |
|
|
409 |
|
|
|
56,573 |
|
| Gilead Sciences, Inc. |
|
|
3,620 |
|
|
|
248,368 |
|
| Global Payments, Inc. |
|
|
748 |
|
|
|
72,332 |
|
| GoDaddy, Inc., Class A (B) |
|
|
399 |
|
|
|
55,744 |
|
| Goldman Sachs Group, Inc. |
|
|
942 |
|
|
|
426,085 |
|
| Graco, Inc. |
|
|
492 |
|
|
|
39,006 |
|
| GRAIL, Inc. (B) |
|
|
77 |
|
|
|
1,183 |
|
| Halliburton Co. |
|
|
2,583 |
|
|
|
87,254 |
|
| Hartford Financial Services Group, Inc. |
|
|
867 |
|
|
|
87,168 |
|
| HCA Healthcare, Inc. |
|
|
583 |
|
|
|
187,306 |
|
| Healthpeak Properties, Inc., REIT |
|
|
2,060 |
|
|
|
40,376 |
|
| HEICO Corp. |
|
|
128 |
|
|
|
28,622 |
|
| HEICO Corp., Class A |
|
|
221 |
|
|
|
39,232 |
|
| Henry Schein, Inc. (B) |
|
|
375 |
|
|
|
24,038 |
|
| Hershey Co. |
|
|
429 |
|
|
|
78,863 |
|
| Hess Corp. |
|
|
799 |
|
|
|
117,868 |
|
| Hewlett Packard Enterprise Co. |
|
|
3,824 |
|
|
|
80,954 |
|
| HF Sinclair Corp. |
|
|
479 |
|
|
|
25,550 |
|
| Hilton Worldwide Holdings, Inc. |
|
|
742 |
|
|
|
161,904 |
|
| Hologic, Inc. (B) |
|
|
693 |
|
|
|
51,455 |
|
| Home Depot, Inc. |
|
|
2,929 |
|
|
|
1,008,279 |
|
| Honeywell International, Inc. |
|
|
1,903 |
|
|
|
406,367 |
|
| Hormel Foods Corp. |
|
|
879 |
|
|
|
26,801 |
|
| Host Hotels & Resorts, Inc., REIT |
|
|
2,080 |
|
|
|
37,398 |
|
| Howmet Aerospace, Inc. |
|
|
1,138 |
|
|
|
88,343 |
|
| HP, Inc. |
|
|
2,872 |
|
|
|
100,577 |
|
| Hubbell, Inc. |
|
|
157 |
|
|
|
57,380 |
|
| HubSpot, Inc. (B) |
|
|
142 |
|
|
|
83,750 |
|
| Humana, Inc. |
|
|
355 |
|
|
|
132,646 |
|
The Notes to Financial Statements are an integral part of this report.
|
|
|
|
|
| Transamerica Series Trust |
|
|
|
Semi-Annual Financial Statements 2024 |
|
|
Page 9 |
|
|
Transamerica Morgan Stanley Global Allocation VP
CONSOLIDATED SCHEDULE OF INVESTMENTS (continued)
At June 30, 2024
(unaudited)
|
|
|
|
|
|
|
|
|
| |
|
Shares |
|
|
Value |
|
| COMMON STOCKS (continued) |
|
| United States (continued) |
|
| Huntington Bancshares, Inc. |
|
|
4,209 |
|
|
$ |
55,475 |
|
| Huntington Ingalls Industries, Inc. |
|
|
115 |
|
|
|
28,328 |
|
| Hyatt Hotels Corp., Class A |
|
|
133 |
|
|
|
20,205 |
|
| IDEX Corp. |
|
|
221 |
|
|
|
44,465 |
|
| IDEXX Laboratories, Inc. (B) |
|
|
247 |
|
|
|
120,338 |
|
| Illinois Tool Works, Inc. |
|
|
871 |
|
|
|
206,392 |
|
| Illumina, Inc. (B) |
|
|
462 |
|
|
|
48,224 |
|
| Incyte Corp. (B) |
|
|
458 |
|
|
|
27,764 |
|
| Ingersoll Rand, Inc. |
|
|
1,182 |
|
|
|
107,373 |
|
| Insulet Corp. (B) |
|
|
206 |
|
|
|
41,571 |
|
| Intel Corp. |
|
|
12,639 |
|
|
|
391,430 |
|
| Intercontinental Exchange, Inc. |
|
|
1,676 |
|
|
|
229,428 |
|
| International Business Machines Corp. |
|
|
2,620 |
|
|
|
453,129 |
|
| International Flavors & Fragrances, Inc. |
|
|
745 |
|
|
|
70,931 |
|
| International Paper Co. |
|
|
956 |
|
|
|
41,251 |
|
| Interpublic Group of Cos., Inc. |
|
|
1,114 |
|
|
|
32,406 |
|
| Intuit, Inc. |
|
|
835 |
|
|
|
548,770 |
|
| Intuitive Surgical, Inc. (B) |
|
|
1,051 |
|
|
|
467,537 |
|
| Invitation Homes, Inc., REIT |
|
|
1,782 |
|
|
|
63,956 |
|
| IQVIA Holdings, Inc. (B) |
|
|
535 |
|
|
|
113,120 |
|
| Iron Mountain, Inc., REIT |
|
|
863 |
|
|
|
77,342 |
|
| J.M. Smucker Co. |
|
|
306 |
|
|
|
33,366 |
|
| Jabil, Inc. |
|
|
351 |
|
|
|
38,185 |
|
| Jack Henry & Associates, Inc. |
|
|
214 |
|
|
|
35,528 |
|
| Jacobs Solutions, Inc. |
|
|
368 |
|
|
|
51,413 |
|
| JB Hunt Transport Services, Inc. |
|
|
239 |
|
|
|
38,240 |
|
| Johnson & Johnson |
|
|
7,112 |
|
|
|
1,039,490 |
|
| Johnson Controls International PLC |
|
|
1,986 |
|
|
|
132,009 |
|
| JPMorgan Chase & Co. |
|
|
8,378 |
|
|
|
1,694,534 |
|
| Juniper Networks, Inc. |
|
|
954 |
|
|
|
34,783 |
|
| Kellanova |
|
|
793 |
|
|
|
45,740 |
|
| Kenvue, Inc. |
|
|
5,555 |
|
|
|
100,990 |
|
| Keurig Dr. Pepper, Inc. |
|
|
3,189 |
|
|
|
106,513 |
|
| KeyCorp |
|
|
2,692 |
|
|
|
38,253 |
|
| Keysight Technologies, Inc. (B) |
|
|
513 |
|
|
|
70,153 |
|
| Kimberly-Clark Corp. |
|
|
984 |
|
|
|
135,989 |
|
| Kimco Realty Corp., REIT |
|
|
1,975 |
|
|
|
38,434 |
|
| Kinder Morgan, Inc. |
|
|
5,821 |
|
|
|
115,663 |
|
| KKR & Co., Inc. |
|
|
1,809 |
|
|
|
190,379 |
|
| KLA Corp. |
|
|
404 |
|
|
|
333,102 |
|
| Knight-Swift Transportation Holdings, Inc. |
|
|
469 |
|
|
|
23,412 |
|
| Kraft Heinz Co. |
|
|
2,659 |
|
|
|
85,673 |
|
| Kroger Co. |
|
|
2,023 |
|
|
|
101,008 |
|
| L3 Harris Technologies, Inc. |
|
|
556 |
|
|
|
124,866 |
|
| Labcorp Holdings, Inc. |
|
|
245 |
|
|
|
49,860 |
|
| Lam Research Corp. |
|
|
392 |
|
|
|
417,421 |
|
| Lamb Weston Holdings, Inc. |
|
|
425 |
|
|
|
35,734 |
|
| Las Vegas Sands Corp. |
|
|
1,123 |
|
|
|
49,693 |
|
| Lattice Semiconductor Corp. (B) |
|
|
410 |
|
|
|
23,776 |
|
| Leidos Holdings, Inc. |
|
|
373 |
|
|
|
54,413 |
|
| Lennar Corp., Class A |
|
|
725 |
|
|
|
108,656 |
|
| Lennox International, Inc. |
|
|
94 |
|
|
|
50,288 |
|
| Liberty Media Corp. - Liberty Formula One, Class C (B) |
|
|
583 |
|
|
|
41,883 |
|
| Linde PLC |
|
|
1,418 |
|
|
|
622,233 |
|
| Live Nation Entertainment, Inc. (B) |
|
|
473 |
|
|
|
44,339 |
|
|
|
|
|
|
|
|
|
|
| |
|
Shares |
|
|
Value |
|
| COMMON STOCKS (continued) |
|
| United States (continued) |
|
| LKQ Corp. |
|
|
778 |
|
|
$ |
32,357 |
|
| Lockheed Martin Corp. |
|
|
630 |
|
|
|
294,273 |
|
| Loews Corp. |
|
|
550 |
|
|
|
41,107 |
|
| Lowe’s Cos., Inc. |
|
|
1,684 |
|
|
|
371,255 |
|
| LPL Financial Holdings, Inc. |
|
|
220 |
|
|
|
61,446 |
|
| LyondellBasell Industries NV, Class A |
|
|
756 |
|
|
|
72,319 |
|
| M&T Bank Corp. |
|
|
485 |
|
|
|
73,410 |
|
| Manhattan Associates, Inc. (B) |
|
|
182 |
|
|
|
44,896 |
|
| Marathon Oil Corp. |
|
|
1,661 |
|
|
|
47,621 |
|
| Marathon Petroleum Corp. |
|
|
1,053 |
|
|
|
182,674 |
|
| Markel Group, Inc. (B) |
|
|
38 |
|
|
|
59,875 |
|
| MarketAxess Holdings, Inc. |
|
|
109 |
|
|
|
21,858 |
|
| Marriott International, Inc., Class A |
|
|
721 |
|
|
|
174,316 |
|
| Marsh & McLennan Cos., Inc. |
|
|
1,441 |
|
|
|
303,648 |
|
| Martin Marietta Materials, Inc. |
|
|
182 |
|
|
|
98,608 |
|
| Marvell Technology, Inc. |
|
|
2,621 |
|
|
|
183,208 |
|
| Masco Corp. |
|
|
642 |
|
|
|
42,802 |
|
| Mastercard, Inc., Class A |
|
|
2,425 |
|
|
|
1,069,813 |
|
| Match Group, Inc. (B) |
|
|
786 |
|
|
|
23,879 |
|
| McCormick & Co., Inc. |
|
|
730 |
|
|
|
51,786 |
|
| McDonald’s Corp. |
|
|
2,115 |
|
|
|
538,987 |
|
| McKesson Corp. |
|
|
385 |
|
|
|
224,855 |
|
| Merck & Co., Inc. |
|
|
7,407 |
|
|
|
916,987 |
|
| Meta Platforms, Inc., Class A |
|
|
6,368 |
|
|
|
3,210,873 |
|
| MetLife, Inc. |
|
|
1,789 |
|
|
|
125,570 |
|
| Mettler-Toledo International, Inc. (B) |
|
|
63 |
|
|
|
88,048 |
|
| MGM Resorts International (B) |
|
|
696 |
|
|
|
30,930 |
|
| Microchip Technology, Inc. |
|
|
1,603 |
|
|
|
146,675 |
|
| Micron Technology, Inc. |
|
|
3,243 |
|
|
|
426,552 |
|
| Microsoft Corp. |
|
|
20,797 |
|
|
|
9,295,219 |
|
| MicroStrategy, Inc., Class A (A)(B) |
|
|
198 |
|
|
|
272,741 |
|
| Mid-America Apartment Communities, Inc., REIT |
|
|
340 |
|
|
|
48,487 |
|
| Moderna, Inc. (B) |
|
|
945 |
|
|
|
112,219 |
|
| Molina Healthcare, Inc. (B) |
|
|
171 |
|
|
|
50,838 |
|
| Molson Coors Beverage Co., Class B |
|
|
540 |
|
|
|
27,448 |
|
| Mondelez International, Inc., Class A |
|
|
3,891 |
|
|
|
254,627 |
|
| MongoDB, Inc. (B) |
|
|
212 |
|
|
|
52,992 |
|
| Monolithic Power Systems, Inc. |
|
|
147 |
|
|
|
120,787 |
|
| Monster Beverage Corp. (B) |
|
|
2,155 |
|
|
|
107,642 |
|
| Moody’s Corp. |
|
|
480 |
|
|
|
202,046 |
|
| Mosaic Co. |
|
|
927 |
|
|
|
26,790 |
|
| Motorola Solutions, Inc. |
|
|
487 |
|
|
|
188,006 |
|
| MSCI, Inc. |
|
|
232 |
|
|
|
111,766 |
|
| Nasdaq, Inc. |
|
|
1,177 |
|
|
|
70,926 |
|
| NetApp, Inc. |
|
|
607 |
|
|
|
78,182 |
|
| Netflix, Inc. (B) |
|
|
1,299 |
|
|
|
876,669 |
|
| Neurocrine Biosciences, Inc. (B) |
|
|
293 |
|
|
|
40,337 |
|
| Newmont Corp. |
|
|
3,345 |
|
|
|
140,055 |
|
| News Corp., Class A |
|
|
1,095 |
|
|
|
30,189 |
|
| NextEra Energy, Inc. |
|
|
6,010 |
|
|
|
425,568 |
|
| NIKE, Inc., Class B |
|
|
3,566 |
|
|
|
268,769 |
|
| NiSource, Inc. |
|
|
1,301 |
|
|
|
37,482 |
|
| Nordson Corp. |
|
|
159 |
|
|
|
36,878 |
|
| Norfolk Southern Corp. |
|
|
659 |
|
|
|
141,481 |
|
| Northern Trust Corp. |
|
|
595 |
|
|
|
49,968 |
|
The Notes to Financial Statements are an integral part of this report.
|
|
|
|
|
| Transamerica Series Trust |
|
|
|
Semi-Annual Financial Statements 2024 |
|
|
Page 10 |
|
|
Transamerica Morgan Stanley Global Allocation VP
CONSOLIDATED SCHEDULE OF INVESTMENTS (continued)
At June 30, 2024
(unaudited)
|
|
|
|
|
|
|
|
|
| |
|
Shares |
|
|
Value |
|
| COMMON STOCKS (continued) |
|
| United States (continued) |
|
| Northrop Grumman Corp. |
|
|
411 |
|
|
$ |
179,175 |
|
| NRG Energy, Inc. |
|
|
623 |
|
|
|
48,507 |
|
| Nucor Corp. |
|
|
713 |
|
|
|
112,711 |
|
| NVIDIA Corp. |
|
|
76,980 |
|
|
|
9,510,109 |
|
| NVR, Inc. (B) |
|
|
9 |
|
|
|
68,297 |
|
| Occidental Petroleum Corp. |
|
|
1,917 |
|
|
|
120,829 |
|
| Okta, Inc. (B) |
|
|
469 |
|
|
|
43,903 |
|
| Old Dominion Freight Line, Inc. |
|
|
568 |
|
|
|
100,309 |
|
| Omnicom Group, Inc. |
|
|
569 |
|
|
|
51,039 |
|
| ON Semiconductor Corp. (B) |
|
|
1,261 |
|
|
|
86,442 |
|
| ONEOK, Inc. |
|
|
1,698 |
|
|
|
138,472 |
|
| Oracle Corp. |
|
|
4,883 |
|
|
|
689,480 |
|
| O’Reilly Automotive, Inc. (B) |
|
|
174 |
|
|
|
183,754 |
|
| Otis Worldwide Corp. |
|
|
1,183 |
|
|
|
113,876 |
|
| Ovintiv, Inc. |
|
|
783 |
|
|
|
36,699 |
|
| Owens Corning |
|
|
253 |
|
|
|
43,951 |
|
| PACCAR, Inc. |
|
|
1,514 |
|
|
|
155,851 |
|
| Packaging Corp. of America |
|
|
256 |
|
|
|
46,735 |
|
| Palantir Technologies, Inc., Class A (B) |
|
|
5,639 |
|
|
|
142,836 |
|
| Palo Alto Networks, Inc. (B) |
|
|
942 |
|
|
|
319,347 |
|
| Paramount Global, Class B |
|
|
1,583 |
|
|
|
16,447 |
|
| Parker-Hannifin Corp. |
|
|
373 |
|
|
|
188,667 |
|
| Paychex, Inc. |
|
|
949 |
|
|
|
112,513 |
|
| Paycom Software, Inc. |
|
|
155 |
|
|
|
22,171 |
|
| Paylocity Holding Corp. (B) |
|
|
134 |
|
|
|
17,668 |
|
| PayPal Holdings, Inc. (B) |
|
|
2,968 |
|
|
|
172,233 |
|
| PepsiCo, Inc. |
|
|
4,021 |
|
|
|
663,184 |
|
| Pfizer, Inc. |
|
|
16,604 |
|
|
|
464,580 |
|
| PG&E Corp. |
|
|
5,944 |
|
|
|
103,782 |
|
| Philip Morris International, Inc. |
|
|
4,540 |
|
|
|
460,038 |
|
| Phillips 66 |
|
|
1,253 |
|
|
|
176,886 |
|
| Pinterest, Inc., Class A (B) |
|
|
1,755 |
|
|
|
77,343 |
|
| PNC Financial Services Group, Inc. |
|
|
1,155 |
|
|
|
179,579 |
|
| Pool Corp. |
|
|
114 |
|
|
|
35,036 |
|
| PPG Industries, Inc. |
|
|
688 |
|
|
|
86,612 |
|
| PPL Corp. |
|
|
2,153 |
|
|
|
59,530 |
|
| Principal Financial Group, Inc. |
|
|
685 |
|
|
|
53,738 |
|
| Procter & Gamble Co. |
|
|
6,931 |
|
|
|
1,143,061 |
|
| Progressive Corp. |
|
|
1,707 |
|
|
|
354,561 |
|
| Prologis, Inc., REIT |
|
|
2,673 |
|
|
|
300,205 |
|
| Prudential Financial, Inc. |
|
|
1,045 |
|
|
|
122,464 |
|
| PTC, Inc. (B) |
|
|
350 |
|
|
|
63,585 |
|
| Public Service Enterprise Group, Inc. |
|
|
1,448 |
|
|
|
106,718 |
|
| Public Storage, REIT |
|
|
461 |
|
|
|
132,607 |
|
| PulteGroup, Inc. |
|
|
619 |
|
|
|
68,152 |
|
| Pure Storage, Inc., Class A (B) |
|
|
934 |
|
|
|
59,972 |
|
| Qorvo, Inc. (B) |
|
|
283 |
|
|
|
32,839 |
|
| QUALCOMM, Inc. |
|
|
3,418 |
|
|
|
680,797 |
|
| Quanta Services, Inc. |
|
|
430 |
|
|
|
109,259 |
|
| Quest Diagnostics, Inc. |
|
|
325 |
|
|
|
44,486 |
|
| Raymond James Financial, Inc. |
|
|
579 |
|
|
|
71,570 |
|
| RB Global, Inc. |
|
|
1,507 |
|
|
|
114,938 |
|
| Realty Income Corp., REIT |
|
|
2,511 |
|
|
|
132,631 |
|
| Regency Centers Corp., REIT |
|
|
515 |
|
|
|
32,033 |
|
| Regeneron Pharmaceuticals, Inc. (B) |
|
|
316 |
|
|
|
332,125 |
|
| Regions Financial Corp. |
|
|
2,670 |
|
|
|
53,507 |
|
|
|
|
|
|
|
|
|
|
| |
|
Shares |
|
|
Value |
|
| COMMON STOCKS (continued) |
|
| United States (continued) |
|
| Reliance, Inc. |
|
|
169 |
|
|
$ |
48,266 |
|
| Repligen Corp. (B) |
|
|
155 |
|
|
|
19,539 |
|
| Republic Services, Inc. |
|
|
644 |
|
|
|
125,155 |
|
| ResMed, Inc. |
|
|
488 |
|
|
|
93,413 |
|
| Revvity, Inc. |
|
|
364 |
|
|
|
38,169 |
|
| Riot Platforms, Inc. (A)(B) |
|
|
21,009 |
|
|
|
192,022 |
|
| Rivian Automotive, Inc., Class A (A)(B) |
|
|
2,071 |
|
|
|
27,793 |
|
| Robinhood Markets, Inc., Class A (B) |
|
|
1,591 |
|
|
|
36,132 |
|
| ROBLOX Corp., Class A (B) |
|
|
1,403 |
|
|
|
52,206 |
|
| Rockwell Automation, Inc. |
|
|
333 |
|
|
|
91,668 |
|
| Roku, Inc. (B) |
|
|
374 |
|
|
|
22,414 |
|
| Rollins, Inc. |
|
|
852 |
|
|
|
41,569 |
|
| Roper Technologies, Inc. |
|
|
313 |
|
|
|
176,426 |
|
| Ross Stores, Inc. |
|
|
991 |
|
|
|
144,012 |
|
| Royal Caribbean Cruises Ltd. (B) |
|
|
707 |
|
|
|
112,717 |
|
| Royalty Pharma PLC, Class A |
|
|
1,104 |
|
|
|
29,112 |
|
| RPM International, Inc. |
|
|
382 |
|
|
|
41,134 |
|
| RTX Corp. |
|
|
3,876 |
|
|
|
389,112 |
|
| S&P Global, Inc. |
|
|
935 |
|
|
|
417,010 |
|
| Salesforce, Inc. |
|
|
2,882 |
|
|
|
740,962 |
|
| Samsara, Inc., Class A (B) |
|
|
600 |
|
|
|
20,220 |
|
| SBA Communications Corp., REIT |
|
|
315 |
|
|
|
61,835 |
|
| Schlumberger NV |
|
|
4,088 |
|
|
|
192,872 |
|
| Seagate Technology Holdings PLC |
|
|
588 |
|
|
|
60,723 |
|
| SEI Investments Co. |
|
|
324 |
|
|
|
20,960 |
|
| Sempra |
|
|
1,838 |
|
|
|
139,798 |
|
| ServiceNow, Inc. (B) |
|
|
608 |
|
|
|
478,295 |
|
| Sherwin-Williams Co. |
|
|
708 |
|
|
|
211,288 |
|
| Simon Property Group, Inc., REIT |
|
|
947 |
|
|
|
143,755 |
|
| Skyworks Solutions, Inc. |
|
|
475 |
|
|
|
50,626 |
|
| Snap, Inc., Class A (B) |
|
|
3,092 |
|
|
|
51,358 |
|
| Snap-on, Inc. |
|
|
155 |
|
|
|
40,515 |
|
| Snowflake, Inc., Class A (B) |
|
|
897 |
|
|
|
121,176 |
|
| Solventum Corp. (B) |
|
|
429 |
|
|
|
22,686 |
|
| Southern Co. |
|
|
3,185 |
|
|
|
247,060 |
|
| Southwest Airlines Co. |
|
|
439 |
|
|
|
12,560 |
|
| SS&C Technologies Holdings, Inc. |
|
|
649 |
|
|
|
40,673 |
|
| Stanley Black & Decker, Inc. |
|
|
448 |
|
|
|
35,791 |
|
| Starbucks Corp. |
|
|
3,352 |
|
|
|
260,953 |
|
| State Street Corp. |
|
|
881 |
|
|
|
65,194 |
|
| Steel Dynamics, Inc. |
|
|
447 |
|
|
|
57,887 |
|
| STERIS PLC |
|
|
292 |
|
|
|
64,106 |
|
| Stryker Corp. |
|
|
1,009 |
|
|
|
343,312 |
|
| Sun Communities, Inc., REIT |
|
|
362 |
|
|
|
43,563 |
|
| Super Micro Computer, Inc. (B) |
|
|
165 |
|
|
|
135,193 |
|
| Synchrony Financial |
|
|
1,176 |
|
|
|
55,495 |
|
| Synopsys, Inc. (B) |
|
|
455 |
|
|
|
270,752 |
|
| Sysco Corp. |
|
|
1,450 |
|
|
|
103,516 |
|
| T. Rowe Price Group, Inc. |
|
|
654 |
|
|
|
75,413 |
|
| Take-Two Interactive Software, Inc. (B) |
|
|
475 |
|
|
|
73,858 |
|
| Targa Resources Corp. |
|
|
615 |
|
|
|
79,200 |
|
| Target Corp. |
|
|
1,327 |
|
|
|
196,449 |
|
| TE Connectivity Ltd. |
|
|
904 |
|
|
|
135,989 |
|
| Teledyne Technologies, Inc. (B) |
|
|
140 |
|
|
|
54,317 |
|
| Teleflex, Inc. |
|
|
139 |
|
|
|
29,236 |
|
| Teradyne, Inc. |
|
|
453 |
|
|
|
67,175 |
|
The Notes to Financial Statements are an integral part of this report.
|
|
|
|
|
| Transamerica Series Trust |
|
|
|
Semi-Annual Financial Statements 2024 |
|
|
Page 11 |
|
|
Transamerica Morgan Stanley Global Allocation VP
CONSOLIDATED SCHEDULE OF INVESTMENTS (continued)
At June 30, 2024
(unaudited)
|
|
|
|
|
|
|
|
|
| |
|
Shares |
|
|
Value |
|
| COMMON STOCKS (continued) |
|
| United States (continued) |
|
| Tesla, Inc. (B) |
|
|
8,411 |
|
|
$ |
1,664,369 |
|
| Texas Instruments, Inc. |
|
|
2,690 |
|
|
|
523,286 |
|
| Texas Pacific Land Corp. |
|
|
58 |
|
|
|
42,588 |
|
| Textron, Inc. |
|
|
559 |
|
|
|
47,996 |
|
| Thermo Fisher Scientific, Inc. |
|
|
1,115 |
|
|
|
616,595 |
|
| TJX Cos., Inc. |
|
|
3,329 |
|
|
|
366,523 |
|
| T-Mobile US, Inc. |
|
|
1,564 |
|
|
|
275,546 |
|
| Toast, Inc., Class A (B) |
|
|
1,033 |
|
|
|
26,620 |
|
| Toro Co. |
|
|
308 |
|
|
|
28,801 |
|
| Tractor Supply Co. |
|
|
316 |
|
|
|
85,320 |
|
| Trade Desk, Inc., Class A (B) |
|
|
1,329 |
|
|
|
129,803 |
|
| Tradeweb Markets, Inc., Class A |
|
|
340 |
|
|
|
36,040 |
|
| TransDigm Group, Inc. |
|
|
164 |
|
|
|
209,528 |
|
| TransUnion |
|
|
562 |
|
|
|
41,678 |
|
| Travelers Cos., Inc. |
|
|
670 |
|
|
|
136,238 |
|
| Trimble, Inc. (B) |
|
|
715 |
|
|
|
39,983 |
|
| Truist Financial Corp. |
|
|
3,860 |
|
|
|
149,961 |
|
| Twilio, Inc., Class A (B) |
|
|
509 |
|
|
|
28,916 |
|
| Tyler Technologies, Inc. (B) |
|
|
124 |
|
|
|
62,345 |
|
| Tyson Foods, Inc., Class A |
|
|
833 |
|
|
|
47,598 |
|
| Uber Technologies, Inc. (B) |
|
|
5,513 |
|
|
|
400,685 |
|
| UDR, Inc., REIT |
|
|
911 |
|
|
|
37,488 |
|
| U-Haul Holding Co. |
|
|
284 |
|
|
|
17,046 |
|
| UiPath, Inc., Class A (B) |
|
|
1,294 |
|
|
|
16,408 |
|
| Ulta Beauty, Inc. (B) |
|
|
141 |
|
|
|
54,408 |
|
| Union Pacific Corp. |
|
|
1,787 |
|
|
|
404,327 |
|
| United Parcel Service, Inc., Class B |
|
|
2,121 |
|
|
|
290,259 |
|
| United Rentals, Inc. |
|
|
196 |
|
|
|
126,759 |
|
| United Therapeutics Corp. (B) |
|
|
132 |
|
|
|
42,049 |
|
| UnitedHealth Group, Inc. |
|
|
2,698 |
|
|
|
1,373,983 |
|
| Unity Software, Inc. (B) |
|
|
791 |
|
|
|
12,862 |
|
| Universal Health Services, Inc., Class B |
|
|
176 |
|
|
|
32,548 |
|
| US Bancorp |
|
|
4,526 |
|
|
|
179,682 |
|
| Valero Energy Corp. |
|
|
962 |
|
|
|
150,803 |
|
| Veeva Systems, Inc., Class A (B) |
|
|
448 |
|
|
|
81,988 |
|
| Ventas, Inc., REIT |
|
|
1,183 |
|
|
|
60,641 |
|
| Veralto Corp. |
|
|
718 |
|
|
|
68,547 |
|
| VeriSign, Inc. (B) |
|
|
268 |
|
|
|
47,650 |
|
| Verisk Analytics, Inc. |
|
|
419 |
|
|
|
112,941 |
|
| Verizon Communications, Inc. |
|
|
12,250 |
|
|
|
505,190 |
|
| Vertex Pharmaceuticals, Inc. (B) |
|
|
761 |
|
|
|
356,696 |
|
| Vertiv Holdings Co. |
|
|
1,094 |
|
|
|
94,708 |
|
| Viatris, Inc. |
|
|
3,459 |
|
|
|
36,769 |
|
| VICI Properties, Inc., REIT |
|
|
3,035 |
|
|
|
86,922 |
|
| Visa, Inc., Class A |
|
|
4,597 |
|
|
|
1,206,575 |
|
| Vistra Corp. |
|
|
1,012 |
|
|
|
87,012 |
|
| Vulcan Materials Co. |
|
|
390 |
|
|
|
96,985 |
|
| W.R. Berkley Corp. |
|
|
602 |
|
|
|
47,305 |
|
| Walgreens Boots Alliance, Inc. |
|
|
2,130 |
|
|
|
25,762 |
|
| Walmart, Inc. |
|
|
12,918 |
|
|
|
874,678 |
|
| Walt Disney Co. |
|
|
5,402 |
|
|
|
536,365 |
|
| Warner Bros Discovery, Inc. (B) |
|
|
6,835 |
|
|
|
50,852 |
|
| Waste Management, Inc. |
|
|
1,174 |
|
|
|
250,461 |
|
| Waters Corp. (B) |
|
|
173 |
|
|
|
50,191 |
|
| Watsco, Inc. |
|
|
99 |
|
|
|
45,861 |
|
| WEC Energy Group, Inc. |
|
|
919 |
|
|
|
72,105 |
|
|
|
|
|
|
|
|
|
|
| |
|
Shares |
|
|
Value |
|
| COMMON STOCKS (continued) |
|
| United States (continued) |
|
| Wells Fargo & Co. |
|
|
10,229 |
|
|
$ |
607,500 |
|
| Welltower, Inc., REIT |
|
|
1,670 |
|
|
|
174,098 |
|
| West Pharmaceutical Services, Inc. |
|
|
217 |
|
|
|
71,478 |
|
| Western Digital Corp. (B) |
|
|
965 |
|
|
|
73,118 |
|
| Westinghouse Air Brake Technologies Corp. |
|
|
513 |
|
|
|
81,080 |
|
| Westlake Corp. |
|
|
112 |
|
|
|
16,220 |
|
| Westrock Co. |
|
|
766 |
|
|
|
38,499 |
|
| Weyerhaeuser Co., REIT |
|
|
2,139 |
|
|
|
60,726 |
|
| Williams Cos., Inc. |
|
|
3,534 |
|
|
|
150,195 |
|
| Williams-Sonoma, Inc. |
|
|
181 |
|
|
|
51,109 |
|
| Workday, Inc., Class A (B) |
|
|
622 |
|
|
|
139,054 |
|
| WP Carey, Inc., REIT |
|
|
636 |
|
|
|
35,012 |
|
| WW Grainger, Inc. |
|
|
130 |
|
|
|
117,291 |
|
| Wynn Resorts Ltd. |
|
|
299 |
|
|
|
26,761 |
|
| Xcel Energy, Inc. |
|
|
1,619 |
|
|
|
86,471 |
|
| Xylem, Inc. |
|
|
710 |
|
|
|
96,297 |
|
| Yum! Brands, Inc. |
|
|
831 |
|
|
|
110,074 |
|
| Zebra Technologies Corp., Class A (B) |
|
|
150 |
|
|
|
46,340 |
|
| Zillow Group, Inc., Class C (B) |
|
|
467 |
|
|
|
21,664 |
|
| Zimmer Biomet Holdings, Inc. |
|
|
601 |
|
|
|
65,227 |
|
| Zoetis, Inc. |
|
|
1,335 |
|
|
|
231,436 |
|
| Zoom Video Communications, Inc., Class A (B) |
|
|
738 |
|
|
|
43,682 |
|
| Zscaler, Inc. (B) |
|
|
264 |
|
|
|
50,738 |
|
|
|
|
|
|
|
|
|
|
|
|
|
|
|
|
|
137,883,602 |
|
|
|
|
|
|
|
|
|
|
| Uruguay - 0.0% (F) |
|
| MercadoLibre, Inc. (B) |
|
|
135 |
|
|
|
221,859 |
|
|
|
|
|
|
|
|
|
|
| Total Common Stocks
(Cost $218,004,555) |
|
|
|
|
|
|
278,556,577 |
|
|
|
|
|
|
|
|
|
|
|
|
|
| |
|
Principal |
|
|
Value |
|
| FOREIGN GOVERNMENT OBLIGATIONS - 25.7% |
|
| Australia - 0.4% |
|
| Australia Government Bonds
Series 158, 1.25%, 05/21/2032 |
|
AUD |
3,250,000 |
|
|
|
1,735,872 |
|
| Treasury Corp. of Victoria
5.25%, 09/15/2038 |
|
|
4,020,000 |
|
|
|
2,614,392 |
|
|
|
|
|
|
|
|
|
|
|
|
|
|
|
|
|
4,350,264 |
|
|
|
|
|
|
|
|
|
|
| Austria - 0.1% |
|
| Republic of Austria Government Bonds
0.25%, 10/20/2036 (I) |
|
EUR |
1,570,000 |
|
|
|
1,186,962 |
|
|
|
|
|
|
|
|
|
|
|
| Belgium - 0.3% |
|
| Kingdom of Belgium Government Bonds |
|
|
|
|
|
|
|
|
| 1.70%, 06/22/2050 (I) |
|
|
1,030,000 |
|
|
|
758,824 |
|
| 3.45%, 06/22/2043 (I) |
|
|
1,920,000 |
|
|
|
2,046,898 |
|
|
|
|
|
|
|
|
|
|
|
|
|
|
|
|
|
2,805,722 |
|
|
|
|
|
|
|
|
|
|
| Brazil - 1.2% |
|
| Brazil Notas do Tesouro Nacional
Series F, 10.00%, 01/01/2029 |
|
BRL |
72,127,000 |
|
|
|
12,000,144 |
|
|
|
|
|
|
|
|
|
|
|
| Canada - 1.8% |
|
| Canada Government Bonds
3.25%, 12/01/2033 |
|
CAD |
7,020,000 |
|
|
|
5,026,321 |
|
The Notes to Financial Statements are an integral part of this report.
|
|
|
|
|
| Transamerica Series Trust |
|
|
|
Semi-Annual Financial Statements 2024 |
|
|
Page 12 |
|
|
Transamerica Morgan Stanley Global Allocation VP
CONSOLIDATED SCHEDULE OF INVESTMENTS (continued)
At June 30, 2024
(unaudited)
|
|
|
|
|
|
|
|
|
| |
|
Principal |
|
|
Value |
|
| FOREIGN GOVERNMENT OBLIGATIONS (continued) |
|
| Canada (continued) |
|
| OMERS Finance Trust
4.75%, 03/26/2031 (G) |
|
$ |
1,100,000 |
|
|
$ |
1,098,071 |
|
| Province of British Columbia |
|
|
|
|
|
|
|
|
| 2.20%, 06/18/2030 |
|
CAD |
3,140,000 |
|
|
|
2,088,205 |
|
| 4.75%, 06/12/2034 |
|
$ |
2,170,000 |
|
|
|
2,163,140 |
|
| Province of Ontario |
|
|
|
|
|
|
|
|
| 2.05%, 06/02/2030 |
|
CAD |
3,340,000 |
|
|
|
2,208,631 |
|
| 4.10%, 03/04/2033 |
|
|
2,000,000 |
|
|
|
1,459,384 |
|
| Province of Quebec |
|
|
|
|
|
|
|
|
| Zero Coupon,
10/29/2030 (I) |
|
EUR |
2,160,000 |
|
|
|
1,901,362 |
|
| 1.90%, 09/01/2030 |
|
CAD |
3,340,000 |
|
|
|
2,175,315 |
|
|
|
|
|
|
|
|
|
|
|
|
|
|
|
|
|
18,120,429 |
|
|
|
|
|
|
|
|
|
|
| China - 6.7% |
|
| Agricultural Development Bank of China
2.25%, 04/22/2025 |
|
CNY |
8,500,000 |
|
|
|
1,175,073 |
|
| China Development Bank |
|
|
|
|
|
|
|
|
| 3.34%, 07/14/2025 |
|
|
8,500,000 |
|
|
|
1,189,025 |
|
| 3.70%, 10/20/2030 |
|
|
16,150,000 |
|
|
|
2,412,916 |
|
| China Government Bonds |
|
|
|
|
|
|
|
|
| 2.37%, 01/20/2027 |
|
|
48,000,000 |
|
|
|
6,694,346 |
|
| 2.40%, 07/15/2028 |
|
|
14,000,000 |
|
|
|
1,957,800 |
|
| 2.69%, 08/15/2032 |
|
|
11,950,000 |
|
|
|
1,699,738 |
|
| 2.76%, 05/15/2032 |
|
|
204,100,000 |
|
|
|
29,180,938 |
|
| 2.80%, 11/15/2032 |
|
|
21,400,000 |
|
|
|
3,069,281 |
|
| 3.12%, 10/25/2052 |
|
|
3,000,000 |
|
|
|
463,574 |
|
| Series 1915,
3.13%, 11/21/2029 |
|
|
11,000,000 |
|
|
|
1,601,027 |
|
| 3.27%, 11/19/2030 |
|
|
78,400,000 |
|
|
|
11,584,235 |
|
| Series 1608,
3.52%, 04/25/2046 |
|
|
4,000,000 |
|
|
|
648,170 |
|
| 3.53%, 10/18/2051 |
|
|
4,000,000 |
|
|
|
660,844 |
|
| 3.81%, 09/14/2050 |
|
|
22,000,000 |
|
|
|
3,777,615 |
|
| Export-Import Bank of China |
|
|
|
|
|
|
|
|
| 2.93%, 03/02/2025 |
|
|
8,500,000 |
|
|
|
1,179,396 |
|
|
|
|
|
|
|
|
|
|
|
|
|
|
|
|
|
67,293,978 |
|
|
|
|
|
|
|
|
|
|
| Colombia - 0.1% |
|
| Colombia TES
Series B,
7.00%, 03/26/2031 |
|
COP |
3,601,000,000 |
|
|
|
726,269 |
|
|
|
|
|
|
|
|
|
|
|
| Czech Republic - 0.1% |
|
| Czech Republic Government Bonds
1.20%, 03/13/2031 |
|
CZK |
17,200,000 |
|
|
|
613,361 |
|
|
|
|
|
|
|
|
|
|
|
| Denmark - 0.1% |
|
| Denmark Government Bonds
Series G,
2.25%, 11/15/2033 |
|
DKK |
3,880,000 |
|
|
|
547,140 |
|
|
|
|
|
|
|
|
|
|
|
| Estonia - 0.1% |
|
| Estonia Government International Bonds
3.25%, 01/17/2034 (I) |
|
EUR |
770,000 |
|
|
|
801,810 |
|
|
|
|
|
|
|
|
|
|
|
| Finland - 0.2% |
|
| Finland Government Bonds |
|
|
|
|
|
|
|
|
| 1.13%, 04/15/2034 (I) |
|
|
900,000 |
|
|
|
808,636 |
|
| Series 10Y,
3.00%, 09/15/2034 (I) |
|
|
810,000 |
|
|
|
861,330 |
|
|
|
|
|
|
|
|
|
|
|
|
|
|
|
|
|
1,669,966 |
|
|
|
|
|
|
|
|
|
|
|
|
|
|
|
|
|
|
|
| |
|
Principal |
|
|
Value |
|
| FOREIGN GOVERNMENT OBLIGATIONS (continued) |
|
| France - 1.5% |
|
| Agence Francaise de Developpement EPIC
1.50%, 10/31/2034 (I) |
|
EUR |
1,400,000 |
|
|
$ |
1,241,666 |
|
| French Republic Government Bonds OAT |
|
|
|
|
|
|
|
|
| Zero Coupon,
11/25/2029 (I) |
|
|
12,840,000 |
|
|
|
11,712,748 |
|
| 1.50%, 05/25/2050 (I) |
|
|
1,730,000 |
|
|
|
1,192,078 |
|
| SNCF Reseau
1.88%, 03/30/2034 (I) |
|
|
900,000 |
|
|
|
832,096 |
|
|
|
|
|
|
|
|
|
|
|
|
|
|
|
|
|
14,978,588 |
|
|
|
|
|
|
|
|
|
|
| Germany - 1.9% |
|
| Bundesrepublik Deutschland Bundesanleihe |
|
|
|
|
|
|
|
|
| Zero Coupon, 08/15/2031 - 05/15/2036 (I) |
|
|
11,220,000 |
|
|
|
10,095,260 |
|
| 0.25%, 02/15/2029 (I) |
|
|
3,940,000 |
|
|
|
3,825,714 |
|
| 1.70%, 08/15/2032 (I) |
|
|
1,040,000 |
|
|
|
1,055,744 |
|
| 4.25%, 07/04/2039 (I) |
|
|
3,520,000 |
|
|
|
4,496,157 |
|
|
|
|
|
|
|
|
|
|
|
|
|
|
|
|
|
19,472,875 |
|
|
|
|
|
|
|
|
|
|
| Greece - 1.0% |
|
| Hellenic Republic Government Bonds |
|
|
|
|
|
|
|
|
| 3.38%, 06/15/2034 (I) |
|
|
2,030,000 |
|
|
|
2,112,181 |
|
| 4.25%, 06/15/2033 (I)(J) |
|
|
7,354,000 |
|
|
|
8,252,074 |
|
|
|
|
|
|
|
|
|
|
|
|
|
|
|
|
|
10,364,255 |
|
|
|
|
|
|
|
|
|
|
| Hungary - 0.1% |
|
| Hungary Government Bonds
3.00%, 08/21/2030 |
|
HUF |
113,030,000 |
|
|
|
250,417 |
|
| Hungary Government International Bonds
4.00%, 07/25/2029 (I) |
|
EUR |
461,000 |
|
|
|
488,771 |
|
|
|
|
|
|
|
|
|
|
|
|
|
|
|
|
|
739,188 |
|
|
|
|
|
|
|
|
|
|
| Indonesia - 0.2% |
|
| Indonesia Treasury Bonds
8.38%, 03/15/2034 |
|
IDR |
23,181,000,000 |
|
|
|
1,543,934 |
|
|
|
|
|
|
|
|
|
|
|
| Italy - 0.8% |
|
| Italy Buoni Poliennali Del Tesoro |
|
|
|
|
|
|
|
|
| 2.50%, 12/01/2032 (I) |
|
EUR |
1,000,000 |
|
|
|
968,361 |
|
| Series 7Y,
4.00%, 11/15/2030 (I) |
|
|
3,900,000 |
|
|
|
4,246,571 |
|
| 4.45%, 09/01/2043 (I) |
|
|
1,070,000 |
|
|
|
1,143,293 |
|
| Series 30Y, 4.50%, 10/01/2053 (I) |
|
|
1,570,000 |
|
|
|
1,666,277 |
|
|
|
|
|
|
|
|
|
|
|
|
|
|
|
|
|
8,024,502 |
|
|
|
|
|
|
|
|
|
|
| Japan - 1.9% |
|
| Japan Government Ten Year Bonds |
|
|
|
|
|
|
|
|
| 0.10%, 03/20/2030 - 06/20/2031 |
|
JPY |
373,000,000 |
|
|
|
2,241,233 |
|
| Series 374,
0.80%, 03/20/2034 |
|
|
947,000,000 |
|
|
|
5,753,221 |
|
| Japan Government Thirty Year Bonds
0.40%, 09/20/2049 |
|
|
1,033,000,000 |
|
|
|
4,343,043 |
|
| Japan Government Twenty Year Bonds |
|
|
|
|
|
|
|
|
| 0.40%, 03/20/2040 |
|
|
915,000,000 |
|
|
|
4,746,012 |
|
| 0.60%, 06/20/2037 |
|
|
412,000,000 |
|
|
|
2,327,983 |
|
|
|
|
|
|
|
|
|
|
|
|
|
|
|
|
|
19,411,492 |
|
|
|
|
|
|
|
|
|
|
| Lithuania - 0.1% |
|
| Republic of Lithuania
Series MTN,
3.50%, 07/03/2031 (I)(K) |
|
EUR |
600,000 |
|
|
|
637,713 |
|
|
|
|
|
|
|
|
|
|
The Notes to Financial Statements are an integral part of this report.
|
|
|
|
|
| Transamerica Series Trust |
|
|
|
Semi-Annual Financial Statements 2024 |
|
|
Page 13 |
|
|
Transamerica Morgan Stanley Global Allocation VP
CONSOLIDATED SCHEDULE OF INVESTMENTS (continued)
At June 30, 2024
(unaudited)
|
|
|
|
|
|
|
|
|
| |
|
Principal |
|
|
Value |
|
| FOREIGN GOVERNMENT OBLIGATIONS (continued) |
|
| Luxembourg - 0.2% |
|
| European Financial Stability Facility
3.00%, 09/04/2034 (I) |
|
EUR |
1,510,000 |
|
|
$ |
1,604,389 |
|
|
|
|
|
|
|
|
|
|
|
| Malaysia - 0.2% |
|
| Malaysia Government Bonds |
|
|
|
|
|
|
|
|
| Series 0122,
3.58%, 07/15/2032 |
|
MYR |
2,600,000 |
|
|
|
540,682 |
|
| 3.89%, 08/15/2029 |
|
|
7,100,000 |
|
|
|
1,519,979 |
|
|
|
|
|
|
|
|
|
|
|
|
|
|
|
|
|
2,060,661 |
|
|
|
|
|
|
|
|
|
|
| Mexico - 0.1% |
|
| Mexico Bonos Series M,
8.50%, 05/31/2029 |
|
MXN |
24,000,000 |
|
|
|
1,234,318 |
|
|
|
|
|
|
|
|
|
|
|
| Netherlands - 0.3% |
|
| Netherlands Government Bonds |
|
|
|
|
|
|
|
|
| Zero Coupon,
07/15/2030 (I) |
|
EUR |
2,100,000 |
|
|
|
1,915,515 |
|
| 2.75%, 01/15/2047 (I) |
|
|
660,000 |
|
|
|
688,137 |
|
|
|
|
|
|
|
|
|
|
|
|
|
|
|
|
|
2,603,652 |
|
|
|
|
|
|
|
|
|
|
| Norway - 0.0% (F) |
|
| Norway Government Bonds
3.63%, 05/31/2039 (I) |
|
NOK |
1,120,000 |
|
|
|
104,888 |
|
|
|
|
|
|
|
|
|
|
|
| Poland - 0.1% |
|
| Republic of Poland Government Bonds
Series 0432,
1.75%, 04/25/2032 |
|
PLN |
2,900,000 |
|
|
|
547,758 |
|
|
|
|
|
|
|
|
|
|
|
| Portugal - 0.0% (F) |
|
| Portugal Obrigacoes do Tesouro OT
3.63%, 06/12/2054 (I) |
|
EUR |
320,000 |
|
|
|
330,289 |
|
|
|
|
|
|
|
|
|
|
|
| Republic of Korea - 0.5% |
|
| Export-Import Bank of Korea
0.63%, 02/09/2026 |
|
$ |
1,460,000 |
|
|
|
1,361,339 |
|
| Korea Development Bank
0.80%, 07/19/2026 |
|
|
2,070,000 |
|
|
|
1,900,823 |
|
| Korea Electric Power Corp.
1.13%, 06/15/2025 (G) |
|
|
2,250,000 |
|
|
|
2,159,833 |
|
|
|
|
|
|
|
|
|
|
|
|
|
|
|
|
|
5,421,995 |
|
|
|
|
|
|
|
|
|
|
| Republic of South Africa - 2.2% |
|
| Republic of South Africa Government Bonds
8.88%, 02/28/2035 |
|
ZAR |
483,935,000 |
|
|
|
22,401,652 |
|
|
|
|
|
|
|
|
|
|
|
| Singapore - 0.1% |
|
| Singapore Government Bonds
2.63%, 08/01/2032 |
|
SGD |
1,100,000 |
|
|
|
777,139 |
|
|
|
|
|
|
|
|
|
|
|
| Slovenia - 0.1% |
|
| Slovenia Government International Bonds
5.00%, 09/19/2033 (G) |
|
$ |
1,500,000 |
|
|
|
1,488,375 |
|
|
|
|
|
|
|
|
|
|
|
| Spain - 1.2% |
|
| Spain Government Bonds
Zero Coupon, 01/31/2028 |
|
EUR |
1,570,000 |
|
|
|
1,510,348 |
|
| 2.70%, 10/31/2048 (I) |
|
|
872,000 |
|
|
|
761,294 |
|
| 3.45%, 10/31/2034 - 07/30/2066 (I) |
|
|
4,650,000 |
|
|
|
4,957,298 |
|
| 3.50%, 05/31/2029 |
|
|
4,530,000 |
|
|
|
4,948,822 |
|
|
|
|
|
|
|
|
|
|
|
|
|
|
|
|
|
12,177,762 |
|
|
|
|
|
|
|
|
|
|
|
|
|
|
|
|
|
|
|
| |
|
Principal |
|
|
Value |
|
| FOREIGN GOVERNMENT OBLIGATIONS (continued) |
|
| Supranational - 0.8% |
|
| Africa Finance Corp.
4.38%, 04/17/2026 (I) |
|
$ |
1,240,000 |
|
|
$ |
1,198,336 |
|
| Asian Development Bank
2.13%, 05/19/2031 |
|
NZD |
810,000 |
|
|
|
414,402 |
|
| Banque Ouest Africaine de Developpement
4.70%, 10/22/2031 (I) |
|
$ |
530,000 |
|
|
|
462,934 |
|
| Corp. Andina de Fomento |
|
|
|
|
|
|
|
|
| 5.00%, 01/24/2029 |
|
|
1,600,000 |
|
|
|
1,596,403 |
|
| 5.30%, 02/19/2029 |
|
AUD |
3,370,000 |
|
|
|
2,222,493 |
|
| European Investment Bank
Zero Coupon, 01/14/2031 (I) |
|
EUR |
2,430,000 |
|
|
|
2,156,721 |
|
|
|
|
|
|
|
|
|
|
|
|
|
|
|
|
|
8,051,289 |
|
|
|
|
|
|
|
|
|
|
| Thailand - 0.2% |
|
| Thailand Government Bonds
2.00%, 12/17/2031 |
|
THB |
59,000,000 |
|
|
|
1,539,480 |
|
|
|
|
|
|
|
|
|
|
|
| United Kingdom - 1.1% |
|
| U.K. Gilt |
|
|
|
|
|
|
|
|
| 0.38%, 10/22/2030 (I) |
|
GBP |
3,210,000 |
|
|
|
3,248,806 |
|
| 0.63%, 10/22/2050 (I) |
|
|
4,410,000 |
|
|
|
2,225,412 |
|
| 0.88%, 07/31/2033 (I) |
|
|
720,000 |
|
|
|
686,921 |
|
| 1.63%, 10/22/2028 (I) |
|
|
1,510,000 |
|
|
|
1,730,700 |
|
| 3.50%, 01/22/2045 (I) |
|
|
2,550,000 |
|
|
|
2,741,547 |
|
|
|
|
|
|
|
|
|
|
|
|
|
|
|
|
|
10,633,386 |
|
|
|
|
|
|
|
|
|
|
| Total Foreign Government Obligations
(Cost $284,907,912) |
|
|
|
|
|
|
256,265,625 |
|
|
|
|
|
|
|
|
|
|
|
| CORPORATE DEBT SECURITIES - 11.0% |
|
| Australia - 0.5% |
|
| Australia & New Zealand Banking Group Ltd.
Fixed until 11/25/2030,
2.57% (L), 11/25/2035 (G) |
|
$ |
1,750,000 |
|
|
|
1,438,016 |
|
| Commonwealth Bank of Australia
Fixed until 10/03/2024, 1.94% (L), 10/03/2029 (I) |
|
EUR |
1,000,000 |
|
|
|
1,063,994 |
|
| NBN Co. Ltd. 2.63%, 05/05/2031 (G) |
|
$ |
1,215,000 |
|
|
|
1,044,439 |
|
| Quintis Australia Pty. Ltd.
PIK Rate 12.00%, Cash Rate 12.00%,
10/01/2028 (C)(D)(G)(M) |
|
|
3,336,317 |
|
|
|
375,336 |
|
| PIK Rate 13.51%, Cash Rate 14.36%,
10/01/2026 (C)(D)(G)(M) |
|
|
237,012 |
|
|
|
55,745 |
|
| Westpac Banking Corp.
Fixed until 11/15/2030, 2.67% (L), 11/15/2035 |
|
|
1,250,000 |
|
|
|
1,033,477 |
|
|
|
|
|
|
|
|
|
|
|
|
|
|
|
|
|
5,011,007 |
|
|
|
|
|
|
|
|
|
|
| Canada - 0.3% |
|
| Algonquin Power & Utilities Corp.
5.37%, 06/15/2026 (N) |
|
|
550,000 |
|
|
|
547,328 |
|
| Enbridge, Inc.
2.50%, 01/15/2025 |
|
|
1,775,000 |
|
|
|
1,743,611 |
|
| Rogers Communications, Inc.
3.80%, 03/15/2032 |
|
|
975,000 |
|
|
|
872,603 |
|
|
|
|
|
|
|
|
|
|
|
|
|
|
|
|
|
3,163,542 |
|
|
|
|
|
|
|
|
|
|
The Notes to Financial Statements are an integral part of this report.
|
|
|
|
|
| Transamerica Series Trust |
|
|
|
Semi-Annual Financial Statements 2024 |
|
|
Page 14 |
|
|
Transamerica Morgan Stanley Global Allocation VP
CONSOLIDATED SCHEDULE OF INVESTMENTS (continued)
At June 30, 2024
(unaudited)
|
|
|
|
|
|
|
|
|
|
|
|
|
| |
|
|
|
|
Principal |
|
|
Value |
|
| |
|
| CORPORATE DEBT SECURITIES (continued) |
|
| Cayman Islands - 0.1% |
|
| Alibaba Group Holding Ltd. |
|
|
|
|
|
|
|
|
|
|
|
|
| 2.13%, 02/09/2031 (A) |
|
|
$ |
|
|
|
950,000 |
|
|
$ |
786,162 |
|
|
|
|
|
|
|
|
|
|
|
|
|
|
| France - 1.0% |
|
| AXA SA |
|
|
|
|
|
|
|
|
|
|
|
|
| Fixed until 05/28/2029, 3.25% (L), 05/28/2049 (I) |
|
|
EUR |
|
|
|
1,300,000 |
|
|
|
1,326,291 |
|
| Banque Federative du Credit Mutuel SA |
|
|
|
|
|
|
|
|
|
|
|
|
| 0.75%, 07/17/2025 (I) |
|
|
|
|
|
|
1,000,000 |
|
|
|
1,039,509 |
|
| 1.25%, 12/05/2025 (I) |
|
|
GBP |
|
|
|
1,500,000 |
|
|
|
1,789,737 |
|
| 3.75%, 02/01/2033 (I) |
|
|
EUR |
|
|
|
1,000,000 |
|
|
|
1,069,066 |
|
| BPCE SA |
|
|
|
|
|
|
|
|
|
|
|
|
| 5.15%, 07/21/2024 (G) |
|
|
$ |
|
|
|
1,550,000 |
|
|
|
1,548,563 |
|
| Fixed until 06/01/2028, 5.75% (L), 06/01/2033 (I) |
|
|
EUR |
|
|
|
2,000,000 |
|
|
|
2,244,854 |
|
| Orange SA |
|
|
|
|
|
|
|
|
|
|
|
|
| Fixed until 10/01/2026, 5.00% (I)(L)(O) |
|
|
|
|
|
|
1,360,000 |
|
|
|
1,472,907 |
|
|
|
|
|
|
|
|
|
|
|
|
|
|
|
|
|
|
|
|
|
|
|
|
|
10,490,927 |
|
|
|
|
|
|
|
|
|
|
|
|
|
|
| Germany - 0.6% |
|
| Allianz SE |
|
|
|
|
|
|
|
|
|
|
|
|
| Fixed until 07/08/2030, 2.12% (L), 07/08/2050 (I) |
|
|
|
|
|
|
200,000 |
|
|
|
190,341 |
|
| Kreditanstalt fuer Wiederaufbau |
|
|
|
|
|
|
|
|
|
|
|
|
| 0.38%, 04/23/2030 (I) |
|
|
|
|
|
|
4,630,000 |
|
|
|
4,301,430 |
|
| RWE AG |
|
|
|
|
|
|
|
|
|
|
|
|
| 3.63%, 01/10/2032 (I) |
|
|
|
|
|
|
1,190,000 |
|
|
|
1,265,892 |
|
|
|
|
|
|
|
|
|
|
|
|
|
|
|
|
|
|
|
|
|
|
|
|
|
5,757,663 |
|
|
|
|
|
|
|
|
|
|
|
|
|
|
| Indonesia - 0.1% |
|
| Pertamina Persero PT |
|
|
|
|
|
|
|
|
|
|
|
|
| 6.50%, 11/07/2048 (A)(I) |
|
|
$ |
|
|
|
1,050,000 |
|
|
|
1,118,722 |
|
|
|
|
|
|
|
|
|
|
|
|
|
|
| Ireland - 0.1% |
|
| AIB Group PLC |
|
|
|
|
|
|
|
|
|
|
|
|
| Fixed until 03/28/2034, 5.87% (L), 03/28/2035 (G) |
|
|
|
|
|
|
1,175,000 |
|
|
|
1,170,012 |
|
|
|
|
|
|
|
|
|
|
|
|
|
|
| Italy - 0.1% |
|
| Assicurazioni Generali SpA |
|
|
|
|
|
|
|
|
|
|
|
|
| Fixed until 10/27/2027, 5.50% (L), 10/27/2047 (I) |
|
|
EUR |
|
|
|
1,200,000 |
|
|
|
1,326,249 |
|
|
|
|
|
|
|
|
|
|
|
|
|
|
| Japan - 0.3% |
|
| NTT Finance Corp. |
|
|
|
|
|
|
|
|
|
|
|
|
| 1.59%, 04/03/2028 (G) |
|
|
$ |
|
|
|
1,975,000 |
|
|
|
1,741,799 |
|
| Sumitomo Mitsui Financial Group, Inc. |
|
|
|
|
|
|
|
|
|
|
|
|
| 2.13%, 07/08/2030 |
|
|
|
|
|
|
1,950,000 |
|
|
|
1,631,430 |
|
|
|
|
|
|
|
|
|
|
|
|
|
|
|
|
|
|
|
|
|
|
|
|
|
3,373,229 |
|
|
|
|
|
|
|
|
|
|
|
|
|
|
| Jersey, Channel Islands - 0.1% |
|
| Galaxy Pipeline Assets Bidco Ltd. |
|
|
|
|
|
|
|
|
|
|
|
|
| 2.63%, 03/31/2036 (G) |
|
|
|
|
|
|
1,575,000 |
|
|
|
1,281,747 |
|
|
|
|
|
|
|
|
|
|
|
|
|
|
| Luxembourg - 0.3% |
|
| Blackstone Property Partners Europe Holdings SARL |
|
|
|
|
|
|
|
|
|
|
|
|
| 1.25%, 04/26/2027 (I) |
|
|
EUR |
|
|
|
1,000,000 |
|
|
|
982,940 |
|
|
|
|
|
|
|
|
|
|
|
|
|
|
| |
|
|
|
|
Principal |
|
|
Value |
|
| |
|
| CORPORATE DEBT SECURITIES (continued) |
|
| Luxembourg (continued) |
|
| JBS USA Holding LUX SARL/JBS USA Food Co./JBS LUX Co. SARL |
|
|
|
|
|
|
|
|
|
|
|
|
| 2.50%, 01/15/2027 |
|
|
$ |
|
|
|
1,000,000 |
|
|
$ |
930,522 |
|
| Medtronic Global Holdings SCA |
|
|
|
|
|
|
|
|
|
|
|
|
| 1.00%, 07/02/2031 |
|
|
EUR |
|
|
|
450,000 |
|
|
|
410,259 |
|
| 1.13%, 03/07/2027 |
|
|
|
|
|
|
840,000 |
|
|
|
848,213 |
|
|
|
|
|
|
|
|
|
|
|
|
|
|
|
|
|
|
|
|
|
|
|
|
|
3,171,934 |
|
|
|
|
|
|
|
|
|
|
|
|
|
|
| Netherlands - 0.3% |
|
| Akelius Residential Property Financing BV |
|
|
|
|
|
|
|
|
|
|
|
|
| 1.13%, 01/11/2029 (I) |
|
|
|
|
|
|
1,000,000 |
|
|
|
923,968 |
|
| Alliander NV |
|
|
|
|
|
|
|
|
|
|
|
|
| Fixed until 03/27/2032, 4.50% (I)(L)(O) |
|
|
|
|
|
|
250,000 |
|
|
|
268,162 |
|
| Thermo Fisher Scientific Finance I BV |
|
|
|
|
|
|
|
|
|
|
|
|
| 2.00%, 10/18/2051 |
|
|
|
|
|
|
100,000 |
|
|
|
72,924 |
|
| Upjohn Finance BV |
|
|
|
|
|
|
|
|
|
|
|
|
| 1.91%, 06/23/2032 (I) |
|
|
|
|
|
|
1,400,000 |
|
|
|
1,254,884 |
|
|
|
|
|
|
|
|
|
|
|
|
|
|
|
|
|
|
|
|
|
|
|
|
|
2,519,938 |
|
|
|
|
|
|
|
|
|
|
|
|
|
|
| Republic of Korea - 0.2% |
|
| Korea Southern Power Co. Ltd. |
|
|
|
|
|
|
|
|
|
|
|
|
| 0.75%, 01/27/2026 (G) |
|
|
$ |
|
|
|
1,860,000 |
|
|
|
1,730,531 |
|
|
|
|
|
|
|
|
|
|
|
|
|
|
| Singapore - 0.0% (F) |
|
| Pfizer Investment Enterprises Pte. Ltd. |
|
|
|
|
|
|
|
|
|
|
|
|
| 5.34%, 05/19/2063 |
|
|
|
|
|
|
150,000 |
|
|
|
142,528 |
|
|
|
|
|
|
|
|
|
|
|
|
|
|
| Spain - 0.3% |
|
| Banco Santander SA |
|
|
|
|
|
|
|
|
|
|
|
|
| 3.13%, 01/19/2027 (I) |
|
|
EUR |
|
|
|
1,400,000 |
|
|
|
1,477,681 |
|
| 5.18%, 11/19/2025 |
|
|
$ |
|
|
|
1,400,000 |
|
|
|
1,386,466 |
|
|
|
|
|
|
|
|
|
|
|
|
|
|
|
|
|
|
|
|
|
|
|
|
|
2,864,147 |
|
|
|
|
|
|
|
|
|
|
|
|
|
|
| Switzerland - 0.1% |
|
| UBS Group AG |
|
|
|
|
|
|
|
|
|
|
|
|
| 3.75%, 03/26/2025 |
|
|
|
|
|
|
1,150,000 |
|
|
|
1,134,212 |
|
|
|
|
|
|
|
|
|
|
|
|
|
|
| United Kingdom - 0.9% |
|
| BAE Systems PLC |
|
|
|
|
|
|
|
|
|
|
|
|
| 5.25%, 03/26/2031 (G) |
|
|
|
|
|
|
200,000 |
|
|
|
199,644 |
|
| Barclays PLC |
|
|
|
|
|
|
|
|
|
|
|
|
| Fixed until 03/12/2029, 5.69% (L), 03/12/2030 |
|
|
|
|
|
|
1,925,000 |
|
|
|
1,931,241 |
|
| HSBC Holdings PLC |
|
|
|
|
|
|
|
|
|
|
|
|
| Fixed until 11/13/2025, 2.26% (L), 11/13/2026 (I) |
|
|
GBP |
|
|
|
1,514,000 |
|
|
|
1,829,299 |
|
| Lloyds Banking Group PLC |
|
|
|
|
|
|
|
|
|
|
|
|
| 2.25%, 10/16/2024 (I) |
|
|
|
|
|
|
1,520,000 |
|
|
|
1,902,180 |
|
| National Grid Electricity Distribution West Midlands PLC |
|
|
|
|
|
|
|
|
|
|
|
|
| 5.75%, 04/16/2032 (I) |
|
|
|
|
|
|
750,000 |
|
|
|
967,463 |
|
| NGG Finance PLC |
|
|
|
|
|
|
|
|
|
|
|
|
| Fixed until 06/18/2025, 5.63% (L), 06/18/2073 (I) |
|
|
|
|
|
|
1,360,000 |
|
|
|
1,708,430 |
|
|
|
|
|
|
|
|
|
|
|
|
|
|
|
|
|
|
|
|
|
|
|
|
|
8,538,257 |
|
|
|
|
|
|
|
|
|
|
|
|
|
|
The Notes to Financial Statements are an integral part of this report.
|
|
|
|
|
| Transamerica Series Trust |
|
|
|
Semi-Annual Financial Statements 2024 |
|
|
Page 15 |
|
|
Transamerica Morgan Stanley Global Allocation VP
CONSOLIDATED SCHEDULE OF INVESTMENTS (continued)
At June 30, 2024
(unaudited)
|
|
|
|
|
|
|
|
|
|
|
|
|
| |
|
|
|
|
Principal |
|
|
Value |
|
| |
|
| CORPORATE DEBT SECURITIES (continued) |
|
| United States - 5.7% |
|
| Air Lease Corp. |
|
|
|
|
|
|
|
|
|
|
|
|
| 3.13%, 12/01/2030 |
|
|
$ |
|
|
|
425,000 |
|
|
$ |
371,604 |
|
| Amazon.com, Inc. |
|
|
|
|
|
|
|
|
|
|
|
|
| 3.88%, 08/22/2037 |
|
|
|
|
|
|
1,400,000 |
|
|
|
1,239,786 |
|
| American Express Co. |
|
|
|
|
|
|
|
|
|
|
|
|
| 2.55%, 03/04/2027 |
|
|
|
|
|
|
550,000 |
|
|
|
514,124 |
|
| Aon North America, Inc. |
|
|
|
|
|
|
|
|
|
|
|
|
| 5.45%, 03/01/2034 |
|
|
|
|
|
|
1,350,000 |
|
|
|
1,346,839 |
|
| AT&T, Inc. |
|
|
|
|
|
|
|
|
|
|
|
|
| 1.80%, 09/05/2026 |
|
|
EUR |
|
|
|
1,520,000 |
|
|
|
1,570,341 |
|
| 2.90%, 12/04/2026 |
|
|
GBP |
|
|
|
700,000 |
|
|
|
838,793 |
|
| 3.65%, 06/01/2051 |
|
|
$ |
|
|
|
750,000 |
|
|
|
532,566 |
|
| Bank of America Corp. |
|
|
|
|
|
|
|
|
|
|
|
|
| Fixed until 06/19/2025, 1.32% (L), 06/19/2026 |
|
|
|
|
|
|
2,475,000 |
|
|
|
2,371,468 |
|
| Fixed until 12/20/2027, 3.42% (L), 12/20/2028 |
|
|
|
|
|
|
1,725,000 |
|
|
|
1,622,230 |
|
| Fixed until 09/15/2033, 5.87% (L), 09/15/2034 |
|
|
|
|
|
|
975,000 |
|
|
|
1,004,829 |
|
| Bank of New York Mellon Corp. |
|
|
|
|
|
|
|
|
|
|
|
|
| Fixed until 03/14/2034, 5.19% (L), 03/14/2035 |
|
|
|
|
|
|
1,100,000 |
|
|
|
1,088,006 |
|
| BAT Capital Corp. |
|
|
|
|
|
|
|
|
|
|
|
|
| 3.56%, 08/15/2027 |
|
|
|
|
|
|
442,000 |
|
|
|
419,895 |
|
| Boeing Co. |
|
|
|
|
|
|
|
|
|
|
|
|
| 6.26%, 05/01/2027 (G) |
|
|
|
|
|
|
225,000 |
|
|
|
226,588 |
|
| 6.30%, 05/01/2029 (G) |
|
|
|
|
|
|
425,000 |
|
|
|
431,235 |
|
| Bristol-Myers Squibb Co. |
|
|
|
|
|
|
|
|
|
|
|
|
| 5.65%, 02/22/2064 |
|
|
|
|
|
|
400,000 |
|
|
|
392,646 |
|
| Celanese US Holdings LLC |
|
|
|
|
|
|
|
|
|
|
|
|
| 6.17%, 07/15/2027 |
|
|
|
|
|
|
1,550,000 |
|
|
|
1,573,352 |
|
| Centene Corp. |
|
|
|
|
|
|
|
|
|
|
|
|
| 2.50%, 03/01/2031 |
|
|
|
|
|
|
2,275,000 |
|
|
|
1,867,174 |
|
| Charles Schwab Corp. |
|
|
|
|
|
|
|
|
|
|
|
|
| Fixed until 05/19/2033, 5.85% (L), 05/19/2034 |
|
|
|
|
|
|
1,045,000 |
|
|
|
1,067,565 |
|
| Charter Communications Operating LLC/Charter Communications Operating Capital |
|
|
|
|
|
|
|
|
|
|
|
|
| 4.80%, 03/01/2050 |
|
|
|
|
|
|
1,300,000 |
|
|
|
958,268 |
|
| 6.38%, 10/23/2035 |
|
|
|
|
|
|
425,000 |
|
|
|
415,285 |
|
| Chubb INA Holdings LLC |
|
|
|
|
|
|
|
|
|
|
|
|
| 0.88%, 06/15/2027 |
|
|
EUR |
|
|
|
1,000,000 |
|
|
|
994,344 |
|
| Citigroup, Inc. |
|
|
|
|
|
|
|
|
|
|
|
|
| Fixed until 01/25/2032, 3.06% (L), 01/25/2033 |
|
|
$ |
|
|
|
1,000,000 |
|
|
|
851,040 |
|
| 4.45%, 09/29/2027 |
|
|
|
|
|
|
1,075,000 |
|
|
|
1,047,028 |
|
| Comcast Corp. |
|
|
|
|
|
|
|
|
|
|
|
|
| 3.75%, 04/01/2040 |
|
|
|
|
|
|
850,000 |
|
|
|
694,075 |
|
| Crown Castle, Inc. |
|
|
|
|
|
|
|
|
|
|
|
|
| 3.30%, 07/01/2030 |
|
|
|
|
|
|
1,375,000 |
|
|
|
1,226,300 |
|
| Energy Transfer LP |
|
|
|
|
|
|
|
|
|
|
|
|
| 2.90%, 05/15/2025 |
|
|
|
|
|
|
825,000 |
|
|
|
804,794 |
|
| 4.05%, 03/15/2025 |
|
|
|
|
|
|
324,000 |
|
|
|
320,491 |
|
| Enterprise Products Operating LLC |
|
|
|
|
|
|
|
|
|
|
|
|
| 4.85%, 01/31/2034 (A) |
|
|
|
|
|
|
625,000 |
|
|
|
608,303 |
|
|
|
|
|
|
|
|
|
|
|
|
|
|
| |
|
|
|
|
Principal |
|
|
Value |
|
| |
|
| CORPORATE DEBT SECURITIES (continued) |
|
| United States (continued) |
|
| Ford Motor Credit Co. LLC |
|
|
|
|
|
|
|
|
|
|
|
|
| 7.20%, 06/10/2030 |
|
|
$ |
|
|
|
1,600,000 |
|
|
$ |
1,684,253 |
|
| Georgia-Pacific LLC |
|
|
|
|
|
|
|
|
|
|
|
|
| 2.30%, 04/30/2030 (G) |
|
|
|
|
|
|
2,000,000 |
|
|
|
1,726,448 |
|
| Global Payments, Inc. |
|
|
|
|
|
|
|
|
|
|
|
|
| 4.45%, 06/01/2028 |
|
|
|
|
|
|
1,000,000 |
|
|
|
966,651 |
|
| Goldman Sachs Group, Inc. |
|
|
|
|
|
|
|
|
|
|
|
|
| 0.75%, 03/23/2032 (I) |
|
|
EUR |
|
|
|
1,260,000 |
|
|
|
1,083,788 |
|
| Fixed until 04/25/2034, 5.85% (L), 04/25/2035 |
|
|
$ |
|
|
|
750,000 |
|
|
|
769,834 |
|
| Home Depot, Inc. |
|
|
|
|
|
|
|
|
|
|
|
|
| 4.95%, 06/25/2034 |
|
|
|
|
|
|
800,000 |
|
|
|
793,457 |
|
| JPMorgan Chase & Co. |
|
|
|
|
|
|
|
|
|
|
|
|
| Fixed until 02/17/2032, 0.60% (L), 02/17/2033 (I) |
|
|
EUR |
|
|
|
1,000,000 |
|
|
|
853,783 |
|
| Fixed until 10/23/2033, 6.25% (L), 10/23/2034 |
|
|
$ |
|
|
|
2,700,000 |
|
|
|
2,868,578 |
|
| Las Vegas Sands Corp. |
|
|
|
|
|
|
|
|
|
|
|
|
| 5.90%, 06/01/2027 |
|
|
|
|
|
|
550,000 |
|
|
|
552,953 |
|
| 6.00%, 08/15/2029 |
|
|
|
|
|
|
329,000 |
|
|
|
330,949 |
|
| NextEra Energy Capital Holdings, Inc. |
|
|
|
|
|
|
|
|
|
|
|
|
| 2.75%, 11/01/2029 |
|
|
|
|
|
|
2,175,000 |
|
|
|
1,935,617 |
|
| Nuveen LLC |
|
|
|
|
|
|
|
|
|
|
|
|
| 5.55%, 01/15/2030 (G) |
|
|
|
|
|
|
775,000 |
|
|
|
779,938 |
|
| ONEOK Partners LP |
|
|
|
|
|
|
|
|
|
|
|
|
| 4.90%, 03/15/2025 |
|
|
|
|
|
|
742,000 |
|
|
|
737,729 |
|
| ONEOK, Inc. |
|
|
|
|
|
|
|
|
|
|
|
|
| 2.75%, 09/01/2024 |
|
|
|
|
|
|
435,000 |
|
|
|
432,415 |
|
| Oracle Corp. |
|
|
|
|
|
|
|
|
|
|
|
|
| 2.88%, 03/25/2031 |
|
|
|
|
|
|
2,300,000 |
|
|
|
1,989,151 |
|
| PNC Financial Services Group, Inc. |
|
|
|
|
|
|
|
|
|
|
|
|
| Fixed until 10/20/2033, 6.88% (L), 10/20/2034 |
|
|
|
|
|
|
1,775,000 |
|
|
|
1,937,298 |
|
| Prologis Euro Finance LLC |
|
|
|
|
|
|
|
|
|
|
|
|
| 1.88%, 01/05/2029 |
|
|
EUR |
|
|
|
950,000 |
|
|
|
940,098 |
|
| Republic Services, Inc. |
|
|
|
|
|
|
|
|
|
|
|
|
| 5.00%, 04/01/2034 |
|
|
$ |
|
|
|
600,000 |
|
|
|
588,426 |
|
| Thermo Fisher Scientific, Inc. |
|
|
|
|
|
|
|
|
|
|
|
|
| 0.88%, 10/01/2031 |
|
|
EUR |
|
|
|
1,750,000 |
|
|
|
1,574,859 |
|
| 1.88%, 10/01/2049 |
|
|
|
|
|
|
400,000 |
|
|
|
288,871 |
|
| T-Mobile USA, Inc. |
|
|
|
|
|
|
|
|
|
|
|
|
| 2.25%, 11/15/2031 |
|
|
$ |
|
|
|
1,250,000 |
|
|
|
1,023,716 |
|
| US Bancorp |
|
|
|
|
|
|
|
|
|
|
|
|
| Fixed until 06/10/2033, 5.84% (L), 06/12/2034 |
|
|
|
|
|
|
678,000 |
|
|
|
688,465 |
|
| Verizon Communications, Inc. |
|
|
|
|
|
|
|
|
|
|
|
|
| 2.55%, 03/21/2031 |
|
|
|
|
|
|
1,775,000 |
|
|
|
1,509,706 |
|
| Vontier Corp. |
|
|
|
|
|
|
|
|
|
|
|
|
| 2.40%, 04/01/2028 |
|
|
|
|
|
|
925,000 |
|
|
|
819,920 |
|
| Warnermedia Holdings, Inc. |
|
|
|
|
|
|
|
|
|
|
|
|
| 5.05%, 03/15/2042 |
|
|
|
|
|
|
375,000 |
|
|
|
306,114 |
|
| Wells Fargo & Co. |
|
|
|
|
|
|
|
|
|
|
|
|
| 3.00%, 02/19/2025 |
|
|
|
|
|
|
700,000 |
|
|
|
688,648 |
|
| Williams Cos., Inc. |
|
|
|
|
|
|
|
|
|
|
|
|
| 4.85%, 03/01/2048 |
|
|
|
|
|
|
1,050,000 |
|
|
|
913,719 |
|
The Notes to Financial Statements are an integral part of this report.
|
|
|
|
|
| Transamerica Series Trust |
|
|
|
Semi-Annual Financial Statements 2024 |
|
|
Page 16 |
|
|
Transamerica Morgan Stanley Global Allocation VP
CONSOLIDATED SCHEDULE OF INVESTMENTS (continued)
At June 30, 2024
(unaudited)
|
|
|
|
|
|
|
|
|
|
|
|
|
| |
|
|
|
|
Principal |
|
|
Value |
|
| |
|
| CORPORATE DEBT SECURITIES (continued) |
|
| United States (continued) |
|
| Xcel Energy, Inc. |
|
|
|
|
|
|
|
|
|
|
|
|
| 2.60%, 12/01/2029 |
|
|
|
|
|
$ |
1,425,000 |
|
|
$ |
1,243,998 |
|
|
|
|
|
|
|
|
|
|
|
|
|
|
|
|
|
|
|
|
|
|
|
|
|
56,428,351 |
|
|
|
|
|
|
|
|
|
|
|
|
|
|
| Total Corporate Debt Securities
(Cost $120,537,769) |
|
|
|
|
|
|
|
|
|
|
110,009,158 |
|
|
|
|
|
|
|
|
|
|
|
|
|
|
| U.S. GOVERNMENT OBLIGATIONS - 7.4% |
|
| U.S. Treasury - 6.4% |
|
| U.S. Treasury Bonds |
|
|
|
|
|
|
|
|
|
|
|
|
| 1.13%, 05/15/2040 |
|
|
|
|
|
|
7,850,000 |
|
|
|
4,853,201 |
|
| 1.75%, 08/15/2041 |
|
|
|
|
|
|
4,560,000 |
|
|
|
3,028,837 |
|
| 2.50%, 02/15/2045 |
|
|
|
|
|
|
2,450,000 |
|
|
|
1,756,439 |
|
| 2.75%, 08/15/2047 |
|
|
|
|
|
|
380,000 |
|
|
|
278,439 |
|
| U.S. Treasury Notes |
|
|
|
|
|
|
|
|
|
|
|
|
| 0.38%, 12/31/2025 |
|
|
|
|
|
|
10,450,000 |
|
|
|
9,772,791 |
|
| 0.50%, 04/30/2027 |
|
|
|
|
|
|
5,880,000 |
|
|
|
5,255,480 |
|
| 1.13%, 10/31/2026 |
|
|
|
|
|
|
9,690,000 |
|
|
|
8,943,189 |
|
| 1.38%, 11/15/2031 |
|
|
|
|
|
|
6,710,000 |
|
|
|
5,465,505 |
|
| 1.88%, 02/15/2032 |
|
|
|
|
|
|
4,070,000 |
|
|
|
3,422,139 |
|
| 2.13%, 05/15/2025 |
|
|
|
|
|
|
7,500,000 |
|
|
|
7,306,250 |
|
| 2.38%, 03/31/2029 |
|
|
|
|
|
|
4,900,000 |
|
|
|
4,485,223 |
|
| 3.38%, 05/15/2033 |
|
|
|
|
|
|
9,730,000 |
|
|
|
9,035,217 |
|
|
|
|
|
|
|
|
|
|
|
|
|
|
|
|
|
|
|
|
|
|
|
|
|
63,602,710 |
|
|
|
|
|
|
|
|
|
|
|
|
|
|
| U.S. Treasury Inflation-Protected Securities - 1.0% |
|
| U.S. Treasury Inflation-Protected Indexed Notes |
|
|
|
|
|
|
|
|
|
|
|
|
| 1.75%, 01/15/2034 (J) |
|
|
|
|
|
|
10,831,338 |
|
|
|
10,533,797 |
|
|
|
|
|
|
|
|
|
|
|
|
|
|
|
|
|
|
|
|
|
|
|
|
|
10,533,797 |
|
|
|
|
|
|
|
|
|
|
|
|
|
|
| Total U.S. Government Obligations
(Cost $78,513,694) |
|
|
|
|
|
|
|
|
|
|
74,136,507 |
|
|
|
|
|
|
|
|
|
|
|
|
|
|
| U.S. GOVERNMENT AGENCY OBLIGATIONS - 4.8% |
|
| Federal Home Loan Mortgage Corp. |
|
|
|
|
|
|
|
|
|
|
|
|
| 2.00%, 03/01/2052 |
|
|
|
|
|
|
7,141,581 |
|
|
|
5,611,928 |
|
| 2.50%, 06/01/2050 - 01/01/2053 |
|
|
|
|
|
|
3,149,287 |
|
|
|
2,589,711 |
|
| Federal National Mortgage Association |
|
|
|
|
|
|
|
|
|
|
|
|
| 2.50%, 02/01/2052 - 12/01/2052 |
|
|
|
|
|
|
6,019,233 |
|
|
|
4,937,258 |
|
| 3.00%, 01/01/2053 |
|
|
$ |
|
|
|
11,128,064 |
|
|
|
9,489,343 |
|
| 3.50%, 01/01/2051 |
|
|
|
|
|
|
4,386,864 |
|
|
|
3,935,086 |
|
| 6.50%, 10/01/2053 |
|
|
|
|
|
|
379,986 |
|
|
|
388,875 |
|
| Uniform Mortgage-Backed Security, TBA |
|
|
|
|
|
|
|
|
|
|
|
|
| 3.00%, 07/01/2054 (K) |
|
|
|
|
|
|
300,000 |
|
|
|
255,701 |
|
| 4.00%, 07/01/2054 (K) |
|
|
|
|
|
|
6,800,000 |
|
|
|
6,232,520 |
|
| 4.50%, 07/01/2054 (K) |
|
|
|
|
|
|
2,400,000 |
|
|
|
2,266,331 |
|
| 5.00%, 07/01/2054 (K) |
|
|
|
|
|
|
4,975,000 |
|
|
|
4,816,407 |
|
| 5.50%, 07/01/2054 (K) |
|
|
|
|
|
|
3,325,000 |
|
|
|
3,283,203 |
|
| 6.00%, 07/01/2054 (K) |
|
|
|
|
|
|
4,010,000 |
|
|
|
4,025,097 |
|
|
|
|
|
|
|
|
|
|
|
|
|
|
| Total U.S. Government Agency Obligations
(Cost $50,027,866) |
|
|
|
47,831,460 |
|
|
|
|
|
|
|
|
|
|
|
|
|
|
|
|
|
|
|
|
| |
|
|
|
|
Principal |
|
|
Value |
|
| |
|
| MORTGAGE-BACKED SECURITIES - 2.4% |
|
| Cayman Islands - 0.1% |
|
| HGI CRE CLO Ltd. |
|
|
|
|
|
|
|
|
|
|
|
|
| Series 2021-FL2, Class A, 1-Month Term SOFR + 1.11%, 6.44% (L), 09/17/2036 (G) |
|
|
$ |
|
|
|
700,632 |
|
|
$ |
696,190 |
|
|
|
|
|
|
|
|
|
|
|
|
|
|
|
| Ireland - 0.1% |
|
| Berg Finance DAC |
|
|
|
|
|
|
|
|
|
|
|
|
| Series 2021-1, Class A, 3-Month EURIBOR + 1.05%, 4.95% (L), 04/22/2033 (I) |
|
|
EUR |
|
|
|
151,918 |
|
|
|
157,823 |
|
| Glenbeigh 2 Issuer DAC |
|
|
|
|
|
|
|
|
|
|
|
|
| Series 2021-2A, Class A, 3-Month EURIBOR + 0.75%, 4.68% (L), 06/24/2050 (G) |
|
|
|
|
|
|
799,400 |
|
|
|
856,155 |
|
|
|
|
|
|
|
|
|
|
|
|
|
|
|
|
|
|
|
|
|
|
|
|
|
1,013,978 |
|
|
|
|
|
|
|
|
|
|
|
|
|
|
| United Kingdom - 0.1% |
|
| Landmark Mortgage Securities No. 3 PLC |
|
|
|
|
|
|
|
|
|
|
|
|
| Series 3, Class C, SONIA + 2.22%, 7.45% (L), 04/17/2044 (I) |
|
|
GBP |
|
|
|
1,028,313 |
|
|
|
1,241,693 |
|
|
|
|
|
|
|
|
|
|
|
|
|
|
|
| United States - 2.1% |
|
| BAMLL Commercial Mortgage Securities Trust |
|
|
|
|
|
|
|
|
|
|
|
|
| Series 2016-ISQ, Class A, 2.85%, 08/14/2034 (G) |
|
|
$ |
|
|
|
1,000,000 |
|
|
|
841,838 |
|
| Bayview Opportunity Master Fund VIa Trust |
|
|
|
|
|
|
|
|
|
|
|
|
| Series 2022-3, Class A1, 3.00% (L), 01/25/2052 (G) |
|
|
|
|
|
|
1,665,717 |
|
|
|
1,379,943 |
|
| BPR Trust |
|
|
|
|
|
|
|
|
|
|
|
|
| Series 2022-OANA, Class A, 1-Month Term SOFR + 1.9%, 7.23% (L), 04/15/2037 (G) |
|
|
|
|
|
|
1,000,000 |
|
|
|
1,000,000 |
|
| Series 2022-SSP, Class A, 1-Month Term SOFR + 3.00%, 8.33% (L), 05/15/2039 (G) |
|
|
|
|
|
|
2,000,000 |
|
|
|
2,014,535 |
|
| BX Trust |
|
|
|
|
|
|
|
|
|
|
|
|
| Series 2019-OC11, Class D, 4.08% (L), 12/09/2041 (G) |
|
|
|
|
|
|
576,000 |
|
|
|
509,621 |
|
| Series 2023-DELC, Class A, 1-Month Term SOFR + 2.69%, 8.02% (L), 05/15/2038 (G) |
|
|
|
|
|
|
1,310,000 |
|
|
|
1,313,275 |
|
| CSMC Trust |
|
|
|
|
|
|
|
|
|
|
|
|
| Series 2022-NWPT, Class A, 1-Month Term SOFR + 3.14%, 8.47% (L), 09/09/2024 (G) |
|
|
|
|
|
|
1,000,000 |
|
|
|
1,005,395 |
|
| GCAT Trust |
|
|
|
|
|
|
|
|
|
|
|
|
| Series 2024-INV1, Class 2A2, 6.50% (L), 01/25/2054 (G) |
|
|
|
|
|
|
1,375,567 |
|
|
|
1,385,777 |
|
| GS Mortgage-Backed Securities Corp. Trust |
|
|
|
|
|
|
|
|
|
|
|
|
| Series 2022-PJ2, Class A6, 3.00% (L), 06/25/2052 (G) |
|
|
|
|
|
|
841,475 |
|
|
|
697,909 |
|
| Hundred Acre Wood Trust |
|
|
|
|
|
|
|
|
|
|
|
|
| Series 2021-INV3, Class A3, 2.50% (L), 12/25/2051 (G) |
|
|
|
|
|
|
1,259,406 |
|
|
|
999,220 |
|
The Notes to Financial Statements are an integral part of this report.
|
|
|
|
|
| Transamerica Series Trust |
|
|
|
Semi-Annual Financial Statements 2024 |
|
|
Page 17 |
|
|
Transamerica Morgan Stanley Global Allocation VP
CONSOLIDATED SCHEDULE OF INVESTMENTS (continued)
At June 30, 2024
(unaudited)
|
|
|
|
|
|
|
|
|
| |
|
Principal |
|
|
Value |
|
|
| MORTGAGE-BACKED SECURITIES (continued) |
|
| United States (continued) |
|
| JPMorgan Chase Commercial Mortgage Securities Trust |
|
|
|
|
|
|
|
|
| Series 2022-ACB, Class A, 1-Month SOFR Average + 1.40%, 6.73% (L), 03/15/2039 (G) |
|
|
$ 1,300,000 |
|
|
|
$ 1,283,761 |
|
| JPMorgan Mortgage Trust |
|
|
|
|
|
|
|
|
| Series 2021-INV6, Class A2, 3.00% (L), 04/25/2052 (G) |
|
|
1,470,790 |
|
|
|
1,226,327 |
|
| Series 2022-INV3, Class A3B, 3.00% (L), 09/25/2052 (G) |
|
|
1,245,218 |
|
|
|
1,030,776 |
|
| JW Commercial Mortgage Trust |
|
|
|
|
|
|
|
|
| Series 2024-MRCO, Class A, 1-Month Term SOFR + 1.62%, 6.94% (L), 06/15/2039 (G) |
|
|
1,000,000 |
|
|
|
996,247 |
|
| Ladder Capital Commercial Mortgage Trust |
|
|
|
|
|
|
|
|
| Series 2013-GCP, Class A1, 3.57%, 02/15/2036 (G) |
|
|
507,703 |
|
|
|
475,323 |
|
| Morgan Stanley Bank of America Merrill Lynch Trust |
|
|
|
|
|
|
|
|
| Series 2014-C19, Class LNC3, 4.91% (L), 12/15/2046 (G) |
|
|
877,244 |
|
|
|
832,293 |
|
| OBX Trust |
|
|
|
|
|
|
|
|
| Series 2020-EXP1, Class 1A8, 3.50% (L), 02/25/2060 (G) |
|
|
184,046 |
|
|
|
161,624 |
|
| Olympic Tower Mortgage Trust |
|
|
|
|
|
|
|
|
| Series 2017-OT, Class A, 3.57%, 05/10/2039 (G) |
|
|
1,400,000 |
|
|
|
1,214,075 |
|
| Onslow Bay Financial LLC |
|
|
|
|
|
|
|
|
| Series 2023-INV1, Class A1, 3.00% (L), 01/25/2052 (G) |
|
|
1,133,056 |
|
|
|
942,208 |
|
| PRKCM Trust |
|
|
|
|
|
|
|
|
| Series 2023-AFC1, Class A1, 6.60% (L), 02/25/2058 (G) |
|
|
581,987 |
|
|
|
582,553 |
|
| PRMI Securitization Trust |
|
|
|
|
|
|
|
|
| Series 2021-1, Class A2, 2.50% (L), 04/25/2051 (G) |
|
|
1,621,305 |
|
|
|
1,289,190 |
|
|
|
|
|
|
|
|
|
|
|
|
|
|
|
|
|
21,181,890 |
|
|
|
|
|
|
|
|
|
|
|
|
|
| Total Mortgage-Backed Securities
(Cost $26,291,243) |
|
|
|
|
|
|
24,133,751 |
|
|
|
|
|
|
|
|
|
|
|
| ASSET-BACKED SECURITIES - 0.2% |
|
| United States - 0.2% |
|
|
|
|
|
|
|
|
| Navient Private Education Loan Trust Series 2014-AA, Class A3,
1-Month Term SOFR + 1.71%,
7.04% (L), 10/15/2031 (G) |
|
|
145,342 |
|
|
|
145,765 |
|
| Retained Vantage Data Centers Issuer LLC Series 2023-1A, Class A2A, 5.00%, 09/15/2048 (G) |
|
|
1,500,000 |
|
|
|
1,445,137 |
|
| SLM Private Education Loan Trust Series 2010-C, Class A5,
1-Month Term SOFR + 4.86%,
10.19% (L), 10/15/2041 (G) |
|
|
743,883 |
|
|
|
777,378 |
|
| SMB Private Education Loan Trust Series 2019-A, Class A2A,
3.44%, 07/15/2036 (G) |
|
|
96,838 |
|
|
|
93,430 |
|
|
|
|
|
|
|
|
|
|
|
|
|
| Total Asset-Backed Securities
(Cost $2,435,752) |
|
|
|
|
|
|
2,461,710 |
|
|
|
|
|
|
|
|
|
|
|
|
|
|
|
|
| |
|
Principal |
|
|
Value |
|
|
| MUNICIPAL GOVERNMENT OBLIGATION - 0.1% |
|
| Michigan - 0.1% |
|
| University of Michigan, Revenue Bonds,
Series A, |
|
|
|
|
|
|
|
|
| 4.45%, 04/01/2122 |
|
|
$ 710,000 |
|
|
|
$ 587,297 |
|
|
|
|
|
|
|
|
|
|
| Total Municipal Government Obligation
(Cost $710,000) |
|
|
|
|
|
|
587,297 |
|
|
|
|
|
|
|
|
|
|
|
|
|
| |
|
Shares |
|
|
Value |
|
|
| PREFERRED STOCKS - 0.1% |
|
| Germany - 0.1% |
|
| Bayerische Motoren Werke AG,
7.30% (P) |
|
|
465 |
|
|
|
41,059 |
|
| Dr. Ing. h.c. F. Porsche AG,
3.32% (G)(P) |
|
|
894 |
|
|
|
66,561 |
|
| Henkel AG & Co. KGaA,
2.24% (P) |
|
|
1,364 |
|
|
|
121,566 |
|
| Porsche Automobil Holding SE,
6.08% (P) |
|
|
1,220 |
|
|
|
55,150 |
|
| Sartorius AG,
0.34% (P) |
|
|
216 |
|
|
|
50,660 |
|
| Volkswagen AG,
8.60% (P) |
|
|
1,636 |
|
|
|
184,669 |
|
|
|
|
|
|
|
|
|
|
| Total Preferred Stocks
(Cost $790,735) |
|
|
|
|
|
|
519,665 |
|
|
|
|
|
|
|
|
|
|
|
|
|
| |
|
Principal |
|
|
Value |
|
| CONVERTIBLE BONDS - 0.0% (F) |
|
| India - 0.0% (F) |
|
| REI Agro Ltd. |
|
|
|
|
|
|
|
|
| 5.50%, 11/13/2014 (B)(G)(Q) |
|
|
$ 697,000 |
|
|
|
3,485 |
|
| 5.50%, 11/13/2014 (B)(I)(Q) |
|
|
259,000 |
|
|
|
1,295 |
|
|
|
|
|
|
|
|
|
|
| Total Convertible Bonds
(Cost $542,530) |
|
|
|
|
|
|
4,780 |
|
|
|
|
|
|
|
|
|
|
|
|
|
| |
|
Shares |
|
|
Value |
|
|
| WARRANT - 0.0% |
|
| Canada - 0.0% |
|
| Constellation Software, Inc. |
|
| Exercise Price CAD 0, Expiration Date 03/31/2040(B)(C)(D)(R) |
|
|
203 |
|
|
|
0 |
|
|
|
|
|
|
|
|
|
|
| Total Warrant
(Cost $0) |
|
|
|
|
|
|
0 |
|
|
|
|
|
|
|
|
|
|
|
|
|
| RIGHTS - 0.0% |
|
|
|
|
|
|
|
|
| Italy - 0.0% |
|
|
|
|
|
|
|
|
| Amplifon SpA
Exercise Price EUR 29.56,
Expiration Date 07/09/2024(B)(D)(R) |
|
|
1,047 |
|
|
|
0 |
|
|
|
|
|
|
|
|
|
|
| Total Rights
(Cost $0) |
|
|
|
|
|
|
0 |
|
|
|
|
|
|
|
|
|
|
The Notes to Financial Statements are an integral part of this report.
|
|
|
|
|
| Transamerica Series Trust |
|
|
|
Semi-Annual Financial Statements 2024 |
|
|
Page 18 |
|
|
Transamerica Morgan Stanley Global Allocation VP
CONSOLIDATED SCHEDULE OF INVESTMENTS (continued)
At June 30, 2024
(unaudited)
|
|
|
|
|
|
|
|
|
| |
|
Principal |
|
|
Value |
|
|
| SHORT-TERM U.S. GOVERNMENT OBLIGATIONS - 1.4% |
|
| U.S. Treasury Bills |
|
|
|
|
|
|
|
|
| 5.31% (P), 08/01/2024 (S) |
|
|
$ 5,916,000 |
|
|
|
$ 5,889,356 |
|
| 5.32% (P), 08/22/2024 (A) |
|
|
7,920,000 |
|
|
|
7,860,229 |
|
|
|
|
|
|
|
|
|
|
| Total Short-Term U.S. Government Obligations
(Cost $13,746,317) |
|
|
|
13,749,585 |
|
|
|
|
|
|
|
|
|
|
| |
|
Shares |
|
|
Value |
|
|
| OTHER INVESTMENT COMPANY - 0.5% |
|
| Securities Lending Collateral - 0.5% |
|
| State Street Navigator Securities Lending Trust - Government Money Market Portfolio, 5.28% (P) |
|
|
5,525,381 |
|
|
|
5,525,381 |
|
|
|
|
|
|
|
|
|
|
|
|
| Total Other Investment Company
(Cost $5,525,381) |
|
|
|
5,525,381 |
|
|
|
|
|
|
|
|
|
|
|
|
|
|
|
|
|
|
|
| |
|
Principal |
|
|
Value |
|
|
| REPURCHASE AGREEMENT - 18.5% |
|
| Fixed Income Clearing Corp., 2.50% (P), dated 06/28/2024, to be repurchased at $185,088,140 on 07/01/2024. Collateralized by U.S. Government Obligations, 3.75% - 4.50%, due 03/31/2026 - 04/15/2026, and with a total value of $188,750,845. (J) |
|
|
$ 185,049,588 |
|
|
|
$ 185,049,588 |
|
|
|
|
|
|
|
|
|
|
|
|
| Total Repurchase Agreement
(Cost $185,049,588) |
|
|
|
185,049,588 |
|
|
|
|
|
|
|
| Total Investments
(Cost $987,083,342) |
|
|
|
998,831,084 |
|
| Net Other Assets (Liabilities) - (0.0)% (F) |
|
|
|
(369,519) |
|
|
|
|
|
|
|
|
|
|
| Net Assets - 100.0% |
|
|
|
$ 998,461,565 |
|
|
|
|
|
|
|
CENTRALLY CLEARED SWAP AGREEMENTS:
|
|
|
|
|
|
|
|
|
|
|
|
|
|
|
|
|
|
|
|
|
|
|
|
|
|
|
|
|
|
|
|
|
|
|
|
|
| Interest Rate Swap Agreements |
|
| Floating Rate Index |
|
Pay/Receive Fixed Rate |
|
|
Fixed Rate |
|
|
Payment Frequency |
|
|
Maturity Date |
|
|
Notional Amount |
|
|
Value |
|
|
Premiums Paid (Received) |
|
|
Net Unrealized Appreciation (Depreciation) |
|
| 1-Month CNY-CNRR |
|
|
Receive |
|
|
|
2.38 |
% |
|
|
Quarterly |
|
|
|
11/03/2028 |
|
|
|
CNY |
|
|
|
86,649,500 |
|
|
|
$ 237,317 |
|
|
|
$— |
|
|
|
$ 237,317 |
|
| 1-Month CNY-CNRR |
|
|
Receive |
|
|
|
2.38 |
|
|
|
Quarterly |
|
|
|
11/03/2028 |
|
|
|
CNY |
|
|
|
14,000,000 |
|
|
|
38,303 |
|
|
|
— |
|
|
|
38,303 |
|
| 12-Month EUR-CPTFE |
|
|
Receive |
|
|
|
2.42 |
|
|
|
Maturity |
|
|
|
01/15/2054 |
|
|
|
EUR |
|
|
|
2,936,946 |
|
|
|
(43,666 |
) |
|
|
— |
|
|
|
(43,666) |
|
| 12-Month EUR-CPTFE |
|
|
Receive |
|
|
|
2.42 |
|
|
|
Maturity |
|
|
|
01/15/2054 |
|
|
|
EUR |
|
|
|
2,893,110 |
|
|
|
(46,132 |
) |
|
|
— |
|
|
|
(46,132) |
|
| 12-Month EUR-CPTFE |
|
|
Receive |
|
|
|
2.17 |
|
|
|
Maturity |
|
|
|
01/15/2034 |
|
|
|
EUR |
|
|
|
8,834,236 |
|
|
|
(17,638 |
) |
|
|
— |
|
|
|
(17,638) |
|
| 12-Month EUR-CPTFE |
|
|
Receive |
|
|
|
2.17 |
|
|
|
Maturity |
|
|
|
01/15/2034 |
|
|
|
EUR |
|
|
|
8,161,409 |
|
|
|
(16,295 |
) |
|
|
— |
|
|
|
(16,295) |
|
| 12-Month EUR-CPTFE |
|
|
Receive |
|
|
|
2.17 |
|
|
|
Maturity |
|
|
|
01/15/2034 |
|
|
|
EUR |
|
|
|
8,161,410 |
|
|
|
(17,116 |
) |
|
|
— |
|
|
|
(17,116) |
|
| 12-Month EUR-CPTFE |
|
|
Receive |
|
|
|
2.17 |
|
|
|
Maturity |
|
|
|
01/15/2034 |
|
|
|
EUR |
|
|
|
6,529,127 |
|
|
|
(13,692 |
) |
|
|
— |
|
|
|
(13,692) |
|
| 12-Month EUR-CPTFE |
|
|
Receive |
|
|
|
2.17 |
|
|
|
Maturity |
|
|
|
01/15/2034 |
|
|
|
EUR |
|
|
|
8,161,409 |
|
|
|
(17,115 |
) |
|
|
— |
|
|
|
(17,115) |
|
| 12-Month EUR-CPTFE |
|
|
Receive |
|
|
|
2.18 |
|
|
|
Maturity |
|
|
|
01/15/2034 |
|
|
|
EUR |
|
|
|
8,161,409 |
|
|
|
(9,318 |
) |
|
|
— |
|
|
|
(9,318) |
|
| 12-Month EUR-CPTFE |
|
|
Receive |
|
|
|
2.42 |
|
|
|
Maturity |
|
|
|
01/15/2054 |
|
|
|
EUR |
|
|
|
2,936,944 |
|
|
|
(43,666 |
) |
|
|
— |
|
|
|
(43,666) |
|
|
|
|
|
|
|
|
|
|
|
|
|
|
|
|
|
|
|
|
|
|
|
|
|
|
|
|
|
|
| Total |
|
|
|
|
|
|
|
|
|
|
|
|
|
|
|
|
|
|
|
|
|
|
|
|
|
|
$ 50,982 |
|
|
|
$— |
|
|
|
$ 50,982 |
|
|
|
|
|
|
|
|
|
|
|
|
|
|
|
|
|
|
|
|
|
|
|
|
|
|
|
|
|
|
OVER-THE-COUNTER SWAP AGREEMENTS:
|
|
|
|
|
|
|
|
|
|
|
|
|
|
|
|
|
|
|
|
|
|
|
|
|
|
|
|
|
|
|
|
|
|
|
|
|
| Total Return Swap Agreements (T) |
|
| Reference Entity |
|
Counterparty |
|
Pay/ Receive |
|
|
Payment Frequency |
|
Maturity Date |
|
|
Notional Amount |
|
|
Number of Shares or Units |
|
|
Value |
|
|
Premiums Paid (Received) |
|
|
Net Unrealized Appreciation (Depreciation) |
|
| MSCI Daily Total
Return Net Japan Index |
|
BCLY |
|
|
Receive |
|
|
Quarterly |
|
|
05/12/2025 |
|
|
|
USD |
|
|
|
32,500,508 |
|
|
|
3,883 |
|
|
|
$ 95,963 |
|
|
|
$— |
|
|
|
$ 95,963 |
|
| MSCI Emerging
Markets ex China Gross Return USD Index |
|
BCLY |
|
|
Pay |
|
|
Quarterly |
|
|
05/29/2025 |
|
|
|
USD |
|
|
|
20,471,661 |
|
|
|
2,561 |
|
|
|
(235,205 |
) |
|
|
— |
|
|
|
(235,205) |
|
| MSCI Emerging Net Total Return Index |
|
BCLY |
|
|
Receive |
|
|
Quarterly |
|
|
06/17/2025 |
|
|
|
USD |
|
|
|
61,376,068 |
|
|
|
108,231 |
|
|
|
616,940 |
|
|
|
— |
|
|
|
616,940 |
|
| MSCI USA Gross
Return Index |
|
UBS |
|
|
Receive |
|
|
Quarterly |
|
|
09/24/2024 |
|
|
|
USD |
|
|
|
116,812,759 |
|
|
|
4,733 |
|
|
|
(324,932 |
) |
|
|
— |
|
|
|
(324,932) |
|
| MSCI USA Gross
Return Index |
|
CITI |
|
|
Receive |
|
|
Quarterly |
|
|
05/08/2025 |
|
|
|
USD |
|
|
|
145,186,074 |
|
|
|
6,210 |
|
|
|
6,742,139 |
|
|
|
— |
|
|
|
6,742,139 |
|
|
|
|
|
|
|
|
|
|
|
|
|
|
|
|
|
|
|
|
|
|
|
|
|
|
|
|
|
|
| Total |
|
|
|
|
|
|
|
|
|
|
|
|
|
|
|
|
|
|
|
|
|
|
|
|
|
|
$ 6,894,905 |
|
|
|
$— |
|
|
|
$ 6,894,905 |
|
|
|
|
|
|
|
|
|
|
|
|
|
|
|
|
|
|
|
|
|
|
|
|
|
|
|
|
|
|
The Notes to Financial Statements are an integral part of this report.
|
|
|
|
|
| Transamerica Series Trust |
|
|
|
Semi-Annual Financial Statements 2024 |
|
|
Page 19 |
|
|
Transamerica Morgan Stanley Global Allocation VP
CONSOLIDATED SCHEDULE OF INVESTMENTS (continued)
At June 30, 2024
(unaudited)
|
|
|
|
|
|
|
|
|
|
|
|
|
|
|
|
|
|
|
|
|
|
|
|
|
|
|
|
|
|
|
|
|
|
|
|
|
| Bilateral Equity Basket Total Return Swaps |
|
| Reference Entity |
|
Counterparty |
|
|
Pay/ Receive |
|
|
Expiration Date |
|
|
Notional Amount |
|
|
Notional Amount as a Percentage of Net Assets |
|
|
Value |
|
|
Premiums Paid (Received) |
|
|
Net Unrealized Appreciation (Depreciation) |
|
| BNP Paribas EMU
Anti-Value 5 (a) |
|
|
BNP |
|
|
|
Pay |
|
|
|
09/18/2024 |
|
|
|
EUR |
|
|
|
13,468,386 |
|
|
|
1.3% |
|
|
|
$ 473,550 |
|
|
|
$— |
|
|
|
$ 473,550 |
|
| BNP Paribas EMU Anti- Value+Quality(b) |
|
|
BNP |
|
|
|
Pay |
|
|
|
09/18/2024 |
|
|
|
EUR |
|
|
|
17,804,632 |
|
|
|
1.8 |
|
|
|
558,355 |
|
|
|
— |
|
|
|
558,355 |
|
| BNP Paribas EMU Value 5 (c) |
|
|
BNP |
|
|
|
Receive |
|
|
|
09/18/2024 |
|
|
|
EUR |
|
|
|
13,382,825 |
|
|
|
1.3 |
|
|
|
(436,993 |
) |
|
|
— |
|
|
|
(436,993) |
|
| BNP Paribas EMU Value+Quality(d) |
|
|
BNP |
|
|
|
Receive |
|
|
|
09/18/2024 |
|
|
|
EUR |
|
|
|
17,705,873 |
|
|
|
1.8 |
|
|
|
(479,162 |
) |
|
|
— |
|
|
|
(479,162) |
|
| BNP Paribas Long EMU Domestics(e) |
|
|
BNP |
|
|
|
Receive |
|
|
|
01/15/2025 |
|
|
|
EUR |
|
|
|
6,361,474 |
|
|
|
0.6 |
|
|
|
(344,184 |
) |
|
|
— |
|
|
|
(344,184) |
|
| BNP Paribas Long EMU Domestics(e) |
|
|
BNP |
|
|
|
Receive |
|
|
|
01/15/2025 |
|
|
|
EUR |
|
|
|
5,481,073 |
|
|
|
0.5 |
|
|
|
(296,550 |
) |
|
|
— |
|
|
|
(296,550) |
|
| BNP Paribas Long EMU Domestics(e) |
|
|
BNP |
|
|
|
Receive |
|
|
|
01/15/2025 |
|
|
|
EUR |
|
|
|
4,694,744 |
|
|
|
0.5 |
|
|
|
(218,706 |
) |
|
|
— |
|
|
|
(218,706) |
|
| BNP Paribas Long EMU Value+Quality(f) |
|
|
BNP |
|
|
|
Receive |
|
|
|
05/22/2025 |
|
|
|
USD |
|
|
|
15,770,375 |
|
|
|
1.6 |
|
|
|
111,245 |
|
|
|
— |
|
|
|
111,245 |
|
| BNP Paribas Short US Domestics(g) |
|
|
BNP |
|
|
|
Pay |
|
|
|
01/15/2025 |
|
|
|
USD |
|
|
|
6,318,033 |
|
|
|
0.6 |
|
|
|
10,750 |
|
|
|
— |
|
|
|
10,750 |
|
| BNP Paribas Short US Domestics(g) |
|
|
BNP |
|
|
|
Pay |
|
|
|
01/15/2025 |
|
|
|
USD |
|
|
|
5,549,699 |
|
|
|
0.6 |
|
|
|
68,166 |
|
|
|
— |
|
|
|
68,166 |
|
| BNP Paribas Short US Domestics(g) |
|
|
BNP |
|
|
|
Pay |
|
|
|
01/15/2025 |
|
|
|
USD |
|
|
|
5,206,763 |
|
|
|
0.5 |
|
|
|
24,415 |
|
|
|
— |
|
|
|
24,415 |
|
| JPMorgan Long Japan 80% Value |
|
|
JPM |
|
|
|
Receive |
|
|
|
06/17/2025 |
|
|
|
USD |
|
|
|
7,672,828 |
|
|
|
0.8 |
|
|
|
(60,444 |
) |
|
|
— |
|
|
|
(60,444) |
|
| JPMorgan Long Korea 20% Value |
|
|
JPM |
|
|
|
Receive |
|
|
|
06/17/2025 |
|
|
|
USD |
|
|
|
3,918,760 |
|
|
|
0.4 |
|
|
|
94,639 |
|
|
|
— |
|
|
|
94,639 |
|
| JPMorgan Short Japan 80% Anti-Value |
|
|
JPM |
|
|
|
Pay |
|
|
|
06/17/2025 |
|
|
|
USD |
|
|
|
7,844,655 |
|
|
|
0.8 |
|
|
|
97,597 |
|
|
|
— |
|
|
|
97,597 |
|
|
|
|
|
|
|
|
|
|
|
|
|
|
|
|
|
|
|
|
|
|
|
|
|
|
|
|
|
|
| Total |
|
|
|
|
|
|
|
|
|
|
|
|
|
|
|
|
|
|
|
|
|
|
|
|
|
|
$ (397,322 |
) |
|
|
$— |
|
|
|
$ (397,322) |
|
|
|
|
|
|
|
|
|
|
|
|
|
|
|
|
|
|
|
|
|
|
|
|
|
|
|
|
|
|
|
|
|
|
|
| |
|
Value |
|
| OTC Swap Agreements, at value (Assets) |
|
|
$ 8,893,759 |
|
| OTC Swap Agreements, at value (Liabilities) |
|
|
$ (2,396,176) |
|
| (a) |
The significant reference entities underlying the corresponding total return swap as of June 30, 2024, are as follows: |
|
|
|
|
|
|
|
|
|
|
|
|
|
| Common Stocks - Long |
|
Shares |
|
|
Value |
|
|
Percentage of Basket Value |
|
| Aerospace & Defense |
|
|
|
|
|
|
|
|
|
|
|
|
| MTU Aero Engines AG |
|
|
107 |
|
|
|
$25,466 |
|
|
|
2.70% |
|
| Rheinmetall AG |
|
|
48 |
|
|
|
22,935 |
|
|
|
2.43 |
|
|
|
|
|
|
|
|
|
|
|
|
|
|
|
|
|
|
|
|
|
48,401 |
|
|
|
|
|
|
|
|
|
|
|
|
|
|
|
|
|
|
| Air Freight & Logistics |
|
|
|
|
|
|
|
|
|
|
|
|
| InPost SA |
|
|
1,450 |
|
|
|
23,860 |
|
|
|
2.53 |
|
|
|
|
|
|
|
|
|
|
|
|
|
|
| Automobiles |
|
|
|
|
|
|
|
|
|
|
|
|
| Ferrari NV |
|
|
59 |
|
|
|
22,283 |
|
|
|
2.36 |
|
|
|
|
|
|
|
|
|
|
|
|
|
|
| Banks |
|
|
|
|
|
|
|
|
|
|
|
|
| FinecoBank Banca Fineco SpA |
|
|
1,704 |
|
|
|
23,725 |
|
|
|
2.51 |
|
|
|
|
|
|
|
|
|
|
|
|
|
|
| Beverages |
|
|
|
|
|
|
|
|
|
|
|
|
| Davide Campari-Milano NV |
|
|
2,734 |
|
|
|
24,129 |
|
|
|
2.56 |
|
|
|
|
|
|
|
|
|
|
|
|
|
|
| Biotechnology |
|
|
|
|
|
|
|
|
|
|
|
|
| Argenx SE |
|
|
64 |
|
|
|
25,965 |
|
|
|
2.75 |
|
|
|
|
|
|
|
|
|
|
|
|
|
|
| Broadline Retail |
|
|
|
|
|
|
|
|
|
|
|
|
| Prosus NV |
|
|
658 |
|
|
|
21,887 |
|
|
|
2.32 |
|
|
|
|
|
|
|
|
|
|
|
|
|
|
|
|
|
|
|
|
|
|
|
|
|
|
|
| Common Stocks - Long |
|
Shares |
|
|
Value |
|
|
Percentage of Basket Value |
|
| Capital Markets |
|
|
|
|
|
|
|
|
|
|
|
|
| Deutsche Boerse AG |
|
|
134 |
|
|
|
$25,662 |
|
|
|
2.72% |
|
| Euronext NV |
|
|
265 |
|
|
|
22,936 |
|
|
|
2.43 |
|
|
|
|
|
|
|
|
|
|
|
|
|
|
|
|
|
|
|
|
|
48,598 |
|
|
|
|
|
|
|
|
|
|
|
|
|
|
|
|
|
|
| Chemicals |
|
|
|
|
|
|
|
|
|
|
|
|
| Air Liquide SA |
|
|
162 |
|
|
|
26,112 |
|
|
|
2.77 |
|
| OCI NV |
|
|
622 |
|
|
|
14,171 |
|
|
|
1.50 |
|
| Symrise AG |
|
|
240 |
|
|
|
27,383 |
|
|
|
2.90 |
|
|
|
|
|
|
|
|
|
|
|
|
|
|
|
|
|
|
|
|
|
67,666 |
|
|
|
|
|
|
|
|
|
|
|
|
|
|
|
|
|
|
| Construction & Engineering |
|
|
|
|
|
|
|
|
|
|
|
|
| Ferrovial SE |
|
|
679 |
|
|
|
24,613 |
|
|
|
2.61 |
|
|
|
|
|
|
|
|
|
|
|
|
|
|
| Electric Utilities |
|
|
|
|
|
|
|
|
|
|
|
|
| Redeia Corp. SA |
|
|
1,347 |
|
|
|
21,990 |
|
|
|
2.33 |
|
| Terna - Rete Elettrica Nazionale |
|
|
2,988 |
|
|
|
21,570 |
|
|
|
2.29 |
|
|
|
|
|
|
|
|
|
|
|
|
|
|
|
|
|
|
|
|
|
43,560 |
|
|
|
|
|
|
|
|
|
|
|
|
|
|
|
|
|
|
| Electrical Equipment |
|
|
|
|
|
|
|
|
|
|
|
|
| Schneider Electric SE |
|
|
106 |
|
|
|
23,769 |
|
|
|
2.52 |
|
|
|
|
|
|
|
|
|
|
|
|
|
|
The Notes to Financial Statements are an integral part of this report.
|
|
|
|
|
| Transamerica Series Trust |
|
|
|
Semi-Annual Financial Statements 2024 |
|
|
Page 20 |
|
|
Transamerica Morgan Stanley Global Allocation VP
CONSOLIDATED SCHEDULE OF INVESTMENTS (continued)
At June 30, 2024
(unaudited)
|
|
|
|
|
|
|
|
|
|
|
|
|
| Common Stocks - Long |
|
Shares |
|
|
Value |
|
|
Percentage of
Basket Value |
|
| Entertainment |
|
|
|
|
|
|
|
|
|
|
|
|
| CTS Eventim AG & Co. KGaA |
|
|
321 |
|
|
|
$25,029 |
|
|
|
2.65% |
|
| Universal Music Group NV |
|
|
889 |
|
|
|
24,683 |
|
|
|
2.62 |
|
|
|
|
|
|
|
|
|
|
|
|
|
|
|
|
|
|
|
|
|
49,712 |
|
|
|
|
|
|
|
|
|
|
|
|
|
|
|
|
|
|
| Financial Services |
|
|
|
|
|
|
|
|
|
|
|
|
| Adyen NV |
|
|
20 |
|
|
|
22,311 |
|
|
|
2.36 |
|
| Edenred SE |
|
|
579 |
|
|
|
22,824 |
|
|
|
2.42 |
|
| Sofina SA |
|
|
40 |
|
|
|
8,535 |
|
|
|
0.90 |
|
|
|
|
|
|
|
|
|
|
|
|
|
|
|
|
|
|
|
|
|
53,670 |
|
|
|
|
|
|
|
|
|
|
|
|
|
|
|
|
|
|
| Food Products |
|
|
|
|
|
|
|
|
|
|
|
|
| Lotus Bakeries NV |
|
|
1 |
|
|
|
10,419 |
|
|
|
1.10 |
|
|
|
|
|
|
|
|
|
|
|
|
|
|
| Health Care Providers & Services |
|
|
|
|
|
|
|
|
|
|
|
|
| Amplifon SpA |
|
|
666 |
|
|
|
22,151 |
|
|
|
2.35 |
|
|
|
|
|
|
|
|
|
|
|
|
|
|
| Hotels, Restaurants & Leisure |
|
|
|
|
|
|
|
|
|
|
|
|
| Delivery Hero SE |
|
|
794 |
|
|
|
17,578 |
|
|
|
1.86 |
|
|
|
|
|
|
|
|
|
|
|
|
|
|
| Independent Power & Renewable Electricity Producers |
|
|
|
|
|
|
|
|
|
|
|
|
| EDP Renovaveis SA |
|
|
1,641 |
|
|
|
21,409 |
|
|
|
2.27 |
|
|
|
|
|
|
|
|
|
|
|
|
|
|
| Industrial REITs |
|
|
|
|
|
|
|
|
|
|
|
|
| Warehouses De Pauw CVA |
|
|
118 |
|
|
|
2,983 |
|
|
|
0.32 |
|
|
|
|
|
|
|
|
|
|
|
|
|
|
| Insurance |
|
|
|
|
|
|
|
|
|
|
|
|
| Hannover Rueck SE |
|
|
106 |
|
|
|
24,988 |
|
|
|
2.65 |
|
|
|
|
|
|
|
|
|
|
|
|
|
|
| Muenchener Rueckversicherungs- Gesellschaft AG |
|
|
53 |
|
|
|
24,620 |
|
|
|
2.61 |
|
| Sampo OYJ, A Shares |
|
|
616 |
|
|
|
24,713 |
|
|
|
2.62 |
|
|
|
|
|
|
|
|
|
|
|
|
|
|
|
|
|
|
|
|
|
74,321 |
|
|
|
|
|
|
|
|
|
|
|
|
|
|
|
|
|
|
| Interactive Media & Services |
|
|
|
|
|
|
|
|
|
|
|
|
| Scout24 SE |
|
|
233 |
|
|
|
16,580 |
|
|
|
1.76 |
|
|
|
|
|
|
|
|
|
|
|
|
|
|
| Life Sciences Tools & Services |
|
|
|
|
|
|
|
|
|
| Sartorius AG |
|
|
94 |
|
|
|
20,511 |
|
|
|
2.17 |
|
| Sartorius Stedim Biotech |
|
|
126 |
|
|
|
19,261 |
|
|
|
2.04 |
|
|
|
|
|
|
|
|
|
|
|
|
|
|
|
|
|
|
|
|
|
39,772 |
|
|
|
|
|
|
|
|
|
|
|
|
|
|
|
|
|
|
|
|
|
|
|
|
|
|
|
|
|
|
|
| Common Stocks - Long |
|
Shares |
|
|
Value |
|
|
Percentage of
Basket Value |
|
| Machinery |
|
|
|
|
|
|
|
|
|
|
|
|
| Rational AG |
|
|
12 |
|
|
|
$9,066 |
|
|
|
0.96% |
|
|
|
|
|
|
|
|
|
|
|
|
|
|
| Office REITs |
|
|
|
|
|
|
|
|
|
|
|
|
| Gecina SA |
|
|
207 |
|
|
|
17,795 |
|
|
|
1.89 |
|
|
|
|
|
|
|
|
|
|
|
|
|
|
| Personal Care Products |
|
|
|
|
|
|
|
|
|
|
|
|
| Beiersdorf AG |
|
|
183 |
|
|
|
25,050 |
|
|
|
2.65 |
|
| L’Oreal SA |
|
|
59 |
|
|
|
24,206 |
|
|
|
2.57 |
|
|
|
|
|
|
|
|
|
|
|
|
|
|
|
|
|
|
|
|
|
49,256 |
|
|
|
|
|
|
|
|
|
|
|
|
|
|
|
|
|
|
| Professional Services |
|
|
|
|
|
|
|
|
|
|
|
|
| Wolters Kluwer NV |
|
|
162 |
|
|
|
25,004 |
|
|
|
2.65 |
|
|
|
|
|
|
|
|
|
|
|
|
|
|
| Semiconductors & Semiconductor Equipment |
|
|
|
|
|
|
|
|
|
|
|
|
| ASM International NV |
|
|
33 |
|
|
|
23,250 |
|
|
|
2.46 |
|
| BE Semiconductor Industries NV |
|
|
142 |
|
|
|
22,189 |
|
|
|
2.35 |
|
|
|
|
|
|
|
|
|
|
|
|
|
|
|
|
|
|
|
|
|
45,439 |
|
|
|
|
|
|
|
|
|
|
|
|
|
|
|
|
|
|
| Textiles, Apparel & Luxury Goods |
|
|
|
|
|
|
|
|
|
|
|
|
| adidas AG |
|
|
100 |
|
|
|
22,248 |
|
|
|
2.36 |
|
| Hermes International SCA |
|
|
10 |
|
|
|
22,459 |
|
|
|
2.38 |
|
| Moncler SpA |
|
|
381 |
|
|
|
21,727 |
|
|
|
2.30 |
|
|
|
|
|
|
|
|
|
|
|
|
|
|
|
|
|
|
|
|
|
66,434 |
|
|
|
|
|
|
|
|
|
|
|
|
|
|
|
|
|
|
| Transportation Infrastructure |
|
|
|
|
|
|
|
|
|
|
|
|
| Getlink SE |
|
|
1,530 |
|
|
|
23,632 |
|
|
|
2.50 |
|
|
|
|
|
|
|
|
|
|
|
|
|
|
| Total Common Stocks - Long |
|
|
|
|
|
|
$ 943,677 |
|
|
|
|
|
|
|
|
|
|
|
|
|
|
|
|
|
|
| (b) |
The significant reference entities underlying the corresponding total return swap as of June 30, 2024, are as follows: |
|
|
|
|
|
|
|
|
|
|
|
|
|
| Common Stocks - Long |
|
Shares |
|
|
Value |
|
|
Percentage of
Basket Value |
|
| Aerospace & Defense |
|
|
|
|
|
|
|
|
|
|
|
|
| Airbus SE |
|
|
6 |
|
|
|
$748 |
|
|
|
0.08% |
|
| MTU Aero Engines AG |
|
|
115 |
|
|
|
27,368 |
|
|
|
2.90 |
|
| Rheinmetall AG |
|
|
52 |
|
|
|
24,649 |
|
|
|
2.61 |
|
|
|
|
|
|
|
|
|
|
|
|
|
|
|
|
|
|
|
|
|
52,765 |
|
|
|
|
|
|
|
|
|
|
|
|
|
|
|
|
|
|
| Air Freight & Logistics |
|
|
|
|
|
|
|
|
|
|
|
|
| InPost SA |
|
|
1,507 |
|
|
|
24,812 |
|
|
|
2.63 |
|
|
|
|
|
|
|
|
|
|
|
|
|
|
| Automobiles |
|
|
|
|
|
|
|
|
|
|
|
|
| Ferrari NV |
|
|
57 |
|
|
|
21,666 |
|
|
|
2.30 |
|
|
|
|
|
|
|
|
|
|
|
|
|
|
| Beverages |
|
|
|
|
|
|
|
|
|
|
|
|
| Davide Campari-Milano NV |
|
|
3,501 |
|
|
|
30,892 |
|
|
|
3.27 |
|
| Remy Cointreau SA |
|
|
145 |
|
|
|
11,304 |
|
|
|
1.20 |
|
|
|
|
|
|
|
|
|
|
|
|
|
|
|
|
|
|
|
|
|
42,196 |
|
|
|
|
|
|
|
|
|
|
|
|
|
|
|
|
|
|
| Biotechnology |
|
|
|
|
|
|
|
|
|
|
|
|
| Argenx SE |
|
|
62 |
|
|
|
25,246 |
|
|
|
2.67 |
|
|
|
|
|
|
|
|
|
|
|
|
|
|
|
|
|
|
|
|
|
|
|
|
|
|
|
| Common Stocks - Long |
|
Shares |
|
|
Value |
|
|
Percentage of
Basket Value |
|
| Broadline Retail |
|
|
|
|
|
|
|
|
|
|
|
|
| Prosus NV |
|
|
640 |
|
|
|
$21,282 |
|
|
|
2.25% |
|
|
|
|
|
|
|
|
|
|
|
|
|
|
| Capital Markets |
|
|
|
|
|
|
|
|
|
|
|
|
| Deutsche Boerse AG |
|
|
142 |
|
|
|
27,192 |
|
|
|
2.88 |
|
| Euronext NV |
|
|
257 |
|
|
|
22,244 |
|
|
|
2.36 |
|
|
|
|
|
|
|
|
|
|
|
|
|
|
|
|
|
|
|
|
|
49,436 |
|
|
|
|
|
|
|
|
|
|
|
|
|
|
|
|
|
|
| Chemicals |
|
|
|
|
|
|
|
|
|
|
|
|
| OCI NV |
|
|
474 |
|
|
|
10,809 |
|
|
|
1.15 |
|
| Symrise AG |
|
|
247 |
|
|
|
28,211 |
|
|
|
2.99 |
|
|
|
|
|
|
|
|
|
|
|
|
|
|
|
|
|
|
|
|
|
39,020 |
|
|
|
|
|
|
|
|
|
|
|
|
|
|
|
|
|
|
| Construction & Engineering |
|
|
|
|
|
|
|
|
|
|
|
|
| Ferrovial SE |
|
|
730 |
|
|
|
26,452 |
|
|
|
2.80 |
|
|
|
|
|
|
|
|
|
|
|
|
|
|
| Diversified Telecommunication Services |
|
|
|
|
|
|
|
|
|
|
|
|
| Infrastrutture Wireless Italiane SpA |
|
|
2,020 |
|
|
|
19,696 |
|
|
|
2.09 |
|
|
|
|
|
|
|
|
|
|
|
|
|
|
The Notes to Financial Statements are an integral part of this report.
|
|
|
|
|
| Transamerica Series Trust |
|
|
|
Semi-Annual Financial Statements 2024 |
|
|
Page 21 |
|
|
Transamerica Morgan Stanley Global Allocation VP
CONSOLIDATED SCHEDULE OF INVESTMENTS (continued)
At June 30, 2024
(unaudited)
|
|
|
|
|
|
|
|
|
|
|
|
|
| Common Stocks - Long |
|
Shares |
|
|
Value |
|
|
Percentage of
Basket Value |
|
| Electric Utilities |
|
|
|
|
|
|
|
|
|
|
|
|
| EDP - Energias de Portugal |
|
|
|
|
|
|
|
|
|
|
|
|
| SA |
|
|
9,757 |
|
|
|
$34,139 |
|
|
|
3.62 |
% |
| Elia Group SA |
|
|
107 |
|
|
|
9,380 |
|
|
|
0.99 |
|
|
|
|
|
|
|
|
|
|
|
|
|
|
|
|
|
|
|
|
|
43,519 |
|
|
|
|
|
|
|
|
|
|
|
|
|
|
|
|
|
|
| Electrical Equipment |
|
|
|
|
|
|
|
|
|
|
|
|
| Siemens Energy AG |
|
|
1,120 |
|
|
|
27,233 |
|
|
|
2.89 |
|
|
|
|
|
|
|
|
|
|
|
|
|
|
| Entertainment |
|
|
|
|
|
|
|
|
|
|
|
|
| Bollore SE |
|
|
1,054 |
|
|
|
5,775 |
|
|
|
0.61 |
|
| CTS Eventim AG & Co. KGaA |
|
|
172 |
|
|
|
13,371 |
|
|
|
1.42 |
|
|
|
|
|
|
|
|
|
|
|
|
|
|
|
|
|
|
|
|
|
19,146 |
|
|
|
|
|
|
|
|
|
|
|
|
|
|
|
|
|
|
| Financial Services |
|
|
|
|
|
|
|
|
|
|
|
|
| Adyen NV |
|
|
21 |
|
|
|
23,641 |
|
|
|
2.50 |
|
| Edenred SE |
|
|
614 |
|
|
|
24,184 |
|
|
|
2.56 |
|
| Eurazeo SE |
|
|
29 |
|
|
|
2,181 |
|
|
|
0.23 |
|
| Groupe Bruxelles Lambert NV |
|
|
157 |
|
|
|
10,444 |
|
|
|
1.11 |
|
| Nexi SpA |
|
|
4,354 |
|
|
|
24,794 |
|
|
|
2.63 |
|
| Sofina SA |
|
|
31 |
|
|
|
6,510 |
|
|
|
0.69 |
|
|
|
|
|
|
|
|
|
|
|
|
|
|
|
|
|
|
|
|
|
91,754 |
|
|
|
|
|
|
|
|
|
|
|
|
|
|
|
|
|
|
| Food Products |
|
|
|
|
|
|
|
|
|
|
|
|
| Lotus Bakeries NV |
|
|
1 |
|
|
|
7,947 |
|
|
|
0.84 |
|
|
|
|
|
|
|
|
|
|
|
|
|
|
| Hotels, Restaurants & Leisure |
|
|
|
|
|
|
|
|
|
|
|
|
| Accor SA |
|
|
572 |
|
|
|
21,911 |
|
|
|
2.32 |
|
| Delivery Hero SE |
|
|
772 |
|
|
|
17,091 |
|
|
|
1.81 |
|
|
|
|
|
|
|
|
|
|
|
|
|
|
|
|
|
|
|
|
|
39,002 |
|
|
|
|
|
|
|
|
|
|
|
|
|
|
|
|
|
|
| Independent Power & Renewable Electricity Producers |
|
|
|
|
|
|
|
|
|
|
|
|
| EDP Renovaveis SA |
|
|
1,460 |
|
|
|
19,057 |
|
|
|
2.02 |
|
|
|
|
|
|
|
|
|
|
|
|
|
|
| Insurance |
|
|
|
|
|
|
|
|
|
|
|
|
| Hannover Rueck SE |
|
|
112 |
|
|
|
26,478 |
|
|
|
2.81 |
|
| Sampo OYJ, A Shares |
|
|
653 |
|
|
|
26,186 |
|
|
|
2.77 |
|
|
|
|
|
|
|
|
|
|
|
|
|
|
|
|
|
|
|
|
|
52,664 |
|
|
|
|
|
|
|
|
|
|
|
|
|
|
|
|
|
|
| Interactive Media & Services |
|
|
|
|
|
|
|
|
|
|
|
|
| Scout24 SE |
|
|
178 |
|
|
|
12,647 |
|
|
|
1.34 |
|
| Life Sciences Tools & Services |
|
|
|
|
|
|
|
|
|
|
|
|
| Sartorius AG |
|
|
91 |
|
|
|
19,943 |
|
|
|
2.11 |
|
| Sartorius Stedim Biotech |
|
|
122 |
|
|
|
18,728 |
|
|
|
1.98 |
|
|
|
|
|
|
|
|
|
|
|
|
|
|
|
|
|
|
|
|
|
38,671 |
|
|
|
|
|
|
|
|
|
|
|
|
|
|
|
|
|
|
|
|
|
|
|
|
|
|
|
|
|
|
|
| Common Stocks - Long |
|
Shares |
|
|
Value |
|
|
Percentage of
Basket Value |
|
| Machinery |
|
|
|
|
|
|
|
|
|
|
|
|
| Rational AG |
|
|
9 |
|
|
|
$6,916 |
|
|
|
0.73 |
% |
|
|
|
|
|
|
|
|
|
|
|
|
|
| Media |
|
|
|
|
|
|
|
|
|
|
|
|
| Vivendi SE |
|
|
1,398 |
|
|
|
13,643 |
|
|
|
1.45 |
|
|
|
|
|
|
|
|
|
|
|
|
|
|
| Office REITs |
|
|
|
|
|
|
|
|
|
|
|
|
| Gecina SA |
|
|
158 |
|
|
|
13,574 |
|
|
|
1.44 |
|
|
|
|
|
|
|
|
|
|
|
|
|
|
| Oil, Gas & Consumable Fuels |
|
|
|
|
|
|
|
|
|
|
|
|
| Galp Energia SGPS SA |
|
|
1,170 |
|
|
|
23,081 |
|
|
|
2.45 |
|
|
|
|
|
|
|
|
|
|
|
|
|
|
| Paper & Forest Products |
|
|
|
|
|
|
|
|
|
|
|
|
| Stora Enso OYJ, R Shares |
|
|
2,156 |
|
|
|
27,506 |
|
|
|
2.91 |
|
|
|
|
|
|
|
|
|
|
|
|
|
|
| Personal Care Products |
|
|
|
|
|
|
|
|
|
|
|
|
| Beiersdorf AG |
|
|
235 |
|
|
|
32,072 |
|
|
|
3.40 |
|
|
|
|
|
|
|
|
|
|
|
|
|
|
| Pharmaceuticals |
|
|
|
|
|
|
|
|
|
|
|
|
| UCB SA |
|
|
163 |
|
|
|
22,545 |
|
|
|
2.39 |
|
|
|
|
|
|
|
|
|
|
|
|
|
|
| Professional Services |
|
|
|
|
|
|
|
|
|
|
|
|
| Automatic Data Processing, Inc. |
|
|
138 |
|
|
|
15,713 |
|
|
|
1.66 |
|
|
|
|
|
|
|
|
|
|
|
|
|
|
| Real Estate Management & Development |
|
|
|
|
|
|
|
|
|
|
|
|
| LEG Immobilien SE |
|
|
93 |
|
|
|
7,060 |
|
|
|
0.75 |
|
|
|
|
|
|
|
|
|
|
|
|
|
|
| Semiconductors & Semiconductor Equipment |
|
|
|
|
|
|
|
|
|
|
|
|
| ASM International NV |
|
|
32 |
|
|
|
22,606 |
|
|
|
2.39 |
|
| BE Semiconductor Industries NV |
|
|
138 |
|
|
|
21,575 |
|
|
|
2.29 |
|
|
|
|
|
|
|
|
|
|
|
|
|
|
|
|
|
|
|
|
|
44,181 |
|
|
|
|
|
|
|
|
|
|
|
|
|
|
|
|
|
|
| Textiles, Apparel & Luxury Goods |
|
|
|
|
|
|
|
|
|
|
|
|
| adidas AG |
|
|
97 |
|
|
|
21,633 |
|
|
|
2.29 |
|
| Hermes International SCA |
|
|
10 |
|
|
|
21,838 |
|
|
|
2.31 |
|
|
|
|
|
|
|
|
|
|
|
|
|
|
|
|
|
|
|
|
|
43,471 |
|
|
|
|
|
|
|
|
|
|
|
|
|
|
|
|
|
|
| Transportation Infrastructure |
|
|
|
|
|
|
|
|
|
|
|
|
| Getlink SE |
|
|
1,291 |
|
|
|
19,941 |
|
|
|
2.11 |
|
|
|
|
|
|
|
|
|
|
|
|
|
|
| Total Common Stocks - Long |
|
|
|
|
|
$ |
943,914 |
|
|
|
|
|
|
|
|
|
|
|
|
|
|
|
|
|
|
| (c) |
The significant reference entities underlying the corresponding total return swap as of June 30, 2024, are as follows: |
|
|
|
|
|
|
|
|
|
|
|
|
|
| Common Stocks - Long |
|
Shares |
|
|
Value |
|
|
Percentage of
Basket Value |
|
| Automobiles |
|
|
|
|
|
|
|
|
|
|
|
|
| Bayerische Motoren Werke AG |
|
|
288 |
|
|
|
$25,468 |
|
|
|
2.81 |
% |
| Bayerische Motoren Werke AG |
|
|
209 |
|
|
|
17,230 |
|
|
|
1.90 |
|
| Mercedes-Benz Group AG |
|
|
400 |
|
|
|
25,809 |
|
|
|
2.84 |
|
| Stellantis NV |
|
|
1,292 |
|
|
|
23,868 |
|
|
|
2.63 |
|
| Volkswagen AG |
|
|
241 |
|
|
|
25,364 |
|
|
|
2.79 |
|
| Volkswagen AG |
|
|
96 |
|
|
|
10,796 |
|
|
|
1.19 |
|
|
|
|
|
|
|
|
|
|
|
|
|
|
|
|
|
|
|
|
|
128,535 |
|
|
|
|
|
|
|
|
|
|
|
|
|
|
|
|
|
|
| Banks |
|
|
|
|
|
|
|
|
|
|
|
|
| ABN AMRO Bank NV |
|
|
1,400 |
|
|
|
21,494 |
|
|
|
2.37 |
|
|
|
|
|
|
|
|
|
|
|
|
|
|
| Common Stocks - Long |
|
Shares |
|
|
Value |
|
|
Percentage of
Basket Value |
|
| AIB Group PLC |
|
|
4,476 |
|
|
|
$22,091 |
|
|
|
2.43 |
% |
| Banco BPM SpA |
|
|
3,561 |
|
|
|
21,417 |
|
|
|
2.36 |
|
| Banco Santander SA |
|
|
4,862 |
|
|
|
21,057 |
|
|
|
2.32 |
|
| Bank of Ireland Group PLC |
|
|
2,213 |
|
|
|
21,613 |
|
|
|
2.38 |
|
| Commerzbank AG |
|
|
1,500 |
|
|
|
21,273 |
|
|
|
2.34 |
|
| Deutsche Bank AG |
|
|
1,485 |
|
|
|
22,138 |
|
|
|
2.44 |
|
| Erste Group Bank AG |
|
|
496 |
|
|
|
21,944 |
|
|
|
2.42 |
|
| UniCredit SpA |
|
|
621 |
|
|
|
21,501 |
|
|
|
2.37 |
|
|
|
|
|
|
|
|
|
|
|
|
|
|
|
|
|
|
|
|
|
194,528 |
|
|
|
|
|
|
|
|
|
|
|
|
|
|
|
|
|
|
| Commercial Services & Supplies |
|
|
|
|
|
|
|
|
|
|
|
|
| DHL Group |
|
|
562 |
|
|
|
21,253 |
|
|
|
2.34 |
|
|
|
|
|
|
|
|
|
|
|
|
|
|
|
|
|
|
|
| The Notes to Financial Statements are an integral part of this report. Transamerica Series Trust |
|
|
|
Semi-Annual Financial Statements 2024 |
|
|
Page 22 |
|
|
Transamerica Morgan Stanley Global Allocation VP
CONSOLIDATED SCHEDULE OF INVESTMENTS (continued)
At June 30, 2024
(unaudited)
|
|
|
|
|
|
|
|
|
|
|
|
|
| Common Stocks - Long |
|
Shares |
|
|
Value |
|
|
Percentage of
Basket Value |
|
| Communications Equipment |
|
|
|
|
|
|
|
|
|
|
|
|
| Nokia OYJ |
|
|
6,209 |
|
|
|
$22,096 |
|
|
|
2.43 |
% |
|
|
|
|
|
|
|
|
|
|
|
|
|
| Construction & Engineering |
|
|
|
|
|
|
|
|
|
|
|
|
| Bouygues SA |
|
|
693 |
|
|
|
20,763 |
|
|
|
2.29 |
|
| Eiffage SA |
|
|
244 |
|
|
|
20,931 |
|
|
|
2.31 |
|
|
|
|
|
|
|
|
|
|
|
|
|
|
|
|
|
|
|
|
|
41,694 |
|
|
|
|
|
|
|
|
|
|
|
|
|
|
|
|
|
|
| Construction Materials |
|
|
|
|
|
|
|
|
|
|
|
|
| Heidelberg Materials AG |
|
|
274 |
|
|
|
26,518 |
|
|
|
2.92 |
|
|
|
|
|
|
|
|
|
|
|
|
|
|
| Consumer Staples Distribution & Retail |
|
|
|
|
|
|
|
|
|
|
|
|
| Carrefour SA |
|
|
2,034 |
|
|
|
26,851 |
|
|
|
2.96 |
|
| Kesko OYJ, B Shares |
|
|
1,045 |
|
|
|
17,134 |
|
|
|
1.89 |
|
| Koninklijke Ahold Delhaize NV |
|
|
1,064 |
|
|
|
29,352 |
|
|
|
3.23 |
|
|
|
|
|
|
|
|
|
|
|
|
|
|
|
|
|
|
|
|
|
73,337 |
|
|
|
|
|
|
|
|
|
|
|
|
|
|
|
|
|
|
| Diversified REITs |
|
|
|
|
|
|
|
|
|
|
|
|
| Covivio SA |
|
|
304 |
|
|
|
13,495 |
|
|
|
1.49 |
|
|
|
|
|
|
|
|
|
|
|
|
|
|
| Diversified Telecommunication Services |
|
|
|
|
|
|
|
|
|
|
|
|
| Deutsche Telekom AG |
|
|
964 |
|
|
|
22,632 |
|
|
|
2.49 |
|
| Telefonica SA |
|
|
5,250 |
|
|
|
20,790 |
|
|
|
2.29 |
|
|
|
|
|
|
|
|
|
|
|
|
|
|
|
|
|
|
|
|
|
43,422 |
|
|
|
|
|
|
|
|
|
|
|
|
|
|
|
|
|
|
| Electric Utilities |
|
|
|
|
|
|
|
|
|
|
|
|
| Enel SpA |
|
|
3,306 |
|
|
|
21,472 |
|
|
|
2.37 |
|
| Fortum OYJ |
|
|
1,536 |
|
|
|
20,969 |
|
|
|
2.31 |
|
|
|
|
|
|
|
|
|
|
|
|
|
|
|
|
|
|
|
|
|
42,441 |
|
|
|
|
|
|
|
|
|
|
|
|
|
|
|
|
|
|
| Food Products |
|
|
|
|
|
|
|
|
|
|
|
|
| JDE Peet’s NV |
|
|
537 |
|
|
|
9,982 |
|
|
|
1.10 |
|
|
|
|
|
|
|
|
|
|
|
|
|
|
| Health Care Providers & Services |
|
|
|
|
|
|
|
|
|
|
|
|
| Fresenius Medical Care AG |
|
|
559 |
|
|
|
19,977 |
|
|
|
2.20 |
|
| Fresenius SE & Co. KGaA |
|
|
727 |
|
|
|
20,273 |
|
|
|
2.23 |
|
|
|
|
|
|
|
|
|
|
|
|
|
|
|
|
|
|
|
|
|
40,250 |
|
|
|
|
|
|
|
|
|
|
|
|
|
|
|
|
|
|
|
|
|
|
|
|
|
|
|
|
|
|
|
| Common Stocks - Long |
|
Shares |
|
|
Value |
|
|
Percentage of
Basket Value |
|
| Machinery |
|
|
|
|
|
|
|
|
|
|
|
|
| Daimler Truck Holding AG |
|
|
577 |
|
|
|
$21,460 |
|
|
|
2.36 |
% |
|
|
|
|
|
|
|
|
|
|
|
|
|
| Metals & Mining |
|
|
|
|
|
|
|
|
|
|
|
|
| ArcelorMittal SA |
|
|
1,199 |
|
|
|
25,625 |
|
|
|
2.82 |
|
| voestalpine AG |
|
|
469 |
|
|
|
11,820 |
|
|
|
1.30 |
|
|
|
|
|
|
|
|
|
|
|
|
|
|
|
|
|
|
|
|
|
37,445 |
|
|
|
|
|
|
|
|
|
|
|
|
|
|
|
|
|
|
| Multi-Utilities |
|
|
|
|
|
|
|
|
|
|
|
|
| Engie SA |
|
|
1,591 |
|
|
|
21,214 |
|
|
|
2.34 |
|
|
|
|
|
|
|
|
|
|
|
|
|
|
| Passenger Airlines |
|
|
|
|
|
|
|
|
|
|
|
|
| Deutsche Lufthansa AG |
|
|
3,647 |
|
|
|
20,824 |
|
|
|
2.29 |
|
|
|
|
|
|
|
|
|
|
|
|
|
|
| Pharmaceuticals |
|
|
|
|
|
|
|
|
|
|
|
|
| Bayer AG |
|
|
797 |
|
|
|
21,015 |
|
|
|
2.32 |
|
| Grifols SA |
|
|
2,350 |
|
|
|
18,467 |
|
|
|
2.03 |
|
|
|
|
|
|
|
|
|
|
|
|
|
|
|
|
|
|
|
|
|
39,482 |
|
|
|
|
|
|
|
|
|
|
|
|
|
|
|
|
|
|
| Professional Services |
|
|
|
|
|
|
|
|
|
|
|
|
| Randstad NV |
|
|
470 |
|
|
|
19,887 |
|
|
|
2.19 |
|
| Teleperformance SE |
|
|
221 |
|
|
|
21,719 |
|
|
|
2.39 |
|
|
|
|
|
|
|
|
|
|
|
|
|
|
|
|
|
|
|
|
|
41,606 |
|
|
|
|
|
|
|
|
|
|
|
|
|
|
|
|
|
|
| Retail REITs |
|
|
|
|
|
|
|
|
|
|
|
|
| Klepierre SA |
|
|
288 |
|
|
|
7,196 |
|
|
|
0.79 |
|
|
|
|
|
|
|
|
|
|
|
|
|
|
| Semiconductors & Semiconductor Equipment |
|
|
|
|
|
|
|
|
|
|
|
|
| STMicroelectronics NV |
|
|
531 |
|
|
|
19,586 |
|
|
|
2.16 |
|
|
|
|
|
|
|
|
|
|
|
|
|
|
| Trading Companies & Distributors |
|
|
|
|
|
|
|
|
|
|
|
|
| Rexel SA |
|
|
822 |
|
|
|
19,855 |
|
|
|
2.19 |
|
|
|
|
|
|
|
|
|
|
|
|
|
|
| Wireless Telecommunication Services |
|
|
|
|
|
|
|
|
|
|
|
|
| Orange SA |
|
|
2,302 |
|
|
|
21,537 |
|
|
|
2.37 |
|
|
|
|
|
|
|
|
|
|
|
|
|
|
| Total Common Stocks - Long |
|
|
|
|
|
|
$ 907,756 |
|
|
|
|
|
|
|
|
|
|
|
|
|
|
|
|
|
|
| (d) |
The significant reference entities underlying the corresponding total return swap as of June 30, 2024, are as follows: |
|
|
|
|
|
|
|
|
|
|
|
|
|
| Common Stocks - Long |
|
Shares |
|
|
Value |
|
|
Percentage of
Basket Value |
|
| Automobile Components |
|
|
|
|
|
|
|
|
|
|
|
|
| Cie Generale des Etablissements Michelin SCA |
|
|
630 |
|
|
|
$22,753 |
|
|
|
2.46 |
% |
|
|
|
|
|
|
|
|
|
|
|
|
|
| Automobiles |
|
|
|
|
|
|
|
|
|
|
|
|
| Bayerische Motoren Werke AG |
|
|
272 |
|
|
|
24,041 |
|
|
|
2.60 |
|
| Mercedes-Benz Group AG |
|
|
377 |
|
|
|
24,363 |
|
|
|
2.64 |
|
| Stellantis NV |
|
|
1,220 |
|
|
|
22,530 |
|
|
|
2.44 |
|
| Volkswagen AG |
|
|
227 |
|
|
|
23,942 |
|
|
|
2.59 |
|
| Volkswagen AG |
|
|
75 |
|
|
|
8,366 |
|
|
|
0.91 |
|
|
|
|
|
|
|
|
|
|
|
|
|
|
|
|
|
|
|
|
|
103,242 |
|
|
|
|
|
|
|
|
|
|
|
|
|
|
|
|
|
|
| Banks |
|
|
|
|
|
|
|
|
|
|
|
|
| ABN AMRO Bank NV |
|
|
1,383 |
|
|
|
21,231 |
|
|
|
2.30 |
|
| AIB Group PLC |
|
|
4,421 |
|
|
|
21,822 |
|
|
|
2.36 |
|
| Banco Bilbao Vizcaya Argentaria SA |
|
|
2,340 |
|
|
|
21,884 |
|
|
|
2.37 |
|
| Banco Santander SA |
|
|
4,803 |
|
|
|
20,799 |
|
|
|
2.25 |
|
| Bank of Ireland Group PLC |
|
|
2,186 |
|
|
|
21,349 |
|
|
|
2.31 |
|
|
|
|
|
|
|
|
|
|
|
|
|
|
| Common Stocks - Long |
|
Shares |
|
|
Value |
|
|
Percentage of
Basket Value |
|
| Erste Group Bank AG |
|
|
490 |
|
|
|
$21,676 |
|
|
|
2.35 |
% |
| UniCredit SpA |
|
|
614 |
|
|
|
21,239 |
|
|
|
2.30 |
|
|
|
|
|
|
|
|
|
|
|
|
|
|
|
|
|
|
|
|
|
150,000 |
|
|
|
|
|
|
|
|
|
|
|
|
|
|
|
|
|
|
| Building Products |
|
|
|
|
|
|
|
|
|
|
|
|
| Cie de Saint-Gobain SA |
|
|
282 |
|
|
|
20,494 |
|
|
|
2.22 |
|
|
|
|
|
|
|
|
|
|
|
|
|
|
| Capital Markets |
|
|
|
|
|
|
|
|
|
|
|
|
| Deutsche Bank AG |
|
|
1,467 |
|
|
|
21,868 |
|
|
|
2.37 |
|
|
|
|
|
|
|
|
|
|
|
|
|
|
| Communications Equipment |
|
|
|
|
|
|
|
|
|
|
|
|
| Nokia OYJ |
|
|
6,134 |
|
|
|
21,826 |
|
|
|
2.36 |
|
|
|
|
|
|
|
|
|
|
|
|
|
|
| Construction & Engineering |
|
|
|
|
|
|
|
|
|
|
|
|
| Bouygues SA |
|
|
684 |
|
|
|
20,509 |
|
|
|
2.22 |
|
| Eiffage SA |
|
|
241 |
|
|
|
20,675 |
|
|
|
2.24 |
|
| Vinci SA |
|
|
213 |
|
|
|
20,928 |
|
|
|
2.27 |
|
|
|
|
|
|
|
|
|
|
|
|
|
|
|
|
|
|
|
|
|
62,112 |
|
|
|
|
|
|
|
|
|
|
|
|
|
|
|
|
|
|
| Construction Materials |
|
|
|
|
|
|
|
|
|
|
|
|
| Heidelberg Materials AG |
|
|
220 |
|
|
|
21,338 |
|
|
|
2.31 |
|
|
|
|
|
|
|
|
|
|
|
|
|
|
|
|
|
|
|
| The Notes to Financial Statements are an integral part of this report. Transamerica Series Trust |
|
|
|
Semi-Annual Financial Statements 2024 |
|
|
Page 23 |
|
|
Transamerica Morgan Stanley Global Allocation VP
CONSOLIDATED SCHEDULE OF INVESTMENTS (continued)
At June 30, 2024
(unaudited)
|
|
|
|
|
|
|
|
|
|
|
|
|
| Common Stocks - Long |
|
Shares |
|
|
Value |
|
|
Percentage of
Basket Value |
|
| Consumer Staples Distribution & Retail |
|
|
|
|
|
|
|
|
|
|
|
|
| Carrefour SA |
|
|
1,659 |
|
|
|
$21,896 |
|
|
|
2.37 |
% |
| Jeronimo Martins SGPS SA |
|
|
1,239 |
|
|
|
22,618 |
|
|
|
2.45 |
|
| Kesko OYJ, B Shares |
|
|
810 |
|
|
|
13,278 |
|
|
|
1.44 |
|
| Koninklijke Ahold Delhaize NV |
|
|
868 |
|
|
|
23,935 |
|
|
|
2.59 |
|
|
|
|
|
|
|
|
|
|
|
|
|
|
|
|
|
|
|
|
|
81,727 |
|
|
|
|
|
|
|
|
|
|
|
|
|
|
|
|
|
|
| Containers & Packaging |
|
|
|
|
|
|
|
|
|
|
|
|
| Smurfit Kappa Group PLC |
|
|
510 |
|
|
|
21,218 |
|
|
|
2.30 |
|
|
|
|
|
|
|
|
|
|
|
|
|
|
| Diversified REITs |
|
|
|
|
|
|
|
|
|
|
|
|
| Covivio SA |
|
|
236 |
|
|
|
10,457 |
|
|
|
1.13 |
|
|
|
|
|
|
|
|
|
|
|
|
|
|
| Diversified Telecommunication Services |
|
|
|
|
|
|
|
|
|
|
|
|
| Deutsche Telekom AG |
|
|
952 |
|
|
|
22,355 |
|
|
|
2.42 |
|
|
|
|
|
|
|
|
|
|
|
|
|
|
| Electric Utilities |
|
|
|
|
|
|
|
|
|
|
|
|
| Enel SpA |
|
|
3,266 |
|
|
|
21,210 |
|
|
|
2.30 |
|
| Fortum OYJ |
|
|
1,517 |
|
|
|
20,713 |
|
|
|
2.24 |
|
|
|
|
|
|
|
|
|
|
|
|
|
|
|
|
|
|
|
|
|
41,923 |
|
|
|
|
|
|
|
|
|
|
|
|
|
|
|
|
|
|
| Energy Equipment & Services |
|
|
|
|
|
|
|
|
|
|
|
|
| Tenaris SA |
|
|
1,469 |
|
|
|
21,074 |
|
|
|
2.28 |
|
|
|
|
|
|
|
|
|
|
|
|
|
|
| Health Care Providers & Services |
|
|
|
|
|
|
|
|
|
|
|
|
| Fresenius Medical Care AG |
|
|
552 |
|
|
|
19,733 |
|
|
|
2.14 |
|
| Fresenius SE & Co. KGaA |
|
|
718 |
|
|
|
20,026 |
|
|
|
2.17 |
|
|
|
|
|
|
|
|
|
|
|
|
|
|
|
|
|
|
|
|
|
39,759 |
|
|
|
|
|
|
|
|
|
|
|
|
|
|
|
|
|
|
| Insurance |
|
|
|
|
|
|
|
|
|
|
|
|
| Ageas SA |
|
|
500 |
|
|
|
21,339 |
|
|
|
2.31 |
|
|
|
|
|
|
|
|
|
|
|
|
|
|
| IT Services |
|
|
|
|
|
|
|
|
|
|
|
|
| Capgemini SE |
|
|
114 |
|
|
|
21,224 |
|
|
|
2.30 |
|
|
|
|
|
|
|
|
|
|
|
|
|
|
|
|
|
|
|
|
|
|
|
|
|
|
|
| Common Stocks - Long |
|
Shares |
|
|
Value |
|
|
Percentage of
Basket Value |
|
| Machinery |
|
|
|
|
|
|
|
|
|
|
|
|
| Daimler Truck Holding AG |
|
|
570 |
|
|
|
$21,198 |
|
|
|
2.30 |
% |
|
|
|
|
|
|
|
|
|
|
|
|
|
| Media |
|
|
|
|
|
|
|
|
|
|
|
|
| Publicis Groupe SA |
|
|
212 |
|
|
|
21,030 |
|
|
|
2.28 |
|
|
|
|
|
|
|
|
|
|
|
|
|
|
| Metals & Mining |
|
|
|
|
|
|
|
|
|
|
|
|
| ArcelorMittal SA |
|
|
965 |
|
|
|
20,620 |
|
|
|
2.23 |
|
|
|
|
|
|
|
|
|
|
|
|
|
|
| Multi-Utilities |
|
|
|
|
|
|
|
|
|
|
|
|
| Engie SA |
|
|
1,571 |
|
|
|
20,955 |
|
|
|
2.27 |
|
|
|
|
|
|
|
|
|
|
|
|
|
|
| Pharmaceuticals |
|
|
|
|
|
|
|
|
|
|
|
|
| Bayer AG |
|
|
787 |
|
|
|
20,758 |
|
|
|
2.25 |
|
| Sanofi SA |
|
|
244 |
|
|
|
21,916 |
|
|
|
2.37 |
|
|
|
|
|
|
|
|
|
|
|
|
|
|
|
|
|
|
|
|
|
42,674 |
|
|
|
|
|
|
|
|
|
|
|
|
|
|
|
|
|
|
| Professional Services |
|
|
|
|
|
|
|
|
|
|
|
|
| Randstad NV |
|
|
464 |
|
|
|
19,644 |
|
|
|
2.13 |
|
| Teleperformance SE |
|
|
218 |
|
|
|
21,454 |
|
|
|
2.32 |
|
|
|
|
|
|
|
|
|
|
|
|
|
|
|
|
|
|
|
|
|
41,098 |
|
|
|
|
|
|
|
|
|
|
|
|
|
|
|
|
|
|
| Retail REITs |
|
|
|
|
|
|
|
|
|
|
|
|
| Klepierre SA |
|
|
399 |
|
|
|
9,964 |
|
|
|
1.08 |
|
|
|
|
|
|
|
|
|
|
|
|
|
|
| Trading Companies & Distributors |
|
|
|
|
|
|
|
|
|
|
|
|
| Rexel SA |
|
|
812 |
|
|
|
19,613 |
|
|
|
2.12 |
|
|
|
|
|
|
|
|
|
|
|
|
|
|
| Wireless Telecommunication Services |
|
|
|
|
|
|
|
|
|
|
|
|
| Orange SA |
|
|
2,274 |
|
|
|
21,274 |
|
|
|
2.30 |
|
|
|
|
|
|
|
|
|
|
|
|
|
|
| Total Common Stocks - Long |
|
|
|
|
|
|
$ 923,135 |
|
|
|
|
|
|
|
|
|
|
|
|
|
|
|
|
|
|
| (e) |
The significant reference entities underlying the corresponding total return swap as of June 30, 2024, are as follows: |
|
|
|
|
|
|
|
|
|
|
|
|
|
| Common Stocks - Long |
|
Shares |
|
|
Value |
|
|
Percentage of
Basket Value |
|
| Aerospace & Defense |
|
|
|
|
|
|
|
|
|
|
|
|
| Indra Sistemas SA |
|
|
958 |
|
|
|
$18,492 |
|
|
|
1.76 |
% |
| Rheinmetall AG |
|
|
150 |
|
|
|
71,180 |
|
|
|
6.79 |
|
|
|
|
|
|
|
|
|
|
|
|
|
|
|
|
|
|
|
|
|
89,672 |
|
|
|
|
|
|
|
|
|
|
|
|
|
|
|
|
|
|
| Air Freight & Logistics |
|
|
|
|
|
|
|
|
|
|
|
|
| Fraport AG Frankfurt Airport |
|
|
313 |
|
|
|
15,092 |
|
|
|
1.44 |
|
|
|
|
|
|
|
|
|
|
|
|
|
|
| Building Products |
|
|
|
|
|
|
|
|
|
|
|
|
| Cie de Saint-Gobain SA |
|
|
1,181 |
|
|
|
85,732 |
|
|
|
8.18 |
|
| Kingspan Group PLC |
|
|
577 |
|
|
|
45,909 |
|
|
|
4.38 |
|
|
|
|
|
|
|
|
|
|
|
|
|
|
|
|
|
|
|
|
|
131,641 |
|
|
|
|
|
|
|
|
|
|
|
|
|
|
|
|
|
|
| Construction & Engineering |
|
|
|
|
|
|
|
|
|
|
|
|
| Bouygues SA |
|
|
957 |
|
|
|
28,681 |
|
|
|
2.74 |
|
| Eiffage SA |
|
|
356 |
|
|
|
30,559 |
|
|
|
2.92 |
|
| Vinci SA |
|
|
1,089 |
|
|
|
107,147 |
|
|
|
10.22 |
|
|
|
|
|
|
|
|
|
|
|
|
|
|
|
|
|
|
|
|
|
166,387 |
|
|
|
|
|
|
|
|
|
|
|
|
|
|
|
|
|
|
| Containers & Packaging |
|
|
|
|
|
|
|
|
|
|
|
|
| Smurfit Kappa Group PLC |
|
|
1,090 |
|
|
|
45,350 |
|
|
|
4.33 |
|
|
|
|
|
|
|
|
|
|
|
|
|
|
| Distributors |
|
|
|
|
|
|
|
|
|
|
|
|
| D’ieteren Group |
|
|
134 |
|
|
|
26,576 |
|
|
|
2.54 |
|
|
|
|
|
|
|
|
|
|
|
|
|
|
| Health Care Providers & Services |
|
|
|
|
|
|
|
|
|
|
|
|
| Basic Fit NV |
|
|
326 |
|
|
|
6,551 |
|
|
|
0.63 |
|
|
|
|
|
|
|
|
|
|
|
|
|
|
|
|
|
|
|
|
|
|
|
|
|
|
|
| Common Stocks - Long |
|
Shares |
|
|
Value |
|
|
Percentage of
Basket Value |
|
| Hotels, Restaurants & Leisure |
|
|
|
|
|
|
|
|
|
|
|
|
| La Francaise des Jeux SAEM |
|
|
504 |
|
|
|
$16,024 |
|
|
|
1.53 |
% |
|
|
|
|
|
|
|
|
|
|
|
|
|
| Interactive Media & Services |
|
|
|
|
|
|
|
|
|
|
|
|
| Scout24 SE |
|
|
461 |
|
|
|
32,858 |
|
|
|
3.13 |
|
|
|
|
|
|
|
|
|
|
|
|
|
|
| IT Services |
|
|
|
|
|
|
|
|
|
|
|
|
| Bechtle AG |
|
|
477 |
|
|
|
20,967 |
|
|
|
2.00 |
|
| Capgemini SE |
|
|
406 |
|
|
|
75,322 |
|
|
|
7.19 |
|
| Exclusive Networks SA |
|
|
89 |
|
|
|
1,686 |
|
|
|
0.16 |
|
|
|
|
|
|
|
|
|
|
|
|
|
|
|
|
|
|
|
|
|
97,975 |
|
|
|
|
|
|
|
|
|
|
|
|
|
|
|
|
|
|
| Machinery |
|
|
|
|
|
|
|
|
|
|
|
|
| Iveco Group NV |
|
|
2,828 |
|
|
|
29,613 |
|
|
|
2.83 |
|
|
|
|
|
|
|
|
|
|
|
|
|
|
| Media |
|
|
|
|
|
|
|
|
|
|
|
|
| ProSiebenSat.1 Media SE |
|
|
1,885 |
|
|
|
12,467 |
|
|
|
1.19 |
|
| Vivendi SE |
|
|
3,420 |
|
|
|
33,362 |
|
|
|
3.18 |
|
|
|
|
|
|
|
|
|
|
|
|
|
|
|
|
|
|
|
|
|
45,829 |
|
|
|
|
|
|
|
|
|
|
|
|
|
|
|
|
|
|
| Paper & Forest Products |
|
|
|
|
|
|
|
|
|
|
|
|
| Stora Enso OYJ, R Shares |
|
|
2,879 |
|
|
|
36,728 |
|
|
|
3.50 |
|
|
|
|
|
|
|
|
|
|
|
|
|
|
| Passenger Airlines |
|
|
|
|
|
|
|
|
|
|
|
|
| Deutsche Lufthansa AG |
|
|
3,894 |
|
|
|
22,233 |
|
|
|
2.12 |
|
|
|
|
|
|
|
|
|
|
|
|
|
|
|
|
|
|
|
| The Notes to Financial Statements are an integral part of this report. Transamerica Series Trust |
|
|
|
Semi-Annual Financial Statements 2024 |
|
|
Page 24 |
|
|
Transamerica Morgan Stanley Global Allocation VP
CONSOLIDATED SCHEDULE OF INVESTMENTS (continued)
At June 30, 2024
(unaudited)
|
|
|
|
|
|
|
|
|
|
|
|
|
| Common Stocks - Long |
|
Shares |
|
|
Value |
|
|
Percentage of
Basket Value |
|
| Professional Services |
|
|
|
|
|
|
|
|
|
|
|
|
| Automatic Data Processing, Inc. |
|
|
249 |
|
|
$ |
28,297 |
|
|
|
2.70 |
% |
| Randstad NV |
|
|
627 |
|
|
|
26,545 |
|
|
|
2.53 |
|
|
|
|
|
|
|
|
|
|
|
|
|
|
|
|
|
|
|
|
|
54,842 |
|
|
|
|
|
|
|
|
|
|
|
|
|
|
|
|
|
|
| Specialty Retail |
|
|
|
|
|
|
|
|
|
|
|
|
| Industria de Diseno Textil SA |
|
|
2,512 |
|
|
|
116,438 |
|
|
|
11.11 |
|
| Zalando SE |
|
|
1,570 |
|
|
|
34,362 |
|
|
|
3.28 |
|
|
|
|
|
|
|
|
|
|
|
|
|
|
|
|
|
|
|
|
|
150,800 |
|
|
|
|
|
|
|
|
|
|
|
|
|
|
|
|
|
|
|
|
|
|
|
|
|
|
|
|
|
|
|
| Common Stocks - Long |
|
Shares |
|
|
Value |
|
|
Percentage of
Basket Value |
|
| Transportation Infrastructure |
|
|
|
|
|
|
|
|
|
|
|
|
| Aena SME SA |
|
|
263 |
|
|
|
$49,354 |
|
|
|
4.71 |
% |
| Getlink SE |
|
|
1,986 |
|
|
|
30,683 |
|
|
|
2.93 |
|
|
|
|
|
|
|
|
|
|
|
|
|
|
|
|
|
|
|
|
|
80,037 |
|
|
|
|
|
|
|
|
|
|
|
|
|
|
|
|
|
|
| Total Common Stocks - Long |
|
|
|
|
|
$ |
1,048,208 |
|
|
|
|
|
|
|
|
|
|
|
|
|
|
|
|
|
|
| (f) |
The significant reference entities underlying the corresponding total return swap as of June 30, 2024, are as follows: |
|
|
|
|
|
|
|
|
|
|
|
|
|
| Common Stocks - Long |
|
Shares |
|
|
Value |
|
|
Percentage of
Basket Value |
|
| Automobile Components |
|
|
|
|
|
|
|
|
|
|
|
|
| Astra International TBK |
|
|
26,231 |
|
|
$ |
7,153 |
|
|
|
0.70 |
% |
|
|
|
|
|
|
|
|
|
|
|
|
|
| Automobiles |
|
|
|
|
|
|
|
|
|
|
|
|
| Hyundai Mobis |
|
|
57 |
|
|
|
10,439 |
|
|
|
1.02 |
|
| Kia Corp. |
|
|
229 |
|
|
|
21,477 |
|
|
|
2.09 |
|
| Koç Holding AS |
|
|
970 |
|
|
|
6,715 |
|
|
|
0.65 |
|
|
|
|
|
|
|
|
|
|
|
|
|
|
|
|
|
|
|
|
|
38,631 |
|
|
|
|
|
|
|
|
|
|
|
|
|
|
|
|
|
|
| Banks |
|
|
|
|
|
|
|
|
|
|
|
|
| Akbank T.A.Ş. |
|
|
4,919 |
|
|
|
9,622 |
|
|
|
0.94 |
|
| Alpha Bank |
|
|
3,793 |
|
|
|
6,192 |
|
|
|
0.60 |
|
| Bank Pekao SA |
|
|
304 |
|
|
|
12,697 |
|
|
|
1.24 |
|
| Commercial Bank of Qatar |
|
|
5,285 |
|
|
|
6,227 |
|
|
|
0.61 |
|
| Dubai Islamic Bank |
|
|
5,947 |
|
|
|
9,294 |
|
|
|
0.91 |
|
| Emirates NBD Bank |
|
|
2,649 |
|
|
|
11,901 |
|
|
|
1.16 |
|
| NBS Group Ltd. |
|
|
721 |
|
|
|
10,145 |
|
|
|
0.99 |
|
| OTP Bank |
|
|
366 |
|
|
|
18,208 |
|
|
|
1.77 |
|
| Shinhan Financial Group Co. Ltd. |
|
|
728 |
|
|
|
25,410 |
|
|
|
2.48 |
|
|
|
|
|
|
|
|
|
|
|
|
|
|
|
|
|
|
|
|
|
109,696 |
|
|
|
|
|
|
|
|
|
|
|
|
|
|
|
|
|
|
| Beverages |
|
|
|
|
|
|
|
|
|
|
|
|
| Arca Continental S.A.B. de C.V. |
|
|
802 |
|
|
|
7,888 |
|
|
|
0.77 |
|
|
|
|
|
|
|
|
|
|
|
|
|
|
| Commercial Services & Supplies |
|
|
|
|
|
|
|
|
|
|
|
|
| GlobalWafers Co. Ltd. |
|
|
715 |
|
|
|
11,885 |
|
|
|
1.16 |
|
|
|
|
|
|
|
|
|
|
|
|
|
|
| Communications Equipment |
|
|
|
|
|
|
|
|
|
|
|
|
| Liteone Technology |
|
|
4,785 |
|
|
|
15,634 |
|
|
|
1.52 |
|
|
|
|
|
|
|
|
|
|
|
|
|
|
| Construction & Engineering |
|
|
|
|
|
|
|
|
|
|
|
|
| Samsung C&T Corp. |
|
|
118 |
|
|
|
12,139 |
|
|
|
1.18 |
|
|
|
|
|
|
|
|
|
|
|
|
|
|
| Consumer Staples Distribution & Retail |
|
|
|
|
|
|
|
|
|
|
|
|
| Companhia Energética de Minas Gerais |
|
|
3,584 |
|
|
|
6,364 |
|
|
|
0.62 |
|
|
|
|
|
|
|
|
|
|
|
|
|
|
| Distributors |
|
|
|
|
|
|
|
|
|
|
|
|
| Ambev SA |
|
|
7,346 |
|
|
|
15,051 |
|
|
|
1.47 |
|
| Bidvest Group Ltd. |
|
|
374 |
|
|
|
5,841 |
|
|
|
0.57 |
|
|
|
|
|
|
|
|
|
|
|
|
|
|
|
|
|
|
|
|
|
20,892 |
|
|
|
|
|
|
|
|
|
|
|
|
|
|
|
|
|
|
| Diversified Telecommunication Services |
|
|
|
|
|
|
|
|
|
|
|
|
| Telefônica Brasil SA |
|
|
754 |
|
|
|
6,140 |
|
|
|
0.60 |
|
|
|
|
|
|
|
|
|
|
|
|
|
|
| Electric Utilities |
|
|
|
|
|
|
|
|
|
|
|
|
| Pegatron Corp. |
|
|
5,369 |
|
|
|
17,295 |
|
|
|
1.69 |
|
|
|
|
|
|
|
|
|
|
|
|
|
|
|
|
|
|
|
|
|
|
|
|
|
|
|
| Common Stocks - Long |
|
Shares |
|
|
Value |
|
|
Percentage of
Basket Value |
|
| Electronic Equipment, Instruments & Components |
|
|
|
|
|
|
|
|
|
|
|
|
| Hon Hai Precision Industry Co. Ltd. |
|
|
32,361 |
|
|
|
$213,483 |
|
|
|
20.81 |
% |
|
|
|
|
|
|
|
|
|
|
|
|
|
| Financial Services |
|
|
|
|
|
|
|
|
|
|
|
|
| Absa Group Ltd. |
|
|
1,395 |
|
|
|
12,122 |
|
|
|
1.18 |
|
| Banco do Brasil |
|
|
2,888 |
|
|
|
13,850 |
|
|
|
1.35 |
|
| Bancolombia SA |
|
|
787 |
|
|
|
6,451 |
|
|
|
0.63 |
|
| Eurobank Group |
|
|
4,360 |
|
|
|
9,443 |
|
|
|
0.92 |
|
| Hana Finanacial Group |
|
|
498 |
|
|
|
21,905 |
|
|
|
2.14 |
|
| Itaúsa SA |
|
|
9,035 |
|
|
|
15,932 |
|
|
|
1.55 |
|
| National Bank of Greece |
|
|
1,295 |
|
|
|
10,804 |
|
|
|
1.05 |
|
| Turkiye Is Bankasi AS, Class C |
|
|
14,091 |
|
|
|
6,820 |
|
|
|
0.66 |
|
| Woori Financial Group |
|
|
1,007 |
|
|
|
10,730 |
|
|
|
1.05 |
|
|
|
|
|
|
|
|
|
|
|
|
|
|
|
|
|
|
|
|
|
108,057 |
|
|
|
|
|
|
|
|
|
|
|
|
|
|
|
|
|
|
| Insurance |
|
|
|
|
|
|
|
|
|
|
|
|
| Db Insurance Co. Ltd. |
|
|
85 |
|
|
|
7,064 |
|
|
|
0.69 |
|
|
|
|
|
|
|
|
|
|
|
|
|
|
| IT Services |
|
|
|
|
|
|
|
|
|
|
|
|
| Micro-Star International Co. Ltd. |
|
|
1,764 |
|
|
|
9,677 |
|
|
|
0.94 |
|
| Samsung SDS Co. Ltd. |
|
|
100 |
|
|
|
10,794 |
|
|
|
1.05 |
|
|
|
|
|
|
|
|
|
|
|
|
|
|
|
|
|
|
|
|
|
20,471 |
|
|
|
|
|
|
|
|
|
|
|
|
|
|
|
|
|
|
| Metals & Mining |
|
|
|
|
|
|
|
|
|
|
|
|
| CEMEX S.A.B. de C.V., |
|
|
15,551 |
|
|
|
9,977 |
|
|
|
0.97 |
|
| Vale SA |
|
|
3,488 |
|
|
|
38,966 |
|
|
|
3.80 |
|
|
|
|
|
|
|
|
|
|
|
|
|
|
|
|
|
|
|
|
|
48,943 |
|
|
|
|
|
|
|
|
|
|
|
|
|
|
|
|
|
|
| Oil, Gas & Consumable Fuels |
|
|
|
|
|
|
|
|
|
|
|
|
| Petroleo Brasileiro SA |
|
|
4,041 |
|
|
|
29,303 |
|
|
|
2.86 |
|
|
|
|
|
|
|
|
|
|
|
|
|
|
| Paper & Forest Products |
|
|
|
|
|
|
|
|
|
|
|
|
| Suzano SA |
|
|
835 |
|
|
|
8,551 |
|
|
|
0.83 |
|
|
|
|
|
|
|
|
|
|
|
|
|
|
| Passenger Airlines |
|
|
|
|
|
|
|
|
|
|
|
|
| Turk Hava Yollari |
|
|
722 |
|
|
|
6,808 |
|
|
|
0.66 |
|
|
|
|
|
|
|
|
|
|
|
|
|
|
| Pharmaceuticals |
|
|
|
|
|
|
|
|
|
|
|
|
| Gedeon Richter PLC |
|
|
276 |
|
|
|
7,181 |
|
|
|
0.70 |
|
|
|
|
|
|
|
|
|
|
|
|
|
|
| Real Estate Management & Development |
|
|
|
|
|
|
|
|
|
|
|
|
| Emaar Properties PJSC |
|
|
3,523 |
|
|
|
7,864 |
|
|
|
0.77 |
|
|
|
|
|
|
|
|
|
|
|
|
|
|
| Semiconductors & Semiconductor Equipment |
|
|
|
|
|
|
|
|
|
|
|
|
| Advanced Semiconductor Engineering, Inc. |
|
|
7,963 |
|
|
|
41,364 |
|
|
|
4.03 |
|
| Zhen Ding Tech. Group |
|
|
1,799 |
|
|
|
7,182 |
|
|
|
0.70 |
|
|
|
|
|
|
|
|
|
|
|
|
|
|
|
|
|
|
|
|
|
48,546 |
|
|
|
|
|
|
|
|
|
|
|
|
|
|
|
|
|
|
|
|
|
|
|
| The Notes to Financial Statements are an integral part of this report. Transamerica Series Trust |
|
|
|
Semi-Annual Financial Statements 2024 |
|
|
Page 25 |
|
|
Transamerica Morgan Stanley Global Allocation VP
CONSOLIDATED SCHEDULE OF INVESTMENTS (continued)
At June 30, 2024
(unaudited)
|
|
|
|
|
|
|
|
|
|
|
|
|
| Common Stocks - Long |
|
Shares |
|
|
Value |
|
|
Percentage of
Basket Value |
|
| Technology Hardware, Storage & Peripherals |
|
|
|
|
|
|
|
|
|
|
|
|
| Compal Electronics, Inc. |
|
|
10,892 |
|
|
|
$11,651 |
|
|
|
1.14 |
% |
| Largan Precision Co. Ltd. |
|
|
291 |
|
|
|
24,628 |
|
|
|
2.40 |
|
| LG Elecronics, Inc. |
|
|
101 |
|
|
|
8,114 |
|
|
|
0.79 |
|
| LG Innotek Co., Ltd. |
|
|
39 |
|
|
|
7,673 |
|
|
|
0.75 |
|
| Samsung Electronics Co. Ltd. |
|
|
152 |
|
|
|
17,445 |
|
|
|
1.70 |
|
|
|
|
|
|
|
|
|
|
|
|
|
|
|
|
|
|
|
|
|
69,511 |
|
|
|
|
|
|
|
|
|
|
|
|
|
|
|
|
|
|
|
|
|
|
|
|
|
|
|
|
|
|
|
| Common Stocks - Long |
|
Shares |
|
|
Value |
|
|
Percentage of
Basket Value |
|
| Wireless Telecommunication Services |
|
|
|
|
|
|
|
|
|
|
|
|
| PT Telekomunikasi Indonesia TBK |
|
|
91,692 |
|
|
|
$17,550 |
|
|
|
1.71 |
% |
|
|
|
|
|
|
|
|
|
|
|
|
|
| Total Common Stocks - Long |
|
|
|
|
|
$ |
847,049 |
|
|
|
|
|
|
|
|
|
|
|
|
|
|
|
|
|
|
| (g) |
The significant reference entities underlying the corresponding total return swap as of June 30, 2024, are as follows: |
|
|
|
|
|
|
|
|
|
|
|
|
|
| Common Stocks - Long |
|
Shares |
|
|
Value |
|
|
Percentage of
Basket Value |
|
| Automobile Components |
|
|
|
|
|
|
|
|
|
|
|
|
| AutoZone, Inc. |
|
|
5 |
|
|
$ |
13,437 |
|
|
|
1.31 |
% |
|
|
|
|
|
|
|
|
|
|
|
|
|
| Beverages |
|
|
|
|
|
|
|
|
|
|
|
|
| Starbucks Corp. |
|
|
292 |
|
|
|
22,733 |
|
|
|
2.22 |
|
|
|
|
|
|
|
|
|
|
|
|
|
|
| Building Products |
|
|
|
|
|
|
|
|
|
|
|
|
| Martin Marietta Materials, Inc. |
|
|
16 |
|
|
|
8,454 |
|
|
|
0.82 |
|
| NVR, Inc. |
|
|
1 |
|
|
|
6,159 |
|
|
|
0.60 |
|
| Trane Technologies PLC |
|
|
57 |
|
|
|
18,731 |
|
|
|
1.83 |
|
|
|
|
|
|
|
|
|
|
|
|
|
|
|
|
|
|
|
|
|
33,344 |
|
|
|
|
|
|
|
|
|
|
|
|
|
|
|
|
|
|
| Commercial Services & Supplies |
|
|
|
|
|
|
|
|
|
|
|
|
| Tractor Supply Co. |
|
|
28 |
|
|
|
7,609 |
|
|
|
0.74 |
|
|
|
|
|
|
|
|
|
|
|
|
|
|
| Construction & Engineering |
|
|
|
|
|
|
|
|
|
|
|
|
| D.R. Horton, Inc. |
|
|
76 |
|
|
|
10,672 |
|
|
|
1.04 |
|
|
|
|
|
|
|
|
|
|
|
|
|
|
| Consumer Finance |
|
|
|
|
|
|
|
|
|
|
|
|
| Copart, Inc. |
|
|
215 |
|
|
|
11,640 |
|
|
|
1.13 |
|
|
|
|
|
|
|
|
|
|
|
|
|
|
| Consumer Staples Distribution & Retail |
|
|
|
|
|
|
|
|
|
|
|
|
| Cintas Corp. |
|
|
23 |
|
|
|
16,106 |
|
|
|
1.57 |
|
| Home Depot, Inc. |
|
|
247 |
|
|
|
84,911 |
|
|
|
8.28 |
|
| Lowe’s Companies, Inc |
|
|
144 |
|
|
|
31,739 |
|
|
|
3.09 |
|
| O’Reilly Automotive, Inc. |
|
|
15 |
|
|
|
15,901 |
|
|
|
1.55 |
|
| Sherwin-Williams |
|
|
62 |
|
|
|
18,504 |
|
|
|
1.80 |
|
| TJX Companies, Inc. |
|
|
286 |
|
|
|
31,464 |
|
|
|
3.07 |
|
| Vulcan Materials |
|
|
33 |
|
|
|
8,249 |
|
|
|
0.80 |
|
|
|
|
|
|
|
|
|
|
|
|
|
|
|
|
|
|
|
|
|
206,874 |
|
|
|
|
|
|
|
|
|
|
|
|
|
|
|
|
|
|
| Containers & Packaging |
|
|
|
|
|
|
|
|
|
|
|
|
| Waste Connections, Inc. |
|
|
65 |
|
|
|
11,327 |
|
|
|
1.10 |
|
|
|
|
|
|
|
|
|
|
|
|
|
|
| Distributors |
|
|
|
|
|
|
|
|
|
|
|
|
| Fastenal CO |
|
|
143 |
|
|
|
8,967 |
|
|
|
0.87 |
|
|
|
|
|
|
|
|
|
|
|
|
|
|
| Diversified Consumer Services |
|
|
|
|
|
|
|
|
|
|
|
|
| Equifax, Inc. |
|
|
31 |
|
|
|
7,527 |
|
|
|
0.73 |
|
|
|
|
|
|
|
|
|
|
|
|
|
|
| Diversified Telecommunication Services |
|
|
|
|
|
|
|
|
|
|
|
|
| Comcast Corp., Class A |
|
|
1,047 |
|
|
|
40,983 |
|
|
|
4.00 |
|
| Roper Technologies, Inc. |
|
|
27 |
|
|
|
15,201 |
|
|
|
1.48 |
|
|
|
|
|
|
|
|
|
|
|
|
|
|
|
|
|
|
|
|
|
56,184 |
|
|
|
|
|
|
|
|
|
|
|
|
|
|
|
|
|
|
| Electronic Equipment, Instruments & Components |
|
|
|
|
|
|
|
|
|
|
|
|
| Quanta Services |
|
|
37 |
|
|
|
9,359 |
|
|
|
0.91 |
|
| W. W. Grainger, Inc. |
|
|
11 |
|
|
|
10,209 |
|
|
|
1.00 |
|
|
|
|
|
|
|
|
|
|
|
|
|
|
|
|
|
|
|
|
|
19,568 |
|
|
|
|
|
|
|
|
|
|
|
|
|
|
|
|
|
|
|
|
|
|
|
|
|
|
|
|
|
|
|
| Common Stocks - Long |
|
Shares |
|
|
Value |
|
|
Percentage of
Basket Value |
|
| Energy Equipment & Services |
|
|
|
|
|
|
|
|
|
|
|
|
| Republic Services, Inc. |
|
|
56 |
|
|
|
$10,883 |
|
|
|
1.06 |
% |
|
|
|
|
|
|
|
|
|
|
|
|
|
| Food Products |
|
|
|
|
|
|
|
|
|
|
|
|
| DoorDash, Inc., Class A |
|
|
61 |
|
|
|
6,594 |
|
|
|
0.64 |
|
|
|
|
|
|
|
|
|
|
|
|
|
|
| Ground Transportation |
|
|
|
|
|
|
|
|
|
|
|
|
| CSX Corp. |
|
|
507 |
|
|
|
16,968 |
|
|
|
1.65 |
|
| FedEx Corp. |
|
|
60 |
|
|
|
17,934 |
|
|
|
1.75 |
|
| Norfolk Southern Corp. |
|
|
58 |
|
|
|
12,384 |
|
|
|
1.21 |
|
| Union Pacific Railroad |
|
|
155 |
|
|
|
35,126 |
|
|
|
3.42 |
|
|
|
|
|
|
|
|
|
|
|
|
|
|
|
|
|
|
|
|
|
82,412 |
|
|
|
|
|
|
|
|
|
|
|
|
|
|
|
|
|
|
| Health Care Providers & Services |
|
|
|
|
|
|
|
|
|
|
|
|
| Waste Management, Inc. |
|
|
102 |
|
|
|
21,791 |
|
|
|
2.12 |
|
|
|
|
|
|
|
|
|
|
|
|
|
|
| Hotels, Restaurants & Leisure |
|
|
|
|
|
|
|
|
|
|
|
|
| Hilton |
|
|
66 |
|
|
|
14,347 |
|
|
|
1.40 |
|
| Marriott International, Class A |
|
|
64 |
|
|
|
15,567 |
|
|
|
1.52 |
|
|
|
|
|
|
|
|
|
|
|
|
|
|
|
|
|
|
|
|
|
29,914 |
|
|
|
|
|
|
|
|
|
|
|
|
|
|
|
|
|
|
| IT Services |
|
|
|
|
|
|
|
|
|
|
|
|
| Cognizant Technology Solutions, Class A |
|
|
128 |
|
|
|
8,715 |
|
|
|
0.85 |
|
| CrowdStrike Holdings, Inc., Class A |
|
|
53 |
|
|
|
20,246 |
|
|
|
1.97 |
|
| Datadog, Inc., Class A |
|
|
64 |
|
|
|
8,309 |
|
|
|
0.81 |
|
|
|
|
|
|
|
|
|
|
|
|
|
|
|
|
|
|
|
|
|
37,270 |
|
|
|
|
|
|
|
|
|
|
|
|
|
|
|
|
|
|
| Machinery |
|
|
|
|
|
|
|
|
|
|
|
|
| United Rentals |
|
|
17 |
|
|
|
11,178 |
|
|
|
1.09 |
|
|
|
|
|
|
|
|
|
|
|
|
|
|
| Media |
|
|
|
|
|
|
|
|
|
|
|
|
| Charter Communication, Inc., Class A |
|
|
25 |
|
|
|
7,577 |
|
|
|
0.74 |
|
| Walt Disney |
|
|
475 |
|
|
|
47,153 |
|
|
|
4.60 |
|
|
|
|
|
|
|
|
|
|
|
|
|
|
|
|
|
|
|
|
|
54,730 |
|
|
|
|
|
|
|
|
|
|
|
|
|
|
|
|
|
|
| Professional Services |
|
|
|
|
|
|
|
|
|
|
|
|
| Automatic Data Processing, Inc. |
|
|
105 |
|
|
|
25,059 |
|
|
|
2.44 |
|
|
|
|
|
|
|
|
|
|
|
|
|
|
| Real Estate Management & Development |
|
|
|
|
|
|
|
|
|
|
|
|
| Lennar Corp., Class A |
|
|
61 |
|
|
|
9,188 |
|
|
|
0.90 |
|
|
|
|
|
|
|
|
|
|
|
|
|
|
| Software |
|
|
|
|
|
|
|
|
|
|
|
|
| Arista Networks, Inc |
|
|
66 |
|
|
|
23,065 |
|
|
|
2.25 |
|
| CDW Corp. |
|
|
34 |
|
|
|
7,521 |
|
|
|
0.73 |
|
| Pinterest, Inc., Class A |
|
|
146 |
|
|
|
6,420 |
|
|
|
0.63 |
|
| Snowflake, Inc., Class A |
|
|
70 |
|
|
|
9,513 |
|
|
|
0.93 |
|
| Workday, Inc., Class A |
|
|
52 |
|
|
|
11,550 |
|
|
|
1.13 |
|
|
|
|
|
|
|
|
|
|
|
|
|
|
|
|
|
|
|
|
|
58,069 |
|
|
|
|
|
|
|
|
|
|
|
|
|
|
|
|
|
|
|
|
|
|
|
| The Notes to Financial Statements are an integral part of this report. Transamerica Series Trust |
|
|
|
Semi-Annual Financial Statements 2024 |
|
|
Page 26 |
|
|
Transamerica Morgan Stanley Global Allocation VP
CONSOLIDATED SCHEDULE OF INVESTMENTS (continued)
At June 30, 2024
(unaudited)
|
|
|
|
|
|
|
|
|
|
|
|
|
| Common Stocks - Long |
|
Shares |
|
|
Value |
|
|
Percentage of
Basket Value |
|
| Technology Hardware, Storage & Peripherals |
|
|
|
|
|
|
|
|
|
|
|
|
| FICO |
|
|
6 |
|
|
|
$8,931 |
|
|
|
0.87 |
% |
| Verisk Analytics, Inc. |
|
|
36 |
|
|
|
9,794 |
|
|
|
0.95 |
|
|
|
|
|
|
|
|
|
|
|
|
|
|
|
|
|
|
|
|
|
18,725 |
|
|
|
|
|
|
|
|
|
|
|
|
|
|
|
|
|
|
| Textiles, Apparel & Luxury Goods |
|
|
|
|
|
|
|
|
|
|
|
|
| Lululemon Athletica, Inc. |
|
|
30 |
|
|
|
8,824 |
|
|
|
0.86 |
|
| Ross Stores, Inc. |
|
|
85 |
|
|
|
12,400 |
|
|
|
1.21 |
|
|
|
|
|
|
|
|
|
|
|
|
|
|
|
|
|
|
|
|
|
21,224 |
|
|
|
|
|
|
|
|
|
|
|
|
|
|
|
|
|
|
|
|
|
|
|
|
|
|
|
|
|
|
|
| Common Stocks - Long |
|
Shares |
|
|
Value |
|
|
Percentage of
Basket Value |
|
| Trading Companies & Distributors |
|
|
|
|
|
|
|
|
|
|
|
|
| United Parcel Service, Inc., Class B |
|
|
182 |
|
|
|
$24,874 |
|
|
|
2.42 |
% |
|
|
|
|
|
|
|
|
|
|
|
|
|
| Transportation Infrastructure |
|
|
|
|
|
|
|
|
|
|
|
|
| Old Dominion Freight Line |
|
|
50 |
|
|
|
8,853 |
|
|
|
0.86 |
|
|
|
|
|
|
|
|
|
|
|
|
|
|
| Total Common Stocks - Long |
|
|
|
|
|
$ |
830,646 |
|
|
|
|
|
|
|
|
|
|
|
|
|
|
|
|
|
|
FUTURES CONTRACTS:
|
|
|
|
|
|
|
|
|
|
|
|
|
|
|
|
|
|
|
|
|
|
|
|
|
| Long Futures Contracts |
|
| Description |
|
Number of Contracts |
|
|
Expiration Date |
|
|
Notional Amount |
|
|
Value |
|
|
Unrealized Appreciation |
|
|
Unrealized Depreciation |
|
| 5-Year U.S. Treasury Notes |
|
|
191 |
|
|
|
09/30/2024 |
|
|
|
$20,216,139 |
|
|
|
$20,356,422 |
|
|
|
$ 140,283 |
|
|
|
$— |
|
| 10-Year Korea Government Bonds |
|
|
68 |
|
|
|
09/13/2024 |
|
|
|
5,639,687 |
|
|
|
5,662,303 |
|
|
|
22,616 |
|
|
|
— |
|
| 10-Year U.S. Treasury Ultra Notes |
|
|
102 |
|
|
|
09/19/2024 |
|
|
|
11,483,517 |
|
|
|
11,580,188 |
|
|
|
96,671 |
|
|
|
— |
|
| 30-Year U.S. Treasury Bonds |
|
|
47 |
|
|
|
09/19/2024 |
|
|
|
5,446,450 |
|
|
|
5,560,688 |
|
|
|
114,238 |
|
|
|
— |
|
| Brent Crude Oil(J) |
|
|
38 |
|
|
|
07/31/2024 |
|
|
|
3,207,330 |
|
|
|
3,230,000 |
|
|
|
22,670 |
|
|
|
— |
|
| EURO-BUXL |
|
|
4 |
|
|
|
09/06/2024 |
|
|
|
544,048 |
|
|
|
557,922 |
|
|
|
13,874 |
|
|
|
— |
|
| German Euro Schatz |
|
|
158 |
|
|
|
09/06/2024 |
|
|
|
17,807,036 |
|
|
|
17,885,515 |
|
|
|
78,479 |
|
|
|
— |
|
| IFSC NIFTY 50 Index |
|
|
102 |
|
|
|
07/25/2024 |
|
|
|
4,841,897 |
|
|
|
4,924,458 |
|
|
|
82,561 |
|
|
|
— |
|
| U.K. Gilt |
|
|
4 |
|
|
|
09/26/2024 |
|
|
|
490,627 |
|
|
|
493,353 |
|
|
|
2,726 |
|
|
|
— |
|
|
|
|
|
|
|
|
|
|
|
|
|
|
|
|
|
|
|
|
|
|
| Total |
|
|
|
$ 574,118 |
|
|
|
$— |
|
|
|
|
|
|
|
|
|
|
|
|
|
|
|
|
|
|
|
|
|
|
|
|
|
|
|
|
|
|
|
|
|
|
|
|
|
|
|
|
|
|
|
|
|
|
|
| Short Futures Contracts |
|
| Description |
|
Number of Contracts |
|
|
Expiration Date |
|
|
Notional Amount |
|
|
Value |
|
|
Unrealized Appreciation |
|
|
Unrealized Depreciation |
|
| 10-Year Australia Treasury Bonds |
|
|
(23) |
|
|
|
09/16/2024 |
|
|
|
$(1,741,288 |
) |
|
|
$(1,742,522 |
) |
|
|
$ — |
|
|
|
$ (1,234) |
|
| 10-Year Japan Government Bonds |
|
|
(52) |
|
|
|
09/12/2024 |
|
|
|
(46,204,009 |
) |
|
|
(46,172,664 |
) |
|
|
31,345 |
|
|
|
— |
|
| 10-Year U.S. Treasury Notes |
|
|
(333) |
|
|
|
09/19/2024 |
|
|
|
(36,295,631 |
) |
|
|
(36,624,797 |
) |
|
|
— |
|
|
|
(329,166) |
|
| EURO STOXX 50® Index |
|
|
(169) |
|
|
|
09/20/2024 |
|
|
|
(8,947,696 |
) |
|
|
(8,915,598 |
) |
|
|
32,098 |
|
|
|
— |
|
| Euro-BTP Italy Government Bonds |
|
|
(69) |
|
|
|
09/06/2024 |
|
|
|
(8,639,719 |
) |
|
|
(8,519,422 |
) |
|
|
120,297 |
|
|
|
— |
|
| FTSE 100 Index |
|
|
(7) |
|
|
|
09/20/2024 |
|
|
|
(725,190 |
) |
|
|
(726,655 |
) |
|
|
— |
|
|
|
(1,465) |
|
| German Euro BOBL |
|
|
(8) |
|
|
|
09/06/2024 |
|
|
|
(988,777 |
) |
|
|
(997,612 |
) |
|
|
— |
|
|
|
(8,835) |
|
| German Euro Bund |
|
|
(125) |
|
|
|
09/06/2024 |
|
|
|
(17,410,817 |
) |
|
|
(17,619,813 |
) |
|
|
— |
|
|
|
(208,996) |
|
| Gold 100 oz(J) |
|
|
(33) |
|
|
|
08/28/2024 |
|
|
|
(7,817,264 |
) |
|
|
(7,720,680 |
) |
|
|
96,584 |
|
|
|
— |
|
| HSCEI Index |
|
|
(186) |
|
|
|
07/30/2024 |
|
|
|
(7,595,790 |
) |
|
|
(7,461,151 |
) |
|
|
134,639 |
|
|
|
— |
|
| KOSPI 200 Index |
|
|
(58) |
|
|
|
09/12/2024 |
|
|
|
(3,893,117 |
) |
|
|
(4,069,797 |
) |
|
|
— |
|
|
|
(176,680) |
|
| MSCI Emerging Markets Index |
|
|
(130) |
|
|
|
09/20/2024 |
|
|
|
(7,128,505 |
) |
|
|
(7,073,300 |
) |
|
|
55,205 |
|
|
|
— |
|
| Nikkei 225 Index |
|
|
(8) |
|
|
|
09/12/2024 |
|
|
|
(983,324 |
) |
|
|
(989,247 |
) |
|
|
— |
|
|
|
(5,923) |
|
| S&P 500® E-Mini Index |
|
|
(68) |
|
|
|
09/20/2024 |
|
|
|
(18,783,269 |
) |
|
|
(18,773,100 |
) |
|
|
10,169 |
|
|
|
— |
|
| S&P/TSX 60 Index |
|
|
(1) |
|
|
|
09/19/2024 |
|
|
|
(190,144 |
) |
|
|
(191,587 |
) |
|
|
— |
|
|
|
(1,443) |
|
| U.S. Treasury Ultra Bonds |
|
|
(29) |
|
|
|
09/19/2024 |
|
|
|
(3,543,833 |
) |
|
|
(3,634,969 |
) |
|
|
— |
|
|
|
(91,136) |
|
|
|
|
|
|
|
|
|
|
|
|
|
|
|
|
|
|
|
|
|
|
| Total |
|
|
|
$ 480,337 |
|
|
|
$ (824,878) |
|
|
|
|
|
|
|
|
|
|
|
|
|
|
|
|
|
|
|
|
|
|
| Total Futures Contracts |
|
|
|
$ 1,054,455 |
|
|
|
$ (824,878) |
|
|
|
|
|
|
|
|
|
|
|
|
|
|
|
|
|
|
|
|
|
|
FORWARD FOREIGN CURRENCY CONTRACTS:
|
|
|
|
|
|
|
|
|
|
|
|
|
|
|
|
|
|
|
|
|
|
|
|
|
|
|
| |
|
|
|
|
|
| Counterparty |
|
Settlement Date |
|
Currency Purchased |
|
|
Currency Sold |
|
|
Unrealized Appreciation |
|
|
Unrealized Depreciation |
|
| BCLY |
|
07/24/2024 |
|
|
USD |
|
|
|
585,188 |
|
|
|
MYR |
|
|
|
2,790,000 |
|
|
$ |
— |
|
|
$ |
(7,196 |
) |
| BCLY |
|
07/24/2024 |
|
|
PLN |
|
|
|
50,750 |
|
|
|
USD |
|
|
|
12,522 |
|
|
|
81 |
|
|
|
— |
|
| BCLY |
|
07/24/2024 |
|
|
SEK |
|
|
|
10,611,954 |
|
|
|
USD |
|
|
|
974,123 |
|
|
|
28,325 |
|
|
|
— |
|
| BCLY |
|
07/24/2024 |
|
|
SGD |
|
|
|
28,875 |
|
|
|
USD |
|
|
|
21,282 |
|
|
|
37 |
|
|
|
— |
|
| BCLY |
|
09/19/2024 |
|
|
USD |
|
|
|
299,696 |
|
|
|
AUD |
|
|
|
449,320 |
|
|
|
— |
|
|
|
(669 |
) |
|
|
|
|
|
| The Notes to Financial Statements are an integral part of this report. Transamerica Series Trust |
|
|
|
Semi-Annual Financial Statements 2024 |
|
|
Page 27 |
|
|
Transamerica Morgan Stanley Global Allocation VP
CONSOLIDATED SCHEDULE OF INVESTMENTS (continued)
At June 30, 2024
(unaudited)
FORWARD FOREIGN CURRENCY CONTRACTS (continued):
|
|
|
|
|
|
|
|
|
|
|
|
|
|
|
|
|
|
|
|
|
|
|
|
|
|
|
| Counterparty |
|
Settlement Date |
|
Currency Purchased |
|
|
Currency Sold |
|
|
Unrealized Appreciation |
|
|
Unrealized Depreciation |
|
| BCLY |
|
09/19/2024 |
|
|
USD |
|
|
|
319,899 |
|
|
|
GBP |
|
|
|
251,633 |
|
|
$ |
1,620 |
|
|
$ |
— |
|
| BCLY |
|
09/19/2024 |
|
|
USD |
|
|
|
136,261 |
|
|
|
HKD |
|
|
|
1,061,299 |
|
|
|
50 |
|
|
|
— |
|
| BCLY |
|
09/19/2024 |
|
|
USD |
|
|
|
33,597 |
|
|
|
SGD |
|
|
|
45,202 |
|
|
|
136 |
|
|
|
— |
|
| BCLY |
|
09/19/2024 |
|
|
EUR |
|
|
|
1,366,421 |
|
|
|
USD |
|
|
|
1,471,044 |
|
|
|
— |
|
|
|
(1,977 |
) |
| BCLY |
|
09/19/2024 |
|
|
ILS |
|
|
|
130,894 |
|
|
|
USD |
|
|
|
35,316 |
|
|
|
— |
|
|
|
(537 |
) |
| BCLY |
|
04/06/2026 |
|
|
USD |
|
|
|
490,547 |
|
|
|
TRY |
|
|
|
26,202,556 |
|
|
|
21,013 |
|
|
|
— |
|
| BCLY |
|
04/06/2026 |
|
|
TRY |
|
|
|
210,424,930 |
|
|
|
USD |
|
|
|
3,626,140 |
|
|
|
144,549 |
|
|
|
— |
|
| BNP |
|
07/24/2024 |
|
|
USD |
|
|
|
509,457 |
|
|
|
AUD |
|
|
|
787,392 |
|
|
|
— |
|
|
|
(16,163 |
) |
| BNP |
|
07/24/2024 |
|
|
USD |
|
|
|
167,699 |
|
|
|
EUR |
|
|
|
153,874 |
|
|
|
2,716 |
|
|
|
— |
|
| BNP |
|
07/24/2024 |
|
|
USD |
|
|
|
378,729 |
|
|
|
HUF |
|
|
|
139,656,301 |
|
|
|
416 |
|
|
|
— |
|
| BNP |
|
07/24/2024 |
|
|
USD |
|
|
|
1,641,960 |
|
|
|
IDR |
|
|
|
26,753,765,347 |
|
|
|
8,723 |
|
|
|
— |
|
| BNP |
|
07/24/2024 |
|
|
USD |
|
|
|
258,744 |
|
|
|
THB |
|
|
|
9,493,668 |
|
|
|
— |
|
|
|
(469 |
) |
| BNP |
|
07/24/2024 |
|
|
CHF |
|
|
|
2,359,268 |
|
|
|
USD |
|
|
|
2,620,623 |
|
|
|
13,120 |
|
|
|
— |
|
| BNP |
|
07/24/2024 |
|
|
EUR |
|
|
|
2,184,250 |
|
|
|
USD |
|
|
|
2,341,098 |
|
|
|
845 |
|
|
|
— |
|
| BNP |
|
07/24/2024 |
|
|
HUF |
|
|
|
213,086,621 |
|
|
|
USD |
|
|
|
577,465 |
|
|
|
— |
|
|
|
(238 |
) |
| BNP |
|
07/24/2024 |
|
|
IDR |
|
|
|
30,874,488,000 |
|
|
|
USD |
|
|
|
1,870,898 |
|
|
|
13,896 |
|
|
|
— |
|
| BNP |
|
07/24/2024 |
|
|
JPY |
|
|
|
1,283,500 |
|
|
|
USD |
|
|
|
8,028 |
|
|
|
— |
|
|
|
(21 |
) |
| BNP |
|
07/24/2024 |
|
|
PEN |
|
|
|
1,940,000 |
|
|
|
USD |
|
|
|
525,375 |
|
|
|
— |
|
|
|
(20,630 |
) |
| BNP |
|
09/17/2024 |
|
|
CLP |
|
|
|
185,762,384 |
|
|
|
USD |
|
|
|
202,069 |
|
|
|
— |
|
|
|
(4,773 |
) |
| BNP |
|
09/19/2024 |
|
|
USD |
|
|
|
10,158,861 |
|
|
|
BRL |
|
|
|
55,516,651 |
|
|
|
317,103 |
|
|
|
— |
|
| BNP |
|
09/19/2024 |
|
|
USD |
|
|
|
711,599 |
|
|
|
CHF |
|
|
|
622,690 |
|
|
|
11,759 |
|
|
|
— |
|
| BNP |
|
09/19/2024 |
|
|
USD |
|
|
|
648,946 |
|
|
|
GBP |
|
|
|
510,544 |
|
|
|
3,183 |
|
|
|
— |
|
| BNP |
|
09/19/2024 |
|
|
USD |
|
|
|
227,964 |
|
|
|
HKD |
|
|
|
1,775,498 |
|
|
|
88 |
|
|
|
— |
|
| BNP |
|
09/19/2024 |
|
|
USD |
|
|
|
20,705 |
|
|
|
IDR |
|
|
|
337,333,091 |
|
|
|
132 |
|
|
|
— |
|
| BNP |
|
09/19/2024 |
|
|
BRL |
|
|
|
2,319,722 |
|
|
|
USD |
|
|
|
411,663 |
|
|
|
— |
|
|
|
(433 |
) |
| BNP |
|
09/19/2024 |
|
|
COP |
|
|
|
437,501,613 |
|
|
|
USD |
|
|
|
105,068 |
|
|
|
— |
|
|
|
(987 |
) |
| BNP |
|
09/19/2024 |
|
|
CZK |
|
|
|
2,606,976 |
|
|
|
USD |
|
|
|
112,886 |
|
|
|
— |
|
|
|
(1,235 |
) |
| BNP |
|
09/19/2024 |
|
|
EUR |
|
|
|
297,677 |
|
|
|
USD |
|
|
|
320,924 |
|
|
|
— |
|
|
|
(885 |
) |
| BNP |
|
09/19/2024 |
|
|
EUR |
|
|
|
587,487 |
|
|
|
USD |
|
|
|
631,067 |
|
|
|
553 |
|
|
|
— |
|
| BNP |
|
09/19/2024 |
|
|
INR |
|
|
|
402,675,786 |
|
|
|
USD |
|
|
|
4,807,495 |
|
|
|
9,307 |
|
|
|
— |
|
| BNY |
|
09/19/2024 |
|
|
USD |
|
|
|
287,193 |
|
|
|
AUD |
|
|
|
430,852 |
|
|
|
— |
|
|
|
(827 |
) |
| BOA |
|
07/24/2024 |
|
|
USD |
|
|
|
1,237,170 |
|
|
|
CAD |
|
|
|
1,694,956 |
|
|
|
— |
|
|
|
(2,491 |
) |
| BOA |
|
09/19/2024 |
|
|
USD |
|
|
|
265,575 |
|
|
|
PLN |
|
|
|
1,074,080 |
|
|
|
— |
|
|
|
(976 |
) |
| CITI |
|
07/24/2024 |
|
|
NOK |
|
|
|
2,802,623 |
|
|
|
USD |
|
|
|
257,189 |
|
|
|
5,471 |
|
|
|
— |
|
| GSI |
|
07/24/2024 |
|
|
JPY |
|
|
|
4,111,940,483 |
|
|
|
USD |
|
|
|
26,942,909 |
|
|
|
— |
|
|
|
(1,289,205 |
) |
| GSI |
|
07/24/2024 |
|
|
MXN |
|
|
|
7,228,687 |
|
|
|
USD |
|
|
|
419,665 |
|
|
|
— |
|
|
|
(26,034 |
) |
| GSI |
|
07/24/2024 |
|
|
PLN |
|
|
|
1,805,988 |
|
|
|
USD |
|
|
|
448,086 |
|
|
|
420 |
|
|
|
— |
|
| GSI |
|
09/19/2024 |
|
|
USD |
|
|
|
8,215 |
|
|
|
DKK |
|
|
|
56,765 |
|
|
|
25 |
|
|
|
— |
|
| GSI |
|
09/19/2024 |
|
|
USD |
|
|
|
326,993 |
|
|
|
GBP |
|
|
|
258,525 |
|
|
|
— |
|
|
|
(2 |
) |
| GSI |
|
09/19/2024 |
|
|
USD |
|
|
|
200,450 |
|
|
|
JPY |
|
|
|
31,198,805 |
|
|
|
4,138 |
|
|
|
— |
|
| GSI |
|
09/19/2024 |
|
|
USD |
|
|
|
14,002 |
|
|
|
MYR |
|
|
|
65,580 |
|
|
|
28 |
|
|
|
— |
|
| GSI |
|
09/19/2024 |
|
|
USD |
|
|
|
12,090 |
|
|
|
NOK |
|
|
|
127,815 |
|
|
|
95 |
|
|
|
— |
|
| GSI |
|
09/19/2024 |
|
|
USD |
|
|
|
8,899,196 |
|
|
|
TWD |
|
|
|
286,109,156 |
|
|
|
2,186 |
|
|
|
— |
|
| GSI |
|
09/19/2024 |
|
|
JPY |
|
|
|
119,553,559 |
|
|
|
USD |
|
|
|
766,546 |
|
|
|
— |
|
|
|
(14,281 |
) |
| GSI |
|
09/19/2024 |
|
|
SEK |
|
|
|
516,179 |
|
|
|
USD |
|
|
|
49,649 |
|
|
|
— |
|
|
|
(747 |
) |
| GSI |
|
12/23/2024 |
|
|
USD |
|
|
|
4,502,442 |
|
|
|
TRY |
|
|
|
190,543,352 |
|
|
|
— |
|
|
|
(351,909 |
) |
| GSI |
|
12/23/2024 |
|
|
TRY |
|
|
|
190,543,352 |
|
|
|
USD |
|
|
|
4,869,495 |
|
|
|
— |
|
|
|
(15,144 |
) |
| GSI |
|
04/06/2026 |
|
|
TRY |
|
|
|
228,025,317 |
|
|
|
USD |
|
|
|
3,962,212 |
|
|
|
123,866 |
|
|
|
— |
|
| GSI |
|
04/06/2026 |
|
|
TRY |
|
|
|
439,515,449 |
|
|
|
USD |
|
|
|
7,979,033 |
|
|
|
— |
|
|
|
(103,178 |
) |
| JPM |
|
07/24/2024 |
|
|
USD |
|
|
|
343,169 |
|
|
|
EUR |
|
|
|
320,000 |
|
|
|
67 |
|
|
|
— |
|
| JPM |
|
07/24/2024 |
|
|
USD |
|
|
|
3,829,131 |
|
|
|
GBP |
|
|
|
3,075,137 |
|
|
|
— |
|
|
|
(58,713 |
) |
| JPM |
|
07/24/2024 |
|
|
USD |
|
|
|
666,526 |
|
|
|
JPY |
|
|
|
106,920,000 |
|
|
|
— |
|
|
|
(530 |
) |
| JPM |
|
07/24/2024 |
|
|
CAD |
|
|
|
755,640 |
|
|
|
USD |
|
|
|
551,949 |
|
|
|
713 |
|
|
|
— |
|
| JPM |
|
07/24/2024 |
|
|
CNY |
|
|
|
17,867,000 |
|
|
|
USD |
|
|
|
2,504,837 |
|
|
|
— |
|
|
|
(39,591 |
) |
| JPM |
|
07/24/2024 |
|
|
DKK |
|
|
|
2,937,717 |
|
|
|
USD |
|
|
|
423,348 |
|
|
|
— |
|
|
|
(904 |
) |
| JPM |
|
07/24/2024 |
|
|
GBP |
|
|
|
136,555 |
|
|
|
USD |
|
|
|
170,241 |
|
|
|
2,403 |
|
|
|
— |
|
| JPM |
|
07/24/2024 |
|
|
RON |
|
|
|
1,821,720 |
|
|
|
USD |
|
|
|
391,297 |
|
|
|
565 |
|
|
|
— |
|
|
|
|
|
|
| The Notes to Financial Statements are an integral part of this report. |
|
|
|
Semi-Annual Financial Statements 2024 |
| Transamerica Series Trust |
|
|
|
|
|
|
Page 28 |
|
|
Transamerica Morgan Stanley Global Allocation VP
CONSOLIDATED SCHEDULE OF INVESTMENTS (continued)
At June 30, 2024
(unaudited)
FORWARD FOREIGN CURRENCY CONTRACTS (continued):
|
|
|
|
|
|
|
|
|
|
|
|
|
|
|
|
|
|
|
|
|
|
|
|
|
|
|
| Counterparty |
|
Settlement Date |
|
Currency Purchased |
|
|
Currency Sold |
|
|
Unrealized Appreciation |
|
|
Unrealized Depreciation |
| JPM |
|
07/24/2024 |
|
|
SEK |
|
|
|
5,740,824 |
|
|
|
USD |
|
|
|
533,005 |
|
|
$ |
9,296 |
|
|
$ |
— |
|
| JPM |
|
07/24/2024 |
|
|
SGD |
|
|
|
457,617 |
|
|
|
USD |
|
|
|
337,568 |
|
|
|
306 |
|
|
|
— |
|
| JPM |
|
07/24/2024 |
|
|
THB |
|
|
|
1,442,237 |
|
|
|
USD |
|
|
|
39,128 |
|
|
|
250 |
|
|
|
— |
|
| JPM |
|
09/19/2024 |
|
|
USD |
|
|
|
352,622 |
|
|
|
AUD |
|
|
|
528,831 |
|
|
|
— |
|
|
|
(895 |
) |
| JPM |
|
09/19/2024 |
|
|
USD |
|
|
|
1,222,429 |
|
|
|
CAD |
|
|
|
1,673,761 |
|
|
|
— |
|
|
|
(3,379 |
) |
| JPM |
|
09/19/2024 |
|
|
USD |
|
|
|
115,741 |
|
|
|
CHF |
|
|
|
101,281 |
|
|
|
1,912 |
|
|
|
— |
|
| JPM |
|
09/19/2024 |
|
|
USD |
|
|
|
1,882,453 |
|
|
|
CNH |
|
|
|
13,594,637 |
|
|
|
8,710 |
|
|
|
— |
|
| JPM |
|
09/19/2024 |
|
|
USD |
|
|
|
252,830 |
|
|
|
DKK |
|
|
|
1,747,128 |
|
|
|
762 |
|
|
|
— |
|
| JPM |
|
09/19/2024 |
|
|
USD |
|
|
|
1,242,472 |
|
|
|
GBP |
|
|
|
977,122 |
|
|
|
6,558 |
|
|
|
— |
|
| JPM |
|
09/19/2024 |
|
|
USD |
|
|
|
64,000 |
|
|
|
HKD |
|
|
|
498,457 |
|
|
|
25 |
|
|
|
— |
|
| JPM |
|
09/19/2024 |
|
|
USD |
|
|
|
519,389 |
|
|
|
JPY |
|
|
|
80,849,250 |
|
|
|
10,663 |
|
|
|
— |
|
| JPM |
|
09/19/2024 |
|
|
USD |
|
|
|
160,918 |
|
|
|
NZD |
|
|
|
262,043 |
|
|
|
1,309 |
|
|
|
— |
|
| JPM |
|
09/19/2024 |
|
|
USD |
|
|
|
553,036 |
|
|
|
SGD |
|
|
|
744,101 |
|
|
|
2,201 |
|
|
|
— |
|
| JPM |
|
09/19/2024 |
|
|
ILS |
|
|
|
133,729 |
|
|
|
USD |
|
|
|
36,087 |
|
|
|
— |
|
|
|
(555 |
) |
| SCB |
|
09/19/2024 |
|
|
USD |
|
|
|
244,875 |
|
|
|
HKD |
|
|
|
1,907,276 |
|
|
|
87 |
|
|
|
— |
|
| SSB |
|
09/19/2024 |
|
|
USD |
|
|
|
93,261 |
|
|
|
HUF |
|
|
|
34,446,259 |
|
|
|
126 |
|
|
|
— |
|
| SSB |
|
09/19/2024 |
|
|
EUR |
|
|
|
312,628 |
|
|
|
USD |
|
|
|
336,050 |
|
|
|
63 |
|
|
|
— |
|
| UBS |
|
07/24/2024 |
|
|
USD |
|
|
|
1,782,772 |
|
|
|
CNY |
|
|
|
12,660,000 |
|
|
|
35,976 |
|
|
|
— |
|
| UBS |
|
07/24/2024 |
|
|
USD |
|
|
|
333,426 |
|
|
|
COP |
|
|
|
1,326,670,000 |
|
|
|
15,264 |
|
|
|
— |
|
| UBS |
|
07/24/2024 |
|
|
USD |
|
|
|
10,051,861 |
|
|
|
EUR |
|
|
|
9,361,214 |
|
|
|
14,813 |
|
|
|
— |
|
| UBS |
|
07/24/2024 |
|
|
USD |
|
|
|
4,365,643 |
|
|
|
JPY |
|
|
|
674,372,462 |
|
|
|
158,346 |
|
|
|
— |
|
| UBS |
|
07/24/2024 |
|
|
AUD |
|
|
|
105,525 |
|
|
|
USD |
|
|
|
69,060 |
|
|
|
1,383 |
|
|
|
— |
|
| UBS |
|
07/24/2024 |
|
|
CAD |
|
|
|
65,025 |
|
|
|
USD |
|
|
|
47,585 |
|
|
|
— |
|
|
|
(27 |
) |
| UBS |
|
07/24/2024 |
|
|
CNY |
|
|
|
11,410,000 |
|
|
|
USD |
|
|
|
1,605,572 |
|
|
|
— |
|
|
|
(31,248 |
) |
| UBS |
|
07/24/2024 |
|
|
KRW |
|
|
|
6,093,274,834 |
|
|
|
USD |
|
|
|
4,440,968 |
|
|
|
— |
|
|
|
(8,269 |
) |
| UBS |
|
07/24/2024 |
|
|
MXN |
|
|
|
1,031,334 |
|
|
|
USD |
|
|
|
57,913 |
|
|
|
— |
|
|
|
(1,753 |
) |
| UBS |
|
07/24/2024 |
|
|
NZD |
|
|
|
577,741 |
|
|
|
USD |
|
|
|
342,783 |
|
|
|
9,121 |
|
|
|
— |
|
| UBS |
|
09/19/2024 |
|
|
USD |
|
|
|
139,348 |
|
|
|
AUD |
|
|
|
208,900 |
|
|
|
— |
|
|
|
(299 |
) |
| UBS |
|
09/19/2024 |
|
|
USD |
|
|
|
113,012 |
|
|
|
CAD |
|
|
|
154,722 |
|
|
|
— |
|
|
|
(301 |
) |
| UBS |
|
09/19/2024 |
|
|
USD |
|
|
|
24,745,190 |
|
|
|
CNY |
|
|
|
176,383,195 |
|
|
|
244,279 |
|
|
|
— |
|
| UBS |
|
09/19/2024 |
|
|
USD |
|
|
|
33,914 |
|
|
|
HKD |
|
|
|
264,154 |
|
|
|
11 |
|
|
|
— |
|
| UBS |
|
09/19/2024 |
|
|
USD |
|
|
|
3,563,940 |
|
|
|
JPY |
|
|
|
554,737,932 |
|
|
|
73,372 |
|
|
|
— |
|
| UBS |
|
09/19/2024 |
|
|
USD |
|
|
|
5,265,823 |
|
|
|
KRW |
|
|
|
7,196,379,511 |
|
|
|
13,682 |
|
|
|
— |
|
| UBS |
|
09/19/2024 |
|
|
USD |
|
|
|
634,022 |
|
|
|
MXN |
|
|
|
11,870,308 |
|
|
|
— |
|
|
|
(6,722 |
) |
| UBS |
|
09/19/2024 |
|
|
USD |
|
|
|
276,266 |
|
|
|
NOK |
|
|
|
2,920,252 |
|
|
|
2,211 |
|
|
|
— |
|
| UBS |
|
09/19/2024 |
|
|
USD |
|
|
|
135,353 |
|
|
|
SGD |
|
|
|
182,121 |
|
|
|
535 |
|
|
|
— |
|
| UBS |
|
09/19/2024 |
|
|
USD |
|
|
|
10,995 |
|
|
|
THB |
|
|
|
400,830 |
|
|
|
1 |
|
|
|
— |
|
| UBS |
|
09/19/2024 |
|
|
CAD |
|
|
|
575,453 |
|
|
|
USD |
|
|
|
421,320 |
|
|
|
123 |
|
|
|
— |
|
| UBS |
|
09/19/2024 |
|
|
EUR |
|
|
|
3,672,817 |
|
|
|
USD |
|
|
|
3,949,788 |
|
|
|
— |
|
|
|
(1,067 |
) |
| UBS |
|
09/19/2024 |
|
|
ILS |
|
|
|
1,429,491 |
|
|
|
USD |
|
|
|
385,787 |
|
|
|
— |
|
|
|
(5,973 |
) |
| UBS |
|
09/19/2024 |
|
|
JPY |
|
|
|
59,922,386 |
|
|
|
USD |
|
|
|
377,896 |
|
|
|
— |
|
|
|
(847 |
) |
| UBS |
|
09/19/2024 |
|
|
TRY |
|
|
|
648,046 |
|
|
|
USD |
|
|
|
18,105 |
|
|
|
78 |
|
|
|
— |
|
| UBS |
|
09/19/2024 |
|
|
USD |
|
|
|
126,084 |
|
|
|
ZAR |
|
|
|
2,290,700 |
|
|
|
946 |
|
|
|
— |
|
|
|
|
|
|
|
|
|
|
|
|
|
|
|
|
|
|
|
|
|
|
|
|
| Total |
|
|
|
|
|
|
|
|
|
|
|
|
|
|
|
|
|
|
|
$ |
1,330,038 |
|
|
$ |
(2,022,080 |
) |
|
|
|
|
|
|
|
|
|
|
|
|
|
|
|
|
|
|
|
|
|
|
|
|
|
|
|
|
| The Notes to Financial Statements are an integral part of this report. |
|
|
|
Semi-Annual Financial Statements 2024 |
| Transamerica Series Trust |
|
|
|
|
|
|
Page 29 |
|
|
Transamerica Morgan Stanley Global Allocation VP
CONSOLIDATED SCHEDULE OF INVESTMENTS (continued)
At June 30, 2024
(unaudited)
INVESTMENT VALUATION:
Valuation Inputs (U)
|
|
|
|
|
|
|
|
|
|
|
|
|
|
|
|
|
| |
|
Level 1 - Unadjusted Quoted Prices |
|
|
Level 2 - Other Significant Observable Inputs |
|
|
Level 3 - Significant Unobservable Inputs (V) |
|
|
Value |
|
| ASSETS |
|
|
|
|
|
|
|
|
|
|
|
|
|
|
|
|
| Investments |
|
|
|
|
|
|
|
|
|
|
|
|
|
|
|
|
| Common Stocks |
|
$ |
157,531,152 |
|
|
$ |
120,737,903 |
|
|
$ |
287,522 |
|
|
$ |
278,556,577 |
|
| Foreign Government Obligations |
|
|
— |
|
|
|
256,265,625 |
|
|
|
— |
|
|
|
256,265,625 |
|
| Corporate Debt Securities |
|
|
— |
|
|
|
109,578,077 |
|
|
|
431,081 |
|
|
|
110,009,158 |
|
| U.S. Government Obligations |
|
|
— |
|
|
|
74,136,507 |
|
|
|
— |
|
|
|
74,136,507 |
|
| U.S. Government Agency Obligations |
|
|
— |
|
|
|
47,831,460 |
|
|
|
— |
|
|
|
47,831,460 |
|
| Mortgage-Backed Securities |
|
|
— |
|
|
|
24,133,751 |
|
|
|
— |
|
|
|
24,133,751 |
|
| Asset-Backed Securities |
|
|
— |
|
|
|
2,461,710 |
|
|
|
— |
|
|
|
2,461,710 |
|
| Municipal Government Obligation |
|
|
— |
|
|
|
587,297 |
|
|
|
— |
|
|
|
587,297 |
|
| Preferred Stocks |
|
|
— |
|
|
|
519,665 |
|
|
|
— |
|
|
|
519,665 |
|
| Convertible Bonds |
|
|
— |
|
|
|
4,780 |
|
|
|
— |
|
|
|
4,780 |
|
| Warrant |
|
|
— |
|
|
|
— |
|
|
|
0 |
|
|
|
0 |
|
| Rights |
|
|
— |
|
|
|
0 |
|
|
|
— |
|
|
|
0 |
|
| Short-Term U.S. Government Obligations |
|
|
— |
|
|
|
13,749,585 |
|
|
|
— |
|
|
|
13,749,585 |
|
| Other Investment Company |
|
|
5,525,381 |
|
|
|
— |
|
|
|
— |
|
|
|
5,525,381 |
|
| Repurchase Agreement |
|
|
— |
|
|
|
185,049,588 |
|
|
|
— |
|
|
|
185,049,588 |
|
|
|
|
|
|
|
|
|
|
|
|
|
|
|
|
|
|
|
|
|
|
|
| Total Investments |
|
$ |
163,056,533 |
|
|
$ |
835,055,948 |
|
|
$ |
718,603 |
|
|
$ |
998,831,084 |
|
|
|
|
|
|
|
|
|
|
|
|
|
|
|
|
|
|
|
|
|
|
|
| Other Financial Instruments |
|
|
|
|
|
|
|
|
|
|
|
|
|
|
|
|
| Centrally Cleared Swap Agreements |
|
$ |
— |
|
|
$ |
275,620 |
|
|
$ |
— |
|
|
$ |
275,620 |
|
| Over-the-Counter Swap Agreements |
|
|
— |
|
|
|
8,893,759 |
|
|
|
— |
|
|
|
8,893,759 |
|
| Futures Contracts (W) |
|
|
1,054,455 |
|
|
|
— |
|
|
|
— |
|
|
|
1,054,455 |
|
| Forward Foreign Currency Contracts (W) |
|
|
— |
|
|
|
1,330,038 |
|
|
|
— |
|
|
|
1,330,038 |
|
|
|
|
|
|
|
|
|
|
|
|
|
|
|
|
|
|
|
|
|
|
|
| Total Other Financial Instruments |
|
$ |
1,054,455 |
|
|
$ |
10,499,417 |
|
|
$ |
— |
|
|
$ |
11,553,872 |
|
|
|
|
|
|
|
|
|
|
|
|
|
|
|
|
|
|
|
|
|
|
|
| LIABILITIES |
|
|
|
|
|
|
|
|
|
|
|
|
|
|
|
|
| Other Financial Instruments |
|
|
|
|
|
|
|
|
|
|
|
|
|
|
|
|
| Centrally Cleared Swap Agreements |
|
$ |
— |
|
|
$ |
(224,638 |
) |
|
$ |
— |
|
|
$ |
(224,638 |
) |
| Over-the-Counter Swap Agreements |
|
|
— |
|
|
|
(2,396,176 |
) |
|
|
— |
|
|
|
(2,396,176 |
) |
| Futures Contracts (W) |
|
|
(824,878 |
) |
|
|
— |
|
|
|
— |
|
|
|
(824,878 |
) |
| Forward Foreign Currency Contracts (W) |
|
|
— |
|
|
|
(2,022,080 |
) |
|
|
— |
|
|
|
(2,022,080 |
) |
|
|
|
|
|
|
|
|
|
|
|
|
|
|
|
|
|
|
|
|
|
|
| Total Other Financial Instruments |
|
$ |
(824,878 |
) |
|
$ |
(4,642,894 |
) |
|
$ |
— |
|
|
$ |
(5,467,772 |
) |
|
|
|
|
|
|
|
|
|
|
|
|
|
|
|
|
|
FOOTNOTES TO SCHEDULE OF INVESTMENTS:
| (A) |
All or a portion of the security is on loan. The total value of the securities on loan is $7,081,046, collateralized by cash collateral of $5,525,381 and non-cash collateral, such as U.S. government securities and irrevocable letters of credit, of $1,961,083. The amount on loan indicated may not correspond with the securities on loan identified because a security with pending sales are in the process of recall from the brokers. |
| (B) |
Non-income producing security. |
| (C) |
Security is Level 3 of the fair value hierarchy. |
| (D) |
Fair valued as determined in good faith in accordance with TAM’s procedures. At June 30, 2024, the total value of the securities is $762,459, representing 0.1% of the Portfolio’s net assets. |
| (E) |
Restricted security. At June 30, 2024, the total value of such securities held by the Portfolio is as follows: |
|
|
|
|
|
|
|
|
|
|
|
|
|
|
|
|
|
|
|
| Investments |
|
Description |
|
Acquisition Date |
|
|
Acquisition Cost |
|
|
Value |
|
|
Value as Percentage of Net Assets |
|
| Common Stocks |
|
Quintis Australia Pty. Ltd. |
|
|
10/25/2018 |
|
|
|
$1,059,498 |
|
|
|
$1 |
|
|
|
0.0 |
%(F) |
| (F) |
Percentage rounds to less than 0.1% or (0.1)%. |
| (G) |
Security is exempt from registration pursuant to Rule 144A of the Securities Act of 1933. Security may be resold as transactions exempt from registration, normally to qualified institutional buyers. At June 30, 2024, the total value of 144A securities is $45,562,775, representing 4.6% of the Portfolio’s net assets. |
| (H) |
Security deemed worthless. |
The Notes to Financial Statements are an integral part of this report.
|
|
|
|
|
| Transamerica Series Trust |
|
|
|
Semi-Annual Financial Statements 2024 |
|
|
Page 30 |
|
|
Transamerica Morgan Stanley Global Allocation VP
CONSOLIDATED SCHEDULE OF INVESTMENTS (continued)
At June 30, 2024
(unaudited)
FOOTNOTES TO SCHEDULE OF INVESTMENTS (continued):
| (I) |
Security exempt from registration under Regulation S of the Securities Act of 1933, which exempts from registration securities offered and sold outside the United States. Security may not be offered or sold in the United States except pursuant to an exemption from, or in a transaction not subject to, the registration requirements of the Securities Act of 1933. At June 30, 2024, the total value of the Regulation S securities is $120,008,094, representing 12.0% of the Portfolio’s net assets. |
| (J) |
All or a portion of investments is owned by Transamerica Cayman Morgan Stanley Global Allocation Ltd., a wholly-owned subsidiary of the Portfolio. |
| (K) |
When-issued, delayed-delivery and/or forward commitment (including TBAs) security. Security to be settled and delivered after June 30, 2024. Security may display a coupon rate of 0.00%, as the rate is to be determined at time of settlement. |
| (L) |
Floating or variable rate security. The rate disclosed is as of June 30, 2024. For securities based on a published reference rate and spread, the reference rate and spread are indicated within the description. Variable rate securities with a floor or ceiling feature are disclosed at the inherent rate, where applicable. Certain variable rate securities are not based on a published reference rate and spread, but are determined by the issuer or agent and are based on current market conditions; these securities do not indicate a reference rate and spread in the description. |
| (M) |
Payment in-kind. Security pays interest or dividends in the form of additional bonds or preferred stock. If the security makes a cash payment in addition to in-kind, the cash rate is disclosed separately. |
| (N) |
Step bond. Coupon rate changes in increments to maturity. The rate disclosed is as of June 30, 2024; the maturity date disclosed is the ultimate maturity date. |
| (O) |
Perpetual maturity. The date displayed is the next call date. |
| (P) |
Rate disclosed reflects the yield at June 30, 2024. |
| (Q) |
Security in default; no interest payments received and/or dividends declared during the last 12 months. At June 30, 2024, the value of this security is $4,780, representing 0.0% of the Portfolio’s net assets. |
| (R) |
Rounds to less than $1 or $(1). |
| (S) |
All or a portion of the security has been segregated by the custodian as collateral for centrally cleared swap agreements. The total value of the securities is $5,889,356. |
| (T) |
At the termination date, a net cash flow is exchanged where the total return is equivalent to the return of the reference entity less a financing rate, if any. As a receiver, the Portfolio would receive payments based on any positive total return and would owe payments in the event of a negative total return. As the payer, the Portfolio would owe payments on any net positive total return and would receive payment in the event of a negative total return. |
| (U) |
There were no transfers in or out of Level 3 during the period ended June 30, 2024. Please reference the Investment Valuation section of the Notes to Financial Statements for more information regarding investment valuation and pricing inputs. |
| (V) |
Level 3 securities were not considered significant to the Portfolio. |
| (W) |
Derivative instruments are valued at unrealized appreciation (depreciation). |
CURRENCY ABBREVIATION(S):
|
|
|
| AUD |
|
Australian Dollar |
| BRL |
|
Brazilian Real |
| CAD |
|
Canadian Dollar |
| CHF |
|
Swiss Franc |
| CLP |
|
Chile Peso |
| CNH |
|
Chinese Yuan Renminbi (offshore) |
| CNY |
|
China Yuan Renminbi |
| COP |
|
Colombian Peso |
| CZK |
|
Czech Republic Koruna |
| DKK |
|
Denmark Krone |
| EUR |
|
Euro |
| GBP |
|
British Pound |
| HKD |
|
Hong Kong Dollar |
| HUF |
|
Hungary Forint |
| IDR |
|
Indonesia Rupiah |
| ILS |
|
Israel New Shekel |
| INR |
|
Indian Rupee |
| JPY |
|
Japanese Yen |
| KRW |
|
South Korean Won |
| MXN |
|
Mexico Peso |
| MYR |
|
Malaysia Ringgit |
| NOK |
|
Norwegian Krone |
| NZD |
|
New Zealand Dollar |
| PEN |
|
Peruvian Sol |
| PLN |
|
Poland Zloty |
| RON |
|
Romania New Leu |
| SEK |
|
Swedish Krona |
| SGD |
|
Singapore Dollar |
| THB |
|
Thailand Baht |
The Notes to Financial Statements are an integral part of this report.
|
|
|
|
|
| Transamerica Series Trust |
|
|
|
Semi-Annual Financial Statements 2024 |
|
|
Page 31 |
|
|
Transamerica Morgan Stanley Global Allocation VP
CONSOLIDATED SCHEDULE OF INVESTMENTS (continued)
At June 30, 2024
(unaudited)
CURRENCY ABBREVIATION(S) (continued):
|
|
|
| TRY |
|
Turkish New Lira |
| TWD |
|
Taiwan New Dollar |
| USD |
|
United States Dollar |
| ZAR |
|
South Africa Rand |
COUNTERPARTY ABBREVIATION(S):
|
|
|
| BCLY |
|
Barclays Bank PLC |
| BNP |
|
BNP Paribas |
| BNY |
|
Bank of New York |
| BOA |
|
Bank of America, N.A. |
| CITI |
|
Citibank, N.A. |
| GSI |
|
Goldman Sachs International |
| HSBC |
|
HSBC Bank USA |
| JPM |
|
JPMorgan Chase Bank, N.A. |
| SCB |
|
Standard Chartered Bank |
| SSB |
|
State Street Bank & Trust Co. |
| UBS |
|
UBS AG |
PORTFOLIO ABBREVIATION(S):
|
|
|
| ADR |
|
American Depositary Receipt |
| BOBL |
|
Bundesobligationen (German Federal Government Securities) |
| BTP |
|
Buoni del Tesoro Poliennali (Italian Treasury Bonds) |
| BUXL |
|
Bundesanleihen (German Long-Term Debt) |
| CDI |
|
CHESS Depositary Interests |
| CLO |
|
Collateralized Loan Obligation |
| CVA |
|
Commanditaire Vennootschap op Aandelen (Dutch Certificate) |
| EURIBOR |
|
Euro Interbank Offer Rate |
| FTSE |
|
Financial Times Stock Exchange |
| HSCEI |
|
Hang Seng China Enterprises Index |
| KOSPI |
|
Korean Composite Stock Price Index |
| MTN |
|
Medium Term Note |
| OAT |
|
Obligations Assimilables du Tresor (Treasury Obligations) |
| REIT |
|
Real Estate Investment Trust |
| SOFR |
|
Secured Overnight Financing Rate |
| SONIA |
|
Sterling Overnight Interbank Average |
| STOXX |
|
Deutsche Börse Group & SIX Group Index |
| Schatz |
|
Bundesschatzanweisungen (German Federal Government 2-Year Securities) |
| TBA |
|
To Be Announced |
The Notes to Financial Statements are an integral part of this report.
|
|
|
|
|
| Transamerica Series Trust |
|
|
|
Semi-Annual Financial Statements 2024 |
|
|
Page 32 |
|
|
Transamerica Morgan Stanley Global Allocation VP
CONSOLIDATED STATEMENT OF ASSETS AND LIABILITIES
At June 30, 2024
(unaudited)
|
|
|
|
|
| Assets: |
|
|
|
|
|
|
| Investments, at value (cost $802,033,754) (including securities loaned of $7,081,046) |
|
$ |
813,781,496 |
|
| Repurchase agreement, at value (cost $185,049,588) |
|
|
185,049,588 |
|
| Cash collateral pledged at broker for: |
|
|
|
|
| Prime broker securities |
|
|
2,923,418 |
|
| Centrally cleared swap agreements |
|
|
2,832,000 |
|
| OTC derivatives (A) |
|
|
1,462,183 |
|
| Futures contracts |
|
|
4,747,714 |
|
| OTC swap agreements, at value (premium paid $0) |
|
|
8,893,759 |
|
| Foreign currency, at value (cost $13,875,737) |
|
|
13,106,048 |
|
| Receivables and other assets: |
|
|
|
|
| Investments sold |
|
|
2,958,048 |
|
| Net income from securities lending |
|
|
4,010 |
|
| Shares of beneficial interest sold |
|
|
4,945 |
|
| Dividends |
|
|
245,179 |
|
| Interest |
|
|
4,323,454 |
|
| Tax reclaims |
|
|
664,317 |
|
| Variation margin receivable on centrally cleared swap agreements |
|
|
118,623 |
|
| Unrealized appreciation on forward foreign currency contracts |
|
|
1,330,038 |
|
| Prepaid expenses |
|
|
4,016 |
|
|
|
| Total assets |
|
|
1,042,448,836 |
|
|
|
| Liabilities: |
|
|
|
|
|
|
| Cash collateral received upon return of: |
|
|
|
|
| Securities on loan |
|
|
5,525,381 |
|
| Cash collateral at broker for: |
|
|
|
|
| Centrally cleared swap agreements |
|
|
7,241,018 |
|
| OTC derivatives (A) |
|
|
200,000 |
|
| OTC swap agreements, at value (premium received $0) |
|
|
2,396,176 |
|
| Payables and other liabilities: |
|
|
|
|
| Investments purchased |
|
|
1,769 |
|
| When-issued, delayed-delivery, forward and TBA commitments purchased |
|
|
21,413,175 |
|
| Shares of beneficial interest redeemed |
|
|
540,364 |
|
| Due to custodian |
|
|
2,588,914 |
|
| Investment management fees |
|
|
501,057 |
|
| Distribution and service fees |
|
|
151,044 |
|
| Transfer agent costs |
|
|
1,077 |
|
| Trustee and CCO fees |
|
|
3,133 |
|
| Audit and tax fees |
|
|
36,233 |
|
| Custody fees |
|
|
195,635 |
|
| Legal fees |
|
|
23,503 |
|
| Printing and shareholder reports fees |
|
|
39,316 |
|
| Other accrued expenses |
|
|
28,730 |
|
| Variation margin payable on futures contracts |
|
|
1,078,666 |
|
| Unrealized depreciation on forward foreign currency contracts |
|
|
2,022,080 |
|
|
|
| Total liabilities |
|
|
43,987,271 |
|
|
|
| Net assets |
|
$ |
998,461,565 |
|
|
|
| Net assets consist of: |
|
|
|
|
|
|
| Capital stock ($0.01 par value) |
|
$ |
964,542 |
|
| Additional paid-in capital |
|
|
938,571,072 |
|
| Total distributable earnings (accumulated losses) |
|
|
58,925,951 |
|
|
|
| Net assets |
|
$ |
998,461,565 |
|
|
|
|
|
|
| Net assets by class: |
|
|
|
|
|
|
| Initial Class |
|
$ |
213,371,767 |
|
| Service Class |
|
|
785,089,798 |
|
|
|
| Shares outstanding: |
|
|
|
|
|
|
| Initial Class |
|
|
37,188,033 |
|
| Service Class |
|
|
59,266,134 |
|
|
|
| Net asset value and offering price per share: |
|
|
|
|
|
|
| Initial Class |
|
$ |
5.74 |
|
| Service Class |
|
|
13.25 |
|
| (A) |
OTC derivatives may include swaps, options and/or swaptions and forward foreign currency contracts. |
The Notes to Financial Statements are an integral part of this report.
|
|
|
|
|
| Transamerica Series Trust |
|
|
|
Semi-Annual Financial Statements 2024 |
|
|
Page 33 |
|
|
Transamerica Morgan Stanley Global Allocation VP
CONSOLIDATED STATEMENT OF OPERATIONS
For the period ended June 30, 2024
(unaudited)
|
|
|
|
|
| Investment income: |
|
|
|
|
|
|
| Dividend income |
|
$ |
5,006,574 |
|
| Interest income |
|
|
10,882,641 |
|
| Net income from securities lending |
|
|
51,924 |
|
| Withholding taxes on foreign income |
|
|
(472,000 |
) |
|
|
| Total investment income |
|
|
15,469,139 |
|
|
|
| Expenses: |
|
|
|
|
|
|
| Investment management fees |
|
|
3,253,645 |
|
| Distribution and service fees: |
|
|
|
|
| Service Class |
|
|
982,089 |
|
| Transfer agent costs |
|
|
5,784 |
|
| Trustee and CCO fees |
|
|
23,497 |
|
| Audit and tax fees |
|
|
32,619 |
|
| Custody fees |
|
|
224,759 |
|
| Legal fees |
|
|
91,661 |
|
| Printing and shareholder reports fees |
|
|
37,321 |
|
| Filing fees |
|
|
15,457 |
|
| Interest expense |
|
|
391,173 |
|
|
|
| Other |
|
|
280,358 |
|
|
|
| Total expenses |
|
|
5,338,363 |
|
|
|
| Net investment income (loss) |
|
|
10,130,776 |
|
|
|
| Net realized gain (loss) on: |
|
|
|
|
|
|
| Investments |
|
|
4,788,763 |
(A) |
| Swap agreements |
|
|
38,773,885 |
|
| Futures contracts |
|
|
(3,841,689 |
) |
| Forward foreign currency contracts |
|
|
355,484 |
|
| Foreign currency transactions |
|
|
(110,805 |
) |
|
|
| Net realized gain (loss) |
|
|
39,965,638 |
|
|
|
| Net change in unrealized appreciation (depreciation) on: |
|
|
|
|
|
|
| Investments |
|
|
998,766 |
(B) |
| Swap agreements |
|
|
(12,461,962 |
) |
| Futures contracts |
|
|
1,425,717 |
|
| Forward foreign currency contracts |
|
|
(179,750 |
) |
| Translation of assets and liabilities denominated in foreign currencies |
|
|
788,442 |
|
|
|
| Net change in unrealized appreciation (depreciation) |
|
|
(9,428,787 |
) |
|
|
| Net realized and change in unrealized gain (loss) |
|
|
30,536,851 |
|
|
|
| Net increase (decrease) in net assets resulting from operations |
|
$ |
40,667,627 |
|
| (A) |
Includes net of realized foreign capital gains tax of $260. |
| (B) |
Includes net change in foreign capital gains tax of $3,067. |
The Notes to Financial Statements are an integral part of this report.
|
|
|
|
|
| Transamerica Series Trust |
|
|
|
Semi-Annual Financial Statements 2024 |
|
|
Page 34 |
|
|
Transamerica Morgan Stanley Global Allocation VP
CONSOLIDATED STATEMENT OF CHANGES IN NET ASSETS
For the period and year ended:
|
|
|
|
|
|
|
|
|
|
|
|
|
|
| |
|
June 30, 2024 (unaudited) |
|
December 31, 2023 |
|
|
|
| From operations: |
|
|
|
|
|
|
|
|
|
|
| Net investment income (loss) |
|
|
$ |
10,130,776 |
|
|
|
$ |
18,816,507 |
|
| Net realized gain (loss) |
|
|
|
39,965,638 |
|
|
|
|
1,861,268 |
|
| Net change in unrealized appreciation (depreciation) |
|
|
|
(9,428,787 |
) |
|
|
|
113,943,496 |
|
|
|
|
| Net increase (decrease) in net assets resulting from operations |
|
|
|
40,667,627 |
|
|
|
|
134,621,271 |
|
|
|
|
| Dividends and/or distributions to shareholders: |
|
|
|
|
|
|
|
|
|
|
| Initial Class |
|
|
|
— |
|
|
|
|
(17,229,740 |
) |
|
|
|
| Service Class |
|
|
|
— |
|
|
|
|
(30,009,121 |
) |
|
|
|
| Net increase (decrease) in net assets resulting from dividends and/or distributions to shareholders |
|
|
|
— |
|
|
|
|
(47,238,861 |
) |
|
|
|
| Capital share transactions: |
|
|
|
|
|
|
|
|
|
|
| Proceeds from shares sold: |
|
|
|
|
|
|
|
|
|
|
| Initial Class |
|
|
|
130,990 |
|
|
|
|
3,666,953 |
|
|
|
|
| Service Class |
|
|
|
1,711,639 |
|
|
|
|
2,611,147 |
|
|
|
|
| |
|
|
|
1,842,629 |
|
|
|
|
6,278,100 |
|
| Dividends and/or distributions reinvested: |
|
|
|
|
|
|
|
|
|
|
| Initial Class |
|
|
|
— |
|
|
|
|
17,229,740 |
|
|
|
|
| Service Class |
|
|
|
— |
|
|
|
|
30,009,121 |
|
|
|
|
| |
|
|
|
— |
|
|
|
|
47,238,861 |
|
| Cost of shares redeemed: |
|
|
|
|
|
|
|
|
|
|
| Initial Class |
|
|
|
(16,920,464 |
) |
|
|
|
(20,687,584 |
) |
|
|
|
| Service Class |
|
|
|
(71,388,824 |
) |
|
|
|
(135,730,358 |
) |
|
|
|
| |
|
|
|
(88,309,288 |
) |
|
|
|
(156,417,942 |
) |
|
|
|
| Net increase (decrease) in net assets resulting from capital share transactions |
|
|
|
(86,466,659 |
) |
|
|
|
(102,900,981 |
) |
|
|
|
| Net increase (decrease) in net assets |
|
|
|
(45,799,032 |
) |
|
|
|
(15,518,571 |
) |
|
|
|
| Net assets: |
|
|
|
|
|
|
|
|
|
|
| Beginning of period/year |
|
|
|
1,044,260,597 |
|
|
|
|
1,059,779,168 |
|
| End of period/year |
|
|
$ |
998,461,565 |
|
|
|
$ |
1,044,260,597 |
|
|
|
|
| Capital share transactions - shares: |
|
|
|
|
|
|
|
|
|
|
| Shares issued: |
|
|
|
|
|
|
|
|
|
|
| Initial Class |
|
|
|
23,564 |
|
|
|
|
658,250 |
|
|
|
|
| Service Class |
|
|
|
132,767 |
|
|
|
|
214,970 |
|
|
|
|
| |
|
|
|
156,331 |
|
|
|
|
873,220 |
|
| Shares reinvested: |
|
|
|
|
|
|
|
|
|
|
| Initial Class |
|
|
|
— |
|
|
|
|
3,319,796 |
|
|
|
|
| Service Class |
|
|
|
— |
|
|
|
|
2,498,678 |
|
|
|
|
| |
|
|
|
— |
|
|
|
|
5,818,474 |
|
| Shares redeemed: |
|
|
|
|
|
|
|
|
|
|
| Initial Class |
|
|
|
(3,034,263 |
) |
|
|
|
(3,816,248 |
) |
|
|
|
| Service Class |
|
|
|
(5,535,908 |
) |
|
|
|
(11,210,299 |
) |
|
|
|
| |
|
|
|
(8,570,171 |
) |
|
|
|
(15,026,547 |
) |
|
|
|
| Net increase (decrease) in shares outstanding: |
|
|
|
|
|
|
|
|
|
|
| Initial Class |
|
|
|
(3,010,699 |
) |
|
|
|
161,798 |
|
|
|
|
| Service Class |
|
|
|
(5,403,141 |
) |
|
|
|
(8,496,651 |
) |
|
|
|
| |
|
|
|
(8,413,840 |
) |
|
|
|
(8,334,853 |
) |
The Notes to Financial Statements are an integral part of this report.
|
|
|
|
|
| Transamerica Series Trust |
|
|
|
Semi-Annual Financial Statements 2024 |
|
|
Page 35 |
|
|
Transamerica Morgan Stanley Global Allocation VP
CONSOLIDATED FINANCIAL HIGHLIGHTS
|
|
|
|
|
|
|
|
|
|
|
|
|
|
|
|
|
|
|
|
|
|
|
|
|
|
|
| For a share outstanding during the period and years indicated: |
|
Initial Class |
|
|
|
|
|
|
|
| |
|
June 30, 2024 (unaudited) |
|
December 31, 2023 |
|
December 31, 2022 |
|
December 31, 2021 |
|
December 31, 2020 |
|
December 31, 2019 |
|
|
|
|
|
|
|
| Net asset value, beginning of period/year |
|
$ |
5.50 |
|
|
$ |
5.25 |
|
|
$ |
9.14 |
|
|
$ |
9.92 |
|
|
$ |
9.08 |
|
|
$ |
8.41 |
|
|
|
|
|
|
|
|
| Investment operations: |
|
|
|
|
|
|
|
|
|
|
|
|
|
|
|
|
|
|
|
|
|
|
|
|
| Net investment income (loss)(A) |
|
|
0.06 |
|
|
|
0.11 |
|
|
|
0.06 |
|
|
|
0.08 |
|
|
|
0.06 |
|
|
|
0.14 |
|
| Net realized and unrealized gain (loss) |
|
|
0.18 |
|
|
|
0.59 |
|
|
|
(1.60 |
) |
|
|
0.73 |
|
|
|
1.56 |
|
|
|
1.33 |
|
| |
|
|
|
|
|
|
| Total investment operations |
|
|
0.24 |
|
|
|
0.70 |
|
|
|
(1.54 |
) |
|
|
0.81 |
|
|
|
1.62 |
|
|
|
1.47 |
|
|
|
|
|
|
|
|
| Dividends and/or distributions to shareholders: |
|
|
|
|
|
|
|
|
|
|
|
|
|
|
|
|
|
|
|
|
|
|
|
|
| Net investment income |
|
|
— |
|
|
|
— |
|
|
|
(0.06 |
) |
|
|
(0.13 |
) |
|
|
(0.19 |
) |
|
|
(0.18 |
) |
| Net realized gains |
|
|
— |
|
|
|
(0.45 |
) |
|
|
(2.29 |
) |
|
|
(1.46 |
) |
|
|
(0.59 |
) |
|
|
(0.62 |
) |
| |
|
|
|
|
|
|
| Total dividends and/or distributions to shareholders |
|
|
— |
|
|
|
(0.45 |
) |
|
|
(2.35 |
) |
|
|
(1.59 |
) |
|
|
(0.78 |
) |
|
|
(0.80 |
) |
|
|
|
|
|
|
|
| Net asset value, end of period/year |
|
$ |
5.74 |
|
|
$ |
5.50 |
|
|
$ |
5.25 |
|
|
$ |
9.14 |
|
|
$ |
9.92 |
|
|
$ |
9.08 |
|
| |
|
|
|
|
|
|
|
|
|
|
|
|
|
|
|
|
|
|
|
|
|
|
|
|
|
|
|
|
|
|
|
| Total return |
|
|
4.36 |
%(B) |
|
|
13.89 |
% |
|
|
(17.51 |
)% |
|
|
8.42 |
% |
|
|
18.59 |
% |
|
|
18.20 |
% |
|
|
|
|
|
|
|
| Ratio and supplemental data: |
|
|
|
|
|
|
|
|
|
|
|
|
|
|
|
|
|
|
|
|
|
|
|
|
| Net assets end of period/year (000’s) |
|
$ |
213,372 |
|
|
$ |
221,294 |
|
|
$ |
210,172 |
|
|
$ |
299,521 |
|
|
$ |
294,447 |
|
|
$ |
476,636 |
|
| Expenses to average net assets |
|
|
|
|
|
|
|
|
|
|
|
|
|
|
|
|
|
|
|
|
|
|
|
|
| Excluding dividend and interest expenses related to short sales, interest, taxes, brokerage commissions and extraordinary expenses |
|
|
0.79 |
%(C) |
|
|
0.78 |
% |
|
|
0.79 |
% |
|
|
0.73 |
% |
|
|
0.75 |
% |
|
|
0.76 |
%(D) |
| Including dividend and interest expenses related to short sales, interest, taxes, brokerage commissions and extraordinary expenses |
|
|
0.87 |
%(C)(E) |
|
|
0.98 |
%(E) |
|
|
0.89 |
% |
|
|
0.84 |
%(D) |
|
|
0.83 |
%(D) |
|
|
0.76 |
%(D)(F) |
| Net investment income (loss) to average net assets |
|
|
2.23 |
%(C) |
|
|
1.99 |
% |
|
|
0.86 |
% |
|
|
0.82 |
% |
|
|
0.62 |
% |
|
|
1.55 |
% |
| Portfolio turnover rate |
|
|
31 |
%(B) |
|
|
82 |
% |
|
|
51 |
% |
|
|
65 |
% |
|
|
151 |
% |
|
|
190 |
% |
| (A) |
Calculated based on average number of shares outstanding. |
| (D) |
Does not include expenses of the underlying investments in which the Portfolio invests. |
| (E) |
Includes extraordinary expenses outside the operating expense limit. |
| (F) |
Dividends and interest from securities sold short rounds to less than 0.01%. |
The Notes to Financial Statements are an integral part of this report.
|
|
|
|
|
| Transamerica Series Trust |
|
|
|
Semi-Annual Financial Statements 2024 |
|
|
Page 36 |
|
|
Transamerica Morgan Stanley Global Allocation VP
CONSOLIDATED FINANCIAL HIGHLIGHTS (continued)
|
|
|
|
|
|
|
|
|
|
|
|
|
|
|
|
|
|
|
|
|
|
|
|
|
|
|
| For a share outstanding during the period and years indicated: |
|
Service Class |
|
|
|
|
|
|
|
| |
|
June 30, 2024 (unaudited) |
|
December 31, 2023 |
|
December 31, 2022 |
|
December 31, 2021 |
|
December 31, 2020 |
|
December 31, 2019 |
|
|
|
|
|
|
|
| Net asset value, beginning of period/year |
|
$ |
12.73 |
|
|
$ |
11.61 |
|
|
$ |
16.84 |
|
|
$ |
17.04 |
|
|
$ |
15.06 |
|
|
$ |
13.47 |
|
|
|
|
|
|
|
|
| Investment operations: |
|
|
|
|
|
|
|
|
|
|
|
|
|
|
|
|
|
|
|
|
|
|
|
|
| Net investment income (loss)(A) |
|
|
0.13 |
|
|
|
0.21 |
|
|
|
0.09 |
|
|
|
0.08 |
|
|
|
0.05 |
|
|
|
0.19 |
|
| Net realized and unrealized gain (loss) |
|
|
0.39 |
|
|
|
1.36 |
|
|
|
(3.02 |
) |
|
|
1.27 |
|
|
|
2.67 |
|
|
|
2.16 |
|
| |
|
|
|
|
|
|
| Total investment operations |
|
|
0.52 |
|
|
|
1.57 |
|
|
|
(2.93 |
) |
|
|
1.35 |
|
|
|
2.72 |
|
|
|
2.35 |
|
|
|
|
|
|
|
|
| Dividends and/or distributions to shareholders: |
|
|
|
|
|
|
|
|
|
|
|
|
|
|
|
|
|
|
|
|
|
|
|
|
| Net investment income |
|
|
— |
|
|
|
— |
|
|
|
(0.01 |
) |
|
|
(0.09 |
) |
|
|
(0.15 |
) |
|
|
(0.14 |
) |
| Net realized gains |
|
|
— |
|
|
|
(0.45 |
) |
|
|
(2.29 |
) |
|
|
(1.46 |
) |
|
|
(0.59 |
) |
|
|
(0.62 |
) |
| |
|
|
|
|
|
|
| Total dividends and/or distributions to shareholders |
|
|
— |
|
|
|
(0.45 |
) |
|
|
(2.30 |
) |
|
|
(1.55 |
) |
|
|
(0.74 |
) |
|
|
(0.76 |
) |
|
|
|
|
|
|
|
| Net asset value, end of period/year |
|
$ |
13.25 |
|
|
$ |
12.73 |
|
|
$ |
11.61 |
|
|
$ |
16.84 |
|
|
$ |
17.04 |
|
|
$ |
15.06 |
|
| |
|
|
|
|
|
|
|
|
|
|
|
|
|
|
|
|
|
|
|
|
|
|
|
|
|
|
|
|
|
|
|
| Total return |
|
|
4.08 |
%(B) |
|
|
13.69 |
% |
|
|
(17.76 |
)% |
|
|
8.18 |
% |
|
|
18.34 |
% |
|
|
17.85 |
% |
|
|
|
|
|
|
|
| Ratio and supplemental data: |
|
|
|
|
|
|
|
|
|
|
|
|
|
|
|
|
|
|
|
|
|
|
|
|
| Net assets end of period/year (000’s) |
|
$ |
785,090 |
|
|
$ |
822,967 |
|
|
$ |
849,607 |
|
|
$ |
1,181,323 |
|
|
$ |
1,254,989 |
|
|
$ |
1,205,764 |
|
| Expenses to average net assets |
|
|
|
|
|
|
|
|
|
|
|
|
|
|
|
|
|
|
|
|
|
|
|
|
| Excluding dividend and interest expenses related to short sales, interest, taxes, brokerage commissions and extraordinary expenses |
|
|
1.04 |
%(C) |
|
|
1.03 |
% |
|
|
1.00 |
% |
|
|
0.97 |
% |
|
|
0.99 |
% |
|
|
1.01 |
%(D) |
| Including dividend and interest expenses related to short sales, interest, taxes, brokerage commissions and extraordinary expenses |
|
|
1.12 |
%(C)(E) |
|
|
1.23 |
%(E) |
|
|
1.10 |
% |
|
|
1.08 |
%(D) |
|
|
1.09 |
%(D) |
|
|
1.01 |
%(D)(F) |
| Net investment income (loss) to average net assets |
|
|
1.98 |
%(C) |
|
|
1.74 |
% |
|
|
0.62 |
% |
|
|
0.48 |
% |
|
|
0.30 |
% |
|
|
1.31 |
% |
| Portfolio turnover rate |
|
|
31 |
%(B) |
|
|
82 |
% |
|
|
51 |
% |
|
|
65 |
% |
|
|
151 |
% |
|
|
190 |
% |
| (A) |
Calculated based on average number of shares outstanding. |
| (D) |
Does not include expenses of the underlying investments in which the Portfolio invests. |
| (E) |
Includes extraordinary expenses outside the operating expense limit. |
| (F) |
Dividends and interest from securities sold short rounds to less than 0.01%. |
The Notes to Financial Statements are an integral part of this report.
|
|
|
|
|
| Transamerica Series Trust |
|
|
|
Semi-Annual Financial Statements 2024 |
|
|
Page 37 |
|
|
Transamerica Morgan Stanley Global Allocation VP
NOTES TO FINANCIAL STATEMENTS
At June 30, 2024
(unaudited)
1. ORGANIZATION
Transamerica Series Trust (“TST”) is an open-end management investment company registered under the Investment Company Act of 1940, as amended (the “1940 Act”). TST applies investment company accounting and reporting guidance. TST serves as a funding vehicle for variable life insurance, variable annuity, and group annuity products. Transamerica Morgan Stanley Global Allocation VP (the “Portfolio”) is a series of TST and is classified as diversified under the 1940 Act. The Portfolio currently offers two classes of shares, Initial Class and Service Class.
Transamerica Cayman Morgan Stanley Global Allocation, Ltd. is a wholly-owned subsidiary which acts as an investment vehicle for the Portfolio. Please reference the Basis for Consolidation section of the Notes to Financial Statements for more information. The only shareholders of the Portfolio are affiliated insurance company separate accounts and/or affiliated asset allocation portfolios. Contract holders of the variable life and annuity contracts are not shareholders of the Portfolio. For ease of reference, shareholders and contract holders are collectively referred to in this report as “shareholders.”
This report must be accompanied or preceded by the Portfolio’s current prospectus, which contains additional information about the Portfolio, including risks, as well as investment objectives and strategies.
Transamerica Asset Management, Inc. (“TAM”) serves as investment manager for the Portfolio pursuant to an investment management agreement. TAM provides continuous and regular investment management services to the Portfolio. TAM supervises the Portfolio’s investments, conducts its investment program and provides supervisory, compliance and administrative services to the Portfolio.
TAM currently acts as a “manager of managers” and has hired sub-advisers to furnish day-to-day investment advice and recommendations. TAM may, in the future, determine to provide all aspects of the day-to-day management of the Portfolio without the use of a sub-adviser. When acting as a manager of managers, TAM provides investment management services that include, without limitation, the design and development of the Portfolio and its investment strategies and the ongoing review and evaluation of those investment strategies including recommending changes in strategy where it believes appropriate or advisable; the selection of one or more sub-advisers for the Portfolio employing a combination of quantitative and qualitative screens, research, analysis and due diligence; negotiation of sub-advisory agreements and fees; oversight and monitoring of sub-advisers and recommending changes to sub-advisers where it believes appropriate or advisable; recommending portfolio combinations and liquidations where it believes appropriate or advisable; selection and oversight of transition managers, as needed; regular supervision of the Portfolio’s investments; regular review and evaluation of sub-adviser performance; daily monitoring of the sub-advisers’ buying and selling of securities for the Portfolio; regular review of holdings; ongoing trade oversight and analysis; regular monitoring to ensure adherence to investment process; regular calls and periodic on-site visits with sub-advisers; portfolio construction and asset allocation when using multiple sub-advisers for the Portfolio; risk management oversight and analysis; oversight of negotiation of investment documentation and agreements; design, development, implementation and regular monitoring of the valuation process; periodic due diligence reviews of pricing vendors and vendor methodology; design, development, implementation and regular monitoring of the compliance process; respond to regulatory inquiries and determine appropriate litigation strategy, as needed; review of proxies voted by sub-advisers; oversight of preparation and review of materials for meetings of the Portfolio’s Board of Trustees (the “Board”), participation in these meetings and preparation of regular communications with the Board; oversight of preparation and review of prospectuses, shareholder reports and other disclosure materials and regulatory filings for the Portfolio; oversight of other service providers to the Portfolio, such as the custodian, the transfer agent, the Portfolio’s independent accounting firm and legal counsel; supervision of the performance of recordkeeping and shareholder relations functions for the Portfolio; and oversight of cash management services. TAM uses a variety of quantitative and qualitative tools to carry out its investment management services. TAM, not the Portfolio, is responsible for paying the sub-adviser(s) for their services, and sub-advisory fees are TAM’s expense.
TAM’s investment management services also include the provision of supervisory and administrative services to the Portfolio. These services include performing certain administrative services for the Portfolio and supervising and overseeing the administrative, clerical, recordkeeping and bookkeeping services provided to the Portfolio by State Street Bank and Trust Company (“State Street”), to whom TAM has outsourced the provision of certain sub-administration services. To the extent agreed upon by TAM and the Portfolio from time to time, TAM’s supervisory and administrative services include, but are not limited to: monitoring and verifying the custodian’s daily calculation of the Net Asset Values (“NAV”); shareholder relations functions; compliance services; valuation services; assisting in due diligence and in the oversight and monitoring of certain activities of sub-advisers and certain aspects of Portfolio investments; assisting with Portfolio combinations and liquidations; oversight of the preparation and filing, and review, of all returns and reports, in connection with federal, state and local taxes; oversight and review of regulatory reporting; supervising and coordinating the Portfolio’s custodian and dividend disbursing agent and monitoring their services to the Portfolio; assisting the Portfolio in preparing reports to shareholders; acting as liaison with the Portfolio’s independent public accountants and providing, upon request, analyses, fiscal year summaries and other audit related services; assisting in the preparation of agendas and supporting documents for and minutes of meetings of trustees and committees of
|
|
|
| Transamerica Series Trust |
|
Semi-Annual Financial Statements 2024 |
Page 38
Transamerica Morgan Stanley Global Allocation VP
NOTES TO FINANCIAL STATEMENTS (continued)
At June 30, 2024
(unaudited)
1. ORGANIZATION (continued)
trustees; assisting in the preparation of regular communications with the trustees; and providing personnel and office space, telephones and other office equipment as necessary in order for TAM to perform supervisory and administrative services to the Portfolio. The Portfolio pays certain fees and expenses to State Street for sub-administration services which are not administrative services covered by the management agreement with TAM or paid for through the management fees payable thereunder. For the period ended June 30, 2024, (i) the expenses paid to State Street for sub-administration services by the Portfolio are shown as a part of Other expenses within the Consolidated Statement of Operations and (ii) the expenses payable to State Street for sub-administration services from the Portfolio are shown as part of Other accrued expenses within the Consolidated Statement of Assets and Liabilities.
2. BASIS FOR CONSOLIDATION
Transamerica Cayman Morgan Stanley Global Allocation, Ltd. (the “Subsidiary”) is organized under the laws of the Cayman Islands and is a wholly-owned subsidiary which acts as an investment vehicle for the Portfolio. The principal purpose of investment in the Subsidiary is to allow the Portfolio noted above to gain exposure to the commodity markets within the limitations of the federal tax law requirements applicable to regulated investment companies.
At June 30, 2024, the net assets of the Subsidiary as a percentage of the Portfolio’s net assets is as follows:
|
|
|
|
|
| Subsidiary Net Assets |
|
|
|
Percentage of
Net Assets |
| $ 133,676,005 |
|
|
|
13.39% |
3. SIGNIFICANT ACCOUNTING POLICIES
In preparing the Portfolio’s consolidated financial statements in accordance with Generally Accepted Accounting Principles in the United States of America (“GAAP”), estimates or assumptions (which could differ from actual results) may be used that affect reported amounts and disclosures. The following is a summary of significant accounting policies followed by the Portfolio.
Foreign currency denominated investments: The accounting records of the Portfolio are maintained in U.S. dollars. Securities and other assets and liabilities denominated in foreign currencies are translated into U.S. dollars based on the closing exchange rate each day. The cost of foreign securities purchased and any realized gains or losses are translated at the prevailing exchange rates in effect on the date of the respective transaction. The Portfolio combines fluctuations from currency exchange rates and fluctuations in value when computing net realized and unrealized gains or losses from investments.
Net foreign currency gains and losses resulting from changes in exchange rates include, foreign currency fluctuations between trade date and settlement date of investment security transactions, gains and losses on forward foreign currency contracts, and the difference between the receivable amounts of interest and dividends recorded in the accounting records in U.S. dollars and the amounts actually received.
Foreign currency denominated assets may involve risks not typically associated with domestic transactions. These risks include revaluation of currencies, adverse fluctuations in foreign currency values, and possible adverse political, social, and economic developments, including those particular to a specific industry, country or region.
Security transactions and investment income: Security transactions are accounted for on the trade date. Security gains and losses are calculated on a first-in, first-out basis. Dividend income, if any, is recorded on the ex-dividend date or, in the case of foreign securities, as soon as the Portfolio is informed of the ex-dividend dates, net of foreign taxes. Non-cash dividends, if any, are recorded on the ex-dividend date at fair value. Interest income, if any, is recorded on the accrual basis from settlement date, net of foreign taxes. Fixed income premiums and discounts are amortized and/or accreted over the lives of the respective securities.
Multiple class operations, income, and expenses: Income, non-class specific expenses, and realized and unrealized gains and losses are allocated to each class daily based upon net assets. Each class bears its own specific expenses in addition to the allocated non-class specific expenses.
Distributions to shareholders: Distributions are recorded on the ex-dividend date and are determined in accordance with federal income tax regulations, which may differ from GAAP.
|
|
|
| Transamerica Series Trust |
|
Semi-Annual Financial Statements 2024 |
Page 39
Transamerica Morgan Stanley Global Allocation VP
NOTES TO FINANCIAL STATEMENTS (continued)
At June 30, 2024
(unaudited)
3. SIGNIFICANT ACCOUNTING POLICIES (continued)
Foreign taxes: The Portfolio may be subject to taxes imposed by the countries in which it invests, with respect to its investments in issuers existing or operating in such countries. The Portfolio may also be subject to foreign taxes on income, gains on investments, or currency repatriation, a portion of which may be recoverable. The Portfolio accrues such taxes and recoveries as applicable when the related income or capital gains are earned or unrealized, and based upon the current interpretation of tax rules and regulations that exist in the markets in which the Portfolio invests. Some countries require governmental approval for the repatriation of investment income, capital, or the proceeds of sales earned by foreign investors. In addition, if there is deterioration in a country’s balance of payments or for other reasons, a country may impose temporary restrictions of foreign capital remittances abroad.
Cash overdraft: The Portfolio may have cash overdraft balances. A fee is incurred on these overdrafts, calculated by multiplying the overdraft by a rate based on the Federal Funds Rate.
Payables, if any, are reflected as Due to custodian within the Consolidated Statement of Assets and Liabilities. Expenses, if any, from U.S. cash overdrafts are reflected in Custody fees within the Consolidated Statement of Operations. Expenses, if any, from foreign cash overdrafts are reflected in Other expenses within the Consolidated Statement of Operations.
Commission recapture: The sub-adviser(s), to the extent consistent with the best execution and usual commission rate policies and practices, may elect to place security transactions of the Portfolio with broker/dealers with which TST has established a commission recapture program. A commission recapture program is any arrangement under which a broker/dealer applies a portion of the commissions received by such broker/dealer on the security transactions to the Portfolio. In no event will commissions, paid by the Portfolio, be used to pay expenses that would otherwise be borne by any other Portfolios within TST, or by any other party.
There were no commissions recaptured during the period ended June 30, 2024 by the Portfolio.
Indemnification: In the normal course of business, the Portfolio enters into contracts that contain a variety of representations that provide general indemnifications. The Portfolio’s maximum exposure under these arrangements is unknown, as this would involve future claims that may be made against the Portfolio and/or its affiliates that have not yet occurred. However, based on experience, the Portfolio expects the risk of loss to be remote.
4. INVESTMENT VALUATION
TAM has been designated as the Portfolio’s valuation designee pursuant to Rule 2a-5 under the 1940 Act with responsibility for fair valuation subject to oversight by the Portfolio’s Board of Trustees. The net asset value of the Portfolio is computed as of the official close of the New York Stock Exchange (“NYSE”) each day the NYSE is open for business.
TAM utilizes various methods to measure the fair value of its investments on a recurring basis. GAAP establishes a hierarchy that prioritizes inputs to valuation methods. The inputs or methodology used for valuing securities are not necessarily an indication of the risk associated with investing in those securities. The three levels (“Levels”) of inputs of the fair value hierarchy are defined as follows:
Level 1—Unadjusted quoted prices in active markets for identical securities.
Level 2—Inputs, other than quoted prices included in Level 1, which are observable, either directly or indirectly. These inputs may include quoted prices for the identical instrument on an inactive market, prices for similar instruments, interest rates, prepayment speeds, credit risk, yield curves, default rates, and similar data.
Level 3—Unobservable inputs based on the best information available in the circumstances, to the extent observable inputs are not available, which may include TAM’s own assumptions used in determining the fair value of the Portfolio’s investments and derivative instruments.
The inputs used to measure fair value may fall into different Levels of the fair value hierarchy. In such cases, for disclosure purposes, the Level in the fair value hierarchy that is assigned to the fair value measurement of a security is determined based on the lowest Level input that is significant to the fair value measurement in its entirety. Certain investments that are measured at fair value using NAV per share, or its equivalent, using the “practical expedient” have not been classified in the fair value Levels. The hierarchy classification of inputs used to value the Portfolio’s investments at June 30, 2024, is disclosed within the Investment Valuation section of the Consolidated Schedule of Investments.
|
|
|
| Transamerica Series Trust |
|
Semi-Annual Financial Statements 2024 |
Page 40
Transamerica Morgan Stanley Global Allocation VP
NOTES TO FINANCIAL STATEMENTS (continued)
At June 30, 2024
(unaudited)
4. INVESTMENT VALUATION (continued)
The availability of observable inputs can vary from security to security and is affected by a wide variety of factors, including, but not limited to, the type of security, whether the security is new and not yet established in the marketplace, the liquidity of markets, and other characteristics particular to the security. To the extent that valuation is based on models or inputs that are less observable or unobservable in the market, the determination of fair value requires more judgment. Accordingly, the degree of judgment exercised in determining fair value is generally greatest for instruments categorized in Level 3. Due to the inherent uncertainty of valuation, the determination of values may differ significantly from values that would have been realized had a ready market for investments existed, and the differences could be material.
Fair value measurements: Descriptions of the valuation techniques applied to the Portfolio’s significant categories of assets and liabilities measured at fair value on a recurring basis are as follows:
Asset-backed securities: The fair value of asset-backed securities is estimated based on models that consider the estimated cash flows of each tranche of the entity, establish a benchmark yield, and develop an estimated tranche specific spread to the benchmark yield based on the unique attributes of the tranche. To the extent the inputs are observable and timely, the values would generally be categorized in Level 2 of the fair value hierarchy; otherwise they would be categorized in Level 3.
Convertible bonds: The fair value of convertible bonds is estimated using various techniques, which consider recently executed transactions in securities of the issuer or comparable issuers, broker price quotations (where observable), and models incorporating benchmark curves, underlying stock data, and foreign exchange rates. While most convertible bonds are categorized in Level 2 of the fair value hierarchy, in instances where lower relative weight is placed on transaction prices, quotations, or similar observable inputs, they are categorized in Level 3.
Corporate debt securities: The fair value of corporate debt securities is estimated using various techniques, which consider recently executed transactions in securities of the issuer or comparable issuers, market price quotations (where observable), bond spreads, fundamental data relating to the issuer, and credit default swap spreads adjusted for any basis difference between cash and derivative instruments. While most corporate debt securities are categorized in Level 2 of the fair value hierarchy, in instances where lower relative weight is placed on transaction prices, quotations, or similar observable inputs, they are categorized in Level 3.
Equity securities: Securities are stated at the last reported sales price or closing price on the day of valuation taken from the primary exchange where the security is principally traded. To the extent these securities are actively traded and valuation adjustments are not applied, they are categorized in Level 1 of the fair value hierarchy. Equities traded on inactive markets or valued by reference to similar instruments are generally categorized in Level 2 or Level 3 if inputs are unobservable.
Foreign equity securities: Securities in which the primary trading market closes at the same time or after the NYSE, are valued based on quotations from the primary market in which they are traded and are categorized in Level 1. Because many foreign securities markets and exchanges close prior to the close of the NYSE, closing prices for foreign securities in those markets or on those exchanges do not reflect the events that occur after that close. Certain foreign securities may be fair valued using a pricing service that considers the correlation of the trading patterns of the foreign security to the intraday trading in the U.S. markets for investments such as American Depositary Receipts, financial futures, or ETFs and the movement of certain indices of securities based on a statistical analysis of their historical relationship; such valuations generally are categorized in Level 2.
Foreign government obligations: Foreign government obligations are normally valued using a model that incorporates market observable data such as reported sales of similar securities, broker quotes, yields, bids, offers, and reference data. Certain securities are valued by principally using dealer quotations. Foreign government obligations generally are categorized in Level 2 of the fair value hierarchy, or Level 3 if inputs are unobservable.
Mortgage-backed securities: The fair value of mortgage-backed securities is estimated based on models that consider issuer type, coupon, cash flows, mortgage prepayment projection tables and adjustable rate mortgage evaluations that incorporate index data, periodic life caps and the next coupon reset date. To the extent the inputs are observable and timely, the values would generally be categorized in Level 2 of the fair value hierarchy; otherwise they are categorized in Level 3.
Municipal government obligations: The fair value of municipal government obligations and variable rate notes is estimated based on models that consider, among other factors, information received from market makers and broker-dealers, current trades, bid-want lists,
|
|
|
| Transamerica Series Trust |
|
Semi-Annual Financial Statements 2024 |
Page 41
Transamerica Morgan Stanley Global Allocation VP
NOTES TO FINANCIAL STATEMENTS (continued)
At June 30, 2024
(unaudited)
4. INVESTMENT VALUATION (continued)
offerings, market movements, the liquidity of the bond, state of issuance, benchmark yield curves, and bond or note insurance. To the extent the inputs are observable and timely, the values would generally be categorized in Level 2 of the fair value hierarchy; otherwise they are categorized in Level 3.
Rights: Rights may be priced intrinsically using a model that incorporates the subscription or strike price, the daily market price for the underlying security, and a subscription ratio. If the inputs are unavailable, or if the subscription or strike price is higher than the market price, then the rights are priced at zero. Rights are generally categorized in Level 2 of the fair value hierarchy, or Level 3 if inputs are unobservable.
U.S. government agency obligations: U.S. government agency obligations are comprised of two main categories consisting of agency issued debt and mortgage pass-throughs. Generally, agency issued debt securities are valued in a manner similar to U.S. government obligations. Mortgage pass-throughs include to be announced (“TBA”) securities and mortgage pass-through certificates. Generally, TBA securities and mortgage pass-throughs are valued using dealer quotations. Depending on market activity levels and whether quotations or other observable data are used, these securities are typically categorized in Level 2 of the fair value hierarchy; otherwise they would be categorized in Level 3.
U.S. government obligations: U.S. government obligations are normally valued using a model that incorporates market observable data such as reported sales of similar securities, broker quotes, yields, bids, offers, and reference data. Certain securities are valued by principally using dealer quotations. U.S. government obligations generally are categorized in Level 2 of the fair value hierarchy, or Level 3 if inputs are unobservable.
Warrants: Warrants may be priced intrinsically using a model that incorporates the subscription or strike price, the daily market price for the underlying security, and a subscription ratio. If the inputs are unavailable, or if the subscription or strike price is higher than the market price, then the warrants are priced at zero. Warrants are generally categorized in Level 2 of the fair value hierarchy, or Level 3 if inputs are unobservable.
Short-term notes: The Portfolio normally values short-term government and U.S. government agency securities using a model that incorporates market observable data such as reported sales of similar securities, broker quotes, yields, bids, offers and reference data. Certain securities are valued by principally using dealer quotations. Short-term government and U.S. government agency securities generally are categorized in Level 2 of the fair value hierarchy, or Level 3 if inputs are unobservable.
Securities lending collateral: Securities lending collateral is invested in a money market fund which is valued at the actively traded NAV and no valuation adjustments are applied. Securities lending collateral is categorized in Level 1 of the fair value hierarchy.
Repurchase agreements: Repurchase agreements are valued at cost, which approximates fair value. To the extent the inputs are observable and timely, the values are generally categorized in Level 2 of the fair value hierarchy.
Restricted securities: Restricted securities for which quotations are not readily available are valued at fair value. Restricted securities issued by publicly traded companies are generally valued at a discount to similar publicly traded securities. Restricted securities issued by nonpublic entities may be valued by reference to comparable public entities and/or fundamental data relating to the issuer. Depending on the relative significance of observable valuation inputs, these instruments may be classified in either Level 2 or Level 3 of the fair value hierarchy.
Derivative instruments: Centrally cleared or listed derivatives that are actively traded are valued based on quoted prices from the exchange and are categorized in Level 1 of the fair value hierarchy. Over-the-counter (“OTC”) derivative contracts include forward, swap, swaption, and option contracts related to interest rates, foreign currencies, credit standing of reference entities, equity prices, or commodity prices. Depending on the product and the terms of the transaction, the fair value of the OTC derivative products are modeled taking into account the counterparties’ creditworthiness and using a series of techniques, including simulation models. Many pricing models do not entail material subjectivity because the methodologies employed do not necessitate significant judgments and the pricing inputs are observed from actively quoted markets, as is the case of interest rate swap and option contracts. The majority of OTC derivative products valued by the Portfolio using pricing models fall into this category and are categorized within Level 2 of the fair value hierarchy or Level 3 if inputs are unobservable.
|
|
|
| Transamerica Series Trust |
|
Semi-Annual Financial Statements 2024 |
Page 42
Transamerica Morgan Stanley Global Allocation VP
NOTES TO FINANCIAL STATEMENTS (continued)
At June 30, 2024
(unaudited)
5. SECURITIES AND OTHER INVESTMENTS
Real estate investment trusts (“REITs”): REITs are pooled investment vehicles which invest primarily in income producing real estate, or real estate related loans or interests. Distributions received by REITs are classified at management’s estimate of the dividend income, return of capital and capital gains. Estimates are based on information available at year-end, which includes the previous fiscal year’s classification. The actual amounts of dividend income, return of capital, and capital gains are only determined by each REIT after the fiscal year end and may differ from the estimated amounts. Upon notification from the REITs, some of the distributions received may be re-classified and recorded as a return of capital or capital gains. There are certain additional risks involved in investing in REITs. These include, but are not limited to, economic conditions, changes in zoning laws, real estate values, property taxes, and interest rates.
REITs held at June 30, 2024, if any, are identified within the Consolidated Schedule of Investments.
Restricted securities: The Portfolio may invest in unregulated restricted securities. Restricted securities are subject to legal or contractual restrictions on resale. Restricted securities generally may be resold in transactions exempt from registration under the Securities Act of 1933.
Restricted securities held at June 30, 2024, if any, are identified within the Consolidated Schedule of Investments.
Treasury inflation-protected securities (“TIPS”): The Portfolio may invest in TIPS, which are fixed income securities whose principal value is periodically adjusted according to the rate of inflation/deflation. If the index measuring inflation/deflation rises or falls, the principal value of TIPS will be adjusted upward or downward, and consequently the interest payable on these securities (calculated with respect to a larger or smaller principal amount) will be increased or reduced, respectively. Repayment of the original bond principal upon maturity (as adjusted for inflation) is guaranteed in the case of U.S. Treasury inflation-indexed bonds and notes. For bonds and notes that do not provide a similar guarantee, the adjusted principal value of the bond repaid at maturity may be less than the original principal.
TIPS held at June 30, 2024, if any, are included within the Consolidated Schedule of Investments. The adjustments, if any, to principal due to inflation/deflation are reflected as increases/decreases to Interest income within the Consolidated Statement of Operations, with a corresponding adjustment to Investments, at cost within the Consolidated Statement of Assets and Liabilities.
When-issued, delayed-delivery, forward, and to be announced (“TBA”) commitment transactions: The Portfolio may purchase or sell securities on a when-issued, delayed-delivery, forward and TBA commitment basis. When-issued and forward commitment transactions are made conditionally because a security, although authorized, has not yet been issued in the market. Settlement of such transactions normally occurs within a month or more after the purchase or sale commitment is made. The Portfolio engages in when-issued and forward commitment transactions to obtain an advantageous price and yield at the time of the transaction. The Portfolio engages in when-issued and forward commitment transactions for the purpose of acquiring securities, but may enter into a separate agreement to sell the securities before the settlement date. Since the value of securities purchased may fluctuate prior to settlement, the Portfolio may be required to pay more at settlement than the security is worth. In addition, the Portfolio is not entitled to any of the interest earned prior to settlement.
Delayed-delivery transactions involve a commitment by the Portfolio to purchase or sell securities for a predetermined price or yield, with payment and delivery taking place beyond the customary settlement period. When delayed-delivery transactions are outstanding, the Portfolio will segregate with its custodian either cash, U.S. government securities, or other liquid assets at least equal to the value or purchase commitments until payment is made. When purchasing a security on a delayed-delivery basis, the Portfolio assumes the rights and risks of ownership of the security, including the risk of price and yield fluctuations. These transactions also involve a risk to the Portfolio if the other party to the transaction defaults on its obligation to make payment or delivery, and the Portfolio is delayed or prevented from completing the transaction. The Portfolio may dispose of or renegotiate a delayed-delivery transaction after it is entered into, which may result in a realized gain or loss. When the Portfolio sells a security on a delayed-delivery basis, the Portfolio does not participate in future gains and losses on the security.
TBA commitments are entered into to purchase or sell securities for a fixed price at a future date, typically not to exceed 45 days. TBAs are considered securities in themselves, and involve a risk of loss if the value of the security to be purchased declines, or the value of the security sold increases, prior to settlement date, in addition to the risk of decline in the value of a Portfolio’s other assets. Unsettled TBA commitments are valued at the current value of the underlying securities. TBA collateral requirements are typically calculated by netting the mark-to-market amount for each transaction and comparing that amount to the value of the collateral currently pledged by a Portfolio and the counterparty. Cash collateral that has been pledged to cover the obligations of a Portfolio and cash collateral received from the counterparty, if any, is reported separately in the Consolidated Statement of Assets and Liabilities as Cash collateral pledged at broker for TBA commitments or Cash collateral at broker for TBA commitments, respectively. Non-cash collateral pledged by a Portfolio, if any, is
|
|
|
| Transamerica Series Trust |
|
Semi-Annual Financial Statements 2024 |
Page 43
Transamerica Morgan Stanley Global Allocation VP
NOTES TO FINANCIAL STATEMENTS (continued)
At June 30, 2024
(unaudited)
5. SECURITIES AND OTHER INVESTMENTS (continued)
disclosed within the Consolidated Schedule of Investments. Typically, a Portfolio is permitted to sell, re-pledge or use the collateral it receives; however, the counterparty is not permitted. To the extent amounts due to a Portfolio are not fully collateralized, contractually or otherwise, a Portfolio bears the risk of loss from counterparty non-performance.
When-issued, delayed-delivery, forward and TBA commitment transactions held at June 30, 2024, if any, are identified within the Consolidated Schedule of Investments. Open trades, if any, are reflected as When-issued, delayed-delivery, forward and TBA commitments purchased or sold within the Consolidated Statement of Assets and Liabilities.
6. BORROWINGS AND OTHER FINANCING TRANSACTIONS
The Portfolio may engage in borrowing transactions as a means of raising cash to satisfy redemption requests, for other temporary or emergency purposes or, to the extent permitted by its investment policies, to raise additional cash to be invested in other securities or instruments. When the Portfolio invests borrowing proceeds in other securities, the Portfolio will bear the risk that the market value of the securities in which such proceeds are invested goes down and is insufficient to repay the borrowed proceeds. The Portfolio may borrow on a secured or on an unsecured basis. If the Portfolio enters into a secured borrowing arrangement, a portion of the Portfolio’s assets will be used as collateral. The 1940 Act requires the Portfolio to maintain asset coverage of at least 300% of the amount of its borrowings. Asset coverage means the ratio that the value of the Portfolio’s total assets, minus liabilities other than borrowings, bears to the aggregate amount of all borrowings. Although complying with this requirement has the effect of limiting the amount that the Portfolio may borrow, it does not otherwise mitigate the risks of entering into borrowing transactions.
Interfund lending: The Portfolio, along with other funds and portfolios advised by TAM, may participate in an interfund lending program pursuant to exemptive relief granted by the Securities and Exchange Commission on January 18, 2017. This program allows the Portfolio to lend to and borrow from other funds and portfolios advised by TAM. Interfund lending transactions are subject to the conditions of the exemptive relief which places limits on the amount of lending or borrowing a Portfolio may participate in under the program. Interest earned or paid on an interfund lending transaction will be based on the average of certain current market rates. For the period ended June 30, 2024, the Portfolio has not utilized the program.
Repurchase agreements: In a repurchase agreement, the Portfolio purchases a security and simultaneously commits to resell that security to the seller at an agreed-upon price on an agreed-upon date. Securities purchased subject to a repurchase agreement are held at the Portfolio’s custodian, or designated sub-custodian related to tri-party repurchase agreements, and, pursuant to the terms of the repurchase agreement, must be collateralized by securities with an aggregate market value greater than or equal to 100% of the resale price. The Portfolio will bear the risk of value fluctuations until the securities can be sold and may encounter delays and incur costs in liquidating the securities. In the event of bankruptcy or insolvency of the seller, delays and costs may be incurred.
Repurchase agreements are subject to netting agreements, which are agreements between the Portfolio and its counterparties that provide for the net settlement of all transactions and collateral with the Portfolio, through a single payment, in the event of default or termination. Amounts presented within the Consolidated Schedule of Investments, and as part of Repurchase agreements, at value within the Consolidated Statement of Assets and Liabilities are shown on a gross basis. The value of the related collateral for each repurchase agreement, as reflected within the Consolidated Schedule of Investments, exceeds the value of each repurchase agreement at June 30, 2024.
Repurchase agreements at June 30, 2024, if any, are included within the Consolidated Schedule of Investments and Consolidated Statement of Assets and Liabilities.
Securities lending: The Portfolio may lend securities to qualified financial institutions, brokers and dealers. State Street serves as securities lending agent to the Portfolio pursuant to a Securities Lending Agreement. Loans of securities are terminable at any time and the borrower, after notice, is required to return borrowed securities within the standard time period for settlement of securities transactions. The lending of securities exposes the Portfolio to risks such as: the borrowers may fail to return the loaned securities or may not be able to provide additional collateral, the Portfolio may experience delays in recovery of the loaned securities or delays in access to collateral, or the Portfolio may experience losses related to the investment collateral. To minimize certain risks, loan counterparties pledge cash, securities issued or guaranteed by the U.S. Government and irrevocable letters of credit issued by banks as collateral. The initial collateral received by the Portfolio is required to have a value of at least 102% of the current value of the loaned securities traded on U.S. exchanges, and a value of at least 105% for all other securities. Typically the lending agent is not permitted to sell, re-pledge or use cash and non-cash collateral it receives. The lending agent has agreed to indemnify the Portfolio in the case of default of any securities borrower.
|
|
|
| Transamerica Series Trust |
|
Semi-Annual Financial Statements 2024 |
Page 44
Transamerica Morgan Stanley Global Allocation VP
NOTES TO FINANCIAL STATEMENTS (continued)
At June 30, 2024
(unaudited)
6. BORROWINGS AND OTHER FINANCING TRANSACTIONS (continued)
The Portfolio receives compensation for lending securities from interest or dividends earned on the cash, U.S. Government securities and irrevocable letters of credit held as collateral, less associated fees and expenses. Such income is reflected in Net income from securities lending within the Consolidated Statement of Operations. Cash collateral received is invested in the State Street Navigator Securities Lending Trust — Government Money Market Portfolio.
The value of loaned securities and related cash and non-cash collateral outstanding at June 30, 2024, if any, are shown on a gross basis within the Consolidated Schedule of Investments.
The following table reflects a breakdown of transactions accounted for as secured borrowings, the gross obligation by the type, and the remaining contractual maturity of those transactions as of June 30, 2024.
|
|
|
|
|
|
|
|
|
|
|
|
|
|
|
|
|
|
|
|
|
| |
|
Remaining Contractual Maturity of the Agreements |
|
| |
|
Overnight and Continuous |
|
|
Less Than 30 Days |
|
|
Between 30 & 90 Days |
|
|
Greater Than 90 Days |
|
|
Total |
|
| Securities Lending Transactions |
|
|
|
|
|
|
|
|
|
|
|
|
|
|
|
|
|
|
|
|
| Common Stocks |
|
|
$ 1,873,710 |
|
|
$ |
— |
|
|
$ |
— |
|
|
$ |
— |
|
|
$ |
1,873,710 |
|
| Corporate Debt Securities |
|
|
2,318,479 |
|
|
|
— |
|
|
|
— |
|
|
|
— |
|
|
|
2,318,479 |
|
| Short-Term U.S. Government Obligations |
|
|
1,333,192 |
|
|
|
— |
|
|
|
— |
|
|
|
— |
|
|
|
1,333,192 |
|
| Total Securities Lending Transactions |
|
|
$ 5,525,381 |
|
|
$ |
— |
|
|
$ |
— |
|
|
$ |
— |
|
|
$ |
5,525,381 |
|
| Total Borrowings |
|
|
$ 5,525,381 |
|
|
$ |
— |
|
|
$ |
— |
|
|
$ |
— |
|
|
$ |
5,525,381 |
|
| |
|
|
|
|
|
|
|
|
|
|
|
|
|
|
|
|
|
|
|
|
7. RISK EXPOSURES AND THE USE OF DERIVATIVE INSTRUMENTS
The Portfolio’s investment strategies allow the Portfolio to use various types of derivative contracts, including option contracts, swap agreements, futures contracts, and forward foreign currency contracts. Derivatives are investments whose value is primarily derived from underlying assets, indices or reference rates and may be transacted on an exchange or OTC.
Market Risk Factors: In pursuit of the Portfolio’s investment strategies, the Portfolio may seek to use derivatives to increase or decrease its exposure to certain market risks, including:
Interest rate risk: Interest rate risk relates to the fluctuations in the value of fixed income securities due to changes in the prevailing levels of market interest rates.
Foreign exchange rate risk: Foreign exchange rate risk relates to fluctuations in the value of an asset or liability due to changes in the currency exchange rates.
Equity risk: Equity risk relates to the change in value of equity securities as they relate to increases or decreases in the general market.
Credit risk: Credit risk relates to the ability of the issuer of a financial instrument to make further principal or interest payments on an obligation or commitment that it has to the Portfolio.
Commodity risk: Commodity risk relates to the change in value of commodities or commodity indices as they relate to increases or decreases in the commodities market. Commodities are physical assets that have tangible properties. Examples of these types of assets are crude oil, heating oil, metals, livestock, and agricultural products.
The Portfolio is also exposed to additional risks from investing in derivatives, such as liquidity and counterparty credit risk. Liquidity risk is the risk that the Portfolio will be unable to sell or close out the derivative in the open market in a timely manner. Counterparty credit risk is the risk that the counterparty will not be able to fulfill its obligations to the Portfolio. Investing in derivatives may also involve greater risks than investing directly in the underlying assets, such as losses in excess of any initial investment and collateral received. In addition, there may be the risk that the change in value of the derivative contract does not correspond to the change in value of the underlying instrument.
The Portfolio’s exposure to market risk factors and certain other associated risks are summarized by derivative type as follows:
|
|
|
| Transamerica Series Trust |
|
Semi-Annual Financial Statements 2024 |
Page 45
Transamerica Morgan Stanley Global Allocation VP
NOTES TO FINANCIAL STATEMENTS (continued)
At June 30, 2024
(unaudited)
7. RISK EXPOSURES AND THE USE OF DERIVATIVE INSTRUMENTS (continued)
Swap agreements: Swap agreements are bilaterally negotiated agreements between the Portfolio and a counterparty to exchange or swap investments, cash flows, assets, foreign currencies, or market-linked returns at specified, future intervals. Swap agreements can be executed in a bilateral privately negotiated arrangement with a dealer in an OTC transaction or executed on a regular market. Certain swaps regardless of the venue of execution are required to be cleared through a clearinghouse (“centrally cleared swap agreements”). Centrally cleared swap agreements listed or traded on a multilateral platform, are valued at the daily settlement price determined by the corresponding exchange. For centrally cleared credit default swap agreements the clearing exchange requires all members to provide applicable levels across complete term levels. Centrally cleared interest rate swap agreements are valued using a pricing model that references the underlying rates including but not limited to the overnight index swap rate and London Interbank Offered Rate (“LIBOR”) forward rate to calculate the daily settlement price. The Portfolio may enter into credit default, cross-currency, interest rate, total return, including contracts for difference (“CFD”), and other forms of swap agreements to manage exposure to credit, currency, interest rate, and commodity risks. In connection with these agreements, securities or cash may be identified as collateral or margin in accordance with the terms of the respective swap agreements to provide assets of value and recourse in the event of default or bankruptcy/insolvency. Centrally cleared swap agreements are marked-to-market daily based upon values from third party vendors, which may include a registered exchange, or quotations from market makers to the extent available and the change in value, if any, is recorded as Variation margin receivable (payable) on centrally cleared swap agreements within the Consolidated Statement of Assets and Liabilities.
For OTC swap agreements, payments received or made at the beginning of the measurement period are reflected in OTC swap agreements, at value within the Consolidated Statement of Assets and Liabilities and represent payments made or received upon entering into the swap agreements to compensate for differences between the stated terms of the swap agreement and prevailing market conditions (credit spreads, currency exchange rates, interest rates, and other relevant factors). Additionally, these upfront payments as well as any periodic payments received or paid by the Portfolio, including any liquidation payment received or made at the termination of the swap are recorded as part of Net realized gain (loss) on swap agreements within the Consolidated Statement of Operations.
Interest rate swap agreements: The Portfolio is subject to interest rate risk exposure in the normal course of pursuing its investment objective. Because the Portfolio holds fixed rate bonds, the value of these bonds may decrease if interest rates rise. To help hedge against this risk, the Portfolio enters into interest rate swap agreements. Under an interest rate swap agreement, two parties will exchange cash flows based on a notional principal amount. A Portfolio with interest rate agreements can elect to pay a fixed rate and receive a floating rate, or receive a fixed rate and pay a floating rate, on a notional principal amount. The risks of interest rate swap agreements include changes in market conditions which will affect the value of the contract or the cash flows, and the possible inability of the counterparty to fulfill its obligations under the agreement. The Portfolio’s maximum risk of loss from counterparty credit risk is the discounted net value of the cash flows to be received from/paid to the counterparties over the contracts’ remaining lives, to the extent that amount is positive. This risk is mitigated by having a master netting arrangement between the Portfolio and the counterparty, and by the posting of collateral.
Total return swap agreements: The Portfolio is subject to commodity risk, equity risk, and other risks related to the underlying investments of the swap agreement, including CFDs, in the normal course of pursuing its investment objective. The value of the commodity-linked investments held by a Portfolio can be affected by a variety of factors, including, but not limited to, overall market movements and other factors affecting the value of particular industries or commodities, such as weather, disease, embargoes, acts of war or terrorism, or political and regulatory developments. Commodity-linked derivatives are available from a relatively small number of issuers, subjecting the Portfolio’s investments in commodity-linked derivatives to counterparty risk, which is the risk that the issuer of the commodity-linked derivative will not fulfill its contractual obligations. Total return swap agreements on commodities involve commitments whereby cash flows are exchanged based on the price of a commodity in exchange for either a fixed or floating price or rate. One party would receive payments based on the market value of the commodity involved and pay a fixed amount. Total return swap agreements on indices involve commitments to pay interest in exchange for a market-linked return. One counterparty pays out the total return of a specific reference entity, which may be an equity, index, or bond, and in return receives a regular stream of payments.
Equity basket total return swap agreements: The Portfolio may enter into equity basket total return swap agreements to obtain exposure to a portfolio of long and/or short securities. Under the terms of the agreements, the swaps are designed to function as a portfolio of direct investments in long and/or short equity or fixed income positions. An equity basket total return swap is an agreement between two parties to exchange, for a specified period and based on the notional amount, the total return on an underlying basket of equity securities for typically fixed or floating interest payments. Equity basket total return swap agreements typically reset on a monthly basis and are privately negotiated in the OTC market. The swaps are entered into as bilateral swap agreements and are traded between counterparties, and as such, subject to counterparty risk.
Open centrally cleared swap agreements and open OTC swap agreements at June 30, 2024, if any, are listed within the Consolidated Schedule of Investments.
|
|
|
| Transamerica Series Trust |
|
Semi-Annual Financial Statements 2024 |
Page 46
Transamerica Morgan Stanley Global Allocation VP
NOTES TO FINANCIAL STATEMENTS (continued)
At June 30, 2024
(unaudited)
7. RISK EXPOSURES AND THE USE OF DERIVATIVE INSTRUMENTS (continued)
Futures contracts: The Portfolio is subject to equity risk, credit risk, commodity risk, interest rate risk and foreign exchange rate risk in the normal course of pursuing its investment objective. The Portfolio uses futures contracts to gain exposure to, or hedge against, changes in the value of equities and commodities, interest rates, or foreign currencies. A futures contract represents a commitment for the future purchase or sale of an asset at a specified price on a specified date. Upon entering into such contracts, the Portfolio is required to deposit with the broker, either in cash or in securities, an initial margin in an amount equal to a certain percentage of the contract amount. Subsequent payments (variation margin) are paid or received by the Portfolio, depending on the daily fluctuations in the value of the contract, and are recorded for financial statement purposes as unrealized gains or losses by the Portfolio. Upon entering into such contracts, the Portfolio bears the risk of equity and commodity prices, interest rates, or exchange rates moving unexpectedly, in which case, the Portfolio may not achieve the anticipated benefits of the futures contracts and may realize losses. With futures, there is minimal counterparty credit risk to the Portfolio since futures are exchange-traded and the exchange’s clearinghouse, as counterparty to all exchange-traded futures, guarantees the futures against default. Futures contracts are generally entered into on a regulated futures exchange and cleared through a clearinghouse associated with the exchange.
Open futures contracts at June 30, 2024 are listed within the Consolidated Schedule of Investments. Variation margin, if applicable, is shown in Variation margin receivable or payable on futures contracts within the Consolidated Statement of Assets and Liabilities.
Forward foreign currency contracts: The Portfolio is subject to foreign exchange rate risk exposure in the normal course of pursuing its investment objective. The Portfolio may enter into forward foreign currency contracts to hedge against exchange rate risk arising from investments in securities denominated in foreign currencies. Forward foreign currency contracts are marked-to-market daily, with the change in value recorded as an unrealized gain or loss and is shown in Unrealized appreciation (depreciation) on forward foreign currency contracts within the Consolidated Statement of Assets and Liabilities. When the contracts are settled, a realized gain or loss is incurred and is shown in Net realized gain (loss) on forward foreign currency contracts within the Consolidated Statement of Operations. Risks may arise from changes in market value of the underlying currencies and from the possible inability of counterparties to meet the terms of their contracts. Forward foreign currency contracts are traded in the OTC inter-bank currency dealer market.
Open forward foreign currency contracts at June 30, 2024 are listed within the Consolidated Schedule of Investments.
The following is a summary of the location and the Portfolio’s fair values of derivative investments disclosed within the Consolidated Statement of Assets and Liabilities, categorized by primary market risk exposure as of June 30, 2024.
|
|
|
|
|
|
|
|
|
|
|
|
|
|
|
|
|
|
|
|
|
|
|
|
|
| Asset Derivatives |
|
| Location |
|
Interest Rate Contracts |
|
|
Foreign Exchange Contracts |
|
|
Equity Contracts |
|
|
Credit Contracts |
|
|
Commodity Contracts |
|
|
Total |
|
| Centrally cleared swaps: |
|
|
|
|
|
|
|
|
|
|
|
|
|
|
|
|
|
|
|
|
|
|
|
|
| Total distributable earnings
(accumulated losses) (A)(B) |
|
|
$ 275,620 |
|
|
$ |
— |
|
|
$ |
— |
|
|
$ |
— |
|
|
$ |
— |
|
|
$ |
275,620 |
|
| OTC swaps: |
|
|
|
|
|
|
|
|
|
|
|
|
|
|
|
|
|
|
|
|
|
|
|
|
| OTC swap agreements, at value |
|
|
— |
|
|
|
— |
|
|
|
8,893,759 |
|
|
|
— |
|
|
|
— |
|
|
|
8,893,759 |
|
| Futures contracts: |
|
|
|
|
|
|
|
|
|
|
|
|
|
|
|
|
|
|
|
|
|
|
|
|
| Total distributable earnings
(accumulated losses) (A)(C) |
|
|
620,529 |
|
|
|
— |
|
|
|
314,672 |
|
|
|
— |
|
|
|
119,254 |
|
|
|
1,054,455 |
|
| Forward foreign currency contracts: |
|
|
|
|
|
|
|
|
|
|
|
|
|
|
|
|
|
|
|
|
|
|
|
|
| Unrealized appreciation on forward foreign currency contracts |
|
|
— |
|
|
|
1,330,038 |
|
|
|
— |
|
|
|
— |
|
|
|
— |
|
|
|
1,330,038 |
|
| Total |
|
|
$ 896,149 |
|
|
$ |
1,330,038 |
|
|
$ |
9,208,431 |
|
|
$ |
— |
|
|
$ |
119,254 |
|
|
$ |
11,553,872 |
|
| |
|
|
|
|
|
|
|
|
|
|
|
|
|
|
|
|
|
|
|
|
|
|
|
|
|
|
|
| Transamerica Series Trust |
|
Semi-Annual Financial Statements 2024 |
Page 47
Transamerica Morgan Stanley Global Allocation VP
NOTES TO FINANCIAL STATEMENTS (continued)
At June 30, 2024
(unaudited)
7. RISK EXPOSURES AND THE USE OF DERIVATIVE INSTRUMENTS (continued)
|
|
|
|
|
|
|
|
|
|
|
|
|
|
|
|
|
|
|
|
|
|
|
|
|
| Liability Derivatives |
|
| Location |
|
Interest Rate Contracts |
|
|
Foreign Exchange Contracts |
|
|
Equity Contracts |
|
|
Credit Contracts |
|
|
Commodity Contracts |
|
|
Total |
|
| Centrally cleared swaps: |
|
|
|
|
|
|
|
|
|
|
|
|
|
|
|
|
|
|
|
|
|
|
|
|
| Total distributable earnings (accumulated losses) (A)(B) |
|
|
$ (224,638 |
) |
|
$ |
— |
|
|
$ |
— |
|
|
$ |
— |
|
|
$ |
— |
|
|
$ |
(224,638 |
) |
| OTC swaps: |
|
|
|
|
|
|
|
|
|
|
|
|
|
|
|
|
|
|
|
|
|
|
|
|
| OTC swap agreements, at value |
|
|
— |
|
|
|
— |
|
|
|
(2,396,176 |
) |
|
|
— |
|
|
|
— |
|
|
|
(2,396,176 |
) |
| Futures contracts: |
|
|
|
|
|
|
|
|
|
|
|
|
|
|
|
|
|
|
|
|
|
|
|
|
| Total distributable earnings (accumulated losses) (A)(C) |
|
|
(639,367 |
) |
|
|
— |
|
|
|
(185,511 |
) |
|
|
— |
|
|
|
— |
|
|
|
(824,878 |
) |
| Forward foreign currency contracts: |
|
|
|
|
|
|
|
|
|
|
|
|
|
|
|
|
|
|
|
|
|
|
|
|
| Unrealized depreciation on forward foreign currency contracts |
|
|
— |
|
|
|
(2,022,080 |
) |
|
|
— |
|
|
|
— |
|
|
|
— |
|
|
|
(2,022,080 |
) |
| Total |
|
$ |
(864,005 |
) |
|
$ |
(2,022,080 |
) |
|
$ |
(2,581,687 |
) |
|
$ |
— |
|
|
$ |
— |
|
|
$ |
(5,467,772 |
) |
| |
|
|
|
|
|
|
|
|
|
|
|
|
|
|
|
|
|
|
|
|
|
|
|
|
| (A) |
May include exchange-traded derivatives which are not subject to a master netting arrangement, or another similar arrangement. |
| (B) |
Included within Value of centrally cleared swap agreements as reported in the Consolidated Schedule of Investments. Only current day’s variation margin is reported within the Consolidated Statement of Assets and Liabilities. |
| (C) |
Included within unrealized appreciation (depreciation) on futures contracts as reported in the Consolidated Schedule of Investments. Only current day’s variation margin is reported within the Consolidated Statement of Assets and Liabilities. |
The following is a summary of the location and the effect of derivative investments within the Consolidated Statement of Operations, categorized by primary market risk exposure as of June 30, 2024.
|
|
|
|
|
|
|
|
|
|
|
|
|
|
|
|
|
|
|
|
|
|
|
|
|
| Realized Gain (Loss) on Derivative Instruments |
|
| Location |
|
Interest Rate Contracts |
|
|
Foreign Exchange Contracts |
|
|
Equity Contracts |
|
|
Credit Contracts |
|
|
Commodity Contracts |
|
|
Total |
|
| Swap agreements |
|
|
$ (793,320 |
) |
|
$ |
— |
|
|
$ |
39,567,205 |
|
|
$ |
— |
|
|
$ |
— |
|
|
$ |
38,773,885 |
|
| Futures contracts |
|
|
215,710 |
|
|
|
— |
|
|
|
(4,019,056 |
) |
|
|
— |
|
|
|
(38,343 |
) |
|
|
(3,841,689 |
) |
| Forward foreign currency contracts |
|
|
— |
|
|
|
355,484 |
|
|
|
— |
|
|
|
— |
|
|
|
— |
|
|
|
355,484 |
|
| Total |
|
|
$ (577,610 |
) |
|
$ |
355,484 |
|
|
$ |
35,548,149 |
|
|
$ |
— |
|
|
$ |
(38,343 |
) |
|
$ |
35,287,680 |
|
| |
|
|
|
|
|
|
|
|
|
|
|
|
|
|
|
|
|
|
|
|
|
|
|
|
|
| Net Change in Unrealized Appreciation (Depreciation) on Derivative Instruments |
|
| Location |
|
Interest Rate Contracts |
|
|
Foreign Exchange Contracts |
|
|
Equity Contracts |
|
|
Credit Contracts |
|
|
Commodity Contracts |
|
|
Total |
|
| Swap agreements |
|
|
$ (715,050 |
) |
|
$ |
— |
|
|
$ |
(11,746,912 |
) |
|
$ |
— |
|
|
$ |
— |
|
|
$ |
(12,461,962 |
) |
| Futures contracts |
|
|
1,136,842 |
|
|
|
— |
|
|
|
169,621 |
|
|
|
— |
|
|
|
119,254 |
|
|
|
1,425,717 |
|
| Forward foreign currency contracts |
|
|
— |
|
|
|
(179,750 |
) |
|
|
— |
|
|
|
— |
|
|
|
— |
|
|
|
(179,750 |
) |
| Total |
|
|
$ 421,792 |
|
|
$ |
(179,750 |
) |
|
$ |
(11,577,291 |
) |
|
$ |
— |
|
|
$ |
119,254 |
|
|
$ |
(11,215,995 |
) |
| |
|
|
|
|
|
|
|
|
|
|
|
|
|
|
|
|
|
|
|
|
|
|
|
|
|
|
|
| Transamerica Series Trust |
|
Semi-Annual Financial Statements 2024 |
Page 48
Transamerica Morgan Stanley Global Allocation VP
NOTES TO FINANCIAL STATEMENTS (continued)
At June 30, 2024
(unaudited)
7. RISK EXPOSURES AND THE USE OF DERIVATIVE INSTRUMENTS (continued)
The following is a summary of the ending monthly average volume on derivative activity during the period ended June 30, 2024.
|
|
|
|
|
| Interest rate swaps: |
|
|
|
|
| Average notional value — receives fixed rate |
|
$ |
96,657,873 |
|
| Total return swaps: |
|
|
|
|
| Average notional value — long |
|
|
478,193,358 |
|
| Average notional value — short |
|
|
117,456,835 |
|
| Futures contracts: |
|
|
|
|
| Average notional value of contracts — long |
|
|
64,223,708 |
|
| Average notional value of contracts — short |
|
|
(195,905,940 |
) |
| Forward foreign currency exchange contracts: |
|
|
|
|
| Average contract amounts purchased — in USD |
|
|
116,098,479 |
|
| Average contract amounts sold — in USD |
|
|
175,538,057 |
|
The Portfolio typically enters into International Swaps and Derivatives Association, Inc. Master Agreements (“ISDA Master Agreements”) or similar master agreements (collectively, “Master Agreements”) with its contract counterparties for certain OTC derivatives in order to, among other things, reduce credit risk to counterparties.
ISDA Master Agreements include provisions for general obligations, representations, collateral and events of default or termination. Under an ISDA Master Agreement, the Portfolio typically may offset with the counterparty certain OTC derivative financial instruments payables and/or receivables with collateral held and/or posted and create one single net payment (close-out netting) in the event of default, termination and/or potential deterioration in the credit quality of the counterparty.
Various Master Agreements govern the terms of certain transactions with counterparties and typically attempt to reduce the counterparty risk associated with such transactions by specifying credit protection mechanisms and providing standardization that improves legal certainty. Cross-termination provisions under Master Agreements typically provide that a default in connection with one transaction between the Portfolio and a counterparty gives the non-defaulting party the right to terminate any other transactions in place with the defaulting party to create one single net payment due to/due from the defaulting party and may be a feature in certain Master Agreements. In the event the Portfolio exercises its right to terminate a Master Agreement after a counterparty experiences a termination event as defined in the Master Agreement, the return of collateral with market value in excess of the Portfolio’s net liability may be delayed or denied.
Collateral requirements: Collateral or margin requirements are set by the broker or exchange clearing house for exchange-traded derivatives (futures contracts, exchange-traded options, and exchange-traded swap agreements) while collateral terms are contract specific for OTC derivatives (forward foreign currency exchange contracts, OTC options, and OTC swap agreements). For OTC derivatives, under standard derivatives agreements, the Portfolio may be required to pledge collateral on derivatives to a counterparty if the Portfolio is in a net liability position, and receive collateral if in a net positive position. For financial reporting purposes, cash collateral that has been pledged by the Portfolio to cover obligations, if any, is reported in Cash collateral at broker within the Consolidated Statement of Assets and Liabilities. Cash collateral that has been received by the Portfolio from a counterparty, if any, is reported separately in Cash collateral pledged at custodian and/or broker within the Consolidated Statement of Assets and Liabilities. Non-cash collateral pledged to the Portfolio, if any, is disclosed within the Consolidated Schedule of Investments.
Generally, the amount of collateral due from or to a party must exceed a minimum transfer amount threshold before a transfer has been made. Typically a counterparty is not permitted to sell, re-pledge or use cash and non-cash collateral it receives. The Portfolio generally does not use non-cash collateral that it receives but may, absent default or certain other circumstances, be permitted to use cash collateral received. In such cases, interest may be paid pursuant to the collateral arrangement with the counterparty.
To the extent amounts due to the Portfolio from its counterparties are not fully collateralized, contractually or otherwise, the Portfolio bears the risk of loss from counterparty non-performance. Additionally, to the extent the Portfolio has delivered collateral to a counterparty, the Portfolio bears the risk of loss from a counterparty in the event the counterparty fails to return such collateral. Counterparties may immediately terminate derivatives contracts if the Portfolio fails to maintain sufficient asset coverage for its contracts or its net assets decline by stated percentages. Collateral may not be required for all derivative contracts.
The following is a summary of the Portfolio OTC derivative assets and liabilities by counterparty net of amounts available for offset under a master netting agreement and net of the related collateral received/pledged by the Portfolio as of June 30, 2024. For financial reporting purposes, the Portfolio does not offset assets and liabilities that are subject to a master netting agreement or similar arrangement on the
|
|
|
| Transamerica Series Trust |
|
Semi-Annual Financial Statements 2024 |
Page 49
Transamerica Morgan Stanley Global Allocation VP
NOTES TO FINANCIAL STATEMENTS (continued)
At June 30, 2024
(unaudited)
7. RISK EXPOSURES AND THE USE OF DERIVATIVE INSTRUMENTS (continued)
Consolidated Statement of Assets and Liabilities. See the Repurchase agreement section within the notes for offsetting and collateral information pertaining to repurchase agreements that are subject to master netting agreements.
|
|
|
|
|
|
|
|
|
|
|
|
|
|
|
|
|
|
|
|
|
|
|
|
|
|
|
|
|
|
|
|
|
| |
|
Gross Amounts of Assets Presented within Consolidated Statement of Assets and Liabilities (A) |
|
|
Gross Amounts Not Offset
within Consolidated Statement
of Assets and Liabilities |
|
|
Gross Amounts of Liabilities Presented within Consolidated Statement of Assets and Liabilities (A) |
|
|
Gross Amounts Not Offset
within Consolidated Statement
of Assets and Liabilities |
|
| Counterparty |
|
Financial Instruments |
|
|
Collateral Received (B) |
|
|
Net Receivable |
|
|
Financial Instruments |
|
|
Collateral Pledged (B) |
|
|
Net Payable |
|
|
|
|
| |
|
Assets |
|
|
Liabilities |
|
| Barclays Bank PLC |
|
$ |
908,714 |
|
|
$ |
(245,584 |
) |
|
$ |
— |
|
|
$ |
663,130 |
|
|
$ |
245,584 |
|
|
$ |
(245,584 |
) |
|
$ |
— |
|
|
$ |
— |
|
| BNP Paribas |
|
|
1,628,322 |
|
|
|
(1,628,322 |
) |
|
|
— |
|
|
|
— |
|
|
|
1,821,429 |
|
|
|
(1,628,322 |
) |
|
|
(193,107 |
) |
|
|
— |
|
| Citibank, N.A. |
|
|
6,742,139 |
|
|
|
— |
|
|
|
— |
|
|
|
6,742,139 |
|
|
|
— |
|
|
|
— |
|
|
|
— |
|
|
|
— |
|
| Goldman Sachs International |
|
|
130,758 |
|
|
|
(130,758 |
) |
|
|
— |
|
|
|
— |
|
|
|
1,800,500 |
|
|
|
(130,758 |
) |
|
|
— |
|
|
|
1,669,742 |
|
| JPMorgan Chase Bank, N.A. |
|
|
237,976 |
|
|
|
(165,011 |
) |
|
|
(10,000 |
) |
|
|
62,965 |
|
|
|
165,011 |
|
|
|
(165,011 |
) |
|
|
— |
|
|
|
— |
|
| Standard Chartered Bank |
|
|
87 |
|
|
|
— |
|
|
|
— |
|
|
|
87 |
|
|
|
— |
|
|
|
— |
|
|
|
— |
|
|
|
— |
|
| UBS AG |
|
|
570,141 |
|
|
|
(381,438 |
) |
|
|
— |
|
|
|
188,703 |
|
|
|
381,438 |
|
|
|
(381,438 |
) |
|
|
— |
|
|
|
— |
|
| Other Derivatives (C) |
|
|
1,335,735 |
|
|
|
— |
|
|
|
— |
|
|
|
1,335,735 |
|
|
|
1,053,810 |
|
|
|
— |
|
|
|
— |
|
|
|
1,053,810 |
|
|
|
|
|
|
|
|
|
|
| Total |
|
$ |
11,553,872 |
|
|
$ |
(2,551,113 |
) |
|
$ |
(10,000 |
) |
|
$ |
8,992,759 |
|
|
$ |
5,467,772 |
|
|
$ |
(2,551,113 |
) |
|
$ |
(193,107 |
) |
|
$ |
2,723,552 |
|
| |
|
| (A) |
Absent an event of default or early termination, OTC derivative assets and liabilities are presented gross and not offset within the Consolidated Statement of Assets and Liabilities. |
| (B) |
In some instances, the actual collateral received and/or pledged may be more than the amount shown due to overcollateralization. |
| (C) |
Other Derivatives, which includes future contracts, exchange-traded options, exchange-traded swap agreements and occasionally forward positions, that are not subject to a master netting arrangement or another similar arrangement. The amount presented is intended to permit reconciliation to the amount presented within the Consolidated Schedule of Investments. |
8. RISK FACTORS
Investing in the Portfolio involves certain key risks related to the Portfolio’s trading activity. Please reference the Portfolio’s prospectus for a more complete discussion of the following risk(s), as well as other risks of investing in the Portfolio.
Market risk: The market prices of the Portfolio’s securities or other assets may go up or down, sometimes rapidly or unpredictably, due to factors such as economic events, inflation, changes in interest rates, governmental actions or interventions, actions taken by the U.S. Federal Reserve or foreign central banks, market disruptions caused by tariffs, trade disputes or other factors, political developments, armed conflicts, economic sanctions, cybersecurity events, investor sentiment, the global and domestic effects of widespread or local health, weather or climate events, and other factors that may or may not be related to the issuer of the security or other asset. If the market prices of the Portfolio’s securities and assets fall, the value of your investment in the Portfolio could go down.
Economies and financial markets throughout the world are increasingly interconnected. Events or circumstances in one or more countries or regions could be highly disruptive to, and have profound impacts on, global economies or markets. As a result, whether or not the Portfolio invests in securities of issuers located in or with significant exposure to the countries directly affected, the value and liquidity of the Portfolio’s investments may go down.
Asset class allocation risk: The Portfolio’s investment performance is significantly impacted by the Portfolio’s asset class allocation and reallocation from time to time. The value of your investment may decrease if the sub-adviser’s judgment about the attractiveness, value or market trends affecting a particular asset class is incorrect.
Equity securities risk: Equity securities generally have greater risk of loss than debt securities. Stock markets are volatile and the value of equity securities may go up or down, sometimes rapidly and unpredictably. The market price of an equity security may fluctuate based on overall market conditions, such as real or perceived adverse economic or political conditions or trends, tariffs and trade disruptions, inflation, substantial economic downturn or recession, changes in interest rates, or adverse investor sentiment. The market price of an equity security also may fluctuate based on real or perceived factors affecting a particular industry or industries or the company itself. If the
|
|
|
|
|
| Transamerica Series Trust |
|
|
|
Semi-Annual Financial Statements 2024 |
|
|
Page 50 |
|
|
Transamerica Morgan Stanley Global Allocation VP
NOTES TO FINANCIAL STATEMENTS (continued)
At June 30, 2024
(unaudited)
8. RISK FACTORS (continued)
market prices of the equity securities owned by the Portfolio fall, the value of your investment in the Portfolio will decline. The Portfolio may lose its entire investment in the equity securities of an issuer. A change in financial condition or other event affecting a single issuer may adversely impact securities markets as a whole.
Real estate investment trusts (“REITs”) risk: Investing in real estate investment trusts (“REITs”) involves unique risks. When the Portfolio invests in REITs, it is subject to risks generally associated with investing in real estate. A REIT’s performance depends on the types and locations of the properties it owns, how well it manages those properties and cash flow. REITs may have limited financial resources, may trade less frequently and in limited volume, may engage in dilutive offerings, and may be subject to more abrupt or erratic price movements than the overall securities markets. In addition to its own expenses, the Portfolio will indirectly bear its proportionate share of any management and other expenses paid by REITs in which it invests. U.S. REITs are subject to a number of highly technical tax-related rules and requirements; and a U.S. REIT’s failure to qualify for the favorable U.S. federal income tax treatment generally available to U.S. REITs could result in corporate-level taxation, significantly reducing the return on an investment to the Portfolio.
9. FEES AND OTHER AFFILIATED TRANSACTIONS
TST serves as a funding vehicle for certain affiliated asset allocation portfolios and certain affiliated separate accounts of Transamerica Life Insurance Company (“TLIC”) and Transamerica Financial Life Insurance Company.
TAM, the Portfolio’s investment manager, is directly owned by Transamerica Life Insurance Company (“TLIC”) and AUSA Holding, LLC (“AUSA”), both of which are indirect, wholly owned subsidiaries of Aegon Ltd. TLIC is owned by Commonwealth General Corporation (“Commonwealth”). Commonwealth and AUSA are wholly owned by Transamerica Corporation (DE). Transamerica Corporation (DE) is wholly owned by Aegon International B.V., which is wholly owned by Aegon Ltd., a Bermuda exempted company with liability limited by shares (formerly, Aegon NV, a Netherlands corporation) and a publicly traded international insurance group.
Transamerica Fund Services, Inc. (“TFS”) is the Portfolio’s transfer agent. Transamerica Capital, Inc. (“TCI”) is the Portfolio’s distributor/principal underwriter. TAM, TFS and TCI are affiliates of Aegon Ltd.
Certain officers and trustees of the Portfolio may also be officers and/or trustees of TAM, TFS and TCI. No interested trustee who is deemed an interested person due to current or former service with TAM or an affiliate of TAM receives compensation from the Portfolio. The Portfolio does pay non-interested persons (independent trustees), as disclosed in Trustee and CCO fees within the Consolidated Statement of Operations.
Investment management fees: TAM serves as the Portfolio’s investment manager, performing administration as well as investment advisory services. TAM renders investment advisory, supervisory, and administration services under an investment management agreement and the Portfolio pays a single management fee, which is reflected in Investment management fees within the Consolidated Statement of Operations.
The Portfolio pays a management fee to TAM based on daily average net assets at the following rates:
|
|
|
| Breakpoints |
|
Rate |
| First $500 million |
|
0.66% |
| Over $500 million up to $750 million |
|
0.65 |
| Over $750 million up to $1 billion |
|
0.64 |
| Over $1 billion up to $3 billion |
|
0.63 |
| Over $3 billion |
|
0.59 |
The Subsidiary entered into a separate contract with TAM for the management of the Subsidiary pursuant to which the Subsidiary pays TAM a fee that is the same, as a percentage of net assets, as the management fee of the Portfolio. TAM has contractually agreed to waive a portion of the Portfolio’s management fee in an amount equal to the management fee paid to TAM by the Subsidiary. This management fee waiver may not be discontinued by TAM as long as its contract with the Subsidiary is in place.
For the period ended June 30, 2024, the amount waived is $455,947 for the Subsidiary and is not subject to recapture.
TAM has contractually agreed to waive fees and/or reimburse Portfolio expenses to the extent that the total operating expenses excluding, as applicable, acquired fund fees and expenses, interest (including borrowing costs and overdraft charges), taxes, brokerage
|
|
|
| Transamerica Series Trust |
|
Semi-Annual Financial Statements 2024 |
Page 51
Transamerica Morgan Stanley Global Allocation VP
NOTES TO FINANCIAL STATEMENTS (continued)
At June 30, 2024
(unaudited)
9. FEES AND OTHER AFFILIATED TRANSACTIONS (continued)
commissions, dividend and interest expenses on securities sold short, extraordinary expenses and other expenses not incurred in the ordinary course of the Portfolio’s business, exceed the following stated annual operating expense limits to the Portfolio’s daily average net assets. To the extent an expense limit changed during the period, the prior limit is also listed below. The expenses waived and/or reimbursed, if any, are included in Expenses waived and/or reimbursed within the Consolidated Statement of Operations.
|
|
|
|
|
| Class |
|
Operating Expense Limit |
|
Operating Expense Limit Effective Through |
| Initial Class |
|
0.81% |
|
May 1, 2025 |
| Service Class |
|
1.06 |
|
May 1, 2025 |
TAM is permitted to recapture amounts contractually waived and/or reimbursed to a class during any of the 36 months from the date on which TAM waived fees and/or reimbursed expenses for the class. A class may recapture and reimburse TAM only if such amount does not cause, on any particular business day of the Portfolio, the class’s total annual operating expenses (after the recapture is taken into account) to exceed the Operating Expense Limits or any other lower limit then in effect. Amounts recaptured, if any, by TAM for the period ended June 30, 2024 are disclosed in Recapture of previously waived and/or reimbursed fees within the Consolidated Statement of Operations.
TAM, on a voluntary basis and in addition to the contractual operating expense limits in effect, from time to time may waive and/or reimburse expenses of the Portfolio, or any classes thereof, to such level(s) as the Trust’s officers have determined or may reasonably determine from time to time. Any such voluntary waiver or expense reimbursement may be discontinued by TAM at any time. These amounts are not subject to recapture by TAM.
As of June 30, 2024, there are no amounts available for recapture by TAM.
Distribution and service fees: TST has a distribution plan (“Distribution Plan”) pursuant to Rule 12b-1 under the 1940 Act. Pursuant to the Distribution Plan, TST entered into a distribution agreement with TCI as the Portfolio’s distributor.
The Distribution Plan requires the Portfolio to pay distribution fees to TCI as compensation for various distribution activities, not as reimbursement for specific expenses. Under the Distribution Plan and distribution agreement, TCI, on behalf of the Portfolio, is authorized to pay various service providers, as direct payment for expenses incurred in connection with distribution of the Portfolio’s shares.
The fee on the Service Class shares is paid to the insurance companies for providing services and account maintenance for the policyholders who invest in the variable insurance products which invest in the Service Class shares. TCI has determined that it will not seek payment for the distribution expenses incurred by the Portfolio with respect to the Initial Class shares before May 1, 2025. Prior to TCI seeking distribution expenses on Initial Class shares, policy and contract owners will be notified in advance. The Portfolio will pay fees relating to Service Class shares. The distribution and service fees are included in Distribution and service fees within the Consolidated Statement of Operations.
The Portfolio is authorized under the Distribution Plan to pay fees to TCI based on daily average net assets of each applicable class up to the following annual rates:
|
|
|
| Class |
|
Rate |
| Initial Class |
|
0.15% |
| Service Class |
|
0.25 |
Transfer agent costs: TFS provides transfer agency services under an intercompany agreement with TAM. TFS has outsourced the provision of certain sub-transfer agency services to SS&C Global Investor & Distribution Solutions, Inc. (“SS&C GIDS”). The Portfolio does not pay a separate transfer agent fee to TAM or TFS but does pay certain expenses to SS&C GIDS related to applicable sub-transfer agency services. For the period ended June 30, 2024, (i) the expenses paid to SS&C GIDS by the Portfolio are referred to as transfer agent costs and are included within the Consolidated Statement of Operations and (ii) the expenses payable to SS&C GIDS by the Portfolio are referred to as transfer agent costs within the Consolidated Statement of Assets and Liabilities.
|
|
|
| Transamerica Series Trust |
|
Semi-Annual Financial Statements 2024 |
Page 52
Transamerica Morgan Stanley Global Allocation VP
NOTES TO FINANCIAL STATEMENTS (continued)
At June 30, 2024
(unaudited)
9. FEES AND OTHER AFFILIATED TRANSACTIONS (continued)
Brokerage commissions: The Portfolio incurred no brokerage commissions on security transactions placed with affiliates of the investment manager or sub-adviser(s) for the period ended June 30, 2024.
10. PURCHASES AND SALES OF SECURITIES
For the period ended June 30, 2024, the cost of securities purchased and proceeds from securities sold (excluding short-term securities) are as follows:
|
|
|
|
|
|
|
| Purchases of Securities |
|
Sales/Maturities of Securities |
| Long-Term |
|
U.S. Government |
|
Long-Term |
|
U.S. Government |
| |
| $ 213,958,339 |
|
$ 23,898,103 |
|
$ 253,659,385 |
|
$ 12,549,044 |
11. FEDERAL INCOME TAXES AND DISTRIBUTIONS TO SHAREHOLDERS
The Portfolio has not made any provision for federal income or excise taxes due to its policy to distribute all of its taxable income and capital gains to its shareholders and otherwise qualify as a regulated investment company under Subchapter M of the Internal Revenue Code. The Portfolio recognizes the tax benefits of uncertain tax positions only where the position is “more likely than not” to be sustained assuming examination by tax authorities. The Portfolio’s tax returns remain subject to examination by the Internal Revenue Service and state tax authorities three years from the date of filing for federal purposes and four years from the date of filing for state purposes. Management has evaluated the Portfolio’s tax provisions taken for all open tax years, and has concluded that no provision for income tax is required in the Portfolio’s financial statements. If applicable, the Portfolio recognizes interest accrued related to unrecognized tax benefits in relation to interest and penalties expense in Other within the Consolidated Statement of Operations. The Portfolio identifies its major tax jurisdictions as U.S. Federal, the state of Colorado, and foreign jurisdictions where the Portfolio makes significant investments; however, the Portfolio is not aware of any tax positions for which it is reasonably possible that the total amounts of unrecognized tax benefits will change materially in the next twelve months. Distributions are determined in accordance with income tax regulations, which may differ from GAAP.
As of June 30, 2024, the approximate cost for U.S. federal income tax purposes, and the aggregate gross/net unrealized appreciation (depreciation) in the value of investments (including securities sold short and derivatives, if any) are as follows:
|
|
|
|
|
|
|
| Cost |
|
Gross Appreciation |
|
Gross (Depreciation) |
|
Net Appreciation (Depreciation) |
| $ 987,083,342 |
|
$ 89,737,372 |
|
$ (71,903,530) |
|
$ 17,833,842 |
12. NEW ACCOUNTING PRONOUNCEMENTS
In June 2022, the Financial Accounting Standards Board issued Accounting Standards Update No. 2022-03 (“ASU 2022-03”), “Fair Value Measurement of Equity Securities Subject to Contractual Sale Restrictions” (“Topic 820”). ASU 2022-03 clarifies the guidance in Topic 820, related to the measurement of the fair value of an equity security subject to contractual sale restrictions, where it eliminates the need to apply a discount to fair value of these securities, and introduces disclosure requirements related to such equity securities. The guidance is effective for fiscal years, and interim periods within those fiscal years, beginning after December 15, 2023, and allows for early adoption. Management is currently evaluating the implications, if any, of the additional requirements and their impact on the Portfolio’s financial statements.
Please see TST’s most recent report on Form N-CSR, available at: www.transamerica.com/annuities/prospectus, for additional information. For the most recently filed complete proxy voting records for the Trust please visit: https://www.transamerica.com/sites/default/files/files/e070d/TST%20N-PX%202021.pdf
|
|
|
| Transamerica Series Trust |
|
Semi-Annual Financial Statements 2024 |
Page 53
Transamerica Morgan Stanley Global Allocation VP
MANAGEMENT AND SUB-ADVISORY AGREEMENT — CONTRACT RENEWAL
(unaudited)
At a meeting of the Board of Trustees of Transamerica Series Trust (the “Trustees” or the “Board”) held on June 12-13, 2024, the Board considered the renewal of the management agreement (the “Management Agreement”) between Transamerica Asset Management, Inc. (“TAM”) and Transamerica Series Trust, on behalf of Transamerica Morgan Stanley Global Allocation VP (the “Portfolio”). The Board also considered the renewal of the investment sub-advisory agreement (the “Sub-Advisory Agreement” and together with the Management Agreement, the “Agreements”) for the Portfolio between TAM and Morgan Stanley Investment Management Inc. (the “Sub-Adviser”).
Following its review and consideration, the Board determined that the terms of the Management Agreement and Sub-Advisory Agreement were reasonable and that the renewal of each of the Agreements was in the best interests of the Portfolio and the holders invested in the Portfolio. The Board, including the independent members of the Board (the “Independent Trustees”), unanimously approved the renewal of each of the Agreements through June 30, 2025.
Prior to reaching their decision, the Trustees requested and received from TAM and the Sub-Adviser certain information. They then reviewed such information as they deemed reasonably necessary to evaluate the Agreements, including information they had previously received from TAM and the Sub-Adviser as part of their regular oversight of the Portfolio, and knowledge they gained over time through meeting with TAM and the Sub-Adviser. Among other materials, the Trustees considered comparative fee, expense and performance information prepared by Broadridge Financial Solutions, Inc. (“Broadridge”), an independent provider of mutual fund performance information, as well as fee, expense and profitability information prepared by TAM. In addition, TAM provided the Board with additional supplemental comparative fee, expense and performance information. To the extent applicable, the Trustees considered information about fees and performance of comparable funds and/or accounts managed by the Sub-Adviser. The Board also considered reductions to the Portfolio’s expense limits, if any, that took effect after the last renewal of the Agreements. In their review, the Trustees also sought to identify instances in which the Portfolio’s performance, fees, total expenses and/or profitability appeared to be outliers within its respective peer group or other comparative metrics and sought to understand the reasons for such comparative positions.
In their deliberations, the Independent Trustees met privately without representatives of TAM or the Sub-Adviser present and were represented throughout the process by their independent legal counsel. In considering the proposed continuation of each of the Agreements, the Trustees evaluated and weighed a number of considerations that they believed to be relevant in light of the legal advice furnished to them by counsel, including independent legal counsel, and made a decision in the exercise of their own business judgment. They based their decisions on the considerations discussed below, among others, although they did not identify any particular consideration or item of information that was controlling of their decisions, and each Trustee may have attributed different weights to the various factors.
Nature, Extent and Quality of the Services Provided
The Board considered the nature, extent and quality of the services provided by TAM and the Sub-Adviser to the Portfolio in the past and the services anticipated to be provided in the future. The Board also considered the investment approach for the Portfolio; the experience, capability and integrity of TAM’s senior management; the financial resources of TAM; TAM’s management oversight process; TAM’s and the Sub-Adviser’s responsiveness to any questions by the Trustees; and the professional qualifications and compensation program of the portfolio management team of the Sub-Adviser. The Trustees noted that they receive, on a quarterly basis, an execution analysis from Capital Institutional Services, Inc. (CAPIS), an independent provider of trade analyses, for the Sub-Adviser and a comparison of trading results against a peer universe of managers.
The Board also considered the continuous and regular investment management and other services provided by TAM, when acting as a manager of managers, for the portion of the management fee it retains from the Portfolio after payment of the sub-advisory fees. The Board noted that the investment management and other services provided by TAM include the design, development and ongoing review and evaluation of the Portfolio and its investment strategy; the selection, oversight and monitoring of one or more investment sub-advisers to perform certain duties with respect to the Portfolio; ongoing portfolio trading oversight and analysis; risk management oversight and analysis; design, development, implementation and ongoing review and evaluation of a process for the valuation of Portfolio investments; design, development, implementation and ongoing review and evaluation of a compliance program for the Portfolio; design, development, implementation and ongoing review and evaluation of a process for the voting of proxies and exercise of rights to consent to corporate action for Portfolio investments; participation in Board meetings and oversight of preparation of materials for the Board, including materials for Board meetings and regular communications with the Board; oversight of preparation of the Portfolio’s prospectus, statement of additional information, shareholder reports and other disclosure materials and regulatory filings for the Portfolio; and ongoing cash management services for the Portfolio. The Board considered that TAM’s investment management services also include the provision of supervisory and administrative services to the Portfolio. The Board also noted that TAM, as part of the services it provides to all Transamerica mutual funds, including the Portfolio, oversees the services provided by the funds’ custodian, transfer agent, independent accountant and legal counsel and supervises the performance of the recordkeeping and holder service functions of the funds.
Investment Performance
In addition, the Board considered the short- and longer-term performance of the Portfolio in light of its investment objective, policies and strategies, including relative performance against (i) a peer universe of comparable mutual funds, as prepared by Broadridge, and (ii) the Portfolio’s benchmarks, in each case for various trailing periods ended December 31, 2023. Based on these considerations, the Board determined that TAM and the Sub-Adviser can provide investment and related services that are appropriate in scope and extent in light of
|
|
|
| Transamerica Series Trust |
|
Semi-Annual Financial Statements 2024 |
Page 54
Transamerica Morgan Stanley Global Allocation VP
MANAGEMENT AND SUB-ADVISORY AGREEMENT — CONTRACT RENEWAL (continued)
(unaudited)
the Portfolio’s investment objectives, policies and strategies and operations, the competitive landscape of the investment company business and investor needs. The Board’s conclusions as to the Portfolio’s performance are summarized below. For purposes of its review, the Board generally used the performance of Service Class Shares. In describing the Portfolio’s performance relative to its peer universe, the summary conclusions characterize performance for the relevant periods in relation to whether it was “above,” “below” or “in line with” the peer universe median and do so using quintile rankings prepared by Broadridge. For simplicity, performance is described as “above” the median if the Portfolio’s performance ranked anywhere in the first or second quintiles, as “below” the median if it ranked anywhere in the fourth or fifth quintiles, or “in line with” the median if it ranked anywhere in the third quintile (i.e., even if its precise return was somewhat above or somewhat below the precise median return).
When considering the Portfolio’s performance, the Trustees considered any representations made by TAM regarding the appropriateness of certain peer groups and benchmarks. They recognized that performance reflects a snapshot of a period as of a specific date, and that consideration of performance data for a different period could generate significantly different performance results. The Trustees also recognized that even longer-term performance can be negatively affected by performance over a short-term period when that short-term performance is significantly below the performance of the comparable benchmark or universe of peer funds.
The Board noted that the performance of Service Class Shares of the Portfolio was in line with the median for its peer universe for the past 1- and 5-year periods and below the median for the past 3- and 10-year periods. The Board also noted that the performance of Service Class Shares of the Portfolio was below the benchmark that TAM utilizes to measure performance of the Portfolio for the past 1-, 3-, 5- and 10-year periods. The Board noted that the Sub-Adviser had commenced sub-advising the Portfolio on May 1, 2020 pursuant to its current investment objective, investment strategies and benchmark. The Trustees also noted recent changes in the portfolio management team at the Sub-Adviser. The Trustees noted that TAM intends to monitor and report to the Board on the portfolio manager transition and performance going forward.
Management Fee and Sub-Advisory Fees and Total Expense Ratio
The Board considered the management fee and total expense ratio of the Portfolio, including information provided by Broadridge comparing the management fee and total expense ratio of the Portfolio to the management fees and total expense ratios of comparable investment companies in both a peer group and broader peer universe compiled by Broadridge. The Board’s conclusions as to the Portfolio’s management fee and total expense ratio are summarized below. For purposes of its review, the Board generally used the actual total expenses (i.e., expenses reflecting any waivers and/or reimbursements) of Service Class Shares. In describing the Portfolio’s management fee and total expense ratio relative to its peer group and peer universe, the summary conclusions characterize management fees and total expense ratios for the relevant periods in relation to whether they were “above,” “below” or “in line with” the peer group or peer universe median and do so using quintile rankings prepared by Broadridge. For simplicity, management fees and total expense ratios are described as “above” the median if the Portfolio’s management fee or total expense ratio ranked anywhere in the fourth or fifth quintiles, as “below” the median if it ranked anywhere in the first or second quintiles, or “in line with” the median if it ranked anywhere in the third quintile (i.e., even if its precise management fee or total expense ratio was somewhat above or somewhat below the precise median management fee or total expense ratio).
The Board also considered the fees charged by the Sub-Adviser for sub-advisory services, as well as the portion of the Portfolio’s management fee retained by TAM following payment of the sub-advisory fee and how the portion of the contractual management fee retained by TAM at a specified asset level compared to the portions retained by other investment advisers managing mutual funds with similar investment strategies as calculated by an independent provider of information.
The Board noted that the Portfolio’s contractual management fee and the actual total expenses (i.e., expenses reflecting any waivers and/or reimbursements) of Service Class Shares of the Portfolio were above the medians for its peer group and peer universe. The Trustees also considered that TAM has entered into an expense limitation arrangement with the Portfolio, which may result in TAM waiving fees for the benefit of holders. The Board noted that the Portfolio’s acquired fund fees and expenses included customary fees paid by the underlying portfolio in which the Portfolio invests in connection with the underlying portfolio’s short sale strategy. Specifically, such fees (sometimes referred to as “fees in lieu of” interest or dividends) are paid to parties lending securities to the underlying portfolio to compensate them for interest or dividends received by the underlying portfolio, but foregone by the lending parties, on the borrowed securities.
On the basis of these considerations, together with the other information it considered, the Board determined that the management and sub-advisory fees to be received by TAM and the Sub-Adviser under the Management Agreement and Sub-Advisory Agreement are reasonable in light of the services provided.
Cost of Services Provided and Level of Profitability
The Board reviewed information provided by TAM about the cost of providing and procuring fund management services, as well as the costs of the provision of administration, transfer agency and other services, to the Portfolio and to Transamerica Series Trust as a whole by TAM and its affiliates. The Board considered the profitability of TAM and its affiliates in providing these services for the Portfolio and Transamerica Series Trust as a whole. The Trustees recognized the competitiveness of the mutual fund industry and the importance of an investment adviser’s long-term profitability, including for maintaining company and management stability and accountability.
|
|
|
|
|
| Transamerica Series Trust |
|
|
|
Semi-Annual Financial Statements 2024 |
|
|
Page 55 |
|
|
Transamerica Morgan Stanley Global Allocation VP
MANAGEMENT AND SUB-ADVISORY AGREEMENT — CONTRACT RENEWAL (continued)
(unaudited)
The Board also considered the allocation methodology used for calculating the profitability of TAM and its affiliates. The Board noted that the revenue and expense allocation methodology used by TAM to estimate its profitability with respect to its relationship with the Portfolio had been reviewed previously by an independent consultant. The Trustees considered that TAM reported that it had not made material changes to this methodology, and that the methodology had been applied consistently for the Portfolio.
In addition, the Board noted that TAM had agreed to waive a portion of the Portfolio’s management fee in an amount equal to the entire management fee paid to TAM by the Portfolio’s wholly-owned subsidiary.
With respect to the Sub-Adviser, the Board noted that the sub-advisory fee is the product of arm’s-length negotiation between TAM and the Sub-Adviser, which is not affiliated with TAM, and is paid by TAM and not the Portfolio. As a result, the Board focused on the profitability of TAM and its affiliates with respect to the Portfolio.
Based on this information, the Board determined that the profitability of TAM and its affiliates from their relationships with the Portfolio was not excessive.
Economies of Scale
The Board considered economies of scale with respect to the management of the Portfolio, whether the Portfolio had appropriately benefited from any economies of scale and whether there was the potential for realization of any future economies of scale. The Board also considered the existence of economies of scale with respect to management of the Transamerica mutual funds overall and the extent to which the Portfolio benefited from any economies of scale. The Board recognized that, as the Portfolio’s assets increase, any economies of scale realized by TAM or the Sub-Adviser may not directly correlate with each other or with any economies of scale that might be realized by the Portfolio. The Board considered the Portfolio’s management fee schedule and the existence of breakpoints and also considered the extent to which TAM shared economies of scale, if any, with the Portfolio through undertakings to limit or reimburse Portfolio expenses and to invest in maintaining and developing its capabilities and services. The Board also considered the Sub-Adviser’s sub-advisory fee schedule and the existence of breakpoints, if any, and how such breakpoints relate to any breakpoints in the Portfolio’s management fee schedule. The Trustees concluded that the Portfolio’s fee structure reflected an appropriate sharing of any efficiencies or economies of scale to date and noted that they will have the opportunity to periodically reexamine the appropriateness of the management fee payable to TAM and the fee paid to the Sub-Adviser in light of any economies of scale experienced in the future.
Benefits to TAM, its Affiliates and/or the Sub-Adviser from their Relationships with the Portfolio
The Board considered other benefits derived by TAM, its affiliates, and/or the Sub-Adviser from their relationships with the Portfolio. The Board noted that TAM does not receive benefits from research obtained with commissions paid to broker-dealers for portfolio transactions (commonly referred to as “soft dollars”) as a result of its relationship with the Portfolio and that TAM believes the use of soft dollars by the Sub-Adviser is generally appropriate and in the best interests of the Portfolio.
Other Considerations
The Board noted that TAM has made a substantial commitment to the recruitment and retention of high-quality personnel and maintains the financial, compliance and operational resources reasonably necessary to manage the Portfolio in a professional manner that is consistent with the best interests of the Portfolio and the holders. In this regard, the Board favorably considered the procedures and policies TAM has in place to enforce compliance with applicable laws and regulations and oversee the portfolio management activities of the Sub-Adviser. The Board also noted that TAM has made an entrepreneurial commitment and undertaken certain business risks with respect to the management and success of the Portfolio.
Conclusion
After consideration of the factors described above, as well as other factors, the Trustees, including the Independent Trustees, concluded that the renewal of the Management Agreement and the Sub-Advisory Agreement was in the best interests of the Portfolio and the holders and voted to approve the renewal of the Agreements.
|
|
|
| Transamerica Series Trust |
|
Semi-Annual Financial Statements 2024 |
Page 56
PROXY VOTING POLICIES AND PROCEDURES AND QUARTERLY PORTFOLIO HOLDINGS
(unaudited)
A description of Transamerica Series Trust’s (the “Trust”) proxy voting policies and procedures is available in the Statement of Additional Information of the Portfolios, available without charge upon request by calling 1-800-851-9777 (toll free) or on the Securities and Exchange Commission’s (“SEC”) website at http://www.sec.gov.
In addition, the Portfolio is required to file Form N-PX, with their complete proxy voting records for the most recent 12 months ended June 30th, no later than August 31st of each year. The Form is available without charge: (1) on the Transamerica Funds website at https://www.transamerica.com/sites/default/files/files/e070d/TST%20N-PX%202021.pdf; and (2) on the SEC’s website at http://www.sec.gov.
Each fiscal quarter, the Portfolios, except Transamerica BlackRock Government Money Market VP, will file with the SEC a complete schedule of its monthly portfolio holdings on Form N-PORT. The Portfolios’ holdings as of the end of the third month of every fiscal quarter, as reported on Form N-PORT, will be publicly available on the SEC’s website at http://www.sec.gov within 60 days of the end of the fiscal quarter.
On a monthly basis, Transamerica BlackRock Government Money Market VP will file with the SEC portfolio holdings information on Form N-MFP3. A complete schedule of portfolio holdings is also available at www.transamerica.com.
You may also visit the Trust’s website at www.transamerica.com/annuities/prospectus for this and other information about the Portfolios and the Trust.
Important Notice Regarding Delivery of Shareholder Documents
Every year we provide shareholders informative materials such as the Transamerica Series Trust Annual Report, the Transamerica Series Trust Prospectus, and other required documents that keep you informed regarding your Portfolios. To the extent provided by mail, Transamerica Series Trust will only send one piece per mailing address, a method that saves your Portfolios money by reducing mailing and printing costs. We will continue to do this unless you tell us not to. To elect to receive individual mailings, simply call a Transamerica Customer Service Representative toll free at 1-800-851-9777, 8 a.m. to 7 p.m. Eastern Time, Monday-Friday. Your request will take effect within 30 days.
|
|
|
|
|
| Transamerica Series Trust |
|
|
|
Semi-Annual Financial Statements 2024 |
|
|
Page 57 |
|
|
NOTICE OF PRIVACY POLICY
(unaudited)
Your privacy is very important to us. We want you to understand what information we collect and how we use it. We collect and use “nonpublic personal information” in connection with providing our customers with a broad range of financial products and services as effectively and conveniently as possible. We treat nonpublic personal information in accordance with our Privacy Policy.
What Information We Collect and From Whom We Collect It
We may collect nonpublic personal information about you from the following sources:
| • |
|
Information we receive from you on applications or other forms, such as your name, address, and account number; |
| • |
|
Information about your transactions with us, our affiliates, or others, such as your account balance and purchase/redemption history; and |
| • |
|
Information we receive from non-affiliated third parties, including consumer reporting agencies. |
What Information We Disclose and To Whom We Disclose It
We do not disclose any nonpublic personal information about current or former customers to anyone without their express consent, except as permitted by law. We may disclose the nonpublic personal information we collect, as described above, to persons or companies that perform services on our behalf and to other financial institutions with which we have joint marketing agreements. We will require these companies to protect the confidentiality of your nonpublic personal information and to use it only to perform the services for which we have hired them.
Our Security Procedures
We restrict access to your nonpublic personal information and only allow disclosures to persons and companies as permitted by law to assist in providing products or services to you. We maintain physical, electronic, and procedural safeguards to protect your nonpublic personal information and to safeguard the disposal of certain consumer information.
Contact Us
If you have any questions about our Privacy Policy, please call 1-800-851-9777 on any business day between 8 a.m. and 7 p.m. Eastern Time.
Note: This Privacy Policy applies only to customers that have a direct relationship with us or our affiliates. If you own shares of our portfolios in the name of a third party such as a bank or broker-dealer, its privacy policy may apply to you instead of ours.
|
|
|
|
|
| Transamerica Series Trust |
|
|
|
Semi-Annual Financial Statements 2024 |
|
|
Page 58 |
|
|
PO Box 219945
Kansas City, MO 64121-9945
|
|
|
| Distributor: |
|
Transamerica Capital, Inc. |
|
|
PO Box 219945 |
|
|
Kansas City, MO 64121-9945 |
|
|
|
|
Customer Service: 1-800-851-9777 |
Transamerica Series Trust Semi-Annual Financial Statements
June 30, 2024
1801 California St., Suite 5200
Denver, CO 80202
Distributor: Transamerica Capital, Inc.
Customer Service: 1-800-851-9777
The following pages contain the most recent semi-annual financial statements for the investment options in which you are invested. In compliance with Securities and Exchange Commission regulations, we present these reports on an annual and semi-annual basis with the hope that they will foster greater understanding of the investment options’ holdings, performance, financial data, accounting policies and other issues. This streamlined version provides information only on the investment options in which you are invested.
If you have any questions about these reports, please do not hesitate to contact your financial professional. As always, we thank you for your trust and the opportunity to serve you.
Transamerica MSCI EAFE Index VP
SCHEDULE OF INVESTMENTS
At June 30, 2024
(unaudited)
|
|
|
|
|
|
|
|
|
| |
|
Shares |
|
|
Value |
|
| COMMON STOCKS - 97.6% |
|
| Australia - 7.2% |
|
| Ampol Ltd. |
|
|
1,166 |
|
|
|
$ 25,155 |
|
| ANZ Group Holdings Ltd. |
|
|
15,686 |
|
|
|
295,507 |
|
| APA Group |
|
|
6,502 |
|
|
|
34,656 |
|
| Aristocrat Leisure Ltd. |
|
|
2,923 |
|
|
|
97,029 |
|
| ASX Ltd. |
|
|
982 |
|
|
|
39,306 |
|
| Aurizon Holdings Ltd. |
|
|
9,920 |
|
|
|
24,154 |
|
| BHP Group Ltd. |
|
|
26,737 |
|
|
|
761,251 |
|
| BlueScope Steel Ltd. |
|
|
2,326 |
|
|
|
31,701 |
|
| Brambles Ltd. |
|
|
7,392 |
|
|
|
71,650 |
|
| CAR Group Ltd. |
|
|
1,779 |
|
|
|
41,834 |
|
| Cochlear Ltd. |
|
|
332 |
|
|
|
73,564 |
|
| Coles Group Ltd. |
|
|
6,941 |
|
|
|
78,855 |
|
| Commonwealth Bank of Australia |
|
|
8,826 |
|
|
|
749,991 |
|
| Computershare Ltd. |
|
|
2,714 |
|
|
|
47,689 |
|
| CSL Ltd. |
|
|
2,550 |
|
|
|
502,183 |
|
| Dexus, REIT |
|
|
5,507 |
|
|
|
23,806 |
|
| Endeavour Group Ltd. |
|
|
7,744 |
|
|
|
26,088 |
|
| Fortescue Ltd. |
|
|
8,874 |
|
|
|
126,744 |
|
| Goodman Group, REIT |
|
|
9,034 |
|
|
|
209,424 |
|
| GPT Group, REIT |
|
|
10,265 |
|
|
|
27,391 |
|
| Insurance Australia Group Ltd. |
|
|
12,527 |
|
|
|
59,667 |
|
| Lottery Corp. Ltd. |
|
|
11,597 |
|
|
|
39,223 |
|
| Macquarie Group Ltd. |
|
|
1,921 |
|
|
|
262,310 |
|
| Medibank Pvt Ltd. |
|
|
14,406 |
|
|
|
35,846 |
|
| Mineral Resources Ltd. |
|
|
888 |
|
|
|
31,941 |
|
| Mirvac Group, REIT |
|
|
20,151 |
|
|
|
25,138 |
|
| National Australia Bank Ltd. |
|
|
16,252 |
|
|
|
392,795 |
|
| Northern Star Resources Ltd. |
|
|
6,141 |
|
|
|
53,257 |
|
| Orica Ltd. |
|
|
2,395 |
|
|
|
28,551 |
|
| Origin Energy Ltd. |
|
|
9,194 |
|
|
|
66,608 |
|
| Pilbara Minerals Ltd. |
|
|
14,969 |
|
|
|
30,656 |
|
| Pro Medicus Ltd. |
|
|
314 |
|
|
|
30,009 |
|
| Qantas Airways Ltd. (A) |
|
|
4,255 |
|
|
|
16,605 |
|
| QBE Insurance Group Ltd. |
|
|
7,900 |
|
|
|
91,647 |
|
| Ramsay Health Care Ltd. |
|
|
972 |
|
|
|
30,774 |
|
| REA Group Ltd. |
|
|
272 |
|
|
|
35,684 |
|
| Reece Ltd. |
|
|
1,112 |
|
|
|
18,671 |
|
| Rio Tinto Ltd. |
|
|
1,946 |
|
|
|
154,483 |
|
| Santos Ltd. |
|
|
17,265 |
|
|
|
88,224 |
|
| Scentre Group, REIT |
|
|
26,254 |
|
|
|
54,644 |
|
| SEEK Ltd. |
|
|
1,820 |
|
|
|
25,934 |
|
| Seven Group Holdings Ltd. |
|
|
1,082 |
|
|
|
27,197 |
|
| Sonic Healthcare Ltd. |
|
|
2,456 |
|
|
|
43,090 |
|
| South32 Ltd. |
|
|
22,917 |
|
|
|
55,954 |
|
| Stockland, REIT |
|
|
12,140 |
|
|
|
33,771 |
|
| Suncorp Group Ltd. |
|
|
6,504 |
|
|
|
75,539 |
|
| Telstra Group Ltd. |
|
|
20,155 |
|
|
|
48,672 |
|
| Transurban Group |
|
|
16,207 |
|
|
|
134,065 |
|
| Treasury Wine Estates Ltd. |
|
|
4,169 |
|
|
|
34,597 |
|
| Vicinity Ltd., REIT |
|
|
18,580 |
|
|
|
22,930 |
|
| Washington H Soul Pattinson & Co. Ltd. |
|
|
1,231 |
|
|
|
26,952 |
|
| Wesfarmers Ltd. |
|
|
5,997 |
|
|
|
260,759 |
|
| Westpac Banking Corp. |
|
|
18,256 |
|
|
|
331,623 |
|
| WiseTech Global Ltd. |
|
|
843 |
|
|
|
56,405 |
|
|
|
|
|
|
|
|
|
|
| |
|
Shares |
|
|
Value |
|
| COMMON STOCKS (continued) |
|
| Australia (continued) |
|
| Woodside Energy Group Ltd. |
|
|
10,040 |
|
|
|
$ 188,942 |
|
| Woolworths Group Ltd. |
|
|
6,413 |
|
|
|
144,557 |
|
|
|
|
|
|
|
|
|
|
|
|
|
|
|
|
|
|
|
|
6,345,698 |
|
|
|
|
|
|
|
|
|
|
| Austria - 0.2% |
|
| Erste Group Bank AG |
|
|
1,823 |
|
|
|
86,372 |
|
| OMV AG |
|
|
793 |
|
|
|
34,531 |
|
| Verbund AG |
|
|
326 |
|
|
|
25,713 |
|
| voestalpine AG |
|
|
633 |
|
|
|
17,097 |
|
|
|
|
|
|
|
|
|
|
|
|
|
|
|
|
|
|
|
|
163,713 |
|
|
|
|
|
|
|
|
|
|
| Belgium - 0.8% |
|
| Ageas SA |
|
|
837 |
|
|
|
38,258 |
|
| Anheuser-Busch InBev SA |
|
|
4,746 |
|
|
|
275,077 |
|
| D’ieteren Group |
|
|
103 |
|
|
|
21,852 |
|
| Elia Group SA |
|
|
135 |
|
|
|
12,643 |
|
| Groupe Bruxelles Lambert NV |
|
|
457 |
|
|
|
32,620 |
|
| KBC Group NV |
|
|
1,284 |
|
|
|
90,619 |
|
| Lotus Bakeries NV |
|
|
2 |
|
|
|
20,627 |
|
| Sofina SA |
|
|
83 |
|
|
|
18,951 |
|
| Syensqo SA |
|
|
376 |
|
|
|
33,652 |
|
| UCB SA |
|
|
672 |
|
|
|
99,819 |
|
| Umicore SA |
|
|
1,003 |
|
|
|
15,071 |
|
| Warehouses De Pauw CVA, REIT |
|
|
917 |
|
|
|
24,846 |
|
|
|
|
|
|
|
|
|
|
|
|
|
|
|
|
|
|
|
|
684,035 |
|
|
|
|
|
|
|
|
|
|
| Chile - 0.1% |
|
| Antofagasta PLC |
|
|
2,061 |
|
|
|
54,972 |
|
|
|
|
|
|
|
|
|
|
|
| Denmark - 3.9% |
|
| AP Moller - Maersk AS, Class A |
|
|
16 |
|
|
|
27,157 |
|
| AP Moller - Maersk AS, Class B |
|
|
24 |
|
|
|
41,718 |
|
| Carlsberg AS, Class B |
|
|
488 |
|
|
|
58,555 |
|
| Coloplast AS, Class B |
|
|
698 |
|
|
|
83,853 |
|
| Danske Bank AS |
|
|
3,660 |
|
|
|
109,055 |
|
| Demant AS (A) |
|
|
514 |
|
|
|
22,246 |
|
| DSV AS |
|
|
933 |
|
|
|
142,953 |
|
| Genmab AS (A) |
|
|
351 |
|
|
|
87,953 |
|
| Novo Nordisk AS, Class B |
|
|
17,180 |
|
|
|
2,480,824 |
|
| Novonesis (Novozymes) B, Class B |
|
|
1,979 |
|
|
|
121,089 |
|
| Orsted AS (A)(B) |
|
|
1,010 |
|
|
|
53,750 |
|
| Pandora AS |
|
|
430 |
|
|
|
64,896 |
|
| Rockwool AS, B Shares |
|
|
52 |
|
|
|
21,102 |
|
| Tryg AS |
|
|
1,809 |
|
|
|
39,537 |
|
| Vestas Wind Systems AS (A) |
|
|
5,349 |
|
|
|
123,857 |
|
|
|
|
|
|
|
|
|
|
|
|
|
|
|
|
|
|
|
|
3,478,545 |
|
|
|
|
|
|
|
|
|
|
| Finland - 1.0% |
|
| Elisa OYJ |
|
|
768 |
|
|
|
35,235 |
|
| Fortum OYJ |
|
|
2,361 |
|
|
|
34,514 |
|
| Kesko OYJ, B Shares |
|
|
1,422 |
|
|
|
24,960 |
|
| Kone OYJ, Class B |
|
|
1,744 |
|
|
|
86,084 |
|
| Metso OYJ |
|
|
3,595 |
|
|
|
38,054 |
|
| Neste OYJ |
|
|
2,134 |
|
|
|
37,995 |
|
| Nokia OYJ |
|
|
28,293 |
|
|
|
107,824 |
|
| Nordea Bank Abp |
|
|
16,676 |
|
|
|
198,441 |
|
| Orion OYJ, Class B |
|
|
511 |
|
|
|
21,814 |
|
| Sampo OYJ, A Shares |
|
|
2,396 |
|
|
|
102,897 |
|
The Notes to Financial Statements are an integral part of this report.
|
|
|
|
|
| Transamerica Series Trust |
|
|
|
Semi-Annual Financial Statements 2024 |
|
|
Page 1 |
|
|
Transamerica MSCI EAFE Index VP
SCHEDULE OF INVESTMENTS (continued)
At June 30, 2024
(unaudited)
|
|
|
|
|
|
|
|
|
| |
|
Shares |
|
|
Value |
|
| COMMON STOCKS (continued) |
|
| Finland (continued) |
|
| Stora Enso OYJ, R Shares |
|
|
2,997 |
|
|
$ |
40,939 |
|
| UPM-Kymmene OYJ |
|
|
2,832 |
|
|
|
98,934 |
|
| Wartsila OYJ Abp |
|
|
2,691 |
|
|
|
51,875 |
|
|
|
|
|
|
|
|
|
|
|
|
|
|
|
|
|
|
|
|
879,566 |
|
|
|
|
|
|
|
|
|
|
| France - 10.7% |
|
| Accor SA |
|
|
1,004 |
|
|
|
41,181 |
|
| Aeroports de Paris SA |
|
|
175 |
|
|
|
21,290 |
|
| Air Liquide SA |
|
|
3,044 |
|
|
|
525,768 |
|
| Airbus SE |
|
|
3,134 |
|
|
|
430,487 |
|
| Alstom SA |
|
|
1,852 |
|
|
|
31,139 |
|
| Amundi SA (B) |
|
|
327 |
|
|
|
21,100 |
|
| Arkema SA |
|
|
303 |
|
|
|
26,333 |
|
| AXA SA |
|
|
9,588 |
|
|
|
313,901 |
|
| BioMerieux |
|
|
195 |
|
|
|
18,534 |
|
| BNP Paribas SA |
|
|
5,451 |
|
|
|
347,521 |
|
| Bollore SE |
|
|
4,007 |
|
|
|
23,516 |
|
| Bouygues SA |
|
|
974 |
|
|
|
31,262 |
|
| Bureau Veritas SA |
|
|
1,702 |
|
|
|
47,136 |
|
| Capgemini SE |
|
|
822 |
|
|
|
163,476 |
|
| Carrefour SA |
|
|
2,960 |
|
|
|
41,844 |
|
| Cie de Saint-Gobain SA |
|
|
2,409 |
|
|
|
187,354 |
|
| Cie Generale des Etablissements Michelin SCA |
|
|
3,568 |
|
|
|
137,982 |
|
| Covivio SA, REIT |
|
|
264 |
|
|
|
12,548 |
|
| Credit Agricole SA |
|
|
5,484 |
|
|
|
74,823 |
|
| Danone SA |
|
|
3,365 |
|
|
|
205,702 |
|
| Dassault Aviation SA |
|
|
105 |
|
|
|
19,071 |
|
| Dassault Systemes SE |
|
|
3,501 |
|
|
|
132,354 |
|
| Edenred SE |
|
|
1,294 |
|
|
|
54,615 |
|
| Eiffage SA |
|
|
376 |
|
|
|
34,534 |
|
| Engie SA |
|
|
9,664 |
|
|
|
138,013 |
|
| EssilorLuxottica SA |
|
|
1,590 |
|
|
|
342,606 |
|
| Eurazeo SE |
|
|
219 |
|
|
|
17,438 |
|
| Gecina SA, REIT |
|
|
220 |
|
|
|
20,251 |
|
| Getlink SE |
|
|
1,851 |
|
|
|
30,627 |
|
| Hermes International SCA |
|
|
167 |
|
|
|
382,736 |
|
| Ipsen SA |
|
|
182 |
|
|
|
22,317 |
|
| Kering SA |
|
|
390 |
|
|
|
141,381 |
|
| Klepierre SA, REIT |
|
|
1,062 |
|
|
|
28,411 |
|
| La Francaise des Jeux SAEM (B) |
|
|
510 |
|
|
|
17,369 |
|
| Legrand SA |
|
|
1,398 |
|
|
|
138,700 |
|
| L’Oreal SA |
|
|
1,269 |
|
|
|
557,273 |
|
| LVMH Moet Hennessy Louis Vuitton SE |
|
|
1,453 |
|
|
|
1,110,427 |
|
| Orange SA |
|
|
9,875 |
|
|
|
98,924 |
|
| Pernod Ricard SA |
|
|
1,082 |
|
|
|
146,816 |
|
| Publicis Groupe SA |
|
|
1,212 |
|
|
|
128,994 |
|
| Remy Cointreau SA |
|
|
128 |
|
|
|
10,679 |
|
| Renault SA |
|
|
1,007 |
|
|
|
51,593 |
|
| Rexel SA |
|
|
1,194 |
|
|
|
30,894 |
|
| Safran SA |
|
|
1,804 |
|
|
|
381,376 |
|
| Sanofi SA |
|
|
6,004 |
|
|
|
578,313 |
|
| Sartorius Stedim Biotech |
|
|
145 |
|
|
|
23,806 |
|
| Schneider Electric SE |
|
|
2,869 |
|
|
|
689,174 |
|
| SEB SA |
|
|
124 |
|
|
|
12,695 |
|
| Societe Generale SA |
|
|
3,735 |
|
|
|
87,680 |
|
| Sodexo SA |
|
|
449 |
|
|
|
40,392 |
|
|
|
|
|
|
|
|
|
|
| |
|
Shares |
|
|
Value |
|
| COMMON STOCKS (continued) |
|
| France (continued) |
|
| Teleperformance SE |
|
|
296 |
|
|
$ |
31,174 |
|
| Thales SA |
|
|
523 |
|
|
|
83,736 |
|
| TotalEnergies SE |
|
|
11,283 |
|
|
|
753,167 |
|
| Unibail-Rodamco-Westfield, CDI |
|
|
4,482 |
|
|
|
17,670 |
|
| Unibail-Rodamco-Westfield, REIT (A) |
|
|
389 |
|
|
|
30,628 |
|
| Veolia Environnement SA |
|
|
3,627 |
|
|
|
108,451 |
|
| Vinci SA |
|
|
2,646 |
|
|
|
278,783 |
|
| Vivendi SE |
|
|
3,875 |
|
|
|
40,487 |
|
|
|
|
|
|
|
|
|
|
|
|
|
|
|
|
|
|
|
|
9,516,452 |
|
|
|
|
|
|
|
|
|
|
| Germany - 8.0% |
|
| adidas AG |
|
|
857 |
|
|
|
204,671 |
|
| Allianz SE |
|
|
2,066 |
|
|
|
574,166 |
|
| BASF SE |
|
|
4,662 |
|
|
|
225,598 |
|
| Bayer AG |
|
|
5,149 |
|
|
|
145,468 |
|
| Bayerische Motoren Werke AG |
|
|
1,668 |
|
|
|
157,877 |
|
| Bechtle AG |
|
|
423 |
|
|
|
19,905 |
|
| Beiersdorf AG |
|
|
534 |
|
|
|
78,091 |
|
| Brenntag SE |
|
|
715 |
|
|
|
48,210 |
|
| Carl Zeiss Meditec AG |
|
|
194 |
|
|
|
13,640 |
|
| Commerzbank AG |
|
|
5,600 |
|
|
|
85,072 |
|
| Continental AG |
|
|
558 |
|
|
|
31,613 |
|
| Covestro AG (A)(B) |
|
|
968 |
|
|
|
56,810 |
|
| CTS Eventim AG & Co. KGaA |
|
|
338 |
|
|
|
28,198 |
|
| Daimler Truck Holding AG |
|
|
2,816 |
|
|
|
112,097 |
|
| Delivery Hero SE (A)(B) |
|
|
927 |
|
|
|
21,990 |
|
| Deutsche Bank AG |
|
|
10,178 |
|
|
|
162,499 |
|
| Deutsche Boerse AG |
|
|
1,004 |
|
|
|
205,477 |
|
| Deutsche Lufthansa AG |
|
|
3,207 |
|
|
|
19,611 |
|
| Deutsche Post AG |
|
|
5,237 |
|
|
|
211,948 |
|
| Deutsche Telekom AG |
|
|
17,106 |
|
|
|
430,146 |
|
| E.ON SE |
|
|
11,889 |
|
|
|
156,037 |
|
| Evonik Industries AG |
|
|
1,389 |
|
|
|
28,338 |
|
| Fresenius Medical Care AG |
|
|
1,052 |
|
|
|
40,289 |
|
| Fresenius SE & Co. KGaA (A) |
|
|
2,251 |
|
|
|
67,211 |
|
| GEA Group AG |
|
|
838 |
|
|
|
34,911 |
|
| Hannover Rueck SE |
|
|
310 |
|
|
|
78,583 |
|
| Heidelberg Materials AG |
|
|
718 |
|
|
|
74,449 |
|
| Henkel AG & Co. KGaA |
|
|
539 |
|
|
|
42,399 |
|
| Infineon Technologies AG |
|
|
6,819 |
|
|
|
250,523 |
|
| Knorr-Bremse AG |
|
|
393 |
|
|
|
30,009 |
|
| LEG Immobilien SE |
|
|
379 |
|
|
|
30,953 |
|
| Mercedes-Benz Group AG |
|
|
4,235 |
|
|
|
292,856 |
|
| Merck KGaA |
|
|
680 |
|
|
|
112,696 |
|
| MTU Aero Engines AG |
|
|
286 |
|
|
|
73,143 |
|
| Muenchener Rueckversicherungs-Gesellschaft AG |
|
|
720 |
|
|
|
360,096 |
|
| Nemetschek SE |
|
|
279 |
|
|
|
27,444 |
|
| Puma SE |
|
|
550 |
|
|
|
25,251 |
|
| Rational AG |
|
|
24 |
|
|
|
19,984 |
|
| Rheinmetall AG |
|
|
230 |
|
|
|
117,174 |
|
| RWE AG |
|
|
3,330 |
|
|
|
113,942 |
|
| SAP SE |
|
|
5,503 |
|
|
|
1,116,925 |
|
| Scout24 SE (B) |
|
|
404 |
|
|
|
30,806 |
|
| Siemens AG |
|
|
4,007 |
|
|
|
745,484 |
|
| Siemens Healthineers AG (B) |
|
|
1,446 |
|
|
|
83,314 |
|
| Symrise AG |
|
|
705 |
|
|
|
86,299 |
|
The Notes to Financial Statements are an integral part of this report.
|
|
|
|
|
| Transamerica Series Trust |
|
|
|
Semi-Annual Financial Statements 2024 |
|
|
Page 2 |
|
|
Transamerica MSCI EAFE Index VP
SCHEDULE OF INVESTMENTS (continued)
At June 30, 2024
(unaudited)
|
|
|
|
|
|
|
|
|
| |
|
Shares |
|
|
Value |
|
| COMMON STOCKS (continued) |
|
| Germany (continued) |
|
| Talanx AG |
|
|
350 |
|
|
|
$ 27,944 |
|
| Volkswagen AG |
|
|
140 |
|
|
|
16,808 |
|
| Vonovia SE |
|
|
3,888 |
|
|
|
110,550 |
|
| Zalando SE (A)(B) |
|
|
1,145 |
|
|
|
26,842 |
|
|
|
|
|
|
|
|
|
|
|
|
|
|
|
|
|
|
|
|
7,054,347 |
|
|
|
|
|
|
|
|
|
|
| Hong Kong - 1.8% |
|
| AIA Group Ltd. |
|
|
59,200 |
|
|
|
401,790 |
|
| BOC Hong Kong Holdings Ltd. |
|
|
19,500 |
|
|
|
60,055 |
|
| CK Asset Holdings Ltd. |
|
|
9,915 |
|
|
|
37,138 |
|
| CK Hutchison Holdings Ltd. |
|
|
14,500 |
|
|
|
69,445 |
|
| CK Infrastructure Holdings Ltd. |
|
|
3,000 |
|
|
|
16,942 |
|
| CLP Holdings Ltd. |
|
|
8,500 |
|
|
|
68,683 |
|
| Futu Holdings Ltd., ADR (A) |
|
|
300 |
|
|
|
19,682 |
|
| Galaxy Entertainment Group Ltd. |
|
|
11,000 |
|
|
|
51,274 |
|
| Hang Seng Bank Ltd. |
|
|
3,900 |
|
|
|
50,142 |
|
| Henderson Land Development Co. Ltd. |
|
|
7,531 |
|
|
|
20,204 |
|
| HKT Trust & HKT Ltd. |
|
|
18,000 |
|
|
|
20,192 |
|
| Hong Kong & China Gas Co. Ltd. |
|
|
58,085 |
|
|
|
44,183 |
|
| Hong Kong Exchanges & Clearing Ltd. |
|
|
6,272 |
|
|
|
200,953 |
|
| Hongkong Land Holdings Ltd. |
|
|
5,500 |
|
|
|
17,765 |
|
| Jardine Matheson Holdings Ltd. |
|
|
800 |
|
|
|
28,304 |
|
| Link, REIT |
|
|
13,751 |
|
|
|
53,444 |
|
| MTR Corp. Ltd. |
|
|
7,687 |
|
|
|
24,265 |
|
| Power Assets Holdings Ltd. |
|
|
7,000 |
|
|
|
37,873 |
|
| Prudential PLC |
|
|
14,422 |
|
|
|
130,970 |
|
| Sino Land Co. Ltd. |
|
|
20,037 |
|
|
|
20,655 |
|
| SITC International Holdings Co. Ltd. |
|
|
6,000 |
|
|
|
16,289 |
|
| Sun Hung Kai Properties Ltd. |
|
|
7,350 |
|
|
|
63,579 |
|
| Swire Pacific Ltd., Class A |
|
|
2,000 |
|
|
|
17,672 |
|
| Swire Properties Ltd. |
|
|
5,800 |
|
|
|
9,240 |
|
| Techtronic Industries Co. Ltd. |
|
|
7,500 |
|
|
|
85,670 |
|
| WH Group Ltd. (B) |
|
|
40,287 |
|
|
|
26,517 |
|
| Wharf Holdings Ltd. |
|
|
5,000 |
|
|
|
14,054 |
|
| Wharf Real Estate Investment Co. Ltd. |
|
|
8,300 |
|
|
|
22,001 |
|
|
|
|
|
|
|
|
|
|
|
|
|
|
|
|
|
|
|
|
1,628,981 |
|
|
|
|
|
|
|
|
|
|
| Ireland - 1.0% |
|
| AerCap Holdings NV |
|
|
1,100 |
|
|
|
102,520 |
|
| AIB Group PLC |
|
|
9,124 |
|
|
|
48,231 |
|
| Bank of Ireland Group PLC |
|
|
5,348 |
|
|
|
55,946 |
|
| DCC PLC |
|
|
514 |
|
|
|
35,996 |
|
| Experian PLC |
|
|
4,852 |
|
|
|
226,077 |
|
| Flutter Entertainment PLC (A) |
|
|
938 |
|
|
|
171,515 |
|
| James Hardie Industries PLC, CDI (A) |
|
|
2,225 |
|
|
|
70,207 |
|
| Kerry Group PLC, Class A |
|
|
794 |
|
|
|
64,328 |
|
| Kingspan Group PLC |
|
|
826 |
|
|
|
70,326 |
|
| Smurfit Kappa Group PLC |
|
|
1,321 |
|
|
|
58,947 |
|
|
|
|
|
|
|
|
|
|
|
|
|
|
|
|
|
|
|
|
904,093 |
|
|
|
|
|
|
|
|
|
|
| Israel - 0.7% |
|
| Azrieli Group Ltd. |
|
|
202 |
|
|
|
11,802 |
|
| Bank Hapoalim BM |
|
|
6,440 |
|
|
|
56,875 |
|
| Bank Leumi Le-Israel BM |
|
|
7,659 |
|
|
|
62,433 |
|
| Check Point Software Technologies Ltd. (A) |
|
|
450 |
|
|
|
74,250 |
|
| CyberArk Software Ltd. (A) |
|
|
200 |
|
|
|
54,684 |
|
| Elbit Systems Ltd. |
|
|
129 |
|
|
|
22,448 |
|
|
|
|
|
|
|
|
|
|
| |
|
Shares |
|
|
Value |
|
| COMMON STOCKS (continued) |
|
| Israel (continued) |
|
| Global-e Online Ltd. (A) |
|
|
500 |
|
|
|
$ 18,135 |
|
| ICL Group Ltd. |
|
|
3,678 |
|
|
|
15,816 |
|
| Isracard Ltd. |
|
|
1 |
|
|
|
2 |
|
| Israel Discount Bank Ltd., Class A |
|
|
6,503 |
|
|
|
32,453 |
|
| Mizrahi Tefahot Bank Ltd. |
|
|
740 |
|
|
|
25,095 |
|
| Monday.com Ltd. (A) |
|
|
240 |
|
|
|
57,782 |
|
| Nice Ltd. (A) |
|
|
336 |
|
|
|
57,804 |
|
| Teva Pharmaceutical Industries Ltd., ADR (A) |
|
|
5,915 |
|
|
|
96,119 |
|
| Wix.com Ltd. (A) |
|
|
300 |
|
|
|
47,721 |
|
|
|
|
|
|
|
|
|
|
|
|
|
|
|
|
|
|
|
|
633,419 |
|
|
|
|
|
|
|
|
|
|
| Italy - 2.3% |
|
| Amplifon SpA |
|
|
662 |
|
|
|
23,566 |
|
| Assicurazioni Generali SpA |
|
|
5,406 |
|
|
|
134,839 |
|
| Banco BPM SpA |
|
|
6,909 |
|
|
|
44,499 |
|
| Davide Campari-Milano NV |
|
|
3,253 |
|
|
|
30,741 |
|
| DiaSorin SpA |
|
|
114 |
|
|
|
11,361 |
|
| Enel SpA |
|
|
42,439 |
|
|
|
295,153 |
|
| Eni SpA |
|
|
11,357 |
|
|
|
174,585 |
|
| Ferrari NV |
|
|
658 |
|
|
|
268,274 |
|
| FinecoBank Banca Fineco SpA |
|
|
3,101 |
|
|
|
46,228 |
|
| Infrastrutture Wireless Italiane SpA (B) |
|
|
1,584 |
|
|
|
16,540 |
|
| Intesa Sanpaolo SpA |
|
|
77,253 |
|
|
|
287,170 |
|
| Leonardo SpA |
|
|
2,052 |
|
|
|
47,644 |
|
| Mediobanca Banca di Credito Finanziario SpA |
|
|
2,679 |
|
|
|
39,278 |
|
| Moncler SpA |
|
|
1,170 |
|
|
|
71,497 |
|
| Nexi SpA (A)(B) |
|
|
2,832 |
|
|
|
17,269 |
|
| Poste Italiane SpA (B) |
|
|
2,795 |
|
|
|
35,605 |
|
| Prysmian SpA |
|
|
1,397 |
|
|
|
86,505 |
|
| Recordati Industria Chimica e Farmaceutica SpA |
|
|
552 |
|
|
|
28,790 |
|
| Snam SpA |
|
|
10,221 |
|
|
|
45,219 |
|
| Telecom Italia SpA (A) |
|
|
46,799 |
|
|
|
11,202 |
|
| Terna - Rete Elettrica Nazionale |
|
|
7,510 |
|
|
|
58,053 |
|
| UniCredit SpA |
|
|
7,963 |
|
|
|
295,111 |
|
|
|
|
|
|
|
|
|
|
|
|
|
|
|
|
|
|
|
|
2,069,129 |
|
|
|
|
|
|
|
|
|
|
| Japan - 22.3% |
|
| Advantest Corp. |
|
|
4,000 |
|
|
|
159,736 |
|
| Aeon Co. Ltd. |
|
|
3,500 |
|
|
|
74,812 |
|
| AGC, Inc. |
|
|
1,000 |
|
|
|
32,358 |
|
| Aisin Corp. |
|
|
800 |
|
|
|
26,070 |
|
| Ajinomoto Co., Inc. |
|
|
2,500 |
|
|
|
87,653 |
|
| ANA Holdings, Inc. |
|
|
800 |
|
|
|
14,765 |
|
| Asahi Group Holdings Ltd. |
|
|
2,500 |
|
|
|
88,181 |
|
| Asahi Kasei Corp. |
|
|
6,400 |
|
|
|
40,992 |
|
| Asics Corp. |
|
|
3,600 |
|
|
|
55,066 |
|
| Astellas Pharma, Inc. |
|
|
9,600 |
|
|
|
94,872 |
|
| Bandai Namco Holdings, Inc. |
|
|
3,200 |
|
|
|
62,453 |
|
| Bridgestone Corp. |
|
|
3,000 |
|
|
|
117,882 |
|
| Brother Industries Ltd. |
|
|
1,100 |
|
|
|
19,355 |
|
| Canon, Inc. |
|
|
5,200 |
|
|
|
140,722 |
|
| Capcom Co. Ltd. |
|
|
1,800 |
|
|
|
33,933 |
|
| Central Japan Railway Co. |
|
|
4,000 |
|
|
|
86,345 |
|
| Chiba Bank Ltd. |
|
|
2,500 |
|
|
|
22,251 |
|
| Chubu Electric Power Co., Inc. |
|
|
3,300 |
|
|
|
38,991 |
|
The Notes to Financial Statements are an integral part of this report.
|
|
|
|
|
| Transamerica Series Trust |
|
|
|
Semi-Annual Financial Statements 2024 |
|
|
Page 3 |
|
|
Transamerica MSCI EAFE Index VP
SCHEDULE OF INVESTMENTS (continued)
At June 30, 2024
(unaudited)
|
|
|
|
|
|
|
|
|
| |
|
Shares |
|
|
Value |
|
| COMMON STOCKS (continued) |
|
| Japan (continued) |
|
| Chugai Pharmaceutical Co. Ltd. |
|
|
3,500 |
|
|
|
$ 124,346 |
|
| Concordia Financial Group Ltd. |
|
|
5,500 |
|
|
|
32,346 |
|
| Dai Nippon Printing Co. Ltd. |
|
|
1,100 |
|
|
|
37,002 |
|
| Daifuku Co. Ltd. |
|
|
1,500 |
|
|
|
28,063 |
|
| Dai-ichi Life Holdings, Inc. |
|
|
5,000 |
|
|
|
133,570 |
|
| Daiichi Sankyo Co. Ltd. |
|
|
9,800 |
|
|
|
336,473 |
|
| Daikin Industries Ltd. |
|
|
1,400 |
|
|
|
194,655 |
|
| Daito Trust Construction Co. Ltd. |
|
|
300 |
|
|
|
30,925 |
|
| Daiwa House Industry Co. Ltd. |
|
|
3,000 |
|
|
|
76,021 |
|
| Daiwa Securities Group, Inc. |
|
|
6,800 |
|
|
|
51,859 |
|
| Denso Corp. |
|
|
9,900 |
|
|
|
153,709 |
|
| Dentsu Group, Inc. |
|
|
1,000 |
|
|
|
25,191 |
|
| Disco Corp. |
|
|
500 |
|
|
|
189,695 |
|
| East Japan Railway Co. |
|
|
4,800 |
|
|
|
79,493 |
|
| Eisai Co. Ltd. |
|
|
1,300 |
|
|
|
53,264 |
|
| ENEOS Holdings, Inc. |
|
|
15,300 |
|
|
|
78,606 |
|
| FANUC Corp. |
|
|
5,000 |
|
|
|
137,019 |
|
| Fast Retailing Co. Ltd. |
|
|
900 |
|
|
|
226,888 |
|
| Fuji Electric Co. Ltd. |
|
|
700 |
|
|
|
39,819 |
|
| FUJIFILM Holdings Corp. |
|
|
5,900 |
|
|
|
137,956 |
|
| Fujitsu Ltd. |
|
|
9,300 |
|
|
|
145,491 |
|
| Hamamatsu Photonics KK |
|
|
700 |
|
|
|
18,743 |
|
| Hankyu Hanshin Holdings, Inc. |
|
|
1,100 |
|
|
|
29,221 |
|
| Hikari Tsushin, Inc. |
|
|
100 |
|
|
|
18,625 |
|
| Hitachi Construction Machinery Co. Ltd. |
|
|
500 |
|
|
|
13,388 |
|
| Hitachi Ltd. |
|
|
24,500 |
|
|
|
548,353 |
|
| Honda Motor Co. Ltd. |
|
|
23,900 |
|
|
|
255,504 |
|
| Hoshizaki Corp. |
|
|
500 |
|
|
|
15,856 |
|
| Hoya Corp. |
|
|
1,900 |
|
|
|
220,893 |
|
| Hulic Co. Ltd. |
|
|
1,800 |
|
|
|
15,937 |
|
| Ibiden Co. Ltd. |
|
|
600 |
|
|
|
24,419 |
|
| Idemitsu Kosan Co. Ltd. |
|
|
5,000 |
|
|
|
32,367 |
|
| Inpex Corp. |
|
|
4,900 |
|
|
|
72,088 |
|
| Isuzu Motors Ltd. |
|
|
3,000 |
|
|
|
39,735 |
|
| ITOCHU Corp. |
|
|
6,300 |
|
|
|
307,541 |
|
| Japan Airlines Co. Ltd. |
|
|
700 |
|
|
|
11,045 |
|
| Japan Exchange Group, Inc. |
|
|
2,700 |
|
|
|
62,965 |
|
| Japan Post Bank Co. Ltd. |
|
|
7,700 |
|
|
|
72,721 |
|
| Japan Post Holdings Co. Ltd. |
|
|
11,100 |
|
|
|
110,041 |
|
| Japan Post Insurance Co. Ltd. |
|
|
1,000 |
|
|
|
19,398 |
|
| Japan Real Estate Investment Corp., REIT |
|
|
7 |
|
|
|
22,102 |
|
| Japan Tobacco, Inc. |
|
|
6,300 |
|
|
|
170,255 |
|
| JFE Holdings, Inc. |
|
|
2,900 |
|
|
|
41,736 |
|
| Kajima Corp. |
|
|
2,100 |
|
|
|
36,305 |
|
| Kansai Electric Power Co., Inc. |
|
|
3,600 |
|
|
|
60,459 |
|
| Kao Corp. |
|
|
2,500 |
|
|
|
101,374 |
|
| Kawasaki Kisen Kaisha Ltd. |
|
|
2,100 |
|
|
|
30,543 |
|
| KDDI Corp. |
|
|
7,800 |
|
|
|
206,235 |
|
| Keisei Electric Railway Co. Ltd. |
|
|
700 |
|
|
|
22,520 |
|
| Keyence Corp. |
|
|
1,000 |
|
|
|
438,498 |
|
| Kikkoman Corp. |
|
|
3,500 |
|
|
|
40,539 |
|
| Kintetsu Group Holdings Co. Ltd. |
|
|
900 |
|
|
|
19,590 |
|
| Kirin Holdings Co. Ltd. |
|
|
3,900 |
|
|
|
50,250 |
|
| Kobe Bussan Co. Ltd. |
|
|
700 |
|
|
|
15,593 |
|
| Koito Manufacturing Co. Ltd. |
|
|
1,000 |
|
|
|
13,792 |
|
| Komatsu Ltd. |
|
|
4,900 |
|
|
|
142,258 |
|
|
|
|
|
|
|
|
|
|
| |
|
Shares |
|
|
Value |
|
| COMMON STOCKS (continued) |
|
| Japan (continued) |
|
| Konami Group Corp. |
|
|
500 |
|
|
|
$ 35,987 |
|
| Kubota Corp. |
|
|
5,100 |
|
|
|
71,322 |
|
| Kyocera Corp. |
|
|
6,800 |
|
|
|
78,253 |
|
| Kyowa Kirin Co. Ltd. |
|
|
1,300 |
|
|
|
22,200 |
|
| Lasertec Corp. |
|
|
400 |
|
|
|
89,726 |
|
| LY Corp. |
|
|
13,800 |
|
|
|
33,357 |
|
| M3, Inc. |
|
|
2,300 |
|
|
|
21,922 |
|
| Makita Corp. |
|
|
1,100 |
|
|
|
29,891 |
|
| Marubeni Corp. |
|
|
7,500 |
|
|
|
138,705 |
|
| MatsukiyoCocokara & Co. |
|
|
1,800 |
|
|
|
25,844 |
|
| Mazda Motor Corp. |
|
|
3,000 |
|
|
|
29,014 |
|
| McDonald’s Holdings Co. Japan Ltd. |
|
|
400 |
|
|
|
15,762 |
|
| MEIJI Holdings Co. Ltd. |
|
|
1,200 |
|
|
|
25,874 |
|
| Minebea Mitsumi, Inc. |
|
|
1,900 |
|
|
|
38,912 |
|
| Mitsubishi Chemical Group Corp. |
|
|
7,200 |
|
|
|
39,967 |
|
| Mitsubishi Corp. |
|
|
17,600 |
|
|
|
344,364 |
|
| Mitsubishi Electric Corp. |
|
|
10,200 |
|
|
|
162,773 |
|
| Mitsubishi Estate Co. Ltd. |
|
|
6,000 |
|
|
|
93,977 |
|
| Mitsubishi HC Capital, Inc. |
|
|
4,100 |
|
|
|
27,063 |
|
| Mitsubishi Heavy Industries Ltd. |
|
|
17,000 |
|
|
|
182,056 |
|
| Mitsubishi UFJ Financial Group, Inc. |
|
|
58,600 |
|
|
|
629,743 |
|
| Mitsui & Co. Ltd. |
|
|
13,600 |
|
|
|
308,618 |
|
| Mitsui Chemicals, Inc. |
|
|
900 |
|
|
|
24,837 |
|
| Mitsui Fudosan Co. Ltd. |
|
|
14,100 |
|
|
|
128,696 |
|
| Mitsui OSK Lines Ltd. |
|
|
1,800 |
|
|
|
53,903 |
|
| Mizuho Financial Group, Inc. |
|
|
12,800 |
|
|
|
267,154 |
|
| MonotaRO Co. Ltd. |
|
|
1,200 |
|
|
|
14,104 |
|
| MS&AD Insurance Group Holdings, Inc. |
|
|
6,800 |
|
|
|
151,097 |
|
| Murata Manufacturing Co. Ltd. |
|
|
9,000 |
|
|
|
185,829 |
|
| NEC Corp. |
|
|
1,300 |
|
|
|
107,020 |
|
| Nexon Co. Ltd. |
|
|
1,800 |
|
|
|
33,284 |
|
| Nidec Corp. |
|
|
2,200 |
|
|
|
98,247 |
|
| Nintendo Co. Ltd. |
|
|
5,500 |
|
|
|
292,486 |
|
| Nippon Building Fund, Inc., REIT |
|
|
8 |
|
|
|
27,994 |
|
| Nippon Express Holdings, Inc. |
|
|
400 |
|
|
|
18,435 |
|
| Nippon Paint Holdings Co. Ltd. |
|
|
4,900 |
|
|
|
31,917 |
|
| Nippon Prologis, Inc., REIT |
|
|
12 |
|
|
|
18,721 |
|
| Nippon Sanso Holdings Corp. |
|
|
900 |
|
|
|
26,621 |
|
| Nippon Steel Corp. |
|
|
4,500 |
|
|
|
95,124 |
|
| Nippon Telegraph & Telephone Corp. |
|
|
158,100 |
|
|
|
149,168 |
|
| Nippon Yusen KK |
|
|
2,400 |
|
|
|
69,842 |
|
| Nissan Chemical Corp. |
|
|
600 |
|
|
|
19,008 |
|
| Nissan Motor Co. Ltd. |
|
|
11,900 |
|
|
|
40,377 |
|
| Nissin Foods Holdings Co. Ltd. |
|
|
1,200 |
|
|
|
30,446 |
|
| Nitori Holdings Co. Ltd. |
|
|
400 |
|
|
|
42,240 |
|
| Nitto Denko Corp. |
|
|
800 |
|
|
|
63,198 |
|
| Nomura Holdings, Inc. |
|
|
15,900 |
|
|
|
91,117 |
|
| Nomura Real Estate Holdings, Inc. |
|
|
600 |
|
|
|
15,033 |
|
| Nomura Real Estate Master Fund, Inc., REIT |
|
|
20 |
|
|
|
17,739 |
|
| Nomura Research Institute Ltd. |
|
|
2,000 |
|
|
|
56,200 |
|
| NTT Data Group Corp. |
|
|
3,300 |
|
|
|
48,447 |
|
| Obayashi Corp. |
|
|
3,500 |
|
|
|
41,594 |
|
| OBIC Co. Ltd. |
|
|
300 |
|
|
|
38,672 |
|
| Olympus Corp. |
|
|
6,100 |
|
|
|
98,330 |
|
| Omron Corp. |
|
|
900 |
|
|
|
30,929 |
|
The Notes to Financial Statements are an integral part of this report.
|
|
|
|
|
| Transamerica Series Trust |
|
|
|
Semi-Annual Financial Statements 2024 |
|
|
Page 4 |
|
|
Transamerica MSCI EAFE Index VP
SCHEDULE OF INVESTMENTS (continued)
At June 30, 2024
(unaudited)
|
|
|
|
|
|
|
|
|
| |
|
Shares |
|
|
Value |
|
| COMMON STOCKS (continued) |
|
| Japan (continued) |
|
| Ono Pharmaceutical Co. Ltd. |
|
|
2,000 |
|
|
|
$ 27,304 |
|
| Oracle Corp. |
|
|
200 |
|
|
|
13,798 |
|
| Oriental Land Co. Ltd. |
|
|
5,800 |
|
|
|
161,574 |
|
| ORIX Corp. |
|
|
6,000 |
|
|
|
132,463 |
|
| Osaka Gas Co. Ltd. |
|
|
1,900 |
|
|
|
41,840 |
|
| Otsuka Corp. |
|
|
1,200 |
|
|
|
23,054 |
|
| Otsuka Holdings Co. Ltd. |
|
|
2,200 |
|
|
|
92,573 |
|
| Pan Pacific International Holdings Corp. |
|
|
1,900 |
|
|
|
44,450 |
|
| Panasonic Holdings Corp. |
|
|
12,400 |
|
|
|
101,503 |
|
| Rakuten Group, Inc. (A) |
|
|
7,800 |
|
|
|
40,234 |
|
| Recruit Holdings Co. Ltd. |
|
|
7,900 |
|
|
|
422,620 |
|
| Renesas Electronics Corp. |
|
|
7,900 |
|
|
|
147,748 |
|
| Resona Holdings, Inc. |
|
|
10,800 |
|
|
|
71,456 |
|
| Ricoh Co. Ltd. |
|
|
2,700 |
|
|
|
23,083 |
|
| Rohm Co. Ltd. |
|
|
1,600 |
|
|
|
21,381 |
|
| SBI Holdings, Inc. |
|
|
1,500 |
|
|
|
37,917 |
|
| SCREEN Holdings Co. Ltd. |
|
|
400 |
|
|
|
36,049 |
|
| SCSK Corp. |
|
|
700 |
|
|
|
13,979 |
|
| Secom Co. Ltd. |
|
|
1,100 |
|
|
|
64,931 |
|
| Seiko Epson Corp. |
|
|
1,400 |
|
|
|
21,745 |
|
| Sekisui Chemical Co. Ltd. |
|
|
2,000 |
|
|
|
27,671 |
|
| Sekisui House Ltd. |
|
|
3,100 |
|
|
|
68,651 |
|
| Seven & i Holdings Co. Ltd. |
|
|
11,800 |
|
|
|
143,750 |
|
| SG Holdings Co. Ltd. |
|
|
1,500 |
|
|
|
13,822 |
|
| Shimadzu Corp. |
|
|
1,200 |
|
|
|
30,021 |
|
| Shimano, Inc. |
|
|
400 |
|
|
|
61,769 |
|
| Shin-Etsu Chemical Co. Ltd. |
|
|
9,500 |
|
|
|
368,332 |
|
| Shionogi & Co. Ltd. |
|
|
1,300 |
|
|
|
50,719 |
|
| Shiseido Co. Ltd. |
|
|
2,100 |
|
|
|
59,884 |
|
| Shizuoka Financial Group, Inc. |
|
|
2,400 |
|
|
|
23,032 |
|
| SMC Corp. |
|
|
300 |
|
|
|
142,346 |
|
| SoftBank Corp. |
|
|
14,900 |
|
|
|
181,932 |
|
| SoftBank Group Corp. |
|
|
5,400 |
|
|
|
348,723 |
|
| Sompo Holdings, Inc. |
|
|
4,700 |
|
|
|
100,345 |
|
| Sony Group Corp. |
|
|
6,600 |
|
|
|
559,538 |
|
| Subaru Corp. |
|
|
3,100 |
|
|
|
65,703 |
|
| SUMCO Corp. |
|
|
1,700 |
|
|
|
24,466 |
|
| Sumitomo Corp. |
|
|
5,500 |
|
|
|
137,321 |
|
| Sumitomo Electric Industries Ltd. |
|
|
3,800 |
|
|
|
59,106 |
|
| Sumitomo Metal Mining Co. Ltd. |
|
|
1,300 |
|
|
|
39,415 |
|
| Sumitomo Mitsui Financial Group, Inc. |
|
|
6,600 |
|
|
|
439,959 |
|
| Sumitomo Mitsui Trust Holdings, Inc. |
|
|
3,400 |
|
|
|
77,556 |
|
| Sumitomo Realty & Development Co. Ltd. |
|
|
1,500 |
|
|
|
44,015 |
|
| Suntory Beverage & Food Ltd. |
|
|
700 |
|
|
|
24,830 |
|
| Suzuki Motor Corp. |
|
|
8,300 |
|
|
|
95,489 |
|
| Sysmex Corp. |
|
|
2,700 |
|
|
|
43,481 |
|
| T&D Holdings, Inc. |
|
|
2,500 |
|
|
|
43,640 |
|
| Taisei Corp. |
|
|
900 |
|
|
|
33,289 |
|
| Takeda Pharmaceutical Co. Ltd. |
|
|
8,300 |
|
|
|
215,225 |
|
| TDK Corp. |
|
|
2,100 |
|
|
|
128,762 |
|
| Terumo Corp. |
|
|
7,000 |
|
|
|
115,427 |
|
| TIS, Inc. |
|
|
1,200 |
|
|
|
23,256 |
|
| Toho Co. Ltd. |
|
|
600 |
|
|
|
17,542 |
|
| Tokio Marine Holdings, Inc. |
|
|
9,900 |
|
|
|
369,504 |
|
| Tokyo Electric Power Co. Holdings, Inc. (A) |
|
|
8,200 |
|
|
|
44,147 |
|
| Tokyo Electron Ltd. |
|
|
2,500 |
|
|
|
542,296 |
|
|
|
|
|
|
|
|
|
|
| |
|
Shares |
|
|
Value |
|
| COMMON STOCKS (continued) |
|
| Japan (continued) |
|
| Tokyo Gas Co. Ltd. |
|
|
1,900 |
|
|
|
$ 40,801 |
|
| Tokyu Corp. |
|
|
2,500 |
|
|
|
27,534 |
|
| TOPPAN Holdings, Inc. |
|
|
1,200 |
|
|
|
33,064 |
|
| Toray Industries, Inc. |
|
|
7,200 |
|
|
|
34,078 |
|
| TOTO Ltd. |
|
|
700 |
|
|
|
16,524 |
|
| Toyota Industries Corp. |
|
|
800 |
|
|
|
67,450 |
|
| Toyota Motor Corp. |
|
|
56,100 |
|
|
|
1,147,175 |
|
| Toyota Tsusho Corp. |
|
|
3,300 |
|
|
|
64,240 |
|
| Trend Micro, Inc. |
|
|
700 |
|
|
|
28,415 |
|
| Unicharm Corp. |
|
|
2,200 |
|
|
|
70,653 |
|
| West Japan Railway Co. |
|
|
2,200 |
|
|
|
40,953 |
|
| Yakult Honsha Co. Ltd. |
|
|
1,300 |
|
|
|
23,242 |
|
| Yamaha Motor Co. Ltd. |
|
|
4,500 |
|
|
|
41,646 |
|
| Yamato Holdings Co. Ltd. |
|
|
1,400 |
|
|
|
15,389 |
|
| Yaskawa Electric Corp. |
|
|
1,300 |
|
|
|
46,678 |
|
| Yokogawa Electric Corp. |
|
|
1,100 |
|
|
|
26,596 |
|
| Zensho Holdings Co. Ltd. |
|
|
500 |
|
|
|
19,112 |
|
| ZOZO, Inc. |
|
|
700 |
|
|
|
17,525 |
|
|
|
|
|
|
|
|
|
|
|
|
|
|
|
|
|
|
|
|
19,748,597 |
|
|
|
|
|
|
|
|
|
|
| Jordan - 0.0% (C) |
|
| Hikma Pharmaceuticals PLC |
|
|
787 |
|
|
|
18,813 |
|
|
|
|
|
|
|
|
|
|
|
| Luxembourg - 0.2% |
|
| ArcelorMittal SA |
|
|
2,719 |
|
|
|
62,228 |
|
| Eurofins Scientific SE |
|
|
689 |
|
|
|
34,348 |
|
| Tenaris SA |
|
|
2,489 |
|
|
|
38,251 |
|
|
|
|
|
|
|
|
|
|
|
|
|
|
|
|
|
|
|
|
134,827 |
|
|
|
|
|
|
|
|
|
|
| Macau - 0.0% (C) |
|
| Sands China Ltd. (A) |
|
|
12,400 |
|
|
|
25,851 |
|
|
|
|
|
|
|
|
|
|
|
| Netherlands - 5.5% |
|
| ABN AMRO Bank NV (B) |
|
|
2,470 |
|
|
|
40,605 |
|
| Adyen NV (A)(B) |
|
|
114 |
|
|
|
135,909 |
|
| Akzo Nobel NV |
|
|
910 |
|
|
|
55,336 |
|
| Argenx SE (A) |
|
|
311 |
|
|
|
136,091 |
|
| ASM International NV |
|
|
249 |
|
|
|
189,813 |
|
| ASML Holding NV |
|
|
2,104 |
|
|
|
2,172,612 |
|
| BE Semiconductor Industries NV |
|
|
412 |
|
|
|
68,898 |
|
| Euronext NV (B) |
|
|
450 |
|
|
|
41,687 |
|
| EXOR NV |
|
|
531 |
|
|
|
55,559 |
|
| Ferrovial SE |
|
|
2,733 |
|
|
|
106,130 |
|
| Heineken Holding NV |
|
|
693 |
|
|
|
54,661 |
|
| Heineken NV |
|
|
1,525 |
|
|
|
147,478 |
|
| IMCD NV |
|
|
294 |
|
|
|
40,711 |
|
| ING Groep NV, Series N |
|
|
17,434 |
|
|
|
298,026 |
|
| JDE Peet’s NV |
|
|
679 |
|
|
|
13,525 |
|
| Koninklijke Ahold Delhaize NV |
|
|
4,908 |
|
|
|
145,019 |
|
| Koninklijke KPN NV |
|
|
21,025 |
|
|
|
80,610 |
|
| Koninklijke Philips NV (A) |
|
|
4,183 |
|
|
|
105,678 |
|
| NN Group NV |
|
|
1,465 |
|
|
|
68,170 |
|
| OCI NV |
|
|
488 |
|
|
|
11,911 |
|
| Prosus NV |
|
|
7,641 |
|
|
|
272,171 |
|
| Qiagen NV (A) |
|
|
1,103 |
|
|
|
45,537 |
|
| Randstad NV |
|
|
545 |
|
|
|
24,707 |
|
| Stellantis NV |
|
|
11,707 |
|
|
|
231,595 |
|
The Notes to Financial Statements are an integral part of this report.
|
|
|
|
|
| Transamerica Series Trust |
|
|
|
Semi-Annual Financial Statements 2024 |
|
|
Page 5 |
|
|
Transamerica MSCI EAFE Index VP
SCHEDULE OF INVESTMENTS (continued)
At June 30, 2024
(unaudited)
|
|
|
|
|
|
|
|
|
| |
|
Shares |
|
|
Value |
|
| COMMON STOCKS (continued) |
|
| Netherlands (continued) |
|
| Universal Music Group NV |
|
|
4,359 |
|
|
|
$ 129,685 |
|
| Wolters Kluwer NV |
|
|
1,299 |
|
|
|
215,352 |
|
|
|
|
|
|
|
|
|
|
|
|
|
|
|
|
|
|
|
|
4,887,476 |
|
|
|
|
|
|
|
|
|
|
| New Zealand - 0.2% |
|
| Auckland International Airport Ltd. |
|
|
6,774 |
|
|
|
31,482 |
|
| Fisher & Paykel Healthcare Corp. Ltd. |
|
|
3,021 |
|
|
|
55,294 |
|
| Mercury Ltd. |
|
|
3,934 |
|
|
|
15,731 |
|
| Meridian Energy Ltd. |
|
|
6,800 |
|
|
|
26,052 |
|
| Spark New Zealand Ltd. |
|
|
8,933 |
|
|
|
22,635 |
|
| Xero Ltd. (A) |
|
|
771 |
|
|
|
70,155 |
|
|
|
|
|
|
|
|
|
|
|
|
|
|
|
|
|
|
|
|
221,349 |
|
|
|
|
|
|
|
|
|
|
| Norway - 0.6% |
|
| Aker BP ASA |
|
|
1,603 |
|
|
|
40,867 |
|
| DNB Bank ASA |
|
|
4,741 |
|
|
|
93,115 |
|
| Equinor ASA |
|
|
4,772 |
|
|
|
135,848 |
|
| Gjensidige Forsikring ASA |
|
|
1,033 |
|
|
|
18,460 |
|
| Kongsberg Gruppen ASA |
|
|
473 |
|
|
|
38,542 |
|
| Mowi ASA |
|
|
2,355 |
|
|
|
39,195 |
|
| Norsk Hydro ASA |
|
|
6,727 |
|
|
|
41,898 |
|
| Orkla ASA |
|
|
3,802 |
|
|
|
30,891 |
|
| Salmar ASA |
|
|
344 |
|
|
|
18,107 |
|
| Telenor ASA |
|
|
3,317 |
|
|
|
37,808 |
|
| Yara International ASA |
|
|
788 |
|
|
|
22,702 |
|
|
|
|
|
|
|
|
|
|
|
|
|
|
|
|
|
|
|
|
517,433 |
|
|
|
|
|
|
|
|
|
|
| Poland - 0.0% (C) |
|
| InPost SA (A) |
|
|
1,102 |
|
|
|
19,426 |
|
|
|
|
|
|
|
|
|
|
|
| Portugal - 0.2% |
|
| EDP - Energias de Portugal SA |
|
|
16,732 |
|
|
|
62,699 |
|
| Galp Energia SGPS SA |
|
|
2,518 |
|
|
|
53,178 |
|
| Jeronimo Martins SGPS SA |
|
|
1,477 |
|
|
|
28,868 |
|
|
|
|
|
|
|
|
|
|
|
|
|
|
|
|
|
|
|
|
144,745 |
|
|
|
|
|
|
|
|
|
|
| Singapore - 1.3% |
|
| CapitaLand Ascendas, REIT |
|
|
18,803 |
|
|
|
35,498 |
|
| CapitaLand Integrated Commercial Trust, REIT |
|
|
27,252 |
|
|
|
39,793 |
|
| Capitaland Investment Ltd. |
|
|
13,294 |
|
|
|
26,078 |
|
| DBS Group Holdings Ltd. |
|
|
10,480 |
|
|
|
276,607 |
|
| Genting Singapore Ltd. |
|
|
29,200 |
|
|
|
18,627 |
|
| Grab Holdings Ltd., Class A (A) |
|
|
11,300 |
|
|
|
40,115 |
|
| Keppel Ltd. |
|
|
7,500 |
|
|
|
35,786 |
|
| Oversea-Chinese Banking Corp. Ltd. |
|
|
17,560 |
|
|
|
186,866 |
|
| Sea Ltd., ADR (A) |
|
|
1,900 |
|
|
|
135,698 |
|
| Sembcorp Industries Ltd. |
|
|
4,600 |
|
|
|
16,317 |
|
| Singapore Airlines Ltd. |
|
|
7,500 |
|
|
|
38,164 |
|
| Singapore Exchange Ltd. |
|
|
4,600 |
|
|
|
32,159 |
|
| Singapore Technologies Engineering Ltd. |
|
|
8,200 |
|
|
|
26,184 |
|
| Singapore Telecommunications Ltd. |
|
|
43,800 |
|
|
|
88,828 |
|
| United Overseas Bank Ltd. |
|
|
6,700 |
|
|
|
154,802 |
|
| Wilmar International Ltd. |
|
|
10,000 |
|
|
|
22,861 |
|
|
|
|
|
|
|
|
|
|
|
|
|
|
|
|
|
|
|
|
1,174,383 |
|
|
|
|
|
|
|
|
|
|
| Spain - 2.5% |
|
| Acciona SA |
|
|
114 |
|
|
|
13,466 |
|
|
|
|
|
|
|
|
|
|
| |
|
Shares |
|
|
Value |
|
| COMMON STOCKS (continued) |
|
| Spain (continued) |
|
| ACS Actividades de Construccion y Servicios SA |
|
|
1,090 |
|
|
|
$ 47,020 |
|
| Aena SME SA (B) |
|
|
398 |
|
|
|
80,133 |
|
| Amadeus IT Group SA |
|
|
2,362 |
|
|
|
157,188 |
|
| Banco Bilbao Vizcaya Argentaria SA |
|
|
30,803 |
|
|
|
308,508 |
|
| Banco de Sabadell SA |
|
|
29,079 |
|
|
|
56,072 |
|
| Banco Santander SA |
|
|
83,563 |
|
|
|
387,544 |
|
| CaixaBank SA |
|
|
19,509 |
|
|
|
103,275 |
|
| Cellnex Telecom SA (A)(B) |
|
|
2,629 |
|
|
|
85,508 |
|
| EDP Renovaveis SA |
|
|
1,577 |
|
|
|
22,040 |
|
| Endesa SA |
|
|
1,645 |
|
|
|
30,892 |
|
| Grifols SA (A) |
|
|
1,427 |
|
|
|
12,012 |
|
| Iberdrola SA |
|
|
30,510 |
|
|
|
395,854 |
|
| Industria de Diseno Textil SA |
|
|
5,694 |
|
|
|
282,703 |
|
| Redeia Corp. SA |
|
|
2,103 |
|
|
|
36,756 |
|
| Repsol SA |
|
|
6,543 |
|
|
|
103,252 |
|
| Telefonica SA |
|
|
25,025 |
|
|
|
106,130 |
|
|
|
|
|
|
|
|
|
|
|
|
|
|
|
|
|
|
|
|
2,228,353 |
|
|
|
|
|
|
|
|
|
|
| Sweden - 3.2% |
|
| Alfa Laval AB |
|
|
1,542 |
|
|
|
67,520 |
|
| Assa Abloy AB, Class B |
|
|
5,308 |
|
|
|
150,040 |
|
| Atlas Copco AB, A Shares |
|
|
14,025 |
|
|
|
263,589 |
|
| Atlas Copco AB, B Shares |
|
|
8,206 |
|
|
|
132,508 |
|
| Beijer Ref AB |
|
|
1,899 |
|
|
|
29,294 |
|
| Boliden AB |
|
|
1,385 |
|
|
|
44,311 |
|
| Epiroc AB, Class A |
|
|
3,508 |
|
|
|
70,001 |
|
| Epiroc AB, Class B |
|
|
2,029 |
|
|
|
37,100 |
|
| EQT AB |
|
|
1,994 |
|
|
|
58,923 |
|
| Essity AB, Class B |
|
|
3,126 |
|
|
|
80,045 |
|
| Evolution AB (B) |
|
|
963 |
|
|
|
100,307 |
|
| Fastighets AB Balder, B Shares (A) |
|
|
3,367 |
|
|
|
23,069 |
|
| Getinge AB, B Shares |
|
|
1,095 |
|
|
|
18,601 |
|
| H&M Hennes & Mauritz AB, B Shares |
|
|
3,278 |
|
|
|
51,850 |
|
| Hexagon AB, B Shares |
|
|
10,909 |
|
|
|
123,150 |
|
| Holmen AB, B Shares |
|
|
345 |
|
|
|
13,580 |
|
| Husqvarna AB, B Shares |
|
|
1,919 |
|
|
|
15,379 |
|
| Industrivarden AB, A Shares |
|
|
709 |
|
|
|
24,122 |
|
| Industrivarden AB, C Shares |
|
|
762 |
|
|
|
25,709 |
|
| Indutrade AB |
|
|
1,398 |
|
|
|
35,824 |
|
| Investment AB Latour, B Shares |
|
|
814 |
|
|
|
21,980 |
|
| Investor AB, B Shares |
|
|
9,141 |
|
|
|
250,280 |
|
| L E Lundbergforetagen AB, B Shares |
|
|
413 |
|
|
|
20,418 |
|
| Lifco AB, B Shares |
|
|
1,260 |
|
|
|
34,594 |
|
| Nibe Industrier AB, B Shares |
|
|
7,569 |
|
|
|
32,093 |
|
| Saab AB, Class B |
|
|
1,748 |
|
|
|
42,055 |
|
| Sagax AB, Class B |
|
|
1,189 |
|
|
|
30,423 |
|
| Sandvik AB |
|
|
5,605 |
|
|
|
112,322 |
|
| Securitas AB, B Shares |
|
|
2,645 |
|
|
|
26,253 |
|
| Skandinaviska Enskilda Banken AB, Class A |
|
|
8,345 |
|
|
|
123,218 |
|
| Skanska AB, B Shares |
|
|
1,674 |
|
|
|
30,135 |
|
| SKF AB, B Shares |
|
|
1,737 |
|
|
|
34,874 |
|
| Svenska Cellulosa AB SCA, Class B |
|
|
3,062 |
|
|
|
45,227 |
|
| Svenska Handelsbanken AB, A Shares |
|
|
7,707 |
|
|
|
73,405 |
|
| Swedbank AB, A Shares |
|
|
4,353 |
|
|
|
89,574 |
|
| Swedish Orphan Biovitrum AB (A) |
|
|
1,009 |
|
|
|
26,998 |
|
| Tele2 AB, B Shares |
|
|
2,882 |
|
|
|
29,013 |
|
The Notes to Financial Statements are an integral part of this report.
|
|
|
|
|
| Transamerica Series Trust |
|
|
|
Semi-Annual Financial Statements 2024 |
|
|
Page 6 |
|
|
Transamerica MSCI EAFE Index VP
SCHEDULE OF INVESTMENTS (continued)
At June 30, 2024
(unaudited)
|
|
|
|
|
|
|
|
|
| |
|
Shares |
|
|
Value |
|
| COMMON STOCKS (continued) |
|
| Sweden (continued) |
|
| Telefonaktiebolaget LM Ericsson, B Shares |
|
|
15,496 |
|
|
|
$ 96,201 |
|
| Telia Co. AB |
|
|
11,367 |
|
|
|
30,490 |
|
| Trelleborg AB, B Shares |
|
|
1,156 |
|
|
|
44,979 |
|
| Volvo AB, A Shares |
|
|
1,079 |
|
|
|
28,138 |
|
| Volvo AB, B Shares |
|
|
8,398 |
|
|
|
214,803 |
|
| Volvo Car AB, B Shares (A) |
|
|
4,366 |
|
|
|
13,505 |
|
|
|
|
|
|
|
|
|
|
|
|
|
|
|
|
|
|
|
|
2,815,900 |
|
|
|
|
|
|
|
|
|
|
| Switzerland - 10.3% |
|
| ABB Ltd. |
|
|
8,440 |
|
|
|
468,946 |
|
| Adecco Group AG |
|
|
829 |
|
|
|
27,515 |
|
| Alcon, Inc. |
|
|
2,639 |
|
|
|
235,629 |
|
| Avolta AG |
|
|
465 |
|
|
|
18,063 |
|
| Bachem Holding AG |
|
|
197 |
|
|
|
18,079 |
|
| Baloise Holding AG |
|
|
248 |
|
|
|
43,668 |
|
| Banque Cantonale Vaudoise |
|
|
148 |
|
|
|
15,707 |
|
| Barry Callebaut AG |
|
|
18 |
|
|
|
29,331 |
|
| BKW AG |
|
|
117 |
|
|
|
18,661 |
|
| Chocoladefabriken Lindt & Spruengli AG |
|
|
6 |
|
|
|
173,910 |
|
| Cie Financiere Richemont SA, Class A |
|
|
2,837 |
|
|
|
442,862 |
|
| Clariant AG |
|
|
978 |
|
|
|
15,392 |
|
| Coca-Cola HBC AG |
|
|
1,138 |
|
|
|
38,812 |
|
| DSM-Firmenich AG |
|
|
980 |
|
|
|
110,831 |
|
| EMS-Chemie Holding AG |
|
|
39 |
|
|
|
31,970 |
|
| Geberit AG |
|
|
176 |
|
|
|
103,980 |
|
| Givaudan SA |
|
|
48 |
|
|
|
227,592 |
|
| Glencore PLC |
|
|
54,756 |
|
|
|
312,238 |
|
| Helvetia Holding AG |
|
|
181 |
|
|
|
24,477 |
|
| Holcim AG |
|
|
2,753 |
|
|
|
243,969 |
|
| Julius Baer Group Ltd. |
|
|
1,061 |
|
|
|
59,282 |
|
| Kuehne & Nagel International AG |
|
|
258 |
|
|
|
74,202 |
|
| Logitech International SA |
|
|
827 |
|
|
|
80,008 |
|
| Lonza Group AG |
|
|
389 |
|
|
|
212,327 |
|
| Nestle SA |
|
|
13,579 |
|
|
|
1,386,238 |
|
| Novartis AG |
|
|
10,388 |
|
|
|
1,111,930 |
|
| Partners Group Holding AG |
|
|
120 |
|
|
|
154,132 |
|
| Roche Holding AG |
|
|
3,875 |
|
|
|
1,080,742 |
|
| Sandoz Group AG |
|
|
2,177 |
|
|
|
78,846 |
|
| Schindler Holding AG |
|
|
328 |
|
|
|
82,192 |
|
| SGS SA |
|
|
788 |
|
|
|
70,165 |
|
| Siemens Energy AG (A) |
|
|
3,189 |
|
|
|
83,025 |
|
| SIG Group AG |
|
|
1,672 |
|
|
|
30,613 |
|
| Sika AG |
|
|
805 |
|
|
|
230,448 |
|
| Sonova Holding AG |
|
|
260 |
|
|
|
80,334 |
|
| STMicroelectronics NV |
|
|
3,582 |
|
|
|
141,419 |
|
| Straumann Holding AG |
|
|
572 |
|
|
|
70,859 |
|
| Swatch Group AG |
|
|
422 |
|
|
|
41,839 |
|
| Swiss Life Holding AG |
|
|
157 |
|
|
|
115,437 |
|
| Swiss Prime Site AG |
|
|
397 |
|
|
|
37,648 |
|
| Swiss Re AG |
|
|
1,594 |
|
|
|
197,820 |
|
| Swisscom AG |
|
|
138 |
|
|
|
77,644 |
|
| Temenos AG |
|
|
304 |
|
|
|
20,978 |
|
| UBS Group AG |
|
|
17,349 |
|
|
|
510,747 |
|
| VAT Group AG (B) |
|
|
144 |
|
|
|
81,645 |
|
| Zurich Insurance Group AG |
|
|
772 |
|
|
|
411,670 |
|
|
|
|
|
|
|
|
|
|
|
|
|
|
|
|
|
|
|
|
9,123,822 |
|
|
|
|
|
|
|
|
|
|
|
|
|
|
|
|
|
|
|
| |
|
Shares |
|
|
Value |
|
| COMMON STOCKS (continued) |
|
| United Kingdom - 13.6% |
|
| 3i Group PLC |
|
|
5,146 |
|
|
|
$ 199,445 |
|
| Admiral Group PLC |
|
|
1,325 |
|
|
|
43,799 |
|
| Anglo American PLC |
|
|
6,667 |
|
|
|
210,862 |
|
| Ashtead Group PLC |
|
|
2,293 |
|
|
|
153,103 |
|
| Associated British Foods PLC |
|
|
1,806 |
|
|
|
56,481 |
|
| AstraZeneca PLC |
|
|
8,169 |
|
|
|
1,275,934 |
|
| Auto Trader Group PLC (B) |
|
|
4,647 |
|
|
|
47,065 |
|
| Aviva PLC |
|
|
14,055 |
|
|
|
84,677 |
|
| BAE Systems PLC |
|
|
15,973 |
|
|
|
266,527 |
|
| Barclays PLC |
|
|
79,388 |
|
|
|
209,640 |
|
| Barratt Developments PLC |
|
|
4,981 |
|
|
|
29,732 |
|
| Berkeley Group Holdings PLC |
|
|
571 |
|
|
|
33,116 |
|
| BP PLC |
|
|
89,041 |
|
|
|
534,869 |
|
| British American Tobacco PLC |
|
|
10,603 |
|
|
|
325,699 |
|
| BT Group PLC |
|
|
33,294 |
|
|
|
59,069 |
|
| Bunzl PLC |
|
|
1,795 |
|
|
|
68,299 |
|
| Burberry Group PLC |
|
|
1,804 |
|
|
|
20,018 |
|
| Centrica PLC |
|
|
28,376 |
|
|
|
48,389 |
|
| Coca-Cola Europacific Partners PLC |
|
|
1,147 |
|
|
|
83,582 |
|
| Compass Group PLC |
|
|
8,923 |
|
|
|
243,638 |
|
| Croda International PLC |
|
|
720 |
|
|
|
35,933 |
|
| Diageo PLC |
|
|
11,636 |
|
|
|
366,182 |
|
| Endeavour Mining PLC |
|
|
871 |
|
|
|
18,563 |
|
| Entain PLC |
|
|
3,096 |
|
|
|
24,656 |
|
| GSK PLC |
|
|
21,866 |
|
|
|
422,766 |
|
| Haleon PLC |
|
|
35,833 |
|
|
|
146,126 |
|
| Halma PLC |
|
|
1,927 |
|
|
|
65,916 |
|
| Hargreaves Lansdown PLC |
|
|
1,738 |
|
|
|
24,870 |
|
| HSBC Holdings PLC |
|
|
99,070 |
|
|
|
856,478 |
|
| Imperial Brands PLC |
|
|
4,326 |
|
|
|
110,682 |
|
| Informa PLC |
|
|
6,913 |
|
|
|
74,786 |
|
| InterContinental Hotels Group PLC |
|
|
849 |
|
|
|
89,356 |
|
| Intertek Group PLC |
|
|
820 |
|
|
|
49,693 |
|
| J Sainsbury PLC |
|
|
8,635 |
|
|
|
27,835 |
|
| JD Sports Fashion PLC |
|
|
13,869 |
|
|
|
20,951 |
|
| Kingfisher PLC |
|
|
9,457 |
|
|
|
29,743 |
|
| Land Securities Group PLC, REIT |
|
|
3,597 |
|
|
|
28,168 |
|
| Legal & General Group PLC |
|
|
31,749 |
|
|
|
91,104 |
|
| Lloyds Banking Group PLC |
|
|
332,539 |
|
|
|
230,106 |
|
| London Stock Exchange Group PLC |
|
|
2,405 |
|
|
|
285,775 |
|
| M&G PLC |
|
|
11,813 |
|
|
|
30,463 |
|
| Melrose Industries PLC |
|
|
6,776 |
|
|
|
47,402 |
|
| Mondi PLC |
|
|
2,276 |
|
|
|
43,689 |
|
| National Grid PLC |
|
|
25,380 |
|
|
|
283,163 |
|
| NatWest Group PLC |
|
|
34,684 |
|
|
|
136,706 |
|
| Next PLC |
|
|
643 |
|
|
|
73,446 |
|
| Pearson PLC |
|
|
3,314 |
|
|
|
41,507 |
|
| Persimmon PLC |
|
|
1,576 |
|
|
|
26,935 |
|
| Phoenix Group Holdings PLC |
|
|
4,054 |
|
|
|
26,725 |
|
| Reckitt Benckiser Group PLC |
|
|
3,724 |
|
|
|
201,575 |
|
| RELX PLC |
|
|
9,905 |
|
|
|
455,636 |
|
| Rentokil Initial PLC |
|
|
13,456 |
|
|
|
78,449 |
|
| Rio Tinto PLC |
|
|
5,948 |
|
|
|
391,056 |
|
| Rolls-Royce Holdings PLC (A) |
|
|
44,013 |
|
|
|
254,149 |
|
| Sage Group PLC |
|
|
5,400 |
|
|
|
74,303 |
|
| Schroders PLC |
|
|
4,010 |
|
|
|
18,441 |
|
The Notes to Financial Statements are an integral part of this report.
|
|
|
|
|
| Transamerica Series Trust |
|
|
|
Semi-Annual Financial Statements 2024 |
|
|
Page 7 |
|
|
Transamerica MSCI EAFE Index VP
SCHEDULE OF INVESTMENTS (continued)
At June 30, 2024
(unaudited)
|
|
|
|
|
|
|
|
|
| |
|
Shares |
|
|
Value |
|
| COMMON STOCKS (continued) |
|
| United Kingdom (continued) |
|
| Segro PLC, REIT |
|
|
6,772 |
|
|
|
$ 76,890 |
|
| Severn Trent PLC |
|
|
1,356 |
|
|
|
40,796 |
|
| Shell PLC |
|
|
33,771 |
|
|
|
1,209,832 |
|
| Smith & Nephew PLC |
|
|
4,652 |
|
|
|
57,665 |
|
| Smiths Group PLC |
|
|
1,802 |
|
|
|
38,838 |
|
| Spirax Group PLC |
|
|
370 |
|
|
|
39,662 |
|
| SSE PLC |
|
|
5,753 |
|
|
|
130,139 |
|
| Standard Chartered PLC |
|
|
11,736 |
|
|
|
106,222 |
|
| Taylor Wimpey PLC |
|
|
18,153 |
|
|
|
32,619 |
|
| Tesco PLC |
|
|
37,263 |
|
|
|
144,139 |
|
| Unilever PLC |
|
|
13,209 |
|
|
|
725,506 |
|
| United Utilities Group PLC |
|
|
3,464 |
|
|
|
43,026 |
|
| Vodafone Group PLC |
|
|
122,078 |
|
|
|
107,653 |
|
| Whitbread PLC |
|
|
949 |
|
|
|
35,689 |
|
| Wise PLC, Class A (A) |
|
|
3,204 |
|
|
|
27,602 |
|
| WPP PLC |
|
|
5,760 |
|
|
|
52,745 |
|
|
|
|
|
|
|
|
|
|
|
|
|
|
|
|
|
|
|
|
12,046,301 |
|
|
|
|
|
|
|
|
|
|
|
|
|
| Total Common Stocks
(Cost $72,595,103) |
|
|
|
|
|
|
86,520,226 |
|
|
|
|
|
|
|
|
|
|
|
| PREFERRED STOCKS - 0.4% |
|
| Germany - 0.4% |
|
| Bayerische Motoren Werke AG,
7.30% (D) |
|
|
312 |
|
|
|
27,549 |
|
| Dr. Ing. h.c. F. Porsche AG,
3.32% (B)(D) |
|
|
610 |
|
|
|
45,416 |
|
| Henkel AG & Co. KGaA,
2.24% (D) |
|
|
870 |
|
|
|
77,538 |
|
| Porsche Automobil Holding SE,
6.08% (D) |
|
|
770 |
|
|
|
34,808 |
|
|
|
|
|
|
|
|
|
|
| |
|
Shares |
|
|
Value |
|
| PREFERRED STOCKS (continued) |
|
| Germany (continued) |
|
| Sartorius AG,
0.34% (D) |
|
|
133 |
|
|
|
$ 31,194 |
|
| Volkswagen AG,
8.60% (D) |
|
|
1,092 |
|
|
|
123,263 |
|
|
|
|
|
|
|
|
|
|
|
|
|
| Total Preferred Stocks
(Cost $442,646) |
|
|
|
|
|
|
339,768 |
|
|
|
|
|
|
|
|
|
|
|
| RIGHTS - 0.0% |
|
| Italy - 0.0% |
|
| Amplifon SpA, (A)(E)(F)
Exercise Price EUR 29.56,
Expiration Date 07/09/2024 |
|
|
662 |
|
|
|
0 |
|
|
|
|
|
|
|
|
|
|
|
|
|
| Total Rights
(Cost $0) |
|
|
|
|
|
|
0 |
|
|
|
|
|
|
|
|
|
|
|
|
|
| |
|
Principal |
|
|
Value |
|
| REPURCHASE AGREEMENT - 1.2% |
|
| Fixed Income Clearing Corp.,
2.50% (D), dated 06/28/2024, to be repurchased at $1,060,450 on 07/01/2024. Collateralized by a U.S. Government Obligation, 3.75%, due 04/15/2026, and with a value of $1,081,605. |
|
|
$ 1,060,229 |
|
|
|
1,060,229 |
|
|
|
|
|
|
|
|
|
|
| Total Repurchase Agreement
(Cost $1,060,229) |
|
|
|
1,060,229 |
|
|
|
|
|
|
|
|
|
| Total Investments
(Cost $74,097,978) |
|
|
|
87,920,223 |
|
|
|
| Net Other Assets (Liabilities) - 0.8% |
|
|
|
720,008 |
|
|
|
|
|
|
|
|
|
|
|
|
| Net Assets - 100.0% |
|
|
|
$ 88,640,231 |
|
|
|
|
|
|
|
FUTURES CONTRACTS:
|
|
|
|
|
|
|
|
|
|
|
|
|
| Long Futures Contracts |
| |
|
|
|
|
|
|
| Description |
|
Number of Contracts |
|
Expiration Date |
|
Notional Amount |
|
Value |
|
Unrealized Appreciation |
|
Unrealized Depreciation |
| MSCI EAFE Mini Index |
|
16 |
|
09/20/2024 |
|
$1,875,290 |
|
$1,874,560 |
|
$— |
|
$(730) |
|
|
|
|
|
| The Notes to Financial Statements are an integral part of this report. |
|
|
|
Semi-Annual Financial Statements 2024 |
| Transamerica Series Trust |
|
|
|
|
|
|
Page 8 |
|
|
Transamerica MSCI EAFE Index VP
SCHEDULE OF INVESTMENTS (continued)
At June 30, 2024
(unaudited)
INVESTMENT VALUATION:
|
|
|
|
|
|
|
|
|
|
|
|
|
|
|
|
|
| |
|
|
|
|
| Valuation Inputs (G) |
|
|
|
|
|
|
|
|
|
|
|
|
|
|
|
|
|
| |
|
Level 1 - Unadjusted Quoted Prices |
|
|
Level 2 - Other Significant Observable Inputs |
|
|
Level 3 - Significant Unobservable Inputs |
|
|
Value |
|
| ASSETS |
|
|
|
|
|
|
|
|
|
|
|
|
|
|
|
|
| Investments |
|
|
|
|
|
|
|
|
|
|
|
|
|
|
|
|
| Common Stocks |
|
$ |
730,288 |
|
|
$ |
85,789,938 |
|
|
$ |
— |
|
|
$ |
86,520,226 |
|
| Preferred Stocks |
|
|
— |
|
|
|
339,768 |
|
|
|
— |
|
|
|
339,768 |
|
| Rights |
|
|
— |
|
|
|
0 |
|
|
|
— |
|
|
|
0 |
|
| Repurchase Agreement |
|
|
— |
|
|
|
1,060,229 |
|
|
|
— |
|
|
|
1,060,229 |
|
|
|
|
|
|
|
|
|
|
|
|
|
|
|
|
|
|
| Total Investments |
|
$ |
730,288 |
|
|
$ |
87,189,935 |
|
|
$ |
— |
|
|
$ |
87,920,223 |
|
|
|
|
|
|
|
|
|
|
|
|
|
|
|
|
|
|
|
|
|
|
|
| LIABILITIES |
|
|
|
|
|
|
|
|
|
|
|
|
|
|
|
|
| Other Financial Instruments |
|
|
|
|
|
|
|
|
|
|
|
|
|
|
|
|
| Futures Contracts (H) |
|
$ |
(730 |
) |
|
$ |
— |
|
|
$ |
— |
|
|
$ |
(730 |
) |
|
|
|
|
|
|
|
|
|
|
|
|
|
|
|
|
|
| Total Other Financial Instruments |
|
$ |
(730 |
) |
|
$ |
— |
|
|
$ |
— |
|
|
$ |
(730 |
) |
|
|
|
|
|
|
|
|
|
|
|
|
|
|
|
|
|
FOOTNOTES TO SCHEDULE OF INVESTMENTS:
| (A) |
Non-income producing security. |
| (B) |
Security is exempt from registration pursuant to Rule 144A of the Securities Act of 1933. Security may be resold as transactions exempt from registration, normally to qualified institutional buyers. At June 30, 2024, the total value of 144A securities is $1,066,187, representing 1.2% of the Portfolio’s net assets. |
| (C) |
Percentage rounds to less than 0.1% or (0.1)%. |
| (D) |
Rate disclosed reflects the yield at June 30, 2024. |
| (E) |
Fair valued as determined in good faith in accordance with TAM’s procedures. At June 30, 2024, the total value of the securities is $0, representing 0.0% of the Portfolio’s net assets. |
| (F) |
Rounds to less than $1 or $(1). |
| (G) |
There were no transfers in or out of Level 3 during the period ended June 30, 2024. Please reference the Investment Valuation section of the Notes to Financial Statements for more information regarding investment valuation and pricing inputs. |
| (H) |
Derivative instruments are valued at unrealized appreciation (depreciation). |
CURRENCY ABBREVIATION(S):
PORTFOLIO ABBREVIATION(S):
|
|
|
| ADR |
|
American Depositary Receipt |
| CDI |
|
CHESS Depositary Interests |
| CVA |
|
Commanditaire Vennootschap op Aandelen (Dutch Certificate) |
| EAFE |
|
Europe, Australasia and Far East |
| REIT |
|
Real Estate Investment Trust |
The Notes to Financial Statements are an integral part of this report.
|
|
|
|
|
| Transamerica Series Trust |
|
|
|
Semi-Annual Financial Statements 2024 |
|
|
Page 9 |
|
|
Transamerica MSCI EAFE Index VP
STATEMENT OF ASSETS AND LIABILITIES
At June 30, 2024
(unaudited)
|
|
|
|
|
|
|
| Assets: |
|
|
|
|
| Investments, at value (cost $73,037,749) |
|
$ |
86,859,994 |
|
| Repurchase agreement, at value (cost $1,060,229) |
|
|
1,060,229 |
|
| Cash collateral pledged at broker for: |
|
|
|
|
| Futures contracts |
|
|
65,465 |
|
| Foreign currency, at value (cost $344,386) |
|
|
341,827 |
|
| Receivables and other assets: |
|
|
|
|
| Shares of beneficial interest sold |
|
|
11,397 |
|
| Dividends |
|
|
110,768 |
|
| Interest |
|
|
221 |
|
| Tax reclaims |
|
|
285,794 |
|
| Due from investment manager |
|
|
1,889 |
|
| Prepaid expenses |
|
|
359 |
|
| |
|
| Total assets |
|
|
88,737,943 |
|
|
|
| Liabilities: |
|
|
|
|
| Payables and other liabilities: |
|
|
|
|
| Shares of beneficial interest redeemed |
|
|
100 |
|
| Distribution and service fees |
|
|
14,697 |
|
| Transfer agent costs |
|
|
55 |
|
| Trustee and CCO fees |
|
|
177 |
|
| Audit and tax fees |
|
|
25,670 |
|
| Custody fees |
|
|
40,792 |
|
| Legal fees |
|
|
1,230 |
|
| Printing and shareholder reports fees |
|
|
1,205 |
|
| Other accrued expenses |
|
|
7,550 |
|
| Variation margin payable on futures contracts |
|
|
6,236 |
|
|
|
| Total liabilities |
|
|
97,712 |
|
|
|
| Net assets |
|
$ |
88,640,231 |
|
|
|
| Net assets consist of: |
|
|
|
|
| Capital stock ($0.01 par value) |
|
$ |
67,042 |
|
| Additional paid-in capital |
|
|
73,523,449 |
|
| Total distributable earnings (accumulated losses) |
|
|
15,049,740 |
|
| |
|
| Net assets |
|
$ |
88,640,231 |
|
|
|
| Net assets by class: |
|
|
|
|
| Initial Class |
|
$ |
12,318,204 |
|
| Service Class |
|
|
76,322,027 |
|
|
|
| Shares outstanding: |
|
|
|
|
| Initial Class |
|
|
926,191 |
|
| Service Class |
|
|
5,778,021 |
|
|
|
| Net asset value and offering price per share: |
|
|
|
|
| Initial Class |
|
$ |
13.30 |
|
| Service Class |
|
|
13.21 |
|
STATEMENT OF OPERATIONS
For the period ended June 30, 2024
(unaudited)
|
|
|
|
|
|
|
| Investment income: |
|
|
|
|
| Dividend income |
|
$ |
1,863,780 |
|
| Interest income |
|
|
10,276 |
|
| Withholding taxes on foreign income |
|
|
(200,323 |
) |
|
|
| Total investment income |
|
|
1,673,733 |
|
|
|
| Expenses: |
|
|
|
|
| Investment management fees |
|
|
46,808 |
|
| Distribution and service fees: |
|
|
|
|
| Service Class |
|
|
91,382 |
|
| Transfer agent costs |
|
|
463 |
|
| Trustee and CCO fees |
|
|
1,943 |
|
| Audit and tax fees |
|
|
25,603 |
|
| Custody fees |
|
|
42,586 |
|
| Legal fees |
|
|
2,955 |
|
| Printing and shareholder reports fees |
|
|
2,474 |
|
| Filing fees |
|
|
4,982 |
|
| Other |
|
|
7,051 |
|
|
|
| Total expenses before waiver and/or reimbursement and recapture |
|
|
226,247 |
|
| Expenses waived and/or reimbursed: |
|
|
|
|
| Initial Class |
|
|
(8,209 |
) |
| Service Class |
|
|
(50,061 |
) |
|
|
| Net expenses |
|
|
167,977 |
|
|
|
| Net investment income (loss) |
|
|
1,505,756 |
|
|
|
| Net realized gain (loss) on: |
|
|
|
|
| Investments |
|
|
(410,766 |
) |
| Futures contracts |
|
|
87,913 |
|
| Foreign currency transactions |
|
|
(14,491 |
) |
|
|
| Net realized gain (loss) |
|
|
(337,344 |
) |
|
|
| Net change in unrealized appreciation (depreciation) on: |
|
|
|
|
| Investments |
|
|
3,281,776 |
|
| Futures contracts |
|
|
(40,622 |
) |
| Translation of assets and liabilities denominated in foreign currencies |
|
|
(15,764 |
) |
|
|
| Net change in unrealized appreciation (depreciation) |
|
|
3,225,390 |
|
|
|
| Net realized and change in unrealized gain (loss) |
|
|
2,888,046 |
|
|
|
| Net increase (decrease) in net assets resulting from operations |
|
$ |
4,393,802 |
|
The Notes to Financial Statements are an integral part of this report.
|
|
|
|
|
| Transamerica Series Trust |
|
|
|
Semi-Annual Financial Statements 2024 |
|
|
Page 10 |
|
|
Transamerica MSCI EAFE Index VP
STATEMENT OF CHANGES IN NET ASSETS
For the period and year ended:
|
|
|
|
|
|
|
|
|
|
|
|
| |
|
June 30, 2024
(unaudited) |
|
|
December 31, 2023 |
|
|
|
|
| From operations: |
|
|
|
|
|
|
|
|
|
|
|
| Net investment income (loss) |
|
$ |
1,505,756 |
|
|
$ |
1,903,649 |
|
| Net realized gain (loss) |
|
|
(337,344 |
) |
|
|
(373,150 |
) |
| Net change in unrealized appreciation (depreciation) |
|
|
3,225,390 |
|
|
|
10,421,086 |
|
|
|
|
| Net increase (decrease) in net assets resulting from operations |
|
|
4,393,802 |
|
|
|
11,951,585 |
|
|
|
|
| Dividends and/or distributions to shareholders: |
|
|
|
|
|
|
|
|
| Initial Class |
|
|
— |
|
|
|
(229,190 |
) |
|
|
|
| Service Class |
|
|
— |
|
|
|
(1,514,516 |
) |
|
|
|
| Net increase (decrease) in net assets resulting from dividends and/or distributions to shareholders |
|
|
— |
|
|
|
(1,743,706 |
) |
|
|
|
| Capital share transactions: |
|
|
|
|
|
|
|
|
| Proceeds from shares sold: |
|
|
|
|
|
|
|
|
| Initial Class |
|
|
489,791 |
|
|
|
3,903,876 |
|
|
|
|
| Service Class |
|
|
4,305,941 |
|
|
|
11,643,185 |
|
|
|
|
| |
|
|
4,795,732 |
|
|
|
15,547,061 |
|
| Dividends and/or distributions reinvested: |
|
|
|
|
|
|
|
|
| Initial Class |
|
|
— |
|
|
|
229,190 |
|
|
|
|
| Service Class |
|
|
— |
|
|
|
1,514,516 |
|
|
|
|
| |
|
|
— |
|
|
|
1,743,706 |
|
| Cost of shares redeemed: |
|
|
|
|
|
|
|
|
| Initial Class |
|
|
(680,049 |
) |
|
|
(832,353 |
) |
|
|
|
| Service Class |
|
|
(3,257,232 |
) |
|
|
(10,195,392 |
) |
|
|
|
|
|
|
(3,937,281 |
) |
|
|
(11,027,745 |
) |
| |
|
|
| Net increase (decrease) in net assets resulting from capital share transactions |
|
|
858,451 |
|
|
|
6,263,022 |
|
|
|
|
| Net increase (decrease) in net assets |
|
|
5,252,253 |
|
|
|
16,470,901 |
|
|
|
|
| Net assets: |
|
|
|
|
|
|
|
|
| Beginning of period/year |
|
|
83,387,978 |
|
|
|
66,917,077 |
|
| End of period/year |
|
$ |
88,640,231 |
|
|
$ |
83,387,978 |
|
|
|
|
| Capital share transactions - shares: |
|
|
|
|
|
|
|
|
| Shares issued: |
|
|
|
|
|
|
|
|
| Initial Class |
|
|
38,673 |
|
|
|
324,877 |
|
|
|
|
| Service Class |
|
|
331,270 |
|
|
|
974,596 |
|
|
|
|
| |
|
|
369,943 |
|
|
|
1,299,473 |
|
| Shares reinvested: |
|
|
|
|
|
|
|
|
| Initial Class |
|
|
— |
|
|
|
19,292 |
|
|
|
|
| Service Class |
|
|
— |
|
|
|
128,132 |
|
|
|
|
| |
|
|
— |
|
|
|
147,424 |
|
| Shares redeemed: |
|
|
|
|
|
|
|
|
| Initial Class |
|
|
(52,045 |
) |
|
|
(69,878 |
) |
|
|
|
| Service Class |
|
|
(250,438 |
) |
|
|
(861,431 |
) |
|
|
|
| |
|
|
(302,483 |
) |
|
|
(931,309 |
) |
| Net increase (decrease) in shares outstanding: |
|
|
|
|
|
|
|
|
| Initial Class |
|
|
(13,372 |
) |
|
|
274,291 |
|
|
|
|
| Service Class |
|
|
80,832 |
|
|
|
241,297 |
|
|
|
|
| |
|
|
67,460 |
|
|
|
515,588 |
|
The Notes to Financial Statements are an integral part of this report.
|
|
|
|
|
| Transamerica Series Trust |
|
|
|
Semi-Annual Financial Statements 2024 |
|
|
Page 11 |
|
|
Transamerica MSCI EAFE Index VP
FINANCIAL HIGHLIGHTS
|
|
|
|
|
|
|
|
|
|
|
|
|
|
|
|
|
|
|
|
|
|
|
|
|
|
|
For a share outstanding during the period and
years indicated: |
|
Initial Class |
| |
|
June 30, 2024
(unaudited) |
|
December 31,
2023 |
|
December 31,
2022 |
|
December 31,
2021 |
|
December 31,
2020 |
|
December 31,
2019 |
|
|
|
|
|
|
|
| Net asset value, beginning of period/year |
|
$ |
12.63 |
|
|
$ |
10.98 |
|
|
$ |
13.25 |
|
|
$ |
12.10 |
|
|
$ |
11.40 |
|
|
$ |
9.53 |
|
|
|
|
|
|
|
|
| Investment operations: |
|
|
|
|
|
|
|
|
|
|
|
|
|
|
|
|
|
|
|
|
|
|
|
|
| Net investment income (loss)(A) |
|
|
0.24 |
|
|
|
0.33 |
|
|
|
0.34 |
|
|
|
0.35 |
|
|
|
0.24 |
|
|
|
0.30 |
|
| Net realized and unrealized gain (loss) |
|
|
0.43 |
|
|
|
1.62 |
|
|
|
(2.25 |
) |
|
|
1.01 |
|
|
|
0.65 |
|
|
|
1.72 |
|
| |
|
|
|
|
|
|
| Total investment operations |
|
|
0.67 |
|
|
|
1.95 |
|
|
|
(1.91 |
) |
|
|
1.36 |
|
|
|
0.89 |
|
|
|
2.02 |
|
|
|
|
|
|
|
|
| Dividends and/or distributions to shareholders: |
|
|
|
|
|
|
|
|
|
|
|
|
|
|
|
|
|
|
|
|
|
|
|
|
| Net investment income |
|
|
— |
|
|
|
(0.30 |
) |
|
|
(0.36 |
) |
|
|
(0.21 |
) |
|
|
(0.18 |
) |
|
|
(0.15 |
) |
| Net realized gains |
|
|
— |
|
|
|
— |
|
|
|
— |
|
|
|
— |
|
|
|
(0.01 |
) |
|
|
— |
|
| |
|
|
|
|
|
|
| Total dividends and/or distributions to shareholders |
|
|
— |
|
|
|
(0.30 |
) |
|
|
(0.36 |
) |
|
|
(0.21 |
) |
|
|
(0.19 |
) |
|
|
(0.15 |
) |
| |
|
|
|
|
|
|
| Net asset value, end of period/year |
|
$ |
13.30 |
|
|
$ |
12.63 |
|
|
$ |
10.98 |
|
|
$ |
13.25 |
|
|
$ |
12.10 |
|
|
$ |
11.40 |
|
| |
|
|
|
|
|
|
|
|
|
|
|
|
|
|
|
|
|
|
|
|
|
|
|
|
|
|
|
|
|
|
|
| Total return |
|
|
5.30 |
%(B) |
|
|
17.92 |
% |
|
|
(14.28 |
)% |
|
|
11.26 |
% |
|
|
8.12 |
% |
|
|
21.32 |
% |
|
|
|
|
|
|
|
| Ratio and supplemental data: |
|
|
|
|
|
|
|
|
|
|
|
|
|
|
|
|
|
|
|
|
|
|
|
|
| Net assets end of period/year (000’s) |
|
$ |
12,318 |
|
|
$ |
11,862 |
|
|
$ |
7,307 |
|
|
$ |
8,288 |
|
|
$ |
6,492 |
|
|
$ |
3,937 |
|
| Expenses to average net assets |
|
|
|
|
|
|
|
|
|
|
|
|
|
|
|
|
|
|
|
|
|
|
|
|
| Excluding waiver and/or reimbursement and recapture |
|
|
0.32 |
%(C) |
|
|
0.36 |
% |
|
|
0.50 |
% |
|
|
0.34 |
% |
|
|
0.57 |
% |
|
|
0.59 |
% |
| Including waiver and/or reimbursement and recapture |
|
|
0.18 |
%(C) |
|
|
0.18 |
% |
|
|
0.18 |
% |
|
|
0.18 |
% |
|
|
0.18 |
% |
|
|
0.18 |
% |
| Net investment income (loss) to average net assets |
|
|
3.74 |
%(C) |
|
|
2.75 |
% |
|
|
3.04 |
% |
|
|
2.67 |
% |
|
|
2.29 |
% |
|
|
2.85 |
% |
| Portfolio turnover rate |
|
|
1 |
%(B) |
|
|
6 |
% |
|
|
4 |
% |
|
|
3 |
% |
|
|
3 |
% |
|
|
5 |
% |
| (A) |
Calculated based on average number of shares outstanding. |
The Notes to Financial Statements are an integral part of this report.
|
|
|
|
|
| Transamerica Series Trust |
|
|
|
Semi-Annual Financial Statements 2024 |
|
|
Page 12 |
|
|
Transamerica MSCI EAFE Index VP
FINANCIAL HIGHLIGHTS (continued)
|
|
|
|
|
|
|
|
|
|
|
|
|
|
|
|
|
|
|
|
|
|
|
|
|
|
|
For a share outstanding during the period and
years indicated: |
|
Service Class |
| |
|
June 30, 2024
(unaudited) |
|
December 31,
2023 |
|
December 31,
2022 |
|
December 31,
2021 |
|
December 31,
2020 |
|
December 31,
2019 |
|
|
|
|
|
|
|
| Net asset value, beginning of period/year |
|
$ |
12.55 |
|
|
$ |
10.93 |
|
|
$ |
13.18 |
|
|
$ |
12.04 |
|
|
$ |
11.37 |
|
|
$ |
9.51 |
|
|
|
|
|
|
|
|
| Investment operations: |
|
|
|
|
|
|
|
|
|
|
|
|
|
|
|
|
|
|
|
|
|
|
|
|
| Net investment income (loss)(A) |
|
|
0.22 |
|
|
|
0.30 |
|
|
|
0.31 |
|
|
|
0.31 |
|
|
|
0.21 |
|
|
|
0.28 |
|
| Net realized and unrealized gain (loss) |
|
|
0.44 |
|
|
|
1.59 |
|
|
|
(2.23 |
) |
|
|
1.02 |
|
|
|
0.64 |
|
|
|
1.71 |
|
| |
|
|
|
|
|
|
| Total investment operations |
|
|
0.66 |
|
|
|
1.89 |
|
|
|
(1.92 |
) |
|
|
1.33 |
|
|
|
0.85 |
|
|
|
1.99 |
|
|
|
|
|
|
|
|
| Dividends and/or distributions to shareholders: |
|
|
|
|
|
|
|
|
|
|
|
|
|
|
|
|
|
|
|
|
|
|
|
|
| Net investment income |
|
|
— |
|
|
|
(0.27 |
) |
|
|
(0.33 |
) |
|
|
(0.19 |
) |
|
|
(0.17 |
) |
|
|
(0.13 |
) |
| Net realized gains |
|
|
— |
|
|
|
— |
|
|
|
— |
|
|
|
— |
|
|
|
(0.01 |
) |
|
|
— |
|
| |
|
|
|
|
|
|
| Total dividends and/or distributions to shareholders |
|
|
— |
|
|
|
(0.27 |
) |
|
|
(0.33 |
) |
|
|
(0.19 |
) |
|
|
(0.18 |
) |
|
|
(0.13 |
) |
| |
|
|
|
|
|
|
| Net asset value, end of period/year |
|
$ |
13.21 |
|
|
$ |
12.55 |
|
|
$ |
10.93 |
|
|
$ |
13.18 |
|
|
$ |
12.04 |
|
|
$ |
11.37 |
|
| |
|
|
|
|
|
|
|
|
|
|
|
|
|
|
|
|
|
|
|
|
|
|
|
|
|
|
|
|
|
|
|
| Total return |
|
|
5.26 |
%(B) |
|
|
17.46 |
% |
|
|
(14.45 |
)% |
|
|
10.95 |
% |
|
|
7.81 |
% |
|
|
21.10 |
% |
|
|
|
|
|
|
|
| Ratio and supplemental data: |
|
|
|
|
|
|
|
|
|
|
|
|
|
|
|
|
|
|
|
|
|
|
|
|
| Net assets end of period/year (000’s) |
|
$ |
76,322 |
|
|
$ |
71,526 |
|
|
$ |
59,610 |
|
|
$ |
70,417 |
|
|
$ |
59,190 |
|
|
$ |
42,262 |
|
| Expenses to average net assets |
|
|
|
|
|
|
|
|
|
|
|
|
|
|
|
|
|
|
|
|
|
|
|
|
| Excluding waiver and/or reimbursement and recapture |
|
|
0.57 |
%(C) |
|
|
0.61 |
% |
|
|
0.75 |
% |
|
|
0.59 |
% |
|
|
0.82 |
% |
|
|
0.84 |
% |
| Including waiver and/or reimbursement and recapture |
|
|
0.43 |
%(C) |
|
|
0.43 |
% |
|
|
0.43 |
% |
|
|
0.43 |
% |
|
|
0.43 |
% |
|
|
0.43 |
% |
| Net investment income (loss) to average net assets |
|
|
3.51 |
%(C) |
|
|
2.55 |
% |
|
|
2.77 |
% |
|
|
2.41 |
% |
|
|
2.01 |
% |
|
|
2.62 |
% |
| Portfolio turnover rate |
|
|
1 |
%(B) |
|
|
6 |
% |
|
|
4 |
% |
|
|
3 |
% |
|
|
3 |
% |
|
|
5 |
% |
| (A) |
Calculated based on average number of shares outstanding. |
The Notes to Financial Statements are an integral part of this report.
|
|
|
|
|
| Transamerica Series Trust |
|
|
|
Semi-Annual Financial Statements 2024 |
|
|
Page 13 |
|
|
Transamerica MSCI EAFE Index VP
NOTES TO FINANCIAL STATEMENTS
At June 30, 2024
(unaudited)
1. ORGANIZATION
Transamerica Series Trust (“TST”) is an open-end management investment company registered under the Investment Company Act of 1940, as amended (the “1940 Act”). TST applies investment company accounting and reporting guidance. TST serves as a funding vehicle for variable life insurance, variable annuity, and group annuity products. Transamerica MSCI EAFE Index VP (the “Portfolio”) is a series of TST and is classified as diversified under the 1940 Act. The Portfolio currently offers two classes of shares, Initial Class and Service Class.
The only shareholders of the Portfolio are affiliated insurance company separate accounts and/or affiliated asset allocation portfolios. Contract holders of the variable life and annuity contracts are not shareholders of the Portfolio. For ease of reference, shareholders and contract holders are collectively referred to in this report as “shareholders.”
This report must be accompanied or preceded by the Portfolio’s current prospectus, which contains additional information about the Portfolio, including risks, as well as investment objectives and strategies.
Transamerica Asset Management, Inc. (“TAM”) serves as investment manager for the Portfolio pursuant to an investment management agreement. TAM provides continuous and regular investment management services to the Portfolio. TAM supervises the Portfolio’s investments, conducts its investment program and provides supervisory, compliance and administrative services to the Portfolio.
TAM currently acts as a “manager of managers” and has hired sub-advisers to furnish day-to-day investment advice and recommendations. TAM may, in the future, determine to provide all aspects of the day-to-day management of the Portfolio without the use of a sub-adviser. When acting as a manager of managers, TAM provides investment management services that include, without limitation, the design and development of the Portfolio and its investment strategies and the ongoing review and evaluation of those investment strategies including recommending changes in strategy where it believes appropriate or advisable; the selection of one or more sub-advisers for the Portfolio employing a combination of quantitative and qualitative screens, research, analysis and due diligence; negotiation of sub-advisory agreements and fees; oversight and monitoring of sub-advisers and recommending changes to sub-advisers where it believes appropriate or advisable; recommending portfolio combinations and liquidations where it believes appropriate or advisable; selection and oversight of transition managers, as needed; regular supervision of the Portfolio’s investments; regular review and evaluation of sub-adviser performance; daily monitoring of the sub-advisers’ buying and selling of securities for the Portfolio; regular review of holdings; ongoing trade oversight and analysis; regular monitoring to ensure adherence to investment process; regular calls and periodic on-site visits with sub-advisers; portfolio construction and asset allocation when using multiple sub-advisers for the Portfolio; risk management oversight and analysis; oversight of negotiation of investment documentation and agreements; design, development, implementation and regular monitoring of the valuation process; periodic due diligence reviews of pricing vendors and vendor methodology; design, development, implementation and regular monitoring of the compliance process; respond to regulatory inquiries and determine appropriate litigation strategy, as needed; review of proxies voted by sub-advisers; oversight of preparation and review of materials for meetings of the Portfolio’s Board of Trustees (the “Board”), participation in these meetings and preparation of regular communications with the Board; oversight of preparation and review of prospectuses, shareholder reports and other disclosure materials and regulatory filings for the Portfolio; oversight of other service providers to the Portfolio, such as the custodian, the transfer agent, the Portfolio’s independent accounting firm and legal counsel; supervision of the performance of recordkeeping and shareholder relations functions for the Portfolio; and oversight of cash management services. TAM uses a variety of quantitative and qualitative tools to carry out its investment management services. TAM, not the Portfolio, is responsible for paying the sub-adviser(s) for their services, and sub-advisory fees are TAM’s expense.
TAM’s investment management services also include the provision of supervisory and administrative services to the Portfolio. These services include performing certain administrative services for the Portfolio and supervising and overseeing the administrative, clerical, recordkeeping and bookkeeping services provided to the Portfolio by State Street Bank and Trust Company (“State Street”), to whom TAM has outsourced the provision of certain sub-administration services. To the extent agreed upon by TAM and the Portfolio from time to time, TAM’s supervisory and administrative services include, but are not limited to: monitoring and verifying the custodian’s daily calculation of the Net Asset Values (“NAV”); shareholder relations functions; compliance services; valuation services; assisting in due diligence and in the oversight and monitoring of certain activities of sub-advisers and certain aspects of Portfolio investments; assisting with Portfolio combinations and liquidations; oversight of the preparation and filing, and review, of all returns and reports, in connection with federal, state and local taxes; oversight and review of regulatory reporting; supervising and coordinating the Portfolio’s custodian and dividend disbursing agent and monitoring their services to the Portfolio; assisting the Portfolio in preparing reports to shareholders; acting as liaison with the Portfolio’s independent public accountants and providing, upon request, analyses, fiscal year summaries and other audit related services; assisting in the preparation of agendas and supporting documents for and minutes of meetings of trustees and committees of trustees; assisting in the preparation of regular communications with the trustees; and providing personnel and office space, telephones and other office equipment as necessary in order for TAM to perform supervisory and administrative services to the Portfolio. The Portfolio pays certain fees and expenses to State Street for sub-administration services which are not administrative services covered by the
|
|
|
|
|
| Transamerica Series Trust |
|
|
|
Semi-Annual Financial Statements 2024 |
|
|
Page 14 |
|
|
Transamerica MSCI EAFE Index VP
NOTES TO FINANCIAL STATEMENTS (continued)
At June 30, 2024
(unaudited)
1. ORGANIZATION (continued)
management agreement with TAM or paid for through the management fees payable thereunder. For the period ended June 30, 2024, (i) the expenses paid to State Street for sub-administration services by the Portfolio are shown as a part of Other expenses within the Statement of Operations and (ii) the expenses payable to State Street for sub-administration services from the Portfolio are shown as part of Other accrued expenses within the Statement of Assets and Liabilities.
2. SIGNIFICANT ACCOUNTING POLICIES
In preparing the Portfolio’s financial statements in accordance with Generally Accepted Accounting Principles in the United States of America (“GAAP”), estimates or assumptions (which could differ from actual results) may be used that affect reported amounts and disclosures. The following is a summary of significant accounting policies followed by the Portfolio.
Foreign currency denominated investments: The accounting records of the Portfolio are maintained in U.S. dollars. Securities and other assets and liabilities denominated in foreign currencies are translated into U.S. dollars based on the closing exchange rate each day. The cost of foreign securities purchased and any realized gains or losses are translated at the prevailing exchange rates in effect on the date of the respective transaction. The Portfolio combines fluctuations from currency exchange rates and fluctuations in value when computing net realized and unrealized gains or losses from investments.
Net foreign currency gains and losses resulting from changes in exchange rates include, foreign currency fluctuations between trade date and settlement date of investment security transactions, gains and losses on forward foreign currency contracts, and the difference between the receivable amounts of interest and dividends recorded in the accounting records in U.S. dollars and the amounts actually received.
Foreign currency denominated assets may involve risks not typically associated with domestic transactions. These risks include revaluation of currencies, adverse fluctuations in foreign currency values, and possible adverse political, social, and economic developments, including those particular to a specific industry, country or region.
Security transactions and investment income: Security transactions are accounted for on the trade date. Security gains and losses are calculated on a first-in, first-out basis. Dividend income, if any, is recorded on the ex-dividend date or, in the case of foreign securities, as soon as the Portfolio is informed of the ex-dividend dates, net of foreign taxes. Non-cash dividends, if any, are recorded on the ex-dividend date at fair value. Interest income, if any, is recorded on the accrual basis from settlement date, net of foreign taxes. Fixed income premiums and discounts are amortized and/or accreted over the lives of the respective securities.
Multiple class operations, income, and expenses: Income, non-class specific expenses, and realized and unrealized gains and losses are allocated to each class daily based upon net assets. Each class bears its own specific expenses in addition to the allocated non-class specific expenses.
Distributions to shareholders: Distributions are recorded on the ex-dividend date and are determined in accordance with federal income tax regulations, which may differ from GAAP.
Foreign taxes: The Portfolio may be subject to taxes imposed by the countries in which it invests, with respect to its investments in issuers existing or operating in such countries. The Portfolio may also be subject to foreign taxes on income, gains on investments, or currency repatriation, a portion of which may be recoverable. The Portfolio accrues such taxes and recoveries as applicable when the related income or capital gains are earned or unrealized, and based upon the current interpretation of tax rules and regulations that exist in the markets in which the Portfolio invests. Some countries require governmental approval for the repatriation of investment income, capital, or the proceeds of sales earned by foreign investors. In addition, if there is deterioration in a country’s balance of payments or for other reasons, a country may impose temporary restrictions of foreign capital remittances abroad.
Commission recapture: The sub-adviser(s), to the extent consistent with the best execution and usual commission rate policies and practices, may elect to place security transactions of the Portfolio with broker/dealers with which TST has established a commission recapture program. A commission recapture program is any arrangement under which a broker/dealer applies a portion of the commissions received by such broker/dealer on the security transactions to the Portfolio. In no event will commissions, paid by the Portfolio, be used to pay expenses that would otherwise be borne by any other Portfolios within TST, or by any other party.
There were no commissions recaptured during the period ended June 30, 2024 by the Portfolio.
|
|
|
|
|
| Transamerica Series Trust |
|
|
|
Semi-Annual Financial Statements 2024 |
|
|
Page 15 |
|
|
Transamerica MSCI EAFE Index VP
NOTES TO FINANCIAL STATEMENTS (continued)
At June 30, 2024
(unaudited)
2. SIGNIFICANT ACCOUNTING POLICIES (continued)
Indemnification: In the normal course of business, the Portfolio enters into contracts that contain a variety of representations that provide general indemnifications. The Portfolio’s maximum exposure under these arrangements is unknown, as this would involve future claims that may be made against the Portfolio and/or its affiliates that have not yet occurred. However, based on experience, the Portfolio expects the risk of loss to be remote.
3. INVESTMENT VALUATION
TAM has been designated as the Portfolio’s valuation designee pursuant to Rule 2a-5 under the 1940 Act with responsibility for fair valuation subject to oversight by the Portfolio’s Board of Trustees. The net asset value of the Portfolio is computed as of the official close of the New York Stock Exchange (“NYSE”) each day the NYSE is open for business.
TAM utilizes various methods to measure the fair value of its investments on a recurring basis. GAAP establishes a hierarchy that prioritizes inputs to valuation methods. The inputs or methodology used for valuing securities are not necessarily an indication of the risk associated with investing in those securities. The three levels (“Levels”) of inputs of the fair value hierarchy are defined as follows:
Level 1—Unadjusted quoted prices in active markets for identical securities.
Level 2—Inputs, other than quoted prices included in Level 1, which are observable, either directly or indirectly. These inputs may include quoted prices for the identical instrument on an inactive market, prices for similar instruments, interest rates, prepayment speeds, credit risk, yield curves, default rates, and similar data.
Level 3—Unobservable inputs based on the best information available in the circumstances, to the extent observable inputs are not available, which may include TAM’s own assumptions used in determining the fair value of the Portfolio’s investments and derivative instruments.
The inputs used to measure fair value may fall into different Levels of the fair value hierarchy. In such cases, for disclosure purposes, the Level in the fair value hierarchy that is assigned to the fair value measurement of a security is determined based on the lowest Level input that is significant to the fair value measurement in its entirety. Certain investments that are measured at fair value using NAV per share, or its equivalent, using the “practical expedient” have not been classified in the fair value Levels. The hierarchy classification of inputs used to value the Portfolio’s investments at June 30, 2024, is disclosed within the Investment Valuation section of the Schedule of Investments.
The availability of observable inputs can vary from security to security and is affected by a wide variety of factors, including, but not limited to, the type of security, whether the security is new and not yet established in the marketplace, the liquidity of markets, and other characteristics particular to the security. To the extent that valuation is based on models or inputs that are less observable or unobservable in the market, the determination of fair value requires more judgment. Accordingly, the degree of judgment exercised in determining fair value is generally greatest for instruments categorized in Level 3. Due to the inherent uncertainty of valuation, the determination of values may differ significantly from values that would have been realized had a ready market for investments existed, and the differences could be material.
Fair value measurements: Descriptions of the valuation techniques applied to the Portfolio’s significant categories of assets and liabilities measured at fair value on a recurring basis are as follows:
Equity securities: Securities are stated at the last reported sales price or closing price on the day of valuation taken from the primary exchange where the security is principally traded. To the extent these securities are actively traded and valuation adjustments are not applied, they are categorized in Level 1 of the fair value hierarchy. Equities traded on inactive markets or valued by reference to similar instruments are generally categorized in Level 2 or Level 3 if inputs are unobservable.
Foreign equity securities: Securities in which the primary trading market closes at the same time or after the NYSE, are valued based on quotations from the primary market in which they are traded and are categorized in Level 1. Because many foreign securities markets and exchanges close prior to the close of the NYSE, closing prices for foreign securities in those markets or on those exchanges do not reflect the events that occur after that close. Certain foreign securities may be fair valued using a pricing service that considers the correlation of the trading patterns of the foreign security to the intraday trading in the U.S. markets for investments such as American Depositary Receipts, financial futures, or ETFs and the movement of certain indices of securities based on a statistical analysis of their historical relationship; such valuations generally are categorized in Level 2.
|
|
|
|
|
| Transamerica Series Trust |
|
|
|
Semi-Annual Financial Statements 2024 |
|
|
Page 16 |
|
|
Transamerica MSCI EAFE Index VP
NOTES TO FINANCIAL STATEMENTS (continued)
At June 30, 2024
(unaudited)
3. INVESTMENT VALUATION (continued)
Rights: Rights may be priced intrinsically using a model that incorporates the subscription or strike price, the daily market price for the underlying security, and a subscription ratio. If the inputs are unavailable, or if the subscription or strike price is higher than the market price, then the rights are priced at zero. Rights are generally categorized in Level 2 of the fair value hierarchy, or Level 3 if inputs are unobservable.
Repurchase agreements: Repurchase agreements are valued at cost, which approximates fair value. To the extent the inputs are observable and timely, the values are generally categorized in Level 2 of the fair value hierarchy.
Derivative instruments: Centrally cleared or listed derivatives that are actively traded are valued based on quoted prices from the exchange and are categorized in Level 1 of the fair value hierarchy. Over-the-counter (“OTC”) derivative contracts include forward, swap, swaption, and option contracts related to interest rates, foreign currencies, credit standing of reference entities, equity prices, or commodity prices. Depending on the product and the terms of the transaction, the fair value of the OTC derivative products are modeled taking into account the counterparties’ creditworthiness and using a series of techniques, including simulation models. Many pricing models do not entail material subjectivity because the methodologies employed do not necessitate significant judgments and the pricing inputs are observed from actively quoted markets, as is the case of interest rate swap and option contracts. The majority of OTC derivative products valued by the Portfolio using pricing models fall into this category and are categorized within Level 2 of the fair value hierarchy or Level 3 if inputs are unobservable.
4. SECURITIES AND OTHER INVESTMENTS
Real estate investment trusts (“REITs”): REITs are pooled investment vehicles which invest primarily in income producing real estate, or real estate related loans or interests. Distributions received by REITs are classified at management’s estimate of the dividend income, return of capital and capital gains. Estimates are based on information available at year-end, which includes the previous fiscal year’s classification. The actual amounts of dividend income, return of capital, and capital gains are only determined by each REIT after the fiscal year end and may differ from the estimated amounts. Upon notification from the REITs, some of the distributions received may be re-classified and recorded as a return of capital or capital gains. There are certain additional risks involved in investing in REITs. These include, but are not limited to, economic conditions, changes in zoning laws, real estate values, property taxes, and interest rates.
REITs held at June 30, 2024, if any, are identified within the Schedule of Investments.
5. BORROWINGS AND OTHER FINANCING TRANSACTIONS
The Portfolio may engage in borrowing transactions as a means of raising cash to satisfy redemption requests, for other temporary or emergency purposes or, to the extent permitted by its investment policies, to raise additional cash to be invested in other securities or instruments. When the Portfolio invests borrowing proceeds in other securities, the Portfolio will bear the risk that the market value of the securities in which such proceeds are invested goes down and is insufficient to repay the borrowed proceeds. The Portfolio may borrow on a secured or on an unsecured basis. If the Portfolio enters into a secured borrowing arrangement, a portion of the Portfolio’s assets will be used as collateral. The 1940 Act requires the Portfolio to maintain asset coverage of at least 300% of the amount of its borrowings. Asset coverage means the ratio that the value of the Portfolio’s total assets, minus liabilities other than borrowings, bears to the aggregate amount of all borrowings. Although complying with this requirement has the effect of limiting the amount that the Portfolio may borrow, it does not otherwise mitigate the risks of entering into borrowing transactions.
Interfund lending: The Portfolio, along with other funds and portfolios advised by TAM, may participate in an interfund lending program pursuant to exemptive relief granted by the Securities and Exchange Commission on January 18, 2017. This program allows the Portfolio to lend to and borrow from other funds and portfolios advised by TAM. Interfund lending transactions are subject to the conditions of the exemptive relief which places limits on the amount of lending or borrowing a Portfolio may participate in under the program. Interest earned or paid on an interfund lending transaction will be based on the average of certain current market rates. For the period ended June 30, 2024, the Portfolio has not utilized the program.
Repurchase agreements: In a repurchase agreement, the Portfolio purchases a security and simultaneously commits to resell that security to the seller at an agreed-upon price on an agreed-upon date. Securities purchased subject to a repurchase agreement are held at the Portfolio’s custodian, or designated sub-custodian related to tri-party repurchase agreements, and, pursuant to the terms of the repurchase agreement, must be collateralized by securities with an aggregate market value greater than or equal to 100% of the resale price. The Portfolio will bear the risk of value fluctuations until the securities can be sold and may encounter delays and incur costs in liquidating the securities. In the event of bankruptcy or insolvency of the seller, delays and costs may be incurred.
|
|
|
|
|
| Transamerica Series Trust |
|
|
|
Semi-Annual Financial Statements 2024 |
|
|
Page 17 |
|
|
Transamerica MSCI EAFE Index VP
NOTES TO FINANCIAL STATEMENTS (continued)
At June 30, 2024
(unaudited)
5. BORROWINGS AND OTHER FINANCING TRANSACTIONS (continued)
Repurchase agreements are subject to netting agreements, which are agreements between the Portfolio and its counterparties that provide for the net settlement of all transactions and collateral with the Portfolio, through a single payment, in the event of default or termination. Amounts presented within the Schedule of Investments, and as part of Repurchase agreements, at value within the Statement of Assets and Liabilities are shown on a gross basis. The value of the related collateral for each repurchase agreement, as reflected within the Schedule of Investments, exceeds the value of each repurchase agreement at June 30, 2024.
Repurchase agreements at June 30, 2024, if any, are included within the Schedule of Investments and Statement of Assets and Liabilities.
6. RISK EXPOSURES AND THE USE OF DERIVATIVE INSTRUMENTS
The Portfolio’s investment strategies allow the Portfolio to use various types of derivative contracts, including option contracts, swap agreements, futures contracts, and forward foreign currency contracts. Derivatives are investments whose value is primarily derived from underlying assets, indices or reference rates and may be transacted on an exchange or OTC.
Market Risk Factors: In pursuit of the Portfolio’s investment strategies, the Portfolio may seek to use derivatives to increase or decrease its exposure to certain market risks, including:
Interest rate risk: Interest rate risk relates to the fluctuations in the value of fixed income securities due to changes in the prevailing levels of market interest rates.
Foreign exchange rate risk: Foreign exchange rate risk relates to fluctuations in the value of an asset or liability due to changes in the currency exchange rates.
Equity risk: Equity risk relates to the change in value of equity securities as they relate to increases or decreases in the general market.
Credit risk: Credit risk relates to the ability of the issuer of a financial instrument to make further principal or interest payments on an obligation or commitment that it has to the Portfolio.
Commodity risk: Commodity risk relates to the change in value of commodities or commodity indices as they relate to increases or decreases in the commodities market. Commodities are physical assets that have tangible properties. Examples of these types of assets are crude oil, heating oil, metals, livestock, and agricultural products.
The Portfolio is also exposed to additional risks from investing in derivatives, such as liquidity and counterparty credit risk. Liquidity risk is the risk that the Portfolio will be unable to sell or close out the derivative in the open market in a timely manner. Counterparty credit risk is the risk that the counterparty will not be able to fulfill its obligations to the Portfolio. Investing in derivatives may also involve greater risks than investing directly in the underlying assets, such as losses in excess of any initial investment and collateral received. In addition, there may be the risk that the change in value of the derivative contract does not correspond to the change in value of the underlying instrument.
The Portfolio’s exposure to market risk factors and certain other associated risks are summarized by derivative type as follows:
Futures contracts: The Portfolio is subject to equity risk, credit risk, commodity risk, interest rate risk and foreign exchange rate risk in the normal course of pursuing its investment objective. The Portfolio uses futures contracts to gain exposure to, or hedge against, changes in the value of equities and commodities, interest rates, or foreign currencies. A futures contract represents a commitment for the future purchase or sale of an asset at a specified price on a specified date. Upon entering into such contracts, the Portfolio is required to deposit with the broker, either in cash or in securities, an initial margin in an amount equal to a certain percentage of the contract amount. Subsequent payments (variation margin) are paid or received by the Portfolio, depending on the daily fluctuations in the value of the contract, and are recorded for financial statement purposes as unrealized gains or losses by the Portfolio. Upon entering into such contracts, the Portfolio bears the risk of equity and commodity prices, interest rates, or exchange rates moving unexpectedly, in which case, the Portfolio may not achieve the anticipated benefits of the futures contracts and may realize losses. With futures, there is minimal counterparty credit risk to the Portfolio since futures are exchange-traded and the exchange’s clearinghouse, as counterparty to all exchange-traded futures, guarantees the futures against default. Futures contracts are generally entered into on a regulated futures exchange and cleared through a clearinghouse associated with the exchange.
Open futures contracts at June 30, 2024 are listed within the Schedule of Investments. Variation margin, if applicable, is shown in Variation margin receivable or payable on futures contracts within the Statement of Assets and Liabilities.
|
|
|
|
|
| Transamerica Series Trust |
|
|
|
Semi-Annual Financial Statements 2024 |
|
|
Page 18 |
|
|
Transamerica MSCI EAFE Index VP
NOTES TO FINANCIAL STATEMENTS (continued)
At June 30, 2024
(unaudited)
6. RISK EXPOSURES AND THE USE OF DERIVATIVE INSTRUMENTS (continued)
The following is a summary of the location and the Portfolio’s fair values of derivative investments disclosed within the Statement of Assets and Liabilities, categorized by primary market risk exposure as of June 30, 2024.
|
|
|
|
|
|
|
|
|
|
|
|
|
|
|
|
|
|
|
|
|
|
|
|
|
|
|
|
|
| Liability Derivatives |
|
|
|
|
| |
|
| Location |
|
Interest Rate Contracts |
|
|
Foreign Exchange Contracts |
|
|
Equity Contracts |
|
|
Credit Contracts |
|
|
Commodity Contracts |
|
|
Total |
|
|
|
|
| |
|
| Futures contracts: |
|
|
|
|
|
|
|
|
|
|
|
|
|
|
|
|
|
|
|
|
|
|
|
|
|
|
|
|
| Total distributable earnings
(accumulated losses) (A)(B) |
|
|
$ — |
|
|
|
$ — |
|
|
|
$ (730 |
) |
|
|
$ — |
|
|
|
$ — |
|
|
|
$ (730 |
) |
|
|
|
|
| |
|
| Total |
|
|
$ — |
|
|
|
$ — |
|
|
|
$ (730 |
) |
|
|
$ — |
|
|
|
$ — |
|
|
|
$ (730 |
) |
|
|
|
|
| |
|
| (A) |
May include exchange-traded derivatives which are not subject to a master netting arrangement, or another similar arrangement. |
| (B) |
Included within unrealized appreciation (depreciation) on futures contracts as reported in the Schedule of Investments. Only current day’s variation margin is reported within the Statement of Assets and Liabilities. |
The following is a summary of the location and the effect of derivative investments within the Statement of Operations, categorized by primary market risk exposure as of June 30, 2024.
|
|
|
|
|
|
|
|
|
|
|
|
|
|
|
|
|
|
|
|
|
|
|
|
|
|
|
|
|
| Realized Gain (Loss) on Derivative Instruments |
|
|
|
|
| |
|
| Location |
|
Interest Rate Contracts |
|
|
Foreign Exchange Contracts |
|
|
Equity Contracts |
|
|
Credit Contracts |
|
|
Commodity Contracts |
|
|
Total |
|
|
|
|
| |
|
| Futures contracts |
|
|
$ — |
|
|
|
$ — |
|
|
|
$ 87,913 |
|
|
|
$ — |
|
|
|
$ — |
|
|
|
$ 87,913 |
|
|
|
|
|
| |
|
| Total |
|
|
$ — |
|
|
|
$ — |
|
|
|
$ 87,913 |
|
|
|
$ — |
|
|
|
$ — |
|
|
|
$ 87,913 |
|
|
|
|
|
| |
|
|
|
|
|
|
|
|
|
|
|
|
|
|
|
|
|
|
|
|
|
|
|
|
|
|
|
|
|
|
| Net Change in Unrealized Appreciation (Depreciation) on Derivative Instruments |
|
|
|
|
| |
|
| Location |
|
Interest Rate Contracts |
|
|
Foreign Exchange Contracts |
|
|
Equity Contracts |
|
|
Credit Contracts |
|
|
Commodity Contracts |
|
|
Total |
|
|
|
|
| |
|
| Futures contracts |
|
|
$ — |
|
|
|
$ — |
|
|
|
$ (40,622 |
) |
|
|
$ — |
|
|
|
$ — |
|
|
|
$ (40,622 |
) |
|
|
|
|
| |
|
| Total |
|
|
$ — |
|
|
|
$ — |
|
|
|
$ (40,622 |
) |
|
|
$ — |
|
|
|
$ — |
|
|
|
$ (40,622 |
) |
|
|
|
|
| |
|
The following is a summary of the ending monthly average volume on derivative activity during the period ended June 30, 2024.
|
|
|
|
|
| Futures contracts: |
|
|
|
|
| Average notional value of contracts — long |
|
$ |
1,337,558 |
|
Collateral requirements: Collateral or margin requirements are set by the broker or exchange clearing house for exchange-traded derivatives (futures contracts, exchange-traded options, and exchange-traded swap agreements) while collateral terms are contract specific for OTC derivatives (forward foreign currency exchange contracts, OTC options, and OTC swap agreements). For OTC derivatives, under standard derivatives agreements, the Portfolio may be required to pledge collateral on derivatives to a counterparty if the Portfolio is in a net liability position, and receive collateral if in a net positive position. For financial reporting purposes, cash collateral that has been pledged by the Portfolio to cover obligations, if any, is reported in Cash collateral at broker within the Statement of Assets and Liabilities. Cash collateral that has been received by the Portfolio from a counterparty, if any, is reported separately in Cash collateral pledged at custodian and/or broker within the Statement of Assets and Liabilities. Non-cash collateral pledged to the Portfolio, if any, is disclosed within the Schedule of Investments.
Generally, the amount of collateral due from or to a party must exceed a minimum transfer amount threshold before a transfer has been made. Typically a counterparty is not permitted to sell, re-pledge or use cash and non-cash collateral it receives. The Portfolio generally
|
|
|
|
|
| Transamerica Series Trust |
|
|
|
Semi-Annual Financial Statements 2024 |
|
|
Page 19 |
|
|
Transamerica MSCI EAFE Index VP
NOTES TO FINANCIAL STATEMENTS (continued)
At June 30, 2024
(unaudited)
6. RISK EXPOSURES AND THE USE OF DERIVATIVE INSTRUMENTS (continued)
does not use non-cash collateral that it receives but may, absent default or certain other circumstances, be permitted to use cash collateral received. In such cases, interest may be paid pursuant to the collateral arrangement with the counterparty.
To the extent amounts due to the Portfolio from its counterparties are not fully collateralized, contractually or otherwise, the Portfolio bears the risk of loss from counterparty non-performance. Additionally, to the extent the Portfolio has delivered collateral to a counterparty, the Portfolio bears the risk of loss from a counterparty in the event the counterparty fails to return such collateral. Counterparties may immediately terminate derivatives contracts if the Portfolio fails to maintain sufficient asset coverage for its contracts or its net assets decline by stated percentages. Collateral may not be required for all derivative contracts.
7. RISK FACTORS
Investing in the Portfolio involves certain key risks related to the Portfolio’s trading activity. Please reference the Portfolio’s prospectus for a more complete discussion of the following risk(s), as well as other risks of investing in the Portfolio.
Market risk: The market prices of the Portfolio’s securities or other assets may go up or down, sometimes rapidly or unpredictably, due to factors such as economic events, inflation, changes in interest rates, governmental actions or interventions, actions taken by the U.S. Federal Reserve or foreign central banks, market disruptions caused by tariffs, trade disputes or other factors, political developments, armed conflicts, economic sanctions, cybersecurity events, investor sentiment, the global and domestic effects of widespread or local health, weather or climate events, and other factors that may or may not be related to the issuer of the security or other asset. If the market prices of the Portfolio’s securities and assets fall, the value of your investment in the Portfolio could go down.
Economies and financial markets throughout the world are increasingly interconnected. Events or circumstances in one or more countries or regions could be highly disruptive to, and have profound impacts on, global economies or markets. As a result, whether or not the Portfolio invests in securities of issuers located in or with significant exposure to the countries directly affected, the value and liquidity of the Portfolio’s investments may go down.
Index fund risk: While the Portfolio seeks to track the performance of the MSCI EAFE Index (i.e., achieve a high degree of correlation with the index), the Portfolio’s return may not match the return of the index. The Portfolio incurs a number of operating expenses not applicable to the index, and incurs costs in buying and selling securities. In addition, the Portfolio may not be fully invested at times, generally as a result of cash flows into or out of the Portfolio or reserves of cash held by the Portfolio to meet redemptions. The Portfolio may attempt to replicate the index return by investing in fewer than all of the securities in the index, or in some securities not included in the index, potentially increasing the risk of divergence between the Portfolio’s return and that of the index.
Passive strategy/index risk: The Portfolio is managed with a passive investment strategy, attempting to track the performance of an unmanaged index of securities, regardless of the current or projected performance of the index or of the actual securities comprising the index. This differs from an actively-managed fund, which typically seeks to outperform a benchmark index. As a result, the Portfolio’s performance may be less favorable than that of a portfolio managed using an active investment strategy. The structure and composition of the index will affect the performance, volatility, and risk of the index and, consequently, the performance, volatility, and risk of the Portfolio.
Real estate investment trusts (“REITs”) risk: Investing in real estate investment trusts (“REITs”) involves unique risks. When the Portfolio invests in REITs, it is subject to risks generally associated with investing in real estate. A REIT’s performance depends on the types and locations of the properties it owns, how well it manages those properties and cash flow. REITs may have limited financial resources, may trade less frequently and in limited volume, may engage in dilutive offerings, and may be subject to more abrupt or erratic price movements than the overall securities markets. In addition to its own expenses, the Portfolio will indirectly bear its proportionate share of any management and other expenses paid by REITs in which it invests. U.S. REITs are subject to a number of highly technical tax-related rules and requirements; and a U.S. REIT’s failure to qualify for the favorable U.S. federal income tax treatment generally available to U.S. REITs could result in corporate-level taxation, significantly reducing the return on an investment to the Portfolio.
8. FEES AND OTHER AFFILIATED TRANSACTIONS
TST serves as a funding vehicle for certain affiliated asset allocation portfolios and certain affiliated separate accounts of Transamerica Life Insurance Company (“TLIC”) and Transamerica Financial Life Insurance Company.
TAM, the Portfolio’s investment manager, is directly owned by TLIC and AUSA Holding, LLC (“AUSA”), both of which are indirect, wholly owned subsidiaries of Aegon Ltd. TLIC is owned by Commonwealth General Corporation (“Commonwealth”). Commonwealth and AUSA
|
|
|
|
|
| Transamerica Series Trust |
|
|
|
Semi-Annual Financial Statements 2024 |
|
|
Page 20 |
|
|
Transamerica MSCI EAFE Index VP
NOTES TO FINANCIAL STATEMENTS (continued)
At June 30, 2024
(unaudited)
8. FEES AND OTHER AFFILIATED TRANSACTIONS (continued)
are wholly owned by Transamerica Corporation (DE). Transamerica Corporation (DE) is wholly owned by Aegon International B.V., which is wholly owned by Aegon Ltd., a Bermuda exempted company with liability limited by shares (formerly, Aegon NV, a Netherlands corporation) and a publicly traded international insurance group.
Transamerica Fund Services, Inc. (“TFS”) is the Portfolio’s transfer agent. Transamerica Capital, Inc. (“TCI”) is the Portfolio’s distributor/principal underwriter. TAM, TFS and TCI are affiliates of Aegon Ltd.
Certain officers and trustees of the Portfolio may also be officers and/or trustees of TAM, TFS and TCI. No interested trustee who is deemed an interested person due to current or former service with TAM or an affiliate of TAM receives compensation from the Portfolio. The Portfolio does pay non-interested persons (independent trustees), as disclosed in Trustee and CCO fees within the Statement of Operations.
Investment management fees: TAM serves as the Portfolio’s investment manager, performing administration as well as investment advisory services. TAM renders investment advisory, supervisory, and administration services under an investment management agreement and the Portfolio pays a single management fee, which is reflected in Investment management fees within the Statement of Operations.
The Portfolio pays a management fee to TAM at an annual rate of 0.11% of daily average net assets.
TAM has contractually agreed to waive fees and/or reimburse Portfolio expenses to the extent that the total operating expenses excluding, as applicable, acquired fund fees and expenses, interest (including borrowing costs and overdraft charges), taxes, brokerage commissions, dividend and interest expenses on securities sold short, extraordinary expenses and other expenses not incurred in the ordinary course of the Portfolio’s business, exceed the following stated annual operating expense limits to the Portfolio’s daily average net assets. To the extent an expense limit changed during the period, the prior limit is also listed below. The expenses waived and/or reimbursed, if any, are included in Expenses waived and/or reimbursed within the Statement of Operations.
|
|
|
|
|
|
|
| Class |
|
Operating Expense Limit |
|
Operating Expense Limit Effective Through |
| Initial Class |
|
|
0.18 |
% |
|
May 1, 2025 |
| Service Class |
|
|
0.43 |
|
|
May 1, 2025 |
TAM is permitted to recapture amounts contractually waived and/or reimbursed to a class during any of the 36 months from the date on which TAM waived fees and/or reimbursed expenses for the class. A class may recapture and reimburse TAM only if such amount does not cause, on any particular business day of the Portfolio, the class’s total annual operating expenses (after the recapture is taken into account) to exceed the Operating Expense Limits or any other lower limit then in effect. Amounts recaptured, if any, by TAM for the period ended June 30, 2024 are disclosed in Recapture of previously waived and/or reimbursed fees within the Statement of Operations.
TAM, on a voluntary basis and in addition to the contractual operating expense limits in effect, from time to time may waive and/or reimburse expenses of the Portfolio, or any classes thereof, to such level(s) as the Trust’s officers have determined or may reasonably determine from time to time. Any such voluntary waiver or expense reimbursement may be discontinued by TAM at any time. These amounts are not subject to recapture by TAM.
For the 36-month period ended June 30, 2024, the balances available for recapture by TAM for the Portfolio are as follows:
|
|
|
|
|
|
|
|
|
|
|
|
|
|
|
|
|
|
|
|
|
| |
|
Amounts Available |
|
|
|
|
| |
|
2021 |
|
|
2022 |
|
|
2023 |
|
|
2024 |
|
|
Total |
|
| Initial Class |
|
$ |
5,073 |
|
|
$ |
24,890 |
|
|
$ |
22,700 |
|
|
$ |
8,209 |
|
|
$ |
60,872 |
|
| Service Class |
|
|
60,257 |
|
|
|
202,553 |
|
|
|
159,222 |
|
|
|
50,061 |
|
|
|
472,093 |
|
Distribution and service fees: TST has a distribution plan (“Distribution Plan”) pursuant to Rule 12b-1 under the 1940 Act. Pursuant to the Distribution Plan, TST entered into a distribution agreement with TCI as the Portfolio’s distributor.
|
|
|
|
|
| Transamerica Series Trust |
|
|
|
Semi-Annual Financial Statements 2024 |
|
|
Page 21 |
|
|
Transamerica MSCI EAFE Index VP
NOTES TO FINANCIAL STATEMENTS (continued)
At June 30, 2024
(unaudited)
8. FEES AND OTHER AFFILIATED TRANSACTIONS (continued)
The Distribution Plan requires the Portfolio to pay distribution fees to TCI as compensation for various distribution activities, not as reimbursement for specific expenses. Under the Distribution Plan and distribution agreement, TCI, on behalf of the Portfolio, is authorized to pay various service providers, as direct payment for expenses incurred in connection with distribution of the Portfolio’s shares.
The fee on the Service Class shares is paid to the insurance companies for providing services and account maintenance for the policyholders who invest in the variable insurance products which invest in the Service Class shares. TCI has determined that it will not seek payment for the distribution expenses incurred by the Portfolio with respect to the Initial Class shares before May 1, 2025. Prior to TCI seeking distribution expenses on Initial Class shares, policy and contract owners will be notified in advance. The Portfolio will pay fees relating to Service Class shares. The distribution and service fees are included in Distribution and service fees within the Statement of Operations.
The Portfolio is authorized under the Distribution Plan to pay fees to TCI based on daily average net assets of each applicable class up to the following annual rates:
|
|
|
|
|
| Class |
|
Rate |
| Initial Class |
|
|
0.15 |
% |
| Service Class |
|
|
0.25 |
|
Transfer agent costs: TFS provides transfer agency services under an intercompany agreement with TAM. TFS has outsourced the provision of certain sub-transfer agency services to SS&C Global Investor & Distribution Solutions, Inc. (“SS&C GIDS”). The Portfolio does not pay a separate transfer agent fee to TAM or TFS but does pay certain expenses to SS&C GIDS related to applicable sub-transfer agency services. For the period ended June 30, 2024, (i) the expenses paid to SS&C GIDS by the Portfolio are referred to as transfer agent costs and are included within the Statement of Operations and (ii) the expenses payable to SS&C GIDS by the Portfolio are referred to as transfer agent costs within the Statement of Assets and Liabilities.
Brokerage commissions: The Portfolio incurred no brokerage commissions on security transactions placed with affiliates of the investment manager or sub-adviser(s) for the period ended June 30, 2024.
9. PURCHASES AND SALES OF SECURITIES
For the period ended June 30, 2024, the cost of securities purchased and proceeds from securities sold (excluding short-term securities) are as follows:
|
|
|
|
|
|
|
| Purchases of Securities |
|
Sales/Maturities of Securities |
| Long-Term |
|
U.S. Government |
|
Long-Term |
|
U.S. Government |
| $ 3,115,028 |
|
$ — |
|
$ 1,188,370 |
|
$ — |
10. FEDERAL INCOME TAXES AND DISTRIBUTIONS TO SHAREHOLDERS
The Portfolio has not made any provision for federal income or excise taxes due to its policy to distribute all of its taxable income and capital gains to its shareholders and otherwise qualify as a regulated investment company under Subchapter M of the Internal Revenue Code. The Portfolio recognizes the tax benefits of uncertain tax positions only where the position is “more likely than not” to be sustained assuming examination by tax authorities. The Portfolio’s tax returns remain subject to examination by the Internal Revenue Service and state tax authorities three years from the date of filing for federal purposes and four years from the date of filing for state purposes. Management has evaluated the Portfolio’s tax provisions taken for all open tax years, and has concluded that no provision for income tax is required in the Portfolio’s financial statements. If applicable, the Portfolio recognizes interest accrued related to unrecognized tax benefits in relation to interest and penalties expense in Other within the Statement of Operations. The Portfolio identifies its major tax jurisdictions as U.S. Federal, the state of Colorado, and foreign jurisdictions where the Portfolio makes significant investments; however, the Portfolio is not aware of any tax positions for which it is reasonably possible that the total amounts of unrecognized tax benefits will change materially in the next twelve months. Distributions are determined in accordance with income tax regulations, which may differ from GAAP.
|
|
|
|
|
| Transamerica Series Trust |
|
|
|
Semi-Annual Financial Statements 2024 |
|
|
Page 22 |
|
|
Transamerica MSCI EAFE Index VP
NOTES TO FINANCIAL STATEMENTS (continued)
At June 30, 2024
(unaudited)
10. FEDERAL INCOME TAXES AND DISTRIBUTIONS TO SHAREHOLDERS (continued)
As of June 30, 2024, the approximate cost for U.S. federal income tax purposes, and the aggregate gross/net unrealized appreciation (depreciation) in the value of investments (including securities sold short and derivatives, if any) are as follows:
|
|
|
|
|
|
|
| Cost |
|
Gross Appreciation |
|
Gross (Depreciation) |
|
Net Appreciation (Depreciation) |
| $ 74,097,978 |
|
$ 19,893,595 |
|
$ (6,072,080) |
|
$ 13,821,515 |
11. NEW ACCOUNTING PRONOUNCEMENT
In June 2022, the Financial Accounting Standards Board issued Accounting Standards Update No. 2022-03 (“ASU 2022-03”), “Fair Value Measurement of Equity Securities Subject to Contractual Sale Restrictions” (“Topic 820”). ASU 2022-03 clarifies the guidance in Topic 820, related to the measurement of the fair value of an equity security subject to contractual sale restrictions, where it eliminates the need to apply a discount to fair value of these securities, and introduces disclosure requirements related to such equity securities. The guidance is effective for fiscal years, and interim periods within those fiscal years, beginning after December 15, 2023, and allows for early adoption. Management is currently evaluating the implications, if any, of the additional requirements and their impact on the Portfolio’s financial statements.
Please see TST’s most recent report on Form N-CSR, available at: www.transamerica.com/annuities/prospectus, for additional information. For the most recently filed complete proxy voting records for the Trust please visit: https://www.transamerica.com/sites/default/files/files/e070d/TST%20N-PX%202021.pdf
|
|
|
|
|
| Transamerica Series Trust |
|
|
|
Semi-Annual Financial Statements 2024 |
|
|
Page 23 |
|
|
Transamerica MSCI EAFE Index VP
MANAGEMENT AND SUB-ADVISORY AGREEMENT — CONTRACT RENEWAL
(unaudited)
At a meeting of the Board of Trustees of Transamerica Series Trust (the “Trustees” or the “Board”) held on June 12-13, 2024, the Board considered the renewal of the management agreement (the “Management Agreement”) between Transamerica Asset Management, Inc. (“TAM”) and Transamerica Series Trust, on behalf of Transamerica MSCI EAFE Index VP (the “Portfolio”). The Board also considered the renewal of the investment sub-advisory agreement (the “Sub-Advisory Agreement” and together with the Management Agreement, the “Agreements”) for the Portfolio between TAM and SSGA Funds Management, Inc. (the “Sub-Adviser”).
Following its review and consideration, the Board determined that the terms of the Management Agreement and Sub-Advisory Agreement were reasonable and that the renewal of each of the Agreements was in the best interests of the Portfolio and the holders invested in the Portfolio. The Board, including the independent members of the Board (the “Independent Trustees”), unanimously approved the renewal of each of the Agreements through June 30, 2025.
Prior to reaching their decision, the Trustees requested and received from TAM and the Sub-Adviser certain information. They then reviewed such information as they deemed reasonably necessary to evaluate the Agreements, including information they had previously received from TAM and the Sub-Adviser as part of their regular oversight of the Portfolio, and knowledge they gained over time through meeting with TAM and the Sub-Adviser. Among other materials, the Trustees considered comparative fee, expense and performance information prepared by Broadridge Financial Solutions, Inc. (“Broadridge”), an independent provider of mutual fund performance information, as well as fee, expense and profitability information prepared by TAM. To the extent applicable, the Trustees considered information about fees and performance of comparable funds and/or accounts managed by the Sub-Adviser. The Board also considered reductions to the Portfolio’s expense limits, if any, that took effect after the last renewal of the Agreements. In their review, the Trustees also sought to identify instances in which the Portfolio’s performance, fees, total expenses and/or profitability appeared to be outliers within its respective peer group or other comparative metrics and sought to understand the reasons for such comparative positions.
In their deliberations, the Independent Trustees met privately without representatives of TAM or the Sub-Adviser present and were represented throughout the process by their independent legal counsel. In considering the proposed continuation of each of the Agreements, the Trustees evaluated and weighed a number of considerations that they believed to be relevant in light of the legal advice furnished to them by counsel, including independent legal counsel, and made a decision in the exercise of their own business judgment. They based their decisions on the considerations discussed below, among others, although they did not identify any particular consideration or item of information that was controlling of their decisions, and each Trustee may have attributed different weights to the various factors.
Nature, Extent and Quality of the Services Provided
The Board considered the nature, extent and quality of the services provided by TAM and the Sub-Adviser to the Portfolio in the past and the services anticipated to be provided in the future. The Board also considered the investment approach for the Portfolio; the experience, capability and integrity of TAM’s senior management; the financial resources of TAM; TAM’s management oversight process; TAM’s and the Sub-Adviser’s responsiveness to any questions by the Trustees; and the professional qualifications and compensation program of the portfolio management team of the Sub-Adviser. The Trustees noted that they receive, on a quarterly basis, an execution analysis from Capital Institutional Services, Inc. (CAPIS), an independent provider of trade analyses, for the Sub-Adviser and a comparison of trading results against a peer universe of managers.
The Board also considered the continuous and regular investment management and other services provided by TAM, when acting as a manager of managers, for the portion of the management fee it retains from the Portfolio after payment of the sub-advisory fees. The Board noted that the investment management and other services provided by TAM include the design, development and ongoing review and evaluation of the Portfolio and its investment strategy; the selection, oversight and monitoring of one or more investment sub-advisers to perform certain duties with respect to the Portfolio; ongoing portfolio trading oversight and analysis; risk management oversight and analysis; design, development, implementation and ongoing review and evaluation of a process for the valuation of Portfolio investments; design, development, implementation and ongoing review and evaluation of a compliance program for the Portfolio; design, development, implementation and ongoing review and evaluation of a process for the voting of proxies and exercise of rights to consent to corporate action for Portfolio investments; participation in Board meetings and oversight of preparation of materials for the Board, including materials for Board meetings and regular communications with the Board; oversight of preparation of the Portfolio’s prospectus, statement of additional information, shareholder reports and other disclosure materials and regulatory filings for the Portfolio; and ongoing cash management services for the Portfolio. The Board considered that TAM’s investment management services also include the provision of supervisory and administrative services to the Portfolio. The Board also noted that TAM, as part of the services it provides to all Transamerica mutual funds, including the Portfolio, oversees the services provided by the funds’ custodian, transfer agent, independent accountant and legal counsel and supervises the performance of the recordkeeping and holder service functions of the funds.
Investment Performance
In addition, the Board considered the short- and longer-term performance of the Portfolio in light of its investment objective, policies and strategies, including relative performance against (i) a peer universe of comparable mutual funds, as prepared by Broadridge, and (ii) the Portfolio’s benchmark, in each case for various trailing periods ended December 31, 2023. Based on these considerations, the Board determined that TAM and the Sub-Adviser can provide investment and related services that are appropriate in scope and extent in light of the Portfolio’s investment objectives, policies and strategies and operations, the competitive landscape of the investment company
|
|
|
| Transamerica Series Trust |
|
Semi-Annual Financial Statements 2024 |
Page 24
Transamerica MSCI EAFE Index VP
MANAGEMENT AND SUB-ADVISORY AGREEMENT — CONTRACT RENEWAL (continued)
(unaudited)
business and investor needs. The Trustees noted that the objective of the Portfolio, as an index fund, is to track, and not necessarily exceed, its benchmark index, and that unlike the Portfolio, the index is not subject to any expenses or transaction costs. The Board’s conclusions as to the Portfolio’s performance are summarized below. For purposes of its review, the Board generally used the performance of Service Class Shares. In describing the Portfolio’s performance relative to its peer universe, the summary conclusions characterize performance for the relevant periods in relation to whether it was “above,” “below” or “in line with” the peer universe median and do so using quintile rankings prepared by Broadridge. For simplicity, performance is described as “above” the median if the Portfolio’s performance ranked anywhere in the first or second quintiles, as “below” the median if it ranked anywhere in the fourth or fifth quintiles, or “in line with” the median if it ranked anywhere in the third quintile (i.e., even if its precise return was somewhat above or somewhat below the precise median return).
When considering the Portfolio’s performance, the Trustees considered any representations made by TAM regarding the appropriateness of certain peer groups and benchmarks. They recognized that performance reflects a snapshot of a period as of a specific date, and that consideration of performance data for a different period could generate significantly different performance results. The Trustees also recognized that even longer-term performance can be negatively affected by performance over a short-term period when that short-term performance is significantly below the performance of the comparable benchmark or universe of peer funds.
The Board noted that the performance of Service Class Shares of the Portfolio was in line with the median for its peer universe for the past 1-, 3- and 5-year periods. The Board also noted that the performance of Service Class Shares of the Portfolio was below the benchmark that TAM utilizes to measure performance of the Portfolio for the past 1-, 3-, and 5-year periods.
Management Fee and Sub-Advisory Fees and Total Expense Ratio
The Board considered the management fee and total expense ratio of the Portfolio, including information provided by Broadridge comparing the management fee and total expense ratio of the Portfolio to the management fees and total expense ratios of comparable investment companies in both a peer group and broader peer universe compiled by Broadridge. The Board’s conclusions as to the Portfolio’s management fee and total expense ratio are summarized below. For purposes of its review, the Board generally used the actual total expenses (i.e., expenses reflecting any waivers and/or reimbursements) of Service Class Shares. In describing the Portfolio’s management fee and total expense ratio relative to its peer group and peer universe, the summary conclusions characterize management fees and total expense ratios for the relevant periods in relation to whether they were “above,” “below” or “in line with” the peer group or peer universe median and do so using quintile rankings prepared by Broadridge. For simplicity, management fees and total expense ratios are described as “above” the median if the Portfolio’s management fee or total expense ratio ranked anywhere in the fourth or fifth quintiles, as “below” the median if it ranked anywhere in the first or second quintiles, or “in line with” the median if it ranked anywhere in the third quintile (i.e., even if its precise management fee or total expense ratio was somewhat above or somewhat below the precise median management fee or total expense ratio).
The Board also considered the fees charged by the Sub-Adviser for sub-advisory services, as well as the portion of the Portfolio’s management fee retained by TAM following payment of the sub-advisory fee and how the portion of the contractual management fee retained by TAM at a specified asset level compared to the portions retained by other investment advisers managing mutual funds with similar investment strategies as calculated by an independent provider of information.
The Board noted that the Portfolio’s contractual management fee and the actual total expenses (i.e., expenses reflecting any waivers and/or reimbursements) of Service Class Shares of the Portfolio were below the medians for its peer group and peer universe. The Trustees also considered that TAM has entered into an expense limitation arrangement with the Portfolio, which may result in TAM waiving fees for the benefit of holders.
On the basis of these considerations, together with the other information it considered, the Board determined that the management and sub-advisory fees to be received by TAM and the Sub-Adviser under the Management Agreement and Sub-Advisory Agreement are reasonable in light of the services provided.
Cost of Services Provided and Level of Profitability
The Board reviewed information provided by TAM about the cost of providing and procuring fund management services, as well as the costs of the provision of administration, transfer agency and other services, to the Portfolio and to Transamerica Series Trust as a whole by TAM and its affiliates. The Board considered the profitability of TAM and its affiliates in providing these services for the Portfolio and Transamerica Series Trust as a whole. The Trustees recognized the competitiveness of the mutual fund industry and the importance of an investment adviser’s long-term profitability, including for maintaining company and management stability and accountability.
The Board also considered the allocation methodology used for calculating the profitability of TAM and its affiliates. The Board noted that the revenue and expense allocation methodology used by TAM to estimate its profitability with respect to its relationship with the Portfolio had been reviewed previously by an independent consultant. The Trustees considered that TAM reported that it had not made material changes to this methodology, and that the methodology had been applied consistently for the Portfolio.
|
|
|
| Transamerica Series Trust |
|
Semi-Annual Financial Statements 2024 |
Page 25
Transamerica MSCI EAFE Index VP
MANAGEMENT AND SUB-ADVISORY AGREEMENT — CONTRACT RENEWAL (continued)
(unaudited)
With respect to the Sub-Adviser, the Board noted that the sub-advisory fee is the product of arm’s-length negotiation between TAM and the Sub-Adviser, which is not affiliated with TAM, and is paid by TAM and not the Portfolio. As a result, the Board focused on the profitability of TAM and its affiliates with respect to the Portfolio.
Based on this information, the Board determined that the profitability of TAM and its affiliates from their relationships with the Portfolio was not excessive.
Economies of Scale
The Board considered economies of scale with respect to the management of the Portfolio, whether the Portfolio had appropriately benefited from any economies of scale and whether there was the potential for realization of any future economies of scale. The Board also considered the existence of economies of scale with respect to management of the Transamerica mutual funds overall and the extent to which the Portfolio benefited from any economies of scale. The Board recognized that, as the Portfolio’s assets increase, any economies of scale realized by TAM or the Sub-Adviser may not directly correlate with each other or with any economies of scale that might be realized by the Portfolio. The Trustees noted that the Portfolio’s management fee schedule does not contain breakpoints and determined that, based on all of the information provided, breakpoints were not warranted at this time. The Board also considered the Sub-Adviser’s sub-advisory fee schedule and the existence of breakpoints, if any, and how such breakpoints relate to any breakpoints in the Portfolio’s management fee schedule. The Trustees concluded that the Portfolio’s fee structure reflected an appropriate sharing of any efficiencies or economies of scale to date and noted that they will have the opportunity to periodically reexamine the appropriateness of the management fee payable to TAM and the fee paid to the Sub-Adviser in light of any economies of scale experienced in the future.
Benefits to TAM, its Affiliates and/or the Sub-Adviser from their Relationships with the Portfolio
The Board considered other benefits derived by TAM, its affiliates, and/or the Sub-Adviser from their relationships with the Portfolio. The Board noted that TAM does not receive benefits from research obtained with commissions paid to broker-dealers for portfolio transactions (commonly referred to as “soft dollars”) as a result of its relationship with the Portfolio.
Other Considerations
The Board noted that TAM has made a substantial commitment to the recruitment and retention of high-quality personnel and maintains the financial, compliance and operational resources reasonably necessary to manage the Portfolio in a professional manner that is consistent with the best interests of the Portfolio and the holders. In this regard, the Board favorably considered the procedures and policies TAM has in place to enforce compliance with applicable laws and regulations and oversee the portfolio management activities of the Sub-Adviser. The Board also noted that TAM has made an entrepreneurial commitment and undertaken certain business risks with respect to the management and success of the Portfolio.
Conclusion
After consideration of the factors described above, as well as other factors, the Trustees, including the Independent Trustees, concluded that the renewal of the Management Agreement and the Sub-Advisory Agreement was in the best interests of the Portfolio and the holders and voted to approve the renewal of the Agreements.
|
|
|
| Transamerica Series Trust |
|
Semi-Annual Financial Statements 2024 |
Page 26
PROXY VOTING POLICIES AND PROCEDURES AND QUARTERLY PORTFOLIO HOLDINGS
(unaudited)
A description of Transamerica Series Trust’s (the “Trust”) proxy voting policies and procedures is available in the Statement of Additional Information of the Portfolios, available without charge upon request by calling 1-800-851-9777 (toll free) or on the Securities and Exchange Commission’s (“SEC”) website at http://www.sec.gov.
In addition, the Portfolio is required to file Form N-PX, with their complete proxy voting records for the most recent 12 months ended June 30th, no later than August 31st of each year. The Form is available without charge: (1) on the Transamerica Funds website at https://www.transamerica.com/sites/default/files/files/e070d/TST%20N-PX%202021.pdf; and (2) on the SEC’s website at http://www.sec.gov.
Each fiscal quarter, the Portfolios, except Transamerica BlackRock Government Money Market VP, will file with the SEC a complete schedule of its monthly portfolio holdings on Form N-PORT. The Portfolios’ holdings as of the end of the third month of every fiscal quarter, as reported on Form N-PORT, will be publicly available on the SEC’s website at http://www.sec.gov within 60 days of the end of the fiscal quarter.
On a monthly basis, Transamerica BlackRock Government Money Market VP will file with the SEC portfolio holdings information on Form N-MFP3. A complete schedule of portfolio holdings is also available at www.transamerica.com.
You may also visit the Trust’s website at www.transamerica.com/annuities/prospectus for this and other information about the Portfolios and the Trust.
Important Notice Regarding Delivery of Shareholder Documents
Every year we provide shareholders informative materials such as the Transamerica Series Trust Annual Report, the Transamerica Series Trust Prospectus, and other required documents that keep you informed regarding your Portfolios. To the extent provided by mail, Transamerica Series Trust will only send one piece per mailing address, a method that saves your Portfolios money by reducing mailing and printing costs. We will continue to do this unless you tell us not to. To elect to receive individual mailings, simply call a Transamerica Customer Service Representative toll free at 1-800-851-9777, 8 a.m. to 7 p.m. Eastern Time, Monday-Friday. Your request will take effect within 30 days.
|
|
|
| Transamerica Series Trust |
|
Semi-Annual Financial Statements 2024 |
Page 27
NOTICE OF PRIVACY POLICY
(unaudited)
Your privacy is very important to us. We want you to understand what information we collect and how we use it. We collect and use “nonpublic personal information” in connection with providing our customers with a broad range of financial products and services as effectively and conveniently as possible. We treat nonpublic personal information in accordance with our Privacy Policy.
What Information We Collect and From Whom We Collect It
We may collect nonpublic personal information about you from the following sources:
| • |
|
Information we receive from you on applications or other forms, such as your name, address, and account number; |
| • |
|
Information about your transactions with us, our affiliates, or others, such as your account balance and purchase/redemption history; and |
| • |
|
Information we receive from non-affiliated third parties, including consumer reporting agencies. |
What Information We Disclose and To Whom We Disclose It
We do not disclose any nonpublic personal information about current or former customers to anyone without their express consent, except as permitted by law. We may disclose the nonpublic personal information we collect, as described above, to persons or companies that perform services on our behalf and to other financial institutions with which we have joint marketing agreements. We will require these companies to protect the confidentiality of your nonpublic personal information and to use it only to perform the services for which we have hired them.
Our Security Procedures
We restrict access to your nonpublic personal information and only allow disclosures to persons and companies as permitted by law to assist in providing products or services to you. We maintain physical, electronic, and procedural safeguards to protect your nonpublic personal information and to safeguard the disposal of certain consumer information.
Contact Us
If you have any questions about our Privacy Policy, please call 1-800-851-9777 on any business day between 8 a.m. and 7 p.m. Eastern Time.
Note: This Privacy Policy applies only to customers that have a direct relationship with us or our affiliates. If you own shares of our portfolios in the name of a third party such as a bank or broker-dealer, its privacy policy may apply to you instead of ours.
|
|
|
|
|
| Transamerica Series Trust |
|
|
|
Semi-Annual Financial Statements 2024 |
|
|
Page 28 |
|
|
PO Box 219945
Kansas City, MO 64121-9945
|
|
|
| Distributor: |
|
Transamerica Capital, Inc. |
|
|
PO Box 219945 |
|
|
Kansas City, MO 64121-9945 |
|
|
|
|
Customer Service: 1-800-851-9777 |
Transamerica Series Trust Semi-Annual Financial Statements
June 30, 2024
1801 California St., Suite 5200
Denver, CO 80202
Distributor: Transamerica Capital, Inc.
Customer Service: 1-800-851-9777
The following pages contain the most recent semi-annual financial statements for the investment options in which you are invested. In compliance with Securities and Exchange Commission regulations, we present these reports on an annual and semi-annual basis with the hope that they will foster greater understanding of the investment options’ holdings, performance, financial data, accounting policies and other issues. This streamlined version provides information only on the investment options in which you are invested.
If you have any questions about these reports, please do not hesitate to contact your financial professional. As always, we thank you for your trust and the opportunity to serve you.
Transamerica Multi-Managed Balanced VP
SCHEDULE OF INVESTMENTS
At June 30, 2024
(unaudited)
|
|
|
|
|
|
|
|
|
| |
|
Shares |
|
|
Value |
|
| COMMON STOCKS - 60.6% |
|
| Aerospace & Defense - 0.7% |
|
| Howmet Aerospace, Inc. |
|
|
50,588 |
|
|
$ |
3,927,146 |
|
| Northrop Grumman Corp. |
|
|
2,822 |
|
|
|
1,230,251 |
|
| RTX Corp. |
|
|
10,820 |
|
|
|
1,086,220 |
|
| Textron, Inc. |
|
|
35,948 |
|
|
|
3,086,495 |
|
| TransDigm Group, Inc. |
|
|
1,247 |
|
|
|
1,593,180 |
|
|
|
|
|
|
|
|
|
|
|
|
|
|
|
|
|
10,923,292 |
|
|
|
|
|
|
|
|
|
|
| Air Freight & Logistics - 0.6% |
|
| FedEx Corp. |
|
|
11,188 |
|
|
|
3,354,610 |
|
| United Parcel Service, Inc., Class B |
|
|
40,062 |
|
|
|
5,482,485 |
|
|
|
|
|
|
|
|
|
|
|
|
|
|
|
|
|
8,837,095 |
|
|
|
|
|
|
|
|
|
|
|
| Automobile Components - 0.1% |
|
| Aptiv PLC (A) |
|
|
17,660 |
|
|
|
1,243,617 |
|
|
|
|
|
|
|
|
|
|
|
| Automobiles - 0.6% |
|
| Tesla, Inc. (A) |
|
|
46,188 |
|
|
|
9,139,682 |
|
|
|
|
|
|
|
|
|
|
|
| Banks - 2.1% |
|
| Bank of America Corp. |
|
|
266,431 |
|
|
|
10,595,961 |
|
| Citigroup, Inc. |
|
|
18,468 |
|
|
|
1,171,979 |
|
| Fifth Third Bancorp |
|
|
100,088 |
|
|
|
3,652,211 |
|
| Truist Financial Corp. |
|
|
119,519 |
|
|
|
4,643,313 |
|
| US Bancorp |
|
|
77,462 |
|
|
|
3,075,242 |
|
| Wells Fargo & Co. |
|
|
140,357 |
|
|
|
8,335,802 |
|
|
|
|
|
|
|
|
|
|
|
|
|
|
|
|
|
31,474,508 |
|
|
|
|
|
|
|
|
|
|
| Beverages - 1.1% |
|
| Coca-Cola Co. |
|
|
141,197 |
|
|
|
8,987,189 |
|
| Monster Beverage Corp. (A) |
|
|
51,747 |
|
|
|
2,584,763 |
|
| PepsiCo, Inc. |
|
|
34,679 |
|
|
|
5,719,607 |
|
|
|
|
|
|
|
|
|
|
|
|
|
|
|
|
|
17,291,559 |
|
|
|
|
|
|
|
|
|
|
| Biotechnology - 1.7% |
|
| AbbVie, Inc. |
|
|
63,300 |
|
|
|
10,857,216 |
|
| Biogen, Inc. (A) |
|
|
7,151 |
|
|
|
1,657,745 |
|
| BioMarin Pharmaceutical, Inc. (A) |
|
|
4,621 |
|
|
|
380,447 |
|
| Neurocrine Biosciences, Inc. (A) |
|
|
6,090 |
|
|
|
838,410 |
|
| Regeneron Pharmaceuticals, Inc. (A) |
|
|
5,588 |
|
|
|
5,873,156 |
|
| Sarepta Therapeutics, Inc. (A) |
|
|
2,960 |
|
|
|
467,680 |
|
| Vertex Pharmaceuticals, Inc. (A) |
|
|
12,243 |
|
|
|
5,738,539 |
|
|
|
|
|
|
|
|
|
|
|
|
|
|
|
|
|
25,813,193 |
|
|
|
|
|
|
|
|
|
|
| Broadline Retail - 2.7% |
|
| Amazon.com, Inc. (A) |
|
|
209,367 |
|
|
|
40,460,173 |
|
|
|
|
|
|
|
|
|
|
|
| Building Products - 0.9% |
|
| Carrier Global Corp. |
|
|
60,573 |
|
|
|
3,820,945 |
|
| Masco Corp. |
|
|
30,727 |
|
|
|
2,048,569 |
|
| Trane Technologies PLC |
|
|
23,213 |
|
|
|
7,635,452 |
|
|
|
|
|
|
|
|
|
|
|
|
|
|
|
|
|
13,504,966 |
|
|
|
|
|
|
|
|
|
|
| Capital Markets - 1.4% |
|
| Ameriprise Financial, Inc. |
|
|
2,615 |
|
|
|
1,117,102 |
|
| Charles Schwab Corp. |
|
|
49,169 |
|
|
|
3,623,264 |
|
| CME Group, Inc. |
|
|
22,823 |
|
|
|
4,487,002 |
|
| Goldman Sachs Group, Inc. |
|
|
12,253 |
|
|
|
5,542,277 |
|
|
|
|
|
|
|
|
|
|
| |
|
Shares |
|
|
Value |
|
| COMMON STOCKS (continued) |
|
| Capital Markets (continued) |
|
| Intercontinental Exchange, Inc. |
|
|
26,916 |
|
|
$ |
3,684,531 |
|
| State Street Corp. |
|
|
43,415 |
|
|
|
3,212,710 |
|
|
|
|
|
|
|
|
|
|
|
|
|
|
|
|
|
21,666,886 |
|
|
|
|
|
|
|
|
|
|
| Chemicals - 1.1% |
|
| Dow, Inc. |
|
|
76,877 |
|
|
|
4,078,325 |
|
| Eastman Chemical Co. |
|
|
9,155 |
|
|
|
896,915 |
|
| Linde PLC |
|
|
17,986 |
|
|
|
7,892,437 |
|
| LyondellBasell Industries NV, Class A |
|
|
23,961 |
|
|
|
2,292,109 |
|
| PPG Industries, Inc. |
|
|
9,589 |
|
|
|
1,207,159 |
|
|
|
|
|
|
|
|
|
|
|
|
|
|
|
|
|
16,366,945 |
|
|
|
|
|
|
|
|
|
|
| Commercial Services & Supplies - 0.1% |
|
| Cintas Corp. |
|
|
1,725 |
|
|
|
1,207,949 |
|
|
|
|
|
|
|
|
|
|
|
| Communications Equipment - 0.1% |
|
| Motorola Solutions, Inc. |
|
|
3,355 |
|
|
|
1,295,198 |
|
|
|
|
|
|
|
|
|
|
|
| Construction Materials - 0.1% |
|
| Martin Marietta Materials, Inc. |
|
|
2,223 |
|
|
|
1,204,421 |
|
|
|
|
|
|
|
|
|
|
|
| Consumer Staples Distribution & Retail - 0.5% |
|
| Costco Wholesale Corp. |
|
|
9,356 |
|
|
|
7,952,506 |
|
|
|
|
|
|
|
|
|
|
|
| Distributors - 0.0% (B) |
|
| LKQ Corp. |
|
|
13,866 |
|
|
|
576,687 |
|
|
|
|
|
|
|
|
|
|
|
| Electric Utilities - 1.2% |
|
| NextEra Energy, Inc. |
|
|
89,914 |
|
|
|
6,366,810 |
|
| NRG Energy, Inc. |
|
|
4,598 |
|
|
|
358,000 |
|
| PG&E Corp. |
|
|
248,155 |
|
|
|
4,332,786 |
|
| Southern Co. |
|
|
98,071 |
|
|
|
7,607,368 |
|
|
|
|
|
|
|
|
|
|
|
|
|
|
|
|
|
18,664,964 |
|
|
|
|
|
|
|
|
|
|
| Electrical Equipment - 0.4% |
|
| AMETEK, Inc. |
|
|
3,436 |
|
|
|
572,816 |
|
| Eaton Corp. PLC |
|
|
16,581 |
|
|
|
5,198,972 |
|
|
|
|
|
|
|
|
|
|
|
|
|
|
|
|
|
5,771,788 |
|
|
|
|
|
|
|
|
|
|
| Electronic Equipment, Instruments & Components - 0.1% |
|
| Corning, Inc. |
|
|
19,640 |
|
|
|
763,014 |
|
| TE Connectivity Ltd. |
|
|
6,162 |
|
|
|
926,950 |
|
|
|
|
|
|
|
|
|
|
|
|
|
|
|
|
|
1,689,964 |
|
|
|
|
|
|
|
|
|
|
| Energy Equipment & Services - 0.1% |
|
| Baker Hughes Co. |
|
|
35,127 |
|
|
|
1,235,417 |
|
|
|
|
|
|
|
|
|
|
|
| Entertainment - 0.2% |
|
| Netflix, Inc. (A) |
|
|
3,154 |
|
|
|
2,128,572 |
|
| Warner Music Group Corp., Class A |
|
|
34,388 |
|
|
|
1,053,992 |
|
|
|
|
|
|
|
|
|
|
|
|
|
|
|
|
|
3,182,564 |
|
|
|
|
|
|
|
|
|
|
| Financial Services - 2.8% |
|
| Berkshire Hathaway, Inc., Class B (A) |
|
|
29,774 |
|
|
|
12,112,063 |
|
| Block, Inc. (A) |
|
|
9,572 |
|
|
|
617,298 |
|
| Corpay, Inc. (A) |
|
|
11,670 |
|
|
|
3,109,005 |
|
| Fidelity National Information Services, Inc. |
|
|
38,471 |
|
|
|
2,899,175 |
|
| Mastercard, Inc., Class A |
|
|
31,350 |
|
|
|
13,830,366 |
|
| Visa, Inc., Class A |
|
|
38,950 |
|
|
|
10,223,206 |
|
|
|
|
|
|
|
|
|
|
|
|
|
|
|
|
|
42,791,113 |
|
|
|
|
|
|
|
|
|
|
The Notes to Financial Statements are an integral part of this report.
|
|
|
|
|
| Transamerica Series Trust |
|
|
|
Semi-Annual Financial Statements 2024 |
|
|
Page 1 |
|
|
Transamerica Multi-Managed Balanced VP
SCHEDULE OF INVESTMENTS (continued)
At June 30, 2024
(unaudited)
|
|
|
|
|
|
|
|
|
| |
|
Shares |
|
|
Value |
|
| COMMON STOCKS (continued) |
|
| Food Products - 0.5% |
|
| Mondelez International, Inc., Class A |
|
|
108,312 |
|
|
$ |
7,087,937 |
|
|
| Ground Transportation - 0.7% |
|
| CSX Corp. |
|
|
97,848 |
|
|
|
3,273,015 |
|
| Uber Technologies, Inc. (A) |
|
|
79,126 |
|
|
|
5,750,878 |
|
| Union Pacific Corp. |
|
|
9,487 |
|
|
|
2,146,529 |
|
|
|
|
|
|
|
|
|
|
|
|
|
|
|
|
|
11,170,422 |
|
|
|
|
|
|
|
|
|
|
| Health Care Equipment & Supplies - 1.2% |
|
| Baxter International, Inc. |
|
|
17,629 |
|
|
|
589,690 |
|
| Becton Dickinson & Co. |
|
|
4,832 |
|
|
|
1,129,287 |
|
| Boston Scientific Corp. (A) |
|
|
64,137 |
|
|
|
4,939,190 |
|
| Dexcom, Inc. (A) |
|
|
7,660 |
|
|
|
868,491 |
|
| Medtronic PLC |
|
|
52,471 |
|
|
|
4,129,992 |
|
| Stryker Corp. |
|
|
20,296 |
|
|
|
6,905,714 |
|
|
|
|
|
|
|
|
|
|
|
|
|
|
|
|
|
18,562,364 |
|
|
|
|
|
|
|
|
|
|
| Health Care Providers & Services - 1.5% |
|
| Elevance Health, Inc. |
|
|
7,922 |
|
|
|
4,292,615 |
|
| HCA Healthcare, Inc. |
|
|
3,267 |
|
|
|
1,049,622 |
|
| Humana, Inc. |
|
|
6,155 |
|
|
|
2,299,816 |
|
| McKesson Corp. |
|
|
2,611 |
|
|
|
1,524,928 |
|
| UnitedHealth Group, Inc. |
|
|
27,253 |
|
|
|
13,878,863 |
|
|
|
|
|
|
|
|
|
|
|
|
|
|
|
|
|
23,045,844 |
|
|
|
|
|
|
|
|
|
|
| Health Care REITs - 0.3% |
|
| Ventas, Inc. |
|
|
61,024 |
|
|
|
3,128,090 |
|
| Welltower, Inc. |
|
|
19,752 |
|
|
|
2,059,146 |
|
|
|
|
|
|
|
|
|
|
|
|
|
|
|
|
|
5,187,236 |
|
|
|
|
|
|
|
|
|
|
| Hotels, Restaurants & Leisure - 1.8% |
|
| Booking Holdings, Inc. |
|
|
1,505 |
|
|
|
5,962,057 |
|
| Chipotle Mexican Grill, Inc. (A) |
|
|
74,600 |
|
|
|
4,673,690 |
|
| Expedia Group, Inc. (A) |
|
|
18,330 |
|
|
|
2,309,397 |
|
| Hilton Worldwide Holdings, Inc. |
|
|
12,004 |
|
|
|
2,619,273 |
|
| McDonald’s Corp. |
|
|
16,177 |
|
|
|
4,122,547 |
|
| Royal Caribbean Cruises Ltd. (A) |
|
|
21,052 |
|
|
|
3,356,320 |
|
| Yum! Brands, Inc. |
|
|
32,755 |
|
|
|
4,338,727 |
|
|
|
|
|
|
|
|
|
|
|
|
|
|
|
|
|
27,382,011 |
|
|
|
|
|
|
|
|
|
|
| Household Durables - 0.1% |
|
| Lennar Corp., Class A |
|
|
8,043 |
|
|
|
1,205,405 |
|
| Toll Brothers, Inc. |
|
|
8,456 |
|
|
|
973,962 |
|
|
|
|
|
|
|
|
|
|
|
|
|
|
|
|
|
2,179,367 |
|
|
|
|
|
|
|
|
|
|
| Household Products - 0.3% |
|
| Church & Dwight Co., Inc. |
|
|
10,209 |
|
|
|
1,058,469 |
|
| Procter & Gamble Co. |
|
|
22,459 |
|
|
|
3,703,938 |
|
|
|
|
|
|
|
|
|
|
|
|
|
|
|
|
|
4,762,407 |
|
|
|
|
|
|
|
|
|
|
| Independent Power & Renewable Electricity Producers - 0.0% (B) |
|
| Vistra Corp. |
|
|
6,808 |
|
|
|
585,352 |
|
|
|
|
|
|
|
|
|
|
|
| Industrial Conglomerates - 0.6% |
|
| Honeywell International, Inc. |
|
|
43,320 |
|
|
|
9,250,553 |
|
|
|
|
|
|
|
|
|
|
|
| Industrial REITs - 0.3% |
|
| Prologis, Inc. |
|
|
46,607 |
|
|
|
5,234,432 |
|
|
|
|
|
|
|
|
|
|
|
|
|
|
|
|
|
|
|
| |
|
Shares |
|
|
Value |
|
| COMMON STOCKS (continued) |
|
| Insurance - 1.2% |
|
| Aflac, Inc. |
|
|
29,803 |
|
|
$ |
2,661,706 |
|
| Aon PLC, Class A |
|
|
3,095 |
|
|
|
908,630 |
|
| MetLife, Inc. |
|
|
35,742 |
|
|
|
2,508,731 |
|
| Principal Financial Group, Inc. |
|
|
23,003 |
|
|
|
1,804,585 |
|
| Progressive Corp. |
|
|
27,720 |
|
|
|
5,757,721 |
|
| Travelers Cos., Inc. |
|
|
24,660 |
|
|
|
5,014,365 |
|
|
|
|
|
|
|
|
|
|
|
|
|
|
|
|
|
18,655,738 |
|
|
|
|
|
|
|
|
|
|
| Interactive Media & Services - 4.2% |
|
| Alphabet, Inc., Class A |
|
|
119,781 |
|
|
|
21,818,109 |
|
| Alphabet, Inc., Class C |
|
|
88,922 |
|
|
|
16,310,073 |
|
| Meta Platforms, Inc., Class A |
|
|
51,159 |
|
|
|
25,795,391 |
|
|
|
|
|
|
|
|
|
|
|
|
|
|
|
|
|
63,923,573 |
|
|
|
|
|
|
|
|
|
|
| IT Services - 0.6% |
|
| Accenture PLC, Class A |
|
|
15,412 |
|
|
|
4,676,155 |
|
| Cognizant Technology Solutions Corp., Class A |
|
|
55,340 |
|
|
|
3,763,120 |
|
|
|
|
|
|
|
|
|
|
|
|
|
|
|
|
|
8,439,275 |
|
|
|
|
|
|
|
|
|
|
| Life Sciences Tools & Services - 0.8% |
|
| Danaher Corp. |
|
|
20,393 |
|
|
|
5,095,191 |
|
| Thermo Fisher Scientific, Inc. |
|
|
13,750 |
|
|
|
7,603,750 |
|
|
|
|
|
|
|
|
|
|
|
|
|
|
|
|
|
12,698,941 |
|
|
|
|
|
|
|
|
|
|
| Machinery - 0.8% |
|
| Deere & Co. |
|
|
17,437 |
|
|
|
6,514,986 |
|
| Ingersoll Rand, Inc. |
|
|
16,953 |
|
|
|
1,540,011 |
|
| Otis Worldwide Corp. |
|
|
49,532 |
|
|
|
4,767,950 |
|
|
|
|
|
|
|
|
|
|
|
|
|
|
|
|
|
12,822,947 |
|
|
|
|
|
|
|
|
|
|
| Media - 0.6% |
|
| Charter Communications, Inc., Class A (A) |
|
|
6,181 |
|
|
|
1,847,872 |
|
| Comcast Corp., Class A |
|
|
167,314 |
|
|
|
6,552,016 |
|
| Liberty Media Corp. - Liberty SiriusXM,
Class A (A) |
|
|
30,016 |
|
|
|
664,854 |
|
|
|
|
|
|
|
|
|
|
|
|
|
|
|
|
|
9,064,742 |
|
|
|
|
|
|
|
|
|
|
| Metals & Mining - 0.1% |
|
| Nucor Corp. |
|
|
7,246 |
|
|
|
1,145,448 |
|
|
|
|
|
|
|
|
|
|
|
| Multi-Utilities - 0.1% |
|
| CMS Energy Corp. |
|
|
32,710 |
|
|
|
1,947,226 |
|
|
|
|
|
|
|
|
|
|
|
| Oil, Gas & Consumable Fuels - 2.2% |
|
| Chevron Corp. |
|
|
10,200 |
|
|
|
1,595,484 |
|
| ConocoPhillips |
|
|
51,501 |
|
|
|
5,890,684 |
|
| Diamondback Energy, Inc. |
|
|
20,236 |
|
|
|
4,051,045 |
|
| EOG Resources, Inc. |
|
|
44,716 |
|
|
|
5,628,403 |
|
| Exxon Mobil Corp. |
|
|
136,413 |
|
|
|
15,703,865 |
|
|
|
|
|
|
|
|
|
|
|
|
|
|
|
|
|
32,869,481 |
|
|
|
|
|
|
|
|
|
|
| Passenger Airlines - 0.1% |
|
| Delta Air Lines, Inc. |
|
|
28,769 |
|
|
|
1,364,801 |
|
|
|
|
|
|
|
|
|
|
|
| Personal Care Products - 0.2% |
|
| Estee Lauder Cos., Inc., Class A |
|
|
7,924 |
|
|
|
843,114 |
|
| Kenvue, Inc. |
|
|
99,583 |
|
|
|
1,810,419 |
|
|
|
|
|
|
|
|
|
|
|
|
|
|
|
|
|
2,653,533 |
|
|
|
|
|
|
|
|
|
|
The Notes to Financial Statements are an integral part of this report.
|
|
|
|
|
| Transamerica Series Trust |
|
|
|
Semi-Annual Financial Statements 2024 |
|
|
Page 2 |
|
|
Transamerica Multi-Managed Balanced VP
SCHEDULE OF INVESTMENTS (continued)
At June 30, 2024
(unaudited)
|
|
|
|
|
|
|
|
|
| |
|
Shares |
|
|
Value |
|
| COMMON STOCKS (continued) |
|
| Pharmaceuticals - 1.9% |
|
| Bristol-Myers Squibb Co. |
|
|
114,909 |
|
|
$ |
4,772,171 |
|
| Eli Lilly & Co. |
|
|
14,254 |
|
|
|
12,905,286 |
|
| Johnson & Johnson |
|
|
35,679 |
|
|
|
5,214,843 |
|
| Merck & Co., Inc. |
|
|
42,964 |
|
|
|
5,318,943 |
|
|
|
|
|
|
|
|
|
|
|
|
|
|
|
|
|
28,211,243 |
|
|
|
|
|
|
|
|
|
|
| Professional Services - 0.2% |
|
| Leidos Holdings, Inc. |
|
|
20,793 |
|
|
|
3,033,283 |
|
|
|
|
|
|
|
|
|
|
|
| Residential REITs - 0.1% |
|
| Equity LifeStyle Properties, Inc. |
|
|
29,868 |
|
|
|
1,945,303 |
|
|
|
|
|
|
|
|
|
|
|
| Semiconductors & Semiconductor Equipment - 7.6% |
|
| Advanced Micro Devices, Inc. (A) |
|
|
42,461 |
|
|
|
6,887,599 |
|
| Analog Devices, Inc. |
|
|
34,044 |
|
|
|
7,770,883 |
|
| Broadcom, Inc. |
|
|
5,397 |
|
|
|
8,665,045 |
|
| Lam Research Corp. |
|
|
2,949 |
|
|
|
3,140,243 |
|
| Micron Technology, Inc. |
|
|
42,274 |
|
|
|
5,560,299 |
|
| NVIDIA Corp. |
|
|
528,006 |
|
|
|
65,229,861 |
|
| NXP Semiconductors NV |
|
|
30,226 |
|
|
|
8,133,514 |
|
| Qorvo, Inc. (A) |
|
|
8,120 |
|
|
|
942,245 |
|
| Texas Instruments, Inc. |
|
|
43,433 |
|
|
|
8,449,022 |
|
|
|
|
|
|
|
|
|
|
|
|
|
|
|
|
|
114,778,711 |
|
|
|
|
|
|
|
|
|
|
| Software - 6.6% |
|
| Adobe, Inc. (A) |
|
|
3,030 |
|
|
|
1,683,286 |
|
| Cadence Design Systems, Inc. (A) |
|
|
5,460 |
|
|
|
1,680,315 |
|
| Intuit, Inc. |
|
|
9,922 |
|
|
|
6,520,838 |
|
| Microsoft Corp. |
|
|
164,847 |
|
|
|
73,678,367 |
|
| Salesforce, Inc. |
|
|
30,059 |
|
|
|
7,728,169 |
|
| ServiceNow, Inc. (A) |
|
|
10,450 |
|
|
|
8,220,701 |
|
|
|
|
|
|
|
|
|
|
|
|
|
|
|
|
|
99,511,676 |
|
|
|
|
|
|
|
|
|
|
| Specialized REITs - 0.4% |
|
| Digital Realty Trust, Inc. |
|
|
21,982 |
|
|
|
3,342,363 |
|
| SBA Communications Corp. |
|
|
13,900 |
|
|
|
2,728,570 |
|
|
|
|
|
|
|
|
|
|
|
|
|
|
|
|
|
6,070,933 |
|
|
|
|
|
|
|
|
|
|
| Specialty Retail - 1.7% |
|
| AutoNation, Inc. (A) |
|
|
1,207 |
|
|
|
192,372 |
|
| AutoZone, Inc. (A) |
|
|
2,255 |
|
|
|
6,684,046 |
|
| Best Buy Co., Inc. |
|
|
23,660 |
|
|
|
1,994,301 |
|
| Burlington Stores, Inc. (A) |
|
|
8,911 |
|
|
|
2,138,640 |
|
| Lowe’s Cos., Inc. |
|
|
38,604 |
|
|
|
8,510,638 |
|
| O’Reilly Automotive, Inc. (A) |
|
|
1,389 |
|
|
|
1,466,867 |
|
| Ross Stores, Inc. |
|
|
21,414 |
|
|
|
3,111,882 |
|
| TJX Cos., Inc. |
|
|
10,556 |
|
|
|
1,162,216 |
|
|
|
|
|
|
|
|
|
|
|
|
|
|
|
|
|
25,260,962 |
|
|
|
|
|
|
|
|
|
|
| Technology Hardware, Storage & Peripherals - 4.7% |
|
| Apple, Inc. |
|
|
302,069 |
|
|
|
63,621,773 |
|
| Hewlett Packard Enterprise Co. |
|
|
93,210 |
|
|
|
1,973,255 |
|
| Seagate Technology Holdings PLC |
|
|
44,596 |
|
|
|
4,605,429 |
|
| Western Digital Corp. (A) |
|
|
11,466 |
|
|
|
868,779 |
|
|
|
|
|
|
|
|
|
|
|
|
|
|
|
|
|
71,069,236 |
|
|
|
|
|
|
|
|
|
|
|
|
|
|
|
|
|
|
|
| |
|
Shares |
|
|
Value |
|
| COMMON STOCKS (continued) |
|
| Tobacco - 0.3% |
|
| Altria Group, Inc. |
|
|
27,202 |
|
|
$ |
1,239,051 |
|
| Philip Morris International, Inc. |
|
|
24,579 |
|
|
|
2,490,590 |
|
|
|
|
|
|
|
|
|
|
|
|
|
|
|
|
|
3,729,641 |
|
|
|
|
|
|
|
|
|
|
| Trading Companies & Distributors - 0.1% |
|
| United Rentals, Inc. |
|
|
2,677 |
|
|
|
1,731,296 |
|
|
|
|
|
|
|
|
|
|
|
| Wireless Telecommunication Services - 0.2% |
|
| T-Mobile US, Inc. |
|
|
16,973 |
|
|
|
2,990,303 |
|
|
|
|
|
|
|
|
|
|
| Total Common Stocks
(Cost $589,176,483) |
|
|
|
|
|
|
920,660,704 |
|
|
|
|
|
|
|
|
|
|
|
|
|
| |
|
Principal |
|
|
Value |
|
| CORPORATE DEBT SECURITIES - 13.9% |
|
| Aerospace & Defense - 0.4% |
|
| BAE Systems PLC |
|
|
|
|
|
|
|
|
| 5.30%, 03/26/2034 (C) |
|
$ |
780,000 |
|
|
|
774,429 |
|
| Boeing Co. |
|
|
|
|
|
|
|
|
| 3.50%, 03/01/2039 |
|
|
2,022,000 |
|
|
|
1,440,085 |
|
| 6.53%, 05/01/2034 (C) |
|
|
350,000 |
|
|
|
359,020 |
|
| 6.86%, 05/01/2054 (C) |
|
|
601,000 |
|
|
|
619,611 |
|
| General Electric Co. |
|
|
|
|
|
|
|
|
| 4.13%, 10/09/2042 |
|
|
690,000 |
|
|
|
579,399 |
|
| 4.50%, 03/11/2044 |
|
|
932,000 |
|
|
|
813,823 |
|
| HEICO Corp. |
|
|
|
|
|
|
|
|
| 5.35%, 08/01/2033 |
|
|
1,548,000 |
|
|
|
1,536,858 |
|
|
|
|
|
|
|
|
|
|
|
|
|
|
|
|
|
6,123,225 |
|
|
|
|
|
|
|
|
|
|
| Automobile Components - 0.1% |
|
| Aptiv PLC/Aptiv Corp. |
|
|
|
|
|
|
|
|
| 3.25%, 03/01/2032 |
|
|
769,000 |
|
|
|
667,918 |
|
| ZF North America Capital, Inc. |
|
|
|
|
|
|
|
|
| 6.88%, 04/23/2032 (C) |
|
|
600,000 |
|
|
|
620,270 |
|
|
|
|
|
|
|
|
|
|
|
|
|
|
|
|
|
1,288,188 |
|
|
|
|
|
|
|
|
|
|
| Automobiles - 0.5% |
|
| BMW US Capital LLC |
|
|
|
|
|
|
|
|
| 2.80%, 04/11/2026 (C) |
|
|
1,104,000 |
|
|
|
1,059,429 |
|
| Ford Motor Credit Co. LLC |
|
|
|
|
|
|
|
|
| 3.38%, 11/13/2025 |
|
|
1,545,000 |
|
|
|
1,495,176 |
|
| 6.95%, 03/06/2026 |
|
|
392,000 |
|
|
|
398,313 |
|
| General Motors Co. |
|
|
|
|
|
|
|
|
| 6.25%, 10/02/2043 |
|
|
326,000 |
|
|
|
325,851 |
|
| General Motors Financial Co., Inc. |
|
|
|
|
|
|
|
|
| 5.00%, 04/09/2027 |
|
|
872,000 |
|
|
|
863,213 |
|
| Nissan Motor Acceptance Co. LLC |
|
|
|
|
|
|
|
|
| 7.05%, 09/15/2028 (C) |
|
|
1,307,000 |
|
|
|
1,361,002 |
|
| Stellantis Finance US, Inc. |
|
|
|
|
|
|
|
|
| 2.69%, 09/15/2031 (C) |
|
|
887,000 |
|
|
|
733,634 |
|
| Volkswagen Group of America Finance LLC |
|
|
|
|
|
|
|
|
| 1.63%, 11/24/2027 (C) |
|
|
1,088,000 |
|
|
|
964,374 |
|
|
|
|
|
|
|
|
|
|
|
|
|
|
|
|
|
7,200,992 |
|
|
|
|
|
|
|
|
|
|
The Notes to Financial Statements are an integral part of this report.
|
|
|
|
|
| Transamerica Series Trust |
|
|
|
Semi-Annual Financial Statements 2024 |
|
|
Page 3 |
|
|
Transamerica Multi-Managed Balanced VP
SCHEDULE OF INVESTMENTS (continued)
At June 30, 2024
(unaudited)
|
|
|
|
|
|
|
|
|
| |
|
Principal |
|
|
Value |
|
| CORPORATE DEBT SECURITIES (continued) |
|
| Banks - 2.5% |
|
| Banco Santander SA |
|
|
|
|
|
|
|
|
| Fixed until 03/14/2027, 5.55% (D), 03/14/2028 |
|
$ |
1,000,000 |
|
|
$ |
998,415 |
|
| Bank of America Corp. |
|
|
|
|
|
|
|
|
| Fixed until 01/23/2034, 5.47% (D), 01/23/2035 |
|
|
1,199,000 |
|
|
|
1,200,785 |
|
| Fixed until 09/15/2028, 5.82% (D), 09/15/2029 |
|
|
4,009,000 |
|
|
|
4,094,783 |
|
| Barclays PLC |
|
|
|
|
|
|
|
|
| Fixed until 03/12/2054, 6.04% (D), 03/12/2055 |
|
|
256,000 |
|
|
|
260,690 |
|
| Fixed until 11/02/2025, 7.33% (D), 11/02/2026 |
|
|
1,407,000 |
|
|
|
1,431,600 |
|
| Citigroup, Inc. |
|
|
|
|
|
|
|
|
| Fixed until 06/11/2034, 5.45% (D), 06/11/2035 |
|
|
598,000 |
|
|
|
594,615 |
|
| Fixed until 05/25/2033, 6.17% (D), 05/25/2034 |
|
|
956,000 |
|
|
|
973,561 |
|
| Deutsche Bank AG |
|
|
|
|
|
|
|
|
| Fixed until 11/26/2024, 3.96% (D), 11/26/2025 |
|
|
681,000 |
|
|
|
675,138 |
|
| Goldman Sachs Group, Inc. |
|
|
|
|
|
|
|
|
| Fixed until 10/21/2031, 2.65% (D), 10/21/2032 |
|
|
1,620,000 |
|
|
|
1,349,251 |
|
| ING Groep NV |
|
|
|
|
|
|
|
|
| Fixed until 09/11/2033, 6.11% (D), 09/11/2034 |
|
|
840,000 |
|
|
|
867,588 |
|
| Intesa Sanpaolo SpA |
|
|
|
|
|
|
|
|
| Fixed until 11/21/2032, 8.25% (D), 11/21/2033 (C) |
|
|
2,293,000 |
|
|
|
2,533,199 |
|
| JPMorgan Chase & Co. |
|
|
|
|
|
|
|
|
| Fixed until 04/22/2026, 1.58% (D), 04/22/2027 |
|
|
1,769,000 |
|
|
|
1,650,873 |
|
| Fixed until 01/23/2029, 5.01% (D), 01/23/2030 |
|
|
3,100,000 |
|
|
|
3,078,114 |
|
| Fixed until 01/23/2034, 5.34% (D), 01/23/2035 |
|
|
724,000 |
|
|
|
721,177 |
|
| Fixed until 04/22/2034, 5.77% (D), 04/22/2035 |
|
|
559,000 |
|
|
|
574,717 |
|
| Lloyds Banking Group PLC |
|
|
|
|
|
|
|
|
| Fixed until 08/11/2032, 4.98% (D), 08/11/2033 |
|
|
725,000 |
|
|
|
694,067 |
|
| Fixed until 01/05/2034, 5.68% (D), 01/05/2035 |
|
|
1,195,000 |
|
|
|
1,192,477 |
|
| M&T Bank Corp. |
|
|
|
|
|
|
|
|
| Fixed until 03/13/2031, 6.08% (D), 03/13/2032 (E) |
|
|
600,000 |
|
|
|
598,582 |
|
| Morgan Stanley |
|
|
|
|
|
|
|
|
| Fixed until 01/16/2029, 5.17% (D), 01/16/2030 |
|
|
2,969,000 |
|
|
|
2,963,278 |
|
| Fixed until 01/18/2034, 5.47% (D), 01/18/2035 |
|
|
544,000 |
|
|
|
543,636 |
|
| Fixed until 04/19/2034, 5.83% (D), 04/19/2035 |
|
|
1,164,000 |
|
|
|
1,195,723 |
|
| PNC Financial Services Group, Inc. |
|
|
|
|
|
|
|
|
| Fixed until 01/22/2034, 5.68% (D), 01/22/2035 |
|
|
203,000 |
|
|
|
204,522 |
|
| Fixed until 08/18/2033, 5.94% (D), 08/18/2034 |
|
|
1,117,000 |
|
|
|
1,147,091 |
|
|
|
|
|
|
|
|
|
|
| |
|
Principal |
|
|
Value |
|
| CORPORATE DEBT SECURITIES (continued) |
|
| Banks (continued) |
|
| Truist Financial Corp. |
|
|
|
|
|
|
|
|
| Fixed until 01/26/2033, 5.12% (D), 01/26/2034 |
|
$ |
1,160,000 |
|
|
$ |
1,112,686 |
|
| Fixed until 01/24/2034, 5.71% (D), 01/24/2035 |
|
|
776,000 |
|
|
|
774,129 |
|
| Fixed until 06/08/2033, 5.87% (D), 06/08/2034 |
|
|
689,000 |
|
|
|
695,519 |
|
| Fixed until 10/30/2028, 7.16% (D), 10/30/2029 |
|
|
571,000 |
|
|
|
606,594 |
|
| UBS Group AG |
|
|
|
|
|
|
|
|
| Fixed until 09/11/2024, 2.59% (D), 09/11/2025 (C) |
|
|
1,088,000 |
|
|
|
1,080,781 |
|
| Fixed until 08/12/2032, 6.54% (D), 08/12/2033 (C) |
|
|
1,772,000 |
|
|
|
1,863,902 |
|
| Wells Fargo & Co. |
|
|
|
|
|
|
|
|
| Fixed until 07/25/2033, 5.56% (D), 07/25/2034 |
|
|
1,617,000 |
|
|
|
1,619,185 |
|
|
|
|
|
|
|
|
|
|
|
|
|
|
|
|
|
37,296,678 |
|
|
|
|
|
|
|
|
|
|
| Beverages - 0.2% |
|
| Anheuser-Busch InBev Worldwide, Inc. |
|
|
|
|
|
|
|
|
| 4.44%, 10/06/2048 |
|
|
1,226,000 |
|
|
|
1,054,530 |
|
| Constellation Brands, Inc. |
|
|
|
|
|
|
|
|
| 3.15%, 08/01/2029 |
|
|
581,000 |
|
|
|
527,302 |
|
| 3.70%, 12/06/2026 |
|
|
276,000 |
|
|
|
266,638 |
|
| Diageo Capital PLC |
|
|
|
|
|
|
|
|
| 5.50%, 01/24/2033 |
|
|
660,000 |
|
|
|
679,781 |
|
|
|
|
|
|
|
|
|
|
|
|
|
|
|
|
|
2,528,251 |
|
|
|
|
|
|
|
|
|
|
| Biotechnology - 0.2% |
|
| Amgen, Inc. |
|
|
|
|
|
|
|
|
| 2.80%, 08/15/2041 |
|
|
708,000 |
|
|
|
499,709 |
|
| 5.60%, 03/02/2043 |
|
|
897,000 |
|
|
|
887,293 |
|
| CSL Finance PLC |
|
|
|
|
|
|
|
|
| 4.63%, 04/27/2042 (C) |
|
|
709,000 |
|
|
|
636,025 |
|
| Gilead Sciences, Inc. |
|
|
|
|
|
|
|
|
| 4.15%, 03/01/2047 |
|
|
285,000 |
|
|
|
232,509 |
|
| Royalty Pharma PLC |
|
|
|
|
|
|
|
|
| 2.20%, 09/02/2030 |
|
|
937,000 |
|
|
|
781,539 |
|
|
|
|
|
|
|
|
|
|
|
|
|
|
|
|
|
3,037,075 |
|
|
|
|
|
|
|
|
|
|
| Building Products - 0.1% |
|
| Lowe’s Cos., Inc. |
|
|
|
|
|
|
|
|
| 3.75%, 04/01/2032 |
|
|
1,344,000 |
|
|
|
1,222,344 |
|
| Mohawk Industries, Inc. |
|
|
|
|
|
|
|
|
| 5.85%, 09/18/2028 |
|
|
658,000 |
|
|
|
671,606 |
|
|
|
|
|
|
|
|
|
|
|
|
|
|
|
|
|
1,893,950 |
|
|
|
|
|
|
|
|
|
|
| Capital Markets - 0.2% |
|
| Charles Schwab Corp. |
|
|
|
|
|
|
|
|
| Fixed until 05/19/2033, 5.85% (D), 05/19/2034 |
|
|
1,945,000 |
|
|
|
1,986,999 |
|
| LPL Holdings, Inc. |
|
|
|
|
|
|
|
|
| 5.70%, 05/20/2027 |
|
|
605,000 |
|
|
|
607,490 |
|
|
|
|
|
|
|
|
|
|
|
|
|
|
|
|
|
2,594,489 |
|
|
|
|
|
|
|
|
|
|
| Chemicals - 0.1% |
|
| Celanese US Holdings LLC |
|
|
|
|
|
|
|
|
| 6.70%, 11/15/2033 |
|
|
873,000 |
|
|
|
919,097 |
|
The Notes to Financial Statements are an integral part of this report.
|
|
|
|
|
| Transamerica Series Trust |
|
|
|
Semi-Annual Financial Statements 2024 |
|
|
Page 4 |
|
|
Transamerica Multi-Managed Balanced VP
SCHEDULE OF INVESTMENTS (continued)
At June 30, 2024
(unaudited)
|
|
|
|
|
|
|
|
|
| |
|
Principal |
|
|
Value |
|
| CORPORATE DEBT SECURITIES (continued) |
|
| Chemicals (continued) |
|
| Nutrien Ltd. |
|
|
|
|
|
|
|
|
| 4.90%, 03/27/2028 |
|
$ |
697,000 |
|
|
$ |
689,137 |
|
| OCP SA |
|
|
|
|
|
|
|
|
| 6.75%, 05/02/2034 (C) |
|
|
565,000 |
|
|
|
579,396 |
|
|
|
|
|
|
|
|
|
|
|
|
|
|
|
|
|
2,187,630 |
|
|
|
|
|
|
|
|
|
|
| Commercial Services & Supplies - 0.6% |
|
| ADT Security Corp. |
|
|
|
|
|
|
|
|
| 4.13%, 08/01/2029 (C) |
|
|
1,193,000 |
|
|
|
1,100,342 |
|
| Ashtead Capital, Inc. |
|
|
|
|
|
|
|
|
| 5.55%, 05/30/2033 (C) |
|
|
294,000 |
|
|
|
286,995 |
|
| 5.80%, 04/15/2034 (C) |
|
|
366,000 |
|
|
|
363,900 |
|
| Element Fleet Management Corp. |
|
|
|
|
|
|
|
|
| 6.32%, 12/04/2028 (C) |
|
|
1,774,000 |
|
|
|
1,835,277 |
|
| GXO Logistics, Inc. |
|
|
|
|
|
|
|
|
| 2.65%, 07/15/2031 |
|
|
2,268,000 |
|
|
|
1,841,850 |
|
| 6.50%, 05/06/2034 |
|
|
698,000 |
|
|
|
710,108 |
|
| Quanta Services, Inc. |
|
|
|
|
|
|
|
|
| 2.90%, 10/01/2030 |
|
|
822,000 |
|
|
|
724,919 |
|
| Triton Container International Ltd./TAL International Container Corp. |
|
|
|
|
|
|
|
|
| 3.25%, 03/15/2032 |
|
|
2,216,000 |
|
|
|
1,827,379 |
|
| Veralto Corp. |
|
|
|
|
|
|
|
|
| 5.45%, 09/18/2033 (C) |
|
|
1,002,000 |
|
|
|
1,002,007 |
|
|
|
|
|
|
|
|
|
|
|
|
|
|
|
|
|
9,692,777 |
|
|
|
|
|
|
|
|
|
|
| Construction Materials - 0.0% (B) |
|
| Holcim Finance US LLC |
|
|
|
|
|
|
|
|
| 4.75%, 09/22/2046 (C) |
|
|
277,000 |
|
|
|
240,532 |
|
|
|
|
|
|
|
|
|
|
|
| Consumer Staples Distribution & Retail - 0.1% |
|
| 7-Eleven, Inc. |
|
|
|
|
|
|
|
|
| 1.80%, 02/10/2031 (C) |
|
|
1,372,000 |
|
|
|
1,100,765 |
|
| Sysco Corp. |
|
|
|
|
|
|
|
|
| 3.30%, 07/15/2026 |
|
|
897,000 |
|
|
|
862,649 |
|
|
|
|
|
|
|
|
|
|
|
|
|
|
|
|
|
1,963,414 |
|
|
|
|
|
|
|
|
|
|
| Containers & Packaging - 0.1% |
|
| Sonoco Products Co. |
|
|
|
|
|
|
|
|
| 2.25%, 02/01/2027 |
|
|
931,000 |
|
|
|
862,984 |
|
|
|
|
|
|
|
|
|
|
|
| Distributors - 0.0% (B) |
|
| LKQ Corp. |
|
|
|
|
|
|
|
|
| 6.25%, 06/15/2033 |
|
|
640,000 |
|
|
|
657,344 |
|
|
|
|
|
|
|
|
|
|
|
| Diversified REITs - 0.6% |
|
| Broadstone Net Lease LLC |
|
|
|
|
|
|
|
|
| 2.60%, 09/15/2031 |
|
|
1,578,000 |
|
|
|
1,256,218 |
|
| Safehold GL Holdings LLC |
|
|
|
|
|
|
|
|
| 6.10%, 04/01/2034 |
|
|
1,218,000 |
|
|
|
1,205,546 |
|
| SBA Tower Trust |
|
|
|
|
|
|
|
|
| 1.63%, 05/15/2051 (C) |
|
|
848,000 |
|
|
|
770,270 |
|
| 1.88%, 07/15/2050 (C) |
|
|
1,309,000 |
|
|
|
1,231,036 |
|
| 2.84%, 01/15/2050 (C) |
|
|
3,421,000 |
|
|
|
3,360,914 |
|
| WP Carey, Inc. |
|
|
|
|
|
|
|
|
| 5.38%, 06/30/2034 |
|
|
956,000 |
|
|
|
931,351 |
|
|
|
|
|
|
|
|
|
|
|
|
|
|
|
|
|
8,755,335 |
|
|
|
|
|
|
|
|
|
|
|
|
|
|
|
|
|
|
|
| |
|
Principal |
|
|
Value |
|
| CORPORATE DEBT SECURITIES (continued) |
|
| Diversified Telecommunication Services - 0.2% |
|
| Verizon Communications, Inc. |
|
|
|
|
|
|
|
|
| 1.68%, 10/30/2030 |
|
$ |
1,337,000 |
|
|
$ |
1,087,369 |
|
| 2.99%, 10/30/2056 |
|
|
1,928,000 |
|
|
|
1,188,267 |
|
|
|
|
|
|
|
|
|
|
|
|
|
|
|
|
|
2,275,636 |
|
|
|
|
|
|
|
|
|
|
| Electric Utilities - 0.4% |
|
| Appalachian Power Co. |
|
|
|
|
|
|
|
|
| 3.40%, 06/01/2025 |
|
|
505,000 |
|
|
|
494,400 |
|
| Cleveland Electric Illuminating Co. |
|
|
|
|
|
|
|
|
| 5.95%, 12/15/2036 |
|
|
104,000 |
|
|
|
105,639 |
|
| CMS Energy Corp. |
|
|
|
|
|
|
|
|
| 4.88%, 03/01/2044 |
|
|
185,000 |
|
|
|
167,860 |
|
| DTE Electric Co. |
|
|
|
|
|
|
|
|
| 4.30%, 07/01/2044 |
|
|
1,778,000 |
|
|
|
1,515,822 |
|
| Duke Energy Corp. |
|
|
|
|
|
|
|
|
| 3.75%, 09/01/2046 |
|
|
1,830,000 |
|
|
|
1,337,891 |
|
| Duke Energy Progress LLC |
|
|
|
|
|
|
|
|
| 3.60%, 09/15/2047 |
|
|
1,265,000 |
|
|
|
917,461 |
|
| Oncor Electric Delivery Co. LLC |
|
|
|
|
|
|
|
|
| 5.30%, 06/01/2042 |
|
|
69,000 |
|
|
|
66,729 |
|
| Pacific Gas & Electric Co. |
|
|
|
|
|
|
|
|
| 2.50%, 02/01/2031 |
|
|
1,026,000 |
|
|
|
847,442 |
|
| Public Service Electric & Gas Co. |
|
|
|
|
|
|
|
|
| 3.00%, 05/15/2025 |
|
|
515,000 |
|
|
|
504,723 |
|
| Vistra Operations Co. LLC |
|
|
|
|
|
|
|
|
| 6.88%, 04/15/2032 (C) |
|
|
596,000 |
|
|
|
605,036 |
|
|
|
|
|
|
|
|
|
|
|
|
|
|
|
|
|
6,563,003 |
|
|
|
|
|
|
|
|
|
|
| Electronic Equipment, Instruments & Components - 0.4% |
|
| Amphenol Corp. |
|
|
|
|
|
|
|
|
| 5.25%, 04/05/2034 |
|
|
1,202,000 |
|
|
|
1,200,749 |
|
| Arrow Electronics, Inc. |
|
|
|
|
|
|
|
|
| 2.95%, 02/15/2032 |
|
|
1,241,000 |
|
|
|
1,039,843 |
|
| 5.88%, 04/10/2034 |
|
|
612,000 |
|
|
|
607,047 |
|
| Keysight Technologies, Inc. |
|
|
|
|
|
|
|
|
| 4.60%, 04/06/2027 |
|
|
1,026,000 |
|
|
|
1,007,893 |
|
| Sensata Technologies, Inc. |
|
|
|
|
|
|
|
|
| 4.38%, 02/15/2030 (C) |
|
|
697,000 |
|
|
|
640,137 |
|
| Trimble, Inc. |
|
|
|
|
|
|
|
|
| 6.10%, 03/15/2033 |
|
|
985,000 |
|
|
|
1,021,762 |
|
|
|
|
|
|
|
|
|
|
|
|
|
|
|
|
|
5,517,431 |
|
|
|
|
|
|
|
|
|
|
| Energy Equipment & Services - 0.1% |
|
| Schlumberger Holdings Corp. |
|
|
|
|
|
|
|
|
| 3.90%, 05/17/2028 (C) |
|
|
1,381,000 |
|
|
|
1,319,270 |
|
|
|
|
|
|
|
|
|
|
|
| Financial Services - 0.5% |
|
| AerCap Ireland Capital DAC/AerCap Global Aviation Trust |
|
|
|
|
|
|
|
|
| 4.45%, 04/03/2026 |
|
|
1,562,000 |
|
|
|
1,533,154 |
|
| Aviation Capital Group LLC |
|
|
|
|
|
|
|
|
| 1.95%, 01/30/2026 (C) |
|
|
726,000 |
|
|
|
683,126 |
|
| 5.50%, 12/15/2024 (C) |
|
|
2,174,000 |
|
|
|
2,168,126 |
|
| Avolon Holdings Funding Ltd. |
|
|
|
|
|
|
|
|
| 5.50%, 01/15/2026 (C) |
|
|
682,000 |
|
|
|
676,567 |
|
| 5.75%, 11/15/2029 (C) |
|
|
1,771,000 |
|
|
|
1,759,941 |
|
|
|
|
|
|
|
|
|
|
|
|
|
|
|
|
|
6,820,914 |
|
|
|
|
|
|
|
|
|
|
The Notes to Financial Statements are an integral part of this report.
|
|
|
|
|
| Transamerica Series Trust |
|
|
|
Semi-Annual Financial Statements 2024 |
|
|
Page 5 |
|
|
Transamerica Multi-Managed Balanced VP
SCHEDULE OF INVESTMENTS (continued)
At June 30, 2024
(unaudited)
|
|
|
|
|
|
|
|
|
| |
|
Principal |
|
|
Value |
|
| CORPORATE DEBT SECURITIES (continued) |
|
| Food Products - 0.2% |
|
| Bunge Ltd. Finance Corp. |
|
|
|
|
|
|
|
|
| 2.75%, 05/14/2031 |
|
$ |
1,353,000 |
|
|
$ |
1,159,340 |
|
| Cargill, Inc. |
|
|
|
|
|
|
|
|
| 5.13%, 10/11/2032 (C) |
|
|
725,000 |
|
|
|
724,784 |
|
| J M Smucker Co. |
|
|
|
|
|
|
|
|
| 6.50%, 11/15/2043 |
|
|
592,000 |
|
|
|
625,243 |
|
| Viterra Finance BV |
|
|
|
|
|
|
|
|
| 4.90%, 04/21/2027 (C) |
|
|
1,213,000 |
|
|
|
1,194,210 |
|
|
|
|
|
|
|
|
|
|
|
|
|
|
|
|
|
3,703,577 |
|
|
|
|
|
|
|
|
|
|
| Health Care Equipment & Supplies - 0.1% |
|
| Alcon Finance Corp. |
|
|
|
|
|
|
|
|
| 2.75%, 09/23/2026 (C) |
|
|
619,000 |
|
|
|
585,535 |
|
| 5.75%, 12/06/2052 (C) |
|
|
262,000 |
|
|
|
266,301 |
|
|
|
|
|
|
|
|
|
|
|
|
|
|
|
|
|
851,836 |
|
|
|
|
|
|
|
|
|
|
| Health Care Providers & Services - 0.8% |
|
| Cardinal Health, Inc. |
|
|
|
|
|
|
|
|
| 5.45%, 02/15/2034 |
|
|
773,000 |
|
|
|
771,003 |
|
| Centene Corp. |
|
|
|
|
|
|
|
|
| 3.00%, 10/15/2030 |
|
|
1,425,000 |
|
|
|
1,218,361 |
|
| 3.38%, 02/15/2030 |
|
|
683,000 |
|
|
|
606,255 |
|
| Cigna Group |
|
|
|
|
|
|
|
|
| 2.40%, 03/15/2030 |
|
|
776,000 |
|
|
|
671,876 |
|
| 5.25%, 02/15/2034 |
|
|
1,369,000 |
|
|
|
1,352,706 |
|
| CVS Health Corp. |
|
|
|
|
|
|
|
|
| 5.25%, 01/30/2031 |
|
|
445,000 |
|
|
|
440,555 |
|
| 6.00%, 06/01/2044 |
|
|
1,075,000 |
|
|
|
1,057,414 |
|
| Elevance Health, Inc. |
|
|
|
|
|
|
|
|
| 2.25%, 05/15/2030 |
|
|
886,000 |
|
|
|
759,736 |
|
| 5.13%, 02/15/2053 |
|
|
724,000 |
|
|
|
669,291 |
|
| HCA, Inc. |
|
|
|
|
|
|
|
|
| 5.60%, 04/01/2034 |
|
|
1,266,000 |
|
|
|
1,260,813 |
|
| 6.00%, 04/01/2054 |
|
|
979,000 |
|
|
|
969,971 |
|
| Health Care Service Corp. A Mutual Legal Reserve Co. |
|
|
|
|
|
|
|
|
| 5.88%, 06/15/2054 (C) |
|
|
451,000 |
|
|
|
445,288 |
|
| Laboratory Corp. of America Holdings |
|
|
|
|
|
|
|
|
| 2.95%, 12/01/2029 |
|
|
736,000 |
|
|
|
657,827 |
|
| Molina Healthcare, Inc. |
|
|
|
|
|
|
|
|
| 4.38%, 06/15/2028 (C) |
|
|
525,000 |
|
|
|
494,148 |
|
| UnitedHealth Group, Inc. |
|
|
|
|
|
|
|
|
| 5.20%, 04/15/2063 |
|
|
1,043,000 |
|
|
|
971,248 |
|
|
|
|
|
|
|
|
|
|
|
|
|
|
|
|
|
12,346,492 |
|
|
|
|
|
|
|
|
|
|
| Health Care REITs - 0.1% |
|
| DOC DR LLC |
|
|
|
|
|
|
|
|
| 2.63%, 11/01/2031 |
|
|
1,347,000 |
|
|
|
1,117,110 |
|
|
|
|
|
|
|
|
|
|
|
| Health Care Technology - 0.0% (B) |
|
| GE HealthCare Technologies, Inc. |
|
|
|
|
|
|
|
|
| 5.86%, 03/15/2030 |
|
|
589,000 |
|
|
|
605,708 |
|
|
|
|
|
|
|
|
|
|
|
| Hotel & Resort REITs - 0.0% (B) |
|
| Host Hotels & Resorts LP |
|
|
|
|
|
|
|
|
| 5.70%, 07/01/2034 |
|
|
442,000 |
|
|
|
435,262 |
|
|
|
|
|
|
|
|
|
|
|
|
|
|
|
|
|
|
|
| |
|
Principal |
|
|
Value |
|
| CORPORATE DEBT SECURITIES (continued) |
|
| Hotels, Restaurants & Leisure - 0.2% |
|
| Hyatt Hotels Corp. |
|
|
|
|
|
|
|
|
| 1.80%, 10/01/2024 |
|
$ |
593,000 |
|
|
$ |
586,745 |
|
| 5.25%, 06/30/2029 |
|
|
928,000 |
|
|
|
920,988 |
|
| Warnermedia Holdings, Inc. |
|
|
|
|
|
|
|
|
| 5.05%, 03/15/2042 |
|
|
1,638,000 |
|
|
|
1,337,105 |
|
|
|
|
|
|
|
|
|
|
|
|
|
|
|
|
|
2,844,838 |
|
|
|
|
|
|
|
|
|
|
| Insurance - 0.6% |
|
| Allstate Corp. |
|
|
|
|
|
|
|
|
| 5.05%, 06/24/2029 |
|
|
1,890,000 |
|
|
|
1,882,642 |
|
| Constellation Insurance, Inc. |
|
|
|
|
|
|
|
|
| 6.80%, 01/24/2030 (C) |
|
|
2,287,000 |
|
|
|
2,237,064 |
|
| Equitable Holdings, Inc. |
|
|
|
|
|
|
|
|
| 5.59%, 01/11/2033 |
|
|
1,663,000 |
|
|
|
1,687,746 |
|
| Global Atlantic Finance Co. |
|
|
|
|
|
|
|
|
| 6.75%, 03/15/2054 (C) |
|
|
249,000 |
|
|
|
247,412 |
|
| 7.95%, 06/15/2033 (C) |
|
|
1,043,000 |
|
|
|
1,146,978 |
|
| Muenchener Rueckversicherungs- Gesellschaft AG |
|
|
|
|
|
|
|
|
| Fixed until 11/23/2031, 5.88% (D), 05/23/2042 (C) |
|
|
800,000 |
|
|
|
798,048 |
|
| Prudential Financial, Inc. |
|
|
|
|
|
|
|
|
| Fixed until 07/01/2030, 3.70% (D), 10/01/2050 |
|
|
1,377,000 |
|
|
|
1,197,491 |
|
|
|
|
|
|
|
|
|
|
|
|
|
|
|
|
|
9,197,381 |
|
|
|
|
|
|
|
|
|
|
| Interactive Media & Services - 0.1% |
|
| Meta Platforms, Inc. |
|
|
|
|
|
|
|
|
| 4.80%, 05/15/2030 |
|
|
1,052,000 |
|
|
|
1,054,145 |
|
|
|
|
|
|
|
|
|
|
|
| Internet & Catalog Retail - 0.0% (B) |
|
| Expedia Group, Inc. |
|
|
|
|
|
|
|
|
| 2.95%, 03/15/2031 |
|
|
90,000 |
|
|
|
77,945 |
|
|
|
|
|
|
|
|
|
|
|
| Machinery - 0.2% |
|
| CNH Industrial Capital LLC |
|
|
|
|
|
|
|
|
| 4.55%, 04/10/2028 |
|
|
974,000 |
|
|
|
953,081 |
|
| Huntington Ingalls Industries, Inc. |
|
|
|
|
|
|
|
|
| 2.04%, 08/16/2028 |
|
|
1,640,000 |
|
|
|
1,443,193 |
|
| Ingersoll Rand, Inc. |
|
|
|
|
|
|
|
|
| 5.45%, 06/15/2034 |
|
|
905,000 |
|
|
|
914,712 |
|
|
|
|
|
|
|
|
|
|
|
|
|
|
|
|
|
3,310,986 |
|
|
|
|
|
|
|
|
|
|
| Media - 0.1% |
|
| Charter Communications Operating LLC/Charter Communications Operating Capital |
|
|
|
|
|
|
|
|
| 4.80%, 03/01/2050 |
|
|
649,000 |
|
|
|
478,397 |
|
| Comcast Corp. |
|
|
|
|
|
|
|
|
| 2.94%, 11/01/2056 |
|
|
594,000 |
|
|
|
360,495 |
|
| NBCUniversal Media LLC |
|
|
|
|
|
|
|
|
| 4.45%, 01/15/2043 |
|
|
627,000 |
|
|
|
542,987 |
|
| Paramount Global |
|
|
|
|
|
|
|
|
| 4.20%, 05/19/2032 |
|
|
635,000 |
|
|
|
519,649 |
|
|
|
|
|
|
|
|
|
|
|
|
|
|
|
|
|
1,901,528 |
|
|
|
|
|
|
|
|
|
|
| Metals & Mining - 0.3% |
|
| Anglo American Capital PLC |
|
|
|
|
|
|
|
|
| 4.50%, 03/15/2028 (C) |
|
|
1,401,000 |
|
|
|
1,358,933 |
|
The Notes to Financial Statements are an integral part of this report.
|
|
|
|
|
| Transamerica Series Trust |
|
|
|
Semi-Annual Financial Statements 2024 |
|
|
Page 6 |
|
|
Transamerica Multi-Managed Balanced VP
SCHEDULE OF INVESTMENTS (continued)
At June 30, 2024
(unaudited)
|
|
|
|
|
|
|
|
|
| |
|
Principal |
|
|
Value |
|
| CORPORATE DEBT SECURITIES (continued) |
|
| Metals & Mining (continued) |
|
| ArcelorMittal SA |
|
|
|
|
|
|
|
|
| 6.55%, 11/29/2027 |
|
$ |
1,457,000 |
|
|
$ |
1,502,515 |
|
| Glencore Funding LLC |
|
|
|
|
|
|
|
|
| 2.63%, 09/23/2031 (C) |
|
|
1,387,000 |
|
|
|
1,140,027 |
|
|
|
|
|
|
|
|
|
|
|
|
|
|
|
|
|
4,001,475 |
|
|
|
|
|
|
|
|
|
|
| Office REITs - 0.1% |
|
| COPT Defense Properties LP |
|
|
|
|
|
|
|
|
| 2.00%, 01/15/2029 |
|
|
141,000 |
|
|
|
119,625 |
|
| 2.25%, 03/15/2026 |
|
|
519,000 |
|
|
|
489,986 |
|
| Highwoods Realty LP |
|
|
|
|
|
|
|
|
| 7.65%, 02/01/2034 |
|
|
432,000 |
|
|
|
464,553 |
|
| Kilroy Realty LP |
|
|
|
|
|
|
|
|
| 4.25%, 08/15/2029 |
|
|
485,000 |
|
|
|
439,827 |
|
|
|
|
|
|
|
|
|
|
|
|
|
|
|
|
|
1,513,991 |
|
|
|
|
|
|
|
|
|
|
| Oil, Gas & Consumable Fuels - 1.3% |
|
| Boardwalk Pipelines LP |
|
|
|
|
|
|
|
|
| 3.40%, 02/15/2031 |
|
|
647,000 |
|
|
|
567,096 |
|
| Chevron USA, Inc. |
|
|
|
|
|
|
|
|
| 3.25%, 10/15/2029 |
|
|
796,000 |
|
|
|
739,052 |
|
| Diamondback Energy, Inc. |
|
|
|
|
|
|
|
|
| 5.40%, 04/18/2034 |
|
|
1,604,000 |
|
|
|
1,589,987 |
|
| Enbridge, Inc. |
|
|
|
|
|
|
|
|
| 5.63%, 04/05/2034 |
|
|
1,339,000 |
|
|
|
1,339,859 |
|
| Energy Transfer LP |
|
|
|
|
|
|
|
|
| 5.15%, 02/01/2043 |
|
|
811,000 |
|
|
|
712,340 |
|
| 5.55%, 02/15/2028 |
|
|
619,000 |
|
|
|
624,034 |
|
| 5.95%, 10/01/2043 |
|
|
680,000 |
|
|
|
661,033 |
|
| Enterprise Products Operating LLC |
|
|
|
|
|
|
|
|
| 4.25%, 02/15/2048 |
|
|
2,275,000 |
|
|
|
1,869,098 |
|
| EQM Midstream Partners LP |
|
|
|
|
|
|
|
|
| 6.38%, 04/01/2029 (C) |
|
|
325,000 |
|
|
|
328,278 |
|
| Hess Midstream Operations LP |
|
|
|
|
|
|
|
|
| 6.50%, 06/01/2029 (C) |
|
|
530,000 |
|
|
|
537,345 |
|
| Occidental Petroleum Corp. |
|
|
|
|
|
|
|
|
| 5.55%, 03/15/2026 |
|
|
1,547,000 |
|
|
|
1,544,101 |
|
| ONEOK, Inc. |
|
|
|
|
|
|
|
|
| 6.10%, 11/15/2032 |
|
|
1,442,000 |
|
|
|
1,492,565 |
|
| Ovintiv, Inc. |
|
|
|
|
|
|
|
|
| 6.25%, 07/15/2033 |
|
|
926,000 |
|
|
|
956,293 |
|
| Petroleos Mexicanos |
|
|
|
|
|
|
|
|
| 6.50%, 01/23/2029 |
|
|
656,000 |
|
|
|
592,438 |
|
| 6.84%, 01/23/2030 |
|
|
1,509,000 |
|
|
|
1,328,362 |
|
| 6.88%, 08/04/2026 |
|
|
400,000 |
|
|
|
391,074 |
|
| 7.69%, 01/23/2050 |
|
|
166,000 |
|
|
|
119,948 |
|
| Plains All American Pipeline LP/PAA Finance Corp. |
|
|
|
|
|
|
|
|
| 3.55%, 12/15/2029 |
|
|
1,050,000 |
|
|
|
959,432 |
|
| Sabine Pass Liquefaction LLC |
|
|
|
|
|
|
|
|
| 4.20%, 03/15/2028 |
|
|
940,000 |
|
|
|
907,427 |
|
| Shell International Finance BV |
|
|
|
|
|
|
|
|
| 2.50%, 09/12/2026 |
|
|
652,000 |
|
|
|
617,153 |
|
| 3.75%, 09/12/2046 |
|
|
244,000 |
|
|
|
189,447 |
|
| Western Midstream Operating LP |
|
|
|
|
|
|
|
|
| 6.15%, 04/01/2033 |
|
|
964,000 |
|
|
|
988,736 |
|
|
|
|
|
|
|
|
|
|
| |
|
Principal |
|
|
Value |
|
| CORPORATE DEBT SECURITIES (continued) |
|
| Oil, Gas & Consumable Fuels (continued) |
|
| Williams Cos., Inc. |
|
|
|
|
|
|
|
|
| 5.40%, 03/04/2044 |
|
$ |
117,000 |
|
|
$ |
110,652 |
|
|
|
|
|
|
|
|
|
|
|
|
|
|
|
|
|
19,165,750 |
|
|
|
|
|
|
|
|
|
|
| Passenger Airlines - 0.1% |
|
| American Airlines Pass-Through Trust |
|
|
|
|
|
|
|
|
| 3.20%, 12/15/2029 |
|
|
545,744 |
|
|
|
505,663 |
|
| United Airlines Pass-Through Trust |
|
|
|
|
|
|
|
|
| 3.75%, 03/03/2028 |
|
|
818,199 |
|
|
|
789,507 |
|
|
|
|
|
|
|
|
|
|
|
|
|
|
|
|
|
1,295,170 |
|
|
|
|
|
|
|
|
|
|
| Personal Care Products - 0.1% |
|
| Haleon US Capital LLC |
|
|
|
|
|
|
|
|
| 3.38%, 03/24/2027 |
|
|
627,000 |
|
|
|
598,328 |
|
| Kenvue, Inc. |
|
|
|
|
|
|
|
|
| 5.00%, 03/22/2030 |
|
|
1,570,000 |
|
|
|
1,576,189 |
|
|
|
|
|
|
|
|
|
|
|
|
|
|
|
|
|
2,174,517 |
|
|
|
|
|
|
|
|
|
|
| Pharmaceuticals - 0.3% |
|
| AbbVie, Inc. |
|
|
|
|
|
|
|
|
| 5.05%, 03/15/2034 |
|
|
1,224,000 |
|
|
|
1,222,967 |
|
| Bayer US Finance II LLC |
|
|
|
|
|
|
|
|
| 4.38%, 12/15/2028 (C) |
|
|
890,000 |
|
|
|
845,734 |
|
| Bristol-Myers Squibb Co. |
|
|
|
|
|
|
|
|
| 5.65%, 02/22/2064 |
|
|
472,000 |
|
|
|
463,322 |
|
| Merck & Co., Inc. |
|
|
|
|
|
|
|
|
| 5.00%, 05/17/2053 |
|
|
1,230,000 |
|
|
|
1,162,906 |
|
| Pfizer Investment Enterprises Pte. Ltd. |
|
|
|
|
|
|
|
|
| 5.11%, 05/19/2043 |
|
|
1,029,000 |
|
|
|
982,600 |
|
| Viatris, Inc. |
|
|
|
|
|
|
|
|
| 2.30%, 06/22/2027 |
|
|
510,000 |
|
|
|
465,713 |
|
|
|
|
|
|
|
|
|
|
|
|
|
|
|
|
|
5,143,242 |
|
|
|
|
|
|
|
|
|
|
| Professional Services - 0.1% |
|
| Equifax, Inc. |
|
|
|
|
|
|
|
|
| 2.60%, 12/01/2024 |
|
|
1,068,000 |
|
|
|
1,053,864 |
|
| 5.10%, 12/15/2027 |
|
|
1,150,000 |
|
|
|
1,145,524 |
|
|
|
|
|
|
|
|
|
|
|
|
|
|
|
|
|
2,199,388 |
|
|
|
|
|
|
|
|
|
|
| Residential REITs - 0.1% |
|
| American Homes 4 Rent LP |
|
|
|
|
|
|
|
|
| 5.50%, 02/01/2034 |
|
|
1,176,000 |
|
|
|
1,158,393 |
|
| Invitation Homes Operating Partnership LP |
|
|
|
|
|
|
|
|
| 4.15%, 04/15/2032 |
|
|
1,171,000 |
|
|
|
1,070,182 |
|
|
|
|
|
|
|
|
|
|
|
|
|
|
|
|
|
2,228,575 |
|
|
|
|
|
|
|
|
|
|
| Semiconductors & Semiconductor Equipment - 0.6% |
|
| Advanced Micro Devices, Inc. |
|
|
|
|
|
|
|
|
| 3.92%, 06/01/2032 |
|
|
1,267,000 |
|
|
|
1,177,683 |
|
| Broadcom, Inc. |
|
|
|
|
|
|
|
|
| 3.14%, 11/15/2035 (C) |
|
|
1,239,000 |
|
|
|
994,728 |
|
| Foundry JV Holdco LLC |
|
|
|
|
|
|
|
|
| 5.88%, 01/25/2034 (C) |
|
|
957,000 |
|
|
|
950,488 |
|
| 6.15%, 01/25/2032 (C) |
|
|
277,000 |
|
|
|
282,757 |
|
| KLA Corp. |
|
|
|
|
|
|
|
|
| 3.30%, 03/01/2050 |
|
|
905,000 |
|
|
|
640,365 |
|
The Notes to Financial Statements are an integral part of this report.
|
|
|
|
|
| Transamerica Series Trust |
|
|
|
Semi-Annual Financial Statements 2024 |
|
|
Page 7 |
|
|
Transamerica Multi-Managed Balanced VP
SCHEDULE OF INVESTMENTS (continued)
At June 30, 2024
(unaudited)
|
|
|
|
|
|
|
|
|
| |
|
Principal |
|
|
Value |
|
| CORPORATE DEBT SECURITIES (continued) |
|
| Semiconductors & Semiconductor Equipment (continued) |
|
| Microchip Technology, Inc. |
|
|
|
|
|
|
|
|
| 0.98%, 09/01/2024 |
|
$ |
1,044,000 |
|
|
$ |
1,035,169 |
|
| 5.05%, 03/15/2029 |
|
|
1,170,000 |
|
|
|
1,161,202 |
|
| Micron Technology, Inc. |
|
|
|
|
|
|
|
|
| 5.30%, 01/15/2031 |
|
|
1,204,000 |
|
|
|
1,202,472 |
|
| NXP BV/NXP Funding LLC/NXP USA, Inc. |
|
|
|
|
|
|
|
|
| 3.25%, 11/30/2051 |
|
|
563,000 |
|
|
|
372,306 |
|
| 3.40%, 05/01/2030 |
|
|
432,000 |
|
|
|
391,712 |
|
| QUALCOMM, Inc. |
|
|
|
|
|
|
|
|
| 3.25%, 05/20/2050 |
|
|
598,000 |
|
|
|
424,442 |
|
|
|
|
|
|
|
|
|
|
|
|
|
|
|
|
|
8,633,324 |
|
|
|
|
|
|
|
|
|
|
| Software - 0.5% |
|
| Constellation Software, Inc. |
|
|
|
|
|
|
|
|
| 5.16%, 02/16/2029 (C) |
|
|
358,000 |
|
|
|
358,098 |
|
| Crowdstrike Holdings, Inc. |
|
|
|
|
|
|
|
|
| 3.00%, 02/15/2029 |
|
|
221,000 |
|
|
|
199,287 |
|
| Fiserv, Inc. |
|
|
|
|
|
|
|
|
| 5.45%, 03/02/2028 |
|
|
1,000,000 |
|
|
|
1,009,463 |
|
| Infor, Inc. |
|
|
|
|
|
|
|
|
| 1.75%, 07/15/2025 (C) |
|
|
1,376,000 |
|
|
|
1,319,333 |
|
| Intuit, Inc. |
|
|
|
|
|
|
|
|
| 5.50%, 09/15/2053 |
|
|
465,000 |
|
|
|
469,886 |
|
| Oracle Corp. |
|
|
|
|
|
|
|
|
| 3.65%, 03/25/2041 |
|
|
826,000 |
|
|
|
634,426 |
|
| 6.90%, 11/09/2052 |
|
|
1,139,000 |
|
|
|
1,281,567 |
|
| Take-Two Interactive Software, Inc. |
|
|
|
|
|
|
|
|
| 3.55%, 04/14/2025 |
|
|
1,686,000 |
|
|
|
1,658,368 |
|
|
|
|
|
|
|
|
|
|
|
|
|
|
|
|
|
6,930,428 |
|
|
|
|
|
|
|
|
|
|
| Specialized REITs - 0.3% |
|
| American Tower Trust #1 |
|
|
|
|
|
|
|
|
| 3.65%, 03/15/2048 (C) |
|
|
775,000 |
|
|
|
728,572 |
|
| Extra Space Storage LP |
|
|
|
|
|
|
|
|
| 5.90%, 01/15/2031 |
|
|
1,480,000 |
|
|
|
1,513,467 |
|
| VICI Properties LP |
|
|
|
|
|
|
|
|
| 4.95%, 02/15/2030 |
|
|
1,735,000 |
|
|
|
1,674,292 |
|
| Weyerhaeuser Co. |
|
|
|
|
|
|
|
|
| 4.00%, 04/15/2030 |
|
|
1,286,000 |
|
|
|
1,201,177 |
|
|
|
|
|
|
|
|
|
|
|
|
|
|
|
|
|
5,117,508 |
|
|
|
|
|
|
|
|
|
|
| Tobacco - 0.2% |
|
| BAT Capital Corp. |
|
|
|
|
|
|
|
|
| 6.00%, 02/20/2034 |
|
|
1,407,000 |
|
|
|
1,426,319 |
|
| Philip Morris International, Inc. |
|
|
|
|
|
|
|
|
| 5.25%, 02/13/2034 |
|
|
897,000 |
|
|
|
881,677 |
|
| 5.63%, 11/17/2029 |
|
|
1,114,000 |
|
|
|
1,138,406 |
|
|
|
|
|
|
|
|
|
|
|
|
|
|
|
|
|
3,446,402 |
|
|
|
|
|
|
|
|
|
|
| Wireless Telecommunication Services - 0.2% |
|
| America Movil SAB de CV |
|
|
|
|
|
|
|
|
| 4.38%, 07/16/2042 |
|
|
250,000 |
|
|
|
212,054 |
|
|
|
|
|
|
|
|
|
|
| |
|
Principal |
|
|
Value |
|
| CORPORATE DEBT SECURITIES (continued) |
|
| Wireless Telecommunication Services (continued) |
|
| T-Mobile USA, Inc. |
|
|
|
|
|
|
|
|
| 3.50%, 04/15/2031 |
|
$ |
1,198,000 |
|
|
$ |
1,078,598 |
|
| 3.88%, 04/15/2030 |
|
|
796,000 |
|
|
|
744,594 |
|
| 5.15%, 04/15/2034 |
|
|
1,201,000 |
|
|
|
1,183,047 |
|
|
|
|
|
|
|
|
|
|
|
|
|
|
|
|
|
3,218,293 |
|
|
|
|
|
|
|
|
|
|
| Total Corporate Debt Securities
(Cost $222,305,932) |
|
|
|
|
|
|
211,333,989 |
|
|
|
|
|
|
|
|
|
|
|
| U.S. GOVERNMENT AGENCY OBLIGATIONS - 10.6% |
|
| Federal Home Loan Mortgage Corp. |
|
|
|
|
|
|
|
|
| 5.00%, 08/01/2035 |
|
|
170,927 |
|
|
|
168,440 |
|
| 5.50%, 07/01/2037 - 06/01/2041 |
|
|
49,240 |
|
|
|
49,542 |
|
| 5.50%, 04/01/2053 - 07/01/2053 (F) |
|
|
4,080,022 |
|
|
|
4,030,744 |
|
| 6.00%, 12/01/2037 |
|
|
18,471 |
|
|
|
18,994 |
|
| Federal Home Loan Mortgage Corp. Multifamily Structured Pass-Through Certificates |
|
|
|
|
|
|
|
|
| 1.38%, 06/25/2030 |
|
|
4,208,000 |
|
|
|
3,480,900 |
|
| 2.81%, 01/25/2025 |
|
|
687,588 |
|
|
|
677,173 |
|
| 2.89%, 06/25/2027 |
|
|
26,883 |
|
|
|
26,768 |
|
| 3.01%, 07/25/2025 |
|
|
2,829,801 |
|
|
|
2,762,853 |
|
| 3.06% (D), 08/25/2024 |
|
|
2,230,519 |
|
|
|
2,218,344 |
|
| 3.30% (D), 11/25/2027 |
|
|
300,000 |
|
|
|
285,632 |
|
| Federal National Mortgage Association |
|
|
|
|
|
|
|
|
| 3.50%, 07/01/2028 - 01/01/2029 |
|
|
94,589 |
|
|
|
91,699 |
|
| 4.00%, 06/01/2042 |
|
|
44,329 |
|
|
|
41,904 |
|
| 4.50%, 02/01/2025 - 08/01/2052 |
|
|
2,656,858 |
|
|
|
2,512,938 |
|
| 5.00%, 04/01/2039 - 02/01/2054 |
|
|
12,646,331 |
|
|
|
12,259,237 |
|
| 5.50%, 04/01/2037 - 03/01/2053 |
|
|
3,106,249 |
|
|
|
3,076,398 |
|
| 1-Year RFUCC Treasury + 1.52%, 5.83% (D), 02/01/2043 |
|
|
19,819 |
|
|
|
19,855 |
|
| 6.00%, 08/01/2036 - 06/01/2041 |
|
|
634,721 |
|
|
|
649,731 |
|
| 6.00%, 06/01/2054 (F) |
|
|
3,523,682 |
|
|
|
3,542,027 |
|
| 6.50%, 05/01/2040 |
|
|
48,868 |
|
|
|
50,339 |
|
| Government National Mortgage Association REMICS, Interest Only STRIPS |
|
|
|
|
|
|
|
|
| 0.64% (D), 02/16/2053 |
|
|
278,335 |
|
|
|
4,333 |
|
| Tennessee Valley Authority |
|
|
|
|
|
|
|
|
| 5.88%, 04/01/2036 |
|
|
1,170,000 |
|
|
|
1,289,824 |
|
| Uniform Mortgage-Backed Security, TBA |
|
|
|
|
|
|
|
|
| 2.00%, 07/01/2039 - 07/01/2054 (F) |
|
|
15,450,000 |
|
|
|
12,770,358 |
|
| 2.50%, 07/01/2039 - 07/01/2054 (F) |
|
|
33,904,000 |
|
|
|
28,250,942 |
|
| 3.00%, 07/01/2039 - 07/01/2054 (F) |
|
|
28,117,000 |
|
|
|
24,173,713 |
|
| 3.50%, 07/01/2039 - 07/01/2054 (F) |
|
|
21,736,000 |
|
|
|
19,436,261 |
|
| 4.00%, 07/01/2054 (F) |
|
|
12,069,000 |
|
|
|
11,061,806 |
|
| 4.50%, 07/01/2054 (F) |
|
|
11,225,000 |
|
|
|
10,599,820 |
|
| 5.50%, 07/01/2054 (F) |
|
|
13,070,000 |
|
|
|
12,905,704 |
|
| 6.00%, 07/01/2054 (F) |
|
|
4,977,000 |
|
|
|
4,995,738 |
|
|
|
|
|
|
|
|
|
|
| Total U.S. Government Agency Obligations
(Cost $162,784,755) |
|
|
|
161,452,017 |
|
|
|
|
|
|
|
|
|
|
|
| U.S. GOVERNMENT OBLIGATIONS - 9.0% |
|
| U.S. Treasury - 8.1% |
|
| U.S. Treasury Bonds |
|
|
|
|
|
|
|
|
| 1.25%, 05/15/2050 |
|
|
4,111,000 |
|
|
|
2,052,609 |
|
The Notes to Financial Statements are an integral part of this report.
|
|
|
|
|
| Transamerica Series Trust |
|
|
|
Semi-Annual Financial Statements 2024 |
|
|
Page 8 |
|
|
Transamerica Multi-Managed Balanced VP
SCHEDULE OF INVESTMENTS (continued)
At June 30, 2024
(unaudited)
|
|
|
|
|
|
|
|
|
| |
|
Principal |
|
|
Value |
|
| U.S. GOVERNMENT OBLIGATIONS (continued) |
|
| U.S. Treasury (continued) |
|
| U.S. Treasury Bonds (continued) |
|
|
|
|
|
|
|
|
| 1.88%, 02/15/2051 - 11/15/2051 |
|
$ |
1,934,000 |
|
|
$ |
1,132,051 |
|
| 2.00%, 02/15/2050 |
|
|
1,923,000 |
|
|
|
1,175,809 |
|
| 2.25%, 08/15/2046 - 02/15/2052 |
|
|
5,051,000 |
|
|
|
3,326,112 |
|
| 2.38%, 02/15/2042 - 05/15/2051 |
|
|
5,479,000 |
|
|
|
3,898,127 |
|
| 2.50%, 02/15/2045 - 05/15/2046 |
|
|
9,156,000 |
|
|
|
6,519,164 |
|
| 2.75%, 08/15/2042 - 11/15/2047 |
|
|
6,635,000 |
|
|
|
4,989,800 |
|
| 2.88%, 08/15/2045 - 05/15/2049 |
|
|
6,348,900 |
|
|
|
4,807,058 |
|
| 3.00%, 05/15/2042 - 08/15/2052 |
|
|
8,631,900 |
|
|
|
6,641,369 |
|
| 3.13%, 05/15/2048 |
|
|
63,000 |
|
|
|
49,275 |
|
| 3.50%, 02/15/2039 |
|
|
512,000 |
|
|
|
462,380 |
|
| 3.63%, 02/15/2044 - 05/15/2053 |
|
|
5,528,800 |
|
|
|
4,773,149 |
|
| 3.88%, 02/15/2043 |
|
|
1,559,000 |
|
|
|
1,415,036 |
|
| 4.00%, 11/15/2052 |
|
|
2,317,000 |
|
|
|
2,123,585 |
|
| 4.13%, 08/15/2053 |
|
|
2,126,000 |
|
|
|
1,992,128 |
|
| 4.25%, 05/15/2039 - 02/15/2054 |
|
|
4,974,000 |
|
|
|
4,821,736 |
|
| 4.63%, 05/15/2054 |
|
|
1,795,000 |
|
|
|
1,830,900 |
|
| 4.75%, 11/15/2043 - 11/15/2053 |
|
|
3,963,000 |
|
|
|
4,079,300 |
|
| 5.25%, 02/15/2029 |
|
|
696,000 |
|
|
|
723,595 |
|
| U.S. Treasury Notes |
|
|
|
|
|
|
|
|
| 0.63%, 05/15/2030 - 08/15/2030 |
|
|
8,240,000 |
|
|
|
6,620,686 |
|
| 0.88%, 06/30/2026 |
|
|
588,100 |
|
|
|
545,555 |
|
| 1.13%, 10/31/2026 - 02/15/2031 |
|
|
7,909,000 |
|
|
|
6,858,918 |
|
| 1.38%, 11/15/2031 |
|
|
5,801,000 |
|
|
|
4,725,096 |
|
| 1.50%, 01/31/2027 - 02/15/2030 |
|
|
1,581,000 |
|
|
|
1,450,716 |
|
| 1.63%, 02/15/2026 - 05/15/2031 |
|
|
9,456,300 |
|
|
|
8,367,931 |
|
| 1.88%, 02/15/2032 |
|
|
1,539,300 |
|
|
|
1,294,275 |
|
| 2.25%, 11/15/2027 |
|
|
1,239,200 |
|
|
|
1,153,037 |
|
| 2.63%, 02/15/2029 |
|
|
817,000 |
|
|
|
757,768 |
|
| 2.75%, 02/15/2028 - 08/15/2032 |
|
|
4,686,500 |
|
|
|
4,397,592 |
|
| 2.88%, 05/15/2028 |
|
|
7,586,800 |
|
|
|
7,171,008 |
|
| 3.13%, 11/15/2028 |
|
|
1,274,600 |
|
|
|
1,210,920 |
|
| 3.50%, 01/31/2028 |
|
|
3,018,000 |
|
|
|
2,923,805 |
|
| 3.63%, 05/31/2028 |
|
|
3,548,000 |
|
|
|
3,448,490 |
|
| 3.75%, 12/31/2028 |
|
|
1,813,000 |
|
|
|
1,767,604 |
|
| 3.88%, 11/30/2027 |
|
|
1,450,800 |
|
|
|
1,423,654 |
|
| 4.00%, 01/15/2027 |
|
|
1,067,000 |
|
|
|
1,051,662 |
|
| 4.13%, 09/30/2027 - 11/15/2032 |
|
|
821,100 |
|
|
|
811,374 |
|
| 4.38%, 08/31/2028 - 05/15/2034 |
|
|
5,874,000 |
|
|
|
5,876,228 |
|
| 4.63%, 04/30/2029 |
|
|
1,083,000 |
|
|
|
1,096,114 |
|
| 4.88%, 11/30/2025 |
|
|
2,902,000 |
|
|
|
2,898,713 |
|
|
|
|
|
|
|
|
|
|
|
|
|
|
|
|
|
122,664,329 |
|
|
|
|
|
|
|
|
|
|
| U.S. Treasury Inflation-Protected Securities - 0.9% |
|
| U.S. Treasury Inflation-Protected Indexed Bonds |
|
|
|
|
|
|
|
|
| 0.25%, 02/15/2050 |
|
|
3,091,230 |
|
|
|
1,902,885 |
|
| 1.75%, 01/15/2028 |
|
|
1,804,755 |
|
|
|
1,775,644 |
|
| 2.50%, 01/15/2029 |
|
|
6,019,131 |
|
|
|
6,126,308 |
|
| U.S. Treasury Inflation-Protected Indexed Notes |
|
|
|
|
|
|
|
|
| 0.13%, 07/15/2030 |
|
|
4,057,151 |
|
|
|
3,633,535 |
|
|
|
|
|
|
|
|
|
|
|
|
|
|
|
|
|
13,438,372 |
|
|
|
|
|
|
|
|
|
|
| Total U.S. Government Obligations
(Cost $150,853,978) |
|
|
|
|
|
|
136,102,701 |
|
|
|
|
|
|
|
|
|
|
|
|
|
|
|
|
|
|
|
| |
|
Principal |
|
|
Value |
|
| MORTGAGE-BACKED SECURITIES - 2.5% |
|
| BB-UBS Trust |
|
|
|
|
|
|
|
|
| Series 2012-TFT, Class A, 2.89%, 06/05/2030 (C) |
|
$ |
552,237 |
|
|
$ |
511,923 |
|
| BB-UBS Trust, Interest Only STRIPS |
|
|
|
|
|
|
|
|
| Series 2012-SHOW, Class XA, 0.73% (D), 11/05/2036 (C) |
|
|
3,935,000 |
|
|
|
2,573 |
|
| BRAVO Residential Funding Trust |
|
|
|
|
|
|
|
|
| Series 2024-NQM3, Class A1, 6.19% (D), 03/25/2064 (C) |
|
|
936,648 |
|
|
|
938,960 |
|
| CIM Trust |
|
|
|
|
|
|
|
|
| Series 2021-R6, Class A1, 1.43% (D), 07/25/2061 (C) |
|
|
2,080,969 |
|
|
|
1,791,850 |
|
| Citigroup Commercial Mortgage Trust |
|
|
|
|
|
|
|
|
| Series 2015-GC27, Class B, 3.77%, 02/10/2048 |
|
|
600,000 |
|
|
|
587,811 |
|
| Citigroup Mortgage Loan Trust, Inc. |
|
|
|
|
|
|
|
|
| Series 2018-RP1, Class A1, 3.00% (D), 09/25/2064 (C) |
|
|
211,879 |
|
|
|
204,552 |
|
| COLT Mortgage Loan Trust |
|
|
|
|
|
|
|
|
| Series 2024-2, Class A1, 6.13% (D), 04/25/2069 (C) |
|
|
978,906 |
|
|
|
979,178 |
|
| COMM Mortgage Trust |
|
|
|
|
|
|
|
|
| Series 2015-3BP, Class A, 3.18%, 02/10/2035 (C) |
|
|
4,500,000 |
|
|
|
4,125,241 |
|
| CSMC Trust |
|
|
|
|
|
|
|
|
| Series 2021-RPL2, Class A1A, 1.11% (D), 01/25/2060 (C) |
|
|
1,987,822 |
|
|
|
1,628,895 |
|
| Series 2021-RPL6, Class A1, 2.00% (D), 10/25/2060 (C) |
|
|
2,039,899 |
|
|
|
1,793,291 |
|
| Deutsche Alt-A Securities Mortgage Loan Trust |
|
|
|
|
|
|
|
|
| Series 2007-RMP1, Class A2, 1-Month Term SOFR + 0.41%, 5.76% (D), 12/25/2036 |
|
|
47,322 |
|
|
|
42,434 |
|
| Fontainebleau Miami Beach Trust |
|
|
|
|
|
|
|
|
| Series 2019-FBLU, Class B, 3.45%, 12/10/2036 (C) |
|
|
2,200,000 |
|
|
|
2,161,788 |
|
| Houston Galleria Mall Trust |
|
|
|
|
|
|
|
|
| Series 2015-HGLR, Class A1A2, 3.09%, 03/05/2037 (C) |
|
|
800,000 |
|
|
|
779,127 |
|
| MetLife Securitization Trust |
|
|
|
|
|
|
|
|
| Series 2019-1A, Class A1A, 3.75% (D), 04/25/2058 (C) |
|
|
57,464 |
|
|
|
55,668 |
|
| Morgan Stanley Bank of America Merrill Lynch Trust |
|
|
|
|
|
|
|
|
| Series 2013-C11, Class B, 4.21% (D), 08/15/2046 |
|
|
945,000 |
|
|
|
577,390 |
|
| Nationstar Mortgage Loan Trust |
|
|
|
|
|
|
|
|
| Series 2013-A, Class A, 3.75% (D), 12/25/2052 (C) |
|
|
86,457 |
|
|
|
79,180 |
|
| New Residential Mortgage Loan Trust |
|
|
|
|
|
|
|
|
| Series 2014-1A, Class A, 3.75% (D), 01/25/2054 (C) |
|
|
85,839 |
|
|
|
79,798 |
|
| Series 2014-2A, Class A3, 3.75% (D), 05/25/2054 (C) |
|
|
319,345 |
|
|
|
297,136 |
|
| Series 2014-3A, Class AFX3, 3.75% (D), 11/25/2054 (C) |
|
|
85,250 |
|
|
|
79,169 |
|
| Series 2015-2A, Class A1, 3.75% (D), 08/25/2055 (C) |
|
|
163,061 |
|
|
|
151,082 |
|
| Series 2016-2A, Class A1, 3.75% (D), 11/26/2035 (C) |
|
|
174,735 |
|
|
|
162,958 |
|
The Notes to Financial Statements are an integral part of this report.
|
|
|
|
|
| Transamerica Series Trust |
|
|
|
Semi-Annual Financial Statements 2024 |
|
|
Page 9 |
|
|
Transamerica Multi-Managed Balanced VP
SCHEDULE OF INVESTMENTS (continued)
At June 30, 2024
(unaudited)
|
|
|
|
|
|
|
|
|
| |
|
Principal |
|
|
Value |
|
| MORTGAGE-BACKED SECURITIES (continued) |
|
| New Residential Mortgage Loan Trust (continued) |
|
|
|
|
|
|
|
|
| Series 2016-3A, Class A1B, 3.25% (D), 09/25/2056 (C) |
|
$ |
294,224 |
|
|
$ |
268,328 |
|
| Series 2016-4A, Class A1, 3.75% (D), 11/25/2056 (C) |
|
|
383,680 |
|
|
|
355,614 |
|
| Series 2017-1A, Class A1, 4.00% (D), 02/25/2057 (C) |
|
|
436,055 |
|
|
|
413,582 |
|
| Series 2017-2A, Class A3, 4.00% (D), 03/25/2057 (C) |
|
|
432,696 |
|
|
|
407,143 |
|
| Series 2017-3A, Class A1, 4.00% (D), 04/25/2057 (C) |
|
|
665,345 |
|
|
|
625,212 |
|
| Series 2017-4A, Class A1, 4.00% (D), 05/25/2057 (C) |
|
|
469,561 |
|
|
|
441,219 |
|
| Series 2018-1A, Class A1A, 4.00% (D), 12/25/2057 (C) |
|
|
507,875 |
|
|
|
479,056 |
|
| Series 2018-RPL1, Class A1, 3.50% (D), 12/25/2057 (C) |
|
|
287,538 |
|
|
|
272,159 |
|
| Series 2019-4A, Class A1B, 3.50% (D), 12/25/2058 (C) |
|
|
1,100,491 |
|
|
|
1,007,488 |
|
| Series 2019-5A, Class A1B, 3.50% (D), 08/25/2059 (C) |
|
|
1,143,751 |
|
|
|
1,053,672 |
|
| OBX Trust |
|
|
|
|
|
|
|
|
| Series 2023-NQM4, Class A1, 6.11% (D), 03/25/2063 (C) |
|
|
918,934 |
|
|
|
918,986 |
|
| Series 2024-NQM4, Class A1, 6.07% (D), 01/25/2064 (C) |
|
|
1,192,884 |
|
|
|
1,190,993 |
|
| Series 2024-NQM5, Class A1, 5.99% (D), 12/01/2064 (C) |
|
|
477,481 |
|
|
|
477,234 |
|
| Series 2024-NQM6, Class A1, 6.45% (D), 02/25/2064 (C) |
|
|
1,173,957 |
|
|
|
1,182,540 |
|
| Series 2024-NQM7, Class A1, 6.24% (D), 03/25/2064 (C) |
|
|
1,657,719 |
|
|
|
1,664,622 |
|
| Towd Point Mortgage Trust |
|
|
|
|
|
|
|
|
| Series 2017-3, Class A1, 2.75% (D), 07/25/2057 (C) |
|
|
40,537 |
|
|
|
39,951 |
|
| Series 2017-4, Class A1, 2.75% (D), 06/25/2057 (C) |
|
|
498,991 |
|
|
|
476,744 |
|
| Series 2017-6, Class A1, 2.75% (D), 10/25/2057 (C) |
|
|
397,364 |
|
|
|
383,073 |
|
| Series 2018-1, Class A1, 3.00% (D), 01/25/2058 (C) |
|
|
244,363 |
|
|
|
237,508 |
|
| Series 2018-4, Class A1, 3.00% (D), 06/25/2058 (C) |
|
|
893,279 |
|
|
|
822,442 |
|
| Series 2019-1, Class A1, 3.75% (D), 03/25/2058 (C) |
|
|
1,648,980 |
|
|
|
1,569,917 |
|
| Series 2020-4, Class A1, 1.75%, 10/25/2060 (C) |
|
|
2,487,239 |
|
|
|
2,201,852 |
|
| Series 2021-1, Class A1, 2.25% (D), 11/25/2061 (C) |
|
|
1,947,580 |
|
|
|
1,776,936 |
|
| Series 2022-4, Class A1, 3.75%, 09/25/2062 (C) |
|
|
548,930 |
|
|
|
512,208 |
|
| Series 2023-1, Class A1, 3.75%, 01/25/2063 (C) |
|
|
2,205,023 |
|
|
|
2,077,140 |
|
| UBS-BAMLL Trust |
|
|
|
|
|
|
|
|
| Series 2012-WRM, Class A, 3.66%, 06/10/2030 (C) |
|
|
29,028 |
|
|
|
27,243 |
|
|
|
|
|
|
|
|
|
|
| Total Mortgage-Backed Securities
(Cost $41,124,540) |
|
|
|
|
|
|
37,912,866 |
|
|
|
|
|
|
|
|
|
|
|
|
|
|
|
|
|
|
|
| |
|
Principal |
|
|
Value |
|
| ASSET-BACKED SECURITIES - 2.2% |
|
| 321 Henderson Receivables VI LLC |
|
|
|
|
|
|
|
|
| Series 2010-1A, Class A, 5.56%, 07/15/2059 (C) |
|
$ |
203,654 |
|
|
$ |
202,708 |
|
| Accelerated LLC |
|
|
|
|
|
|
|
|
| Series 2021-1H, Class A, 1.35%, 10/20/2040 (C) |
|
|
261,718 |
|
|
|
240,018 |
|
| Avis Budget Rental Car Funding AESOP LLC |
|
|
|
|
|
|
|
|
| Series 2020-2A, Class A, 2.02%, 02/20/2027 (C) |
|
|
660,000 |
|
|
|
626,540 |
|
| Series 2023-7A, Class A, 5.90%, 08/21/2028 (C) |
|
|
1,530,000 |
|
|
|
1,547,782 |
|
| Series 2024-1A, Class A, 5.36%, 06/20/2030 (C) |
|
|
1,230,000 |
|
|
|
1,224,884 |
|
| BXG Receivables Note Trust |
|
|
|
|
|
|
|
|
| Series 2023-A, Class A, 5.77%, 11/15/2038 (C) |
|
|
1,144,900 |
|
|
|
1,138,980 |
|
| Chase Issuance Trust |
|
|
|
|
|
|
|
|
| Series 2023-A1, Class A, 5.16%, 09/15/2028 |
|
|
1,350,000 |
|
|
|
1,353,481 |
|
| CIFC Funding Ltd. |
|
|
|
|
|
|
|
|
| Series 2013-2A, Class A1L2, 3-Month Term SOFR + 1.26%, 6.59% (D), 10/18/2030 (C) |
|
|
2,786,564 |
|
|
|
2,787,519 |
|
| First National Master Note Trust |
|
|
|
|
|
|
|
|
| Series 2023-2, Class A, 5.77%, 09/15/2029 |
|
|
1,375,000 |
|
|
|
1,392,556 |
|
| Ford Credit Auto Owner Trust |
|
|
|
|
|
|
|
|
| Series 2018-1, Class B, 3.34%, 07/15/2031 (C) |
|
|
500,000 |
|
|
|
493,142 |
|
| GM Financial Consumer Automobile Receivables Trust |
|
|
|
|
|
|
|
|
| Series 2023-1, Class A2A, 5.19%, 03/16/2026 |
|
|
110,209 |
|
|
|
110,110 |
|
| GoodLeap Sustainable Home Solutions Trust |
|
|
|
|
|
|
|
|
| Series 2021-4GS, Class A, 1.93%, 07/20/2048 (C) |
|
|
1,067,427 |
|
|
|
830,621 |
|
| Series 2021-5CS, Class A, 2.31%, 10/20/2048 (C) |
|
|
1,135,303 |
|
|
|
905,569 |
|
| Series 2022-1GS, Class A, 2.70%, 01/20/2049 (C) |
|
|
1,477,285 |
|
|
|
1,217,169 |
|
| Hertz Vehicle Financing III LLC |
|
|
|
|
|
|
|
|
| Series 2023-3A, Class A, 5.94%, 02/25/2028 (C) |
|
|
1,215,000 |
|
|
|
1,220,475 |
|
| Hilton Grand Vacations Trust |
|
|
|
|
|
|
|
|
| Series 2023-1A, Class A, 5.72%, 01/25/2038 (C) |
|
|
868,359 |
|
|
|
875,105 |
|
| Series 2024-1B, Class A, 5.75%, 09/15/2039 (C) |
|
|
639,028 |
|
|
|
645,572 |
|
| Series 2024-2A, Class A, 5.50%, 03/25/2038 (C) |
|
|
537,964 |
|
|
|
541,026 |
|
| HINNT LLC |
|
|
|
|
|
|
|
|
| Series 2024-A, Class A, 5.49%, 03/15/2043 (C) |
|
|
1,405,757 |
|
|
|
1,407,277 |
|
| ICG US CLO Ltd. |
|
|
|
|
|
|
|
|
| Series 2014-1A, Class A1A2, 3-Month Term SOFR + 1.46%, 6.79% (D), 10/20/2034 (C) |
|
|
2,600,000 |
|
|
|
2,602,304 |
|
The Notes to Financial Statements are an integral part of this report.
|
|
|
|
|
| Transamerica Series Trust |
|
|
|
Semi-Annual Financial Statements 2024 |
|
|
Page 10 |
|
|
Transamerica Multi-Managed Balanced VP
SCHEDULE OF INVESTMENTS (continued)
At June 30, 2024
(unaudited)
|
|
|
|
|
|
|
|
|
| |
|
Principal |
|
|
Value |
|
| ASSET-BACKED SECURITIES (continued) |
|
| JG Wentworth XXII LLC |
|
|
|
|
|
|
|
|
| Series 2010-3A, Class A, 3.82%, 12/15/2048 (C) |
|
$ |
298,673 |
|
|
$ |
298,329 |
|
| JGWPT XXVIII LLC |
|
|
|
|
|
|
|
|
| Series 2013-1A, Class A, 3.22%, 04/15/2067 (C) |
|
|
957,740 |
|
|
|
854,532 |
|
| MVW LLC |
|
|
|
|
|
|
|
|
| Series 2021-1WA, Class A, 1.14%, 01/22/2041 (C) |
|
|
205,994 |
|
|
|
192,258 |
|
| Series 2023-1A, Class A, 4.93%, 10/20/2040 (C) |
|
|
877,658 |
|
|
|
869,243 |
|
| Series 2024-1A, Class A, 5.32%, 02/20/2043 (C) |
|
|
1,067,235 |
|
|
|
1,065,235 |
|
| MVW Owner Trust |
|
|
|
|
|
|
|
|
| Series 2019-1A, Class A, 2.89%, 11/20/2036 (C) |
|
|
97,549 |
|
|
|
95,143 |
|
| Octagon Investment Partners 33 Ltd. |
|
|
|
|
|
|
|
|
| Series 2017-1A, Class A1, 3-Month Term SOFR + 1.45%, 6.78% (D), 01/20/2031 (C) |
|
|
820,735 |
|
|
|
821,561 |
|
| Palmer Square CLO Ltd. |
|
|
|
|
|
|
|
|
| Series 2015-2A, Class A1R2, 3-Month Term SOFR + 1.36%, 6.69% (D), 07/20/2030 (C) |
|
|
816,086 |
|
|
|
816,734 |
|
| Sierra Timeshare Receivables Funding LLC |
|
|
|
|
|
|
|
|
| Series 2020-2A, Class A, 1.33%, 07/20/2037 (C) |
|
|
304,908 |
|
|
|
294,606 |
|
| Series 2021-1A, Class A, 0.99%, 11/20/2037 (C) |
|
|
525,760 |
|
|
|
499,710 |
|
| Series 2023-1A, Class A, 5.20%, 01/20/2040 (C) |
|
|
516,882 |
|
|
|
512,304 |
|
| Series 2023-2A, Class A, 5.80%, 04/20/2040 (C) |
|
|
1,046,996 |
|
|
|
1,045,382 |
|
| Series 2023-3A, Class A, 6.10%, 09/20/2040 (C) |
|
|
1,407,446 |
|
|
|
1,423,157 |
|
| Series 2024-1A, Class A, 5.15%, 01/20/2043 (C) |
|
|
774,318 |
|
|
|
770,461 |
|
| Trafigura Securitisation Finance PLC |
|
|
|
|
|
|
|
|
| Series 2021-1A, Class A2, 1.08%, 01/15/2025 (C) |
|
|
2,000,000 |
|
|
|
1,995,864 |
|
| Veridian Auto Receivables Trust |
|
|
|
|
|
|
|
|
| Series 2023-1A, Class A2, 5.97%, 08/17/2026 (C) |
|
|
493,653 |
|
|
|
493,853 |
|
|
|
|
|
|
|
|
|
|
| Total Asset-Backed Securities
(Cost $34,291,039) |
|
|
|
33,411,210 |
|
|
|
|
|
|
|
|
|
|
|
| FOREIGN GOVERNMENT OBLIGATIONS - 0.5% |
|
| Brazil - 0.0% (B) |
|
| Brazil Government International Bonds |
|
|
|
|
|
|
|
|
| 4.25%, 01/07/2025 |
|
|
480,000 |
|
|
|
474,412 |
|
|
|
|
|
|
|
|
|
|
|
| Chile - 0.0% (B) |
|
| Chile Government International Bonds |
|
|
|
|
|
|
|
|
| 3.50%, 01/25/2050 |
|
|
675,000 |
|
|
|
486,327 |
|
|
|
|
|
|
|
|
|
|
|
| Colombia - 0.0% (B) |
|
| Colombia Government International Bonds |
|
|
|
|
|
|
|
|
| 3.13%, 04/15/2031 |
|
|
615,000 |
|
|
|
483,951 |
|
|
|
|
|
|
|
|
|
|
|
|
|
|
|
|
|
|
|
| |
|
Principal |
|
|
Value |
|
| FOREIGN GOVERNMENT OBLIGATIONS (continued) |
|
| Dominican Republic - 0.1% |
|
| Dominican Republic International Bonds |
|
|
|
|
|
|
|
|
| 6.60%, 06/01/2036 (C)(F) |
|
$ |
1,346,000 |
|
|
$ |
1,338,885 |
|
|
|
|
|
|
|
|
|
|
|
| Indonesia - 0.1% |
|
| Indonesia Government International Bonds |
|
|
|
|
|
|
|
|
| 4.75%, 01/08/2026 (C) |
|
|
1,429,000 |
|
|
|
1,416,496 |
|
|
|
|
|
|
|
|
|
|
|
| Mexico - 0.1% |
|
| Mexico Government International Bonds |
|
|
|
|
|
|
|
|
| 3.75%, 01/11/2028 |
|
|
1,883,000 |
|
|
|
1,780,155 |
|
|
|
|
|
|
|
|
|
|
|
| Panama - 0.1% |
|
| Panama Government International Bonds |
|
|
|
|
|
|
|
|
| 3.88%, 03/17/2028 |
|
|
550,000 |
|
|
|
506,710 |
|
|
|
|
|
|
|
|
|
|
|
| Serbia - 0.1% |
|
| Serbia International Bonds |
|
|
|
|
|
|
|
|
| 6.00%, 06/12/2034 (C) |
|
|
955,000 |
|
|
|
940,241 |
|
|
|
|
|
|
|
|
|
|
| Total Foreign Government Obligations
(Cost $7,822,730) |
|
|
|
7,427,177 |
|
|
|
|
|
|
|
|
|
|
|
|
|
| |
|
Shares |
|
|
Value |
|
| PREFERRED STOCK - 0.0% (B) |
|
| Banks - 0.0% (B) |
|
| Citigroup Capital XIII,
3-Month Term SOFR + 6.63%, 11.96% (D) |
|
|
22,096 |
|
|
|
646,750 |
|
|
|
|
|
|
|
|
|
|
| Total Preferred Stock
(Cost $638,921) |
|
|
|
646,750 |
|
|
|
|
|
|
|
|
|
|
|
|
|
| |
|
Principal |
|
|
Value |
|
| MUNICIPAL GOVERNMENT OBLIGATION - 0.0% (B) |
|
| Georgia - 0.0% (B) |
|
| Municipal Electric Authority of Georgia, Revenue Bonds, |
|
|
|
|
|
|
|
|
| Series A, 6.64%, 04/01/2057 |
|
$ |
45,000 |
|
|
|
48,972 |
|
|
|
|
|
|
|
|
|
|
| Total Municipal Government Obligation
(Cost $49,322) |
|
|
|
48,972 |
|
|
|
|
|
|
|
|
|
|
|
| COMMERCIAL PAPER - 7.6% |
|
| Banks - 2.8% |
|
| ABN AMRO Funding USA LLC |
|
|
|
|
|
|
|
|
| 5.36% (G), 08/01/2024 (C) |
|
|
5,000,000 |
|
|
|
4,974,490 |
|
| 5.45% (G), 07/17/2024 (C) |
|
|
1,500,000 |
|
|
|
1,495,733 |
|
| Australia & New Zealand Banking Group Ltd. |
|
|
|
|
|
|
|
|
| 5.38% (G), 08/07/2024 (C) |
|
|
1,350,000 |
|
|
|
1,341,982 |
|
| HSBC USA, Inc. |
|
|
|
|
|
|
|
|
| 5.57% (G), 07/23/2024 (C) |
|
|
6,300,000 |
|
|
|
6,276,346 |
|
| Korea Development Bank |
|
|
|
|
|
|
|
|
| 5.47% (G), 07/08/2024 |
|
|
6,000,000 |
|
|
|
5,991,112 |
|
| Lloyds Bank PLC |
|
|
|
|
|
|
|
|
| 5.33% (G), 08/01/2024 |
|
|
5,569,000 |
|
|
|
5,540,836 |
|
| Macquarie Bank Ltd. |
|
|
|
|
|
|
|
|
| 5.39% (G), 08/12/2024 (C) |
|
|
4,000,000 |
|
|
|
3,972,960 |
|
The Notes to Financial Statements are an integral part of this report.
|
|
|
|
|
| Transamerica Series Trust |
|
|
|
Semi-Annual Financial Statements 2024 |
|
|
Page 11 |
|
|
Transamerica Multi-Managed Balanced VP
SCHEDULE OF INVESTMENTS (continued)
At June 30, 2024
(unaudited)
|
|
|
|
|
|
|
|
|
| |
|
Principal |
|
|
Value |
|
| COMMERCIAL PAPER (continued) |
|
| Banks (continued) |
|
| Nordea Bank Abp |
|
|
|
|
|
|
|
|
| 5.39% (G), 09/03/2024 (C) |
|
$ |
6,525,000 |
|
|
$ |
6,460,870 |
|
| Svenska Handelsbanken AB |
|
|
|
|
|
|
|
|
| 5.36% (G), 07/30/2024 (C) |
|
|
6,375,000 |
|
|
|
6,345,049 |
|
|
|
|
|
|
|
|
|
|
|
|
|
|
|
|
|
42,399,378 |
|
|
|
|
|
|
|
|
|
|
| Consumer Finance - 0.4% |
|
| Toyota Motor Credit Corp. |
|
|
|
|
|
|
|
|
| 5.46% (G), 07/03/2024 |
|
|
5,500,000 |
|
|
|
5,495,961 |
|
|
|
|
|
|
|
|
|
|
|
| Financial Services - 2.9% |
|
| Anglesea Funding LLC |
|
|
|
|
|
|
|
|
| 5.38% (G), 07/26/2024 (C) |
|
|
6,375,000 |
|
|
|
6,348,342 |
|
| Barton Capital SA |
|
|
|
|
|
|
|
|
| 5.59% (G), 10/04/2024 (C) |
|
|
4,925,000 |
|
|
|
4,852,751 |
|
| CAFCO LLC |
|
|
|
|
|
|
|
|
| 5.48% (G), 09/03/2024 (C) |
|
|
1,750,000 |
|
|
|
1,732,470 |
|
| Glencove Funding LLC |
|
|
|
|
|
|
|
|
| 5.50% (G), 10/07/2024 (C) |
|
|
6,000,000 |
|
|
|
5,909,248 |
|
| Gotham Funding Corp. |
|
|
|
|
|
|
|
|
| 5.55% (G), 10/11/2024 (C) |
|
|
3,000,000 |
|
|
|
2,952,768 |
|
| GTA Funding LLC |
|
|
|
|
|
|
|
|
| 5.45% (G), 08/30/2024 (C) |
|
|
5,800,000 |
|
|
|
5,745,271 |
|
| LMA-Americas LLC |
|
|
|
|
|
|
|
|
| 5.58% (G), 10/18/2024 (C) |
|
|
4,750,000 |
|
|
|
4,670,467 |
|
| Sheffield Receivables Co. LLC |
|
|
|
|
|
|
|
|
| 5.48% (G), 09/03/2024 (C) |
|
|
6,525,000 |
|
|
|
6,459,331 |
|
| Starbird Funding Corp. |
|
|
|
|
|
|
|
|
| 5.47% (G), 07/11/2024 (C) |
|
|
6,000,000 |
|
|
|
5,988,407 |
|
|
|
|
|
|
|
|
|
|
|
|
|
|
|
|
|
44,659,055 |
|
|
|
|
|
|
|
|
|
|
| Health Care Providers & Services - 0.8% |
|
| Columbia Funding Co. LLC |
|
|
|
|
|
|
|
|
| 5.48% (G), 09/04/2024 (C) |
|
|
6,250,000 |
|
|
|
6,185,746 |
|
| UnitedHealth Group, Inc. |
|
|
|
|
|
|
|
|
| 5.61% (G), 09/26/2024 (C) |
|
|
6,000,000 |
|
|
|
5,919,000 |
|
|
|
|
|
|
|
|
|
|
|
|
|
|
|
|
|
12,104,746 |
|
|
|
|
|
|
|
|
|
|
| Pharmaceuticals - 0.7% |
|
| AstraZeneca PLC |
|
|
|
|
|
|
|
|
| 5.41% (G), 07/16/2024 (C) |
|
|
6,500,000 |
|
|
|
6,482,159 |
|
| Pfizer, Inc. |
|
|
|
|
|
|
|
|
| 5.30% (G), 08/01/2024 (C) |
|
|
4,200,000 |
|
|
|
4,178,847 |
|
|
|
|
|
|
|
|
|
|
|
|
|
|
|
|
|
10,661,006 |
|
|
|
|
|
|
|
|
|
|
| Total Commercial Paper
(Cost $115,355,669) |
|
|
|
|
|
|
115,320,146 |
|
|
|
|
|
|
|
|
|
|
|
|
|
|
|
|
|
|
|
| |
|
Principal |
|
|
Value |
|
| SHORT-TERM U.S. GOVERNMENT OBLIGATIONS - 0.7% |
|
| U.S. Treasury Bills |
|
|
|
|
|
|
|
|
| 5.34% (G), 09/19/2024 |
|
$ |
240,000 |
|
|
$ |
237,220 |
|
| 5.37% (G), 09/19/2024 |
|
|
2,534,000 |
|
|
|
2,504,645 |
|
| 5.38% (G), 09/12/2024 |
|
|
1,675,000 |
|
|
|
1,657,241 |
|
| 5.39% (G), 07/18/2024 - 08/08/2024 |
|
|
5,772,000 |
|
|
|
5,745,349 |
|
|
|
|
|
|
|
|
|
|
| Total Short-Term U.S. Government Obligations
(Cost $10,141,364) |
|
|
|
10,144,455 |
|
|
|
|
|
|
|
|
|
|
|
|
|
| |
|
Shares |
|
|
Value |
|
| OTHER INVESTMENT COMPANY - 0.0% (B) |
|
| Securities Lending Collateral - 0.0% (B) |
|
| State Street Navigator Securities Lending Trust - Government Money Market Portfolio, 5.28% (G) |
|
|
622,500 |
|
|
|
622,500 |
|
|
|
|
|
|
|
|
|
|
| Total Other Investment Company
(Cost $622,500) |
|
|
|
622,500 |
|
|
|
|
|
|
|
|
|
|
|
|
|
| |
|
Principal |
|
|
Value |
|
| REPURCHASE AGREEMENT - 1.2% |
|
| Fixed Income Clearing Corp., 2.50% (G), dated 06/28/2024, to be repurchased at $18,822,585 on 07/01/2024. Collateralized by a U.S. Government Obligation, 3.75%, due 04/15/2026, and with a value of $19,195,231. |
|
$ |
18,818,664 |
|
|
|
18,818,664 |
|
|
|
|
|
|
|
|
|
|
| Total Repurchase Agreement
(Cost $18,818,664) |
|
|
|
18,818,664 |
|
|
|
|
|
|
|
|
|
|
| Total Investments
(Cost $1,353,985,897) |
|
|
|
1,653,902,151 |
|
|
|
|
|
|
|
|
|
|
| Net Other Assets (Liabilities) - (8.8)% |
|
|
|
(134,042,420 |
) |
|
|
|
|
|
|
|
|
|
|
|
| Net Assets - 100.0% |
|
|
$ |
1,519,859,731 |
|
|
|
|
|
|
|
|
|
|
FUTURES CONTRACTS:
|
|
|
|
|
|
|
|
|
|
|
|
|
| Long Futures Contracts |
|
|
|
|
|
|
|
| Description |
|
Number of Contracts |
|
Expiration Date |
|
Notional Amount |
|
Value |
|
Unrealized Appreciation |
|
Unrealized Depreciation |
| S&P 500® E-Mini Index |
|
31 |
|
09/20/2024 |
|
$8,605,829 |
|
$8,558,325 |
|
$— |
|
$(47,504) |
The Notes to Financial Statements are an integral part of this report.
|
|
|
|
|
| Transamerica Series Trust |
|
|
|
Semi-Annual Financial Statements 2024 |
|
|
Page 12 |
|
|
Transamerica Multi-Managed Balanced VP
SCHEDULE OF INVESTMENTS (continued)
At June 30, 2024
(unaudited)
INVESTMENT VALUATION:
Valuation Inputs (H)
|
|
|
|
|
|
|
|
|
|
|
|
|
|
|
|
|
| |
|
Level 1 -
Unadjusted
Quoted Prices |
|
|
Level 2 - Other Significant
Observable Inputs |
|
|
Level 3 - Significant
Unobservable Inputs |
|
|
Value |
|
| ASSETS |
|
|
|
|
|
|
|
|
|
|
|
|
|
|
|
|
| Investments |
|
|
|
|
|
|
|
|
|
|
|
|
|
|
|
|
| Common Stocks |
|
$ |
920,660,704 |
|
|
$ |
— |
|
|
$ |
— |
|
|
$ |
920,660,704 |
|
| Corporate Debt Securities |
|
|
— |
|
|
|
211,333,989 |
|
|
|
— |
|
|
|
211,333,989 |
|
| U.S. Government Agency Obligations |
|
|
— |
|
|
|
161,452,017 |
|
|
|
— |
|
|
|
161,452,017 |
|
| U.S. Government Obligations |
|
|
— |
|
|
|
136,102,701 |
|
|
|
— |
|
|
|
136,102,701 |
|
| Mortgage-Backed Securities |
|
|
— |
|
|
|
37,912,866 |
|
|
|
— |
|
|
|
37,912,866 |
|
| Asset-Backed Securities |
|
|
— |
|
|
|
33,411,210 |
|
|
|
— |
|
|
|
33,411,210 |
|
| Foreign Government Obligations\ |
|
|
— |
|
|
|
7,427,177 |
|
|
|
— |
|
|
|
7,427,177 |
|
| Preferred Stock |
|
|
646,750 |
|
|
|
— |
|
|
|
— |
|
|
|
646,750 |
|
| Municipal Government Obligation |
|
|
— |
|
|
|
48,972 |
|
|
|
— |
|
|
|
48,972 |
|
| Commercial Paper |
|
|
— |
|
|
|
115,320,146 |
|
|
|
— |
|
|
|
115,320,146 |
|
| Short-Term U.S. Government Obligations |
|
|
— |
|
|
|
10,144,455 |
|
|
|
— |
|
|
|
10,144,455 |
|
| Other Investment Company |
|
|
622,500 |
|
|
|
— |
|
|
|
— |
|
|
|
622,500 |
|
| Repurchase Agreement |
|
|
— |
|
|
|
18,818,664 |
|
|
|
— |
|
|
|
18,818,664 |
|
|
|
|
|
|
|
|
|
|
|
|
|
|
|
|
|
|
| Total Investments |
|
$ |
921,929,954 |
|
|
$ |
731,972,197 |
|
|
$ |
— |
|
|
$ |
1,653,902,151 |
|
|
|
|
|
|
|
|
|
|
|
|
|
|
|
|
|
|
|
|
|
|
|
| LIABILITIES |
|
|
|
|
|
|
|
|
|
|
|
|
|
|
|
|
| Other Financial Instruments |
|
|
|
|
|
|
|
|
|
|
|
|
|
|
|
|
| Futures Contracts (I) |
|
$ |
(47,504 |
) |
|
$ |
— |
|
|
$ |
— |
|
|
$ |
(47,504 |
) |
|
|
|
|
|
|
|
|
|
|
|
|
|
|
|
|
|
| Total Other Financial Instruments |
|
$ |
(47,504 |
) |
|
$ |
— |
|
|
$ |
— |
|
|
$ |
(47,504 |
) |
|
|
|
|
|
|
|
|
|
|
|
|
|
|
|
|
|
FOOTNOTES TO SCHEDULE OF INVESTMENTS:
| (A) |
Non-income producing security. |
| (B) |
Percentage rounds to less than 0.1% or (0.1)%. |
| (C) |
Security is exempt from registration pursuant to Rule 144A of the Securities Act of 1933. Security may be resold as transactions exempt from registration, normally to qualified institutional buyers. At June 30, 2024, the total value of 144A securities is $218,561,527, representing 14.4% of the Portfolio’s net assets. |
| (D) |
Floating or variable rate security. The rate disclosed is as of June 30, 2024. For securities based on a published reference rate and spread, the reference rate and spread are indicated within the description. Variable rate securities with a floor or ceiling feature are disclosed at the inherent rate, where applicable. Certain variable rate securities are not based on a published reference rate and spread, but are determined by the issuer or agent and are based on current market conditions; these securities do not indicate a reference rate and spread in the description. |
| (E) |
All or a portion of the security is on loan. The total value of the securities on loan is $609,227, collateralized by cash collateral of $622,500. The amount on loan indicated may not correspond with the securities on loan identified because a security with pending sales are in the process of recall from the brokers. |
| (F) |
When-issued, delayed-delivery and/or forward commitment (including TBAs) security. Security to be settled and delivered after June 30, 2024. Security may display a coupon rate of 0.00%, as the rate is to be determined at time of settlement. |
| (G) |
Rate disclosed reflects the yield at June 30, 2024. |
| (H) |
There were no transfers in or out of Level 3 during the period ended June 30, 2024. Please reference the Investment Valuation section of the Notes to Financial Statements for more information regarding investment valuation and pricing inputs. |
| (I) |
Derivative instruments are valued at unrealized appreciation (depreciation). |
PORTFOLIO ABBREVIATION(S):
|
|
|
| REIT |
|
Real Estate Investment Trust |
| RFUCC |
|
Refinitiv USD IBOR Consumer Cash Fallbacks |
| SOFR |
|
Secured Overnight Financing Rate |
| STRIPS |
|
Separate Trading of Registered Interest and Principal of Securities |
| TBA |
|
To Be Announced |
The Notes to Financial Statements are an integral part of this report.
|
|
|
|
|
| Transamerica Series Trust |
|
|
|
Semi-Annual Financial Statements 2024 |
|
|
Page 13 |
|
|
Transamerica Multi-Managed Balanced VP
STATEMENT OF ASSETS AND LIABILITIES
At June 30, 2024
(unaudited)
|
|
|
|
|
| Assets: |
|
|
|
|
| Investments, at value (cost $1,335,167,233) (including securities loaned of $609,227) |
|
$ |
1,635,083,487 |
|
| Repurchase agreement, at value (cost $18,818,664) |
|
|
18,818,664 |
|
| Cash |
|
|
15,427 |
|
| Cash collateral pledged at broker for: |
|
|
|
|
| Futures contracts |
|
|
566,000 |
|
| Receivables and other assets: |
|
|
|
|
| Investments sold |
|
|
4,280,778 |
|
| Net income from securities lending |
|
|
41 |
|
| Shares of beneficial interest sold |
|
|
1,233 |
|
| Dividends |
|
|
553,208 |
|
| Interest |
|
|
4,412,907 |
|
| Prepaid expenses |
|
|
6,186 |
|
|
|
| Total assets |
|
|
1,663,737,931 |
|
|
|
| Liabilities: |
|
|
|
|
| Cash collateral received upon return of: |
|
|
|
|
| Securities on loan |
|
|
622,500 |
|
| Cash collateral at broker for: |
|
|
|
|
| TBA commitments |
|
|
711,500 |
|
| Payables and other liabilities: |
|
|
|
|
| Investments purchased |
|
|
7,003,703 |
|
| When-issued, delayed-delivery, forward and TBA commitments purchased |
|
|
132,853,044 |
|
| Shares of beneficial interest redeemed |
|
|
1,507,361 |
|
| Investment management fees |
|
|
683,415 |
|
| Distribution and service fees |
|
|
226,499 |
|
| Transfer agent costs |
|
|
1,481 |
|
| Trustee and CCO fees |
|
|
4,256 |
|
| Audit and tax fees |
|
|
26,447 |
|
| Custody fees |
|
|
68,975 |
|
| Legal fees |
|
|
30,192 |
|
| Printing and shareholder reports fees |
|
|
73,308 |
|
| Other accrued expenses |
|
|
27,562 |
|
| Variation margin payable on futures contracts |
|
|
37,957 |
|
|
|
| Total liabilities |
|
|
143,878,200 |
|
|
|
| Net assets |
|
$ |
1,519,859,731 |
|
|
|
| Net assets consist of: |
|
|
|
|
| Capital stock ($0.01 par value) |
|
$ |
926,013 |
|
| Additional paid-in capital |
|
|
1,035,275,051 |
|
| Total distributable earnings (accumulated losses) |
|
|
483,658,667 |
|
|
|
| Net assets |
|
$ |
1,519,859,731 |
|
|
|
| Net assets by class: |
|
|
|
|
| Initial Class |
|
$ |
340,799,076 |
|
| Service Class |
|
|
1,179,060,655 |
|
|
|
| Shares outstanding: |
|
|
|
|
| Initial Class |
|
|
20,243,000 |
|
| Service Class |
|
|
72,358,347 |
|
|
|
| Net asset value and offering price per share: |
|
|
|
|
| Initial Class |
|
$ |
16.84 |
|
| Service Class |
|
|
16.29 |
|
STATEMENT OF OPERATIONS
For the period ended June 30, 2024
(unaudited)
|
|
|
|
|
| Investment income: |
|
|
|
|
| Dividend income |
|
$ |
6,137,595 |
|
| Interest income |
|
|
13,321,832 |
|
| Net income from securities lending |
|
|
5,158 |
|
| Withholding taxes on foreign income |
|
|
(9,814 |
) |
|
|
| Total investment income |
|
|
19,454,771 |
|
|
|
| Expenses: |
|
|
|
|
| Investment management fees |
|
|
4,397,819 |
|
| Distribution and service fees: |
|
|
|
|
| Service Class |
|
|
1,467,618 |
|
| Transfer agent costs |
|
|
8,557 |
|
| Trustee and CCO fees |
|
|
35,028 |
|
| Audit and tax fees |
|
|
26,009 |
|
| Custody fees |
|
|
76,091 |
|
| Legal fees |
|
|
59,595 |
|
| Printing and shareholder reports fees |
|
|
69,471 |
|
| Other |
|
|
62,178 |
|
|
|
| Total expenses |
|
|
6,202,366 |
|
|
|
| Net investment income (loss) |
|
|
13,252,405 |
|
|
|
| Net realized gain (loss) on: |
|
|
|
|
| Investments |
|
|
84,373,349 |
|
| Futures contracts |
|
|
1,339,592 |
|
| Net realized gain (loss) |
|
|
85,712,941 |
|
|
|
| Net change in unrealized appreciation (depreciation) on: |
|
|
|
|
| Investments |
|
|
38,221,436 |
|
| Futures contracts |
|
|
(279,351 |
) |
|
|
| Net change in unrealized appreciation (depreciation) |
|
|
37,942,085 |
|
|
|
| Net realized and change in unrealized gain (loss) |
|
|
123,655,026 |
|
|
|
| Net increase (decrease) in net assets resulting from operations |
|
$ |
136,907,431 |
|
|
|
|
|
|
| The Notes to Financial Statements are an integral part of this report. Transamerica Series Trust |
|
|
|
Semi-Annual Financial Statements 2024 |
|
|
Page 14 |
|
|
Transamerica Multi-Managed Balanced VP
STATEMENT OF CHANGES IN NET ASSETS
For the period and year ended:
|
|
|
|
|
|
|
|
|
| |
|
June 30, 2024 (unaudited) |
|
December 31, 2023 |
|
|
|
|
| From operations: |
|
|
|
|
|
|
|
|
| Net investment income (loss) |
|
$ |
13,252,405 |
|
|
$ |
25,751,388 |
|
| Net realized gain (loss) |
|
|
85,712,941 |
|
|
|
64,416,423 |
|
| Net change in unrealized appreciation (depreciation) |
|
|
37,942,085 |
|
|
|
164,461,920 |
|
|
|
|
| Net increase (decrease) in net assets resulting from operations |
|
|
136,907,431 |
|
|
|
254,629,731 |
|
|
|
|
| Dividends and/or distributions to shareholders: |
|
|
|
|
|
|
|
|
| Initial Class |
|
|
— |
|
|
|
(15,241,932 |
) |
| Service Class |
|
|
— |
|
|
|
(56,647,063 |
) |
| |
|
|
| Net increase (decrease) in net assets resulting from dividends and/or distributions to shareholders |
|
|
— |
|
|
|
(71,888,995 |
) |
|
|
|
| Capital share transactions: |
|
|
|
|
|
|
|
|
| Proceeds from shares sold: |
|
|
|
|
|
|
|
|
| Initial Class |
|
|
2,880,406 |
|
|
|
8,648,051 |
|
| Service Class |
|
|
5,034,568 |
|
|
|
6,777,108 |
|
|
|
|
7,914,974 |
|
|
|
15,425,159 |
|
| Dividends and/or distributions reinvested: |
|
|
|
|
|
|
|
|
| Initial Class |
|
|
— |
|
|
|
15,241,932 |
|
| Service Class |
|
|
— |
|
|
|
56,647,063 |
|
|
|
|
— |
|
|
|
71,888,995 |
|
| Cost of shares redeemed: |
|
|
|
|
|
|
|
|
| Initial Class |
|
|
(18,029,890 |
) |
|
|
(28,153,988 |
) |
| Service Class |
|
|
(131,637,684 |
) |
|
|
(196,128,617 |
) |
| |
|
|
(149,667,574 |
) |
|
|
(224,282,605 |
) |
|
|
|
| Net increase (decrease) in net assets resulting from capital share transactions |
|
|
(141,752,600 |
) |
|
|
(136,968,451 |
) |
|
|
|
| Net increase (decrease) in net assets |
|
|
(4,845,169 |
) |
|
|
45,772,285 |
|
|
|
|
| Net assets: |
|
|
|
|
|
|
|
|
| Beginning of period/year |
|
|
1,524,704,900 |
|
|
|
1,478,932,615 |
|
| End of period/year |
|
$ |
1,519,859,731 |
|
|
$ |
1,524,704,900 |
|
|
|
|
| Capital share transactions - shares: |
|
|
|
|
|
|
|
|
| Shares issued: |
|
|
|
|
|
|
|
|
| Initial Class |
|
|
179,740 |
|
|
|
588,211 |
|
| Service Class |
|
|
325,025 |
|
|
|
479,674 |
|
| |
|
|
504,765 |
|
|
|
1,067,885 |
|
| Shares reinvested: |
|
|
|
|
|
|
|
|
| Initial Class |
|
|
— |
|
|
|
1,048,276 |
|
| Service Class |
|
|
— |
|
|
|
4,017,522 |
|
| |
|
|
— |
|
|
|
5,065,798 |
|
| Shares redeemed: |
|
|
|
|
|
|
|
|
| Initial Class |
|
|
(1,122,037 |
) |
|
|
(1,944,799 |
) |
| Service Class |
|
|
(8,441,048 |
) |
|
|
(13,922,101 |
) |
| |
|
|
(9,563,085 |
) |
|
|
(15,866,900 |
) |
| Net increase (decrease) in shares outstanding: |
|
|
|
|
|
|
|
|
| Initial Class |
|
|
(942,297 |
) |
|
|
(308,312 |
) |
| Service Class |
|
|
(8,116,023 |
) |
|
|
(9,424,905 |
) |
| |
|
|
(9,058,320 |
) |
|
|
(9,733,217 |
) |
The Notes to Financial Statements are an integral part of this report.
|
|
|
|
|
| Transamerica Series Trust |
|
|
|
Semi-Annual Financial Statements 2024 |
|
|
Page 15 |
|
|
Transamerica Multi-Managed Balanced VP
FINANCIAL HIGHLIGHTS
|
|
|
|
|
|
|
|
|
|
|
|
|
|
|
|
|
|
|
|
|
|
|
|
|
| For a share outstanding during the period and years indicated: |
|
|
Initial Class |
|
| |
|
June 30, 2024 (unaudited) |
|
|
December 31, 2023 |
|
|
December 31, 2022 |
|
|
December 31, 2021 |
|
|
December 31, 2020 |
|
|
December 31, 2019 |
|
| Net asset value, beginning of period/year |
|
$ |
15.37 |
|
|
$ |
13.60 |
|
|
$ |
18.68 |
|
|
$ |
17.04 |
|
|
$ |
15.54 |
|
|
$ |
13.85 |
|
|
|
|
|
|
|
|
| Investment operations: |
|
|
|
|
|
|
|
|
|
|
|
|
|
|
|
|
|
|
|
|
|
|
|
|
| Net investment income (loss)(A) |
|
|
0.16 |
|
|
|
0.28 |
|
|
|
0.22 |
|
|
|
0.17 |
|
|
|
0.20 |
|
|
|
0.24 |
|
| Net realized and unrealized gain (loss) |
|
|
1.31 |
|
|
|
2.23 |
|
|
|
(3.14 |
) |
|
|
2.68 |
|
|
|
2.20 |
|
|
|
2.69 |
|
| Total investment operations |
|
|
1.47 |
|
|
|
2.51 |
|
|
|
(2.92 |
) |
|
|
2.85 |
|
|
|
2.40 |
|
|
|
2.93 |
|
|
|
|
|
|
|
|
| Dividends and/or distributions to shareholders: |
|
|
|
|
|
|
|
|
|
|
|
|
|
|
|
|
|
|
|
|
|
|
|
|
| Net investment income |
|
|
— |
|
|
|
(0.24 |
) |
|
|
(0.20 |
) |
|
|
(0.21 |
) |
|
|
(0.25 |
) |
|
|
(0.26 |
) |
| Net realized gains |
|
|
— |
|
|
|
(0.50 |
) |
|
|
(1.96 |
) |
|
|
(1.00 |
) |
|
|
(0.65 |
) |
|
|
(0.98 |
) |
| Total dividends and/or distributions to shareholders |
|
|
— |
|
|
|
(0.74 |
) |
|
|
(2.16 |
) |
|
|
(1.21 |
) |
|
|
(0.90 |
) |
|
|
(1.24 |
) |
|
|
|
|
|
|
|
| Net asset value, end of period/year |
|
$ |
16.84 |
|
|
$ |
15.37 |
|
|
$ |
13.60 |
|
|
$ |
18.68 |
|
|
$ |
17.04 |
|
|
$ |
15.54 |
|
| |
|
|
|
|
|
|
|
|
|
|
|
|
|
|
|
|
|
|
|
|
|
|
|
|
|
|
|
|
|
|
|
| Total return |
|
|
9.56 |
%(B) |
|
|
18.73 |
% |
|
|
(16.28 |
)% |
|
|
17.04 |
% |
|
|
15.90 |
% |
|
|
21.77 |
% |
|
|
|
|
|
|
|
| Ratio and supplemental data: |
|
|
|
|
|
|
|
|
|
|
|
|
|
|
|
|
|
|
|
|
|
|
|
|
| Net assets end of period/year (000’s) |
|
$ |
340,799 |
|
|
$ |
325,714 |
|
|
$ |
292,382 |
|
|
$ |
381,588 |
|
|
$ |
376,902 |
|
|
$ |
345,274 |
|
| Expenses to average net assets |
|
|
0.63 |
%(C) |
|
|
0.64 |
% |
|
|
0.62 |
% |
|
|
0.61 |
% |
|
|
0.63 |
% |
|
|
0.66 |
% |
| Net investment income (loss) to average net assets |
|
|
1.96 |
%(C) |
|
|
1.92 |
% |
|
|
1.43 |
% |
|
|
0.97 |
% |
|
|
1.29 |
% |
|
|
1.61 |
% |
| Portfolio turnover rate |
|
|
23 |
%(B) |
|
|
35 |
% |
|
|
33 |
% |
|
|
35 |
% |
|
|
51 |
% |
|
|
45 |
% |
| (A) |
Calculated based on average number of shares outstanding. |
|
|
|
|
|
|
|
|
|
|
|
|
|
|
|
|
|
|
|
|
|
|
|
|
|
| For a share outstanding during the period and years indicated: |
|
|
Service Class |
|
| |
|
June 30, 2024
(unaudited) |
|
|
December 31, 2023 |
|
|
December 31, 2022 |
|
|
December 31, 2021 |
|
|
December 31, 2020 |
|
|
December 31, 2019 |
|
| Net asset value, beginning of period/year |
|
$ |
14.90 |
|
|
$ |
13.20 |
|
|
$ |
18.19 |
|
|
$ |
16.62 |
|
|
$ |
15.18 |
|
|
$ |
13.55 |
|
|
|
|
|
|
|
|
| Investment operations: |
|
|
|
|
|
|
|
|
|
|
|
|
|
|
|
|
|
|
|
|
|
|
|
|
| Net investment income (loss)(A) |
|
|
0.13 |
|
|
|
0.23 |
|
|
|
0.18 |
|
|
|
0.13 |
|
|
|
0.16 |
|
|
|
0.20 |
|
| Net realized and unrealized gain (loss) |
|
|
1.26 |
|
|
|
2.17 |
|
|
|
(3.06 |
) |
|
|
2.61 |
|
|
|
2.15 |
|
|
|
2.63 |
|
| Total investment operations |
|
|
1.39 |
|
|
|
2.40 |
|
|
|
(2.88 |
) |
|
|
2.74 |
|
|
|
2.31 |
|
|
|
2.83 |
|
|
|
|
|
|
|
|
| Dividends and/or distributions to shareholders: |
|
|
|
|
|
|
|
|
|
|
|
|
|
|
|
|
|
|
|
|
|
|
|
|
| Net investment income |
|
|
— |
|
|
|
(0.20 |
) |
|
|
(0.15 |
) |
|
|
(0.17 |
) |
|
|
(0.22 |
) |
|
|
(0.22 |
) |
| Net realized gains |
|
|
— |
|
|
|
(0.50 |
) |
|
|
(1.96 |
) |
|
|
(1.00 |
) |
|
|
(0.65 |
) |
|
|
(0.98 |
) |
| Total dividends and/or distributions to shareholders |
|
|
— |
|
|
|
(0.70 |
) |
|
|
(2.11 |
) |
|
|
(1.17 |
) |
|
|
(0.87 |
) |
|
|
(1.20 |
) |
|
|
|
|
|
|
|
| Net asset value, end of period/year |
|
$ |
16.29 |
|
|
$ |
14.90 |
|
|
$ |
13.20 |
|
|
$ |
18.19 |
|
|
$ |
16.62 |
|
|
$ |
15.18 |
|
| |
|
|
|
|
|
|
|
|
|
|
|
|
|
|
|
|
|
|
|
|
|
|
|
|
|
|
|
|
|
|
|
| Total return |
|
|
9.33 |
%(B) |
|
|
18.44 |
% |
|
|
(16.49 |
)% |
|
|
16.79 |
% |
|
|
15.60 |
% |
|
|
21.50 |
% |
|
|
|
|
|
|
|
| Ratio and supplemental data: |
|
|
|
|
|
|
|
|
|
|
|
|
|
|
|
|
|
|
|
|
|
|
|
|
| Net assets end of period/year (000’s) |
|
$ |
1,179,061 |
|
|
$ |
1,198,991 |
|
|
$ |
1,186,551 |
|
|
$ |
1,619,087 |
|
|
$ |
1,540,413 |
|
|
$ |
1,451,102 |
|
| Expenses to average net assets |
|
|
0.88 |
%(C) |
|
|
0.89 |
% |
|
|
0.87 |
% |
|
|
0.86 |
% |
|
|
0.88 |
% |
|
|
0.91 |
% |
| Net investment income (loss) to average net assets |
|
|
1.71 |
%(C) |
|
|
1.66 |
% |
|
|
1.18 |
% |
|
|
0.72 |
% |
|
|
1.04 |
% |
|
|
1.36 |
% |
| Portfolio turnover rate |
|
|
23 |
%(B) |
|
|
35 |
% |
|
|
33 |
% |
|
|
35 |
% |
|
|
51 |
% |
|
|
45 |
% |
| (A) |
Calculated based on average number of shares outstanding. |
The Notes to Financial Statements are an integral part of this report.
|
|
|
|
|
| Transamerica Series Trust |
|
|
|
Semi-Annual Financial Statements 2024 |
|
|
Page 16 |
|
|
Transamerica Multi-Managed Balanced VP
NOTES TO FINANCIAL STATEMENTS
At June 30, 2024
(unaudited)
1. ORGANIZATION
Transamerica Series Trust (“TST”) is an open-end management investment company registered under the Investment Company Act of 1940, as amended (the “1940 Act”). TST applies investment company accounting and reporting guidance. TST serves as a funding vehicle for variable life insurance, variable annuity, and group annuity products. Transamerica Multi-Managed Balanced VP (the “Portfolio”) is a series of TST and is classified as diversified under the 1940 Act. The Portfolio currently offers two classes of shares, Initial Class and Service Class.
The only shareholders of the Portfolio are affiliated insurance company separate accounts and/or affiliated asset allocation portfolios. Contract holders of the variable life and annuity contracts are not shareholders of the Portfolio. For ease of reference, shareholders and contract holders are collectively referred to in this report as “shareholders.”
This report must be accompanied or preceded by the Portfolio’s current prospectus, which contains additional information about the Portfolio, including risks, as well as investment objectives and strategies.
Transamerica Asset Management, Inc. (“TAM”) serves as investment manager for the Portfolio pursuant to an investment management agreement. TAM provides continuous and regular investment management services to the Portfolio. TAM supervises the Portfolio’s investments, conducts its investment program and provides supervisory, compliance and administrative services to the Portfolio.
TAM currently acts as a “manager of managers” and has hired sub-advisers to furnish day-to-day investment advice and recommendations. TAM may, in the future, determine to provide all aspects of the day-to-day management of the Portfolio without the use of a sub-adviser. When acting as a manager of managers, TAM provides investment management services that include, without limitation, the design and development of the Portfolio and its investment strategies and the ongoing review and evaluation of those investment strategies including recommending changes in strategy where it believes appropriate or advisable; the selection of one or more sub-advisers for the Portfolio employing a combination of quantitative and qualitative screens, research, analysis and due diligence; negotiation of sub-advisory agreements and fees; oversight and monitoring of sub-advisers and recommending changes to sub-advisers where it believes appropriate or advisable; recommending portfolio combinations and liquidations where it believes appropriate or advisable; selection and oversight of transition managers, as needed; regular supervision of the Portfolio’s investments; regular review and evaluation of sub-adviser performance; daily monitoring of the sub-advisers’ buying and selling of securities for the Portfolio; regular review of holdings; ongoing trade oversight and analysis; regular monitoring to ensure adherence to investment process; regular calls and periodic on-site visits with sub-advisers; portfolio construction and asset allocation when using multiple sub-advisers for the Portfolio; risk management oversight and analysis; oversight of negotiation of investment documentation and agreements; design, development, implementation and regular monitoring of the valuation process; periodic due diligence reviews of pricing vendors and vendor methodology; design, development, implementation and regular monitoring of the compliance process; respond to regulatory inquiries and determine appropriate litigation strategy, as needed; review of proxies voted by sub-advisers; oversight of preparation and review of materials for meetings of the Portfolio’s Board of Trustees (the “Board”), participation in these meetings and preparation of regular communications with the Board; oversight of preparation and review of prospectuses, shareholder reports and other disclosure materials and regulatory filings for the Portfolio; oversight of other service providers to the Portfolio, such as the custodian, the transfer agent, the Portfolio’s independent accounting firm and legal counsel; supervision of the performance of recordkeeping and shareholder relations functions for the Portfolio; and oversight of cash management services. TAM uses a variety of quantitative and qualitative tools to carry out its investment management services. TAM, not the Portfolio, is responsible for paying the sub-adviser(s) for their services, and sub-advisory fees are TAM’s expense.
TAM’s investment management services also include the provision of supervisory and administrative services to the Portfolio. These services include performing certain administrative services for the Portfolio and supervising and overseeing the administrative, clerical, recordkeeping and bookkeeping services provided to the Portfolio by State Street Bank and Trust Company (“State Street”), to whom TAM has outsourced the provision of certain sub-administration services. To the extent agreed upon by TAM and the Portfolio from time to time, TAM’s supervisory and administrative services include, but are not limited to: monitoring and verifying the custodian’s daily calculation of the Net Asset Values (“NAV”); shareholder relations functions; compliance services; valuation services; assisting in due diligence and in the oversight and monitoring of certain activities of sub-advisers and certain aspects of Portfolio investments; assisting with Portfolio combinations and liquidations; oversight of the preparation and filing, and review, of all returns and reports, in connection with federal, state and local taxes; oversight and review of regulatory reporting; supervising and coordinating the Portfolio’s custodian and dividend disbursing agent and monitoring their services to the Portfolio; assisting the Portfolio in preparing reports to shareholders; acting as liaison with the Portfolio’s independent public accountants and providing, upon request, analyses, fiscal year summaries and other audit related services; assisting in the preparation of agendas and supporting documents for and minutes of meetings of trustees and committees of trustees; assisting in the preparation of regular communications with the trustees; and providing personnel and office space, telephones and other office equipment as necessary in order for TAM to perform supervisory and administrative services to the Portfolio. The Portfolio
|
|
|
| Transamerica Series Trust |
|
Semi-Annual Financial Statements 2024 |
Page 17
Transamerica Multi-Managed Balanced VP
NOTES TO FINANCIAL STATEMENTS (continued)
At June 30, 2024
(unaudited)
1. ORGANIZATION (continued)
pays certain fees and expenses to State Street for sub-administration services which are not administrative services covered by the management agreement with TAM or paid for through the management fees payable thereunder. For the period ended June 30, 2024, (i) the expenses paid to State Street for sub-administration services by the Portfolio are shown as a part of Other expenses within the Statement of Operations and (ii) the expenses payable to State Street for sub-administration services from the Portfolio are shown as part of Other accrued expenses within the Statement of Assets and Liabilities.
2. SIGNIFICANT ACCOUNTING POLICIES
In preparing the Portfolio’s financial statements in accordance with Generally Accepted Accounting Principles in the United States of America (“GAAP”), estimates or assumptions (which could differ from actual results) may be used that affect reported amounts and disclosures. The following is a summary of significant accounting policies followed by the Portfolio.
Security transactions and investment income: Security transactions are accounted for on the trade date. Security gains and losses are calculated on a first-in, first-out basis. Dividend income, if any, is recorded on the ex-dividend date or, in the case of foreign securities, as soon as the Portfolio is informed of the ex-dividend dates, net of foreign taxes. Non-cash dividends, if any, are recorded on the ex-dividend date at fair value. Interest income, if any, is recorded on the accrual basis from settlement date, net of foreign taxes. Fixed income premiums and discounts are amortized and/or accreted over the lives of the respective securities.
Multiple class operations, income, and expenses: Income, non-class specific expenses, and realized and unrealized gains and losses are allocated to each class daily based upon net assets. Each class bears its own specific expenses in addition to the allocated non-class specific expenses.
Distributions to shareholders: Distributions are recorded on the ex-dividend date and are determined in accordance with federal income tax regulations, which may differ from GAAP.
Foreign taxes: The Portfolio may be subject to taxes imposed by the countries in which it invests, with respect to its investments in issuers existing or operating in such countries. The Portfolio may also be subject to foreign taxes on income, gains on investments, or currency repatriation, a portion of which may be recoverable. The Portfolio accrues such taxes and recoveries as applicable when the related income or capital gains are earned or unrealized, and based upon the current interpretation of tax rules and regulations that exist in the markets in which the Portfolio invests. Some countries require governmental approval for the repatriation of investment income, capital, or the proceeds of sales earned by foreign investors. In addition, if there is deterioration in a country’s balance of payments or for other reasons, a country may impose temporary restrictions of foreign capital remittances abroad.
Commission recapture: The sub-adviser(s), to the extent consistent with the best execution and usual commission rate policies and practices, may elect to place security transactions of the Portfolio with broker/dealers with which TST has established a commission recapture program. A commission recapture program is any arrangement under which a broker/dealer applies a portion of the commissions received by such broker/dealer on the security transactions to the Portfolio. In no event will commissions, paid by the Portfolio, be used to pay expenses that would otherwise be borne by any other Portfolios within TST, or by any other party.
Commissions recaptured are included within Net realized gain (loss) within the Statement of Operations. For the period ended June 30, 2024, commissions recaptured are $4,550.
Indemnification: In the normal course of business, the Portfolio enters into contracts that contain a variety of representations that provide general indemnifications. The Portfolio’s maximum exposure under these arrangements is unknown, as this would involve future claims that may be made against the Portfolio and/or its affiliates that have not yet occurred. However, based on experience, the Portfolio expects the risk of loss to be remote.
3. INVESTMENT VALUATION
TAM has been designated as the Portfolio’s valuation designee pursuant to Rule 2a-5 under the 1940 Act with responsibility for fair valuation subject to oversight by the Portfolio’s Board of Trustees. The net asset value of the Portfolio is computed as of the official close of the New York Stock Exchange (“NYSE”) each day the NYSE is open for business.
TAM utilizes various methods to measure the fair value of its investments on a recurring basis. GAAP establishes a hierarchy that prioritizes inputs to valuation methods. The inputs or methodology used for valuing securities are not necessarily an indication of the risk associated with investing in those securities. The three levels (“Levels”) of inputs of the fair value hierarchy are defined as follows:
|
|
|
| Transamerica Series Trust |
|
Semi-Annual Financial Statements 2024 |
Page 18
Transamerica Multi-Managed Balanced VP
NOTES TO FINANCIAL STATEMENTS (continued)
At June 30, 2024
(unaudited)
3. INVESTMENT VALUATION (continued)
Level 1—Unadjusted quoted prices in active markets for identical securities.
Level 2—Inputs, other than quoted prices included in Level 1, which are observable, either directly or indirectly. These inputs may include quoted prices for the identical instrument on an inactive market, prices for similar instruments, interest rates, prepayment speeds, credit risk, yield curves, default rates, and similar data.
Level 3—Unobservable inputs based on the best information available in the circumstances, to the extent observable inputs are not available, which may include TAM’s own assumptions used in determining the fair value of the Portfolio’s investments and derivative instruments.
The inputs used to measure fair value may fall into different Levels of the fair value hierarchy. In such cases, for disclosure purposes, the Level in the fair value hierarchy that is assigned to the fair value measurement of a security is determined based on the lowest Level input that is significant to the fair value measurement in its entirety. Certain investments that are measured at fair value using NAV per share, or its equivalent, using the “practical expedient” have not been classified in the fair value Levels. The hierarchy classification of inputs used to value the Portfolio’s investments at June 30, 2024, is disclosed within the Investment Valuation section of the Schedule of Investments.
The availability of observable inputs can vary from security to security and is affected by a wide variety of factors, including, but not limited to, the type of security, whether the security is new and not yet established in the marketplace, the liquidity of markets, and other characteristics particular to the security. To the extent that valuation is based on models or inputs that are less observable or unobservable in the market, the determination of fair value requires more judgment. Accordingly, the degree of judgment exercised in determining fair value is generally greatest for instruments categorized in Level 3. Due to the inherent uncertainty of valuation, the determination of values may differ significantly from values that would have been realized had a ready market for investments existed, and the differences could be material.
Fair value measurements: Descriptions of the valuation techniques applied to the Portfolio’s significant categories of assets and liabilities measured at fair value on a recurring basis are as follows:
Asset-backed securities: The fair value of asset-backed securities is estimated based on models that consider the estimated cash flows of each tranche of the entity, establish a benchmark yield, and develop an estimated tranche specific spread to the benchmark yield based on the unique attributes of the tranche. To the extent the inputs are observable and timely, the values would generally be categorized in Level 2 of the fair value hierarchy; otherwise they would be categorized in Level 3.
Commercial paper: Commercial paper is valued using amortized cost, which approximates fair value. The values are generally categorized in Level 2 of the fair value hierarchy, or Level 3 if inputs are unobservable.
Corporate debt securities: The fair value of corporate debt securities is estimated using various techniques, which consider recently executed transactions in securities of the issuer or comparable issuers, market price quotations (where observable), bond spreads, fundamental data relating to the issuer, and credit default swap spreads adjusted for any basis difference between cash and derivative instruments. While most corporate debt securities are categorized in Level 2 of the fair value hierarchy, in instances where lower relative weight is placed on transaction prices, quotations, or similar observable inputs, they are categorized in Level 3.
Equity securities: Securities are stated at the last reported sales price or closing price on the day of valuation taken from the primary exchange where the security is principally traded. To the extent these securities are actively traded and valuation adjustments are not applied, they are categorized in Level 1 of the fair value hierarchy. Equities traded on inactive markets or valued by reference to similar instruments are generally categorized in Level 2 or Level 3 if inputs are unobservable.
Foreign equity securities: Securities in which the primary trading market closes at the same time or after the NYSE, are valued based on quotations from the primary market in which they are traded and are categorized in Level 1. Because many foreign securities markets and exchanges close prior to the close of the NYSE, closing prices for foreign securities in those markets or on those exchanges do not reflect the events that occur after that close. Certain foreign securities may be fair valued using a pricing service that considers the correlation of the trading patterns of the foreign security to the intraday trading in the U.S. markets for investments such as American Depositary Receipts, financial futures, or ETFs and the movement of certain indices of securities based on a statistical analysis of their historical relationship; such valuations generally are categorized in Level 2.
|
|
|
| Transamerica Series Trust |
|
Semi-Annual Financial Statements 2024 |
Page 19
Transamerica Multi-Managed Balanced VP
NOTES TO FINANCIAL STATEMENTS (continued)
At June 30, 2024
(unaudited)
3. INVESTMENT VALUATION (continued)
Foreign government obligations: Foreign government obligations are normally valued using a model that incorporates market observable data such as reported sales of similar securities, broker quotes, yields, bids, offers, and reference data. Certain securities are valued by principally using dealer quotations. Foreign government obligations generally are categorized in Level 2 of the fair value hierarchy, or Level 3 if inputs are unobservable.
Mortgage-backed securities: The fair value of mortgage-backed securities is estimated based on models that consider issuer type, coupon, cash flows, mortgage prepayment projection tables and adjustable rate mortgage evaluations that incorporate index data, periodic life caps and the next coupon reset date. To the extent the inputs are observable and timely, the values would generally be categorized in Level 2 of the fair value hierarchy; otherwise they are categorized in Level 3.
Municipal government obligations: The fair value of municipal government obligations and variable rate notes is estimated based on models that consider, among other factors, information received from market makers and broker-dealers, current trades, bid-want lists, offerings, market movements, the liquidity of the bond, state of issuance, benchmark yield curves, and bond or note insurance. To the extent the inputs are observable and timely, the values would generally be categorized in Level 2 of the fair value hierarchy; otherwise they are categorized in Level 3.
U.S. government agency obligations: U.S. government agency obligations are comprised of two main categories consisting of agency issued debt and mortgage pass-throughs. Generally, agency issued debt securities are valued in a manner similar to U.S. government obligations. Mortgage pass-throughs include to be announced (“TBA”) securities and mortgage pass-through certificates. Generally, TBA securities and mortgage pass-throughs are valued using dealer quotations. Depending on market activity levels and whether quotations or other observable data are used, these securities are typically categorized in Level 2 of the fair value hierarchy; otherwise they would be categorized in Level 3.
U.S. government obligations: U.S. government obligations are normally valued using a model that incorporates market observable data such as reported sales of similar securities, broker quotes, yields, bids, offers, and reference data. Certain securities are valued by principally using dealer quotations. U.S. government obligations generally are categorized in Level 2 of the fair value hierarchy, or Level 3 if inputs are unobservable.
Short-term notes: The Portfolio normally values short-term government and U.S. government agency securities using a model that incorporates market observable data such as reported sales of similar securities, broker quotes, yields, bids, offers and reference data. Certain securities are valued by principally using dealer quotations. Short-term government and U.S. government agency securities generally are categorized in Level 2 of the fair value hierarchy, or Level 3 if inputs are unobservable.
Securities lending collateral: Securities lending collateral is invested in a money market fund which is valued at the actively traded NAV and no valuation adjustments are applied. Securities lending collateral is categorized in Level 1 of the fair value hierarchy.
Repurchase agreements: Repurchase agreements are valued at cost, which approximates fair value. To the extent the inputs are observable and timely, the values are generally categorized in Level 2 of the fair value hierarchy.
Derivative instruments: Centrally cleared or listed derivatives that are actively traded are valued based on quoted prices from the exchange and are categorized in Level 1 of the fair value hierarchy. Over-the-counter (“OTC”) derivative contracts include forward, swap, swaption, and option contracts related to interest rates, foreign currencies, credit standing of reference entities, equity prices, or commodity prices. Depending on the product and the terms of the transaction, the fair value of the OTC derivative products are modeled taking into account the counterparties’ creditworthiness and using a series of techniques, including simulation models. Many pricing models do not entail material subjectivity because the methodologies employed do not necessitate significant judgments and the pricing inputs are observed from actively quoted markets, as is the case of interest rate swap and option contracts. The majority of OTC derivative products valued by the Portfolio using pricing models fall into this category and are categorized within Level 2 of the fair value hierarchy or Level 3 if inputs are unobservable.
4. SECURITIES AND OTHER INVESTMENTS
Real estate investment trusts (“REITs”): REITs are pooled investment vehicles which invest primarily in income producing real estate, or real estate related loans or interests. Distributions received by REITs are classified at management’s estimate of the dividend income, return of capital and capital gains. Estimates are based on information available at year-end, which includes the previous fiscal year’s classification. The actual amounts of dividend income, return of capital, and capital gains are only determined by each REIT after the fiscal
|
|
|
| Transamerica Series Trust |
|
Semi-Annual Financial Statements 2024 |
Page 20
Transamerica Multi-Managed Balanced VP
NOTES TO FINANCIAL STATEMENTS (continued)
At June 30, 2024
(unaudited)
4. SECURITIES AND OTHER INVESTMENTS (continued)
year end and may differ from the estimated amounts. Upon notification from the REITs, some of the distributions received may be re-classified and recorded as a return of capital or capital gains. There are certain additional risks involved in investing in REITs. These include, but are not limited to, economic conditions, changes in zoning laws, real estate values, property taxes, and interest rates.
REITs held at June 30, 2024, if any, are identified within the Schedule of Investments.
Treasury inflation-protected securities (“TIPS”): The Portfolio may invest in TIPS, which are fixed income securities whose principal value is periodically adjusted according to the rate of inflation/deflation. If the index measuring inflation/deflation rises or falls, the principal value of TIPS will be adjusted upward or downward, and consequently the interest payable on these securities (calculated with respect to a larger or smaller principal amount) will be increased or reduced, respectively. Repayment of the original bond principal upon maturity (as adjusted for inflation) is guaranteed in the case of U.S. Treasury inflation-indexed bonds and notes. For bonds and notes that do not provide a similar guarantee, the adjusted principal value of the bond repaid at maturity may be less than the original principal.
TIPS held at June 30, 2024, if any, are included within the Schedule of Investments. The adjustments, if any, to principal due to inflation/deflation are reflected as increases/decreases to Interest income within the Statement of Operations, with a corresponding adjustment to Investments, at cost within the Statement of Assets and Liabilities.
When-issued, delayed-delivery, forward, and to be announced (“TBA”) commitment transactions: The Portfolio may purchase or sell securities on a when-issued, delayed-delivery, forward and TBA commitment basis. When-issued and forward commitment transactions are made conditionally because a security, although authorized, has not yet been issued in the market. Settlement of such transactions normally occurs within a month or more after the purchase or sale commitment is made. The Portfolio engages in when-issued and forward commitment transactions to obtain an advantageous price and yield at the time of the transaction. The Portfolio engages in when-issued and forward commitment transactions for the purpose of acquiring securities, but may enter into a separate agreement to sell the securities before the settlement date. Since the value of securities purchased may fluctuate prior to settlement, the Portfolio may be required to pay more at settlement than the security is worth. In addition, the Portfolio is not entitled to any of the interest earned prior to settlement.
Delayed-delivery transactions involve a commitment by the Portfolio to purchase or sell securities for a predetermined price or yield, with payment and delivery taking place beyond the customary settlement period. When delayed-delivery transactions are outstanding, the Portfolio will segregate with its custodian either cash, U.S. government securities, or other liquid assets at least equal to the value or purchase commitments until payment is made. When purchasing a security on a delayed-delivery basis, the Portfolio assumes the rights and risks of ownership of the security, including the risk of price and yield fluctuations. These transactions also involve a risk to the Portfolio if the other party to the transaction defaults on its obligation to make payment or delivery, and the Portfolio is delayed or prevented from completing the transaction. The Portfolio may dispose of or renegotiate a delayed-delivery transaction after it is entered into, which may result in a realized gain or loss. When the Portfolio sells a security on a delayed-delivery basis, the Portfolio does not participate in future gains and losses on the security.
TBA commitments are entered into to purchase or sell securities for a fixed price at a future date, typically not to exceed 45 days. TBAs are considered securities in themselves, and involve a risk of loss if the value of the security to be purchased declines, or the value of the security sold increases, prior to settlement date, in addition to the risk of decline in the value of a Portfolio’s other assets. Unsettled TBA commitments are valued at the current value of the underlying securities. TBA collateral requirements are typically calculated by netting the mark-to-market amount for each transaction and comparing that amount to the value of the collateral currently pledged by a Portfolio and the counterparty. Cash collateral that has been pledged to cover the obligations of a Portfolio and cash collateral received from the counterparty, if any, is reported separately in the Statement of Assets and Liabilities as Cash collateral pledged at broker for TBA commitments or Cash collateral at broker for TBA commitments, respectively. Non-cash collateral pledged by a Portfolio, if any, is disclosed within the Schedule of Investments. Typically, a Portfolio is permitted to sell, re-pledge or use the collateral it receives; however, the counterparty is not permitted. To the extent amounts due to a Portfolio are not fully collateralized, contractually or otherwise, a Portfolio bears the risk of loss from counterparty non-performance.
When-issued, delayed-delivery, forward and TBA commitment transactions held at June 30, 2024, if any, are identified within the Schedule of Investments. Open trades, if any, are reflected as When-issued, delayed-delivery, forward and TBA commitments purchased or sold within the Statement of Assets and Liabilities.
|
|
|
| Transamerica Series Trust |
|
Semi-Annual Financial Statements 2024 |
Page 21
Transamerica Multi-Managed Balanced VP
NOTES TO FINANCIAL STATEMENTS (continued)
At June 30, 2024
(unaudited)
5. BORROWINGS AND OTHER FINANCING TRANSACTIONS
The Portfolio may engage in borrowing transactions as a means of raising cash to satisfy redemption requests, for other temporary or emergency purposes or, to the extent permitted by its investment policies, to raise additional cash to be invested in other securities or instruments. When the Portfolio invests borrowing proceeds in other securities, the Portfolio will bear the risk that the market value of the securities in which such proceeds are invested goes down and is insufficient to repay the borrowed proceeds. The Portfolio may borrow on a secured or on an unsecured basis. If the Portfolio enters into a secured borrowing arrangement, a portion of the Portfolio’s assets will be used as collateral. The 1940 Act requires the Portfolio to maintain asset coverage of at least 300% of the amount of its borrowings. Asset coverage means the ratio that the value of the Portfolio’s total assets, minus liabilities other than borrowings, bears to the aggregate amount of all borrowings. Although complying with this requirement has the effect of limiting the amount that the Portfolio may borrow, it does not otherwise mitigate the risks of entering into borrowing transactions.
Interfund lending: The Portfolio, along with other funds and portfolios advised by TAM, may participate in an interfund lending program pursuant to exemptive relief granted by the Securities and Exchange Commission on January 18, 2017. This program allows the Portfolio to lend to and borrow from other funds and portfolios advised by TAM. Interfund lending transactions are subject to the conditions of the exemptive relief which places limits on the amount of lending or borrowing a Portfolio may participate in under the program. Interest earned or paid on an interfund lending transaction will be based on the average of certain current market rates. For the period ended June 30, 2024, the Portfolio has not utilized the program.
Repurchase agreements: In a repurchase agreement, the Portfolio purchases a security and simultaneously commits to resell that security to the seller at an agreed-upon price on an agreed-upon date. Securities purchased subject to a repurchase agreement are held at the Portfolio’s custodian, or designated sub-custodian related to tri-party repurchase agreements, and, pursuant to the terms of the repurchase agreement, must be collateralized by securities with an aggregate market value greater than or equal to 100% of the resale price. The Portfolio will bear the risk of value fluctuations until the securities can be sold and may encounter delays and incur costs in liquidating the securities. In the event of bankruptcy or insolvency of the seller, delays and costs may be incurred.
Repurchase agreements are subject to netting agreements, which are agreements between the Portfolio and its counterparties that provide for the net settlement of all transactions and collateral with the Portfolio, through a single payment, in the event of default or termination. Amounts presented within the Schedule of Investments, and as part of Repurchase agreements, at value within the Statement of Assets and Liabilities are shown on a gross basis. The value of the related collateral for each repurchase agreement, as reflected within the Schedule of Investments, exceeds the value of each repurchase agreement at June 30, 2024.
Repurchase agreements at June 30, 2024, if any, are included within the Schedule of Investments and Statement of Assets and Liabilities.
Securities lending: The Portfolio may lend securities to qualified financial institutions, brokers and dealers. State Street serves as securities lending agent to the Portfolio pursuant to a Securities Lending Agreement. Loans of securities are terminable at any time and the borrower, after notice, is required to return borrowed securities within the standard time period for settlement of securities transactions. The lending of securities exposes the Portfolio to risks such as: the borrowers may fail to return the loaned securities or may not be able to provide additional collateral, the Portfolio may experience delays in recovery of the loaned securities or delays in access to collateral, or the Portfolio may experience losses related to the investment collateral. To minimize certain risks, loan counterparties pledge cash, securities issued or guaranteed by the U.S. Government and irrevocable letters of credit issued by banks as collateral. The initial collateral received by the Portfolio is required to have a value of at least 102% of the current value of the loaned securities traded on U.S. exchanges, and a value of at least 105% for all other securities. Typically the lending agent is not permitted to sell, re-pledge or use cash and non-cash collateral it receives. The lending agent has agreed to indemnify the Portfolio in the case of default of any securities borrower.
The Portfolio receives compensation for lending securities from interest or dividends earned on the cash, U.S. Government securities and irrevocable letters of credit held as collateral, less associated fees and expenses. Such income is reflected in Net income from securities lending within the Statement of Operations. Cash collateral received is invested in the State Street Navigator Securities Lending Trust — Government Money Market Portfolio.
The value of loaned securities and related cash and non-cash collateral outstanding at June 30, 2024, if any, are shown on a gross basis within the Schedule of Investments.
|
|
|
| Transamerica Series Trust |
|
Semi-Annual Financial Statements 2024 |
Page 22
Transamerica Multi-Managed Balanced VP
NOTES TO FINANCIAL STATEMENTS (continued)
At June 30, 2024
(unaudited)
5. BORROWINGS AND OTHER FINANCING TRANSACTIONS (continued)
The following table reflects a breakdown of transactions accounted for as secured borrowings, the gross obligation by the type, and the remaining contractual maturity of those transactions as of June 30, 2024.
|
|
|
|
|
|
|
|
|
|
|
|
|
|
|
|
|
|
|
|
|
| |
|
Remaining Contractual Maturity of the Agreements |
|
|
|
|
|
|
|
| |
|
Overnight and
Continuous |
|
|
Less Than
30 Days |
|
|
Between
30 & 90 Days |
|
|
Greater Than
90 Days |
|
|
Total |
|
|
|
|
|
|
|
| Securities Lending Transactions |
|
|
|
|
|
|
|
|
|
|
|
|
|
|
|
|
|
|
|
|
|
|
|
|
|
|
| Corporate Debt Securities |
|
|
$ 622,500 |
|
|
|
$ — |
|
|
|
$ — |
|
|
|
$ — |
|
|
|
$ 622,500 |
|
| |
|
|
|
|
|
|
|
| Total Borrowings |
|
|
$ 622,500 |
|
|
|
$ — |
|
|
|
$ — |
|
|
|
$ — |
|
|
|
$ 622,500 |
|
| |
|
6. RISK EXPOSURES AND THE USE OF DERIVATIVE INSTRUMENTS
The Portfolio’s investment strategies allow the Portfolio to use various types of derivative contracts, including option contracts, swap agreements, futures contracts, and forward foreign currency contracts. Derivatives are investments whose value is primarily derived from underlying assets, indices or reference rates and may be transacted on an exchange or OTC.
Market Risk Factors: In pursuit of the Portfolio’s investment strategies, the Portfolio may seek to use derivatives to increase or decrease its exposure to certain market risks, including:
Interest rate risk: Interest rate risk relates to the fluctuations in the value of fixed income securities due to changes in the prevailing levels of market interest rates.
Foreign exchange rate risk: Foreign exchange rate risk relates to fluctuations in the value of an asset or liability due to changes in the currency exchange rates.
Equity risk: Equity risk relates to the change in value of equity securities as they relate to increases or decreases in the general market.
Credit risk: Credit risk relates to the ability of the issuer of a financial instrument to make further principal or interest payments on an obligation or commitment that it has to the Portfolio.
Commodity risk: Commodity risk relates to the change in value of commodities or commodity indices as they relate to increases or decreases in the commodities market. Commodities are physical assets that have tangible properties. Examples of these types of assets are crude oil, heating oil, metals, livestock, and agricultural products.
The Portfolio is also exposed to additional risks from investing in derivatives, such as liquidity and counterparty credit risk. Liquidity risk is the risk that the Portfolio will be unable to sell or close out the derivative in the open market in a timely manner. Counterparty credit risk is the risk that the counterparty will not be able to fulfill its obligations to the Portfolio. Investing in derivatives may also involve greater risks than investing directly in the underlying assets, such as losses in excess of any initial investment and collateral received. In addition, there may be the risk that the change in value of the derivative contract does not correspond to the change in value of the underlying instrument.
The Portfolio’s exposure to market risk factors and certain other associated risks are summarized by derivative type as follows:
Futures contracts: The Portfolio is subject to equity risk, credit risk, commodity risk, interest rate risk and foreign exchange rate risk in the normal course of pursuing its investment objective. The Portfolio uses futures contracts to gain exposure to, or hedge against, changes in the value of equities and commodities, interest rates, or foreign currencies. A futures contract represents a commitment for the future purchase or sale of an asset at a specified price on a specified date. Upon entering into such contracts, the Portfolio is required to deposit with the broker, either in cash or in securities, an initial margin in an amount equal to a certain percentage of the contract amount. Subsequent payments (variation margin) are paid or received by the Portfolio, depending on the daily fluctuations in the value of the contract, and are recorded for financial statement purposes as unrealized gains or losses by the Portfolio. Upon entering into such contracts, the Portfolio bears the risk of equity and commodity prices, interest rates, or exchange rates moving unexpectedly, in which case, the Portfolio may not achieve the anticipated benefits of the futures contracts and may realize losses. With futures, there is minimal counterparty credit risk to the Portfolio since futures are exchange-traded and the exchange’s clearinghouse, as counterparty to all exchange-traded futures, guarantees the futures against default. Futures contracts are generally entered into on a regulated futures exchange and cleared through a clearinghouse associated with the exchange.
|
|
|
| Transamerica Series Trust |
|
Semi-Annual Financial Statements 2024 |
Page 23
Transamerica Multi-Managed Balanced VP
NOTES TO FINANCIAL STATEMENTS (continued)
At June 30, 2024
(unaudited)
6. RISK EXPOSURES AND THE USE OF DERIVATIVE INSTRUMENTS (continued)
Open futures contracts at June 30, 2024 are listed within the Schedule of Investments. Variation margin, if applicable, is shown in Variation margin receivable or payable on futures contracts within the Statement of Assets and Liabilities.
The following is a summary of the location and the Portfolio’s fair values of derivative investments disclosed within the Statement of Assets and Liabilities, categorized by primary market risk exposure as of June 30, 2024.
|
|
|
|
|
|
|
|
|
|
|
|
|
|
|
|
|
|
|
|
|
|
|
|
|
| Liability Derivatives |
|
|
|
|
|
|
|
|
| Location |
|
Interest Rate Contracts |
|
|
Foreign Exchange Contracts |
|
|
Equity Contracts |
|
|
Credit Contracts |
|
|
Commodity Contracts |
|
|
Total |
|
|
|
|
|
|
|
|
| Futures contracts: |
|
|
|
|
|
|
|
|
|
|
|
|
|
|
|
|
|
|
|
|
|
|
|
|
| Total distributable earnings
(accumulated losses) (A)(B) |
|
|
$ — |
|
|
|
$ — |
|
|
|
$ (47,504) |
|
|
|
$ — |
|
|
|
$ — |
|
|
|
$ (47,504) |
|
| |
|
|
|
|
|
|
|
|
| Total |
|
|
$ — |
|
|
|
$ — |
|
|
|
$ (47,504) |
|
|
|
$ — |
|
|
|
$ — |
|
|
|
$ (47,504) |
|
| |
|
| (A) |
May include exchange-traded derivatives which are not subject to a master netting arrangement, or another similar arrangement. |
| (B) |
Included within unrealized appreciation (depreciation) on futures contracts as reported in the Schedule of Investments. Only current day’s variation margin is reported within the Statement of Assets and Liabilities. |
The following is a summary of the location and the effect of derivative investments within the Statement of Operations, categorized by primary market risk exposure as of June 30, 2024.
|
|
|
|
|
|
|
|
|
|
|
|
|
| Realized Gain (Loss) on Derivative Instruments |
|
|
|
|
|
|
|
| Location |
|
Interest Rate Contracts |
|
Foreign Exchange Contracts |
|
Equity Contracts |
|
Credit Contracts |
|
Commodity Contracts |
|
Total |
| Futures contracts |
|
$ — |
|
$ — |
|
$ 1,339,592 |
|
$ — |
|
$ — |
|
$ 1,339,592 |
| |
|
|
|
|
|
|
|
| Total |
|
$ — |
|
$ — |
|
$ 1,339,592 |
|
$ — |
|
$ — |
|
$ 1,339,592 |
| |
|
| Net Change in Unrealized Appreciation (Depreciation) on Derivative Instruments |
|
|
|
|
|
|
|
| Location |
|
Interest Rate Contracts |
|
Foreign Exchange Contracts |
|
Equity Contracts |
|
Credit Contracts |
|
Commodity Contracts |
|
Total |
| Futures contracts |
|
$ — |
|
$ — |
|
$ (279,351) |
|
$ — |
|
$ — |
|
$ (279,351) |
| |
|
|
|
|
|
|
|
| Total |
|
$ — |
|
$ — |
|
$ (279,351) |
|
$ — |
|
$ — |
|
$ (279,351) |
| |
The following is a summary of the ending monthly average volume on derivative activity during the period ended June 30, 2024.
|
|
|
|
|
| Futures contracts: |
|
|
|
|
| Average notional value of contracts — long |
|
$ |
8,907,844 |
|
Collateral requirements: Collateral or margin requirements are set by the broker or exchange clearing house for exchange-traded derivatives (futures contracts, exchange-traded options, and exchange-traded swap agreements) while collateral terms are contract specific for OTC derivatives (forward foreign currency exchange contracts, OTC options, and OTC swap agreements). For OTC derivatives, under standard derivatives agreements, the Portfolio may be required to pledge collateral on derivatives to a counterparty if the Portfolio is in a net liability position, and receive collateral if in a net positive position. For financial reporting purposes, cash collateral that has been pledged by the Portfolio to cover obligations, if any, is reported in Cash collateral at broker within the Statement of Assets and Liabilities. Cash collateral that has been received by the Portfolio from a counterparty, if any, is reported separately in Cash collateral pledged at custodian and/or broker within the Statement of Assets and Liabilities. Non-cash collateral pledged to the Portfolio, if any, is disclosed within the Schedule of Investments.
|
|
|
| Transamerica Series Trust |
|
Semi-Annual Financial Statements 2024 |
Page 24
Transamerica Multi-Managed Balanced VP
NOTES TO FINANCIAL STATEMENTS (continued)
At June 30, 2024
(unaudited)
6. RISK EXPOSURES AND THE USE OF DERIVATIVE INSTRUMENTS (continued)
Generally, the amount of collateral due from or to a party must exceed a minimum transfer amount threshold before a transfer has been made. Typically a counterparty is not permitted to sell, re-pledge or use cash and non-cash collateral it receives. The Portfolio generally does not use non-cash collateral that it receives but may, absent default or certain other circumstances, be permitted to use cash collateral received. In such cases, interest may be paid pursuant to the collateral arrangement with the counterparty.
To the extent amounts due to the Portfolio from its counterparties are not fully collateralized, contractually or otherwise, the Portfolio bears the risk of loss from counterparty non-performance. Additionally, to the extent the Portfolio has delivered collateral to a counterparty, the Portfolio bears the risk of loss from a counterparty in the event the counterparty fails to return such collateral. Counterparties may immediately terminate derivatives contracts if the Portfolio fails to maintain sufficient asset coverage for its contracts or its net assets decline by stated percentages. Collateral may not be required for all derivative contracts.
7. RISK FACTORS
Investing in the Portfolio involves certain key risks related to the Portfolio’s trading activity. Please reference the Portfolio’s prospectus for a more complete discussion of the following risk(s), as well as other risks of investing in the Portfolio.
Market risk: The market prices of the Portfolio’s securities or other assets may go up or down, sometimes rapidly or unpredictably, due to factors such as economic events, inflation, changes in interest rates, governmental actions or interventions, actions taken by the U.S. Federal Reserve or foreign central banks, market disruptions caused by tariffs, trade disputes or other factors, political developments, armed conflicts, economic sanctions, cybersecurity events, investor sentiment, the global and domestic effects of widespread or local health, weather or climate events, and other factors that may or may not be related to the issuer of the security or other asset. If the market prices of the Portfolio’s securities and assets fall, the value of your investment in the Portfolio could go down.
Economies and financial markets throughout the world are increasingly interconnected. Events or circumstances in one or more countries or regions could be highly disruptive to, and have profound impacts on, global economies or markets. As a result, whether or not the Portfolio invests in securities of issuers located in or with significant exposure to the countries directly affected, the value and liquidity of the Portfolio’s investments may go down.
Asset class allocation risk: The Portfolio’s investment performance is significantly impacted by the Portfolio’s asset allocation and reallocation from time to time. The value of your investment may decrease if the Investment Manager’s judgment about the attractiveness, value or market trends affecting a particular asset class is incorrect. The Portfolio’s balance between equity and debt securities limits its potential for capital appreciation relative to an all-stock fund and contributes to greater volatility relative to an all-bond fund.
Equity securities risk: Equity securities generally have greater risk of loss than debt securities. Stock markets are volatile and the value of equity securities may go up or down, sometimes rapidly and unpredictably. The market price of an equity security may fluctuate based on overall market conditions, such as real or perceived adverse economic or political conditions or trends, tariffs and trade disruptions, inflation, substantial economic downturn or recession, changes in interest rates, or adverse investor sentiment. The market price of an equity security also may fluctuate based on real or perceived factors affecting a particular industry or industries or the company itself. If the market prices of the equity securities owned by the Portfolio fall, the value of your investment in the Portfolio will decline. The Portfolio may lose its entire investment in the equity securities of an issuer. A change in financial condition or other event affecting a single issuer may adversely impact securities markets as a whole.
Real estate investment trusts (“REITs”) risk: Investing in real estate investment trusts (“REITs”) involves unique risks. When the Portfolio invests in REITs, it is subject to risks generally associated with investing in real estate. A REIT’s performance depends on the types and locations of the properties it owns, how well it manages those properties and cash flow. REITs may have limited financial resources, may trade less frequently and in limited volume, may engage in dilutive offerings, and may be subject to more abrupt or erratic price movements than the overall securities markets. In addition to its own expenses, the Portfolio will indirectly bear its proportionate share of any management and other expenses paid by REITs in which it invests. U.S. REITs are subject to a number of highly technical tax-related rules and requirements; and a U.S. REIT’s failure to qualify for the favorable U.S. federal income tax treatment generally available to U.S. REITs could result in corporate-level taxation, significantly reducing the return on an investment to the Portfolio.
8. FEES AND OTHER AFFILIATED TRANSACTIONS
TST serves as a funding vehicle for certain affiliated asset allocation portfolios and certain affiliated separate accounts of Transamerica Life Insurance Company (“TLIC”) and Transamerica Financial Life Insurance Company.
|
|
|
| Transamerica Series Trust |
|
Semi-Annual Financial Statements 2024 |
Page 25
Transamerica Multi-Managed Balanced VP
NOTES TO FINANCIAL STATEMENTS (continued)
At June 30, 2024
(unaudited)
8. FEES AND OTHER AFFILIATED TRANSACTIONS (continued)
TAM, the Portfolio’s investment manager, is directly owned by TLIC and AUSA Holding, LLC (“AUSA”), both of which are indirect, wholly owned subsidiaries of Aegon Ltd. TLIC is owned by Commonwealth General Corporation (“Commonwealth”). Commonwealth and AUSA are wholly owned by Transamerica Corporation (DE). Transamerica Corporation (DE) is wholly owned by Aegon International B.V., which is wholly owned by Aegon Ltd., a Bermuda exempted company with liability limited by shares (formerly, Aegon NV, a Netherlands corporation) and a publicly traded international insurance group.
TAM has entered into a sub-advisory agreement with Aegon USA Investment Management, LLC (“AUIM”), an affiliate of TAM. AUIM provides day-to-day portfolio management services to an allocated portion of the Portfolio, subject to the supervision of TAM. TAM is responsible for compensating the sub-adviser for its services.
Transamerica Fund Services, Inc. (“TFS”) is the Portfolio’s transfer agent. Transamerica Capital, Inc. (“TCI”) is the Portfolio’s distributor/principal underwriter. TAM, AUIM, TFS and TCI are affiliates of Aegon Ltd.
Certain officers and trustees of the Portfolio may also be officers and/or trustees of TAM, AUIM, TFS and TCI. No interested trustee who is deemed an interested person due to current or former service with TAM or an affiliate of TAM receives compensation from the Portfolio. The Portfolio does pay non-interested persons (independent trustees), as disclosed in Trustee and CCO fees within the Statement of Operations.
Investment management fees: TAM serves as the Portfolio’s investment manager, performing administration as well as investment advisory services. TAM renders investment advisory, supervisory, and administration services under an investment management agreement and the Portfolio pays a single management fee, which is reflected in Investment management fees within the Statement of Operations.
The Portfolio pays a management fee to TAM based on daily average net assets at the following rates:
|
|
|
| Breakpoints |
|
Rate |
|
|
| First $500 million |
|
0.61% |
| Over $500 million up to $1 billion |
|
0.59 |
| Over $1 billion up to $1.5 billion |
|
0.56 |
| Over $1.5 billion up to $2 billion |
|
0.55 |
| Over $2 billion up to $5 billion |
|
0.52 |
| Over $5 billion |
|
0.50 |
TAM has contractually agreed to waive fees and/or reimburse Portfolio expenses to the extent that the total operating expenses excluding, as applicable, acquired fund fees and expenses, interest (including borrowing costs and overdraft charges), taxes, brokerage commissions, dividend and interest expenses on securities sold short, extraordinary expenses and other expenses not incurred in the ordinary course of the Portfolio’s business, exceed the following stated annual operating expense limits to the Portfolio’s daily average net assets. To the extent an expense limit changed during the period, the prior limit is also listed below. The expenses waived and/or reimbursed, if any, are included in Expenses waived and/or reimbursed within the Statement of Operations.
|
|
|
|
|
| Class |
|
Operating Expense Limit |
|
Operating Expense Limit Effective Through |
| Initial Class |
|
0.75% |
|
May 1, 2025 |
| Service Class |
|
1.00 |
|
May 1, 2025 |
TAM is permitted to recapture amounts contractually waived and/or reimbursed to a class during any of the 36 months from the date on which TAM waived fees and/or reimbursed expenses for the class. A class may recapture and reimburse TAM only if such amount does not cause, on any particular business day of the Portfolio, the class’s total annual operating expenses (after the recapture is taken into account) to exceed the Operating Expense Limits or any other lower limit then in effect. Amounts recaptured, if any, by TAM for the period ended June 30, 2024 are disclosed in Recapture of previously waived and/or reimbursed fees within the Statement of Operations.
|
|
|
| Transamerica Series Trust |
|
Semi-Annual Financial Statements 2024 |
Page 26
Transamerica Multi-Managed Balanced VP
NOTES TO FINANCIAL STATEMENTS (continued)
At June 30, 2024
(unaudited)
8. FEES AND OTHER AFFILIATED TRANSACTIONS (continued)
TAM, on a voluntary basis and in addition to the contractual operating expense limits in effect, from time to time may waive and/or reimburse expenses of the Portfolio, or any classes thereof, to such level(s) as the Trust’s officers have determined or may reasonably determine from time to time. Any such voluntary waiver or expense reimbursement may be discontinued by TAM at any time. These amounts are not subject to recapture by TAM.
As of June 30, 2024, there are no amounts available for recapture by TAM.
Distribution and service fees: TST has a distribution plan (“Distribution Plan”) pursuant to Rule 12b-1 under the 1940 Act. Pursuant to the Distribution Plan, TST entered into a distribution agreement with TCI as the Portfolio’s distributor.
The Distribution Plan requires the Portfolio to pay distribution fees to TCI as compensation for various distribution activities, not as reimbursement for specific expenses. Under the Distribution Plan and distribution agreement, TCI, on behalf of the Portfolio, is authorized to pay various service providers, as direct payment for expenses incurred in connection with distribution of the Portfolio’s shares.
The fee on the Service Class shares is paid to the insurance companies for providing services and account maintenance for the policyholders who invest in the variable insurance products which invest in the Service Class shares. TCI has determined that it will not seek payment for the distribution expenses incurred by the Portfolio with respect to the Initial Class shares before May 1, 2025. Prior to TCI seeking distribution expenses on Initial Class shares, policy and contract owners will be notified in advance. The Portfolio will pay fees relating to Service Class shares. The distribution and service fees are included in Distribution and service fees within the Statement of Operations.
The Portfolio is authorized under the Distribution Plan to pay fees to TCI based on daily average net assets of each applicable class up to the following annual rates:
|
|
|
| Class |
|
Rate |
| Initial Class |
|
0.15% |
| Service Class |
|
0.25 |
Transfer agent costs: TFS provides transfer agency services under an intercompany agreement with TAM. TFS has outsourced the provision of certain sub-transfer agency services to SS&C Global Investor & Distribution Solutions, Inc. (“SS&C GIDS”). The Portfolio does not pay a separate transfer agent fee to TAM or TFS but does pay certain expenses to SS&C GIDS related to applicable sub-transfer agency services. For the period ended June 30, 2024, (i) the expenses paid to SS&C GIDS by the Portfolio are referred to as transfer agent costs and are included within the Statement of Operations and (ii) the expenses payable to SS&C GIDS by the Portfolio are referred to as transfer agent costs within the Statement of Assets and Liabilities.
Brokerage commissions: The Portfolio incurred no brokerage commissions on security transactions placed with affiliates of the investment manager or sub-adviser(s) for the period ended June 30, 2024.
9. PURCHASES AND SALES OF SECURITIES
For the period ended June 30, 2024, the cost of securities purchased and proceeds from securities sold (excluding short-term securities) are as follows:
|
|
|
|
|
|
|
|
|
| Purchases of Securities |
|
|
|
Sales/Maturities of Securities |
| Long-Term |
|
U.S. Government |
|
|
|
Long-Term |
|
U.S. Government |
| $ 227,024,265 |
|
$ 90,296,496 |
|
|
|
$ 356,385,058 |
|
$ 85,910,545 |
10. FEDERAL INCOME TAXES AND DISTRIBUTIONS TO SHAREHOLDERS
The Portfolio has not made any provision for federal income or excise taxes due to its policy to distribute all of its taxable income and capital gains to its shareholders and otherwise qualify as a regulated investment company under Subchapter M of the Internal Revenue Code. The Portfolio recognizes the tax benefits of uncertain tax positions only where the position is “more likely than not” to be sustained assuming examination by tax authorities. The Portfolio’s tax returns remain subject to examination by the Internal Revenue Service and state tax authorities three years from the date of filing for federal purposes and four years from the date of filing for state purposes.
|
|
|
| Transamerica Series Trust |
|
Semi-Annual Financial Statements 2024 |
Page 27
Transamerica Multi-Managed Balanced VP
NOTES TO FINANCIAL STATEMENTS (continued)
At June 30, 2024
(unaudited)
10. FEDERAL INCOME TAXES AND DISTRIBUTIONS TO SHAREHOLDERS (continued)
Management has evaluated the Portfolio’s tax provisions taken for all open tax years, and has concluded that no provision for income tax is required in the Portfolio’s financial statements. If applicable, the Portfolio recognizes interest accrued related to unrecognized tax benefits in relation to interest and penalties expense in Other within the Statement of Operations. The Portfolio identifies its major tax jurisdictions as U.S. Federal, the state of Colorado, and foreign jurisdictions where the Portfolio makes significant investments; however, the Portfolio is not aware of any tax positions for which it is reasonably possible that the total amounts of unrecognized tax benefits will change materially in the next twelve months. Distributions are determined in accordance with income tax regulations, which may differ from GAAP.
As of June 30, 2024, the approximate cost for U.S. federal income tax purposes, and the aggregate gross/net unrealized appreciation (depreciation) in the value of investments (including securities sold short and derivatives, if any) are as follows:
|
|
|
|
|
|
|
| Cost |
|
Gross Appreciation |
|
Gross (Depreciation) |
|
Net Appreciation (Depreciation) |
| $ 1,353,985,897 |
|
$ 350,768,463 |
|
$ (50,899,713) |
|
$ 299,868,750 |
11. NEW ACCOUNTING PRONOUNCEMENT
In June 2022, the Financial Accounting Standards Board issued Accounting Standards Update No. 2022-03 (“ASU 2022-03”), “Fair Value Measurement of Equity Securities Subject to Contractual Sale Restrictions” (“Topic 820”). ASU 2022-03 clarifies the guidance in Topic 820, related to the measurement of the fair value of an equity security subject to contractual sale restrictions, where it eliminates the need to apply a discount to fair value of these securities, and introduces disclosure requirements related to such equity securities. The guidance is effective for fiscal years, and interim periods within those fiscal years, beginning after December 15, 2023, and allows for early adoption. Management is currently evaluating the implications, if any, of the additional requirements and their impact on the Portfolio’s financial statements.
Please see TST’s most recent report on Form N-CSR, available at: www.transamerica.com/annuities/prospectus, for additional information. For the most recently filed complete proxy voting records for the Trust please visit: https://www.transamerica.com/sites/default/files/files/e070d/TST%20N-PX%202021.pdf
|
|
|
| Transamerica Series Trust |
|
Semi-Annual Financial Statements 2024 |
Page 28
Transamerica Multi-Managed Balanced VP
MANAGEMENT AND SUB-ADVISORY AGREEMENTS — CONTRACT RENEWAL
(unaudited)
At a meeting of the Board of Trustees of Transamerica Series Trust (the “Trustees” or the “Board”) held on June 12-13, 2024, the Board considered the renewal of the management agreement (the “Management Agreement”) between Transamerica Asset Management, Inc. (“TAM”) and Transamerica Series Trust, on behalf of Transamerica Multi-Managed Balanced VP (the “Portfolio”). The Board also considered the renewal of the investment sub-advisory agreements (each a “Sub-Advisory Agreement,” collectively the “Sub-Advisory Agreements” and together with the Management Agreement, the “Agreements”) for the Portfolio between TAM and each of Aegon USA Investment Management, LLC (“AUIM”) and J.P. Morgan Investment Management, Inc. (“J.P. Morgan”) (each a “Sub-Adviser” and collectively the “Sub-Advisers”).
Following its review and consideration, the Board determined that the terms of the Management Agreement and each Sub-Advisory Agreement were reasonable and that the renewal of each of the Agreements was in the best interests of the Portfolio and the holders invested in the Portfolio. The Board, including the independent members of the Board (the “Independent Trustees”), unanimously approved the renewal of each of the Agreements through June 30, 2025.
Prior to reaching their decision, the Trustees requested and received from TAM and each Sub-Adviser certain information. They then reviewed such information as they deemed reasonably necessary to evaluate the Agreements, including information they had previously received from TAM and each Sub-Adviser as part of their regular oversight of the Portfolio, and knowledge they gained over time through meeting with TAM and each Sub-Adviser. Among other materials, the Trustees considered comparative fee, expense and performance information prepared by Broadridge Financial Solutions, Inc. (“Broadridge”), an independent provider of mutual fund performance information, as well as fee, expense and profitability information prepared by TAM. In addition, TAM provided the Board with additional supplemental comparative fee, expense and performance information. To the extent applicable, the Trustees considered information about fees and performance of comparable funds and/or accounts managed by each Sub-Adviser. The Board also considered reductions to the Portfolio’s expense limits, if any, that took effect after the last renewal of the Agreements. In their review, the Trustees also sought to identify instances in which the Portfolio’s performance, fees, total expenses and/or profitability appeared to be outliers within its respective peer group or other comparative metrics and sought to understand the reasons for such comparative positions.
In their deliberations, the Independent Trustees met privately without representatives of TAM or any Sub-Adviser present and were represented throughout the process by their independent legal counsel. In considering the proposed continuation of each of the Agreements, the Trustees evaluated and weighed a number of considerations that they believed to be relevant in light of the legal advice furnished to them by counsel, including independent legal counsel, and made a decision in the exercise of their own business judgment. They based their decisions on the considerations discussed below, among others, although they did not identify any particular consideration or item of information that was controlling of their decisions, and each Trustee may have attributed different weights to the various factors.
Nature, Extent and Quality of the Services Provided
The Board considered the nature, extent and quality of the services provided by TAM and each Sub-Adviser to the Portfolio in the past and the services anticipated to be provided in the future. The Board also considered the investment approach for the Portfolio; the experience, capability and integrity of TAM’s senior management; the financial resources of TAM; TAM’s management oversight process; TAM’s and each Sub-Adviser’s responsiveness to any questions by the Trustees; and the professional qualifications and compensation program of the portfolio management team of each Sub-Adviser. The Trustees noted that they receive, on a quarterly basis, an execution analysis from Capital Institutional Services, Inc. (CAPIS), an independent provider of trade analyses, for each Sub-Adviser and a comparison of trading results against a peer universe of managers.
The Board also considered the continuous and regular investment management and other services provided by TAM, when acting as a manager of managers, for the portion of the management fee it retains from the Portfolio after payment of the sub-advisory fees. The Board noted that the investment management and other services provided by TAM include the design, development and ongoing review and evaluation of the Portfolio and its investment strategy; the selection, oversight and monitoring of one or more investment sub-advisers to perform certain duties with respect to the Portfolio; ongoing portfolio trading oversight and analysis; risk management oversight and analysis; design, development, implementation and ongoing review and evaluation of a process for the valuation of Portfolio investments; design, development, implementation and ongoing review and evaluation of a compliance program for the Portfolio; design, development, implementation and ongoing review and evaluation of a process for the voting of proxies and exercise of rights to consent to corporate action for Portfolio investments; participation in Board meetings and oversight of preparation of materials for the Board, including materials for Board meetings and regular communications with the Board; oversight of preparation of the Portfolio’s prospectus, statement of additional information, shareholder reports and other disclosure materials and regulatory filings for the Portfolio; and ongoing cash management services for the Portfolio. The Board considered that TAM’s investment management services also include the provision of supervisory and administrative services to the Portfolio. The Board also noted that TAM, as part of the services it provides to all Transamerica mutual funds, including the Portfolio, oversees the services provided by the funds’ custodian, transfer agent, independent accountant and legal counsel and supervises the performance of the recordkeeping and holder service functions of the funds.
Investment Performance
In addition, the Board considered the short- and longer-term performance of the Portfolio in light of its investment objective, policies and strategies, including relative performance against (i) a peer universe of comparable mutual funds, as prepared by Broadridge, and (ii) the
|
|
|
| Transamerica Series Trust |
|
Semi-Annual Financial Statements 2024 |
Page 29
Transamerica Multi-Managed Balanced VP
MANAGEMENT AND SUB-ADVISORY AGREEMENTS — CONTRACT RENEWAL (continued)
(unaudited)
Portfolio’s benchmarks, in each case for various trailing periods ended December 31, 2023. Based on these considerations, the Board determined that TAM and each Sub-Adviser can provide investment and related services that are appropriate in scope and extent in light of the Portfolio’s investment objectives, policies and strategies and operations, the competitive landscape of the investment company business and investor needs. The Board’s conclusions as to the Portfolio’s performance are summarized below. For purposes of its review, the Board generally used the performance of Service Class Shares. In describing the Portfolio’s performance relative to its peer universe, the summary conclusions characterize performance for the relevant periods in relation to whether it was “above,” “below” or “in line with” the peer universe median and do so using quintile rankings prepared by Broadridge. For simplicity, performance is described as “above” the median if the Portfolio’s performance ranked anywhere in the first or second quintiles, as “below” the median if it ranked anywhere in the fourth or fifth quintiles, or “in line with” the median if it ranked anywhere in the third quintile (i.e., even if its precise return was somewhat above or somewhat below the precise median return).
When considering the Portfolio’s performance, the Trustees considered any representations made by TAM regarding the appropriateness of certain peer groups and benchmarks. They recognized that performance reflects a snapshot of a period as of a specific date, and that consideration of performance data for a different period could generate significantly different performance results. The Trustees also recognized that even longer-term performance can be negatively affected by performance over a short-term period when that short-term performance is significantly below the performance of the comparable benchmark or universe of peer funds.
The Board noted that the performance of Service Class Shares of the Portfolio was above the median for its peer universe for the past 1-, 3-, 5- and 10-year periods. The Board also noted that the performance of Service Class Shares of the Portfolio was above the benchmark that TAM utilizes to measure performance of the Portfolio for the past 1-, 3- and 5-year periods and below the benchmark for the past 10-year period. The Board noted that J.P. Morgan had commenced sub-advising the equity sleeve of the Portfolio on March 21, 2011 pursuant to its current equity investment strategies. The Board noted that AUIM had commenced sub-advising the fixed-income sleeve of the Portfolio on May 1, 2014 pursuant to its current fixed-income investment strategies.
Management Fee and Sub-Advisory Fees and Total Expense Ratio
The Board considered the management fee and total expense ratio of the Portfolio, including information provided by Broadridge comparing the management fee and total expense ratio of the Portfolio to the management fees and total expense ratios of comparable investment companies in both a peer group and broader peer universe compiled by Broadridge. The Board’s conclusions as to the Portfolio’s management fee and total expense ratio are summarized below. For purposes of its review, the Board generally used the actual total expenses (i.e., expenses reflecting any waivers and/or reimbursements) of Service Class Shares. In describing the Portfolio’s management fee and total expense ratio relative to its peer group and peer universe, the summary conclusions characterize management fees and total expense ratios for the relevant periods in relation to whether they were “above,” “below” or “in line with” the peer group or peer universe median and do so using quintile rankings prepared by Broadridge. For simplicity, management fees and total expense ratios are described as “above” the median if the Portfolio’s management fee or total expense ratio ranked anywhere in the fourth or fifth quintiles, as “below” the median if it ranked anywhere in the first or second quintiles, or “in line with” the median if it ranked anywhere in the third quintile (i.e., even if its precise management fee or total expense ratio was somewhat above or somewhat below the precise median management fee or total expense ratio). The Board also considered the fees charged by the Sub-Advisers for sub-advisory services, as well as the portion of the Portfolio’s management fee retained by TAM following payment of the sub-advisory fees and how the portion of the contractual management fee retained by TAM at a specified asset level compared to the portions retained by other investment advisers managing mutual funds with similar investment strategies as calculated by an independent provider of information.
The Board noted that the Portfolio’s contractual management fee and actual total expenses (i.e., expenses reflecting any waivers and/or reimbursements) of Service Class Shares of the Portfolio were above the medians for its peer group and in line with the medians for its peer universe. The Trustees also considered that TAM has entered into an expense limitation arrangement with the Portfolio, which may result in TAM waiving fees for the benefit of holders.
On the basis of these considerations, together with the other information it considered, the Board determined that the management and sub-advisory fees to be received by TAM and the Sub-Advisers under the Management Agreement and each Sub-Advisory Agreement are reasonable in light of the services provided.
Cost of Services Provided and Level of Profitability
The Board reviewed information provided by TAM about the cost of providing and procuring fund management services, as well as the costs of the provision of administration, transfer agency and other services, to the Portfolio and to Transamerica Series Trust as a whole by TAM and its affiliates. The Board considered the profitability of TAM and its affiliates in providing these services for the Portfolio and Transamerica Series Trust as a whole. The Trustees recognized the competitiveness of the mutual fund industry and the importance of an investment adviser’s long-term profitability, including for maintaining company and management stability and accountability.
The Board also considered the allocation methodology used for calculating the profitability of TAM and its affiliates. The Board noted that the revenue and expense allocation methodology used by TAM to estimate its profitability with respect to its relationship with the Portfolio had been reviewed previously by an independent consultant. The Trustees considered that TAM reported that it had not made material changes to this methodology, and that the methodology had been applied consistently for the Portfolio.
|
|
|
| Transamerica Series Trust |
|
Semi-Annual Financial Statements 2024 |
Page 30
Transamerica Multi-Managed Balanced VP
MANAGEMENT AND SUB-ADVISORY AGREEMENTS — CONTRACT RENEWAL (continued)
(unaudited)
With respect to J.P. Morgan, the Board noted that the sub-advisory fee is the product of arm’s-length negotiation between TAM and J.P. Morgan, which is not affiliated with TAM, and is paid by TAM and not the Portfolio. As a result, for J.P. Morgan, the Board focused on the profitability of TAM and its affiliates with respect to the Portfolio. With respect to AUIM, the Board noted that information about AUIM’s revenues and expenses was incorporated into the profitability analysis for TAM and its affiliates with respect to the Portfolio. As a result, the Board focused on profitability information for TAM and its affiliates and AUIM in the aggregate.
Based on this information, the Board determined that the profitability of TAM and its affiliates from their relationships with the Portfolio was not excessive.
Economies of Scale
The Board considered economies of scale with respect to the management of the Portfolio, whether the Portfolio had appropriately benefited from any economies of scale and whether there was the potential for realization of any future economies of scale. The Board also considered the existence of economies of scale with respect to management of the Transamerica mutual funds overall and the extent to which the Portfolio benefited from any economies of scale. The Board recognized that, as the Portfolio’s assets increase, any economies of scale realized by TAM or a Sub-Adviser may not directly correlate with each other or with any economies of scale that might be realized by the Portfolio. The Board considered the Portfolio’s management fee schedule and the existence of breakpoints and also considered the extent to which TAM shared economies of scale, if any, with the Portfolio through undertakings to limit or reimburse Portfolio expenses and to invest in maintaining and developing its capabilities and services. The Board also considered each Sub-Adviser’s sub-advisory fee schedule and the existence of breakpoints, if any, and how such breakpoints relate to any breakpoints in the Portfolio’s management fee schedule. The Board considered that each Sub-Adviser’s sub-advisory fees would be based on the combined assets of multiple funds. The Trustees concluded that the Portfolio’s fee structure reflected an appropriate sharing of any efficiencies or economies of scale to date and noted that they will have the opportunity to periodically reexamine the appropriateness of the management fee payable to TAM and the fees paid to the Sub-Advisers in light of any economies of scale experienced in the future.
Benefits to TAM, its Affiliates and/or the Sub-Advisers from their Relationships with the Portfolio
The Board considered other benefits derived by TAM, its affiliates, and/or the Sub-Advisers from their relationships with the Portfolio. The Board noted that TAM does not receive benefits from research obtained with commissions paid to broker-dealers for portfolio transactions (commonly referred to as “soft dollars”) as a result of its relationship with the Portfolio and that TAM believes the use of soft dollars by J.P. Morgan is generally appropriate and in the best interests of the Portfolio. The Board also noted that J.P. Morgan participates in a brokerage program pursuant to which a portion of brokerage commissions paid by the Portfolio is recaptured for the benefit of the Portfolio and the holders, thus limiting the amount of soft dollar arrangements J.P. Morgan may engage in with respect to the Portfolio’s brokerage transactions.
Other Considerations
The Board noted that TAM has made a substantial commitment to the recruitment and retention of high-quality personnel and maintains the financial, compliance and operational resources reasonably necessary to manage the Portfolio in a professional manner that is consistent with the best interests of the Portfolio and the holders. In this regard, the Board favorably considered the procedures and policies TAM has in place to enforce compliance with applicable laws and regulations and oversee the portfolio management activities of the Sub-Advisers. The Board also noted that TAM has made an entrepreneurial commitment and undertaken certain business risks with respect to the management and success of the Portfolio.
Conclusion
After consideration of the factors described above, as well as other factors, the Trustees, including the Independent Trustees, concluded that the renewal of the Management Agreement and each Sub-Advisory Agreement was in the best interests of the Portfolio and the holders and voted to approve the renewal of the Agreements.
|
|
|
| Transamerica Series Trust |
|
Semi-Annual Financial Statements 2024 |
Page 31
PROXY VOTING POLICIES AND PROCEDURES AND QUARTERLY PORTFOLIO HOLDINGS
(unaudited)
A description of Transamerica Series Trust’s (the “Trust”) proxy voting policies and procedures is available in the Statement of Additional Information of the Portfolios, available without charge upon request by calling 1-800-851-9777 (toll free) or on the Securities and Exchange Commission’s (“SEC”) website at http://www.sec.gov.
In addition, the Portfolio is required to file Form N-PX, with their complete proxy voting records for the most recent 12 months ended June 30th, no later than August 31st of each year. The Form is available without charge: (1) on the Transamerica Funds website at https://www.transamerica.com/sites/default/files/files/e070d/TST%20N-PX%202021.pdf; and (2) on the SEC’s website at http://www.sec.gov.
Each fiscal quarter, the Portfolios, except Transamerica BlackRock Government Money Market VP, will file with the SEC a complete schedule of its monthly portfolio holdings on Form N-PORT. The Portfolios’ holdings as of the end of the third month of every fiscal quarter, as reported on Form N-PORT, will be publicly available on the SEC’s website at http://www.sec.gov within 60 days of the end of the fiscal quarter.
On a monthly basis, Transamerica BlackRock Government Money Market VP will file with the SEC portfolio holdings information on Form N-MFP3. A complete schedule of portfolio holdings is also available at www.transamerica.com.
You may also visit the Trust’s website at www.transamerica.com/annuities/prospectus for this and other information about the Portfolios and the Trust.
Important Notice Regarding Delivery of Shareholder Documents
Every year we provide shareholders informative materials such as the Transamerica Series Trust Annual Report, the Transamerica Series Trust Prospectus, and other required documents that keep you informed regarding your Portfolios. To the extent provided by mail, Transamerica Series Trust will only send one piece per mailing address, a method that saves your Portfolios money by reducing mailing and printing costs. We will continue to do this unless you tell us not to. To elect to receive individual mailings, simply call a Transamerica Customer Service Representative toll free at 1-800-851-9777, 8 a.m. to 7 p.m. Eastern Time, Monday-Friday. Your request will take effect within 30 days.
|
|
|
| Transamerica Series Trust |
|
Semi-Annual Financial Statements 2024 |
Page 32
NOTICE OF PRIVACY POLICY
(unaudited)
Your privacy is very important to us. We want you to understand what information we collect and how we use it. We collect and use “nonpublic personal information” in connection with providing our customers with a broad range of financial products and services as effectively and conveniently as possible. We treat nonpublic personal information in accordance with our Privacy Policy.
What Information We Collect and From Whom We Collect It
We may collect nonpublic personal information about you from the following sources:
| • |
|
Information we receive from you on applications or other forms, such as your name, address, and account number; |
| • |
|
Information about your transactions with us, our affiliates, or others, such as your account balance and purchase/redemption history; and |
| • |
|
Information we receive from non-affiliated third parties, including consumer reporting agencies. |
What Information We Disclose and To Whom We Disclose It
We do not disclose any nonpublic personal information about current or former customers to anyone without their express consent, except as permitted by law. We may disclose the nonpublic personal information we collect, as described above, to persons or companies that perform services on our behalf and to other financial institutions with which we have joint marketing agreements. We will require these companies to protect the confidentiality of your nonpublic personal information and to use it only to perform the services for which we have hired them.
Our Security Procedures
We restrict access to your nonpublic personal information and only allow disclosures to persons and companies as permitted by law to assist in providing products or services to you. We maintain physical, electronic, and procedural safeguards to protect your nonpublic personal information and to safeguard the disposal of certain consumer information.
Contact Us
If you have any questions about our Privacy Policy, please call 1-800-851-9777 on any business day between 8 a.m. and 7 p.m. Eastern Time.
Note: This Privacy Policy applies only to customers that have a direct relationship with us or our affiliates. If you own shares of our portfolios in the name of a third party such as a bank or broker-dealer, its privacy policy may apply to you instead of ours.
|
|
|
| Transamerica Series Trust |
|
Semi-Annual Financial Statements 2024 |
Page 33
PO Box 219945
Kansas City, MO 64121-9945
|
|
|
| Distributor: |
|
Transamerica Capital, Inc. |
|
|
PO Box 219945 Kansas City, MO 64121-9945 Customer Service: 1-800-851-9777 |
Transamerica Series Trust Semi-Annual Financial Statements
June 30, 2024
1801 California St., Suite 5200
Denver, CO 80202
Distributor: Transamerica Capital, Inc.
Customer Service: 1-800-851-9777
|
|
|
|
|
The following pages contain the most recent semi-annual financial statements for the investment options in which you are invested. In compliance with Securities and Exchange Commission regulations, we present these reports on an annual and semi-annual basis with the hope that they will foster greater understanding of the investment options’ holdings, performance, financial data, accounting policies and other issues. This streamlined version provides information only on the investment options in which you are invested. If you have any questions about these reports, please do not hesitate to contact your financial professional. As always, we thank you for your trust and the opportunity to serve you. |
Transamerica PineBridge Inflation Opportunities VP
SCHEDULE OF INVESTMENTS
At June 30, 2024
(unaudited)
|
|
|
|
|
|
|
|
|
| |
|
Principal |
|
|
Value |
|
| U.S. GOVERNMENT OBLIGATIONS - 51.1% |
|
| U.S. Treasury - 0.4% |
|
| U.S. Treasury Notes |
|
|
|
|
|
|
|
|
| 4.38%, 05/15/2034 |
|
|
$ 500,000 |
|
|
|
$ 501,250 |
|
|
|
|
|
|
|
|
|
|
|
|
|
|
|
|
|
501,250 |
|
|
|
|
|
|
|
|
|
|
| U.S. Treasury Inflation-Protected Securities - 50.7% |
|
| U.S. Treasury Inflation-Protected Indexed Bonds |
|
|
|
|
|
|
|
|
| 0.13%, 02/15/2051 - 02/15/2052 |
|
|
2,781,944 |
|
|
|
1,611,180 |
|
| 0.63%, 02/15/2043 |
|
|
3,272,640 |
|
|
|
2,471,931 |
|
| 0.75%, 02/15/2042 - 02/15/2045 |
|
|
4,421,500 |
|
|
|
3,354,751 |
|
| 1.38%, 02/15/2044 |
|
|
1,748,734 |
|
|
|
1,507,155 |
|
| 1.50%, 02/15/2053 |
|
|
5,062,464 |
|
|
|
4,287,043 |
|
| 2.00%, 01/15/2026 |
|
|
1,421,604 |
|
|
|
1,404,048 |
|
| 2.38%, 01/15/2027 |
|
|
3,264,660 |
|
|
|
3,262,776 |
|
| 3.63%, 04/15/2028 |
|
|
1,163,004 |
|
|
|
1,222,398 |
|
| U.S. Treasury Inflation-Protected Indexed Notes |
|
|
|
|
|
|
|
|
| 0.13%, 04/15/2025 - 01/15/2032 |
|
|
11,078,192 |
|
|
|
10,055,708 |
|
| 0.25%, 01/15/2025 - 07/15/2029 |
|
|
3,774,890 |
|
|
|
3,548,024 |
|
| 0.38%, 01/15/2027 - 07/15/2027 |
|
|
5,150,825 |
|
|
|
4,890,560 |
|
| 0.50%, 01/15/2028 |
|
|
3,812,940 |
|
|
|
3,592,191 |
|
| 0.63%, 07/15/2032 |
|
|
2,697,550 |
|
|
|
2,423,280 |
|
| 0.75%, 07/15/2028 |
|
|
2,497,900 |
|
|
|
2,374,225 |
|
| 0.88%, 01/15/2029 |
|
|
1,117,440 |
|
|
|
1,058,940 |
|
| 1.13%, 01/15/2033 |
|
|
1,052,480 |
|
|
|
975,339 |
|
| 1.25%, 04/15/2028 |
|
|
626,075 |
|
|
|
604,804 |
|
| 1.38%, 07/15/2033 |
|
|
5,419,417 |
|
|
|
5,127,133 |
|
| 1.75%, 01/15/2034 |
|
|
305,970 |
|
|
|
297,565 |
|
| 2.38%, 10/15/2028 |
|
|
2,251,810 |
|
|
|
2,281,839 |
|
|
|
|
|
|
|
|
|
|
|
|
|
|
|
|
|
56,350,890 |
|
|
|
|
|
|
|
|
|
|
| Total U.S. Government Obligations
(Cost $61,979,932) |
|
|
|
56,852,140 |
|
|
|
|
|
|
|
|
|
|
|
| FOREIGN GOVERNMENT OBLIGATIONS - 27.8% |
|
| Australia - 3.4% |
|
| Australia Government Bonds |
|
|
|
|
|
|
|
|
| 2.50%, 09/20/2030 (A) |
|
|
AUD 3,775,000 |
|
|
|
3,773,827 |
|
|
|
|
|
|
|
|
|
|
|
|
|
| Canada - 0.8% |
|
|
|
|
|
|
|
|
| Canada Government Real Return Bonds |
|
|
|
|
|
|
|
|
| 4.00%, 12/01/2031 |
|
|
CAD 1,054,296 |
|
|
|
893,822 |
|
|
|
|
|
|
|
|
|
|
|
|
|
| France - 4.2% |
|
|
|
|
|
|
|
|
| French Republic Government Bonds OAT |
|
|
|
|
|
|
|
|
| 0.70%, 07/25/2030 (A) |
|
|
EUR 3,141,325 |
|
|
|
3,319,628 |
|
| 3.15%, 07/25/2032 (A) |
|
|
1,084,454 |
|
|
|
1,351,656 |
|
|
|
|
|
|
|
|
|
|
|
|
|
|
|
|
|
4,671,284 |
|
|
|
|
|
|
|
|
|
|
| Germany - 2.6% |
|
| Deutsche Bundesrepublik Inflation-Linked Bonds |
|
|
|
|
|
|
|
|
| 0.10%, 04/15/2026 (A) |
|
|
1,262,800 |
|
|
|
1,318,863 |
|
| 0.50%, 04/15/2030 (A) |
|
|
1,487,726 |
|
|
|
1,590,541 |
|
|
|
|
|
|
|
|
|
|
|
|
|
|
|
|
|
2,909,404 |
|
|
|
|
|
|
|
|
|
|
| Japan - 7.6% |
|
| Japan Government CPI-Linked Bonds |
|
|
|
|
|
|
|
|
| 0.10%, 03/10/2026 - 03/10/2029 |
|
|
JPY 1,304,798,600 |
|
|
|
8,433,272 |
|
|
|
|
|
|
|
|
|
|
|
|
|
|
|
|
|
|
|
| |
|
Principal |
|
|
Value |
|
| FOREIGN GOVERNMENT OBLIGATIONS (continued) |
|
| Mexico - 0.5% |
|
| Mexico Government International Bonds |
|
|
|
|
|
|
|
|
| 4.28%, 08/14/2041 |
|
|
$ 677,000 |
|
|
|
$ 524,452 |
|
|
|
|
|
|
|
|
|
|
| New Zealand - 2.9% |
|
| New Zealand Government Inflation-Linked Bonds |
|
|
|
|
|
|
|
|
| 2.00%, 09/20/2025 (A) |
|
|
NZD 4,000,000 |
|
|
|
3,217,186 |
|
|
|
|
|
|
|
|
|
|
| United Kingdom - 5.8% |
|
| U.K. Inflation-Linked Gilt |
|
|
|
|
|
|
|
|
| 0.13%, 03/22/2029 - 03/22/2044 (A) |
|
|
GBP 4,306,081 |
|
|
|
5,017,734 |
|
| 1.25%, 11/22/2032 (A) |
|
|
1,063,686 |
|
|
|
1,429,423 |
|
|
|
|
|
|
|
|
|
|
|
|
|
|
|
|
|
6,447,157 |
|
|
|
|
|
|
|
|
|
|
| Total Foreign Government Obligations
(Cost $34,670,576) |
|
|
|
30,870,404 |
|
|
|
|
|
|
|
|
|
|
|
| CORPORATE DEBT SECURITIES - 19.4% |
|
| Aerospace & Defense - 0.2% |
|
| BAE Systems PLC |
|
|
|
|
|
|
|
|
| 5.30%, 03/26/2034 (B) |
|
|
$ 277,000 |
|
|
|
275,022 |
|
|
|
|
|
|
|
|
|
|
| Banks - 10.2% |
|
|
|
|
|
|
|
|
| BAC Capital Trust XIV |
|
|
|
|
|
|
|
|
| 3-Month Term SOFR + 0.66%, 6.00% (C), 07/15/2024 (D) |
|
|
779,000 |
|
|
|
667,631 |
|
| Banco Santander Chile |
|
|
|
|
|
|
|
|
| 3.18%, 10/26/2031 (B) |
|
|
505,000 |
|
|
|
437,711 |
|
| Bank of America Corp. |
|
|
|
|
|
|
|
|
| Fixed until 12/20/2027, 3.42% (C), 12/20/2028 |
|
|
481,000 |
|
|
|
452,344 |
|
| CPI-YoY + 1.10%, 4.37% (C), 11/19/2024 |
|
|
5,000,000 |
|
|
|
4,940,650 |
|
| Citigroup, Inc. |
|
|
|
|
|
|
|
|
| Fixed until 11/03/2031, 2.52% (C), 11/03/2032 |
|
|
490,000 |
|
|
|
403,298 |
|
| CPI-YoY + 0.00%, 4.51% (C), 03/27/2025 |
|
|
1,000,000 |
|
|
|
966,480 |
|
| Corestates Capital II |
|
|
|
|
|
|
|
|
| 3-Month Term SOFR + 0.91%, 6.24% (C), 01/15/2027 (B) |
|
|
244,000 |
|
|
|
235,561 |
|
| Deutsche Bank AG |
|
|
|
|
|
|
|
|
| Fixed until 05/28/2031, 3.04% (C), 05/28/2032 |
|
|
400,000 |
|
|
|
336,328 |
|
| Goldman Sachs Group, Inc. |
|
|
|
|
|
|
|
|
| Fixed until 07/21/2031, 2.38% (C), 07/21/2032 |
|
|
800,000 |
|
|
|
658,143 |
|
| HSBC Holdings PLC |
|
|
|
|
|
|
|
|
| Fixed until 03/09/2043, 6.33% (C), 03/09/2044 |
|
|
202,000 |
|
|
|
212,081 |
|
| Fixed until 11/03/2032, 8.11% (C), 11/03/2033 |
|
|
497,000 |
|
|
|
562,394 |
|
| Intesa Sanpaolo SpA |
|
|
|
|
|
|
|
|
| Fixed until 06/01/2041, 4.95% (C), 06/01/2042 (B) |
|
|
309,000 |
|
|
|
231,551 |
|
| Lloyds Banking Group PLC |
|
|
|
|
|
|
|
|
| Fixed Until 06/05/2029, 5.72% (C), 06/05/2030 |
|
|
218,000 |
|
|
|
219,903 |
|
The Notes to Financial Statements are an integral part of this report.
|
|
|
|
|
| Transamerica Series Trust |
|
|
|
Semi-Annual Financial Statements 2024 |
|
|
Page 1 |
|
|
Transamerica PineBridge Inflation Opportunities VP
SCHEDULE OF INVESTMENTS (continued)
At June 30, 2024
(unaudited)
|
|
|
|
|
|
|
|
|
| |
|
Principal |
|
|
Value |
|
| CORPORATE DEBT SECURITIES (continued) |
|
| Banks (continued) |
|
| Mizuho Financial Group, Inc. |
|
|
|
|
|
|
|
|
| Fixed until 05/27/2030, 5.74% (C), 05/27/2031 |
|
|
$ 500,000 |
|
|
|
$ 507,803 |
|
| Morgan Stanley |
|
|
|
|
|
|
|
|
| Fixed until 09/16/2031, 2.48% (C), 09/16/2036 |
|
|
167,000 |
|
|
|
132,299 |
|
| NatWest Group PLC |
|
|
|
|
|
|
|
|
| Fixed until 08/28/2030, 3.03% (C), 11/28/2035 |
|
|
499,000 |
|
|
|
418,074 |
|
|
|
|
|
|
|
|
|
|
|
|
|
|
|
|
|
11,382,251 |
|
|
|
|
|
|
|
|
|
|
| Chemicals - 0.8% |
|
| Albemarle Corp. |
|
|
|
|
|
|
|
|
| 5.65%, 06/01/2052 (E) |
|
|
630,000 |
|
|
|
561,080 |
|
| Dow Chemical Co. |
|
|
|
|
|
|
|
|
| 5.60%, 02/15/2054 |
|
|
88,000 |
|
|
|
85,055 |
|
| Eastman Chemical Co. |
|
|
|
|
|
|
|
|
| 5.75%, 03/08/2033 |
|
|
258,000 |
|
|
|
260,706 |
|
|
|
|
|
|
|
|
|
|
|
|
|
|
|
|
|
906,841 |
|
|
|
|
|
|
|
|
|
|
| Commercial Services & Supplies - 0.3% |
|
| Triton Container International Ltd. |
|
|
|
|
|
|
|
|
| 3.15%, 06/15/2031 (B) |
|
|
402,000 |
|
|
|
335,087 |
|
|
|
|
|
|
|
|
|
|
|
| Construction & Engineering - 0.1% |
|
| MasTec, Inc. |
|
|
|
|
|
|
|
|
| 5.90%, 06/15/2029 |
|
|
149,000 |
|
|
|
149,631 |
|
|
|
|
|
|
|
|
|
|
|
| Containers & Packaging - 0.2% |
|
| Smurfit Kappa Treasury ULC |
|
|
|
|
|
|
|
|
| 5.78%, 04/03/2054 (B) |
|
|
214,000 |
|
|
|
211,875 |
|
|
|
|
|
|
|
|
|
|
|
| Electronic Equipment, Instruments & Components - 0.4% |
|
| Allegion US Holding Co., Inc. |
|
|
|
|
|
|
|
|
| 5.60%, 05/29/2034 |
|
|
481,000 |
|
|
|
482,055 |
|
|
|
|
|
|
|
|
|
|
|
| Food Products - 0.6% |
|
| Smithfield Foods, Inc. |
|
|
|
|
|
|
|
|
| 5.20%, 04/01/2029 (B) |
|
|
670,000 |
|
|
|
649,991 |
|
|
|
|
|
|
|
|
|
|
|
| Hotels, Restaurants & Leisure - 0.6% |
|
| Warnermedia Holdings, Inc. |
|
|
|
|
|
|
|
|
| 5.14%, 03/15/2052 |
|
|
788,000 |
|
|
|
616,502 |
|
|
|
|
|
|
|
|
|
|
|
| Insurance - 1.3% |
|
| Enstar Group Ltd. |
|
|
|
|
|
|
|
|
| 3.10%, 09/01/2031 |
|
|
588,000 |
|
|
|
485,704 |
|
| Hartford Financial Services Group, Inc. |
|
|
|
|
|
| 3-Month Term SOFR + 2.39%, 7.71% (C), 02/12/2067 |
|
|
1,051,000 |
|
|
|
935,455 |
|
|
|
|
|
|
|
|
|
|
|
|
|
|
|
|
|
1,421,159 |
|
|
|
|
|
|
|
|
|
|
| Media - 0.2% |
|
| Charter Communications
Operating LLC/Charter Communications
Operating Capital |
|
|
|
|
|
| 6.10%, 06/01/2029 |
|
|
186,000 |
|
|
|
186,783 |
|
|
|
|
|
|
|
|
|
|
|
|
|
|
|
|
|
|
|
| |
|
Principal |
|
|
Value |
|
| CORPORATE DEBT SECURITIES (continued) |
|
| Metals & Mining - 2.0% |
|
| BHP Billiton Finance USA Ltd. |
|
|
|
|
|
|
|
|
| 4.90%, 02/28/2033 |
|
|
$ 200,000 |
|
|
|
$ 196,443 |
|
| Glencore Funding LLC |
|
|
|
|
|
|
|
|
| 2.63%, 09/23/2031 (B) |
|
|
93,000 |
|
|
|
76,440 |
|
| 2.85%, 04/27/2031 (B) |
|
|
547,000 |
|
|
|
461,414 |
|
| Newmont Corp./Newcrest Finance Pty. Ltd. |
|
|
|
|
|
| 5.75%, 11/15/2041 (B) |
|
|
515,000 |
|
|
|
518,807 |
|
| South32 Treasury Ltd. |
|
|
|
|
|
|
|
|
| 4.35%, 04/14/2032 (B) |
|
|
1,013,000 |
|
|
|
916,137 |
|
|
|
|
|
|
|
|
|
|
|
|
|
|
|
|
|
2,169,241 |
|
|
|
|
|
|
|
|
|
|
| Oil, Gas & Consumable Fuels - 2.5% |
|
| Apache Corp. |
|
|
|
|
|
|
|
|
| 4.25%, 01/15/2030 |
|
|
400,000 |
|
|
|
373,202 |
|
| Diamondback Energy, Inc. |
|
|
|
|
|
|
|
|
| 5.40%, 04/18/2034 |
|
|
393,000 |
|
|
|
389,567 |
|
| Enbridge, Inc. |
|
|
|
|
|
|
|
|
| Fixed until 07/15/2027, 5.50% (C), 07/15/2077 |
|
|
874,000 |
|
|
|
823,620 |
|
| Energy Transfer LP |
|
|
|
|
|
|
|
|
| 5.25%, 07/01/2029 |
|
|
390,000 |
|
|
|
387,618 |
|
| EnLink Midstream Partners LP |
|
|
|
|
|
|
|
|
| 3-Month Term SOFR + 4.37%, 9.71% (C), 07/29/2024 (D) |
|
|
142,000 |
|
|
|
140,777 |
|
| Enterprise Products Operating LLC |
|
|
|
|
|
|
|
|
| 3.70%, 01/31/2051 |
|
|
438,000 |
|
|
|
325,227 |
|
| Fixed until 08/16/2027, 5.25% (C), 08/16/2077 |
|
|
278,000 |
|
|
|
265,864 |
|
| Marathon Oil Corp. |
|
|
|
|
|
|
|
|
| 5.30%, 04/01/2029 |
|
|
103,000 |
|
|
|
103,479 |
|
|
|
|
|
|
|
|
|
|
|
|
|
|
|
|
|
2,809,354 |
|
|
|
|
|
|
|
|
|
|
|
|
|
| Total Corporate Debt Securities
(Cost $23,261,251) |
|
|
|
|
|
|
21,595,792 |
|
|
|
|
|
|
|
|
|
|
|
| ASSET-BACKED SECURITY - 0.6% |
|
| American Express Credit Account Master Trust |
|
|
|
|
|
|
|
|
| Series 2022-3, Class A, 3.75%, 08/15/2027 |
|
|
625,000 |
|
|
|
613,754 |
|
|
|
|
|
|
|
|
|
|
|
|
| Total Asset-Backed Security
(Cost $609,106) |
|
|
|
613,754 |
|
|
|
|
|
|
|
|
|
|
| |
|
Shares |
|
|
Value |
|
| SHORT-TERM INVESTMENT COMPANY - 0.6% |
|
| Money Market Fund - 0.6% |
|
| State Street Institutional U.S. Government Money Market Fund,
5.25% (F) |
|
|
663,261 |
|
|
|
663,261 |
|
|
|
|
|
|
|
|
|
|
|
|
| Total Short-Term Investment Company
(Cost $663,261) |
|
|
|
663,261 |
|
|
|
|
|
|
|
|
|
|
The Notes to Financial Statements are an integral part of this report.
|
|
|
|
|
| Transamerica Series Trust |
|
|
|
Semi-Annual Financial Statements 2024 |
|
|
Page 2 |
|
|
Transamerica PineBridge Inflation Opportunities VP
SCHEDULE OF INVESTMENTS (continued)
At June 30, 2024
(unaudited)
|
|
|
|
|
|
|
|
|
| |
|
Shares |
|
|
Value |
|
| OTHER INVESTMENT COMPANY - 0.1% |
|
| Securities Lending Collateral - 0.1% |
|
| State Street Navigator Securities Lending Trust - Government Money Market Portfolio,
5.28% (F) |
|
|
157,380 |
|
|
|
$ 157,380 |
|
|
|
|
|
|
|
|
|
|
|
|
| Total Other Investment Company
(Cost $157,380) |
|
|
|
157,380 |
|
|
|
|
|
|
|
|
|
| Total Investments
(Cost $121,341,506) |
|
|
|
110,752,731 |
|
|
|
|
|
|
|
|
|
| Net Other Assets (Liabilities) - 0.4% |
|
|
|
406,195 |
|
|
|
|
|
|
|
|
|
|
|
|
| Net Assets - 100.0% |
|
|
|
$ 111,158,926 |
|
|
|
|
|
|
|
FORWARD FOREIGN CURRENCY CONTRACTS:
|
|
|
|
|
|
|
|
|
|
|
|
|
|
|
|
|
|
|
|
|
|
|
|
|
|
|
|
|
| |
|
|
|
|
|
| Counterparty |
|
Settlement Date |
|
|
Currency Purchased |
|
|
Currency Sold |
|
|
Unrealized Appreciation |
|
|
Unrealized Depreciation |
|
| MSC |
|
|
09/19/2024 |
|
|
|
USD |
|
|
|
3,725,300 |
|
|
|
AUD |
|
|
|
5,608,100 |
|
|
|
$ — |
|
|
|
$ (23,648) |
|
| MSC |
|
|
09/19/2024 |
|
|
|
USD |
|
|
|
876,863 |
|
|
|
CAD |
|
|
|
1,194,100 |
|
|
|
2,343 |
|
|
|
— |
|
| MSC |
|
|
09/19/2024 |
|
|
|
USD |
|
|
|
7,693,552 |
|
|
|
EUR |
|
|
|
7,072,300 |
|
|
|
89,978 |
|
|
|
— |
|
| MSC |
|
|
09/19/2024 |
|
|
|
USD |
|
|
|
6,444,997 |
|
|
|
GBP |
|
|
|
5,120,000 |
|
|
|
— |
|
|
|
(31,044) |
|
| MSC |
|
|
09/19/2024 |
|
|
|
USD |
|
|
|
8,782,055 |
|
|
|
JPY |
|
|
|
1,347,708,000 |
|
|
|
301,896 |
|
|
|
— |
|
| MSC |
|
|
09/19/2024 |
|
|
|
USD |
|
|
|
3,166,443 |
|
|
|
NZD |
|
|
|
5,250,000 |
|
|
|
— |
|
|
|
(31,289) |
|
|
|
|
|
|
|
|
|
|
|
|
|
|
|
|
|
|
|
|
|
|
|
|
|
|
| Total |
|
|
|
$ 394,217 |
|
|
|
$ (85,981) |
|
|
|
|
|
|
|
INVESTMENT VALUATION:
|
|
|
|
|
|
|
|
|
|
|
|
|
|
|
|
|
| Valuation Inputs (G) |
|
|
|
|
|
|
|
|
|
|
|
|
| |
|
Level 1 - Unadjusted Quoted Prices |
|
|
Level 2 - Other Significant Observable Inputs |
|
|
Level 3 - Significant Unobservable Inputs |
|
|
Value |
|
| ASSETS |
|
|
|
|
|
|
|
|
|
|
|
|
|
|
|
|
| Investments |
|
|
|
|
|
|
|
|
|
|
|
|
|
|
|
|
| U.S. Government Obligations |
|
$ |
— |
|
|
$ |
56,852,140 |
|
|
$ |
— |
|
|
$ |
56,852,140 |
|
| Foreign Government Obligations |
|
|
— |
|
|
|
30,870,404 |
|
|
|
— |
|
|
|
30,870,404 |
|
| Corporate Debt Securities |
|
|
— |
|
|
|
21,595,792 |
|
|
|
— |
|
|
|
21,595,792 |
|
| Asset-Backed Security |
|
|
— |
|
|
|
613,754 |
|
|
|
— |
|
|
|
613,754 |
|
| Short-Term Investment Company |
|
|
663,261 |
|
|
|
— |
|
|
|
— |
|
|
|
663,261 |
|
| Other Investment Company |
|
|
157,380 |
|
|
|
— |
|
|
|
— |
|
|
|
157,380 |
|
|
|
|
|
|
|
|
|
|
|
|
|
|
|
|
|
|
| Total Investments |
|
$ |
820,641 |
|
|
$ |
109,932,090 |
|
|
$ |
— |
|
|
$ |
110,752,731 |
|
|
|
|
|
|
|
|
|
|
|
|
|
|
|
|
|
|
|
|
|
|
|
| Other Financial Instruments |
|
|
|
|
|
|
|
|
|
|
|
|
|
|
|
|
| Forward Foreign Currency Contracts (H) |
|
$ |
— |
|
|
$ |
394,217 |
|
|
$ |
— |
|
|
$ |
394,217 |
|
|
|
|
|
|
|
|
|
|
|
|
|
|
|
|
|
|
| Total Other Financial Instruments |
|
$ |
— |
|
|
$ |
394,217 |
|
|
$ |
— |
|
|
$ |
394,217 |
|
|
|
|
|
|
|
|
|
|
|
|
|
|
|
|
|
|
|
|
|
|
|
| LIABILITIES |
|
|
|
|
|
|
|
|
|
|
|
|
|
|
|
|
| Other Financial Instruments |
|
|
|
|
|
|
|
|
|
|
|
|
|
|
|
|
| Forward Foreign Currency Contracts (H) |
|
$ |
— |
|
|
$ |
(85,981 |
) |
|
$ |
— |
|
|
$ |
(85,981 |
) |
|
|
|
|
|
|
|
|
|
|
|
|
|
|
|
|
|
| Total Other Financial Instruments |
|
$ |
— |
|
|
$ |
(85,981 |
) |
|
$ |
— |
|
|
$ |
(85,981 |
) |
|
|
|
|
|
|
|
|
|
|
|
|
|
|
|
|
|
The Notes to Financial Statements are an integral part of this report.
|
|
|
|
|
| Transamerica Series Trust |
|
|
|
Semi-Annual Financial Statements 2024 |
|
|
Page 3 |
|
|
Transamerica PineBridge Inflation Opportunities VP
SCHEDULE OF INVESTMENTS (continued)
At June 30, 2024
(unaudited)
FOOTNOTES TO SCHEDULE OF INVESTMENTS:
| (A) |
Security exempt from registration under Regulation S of the Securities Act of 1933, which exempts from registration securities offered and sold outside the United States. Security may not be offered or sold in the United States except pursuant to an exemption from, or in a transaction not subject to, the registration requirements of the Securities Act of 1933. At June 30, 2024, the total value of the Regulation S securities is $21,018,858, representing 18.9% of the Portfolio’s net assets. |
| (B) |
Security is exempt from registration pursuant to Rule 144A of the Securities Act of 1933. Security may be resold as transactions exempt from registration, normally to qualified institutional buyers. At June 30, 2024, the total value of 144A securities is $4,349,596, representing 3.9% of the Portfolio’s net assets. |
| (C) |
Floating or variable rate security. The rate disclosed is as of June 30, 2024. For securities based on a published reference rate and spread, the reference rate and spread are indicated within the description. Variable rate securities with a floor or ceiling feature are disclosed at the inherent rate, where applicable. Certain variable rate securities are not based on a published reference rate and spread, but are determined by the issuer or agent and are based on current market conditions; these securities do not indicate a reference rate and spread in the description. |
| (D) |
Perpetual maturity. The date displayed is the next call date. |
| (E) |
All or a portion of the security is on loan. The total value of the securities on loan is $153,912, collateralized by cash collateral of $157,380. The amount on loan indicated may not correspond with the securities on loan identified because a security with pending sales are in the process of recall from the brokers. |
| (F) |
Rate disclosed reflects the yield at June 30, 2024. |
| (G) |
There were no transfers in or out of Level 3 during the period ended June 30, 2024. Please reference the Investment Valuation section of the Notes to Financial Statements for more information regarding investment valuation and pricing inputs. |
| (H) |
Derivative instruments are valued at unrealized appreciation (depreciation). |
CURRENCY ABBREVIATION(S):
|
|
|
| AUD |
|
Australian Dollar |
| CAD |
|
Canadian Dollar |
| EUR |
|
Euro |
| GBP |
|
British Pound |
| JPY |
|
Japanese Yen |
| NZD |
|
New Zealand Dollar |
| USD |
|
United States Dollar |
COUNTERPARTY ABBREVIATION(S):
PORTFOLIO ABBREVIATION(S):
|
|
|
| CPI-YoY |
|
Consumer Price Index- Year Over Year |
| SOFR |
|
Secured Overnight Financing Rate |
The Notes to Financial Statements are an integral part of this report.
|
|
|
|
|
| Transamerica Series Trust |
|
|
|
Semi-Annual Financial Statements 2024 |
|
|
Page 4 |
|
|
Transamerica PineBridge Inflation Opportunities VP
STATEMENT OF ASSETS AND LIABILITIES
At June 30, 2024
(unaudited)
|
|
|
|
|
| Assets: |
|
|
|
|
| Investments, at value (cost $121,341,506) (including securities loaned of $153,912) |
|
$ |
110,752,731 |
|
| Foreign currency, at value (cost $13,919) |
|
|
13,840 |
|
| Receivables and other assets: |
|
|
|
|
| Net income from securities lending |
|
|
103 |
|
| Interest |
|
|
472,166 |
|
| Unrealized appreciation on forward foreign currency contracts |
|
|
394,217 |
|
| Prepaid expenses |
|
|
452 |
|
| |
|
| Total assets |
|
|
111,633,509 |
|
|
|
| Liabilities: |
|
|
|
|
| Cash collateral received upon return of: |
|
|
|
|
| Securities on loan |
|
|
157,380 |
|
| Payables and other liabilities: |
|
|
|
|
| Shares of beneficial interest redeemed |
|
|
117,292 |
|
| Investment management fees |
|
|
36,398 |
|
| Distribution and service fees |
|
|
21,398 |
|
| Transfer agent costs |
|
|
159 |
|
| Trustee and CCO fees |
|
|
421 |
|
| Audit and tax fees |
|
|
21,617 |
|
| Custody fees |
|
|
10,941 |
|
| Legal fees |
|
|
2,706 |
|
| Printing and shareholder reports fees |
|
|
14,544 |
|
| Other accrued expenses |
|
|
5,746 |
|
| Unrealized depreciation on forward foreign currency contracts |
|
|
85,981 |
|
| |
|
| Total liabilities |
|
|
474,583 |
|
|
|
| Net assets |
|
$ |
111,158,926 |
|
|
|
| Net assets consist of: |
|
|
|
|
| Capital stock ($0.01 par value) |
|
|
$111,755 |
|
| Additional paid-in capital |
|
|
127,787,897 |
|
| Total distributable earnings (accumulated losses) |
|
|
(16,740,726 |
) |
| |
|
| Net assets |
|
$ |
111,158,926 |
|
|
|
| Net assets by class: |
|
|
|
|
| Initial Class |
|
$ |
164,986 |
|
| Service Class |
|
|
110,993,940 |
|
|
|
| Shares outstanding: |
|
|
|
|
| Initial Class |
|
|
16,843 |
|
| Service Class |
|
|
11,158,633 |
|
|
|
| Net asset value and offering price per share: |
|
|
|
|
| Initial Class |
|
$ |
9.80 |
|
| Service Class |
|
|
9.95 |
|
STATEMENT OF OPERATIONS
For the period ended June 30, 2024
(unaudited)
|
|
|
|
|
| Investment income: |
|
|
|
|
| Interest income |
|
|
$ 2,148,784 |
|
| Net income from securities lending |
|
|
384 |
|
| Withholding taxes on foreign income |
|
|
16 |
|
|
|
| Total investment income |
|
|
2,149,184 |
|
|
|
| Expenses: |
|
|
|
|
| Investment management fees |
|
|
241,176 |
|
| Distribution and service fees: |
|
|
|
|
| Service Class |
|
|
142,308 |
|
| Transfer agent costs |
|
|
693 |
|
| Trustee and CCO fees |
|
|
2,723 |
|
| Audit and tax fees |
|
|
21,501 |
|
| Custody fees |
|
|
10,333 |
|
| Legal fees |
|
|
5,440 |
|
| Printing and shareholder reports fees |
|
|
13,429 |
|
| Other |
|
|
7,872 |
|
|
|
| Total expenses |
|
|
445,475 |
|
|
|
| Net investment income (loss) |
|
|
1,703,709 |
|
|
|
| Net realized gain (loss) on: |
|
|
|
|
| Investments |
|
|
(496,017 |
) |
| Forward foreign currency contracts |
|
|
541,808 |
|
| Foreign currency transactions |
|
|
(2,033 |
) |
| Net realized gain (loss) |
|
|
43,758 |
|
|
|
| Net change in unrealized appreciation (depreciation) on: |
|
|
|
|
| Investments |
|
|
(2,851,655 |
) |
| Forward foreign currency contracts |
|
|
1,494,186 |
|
| Translation of assets and liabilities denominated in foreign currencies |
|
|
(1,698 |
) |
|
|
| Net change in unrealized appreciation (depreciation) |
|
|
(1,359,167 |
) |
|
|
| Net realized and change in unrealized gain (loss) |
|
|
(1,315,409 |
) |
|
|
| Net increase (decrease) in net assets resulting from
operations |
|
$ |
388,300 |
|
The Notes to Financial Statements are an integral part of this report.
|
|
|
|
|
| Transamerica Series Trust |
|
|
|
Semi-Annual Financial Statements 2024 |
|
|
Page 5 |
|
|
Transamerica PineBridge Inflation Opportunities VP
STATEMENT OF CHANGES IN NET ASSETS
For the period and year ended:
|
|
|
|
|
|
|
|
|
|
|
| |
|
June 30, 2024 (unaudited) |
|
December 31, 2023 |
|
|
|
| From operations: |
|
|
|
|
|
|
|
|
|
|
| Net investment income (loss) |
|
|
$ |
1,703,709 |
|
|
|
$ |
3,654,525 |
|
| Net realized gain (loss) |
|
|
|
43,758 |
|
|
|
|
(3,087,774 |
) |
| Net change in unrealized appreciation (depreciation) |
|
|
|
(1,359,167 |
) |
|
|
|
6,374,160 |
|
|
|
|
| Net increase (decrease) in net assets resulting from operations |
|
|
|
388,300 |
|
|
|
|
6,940,911 |
|
|
|
|
| Dividends and/or distributions to shareholders: |
|
|
|
|
|
|
|
|
|
|
| Initial Class |
|
|
|
— |
|
|
|
|
(7,094 |
) |
| Service Class |
|
|
|
— |
|
|
|
|
(6,980,144 |
) |
| Net increase (decrease) in net assets resulting from dividends and/or distributions to shareholders |
|
|
|
— |
|
|
|
|
(6,987,238 |
) |
|
|
|
| Capital share transactions: |
|
|
|
|
|
|
|
|
|
|
| Proceeds from shares sold: |
|
|
|
|
|
|
|
|
|
|
| Initial Class |
|
|
|
30,000 |
|
|
|
|
29,000 |
|
| Service Class |
|
|
|
982,532 |
|
|
|
|
5,518,098 |
|
| |
|
|
|
1,012,532 |
|
|
|
|
5,547,098 |
|
| Dividends and/or distributions reinvested: |
|
|
|
|
|
|
|
|
|
|
| Initial Class |
|
|
|
— |
|
|
|
|
7,094 |
|
| Service Class |
|
|
|
— |
|
|
|
|
6,980,144 |
|
| |
|
|
|
— |
|
|
|
|
6,987,238 |
|
| Cost of shares redeemed: |
|
|
|
|
|
|
|
|
|
|
| Service Class |
|
|
|
(14,783,800 |
) |
|
|
|
(32,628,817 |
) |
| |
|
|
|
(14,783,800 |
) |
|
|
|
(32,628,817 |
) |
|
|
|
| Net increase (decrease) in net assets resulting from capital share transactions |
|
|
|
(13,771,268 |
) |
|
|
|
(20,094,481 |
) |
|
|
|
| Net increase (decrease) in net assets |
|
|
|
(13,382,968 |
) |
|
|
|
(20,140,808 |
) |
|
|
|
| Net assets: |
|
|
|
|
|
|
|
|
|
|
| Beginning of period/year |
|
|
|
124,541,894 |
|
|
|
|
144,682,702 |
|
| End of period/year |
|
|
$ |
111,158,926 |
|
|
|
$ |
124,541,894 |
|
|
|
|
| Capital share transactions - shares: |
|
|
|
|
|
|
|
|
|
|
| Shares issued: |
|
|
|
|
|
|
|
|
|
|
| Initial Class |
|
|
|
3,096 |
|
|
|
|
2,959 |
|
| Service Class |
|
|
|
99,702 |
|
|
|
|
576,467 |
|
| |
|
|
|
102,798 |
|
|
|
|
579,426 |
|
| Shares reinvested: |
|
|
|
|
|
|
|
|
|
|
| Initial Class |
|
|
|
— |
|
|
|
|
754 |
|
| Service Class |
|
|
|
— |
|
|
|
|
728,616 |
|
| |
|
|
|
— |
|
|
|
|
729,370 |
|
| Shares redeemed: |
|
|
|
|
|
|
|
|
|
|
| Service Class |
|
|
|
(1,505,328 |
) |
|
|
|
(3,280,413 |
) |
| |
|
|
|
(1,505,328 |
) |
|
|
|
(3,280,413 |
) |
|
|
|
| Net increase (decrease) in shares outstanding: |
|
|
|
|
|
|
|
|
|
|
| Initial Class |
|
|
|
3,096 |
|
|
|
|
3,713 |
|
| Service Class |
|
|
|
(1,405,626 |
) |
|
|
|
(1,975,330 |
) |
| |
|
|
|
(1,402,530 |
) |
|
|
|
(1,971,617 |
) |
The Notes to Financial Statements are an integral part of this report.
|
|
|
|
|
| Transamerica Series Trust |
|
|
|
Semi-Annual Financial Statements 2024 |
|
|
Page 6 |
|
|
Transamerica PineBridge Inflation Opportunities VP
FINANCIAL HIGHLIGHTS
|
|
|
|
|
|
|
|
|
|
|
|
|
|
|
|
|
|
|
|
|
|
|
|
|
|
|
|
|
|
|
| For a share outstanding during the period and years indicated: |
|
Initial Class |
| |
|
June 30, 2024 (unaudited) |
|
December 31, 2023 |
|
December 31, 2022 |
|
December 31, 2021 |
|
December 31, 2020 |
|
December 31, 2019 |
| Net asset value, beginning of period/year |
|
|
$ |
9.74 |
|
|
|
$ |
9.80 |
|
|
|
$ |
11.37 |
|
|
|
$ |
11.08 |
|
|
|
$ |
10.35 |
|
|
|
$ |
9.80 |
|
|
|
|
|
|
|
|
| Investment operations: |
|
|
|
|
|
|
|
|
|
|
|
|
|
|
|
|
|
|
|
|
|
|
|
|
|
|
|
|
|
|
| Net investment income (loss)(A) |
|
|
|
0.17 |
|
|
|
|
0.29 |
|
|
|
|
0.62 |
|
|
|
|
0.45 |
|
|
|
|
0.11 |
|
|
|
|
0.17 |
|
| Net realized and unrealized gain (loss) |
|
|
|
(0.11 |
) |
|
|
|
0.24 |
|
|
|
|
(1.76 |
) |
|
|
|
0.00 |
(B) |
|
|
|
0.82 |
|
|
|
|
0.65 |
|
| Total investment operations |
|
|
|
0.06 |
|
|
|
|
0.53 |
|
|
|
|
(1.14 |
) |
|
|
|
0.45 |
|
|
|
|
0.93 |
|
|
|
|
0.82 |
|
| Dividends and/or distributions to shareholders: |
|
|
|
|
|
|
|
|
|
|
|
|
|
|
|
|
|
|
|
|
|
|
|
|
|
|
|
|
|
|
| Net investment income |
|
|
|
— |
|
|
|
|
(0.59 |
) |
|
|
|
(0.43 |
) |
|
|
|
(0.16 |
) |
|
|
|
(0.20 |
) |
|
|
|
(0.27 |
) |
| Net asset value, end of period/year |
|
|
$ |
9.80 |
|
|
|
$ |
9.74 |
|
|
|
$ |
9.80 |
|
|
|
$ |
11.37 |
|
|
|
$ |
11.08 |
|
|
|
$ |
10.35 |
|
| |
|
|
|
|
|
|
|
|
|
|
|
|
|
|
|
|
|
|
|
|
|
|
|
|
|
|
|
|
|
|
| Total return |
|
|
|
0.62 |
%(C) |
|
|
|
5.67 |
% |
|
|
|
(10.21 |
)% |
|
|
|
4.08 |
% |
|
|
|
9.01 |
% |
|
|
|
8.39 |
% |
| Ratio and supplemental data: |
|
|
|
|
|
|
|
|
|
|
|
|
|
|
|
|
|
|
|
|
|
|
|
|
|
|
|
|
|
|
| Net assets end of period/year (000’s) |
|
|
$ |
165 |
|
|
|
$ |
134 |
|
|
|
$ |
98 |
|
|
|
$ |
184 |
|
|
|
$ |
60 |
|
|
|
$ |
11 |
|
| Expenses to average net assets(D) |
|
|
|
0.53 |
%(E) |
|
|
|
0.59 |
% |
|
|
|
0.56 |
% |
|
|
|
0.57 |
% |
|
|
|
0.63 |
% |
|
|
|
0.65 |
% |
| Net investment income (loss) to average net assets |
|
|
|
3.53 |
%(E) |
|
|
|
2.97 |
% |
|
|
|
5.84 |
% |
|
|
|
4.01 |
% |
|
|
|
1.00 |
% |
|
|
|
1.71 |
% |
| Portfolio turnover rate |
|
|
|
14 |
%(C) |
|
|
|
22 |
% |
|
|
|
43 |
% |
|
|
|
32 |
% |
|
|
|
29 |
% |
|
|
|
26 |
% |
| (A) |
Calculated based on average number of shares outstanding. |
| (B) |
Rounds to less than $0.01 or $(0.01). |
| (D) |
Does not include expenses of the underlying investments in which the Portfolio invests. |
|
|
|
|
|
|
|
|
|
|
|
|
|
|
|
|
|
|
|
|
|
|
|
|
|
|
|
|
|
|
|
| For a share outstanding during the period and years indicated: |
|
Service Class |
| |
|
June 30, 2024 (unaudited) |
|
December 31, 2023 |
|
December 31, 2022 |
|
December 31, 2021 |
|
December 31, 2020 |
|
December 31, 2019 |
| Net asset value, beginning of period/year |
|
|
$ |
9.90 |
|
|
|
$ |
9.94 |
|
|
|
$ |
11.54 |
|
|
|
$ |
11.24 |
|
|
|
$ |
10.50 |
|
|
|
$ |
9.93 |
|
|
|
|
|
|
|
|
| Investment operations: |
|
|
|
|
|
|
|
|
|
|
|
|
|
|
|
|
|
|
|
|
|
|
|
|
|
|
|
|
|
|
| Net investment income (loss)(A) |
|
|
|
0.14 |
|
|
|
|
0.27 |
|
|
|
|
0.59 |
|
|
|
|
0.39 |
|
|
|
|
0.09 |
|
|
|
|
0.15 |
|
| Net realized and unrealized gain (loss) |
|
|
|
(0.09 |
) |
|
|
|
0.25 |
|
|
|
|
(1.79 |
) |
|
|
|
0.04 |
|
|
|
|
0.82 |
|
|
|
|
0.66 |
|
| Total investment operations |
|
|
|
0.05 |
|
|
|
|
0.52 |
|
|
|
|
(1.20 |
) |
|
|
|
0.43 |
|
|
|
|
0.91 |
|
|
|
|
0.81 |
|
| Dividends and/or distributions to shareholders: |
|
|
|
|
|
|
|
|
|
|
|
|
|
|
|
|
|
|
|
|
|
|
|
|
|
|
|
|
|
|
| Net investment income |
|
|
|
— |
|
|
|
|
(0.56 |
) |
|
|
|
(0.40 |
) |
|
|
|
(0.13 |
) |
|
|
|
(0.17 |
) |
|
|
|
(0.24 |
) |
| Net asset value, end of period/year |
|
|
$ |
9.95 |
|
|
|
$ |
9.90 |
|
|
|
$ |
9.94 |
|
|
|
$ |
11.54 |
|
|
|
$ |
11.24 |
|
|
|
$ |
10.50 |
|
| |
|
|
|
|
|
|
|
|
|
|
|
|
|
|
|
|
|
|
|
|
|
|
|
|
|
|
|
|
|
|
| Total return |
|
|
|
0.51 |
%(B) |
|
|
|
5.44 |
% |
|
|
|
(10.55 |
)% |
|
|
|
3.86 |
% |
|
|
|
8.69 |
% |
|
|
|
8.20 |
% |
| Ratio and supplemental data: |
|
|
|
|
|
|
|
|
|
|
|
|
|
|
|
|
|
|
|
|
|
|
|
|
|
|
|
|
|
|
| Net assets end of period/year (000’s) |
|
|
$ |
110,994 |
|
|
|
$ |
124,408 |
|
|
|
$ |
144,585 |
|
|
|
$ |
168,860 |
|
|
|
$ |
163,571 |
|
|
|
$ |
164,616 |
|
| Expenses to average net assets(C) |
|
|
|
0.78 |
%(D) |
|
|
|
0.84 |
% |
|
|
|
0.81 |
% |
|
|
|
0.82 |
% |
|
|
|
0.88 |
% |
|
|
|
0.90 |
% |
| Net investment income (loss) to average net assets |
|
|
|
2.99 |
%(D) |
|
|
|
2.75 |
% |
|
|
|
5.54 |
% |
|
|
|
3.40 |
% |
|
|
|
0.82 |
% |
|
|
|
1.45 |
% |
| Portfolio turnover rate |
|
|
|
14 |
%(B) |
|
|
|
22 |
% |
|
|
|
43 |
% |
|
|
|
32 |
% |
|
|
|
29 |
% |
|
|
|
26 |
% |
| (A) |
Calculated based on average number of shares outstanding. |
| (C) |
Does not include expenses of the underlying investments in which the Portfolio invests. |
The Notes to Financial Statements are an integral part of this report.
|
|
|
|
|
| Transamerica Series Trust |
|
|
|
Semi-Annual Financial Statements 2024 |
|
|
Page 7 |
|
|
Transamerica PineBridge Inflation Opportunities VP
NOTES TO FINANCIAL STATEMENTS
At June 30, 2024
(unaudited)
1. ORGANIZATION
Transamerica Series Trust (“TST”) is an open-end management investment company registered under the Investment Company Act of 1940, as amended (the “1940 Act”). TST applies investment company accounting and reporting guidance. TST serves as a funding vehicle for variable life insurance, variable annuity, and group annuity products. Transamerica PineBridge Inflation Opportunities VP (the “Portfolio”) is a series of TST and is classified as diversified under the 1940 Act. The Portfolio currently offers two classes of shares, Initial Class and Service Class.
The only shareholders of the Portfolio are affiliated insurance company separate accounts and/or affiliated asset allocation portfolios. Contract holders of the variable life and annuity contracts are not shareholders of the Portfolio. For ease of reference, shareholders and contract holders are collectively referred to in this report as “shareholders.”
This report must be accompanied or preceded by the Portfolio’s current prospectus, which contains additional information about the Portfolio, including risks, as well as investment objectives and strategies.
Transamerica Asset Management, Inc. (“TAM”) serves as investment manager for the Portfolio pursuant to an investment management agreement. TAM provides continuous and regular investment management services to the Portfolio. TAM supervises the Portfolio’s investments, conducts its investment program and provides supervisory, compliance and administrative services to the Portfolio.
TAM currently acts as a “manager of managers” and has hired sub-advisers to furnish day-to-day investment advice and recommendations. TAM may, in the future, determine to provide all aspects of the day-to-day management of the Portfolio without the use of a sub-adviser. When acting as a manager of managers, TAM provides investment management services that include, without limitation, the design and development of the Portfolio and its investment strategies and the ongoing review and evaluation of those investment strategies including recommending changes in strategy where it believes appropriate or advisable; the selection of one or more sub-advisers for the Portfolio employing a combination of quantitative and qualitative screens, research, analysis and due diligence; negotiation of sub-advisory agreements and fees; oversight and monitoring of sub-advisers and recommending changes to sub-advisers where it believes appropriate or advisable; recommending portfolio combinations and liquidations where it believes appropriate or advisable; selection and oversight of transition managers, as needed; regular supervision of the Portfolio’s investments; regular review and evaluation of sub-adviser performance; daily monitoring of the sub-advisers’ buying and selling of securities for the Portfolio; regular review of holdings; ongoing trade oversight and analysis; regular monitoring to ensure adherence to investment process; regular calls and periodic on-site visits with sub-advisers; portfolio construction and asset allocation when using multiple sub-advisers for the Portfolio; risk management oversight and analysis; oversight of negotiation of investment documentation and agreements; design, development, implementation and regular monitoring of the valuation process; periodic due diligence reviews of pricing vendors and vendor methodology; design, development, implementation and regular monitoring of the compliance process; respond to regulatory inquiries and determine appropriate litigation strategy, as needed; review of proxies voted by sub-advisers; oversight of preparation and review of materials for meetings of the Portfolio’s Board of Trustees (the “Board”), participation in these meetings and preparation of regular communications with the Board; oversight of preparation and review of prospectuses, shareholder reports and other disclosure materials and regulatory filings for the Portfolio; oversight of other service providers to the Portfolio, such as the custodian, the transfer agent, the Portfolio’s independent accounting firm and legal counsel; supervision of the performance of recordkeeping and shareholder relations functions for the Portfolio; and oversight of cash management services. TAM uses a variety of quantitative and qualitative tools to carry out its investment management services. TAM, not the Portfolio, is responsible for paying the sub-adviser(s) for their services, and sub-advisory fees are TAM’s expense.
TAM’s investment management services also include the provision of supervisory and administrative services to the Portfolio. These services include performing certain administrative services for the Portfolio and supervising and overseeing the administrative, clerical, recordkeeping and bookkeeping services provided to the Portfolio by State Street Bank and Trust Company (“State Street”), to whom TAM has outsourced the provision of certain sub-administration services. To the extent agreed upon by TAM and the Portfolio from time to time, TAM’s supervisory and administrative services include, but are not limited to: monitoring and verifying the custodian’s daily calculation of the Net Asset Values (“NAV”); shareholder relations functions; compliance services; valuation services; assisting in due diligence and in the oversight and monitoring of certain activities of sub-advisers and certain aspects of Portfolio investments; assisting with Portfolio combinations and liquidations; oversight of the preparation and filing, and review, of all returns and reports, in connection with federal, state and local taxes; oversight and review of regulatory reporting; supervising and coordinating the Portfolio’s custodian and dividend disbursing agent and monitoring their services to the Portfolio; assisting the Portfolio in preparing reports to shareholders; acting as liaison with the Portfolio’s independent public accountants and providing, upon request, analyses, fiscal year summaries and other audit related services; assisting in the preparation of agendas and supporting documents for and minutes of meetings of trustees and committees of trustees; assisting in the preparation of regular communications with the trustees; and providing personnel and office space, telephones and other office equipment as necessary in order for TAM to perform supervisory and administrative services to the Portfolio. The Portfolio pays certain fees and expenses to State Street for sub-administration services which are not administrative services covered by the management agreement with TAM or paid for through the management fees payable thereunder. For the period ended June 30, 2024, (i) the expenses paid to State Street for sub-administration services by the Portfolio are shown as a part of Other expenses within the Statement of Operations and (ii) the expenses payable to State Street for sub-administration services from the Portfolio are shown as part of Other accrued expenses within the Statement of Assets and Liabilities.
|
|
|
| Transamerica Series Trust |
|
Semi-Annual Financial Statements 2024 |
Page 8
Transamerica PineBridge Inflation Opportunities VP
NOTES TO FINANCIAL STATEMENTS (continued)
At June 30, 2024
(unaudited)
2. SIGNIFICANT ACCOUNTING POLICIES
In preparing the Portfolio’s financial statements in accordance with Generally Accepted Accounting Principles in the United States of America (“GAAP”), estimates or assumptions (which could differ from actual results) may be used that affect reported amounts and disclosures. The following is a summary of significant accounting policies followed by the Portfolio.
Foreign currency denominated investments: The accounting records of the Portfolio are maintained in U.S. dollars. Securities and other assets and liabilities denominated in foreign currencies are translated into U.S. dollars based on the closing exchange rate each day. The cost of foreign securities purchased and any realized gains or losses are translated at the prevailing exchange rates in effect on the date of the respective transaction. The Portfolio combines fluctuations from currency exchange rates and fluctuations in value when computing net realized and unrealized gains or losses from investments.
Net foreign currency gains and losses resulting from changes in exchange rates include, foreign currency fluctuations between trade date and settlement date of investment security transactions, gains and losses on forward foreign currency contracts, and the difference between the receivable amounts of interest and dividends recorded in the accounting records in U.S. dollars and the amounts actually received.
Foreign currency denominated assets may involve risks not typically associated with domestic transactions. These risks include revaluation of currencies, adverse fluctuations in foreign currency values, and possible adverse political, social, and economic developments, including those particular to a specific industry, country or region.
Security transactions and investment income: Security transactions are accounted for on the trade date. Security gains and losses are calculated on a first-in, first-out basis. Dividend income, if any, is recorded on the ex-dividend date or, in the case of foreign securities, as soon as the Portfolio is informed of the ex-dividend dates, net of foreign taxes. Non-cash dividends, if any, are recorded on the ex-dividend date at fair value. Interest income, if any, is recorded on the accrual basis from settlement date, net of foreign taxes. Fixed income premiums and discounts are amortized and/or accreted over the lives of the respective securities.
Multiple class operations, income, and expenses: Income, non-class specific expenses, and realized and unrealized gains and losses are allocated to each class daily based upon net assets. Each class bears its own specific expenses in addition to the allocated non-class specific expenses.
Distributions to shareholders: Distributions are recorded on the ex-dividend date and are determined in accordance with federal income tax regulations, which may differ from GAAP.
Foreign taxes: The Portfolio may be subject to taxes imposed by the countries in which it invests, with respect to its investments in issuers existing or operating in such countries. The Portfolio may also be subject to foreign taxes on income, gains on investments, or currency repatriation, a portion of which may be recoverable. The Portfolio accrues such taxes and recoveries as applicable when the related income or capital gains are earned or unrealized, and based upon the current interpretation of tax rules and regulations that exist in the markets in which the Portfolio invests. Some countries require governmental approval for the repatriation of investment income, capital, or the proceeds of sales earned by foreign investors. In addition, if there is deterioration in a country’s balance of payments or for other reasons, a country may impose temporary restrictions of foreign capital remittances abroad.
Commission recapture: The sub-adviser(s), to the extent consistent with the best execution and usual commission rate policies and practices, may elect to place security transactions of the Portfolio with broker/dealers with which TST has established a commission recapture program. A commission recapture program is any arrangement under which a broker/dealer applies a portion of the commissions received by such broker/dealer on the security transactions to the Portfolio. In no event will commissions, paid by the Portfolio, be used to pay expenses that would otherwise be borne by any other Portfolios within TST, or by any other party.
There were no commissions recaptured during the period ended June 30, 2024 by the Portfolio.
Indemnification: In the normal course of business, the Portfolio enters into contracts that contain a variety of representations that provide general indemnifications. The Portfolio’s maximum exposure under these arrangements is unknown, as this would involve future claims that may be made against the Portfolio and/or its affiliates that have not yet occurred. However, based on experience, the Portfolio expects the risk of loss to be remote.
3. INVESTMENT VALUATION
TAM has been designated as the Portfolio’s valuation designee pursuant to Rule 2a-5 under the 1940 Act with responsibility for fair valuation subject to oversight by the Portfolio’s Board of Trustees. The net asset value of the Portfolio is computed as of the official close of the New York Stock Exchange (“NYSE”) each day the NYSE is open for business.
TAM utilizes various methods to measure the fair value of its investments on a recurring basis. GAAP establishes a hierarchy that prioritizes inputs to valuation methods. The inputs or methodology used for valuing securities are not necessarily an indication of the risk associated with investing in those securities. The three levels (“Levels”) of inputs of the fair value hierarchy are defined as follows:
Level 1—Unadjusted quoted prices in active markets for identical securities.
Level 2—Inputs, other than quoted prices included in Level 1, which are observable, either directly or indirectly. These inputs may include quoted prices for the identical instrument on an inactive market, prices for similar instruments, interest rates, prepayment speeds, credit risk, yield curves, default rates, and similar data.
|
|
|
| Transamerica Series Trust |
|
Semi-Annual Financial Statements 2024 |
Page 9
Transamerica PineBridge Inflation Opportunities VP
NOTES TO FINANCIAL STATEMENTS (continued)
At June 30, 2024
(unaudited)
3. INVESTMENT VALUATION (continued)
Level 3—Unobservable inputs based on the best information available in the circumstances, to the extent observable inputs are not available, which may include TAM’s own assumptions used in determining the fair value of the Portfolio’s investments and derivative instruments.
The inputs used to measure fair value may fall into different Levels of the fair value hierarchy. In such cases, for disclosure purposes, the Level in the fair value hierarchy that is assigned to the fair value measurement of a security is determined based on the lowest Level input that is significant to the fair value measurement in its entirety. Certain investments that are measured at fair value using NAV per share, or its equivalent, using the “practical expedient” have not been classified in the fair value Levels. The hierarchy classification of inputs used to value the Portfolio’s investments at June 30, 2024, is disclosed within the Investment Valuation section of the Schedule of Investments.
The availability of observable inputs can vary from security to security and is affected by a wide variety of factors, including, but not limited to, the type of security, whether the security is new and not yet established in the marketplace, the liquidity of markets, and other characteristics particular to the security. To the extent that valuation is based on models or inputs that are less observable or unobservable in the market, the determination of fair value requires more judgment. Accordingly, the degree of judgment exercised in determining fair value is generally greatest for instruments categorized in Level 3. Due to the inherent uncertainty of valuation, the determination of values may differ significantly from values that would have been realized had a ready market for investments existed, and the differences could be material.
Fair value measurements: Descriptions of the valuation techniques applied to the Portfolio’s significant categories of assets and liabilities measured at fair value on a recurring basis are as follows:
Asset-backed securities: The fair value of asset-backed securities is estimated based on models that consider the estimated cash flows of each tranche of the entity, establish a benchmark yield, and develop an estimated tranche specific spread to the benchmark yield based on the unique attributes of the tranche. To the extent the inputs are observable and timely, the values would generally be categorized in Level 2 of the fair value hierarchy; otherwise they would be categorized in Level 3.
Corporate debt securities: The fair value of corporate debt securities is estimated using various techniques, which consider recently executed transactions in securities of the issuer or comparable issuers, market price quotations (where observable), bond spreads, fundamental data relating to the issuer, and credit default swap spreads adjusted for any basis difference between cash and derivative instruments. While most corporate debt securities are categorized in Level 2 of the fair value hierarchy, in instances where lower relative weight is placed on transaction prices, quotations, or similar observable inputs, they are categorized in Level 3.
Foreign government obligations: Foreign government obligations are normally valued using a model that incorporates market observable data such as reported sales of similar securities, broker quotes, yields, bids, offers, and reference data. Certain securities are valued by principally using dealer quotations. Foreign government obligations generally are categorized in Level 2 of the fair value hierarchy, or Level 3 if inputs are unobservable.
Investment companies: Certain investment companies are valued at the NAV as the practical expedient. These investment companies are not included within the fair value hierarchy. Certain other investment companies are valued at the actively traded NAV and no valuation adjustments are applied. These investment companies are categorized in Level 1 of the fair value hierarchy.
U.S. government obligations: U.S. government obligations are normally valued using a model that incorporates market observable data such as reported sales of similar securities, broker quotes, yields, bids, offers, and reference data. Certain securities are valued by principally using dealer quotations. U.S. government obligations generally are categorized in Level 2 of the fair value hierarchy, or Level 3 if inputs are unobservable.
Securities lending collateral: Securities lending collateral is invested in a money market fund which is valued at the actively traded NAV and no valuation adjustments are applied. Securities lending collateral is categorized in Level 1 of the fair value hierarchy.
Derivative instruments: Centrally cleared or listed derivatives that are actively traded are valued based on quoted prices from the exchange and are categorized in Level 1 of the fair value hierarchy. Over-the-counter (“OTC”) derivative contracts include forward, swap, swaption, and option contracts related to interest rates, foreign currencies, credit standing of reference entities, equity prices, or commodity prices. Depending on the product and the terms of the transaction, the fair value of the OTC derivative products are modeled taking into account the counterparties’ creditworthiness and using a series of techniques, including simulation models. Many pricing models do not entail material subjectivity because the methodologies employed do not necessitate significant judgments and the pricing inputs are observed from actively quoted markets, as is the case of interest rate swap and option contracts. The majority of OTC derivative products valued by the Portfolio using pricing models fall into this category and are categorized within Level 2 of the fair value hierarchy or Level 3 if inputs are unobservable.
4. SECURITIES AND OTHER INVESTMENTS
Treasury inflation-protected securities (“TIPS”): The Portfolio may invest in TIPS, which are fixed income securities whose principal value is periodically adjusted according to the rate of inflation/deflation. If the index measuring inflation/deflation rises or falls, the principal value of TIPS will be adjusted upward or downward, and consequently the interest payable on these securities (calculated with respect to a larger or smaller principal amount) will be increased or reduced, respectively. Repayment of the original bond principal upon maturity (as
|
|
|
| Transamerica Series Trust |
|
Semi-Annual Financial Statements 2024 |
Page 10
Transamerica PineBridge Inflation Opportunities VP
NOTES TO FINANCIAL STATEMENTS (continued)
At June 30, 2024
(unaudited)
4. SECURITIES AND OTHER INVESTMENTS (continued)
adjusted for inflation) is guaranteed in the case of U.S. Treasury inflation-indexed bonds and notes. For bonds and notes that do not provide a similar guarantee, the adjusted principal value of the bond repaid at maturity may be less than the original principal.
TIPS held at June 30, 2024, if any, are included within the Schedule of Investments. The adjustments, if any, to principal due to inflation/deflation are reflected as increases/decreases to Interest income within the Statement of Operations, with a corresponding adjustment to Investments, at cost within the Statement of Assets and Liabilities.
5. BORROWINGS AND OTHER FINANCING TRANSACTIONS
The Portfolio may engage in borrowing transactions as a means of raising cash to satisfy redemption requests, for other temporary or emergency purposes or, to the extent permitted by its investment policies, to raise additional cash to be invested in other securities or instruments. When the Portfolio invests borrowing proceeds in other securities, the Portfolio will bear the risk that the market value of the securities in which such proceeds are invested goes down and is insufficient to repay the borrowed proceeds. The Portfolio may borrow on a secured or on an unsecured basis. If the Portfolio enters into a secured borrowing arrangement, a portion of the Portfolio’s assets will be used as collateral. The 1940 Act requires the Portfolio to maintain asset coverage of at least 300% of the amount of its borrowings. Asset coverage means the ratio that the value of the Portfolio’s total assets, minus liabilities other than borrowings, bears to the aggregate amount of all borrowings. Although complying with this requirement has the effect of limiting the amount that the Portfolio may borrow, it does not otherwise mitigate the risks of entering into borrowing transactions.
Interfund lending: The Portfolio, along with other funds and portfolios advised by TAM, may participate in an interfund lending program pursuant to exemptive relief granted by the Securities and Exchange Commission on January 18, 2017. This program allows the Portfolio to lend to and borrow from other funds and portfolios advised by TAM. Interfund lending transactions are subject to the conditions of the exemptive relief which places limits on the amount of lending or borrowing a Portfolio may participate in under the program. Interest earned or paid on an interfund lending transaction will be based on the average of certain current market rates. For the period ended June 30, 2024, the Portfolio has not utilized the program.
Securities lending: The Portfolio may lend securities to qualified financial institutions, brokers and dealers. State Street serves as securities lending agent to the Portfolio pursuant to a Securities Lending Agreement. Loans of securities are terminable at any time and the borrower, after notice, is required to return borrowed securities within the standard time period for settlement of securities transactions. The lending of securities exposes the Portfolio to risks such as: the borrowers may fail to return the loaned securities or may not be able to provide additional collateral, the Portfolio may experience delays in recovery of the loaned securities or delays in access to collateral, or the Portfolio may experience losses related to the investment collateral. To minimize certain risks, loan counterparties pledge cash, securities issued or guaranteed by the U.S. Government and irrevocable letters of credit issued by banks as collateral. The initial collateral received by the Portfolio is required to have a value of at least 102% of the current value of the loaned securities traded on U.S. exchanges, and a value of at least 105% for all other securities. Typically the lending agent is not permitted to sell, re-pledge or use cash and non-cash collateral it receives. The lending agent has agreed to indemnify the Portfolio in the case of default of any securities borrower.
The Portfolio receives compensation for lending securities from interest or dividends earned on the cash, U.S. Government securities and irrevocable letters of credit held as collateral, less associated fees and expenses. Such income is reflected in Net income from securities lending within the Statement of Operations. Cash collateral received is invested in the State Street Navigator Securities Lending Trust — Government Money Market Portfolio.
The value of loaned securities and related cash and non-cash collateral outstanding at June 30, 2024, if any, are shown on a gross basis within the Schedule of Investments.
The following table reflects a breakdown of transactions accounted for as secured borrowings, the gross obligation by the type, and the remaining contractual maturity of those transactions as of June 30, 2024.
|
|
|
|
|
|
|
|
|
|
|
|
|
|
|
|
|
|
|
|
|
|
|
|
|
|
| |
|
Remaining Contractual Maturity of the Agreements |
| |
|
Overnight and Continuous |
|
Less Than 30 Days |
|
Between 30 & 90 Days |
|
Greater Than 90 Days |
|
Total |
| Securities Lending Transactions
Corporate Debt Securities |
|
|
|
$ 157,380 |
|
|
|
$ |
— |
|
|
|
$ |
— |
|
|
|
$ |
— |
|
|
|
|
$ 157,380 |
|
| Total Borrowings |
|
|
|
$ 157,380 |
|
|
|
$ |
— |
|
|
|
$ |
— |
|
|
|
$ |
— |
|
|
|
|
$ 157,380 |
|
| |
|
|
|
|
|
|
|
|
|
|
|
|
|
|
|
|
|
|
|
|
|
|
|
|
|
6. RISK EXPOSURES AND THE USE OF DERIVATIVE INSTRUMENTS
The Portfolio’s investment strategies allow the Portfolio to use various types of derivative contracts, including option contracts, swap agreements, futures contracts, and forward foreign currency contracts. Derivatives are investments whose value is primarily derived from underlying assets, indices or reference rates and may be transacted on an exchange or OTC.
Market Risk Factors: In pursuit of the Portfolio’s investment strategies, the Portfolio may seek to use derivatives to increase or decrease its exposure to certain market risks, including:
|
|
|
| Transamerica Series Trust |
|
Semi-Annual Financial Statements 2024 |
Page 11
Transamerica PineBridge Inflation Opportunities VP
NOTES TO FINANCIAL STATEMENTS (continued)
At June 30, 2024
(unaudited)
6. RISK EXPOSURES AND THE USE OF DERIVATIVE INSTRUMENTS (continued)
Interest rate risk: Interest rate risk relates to the fluctuations in the value of fixed income securities due to changes in the prevailing levels of market interest rates.
Foreign exchange rate risk: Foreign exchange rate risk relates to fluctuations in the value of an asset or liability due to changes in the currency exchange rates.
Equity risk: Equity risk relates to the change in value of equity securities as they relate to increases or decreases in the general market.
Credit risk: Credit risk relates to the ability of the issuer of a financial instrument to make further principal or interest payments on an obligation or commitment that it has to the Portfolio.
Commodity risk: Commodity risk relates to the change in value of commodities or commodity indices as they relate to increases or decreases in the commodities market. Commodities are physical assets that have tangible properties. Examples of these types of assets are crude oil, heating oil, metals, livestock, and agricultural products.
The Portfolio is also exposed to additional risks from investing in derivatives, such as liquidity and counterparty credit risk. Liquidity risk is the risk that the Portfolio will be unable to sell or close out the derivative in the open market in a timely manner. Counterparty credit risk is the risk that the counterparty will not be able to fulfill its obligations to the Portfolio. Investing in derivatives may also involve greater risks than investing directly in the underlying assets, such as losses in excess of any initial investment and collateral received. In addition, there may be the risk that the change in value of the derivative contract does not correspond to the change in value of the underlying instrument.
The Portfolio’s exposure to market risk factors and certain other associated risks are summarized by derivative type as follows:
Forward foreign currency contracts: The Portfolio is subject to foreign exchange rate risk exposure in the normal course of pursuing its investment objective. The Portfolio may enter into forward foreign currency contracts to hedge against exchange rate risk arising from investments in securities denominated in foreign currencies. Forward foreign currency contracts are marked-to-market daily, with the change in value recorded as an unrealized gain or loss and is shown in Unrealized appreciation (depreciation) on forward foreign currency contracts within the Statement of Assets and Liabilities. When the contracts are settled, a realized gain or loss is incurred and is shown in Net realized gain (loss) on forward foreign currency contracts within the Statement of Operations. Risks may arise from changes in market value of the underlying currencies and from the possible inability of counterparties to meet the terms of their contracts. Forward foreign currency contracts are traded in the OTC inter-bank currency dealer market.
Open forward foreign currency contracts at June 30, 2024 are listed within the Schedule of Investments.
The following is a summary of the location and the Portfolio’s fair values of derivative investments disclosed within the Statement of Assets and Liabilities, categorized by primary market risk exposure as of June 30, 2024.
|
|
|
|
|
|
|
|
|
|
|
|
|
|
|
|
|
|
|
|
|
|
|
|
|
|
|
|
|
|
|
| Asset Derivatives |
| Location |
|
Interest Rate Contracts |
|
Foreign Exchange Contracts |
|
Equity Contracts |
|
Credit Contracts |
|
Commodity Contracts |
|
Total |
| Forward foreign currency contracts:
Unrealized appreciation on forward
foreign currency contracts |
|
|
$ |
— |
|
|
|
$ |
394,217 |
|
|
|
$ |
— |
|
|
|
$ |
— |
|
|
|
$ |
— |
|
|
|
$ |
394,217 |
|
| Total |
|
|
$ |
— |
|
|
|
$ |
394,217 |
|
|
|
$ |
— |
|
|
|
$ |
— |
|
|
|
$ |
— |
|
|
|
$ |
394,217 |
|
| |
|
|
|
|
|
|
|
|
|
|
|
|
|
|
|
|
|
|
|
|
|
|
|
|
|
|
|
|
|
|
|
| Liability Derivatives |
| Location |
|
Interest Rate Contracts |
|
Foreign Exchange Contracts |
|
Equity Contracts |
|
Credit Contracts |
|
Commodity Contracts |
|
Total |
| Forward foreign currency contracts:
Unrealized depreciation on forward
foreign currency contracts |
|
|
$ |
— |
|
|
|
$ |
(85,981 |
) |
|
|
$ |
— |
|
|
|
$ |
— |
|
|
|
$ |
— |
|
|
|
$ |
(85,981 |
) |
| Total |
|
|
$ |
— |
|
|
|
$ |
(85,981 |
) |
|
|
$ |
— |
|
|
|
$ |
— |
|
|
|
$ |
— |
|
|
|
$ |
(85,981 |
) |
| |
|
|
|
|
|
|
|
|
|
|
|
|
|
|
|
|
|
|
|
|
|
|
|
|
|
|
|
|
|
|
|
|
|
| Transamerica Series Trust |
|
Semi-Annual Financial Statements 2024 |
Page 12
Transamerica PineBridge Inflation Opportunities VP
NOTES TO FINANCIAL STATEMENTS (continued)
At June 30, 2024
(unaudited)
6. RISK EXPOSURES AND THE USE OF DERIVATIVE INSTRUMENTS (continued)
The following is a summary of the location and the effect of derivative investments within the Statement of Operations, categorized by primary market risk exposure as of June 30, 2024.
|
|
|
|
|
|
|
|
|
|
|
|
|
|
|
|
|
|
|
|
|
|
|
|
|
|
|
|
|
|
|
| Realized Gain (Loss) on Derivative Instruments |
| Location |
|
Interest Rate Contracts |
|
Foreign Exchange Contracts |
|
Equity Contracts |
|
Credit Contracts |
|
Commodity Contracts |
|
Total |
| Forward foreign currency contracts |
|
|
$ |
— |
|
|
|
$ |
541,808 |
|
|
|
$ |
— |
|
|
|
$ |
— |
|
|
|
$ |
— |
|
|
|
|
$ 541,808 |
|
| Total |
|
|
$ |
— |
|
|
|
$ |
541,808 |
|
|
|
$ |
— |
|
|
|
$ |
— |
|
|
|
$ |
— |
|
|
|
|
$ 541,808 |
|
| |
|
|
|
|
|
|
|
|
|
|
|
|
|
|
|
|
|
|
|
|
|
|
|
|
|
|
|
|
|
|
|
| Net Change in Unrealized Appreciation (Depreciation) on Derivative Instruments |
| Location |
|
Interest Rate Contracts |
|
Foreign Exchange Contracts |
|
Equity Contracts |
|
Credit Contracts |
|
Commodity Contracts |
|
Total |
| Forward foreign currency contracts |
|
|
$ |
— |
|
|
|
$ |
1,494,186 |
|
|
|
$ |
— |
|
|
|
$ |
— |
|
|
|
$ |
— |
|
|
|
$ |
1,494,186 |
|
| Total |
|
|
$ |
— |
|
|
|
$ |
1,494,186 |
|
|
|
$ |
— |
|
|
|
$ |
— |
|
|
|
$ |
— |
|
|
|
$ |
1,494,186 |
|
| |
|
|
|
|
|
|
|
|
|
|
|
|
|
|
|
|
|
|
|
|
|
|
|
|
|
|
|
|
|
|
The following is a summary of the ending monthly average volume on derivative activity during the period ended June 30, 2024.
|
|
|
|
|
| Forward foreign currency exchange contracts: |
|
|
|
|
| Average contract amounts purchased — in USD |
|
|
$ 3,427,650 |
|
| Average contract amounts sold — in USD |
|
|
35,183,932 |
|
The Portfolio typically enters into International Swaps and Derivatives Association, Inc. Master Agreements (“ISDA Master Agreements”) or similar master agreements (collectively, “Master Agreements”) with its contract counterparties for certain OTC derivatives in order to, among other things, reduce credit risk to counterparties.
ISDA Master Agreements include provisions for general obligations, representations, collateral and events of default or termination. Under an ISDA Master Agreement, the Portfolio typically may offset with the counterparty certain OTC derivative financial instruments payables and/or receivables with collateral held and/or posted and create one single net payment (close-out netting) in the event of default, termination and/or potential deterioration in the credit quality of the counterparty.
Various Master Agreements govern the terms of certain transactions with counterparties and typically attempt to reduce the counterparty risk associated with such transactions by specifying credit protection mechanisms and providing standardization that improves legal certainty. Cross-termination provisions under Master Agreements typically provide that a default in connection with one transaction between the Portfolio and a counterparty gives the non-defaulting party the right to terminate any other transactions in place with the defaulting party to create one single net payment due to/due from the defaulting party and may be a feature in certain Master Agreements. In the event the Portfolio exercises its right to terminate a Master Agreement after a counterparty experiences a termination event as defined in the Master Agreement, the return of collateral with market value in excess of the Portfolio’s net liability may be delayed or denied.
Collateral requirements: Collateral or margin requirements are set by the broker or exchange clearing house for exchange-traded derivatives (futures contracts, exchange-traded options, and exchange-traded swap agreements) while collateral terms are contract specific for OTC derivatives (forward foreign currency exchange contracts, OTC options, and OTC swap agreements). For OTC derivatives, under standard derivatives agreements, the Portfolio may be required to pledge collateral on derivatives to a counterparty if the Portfolio is in a net liability position, and receive collateral if in a net positive position. For financial reporting purposes, cash collateral that has been pledged by the Portfolio to cover obligations, if any, is reported in Cash collateral at broker within the Statement of Assets and Liabilities. Cash collateral that has been received by the Portfolio from a counterparty, if any, is reported separately in Cash collateral pledged at custodian and/or broker within the Statement of Assets and Liabilities. Non-cash collateral pledged to the Portfolio, if any, is disclosed within the Schedule of Investments.
Generally, the amount of collateral due from or to a party must exceed a minimum transfer amount threshold before a transfer has been made. Typically a counterparty is not permitted to sell, re-pledge or use cash and non-cash collateral it receives. The Portfolio generally does not use non-cash collateral that it receives but may, absent default or certain other circumstances, be permitted to use cash collateral received. In such cases, interest may be paid pursuant to the collateral arrangement with the counterparty.
To the extent amounts due to the Portfolio from its counterparties are not fully collateralized, contractually or otherwise, the Portfolio bears the risk of loss from counterparty non-performance. Additionally, to the extent the Portfolio has delivered collateral to a counterparty, the Portfolio bears the risk of loss from a counterparty in the event the counterparty fails to return such collateral. Counterparties may immediately terminate derivatives contracts if the Portfolio fails to maintain sufficient asset coverage for its contracts or its net assets decline by stated percentages. Collateral may not be required for all derivative contracts.
|
|
|
| Transamerica Series Trust |
|
Semi-Annual Financial Statements 2024 |
Page 13
Transamerica PineBridge Inflation Opportunities VP
NOTES TO FINANCIAL STATEMENTS (continued)
At June 30, 2024
(unaudited)
7. RISK FACTORS
Investing in the Portfolio involves certain key risks related to the Portfolio’s trading activity. Please reference the Portfolio’s prospectus for a more complete discussion of the following risk(s), as well as other risks of investing in the Portfolio.
Market risk: The market prices of the Portfolio’s securities or other assets may go up or down, sometimes rapidly or unpredictably, due to factors such as economic events, inflation, changes in interest rates, governmental actions or interventions, actions taken by the U.S. Federal Reserve or foreign central banks, market disruptions caused by tariffs, trade disputes or other factors, political developments, armed conflicts, economic sanctions, cybersecurity events, investor sentiment, the global and domestic effects of widespread or local health, weather or climate events, and other factors that may or may not be related to the issuer of the security or other asset. If the market prices of the Portfolio’s securities and assets fall, the value of your investment in the Portfolio could go down.
Economies and financial markets throughout the world are increasingly interconnected. Events or circumstances in one or more countries or regions could be highly disruptive to, and have profound impacts on, global economies or markets. As a result, whether or not the Portfolio invests in securities of issuers located in or with significant exposure to the countries directly affected, the value and liquidity of the Portfolio’s investments may go down.
Inflation-protected securities risk: Inflation-protected debt securities may react differently from other types of debt securities and tend to react to changes in “real” interest rates, which represent nominal (stated) interest rates reduced by the expected impact of inflation. In general, the price of an inflation-protected debt security can fall when real interest rates rise, and can rise when real interest rates fall. Interest payments on inflation-protected debt securities can be unpredictable and will vary as the principal and/or interest is adjusted for inflation.
Interest rate risk: The value of fixed-income securities generally goes down when interest rates rise. A rise in rates tends to have a greater impact on the prices of longer term or duration securities. Changes in interest rates also may affect the liquidity of the Portfolio’s investments. A general rise in interest rates may cause investors to sell fixed-income securities on a large scale, which could adversely affect the price and liquidity of fixed-income securities generally and could also result in increased redemptions from the Portfolio. Increased redemptions could cause the Portfolio to sell securities at inopportune times or depressed prices and result in further losses. The U.S. Federal Reserve has raised interest rates from historically low levels. Any additional interest rate increases in the future may cause the value of fixed-income securities to decrease.
8. FEES AND OTHER AFFILIATED TRANSACTIONS
TST serves as a funding vehicle for certain affiliated asset allocation portfolios and certain affiliated separate accounts of Transamerica Life Insurance Company (“TLIC”) and Transamerica Financial Life Insurance Company.
TAM, the Portfolio’s investment manager, is directly owned by TLIC and AUSA Holding, LLC (“AUSA”), both of which are indirect, wholly owned subsidiaries of Aegon Ltd. TLIC is owned by Commonwealth General Corporation (“Commonwealth”). Commonwealth and AUSA are wholly owned by Transamerica Corporation (DE). Transamerica Corporation (DE) is wholly owned by Aegon International B.V., which is wholly owned by Aegon Ltd., a Bermuda exempted company with liability limited by shares (formerly, Aegon NV, a Netherlands corporation) and a publicly traded international insurance group.
Transamerica Fund Services, Inc. (“TFS”) is the Portfolio’s transfer agent. Transamerica Capital, Inc. (“TCI”) is the Portfolio’s distributor/principal underwriter. TAM, TFS and TCI are affiliates of Aegon Ltd.
Certain officers and trustees of the Portfolio may also be officers and/or trustees of TAM, TFS and TCI. No interested trustee who is deemed an interested person due to current or former service with TAM or an affiliate of TAM receives compensation from the Portfolio. The Portfolio does pay non-interested persons (independent trustees), as disclosed in Trustee and CCO fees within the Statement of Operations.
Investment management fees: TAM serves as the Portfolio’s investment manager, performing administration as well as investment advisory services. TAM renders investment advisory, supervisory, and administration services under an investment management agreement and the Portfolio pays a single management fee, which is reflected in Investment management fees within the Statement of Operations.
The Portfolio pays a management fee to TAM based on daily average net assets at the following rates:
|
|
|
|
|
|
| Breakpoints |
|
Rate |
| First $100 million |
|
|
|
0.430 |
% |
| Over $100 million up to $500 million |
|
|
|
0.380 |
|
| Over $500 million up to $750 million |
|
|
|
0.375 |
|
| Over $750 million |
|
|
|
0.370 |
|
TAM has contractually agreed to waive fees and/or reimburse Portfolio expenses to the extent that the total operating expenses excluding, as applicable, acquired fund fees and expenses, interest (including borrowing costs and overdraft charges), taxes, brokerage commissions, dividend and interest expenses on securities sold short, extraordinary expenses and other expenses not incurred in the ordinary course of the Portfolio’s business, exceed the following stated annual operating expense limits to the Portfolio’s daily average net
Transamerica Series Trust
Semi-Annual Financial Statements 2024
Page 14
Transamerica PineBridge Inflation Opportunities VP
NOTES TO FINANCIAL STATEMENTS (continued)
At June 30, 2024
(unaudited)
8. FEES AND OTHER AFFILIATED TRANSACTIONS (continued)
assets. To the extent an expense limit changed during the period, the prior limit is also listed below. The expenses waived and/or reimbursed, if any, are included in Expenses waived and/or reimbursed within the Statement of Operations.
|
|
|
|
|
|
|
| Class |
|
Operating Expense Limit |
|
|
Operating Expense Limit Effective Through |
| Initial Class |
|
|
0.63 |
% |
|
May 1, 2025 |
| Service Class |
|
|
0.88 |
|
|
May 1, 2025 |
TAM is permitted to recapture amounts contractually waived and/or reimbursed to a class during any of the 36 months from the date on which TAM waived fees and/or reimbursed expenses for the class. A class may recapture and reimburse TAM only if such amount does not cause, on any particular business day of the Portfolio, the class’s total annual operating expenses (after the recapture is taken into account) to exceed the Operating Expense Limits or any other lower limit then in effect. Amounts recaptured, if any, by TAM for the period ended June 30, 2024 are disclosed in Recapture of previously waived and/or reimbursed fees within the Statement of Operations.
TAM, on a voluntary basis and in addition to the contractual operating expense limits in effect, from time to time may waive and/or reimburse expenses of the Portfolio, or any classes thereof, to such level(s) as the Trust’s officers have determined or may reasonably determine from time to time. Any such voluntary waiver or expense reimbursement may be discontinued by TAM at any time. These amounts are not subject to recapture by TAM.
As of June 30, 2024, there are no amounts available for recapture by TAM.
Distribution and service fees: TST has a distribution plan (“Distribution Plan”) pursuant to Rule 12b-1 under the 1940 Act. Pursuant to the Distribution Plan, TST entered into a distribution agreement with TCI as the Portfolio’s distributor.
The Distribution Plan requires the Portfolio to pay distribution fees to TCI as compensation for various distribution activities, not as reimbursement for specific expenses. Under the Distribution Plan and distribution agreement, TCI, on behalf of the Portfolio, is authorized to pay various service providers, as direct payment for expenses incurred in connection with distribution of the Portfolio’s shares.
The fee on the Service Class shares is paid to the insurance companies for providing services and account maintenance for the policyholders who invest in the variable insurance products which invest in the Service Class shares. TCI has determined that it will not seek payment for the distribution expenses incurred by the Portfolio with respect to the Initial Class shares before May 1, 2025. Prior to TCI seeking distribution expenses on Initial Class shares, policy and contract owners will be notified in advance. The Portfolio will pay fees relating to Service Class shares. The distribution and service fees are included in Distribution and service fees within the Statement of Operations.
The Portfolio is authorized under the Distribution Plan to pay fees to TCI based on daily average net assets of each applicable class up to the following annual rates:
|
|
|
|
|
|
|
|
|
| Class |
|
Rate |
|
|
|
|
| Initial Class |
|
|
0.15 |
% |
|
|
|
|
| Service Class |
|
|
0.25 |
|
|
|
|
|
Transfer agent costs: TFS provides transfer agency services under an intercompany agreement with TAM. TFS has outsourced the provision of certain sub-transfer agency services to SS&C Global Investor & Distribution Solutions, Inc. (“SS&C GIDS”). The Portfolio does not pay a separate transfer agent fee to TAM or TFS but does pay certain expenses to SS&C GIDS related to applicable sub-transfer agency services. For the period ended June 30, 2024, (i) the expenses paid to SS&C GIDS by the Portfolio are referred to as transfer agent costs and are included within the Statement of Operations and (ii) the expenses payable to SS&C GIDS by the Portfolio are referred to as transfer agent costs within the Statement of Assets and Liabilities.
Brokerage commissions: The Portfolio incurred no brokerage commissions on security transactions placed with affiliates of the investment manager or sub-adviser(s) for the period ended June 30, 2024.
9. PURCHASES AND SALES OF SECURITIES
For the period ended June 30, 2024, the cost of securities purchased and proceeds from securities sold (excluding short-term securities) are as follows:
|
|
|
|
|
|
|
|
|
| Purchases of Securities |
|
|
|
Sales/Maturities of Securities |
| Long-Term |
|
U.S. Government |
|
|
|
Long-Term |
|
U.S. Government |
| $ 10,642,501 |
|
$ 5,837,509 |
|
|
|
$ 19,737,767 |
|
$ 9,850,406 |
10. FEDERAL INCOME TAXES AND DISTRIBUTIONS TO SHAREHOLDERS
The Portfolio has not made any provision for federal income or excise taxes due to its policy to distribute all of its taxable income and capital gains to its shareholders and otherwise qualify as a regulated investment company under Subchapter M of the Internal Revenue
|
|
|
|
|
| Transamerica Series Trust |
|
|
|
Semi-Annual Financial Statements 2024 |
|
|
Page 15 |
|
|
Transamerica PineBridge Inflation Opportunities VP
NOTES TO FINANCIAL STATEMENTS (continued)
At June 30, 2024
(unaudited)
10. FEDERAL INCOME TAXES AND DISTRIBUTIONS TO SHAREHOLDERS (continued)
Code. The Portfolio recognizes the tax benefits of uncertain tax positions only where the position is “more likely than not” to be sustained assuming examination by tax authorities. The Portfolio’s tax returns remain subject to examination by the Internal Revenue Service and state tax authorities three years from the date of filing for federal purposes and four years from the date of filing for state purposes. Management has evaluated the Portfolio’s tax provisions taken for all open tax years, and has concluded that no provision for income tax is required in the Portfolio’s financial statements. If applicable, the Portfolio recognizes interest accrued related to unrecognized tax benefits in relation to interest and penalties expense in Other within the Statement of Operations. The Portfolio identifies its major tax jurisdictions as U.S. Federal, the state of Colorado, and foreign jurisdictions where the Portfolio makes significant investments; however, the Portfolio is not aware of any tax positions for which it is reasonably possible that the total amounts of unrecognized tax benefits will change materially in the next twelve months. Distributions are determined in accordance with income tax regulations, which may differ from GAAP.
As of June 30, 2024, the approximate cost for U.S. federal income tax purposes, and the aggregate gross/net unrealized appreciation (depreciation) in the value of investments (including securities sold short and derivatives, if any) are as follows:
|
|
|
|
|
|
|
|
|
|
|
| |
|
Cost |
|
Gross Appreciation |
|
Gross (Depreciation) |
|
Net Appreciation (Depreciation) |
|
|
|
|
$ 121,341,506 |
|
$ 1,117,389 |
|
$ (11,397,928) |
|
$ (10,280,539) |
|
|
Please see TST’s most recent report on Form N-CSR, available at: www.transamerica.com/annuities/prospectus, for additional information. For the most recently filed complete proxy voting records for the Trust please visit: https://www.transamerica.com/sites/default/files/files/e070d/TST%20N-PX%202021.pdf
|
|
|
|
|
| Transamerica Series Trust |
|
|
|
Semi-Annual Financial Statements 2024 |
|
|
Page 16 |
|
|
Transamerica PineBridge Inflation Opportunities VP
MANAGEMENT AND SUB-ADVISORY AGREEMENT — CONTRACT RENEWAL
(unaudited)
At a meeting of the Board of Trustees of Transamerica Series Trust (the “Trustees” or the “Board”) held on June 12-13, 2024, the Board considered the renewal of the management agreement (the “Management Agreement”) between Transamerica Asset Management, Inc. (“TAM”) and Transamerica Series Trust, on behalf of Transamerica PineBridge Inflation Opportunities VP (the “Portfolio”). The Board also considered the renewal of the investment sub-advisory agreement (the “Sub-Advisory Agreement” and together with the Management Agreement, the “Agreements”) for the Portfolio between TAM and PineBridge Investments LLC (the “Sub-Adviser”).
Following its review and consideration, the Board determined that the terms of the Management Agreement and Sub-Advisory Agreement were reasonable and that the renewal of each of the Agreements was in the best interests of the Portfolio and the holders invested in the Portfolio. The Board, including the independent members of the Board (the “Independent Trustees”), unanimously approved the renewal of each of the Agreements through June 30, 2025.
Prior to reaching their decision, the Trustees requested and received from TAM and the Sub-Adviser certain information. They then reviewed such information as they deemed reasonably necessary to evaluate the Agreements, including information they had previously received from TAM and the Sub-Adviser as part of their regular oversight of the Portfolio, and knowledge they gained over time through meeting with TAM and the Sub-Adviser. Among other materials, the Trustees considered comparative fee, expense and performance information prepared by Broadridge Financial Solutions, Inc. (“Broadridge”), an independent provider of mutual fund performance information, as well as fee, expense and profitability information prepared by TAM. To the extent applicable, the Trustees considered information about fees and performance of comparable funds and/or accounts managed by the Sub-Adviser. The Board also considered reductions to the Portfolio’s expense limits, if any, that took effect after the last renewal of the Agreements. In their review, the Trustees also sought to identify instances in which the Portfolio’s performance, fees, total expenses and/or profitability appeared to be outliers within its respective peer group or other comparative metrics and sought to understand the reasons for such comparative positions.
In their deliberations, the Independent Trustees met privately without representatives of TAM or the Sub-Adviser present and were represented throughout the process by their independent legal counsel. In considering the proposed continuation of each of the Agreements, the Trustees evaluated and weighed a number of considerations that they believed to be relevant in light of the legal advice furnished to them by counsel, including independent legal counsel, and made a decision in the exercise of their own business judgment. They based their decisions on the considerations discussed below, among others, although they did not identify any particular consideration or item of information that was controlling of their decisions, and each Trustee may have attributed different weights to the various factors.
Nature, Extent and Quality of the Services Provided
The Board considered the nature, extent and quality of the services provided by TAM and the Sub-Adviser to the Portfolio in the past and the services anticipated to be provided in the future. The Board also considered the investment approach for the Portfolio; the experience, capability and integrity of TAM’s senior management; the financial resources of TAM; TAM’s management oversight process; TAM’s and the Sub-Adviser’s responsiveness to any questions by the Trustees; and the professional qualifications and compensation program of the portfolio management team of the Sub-Adviser. The Trustees noted that they receive, on a quarterly basis, an execution analysis from Capital Institutional Services, Inc. (CAPIS), an independent provider of trade analyses, for the Sub-Adviser and a comparison of trading results against a peer universe of managers.
The Board also considered the continuous and regular investment management and other services provided by TAM, when acting as a manager of managers, for the portion of the management fee it retains from the Portfolio after payment of the sub-advisory fees. The Board noted that the investment management and other services provided by TAM include the design, development and ongoing review and evaluation of the Portfolio and its investment strategy; the selection, oversight and monitoring of one or more investment sub-advisers to perform certain duties with respect to the Portfolio; ongoing portfolio trading oversight and analysis; risk management oversight and analysis; design, development, implementation and ongoing review and evaluation of a process for the valuation of Portfolio investments; design, development, implementation and ongoing review and evaluation of a compliance program for the Portfolio; design, development, implementation and ongoing review and evaluation of a process for the voting of proxies and exercise of rights to consent to corporate action for Portfolio investments; participation in Board meetings and oversight of preparation of materials for the Board, including materials for Board meetings and regular communications with the Board; oversight of preparation of the Portfolio’s prospectus, statement of additional information, shareholder reports and other disclosure materials and regulatory filings for the Portfolio; and ongoing cash management services for the Portfolio. The Board considered that TAM’s investment management services also include the provision of supervisory and administrative services to the Portfolio. The Board also noted that TAM, as part of the services it provides to all Transamerica mutual funds, including the Portfolio, oversees the services provided by the funds’ custodian, transfer agent, independent accountant and legal counsel and supervises the performance of the recordkeeping and holder service functions of the funds.
Investment Performance
In addition, the Board considered the short- and longer-term performance of the Portfolio in light of its investment objective, policies and strategies, including relative performance against (i) a peer universe of comparable mutual funds, as prepared by Broadridge, and (ii) the Portfolio’s benchmarks, in each case for various trailing periods ended December 31, 2023. Based on these considerations, the Board determined that TAM and the Sub-Adviser can provide investment and related services that are appropriate in scope and extent in light of the Portfolio’s investment objectives, policies and strategies and operations, the competitive landscape of the investment company
|
|
|
|
|
| Transamerica Series Trust |
|
|
|
Semi-Annual Financial Statements 2024 |
|
|
Page 17 |
|
|
Transamerica PineBridge Inflation Opportunities VP
MANAGEMENT AND SUB-ADVISORY AGREEMENT — CONTRACT RENEWAL (continued)
(unaudited)
business and investor needs. The Board’s conclusions as to the Portfolio’s performance are summarized below. For purposes of its review, the Board generally used the performance of Service Class Shares. In describing the Portfolio’s performance relative to its peer universe, the summary conclusions characterize performance for the relevant periods in relation to whether it was “above,” “below” or “in line with” the peer universe median and do so using quintile rankings prepared by Broadridge. For simplicity, performance is described as “above” the median if the Portfolio’s performance ranked anywhere in the first or second quintiles, as “below” the median if it ranked anywhere in the fourth or fifth quintiles, or “in line with” the median if it ranked anywhere in the third quintile (i.e., even if its precise return was somewhat above or somewhat below the precise median return).
When considering the Portfolio’s performance, the Trustees considered any representations made by TAM regarding the appropriateness of certain peer groups and benchmarks. They recognized that performance reflects a snapshot of a period as of a specific date, and that consideration of performance data for a different period could generate significantly different performance results. The Trustees also recognized that even longer-term performance can be negatively affected by performance over a short-term period when that short-term performance is significantly below the performance of the comparable benchmark or universe of peer funds.
The Board noted that the performance of Service Class Shares of the Portfolio was above the median for its peer universe for the past 1- and 3-year periods, in line with the median for the past 5-year period and below the median for the past 10-year period. The Board also noted that the performance of Service Class Shares of the Portfolio was above the benchmark that TAM utilizes to measure performance of the Portfolio for the past 1- and 3-year periods and below the benchmark for the past 5- and 10-year periods. The Board noted that the Sub-Adviser had commenced sub-advising the Portfolio on November 10, 2014 pursuant to its current investment objective and investment strategies and used a different benchmark. The Trustees also noted recent organizational changes at the Sub-Adviser. The Trustees noted that TAM intends to monitor and report to the Board on the organizational transition and performance going forward.
Management Fee and Sub-Advisory Fees and Total Expense Ratio
The Board considered the management fee and total expense ratio of the Portfolio, including information provided by Broadridge comparing the management fee and total expense ratio of the Portfolio to the management fees and total expense ratios of comparable investment companies in both a peer group and broader peer universe compiled by Broadridge. The Board’s conclusions as to the Portfolio’s management fee and total expense ratio are summarized below. For purposes of its review, the Board generally used the actual total expenses (i.e., expenses reflecting any waivers and/or reimbursements) of Service Class Shares. In describing the Portfolio’s management fee and total expense ratio relative to its peer group and peer universe, the summary conclusions characterize management fees and total expense ratios for the relevant periods in relation to whether they were “above,” “below” or “in line with” the peer group or peer universe median and do so using quintile rankings prepared by Broadridge. For simplicity, management fees and total expense ratios are described as “above” the median if the Portfolio’s management fee or total expense ratio ranked anywhere in the fourth or fifth quintiles, as “below” the median if it ranked anywhere in the first or second quintiles, or “in line with” the median if it ranked anywhere in the third quintile (i.e., even if its precise management fee or total expense ratio was somewhat above or somewhat below the precise median management fee or total expense ratio).
The Board also considered the fees charged by the Sub-Adviser for sub-advisory services, as well as the portion of the Portfolio’s management fee retained by TAM following payment of the sub-advisory fee and how the portion of the contractual management fee retained by TAM at a specified asset level compared to the portions retained by other investment advisers managing mutual funds with similar investment strategies as calculated by an independent provider of information.
The Board noted that the Portfolio’s contractual management fee was below the medians for its peer group and peer universe and that the actual total expenses (i.e., expenses reflecting any waivers and/or reimbursements) of Service Class Shares of the Portfolio were above the medians for its peer group and peer universe. The Trustees also considered that TAM has entered into an expense limitation arrangement with the Portfolio, which may result in TAM waiving fees for the benefit of holders. The Trustees noted that they had previously approved a reduction to the Portfolio’s management fee schedule, which took effect on November 1, 2023 and was not fully reflected in the comparative data.
On the basis of these considerations, together with the other information it considered, the Board determined that the management and sub-advisory fees to be received by TAM and the Sub-Adviser under the Management Agreement and Sub-Advisory Agreement are reasonable in light of the services provided.
Cost of Services Provided and Level of Profitability
The Board reviewed information provided by TAM about the cost of providing and procuring fund management services, as well as the costs of the provision of administration, transfer agency and other services, to the Portfolio and to Transamerica Series Trust as a whole by TAM and its affiliates. The Board considered the profitability of TAM and its affiliates in providing these services for the Portfolio and Transamerica Series Trust as a whole. The Trustees recognized the competitiveness of the mutual fund industry and the importance of an investment adviser’s long-term profitability, including for maintaining company and management stability and accountability.
The Board also considered the allocation methodology used for calculating the profitability of TAM and its affiliates. The Board noted that the revenue and expense allocation methodology used by TAM to estimate its profitability with respect to its relationship with the Portfolio
|
|
|
|
|
| Transamerica Series Trust |
|
|
|
Semi-Annual Financial Statements 2024 |
|
|
Page 18 |
|
|
Transamerica PineBridge Inflation Opportunities VP
MANAGEMENT AND SUB-ADVISORY AGREEMENT — CONTRACT RENEWAL (continued)
(unaudited)
had been reviewed previously by an independent consultant. The Trustees considered that TAM reported that it had not made material changes to this methodology, and that the methodology had been applied consistently for the Portfolio.
With respect to the Sub-Adviser, the Board noted that the sub-advisory fee is the product of arm’s-length negotiation between TAM and the Sub-Adviser, which is not affiliated with TAM, and is paid by TAM and not the Portfolio. As a result, the Board focused on the profitability of TAM and its affiliates with respect to the Portfolio.
Based on this information, the Board determined that the profitability of TAM and its affiliates from their relationships with the Portfolio was not excessive.
Economies of Scale
The Board considered economies of scale with respect to the management of the Portfolio, whether the Portfolio had appropriately benefited from any economies of scale and whether there was the potential for realization of any future economies of scale. The Board also considered the existence of economies of scale with respect to management of the Transamerica mutual funds overall and the extent to which the Portfolio benefited from any economies of scale. The Board recognized that, as the Portfolio’s assets increase, any economies of scale realized by TAM or the Sub-Adviser may not directly correlate with each other or with any economies of scale that might be realized by the Portfolio. The Board considered the Portfolio’s management fee schedule and the existence of breakpoints and also considered the extent to which TAM shared economies of scale, if any, with the Portfolio through undertakings to limit or reimburse Portfolio expenses and to invest in maintaining and developing its capabilities and services. The Board also considered the Sub-Adviser’s sub-advisory fee schedule and the existence of breakpoints, if any, and how such breakpoints relate to any breakpoints in the Portfolio’s management fee schedule. The Board considered that the Sub-Adviser’s sub-advisory fees would be based on the combined assets of multiple funds. The Trustees concluded that the Portfolio’s fee structure reflected an appropriate sharing of any efficiencies or economies of scale to date and noted that they will have the opportunity to periodically reexamine the appropriateness of the management fee payable to TAM and the fee paid to the Sub-Adviser in light of any economies of scale experienced in the future.
Benefits to TAM, its Affiliates and/or the Sub-Adviser from their Relationships with the Portfolio
The Board considered other benefits derived by TAM, its affiliates, and/or the Sub-Adviser from their relationships with the Portfolio. The Board noted that TAM does not receive benefits from research obtained with commissions paid to broker-dealers for portfolio transactions (commonly referred to as “soft dollars”) as a result of its relationship with the Portfolio.
Other Considerations
The Board noted that TAM has made a substantial commitment to the recruitment and retention of high-quality personnel and maintains the financial, compliance and operational resources reasonably necessary to manage the Portfolio in a professional manner that is consistent with the best interests of the Portfolio and the holders. In this regard, the Board favorably considered the procedures and policies TAM has in place to enforce compliance with applicable laws and regulations and oversee the portfolio management activities of the Sub-Adviser. The Board also noted that TAM has made an entrepreneurial commitment and undertaken certain business risks with respect to the management and success of the Portfolio.
Conclusion
After consideration of the factors described above, as well as other factors, the Trustees, including the Independent Trustees, concluded that the renewal of the Management Agreement and the Sub-Advisory Agreement was in the best interests of the Portfolio and the holders and voted to approve the renewal of the Agreements.
|
|
|
|
|
| Transamerica Series Trust |
|
|
|
Semi-Annual Financial Statements 2024 |
|
|
Page 19 |
|
|
PROXY VOTING POLICIES AND PROCEDURES AND QUARTERLY PORTFOLIO HOLDINGS
(unaudited)
A description of Transamerica Series Trust’s (the “Trust”) proxy voting policies and procedures is available in the Statement of Additional Information of the Portfolios, available without charge upon request by calling 1-800-851-9777 (toll free) or on the Securities and Exchange Commission’s (“SEC”) website at http://www.sec.gov.
In addition, the Portfolio is required to file Form N-PX, with their complete proxy voting records for the most recent 12 months ended June 30th, no later than August 31st of each year. The Form is available without charge: (1) on the Transamerica Funds website at https://www.transamerica.com/sites/default/files/files/e070d/TST%20N-PX%202021.pdf; and (2) on the SEC’s website at http://www.sec.gov.
Each fiscal quarter, the Portfolios, except Transamerica BlackRock Government Money Market VP, will file with the SEC a complete schedule of its monthly portfolio holdings on Form N-PORT. The Portfolios’ holdings as of the end of the third month of every fiscal quarter, as reported on Form N-PORT, will be publicly available on the SEC’s website at http://www.sec.gov within 60 days of the end of the fiscal quarter.
On a monthly basis, Transamerica BlackRock Government Money Market VP will file with the SEC portfolio holdings information on Form N-MFP3. A complete schedule of portfolio holdings is also available at www.transamerica.com.
You may also visit the Trust’s website at www.transamerica.com/annuities/prospectus for this and other information about the Portfolios and the Trust.
Important Notice Regarding Delivery of Shareholder Documents
Every year we provide shareholders informative materials such as the Transamerica Series Trust Annual Report, the Transamerica Series Trust Prospectus, and other required documents that keep you informed regarding your Portfolios. To the extent provided by mail, Transamerica Series Trust will only send one piece per mailing address, a method that saves your Portfolios money by reducing mailing and printing costs. We will continue to do this unless you tell us not to. To elect to receive individual mailings, simply call a Transamerica Customer Service Representative toll free at 1-800-851-9777, 8 a.m. to 7 p.m. Eastern Time, Monday-Friday. Your request will take effect within 30 days.
|
|
|
| Transamerica Series Trust |
|
Semi-Annual Financial Statements 2024 |
Page 20
NOTICE OF PRIVACY POLICY
(unaudited)
Your privacy is very important to us. We want you to understand what information we collect and how we use it. We collect and use “nonpublic personal information” in connection with providing our customers with a broad range of financial products and services as effectively and conveniently as possible. We treat nonpublic personal information in accordance with our Privacy Policy.
What Information We Collect and From Whom We Collect It
We may collect nonpublic personal information about you from the following sources:
| • |
|
Information we receive from you on applications or other forms, such as your name, address, and account number; |
| • |
|
Information about your transactions with us, our affiliates, or others, such as your account balance and purchase/redemption history; and |
| • |
|
Information we receive from non-affiliated third parties, including consumer reporting agencies. |
What Information We Disclose and To Whom We Disclose It
We do not disclose any nonpublic personal information about current or former customers to anyone without their express consent, except as permitted by law. We may disclose the nonpublic personal information we collect, as described above, to persons or companies that perform services on our behalf and to other financial institutions with which we have joint marketing agreements. We will require these companies to protect the confidentiality of your nonpublic personal information and to use it only to perform the services for which we have hired them.
Our Security Procedures
We restrict access to your nonpublic personal information and only allow disclosures to persons and companies as permitted by law to assist in providing products or services to you. We maintain physical, electronic, and procedural safeguards to protect your nonpublic personal information and to safeguard the disposal of certain consumer information.
Contact Us
If you have any questions about our Privacy Policy, please call 1-800-851-9777 on any business day between 8 a.m. and 7 p.m. Eastern Time.
Note: This Privacy Policy applies only to customers that have a direct relationship with us or our affiliates. If you own shares of our portfolios in the name of a third party such as a bank or broker-dealer, its privacy policy may apply to you instead of ours.
|
|
|
| Transamerica Series Trust |
|
Semi-Annual Financial Statements 2024 |
Page 21
PO Box 219945
Kansas City, MO 64121-9945
|
|
|
| Distributor: |
|
Transamerica Capital, Inc. |
|
|
PO Box 219945 |
|
|
Kansas City, MO 64121-9945 |
|
|
|
|
Customer Service: 1-800-851-9777 |
Transamerica Series Trust Semi-Annual Financial Statements
June 30, 2024
1801 California St., Suite 5200
Denver, CO 80202
Distributor: Transamerica Capital, Inc.
Customer Service: 1-800-851-9777
The following pages contain the most recent semi-annual financial statements for the investment options in which you are invested. In compliance with Securities and Exchange Commission regulations, we present these reports on an annual and semi-annual basis with the hope that they will foster greater understanding of the investment options’ holdings, performance, financial data, accounting policies and other issues. This streamlined version provides information only on the investment options in which you are invested.
If you have any questions about these reports, please do not hesitate to contact your financial professional. As always, we thank you for your trust and the opportunity to serve you.
Transamerica ProFund UltraBear VP
SCHEDULE OF INVESTMENTS
At June 30, 2024
(unaudited)
|
|
|
|
|
|
|
|
|
| |
|
Shares |
|
|
Value |
|
| SHORT-TERM INVESTMENT COMPANIES - 72.0% |
|
| Money Market Funds - 72.0% |
|
| BlackRock Liquidity Funds T-Fund,
5.18% (A) |
|
|
2,991,425 |
|
|
$ |
2,991,425 |
|
| Dreyfus Treasury & Agency Cash
Management Fund,
5.18% (A) |
|
|
3,006,517 |
|
|
|
3,006,517 |
|
| State Street Institutional U.S. Government
Money Market Fund,
5.25% (A) |
|
|
2,991,425 |
|
|
|
2,991,425 |
|
| UBS Select Treasury Preferred Fund,
5.24% (A) |
|
|
2,991,425 |
|
|
|
2,991,425 |
|
|
|
|
|
|
|
|
|
|
| Total Short-Term Investment Companies
(Cost $11,980,792) |
|
|
|
|
|
|
11,980,792 |
|
|
|
|
|
|
|
|
|
|
|
|
|
|
|
|
|
|
|
| |
|
Principal |
|
|
Value |
|
| REPURCHASE AGREEMENT—18.0% |
|
| Fixed Income Clearing Corp.,
2.50% (A), dated 06/28/2024, to be
repurchased at $2,992,049 on 07/01/2024.
Collateralized by a U.S. Government
Obligation, 4.50%, due 03/31/2026, and
with a value of $3,051,384. |
|
|
$ 2,991,425 |
|
|
$ |
2,991,425 |
|
|
|
|
|
|
|
|
|
|
| Total Repurchase Agreement
(Cost $2,991,425) |
|
|
|
|
|
|
2,991,425 |
|
|
|
|
|
|
|
|
|
|
| Total Investments
(Cost $14,972,217) |
|
|
|
|
|
|
14,972,217 |
|
|
|
|
|
|
|
|
|
|
| Net Other Assets (Liabilities)—10.0% |
|
|
|
|
|
|
1,662,515 |
|
|
|
|
|
|
|
|
|
|
|
|
|
| Net Assets—100.0% |
|
|
|
|
|
$ |
16,634,732 |
|
|
|
|
|
|
|
FUTURES CONTRACTS:
Short Futures Contracts
|
|
|
|
|
|
|
|
|
|
|
|
|
| Description |
|
Number of Contracts |
|
Expiration Date |
|
Notional Amount |
|
Value |
|
Unrealized Appreciation |
|
Unrealized Depreciation |
| S&P 500® E-Mini Index |
|
(119) |
|
09/20/2024 |
|
$(32,680,414) |
|
$(32,852,925) |
|
$— |
|
$(172,511) |
INVESTMENT VALUATION:
Valuation Inputs (B)
|
|
|
|
|
|
|
|
|
|
|
|
|
|
|
|
|
| |
|
Level 1 - Unadjusted Quoted Prices |
|
|
Level 2 - Other Significant Observable Inputs |
|
|
Level 3 - Significant Unobservable Inputs |
|
|
Value |
|
| ASSETS |
|
|
|
|
|
|
|
|
|
|
|
|
|
|
|
|
| Investments |
|
|
|
|
|
|
|
|
|
|
|
|
|
|
|
|
| Short-Term Investment Companies |
|
$ |
11,980,792 |
|
|
$ |
— |
|
|
$ |
— |
|
|
$ |
11,980,792 |
|
| Repurchase Agreement |
|
|
— |
|
|
|
2,991,425 |
|
|
|
— |
|
|
|
2,991,425 |
|
|
|
|
|
|
|
|
|
|
|
|
|
|
|
|
|
|
| Total Investments |
|
$ |
11,980,792 |
|
|
$ |
2,991,425 |
|
|
$ |
— |
|
|
$ |
14,972,217 |
|
|
|
|
|
|
|
|
|
|
|
|
|
|
|
|
|
|
|
|
|
|
|
| LIABILITIES |
|
|
|
|
|
|
|
|
|
|
|
|
|
|
|
|
| Other Financial Instruments |
|
|
|
|
|
|
|
|
|
|
|
|
|
|
|
|
| Futures Contracts (C) |
|
$ |
(172,511 |
) |
|
$ |
— |
|
|
$ |
— |
|
|
$ |
(172,511 |
) |
|
|
|
|
|
|
|
|
|
|
|
|
|
|
|
|
|
| Total Other Financial Instruments |
|
$ |
(172,511 |
) |
|
$ |
— |
|
|
$ |
— |
|
|
$ |
(172,511 |
) |
|
|
|
|
|
|
|
|
|
|
|
|
|
|
|
|
|
FOOTNOTES TO SCHEDULE OF INVESTMENTS:
| (A) |
Rate disclosed reflects the yield at June 30, 2024. |
| (B) |
There were no transfers in or out of Level 3 during the period ended June 30, 2024. Please reference the Investment Valuation section of the Notes to Financial Statements for more information regarding investment valuation and pricing inputs. |
| (C) |
Derivative instruments are valued at unrealized appreciation (depreciation). |
The Notes to Financial Statements are an integral part of this report.
|
|
|
|
|
| Transamerica Series Trust |
|
|
|
Semi-Annual Financial Statements 2024 |
|
|
Page 1 |
|
|
Transamerica ProFund UltraBear VP
|
|
|
| STATEMENT OF ASSETS AND LIABILITIES At June 30, 2024 (unaudited) |
|
STATEMENT OF OPERATIONS For the period ended June 30, 2024 (unaudited) |
|
|
|
|
|
|
|
| Assets: |
|
|
|
|
| Unaffiliated investments, at value (cost $11,980,792) |
|
$ |
11,980,792 |
|
| Repurchase agreement, at value (cost $2,991,425) |
|
|
2,991,425 |
|
| Cash collateral pledged at broker for: |
|
|
|
|
| Futures contracts |
|
|
1,544,620 |
|
| Receivables and other assets: |
|
|
|
|
| Interest |
|
|
5,807 |
|
| Variation margin receivable on futures contracts |
|
|
145,762 |
|
| Prepaid expenses |
|
|
67 |
|
|
|
| Total assets |
|
|
16,668,473 |
|
|
|
| Liabilities: |
|
|
|
|
| Payables and other liabilities: |
|
|
|
|
| Shares of beneficial interest redeemed |
|
|
1,364 |
|
| Investment management fees |
|
|
9,327 |
|
| Distribution and service fees |
|
|
3,237 |
|
| Transfer agent costs |
|
|
48 |
|
| Trustee and CCO fees |
|
|
87 |
|
| Audit and tax fees |
|
|
7,873 |
|
| Custody fees |
|
|
1,699 |
|
| Legal fees |
|
|
711 |
|
| Printing and shareholder reports fees |
|
|
5,191 |
|
| Other accrued expenses |
|
|
4,204 |
|
|
|
| Total liabilities |
|
|
33,741 |
|
|
|
| Net assets |
|
$ |
16,634,732 |
|
|
|
| Net assets consist of: |
|
|
|
|
| Capital stock ($0.01 par value) |
|
$ |
25,338 |
|
| Additional paid-in capital |
|
|
220,872,692 |
|
| Total distributable earnings (accumulated losses) |
|
|
(204,263,298 |
) |
|
|
| Net assets |
|
$ |
16,634,732 |
|
|
|
| Shares outstanding |
|
|
2,533,766 |
|
|
|
| Net asset value and offering price per share |
|
$ |
6.57 |
|
|
|
|
|
|
|
|
| Investment income: |
|
|
|
|
| Interest income from unaffiliated investments |
|
$ |
256,093 |
|
|
|
| Total investment income |
|
|
256,093 |
|
|
|
| Expenses: |
|
|
|
|
| Investment management fees |
|
|
78,523 |
|
| Distribution and service fees |
|
|
22,308 |
|
| Transfer agent costs |
|
|
125 |
|
| Trustee and CCO fees |
|
|
436 |
|
| Audit and tax fees |
|
|
7,854 |
|
| Custody fees |
|
|
1,793 |
|
| Legal fees |
|
|
1,010 |
|
| Printing and shareholder reports fees |
|
|
4,981 |
|
| Other |
|
|
5,610 |
|
| Total expenses before waiver and/or reimbursement and recapture |
|
|
122,640 |
|
| Expenses waived and/or reimbursed |
|
|
(12,887 |
) |
| Net expenses |
|
|
109,753 |
|
|
|
| Net investment income (loss) |
|
|
146,340 |
|
|
|
| Net realized gain (loss) on: |
|
|
|
|
| Futures contracts |
|
|
(5,952,015 |
) |
|
|
| Net change in unrealized appreciation (depreciation) on: |
|
|
|
|
| Futures contracts |
|
|
1,473,243 |
|
| Net realized and change in unrealized gain (loss) |
|
|
(4,478,772 |
) |
|
|
| Net increase (decrease) in net assets resulting from operations |
|
$ |
(4,332,432 |
) |
The Notes to Financial Statements are an integral part of this report.
|
|
|
|
|
| Transamerica Series Trust |
|
|
|
Semi-Annual Financial Statements 2024 |
|
|
Page 2 |
|
|
Transamerica ProFund UltraBear VP
STATEMENT OF CHANGES IN NET ASSETS
For the period and year ended:
|
|
|
|
|
|
|
|
|
|
|
| |
|
June 30, 2024 (unaudited) |
|
December 31, 2023 |
|
|
|
| From operations: |
|
|
|
|
|
|
|
|
|
|
| Net investment income (loss) |
|
|
|
$ 146,340 |
|
|
|
$ |
348,642 |
|
| Net realized gain (loss) |
|
|
|
(5,952,015) |
|
|
|
|
(8,130,305 |
) |
| Net change in unrealized appreciation (depreciation) |
|
|
|
1,473,243 |
|
|
|
|
(3,017,265 |
) |
| Net increase (decrease) in net assets resulting from operations |
|
|
|
(4,332,432) |
|
|
|
|
(10,798,928 |
) |
|
|
|
| Capital share transactions: |
|
|
|
|
|
|
|
|
|
|
| Proceeds from shares sold |
|
|
|
2,545,718 |
|
|
|
|
8,539,506 |
|
| Cost of shares redeemed |
|
|
|
(2,600,948) |
|
|
|
|
(8,427,386 |
) |
| Net increase (decrease) in net assets resulting from capital share transactions |
|
|
|
(55,230) |
|
|
|
|
112,120 |
|
|
|
|
| Net increase (decrease) in net assets |
|
|
|
(4,387,662) |
|
|
|
|
(10,686,808 |
) |
|
|
|
| Net assets: |
|
|
|
|
|
|
|
|
|
|
| Beginning of period/year |
|
|
|
21,022,394 |
|
|
|
|
31,709,202 |
|
| End of period/year |
|
|
|
$16,634,732 |
|
|
|
$ |
21,022,394 |
|
|
|
|
| Capital share transactions - shares: |
|
|
|
|
|
|
|
|
|
|
| Shares issued |
|
|
|
339,966 |
|
|
|
|
824,007 |
|
| Shares redeemed |
|
|
|
(343,732) |
|
|
|
|
(862,267 |
) |
| Net increase (decrease) in shares outstanding |
|
|
|
(3,766) |
|
|
|
|
(38,260 |
) |
FINANCIAL HIGHLIGHTS
For a share outstanding during the period and
years indicated:
|
|
|
|
|
|
|
|
|
|
|
|
|
|
|
|
|
|
|
|
|
|
|
|
|
|
|
|
|
|
|
| |
|
Service Class |
| |
|
June 30, 2024 (unaudited) |
|
December 31, 2023 |
|
December 31, 2022 (A) |
|
December 31, 2021 (A) |
|
December 31, 2020 (A) |
|
December 31, 2019 (A) |
| Net asset value, beginning of period/year |
|
|
$ |
8.28 |
|
|
|
$ |
12.31 |
|
|
|
$ |
9.41 |
|
|
|
$ |
16.51 |
|
|
|
$ |
35.45 |
|
|
|
$ |
61.23 |
|
| Investment operations: |
|
|
|
|
|
|
|
|
|
|
|
|
|
|
|
|
|
|
|
|
|
|
|
|
|
|
|
|
|
|
| Net investment income (loss)(B) |
|
|
|
0.06 |
|
|
|
|
0.14 |
|
|
|
|
(0.02 |
) |
|
|
|
(0.15 |
) |
|
|
|
(0.30 |
) |
|
|
|
0.08 |
|
| Net realized and unrealized gain (loss) |
|
|
|
(1.77 |
) |
|
|
|
(4.17 |
) |
|
|
|
2.92 |
|
|
|
|
(6.95 |
) |
|
|
|
(18.56 |
) |
|
|
|
(25.86 |
) |
| Total investment operations |
|
|
|
(1.71 |
) |
|
|
|
(4.03 |
) |
|
|
|
2.90 |
|
|
|
|
(7.10 |
) |
|
|
|
(18.86 |
) |
|
|
|
(25.78 |
) |
| Dividends and/or distributions to shareholders: |
|
|
|
|
|
|
|
|
|
|
|
|
|
|
|
|
|
|
|
|
|
|
|
|
|
|
|
|
|
|
| Net investment income |
|
|
|
— |
|
|
|
|
— |
|
|
|
|
— |
|
|
|
|
— |
|
|
|
|
(0.08 |
) |
|
|
|
— |
|
| Net asset value, end of period/year |
|
|
$ |
6.57 |
|
|
|
$ |
8.28 |
|
|
|
$ |
12.31 |
|
|
|
$ |
9.41 |
|
|
|
$ |
16.51 |
|
|
|
$ |
35.45 |
|
| |
|
|
|
|
|
|
|
|
|
|
|
|
|
|
|
|
|
|
|
|
|
|
|
|
|
|
|
|
|
|
| Total return |
|
|
|
(20.65 |
)%(C) |
|
|
|
(32.74 |
)% |
|
|
|
23.10 |
% |
|
|
|
(38.46 |
)% |
|
|
|
(53.41 |
)% |
|
|
|
(42.86 |
)% |
| Ratio and supplemental data: |
|
|
|
|
|
|
|
|
|
|
|
|
|
|
|
|
|
|
|
|
|
|
|
|
|
|
|
|
|
|
| Net assets end of period/year (000’s) |
|
|
$ |
16,635 |
|
|
|
$ |
21,022 |
|
|
|
$ |
31,709 |
|
|
|
$ |
7,424 |
|
|
|
$ |
9,355 |
|
|
|
$ |
13,250 |
|
| Expenses to average net assets(D) |
|
|
|
|
|
|
|
|
|
|
|
|
|
|
|
|
|
|
|
|
|
|
|
|
|
|
|
|
|
|
| Excluding waiver and/or reimbursement and recapture |
|
|
|
1.37 |
%(E) |
|
|
|
1.33 |
% |
|
|
|
1.27 |
% |
|
|
|
1.58 |
% |
|
|
|
1.34 |
% |
|
|
|
1.29 |
% |
| Including waiver and/or reimbursement and recapture |
|
|
|
1.23 |
%(E) |
|
|
|
1.23 |
% |
|
|
|
1.23 |
% |
|
|
|
1.24 |
%(F) |
|
|
|
1.23 |
% |
|
|
|
1.23 |
% |
| Net investment income (loss) to average net assets |
|
|
|
1.64 |
%(E) |
|
|
|
1.34 |
% |
|
|
|
(0.60 |
)% |
|
|
|
(1.24 |
)% |
|
|
|
(1.10 |
)% |
|
|
|
0.17 |
% |
| Portfolio turnover rate |
|
|
|
— |
%(C) |
|
|
|
— |
% |
|
|
|
— |
% |
|
|
|
— |
% |
|
|
|
— |
% |
|
|
|
— |
% |
| (A) |
Updated to reflect the effect of a 1-for-125 reverse share split on January 21, 2022. |
| (B) |
Calculated based on average number of shares outstanding. |
| (D) |
Does not include expenses of the underlying investments in which the Portfolio invests. |
| (F) |
Includes extraordinary expenses outside the operating expense limit. |
The Notes to Financial Statements are an integral part of this report.
|
|
|
|
|
| Transamerica Series Trust |
|
|
|
Semi-Annual Financial Statements 2024 |
|
|
Page 3 |
|
|
Transamerica ProFund UltraBear VP
NOTES TO FINANCIAL STATEMENTS
At June 30, 2024
(unaudited)
1. ORGANIZATION
Transamerica Series Trust (“TST”) is an open-end management investment company registered under the Investment Company Act of 1940, as amended (the “1940 Act”). TST applies investment company accounting and reporting guidance. TST serves as a funding vehicle for variable life insurance, variable annuity, and group annuity products. Transamerica ProFund UltraBear VP (the “Portfolio”) is a series of TST and is classified as non-diversified under the 1940 Act. The Portfolio currently offers one class of shares, Service Class.
The only shareholders of the Portfolio are affiliated insurance company separate accounts and/or affiliated asset allocation portfolios. Contract holders of the variable life and annuity contracts are not shareholders of the Portfolio. For ease of reference, shareholders and contract holders are collectively referred to in this report as “shareholders.”
This report must be accompanied or preceded by the Portfolio’s current prospectus, which contains additional information about the Portfolio, including risks, as well as investment objectives and strategies.
Transamerica Asset Management, Inc. (“TAM”) serves as investment manager for the Portfolio pursuant to an investment management agreement. TAM provides continuous and regular investment management services to the Portfolio. TAM supervises the Portfolio’s investments, conducts its investment program and provides supervisory, compliance and administrative services to the Portfolio.
TAM currently acts as a “manager of managers” and has hired sub-advisers to furnish day-to-day investment advice and recommendations. TAM may, in the future, determine to provide all aspects of the day-to-day management of the Portfolio without the use of a sub-adviser. When acting as a manager of managers, TAM provides investment management services that include, without limitation, the design and development of the Portfolio and its investment strategies and the ongoing review and evaluation of those investment strategies including recommending changes in strategy where it believes appropriate or advisable; the selection of one or more sub-advisers for the Portfolio employing a combination of quantitative and qualitative screens, research, analysis and due diligence; negotiation of sub-advisory agreements and fees; oversight and monitoring of sub-advisers and recommending changes to sub-advisers where it believes appropriate or advisable; recommending portfolio combinations and liquidations where it believes appropriate or advisable; selection and oversight of transition managers, as needed; regular supervision of the Portfolio’s investments; regular review and evaluation of sub-adviser performance; daily monitoring of the sub-advisers’ buying and selling of securities for the Portfolio; regular review of holdings; ongoing trade oversight and analysis; regular monitoring to ensure adherence to investment process; regular calls and periodic on-site visits with sub-advisers; portfolio construction and asset allocation when using multiple sub-advisers for the Portfolio; risk management oversight and analysis; oversight of negotiation of investment documentation and agreements; design, development, implementation and regular monitoring of the valuation process; periodic due diligence reviews of pricing vendors and vendor methodology; design, development, implementation and regular monitoring of the compliance process; respond to regulatory inquiries and determine appropriate litigation strategy, as needed; review of proxies voted by sub-advisers; oversight of preparation and review of materials for meetings of the Portfolio’s Board of Trustees (the “Board”), participation in these meetings and preparation of regular communications with the Board; oversight of preparation and review of prospectuses, shareholder reports and other disclosure materials and regulatory filings for the Portfolio; oversight of other service providers to the Portfolio, such as the custodian, the transfer agent, the Portfolio’s independent accounting firm and legal counsel; supervision of the performance of recordkeeping and shareholder relations functions for the Portfolio; and oversight of cash management services. TAM uses a variety of quantitative and qualitative tools to carry out its investment management services. TAM, not the Portfolio, is responsible for paying the sub-adviser(s) for their services, and sub-advisory fees are TAM’s expense.
TAM’s investment management services also include the provision of supervisory and administrative services to the Portfolio. These services include performing certain administrative services for the Portfolio and supervising and overseeing the administrative, clerical, recordkeeping and bookkeeping services provided to the Portfolio by State Street Bank and Trust Company (“State Street”), to whom TAM has outsourced the provision of certain sub-administration services. To the extent agreed upon by TAM and the Portfolio from time to time, TAM’s supervisory and administrative services include, but are not limited to: monitoring and verifying the custodian’s daily calculation of the Net Asset Values (“NAV”); shareholder relations functions; compliance services; valuation services; assisting in due diligence and in the oversight and monitoring of certain activities of sub-advisers and certain aspects of Portfolio investments; assisting with Portfolio combinations and liquidations; oversight of the preparation and filing, and review, of all returns and reports, in connection with federal, state and local taxes; oversight and review of regulatory reporting; supervising and coordinating the Portfolio’s custodian and dividend disbursing agent and monitoring their services to the Portfolio; assisting the Portfolio in preparing reports to shareholders; acting as liaison with the Portfolio’s independent public accountants and providing, upon request, analyses, fiscal year summaries and other audit related services; assisting in the preparation of agendas and supporting documents for and minutes of meetings of trustees and committees of trustees; assisting in the preparation of regular communications with the trustees; and providing personnel and office space, telephones and other office equipment as necessary in order for TAM to perform supervisory and administrative services to the Portfolio. The Portfolio pays certain fees and expenses to State Street for sub-administration services which are not administrative services covered by the
|
|
|
|
|
| Transamerica Series Trust |
|
|
|
Semi-Annual Financial Statements 2024 |
|
|
Page 4 |
|
|
Transamerica ProFund UltraBear VP
NOTES TO FINANCIAL STATEMENTS (continued)
At June 30, 2024
(unaudited)
1. ORGANIZATION (continued)
management agreement with TAM or paid for through the management fees payable thereunder. For the period ended June 30, 2024, (i) the expenses paid to State Street for sub-administration services by the Portfolio are shown as a part of Other expenses within the Statement of Operations and (ii) the expenses payable to State Street for sub-administration services from the Portfolio are shown as part of Other accrued expenses within the Statement of Assets and Liabilities.
2. SIGNIFICANT ACCOUNTING POLICIES
In preparing the Portfolio’s financial statements in accordance with Generally Accepted Accounting Principles in the United States of America (“GAAP”), estimates or assumptions (which could differ from actual results) may be used that affect reported amounts and disclosures. The following is a summary of significant accounting policies followed by the Portfolio.
Security transactions and investment income: Security transactions are accounted for on the trade date. Security gains and losses are calculated on a first-in, first-out basis. Interest income, if any, is accrued as earned. Dividend income and capital gain distributions from underlying investments, if any, are recorded on the ex-dividend date. Income or short-term capital gain distributions received from underlying investments, if any, are recorded as Dividend income from investments within the Statement of Operations. Long-term capital gain distributions received from underlying investments, if any, are recorded as Net realized gain (loss) on Capital gain distributions received from investments within the Statement of Operations.
Distributions to shareholders: Distributions are recorded on the ex-dividend date and are determined in accordance with federal income tax regulations, which may differ from GAAP.
Indemnification: In the normal course of business, the Portfolio enters into contracts that contain a variety of representations that provide general indemnifications. The Portfolio’s maximum exposure under these arrangements is unknown, as this would involve future claims that may be made against the Portfolio and/or its affiliates that have not yet occurred. However, based on experience, the Portfolio expects the risk of loss to be remote.
3. INVESTMENT VALUATION
TAM has been designated as the Portfolio’s valuation designee pursuant to Rule 2a-5 under the 1940 Act with responsibility for fair valuation subject to oversight by the Portfolio’s Board of Trustees. The net asset value of the Portfolio is computed as of the official close of the New York Stock Exchange (“NYSE”) each day the NYSE is open for business.
TAM utilizes various methods to measure the fair value of its investments on a recurring basis. GAAP establishes a hierarchy that prioritizes inputs to valuation methods. The inputs or methodology used for valuing securities are not necessarily an indication of the risk associated with investing in those securities. The three levels (“Levels”) of inputs of the fair value hierarchy are defined as follows:
Level 1—Unadjusted quoted prices in active markets for identical securities.
Level 2—Inputs, other than quoted prices included in Level 1, which are observable, either directly or indirectly. These inputs may include quoted prices for the identical instrument on an inactive market, prices for similar instruments, interest rates, prepayment speeds, credit risk, yield curves, default rates, and similar data.
Level 3—Unobservable inputs based on the best information available in the circumstances, to the extent observable inputs are not available, which may include TAM’s own assumptions used in determining the fair value of the Portfolio’s investments and derivative instruments.
The inputs used to measure fair value may fall into different Levels of the fair value hierarchy. In such cases, for disclosure purposes, the Level in the fair value hierarchy that is assigned to the fair value measurement of a security is determined based on the lowest Level input that is significant to the fair value measurement in its entirety. Certain investments that are measured at fair value using NAV per share, or its equivalent, using the “practical expedient” have not been classified in the fair value Levels. The hierarchy classification of inputs used to value the Portfolio’s investments at June 30, 2024, is disclosed within the Investment Valuation section of the Schedule of Investments.
The availability of observable inputs can vary from security to security and is affected by a wide variety of factors, including, but not limited to, the type of security, whether the security is new and not yet established in the marketplace, the liquidity of markets, and other characteristics particular to the security. To the extent that valuation is based on models or inputs that are less observable or unobservable in the market, the determination of fair value requires more judgment. Accordingly, the degree of judgment exercised in determining fair
|
|
|
|
|
| Transamerica Series Trust |
|
|
|
Semi-Annual Financial Statements 2024 |
|
|
Page 5 |
|
|
Transamerica ProFund UltraBear VP
NOTES TO FINANCIAL STATEMENTS (continued)
At June 30, 2024
(unaudited)
3. INVESTMENT VALUATION (continued)
value is generally greatest for instruments categorized in Level 3. Due to the inherent uncertainty of valuation, the determination of values may differ significantly from values that would have been realized had a ready market for investments existed, and the differences could be material.
Fair value measurements: Descriptions of the valuation techniques applied to the Portfolio’s significant categories of assets and liabilities measured at fair value on a recurring basis are as follows:
Investment companies: Certain investment companies are valued at the NAV as the practical expedient. These investment companies are not included within the fair value hierarchy. Certain other investment companies are valued at the actively traded NAV and no valuation adjustments are applied. These investment companies are categorized in Level 1 of the fair value hierarchy.
Repurchase agreements: Repurchase agreements are valued at cost, which approximates fair value. To the extent the inputs are observable and timely, the values are generally categorized in Level 2 of the fair value hierarchy.
Derivative instruments: Centrally cleared or listed derivatives that are actively traded are valued based on quoted prices from the exchange and are categorized in Level 1 of the fair value hierarchy. Over-the-counter (“OTC”) derivative contracts include forward, swap, swaption, and option contracts related to interest rates, foreign currencies, credit standing of reference entities, equity prices, or commodity prices. Depending on the product and the terms of the transaction, the fair value of the OTC derivative products are modeled taking into account the counterparties’ creditworthiness and using a series of techniques, including simulation models. Many pricing models do not entail material subjectivity because the methodologies employed do not necessitate significant judgments and the pricing inputs are observed from actively quoted markets, as is the case of interest rate swap and option contracts. The majority of OTC derivative products valued by the Portfolio using pricing models fall into this category and are categorized within Level 2 of the fair value hierarchy or Level 3 if inputs are unobservable.
4. BORROWINGS AND OTHER FINANCING TRANSACTIONS
The Portfolio may engage in borrowing transactions as a means of raising cash to satisfy redemption requests, for other temporary or emergency purposes or, to the extent permitted by its investment policies, to raise additional cash to be invested in other securities or instruments. When the Portfolio invests borrowing proceeds in other securities, the Portfolio will bear the risk that the market value of the securities in which such proceeds are invested goes down and is insufficient to repay the borrowed proceeds. The Portfolio may borrow on a secured or on an unsecured basis. If the Portfolio enters into a secured borrowing arrangement, a portion of the Portfolio’s assets will be used as collateral. The 1940 Act requires the Portfolio to maintain asset coverage of at least 300% of the amount of its borrowings. Asset coverage means the ratio that the value of the Portfolio’s total assets, minus liabilities other than borrowings, bears to the aggregate amount of all borrowings. Although complying with this requirement has the effect of limiting the amount that the Portfolio may borrow, it does not otherwise mitigate the risks of entering into borrowing transactions.
Interfund lending: The Portfolio, along with other funds and portfolios advised by TAM, may participate in an interfund lending program pursuant to exemptive relief granted by the Securities and Exchange Commission on January 18, 2017. This program allows the Portfolio to lend to and borrow from other funds and portfolios advised by TAM. Interfund lending transactions are subject to the conditions of the exemptive relief which places limits on the amount of lending or borrowing a Portfolio may participate in under the program. Interest earned or paid on an interfund lending transaction will be based on the average of certain current market rates. For the period ended June 30, 2024, the Portfolio has not utilized the program.
Repurchase agreements: In a repurchase agreement, the Portfolio purchases a security and simultaneously commits to resell that security to the seller at an agreed-upon price on an agreed-upon date. Securities purchased subject to a repurchase agreement are held at the Portfolio’s custodian, or designated sub-custodian related to tri-party repurchase agreements, and, pursuant to the terms of the repurchase agreement, must be collateralized by securities with an aggregate market value greater than or equal to 100% of the resale price. The Portfolio will bear the risk of value fluctuations until the securities can be sold and may encounter delays and incur costs in liquidating the securities. In the event of bankruptcy or insolvency of the seller, delays and costs may be incurred.
Repurchase agreements are subject to netting agreements, which are agreements between the Portfolio and its counterparties that provide for the net settlement of all transactions and collateral with the Portfolio, through a single payment, in the event of default or termination. Amounts presented within the Schedule of Investments, and as part of Repurchase agreements, at value within the Statement of Assets and Liabilities are shown on a gross basis. The value of the related collateral for each repurchase agreement, as reflected within the Schedule of Investments, exceeds the value of each repurchase agreement at June 30, 2024.
|
|
|
|
|
| Transamerica Series Trust |
|
|
|
Semi-Annual Financial Statements 2024 |
|
|
Page 6 |
|
|
Transamerica ProFund UltraBear VP
NOTES TO FINANCIAL STATEMENTS (continued)
At June 30, 2024
(unaudited)
4. BORROWINGS AND OTHER FINANCING TRANSACTIONS (continued)
Repurchase agreements at June 30, 2024, if any, are included within the Schedule of Investments and Statement of Assets and Liabilities.
5. RISK EXPOSURES AND THE USE OF DERIVATIVE INSTRUMENTS
The Portfolio’s investment strategies allow the Portfolio to use various types of derivative contracts, including option contracts, swap agreements, futures contracts, and forward foreign currency contracts. Derivatives are investments whose value is primarily derived from underlying assets, indices or reference rates and may be transacted on an exchange or OTC.
Market Risk Factors: In pursuit of the Portfolio’s investment strategies, the Portfolio may seek to use derivatives to increase or decrease its exposure to certain market risks, including:
Interest rate risk: Interest rate risk relates to the fluctuations in the value of fixed income securities due to changes in the prevailing levels of market interest rates.
Foreign exchange rate risk: Foreign exchange rate risk relates to fluctuations in the value of an asset or liability due to changes in the currency exchange rates.
Equity risk: Equity risk relates to the change in value of equity securities as they relate to increases or decreases in the general market.
Credit risk: Credit risk relates to the ability of the issuer of a financial instrument to make further principal or interest payments on an obligation or commitment that it has to the Portfolio.
Commodity risk: Commodity risk relates to the change in value of commodities or commodity indices as they relate to increases or decreases in the commodities market. Commodities are physical assets that have tangible properties. Examples of these types of assets are crude oil, heating oil, metals, livestock, and agricultural products.
The Portfolio is also exposed to additional risks from investing in derivatives, such as liquidity and counterparty credit risk. Liquidity risk is the risk that the Portfolio will be unable to sell or close out the derivative in the open market in a timely manner. Counterparty credit risk is the risk that the counterparty will not be able to fulfill its obligations to the Portfolio. Investing in derivatives may also involve greater risks than investing directly in the underlying assets, such as losses in excess of any initial investment and collateral received. In addition, there may be the risk that the change in value of the derivative contract does not correspond to the change in value of the underlying instrument.
The Portfolio’s exposure to market risk factors and certain other associated risks are summarized by derivative type as follows:
Futures contracts: The Portfolio is subject to equity risk, credit risk, commodity risk, interest rate risk and foreign exchange rate risk in the normal course of pursuing its investment objective. The Portfolio uses futures contracts to gain exposure to, or hedge against, changes in the value of equities and commodities, interest rates, or foreign currencies. A futures contract represents a commitment for the future purchase or sale of an asset at a specified price on a specified date. Upon entering into such contracts, the Portfolio is required to deposit with the broker, either in cash or in securities, an initial margin in an amount equal to a certain percentage of the contract amount. Subsequent payments (variation margin) are paid or received by the Portfolio, depending on the daily fluctuations in the value of the contract, and are recorded for financial statement purposes as unrealized gains or losses by the Portfolio. Upon entering into such contracts, the Portfolio bears the risk of equity and commodity prices, interest rates, or exchange rates moving unexpectedly, in which case, the Portfolio may not achieve the anticipated benefits of the futures contracts and may realize losses. With futures, there is minimal counterparty credit risk to the Portfolio since futures are exchange-traded and the exchange’s clearinghouse, as counterparty to all exchange-traded futures, guarantees the futures against default. Futures contracts are generally entered into on a regulated futures exchange and cleared through a clearinghouse associated with the exchange.
Open futures contracts at June 30, 2024 are listed within the Schedule of Investments. Variation margin, if applicable, is shown in Variation margin receivable or payable on futures contracts within the Statement of Assets and Liabilities.
|
|
|
|
|
| Transamerica Series Trust |
|
|
|
Semi-Annual Financial Statements 2024 |
|
|
Page 7 |
|
|
Transamerica ProFund UltraBear VP
NOTES TO FINANCIAL STATEMENTS (continued)
At June 30, 2024
(unaudited)
5. RISK EXPOSURES AND THE USE OF DERIVATIVE INSTRUMENTS (continued)
The following is a summary of the location and the Portfolio’s fair values of derivative investments disclosed within the Statement of Assets and Liabilities, categorized by primary market risk exposure as of June 30, 2024.
|
|
|
|
|
|
|
|
|
|
|
|
|
|
|
|
|
|
|
|
|
|
|
|
|
|
|
|
|
|
|
| Liability Derivatives |
| Location |
|
Interest Rate Contracts |
|
Foreign Exchange Contracts |
|
Equity Contracts |
|
Credit Contracts |
|
Commodity Contracts |
|
Total |
| Futures contracts: |
|
|
|
|
|
|
|
|
|
|
|
|
|
|
|
|
|
|
|
|
|
|
|
|
|
|
|
|
|
|
| Total distributable earnings (accumulated losses) (A)(B) |
|
|
|
$ — |
|
|
|
|
$ — |
|
|
|
|
$ (172,511) |
|
|
|
|
$ — |
|
|
|
|
$ — |
|
|
|
$ |
(172,511) |
|
| Total |
|
|
|
$ — |
|
|
|
|
$ — |
|
|
|
|
$ (172,511) |
|
|
|
|
$ — |
|
|
|
|
$ — |
|
|
|
$ |
(172,511) |
|
| |
|
|
|
|
|
|
|
|
|
|
|
|
|
|
|
|
|
|
|
|
|
|
|
|
|
|
|
|
|
|
| (A) |
May include exchange-traded derivatives which are not subject to a master netting arrangement, or another similar arrangement. |
| (B) |
Included within unrealized appreciation (depreciation) on futures contracts as reported in the Schedule of Investments. Only current day’s variation margin is reported within the Statement of Assets and Liabilities. |
The following is a summary of the location and the effect of derivative investments within the Statement of Operations, categorized by primary market risk exposure as of June 30, 2024.
|
|
|
|
|
|
|
|
|
|
|
|
|
|
|
|
|
|
|
|
|
|
|
|
|
|
|
|
|
|
|
| Realized Gain (Loss) on Derivative Instruments |
| Location |
|
Interest Rate Contracts |
|
Foreign Exchange Contracts |
|
Equity Contracts |
|
Credit Contracts |
|
Commodity Contracts |
|
Total |
| Futures contracts |
|
|
|
$ — |
|
|
|
|
$ — |
|
|
|
$ |
(5,952,015) |
|
|
|
|
$ — |
|
|
|
|
$ — |
|
|
|
$ |
(5,952,015) |
|
| |
|
| Total |
|
|
|
$ — |
|
|
|
|
$ — |
|
|
|
$ |
(5,952,015) |
|
|
|
|
$ — |
|
|
|
|
$ — |
|
|
|
$ |
(5,952,015) |
|
| |
|
|
|
|
|
|
|
|
|
|
|
|
|
|
|
|
|
|
|
|
|
|
|
|
|
|
|
|
|
|
|
| Net Change in Unrealized Appreciation (Depreciation) on Derivative Instruments |
| Location |
|
Interest Rate Contracts |
|
Foreign Exchange Contracts |
|
Equity Contracts |
|
Credit Contracts |
|
Commodity Contracts |
|
Total |
| Futures contracts |
|
|
|
$ — |
|
|
|
|
$ — |
|
|
|
$ |
1,473,243 |
|
|
|
|
$ — |
|
|
|
|
$ — |
|
|
|
$ |
1,473,243 |
|
| Total |
|
|
|
$ — |
|
|
|
|
$ — |
|
|
|
$ |
1,473,243 |
|
|
|
|
$ — |
|
|
|
|
$ — |
|
|
|
$ |
1,473,243 |
|
| |
|
|
|
|
|
|
|
|
|
|
|
|
|
|
|
|
|
|
|
|
|
|
|
|
|
|
|
|
|
|
The following is a summary of the ending monthly average volume on derivative activity during the period ended June 30, 2024.
|
|
|
|
|
| Futures contracts: |
|
|
|
|
| Average notional value of contracts — short |
|
$ |
(35,512,505) |
|
Collateral requirements: Collateral or margin requirements are set by the broker or exchange clearing house for exchange-traded derivatives (futures contracts, exchange-traded options, and exchange-traded swap agreements) while collateral terms are contract specific for OTC derivatives (forward foreign currency exchange contracts, OTC options, and OTC swap agreements). For OTC derivatives, under standard derivatives agreements, the Portfolio may be required to pledge collateral on derivatives to a counterparty if the Portfolio is in a net liability position, and receive collateral if in a net positive position. For financial reporting purposes, cash collateral that has been pledged by the Portfolio to cover obligations, if any, is reported in Cash collateral at broker within the Statement of Assets and Liabilities. Cash collateral that has been received by the Portfolio from a counterparty, if any, is reported separately in Cash collateral pledged at custodian and/or broker within the Statement of Assets and Liabilities. Non-cash collateral pledged to the Portfolio, if any, is disclosed within the Schedule of Investments.
Generally, the amount of collateral due from or to a party must exceed a minimum transfer amount threshold before a transfer has been made. Typically a counterparty is not permitted to sell, re-pledge or use cash and non-cash collateral it receives. The Portfolio generally
|
|
|
|
|
| Transamerica Series Trust |
|
|
|
Semi-Annual Financial Statements 2024 |
|
|
Page 8 |
|
|
Transamerica ProFund UltraBear VP
NOTES TO FINANCIAL STATEMENTS (continued)
At June 30, 2024
(unaudited)
5. RISK EXPOSURES AND THE USE OF DERIVATIVE INSTRUMENTS (continued)
does not use non-cash collateral that it receives but may, absent default or certain other circumstances, be permitted to use cash collateral received. In such cases, interest may be paid pursuant to the collateral arrangement with the counterparty.
To the extent amounts due to the Portfolio from its counterparties are not fully collateralized, contractually or otherwise, the Portfolio bears the risk of loss from counterparty non-performance. Additionally, to the extent the Portfolio has delivered collateral to a counterparty, the Portfolio bears the risk of loss from a counterparty in the event the counterparty fails to return such collateral. Counterparties may immediately terminate derivatives contracts if the Portfolio fails to maintain sufficient asset coverage for its contracts or its net assets decline by stated percentages. Collateral may not be required for all derivative contracts.
6. RISK FACTORS
Investing in the Portfolio involves certain key risks related to the Portfolio’s trading activity. Please reference the Portfolio’s prospectus for a more complete discussion of the following risk(s), as well as other risks of investing in the Portfolio.
Market risk: The market prices of the Portfolio’s securities or other assets may go up or down, sometimes rapidly or unpredictably, due to factors such as economic events, inflation, changes in interest rates, governmental actions or interventions, actions taken by the U.S. Federal Reserve or foreign central banks, market disruptions caused by tariffs, trade disputes or other factors, political developments, armed conflicts, economic sanctions, cybersecurity events, investor sentiment, the global and domestic effects of widespread or local health, weather or climate events, and other factors that may or may not be related to the issuer of the security or other asset. If the market prices of the Portfolio’s securities and assets fall, the value of your investment in the Portfolio could go down.
Economies and financial markets throughout the world are increasingly interconnected. Events or circumstances in one or more countries or regions could be highly disruptive to, and have profound impacts on, global economies or markets. As a result, whether or not the Portfolio invests in securities of issuers located in or with significant exposure to the countries directly affected, the value and liquidity of the Portfolio’s investments may go down.
Equity and market risk: Equity markets are volatile, and the value of securities, swaps, futures and other instruments related to equity markets may fluctuate dramatically from day-to-day. Equity markets are subject to corporate, political, regulatory, market and economic developments, as well as developments that impact specific economic sectors, industries or segments of the market. Further, stocks in the Index may underperform other equity investments. Volatility in the markets and/or market developments may cause the value of an investment in the Portfolio to decrease over short or long periods of time. As a portfolio seeking daily investment results, before fees and expenses, that correspond to two times the inverse (-2x) of the daily return of the S&P 500 Index, the value of an investment in the Portfolio is expected to decline when market conditions cause the level of the Index to rise.
Inverse correlation risk: Investors will lose money when the Index rises – a result that is the opposite from traditional funds.
Non-diversification risk: As a “non-diversified” Portfolio, the Portfolio may invest a larger percentage of its assets in a smaller number of issuers than a diversified fund. Investing in a smaller number of issuers will make the Portfolio more susceptible to the risks associated with investing in those issuers.
7. FEES AND OTHER AFFILIATED TRANSACTIONS
TST serves as a funding vehicle for certain affiliated asset allocation portfolios and certain affiliated separate accounts of Transamerica Life Insurance Company (“TLIC”) and Transamerica Financial Life Insurance Company.
TAM, the Portfolio’s investment manager, is directly owned by TLIC and AUSA Holding, LLC (“AUSA”), both of which are indirect, wholly owned subsidiaries of Aegon Ltd. TLIC is owned by Commonwealth General Corporation (“Commonwealth”). Commonwealth and AUSA are wholly owned by Transamerica Corporation (DE). Transamerica Corporation (DE) is wholly owned by Aegon International B.V., which is wholly owned by Aegon Ltd., a Bermuda exempted company with liability limited by shares (formerly, Aegon NV, a Netherlands corporation) and a publicly traded international insurance group.
Transamerica Fund Services, Inc. (“TFS”) is the Portfolio’s transfer agent. Transamerica Capital, Inc. (“TCI”) is the Portfolio’s distributor/principal underwriter. TAM, TFS and TCI are affiliates of Aegon Ltd.
|
|
|
|
|
| Transamerica Series Trust |
|
|
|
Semi-Annual Financial Statements 2024 |
|
|
Page 9 |
|
|
Transamerica ProFund UltraBear VP
NOTES TO FINANCIAL STATEMENTS (continued)
At June 30, 2024
(unaudited)
7. FEES AND OTHER AFFILIATED TRANSACTIONS (continued)
Certain officers and trustees of the Portfolio may also be officers and/or trustees of TAM, TFS and TCI. No interested trustee who is deemed an interested person due to current or former service with TAM or an affiliate of TAM receives compensation from the Portfolio. The Portfolio does pay non-interested persons (independent trustees), as disclosed in Trustee and CCO fees within the Statement of Operations.
Investment management fees: TAM serves as the Portfolio’s investment manager, performing administration as well as investment advisory services. TAM renders investment advisory, supervisory, and administration services under an investment management agreement and the Portfolio pays a single management fee, which is reflected in Investment management fees within the Statement of Operations.
The Portfolio pays a management fee to TAM based on daily average net assets at the following rates:
|
|
|
|
|
| Breakpoints |
|
Rate |
|
| First $250 million |
|
|
0.88 |
% |
| Over $250 million up to $750 million |
|
|
0.83 |
|
| Over $750 million |
|
|
0.78 |
|
TAM has contractually agreed to waive fees and/or reimburse Portfolio expenses to the extent that the total operating expenses excluding, as applicable, acquired fund fees and expenses, interest (including borrowing costs and overdraft charges), taxes, brokerage commissions, dividend and interest expenses on securities sold short, extraordinary expenses and other expenses not incurred in the ordinary course of the Portfolio’s business, exceed the following stated annual operating expense limits to the Portfolio’s daily average net assets. To the extent an expense limit changed during the period, the prior limit is also listed below. The expenses waived and/or reimbursed, if any, are included in Expenses waived and/or reimbursed within the Statement of Operations.
|
|
|
|
|
| Class |
|
Operating Expense Limit |
|
Operating Expense Limit Effective Through |
| Service Class |
|
1.23% |
|
May 1, 2025 |
TAM is permitted to recapture amounts contractually waived and/or reimbursed to a class during any of the 36 months from the date on which TAM waived fees and/or reimbursed expenses for the class. A class may recapture and reimburse TAM only if such amount does not cause, on any particular business day of the Portfolio, the class’s total annual operating expenses (after the recapture is taken into account) to exceed the Operating Expense Limits or any other lower limit then in effect. Amounts recaptured, if any, by TAM for the period ended June 30, 2024 are disclosed in Recapture of previously waived and/or reimbursed fees within the Statement of Operations.
TAM, on a voluntary basis and in addition to the contractual operating expense limits in effect, from time to time may waive and/or reimburse expenses of the Portfolio, or any classes thereof, to such level(s) as the Trust’s officers have determined or may reasonably determine from time to time. Any such voluntary waiver or expense reimbursement may be discontinued by TAM at any time. These amounts are not subject to recapture by TAM.
For the 36-month period ended June 30, 2024, the balances available for recapture by TAM for the Portfolio are as follows:
|
|
|
|
|
|
|
|
|
|
|
|
|
|
|
|
|
|
|
|
|
| |
|
Amounts Available |
|
|
|
|
|
|
|
|
|
|
| |
|
2021 (A) |
|
|
2022 |
|
|
2023 |
|
|
2024 |
|
|
Total |
|
| Service Class |
|
$ |
17,705 |
|
|
$ |
12,473 |
|
|
$ |
26,415 |
|
|
$ |
12,887 |
|
|
$ |
69,480 |
|
| |
(A) |
For the six-month period of July 1, 2021 through December 31, 2021. |
Distribution and service fees: TST has a distribution plan (“Distribution Plan”) pursuant to Rule 12b-1 under the 1940 Act. Pursuant to the Distribution Plan, TST entered into a distribution agreement with TCI as the Portfolio’s distributor.
|
|
|
|
|
| Transamerica Series Trust |
|
|
|
Semi-Annual Financial Statements 2024 |
|
|
Page 10 |
|
|
Transamerica ProFund UltraBear VP
NOTES TO FINANCIAL STATEMENTS (continued)
At June 30, 2024
(unaudited)
7. FEES AND OTHER AFFILIATED TRANSACTIONS (continued)
The Distribution Plan requires the Portfolio to pay distribution fees to TCI as compensation for various distribution activities, not as reimbursement for specific expenses. Under the Distribution Plan and distribution agreement, TCI, on behalf of the Portfolio, is authorized to pay various service providers, as direct payment for expenses incurred in connection with distribution of the Portfolio’s shares.
The fee on the Service Class shares is paid to the insurance companies for providing services and account maintenance for the policyholders who invest in the variable insurance products which invest in the Service Class shares. The distribution and service fees are included in Distribution and service fees within the Statement of Operations.
The Portfolio is authorized under the Distribution Plan to pay fees to TCI based on daily average net assets up to an annual fee of 0.25% of Service Class shares.
Transfer agent costs: TFS provides transfer agency services under an intercompany agreement with TAM. TFS has outsourced the provision of certain sub-transfer agency services to SS&C Global Investor & Distribution Solutions, Inc. (“SS&C GIDS”). The Portfolio does not pay a separate transfer agent fee to TAM or TFS but does pay certain expenses to SS&C GIDS related to applicable sub-transfer agency services. For the period ended June 30, 2024, (i) the expenses paid to SS&C GIDS by the Portfolio are referred to as transfer agent costs and are included within the Statement of Operations and (ii) the expenses payable to SS&C GIDS by the Portfolio are referred to as transfer agent costs within the Statement of Assets and Liabilities.
Brokerage commissions: The Portfolio incurred no brokerage commissions on security transactions placed with affiliates of the investment manager or sub-adviser(s) for the period ended June 30, 2024.
8. PURCHASES AND SALES OF SECURITIES
During the period ended June 30, 2024, there were no proceeds from securities purchased or securities sold (excluding short-term securities).
9. FEDERAL INCOME TAXES AND DISTRIBUTIONS TO SHAREHOLDERS
The Portfolio has not made any provision for federal income or excise taxes due to its policy to distribute all of its taxable income and capital gains to its shareholders and otherwise qualify as a regulated investment company under Subchapter M of the Internal Revenue Code. The Portfolio recognizes the tax benefits of uncertain tax positions only where the position is “more likely than not” to be sustained assuming examination by tax authorities. The Portfolio’s tax returns remain subject to examination by the Internal Revenue Service and state tax authorities three years from the date of filing for federal purposes and four years from the date of filing for state purposes. Management has evaluated the Portfolio’s tax provisions taken for all open tax years, and has concluded that no provision for income tax is required in the Portfolio’s financial statements. If applicable, the Portfolio recognizes interest accrued related to unrecognized tax benefits in relation to interest and penalties expense in Other within the Statement of Operations. The Portfolio identifies its major tax jurisdictions as U.S. Federal, the state of Colorado, and foreign jurisdictions where the Portfolio makes significant investments; however, the Portfolio is not aware of any tax positions for which it is reasonably possible that the total amounts of unrecognized tax benefits will change materially in the next twelve months. Distributions are determined in accordance with income tax regulations, which may differ from GAAP.
As of June 30, 2024, the approximate cost for U.S. federal income tax purposes, and the aggregate gross/net unrealized appreciation (depreciation) in the value of investments (including securities sold short and derivatives, if any) are as follows:
|
|
|
|
|
|
|
|
|
|
|
|
|
|
|
|
| Cost |
|
Gross Appreciation |
|
Gross (Depreciation) |
|
Net Appreciation (Depreciation) |
| $ 14,972,217 |
|
$ — |
|
$ (172,511) |
|
$ (172,511) |
10. STOCK SPLIT
Effective as of the close of business on the date listed in the subsequent table, the Portfolio’s shares underwent a stock split. There was no impact to the aggregate market value of shares outstanding. The historical per share data presented within the Financial Highlights has
|
|
|
|
|
| Transamerica Series Trust |
|
|
|
Semi-Annual Financial Statements 2024 |
|
|
Page 11 |
|
|
Transamerica ProFund UltraBear VP
NOTES TO FINANCIAL STATEMENTS (continued)
At June 30, 2024
(unaudited)
10. STOCK SPLIT (continued)
been retroactively adjusted to reflect the stock split. The stock split ratios, net effect on the NAV per share, and the number of shares outstanding as of the date indicated were as follows:
|
|
|
|
|
|
|
|
|
|
|
| Date |
|
Share Split Ratio |
|
Shares Prior to Stock Split |
|
Shares After Stock Split |
|
Increase (Decrease) Net Asset Value per Share |
|
Increase (Decrease) Net Shares Outstanding |
| January 21, 2022 |
|
125 for 1 |
|
98,591,154 |
|
788,729 |
|
Increase |
|
Decrease |
Please see TST’s most recent report on Form N-CSR, available at: www.transamerica.com/annuities/prospectus, for additional information. For the most recently filed complete proxy voting records for the Trust please visit: https://www.transamerica.com/sites/default/files/files/e070d/TST%20N-PX%202021.pdf
|
|
|
|
|
| Transamerica Series Trust |
|
|
|
Semi-Annual Financial Statements 2024 |
|
|
Page 12 |
|
|
Transamerica ProFund UltraBear VP
MANAGEMENT AND SUB-ADVISORY AGREEMENT — CONTRACT RENEWAL
(unaudited)
At a meeting of the Board of Trustees of Transamerica Series Trust (the “Trustees” or the “Board”) held on June 12-13, 2024, the Board considered the renewal of the management agreement (the “Management Agreement”) between Transamerica Asset Management, Inc. (“TAM”) and Transamerica Series Trust, on behalf of Transamerica ProFund UltraBear VP (the “Portfolio”). The Board also considered the renewal of the investment sub-advisory agreement (the “Sub-Advisory Agreement” and together with the Management Agreement, the “Agreements”) for the Portfolio between TAM and ProFund Advisors LLC (the “Sub-Adviser”).
Following its review and consideration, the Board determined that the terms of the Management Agreement and Sub-Advisory Agreement were reasonable and that the renewal of each of the Agreements was in the best interests of the Portfolio and the holders invested in the Portfolio. The Board, including the independent members of the Board (the “Independent Trustees”), unanimously approved the renewal of each of the Agreements through June 30, 2025.
Prior to reaching their decision, the Trustees requested and received from TAM and the Sub-Adviser certain information. They then reviewed such information as they deemed reasonably necessary to evaluate the Agreements, including information they had previously received from TAM and the Sub-Adviser as part of their regular oversight of the Portfolio, and knowledge they gained over time through meeting with TAM and the Sub-Adviser. Among other materials, the Trustees considered comparative fee, expense and performance information prepared by Broadridge Financial Solutions, Inc. (“Broadridge”), an independent provider of mutual fund performance information, as well as fee, expense and profitability information prepared by TAM. In addition, TAM provided the Board with additional supplemental comparative performance information. To the extent applicable, the Trustees considered information about fees and performance of comparable funds and/or accounts managed by the Sub-Adviser. The Board also considered reductions to the Portfolio’s expense limits, if any, that took effect after the last renewal of the Agreements. In their review, the Trustees also sought to identify instances in which the Portfolio’s performance, fees, total expenses and/or profitability appeared to be outliers within its respective peer group or other comparative metrics and sought to understand the reasons for such comparative positions.
In their deliberations, the Independent Trustees met privately without representatives of TAM or the Sub-Adviser present and were represented throughout the process by their independent legal counsel. In considering the proposed continuation of each of the Agreements, the Trustees evaluated and weighed a number of considerations that they believed to be relevant in light of the legal advice furnished to them by counsel, including independent legal counsel, and made a decision in the exercise of their own business judgment. They based their decisions on the considerations discussed below, among others, although they did not identify any particular consideration or item of information that was controlling of their decisions, and each Trustee may have attributed different weights to the various factors.
Nature, Extent and Quality of the Services Provided
The Board considered the nature, extent and quality of the services provided by TAM and the Sub-Adviser to the Portfolio in the past and the services anticipated to be provided in the future. The Board also considered the investment approach for the Portfolio; the experience, capability and integrity of TAM’s senior management; the financial resources of TAM; TAM’s management oversight process; TAM’s and the Sub-Adviser’s responsiveness to any questions by the Trustees; and the professional qualifications and compensation program of the portfolio management team of the Sub-Adviser.
The Board also considered the continuous and regular investment management and other services provided by TAM, when acting as a manager of managers, for the portion of the management fee it retains from the Portfolio after payment of the sub-advisory fees. The Board noted that the investment management and other services provided by TAM include the design, development and ongoing review and evaluation of the Portfolio and its investment strategy; the selection, oversight and monitoring of one or more investment sub-advisers to perform certain duties with respect to the Portfolio; ongoing portfolio trading oversight and analysis; risk management oversight and analysis; design, development, implementation and ongoing review and evaluation of a process for the valuation of Portfolio investments; design, development, implementation and ongoing review and evaluation of a compliance program for the Portfolio; design, development, implementation and ongoing review and evaluation of a process for the voting of proxies and exercise of rights to consent to corporate action for Portfolio investments; participation in Board meetings and oversight of preparation of materials for the Board, including materials for Board meetings and regular communications with the Board; oversight of preparation of the Portfolio’s prospectus, statement of additional information, shareholder reports and other disclosure materials and regulatory filings for the Portfolio; and ongoing cash management services for the Portfolio. The Board considered that TAM’s investment management services also include the provision of supervisory and administrative services to the Portfolio. The Board also noted that TAM, as part of the services it provides to all Transamerica mutual funds, including the Portfolio, oversees the services provided by the funds’ custodian, transfer agent, independent accountant and legal counsel and supervises the performance of the recordkeeping and holder service functions of the funds.
Investment Performance
In addition, the Board considered the short- and longer-term performance of the Portfolio in light of its investment objective, policies and strategies, including relative performance against (i) a peer universe of comparable mutual funds, as prepared by Broadridge, and (ii) the Portfolio’s benchmark, in each case for various trailing periods ended December 31, 2023. Based on these considerations, the Board determined that TAM and the Sub-Adviser can provide investment and related services that are appropriate in scope and extent in light of the Portfolio’s investment objectives, policies and strategies and operations, the competitive landscape of the investment company business and investor needs. The Board’s conclusions as to the Portfolio’s performance are summarized below. For purposes of its review,
|
|
|
|
|
| Transamerica Series Trust |
|
|
|
Semi-Annual Financial Statements 2024 |
|
|
Page 13 |
|
|
Transamerica ProFund UltraBear VP
MANAGEMENT AND SUB-ADVISORY AGREEMENT — CONTRACT RENEWAL (continued)
(unaudited)
the Board generally used the performance of Service Class Shares. In describing the Portfolio’s performance relative to its peer universe, the summary conclusions characterize performance for the relevant periods in relation to whether it was “above,” “below” or “in line with” the peer universe median and do so using quintile rankings prepared by Broadridge. For simplicity, performance is described as “above” the median if the Portfolio’s performance ranked anywhere in the first or second quintiles, as “below” the median if it ranked anywhere in the fourth or fifth quintiles, or “in line with” the median if it ranked anywhere in the third quintile (i.e., even if its precise return was somewhat above or somewhat below the precise median return).
When considering the Portfolio’s performance, the Trustees considered any representations made by TAM regarding the appropriateness of certain peer groups and benchmarks. They recognized that performance reflects a snapshot of a period as of a specific date, and that consideration of performance data for a different period could generate significantly different performance results. The Trustees also recognized that even longer-term performance can be negatively affected by performance over a short-term period when that short-term performance is significantly below the performance of the comparable benchmark or universe of peer funds.
The Board noted that the performance of Service Class Shares of the Portfolio was below the median for its peer universe and below the benchmark that TAM utilizes to measure performance of the Portfolio, each for the past 1-, 3-, 5- and 10-year periods. The Board considered that the Portfolio’s investment objective is to seek returns that are twice the inverse of the Portfolio’s benchmark and that the Portfolio’s underperformance relative to its peer universe and benchmark (the S&P 500 Index) for certain periods was consistent with its investment approach given the leveraged nature of the Portfolio and the positive market environment during the relevant periods.
Management Fee and Sub-Advisory Fees and Total Expense Ratio
The Board considered the management fee and total expense ratio of the Portfolio, including information provided by Broadridge comparing the management fee and total expense ratio of the Portfolio to the management fees and total expense ratios of comparable investment companies in both a peer group and broader peer universe compiled by Broadridge. The Board’s conclusions as to the Portfolio’s management fee and total expense ratio are summarized below. For purposes of its review, the Board generally used the actual total expenses (i.e., expenses reflecting any waivers and/or reimbursements) of Service Class Shares. In describing the Portfolio’s management fee and total expense ratio relative to its peer group and peer universe, the summary conclusions characterize management fees and total expense ratios for the relevant periods in relation to whether they were “above,” “below” or “in line with” the peer group or peer universe median and do so using quintile rankings prepared by Broadridge. For simplicity, management fees and total expense ratios are described as “above” the median if the Portfolio’s management fee or total expense ratio ranked anywhere in the fourth or fifth quintiles, as “below” the median if it ranked anywhere in the first or second quintiles, or “in line with” the median if it ranked anywhere in the third quintile (i.e., even if its precise management fee or total expense ratio was somewhat above or somewhat below the precise median management fee or total expense ratio).
The Board also considered the fees charged by the Sub-Adviser for sub-advisory services, as well as the portion of the Portfolio’s management fee retained by TAM following payment of the sub-advisory fee and how the portion of the contractual management fee retained by TAM at a specified asset level compared to the portions retained by other investment advisers managing mutual funds with similar investment strategies as calculated by an independent provider of information.
The Board noted that the Portfolio’s contractual management fee and the actual total expenses (i.e., expenses reflecting any waivers and/or reimbursements) of Service Class Shares of the Portfolio were below the medians for its peer group and peer universe. The Trustees also considered that TAM has entered into an expense limitation arrangement with the Portfolio, which may result in TAM waiving fees for the benefit of holders.
On the basis of these considerations, together with the other information it considered, the Board determined that the management and sub-advisory fees to be received by TAM and the Sub-Adviser under the Management Agreement and Sub-Advisory Agreement are reasonable in light of the services provided.
Cost of Services Provided and Level of Profitability
The Board reviewed information provided by TAM about the cost of providing and procuring fund management services, as well as the costs of the provision of administration, transfer agency and other services, to the Portfolio and to Transamerica Series Trust as a whole by TAM and its affiliates. The Board considered the profitability of TAM and its affiliates in providing these services for the Portfolio and Transamerica Series Trust as a whole. The Trustees recognized the competitiveness of the mutual fund industry and the importance of an investment adviser’s long-term profitability, including for maintaining company and management stability and accountability.
The Board also considered the allocation methodology used for calculating the profitability of TAM and its affiliates. The Board noted that the revenue and expense allocation methodology used by TAM to estimate its profitability with respect to its relationship with the Portfolio had been reviewed previously by an independent consultant. The Trustees considered that TAM reported that it had not made material changes to this methodology, and that the methodology had been applied consistently for the Portfolio.
|
|
|
|
|
| Transamerica Series Trust |
|
|
|
Semi-Annual Financial Statements 2024 |
|
|
Page 14 |
|
|
Transamerica ProFund UltraBear VP
MANAGEMENT AND SUB-ADVISORY AGREEMENT — CONTRACT RENEWAL (continued)
(unaudited)
With respect to the Sub-Adviser, the Board noted that the sub-advisory fee is the product of arm’s-length negotiation between TAM and the Sub-Adviser, which is not affiliated with TAM, and is paid by TAM and not the Portfolio. As a result, the Board focused on the profitability of TAM and its affiliates with respect to the Portfolio.
Based on this information, the Board determined that the profitability of TAM and its affiliates from their relationships with the Portfolio was not excessive.
Economies of Scale
The Board considered economies of scale with respect to the management of the Portfolio, whether the Portfolio had appropriately benefited from any economies of scale and whether there was the potential for realization of any future economies of scale. The Board also considered the existence of economies of scale with respect to management of the Transamerica mutual funds overall and the extent to which the Portfolio benefited from any economies of scale. The Board recognized that, as the Portfolio’s assets increase, any economies of scale realized by TAM or the Sub-Adviser may not directly correlate with each other or with any economies of scale that might be realized by the Portfolio. The Board considered the Portfolio’s management fee schedule and the existence of breakpoints and also considered the extent to which TAM shared economies of scale, if any, with the Portfolio through undertakings to limit or reimburse Portfolio expenses and to invest in maintaining and developing its capabilities and services. The Board also considered the Sub-Adviser’s sub-advisory fee schedule and the existence of breakpoints, if any, and how such breakpoints relate to any breakpoints in the Portfolio’s management fee schedule. The Trustees concluded that the Portfolio’s fee structure reflected an appropriate sharing of any efficiencies or economies of scale to date and noted that they will have the opportunity to periodically reexamine the appropriateness of the management fee payable to TAM and the fee paid to the Sub-Adviser in light of any economies of scale experienced in the future.
Benefits to TAM, its Affiliates and/or the Sub-Adviser from their Relationships with the Portfolio
The Board considered other benefits derived by TAM, its affiliates, and/or the Sub-Adviser from their relationships with the Portfolio. The Board noted that TAM does not receive benefits from research obtained with commissions paid to broker-dealers for portfolio transactions (commonly referred to as “soft dollars”) as a result of its relationship with the Portfolio.
Other Considerations
The Board noted that TAM has made a substantial commitment to the recruitment and retention of high-quality personnel and maintains the financial, compliance and operational resources reasonably necessary to manage the Portfolio in a professional manner that is consistent with the best interests of the Portfolio and the holders. In this regard, the Board favorably considered the procedures and policies TAM has in place to enforce compliance with applicable laws and regulations and oversee the portfolio management activities of the Sub-Adviser. The Board also noted that TAM has made an entrepreneurial commitment and undertaken certain business risks with respect to the management and success of the Portfolio.
Conclusion
After consideration of the factors described above, as well as other factors, the Trustees, including the Independent Trustees, concluded that the renewal of the Management Agreement and the Sub-Advisory Agreement was in the best interests of the Portfolio and the holders and voted to approve the renewal of the Agreements.
|
|
|
|
|
| Transamerica Series Trust |
|
|
|
Semi-Annual Financial Statements 2024 |
|
|
Page 15 |
|
|
PROXY VOTING POLICIES AND PROCEDURES AND QUARTERLY PORTFOLIO HOLDINGS
(unaudited)
A description of Transamerica Series Trust’s (the “Trust”) proxy voting policies and procedures is available in the Statement of Additional Information of the Portfolios, available without charge upon request by calling 1-800-851-9777 (toll free) or on the Securities and Exchange Commission’s (“SEC”) website at http://www.sec.gov.
In addition, the Portfolio is required to file Form N-PX, with their complete proxy voting records for the most recent 12 months ended June 30th, no later than August 31st of each year. The Form is available without charge: (1) on the Transamerica Funds website at https://www.transamerica.com/sites/default/files/files/e070d/TST%20N-PX%202021.pdf; and (2) on the SEC’s website at http://www.sec.gov.
Each fiscal quarter, the Portfolios, except Transamerica BlackRock Government Money Market VP, will file with the SEC a complete schedule of its monthly portfolio holdings on Form N-PORT. The Portfolios’ holdings as of the end of the third month of every fiscal quarter, as reported on Form N-PORT, will be publicly available on the SEC’s website at http://www.sec.gov within 60 days of the end of the fiscal quarter.
On a monthly basis, Transamerica BlackRock Government Money Market VP will file with the SEC portfolio holdings information on Form N-MFP3. A complete schedule of portfolio holdings is also available at www.transamerica.com.
You may also visit the Trust’s website at www.transamerica.com/annuities/prospectus for this and other information about the Portfolios and the Trust.
Important Notice Regarding Delivery of Shareholder Documents
Every year we provide shareholders informative materials such as the Transamerica Series Trust Annual Report, the Transamerica Series Trust Prospectus, and other required documents that keep you informed regarding your Portfolios. To the extent provided by mail, Transamerica Series Trust will only send one piece per mailing address, a method that saves your Portfolios money by reducing mailing and printing costs. We will continue to do this unless you tell us not to. To elect to receive individual mailings, simply call a Transamerica Customer Service Representative toll free at 1-800-851-9777, 8 a.m. to 7 p.m. Eastern Time, Monday-Friday. Your request will take effect within 30 days.
|
|
|
|
|
| Transamerica Series Trust |
|
|
|
Semi-Annual Financial Statements 2024 |
|
|
Page 16 |
|
|
NOTICE OF PRIVACY POLICY
(unaudited)
Your privacy is very important to us. We want you to understand what information we collect and how we use it. We collect and use “nonpublic personal information” in connection with providing our customers with a broad range of financial products and services as effectively and conveniently as possible. We treat nonpublic personal information in accordance with our Privacy Policy.
What Information We Collect and From Whom We Collect It
We may collect nonpublic personal information about you from the following sources:
| • |
|
Information we receive from you on applications or other forms, such as your name, address, and account number; |
| • |
|
Information about your transactions with us, our affiliates, or others, such as your account balance and purchase/redemption history; and |
| • |
|
Information we receive from non-affiliated third parties, including consumer reporting agencies. |
What Information We Disclose and To Whom We Disclose It
We do not disclose any nonpublic personal information about current or former customers to anyone without their express consent, except as permitted by law. We may disclose the nonpublic personal information we collect, as described above, to persons or companies that perform services on our behalf and to other financial institutions with which we have joint marketing agreements. We will require these companies to protect the confidentiality of your nonpublic personal information and to use it only to perform the services for which we have hired them.
Our Security Procedures
We restrict access to your nonpublic personal information and only allow disclosures to persons and companies as permitted by law to assist in providing products or services to you. We maintain physical, electronic, and procedural safeguards to protect your nonpublic personal information and to safeguard the disposal of certain consumer information.
Contact Us
If you have any questions about our Privacy Policy, please call 1-800-851-9777 on any business day between 8 a.m. and 7 p.m. Eastern Time.
Note: This Privacy Policy applies only to customers that have a direct relationship with us or our affiliates. If you own shares of our portfolios in the name of a third party such as a bank or broker-dealer, its privacy policy may apply to you instead of ours.
|
|
|
|
|
| Transamerica Series Trust |
|
|
|
Semi-Annual Financial Statements 2024 |
|
|
Page 17 |
|
|
PO Box 219945
Kansas City, MO 64121-9945
Distributor: Transamerica Capital, Inc.
PO Box 219945
Kansas City, MO 64121-9945
Customer Service: 1-800-851-9777
Transamerica Series Trust Semi-Annual Financial Statements
June 30, 2024
1801 California St., Suite 5200
Denver, CO 80202
Distributor: Transamerica Capital, Inc.
Customer Service: 1-800-851-9777
The following pages contain the most recent semi-annual financial statements for the investment options in which you are invested. In compliance with Securities and Exchange Commission regulations, we present these reports on an annual and semi-annual basis with the hope that they will foster greater understanding of the investment options’ holdings, performance, financial data, accounting policies and other issues. This streamlined version provides information only on the investment options in which you are invested.
If you have any questions about these reports, please do not hesitate to contact your financial professional. As always, we thank you for your trust and the opportunity to serve you.
Transamerica S&P 500 Index VP
SCHEDULE OF INVESTMENTS
At June 30, 2024
(unaudited)
|
|
|
|
|
|
|
|
|
| |
|
Shares |
|
|
Value |
|
| COMMON STOCKS - 99.4% |
|
| Aerospace & Defense - 1.8% |
|
| Axon Enterprise, Inc. (A) |
|
|
1,433 |
|
|
|
$ 421,646 |
|
| Boeing Co. (A) |
|
|
11,561 |
|
|
|
2,104,218 |
|
| General Dynamics Corp. |
|
|
4,565 |
|
|
|
1,324,489 |
|
| General Electric Co. |
|
|
21,888 |
|
|
|
3,479,535 |
|
| Howmet Aerospace, Inc. |
|
|
7,664 |
|
|
|
594,956 |
|
| Huntington Ingalls Industries, Inc. |
|
|
759 |
|
|
|
186,965 |
|
| L3 Harris Technologies, Inc. |
|
|
3,756 |
|
|
|
843,523 |
|
| Lockheed Martin Corp. |
|
|
4,283 |
|
|
|
2,000,589 |
|
| Northrop Grumman Corp. |
|
|
2,773 |
|
|
|
1,208,889 |
|
| RTX Corp. |
|
|
26,606 |
|
|
|
2,670,976 |
|
| Textron, Inc. |
|
|
3,721 |
|
|
|
319,485 |
|
| TransDigm Group, Inc. |
|
|
1,123 |
|
|
|
1,434,756 |
|
|
|
|
|
|
|
|
|
|
|
|
|
|
|
|
|
16,590,027 |
|
|
|
|
|
|
|
|
|
|
|
| Air Freight & Logistics - 0.4% |
|
| CH Robinson Worldwide, Inc. |
|
|
2,217 |
|
|
|
195,362 |
|
| Expeditors International of Washington, Inc. |
|
|
2,836 |
|
|
|
353,904 |
|
| FedEx Corp. |
|
|
4,594 |
|
|
|
1,377,465 |
|
| United Parcel Service, Inc., Class B |
|
|
14,615 |
|
|
|
2,000,063 |
|
|
|
|
|
|
|
|
|
|
|
|
|
|
|
|
|
3,926,794 |
|
|
|
|
|
|
|
|
|
|
|
| Automobile Components - 0.1% |
|
| Aptiv PLC (A) |
|
|
5,578 |
|
|
|
392,803 |
|
| BorgWarner, Inc. |
|
|
4,610 |
|
|
|
148,626 |
|
|
|
|
|
|
|
|
|
|
|
|
|
|
|
|
|
541,429 |
|
|
|
|
|
|
|
|
|
|
|
| Automobiles - 1.4% |
|
| Ford Motor Co. |
|
|
78,132 |
|
|
|
979,775 |
|
| General Motors Co. |
|
|
22,836 |
|
|
|
1,060,961 |
|
| Tesla, Inc. (A) |
|
|
55,472 |
|
|
|
10,976,799 |
|
|
|
|
|
|
|
|
|
|
|
|
|
|
|
|
|
13,017,535 |
|
|
|
|
|
|
|
|
|
|
|
| Banks - 3.2% |
|
| Bank of America Corp. |
|
|
136,728 |
|
|
|
5,437,673 |
|
| Citigroup, Inc. |
|
|
38,181 |
|
|
|
2,422,966 |
|
| Citizens Financial Group, Inc. |
|
|
8,939 |
|
|
|
322,072 |
|
| Fifth Third Bancorp |
|
|
13,591 |
|
|
|
495,936 |
|
| Huntington Bancshares, Inc. |
|
|
29,637 |
|
|
|
390,616 |
|
| JPMorgan Chase & Co. |
|
|
57,363 |
|
|
|
11,602,240 |
|
| KeyCorp |
|
|
19,477 |
|
|
|
276,768 |
|
| M&T Bank Corp. |
|
|
3,390 |
|
|
|
513,111 |
|
| PNC Financial Services Group, Inc. |
|
|
7,900 |
|
|
|
1,228,292 |
|
| Regions Financial Corp. |
|
|
18,576 |
|
|
|
372,263 |
|
| Truist Financial Corp. |
|
|
26,752 |
|
|
|
1,039,315 |
|
| US Bancorp |
|
|
31,099 |
|
|
|
1,234,630 |
|
| Wells Fargo & Co. |
|
|
69,690 |
|
|
|
4,138,889 |
|
|
|
|
|
|
|
|
|
|
|
|
|
|
|
|
|
29,474,771 |
|
|
|
|
|
|
|
|
|
|
|
| Beverages - 1.3% |
|
| Brown-Forman Corp., Class B |
|
|
3,525 |
|
|
|
152,245 |
|
| Coca-Cola Co. |
|
|
77,515 |
|
|
|
4,933,830 |
|
| Constellation Brands, Inc., Class A |
|
|
3,190 |
|
|
|
820,723 |
|
| Keurig Dr. Pepper, Inc. |
|
|
20,986 |
|
|
|
700,932 |
|
| Molson Coors Beverage Co., Class B |
|
|
3,406 |
|
|
|
173,127 |
|
| Monster Beverage Corp. (A) |
|
|
14,652 |
|
|
|
731,867 |
|
| PepsiCo, Inc. |
|
|
27,475 |
|
|
|
4,531,452 |
|
|
|
|
|
|
|
|
|
|
|
|
|
|
|
|
|
12,044,176 |
|
|
|
|
|
|
|
|
|
|
|
|
|
|
|
|
|
|
|
| |
|
Shares |
|
|
Value |
|
| COMMON STOCKS (continued) |
|
|
|
|
|
|
|
|
| Biotechnology - 1.9% |
|
| AbbVie, Inc. |
|
|
35,274 |
|
|
|
$ 6,050,196 |
|
| Amgen, Inc. |
|
|
10,729 |
|
|
|
3,352,276 |
|
| Biogen, Inc. (A) |
|
|
2,929 |
|
|
|
679,001 |
|
| Gilead Sciences, Inc. |
|
|
24,845 |
|
|
|
1,704,615 |
|
| Incyte Corp. (A) |
|
|
3,800 |
|
|
|
230,356 |
|
| Moderna, Inc. (A) |
|
|
6,698 |
|
|
|
795,388 |
|
| Regeneron Pharmaceuticals, Inc. (A) |
|
|
2,123 |
|
|
|
2,231,337 |
|
| Vertex Pharmaceuticals, Inc. (A) |
|
|
5,159 |
|
|
|
2,418,126 |
|
|
|
|
|
|
|
|
|
|
|
|
|
|
|
|
|
17,461,295 |
|
|
|
|
|
|
|
|
|
|
|
| Broadline Retail - 3.9% |
|
| Amazon.com, Inc. (A) |
|
|
183,089 |
|
|
|
35,381,949 |
|
| eBay, Inc. |
|
|
10,160 |
|
|
|
545,795 |
|
| Etsy, Inc. (A) |
|
|
2,235 |
|
|
|
131,821 |
|
|
|
|
|
|
|
|
|
|
|
|
|
|
|
|
|
36,059,565 |
|
|
|
|
|
|
|
|
|
|
|
| Building Products - 0.5% |
|
| A.O. Smith Corp. |
|
|
2,371 |
|
|
|
193,900 |
|
| Allegion PLC |
|
|
1,675 |
|
|
|
197,901 |
|
| Builders FirstSource, Inc. (A) |
|
|
2,470 |
|
|
|
341,873 |
|
| Carrier Global Corp. |
|
|
16,705 |
|
|
|
1,053,751 |
|
| Johnson Controls International PLC |
|
|
13,482 |
|
|
|
896,149 |
|
| Masco Corp. |
|
|
4,436 |
|
|
|
295,748 |
|
| Trane Technologies PLC |
|
|
4,536 |
|
|
|
1,492,027 |
|
|
|
|
|
|
|
|
|
|
|
|
|
|
|
|
|
4,471,349 |
|
|
|
|
|
|
|
|
|
|
|
| Capital Markets - 2.8% |
|
| Ameriprise Financial, Inc. |
|
|
1,985 |
|
|
|
847,972 |
|
| Bank of New York Mellon Corp. |
|
|
15,209 |
|
|
|
910,867 |
|
| BlackRock, Inc. |
|
|
2,784 |
|
|
|
2,191,899 |
|
| Blackstone, Inc. |
|
|
14,288 |
|
|
|
1,768,854 |
|
| Cboe Global Markets, Inc. |
|
|
2,118 |
|
|
|
360,187 |
|
| Charles Schwab Corp. |
|
|
29,902 |
|
|
|
2,203,478 |
|
| CME Group, Inc. |
|
|
7,137 |
|
|
|
1,403,134 |
|
| FactSet Research Systems, Inc. |
|
|
748 |
|
|
|
305,386 |
|
| Franklin Resources, Inc. |
|
|
5,960 |
|
|
|
133,206 |
|
| Goldman Sachs Group, Inc. |
|
|
6,486 |
|
|
|
2,933,748 |
|
| Intercontinental Exchange, Inc. |
|
|
11,492 |
|
|
|
1,573,140 |
|
| Invesco Ltd. |
|
|
8,399 |
|
|
|
125,649 |
|
| KKR & Co., Inc. |
|
|
13,358 |
|
|
|
1,405,796 |
|
| MarketAxess Holdings, Inc. |
|
|
721 |
|
|
|
144,582 |
|
| Moody’s Corp. |
|
|
3,140 |
|
|
|
1,321,720 |
|
| Morgan Stanley |
|
|
24,932 |
|
|
|
2,423,141 |
|
| MSCI, Inc. |
|
|
1,569 |
|
|
|
755,866 |
|
| Nasdaq, Inc. |
|
|
7,744 |
|
|
|
466,654 |
|
| Northern Trust Corp. |
|
|
3,990 |
|
|
|
335,080 |
|
| Raymond James Financial, Inc. |
|
|
3,644 |
|
|
|
450,435 |
|
| S&P Global, Inc. |
|
|
6,391 |
|
|
|
2,850,386 |
|
| State Street Corp. |
|
|
5,854 |
|
|
|
433,196 |
|
| T. Rowe Price Group, Inc. |
|
|
4,356 |
|
|
|
502,290 |
|
|
|
|
|
|
|
|
|
|
|
|
|
|
|
|
|
25,846,666 |
|
|
|
|
|
|
|
|
|
|
|
| Chemicals - 1.4% |
|
| Air Products & Chemicals, Inc. |
|
|
4,439 |
|
|
|
1,145,484 |
|
| Albemarle Corp. |
|
|
2,255 |
|
|
|
215,397 |
|
| Celanese Corp. |
|
|
1,982 |
|
|
|
267,352 |
|
| CF Industries Holdings, Inc. |
|
|
3,614 |
|
|
|
267,870 |
|
The Notes to Financial Statements are an integral part of this report.
|
|
|
|
|
| Transamerica Series Trust |
|
|
|
Semi-Annual Financial Statements 2024 |
|
|
Page 1 |
|
|
Transamerica S&P 500 Index VP
SCHEDULE OF INVESTMENTS (continued)
At June 30, 2024
(unaudited)
|
|
|
|
|
|
|
|
|
| |
|
Shares |
|
|
Value |
|
| COMMON STOCKS (continued) |
|
| Chemicals (continued) |
|
| Corteva, Inc. |
|
|
13,754 |
|
|
|
$ 741,891 |
|
| Dow, Inc. |
|
|
13,923 |
|
|
|
738,615 |
|
| DuPont de Nemours, Inc. |
|
|
8,447 |
|
|
|
679,899 |
|
| Eastman Chemical Co. |
|
|
2,308 |
|
|
|
226,115 |
|
| Ecolab, Inc. |
|
|
5,107 |
|
|
|
1,215,466 |
|
| FMC Corp. |
|
|
2,412 |
|
|
|
138,811 |
|
| International Flavors & Fragrances, Inc. |
|
|
5,097 |
|
|
|
485,285 |
|
| Linde PLC |
|
|
9,634 |
|
|
|
4,227,495 |
|
| LyondellBasell Industries NV, Class A |
|
|
5,227 |
|
|
|
500,015 |
|
| Mosaic Co. |
|
|
6,342 |
|
|
|
183,284 |
|
| PPG Industries, Inc. |
|
|
4,705 |
|
|
|
592,312 |
|
| Sherwin-Williams Co. |
|
|
4,669 |
|
|
|
1,393,370 |
|
|
|
|
|
|
|
|
|
|
|
|
|
|
|
|
|
13,018,661 |
|
|
|
|
|
|
|
|
|
|
|
| Commercial Services & Supplies - 0.6% |
|
| Cintas Corp. |
|
|
1,711 |
|
|
|
1,198,145 |
|
| Copart, Inc. (A) |
|
|
17,620 |
|
|
|
954,299 |
|
| Republic Services, Inc. |
|
|
4,057 |
|
|
|
788,437 |
|
| Rollins, Inc. |
|
|
5,787 |
|
|
|
282,348 |
|
| Veralto Corp. |
|
|
4,386 |
|
|
|
418,732 |
|
| Waste Management, Inc. |
|
|
7,265 |
|
|
|
1,549,915 |
|
|
|
|
|
|
|
|
|
|
|
|
|
|
|
|
|
5,191,876 |
|
|
|
|
|
|
|
|
|
|
|
| Communications Equipment - 0.8% |
|
| Arista Networks, Inc. (A) |
|
|
5,089 |
|
|
|
1,783,593 |
|
| Cisco Systems, Inc. |
|
|
80,957 |
|
|
|
3,846,267 |
|
| F5, Inc. (A) |
|
|
1,154 |
|
|
|
198,753 |
|
| Juniper Networks, Inc. |
|
|
6,621 |
|
|
|
241,402 |
|
| Motorola Solutions, Inc. |
|
|
3,344 |
|
|
|
1,290,951 |
|
|
|
|
|
|
|
|
|
|
|
|
|
|
|
|
|
7,360,966 |
|
|
|
|
|
|
|
|
|
|
|
| Construction & Engineering - 0.1% |
|
| Quanta Services, Inc. |
|
|
2,953 |
|
|
|
750,328 |
|
|
|
|
|
|
|
|
|
|
|
| Construction Materials - 0.1% |
|
| Martin Marietta Materials, Inc. |
|
|
1,240 |
|
|
|
671,832 |
|
| Vulcan Materials Co. |
|
|
2,644 |
|
|
|
657,510 |
|
|
|
|
|
|
|
|
|
|
|
|
|
|
|
|
|
1,329,342 |
|
|
|
|
|
|
|
|
|
|
|
| Consumer Finance - 0.5% |
|
| American Express Co. |
|
|
11,306 |
|
|
|
2,617,904 |
|
| Capital One Financial Corp. |
|
|
7,667 |
|
|
|
1,061,496 |
|
| Discover Financial Services |
|
|
4,974 |
|
|
|
650,649 |
|
| Synchrony Financial |
|
|
7,863 |
|
|
|
371,055 |
|
|
|
|
|
|
|
|
|
|
|
|
|
|
|
|
|
4,701,104 |
|
|
|
|
|
|
|
|
|
|
|
| Consumer Staples Distribution & Retail - 1.9% |
|
| Costco Wholesale Corp. |
|
|
8,856 |
|
|
|
7,527,511 |
|
| Dollar General Corp. |
|
|
4,317 |
|
|
|
570,837 |
|
| Dollar Tree, Inc. (A) |
|
|
4,054 |
|
|
|
432,846 |
|
| Kroger Co. |
|
|
13,533 |
|
|
|
675,703 |
|
| Sysco Corp. |
|
|
9,837 |
|
|
|
702,263 |
|
| Target Corp. |
|
|
9,291 |
|
|
|
1,375,440 |
|
| Walgreens Boots Alliance, Inc. |
|
|
13,643 |
|
|
|
165,012 |
|
| Walmart, Inc. |
|
|
85,406 |
|
|
|
5,782,840 |
|
|
|
|
|
|
|
|
|
|
|
|
|
|
|
|
|
17,232,452 |
|
|
|
|
|
|
|
|
|
|
|
|
|
|
|
|
|
|
|
| |
|
Shares |
|
|
Value |
|
| COMMON STOCKS (continued) |
|
| Containers & Packaging - 0.2% |
|
| Amcor PLC |
|
|
29,755 |
|
|
|
$ 291,004 |
|
| Avery Dennison Corp. |
|
|
1,636 |
|
|
|
357,711 |
|
| Ball Corp. |
|
|
6,310 |
|
|
|
378,726 |
|
| International Paper Co. |
|
|
7,037 |
|
|
|
303,647 |
|
| Packaging Corp. of America |
|
|
1,792 |
|
|
|
327,148 |
|
| Westrock Co. |
|
|
4,932 |
|
|
|
247,882 |
|
|
|
|
|
|
|
|
|
|
|
|
|
|
|
|
|
1,906,118 |
|
|
|
|
|
|
|
|
|
|
|
| Distributors - 0.1% |
|
| Genuine Parts Co. |
|
|
2,719 |
|
|
|
376,092 |
|
| LKQ Corp. |
|
|
5,145 |
|
|
|
213,980 |
|
| Pool Corp. |
|
|
757 |
|
|
|
232,649 |
|
|
|
|
|
|
|
|
|
|
|
|
|
|
|
|
|
822,721 |
|
|
|
|
|
|
|
|
|
|
|
| Diversified Telecommunication Services - 0.7% |
|
| AT&T, Inc. |
|
|
143,489 |
|
|
|
2,742,075 |
|
| Verizon Communications, Inc. |
|
|
84,181 |
|
|
|
3,471,624 |
|
|
|
|
|
|
|
|
|
|
|
|
|
|
|
|
|
6,213,699 |
|
|
|
|
|
|
|
|
|
|
|
| Electric Utilities - 1.5% |
|
| Alliant Energy Corp. |
|
|
5,078 |
|
|
|
258,470 |
|
| American Electric Power Co., Inc. |
|
|
10,411 |
|
|
|
913,461 |
|
| Constellation Energy Corp. |
|
|
6,373 |
|
|
|
1,276,321 |
|
| Duke Energy Corp. |
|
|
15,464 |
|
|
|
1,549,957 |
|
| Edison International |
|
|
7,728 |
|
|
|
554,948 |
|
| Entergy Corp. |
|
|
4,269 |
|
|
|
456,783 |
|
| Evergy, Inc. |
|
|
4,378 |
|
|
|
231,903 |
|
| Eversource Energy |
|
|
7,002 |
|
|
|
397,083 |
|
| Exelon Corp. |
|
|
19,758 |
|
|
|
683,824 |
|
| FirstEnergy Corp. |
|
|
10,103 |
|
|
|
386,642 |
|
| NextEra Energy, Inc. |
|
|
41,108 |
|
|
|
2,910,857 |
|
| NRG Energy, Inc. |
|
|
4,294 |
|
|
|
334,331 |
|
| PG&E Corp. |
|
|
42,311 |
|
|
|
738,750 |
|
| Pinnacle West Capital Corp. |
|
|
2,270 |
|
|
|
173,383 |
|
| PPL Corp. |
|
|
14,759 |
|
|
|
408,086 |
|
| Southern Co. |
|
|
21,925 |
|
|
|
1,700,722 |
|
| Xcel Energy, Inc. |
|
|
10,932 |
|
|
|
583,878 |
|
|
|
|
|
|
|
|
|
|
|
|
|
|
|
|
|
13,559,399 |
|
|
|
|
|
|
|
|
|
|
|
| Electrical Equipment - 0.7% |
|
| AMETEK, Inc. |
|
|
4,576 |
|
|
|
762,865 |
|
| Eaton Corp. PLC |
|
|
8,002 |
|
|
|
2,509,027 |
|
| Emerson Electric Co. |
|
|
11,473 |
|
|
|
1,263,866 |
|
| GE Vernova, Inc. (A) |
|
|
5,446 |
|
|
|
934,043 |
|
| Generac Holdings, Inc. (A) |
|
|
1,140 |
|
|
|
150,731 |
|
| Hubbell, Inc. |
|
|
1,073 |
|
|
|
392,160 |
|
| Rockwell Automation, Inc. |
|
|
2,307 |
|
|
|
635,071 |
|
|
|
|
|
|
|
|
|
|
|
|
|
|
|
|
|
6,647,763 |
|
|
|
|
|
|
|
|
|
|
|
| Electronic Equipment, Instruments & Components - 0.6% |
|
| Amphenol Corp., Class A |
|
|
24,092 |
|
|
|
1,623,078 |
|
| CDW Corp. |
|
|
2,679 |
|
|
|
599,667 |
|
| Corning, Inc. |
|
|
15,607 |
|
|
|
606,332 |
|
| Jabil, Inc. |
|
|
2,447 |
|
|
|
266,209 |
|
| Keysight Technologies, Inc. (A) |
|
|
3,521 |
|
|
|
481,497 |
|
| TE Connectivity Ltd. |
|
|
6,113 |
|
|
|
919,579 |
|
| Teledyne Technologies, Inc. (A) |
|
|
947 |
|
|
|
367,417 |
|
The Notes to Financial Statements are an integral part of this report.
|
|
|
|
|
| Transamerica Series Trust |
|
|
|
Semi-Annual Financial Statements 2024 |
|
|
Page 2 |
|
|
Transamerica S&P 500 Index VP
SCHEDULE OF INVESTMENTS (continued)
At June 30, 2024
(unaudited)
|
|
|
|
|
|
|
|
|
| |
|
Shares |
|
|
Value |
|
| COMMON STOCKS (continued) |
|
| Electronic Equipment, Instruments & Components (continued) |
|
| Trimble, Inc. (A) |
|
|
4,693 |
|
|
|
$ 262,432 |
|
| Zebra Technologies Corp., Class A (A) |
|
|
1,034 |
|
|
|
319,434 |
|
|
|
|
|
|
|
|
|
|
|
|
|
|
|
|
|
5,445,645 |
|
|
|
|
|
|
|
|
|
|
|
| Energy Equipment & Services - 0.3% |
|
| Baker Hughes Co. |
|
|
19,897 |
|
|
|
699,777 |
|
| Halliburton Co. |
|
|
17,915 |
|
|
|
605,169 |
|
| Schlumberger NV |
|
|
28,505 |
|
|
|
1,344,866 |
|
|
|
|
|
|
|
|
|
|
|
|
|
|
|
|
|
2,649,812 |
|
|
|
|
|
|
|
|
|
|
|
| Entertainment - 1.2% |
|
| Electronic Arts, Inc. |
|
|
4,919 |
|
|
|
685,364 |
|
| Live Nation Entertainment, Inc. (A) |
|
|
2,873 |
|
|
|
269,315 |
|
| Netflix, Inc. (A) |
|
|
8,615 |
|
|
|
5,814,091 |
|
| Take-Two Interactive Software, Inc. (A) |
|
|
3,202 |
|
|
|
497,879 |
|
| Walt Disney Co. |
|
|
36,465 |
|
|
|
3,620,610 |
|
| Warner Bros Discovery, Inc. (A) |
|
|
43,166 |
|
|
|
321,155 |
|
|
|
|
|
|
|
|
|
|
|
|
|
|
|
|
|
11,208,414 |
|
|
|
|
|
|
|
|
|
|
|
| Financial Services - 3.8% |
|
| Berkshire Hathaway, Inc., Class B (A) |
|
|
36,178 |
|
|
|
14,717,210 |
|
| Corpay, Inc. (A) |
|
|
1,373 |
|
|
|
365,781 |
|
| Fidelity National Information Services, Inc. |
|
|
11,731 |
|
|
|
884,048 |
|
| Fiserv, Inc. (A) |
|
|
11,828 |
|
|
|
1,762,845 |
|
| Global Payments, Inc. |
|
|
5,083 |
|
|
|
491,526 |
|
| Jack Henry & Associates, Inc. |
|
|
1,484 |
|
|
|
246,374 |
|
| Mastercard, Inc., Class A |
|
|
16,414 |
|
|
|
7,241,200 |
|
| PayPal Holdings, Inc. (A) |
|
|
21,395 |
|
|
|
1,241,552 |
|
| Visa, Inc., Class A |
|
|
31,465 |
|
|
|
8,258,619 |
|
|
|
|
|
|
|
|
|
|
|
|
|
|
|
|
|
35,209,155 |
|
|
|
|
|
|
|
|
|
|
|
| Food Products - 0.7% |
|
| Archer-Daniels-Midland Co. |
|
|
10,558 |
|
|
|
638,231 |
|
| Bunge Global SA |
|
|
2,840 |
|
|
|
303,227 |
|
| Campbell Soup Co. |
|
|
3,917 |
|
|
|
177,009 |
|
| Conagra Brands, Inc. |
|
|
9,662 |
|
|
|
274,594 |
|
| General Mills, Inc. |
|
|
11,350 |
|
|
|
718,001 |
|
| Hershey Co. |
|
|
2,984 |
|
|
|
548,549 |
|
| Hormel Foods Corp. |
|
|
5,650 |
|
|
|
172,269 |
|
| J.M. Smucker Co. |
|
|
2,115 |
|
|
|
230,620 |
|
| Kellanova |
|
|
5,252 |
|
|
|
302,935 |
|
| Kraft Heinz Co. |
|
|
15,780 |
|
|
|
508,432 |
|
| Lamb Weston Holdings, Inc. |
|
|
2,929 |
|
|
|
246,270 |
|
| McCormick & Co., Inc. |
|
|
4,892 |
|
|
|
347,038 |
|
| Mondelez International, Inc., Class A |
|
|
26,831 |
|
|
|
1,755,821 |
|
| Tyson Foods, Inc., Class A |
|
|
5,575 |
|
|
|
318,555 |
|
|
|
|
|
|
|
|
|
|
|
|
|
|
|
|
|
6,541,551 |
|
|
|
|
|
|
|
|
|
|
|
| Gas Utilities - 0.0% (B) |
|
| Atmos Energy Corp. |
|
|
2,917 |
|
|
|
340,268 |
|
|
|
|
|
|
|
|
|
|
|
| Ground Transportation - 1.0% |
|
| CSX Corp. |
|
|
39,456 |
|
|
|
1,319,803 |
|
| JB Hunt Transport Services, Inc. |
|
|
1,654 |
|
|
|
264,640 |
|
| Norfolk Southern Corp. |
|
|
4,490 |
|
|
|
963,958 |
|
| Old Dominion Freight Line, Inc. |
|
|
3,586 |
|
|
|
633,288 |
|
|
|
|
|
|
|
|
|
|
| |
|
Shares |
|
|
Value |
|
| COMMON STOCKS (continued) |
|
| Ground Transportation (continued) |
|
| Uber Technologies, Inc. (A) |
|
|
41,806 |
|
|
|
$ 3,038,460 |
|
| Union Pacific Corp. |
|
|
12,210 |
|
|
|
2,762,635 |
|
|
|
|
|
|
|
|
|
|
|
|
|
|
|
|
|
8,982,784 |
|
|
|
|
|
|
|
|
|
|
|
| Health Care Equipment & Supplies - 2.3% |
|
| Abbott Laboratories |
|
|
34,783 |
|
|
|
3,614,302 |
|
| Align Technology, Inc. (A) |
|
|
1,431 |
|
|
|
345,486 |
|
| Baxter International, Inc. |
|
|
10,336 |
|
|
|
345,739 |
|
| Becton Dickinson & Co. |
|
|
5,803 |
|
|
|
1,356,219 |
|
| Boston Scientific Corp. (A) |
|
|
29,430 |
|
|
|
2,266,404 |
|
| Cooper Cos., Inc. |
|
|
3,860 |
|
|
|
336,978 |
|
| Dexcom, Inc. (A) |
|
|
8,011 |
|
|
|
908,287 |
|
| Edwards Lifesciences Corp. (A) |
|
|
11,993 |
|
|
|
1,107,793 |
|
| GE HealthCare Technologies, Inc. |
|
|
8,414 |
|
|
|
655,619 |
|
| Hologic, Inc. (A) |
|
|
4,668 |
|
|
|
346,599 |
|
| IDEXX Laboratories, Inc. (A) |
|
|
1,628 |
|
|
|
793,162 |
|
| Insulet Corp. (A) |
|
|
1,378 |
|
|
|
278,080 |
|
| Intuitive Surgical, Inc. (A) |
|
|
7,096 |
|
|
|
3,156,656 |
|
| Medtronic PLC |
|
|
26,472 |
|
|
|
2,083,611 |
|
| ResMed, Inc. |
|
|
2,959 |
|
|
|
566,412 |
|
| Solventum Corp. (A) |
|
|
2,626 |
|
|
|
138,863 |
|
| STERIS PLC |
|
|
1,944 |
|
|
|
426,786 |
|
| Stryker Corp. |
|
|
6,787 |
|
|
|
2,309,277 |
|
| Teleflex, Inc. |
|
|
964 |
|
|
|
202,758 |
|
| Zimmer Biomet Holdings, Inc. |
|
|
4,030 |
|
|
|
437,376 |
|
|
|
|
|
|
|
|
|
|
|
|
|
|
|
|
|
21,676,407 |
|
|
|
|
|
|
|
|
|
|
|
| Health Care Providers & Services - 2.4% |
|
| Cardinal Health, Inc. |
|
|
4,883 |
|
|
|
480,097 |
|
| Cencora, Inc. |
|
|
3,341 |
|
|
|
752,727 |
|
| Centene Corp. (A) |
|
|
10,728 |
|
|
|
711,266 |
|
| Cigna Group |
|
|
5,762 |
|
|
|
1,904,744 |
|
| CVS Health Corp. |
|
|
25,189 |
|
|
|
1,487,662 |
|
| DaVita, Inc. (A) |
|
|
1,065 |
|
|
|
147,577 |
|
| Elevance Health, Inc. |
|
|
4,675 |
|
|
|
2,533,196 |
|
| HCA Healthcare, Inc. |
|
|
3,912 |
|
|
|
1,256,847 |
|
| Henry Schein, Inc. (A) |
|
|
2,486 |
|
|
|
159,353 |
|
| Humana, Inc. |
|
|
2,448 |
|
|
|
914,695 |
|
| Labcorp Holdings, Inc. |
|
|
1,709 |
|
|
|
347,799 |
|
| McKesson Corp. |
|
|
2,605 |
|
|
|
1,521,424 |
|
| Molina Healthcare, Inc. (A) |
|
|
1,199 |
|
|
|
356,463 |
|
| Quest Diagnostics, Inc. |
|
|
2,201 |
|
|
|
301,273 |
|
| UnitedHealth Group, Inc. |
|
|
18,397 |
|
|
|
9,368,856 |
|
| Universal Health Services, Inc., Class B |
|
|
1,169 |
|
|
|
216,183 |
|
|
|
|
|
|
|
|
|
|
|
|
|
|
|
|
|
22,460,162 |
|
|
|
|
|
|
|
|
|
|
|
| Health Care REITs - 0.2% |
|
| Alexandria Real Estate Equities, Inc. |
|
|
3,123 |
|
|
|
365,297 |
|
| Healthpeak Properties, Inc. |
|
|
13,658 |
|
|
|
267,697 |
|
| Ventas, Inc. |
|
|
8,256 |
|
|
|
423,203 |
|
| Welltower, Inc. |
|
|
12,014 |
|
|
|
1,252,459 |
|
|
|
|
|
|
|
|
|
|
|
|
|
|
|
|
|
2,308,656 |
|
|
|
|
|
|
|
|
|
|
|
| Hotel & Resort REITs - 0.0% (B) |
|
| Host Hotels & Resorts, Inc. |
|
|
13,795 |
|
|
|
248,034 |
|
|
|
|
|
|
|
|
|
|
|
| Hotels, Restaurants & Leisure - 1.9% |
|
| Airbnb, Inc., Class A (A) |
|
|
8,868 |
|
|
|
1,344,655 |
|
The Notes to Financial Statements are an integral part of this report.
|
|
|
|
|
| Transamerica Series Trust |
|
|
|
Semi-Annual Financial Statements 2024 |
|
|
Page 3 |
|
|
Transamerica S&P 500 Index VP
SCHEDULE OF INVESTMENTS (continued)
At June 30, 2024
(unaudited)
|
|
|
|
|
|
|
|
|
| |
|
Shares |
|
|
Value |
|
| COMMON STOCKS (continued) |
|
| Hotels, Restaurants & Leisure (continued) |
|
| Booking Holdings, Inc. |
|
|
679 |
|
|
|
$ 2,689,858 |
|
| Caesars Entertainment, Inc. (A) |
|
|
4,553 |
|
|
|
180,936 |
|
| Carnival Corp. (A) |
|
|
20,429 |
|
|
|
382,431 |
|
| Chipotle Mexican Grill, Inc. (A) |
|
|
27,506 |
|
|
|
1,723,251 |
|
| Darden Restaurants, Inc. |
|
|
2,354 |
|
|
|
356,207 |
|
| Domino’s Pizza, Inc. |
|
|
680 |
|
|
|
351,104 |
|
| Expedia Group, Inc. (A) |
|
|
2,582 |
|
|
|
325,306 |
|
| Hilton Worldwide Holdings, Inc. |
|
|
5,012 |
|
|
|
1,093,618 |
|
| Las Vegas Sands Corp. |
|
|
7,063 |
|
|
|
312,538 |
|
| Marriott International, Inc., Class A |
|
|
4,929 |
|
|
|
1,191,684 |
|
| McDonald’s Corp. |
|
|
14,415 |
|
|
|
3,673,519 |
|
| MGM Resorts International (A) |
|
|
5,374 |
|
|
|
238,821 |
|
| Norwegian Cruise Line Holdings Ltd. (A) |
|
|
7,915 |
|
|
|
148,723 |
|
| Royal Caribbean Cruises Ltd. (A) |
|
|
4,685 |
|
|
|
746,930 |
|
| Starbucks Corp. |
|
|
22,707 |
|
|
|
1,767,740 |
|
| Wynn Resorts Ltd. |
|
|
1,852 |
|
|
|
165,754 |
|
| Yum! Brands, Inc. |
|
|
5,574 |
|
|
|
738,332 |
|
|
|
|
|
|
|
|
|
|
|
|
|
|
|
|
|
17,431,407 |
|
|
|
|
|
|
|
|
|
|
|
| Household Durables - 0.3% |
|
| D.R. Horton, Inc. |
|
|
5,945 |
|
|
|
837,829 |
|
| Garmin Ltd. |
|
|
3,055 |
|
|
|
497,721 |
|
| Lennar Corp., Class A |
|
|
4,903 |
|
|
|
734,813 |
|
| Mohawk Industries, Inc. (A) |
|
|
1,060 |
|
|
|
120,405 |
|
| NVR, Inc. (A) |
|
|
62 |
|
|
|
470,491 |
|
| PulteGroup, Inc. |
|
|
4,205 |
|
|
|
462,970 |
|
|
|
|
|
|
|
|
|
|
|
|
|
|
|
|
|
3,124,229 |
|
|
|
|
|
|
|
|
|
|
|
| Household Products - 1.2% |
|
| Church & Dwight Co., Inc. |
|
|
4,889 |
|
|
|
506,892 |
|
| Clorox Co. |
|
|
2,500 |
|
|
|
341,175 |
|
| Colgate-Palmolive Co. |
|
|
16,437 |
|
|
|
1,595,046 |
|
| Kimberly-Clark Corp. |
|
|
6,672 |
|
|
|
922,070 |
|
| Procter & Gamble Co. |
|
|
47,128 |
|
|
|
7,772,350 |
|
|
|
|
|
|
|
|
|
|
|
|
|
|
|
|
|
11,137,533 |
|
|
|
|
|
|
|
|
|
|
|
| Independent Power & Renewable Electricity Producers - 0.1% |
|
| AES Corp. |
|
|
14,660 |
|
|
|
257,576 |
|
| Vistra Corp. |
|
|
6,508 |
|
|
|
559,558 |
|
|
|
|
|
|
|
|
|
|
|
|
|
|
|
|
|
817,134 |
|
|
|
|
|
|
|
|
|
|
|
| Industrial Conglomerates - 0.4% |
|
| 3M Co. |
|
|
10,980 |
|
|
|
1,122,046 |
|
| Honeywell International, Inc. |
|
|
13,032 |
|
|
|
2,782,854 |
|
|
|
|
|
|
|
|
|
|
|
|
|
|
|
|
|
3,904,900 |
|
|
|
|
|
|
|
|
|
|
|
| Industrial REITs - 0.2% |
|
| Prologis, Inc. |
|
|
18,399 |
|
|
|
2,066,392 |
|
|
|
|
|
|
|
|
|
|
|
| Insurance - 2.0% |
|
| Aflac, Inc. |
|
|
10,540 |
|
|
|
941,327 |
|
| Allstate Corp. |
|
|
5,201 |
|
|
|
830,392 |
|
| American International Group, Inc. |
|
|
13,719 |
|
|
|
1,018,499 |
|
| Aon PLC, Class A |
|
|
4,368 |
|
|
|
1,282,357 |
|
| Arch Capital Group Ltd. (A) |
|
|
7,548 |
|
|
|
761,518 |
|
| Arthur J Gallagher & Co. |
|
|
4,333 |
|
|
|
1,123,590 |
|
| Assurant, Inc. |
|
|
1,039 |
|
|
|
172,734 |
|
| Brown & Brown, Inc. |
|
|
4,730 |
|
|
|
422,909 |
|
|
|
|
|
|
|
|
|
|
| |
|
Shares |
|
|
Value |
|
| COMMON STOCKS (continued) |
|
| Insurance (continued) |
|
| Chubb Ltd. |
|
|
8,118 |
|
|
|
$ 2,070,740 |
|
| Cincinnati Financial Corp. |
|
|
3,192 |
|
|
|
376,975 |
|
| Everest Group Ltd. |
|
|
869 |
|
|
|
331,106 |
|
| Globe Life, Inc. |
|
|
1,703 |
|
|
|
140,123 |
|
| Hartford Financial Services Group, Inc. |
|
|
5,940 |
|
|
|
597,208 |
|
| Loews Corp. |
|
|
3,574 |
|
|
|
267,121 |
|
| Marsh & McLennan Cos., Inc. |
|
|
9,870 |
|
|
|
2,079,806 |
|
| MetLife, Inc. |
|
|
12,158 |
|
|
|
853,370 |
|
| Principal Financial Group, Inc. |
|
|
4,407 |
|
|
|
345,729 |
|
| Progressive Corp. |
|
|
11,710 |
|
|
|
2,432,284 |
|
| Prudential Financial, Inc. |
|
|
7,152 |
|
|
|
838,143 |
|
| Travelers Cos., Inc. |
|
|
4,578 |
|
|
|
930,891 |
|
| W.R. Berkley Corp. |
|
|
3,907 |
|
|
|
307,012 |
|
| Willis Towers Watson PLC |
|
|
2,044 |
|
|
|
535,814 |
|
|
|
|
|
|
|
|
|
|
|
|
|
|
|
|
|
18,659,648 |
|
|
|
|
|
|
|
|
|
|
|
| Interactive Media & Services - 6.7% |
|
| Alphabet, Inc., Class A |
|
|
117,374 |
|
|
|
21,379,674 |
|
| Alphabet, Inc., Class C |
|
|
97,652 |
|
|
|
17,911,330 |
|
| Match Group, Inc. (A) |
|
|
5,173 |
|
|
|
157,156 |
|
| Meta Platforms, Inc., Class A |
|
|
43,789 |
|
|
|
22,079,289 |
|
|
|
|
|
|
|
|
|
|
|
|
|
|
|
|
|
61,527,449 |
|
|
|
|
|
|
|
|
|
|
|
| IT Services - 1.0% |
|
| Accenture PLC, Class A |
|
|
12,570 |
|
|
|
3,813,864 |
|
| Akamai Technologies, Inc. (A) |
|
|
2,986 |
|
|
|
268,979 |
|
| Cognizant Technology Solutions Corp., Class A |
|
|
9,782 |
|
|
|
665,176 |
|
| EPAM Systems, Inc. (A) |
|
|
1,128 |
|
|
|
212,188 |
|
| Gartner, Inc. (A) |
|
|
1,561 |
|
|
|
700,983 |
|
| GoDaddy, Inc., Class A (A) |
|
|
2,878 |
|
|
|
402,085 |
|
| International Business Machines Corp. |
|
|
18,374 |
|
|
|
3,177,783 |
|
| VeriSign, Inc. (A) |
|
|
1,742 |
|
|
|
309,728 |
|
|
|
|
|
|
|
|
|
|
|
|
|
|
|
|
|
9,550,786 |
|
|
|
|
|
|
|
|
|
|
|
| Leisure Products - 0.0% (B) |
|
| Hasbro, Inc. |
|
|
2,613 |
|
|
|
152,861 |
|
|
|
|
|
|
|
|
|
|
|
| Life Sciences Tools & Services - 1.2% |
|
| Agilent Technologies, Inc. |
|
|
5,840 |
|
|
|
757,039 |
|
| Bio-Rad Laboratories, Inc., Class A (A) |
|
|
370 |
|
|
|
101,051 |
|
| Bio-Techne Corp. |
|
|
3,022 |
|
|
|
216,526 |
|
| Charles River Laboratories International, Inc. (A) |
|
|
989 |
|
|
|
204,308 |
|
| Danaher Corp. |
|
|
13,185 |
|
|
|
3,294,272 |
|
| IQVIA Holdings, Inc. (A) |
|
|
3,617 |
|
|
|
764,778 |
|
| Mettler-Toledo International, Inc. (A) |
|
|
427 |
|
|
|
596,771 |
|
| Revvity, Inc. |
|
|
2,509 |
|
|
|
263,094 |
|
| Thermo Fisher Scientific, Inc. |
|
|
7,676 |
|
|
|
4,244,828 |
|
| Waters Corp. (A) |
|
|
1,215 |
|
|
|
352,496 |
|
| West Pharmaceutical Services, Inc. |
|
|
1,429 |
|
|
|
470,698 |
|
|
|
|
|
|
|
|
|
|
|
|
|
|
|
|
|
11,265,861 |
|
|
|
|
|
|
|
|
|
|
|
| Machinery - 1.6% |
|
| Caterpillar, Inc. |
|
|
9,782 |
|
|
|
3,258,384 |
|
| Cummins, Inc. |
|
|
2,692 |
|
|
|
745,495 |
|
| Deere & Co. |
|
|
5,186 |
|
|
|
1,937,645 |
|
| Dover Corp. |
|
|
2,709 |
|
|
|
488,839 |
|
The Notes to Financial Statements are an integral part of this report.
|
|
|
|
|
| Transamerica Series Trust |
|
|
|
Semi-Annual Financial Statements 2024 |
|
|
Page 4 |
|
|
Transamerica S&P 500 Index VP
SCHEDULE OF INVESTMENTS (continued)
At June 30, 2024
(unaudited)
|
|
|
|
|
|
|
|
|
| |
|
Shares |
|
|
Value |
|
| COMMON STOCKS (continued) |
|
| Machinery (continued) |
|
| Fortive Corp. |
|
|
7,096 |
|
|
|
$ 525,814 |
|
| IDEX Corp. |
|
|
1,473 |
|
|
|
296,368 |
|
| Illinois Tool Works, Inc. |
|
|
5,454 |
|
|
|
1,292,380 |
|
| Ingersoll Rand, Inc. |
|
|
8,029 |
|
|
|
729,354 |
|
| Nordson Corp. |
|
|
1,101 |
|
|
|
255,366 |
|
| Otis Worldwide Corp. |
|
|
8,083 |
|
|
|
778,070 |
|
| PACCAR, Inc. |
|
|
10,540 |
|
|
|
1,084,988 |
|
| Parker-Hannifin Corp. |
|
|
2,577 |
|
|
|
1,303,472 |
|
| Pentair PLC |
|
|
3,192 |
|
|
|
244,731 |
|
| Snap-on, Inc. |
|
|
1,067 |
|
|
|
278,903 |
|
| Stanley Black & Decker, Inc. |
|
|
2,997 |
|
|
|
239,430 |
|
| Westinghouse Air Brake Technologies Corp. |
|
|
3,461 |
|
|
|
547,011 |
|
| Xylem, Inc. |
|
|
4,814 |
|
|
|
652,923 |
|
|
|
|
|
|
|
|
|
|
|
|
|
|
|
|
|
14,659,173 |
|
|
|
|
|
|
|
|
|
|
|
| Media - 0.5% |
|
| Charter Communications, Inc., Class A (A) |
|
|
1,972 |
|
|
|
589,549 |
|
| Comcast Corp., Class A |
|
|
78,302 |
|
|
|
3,066,306 |
|
| Fox Corp., Class A |
|
|
4,563 |
|
|
|
156,830 |
|
| Fox Corp., Class B |
|
|
2,773 |
|
|
|
88,791 |
|
| Interpublic Group of Cos., Inc. |
|
|
7,275 |
|
|
|
211,630 |
|
| News Corp., Class A |
|
|
7,429 |
|
|
|
204,818 |
|
| News Corp., Class B |
|
|
2,256 |
|
|
|
64,048 |
|
| Omnicom Group, Inc. |
|
|
3,845 |
|
|
|
344,897 |
|
| Paramount Global, Class B |
|
|
8,811 |
|
|
|
91,546 |
|
|
|
|
|
|
|
|
|
|
|
|
|
|
|
|
|
4,818,415 |
|
|
|
|
|
|
|
|
|
|
|
| Metals & Mining - 0.4% |
|
| Freeport-McMoRan, Inc. |
|
|
28,837 |
|
|
|
1,401,478 |
|
| Newmont Corp. |
|
|
22,808 |
|
|
|
954,971 |
|
| Nucor Corp. |
|
|
4,872 |
|
|
|
770,166 |
|
| Steel Dynamics, Inc. |
|
|
2,892 |
|
|
|
374,514 |
|
|
|
|
|
|
|
|
|
|
|
|
|
|
|
|
|
3,501,129 |
|
|
|
|
|
|
|
|
|
|
|
| Multi-Utilities - 0.6% |
|
| Ameren Corp. |
|
|
5,393 |
|
|
|
383,496 |
|
| CenterPoint Energy, Inc. |
|
|
12,729 |
|
|
|
394,344 |
|
| CMS Energy Corp. |
|
|
6,110 |
|
|
|
363,728 |
|
| Consolidated Edison, Inc. |
|
|
6,898 |
|
|
|
616,819 |
|
| Dominion Energy, Inc. |
|
|
16,575 |
|
|
|
812,175 |
|
| DTE Energy Co. |
|
|
4,052 |
|
|
|
449,812 |
|
| NiSource, Inc. |
|
|
9,265 |
|
|
|
266,925 |
|
| Public Service Enterprise Group, Inc. |
|
|
9,958 |
|
|
|
733,905 |
|
| Sempra |
|
|
12,744 |
|
|
|
969,309 |
|
| WEC Energy Group, Inc. |
|
|
6,415 |
|
|
|
503,321 |
|
|
|
|
|
|
|
|
|
|
|
|
|
|
|
|
|
5,493,834 |
|
|
|
|
|
|
|
|
|
|
|
| Office REITs - 0.0% (B) |
|
| Boston Properties, Inc. |
|
|
2,745 |
|
|
|
168,982 |
|
|
|
|
|
|
|
|
|
|
|
| Oil, Gas & Consumable Fuels - 3.4% |
|
| APA Corp. |
|
|
7,107 |
|
|
|
209,230 |
|
| Chevron Corp. |
|
|
34,446 |
|
|
|
5,388,043 |
|
| ConocoPhillips |
|
|
23,292 |
|
|
|
2,664,139 |
|
| Coterra Energy, Inc. |
|
|
14,608 |
|
|
|
389,595 |
|
| Devon Energy Corp. |
|
|
12,745 |
|
|
|
604,113 |
|
| Diamondback Energy, Inc. |
|
|
3,596 |
|
|
|
719,883 |
|
| EOG Resources, Inc. |
|
|
11,564 |
|
|
|
1,455,561 |
|
|
|
|
|
|
|
|
|
|
| |
|
Shares |
|
|
Value |
|
| COMMON STOCKS (continued) |
|
| Oil, Gas & Consumable Fuels (continued) |
|
| EQT Corp. |
|
|
9,050 |
|
|
|
$ 334,669 |
|
| Exxon Mobil Corp. |
|
|
89,685 |
|
|
|
10,324,537 |
|
| Hess Corp. |
|
|
5,456 |
|
|
|
804,869 |
|
| Kinder Morgan, Inc. |
|
|
38,380 |
|
|
|
762,611 |
|
| Marathon Oil Corp. |
|
|
11,405 |
|
|
|
326,981 |
|
| Marathon Petroleum Corp. |
|
|
7,302 |
|
|
|
1,266,751 |
|
| Occidental Petroleum Corp. |
|
|
13,117 |
|
|
|
826,765 |
|
| ONEOK, Inc. |
|
|
11,532 |
|
|
|
940,435 |
|
| Phillips 66 |
|
|
8,493 |
|
|
|
1,198,957 |
|
| Targa Resources Corp. |
|
|
4,449 |
|
|
|
572,942 |
|
| Valero Energy Corp. |
|
|
6,766 |
|
|
|
1,060,638 |
|
| Williams Cos., Inc. |
|
|
24,524 |
|
|
|
1,042,270 |
|
|
|
|
|
|
|
|
|
|
|
|
|
|
|
|
|
30,892,989 |
|
|
|
|
|
|
|
|
|
|
|
| Passenger Airlines - 0.2% |
|
| American Airlines Group, Inc. (A) |
|
|
12,531 |
|
|
|
141,976 |
|
| Delta Air Lines, Inc. |
|
|
12,876 |
|
|
|
610,838 |
|
| Southwest Airlines Co. |
|
|
12,263 |
|
|
|
350,844 |
|
| United Airlines Holdings, Inc. (A) |
|
|
6,631 |
|
|
|
322,665 |
|
|
|
|
|
|
|
|
|
|
|
|
|
|
|
|
|
1,426,323 |
|
|
|
|
|
|
|
|
|
|
|
| Personal Care Products - 0.1% |
|
| Estee Lauder Cos., Inc., Class A |
|
|
4,659 |
|
|
|
495,718 |
|
| Kenvue, Inc. |
|
|
37,818 |
|
|
|
687,531 |
|
|
|
|
|
|
|
|
|
|
|
|
|
|
|
|
|
1,183,249 |
|
|
|
|
|
|
|
|
|
|
|
| Pharmaceuticals - 3.8% |
|
| Bristol-Myers Squibb Co. |
|
|
40,308 |
|
|
|
1,673,991 |
|
| Catalent, Inc. (A) |
|
|
3,476 |
|
|
|
195,456 |
|
| Eli Lilly & Co. |
|
|
15,954 |
|
|
|
14,444,433 |
|
| Johnson & Johnson |
|
|
48,063 |
|
|
|
7,024,888 |
|
| Merck & Co., Inc. |
|
|
50,588 |
|
|
|
6,262,794 |
|
| Pfizer, Inc. |
|
|
113,351 |
|
|
|
3,171,561 |
|
| Viatris, Inc. |
|
|
24,227 |
|
|
|
257,533 |
|
| Zoetis, Inc. |
|
|
9,055 |
|
|
|
1,569,775 |
|
|
|
|
|
|
|
|
|
|
|
|
|
|
|
|
|
34,600,431 |
|
|
|
|
|
|
|
|
|
|
|
| Professional Services - 0.6% |
|
| Automatic Data Processing, Inc. |
|
|
8,201 |
|
|
|
1,957,497 |
|
| Broadridge Financial Solutions, Inc., ADR |
|
|
2,384 |
|
|
|
469,648 |
|
| Dayforce, Inc. (A) |
|
|
2,943 |
|
|
|
145,973 |
|
| Equifax, Inc. |
|
|
2,443 |
|
|
|
592,330 |
|
| Jacobs Solutions, Inc. |
|
|
2,477 |
|
|
|
346,061 |
|
| Leidos Holdings, Inc. |
|
|
2,680 |
|
|
|
390,958 |
|
| Paychex, Inc. |
|
|
6,350 |
|
|
|
752,856 |
|
| Paycom Software, Inc. |
|
|
927 |
|
|
|
132,598 |
|
| Verisk Analytics, Inc. |
|
|
2,891 |
|
|
|
779,269 |
|
|
|
|
|
|
|
|
|
|
|
|
|
|
|
|
|
5,567,190 |
|
|
|
|
|
|
|
|
|
|
|
| Real Estate Management & Development - 0.1% |
|
| CBRE Group, Inc., Class A (A) |
|
|
5,962 |
|
|
|
531,274 |
|
| CoStar Group, Inc. (A) |
|
|
8,221 |
|
|
|
609,505 |
|
|
|
|
|
|
|
|
|
|
|
|
|
|
|
|
|
1,140,779 |
|
|
|
|
|
|
|
|
|
|
|
| Residential REITs - 0.3% |
|
| AvalonBay Communities, Inc. |
|
|
2,877 |
|
|
|
595,223 |
|
| Camden Property Trust |
|
|
2,130 |
|
|
|
232,404 |
|
| Equity Residential |
|
|
6,901 |
|
|
|
478,515 |
|
The Notes to Financial Statements are an integral part of this report.
|
|
|
|
|
| Transamerica Series Trust |
|
|
|
Semi-Annual Financial Statements 2024 |
|
|
Page 5 |
|
|
Transamerica S&P 500 Index VP
SCHEDULE OF INVESTMENTS (continued)
At June 30, 2024
(unaudited)
|
|
|
|
|
|
|
|
|
| |
|
Shares |
|
|
Value |
|
| COMMON STOCKS (continued) |
|
| Residential REITs (continued) |
|
| Essex Property Trust, Inc. |
|
|
1,313 |
|
|
|
$ 357,399 |
|
| Invitation Homes, Inc. |
|
|
11,534 |
|
|
|
413,955 |
|
| Mid-America Apartment Communities, Inc. |
|
|
2,278 |
|
|
|
324,866 |
|
| UDR, Inc. |
|
|
5,860 |
|
|
|
241,139 |
|
|
|
|
|
|
|
|
|
|
|
|
|
|
|
|
|
2,643,501 |
|
|
|
|
|
|
|
|
|
|
|
| Retail REITs - 0.3% |
|
| Federal Realty Investment Trust |
|
|
1,473 |
|
|
|
148,729 |
|
| Kimco Realty Corp. |
|
|
13,079 |
|
|
|
254,517 |
|
| Realty Income Corp. |
|
|
17,541 |
|
|
|
926,516 |
|
| Regency Centers Corp. |
|
|
3,144 |
|
|
|
195,557 |
|
| Simon Property Group, Inc. |
|
|
6,450 |
|
|
|
979,110 |
|
|
|
|
|
|
|
|
|
|
|
|
|
|
|
|
|
2,504,429 |
|
|
|
|
|
|
|
|
|
|
|
| Semiconductors & Semiconductor Equipment - 12.0% |
|
| Advanced Micro Devices, Inc. (A) |
|
|
32,294 |
|
|
|
5,238,410 |
|
| Analog Devices, Inc. |
|
|
9,869 |
|
|
|
2,252,698 |
|
| Applied Materials, Inc. |
|
|
16,610 |
|
|
|
3,919,794 |
|
| Broadcom, Inc. |
|
|
8,706 |
|
|
|
13,977,744 |
|
| Enphase Energy, Inc. (A) |
|
|
2,650 |
|
|
|
264,232 |
|
| First Solar, Inc. (A) |
|
|
2,157 |
|
|
|
486,317 |
|
| Intel Corp. |
|
|
85,205 |
|
|
|
2,638,799 |
|
| KLA Corp. |
|
|
2,696 |
|
|
|
2,222,879 |
|
| Lam Research Corp. |
|
|
2,608 |
|
|
|
2,777,129 |
|
| Microchip Technology, Inc. |
|
|
10,804 |
|
|
|
988,566 |
|
| Micron Technology, Inc. |
|
|
22,150 |
|
|
|
2,913,389 |
|
| Monolithic Power Systems, Inc. |
|
|
978 |
|
|
|
803,603 |
|
| NVIDIA Corp. |
|
|
491,785 |
|
|
|
60,755,119 |
|
| NXP Semiconductors NV |
|
|
5,143 |
|
|
|
1,383,930 |
|
| ON Semiconductor Corp. (A) |
|
|
8,500 |
|
|
|
582,675 |
|
| Qorvo, Inc. (A) |
|
|
1,849 |
|
|
|
214,558 |
|
| QUALCOMM, Inc. |
|
|
22,341 |
|
|
|
4,449,880 |
|
| Skyworks Solutions, Inc. |
|
|
3,119 |
|
|
|
332,423 |
|
| Teradyne, Inc. |
|
|
3,121 |
|
|
|
462,813 |
|
| Texas Instruments, Inc. |
|
|
18,207 |
|
|
|
3,541,808 |
|
|
|
|
|
|
|
|
|
|
|
|
|
|
|
|
|
110,206,766 |
|
|
|
|
|
|
|
|
|
|
|
| Software - 10.9% |
|
| Adobe, Inc. (A) |
|
|
8,981 |
|
|
|
4,989,305 |
|
| ANSYS, Inc. (A) |
|
|
1,751 |
|
|
|
562,946 |
|
| Autodesk, Inc. (A) |
|
|
4,235 |
|
|
|
1,047,951 |
|
| Cadence Design Systems, Inc. (A) |
|
|
5,456 |
|
|
|
1,679,084 |
|
| Crowdstrike Holdings, Inc., Class A (A) |
|
|
4,625 |
|
|
|
1,772,254 |
|
| Fair Isaac Corp. (A) |
|
|
494 |
|
|
|
735,398 |
|
| Fortinet, Inc. (A) |
|
|
12,590 |
|
|
|
758,799 |
|
| Gen Digital, Inc. |
|
|
10,550 |
|
|
|
263,539 |
|
| Intuit, Inc. |
|
|
5,599 |
|
|
|
3,679,719 |
|
| Microsoft Corp. |
|
|
148,591 |
|
|
|
66,412,747 |
|
| Oracle Corp. |
|
|
31,859 |
|
|
|
4,498,491 |
|
| Palo Alto Networks, Inc. (A) |
|
|
6,474 |
|
|
|
2,194,751 |
|
| PTC, Inc. (A) |
|
|
2,366 |
|
|
|
429,831 |
|
| Roper Technologies, Inc. |
|
|
2,121 |
|
|
|
1,195,523 |
|
| Salesforce, Inc. |
|
|
19,410 |
|
|
|
4,990,311 |
|
| ServiceNow, Inc. (A) |
|
|
4,101 |
|
|
|
3,226,134 |
|
| Synopsys, Inc. (A) |
|
|
3,039 |
|
|
|
1,808,387 |
|
| Tyler Technologies, Inc. (A) |
|
|
849 |
|
|
|
426,860 |
|
|
|
|
|
|
|
|
|
|
|
|
|
|
|
|
|
100,672,030 |
|
|
|
|
|
|
|
|
|
|
|
|
|
|
|
|
|
|
|
| |
|
Shares |
|
|
Value |
|
| COMMON STOCKS (continued) |
|
| Specialized REITs - 0.9% |
|
| American Tower Corp. |
|
|
9,361 |
|
|
|
$ 1,819,591 |
|
| Crown Castle, Inc. |
|
|
8,594 |
|
|
|
839,634 |
|
| Digital Realty Trust, Inc. |
|
|
6,514 |
|
|
|
990,454 |
|
| Equinix, Inc. |
|
|
1,902 |
|
|
|
1,439,053 |
|
| Extra Space Storage, Inc. |
|
|
4,184 |
|
|
|
650,235 |
|
| Iron Mountain, Inc. |
|
|
5,773 |
|
|
|
517,376 |
|
| Public Storage |
|
|
3,169 |
|
|
|
911,563 |
|
| SBA Communications Corp. |
|
|
2,089 |
|
|
|
410,071 |
|
| VICI Properties, Inc. |
|
|
20,830 |
|
|
|
596,571 |
|
| Weyerhaeuser Co. |
|
|
14,728 |
|
|
|
418,128 |
|
|
|
|
|
|
|
|
|
|
|
|
|
|
|
|
|
8,592,676 |
|
|
|
|
|
|
|
|
|
|
|
| Specialty Retail - 1.8% |
|
| AutoZone, Inc. (A) |
|
|
342 |
|
|
|
1,013,722 |
|
| Bath & Body Works, Inc. |
|
|
4,398 |
|
|
|
171,742 |
|
| Best Buy Co., Inc. |
|
|
3,877 |
|
|
|
326,792 |
|
| CarMax, Inc. (A) |
|
|
3,234 |
|
|
|
237,182 |
|
| Home Depot, Inc. |
|
|
19,812 |
|
|
|
6,820,083 |
|
| Lowe’s Cos., Inc. |
|
|
11,440 |
|
|
|
2,522,062 |
|
| O’Reilly Automotive, Inc. (A) |
|
|
1,180 |
|
|
|
1,246,151 |
|
| Ross Stores, Inc. |
|
|
6,663 |
|
|
|
968,267 |
|
| TJX Cos., Inc. |
|
|
22,678 |
|
|
|
2,496,848 |
|
| Tractor Supply Co. |
|
|
2,171 |
|
|
|
586,170 |
|
| Ulta Beauty, Inc. (A) |
|
|
927 |
|
|
|
357,702 |
|
|
|
|
|
|
|
|
|
|
|
|
|
|
|
|
|
16,746,721 |
|
|
|
|
|
|
|
|
|
|
|
| Technology Hardware, Storage & Peripherals - 7.0% |
|
| Apple, Inc. |
|
|
288,174 |
|
|
|
60,695,208 |
|
| Hewlett Packard Enterprise Co. |
|
|
25,529 |
|
|
|
540,449 |
|
| HP, Inc. |
|
|
17,430 |
|
|
|
610,398 |
|
| NetApp, Inc. |
|
|
4,116 |
|
|
|
530,141 |
|
| Seagate Technology Holdings PLC |
|
|
3,852 |
|
|
|
397,796 |
|
| Super Micro Computer, Inc. (A) |
|
|
1,012 |
|
|
|
829,182 |
|
| Western Digital Corp. (A) |
|
|
6,370 |
|
|
|
482,655 |
|
|
|
|
|
|
|
|
|
|
|
|
|
|
|
|
|
64,085,829 |
|
|
|
|
|
|
|
|
|
|
|
| Textiles, Apparel & Luxury Goods - 0.4% |
|
| Deckers Outdoor Corp. (A) |
|
|
512 |
|
|
|
495,591 |
|
| Lululemon Athletica, Inc. (A) |
|
|
2,281 |
|
|
|
681,335 |
|
| NIKE, Inc., Class B |
|
|
24,228 |
|
|
|
1,826,064 |
|
| Ralph Lauren Corp. |
|
|
755 |
|
|
|
132,170 |
|
| Tapestry, Inc. |
|
|
4,701 |
|
|
|
201,156 |
|
|
|
|
|
|
|
|
|
|
|
|
|
|
|
|
|
3,336,316 |
|
|
|
|
|
|
|
|
|
|
|
| Tobacco - 0.5% |
|
| Altria Group, Inc. |
|
|
34,937 |
|
|
|
1,591,380 |
|
| Philip Morris International, Inc. |
|
|
31,096 |
|
|
|
3,150,958 |
|
|
|
|
|
|
|
|
|
|
|
|
|
|
|
|
|
4,742,338 |
|
|
|
|
|
|
|
|
|
|
|
| Trading Companies & Distributors - 0.3% |
|
| Fastenal Co. |
|
|
11,354 |
|
|
|
713,486 |
|
| United Rentals, Inc. |
|
|
1,347 |
|
|
|
871,145 |
|
| WW Grainger, Inc. |
|
|
880 |
|
|
|
793,971 |
|
|
|
|
|
|
|
|
|
|
|
|
|
|
|
|
|
2,378,602 |
|
|
|
|
|
|
|
|
|
|
|
| Water Utilities - 0.1% |
|
| American Water Works Co., Inc. |
|
|
3,895 |
|
|
|
503,078 |
|
|
|
|
|
|
|
|
|
|
The Notes to Financial Statements are an integral part of this report.
|
|
|
|
|
| Transamerica Series Trust |
|
|
|
Semi-Annual Financial Statements 2024 |
|
|
Page 6 |
|
|
Transamerica S&P 500 Index VP
SCHEDULE OF INVESTMENTS (continued)
At June 30, 2024
(unaudited)
|
|
|
|
|
|
|
|
|
| |
|
Shares |
|
|
Value |
|
| COMMON STOCKS (continued) |
|
| Wireless Telecommunication Services - 0.2% |
|
| T-Mobile US, Inc. |
|
|
10,293 |
|
|
|
$ 1,813,421 |
|
|
|
|
|
|
|
|
|
|
|
|
|
| Total Common Stocks
(Cost $636,441,128) |
|
|
|
|
|
|
916,555,325 |
|
|
|
|
|
|
|
|
|
|
|
|
|
| |
|
Principal |
|
|
Value |
|
| REPURCHASE AGREEMENT - 0.5% |
|
| Fixed Income Clearing Corp., 2.50% (C), dated 06/28/2024, to be repurchased at $4,402,095 on 07/01/2024. Collateralized by U.S. Government Obligations, 3.75% - 4.50%, due 03/31/2026 - 04/15/2026, and with a total value of $4,488,292. |
|
|
$ 4,400,261 |
|
|
|
4,400,261 |
|
|
|
|
|
|
|
|
|
|
|
|
|
| Total Repurchase Agreement
(Cost $4,400,261) |
|
|
|
|
|
|
4,400,261 |
|
|
|
|
|
|
|
|
|
|
| Total Investments
(Cost $640,841,389) |
|
|
|
|
|
|
920,955,586 |
|
|
|
|
|
|
|
|
|
|
| Net Other Assets (Liabilities) - 0.1% |
|
|
|
|
|
|
579,414 |
|
|
|
|
|
|
|
|
|
|
|
|
| Net Assets - 100.0% |
|
|
|
$ 921,535,000 |
|
|
|
|
|
|
|
|
|
|
FUTURES CONTRACTS:
Long Futures Contracts
|
|
|
|
|
|
|
|
|
|
|
|
|
|
|
|
|
|
|
|
|
|
|
|
|
|
|
|
|
|
|
| Description |
|
Number of Contracts |
|
Expiration Date |
|
Notional Amount |
|
Value |
|
Unrealized Appreciation |
|
Unrealized Depreciation |
| S&P 500® E-Mini Index |
|
|
|
16 |
|
|
|
|
09/20/2024 |
|
|
|
$ |
4,426,336 |
|
|
|
$ |
4,417,200 |
|
|
|
$ |
— |
|
|
|
$ |
(9,136 |
) |
INVESTMENT VALUATION:
Valuation Inputs (D)
|
|
|
|
|
|
|
|
|
|
|
|
|
|
|
|
|
| |
|
Level 1 - Unadjusted Quoted Prices |
|
|
Level 2 - Other Significant Observable Inputs |
|
|
Level 3 - Significant Unobservable Inputs |
|
|
Value |
|
| ASSETS |
|
|
|
|
|
|
|
|
|
|
|
|
|
|
|
|
| Investments |
|
|
|
|
|
|
|
|
|
|
|
|
|
|
|
|
| Common Stocks |
|
$ |
916,555,325 |
|
|
$ |
— |
|
|
$ |
— |
|
|
$ |
916,555,325 |
|
| Repurchase Agreement |
|
|
— |
|
|
|
4,400,261 |
|
|
|
— |
|
|
|
4,400,261 |
|
|
|
|
|
|
|
|
|
|
|
|
|
|
|
|
|
|
| Total Investments |
|
$ |
916,555,325 |
|
|
$ |
4,400,261 |
|
|
$ |
— |
|
|
$ |
920,955,586 |
|
|
|
|
|
|
|
|
|
|
|
|
|
|
|
|
|
|
|
|
|
|
|
| LIABILITIES |
|
|
|
|
|
|
|
|
|
|
|
|
|
|
|
|
| Other Financial Instruments |
|
|
|
|
|
|
|
|
|
|
|
|
|
|
|
|
| Futures Contracts (E) |
|
$ |
(9,136 |
) |
|
$ |
— |
|
|
$ |
— |
|
|
$ |
(9,136 |
) |
|
|
|
|
|
|
|
|
|
|
|
|
|
|
|
|
|
| Total Other Financial Instruments |
|
$ |
(9,136 |
) |
|
$ |
— |
|
|
$ |
— |
|
|
$ |
(9,136 |
) |
|
|
|
|
|
|
|
|
|
|
|
|
|
|
|
|
|
FOOTNOTES TO SCHEDULE OF INVESTMENTS:
| (A) |
Non-income producing security. |
| (B) |
Percentage rounds to less than 0.1% or (0.1)%. |
| (C) |
Rate disclosed reflects the yield at June 30, 2024. |
| (D) |
There were no transfers in or out of Level 3 during the period ended June 30, 2024. Please reference the Investment Valuation section of the Notes to Financial Statements for more information regarding investment valuation and pricing inputs. |
| (E) |
Derivative instruments are valued at unrealized appreciation (depreciation). |
The Notes to Financial Statements are an integral part of this report.
|
|
|
|
|
| Transamerica Series Trust |
|
|
|
Semi-Annual Financial Statements 2024 |
|
|
Page 7 |
|
|
Transamerica S&P 500 Index VP
SCHEDULE OF INVESTMENTS (continued)
At June 30, 2024
(unaudited)
PORTFOLIO ABBREVIATION(S):
|
|
|
| ADR |
|
American Depositary Receipt |
| REIT |
|
Real Estate Investment Trust |
The Notes to Financial Statements are an integral part of this report.
|
|
|
|
|
| Transamerica Series Trust |
|
|
|
Semi-Annual Financial Statements 2024 |
|
|
Page 8 |
|
|
Transamerica S&P 500 Index VP
STATEMENT OF ASSETS AND LIABILITIES
At June 30, 2024
(unaudited)
|
|
|
|
|
|
|
| Assets: |
|
|
|
|
| Investments, at value (cost $636,441,128) |
|
$ |
916,555,325 |
|
| Repurchase agreement, at value (cost $4,400,261) |
|
|
4,400,261 |
|
| Cash collateral pledged at broker for: |
|
|
|
|
| Futures contracts |
|
|
207,680 |
|
| Receivables and other assets: |
|
|
|
|
| Shares of beneficial interest sold |
|
|
809,630 |
|
| Dividends |
|
|
465,566 |
|
| Interest |
|
|
917 |
|
| Prepaid expenses |
|
|
3,467 |
|
| Total assets |
|
|
922,442,846 |
|
|
|
| Liabilities: |
|
|
|
|
| Payables and other liabilities: |
|
|
|
|
| Investments purchased |
|
|
572,344 |
|
| Shares of beneficial interest redeemed |
|
|
14,085 |
|
| Due to custodian |
|
|
1,953 |
|
| Investment management fees |
|
|
55,122 |
|
| Distribution and service fees |
|
|
134,221 |
|
| Transfer agent costs |
|
|
246 |
|
| Trustee and CCO fees |
|
|
2,077 |
|
| Audit and tax fees |
|
|
24,042 |
|
| Custody fees |
|
|
30,054 |
|
| Legal fees |
|
|
7,162 |
|
| Printing and shareholder reports fees |
|
|
6,395 |
|
| Other accrued expenses |
|
|
40,571 |
|
| Variation margin payable on futures contracts |
|
|
19,574 |
|
| Total liabilities |
|
|
907,846 |
|
| Net assets |
|
$ |
921,535,000 |
|
|
|
| Net assets consist of: |
|
|
|
|
| Capital stock ($0.01 par value) |
|
$ |
399,664 |
|
| Additional paid-in capital |
|
|
612,392,795 |
|
| Total distributable earnings (accumulated losses) |
|
|
308,742,541 |
|
| Net assets |
|
$ |
921,535,000 |
|
|
|
| Net assets by class: |
|
|
|
|
| Initial Class |
|
$ |
208,442,934 |
|
| Service Class |
|
|
713,092,066 |
|
|
|
| Shares outstanding: |
|
|
|
|
| Initial Class |
|
|
8,983,426 |
|
| Service Class |
|
|
30,982,989 |
|
|
|
| Net asset value and offering price per share: |
|
|
|
|
| Initial Class |
|
$ |
23.20 |
|
| Service Class |
|
|
23.02 |
|
STATEMENT OF OPERATIONS
For the period ended June 30, 2024
(unaudited)
|
|
|
|
|
|
|
| Investment income: |
|
|
|
|
| Dividend income |
|
$ |
5,735,625 |
|
| Interest income |
|
|
72,522 |
|
| Withholding taxes on foreign income |
|
|
(1,496 |
) |
| Total investment income |
|
|
5,806,651 |
|
|
|
| Expenses: |
|
|
|
|
| Investment management fees |
|
|
321,940 |
|
| Distribution and service fees: |
|
|
|
|
| Service Class |
|
|
793,328 |
|
| Transfer agent costs |
|
|
4,104 |
|
| Trustee and CCO fees |
|
|
19,022 |
|
| Audit and tax fees |
|
|
23,939 |
|
| Custody fees |
|
|
31,749 |
|
| Legal fees |
|
|
23,698 |
|
| Printing and shareholder reports fees |
|
|
11,535 |
|
| Other |
|
|
38,143 |
|
| Total expenses |
|
|
1,267,458 |
|
| Recapture of previously waived and/or reimbursed fees: |
|
|
|
|
| Service Class |
|
|
57,122 |
|
| Net expenses |
|
|
1,324,580 |
|
| Net investment income (loss) |
|
|
4,482,071 |
|
|
|
| Net realized gain (loss) on: |
|
|
|
|
| Investments |
|
|
819,489 |
|
| Futures contracts |
|
|
622,312 |
|
| Net realized gain (loss) |
|
|
1,441,801 |
|
|
|
| Net change in unrealized appreciation (depreciation) on: |
|
|
|
|
| Investments |
|
|
108,878,028 |
|
| Futures contracts |
|
|
(43,478 |
) |
| Net change in unrealized appreciation (depreciation) |
|
|
108,834,550 |
|
| Net realized and change in unrealized gain (loss) |
|
|
110,276,351 |
|
| Net increase (decrease) in net assets resulting from operations |
|
$ |
114,758,422 |
|
The Notes to Financial Statements are an integral part of this report.
|
|
|
|
|
| Transamerica Series Trust |
|
|
|
Semi-Annual Financial Statements 2024 |
|
|
Page 9 |
|
|
Transamerica S&P 500 Index VP
STATEMENT OF CHANGES IN NET ASSETS
For the period and year ended:
|
|
|
|
|
|
|
|
|
| |
|
June 30, 2024 (unaudited) |
|
|
December 31, 2023 |
|
|
|
|
| From operations: |
|
|
|
|
|
|
|
|
| Net investment income (loss) |
|
$ |
4,482,071 |
|
|
$ |
7,721,642 |
|
| Net realized gain (loss) |
|
|
1,441,801 |
|
|
|
16,640,577 |
|
| Net change in unrealized appreciation (depreciation) |
|
|
108,834,550 |
|
|
|
109,836,497 |
|
| Net increase (decrease) in net assets resulting from operations |
|
|
114,758,422 |
|
|
|
134,198,716 |
|
|
|
|
| Dividends and/or distributions to shareholders: |
|
|
|
|
|
|
|
|
| Initial Class |
|
|
— |
|
|
|
(2,695,357 |
) |
| Service Class |
|
|
— |
|
|
|
(11,681,083 |
) |
| Net increase (decrease) in net assets resulting from dividends and/or distributions to shareholders |
|
|
— |
|
|
|
(14,376,440 |
) |
|
|
|
| Capital share transactions: |
|
|
|
|
|
|
|
|
| Proceeds from shares sold: |
|
|
|
|
|
|
|
|
| Initial Class |
|
|
56,687,204 |
|
|
|
111,513,059 |
|
| Service Class |
|
|
69,532,737 |
|
|
|
110,622,682 |
|
| |
|
|
126,219,941 |
|
|
|
222,135,741 |
|
| Dividends and/or distributions reinvested: |
|
|
|
|
|
|
|
|
| Initial Class |
|
|
— |
|
|
|
2,695,357 |
|
| Service Class |
|
|
— |
|
|
|
11,681,083 |
|
| |
|
|
— |
|
|
|
14,376,440 |
|
| Cost of shares redeemed: |
|
|
|
|
|
|
|
|
| Initial Class |
|
|
(14,390,850 |
) |
|
|
(50,273,729 |
) |
| Service Class |
|
|
(30,207,779 |
) |
|
|
(57,978,737 |
) |
|
|
|
(44,598,629 |
) |
|
|
(108,252,466 |
) |
| Net increase (decrease) in net assets resulting from capital share transactions |
|
|
81,621,312 |
|
|
|
128,259,715 |
|
| Net increase (decrease) in net assets |
|
|
196,379,734 |
|
|
|
248,081,991 |
|
|
|
|
| Net assets: |
|
|
|
|
|
|
|
|
| Beginning of period/year |
|
|
725,155,266 |
|
|
|
477,073,275 |
|
| End of period/year |
|
$ |
921,535,000 |
|
|
$ |
725,155,266 |
|
|
|
|
| Capital share transactions - shares: |
|
|
|
|
|
|
|
|
| Shares issued: |
|
|
|
|
|
|
|
|
| Initial Class |
|
|
2,607,939 |
|
|
|
6,012,457 |
|
| Service Class |
|
|
3,230,909 |
|
|
|
6,059,916 |
|
| |
|
|
5,838,848 |
|
|
|
12,072,373 |
|
| Shares reinvested: |
|
|
|
|
|
|
|
|
| Initial Class |
|
|
— |
|
|
|
142,687 |
|
| Service Class |
|
|
— |
|
|
|
621,996 |
|
| |
|
|
— |
|
|
|
764,683 |
|
| Shares redeemed: |
|
|
|
|
|
|
|
|
| Initial Class |
|
|
(671,419 |
) |
|
|
(2,720,587 |
) |
| Service Class |
|
|
(1,410,716 |
) |
|
|
(3,208,556 |
) |
| |
|
|
(2,082,135 |
) |
|
|
(5,929,143 |
) |
| Net increase (decrease) in shares outstanding: |
|
|
|
|
|
|
|
|
| Initial Class |
|
|
1,936,520 |
|
|
|
3,434,557 |
|
| Service Class |
|
|
1,820,193 |
|
|
|
3,473,356 |
|
| |
|
|
3,756,713 |
|
|
|
6,907,913 |
|
The Notes to Financial Statements are an integral part of this report.
|
|
|
|
|
| Transamerica Series Trust |
|
|
|
Semi-Annual Financial Statements 2024 |
|
|
Page 10 |
|
|
Transamerica S&P 500 Index VP
FINANCIAL HIGHLIGHTS
|
|
|
|
|
|
|
|
|
|
|
|
|
|
|
|
|
|
|
|
|
|
|
|
|
| For a share outstanding during the period and years indicated: |
|
Initial Class |
|
| |
|
June 30, 2024 (unaudited) |
|
|
December 31, 2023 |
|
|
December 31, 2022 |
|
|
December 31, 2021 |
|
|
December 31, 2020 |
|
|
December 31, 2019 |
|
| Net asset value, beginning of period/year |
|
|
$ 20.14 |
|
|
|
$ 16.37 |
|
|
|
$ 20.52 |
|
|
|
$ 16.39 |
|
|
|
$ 14.02 |
|
|
|
$ 10.74 |
|
| Investment operations: |
|
|
|
|
|
|
|
|
|
|
|
|
|
|
|
|
|
|
|
|
|
|
|
|
| Net investment income (loss)(A) |
|
|
0.14 |
|
|
|
0.28 |
|
|
|
0.26 |
|
|
|
0.23 |
|
|
|
0.23 |
|
|
|
0.23 |
|
| Net realized and unrealized gain (loss) |
|
|
2.92 |
|
|
|
3.96 |
|
|
|
(3.97 |
) |
|
|
4.41 |
|
|
|
2.30 |
|
|
|
3.12 |
|
| Total investment operations |
|
|
3.06 |
|
|
|
4.24 |
|
|
|
(3.71 |
) |
|
|
4.64 |
|
|
|
2.53 |
|
|
|
3.35 |
|
| Dividends and/or distributions to shareholders: |
|
|
|
|
|
|
|
|
|
|
|
|
|
|
|
|
|
|
|
|
|
|
|
|
| Net investment income |
|
|
— |
|
|
|
(0.22 |
) |
|
|
(0.21 |
) |
|
|
(0.18 |
) |
|
|
(0.11 |
) |
|
|
(0.07 |
) |
| Net realized gains |
|
|
— |
|
|
|
(0.25 |
) |
|
|
(0.23 |
) |
|
|
(0.33 |
) |
|
|
(0.05 |
) |
|
|
— |
|
| Total dividends and/or distributions to shareholders |
|
|
— |
|
|
|
(0.47 |
) |
|
|
(0.44 |
) |
|
|
(0.51 |
) |
|
|
(0.16 |
) |
|
|
(0.07 |
) |
| Net asset value, end of period/year |
|
|
$ 23.20 |
|
|
|
$ 20.14 |
|
|
|
$ 16.37 |
|
|
|
$ 20.52 |
|
|
|
$ 16.39 |
|
|
|
$ 14.02 |
|
| |
|
|
|
|
|
|
|
|
|
|
|
|
|
|
|
|
|
|
|
|
|
|
|
|
| Total return |
|
|
15.19 |
%(B) |
|
|
26.09 |
% |
|
|
(18.22 |
)% |
|
|
28.50 |
% |
|
|
18.18 |
% |
|
|
31.22 |
% |
| Ratio and supplemental data: |
|
|
|
|
|
|
|
|
|
|
|
|
|
|
|
|
|
|
|
|
|
|
|
|
| Net assets end of period/year (000’s) |
|
|
$ 208,443 |
|
|
|
$ 141,895 |
|
|
|
$ 59,133 |
|
|
|
$ 39,034 |
|
|
|
$ 33,069 |
|
|
|
$ 11,818 |
|
| Expenses to average net assets |
|
|
|
|
|
|
|
|
|
|
|
|
|
|
|
|
|
|
|
|
|
|
|
|
| Excluding waiver and/or reimbursement and recapture |
|
|
0.12 |
%(C) |
|
|
0.14 |
% |
|
|
0.13 |
% |
|
|
0.13 |
% |
|
|
0.16 |
% |
|
|
0.19 |
% |
| Including waiver and/or reimbursement and recapture |
|
|
0.12 |
%(C) |
|
|
0.14 |
%(D) |
|
|
0.14 |
% |
|
|
0.14 |
% |
|
|
0.14 |
% |
|
|
0.14 |
% |
| Net investment income (loss) to average net assets |
|
|
1.33 |
%(C) |
|
|
1.54 |
% |
|
|
1.48 |
% |
|
|
1.24 |
% |
|
|
1.65 |
% |
|
|
1.81 |
% |
| Portfolio turnover rate |
|
|
1 |
%(B) |
|
|
8 |
% |
|
|
5 |
% |
|
|
3 |
% |
|
|
10 |
% |
|
|
1 |
% |
|
| (A) Calculated based on average number of shares outstanding. (B) Not annualized. (C) Annualized. (D) Waiver and/or reimbursement rounds to less than 0.01%. |
|
| For a share outstanding during the period and years indicated: |
|
Service Class |
|
| |
|
June 30, 2024 (unaudited) |
|
|
December 31, 2023 |
|
|
December 31, 2022 |
|
|
December 31, 2021 |
|
|
December 31, 2020 |
|
|
December 31, 2019 |
|
| Net asset value, beginning of period/year |
|
|
$ 20.00 |
|
|
|
$ 16.27 |
|
|
|
$ 20.40 |
|
|
|
$ 16.32 |
|
|
|
$ 13.97 |
|
|
|
$ 10.72 |
|
| Investment operations: |
|
|
|
|
|
|
|
|
|
|
|
|
|
|
|
|
|
|
|
|
|
|
|
|
| Net investment income (loss)(A) |
|
|
0.11 |
|
|
|
0.23 |
|
|
|
0.21 |
|
|
|
0.18 |
|
|
|
0.20 |
|
|
|
0.20 |
|
| Net realized and unrealized gain (loss) |
|
|
2.91 |
|
|
|
3.92 |
|
|
|
(3.94 |
) |
|
|
4.38 |
|
|
|
2.30 |
|
|
|
3.11 |
|
| Total investment operations |
|
|
3.02 |
|
|
|
4.15 |
|
|
|
(3.73 |
) |
|
|
4.56 |
|
|
|
2.50 |
|
|
|
3.31 |
|
| Dividends and/or distributions to shareholders: |
|
|
|
|
|
|
|
|
|
|
|
|
|
|
|
|
|
|
|
|
|
|
|
|
| Net investment income |
|
|
— |
|
|
|
(0.17 |
) |
|
|
(0.17 |
) |
|
|
(0.15 |
) |
|
|
(0.10 |
) |
|
|
(0.06 |
) |
| Net realized gains |
|
|
— |
|
|
|
(0.25 |
) |
|
|
(0.23 |
) |
|
|
(0.33 |
) |
|
|
(0.05 |
) |
|
|
— |
|
| Total dividends and/or distributions to shareholders |
|
|
— |
|
|
|
(0.42 |
) |
|
|
(0.40 |
) |
|
|
(0.48 |
) |
|
|
(0.15 |
) |
|
|
(0.06 |
) |
| Net asset value, end of period/year |
|
|
$ 23.02 |
|
|
|
$ 20.00 |
|
|
|
$ 16.27 |
|
|
|
$ 20.40 |
|
|
|
$ 16.32 |
|
|
|
$ 13.97 |
|
| |
|
|
|
|
|
|
|
|
|
|
|
|
|
|
|
|
|
|
|
|
|
|
|
|
| Total return |
|
|
15.10 |
%(B) |
|
|
25.73 |
% |
|
|
(18.44 |
)% |
|
|
28.14 |
% |
|
|
17.98 |
% |
|
|
30.90 |
% |
| Ratio and supplemental data: |
|
|
|
|
|
|
|
|
|
|
|
|
|
|
|
|
|
|
|
|
|
|
|
|
| Net assets end of period/year (000’s) |
|
|
$ 713,092 |
|
|
|
$ 583,260 |
|
|
|
$ 417,940 |
|
|
|
$ 518,804 |
|
|
|
$ 352,326 |
|
|
|
$ 213,010 |
|
| Expenses to average net assets |
|
|
|
|
|
|
|
|
|
|
|
|
|
|
|
|
|
|
|
|
|
|
|
|
| Excluding waiver and/or reimbursement and recapture |
|
|
0.37 |
%(C) |
|
|
0.38 |
% |
|
|
0.38 |
% |
|
|
0.38 |
% |
|
|
0.41 |
% |
|
|
0.44 |
% |
| Including waiver and/or reimbursement and recapture |
|
|
0.39 |
%(C) |
|
|
0.39 |
% |
|
|
0.39 |
% |
|
|
0.39 |
% |
|
|
0.39 |
% |
|
|
0.39 |
% |
| Net investment income (loss) to average net assets |
|
|
1.06 |
%(C) |
|
|
1.28 |
% |
|
|
1.20 |
% |
|
|
0.99 |
% |
|
|
1.43 |
% |
|
|
1.56 |
% |
| Portfolio turnover rate |
|
|
1 |
%(B) |
|
|
8 |
% |
|
|
5 |
% |
|
|
3 |
% |
|
|
10 |
% |
|
|
1 |
% |
| (A) |
Calculated based on average number of shares outstanding. |
The Notes to Financial Statements are an integral part of this report.
|
|
|
|
|
| Transamerica Series Trust |
|
|
|
Semi-Annual Financial Statements 2024 |
|
|
Page 11 |
|
|
Transamerica S&P 500 Index VP
NOTES TO FINANCIAL STATEMENTS
At June 30, 2024
(unaudited)
1. ORGANIZATION
Transamerica Series Trust (“TST”) is an open-end management investment company registered under the Investment Company Act of 1940, as amended (the “1940 Act”). TST applies investment company accounting and reporting guidance. TST serves as a funding vehicle for variable life insurance, variable annuity, and group annuity products. Transamerica S&P 500 Index VP (the “Portfolio”) is a series of TST and is classified as diversified under the 1940 Act. The Portfolio currently offers two classes of shares, Initial Class and Service Class.
The only shareholders of the Portfolio are affiliated insurance company separate accounts and/or affiliated asset allocation portfolios. Contract holders of the variable life and annuity contracts are not shareholders of the Portfolio. For ease of reference, shareholders and contract holders are collectively referred to in this report as “shareholders.”
This report must be accompanied or preceded by the Portfolio’s current prospectus, which contains additional information about the Portfolio, including risks, as well as investment objectives and strategies.
Transamerica Asset Management, Inc. (“TAM”) serves as investment manager for the Portfolio pursuant to an investment management agreement. TAM provides continuous and regular investment management services to the Portfolio. TAM supervises the Portfolio’s investments, conducts its investment program and provides supervisory, compliance and administrative services to the Portfolio.
TAM currently acts as a “manager of managers” and has hired sub-advisers to furnish day-to-day investment advice and recommendations. TAM may, in the future, determine to provide all aspects of the day-to-day management of the Portfolio without the use of a sub-adviser. When acting as a manager of managers, TAM provides investment management services that include, without limitation, the design and development of the Portfolio and its investment strategies and the ongoing review and evaluation of those investment strategies including recommending changes in strategy where it believes appropriate or advisable; the selection of one or more sub-advisers for the Portfolio employing a combination of quantitative and qualitative screens, research, analysis and due diligence; negotiation of sub-advisory agreements and fees; oversight and monitoring of sub-advisers and recommending changes to sub-advisers where it believes appropriate or advisable; recommending portfolio combinations and liquidations where it believes appropriate or advisable; selection and oversight of transition managers, as needed; regular supervision of the Portfolio’s investments; regular review and evaluation of sub-adviser performance; daily monitoring of the sub-advisers’ buying and selling of securities for the Portfolio; regular review of holdings; ongoing trade oversight and analysis; regular monitoring to ensure adherence to investment process; regular calls and periodic on-site visits with sub-advisers; portfolio construction and asset allocation when using multiple sub-advisers for the Portfolio; risk management oversight and analysis; oversight of negotiation of investment documentation and agreements; design, development, implementation and regular monitoring of the valuation process; periodic due diligence reviews of pricing vendors and vendor methodology; design, development, implementation and regular monitoring of the compliance process; respond to regulatory inquiries and determine appropriate litigation strategy, as needed; review of proxies voted by sub-advisers; oversight of preparation and review of materials for meetings of the Portfolio’s Board of Trustees (the “Board”), participation in these meetings and preparation of regular communications with the Board; oversight of preparation and review of prospectuses, shareholder reports and other disclosure materials and regulatory filings for the Portfolio; oversight of other service providers to the Portfolio, such as the custodian, the transfer agent, the Portfolio’s independent accounting firm and legal counsel; supervision of the performance of recordkeeping and shareholder relations functions for the Portfolio; and oversight of cash management services. TAM uses a variety of quantitative and qualitative tools to carry out its investment management services. TAM, not the Portfolio, is responsible for paying the sub-adviser(s) for their services, and sub-advisory fees are TAM’s expense.
TAM’s investment management services also include the provision of supervisory and administrative services to the Portfolio. These services include performing certain administrative services for the Portfolio and supervising and overseeing the administrative, clerical, recordkeeping and bookkeeping services provided to the Portfolio by State Street Bank and Trust Company (“State Street”), to whom TAM has outsourced the provision of certain sub-administration services. To the extent agreed upon by TAM and the Portfolio from time to time, TAM’s supervisory and administrative services include, but are not limited to: monitoring and verifying the custodian’s daily calculation of the Net Asset Values (“NAV”); shareholder relations functions; compliance services; valuation services; assisting in due diligence and in the oversight and monitoring of certain activities of sub-advisers and certain aspects of Portfolio investments; assisting with Portfolio combinations and liquidations; oversight of the preparation and filing, and review, of all returns and reports, in connection with federal, state and local taxes; oversight and review of regulatory reporting; supervising and coordinating the Portfolio’s custodian and dividend disbursing agent and monitoring their services to the Portfolio; assisting the Portfolio in preparing reports to shareholders; acting as liaison with the Portfolio’s independent public accountants and providing, upon request, analyses, fiscal year summaries and other audit related services; assisting in the preparation of agendas and supporting documents for and minutes of meetings of trustees and committees of trustees; assisting in the preparation of regular communications with the trustees; and providing personnel and office space, telephones and other office equipment as necessary in order for TAM to perform supervisory and administrative services to the Portfolio. The Portfolio pays certain fees and expenses to State Street for sub-administration services which are not administrative services covered by the
|
|
|
|
|
| Transamerica Series Trust |
|
|
|
Semi-Annual Financial Statements 2024 |
|
|
Page 12 |
|
|
Transamerica S&P 500 Index VP
NOTES TO FINANCIAL STATEMENTS (continued)
At June 30, 2024
(unaudited)
1. ORGANIZATION (continued)
management agreement with TAM or paid for through the management fees payable thereunder. For the period ended June 30, 2024, (i) the expenses paid to State Street for sub-administration services by the Portfolio are shown as a part of Other expenses within the Statement of Operations and (ii) the expenses payable to State Street for sub-administration services from the Portfolio are shown as part of Other accrued expenses within the Statement of Assets and Liabilities.
2. SIGNIFICANT ACCOUNTING POLICIES
In preparing the Portfolio’s financial statements in accordance with Generally Accepted Accounting Principles in the United States of America (“GAAP”), estimates or assumptions (which could differ from actual results) may be used that affect reported amounts and disclosures. The following is a summary of significant accounting policies followed by the Portfolio.
Security transactions and investment income: Security transactions are accounted for on the trade date. Security gains and losses are calculated on a first-in, first-out basis. Dividend income, if any, is recorded on the ex-dividend date or, in the case of foreign securities, as soon as the Portfolio is informed of the ex-dividend dates, net of foreign taxes. Non-cash dividends, if any, are recorded on the ex-dividend date at fair value. Interest income, if any, is recorded on the accrual basis from settlement date, net of foreign taxes. Fixed income premiums and discounts are amortized and/or accreted over the lives of the respective securities.
Multiple class operations, income, and expenses: Income, non-class specific expenses, and realized and unrealized gains and losses are allocated to each class daily based upon net assets. Each class bears its own specific expenses in addition to the allocated non-class specific expenses.
Distributions to shareholders: Distributions are recorded on the ex-dividend date and are determined in accordance with federal income tax regulations, which may differ from GAAP.
Foreign taxes: The Portfolio may be subject to taxes imposed by the countries in which it invests, with respect to its investments in issuers existing or operating in such countries. The Portfolio may also be subject to foreign taxes on income, gains on investments, or currency repatriation, a portion of which may be recoverable. The Portfolio accrues such taxes and recoveries as applicable when the related income or capital gains are earned or unrealized, and based upon the current interpretation of tax rules and regulations that exist in the markets in which the Portfolio invests. Some countries require governmental approval for the repatriation of investment income, capital, or the proceeds of sales earned by foreign investors. In addition, if there is deterioration in a country’s balance of payments or for other reasons, a country may impose temporary restrictions of foreign capital remittances abroad.
Cash overdraft: The Portfolio may have cash overdraft balances. A fee is incurred on these overdrafts, calculated by multiplying the overdraft by a rate based on the Federal Funds Rate.
Payables, if any, are reflected as Due to custodian within the Statement of Assets and Liabilities. Expenses, if any, from U.S. cash overdrafts are reflected in Custody fees within the Statement of Operations. Expenses, if any, from foreign cash overdrafts are reflected in Other expenses within the Statement of Operations.
Commission recapture: The sub-adviser(s), to the extent consistent with the best execution and usual commission rate policies and practices, may elect to place security transactions of the Portfolio with broker/dealers with which TST has established a commission recapture program. A commission recapture program is any arrangement under which a broker/dealer applies a portion of the commissions received by such broker/dealer on the security transactions to the Portfolio. In no event will commissions, paid by the Portfolio, be used to pay expenses that would otherwise be borne by any other Portfolios within TST, or by any other party.
There were no commissions recaptured during the period ended June 30, 2024 by the Portfolio.
Indemnification: In the normal course of business, the Portfolio enters into contracts that contain a variety of representations that provide general indemnifications. The Portfolio’s maximum exposure under these arrangements is unknown, as this would involve future claims that may be made against the Portfolio and/or its affiliates that have not yet occurred. However, based on experience, the Portfolio expects the risk of loss to be remote.
|
|
|
|
|
| Transamerica Series Trust |
|
|
|
Semi-Annual Financial Statements 2024 |
|
|
Page 13 |
|
|
Transamerica S&P 500 Index VP
NOTES TO FINANCIAL STATEMENTS (continued)
At June 30, 2024
(unaudited)
3. INVESTMENT VALUATION
TAM has been designated as the Portfolio’s valuation designee pursuant to Rule 2a-5 under the 1940 Act with responsibility for fair valuation subject to oversight by the Portfolio’s Board of Trustees. The net asset value of the Portfolio is computed as of the official close of the New York Stock Exchange (“NYSE”) each day the NYSE is open for business.
TAM utilizes various methods to measure the fair value of its investments on a recurring basis. GAAP establishes a hierarchy that prioritizes inputs to valuation methods. The inputs or methodology used for valuing securities are not necessarily an indication of the risk associated with investing in those securities. The three levels (“Levels”) of inputs of the fair value hierarchy are defined as follows:
Level 1—Unadjusted quoted prices in active markets for identical securities.
Level 2—Inputs, other than quoted prices included in Level 1, which are observable, either directly or indirectly. These inputs may include quoted prices for the identical instrument on an inactive market, prices for similar instruments, interest rates, prepayment speeds, credit risk, yield curves, default rates, and similar data.
Level 3—Unobservable inputs based on the best information available in the circumstances, to the extent observable inputs are not available, which may include TAM’s own assumptions used in determining the fair value of the Portfolio’s investments and derivative instruments.
The inputs used to measure fair value may fall into different Levels of the fair value hierarchy. In such cases, for disclosure purposes, the Level in the fair value hierarchy that is assigned to the fair value measurement of a security is determined based on the lowest Level input that is significant to the fair value measurement in its entirety. Certain investments that are measured at fair value using NAV per share, or its equivalent, using the “practical expedient” have not been classified in the fair value Levels. The hierarchy classification of inputs used to value the Portfolio’s investments at June 30, 2024, is disclosed within the Investment Valuation section of the Schedule of Investments.
The availability of observable inputs can vary from security to security and is affected by a wide variety of factors, including, but not limited to, the type of security, whether the security is new and not yet established in the marketplace, the liquidity of markets, and other characteristics particular to the security. To the extent that valuation is based on models or inputs that are less observable or unobservable in the market, the determination of fair value requires more judgment. Accordingly, the degree of judgment exercised in determining fair value is generally greatest for instruments categorized in Level 3. Due to the inherent uncertainty of valuation, the determination of values may differ significantly from values that would have been realized had a ready market for investments existed, and the differences could be material.
Fair value measurements: Descriptions of the valuation techniques applied to the Portfolio’s significant categories of assets and liabilities measured at fair value on a recurring basis are as follows:
Equity securities: Securities are stated at the last reported sales price or closing price on the day of valuation taken from the primary exchange where the security is principally traded. To the extent these securities are actively traded and valuation adjustments are not applied, they are categorized in Level 1 of the fair value hierarchy. Equities traded on inactive markets or valued by reference to similar instruments are generally categorized in Level 2 or Level 3 if inputs are unobservable.
Foreign equity securities: Securities in which the primary trading market closes at the same time or after the NYSE, are valued based on quotations from the primary market in which they are traded and are categorized in Level 1. Because many foreign securities markets and exchanges close prior to the close of the NYSE, closing prices for foreign securities in those markets or on those exchanges do not reflect the events that occur after that close. Certain foreign securities may be fair valued using a pricing service that considers the correlation of the trading patterns of the foreign security to the intraday trading in the U.S. markets for investments such as American Depositary Receipts, financial futures, or ETFs and the movement of certain indices of securities based on a statistical analysis of their historical relationship; such valuations generally are categorized in Level 2.
Repurchase agreements: Repurchase agreements are valued at cost, which approximates fair value. To the extent the inputs are observable and timely, the values are generally categorized in Level 2 of the fair value hierarchy.
Derivative instruments: Centrally cleared or listed derivatives that are actively traded are valued based on quoted prices from the exchange and are categorized in Level 1 of the fair value hierarchy. Over-the-counter (“OTC”) derivative contracts include forward, swap, swaption, and option contracts related to interest rates, foreign currencies, credit standing of reference entities, equity prices, or commodity prices. Depending on the product and the terms of the transaction, the fair value of the OTC derivative products are modeled taking into account
|
|
|
|
|
| Transamerica Series Trust |
|
|
|
Semi-Annual Financial Statements 2024 |
|
|
Page 14 |
|
|
Transamerica S&P 500 Index VP
NOTES TO FINANCIAL STATEMENTS (continued)
At June 30, 2024
(unaudited)
3. INVESTMENT VALUATION (continued)
the counterparties’ creditworthiness and using a series of techniques, including simulation models. Many pricing models do not entail material subjectivity because the methodologies employed do not necessitate significant judgments and the pricing inputs are observed from actively quoted markets, as is the case of interest rate swap and option contracts. The majority of OTC derivative products valued by the Portfolio using pricing models fall into this category and are categorized within Level 2 of the fair value hierarchy or Level 3 if inputs are unobservable.
4. SECURITIES AND OTHER INVESTMENTS
Real estate investment trusts (“REITs”): REITs are pooled investment vehicles which invest primarily in income producing real estate, or real estate related loans or interests. Distributions received by REITs are classified at management’s estimate of the dividend income, return of capital and capital gains. Estimates are based on information available at year-end, which includes the previous fiscal year’s classification. The actual amounts of dividend income, return of capital, and capital gains are only determined by each REIT after the fiscal year end and may differ from the estimated amounts. Upon notification from the REITs, some of the distributions received may be re-classified and recorded as a return of capital or capital gains. There are certain additional risks involved in investing in REITs. These include, but are not limited to, economic conditions, changes in zoning laws, real estate values, property taxes, and interest rates.
REITs held at June 30, 2024, if any, are identified within the Schedule of Investments.
5. BORROWINGS AND OTHER FINANCING TRANSACTIONS
The Portfolio may engage in borrowing transactions as a means of raising cash to satisfy redemption requests, for other temporary or emergency purposes or, to the extent permitted by its investment policies, to raise additional cash to be invested in other securities or instruments. When the Portfolio invests borrowing proceeds in other securities, the Portfolio will bear the risk that the market value of the securities in which such proceeds are invested goes down and is insufficient to repay the borrowed proceeds. The Portfolio may borrow on a secured or on an unsecured basis. If the Portfolio enters into a secured borrowing arrangement, a portion of the Portfolio’s assets will be used as collateral. The 1940 Act requires the Portfolio to maintain asset coverage of at least 300% of the amount of its borrowings. Asset coverage means the ratio that the value of the Portfolio’s total assets, minus liabilities other than borrowings, bears to the aggregate amount of all borrowings. Although complying with this requirement has the effect of limiting the amount that the Portfolio may borrow, it does not otherwise mitigate the risks of entering into borrowing transactions.
Interfund lending: The Portfolio, along with other funds and portfolios advised by TAM, may participate in an interfund lending program pursuant to exemptive relief granted by the Securities and Exchange Commission on January 18, 2017. This program allows the Portfolio to lend to and borrow from other funds and portfolios advised by TAM. Interfund lending transactions are subject to the conditions of the exemptive relief which places limits on the amount of lending or borrowing a Portfolio may participate in under the program. Interest earned or paid on an interfund lending transaction will be based on the average of certain current market rates. For the period ended June 30, 2024, the Portfolio has not utilized the program.
6. RISK EXPOSURES AND THE USE OF DERIVATIVE INSTRUMENTS
The Portfolio’s investment strategies allow the Portfolio to use various types of derivative contracts, including option contracts, swap agreements, futures contracts, and forward foreign currency contracts. Derivatives are investments whose value is primarily derived from underlying assets, indices or reference rates and may be transacted on an exchange or OTC.
Market Risk Factors: In pursuit of the Portfolio’s investment strategies, the Portfolio may seek to use derivatives to increase or decrease its exposure to certain market risks, including:
Interest rate risk: Interest rate risk relates to the fluctuations in the value of fixed income securities due to changes in the prevailing levels of market interest rates.
Foreign exchange rate risk: Foreign exchange rate risk relates to fluctuations in the value of an asset or liability due to changes in the currency exchange rates.
Equity risk: Equity risk relates to the change in value of equity securities as they relate to increases or decreases in the general market.
Credit risk: Credit risk relates to the ability of the issuer of a financial instrument to make further principal or interest payments on an obligation or commitment that it has to the Portfolio.
|
|
|
|
|
| Transamerica Series Trust |
|
|
|
Semi-Annual Financial Statements 2024 |
|
|
Page 15 |
|
|
Transamerica S&P 500 Index VP
NOTES TO FINANCIAL STATEMENTS (continued)
At June 30, 2024
(unaudited)
6. RISK EXPOSURES AND THE USE OF DERIVATIVE INSTRUMENTS (continued)
Commodity risk: Commodity risk relates to the change in value of commodities or commodity indices as they relate to increases or decreases in the commodities market. Commodities are physical assets that have tangible properties. Examples of these types of assets are crude oil, heating oil, metals, livestock, and agricultural products.
The Portfolio is also exposed to additional risks from investing in derivatives, such as liquidity and counterparty credit risk. Liquidity risk is the risk that the Portfolio will be unable to sell or close out the derivative in the open market in a timely manner. Counterparty credit risk is the risk that the counterparty will not be able to fulfill its obligations to the Portfolio. Investing in derivatives may also involve greater risks than investing directly in the underlying assets, such as losses in excess of any initial investment and collateral received. In addition, there may be the risk that the change in value of the derivative contract does not correspond to the change in value of the underlying instrument.
The Portfolio’s exposure to market risk factors and certain other associated risks are summarized by derivative type as follows:
Futures contracts: The Portfolio is subject to equity risk, credit risk, commodity risk, interest rate risk and foreign exchange rate risk in the normal course of pursuing its investment objective. The Portfolio uses futures contracts to gain exposure to, or hedge against, changes in the value of equities and commodities, interest rates, or foreign currencies. A futures contract represents a commitment for the future purchase or sale of an asset at a specified price on a specified date. Upon entering into such contracts, the Portfolio is required to deposit with the broker, either in cash or in securities, an initial margin in an amount equal to a certain percentage of the contract amount. Subsequent payments (variation margin) are paid or received by the Portfolio, depending on the daily fluctuations in the value of the contract, and are recorded for financial statement purposes as unrealized gains or losses by the Portfolio. Upon entering into such contracts, the Portfolio bears the risk of equity and commodity prices, interest rates, or exchange rates moving unexpectedly, in which case, the Portfolio may not achieve the anticipated benefits of the futures contracts and may realize losses. With futures, there is minimal counterparty credit risk to the Portfolio since futures are exchange-traded and the exchange’s clearinghouse, as counterparty to all exchange-traded futures, guarantees the futures against default. Futures contracts are generally entered into on a regulated futures exchange and cleared through a clearinghouse associated with the exchange.
Open futures contracts at June 30, 2024 are listed within the Schedule of Investments. Variation margin, if applicable, is shown in Variation margin receivable or payable on futures contracts within the Statement of Assets and Liabilities.
The following is a summary of the location and the Portfolio’s fair values of derivative investments disclosed within the Statement of Assets and Liabilities, categorized by primary market risk exposure as of June 30, 2024.
|
|
|
|
|
|
|
|
|
|
|
|
|
|
|
|
|
|
|
|
|
|
|
|
|
| Liability Derivatives |
|
| Location |
|
Interest Rate Contracts |
|
|
Foreign Exchange Contracts |
|
|
Equity Contracts |
|
|
Credit Contracts |
|
|
Commodity Contracts |
|
|
Total |
|
| Futures contracts: |
|
|
|
|
|
|
|
|
|
|
|
|
|
|
|
|
|
|
|
|
|
|
|
|
| Total distributable earnings (accumulated losses) (A)(B) |
|
$ |
— |
|
|
$ |
— |
|
|
$ |
(9,136 |
) |
|
$ |
— |
|
|
$ |
— |
|
|
|
$ (9,136) |
|
| Total |
|
$ |
— |
|
|
$ |
— |
|
|
$ |
(9,136 |
) |
|
$ |
— |
|
|
$ |
— |
|
|
|
$ (9,136) |
|
| |
|
|
|
|
|
|
|
|
|
|
|
|
|
|
|
|
|
|
|
|
|
|
|
|
| (A) |
May include exchange-traded derivatives which are not subject to a master netting arrangement, or another similar arrangement. |
| (B) |
Included within unrealized appreciation (depreciation) on futures contracts as reported in the Schedule of Investments. Only current day’s variation margin is reported within the Statement of Assets and Liabilities. |
|
|
|
|
|
| Transamerica Series Trust |
|
|
|
Semi-Annual Financial Statements 2024 |
|
|
Page 16 |
|
|
Transamerica S&P 500 Index VP
NOTES TO FINANCIAL STATEMENTS (continued)
At June 30, 2024
(unaudited)
6. RISK EXPOSURES AND THE USE OF DERIVATIVE INSTRUMENTS (continued)
The following is a summary of the location and the effect of derivative investments within the Statement of Operations, categorized by primary market risk exposure as of June 30, 2024.
|
|
|
|
|
|
|
|
|
|
|
|
|
|
|
|
|
|
|
|
|
|
|
|
|
| Realized Gain (Loss) on Derivative Instruments |
|
| Location |
|
Interest Rate Contracts |
|
|
Foreign Exchange Contracts |
|
|
Equity Contracts |
|
|
Credit Contracts |
|
|
Commodity Contracts |
|
|
Total |
|
| Futures contracts |
|
$ |
— |
|
|
$ |
— |
|
|
$ |
622,312 |
|
|
$ |
— |
|
|
$ |
— |
|
|
$ |
622,312 |
|
| Total |
|
$ |
— |
|
|
$ |
— |
|
|
$ |
622,312 |
|
|
$ |
— |
|
|
$ |
— |
|
|
$ |
622,312 |
|
| |
|
|
|
|
|
|
|
|
|
|
|
|
|
|
|
|
|
|
|
|
|
|
|
|
|
| Net Change in Unrealized Appreciation (Depreciation) on Derivative Instruments |
|
| Location |
|
Interest Rate Contracts |
|
|
Foreign Exchange Contracts |
|
|
Equity Contracts |
|
|
Credit Contracts |
|
|
Commodity Contracts |
|
|
Total |
|
| Futures contracts |
|
$ |
— |
|
|
$ |
— |
|
|
$ |
(43,478 |
) |
|
$ |
— |
|
|
$ |
— |
|
|
$ |
(43,478 |
) |
| Total |
|
$ |
— |
|
|
$ |
— |
|
|
$ |
(43,478 |
) |
|
$ |
— |
|
|
$ |
— |
|
|
$ |
(43,478 |
) |
| |
|
|
|
|
|
|
|
|
|
|
|
|
|
|
|
|
|
|
|
|
|
|
|
|
The following is a summary of the ending monthly average volume on derivative activity during the period ended June 30, 2024.
|
|
|
|
|
| Futures contracts: |
|
|
|
|
| Average notional value of contracts — long |
|
$ |
4,557,567 |
|
Collateral requirements: Collateral or margin requirements are set by the broker or exchange clearing house for exchange-traded derivatives (futures contracts, exchange-traded options, and exchange-traded swap agreements) while collateral terms are contract specific for OTC derivatives (forward foreign currency exchange contracts, OTC options, and OTC swap agreements). For OTC derivatives, under standard derivatives agreements, the Portfolio may be required to pledge collateral on derivatives to a counterparty if the Portfolio is in a net liability position, and receive collateral if in a net positive position. For financial reporting purposes, cash collateral that has been pledged by the Portfolio to cover obligations, if any, is reported in Cash collateral at broker within the Statement of Assets and Liabilities. Cash collateral that has been received by the Portfolio from a counterparty, if any, is reported separately in Cash collateral pledged at custodian and/or broker within the Statement of Assets and Liabilities. Non-cash collateral pledged to the Portfolio, if any, is disclosed within the Schedule of Investments.
Generally, the amount of collateral due from or to a party must exceed a minimum transfer amount threshold before a transfer has been made. Typically a counterparty is not permitted to sell, re-pledge or use cash and non-cash collateral it receives. The Portfolio generally does not use non-cash collateral that it receives but may, absent default or certain other circumstances, be permitted to use cash collateral received. In such cases, interest may be paid pursuant to the collateral arrangement with the counterparty.
To the extent amounts due to the Portfolio from its counterparties are not fully collateralized, contractually or otherwise, the Portfolio bears the risk of loss from counterparty non-performance. Additionally, to the extent the Portfolio has delivered collateral to a counterparty, the Portfolio bears the risk of loss from a counterparty in the event the counterparty fails to return such collateral. Counterparties may immediately terminate derivatives contracts if the Portfolio fails to maintain sufficient asset coverage for its contracts or its net assets decline by stated percentages. Collateral may not be required for all derivative contracts.
7. RISK FACTORS
Investing in the Portfolio involves certain key risks related to the Portfolio’s trading activity. Please reference the Portfolio’s prospectus for a more complete discussion of the following risk(s), as well as other risks of investing in the Portfolio.
Market risk: The market prices of the Portfolio’s securities or other assets may go up or down, sometimes rapidly or unpredictably, due to factors such as economic events, inflation, changes in interest rates, governmental actions or interventions, actions taken by the U.S. Federal Reserve or foreign central banks, market disruptions caused by tariffs, trade disputes or other factors, political developments,
|
|
|
| Transamerica Series Trust |
|
Semi-Annual Financial Statements 2024 |
Page 17
Transamerica S&P 500 Index VP
NOTES TO FINANCIAL STATEMENTS (continued)
At June 30, 2024
(unaudited)
7. RISK FACTORS (continued)
armed conflicts, economic sanctions, cybersecurity events, investor sentiment, the global and domestic effects of widespread or local health, weather or climate events, and other factors that may or may not be related to the issuer of the security or other asset. If the market prices of the Portfolio’s securities and assets fall, the value of your investment in the Portfolio could go down.
Economies and financial markets throughout the world are increasingly interconnected. Events or circumstances in one or more countries or regions could be highly disruptive to, and have profound impacts on, global economies or markets. As a result, whether or not the Portfolio invests in securities of issuers located in or with significant exposure to the countries directly affected, the value and liquidity of the Portfolio’s investments may go down.
Index fund risk: While the Portfolio seeks to track the performance of the S&P 500® Index (i.e., achieve a high degree of correlation with the index), the Portfolio’s return may not match the return of the index. The Portfolio incurs a number of operating expenses not applicable to the index, and incurs costs in buying and selling securities. In addition, the Portfolio may not be fully invested at times, generally as a result of cash flows into or out of the Portfolio or reserves of cash held by the Portfolio to meet redemptions. The Portfolio may attempt to replicate the index return by investing in fewer than all of the securities in the index, or in some securities not included in the index, potentially increasing the risk of divergence between the Portfolio’s return and that of the index.
Passive strategy/index risk: The Portfolio is managed with a passive investment strategy, attempting to track the performance of an unmanaged index of securities, regardless of the current or projected performance of the index or of the actual securities comprising the index. This differs from an actively-managed fund, which typically seeks to outperform a benchmark index. As a result, the Portfolio’s performance may be less favorable than that of a portfolio managed using an active investment strategy. The structure and composition of the index will affect the performance, volatility, and risk of the index and, consequently, the performance, volatility, and risk of the Portfolio.
Real estate investment trusts (“REITs”) risk: Investing in real estate investment trusts (“REITs”) involves unique risks. When the Portfolio invests in REITs, it is subject to risks generally associated with investing in real estate. A REIT’s performance depends on the types and locations of the properties it owns, how well it manages those properties and cash flow. REITs may have limited financial resources, may trade less frequently and in limited volume, may engage in dilutive offerings, and may be subject to more abrupt or erratic price movements than the overall securities markets. In addition to its own expenses, the Portfolio will indirectly bear its proportionate share of any management and other expenses paid by REITs in which it invests. U.S. REITs are subject to a number of highly technical tax-related rules and requirements; and a U.S. REIT’s failure to qualify for the favorable U.S. federal income tax treatment generally available to U.S. REITs could result in corporate-level taxation, significantly reducing the return on an investment to the Portfolio.
8. FEES AND OTHER AFFILIATED TRANSACTIONS
TST serves as a funding vehicle for certain affiliated asset allocation portfolios and certain affiliated separate accounts of Transamerica Life Insurance Company (“TLIC”) and Transamerica Financial Life Insurance Company.
TAM, the Portfolio’s investment manager, is directly owned by TLIC and AUSA Holding, LLC (“AUSA”), both of which are indirect, wholly owned subsidiaries of Aegon Ltd. TLIC is owned by Commonwealth General Corporation (“Commonwealth”). Commonwealth and AUSA are wholly owned by Transamerica Corporation (DE). Transamerica Corporation (DE) is wholly owned by Aegon International B.V., which is wholly owned by Aegon Ltd., a Bermuda exempted company with liability limited by shares (formerly, Aegon NV, a Netherlands corporation) and a publicly traded international insurance group.
Transamerica Fund Services, Inc. (“TFS”) is the Portfolio’s transfer agent. Transamerica Capital, Inc. (“TCI”) is the Portfolio’s distributor/principal underwriter. TAM, TFS and TCI are affiliates of Aegon Ltd.
Certain officers and trustees of the Portfolio may also be officers and/or trustees of TAM, TFS and TCI. No interested trustee who is deemed an interested person due to current or former service with TAM or an affiliate of TAM receives compensation from the Portfolio. The Portfolio does pay non-interested persons (independent trustees), as disclosed in Trustee and CCO fees within the Statement of Operations.
Investment management fees: TAM serves as the Portfolio’s investment manager, performing administration as well as investment advisory services. TAM renders investment advisory, supervisory, and administration services under an investment management agreement and the Portfolio pays a single management fee, which is reflected in Investment management fees within the Statement of Operations.
|
|
|
|
|
| Transamerica Series Trust |
|
|
|
Semi-Annual Financial Statements 2024 |
|
|
Page 18 |
|
|
Transamerica S&P 500 Index VP
NOTES TO FINANCIAL STATEMENTS (continued)
At June 30, 2024
(unaudited)
8. FEES AND OTHER AFFILIATED TRANSACTIONS (continued)
The Portfolio pays a management fee to TAM at an annual rate of 0.08% of daily average net assets.
TAM has contractually agreed to waive fees and/or reimburse Portfolio expenses to the extent that the total operating expenses excluding, as applicable, acquired fund fees and expenses, interest (including borrowing costs and overdraft charges), taxes, brokerage commissions, dividend and interest expenses on securities sold short, extraordinary expenses and other expenses not incurred in the ordinary course of the Portfolio’s business, exceed the following stated annual operating expense limits to the Portfolio’s daily average net assets. To the extent an expense limit changed during the period, the prior limit is also listed below. The expenses waived and/or reimbursed, if any, are included in Expenses waived and/or reimbursed within the Statement of Operations.
|
|
|
|
|
|
|
|
|
|
|
| Class |
|
Operating Expense Limit |
|
Operating Expense Limit Effective Through |
| Initial Class |
|
|
|
0.14 |
% |
|
|
|
May 1, 2025 |
|
| Service Class |
|
|
|
0.39 |
|
|
|
|
May 1, 2025 |
|
TAM is permitted to recapture amounts contractually waived and/or reimbursed to a class during any of the 36 months from the date on which TAM waived fees and/or reimbursed expenses for the class. A class may recapture and reimburse TAM only if such amount does not cause, on any particular business day of the Portfolio, the class’s total annual operating expenses (after the recapture is taken into account) to exceed the Operating Expense Limits or any other lower limit then in effect. Amounts recaptured, if any, by TAM for the period ended June 30, 2024 are disclosed in Recapture of previously waived and/or reimbursed fees within the Statement of Operations.
TAM, on a voluntary basis and in addition to the contractual operating expense limits in effect, from time to time may waive and/or reimburse expenses of the Portfolio, or any classes thereof, to such level(s) as the Trust’s officers have determined or may reasonably determine from time to time. Any such voluntary waiver or expense reimbursement may be discontinued by TAM at any time. These amounts are not subject to recapture by TAM.
As of June 30, 2024, there are no amounts available for recapture by TAM.
Distribution and service fees: TST has a distribution plan (“Distribution Plan”) pursuant to Rule 12b-1 under the 1940 Act. Pursuant to the Distribution Plan, TST entered into a distribution agreement with TCI as the Portfolio’s distributor.
The Distribution Plan requires the Portfolio to pay distribution fees to TCI as compensation for various distribution activities, not as reimbursement for specific expenses. Under the Distribution Plan and distribution agreement, TCI, on behalf of the Portfolio, is authorized to pay various service providers, as direct payment for expenses incurred in connection with distribution of the Portfolio’s shares.
The fee on the Service Class shares is paid to the insurance companies for providing services and account maintenance for the policyholders who invest in the variable insurance products which invest in the Service Class shares. TCI has determined that it will not seek payment for the distribution expenses incurred by the Portfolio with respect to the Initial Class shares before May 1, 2025. Prior to TCI seeking distribution expenses on Initial Class shares, policy and contract owners will be notified in advance. The Portfolio will pay fees relating to Service Class shares. The distribution and service fees are included in Distribution and service fees within the Statement of Operations.
The Portfolio is authorized under the Distribution Plan to pay fees to TCI based on daily average net assets of each applicable class up to the following annual rates:
|
|
|
|
|
|
| Class |
|
Rate |
| Initial Class |
|
|
|
0.15 |
% |
| Service Class |
|
|
|
0.25 |
|
Transfer agent costs: TFS provides transfer agency services under an intercompany agreement with TAM. TFS has outsourced the provision of certain sub-transfer agency services to SS&C Global Investor & Distribution Solutions, Inc. (“SS&C GIDS”). The Portfolio does not pay a separate transfer agent fee to TAM or TFS but does pay certain expenses to SS&C GIDS related to applicable sub-transfer
|
|
|
|
|
| Transamerica Series Trust |
|
|
|
Semi-Annual Financial Statements 2024 |
|
|
Page 19 |
|
|
Transamerica S&P 500 Index VP
NOTES TO FINANCIAL STATEMENTS (continued)
At June 30, 2024
(unaudited)
8. FEES AND OTHER AFFILIATED TRANSACTIONS (continued)
agency services. For the period ended June 30, 2024, (i) the expenses paid to SS&C GIDS by the Portfolio are referred to as transfer agent costs and are included within the Statement of Operations and (ii) the expenses payable to SS&C GIDS by the Portfolio are referred to as transfer agent costs within the Statement of Assets and Liabilities.
Brokerage commissions: The Portfolio incurred no brokerage commissions on security transactions placed with affiliates of the investment manager or sub-adviser(s) for the period ended June 30, 2024.
9. PURCHASES AND SALES OF SECURITIES
For the period ended June 30, 2024, the cost of securities purchased and proceeds from securities sold (excluding short-term securities) are as follows:
|
|
|
|
|
|
|
| Purchases of Securities |
|
Sales/Maturities of Securities |
| Long-Term |
|
U.S. Government |
|
Long-Term |
|
U.S. Government |
| $ 93,921,370 |
|
$ — |
|
$ 5,441,782 |
|
$ — |
10. FEDERAL INCOME TAXES AND DISTRIBUTIONS TO SHAREHOLDERS
The Portfolio has not made any provision for federal income or excise taxes due to its policy to distribute all of its taxable income and capital gains to its shareholders and otherwise qualify as a regulated investment company under Subchapter M of the Internal Revenue Code. The Portfolio recognizes the tax benefits of uncertain tax positions only where the position is “more likely than not” to be sustained assuming examination by tax authorities. The Portfolio’s tax returns remain subject to examination by the Internal Revenue Service and state tax authorities three years from the date of filing for federal purposes and four years from the date of filing for state purposes. Management has evaluated the Portfolio’s tax provisions taken for all open tax years, and has concluded that no provision for income tax is required in the Portfolio’s financial statements. If applicable, the Portfolio recognizes interest accrued related to unrecognized tax benefits in relation to interest and penalties expense in Other within the Statement of Operations. The Portfolio identifies its major tax jurisdictions as U.S. Federal, the state of Colorado, and foreign jurisdictions where the Portfolio makes significant investments; however, the Portfolio is not aware of any tax positions for which it is reasonably possible that the total amounts of unrecognized tax benefits will change materially in the next twelve months. Distributions are determined in accordance with income tax regulations, which may differ from GAAP.
As of June 30, 2024, the approximate cost for U.S. federal income tax purposes, and the aggregate gross/net unrealized appreciation (depreciation) in the value of investments (including securities sold short and derivatives, if any) are as follows:
|
|
|
|
|
|
|
|
|
|
|
| |
|
Cost |
|
Gross Appreciation |
|
Gross (Depreciation) |
|
Net Appreciation (Depreciation) |
|
|
|
|
$ 640,841,389 |
|
$ 305,053,642 |
|
$ (24,939,445) |
|
$ 280,114,197 |
|
|
11. NEW ACCOUNTING PRONOUNCEMENT
In June 2022, the Financial Accounting Standards Board issued Accounting Standards Update No. 2022-03 (“ASU 2022-03”), “Fair Value Measurement of Equity Securities Subject to Contractual Sale Restrictions” (“Topic 820”). ASU 2022-03 clarifies the guidance in Topic 820, related to the measurement of the fair value of an equity security subject to contractual sale restrictions, where it eliminates the need to apply a discount to fair value of these securities, and introduces disclosure requirements related to such equity securities. The guidance is effective for fiscal years, and interim periods within those fiscal years, beginning after December 15, 2023, and allows for early adoption. Management is currently evaluating the implications, if any, of the additional requirements and their impact on the Portfolio’s financial statements.
Please see TST’s most recent report on Form N-CSR, available at: www.transamerica.com/annuities/prospectus, for additional information. For the most recently filed complete proxy voting records for the Trust please visit: https://www.transamerica.com/sites/default/files/files/e070d/TST%20N-PX%202021.pdf
|
|
|
|
|
| Transamerica Series Trust |
|
|
|
Semi-Annual Financial Statements 2024 |
|
|
Page 20 |
|
|
Transamerica S&P 500 Index VP
MANAGEMENT AND SUB-ADVISORY AGREEMENT — CONTRACT RENEWAL
(unaudited)
At a meeting of the Board of Trustees of Transamerica Series Trust (the “Trustees” or the “Board”) held on June 12-13, 2024, the Board considered the renewal of the management agreement (the “Management Agreement”) between Transamerica Asset Management, Inc. (“TAM”) and Transamerica Series Trust, on behalf of Transamerica S&P 500 Index VP (the “Portfolio”). The Board also considered the renewal of the investment sub-advisory agreement (the “Sub-Advisory Agreement” and together with the Management Agreement, the “Agreements”) for the Portfolio between TAM and SSGA Funds Management, Inc. (the “Sub-Adviser”).
Following its review and consideration, the Board determined that the terms of the Management Agreement and Sub-Advisory Agreement were reasonable and that the renewal of each of the Agreements was in the best interests of the Portfolio and the holders invested in the Portfolio. The Board, including the independent members of the Board (the “Independent Trustees”), unanimously approved the renewal of each of the Agreements through June 30, 2025.
Prior to reaching their decision, the Trustees requested and received from TAM and the Sub-Adviser certain information. They then reviewed such information as they deemed reasonably necessary to evaluate the Agreements, including information they had previously received from TAM and the Sub-Adviser as part of their regular oversight of the Portfolio, and knowledge they gained over time through meeting with TAM and the Sub-Adviser. Among other materials, the Trustees considered comparative fee, expense and performance information prepared by Broadridge Financial Solutions, Inc. (“Broadridge”), an independent provider of mutual fund performance information, as well as fee, expense and profitability information prepared by TAM. In addition, TAM provided the Board with additional supplemental comparative performance information. To the extent applicable, the Trustees considered information about fees and performance of comparable funds and/or accounts managed by the Sub-Adviser. The Board also considered reductions to the Portfolio’s expense limits, if any, that took effect after the last renewal of the Agreements. In their review, the Trustees also sought to identify instances in which the Portfolio’s performance, fees, total expenses and/or profitability appeared to be outliers within its respective peer group or other comparative metrics and sought to understand the reasons for such comparative positions.
In their deliberations, the Independent Trustees met privately without representatives of TAM or the Sub-Adviser present and were represented throughout the process by their independent legal counsel. In considering the proposed continuation of each of the Agreements, the Trustees evaluated and weighed a number of considerations that they believed to be relevant in light of the legal advice furnished to them by counsel, including independent legal counsel, and made a decision in the exercise of their own business judgment. They based their decisions on the considerations discussed below, among others, although they did not identify any particular consideration or item of information that was controlling of their decisions, and each Trustee may have attributed different weights to the various factors.
Nature, Extent and Quality of the Services Provided
The Board considered the nature, extent and quality of the services provided by TAM and the Sub-Adviser to the Portfolio in the past and the services anticipated to be provided in the future. The Board also considered the investment approach for the Portfolio; the experience, capability and integrity of TAM’s senior management; the financial resources of TAM; TAM’s management oversight process; TAM’s and the Sub-Adviser’s responsiveness to any questions by the Trustees; and the professional qualifications and compensation program of the portfolio management team of the Sub-Adviser. The Trustees noted that they receive, on a quarterly basis, an execution analysis from Capital Institutional Services, Inc. (CAPIS), an independent provider of trade analyses, for the Sub-Adviser and a comparison of trading results against a peer universe of managers.
The Board also considered the continuous and regular investment management and other services provided by TAM, when acting as a manager of managers, for the portion of the management fee it retains from the Portfolio after payment of the sub-advisory fees. The Board noted that the investment management and other services provided by TAM include the design, development and ongoing review and evaluation of the Portfolio and its investment strategy; the selection, oversight and monitoring of one or more investment sub-advisers to perform certain duties with respect to the Portfolio; ongoing portfolio trading oversight and analysis; risk management oversight and analysis; design, development, implementation and ongoing review and evaluation of a process for the valuation of Portfolio investments; design, development, implementation and ongoing review and evaluation of a compliance program for the Portfolio; design, development, implementation and ongoing review and evaluation of a process for the voting of proxies and exercise of rights to consent to corporate action for Portfolio investments; participation in Board meetings and oversight of preparation of materials for the Board, including materials for Board meetings and regular communications with the Board; oversight of preparation of the Portfolio’s prospectus, statement of additional information, shareholder reports and other disclosure materials and regulatory filings for the Portfolio; and ongoing cash management services for the Portfolio. The Board considered that TAM’s investment management services also include the provision of supervisory and administrative services to the Portfolio. The Board also noted that TAM, as part of the services it provides to all Transamerica mutual funds, including the Portfolio, oversees the services provided by the funds’ custodian, transfer agent, independent accountant and legal counsel and supervises the performance of the recordkeeping and holder service functions of the funds.
Investment Performance
In addition, the Board considered the short- and longer-term performance of the Portfolio in light of its investment objective, policies and strategies, including relative performance against (i) a peer universe of comparable mutual funds, as prepared by Broadridge, and (ii) the Portfolio’s benchmark, in each case for various trailing periods ended December 31, 2023. Based on these considerations, the Board determined that TAM and the Sub-Adviser can provide investment and related services that are appropriate in scope and extent in light of
|
|
|
| Transamerica Series Trust |
|
Semi-Annual Financial Statements 2024 |
Page 21
Transamerica S&P 500 Index VP
MANAGEMENT AND SUB-ADVISORY AGREEMENT — CONTRACT RENEWAL (continued)
(unaudited)
the Portfolio’s investment objectives, policies and strategies and operations, the competitive landscape of the investment company business and investor needs. The Trustees noted that the objective of the Portfolio, as an index fund, is to track, and not necessarily exceed, its benchmark index, and that unlike the Portfolio, the index is not subject to any expenses or transaction costs. The Board’s conclusions as to the Portfolio’s performance are summarized below. For purposes of its review, the Board generally used the performance of Service Class Shares. In describing the Portfolio’s performance relative to its peer universe, the summary conclusions characterize performance for the relevant periods in relation to whether it was “above,” “below” or “in line with” the peer universe median and do so using quintile rankings prepared by Broadridge. For simplicity, performance is described as “above” the median if the Portfolio’s performance ranked anywhere in the first or second quintiles, as “below” the median if it ranked anywhere in the fourth or fifth quintiles, or “in line with” the median if it ranked anywhere in the third quintile (i.e., even if its precise return was somewhat above or somewhat below the precise median return).
When considering the Portfolio’s performance, the Trustees considered any representations made by TAM regarding the appropriateness of certain peer groups and benchmarks. They recognized that performance reflects a snapshot of a period as of a specific date, and that consideration of performance data for a different period could generate significantly different performance results. The Trustees also recognized that even longer-term performance can be negatively affected by performance over a short-term period when that short-term performance is significantly below the performance of the comparable benchmark or universe of peer funds.
The Board noted that the performance of Service Class Shares of the Portfolio was below the median for its peer universe and below the benchmark that TAM utilizes to measure performance of the Portfolio, each for the past 1-, 3- and 5-year periods.
Management Fee and Sub-Advisory Fees and Total Expense Ratio
The Board considered the management fee and total expense ratio of the Portfolio, including information provided by Broadridge comparing the management fee and total expense ratio of the Portfolio to the management fees and total expense ratios of comparable investment companies in both a peer group and broader peer universe compiled by Broadridge. The Board’s conclusions as to the Portfolio’s management fee and total expense ratio are summarized below. For purposes of its review, the Board generally used the actual total expenses (i.e., expenses reflecting any waivers and/or reimbursements) of Service Class Shares. In describing the Portfolio’s management fee and total expense ratio relative to its peer group and peer universe, the summary conclusions characterize management fees and total expense ratios for the relevant periods in relation to whether they were “above,” “below” or “in line with” the peer group or peer universe median and do so using quintile rankings prepared by Broadridge. For simplicity, management fees and total expense ratios are described as “above” the median if the Portfolio’s management fee or total expense ratio ranked anywhere in the fourth or fifth quintiles, as “below” the median if it ranked anywhere in the first or second quintiles, or “in line with” the median if it ranked anywhere in the third quintile (i.e., even if its precise management fee or total expense ratio was somewhat above or somewhat below the precise median management fee or total expense ratio).
The Board also considered the fees charged by the Sub-Adviser for sub-advisory services, as well as the portion of the Portfolio’s management fee retained by TAM following payment of the sub-advisory fee and how the portion of the contractual management fee retained by TAM at a specified asset level compared to the portions retained by other investment advisers managing mutual funds with similar investment strategies as calculated by an independent provider of information.
The Board noted that the Portfolio’s contractual management fee and the actual total expenses (i.e., expenses reflecting any waivers and/or reimbursements) of Service Class Shares of the Portfolio were below the medians for its peer group and peer universe. The Trustees also considered that TAM has entered into an expense limitation arrangement with the Portfolio, which may result in TAM waiving fees for the benefit of holders.
On the basis of these considerations, together with the other information it considered, the Board determined that the management and sub-advisory fees to be received by TAM and the Sub-Adviser under the Management Agreement and Sub-Advisory Agreement are reasonable in light of the services provided.
Cost of Services Provided and Level of Profitability
The Board reviewed information provided by TAM about the cost of providing and procuring fund management services, as well as the costs of the provision of administration, transfer agency and other services, to the Portfolio and to Transamerica Series Trust as a whole by TAM and its affiliates. The Board considered the profitability of TAM and its affiliates in providing these services for the Portfolio and Transamerica Series Trust as a whole. The Trustees recognized the competitiveness of the mutual fund industry and the importance of an investment adviser’s long-term profitability, including for maintaining company and management stability and accountability.
The Board also considered the allocation methodology used for calculating the profitability of TAM and its affiliates. The Board noted that the revenue and expense allocation methodology used by TAM to estimate its profitability with respect to its relationship with the Portfolio had been reviewed previously by an independent consultant. The Trustees considered that TAM reported that it had not made material changes to this methodology, and that the methodology had been applied consistently for the Portfolio.
|
|
|
| Transamerica Series Trust |
|
Semi-Annual Financial Statements 2024 |
Page 22
Transamerica S&P 500 Index VP
MANAGEMENT AND SUB-ADVISORY AGREEMENT — CONTRACT RENEWAL (continued)
(unaudited)
With respect to the Sub-Adviser, the Board noted that the sub-advisory fee is the product of arm’s-length negotiation between TAM and the Sub-Adviser, which is not affiliated with TAM, and is paid by TAM and not the Portfolio. As a result, the Board focused on the profitability of TAM and its affiliates with respect to the Portfolio.
Based on this information, the Board determined that the profitability of TAM and its affiliates from their relationships with the Portfolio was not excessive.
Economies of Scale
The Board considered economies of scale with respect to the management of the Portfolio, whether the Portfolio had appropriately benefited from any economies of scale and whether there was the potential for realization of any future economies of scale. The Board also considered the existence of economies of scale with respect to management of the Transamerica mutual funds overall and the extent to which the Portfolio benefited from any economies of scale. The Board recognized that, as the Portfolio’s assets increase, any economies of scale realized by TAM or the Sub-Adviser may not directly correlate with each other or with any economies of scale that might be realized by the Portfolio. The Trustees noted that the Portfolio’s management fee schedule does not contain breakpoints and determined that, based on all of the information provided, breakpoints were not warranted at this time. The Board also considered the Sub-Adviser’s sub-advisory fee schedule. The Trustees concluded that the Portfolio’s fee structure reflected an appropriate sharing of any efficiencies or economies of scale to date and noted that they will have the opportunity to periodically reexamine the appropriateness of the management fee payable to TAM and the fee paid to the Sub-Adviser in light of any economies of scale experienced in the future.
Benefits to TAM, its Affiliates and/or the Sub-Adviser from their Relationships with the Portfolio
The Board considered other benefits derived by TAM, its affiliates, and/or the Sub-Adviser from their relationships with the Portfolio. The Board noted that TAM does not receive benefits from research obtained with commissions paid to broker-dealers for portfolio transactions (commonly referred to as “soft dollars”) as a result of its relationship with the Portfolio.
Other Considerations
The Board noted that TAM has made a substantial commitment to the recruitment and retention of high-quality personnel and maintains the financial, compliance and operational resources reasonably necessary to manage the Portfolio in a professional manner that is consistent with the best interests of the Portfolio and the holders. In this regard, the Board favorably considered the procedures and policies TAM has in place to enforce compliance with applicable laws and regulations and oversee the portfolio management activities of the Sub-Adviser. The Board also noted that TAM has made an entrepreneurial commitment and undertaken certain business risks with respect to the management and success of the Portfolio.
Conclusion
After consideration of the factors described above, as well as other factors, the Trustees, including the Independent Trustees, concluded that the renewal of the Management Agreement and the Sub-Advisory Agreement was in the best interests of the Portfolio and the holders and voted to approve the renewal of the Agreements.
|
|
|
| Transamerica Series Trust |
|
Semi-Annual Financial Statements 2024 |
Page 23
PROXY VOTING POLICIES AND PROCEDURES AND QUARTERLY PORTFOLIO HOLDINGS
(unaudited)
A description of Transamerica Series Trust’s (the “Trust”) proxy voting policies and procedures is available in the Statement of Additional Information of the Portfolios, available without charge upon request by calling 1-800-851-9777 (toll free) or on the Securities and Exchange Commission’s (“SEC”) website at http://www.sec.gov.
In addition, the Portfolio is required to file Form N-PX, with their complete proxy voting records for the most recent 12 months ended June 30th, no later than August 31st of each year. The Form is available without charge: (1) on the Transamerica Funds website at https://www.transamerica.com/sites/default/files/files/e070d/TST%20N-PX%202021.pdf; and (2) on the SEC’s website at http://www.sec.gov.
Each fiscal quarter, the Portfolios, except Transamerica BlackRock Government Money Market VP, will file with the SEC a complete schedule of its monthly portfolio holdings on Form N-PORT. The Portfolios’ holdings as of the end of the third month of every fiscal quarter, as reported on Form N-PORT, will be publicly available on the SEC’s website at http://www.sec.gov within 60 days of the end of the fiscal quarter.
On a monthly basis, Transamerica BlackRock Government Money Market VP will file with the SEC portfolio holdings information on Form N-MFP3. A complete schedule of portfolio holdings is also available at www.transamerica.com.
You may also visit the Trust’s website at www.transamerica.com/annuities/prospectus for this and other information about the Portfolios and the Trust.
Important Notice Regarding Delivery of Shareholder Documents
Every year we provide shareholders informative materials such as the Transamerica Series Trust Annual Report, the Transamerica Series Trust Prospectus, and other required documents that keep you informed regarding your Portfolios. To the extent provided by mail, Transamerica Series Trust will only send one piece per mailing address, a method that saves your Portfolios money by reducing mailing and printing costs. We will continue to do this unless you tell us not to. To elect to receive individual mailings, simply call a Transamerica Customer Service Representative toll free at 1-800-851-9777, 8 a.m. to 7 p.m. Eastern Time, Monday-Friday. Your request will take effect within 30 days.
|
|
|
| Transamerica Series Trust |
|
Semi-Annual Financial Statements 2024 |
Page 24
NOTICE OF PRIVACY POLICY
(unaudited)
Your privacy is very important to us. We want you to understand what information we collect and how we use it. We collect and use “nonpublic personal information” in connection with providing our customers with a broad range of financial products and services as effectively and conveniently as possible. We treat nonpublic personal information in accordance with our Privacy Policy.
What Information We Collect and From Whom We Collect It
We may collect nonpublic personal information about you from the following sources:
| • |
|
Information we receive from you on applications or other forms, such as your name, address, and account number; |
| • |
|
Information about your transactions with us, our affiliates, or others, such as your account balance and purchase/redemption history; and |
| • |
|
Information we receive from non-affiliated third parties, including consumer reporting agencies. |
What Information We Disclose and To Whom We Disclose It
We do not disclose any nonpublic personal information about current or former customers to anyone without their express consent, except as permitted by law. We may disclose the nonpublic personal information we collect, as described above, to persons or companies that perform services on our behalf and to other financial institutions with which we have joint marketing agreements. We will require these companies to protect the confidentiality of your nonpublic personal information and to use it only to perform the services for which we have hired them.
Our Security Procedures
We restrict access to your nonpublic personal information and only allow disclosures to persons and companies as permitted by law to assist in providing products or services to you. We maintain physical, electronic, and procedural safeguards to protect your nonpublic personal information and to safeguard the disposal of certain consumer information.
Contact Us
If you have any questions about our Privacy Policy, please call 1-800-851-9777 on any business day between 8 a.m. and 7 p.m. Eastern Time.
Note: This Privacy Policy applies only to customers that have a direct relationship with us or our affiliates. If you own shares of our portfolios in the name of a third party such as a bank or broker-dealer, its privacy policy may apply to you instead of ours.
|
|
|
| Transamerica Series Trust |
|
Semi-Annual Financial Statements 2024 |
Page 25
PO Box 219945
Kansas City, MO 64121-9945
|
|
|
| Distributor: |
|
Transamerica Capital, Inc. |
|
|
PO Box 219945 |
|
|
Kansas City, MO 64121-9945 |
|
|
|
|
Customer Service: 1-800-851-9777 |
Transamerica Series Trust Semi-Annual Financial Statements
June 30, 2024
1801 California St., Suite 5200
Denver, CO 80202
Distributor: Transamerica Capital, Inc.
Customer Service: 1-800-851-9777
The following pages contain the most recent semi-annual financial statements for the investment options in which you are invested. In compliance with Securities and Exchange Commission regulations, we present these reports on an annual and semi-annual basis with the hope that they will foster greater understanding of the investment options’ holdings, performance, financial data, accounting policies and other issues. This streamlined version provides information only on the investment options in which you are invested.
If you have any questions about these reports, please do not hesitate to contact your financial professional. As always, we thank you for your trust and the opportunity to serve you.
Transamerica Small/Mid Cap Value VP
SCHEDULE OF INVESTMENTS
At June 30, 2024
(unaudited)
|
|
|
|
|
|
|
|
|
| |
|
Shares |
|
|
Value |
|
| COMMON STOCKS - 96.7% |
|
| Aerospace & Defense - 2.4% |
|
| Curtiss-Wright Corp. |
|
|
10,300 |
|
|
|
$ 2,791,094 |
|
| Elbit Systems Ltd. |
|
|
5,000 |
|
|
|
883,150 |
|
| Huntington Ingalls Industries, Inc. |
|
|
32,800 |
|
|
|
8,079,624 |
|
| V2X, Inc. (A) |
|
|
20,350 |
|
|
|
975,986 |
|
|
|
|
|
|
|
|
|
|
|
|
|
|
|
|
|
12,729,854 |
|
|
|
|
|
|
|
|
|
|
|
| Automobile Components - 0.6% |
|
| Dana, Inc. |
|
|
34,350 |
|
|
|
416,322 |
|
| Gentex Corp. |
|
|
18,900 |
|
|
|
637,119 |
|
| Stoneridge, Inc. (A) |
|
|
7,600 |
|
|
|
121,296 |
|
| Visteon Corp. (A) |
|
|
16,000 |
|
|
|
1,707,200 |
|
|
|
|
|
|
|
|
|
|
|
|
|
|
|
|
|
2,881,937 |
|
|
|
|
|
|
|
|
|
|
|
| Banks - 6.5% |
|
| Atlantic Union Bankshares Corp. |
|
|
24,900 |
|
|
|
817,965 |
|
| Berkshire Hills Bancorp, Inc. |
|
|
62,700 |
|
|
|
1,429,560 |
|
| Columbia Banking System, Inc. |
|
|
68,850 |
|
|
|
1,369,427 |
|
| Community West Bancshares |
|
|
12,700 |
|
|
|
234,950 |
|
| Dime Community Bancshares, Inc. |
|
|
68,600 |
|
|
|
1,399,440 |
|
| Eastern Bankshares, Inc. |
|
|
14,000 |
|
|
|
195,720 |
|
| First Citizens BancShares, Inc., Class A |
|
|
6,884 |
|
|
|
11,589,971 |
|
| First Community Bankshares, Inc. |
|
|
38,350 |
|
|
|
1,412,814 |
|
| First Merchants Corp. |
|
|
45,400 |
|
|
|
1,511,366 |
|
| OceanFirst Financial Corp. |
|
|
57,150 |
|
|
|
908,114 |
|
| Princeton Bancorp, Inc. |
|
|
7,700 |
|
|
|
254,870 |
|
| Provident Financial Services, Inc. |
|
|
122,503 |
|
|
|
1,757,918 |
|
| Sandy Spring Bancorp, Inc. |
|
|
64,850 |
|
|
|
1,579,746 |
|
| TrustCo Bank Corp. |
|
|
68,000 |
|
|
|
1,956,360 |
|
| UMB Financial Corp. |
|
|
3,095 |
|
|
|
258,185 |
|
| United Bankshares, Inc. |
|
|
21,000 |
|
|
|
681,240 |
|
| United Community Banks, Inc. |
|
|
61,250 |
|
|
|
1,559,425 |
|
| WaFd, Inc. |
|
|
85,450 |
|
|
|
2,442,161 |
|
| Webster Financial Corp. |
|
|
64,250 |
|
|
|
2,800,657 |
|
|
|
|
|
|
|
|
|
|
|
|
|
|
|
|
|
34,159,889 |
|
|
|
|
|
|
|
|
|
|
|
| Biotechnology - 0.4% |
|
| Exelixis, Inc. (A) |
|
|
72,800 |
|
|
|
1,635,816 |
|
| Prothena Corp. PLC (A) |
|
|
10,100 |
|
|
|
208,464 |
|
|
|
|
|
|
|
|
|
|
|
|
|
|
|
|
|
1,844,280 |
|
|
|
|
|
|
|
|
|
|
|
| Building Products - 1.9% |
|
| American Woodmark Corp. (A) |
|
|
19,950 |
|
|
|
1,568,070 |
|
| Builders FirstSource, Inc. (A) |
|
|
16,800 |
|
|
|
2,325,288 |
|
| Gibraltar Industries, Inc. (A) |
|
|
8,200 |
|
|
|
562,110 |
|
| Hayward Holdings, Inc. (A) |
|
|
91,100 |
|
|
|
1,120,530 |
|
| Owens Corning |
|
|
14,600 |
|
|
|
2,536,312 |
|
| Quanex Building Products Corp. |
|
|
63,400 |
|
|
|
1,753,010 |
|
|
|
|
|
|
|
|
|
|
|
|
|
|
|
|
|
9,865,320 |
|
|
|
|
|
|
|
|
|
|
|
| Capital Markets - 1.0% |
|
| Piper Sandler Cos. |
|
|
13,000 |
|
|
|
2,992,210 |
|
| Stifel Financial Corp. |
|
|
26,600 |
|
|
|
2,238,390 |
|
|
|
|
|
|
|
|
|
|
|
|
|
|
|
|
|
5,230,600 |
|
|
|
|
|
|
|
|
|
|
|
| Chemicals - 1.4% |
|
| Huntsman Corp. |
|
|
33,850 |
|
|
|
770,765 |
|
|
|
|
|
|
|
|
|
|
| |
|
Shares |
|
|
Value |
|
| COMMON STOCKS (continued) |
|
|
|
|
|
|
|
|
| Chemicals (continued) |
|
| LSB Industries, Inc. (A) |
|
|
113,150 |
|
|
|
$ 925,567 |
|
| Mosaic Co. |
|
|
198,500 |
|
|
|
5,736,650 |
|
|
|
|
|
|
|
|
|
|
|
|
|
|
|
|
|
7,432,982 |
|
|
|
|
|
|
|
|
|
|
|
| Commercial Services & Supplies - 0.4% |
|
| HNI Corp. |
|
|
30,000 |
|
|
|
1,350,600 |
|
| Tetra Tech, Inc. |
|
|
3,300 |
|
|
|
674,784 |
|
|
|
|
|
|
|
|
|
|
|
|
|
|
|
|
|
2,025,384 |
|
|
|
|
|
|
|
|
|
|
|
| Communications Equipment - 0.3% |
|
| Harmonic, Inc. (A) |
|
|
67,700 |
|
|
|
796,829 |
|
| KVH Industries, Inc. (A) |
|
|
76,500 |
|
|
|
355,725 |
|
| Silicom Ltd. (A) |
|
|
32,300 |
|
|
|
488,376 |
|
|
|
|
|
|
|
|
|
|
|
|
|
|
|
|
|
1,640,930 |
|
|
|
|
|
|
|
|
|
|
|
| Construction & Engineering - 1.7% |
|
| Comfort Systems USA, Inc. |
|
|
9,450 |
|
|
|
2,873,934 |
|
| EMCOR Group, Inc. |
|
|
10,700 |
|
|
|
3,906,356 |
|
| Granite Construction, Inc. |
|
|
36,100 |
|
|
|
2,237,117 |
|
|
|
|
|
|
|
|
|
|
|
|
|
|
|
|
|
9,017,407 |
|
|
|
|
|
|
|
|
|
|
|
| Consumer Finance - 0.7% |
|
| Ally Financial, Inc. |
|
|
94,700 |
|
|
|
3,756,749 |
|
|
|
|
|
|
|
|
|
|
|
| Consumer Staples Distribution & Retail - 3.3% |
|
| Dollar General Corp. |
|
|
12,100 |
|
|
|
1,599,983 |
|
| Dollar Tree, Inc. (A) |
|
|
42,800 |
|
|
|
4,569,756 |
|
| Ingles Markets, Inc., Class A |
|
|
13,100 |
|
|
|
898,791 |
|
| US Foods Holding Corp. (A) |
|
|
73,300 |
|
|
|
3,883,434 |
|
| Village Super Market, Inc., Class A |
|
|
23,700 |
|
|
|
625,917 |
|
| Walgreens Boots Alliance, Inc. |
|
|
453,800 |
|
|
|
5,488,711 |
|
|
|
|
|
|
|
|
|
|
|
|
|
|
|
|
|
17,066,592 |
|
|
|
|
|
|
|
|
|
|
|
| Containers & Packaging - 1.1% |
|
| Graphic Packaging Holding Co. |
|
|
184,300 |
|
|
|
4,830,503 |
|
| Greif, Inc., Class A |
|
|
18,800 |
|
|
|
1,080,436 |
|
|
|
|
|
|
|
|
|
|
|
|
|
|
|
|
|
5,910,939 |
|
|
|
|
|
|
|
|
|
|
|
| Distributors - 1.1% |
|
| LKQ Corp. |
|
|
134,000 |
|
|
|
5,573,060 |
|
|
|
|
|
|
|
|
|
|
|
| Diversified Consumer Services - 0.4% |
|
| American Public Education, Inc. (A) |
|
|
4,500 |
|
|
|
79,110 |
|
| Stride, Inc. (A) |
|
|
26,800 |
|
|
|
1,889,400 |
|
|
|
|
|
|
|
|
|
|
|
|
|
|
|
|
|
1,968,510 |
|
|
|
|
|
|
|
|
|
|
|
| Diversified REITs - 0.0% (B) |
|
| Broadstone Net Lease, Inc. |
|
|
10,400 |
|
|
|
165,048 |
|
|
|
|
|
|
|
|
|
|
|
| Diversified Telecommunication Services - 0.8% |
|
| GCI Liberty, Inc. (A)(C)(D)(E) |
|
|
60,500 |
|
|
|
0 |
|
| Liberty Global Ltd., Class A (A) |
|
|
247,300 |
|
|
|
4,310,439 |
|
|
|
|
|
|
|
|
|
|
|
|
|
|
|
|
|
4,310,439 |
|
|
|
|
|
|
|
|
|
|
|
| Electric Utilities - 3.2% |
|
| Evergy, Inc. |
|
|
146,301 |
|
|
|
7,749,564 |
|
| OGE Energy Corp. |
|
|
218,500 |
|
|
|
7,800,450 |
|
| Portland General Electric Co. |
|
|
32,350 |
|
|
|
1,398,814 |
|
|
|
|
|
|
|
|
|
|
|
|
|
|
|
|
|
16,948,828 |
|
|
|
|
|
|
|
|
|
|
The Notes to Financial Statements are an integral part of this report.
|
|
|
|
|
| Transamerica Series Trust |
|
|
|
Semi-Annual Financial Statements 2024 |
|
|
Page 1 |
|
|
Transamerica Small/Mid Cap Value VP
SCHEDULE OF INVESTMENTS (continued)
At June 30, 2024
(unaudited)
|
|
|
|
|
|
|
|
|
| |
|
Shares |
|
|
Value |
|
| COMMON STOCKS (continued) |
|
| Electrical Equipment - 0.8% |
|
| Acuity Brands, Inc. |
|
|
1,400 |
|
|
|
$ 338,016 |
|
| LSI Industries, Inc. |
|
|
164,500 |
|
|
|
2,380,315 |
|
| Regal Rexnord Corp. |
|
|
10,850 |
|
|
|
1,467,137 |
|
|
|
|
|
|
|
|
|
|
|
|
|
|
|
|
|
4,185,468 |
|
|
|
|
|
|
|
|
|
|
| Electronic Equipment, Instruments & Components - 3.1% |
|
| Coherent Corp. (A) |
|
|
15,300 |
|
|
|
1,108,638 |
|
| IPG Photonics Corp. (A) |
|
|
7,500 |
|
|
|
632,925 |
|
| Itron, Inc. (A) |
|
|
8,750 |
|
|
|
865,900 |
|
| Methode Electronics, Inc. |
|
|
17,400 |
|
|
|
180,090 |
|
| OSI Systems, Inc. (A) |
|
|
17,000 |
|
|
|
2,337,840 |
|
| TD SYNNEX Corp. |
|
|
32,500 |
|
|
|
3,750,500 |
|
| Vishay Intertechnology, Inc. |
|
|
79,850 |
|
|
|
1,780,655 |
|
| Vontier Corp. |
|
|
140,487 |
|
|
|
5,366,603 |
|
|
|
|
|
|
|
|
|
|
|
|
|
|
|
|
|
16,023,151 |
|
|
|
|
|
|
|
|
|
|
| Energy Equipment & Services - 1.6% |
|
| Helix Energy Solutions Group, Inc. (A) |
|
|
150,800 |
|
|
|
1,800,552 |
|
| Helmerich & Payne, Inc. |
|
|
33,200 |
|
|
|
1,199,848 |
|
| Noble Corp. PLC |
|
|
82,500 |
|
|
|
3,683,625 |
|
| Seadrill Ltd. (A) |
|
|
17,500 |
|
|
|
901,250 |
|
| Select Water Solutions, Inc. |
|
|
51,300 |
|
|
|
548,910 |
|
|
|
|
|
|
|
|
|
|
|
|
|
|
|
|
|
8,134,185 |
|
|
|
|
|
|
|
|
|
|
| Entertainment - 1.7% |
|
| Madison Square Garden Entertainment Corp. (A) |
|
|
55,500 |
|
|
|
1,899,765 |
|
| Madison Square Garden Sports Corp. (A) |
|
|
7,800 |
|
|
|
1,467,414 |
|
| Sphere Entertainment Co. (A) |
|
|
24,700 |
|
|
|
865,982 |
|
| Warner Bros Discovery, Inc. (A) |
|
|
636,700 |
|
|
|
4,737,048 |
|
|
|
|
|
|
|
|
|
|
|
|
|
|
|
|
|
8,970,209 |
|
|
|
|
|
|
|
|
|
|
| Financial Services - 2.8% |
|
| Corpay, Inc. (A) |
|
|
21,500 |
|
|
|
5,727,815 |
|
| Fidelity National Information Services, Inc. |
|
|
42,200 |
|
|
|
3,180,192 |
|
| Global Payments, Inc. |
|
|
61,400 |
|
|
|
5,937,380 |
|
|
|
|
|
|
|
|
|
|
|
|
|
|
|
|
|
14,845,387 |
|
|
|
|
|
|
|
|
|
|
| Food Products - 3.4% |
|
| Archer-Daniels-Midland Co. |
|
|
89,800 |
|
|
|
5,428,410 |
|
| Nomad Foods Ltd. |
|
|
77,000 |
|
|
|
1,268,960 |
|
| Post Holdings, Inc. (A) |
|
|
53,968 |
|
|
|
5,621,307 |
|
| Tyson Foods, Inc., Class A |
|
|
97,000 |
|
|
|
5,542,580 |
|
|
|
|
|
|
|
|
|
|
|
|
|
|
|
|
|
17,861,257 |
|
|
|
|
|
|
|
|
|
|
| Gas Utilities - 0.9% |
|
| National Fuel Gas Co. |
|
|
82,400 |
|
|
|
4,465,256 |
|
|
|
|
|
|
|
|
|
|
|
| Ground Transportation - 0.2% |
|
| U-Haul Holding Co. |
|
|
15,900 |
|
|
|
954,318 |
|
|
|
|
|
|
|
|
|
|
|
| Health Care Equipment & Supplies - 2.3% |
|
| AngioDynamics, Inc. (A) |
|
|
112,500 |
|
|
|
680,625 |
|
| Baxter International, Inc. |
|
|
188,400 |
|
|
|
6,301,980 |
|
| Inmode Ltd. (A) |
|
|
60,100 |
|
|
|
1,096,224 |
|
| Integra LifeSciences Holdings Corp. (A) |
|
|
28,300 |
|
|
|
824,662 |
|
| Koninklijke Philips NV (A)(F) |
|
|
112,782 |
|
|
|
2,842,106 |
|
|
|
|
|
|
|
|
|
|
| |
|
Shares |
|
|
Value |
|
| COMMON STOCKS (continued) |
|
| Health Care Equipment & Supplies (continued) |
|
| OraSure Technologies, Inc. (A) |
|
|
60,000 |
|
|
|
$ 255,600 |
|
| QuidelOrtho Corp. (A) |
|
|
7,000 |
|
|
|
232,540 |
|
|
|
|
|
|
|
|
|
|
|
|
|
|
|
|
|
12,233,737 |
|
|
|
|
|
|
|
|
|
|
| Health Care Providers & Services - 4.1% |
|
| AMN Healthcare Services, Inc. (A) |
|
|
15,000 |
|
|
|
768,450 |
|
| Centene Corp. (A) |
|
|
92,522 |
|
|
|
6,134,209 |
|
| Cross Country Healthcare, Inc. (A) |
|
|
97,500 |
|
|
|
1,349,400 |
|
| Encompass Health Corp. |
|
|
28,000 |
|
|
|
2,402,120 |
|
| Enhabit, Inc. (A) |
|
|
96,850 |
|
|
|
863,902 |
|
| Henry Schein, Inc. (A) |
|
|
48,000 |
|
|
|
3,076,800 |
|
| Labcorp Holdings, Inc. |
|
|
31,377 |
|
|
|
6,385,533 |
|
| National HealthCare Corp. |
|
|
6,600 |
|
|
|
715,440 |
|
|
|
|
|
|
|
|
|
|
|
|
|
|
|
|
|
21,695,854 |
|
|
|
|
|
|
|
|
|
|
| Health Care REITs - 1.0% |
|
| Community Healthcare Trust, Inc. |
|
|
48,400 |
|
|
|
1,132,076 |
|
| Healthpeak Properties, Inc. |
|
|
89,608 |
|
|
|
1,756,317 |
|
| Sabra Health Care, Inc. |
|
|
142,000 |
|
|
|
2,186,800 |
|
|
|
|
|
|
|
|
|
|
|
|
|
|
|
|
|
5,075,193 |
|
|
|
|
|
|
|
|
|
|
| Hotel & Resort REITs - 0.6% |
|
| Apple Hospitality, Inc. |
|
|
127,900 |
|
|
|
1,859,666 |
|
| DiamondRock Hospitality Co. |
|
|
98,700 |
|
|
|
834,015 |
|
| Summit Hotel Properties, Inc. |
|
|
55,800 |
|
|
|
334,242 |
|
|
|
|
|
|
|
|
|
|
|
|
|
|
|
|
|
3,027,923 |
|
|
|
|
|
|
|
|
|
|
| Hotels, Restaurants & Leisure - 0.7% |
|
| Bloomin’ Brands, Inc. |
|
|
40,450 |
|
|
|
777,853 |
|
| Bowlero Corp., Class A |
|
|
43,450 |
|
|
|
629,591 |
|
| Churchill Downs, Inc. |
|
|
10,400 |
|
|
|
1,451,840 |
|
| Golden Entertainment, Inc. |
|
|
20,050 |
|
|
|
623,756 |
|
|
|
|
|
|
|
|
|
|
|
|
|
|
|
|
|
3,483,040 |
|
|
|
|
|
|
|
|
|
|
| Household Durables - 1.2% |
|
| Helen of Troy Ltd. (A) |
|
|
13,800 |
|
|
|
1,279,812 |
|
| KB Home |
|
|
31,250 |
|
|
|
2,193,125 |
|
| La-Z-Boy, Inc. |
|
|
33,750 |
|
|
|
1,258,200 |
|
| PulteGroup, Inc. |
|
|
7,600 |
|
|
|
836,760 |
|
| Sonos, Inc. (A) |
|
|
56,050 |
|
|
|
827,298 |
|
|
|
|
|
|
|
|
|
|
|
|
|
|
|
|
|
6,395,195 |
|
|
|
|
|
|
|
|
|
|
| Household Products - 0.3% |
|
| Spectrum Brands Holdings, Inc. |
|
|
20,500 |
|
|
|
1,761,565 |
|
|
|
|
|
|
|
|
|
|
| Industrial REITs - 0.3% |
|
| LXP Industrial Trust |
|
|
163,550 |
|
|
|
1,491,576 |
|
|
|
|
|
|
|
|
|
|
| Insurance - 4.6% |
|
| Arch Capital Group Ltd. (A) |
|
|
14,800 |
|
|
|
1,493,172 |
|
| Everest Group Ltd. |
|
|
6,800 |
|
|
|
2,590,936 |
|
| Fidelity National Financial, Inc. |
|
|
111,307 |
|
|
|
5,500,792 |
|
| Markel Group, Inc. (A) |
|
|
3,378 |
|
|
|
5,322,579 |
|
| Old Republic International Corp. |
|
|
110,179 |
|
|
|
3,404,531 |
|
| Selective Insurance Group, Inc. |
|
|
21,000 |
|
|
|
1,970,430 |
|
| United Fire Group, Inc. |
|
|
30,850 |
|
|
|
662,967 |
|
| Willis Towers Watson PLC |
|
|
11,600 |
|
|
|
3,040,824 |
|
|
|
|
|
|
|
|
|
|
|
|
|
|
|
|
|
23,986,231 |
|
|
|
|
|
|
|
|
|
|
The Notes to Financial Statements are an integral part of this report.
|
|
|
|
|
| Transamerica Series Trust |
|
|
|
Semi-Annual Financial Statements 2024 |
|
|
Page 2 |
|
|
Transamerica Small/Mid Cap Value VP
SCHEDULE OF INVESTMENTS (continued)
At June 30, 2024
(unaudited)
|
|
|
|
|
|
|
|
|
| |
|
Shares |
|
|
Value |
|
| COMMON STOCKS (continued) |
|
| Interactive Media & Services - 1.7% |
|
| IAC, Inc. (A) |
|
|
117,564 |
|
|
|
$ 5,507,873 |
|
| Match Group, Inc. (A) |
|
|
106,800 |
|
|
|
3,244,584 |
|
|
|
|
|
|
|
|
|
|
|
|
|
|
|
|
|
8,752,457 |
|
|
|
|
|
|
|
|
|
|
| IT Services - 0.3% |
|
| ASGN, Inc. (A) |
|
|
15,700 |
|
|
|
1,384,269 |
|
|
|
|
|
|
|
|
|
|
| Leisure Products - 0.6% |
|
| BRP, Inc. (F) |
|
|
14,000 |
|
|
|
896,420 |
|
| MasterCraft Boat Holdings, Inc. (A) |
|
|
60,500 |
|
|
|
1,142,240 |
|
| Polaris, Inc. |
|
|
15,400 |
|
|
|
1,205,974 |
|
|
|
|
|
|
|
|
|
|
|
|
|
|
|
|
|
3,244,634 |
|
|
|
|
|
|
|
|
|
|
| Life Sciences Tools & Services - 1.8% |
|
| Azenta, Inc. (A) |
|
|
23,700 |
|
|
|
1,247,094 |
|
| Bio-Rad Laboratories, Inc., Class A (A) |
|
|
27,500 |
|
|
|
7,510,525 |
|
| Maravai LifeSciences Holdings, Inc., Class A (A) |
|
|
79,700 |
|
|
|
570,652 |
|
|
|
|
|
|
|
|
|
|
|
|
|
|
|
|
|
9,328,271 |
|
|
|
|
|
|
|
|
|
|
| Machinery - 2.3% |
|
| Allison Transmission Holdings, Inc. |
|
|
21,400 |
|
|
|
1,624,260 |
|
| CNH Industrial NV |
|
|
222,200 |
|
|
|
2,250,886 |
|
| Columbus McKinnon Corp. |
|
|
44,600 |
|
|
|
1,540,484 |
|
| Douglas Dynamics, Inc. |
|
|
19,000 |
|
|
|
444,600 |
|
| Gencor Industries, Inc. (A) |
|
|
46,400 |
|
|
|
897,376 |
|
| Miller Industries, Inc. |
|
|
22,400 |
|
|
|
1,232,448 |
|
| Mueller Industries, Inc. |
|
|
61,650 |
|
|
|
3,510,351 |
|
| Oshkosh Corp. |
|
|
6,350 |
|
|
|
687,070 |
|
|
|
|
|
|
|
|
|
|
|
|
|
|
|
|
|
12,187,475 |
|
|
|
|
|
|
|
|
|
|
| Media - 4.8% |
|
| Altice USA, Inc., Class A (A) |
|
|
530,700 |
|
|
|
1,082,628 |
|
| EchoStar Corp., Class A (A) |
|
|
78,833 |
|
|
|
1,404,016 |
|
| Fox Corp., Class A |
|
|
158,500 |
|
|
|
5,447,645 |
|
| Liberty Broadband Corp., Class C (A) |
|
|
121,590 |
|
|
|
6,665,564 |
|
| Liberty Media Corp. - Liberty SiriusXM, Class C (A) |
|
|
278,757 |
|
|
|
6,177,255 |
|
| News Corp., Class A |
|
|
143,400 |
|
|
|
3,953,538 |
|
| Perion Network Ltd. (A) |
|
|
33,350 |
|
|
|
278,472 |
|
|
|
|
|
|
|
|
|
|
|
|
|
|
|
|
|
25,009,118 |
|
|
|
|
|
|
|
|
|
|
| Metals & Mining - 1.7% |
|
| Commercial Metals Co. |
|
|
104,450 |
|
|
|
5,743,705 |
|
| Kaiser Aluminum Corp. |
|
|
15,900 |
|
|
|
1,397,610 |
|
| Metallus, Inc. (A) |
|
|
70,350 |
|
|
|
1,425,995 |
|
| Radius Recycling, Inc. |
|
|
37,250 |
|
|
|
568,808 |
|
|
|
|
|
|
|
|
|
|
|
|
|
|
|
|
|
9,136,118 |
|
|
|
|
|
|
|
|
|
|
| Multi-Utilities - 5.2% |
|
| CenterPoint Energy, Inc. |
|
|
178,300 |
|
|
|
5,523,734 |
|
| Dominion Energy, Inc. |
|
|
200,200 |
|
|
|
9,809,800 |
|
| NiSource, Inc. |
|
|
299,200 |
|
|
|
8,619,952 |
|
| Northwestern Energy Group, Inc. |
|
|
66,800 |
|
|
|
3,345,344 |
|
|
|
|
|
|
|
|
|
|
|
|
|
|
|
|
|
27,298,830 |
|
|
|
|
|
|
|
|
|
|
| Office REITs - 0.8% |
|
| Brandywine Realty Trust |
|
|
51,750 |
|
|
|
231,840 |
|
|
|
|
|
|
|
|
|
|
| |
|
Shares |
|
|
Value |
|
| COMMON STOCKS (continued) |
|
| Office REITs (continued) |
|
| JBG SMITH Properties |
|
|
218,800 |
|
|
|
$ 3,332,324 |
|
| Piedmont Office Realty Trust, Inc., Class A |
|
|
64,100 |
|
|
|
464,725 |
|
|
|
|
|
|
|
|
|
|
|
|
|
|
|
|
|
4,028,889 |
|
|
|
|
|
|
|
|
|
|
| Oil, Gas & Consumable Fuels - 5.1% |
|
| Delek US Holdings, Inc. |
|
|
51,850 |
|
|
|
1,283,806 |
|
| HF Sinclair Corp. |
|
|
59,200 |
|
|
|
3,157,728 |
|
| Kinder Morgan, Inc. |
|
|
328,700 |
|
|
|
6,531,269 |
|
| Magnolia Oil & Gas Corp., Class A |
|
|
193,300 |
|
|
|
4,898,222 |
|
| Ovintiv, Inc. |
|
|
40,150 |
|
|
|
1,881,830 |
|
| REX American Resources Corp. (A) |
|
|
45,500 |
|
|
|
2,074,345 |
|
| Teekay Tankers Ltd., Class A |
|
|
10,650 |
|
|
|
732,827 |
|
| Williams Cos., Inc. |
|
|
143,949 |
|
|
|
6,117,832 |
|
|
|
|
|
|
|
|
|
|
|
|
|
|
|
|
|
26,677,859 |
|
|
|
|
|
|
|
|
|
|
| Paper & Forest Products - 0.3% |
|
| Louisiana-Pacific Corp. |
|
|
16,600 |
|
|
|
1,366,678 |
|
|
|
|
|
|
|
|
|
|
| Pharmaceuticals - 4.3% |
|
| Innoviva, Inc. (A) |
|
|
121,500 |
|
|
|
1,992,600 |
|
| Jazz Pharmaceuticals PLC (A) |
|
|
48,650 |
|
|
|
5,192,414 |
|
| Organon & Co. |
|
|
190,400 |
|
|
|
3,941,280 |
|
| Perrigo Co. PLC |
|
|
246,100 |
|
|
|
6,319,848 |
|
| Viatris, Inc. |
|
|
454,400 |
|
|
|
4,830,272 |
|
|
|
|
|
|
|
|
|
|
|
|
|
|
|
|
|
22,276,414 |
|
|
|
|
|
|
|
|
|
|
| Professional Services - 3.2% |
|
| Clarivate PLC (A)(F) |
|
|
397,500 |
|
|
|
2,261,775 |
|
| FTI Consulting, Inc. (A) |
|
|
2,500 |
|
|
|
538,825 |
|
| Heidrick & Struggles International, Inc. |
|
|
38,100 |
|
|
|
1,203,198 |
|
| ICF International, Inc. |
|
|
18,500 |
|
|
|
2,746,510 |
|
| Jacobs Solutions, Inc. |
|
|
24,500 |
|
|
|
3,422,895 |
|
| KBR, Inc. |
|
|
50,150 |
|
|
|
3,216,621 |
|
| Leidos Holdings, Inc. |
|
|
12,300 |
|
|
|
1,794,324 |
|
| Science Applications International Corp. |
|
|
13,900 |
|
|
|
1,633,945 |
|
|
|
|
|
|
|
|
|
|
|
|
|
|
|
|
|
16,818,093 |
|
|
|
|
|
|
|
|
|
|
| Real Estate Management & Development - 0.1% |
|
| Newmark Group, Inc., Class A |
|
|
52,150 |
|
|
|
533,495 |
|
|
|
|
|
|
|
|
|
|
| Retail REITs - 0.5% |
|
| Agree Realty Corp. |
|
|
23,000 |
|
|
|
1,424,620 |
|
| Kite Realty Group Trust |
|
|
54,300 |
|
|
|
1,215,234 |
|
|
|
|
|
|
|
|
|
|
|
|
|
|
|
|
|
2,639,854 |
|
|
|
|
|
|
|
|
|
|
| Semiconductors & Semiconductor Equipment - 2.5% |
|
| AXT, Inc. (A) |
|
|
90,000 |
|
|
|
304,200 |
|
| Cohu, Inc. (A) |
|
|
52,250 |
|
|
|
1,729,475 |
|
| Kulicke & Soffa Industries, Inc. |
|
|
5,800 |
|
|
|
285,302 |
|
| Magnachip Semiconductor Corp. (A) |
|
|
128,000 |
|
|
|
623,360 |
|
| MKS Instruments, Inc. |
|
|
11,700 |
|
|
|
1,527,786 |
|
| Onto Innovation, Inc. (A) |
|
|
9,900 |
|
|
|
2,173,644 |
|
| Qorvo, Inc. (A) |
|
|
11,150 |
|
|
|
1,293,846 |
|
| Silicon Motion Technology Corp., ADR |
|
|
27,100 |
|
|
|
2,194,829 |
|
| Tower Semiconductor Ltd. (A) |
|
|
39,650 |
|
|
|
1,558,642 |
|
| Universal Display Corp. |
|
|
7,425 |
|
|
|
1,561,106 |
|
|
|
|
|
|
|
|
|
|
|
|
|
|
|
|
|
13,252,190 |
|
|
|
|
|
|
|
|
|
|
The Notes to Financial Statements are an integral part of this report.
|
|
|
|
|
| Transamerica Series Trust |
|
|
|
Semi-Annual Financial Statements 2024 |
|
|
Page 3 |
|
|
Transamerica Small/Mid Cap Value VP
SCHEDULE OF INVESTMENTS (continued)
At June 30, 2024
(unaudited)
|
|
|
|
|
|
|
|
|
| |
|
Shares |
|
|
Value |
|
| COMMON STOCKS (continued) |
|
| Software - 0.6% |
|
| Adeia, Inc. |
|
|
117,250 |
|
|
|
$ 1,311,441 |
|
| Progress Software Corp. |
|
|
36,300 |
|
|
|
1,969,638 |
|
|
|
|
|
|
|
|
3,281,079 |
|
|
|
|
|
|
|
|
|
|
| Specialized REITs - 1.4% |
|
| Crown Castle, Inc. |
|
|
24,900 |
|
|
|
2,432,730 |
|
| Gaming & Leisure Properties, Inc. |
|
|
111,153 |
|
|
|
5,025,227 |
|
|
|
|
|
|
|
|
7,457,957 |
|
|
|
|
|
|
|
|
|
|
| Specialty Retail - 1.9% |
|
| Abercrombie & Fitch Co., Class A (A) |
|
|
15,375 |
|
|
|
2,734,290 |
|
| Academy Sports & Outdoors, Inc. |
|
|
11,000 |
|
|
|
585,750 |
|
| Advance Auto Parts, Inc. |
|
|
24,000 |
|
|
|
1,519,920 |
|
| American Eagle Outfitters, Inc. |
|
|
86,250 |
|
|
|
1,721,550 |
|
| Urban Outfitters, Inc. (A) |
|
|
44,900 |
|
|
|
1,843,145 |
|
| Williams-Sonoma, Inc. |
|
|
6,150 |
|
|
|
1,736,575 |
|
|
|
|
|
|
|
|
10,141,230 |
|
|
|
|
|
|
|
|
|
|
| Technology Hardware, Storage & Peripherals - 0.3% |
|
| Hewlett Packard Enterprise Co. |
|
|
69,800 |
|
|
|
1,477,666 |
|
|
|
|
|
|
|
|
|
|
| Textiles, Apparel & Luxury Goods - 0.5% |
|
| Steven Madden Ltd. |
|
|
29,200 |
|
|
|
1,235,160 |
|
| Tapestry, Inc. |
|
|
28,600 |
|
|
|
1,223,794 |
|
|
|
|
|
|
|
|
|
|
|
|
|
|
|
|
|
2,458,954 |
|
|
|
|
|
|
|
|
|
|
|
|
| Total Common Stocks
(Cost $445,622,939) |
|
|
|
505,869,823 |
|
|
|
|
|
|
|
|
|
|
|
|
|
|
|
|
|
|
|
| |
|
Shares |
|
|
Value |
|
| OTHER INVESTMENT COMPANY - 0.4% |
|
| Securities Lending Collateral - 0.4% |
|
| State Street Navigator Securities Lending Trust - Government Money Market Portfolio, 5.28% (G) |
|
|
2,045,992 |
|
|
|
$ 2,045,992 |
|
|
|
|
|
|
|
|
|
|
|
|
| Total Other Investment Company
(Cost $2,045,992) |
|
|
|
2,045,992 |
|
|
|
|
|
|
|
|
|
|
| |
|
Principal |
|
|
Value |
|
| REPURCHASE AGREEMENT - 3.2% |
|
| Fixed Income Clearing Corp., 2.50% (G), dated 06/28/2024, to be repurchased at $16,973,820 on 07/01/2024. Collateralized by U.S. Government Obligations, 3.75% - 4.50%, due 03/31/2026 - 04/15/2026, and with a total value of $17,309,946. |
|
|
$ 16,970,285 |
|
|
|
16,970,285 |
|
|
|
|
|
|
|
|
|
|
|
|
| Total Repurchase Agreement
(Cost $16,970,285) |
|
|
|
16,970,285 |
|
|
|
|
|
|
|
|
|
| Total Investments
(Cost $464,639,216) |
|
|
|
524,886,100 |
|
|
|
|
|
|
|
|
|
| Net Other Assets (Liabilities) - (0.3)% |
|
|
|
(1,809,999 |
) |
|
|
|
|
|
|
|
|
|
|
|
| Net Assets - 100.0% |
|
|
|
$ 523,076,101 |
|
|
|
|
|
|
|
INVESTMENT VALUATION:
|
|
|
|
|
|
|
|
|
|
|
|
|
|
|
|
|
| |
|
|
|
|
| Valuation Inputs (H) |
|
|
|
|
|
|
|
|
|
|
|
|
| |
|
Level 1 - Unadjusted Quoted Prices |
|
|
Level 2 - Other Significant Observable Inputs |
|
|
Level 3 - Significant Unobservable Inputs (I) |
|
|
Value |
|
| ASSETS |
|
|
|
|
|
|
|
|
|
|
|
|
|
|
|
|
| Investments |
|
|
|
|
|
|
|
|
|
|
|
|
|
|
|
|
| Common Stocks |
|
$ |
505,869,823 |
|
|
$ |
— |
|
|
$ |
0 |
|
|
$ |
505,869,823 |
|
| Other Investment Company |
|
|
2,045,992 |
|
|
|
— |
|
|
|
— |
|
|
|
2,045,992 |
|
| Repurchase Agreement |
|
|
— |
|
|
|
16,970,285 |
|
|
|
— |
|
|
|
16,970,285 |
|
|
|
|
|
|
|
|
|
|
|
|
|
|
|
|
|
|
| Total Investments |
|
$ |
507,915,815 |
|
|
$ |
16,970,285 |
|
|
$ |
0 |
|
|
$ |
524,886,100 |
|
|
|
|
|
|
|
|
|
|
|
|
|
|
|
|
|
|
FOOTNOTES TO SCHEDULE OF INVESTMENTS:
| (A) |
Non-income producing security. |
| (B) |
Percentage rounds to less than 0.1% or (0.1)%. |
| (C) |
Security is Level 3 of the fair value hierarchy. |
| (D) |
Fair valued as determined in good faith in accordance with TAM’s procedures. At June 30, 2024, the total value of the securities is $0, representing 0.0% of the Portfolio’s net assets. |
| (E) |
Security deemed worthless. |
| (F) |
All or a portion of the security is on loan. The total value of the securities on loan is $3,286,343, collateralized by cash collateral of $2,045,992 and non-cash collateral, such as U.S. government securities and irrevocable letters of credit, of $1,317,635. The amount on loan indicated may not correspond with the securities on loan identified because a security with pending sales are in the process of recall from the brokers. |
| (G) |
Rate disclosed reflects the yield at June 30, 2024. |
| (H) |
There were no transfers in or out of Level 3 during the period ended June 30, 2024. Please reference the Investment Valuation section of the Notes to Financial Statements for more information regarding investment valuation and pricing inputs. |
| (I) |
Level 3 securities were not considered significant to the Portfolio. |
The Notes to Financial Statements are an integral part of this report.
|
|
|
|
|
| Transamerica Series Trust |
|
|
|
Semi-Annual Financial Statements 2024 |
|
|
Page 4 |
|
|
Transamerica Small/Mid Cap Value VP
SCHEDULE OF INVESTMENTS (continued)
At June 30, 2024
(unaudited)
PORTFOLIO ABBREVIATION(S):
|
|
|
| ADR |
|
American Depositary Receipt |
| REIT |
|
Real Estate Investment Trust |
The Notes to Financial Statements are an integral part of this report.
|
|
|
|
|
| Transamerica Series Trust |
|
|
|
Semi-Annual Financial Statements 2024 |
|
|
Page 5 |
|
|
Transamerica Small/Mid Cap Value VP
STATEMENT OF ASSETS AND LIABILITIES
At June 30, 2024
(unaudited)
|
|
|
|
|
| Assets: |
|
|
|
|
| Investments, at value (cost $447,668,931) (including securities loaned of $3,286,343) |
|
$ |
507,915,815 |
|
| Repurchase agreement, at value (cost $16,970,285) |
|
|
16,970,285 |
|
| Receivables and other assets: |
|
|
|
|
| Investments sold |
|
|
557,108 |
|
| Net income from securities lending |
|
|
1,682 |
|
| Shares of beneficial interest sold |
|
|
89,226 |
|
| Dividends |
|
|
295,448 |
|
| Interest |
|
|
3,536 |
|
| Prepaid expenses |
|
|
2,107 |
|
| Total assets |
|
|
525,835,207 |
|
|
|
| Liabilities: |
|
|
|
|
| Cash collateral received upon return of: |
|
|
|
|
| Securities on loan |
|
|
2,045,992 |
|
| Payables and other liabilities: |
|
|
|
|
| Investments purchased |
|
|
120,131 |
|
| Shares of beneficial interest redeemed |
|
|
129,737 |
|
| Investment management fees |
|
|
303,604 |
|
| Distribution and service fees |
|
|
43,862 |
|
| Transfer agent costs |
|
|
453 |
|
| Trustee and CCO fees |
|
|
1,547 |
|
| Audit and tax fees |
|
|
12,833 |
|
| Custody fees |
|
|
20,929 |
|
| Legal fees |
|
|
10,194 |
|
| Printing and shareholder reports fees |
|
|
56,218 |
|
| Other accrued expenses |
|
|
13,606 |
|
| Total liabilities |
|
|
2,759,106 |
|
| Net assets |
|
$ |
523,076,101 |
|
|
|
| Net assets consist of: |
|
|
|
|
| Capital stock ($0.01 par value) |
|
|
$275,470 |
|
| Additional paid-in capital |
|
|
418,123,944 |
|
| Total distributable earnings (accumulated losses) |
|
|
104,676,687 |
|
| Net assets |
|
$ |
523,076,101 |
|
|
|
| Net assets by class: |
|
|
|
|
| Initial Class |
|
$ |
295,035,654 |
|
| Service Class |
|
|
228,040,447 |
|
|
|
| Shares outstanding: |
|
|
|
|
| Initial Class |
|
|
15,231,276 |
|
| Service Class |
|
|
12,315,746 |
|
|
|
| Net asset value and offering price per share: |
|
|
|
|
| Initial Class |
|
$ |
19.37 |
|
| Service Class |
|
|
18.52 |
|
STATEMENT OF OPERATIONS
For the period ended June 30, 2024
(unaudited)
|
|
|
|
|
| Investment income: |
|
|
|
|
| Dividend income |
|
$ |
5,071,841 |
|
| Interest income |
|
|
232,094 |
|
| Net income from securities lending |
|
|
32,359 |
|
| Withholding taxes on foreign income |
|
|
(1,489 |
) |
| Total investment income |
|
|
5,334,805 |
|
|
|
| Expenses: |
|
|
|
|
| Investment management fees |
|
|
2,030,962 |
|
| Distribution and service fees: |
|
|
|
|
| Service Class |
|
|
286,277 |
|
| Transfer agent costs |
|
|
2,973 |
|
| Trustee and CCO fees |
|
|
12,299 |
|
| Audit and tax fees |
|
|
12,632 |
|
| Custody fees |
|
|
21,751 |
|
| Legal fees |
|
|
20,545 |
|
| Printing and shareholder reports fees |
|
|
54,543 |
|
| Other |
|
|
23,742 |
|
| Total expenses |
|
|
2,465,724 |
|
| Net investment income (loss) |
|
|
2,869,081 |
|
|
|
| Net realized gain (loss) on: |
|
|
|
|
| Investments |
|
|
35,398,082 |
|
| Foreign currency transactions |
|
|
(46 |
) |
| Net realized gain (loss) |
|
|
35,398,036 |
|
|
|
| Net change in unrealized appreciation (depreciation) on: |
|
|
|
|
| Investments |
|
|
(27,053,207 |
) |
| Translation of assets and liabilities denominated in foreign currencies |
|
|
9 |
|
| Net change in unrealized appreciation (depreciation) |
|
|
(27,053,198 |
) |
| Net realized and change in unrealized gain (loss) |
|
|
8,344,838 |
|
| Net increase (decrease) in net assets resulting from operations |
|
$ |
11,213,919 |
|
The Notes to Financial Statements are an integral part of this report.
|
|
|
|
|
| Transamerica Series Trust |
|
|
|
Semi-Annual Financial Statements 2024 |
|
|
Page 6 |
|
|
Transamerica Small/Mid Cap Value VP
STATEMENT OF CHANGES IN NET ASSETS
For the period and year ended:
|
|
|
|
|
|
|
|
|
| |
|
June 30, 2024 (unaudited) |
|
|
December 31, 2023 |
|
|
|
|
| From operations: |
|
|
|
|
|
|
|
|
| Net investment income (loss) |
|
$ |
2,869,081 |
|
|
$ |
4,541,733 |
|
| Net realized gain (loss) |
|
|
35,398,036 |
|
|
|
13,834,359 |
|
| Net change in unrealized appreciation (depreciation) |
|
|
(27,053,198 |
) |
|
|
41,877,194 |
|
|
|
|
| Net increase (decrease) in net assets resulting from operations |
|
|
11,213,919 |
|
|
|
60,253,286 |
|
|
|
|
| Dividends and/or distributions to shareholders: |
|
|
|
|
|
|
|
|
| Initial Class |
|
|
— |
|
|
|
(31,498,528 |
) |
| Service Class |
|
|
— |
|
|
|
(24,207,774 |
) |
| |
|
|
| Net increase (decrease) in net assets resulting from dividends and/or distributions to shareholders |
|
|
— |
|
|
|
(55,706,302 |
) |
|
|
|
| Capital share transactions: |
|
|
|
|
|
|
|
|
| Proceeds from shares sold: |
|
|
|
|
|
|
|
|
| Initial Class |
|
|
3,445,160 |
|
|
|
4,469,451 |
|
| Service Class |
|
|
6,762,582 |
|
|
|
12,339,776 |
|
|
|
|
10,207,742 |
|
|
|
16,809,227 |
|
| Dividends and/or distributions reinvested: |
|
|
|
|
|
|
|
|
| Initial Class |
|
|
— |
|
|
|
31,498,528 |
|
| Service Class |
|
|
— |
|
|
|
24,207,774 |
|
|
|
|
— |
|
|
|
55,706,302 |
|
| Cost of shares redeemed: |
|
|
|
|
|
|
|
|
| Initial Class |
|
|
(20,866,852 |
) |
|
|
(31,579,658 |
) |
| Service Class |
|
|
(15,229,964 |
) |
|
|
(25,753,471 |
) |
|
|
|
| |
|
|
(36,096,816 |
) |
|
|
(57,333,129 |
) |
|
|
|
| Net increase (decrease) in net assets resulting from capital share transactions |
|
|
(25,889,074 |
) |
|
|
15,182,400 |
|
|
|
|
| Net increase (decrease) in net assets |
|
|
(14,675,155 |
) |
|
|
19,729,384 |
|
|
|
|
| Net assets: |
|
|
|
|
|
|
|
|
| Beginning of period/year |
|
|
537,751,256 |
|
|
|
518,021,872 |
|
| End of period/year |
|
$ |
523,076,101 |
|
|
$ |
537,751,256 |
|
|
|
|
| Capital share transactions - shares: |
|
|
|
|
|
|
|
|
| Shares issued: |
|
|
|
|
|
|
|
|
| Initial Class |
|
|
175,736 |
|
|
|
238,557 |
|
| Service Class |
|
|
362,830 |
|
|
|
675,924 |
|
| |
|
|
538,566 |
|
|
|
914,481 |
|
| Shares reinvested: |
|
|
|
|
|
|
|
|
| Initial Class |
|
|
— |
|
|
|
1,737,371 |
|
| Service Class |
|
|
— |
|
|
|
1,393,654 |
|
| |
|
|
— |
|
|
|
3,131,025 |
|
| Shares redeemed: |
|
|
|
|
|
|
|
|
| Initial Class |
|
|
(1,076,741 |
) |
|
|
(1,691,302 |
) |
| Service Class |
|
|
(821,228 |
) |
|
|
(1,434,497 |
) |
|
|
|
|
|
|
(1,897,969 |
) |
|
|
(3,125,799 |
) |
|
|
|
| Net increase (decrease) in shares outstanding: |
|
|
|
|
|
|
|
|
| Initial Class |
|
|
(901,005 |
) |
|
|
284,626 |
|
| Service Class |
|
|
(458,398 |
) |
|
|
635,081 |
|
| |
|
|
(1,359,403 |
) |
|
|
919,707 |
|
The Notes to Financial Statements are an integral part of this report.
|
|
|
|
|
| Transamerica Series Trust |
|
|
|
Semi-Annual Financial Statements 2024 |
|
|
Page 7 |
|
|
Transamerica Small/Mid Cap Value VP
FINANCIAL HIGHLIGHTS
|
|
|
|
|
|
|
|
|
|
|
|
|
|
|
|
|
|
|
|
|
|
|
|
|
|
|
|
|
|
|
| For a share outstanding during the period and years indicated: |
|
Initial Class |
| |
|
June 30, 2024 (unaudited) |
|
December 31, 2023 |
|
December 31, 2022 |
|
December 31, 2021 |
|
December 31, 2020 |
|
December 31, 2019 |
|
|
|
|
|
|
|
| Net asset value, beginning of period/year |
|
|
$ |
18.96 |
|
|
|
$ |
18.83 |
|
|
|
$ |
24.43 |
|
|
|
$ |
19.19 |
|
|
|
$ |
19.51 |
|
|
|
$ |
17.11 |
|
|
|
|
|
|
|
|
| Investment operations: |
|
|
|
|
|
|
|
|
|
|
|
|
|
|
|
|
|
|
|
|
|
|
|
|
|
|
|
|
|
|
|
|
|
|
|
|
|
| Net investment income (loss)(A) |
|
|
|
0.11 |
|
|
|
|
0.19 |
|
|
|
|
0.20 |
|
|
|
|
0.13 |
|
|
|
|
0.17 |
|
|
|
|
0.18 |
|
|
|
|
|
|
|
|
| Net realized and unrealized gain (loss) |
|
|
|
0.30 |
|
|
|
|
2.05 |
|
|
|
|
(2.09 |
) |
|
|
|
5.26 |
|
|
|
|
0.41 |
|
|
|
|
3.95 |
|
|
|
|
|
|
|
|
| Total investment operations |
|
|
|
0.41 |
|
|
|
|
2.24 |
|
|
|
|
(1.89 |
) |
|
|
|
5.39 |
|
|
|
|
0.58 |
|
|
|
|
4.13 |
|
|
|
|
|
|
|
|
| Dividends and/or distributions to
shareholders: |
|
|
|
|
|
|
|
|
|
|
|
|
|
|
|
|
|
|
|
|
|
|
|
|
|
|
|
|
|
|
|
|
|
|
|
|
|
| Net investment income |
|
|
|
— |
|
|
|
|
(0.21 |
) |
|
|
|
(0.14 |
) |
|
|
|
(0.15 |
) |
|
|
|
(0.20 |
) |
|
|
|
(0.19 |
) |
|
|
|
|
|
|
|
| Net realized gains |
|
|
|
— |
|
|
|
|
(1.90 |
) |
|
|
|
(3.57 |
) |
|
|
|
— |
|
|
|
|
(0.70 |
) |
|
|
|
(1.54 |
) |
|
|
|
|
|
|
|
| Total dividends and/or distributions to shareholders |
|
|
|
— |
|
|
|
|
(2.11 |
) |
|
|
|
(3.71 |
) |
|
|
|
(0.15 |
) |
|
|
|
(0.90 |
) |
|
|
|
(1.73 |
) |
|
|
|
|
|
|
|
| Net asset value, end of period/year |
|
|
$ |
19.37 |
|
|
|
$ |
18.96 |
|
|
|
$ |
18.83 |
|
|
|
$ |
24.43 |
|
|
|
$ |
19.19 |
|
|
|
$ |
19.51 |
|
|
|
|
|
|
|
|
| |
|
|
|
|
|
|
|
|
|
|
|
|
|
|
|
|
|
|
|
|
|
|
|
|
|
|
|
|
|
|
|
|
|
|
|
|
|
| Total return |
|
|
|
2.16 |
%(B) |
|
|
|
12.40 |
% |
|
|
|
(8.31 |
)% |
|
|
|
28.12 |
% |
|
|
|
4.04 |
% |
|
|
|
25.28 |
% |
|
|
|
|
|
|
|
| Ratio and supplemental data: |
|
|
|
|
|
|
|
|
|
|
|
|
|
|
|
|
|
|
|
|
|
|
|
|
|
|
|
|
|
|
|
|
|
|
|
|
|
| Net assets end of period/year (000’s) |
|
|
$ |
295,036 |
|
|
|
$ |
305,914 |
|
|
|
$ |
298,340 |
|
|
|
$ |
355,144 |
|
|
|
$ |
316,185 |
|
|
|
$ |
339,556 |
|
|
|
|
|
|
|
|
| Expenses to average net assets |
|
|
|
0.82 |
%(C) |
|
|
|
0.85 |
% |
|
|
|
0.81 |
% |
|
|
|
0.82 |
% |
|
|
|
0.83 |
% |
|
|
|
0.83 |
% |
|
|
|
|
|
|
|
| Net investment income (loss) to average net assets |
|
|
|
1.19 |
%(C) |
|
|
|
0.98 |
% |
|
|
|
0.91 |
% |
|
|
|
0.57 |
% |
|
|
|
1.03 |
% |
|
|
|
0.96 |
% |
|
|
|
|
|
|
|
| Portfolio turnover rate |
|
|
|
26 |
%(B) |
|
|
|
33 |
% |
|
|
|
44 |
% |
|
|
|
46 |
% |
|
|
|
71 |
% |
|
|
|
56 |
% |
| (A) |
Calculated based on average number of shares outstanding. |
|
|
|
|
|
|
|
|
|
|
|
|
|
|
|
|
|
|
|
|
|
|
|
|
|
|
|
|
|
|
|
| For a share outstanding during the period and years indicated: |
|
Service Class |
| |
|
June 30, 2024 (unaudited) |
|
December 31, 2023 |
|
December 31, 2022 |
|
December 31, 2021 |
|
December 31, 2020 |
|
December 31, 2019 |
|
|
|
|
|
|
|
| Net asset value, beginning of period/year |
|
|
$ |
18.15 |
|
|
|
$ |
18.10 |
|
|
|
$ |
23.62 |
|
|
|
$ |
18.57 |
|
|
|
$ |
18.92 |
|
|
|
$ |
16.64 |
|
|
|
|
|
|
|
|
| Investment operations: |
|
|
|
|
|
|
|
|
|
|
|
|
|
|
|
|
|
|
|
|
|
|
|
|
|
|
|
|
|
|
|
|
|
|
|
|
|
| Net investment income (loss)(A) |
|
|
|
0.09 |
|
|
|
|
0.13 |
|
|
|
|
0.14 |
|
|
|
|
0.07 |
|
|
|
|
0.12 |
|
|
|
|
0.13 |
|
|
|
|
|
|
|
|
| Net realized and unrealized gain (loss) |
|
|
|
0.28 |
|
|
|
|
1.98 |
|
|
|
|
(2.01 |
) |
|
|
|
5.09 |
|
|
|
|
0.39 |
|
|
|
|
3.83 |
|
|
|
|
|
|
|
|
| Total investment operations |
|
|
|
0.37 |
|
|
|
|
2.11 |
|
|
|
|
(1.87 |
) |
|
|
|
5.16 |
|
|
|
|
0.51 |
|
|
|
|
3.96 |
|
|
|
|
|
|
|
|
| Dividends and/or distributions to shareholders: |
|
|
|
|
|
|
|
|
|
|
|
|
|
|
|
|
|
|
|
|
|
|
|
|
|
|
|
|
|
|
|
|
|
|
|
|
|
| Net investment income |
|
|
|
— |
|
|
|
|
(0.16 |
) |
|
|
|
(0.08 |
) |
|
|
|
(0.11 |
) |
|
|
|
(0.16 |
) |
|
|
|
(0.14 |
) |
|
|
|
|
|
|
|
| Net realized gains |
|
|
|
— |
|
|
|
|
(1.90 |
) |
|
|
|
(3.57 |
) |
|
|
|
— |
|
|
|
|
(0.70 |
) |
|
|
|
(1.54 |
) |
|
|
|
|
|
|
|
| Total dividends and/or distributions to shareholders |
|
|
|
— |
|
|
|
|
(2.06 |
) |
|
|
|
(3.65 |
) |
|
|
|
(0.11 |
) |
|
|
|
(0.86 |
) |
|
|
|
(1.68 |
) |
|
|
|
|
|
|
|
| Net asset value, end of period/year |
|
|
$ |
18.52 |
|
|
|
$ |
18.15 |
|
|
|
$ |
18.10 |
|
|
|
$ |
23.62 |
|
|
|
$ |
18.57 |
|
|
|
$ |
18.92 |
|
|
|
|
|
|
|
|
| |
|
|
|
|
|
|
|
|
|
|
|
|
|
|
|
|
|
|
|
|
|
|
|
|
|
|
|
|
|
|
|
|
|
|
|
|
|
| Total return |
|
|
|
2.04 |
%(B) |
|
|
|
12.15 |
% |
|
|
|
(8.53 |
)% |
|
|
|
27.81 |
% |
|
|
|
3.74 |
% |
|
|
|
24.94 |
% |
|
|
|
|
|
|
|
| Ratio and supplemental data: |
|
|
|
|
|
|
|
|
|
|
|
|
|
|
|
|
|
|
|
|
|
|
|
|
|
|
|
|
|
|
|
|
|
|
|
|
|
| Net assets end of period/year (000’s) |
|
|
$ |
228,040 |
|
|
|
$ |
231,837 |
|
|
|
$ |
219,682 |
|
|
|
$ |
276,007 |
|
|
|
$ |
231,626 |
|
|
|
$ |
218,875 |
|
| |
|
|
|
|
|
|
| Expenses to average net assets |
|
|
|
1.07 |
%(C) |
|
|
|
1.10 |
% |
|
|
|
1.06 |
% |
|
|
|
1.07 |
% |
|
|
|
1.08 |
% |
|
|
|
1.08 |
% |
|
|
|
|
|
|
|
| Net investment income (loss) to average net assets |
|
|
|
0.94 |
%(C) |
|
|
|
0.73 |
% |
|
|
|
0.66 |
% |
|
|
|
0.32 |
% |
|
|
|
0.77 |
% |
|
|
|
0.71 |
% |
|
|
|
|
|
|
|
| Portfolio turnover rate |
|
|
|
26 |
%(B) |
|
|
|
33 |
% |
|
|
|
44 |
% |
|
|
|
46 |
% |
|
|
|
71 |
% |
|
|
|
56 |
% |
| (A) |
Calculated based on average number of shares outstanding. |
The Notes to Financial Statements are an integral part of this report.
|
|
|
|
|
| Transamerica Series Trust |
|
|
|
Semi-Annual Financial Statements 2024 |
|
|
Page 8 |
|
|
Transamerica Small/Mid Cap Value VP
NOTES TO FINANCIAL STATEMENTS
At June 30, 2024
(unaudited)
1. ORGANIZATION
Transamerica Series Trust (“TST”) is an open-end management investment company registered under the Investment Company Act of 1940, as amended (the “1940 Act”). TST applies investment company accounting and reporting guidance. TST serves as a funding vehicle for variable life insurance, variable annuity, and group annuity products. Transamerica Small/Mid Cap Value VP (the “Portfolio”) is a series of TST and is classified as diversified under the 1940 Act. The Portfolio currently offers two classes of shares, Initial Class and Service Class.
The only shareholders of the Portfolio are affiliated insurance company separate accounts and/or affiliated asset allocation portfolios. Contract holders of the variable life and annuity contracts are not shareholders of the Portfolio. For ease of reference, shareholders and contract holders are collectively referred to in this report as “shareholders.”
This report must be accompanied or preceded by the Portfolio’s current prospectus, which contains additional information about the Portfolio, including risks, as well as investment objectives and strategies.
Transamerica Asset Management, Inc. (“TAM”) serves as investment manager for the Portfolio pursuant to an investment management agreement. TAM provides continuous and regular investment management services to the Portfolio. TAM supervises the Portfolio’s investments, conducts its investment program and provides supervisory, compliance and administrative services to the Portfolio.
TAM currently acts as a “manager of managers” and has hired sub-advisers to furnish day-to-day investment advice and recommendations. TAM may, in the future, determine to provide all aspects of the day-to-day management of the Portfolio without the use of a sub-adviser. When acting as a manager of managers, TAM provides investment management services that include, without limitation, the design and development of the Portfolio and its investment strategies and the ongoing review and evaluation of those investment strategies including recommending changes in strategy where it believes appropriate or advisable; the selection of one or more sub-advisers for the Portfolio employing a combination of quantitative and qualitative screens, research, analysis and due diligence; negotiation of sub-advisory agreements and fees; oversight and monitoring of sub-advisers and recommending changes to sub-advisers where it believes appropriate or advisable; recommending portfolio combinations and liquidations where it believes appropriate or advisable; selection and oversight of transition managers, as needed; regular supervision of the Portfolio’s investments; regular review and evaluation of sub-adviser performance; daily monitoring of the sub-advisers’ buying and selling of securities for the Portfolio; regular review of holdings; ongoing trade oversight and analysis; regular monitoring to ensure adherence to investment process; regular calls and periodic on-site visits with sub-advisers; portfolio construction and asset allocation when using multiple sub-advisers for the Portfolio; risk management oversight and analysis; oversight of negotiation of investment documentation and agreements; design, development, implementation and regular monitoring of the valuation process; periodic due diligence reviews of pricing vendors and vendor methodology; design, development, implementation and regular monitoring of the compliance process; respond to regulatory inquiries and determine appropriate litigation strategy, as needed; review of proxies voted by sub-advisers; oversight of preparation and review of materials for meetings of the Portfolio’s Board of Trustees (the “Board”), participation in these meetings and preparation of regular communications with the Board; oversight of preparation and review of prospectuses, shareholder reports and other disclosure materials and regulatory filings for the Portfolio; oversight of other service providers to the Portfolio, such as the custodian, the transfer agent, the Portfolio’s independent accounting firm and legal counsel; supervision of the performance of recordkeeping and shareholder relations functions for the Portfolio; and oversight of cash management services. TAM uses a variety of quantitative and qualitative tools to carry out its investment management services. TAM, not the Portfolio, is responsible for paying the sub-adviser(s) for their services, and sub-advisory fees are TAM’s expense.
TAM’s investment management services also include the provision of supervisory and administrative services to the Portfolio. These services include performing certain administrative services for the Portfolio and supervising and overseeing the administrative, clerical, recordkeeping and bookkeeping services provided to the Portfolio by State Street Bank and Trust Company (“State Street”), to whom TAM has outsourced the provision of certain sub-administration services. To the extent agreed upon by TAM and the Portfolio from time to time, TAM’s supervisory and administrative services include, but are not limited to: monitoring and verifying the custodian’s daily calculation of the Net Asset Values (“NAV”); shareholder relations functions; compliance services; valuation services; assisting in due diligence and in the oversight and monitoring of certain activities of sub-advisers and certain aspects of Portfolio investments; assisting with Portfolio combinations and liquidations; oversight of the preparation and filing, and review, of all returns and reports, in connection with federal, state and local taxes; oversight and review of regulatory reporting; supervising and coordinating the Portfolio’s custodian and dividend disbursing agent and monitoring their services to the Portfolio; assisting the Portfolio in preparing reports to shareholders; acting as liaison with the Portfolio’s independent public accountants and providing, upon request, analyses, fiscal year summaries and other audit related services; assisting in the preparation of agendas and supporting documents for and minutes of meetings of trustees and committees of trustees; assisting in the preparation of regular communications with the trustees; and providing personnel and office space, telephones and other office equipment as necessary in order for TAM to perform supervisory and administrative services to the Portfolio. The Portfolio
|
|
|
|
|
| Transamerica Series Trust |
|
|
|
Semi-Annual Financial Statements 2024 |
|
|
Page 9 |
|
|
Transamerica Small/Mid Cap Value VP
NOTES TO FINANCIAL STATEMENTS (continued)
At June 30, 2024
(unaudited)
1. ORGANIZATION (continued)
pays certain fees and expenses to State Street for sub-administration services which are not administrative services covered by the management agreement with TAM or paid for through the management fees payable thereunder. For the period ended June 30, 2024, (i) the expenses paid to State Street for sub-administration services by the Portfolio are shown as a part of Other expenses within the Statement of Operations and (ii) the expenses payable to State Street for sub-administration services from the Portfolio are shown as part of Other accrued expenses within the Statement of Assets and Liabilities.
2. SIGNIFICANT ACCOUNTING POLICIES
In preparing the Portfolio’s financial statements in accordance with Generally Accepted Accounting Principles in the United States of America (“GAAP”), estimates or assumptions (which could differ from actual results) may be used that affect reported amounts and disclosures. The following is a summary of significant accounting policies followed by the Portfolio. The following is a summary of significant accounting policies followed by the Portfolio.
Foreign currency denominated investments: The accounting records of the Portfolio are maintained in U.S. dollars. Securities and other assets and liabilities denominated in foreign currencies are translated into U.S. dollars based on the closing exchange rate each day. The cost of foreign securities purchased and any realized gains or losses are translated at the prevailing exchange rates in effect on the date of the respective transaction. The Portfolio combines fluctuations from currency exchange rates and fluctuations in value when computing net realized and unrealized gains or losses from investments.
Net foreign currency gains and losses resulting from changes in exchange rates include, foreign currency fluctuations between trade date and settlement date of investment security transactions, gains and losses on forward foreign currency contracts, and the difference between the receivable amounts of interest and dividends recorded in the accounting records in U.S. dollars and the amounts actually received.
Foreign currency denominated assets may involve risks not typically associated with domestic transactions. These risks include revaluation of currencies, adverse fluctuations in foreign currency values, and possible adverse political, social, and economic developments, including those particular to a specific industry, country or region.
Security transactions and investment income: Security transactions are accounted for on the trade date. Security gains and losses are calculated on a first-in, first-out basis. Dividend income, if any, is recorded on the ex-dividend date or, in the case of foreign securities, as soon as the Portfolio is informed of the ex-dividend dates, net of foreign taxes. Non-cash dividends, if any, are recorded on the ex-dividend date at fair value. Interest income, if any, is recorded on the accrual basis from settlement date, net of foreign taxes. Fixed income premiums and discounts are amortized and/or accreted over the lives of the respective securities.
Multiple class operations, income, and expenses: Income, non-class specific expenses, and realized and unrealized gains and losses are allocated to each class daily based upon net assets. Each class bears its own specific expenses in addition to the allocated non-class specific expenses.
Distributions to shareholders: Distributions are recorded on the ex-dividend date and are determined in accordance with federal income tax regulations, which may differ from GAAP.
Foreign taxes: The Portfolio may be subject to taxes imposed by the countries in which it invests, with respect to its investments in issuers existing or operating in such countries. The Portfolio may also be subject to foreign taxes on income, gains on investments, or currency repatriation, a portion of which may be recoverable. The Portfolio accrues such taxes and recoveries as applicable when the related income or capital gains are earned or unrealized, and based upon the current interpretation of tax rules and regulations that exist in the markets in which the Portfolio invests. Some countries require governmental approval for the repatriation of investment income, capital, or the proceeds of sales earned by foreign investors. In addition, if there is deterioration in a country’s balance of payments or for other reasons, a country may impose temporary restrictions of foreign capital remittances abroad.
Commission recapture: The sub-adviser(s), to the extent consistent with the best execution and usual commission rate policies and practices, may elect to place security transactions of the Portfolio with broker/dealers with which TST has established a commission recapture program. A commission recapture program is any arrangement under which a broker/dealer applies a portion of the commissions received by such broker/dealer on the security transactions to the Portfolio. In no event will commissions, paid by the Portfolio, be used to pay expenses that would otherwise be borne by any other Portfolios within TST, or by any other party.
|
|
|
|
|
| Transamerica Series Trust |
|
|
|
Semi-Annual Financial Statements 2024 |
|
|
Page 10 |
|
|
Transamerica Small/Mid Cap Value VP
NOTES TO FINANCIAL STATEMENTS (continued)
At June 30, 2024
(unaudited)
2. SIGNIFICANT ACCOUNTING POLICIES (continued)
Commissions recaptured are included within Net realized gain (loss) within the Statement of Operations. For the period ended June 30, 2024, commissions recaptured are $10,138.
Indemnification: In the normal course of business, the Portfolio enters into contracts that contain a variety of representations that provide general indemnifications. The Portfolio’s maximum exposure under these arrangements is unknown, as this would involve future claims that may be made against the Portfolio and/or its affiliates that have not yet occurred. However, based on experience, the Portfolio expects the risk of loss to be remote.
3. INVESTMENT VALUATION
TAM has been designated as the Portfolio’s valuation designee pursuant to Rule 2a-5 under the 1940 Act with responsibility for fair valuation subject to oversight by the Portfolio’s Board of Trustees. The net asset value of the Portfolio is computed as of the official close of the New York Stock Exchange (“NYSE”) each day the NYSE is open for business.
TAM utilizes various methods to measure the fair value of its investments on a recurring basis. GAAP establishes a hierarchy that prioritizes inputs to valuation methods. The inputs or methodology used for valuing securities are not necessarily an indication of the risk associated with investing in those securities. The three levels (“Levels”) of inputs of the fair value hierarchy are defined as follows:
Level 1—Unadjusted quoted prices in active markets for identical securities.
Level 2—Inputs, other than quoted prices included in Level 1, which are observable, either directly or indirectly. These inputs may include quoted prices for the identical instrument on an inactive market, prices for similar instruments, interest rates, prepayment speeds, credit risk, yield curves, default rates, and similar data.
Level 3—Unobservable inputs based on the best information available in the circumstances, to the extent observable inputs are not available, which may include TAM’s own assumptions used in determining the fair value of the Portfolio’s investments.
The inputs used to measure fair value may fall into different Levels of the fair value hierarchy. In such cases, for disclosure purposes, the Level in the fair value hierarchy that is assigned to the fair value measurement of a security is determined based on the lowest Level input that is significant to the fair value measurement in its entirety. Certain investments that are measured at fair value using NAV per share, or its equivalent, using the “practical expedient” have not been classified in the fair value Levels. The hierarchy classification of inputs used to value the Portfolio’s investments at June 30, 2024, is disclosed within the Investment Valuation section of the Schedule of Investments.
The availability of observable inputs can vary from security to security and is affected by a wide variety of factors, including, but not limited to, the type of security, whether the security is new and not yet established in the marketplace, the liquidity of markets, and other characteristics particular to the security. To the extent that valuation is based on models or inputs that are less observable or unobservable in the market, the determination of fair value requires more judgment. Accordingly, the degree of judgment exercised in determining fair value is generally greatest for instruments categorized in Level 3. Due to the inherent uncertainty of valuation, the determination of values may differ significantly from values that would have been realized had a ready market for investments existed, and the differences could be material.
Fair value measurements: Descriptions of the valuation techniques applied to the Portfolio’s significant categories of assets and liabilities measured at fair value on a recurring basis are as follows:
Equity securities: Securities are stated at the last reported sales price or closing price on the day of valuation taken from the primary exchange where the security is principally traded. To the extent these securities are actively traded and valuation adjustments are not applied, they are categorized in Level 1 of the fair value hierarchy. Equities traded on inactive markets or valued by reference to similar instruments are generally categorized in Level 2 or Level 3 if inputs are unobservable.
Foreign equity securities: Securities in which the primary trading market closes at the same time or after the NYSE, are valued based on quotations from the primary market in which they are traded and are categorized in Level 1. Because many foreign securities markets and exchanges close prior to the close of the NYSE, closing prices for foreign securities in those markets or on those exchanges do not reflect the events that occur after that close. Certain foreign securities may be fair valued using a pricing service that considers the correlation of the trading patterns of the foreign security to the intraday trading in the U.S. markets for investments such as American Depositary Receipts, financial futures, or ETFs and the movement of certain indices of securities based on a statistical analysis of their historical relationship; such valuations generally are categorized in Level 2.
|
|
|
|
|
| Transamerica Series Trust |
|
|
|
Semi-Annual Financial Statements 2024 |
|
|
Page 11 |
|
|
Transamerica Small/Mid Cap Value VP
NOTES TO FINANCIAL STATEMENTS (continued)
At June 30, 2024
(unaudited)
3. INVESTMENT VALUATION (continued)
Securities lending collateral: Securities lending collateral is invested in a money market fund which is valued at the actively traded NAV and no valuation adjustments are applied. Securities lending collateral is categorized in Level 1 of the fair value hierarchy.
Repurchase agreements: Repurchase agreements are valued at cost, which approximates fair value. To the extent the inputs are observable and timely, the values are generally categorized in Level 2 of the fair value hierarchy.
4. SECURITIES AND OTHER INVESTMENTS
Real estate investment trusts (“REITs”): REITs are pooled investment vehicles which invest primarily in income producing real estate, or real estate related loans or interests. Distributions received by REITs are classified at management’s estimate of the dividend income, return of capital and capital gains. Estimates are based on information available at year-end, which includes the previous fiscal year’s classification. The actual amounts of dividend income, return of capital, and capital gains are only determined by each REIT after the fiscal year end and may differ from the estimated amounts. Upon notification from the REITs, some of the distributions received may be re-classified and recorded as a return of capital or capital gains. There are certain additional risks involved in investing in REITs. These include, but are not limited to, economic conditions, changes in zoning laws, real estate values, property taxes, and interest rates.
REITs held at June 30, 2024, if any, are identified within the Schedule of Investments.
5. BORROWINGS AND OTHER FINANCING TRANSACTIONS
The Portfolio may engage in borrowing transactions as a means of raising cash to satisfy redemption requests, for other temporary or emergency purposes or, to the extent permitted by its investment policies, to raise additional cash to be invested in other securities or instruments. When the Portfolio invests borrowing proceeds in other securities, the Portfolio will bear the risk that the market value of the securities in which such proceeds are invested goes down and is insufficient to repay the borrowed proceeds. The Portfolio may borrow on a secured or on an unsecured basis. If the Portfolio enters into a secured borrowing arrangement, a portion of the Portfolio’s assets will be used as collateral. The 1940 Act requires the Portfolio to maintain asset coverage of at least 300% of the amount of its borrowings. Asset coverage means the ratio that the value of the Portfolio’s total assets, minus liabilities other than borrowings, bears to the aggregate amount of all borrowings. Although complying with this requirement has the effect of limiting the amount that the Portfolio may borrow, it does not otherwise mitigate the risks of entering into borrowing transactions.
Interfund lending: The Portfolio, along with other funds and portfolios advised by TAM, may participate in an interfund lending program pursuant to exemptive relief granted by the Securities and Exchange Commission on January 18, 2017. This program allows the Portfolio to lend to and borrow from other funds and portfolios advised by TAM. Interfund lending transactions are subject to the conditions of the exemptive relief which places limits on the amount of lending or borrowing a Portfolio may participate in under the program. Interest earned or paid on an interfund lending transaction will be based on the average of certain current market rates. For the period ended June 30, 2024, the Portfolio has not utilized the program.
Repurchase agreements: In a repurchase agreement, the Portfolio purchases a security and simultaneously commits to resell that security to the seller at an agreed-upon price on an agreed-upon date. Securities purchased subject to a repurchase agreement are held at the Portfolio’s custodian, or designated sub-custodian related to tri-party repurchase agreements, and, pursuant to the terms of the repurchase agreement, must be collateralized by securities with an aggregate market value greater than or equal to 100% of the resale price. The Portfolio will bear the risk of value fluctuations until the securities can be sold and may encounter delays and incur costs in liquidating the securities. In the event of bankruptcy or insolvency of the seller, delays and costs may be incurred.
Repurchase agreements are subject to netting agreements, which are agreements between the Portfolio and its counterparties that provide for the net settlement of all transactions and collateral with the Portfolio, through a single payment, in the event of default or termination. Amounts presented within the Schedule of Investments, and as part of Repurchase agreements, at value within the Statement of Assets and Liabilities are shown on a gross basis. The value of the related collateral for each repurchase agreement, as reflected within the Schedule of Investments, exceeds the value of each repurchase agreement at June 30, 2024.
Repurchase agreements at June 30, 2024, if any, are included within the Schedule of Investments and Statement of Assets and Liabilities.
Securities lending: The Portfolio may lend securities to qualified financial institutions, brokers and dealers. State Street serves as securities lending agent to the Portfolio pursuant to a Securities Lending Agreement. Loans of securities are terminable at any time and the borrower, after notice, is required to return borrowed securities within the standard time period for settlement of securities transactions. The lending of securities exposes the Portfolio to risks such as: the borrowers may fail to return the loaned securities or may not be able to
|
|
|
|
|
| Transamerica Series Trust |
|
|
|
Semi-Annual Financial Statements 2024 |
|
|
Page 12 |
|
|
Transamerica Small/Mid Cap Value VP
NOTES TO FINANCIAL STATEMENTS (continued)
At June 30, 2024
(unaudited)
5. BORROWINGS AND OTHER FINANCING TRANSACTIONS (continued)
provide additional collateral, the Portfolio may experience delays in recovery of the loaned securities or delays in access to collateral, or the Portfolio may experience losses related to the investment collateral. To minimize certain risks, loan counterparties pledge cash, securities issued or guaranteed by the U.S. Government and irrevocable letters of credit issued by banks as collateral. The initial collateral received by the Portfolio is required to have a value of at least 102% of the current value of the loaned securities traded on U.S. exchanges, and a value of at least 105% for all other securities. Typically the lending agent is not permitted to sell, re-pledge or use cash and non-cash collateral it receives. The lending agent has agreed to indemnify the Portfolio in the case of default of any securities borrower.
The Portfolio receives compensation for lending securities from interest or dividends earned on the cash, U.S. Government securities and irrevocable letters of credit held as collateral, less associated fees and expenses. Such income is reflected in Net income from securities lending within the Statement of Operations. Cash collateral received is invested in the State Street Navigator Securities Lending Trust — Government Money Market Portfolio.
The value of loaned securities and related cash and non-cash collateral outstanding at June 30, 2024, if any, are shown on a gross basis within the Schedule of Investments.
The following table reflects a breakdown of transactions accounted for as secured borrowings, the gross obligation by the type, and the remaining contractual maturity of those transactions as of June 30, 2024.
|
|
|
|
|
|
|
|
|
|
|
| |
|
Remaining Contractual Maturity of the Agreements |
| |
|
Overnight and Continuous |
|
Less Than 30 Days |
|
Between 30 & 90 Days |
|
Greater Than 90 Days |
|
Total |
| |
| Securities Lending Transactions
Common Stocks |
|
$ 2,045,992 |
|
$ — |
|
$ — |
|
$ — |
|
$ 2,045,992 |
| |
| Total Borrowings |
|
$ 2,045,992 |
|
$ — |
|
$ — |
|
$ — |
|
$ 2,045,992 |
| |
6. RISK FACTORS
Investing in the Portfolio involves certain key risks related to the Portfolio’s trading activity. Please reference the Portfolio’s prospectus for a more complete discussion of the following risk(s), as well as other risks of investing in the Portfolio.
Market risk: The market prices of the Portfolio’s securities or other assets may go up or down, sometimes rapidly or unpredictably, due to factors such as economic events, inflation, changes in interest rates, governmental actions or interventions, actions taken by the U.S. Federal Reserve or foreign central banks, market disruptions caused by tariffs, trade disputes or other factors, political developments, armed conflicts, economic sanctions, cybersecurity events, investor sentiment, the global and domestic effects of widespread or local health, weather or climate events, and other factors that may or may not be related to the issuer of the security or other asset. If the market prices of the Portfolio’s securities and assets fall, the value of your investment in the Portfolio could go down.
Economies and financial markets throughout the world are increasingly interconnected. Events or circumstances in one or more countries or regions could be highly disruptive to, and have profound impacts on, global economies or markets. As a result, whether or not the Portfolio invests in securities of issuers located in or with significant exposure to the countries directly affected, the value and liquidity of the Portfolio’s investments may go down.
Real estate investment trusts (“REITs”) risk: Investing in real estate investment trusts (“REITs”) involves unique risks. When the Portfolio invests in REITs, it is subject to risks generally associated with investing in real estate. A REIT’s performance depends on the types and locations of the properties it owns, how well it manages those properties and cash flow. REITs may have limited financial resources, may trade less frequently and in limited volume, may engage in dilutive offerings, and may be subject to more abrupt or erratic price movements than the overall securities markets. In addition to its own expenses, the Portfolio will indirectly bear its proportionate share of any management and other expenses paid by REITs in which it invests. U.S. REITs are subject to a number of highly technical tax-related rules and requirements; and a U.S. REIT’s failure to qualify for the favorable U.S. federal income tax treatment generally available to U.S. REITs could result in corporate-level taxation, significantly reducing the return on an investment to the Portfolio.
Small capitalization companies risk: The Portfolio will be exposed to additional risks as a result of its investments in the securities of small capitalization companies. Small capitalization companies may be more at risk than larger capitalization companies because, among
|
|
|
|
|
| Transamerica Series Trust |
|
|
|
Semi-Annual Financial Statements 2024 |
|
|
Page 13 |
|
|
Transamerica Small/Mid Cap Value VP
NOTES TO FINANCIAL STATEMENTS (continued)
At June 30, 2024
(unaudited)
6. RISK FACTORS (continued)
other things, they may have limited product lines, operating history, market or financial resources, or because they may depend on limited management groups. Securities of small capitalization companies are generally more volatile than and may underperform larger capitalization companies, may be harder to sell at times and at prices the Portfolio managers believe appropriate and may offer greater potential for losses.
Value investing risk: The prices of securities the sub-adviser believes are undervalued may not appreciate as anticipated or may go down. The value approach to investing involves the risk that stocks may remain undervalued, undervaluation may become more severe, or perceived undervaluation may actually represent intrinsic value. Value stocks as a group may be out of favor and underperform the overall equity market for a long period of time, for example, while the market favors “growth” stocks.
7. FEES AND OTHER AFFILIATED TRANSACTIONS
TST serves as a funding vehicle for certain affiliated asset allocation portfolios and certain affiliated separate accounts of Transamerica Life Insurance Company (“TLIC”) and Transamerica Financial Life Insurance Company.
TAM, the Portfolio’s investment manager, is directly owned by TLIC and AUSA Holding, LLC (“AUSA”), both of which are indirect, wholly owned subsidiaries of Aegon Ltd. TLIC is owned by Commonwealth General Corporation (“Commonwealth”). Commonwealth and AUSA are wholly owned by Transamerica Corporation (DE). Transamerica Corporation (DE) is wholly owned by Aegon International B.V., which is wholly owned by Aegon Ltd., a Bermuda exempted company with liability limited by shares (formerly, Aegon NV, a Netherlands corporation) and a publicly traded international insurance group.
Transamerica Fund Services, Inc. (“TFS”) is the Portfolio’s transfer agent. Transamerica Capital, Inc. (“TCI”) is the Portfolio’s distributor/principal underwriter. TAM, TFS and TCI are affiliates of Aegon Ltd.
Certain officers and trustees of the Portfolio may also be officers and/or trustees of TAM, TFS and TCI. No interested trustee who is deemed an interested person due to current or former service with TAM or an affiliate of TAM receives compensation from the Portfolio. The Portfolio does pay non-interested persons (independent trustees), as disclosed in Trustee and CCO fees within the Statement of Operations.
Investment management fees: TAM serves as the Portfolio’s investment manager, performing administration as well as investment advisory services. TAM renders investment advisory, supervisory, and administration services under an investment management agreement and the Portfolio pays a single management fee, which is reflected in Investment management fees within the Statement of Operations.
|
|
|
|
|
| Transamerica Series Trust |
|
|
|
Semi-Annual Financial Statements 2024 |
|
|
Page 14 |
|
|
Transamerica Small/Mid Cap Value VP
NOTES TO FINANCIAL STATEMENTS (continued)
At June 30, 2024
(unaudited)
7. FEES AND OTHER AFFILIATED TRANSACTIONS (continued)
The Portfolio pays a management fee to TAM based on daily average net assets at the following rates:
|
|
|
|
|
| Breakpoints |
|
Rate |
| Effective May 1, 2024 |
|
|
|
|
| First $100 million |
|
|
0.775 |
% |
| Over $100 million up to $350 million |
|
|
0.755 |
|
| Over $350 million up to $500 million |
|
|
0.735 |
|
| Over $500 million up to $750 million |
|
|
0.725 |
|
| Over $750 million up to $1 billion |
|
|
0.715 |
|
| Over $1 billion up to $1.5 billion |
|
|
0.690 |
|
| Over $1.5 billion up to $2 billion |
|
|
0.680 |
|
| Over $2 billion |
|
|
0.670 |
|
| Prior to May 1, 2024 |
|
|
|
|
| First $100 million |
|
|
0.790 |
|
| Over $100 million up to $350 million |
|
|
0.780 |
|
| Over $350 million up to $500 million |
|
|
0.770 |
|
| Over $500 million up to $750 million |
|
|
0.750 |
|
| Over $750 million up to $1 billion |
|
|
0.745 |
|
| Over $1 billion up to $1.5 billion |
|
|
0.690 |
|
| Over $1.5 billion up to $2 billion |
|
|
0.680 |
|
| Over $2 billion |
|
|
0.670 |
|
TAM has contractually agreed to waive fees and/or reimburse Portfolio expenses to the extent that the total operating expenses excluding, as applicable, acquired fund fees and expenses, interest (including borrowing costs and overdraft charges), taxes, brokerage commissions, dividend and interest expenses on securities sold short, extraordinary expenses and other expenses not incurred in the ordinary course of the Portfolio’s business, exceed the following stated annual operating expense limits to the Portfolio’s daily average net assets. To the extent an expense limit changed during the period, the prior limit is also listed below. The expenses waived and/or reimbursed, if any, are included in Expenses waived and/or reimbursed within the Statement of Operations.
|
|
|
|
|
| Class |
|
Operating Expense Limit |
|
Operating Expense Limit Effective Through |
| |
| Effective May 1, 2024 |
|
|
|
|
| Initial Class |
|
0.83% |
|
May 1, 2025 |
| Service Class |
|
1.08 |
|
May 1, 2025 |
| Prior to May 1, 2024 |
|
|
|
|
| Initial Class |
|
0.88 |
|
|
| Service Class |
|
1.13 |
|
|
TAM is permitted to recapture amounts contractually waived and/or reimbursed to a class during any of the 36 months from the date on which TAM waived fees and/or reimbursed expenses for the class. A class may recapture and reimburse TAM only if such amount does not cause, on any particular business day of the Portfolio, the class’s total annual operating expenses (after the recapture is taken into account) to exceed the Operating Expense Limits or any other lower limit then in effect. Amounts recaptured, if any, by TAM for the period ended June 30, 2024 are disclosed in Recapture of previously waived and/or reimbursed fees within the Statement of Operations.
TAM, on a voluntary basis and in addition to the contractual operating expense limits in effect, from time to time may waive and/or reimburse expenses of the Portfolio, or any classes thereof, to such level(s) as the Trust’s officers have determined or may reasonably determine from time to time. Any such voluntary waiver or expense reimbursement may be discontinued by TAM at any time. These amounts are not subject to recapture by TAM.
As of June 30, 2024, there are no amounts available for recapture by TAM.
|
|
|
|
|
| Transamerica Series Trust |
|
|
|
Semi-Annual Financial Statements 2024 |
|
|
Page 15 |
|
|
Transamerica Small/Mid Cap Value VP
NOTES TO FINANCIAL STATEMENTS (continued)
At June 30, 2024
(unaudited)
7. FEES AND OTHER AFFILIATED TRANSACTIONS (continued)
Distribution and service fees: TST has a distribution plan (“Distribution Plan”) pursuant to Rule 12b-1 under the 1940 Act. Pursuant to the Distribution Plan, TST entered into a distribution agreement with TCI as the Portfolio’s distributor.
The Distribution Plan requires the Portfolio to pay distribution fees to TCI as compensation for various distribution activities, not as reimbursement for specific expenses. Under the Distribution Plan and distribution agreement, TCI, on behalf of the Portfolio, is authorized to pay various service providers, as direct payment for expenses incurred in connection with distribution of the Portfolio’s shares.
The fee on the Service Class shares is paid to the insurance companies for providing services and account maintenance for the policyholders who invest in the variable insurance products which invest in the Service Class shares. TCI has determined that it will not seek payment for the distribution expenses incurred by the Portfolio with respect to the Initial Class shares before May 1, 2025. Prior to TCI seeking distribution expenses on Initial Class shares, policy and contract owners will be notified in advance. The Portfolio will pay fees relating to Service Class shares. The distribution and service fees are included in Distribution and service fees within the Statement of Operations.
The Portfolio is authorized under the Distribution Plan to pay fees to TCI based on daily average net assets of each applicable class up to the following annual rates:
|
|
|
|
|
| Class |
|
Rate |
| Initial Class |
|
|
0.15 |
% |
| Service Class |
|
|
0.25 |
|
Transfer agent costs: TFS provides transfer agency services under an intercompany agreement with TAM. TFS has outsourced the provision of certain sub-transfer agency services to SS&C Global Investor & Distribution Solutions, Inc. (“SS&C GIDS”). The Portfolio does not pay a separate transfer agent fee to TAM or TFS but does pay certain expenses to SS&C GIDS related to applicable sub-transfer agency services. For the period ended June 30, 2024, (i) the expenses paid to SS&C GIDS by the Portfolio are referred to as transfer agent costs and are included within the Statement of Operations and (ii) the expenses payable to SS&C GIDS by the Portfolio are referred to as transfer agent costs within the Statement of Assets and Liabilities.
Brokerage commissions: The Portfolio incurred no brokerage commissions on security transactions placed with affiliates of the investment manager or sub-adviser(s) for the period ended June 30, 2024.
8. PURCHASES AND SALES OF SECURITIES
For the period ended June 30, 2024, the cost of securities purchased and proceeds from securities sold (excluding short-term securities) are as follows:
|
|
|
|
|
|
|
| Purchases of Securities |
|
Sales/Maturities of Securities |
| Long-Term |
|
U.S. Government |
|
Long-Term |
|
U.S. Government |
| |
| $ 133,789,129 |
|
$ — |
|
$ 156,238,856 |
|
$ — |
9. FEDERAL INCOME TAXES AND DISTRIBUTIONS TO SHAREHOLDERS
The Portfolio has not made any provision for federal income or excise taxes due to its policy to distribute all of its taxable income and capital gains to its shareholders and otherwise qualify as a regulated investment company under Subchapter M of the Internal Revenue Code. The Portfolio recognizes the tax benefits of uncertain tax positions only where the position is “more likely than not” to be sustained assuming examination by tax authorities. The Portfolio’s tax returns remain subject to examination by the Internal Revenue Service and state tax authorities three years from the date of filing for federal purposes and four years from the date of filing for state purposes. Management has evaluated the Portfolio’s tax provisions taken for all open tax years, and has concluded that no provision for income tax is required in the Portfolio’s financial statements. If applicable, the Portfolio recognizes interest accrued related to unrecognized tax benefits in relation to interest and penalties expense in Other within the Statement of Operations. The Portfolio identifies its major tax jurisdictions as U.S. Federal, the state of Colorado, and foreign jurisdictions where the Portfolio makes significant investments; however,
|
|
|
|
|
| Transamerica Series Trust |
|
|
|
Semi-Annual Financial Statements 2024 |
|
|
Page 16 |
|
|
Transamerica Small/Mid Cap Value VP
NOTES TO FINANCIAL STATEMENTS (continued)
At June 30, 2024
(unaudited)
9. FEDERAL INCOME TAXES AND DISTRIBUTIONS TO SHAREHOLDERS (continued)
the Portfolio is not aware of any tax positions for which it is reasonably possible that the total amounts of unrecognized tax benefits will change materially in the next twelve months. Distributions are determined in accordance with income tax regulations, which may differ from GAAP.
As of June 30, 2024, the approximate cost for U.S. federal income tax purposes, and the aggregate gross/net unrealized appreciation (depreciation) in the value of investments (including securities sold short and derivatives, if any) are as follows:
|
|
|
|
|
|
|
| Cost |
|
Gross Appreciation |
|
Gross (Depreciation) |
|
Net Appreciation (Depreciation) |
| $ 464,639,216 |
|
$ 97,448,646 |
|
$ (37,201,762) |
|
$ 60,246,884 |
10. NEW ACCOUNTING PRONOUNCEMENT
In June 2022, the Financial Accounting Standards Board issued Accounting Standards Update No. 2022-03 (“ASU 2022-03”), “Fair Value Measurement of Equity Securities Subject to Contractual Sale Restrictions” (“Topic 820”). ASU 2022-03 clarifies the guidance in Topic 820, related to the measurement of the fair value of an equity security subject to contractual sale restrictions, where it eliminates the need to apply a discount to fair value of these securities, and introduces disclosure requirements related to such equity securities. The guidance is effective for fiscal years, and interim periods within those fiscal years, beginning after December 15, 2023, and allows for early adoption. Management is currently evaluating the implications, if any, of the additional requirements and their impact on the Portfolio’s financial statements.
Please see TST’s most recent report on Form N-CSR, available at: www.transamerica.com/annuities/prospectus, for additional information. For the most recently filed complete proxy voting records for the Trust please visit: https://www.transamerica.com/sites/default/files/files/e070d/TST%20N-PX%202021.pdf
|
|
|
|
|
| Transamerica Series Trust |
|
|
|
Semi-Annual Financial Statements 2024 |
|
|
Page 17 |
|
|
Transamerica Small/Mid Cap Value VP
MANAGEMENT AND SUB-ADVISORY AGREEMENTS — CONTRACT RENEWAL
(unaudited)
At a meeting of the Board of Trustees of Transamerica Series Trust (the “Trustees” or the “Board”) held on June 12-13, 2024, the Board considered the renewal of the management agreement (the “Management Agreement”) between Transamerica Asset Management, Inc. (“TAM”) and Transamerica Series Trust, on behalf of Transamerica Small/Mid Cap Value VP (the “Portfolio”). The Board also considered the renewal of the investment sub-advisory agreements (each a “Sub-Advisory Agreement,” collectively the “Sub-Advisory Agreements” and together with the Management Agreement, the “Agreements”) for the Portfolio between TAM and each of Systematic Financial Management, L.P. (“Systematic”) and Thompson, Siegel & Walmsley LLC (“TSW”) (each a “Sub-Adviser” and collectively the “Sub-Advisers”).
Following its review and consideration, the Board determined that the terms of the Management Agreement and each Sub-Advisory Agreement were reasonable and that the renewal of each of the Agreements was in the best interests of the Portfolio and the holders invested in the Portfolio. The Board, including the independent members of the Board (the “Independent Trustees”), unanimously approved the renewal of each of the Agreements through June 30, 2025.
Prior to reaching their decision, the Trustees requested and received from TAM and each Sub-Adviser certain information. They then reviewed such information as they deemed reasonably necessary to evaluate the Agreements, including information they had previously received from TAM and each Sub-Adviser as part of their regular oversight of the Portfolio, and knowledge they gained over time through meeting with TAM and each Sub-Adviser. Among other materials, the Trustees considered comparative fee, expense and performance information prepared by Broadridge Financial Solutions, Inc. (“Broadridge”), an independent provider of mutual fund performance information, as well as fee, expense and profitability information prepared by TAM. To the extent applicable, the Trustees considered information about fees and performance of comparable funds and/or accounts managed by each Sub-Adviser. The Board also considered reductions to the Portfolio’s expense limits, if any, that took effect after the last renewal of the Agreements. In their review, the Trustees also sought to identify instances in which the Portfolio’s performance, fees, total expenses and/or profitability appeared to be outliers within its respective peer group or other comparative metrics and sought to understand the reasons for such comparative positions.
In their deliberations, the Independent Trustees met privately without representatives of TAM or any Sub-Adviser present and were represented throughout the process by their independent legal counsel. In considering the proposed continuation of each of the Agreements, the Trustees evaluated and weighed a number of considerations that they believed to be relevant in light of the legal advice furnished to them by counsel, including independent legal counsel, and made a decision in the exercise of their own business judgment. They based their decisions on the considerations discussed below, among others, although they did not identify any particular consideration or item of information that was controlling of their decisions, and each Trustee may have attributed different weights to the various factors.
Nature, Extent and Quality of the Services Provided
The Board considered the nature, extent and quality of the services provided by TAM and each Sub-Adviser to the Portfolio in the past and the services anticipated to be provided in the future. The Board also considered the investment approach for the Portfolio; the experience, capability and integrity of TAM’s senior management; the financial resources of TAM; TAM’s management oversight process; TAM’s and each Sub-Adviser’s responsiveness to any questions by the Trustees; and the professional qualifications and compensation program of the portfolio management team of each Sub-Adviser. The Trustees noted that they receive, on a quarterly basis, an execution analysis from Capital Institutional Services, Inc. (CAPIS), an independent provider of trade analyses, for each Sub-Adviser and a comparison of trading results against a peer universe of managers.
The Board also considered the continuous and regular investment management and other services provided by TAM, when acting as a manager of managers, for the portion of the management fee it retains from the Portfolio after payment of the sub-advisory fees. The Board noted that the investment management and other services provided by TAM include the design, development and ongoing review and evaluation of the Portfolio and its investment strategy; the selection, oversight and monitoring of one or more investment sub-advisers to perform certain duties with respect to the Portfolio; ongoing portfolio trading oversight and analysis; risk management oversight and analysis; design, development, implementation and ongoing review and evaluation of a process for the valuation of Portfolio investments; design, development, implementation and ongoing review and evaluation of a compliance program for the Portfolio; design, development, implementation and ongoing review and evaluation of a process for the voting of proxies and exercise of rights to consent to corporate action for Portfolio investments; participation in Board meetings and oversight of preparation of materials for the Board, including materials for Board meetings and regular communications with the Board; oversight of preparation of the Portfolio’s prospectus, statement of additional information, shareholder reports and other disclosure materials and regulatory filings for the Portfolio; and ongoing cash management services for the Portfolio. The Board considered that TAM’s investment management services also include the provision of supervisory and administrative services to the Portfolio. The Board also noted that TAM, as part of the services it provides to all Transamerica mutual funds, including the Portfolio, oversees the services provided by the funds’ custodian, transfer agent, independent accountant and legal counsel and supervises the performance of the recordkeeping and holder service functions of the funds.
Investment Performance
In addition, the Board considered the short- and longer-term performance of the Portfolio in light of its investment objective, policies and strategies, including relative performance against (i) a peer universe of comparable mutual funds, as prepared by Broadridge, and (ii) the Portfolio’s benchmarks, in each case for various trailing periods ended December 31, 2023. Based on these considerations, the Board
|
|
|
|
|
| Transamerica Series Trust |
|
|
|
Semi-Annual Financial Statements 2024 |
|
|
Page 18 |
|
|
Transamerica Small/Mid Cap Value VP
MANAGEMENT AND SUB-ADVISORY AGREEMENTS — CONTRACT RENEWAL (continued)
(unaudited)
determined that TAM and each Sub-Adviser can provide investment and related services that are appropriate in scope and extent in light of the Portfolio’s investment objectives, policies and strategies and operations, the competitive landscape of the investment company business and investor needs. The Board’s conclusions as to the Portfolio’s performance are summarized below. For purposes of its review, the Board generally used the performance of Service Class Shares. In describing the Portfolio’s performance relative to its peer universe, the summary conclusions characterize performance for the relevant periods in relation to whether it was “above,” “below” or “in line with” the peer universe median and do so using quintile rankings prepared by Broadridge. For simplicity, performance is described as “above” the median if the Portfolio’s performance ranked anywhere in the first or second quintiles, as “below” the median if it ranked anywhere in the fourth or fifth quintiles, or “in line with” the median if it ranked anywhere in the third quintile (i.e., even if its precise return was somewhat above or somewhat below the precise median return).
When considering the Portfolio’s performance, the Trustees considered any representations made by TAM regarding the appropriateness of certain peer groups and benchmarks. They recognized that performance reflects a snapshot of a period as of a specific date, and that consideration of performance data for a different period could generate significantly different performance results. The Trustees also recognized that even longer-term performance can be negatively affected by performance over a short-term period when that short-term performance is significantly below the performance of the comparable benchmark or universe of peer funds.
The Board noted that the performance of Service Class Shares of the Portfolio was above the median for its peer universe for the past 1-year period and below the median for the past 3-, 5- and 10-year periods. The Board also noted that the performance of Service Class Shares of the Portfolio was above the benchmark that TAM utilizes to measure performance of the Portfolio for the past 3-, 5- and 10-year periods and below the benchmark for the past 1-year period. The Board noted that TSW had commenced sub-advising the Portfolio’s mid-cap sleeve and Systematic had continued sub-advising the Portfolio’s small-cap sleeve on December 4, 2016 pursuant to the Portfolio’s current investment strategies.
Management Fee and Sub-Advisory Fees and Total Expense Ratio
The Board considered the management fee and total expense ratio of the Portfolio, including information provided by Broadridge comparing the management fee and total expense ratio of the Portfolio to the management fees and total expense ratios of comparable investment companies in both a peer group and broader peer universe compiled by Broadridge. The Board’s conclusions as to the Portfolio’s management fee and total expense ratio are summarized below. For purposes of its review, the Board generally used the actual total expenses (i.e., expenses reflecting any waivers and/or reimbursements) of Service Class Shares. In describing the Portfolio’s management fee and total expense ratio relative to its peer group and peer universe, the summary conclusions characterize management fees and total expense ratios for the relevant periods in relation to whether they were “above,” “below” or “in line with” the peer group or peer universe median and do so using quintile rankings prepared by Broadridge. For simplicity, management fees and total expense ratios are described as “above” the median if the Portfolio’s management fee or total expense ratio ranked anywhere in the fourth or fifth quintiles, as “below” the median if it ranked anywhere in the first or second quintiles, or “in line with” the median if it ranked anywhere in the third quintile (i.e., even if its precise management fee or total expense ratio was somewhat above or somewhat below the precise median management fee or total expense ratio). The Board also considered the fees charged by the Sub-Advisers for sub-advisory services, as well as the portion of the Portfolio’s management fee retained by TAM following payment of the sub-advisory fees and how the portion of the contractual management fee retained by TAM at a specified asset level compared to the portions retained by other investment advisers managing mutual funds with similar investment strategies as calculated by an independent provider of information.
The Board noted that the Portfolio’s contractual management fee and the actual total expenses (i.e., expenses reflecting any waivers and/or reimbursements) of Service Class Shares of the Portfolio were in line with the medians for its peer group and peer universe. The Trustees also considered that TAM has entered into an expense limitation arrangement with the Portfolio, which may result in TAM waiving fees for the benefit of holders.
On the basis of these considerations, together with the other information it considered, the Board determined that the management and sub-advisory fees to be received by TAM and the Sub-Advisers under the Management Agreement and each Sub-Advisory Agreement are reasonable in light of the services provided.
Cost of Services Provided and Level of Profitability
The Board reviewed information provided by TAM about the cost of providing and procuring fund management services, as well as the costs of the provision of administration, transfer agency and other services, to the Portfolio and to Transamerica Series Trust as a whole by TAM and its affiliates. The Board considered the profitability of TAM and its affiliates in providing these services for the Portfolio and Transamerica Series Trust as a whole. The Trustees recognized the competitiveness of the mutual fund industry and the importance of an investment adviser’s long-term profitability, including for maintaining company and management stability and accountability.
The Board also considered the allocation methodology used for calculating the profitability of TAM and its affiliates. The Board noted that the revenue and expense allocation methodology used by TAM to estimate its profitability with respect to its relationship with the Portfolio had been reviewed previously by an independent consultant. The Trustees considered that TAM reported that it had not made material changes to this methodology, and that the methodology had been applied consistently for the Portfolio.
|
|
|
|
|
| Transamerica Series Trust |
|
|
|
Semi-Annual Financial Statements 2024 |
|
|
Page 19 |
|
|
Transamerica Small/Mid Cap Value VP
MANAGEMENT AND SUB-ADVISORY AGREEMENTS — CONTRACT RENEWAL (continued)
(unaudited)
With respect to the Sub-Advisers, the Board noted that the sub-advisory fees are the product of arm’s-length negotiation between TAM and the applicable Sub-Adviser, which is not affiliated with TAM, and are paid by TAM and not the Portfolio. As a result, the Board focused on the profitability of TAM and its affiliates with respect to the Portfolio.
Based on this information, the Board determined that the profitability of TAM and its affiliates from their relationships with the Portfolio was not excessive.
Economies of Scale
The Board considered economies of scale with respect to the management of the Portfolio, whether the Portfolio had appropriately benefited from any economies of scale and whether there was the potential for realization of any future economies of scale. The Board also considered the existence of economies of scale with respect to management of the Transamerica mutual funds overall and the extent to which the Portfolio benefited from any economies of scale. The Board recognized that, as the Portfolio’s assets increase, any economies of scale realized by TAM or a Sub-Adviser may not directly correlate with each other or with any economies of scale that might be realized by the Portfolio. The Board considered the Portfolio’s management fee schedule and the existence of breakpoints and also considered the extent to which TAM shared economies of scale, if any, with the Portfolio through undertakings to limit or reimburse Portfolio expenses and to invest in maintaining and developing its capabilities and services. The Board also considered each Sub-Adviser’s sub-advisory fee schedule and the existence of breakpoints, if any, and how such breakpoints relate to any breakpoints in the Portfolio’s management fee schedule. The Board considered that each Sub-Adviser’s sub-advisory fees would be based on the combined assets of multiple funds. The Trustees concluded that the Portfolio’s fee structure reflected an appropriate sharing of any efficiencies or economies of scale to date and noted that they will have the opportunity to periodically reexamine the appropriateness of the management fee payable to TAM and the fees paid to the Sub-Advisers in light of any economies of scale experienced in the future.
Benefits to TAM, its Affiliates and/or the Sub-Advisers from their Relationships with the Portfolio
The Board considered other benefits derived by TAM, its affiliates, and/or the Sub-Advisers from their relationships with the Portfolio. The Board noted that TAM does not receive benefits from research obtained with commissions paid to broker-dealers for portfolio transactions (commonly referred to as “soft dollars”) as a result of its relationship with the Portfolio and that TAM believes the use of soft dollars by the Sub-Advisers is generally appropriate and in the best interests of the Portfolio. The Board also noted that Sub-Advisers participate in a brokerage program pursuant to which a portion of brokerage commissions paid by the Portfolio is recaptured for the benefit of the Portfolio and the holders, thus limiting the amount of soft dollar arrangements the Sub-Advisers may engage in with respect to the Portfolio’s brokerage transactions.
Other Considerations
The Board noted that TAM has made a substantial commitment to the recruitment and retention of high-quality personnel and maintains the financial, compliance and operational resources reasonably necessary to manage the Portfolio in a professional manner that is consistent with the best interests of the Portfolio and the holders. In this regard, the Board favorably considered the procedures and policies TAM has in place to enforce compliance with applicable laws and regulations and oversee the portfolio management activities of the Sub-Advisers. The Board also noted that TAM has made an entrepreneurial commitment and undertaken certain business risks with respect to the management and success of the Portfolio.
Conclusion
After consideration of the factors described above, as well as other factors, the Trustees, including the Independent Trustees, concluded that the renewal of the Management Agreement and each Sub-Advisory Agreement was in the best interests of the Portfolio and the holders and voted to approve the renewal of the Agreements.
|
|
|
|
|
| Transamerica Series Trust |
|
|
|
Semi-Annual Financial Statements 2024 |
|
|
Page 20 |
|
|
PROXY VOTING POLICIES AND PROCEDURES AND QUARTERLY PORTFOLIO HOLDINGS
(unaudited)
A description of Transamerica Series Trust’s (the “Trust”) proxy voting policies and procedures is available in the Statement of Additional Information of the Portfolios, available without charge upon request by calling 1-800-851-9777 (toll free) or on the Securities and Exchange Commission’s (“SEC”) website at http://www.sec.gov.
In addition, the Portfolio is required to file Form N-PX, with their complete proxy voting records for the most recent 12 months ended June 30th, no later than August 31st of each year. The Form is available without charge: (1) on the Transamerica Funds website at https://www.transamerica.com/sites/default/files/files/e070d/TST%20N-PX%202021.pdf; and (2) on the SEC’s website at http://www.sec.gov.
Each fiscal quarter, the Portfolios, except Transamerica BlackRock Government Money Market VP, will file with the SEC a complete schedule of its monthly portfolio holdings on Form N-PORT. The Portfolios’ holdings as of the end of the third month of every fiscal quarter, as reported on Form N-PORT, will be publicly available on the SEC’s website at http://www.sec.gov within 60 days of the end of the fiscal quarter.
On a monthly basis, Transamerica BlackRock Government Money Market VP will file with the SEC portfolio holdings information on Form N-MFP3. A complete schedule of portfolio holdings is also available at www.transamerica.com.
You may also visit the Trust’s website at www.transamerica.com/annuities/prospectus for this and other information about the Portfolios and the Trust.
Important Notice Regarding Delivery of Shareholder Documents
Every year we provide shareholders informative materials such as the Transamerica Series Trust Annual Report, the Transamerica Series Trust Prospectus, and other required documents that keep you informed regarding your Portfolios. To the extent provided by mail, Transamerica Series Trust will only send one piece per mailing address, a method that saves your Portfolios money by reducing mailing and printing costs. We will continue to do this unless you tell us not to. To elect to receive individual mailings, simply call a Transamerica Customer Service Representative toll free at 1-800-851-9777, 8 a.m. to 7 p.m. Eastern Time, Monday-Friday. Your request will take effect within 30 days.
|
|
|
| Transamerica Series Trust |
|
Semi-Annual Financial Statements 2024 |
Page 21
NOTICE OF PRIVACY POLICY
(unaudited)
Your privacy is very important to us. We want you to understand what information we collect and how we use it. We collect and use “nonpublic personal information” in connection with providing our customers with a broad range of financial products and services as effectively and conveniently as possible. We treat nonpublic personal information in accordance with our Privacy Policy.
What Information We Collect and From Whom We Collect It
We may collect nonpublic personal information about you from the following sources:
| • |
|
Information we receive from you on applications or other forms, such as your name, address, and account number; |
| • |
|
Information about your transactions with us, our affiliates, or others, such as your account balance and purchase/redemption history; and |
| • |
|
Information we receive from non-affiliated third parties, including consumer reporting agencies. |
What Information We Disclose and To Whom We Disclose It
We do not disclose any nonpublic personal information about current or former customers to anyone without their express consent, except as permitted by law. We may disclose the nonpublic personal information we collect, as described above, to persons or companies that perform services on our behalf and to other financial institutions with which we have joint marketing agreements. We will require these companies to protect the confidentiality of your nonpublic personal information and to use it only to perform the services for which we have hired them.
Our Security Procedures
We restrict access to your nonpublic personal information and only allow disclosures to persons and companies as permitted by law to assist in providing products or services to you. We maintain physical, electronic, and procedural safeguards to protect your nonpublic personal information and to safeguard the disposal of certain consumer information.
Contact Us
If you have any questions about our Privacy Policy, please call 1-800-851-9777 on any business day between 8 a.m. and 7 p.m. Eastern Time.
Note: This Privacy Policy applies only to customers that have a direct relationship with us or our affiliates. If you own shares of our portfolios in the name of a third party such as a bank or broker-dealer, its privacy policy may apply to you instead of ours.
|
|
|
|
|
| Transamerica Series Trust |
|
|
|
Semi-Annual Financial Statements 2024 |
|
|
Page 22 |
|
|
PO Box 219945
Kansas City, MO 64121-9945
|
|
|
| Distributor: |
|
Transamerica Capital, Inc. PO Box 219945 Kansas City, MO 64121-9945 Customer Service: 1-800-851-9777 |
Transamerica Series Trust Semi-Annual Financial Statements
June 30, 2024
1801 California St., Suite 5200
Denver, CO 80202
Distributor: Transamerica Capital, Inc.
Customer Service: 1-800-851-9777
The following pages contain the most recent semi-annual financial statements for the investment options in which you are invested. In compliance with Securities and Exchange Commission regulations, we present these reports on an annual and semi-annual basis with the hope that they will foster greater understanding of the investment options’ holdings, performance, financial data, accounting policies and other issues. This streamlined version provides information only on the investment options in which you are invested.
If you have any questions about these reports, please do not hesitate to contact your financial professional. As always, we thank you for your trust and the opportunity to serve you.
Transamerica T. Rowe Price Small Cap VP
SCHEDULE OF INVESTMENTS
At June 30, 2024
(unaudited)
|
|
|
|
|
|
|
|
|
| |
|
Shares |
|
|
Value |
|
| COMMON STOCKS - 99.3% |
|
| Aerospace & Defense - 2.7% |
|
| Cadre Holdings, Inc. |
|
|
29,203 |
|
|
|
$ 980,053 |
|
| Curtiss-Wright Corp. |
|
|
24,597 |
|
|
|
6,665,295 |
|
| Leonardo DRS, Inc. (A) |
|
|
138,818 |
|
|
|
3,541,247 |
|
| Loar Holdings, Inc. (A) |
|
|
10,054 |
|
|
|
536,984 |
|
| Moog, Inc., Class A |
|
|
3,771 |
|
|
|
630,889 |
|
| Woodward, Inc. |
|
|
30,956 |
|
|
|
5,398,107 |
|
|
|
|
|
|
|
|
|
|
|
|
|
|
|
|
|
17,752,575 |
|
|
|
|
|
|
|
|
|
|
| Air Freight & Logistics - 0.4% |
|
| GXO Logistics, Inc. (A) |
|
|
45,696 |
|
|
|
2,307,648 |
|
|
|
|
|
|
|
|
|
|
| Automobile Components - 0.4% |
|
| Patrick Industries, Inc. |
|
|
16,891 |
|
|
|
1,833,518 |
|
| Visteon Corp. (A) |
|
|
7,228 |
|
|
|
771,228 |
|
|
|
|
|
|
|
|
|
|
|
|
|
|
|
|
|
2,604,746 |
|
|
|
|
|
|
|
|
|
|
| Banks - 0.4% |
|
| Bancorp, Inc. (A) |
|
|
47,174 |
|
|
|
1,781,290 |
|
| ServisFirst Bancshares, Inc. |
|
|
16,349 |
|
|
|
1,033,094 |
|
|
|
|
|
|
|
|
|
|
|
|
|
|
|
|
|
2,814,384 |
|
|
|
|
|
|
|
|
|
|
| Beverages - 0.9% |
|
| Celsius Holdings, Inc. (A) |
|
|
21,162 |
|
|
|
1,208,139 |
|
| Coca-Cola Consolidated, Inc. |
|
|
4,037 |
|
|
|
4,380,145 |
|
|
|
|
|
|
|
|
|
|
|
|
|
|
|
|
|
5,588,284 |
|
|
|
|
|
|
|
|
|
|
| Biotechnology - 10.2% |
|
| ACADIA Pharmaceuticals, Inc. (A) |
|
|
25,452 |
|
|
|
413,595 |
|
| ADMA Biologics, Inc. (A) |
|
|
120,600 |
|
|
|
1,348,308 |
|
| Agios Pharmaceuticals, Inc. (A) |
|
|
27,085 |
|
|
|
1,167,905 |
|
| Akero Therapeutics, Inc. (A) |
|
|
24,238 |
|
|
|
568,623 |
|
| Alkermes PLC (A) |
|
|
66,601 |
|
|
|
1,605,084 |
|
| Amicus Therapeutics, Inc. (A) |
|
|
68,646 |
|
|
|
680,968 |
|
| Arcellx, Inc. (A) |
|
|
15,000 |
|
|
|
827,850 |
|
| Avidity Biosciences, Inc. (A) |
|
|
74,079 |
|
|
|
3,026,127 |
|
| Biohaven Ltd. (A) |
|
|
57,869 |
|
|
|
2,008,633 |
|
| Blueprint Medicines Corp. (A) |
|
|
36,332 |
|
|
|
3,915,863 |
|
| Bridgebio Pharma, Inc. (A) |
|
|
45,785 |
|
|
|
1,159,734 |
|
| Catalyst Pharmaceuticals, Inc. (A) |
|
|
73,585 |
|
|
|
1,139,832 |
|
| Celldex Therapeutics, Inc. (A) |
|
|
23,479 |
|
|
|
868,958 |
|
| Crinetics Pharmaceuticals, Inc. (A) |
|
|
42,717 |
|
|
|
1,913,294 |
|
| CRISPR Therapeutics AG (A)(B) |
|
|
26,532 |
|
|
|
1,432,993 |
|
| Cytokinetics, Inc. (A) |
|
|
40,576 |
|
|
|
2,198,408 |
|
| Day One Biopharmaceuticals, Inc. (A) |
|
|
20,533 |
|
|
|
282,945 |
|
| Denali Therapeutics, Inc. (A) |
|
|
46,043 |
|
|
|
1,069,118 |
|
| Disc Medicine, Inc. (A) |
|
|
7,283 |
|
|
|
328,245 |
|
| Dyne Therapeutics, Inc. (A) |
|
|
25,500 |
|
|
|
899,895 |
|
| Exelixis, Inc. (A) |
|
|
106,275 |
|
|
|
2,387,999 |
|
| Halozyme Therapeutics, Inc. (A) |
|
|
73,616 |
|
|
|
3,854,534 |
|
| Ideaya Biosciences, Inc. (A) |
|
|
27,101 |
|
|
|
951,516 |
|
| IGM Biosciences, Inc. (A)(B) |
|
|
13,760 |
|
|
|
94,531 |
|
| Immunovant, Inc. (A) |
|
|
14,081 |
|
|
|
371,738 |
|
| Insmed, Inc. (A) |
|
|
96,332 |
|
|
|
6,454,244 |
|
| Intellia Therapeutics, Inc. (A) |
|
|
24,333 |
|
|
|
544,573 |
|
| Ionis Pharmaceuticals, Inc. (A) |
|
|
40,788 |
|
|
|
1,943,956 |
|
| Iovance Biotherapeutics, Inc. (A) |
|
|
70,244 |
|
|
|
563,357 |
|
| Janux Therapeutics, Inc. (A) |
|
|
4,100 |
|
|
|
171,749 |
|
| Krystal Biotech, Inc. (A) |
|
|
9,063 |
|
|
|
1,664,329 |
|
|
|
|
|
|
|
|
|
|
| |
|
Shares |
|
|
Value |
|
| COMMON STOCKS (continued) |
|
| Biotechnology (continued) |
|
| Kymera Therapeutics, Inc. (A) |
|
|
47,121 |
|
|
|
$ 1,406,562 |
|
| Madrigal Pharmaceuticals, Inc., ADR (A)(B) |
|
|
4,991 |
|
|
|
1,398,279 |
|
| Merus NV (A) |
|
|
12,221 |
|
|
|
723,117 |
|
| Mirum Pharmaceuticals, Inc. (A) |
|
|
6,900 |
|
|
|
235,911 |
|
| Monte Rosa Therapeutics, Inc. (A) |
|
|
5,200 |
|
|
|
19,448 |
|
| MoonLake Immunotherapeutics (A)(B) |
|
|
7,200 |
|
|
|
316,584 |
|
| Morphic Holding, Inc. (A) |
|
|
14,150 |
|
|
|
482,090 |
|
| Natera, Inc. (A) |
|
|
11,653 |
|
|
|
1,261,903 |
|
| Neurocrine Biosciences, Inc. (A) |
|
|
12,995 |
|
|
|
1,789,022 |
|
| Nurix Therapeutics, Inc. (A) |
|
|
17,230 |
|
|
|
359,590 |
|
| Nuvalent, Inc., Class A (A) |
|
|
13,106 |
|
|
|
994,221 |
|
| Praxis Precision Medicines, Inc. (A) |
|
|
11,600 |
|
|
|
479,776 |
|
| Prothena Corp. PLC (A) |
|
|
30,729 |
|
|
|
634,247 |
|
| PTC Therapeutics, Inc. (A) |
|
|
32,517 |
|
|
|
994,370 |
|
| Relay Therapeutics, Inc. (A) |
|
|
30,082 |
|
|
|
196,135 |
|
| Replimune Group, Inc. (A) |
|
|
40,933 |
|
|
|
368,397 |
|
| REVOLUTION Medicines, Inc. (A) |
|
|
33,674 |
|
|
|
1,306,888 |
|
| Rhythm Pharmaceuticals, Inc. (A) |
|
|
14,543 |
|
|
|
597,136 |
|
| Rocket Pharmaceuticals, Inc. (A) |
|
|
24,334 |
|
|
|
523,911 |
|
| Scholar Rock Holding Corp. (A) |
|
|
31,906 |
|
|
|
265,777 |
|
| SpringWorks Therapeutics, Inc. (A) |
|
|
16,059 |
|
|
|
604,942 |
|
| Ultragenyx Pharmaceutical, Inc. (A) |
|
|
30,323 |
|
|
|
1,246,275 |
|
| Vaxcyte, Inc. (A) |
|
|
26,584 |
|
|
|
2,007,358 |
|
| Vera Therapeutics, Inc. (A) |
|
|
28,400 |
|
|
|
1,027,512 |
|
| Xencor, Inc. (A) |
|
|
40,346 |
|
|
|
763,750 |
|
|
|
|
|
|
|
|
|
|
|
|
|
|
|
|
|
65,862,105 |
|
|
|
|
|
|
|
|
|
|
| Building Products - 2.9% |
|
| AAON, Inc. |
|
|
26,012 |
|
|
|
2,269,287 |
|
| AZEK Co., Inc. (A) |
|
|
83,614 |
|
|
|
3,522,658 |
|
| Builders FirstSource, Inc. (A) |
|
|
8,537 |
|
|
|
1,181,606 |
|
| CSW Industrials, Inc. |
|
|
11,583 |
|
|
|
3,073,086 |
|
| Griffon Corp. |
|
|
20,200 |
|
|
|
1,289,972 |
|
| Simpson Manufacturing Co., Inc. |
|
|
21,752 |
|
|
|
3,665,864 |
|
| UFP Industries, Inc. |
|
|
36,532 |
|
|
|
4,091,584 |
|
|
|
|
|
|
|
|
|
|
|
|
|
|
|
|
|
19,094,057 |
|
|
|
|
|
|
|
|
|
|
| Capital Markets - 2.0% |
|
| Blue Owl Capital, Inc. |
|
|
192,770 |
|
|
|
3,421,668 |
|
| Donnelley Financial Solutions, Inc. (A) |
|
|
29,800 |
|
|
|
1,776,676 |
|
| FactSet Research Systems, Inc. |
|
|
2,953 |
|
|
|
1,205,621 |
|
| Hamilton Lane, Inc., Class A |
|
|
25,000 |
|
|
|
3,089,500 |
|
| LPL Financial Holdings, Inc. |
|
|
5,348 |
|
|
|
1,493,696 |
|
| StoneX Group, Inc. (A) |
|
|
24,701 |
|
|
|
1,860,232 |
|
|
|
|
|
|
|
|
|
|
|
|
|
|
|
|
|
12,847,393 |
|
|
|
|
|
|
|
|
|
|
| Chemicals - 1.6% |
|
| Axalta Coating Systems Ltd. (A) |
|
|
79,032 |
|
|
|
2,700,523 |
|
| Balchem Corp. |
|
|
10,271 |
|
|
|
1,581,221 |
|
| Cabot Corp. |
|
|
22,499 |
|
|
|
2,067,433 |
|
| Element Solutions, Inc. |
|
|
71,978 |
|
|
|
1,952,043 |
|
| Olin Corp. |
|
|
42,940 |
|
|
|
2,024,621 |
|
|
|
|
|
|
|
|
|
|
|
|
|
|
|
|
|
10,325,841 |
|
|
|
|
|
|
|
|
|
|
| Commercial Services & Supplies - 2.0% |
|
| Brink’s Co. |
|
|
20,187 |
|
|
|
2,067,149 |
|
| Casella Waste Systems, Inc., Class A (A) |
|
|
44,999 |
|
|
|
4,464,801 |
|
The Notes to Financial Statements are an integral part of this report.
|
|
|
|
|
| Transamerica Series Trust |
|
|
|
Semi-Annual Financial Statements 2024 |
|
|
Page 1 |
|
|
Transamerica T. Rowe Price Small Cap VP
SCHEDULE OF INVESTMENTS (continued)
At June 30, 2024
(unaudited)
|
|
|
|
|
|
|
|
|
| |
|
Shares |
|
|
Value |
|
| COMMON STOCKS (continued) |
|
| Commercial Services & Supplies (continued) |
|
| Clean Harbors, Inc. (A) |
|
|
16,814 |
|
|
|
$ 3,802,486 |
|
| MSA Safety, Inc. |
|
|
13,957 |
|
|
|
2,619,589 |
|
|
|
|
|
|
|
|
|
|
|
|
|
|
|
|
|
12,954,025 |
|
|
|
|
|
|
|
|
|
|
| Communications Equipment - 0.1% |
|
| Extreme Networks, Inc. (A) |
|
|
39,706 |
|
|
|
534,046 |
|
|
|
|
|
|
|
|
|
|
| Construction & Engineering - 1.9% |
|
| API Group Corp. (A) |
|
|
131,247 |
|
|
|
4,938,824 |
|
| Comfort Systems USA, Inc. |
|
|
7,336 |
|
|
|
2,231,024 |
|
| EMCOR Group, Inc. |
|
|
6,508 |
|
|
|
2,375,941 |
|
| Sterling Infrastructure, Inc. (A) |
|
|
13,900 |
|
|
|
1,644,926 |
|
| WillScot Mobile Mini Holdings Corp. (A) |
|
|
26,898 |
|
|
|
1,012,441 |
|
|
|
|
|
|
|
|
|
|
|
|
|
|
|
|
|
12,203,156 |
|
|
|
|
|
|
|
|
|
|
| Construction Materials - 0.6% |
|
| Eagle Materials, Inc. |
|
|
16,469 |
|
|
|
3,581,349 |
|
|
|
|
|
|
|
|
|
|
| Consumer Staples Distribution & Retail - 1.6% |
|
| Casey’s General Stores, Inc. |
|
|
7,717 |
|
|
|
2,944,498 |
|
| Performance Food Group Co. (A) |
|
|
30,690 |
|
|
|
2,028,916 |
|
| Sprouts Farmers Market, Inc. (A) |
|
|
61,000 |
|
|
|
5,103,260 |
|
|
|
|
|
|
|
|
|
|
|
|
|
|
|
|
|
10,076,674 |
|
|
|
|
|
|
|
|
|
|
| Containers & Packaging - 0.1% |
|
| Graphic Packaging Holding Co. |
|
|
23,050 |
|
|
|
604,140 |
|
|
|
|
|
|
|
|
|
|
| Distributors - 0.3% |
|
| Pool Corp. |
|
|
5,976 |
|
|
|
1,836,604 |
|
|
|
|
|
|
|
|
|
|
| Diversified Consumer Services - 2.0% |
|
| Bright Horizons Family Solutions, Inc. (A) |
|
|
23,129 |
|
|
|
2,546,040 |
|
| Duolingo, Inc. (A) |
|
|
11,834 |
|
|
|
2,469,401 |
|
| Grand Canyon Education, Inc. (A) |
|
|
15,898 |
|
|
|
2,224,289 |
|
| H&R Block, Inc. |
|
|
44,000 |
|
|
|
2,386,120 |
|
| Laureate Education, Inc. |
|
|
70,200 |
|
|
|
1,048,788 |
|
| Stride, Inc. (A) |
|
|
36,100 |
|
|
|
2,545,050 |
|
|
|
|
|
|
|
|
|
|
|
|
|
|
|
|
|
13,219,688 |
|
|
|
|
|
|
|
|
|
|
| Diversified Telecommunication Services - 0.3% |
|
| GCI Liberty, Inc. (A)(C)(D)(E) |
|
|
66,048 |
|
|
|
0 |
|
| Iridium Communications, Inc. |
|
|
75,793 |
|
|
|
2,017,610 |
|
|
|
|
|
|
|
|
|
|
|
|
|
|
|
|
|
2,017,610 |
|
|
|
|
|
|
|
|
|
|
| Electrical Equipment - 1.0% |
|
| Atkore, Inc. |
|
|
18,248 |
|
|
|
2,462,203 |
|
| NEXTracker, Inc., Class A (A) |
|
|
9,200 |
|
|
|
431,296 |
|
| Vertiv Holdings Co. |
|
|
42,723 |
|
|
|
3,698,530 |
|
|
|
|
|
|
|
|
|
|
|
|
|
|
|
|
|
6,592,029 |
|
|
|
|
|
|
|
|
|
|
| Electronic Equipment, Instruments & Components - 2.8% |
|
| Advanced Energy Industries, Inc. |
|
|
18,457 |
|
|
|
2,007,383 |
|
| Fabrinet (A) |
|
|
25,272 |
|
|
|
6,186,333 |
|
| Littelfuse, Inc. |
|
|
3,244 |
|
|
|
829,134 |
|
| Novanta, Inc. (A) |
|
|
25,743 |
|
|
|
4,198,941 |
|
| Teledyne Technologies, Inc. (A) |
|
|
2,599 |
|
|
|
1,008,360 |
|
| Vontier Corp. |
|
|
93,174 |
|
|
|
3,559,247 |
|
| Zebra Technologies Corp., Class A (A) |
|
|
996 |
|
|
|
307,694 |
|
|
|
|
|
|
|
|
|
|
|
|
|
|
|
|
|
18,097,092 |
|
|
|
|
|
|
|
|
|
|
|
|
|
|
|
|
|
|
|
| |
|
Shares |
|
|
Value |
|
| COMMON STOCKS (continued) |
|
| Energy Equipment & Services - 2.4% |
|
| Expro Group Holdings NV (A) |
|
|
34,500 |
|
|
|
$ 790,740 |
|
| Liberty Energy, Inc. |
|
|
51,400 |
|
|
|
1,073,746 |
|
| Noble Corp. PLC |
|
|
25,363 |
|
|
|
1,132,458 |
|
| TechnipFMC PLC |
|
|
90,782 |
|
|
|
2,373,949 |
|
| Tidewater, Inc. (A) |
|
|
30,634 |
|
|
|
2,916,663 |
|
| Weatherford International PLC (A) |
|
|
58,994 |
|
|
|
7,223,816 |
|
|
|
|
|
|
|
|
|
|
|
|
|
|
|
|
|
15,511,372 |
|
|
|
|
|
|
|
|
|
|
| Entertainment - 0.9% |
|
| Endeavor Group Holdings, Inc., Class A (B) |
|
|
109,868 |
|
|
|
2,969,732 |
|
| TKO Group Holdings, Inc. |
|
|
28,073 |
|
|
|
3,031,603 |
|
|
|
|
|
|
|
|
|
|
|
|
|
|
|
|
|
6,001,335 |
|
|
|
|
|
|
|
|
|
|
| Financial Services - 1.2% |
|
| Euronet Worldwide, Inc. (A) |
|
|
16,302 |
|
|
|
1,687,257 |
|
| EVERTEC, Inc. |
|
|
37,474 |
|
|
|
1,246,011 |
|
| Mr Cooper Group, Inc. (A) |
|
|
29,900 |
|
|
|
2,428,777 |
|
| Payoneer Global, Inc. (A) |
|
|
265,726 |
|
|
|
1,472,122 |
|
| Shift4 Payments, Inc., Class A (A)(B) |
|
|
14,778 |
|
|
|
1,083,966 |
|
|
|
|
|
|
|
|
|
|
|
|
|
|
|
|
|
7,918,133 |
|
|
|
|
|
|
|
|
|
|
| Food Products - 0.8% |
|
| Post Holdings, Inc. (A) |
|
|
35,523 |
|
|
|
3,700,076 |
|
| Simply Good Foods Co. (A) |
|
|
35,992 |
|
|
|
1,300,391 |
|
|
|
|
|
|
|
|
|
|
|
|
|
|
|
|
|
5,000,467 |
|
|
|
|
|
|
|
|
|
|
| Ground Transportation - 1.2% |
|
| ArcBest Corp. |
|
|
3,200 |
|
|
|
342,656 |
|
| Landstar System, Inc. |
|
|
6,486 |
|
|
|
1,196,537 |
|
| Saia, Inc. (A) |
|
|
7,431 |
|
|
|
3,524,449 |
|
| XPO, Inc. (A) |
|
|
23,917 |
|
|
|
2,538,790 |
|
|
|
|
|
|
|
|
|
|
|
|
|
|
|
|
|
7,602,432 |
|
|
|
|
|
|
|
|
|
|
| Health Care Equipment & Supplies - 4.3% |
|
| CONMED Corp. |
|
|
9,060 |
|
|
|
628,039 |
|
| Globus Medical, Inc., Class A (A) |
|
|
59,830 |
|
|
|
4,097,757 |
|
| Haemonetics Corp. (A) |
|
|
17,451 |
|
|
|
1,443,721 |
|
| Inari Medical, Inc. (A) |
|
|
17,176 |
|
|
|
827,024 |
|
| Inspire Medical Systems, Inc. (A) |
|
|
6,347 |
|
|
|
849,419 |
|
| iRhythm Technologies, Inc. (A) |
|
|
10,813 |
|
|
|
1,163,911 |
|
| Lantheus Holdings, Inc. (A) |
|
|
43,630 |
|
|
|
3,503,053 |
|
| LeMaitre Vascular, Inc. |
|
|
15,700 |
|
|
|
1,291,796 |
|
| Merit Medical Systems, Inc. (A) |
|
|
43,084 |
|
|
|
3,703,070 |
|
| Penumbra, Inc. (A) |
|
|
7,525 |
|
|
|
1,354,274 |
|
| PROCEPT BioRobotics Corp. (A) |
|
|
35,438 |
|
|
|
2,164,908 |
|
| STERIS PLC |
|
|
11,291 |
|
|
|
2,478,826 |
|
| TransMedics Group, Inc. (A) |
|
|
19,300 |
|
|
|
2,906,966 |
|
| UFP Technologies, Inc. (A) |
|
|
6,400 |
|
|
|
1,688,768 |
|
|
|
|
|
|
|
|
|
|
|
|
|
|
|
|
|
28,101,532 |
|
|
|
|
|
|
|
|
|
|
| Health Care Providers & Services - 5.3% |
|
| Addus HomeCare Corp. (A) |
|
|
14,096 |
|
|
|
1,636,687 |
|
| AMN Healthcare Services, Inc. (A) |
|
|
6,525 |
|
|
|
334,276 |
|
| Chemed Corp. |
|
|
1,438 |
|
|
|
780,230 |
|
| CorVel Corp. (A) |
|
|
13,172 |
|
|
|
3,349,244 |
|
| Encompass Health Corp. |
|
|
57,251 |
|
|
|
4,911,563 |
|
| Ensign Group, Inc. |
|
|
48,317 |
|
|
|
5,976,330 |
|
| Guardant Health, Inc. (A) |
|
|
51,264 |
|
|
|
1,480,504 |
|
The Notes to Financial Statements are an integral part of this report.
|
|
|
|
|
| Transamerica Series Trust |
|
|
|
Semi-Annual Financial Statements 2024 |
|
|
Page 2 |
|
|
Transamerica T. Rowe Price Small Cap VP
SCHEDULE OF INVESTMENTS (continued)
At June 30, 2024
(unaudited)
|
|
|
|
|
|
|
|
|
| |
|
Shares |
|
|
Value |
|
| COMMON STOCKS (continued) |
|
| Health Care Providers & Services (continued) |
|
| Molina Healthcare, Inc. (A) |
|
|
12,025 |
|
|
|
$ 3,575,032 |
|
| NeoGenomics, Inc. (A) |
|
|
31,496 |
|
|
|
436,850 |
|
| Option Care Health, Inc. (A) |
|
|
98,313 |
|
|
|
2,723,270 |
|
| RadNet, Inc. (A) |
|
|
32,900 |
|
|
|
1,938,468 |
|
| Tenet Healthcare Corp. (A) |
|
|
54,342 |
|
|
|
7,229,116 |
|
|
|
|
|
|
|
|
|
|
|
|
|
|
|
|
|
34,371,570 |
|
|
|
|
|
|
|
|
|
|
| Health Care Technology - 0.1% |
|
| Evolent Health, Inc., Class A (A) |
|
|
34,800 |
|
|
|
665,376 |
|
|
|
|
|
|
|
|
|
|
| Hotels, Restaurants & Leisure - 5.2% |
|
| Bloomin’ Brands, Inc. |
|
|
54,170 |
|
|
|
1,041,689 |
|
| Boyd Gaming Corp. |
|
|
45,690 |
|
|
|
2,517,519 |
|
| Cava Group, Inc. (A) |
|
|
16,981 |
|
|
|
1,574,988 |
|
| Choice Hotels International, Inc. |
|
|
11,679 |
|
|
|
1,389,801 |
|
| Churchill Downs, Inc. |
|
|
18,990 |
|
|
|
2,651,004 |
|
| Domino’s Pizza, Inc. |
|
|
7,670 |
|
|
|
3,960,251 |
|
| Hilton Grand Vacations, Inc. (A) |
|
|
27,180 |
|
|
|
1,098,888 |
|
| Light & Wonder, Inc. (A) |
|
|
49,200 |
|
|
|
5,160,096 |
|
| Red Rock Resorts, Inc., Class A |
|
|
14,783 |
|
|
|
812,030 |
|
| Texas Roadhouse, Inc. |
|
|
28,885 |
|
|
|
4,959,843 |
|
| Travel & Leisure Co. |
|
|
16,804 |
|
|
|
755,844 |
|
| United Parks & Resorts, Inc. (A) |
|
|
13,240 |
|
|
|
719,064 |
|
| Wingstop, Inc. |
|
|
16,238 |
|
|
|
6,863,153 |
|
|
|
|
|
|
|
|
|
|
|
|
|
|
|
|
|
33,504,170 |
|
|
|
|
|
|
|
|
|
|
| Household Durables - 1.8% |
|
| Cavco Industries, Inc. (A) |
|
|
5,737 |
|
|
|
1,985,977 |
|
| Green Brick Partners, Inc. (A) |
|
|
22,737 |
|
|
|
1,301,466 |
|
| Installed Building Products, Inc. |
|
|
11,310 |
|
|
|
2,326,241 |
|
| Skyline Champion Corp. (A) |
|
|
19,610 |
|
|
|
1,328,578 |
|
| Tempur Sealy International, Inc. |
|
|
69,960 |
|
|
|
3,311,906 |
|
| TopBuild Corp. (A) |
|
|
4,301 |
|
|
|
1,657,046 |
|
|
|
|
|
|
|
|
|
|
|
|
|
|
|
|
|
11,911,214 |
|
|
|
|
|
|
|
|
|
|
| Independent Power & Renewable Electricity Producers - 0.2% |
|
| Ormat Technologies, Inc. |
|
|
19,813 |
|
|
|
1,420,592 |
|
|
|
|
|
|
|
|
|
|
| Industrial REITs - 0.5% |
|
| First Industrial Realty Trust, Inc. |
|
|
31,174 |
|
|
|
1,481,077 |
|
| Rexford Industrial Realty, Inc. |
|
|
18,573 |
|
|
|
828,170 |
|
| Terreno Realty Corp. |
|
|
11,527 |
|
|
|
682,168 |
|
|
|
|
|
|
|
|
|
|
|
|
|
|
|
|
|
2,991,415 |
|
|
|
|
|
|
|
|
|
|
| Insurance - 2.3% |
|
| Baldwin Insurance Group, Inc., Class A (A) |
|
|
43,200 |
|
|
|
1,532,304 |
|
| Bowhead Specialty Holdings, Inc. (A) |
|
|
7,855 |
|
|
|
199,046 |
|
| Kinsale Capital Group, Inc. |
|
|
3,100 |
|
|
|
1,194,368 |
|
| Oscar Health, Inc., Class A (A) |
|
|
86,500 |
|
|
|
1,368,430 |
|
| Palomar Holdings, Inc. (A) |
|
|
16,427 |
|
|
|
1,333,051 |
|
| Primerica, Inc. |
|
|
15,053 |
|
|
|
3,561,239 |
|
| RLI Corp. |
|
|
15,330 |
|
|
|
2,156,778 |
|
| Ryan Specialty Holdings, Inc. |
|
|
54,694 |
|
|
|
3,167,329 |
|
| Selective Insurance Group, Inc. |
|
|
4,929 |
|
|
|
462,488 |
|
|
|
|
|
|
|
|
|
|
|
|
|
|
|
|
|
14,975,033 |
|
|
|
|
|
|
|
|
|
|
| Interactive Media & Services - 0.1% |
|
| Cars.com, Inc. (A) |
|
|
42,321 |
|
|
|
833,724 |
|
|
|
|
|
|
|
|
|
|
|
|
|
|
|
|
|
|
|
| |
|
Shares |
|
|
Value |
|
| COMMON STOCKS (continued) |
|
| IT Services - 0.5% |
|
| ASGN, Inc. (A) |
|
|
14,519 |
|
|
|
$ 1,280,140 |
|
| Gartner, Inc. (A) |
|
|
3,974 |
|
|
|
1,784,564 |
|
| Kyndryl Holdings, Inc. (A) |
|
|
17,767 |
|
|
|
467,450 |
|
|
|
|
|
|
|
|
|
|
|
|
|
|
|
|
|
3,532,154 |
|
|
|
|
|
|
|
|
|
|
| Leisure Products - 0.5% |
|
| Brunswick Corp. |
|
|
13,292 |
|
|
|
967,259 |
|
| Mattel, Inc. (A) |
|
|
124,894 |
|
|
|
2,030,776 |
|
|
|
|
|
|
|
|
|
|
|
|
|
|
|
|
|
2,998,035 |
|
|
|
|
|
|
|
|
|
|
| Life Sciences Tools & Services - 1.4% |
|
| 10X Genomics, Inc., Class A (A) |
|
|
32,289 |
|
|
|
628,021 |
|
| Bruker Corp. |
|
|
11,700 |
|
|
|
746,577 |
|
| Charles River Laboratories International, Inc. (A) |
|
|
6,959 |
|
|
|
1,437,590 |
|
| Medpace Holdings, Inc. (A) |
|
|
5,656 |
|
|
|
2,329,424 |
|
| Repligen Corp. (A) |
|
|
14,246 |
|
|
|
1,795,851 |
|
| West Pharmaceutical Services, Inc. |
|
|
5,498 |
|
|
|
1,810,986 |
|
|
|
|
|
|
|
|
|
|
|
|
|
|
|
|
|
8,748,449 |
|
|
|
|
|
|
|
|
|
|
| Machinery - 3.8% |
|
| Crane Co. |
|
|
22,400 |
|
|
|
3,247,552 |
|
| Federal Signal Corp. |
|
|
41,943 |
|
|
|
3,509,371 |
|
| Kadant, Inc. |
|
|
12,582 |
|
|
|
3,696,340 |
|
| Lincoln Electric Holdings, Inc. |
|
|
13,136 |
|
|
|
2,477,975 |
|
| RBC Bearings, Inc. (A) |
|
|
7,235 |
|
|
|
1,951,858 |
|
| SPX Technologies, Inc. (A) |
|
|
32,296 |
|
|
|
4,590,554 |
|
| Symbotic, Inc. (A)(B) |
|
|
15,947 |
|
|
|
560,697 |
|
| Toro Co. |
|
|
7,791 |
|
|
|
728,536 |
|
| Watts Water Technologies, Inc., Class A |
|
|
19,222 |
|
|
|
3,524,738 |
|
|
|
|
|
|
|
|
|
|
|
|
|
|
|
|
|
24,287,621 |
|
|
|
|
|
|
|
|
|
|
| Media - 0.5% |
|
| Nexstar Media Group, Inc. |
|
|
16,993 |
|
|
|
2,821,008 |
|
| Thryv Holdings, Inc. (A) |
|
|
26,965 |
|
|
|
480,516 |
|
|
|
|
|
|
|
|
|
|
|
|
|
|
|
|
|
3,301,524 |
|
|
|
|
|
|
|
|
|
|
| Metals & Mining - 1.0% |
|
| Alpha Metallurgical Resources, Inc. |
|
|
6,513 |
|
|
|
1,827,092 |
|
| ATI, Inc. (A) |
|
|
69,005 |
|
|
|
3,826,327 |
|
| Warrior Met Coal, Inc. |
|
|
10,400 |
|
|
|
652,808 |
|
|
|
|
|
|
|
|
|
|
|
|
|
|
|
|
|
6,306,227 |
|
|
|
|
|
|
|
|
|
|
| Oil, Gas & Consumable Fuels - 2.1% |
|
| Centrus Energy Corp., Class A (A) |
|
|
18,759 |
|
|
|
801,947 |
|
| CNX Resources Corp. (A) |
|
|
50,000 |
|
|
|
1,215,000 |
|
| CONSOL Energy, Inc. (A) |
|
|
13,700 |
|
|
|
1,397,811 |
|
| Dorian LPG Ltd. |
|
|
13,600 |
|
|
|
570,656 |
|
| Gulfport Energy Corp. (A) |
|
|
6,400 |
|
|
|
966,400 |
|
| Matador Resources Co. |
|
|
55,408 |
|
|
|
3,302,317 |
|
| PBF Energy, Inc., Class A |
|
|
7,246 |
|
|
|
333,461 |
|
| Range Resources Corp. |
|
|
31,809 |
|
|
|
1,066,556 |
|
| SM Energy Co. |
|
|
48,511 |
|
|
|
2,097,131 |
|
| Southwestern Energy Co. (A) |
|
|
235,428 |
|
|
|
1,584,430 |
|
|
|
|
|
|
|
|
|
|
|
|
|
|
|
|
|
13,335,709 |
|
|
|
|
|
|
|
|
|
|
| Paper & Forest Products - 0.5% |
|
| Louisiana-Pacific Corp. |
|
|
42,558 |
|
|
|
3,503,800 |
|
|
|
|
|
|
|
|
|
|
The Notes to Financial Statements are an integral part of this report.
|
|
|
|
|
| Transamerica Series Trust |
|
|
|
Semi-Annual Financial Statements 2024 |
|
|
Page 3 |
|
|
Transamerica T. Rowe Price Small Cap VP
SCHEDULE OF INVESTMENTS (continued)
At June 30, 2024
(unaudited)
|
|
|
|
|
|
|
|
|
| |
|
Shares |
|
|
Value |
|
| COMMON STOCKS (continued) |
|
| Personal Care Products - 1.2% |
|
| BellRing Brands, Inc. (A) |
|
|
58,359 |
|
|
|
$ 3,334,633 |
|
| elf Beauty, Inc. (A) |
|
|
14,329 |
|
|
|
3,019,407 |
|
| Inter Parfums, Inc. |
|
|
10,687 |
|
|
|
1,240,013 |
|
|
|
|
|
|
|
|
|
|
|
|
|
|
|
|
|
7,594,053 |
|
|
|
|
|
|
|
|
|
|
| Pharmaceuticals - 1.1% |
|
| Amphastar Pharmaceuticals, Inc. (A) |
|
|
35,129 |
|
|
|
1,405,160 |
|
| Arvinas, Inc. (A) |
|
|
29,437 |
|
|
|
783,613 |
|
| Intra-Cellular Therapies, Inc. (A) |
|
|
43,582 |
|
|
|
2,984,931 |
|
| Pacira BioSciences, Inc. (A) |
|
|
12,525 |
|
|
|
358,340 |
|
| Pliant Therapeutics, Inc. (A) |
|
|
15,638 |
|
|
|
168,109 |
|
| Prestige Consumer Healthcare, Inc. (A) |
|
|
24,272 |
|
|
|
1,671,127 |
|
|
|
|
|
|
|
|
|
|
|
|
|
|
|
|
|
7,371,280 |
|
|
|
|
|
|
|
|
|
|
| Professional Services - 4.0% |
|
| Booz Allen Hamilton Holding Corp. |
|
|
33,186 |
|
|
|
5,107,325 |
|
| Broadridge Financial Solutions, Inc., ADR |
|
|
9,093 |
|
|
|
1,791,321 |
|
| CACI International, Inc., Class A (A) |
|
|
11,939 |
|
|
|
5,135,322 |
|
| CBIZ, Inc. (A) |
|
|
44,520 |
|
|
|
3,298,932 |
|
| ExlService Holdings, Inc. (A) |
|
|
96,614 |
|
|
|
3,029,815 |
|
| FTI Consulting, Inc. (A) |
|
|
14,958 |
|
|
|
3,223,898 |
|
| Paylocity Holding Corp. (A) |
|
|
1,529 |
|
|
|
201,599 |
|
| TriNet Group, Inc. |
|
|
12,884 |
|
|
|
1,288,400 |
|
| Verra Mobility Corp. (A) |
|
|
101,668 |
|
|
|
2,765,369 |
|
|
|
|
|
|
|
|
|
|
|
|
|
|
|
|
|
25,841,981 |
|
|
|
|
|
|
|
|
|
|
| Residential REITs - 0.2% |
|
| Equity LifeStyle Properties, Inc. |
|
|
15,490 |
|
|
|
1,008,864 |
|
|
|
|
|
|
|
|
|
|
| Semiconductors & Semiconductor Equipment - 5.2% |
|
| Astera Labs, Inc. (A) |
|
|
5,591 |
|
|
|
338,311 |
|
| Axcelis Technologies, Inc. (A) |
|
|
25,998 |
|
|
|
3,696,656 |
|
| Cirrus Logic, Inc. (A) |
|
|
24,290 |
|
|
|
3,100,861 |
|
| Diodes, Inc. (A) |
|
|
34,254 |
|
|
|
2,463,890 |
|
| Entegris, Inc. |
|
|
10,157 |
|
|
|
1,375,258 |
|
| FormFactor, Inc. (A) |
|
|
36,805 |
|
|
|
2,227,807 |
|
| Kulicke & Soffa Industries, Inc. |
|
|
24,619 |
|
|
|
1,211,008 |
|
| MACOM Technology Solutions Holdings, Inc. (A) |
|
|
30,500 |
|
|
|
3,399,835 |
|
| MKS Instruments, Inc. |
|
|
10,021 |
|
|
|
1,308,542 |
|
| Monolithic Power Systems, Inc. |
|
|
3,282 |
|
|
|
2,696,754 |
|
| Onto Innovation, Inc. (A) |
|
|
27,753 |
|
|
|
6,093,449 |
|
| Photronics, Inc. (A) |
|
|
51,800 |
|
|
|
1,277,906 |
|
| Rambus, Inc. (A) |
|
|
59,676 |
|
|
|
3,506,562 |
|
| Veeco Instruments, Inc. (A) |
|
|
21,500 |
|
|
|
1,004,265 |
|
|
|
|
|
|
|
|
|
|
|
|
|
|
|
|
|
33,701,104 |
|
|
|
|
|
|
|
|
|
|
| Software - 9.9% |
|
| A10 Networks, Inc. |
|
|
67,900 |
|
|
|
940,415 |
|
| ACI Worldwide, Inc. (A) |
|
|
48,306 |
|
|
|
1,912,434 |
|
| Agilysys, Inc. (A) |
|
|
23,077 |
|
|
|
2,403,239 |
|
| Appfolio, Inc., Class A (A) |
|
|
11,191 |
|
|
|
2,736,983 |
|
| Blackbaud, Inc. (A) |
|
|
22,498 |
|
|
|
1,713,673 |
|
| Box, Inc., Class A (A) |
|
|
54,568 |
|
|
|
1,442,778 |
|
| CommVault Systems, Inc. (A) |
|
|
23,300 |
|
|
|
2,832,581 |
|
| Descartes Systems Group, Inc. (A) |
|
|
49,512 |
|
|
|
4,794,742 |
|
| DoubleVerify Holdings, Inc. (A) |
|
|
72,656 |
|
|
|
1,414,612 |
|
| Envestnet, Inc. (A) |
|
|
30,500 |
|
|
|
1,908,995 |
|
|
|
|
|
|
|
|
|
|
| |
|
Shares |
|
|
Value |
|
| COMMON STOCKS (continued) |
|
| Software (continued) |
|
| Fair Isaac Corp. (A) |
|
|
2,313 |
|
|
|
$ 3,443,271 |
|
| Fortinet, Inc. (A) |
|
|
28,786 |
|
|
|
1,734,932 |
|
| Informatica, Inc., Class A (A) |
|
|
69,109 |
|
|
|
2,134,086 |
|
| Manhattan Associates, Inc. (A) |
|
|
12,386 |
|
|
|
3,055,378 |
|
| MicroStrategy, Inc., Class A (A)(B) |
|
|
1,050 |
|
|
|
1,446,354 |
|
| Nutanix, Inc., Class A (A) |
|
|
65,394 |
|
|
|
3,717,649 |
|
| PowerSchool Holdings, Inc., Class A (A) |
|
|
79,445 |
|
|
|
1,778,774 |
|
| PTC, Inc. (A) |
|
|
12,811 |
|
|
|
2,327,374 |
|
| Q2 Holdings, Inc. (A) |
|
|
47,333 |
|
|
|
2,855,600 |
|
| Qualys, Inc. (A) |
|
|
16,040 |
|
|
|
2,287,304 |
|
| Rapid7, Inc. (A) |
|
|
29,448 |
|
|
|
1,273,037 |
|
| Sapiens International Corp. NV |
|
|
48,174 |
|
|
|
1,634,544 |
|
| Smartsheet, Inc., Class A (A) |
|
|
54,685 |
|
|
|
2,410,515 |
|
| SPS Commerce, Inc. (A) |
|
|
22,212 |
|
|
|
4,179,410 |
|
| Tenable Holdings, Inc. (A) |
|
|
41,382 |
|
|
|
1,803,428 |
|
| Tyler Technologies, Inc. (A) |
|
|
6,021 |
|
|
|
3,027,238 |
|
| Workiva, Inc. (A) |
|
|
16,658 |
|
|
|
1,215,867 |
|
| Zeta Global Holdings Corp., Class A (A) |
|
|
102,900 |
|
|
|
1,816,185 |
|
|
|
|
|
|
|
|
|
|
|
|
|
|
|
|
|
64,241,398 |
|
|
|
|
|
|
|
|
|
|
| Specialty Retail - 3.8% |
|
| Abercrombie & Fitch Co., Class A (A) |
|
|
28,400 |
|
|
|
5,050,656 |
|
| Academy Sports & Outdoors, Inc. |
|
|
21,297 |
|
|
|
1,134,065 |
|
| Asbury Automotive Group, Inc. (A) |
|
|
5,716 |
|
|
|
1,302,505 |
|
| Carvana Co. (A) |
|
|
37,840 |
|
|
|
4,870,765 |
|
| Dick’s Sporting Goods, Inc. |
|
|
11,486 |
|
|
|
2,467,767 |
|
| Group 1 Automotive, Inc. |
|
|
4,800 |
|
|
|
1,426,944 |
|
| Murphy USA, Inc. |
|
|
14,328 |
|
|
|
6,726,423 |
|
| Valvoline, Inc. (A) |
|
|
33,803 |
|
|
|
1,460,290 |
|
|
|
|
|
|
|
|
|
|
|
|
|
|
|
|
|
24,439,415 |
|
|
|
|
|
|
|
|
|
|
| Technology Hardware, Storage & Peripherals - 0.1% |
|
| Pure Storage, Inc., Class A (A) |
|
|
9,859 |
|
|
|
633,046 |
|
|
|
|
|
|
|
|
|
|
| Textiles, Apparel & Luxury Goods - 0.8% |
|
| Crocs, Inc. (A) |
|
|
10,114 |
|
|
|
1,476,037 |
|
| Deckers Outdoor Corp. (A) |
|
|
3,520 |
|
|
|
3,407,184 |
|
|
|
|
|
|
|
|
|
|
|
|
|
|
|
|
|
4,883,221 |
|
|
|
|
|
|
|
|
|
|
| Trading Companies & Distributors - 2.2% |
|
| Boise Cascade Co. |
|
|
15,900 |
|
|
|
1,895,598 |
|
| Core & Main, Inc., Class A (A) |
|
|
35,596 |
|
|
|
1,742,068 |
|
| FTAI Aviation Ltd. |
|
|
62,874 |
|
|
|
6,490,483 |
|
| Herc Holdings, Inc. |
|
|
5,995 |
|
|
|
799,074 |
|
| SiteOne Landscape Supply, Inc. (A) |
|
|
12,526 |
|
|
|
1,520,782 |
|
| Watsco, Inc. |
|
|
4,501 |
|
|
|
2,085,043 |
|
|
|
|
|
|
|
|
|
|
|
|
|
|
|
|
|
14,533,048 |
|
|
|
|
|
|
|
|
|
|
| Total Common Stocks
(Cost $504,145,522) |
|
|
|
|
|
|
641,982,740 |
|
|
|
|
|
|
|
|
|
|
| OTHER INVESTMENT COMPANY - 0.5% |
|
| Securities Lending Collateral - 0.5% |
|
| State Street Navigator Securities Lending Trust - Government Money Market Portfolio, 5.28% (F) |
|
|
3,313,732 |
|
|
|
3,313,732 |
|
|
|
|
|
|
|
|
|
|
| Total Other Investment Company
(Cost $3,313,732) |
|
|
|
|
|
|
3,313,732 |
|
|
|
|
|
|
|
The Notes to Financial Statements are an integral part of this report.
|
|
|
|
|
| Transamerica Series Trust |
|
|
|
Semi-Annual Financial Statements 2024 |
|
|
Page 4 |
|
|
Transamerica T. Rowe Price Small Cap VP
SCHEDULE OF INVESTMENTS (continued)
At June 30, 2024
(unaudited)
|
|
|
|
|
|
|
|
|
| |
|
Principal |
|
|
Value |
|
| REPURCHASE AGREEMENT - 1.1% |
|
| Fixed Income Clearing Corp., 2.50% (F), dated 06/28/2024, to be repurchased at $7,211,998 on 07/01/2024. Collateralized by a U.S. Government Obligation, 3.75%, due 04/15/2026, and with a value of $7,354,747. |
|
|
$ 7,210,496 |
|
|
|
$ 7,210,496 |
|
|
|
|
|
|
|
|
|
|
| Total Repurchase Agreement
(Cost $7,210,496) |
|
|
|
|
|
|
7,210,496 |
|
|
|
|
|
|
|
|
|
|
| Total Investments
(Cost $514,669,750) |
|
|
|
|
|
|
652,506,968 |
|
|
|
|
|
|
|
|
|
|
| Net Other Assets (Liabilities) - (0.9)% |
|
|
|
(5,674,365) |
|
|
|
|
|
|
|
|
|
|
|
|
| Net Assets - 100.0% |
|
|
|
$ 646,832,603 |
|
|
|
|
|
|
|
INVESTMENT VALUATION:
Valuation Inputs (G)
|
|
|
|
|
|
|
|
|
|
|
|
|
|
|
|
|
|
|
|
|
|
| |
|
Level 1 - Unadjusted Quoted Prices |
|
|
Level 2 - Other Significant Observable Inputs |
|
|
Level 3 - Significant Unobservable Inputs (H) |
|
|
Value |
|
| ASSETS |
|
|
|
|
|
|
|
|
|
|
|
|
|
|
|
|
| Investments |
|
|
|
|
|
|
|
|
|
|
|
|
|
|
|
|
| Common Stocks |
|
$ |
641,982,740 |
|
|
$ |
— |
|
|
$ |
0 |
|
|
$ |
641,982,740 |
|
| Other Investment Company |
|
|
3,313,732 |
|
|
|
— |
|
|
|
— |
|
|
|
3,313,732 |
|
| Repurchase Agreement |
|
|
— |
|
|
|
7,210,496 |
|
|
|
— |
|
|
|
7,210,496 |
|
|
|
|
|
|
|
|
|
|
|
|
|
|
|
|
|
|
| Total Investments |
|
$ |
645,296,472 |
|
|
$ |
7,210,496 |
|
|
$ |
0 |
|
|
$ |
652,506,968 |
|
|
|
|
|
|
|
|
|
|
|
|
|
|
|
|
|
|
FOOTNOTES TO SCHEDULE OF INVESTMENTS:
| (A) |
Non-income producing security. |
| (B) |
All or a portion of the security is on loan. The total value of the securities on loan is $7,363,272, collateralized by cash collateral of $3,313,732 and non-cash collateral, such as U.S. government securities and irrevocable letters of credit, of $4,223,032. The amount on loan indicated may not correspond with the securities on loan identified because a security with pending sales are in the process of recall from the brokers. |
| (C) |
Security is Level 3 of the fair value hierarchy. |
| (D) |
Fair valued as determined in good faith in accordance with TAM’s procedures. At June 30, 2024, the total value of the securities is $0, representing 0.0% of the Portfolio’s net assets. |
| (E) |
Security deemed worthless. |
| (F) |
Rate disclosed reflects the yield at June 30, 2024. |
| (G) |
There were no transfers in or out of Level 3 during the period ended June 30, 2024. Please reference the Investment Valuation section of the Notes to Financial Statements for more information regarding investment valuation and pricing inputs. |
| (H) |
Level 3 securities were not considered significant to the Portfolio. |
PORTFOLIO ABBREVIATION(S):
|
|
|
| ADR |
|
American Depositary Receipt |
| REIT |
|
Real Estate Investment Trust |
The Notes to Financial Statements are an integral part of this report.
|
|
|
|
|
| Transamerica Series Trust |
|
|
|
Semi-Annual Financial Statements 2024 |
|
|
Page 5 |
|
|
Transamerica T. Rowe Price Small Cap VP
STATEMENT OF ASSETS AND LIABILITIES
At June 30, 2024
(unaudited)
|
|
|
|
|
| Assets: |
|
|
|
|
| Investments, at value (cost $507,459,254) (including securities loaned of $7,363,272) |
|
|
$ 645,296,472 |
|
| Repurchase agreement, at value (cost $7,210,496) |
|
|
7,210,496 |
|
| Receivables and other assets: |
|
|
|
|
| Investments sold |
|
|
358,805 |
|
| Net income from securities lending |
|
|
2,296 |
|
| Shares of beneficial interest sold |
|
|
152,720 |
|
| Dividends |
|
|
120,568 |
|
| Interest |
|
|
1,502 |
|
| Prepaid expenses |
|
|
2,764 |
|
| |
|
| Total assets |
|
|
653,145,623 |
|
|
|
| Liabilities: |
|
|
|
|
| Cash collateral received upon return of: |
|
|
|
|
| Securities on loan |
|
|
3,313,732 |
|
| Payables and other liabilities: |
|
|
|
|
| Investments purchased |
|
|
2,090,741 |
|
| Shares of beneficial interest redeemed |
|
|
316,521 |
|
| Investment management fees |
|
|
398,029 |
|
| Distribution and service fees |
|
|
74,110 |
|
| Transfer agent costs |
|
|
648 |
|
| Trustee and CCO fees |
|
|
1,890 |
|
| Audit and tax fees |
|
|
13,170 |
|
| Custody fees |
|
|
29,079 |
|
| Legal fees |
|
|
13,376 |
|
| Printing and shareholder reports fees |
|
|
48,462 |
|
| Other accrued expenses |
|
|
13,262 |
|
| |
|
| Total liabilities |
|
|
6,313,020 |
|
|
|
| Net assets |
|
|
$ 646,832,603 |
|
|
|
| Net assets consist of: |
|
|
|
|
| Capital stock ($0.01 par value) |
|
|
$ 580,073 |
|
| Additional paid-in capital |
|
|
435,117,555 |
|
| Total distributable earnings (accumulated losses) |
|
|
211,134,975 |
|
| |
|
| Net assets |
|
|
$ 646,832,603 |
|
|
|
| Net assets by class: |
|
|
|
|
| Initial Class |
|
|
$ 256,494,390 |
|
| Service Class |
|
|
390,338,213 |
|
|
|
| Shares outstanding: |
|
|
|
|
| Initial Class |
|
|
20,937,675 |
|
| Service Class |
|
|
37,069,671 |
|
|
|
| Net asset value and offering price per share: |
|
|
|
|
| Initial Class |
|
|
$ 12.25 |
|
| Service Class |
|
|
10.53 |
|
STATEMENT OF OPERATIONS
For the period ended June 30, 2024
(unaudited)
|
|
|
|
|
| Investment income: |
|
|
|
|
| Dividend income |
|
|
$ 1,367,452 |
|
| Interest income |
|
|
59,845 |
|
| Net income from securities lending |
|
|
23,189 |
|
| Withholding taxes on foreign income |
|
|
(3,497 |
) |
|
|
| Total investment income |
|
|
1,446,989 |
|
|
|
| Expenses: |
|
|
|
|
| Investment management fees |
|
|
2,585,971 |
|
| Distribution and service fees: |
|
|
|
|
| Service Class |
|
|
473,021 |
|
| Transfer agent costs |
|
|
3,786 |
|
| Trustee and CCO fees |
|
|
15,500 |
|
| Audit and tax fees |
|
|
13,000 |
|
| Custody fees |
|
|
28,022 |
|
| Legal fees |
|
|
26,438 |
|
| Printing and shareholder reports fees |
|
|
49,060 |
|
| Other |
|
|
20,140 |
|
| Total expenses |
|
|
3,214,938 |
|
|
|
| Net investment income (loss) |
|
|
(1,767,949 |
) |
|
|
| Net realized gain (loss) on: |
|
|
|
|
| Investments |
|
|
52,157,184 |
|
|
|
| Net change in unrealized appreciation (depreciation) on: |
|
|
|
|
| Investments |
|
|
(2,070,279 |
) |
|
|
| Net realized and change in unrealized gain (loss) |
|
|
50,086,905 |
|
|
|
| Net increase (decrease) in net assets resulting from operations |
|
|
$ 48,318,956 |
|
The Notes to Financial Statements are an integral part of this report.
|
|
|
|
|
| Transamerica Series Trust |
|
|
|
Semi-Annual Financial Statements 2024 |
|
|
Page 6 |
|
|
Transamerica T. Rowe Price Small Cap VP
STATEMENT OF CHANGES IN NET ASSETS
For the period and year ended:
|
|
|
|
|
|
|
|
|
| |
|
June 30, 2024 (unaudited) |
|
December 31, 2023 |
|
|
|
|
| From operations: |
|
|
|
|
|
|
|
|
| Net investment income (loss) |
|
$ |
(1,767,949 |
) |
|
$ |
(2,915,275 |
) |
| Net realized gain (loss) |
|
|
52,157,184 |
|
|
|
24,593,615 |
|
| Net change in unrealized appreciation (depreciation) |
|
|
(2,070,279 |
) |
|
|
96,075,011 |
|
|
|
|
| Net increase (decrease) in net assets resulting from operations |
|
|
48,318,956 |
|
|
|
117,753,351 |
|
|
|
|
| Dividends and/or distributions to shareholders: |
|
|
|
|
|
|
|
|
| Initial Class |
|
|
— |
|
|
|
(12,975,384 |
) |
| Service Class |
|
|
— |
|
|
|
(16,002,128 |
) |
| |
|
|
| Net increase (decrease) in net assets resulting from dividends and/or distributions to shareholders |
|
|
— |
|
|
|
(28,977,512 |
) |
|
|
|
| Capital share transactions: |
|
|
|
|
|
|
|
|
| Proceeds from shares sold: |
|
|
|
|
|
|
|
|
| Initial Class |
|
|
7,049,825 |
|
|
|
81,983,838 |
|
| Service Class |
|
|
10,430,598 |
|
|
|
16,038,792 |
|
|
|
|
17,480,423 |
|
|
|
98,022,630 |
|
| Dividends and/or distributions reinvested: |
|
|
|
|
|
|
|
|
| Initial Class |
|
|
— |
|
|
|
12,975,384 |
|
| Service Class |
|
|
— |
|
|
|
16,002,128 |
|
|
|
|
— |
|
|
|
28,977,512 |
|
| Cost of shares redeemed: |
|
|
|
|
|
|
|
|
| Initial Class |
|
|
(84,772,476 |
) |
|
|
(92,435,798 |
) |
| Service Class |
|
|
(23,370,650 |
) |
|
|
(41,260,187 |
) |
| |
|
|
(108,143,126 |
) |
|
|
(133,695,985 |
) |
|
|
|
| Net increase (decrease) in net assets resulting from capital share transactions |
|
|
(90,662,703 |
) |
|
|
(6,695,843 |
) |
|
|
|
| Net increase (decrease) in net assets |
|
|
(42,343,747 |
) |
|
|
82,079,996 |
|
|
|
|
| Net assets: |
|
|
|
|
|
|
|
|
| Beginning of period/year |
|
|
689,176,350 |
|
|
|
607,096,354 |
|
| End of period/year |
|
$ |
646,832,603 |
|
|
$ |
689,176,350 |
|
|
|
|
| Capital share transactions - shares: |
|
|
|
|
|
|
|
|
| Shares issued: |
|
|
|
|
|
|
|
|
| Initial Class |
|
|
597,009 |
|
|
|
7,681,469 |
|
| Service Class |
|
|
1,027,705 |
|
|
|
1,752,747 |
|
| |
|
|
1,624,714 |
|
|
|
9,434,216 |
|
| Shares reinvested: |
|
|
|
|
|
|
|
|
| Initial Class |
|
|
— |
|
|
|
1,220,638 |
|
| Service Class |
|
|
— |
|
|
|
1,746,957 |
|
| |
|
|
— |
|
|
|
2,967,595 |
|
| Shares redeemed: |
|
|
|
|
|
|
|
|
| Initial Class |
|
|
(7,184,480 |
) |
|
|
(9,260,574 |
) |
| Service Class |
|
|
(2,287,859 |
) |
|
|
(4,536,808 |
) |
| |
|
|
(9,472,339 |
) |
|
|
(13,797,382 |
) |
|
|
|
| Net increase (decrease) in shares outstanding: |
|
|
|
|
|
|
|
|
| Initial Class |
|
|
(6,587,471 |
) |
|
|
(358,467 |
) |
| Service Class |
|
|
(1,260,154 |
) |
|
|
(1,037,104 |
) |
| |
|
|
(7,847,625 |
) |
|
|
(1,395,571 |
) |
The Notes to Financial Statements are an integral part of this report.
|
|
|
|
|
| Transamerica Series Trust |
|
|
|
Semi-Annual Financial Statements 2024 |
|
|
Page 7 |
|
|
Transamerica T. Rowe Price Small Cap VP
FINANCIAL HIGHLIGHTS
|
|
|
|
|
|
|
|
|
|
|
|
|
|
|
|
|
|
|
|
|
|
|
|
|
|
|
|
|
|
|
| For a share outstanding during the period and years indicated: |
|
Initial Class |
| |
|
June 30, 2024 (unaudited) |
|
December 31, 2023 |
|
December 31, 2022 |
|
December 31, 2021 |
|
December 31, 2020 |
|
December 31, 2019 |
| Net asset value, beginning of period/year |
|
|
$ |
11.39 |
|
|
|
$ |
9.78 |
|
|
|
$ |
19.01 |
|
|
|
$ |
18.92 |
|
|
|
$ |
16.42 |
|
|
|
$ |
13.79 |
|
|
|
|
|
|
|
|
| Investment operations: |
|
|
|
|
|
|
|
|
|
|
|
|
|
|
|
|
|
|
|
|
|
|
|
|
|
|
|
|
|
|
| Net investment income (loss)(A) |
|
|
|
(0.02 |
) |
|
|
|
(0.03 |
) |
|
|
|
(0.03 |
) |
|
|
|
(0.08 |
) |
|
|
|
(0.04 |
) |
|
|
|
(0.03 |
) |
| Net realized and unrealized gain (loss) |
|
|
|
0.88 |
|
|
|
|
2.07 |
|
|
|
|
(3.97 |
) |
|
|
|
2.17 |
|
|
|
|
3.68 |
|
|
|
|
4.42 |
|
| Total investment operations |
|
|
|
0.86 |
|
|
|
|
2.04 |
|
|
|
|
(4.00 |
) |
|
|
|
2.09 |
|
|
|
|
3.64 |
|
|
|
|
4.39 |
|
| Dividends and/or distributions to shareholders: |
|
|
|
|
|
|
|
|
|
|
|
|
|
|
|
|
|
|
|
|
|
|
|
|
|
|
|
|
|
|
| Net realized gains |
|
|
|
— |
|
|
|
|
(0.43 |
) |
|
|
|
(5.23 |
) |
|
|
|
(2.00 |
) |
|
|
|
(1.14 |
) |
|
|
|
(1.76 |
) |
| Net asset value, end of period/year |
|
|
$ |
12.25 |
|
|
|
$ |
11.39 |
|
|
|
$ |
9.78 |
|
|
|
$ |
19.01 |
|
|
|
$ |
18.92 |
|
|
|
$ |
16.42 |
|
| |
|
|
|
|
|
|
|
|
|
|
|
|
|
|
|
|
|
|
|
|
|
|
|
|
|
|
|
|
|
|
| Total return |
|
|
|
7.55 |
%(B) |
|
|
|
21.20 |
% |
|
|
|
(22.39 |
)% |
|
|
|
11.37 |
% |
|
|
|
23.56 |
% |
|
|
|
32.77 |
% |
| Ratio and supplemental data: |
|
|
|
|
|
|
|
|
|
|
|
|
|
|
|
|
|
|
|
|
|
|
|
|
|
|
|
|
|
|
| Net assets end of period/year (000’s) |
|
|
$ |
256,495 |
|
|
|
$ |
313,491 |
|
|
|
$ |
272,748 |
|
|
|
$ |
448,767 |
|
|
|
$ |
757,843 |
|
|
|
$ |
649,477 |
|
| Expenses to average net assets |
|
|
|
0.83 |
%(C) |
|
|
|
0.84 |
% |
|
|
|
0.81 |
% |
|
|
|
0.81 |
% |
|
|
|
0.81 |
% |
|
|
|
0.81 |
% |
| Net investment income (loss) to average net assets |
|
|
|
(0.39 |
)%(C) |
|
|
|
(0.31 |
)% |
|
|
|
(0.24 |
)% |
|
|
|
(0.43 |
)% |
|
|
|
(0.26 |
)% |
|
|
|
(0.19 |
)% |
| Portfolio turnover rate |
|
|
|
19 |
%(B) |
|
|
|
46 |
% |
|
|
|
33 |
% |
|
|
|
28 |
% |
|
|
|
39 |
% |
|
|
|
21 |
% |
| (A) |
Calculated based on average number of shares outstanding. |
|
|
|
|
|
|
|
|
|
|
|
|
|
|
|
|
|
|
|
|
|
|
|
|
|
|
|
|
|
|
|
| For a share outstanding during the period and years indicated: |
|
Service Class |
| |
|
June 30, 2024 (unaudited) |
|
December 31, 2023 |
|
December 31, 2022 |
|
December 31, 2021 |
|
December 31, 2020 |
|
December 31, 2019 |
| Net asset value, beginning of period/year |
|
|
$ |
9.80 |
|
|
|
$ |
8.49 |
|
|
|
$ |
17.39 |
|
|
|
$ |
17.51 |
|
|
|
$ |
15.31 |
|
|
|
$ |
12.99 |
|
|
|
|
|
|
|
|
| Investment operations: |
|
|
|
|
|
|
|
|
|
|
|
|
|
|
|
|
|
|
|
|
|
|
|
|
|
|
|
|
|
|
| Net investment income (loss)(A) |
|
|
|
(0.03 |
) |
|
|
|
(0.05 |
) |
|
|
|
(0.06 |
) |
|
|
|
(0.12 |
) |
|
|
|
(0.07 |
) |
|
|
|
(0.06 |
) |
| Net realized and unrealized gain (loss) |
|
|
|
0.76 |
|
|
|
|
1.79 |
|
|
|
|
(3.61 |
) |
|
|
|
2.00 |
|
|
|
|
3.41 |
|
|
|
|
4.14 |
|
| Total investment operations |
|
|
|
0.73 |
|
|
|
|
1.74 |
|
|
|
|
(3.67 |
) |
|
|
|
1.88 |
|
|
|
|
3.34 |
|
|
|
|
4.08 |
|
| Dividends and/or distributions to shareholders: |
|
|
|
|
|
|
|
|
|
|
|
|
|
|
|
|
|
|
|
|
|
|
|
|
|
|
|
|
|
|
| Net realized gains |
|
|
|
— |
|
|
|
|
(0.43 |
) |
|
|
|
(5.23 |
) |
|
|
|
(2.00 |
) |
|
|
|
(1.14 |
) |
|
|
|
(1.76 |
) |
| Net asset value, end of period/year |
|
|
$ |
10.53 |
|
|
|
$ |
9.80 |
|
|
|
$ |
8.49 |
|
|
|
$ |
17.39 |
|
|
|
$ |
17.51 |
|
|
|
$ |
15.31 |
|
| |
|
|
|
|
|
|
|
|
|
|
|
|
|
|
|
|
|
|
|
|
|
|
|
|
|
|
|
|
|
|
| Total return |
|
|
|
7.45 |
%(B) |
|
|
|
20.88 |
% |
|
|
|
(22.60 |
)% |
|
|
|
11.08 |
% |
|
|
|
23.30 |
% |
|
|
|
32.39 |
% |
| Ratio and supplemental data: |
|
|
|
|
|
|
|
|
|
|
|
|
|
|
|
|
|
|
|
|
|
|
|
|
|
|
|
|
|
|
| Net assets end of period/year (000’s) |
|
|
$ |
390,338 |
|
|
|
$ |
375,685 |
|
|
|
$ |
334,348 |
|
|
|
$ |
479,458 |
|
|
|
$ |
456,089 |
|
|
|
$ |
368,301 |
|
| Expenses to average net assets |
|
|
|
1.08 |
%(C) |
|
|
|
1.09 |
% |
|
|
|
1.06 |
% |
|
|
|
1.06 |
% |
|
|
|
1.06 |
% |
|
|
|
1.06 |
% |
| Net investment income (loss) to average net assets |
|
|
|
(0.64 |
)%(C) |
|
|
|
(0.56 |
)% |
|
|
|
(0.49 |
)% |
|
|
|
(0.67 |
)% |
|
|
|
(0.51 |
)% |
|
|
|
(0.43 |
)% |
| Portfolio turnover rate |
|
|
|
19 |
%(B) |
|
|
|
46 |
% |
|
|
|
33 |
% |
|
|
|
28 |
% |
|
|
|
39 |
% |
|
|
|
21 |
% |
| (A) |
Calculated based on average number of shares outstanding. |
The Notes to Financial Statements are an integral part of this report.
|
|
|
|
|
| Transamerica Series Trust |
|
|
|
Semi-Annual Financial Statements 2024 |
|
|
Page 8 |
|
|
Transamerica T. Rowe Price Small Cap VP
NOTES TO FINANCIAL STATEMENTS
At June 30, 2024
(unaudited)
1. ORGANIZATION
Transamerica Series Trust (“TST”) is an open-end management investment company registered under the Investment Company Act of 1940, as amended (the “1940 Act”). TST applies investment company accounting and reporting guidance. TST serves as a funding vehicle for variable life insurance, variable annuity, and group annuity products. Transamerica T. Rowe Price Small Cap VP (the “Portfolio”) is a series of TST and is classified as diversified under the 1940 Act. The Portfolio currently offers two classes of shares, Initial Class and Service Class.
The only shareholders of the Portfolio are affiliated insurance company separate accounts and/or affiliated asset allocation portfolios. Contract holders of the variable life and annuity contracts are not shareholders of the Portfolio. For ease of reference, shareholders and contract holders are collectively referred to in this report as “shareholders.”
This report must be accompanied or preceded by the Portfolio’s current prospectus, which contains additional information about the Portfolio, including risks, as well as investment objectives and strategies.
Transamerica Asset Management, Inc. (“TAM”) serves as investment manager for the Portfolio pursuant to an investment management agreement. TAM provides continuous and regular investment management services to the Portfolio. TAM supervises the Portfolio’s investments, conducts its investment program and provides supervisory, compliance and administrative services to the Portfolio.
TAM currently acts as a “manager of managers” and has hired sub-advisers to furnish day-to-day investment advice and recommendations. TAM may, in the future, determine to provide all aspects of the day-to-day management of the Portfolio without the use of a sub-adviser. When acting as a manager of managers, TAM provides investment management services that include, without limitation, the design and development of the Portfolio and its investment strategies and the ongoing review and evaluation of those investment strategies including recommending changes in strategy where it believes appropriate or advisable; the selection of one or more sub-advisers for the Portfolio employing a combination of quantitative and qualitative screens, research, analysis and due diligence; negotiation of sub-advisory agreements and fees; oversight and monitoring of sub-advisers and recommending changes to sub-advisers where it believes appropriate or advisable; recommending portfolio combinations and liquidations where it believes appropriate or advisable; selection and oversight of transition managers, as needed; regular supervision of the Portfolio’s investments; regular review and evaluation of sub-adviser performance; daily monitoring of the sub-advisers’ buying and selling of securities for the Portfolio; regular review of holdings; ongoing trade oversight and analysis; regular monitoring to ensure adherence to investment process; regular calls and periodic on-site visits with sub-advisers; portfolio construction and asset allocation when using multiple sub-advisers for the Portfolio; risk management oversight and analysis; oversight of negotiation of investment documentation and agreements; design, development, implementation and regular monitoring of the valuation process; periodic due diligence reviews of pricing vendors and vendor methodology; design, development, implementation and regular monitoring of the compliance process; respond to regulatory inquiries and determine appropriate litigation strategy, as needed; review of proxies voted by sub-advisers; oversight of preparation and review of materials for meetings of the Portfolio’s Board of Trustees (the “Board”), participation in these meetings and preparation of regular communications with the Board; oversight of preparation and review of prospectuses, shareholder reports and other disclosure materials and regulatory filings for the Portfolio; oversight of other service providers to the Portfolio, such as the custodian, the transfer agent, the Portfolio’s independent accounting firm and legal counsel; supervision of the performance of recordkeeping and shareholder relations functions for the Portfolio; and oversight of cash management services. TAM uses a variety of quantitative and qualitative tools to carry out its investment management services. TAM, not the Portfolio, is responsible for paying the sub-adviser(s) for their services, and sub-advisory fees are TAM’s expense.
TAM’s investment management services also include the provision of supervisory and administrative services to the Portfolio. These services include performing certain administrative services for the Portfolio and supervising and overseeing the administrative, clerical, recordkeeping and bookkeeping services provided to the Portfolio by State Street Bank and Trust Company (“State Street”), to whom TAM has outsourced the provision of certain sub-administration services. To the extent agreed upon by TAM and the Portfolio from time to time, TAM’s supervisory and administrative services include, but are not limited to: monitoring and verifying the custodian’s daily calculation of the Net Asset Values (“NAV”); shareholder relations functions; compliance services; valuation services; assisting in due diligence and in the oversight and monitoring of certain activities of sub-advisers and certain aspects of Portfolio investments; assisting with Portfolio combinations and liquidations; oversight of the preparation and filing, and review, of all returns and reports, in connection with federal, state and local taxes; oversight and review of regulatory reporting; supervising and coordinating the Portfolio’s custodian and dividend disbursing agent and monitoring their services to the Portfolio; assisting the Portfolio in preparing reports to shareholders; acting as liaison with the Portfolio’s independent public accountants and providing, upon request, analyses, fiscal year summaries and other audit related services; assisting in the preparation of agendas and supporting documents for and minutes of meetings of trustees and committees of trustees; assisting in the preparation of regular communications with the trustees; and providing personnel and office space, telephones and other office equipment as necessary in order for TAM to perform supervisory and administrative services to the Portfolio. The Portfolio
|
|
|
|
|
| Transamerica Series Trust |
|
|
|
Semi-Annual Financial Statements 2024 |
|
|
Page 9 |
|
|
Transamerica T. Rowe Price Small Cap VP
NOTES TO FINANCIAL STATEMENTS (continued)
At June 30, 2024
(unaudited)
1. ORGANIZATION (continued)
pays certain fees and expenses to State Street for sub-administration services which are not administrative services covered by the management agreement with TAM or paid for through the management fees payable thereunder. For the period ended June 30, 2024, (i) the expenses paid to State Street for sub-administration services by the Portfolio are shown as a part of Other expenses within the Statement of Operations and (ii) the expenses payable to State Street for sub-administration services from the Portfolio are shown as part of Other accrued expenses within the Statement of Assets and Liabilities.
2. SIGNIFICANT ACCOUNTING POLICIES
In preparing the Portfolio’s financial statements in accordance with Generally Accepted Accounting Principles in the United States of America (“GAAP”), estimates or assumptions (which could differ from actual results) may be used that affect reported amounts and disclosures. The following is a summary of significant accounting policies followed by the Portfolio.
Security transactions and investment income: Security transactions are accounted for on the trade date. Security gains and losses are calculated on a first-in, first-out basis. Dividend income, if any, is recorded on the ex-dividend date or, in the case of foreign securities, as soon as the Portfolio is informed of the ex-dividend dates, net of foreign taxes. Non-cash dividends, if any, are recorded on the ex-dividend date at fair value. Interest income, if any, is recorded on the accrual basis from settlement date, net of foreign taxes. Fixed income premiums and discounts are amortized and/or accreted over the lives of the respective securities.
Multiple class operations, income, and expenses: Income, non-class specific expenses, and realized and unrealized gains and losses are allocated to each class daily based upon net assets. Each class bears its own specific expenses in addition to the allocated non-class specific expenses.
Distributions to shareholders: Distributions are recorded on the ex-dividend date and are determined in accordance with federal income tax regulations, which may differ from GAAP.
Foreign taxes: The Portfolio may be subject to taxes imposed by the countries in which it invests, with respect to its investments in issuers existing or operating in such countries. The Portfolio may also be subject to foreign taxes on income, gains on investments, or currency repatriation, a portion of which may be recoverable. The Portfolio accrues such taxes and recoveries as applicable when the related income or capital gains are earned or unrealized, and based upon the current interpretation of tax rules and regulations that exist in the markets in which the Portfolio invests. Some countries require governmental approval for the repatriation of investment income, capital, or the proceeds of sales earned by foreign investors. In addition, if there is deterioration in a country’s balance of payments or for other reasons, a country may impose temporary restrictions of foreign capital remittances abroad.
Commission recapture: The sub-adviser(s), to the extent consistent with the best execution and usual commission rate policies and practices, may elect to place security transactions of the Portfolio with broker/dealers with which TST has established a commission recapture program. A commission recapture program is any arrangement under which a broker/dealer applies a portion of the commissions received by such broker/dealer on the security transactions to the Portfolio. In no event will commissions, paid by the Portfolio, be used to pay expenses that would otherwise be borne by any other Portfolios within TST, or by any other party.
There were no commissions recaptured during the period ended June 30, 2024 by the Portfolio.
Indemnification: In the normal course of business, the Portfolio enters into contracts that contain a variety of representations that provide general indemnifications. The Portfolio’s maximum exposure under these arrangements is unknown, as this would involve future claims that may be made against the Portfolio and/or its affiliates that have not yet occurred. However, based on experience, the Portfolio expects the risk of loss to be remote.
3. INVESTMENT VALUATION
TAM has been designated as the Portfolio’s valuation designee pursuant to Rule 2a-5 under the 1940 Act with responsibility for fair valuation subject to oversight by the Portfolio’s Board of Trustees. The net asset value of the Portfolio is computed as of the official close of the New York Stock Exchange (“NYSE”) each day the NYSE is open for business.
TAM utilizes various methods to measure the fair value of its investments on a recurring basis. GAAP establishes a hierarchy that prioritizes inputs to valuation methods. The inputs or methodology used for valuing securities are not necessarily an indication of the risk associated with investing in those securities. The three levels (“Levels”) of inputs of the fair value hierarchy are defined as follows:
|
|
|
|
|
| Transamerica Series Trust |
|
|
|
Semi-Annual Financial Statements 2024 |
|
|
Page 10 |
|
|
Transamerica T. Rowe Price Small Cap VP
NOTES TO FINANCIAL STATEMENTS (continued)
At June 30, 2024
(unaudited)
3. INVESTMENT VALUATION (continued)
Level 1—Unadjusted quoted prices in active markets for identical securities.
Level 2—Inputs, other than quoted prices included in Level 1, which are observable, either directly or indirectly. These inputs may include quoted prices for the identical instrument on an inactive market, prices for similar instruments, interest rates, prepayment speeds, credit risk, yield curves, default rates, and similar data.
Level 3—Unobservable inputs based on the best information available in the circumstances, to the extent observable inputs are not available, which may include TAM’s own assumptions used in determining the fair value of the Portfolio’s investments.
The inputs used to measure fair value may fall into different Levels of the fair value hierarchy. In such cases, for disclosure purposes, the Level in the fair value hierarchy that is assigned to the fair value measurement of a security is determined based on the lowest Level input that is significant to the fair value measurement in its entirety. Certain investments that are measured at fair value using NAV per share, or its equivalent, using the “practical expedient” have not been classified in the fair value Levels. The hierarchy classification of inputs used to value the Portfolio’s investments at June 30, 2024, is disclosed within the Investment Valuation section of the Schedule of Investments.
The availability of observable inputs can vary from security to security and is affected by a wide variety of factors, including, but not limited to, the type of security, whether the security is new and not yet established in the marketplace, the liquidity of markets, and other characteristics particular to the security. To the extent that valuation is based on models or inputs that are less observable or unobservable in the market, the determination of fair value requires more judgment. Accordingly, the degree of judgment exercised in determining fair value is generally greatest for instruments categorized in Level 3. Due to the inherent uncertainty of valuation, the determination of values may differ significantly from values that would have been realized had a ready market for investments existed, and the differences could be material.
Fair value measurements: Descriptions of the valuation techniques applied to the Portfolio’s significant categories of assets and liabilities measured at fair value on a recurring basis are as follows:
Equity securities: Securities are stated at the last reported sales price or closing price on the day of valuation taken from the primary exchange where the security is principally traded. To the extent these securities are actively traded and valuation adjustments are not applied, they are categorized in Level 1 of the fair value hierarchy. Equities traded on inactive markets or valued by reference to similar instruments are generally categorized in Level 2 or Level 3 if inputs are unobservable.
Foreign equity securities: Securities in which the primary trading market closes at the same time or after the NYSE, are valued based on quotations from the primary market in which they are traded and are categorized in Level 1. Because many foreign securities markets and exchanges close prior to the close of the NYSE, closing prices for foreign securities in those markets or on those exchanges do not reflect the events that occur after that close. Certain foreign securities may be fair valued using a pricing service that considers the correlation of the trading patterns of the foreign security to the intraday trading in the U.S. markets for investments such as American Depositary Receipts, financial futures, or ETFs and the movement of certain indices of securities based on a statistical analysis of their historical relationship; such valuations generally are categorized in Level 2.
Securities lending collateral: Securities lending collateral is invested in a money market fund which is valued at the actively traded NAV and no valuation adjustments are applied. Securities lending collateral is categorized in Level 1 of the fair value hierarchy.
Repurchase agreements: Repurchase agreements are valued at cost, which approximates fair value. To the extent the inputs are observable and timely, the values are generally categorized in Level 2 of the fair value hierarchy.
4. SECURITIES AND OTHER INVESTMENTS
Real estate investment trusts (“REITs”): REITs are pooled investment vehicles which invest primarily in income producing real estate, or real estate related loans or interests. Distributions received by REITs are classified at management’s estimate of the dividend income, return of capital and capital gains. Estimates are based on information available at year-end, which includes the previous fiscal year’s classification. The actual amounts of dividend income, return of capital, and capital gains are only determined by each REIT after the fiscal year end and may differ from the estimated amounts. Upon notification from the REITs, some of the distributions received may be re-classified and recorded as a return of capital or capital gains. There are certain additional risks involved in investing in REITs. These include, but are not limited to, economic conditions, changes in zoning laws, real estate values, property taxes, and interest rates.
REITs held at June 30, 2024, if any, are identified within the Schedule of Investments.
|
|
|
|
|
| Transamerica Series Trust |
|
|
|
Semi-Annual Financial Statements 2024 |
|
|
Page 11 |
|
|
Transamerica T. Rowe Price Small Cap VP
NOTES TO FINANCIAL STATEMENTS (continued)
At June 30, 2024
(unaudited)
5. BORROWINGS AND OTHER FINANCING TRANSACTIONS
The Portfolio may engage in borrowing transactions as a means of raising cash to satisfy redemption requests, for other temporary or emergency purposes or, to the extent permitted by its investment policies, to raise additional cash to be invested in other securities or instruments. When the Portfolio invests borrowing proceeds in other securities, the Portfolio will bear the risk that the market value of the securities in which such proceeds are invested goes down and is insufficient to repay the borrowed proceeds. The Portfolio may borrow on a secured or on an unsecured basis. If the Portfolio enters into a secured borrowing arrangement, a portion of the Portfolio’s assets will be used as collateral. The 1940 Act requires the Portfolio to maintain asset coverage of at least 300% of the amount of its borrowings. Asset coverage means the ratio that the value of the Portfolio’s total assets, minus liabilities other than borrowings, bears to the aggregate amount of all borrowings. Although complying with this requirement has the effect of limiting the amount that the Portfolio may borrow, it does not otherwise mitigate the risks of entering into borrowing transactions.
Interfund lending: The Portfolio, along with other funds and portfolios advised by TAM, may participate in an interfund lending program pursuant to exemptive relief granted by the Securities and Exchange Commission on January 18, 2017. This program allows the Portfolio to lend to and borrow from other funds and portfolios advised by TAM. Interfund lending transactions are subject to the conditions of the exemptive relief which places limits on the amount of lending or borrowing a Portfolio may participate in under the program. Interest earned or paid on an interfund lending transaction will be based on the average of certain current market rates. For the period ended June 30, 2024, the Portfolio has not utilized the program.
Repurchase agreements: In a repurchase agreement, the Portfolio purchases a security and simultaneously commits to resell that security to the seller at an agreed-upon price on an agreed-upon date. Securities purchased subject to a repurchase agreement are held at the Portfolio’s custodian, or designated sub-custodian related to tri-party repurchase agreements, and, pursuant to the terms of the repurchase agreement, must be collateralized by securities with an aggregate market value greater than or equal to 100% of the resale price. The Portfolio will bear the risk of value fluctuations until the securities can be sold and may encounter delays and incur costs in liquidating the securities. In the event of bankruptcy or insolvency of the seller, delays and costs may be incurred.
Repurchase agreements are subject to netting agreements, which are agreements between the Portfolio and its counterparties that provide for the net settlement of all transactions and collateral with the Portfolio, through a single payment, in the event of default or termination. Amounts presented within the Schedule of Investments, and as part of Repurchase agreements, at value within the Statement of Assets and Liabilities are shown on a gross basis. The value of the related collateral for each repurchase agreement, as reflected within the Schedule of Investments, exceeds the value of each repurchase agreement at June 30, 2024.
Repurchase agreements at June 30, 2024, if any, are included within the Schedule of Investments and Statement of Assets and Liabilities.
Securities lending: The Portfolio may lend securities to qualified financial institutions, brokers and dealers. State Street serves as securities lending agent to the Portfolio pursuant to a Securities Lending Agreement. Loans of securities are terminable at any time and the borrower, after notice, is required to return borrowed securities within the standard time period for settlement of securities transactions. The lending of securities exposes the Portfolio to risks such as: the borrowers may fail to return the loaned securities or may not be able to provide additional collateral, the Portfolio may experience delays in recovery of the loaned securities or delays in access to collateral, or the Portfolio may experience losses related to the investment collateral. To minimize certain risks, loan counterparties pledge cash, securities issued or guaranteed by the U.S. Government and irrevocable letters of credit issued by banks as collateral. The initial collateral received by the Portfolio is required to have a value of at least 102% of the current value of the loaned securities traded on U.S. exchanges, and a value of at least 105% for all other securities. Typically the lending agent is not permitted to sell, re-pledge or use cash and non-cash collateral it receives. The lending agent has agreed to indemnify the Portfolio in the case of default of any securities borrower.
The Portfolio receives compensation for lending securities from interest or dividends earned on the cash, U.S. Government securities and irrevocable letters of credit held as collateral, less associated fees and expenses. Such income is reflected in Net income from securities lending within the Statement of Operations. Cash collateral received is invested in the State Street Navigator Securities Lending Trust — Government Money Market Portfolio.
The value of loaned securities and related cash and non-cash collateral outstanding at June 30, 2024, if any, are shown on a gross basis within the Schedule of Investments.
|
|
|
|
|
| Transamerica Series Trust |
|
|
|
Semi-Annual Financial Statements 2024 |
|
|
Page 12 |
|
|
Transamerica T. Rowe Price Small Cap VP
NOTES TO FINANCIAL STATEMENTS (continued)
At June 30, 2024
(unaudited)
5. BORROWINGS AND OTHER FINANCING TRANSACTIONS (continued)
The following table reflects a breakdown of transactions accounted for as secured borrowings, the gross obligation by the type, and the remaining contractual maturity of those transactions as of June 30, 2024.
|
|
|
|
|
|
|
|
|
|
|
|
|
|
|
|
|
|
|
|
|
| |
|
Remaining Contractual Maturity of the Agreements |
|
| |
|
Overnight and Continuous |
|
|
Less Than 30 Days |
|
|
Between 30 & 90 Days |
|
|
Greater Than 90 Days |
|
|
Total |
|
| Securities Lending Transactions
Common Stocks |
|
|
$ 3,313,732 |
|
|
$ |
— |
|
|
$ |
— |
|
|
$ |
— |
|
|
|
$ 3,313,732 |
|
| Total Borrowings |
|
|
$ 3,313,732 |
|
|
$ |
— |
|
|
$ |
— |
|
|
$ |
— |
|
|
|
$ 3,313,732 |
|
| |
|
|
|
|
|
|
|
|
|
|
|
|
|
|
|
|
|
|
|
|
6. RISK FACTORS
Investing in the Portfolio involves certain key risks related to the Portfolio’s trading activity. Please reference the Portfolio’s prospectus for a more complete discussion of the following risk(s), as well as other risks of investing in the Portfolio.
Market risk: The market prices of the Portfolio’s securities or other assets may go up or down, sometimes rapidly or unpredictably, due to factors such as economic events, inflation, changes in interest rates, governmental actions or interventions, actions taken by the U.S. Federal Reserve or foreign central banks, market disruptions caused by tariffs, trade disputes or other factors, political developments, armed conflicts, economic sanctions, cybersecurity events, investor sentiment, the global and domestic effects of widespread or local health, weather or climate events, and other factors that may or may not be related to the issuer of the security or other asset. If the market prices of the Portfolio’s securities and assets fall, the value of your investment in the Portfolio could go down.
Economies and financial markets throughout the world are increasingly interconnected. Events or circumstances in one or more countries or regions could be highly disruptive to, and have profound impacts on, global economies or markets. As a result, whether or not the Portfolio invests in securities of issuers located in or with significant exposure to the countries directly affected, the value and liquidity of the Portfolio’s investments may go down.
Growth stocks risk: Returns on growth stocks may not move in tandem with returns on other categories of stocks or the market as a whole. Growth stocks typically are particularly sensitive to market movements and may involve larger price swings because their market prices tend to reflect future expectations. When it appears those expectations may not be met, the prices of growth stocks typically fall. Growth stocks may also be more volatile because they often do not pay dividends. The values of growth stocks tend to go down when interest rates rise because the rise in interest rates reduces the current value of future cash flows. Growth stocks as a group may be out of favor and underperform the overall equity market for a long period of time, for example, while the market favors “value” stocks.
Model and data risk: If quantitative models, algorithms or calculations (whether proprietary and developed by the sub-adviser or supplied by third parties) (“Models”) or information or data supplied by third parties (“Data”) prove to be incorrect or incomplete, any decisions made, in whole or part, in reliance thereon expose the Portfolio to additional risks. Models can be predictive in nature. The use of predictive Models has inherent risks. The success of relying on or otherwise using Models depends on a number of factors, including the validity, accuracy and completeness of the Model’s development, implementation and maintenance, the Model’s assumptions, factors, algorithms and methodologies, and the accuracy and reliability of the supplied historical or other Data. Models rely on, among other things, correct and complete Data inputs. If incorrect Data is entered into even a well-founded Model, the resulting information will be incorrect. However, even if Data is input correctly, Model prices may differ substantially from market prices, especially for securities with complex characteristics. Investments selected with the use of Models may perform differently than expected as a result of the design of the Model, inputs into the Model or other factors. There also can be no assurance that the use of Models will result in effective investment decisions for the Portfolio.
Real estate investment trusts (“REITs”): REITs are pooled investment vehicles which invest primarily in income producing real estate, or real estate related loans or interests. Distributions received by REITs are classified at management’s estimate of the dividend income, return of capital and capital gains. Estimates are based on information available at year-end, which includes the previous fiscal year’s classification. The actual amounts of dividend income, return of capital, and capital gains are only determined by each REIT after the fiscal year end and may differ from the estimated amounts. Upon notification from the REITs, some of the distributions received may be re-classified and recorded as a return of capital or capital gains. There are certain additional risks involved in investing in REITs. These include, but are not limited to, economic conditions, changes in zoning laws, real estate values, property taxes, and interest rates.
|
|
|
|
|
| Transamerica Series Trust |
|
|
|
Semi-Annual Financial Statements 2024 |
|
|
Page 13 |
|
|
Transamerica T. Rowe Price Small Cap VP
NOTES TO FINANCIAL STATEMENTS (continued)
At June 30, 2024
(unaudited)
6. RISK FACTORS (continued)
REITs held at June 30, 2024, if any, are identified within the Schedule of Investments.
7. FEES AND OTHER AFFILIATED TRANSACTIONS
TST serves as a funding vehicle for certain affiliated asset allocation portfolios and certain affiliated separate accounts of Transamerica Life Insurance Company (“TLIC”) and Transamerica Financial Life Insurance Company.
TAM, the Portfolio’s investment manager, is directly owned by TLIC and AUSA Holding, LLC (“AUSA”), both of which are indirect, wholly owned subsidiaries of Aegon Ltd. TLIC is owned by Commonwealth General Corporation (“Commonwealth”). Commonwealth and AUSA are wholly owned by Transamerica Corporation (DE). Transamerica Corporation (DE) is wholly owned by Aegon International B.V., which is wholly owned by Aegon Ltd., a Bermuda exempted company with liability limited by shares (formerly, Aegon NV, a Netherlands corporation) and a publicly traded international insurance group.
Transamerica Fund Services, Inc. (“TFS”) is the Portfolio’s transfer agent. Transamerica Capital, Inc. (“TCI”) is the Portfolio’s distributor/principal underwriter. TAM, TFS and TCI are affiliates of Aegon Ltd.
Certain officers and trustees of the Portfolio may also be officers and/or trustees of TAM, TFS and TCI. No interested trustee who is deemed an interested person due to current or former service with TAM or an affiliate of TAM receives compensation from the Portfolio. The Portfolio does pay non-interested persons (independent trustees), as disclosed in Trustee and CCO fees within the Statement of Operations.
Investment management fees: TAM serves as the Portfolio’s investment manager, performing administration as well as investment advisory services. TAM renders investment advisory, supervisory, and administration services under an investment management agreement and the Portfolio pays a single management fee, which is reflected in Investment management fees within the Statement of Operations.
The Portfolio pays a management fee to TAM based on daily average net assets at the following rates:
|
|
|
|
|
| Breakpoints |
|
Rate |
| |
|
| First $1 billion |
|
|
0.78 |
% |
| Over $1 billion up to $1.5 billion |
|
|
0.77 |
|
| Over $1.5 billion |
|
|
0.76 |
|
TAM has contractually agreed to waive fees and/or reimburse Portfolio expenses to the extent that the total operating expenses excluding, as applicable, acquired fund fees and expenses, interest (including borrowing costs and overdraft charges), taxes, brokerage commissions, dividend and interest expenses on securities sold short, extraordinary expenses and other expenses not incurred in the ordinary course of the Portfolio’s business, exceed the following stated annual operating expense limits to the Portfolio’s daily average net assets. To the extent an expense limit changed during the period, the prior limit is also listed below. The expenses waived and/or reimbursed, if any, are included in Expenses waived and/or reimbursed within the Statement of Operations.
|
|
|
|
|
| Class |
|
Operating Expense Limit |
|
Operating Expense Limit Effective Through |
| |
| Effective May 1, 2024 |
|
|
|
|
| Initial Class |
|
0.88% |
|
May 1, 2025 |
| Service Class |
|
1.13 |
|
May 1, 2025 |
| Prior to May 1, 2024 |
|
|
|
|
| Initial Class |
|
0.93 |
|
|
| Service Class |
|
1.18 |
|
|
TAM is permitted to recapture amounts contractually waived and/or reimbursed to a class during any of the 36 months from the date on which TAM waived fees and/or reimbursed expenses for the class. A class may recapture and reimburse TAM only if such amount does not cause, on any particular business day of the Portfolio, the class’s total annual operating expenses (after the recapture is taken into
|
|
|
|
|
| Transamerica Series Trust |
|
|
|
Semi-Annual Financial Statements 2024 |
|
|
Page 14 |
|
|
Transamerica T. Rowe Price Small Cap VP
NOTES TO FINANCIAL STATEMENTS (continued)
At June 30, 2024
(unaudited)
7. FEES AND OTHER AFFILIATED TRANSACTIONS (continued)
account) to exceed the Operating Expense Limits or any other lower limit then in effect. Amounts recaptured, if any, by TAM for the period ended June 30, 2024 are disclosed in Recapture of previously waived and/or reimbursed fees within the Statement of Operations.
TAM, on a voluntary basis and in addition to the contractual operating expense limits in effect, from time to time may waive and/or reimburse expenses of the Portfolio, or any classes thereof, to such level(s) as the Trust’s officers have determined or may reasonably determine from time to time. Any such voluntary waiver or expense reimbursement may be discontinued by TAM at any time. These amounts are not subject to recapture by TAM.
As of June 30, 2024, there are no amounts available for recapture by TAM.
Distribution and service fees: TST has a distribution plan (“Distribution Plan”) pursuant to Rule 12b-1 under the 1940 Act. Pursuant to the Distribution Plan, TST entered into a distribution agreement with TCI as the Portfolio’s distributor.
The Distribution Plan requires the Portfolio to pay distribution fees to TCI as compensation for various distribution activities, not as reimbursement for specific expenses. Under the Distribution Plan and distribution agreement, TCI, on behalf of the Portfolio, is authorized to pay various service providers, as direct payment for expenses incurred in connection with distribution of the Portfolio’s shares.
The fee on the Service Class shares is paid to the insurance companies for providing services and account maintenance for the policyholders who invest in the variable insurance products which invest in the Service Class shares. TCI has determined that it will not seek payment for the distribution expenses incurred by the Portfolio with respect to the Initial Class shares before May 1, 2025. Prior to TCI seeking distribution expenses on Initial Class shares, policy and contract owners will be notified in advance. The Portfolio will pay fees relating to Service Class shares. The distribution and service fees are included in Distribution and service fees within the Statement of Operations.
The Portfolio is authorized under the Distribution Plan to pay fees to TCI based on daily average net assets of each applicable class up to the following annual rates:
|
|
|
|
|
| Class |
|
Rate |
| Initial Class |
|
|
0.15 |
% |
| Service Class |
|
|
0.25 |
|
Transfer agent costs: TFS provides transfer agency services under an intercompany agreement with TAM. TFS has outsourced the provision of certain sub-transfer agency services to SS&C Global Investor & Distribution Solutions, Inc. (“SS&C GIDS”). The Portfolio does not pay a separate transfer agent fee to TAM or TFS but does pay certain expenses to SS&C GIDS related to applicable sub-transfer agency services. For the period ended June 30, 2024, (i) the expenses paid to SS&C GIDS by the Portfolio are referred to as transfer agent costs and are included within the Statement of Operations and (ii) the expenses payable to SS&C GIDS by the Portfolio are referred to as transfer agent costs within the Statement of Assets and Liabilities.
Brokerage commissions: The Portfolio incurred no brokerage commissions on security transactions placed with affiliates of the investment manager or sub-adviser(s) for the period ended June 30, 2024.
8. PURCHASES AND SALES OF SECURITIES
For the period ended June 30, 2024, the cost of securities purchased and proceeds from securities sold (excluding short-term securities) are as follows:
|
|
|
|
|
|
|
| Purchases of Securities |
|
Sales/Maturities of Securities |
| Long-Term |
|
U.S. Government |
|
Long-Term |
|
U.S. Government |
| |
| $ 129,702,844 |
|
$ — |
|
$ 216,261,565 |
|
$ — |
9. FEDERAL INCOME TAXES AND DISTRIBUTIONS TO SHAREHOLDERS
The Portfolio has not made any provision for federal income or excise taxes due to its policy to distribute all of its taxable income and capital gains to its shareholders and otherwise qualify as a regulated investment company under Subchapter M of the Internal Revenue
|
|
|
|
|
| Transamerica Series Trust |
|
|
|
Semi-Annual Financial Statements 2024 |
|
|
Page 15 |
|
|
Transamerica T. Rowe Price Small Cap VP
NOTES TO FINANCIAL STATEMENTS (continued)
At June 30, 2024
(unaudited)
9. FEDERAL INCOME TAXES AND DISTRIBUTIONS TO SHAREHOLDERS (continued)
Code. The Portfolio recognizes the tax benefits of uncertain tax positions only where the position is “more likely than not” to be sustained assuming examination by tax authorities. The Portfolio’s tax returns remain subject to examination by the Internal Revenue Service and state tax authorities three years from the date of filing for federal purposes and four years from the date of filing for state purposes. Management has evaluated the Portfolio’s tax provisions taken for all open tax years, and has concluded that no provision for income tax is required in the Portfolio’s financial statements. If applicable, the Portfolio recognizes interest accrued related to unrecognized tax benefits in relation to interest and penalties expense in Other within the Statement of Operations. The Portfolio identifies its major tax jurisdictions as U.S. Federal, the state of Colorado, and foreign jurisdictions where the Portfolio makes significant investments; however, the Portfolio is not aware of any tax positions for which it is reasonably possible that the total amounts of unrecognized tax benefits will change materially in the next twelve months. Distributions are determined in accordance with income tax regulations, which may differ from GAAP.
As of June 30, 2024, the approximate cost for U.S. federal income tax purposes, and the aggregate gross/net unrealized appreciation (depreciation) in the value of investments (including securities sold short and derivatives, if any) are as follows:
|
|
|
|
|
|
|
| Cost |
|
Gross Appreciation |
|
Gross (Depreciation) |
|
Net Appreciation (Depreciation) |
| $ 514,669,750 |
|
$ 170,118,735 |
|
$ (32,281,517) |
|
$ 137,837,218 |
10. NEW ACCOUNTING PRONOUNCEMENT
In June 2022, the Financial Accounting Standards Board issued Accounting Standards Update No. 2022-03 (“ASU 2022-03”), “Fair Value Measurement of Equity Securities Subject to Contractual Sale Restrictions” (“Topic 820”). ASU 2022-03 clarifies the guidance in Topic 820, related to the measurement of the fair value of an equity security subject to contractual sale restrictions, where it eliminates the need to apply a discount to fair value of these securities, and introduces disclosure requirements related to such equity securities. The guidance is effective for fiscal years, and interim periods within those fiscal years, beginning after December 15, 2023, and allows for early adoption. Management is currently evaluating the implications, if any, of the additional requirements and their impact on the Portfolio’s financial statements.
Please see TST’s most recent report on Form N-CSR, available at: www.transamerica.com/annuities/prospectus, for additional information. For the most recently filed complete proxy voting records for the Trust please visit: https://www.transamerica.com/sites/default/files/files/e070d/TST%20N-PX%202021.pdf
|
|
|
|
|
| Transamerica Series Trust |
|
|
|
Semi-Annual Financial Statements 2024 |
|
|
Page 16 |
|
|
Transamerica T. Rowe Price Small Cap VP
MANAGEMENT AND SUB-ADVISORY AGREEMENT — CONTRACT RENEWAL
(unaudited)
At a meeting of the Board of Trustees of Transamerica Series Trust (the “Trustees” or the “Board”) held on June 12-13, 2024, the Board considered the renewal of the management agreement (the “Management Agreement”) between Transamerica Asset Management, Inc. (“TAM”) and Transamerica Series Trust, on behalf of Transamerica T. Rowe Price Small Cap VP (the “Portfolio”). The Board also considered the renewal of the investment sub-advisory agreement (the “Sub-Advisory Agreement” and together with the Management Agreement, the “Agreements”) for the Portfolio between TAM and T. Rowe Price Associates, Inc. (the “Sub-Adviser”).
Following its review and consideration, the Board determined that the terms of the Management Agreement and Sub-Advisory Agreement were reasonable and that the renewal of each of the Agreements was in the best interests of the Portfolio and the holders invested in the Portfolio. The Board, including the independent members of the Board (the “Independent Trustees”), unanimously approved the renewal of each of the Agreements through June 30, 2025.
Prior to reaching their decision, the Trustees requested and received from TAM and the Sub-Adviser certain information. They then reviewed such information as they deemed reasonably necessary to evaluate the Agreements, including information they had previously received from TAM and the Sub-Adviser as part of their regular oversight of the Portfolio, and knowledge they gained over time through meeting with TAM and the Sub-Adviser. Among other materials, the Trustees considered comparative fee, expense and performance information prepared by Broadridge Financial Solutions, Inc. (“Broadridge”), an independent provider of mutual fund performance information, as well as fee, expense and profitability information prepared by TAM. To the extent applicable, the Trustees considered information about fees and performance of comparable funds and/or accounts managed by the Sub-Adviser. The Board also considered reductions to the Portfolio’s expense limits, if any, that took effect after the last renewal of the Agreements. In their review, the Trustees also sought to identify instances in which the Portfolio’s performance, fees, total expenses and/or profitability appeared to be outliers within its respective peer group or other comparative metrics and sought to understand the reasons for such comparative positions.
In their deliberations, the Independent Trustees met privately without representatives of TAM or the Sub-Adviser present and were represented throughout the process by their independent legal counsel. In considering the proposed continuation of each of the Agreements, the Trustees evaluated and weighed a number of considerations that they believed to be relevant in light of the legal advice furnished to them by counsel, including independent legal counsel, and made a decision in the exercise of their own business judgment. They based their decisions on the considerations discussed below, among others, although they did not identify any particular consideration or item of information that was controlling of their decisions, and each Trustee may have attributed different weights to the various factors.
Nature, Extent and Quality of the Services Provided
The Board considered the nature, extent and quality of the services provided by TAM and the Sub-Adviser to the Portfolio in the past and the services anticipated to be provided in the future. The Board also considered the investment approach for the Portfolio; the experience, capability and integrity of TAM’s senior management; the financial resources of TAM; TAM’s management oversight process; TAM’s and the Sub-Adviser’s responsiveness to any questions by the Trustees; and the professional qualifications and compensation program of the portfolio management team of the Sub-Adviser. The Trustees noted that they receive, on a quarterly basis, an execution analysis from Capital Institutional Services, Inc. (CAPIS), an independent provider of trade analyses, for the Sub-Adviser and a comparison of trading results against a peer universe of managers.
The Board also considered the continuous and regular investment management and other services provided by TAM, when acting as a manager of managers, for the portion of the management fee it retains from the Portfolio after payment of the sub-advisory fees. The Board noted that the investment management and other services provided by TAM include the design, development and ongoing review and evaluation of the Portfolio and its investment strategy; the selection, oversight and monitoring of one or more investment sub-advisers to perform certain duties with respect to the Portfolio; ongoing portfolio trading oversight and analysis; risk management oversight and analysis; design, development, implementation and ongoing review and evaluation of a process for the valuation of Portfolio investments; design, development, implementation and ongoing review and evaluation of a compliance program for the Portfolio; design, development, implementation and ongoing review and evaluation of a process for the voting of proxies and exercise of rights to consent to corporate action for Portfolio investments; participation in Board meetings and oversight of preparation of materials for the Board, including materials for Board meetings and regular communications with the Board; oversight of preparation of the Portfolio’s prospectus, statement of additional information, shareholder reports and other disclosure materials and regulatory filings for the Portfolio; and ongoing cash management services for the Portfolio. The Board considered that TAM’s investment management services also include the provision of supervisory and administrative services to the Portfolio. The Board also noted that TAM, as part of the services it provides to all Transamerica mutual funds, including the Portfolio, oversees the services provided by the funds’ custodian, transfer agent, independent accountant and legal counsel and supervises the performance of the recordkeeping and holder service functions of the funds.
Investment Performance
In addition, the Board considered the short- and longer-term performance of the Portfolio in light of its investment objective, policies and strategies, including relative performance against (i) a peer universe of comparable mutual funds, as prepared by Broadridge, and (ii) the Portfolio’s benchmarks, in each case for various trailing periods ended December 31, 2023. Based on these considerations, the Board determined that TAM and the Sub-Adviser can provide investment and related services that are appropriate in scope and extent in light of the Portfolio’s investment objectives, policies and strategies and operations, the competitive landscape of the investment company
|
|
|
|
|
| Transamerica Series Trust |
|
|
|
Semi-Annual Financial Statements 2024 |
|
|
Page 17 |
|
|
Transamerica T. Rowe Price Small Cap VP
MANAGEMENT AND SUB-ADVISORY AGREEMENT — CONTRACT RENEWAL (continued)
(unaudited)
business and investor needs. The Board’s conclusions as to the Portfolio’s performance are summarized below. For purposes of its review, the Board generally used the performance of Service Class Shares. In describing the Portfolio’s performance relative to its peer universe, the summary conclusions characterize performance for the relevant periods in relation to whether it was “above,” “below” or “in line with” the peer universe median and do so using quintile rankings prepared by Broadridge. For simplicity, performance is described as “above” the median if the Portfolio’s performance ranked anywhere in the first or second quintiles, as “below” the median if it ranked anywhere in the fourth or fifth quintiles, or “in line with” the median if it ranked anywhere in the third quintile (i.e., even if its precise return was somewhat above or somewhat below the precise median return).
When considering the Portfolio’s performance, the Trustees considered any representations made by TAM regarding the appropriateness of certain peer groups and benchmarks. They recognized that performance reflects a snapshot of a period as of a specific date, and that consideration of performance data for a different period could generate significantly different performance results. The Trustees also recognized that even longer-term performance can be negatively affected by performance over a short-term period when that short-term performance is significantly below the performance of the comparable benchmark or universe of peer funds.
The Board noted that the performance of Service Class Shares of the Portfolio was above the median for its peer universe for the past 1-, 3-, 5- and 10-year periods. The Board also noted that the performance of Service Class Shares of the Portfolio was above the benchmark that TAM utilizes to measure performance of the Portfolio for the past 3- and 10-year periods and below the benchmark for the past 1- and 5-year periods.
Management Fee and Sub-Advisory Fees and Total Expense Ratio
The Board considered the management fee and total expense ratio of the Portfolio, including information provided by Broadridge comparing the management fee and total expense ratio of the Portfolio to the management fees and total expense ratios of comparable investment companies in both a peer group and broader peer universe compiled by Broadridge. The Board’s conclusions as to the Portfolio’s management fee and total expense ratio are summarized below. For purposes of its review, the Board generally used the actual total expenses (i.e., expenses reflecting any waivers and/or reimbursements) of Service Class Shares. In describing the Portfolio’s management fee and total expense ratio relative to its peer group and peer universe, the summary conclusions characterize management fees and total expense ratios for the relevant periods in relation to whether they were “above,” “below” or “in line with” the peer group or peer universe median and do so using quintile rankings prepared by Broadridge. For simplicity, management fees and total expense ratios are described as “above” the median if the Portfolio’s management fee or total expense ratio ranked anywhere in the fourth or fifth quintiles, as “below” the median if it ranked anywhere in the first or second quintiles, or “in line with” the median if it ranked anywhere in the third quintile (i.e., even if its precise management fee or total expense ratio was somewhat above or somewhat below the precise median management fee or total expense ratio).
The Board also considered the fees charged by the Sub-Adviser for sub-advisory services, as well as the portion of the Portfolio’s management fee retained by TAM following payment of the sub-advisory fee and how the portion of the contractual management fee retained by TAM at a specified asset level compared to the portions retained by other investment advisers managing mutual funds with similar investment strategies as calculated by an independent provider of information.
The Board noted that the Portfolio’s contractual management fee was below the median for its peer group and in line with the median for its peer universe and that the actual total expenses (i.e., expenses reflecting any waivers and/or reimbursements) of Service Class Shares of the Portfolio were in line with the medians for its peer group and peer universe. The Trustees also considered that TAM has entered into an expense limitation arrangement with the Portfolio, which may result in TAM waiving fees for the benefit of holders.
On the basis of these considerations, together with the other information it considered, the Board determined that the management and sub-advisory fees to be received by TAM and the Sub-Adviser under the Management Agreement and Sub-Advisory Agreement are reasonable in light of the services provided.
Cost of Services Provided and Level of Profitability
The Board reviewed information provided by TAM about the cost of providing and procuring fund management services, as well as the costs of the provision of administration, transfer agency and other services, to the Portfolio and to Transamerica Series Trust as a whole by TAM and its affiliates. The Board considered the profitability of TAM and its affiliates in providing these services for the Portfolio and Transamerica Series Trust as a whole. The Trustees recognized the competitiveness of the mutual fund industry and the importance of an investment adviser’s long-term profitability, including for maintaining company and management stability and accountability.
The Board also considered the allocation methodology used for calculating the profitability of TAM and its affiliates. The Board noted that the revenue and expense allocation methodology used by TAM to estimate its profitability with respect to its relationship with the Portfolio had been reviewed previously by an independent consultant. The Trustees considered that TAM reported that it had not made material changes to this methodology, and that the methodology had been applied consistently for the Portfolio.
|
|
|
|
|
| Transamerica Series Trust |
|
|
|
Semi-Annual Financial Statements 2024 |
|
|
Page 18 |
|
|
Transamerica T. Rowe Price Small Cap VP
MANAGEMENT AND SUB-ADVISORY AGREEMENT — CONTRACT RENEWAL (continued)
(unaudited)
With respect to the Sub-Adviser, the Board noted that the sub-advisory fee is the product of arm’s-length negotiation between TAM and the Sub-Adviser, which is not affiliated with TAM, and is paid by TAM and not the Portfolio. As a result, the Board focused on the profitability of TAM and its affiliates with respect to the Portfolio.
Based on this information, the Board determined that the profitability of TAM and its affiliates from their relationships with the Portfolio was not excessive.
Economies of Scale
The Board considered economies of scale with respect to the management of the Portfolio, whether the Portfolio had appropriately benefited from any economies of scale and whether there was the potential for realization of any future economies of scale. The Board also considered the existence of economies of scale with respect to management of the Transamerica mutual funds overall and the extent to which the Portfolio benefited from any economies of scale. The Board recognized that, as the Portfolio’s assets increase, any economies of scale realized by TAM or the Sub-Adviser may not directly correlate with each other or with any economies of scale that might be realized by the Portfolio. The Board considered the Portfolio’s management fee schedule and the existence of breakpoints and also considered the extent to which TAM shared economies of scale, if any, with the Portfolio through undertakings to limit or reimburse Portfolio expenses and to invest in maintaining and developing its capabilities and services. The Board also considered the Sub-Adviser’s sub-advisory fee schedule and the existence of breakpoints, if any, and how such breakpoints relate to any breakpoints in the Portfolio’s management fee schedule. The Trustees concluded that the Portfolio’s fee structure reflected an appropriate sharing of any efficiencies or economies of scale to date and noted that they will have the opportunity to periodically reexamine the appropriateness of the management fee payable to TAM and the fee paid to the Sub-Adviser in light of any economies of scale experienced in the future.
Benefits to TAM, its Affiliates and/or the Sub-Adviser from their Relationships with the Portfolio
The Board considered other benefits derived by TAM, its affiliates, and/or the Sub-Adviser from their relationships with the Portfolio. The Board noted that TAM does not receive benefits from research obtained with commissions paid to broker-dealers for portfolio transactions (commonly referred to as “soft dollars”) as a result of its relationship with the Portfolio and that TAM believes the use of soft dollars by the Sub-Adviser is generally appropriate and in the best interests of the Portfolio.
Other Considerations
The Board noted that TAM has made a substantial commitment to the recruitment and retention of high-quality personnel and maintains the financial, compliance and operational resources reasonably necessary to manage the Portfolio in a professional manner that is consistent with the best interests of the Portfolio and the holders. In this regard, the Board favorably considered the procedures and policies TAM has in place to enforce compliance with applicable laws and regulations and oversee the portfolio management activities of the Sub-Adviser. The Board also noted that TAM has made an entrepreneurial commitment and undertaken certain business risks with respect to the management and success of the Portfolio.
Conclusion
After consideration of the factors described above, as well as other factors, the Trustees, including the Independent Trustees, concluded that the renewal of the Management Agreement and the Sub-Advisory Agreement was in the best interests of the Portfolio and the holders and voted to approve the renewal of the Agreements.
|
|
|
|
|
| Transamerica Series Trust |
|
|
|
Semi-Annual Financial Statements 2024 |
|
|
Page 19 |
|
|
Transamerica T. Rowe Price Small Cap VP
RESULTS OF SHAREHOLDER MEETING
(unaudited)
Rule 30e-1 under the Investment Company Act of 1940, as amended, titled “Reports to Stockholders of Management Companies,” requires regulated investment companies to report on all subject matters put to the vote of shareholders and to provide final results. Accordingly, the Board of Trustees of the Portfolio solicited a vote by the shareholders for the following item:
A special meeting of holders of Transamerica T. Rowe Price Small Cap VP was held on April 29, 2024. The results of Proposal 2 were as follows:
To approve the Portfolio’s use of the manager of managers exemptive order, which will allow TAM, the Portfolio’s investment manager, to enter into and materially amend sub-advisory agreements with respect to the Portfolio in the future without Holder approval, subject to prior approval by the Portfolio’s Board of Trustees.
|
|
|
| Proposal |
|
Number of Shares |
| |
| For |
|
58,656,693 |
| Against |
|
1,527,875 |
| Withheld |
|
1,456,729 |
|
|
|
|
|
| Transamerica Series Trust |
|
|
|
Semi-Annual Financial Statements 2024 |
|
|
Page 20 |
|
|
PROXY VOTING POLICIES AND PROCEDURES AND QUARTERLY PORTFOLIO HOLDINGS
(unaudited)
A description of Transamerica Series Trust’s (the “Trust”) proxy voting policies and procedures is available in the Statement of Additional Information of the Portfolios, available without charge upon request by calling 1-800-851-9777 (toll free) or on the Securities and Exchange Commission’s (“SEC”) website at http://www.sec.gov.
In addition, the Portfolio is required to file Form N-PX, with their complete proxy voting records for the most recent 12 months ended June 30th, no later than August 31st of each year. The Form is available without charge: (1) on the Transamerica Funds website at https://www.transamerica.com/sites/default/files/files/e070d/TST%20N-PX%202021.pdf; and (2) on the SEC’s website at http://www.sec.gov.
Each fiscal quarter, the Portfolios, except Transamerica BlackRock Government Money Market VP, will file with the SEC a complete schedule of its monthly portfolio holdings on Form N-PORT. The Portfolios’ holdings as of the end of the third month of every fiscal quarter, as reported on Form N-PORT, will be publicly available on the SEC’s website at http://www.sec.gov within 60 days of the end of the fiscal quarter.
On a monthly basis, Transamerica BlackRock Government Money Market VP will file with the SEC portfolio holdings information on Form N-MFP3. A complete schedule of portfolio holdings is also available at www.transamerica.com.
You may also visit the Trust’s website at www.transamerica.com/annuities/prospectus for this and other information about the Portfolios and the Trust.
Important Notice Regarding Delivery of Shareholder Documents
Every year we provide shareholders informative materials such as the Transamerica Series Trust Annual Report, the Transamerica Series Trust Prospectus, and other required documents that keep you informed regarding your Portfolios. To the extent provided by mail, Transamerica Series Trust will only send one piece per mailing address, a method that saves your Portfolios money by reducing mailing and printing costs. We will continue to do this unless you tell us not to. To elect to receive individual mailings, simply call a Transamerica Customer Service Representative toll free at 1-800-851-9777, 8 a.m. to 7 p.m. Eastern Time, Monday-Friday. Your request will take effect within 30 days.
|
|
|
|
|
| Transamerica Series Trust |
|
|
|
Semi-Annual Financial Statements 2024 |
|
|
Page 21 |
|
|
NOTICE OF PRIVACY POLICY
(unaudited)
Your privacy is very important to us. We want you to understand what information we collect and how we use it. We collect and use “nonpublic personal information” in connection with providing our customers with a broad range of financial products and services as effectively and conveniently as possible. We treat nonpublic personal information in accordance with our Privacy Policy.
What Information We Collect and From Whom We Collect It
We may collect nonpublic personal information about you from the following sources:
| • |
|
Information we receive from you on applications or other forms, such as your name, address, and account number; |
| • |
|
Information about your transactions with us, our affiliates, or others, such as your account balance and purchase/redemption history; and |
| • |
|
Information we receive from non-affiliated third parties, including consumer reporting agencies. |
What Information We Disclose and To Whom We Disclose It
We do not disclose any nonpublic personal information about current or former customers to anyone without their express consent, except as permitted by law. We may disclose the nonpublic personal information we collect, as described above, to persons or companies that perform services on our behalf and to other financial institutions with which we have joint marketing agreements. We will require these companies to protect the confidentiality of your nonpublic personal information and to use it only to perform the services for which we have hired them.
Our Security Procedures
We restrict access to your nonpublic personal information and only allow disclosures to persons and companies as permitted by law to assist in providing products or services to you. We maintain physical, electronic, and procedural safeguards to protect your nonpublic personal information and to safeguard the disposal of certain consumer information.
Contact Us
If you have any questions about our Privacy Policy, please call 1-800-851-9777 on any business day between 8 a.m. and 7 p.m. Eastern Time.
Note: This Privacy Policy applies only to customers that have a direct relationship with us or our affiliates. If you own shares of our portfolios in the name of a third party such as a bank or broker-dealer, its privacy policy may apply to you instead of ours.
|
|
|
|
|
| Transamerica Series Trust |
|
|
|
Semi-Annual Financial Statements 2024 |
|
|
Page 22 |
|
|
PO Box 219945
Kansas City, MO 64121-9945
|
|
|
|
|
| Distributor: |
|
Transamerica Capital, Inc. |
|
|
PO Box 219945 Kansas City, MO 64121-9945 Customer Service: 1-800-851-9777 |
Transamerica Series Trust Semi-Annual Financial Statements
June 30, 2024
1801 California St., Suite 5200
Denver, CO 80202
Distributor: Transamerica Capital, Inc.
Customer Service: 1-800-851-9777
|
| The following pages contain the most recent semi-annual financial statements for the investment options in which you are invested. In compliance with Securities and Exchange Commission regulations, we present these reports on an annual and semi-annual basis with the hope that they will foster greater understanding of the investment options’ holdings, performance, financial data, accounting policies and other issues. This streamlined version provides information only on the investment options in which you are invested. If you have any questions about these reports, please do not hesitate to contact your financial professional. As always, we thank you for your trust and the opportunity to serve you. |
Transamerica TSW International Equity VP
SCHEDULE OF INVESTMENTS
At June 30, 2024
(unaudited)
|
|
|
|
|
|
|
|
|
| |
|
Shares |
|
|
Value |
|
| COMMON STOCKS - 97.7% |
|
| Australia - 3.5% |
|
| BHP Group Ltd. |
|
|
17,500 |
|
|
|
$ 498,257 |
|
| Macquarie Group Ltd. |
|
|
15,800 |
|
|
|
2,157,469 |
|
| Santos Ltd. |
|
|
355,900 |
|
|
|
1,818,643 |
|
| Sonic Healthcare Ltd. |
|
|
84,600 |
|
|
|
1,484,284 |
|
| Whitehaven Coal Ltd. |
|
|
117,100 |
|
|
|
597,598 |
|
|
|
|
|
|
|
|
|
|
|
|
|
|
|
|
|
|
|
|
6,556,251 |
|
|
|
|
|
|
|
|
|
|
| Belgium - 3.1% |
|
| Anheuser-Busch InBev SA |
|
|
56,500 |
|
|
|
3,274,731 |
|
| Groupe Bruxelles Lambert NV |
|
|
10,600 |
|
|
|
756,616 |
|
| KBC Group NV |
|
|
24,600 |
|
|
|
1,736,160 |
|
|
|
|
|
|
|
|
|
|
|
|
|
|
|
|
|
|
|
|
5,767,507 |
|
|
|
|
|
|
|
|
|
|
| Canada - 0.8% |
|
| CCL Industries, Inc., Class B |
|
|
21,700 |
|
|
|
1,141,112 |
|
| TFI International, Inc. (A) |
|
|
2,100 |
|
|
|
304,919 |
|
|
|
|
|
|
|
|
|
|
|
|
|
|
|
|
|
1,446,031 |
|
|
|
|
|
|
|
|
|
|
| Denmark - 0.6% |
|
| Novo Nordisk AS, Class B |
|
|
7,500 |
|
|
|
1,083,014 |
|
|
|
|
|
|
|
|
|
|
|
| France - 10.5% |
|
| Accor SA |
|
|
51,900 |
|
|
|
2,128,803 |
|
| Amundi SA (B) |
|
|
18,900 |
|
|
|
1,219,518 |
|
| Capgemini SE |
|
|
11,198 |
|
|
|
2,227,008 |
|
| Cie de Saint-Gobain SA |
|
|
19,300 |
|
|
|
1,501,008 |
|
| Pluxee NV (C) |
|
|
17,400 |
|
|
|
488,132 |
|
| Rexel SA |
|
|
24,400 |
|
|
|
631,330 |
|
| Sanofi SA |
|
|
26,168 |
|
|
|
2,520,535 |
|
| Societe Generale SA |
|
|
77,400 |
|
|
|
1,816,983 |
|
| Sodexo SA |
|
|
17,300 |
|
|
|
1,556,305 |
|
| Teleperformance SE (A) |
|
|
6,400 |
|
|
|
674,031 |
|
| TotalEnergies SE |
|
|
35,400 |
|
|
|
2,363,033 |
|
| Veolia Environnement SA |
|
|
92,656 |
|
|
|
2,770,501 |
|
|
|
|
|
|
|
|
|
|
|
|
|
|
|
|
|
|
|
|
19,897,187 |
|
|
|
|
|
|
|
|
|
|
| Germany - 10.8% |
|
| Allianz SE |
|
|
6,741 |
|
|
|
1,873,402 |
|
| BASF SE |
|
|
21,600 |
|
|
|
1,045,243 |
|
| Deutsche Boerse AG |
|
|
10,100 |
|
|
|
2,067,052 |
|
| Deutsche Post AG |
|
|
49,200 |
|
|
|
1,991,184 |
|
| Heidelberg Materials AG |
|
|
23,000 |
|
|
|
2,384,857 |
|
| Infineon Technologies AG |
|
|
62,285 |
|
|
|
2,288,286 |
|
| K&S AG |
|
|
32,900 |
|
|
|
443,071 |
|
| SAP SE |
|
|
21,100 |
|
|
|
4,282,594 |
|
| Siemens AG |
|
|
15,007 |
|
|
|
2,791,985 |
|
| Zalando SE (B)(C) |
|
|
51,100 |
|
|
|
1,197,943 |
|
|
|
|
|
|
|
|
|
|
|
|
|
|
|
|
|
|
|
|
20,365,617 |
|
|
|
|
|
|
|
|
|
|
| Hong Kong - 2.2% |
|
| AIA Group Ltd. |
|
|
162,900 |
|
|
|
1,105,602 |
|
| CK Asset Holdings Ltd. |
|
|
231,200 |
|
|
|
865,995 |
|
| CK Hutchison Holdings Ltd. |
|
|
438,000 |
|
|
|
2,097,720 |
|
|
|
|
|
|
|
|
|
|
|
|
|
|
|
|
|
|
|
|
4,069,317 |
|
|
|
|
|
|
|
|
|
|
| Ireland - 5.0% |
|
| AerCap Holdings NV |
|
|
31,190 |
|
|
|
2,906,908 |
|
| AIB Group PLC |
|
|
352,300 |
|
|
|
1,862,332 |
|
|
|
|
|
|
|
|
|
|
| |
|
Shares |
|
|
Value |
|
| COMMON STOCKS (continued) |
|
| Ireland (continued) |
|
| DCC PLC |
|
|
29,700 |
|
|
|
$ 2,079,924 |
|
| Ryanair Holdings PLC, ADR |
|
|
3,427 |
|
|
|
399,040 |
|
| Smurfit Kappa Group PLC |
|
|
49,521 |
|
|
|
2,206,237 |
|
|
|
|
|
|
|
|
|
|
|
|
|
|
|
|
|
|
|
|
9,454,441 |
|
|
|
|
|
|
|
|
|
|
| Israel - 1.0% |
|
| Check Point Software Technologies Ltd. (C) |
|
|
11,700 |
|
|
|
1,930,500 |
|
|
|
|
|
|
|
|
|
|
|
| Italy - 0.3% |
|
| Prysmian SpA |
|
|
9,535 |
|
|
|
590,430 |
|
|
|
|
|
|
|
|
|
|
|
| Japan - 19.3% |
|
| Astellas Pharma, Inc. |
|
|
115,200 |
|
|
|
1,138,467 |
|
| Canon, Inc. (A) |
|
|
44,700 |
|
|
|
1,209,670 |
|
| FANUC Corp. |
|
|
49,900 |
|
|
|
1,367,450 |
|
| Fujitsu Ltd. |
|
|
160,800 |
|
|
|
2,515,592 |
|
| Hitachi Ltd. |
|
|
160,200 |
|
|
|
3,585,557 |
|
| Kyocera Corp. |
|
|
144,400 |
|
|
|
1,661,735 |
|
| Nintendo Co. Ltd. |
|
|
36,600 |
|
|
|
1,946,358 |
|
| Olympus Corp. |
|
|
132,200 |
|
|
|
2,131,026 |
|
| ORIX Corp. |
|
|
130,300 |
|
|
|
2,876,659 |
|
| Rakuten Group, Inc. (C) |
|
|
270,100 |
|
|
|
1,393,225 |
|
| Renesas Electronics Corp. |
|
|
95,600 |
|
|
|
1,787,932 |
|
| SBI Holdings, Inc. |
|
|
96,000 |
|
|
|
2,426,702 |
|
| Seven & i Holdings Co. Ltd. |
|
|
172,300 |
|
|
|
2,098,999 |
|
| Sony Group Corp. |
|
|
46,000 |
|
|
|
3,899,807 |
|
| Square Enix Holdings Co. Ltd. |
|
|
14,300 |
|
|
|
429,471 |
|
| Sumitomo Mitsui Financial Group, Inc. |
|
|
50,200 |
|
|
|
3,346,355 |
|
| Toyota Industries Corp. |
|
|
30,100 |
|
|
|
2,537,799 |
|
|
|
|
|
|
|
|
|
|
|
|
|
|
|
|
|
|
|
|
36,352,804 |
|
|
|
|
|
|
|
|
|
|
| Luxembourg - 1.8% |
|
| ArcelorMittal SA |
|
|
66,600 |
|
|
|
1,524,222 |
|
| Eurofins Scientific SE (A) |
|
|
24,100 |
|
|
|
1,201,451 |
|
| Tenaris SA |
|
|
48,800 |
|
|
|
749,965 |
|
|
|
|
|
|
|
|
|
|
|
|
|
|
|
|
|
|
|
|
3,475,638 |
|
|
|
|
|
|
|
|
|
|
| Netherlands - 4.2% |
|
| ASML Holding NV |
|
|
2,800 |
|
|
|
2,891,309 |
|
| EXOR NV |
|
|
6,200 |
|
|
|
648,718 |
|
| Heineken Holding NV |
|
|
23,443 |
|
|
|
1,849,078 |
|
| ING Groep NV, Series N |
|
|
89,700 |
|
|
|
1,533,378 |
|
| Koninklijke Philips NV (C) |
|
|
16,920 |
|
|
|
427,462 |
|
| Stellantis NV |
|
|
33,600 |
|
|
|
664,623 |
|
|
|
|
|
|
|
|
|
|
|
|
|
|
|
|
|
|
|
|
8,014,568 |
|
|
|
|
|
|
|
|
|
|
| Norway - 2.0% |
|
| Aker BP ASA |
|
|
69,638 |
|
|
|
1,775,355 |
|
| DNB Bank ASA |
|
|
100,200 |
|
|
|
1,967,963 |
|
|
|
|
|
|
|
|
|
|
|
|
|
|
|
|
|
|
|
|
3,743,318 |
|
|
|
|
|
|
|
|
|
|
| Republic of Korea - 1.6% |
|
| Samsung Electronics Co. Ltd. |
|
|
51,200 |
|
|
|
3,031,457 |
|
|
|
|
|
|
|
|
|
|
|
| Singapore - 1.5% |
|
| DBS Group Holdings Ltd. |
|
|
104,170 |
|
|
|
2,749,443 |
|
|
|
|
|
|
|
|
|
|
|
| Sweden - 2.8% |
|
| Boliden AB |
|
|
18,700 |
|
|
|
598,280 |
|
The Notes to Financial Statements are an integral part of this report.
|
|
|
|
|
| Transamerica Series Trust |
|
|
|
Semi-Annual Financial Statements 2024 |
|
|
Page 1 |
|
|
Transamerica TSW International Equity VP
SCHEDULE OF INVESTMENTS (continued)
At June 30, 2024
(unaudited)
|
|
|
|
|
|
|
|
|
| |
|
Shares |
|
|
Value |
|
| COMMON STOCKS (continued) |
|
| Sweden (continued) |
|
| Essity AB, Class B |
|
|
80,400 |
|
|
|
$ 2,058,737 |
|
| Husqvarna AB, B Shares |
|
|
35,600 |
|
|
|
285,297 |
|
| Skandinaviska Enskilda Banken AB, Class A |
|
|
117,600 |
|
|
|
1,736,428 |
|
| Volvo AB, B Shares |
|
|
22,549 |
|
|
|
576,756 |
|
|
|
|
|
|
|
|
|
|
|
|
|
|
|
|
|
|
|
|
5,255,498 |
|
|
|
|
|
|
|
|
|
|
| Switzerland - 7.7% |
|
| Cie Financiere Richemont SA, Class A |
|
|
13,600 |
|
|
|
2,122,990 |
|
| Glencore PLC |
|
|
293,800 |
|
|
|
1,675,351 |
|
| Julius Baer Group Ltd. |
|
|
23,300 |
|
|
|
1,301,864 |
|
| Nestle SA |
|
|
33,476 |
|
|
|
3,417,462 |
|
| Novartis AG |
|
|
19,380 |
|
|
|
2,074,433 |
|
| Roche Holding AG |
|
|
14,532 |
|
|
|
4,035,544 |
|
|
|
|
|
|
|
|
|
|
|
|
|
|
|
|
|
|
|
|
14,627,644 |
|
|
|
|
|
|
|
|
|
|
| United Kingdom - 19.0% |
|
| Ashtead Group PLC |
|
|
29,300 |
|
|
|
1,956,353 |
|
| Aviva PLC |
|
|
202,765 |
|
|
|
1,221,598 |
|
| Barratt Developments PLC |
|
|
122,700 |
|
|
|
732,406 |
|
| BP PLC |
|
|
496,100 |
|
|
|
2,980,073 |
|
| Bunzl PLC |
|
|
26,900 |
|
|
|
1,023,529 |
|
| Burberry Group PLC |
|
|
33,400 |
|
|
|
370,615 |
|
| CNH Industrial NV |
|
|
145,200 |
|
|
|
1,470,876 |
|
| Dowlais Group PLC |
|
|
363,603 |
|
|
|
335,990 |
|
| Entain PLC |
|
|
82,400 |
|
|
|
656,219 |
|
| GSK PLC |
|
|
105,780 |
|
|
|
2,045,193 |
|
| Inchcape PLC |
|
|
133,287 |
|
|
|
1,253,551 |
|
| Informa PLC |
|
|
80,704 |
|
|
|
873,069 |
|
| Kingfisher PLC |
|
|
430,800 |
|
|
|
1,354,900 |
|
| Legal & General Group PLC |
|
|
713,200 |
|
|
|
2,046,531 |
|
| Liberty Global Ltd., Class C (C) |
|
|
53,323 |
|
|
|
951,815 |
|
| Lloyds Banking Group PLC |
|
|
3,723,900 |
|
|
|
2,576,820 |
|
| Pearson PLC |
|
|
83,200 |
|
|
|
1,042,055 |
|
| Persimmon PLC |
|
|
49,000 |
|
|
|
837,441 |
|
| Reckitt Benckiser Group PLC |
|
|
38,600 |
|
|
|
2,089,369 |
|
| Shell PLC |
|
|
71,100 |
|
|
|
2,547,127 |
|
| Smith & Nephew PLC |
|
|
168,900 |
|
|
|
2,093,644 |
|
|
|
|
|
|
|
|
|
|
| |
|
Shares |
|
|
Value |
|
| COMMON STOCKS (continued) |
|
| United Kingdom (continued) |
|
| Tesco PLC |
|
|
572,574 |
|
|
|
$ 2,214,799 |
|
| Unilever PLC |
|
|
59,593 |
|
|
|
3,273,153 |
|
|
|
|
|
|
|
|
|
|
|
|
|
|
|
|
|
|
|
|
35,947,126 |
|
|
|
|
|
|
|
|
|
|
| Total Common Stocks (Cost $163,993,852) |
|
|
|
184,357,791 |
|
|
|
|
|
|
|
|
|
|
| PREFERRED STOCK - 0.7% |
|
| Germany - 0.7% |
|
| Henkel AG & Co. KGaA, 2.24% (D) |
|
|
14,700 |
|
|
|
1,310,130 |
|
|
|
|
|
|
|
|
|
|
|
|
|
| Total Preferred Stock (Cost $1,139,019) |
|
|
|
|
|
|
1,310,130 |
|
|
|
|
|
|
|
|
|
|
|
|
| OTHER INVESTMENT COMPANY - 0.2% |
|
|
|
|
|
| Securities Lending Collateral - 0.2% |
|
| State Street Navigator Securities Lending Trust - Government Money Market Portfolio, 5.28% (D) |
|
|
313,639 |
|
|
|
313,639 |
|
|
|
|
|
|
|
|
|
|
|
|
| Total Other Investment Company (Cost $313,639) |
|
|
|
313,639 |
|
|
|
|
|
|
|
|
|
|
|
|
|
|
|
|
| |
|
Principal |
|
|
Value |
|
| REPURCHASE AGREEMENT - 1.2% |
|
| Fixed Income Clearing Corp., 2.50% (D), dated 06/28/2024, to be repurchased at $2,321,563 on 07/01/2024. Collateralized by a U.S. Government Obligation, 3.75%, due 04/15/2026, and with a value of $2,367,634. |
|
$ |
2,321,079 |
|
|
|
2,321,079 |
|
|
|
|
|
|
|
|
|
|
|
|
| Total Repurchase Agreement (Cost $2,321,079) |
|
|
|
2,321,079 |
|
|
|
|
|
|
|
| Total Investments (Cost $167,767,589) |
|
|
|
188,302,639 |
|
| Net Other Assets (Liabilities) - 0.2% |
|
|
|
386,415 |
|
|
|
|
|
|
|
|
|
|
|
|
| Net Assets - 100.0% |
|
|
$ |
188,689,054 |
|
|
|
|
|
|
|
INVESTMENT VALUATION:
Valuation Inputs (E)
|
|
|
|
|
|
|
|
|
|
|
|
|
|
|
|
|
| |
|
Level 1 - Unadjusted Quoted Prices |
|
|
Level 2 - Other Significant Observable Inputs |
|
|
Level 3 - Significant
Unobservable Inputs |
|
|
Value |
|
| |
|
| ASSETS |
|
|
|
|
|
|
|
|
|
|
|
|
|
|
|
|
| Investments |
|
|
|
|
|
|
|
|
|
|
|
|
|
|
|
|
| Common Stocks |
|
$ |
9,105,170 |
|
|
$ |
175,252,621 |
|
|
$ |
— |
|
|
$ |
184,357,791 |
|
| Preferred Stock |
|
|
— |
|
|
|
1,310,130 |
|
|
|
— |
|
|
|
1,310,130 |
|
| Other Investment Company |
|
|
313,639 |
|
|
|
— |
|
|
|
— |
|
|
|
313,639 |
|
| Repurchase Agreement |
|
|
— |
|
|
|
2,321,079 |
|
|
|
— |
|
|
|
2,321,079 |
|
|
|
|
|
|
|
|
|
|
|
|
|
|
|
|
|
|
|
|
|
|
|
| Total Investments |
|
$ |
9,418,809 |
|
|
$ |
178,883,830 |
|
|
$ |
— |
|
|
$ |
188,302,639 |
|
|
|
|
|
|
|
|
|
|
|
|
|
|
|
|
|
|
The Notes to Financial Statements are an integral part of this report.
|
|
|
|
|
| Transamerica Series Trust |
|
|
|
Semi-Annual Financial Statements 2024 |
|
|
Page 2 |
|
|
Transamerica TSW International Equity VP
SCHEDULE OF INVESTMENTS (continued)
At June 30, 2024
(unaudited)
FOOTNOTES TO SCHEDULE OF INVESTMENTS:
| (A) |
All or a portion of the security is on loan. The total value of the securities on loan is $3,322,967, collateralized by cash collateral of $313,639 and non-cash collateral, such as U.S. government securities and irrevocable letters of credit, of $3,177,690. The amount on loan indicated may not correspond with the securities on loan identified because a security with pending sales are in the process of recall from the brokers. |
| (B) |
Security is exempt from registration pursuant to Rule 144A of the Securities Act of 1933. Security may be resold as transactions exempt from registration, normally to qualified institutional buyers. At June 30, 2024, the total value of 144A securities is $2,417,461, representing 1.3% of the Portfolio’s net assets. |
| (C) |
Non-income producing security. |
| (D) |
Rate disclosed reflects the yield at June 30, 2024. |
| (E) |
There were no transfers in or out of Level 3 during the period ended June 30, 2024. Please reference the Investment Valuation section of the Notes to Financial Statements for more information regarding investment valuation and pricing inputs. |
PORTFOLIO ABBREVIATION(S):
ADR American Depositary Receipt
The Notes to Financial Statements are an integral part of this report.
|
|
|
|
|
| Transamerica Series Trust |
|
|
|
Semi-Annual Financial Statements 2024 |
|
|
Page 3 |
|
|
Transamerica TSW International Equity VP
|
|
|
| STATEMENT OF ASSETS AND LIABILITIES At June 30, 2024 (unaudited) |
|
STATEMENT OF OPERATIONS For the period ended June 30, 2024 (unaudited) |
|
|
|
|
|
|
|
| Assets: |
|
|
|
|
| Investments, at value (cost $165,446,510) (including securities loaned of $3,322,967) |
|
$ |
185,981,560 |
|
| Repurchase agreement, at value (cost $2,321,079) |
|
|
2,321,079 |
|
| Foreign currency, at value (cost $203,985) |
|
|
203,892 |
|
| Receivables and other assets: |
|
|
|
|
| Net income from securities lending |
|
|
2,157 |
|
| Shares of beneficial interest sold |
|
|
2,623 |
|
| Dividends |
|
|
240,008 |
|
| Interest |
|
|
484 |
|
| Tax reclaims |
|
|
883,315 |
|
| Prepaid expenses |
|
|
776 |
|
| Total assets |
|
|
189,635,894 |
|
|
|
| Liabilities: |
|
|
|
|
| Cash collateral received upon return of: |
|
|
|
|
| Securities on loan |
|
|
313,639 |
|
| Payables and other liabilities: |
|
|
|
|
| Investments purchased |
|
|
422,342 |
|
| Shares of beneficial interest redeemed |
|
|
22,902 |
|
| Investment management fees |
|
|
112,823 |
|
| Distribution and service fees |
|
|
12,643 |
|
| Transfer agent costs |
|
|
173 |
|
| Trustee and CCO fees |
|
|
582 |
|
| Audit and tax fees |
|
|
10,981 |
|
| Custody fees |
|
|
27,365 |
|
| Legal fees |
|
|
3,412 |
|
| Printing and shareholder reports fees |
|
|
12,205 |
|
| Other accrued expenses |
|
|
7,773 |
|
| Total liabilities |
|
|
946,840 |
|
| Net assets |
|
$ |
188,689,054 |
|
|
|
| Net assets consist of: |
|
|
|
|
| Capital stock ($0.01 par value) |
|
$ |
127,015 |
|
| Additional paid-in capital |
|
|
156,568,228 |
|
| Total distributable earnings (accumulated losses) |
|
|
31,993,811 |
|
| |
|
| Net assets |
|
$ |
188,689,054 |
|
|
|
| Net assets by class: |
|
|
|
|
| Initial Class |
|
$ |
122,715,341 |
|
| Service Class |
|
|
65,973,713 |
|
|
|
| Shares outstanding: |
|
|
|
|
| Initial Class |
|
|
8,227,139 |
|
| Service Class |
|
|
4,474,332 |
|
|
|
| Net asset value and offering price per share: |
|
|
|
|
| Initial Class |
|
$ |
14.92 |
|
| Service Class |
|
|
14.74 |
|
|
|
|
|
|
| Investment income: |
|
|
|
|
| Dividend income |
|
$ |
4,636,259 |
|
| Interest income |
|
|
50,857 |
|
| Net income from securities lending |
|
|
15,843 |
|
| Withholding taxes on foreign income |
|
|
(462,987 |
) |
| |
|
| Total investment income |
|
|
4,239,972 |
|
|
|
| Expenses: |
|
|
|
|
| Investment management fees |
|
|
730,750 |
|
| Distribution and service fees: |
|
|
|
|
| Service Class |
|
|
80,051 |
|
| Transfer agent costs |
|
|
1,075 |
|
| Trustee and CCO fees |
|
|
4,472 |
|
| Audit and tax fees |
|
|
10,819 |
|
| Custody fees |
|
|
27,230 |
|
| Legal fees |
|
|
7,234 |
|
| Printing and shareholder reports fees |
|
|
12,350 |
|
| Other |
|
|
9,868 |
|
| Total expenses |
|
|
883,849 |
|
| |
|
| Net investment income (loss) |
|
|
3,356,123 |
|
|
|
| Net realized gain (loss) on: |
|
|
|
|
| Investments |
|
|
5,121,688 |
|
|
|
| Foreign currency transactions |
|
|
(24,510 |
) |
| |
|
| Net realized gain (loss) |
|
|
5,097,178 |
|
|
|
| Net change in unrealized appreciation (depreciation) on: |
|
|
|
|
|
|
| Investments |
|
|
(2,193,872 |
) |
|
|
| Translation of assets and liabilities denominated in foreign currencies |
|
|
(33,434 |
) |
|
|
| Net change in unrealized appreciation (depreciation) |
|
|
(2,227,306 |
) |
|
|
| Net realized and change in unrealized gain (loss) |
|
|
2,869,872 |
|
|
|
| Net increase (decrease) in net assets resulting from operations |
|
$ |
6,225,995 |
|
The Notes to Financial Statements are an integral part of this report.
|
|
|
|
|
| Transamerica Series Trust |
|
|
|
Semi-Annual Financial Statements 2024 |
|
|
Page 4 |
|
|
Transamerica TSW International Equity VP
STATEMENT OF CHANGES IN NET ASSETS
For the period and year ended:
|
|
|
|
|
|
|
|
|
| |
|
June 30, 2024 (unaudited) |
|
|
December 31, 2023 |
|
|
|
| From operations: |
|
|
|
|
|
|
|
|
| Net investment income (loss) |
|
$ |
3,356,123 |
|
|
$ |
3,907,296 |
|
| Net realized gain (loss) |
|
|
5,097,178 |
|
|
|
2,597,913 |
|
| Net change in unrealized appreciation (depreciation) |
|
|
(2,227,306 |
) |
|
|
19,692,519 |
|
| Net increase (decrease) in net assets resulting from operations |
|
|
6,225,995 |
|
|
|
26,197,728 |
|
|
|
|
| Dividends and/or distributions to shareholders: |
|
|
|
|
|
|
|
|
| Initial Class |
|
|
— |
|
|
|
(1,298,953 |
) |
| Service Class |
|
|
— |
|
|
|
(517,359 |
) |
| |
|
|
| Net increase (decrease) in net assets resulting from dividends and/or distributions to shareholders |
|
|
— |
|
|
|
(1,816,312 |
) |
|
|
|
| Capital share transactions: |
|
|
|
|
|
|
|
|
| Proceeds from shares sold: |
|
|
|
|
|
|
|
|
| Initial Class |
|
|
8,810,640 |
|
|
|
30,649,107 |
|
| Service Class |
|
|
3,904,527 |
|
|
|
6,254,290 |
|
| |
|
|
| |
|
|
12,715,167 |
|
|
|
36,903,397 |
|
| Dividends and/or distributions reinvested: |
|
|
|
|
|
|
|
|
| Initial Class |
|
|
— |
|
|
|
1,298,953 |
|
| Service Class |
|
|
— |
|
|
|
517,359 |
|
| |
|
|
| |
|
|
— |
|
|
|
1,816,312 |
|
| Cost of shares redeemed: |
|
|
|
|
|
|
|
|
| Initial Class |
|
|
(15,032,848 |
) |
|
|
(26,032,114 |
) |
| Service Class |
|
|
(4,633,672 |
) |
|
|
(10,053,658 |
) |
|
|
|
| |
|
|
(19,666,520 |
) |
|
|
(36,085,772 |
) |
| Net increase (decrease) in net assets resulting from capital share transactions |
|
|
(6,951,353 |
) |
|
|
2,633,937 |
|
|
|
|
| Net increase (decrease) in net assets |
|
|
(725,358 |
) |
|
|
27,015,353 |
|
|
|
|
| Net assets: |
|
|
|
|
|
|
|
|
| Beginning of period/year |
|
|
189,414,412 |
|
|
|
162,399,059 |
|
| End of period/year |
|
$ |
188,689,054 |
|
|
$ |
189,414,412 |
|
|
|
|
| Capital share transactions - shares: |
|
|
|
|
|
|
|
|
| Shares issued: |
|
|
|
|
|
|
|
|
| Initial Class |
|
|
604,608 |
|
|
|
2,271,080 |
|
| Service Class |
|
|
264,428 |
|
|
|
463,366 |
|
| |
|
|
| |
|
|
869,036 |
|
|
|
2,734,446 |
|
| Shares reinvested: |
|
|
|
|
|
|
|
|
| Initial Class |
|
|
— |
|
|
|
95,092 |
|
| Service Class |
|
|
— |
|
|
|
38,238 |
|
| |
|
|
| |
|
|
— |
|
|
|
133,330 |
|
| Shares redeemed: |
|
|
|
|
|
|
|
|
| Initial Class |
|
|
(1,000,494 |
) |
|
|
(1,859,276 |
) |
| Service Class |
|
|
(318,592 |
) |
|
|
(747,815 |
) |
| |
|
|
| |
|
|
(1,319,086 |
) |
|
|
(2,607,091 |
) |
| Net increase (decrease) in shares outstanding: |
|
|
|
|
|
|
|
|
| Initial Class |
|
|
(395,886 |
) |
|
|
506,896 |
|
| Service Class |
|
|
(54,164 |
) |
|
|
(246,211 |
) |
| |
|
|
| |
|
|
(450,050 |
) |
|
|
260,685 |
|
The Notes to Financial Statements are an integral part of this report.
|
|
|
|
|
| Transamerica Series Trust |
|
|
|
Semi-Annual Financial Statements 2024 |
|
|
Page 5 |
|
|
Transamerica TSW International Equity VP
FINANCIAL HIGHLIGHTS
|
|
|
|
|
|
|
|
|
|
|
|
|
|
|
|
|
|
|
|
|
|
|
|
|
| For a share outstanding during the period and years indicated: |
|
Initial Class |
|
|
|
|
|
|
|
|
| |
|
June 30, 2024 (unaudited) |
|
|
December 31, 2023 |
|
|
December 31, 2022 |
|
|
December 31, 2021 |
|
|
December 31, 2020 |
|
|
December 31, 2019 |
|
|
|
|
|
|
|
|
| Net asset value, beginning of period/year |
|
$ |
14.45 |
|
|
$ |
12.65 |
|
|
$ |
16.04 |
|
|
$ |
14.40 |
|
|
$ |
13.95 |
|
|
$ |
11.90 |
|
|
|
|
|
|
|
|
| Investment operations: |
|
|
|
|
|
|
|
|
|
|
|
|
|
|
|
|
|
|
|
|
|
|
|
|
| Net investment income (loss)(A) |
|
|
0.26 |
|
|
|
0.30 |
|
|
|
0.34 |
|
|
|
0.31 |
|
|
|
0.20 |
|
|
|
0.30 |
|
| Net realized and unrealized gain (loss) |
|
|
0.21 |
|
|
|
1.65 |
|
|
|
(2.70 |
) |
|
|
1.62 |
|
|
|
0.65 |
|
|
|
2.15 |
|
|
|
|
|
|
|
|
| Total investment operations |
|
|
0.47 |
|
|
|
1.95 |
|
|
|
(2.36 |
) |
|
|
1.93 |
|
|
|
0.85 |
|
|
|
2.45 |
|
|
|
|
|
|
|
|
| Dividends and/or distributions to shareholders: |
|
|
|
|
|
|
|
|
|
|
|
|
|
|
|
|
|
|
|
|
|
|
|
|
| Net investment income |
|
|
— |
|
|
|
(0.15 |
) |
|
|
(0.47 |
) |
|
|
(0.29 |
) |
|
|
(0.40 |
) |
|
|
(0.19 |
) |
| Net realized gains |
|
|
— |
|
|
|
— |
|
|
|
(0.56 |
) |
|
|
— |
|
|
|
— |
|
|
|
(0.21 |
) |
|
|
|
|
|
|
|
| Total dividends and/or distributions to shareholders |
|
|
— |
|
|
|
(0.15 |
) |
|
|
(1.03 |
) |
|
|
(0.29 |
) |
|
|
(0.40 |
) |
|
|
(0.40 |
) |
|
|
|
|
|
|
|
| Net asset value, end of period/year |
|
$ |
14.92 |
|
|
$ |
14.45 |
|
|
$ |
12.65 |
|
|
$ |
16.04 |
|
|
$ |
14.40 |
|
|
$ |
13.95 |
|
| |
|
|
|
|
|
|
|
|
|
|
|
|
|
|
|
|
|
|
|
|
|
|
|
|
|
| Total return |
|
|
3.25 |
%(B) |
|
|
15.48 |
% |
|
|
(14.40 |
)% |
|
|
13.41 |
% |
|
|
6.54 |
% |
|
|
21.06 |
% |
|
|
|
|
|
|
|
| Ratio and supplemental data: |
|
|
|
|
|
|
|
|
|
|
|
|
|
|
|
|
|
|
|
|
|
|
|
|
| Net assets end of period/year (000’s) |
|
$ |
122,715 |
|
|
$ |
124,632 |
|
|
$ |
102,637 |
|
|
$ |
124,895 |
|
|
$ |
126,686 |
|
|
$ |
133,161 |
|
| Expenses to average net assets |
|
|
0.85 |
%(C) |
|
|
0.86 |
% |
|
|
0.85 |
% |
|
|
0.85 |
% |
|
|
0.88 |
% |
|
|
0.84 |
% |
| Net investment income (loss) to average net assets |
|
|
3.65 |
%(C) |
|
|
2.21 |
% |
|
|
2.49 |
% |
|
|
1.97 |
% |
|
|
1.59 |
% |
|
|
2.28 |
% |
| Portfolio turnover rate |
|
|
6 |
%(B) |
|
|
17 |
% |
|
|
14 |
% |
|
|
19 |
% |
|
|
20 |
% |
|
|
16 |
% |
| (A) |
Calculated based on average number of shares outstanding. |
|
|
|
|
|
|
|
|
|
|
|
|
|
|
|
|
|
|
|
|
|
|
|
|
|
| For a share outstanding during the period and years indicated: |
|
Service Class |
|
|
|
|
|
|
|
|
| |
|
June 30, 2024 (unaudited) |
|
|
December 31, 2023 |
|
|
December 31, 2022 |
|
|
December 31, 2021 |
|
|
December 31, 2020 |
|
|
December 31, 2019 |
|
|
|
|
|
|
|
|
| Net asset value, beginning of period/year |
|
$ |
14.31 |
|
|
$ |
12.52 |
|
|
$ |
15.88 |
|
|
$ |
14.26 |
|
|
$ |
13.83 |
|
|
$ |
11.80 |
|
|
|
|
|
|
|
|
| Investment operations: |
|
|
|
|
|
|
|
|
|
|
|
|
|
|
|
|
|
|
|
|
|
|
|
|
| Net investment income (loss)(A) |
|
|
0.24 |
|
|
|
0.27 |
|
|
|
0.31 |
|
|
|
0.26 |
|
|
|
0.16 |
|
|
|
0.26 |
|
| Net realized and unrealized gain (loss) |
|
|
0.19 |
|
|
|
1.63 |
|
|
|
(2.68 |
) |
|
|
1.62 |
|
|
|
0.64 |
|
|
|
2.13 |
|
|
|
|
|
|
|
|
| Total investment operations |
|
|
0.43 |
|
|
|
1.90 |
|
|
|
(2.37 |
) |
|
|
1.88 |
|
|
|
0.80 |
|
|
|
2.39 |
|
|
|
|
|
|
|
|
| Dividends and/or distributions to shareholders: |
|
|
|
|
|
|
|
|
|
|
|
|
|
|
|
|
|
|
|
|
|
|
|
|
| Net investment income |
|
|
— |
|
|
|
(0.11 |
) |
|
|
(0.43 |
) |
|
|
(0.26 |
) |
|
|
(0.37 |
) |
|
|
(0.15 |
) |
| Net realized gains |
|
|
— |
|
|
|
— |
|
|
|
(0.56 |
) |
|
|
— |
|
|
|
— |
|
|
|
(0.21 |
) |
|
|
|
|
|
|
|
| Total dividends and/or distributions to shareholders |
|
|
— |
|
|
|
(0.11 |
) |
|
|
(0.99 |
) |
|
|
(0.26 |
) |
|
|
(0.37 |
) |
|
|
(0.36 |
) |
|
|
|
|
|
|
|
| Net asset value, end of period/year |
|
$ |
14.74 |
|
|
$ |
14.31 |
|
|
$ |
12.52 |
|
|
$ |
15.88 |
|
|
$ |
14.26 |
|
|
$ |
13.83 |
|
| |
|
|
|
|
|
|
|
|
|
|
|
|
|
|
|
|
|
|
|
|
|
|
|
|
|
| Total return |
|
|
3.00 |
%(B) |
|
|
15.26 |
% |
|
|
(14.63 |
)% |
|
|
13.20 |
% |
|
|
6.20 |
% |
|
|
20.74 |
% |
|
|
|
|
|
|
|
| Ratio and supplemental data: |
|
|
|
|
|
|
|
|
|
|
|
|
|
|
|
|
|
|
|
|
|
|
|
|
| Net assets end of period/year (000’s) |
|
$ |
65,974 |
|
|
$ |
64,782 |
|
|
$ |
59,762 |
|
|
$ |
77,923 |
|
|
$ |
68,290 |
|
|
$ |
57,952 |
|
| Expenses to average net assets |
|
|
1.10 |
%(C) |
|
|
1.11 |
% |
|
|
1.10 |
% |
|
|
1.10 |
% |
|
|
1.13 |
% |
|
|
1.09 |
% |
| Net investment income (loss) to average net assets |
|
|
3.32 |
%(C) |
|
|
2.02 |
% |
|
|
2.29 |
% |
|
|
1.67 |
% |
|
|
1.28 |
% |
|
|
2.01 |
% |
| Portfolio turnover rate |
|
|
6 |
%(B) |
|
|
17 |
% |
|
|
14 |
% |
|
|
19 |
% |
|
|
20 |
% |
|
|
16 |
% |
| (A) |
Calculated based on average number of shares outstanding. |
The Notes to Financial Statements are an integral part of this report.
|
|
|
|
|
| Transamerica Series Trust |
|
|
|
Semi-Annual Financial Statements 2024 |
|
|
Page 6 |
|
|
Transamerica TSW International Equity VP
NOTES TO FINANCIAL STATEMENTS
At June 30, 2024
(unaudited)
1. ORGANIZATION
Transamerica Series Trust (“TST”) is an open-end management investment company registered under the Investment Company Act of 1940, as amended (the “1940 Act”). TST applies investment company accounting and reporting guidance. TST serves as a funding vehicle for variable life insurance, variable annuity, and group annuity products. Transamerica TSW International Equity VP (formerly, Transamerica TS&W International Equity VP) (the “Portfolio”) is a series of TST and is classified as diversified under the 1940 Act. The Portfolio currently offers two classes of shares, Initial Class and Service Class.
The only shareholders of the Portfolio are affiliated insurance company separate accounts and/or affiliated asset allocation portfolios. Contract holders of the variable life and annuity contracts are not shareholders of the Portfolio. For ease of reference, shareholders and contract holders are collectively referred to in this report as “shareholders.”
This report must be accompanied or preceded by the Portfolio’s current prospectus, which contains additional information about the Portfolio, including risks, as well as investment objectives and strategies.
Transamerica Asset Management, Inc. (“TAM”) serves as investment manager for the Portfolio pursuant to an investment management agreement. TAM provides continuous and regular investment management services to the Portfolio. TAM supervises the Portfolio’s investments, conducts its investment program and provides supervisory, compliance and administrative services to the Portfolio.
TAM currently acts as a “manager of managers” and has hired sub-advisers to furnish day-to-day investment advice and recommendations. TAM may, in the future, determine to provide all aspects of the day-to-day management of the Portfolio without the use of a sub-adviser. When acting as a manager of managers, TAM provides investment management services that include, without limitation, the design and development of the Portfolio and its investment strategies and the ongoing review and evaluation of those investment strategies including recommending changes in strategy where it believes appropriate or advisable; the selection of one or more sub-advisers for the Portfolio employing a combination of quantitative and qualitative screens, research, analysis and due diligence; negotiation of sub-advisory agreements and fees; oversight and monitoring of sub-advisers and recommending changes to sub-advisers where it believes appropriate or advisable; recommending portfolio combinations and liquidations where it believes appropriate or advisable; selection and oversight of transition managers, as needed; regular supervision of the Portfolio’s investments; regular review and evaluation of sub-adviser performance; daily monitoring of the sub-advisers’ buying and selling of securities for the Portfolio; regular review of holdings; ongoing trade oversight and analysis; regular monitoring to ensure adherence to investment process; regular calls and periodic on-site visits with sub-advisers; portfolio construction and asset allocation when using multiple sub-advisers for the Portfolio; risk management oversight and analysis; oversight of negotiation of investment documentation and agreements; design, development, implementation and regular monitoring of the valuation process; periodic due diligence reviews of pricing vendors and vendor methodology; design, development, implementation and regular monitoring of the compliance process; respond to regulatory inquiries and determine appropriate litigation strategy, as needed; review of proxies voted by sub-advisers; oversight of preparation and review of materials for meetings of the Portfolio’s Board of Trustees (the “Board”), participation in these meetings and preparation of regular communications with the Board; oversight of preparation and review of prospectuses, shareholder reports and other disclosure materials and regulatory filings for the Portfolio; oversight of other service providers to the Portfolio, such as the custodian, the transfer agent, the Portfolio’s independent accounting firm and legal counsel; supervision of the performance of recordkeeping and shareholder relations functions for the Portfolio; and oversight of cash management services. TAM uses a variety of quantitative and qualitative tools to carry out its investment management services. TAM, not the Portfolio, is responsible for paying the sub-adviser(s) for their services, and sub-advisory fees are TAM’s expense.
TAM’s investment management services also include the provision of supervisory and administrative services to the Portfolio. These services include performing certain administrative services for the Portfolio and supervising and overseeing the administrative, clerical, recordkeeping and bookkeeping services provided to the Portfolio by State Street Bank and Trust Company (“State Street”), to whom TAM has outsourced the provision of certain sub-administration services. To the extent agreed upon by TAM and the Portfolio from time to time, TAM’s supervisory and administrative services include, but are not limited to: monitoring and verifying the custodian’s daily calculation of the Net Asset Values (“NAV”); shareholder relations functions; compliance services; valuation services; assisting in due diligence and in the oversight and monitoring of certain activities of sub-advisers and certain aspects of Portfolio investments; assisting with Portfolio combinations and liquidations; oversight of the preparation and filing, and review, of all returns and reports, in connection with federal, state and local taxes; oversight and review of regulatory reporting; supervising and coordinating the Portfolio’s custodian and dividend disbursing agent and monitoring their services to the Portfolio; assisting the Portfolio in preparing reports to shareholders; acting as liaison with the Portfolio’s independent public accountants and providing, upon request, analyses, fiscal year summaries and other audit related services; assisting in the preparation of agendas and supporting documents for and minutes of meetings of trustees and committees of trustees; assisting in the preparation of regular communications with the trustees; and providing personnel and office space, telephones and other office equipment as necessary in order for TAM to perform supervisory and administrative services to the Portfolio. The Portfolio
|
|
|
|
|
| Transamerica Series Trust |
|
|
|
Semi-Annual Financial Statements 2024 |
|
|
Page 7 |
|
|
Transamerica TSW International Equity VP
NOTES TO FINANCIAL STATEMENTS (continued)
At June 30, 2024
(unaudited)
1. ORGANIZATION (continued)
pays certain fees and expenses to State Street for sub-administration services which are not administrative services covered by the management agreement with TAM or paid for through the management fees payable thereunder. For the period ended June 30, 2024, (i) the expenses paid to State Street for sub-administration services by the Portfolio are shown as a part of Other expenses within the Statement of Operations and (ii) the expenses payable to State Street for sub-administration services from the Portfolio are shown as part of Other accrued expenses within the Statement of Assets and Liabilities.
2. SIGNIFICANT ACCOUNTING POLICIES
In preparing the Portfolio’s financial statements in accordance with Generally Accepted Accounting Principles in the United States of America (“GAAP”), estimates or assumptions (which could differ from actual results) may be used that affect reported amounts and disclosures. The following is a summary of significant accounting policies followed by the Portfolio.
Foreign currency denominated investments: The accounting records of the Portfolio are maintained in U.S. dollars. Securities and other assets and liabilities denominated in foreign currencies are translated into U.S. dollars based on the closing exchange rate each day. The cost of foreign securities purchased and any realized gains or losses are translated at the prevailing exchange rates in effect on the date of the respective transaction. The Portfolio combines fluctuations from currency exchange rates and fluctuations in value when computing net realized and unrealized gains or losses from investments.
Net foreign currency gains and losses resulting from changes in exchange rates include, foreign currency fluctuations between trade date and settlement date of investment security transactions, gains and losses on forward foreign currency contracts, and the difference between the receivable amounts of interest and dividends recorded in the accounting records in U.S. dollars and the amounts actually received.
Foreign currency denominated assets may involve risks not typically associated with domestic transactions. These risks include revaluation of currencies, adverse fluctuations in foreign currency values, and possible adverse political, social, and economic developments, including those particular to a specific industry, country or region.
Security transactions and investment income: Security transactions are accounted for on the trade date. Security gains and losses are calculated on a first-in, first-out basis. Dividend income, if any, is recorded on the ex-dividend date or, in the case of foreign securities, as soon as the Portfolio is informed of the ex-dividend dates, net of foreign taxes. Non-cash dividends, if any, are recorded on the ex-dividend date at fair value. Interest income, if any, is recorded on the accrual basis from settlement date, net of foreign taxes. Fixed income premiums and discounts are amortized and/or accreted over the lives of the respective securities.
Multiple class operations, income, and expenses: Income, non-class specific expenses, and realized and unrealized gains and losses are allocated to each class daily based upon net assets. Each class bears its own specific expenses in addition to the allocated non-class specific expenses.
Distributions to shareholders: Distributions are recorded on the ex-dividend date and are determined in accordance with federal income tax regulations, which may differ from GAAP.
Foreign taxes: The Portfolio may be subject to taxes imposed by the countries in which it invests, with respect to its investments in issuers existing or operating in such countries. The Portfolio may also be subject to foreign taxes on income, gains on investments, or currency repatriation, a portion of which may be recoverable. The Portfolio accrues such taxes and recoveries as applicable when the related income or capital gains are earned or unrealized, and based upon the current interpretation of tax rules and regulations that exist in the markets in which the Portfolio invests. Some countries require governmental approval for the repatriation of investment income, capital, or the proceeds of sales earned by foreign investors. In addition, if there is deterioration in a country’s balance of payments or for other reasons, a country may impose temporary restrictions of foreign capital remittances abroad.
Commission recapture: The sub-adviser(s), to the extent consistent with the best execution and usual commission rate policies and practices, may elect to place security transactions of the Portfolio with broker/dealers with which TST has established a commission recapture program. A commission recapture program is any arrangement under which a broker/dealer applies a portion of the commissions received by such broker/dealer on the security transactions to the Portfolio. In no event will commissions, paid by the Portfolio, be used to pay expenses that would otherwise be borne by any other Portfolios within TST, or by any other party.
|
|
|
|
|
| Transamerica Series Trust |
|
|
|
Semi-Annual Financial Statements 2024 |
|
|
Page 8 |
|
|
Transamerica TSW International Equity VP
NOTES TO FINANCIAL STATEMENTS (continued)
At June 30, 2024
(unaudited)
2. SIGNIFICANT ACCOUNTING POLICIES (continued)
Commissions recaptured are included within Net realized gain (loss) within the Statement of Operations. For the period ended June 30, 2024, commissions recaptured are $464.
Indemnification: In the normal course of business, the Portfolio enters into contracts that contain a variety of representations that provide general indemnifications. The Portfolio’s maximum exposure under these arrangements is unknown, as this would involve future claims that may be made against the Portfolio and/or its affiliates that have not yet occurred. However, based on experience, the Portfolio expects the risk of loss to be remote.
3. INVESTMENT VALUATION
TAM has been designated as the Portfolio’s valuation designee pursuant to Rule 2a-5 under the 1940 Act with responsibility for fair valuation subject to oversight by the Portfolio’s Board of Trustees. The net asset value of the Portfolio is computed as of the official close of the New York Stock Exchange (“NYSE”) each day the NYSE is open for business.
TAM utilizes various methods to measure the fair value of its investments on a recurring basis. GAAP establishes a hierarchy that prioritizes inputs to valuation methods. The inputs or methodology used for valuing securities are not necessarily an indication of the risk associated with investing in those securities. The three levels (“Levels”) of inputs of the fair value hierarchy are defined as follows:
Level 1—Unadjusted quoted prices in active markets for identical securities.
Level 2—Inputs, other than quoted prices included in Level 1, which are observable, either directly or indirectly. These inputs may include quoted prices for the identical instrument on an inactive market, prices for similar instruments, interest rates, prepayment speeds, credit risk, yield curves, default rates, and similar data.
Level 3—Unobservable inputs based on the best information available in the circumstances, to the extent observable inputs are not available, which may include TAM’s own assumptions used in determining the fair value of the Portfolio’s investments.
The inputs used to measure fair value may fall into different Levels of the fair value hierarchy. In such cases, for disclosure purposes, the Level in the fair value hierarchy that is assigned to the fair value measurement of a security is determined based on the lowest Level input that is significant to the fair value measurement in its entirety. Certain investments that are measured at fair value using NAV per share, or its equivalent, using the “practical expedient” have not been classified in the fair value Levels. The hierarchy classification of inputs used to value the Portfolio’s investments at June 30, 2024, is disclosed within the Investment Valuation section of the Schedule of Investments.
The availability of observable inputs can vary from security to security and is affected by a wide variety of factors, including, but not limited to, the type of security, whether the security is new and not yet established in the marketplace, the liquidity of markets, and other characteristics particular to the security. To the extent that valuation is based on models or inputs that are less observable or unobservable in the market, the determination of fair value requires more judgment. Accordingly, the degree of judgment exercised in determining fair value is generally greatest for instruments categorized in Level 3. Due to the inherent uncertainty of valuation, the determination of values may differ significantly from values that would have been realized had a ready market for investments existed, and the differences could be material.
Fair value measurements: Descriptions of the valuation techniques applied to the Portfolio’s significant categories of assets and liabilities measured at fair value on a recurring basis are as follows:
Equity securities: Securities are stated at the last reported sales price or closing price on the day of valuation taken from the primary exchange where the security is principally traded. To the extent these securities are actively traded and valuation adjustments are not applied, they are categorized in Level 1 of the fair value hierarchy. Equities traded on inactive markets or valued by reference to similar instruments are generally categorized in Level 2 or Level 3 if inputs are unobservable.
Foreign equity securities: Securities in which the primary trading market closes at the same time or after the NYSE, are valued based on quotations from the primary market in which they are traded and are categorized in Level 1. Because many foreign securities markets and exchanges close prior to the close of the NYSE, closing prices for foreign securities in those markets or on those exchanges do not reflect the events that occur after that close. Certain foreign securities may be fair valued using a pricing service that considers the correlation of the trading patterns of the foreign security to the intraday trading in the U.S. markets for investments such as American Depositary Receipts, financial futures, or ETFs and the movement of certain indices of securities based on a statistical analysis of their historical relationship; such valuations generally are categorized in Level 2.
|
|
|
|
|
| Transamerica Series Trust |
|
|
|
Semi-Annual Financial Statements 2024 |
|
|
Page 9 |
|
|
Transamerica TSW International Equity VP
NOTES TO FINANCIAL STATEMENTS (continued)
At June 30, 2024
(unaudited)
3. INVESTMENT VALUATION (continued)
Securities lending collateral: Securities lending collateral is invested in a money market fund which is valued at the actively traded NAV and no valuation adjustments are applied. Securities lending collateral is categorized in Level 1 of the fair value hierarchy.
Repurchase agreements: Repurchase agreements are valued at cost, which approximates fair value. To the extent the inputs are observable and timely, the values are generally categorized in Level 2 of the fair value hierarchy.
4. BORROWINGS AND OTHER FINANCING TRANSACTIONS
The Portfolio may engage in borrowing transactions as a means of raising cash to satisfy redemption requests, for other temporary or emergency purposes or, to the extent permitted by its investment policies, to raise additional cash to be invested in other securities or instruments. When the Portfolio invests borrowing proceeds in other securities, the Portfolio will bear the risk that the market value of the securities in which such proceeds are invested goes down and is insufficient to repay the borrowed proceeds. The Portfolio may borrow on a secured or on an unsecured basis. If the Portfolio enters into a secured borrowing arrangement, a portion of the Portfolio’s assets will be used as collateral. The 1940 Act requires the Portfolio to maintain asset coverage of at least 300% of the amount of its borrowings. Asset coverage means the ratio that the value of the Portfolio’s total assets, minus liabilities other than borrowings, bears to the aggregate amount of all borrowings. Although complying with this requirement has the effect of limiting the amount that the Portfolio may borrow, it does not otherwise mitigate the risks of entering into borrowing transactions.
Interfund lending: The Portfolio, along with other funds and portfolios advised by TAM, may participate in an interfund lending program pursuant to exemptive relief granted by the Securities and Exchange Commission on January 18, 2017. This program allows the Portfolio to lend to and borrow from other funds and portfolios advised by TAM. Interfund lending transactions are subject to the conditions of the exemptive relief which places limits on the amount of lending or borrowing a Portfolio may participate in under the program. Interest earned or paid on an interfund lending transaction will be based on the average of certain current market rates. For the period ended June 30, 2024, the Portfolio has not utilized the program.
Repurchase agreements: In a repurchase agreement, the Portfolio purchases a security and simultaneously commits to resell that security to the seller at an agreed-upon price on an agreed-upon date. Securities purchased subject to a repurchase agreement are held at the Portfolio’s custodian, or designated sub-custodian related to tri-party repurchase agreements, and, pursuant to the terms of the repurchase agreement, must be collateralized by securities with an aggregate market value greater than or equal to 100% of the resale price. The Portfolio will bear the risk of value fluctuations until the securities can be sold and may encounter delays and incur costs in liquidating the securities. In the event of bankruptcy or insolvency of the seller, delays and costs may be incurred.
Repurchase agreements are subject to netting agreements, which are agreements between the Portfolio and its counterparties that provide for the net settlement of all transactions and collateral with the Portfolio, through a single payment, in the event of default or termination. Amounts presented within the Schedule of Investments, and as part of Repurchase agreements, at value within the Statement of Assets and Liabilities are shown on a gross basis. The value of the related collateral for each repurchase agreement, as reflected within the Schedule of Investments, exceeds the value of each repurchase agreement at June 30, 2024.
Repurchase agreements at June 30, 2024, if any, are included within the Schedule of Investments and Statement of Assets and Liabilities.
Securities lending: The Portfolio may lend securities to qualified financial institutions, brokers and dealers. State Street serves as securities lending agent to the Portfolio pursuant to a Securities Lending Agreement. Loans of securities are terminable at any time and the borrower, after notice, is required to return borrowed securities within the standard time period for settlement of securities transactions. The lending of securities exposes the Portfolio to risks such as: the borrowers may fail to return the loaned securities or may not be able to provide additional collateral, the Portfolio may experience delays in recovery of the loaned securities or delays in access to collateral, or the Portfolio may experience losses related to the investment collateral. To minimize certain risks, loan counterparties pledge cash, securities issued or guaranteed by the U.S. Government and irrevocable letters of credit issued by banks as collateral. The initial collateral received by the Portfolio is required to have a value of at least 102% of the current value of the loaned securities traded on U.S. exchanges, and a value of at least 105% for all other securities. Typically the lending agent is not permitted to sell, re-pledge or use cash and non-cash collateral it receives. The lending agent has agreed to indemnify the Portfolio in the case of default of any securities borrower.
The Portfolio receives compensation for lending securities from interest or dividends earned on the cash, U.S. Government securities and irrevocable letters of credit held as collateral, less associated fees and expenses. Such income is reflected in Net income from securities lending within the Statement of Operations. Cash collateral received is invested in the State Street Navigator Securities Lending Trust — Government Money Market Portfolio.
|
|
|
|
|
| Transamerica Series Trust |
|
|
|
Semi-Annual Financial Statements 2024 |
|
|
Page 10 |
|
|
Transamerica TSW International Equity VP
SCHEDULE OF INVESTMENTS (continued)
At June 30, 2024
(unaudited)
4. BORROWINGS AND OTHER FINANCING TRANSACTIONS (continued)
The value of loaned securities and related cash and non-cash collateral outstanding at June 30, 2024, if any, are shown on a gross basis within the Schedule of Investments.
The following table reflects a breakdown of transactions accounted for as secured borrowings, the gross obligation by the type, and the remaining contractual maturity of those transactions as of June 30, 2024.
|
|
|
|
|
|
|
|
|
|
|
|
|
|
|
|
|
|
|
|
|
| |
|
Remaining Contractual Maturity of the Agreements |
|
| |
|
Overnight and Continuous |
|
|
Less Than 30 Days |
|
|
Between 30 & 90 Days |
|
|
Greater Than 90 Days |
|
|
Total |
|
| |
|
| Securities Lending Transactions |
|
|
|
|
|
|
|
|
|
|
|
|
|
|
|
|
|
|
|
|
| Common Stocks |
|
|
$ 313,639 |
|
|
|
$ — |
|
|
|
$ — |
|
|
|
$ — |
|
|
|
$ 313,639 |
|
| |
|
| Total Borrowings |
|
|
$ 313,639 |
|
|
|
$ — |
|
|
|
$ — |
|
|
|
$ — |
|
|
|
$ 313,639 |
|
| |
|
5. RISK FACTORS
Investing in the Portfolio involves certain key risks related to the Portfolio’s trading activity. Please reference the Portfolio’s prospectus for a more complete discussion of the following risk(s), as well as other risks of investing in the Portfolio.
Market risk: The market prices of the Portfolio’s securities or other assets may go up or down, sometimes rapidly or unpredictably, due to factors such as economic events, inflation, changes in interest rates, governmental actions or interventions, actions taken by the U.S. Federal Reserve or foreign central banks, market disruptions caused by tariffs, trade disputes or other factors, political developments, armed conflicts, economic sanctions, cybersecurity events, investor sentiment, the global and domestic effects of widespread or local health, weather or climate events, and other factors that may or may not be related to the issuer of the security or other asset. If the market prices of the Portfolio’s securities and assets fall, the value of your investment in the Portfolio could go down.
Economies and financial markets throughout the world are increasingly interconnected. Events or circumstances in one or more countries or regions could be highly disruptive to, and have profound impacts on, global economies or markets. As a result, whether or not the Portfolio invests in securities of issuers located in or with significant exposure to the countries directly affected, the value and liquidity of the Portfolio’s investments may go down.
Foreign investments risk: Investing in securities of foreign issuers or issuers with significant exposure to foreign markets involves additional risks. Foreign markets can be less liquid, less regulated, less transparent and more volatile than U.S. markets. The value of the Portfolio’s foreign investments may decline, sometimes rapidly or unpredictably, because of factors affecting the particular issuer as well as foreign markets and issuers generally, such as unfavorable government actions, including nationalization, expropriation or confiscatory taxation, reduction of government or central bank support, tariffs and trade disruptions, sanctions, political or financial instability, social unrest or other adverse economic or political developments. Foreign investments may also be subject to different accounting practices and different regulatory, legal, auditing, financial reporting and recordkeeping standards and practices, and may be more difficult to value than investments in U.S. issuers. Certain foreign clearance and settlement procedures may result in an inability to execute transactions or delays in settlement.
Value investing risk: The prices of securities the sub-adviser believes are undervalued may not appreciate as anticipated or may go down. The value approach to investing involves the risk that stocks may remain undervalued, undervaluation may become more severe, or perceived undervaluation may actually represent intrinsic value. Value stocks as a group may be out of favor and underperform the overall equity market for a long period of time, for example, while the market favors “growth” stocks.
6. FEES AND OTHER AFFILIATED TRANSACTIONS
TST serves as a funding vehicle for certain affiliated asset allocation portfolios and certain affiliated separate accounts of Transamerica Life Insurance Company (“TLIC”) and Transamerica Financial Life Insurance Company.
TAM, the Portfolio’s investment manager, is directly owned by TLIC and AUSA Holding, LLC (“AUSA”), both of which are indirect, wholly owned subsidiaries of Aegon Ltd. TLIC is owned by Commonwealth General Corporation (“Commonwealth”). Commonwealth and AUSA
|
|
|
|
|
| Transamerica Series Trust |
|
|
|
Semi-Annual Financial Statements 2024 |
|
|
Page 11 |
|
|
Transamerica TSW International Equity VP
SCHEDULE OF INVESTMENTS (continued)
At June 30, 2024
(unaudited)
6. FEES AND OTHER AFFILIATED TRANSACTIONS (continued)
are wholly owned by Transamerica Corporation (DE). Transamerica Corporation (DE) is wholly owned by Aegon International B.V., which is wholly owned by Aegon Ltd., a Bermuda exempted company with liability limited by shares (formerly, Aegon NV, a Netherlands corporation) and a publicly traded international insurance group.
Transamerica Fund Services, Inc. (“TFS”) is the Portfolio’s transfer agent. Transamerica Capital, Inc. (“TCI”) is the Portfolio’s distributor/principal underwriter. TAM, TFS and TCI are affiliates of Aegon Ltd.
Certain officers and trustees of the Portfolio may also be officers and/or trustees of TAM, TFS and TCI. No interested trustee who is deemed an interested person due to current or former service with TAM or an affiliate of TAM receives compensation from the Portfolio. The Portfolio does pay non-interested persons (independent trustees), as disclosed in Trustee and CCO fees within the Statement of Operations.
Investment management fees: TAM serves as the Portfolio’s investment manager, performing administration as well as investment advisory services. TAM renders investment advisory, supervisory, and administration services under an investment management agreement and the Portfolio pays a single management fee, which is reflected in Investment management fees within the Statement of Operations.
The Portfolio pays a management fee to TAM based on daily average net assets at the following rates:
|
|
|
|
|
| Breakpoints |
|
Rate |
| |
|
| First $250 million |
|
|
0.77 |
% |
| Over $250 million up to $1 billion |
|
|
0.74 |
|
| Over $1 billion up to $2 billion |
|
|
0.72 |
|
| Over $2 billion up to $6 billion |
|
|
0.69 |
|
| Over $6 billion up to $8 billion |
|
|
0.68 |
|
| Over $8 billion |
|
|
0.66 |
|
TAM has contractually agreed to waive fees and/or reimburse Portfolio expenses to the extent that the total operating expenses excluding, as applicable, acquired fund fees and expenses, interest (including borrowing costs and overdraft charges), taxes, brokerage commissions, dividend and interest expenses on securities sold short, extraordinary expenses and other expenses not incurred in the ordinary course of the Portfolio’s business, exceed the following stated annual operating expense limits to the Portfolio’s daily average net assets. To the extent an expense limit changed during the period, the prior limit is also listed below. The expenses waived and/or reimbursed, if any, are included in Expenses waived and/or reimbursed within the Statement of Operations.
|
|
|
|
|
| Class |
|
Operating Expense Limit |
|
Operating Expense Limit Effective Through |
| |
| Effective May 1, 2024 |
|
|
|
|
| Initial Class |
|
0.91% |
|
May 1, 2025 |
| Service Class |
|
1.16 |
|
May 1, 2025 |
| Prior to May 1, 2024 |
|
|
|
|
| Initial Class |
|
0.92 |
|
|
| Service Class |
|
1.17 |
|
|
TAM is permitted to recapture amounts contractually waived and/or reimbursed to a class during any of the 36 months from the date on which TAM waived fees and/or reimbursed expenses for the class. A class may recapture and reimburse TAM only if such amount does not cause, on any particular business day of the Portfolio, the class’s total annual operating expenses (after the recapture is taken into account) to exceed the Operating Expense Limits or any other lower limit then in effect. Amounts recaptured, if any, by TAM for the period ended June 30, 2024 are disclosed in Recapture of previously waived and/or reimbursed fees within the Statement of Operations.
TAM, on a voluntary basis and in addition to the contractual operating expense limits in effect, from time to time may waive and/or reimburse expenses of the Portfolio, or any classes thereof, to such level(s) as the Trust’s officers have determined or may reasonably determine from time to time. Any such voluntary waiver or expense reimbursement may be discontinued by TAM at any time. These amounts are not subject to recapture by TAM.
|
|
|
|
|
| Transamerica Series Trust |
|
|
|
Semi-Annual Financial Statements 2024 |
|
|
Page 12 |
|
|
Transamerica TSW International Equity VP
NOTES TO FINANCIAL STATEMENTS (continued)
At June 30, 2024
(unaudited)
6. FEES AND OTHER AFFILIATED TRANSACTIONS (continued)
As of June 30, 2024, there are no amounts available for recapture by TAM.
Distribution and service fees: TST has a distribution plan (“Distribution Plan”) pursuant to Rule 12b-1 under the 1940 Act. Pursuant to the Distribution Plan, TST entered into a distribution agreement with TCI as the Portfolio’s distributor.
The Distribution Plan requires the Portfolio to pay distribution fees to TCI as compensation for various distribution activities, not as reimbursement for specific expenses. Under the Distribution Plan and distribution agreement, TCI, on behalf of the Portfolio, is authorized to pay various service providers, as direct payment for expenses incurred in connection with distribution of the Portfolio’s shares.
The fee on the Service Class shares is paid to the insurance companies for providing services and account maintenance for the policyholders who invest in the variable insurance products which invest in the Service Class shares. TCI has determined that it will not seek payment for the distribution expenses incurred by the Portfolio with respect to the Initial Class shares before May 1, 2025. Prior to TCI seeking distribution expenses on Initial Class shares, policy and contract owners will be notified in advance. The Portfolio will pay fees relating to Service Class shares. The distribution and service fees are included in Distribution and service fees within the Statement of Operations.
The Portfolio is authorized under the Distribution Plan to pay fees to TCI based on daily average net assets of each applicable class up to the following annual rates:
|
|
|
|
|
| Class |
|
Rate |
| Initial Class |
|
|
0.15 |
% |
| Service Class |
|
|
0.25 |
|
Transfer agent costs: TFS provides transfer agency services under an intercompany agreement with TAM. TFS has outsourced the provision of certain sub-transfer agency services to SS&C Global Investor & Distribution Solutions, Inc. (“SS&C GIDS”). The Portfolio does not pay a separate transfer agent fee to TAM or TFS but does pay certain expenses to SS&C GIDS related to applicable sub-transfer agency services. For the period ended June 30, 2024, (i) the expenses paid to SS&C GIDS by the Portfolio are referred to as transfer agent costs and are included within the Statement of Operations and (ii) the expenses payable to SS&C GIDS by the Portfolio are referred to as transfer agent costs within the Statement of Assets and Liabilities.
Brokerage commissions: The Portfolio incurred no brokerage commissions on security transactions placed with affiliates of the investment manager or sub-adviser(s) for the period ended June 30, 2024.
7. PURCHASES AND SALES OF SECURITIES
For the period ended June 30, 2024, the cost of securities purchased and proceeds from securities sold (excluding short-term securities) are as follows:
|
|
|
|
|
|
|
| Purchases of Securities |
|
Sales/Maturities of Securities |
|
|
|
|
| Long-Term |
|
U.S. Government |
|
Long-Term |
|
U.S. Government |
| $ 11,944,967 |
|
$ — |
|
$ 17,802,307 |
|
$ — |
8. FEDERAL INCOME TAXES AND DISTRIBUTIONS TO SHAREHOLDERS
The Portfolio has not made any provision for federal income or excise taxes due to its policy to distribute all of its taxable income and capital gains to its shareholders and otherwise qualify as a regulated investment company under Subchapter M of the Internal Revenue Code. The Portfolio recognizes the tax benefits of uncertain tax positions only where the position is “more likely than not” to be sustained assuming examination by tax authorities. The Portfolio’s tax returns remain subject to examination by the Internal Revenue Service and state tax authorities three years from the date of filing for federal purposes and four years from the date of filing for state purposes. Management has evaluated the Portfolio’s tax provisions taken for all open tax years, and has concluded that no provision for income tax is required in the Portfolio’s financial statements. If applicable, the Portfolio recognizes interest accrued related to unrecognized tax benefits in relation to interest and penalties expense in Other within the Statement of Operations. The Portfolio identifies its major tax jurisdictions as U.S. Federal, the state of Colorado, and foreign jurisdictions where the Portfolio makes significant investments; however,
|
|
|
|
|
| Transamerica Series Trust |
|
|
|
Semi-Annual Financial Statements 2024 |
|
|
Page 13 |
|
|
Transamerica TSW International Equity VP
NOTES TO FINANCIAL STATEMENTS (continued)
At June 30, 2024
(unaudited)
8. FEDERAL INCOME TAXES AND DISTRIBUTIONS TO SHAREHOLDERS (continued)
the Portfolio is not aware of any tax positions for which it is reasonably possible that the total amounts of unrecognized tax benefits will change materially in the next twelve months. Distributions are determined in accordance with income tax regulations, which may differ from GAAP.
As of June 30, 2024, the approximate cost for U.S. federal income tax purposes, and the aggregate gross/net unrealized appreciation (depreciation) in the value of investments (including securities sold short and derivatives, if any) are as follows:
|
|
|
|
|
|
|
| Cost |
|
Gross Appreciation |
|
Gross (Depreciation) |
|
Net Appreciation (Depreciation) |
| $ 167,767,589 |
|
$ 34,764,223 |
|
$ (14,229,173) |
|
$ 20,535,050 |
9. NEW ACCOUNTING PRONOUNCEMENT
In June 2022, the Financial Accounting Standards Board issued Accounting Standards Update No. 2022-03 (“ASU 2022-03”), “Fair Value Measurement of Equity Securities Subject to Contractual Sale Restrictions” (“Topic 820”). ASU 2022-03 clarifies the guidance in Topic 820, related to the measurement of the fair value of an equity security subject to contractual sale restrictions, where it eliminates the need to apply a discount to fair value of these securities, and introduces disclosure requirements related to such equity securities. The guidance is effective for fiscal years, and interim periods within those fiscal years, beginning after December 15, 2023, and allows for early adoption. Management is currently evaluating the implications, if any, of the additional requirements and their impact on the Portfolio’s financial statements.
Please see TST’s most recent report on Form N-CSR, available at: www.transamerica.com/annuities/prospectus, for additional information. For the most recently filed complete proxy voting records for the Trust please visit: https://www.transamerica.com/sites/default/files/files/e070d/TST%20N-PX%202021.pdf
|
|
|
|
|
| Transamerica Series Trust |
|
|
|
Semi-Annual Financial Statements 2024 |
|
|
Page 14 |
|
|
Transamerica TSW International Equity VP
MANAGEMENT AND SUB-ADVISORY AGREEMENT — CONTRACT RENEWAL
(unaudited)
At a meeting of the Board of Trustees of Transamerica Series Trust (the “Trustees” or the “Board”) held on June 12-13, 2024, the Board considered the renewal of the management agreement (the “Management Agreement”) between Transamerica Asset Management, Inc. (“TAM”) and Transamerica Series Trust, on behalf of Transamerica TSW International Equity VP (the “Portfolio”). The Board also considered the renewal of the investment sub-advisory agreement (the “Sub-Advisory Agreement” and together with the Management Agreement, the “Agreements”) for the Portfolio between TAM and Thompson, Siegel & Walmsley LLC (the “Sub-Adviser”).
Following its review and consideration, the Board determined that the terms of the Management Agreement and Sub-Advisory Agreement were reasonable and that the renewal of each of the Agreements was in the best interests of the Portfolio and the holders invested in the Portfolio. The Board, including the independent members of the Board (the “Independent Trustees”), unanimously approved the renewal of each of the Agreements through June 30, 2025.
Prior to reaching their decision, the Trustees requested and received from TAM and the Sub-Adviser certain information. They then reviewed such information as they deemed reasonably necessary to evaluate the Agreements, including information they had previously received from TAM and the Sub-Adviser as part of their regular oversight of the Portfolio, and knowledge they gained over time through meeting with TAM and the Sub-Adviser. Among other materials, the Trustees considered comparative fee, expense and performance information prepared by Broadridge Financial Solutions, Inc. (“Broadridge”), an independent provider of mutual fund performance information, as well as fee, expense and profitability information prepared by TAM. In addition, TAM provided the Board with additional supplemental comparative fee, expense and performance information. To the extent applicable, the Trustees considered information about fees and performance of comparable funds and/or accounts managed by the Sub-Adviser. The Board also considered reductions to the Portfolio’s expense limits, if any, that took effect after the last renewal of the Agreements. In their review, the Trustees also sought to identify instances in which the Portfolio’s performance, fees, total expenses and/or profitability appeared to be outliers within its respective peer group or other comparative metrics and sought to understand the reasons for such comparative positions.
In their deliberations, the Independent Trustees met privately without representatives of TAM or the Sub-Adviser present and were represented throughout the process by their independent legal counsel. In considering the proposed continuation of each of the Agreements, the Trustees evaluated and weighed a number of considerations that they believed to be relevant in light of the legal advice furnished to them by counsel, including independent legal counsel, and made a decision in the exercise of their own business judgment. They based their decisions on the considerations discussed below, among others, although they did not identify any particular consideration or item of information that was controlling of their decisions, and each Trustee may have attributed different weights to the various factors.
Nature, Extent and Quality of the Services Provided
The Board considered the nature, extent and quality of the services provided by TAM and the Sub-Adviser to the Portfolio in the past and the services anticipated to be provided in the future. The Board also considered the investment approach for the Portfolio; the experience, capability and integrity of TAM’s senior management; the financial resources of TAM; TAM’s management oversight process; TAM’s and the Sub-Adviser’s responsiveness to any questions by the Trustees; and the professional qualifications and compensation program of the portfolio management team of the Sub-Adviser. The Trustees noted that they receive, on a quarterly basis, an execution analysis from Capital Institutional Services, Inc. (CAPIS), an independent provider of trade analyses, for the Sub-Adviser and a comparison of trading results against a peer universe of managers.
The Board also considered the continuous and regular investment management and other services provided by TAM, when acting as a manager of managers, for the portion of the management fee it retains from the Portfolio after payment of the sub-advisory fees. The Board noted that the investment management and other services provided by TAM include the design, development and ongoing review and evaluation of the Portfolio and its investment strategy; the selection, oversight and monitoring of one or more investment sub-advisers to perform certain duties with respect to the Portfolio; ongoing portfolio trading oversight and analysis; risk management oversight and analysis; design, development, implementation and ongoing review and evaluation of a process for the valuation of Portfolio investments; design, development, implementation and ongoing review and evaluation of a compliance program for the Portfolio; design, development, implementation and ongoing review and evaluation of a process for the voting of proxies and exercise of rights to consent to corporate action for Portfolio investments; participation in Board meetings and oversight of preparation of materials for the Board, including materials for Board meetings and regular communications with the Board; oversight of preparation of the Portfolio’s prospectus, statement of additional information, shareholder reports and other disclosure materials and regulatory filings for the Portfolio; and ongoing cash management services for the Portfolio. The Board considered that TAM’s investment management services also include the provision of supervisory and administrative services to the Portfolio. The Board also noted that TAM, as part of the services it provides to all Transamerica mutual funds, including the Portfolio, oversees the services provided by the funds’ custodian, transfer agent, independent accountant and legal counsel and supervises the performance of the recordkeeping and holder service functions of the funds.
Investment Performance
In addition, the Board considered the short- and longer-term performance of the Portfolio in light of its investment objective, policies and strategies, including relative performance against (i) a peer universe of comparable mutual funds, as prepared by Broadridge, and (ii) the Portfolio’s benchmark, in each case for various trailing periods ended December 31, 2023. Based on these considerations, the Board determined that TAM and the Sub-Adviser can provide investment and related services that are appropriate in scope and extent in light of
|
|
|
|
|
| Transamerica Series Trust |
|
|
|
Semi-Annual Financial Statements 2024 |
|
|
Page 15 |
|
|
Transamerica TSW International Equity VP
MANAGEMENT AND SUB-ADVISORY AGREEMENT — CONTRACT RENEWAL (continued)
(unaudited)
the Portfolio’s investment objectives, policies and strategies and operations, the competitive landscape of the investment company business and investor needs. The Board’s conclusions as to the Portfolio’s performance are summarized below. For purposes of its review, the Board generally used the performance of Service Class Shares. In describing the Portfolio’s performance relative to its peer universe, the summary conclusions characterize performance for the relevant periods in relation to whether it was “above,” “below” or “in line with” the peer universe median and do so using quintile rankings prepared by Broadridge. For simplicity, performance is described as “above” the median if the Portfolio’s performance ranked anywhere in the first or second quintiles, as “below” the median if it ranked anywhere in the fourth or fifth quintiles, or “in line with” the median if it ranked anywhere in the third quintile (i.e., even if its precise return was somewhat above or somewhat below the precise median return).
When considering the Portfolio’s performance, the Trustees considered any representations made by TAM regarding the appropriateness of certain peer groups and benchmarks. They recognized that performance reflects a snapshot of a period as of a specific date, and that consideration of performance data for a different period could generate significantly different performance results. The Trustees also recognized that even longer-term performance can be negatively affected by performance over a short-term period when that short-term performance is significantly below the performance of the comparable benchmark or universe of peer funds.
The Board noted that the performance of Service Class Shares of the Portfolio was in line with the median for its peer universe for the past 10-year period and below the median for the past 1-, 3- and 5-year periods. The Board also noted that the performance of Service Class Shares of the Portfolio was below the benchmark that TAM utilizes to measure performance of the Portfolio for the past 1-, 3-, 5- and 10-year periods. The Trustees discussed the reasons for the underperformance with TAM and TAM agreed to continue to closely monitor and report to the Board on the performance of the Portfolio.
Management Fee and Sub-Advisory Fees and Total Expense Ratio
The Board considered the management fee and total expense ratio of the Portfolio, including information provided by Broadridge comparing the management fee and total expense ratio of the Portfolio to the management fees and total expense ratios of comparable investment companies in both a peer group and broader peer universe compiled by Broadridge. The Board’s conclusions as to the Portfolio’s management fee and total expense ratio are summarized below. For purposes of its review, the Board generally used the actual total expenses (i.e., expenses reflecting any waivers and/or reimbursements) of Service Class Shares. In describing the Portfolio’s management fee and total expense ratio relative to its peer group and peer universe, the summary conclusions characterize management fees and total expense ratios for the relevant periods in relation to whether they were “above,” “below” or “in line with” the peer group or peer universe median and do so using quintile rankings prepared by Broadridge. For simplicity, management fees and total expense ratios are described as “above” the median if the Portfolio’s management fee or total expense ratio ranked anywhere in the fourth or fifth quintiles, as “below” the median if it ranked anywhere in the first or second quintiles, or “in line with” the median if it ranked anywhere in the third quintile (i.e., even if its precise management fee or total expense ratio was somewhat above or somewhat below the precise median management fee or total expense ratio).
The Board also considered the fees charged by the Sub-Adviser for sub-advisory services, as well as the portion of the Portfolio’s management fee retained by TAM following payment of the sub-advisory fee and how the portion of the contractual management fee retained by TAM at a specified asset level compared to the portions retained by other investment advisers managing mutual funds with similar investment strategies as calculated by an independent provider of information.
The Board noted that the Portfolio’s contractual management fee was in line with the medians for its peer group and peer universe and that the actual total expenses (i.e., expenses reflecting any waivers and/or reimbursements) of Service Class Shares of the Portfolio were in line with the median for its peer group and above the median for its peer universe. The Trustees also considered that TAM has entered into an expense limitation arrangement with the Portfolio, which may result in TAM waiving fees for the benefit of holders.
On the basis of these considerations, together with the other information it considered, the Board determined that the management and sub-advisory fees to be received by TAM and the Sub-Adviser under the Management Agreement and Sub-Advisory Agreement are reasonable in light of the services provided.
Cost of Services Provided and Level of Profitability
The Board reviewed information provided by TAM about the cost of providing and procuring fund management services, as well as the costs of the provision of administration, transfer agency and other services, to the Portfolio and to Transamerica Series Trust as a whole by TAM and its affiliates. The Board considered the profitability of TAM and its affiliates in providing these services for the Portfolio and Transamerica Series Trust as a whole. The Trustees recognized the competitiveness of the mutual fund industry and the importance of an investment adviser’s long-term profitability, including for maintaining company and management stability and accountability.
The Board also considered the allocation methodology used for calculating the profitability of TAM and its affiliates. The Board noted that the revenue and expense allocation methodology used by TAM to estimate its profitability with respect to its relationship with the Portfolio had been reviewed previously by an independent consultant. The Trustees considered that TAM reported that it had not made material changes to this methodology, and that the methodology had been applied consistently for the Portfolio.
|
|
|
|
|
| Transamerica Series Trust |
|
|
|
Semi-Annual Financial Statements 2024 |
|
|
Page 16 |
|
|
Transamerica TSW International Equity VP
MANAGEMENT AND SUB-ADVISORY AGREEMENT — CONTRACT RENEWAL (continued)
(unaudited)
With respect to the Sub-Adviser, the Board noted that the sub-advisory fee is the product of arm’s-length negotiation between TAM and the Sub-Adviser, which is not affiliated with TAM, and is paid by TAM and not the Portfolio. As a result, the Board focused on the profitability of TAM and its affiliates with respect to the Portfolio.
Based on this information, the Board determined that the profitability of TAM and its affiliates from their relationships with the Portfolio was not excessive.
Economies of Scale
The Board considered economies of scale with respect to the management of the Portfolio, whether the Portfolio had appropriately benefited from any economies of scale and whether there was the potential for realization of any future economies of scale. The Board also considered the existence of economies of scale with respect to management of the Transamerica mutual funds overall and the extent to which the Portfolio benefited from any economies of scale. The Board recognized that, as the Portfolio’s assets increase, any economies of scale realized by TAM or the Sub-Adviser may not directly correlate with each other or with any economies of scale that might be realized by the Portfolio. The Board considered the Portfolio’s management fee schedule and the existence of breakpoints and also considered the extent to which TAM shared economies of scale, if any, with the Portfolio through undertakings to limit or reimburse Portfolio expenses and to invest in maintaining and developing its capabilities and services. The Board also considered the Sub-Adviser’s sub-advisory fee schedule and the existence of breakpoints, if any, and how such breakpoints relate to any breakpoints in the Portfolio’s management fee schedule. The Board considered that the Sub-Adviser’s sub-advisory fees would be based on the combined assets of multiple funds. The Trustees concluded that the Portfolio’s fee structure reflected an appropriate sharing of any efficiencies or economies of scale to date and noted that they will have the opportunity to periodically reexamine the appropriateness of the management fee payable to TAM and the fee paid to the Sub-Adviser in light of any economies of scale experienced in the future.
Benefits to TAM, its Affiliates and/or the Sub-Adviser from their Relationships with the Portfolio
The Board considered other benefits derived by TAM, its affiliates, and/or the Sub-Adviser from their relationships with the Portfolio. The Board noted that TAM does not receive benefits from research obtained with commissions paid to broker-dealers for portfolio transactions (commonly referred to as “soft dollars”) as a result of its relationship with the Portfolio and that TAM believes the use of soft dollars by the Sub-Adviser is generally appropriate and in the best interests of the Portfolio. The Board also noted that the Sub-Adviser participates in a brokerage program pursuant to which a portion of brokerage commissions paid by the Portfolio is recaptured for the benefit of the Portfolio and the holders, thus limiting the amount of soft dollar arrangements the Sub-Adviser may engage in with respect to the Portfolio’s brokerage transactions.
Other Considerations
The Board noted that TAM has made a substantial commitment to the recruitment and retention of high-quality personnel and maintains the financial, compliance and operational resources reasonably necessary to manage the Portfolio in a professional manner that is consistent with the best interests of the Portfolio and the holders. In this regard, the Board favorably considered the procedures and policies TAM has in place to enforce compliance with applicable laws and regulations and oversee the portfolio management activities of the Sub-Adviser. The Board also noted that TAM has made an entrepreneurial commitment and undertaken certain business risks with respect to the management and success of the Portfolio.
Conclusion
After consideration of the factors described above, as well as other factors, the Trustees, including the Independent Trustees, concluded that the renewal of the Management Agreement and the Sub-Advisory Agreement was in the best interests of the Portfolio and the holders and voted to approve the renewal of the Agreements.
|
|
|
|
|
| Transamerica Series Trust |
|
|
|
Semi-Annual Financial Statements 2024 |
|
|
Page 17 |
|
|
Transamerica TSW International Equity VP
RESULTS OF SHAREHOLDER MEETING
(unaudited)
Rule 30e-1 under the Investment Company Act of 1940, as amended, titled “Reports to Stockholders of Management Companies,” requires regulated investment companies to report on all subject matters put to the vote of shareholders and to provide final results. Accordingly, the Board of Trustees of the Portfolio solicited a vote by the shareholders for the following item:
A special meeting of holders of Transamerica TSW International Equity VP (formerly, Transamerica TS&W International Equity VP) was held on April 29, 2024. The results of Proposal 2 were as follows:
To approve the Portfolio’s use of the manager of managers exemptive order, which will allow TAM, the Portfolio’s investment manager, to enter into and materially amend sub-advisory agreements with respect to the Portfolio in the future without Holder approval, subject to prior approval by the Portfolio’s Board of Trustees.
|
|
|
| Proposal |
|
Number of Shares |
| |
| For |
|
13,018,099 |
| Against |
|
151,747 |
| Withheld |
|
210,030 |
|
|
|
|
|
| Transamerica Series Trust |
|
|
|
Semi-Annual Financial Statements 2024 |
|
|
Page 18 |
|
|
PROXY VOTING POLICIES AND PROCEDURES AND QUARTERLY PORTFOLIO HOLDINGS
(unaudited)
A description of Transamerica Series Trust’s (the “Trust”) proxy voting policies and procedures is available in the Statement of Additional Information of the Portfolios, available without charge upon request by calling 1-800-851-9777 (toll free) or on the Securities and Exchange Commission’s (“SEC”) website at http://www.sec.gov.
In addition, the Portfolio is required to file Form N-PX, with their complete proxy voting records for the most recent 12 months ended June 30th, no later than August 31st of each year. The Form is available without charge: (1) on the Transamerica Funds website at https://www.transamerica.com/sites/default/files/files/e070d/TST%20N-PX%202021.pdf; and (2) on the SEC’s website at http://www.sec.gov.
Each fiscal quarter, the Portfolios, except Transamerica BlackRock Government Money Market VP, will file with the SEC a complete schedule of its monthly portfolio holdings on Form N-PORT. The Portfolios’ holdings as of the end of the third month of every fiscal quarter, as reported on Form N-PORT, will be publicly available on the SEC’s website at http://www.sec.gov within 60 days of the end of the fiscal quarter.
On a monthly basis, Transamerica BlackRock Government Money Market VP will file with the SEC portfolio holdings information on Form N-MFP3. A complete schedule of portfolio holdings is also available at www.transamerica.com.
You may also visit the Trust’s website at www.transamerica.com/annuities/prospectus for this and other information about the Portfolios and the Trust.
Important Notice Regarding Delivery of Shareholder Documents
Every year we provide shareholders informative materials such as the Transamerica Series Trust Annual Report, the Transamerica Series Trust Prospectus, and other required documents that keep you informed regarding your Portfolios. To the extent provided by mail, Transamerica Series Trust will only send one piece per mailing address, a method that saves your Portfolios money by reducing mailing and printing costs. We will continue to do this unless you tell us not to. To elect to receive individual mailings, simply call a Transamerica Customer Service Representative toll free at 1-800-851-9777, 8 a.m. to 7 p.m. Eastern Time, Monday-Friday. Your request will take effect within 30 days.
|
|
|
|
|
| Transamerica Series Trust |
|
|
|
Semi-Annual Financial Statements 2024 |
|
|
Page 19 |
|
|
NOTICE OF PRIVACY POLICY
(unaudited)
Your privacy is very important to us. We want you to understand what information we collect and how we use it. We collect and use “nonpublic personal information” in connection with providing our customers with a broad range of financial products and services as effectively and conveniently as possible. We treat nonpublic personal information in accordance with our Privacy Policy.
What Information We Collect and From Whom We Collect It
We may collect nonpublic personal information about you from the following sources:
| • |
|
Information we receive from you on applications or other forms, such as your name, address, and account number; |
| • |
|
Information about your transactions with us, our affiliates, or others, such as your account balance and purchase/redemption history; and |
| • |
|
Information we receive from non-affiliated third parties, including consumer reporting agencies. |
What Information We Disclose and To Whom We Disclose It
We do not disclose any nonpublic personal information about current or former customers to anyone without their express consent, except as permitted by law. We may disclose the nonpublic personal information we collect, as described above, to persons or companies that perform services on our behalf and to other financial institutions with which we have joint marketing agreements. We will require these companies to protect the confidentiality of your nonpublic personal information and to use it only to perform the services for which we have hired them.
Our Security Procedures
We restrict access to your nonpublic personal information and only allow disclosures to persons and companies as permitted by law to assist in providing products or services to you. We maintain physical, electronic, and procedural safeguards to protect your nonpublic personal information and to safeguard the disposal of certain consumer information.
Contact Us
If you have any questions about our Privacy Policy, please call 1-800-851-9777 on any business day between 8 a.m. and 7 p.m. Eastern Time.
Note: This Privacy Policy applies only to customers that have a direct relationship with us or our affiliates. If you own shares of our portfolios in the name of a third party such as a bank or broker-dealer, its privacy policy may apply to you instead of ours.
|
|
|
|
|
| Transamerica Series Trust |
|
|
|
Semi-Annual Financial Statements 2024 |
|
|
Page 20 |
|
|
PO Box 219945
Kansas City, MO 64121-9945
|
|
|
| Distributor: |
|
Transamerica Capital, Inc. |
|
|
PO Box 219945 |
|
|
Kansas City, MO 64121-9945 |
|
|
|
|
Customer Service: 1-800-851-9777 |
Transamerica Series Trust Semi-Annual Financial Statements
June 30, 2024
1801 California St., Suite 5200
Denver, CO 80202
Distributor: Transamerica Capital, Inc.
Customer Service: 1-800-851-9777
|
| The following pages contain the most recent semi-annual financial statements for the investment options in which you are invested. In compliance with Securities and Exchange Commission regulations, we present these reports on an annual and semi-annual basis with the hope that they will foster greater understanding of the investment options’ holdings, performance, financial data, accounting policies and other issues. This streamlined version provides information only on the investment options in which you are invested. If you have any questions about these reports, please do not hesitate to contact your financial professional. As always, we thank you for your trust and the opportunity to serve you. |
Transamerica TSW Mid Cap Value Opportunities VP
SCHEDULE OF INVESTMENTS
At June 30, 2024
(unaudited)
|
|
|
|
|
|
|
|
|
| |
|
Shares |
|
|
Value |
|
|
| COMMON STOCKS - 97.1% |
|
| Aerospace & Defense - 3.0% |
|
| Huntington Ingalls Industries, Inc. |
|
|
29,000 |
|
|
$ |
7,143,570 |
|
|
|
|
|
|
|
|
|
|
|
| Banks - 1.4% |
|
| First Citizens BancShares, Inc., Class A |
|
|
2,035 |
|
|
|
3,426,146 |
|
|
|
|
|
|
|
|
|
|
|
| Building Products - 0.5% |
|
| Builders FirstSource, Inc. (A) |
|
|
9,000 |
|
|
|
1,245,690 |
|
|
|
|
|
|
|
|
|
|
|
| Chemicals - 2.2% |
|
| Mosaic Co. |
|
|
182,200 |
|
|
|
5,265,580 |
|
|
|
|
|
|
|
|
|
|
|
| Consumer Finance - 1.2% |
|
| Ally Financial, Inc. |
|
|
74,800 |
|
|
|
2,967,316 |
|
|
|
|
|
|
|
|
|
|
|
| Consumer Staples Distribution & Retail - 4.7% |
|
| Dollar Tree, Inc. (A) |
|
|
34,700 |
|
|
|
3,704,919 |
|
| US Foods Holding Corp. (A) |
|
|
60,222 |
|
|
|
3,190,562 |
|
| Walgreens Boots Alliance, Inc. |
|
|
359,500 |
|
|
|
4,348,152 |
|
|
|
|
|
|
|
|
|
|
|
|
|
|
|
|
|
11,243,633 |
|
|
|
|
|
|
|
|
|
|
|
| Containers & Packaging - 1.6% |
|
| Graphic Packaging Holding Co. |
|
|
150,652 |
|
|
|
3,948,589 |
|
|
|
|
|
|
|
|
|
|
|
| Distributors - 2.1% |
|
| LKQ Corp. |
|
|
120,298 |
|
|
|
5,003,194 |
|
|
|
|
|
|
|
|
|
|
|
| Diversified Telecommunication Services - 2.0% |
|
| Liberty Global Ltd., Class A (A) |
|
|
278,300 |
|
|
|
4,850,769 |
|
|
|
|
|
|
|
|
|
|
|
| Electric Utilities - 4.6% |
|
| Evergy, Inc. |
|
|
94,600 |
|
|
|
5,010,962 |
|
| OGE Energy Corp. |
|
|
172,100 |
|
|
|
6,143,970 |
|
|
|
|
|
|
|
|
|
|
|
|
|
|
|
|
|
11,154,932 |
|
|
|
|
|
|
|
|
|
|
|
| Electronic Equipment, Instruments & Components - 2.7% |
|
| TD SYNNEX Corp. |
|
|
19,920 |
|
|
|
2,298,768 |
|
| Vontier Corp. |
|
|
113,372 |
|
|
|
4,330,810 |
|
|
|
|
|
|
|
|
|
|
|
|
|
|
|
|
|
6,629,578 |
|
|
|
|
|
|
|
|
|
|
|
| Energy Equipment & Services - 0.8% |
|
| Noble Corp. PLC |
|
|
45,000 |
|
|
|
2,009,250 |
|
|
|
|
|
|
|
|
|
|
|
| Entertainment - 1.6% |
|
| Warner Bros Discovery, Inc. (A) |
|
|
504,900 |
|
|
|
3,756,456 |
|
|
|
|
|
|
|
|
|
|
|
| Financial Services - 5.0% |
|
| Corpay, Inc. (A) |
|
|
17,000 |
|
|
|
4,528,970 |
|
| Fidelity National Information Services, Inc. |
|
|
34,515 |
|
|
|
2,601,050 |
|
| Global Payments, Inc. |
|
|
50,100 |
|
|
|
4,844,670 |
|
|
|
|
|
|
|
|
|
|
|
|
|
|
|
|
|
11,974,690 |
|
|
|
|
|
|
|
|
|
|
|
| Food Products - 5.9% |
|
| Archer-Daniels-Midland Co. |
|
|
73,200 |
|
|
|
4,424,940 |
|
| Post Holdings, Inc. (A) |
|
|
43,886 |
|
|
|
4,571,166 |
|
| Tyson Foods, Inc., Class A |
|
|
90,600 |
|
|
|
5,176,884 |
|
|
|
|
|
|
|
|
|
|
|
|
|
|
|
|
|
14,172,990 |
|
|
|
|
|
|
|
|
|
|
|
| Gas Utilities - 0.9% |
|
| National Fuel Gas Co. |
|
|
42,265 |
|
|
|
2,290,340 |
|
|
|
|
|
|
|
|
|
|
|
|
|
|
|
|
|
|
|
| |
|
Shares |
|
|
Value |
|
|
| COMMON STOCKS (continued) |
|
| Health Care Equipment & Supplies - 3.2% |
|
| Baxter International, Inc. |
|
|
153,300 |
|
|
$ |
5,127,885 |
|
| Koninklijke Philips NV (A)(B) |
|
|
101,142 |
|
|
|
2,548,778 |
|
|
|
|
|
|
|
|
|
|
|
|
|
|
|
|
|
7,676,663 |
|
|
|
|
|
|
|
|
|
|
|
| Health Care Providers & Services - 5.1% |
|
| Centene Corp. (A) |
|
|
64,100 |
|
|
|
4,249,830 |
|
| Henry Schein, Inc. (A) |
|
|
47,864 |
|
|
|
3,068,083 |
|
| Labcorp Holdings, Inc. |
|
|
24,075 |
|
|
|
4,899,503 |
|
|
|
|
|
|
|
|
|
|
|
|
|
|
|
|
|
12,217,416 |
|
|
|
|
|
|
|
|
|
|
|
| Household Durables - 1.0% |
|
| Mohawk Industries, Inc. (A) |
|
|
20,335 |
|
|
|
2,309,853 |
|
|
|
|
|
|
|
|
|
|
|
| Insurance - 5.8% |
|
| Arch Capital Group Ltd. (A) |
|
|
18,592 |
|
|
|
1,875,747 |
|
| Fidelity National Financial, Inc. |
|
|
79,600 |
|
|
|
3,933,832 |
|
| Markel Group, Inc. (A) |
|
|
2,500 |
|
|
|
3,939,150 |
|
| Willis Towers Watson PLC |
|
|
16,100 |
|
|
|
4,220,454 |
|
|
|
|
|
|
|
|
|
|
|
|
|
|
|
|
|
13,969,183 |
|
|
|
|
|
|
|
|
|
|
|
| Interactive Media & Services - 2.9% |
|
| IAC, Inc. (A) |
|
|
95,458 |
|
|
|
4,472,207 |
|
| Match Group, Inc. (A) |
|
|
86,900 |
|
|
|
2,640,022 |
|
|
|
|
|
|
|
|
|
|
|
|
|
|
|
|
|
7,112,229 |
|
|
|
|
|
|
|
|
|
|
|
| Life Sciences Tools & Services - 2.6% |
|
| Bio-Rad Laboratories, Inc., Class A (A) |
|
|
22,600 |
|
|
|
6,172,286 |
|
|
|
|
|
|
|
|
|
|
|
| Machinery - 1.3% |
|
| Allison Transmission Holdings, Inc. |
|
|
17,600 |
|
|
|
1,335,840 |
|
| CNH Industrial NV |
|
|
181,400 |
|
|
|
1,837,582 |
|
|
|
|
|
|
|
|
|
|
|
|
|
|
|
|
|
3,173,422 |
|
|
|
|
|
|
|
|
|
|
|
| Media - 7.6% |
|
| Altice USA, Inc., Class A (A) |
|
|
171,200 |
|
|
|
349,248 |
|
| EchoStar Corp., Class A (A) |
|
|
64,100 |
|
|
|
1,141,621 |
|
| Fox Corp., Class A |
|
|
110,500 |
|
|
|
3,797,885 |
|
| Liberty Broadband Corp., Class C (A) |
|
|
88,580 |
|
|
|
4,855,955 |
|
| Liberty Media Corp. - Liberty SiriusXM, Class C (A) |
|
|
221,579 |
|
|
|
4,910,191 |
|
| News Corp., Class A |
|
|
116,600 |
|
|
|
3,214,662 |
|
|
|
|
|
|
|
|
|
|
|
|
|
|
|
|
|
18,269,562 |
|
|
|
|
|
|
|
|
|
|
|
| Metals & Mining - 1.1% |
|
| Commercial Metals Co. |
|
|
48,900 |
|
|
|
2,689,011 |
|
|
|
|
|
|
|
|
|
|
|
| Multi-Utilities - 7.9% |
|
| CenterPoint Energy, Inc. |
|
|
145,900 |
|
|
|
4,519,982 |
|
| Dominion Energy, Inc. |
|
|
161,300 |
|
|
|
7,903,700 |
|
| NiSource, Inc. |
|
|
229,160 |
|
|
|
6,602,100 |
|
|
|
|
|
|
|
|
|
|
|
|
|
|
|
|
|
19,025,782 |
|
|
|
|
|
|
|
|
|
|
|
| Office REITs - 0.9% |
|
| JBG SMITH Properties |
|
|
139,300 |
|
|
|
2,121,539 |
|
|
|
|
|
|
|
|
|
|
|
| Oil, Gas & Consumable Fuels - 5.2% |
|
| HF Sinclair Corp. |
|
|
47,800 |
|
|
|
2,549,652 |
|
The Notes to Financial Statements are an integral part of this report.
|
|
|
|
|
| Transamerica Series Trust |
|
|
|
Semi-Annual Financial Statements 2024 |
|
|
Page 1 |
|
|
Transamerica TSW Mid Cap Value Opportunities VP
SCHEDULE OF INVESTMENTS (continued)
At June 30, 2024
(unaudited)
|
|
|
|
|
|
|
|
|
| |
|
Shares |
|
|
Value |
|
| COMMON STOCKS (continued) |
|
| Oil, Gas & Consumable Fuels (continued) |
|
| Kinder Morgan, Inc. |
|
|
259,800 |
|
|
$ |
5,162,226 |
|
| Williams Cos., Inc. |
|
|
113,785 |
|
|
|
4,835,863 |
|
|
|
|
|
|
|
|
|
|
|
|
|
|
|
|
|
12,547,741 |
|
|
|
|
|
|
|
|
|
|
|
| Pharmaceuticals - 6.9% |
|
| Jazz Pharmaceuticals PLC (A) |
|
|
45,507 |
|
|
|
4,856,962 |
|
| Organon & Co. |
|
|
139,400 |
|
|
|
2,885,580 |
|
| Perrigo Co. PLC |
|
|
198,200 |
|
|
|
5,089,776 |
|
| Viatris, Inc. |
|
|
369,700 |
|
|
|
3,929,911 |
|
|
|
|
|
|
|
|
|
|
|
|
|
|
|
|
|
16,762,229 |
|
|
|
|
|
|
|
|
|
|
|
| Professional Services - 2.4% |
|
| Clarivate PLC (A) |
|
|
545,150 |
|
|
|
3,101,904 |
|
| Jacobs Solutions, Inc. |
|
|
18,800 |
|
|
|
2,626,548 |
|
|
|
|
|
|
|
|
|
|
|
|
|
|
|
|
|
5,728,452 |
|
|
|
|
|
|
|
|
|
|
|
| Specialized REITs - 1.7% |
|
| Crown Castle, Inc. |
|
|
20,700 |
|
|
|
2,022,390 |
|
| Gaming & Leisure Properties, Inc. |
|
|
45,900 |
|
|
|
2,075,139 |
|
|
|
|
|
|
|
|
|
|
|
|
|
|
|
|
|
4,097,529 |
|
|
|
|
|
|
|
|
|
|
|
| Specialty Retail - 0.5% |
|
| Advance Auto Parts, Inc. |
|
|
19,700 |
|
|
|
1,247,601 |
|
|
|
|
|
|
|
|
|
|
|
| Technology Hardware, Storage & Peripherals - 0.8% |
|
| Hewlett Packard Enterprise Co. |
|
|
94,400 |
|
|
|
1,998,448 |
|
|
|
|
|
|
|
|
|
|
|
|
| Total Common Stocks
(Cost $237,624,264) |
|
|
|
234,201,669 |
|
|
|
|
|
|
|
|
|
|
|
|
|
|
|
|
|
|
|
| |
|
Shares |
|
|
Value |
|
| OTHER INVESTMENT COMPANY - 0.2% |
|
| Securities Lending Collateral - 0.2% |
|
| State Street Navigator Securities Lending Trust - Government Money Market Portfolio, 5.28% (C) |
|
|
376,491 |
|
|
$ |
376,491 |
|
|
|
|
|
|
|
|
|
|
|
|
| Total Other Investment Company
(Cost $376,491) |
|
|
|
376,491 |
|
|
|
|
|
|
|
|
|
|
| |
|
Principal |
|
|
Value |
|
| REPURCHASE AGREEMENT - 2.9% |
|
| Fixed Income Clearing Corp., 2.50% (C), dated 06/28/2024, to be repurchased at $7,097,686 on 07/01/2024. Collateralized by a U.S. Government Obligation, 3.75%, due 04/15/2026, and with a value of $7,238,195. |
|
$ |
7,096,208 |
|
|
|
7,096,208 |
|
|
|
|
|
|
|
|
|
|
|
|
| Total Repurchase Agreement
(Cost $7,096,208) |
|
|
|
7,096,208 |
|
|
|
|
|
|
|
|
|
| Total Investments
(Cost $245,096,963) |
|
|
|
241,674,368 |
|
|
|
|
|
|
|
| Net Other Assets (Liabilities) - (0.2)% |
|
|
|
(365,311) |
|
|
|
|
|
|
|
|
|
|
|
|
| Net Assets - 100.0% |
|
|
$ |
241,309,057 |
|
|
|
|
|
|
|
INVESTMENT VALUATION:
|
|
|
|
|
|
|
|
|
|
|
|
|
|
|
|
|
| Valuation Inputs (D) |
|
|
|
|
|
|
|
|
|
|
|
|
| |
|
Level 1 - Unadjusted Quoted Prices |
|
|
Level 2 - Other Significant Observable Inputs |
|
|
Level 3 - Significant Unobservable Inputs |
|
|
Value |
|
| ASSETS |
|
|
|
|
|
|
|
|
|
|
|
|
|
|
|
|
| Investments |
|
|
|
|
|
|
|
|
|
|
|
|
|
|
|
|
| Common Stocks |
|
$ |
234,201,669 |
|
|
$ |
— |
|
|
$ |
— |
|
|
$ |
234,201,669 |
|
| Other Investment Company |
|
|
376,491 |
|
|
|
— |
|
|
|
— |
|
|
|
376,491 |
|
| Repurchase Agreement |
|
|
— |
|
|
|
7,096,208 |
|
|
|
— |
|
|
|
7,096,208 |
|
|
|
|
|
|
|
|
|
|
|
|
|
|
|
|
|
|
| Total Investments |
|
$ |
234,578,160 |
|
|
$ |
7,096,208 |
|
|
$ |
— |
|
|
$ |
241,674,368 |
|
|
|
|
|
|
|
|
|
|
|
|
|
|
|
|
|
|
FOOTNOTES TO SCHEDULE OF INVESTMENTS:
| (A) |
Non-income producing security. |
| (B) |
All or a portion of the security is on loan. The total value of the securities on loan is $1,155,974, collateralized by cash collateral of $376,491 and non-cash collateral, such as U.S. government securities and irrevocable letters of credit, of $804,713. The amount on loan indicated may not correspond with the securities on loan identified because a security with pending sales are in the process of recall from the brokers. |
| (C) |
Rate disclosed reflects the yield at June 30, 2024. |
| (D) |
There were no transfers in or out of Level 3 during the period ended June 30, 2024. Please reference the Investment Valuation section of the Notes to Financial Statements for more information regarding investment valuation and pricing inputs. |
PORTFOLIO ABBREVIATION(S):
|
|
|
| REIT |
|
Real Estate Investment Trust |
The Notes to Financial Statements are an integral part of this report.
|
|
|
|
|
| Transamerica Series Trust |
|
|
|
Semi-Annual Financial Statements 2024 |
|
|
Page 2 |
|
|
Transamerica TSW Mid Cap Value Opportunities VP
|
|
|
| STATEMENT OF ASSETS AND LIABILITIES At June 30, 2024 (unaudited) |
|
STATEMENT OF OPERATIONS For the period ended June 30, 2024 (unaudited) |
|
|
|
|
|
| Assets: |
|
|
|
|
| Investments, at value (cost $238,000,755) (including securities loaned of $1,155,974) |
|
$ |
234,578,160 |
|
| Repurchase agreement, at value (cost $7,096,208) |
|
|
7,096,208 |
|
| Receivables and other assets: |
|
|
|
|
| Investments sold |
|
|
128,615 |
|
| Net income from securities lending |
|
|
506 |
|
| Shares of beneficial interest sold |
|
|
17,502 |
|
| Dividends |
|
|
120,744 |
|
| Interest |
|
|
1,478 |
|
| Prepaid expenses |
|
|
904 |
|
|
|
| Total assets |
|
|
241,944,117 |
|
|
|
| Liabilities: |
|
|
|
|
| Cash collateral received upon return of: |
|
|
|
|
| Securities on loan |
|
|
376,491 |
|
| Payables and other liabilities: |
|
|
|
|
| Shares of beneficial interest redeemed |
|
|
26,625 |
|
| Investment management fees |
|
|
132,536 |
|
| Distribution and service fees |
|
|
43,791 |
|
| Transfer agent costs |
|
|
482 |
|
| Trustee and CCO fees |
|
|
1,297 |
|
| Audit and tax fees |
|
|
11,377 |
|
| Custody fees |
|
|
11,960 |
|
| Legal fees |
|
|
1,352 |
|
| Printing and shareholder reports fees |
|
|
20,144 |
|
| Other accrued expenses |
|
|
9,005 |
|
|
|
| Total liabilities |
|
|
635,060 |
|
|
|
| Net assets |
|
$ |
241,309,057 |
|
|
|
| Net assets consist of: |
|
|
|
|
| Capital stock ($0.01 par value) |
|
$ |
168,761 |
|
| Additional paid-in capital |
|
|
149,188,936 |
|
| Total distributable earnings (accumulated losses) |
|
|
91,951,360 |
|
|
|
| Net assets |
|
$ |
241,309,057 |
|
|
|
| Net assets by class: |
|
|
|
|
| Initial Class |
|
$ |
15,396,321 |
|
| Service Class |
|
|
225,912,736 |
|
|
|
| Shares outstanding: |
|
|
|
|
| Initial Class |
|
|
1,046,473 |
|
| Service Class |
|
|
15,829,602 |
|
|
|
| Net asset value and offering price per share: |
|
|
|
|
| Initial Class |
|
$ |
14.71 |
|
| Service Class |
|
|
14.27 |
|
|
|
|
|
|
| Investment income: |
|
|
|
|
| Dividend income |
|
$ |
2,306,726 |
|
| Interest income |
|
|
85,490 |
|
| Net income from securities lending |
|
|
1,332 |
|
| Total investment income |
|
|
2,393,548 |
|
|
|
| Expenses: |
|
|
|
|
| Investment management fees |
|
|
1,098,144 |
|
| Distribution and service fees: |
|
|
|
|
| Service Class |
|
|
291,309 |
|
| Transfer agent costs |
|
|
1,737 |
|
| Trustee and CCO fees |
|
|
6,591 |
|
| Audit and tax fees |
|
|
11,015 |
|
| Custody fees |
|
|
11,153 |
|
| Legal fees |
|
|
14,085 |
|
| Printing and shareholder reports fees |
|
|
21,114 |
|
| Other |
|
|
15,467 |
|
| Total expenses before waiver and/or reimbursement and recapture |
|
|
1,470,615 |
|
| Expenses waived and/or reimbursed: |
|
|
|
|
| Initial Class |
|
|
(4,316 |
) |
| Recapture of previously waived and/or reimbursed fees: |
|
|
|
|
| Initial Class |
|
|
4,316 |
|
|
|
| Net expenses |
|
|
1,470,615 |
|
|
|
| Net investment income (loss) |
|
|
922,933 |
|
|
|
| Net realized gain (loss) on: |
|
|
|
|
| Investments |
|
|
52,153,720 |
|
|
|
| Net change in unrealized appreciation (depreciation) on: |
|
|
|
|
| Investments |
|
|
(47,355,751 |
) |
|
|
| Net realized and change in unrealized gain (loss) |
|
|
4,797,969 |
|
|
|
| Net increase (decrease) in net assets resulting from operations |
|
$ |
5,720,902 |
|
The Notes to Financial Statements are an integral part of this report.
|
|
|
|
|
| Transamerica Series Trust |
|
|
|
Semi-Annual Financial Statements 2024 |
|
|
Page 3 |
|
|
Transamerica TSW Mid Cap Value Opportunities VP
STATEMENT OF CHANGES IN NET ASSETS
For the period and year ended:
|
|
|
|
|
|
|
|
|
|
|
|
|
|
|
|
|
|
|
|
|
|
| |
|
|
|
|
June 30, 2024 (unaudited) |
|
|
December 31, 2023 |
|
|
| From operations: |
|
|
|
|
|
|
|
|
|
|
|
|
|
|
|
|
| Net investment income (loss) |
|
|
|
|
|
$ |
922,933 |
|
|
|
$ 3,094,762 |
|
|
|
|
|
| Net realized gain (loss) |
|
|
|
|
|
|
52,153,720 |
|
|
|
39,876,868 |
|
|
|
|
|
| Net change in unrealized appreciation (depreciation) |
|
|
|
|
|
|
(47,355,751 |
) |
|
|
(6,268,729) |
|
|
|
|
|
|
|
|
|
|
| Net increase (decrease) in net assets resulting from operations |
|
|
|
|
|
|
5,720,902 |
|
|
|
36,702,901 |
|
|
|
|
|
|
|
|
|
|
| Dividends and/or distributions to shareholders: |
|
|
|
|
|
|
|
|
|
|
|
|
|
|
|
|
| Initial Class |
|
|
|
|
|
|
— |
|
|
|
(12,473,236) |
|
|
|
|
|
| Service Class |
|
|
|
|
|
|
— |
|
|
|
(24,604,745) |
|
|
|
|
|
|
|
|
|
|
| Net increase (decrease) in net assets resulting from dividends and/or distributions to shareholders |
|
|
|
|
|
|
— |
|
|
|
(37,077,981) |
|
|
|
|
|
|
|
|
|
|
| Capital share transactions: |
|
|
|
|
|
|
|
|
|
|
|
|
|
|
|
|
| Proceeds from shares sold: |
|
|
|
|
|
|
|
|
|
|
|
|
|
|
|
|
| Initial Class |
|
|
|
|
|
|
93,292 |
|
|
|
23,090,348 |
|
|
|
|
|
| Service Class |
|
|
|
|
|
|
2,093,682 |
|
|
|
7,766,899 |
|
|
|
|
|
| |
|
|
|
|
|
|
2,186,974 |
|
|
|
30,857,247 |
|
|
|
|
|
| Dividends and/or distributions reinvested: |
|
|
|
|
|
|
|
|
|
|
|
|
|
|
|
|
| Initial Class |
|
|
|
|
|
|
— |
|
|
|
12,473,236 |
|
|
|
|
|
| Service Class |
|
|
|
|
|
|
— |
|
|
|
24,604,745 |
|
|
|
|
|
| |
|
|
|
|
|
|
— |
|
|
|
37,077,981 |
|
|
|
|
|
| Cost of shares redeemed: |
|
|
|
|
|
|
|
|
|
|
|
|
|
|
|
|
| Initial Class |
|
|
|
|
|
|
(67,266,234 |
) |
|
|
(192,211,978) |
|
|
|
|
|
| Service Class |
|
|
|
|
|
|
(16,386,570 |
) |
|
|
(36,678,211) |
|
|
|
|
|
|
|
|
|
|
| |
|
|
|
|
|
|
(83,652,804 |
) |
|
|
(228,890,189) |
|
|
|
|
|
|
|
|
|
|
| Net increase (decrease) in net assets resulting from capital share transactions |
|
|
|
|
|
|
(81,465,830 |
) |
|
|
(160,954,961) |
|
|
|
|
|
|
|
|
|
|
| Net increase (decrease) in net assets |
|
|
|
|
|
|
(75,744,928 |
) |
|
|
(161,330,041) |
|
|
|
|
|
|
|
|
|
|
| Net assets: |
|
|
|
|
|
|
|
|
|
|
|
|
|
|
|
|
| Beginning of period/year |
|
|
|
|
|
|
317,053,985 |
|
|
|
478,384,026 |
|
|
|
|
|
| End of period/year |
|
|
|
|
|
$ |
241,309,057 |
|
|
|
$ 317,053,985 |
|
|
|
|
|
|
|
|
|
|
| Capital share transactions - shares: |
|
|
|
|
|
|
|
|
|
|
|
|
|
|
|
|
| Shares issued: |
|
|
|
|
|
|
|
|
|
|
|
|
|
|
|
|
| Initial Class |
|
|
|
|
|
|
6,211 |
|
|
|
1,669,930 |
|
|
|
|
|
| Service Class |
|
|
|
|
|
|
144,429 |
|
|
|
545,147 |
|
|
|
|
|
| |
|
|
|
|
|
|
150,640 |
|
|
|
2,215,077 |
|
|
|
|
|
| Shares reinvested: |
|
|
|
|
|
|
|
|
|
|
|
|
|
|
|
|
| Initial Class |
|
|
|
|
|
|
— |
|
|
|
924,628 |
|
|
|
|
|
| Service Class |
|
|
|
|
|
|
— |
|
|
|
1,876,792 |
|
|
|
|
|
| |
|
|
|
|
|
|
— |
|
|
|
2,801,420 |
|
|
|
|
|
| Shares redeemed: |
|
|
|
|
|
|
|
|
|
|
|
|
|
|
|
|
| Initial Class |
|
|
|
|
|
|
(4,513,949 |
) |
|
|
(13,168,551) |
|
|
|
|
|
| Service Class |
|
|
|
|
|
|
(1,133,164 |
) |
|
|
(2,645,463) |
|
|
|
|
|
| |
|
|
|
|
|
|
(5,647,113 |
) |
|
|
(15,814,014) |
|
|
|
|
|
| Net increase (decrease) in shares outstanding: |
|
|
|
|
|
|
|
|
|
|
|
|
|
|
|
|
| Initial Class |
|
|
|
|
|
|
(4,507,738 |
) |
|
|
(10,573,993) |
|
|
|
|
|
| Service Class |
|
|
|
|
|
|
(988,735 |
) |
|
|
(223,524) |
|
|
|
|
|
| |
|
|
|
|
|
|
(5,496,473 |
) |
|
|
(10,797,517) |
|
|
|
|
|
The Notes to Financial Statements are an integral part of this report.
|
|
|
|
|
| Transamerica Series Trust |
|
|
|
Semi-Annual Financial Statements 2024 |
|
|
Page 4 |
|
|
Transamerica TSW Mid Cap Value Opportunities VP
FINANCIAL HIGHLIGHTS
|
|
|
|
|
|
|
|
|
|
|
|
|
|
|
|
|
|
|
|
|
|
|
|
|
|
|
|
|
|
|
| For a share outstanding during the period and
years indicated: |
|
Initial Class |
|
|
|
|
|
|
|
| |
|
June 30, 2024 (unaudited) |
|
December 31, 2023 |
|
December 31, 2022 |
|
December 31, 2021 |
|
December 31, 2020 |
|
December 31, 2019 |
|
|
|
|
|
|
|
| Net asset value, beginning of period/year |
|
|
$ |
14.48 |
|
|
|
$ |
14.62 |
|
|
|
$ |
19.74 |
|
|
|
$ |
15.64 |
|
|
|
$ |
16.28 |
|
|
|
$ |
14.44 |
|
|
|
|
|
|
|
|
| Investment operations: |
|
|
|
|
|
|
|
|
|
|
|
|
|
|
|
|
|
|
|
|
|
|
|
|
|
|
|
|
|
|
|
|
|
|
|
|
|
| Net investment income (loss)(A) |
|
|
|
0.05 |
|
|
|
|
0.13 |
|
|
|
|
0.18 |
|
|
|
|
0.13 |
|
|
|
|
0.16 |
|
|
|
|
0.19 |
|
|
|
|
|
|
|
|
| Net realized and unrealized gain (loss) |
|
|
|
0.18 |
|
|
|
|
1.33 |
|
|
|
|
(1.72 |
) |
|
|
|
4.41 |
|
|
|
|
(0.08 |
) |
|
|
|
3.42 |
|
| Total investment operations |
|
|
|
0.23 |
|
|
|
|
1.46 |
|
|
|
|
(1.54 |
) |
|
|
|
4.54 |
|
|
|
|
0.08 |
|
|
|
|
3.61 |
|
|
|
|
|
|
|
|
| Dividends and/or distributions to shareholders: |
|
|
|
|
|
|
|
|
|
|
|
|
|
|
|
|
|
|
|
|
|
|
|
|
|
|
|
|
|
|
|
|
|
|
|
|
|
| Net investment income |
|
|
|
— |
|
|
|
|
(0.22 |
) |
|
|
|
(0.15 |
) |
|
|
|
(0.14 |
) |
|
|
|
(0.18 |
) |
|
|
|
(0.24 |
) |
|
|
|
|
|
|
|
| Net realized gains |
|
|
|
— |
|
|
|
|
(1.38 |
) |
|
|
|
(3.43 |
) |
|
|
|
(0.30 |
) |
|
|
|
(0.54 |
) |
|
|
|
(1.53 |
) |
|
|
|
|
|
|
|
| Total dividends and/or distributions to shareholders |
|
|
|
— |
|
|
|
|
(1.60 |
) |
|
|
|
(3.58 |
) |
|
|
|
(0.44 |
) |
|
|
|
(0.72 |
) |
|
|
|
(1.77 |
) |
|
|
|
|
|
|
|
| Net asset value, end of period/year |
|
|
$ |
14.71 |
|
|
|
$ |
14.48 |
|
|
|
$ |
14.62 |
|
|
|
$ |
19.74 |
|
|
|
$ |
15.64 |
|
|
|
$ |
16.28 |
|
| |
|
|
|
|
|
|
|
|
|
|
|
|
|
|
|
|
|
|
|
| Total return |
|
|
|
1.59 |
%(B) |
|
|
|
10.81 |
% |
|
|
|
(8.23 |
)% |
|
|
|
29.19 |
% |
|
|
|
1.35 |
% |
|
|
|
26.21 |
% |
|
|
|
|
|
|
|
| Ratio and supplemental data: |
|
|
|
|
|
|
|
|
|
|
|
|
|
|
|
|
|
|
|
|
|
|
|
|
|
|
|
|
|
|
|
|
|
|
|
|
|
| Net assets end of period/year (000’s) |
|
|
$ |
15,396 |
|
|
|
$ |
80,441 |
|
|
|
$ |
235,756 |
|
|
|
$ |
263,545 |
|
|
|
$ |
199,873 |
|
|
|
$ |
230,002 |
|
|
|
|
|
|
|
|
| Expenses to average net assets |
|
|
|
|
|
|
|
|
|
|
|
|
|
|
|
|
|
|
|
|
|
|
|
|
|
|
|
|
|
|
|
|
|
|
|
|
|
| Excluding waiver and/or reimbursement and recapture |
|
|
|
0.86 |
%(C) |
|
|
|
0.91 |
% |
|
|
|
0.87 |
% |
|
|
|
0.87 |
% |
|
|
|
0.88 |
% |
|
|
|
0.87 |
% |
|
|
|
|
|
|
|
| Including waiver and/or reimbursement and recapture |
|
|
|
0.86 |
%(C)(D) |
|
|
|
0.91 |
% |
|
|
|
0.87 |
% |
|
|
|
0.87 |
% |
|
|
|
0.88 |
% |
|
|
|
0.87 |
% |
|
|
|
|
|
|
|
| Net investment income (loss) to average net assets |
|
|
|
0.65 |
%(C) |
|
|
|
0.93 |
% |
|
|
|
1.05 |
% |
|
|
|
0.68 |
% |
|
|
|
1.14 |
% |
|
|
|
1.15 |
% |
|
|
|
|
|
|
|
| Portfolio turnover rate |
|
|
|
87 |
%(B) |
|
|
|
18 |
% |
|
|
|
15 |
% |
|
|
|
45 |
% |
|
|
|
22 |
% |
|
|
|
14 |
% |
| (A) |
Calculated based on average number of shares outstanding. |
| (D) |
Waiver and/or reimbursement rounds to less than 0.01%. |
|
|
|
|
|
|
|
|
|
|
|
|
|
|
|
|
|
|
|
|
|
|
|
|
|
|
|
|
|
|
|
| For a share outstanding during the period and
years indicated: |
|
Service Class |
|
|
|
|
|
|
|
| |
|
June 30, 2024 (unaudited) |
|
December 31, 2023 |
|
December 31, 2022 |
|
December 31, 2021 |
|
December 31, 2020 |
|
December 31, 2019 |
|
|
|
|
|
|
|
| Net asset value, beginning of period/year |
|
|
$ |
14.07 |
|
|
|
$ |
14.24 |
|
|
|
$ |
19.31 |
|
|
|
$ |
15.32 |
|
|
|
$ |
15.97 |
|
|
|
$ |
14.18 |
|
|
|
|
|
|
|
|
| Investment operations: |
|
|
|
|
|
|
|
|
|
|
|
|
|
|
|
|
|
|
|
|
|
|
|
|
|
|
|
|
|
|
|
|
|
|
|
|
|
| Net investment income (loss)(A) |
|
|
|
0.05 |
|
|
|
|
0.12 |
|
|
|
|
0.13 |
|
|
|
|
0.08 |
|
|
|
|
0.12 |
|
|
|
|
0.14 |
|
|
|
|
|
|
|
|
| Net realized and unrealized gain (loss) |
|
|
|
0.15 |
|
|
|
|
1.27 |
|
|
|
|
(1.67 |
) |
|
|
|
4.32 |
|
|
|
|
(0.09 |
) |
|
|
|
3.37 |
|
|
|
|
|
|
|
|
| Total investment operations |
|
|
|
0.20 |
|
|
|
|
1.39 |
|
|
|
|
(1.54 |
) |
|
|
|
4.40 |
|
|
|
|
0.03 |
|
|
|
|
3.51 |
|
|
|
|
|
|
|
|
| Dividends and/or distributions to shareholders: |
|
|
|
|
|
|
|
|
|
|
|
|
|
|
|
|
|
|
|
|
|
|
|
|
|
|
|
|
|
|
|
|
|
|
|
|
|
| Net investment income |
|
|
|
— |
|
|
|
|
(0.18 |
) |
|
|
|
(0.10 |
) |
|
|
|
(0.11 |
) |
|
|
|
(0.14 |
) |
|
|
|
(0.19 |
) |
|
|
|
|
|
|
|
| Net realized gains |
|
|
|
— |
|
|
|
|
(1.38 |
) |
|
|
|
(3.43 |
) |
|
|
|
(0.30 |
) |
|
|
|
(0.54 |
) |
|
|
|
(1.53 |
) |
|
|
|
|
|
|
|
| Total dividends and/or distributions to shareholders |
|
|
|
— |
|
|
|
|
(1.56 |
) |
|
|
|
(3.53 |
) |
|
|
|
(0.41 |
) |
|
|
|
(0.68 |
) |
|
|
|
(1.72 |
) |
|
|
|
|
|
|
|
| Net asset value, end of period/year |
|
|
$ |
14.27 |
|
|
|
$ |
14.07 |
|
|
|
$ |
14.24 |
|
|
|
$ |
19.31 |
|
|
|
$ |
15.32 |
|
|
|
$ |
15.97 |
|
| |
|
|
|
|
|
|
|
|
|
|
|
|
|
|
|
|
|
|
|
| Total return |
|
|
|
1.42 |
%(B) |
|
|
|
10.57 |
% |
|
|
|
(8.43 |
)% |
|
|
|
28.84 |
% |
|
|
|
1.03 |
% |
|
|
|
25.99 |
% |
|
|
|
|
|
|
|
| Ratio and supplemental data: |
|
|
|
|
|
|
|
|
|
|
|
|
|
|
|
|
|
|
|
|
|
|
|
|
|
|
|
|
|
|
|
|
|
|
|
|
|
| Net assets end of period/year (000’s) |
|
|
$ |
225,913 |
|
|
|
$ |
236,613 |
|
|
|
$ |
242,628 |
|
|
|
$ |
297,801 |
|
|
|
$ |
251,374 |
|
|
|
$ |
258,115 |
|
|
|
|
|
|
|
|
| Expenses to average net assets |
|
|
|
|
|
|
|
|
|
|
|
|
|
|
|
|
|
|
|
|
|
|
|
|
|
|
|
|
|
|
|
|
|
|
|
|
|
| Excluding waiver and/or reimbursement and recapture |
|
|
|
1.11 |
%(C) |
|
|
|
1.16 |
% |
|
|
|
1.12 |
% |
|
|
|
1.12 |
% |
|
|
|
1.13 |
% |
|
|
|
1.12 |
% |
|
|
|
|
|
|
|
| Including waiver and/or reimbursement and recapture |
|
|
|
1.11 |
%(C)(D) |
|
|
|
1.16 |
% |
|
|
|
1.12 |
% |
|
|
|
1.12 |
% |
|
|
|
1.13 |
% |
|
|
|
1.12 |
% |
|
|
|
|
|
|
|
| Net investment income (loss) to average net assets |
|
|
|
0.68 |
%(C) |
|
|
|
0.83 |
% |
|
|
|
0.81 |
% |
|
|
|
0.43 |
% |
|
|
|
0.88 |
% |
|
|
|
0.90 |
% |
|
|
|
|
|
|
|
| Portfolio turnover rate |
|
|
|
87 |
%(B) |
|
|
|
18 |
% |
|
|
|
15 |
% |
|
|
|
45 |
% |
|
|
|
22 |
% |
|
|
|
14 |
% |
| (A) |
Calculated based on average number of shares outstanding. |
| (D) |
Waiver and/or reimbursement rounds to less than 0.01%. |
The Notes to Financial Statements are an integral part of this report.
|
|
|
|
|
| Transamerica Series Trust |
|
|
|
Semi-Annual Financial Statements 2024 |
|
|
Page 5 |
|
|
Transamerica TSW Mid Cap Value Opportunities VP
NOTES TO FINANCIAL STATEMENTS
At June 30, 2024
(unaudited)
1. ORGANIZATION
Transamerica Series Trust (“TST”) is an open-end management investment company registered under the Investment Company Act of 1940, as amended (the “1940 Act”). TST applies investment company accounting and reporting guidance. TST serves as a funding vehicle for variable life insurance, variable annuity, and group annuity products. Transamerica TSW Mid Cap Value Opportunities VP (formerly, Transamerica JPMorgan Mid Cap Value VP) (the “Portfolio”) is a series of TST and is classified as diversified under the 1940 Act. The Portfolio currently offers two classes of shares, Initial Class and Service Class.
The only shareholders of the Portfolio are affiliated insurance company separate accounts and/or affiliated asset allocation portfolios. Contract holders of the variable life and annuity contracts are not shareholders of the Portfolio. For ease of reference, shareholders and contract holders are collectively referred to in this report as “shareholders.”
This report must be accompanied or preceded by the Portfolio’s current prospectus, which contains additional information about the Portfolio, including risks, as well as investment objectives and strategies.
Transamerica Asset Management, Inc. (“TAM”) serves as investment manager for the Portfolio pursuant to an investment management agreement. TAM provides continuous and regular investment management services to the Portfolio. TAM supervises the Portfolio’s investments, conducts its investment program and provides supervisory, compliance and administrative services to the Portfolio.
TAM currently acts as a “manager of managers” and has hired sub-advisers to furnish day-to-day investment advice and recommendations. TAM may, in the future, determine to provide all aspects of the day-to-day management of the Portfolio without the use of a sub-adviser. When acting as a manager of managers, TAM provides investment management services that include, without limitation, the design and development of the Portfolio and its investment strategies and the ongoing review and evaluation of those investment strategies including recommending changes in strategy where it believes appropriate or advisable; the selection of one or more sub-advisers for the Portfolio employing a combination of quantitative and qualitative screens, research, analysis and due diligence; negotiation of sub-advisory agreements and fees; oversight and monitoring of sub-advisers and recommending changes to sub-advisers where it believes appropriate or advisable; recommending portfolio combinations and liquidations where it believes appropriate or advisable; selection and oversight of transition managers, as needed; regular supervision of the Portfolio’s investments; regular review and evaluation of sub-adviser performance; daily monitoring of the sub-advisers’ buying and selling of securities for the Portfolio; regular review of holdings; ongoing trade oversight and analysis; regular monitoring to ensure adherence to investment process; regular calls and periodic on-site visits with sub-advisers; portfolio construction and asset allocation when using multiple sub-advisers for the Portfolio; risk management oversight and analysis; oversight of negotiation of investment documentation and agreements; design, development, implementation and regular monitoring of the valuation process; periodic due diligence reviews of pricing vendors and vendor methodology; design, development, implementation and regular monitoring of the compliance process; respond to regulatory inquiries and determine appropriate litigation strategy, as needed; review of proxies voted by sub-advisers; oversight of preparation and review of materials for meetings of the Portfolio’s Board of Trustees (the “Board”), participation in these meetings and preparation of regular communications with the Board; oversight of preparation and review of prospectuses, shareholder reports and other disclosure materials and regulatory filings for the Portfolio; oversight of other service providers to the Portfolio, such as the custodian, the transfer agent, the Portfolio’s independent accounting firm and legal counsel; supervision of the performance of recordkeeping and shareholder relations functions for the Portfolio; and oversight of cash management services. TAM uses a variety of quantitative and qualitative tools to carry out its investment management services. TAM, not the Portfolio, is responsible for paying the sub-adviser(s) for their services, and sub-advisory fees are TAM’s expense.
TAM’s investment management services also include the provision of supervisory and administrative services to the Portfolio. These services include performing certain administrative services for the Portfolio and supervising and overseeing the administrative, clerical, recordkeeping and bookkeeping services provided to the Portfolio by State Street Bank and Trust Company (“State Street”), to whom TAM has outsourced the provision of certain sub-administration services. To the extent agreed upon by TAM and the Portfolio from time to time, TAM’s supervisory and administrative services include, but are not limited to: monitoring and verifying the custodian’s daily calculation of the Net Asset Values (“NAV”); shareholder relations functions; compliance services; valuation services; assisting in due diligence and in the oversight and monitoring of certain activities of sub-advisers and certain aspects of Portfolio investments; assisting with Portfolio combinations and liquidations; oversight of the preparation and filing, and review, of all returns and reports, in connection with federal, state and local taxes; oversight and review of regulatory reporting; supervising and coordinating the Portfolio’s custodian and dividend disbursing agent and monitoring their services to the Portfolio; assisting the Portfolio in preparing reports to shareholders; acting as liaison with the Portfolio’s independent public accountants and providing, upon request, analyses, fiscal year summaries and other audit related services; assisting in the preparation of agendas and supporting documents for and minutes of meetings of trustees and committees of trustees; assisting in the preparation of regular communications with the trustees; and providing personnel and office space, telephones and other office equipment as necessary in order for TAM to perform supervisory and administrative services to the Portfolio. The Portfolio
|
|
|
|
|
| Transamerica Series Trust |
|
|
|
Semi-Annual Financial Statements 2024 |
|
|
Page 6 |
|
|
Transamerica TSW Mid Cap Value Opportunities VP
NOTES TO FINANCIAL STATEMENTS (continued)
At June 30, 2024
(unaudited)
1. ORGANIZATION (continued)
pays certain fees and expenses to State Street for sub-administration services which are not administrative services covered by the management agreement with TAM or paid for through the management fees payable thereunder. For the period ended June 30, 2024, (i) the expenses paid to State Street for sub-administration services by the Portfolio are shown as a part of Other expenses within the Statement of Operations and (ii) the expenses payable to State Street for sub-administration services from the Portfolio are shown as part of Other accrued expenses within the Statement of Assets and Liabilities.
2. SIGNIFICANT ACCOUNTING POLICIES
In preparing the Portfolio’s financial statements in accordance with Generally Accepted Accounting Principles in the United States of America (“GAAP”), estimates or assumptions (which could differ from actual results) may be used that affect reported amounts and disclosures. The following is a summary of significant accounting policies followed by the Portfolio.
Security transactions and investment income: Security transactions are accounted for on the trade date. Security gains and losses are calculated on a first-in, first-out basis. Dividend income, if any, is recorded on the ex-dividend date or, in the case of foreign securities, as soon as the Portfolio is informed of the ex-dividend dates, net of foreign taxes. Non-cash dividends, if any, are recorded on the ex-dividend date at fair value. Interest income, if any, is recorded on the accrual basis from settlement date, net of foreign taxes. Fixed income premiums and discounts are amortized and/or accreted over the lives of the respective securities.
Multiple class operations, income, and expenses: Income, non-class specific expenses, and realized and unrealized gains and losses are allocated to each class daily based upon net assets. Each class bears its own specific expenses in addition to the allocated non-class specific expenses.
Distributions to shareholders: Distributions are recorded on the ex-dividend date and are determined in accordance with federal income tax regulations, which may differ from GAAP.
Commission recapture: The sub-adviser(s), to the extent consistent with the best execution and usual commission rate policies and practices, may elect to place security transactions of the Portfolio with broker/dealers with which TST has established a commission recapture program. A commission recapture program is any arrangement under which a broker/dealer applies a portion of the commissions received by such broker/dealer on the security transactions to the Portfolio. In no event will commissions, paid by the Portfolio, be used to pay expenses that would otherwise be borne by any other Portfolios within TST, or by any other party.
Commissions recaptured are included within Net realized gain (loss) within the Statement of Operations. For the period ended June 30, 2024, commissions recaptured are $5,444.
Indemnification: In the normal course of business, the Portfolio enters into contracts that contain a variety of representations that provide general indemnifications. The Portfolio’s maximum exposure under these arrangements is unknown, as this would involve future claims that may be made against the Portfolio and/or its affiliates that have not yet occurred. However, based on experience, the Portfolio expects the risk of loss to be remote.
3. INVESTMENT VALUATION
TAM has been designated as the Portfolio’s valuation designee pursuant to Rule 2a-5 under the 1940 Act with responsibility for fair valuation subject to oversight by the Portfolio’s Board of Trustees. The net asset value of the Portfolio is computed as of the official close of the New York Stock Exchange (“NYSE”) each day the NYSE is open for business.
TAM utilizes various methods to measure the fair value of its investments on a recurring basis. GAAP establishes a hierarchy that prioritizes inputs to valuation methods. The inputs or methodology used for valuing securities are not necessarily an indication of the risk associated with investing in those securities. The three levels (“Levels”) of inputs of the fair value hierarchy are defined as follows:
Level 1—Unadjusted quoted prices in active markets for identical securities.
Level 2—Inputs, other than quoted prices included in Level 1, which are observable, either directly or indirectly. These inputs may include quoted prices for the identical instrument on an inactive market, prices for similar instruments, interest rates, prepayment speeds, credit risk, yield curves, default rates, and similar data.
|
|
|
|
|
| Transamerica Series Trust |
|
|
|
Semi-Annual Financial Statements 2024 |
|
|
Page 7 |
|
|
Transamerica TSW Mid Cap Value Opportunities VP
NOTES TO FINANCIAL STATEMENTS (continued)
At June 30, 2024
(unaudited)
3. INVESTMENT VALUATION (continued)
Level 3—Unobservable inputs based on the best information available in the circumstances, to the extent observable inputs are not available, which may include TAM’s own assumptions used in determining the fair value of the Portfolio’s investments.
The inputs used to measure fair value may fall into different Levels of the fair value hierarchy. In such cases, for disclosure purposes, the Level in the fair value hierarchy that is assigned to the fair value measurement of a security is determined based on the lowest Level input that is significant to the fair value measurement in its entirety. Certain investments that are measured at fair value using NAV per share, or its equivalent, using the “practical expedient” have not been classified in the fair value Levels. The hierarchy classification of inputs used to value the Portfolio’s investments at June 30, 2024, is disclosed within the Investment Valuation section of the Schedule of Investments.
The availability of observable inputs can vary from security to security and is affected by a wide variety of factors, including, but not limited to, the type of security, whether the security is new and not yet established in the marketplace, the liquidity of markets, and other characteristics particular to the security. To the extent that valuation is based on models or inputs that are less observable or unobservable in the market, the determination of fair value requires more judgment. Accordingly, the degree of judgment exercised in determining fair value is generally greatest for instruments categorized in Level 3. Due to the inherent uncertainty of valuation, the determination of values may differ significantly from values that would have been realized had a ready market for investments existed, and the differences could be material.
Fair value measurements: Descriptions of the valuation techniques applied to the Portfolio’s significant categories of assets and liabilities measured at fair value on a recurring basis are as follows:
Equity securities: Securities are stated at the last reported sales price or closing price on the day of valuation taken from the primary exchange where the security is principally traded. To the extent these securities are actively traded and valuation adjustments are not applied, they are categorized in Level 1 of the fair value hierarchy. Equities traded on inactive markets or valued by reference to similar instruments are generally categorized in Level 2 or Level 3 if inputs are unobservable.
Foreign equity securities: Securities in which the primary trading market closes at the same time or after the NYSE, are valued based on quotations from the primary market in which they are traded and are categorized in Level 1. Because many foreign securities markets and exchanges close prior to the close of the NYSE, closing prices for foreign securities in those markets or on those exchanges do not reflect the events that occur after that close. Certain foreign securities may be fair valued using a pricing service that considers the correlation of the trading patterns of the foreign security to the intraday trading in the U.S. markets for investments such as American Depositary Receipts, financial futures, or ETFs and the movement of certain indices of securities based on a statistical analysis of their historical relationship; such valuations generally are categorized in Level 2.
Securities lending collateral: Securities lending collateral is invested in a money market fund which is valued at the actively traded NAV and no valuation adjustments are applied. Securities lending collateral is categorized in Level 1 of the fair value hierarchy.
Repurchase agreements: Repurchase agreements are valued at cost, which approximates fair value. To the extent the inputs are observable and timely, the values are generally categorized in Level 2 of the fair value hierarchy.
4. SECURITIES AND OTHER INVESTMENTS
Real estate investment trusts (“REITs”): REITs are pooled investment vehicles which invest primarily in income producing real estate, or real estate related loans or interests. Distributions received by REITs are classified at management’s estimate of the dividend income, return of capital and capital gains. Estimates are based on information available at year-end, which includes the previous fiscal year’s classification. The actual amounts of dividend income, return of capital, and capital gains are only determined by each REIT after the fiscal year end and may differ from the estimated amounts. Upon notification from the REITs, some of the distributions received may be re-classified and recorded as a return of capital or capital gains. There are certain additional risks involved in investing in REITs. These include, but are not limited to, economic conditions, changes in zoning laws, real estate values, property taxes, and interest rates.
REITs held at June 30, 2024, if any, are identified within the Schedule of Investments.
5. BORROWINGS AND OTHER FINANCING TRANSACTIONS
The Portfolio may engage in borrowing transactions as a means of raising cash to satisfy redemption requests, for other temporary or emergency purposes or, to the extent permitted by its investment policies, to raise additional cash to be invested in other securities or instruments. When the Portfolio invests borrowing proceeds in other securities, the Portfolio will bear the risk that the market value of the
|
|
|
|
|
| Transamerica Series Trust |
|
|
|
Semi-Annual Financial Statements 2024 |
|
|
Page 8 |
|
|
Transamerica TSW Mid Cap Value Opportunities VP
NOTES TO FINANCIAL STATEMENTS (continued)
At June 30, 2024
(unaudited)
5. BORROWINGS AND OTHER FINANCING TRANSACTIONS (continued)
securities in which such proceeds are invested goes down and is insufficient to repay the borrowed proceeds. The Portfolio may borrow on a secured or on an unsecured basis. If the Portfolio enters into a secured borrowing arrangement, a portion of the Portfolio’s assets will be used as collateral. The 1940 Act requires the Portfolio to maintain asset coverage of at least 300% of the amount of its borrowings. Asset coverage means the ratio that the value of the Portfolio’s total assets, minus liabilities other than borrowings, bears to the aggregate amount of all borrowings. Although complying with this requirement has the effect of limiting the amount that the Portfolio may borrow, it does not otherwise mitigate the risks of entering into borrowing transactions.
Interfund lending: The Portfolio, along with other funds and portfolios advised by TAM, may participate in an interfund lending program pursuant to exemptive relief granted by the Securities and Exchange Commission on January 18, 2017. This program allows the Portfolio to lend to and borrow from other funds and portfolios advised by TAM. Interfund lending transactions are subject to the conditions of the exemptive relief which places limits on the amount of lending or borrowing a Portfolio may participate in under the program. Interest earned or paid on an interfund lending transaction will be based on the average of certain current market rates. For the period ended June 30, 2024, the Portfolio has not utilized the program.
Repurchase agreements: In a repurchase agreement, the Portfolio purchases a security and simultaneously commits to resell that security to the seller at an agreed-upon price on an agreed-upon date. Securities purchased subject to a repurchase agreement are held at the Portfolio’s custodian, or designated sub-custodian related to tri-party repurchase agreements, and, pursuant to the terms of the repurchase agreement, must be collateralized by securities with an aggregate market value greater than or equal to 100% of the resale price. The Portfolio will bear the risk of value fluctuations until the securities can be sold and may encounter delays and incur costs in liquidating the securities. In the event of bankruptcy or insolvency of the seller, delays and costs may be incurred.
Repurchase agreements are subject to netting agreements, which are agreements between the Portfolio and its counterparties that provide for the net settlement of all transactions and collateral with the Portfolio, through a single payment, in the event of default or termination. Amounts presented within the Schedule of Investments, and as part of Repurchase agreements, at value within the Statement of Assets and Liabilities are shown on a gross basis. The value of the related collateral for each repurchase agreement, as reflected within the Schedule of Investments, exceeds the value of each repurchase agreement at June 30, 2024.
Repurchase agreements at June 30, 2024, if any, are included within the Schedule of Investments and Statement of Assets and Liabilities.
Securities lending: The Portfolio may lend securities to qualified financial institutions, brokers and dealers. State Street serves as securities lending agent to the Portfolio pursuant to a Securities Lending Agreement. Loans of securities are terminable at any time and the borrower, after notice, is required to return borrowed securities within the standard time period for settlement of securities transactions. The lending of securities exposes the Portfolio to risks such as: the borrowers may fail to return the loaned securities or may not be able to provide additional collateral, the Portfolio may experience delays in recovery of the loaned securities or delays in access to collateral, or the Portfolio may experience losses related to the investment collateral. To minimize certain risks, loan counterparties pledge cash, securities issued or guaranteed by the U.S. Government and irrevocable letters of credit issued by banks as collateral. The initial collateral received by the Portfolio is required to have a value of at least 102% of the current value of the loaned securities traded on U.S. exchanges, and a value of at least 105% for all other securities. Typically the lending agent is not permitted to sell, re-pledge or use cash and non-cash collateral it receives. The lending agent has agreed to indemnify the Portfolio in the case of default of any securities borrower.
The Portfolio receives compensation for lending securities from interest or dividends earned on the cash, U.S. Government securities and irrevocable letters of credit held as collateral, less associated fees and expenses. Such income is reflected in Net income from securities lending within the Statement of Operations. Cash collateral received is invested in the State Street Navigator Securities Lending Trust — Government Money Market Portfolio.
|
|
|
|
|
| Transamerica Series Trust |
|
|
|
Semi-Annual Financial Statements 2024 |
|
|
Page 9 |
|
|
Transamerica TSW Mid Cap Value Opportunities VP
NOTES TO FINANCIAL STATEMENTS (continued)
At June 30, 2024
(unaudited)
5. BORROWINGS AND OTHER FINANCING TRANSACTIONS (continued)
The value of loaned securities and related cash and non-cash collateral outstanding at June 30, 2024, if any, are shown on a gross basis within the Schedule of Investments.
|
|
|
|
|
|
|
|
|
|
|
|
|
|
|
|
|
|
|
|
|
| |
|
Remaining Contractual Maturity of the Agreements |
|
| |
|
Overnight and Continuous |
|
|
Less Than 30 Days |
|
|
Between 30 & 90 Days |
|
|
Greater Than 90 Days |
|
|
Total |
|
| |
|
| Securities Lending Transactions |
|
|
|
|
|
|
|
|
|
|
|
|
|
|
|
|
|
|
|
|
| Common Stocks |
|
|
$ 376,491 |
|
|
|
$ — |
|
|
|
$ — |
|
|
|
$ — |
|
|
|
$376,491 |
|
| |
|
| Total Borrowings |
|
|
$ 376,491 |
|
|
|
$ — |
|
|
|
$ — |
|
|
|
$ — |
|
|
|
$376,491 |
|
| |
|
6. RISK FACTORS
Investing in the Portfolio involves certain key risks related to the Portfolio’s trading activity. Please reference the Portfolio’s prospectus for a more complete discussion of the following risk(s), as well as other risks of investing in the Portfolio.
Market risk: The market prices of the Portfolio’s securities or other assets may go up or down, sometimes rapidly or unpredictably, due to factors such as economic events, inflation, changes in interest rates, governmental actions or interventions, actions taken by the U.S. Federal Reserve or foreign central banks, market disruptions caused by tariffs, trade disputes or other factors, political developments, armed conflicts, economic sanctions, cybersecurity events, investor sentiment, the global and domestic effects of widespread or local health, weather or climate events, and other factors that may or may not be related to the issuer of the security or other asset. If the market prices of the Portfolio’s securities and assets fall, the value of your investment in the Portfolio could go down.
Economies and financial markets throughout the world are increasingly interconnected. Events or circumstances in one or more countries or regions could be highly disruptive to, and have profound impacts on, global economies or markets. As a result, whether or not the Portfolio invests in securities of issuers located in or with significant exposure to the countries directly affected, the value and liquidity of the Portfolio’s investments may go down.
Medium capitalization companies risk: The Portfolio will be exposed to additional risks as a result of its investments in the securities of medium capitalization companies. Investing in medium capitalization companies involves greater risk than is customarily associated with more established companies. The prices of securities of medium capitalization companies generally are more volatile and are more likely to be adversely affected by changes in earnings results and investor expectations or poor economic or market conditions. Securities of medium capitalization companies may underperform larger capitalization companies, may be harder to sell at times and at prices the Portfolio managers believe appropriate and may offer greater potential for losses.
Real estate investment trusts (“REITs”) risk: Investing in real estate investment trusts (“REITs”) involves unique risks. When the Portfolio invests in REITs, it is subject to risks generally associated with investing in real estate. A REIT’s performance depends on the types and locations of the properties it owns, how well it manages those properties and cash flow. REITs may have limited financial resources, may trade less frequently and in limited volume, may engage in dilutive offerings, and may be subject to more abrupt or erratic price movements than the overall securities markets. In addition to its own expenses, the Portfolio will indirectly bear its
proportionate share of any management and other expenses paid by REITs in which it invests. U.S. REITs are subject to a number of highly technical tax-related rules and requirements; and a U.S. REIT’s failure to qualify for the favorable U.S. federal income tax treatment generally available to U.S. REITs could result in corporate-level taxation, significantly reducing the return on an investment to the Portfolio.
Value investing risk: The prices of securities the sub-adviser believes are undervalued may not appreciate as anticipated or may go down. The value approach to investing involves the risk that stocks may remain undervalued, undervaluation may become more severe, or perceived undervaluation may actually represent intrinsic value. Value stocks as a group may be out of favor and underperform the overall equity market for a long period of time, for example, while the market favors “growth” stocks.
7. FEES AND OTHER AFFILIATED TRANSACTIONS
TST serves as a funding vehicle for certain affiliated asset allocation portfolios and certain affiliated separate accounts of Transamerica Life Insurance Company (“TLIC”) and Transamerica Financial Life Insurance Company.
|
|
|
|
|
| Transamerica Series Trust |
|
|
|
Semi-Annual Financial Statements 2024 |
|
|
Page 10 |
|
|
Transamerica TSW Mid Cap Value Opportunities VP
NOTES TO FINANCIAL STATEMENTS (continued)
At June 30, 2024
(unaudited)
7. FEES AND OTHER AFFILIATED TRANSACTIONS (continued)
TAM, the Portfolio’s investment manager, is directly owned by TLIC and AUSA Holding, LLC (“AUSA”), both of which are indirect, wholly owned subsidiaries of Aegon Ltd. TLIC is owned by Commonwealth General Corporation (“Commonwealth”). Commonwealth and AUSA are wholly owned by Transamerica Corporation (DE). Transamerica Corporation (DE) is wholly owned by Aegon International B.V., which is wholly owned by Aegon Ltd., a Bermuda exempted company with liability limited by shares (formerly, Aegon NV, a Netherlands corporation) and a publicly traded international insurance group.
Transamerica Fund Services, Inc. (“TFS”) is the Portfolio’s transfer agent. Transamerica Capital, Inc. (“TCI”) is the Portfolio’s distributor/principal underwriter. TAM, TFS and TCI are affiliates of Aegon Ltd.
Certain officers and trustees of the Portfolio may also be officers and/or trustees of TAM, TFS and TCI. No interested trustee who is deemed an interested person due to current or former service with TAM or an affiliate of TAM receives compensation from the Portfolio. The Portfolio does pay non-interested persons (independent trustees), as disclosed in Trustee and CCO fees within the Statement of Operations.
Investment management fees: TAM serves as the Portfolio’s investment manager, performing administration as well as investment advisory services. TAM renders investment advisory, supervisory, and administration services under an investment management agreement and the Portfolio pays a single management fee, which is reflected in Investment management fees within the Statement of Operations.
The Portfolio pays a management fee to TAM based on daily average net assets at the following rates:
|
|
|
|
|
|
|
|
|
| Breakpoints |
|
Rate |
|
|
|
|
| |
|
| Effective May 1, 2024 |
|
|
|
|
|
|
|
|
| First $750 million |
|
|
0.6950 |
% |
|
|
|
|
| Over $750 million up to $1.5 billion |
|
|
0.6925 |
|
|
|
|
|
| Over $1.5 billion up to $2 billion |
|
|
0.6500 |
|
|
|
|
|
| Over $2 billion |
|
|
0.6300 |
|
|
|
|
|
| Prior to May 1, 2024 |
|
|
|
|
|
|
|
|
| First $100 million |
|
|
0.8800 |
|
|
|
|
|
| Over $100 million up to $550 million |
|
|
0.8300 |
|
|
|
|
|
| Over $550 million up to $750 million |
|
|
0.7900 |
|
|
|
|
|
| Over $750 million up to $1 billion |
|
|
0.7700 |
|
|
|
|
|
| Over $1 billion |
|
|
0.7600 |
|
|
|
|
|
TAM has contractually agreed to waive fees and/or reimburse Portfolio expenses to the extent that the total operating expenses excluding, as applicable, acquired fund fees and expenses, interest (including borrowing costs and overdraft charges), taxes, brokerage commissions, dividend and interest expenses on securities sold short, extraordinary expenses and other expenses not incurred in the ordinary course of the Portfolio’s business, exceed the following stated annual operating expense limits to the Portfolio’s daily average net assets. To the extent an expense limit changed during the period, the prior limit is also listed below. The expenses waived and/or reimbursed, if any, are included in Expenses waived and/or reimbursed within the Statement of Operations.
|
|
|
|
|
| Class |
|
Operating Expense Limit |
|
Operating Expense Limit Effective Through |
| |
| Effective May 1, 2024 |
|
|
|
|
| Initial Class |
|
0.78% |
|
May 1, 2025 |
| Service Class |
|
1.03 |
|
May 1, 2025 |
| Prior to May 1, 2024 |
|
|
|
|
| Initial Class |
|
0.93 |
|
|
| Service Class |
|
1.17 |
|
|
TAM is permitted to recapture amounts contractually waived and/or reimbursed to a class during any of the 36 months from the date on which TAM waived fees and/or reimbursed expenses for the class. A class may recapture and reimburse TAM only if such amount does not cause, on any particular business day of the Portfolio, the class’s total annual operating expenses (after the recapture is taken into
|
|
|
|
|
| Transamerica Series Trust |
|
|
|
Semi-Annual Financial Statements 2024 |
|
|
Page 11 |
|
|
Transamerica TSW Mid Cap Value Opportunities VP
NOTES TO FINANCIAL STATEMENTS (continued)
At June 30, 2024
(unaudited)
7. FEES AND OTHER AFFILIATED TRANSACTIONS (continued)
account) to exceed the Operating Expense Limits or any other lower limit then in effect. Amounts recaptured, if any, by TAM for the period ended June 30, 2024 are disclosed in Recapture of previously waived and/or reimbursed fees within the Statement of Operations.
TAM, on a voluntary basis and in addition to the contractual operating expense limits in effect, from time to time may waive and/or reimburse expenses of the Portfolio, or any classes thereof, to such level(s) as the Trust’s officers have determined or may reasonably determine from time to time. Any such voluntary waiver or expense reimbursement may be discontinued by TAM at any time. These amounts are not subject to recapture by TAM.
As of June 30, 2024, there are no amounts available for recapture by TAM.
Distribution and service fees: TST has a distribution plan (“Distribution Plan”) pursuant to Rule 12b-1 under the 1940 Act. Pursuant to the Distribution Plan, TST entered into a distribution agreement with TCI as the Portfolio’s distributor.
The Distribution Plan requires the Portfolio to pay distribution fees to TCI as compensation for various distribution activities, not as reimbursement for specific expenses. Under the Distribution Plan and distribution agreement, TCI, on behalf of the Portfolio, is authorized to pay various service providers, as direct payment for expenses incurred in connection with distribution of the Portfolio’s shares.
The fee on the Service Class shares is paid to the insurance companies for providing services and account maintenance for the policyholders who invest in the variable insurance products which invest in the Service Class shares. TCI has determined that it will not seek payment for the distribution expenses incurred by the Portfolio with respect to the Initial Class shares before May 1, 2025. Prior to TCI seeking distribution expenses on Initial Class shares, policy and contract owners will be notified in advance. The Portfolio will pay fees relating to Service Class shares. The distribution and service fees are included in Distribution and service fees within the Statement of Operations.
The Portfolio is authorized under the Distribution Plan to pay fees to TCI based on daily average net assets of each applicable class up to the following annual rates:
|
|
|
|
|
|
|
|
|
| Class |
|
Rate |
|
|
|
|
| |
|
| Initial Class |
|
|
0.15 |
% |
|
|
|
|
| Service Class |
|
|
0.25 |
|
|
|
|
|
Transfer agent costs: TFS provides transfer agency services under an intercompany agreement with TAM. TFS has outsourced the provision of certain sub-transfer agency services to SS&C Global Investor & Distribution Solutions, Inc. (“SS&C GIDS”). The Portfolio does not pay a separate transfer agent fee to TAM or TFS but does pay certain expenses to SS&C GIDS related to applicable sub-transfer agency services. For the period ended June 30, 2024, (i) the expenses paid to SS&C GIDS by the Portfolio are referred to as transfer agent costs and are included within the Statement of Operations and (ii) the expenses payable to SS&C GIDS by the Portfolio are referred to as transfer agent costs within the Statement of Assets and Liabilities.
Brokerage commissions: The Portfolio incurred no brokerage commissions on security transactions placed with affiliates of the investment manager or sub-adviser(s) for the period ended June 30, 2024.
8. PURCHASES AND SALES OF SECURITIES
For the period ended June 30, 2024, the cost of securities purchased and proceeds from securities sold (excluding short-term securities) are as follows:
|
|
|
|
|
|
|
| Purchases of Securities |
|
Sales/Maturities of Securities |
| Long-Term |
|
U.S. Government |
|
Long-Term |
|
U.S. Government |
| |
| $ 234,614,974 |
|
$ — |
|
$ 316,462,026 |
|
$ — |
9. FEDERAL INCOME TAXES AND DISTRIBUTIONS TO SHAREHOLDERS
The Portfolio has not made any provision for federal income or excise taxes due to its policy to distribute all of its taxable income and capital gains to its shareholders and otherwise qualify as a regulated investment company under Subchapter M of the Internal Revenue
|
|
|
|
|
| Transamerica Series Trust |
|
|
|
Semi-Annual Financial Statements 2024 |
|
|
Page 12 |
|
|
Transamerica TSW Mid Cap Value Opportunities VP
NOTES TO FINANCIAL STATEMENTS (continued)
At June 30, 2024
(unaudited)
9. FEDERAL INCOME TAXES AND DISTRIBUTIONS TO SHAREHOLDERS (continued)
Code. The Portfolio recognizes the tax benefits of uncertain tax positions only where the position is “more likely than not” to be sustained assuming examination by tax authorities. The Portfolio’s tax returns remain subject to examination by the Internal Revenue Service and state tax authorities three years from the date of filing for federal purposes and four years from the date of filing for state purposes. Management has evaluated the Portfolio’s tax provisions taken for all open tax years, and has concluded that no provision for income tax is required in the Portfolio’s financial statements. If applicable, the Portfolio recognizes interest accrued related to unrecognized tax benefits in relation to interest and penalties expense in Other within the Statement of Operations. The Portfolio identifies its major tax jurisdictions as U.S. Federal, the state of Colorado, and foreign jurisdictions where the Portfolio makes significant investments; however, the Portfolio is not aware of any tax positions for which it is reasonably possible that the total amounts of unrecognized tax benefits will change materially in the next twelve months. Distributions are determined in accordance with income tax regulations, which may differ from GAAP.
As of June 30, 2024, the approximate cost for U.S. federal income tax purposes, and the aggregate gross/net unrealized appreciation (depreciation) in the value of investments (including securities sold short and derivatives, if any) are as follows:
|
|
|
|
|
|
|
| Cost |
|
Gross Appreciation |
|
Gross (Depreciation) |
|
Net Appreciation (Depreciation) |
| |
| $ 245,096,963 |
|
$ 9,889,589 |
|
$ (13,312,184) |
|
$ (3,422,595) |
10. NEW ACCOUNTING PRONOUNCEMENT
In June 2022, the Financial Accounting Standards Board issued Accounting Standards Update No. 2022-03 (“ASU 2022-03”), “Fair Value Measurement of Equity Securities Subject to Contractual Sale Restrictions” (“Topic 820”). ASU 2022-03 clarifies the guidance in Topic 820, related to the measurement of the fair value of an equity security subject to contractual sale restrictions, where it eliminates the need to apply a discount to fair value of these securities, and introduces disclosure requirements related to such equity securities. The guidance is effective for fiscal years, and interim periods within those fiscal years, beginning after December 15, 2023, and allows for early adoption. Management is currently evaluating the implications, if any, of the additional requirements and their impact on the Portfolio’s financial statements.
Please see TST’s most recent report on Form N-CSR, available at: www.transamerica.com/annuities/prospectus, for additional information. For the most recently filed complete proxy voting records for the Trust please visit: https://www.transamerica.com/sites/default/files/files/e070d/TST%20N-PX%202021.pdf
|
|
|
|
|
| Transamerica Series Trust |
|
|
|
Semi-Annual Financial Statements 2024 |
|
|
Page 13 |
|
|
Transamerica TSW Mid Cap Value Opportunities VP
MANAGEMENT AGREEMENT — CONTRACT RENEWAL
(unaudited)
At a meeting of the Board of Trustees of Transamerica Series Trust (the “Trustees” or the “Board”) held on June 12-13, 2024, the Board considered the renewal of the management agreement (the “Management Agreement”) between Transamerica Asset Management, Inc. (“TAM”) and Transamerica Series Trust, on behalf of Transamerica TSW Mid Cap Value Opportunities VP (formerly, Transamerica JPMorgan Mid Cap Value VP) (the “Portfolio”).
Following its review and consideration, the Board determined that the terms of the Management Agreement were reasonable and that the renewal of the Management Agreement was in the best interests of the Portfolio and the holders invested in the Portfolio. The Board, including the independent members of the Board (the “Independent Trustees”), unanimously approved the renewal of the Management Agreement through June 30, 2025.
Prior to reaching their decision, the Trustees requested and received from TAM certain information. They then reviewed such information as they deemed reasonably necessary to evaluate the Management Agreement, including information they had previously received from TAM as part of their regular oversight of the Portfolio, and knowledge they gained over time through meeting with TAM. Among other materials, the Trustees considered comparative fee, expense and performance information prepared by Broadridge Financial Solutions, Inc. (“Broadridge”), an independent provider of mutual fund performance information, as well as fee, expense and profitability information prepared by TAM. The Board also considered reductions to the Portfolio’s expense limits, if any, that took effect after the last renewal of the Management Agreement. In their review, the Trustees also sought to identify instances in which the Portfolio’s performance, fees, total expenses and/or profitability appeared to be outliers within its respective peer group or other comparative metrics and sought to understand the reasons for such comparative positions.
In their deliberations, the Independent Trustees met privately without representatives of TAM present and were represented throughout the process by their independent legal counsel. In considering the proposed continuation of the Management Agreement, the Trustees evaluated and weighed a number of considerations that they believed to be relevant in light of the legal advice furnished to them by counsel, including independent legal counsel, and made a decision in the exercise of their own business judgment. They based their decisions on the considerations discussed below, among others, although they did not identify any particular consideration or item of information that was controlling of their decisions, and each Trustee may have attributed different weights to the various factors.
Nature, Extent and Quality of the Services Provided
The Board considered the nature, extent and quality of the services provided by TAM to the Portfolio in the past and the services anticipated to be provided in the future. The Board also considered the investment approach for the Portfolio; the experience, capability and integrity of TAM’s senior management; the financial resources of TAM; TAM’s management oversight process; and TAM’s responsiveness to any questions by the Trustees.
The Board also considered the continuous and regular investment management and other services provided by TAM, when acting as a manager of managers, for the portion of the management fee it retains from the Portfolio after payment of the sub-advisory fees. The Board noted that the investment management and other services provided by TAM include the design, development and ongoing review and evaluation of the Portfolio and its investment strategy; the selection, oversight and monitoring of one or more investment sub-advisers to perform certain duties with respect to the Portfolio; ongoing portfolio trading oversight and analysis; risk management oversight and analysis; design, development, implementation and ongoing review and evaluation of a process for the valuation of Portfolio investments; design, development, implementation and ongoing review and evaluation of a compliance program for the Portfolio; design, development, implementation and ongoing review and evaluation of a process for the voting of proxies and exercise of rights to consent to corporate action for Portfolio investments; participation in Board meetings and oversight of preparation of materials for the Board, including materials for Board meetings and regular communications with the Board; oversight of preparation of the Portfolio’s prospectus, statement of additional information, shareholder reports and other disclosure materials and regulatory filings for the Portfolio; and ongoing cash management services for the Portfolio. The Board considered that TAM’s investment management services also include the provision of supervisory and administrative services to the Portfolio. The Board also noted that TAM, as part of the services it provides to all Transamerica mutual funds, including the Portfolio, oversees the services provided by the funds’ custodian, transfer agent, independent accountant and legal counsel and supervises the performance of the recordkeeping and holder service functions of the funds.
Investment Performance
In addition, the Board considered the short- and longer-term performance of the Portfolio in light of its investment objective, policies and strategies, including relative performance against (i) a peer universe of comparable mutual funds, as prepared by Broadridge, and (ii) the Portfolio’s benchmarks, in each case for various trailing periods ended December 31, 2023. Based on these considerations, the Board determined that TAM can provide investment and related services that are appropriate in scope and extent in light of the Portfolio’s investment objectives, policies and strategies and operations, the competitive landscape of the investment company business and investor needs. The Board’s conclusions as to the Portfolio’s performance are summarized below. For purposes of its review, the Board generally used the performance of Service Class Shares. In describing the Portfolio’s performance relative to its peer universe, the summary conclusions characterize performance for the relevant periods in relation to whether it was “above,” “below” or “in line with” the peer universe median and do so using quintile rankings prepared by Broadridge. For simplicity, performance is described as “above” the median if the Portfolio’s performance ranked anywhere in the first or second quintiles, as “below” the median if it ranked anywhere in the
|
|
|
|
|
| Transamerica Series Trust |
|
|
|
Semi-Annual Financial Statements 2024 |
|
|
Page 14 |
|
|
Transamerica TSW Mid Cap Value Opportunities VP
MANAGEMENT AGREEMENT — CONTRACT RENEWAL (continued)
(unaudited)
fourth or fifth quintiles, or “in line with” the median if it ranked anywhere in the third quintile (i.e., even if its precise return was somewhat above or somewhat below the precise median return).
When considering the Portfolio’s performance, the Trustees considered any representations made by TAM regarding the appropriateness of certain peer groups and benchmarks. They recognized that performance reflects a snapshot of a period as of a specific date, and that consideration of performance data for a different period could generate significantly different performance results. The Trustees also recognized that even longer-term performance can be negatively affected by performance over a short-term period when that short-term performance is significantly below the performance of the comparable benchmark or universe of peer funds.
The Board noted that the performance of Service Class Shares of the Portfolio was in line with the median for its peer universe for the past 1-year period and below the median for the past 3-, 5- and 10-year periods. The Board also noted that the performance of Service Class Shares of the Portfolio was above the benchmark that TAM utilizes to measure performance of the Portfolio for the past 3-year period and below the benchmark for the past 1-, 5- and 10-year periods. The Board noted that the Portfolio’s sub-adviser had commenced sub-advising the Portfolio on May 1, 2024 pursuant to its current investment objective and investment strategies.
Management Fee and Total Expense Ratio
The Board considered the management fee and total expense ratio of the Portfolio, including information provided by Broadridge comparing the management fee and total expense ratio of the Portfolio to the management fees and total expense ratios of comparable investment companies in both a peer group and broader peer universe compiled by Broadridge. The Board’s conclusions as to the Portfolio’s management fee and total expense ratio are summarized below. For purposes of its review, the Board generally used the actual total expenses (i.e., expenses reflecting any waivers and/or reimbursements) of Service Class Shares. In describing the Portfolio’s management fee and total expense ratio relative to its peer group and peer universe, the summary conclusions characterize management fees and total expense ratios for the relevant periods in relation to whether they were “above,” “below” or “in line with” the peer group or peer universe median and do so using quintile rankings prepared by Broadridge. For simplicity, management fees and total expense ratios are described as “above” the median if the Portfolio’s management fee or total expense ratio ranked anywhere in the fourth or fifth quintiles, as “below” the median if it ranked anywhere in the first or second quintiles, or “in line with” the median if it ranked anywhere in the third quintile (i.e., even if its precise management fee or total expense ratio was somewhat above or somewhat below the precise median management fee or total expense ratio). The Board also considered the fees charged by the Portfolio’s sub-adviser for sub-advisory services, as well as the portion of the Portfolio’s management fee retained by TAM following payment of the sub-advisory fee and how the portion of the contractual management fee retained by TAM at a specified asset level compared to the portions retained by other investment advisers managing mutual funds with similar investment strategies as calculated by an independent provider of information.
The Board noted that the Portfolio’s contractual management fee and the actual total expenses (i.e., expenses reflecting any waivers and/or reimbursements) of Service Class Shares of the Portfolio were above the medians for its peer group and peer universe. The Trustees also considered that TAM has entered into an expense limitation arrangement with the Portfolio, which may result in TAM waiving fees for the benefit of holders. The Trustees noted that they had previously approved a reduction to the Portfolio’s management fee schedule, which took effect on May 1, 2024 and was not fully reflected in the comparative data.
On the basis of these considerations, together with the other information it considered, the Board determined that the management fee to be received by TAM under the Management Agreement is reasonable in light of the services provided.
Cost of Services Provided and Level of Profitability
The Board reviewed information provided by TAM about the cost of providing and procuring fund management services, as well as the costs of the provision of administration, transfer agency and other services, to the Portfolio and to Transamerica Series Trust as a whole by TAM and its affiliates. The Board considered the profitability of TAM and its affiliates in providing these services for the Portfolio and Transamerica Series Trust as a whole. The Trustees recognized the competitiveness of the mutual fund industry and the importance of an investment adviser’s long-term profitability, including for maintaining company and management stability and accountability.
The Board also considered the allocation methodology used for calculating the profitability of TAM and its affiliates. The Board noted that the revenue and expense allocation methodology used by TAM to estimate its profitability with respect to its relationship with the Portfolio had been reviewed previously by an independent consultant. The Trustees considered that TAM reported that it had not made material changes to this methodology, and that the methodology had been applied consistently for the Portfolio.
Based on this information, the Board determined that the profitability of TAM and its affiliates from their relationships with the Portfolio was not excessive.
Economies of Scale
The Board considered economies of scale with respect to the management of the Portfolio, whether the Portfolio had appropriately benefited from any economies of scale and whether there was the potential for realization of any future economies of scale. The Board also considered the existence of economies of scale with respect to management of the Transamerica mutual funds overall and the extent to which the Portfolio benefited from any economies of scale. The Board recognized that, as the Portfolio’s assets increase, any economies
|
|
|
|
|
| Transamerica Series Trust |
|
|
|
Semi-Annual Financial Statements 2024 |
|
|
Page 15 |
|
|
Transamerica TSW Mid Cap Value Opportunities VP
MANAGEMENT AGREEMENT — CONTRACT RENEWAL (continued)
(unaudited)
of scale realized by TAM may not directly correlate with any economies of scale that might be realized by the Portfolio. The Board considered the Portfolio’s management fee schedule and the existence of breakpoints and also considered the extent to which TAM shared economies of scale, if any, with the Portfolio through undertakings to limit or reimburse Portfolio expenses and to invest in maintaining and developing its capabilities and services. The Trustees concluded that the Portfolio’s fee structure reflected an appropriate sharing of any efficiencies or economies of scale to date and noted that they will have the opportunity to periodically reexamine the appropriateness of the management fee payable to TAM in light of any economies of scale experienced in the future.
Benefits to TAM and/or its Affiliates from their Relationships with the Portfolio
The Board considered other benefits derived by TAM and/or its affiliates from their relationships with the Portfolio. The Board noted that TAM does not receive benefits from research obtained with commissions paid to broker-dealers for portfolio transactions (commonly referred to as “soft dollars”) as a result of its relationship with the Portfolio. The Board also noted that the Sub-Adviser participates in a brokerage program pursuant to which a portion of brokerage commissions paid by the Portfolio is recaptured for the benefit of the Portfolio and the holders, thus limiting the amount of soft dollar arrangements the Sub-Adviser may engage in with respect to the Portfolio’s brokerage transactions.
Other Considerations
The Board noted that TAM has made a substantial commitment to the recruitment and retention of high-quality personnel and maintains the financial, compliance and operational resources reasonably necessary to manage the Portfolio in a professional manner that is consistent with the best interests of the Portfolio and the holders. In this regard, the Board favorably considered the procedures and policies TAM has in place to enforce compliance with applicable laws and regulations and oversee the portfolio management activities of the Portfolio’s sub-adviser. The Board also noted that TAM has made an entrepreneurial commitment and undertaken certain business risks with respect to the management and success of the Portfolio.
Conclusion
After consideration of the factors described above, as well as other factors, the Trustees, including the Independent Trustees, concluded that the renewal of the Management Agreement was in the best interests of the Portfolio and the holders and voted to approve the renewal of the Management Agreement.
|
|
|
|
|
| Transamerica Series Trust |
|
|
|
Semi-Annual Financial Statements 2024 |
|
|
Page 16 |
|
|
Transamerica TSW Mid Cap Value Opportunities VP
RESULTS OF SHAREHOLDER MEETING
(unaudited)
Rule 30e-1 under the Investment Company Act of 1940, as amended, titled “Reports to Stockholders of Management Companies,” requires regulated investment companies to report on all subject matters put to the vote of shareholders and to provide final results. Accordingly, the Board of Trustees of the Portfolio solicited a vote by the shareholders for the following item:
A special meeting of holders of Transamerica TSW Mid Cap Value Opportunities VP (formerly, Transamerica JPMorgan Mid Cap Value VP) was held on April 29, 2024. The results of Proposal 2 were as follows:
To approve the Portfolio’s use of the manager of managers exemptive order, which will allow TAM, the Portfolio’s investment manager, to enter into and materially amend sub-advisory agreements with respect to the Portfolio in the future without Holder approval, subject to prior approval by the Portfolio’s Board of Trustees.
|
|
|
| Proposal |
|
Number of Shares |
| |
| For |
|
16,858,443 |
| Against |
|
892,035 |
| Withheld |
|
601,721 |
|
|
|
|
|
| Transamerica Series Trust |
|
|
|
Semi-Annual Financial Statements 2024 |
|
|
Page 17 |
|
|
PROXY VOTING POLICIES AND PROCEDURES AND QUARTERLY PORTFOLIO HOLDINGS
(unaudited)
A description of Transamerica Series Trust’s (the “Trust”) proxy voting policies and procedures is available in the Statement of Additional Information of the Portfolios, available without charge upon request by calling 1-800-851-9777 (toll free) or on the Securities and Exchange Commission’s (“SEC”) website at http://www.sec.gov.
In addition, the Portfolio is required to file Form N-PX, with their complete proxy voting records for the most recent 12 months ended June 30th, no later than August 31st of each year. The Form is available without charge: (1) on the Transamerica Funds website at https://www.transamerica.com/sites/default/files/files/e070d/TST%20N-PX%202021.pdf; and (2) on the SEC’s website at http://www.sec.gov.
Each fiscal quarter, the Portfolios, except Transamerica BlackRock Government Money Market VP, will file with the SEC a complete schedule of its monthly portfolio holdings on Form N-PORT. The Portfolios’ holdings as of the end of the third month of every fiscal quarter, as reported on Form N-PORT, will be publicly available on the SEC’s website at http://www.sec.gov within 60 days of the end of the fiscal quarter.
On a monthly basis, Transamerica BlackRock Government Money Market VP will file with the SEC portfolio holdings information on Form N-MFP3. A complete schedule of portfolio holdings is also available at www.transamerica.com.
You may also visit the Trust’s website at www.transamerica.com/annuities/prospectus for this and other information about the Portfolios and the Trust.
Important Notice Regarding Delivery of Shareholder Documents
Every year we provide shareholders informative materials such as the Transamerica Series Trust Annual Report, the Transamerica Series Trust Prospectus, and other required documents that keep you informed regarding your Portfolios. To the extent provided by mail, Transamerica Series Trust will only send one piece per mailing address, a method that saves your Portfolios money by reducing mailing and printing costs. We will continue to do this unless you tell us not to. To elect to receive individual mailings, simply call a Transamerica Customer Service Representative toll free at 1-800-851-9777, 8 a.m. to 7 p.m. Eastern Time, Monday-Friday. Your request will take effect within 30 days.
|
|
|
|
|
| Transamerica Series Trust |
|
|
|
Semi-Annual Financial Statements 2024 |
|
|
Page 18 |
|
|
NOTICE OF PRIVACY POLICY
(unaudited)
Your privacy is very important to us. We want you to understand what information we collect and how we use it. We collect and use “nonpublic personal information” in connection with providing our customers with a broad range of financial products and services as effectively and conveniently as possible. We treat nonpublic personal information in accordance with our Privacy Policy.
What Information We Collect and From Whom We Collect It
We may collect nonpublic personal information about you from the following sources:
| • |
|
Information we receive from you on applications or other forms, such as your name, address, and account number; |
| • |
|
Information about your transactions with us, our affiliates, or others, such as your account balance and purchase/redemption history; and |
| • |
|
Information we receive from non-affiliated third parties, including consumer reporting agencies. |
What Information We Disclose and To Whom We Disclose It
We do not disclose any nonpublic personal information about current or former customers to anyone without their express consent, except as permitted by law. We may disclose the nonpublic personal information we collect, as described above, to persons or companies that perform services on our behalf and to other financial institutions with which we have joint marketing agreements. We will require these companies to protect the confidentiality of your nonpublic personal information and to use it only to perform the services for which we have hired them.
Our Security Procedures
We restrict access to your nonpublic personal information and only allow disclosures to persons and companies as permitted by law to assist in providing products or services to you. We maintain physical, electronic, and procedural safeguards to protect your nonpublic personal information and to safeguard the disposal of certain consumer information.
Contact Us
If you have any questions about our Privacy Policy, please call 1-800-851-9777 on any business day between 8 a.m. and 7 p.m. Eastern Time.
Note: This Privacy Policy applies only to customers that have a direct relationship with us or our affiliates. If you own shares of our portfolios in the name of a third party such as a bank or broker-dealer, its privacy policy may apply to you instead of ours.
|
|
|
|
|
| Transamerica Series Trust |
|
|
|
Semi-Annual Financial Statements 2024 |
|
|
Page 19 |
|
|
PO Box 219945
Kansas City, MO 64121-9945
|
|
|
| Distributor: |
|
Transamerica Capital, Inc. PO Box 219945 Kansas City, MO 64121-9945 Customer Service: 1-800-851-9777 |
Transamerica Series Trust Semi-Annual Financial Statements
June 30, 2024
1801 California St., Suite 5200
Denver, CO 80202
Distributor: Transamerica Capital, Inc.
Customer Service: 1-800-851-9777
The following pages contain the most recent semi-annual financial statements for the investment options in which you are invested. In compliance with Securities and Exchange Commission regulations, we present these reports on an annual and semi-annual basis with the hope that they will foster greater understanding of the investment options’ holdings, performance, financial data, accounting policies and other issues. This streamlined version provides information only on the investment options in which you are invested.
If you have any questions about these reports, please do not hesitate to contact your financial professional. As always, we thank you for your trust and the opportunity to serve you.
Transamerica WMC US Growth VP
SCHEDULE OF INVESTMENTS
At June 30, 2024
(unaudited)
|
|
|
|
|
|
|
|
|
| |
|
Shares |
|
|
Value |
|
| COMMON STOCKS - 99.1% |
|
| Automobiles - 1.1% |
|
| Tesla, Inc. (A) |
|
|
320,920 |
|
|
$ |
63,503,650 |
|
|
|
|
|
|
|
|
|
|
| Beverages - 1.8% |
|
| Brown-Forman Corp., Class B |
|
|
804,408 |
|
|
|
34,742,382 |
|
| Constellation Brands, Inc., Class A |
|
|
144,930 |
|
|
|
37,287,590 |
|
| Monster Beverage Corp. (A) |
|
|
673,671 |
|
|
|
33,649,866 |
|
|
|
|
|
|
|
|
|
|
|
|
|
|
|
|
|
105,679,838 |
|
|
|
|
|
|
|
|
|
|
| Biotechnology - 1.0% |
|
| Vertex Pharmaceuticals, Inc. (A) |
|
|
131,352 |
|
|
|
61,567,309 |
|
|
|
|
|
|
|
|
|
|
| Broadline Retail - 5.0% |
|
| Amazon.com, Inc. (A) |
|
|
1,534,504 |
|
|
|
296,542,898 |
|
|
|
|
|
|
|
|
|
|
| Building Products - 0.5% |
|
| Builders FirstSource, Inc. (A) |
|
|
232,291 |
|
|
|
32,151,397 |
|
|
|
|
|
|
|
|
|
|
| Capital Markets - 2.7% |
|
| Ares Management Corp., Class A |
|
|
306,319 |
|
|
|
40,826,196 |
|
| KKR & Co., Inc. |
|
|
315,871 |
|
|
|
33,242,264 |
|
| Morgan Stanley |
|
|
363,737 |
|
|
|
35,351,599 |
|
| S&P Global, Inc. |
|
|
107,699 |
|
|
|
48,033,754 |
|
|
|
|
|
|
|
|
|
|
|
|
|
|
|
|
|
157,453,813 |
|
|
|
|
|
|
|
|
|
|
| Chemicals - 1.0% |
|
| Sherwin-Williams Co. |
|
|
200,714 |
|
|
|
59,899,079 |
|
|
|
|
|
|
|
|
|
|
| Communications Equipment - 0.8% |
|
| Arista Networks, Inc. (A) |
|
|
137,005 |
|
|
|
48,017,512 |
|
|
|
|
|
|
|
|
|
|
| Consumer Finance - 0.9% |
|
| American Express Co. |
|
|
218,157 |
|
|
|
50,514,253 |
|
|
|
|
|
|
|
|
|
|
| Electronic Equipment, Instruments & Components - 3.2% |
|
| Amphenol Corp., Class A |
|
|
1,155,556 |
|
|
|
77,849,808 |
|
| CDW Corp. |
|
|
275,431 |
|
|
|
61,652,475 |
|
| Coherent Corp. (A) |
|
|
448,987 |
|
|
|
32,533,598 |
|
| Jabil, Inc. |
|
|
135,071 |
|
|
|
14,694,374 |
|
|
|
|
|
|
|
|
|
|
|
|
|
|
|
|
|
186,730,255 |
|
|
|
|
|
|
|
|
|
|
| Entertainment - 3.2% |
|
| Live Nation Entertainment, Inc. (A) |
|
|
580,654 |
|
|
|
54,430,506 |
|
| Netflix, Inc. (A) |
|
|
201,281 |
|
|
|
135,840,521 |
|
|
|
|
|
|
|
|
|
|
|
|
|
|
|
|
|
190,271,027 |
|
|
|
|
|
|
|
|
|
|
| Financial Services - 2.8% |
|
| Mastercard, Inc., Class A |
|
|
376,973 |
|
|
|
166,305,409 |
|
|
|
|
|
|
|
|
|
|
| Ground Transportation - 1.5% |
|
| Uber Technologies, Inc. (A) |
|
|
1,222,088 |
|
|
|
88,821,356 |
|
|
|
|
|
|
|
|
|
|
| Health Care Equipment & Supplies - 1.5% |
|
| Boston Scientific Corp. (A) |
|
|
628,509 |
|
|
|
48,401,478 |
|
| Edwards Lifesciences Corp. (A) |
|
|
462,796 |
|
|
|
42,748,467 |
|
|
|
|
|
|
|
|
|
|
|
|
|
|
|
|
|
91,149,945 |
|
|
|
|
|
|
|
|
|
|
| Health Care Providers & Services - 1.0% |
|
| UnitedHealth Group, Inc. |
|
|
115,715 |
|
|
|
58,929,021 |
|
|
|
|
|
|
|
|
|
|
| Health Care Technology - 0.9% |
|
| Veeva Systems, Inc., Class A (A) |
|
|
286,330 |
|
|
|
52,401,253 |
|
|
|
|
|
|
|
|
|
|
|
|
|
|
|
|
|
|
|
| |
|
Shares |
|
|
Value |
|
| COMMON STOCKS (continued) |
|
| Hotels, Restaurants & Leisure - 3.7% |
|
| Airbnb, Inc., Class A (A) |
|
|
261,308 |
|
|
$ |
39,622,132 |
|
| Chipotle Mexican Grill, Inc. (A) |
|
|
1,311,350 |
|
|
|
82,156,077 |
|
| DoorDash, Inc., Class A (A) |
|
|
439,295 |
|
|
|
47,786,510 |
|
| DraftKings, Inc., Class A (A) |
|
|
657,345 |
|
|
|
25,090,859 |
|
| Viking Holdings Ltd. (A) |
|
|
776,829 |
|
|
|
26,365,576 |
|
|
|
|
|
|
|
|
|
|
|
|
|
|
|
|
|
221,021,154 |
|
|
|
|
|
|
|
|
|
|
| Independent Power & Renewable Electricity Producers - 0.4% |
|
| Vistra Corp. |
|
|
299,517 |
|
|
|
25,752,472 |
|
|
|
|
|
|
|
|
|
|
| Insurance - 0.8% |
|
| Arch Capital Group Ltd. (A) |
|
|
439,135 |
|
|
|
44,304,330 |
|
|
|
|
|
|
|
|
|
|
| Interactive Media & Services - 10.1% |
|
| Alphabet, Inc., Class A |
|
|
1,603,151 |
|
|
|
292,013,955 |
|
| Meta Platforms, Inc., Class A |
|
|
544,887 |
|
|
|
274,742,923 |
|
| Pinterest, Inc., Class A (A) |
|
|
789,713 |
|
|
|
34,802,652 |
|
|
|
|
|
|
|
|
|
|
|
|
|
|
|
|
|
601,559,530 |
|
|
|
|
|
|
|
|
|
|
| IT Services - 1.4% |
|
| Gartner, Inc. (A) |
|
|
114,754 |
|
|
|
51,531,431 |
|
| MongoDB, Inc. (A) |
|
|
130,764 |
|
|
|
32,685,770 |
|
|
|
|
|
|
|
|
|
|
|
|
|
|
|
|
|
84,217,201 |
|
|
|
|
|
|
|
|
|
|
| Life Sciences Tools & Services - 0.2% |
|
| Thermo Fisher Scientific, Inc. |
|
|
21,807 |
|
|
|
12,059,271 |
|
|
|
|
|
|
|
|
|
|
| Machinery - 2.4% |
|
| Deere & Co. |
|
|
109,452 |
|
|
|
40,894,551 |
|
| Ingersoll Rand, Inc. |
|
|
626,924 |
|
|
|
56,949,776 |
|
| Nordson Corp. |
|
|
190,469 |
|
|
|
44,177,380 |
|
|
|
|
|
|
|
|
|
|
|
|
|
|
|
|
|
142,021,707 |
|
|
|
|
|
|
|
|
|
|
| Oil, Gas & Consumable Fuels - 0.4% |
|
| Diamondback Energy, Inc. |
|
|
127,560 |
|
|
|
25,536,236 |
|
|
|
|
|
|
|
|
|
|
| Personal Care Products - 0.9% |
|
| Estee Lauder Cos., Inc., Class A |
|
|
510,084 |
|
|
|
54,272,938 |
|
|
|
|
|
|
|
|
|
|
| Pharmaceuticals - 4.9% |
|
| Eli Lilly & Co. |
|
|
254,652 |
|
|
|
230,556,828 |
|
| Merck & Co., Inc. |
|
|
469,531 |
|
|
|
58,127,938 |
|
|
|
|
|
|
|
|
|
|
|
|
|
|
|
|
|
288,684,766 |
|
|
|
|
|
|
|
|
|
|
| Semiconductors & Semiconductor Equipment - 16.8% |
|
| Advanced Micro Devices, Inc. (A) |
|
|
253,765 |
|
|
|
41,163,221 |
|
| Broadcom, Inc. |
|
|
148,146 |
|
|
|
237,852,847 |
|
| KLA Corp. |
|
|
109,118 |
|
|
|
89,968,882 |
|
| NVIDIA Corp. |
|
|
4,325,688 |
|
|
|
534,395,496 |
|
| QUALCOMM, Inc. |
|
|
301,900 |
|
|
|
60,132,442 |
|
| Texas Instruments, Inc. |
|
|
174,829 |
|
|
|
34,009,485 |
|
|
|
|
|
|
|
|
|
|
|
|
|
|
|
|
|
997,522,373 |
|
|
|
|
|
|
|
|
|
|
| Software - 17.2% |
|
| Adobe, Inc. (A) |
|
|
133,347 |
|
|
|
74,079,592 |
|
| Cadence Design Systems, Inc. (A) |
|
|
201,958 |
|
|
|
62,152,575 |
|
| HubSpot, Inc. (A) |
|
|
50,789 |
|
|
|
29,954,844 |
|
| Intuit, Inc. |
|
|
129,161 |
|
|
|
84,885,901 |
|
| Microsoft Corp. |
|
|
1,060,553 |
|
|
|
474,014,163 |
|
| Palo Alto Networks, Inc. (A) |
|
|
120,274 |
|
|
|
40,774,089 |
|
The Notes to Financial Statements are an integral part of this report.
|
|
|
|
|
| Transamerica Series Trust |
|
|
|
Semi-Annual Financial Statements 2024 |
|
|
Page 1 |
|
|
Transamerica WMC US Growth VP
SCHEDULE OF INVESTMENTS (continued)
At June 30, 2024
(unaudited)
|
|
|
|
|
|
|
|
|
| |
|
Shares |
|
|
Value |
|
| COMMON STOCKS (continued) |
|
| Software (continued) |
|
| PTC, Inc. (A) |
|
|
260,922 |
|
|
$ |
47,401,700 |
|
| Salesforce, Inc. |
|
|
282,609 |
|
|
|
72,658,774 |
|
| ServiceNow, Inc. (A) |
|
|
106,425 |
|
|
|
83,721,355 |
|
| Workday, Inc., Class A (A) |
|
|
218,524 |
|
|
|
48,853,225 |
|
|
|
|
|
|
|
|
|
|
|
|
|
|
|
|
|
1,018,496,218 |
|
|
|
|
|
|
|
|
|
|
| Specialized REITs - 0.7% |
|
| Equinix, Inc. |
|
|
56,908 |
|
|
|
43,056,593 |
|
|
|
|
|
|
|
|
|
|
| Specialty Retail - 1.2% |
|
| O’Reilly Automotive, Inc. (A) |
|
|
66,266 |
|
|
|
69,980,872 |
|
|
|
|
|
|
|
|
|
|
| Technology Hardware, Storage & Peripherals - 7.9% |
|
| Apple, Inc. |
|
|
2,226,830 |
|
|
|
469,014,935 |
|
|
|
|
|
|
|
|
|
|
| Textiles, Apparel & Luxury Goods - 1.2% |
|
| Lululemon Athletica, Inc. (A) |
|
|
138,511 |
|
|
|
41,373,236 |
|
| NIKE, Inc., Class B |
|
|
429,138 |
|
|
|
32,344,131 |
|
|
|
|
|
|
|
|
|
|
|
|
|
|
|
|
|
73,717,367 |
|
|
|
|
|
|
|
|
|
|
| Total Common Stocks
(Cost $4,173,471,329) |
|
|
|
|
|
|
5,881,155,978 |
|
|
|
|
|
|
|
|
|
|
|
|
|
|
|
|
|
|
|
| |
|
Principal |
|
|
Value |
|
| REPURCHASE AGREEMENT - 0.8% |
|
| Fixed Income Clearing Corp., 2.50% (B), dated 06/28/2024, to be repurchased at $45,839,318 on 07/01/2024. Collateralized by a U.S. Government Obligation, 3.75%, due 04/15/2026, and with a value of $46,746,563. |
|
$ |
45,829,770 |
|
|
$ |
45,829,770 |
|
|
|
|
|
|
|
|
|
|
| Total Repurchase Agreement (Cost $45,829,770) |
|
|
|
45,829,770 |
|
|
|
|
|
|
|
| Total Investments (Cost $4,219,301,099) |
|
|
|
5,926,985,748 |
|
|
|
|
|
|
|
| Net Other Assets (Liabilities) - 0.1% |
|
|
|
5,433,407 |
|
|
|
|
|
|
|
|
|
|
| Net Assets - 100.0% |
|
|
$ |
5,932,419,155 |
|
|
|
|
|
|
|
INVESTMENT VALUATION:
|
|
|
|
|
|
|
|
|
|
|
|
|
|
|
|
|
| Valuation Inputs (C) |
|
|
|
|
|
|
|
|
|
|
|
|
|
|
|
|
|
| |
|
Level 1 - Unadjusted Quoted Prices |
|
|
Level 2 - Other Significant Observable Inputs |
|
|
Level 3 - Significant Unobservable Inputs |
|
|
Value |
|
| ASSETS |
|
|
|
|
|
|
|
|
|
|
|
|
|
|
|
|
| Investments |
|
|
|
|
|
|
|
|
|
|
|
|
|
|
|
|
| Common Stocks |
|
$ |
5,881,155,978 |
|
|
$ |
— |
|
|
$ |
— |
|
|
$ |
5,881,155,978 |
|
| Repurchase Agreement |
|
|
— |
|
|
|
45,829,770 |
|
|
|
— |
|
|
|
45,829,770 |
|
|
|
|
|
|
|
|
|
|
|
|
|
|
|
|
|
|
| Total Investments |
|
$ |
5,881,155,978 |
|
|
$ |
45,829,770 |
|
|
$ |
— |
|
|
$ |
5,926,985,748 |
|
|
|
|
|
|
|
|
|
|
|
|
|
|
|
|
|
|
FOOTNOTES TO SCHEDULE OF INVESTMENTS:
| (A) |
Non-income producing security. |
| (B) |
Rate disclosed reflects the yield at June 30, 2024. |
| (C) |
There were no transfers in or out of Level 3 during the period ended June 30, 2024. Please reference the Investment Valuation section of the Notes to Financial Statements for more information regarding investment valuation and pricing inputs. |
PORTFOLIO ABBREVIATION(S):
|
|
|
| REIT |
|
Real Estate Investment Trust |
The Notes to Financial Statements are an integral part of this report.
|
|
|
|
|
| Transamerica Series Trust |
|
|
|
Semi-Annual Financial Statements 2024 |
|
|
Page 2 |
|
|
Transamerica WMC US Growth VP
STATEMENT OF ASSETS AND LIABILITIES
At June 30, 2024
(unaudited)
|
|
|
|
|
|
|
| Assets: |
|
|
|
|
| Investments, at value (cost $4,173,471,329) |
|
$ |
5,881,155,978 |
|
| Repurchase agreement, at value (cost $45,829,770) |
|
|
45,829,770 |
|
| Receivables and other assets: |
|
|
|
|
| Investments sold |
|
|
57,697,090 |
|
| Shares of beneficial interest sold |
|
|
66,401 |
|
| Dividends |
|
|
1,010,954 |
|
| Interest |
|
|
9,548 |
|
| Tax reclaims |
|
|
1,202 |
|
| Prepaid expenses |
|
|
23,544 |
|
| |
|
| Total assets |
|
|
5,985,794,487 |
|
| Liabilities: |
|
|
|
|
| Payables and other liabilities: |
|
|
|
|
| Investments purchased |
|
|
48,486,305 |
|
| Shares of beneficial interest redeemed |
|
|
1,535,955 |
|
| Investment management fees |
|
|
2,707,283 |
|
| Distribution and service fees |
|
|
192,984 |
|
| Transfer agent costs |
|
|
2,808 |
|
| Trustee and CCO fees |
|
|
7,105 |
|
| Audit and tax fees |
|
|
36,924 |
|
| Custody fees |
|
|
130,451 |
|
| Legal fees |
|
|
54,437 |
|
| Printing and shareholder reports fees |
|
|
132,441 |
|
| Other accrued expenses |
|
|
88,639 |
|
| |
|
| Total liabilities |
|
|
53,375,332 |
|
| |
|
| Net assets |
|
$ |
5,932,419,155 |
|
| Net assets consist of: |
|
|
|
|
| Capital stock ($0.01 par value) |
|
$ |
1,403,495 |
|
| Additional paid-in capital |
|
|
3,122,064,405 |
|
| Total distributable earnings (accumulated losses) |
|
|
2,808,951,255 |
|
| |
|
| Net assets |
|
$ |
5,932,419,155 |
|
|
|
| Net assets by class: |
|
|
|
|
| Initial Class |
|
$ |
4,909,366,251 |
|
| Service Class |
|
|
1,023,052,904 |
|
|
|
| Shares outstanding: |
|
|
|
|
| Initial Class |
|
|
115,040,806 |
|
| Service Class |
|
|
25,308,683 |
|
|
|
| Net asset value and offering price per share: |
|
|
|
|
| Initial Class |
|
$ |
42.67 |
|
| Service Class |
|
|
40.42 |
|
STATEMENT OF OPERATIONS
For the period ended June 30, 2024
(unaudited)
|
|
|
|
|
| Investment income: |
|
|
|
|
| Dividend income |
|
$ |
14,238,099 |
|
| Interest income |
|
|
727,625 |
|
| |
|
| Total investment income |
|
|
14,965,724 |
|
|
|
| Expenses: |
|
|
|
|
| Investment management fees |
|
|
16,461,006 |
|
| Distribution and service fees: |
|
|
|
|
| Service Class |
|
|
1,194,976 |
|
| Transfer agent costs |
|
|
28,347 |
|
| Trustee and CCO fees |
|
|
121,800 |
|
| Audit and tax fees |
|
|
35,500 |
|
| Custody fees |
|
|
130,657 |
|
| Legal fees |
|
|
166,793 |
|
| Printing and shareholder reports fees |
|
|
210,360 |
|
| Other |
|
|
132,557 |
|
| Total expenses |
|
|
18,481,996 |
|
| |
|
| Net investment income (loss) |
|
|
(3,516,272 |
) |
|
|
| Net realized gain (loss) on: |
|
|
|
|
|
|
| Investments |
|
|
582,385,533 |
|
|
|
| Net change in unrealized appreciation (depreciation) on: |
|
|
|
|
|
|
| Investments |
|
|
356,984,190 |
|
|
|
| Net realized and change in unrealized gain (loss) |
|
|
939,369,723 |
|
|
|
| Net increase (decrease) in net assets resulting from operations |
|
$ |
935,853,451 |
|
The Notes to Financial Statements are an integral part of this report.
|
|
|
|
|
| Transamerica Series Trust |
|
|
|
Semi-Annual Financial Statements 2024 |
|
|
Page 3 |
|
|
Transamerica WMC US Growth VP
STATEMENT OF CHANGES IN NET ASSETS
For the period and year ended:
|
|
|
|
|
|
|
|
|
| |
|
June 30, 2024 (unaudited) |
|
|
December 31, 2023 |
|
|
|
| From operations: |
|
|
|
|
|
|
|
|
| Net investment income (loss) |
|
$ |
(3,516,272 |
) |
|
$ |
1,031,436 |
|
| Net realized gain (loss) |
|
|
582,385,533 |
|
|
|
527,612,656 |
|
| Net change in unrealized appreciation (depreciation) |
|
|
356,984,190 |
|
|
|
883,803,794 |
|
|
|
|
| Net increase (decrease) in net assets resulting from operations |
|
|
935,853,451 |
|
|
|
1,412,447,886 |
|
|
|
|
| Dividends and/or distributions to shareholders: |
|
|
|
|
|
|
|
|
| Initial Class |
|
|
— |
|
|
|
(106,094,868 |
) |
| Service Class |
|
|
— |
|
|
|
(24,087,479 |
) |
| |
|
|
| Net increase (decrease) in net assets resulting from dividends and/or distributions to shareholders |
|
|
— |
|
|
|
(130,182,347 |
) |
|
|
|
| Capital share transactions: |
|
|
|
|
|
|
|
|
| Proceeds from shares sold: |
|
|
|
|
|
|
|
|
| Initial Class |
|
|
401,455,710 |
|
|
|
531,938,403 |
|
| Service Class |
|
|
25,215,221 |
|
|
|
456,702,923 |
|
| |
|
|
| |
|
|
426,670,931 |
|
|
|
988,641,326 |
|
| Dividends and/or distributions reinvested: |
|
|
|
|
|
|
|
|
| Initial Class |
|
|
— |
|
|
|
106,094,868 |
|
| Service Class |
|
|
— |
|
|
|
24,087,479 |
|
| |
|
|
| |
|
|
— |
|
|
|
130,182,347 |
|
| Cost of shares redeemed: |
|
|
|
|
|
|
|
|
| Initial Class |
|
|
(160,377,409 |
) |
|
|
(591,512,177 |
) |
| Service Class |
|
|
(72,618,841 |
) |
|
|
(88,960,792 |
) |
| |
|
|
|
|
|
(232,996,250 |
) |
|
|
(680,472,969 |
) |
| |
|
|
| Net increase (decrease) in net assets resulting from capital share transactions |
|
|
193,674,681 |
|
|
|
438,350,704 |
|
|
|
|
| Net increase (decrease) in net assets |
|
|
1,129,528,132 |
|
|
|
1,720,616,243 |
|
|
|
|
| Net assets: |
|
|
|
|
|
|
|
|
| Beginning of period/year |
|
|
4,802,891,023 |
|
|
|
3,082,274,780 |
|
| End of period/year |
|
$ |
5,932,419,155 |
|
|
$ |
4,802,891,023 |
|
|
|
|
| Capital share transactions - shares: |
|
|
|
|
|
|
|
|
| Shares issued: |
|
|
|
|
|
|
|
|
| Initial Class |
|
|
10,314,819 |
|
|
|
17,056,425 |
|
| Service Class |
|
|
669,163 |
|
|
|
15,960,292 |
|
| |
|
|
|
|
|
10,983,982 |
|
|
|
33,016,717 |
|
| Shares reinvested: |
|
|
|
|
|
|
|
|
| Initial Class |
|
|
— |
|
|
|
3,229,676 |
|
| Service Class |
|
|
— |
|
|
|
772,530 |
|
| |
|
|
| |
|
|
— |
|
|
|
4,002,206 |
|
| Shares redeemed: |
|
|
|
|
|
|
|
|
| Initial Class |
|
|
(4,052,253 |
) |
|
|
(18,151,258 |
) |
| Service Class |
|
|
(1,941,451 |
) |
|
|
(2,942,636 |
) |
| |
|
|
| |
|
|
(5,993,704 |
) |
|
|
(21,093,894 |
) |
| Net increase (decrease) in shares outstanding: |
|
|
|
|
|
|
|
|
| Initial Class |
|
|
6,262,566 |
|
|
|
2,134,843 |
|
| Service Class |
|
|
(1,272,288 |
) |
|
|
13,790,186 |
|
| |
|
|
| |
|
|
4,990,278 |
|
|
|
15,925,029 |
|
The Notes to Financial Statements are an integral part of this report.
|
|
|
|
|
| Transamerica Series Trust |
|
|
|
Semi-Annual Financial Statements 2024 |
|
|
Page 4 |
|
|
Transamerica WMC US Growth VP
FINANCIAL HIGHLIGHTS
|
|
|
|
|
|
|
|
|
|
|
|
|
|
|
|
|
|
|
|
|
|
|
|
|
|
|
| For a share outstanding during the period and years indicated: |
|
Initial Class |
| |
|
June 30, 2024 (unaudited) |
|
December 31, 2023 |
|
December 31, 2022 |
|
December 31, 2021 |
|
December 31, 2020 |
|
December 31, 2019 |
|
|
|
|
|
|
|
| Net asset value, beginning of period/year |
|
$ |
35.85 |
|
|
$ |
25.94 |
|
|
$ |
45.46 |
|
|
$ |
43.71 |
|
|
$ |
34.35 |
|
|
$ |
26.86 |
|
| Investment operations: |
|
|
|
|
|
|
|
|
|
|
|
|
|
|
|
|
|
|
|
|
|
|
|
|
| Net investment income (loss)(A) |
|
|
(0.02 |
) |
|
|
0.02 |
|
|
|
0.02 |
|
|
|
(0.05 |
) |
|
|
0.04 |
|
|
|
0.05 |
|
| Net realized and unrealized gain (loss) |
|
|
6.84 |
|
|
|
10.81 |
|
|
|
(13.49 |
) |
|
|
8.86 |
|
|
|
12.37 |
|
|
|
10.31 |
|
|
|
|
|
|
|
|
| Total investment operations |
|
|
6.82 |
|
|
|
10.83 |
|
|
|
(13.47 |
) |
|
|
8.81 |
|
|
|
12.41 |
|
|
|
10.36 |
|
| Dividends and/or distributions to shareholders: |
|
|
|
|
|
|
|
|
|
|
|
|
|
|
|
|
|
|
|
|
|
|
|
|
| Net investment income |
|
|
— |
|
|
|
(0.01 |
) |
|
|
— |
|
|
|
(0.04 |
) |
|
|
(0.04 |
) |
|
|
(0.04 |
) |
| Net realized gains |
|
|
— |
|
|
|
(0.91 |
) |
|
|
(6.05 |
) |
|
|
(7.02 |
) |
|
|
(3.01 |
) |
|
|
(2.83 |
) |
|
|
|
|
|
|
|
| Total dividends and/or distributions to shareholders |
|
|
— |
|
|
|
(0.92 |
) |
|
|
(6.05 |
) |
|
|
(7.06 |
) |
|
|
(3.05 |
) |
|
|
(2.87 |
) |
|
|
|
|
|
|
|
| Net asset value, end of period/year |
|
$ |
42.67 |
|
|
$ |
35.85 |
|
|
$ |
25.94 |
|
|
$ |
45.46 |
|
|
$ |
43.71 |
|
|
$ |
34.35 |
|
|
|
|
|
|
|
|
| |
|
|
|
|
|
|
|
|
|
|
|
|
|
|
|
|
|
|
|
|
|
|
|
|
|
|
|
|
|
|
|
| Total return |
|
|
19.02 |
%(B) |
|
|
42.08 |
% |
|
|
(31.35 |
)% |
|
|
20.67 |
% |
|
|
37.30 |
% |
|
|
40.05 |
% |
|
|
|
|
|
|
|
| Ratio and supplemental data: |
|
|
|
|
|
|
|
|
|
|
|
|
|
|
|
|
|
|
|
|
|
|
|
|
| Net assets end of period/year (000’s) |
|
$ |
4,909,366 |
|
|
$ |
3,899,250 |
|
|
$ |
2,766,449 |
|
|
$ |
3,959,377 |
|
|
$ |
3,646,030 |
|
|
$ |
3,064,686 |
|
| Expenses to average net assets |
|
|
0.64 |
%(C) |
|
|
0.66 |
% |
|
|
0.65 |
% |
|
|
0.64 |
% |
|
|
0.65 |
% |
|
|
0.68 |
% |
| Net investment income (loss) to average net assets |
|
|
(0.08 |
)%(C) |
|
|
0.06 |
% |
|
|
0.07 |
% |
|
|
(0.11 |
)% |
|
|
0.11 |
% |
|
|
0.15 |
% |
| Portfolio turnover rate |
|
|
26 |
%(B) |
|
|
52 |
% |
|
|
34 |
% |
|
|
25 |
% |
|
|
30 |
% |
|
|
26 |
% |
|
| (A) Calculated based on average number of shares outstanding. (B) Not annualized. (C) Annualized. |
|
|
|
| For a share outstanding during the period and years indicated: |
|
Service Class |
| |
|
June 30, 2024 (unaudited) |
|
December 31, 2023 |
|
December 31, 2022 |
|
December 31, 2021 |
|
December 31, 2020 |
|
December 31, 2019 |
|
|
|
|
|
|
|
| Net asset value, beginning of period/year |
|
$ |
34.00 |
|
|
$ |
24.69 |
|
|
$ |
43.74 |
|
|
$ |
42.35 |
|
|
$ |
33.41 |
|
|
$ |
26.22 |
|
| Investment operations: |
|
|
|
|
|
|
|
|
|
|
|
|
|
|
|
|
|
|
|
|
|
|
|
|
| Net investment income (loss)(A) |
|
|
(0.06 |
) |
|
|
(0.05 |
) |
|
|
(0.06 |
) |
|
|
(0.16 |
) |
|
|
(0.05 |
) |
|
|
(0.03 |
) |
| Net realized and unrealized gain (loss) |
|
|
6.48 |
|
|
|
10.27 |
|
|
|
(12.94 |
) |
|
|
8.57 |
|
|
|
12.00 |
|
|
|
10.05 |
|
|
|
|
|
|
|
|
| Total investment operations |
|
|
6.42 |
|
|
|
10.22 |
|
|
|
(13.00 |
) |
|
|
8.41 |
|
|
|
11.95 |
|
|
|
10.02 |
|
| Dividends and/or distributions to shareholders: |
|
|
|
|
|
|
|
|
|
|
|
|
|
|
|
|
|
|
|
|
|
|
|
|
| Net realized gains |
|
|
— |
|
|
|
(0.91 |
) |
|
|
(6.05 |
) |
|
|
(7.02 |
) |
|
|
(3.01 |
) |
|
|
(2.83 |
) |
|
|
|
|
|
|
|
| Net asset value, end of period/year |
|
$ |
40.42 |
|
|
$ |
34.00 |
|
|
$ |
24.69 |
|
|
$ |
43.74 |
|
|
$ |
42.35 |
|
|
$ |
33.41 |
|
| |
|
|
|
|
|
|
|
|
|
|
|
|
|
|
|
|
|
|
|
|
|
|
|
|
|
|
|
|
|
|
|
| Total return |
|
|
18.88 |
%(B) |
|
|
41.72 |
% |
|
|
(31.52 |
)% |
|
|
20.37 |
% |
|
|
36.94 |
% |
|
|
39.68 |
% |
|
|
|
|
|
|
|
| Ratio and supplemental data: |
|
|
|
|
|
|
|
|
|
|
|
|
|
|
|
|
|
|
|
|
|
|
|
|
| Net assets end of period/year (000’s) |
|
$ |
1,023,053 |
|
|
$ |
903,641 |
|
|
$ |
315,826 |
|
|
$ |
499,931 |
|
|
$ |
457,707 |
|
|
$ |
345,318 |
|
| Expenses to average net assets |
|
|
0.89 |
%(C) |
|
|
0.91 |
% |
|
|
0.90 |
% |
|
|
0.89 |
% |
|
|
0.90 |
% |
|
|
0.93 |
% |
| Net investment income (loss) to average net assets |
|
|
(0.34 |
)%(C) |
|
|
(0.18 |
)% |
|
|
(0.19 |
)% |
|
|
(0.36 |
)% |
|
|
(0.14 |
)% |
|
|
(0.10 |
)% |
| Portfolio turnover rate |
|
|
26 |
%(B) |
|
|
52 |
% |
|
|
34 |
% |
|
|
25 |
% |
|
|
30 |
% |
|
|
26 |
% |
| (A) |
Calculated based on average number of shares outstanding. |
The Notes to Financial Statements are an integral part of this report.
|
|
|
|
|
| Transamerica Series Trust |
|
|
|
Semi-Annual Financial Statements 2024 |
|
|
Page 5 |
|
|
Transamerica WMC US Growth VP
NOTES TO FINANCIAL STATEMENTS
At June 30, 2024
(unaudited)
1. ORGANIZATION
Transamerica Series Trust (“TST”) is an open-end management investment company registered under the Investment Company Act of 1940, as amended (the “1940 Act”). TST applies investment company accounting and reporting guidance. TST serves as a funding vehicle for variable life insurance, variable annuity, and group annuity products. Transamerica WMC US Growth VP (the “Portfolio”) is a series of TST and is classified as diversified under the 1940 Act. The Portfolio currently offers two classes of shares, Initial Class and Service Class.
The only shareholders of the Portfolio are affiliated insurance company separate accounts and/or affiliated asset allocation portfolios. Contract holders of the variable life and annuity contracts are not shareholders of the Portfolio. For ease of reference, shareholders and contract holders are collectively referred to in this report as “shareholders.”
This report must be accompanied or preceded by the Portfolio’s current prospectus, which contains additional information about the Portfolio, including risks, as well as investment objectives and strategies.
Transamerica Asset Management, Inc. (“TAM”) serves as investment manager for the Portfolio pursuant to an investment management agreement. TAM provides continuous and regular investment management services to the Portfolio. TAM supervises the Portfolio’s investments, conducts its investment program and provides supervisory, compliance and administrative services to the Portfolio.
TAM currently acts as a “manager of managers” and has hired sub-advisers to furnish day-to-day investment advice and recommendations. TAM may, in the future, determine to provide all aspects of the day-to-day management of the Portfolio without the use of a sub-adviser. When acting as a manager of managers, TAM provides investment management services that include, without limitation, the design and development of the Portfolio and its investment strategies and the ongoing review and evaluation of those investment strategies including recommending changes in strategy where it believes appropriate or advisable; the selection of one or more sub-advisers for the Portfolio employing a combination of quantitative and qualitative screens, research, analysis and due diligence; negotiation of sub-advisory agreements and fees; oversight and monitoring of sub-advisers and recommending changes to sub-advisers where it believes appropriate or advisable; recommending portfolio combinations and liquidations where it believes appropriate or advisable; selection and oversight of transition managers, as needed; regular supervision of the Portfolio’s investments; regular review and evaluation of sub-adviser performance; daily monitoring of the sub-advisers’ buying and selling of securities for the Portfolio; regular review of holdings; ongoing trade oversight and analysis; regular monitoring to ensure adherence to investment process; regular calls and periodic on-site visits with sub-advisers; portfolio construction and asset allocation when using multiple sub-advisers for the Portfolio; risk management oversight and analysis; oversight of negotiation of investment documentation and agreements; design, development, implementation and regular monitoring of the valuation process; periodic due diligence reviews of pricing vendors and vendor methodology; design, development, implementation and regular monitoring of the compliance process; respond to regulatory inquiries and determine appropriate litigation strategy, as needed; review of proxies voted by sub-advisers; oversight of preparation and review of materials for meetings of the Portfolio’s Board of Trustees (the “Board”), participation in these meetings and preparation of regular communications with the Board; oversight of preparation and review of prospectuses, shareholder reports and other disclosure materials and regulatory filings for the Portfolio; oversight of other service providers to the Portfolio, such as the custodian, the transfer agent, the Portfolio’s independent accounting firm and legal counsel; supervision of the performance of recordkeeping and shareholder relations functions for the Portfolio; and oversight of cash management services. TAM uses a variety of quantitative and qualitative tools to carry out its investment management services. TAM, not the Portfolio, is responsible for paying the sub-adviser(s) for their services, and sub-advisory fees are TAM’s expense.
TAM’s investment management services also include the provision of supervisory and administrative services to the Portfolio. These services include performing certain administrative services for the Portfolio and supervising and overseeing the administrative, clerical, recordkeeping and bookkeeping services provided to the Portfolio by State Street Bank and Trust Company (“State Street”), to whom TAM has outsourced the provision of certain sub-administration services. To the extent agreed upon by TAM and the Portfolio from time to time, TAM’s supervisory and administrative services include, but are not limited to: monitoring and verifying the custodian’s daily calculation of the Net Asset Values (“NAV”); shareholder relations functions; compliance services; valuation services; assisting in due diligence and in the oversight and monitoring of certain activities of sub-advisers and certain aspects of Portfolio investments; assisting with Portfolio combinations and liquidations; oversight of the preparation and filing, and review, of all returns and reports, in connection with federal, state and local taxes; oversight and review of regulatory reporting; supervising and coordinating the Portfolio’s custodian and dividend disbursing agent and monitoring their services to the Portfolio; assisting the Portfolio in preparing reports to shareholders; acting as liaison with the Portfolio’s independent public accountants and providing, upon request, analyses, fiscal year summaries and other audit related services; assisting in the preparation of agendas and supporting documents for and minutes of meetings of trustees and committees of trustees; assisting in the preparation of regular communications with the trustees; and providing personnel and office space, telephones and other office equipment as necessary in order for TAM to perform supervisory and administrative services to the Portfolio. The Portfolio pays certain fees and expenses to State Street for sub-administration services which are not administrative services covered by the
|
|
|
|
|
| Transamerica Series Trust |
|
|
|
Semi-Annual Financial Statements 2024 |
|
|
Page 6 |
|
|
Transamerica WMC US Growth VP
NOTES TO FINANCIAL STATEMENTS (continued)
At June 30, 2024
(unaudited)
1. ORGANIZATION (continued)
management agreement with TAM or paid for through the management fees payable thereunder. For the period ended June 30, 2024, (i) the expenses paid to State Street for sub-administration services by the Portfolio are shown as a part of Other expenses within the Statement of Operations and (ii) the expenses payable to State Street for sub-administration services from the Portfolio are shown as part of Other accrued expenses within the Statement of Assets and Liabilities.
2. SIGNIFICANT ACCOUNTING POLICIES
In preparing the Portfolio’s financial statements in accordance with Generally Accepted Accounting Principles in the United States of America (“GAAP”), estimates or assumptions (which could differ from actual results) may be used that affect reported amounts and disclosures. The following is a summary of significant accounting policies followed by the Portfolio.
Security transactions and investment income: Security transactions are accounted for on the trade date. Security gains and losses are calculated on a first-in, first-out basis. Dividend income, if any, is recorded on the ex-dividend date or, in the case of foreign securities, as soon as the Portfolio is informed of the ex-dividend dates, net of foreign taxes. Non-cash dividends, if any, are recorded on the ex-dividend date at fair value. Interest income, if any, is recorded on the accrual basis from settlement date, net of foreign taxes. Fixed income premiums and discounts are amortized and/or accreted over the lives of the respective securities.
Multiple class operations, income, and expenses: Income, non-class specific expenses, and realized and unrealized gains and losses are allocated to each class daily based upon net assets. Each class bears its own specific expenses in addition to the allocated non-class specific expenses.
Distributions to shareholders: Distributions are recorded on the ex-dividend date and are determined in accordance with federal income tax regulations, which may differ from GAAP.
Foreign taxes: The Portfolio may be subject to taxes imposed by the countries in which it invests, with respect to its investments in issuers existing or operating in such countries. The Portfolio may also be subject to foreign taxes on income, gains on investments, or currency repatriation, a portion of which may be recoverable. The Portfolio accrues such taxes and recoveries as applicable when the related income or capital gains are earned or unrealized, and based upon the current interpretation of tax rules and regulations that exist in the markets in which the Portfolio invests. Some countries require governmental approval for the repatriation of investment income, capital, or the proceeds of sales earned by foreign investors. In addition, if there is deterioration in a country’s balance of payments or for other reasons, a country may impose temporary restrictions of foreign capital remittances abroad.
Commission recapture: The sub-adviser(s), to the extent consistent with the best execution and usual commission rate policies and practices, may elect to place security transactions of the Portfolio with broker/dealers with which TST has established a commission recapture program. A commission recapture program is any arrangement under which a broker/dealer applies a portion of the commissions received by such broker/dealer on the security transactions to the Portfolio. In no event will commissions, paid by the Portfolio, be used to pay expenses that would otherwise be borne by any other Portfolios within TST, or by any other party.
Commissions recaptured are included within Net realized gain (loss) within the Statement of Operations. For the period ended June 30, 2024, commissions recaptured are $7,277.
Indemnification: In the normal course of business, the Portfolio enters into contracts that contain a variety of representations that provide general indemnifications. The Portfolio’s maximum exposure under these arrangements is unknown, as this would involve future claims that may be made against the Portfolio and/or its affiliates that have not yet occurred. However, based on experience, the Portfolio expects the risk of loss to be remote.
3. INVESTMENT VALUATION
TAM has been designated as the Portfolio’s valuation designee pursuant to Rule 2a-5 under the 1940 Act with responsibility for fair valuation subject to oversight by the Portfolio’s Board of Trustees. The net asset value of the Portfolio is computed as of the official close of the New York Stock Exchange (“NYSE”) each day the NYSE is open for business.
TAM utilizes various methods to measure the fair value of its investments on a recurring basis. GAAP establishes a hierarchy that prioritizes inputs to valuation methods. The inputs or methodology used for valuing securities are not necessarily an indication of the risk associated with investing in those securities. The three levels (“Levels”) of inputs of the fair value hierarchy are defined as follows:
|
|
|
|
|
| Transamerica Series Trust |
|
|
|
Semi-Annual Financial Statements 2024 |
|
|
Page 7 |
|
|
Transamerica WMC US Growth VP
NOTES TO FINANCIAL STATEMENTS (continued)
At June 30, 2024
(unaudited)
3. INVESTMENT VALUATION (continued)
Level 1—Unadjusted quoted prices in active markets for identical securities.
Level 2—Inputs, other than quoted prices included in Level 1, which are observable, either directly or indirectly. These inputs may include quoted prices for the identical instrument on an inactive market, prices for similar instruments, interest rates, prepayment speeds, credit risk, yield curves, default rates, and similar data.
Level 3—Unobservable inputs based on the best information available in the circumstances, to the extent observable inputs are not available, which may include TAM’s own assumptions used in determining the fair value of the Portfolio’s investments.
The inputs used to measure fair value may fall into different Levels of the fair value hierarchy. In such cases, for disclosure purposes, the Level in the fair value hierarchy that is assigned to the fair value measurement of a security is determined based on the lowest Level input that is significant to the fair value measurement in its entirety. Certain investments that are measured at fair value using NAV per share, or its equivalent, using the “practical expedient” have not been classified in the fair value Levels. The hierarchy classification of inputs used to value the Portfolio’s investments at June 30, 2024, is disclosed within the Investment Valuation section of the Schedule of Investments.
The availability of observable inputs can vary from security to security and is affected by a wide variety of factors, including, but not limited to, the type of security, whether the security is new and not yet established in the marketplace, the liquidity of markets, and other characteristics particular to the security. To the extent that valuation is based on models or inputs that are less observable or unobservable in the market, the determination of fair value requires more judgment. Accordingly, the degree of judgment exercised in determining fair value is generally greatest for instruments categorized in Level 3. Due to the inherent uncertainty of valuation, the determination of values may differ significantly from values that would have been realized had a ready market for investments existed, and the differences could be material.
Fair value measurements: Descriptions of the valuation techniques applied to the Portfolio’s significant categories of assets and liabilities measured at fair value on a recurring basis are as follows:
Equity securities: Securities are stated at the last reported sales price or closing price on the day of valuation taken from the primary exchange where the security is principally traded. To the extent these securities are actively traded and valuation adjustments are not applied, they are categorized in Level 1 of the fair value hierarchy. Equities traded on inactive markets or valued by reference to similar instruments are generally categorized in Level 2 or Level 3 if inputs are unobservable.
Foreign equity securities: Securities in which the primary trading market closes at the same time or after the NYSE, are valued based on quotations from the primary market in which they are traded and are categorized in Level 1. Because many foreign securities markets and exchanges close prior to the close of the NYSE, closing prices for foreign securities in those markets or on those exchanges do not reflect the events that occur after that close. Certain foreign securities may be fair valued using a pricing service that considers the correlation of the trading patterns of the foreign security to the intraday trading in the U.S. markets for investments such as American Depositary Receipts, financial futures, or ETFs and the movement of certain indices of securities based on a statistical analysis of their historical relationship; such valuations generally are categorized in Level 2.
Repurchase agreements: Repurchase agreements are valued at cost, which approximates fair value. To the extent the inputs are observable and timely, the values are generally categorized in Level 2 of the fair value hierarchy.
4. SECURITIES AND OTHER INVESTMENTS
Real estate investment trusts (“REITs”): REITs are pooled investment vehicles which invest primarily in income producing real estate, or real estate related loans or interests. Distributions received by REITs are classified at management’s estimate of the dividend income, return of capital and capital gains. Estimates are based on information available at year-end, which includes the previous fiscal year’s classification. The actual amounts of dividend income, return of capital, and capital gains are only determined by each REIT after the fiscal year end and may differ from the estimated amounts. Upon notification from the REITs, some of the distributions received may be re-classified and recorded as a return of capital or capital gains. There are certain additional risks involved in investing in REITs. These include, but are not limited to, economic conditions, changes in zoning laws, real estate values, property taxes, and interest rates.
REITs held at June 30, 2024, if any, are identified within the Schedule of Investments.
|
|
|
|
|
| Transamerica Series Trust |
|
|
|
Semi-Annual Financial Statements 2024 |
|
|
Page 8 |
|
|
Transamerica WMC US Growth VP
NOTES TO FINANCIAL STATEMENTS (continued)
At June 30, 2024
(unaudited)
5. BORROWINGS AND OTHER FINANCING TRANSACTIONS
The Portfolio may engage in borrowing transactions as a means of raising cash to satisfy redemption requests, for other temporary or emergency purposes or, to the extent permitted by its investment policies, to raise additional cash to be invested in other securities or instruments. When the Portfolio invests borrowing proceeds in other securities, the Portfolio will bear the risk that the market value of the securities in which such proceeds are invested goes down and is insufficient to repay the borrowed proceeds. The Portfolio may borrow on a secured or on an unsecured basis. If the Portfolio enters into a secured borrowing arrangement, a portion of the Portfolio’s assets will be used as collateral. The 1940 Act requires the Portfolio to maintain asset coverage of at least 300% of the amount of its borrowings. Asset coverage means the ratio that the value of the Portfolio’s total assets, minus liabilities other than borrowings, bears to the aggregate amount of all borrowings. Although complying with this requirement has the effect of limiting the amount that the Portfolio may borrow, it does not otherwise mitigate the risks of entering into borrowing transactions.
Interfund lending: The Portfolio, along with other funds and portfolios advised by TAM, may participate in an interfund lending program pursuant to exemptive relief granted by the Securities and Exchange Commission on January 18, 2017. This program allows the Portfolio to lend to and borrow from other funds and portfolios advised by TAM. Interfund lending transactions are subject to the conditions of the exemptive relief which places limits on the amount of lending or borrowing a Portfolio may participate in under the program. Interest earned or paid on an interfund lending transaction will be based on the average of certain current market rates. For the period ended June 30, 2024, the Portfolio has not utilized the program.
Repurchase agreements: In a repurchase agreement, the Portfolio purchases a security and simultaneously commits to resell that security to the seller at an agreed-upon price on an agreed-upon date. Securities purchased subject to a repurchase agreement are held at the Portfolio’s custodian, or designated sub-custodian related to tri-party repurchase agreements, and, pursuant to the terms of the repurchase agreement, must be collateralized by securities with an aggregate market value greater than or equal to 100% of the resale price. The Portfolio will bear the risk of value fluctuations until the securities can be sold and may encounter delays and incur costs in liquidating the securities. In the event of bankruptcy or insolvency of the seller, delays and costs may be incurred.
Repurchase agreements are subject to netting agreements, which are agreements between the Portfolio and its counterparties that provide for the net settlement of all transactions and collateral with the Portfolio, through a single payment, in the event of default or termination. Amounts presented within the Schedule of Investments, and as part of Repurchase agreements, at value within the Statement of Assets and Liabilities are shown on a gross basis. The value of the related collateral for each repurchase agreement, as reflected within the Schedule of Investments, exceeds the value of each repurchase agreement at June 30, 2024.
Repurchase agreements at June 30, 2024, if any, are included within the Schedule of Investments and Statement of Assets and Liabilities.
6. RISK FACTORS
Investing in the Portfolio involves certain key risks related to the Portfolio’s trading activity. Please reference the Portfolio’s prospectus for a more complete discussion of the following risk(s), as well as other risks of investing in the Portfolio.
Market risk: The market prices of the Portfolio’s securities or other assets may go up or down, sometimes rapidly or unpredictably, due to factors such as economic events, inflation, changes in interest rates, governmental actions or interventions, actions taken by the U.S. Federal Reserve or foreign central banks, market disruptions caused by tariffs, trade disputes or other factors, political developments, armed conflicts, economic sanctions, cybersecurity events, investor sentiment, the global and domestic effects of widespread or local health, weather or climate events, and other factors that may or may not be related to the issuer of the security or other asset. If the market prices of the Portfolio’s securities and assets fall, the value of your investment in the Portfolio could go down.
Economies and financial markets throughout the world are increasingly interconnected. Events or circumstances in one or more countries or regions could be highly disruptive to, and have profound impacts on, global economies or markets. As a result, whether or not the Portfolio invests in securities of issuers located in or with significant exposure to the countries directly affected, the value and liquidity of the Portfolio’s investments may go down.
Growth stocks risk: Returns on growth stocks may not move in tandem with returns on other categories of stocks or the market as a whole. Growth stocks typically are particularly sensitive to market movements and may involve larger price swings because their market prices tend to reflect future expectations. When it appears those expectations may not be met, the prices of growth stocks typically fall. Growth stocks may also be more volatile because they often do not pay dividends. The values of growth stocks tend to go down when interest rates rise because the rise in interest rates reduces the current value of future cash flows. Growth stocks as a group may be out of favor and underperform the overall equity market for a long period of time, for example, while the market favors “value” stocks.
|
|
|
|
|
| Transamerica Series Trust |
|
|
|
Semi-Annual Financial Statements 2024 |
|
|
Page 9 |
|
|
Transamerica WMC US Growth VP
NOTES TO FINANCIAL STATEMENTS (continued)
At June 30, 2024
(unaudited)
6. RISK FACTORS (continued)
Large capitalization companies risk: The Portfolio’s investments in larger, more established companies may underperform other segments of the market because they may be less responsive to competitive challenges and opportunities and unable to attain high growth rates during periods of economic expansion.
Real estate investment trusts (“REITs”) risk: Investing in real estate investment trusts (“REITs”) involves unique risks. When the Portfolio invests in REITs, it is subject to risks generally associated with investing in real estate. A REIT’s performance depends on the types and locations of the properties it owns, how well it manages those properties and cash flow. REITs may have limited financial resources, may trade less frequently and in limited volume, may engage in dilutive offerings, and may be subject to more abrupt or erratic price movements than the overall securities markets. In addition to its own expenses, the Portfolio will indirectly bear its proportionate share of any management and other expenses paid by REITs in which it invests. U.S. REITs are subject to a number of highly technical tax-related rules and requirements; and a U.S. REIT’s failure to qualify for the favorable U.S. federal income tax treatment generally available to U.S. REITs could result in corporate-level taxation, significantly reducing the return on an investment to the Portfolio.
7. FEES AND OTHER AFFILIATED TRANSACTIONS
TST serves as a funding vehicle for certain affiliated asset allocation portfolios and certain affiliated separate accounts of Transamerica Life Insurance Company (“TLIC”) and Transamerica Financial Life Insurance Company.
TAM, the Portfolio’s investment manager, is directly owned by TLIC and AUSA Holding, LLC (“AUSA”), both of which are indirect, wholly owned subsidiaries of Aegon Ltd. TLIC is owned by Commonwealth General Corporation (“Commonwealth”). Commonwealth and AUSA are wholly owned by Transamerica Corporation (DE). Transamerica Corporation (DE) is wholly owned by Aegon International B.V., which is wholly owned by Aegon Ltd., a Bermuda exempted company with liability limited by shares (formerly, Aegon NV, a Netherlands corporation) and a publicly traded international insurance group.
Transamerica Fund Services, Inc. (“TFS”) is the Portfolio’s transfer agent. Transamerica Capital, Inc. (“TCI”) is the Portfolio’s distributor/principal underwriter. TAM, TFS and TCI are affiliates of Aegon Ltd.
Certain officers and trustees of the Portfolio may also be officers and/or trustees of TAM, TFS and TCI. No interested trustee who is deemed an interested person due to current or former service with TAM or an affiliate of TAM receives compensation from the Portfolio. The Portfolio does pay non-interested persons (independent trustees), as disclosed in Trustee and CCO fees within the Statement of Operations.
Investment management fees: TAM serves as the Portfolio’s investment manager, performing administration as well as investment advisory services. TAM renders investment advisory, supervisory, and administration services under an investment management agreement and the Portfolio pays a single management fee, which is reflected in Investment management fees within the Statement of Operations.
The Portfolio pays a management fee to TAM based on daily average net assets at the following rates:
|
|
|
|
|
|
|
|
|
| Breakpoints |
|
Rate |
|
|
|
|
| First $500 million |
|
|
0.6800 |
% |
|
|
|
|
| Over $500 million up to $800 million |
|
|
0.6700 |
|
|
|
|
|
| Over $800 million up to $1 billion |
|
|
0.6575 |
|
|
|
|
|
| Over $1 billion up to $2 billion |
|
|
0.6130 |
|
|
|
|
|
| Over $2 billion up to $3 billion |
|
|
0.6050 |
|
|
|
|
|
| Over $3 billion up to $4 billion |
|
|
0.5900 |
|
|
|
|
|
| Over $4 billion up to $5 billion |
|
|
0.5750 |
|
|
|
|
|
| Over $5 billion up to $7 billion |
|
|
0.5700 |
|
|
|
|
|
| Over $7 billion |
|
|
0.5500 |
|
|
|
|
|
TAM has contractually agreed to waive fees and/or reimburse Portfolio expenses to the extent that the total operating expenses excluding, as applicable, acquired fund fees and expenses, interest (including borrowing costs and overdraft charges), taxes, brokerage commissions, dividend and interest expenses on securities sold short, extraordinary expenses and other expenses not incurred in the ordinary course of the Portfolio’s business, exceed the following stated annual operating expense limits to the Portfolio’s daily average net
|
|
|
|
|
| Transamerica Series Trust |
|
|
|
Semi-Annual Financial Statements 2024 |
|
|
Page 10 |
|
|
Transamerica WMC US Growth VP
NOTES TO FINANCIAL STATEMENTS (continued)
At June 30, 2024
(unaudited)
7. FEES AND OTHER AFFILIATED TRANSACTIONS (continued)
assets. To the extent an expense limit changed during the period, the prior limit is also listed below. The expenses waived and/or reimbursed, if any, are included in Expenses waived and/or reimbursed within the Statement of Operations.
|
|
|
|
|
|
|
|
|
|
|
| Class |
|
Operating Expense Limit |
|
Operating Expense Limit Effective Through |
| Initial Class |
|
0.74% |
|
May 1, 2025 |
| Service Class |
|
0.99 |
|
May 1, 2025 |
TAM is permitted to recapture amounts contractually waived and/or reimbursed to a class during any of the 36 months from the date on which TAM waived fees and/or reimbursed expenses for the class. A class may recapture and reimburse TAM only if such amount does not cause, on any particular business day of the Portfolio, the class’s total annual operating expenses (after the recapture is taken into account) to exceed the Operating Expense Limits or any other lower limit then in effect. Amounts recaptured, if any, by TAM for the period ended June 30, 2024 are disclosed in Recapture of previously waived and/or reimbursed fees within the Statement of Operations.
TAM, on a voluntary basis and in addition to the contractual operating expense limits in effect, from time to time may waive and/or reimburse expenses of the Portfolio, or any classes thereof, to such level(s) as the Trust’s officers have determined or may reasonably determine from time to time. Any such voluntary waiver or expense reimbursement may be discontinued by TAM at any time. These amounts are not subject to recapture by TAM.
As of June 30, 2024, there are no amounts available for recapture by TAM.
Distribution and service fees: TST has a distribution plan (“Distribution Plan”) pursuant to Rule 12b-1 under the 1940 Act. Pursuant to the Distribution Plan, TST entered into a distribution agreement with TCI as the Portfolio’s distributor.
The Distribution Plan requires the Portfolio to pay distribution fees to TCI as compensation for various distribution activities, not as reimbursement for specific expenses. Under the Distribution Plan and distribution agreement, TCI, on behalf of the Portfolio, is authorized to pay various service providers, as direct payment for expenses incurred in connection with distribution of the Portfolio’s shares.
The fee on the Service Class shares is paid to the insurance companies for providing services and account maintenance for the policyholders who invest in the variable insurance products which invest in the Service Class shares. TCI has determined that it will not seek payment for the distribution expenses incurred by the Portfolio with respect to the Initial Class shares before May 1, 2025. Prior to TCI seeking distribution expenses on Initial Class shares, policy and contract owners will be notified in advance. The Portfolio will pay fees relating to Service Class shares. The distribution and service fees are included in Distribution and service fees within the Statement of Operations.
The Portfolio is authorized under the Distribution Plan to pay fees to TCI based on daily average net assets of each applicable class up to the following annual rates:
|
|
|
|
|
|
|
|
|
| Class |
|
Rate |
|
|
|
|
| Initial Class |
|
|
0.15 |
% |
|
|
|
|
| Service Class |
|
|
0.25 |
|
|
|
|
|
Transfer agent costs: TFS provides transfer agency services under an intercompany agreement with TAM. TFS has outsourced the provision of certain sub-transfer agency services to SS&C Global Investor & Distribution Solutions, Inc. (“SS&C GIDS”). The Portfolio does not pay a separate transfer agent fee to TAM or TFS but does pay certain expenses to SS&C GIDS related to applicable sub-transfer agency services. For the period ended June 30, 2024, (i) the expenses paid to SS&C GIDS by the Portfolio are referred to as transfer agent costs and are included within the Statement of Operations and (ii) the expenses payable to SS&C GIDS by the Portfolio are referred to as transfer agent costs within the Statement of Assets and Liabilities.
Brokerage commissions: The Portfolio incurred no brokerage commissions on security transactions placed with affiliates of the investment manager or sub-adviser(s) for the period ended June 30, 2024.
|
|
|
|
|
| Transamerica Series Trust |
|
|
|
Semi-Annual Financial Statements 2024 |
|
|
Page 11 |
|
|
Transamerica WMC US Growth VP
NOTES TO FINANCIAL STATEMENTS (continued)
At June 30, 2024
(unaudited)
8. PURCHASES AND SALES OF SECURITIES
For the period ended June 30, 2024, the cost of securities purchased and proceeds from securities sold (excluding short-term securities) are as follows:
|
|
|
|
|
|
|
| Purchases of Securities |
|
Sales/Maturities of Securities |
| Long-Term |
|
U.S. Government |
|
Long-Term |
|
U.S. Government |
| $1,584,189,562 |
|
$ — |
|
$1,432,666,744 |
|
$ — |
9. FEDERAL INCOME TAXES AND DISTRIBUTIONS TO SHAREHOLDERS
The Portfolio has not made any provision for federal income or excise taxes due to its policy to distribute all of its taxable income and capital gains to its shareholders and otherwise qualify as a regulated investment company under Subchapter M of the Internal Revenue Code. The Portfolio recognizes the tax benefits of uncertain tax positions only where the position is “more likely than not” to be sustained assuming examination by tax authorities. The Portfolio’s tax returns remain subject to examination by the Internal Revenue Service and state tax authorities three years from the date of filing for federal purposes and four years from the date of filing for state purposes. Management has evaluated the Portfolio’s tax provisions taken for all open tax years, and has concluded that no provision for income tax is required in the Portfolio’s financial statements. If applicable, the Portfolio recognizes interest accrued related to unrecognized tax benefits in relation to interest and penalties expense in Other within the Statement of Operations. The Portfolio identifies its major tax jurisdictions as U.S. Federal, the state of Colorado, and foreign jurisdictions where the Portfolio makes significant investments; however, the Portfolio is not aware of any tax positions for which it is reasonably possible that the total amounts of unrecognized tax benefits will change materially in the next twelve months. Distributions are determined in accordance with income tax regulations, which may differ from GAAP.
As of June 30, 2024, the approximate cost for U.S. federal income tax purposes, and the aggregate gross/net unrealized appreciation (depreciation) in the value of investments (including securities sold short and derivatives, if any) are as follows:
|
|
|
|
|
|
|
| Cost |
|
Gross Appreciation |
|
Gross (Depreciation) |
|
Net Appreciation (Depreciation) |
| $4,219,301,099 |
|
$1,827,280,419 |
|
$(119,595,770) |
|
$1,707,684,649 |
10. NEW ACCOUNTING PRONOUNCEMENT
In June 2022, the Financial Accounting Standards Board issued Accounting Standards Update No. 2022-03 (“ASU 2022-03”), “Fair Value Measurement of Equity Securities Subject to Contractual Sale Restrictions” (“Topic 820”). ASU 2022-03 clarifies the guidance in Topic 820, related to the measurement of the fair value of an equity security subject to contractual sale restrictions, where it eliminates the need to apply a discount to fair value of these securities, and introduces disclosure requirements related to such equity securities. The guidance is effective for fiscal years, and interim periods within those fiscal years, beginning after December 15, 2023, and allows for early adoption. Management is currently evaluating the implications, if any, of the additional requirements and their impact on the Portfolio’s financial statements.
Please see TST’s most recent report on Form N-CSR, available at: www.transamerica.com/annuities/prospectus, for additional information. For the most recently filed complete proxy voting records for the Trust please visit: https://www.transamerica.com/sites/default/files/files/e070d/TST%20N-PX%202021.pdf
|
|
|
|
|
| Transamerica Series Trust |
|
|
|
Semi-Annual Financial Statements 2024 |
|
|
Page 12 |
|
|
Transamerica WMC US Growth VP
MANAGEMENT AND SUB-ADVISORY AGREEMENT — CONTRACT RENEWAL
(unaudited)
At a meeting of the Board of Trustees of Transamerica Series Trust (the “Trustees” or the “Board”) held on June 12-13, 2024, the Board considered the renewal of the management agreement (the “Management Agreement”) between Transamerica Asset Management, Inc. (“TAM”) and Transamerica Series Trust, on behalf of Transamerica WMC US Growth VP (the “Portfolio”). The Board also considered the renewal of the investment sub-advisory agreement (the “Sub-Advisory Agreement” and together with the Management Agreement, the “Agreements”) for the Portfolio between TAM and Wellington Management Company LLP (the “Sub-Adviser”).
Following its review and consideration, the Board determined that the terms of the Management Agreement and Sub-Advisory Agreement were reasonable and that the renewal of each of the Agreements was in the best interests of the Portfolio and the holders invested in the Portfolio. The Board, including the independent members of the Board (the “Independent Trustees”), unanimously approved the renewal of each of the Agreements through June 30, 2025.
Prior to reaching their decision, the Trustees requested and received from TAM and the Sub-Adviser certain information. They then reviewed such information as they deemed reasonably necessary to evaluate the Agreements, including information they had previously received from TAM and the Sub-Adviser as part of their regular oversight of the Portfolio, and knowledge they gained over time through meeting with TAM and the Sub-Adviser. Among other materials, the Trustees considered comparative fee, expense and performance information prepared by Broadridge Financial Solutions, Inc. (“Broadridge”), an independent provider of mutual fund performance information, as well as fee, expense and profitability information prepared by TAM. To the extent applicable, the Trustees considered information about fees and performance of comparable funds and/or accounts managed by the Sub-Adviser. The Board also considered reductions to the Portfolio’s expense limits, if any, that took effect after the last renewal of the Agreements. In their review, the Trustees also sought to identify instances in which the Portfolio’s performance, fees, total expenses and/or profitability appeared to be outliers within its respective peer group or other comparative metrics and sought to understand the reasons for such comparative positions.
In their deliberations, the Independent Trustees met privately without representatives of TAM or the Sub-Adviser present and were represented throughout the process by their independent legal counsel. In considering the proposed continuation of each of the Agreements, the Trustees evaluated and weighed a number of considerations that they believed to be relevant in light of the legal advice furnished to them by counsel, including independent legal counsel, and made a decision in the exercise of their own business judgment. They based their decisions on the considerations discussed below, among others, although they did not identify any particular consideration or item of information that was controlling of their decisions, and each Trustee may have attributed different weights to the various factors.
Nature, Extent and Quality of the Services Provided
The Board considered the nature, extent and quality of the services provided by TAM and the Sub-Adviser to the Portfolio in the past and the services anticipated to be provided in the future. The Board also considered the investment approach for the Portfolio; the experience, capability and integrity of TAM’s senior management; the financial resources of TAM; TAM’s management oversight process; TAM’s and the Sub-Adviser’s responsiveness to any questions by the Trustees; and the professional qualifications and compensation program of the portfolio management team of the Sub-Adviser. The Trustees noted that they receive, on a quarterly basis, an execution analysis from Capital Institutional Services, Inc. (CAPIS), an independent provider of trade analyses, for the Sub-Adviser and a comparison of trading results against a peer universe of managers.
The Board also considered the continuous and regular investment management and other services provided by TAM, when acting as a manager of managers, for the portion of the management fee it retains from the Portfolio after payment of the sub-advisory fees. The Board noted that the investment management and other services provided by TAM include the design, development and ongoing review and evaluation of the Portfolio and its investment strategy; the selection, oversight and monitoring of one or more investment sub-advisers to perform certain duties with respect to the Portfolio; ongoing portfolio trading oversight and analysis; risk management oversight and analysis; design, development, implementation and ongoing review and evaluation of a process for the valuation of Portfolio investments; design, development, implementation and ongoing review and evaluation of a compliance program for the Portfolio; design, development, implementation and ongoing review and evaluation of a process for the voting of proxies and exercise of rights to consent to corporate action for Portfolio investments; participation in Board meetings and oversight of preparation of materials for the Board, including materials for Board meetings and regular communications with the Board; oversight of preparation of the Portfolio’s prospectus, statement of additional information, shareholder reports and other disclosure materials and regulatory filings for the Portfolio; and ongoing cash management services for the Portfolio. The Board considered that TAM’s investment management services also include the provision of supervisory and administrative services to the Portfolio. The Board also noted that TAM, as part of the services it provides to all Transamerica mutual funds, including the Portfolio, oversees the services provided by the funds’ custodian, transfer agent, independent accountant and legal counsel and supervises the performance of the recordkeeping and holder service functions of the funds.
Investment Performance
In addition, the Board considered the short- and longer-term performance of the Portfolio in light of its investment objective, policies and strategies, including relative performance against (i) a peer universe of comparable mutual funds, as prepared by Broadridge, and (ii) the Portfolio’s benchmarks, in each case for various trailing periods ended December 31, 2023. Based on these considerations, the Board determined that TAM and the Sub-Adviser can provide investment and related services that are appropriate in scope and extent in light of the Portfolio’s investment objectives, policies and strategies and operations, the competitive landscape of the investment company
|
|
|
|
|
| Transamerica Series Trust |
|
|
|
Semi-Annual Financial Statements 2024 |
|
|
Page 13 |
|
|
Transamerica WMC US Growth VP
MANAGEMENT AND SUB-ADVISORY AGREEMENT — CONTRACT RENEWAL (continued)
(unaudited)
business and investor needs. The Board’s conclusions as to the Portfolio’s performance are summarized below. For purposes of its review, the Board generally used the performance of Service Class Shares. In describing the Portfolio’s performance relative to its peer universe, the summary conclusions characterize performance for the relevant periods in relation to whether it was “above,” “below” or “in line with” the peer universe median and do so using quintile rankings prepared by Broadridge. For simplicity, performance is described as “above” the median if the Portfolio’s performance ranked anywhere in the first or second quintiles, as “below” the median if it ranked anywhere in the fourth or fifth quintiles, or “in line with” the median if it ranked anywhere in the third quintile (i.e., even if its precise return was somewhat above or somewhat below the precise median return).
When considering the Portfolio’s performance, the Trustees considered any representations made by TAM regarding the appropriateness of certain peer groups and benchmarks. They recognized that performance reflects a snapshot of a period as of a specific date, and that consideration of performance data for a different period could generate significantly different performance results. The Trustees also recognized that even longer-term performance can be negatively affected by performance over a short-term period when that short-term performance is significantly below the performance of the comparable benchmark or universe of peer funds.
The Board noted that the performance of Service Class Shares of the Portfolio was above the median for its peer universe for the past 5- and 10-year periods and in line with the median for the past 1- and 3-year periods. The Board also noted that the performance of Service Class Shares of the Portfolio was below the benchmark that TAM utilizes to measure performance of the Portfolio for the past 1-, 3-, 5- and 10-year periods. The Board noted that the Sub-Adviser had commenced sub-advising the Portfolio on July 1, 2014 pursuant to its current investment strategies.
Management Fee and Sub-Advisory Fees and Total Expense Ratio
The Board considered the management fee and total expense ratio of the Portfolio, including information provided by Broadridge comparing the management fee and total expense ratio of the Portfolio to the management fees and total expense ratios of comparable investment companies in both a peer group and broader peer universe compiled by Broadridge. The Board’s conclusions as to the Portfolio’s management fee and total expense ratio are summarized below. For purposes of its review, the Board generally used the actual total expenses (i.e., expenses reflecting any waivers and/or reimbursements) of Service Class Shares. In describing the Portfolio’s management fee and total expense ratio relative to its peer group and peer universe, the summary conclusions characterize management fees and total expense ratios for the relevant periods in relation to whether they were “above,” “below” or “in line with” the peer group or peer universe median and do so using quintile rankings prepared by Broadridge. For simplicity, management fees and total expense ratios are described as “above” the median if the Portfolio’s management fee or total expense ratio ranked anywhere in the fourth or fifth quintiles, as “below” the median if it ranked anywhere in the first or second quintiles, or “in line with” the median if it ranked anywhere in the third quintile (i.e., even if its precise management fee or total expense ratio was somewhat above or somewhat below the precise median management fee or total expense ratio).
The Board also considered the fees charged by the Sub-Adviser for sub-advisory services, as well as the portion of the Portfolio’s management fee retained by TAM following payment of the sub-advisory fee and how the portion of the contractual management fee retained by TAM at a specified asset level compared to the portions retained by other investment advisers managing mutual funds with similar investment strategies as calculated by an independent provider of information.
The Board noted that the Portfolio’s contractual management fee and the actual total expenses (i.e., expenses reflecting any waivers and/or reimbursements) of Service Class Shares of the Portfolio were in line with the medians for its peer group and peer universe. The Trustees also considered that TAM has entered into an expense limitation arrangement with the Portfolio, which may result in TAM waiving fees for the benefit of holders.
On the basis of these considerations, together with the other information it considered, the Board determined that the management and sub-advisory fees to be received by TAM and the Sub-Adviser under the Management Agreement and Sub-Advisory Agreement are reasonable in light of the services provided.
Cost of Services Provided and Level of Profitability
The Board reviewed information provided by TAM about the cost of providing and procuring fund management services, as well as the costs of the provision of administration, transfer agency and other services, to the Portfolio and to Transamerica Series Trust as a whole by TAM and its affiliates. The Board considered the profitability of TAM and its affiliates in providing these services for the Portfolio and Transamerica Series Trust as a whole. The Trustees recognized the competitiveness of the mutual fund industry and the importance of an investment adviser’s long-term profitability, including for maintaining company and management stability and accountability.
The Board also considered the allocation methodology used for calculating the profitability of TAM and its affiliates. The Board noted that the revenue and expense allocation methodology used by TAM to estimate its profitability with respect to its relationship with the Portfolio had been reviewed previously by an independent consultant. The Trustees considered that TAM reported that it had not made material changes to this methodology, and that the methodology had been applied consistently for the Portfolio.
|
|
|
|
|
| Transamerica Series Trust |
|
|
|
Semi-Annual Financial Statements 2024 |
|
|
Page 14 |
|
|
Transamerica WMC US Growth VP
MANAGEMENT AND SUB-ADVISORY AGREEMENT — CONTRACT RENEWAL (continued)
(unaudited)
With respect to the Sub-Adviser, the Board noted that the sub-advisory fee is the product of arm’s-length negotiation between TAM and the Sub-Adviser, which is not affiliated with TAM, and is paid by TAM and not the Portfolio. As a result, the Board focused on the profitability of TAM and its affiliates with respect to the Portfolio.
Based on this information, the Board determined that the profitability of TAM and its affiliates from their relationships with the Portfolio was not excessive.
Economies of Scale
The Board considered economies of scale with respect to the management of the Portfolio, whether the Portfolio had appropriately benefited from any economies of scale and whether there was the potential for realization of any future economies of scale. The Board also considered the existence of economies of scale with respect to management of the Transamerica mutual funds overall and the extent to which the Portfolio benefited from any economies of scale. The Board recognized that, as the Portfolio’s assets increase, any economies of scale realized by TAM or the Sub-Adviser may not directly correlate with each other or with any economies of scale that might be realized by the Portfolio. The Board considered the Portfolio’s management fee schedule and the existence of breakpoints and also considered the extent to which TAM shared economies of scale, if any, with the Portfolio through undertakings to limit or reimburse Portfolio expenses and to invest in maintaining and developing its capabilities and services. The Board also considered the Sub-Adviser’s sub-advisory fee schedule and the existence of breakpoints, if any, and how such breakpoints relate to any breakpoints in the Portfolio’s management fee schedule. The Board considered that the Sub-Adviser’s sub-advisory fees would be based on the combined assets of multiple funds. The Trustees concluded that the Portfolio’s fee structure reflected an appropriate sharing of any efficiencies or economies of scale to date and noted that they will have the opportunity to periodically reexamine the appropriateness of the management fee payable to TAM and the fee paid to the Sub-Adviser in light of any economies of scale experienced in the future.
Benefits to TAM, its Affiliates and/or the Sub-Adviser from their Relationships with the Portfolio
The Board considered other benefits derived by TAM, its affiliates, and/or the Sub-Adviser from their relationships with the Portfolio. The Board noted that TAM does not receive benefits from research obtained with commissions paid to broker-dealers for portfolio transactions (commonly referred to as “soft dollars”) as a result of its relationship with the Portfolio and that TAM believes the use of soft dollars by the Sub-Adviser is generally appropriate and in the best interests of the Portfolio. The Board also noted that the Sub-Adviser participates in a brokerage program pursuant to which a portion of brokerage commissions paid by the Portfolio is recaptured for the benefit of the Portfolio and the holders, thus limiting the amount of soft dollar arrangements the Sub-Adviser may engage in with respect to the Portfolio’s brokerage transactions.
Other Considerations
The Board noted that TAM has made a substantial commitment to the recruitment and retention of high-quality personnel and maintains the financial, compliance and operational resources reasonably necessary to manage the Portfolio in a professional manner that is consistent with the best interests of the Portfolio and the holders. In this regard, the Board favorably considered the procedures and policies TAM has in place to enforce compliance with applicable laws and regulations and oversee the portfolio management activities of the Sub-Adviser. The Board also noted that TAM has made an entrepreneurial commitment and undertaken certain business risks with respect to the management and success of the Portfolio.
Conclusion
After consideration of the factors described above, as well as other factors, the Trustees, including the Independent Trustees, concluded that the renewal of the Management Agreement and the Sub-Advisory Agreement was in the best interests of the Portfolio and the holders and voted to approve the renewal of the Agreements.
|
|
|
|
|
| Transamerica Series Trust |
|
|
|
Semi-Annual Financial Statements 2024 |
|
|
Page 15 |
|
|
Transamerica WMC US Growth VP
RESULTS OF SHAREHOLDER MEETING
(unaudited)
Rule 30e-1 under the Investment Company Act of 1940, as amended, titled “Reports to Stockholders of Management Companies,” requires regulated investment companies to report on all subject matters put to the vote of shareholders and to provide final results. Accordingly, the Board of Trustees of the Portfolio solicited a vote by the shareholders for the following item:
A special meeting of holders of Transamerica WMC US Growth VP was held on April 29, 2024. The results of Proposal 2 were as follows:
To approve the Portfolio’s use of the manager of managers exemptive order, which will allow TAM, the Portfolio’s investment manager, to enter into and materially amend sub-advisory agreements with respect to the Portfolio in the future without Holder approval, subject to prior approval by the Portfolio’s Board of Trustees.
|
|
|
| Proposal |
|
Number of Shares |
| For |
|
140,505,123 |
| Against |
|
1,540,884 |
| Withheld |
|
1,365,602 |
|
|
|
|
|
| Transamerica Series Trust |
|
|
|
Semi-Annual Financial Statements 2024 |
|
|
Page 16 |
|
|
PROXY VOTING POLICIES AND PROCEDURES AND QUARTERLY PORTFOLIO HOLDINGS
(unaudited)
A description of Transamerica Series Trust’s (the “Trust”) proxy voting policies and procedures is available in the Statement of Additional Information of the Portfolios, available without charge upon request by calling 1-800-851-9777 (toll free) or on the Securities and Exchange Commission’s (“SEC”) website at http://www.sec.gov.
In addition, the Portfolio is required to file Form N-PX, with their complete proxy voting records for the most recent 12 months ended June 30th, no later than August 31st of each year. The Form is available without charge: (1) on the Transamerica Funds website at https://www.transamerica.com/sites/default/files/files/e070d/TST%20N-PX%202021.pdf; and (2) on the SEC’s website at http://www.sec.gov.
Each fiscal quarter, the Portfolios, except Transamerica BlackRock Government Money Market VP, will file with the SEC a complete schedule of its monthly portfolio holdings on Form N-PORT. The Portfolios’ holdings as of the end of the third month of every fiscal quarter, as reported on Form N-PORT, will be publicly available on the SEC’s website at http://www.sec.gov within 60 days of the end of the fiscal quarter.
On a monthly basis, Transamerica BlackRock Government Money Market VP will file with the SEC portfolio holdings information on Form N-MFP3. A complete schedule of portfolio holdings is also available at www.transamerica.com.
You may also visit the Trust’s website at www.transamerica.com/annuities/prospectus for this and other information about the Portfolios and the Trust.
Important Notice Regarding Delivery of Shareholder Documents
Every year we provide shareholders informative materials such as the Transamerica Series Trust Annual Report, the Transamerica Series Trust Prospectus, and other required documents that keep you informed regarding your Portfolios. To the extent provided by mail, Transamerica Series Trust will only send one piece per mailing address, a method that saves your Portfolios money by reducing mailing and printing costs. We will continue to do this unless you tell us not to. To elect to receive individual mailings, simply call a Transamerica Customer Service Representative toll free at 1-800-851-9777, 8 a.m. to 7 p.m. Eastern Time, Monday-Friday. Your request will take effect within 30 days.
|
|
|
|
|
| Transamerica Series Trust |
|
|
|
Semi-Annual Financial Statements 2024 |
|
|
Page 17 |
|
|
NOTICE OF PRIVACY POLICY
(unaudited)
Your privacy is very important to us. We want you to understand what information we collect and how we use it. We collect and use “nonpublic personal information” in connection with providing our customers with a broad range of financial products and services as effectively and conveniently as possible. We treat nonpublic personal information in accordance with our Privacy Policy.
What Information We Collect and From Whom We Collect It
We may collect nonpublic personal information about you from the following sources:
| • |
|
Information we receive from you on applications or other forms, such as your name, address, and account number; |
| • |
|
Information about your transactions with us, our affiliates, or others, such as your account balance and purchase/redemption history; and |
| • |
|
Information we receive from non-affiliated third parties, including consumer reporting agencies. |
What Information We Disclose and To Whom We Disclose It
We do not disclose any nonpublic personal information about current or former customers to anyone without their express consent, except as permitted by law. We may disclose the nonpublic personal information we collect, as described above, to persons or companies that perform services on our behalf and to other financial institutions with which we have joint marketing agreements. We will require these companies to protect the confidentiality of your nonpublic personal information and to use it only to perform the services for which we have hired them.
Our Security Procedures
We restrict access to your nonpublic personal information and only allow disclosures to persons and companies as permitted by law to assist in providing products or services to you. We maintain physical, electronic, and procedural safeguards to protect your nonpublic personal information and to safeguard the disposal of certain consumer information.
Contact Us
If you have any questions about our Privacy Policy, please call 1-800-851-9777 on any business day between 8 a.m. and 7 p.m. Eastern Time.
Note: This Privacy Policy applies only to customers that have a direct relationship with us or our affiliates. If you own shares of our portfolios in the name of a third party such as a bank or broker-dealer, its privacy policy may apply to you instead of ours.
|
|
|
|
|
| Transamerica Series Trust |
|
|
|
Semi-Annual Financial Statements 2024 |
|
|
Page 18 |
|
|
PO Box 219945
Kansas City, MO 64121-9945
|
|
|
| Distributor: |
|
Transamerica Capital, Inc. |
|
|
PO Box 219945 |
|
|
Kansas City, MO 64121-9945 |
|
|
|
|
Customer Service: 1-800-851-9777 |
| (b) |
The registrant’s Financial Highlights are filed under Item 7(a) of this Form. |
| Item 8. |
Changes in and Disagreements with Accountants for Open-End Management Investment Companies. |
There were no changes in or disagreements with accountants during the period covered by this report.
| Item 9. |
Proxy Disclosures for Open-End Management Investment Companies. |
Proxy disclosures for the following series of the registrant are included within the Financial Statements of such series filed under Item 7(a) of this Form:
| |
● |
|
Transamerica Aegon Core Bond VP; |
| |
● |
|
Transamerica Aegon Sustainable Equity Income VP; |
| |
● |
|
Transamerica International Focus VP; |
| |
● |
|
Transamerica JPMorgan Mid Cap Value VP; |
| |
● |
|
Transamerica T. Rowe Price Small Cap VP; |
| |
● |
|
Transamerica TSW International Equity VP; and |
| |
● |
|
Transamerica WMC US Growth VP. |
There were no broker-non votes to report with respect to any of the above-listed series.
There are no proxy disclosures for the other series of the registrant.
| Item 10. |
Remuneration Paid to Directors, Officers, and Others of Open-End Management Investment Companies. |
Renumeration Paid to Directors, Officers, and Others of Open-End Investment Companies is included within the Financial Statements filed under Item 7(a) of this Form.
| Item 11. |
Statement Regarding Basis for Approval of Investment Advisory Contract. |
The registrant’s Statement Regarding Basis for Approval of Investment Management and Sub-Advisory Contracts is included within the Financial Statements filed under Item 7(a) of this Form.
| Item 12. |
Disclosure of Proxy Voting Policies and Procedures for Closed-End Management Investment Companies. |
Not applicable to the registrant.
| Item 13. |
Portfolio Managers of Closed-End Management Investment Companies. |
Not applicable to the registrant.
| Item 14. |
Purchases of Equity Securities by Closed-End Management Investment Company and Affiliated Purchasers. |
Not applicable to the registrant.
| Item 15. |
Submission of Matters to a Vote of Security Holders. |
There have been no material changes to the procedures by which shareholders may recommend nominees to the registrant’s board of trustees that have been implemented since the registrant last provided disclosure in response to the requirements of this Item.
| Item 16. |
Controls and Procedures. |
| (a) |
The registrant’s principal executive officer and principal financial officer have evaluated the effectiveness of the registrant’s disclosure controls and procedures as of a date within 90 days of the filing of this report and have concluded that the registrant’s disclosure controls and procedures (as defined in Rule 30a-3(c) under the Investment Company Act of 1940, as amended) are appropriately designed to ensure that information required to be disclosed by the registrant in the reports that it files on Form N-CSR (a) is accumulated and communicated to registrant’s management, including its principal executive officer and principal financial officer, to allow timely decisions regarding required disclosure, and (b) is recorded, processed, summarized and reported, within the time periods specified in the rules and forms adopted by the U.S. Securities and Exchange Commission. |
| (b) |
The registrant’s principal executive officer and principal financial officer are aware of no change in the registrant’s internal control over financial reporting that occurred during the period covered by this report that has materially affected, or is reasonably likely to materially affect, the registrant’s internal control over financial reporting. |
| Item 17. |
Disclosure of Securities Lending Activities for Closed-End Management Investment Companies. |
Not applicable to the registrant.
| Item 18. |
Recovery of Erroneously Awarded Compensation. |
Not applicable to the registrant.
| (a)(1) |
Any code of ethics or amendment thereto, that is the subject of the disclosure required by Item 2, to the extent that the registrant intends to satisfy Item 2 requirements through filing an exhibit. |
| |
Not applicable for semi-annual reports. |
| (a)(2) |
Any policy required by the listing standards adopted pursuant to Rule 10D-1 under the Exchange Act (17 CFR 240.10D-1) by the registered national securities exchange or registered national securities association upon which the registrant’s securities are listed. |
| |
Not applicable to the registrant. |
| (a)(4) |
Any written solicitation to purchase securities under Rule 23c-1 under the Act (17 CFR 270.23c-1) sent or given during the period covered by the report by or on behalf of the registrant to 10 or more persons. |
| (a)(5) |
Change in the registrant’s independent public accountant. |
SIGNATURES
Pursuant to the requirements of the Securities Exchange Act of 1934 and the Investment Company Act of 1940, the registrant has duly caused this report to be signed on its behalf by the undersigned, thereunto duly authorized.
|
|
|
| Transamerica Series Trust |
| (Registrant) |
| By: |
|
/s/ Marijn P. Smit |
|
|
Marijn P. Smit |
|
|
President and Chief Executive Officer |
|
|
(Principal Executive Officer) |
|
|
| Date: |
|
September 3, 2024 |
Pursuant to the requirements of the Securities Exchange Act of 1934 and the Investment Company Act of 1940, this report has been signed below by the following persons on behalf of the registrant and in the capacities and on the dates indicated.
|
|
|
|
|
| |
|
By: |
|
/s/ Marijn P. Smit |
|
|
|
|
Marijn P. Smit |
|
|
|
|
President and Chief Executive Officer |
|
|
|
|
(Principal Executive Officer) |
|
|
|
|
|
Date: |
|
September 3, 2024 |
|
|
|
| |
|
By: |
|
/s/ Vincent J. Toner |
|
|
|
|
Vincent J. Toner |
|
|
|
|
Vice President and Treasurer (Principal Financial Officer and Principal Accounting Officer) |
|
|
|
|
|
Date: |
|
September 3, 2024 |
EXHIBIT INDEX