UNITED STATES
SECURITIES AND EXCHANGE COMMISSION
Washington, D.C. 20549
Form N-CSR
CERTIFIED SHAREHOLDER REPORT OF REGISTERED
MANAGEMENT INVESTMENT COMPANIES
Investment Company Act File Number: 811-04409
Eaton Vance Municipals Trust
(Exact Name of Registrant as Specified in Charter)
Two International Place, Boston, Massachusetts 02110
(Address of Principal Executive Offices)
Maureen A. Gemma
Two International Place, Boston, Massachusetts 02110
(Name and Address of Agent for Services)
(617) 482-8260
(Registrant’s Telephone Number)
July 31
Date of Fiscal Year End
January 31, 2013
Date of Reporting Period
Item 1. Reports to Stockholders

| | |
Eaton Vance Municipals Trust Semiannual Report January 31, 2013 | | |
Arizona • Connecticut • Minnesota • New Jersey • Pennsylvania

Fund shares are not insured by the FDIC and are not deposits or other obligations of, or guaranteed by, any depository institution. Shares are subject to investment risks, including possible loss of principal invested.
This report must be preceded or accompanied by a current summary prospectus or prospectus. Before investing, investors should consider carefully the investment objective, risks, and charges and expenses of a mutual fund. This and other important information is contained in the summary prospectus and prospectus, which can be obtained from a financial advisor. Prospective investors should read the prospectus carefully before investing. For further information, please call 1-800-262-1122.
Semiannual Report January 31, 2013
Eaton Vance
Municipal Income Funds
Table of Contents
| | | | |
Performance and Fund Profile | | | | |
| |
| | | | |
Arizona | | | 2 | |
Connecticut | | | 3 | |
Minnesota | | | 4 | |
New Jersey | | | 5 | |
Pennsylvania | | | 6 | |
| |
| | | | |
| |
Endnotes and Additional Disclosures | | | 7 | |
| |
Fund Expenses | | | 8 | |
| |
Financial Statements | | | 11 | |
| |
Officers and Trustees | | | 65 | |
| |
Important Notices | | | 66 | |
Eaton Vance
Arizona Municipal Income Fund
January 31, 2013
Performance1,2
Portfolio Manager Craig R. Brandon, CFA
| | | | | | | | | | | | | | | | | | | | | | | | |
| % Average Annual Total Returns | | Inception Date | | | Six Months | | | One Year | | | Five Years | | | Ten Years | | | Since
Inception | |
Class A at NAV | | | 12/13/1993 | | | | 1.83 | % | | | 4.88 | % | | | 5.17 | % | | | 4.86 | % | | | — | |
Class A with 4.75% Maximum Sales Charge | | | — | | | | –3.00 | | | | –0.15 | | | | 4.16 | | | | 4.34 | | | | — | |
Class B at NAV | | | 07/25/1991 | | | | 1.54 | | | | 4.09 | | | | 4.38 | | | | 4.09 | | | | — | |
Class B with 5% Maximum Sales Charge | | | — | | | | –3.46 | | | | –0.91 | | | | 4.04 | | | | 4.09 | | | | — | |
Class C at NAV | | | 12/16/2005 | | | | 1.45 | | | | 4.00 | | | | 4.38 | | | | — | | | | 4.12 | % |
Class C with 1% Maximum Sales Charge | | | — | | | | 0.45 | | | | 3.00 | | | | 4.38 | | | | — | | | | 4.12 | |
Class I at NAV | | | 08/03/2010 | | | | 2.04 | | | | 5.09 | | | | — | | | | — | | | | 7.15 | |
Barclays Capital Municipal Bond Index | | | — | | | | 1.82 | % | | | 4.80 | % | | | 5.73 | % | | | 5.17 | % | | | — | |
Barclays Capital 20 Year Municipal Bond Index | | | — | | | | 2.69 | | | | 6.86 | | | | 6.89 | | | | 6.08 | | | | — | |
| | | | | | |
| | | | | | | | | | | | | | | | | | | | | | | | |
| % Total Annual Operating Expense Ratios3 | | | | | | | | Class A | | | Class B | | | Class C | | | Class I | |
Gross | | | | | | | | | | | 0.76 | % | | | 1.51 | % | | | 1.51 | % | | | 0.56 | % |
Net of Interest Expense | | | | | | | | | | | 0.74 | | | | 1.49 | | | | 1.49 | | | | 0.54 | |
| | | | | | |
| | | | | | | | | | | | | | | | | | | | | | | | |
| % Distribution Rates/Yields4 | | | | | | | | Class A | | | Class B | | | Class C | | | Class I | |
Distribution Rate | | | | | | | | | | | 3.51 | % | | | 2.74 | % | | | 2.74 | % | | | 3.71 | % |
Taxable-Equivalent Distribution Rate | | | | | | | | | | | 6.50 | | | | 5.07 | | | | 5.07 | | | | 6.87 | |
SEC 30-day Yield | | | | | | | | | | | 1.90 | | | | 1.25 | | | | 1.25 | | | | 2.20 | |
Taxable-Equivalent SEC 30-day Yield | | | | | | | | | | | 3.52 | | | | 2.01 | | | | 2.31 | | | | 4.07 | |
| | | | | | |
| | | | | | | | | | | | | | | | | | | | | | | | |
| % Total Leverage5 | | | | | | | | | | | | | | | | | | |
Residual Interest Bond (RIB) | | | | | | | | | | | | | | | | | | | | | | | 1.99 | % |
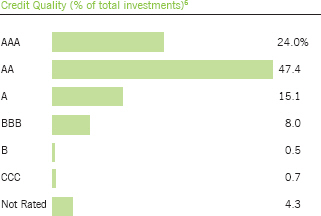
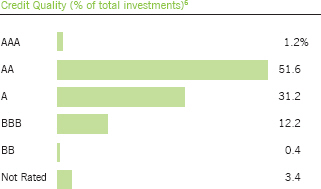
The above chart includes the ratings of securities held by special purpose vehicles established in connection with the RIB financing.5 Absent such securities, credit quality (% of total investments) is as follows:6
| | | | | | | | | | |
AAA | | | 24.5 | % | | B | | | 0.5 | % |
AA | | | 46.3 | | | CCC | | | 0.8 | |
A | | | 15.4 | | | Not Rated | | | 4.4 | |
BBB | | | 8.1 | | | | | | | |
See Endnotes and Additional Disclosures in this report.
Past performance is no guarantee of future results. Returns are historical and are calculated by determining the percentage change in net asset value (NAV) or offering price (as applicable) with all distributions reinvested. Investment return and principal value will fluctuate so that shares, when redeemed, may be worth more or less than their original cost. Performance less than one year is cumulative. Performance is for the stated time period only; due to market volatility, the Fund’s current performance may be lower or higher than quoted. Returns are before taxes unless otherwise noted. For performance as of the most recent month end, please refer to www.eatonvance.com.
Eaton Vance
Connecticut Municipal Income Fund
January 31, 2013
Performance1,2
Portfolio Manager William H. Ahern, Jr., CFA
| | | | | | | | | | | | | | | | | | | | | | | | |
| % Average Annual Total Returns | | Inception Date | | | Six Months | | | One Year | | | Five Years | | | Ten Years | | | Since
Inception | |
Class A at NAV | | | 04/19/1994 | | | | 1.15 | % | | | 3.29 | % | | | 4.65 | % | | | 4.30 | % | | | — | |
Class A with 4.75% Maximum Sales Charge | | | — | | | | –3.69 | | | | –1.66 | | | | 3.65 | | | | 3.79 | | | | — | |
Class B at NAV | | | 05/01/1992 | | | | 0.76 | | | | 2.52 | | | | 3.87 | | | | 3.53 | | | | — | |
Class B with 5% Maximum Sales Charge | | | — | | | | –4.21 | | | | –2.46 | | | | 3.52 | | | | 3.53 | | | | — | |
Class C at NAV | | | 02/09/2006 | | | | 0.76 | | | | 2.52 | | | | 3.87 | | | | — | | | | 3.62 | % |
Class C with 1% Maximum Sales Charge | | | — | | | | –0.23 | | | | 1.52 | | | | 3.87 | | | | — | | | | 3.62 | |
Class I at NAV | | | 03/03/2008 | | | | 1.15 | | | | 3.40 | | | | — | | | | — | | | | 6.41 | |
Barclays Capital Municipal Bond Index | | | — | | | | 1.82 | % | | | 4.80 | % | | | 5.73 | % | | | 5.17 | % | | | — | |
Barclays Capital 20 Year Municipal Bond Index | | | — | | | | 2.69 | | | | 6.86 | | | | 6.89 | | | | 6.08 | | | | — | |
| | | | | | |
| | | | | | | | | | | | | | | | | | | | | | | | |
| % Total Annual Operating Expense Ratios3 | | | | | | | | Class A | | | Class B | | | Class C | | | Class I | |
Gross | | | | | | | | | | | 0.80 | % | | | 1.55 | % | | | 1.55 | % | | | 0.59 | % |
Net of Interest Expense | | | | | | | | | | | 0.75 | | | | 1.50 | | | | 1.50 | | | | 0.54 | |
| | | | | | |
| | | | | | | | | | | | | | | | | | | | | | | | |
| % Distribution Rates/Yields4 | | | | | | | | Class A | | | Class B | | | Class C | | | Class I | |
Distribution Rate | | | | | | | | | | | 3.49 | % | | | 2.73 | % | | | 2.73 | % | | | 3.70 | % |
Taxable-Equivalent Distribution Rate | | | | | | | | | | | 6.61 | | | | 5.17 | | | | 5.17 | | | | 7.01 | |
SEC 30-day Yield | | | | | | | | | | | 2.18 | | | | 1.55 | | | | 1.55 | | | | 2.49 | |
Taxable-Equivalent SEC 30-day Yield | | | | | | | | | | | 4.13 | | | | 2.94 | | | | 2.94 | | | | 4.72 | |
| | | | | | |
| | | | | | | | | | | | | | | | | | | | | | | | |
| % Total Leverage5 | | | | | | | | | | | | | | | | | | |
RIB | | | | | | | | | | | | | | | | | | | | | | | 5.63 | % |
Fund Profile
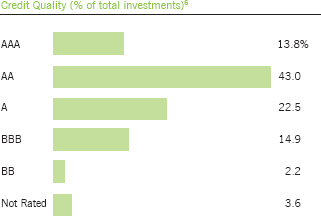
The above chart includes the ratings of securities held by special purpose vehicles established in connection with the RIB financing.5 Absent such securities, credit quality (% of total investments) is as follows:6
| | | | | | | | | | |
AAA | | | 11.3 | % | | BBB | | | 15.8 | % |
AA | | | 42.9 | | | BB | | | 2.3 | |
A | | | 23.9 | | | Not Rated | | | 3.8 | |
See Endnotes and Additional Disclosures in this report.
Past performance is no guarantee of future results. Returns are historical and are calculated by determining the percentage change in net asset value (NAV) or offering price (as applicable) with all distributions reinvested. Investment return and principal value will fluctuate so that shares, when redeemed, may be worth more or less than their original cost. Performance less than one year is cumulative. Performance is for the stated time period only; due to market volatility, the Fund’s current performance may be lower or higher than quoted. Returns are before taxes unless otherwise noted. For performance as of the most recent month end, please refer to www.eatonvance.com.
Eaton Vance
Minnesota Municipal Income Fund
January 31, 2013
Performance 1,2
Portfolio Manager Craig R. Brandon, CFA
| | | | | | | | | | | | | | | | | | | | | | | | |
| % Average Annual Total Returns | | Inception Date | | | Six Months | | | One Year | | | Five Years | | | Ten Years | | | Since
Inception | |
Class A at NAV | | | 12/09/1993 | | | | 2.09 | % | | | 4.62 | % | | | 5.23 | % | | | 4.97 | % | | | — | |
Class A with 4.75% Maximum Sales Charge | | | — | | | | –2.79 | | | | –0.32 | | | | 4.22 | | | | 4.46 | | | | — | |
Class B at NAV | | | 07/29/1991 | | | | 1.77 | | | | 3.95 | | | | 4.46 | | | | 4.21 | | | | — | |
Class B with 5% Maximum Sales Charge | | | — | | | | –3.23 | | | | –1.05 | | | | 4.12 | | | | 4.21 | | | | — | |
Class C at NAV | | | 12/21/2005 | | | | 1.77 | | | | 3.94 | | | | 4.42 | | | | — | | | | 4.23 | % |
Class C with 1% Maximum Sales Charge | | | — | | | | 0.77 | | | | 2.94 | | | | 4.42 | | | | — | | | | 4.23 | |
Class I at NAV | | | 08/03/2010 | | | | 2.30 | | | | 4.94 | | | | — | | | | — | | | | 6.27 | |
Barclays Capital Municipal Bond Index | | | — | | | | 1.82 | % | | | 4.80 | % | | | 5.73 | % | | | 5.17 | % | | | — | |
Barclays Capital 20 Year Municipal Bond Index | | | — | | | | 2.69 | | | | 6.86 | | | | 6.89 | | | | 6.08 | | | | — | |
| | | | | | |
| | | | | | | | | | | | | | | | | | | | | | | | |
| % Total Annual Operating Expense Ratios3 | | | | | | | | Class A | | | Class B | | | Class C | | | Class I | |
| | | | | | | | | | | 0.72 | % | | | 1.47 | % | | | 1.47 | % | | | 0.52 | % |
| | | | | | |
| | | | | | | | | | | | | | | | | | | | | | | | |
| % Distribution Rates/Yields4 | | | | | | | | Class A | | | Class B | | | Class C | | | Class I | |
Distribution Rate | | | | | | | | | | | 3.10 | % | | | 2.33 | % | | | 2.33 | % | | | 3.30 | % |
Taxable-Equivalent Distribution Rate | | | | | | | | | | | 5.94 | | | | 4.47 | | | | 4.47 | | | | 6.33 | |
SEC 30-day Yield | | | | | | | | | | | 1.65 | | | | 0.99 | | | | 0.99 | | | | 1.93 | |
Taxable-Equivalent SEC 30-day Yield | | | | | | | | | | | 3.16 | | | | 1.65 | | | | 1.90 | | | | 3.70 | |
Fund Profile
See Endnotes and Additional Disclosures in this report.
Past performance is no guarantee of future results. Returns are historical and are calculated by determining the percentage change in net asset value (NAV) or offering price (as applicable) with all distributions reinvested. Investment return and principal value will fluctuate so that shares, when redeemed, may be worth more or less than their original cost. Performance less than one year is cumulative. Performance is for the stated time period only; due to market volatility, the Fund’s current performance may be lower or higher than quoted. Returns are before taxes unless otherwise noted. For performance as of the most recent month end, please refer to www.eatonvance.com.
Eaton Vance
New Jersey Municipal Income Fund
January 31, 2013
Performance 1,2
Portfolio Manager Adam Weigold, CFA
| | | | | | | | | | | | | | | | | | | | | | | | |
| % Average Annual Total Returns | | Inception Date | | | Six Months | | | One Year | | | Five Years | | | Ten Years | | | Since
Inception | |
Class A at NAV | | | 04/13/1994 | | | | 3.69 | % | | | 7.51 | % | | | 4.22 | % | | | 4.26 | % | | | — | |
Class A with 4.75% Maximum Sales Charge | | | — | | | | –1.26 | | | | 2.40 | | | | 3.22 | | | | 3.76 | | | | — | |
Class C at NAV | | | 12/14/2005 | | | | 3.43 | | | | 6.77 | | | | 3.45 | | | | — | | | | 3.21 | % |
Class C with 1% Maximum Sales Charge | | | — | | | | 2.43 | | | | 5.77 | | | | 3.45 | | | | — | | | | 3.21 | |
Class I at NAV | | | 03/03/2008 | | | | 3.90 | | | | 7.72 | | | | — | | | | — | | | | 6.38 | |
Barclays Capital Municipal Bond Index | | | — | | | | 1.82 | % | | | 4.80 | % | | | 5.73 | % | | | 5.17 | % | | | — | |
Barclays Capital 20 Year Municipal Bond Index | | | — | | | | 2.69 | | | | 6.86 | | | | 6.89 | | | | 6.08 | | | | — | |
| | | | | | |
| | | | | | | | | | | | | | | | | | | | | | | | |
| % Total Annual Operating Expense Ratios3 | | | | | | | | | | | Class A | | | Class C | | | Class I | |
Gross | | | | | | | | | | | | | | | 0.83 | % | | | 1.58 | % | | | 0.63 | % |
Net of Interest Expense | | | | | | | | | | | | | | | 0.76 | | | | 1.51 | | | | 0.56 | |
| | | | | | |
| | | | | | | | | | | | | | | | | | | | | | | | |
| % Distribution Rates/Yields4 | | | | | | | | | | | Class A | | | Class C | | | Class I | |
Distribution Rate | | | | | | | | | | | | | | | 3.92 | % | | | 3.15 | % | | | 4.12 | % |
Taxable-Equivalent Distribution Rate | | | | | | | | | | | | | | | 7.61 | | | | 6.11 | | | | 8.00 | |
SEC 30-day Yield | | | | | | | | | | | | | | | 2.42 | | | | 1.79 | | | | 2.74 | |
Taxable-Equivalent SEC 30-day Yield | | | | | | | | | | | | | | | 4.70 | | | | 3.47 | | | | 5.32 | |
| | | | | | |
| | | | | | | | | | | | | | | | | | | | | | | | |
| % Total Leverage5 | | | | | | | | | | | | | | | | | | |
RIB | | | | | | | | | | | | | | | | | | | | | | | 8.85 | % |
Fund Profile
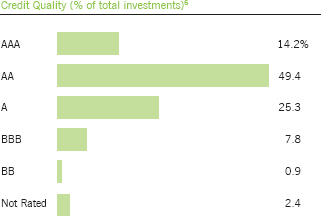
The above chart includes the ratings of securities held by special purpose vehicles established in connection with the RIB financing.5 Absent such securities, credit quality (% of total investments) is as follows:6
| | | | | | | | | | |
AAA | | | 5.2 | % | | BBB | | | 17.0 | % |
AA | | | 32.6 | | | B | | | 1.5 | |
A | | | 39.7 | | | Not Rated | | | 4.0 | |
See Endnotes and Additional Disclosures in this report.
Past performance is no guarantee of future results. Returns are historical and are calculated by determining the percentage change in net asset value (NAV) or offering price (as applicable) with all distributions reinvested. Investment return and principal value will fluctuate so that shares, when redeemed, may be worth more or less than their original cost. Performance less than one year is cumulative. Performance is for the stated time period only; due to market volatility, the Fund’s current performance may be lower or higher than quoted. Returns are before taxes unless otherwise noted. For performance as of the most recent month end, please refer to www.eatonvance.com.
Eaton Vance
Pennsylvania Municipal Income Fund
January 31, 2013
Performance 1,2
Portfolio Manager Adam Weigold, CFA
| | | | | | | | | | | | | | | | | | | | | | | | |
| % Average Annual Total Returns | | Inception Date | | | Six Months | | | One Year | | | Five Years | | | Ten Years | | | Since
Inception | |
Class A at NAV | | | 06/01/1994 | | | | 3.80 | % | | | 6.14 | % | | | 3.99 | % | | | 4.29 | % | | | — | |
Class A with 4.75% Maximum Sales Charge | | | — | | | | ���1.16 | | | | 1.06 | | | | 2.99 | | | | 3.78 | | | | — | |
Class B at NAV | | | 01/08/1991 | | | | 3.45 | | | | 5.39 | | | | 3.23 | | | | 3.54 | | | | — | |
Class B with 5% Maximum Sales Charge | | | — | | | | –1.55 | | | | 0.39 | | | | 2.89 | | | | 3.54 | | | | — | |
Class C at NAV | | | 01/13/2006 | | | | 3.45 | | | | 5.28 | | | | 3.21 | | | | — | | | | 3.02 | % |
Class C with 1% Maximum Sales Charge | | | — | | | | 2.45 | | | | 4.28 | | | | 3.21 | | | | — | | | | 3.02 | |
Class I at NAV | | | 03/03/2008 | | | | 4.01 | | | | 6.34 | | | | — | | | | — | | | | 6.06 | |
Barclays Capital Municipal Bond Index | | | — | | | | 1.82 | % | | | 4.80 | % | | | 5.73 | % | | | 5.17 | % | | | — | |
Barclays Capital 20 Year Municipal Bond Index | | | — | | | | 2.69 | | | | 6.86 | | | | 6.89 | | | | 6.08 | | | | — | |
| | | | | | |
| | | | | | | | | | | | | | | | | | | | | | | | |
| % Total Annual Operating Expense Ratios3 | | | | | | | | Class A | | | Class B | | | Class C | | | Class I | |
Gross | | | | | | | | | | | 0.82 | % | | | 1.57 | % | | | 1.57 | % | | | 0.62 | % |
Net of Interest Expense | | | | | | | | | | | 0.77 | | | | 1.52 | | | | 1.52 | | | | 0.57 | |
| | | | | | |
| | | | | | | | | | | | | | | | | | | | | | | | |
| % Distribution Rates/Yields4 | | | | | | | | Class A | | | Class B | | | Class C | | | Class I | |
Distribution Rate | | | | | | | | | | | 3.89 | % | | | 3.12 | % | | | 3.12 | % | | | 4.09 | % |
Taxable-Equivalent Distribution Rate | | | | | | | | | | | 7.09 | | | | 5.69 | | | | 5.69 | | | | 7.46 | |
SEC 30-day Yield | | | | | | | | | | | 2.08 | | | | 1.44 | | | | 1.43 | | | | 2.37 | |
Taxable-Equivalent SEC 30-day Yield | | | | | | | | | | | 3.79 | | | | 2.62 | | | | 2.61 | | | | 4.32 | |
| | | | | | |
| | | | | | | | | | | | | | | | | | | | | | | | |
| % Total Leverage5 | | | | | | | | | | | | | | | | | | |
RIB | | | | | | | | | | | | | | | | | | | | | | | 6.31 | % |
Fund Profile
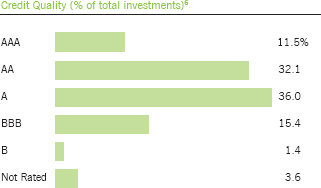
The above chart includes the ratings of securities held by special purpose vehicles established in connection with the RIB financing.5 Absent such securities, credit quality (% of total investments) is as follows:6
| | | | | | | | | | |
AAA | | | 1.3 | % | | BBB | | | 13.1 | % |
AA | | | 48.2 | | | BB | | | 0.4 | |
A | | | 33.3 | | | Not Rated | | | 3.7 | |
See Endnotes and Additional Disclosures in this report.
Past performance is no guarantee of future results. Returns are historical and are calculated by determining the percentage change in net asset value (NAV) or offering price (as applicable) with all distributions reinvested. Investment return and principal value will fluctuate so that shares, when redeemed, may be worth more or less than their original cost. Performance less than one year is cumulative. Performance is for the stated time period only; due to market volatility, the Fund’s current performance may be lower or higher than quoted. Returns are before taxes unless otherwise noted. For performance as of the most recent month end, please refer to www.eatonvance.com.
Eaton Vance
Municipal Income Funds
January 31, 2013
Endnotes and Additional Disclosures
| 1 | Barclays Capital Municipal Bond Index is an unmanaged index of municipal bonds traded in the U.S. Barclays Capital 20 Year Municipal Bond Index is an unmanaged index of municipal bonds traded in the U.S. with maturities ranging from 17-22 years. Unless otherwise stated, index returns do not reflect the effect of any applicable sales charges, commissions, expenses, taxes or leverage, as applicable. It is not possible to invest directly in an index. |
| 2 | Total Returns at NAV do not include applicable sales charges. If sales charges were deducted, the returns would be lower. Total Returns shown with maximum sales charge reflect the stated maximum sales charge. Unless otherwise stated, performance does not reflect the deduction of taxes on Fund distributions or redemptions of Fund shares. |
| 3 | Total annual operating expense ratios are as stated in the Fund’s most recent prospectus. Net expense ratio excludes interest expense relating to the Fund’s liability with respect to floating rate notes held by third parties in conjunction with residual interest bond transactions by the Fund. The Fund also records offsetting interest income in an amount equal to this expense relating to the municipal obligations underlying such transactions and, as a result, net asset value and performance have not been affected by this expense. |
| 4 | The Distribution Rate is based on the Fund’s last regular distribution per share in the period (annualized) divided by the Fund’s NAV at the end of the period. The Fund’s distributions may be composed of ordinary income, tax-exempt income, net realized capital gains and return of capital. Taxable-equivalent performance is based on the highest combined federal and state income tax rates, where applicable. Lower tax rates would result in lower tax-equivalent performance. Actual tax rates will vary depending on your income, exemptions and deductions. Rates do not include local taxes. SEC Yield is a standardized measure based on the estimated yield to maturity of a fund’s investments over a 30-day period and is based on the maximum offer price at the date specified. The SEC Yield is not based on the distributions made by the Fund, which may differ. |
| 5 | Fund employs RIB financing. The leverage created by RIB investments provides an opportunity for increased income but, at the same time, creates special risks (including the likelihood of greater volatility of NAV). The cost of leverage rises and falls with changes in short-term interest rates. See “Floating Rate Notes Issued in Conjunction with Securities Held” in the notes to the financial statements for more information about RIB financing. RIB leverage represents the amount of Floating Rate Notes outstanding at period end as a percentage of Fund net assets plus Floating Rate Notes. |
| 6 | Ratings are based on Moody’s, S&P or Fitch, as applicable. Credit ratings are based largely on the rating agency’s investment analysis at the time of rating and the rating assigned to any particular security is not necessarily a reflection of the issuer’s current financial condition. The rating assigned to a security by a rating agency does not necessarily reflect its assessment of the volatility of a security’s market value or of the liquidity of an investment in the security. If securities are rated differently by the rating agencies, the higher rating is applied. Ratings of BBB or higher by Standard and Poor’s or Fitch (Baa or higher by Moody’s) are considered to be investment grade quality. |
| | Fund profile subject to change due to active management. |
Eaton Vance
Municipal Income Funds
January 31, 2013
Fund Expenses
Example: As a Fund shareholder, you incur two types of costs: (1) transaction costs, including sales charges (loads) on purchases and redemption fees (if applicable); and (2) ongoing costs, including management fees; distribution and/or service fees; and other Fund expenses. This Example is intended to help you understand your ongoing costs (in dollars) of Fund investing and to compare these costs with the ongoing costs of investing in other mutual funds. The Example is based on an investment of $1,000 invested at the beginning of the period and held for the entire period (August 1, 2012 – January 31, 2013).
Actual Expenses: The first section of each table below provides information about actual account values and actual expenses. You may use the information in this section, together with the amount you invested, to estimate the expenses that you paid over the period. Simply divide your account value by $1,000 (for example, an $8,600 account value divided by $1,000 = 8.6), then multiply the result by the number in the first section under the heading entitled “Expenses Paid During Period” to estimate the expenses you paid on your account during this period.
Hypothetical Example for Comparison Purposes: The second section of each table below provides information about hypothetical account values and hypothetical expenses based on the actual Fund expense ratio and an assumed rate of return of 5% per year (before expenses), which is not the actual Fund return. The hypothetical account values and expenses may not be used to estimate the actual ending account balance or expenses you paid for the period. You may use this information to compare the ongoing costs of investing in your Fund and other funds. To do so, compare this 5% hypothetical example with the 5% hypothetical examples that appear in the shareholder reports of the other funds.
Please note that the expenses shown in each table are meant to highlight your ongoing costs only and do not reflect any transactional costs, such as sales charges (loads) or redemption fees (if applicable). Therefore, the second section of each table is useful in comparing ongoing costs only, and will not help you determine the relative total costs of owning different funds. In addition, if these transactional costs were included, your costs would be higher.
Eaton Vance Arizona Municipal Income Fund
| | | | | | | | | | | | | | | | |
| | | Beginning
Account Value
(8/1/12) | | | Ending
Account Value
(1/31/13) | | | Expenses Paid
During Period*
(8/1/12 – 1/31/13) | | | Annualized
Expense
Ratio | |
| | | | |
| | | | | | | | | | | | | | | | |
Actual | | | | | | | | | | | | | |
Class A | | $ | 1,000.00 | | | $ | 1,018.30 | | | $ | 3.82 | | | | 0.75 | % |
Class B | | $ | 1,000.00 | | | $ | 1,015.40 | | | $ | 7.67 | | | | 1.51 | % |
Class C | | $ | 1,000.00 | | | $ | 1,014.50 | | | $ | 7.62 | | | | 1.50 | % |
Class I | | $ | 1,000.00 | | | $ | 1,020.40 | | | $ | 2.80 | | | | 0.55 | % |
| | | | | | | | | | | | | | | | | |
| | | | |
| | | | | | | | | | | | | | | | |
Hypothetical | | | | | | | | | | | | | |
(5% return per year before expenses) | | | | | | | | | | | | | |
Class A | | $ | 1,000.00 | | | $ | 1,021.40 | | | $ | 3.82 | | | | 0.75 | % |
Class B | | $ | 1,000.00 | | | $ | 1,017.60 | | | $ | 7.68 | | | | 1.51 | % |
Class C | | $ | 1,000.00 | | | $ | 1,017.60 | | | $ | 7.63 | | | | 1.50 | % |
Class I | | $ | 1,000.00 | | | $ | 1,022.40 | | | $ | 2.80 | | | | 0.55 | % |
| * | Expenses are equal to the Fund’s annualized expense ratio for the indicated Class, multiplied by the average account value over the period, multiplied by 184/365 (to reflect the one-half year period). The Example assumes that the $1,000 was invested at the net asset value per share determined at the close of business on July 31, 2012. |
Eaton Vance
Municipal Income Funds
January 31, 2013
Fund Expenses — continued
Eaton Vance Connecticut Municipal Income Fund
| | | | | | | | | | | | | | | | |
| | | Beginning
Account Value
(8/1/12) | | | Ending
Account Value
(1/31/13) | | | Expenses Paid
During Period*
(8/1/12 – 1/31/13) | | | Annualized
Expense
Ratio | |
| | | | |
| | | | | | | | | | | | | | | | |
Actual | | | | | | | | | | | | | |
Class A | | $ | 1,000.00 | | | $ | 1,011.50 | | | $ | 4.01 | | | | 0.79 | % |
Class B | | $ | 1,000.00 | | | $ | 1,007.60 | | | $ | 7.79 | | | | 1.54 | % |
Class C | | $ | 1,000.00 | | | $ | 1,007.60 | | | $ | 7.74 | | | | 1.53 | % |
Class I | | $ | 1,000.00 | | | $ | 1,011.50 | | | $ | 2.99 | | | | 0.59 | % |
| | | | | | | | | | | | | | | | | |
| | | | |
| | | | | | | | | | | | | | | | |
Hypothetical | | | | | | | | | | | | | |
(5% return per year before expenses) | | | | | | | | | | | | | |
Class A | | $ | 1,000.00 | | | $ | 1,021.20 | | | $ | 4.02 | | | | 0.79 | % |
Class B | | $ | 1,000.00 | | | $ | 1,017.40 | | | $ | 7.83 | | | | 1.54 | % |
Class C | | $ | 1,000.00 | | | $ | 1,017.50 | | | $ | 7.78 | | | | 1.53 | % |
Class I | | $ | 1,000.00 | | | $ | 1,022.20 | | | $ | 3.01 | | | | 0.59 | % |
| * | Expenses are equal to the Fund’s annualized expense ratio for the indicated Class, multiplied by the average account value over the period, multiplied by 184/365 (to reflect the one-half year period). The Example assumes that the $1,000 was invested at the net asset value per share determined at the close of business on July 31, 2012. |
Eaton Vance Minnesota Municipal Income Fund
| | | | | | | | | | | | | | | | |
| | | Beginning
Account Value
(8/1/12) | | | Ending
Account Value
(1/31/13) | | | Expenses Paid
During Period*
(8/1/12 – 1/31/13) | | | Annualized
Expense
Ratio | |
| | | | |
| | | | | | | | | | | | | | | | |
Actual | | | | | | | | | | | | | |
Class A | | $ | 1,000.00 | | | $ | 1,020.90 | | | $ | 3.67 | | | | 0.72 | % |
Class B | | $ | 1,000.00 | | | $ | 1,017.70 | | | $ | 7.48 | | | | 1.47 | % |
Class C | | $ | 1,000.00 | | | $ | 1,017.70 | | | $ | 7.48 | | | | 1.47 | % |
Class I | | $ | 1,000.00 | | | $ | 1,023.00 | | | $ | 2.65 | | | | 0.52 | % |
| | | | | | | | | | | | | | | | | |
| | | | |
| | | | | | | | | | | | | | | | |
Hypothetical | | | | | | | | | | | | | |
(5% return per year before expenses) | | | | | | | | | | | | | |
Class A | | $ | 1,000.00 | | | $ | 1,021.60 | | | $ | 3.67 | | | | 0.72 | % |
Class B | | $ | 1,000.00 | | | $ | 1,017.80 | | | $ | 7.48 | | | | 1.47 | % |
Class C | | $ | 1,000.00 | | | $ | 1,017.80 | | | $ | 7.48 | | | | 1.47 | % |
Class I | | $ | 1,000.00 | | | $ | 1,022.60 | | | $ | 2.65 | | | | 0.52 | % |
| * | Expenses are equal to the Fund’s annualized expense ratio for the indicated Class, multiplied by the average account value over the period, multiplied by 184/365 (to reflect the one-half year period). The Example assumes that the $1,000 was invested at the net asset value per share determined at the close of business on July 31, 2012. |
Eaton Vance
Municipal Income Funds
January 31, 2013
Fund Expenses — continued
Eaton Vance New Jersey Municipal Income Fund
| | | | | | | | | | | | | | | | |
| | | Beginning
Account Value
(8/1/12) | | | Ending
Account Value
(1/31/13) | | | Expenses Paid
During Period*
(8/1/12 – 1/31/13) | | | Annualized
Expense
Ratio | |
| | | | |
| | | | | | | | | | | | | | | | |
Actual | | | | | | | | | | | | | |
Class A | | $ | 1,000.00 | | | $ | 1,036.90 | | | $ | 4.21 | | | | 0.82 | % |
Class C | | $ | 1,000.00 | | | $ | 1,034.30 | | | $ | 8.00 | | | | 1.56 | % |
Class I | | $ | 1,000.00 | | | $ | 1,039.00 | | | $ | 3.14 | | | | 0.61 | % |
| | | | | | | | | | | | | | | | | |
| | | | |
| | | | | | | | | | | | | | | | |
Hypothetical | | | | | | | | | | | | | |
(5% return per year before expenses) | | | | | | | | | | | | | |
Class A | | $ | 1,000.00 | | | $ | 1,021.10 | | | $ | 4.18 | | | | 0.82 | % |
Class C | | $ | 1,000.00 | | | $ | 1,017.30 | | | $ | 7.93 | | | | 1.56 | % |
Class I | | $ | 1,000.00 | | | $ | 1,022.10 | | | $ | 3.11 | | | | 0.61 | % |
| * | Expenses are equal to the Fund’s annualized expense ratio for the indicated Class, multiplied by the average account value over the period, multiplied by 184/365 (to reflect the one-half year period). The Example assumes that the $1,000 was invested at the net asset value per share determined at the close of business on July 31, 2012. |
Eaton Vance Pennsylvania Municipal Income Fund
| | | | | | | | | | | | | | | | |
| | | Beginning
Account Value
(8/1/12) | | | Ending
Account Value
(1/31/13) | | | Expenses Paid
During Period*
(8/1/12 – 1/31/13) | | | Annualized
Expense
Ratio | |
| | | | |
| | | | | | | | | | | | | | | | |
Actual | | | | | | | | | | | | | |
Class A | | $ | 1,000.00 | | | $ | 1,038.00 | | | $ | 4.16 | | | | 0.81 | % |
Class B | | $ | 1,000.00 | | | $ | 1,034.50 | | | $ | 8.05 | | | | 1.57 | % |
Class C | | $ | 1,000.00 | | | $ | 1,034.50 | | | $ | 8.00 | | | | 1.56 | % |
Class I | | $ | 1,000.00 | | | $ | 1,040.10 | | | $ | 3.14 | | | | 0.61 | % |
| | | | | | | | | | | | | | | | | |
| | | | |
| | | | | | | | | | | | | | | | |
Hypothetical | | | | | | | | | | | | | |
(5% return per year before expenses) | | | | | | | | | | | | | |
Class A | | $ | 1,000.00 | | | $ | 1,021.10 | | | $ | 4.13 | | | | 0.81 | % |
Class B | | $ | 1,000.00 | | | $ | 1,017.30 | | | $ | 7.98 | | | | 1.57 | % |
Class C | | $ | 1,000.00 | | | $ | 1,017.30 | | | $ | 7.93 | | | | 1.56 | % |
Class I | | $ | 1,000.00 | | | $ | 1,022.10 | | | $ | 3.11 | | | | 0.61 | % |
| * | Expenses are equal to the Fund’s annualized expense ratio for the indicated Class, multiplied by the average account value over the period, multiplied by 184/365 (to reflect the one-half year period). The Example assumes that the $1,000 was invested at the net asset value per share determined at the close of business on July 31, 2012. |
Eaton Vance
Arizona Municipal Income Fund
January 31, 2013
Portfolio of Investments (Unaudited)
| | | | | | | | |
| Tax-Exempt Investments — 98.1% | |
| | |
| | | | | | | | |
| Security | | Principal
Amount
(000’s omitted) | | | Value | |
| | | | | | | | |
|
Bond Bank — 1.5% | |
Arizona Water Infrastructure Finance Authority, 5.00%, 10/1/30 | | $ | 1,000 | | | $ | 1,216,110 | |
| | | | | | | | | |
| | | | | | $ | 1,216,110 | |
| | | | | | | | | |
|
Education — 5.5% | |
Arizona Board of Regents, (Arizona State University), 5.00%, 7/1/37 | | $ | 1,000 | | | $ | 1,158,100 | |
Arizona Board of Regents, (University of Arizona), 5.00%, 6/1/33 | | | 1,500 | | | | 1,709,580 | |
Glendale Industrial Development Authority, (Midwestern University), 5.00%, 5/15/25 | | | 1,500 | | | | 1,703,145 | |
| | | | | | | | | |
| | | | | | $ | 4,570,825 | |
| | | | | | | | | |
| | |
Electric Utilities — 7.4% | | | | | | | | |
Maricopa County Pollution Control Corp., (Arizona Public Service Co.), 6.00% to 5/1/14 (Put Date), 5/1/29 | | $ | 500 | | | $ | 528,190 | |
Pima County Industrial Development Authority, (Tucson Electric Power Co.), 5.25%, 10/1/40 | | | 1,000 | | | | 1,094,910 | |
Pinal County Electrical District No. 3, 5.25%, 7/1/36 | | | 1,000 | | | | 1,132,440 | |
Salt River Agricultural Improvements and Power District, 5.00%, 1/1/33 | | | 1,000 | | | | 1,157,230 | |
Salt River Agricultural Improvements and Power District, 5.00%, 1/1/39 | | | 2,000 | | | | 2,308,440 | |
| | | | | | | | | |
| | | | | | $ | 6,221,210 | |
| | | | | | | | | |
| | |
Escrowed / Prerefunded — 8.9% | | | | | | | | |
Glendale, (Western Loop 101 Public Facilities Corp.), Series A, Prerefunded to 1/1/14, 6.25%, 7/1/38 | | $ | 1,000 | | | $ | 1,054,180 | |
Maricopa County, SFMR, Escrowed to Maturity, 0.00%, 2/1/16 | | | 3,000 | | | | 2,935,920 | |
Phoenix Industrial Development Authority, SFMR, Escrowed to Maturity, 0.00%, 12/1/14 | | | 3,500 | | | | 3,468,605 | |
| | | | | | | | | |
| | | | | | $ | 7,458,705 | |
| | | | | | | | | |
| | |
General Obligations — 6.0% | | | | | | | | |
Maricopa County Community College District, 3.00%, 7/1/23 | | $ | 785 | | | $ | 831,315 | |
Paradise Valley Unified School District No. 69, 4.00%, 7/1/28 | | | 1,000 | | | | 1,100,010 | |
Tempe, 3.75%, 7/1/24 | | | 1,000 | | | | 1,019,100 | |
Tempe, 5.375%, 7/1/21 | | | 1,600 | | | | 2,044,864 | |
| | | | | | | | | |
| | | | | | $ | 4,995,289 | |
| | | | | | | | | |
| | | | | | | | |
| Security | | Principal
Amount
(000’s omitted) | | | Value | |
| | | | | | | | |
| | |
Health Care – Miscellaneous — 3.2% | | | | | | | | |
Arizona Health Facilities Authority, (Blood Systems, Inc.), 4.75%, 4/1/25 | | $ | 1,750 | | | $ | 1,791,282 | |
Yavapai County Industrial Development Authority, (West Yavapai Guidance Clinic), 6.25%, 12/1/36 | | | 450 | | | | 461,758 | |
Yavapai County Industrial Development Authority, (West Yavapai Guidance Clinic), 6.625%, 8/15/24 | | | 410 | | | | 410,431 | |
| | | | | | | | | |
| | | | | | $ | 2,663,471 | |
| | | | | | | | | |
| | |
Hospital — 11.8% | | | | | | | | |
Arizona Health Facilities Authority, (Banner Health System), 5.00%, 1/1/35 | | $ | 2,000 | | | $ | 2,160,160 | |
Glendale Industrial Development Authority, (John C. Lincoln Health Network), 5.00%, 12/1/28 | | | 1,275 | | | | 1,321,397 | |
Glendale Industrial Development Authority, (John C. Lincoln Health Network), 5.00%, 12/1/32 | | | 750 | | | | 780,788 | |
Maricopa County Industrial Development Authority, (Catholic Healthcare West), 5.25%, 7/1/32 | | | 1,000 | | | | 1,081,000 | |
Maricopa County Industrial Development Authority, (Catholic Healthcare West), 5.50%, 7/1/26 | | | 1,350 | | | | 1,419,147 | |
Maricopa County Industrial Development Authority, (Mayo Clinic), 5.00%, 11/15/36 | | | 1,450 | | | | 1,594,710 | |
Scottsdale Industrial Development Authority, (Scottsdale Healthcare), 5.25%, 9/1/30 | | | 1,500 | | | | 1,513,290 | |
| | | | | | | | | |
| | | | | | $ | 9,870,492 | |
| | | | | | | | | |
| | |
Industrial Development Revenue — 1.3% | | | | | | | | |
Maricopa County Pollution Control Corp., (El Paso Electric Co.), 4.50%, 8/1/42 | | $ | 450 | | | $ | 465,660 | |
Phoenix Industrial Development Authority, (America West Airlines, Inc.), (AMT), 6.25%, 6/1/19 | | | 650 | | | | 607,061 | |
| | | | | | | | | |
| | | | | | $ | 1,072,721 | |
| | | | | | | | | |
| | |
Insured – Electric Utilities — 2.4% | | | | | | | | |
Mesa Utility Systems, (FGIC), (NPFG), 5.00%, 7/1/23 | | $ | 1,000 | | | $ | 1,227,490 | |
Puerto Rico Electric Power Authority, (NPFG), 5.25%, 7/1/29 | | | 750 | | | | 778,050 | |
| | | | | | | | | |
| | | | | | $ | 2,005,540 | |
| | | | | | | | | |
| | |
Insured – Escrowed / Prerefunded — 2.0% | | | | | | | | |
Arizona Sports and Tourism Authority, (Multipurpose Stadium Facility), (NPFG), Prerefunded to 7/1/13, 5.00%, 7/1/25 | | $ | 500 | | | $ | 509,935 | |
Maricopa County Industrial Development Authority, (Samaritan Health Services), (NPFG), Escrowed to Maturity, 7.00%, 12/1/16 | | | 1,000 | | | | 1,146,580 | |
| | | | | | | | | |
| | | | | | $ | 1,656,515 | |
| | | | | | | | | |
| | | | |
| | 11 | | See Notes to Financial Statements. |
Eaton Vance
Arizona Municipal Income Fund
January 31, 2013
Portfolio of Investments (Unaudited) — continued
| | | | | | | | |
| Security | | Principal
Amount
(000’s omitted) | | | Value | |
| | | | | | | | |
| | |
Insured – General Obligations — 7.0% | | | | | | | | |
Apache Junction Unified School District No. 43, (AGM), 5.00%, 7/1/24 | | $ | 1,200 | | | $ | 1,521,600 | |
Goodyear, (NPFG), 3.00%, 7/1/26 | | | 630 | | | | 636,760 | |
Maricopa County Elementary School District No. 3, (AGM), 5.00%, 7/1/25 | | | 2,920 | | | | 3,691,464 | |
| | | | | | | | | |
| | | | | | $ | 5,849,824 | |
| | | | | | | | | |
| | |
Insured – Hospital — 1.5% | | | | | | | | |
Arizona Health Facilities Authority, (Arizona Healthcare Systems), (FGIC), (NPFG), 5.50%, 6/1/15 | | $ | 1,195 | | | $ | 1,292,667 | |
| | | | | | | | | |
| | | | | | $ | 1,292,667 | |
| | | | | | | | | |
| |
Insured – Lease Revenue / Certificates of Participation — 2.4% | | | | | |
Phoenix Civic Improvement Corp., (Civic Plaza), (FGIC), (NPFG), 5.50%, (0.00% until 7/1/13), 7/1/41 | | $ | 1,635 | | | $ | 1,988,258 | |
| | | | | | | | | |
| | | | | | $ | 1,988,258 | |
| | | | | | | | | |
| | |
Insured – Special Tax Revenue — 2.0% | | | | | | | | |
Arizona Sports and Tourism Authority, (Multipurpose Stadium Facility), (NPFG), 4.50%, 7/1/24 | | $ | 915 | | | $ | 977,806 | |
Glendale Transportation, Excise Tax Revenue, (NPFG), 4.50%, 7/1/32 | | | 580 | | | | 619,562 | |
Puerto Rico Sales Tax Financing Corp., (NPFG), 0.00%, 8/1/45 | | | 495 | | | | 82,521 | |
| | | | | | | | | |
| | | | | | $ | 1,679,889 | |
| | | | | | | | | |
| | |
Insured – Transportation — 6.9% | | | | | | | | |
Phoenix Civic Improvement Corp., Airport Revenue, (FGIC), (NPFG), (AMT), 5.25%, 7/1/27 | | $ | 2,750 | | | $ | 2,754,537 | |
Pima County, Street and Highway Revenue, (AMBAC), 3.25%, 7/1/22 | | | 1,000 | | | | 1,057,790 | |
Puerto Rico Highway and Transportation Authority, (AGC), (CIFG),
5.25%, 7/1/41(1)(2) | | | 1,900 | | | | 1,970,091 | |
| | | | | | | | | |
| | | | | | $ | 5,782,418 | |
| | | | | | | | | |
|
Insured – Water and Sewer — 1.5% | |
Phoenix Civic Improvement Corp., Wastewater System Revenue, (AGM), (NPFG), 5.00%, 7/1/37 | | $ | 1,135 | | | $ | 1,266,626 | |
| | | | | | | | | |
| | | | | | $ | 1,266,626 | |
| | | | | | | | | |
| | |
Lease Revenue / Certificates of Participation — 1.1% | | | | | | | | |
Mohave County Industrial Development Authority, (Mohave Prison LLC), 8.00%, 5/1/25 | | $ | 750 | | | $ | 924,420 | |
| | | | | | | | | |
| | | | | | $ | 924,420 | |
| | | | | | | | | |
| | | | | | | | |
| Security | | Principal
Amount
(000’s omitted) | | | Value | |
| | | | | | | | |
| | |
Other Revenue — 1.8% | | | | | | | | |
Children’s Trust Fund, PR, Tobacco Settlement, 0.00%, 5/15/55 | | $ | 10,765 | | | $ | 365,687 | |
Salt Verde Financial Corp., Senior Gas Revenue, 5.00%, 12/1/37 | | | 1,000 | | | | 1,149,360 | |
| | | | | | | | | |
| | | | | | $ | 1,515,047 | |
| | | | | | | | | |
| | |
Senior Living / Life Care — 0.3% | | | | | | | | |
Tempe Industrial Development Authority, (Friendship Village of Tempe), 6.00%, 12/1/32 | | $ | 230 | | | $ | 249,148 | |
| | | | | | | | | |
| | | | | | $ | 249,148 | |
| | | | | | | | | |
| | |
Special Tax Revenue — 17.6% | | | | | | | | |
Arizona Sports and Tourism Authority, (Multipurpose Stadium Facility), 5.00%, 7/1/30 | | $ | 1,000 | | | $ | 1,135,310 | |
Gilbert Public Facilities Municipal Property Corp., 5.50%, 7/1/27 | | | 1,000 | | | | 1,159,140 | |
Glendale, (Western Loop 101 Public Facilities Corp.), Series B, 6.25%, 7/1/38 | | | 250 | | | | 263,545 | |
Guam, Limited Obligation Bonds, 5.625%, 12/1/29 | | | 270 | | | | 302,586 | |
Guam, Limited Obligation Bonds, 5.75%, 12/1/34 | | | 295 | | | | 331,866 | |
Pima County Regional Transportation Authority, Excise Tax Revenue, 5.00%, 6/1/24 | | | 2,000 | | | | 2,410,340 | |
Puerto Rico Sales Tax Financing Corp., 5.25%, 8/1/40 | | | 1,200 | | | | 1,307,640 | |
Puerto Rico Sales Tax Financing Corp., 5.25%, 8/1/57(1)(2) | | | 1,000 | | | | 1,046,490 | |
Scottsdale Municipal Property Corp., 5.00%, 7/1/30 | | | 2,500 | | | | 3,188,500 | |
Scottsdale Municipal Property Corp., 5.00%, 7/1/34 | | | 1,000 | | | | 1,294,620 | |
Tempe, Transit Excise Tax Revenue, 5.00%, 7/1/33 | | | 1,000 | | | | 1,141,400 | |
Tempe, Transit Excise Tax Revenue, 5.00%, 7/1/37 | | | 1,000 | | | | 1,152,790 | |
| | | | | | | | | |
| | | | | | $ | 14,734,227 | |
| | | | | | | | | |
| | |
Transportation — 4.1% | | | | | | | | |
Arizona Transportation Board, Highway Revenue, 5.00%, 7/1/32 | | $ | 3,000 | | | $ | 3,458,970 | |
| | | | | | | | | |
| | | | | | $ | 3,458,970 | |
| | | | | | | | | |
| | |
Water and Sewer — 1.9% | | | | | | | | |
Pima County, Sewer System Revenue, 5.00%, 7/1/27 | | $ | 1,350 | | | $ | 1,609,727 | |
| | | | | | | | | |
| | | | | | $ | 1,609,727 | |
| | | | | | | | | |
| | |
Total Tax-Exempt Investments — 98.1%
(identified cost $74,296,050) | | | | | | $ | 82,082,099 | |
| | | | | | | | | |
| |
Other Assets, Less Liabilities — 1.9% | | | $ | 1,586,130 | |
| | | | | | | | | |
| |
Net Assets — 100.0% | | | $ | 83,668,229 | |
| | | | | | | | | |
| | | | |
| | 12 | | See Notes to Financial Statements. |
Eaton Vance
Arizona Municipal Income Fund
January 31, 2013
Portfolio of Investments (Unaudited) — continued
The percentage shown for each investment category in the Portfolio of Investments is based on net assets.
| | | | |
| AGC | | – | | Assured Guaranty Corp. |
| AGM | | – | | Assured Guaranty Municipal Corp. |
| AMBAC | | – | | AMBAC Financial Group, Inc. |
| AMT | | – | | Interest earned from these securities may be considered a tax preference item for purposes of the Federal Alternative Minimum Tax. |
| CIFG | | – | | CIFG Assurance North America, Inc. |
| FGIC | | – | | Financial Guaranty Insurance Company |
| NPFG | | – | | National Public Finance Guaranty Corp. |
| SFMR | | – | | Single Family Mortgage Revenue |
The Fund invests primarily in debt securities issued by Arizona municipalities. The ability of the issuers of the debt securities to meet their obligations may be affected by economic developments in a specific industry or municipality. In order to reduce the risk associated with such economic developments, at January 31, 2013, 26.2% of total investments are backed by bond insurance of various financial institutions and financial guaranty assurance agencies. The aggregate percentage insured by an individual financial institution ranged from 1.3% to 16.2% of total investments.
| (1) | Security represents the municipal bond held by a trust that issues residual interest bonds (see Note 1I). |
| (2) | Security (or a portion thereof) has been pledged as collateral for residual interest bond transactions. The aggregate value of such collateral is $1,316,581. |
| | | | |
| | 13 | | See Notes to Financial Statements. |
Eaton Vance
Connecticut Municipal Income Fund
January 31, 2013
Portfolio of Investments (Unaudited)
| | | | | | | | |
| Tax-Exempt Investments — 103.6% | |
| | |
| | | | | | | | |
| Security | | Principal
Amount
(000’s omitted) | | | Value | |
| | | | | | | | |
| | |
Bond Bank — 2.4% | | | | | | | | |
Connecticut, (Revolving Fund), 5.00%, 6/1/24 | | $ | 1,000 | | | $ | 1,190,310 | |
Connecticut, (Revolving Fund), 5.00%, 6/1/25 | | | 1,500 | | | | 1,777,965 | |
| | | | | | | | | |
| | | | | | $ | 2,968,275 | |
| | | | | | | | | |
| | |
Education — 16.6% | | | | | | | | |
Connecticut Health and Educational Facilities Authority, (Brunswick School), 5.00%, 7/1/31 | | $ | 500 | | | $ | 586,195 | |
Connecticut Health and Educational Facilities Authority, (Brunswick School), 5.00%, 7/1/32 | | | 1,125 | | | | 1,311,874 | |
Connecticut Health and Educational Facilities Authority, (Connecticut College), 5.00%, 7/1/30 | | | 1,255 | | | | 1,472,479 | |
Connecticut Health and Educational Facilities Authority, (Connecticut State University System), 5.00%, 11/1/32 | | | 1,950 | | | | 2,283,781 | |
Connecticut Health and Educational Facilities Authority, (Fairfield University), 5.00%, 7/1/34 | | | 1,000 | | | | 1,097,130 | |
Connecticut Health and Educational Facilities Authority, (Fairfield University), 5.00%, 7/1/40 | | | 1,500 | | | | 1,656,645 | |
Connecticut Health and Educational Facilities Authority, (Sacred Heart University), 5.00%, 7/1/21 | | | 1,005 | | | | 1,149,087 | |
Connecticut Health and Educational Facilities Authority, (Wesleyan University), 5.00%, 7/1/39 | | | 2,000 | | | | 2,252,120 | |
Connecticut Health and Educational Facilities Authority, (Yale University), 4.85%, 7/1/37(1) | | | 5,000 | | | | 5,655,050 | |
University of Connecticut, 5.00%, 2/15/21 | | | 1,315 | | | | 1,577,921 | |
University of Connecticut, 5.00%, 2/15/28 | | | 875 | | | | 1,037,015 | |
| | | | | | | | | |
| | | | | | $ | 20,079,297 | |
| | | | | | | | | |
| | |
Electric Utilities — 5.4% | | | | | | | | |
Connecticut Development Authority, (Connecticut Light and Power Co.), 4.375%, 9/1/28 | | $ | 3,015 | | | $ | 3,297,928 | |
Connecticut Municipal Electric Energy Cooperative, 5.00%, 1/1/30 | | | 805 | | | | 945,609 | |
Connecticut Transmission Municipal Electric Energy Cooperative, 5.00%, 1/1/42 | | | 2,000 | | | | 2,271,480 | |
| | | | | | | | | |
| | | | | | $ | 6,515,017 | |
| | | | | | | | | |
| | |
General Obligations — 17.4% | | | | | | | | |
Bridgeport, 5.00%, 2/15/32 | | $ | 660 | | | $ | 739,121 | |
Connecticut, 4.875%, 11/1/20 | | | 1,475 | | | | 1,744,040 | |
Connecticut, 5.00%, 2/15/29 | | | 1,000 | | | | 1,162,120 | |
Danbury, 4.00%, 8/1/26 | | | 380 | | | | 425,847 | |
Danbury, 4.00%, 8/1/27 | | | 1,000 | | | | 1,115,770 | |
East Lyme, 4.00%, 7/15/22 | | | 350 | | | | 411,124 | |
East Lyme, 4.00%, 7/15/23 | | | 525 | | | | 609,693 | |
| | | | | | | | |
| Security | | Principal
Amount
(000’s omitted) | | | Value | |
| | | | | | | | |
| | |
General Obligations (continued) | | | | | | | | |
East Lyme, 4.25%, 7/15/24 | | $ | 250 | | | $ | 293,965 | |
East Lyme, 4.25%, 7/15/25 | | | 250 | | | | 290,735 | |
Fairfield, 4.25%, 7/15/26 | | | 250 | | | | 271,967 | |
Fairfield, 5.00%, 1/1/23 | | | 1,000 | | | | 1,281,580 | |
Hartford County Metropolitan District, 5.00%, 7/15/34 | | | 2,020 | | | | 2,338,210 | |
North Haven, 5.00%, 7/15/23 | | | 1,475 | | | | 1,900,582 | |
North Haven, 5.00%, 7/15/25 | | | 1,490 | | | | 1,955,461 | |
Norwalk, 4.00%, 7/1/26 | | | 1,975 | | | | 2,250,019 | |
Norwalk, 4.00%, 7/15/27 | | | 1,000 | | | | 1,127,410 | |
Redding, 5.50%, 10/15/18 | | | 400 | | | | 502,052 | |
Redding, 5.625%, 10/15/19 | | | 650 | | | | 837,817 | |
Stamford, 4.00%, 7/1/25 | | | 370 | | | | 425,974 | |
Wilton, 5.25%, 7/15/18 | | | 535 | | | | 660,099 | |
Wilton, 5.25%, 7/15/19 | | | 535 | | | | 673,560 | |
| | | | | | | | | |
| | | | | | $ | 21,017,146 | |
| | | | | | | | | |
| | |
Hospital — 6.1% | | | | | | | | |
Connecticut Health and Educational Facilities Authority, (Ascension Health), 5.00%, 11/15/40 | | $ | 2,500 | | | $ | 2,808,050 | |
Connecticut Health and Educational Facilities Authority, (Lawrence & Memorial Hospital), 5.00%, 7/1/31 | | | 1,000 | | | | 1,110,430 | |
Connecticut Health and Educational Facilities Authority, (Middlesex Hospital), 5.00%, 7/1/24 | | | 1,000 | | | | 1,133,450 | |
Connecticut Health and Educational Facilities Authority, (Western Connecticut Health Network), 5.00%, 7/1/29 | | | 1,000 | | | | 1,108,890 | |
Connecticut Health and Educational Facilities Authority, (Yale-New Haven Hospital), 5.75%, 7/1/34 | | | 1,000 | | | | 1,195,940 | |
| | | | | | | | | |
| | | | | | $ | 7,356,760 | |
| | | | | | | | | |
| | |
Industrial Development Revenue — 3.7% | | | | | | | | |
Eastern Connecticut Resource Recovery Authority, (Wheelabrator Lisbon), (AMT), 5.50%, 1/1/20 | | $ | 4,500 | | | $ | 4,517,640 | |
| | | | | | | | | |
| | | | | | $ | 4,517,640 | |
| | | | | | | | | |
| | |
Insured – Education — 15.3% | | | | | | | | |
Connecticut Health and Educational Facilities Authority, (Loomis Chaffee School), (AMBAC), 5.25%, 7/1/30 | | $ | 1,950 | | | $ | 2,645,389 | |
Connecticut Health and Educational Facilities Authority, (Loomis Chaffee School), (AMBAC), 5.25%, 7/1/31 | | | 2,050 | | | | 2,788,410 | |
Connecticut Health and Educational Facilities Authority, (Quinnipiac University), (BHAC), (NPFG), 5.00%, 7/1/37 | | | 1,920 | | | | 2,127,533 | |
Connecticut Health and Educational Facilities Authority, (Quinnipiac University), (NPFG), 5.75%, 7/1/33 | | | 2,500 | | | | 2,908,475 | |
Connecticut Health and Educational Facilities Authority, (Sacred Heart University), (AGM), 5.00%, 7/1/28 | | | 500 | | | | 568,090 | |
| | | | |
| | 14 | | See Notes to Financial Statements. |
Eaton Vance
Connecticut Municipal Income Fund
January 31, 2013
Portfolio of Investments (Unaudited) — continued
| | | | | | | | |
| Security | | Principal
Amount
(000’s omitted) | | | Value | |
| | | | | | | | |
| | |
Insured – Education (continued) | | | | | | | | |
Connecticut Health and Educational Facilities Authority, (Trinity College), (NPFG), 5.50%, 7/1/21 | | $ | 5,305 | | | $ | 6,418,732 | |
University of Connecticut, (FGIC), (NPFG), 5.00%, 2/15/24 | | | 1,000 | | | | 1,124,940 | |
| | | | | | | | | |
| | | | | | $ | 18,581,569 | |
| | | | | | | | | |
| | |
Insured – Electric Utilities — 4.0% | | | | | | | | |
Puerto Rico Electric Power Authority, (FGIC), (NPFG), 5.25%, 7/1/35 | | $ | 1,755 | | | $ | 1,798,138 | |
Puerto Rico Electric Power Authority, (NPFG), 5.50%, 7/1/16 | | | 2,840 | | | | 3,067,427 | |
| | | | | | | | | |
| | | | | | $ | 4,865,565 | |
| | | | | | | | | |
| | |
Insured – Escrowed / Prerefunded — 1.8% | | | | | | | | |
Connecticut Health and Educational Facilities Authority, (Connecticut Children’s Medical Center), (NPFG), Prerefunded to 7/1/14, 5.00%, 7/1/21 | | $ | 2,000 | | | $ | 2,122,320 | |
| | | | | | | | | |
| | | | | | $ | 2,122,320 | |
| | | | | | | | | |
| | |
Insured – General Obligations — 4.0% | | | | | | | | |
Bridgeport, (AGM), 4.00%, 8/15/21 | | $ | 1,500 | | | $ | 1,673,250 | |
Connecticut, (AMBAC), 5.25%, 6/1/20 | | | 1,000 | | | | 1,259,390 | |
Hartford, (AGC), 5.00%, 8/15/28 | | | 1,000 | | | | 1,145,720 | |
Hartford, (AGM), 5.00%, 4/1/31 | | | 625 | | | | 719,369 | |
| | | | | | | | | |
| | | | | | $ | 4,797,729 | |
| | | | | | | | | |
|
Insured – Hospital — 0.9% | |
Connecticut Health and Educational Facilities Authority, (William W. Backus Hospital), (AGM), 5.125%, 7/1/35 | | $ | 1,000 | | | $ | 1,092,670 | |
| | | | | | | | | |
| | | $ | 1,092,670 | |
| | | | | | | | | |
| | |
Insured – Housing — 0.4% | | | | | | | | |
Connecticut Housing Finance Authority, (AMBAC), (AMT), 5.10%, 11/15/38 | | $ | 490 | | | $ | 513,598 | |
| | | | | | | | | |
| | | $ | 513,598 | |
| | | | | | | | | |
| |
Insured – Industrial Development Revenue — 0.8% | | | | | |
Connecticut Development Authority, (Signature Flight Support Corp.), (AGM), (AMT), 6.625%, 12/1/14 | | $ | 1,020 | | | $ | 1,015,634 | |
| | | | | | | | | |
| | | $ | 1,015,634 | |
| | | | | | | | | |
|
Insured – Lease Revenue / Certificates of Participation — 2.4% | |
Puerto Rico Public Buildings Authority, (AMBAC), 5.50%, 7/1/21 | | $ | 2,740 | | | $ | 2,958,186 | |
| | | | | | | | | |
| | | $ | 2,958,186 | |
| | | | | | | | | |
| | | | | | | | |
| Security | | Principal
Amount
(000’s omitted) | | | Value | |
| | | | | | | | |
| | |
Insured – Transportation — 5.0% | | | | | | | | |
Guam International Airport Authority, (NPFG), 5.25%, 10/1/23 | | $ | 500 | | | $ | 511,990 | |
Puerto Rico Highway and Transportation Authority, (AGC), (CIFG),
5.25%, 7/1/41(1)(2) | | | 3,900 | | | | 4,043,871 | |
Puerto Rico Highway and Transportation Authority, (AMBAC), 0.00%, 7/1/16 | | | 1,750 | | | | 1,533,648 | |
| | | | | | | | | |
| | | $ | 6,089,509 | |
| | | | | | | | | |
| | |
Insured – Water and Sewer — 6.8% | | | | | | | | |
Connecticut Development Authority, (Aquarion Water Co. of Connecticut), (XLCA), (AMT), 5.00%, 7/1/38 | | $ | 1,300 | | | $ | 1,301,352 | |
Connecticut Development Authority, (Aquarion Water Co. of Connecticut), (XLCA), (AMT), 5.10%, 9/1/37 | | | 1,000 | | | | 1,060,870 | |
South Central Connecticut Regional Water Authority, (NPFG), 5.25%, 8/1/24 | | | 3,420 | | | | 4,467,444 | |
South Central Connecticut Regional Water Authority, (NPFG), 5.25%, 8/1/32 | | | 1,200 | | | | 1,366,152 | |
| | | | | | | | | |
| | | $ | 8,195,818 | |
| | | | | | | | | |
| |
Lease Revenue / Certificates of Participation — 2.4% | | | | | |
Puerto Rico Public Finance Corp., Escrowed to Maturity, 6.00%, 8/1/26 | | $ | 170 | | | $ | 244,358 | |
Puerto Rico Public Finance Corp., Escrowed to Maturity, 6.00%, 8/1/26 | | | 1,830 | | | | 2,630,442 | |
| | | | | | | | | |
| | | $ | 2,874,800 | |
| | | | | | | | | |
| | |
Senior Living / Life Care — 0.9% | | | | | | | | |
Connecticut Development Authority, (Alzheimers Resource Center), 5.50%, 8/15/27 | | $ | 1,000 | | | $ | 1,052,770 | |
| | | | | | | | | |
| | | $ | 1,052,770 | |
| | | | | | | | | |
| | |
Solid Waste — 2.3% | | | | | | | | |
Connecticut Resources Recovery Authority, (American REF-FUEL Co.), (AMT), 6.45%, 11/15/22 | | $ | 2,750 | | | $ | 2,754,923 | |
| | | | | | | | | |
| | | $ | 2,754,923 | |
| | | | | | | | | |
| | |
Special Tax Revenue — 5.0% | | | | | | | | |
Connecticut, Special Tax Obligation, (Transportation Infrastructure), 4.00%, 12/1/31 | | $ | 1,000 | | | $ | 1,090,440 | |
Connecticut, Special Tax Obligation, (Transportation Infrastructure), 4.00%, 1/1/32 | | | 1,155 | | | | 1,256,005 | |
Connecticut, Special Tax Obligation, (Transportation Infrastructure), 5.00%, 1/1/28 | | | 1,000 | | | | 1,223,770 | |
Guam, Limited Obligation Bonds, 5.625%, 12/1/29 | | | 135 | | | | 151,293 | |
Guam, Limited Obligation Bonds, 5.75%, 12/1/34 | | | 150 | | | | 168,745 | |
| | | | |
| | 15 | | See Notes to Financial Statements. |
Eaton Vance
Connecticut Municipal Income Fund
January 31, 2013
Portfolio of Investments (Unaudited) — continued
| | | | | | | | |
| Security | | Principal
Amount
(000’s omitted) | | | Value | |
| | | | | | | | |
| | |
Special Tax Revenue (continued) | | | | | | | | |
Puerto Rico Sales Tax Financing Corp., 5.25%, 8/1/57(1)(2) | | $ | 1,700 | | | $ | 1,779,033 | |
Virgin Islands Public Finance Authority, 6.75%, 10/1/37 | | | 365 | | | | 430,452 | |
| | | | | | | | | |
| | | $ | 6,099,738 | |
| | | | | | | | | |
| |
Total Tax-Exempt Investments — 103.6%
(identified cost $114,148,011) | | | $ | 125,468,964 | |
| | | | | | | | | |
| |
Other Assets, Less Liabilities — (3.6)% | | | $ | (4,356,406 | ) |
| | | | | | | | | |
| |
Net Assets — 100.0% | | | $ | 121,112,558 | |
| | | | | | | | | |
The percentage shown for each investment category in the Portfolio of Investments is based on net assets.
| | | | |
| AGC | | – | | Assured Guaranty Corp. |
| AGM | | – | | Assured Guaranty Municipal Corp. |
| AMBAC | | – | | AMBAC Financial Group, Inc. |
| AMT | | – | | Interest earned from these securities may be considered a tax preference item for purposes of the Federal Alternative Minimum Tax. |
| BHAC | | – | | Berkshire Hathaway Assurance Corp. |
| CIFG | | – | | CIFG Assurance North America, Inc. |
| FGIC | | – | | Financial Guaranty Insurance Company |
| NPFG | | – | | National Public Finance Guaranty Corp. |
| XLCA | | – | | XL Capital Assurance, Inc. |
The Fund invests primarily in debt securities issued by Connecticut municipalities. In addition, 14.9% of the Fund’s net assets at January 31, 2013 were invested in municipal obligations issued by Puerto Rico. The ability of the issuers of the debt securities to meet their obligations may be affected by economic developments in a specific industry or municipality. In order to reduce the risk associated with such economic developments, at January 31, 2013, 40.0% of total investments are backed by bond insurance of various financial institutions and financial guaranty assurance agencies. The aggregate percentage insured by an individual financial institution ranged from 1.7% to 20.7% of total investments.
| (1) | Security represents the municipal bond held by a trust that issues residual interest bonds (see Note 1I). |
| (2) | Security (or a portion thereof) has been pledged as collateral for residual interest bond transactions. The aggregate value of such collateral is $2,597,904. |
| | | | |
| | 16 | | See Notes to Financial Statements. |
Eaton Vance
Minnesota Municipal Income Fund
January 31, 2013
Portfolio of Investments (Unaudited)
| | | | | | | | |
| Tax-Exempt Investments — 94.8% | |
| | |
| | | | | | | | |
| Security | | Principal
Amount
(000’s omitted) | | | Value | |
| | | | | | | | |
| | |
Bond Bank — 2.0% | | | | | | | | |
Minnesota Public Facilities Authority, (Revolving Fund), 5.00%, 3/1/22 | | $ | 2,000 | | | $ | 2,445,540 | |
| | | | | | | | | |
| | | | | | $ | 2,445,540 | |
| | | | | | | | | |
| | |
Education — 11.8% | | | | | | | | |
Minnesota Higher Education Facilities Authority, (Carleton College), 5.00%, 1/1/28 | | $ | 1,000 | | | $ | 1,148,130 | |
Minnesota Higher Education Facilities Authority, (Carleton College), 5.00%, 3/1/40 | | | 1,500 | | | | 1,699,965 | |
Minnesota Higher Education Facilities Authority, (Gustavus Adolphus College), 5.00%, 10/1/31 | | | 1,000 | | | | 1,141,720 | |
Minnesota Higher Education Facilities Authority, (St. Catherine University), 5.00%, 10/1/26 | | | 280 | | | | 321,810 | |
Minnesota Higher Education Facilities Authority, (St. Catherine University), 5.00%, 10/1/27 | | | 210 | | | | 239,894 | |
Minnesota Higher Education Facilities Authority, (St. Catherine University), 5.00%, 10/1/32 | | | 700 | | | | 793,128 | |
Minnesota Higher Education Facilities Authority, (University of St. Thomas), 5.00%, 10/1/39 | | | 1,000 | | | | 1,119,030 | |
Minnesota Higher Education Facilities Authority, (University of St. Thomas), 5.25%, 4/1/39 | | | 1,475 | | | | 1,647,398 | |
Minnesota State Colleges and Universities, 5.00%, 10/1/28 | | | 1,375 | | | | 1,647,827 | |
Minnesota State Colleges and Universities, 5.00%, 10/1/30 | | | 1,455 | | | | 1,734,942 | |
University of Minnesota, 5.00%, 12/1/36 | | | 500 | | | | 580,880 | |
University of Minnesota, 5.125%, 4/1/34 | | | 1,000 | | | | 1,182,520 | |
University of Minnesota, (State Supported Stadium Debt), 5.00%, 8/1/29 | | | 1,000 | | | | 1,133,140 | |
| | | | | | | | | |
| | | | | | $ | 14,390,384 | |
| | | | | | | | | |
| | |
Electric Utilities — 7.5% | | | | | | | | |
Central Minnesota Municipal Power Agency, 5.00%, 1/1/32 | | $ | 2,100 | | | $ | 2,423,736 | |
Hutchinson, Public Utility Revenue, 5.00%, 12/1/26 | | | 350 | | | | 420,308 | |
Minnesota Municipal Power Agency, 4.75%, 10/1/32 | | | 500 | | | | 538,500 | |
Minnesota Municipal Power Agency, 5.00%, 10/1/34 | | | 750 | | | | 797,235 | |
Minnesota Municipal Power Agency, 5.00%, 10/1/35 | | | 2,000 | | | | 2,163,580 | |
Northern Municipal Power Agency, 5.00%, 1/1/19 | | | 750 | | | | 895,035 | |
Rochester, Electric Utility Revenue, 5.00%, 12/1/30 | | | 1,000 | | | | 1,116,300 | |
Western Minnesota Municipal Power Agency, 5.00%, 1/1/26 | | | 665 | | | | 821,727 | |
| | | | | | | | | |
| | | | | | $ | 9,176,421 | |
| | | | | | | | | |
| | |
Escrowed / Prerefunded — 2.8% | | | | | | | | |
Minnesota Public Facilities Authority, Clean Water Revenue, Prerefunded to 3/1/17, 5.00%, 3/1/26 | | $ | 2,000 | | | $ | 2,348,860 | |
St. Louis Park, (Park Nicollet Health Services), Prerefunded to 7/1/14, 5.25%, 7/1/30 | | | 1,000 | | | | 1,069,260 | |
| | | | | | | | | |
| | | | | | $ | 3,418,120 | |
| | | | | | | | | |
| | | | | | | | |
| Security | | Principal
Amount
(000’s omitted) | | | Value | |
| | | | | | | | |
| | |
General Obligations — 23.3% | | | | | | | | |
Buffalo-Hanover-Montrose Independent School District No. 877, 4.00%, 2/1/24 | | $ | 2,000 | | | $ | 2,292,660 | |
Burnsville-Eagan-Savage Independent School District No. 191, 4.75%, 2/1/29 | | | 1,000 | | | | 1,136,200 | |
Chaska Independent School District No. 112, 4.00%, 2/1/23 | | | 2,000 | | | | 2,316,900 | |
Dakota County Community Development Agency, (Senior Housing Facilities), 5.125%, 1/1/35 | | | 500 | | | | 561,000 | |
Duluth, 5.00%, 2/1/34 | | | 2,000 | | | | 2,255,500 | |
Fairmont Independent School District No. 2752, 5.00%, 2/1/34 | | | 2,000 | | | | 2,291,980 | |
Hennepin County, 4.00%, 12/1/20 | | | 1,885 | | | | 2,253,254 | |
Hennepin County Regional Railroad Authority, 4.00%, 12/1/29 | | | 1,500 | | | | 1,646,910 | |
Minnesota, 5.00%, 6/1/21 | | | 1,155 | | | | 1,392,480 | |
Minnesota, 5.00%, 8/1/22 | | | 1,000 | | | | 1,212,130 | |
Minnesota, 5.00%, 11/1/26 | | | 1,000 | | | | 1,143,430 | |
Minnesota, 5.00%, 10/1/27 | | | 2,000 | | | | 2,458,580 | |
Minnesota, (Public Safety Radio Communications System), 5.00%, 6/1/22 | | | 485 | | | | 578,615 | |
Ramsey County, Series 2011A, 4.00%, 2/1/24 | | | 500 | | | | 573,630 | |
Ramsey County, Series 2012A, 4.00%, 2/1/24 | | | 500 | | | | 575,370 | |
Shakopee Independent School District No. 720, 5.00%, 2/1/21 | | | 1,740 | | | | 2,168,231 | |
St. Paul Independent School District No. 625, 4.00%, 2/1/25 | | | 1,000 | | | | 1,126,850 | |
Washington County, 3.50%, 2/1/28 | | | 1,500 | | | | 1,557,300 | |
Zumbrota-Mazeppa Independent School District No. 2805, 4.50%, 2/1/28 | | | 750 | | | | 822,127 | |
| | | | | | | | | |
| | | | | | $ | 28,363,147 | |
| | | | | | | | | |
| | |
Hospital — 12.5% | | | | | | | | |
Douglas County, (Douglas County Hospital), 6.25%, 7/1/38 | | $ | 1,000 | | | $ | 1,106,260 | |
Minneapolis and St. Paul Housing and Redevelopment Authority, (Children’s Health Care), 5.25%, 8/15/35 | | | 1,000 | | | | 1,146,800 | |
Minneapolis, (National Marrow Donor Program), 4.875%, 8/1/25 | | | 1,000 | | | | 1,041,460 | |
Rochester, (Mayo Clinic), 5.00%, 11/15/36 | | | 2,000 | | | | 2,213,100 | |
Rochester, (Mayo Clinic), 5.00%, 11/15/38 | | | 1,000 | | | | 1,145,880 | |
Rochester, (Olmsted Medical Center), 5.875%, 7/1/30 | | | 1,500 | | | | 1,661,145 | |
St. Cloud, (CentraCare Health System), 5.125%, 5/1/30 | | | 1,000 | | | | 1,115,070 | |
St. Louis Park, (Park Nicollet Health Services), 5.75%, 7/1/30 | | | 1,000 | | | | 1,129,840 | |
St. Louis Park, (Park Nicollet Health Services), 5.75%, 7/1/39 | | | 1,000 | | | | 1,132,880 | |
St. Paul Housing and Redevelopment Authority, (Allina Health System), 5.25%, 11/15/29 | | | 1,000 | | | | 1,125,580 | |
St. Paul Housing and Redevelopment Authority, (HealthEast), 6.00%, 11/15/35 | | | 750 | | | | 809,835 | |
St. Paul Housing and Redevelopment Authority, (HealthPartners Obligated Group), 5.25%, 5/15/36 | | | 1,500 | | | | 1,574,100 | |
| | | | | | | | | |
| | | | | | $ | 15,201,950 | |
| | | | | | | | | |
| | | | |
| | 17 | | See Notes to Financial Statements. |
Eaton Vance
Minnesota Municipal Income Fund
January 31, 2013
Portfolio of Investments (Unaudited) — continued
| | | | | | | | |
| Security | | Principal
Amount
(000’s omitted) | | | Value | |
| | | | | | | | |
| | |
Housing — 4.4% | | | | | | | | |
Minnesota Housing Finance Agency, (AMT), 4.80%, 7/1/38 | | $ | 880 | | | $ | 902,950 | |
Minnesota Housing Finance Agency, (AMT), 4.85%, 7/1/38 | | | 855 | | | | 878,658 | |
Minnesota Housing Finance Agency, (AMT), 4.90%, 7/1/37 | | | 595 | | | | 608,441 | |
Minnesota Housing Finance Agency, (AMT), 5.00%, 8/1/40 | | | 500 | | | | 511,725 | |
Minnesota Housing Finance Agency, (AMT), 5.15%, 7/1/38 | | | 85 | | | | 87,675 | |
Minnesota Housing Finance Agency, (AMT), 5.25%, 7/1/33 | | | 685 | | | | 724,018 | |
Minnetonka, MFMR, (Archer Heights Apartments), (AMT), 6.00%, 1/20/27 | | | 1,650 | | | | 1,654,306 | |
| | | | | | | | | |
| | | | | | $ | 5,367,773 | |
| | | | | | | | | |
| | |
Industrial Development Revenue — 0.8% | | | | | | | | |
Cloquet, (Potlach Corp.), 5.90%, 10/1/26 | | $ | 1,000 | | | $ | 1,003,800 | |
| | | | | | | | | |
| | | | | | $ | 1,003,800 | |
| | | | | | | | | |
| | |
Insured – Electric Utilities — 10.0% | | | | | | | | |
Northern Municipal Power Agency, (AGC), 5.00%, 1/1/21 | | $ | 1,000 | | | $ | 1,158,850 | |
Puerto Rico Electric Power Authority, (FGIC), (NPFG), 5.25%, 7/1/32 | | | 1,150 | | | | 1,180,360 | |
Puerto Rico Electric Power Authority, (FGIC), (NPFG), 5.25%, 7/1/35 | | | 315 | | | | 322,743 | |
Rochester, Electric Utility Revenue, (NPFG), 4.50%, 12/1/26 | | | 2,000 | | | | 2,219,120 | |
Southern Minnesota Municipal Power Agency, (NPFG), 0.00%, 1/1/25 | | | 9,000 | | | | 6,226,920 | |
Western Minnesota Municipal Power Agency, (AGM), 5.00%, 1/1/36 | | | 1,000 | | | | 1,099,260 | |
| | | | | | | | | |
| | | | | | $ | 12,207,253 | |
| | | | | | | | | |
|
Insured – General Obligations — 3.6% | |
Alexandria Independent School District No. 206, (AGM), 5.00%, 2/1/27 | | $ | 1,200 | | | $ | 1,386,996 | |
Cambridge Independent School District No. 911, (NPFG), 0.00%, 2/1/29 | | | 2,245 | | | | 1,091,519 | |
Fergus Falls Independent School District No. 544, (AGM), 4.625%, 1/1/28 | | | 705 | | | | 775,782 | |
St. Francis Independent School District No. 15, (NPFG), 5.00%, 2/1/27 | | | 1,000 | | | | 1,135,600 | |
| | | | | | | | | |
| | | $ | 4,389,897 | |
| | | | | | | | | |
| | |
Insured – Hospital — 4.6% | | | | | | | | |
Minneapolis and St. Paul Housing and Redevelopment Authority, (Children’s Hospitals and Clinics), (AGM), 5.00%, 8/15/34 | | $ | 750 | | | $ | 829,988 | |
Minneapolis, (Fairview Health Services), (AMBAC), 5.00%, 11/15/34 | | | 1,950 | | | | 2,015,695 | |
Minnesota Agricultural and Economic Development Board, (Essentia Health Obligated Group), (AGC), 5.00%, 2/15/37 | | | 2,000 | | | | 2,161,920 | |
St. Cloud, (CentraCare Health System), (AGC), 5.50%, 5/1/39 | | | 500 | | | | 557,215 | |
| | | | | | | | | |
| | | $ | 5,564,818 | |
| | | | | | | | | |
| | | | | | | | |
| Security | | Principal
Amount
(000’s omitted) | | | Value | |
| | | | | | | | |
| | |
Insured – Special Tax Revenue — 2.0% | | | | | | | | |
St. Paul, Sales Tax Revenue, (XLCA), 5.00%, 11/1/30 | | $ | 2,000 | | | $ | 2,165,160 | |
Washington County Housing and Redevelopment Authority, (NPFG), 5.50%, 2/1/32 | | | 305 | | | | 306,043 | |
| | | | | | | | | |
| | | $ | 2,471,203 | |
| | | | | | | | | |
| | |
Insured – Transportation — 2.0% | | | | | | | | |
Minneapolis - St. Paul Metropolitan Airports Commission, (AMBAC), (AMT), 5.00%, 1/1/22 | | $ | 1,000 | | | $ | 1,067,740 | |
Minneapolis - St. Paul Metropolitan Airports Commission, (AMBAC), (BHAC), 4.50%, 1/1/32 | | | 1,275 | | | | 1,361,930 | |
| | | | | | | | | |
| | | $ | 2,429,670 | |
| | | | | | | | | |
| | |
Lease Revenue / Certificates of Participation — 1.0% | | | | | | | | |
Minneapolis Special School District No. 1, 5.00%, 2/1/20 | | $ | 505 | | | $ | 617,226 | |
Minnetonka Independent School District No. 276, 5.00%, 3/1/29 | | | 560 | | | | 637,353 | |
| | | | | | | | | |
| | | $ | 1,254,579 | |
| | | | | | | | | |
| | |
Special Tax Revenue — 4.7% | | | | | | | | |
Guam, Limited Obligation Bonds, 5.625%, 12/1/29 | | $ | 270 | | | $ | 302,586 | |
Guam, Limited Obligation Bonds, 5.75%, 12/1/34 | | | 295 | | | | 331,866 | |
Hennepin County, Sales Tax Revenue, 4.75%, 12/15/33 | | | 2,000 | | | | 2,268,000 | |
Hennepin County, Sales Tax Revenue, 4.75%, 12/15/37 | | | 2,000 | | | | 2,254,380 | |
Virgin Islands Public Finance Authority, 6.75%, 10/1/37 | | | 500 | | | | 589,660 | |
| | | | | | | | | |
| | | $ | 5,746,492 | |
| | | | | | | | | |
| | |
Student Loan — 0.9% | | | | | | | | |
Minnesota Office of Higher Education, (Supplemental Student Loan Program), 5.00%, 11/1/29 | | $ | 1,000 | | | $ | 1,128,860 | |
| | | | | | | | | |
| | | $ | 1,128,860 | |
| | | | | | | | | |
| | |
Transportation — 0.9% | | | | | | | | |
Minneapolis - St. Paul Metropolitan Airports Commission, 5.00%, 1/1/35 | | $ | 1,000 | | | $ | 1,131,730 | |
| | | | | | | | | |
| | | $ | 1,131,730 | |
| | | | | | | | | |
| | |
Total Tax-Exempt Investments — 94.8%
(identified cost $104,416,735) | | | | | | $ | 115,691,637 | |
| | | | | | | | | |
| |
Other Assets, Less Liabilities — 5.2% | | | $ | 6,377,141 | |
| | | | | | | | | |
| |
Net Assets — 100.0% | | | $ | 122,068,778 | |
| | | | | | | | | |
| | | | |
| | 18 | | See Notes to Financial Statements. |
Eaton Vance
Minnesota Municipal Income Fund
January 31, 2013
Portfolio of Investments (Unaudited) — continued
The percentage shown for each investment category in the Portfolio of Investments is based on net assets.
| | | | |
| AGC | | – | | Assured Guaranty Corp. |
| AGM | | – | | Assured Guaranty Municipal Corp. |
| AMBAC | | – | | AMBAC Financial Group, Inc. |
| AMT | | – | | Interest earned from these securities may be considered a tax preference item for purposes of the Federal Alternative Minimum Tax. |
| BHAC | | – | | Berkshire Hathaway Assurance Corp. |
| FGIC | | – | | Financial Guaranty Insurance Company |
| MFMR | | – | | Multi-Family Mortgage Revenue |
| NPFG | | – | | National Public Finance Guaranty Corp. |
| XLCA | | – | | XL Capital Assurance, Inc. |
The Fund invests primarily in debt securities issued by Minnesota municipalities. The ability of the issuers of the debt securities to meet their obligations may be affected by economic developments in a specific industry or municipality. In order to reduce the risk associated with such economic developments, at January 31, 2013, 23.4% of total investments are backed by bond insurance of various financial institutions and financial guaranty assurance agencies. The aggregate percentage insured by an individual financial institution ranged from 1.2% to 10.8% of total investments.
| | | | |
| | 19 | | See Notes to Financial Statements. |
Eaton Vance
New Jersey Municipal Income Fund
January 31, 2013
Portfolio of Investments (Unaudited)
| | | | | | | | |
| Tax-Exempt Investments — 105.3% | |
| | |
| | | | | | | | |
| Security | | Principal
Amount
(000’s omitted) | | | Value | |
| | | | | | | | |
| | |
Education — 15.2% | | | | | | | | |
New Jersey Educational Facilities Authority, (Georgian Court University), 5.00%, 7/1/27 | | $ | 750 | | | $ | 799,282 | |
New Jersey Educational Facilities Authority, (Georgian Court University), 5.00%, 7/1/33 | | | 750 | | | | 795,173 | |
New Jersey Educational Facilities Authority, (Georgian Court University), 5.25%, 7/1/37 | | | 660 | | | | 702,834 | |
New Jersey Educational Facilities Authority, (Princeton University), 4.50%, 7/1/38(1) | | | 10,125 | | | | 11,393,764 | |
New Jersey Educational Facilities Authority, (Stevens Institute of Technology), 5.00%, 7/1/27 | | | 3,575 | | | | 3,831,149 | |
New Jersey Educational Facilities Authority, (Stevens Institute of Technology), 5.00%, 7/1/34 | | | 880 | | | | 933,002 | |
New Jersey Educational Facilities Authority, (University of Medicine and Dentistry), 7.50%, 12/1/32 | | | 2,565 | | | | 3,218,536 | |
New Jersey Institute of Technology, 5.00%, 7/1/32 | | | 1,410 | | | | 1,660,698 | |
Rutgers State University, 5.00%, 5/1/39(1) | | | 8,580 | | | | 9,538,043 | |
| | | | | | | | | |
| | | | | | $ | 32,872,481 | |
| | | | | | | | | |
| | |
Electric Utilities — 1.9% | | | | | | | | |
Puerto Rico Electric Power Authority, 5.00%, 7/1/29 | | $ | 4,000 | | | $ | 4,064,440 | |
| | | | | | | | | |
| | | | | | $ | 4,064,440 | |
| | | | | | | | | |
| | |
General Obligations — 4.1% | | | | | | | | |
Monroe Township Board of Education, Middlesex County, 4.00%, 8/1/22 | | $ | 2,000 | | | $ | 2,315,460 | |
Monroe Township Board of Education, Middlesex County, 4.00%, 8/1/23 | | | 4,960 | | | | 5,668,139 | |
Pascack Valley Regional High School District, 3.00%, 8/15/17 | | | 90 | | | | 98,031 | |
Pascack Valley Regional High School District, 3.00%, 8/15/18 | | | 90 | | | | 98,808 | |
Pascack Valley Regional High School District, 3.00%, 8/15/19 | | | 135 | | | | 148,096 | |
Pascack Valley Regional High School District, 3.00%, 8/15/20 | | | 150 | | | | 164,222 | |
Pascack Valley Regional High School District, 3.00%, 8/15/21 | | | 115 | | | | 125,620 | |
Pascack Valley Regional High School District, 3.00%, 8/15/22 | | | 135 | | | | 147,616 | |
| | | | | | | | | |
| | | | | | $ | 8,765,992 | |
| | | | | | | | | |
| | |
Hospital — 11.3% | | | | | | | | |
Camden County Improvement Authority, (Cooper Health System), 5.00%, 2/15/35 | | $ | 1,640 | | | $ | 1,692,382 | |
Camden County Improvement Authority, (Cooper Health System), 5.75%, 2/15/34 | | | 830 | | | | 865,532 | |
New Jersey Health Care Facilities Financing Authority, (AHS Hospital Corp.), 5.00%, 7/1/27 | | | 6,195 | | | | 6,753,417 | |
New Jersey Health Care Facilities Financing Authority, (Atlanticare Regional Medical Center), 5.00%, 7/1/37 | | | 5,120 | | | | 5,411,225 | |
| | | | | | | | |
| Security | | Principal
Amount
(000’s omitted) | | | Value | |
| | | | | | | | |
| | |
Hospital (continued) | | | | | | | | |
New Jersey Health Care Facilities Financing Authority, (Chilton Memorial Hospital), 5.50%, 7/1/29 | | $ | 1,135 | | | $ | 1,264,072 | |
New Jersey Health Care Facilities Financing Authority, (Chilton Memorial Hospital), 5.75%, 7/1/39 | | | 1,135 | | | | 1,279,554 | |
New Jersey Health Care Facilities Financing Authority, (South Jersey Hospital), 5.00%, 7/1/46 | | | 3,730 | | | | 3,865,362 | |
New Jersey Health Care Facilities Financing Authority, (Virtua Health), 5.75%, 7/1/33 | | | 3,000 | | | | 3,432,090 | |
| | | | | | | | | |
| | | | | | $ | 24,563,634 | |
| | | | | | | | | |
| | |
Housing — 2.7% | | | | | | | | |
New Jersey Housing and Mortgage Finance Agency, (Single Family Housing), (AMT), 4.70%, 10/1/37 | | $ | 2,790 | | | $ | 2,874,620 | |
New Jersey Housing and Mortgage Finance Agency, (Single Family Housing), (AMT), 4.95%, 10/1/32 | | | 2,840 | | | | 2,963,739 | |
| | | | | | | | | |
| | | | | | $ | 5,838,359 | |
| | | | | | | | | |
| | |
Industrial Development Revenue — 4.3% | | | | | | | | |
Middlesex County Pollution Control Authority, (Amerada Hess), 6.05%, 9/15/34 | | $ | 2,460 | | | $ | 2,542,238 | |
New Jersey Economic Development Authority, (Continental Airlines), (AMT), 9.00% to 6/1/13 (Put Date), 6/1/33 | | | 1,875 | | | | 1,924,687 | |
New Jersey Economic Development Authority, (New Jersey-American Water Co., Inc.), (AMT), 5.70%, 10/1/39 | | | 4,370 | | | | 4,903,053 | |
| | | | | | | | | |
| | | | | | $ | 9,369,978 | |
| | | | | | | | | |
| | |
Insured – Education — 1.0% | | | | | | | | |
New Jersey Educational Facilities Authority, (Rowan University), (AGM), (FGIC), 3.00%, 7/1/28 | | $ | 2,210 | | | $ | 2,216,785 | |
| | | | | | | | | |
| | | | | | $ | 2,216,785 | |
| | | | | | | | | |
| | |
Insured – Escrowed / Prerefunded — 4.7% | | | | | | | | |
North Hudson Sewerage Authority, (NPFG), Escrowed to Maturity, 0.00%, 8/1/25 | | $ | 13,840 | | | $ | 10,192,883 | |
| | | | | | | | | |
| | | | | | $ | 10,192,883 | |
| | | | | | | | | |
| | |
Insured – Gas Utilities — 2.9% | | | | | | | | |
New Jersey Economic Development Authority, (New Jersey Natural Gas Co.), (FGIC), (NPFG), (AMT), 4.90% to 10/1/25 (Put Date), 10/1/40 | | $ | 5,985 | | | $ | 6,326,624 | |
| | | | | | | | | |
| | | | | | $ | 6,326,624 | |
| | | | | | | | | |
| | |
Insured – General Obligations — 9.8% | | | | | | | | |
Hudson County Improvement Authority, (Harrison Parking), (AGC), 5.25%, 1/1/39 | | $ | 2,785 | | | $ | 3,113,519 | |
| | | | |
| | 20 | | See Notes to Financial Statements. |
Eaton Vance
New Jersey Municipal Income Fund
January 31, 2013
Portfolio of Investments (Unaudited) — continued
| | | | | | | | |
| Security | | Principal
Amount
(000’s omitted) | | | Value | |
| | | | | | | | |
| | |
Insured – General Obligations (continued) | | | | | | | | |
Hudson County Improvement Authority, (Harrison Redevelopment), (NPFG), 0.00%, 12/15/35 | | $ | 2,200 | | | $ | 837,958 | |
Irvington Township, (AGM), 0.00%, 7/15/22 | | | 4,805 | | | | 3,677,266 | |
Irvington Township, (AGM), 0.00%, 7/15/23 | | | 5,075 | | | | 3,697,036 | |
Jackson Township School District, (NPFG), 2.50%, 6/15/27 | | | 10,205 | | | | 9,969,060 | |
| | | | | | | | | |
| | | | | | $ | 21,294,839 | |
| | | | | | | | | |
| | |
Insured – Hospital — 1.5% | | | | | | | | |
New Jersey Economic Development Authority, (Hillcrest Health Services), (AMBAC), 0.00%, 1/1/19 | | $ | 4,100 | | | $ | 3,211,694 | |
| | | | | | | | | |
| | | | | | $ | 3,211,694 | |
| | | | | | | | | |
| | |
Insured – Industrial Development Revenue — 2.8% | | | | | | | | |
New Jersey Economic Development Authority, (United Water New Jersey, Inc.), (AMBAC), (AMT), 4.875%, 11/1/25 | | $ | 5,685 | | | $ | 6,132,353 | |
| | | | | | | | | |
| | | | | | $ | 6,132,353 | |
| | | | | | | | | |
| |
Insured – Lease Revenue / Certificates of Participation — 1.6% | | | | | |
New Jersey Economic Development Authority, (School Facilities Construction), (AGC), 5.50%, 12/15/34 | | $ | 2,000 | | | $ | 2,333,940 | |
South Jersey Port Corp., (Marine Terminal), (AGC), 5.75%, 1/1/34 | | | 1,000 | | | | 1,154,200 | |
| | | | | | | | | |
| | | | | | $ | 3,488,140 | |
| | | | | | | | | |
| | |
Insured – Special Tax Revenue — 8.9% | | | | | | | | |
Garden State Preservation Trust, (AGM), 0.00%, 11/1/24 | | $ | 7,870 | | | $ | 5,756,039 | |
New Jersey Economic Development Authority, (Motor Vehicle Surcharges), (NPFG), 5.25%, 7/1/26 | | | 2,000 | | | | 2,496,480 | |
New Jersey Economic Development Authority, (Motor Vehicle Surcharges), (XLCA), 0.00%, 7/1/26 | | | 12,130 | | | | 7,392,871 | |
New Jersey Economic Development Authority, (Motor Vehicle Surcharges), (XLCA), 0.00%, 7/1/27 | | | 5,890 | | | | 3,430,454 | |
Puerto Rico Sales Tax Financing Corp., (NPFG), 0.00%, 8/1/45 | | | 1,650 | | | | 275,072 | |
| | | | | | | | | |
| | | | | | $ | 19,350,916 | |
| | | | | | | | | |
| | |
Insured – Student Loan — 2.4% | | | | | | | | |
New Jersey Higher Education Student Assistance Authority, (AGC), (AMT), 6.125%, 6/1/30 | | $ | 4,690 | | | $ | 5,227,240 | |
| | | | | | | | | |
| | | | | | $ | 5,227,240 | |
| | | | | | | | | |
| | |
Insured – Transportation — 0.5% | | | | | | | | |
South Jersey Transportation Authority, (AGC), 5.50%, 11/1/33 | | $ | 850 | | | $ | 991,075 | |
| | | | | | | | | |
| | | | | | $ | 991,075 | |
| | | | | | | | | |
| | | | | | | | |
| Security | | Principal
Amount
(000’s omitted) | | | Value | |
| | | | | | | | |
| |
Lease Revenue / Certificates of Participation — 5.2% | | | | | |
Atlantic City, Public Facilities Lease Agreement, 8.875%, 1/15/14 | | $ | 720 | | | $ | 772,193 | |
Atlantic City, Public Facilities Lease Agreement, 8.875%, 1/15/15 | | | 785 | | | | 895,983 | |
New Jersey Economic Development Authority, (School Facilities Construction), 5.00%, 9/1/34 | | | 1,000 | | | | 1,122,140 | |
New Jersey Economic Development Authority, (School Facilities Construction), 5.25%, 12/15/33 | | | 3,000 | | | | 3,421,440 | |
New Jersey Health Care Facilities Financing Authority, (Hospital Asset Transformation Program), 5.25%, 10/1/38 | | | 4,605 | | | | 5,049,244 | |
| | | | | | | | | |
| | | | | | $ | 11,261,000 | |
| | | | | | | | | |
| | |
Other Revenue — 2.3% | | | | | | | | |
Children’s Trust Fund, PR, Tobacco Settlement, 0.00%, 5/15/55 | | $ | 34,960 | | | $ | 1,187,591 | |
New Jersey Economic Development Authority, (The Seeing Eye, Inc.), 5.00%, 6/1/32 | | | 3,250 | | | | 3,785,665 | |
| | | | | | | | | |
| | | | | | $ | 4,973,256 | |
| | | | | | | | | |
| | |
Senior Living / Life Care — 3.5% | | | | | | | | |
New Jersey Economic Development Authority, (Cranes Mill, Inc.), 5.875%, 7/1/28 | | $ | 1,345 | | | $ | 1,444,665 | |
New Jersey Economic Development Authority, (Cranes Mill, Inc.), 6.00%, 7/1/38 | | | 2,230 | | | | 2,385,253 | |
New Jersey Economic Development Authority, (Forsgate), (AMT), 8.625%, 6/1/25(2) | | | 3,390 | | | | 1,695,542 | |
New Jersey Economic Development Authority, (Seabrook Village), 5.25%, 11/15/36 | | | 1,935 | | | | 1,993,398 | |
| | | | | | | | | |
| | | | | | $ | 7,518,858 | |
| | | | | | | | | |
| | |
Special Tax Revenue — 1.1% | | | | | | | | |
New Jersey Economic Development Authority, (Newark Downtown District Management Corp.), 5.125%, 6/15/27 | | $ | 300 | | | $ | 318,843 | |
New Jersey Economic Development Authority, (Newark Downtown District Management Corp.), 5.125%, 6/15/37 | | | 525 | | | | 548,452 | |
Virgin Islands Public Finance Authority, 6.75%, 10/1/37 | | | 1,295 | | | | 1,527,219 | |
| | | | | | | | | |
| | | | | | $ | 2,394,514 | |
| | | | | | | | | |
| | |
Student Loan — 4.2% | | | | | | | | |
New Jersey Higher Education Student Assistance Authority, (AMT), 1.261%, 6/1/36(1)(3)(4) | | $ | 9,000 | | | $ | 9,037,080 | |
| | | | | | | | | |
| | | | | | $ | 9,037,080 | |
| | | | | | | | | |
| | | | |
| | 21 | | See Notes to Financial Statements. |
Eaton Vance
New Jersey Municipal Income Fund
January 31, 2013
Portfolio of Investments (Unaudited) — continued
| | | | | | | | |
| Security | | Principal
Amount
(000’s omitted) | | | Value | |
| | | | | | | | |
| | |
Transportation — 11.3% | | | | | | | | |
Delaware River Joint Toll Bridge Commission,
(Pennsylvania - New Jersey), 3.00%, 7/1/27 | | $ | 230 | | | $ | 230,278 | |
Delaware River Joint Toll Bridge Commission,
(Pennsylvania - New Jersey), 4.00%, 7/1/26 | | | 230 | | | | 252,903 | |
Delaware River Joint Toll Bridge Commission,
(Pennsylvania - New Jersey), 4.00%, 7/1/27 | | | 460 | | | | 499,648 | |
Delaware River Port Authority of Pennsylvania and New Jersey, 5.00%, 1/1/35 | | | 1,550 | | | | 1,756,274 | |
New Jersey Transportation Trust Fund Authority, (Transportation Program), 4.00%, 6/15/31 | | | 2,000 | | | | 2,132,800 | |
New Jersey Transportation Trust Fund Authority, (Transportation System), 5.00%, 12/15/24 | | | 1,000 | | | | 1,233,060 | |
New Jersey Transportation Trust Fund Authority, (Transportation System), 5.875%, 12/15/38 | | | 2,500 | | | | 2,951,950 | |
New Jersey Turnpike Authority, 5.00%, 1/1/35 | | | 1,465 | | | | 1,683,432 | |
New Jersey Turnpike Authority, 5.25%, 1/1/40 | | | 4,000 | | | | 4,494,880 | |
Port Authority of New York and New Jersey, 6.125%, 6/1/94 | | | 7,400 | | | | 9,239,492 | |
| | | | | | | | | |
| | | | | | $ | 24,474,717 | |
| | | | | | | | | |
| | |
Water and Sewer — 2.1% | | | | | | | | |
New Jersey Economic Development Authority, (Atlantic City Sewerage Co.), (AMT), 5.45%, 4/1/28 | | $ | 4,530 | | | $ | 4,536,342 | |
| | | | | | | | | |
| | | | | | $ | 4,536,342 | |
| | | | | | | | | |
| |
Total Tax-Exempt Investments — 105.3%
(identified cost $203,103,474) | | | $ | 228,103,200 | |
| | | | | | | | | |
| | |
Other Assets, Less Liabilities — (5.3)% | | | | | | $ | (11,582,125 | ) |
| | | | | | | | | |
| | |
Net Assets — 100.0% | | | | | | $ | 216,521,075 | |
| | | | | | | | | |
The percentage shown for each investment category in the Portfolio of Investments is based on net assets.
| | | | |
| AGC | | – | | Assured Guaranty Corp. |
| AGM | | – | | Assured Guaranty Municipal Corp. |
| AMBAC | | – | | AMBAC Financial Group, Inc. |
| AMT | | – | | Interest earned from these securities may be considered a tax preference item for purposes of the Federal Alternative Minimum Tax. |
| FGIC | | – | | Financial Guaranty Insurance Company |
| NPFG | | – | | National Public Finance Guaranty Corp. |
| XLCA | | – | | XL Capital Assurance, Inc. |
The Fund invests primarily in debt securities issued by New Jersey municipalities. The ability of the issuers of the debt securities to meet their obligations may be affected by economic developments in a specific industry or municipality. In order to reduce the risk associated with such economic developments, at January 31, 2013, 34.4% of total investments are backed
by bond insurance of various financial institutions and financial guaranty assurance agencies. The aggregate percentage insured by an individual financial institution ranged from 3.7% to 13.2% of total investments.
| (1) | Security represents the municipal bond held by a trust that issues residual interest bonds (see Note 1I). |
| (3) | Variable rate security. The stated interest rate represents the rate in effect at January 31, 2013. |
| (4) | Security (or a portion thereof) has been pledged as collateral for residual interest bond transactions. The aggregate value of such collateral is $1,837,080. |
| | | | |
| | 22 | | See Notes to Financial Statements. |
Eaton Vance
Pennsylvania Municipal Income Fund
January 31, 2013
Portfolio of Investments (Unaudited)
| | | | | | | | |
| Tax-Exempt Investments — 102.3% | |
| | |
| | | | | | | | |
| Security | | Principal
Amount
(000’s omitted) | | | Value | |
| | | | | | | | |
| | |
Cogeneration — 0.5% | | | | | | | | |
Pennsylvania Economic Development Financing Authority, (Northampton Generating), (AMT), 6.50%, 1/1/13(1) | | $ | 1,100 | | | $ | 697,950 | |
Pennsylvania Economic Development Financing Authority, (Northampton Generating), (AMT), 6.60%, 1/1/19(2) | | | 1,000 | | | | 646,800 | |
| | | | | | | | | |
| | | | | | $ | 1,344,750 | |
| | | | | | | | | |
| | |
Education — 13.5% | | | | | | | | |
Allegheny County Higher Education Building Authority, (Duquesne University), 5.00%, 3/1/33 | | $ | 1,150 | | | $ | 1,227,729 | |
Allegheny County Higher Education Building Authority, (Carnegie Mellon University), 5.00%, 3/1/28(3) | | | 2,500 | | | | 3,062,700 | |
Bucks County Industrial Development Authority, (George School), 5.00%, 9/15/34 | | | 1,000 | | | | 1,138,910 | |
Bucks County Industrial Development Authority, (George School), 5.00%, 9/15/39 | | | 1,500 | | | | 1,696,710 | |
Cumberland County Municipal Authority, (Dickinson College), 5.00%, 11/1/37 | | | 1,000 | | | | 1,130,450 | |
Northampton County General Purpose Authority, (Lafayette College), 5.00%, 11/1/34 | | | 3,000 | | | | 3,339,570 | |
Northampton County General Purpose Authority, (Lehigh University), 5.00%, 11/15/39 | | | 3,000 | | | | 3,324,180 | |
Pennsylvania Higher Educational Facilities Authority, (University of Pennsylvania), 4.75%, 7/15/35 | | | 3,800 | | | | 4,094,424 | |
State Public School Building Authority, (Northampton County Area Community College), 5.50%, 3/1/31 | | | 2,645 | | | | 3,082,377 | |
Union County Higher Educational Facilities Financing Authority, (Bucknell University), 5.00%, 4/1/37 | | | 2,000 | | | | 2,331,500 | |
University of Pittsburgh, 5.25%, 9/15/29 | | | 1,500 | | | | 1,801,440 | |
University of Pittsburgh, 5.25%, 9/15/30 | | | 2,500 | | | | 2,995,550 | |
Washington County Industrial Development Authority, (Washington and Jefferson College), 5.25%, 11/1/30 | | | 2,300 | | | | 2,605,210 | |
Wilkes-Barre Finance Authority, (University of Scranton), 5.00%, 11/1/35 | | | 2,500 | | | | 2,807,500 | |
| | | | | | | | | |
| | | | | | $ | 34,638,250 | |
| | | | | | | | | |
| | |
Escrowed / Prerefunded — 1.9% | | | | | | | | |
Lehigh County General Purpose Authority, (Lehigh Valley Health Network), Prerefunded to 7/1/13, 5.25%, 7/1/32 | | $ | 4,855 | | | $ | 5,004,000 | |
| | | | | | | | | |
| | | | | | $ | 5,004,000 | |
| | | | | | | | | |
| | |
General Obligations — 3.9% | | | | | | | | |
Chester County, 5.00%, 7/15/27 | | $ | 1,000 | | | $ | 1,172,240 | |
Chester County, 5.00%, 7/15/28 | | | 410 | | | | 479,134 | |
Delaware Valley Regional Finance Authority, 5.75%, 7/1/32 | | | 5,000 | | | | 6,108,350 | |
Montgomery County, 4.375%, 12/1/31 | | | 2,000 | | | | 2,217,720 | |
| | | | | | | | | |
| | | | | | $ | 9,977,444 | |
| | | | | | | | | |
| | | | | | | | |
| Security | | Principal
Amount
(000’s omitted) | | | Value | |
| | | | | | | | |
| | |
Hospital — 15.8% | | | | | | | | |
Allegheny County Hospital Development Authority, (University of Pittsburgh Medical Center), 5.50%, 8/15/34 | | $ | 3,000 | | | $ | 3,403,200 | |
Chester County Health and Education Facilities Authority, (Jefferson Health System), 5.00%, 5/15/40 | | | 3,440 | | | | 3,838,386 | |
Dauphin County General Authority, (Pinnacle Health System), 6.00%, 6/1/29 | | | 4,220 | | | | 4,825,486 | |
Franklin County Industrial Development Authority, (The Chambersburg Hospital), 5.375%, 7/1/42 | | | 1,000 | | | | 1,099,910 | |
Lancaster County Hospital Authority, (Lancaster General Hospital), 5.00%, 3/15/22 | | | 1,000 | | | | 1,125,510 | |
Lebanon County Health Facilities Authority, (Good Samaritan Hospital), 6.00%, 11/15/35 | | | 1,050 | | | | 1,059,429 | |
Lehigh County General Purpose Authority, (Lehigh Valley Health Network), 4.00%, 7/1/33 | | | 3,000 | | | | 3,115,710 | |
Lycoming County Authority, (Susquehanna Health System), 5.75%, 7/1/39 | | | 3,250 | | | | 3,600,935 | |
Monroe County Hospital Authority, (Pocono Medical Center), 5.125%, 1/1/37 | | | 2,000 | | | | 2,078,920 | |
Monroe County Hospital Authority, (Pocono Medical Center), 5.25%, 1/1/43 | | | 1,000 | | | | 1,042,470 | |
Pennsylvania Higher Educational Facilities Authority, (University of Pennsylvania Health System), 6.00%, 8/15/26(4) | | | 9,000 | | | | 10,851,840 | |
Pennsylvania Higher Educational Facilities Authority, (UPMC Health System), 5.00%, 5/15/31 | | | 2,550 | | | | 2,833,050 | |
South Fork Municipal Authority, (Conemaugh Health System), 5.50%, 7/1/29 | | | 1,500 | | | | 1,666,995 | |
| | | | | | | | | |
| | | | | | $ | 40,541,841 | |
| | | | | | | | | |
| | |
Housing — 2.1% | | | | | | | | |
Allegheny County Residential Finance Authority, SFMR, (AMT), 4.95%, 11/1/37 | | $ | 1,440 | | | $ | 1,509,941 | |
Pennsylvania Housing Finance Agency, SFMR, (AMT), 4.75%, 10/1/25 | | | 1,000 | | | | 1,070,640 | |
Pennsylvania Housing Finance Agency, SFMR, (AMT), 4.875%, 4/1/26 | | | 2,770 | | | | 2,851,299 | |
| | | | | | | | | |
| | | | | | $ | 5,431,880 | |
| | | | | | | | | |
| | |
Industrial Development Revenue — 1.6% | | | | | | | | |
Luzerne County Industrial Development Authority, (Pennsylvania-American Water Co.), 5.50%, 12/1/39 | | $ | 1,200 | | | $ | 1,352,844 | |
Pennsylvania Economic Development Financing Authority, (Pennsylvania-American Water Co.), 6.20%, 4/1/39 | | | 1,000 | | | | 1,170,600 | |
Pennsylvania Economic Development Financing Authority, (Waste Management, Inc.), (AMT), 5.10%, 10/1/27 | | | 1,500 | | | | 1,581,660 | |
| | | | | | | | | |
| | | | | | $ | 4,105,104 | |
| | | | | | | | | |
| | | | |
| | 23 | | See Notes to Financial Statements. |
Eaton Vance
Pennsylvania Municipal Income Fund
January 31, 2013
Portfolio of Investments (Unaudited) — continued
| | | | | | | | |
| Security | | Principal
Amount
(000’s omitted) | | | Value | |
| | | | | | | | |
| | |
Insured – Education — 5.6% | | | | | | | | |
Lycoming County Authority, (Pennsylvania College of Technology), (AGC), 5.50%, 10/1/37 | | $ | 3,000 | | | $ | 3,304,290 | |
Pennsylvania Higher Educational Facilities Authority, (Drexel University), (NPFG), 5.00%, 5/1/37 | | | 2,490 | | | | 2,686,834 | |
Pennsylvania Higher Educational Facilities Authority, (State System of Higher Education), (NPFG), 5.00%, 6/15/23 | | | 2,500 | | | | 2,822,300 | |
Pennsylvania Higher Educational Facilities Authority, (Temple University), (NPFG), 5.00%, 4/1/25 | | | 1,350 | | | | 1,500,350 | |
Pennsylvania Higher Educational Facilities Authority, (University of Sciences in Philadelphia), (AGC), 5.00%, 11/1/32 | | | 2,765 | | | | 3,127,602 | |
Pennsylvania Higher Educational Facilities Authority, (University of Sciences in Philadelphia), (XLCA), 4.75%, 11/1/33 | | | 965 | | | | 1,025,380 | |
| | | | | | | | | |
| | | | | | $ | 14,466,756 | |
| | | | | | | | | |
| | |
Insured – Electric Utilities — 0.7% | | | | | | | | |
Puerto Rico Electric Power Authority, (FGIC), (NPFG), 5.25%, 7/1/34 | | $ | 1,475 | | | $ | 1,518,158 | |
Puerto Rico Electric Power Authority, (FGIC), (NPFG), 5.25%, 7/1/35 | | | 355 | | | | 363,726 | |
| | | | | | | | | |
| | | | | | $ | 1,881,884 | |
| | | | | | | | | |
| | |
Insured – Escrowed / Prerefunded — 11.1% | | | | | | | | |
Allegheny County Hospital Development Authority, (Magee-Women’s Hospital), (FGIC), (NPFG), Escrowed to Maturity, 0.00%, 10/1/15 | | $ | 3,750 | | | $ | 3,667,313 | |
Centre County Hospital Authority, (Mount Nittany Medical Center), (AGC), Prerefunded to 11/15/14, 6.25%, 11/15/44 | | | 3,000 | | | | 3,313,920 | |
Erie School District, (NPFG), Escrowed to Maturity, 0.00%, 5/1/19 | | | 2,500 | | | | 2,307,225 | |
Erie School District, (NPFG), Escrowed to Maturity, 0.00%, 5/1/20 | | | 2,625 | | | | 2,347,328 | |
Erie School District, (NPFG), Escrowed to Maturity, 0.00%, 5/1/21 | | | 2,625 | | | | 2,267,029 | |
Erie School District, (NPFG), Escrowed to Maturity, 0.00%, 5/1/22 | | | 3,625 | | | | 3,003,131 | |
McKeesport Area School District, (AMBAC), Escrowed to Maturity, 0.00%, 10/1/25 | | | 2,320 | | | | 1,689,795 | |
Westmoreland Municipal Authority, Series A, (FGIC), Escrowed to Maturity, 0.00%, 8/15/20 | | | 5,780 | | | | 5,146,396 | |
Westmoreland Municipal Authority, Series C, (FGIC), Escrowed to Maturity, 0.00%, 8/15/20 | | | 5,400 | | | | 4,808,052 | |
| | | | | | | | | |
| | | | | | $ | 28,550,189 | |
| | | | | | | | | |
| | |
Insured – General Obligations — 16.6% | | | | | | | | |
Beaver County, (AGM), 5.55%, 11/15/31 | | $ | 2,150 | | | $ | 2,472,328 | |
Bethlehem Area School District, (AGM), 5.25%, 1/15/25 | | | 1,885 | | | | 2,171,671 | |
| | | | | | | | |
| Security | | Principal
Amount
(000’s omitted) | | | Value | |
| | | | | | | | |
| | |
Insured – General Obligations (continued) | | | | | | | | |
Bethlehem Area School District, (AGM), 5.25%, 1/15/26 | | $ | 940 | | | $ | 1,078,547 | |
Centennial School District, (AGM), 5.25%, 12/15/37 | | | 3,000 | | | | 3,490,440 | |
Elizabeth Forward School District, (NPFG), 0.00%, 9/1/21 | | | 2,170 | | | | 1,643,363 | |
Elizabeth Forward School District, (NPFG), 0.00%, 9/1/22 | | | 2,170 | | | | 1,551,029 | |
Elizabeth Forward School District, (NPFG), 0.00%, 9/1/23 | | | 2,170 | | | | 1,468,330 | |
Harrisburg, (AMBAC), 0.00%, 3/15/17 | | | 2,180 | | | | 1,632,863 | |
Harrisburg School District, (AGC), 5.00%, 11/15/33 | | | 2,000 | | | | 2,200,520 | |
Hazelton School District, (FGIC), (NPFG), 0.00%, 3/1/21 | | | 4,000 | | | | 3,255,520 | |
Hopewell School District, (AGM), 0.00%, 9/1/22 | | | 1,000 | | | | 795,250 | |
Hopewell School District, (AGM), 0.00%, 9/1/26 | | | 2,000 | | | | 1,353,540 | |
Lake Lehman School District, (NPFG), 0.00%, 4/1/26 | | | 1,315 | | | | 832,224 | |
Mars Area School District, (NPFG), Escrowed to Maturity, 0.00%, 3/1/14 | | | 1,430 | | | | 1,423,894 | |
McKeesport Area School District, (AMBAC), 0.00%, 10/1/25 | | | 1,100 | | | | 741,587 | |
Philadelphia, (AGC), 7.00%, 7/15/28 | | | 1,500 | | | | 1,767,630 | |
State Public School Building Authority, (Harrisburg School District), (AGC), 4.75%, 11/15/33 | | | 2,000 | | | | 2,173,460 | |
State Public School Building Authority, (Philadelphia School District), (AGM), 5.50%, 6/1/28(4) | | | 9,500 | | | | 12,574,295 | |
| | | | | | | | | |
| | | | | | $ | 42,626,491 | |
| | | | | | | | | |
| | |
Insured – Hospital — 4.5% | | | | | | | | |
Allegheny County Hospital Development Authority, (UPMC Health System), (NPFG), 6.00%, 7/1/24 | | $ | 2,000 | | | $ | 2,642,360 | |
Lehigh County General Purpose Authority, (Lehigh Valley Health Network), (AGM), 5.00%, 7/1/35(5) | | | 6,930 | | | | 7,512,190 | |
Washington County Hospital Authority, (Washington Hospital), (AMBAC), 5.50%, 7/1/17 | | | 1,310 | | | | 1,501,679 | |
| | | | | | | | | |
| | | | | | $ | 11,656,229 | |
| | | | | | | | | |
| |
Insured – Lease Revenue / Certificates of Participation — 0.4% | | | | | |
Commonwealth Financing Authority, (AGC), 5.00%, 6/1/31 | | $ | 1,000 | | | $ | 1,122,820 | |
| | | | | | | | | |
| | | | | | $ | 1,122,820 | |
| | | | | | | | | |
| | |
Insured – Special Tax Revenue — 1.0% | | | | | | | | |
Puerto Rico Infrastructure Financing Authority, (BHAC), (FGIC), 5.50%, 7/1/20 | | $ | 2,000 | | | $ | 2,328,760 | |
Puerto Rico Sales Tax Financing Corp., (NPFG), 0.00%, 8/1/45 | | | 1,490 | | | | 248,398 | |
| | | | | | | | | |
| | | | | | $ | 2,577,158 | |
| | | | | | | | | |
|
Insured – Transportation — 6.4% | |
Philadelphia, Airport Revenue, (AGM), (AMT), 5.00%, 6/15/27 | | $ | 5,750 | | | $ | 6,165,323 | |
Puerto Rico Highway and Transportation Authority, (AGC), (AGM), 5.25%, 7/1/36 | | | 2,180 | | | | 2,283,942 | |
| | | | |
| | 24 | | See Notes to Financial Statements. |
Eaton Vance
Pennsylvania Municipal Income Fund
January 31, 2013
Portfolio of Investments (Unaudited) — continued
| | | | | | | | |
| Security | | Principal
Amount
(000’s omitted) | | | Value | |
| | | | | | | | |
|
Insured – Transportation (continued) | |
Puerto Rico Highway and Transportation Authority, (AGC), (CIFG),
5.25%, 7/1/41(4)(6) | | $ | 6,000 | | | $ | 6,221,340 | |
Puerto Rico Highway and Transportation Authority, (AGC), 5.50%, 7/1/31 | | | 1,500 | | | | 1,683,375 | |
| | | | | | | | | |
| | | $ | 16,353,980 | |
| | | | | | | | | |
| | |
Insured – Utilities — 1.2% | | | | | | | | |
Philadelphia Gas Works, (AMBAC), 5.00%, 10/1/37 | | $ | 2,850 | | | $ | 2,979,333 | |
| | | | | | | | | |
| | | $ | 2,979,333 | |
| | | | | | | | | |
| | |
Insured – Water and Sewer — 1.4% | | | | | | | | |
Allegheny County Sanitation Authority, (FGIC), (NPFG), 5.00%, 12/1/37 | | $ | 1,500 | | | $ | 1,608,690 | |
Westmoreland Municipal Authority, (FGIC), 0.00%, 8/15/19 | | | 2,235 | | | | 1,956,720 | |
| | | | | | | | | |
| | | $ | 3,565,410 | |
| | | | | | | | | |
| | |
Nursing Home — 1.2% | | | | | | | | |
Montgomery County Industrial Development Authority, (Advancement of Geriatric Health Care Institute), 8.375%, 7/1/23 | | $ | 2,345 | | | $ | 2,347,275 | |
Westmoreland County Industrial Development Authority, (Highland Health Systems, Inc.), 9.25%, 6/1/22 | | | 970 | | | | 753,166 | |
| | | | | | | | | |
| | | $ | 3,100,441 | |
| | | | | | | | | |
| | |
Other Revenue — 1.6% | | | | | | | | |
Southeastern Pennsylvania Transportation Authority, Federal Grant Receipts, 5.00%, 6/1/28 | | $ | 1,875 | | | $ | 2,160,806 | |
Southeastern Pennsylvania Transportation Authority, Federal Grant Receipts, 5.00%, 6/1/29 | | | 1,775 | | | | 2,035,677 | |
| | | | | | | | | |
| | | $ | 4,196,483 | |
| | | | | | | | | |
| | |
Senior Living / Life Care — 1.3% | | | | | | | | |
Cliff House Trust, (AMT), 6.625%, 6/1/27(2) | | $ | 2,500 | | | $ | 1,312,850 | |
Montgomery County Industrial Development Authority, (Foulkeways at Gwynedd), 5.00%, 12/1/24 | | | 600 | | | | 629,982 | |
Montgomery County Industrial Development Authority, (Foulkeways at Gwynedd), 5.00%, 12/1/30 | | | 1,300 | | | | 1,348,347 | |
| | | | | | | | | |
| | | $ | 3,291,179 | |
| | | | | | | | | |
| | |
Special Tax Revenue — 1.3% | | | | | | | | |
Puerto Rico Sales Tax Financing Corp., 0.00%, 8/1/38 | | $ | 7,500 | | | $ | 1,692,075 | |
Puerto Rico Sales Tax Financing Corp., 5.25%, 8/1/57 | | | 760 | | | | 795,333 | |
Virgin Islands Public Finance Authority, 6.75%, 10/1/37 | | | 810 | | | | 955,249 | |
| | | | | | | | | |
| | | $ | 3,442,657 | |
| | | | | | | | | |
| | | | | | | | |
| Security | | Principal
Amount
(000’s omitted) | | | Value | |
| | | | | | | | |
| | |
Transportation — 7.0% | | | | | | | | |
Delaware River Joint Toll Bridge Commission,
(Pennsylvania - New Jersey), 3.00%, 7/1/27 | | $ | 270 | | | $ | 270,327 | |
Delaware River Joint Toll Bridge Commission,
(Pennsylvania - New Jersey), 4.00%, 7/1/26 | | | 270 | | | | 296,887 | |
Delaware River Joint Toll Bridge Commission,
(Pennsylvania - New Jersey), 4.00%, 7/1/27 | | | 540 | | | | 586,542 | |
Delaware River Port Authority of Pennsylvania and New Jersey, 5.00%, 1/1/35 | | | 1,550 | | | | 1,756,274 | |
Delaware River Port Authority of Pennsylvania and New Jersey, 5.00%, 1/1/40 | | | 950 | | | | 1,062,508 | |
Pennsylvania Economic Development Financing Authority, (Amtrak), (AMT), 5.00%, 11/1/41 | | | 1,975 | | | | 2,132,546 | |
Pennsylvania Turnpike Commission, 5.25%, 6/1/36 | | | 4,500 | | | �� | 5,024,790 | |
Pennsylvania Turnpike Commission, 5.45%, (0.00% until 12/1/15), 12/1/35 | | | 4,220 | | | | 4,062,383 | |
Pennsylvania Turnpike Commission, 6.375%, (0.00% until 12/1/17), 12/1/38 | | | 2,000 | | | | 2,006,240 | |
Philadelphia, Airport Revenue, (AMT), 5.00%, 6/15/27 | | | 815 | | | | 911,553 | |
| | | | | | | | | |
| | | $ | 18,110,050 | |
| | | | | | | | | |
| | |
Water and Sewer — 1.7% | | | | | | | | |
Harrisburg Water Authority, 5.25%, 7/15/31 | | $ | 1,750 | | | $ | 1,582,945 | |
Philadelphia, Water and Wastewater Revenue, 5.00%, 1/1/36 | | | 1,250 | | | | 1,418,850 | |
Philadelphia, Water and Wastewater Revenue, 5.25%, 1/1/32 | | | 1,235 | | | | 1,389,214 | |
| | | | | | | | | |
| | | $ | 4,391,009 | |
| | | | | | | | | |
| |
Total Tax-Exempt Investments — 102.3%
(identified cost $234,285,141) | | | $ | 263,355,338 | |
| | | | | | | | | |
| |
Other Assets, Less Liabilities — (2.3)% | | | $ | (5,867,744 | ) |
| | | | | | | | | |
| |
Net Assets — 100.0% | | | $ | 257,487,594 | |
| | | | | | | | | |
The percentage shown for each investment category in the Portfolio of Investments is based on net assets.
| | | | |
| AGC | | – | | Assured Guaranty Corp. |
| AGM | | – | | Assured Guaranty Municipal Corp. |
| AMBAC | | – | | AMBAC Financial Group, Inc. |
| AMT | | – | | Interest earned from these securities may be considered a tax preference item for purposes of the Federal Alternative Minimum Tax. |
| BHAC | | – | | Berkshire Hathaway Assurance Corp. |
| CIFG | | – | | CIFG Assurance North America, Inc. |
| FGIC | | – | | Financial Guaranty Insurance Company |
| NPFG | | – | | National Public Finance Guaranty Corp. |
| SFMR | | – | | Single Family Mortgage Revenue |
| XLCA | | – | | XL Capital Assurance, Inc. |
| | | | |
| | 25 | | See Notes to Financial Statements. |
Eaton Vance
Pennsylvania Municipal Income Fund
January 31, 2013
Portfolio of Investments (Unaudited) — continued
The Fund invests primarily in debt securities issued by Pennsylvania municipalities. The ability of the issuers of the debt securities to meet their obligations may be affected by economic developments in a specific industry or municipality. In order to reduce the risk associated with such economic developments, at January 31, 2013, 47.8% of total investments are backed by bond insurance of various financial institutions and financial guaranty assurance agencies. The aggregate percentage insured by an individual financial institution ranged from 0.4% to 15.1% of total investments.
| (1) | Defaulted matured bond. |
| (3) | When-issued security. |
| (4) | Security represents the municipal bond held by a trust that issues residual interest bonds (see Note 1I). |
| (5) | Security (or a portion thereof) has been segregated to cover payable for when-issued securities. |
| (6) | Security (or a portion thereof) has been pledged as collateral for residual interest bond transactions. The aggregate value of such collateral is $3,221,340. |
| | | | |
| | 26 | | See Notes to Financial Statements. |
Eaton Vance
Municipal Income Funds
January 31, 2013
Statements of Assets and Liabilities (Unaudited)
| | | | | | | | | | | | |
| | | January 31, 2013 | |
| Assets | | Arizona Fund | | | Connecticut Fund | | | Minnesota Fund | |
Investments — | | | | | | | | | | | | |
Identified cost | | $ | 74,296,050 | | | $ | 114,148,011 | | | $ | 104,416,735 | |
Unrealized appreciation | | | 7,786,049 | | | | 11,320,953 | | | | 11,274,902 | |
Investments, at value | | $ | 82,082,099 | | | $ | 125,468,964 | | | $ | 115,691,637 | |
Cash | | $ | 2,810,649 | | | $ | 1,970,396 | | | $ | 3,679,044 | |
Restricted cash* | | | 135,000 | | | | 154,000 | | | | 160,000 | |
Interest receivable | | | 498,578 | | | | 980,120 | | | | 1,376,462 | |
Receivable for investments sold | | | — | | | | — | | | | 1,270,000 | |
Receivable for Fund shares sold | | | 97,418 | | | | 98,018 | | | �� | 226,927 | |
Total assets | | $ | 85,623,744 | | | $ | 128,671,498 | | | $ | 122,404,070 | |
| Liabilities | | | | | | | | | | | | |
Payable for floating rate notes issued | | $ | 1,700,000 | | | $ | 7,225,000 | | | $ | — | |
Payable for variation margin on open financial futures contracts | | | 15,437 | | | | 18,687 | | | | 19,094 | |
Payable for Fund shares redeemed | | | 108,094 | | | | 125,317 | | | | 148,363 | |
Distributions payable | | | 57,172 | | | | 78,599 | | | | 65,360 | |
Payable to affiliates: | | | | | | | | | | | | |
Investment adviser fee | | | 23,076 | | | | 36,339 | | | | 35,524 | |
Distribution and service fees | | | 19,538 | | | | 25,726 | | | | 26,634 | |
Interest expense and fees payable | | | 3,638 | | | | 8,336 | | | | — | |
Accrued expenses | | | 28,560 | | | | 40,936 | | | | 40,317 | |
Total liabilities | | $ | 1,955,515 | | | $ | 7,558,940 | | | $ | 335,292 | |
Net Assets | | $ | 83,668,229 | | | $ | 121,112,558 | | | $ | 122,068,778 | |
| Sources of Net Assets | | | | | | | | | | | | |
Paid-in capital | | $ | 81,708,175 | | | $ | 115,571,547 | | | $ | 114,837,564 | |
Accumulated net realized loss | | | (6,069,966 | ) | | | (5,931,778 | ) | | | (4,406,845 | ) |
Accumulated undistributed (distributions in excess of) net investment income | | | (3,850 | ) | | | (81,228 | ) | | | 56,641 | |
Net unrealized appreciation | | | 8,033,870 | | | | 11,554,017 | | | | 11,581,418 | |
Net Assets | | $ | 83,668,229 | | | $ | 121,112,558 | | | $ | 122,068,778 | |
| Class A Shares | | | | | | | | | | | | |
Net Assets | | $ | 63,563,619 | | | $ | 101,269,828 | | | $ | 86,234,517 | |
Shares Outstanding | | | 6,337,891 | | | | 9,486,403 | | | | 8,786,118 | |
Net Asset Value and Redemption Price Per Share | | | | | | | | | | | | |
(net assets ÷ shares of beneficial interest outstanding) | | $ | 10.03 | | | $ | 10.68 | | | $ | 9.81 | |
Maximum Offering Price Per Share | | | | | | | | | | | | |
(100 ÷ 95.25 of net asset value per share) | | $ | 10.53 | | | $ | 11.21 | | | $ | 10.30 | |
| Class B Shares | | | | | | | | | | | | |
Net Assets | | $ | 1,057,482 | | | $ | 2,307,969 | | | $ | 1,233,225 | |
Shares Outstanding | | | 94,872 | | | | 217,218 | | | | 116,776 | |
Net Asset Value and Offering Price Per Share** | | | | | | | | | | | | |
(net assets ÷ shares of beneficial interest outstanding) | | $ | 11.15 | | | $ | 10.63 | | | $ | 10.56 | |
| Class C Shares | | | | | | | | | | | | |
Net Assets | | $ | 9,820,900 | | | $ | 8,111,936 | | | $ | 13,866,354 | |
Shares Outstanding | | | 880,531 | | | | 762,617 | | | | 1,313,853 | |
Net Asset Value and Offering Price Per Share** | | | | | | | | | | | | |
(net assets ÷ shares of beneficial interest outstanding) | | $ | 11.15 | | | $ | 10.64 | | | $ | 10.55 | |
| Class I Shares | | | | | | | | | | | | |
Net Assets | | $ | 9,226,228 | | | $ | 9,422,825 | | | $ | 20,734,682 | |
Shares Outstanding | | | 920,131 | | | | 882,428 | | | | 2,112,512 | |
Net Asset Value, Offering Price and Redemption Price Per Share | | | | | | | | | | | | |
(net assets ÷ shares of beneficial interest outstanding) | | $ | 10.03 | | | $ | 10.68 | | | $ | 9.82 | |
| On | sales of $50,000 or more, the offering price of Class A shares is reduced. |
| * | Represents restricted cash on deposit at the broker for open financial futures contracts. |
| ** | Redemption price per share is equal to the net asset value less any applicable contingent deferred sales charge. |
| | | | |
| | 27 | | See Notes to Financial Statements. |
Eaton Vance
Municipal Income Funds
January 31, 2013
Statements of Assets and Liabilities (Unaudited) — continued
| | | | | | | | |
| | | January 31, 2013 | |
| Assets | | New Jersey Fund | | | Pennsylvania Fund | |
Investments — | | | | | | | | |
Identified cost | | $ | 203,103,474 | | | $ | 234,285,141 | |
Unrealized appreciation | | | 24,999,726 | | | | 29,070,197 | |
Investments, at value | | $ | 228,103,200 | | | $ | 263,355,338 | |
Cash | | $ | 7,622,600 | | | $ | 11,650,311 | |
Restricted cash* | | | 960,000 | | | | 1,725,000 | |
Interest receivable | | | 1,484,335 | | | | 1,975,279 | |
Receivable for Fund shares sold | | | 147,269 | | | | 139,511 | |
Total assets | | $ | 238,317,404 | | | $ | 278,845,439 | |
| Liabilities | | | | | | | | |
Payable for floating rate notes issued | | $ | 21,020,000 | | | $ | 17,350,000 | |
Payable for when-issued securities | | | — | | | | 3,057,200 | |
Payable for variation margin on open financial futures contracts | | | 112,965 | | | | 223,434 | |
Payable for Fund shares redeemed | | | 294,405 | | | | 280,593 | |
Distributions payable | | | 154,620 | | | | 186,550 | |
Payable to affiliates: | | | | | | | | |
Investment adviser fee | | | 72,401 | | | | 86,311 | |
Distribution and service fees | | | 53,466 | | | | 65,094 | |
Interest expense and fees payable | | | 20,154 | | | | 29,427 | |
Accrued expenses | | | 68,318 | | | | 79,236 | |
Total liabilities | | $ | 21,796,329 | | | $ | 21,357,845 | |
Net Assets | | $ | 216,521,075 | | | $ | 257,487,594 | |
| Sources of Net Assets | | | | | | | | |
Paid-in capital | | $ | 234,266,697 | | | $ | 269,855,423 | |
Accumulated net realized loss | | | (45,720,972 | ) | | | (44,705,475 | ) |
Accumulated undistributed (distributions in excess of) net investment income | | | 1,246,989 | | | | (78,810 | ) |
Net unrealized appreciation | | | 26,728,361 | | | | 32,416,456 | |
Net Assets | | $ | 216,521,075 | | | $ | 257,487,594 | |
| Class A Shares | | | | | | | | |
Net Assets | | $ | 171,674,533 | | | $ | 173,283,652 | |
Shares Outstanding | | | 17,619,637 | | | | 18,566,893 | |
Net Asset Value and Redemption Price Per Share | | | | | | | | |
(net assets ÷ shares of beneficial interest outstanding) | | $ | 9.74 | | | $ | 9.33 | |
Maximum Offering Price Per Share | | | | | | | | |
(100 ÷ 95.25 of net asset value per share) | | $ | 10.23 | | | $ | 9.80 | |
| Class B Shares | | | | | | | | |
Net Assets | | $ | — | | | $ | 5,922,159 | |
Shares Outstanding | | | — | | | | 613,053 | |
Net Asset Value and Offering Price Per Share** | | | | | | | | |
(net assets ÷ shares of beneficial interest outstanding) | | $ | — | | | $ | 9.66 | |
| Class C Shares | | | | | | | | |
Net Assets | | $ | 30,256,613 | | | $ | 38,762,411 | |
Shares Outstanding | | | 2,975,706 | | | | 4,010,855 | |
Net Asset Value and Offering Price Per Share** | | | | | | | | |
(net assets ÷ shares of beneficial interest outstanding) | | $ | 10.17 | | | $ | 9.66 | |
| Class I Shares | | | | | | | | |
Net Assets | | $ | 14,589,929 | | | $ | 39,519,372 | |
Shares Outstanding | | | 1,496,846 | | | | 4,218,355 | |
Net Asset Value, Offering Price and Redemption Price Per Share | | | | | | | | |
(net assets ÷ shares of beneficial interest outstanding) | | $ | 9.75 | | | $ | 9.37 | |
| On | sales of $50,000 or more, the offering price of Class A shares is reduced. |
| * | Represents restricted cash on deposit at the broker for open financial futures contracts. |
| ** | Redemption price per share is equal to the net asset value less any applicable contingent deferred sales charge. |
| | | | |
| | 28 | | See Notes to Financial Statements. |
Eaton Vance
Municipal Income Funds
January 31, 2013
Statements of Operations (Unaudited)
| | | | | | | | | | | | |
| | | Six Months Ended January 31, 2013 | |
| Investment Income | | Arizona Fund | | | Connecticut Fund | | | Minnesota Fund | |
Interest | | $ | 1,819,981 | | | $ | 2,665,135 | | | $ | 2,361,605 | |
Total investment income | | $ | 1,819,981 | | | $ | 2,665,135 | | | $ | 2,361,605 | |
| | | |
| Expenses | | | | | | | | | | | | |
Investment adviser fee | | $ | 131,958 | | | $ | 218,591 | | | $ | 213,251 | |
Distribution and service fees | | | | | | | | | | | | |
Class A | | | 63,317 | | | | 102,332 | | | | 86,676 | |
Class B | | | 6,198 | | | | 12,079 | | | | 6,093 | |
Class C | | | 46,166 | | | | 38,062 | | | | 64,333 | |
Trustees’ fees and expenses | | | 1,870 | | | | 2,576 | | | | 2,574 | |
Custodian fee | | | 25,155 | | | | 34,087 | | | | 34,413 | |
Transfer and dividend disbursing agent fees | | | 12,148 | | | | 20,995 | | | | 22,821 | |
Legal and accounting services | | | 25,734 | | | | 29,696 | | | | 23,666 | |
Printing and postage | | | 5,383 | | | | 7,084 | | | | 8,718 | |
Registration fees | | | 6,831 | | | | 3,362 | | | | 4,111 | |
Interest expense and fees | | | 7,769 | | | | 30,349 | | | | — | |
Miscellaneous | | | 8,554 | | | | 10,627 | | | | 11,100 | |
Total expenses | | $ | 341,083 | | | $ | 509,840 | | | $ | 477,756 | |
Deduct — | | | | | | | | | | | | |
Reduction of custodian fee | | $ | 455 | | | $ | 345 | | | $ | 1,210 | |
Total expense reductions | | $ | 455 | | | $ | 345 | | | $ | 1,210 | |
| | | |
Net expenses | | $ | 340,628 | | | $ | 509,495 | | | $ | 476,546 | |
| | | |
Net investment income | | $ | 1,479,353 | | | $ | 2,155,640 | | | $ | 1,885,059 | |
| | | |
| Realized and Unrealized Gain (Loss) | | | | | | | | | | | | |
Net realized gain (loss) — | | | | | | | | | | | | |
Investment transactions | | $ | (141,676 | ) | | $ | (30,290 | ) | | $ | 62,303 | |
Financial futures contracts | | | (121,700 | ) | | | (152,651 | ) | | | (150,524 | ) |
Net realized loss | | $ | (263,376 | ) | | $ | (182,941 | ) | | $ | (88,221 | ) |
Change in unrealized appreciation (depreciation) — | | | | | | | | | | | | |
Investments | | $ | (174,796 | ) | | $ | (1,112,677 | ) | | $ | 300,390 | |
Financial futures contracts | | | 391,578 | | | | 376,953 | | | | 484,321 | |
Net change in unrealized appreciation (depreciation) | | $ | 216,782 | | | $ | (735,724 | ) | | $ | 784,711 | |
| | | |
Net realized and unrealized gain (loss) | | $ | (46,594 | ) | | $ | (918,665 | ) | | $ | 696,490 | |
| | | |
Net increase in net assets from operations | | $ | 1,432,759 | | | $ | 1,236,975 | | | $ | 2,581,549 | |
| | | | |
| | 29 | | See Notes to Financial Statements. |
Eaton Vance
Municipal Income Funds
January 31, 2013
Statements of Operations (Unaudited) — continued
| | | | | | | | |
| | | Six Months Ended January 31, 2013 | |
| Investment Income | | New Jersey Fund | | | Pennsylvania Fund | |
Interest | | $ | 5,123,401 | | | $ | 6,112,293 | |
Total investment income | | $ | 5,123,401 | | | $ | 6,112,293 | |
| | |
| Expenses | | | | | | | | |
Investment adviser fee | | $ | 430,761 | | | $ | 518,195 | |
Distribution and service fees | | | | | | | | |
Class A | | | 174,477 | | | | 178,819 | |
Class B | | | — | | | | 31,598 | |
Class C | | | 139,370 | | | | 182,239 | |
Trustees’ fees and expenses | | | 4,400 | | | | 5,049 | |
Custodian fee | | | 53,173 | | | | 60,432 | |
Transfer and dividend disbursing agent fees | | | 46,456 | | | | 57,118 | |
Legal and accounting services | | | 30,556 | | | | 40,042 | |
Printing and postage | | | 10,287 | | | | 11,381 | |
Registration fees | | | 3,262 | | | | 3,197 | |
Interest expense and fees | | | 74,694 | | | | 68,314 | |
Miscellaneous | | | 12,304 | | | | 18,495 | |
Total expenses | | $ | 979,740 | | | $ | 1,174,879 | |
Deduct — | | | | | | | | |
Reduction of custodian fee | | $ | 325 | | | $ | 254 | |
Total expense reductions | | $ | 325 | | | $ | 254 | |
| | |
Net expenses | | $ | 979,415 | | | $ | 1,174,625 | |
| | |
Net investment income | | $ | 4,143,986 | | | $ | 4,937,668 | |
| | |
| Realized and Unrealized Gain (Loss) | | | | | | | | |
Net realized gain (loss) — | | | | | | | | |
Investment transactions | | $ | (35,803 | ) | | $ | 1,299,825 | |
Financial futures contracts | | | (889,434 | ) | | | (1,520,823 | ) |
Net realized loss | | $ | (925,237 | ) | | $ | (220,998 | ) |
Change in unrealized appreciation (depreciation) — | | | | | | | | |
Investments | | $ | 1,785,382 | | | $ | (702,815 | ) |
Financial futures contracts | | | 2,879,441 | | | | 5,426,953 | |
Net change in unrealized appreciation (depreciation) | | $ | 4,664,823 | | | $ | 4,724,138 | |
| | |
Net realized and unrealized gain | | $ | 3,739,586 | | | $ | 4,503,140 | |
| | |
Net increase in net assets from operations | | $ | 7,883,572 | | | $ | 9,440,808 | |
| | | | |
| | 30 | | See Notes to Financial Statements. |
Eaton Vance
Municipal Income Funds
January 31, 2013
Statements of Changes in Net Assets
| | | | | | | | | | | | |
| | | Six Months Ended January 31, 2013 (Unaudited) | |
| Increase (Decrease) in Net Assets | | Arizona Fund | | | Connecticut Fund | | | Minnesota Fund | |
From operations — | | | | | | | | | | | | |
Net investment income | | $ | 1,479,353 | | | $ | 2,155,640 | | | $ | 1,885,059 | |
Net realized loss from investment transactions and financial futures contracts | | | (263,376 | ) | | | (182,941 | ) | | | (88,221 | ) |
Net change in unrealized appreciation (depreciation) from investments and financial futures contracts | | | 216,782 | | | | (735,724 | ) | | | 784,711 | |
Net increase in net assets from operations | | $ | 1,432,759 | | | $ | 1,236,975 | | | $ | 2,581,549 | |
Distributions to shareholders — | | | | | | | | | | | | |
From net investment income | | | | | | | | | | | | |
Class A | | $ | (1,142,895 | ) | | $ | (1,823,508 | ) | | $ | (1,343,830 | ) |
Class B | | | (18,718 | ) | | | (35,780 | ) | | | (15,085 | ) |
Class C | | | (138,975 | ) | | | (112,401 | ) | | | (158,887 | ) |
Class I | | | (135,582 | ) | | | (173,380 | ) | | | (355,446 | ) |
Total distributions to shareholders | | $ | (1,436,170 | ) | | $ | (2,145,069 | ) | | $ | (1,873,248 | ) |
Transactions in shares of beneficial interest — | | | | | | | | | | | | |
Proceeds from sale of shares | | | | | | | | | | | | |
Class A | | $ | 3,572,816 | | | $ | 4,792,335 | | | $ | 7,881,106 | |
Class B | | | 780 | | | | 9,432 | | | | – | |
Class C | | | 974,644 | | | | 1,182,694 | | | | 1,856,978 | |
Class I | | | 7,022,710 | | | | 2,153,833 | | | | 7,374,226 | |
Net asset value of shares issued to shareholders in payment of distributions declared | | | | | | | | | | | | |
Class A | | | 929,916 | | | | 1,447,182 | | | | 1,253,187 | |
Class B | | | 15,250 | | | | 21,766 | | | | 12,993 | |
Class C | | | 128,981 | | | | 71,339 | | | | 136,645 | |
Class I | | | 26,349 | | | | 101,955 | | | | 56,502 | |
Cost of shares redeemed | | | | | | | | | | | | |
Class A | | | (3,737,048 | ) | | | (6,107,065 | ) | | | (10,143,848 | ) |
Class B | | | (205,850 | ) | | | (99,442 | ) | | | (72,026 | ) |
Class C | | | (887,995 | ) | | | (850,231 | ) | | | (1,159,004 | ) |
Class I | | | (471,249 | ) | | | (3,445,324 | ) | | | (8,447,268 | ) |
Net asset value of shares exchanged | | | | | | | | | | | | |
Class A | | | 205,671 | | | | 182,430 | | | | 37,759 | |
Class B | | | (205,671 | ) | | | (182,430 | ) | | | (37,759 | ) |
Net increase (decrease) in net assets from Fund share transactions | | $ | 7,369,304 | | | $ | (721,526 | ) | | $ | (1,250,509 | ) |
| | | |
Net increase (decrease) in net assets | | $ | 7,365,893 | | | $ | (1,629,620 | ) | | $ | (542,208 | ) |
| | | |
| Net Assets | | | | | | | | | | | | |
At beginning of period | | $ | 76,302,336 | | | $ | 122,742,178 | | | $ | 122,610,986 | |
At end of period | | $ | 83,668,229 | | | $ | 121,112,558 | | | $ | 122,068,778 | |
| | | |
Accumulated undistributed (distributions in excess of) net investment income
included in net assets | | | | | | | | | | | | |
At end of period | | $ | (3,850 | ) | | $ | (81,228 | ) | | $ | 56,641 | |
| | | | |
| | 31 | | See Notes to Financial Statements. |
Eaton Vance
Municipal Income Funds
January 31, 2013
Statements of Changes in Net Assets — continued
| | | | | | | | |
| | | Six Months Ended January 31, 2013
(Unaudited) | |
| Increase (Decrease) in Net Assets | | New Jersey Fund | | | Pennsylvania Fund | |
From operations — | | | | | | | | |
Net investment income | | $ | 4,143,986 | | | $ | 4,937,668 | |
Net realized loss from investment transactions and financial futures contracts | | | (925,237 | ) | | | (220,998 | ) |
Net change in unrealized appreciation (depreciation) from investments and financial futures contracts | | | 4,664,823 | | | | 4,724,138 | |
Net increase in net assets from operations | | $ | 7,883,572 | | | $ | 9,440,808 | |
Distributions to shareholders — | | | | | | | | |
From net investment income | | | | | | | | |
Class A | | $ | (3,416,296 | ) | | $ | (3,553,556 | ) |
Class B | | | — | | | | (107,151 | ) |
Class C | | | (463,808 | ) | | | (617,482 | ) |
Class I | | | (254,900 | ) | | | (641,978 | ) |
Total distributions to shareholders | | $ | (4,135,004 | ) | | $ | (4,920,167 | ) |
Transactions in shares of beneficial interest — | | | | | | | | |
Proceeds from sale of shares | | | | | | | | |
Class A | | $ | 4,676,700 | | | $ | 5,098,156 | |
Class B | | | — | | | | 7,567 | |
Class C | | | 3,308,904 | | | | 2,590,737 | |
Class I | | | 4,240,293 | | | | 11,145,853 | |
Net asset value of shares issued to shareholders in payment of distributions declared | | | | | | | | |
Class A | | | 2,765,424 | | | | 3,017,773 | |
Class B | | | — | | | | 95,468 | |
Class C | | | 327,547 | | | | 530,614 | |
Class I | | | 126,769 | | | | 169,705 | |
Cost of shares redeemed | | | | | | | | |
Class A | | | (11,854,348 | ) | | | (18,613,156 | ) |
Class B | | | — | | | | (870,462 | ) |
Class C | | | (1,948,778 | ) | | | (3,309,163 | ) |
Class I | | | (912,193 | ) | | | (1,812,077 | ) |
Net asset value of shares exchanged | | | | | | | | |
Class A | | | — | | | | 683,354 | |
Class B | | | — | | | | (683,354 | ) |
Net increase (decrease) in net assets from Fund share transactions | | $ | 730,318 | | | $ | (1,948,985 | ) |
| | |
Net increase in net assets | | $ | 4,478,886 | | | $ | 2,571,656 | |
| | |
| Net Assets | | | | | | | | |
At beginning of period | | $ | 212,042,189 | | | $ | 254,915,938 | |
At end of period | | $ | 216,521,075 | | | $ | 257,487,594 | |
| | |
Accumulated undistributed (distributions in excess of) net investment income
included in net assets | | | | | | | | |
At end of period | | $ | 1,246,989 | | | $ | (78,810 | ) |
| | | | |
| | 32 | | See Notes to Financial Statements. |
Eaton Vance
Municipal Income Funds
January 31, 2013
Statements of Changes in Net Assets — continued
| | | | | | | | | | | | |
| | | Year Ended July 31, 2012 | |
| Increase (Decrease) in Net Assets | | Arizona Fund | | | Connecticut Fund | | | Minnesota Fund | |
From operations — | | | | | | | | | | | | |
Net investment income | | $ | 3,128,741 | | | $ | 4,566,929 | | | $ | 3,720,280 | |
Net realized loss from investment transactions, financial futures contracts and swap contracts | | | (436,428 | ) | | | (1,682,006 | ) | | | (1,018,932 | ) |
Net change in unrealized appreciation (depreciation) from investments, financial futures contracts and swap contracts | | | 6,221,530 | | | | 9,560,523 | | | | 7,412,566 | |
Net increase in net assets from operations | | $ | 8,913,843 | | | $ | 12,445,446 | | | $ | 10,113,914 | |
Distributions to shareholders — | | | | | | | | | | | | |
From net investment income | | | | | | | | | | | | |
Class A | | $ | (2,574,545 | ) | | $ | (3,916,369 | ) | | $ | (2,961,219 | ) |
Class B | | | (50,554 | ) | | | (89,965 | ) | | | (46,935 | ) |
Class C | | | (260,771 | ) | | | (226,477 | ) | | | (331,902 | ) |
Class I | | | (119,658 | ) | | | (297,975 | ) | | | (351,414 | ) |
Tax return of capital | | | | | | | | | | | | |
Class A | | | (18,833 | ) | | | (27,901 | ) | | | — | |
Class B | | | (370 | ) | | | (641 | ) | | | — | |
Class C | | | (1,907 | ) | | | (1,613 | ) | | | — | |
Class I | | | (875 | ) | | | (2,123 | ) | | | — | |
Total distributions to shareholders | | $ | (3,027,513 | ) | | $ | (4,563,064 | ) | | $ | (3,691,470 | ) |
Transactions in shares of beneficial interest — | | | | | | | | | | | | |
Proceeds from sale of shares | | | | | | | | | | | | |
Class A | | $ | 4,724,263 | | | $ | 5,618,274 | | | $ | 12,777,148 | |
Class B | | | 38,546 | | | | 408,692 | | | | 41,678 | |
Class C | | | 2,872,204 | | | | 1,524,044 | | | | 2,999,884 | |
Class I | | | 2,821,798 | | | | 7,386,775 | | | | 20,131,030 | |
Net asset value of shares issued to shareholders in payment of distributions declared | | | | | | | | | | | | |
Class A | | | 1,894,451 | | | | 2,989,440 | | | | 2,600,348 | |
Class B | | | 37,600 | | | | 58,021 | | | | 41,005 | |
Class C | | | 233,715 | | | | 155,896 | | | | 273,649 | |
Class I | | | 64,660 | | | | 170,695 | | | | 85,081 | |
Cost of shares redeemed | | | | | | | | | | | | |
Class A | | | (16,317,630 | ) | | | (13,551,976 | ) | | | (13,356,222 | ) |
Class B | | | (136,679 | ) | | | (129,372 | ) | | | (160,986 | ) |
Class C | | | (1,162,997 | ) | | | (908,312 | ) | | | (2,153,879 | ) |
Class I | | | (1,833,391 | ) | | | (2,595,084 | ) | | | (1,742,125 | ) |
Net asset value of shares exchanged | | | | | | | | | | | | |
Class A | | | 304,646 | | | | 879,388 | | | | 584,067 | |
Class B | | | (304,646 | ) | | | (879,388 | ) | | | (584,067 | ) |
Net increase (decrease) in net assets from Fund share transactions | | $ | (6,763,460 | ) | | $ | 1,127,093 | | | $ | 21,536,611 | |
| | | |
Net increase (decrease) in net assets | | $ | (877,130 | ) | | $ | 9,009,475 | | | $ | 27,959,055 | |
| | | |
| Net Assets | | | | | | | | | | | | |
At beginning of year | | $ | 77,179,466 | | | $ | 113,732,703 | | | $ | 94,651,931 | |
At end of year | | $ | 76,302,336 | | | $ | 122,742,178 | | | $ | 122,610,986 | |
| | | |
Accumulated undistributed (distributions in excess of) net investment income
included in net assets | | | | | | | | | | | | |
At end of year | | $ | (47,033 | ) | | $ | (91,799 | ) | | $ | 44,830 | |
| | | | |
| | 33 | | See Notes to Financial Statements. |
Eaton Vance
Municipal Income Funds
January 31, 2013
Statements of Changes in Net Assets — continued
| | | | | | | | |
| | | Year Ended July 31, 2012 | |
| Increase (Decrease) in Net Assets | | New Jersey Fund | | | Pennsylvania Fund | |
From operations — | | | | | | | | |
Net investment income | | $ | 8,664,268 | | | $ | 10,382,931 | |
Net realized loss from investment transactions, financial futures contracts and swap contracts | | | (7,869,203 | ) | | | (14,026,560 | ) |
Net change in unrealized appreciation (depreciation) from investments, financial futures contracts and swap contracts | | | 24,412,292 | | | | 24,300,421 | |
Net increase in net assets from operations | | $ | 25,207,357 | | | $ | 20,656,792 | |
Distributions to shareholders — | | | | | | | | |
From net investment income | | | | | | | | |
Class A | | $ | (7,361,125 | ) | | $ | (7,482,776 | ) |
Class B | | | — | | | | (303,762 | ) |
Class C | | | (900,611 | ) | | | (1,287,282 | ) |
Class I | | | (385,717 | ) | | | (1,295,918 | ) |
Total distributions to shareholders | | $ | (8,647,453 | ) | | $ | (10,369,738 | ) |
Transactions in shares of beneficial interest — | | | | | | | | |
Proceeds from sale of shares | | | | | | | | |
Class A | | $ | 10,711,170 | | | $ | 10,725,234 | |
Class B | | | — | | | | 122,290 | |
Class C | | | 4,729,718 | | | | 5,061,903 | |
Class I | | | 5,949,507 | | | | 4,425,146 | |
Net asset value of shares issued to shareholders in payment of distributions declared | | | | | | | | |
Class A | | | 5,686,163 | | | | 5,964,494 | |
Class B | | | — | | | | 243,743 | |
Class C | | | 613,906 | | | | 1,055,186 | |
Class I | | | 168,890 | | | | 283,602 | |
Cost of shares redeemed | | | | | | | | |
Class A | | | (28,173,868 | ) | | | (21,527,113 | ) |
Class B | | | — | | | | (1,283,087 | ) |
Class C | | | (4,111,804 | ) | | | (5,781,601 | ) |
Class I | | | (3,280,265 | ) | | | (6,519,074 | ) |
Net asset value of shares exchanged | | | | | | | | |
Class A | | | — | | | | 2,363,410 | |
Class B | | | — | | | | (2,363,410 | ) |
Net decrease in net assets from Fund share transactions | | $ | (7,706,583 | ) | | $ | (7,229,277 | ) |
| | |
Net increase in net assets | | $ | 8,853,321 | | | $ | 3,057,777 | |
| | |
| Net Assets | | | | | | | | |
At beginning of year | | $ | 203,188,868 | | | $ | 251,858,161 | |
At end of year | | $ | 212,042,189 | | | $ | 254,915,938 | |
| | |
Accumulated undistributed (distributions in excess of) net investment income
included in net assets | | | | | | | | |
At end of year | | $ | 1,238,007 | | | $ | (96,311 | ) |
| | | | |
| | 34 | | See Notes to Financial Statements. |
Eaton Vance
Municipal Income Funds
January 31, 2013
Financial Highlights
| | | | | | | | | | | | | | | | | | | | | | | | |
| | | Arizona Fund — Class A | |
| | | Six Months Ended
January 31, 2013
(Unaudited) | | | Year Ended July 31, | |
| | | | 2012 | | | 2011 | | | 2010 | | | 2009 | | | 2008 | |
Net asset value — Beginning of period | | $ | 10.030 | | | $ | 9.280 | | | $ | 9.400 | | | $ | 8.960 | | | $ | 9.220 | | | $ | 9.750 | |
| | | | | | |
| Income (Loss) From Operations | | | | | | | | | | | | | | | | | | | | | | | | |
Net investment income(1) | | $ | 0.188 | | | $ | 0.404 | | | $ | 0.429 | | | $ | 0.400 | | | $ | 0.409 | | | $ | 0.417 | |
Net realized and unrealized gain (loss) | | | (0.005 | ) | | | 0.736 | | | | (0.133 | ) | | | 0.427 | | | | (0.266 | ) | | | (0.535 | ) |
| | | | | | |
Total income (loss) from operations | | $ | 0.183 | | | $ | 1.140 | | | $ | 0.296 | | | $ | 0.827 | | | $ | 0.143 | | | $ | (0.118 | ) |
| | | | | | |
| Less Distributions | | | | | | | | | | | | | | | | | | | | | | | | |
From net investment income | | $ | (0.183 | ) | | $ | (0.387 | ) | | $ | (0.416 | ) | | $ | (0.387 | ) | | $ | (0.403 | ) | | $ | (0.412 | ) |
Tax return of capital | | | — | | | | (0.003 | ) | | | — | | | | — | | | | — | | | | — | |
| | | | | | |
Total distributions | | $ | (0.183 | ) | | $ | (0.390 | ) | | $ | (0.416 | ) | | $ | (0.387 | ) | | $ | (0.403 | ) | | $ | (0.412 | ) |
| | | | | | |
Net asset value — End of period | | $ | 10.030 | | | $ | 10.030 | | | $ | 9.280 | | | $ | 9.400 | | | $ | 8.960 | | | $ | 9.220 | |
| | | | | | |
Total Return(2) | | | 1.83 | %(3) | | | 12.51 | % | | | 3.28 | % | | | 9.35 | % | | | 1.85 | % | | | (1.23 | )% |
| | | | | | |
| Ratios/Supplemental Data | | | | | | | | | | | | | | | | | | | | | | | | |
Net assets, end of period (000’s omitted) | | $ | 63,564 | | | $ | 62,591 | | | $ | 67,029 | | | $ | 83,120 | | | $ | 82,365 | | | $ | 92,266 | |
Ratios (as a percentage of average daily net assets): | | | | | | | | | | | | | | | | | | | | | | | | |
Expenses excluding interest and fees | | | 0.73 | %(4) | | | 0.74 | % | | | 0.75 | % | | | 0.75 | % | | | 0.80 | % | | | 0.76 | % |
Interest and fee expense(5) | | | 0.02 | %(4) | | | 0.02 | % | | | 0.02 | % | | | 0.01 | % | | | 0.06 | % | | | 0.14 | % |
Total expenses before custodian fee reduction | | | 0.75 | %(4) | | | 0.76 | % | | | 0.77 | % | | | 0.76 | % | | | 0.86 | % | | | 0.90 | % |
Expenses after custodian fee reduction excluding interest and fees | | | 0.73 | %(4) | | | 0.74 | % | | | 0.75 | % | | | 0.75 | % | | | 0.79 | % | | | 0.73 | % |
Net investment income | | | 3.72 | %(4) | | | 4.17 | % | | | 4.65 | % | | | 4.30 | % | | | 4.75 | % | | | 4.37 | % |
Portfolio Turnover | | | 2 | %(3) | | | 8 | % | | | 1 | % | | | 5 | % | | | 18 | % | | | 21 | % |
| (1) | Computed using average shares outstanding. |
| (2) | Returns are historical and are calculated by determining the percentage change in net asset value with all distributions reinvested and do not reflect the effect of sales charges. |
| (5) | Interest and fee expense relates to the liability for floating rate notes issued in conjunction with residual interest bond transactions (see Note 1I). |
| | | | |
| | 35 | | See Notes to Financial Statements. |
Eaton Vance
Municipal Income Funds
January 31, 2013
Financial Highlights — continued
| | | | | | | | | | | | | | | | | | | | | | | | |
| | | Arizona Fund — Class B | |
| | | Six Months Ended
January 31, 2013
(Unaudited) | | | Year Ended July 31, | |
| | | | 2012 | | | 2011 | | | 2010 | | | 2009 | | | 2008 | |
Net asset value — Beginning of period | | $ | 11.140 | | | $ | 10.310 | | | $ | 10.440 | | | $ | 9.960 | | | $ | 10.250 | | | $ | 10.840 | |
| | | | | | |
| Income (Loss) From Operations | | | | | | | | | | | | | | | | | | | | | | | | |
Net investment income(1) | | $ | 0.168 | | | $ | 0.368 | | | $ | 0.398 | | | $ | 0.367 | | | $ | 0.383 | | | $ | 0.385 | |
Net realized and unrealized gain (loss) | | | 0.003 | | | | 0.815 | | | | (0.143 | ) | | | 0.468 | | | | (0.299 | ) | | | (0.597 | ) |
| | | | | | |
Total income (loss) from operations | | $ | 0.171 | | | $ | 1.183 | | | $ | 0.255 | | | $ | 0.835 | | | $ | 0.084 | | | $ | (0.212 | ) |
| | | | | | |
| Less Distributions | | | | | | | | | | | | | | | | | | | | | | | | |
From net investment income | | $ | (0.161 | ) | | $ | (0.350 | ) | | $ | (0.385 | ) | | $ | (0.355 | ) | | $ | (0.374 | ) | | $ | (0.378 | ) |
Tax return of capital | | | — | | | | (0.003 | ) | | | — | | | | — | | | | — | | | | — | |
| | | | | | |
Total distributions | | $ | (0.161 | ) | | $ | (0.353 | ) | | $ | (0.385 | ) | | $ | (0.355 | ) | | $ | (0.374 | ) | | $ | (0.378 | ) |
| | | | | | |
Net asset value — End of period | | $ | 11.150 | | | $ | 11.140 | | | $ | 10.310 | | | $ | 10.440 | | | $ | 9.960 | | | $ | 10.250 | |
| | | | | | |
Total Return(2) | | | 1.54 | %(3) | | | 11.64 | % | | | 2.55 | % | | | 8.47 | % | | | 1.06 | % | | | (1.99 | )% |
| | | | | | |
| Ratios/Supplemental Data | | | | | | | | | | | | | | | | | | | | | | | | |
Net assets, end of period (000’s omitted) | | $ | 1,057 | | | $ | 1,451 | | | $ | 1,693 | | | $ | 3,086 | | | $ | 4,759 | | | $ | 7,416 | |
Ratios (as a percentage of average daily net assets): | | | | | | | | | | | | | | | | | | | | | | | | |
Expenses excluding interest and fees | | | 1.49 | %(4) | | | 1.49 | % | | | 1.50 | % | | | 1.50 | % | | | 1.55 | % | | | 1.51 | % |
Interest and fee expense(5) | | | 0.02 | %(4) | | | 0.02 | % | | | 0.02 | % | | | 0.01 | % | | | 0.06 | % | | | 0.14 | % |
Total expenses before custodian fee reduction | | | 1.51 | %(4) | | | 1.51 | % | | | 1.52 | % | | | 1.51 | % | | | 1.61 | % | | | 1.65 | % |
Expenses after custodian fee reduction excluding interest and fees | | | 1.49 | %(4) | | | 1.49 | % | | | 1.50 | % | | | 1.50 | % | | | 1.54 | % | | | 1.48 | % |
Net investment income | | | 2.98 | %(4) | | | 3.42 | % | | | 3.88 | % | | | 3.55 | % | | | 4.01 | % | | | 3.63 | % |
Portfolio Turnover | | | 2 | %(3) | | | 8 | % | | | 1 | % | | | 5 | % | | | 18 | % | | | 21 | % |
| (1) | Computed using average shares outstanding. |
| (2) | Returns are historical and are calculated by determining the percentage change in net asset value with all distributions reinvested and do not reflect the effect of sales charges. |
| (5) | Interest and fee expense relates to the liability for floating rate notes issued in conjunction with residual interest bond transactions (see Note 1I). |
| | | | |
| | 36 | | See Notes to Financial Statements. |
Eaton Vance
Municipal Income Funds
January 31, 2013
Financial Highlights — continued
| | | | | | | | | | | | | | | | | | | | | | | | |
| | | Arizona Fund — Class C | |
| | | Six Months Ended
January 31, 2013
(Unaudited) | | | Year Ended July 31, | |
| | | | 2012 | | | 2011 | | | 2010 | | | 2009 | | | 2008 | |
Net asset value — Beginning of period | | $ | 11.150 | | | $ | 10.320 | | | $ | 10.450 | | | $ | 9.970 | | | $ | 10.260 | | | $ | 10.840 | |
| | | | | | |
| Income (Loss) From Operations | | | | | | | | | | | | | | | | | | | | | | | | |
Net investment income(1) | | $ | 0.167 | | | $ | 0.366 | | | $ | 0.400 | | | $ | 0.367 | | | $ | 0.382 | | | $ | 0.382 | |
Net realized and unrealized gain (loss) | | | (0.006 | ) | | | 0.817 | | | | (0.144 | ) | | | 0.468 | | | | (0.298 | ) | | | (0.584 | ) |
| | | | | | |
Total income (loss) from operations | | $ | 0.161 | | | $ | 1.183 | | | $ | 0.256 | | | $ | 0.835 | | | $ | 0.084 | | | $ | (0.202 | ) |
| | | | | | |
| Less Distributions | | | | | | | | | | | | | | | | | | | | | | | | |
From net investment income | | $ | (0.161 | ) | | $ | (0.350 | ) | | $ | (0.386 | ) | | $ | (0.355 | ) | | $ | (0.374 | ) | | $ | (0.378 | ) |
Tax return of capital | | | — | | | | (0.003 | ) | | | — | | | | — | | | | — | | | | — | |
| | | | | | |
Total distributions | | $ | (0.161 | ) | | $ | (0.353 | ) | | $ | (0.386 | ) | | $ | (0.355 | ) | | $ | (0.374 | ) | | $ | (0.378 | ) |
| | | | | | |
Net asset value — End of period | | $ | 11.150 | | | $ | 11.150 | | | $ | 10.320 | | | $ | 10.450 | | | $ | 9.970 | | | $ | 10.260 | |
| | | | | | |
Total Return(2) | | | 1.45 | %(3) | | | 11.63 | % | | | 2.55 | % | | | 8.46 | % | | | 1.06 | % | | | (1.89 | )% |
| | | | | | |
| Ratios/Supplemental Data | | | | | | | | | | | | | | | | | | | | | | | | |
Net assets, end of period (000’s omitted) | | $ | 9,821 | | | $ | 9,602 | | | $ | 7,060 | | | $ | 8,765 | | | $ | 8,561 | | | $ | 8,481 | |
Ratios (as a percentage of average daily net assets): | | | | | | | | | | | | | | | | | | | | | | | | |
Expenses excluding interest and fees | | | 1.48 | %(4) | | | 1.49 | % | | | 1.50 | % | | | 1.50 | % | | | 1.55 | % | | | 1.51 | % |
Interest and fee expense(5) | | | 0.02 | %(4) | | | 0.02 | % | | | 0.02 | % | | | 0.01 | % | | | 0.06 | % | | | 0.14 | % |
Total expenses before custodian fee reduction | | | 1.50 | %(4) | | | 1.51 | % | | | 1.52 | % | | | 1.51 | % | | | 1.61 | % | | | 1.65 | % |
Expenses after custodian fee reduction excluding interest and fees | | | 1.48 | %(4) | | | 1.49 | % | | | 1.50 | % | | | 1.50 | % | | | 1.54 | % | | | 1.48 | % |
Net investment income | | | 2.97 | %(4) | | | 3.39 | % | | | 3.91 | % | | | 3.54 | % | | | 3.98 | % | | | 3.61 | % |
Portfolio Turnover | | | 2 | %(3) | | | 8 | % | | | 1 | % | | | 5 | % | | | 18 | % | | | 21 | % |
| (1) | Computed using average shares outstanding. |
| (2) | Returns are historical and are calculated by determining the percentage change in net asset value with all distributions reinvested and do not reflect the effect of sales charges. |
| (5) | Interest and fee expense relates to the liability for floating rate notes issued in conjunction with residual interest bond transactions (see Note 1I). |
| | | | |
| | 37 | | See Notes to Financial Statements. |
Eaton Vance
Municipal Income Funds
January 31, 2013
Financial Highlights — continued
| | | | | | | | | | | | |
| | | Arizona Fund — Class I | |
| | | Six Months Ended
January 31, 2013
(Unaudited) | | | Year Ended
July 31, 2012 | | | Period Ended
July 31, 2011(1) | |
Net asset value — Beginning of period | | $ | 10.020 | | | $ | 9.270 | | | $ | 9.400 | |
|
| Income (Loss) From Operations | |
Net investment income | | $ | 0.196 | (2) | | $ | 0.423 | (2) | | $ | 0.433 | |
Net realized and unrealized gain (loss) | | | 0.007 | | | | 0.736 | | | | (0.134 | ) |
| | | |
Total income from operations | | $ | 0.203 | | | $ | 1.159 | | | $ | 0.299 | |
|
| Less Distributions | |
From net investment income | | $ | (0.193 | ) | | $ | (0.406 | ) | | $ | (0.429 | ) |
Tax return of capital | | | — | | | | (0.003 | ) | | | — | |
| | | |
Total distributions | | $ | (0.193 | ) | | $ | (0.409 | ) | | $ | (0.429 | ) |
| | | |
Net asset value — End of period | | $ | 10.030 | | | $ | 10.020 | | | $ | 9.270 | |
| | | |
Total Return(3) | | | 2.04 | %(4) | | | 12.74 | % | | | 3.33 | %(4) |
|
| Ratios/Supplemental Data | |
Net assets, end of period (000’s omitted) | | $ | 9,226 | | | $ | 2,658 | | | $ | 1,397 | |
Ratios (as a percentage of average daily net assets): | | | | | | | | | | | | |
Expenses excluding interest and fees | | | 0.53 | %(5) | | | 0.54 | % | | | 0.55 | %(5) |
Interest and fee expense(6) | | | 0.02 | %(5) | | | 0.02 | % | | | 0.02 | %(5) |
Total expenses(7) | | | 0.55 | %(5) | | | 0.56 | % | | | 0.57 | %(5) |
Net investment income | | | 3.86 | %(5) | | | 4.35 | % | | | 4.65 | %(5) |
Portfolio Turnover | | | 2 | %(4) | | | 8 | % | | | 1 | %(8) |
| (1) | For the period from the commencement of operations on August 3, 2010 to July 31, 2011. |
| (2) | Computed using average shares outstanding. |
| (3) | Returns are historical and are calculated by determining the percentage change in net asset value with all distributions reinvested. |
| (6) | Interest and fee expense relates to the liability for floating rate notes issued in conjunction with residual interest bond transactions (see Note 1I). |
| (7) | Excludes the effect of custody fee credits, if any, of less than 0.005%. |
| (8) | For the year ended July 31, 2011. |
| | | | |
| | 38 | | See Notes to Financial Statements. |
Eaton Vance
Municipal Income Funds
January 31, 2013
Financial Highlights — continued
| | | | | | | | | | | | | | | | | | | | | | | | |
| | | Connecticut Fund — Class A | |
| | | Six Months Ended
January 31, 2013
(Unaudited) | | | Year Ended July 31, | |
| | | | 2012 | | | 2011 | | | 2010 | | | 2009 | | | 2008 | |
Net asset value — Beginning of period | | $ | 10.750 | | | $ | 10.050 | | | $ | 10.200 | | | $ | 9.750 | | | $ | 9.990 | | | $ | 10.530 | |
| | | | | | |
| Income (Loss) From Operations | | | | | | | | | | | | | | | | | | | | | | | | |
Net investment income(1) | | $ | 0.194 | | | $ | 0.415 | | | $ | 0.434 | | | $ | 0.425 | | | $ | 0.446 | | | $ | 0.446 | |
Net realized and unrealized gain (loss) | | | (0.071 | ) | | | 0.700 | | | | (0.154 | ) | | | 0.455 | | | | (0.241 | ) | | | (0.548 | ) |
| | | | | | |
Total income (loss) from operations | | $ | 0.123 | | | $ | 1.115 | | | $ | 0.280 | | | $ | 0.880 | | | $ | 0.205 | | | $ | (0.102 | ) |
| | | | | | |
| Less Distributions | | | | | | | | | | | | | | | | | | | | | | | | |
From net investment income | | $ | (0.193 | ) | | $ | (0.412 | ) | | $ | (0.430 | ) | | $ | (0.430 | ) | | $ | (0.445 | ) | | $ | (0.438 | ) |
Tax return of capital | | | — | | | | (0.003 | ) | | | — | | | | — | | | | — | | | | — | |
| | | | | | |
Total distributions | | $ | (0.193 | ) | | $ | (0.415 | ) | | $ | (0.430 | ) | | $ | (0.430 | ) | | $ | (0.445 | ) | | $ | (0.438 | ) |
| | | | | | |
Net asset value — End of period | | $ | 10.680 | | | $ | 10.750 | | | $ | 10.050 | | | $ | 10.200 | | | $ | 9.750 | | | $ | 9.990 | |
| | | | | | |
Total Return(2) | | | 1.15 | %(3) | | | 11.29 | % | | | 2.85 | % | | | 9.14 | % | | | 2.31 | % | | | (1.01 | )% |
| | | | | | |
| Ratios/Supplemental Data | | | | | | | | | | | | | | | | | | | | | | | | |
Net assets, end of period (000’s omitted) | | $ | 101,270 | | | $ | 101,699 | | | $ | 99,007 | | | $ | 110,955 | | | $ | 107,689 | | | $ | 103,906 | |
Ratios (as a percentage of average daily net assets): | | | | | | | | | | | | | | | | | | | | | | | | |
Expenses excluding interest and fees | | | 0.74 | %(4) | | | 0.75 | % | | | 0.75 | % | | | 0.76 | % | | | 0.80 | % | | | 0.77 | % |
Interest and fee expense(5) | | | 0.05 | %(4) | | | 0.05 | % | | | 0.05 | % | | | 0.05 | % | | | 0.15 | % | | | 0.35 | % |
Total expenses before custodian fee reduction | | | 0.79 | %(4) | | | 0.80 | % | | | 0.80 | % | | | 0.81 | % | | | 0.95 | % | | | 1.12 | % |
Expenses after custodian fee reduction excluding interest and fees | | | 0.74 | %(4) | | | 0.75 | % | | | 0.75 | % | | | 0.76 | % | | | 0.79 | % | | | 0.76 | % |
Net investment income | | | 3.58 | %(4) | | | 3.98 | % | | | 4.34 | % | | | 4.20 | % | | | 4.72 | % | | | 4.31 | % |
Portfolio Turnover | | | 6 | %(3) | | | 13 | % | | | 5 | % | | | 10 | % | | | 20 | % | | | 23 | % |
| (1) | Computed using average shares outstanding. |
| (2) | Returns are historical and are calculated by determining the percentage change in net asset value with all distributions reinvested and do not reflect the effect of sales charges. |
| (5) | Interest and fee expense relates to the liability for floating rate notes issued in conjunction with residual interest bond transactions (see Note 1I). |
| | | | |
| | 39 | | See Notes to Financial Statements. |
Eaton Vance
Municipal Income Funds
January 31, 2013
Financial Highlights — continued
| | | | | | | | | | | | | | | | | | | | | | | | |
| | | Connecticut Fund — Class B | |
| | | Six Months Ended
January 31, 2013
(Unaudited) | | | Year Ended July 31, | |
| | | | 2012 | | | 2011 | | | 2010 | | | 2009 | | | 2008 | |
Net asset value — Beginning of period | | $ | 10.700 | | | $ | 10.000 | | | $ | 10.160 | | | $ | 9.700 | | | $ | 9.940 | | | $ | 10.480 | |
| | | | | | |
| Income (Loss) From Operations | | | | | | | | | | | | | | | | | | | | | | | | |
Net investment income(1) | | $ | 0.153 | | | $ | 0.336 | | | $ | 0.356 | | | $ | 0.348 | | | $ | 0.375 | | | $ | 0.367 | |
Net realized and unrealized gain (loss) | | | (0.071 | ) | | | 0.699 | | | | (0.163 | ) | | | 0.465 | | | | (0.244 | ) | | | (0.552 | ) |
| | | | | | |
Total income (loss) from operations | | $ | 0.082 | | | $ | 1.035 | | | $ | 0.193 | | | $ | 0.813 | | | $ | 0.131 | | | $ | (0.185 | ) |
| | | | | | |
| Less Distributions | | | | | | | | | | | | | | | | | | | | | | | | |
From net investment income | | $ | (0.152 | ) | | $ | (0.333 | ) | | $ | (0.353 | ) | | $ | (0.353 | ) | | $ | (0.371 | ) | | $ | (0.355 | ) |
Tax return of capital | | | — | | | | (0.002 | ) | | | — | | | | — | | | | — | | | | — | |
| | | | | | |
Total distributions | | $ | (0.152 | ) | | $ | (0.335 | ) | | $ | (0.353 | ) | | $ | (0.353 | ) | | $ | (0.371 | ) | | $ | (0.355 | ) |
| | | | | | |
Net asset value — End of period | | $ | 10.630 | | | $ | 10.700 | | | $ | 10.000 | | | $ | 10.160 | | | $ | 9.700 | | | $ | 9.940 | |
| | | | | | |
Total Return(2) | | | 0.76 | %(3) | | | 10.49 | % | | | 1.98 | % | | | 8.46 | % | | | 1.53 | % | | | (1.80 | )% |
| | | | | | |
| Ratios/Supplemental Data | | | | | | | | | | | | | | | | | | | | | | | | |
Net assets, end of period (000’s omitted) | | $ | 2,308 | | | $ | 2,576 | | | $ | 2,927 | | | $ | 5,619 | | | $ | 8,387 | | | $ | 12,622 | |
Ratios (as a percentage of average daily net assets): | | | | | | | | | | | | | | | | | | | | | | | | |
Expenses excluding interest and fees | | | 1.49 | %(4) | | | 1.50 | % | | | 1.51 | % | | | 1.51 | % | | | 1.55 | % | | | 1.52 | % |
Interest and fee expense(5) | | | 0.05 | %(4) | | | 0.05 | % | | | 0.05 | % | | | 0.05 | % | | | 0.15 | % | | | 0.35 | % |
Total expenses before custodian fee reduction | | | 1.54 | %(4) | | | 1.55 | % | | | 1.56 | % | | | 1.56 | % | | | 1.70 | % | | | 1.87 | % |
Expenses after custodian fee reduction excluding interest and fees | | | 1.49 | %(4) | | | 1.50 | % | | | 1.51 | % | | | 1.51 | % | | | 1.54 | % | | | 1.51 | % |
Net investment income | | | 2.83 | %(4) | | | 3.24 | % | | | 3.57 | % | | | 3.46 | % | | | 3.99 | % | | | 3.56 | % |
Portfolio Turnover | | | 6 | %(3) | | | 13 | % | | | 5 | % | | | 10 | % | | | 20 | % | | | 23 | % |
| (1) | Computed using average shares outstanding. |
| (2) | Returns are historical and are calculated by determining the percentage change in net asset value with all distributions reinvested and do not reflect the effect of sales charges. |
| (5) | Interest and fee expense relates to the liability for floating rate notes issued in conjunction with residual interest bond transactions (see Note 1I). |
| | | | |
| | 40 | | See Notes to Financial Statements. |
Eaton Vance
Municipal Income Funds
January 31, 2013
Financial Highlights — continued
| | | | | | | | | | | | | | | | | | | | | | | | |
| | | Connecticut Fund — Class C | |
| | | Six Months Ended
January 31, 2013
(Unaudited) | | | Year Ended July 31, | |
| | | | 2012 | | | 2011 | | | 2010 | | | 2009 | | | 2008 | |
Net asset value — Beginning of period | | $ | 10.710 | | | $ | 10.010 | | | $ | 10.170 | | | $ | 9.710 | | | $ | 9.950 | | | $ | 10.480 | |
| | | | | | |
| Income (Loss) From Operations | | | | | | | | | | | | | | | | | | | | | | | | |
Net investment income(1) | | $ | 0.152 | | | $ | 0.335 | | | $ | 0.357 | | | $ | 0.347 | | | $ | 0.372 | | | $ | 0.366 | |
Net realized and unrealized gain (loss) | | | (0.070 | ) | | | 0.700 | | | | (0.163 | ) | | | 0.466 | | | | (0.240 | ) | | | (0.541 | ) |
| | | | | | |
Total income (loss) from operations | | $ | 0.082 | | | $ | 1.035 | | | $ | 0.194 | | | $ | 0.813 | | | $ | 0.132 | | | $ | (0.175 | ) |
| | | | | | |
| Less Distributions | | | | | | | | | | | | | | | | | | | | | | | | |
From net investment income | | $ | (0.152 | ) | | $ | (0.333 | ) | | $ | (0.354 | ) | | $ | (0.353 | ) | | $ | (0.372 | ) | | $ | (0.355 | ) |
Tax return of capital | | | — | | | | (0.002 | ) | | | — | | | | — | | | | — | | | | — | |
| | | | | | |
Total distributions | | $ | (0.152 | ) | | $ | (0.335 | ) | | $ | (0.354 | ) | | $ | (0.353 | ) | | $ | (0.372 | ) | | $ | (0.355 | ) |
| | | | | | |
Net asset value — End of period | | $ | 10.640 | | | $ | 10.710 | | | $ | 10.010 | | | $ | 10.170 | | | $ | 9.710 | | | $ | 9.950 | |
| | | | | | |
Total Return(2) | | | 0.76 | %(3) | | | 10.49 | % | | | 1.98 | % | | | 8.46 | % | | | 1.53 | % | | | (1.71 | )% |
| | | | | | |
| Ratios/Supplemental Data | | | | | | | | | | | | | | | | | | | | | | | | |
Net assets, end of period (000’s omitted) | | $ | 8,112 | | | $ | 7,766 | | | $ | 6,516 | | | $ | 7,684 | | | $ | 5,664 | | | $ | 3,827 | |
Ratios (as a percentage of average daily net assets): | | | | | | | | | | | | | | | | | | | | | | | | |
Expenses excluding interest and fees | | | 1.48 | %(4) | | | 1.50 | % | | | 1.50 | % | | | 1.51 | % | | | 1.55 | % | | | 1.52 | % |
Interest and fee expense(5) | | | 0.05 | %(4) | | | 0.05 | % | | | 0.05 | % | | | 0.05 | % | | | 0.15 | % | | | 0.35 | % |
Total expenses before custodian fee reduction | | | 1.53 | %(4) | | | 1.55 | % | | | 1.55 | % | | | 1.56 | % | | | 1.70 | % | | | 1.87 | % |
Expenses after custodian fee reduction excluding interest and fees | | | 1.48 | %(4) | | | 1.50 | % | | | 1.50 | % | | | 1.51 | % | | | 1.54 | % | | | 1.51 | % |
Net investment income | | | 2.82 | %(4) | | | 3.22 | % | | | 3.58 | % | | | 3.44 | % | | | 3.96 | % | | | 3.55 | % |
Portfolio Turnover | | | 6 | %(3) | | | 13 | % | | | 5 | % | | | 10 | % | | | 20 | % | | | 23 | % |
| (1) | Computed using average shares outstanding. |
| (2) | Returns are historical and are calculated by determining the percentage change in net asset value with all distributions reinvested and do not reflect the effect of sales charges. |
| (5) | Interest and fee expense relates to the liability for floating rate notes issued in conjunction with residual interest bond transactions (see Note 1I). |
| | | | |
| | 41 | | See Notes to Financial Statements. |
Eaton Vance
Municipal Income Funds
January 31, 2013
Financial Highlights — continued
| | | | | | | | | | | | | | | | | | | | | | | | |
| | | Connecticut Fund — Class I | |
| | | Six Months Ended
January 31, 2013
(Unaudited) | | | Year Ended July 31, | | | Period Ended
July 31, 2008(1) | |
| | | | 2012 | | | 2011 | | | 2010 | | | 2009 | | |
Net asset value — Beginning of period | | $ | 10.760 | | | $ | 10.050 | | | $ | 10.210 | | | $ | 9.750 | | | $ | 9.990 | | | $ | 9.780 | |
| | | | | | |
| Income (Loss) From Operations | | | | | | | | | | | | | | | | | | | | | | | | |
Net investment income | | $ | 0.205 | (2) | | $ | 0.438 | | | $ | 0.455 | (2) | | $ | 0.446 | (2) | | $ | 0.461 | (2) | | $ | 0.196 | (2) |
Net realized and unrealized gain (loss) | | | (0.081 | ) | | | 0.708 | | | | (0.165 | ) | | | 0.464 | | | | (0.237 | ) | | | 0.203 | |
| | | | | | |
Total income from operations | | $ | 0.124 | | | $ | 1.146 | | | $ | 0.290 | | | $ | 0.910 | | | $ | 0.224 | | | $ | 0.399 | |
| | | | | | |
| Less Distributions | | | | | | | | | | | | | | | | | | | | | | | | |
From net investment income | | $ | (0.204 | ) | | $ | (0.433 | ) | | $ | (0.450 | ) | | $ | (0.450 | ) | | $ | (0.464 | ) | | $ | (0.189 | ) |
Tax return of capital | | | — | | | | (0.003 | ) | | | — | | | | — | | | | — | | | | — | |
| | | | | | |
Total distributions | | $ | (0.204 | ) | | $ | (0.436 | ) | | $ | (0.450 | ) | | $ | (0.450 | ) | | $ | (0.464 | ) | | $ | (0.189 | ) |
| | | | | | |
Net asset value — End of period | | $ | 10.680 | | | $ | 10.760 | | | $ | 10.050 | | | $ | 10.210 | | | $ | 9.750 | | | $ | 9.990 | |
| | | | | | |
Total Return(3) | | | 1.15 | %(4) | | | 11.61 | % | | | 2.96 | % | | | 9.46 | % | | | 2.52 | % | | | 4.06 | %(4) |
| | | | | | |
| Ratios/Supplemental Data | | | | | | | | | | | | | | | | | | | | | | | | |
Net assets, end of period (000’s omitted) | | $ | 9,423 | | | $ | 10,701 | | | $ | 5,283 | | | $ | 6,684 | | | $ | 2,122 | | | $ | 10 | |
Ratios (as a percentage of average daily net assets): | | | | | | | | | | | | | | | | | | | | | | | | |
Expenses excluding interest and fees | | | 0.54 | %(5) | | | 0.54 | % | | | 0.56 | % | | | 0.56 | % | | | 0.60 | % | | | 0.58 | %(5) |
Interest and fee expense(6) | | | 0.05 | %(5) | | | 0.05 | % | | | 0.05 | % | | | 0.05 | % | | | 0.15 | % | | | 0.35 | %(5) |
Total expenses before custodian fee reduction | | | 0.59 | %(5) | | | 0.59 | % | | | 0.61 | % | | | 0.61 | % | | | 0.75 | % | | | 0.93 | %(5) |
Expenses after custodian fee reduction excluding interest and fees | | | 0.54 | %(5) | | | 0.54 | % | | | 0.56 | % | | | 0.56 | % | | | 0.59 | % | | | 0.56 | %(5) |
Net investment income | | | 3.79 | %(5) | | | 4.11 | % | | | 4.55 | % | | | 4.40 | % | | | 4.87 | % | | | 4.66 | %(5) |
Portfolio Turnover | | | 6 | %(4) | | | 13 | % | | | 5 | % | | | 10 | % | | | 20 | % | | | 23 | %(7) |
| (1) | For the period from the start of business, March 3, 2008, to July 31, 2008. |
| (2) | Computed using average shares outstanding. |
| (3) | Returns are historical and are calculated by determining the percentage change in net asset value with all distributions reinvested. |
| (6) | Interest and fee expense relates to the liability for floating rate notes issued in conjunction with residual interest bond transactions (see Note 1I). |
| (7) | For the year ended July 31, 2008. |
| | | | |
| | 42 | | See Notes to Financial Statements. |
Eaton Vance
Municipal Income Funds
January 31, 2013
Financial Highlights — continued
| | | | | | | | | | | | | | | | | | | | | | | | |
| | | Minnesota Fund — Class A | |
| | | Six Months Ended
January 31, 2013
(Unaudited) | | | Year Ended July 31, | |
| | | | 2012 | | | 2011 | | | 2010 | | | 2009 | | | 2008 | |
Net asset value — Beginning of period | | $ | 9.760 | | | $ | 9.160 | | | $ | 9.280 | | | $ | 8.900 | | | $ | 8.930 | | | $ | 9.280 | |
| | | | | | |
| Income (Loss) From Operations | | | | | | | | | | | | | | | | | | | | | | | | |
Net investment income(1) | | $ | 0.154 | | | $ | 0.341 | | | $ | 0.373 | | | $ | 0.375 | | | $ | 0.374 | | | $ | 0.382 | |
Net realized and unrealized gain (loss) | | | 0.049 | | | | 0.598 | | | | (0.123 | ) | | | 0.364 | | | | (0.028 | ) | | | (0.336 | ) |
| | | | | | |
Total income from operations | | $ | 0.203 | | | $ | 0.939 | | | $ | 0.250 | | | $ | 0.739 | | | $ | 0.346 | | | $ | 0.046 | |
| | | | | | |
| Less Distributions | | | | | | | | | | | | | | | | | | | | | | | | |
From net investment income | | $ | (0.153 | ) | | $ | (0.339 | ) | | $ | (0.370 | ) | | $ | (0.359 | ) | | $ | (0.376 | ) | | $ | (0.396 | ) |
| | | | | | |
Total distributions | | $ | (0.153 | ) | | $ | (0.339 | ) | | $ | (0.370 | ) | | $ | (0.359 | ) | | $ | (0.376 | ) | | $ | (0.396 | ) |
| | | | | | |
Net asset value — End of period | | $ | 9.810 | | | $ | 9.760 | | | $ | 9.160 | | | $ | 9.280 | | | $ | 8.900 | | | $ | 8.930 | |
| | | | | | |
Total Return(2) | | | 2.09 | %(3) | | | 10.41 | % | | | 2.80 | % | | | 8.40 | % | | | 4.15 | % | | | 0.51 | % |
| | | | | | |
| Ratios/Supplemental Data | | | | | | | | | | | | | | | | | | | | | | | | |
Net assets, end of period (000’s omitted) | | $ | 86,235 | | | $ | 86,725 | | | $ | 78,909 | | | $ | 89,036 | | | $ | 74,358 | | | $ | 69,234 | |
Ratios (as a percentage of average daily net assets): | | | | | | | | | | | | | | | | | | | | | | | | |
Expenses excluding interest and fees | | | 0.72 | %(4) | | | 0.72 | % | | | 0.74 | % | | | 0.73 | % | | | 0.79 | % | | | 0.75 | % |
Interest and fee expense(5) | | | — | | | | — | | | | — | | | | — | | | | — | | | | 0.10 | % |
Total expenses before custodian fee reduction | | | 0.72 | %(4) | | | 0.72 | % | | | 0.74 | % | | | 0.73 | % | | | 0.79 | % | | | 0.85 | % |
Expenses after custodian fee reduction excluding interest and fees | | | 0.72 | %(4) | | | 0.72 | % | | | 0.74 | % | | | 0.73 | % | | | 0.79 | % | | | 0.70 | % |
Net investment income | | | 3.12 | %(4) | | | 3.59 | % | | | 4.10 | % | | | 4.08 | % | | | 4.38 | % | | | 4.17 | % |
Portfolio Turnover | | | 2 | %(3) | | | 8 | % | | | 6 | % | | | 3 | % | | | 23 | % | | | 18 | % |
| (1) | Computed using average shares outstanding. |
| (2) | Returns are historical and are calculated by determining the percentage change in net asset value with all distributions reinvested and do not reflect the effect of sales charges. |
| (5) | Interest and fee expense relates to the liability for floating rate notes issued in conjunction with residual interest bond transactions (see Note 1I). |
| | | | |
| | 43 | | See Notes to Financial Statements. |
Eaton Vance
Municipal Income Funds
January 31, 2013
Financial Highlights — continued
| | | | | | | | | | | | | | | | | | | | | | | | |
| | | Minnesota Fund — Class B | |
| | | Six Months Ended
January 31, 2013
(Unaudited) | | | Year Ended July 31, | |
| | | | 2012 | | | 2011 | | | 2010 | | | 2009 | | | 2008 | |
Net asset value — Beginning of period | | $ | 10.500 | | | $ | 9.860 | | | $ | 9.990 | | | $ | 9.580 | | | $ | 9.600 | | | $ | 9.990 | |
| | | | | | |
| Income (Loss) From Operations | | | | | | | | | | | | | | | | | | | | | | | | |
Net investment income(1) | | $ | 0.126 | | | $ | 0.295 | | | $ | 0.327 | | | $ | 0.330 | | | $ | 0.334 | | | $ | 0.338 | |
Net realized and unrealized gain (loss) | | | 0.059 | | | | 0.633 | | | | (0.132 | ) | | | 0.393 | | | | (0.020 | ) | | | (0.376 | ) |
| | | | | | |
Total income (loss) from operations | | $ | 0.185 | | | $ | 0.928 | | | $ | 0.195 | | | $ | 0.723 | | | $ | 0.314 | | | $ | (0.038 | ) |
| | | | | | |
| Less Distributions | | | | | | | | | | | | | | | | | | | | | | | | |
From net investment income | | $ | (0.125 | ) | | $ | (0.288 | ) | | $ | (0.325 | ) | | $ | (0.313 | ) | | $ | (0.334 | ) | | $ | (0.352 | ) |
| | | | | | |
Total distributions | | $ | (0.125 | ) | | $ | (0.288 | ) | | $ | (0.325 | ) | | $ | (0.313 | ) | | $ | (0.334 | ) | | $ | (0.352 | ) |
| | | | | | |
Net asset value — End of period | | $ | 10.560 | | | $ | 10.500 | | | $ | 9.860 | | | $ | 9.990 | | | $ | 9.580 | | | $ | 9.600 | |
| | | | | | |
Total Return(2) | | | 1.77 | %(3) | | | 9.53 | % | | | 2.02 | % | | | 7.62 | % | | | 3.49 | % | | | (0.39 | )% |
| | | | | | |
| Ratios/Supplemental Data | | | | | | | | | | | | | | | | | | | | | | | | |
Net assets, end of period (000’s omitted) | | $ | 1,233 | | | $ | 1,323 | | | $ | 1,882 | | | $ | 4,038 | | | $ | 5,225 | | | $ | 6,962 | |
Ratios (as a percentage of average daily net assets): | | | | | | | | | | | | | | | | | | | | | | | | |
Expenses excluding interest and fees | | | 1.47 | %(4) | | | 1.47 | % | | | 1.50 | % | | | 1.49 | % | | | 1.54 | % | | | 1.50 | % |
Interest and fee expense(5) | | | — | | | | — | | | | — | | | | — | | | | — | | | | 0.10 | % |
Total expenses before custodian fee reduction | | | 1.47 | %(4) | | | 1.47 | % | | | 1.50 | % | | | 1.49 | % | | | 1.54 | % | | | 1.60 | % |
Expenses after custodian fee reduction excluding interest and fees | | | 1.47 | %(4) | | | 1.47 | % | | | 1.50 | % | | | 1.49 | % | | | 1.54 | % | | | 1.45 | % |
Net investment income | | | 2.37 | %(4) | | | 2.89 | % | | | 3.33 | % | | | 3.33 | % | | | 3.64 | % | | | 3.43 | % |
Portfolio Turnover | | | 2 | %(3) | | | 8 | % | | | 6 | % | | | 3 | % | | | 23 | % | | | 18 | % |
| (1) | Computed using average shares outstanding. |
| (2) | Returns are historical and are calculated by determining the percentage change in net asset value with all distributions reinvested and do not reflect the effect of sales charges. |
| (5) | Interest and fee expense relates to the liability for floating rate notes issued in conjunction with residual interest bond transactions (see Note 1I). |
| | | | |
| | 44 | | See Notes to Financial Statements. |
Eaton Vance
Municipal Income Funds
January 31, 2013
Financial Highlights — continued
| | | | | | | | | | | | | | | | | | | | | | | | |
| | | Minnesota Fund — Class C | |
| | | Six Months Ended
January 31, 2013
(Unaudited) | | | Year Ended July 31, | |
| | | | 2012 | | | 2011 | | | 2010 | | | 2009 | | | 2008 | |
Net asset value — Beginning of period | | $ | 10.490 | | | $ | 9.850 | | | $ | 9.980 | | | $ | 9.570 | | | $ | 9.620 | | | $ | 9.990 | |
| | | | | | |
| Income (Loss) From Operations | | | | | | | | | | | | | | | | | | | | | | | | |
Net investment income(1) | | $ | 0.126 | | | $ | 0.289 | | | $ | 0.327 | | | $ | 0.329 | | | $ | 0.333 | | | $ | 0.335 | |
Net realized and unrealized gain (loss) | | | 0.059 | | | | 0.639 | | | | (0.132 | ) | | | 0.394 | | | | (0.049 | ) | | | (0.353 | ) |
| | | | | | |
Total income (loss) from operations | | $ | 0.185 | | | $ | 0.928 | | | $ | 0.195 | | | $ | 0.723 | | | $ | 0.284 | | | $ | (0.018 | ) |
| | | | | | |
| Less Distributions | | | | | | | | | | | | | | | | | | | | | | | | |
From net investment income | | $ | (0.125 | ) | | $ | (0.288 | ) | | $ | (0.325 | ) | | $ | (0.313 | ) | | $ | (0.334 | ) | | $ | (0.352 | ) |
| | | | | | |
Total distributions | | $ | (0.125 | ) | | $ | (0.288 | ) | | $ | (0.325 | ) | | $ | (0.313 | ) | | $ | (0.334 | ) | | $ | (0.352 | ) |
| | | | | | |
Net asset value — End of period | | $ | 10.550 | | | $ | 10.490 | | | $ | 9.850 | | | $ | 9.980 | | | $ | 9.570 | | | $ | 9.620 | |
| | | | | | |
Total Return(2) | | | 1.77 | %(3) | | | 9.54 | % | | | 2.03 | % | | | 7.63 | % | | | 3.17 | % | | | (0.19 | )% |
| | | | | | |
| Ratios/Supplemental Data | | | | | | | | | | | | | | | | | | | | | | | | |
Net assets, end of period (000’s omitted) | | $ | 13,866 | | | $ | 12,955 | | | $ | 11,116 | | | $ | 15,291 | | | $ | 12,078 | | | $ | 8,569 | |
Ratios (as a percentage of average daily net assets): | | | | | | | | | | | | | | | | | | | | | | | | |
Expenses excluding interest and fees | | | 1.47 | %(4) | | | 1.47 | % | | | 1.50 | % | | | 1.48 | % | | | 1.55 | % | | | 1.50 | % |
Interest and fee expense(5) | | | — | | | | — | | | | — | | | | — | | | | — | | | | 0.10 | % |
Total expenses before custodian fee reduction | | | 1.47 | %(4) | | | 1.47 | % | | | 1.50 | % | | | 1.48 | % | | | 1.55 | % | | | 1.60 | % |
Expenses after custodian fee reduction excluding interest and fees | | | 1.47 | %(4) | | | 1.47 | % | | | 1.50 | % | | | 1.48 | % | | | 1.54 | % | | | 1.45 | % |
Net investment income | | | 2.36 | %(4) | | | 2.83 | % | | | 3.34 | % | | | 3.32 | % | | | 3.61 | % | | | 3.41 | % |
Portfolio Turnover | | | 2 | %(3) | | | 8 | % | | | 6 | % | | | 3 | % | | | 23 | % | | | 18 | % |
| (1) | Computed using average shares outstanding. |
| (2) | Returns are historical and are calculated by determining the percentage change in net asset value with all distributions reinvested and do not reflect the effect of sales charges. |
| (5) | Interest and fee expense relates to the liability for floating rate notes issued in conjunction with residual interest bond transactions (see Note 1I). |
| | | | |
| | 45 | | See Notes to Financial Statements. |
Eaton Vance
Municipal Income Funds
January 31, 2013
Financial Highlights — continued
| | | | | | | | | | | | |
| | | Minnesota Fund — Class I | |
| | | Six Months Ended
January 31, 2013
(Unaudited) | | | Year Ended
July 31, 2012 | | | Period Ended July 31, 2011(1) | |
Net asset value — Beginning of period | | $ | 9.760 | | | $ | 9.160 | | | $ | 9.290 | |
|
| Income (Loss) From Operations | |
Net investment income | | $ | 0.164 | (2) | | $ | 0.358 | | | $ | 0.385 | |
Net realized and unrealized gain (loss) | | | 0.059 | | | | 0.600 | | | | (0.130 | ) |
| | | |
Total income from operations | | $ | 0.223 | | | $ | 0.958 | | | $ | 0.255 | |
|
| Less Distributions | |
From net investment income | | $ | (0.163 | ) | | $ | (0.358 | ) | | $ | (0.385 | ) |
| | | |
Total distributions | | $ | (0.163 | ) | | $ | (0.358 | ) | | $ | (0.385 | ) |
| | | |
Net asset value — End of period | | $ | 9.820 | | | $ | 9.760 | | | $ | 9.160 | |
| | | |
Total Return(3) | | | 2.30 | %(4) | | | 10.63 | % | | | 2.86 | %(4) |
|
| Ratios/Supplemental Data | |
Net assets, end of period (000’s omitted) | | $ | 20,735 | | | $ | 21,608 | | | $ | 2,746 | |
Ratios (as a percentage of average daily net assets): | | | | | | | | | | | | |
Total expenses(5) | | | 0.52 | %(6) | | | 0.52 | % | | | 0.54 | %(6) |
Net investment income | | | 3.32 | %(6) | | | 3.54 | % | | | 4.28 | %(6) |
Portfolio Turnover | | | 2 | %(4) | | | 8 | % | | | 6 | %(7) |
| (1) | For the period from the commencement of operations on August 3, 2010 to July 31, 2011. |
| (2) | Computed using average shares outstanding. |
| (3) | Returns are historical and are calculated by determining the percentage change in net asset value with all distributions reinvested. |
| (5) | Excludes the effect of custody fee credits, if any, of less than 0.005%. |
| (7) | For the year ended July 31, 2011. |
| | | | |
| | 46 | | See Notes to Financial Statements. |
Eaton Vance
Municipal Income Funds
January 31, 2013
Financial Highlights — continued
| | | | | | | | | | | | | | | | | | | | | | | | |
| | | New Jersey Fund — Class A | |
| | | Six Months Ended
January 31, 2013
(Unaudited) | | | Year Ended July 31, | |
| | | | 2012 | | | 2011 | | | 2010 | | | 2009 | | | 2008 | |
Net asset value — Beginning of period | | $ | 9.580 | | | $ | 8.830 | | | $ | 9.220 | | | $ | 8.580 | | | $ | 9.500 | | | $ | 10.500 | |
| | | | | | |
| Income (Loss) From Operations | | | | | | | | | | | | | | | | | | | | | | | | |
Net investment income(1) | | $ | 0.191 | | | $ | 0.396 | | | $ | 0.444 | | | $ | 0.454 | | | $ | 0.457 | | | $ | 0.456 | |
Net realized and unrealized gain (loss) | | | 0.160 | | | | 0.748 | | | | (0.393 | ) | | | 0.627 | | | | (0.929 | ) | | | (0.977 | ) |
| | | | | | |
Total income (loss) from operations | | $ | 0.351 | | | $ | 1.144 | | | $ | 0.051 | | | $ | 1.081 | | | $ | (0.472 | ) | | $ | (0.521 | ) |
| | | | | | |
| Less Distributions | | | | | | | | | | | | | | | | | | | | | | | | |
From net investment income | | $ | (0.191 | ) | | $ | (0.394 | ) | | $ | (0.441 | ) | | $ | (0.441 | ) | | $ | (0.448 | ) | | $ | (0.462 | ) |
From net realized gain | | | — | | | | — | | | | — | | | | — | | | | — | | | | (0.017 | ) |
| | | | | | |
Total distributions | | $ | (0.191 | ) | | $ | (0.394 | ) | | $ | (0.441 | ) | | $ | (0.441 | ) | | $ | (0.448 | ) | | $ | (0.479 | ) |
| | | | | | |
Net asset value — End of period | | $ | 9.740 | | | $ | 9.580 | | | $ | 8.830 | | | $ | 9.220 | | | $ | 8.580 | | | $ | 9.500 | |
| | | | | | |
Total Return(2) | | | 3.69 | %(3) | | | 13.24 | % | | | 0.65 | % | | | 12.76 | % | | | (4.66 | )% | | | (5.04 | )% |
| | | | | | |
| Ratios/Supplemental Data | | | | | | | | | | | | | | | | | | | | | | | | |
Net assets, end of period (000’s omitted) | | $ | 171,675 | | | $ | 173,054 | | | $ | 171,001 | | | $ | 214,220 | | | $ | 215,406 | | | $ | 261,792 | |
Ratios (as a percentage of average daily net assets): | | | | | | | | | | | | | | | | | | | | | | | | |
Expenses excluding interest and fees | | | 0.75 | %(4) | | | 0.76 | % | | | 0.79 | % | | | 0.79 | % | | | 0.85 | % | | | 0.81 | % |
Interest and fee expense(5) | | | 0.07 | %(4) | | | 0.07 | % | | | 0.12 | % | | | 0.11 | % | | | 0.18 | % | | | 0.26 | % |
Total expenses before custodian fee reduction | | | 0.82 | %(4) | | | 0.83 | % | | | 0.91 | % | | | 0.90 | % | | | 1.03 | % | | | 1.07 | % |
Expenses after custodian fee reduction excluding interest and fees | | | 0.75 | %(4) | | | 0.76 | % | | | 0.79 | % | | | 0.79 | % | | | 0.85 | % | | | 0.80 | % |
Net investment income | | | 3.92 | %(4) | | | 4.31 | % | | | 5.00 | % | | | 4.98 | % | | | 5.48 | % | | | 4.57 | % |
Portfolio Turnover | | | 2 | %(3) | | | 15 | % | | | 1 | % | | | 13 | % | | | 35 | % | | | 47 | % |
| (1) | Computed using average shares outstanding. |
| (2) | Returns are historical and are calculated by determining the percentage change in net asset value with all distributions reinvested and do not reflect the effect of sales charges. |
| (5) | Interest and fee expense relates to the liability for floating rate notes issued in conjunction with residual interest bond transactions (see Note 1I). |
| | | | |
| | 47 | | See Notes to Financial Statements. |
Eaton Vance
Municipal Income Funds
January 31, 2013
Financial Highlights — continued
| | | | | | | | | | | | | | | | | | | | | | | | |
| | | New Jersey Fund — Class C | |
| | | Six Months Ended
January 31, 2013
(Unaudited) | | | Year Ended July 31, | |
| | | | 2012 | | | 2011 | | | 2010 | | | 2009 | | | 2008 | |
Net asset value — Beginning of period | | $ | 9.990 | | | $ | 9.210 | | | $ | 9.620 | | | $ | 8.960 | | | $ | 9.920 | | | $ | 10.950 | |
| | | | | | |
| Income (Loss) From Operations | | | | | | | | | | | | | | | | | | | | | | | | |
Net investment income(1) | | $ | 0.161 | | | $ | 0.340 | | | $ | 0.394 | | | $ | 0.402 | | | $ | 0.411 | | | $ | 0.394 | |
Net realized and unrealized gain (loss) | | | 0.180 | | | | 0.780 | | | | (0.413 | ) | | | 0.652 | | | | (0.972 | ) | | | (1.008 | ) |
| | | | | | |
Total income (loss) from operations | | $ | 0.341 | | | $ | 1.120 | | | $ | (0.019 | ) | | $ | 1.054 | | | $ | (0.561 | ) | | $ | (0.614 | ) |
| | | | | | |
| Less Distributions | | | | | | | | | | | | | | | | | | | | | | | | |
From net investment income | | $ | (0.161 | ) | | $ | (0.340 | ) | | $ | (0.391 | ) | | $ | (0.394 | ) | | $ | (0.399 | ) | | $ | (0.399 | ) |
From net realized gain | | | — | | | | — | | | | — | | | | — | | | | — | | | | (0.017 | ) |
| | | | | | |
Total distributions | | $ | (0.161 | ) | | $ | (0.340 | ) | | $ | (0.391 | ) | | $ | (0.394 | ) | | $ | (0.399 | ) | | $ | (0.416 | ) |
| | | | | | |
Net asset value — End of period | | $ | 10.170 | | | $ | 9.990 | | | $ | 9.210 | | | $ | 9.620 | | | $ | 8.960 | | | $ | 9.920 | |
| | | | | | |
Total Return(2) | | | 3.43 | %(3) | | | 12.37 | % | | | (0.13 | )% | | | 11.89 | % | | | (5.40 | )% | | | (5.68 | )% |
| | | | | | |
| Ratios/Supplemental Data | | | | | | | | | | | | | | | | | | | | | | | | |
Net assets, end of period (000’s omitted) | | $ | 30,257 | | | $ | 28,066 | | | $ | 24,768 | | | $ | 31,491 | | | $ | 26,165 | | | $ | 28,204 | |
Ratios (as a percentage of average daily net assets): | | | | | | | | | | | | | | | | | | | | | | | | |
Expenses excluding interest and fees | | | 1.49 | %(4) | | | 1.51 | % | | | 1.54 | % | | | 1.53 | % | | | 1.59 | % | | | 1.56 | % |
Interest and fee expense(5) | | | 0.07 | %(4) | | | 0.07 | % | | | 0.12 | % | | | 0.11 | % | | | 0.18 | % | | | 0.26 | % |
Total expenses before custodian fee reduction | | | 1.56 | %(4) | | | 1.58 | % | | | 1.66 | % | | | 1.64 | % | | | 1.77 | % | | | 1.82 | % |
Expenses after custodian fee reduction excluding interest and fees | | | 1.49 | %(4) | | | 1.51 | % | | | 1.54 | % | | | 1.53 | % | | | 1.59 | % | | | 1.55 | % |
Net investment income | | | 3.17 | %(4) | | | 3.55 | % | | | 4.25 | % | | | 4.21 | % | | | 4.73 | % | | | 3.79 | % |
Portfolio Turnover | | | 2 | %(3) | | | 15 | % | | | 1 | % | | | 13 | % | | | 35 | % | | | 47 | % |
| (1) | Computed using average shares outstanding. |
| (2) | Returns are historical and are calculated by determining the percentage change in net asset value with all distributions reinvested and do not reflect the effect of sales charges. |
| (5) | Interest and fee expense relates to the liability for floating rate notes issued in conjunction with residual interest bond transactions (see Note 1I). |
| | | | |
| | 48 | | See Notes to Financial Statements. |
Eaton Vance
Municipal Income Funds
January 31, 2013
Financial Highlights — continued
| | | | | | | | | | | | | | | | | | | | | | | | |
| | | New Jersey Fund — Class I | |
| | | Six Months Ended
January 31, 2013
(Unaudited) | | | Year Ended July 31, | | | Period Ended July 31, 2008(1) | |
| | | | 2012 | | | 2011 | | | 2010 | | | 2009 | | |
Net asset value —Beginning of period | | $ | 9.580 | | | $ | 8.830 | | | $ | 9.220 | | | $ | 8.580 | | | $ | 9.510 | | | $ | 9.180 | |
| | | | | | |
| Income (Loss) From Operations | | | | | | | | | | | | | | | | | | | | | | | | |
Net investment income(2) | | $ | 0.200 | | | $ | 0.412 | | | $ | 0.463 | | | $ | 0.473 | | | $ | 0.468 | | | $ | 0.190 | |
Net realized and unrealized gain (loss) | | | 0.171 | | | | 0.751 | | | | (0.394 | ) | | | 0.625 | | | | (0.933 | ) | | | 0.337 | |
| | | | | | |
Total income (loss) from operations | | $ | 0.371 | | | $ | 1.163 | | | $ | 0.069 | | | $ | 1.098 | | | $ | (0.465 | ) | | $ | 0.527 | |
| | | | | | |
| Less Distributions | | | | | | | | | | | | | | | | | | | | | | | | |
From net investment income | | $ | (0.201 | ) | | $ | (0.413 | ) | | $ | (0.459 | ) | | $ | (0.458 | ) | | $ | (0.465 | ) | | $ | (0.197 | ) |
| | | | | | |
Total distributions | | $ | (0.201 | ) | | $ | (0.413 | ) | | $ | (0.459 | ) | | $ | (0.458 | ) | | $ | (0.465 | ) | | $ | (0.197 | ) |
| | | | | | |
Net asset value — End of period | | $ | 9.750 | | | $ | 9.580 | | | $ | 8.830 | | | $ | 9.220 | | | $ | 8.580 | | | $ | 9.510 | |
| | | | | | |
Total Return(3) | | | 3.90 | %(4) | | | 13.46 | % | | | 0.85 | % | | | 12.96 | % | | | (4.56 | )% | | | 5.73 | %(4) |
| | | | | | |
| Ratios/Supplemental Data | | | | | | | | | | | | | | | | | | | | | | | | |
Net assets, end of period (000’s omitted) | | $ | 14,590 | | | $ | 10,922 | | | $ | 7,419 | | | $ | 8,386 | | | $ | 1,808 | | | $ | 10 | |
Ratios (as a percentage of average daily net assets): | | | | | | | | | | | | | | | | | | | | | | | | |
Expenses excluding interest and fees | | | 0.54 | %(5) | | | 0.56 | % | | | 0.59 | % | | | 0.58 | % | | | 0.65 | % | | | 0.61 | %(5) |
Interest and fee expense(6) | | | 0.07 | %(5) | | | 0.07 | % | | | 0.12 | % | | | 0.11 | % | | | 0.18 | % | | | 0.26 | %(5) |
Total expenses before custodian fee reduction | | | 0.61 | %(5) | | | 0.63 | % | | | 0.71 | % | | | 0.69 | % | | | 0.83 | % | | | 0.87 | %(5) |
Expenses after custodian fee reduction excluding interest and fees | | | 0.54 | %(5) | | | 0.56 | % | | | 0.59 | % | | | 0.58 | % | | | 0.65 | % | | | 0.60 | %(5) |
Net investment income | | | 4.11 | %(5) | | | 4.47 | % | | | 5.21 | % | | | 5.16 | % | | | 5.74 | % | | | 4.76 | %(5) |
Portfolio Turnover | | | 2 | %(4) | | | 15 | % | | | 1 | % | | | 13 | % | | | 35 | % | | | 47 | %(7) |
| (1) | For the period from the start of business, March 3, 2008, to July 31, 2008. |
| (2) | Computed using average shares outstanding. |
| (3) | Returns are historical and are calculated by determining the percentage change in net asset value with all distributions reinvested. |
| (6) | Interest and fee expense relates to the liability for floating rate notes issued in conjunction with residual interest bond transactions (see Note 1I). |
| (7) | For the year ended July 31, 2008. |
| | | | |
| | 49 | | See Notes to Financial Statements. |
Eaton Vance
Municipal Income Funds
January 31, 2013
Financial Highlights — continued
| | | | | | | | | | | | | | | | | | | | | | | | |
| | | Pennsylvania Fund — Class A | |
| | | Six Months Ended
January 31, 2013
(Unaudited) | | | Year Ended July 31, | |
| | | | 2012 | | | 2011 | | | 2010 | | | 2009 | | | 2008 | |
Net asset value — Beginning of period | | $ | 9.170 | | | $ | 8.800 | | | $ | 9.060 | | | $ | 8.650 | | | $ | 9.190 | | | $ | 9.970 | |
| | | | | | |
| Income (Loss) From Operations | | | | | | | | | | | | | | | | | | | | | | | | |
Net investment income(1) | | $ | 0.186 | | | $ | 0.380 | | | $ | 0.437 | | | $ | 0.431 | | | $ | 0.427 | | | $ | 0.440 | |
Net realized and unrealized gain (loss) | | | 0.159 | | | | 0.370 | | | | (0.262 | ) | | | 0.391 | | | | (0.539 | ) | | | (0.785 | ) |
| | | | | | |
Total income (loss) from operations | | $ | 0.345 | | | $ | 0.750 | | | $ | 0.175 | | | $ | 0.822 | | | $ | (0.112 | ) | | $ | (0.345 | ) |
| | | | | | |
| Less Distributions | | | | | | | | | | | | | | | | | | | | | | | | |
From net investment income | | $ | (0.185 | ) | | $ | (0.380 | ) | | $ | (0.435 | ) | | $ | (0.412 | ) | | $ | (0.428 | ) | | $ | (0.435 | ) |
| | | | | | |
Total distributions | | $ | (0.185 | ) | | $ | (0.380 | ) | | $ | (0.435 | ) | | $ | (0.412 | ) | | $ | (0.428 | ) | | $ | (0.435 | ) |
| | | | | | |
Net asset value — End of period | | $ | 9.330 | | | $ | 9.170 | | | $ | 8.800 | | | $ | 9.060 | | | $ | 8.650 | | | $ | 9.190 | |
| | | | | | |
Total Return(2) | | | 3.80 | %(3) | | | 8.70 | % | | | 2.07 | % | | | 9.60 | % | | | (0.87 | )% | | | (3.52 | )% |
| | | | | | |
| Ratios/Supplemental Data | | | | | | | | | | | | | | | | | | | | | | | | |
Net assets, end of period (000’s omitted) | | $ | 173,284 | | | $ | 179,909 | | | $ | 175,176 | | | $ | 210,024 | | | $ | 212,358 | | | $ | 229,953 | |
Ratios (as a percentage of average daily net assets): | | | | | | | | | | | | | | | | | | | | | | | | |
Expenses excluding interest and fees | | | 0.76 | %(4) | | | 0.77 | % | | | 0.80 | % | | | 0.79 | % | | | 0.82 | % | | | 0.81 | % |
Interest and fee expense(5) | | | 0.05 | %(4) | | | 0.05 | % | | | 0.10 | % | | | 0.09 | % | | | 0.29 | % | | | 0.42 | % |
Total expenses before custodian fee reduction | | | 0.81 | %(4) | | | 0.82 | % | | | 0.90 | % | | | 0.88 | % | | | 1.11 | % | | | 1.23 | % |
Expenses after custodian fee reduction excluding interest and fees | | | 0.76 | %(4) | | | 0.77 | % | | | 0.80 | % | | | 0.79 | % | | | 0.82 | % | | | 0.79 | % |
Net investment income | | | 3.99 | %(4) | | | 4.25 | % | | | 4.97 | % | | | 4.74 | % | | | 5.15 | % | | | 4.58 | % |
Portfolio Turnover | | | 6 | %(3) | | | 6 | % | | | 5 | % | | | 10 | % | | | 27 | % | | | 24 | % |
| (1) | Computed using average shares outstanding. |
| (2) | Returns are historical and are calculated by determining the percentage change in net asset value with all distributions reinvested and do not reflect the effect of sales charges. |
| (5) | Interest and fee expense relates to the liability for floating rate notes issued in conjunction with residual interest bond transactions (see Note 1I). |
| | | | |
| | 50 | | See Notes to Financial Statements. |
Eaton Vance
Municipal Income Funds
January 31, 2013
Financial Highlights — continued
| | | | | | | | | | | | | | | | | | | | | | | | |
| | | Pennsylvania Fund — Class B | |
| | | Six Months Ended
January 31, 2013
(Unaudited) | | | Year Ended July 31, | |
| | | | 2012 | | | 2011 | | | 2010 | | | 2009 | | | 2008 | |
Net asset value — Beginning of period | | $ | 9.490 | | | $ | 9.110 | | | $ | 9.380 | | | $ | 8.960 | | | $ | 9.500 | | | $ | 10.310 | |
| | | | | | |
| Income (Loss) From Operations | | | | | | | | | | | | | | | | | | | | | | | | |
Net investment income(1) | | $ | 0.157 | | | $ | 0.326 | | | $ | 0.384 | | | $ | 0.375 | | | $ | 0.379 | | | $ | 0.381 | |
Net realized and unrealized gain (loss) | | | 0.169 | | | | 0.377 | | | | (0.272 | ) | | | 0.404 | | | | (0.544 | ) | | | (0.818 | ) |
| | | | | | |
Total income (loss) from operations | | $ | 0.326 | | | $ | 0.703 | | | $ | 0.112 | | | $ | 0.779 | | | $ | (0.165 | ) | | $ | (0.437 | ) |
| | | | | | |
| Less Distributions | | | | | | | | | | | | | | | | | | | | | | | | |
From net investment income | | $ | (0.156 | ) | | $ | (0.323 | ) | | $ | (0.382 | ) | | $ | (0.359 | ) | | $ | (0.375 | ) | | $ | (0.373 | ) |
| | | | | | |
Total distributions | | $ | (0.156 | ) | | $ | (0.323 | ) | | $ | (0.382 | ) | | $ | (0.359 | ) | | $ | (0.375 | ) | | $ | (0.373 | ) |
| | | | | | |
Net asset value — End of period | | $ | 9.660 | | | $ | 9.490 | | | $ | 9.110 | | | $ | 9.380 | | | $ | 8.960 | | | $ | 9.500 | |
| | | | | | |
Total Return(2) | | | 3.45 | %(3) | | | 7.86 | % | | | 1.29 | % | | | 8.75 | % | | | (1.45 | )% | | | (4.30 | )% |
| | | | | | |
| Ratios/Supplemental Data | | | | | | | | | | | | | | | | | | | | | | | | |
Net assets, end of period (000’s omitted) | | $ | 5,922 | | | $ | 7,255 | | | $ | 10,191 | | | $ | 17,328 | | | $ | 22,120 | | | $ | 28,571 | |
Ratios (as a percentage of average daily net assets): | | | | | | | | | | | | | | | | | | | | | | | | |
Expenses excluding interest and fees | | | 1.52 | %(4) | | | 1.52 | % | | | 1.56 | % | | | 1.55 | % | | | 1.57 | % | | | 1.56 | % |
Interest and fee expense(5) | | | 0.05 | %(4) | | | 0.05 | % | | | 0.10 | % | | | 0.09 | % | | | 0.29 | % | | | 0.42 | % |
Total expenses before custodian fee reduction | | | 1.57 | %(4) | | | 1.57 | % | | | 1.66 | % | | | 1.64 | % | | | 1.86 | % | | | 1.98 | % |
Expenses after custodian fee reduction excluding interest and fees | | | 1.52 | %(4) | | | 1.52 | % | | | 1.56 | % | | | 1.55 | % | | | 1.57 | % | | | 1.54 | % |
Net investment income | | | 3.24 | %(4) | | | 3.52 | % | | | 4.22 | % | | | 3.99 | % | | | 4.41 | % | | | 3.83 | % |
Portfolio Turnover | | | 6 | %(3) | | | 6 | % | | | 5 | % | | | 10 | % | | | 27 | % | | | 24 | % |
| (1) | Computed using average shares outstanding. |
| (2) | Returns are historical and are calculated by determining the percentage change in net asset value with all distributions reinvested and do not reflect the effect of sales charges. |
| (5) | Interest and fee expense relates to the liability for floating rate notes issued in conjunction with residual interest bond transactions (see Note 1I). |
| | | | |
| | 51 | | See Notes to Financial Statements. |
Eaton Vance
Municipal Income Funds
January 31, 2013
Financial Highlights — continued
| | | | | | | | | | | | | | | | | | | | | | | | |
| | | Pennsylvania Fund — Class C | |
| | | Six Months Ended
January 31, 2013
(Unaudited) | | | Year Ended July 31, | |
| | | | 2012 | | | 2011 | | | 2010 | | | 2009 | | | 2008 | |
Net asset value — Beginning of period | | $ | 9.490 | | | $ | 9.110 | | | $ | 9.380 | | | $ | 8.960 | | | $ | 9.510 | | | $ | 10.320 | |
| | | | | | |
| Income (Loss) From Operations | | | | | | | | | | | | | | | | | | | | | | | | |
Net investment income(1) | | $ | 0.156 | | | $ | 0.324 | | | $ | 0.384 | | | $ | 0.375 | | | $ | 0.377 | | | $ | 0.380 | |
Net realized and unrealized gain (loss) | | | 0.170 | | | | 0.380 | | | | (0.271 | ) | | | 0.404 | | | | (0.551 | ) | | | (0.816 | ) |
| | | | | | |
Total income (loss) from operations | | $ | 0.326 | | | $ | 0.704 | | | $ | 0.113 | | | $ | 0.779 | | | $ | (0.174 | ) | | $ | (0.436 | ) |
| | | | | | |
| Less Distributions | | | | | | | | | | | | | | | | | | | | | | | | |
From net investment income | | $ | (0.156 | ) | | $ | (0.324 | ) | | $ | (0.383 | ) | | $ | (0.359 | ) | | $ | (0.376 | ) | | $ | (0.374 | ) |
| | | | | | |
Total distributions | | $ | (0.156 | ) | | $ | (0.324 | ) | | $ | (0.383 | ) | | $ | (0.359 | ) | | $ | (0.376 | ) | | $ | (0.374 | ) |
| | | | | | |
Net asset value — End of period | | $ | 9.660 | | | $ | 9.490 | | | $ | 9.110 | | | $ | 9.380 | | | $ | 8.960 | | | $ | 9.510 | |
| | | | | | |
Total Return(2) | | | 3.45 | %(3) | | | 7.86 | % | | | 1.30 | % | | | 8.75 | % | | | (1.55 | )% | | | (4.29 | )% |
| | | | | | |
| Ratios/Supplemental Data | | | | | | | | | | | | | | | | | | | | | | | | |
Net assets, end of period (000’s omitted) | | $ | 38,762 | | | $ | 38,268 | | | $ | 36,409 | | | $ | 46,080 | | | $ | 38,427 | | | $ | 33,457 | |
Ratios (as a percentage of average daily net assets): | | | | | | | | | | | | | | | | | | | | | | | | |
Expenses excluding interest and fees | | | 1.51 | %(4) | | | 1.52 | % | | | 1.55 | % | | | 1.54 | % | | | 1.57 | % | | | 1.56 | % |
Interest and fee expense(5) | | | 0.05 | %(4) | | | 0.05 | % | | | 0.10 | % | | | 0.09 | % | | | 0.29 | % | | | 0.42 | % |
Total expenses before custodian fee reduction | | | 1.56 | %(4) | | | 1.57 | % | | | 1.65 | % | | | 1.63 | % | | | 1.86 | % | | | 1.98 | % |
Expenses after custodian fee reduction excluding interest and fees | | | 1.51 | %(4) | | | 1.52 | % | | | 1.55 | % | | | 1.54 | % | | | 1.57 | % | | | 1.54 | % |
Net investment income | | | 3.23 | %(4) | | | 3.49 | % | | | 4.21 | % | | | 3.98 | % | | | 4.38 | % | | | 3.83 | % |
Portfolio Turnover | | | 6 | %(3) | | | 6 | % | | | 5 | % | | | 10 | % | | | 27 | % | | | 24 | % |
| (1) | Computed using average shares outstanding. |
| (2) | Returns are historical and are calculated by determining the percentage change in net asset value with all distributions reinvested and do not reflect the effect of sales charges. |
| (5) | Interest and fee expense relates to the liability for floating rate notes issued in conjunction with residual interest bond transactions (see Note 1I). |
| | | | |
| | 52 | | See Notes to Financial Statements. |
Eaton Vance
Municipal Income Funds
January 31, 2013
Financial Highlights — continued
| | | | | | | | | | | | | | | | | | | | | | | | |
| | | Pennsylvania Fund — Class I | |
| | | Six Months Ended
January 31, 2013
(Unaudited) | | | Year Ended July 31, | | | Period Ended July 31, 2008(1) | |
| | | | 2012 | | | 2011 | | | 2010 | | | 2009 | | |
Net asset value — Beginning of period | | $ | 9.200 | | | $ | 8.830 | | | $ | 9.100 | | | $ | 8.680 | | | $ | 9.200 | | | $ | 8.900 | |
| | | | | | |
| Income (Loss) From Operations | | | | | | | | | | | | | | | | | | | | | | | | |
Net investment income(2) | | $ | 0.195 | | | $ | 0.400 | | | $ | 0.456 | | | $ | 0.450 | | | $ | 0.442 | | | $ | 0.192 | |
Net realized and unrealized gain (loss) | | | 0.170 | | | | 0.369 | | | | (0.271 | ) | | | 0.401 | | | | (0.517 | ) | | | 0.297 | |
| | | | | | |
Total income (loss) from operations | | $ | 0.365 | | | $ | 0.769 | | | $ | 0.185 | | | $ | 0.851 | | | $ | (0.075 | ) | | $ | 0.489 | |
| | | | | | |
| Less Distributions | | | | | | | | | | | | | | | | | | | | | | | | |
From net investment income | | $ | (0.195 | ) | | $ | (0.399 | ) | | $ | (0.455 | ) | | $ | (0.431 | ) | | $ | (0.445 | ) | | $ | (0.189 | ) |
| | | | | | |
Total distributions | | $ | (0.195 | ) | | $ | (0.399 | ) | | $ | (0.455 | ) | | $ | (0.431 | ) | | $ | (0.445 | ) | | $ | (0.189 | ) |
| | | | | | |
Net asset value — End of period | | $ | 9.370 | | | $ | 9.200 | | | $ | 8.830 | | | $ | 9.100 | | | $ | 8.680 | | | $ | 9.200 | |
| | | | | | |
Total Return(3) | | | 4.01 | %(4) | | | 8.91 | % | | | 2.17 | % | | | 9.91 | % | | | (0.45 | )% | | | 5.49 | %(4) |
| | | | | | |
| Ratios/Supplemental Data | | | | | | | | | | | | | | | | | | | | | | | | |
Net assets, end of period (000’s omitted) | | $ | 39,519 | | | $ | 29,484 | | | $ | 30,082 | | | $ | 35,367 | | | $ | 22,621 | | | $ | 32 | |
Ratios (as a percentage of average daily net assets): | | | | | | | | | | | | | | | | | | | | | | | | |
Expenses excluding interest and fees | | | 0.56 | %(5) | | | 0.57 | % | | | 0.60 | % | | | 0.60 | % | | | 0.62 | % | | | 0.60 | %(5) |
Interest and fee expense(6) | | | 0.05 | %(5) | | | 0.05 | % | | | 0.10 | % | | | 0.09 | % | | | 0.29 | % | | | 0.42 | %(5) |
Total expenses before custodian fee reduction | | | 0.61 | %(5) | | | 0.62 | % | | | 0.70 | % | | | 0.69 | % | | | 0.91 | % | | | 1.02 | %(5) |
Expenses after custodian fee reduction excluding interest and fees | | | 0.56 | %(5) | | | 0.57 | % | | | 0.60 | % | | | 0.60 | % | | | 0.62 | % | | | 0.58 | %(5) |
Net investment income | | | 4.17 | %(5) | | | 4.45 | % | | | 5.16 | % | | | 4.93 | % | | | 5.37 | % | | | 4.98 | %(5) |
Portfolio Turnover | | | 6 | %(4) | | | 6 | % | | | 5 | % | | | 10 | % | | | 27 | % | | | 24 | %(7) |
| (1) | For the period from the start of business, March 3, 2008, to July 31, 2008. |
| (2) | Computed using average shares outstanding. |
| (3) | Returns are historical and are calculated by determining the percentage change in net asset value with all distributions reinvested. |
| (6) | Interest and fee expense relates to the liability for floating rate notes issued in conjunction with residual interest bond transactions (see Note 1I). |
| (7) | For the year ended July 31, 2008. |
| | | | |
| | 53 | | See Notes to Financial Statements. |
Eaton Vance
Municipal Income Funds
January 31, 2013
Notes to Financial Statements (Unaudited)
1 Significant Accounting Policies
Eaton Vance Municipals Trust (the Trust) is a Massachusetts business trust registered under the Investment Company Act of 1940, as amended (the 1940 Act), as an open-end management investment company. The Trust presently consists of twenty-two funds, five of which, each non-diversified, are included in these financial statements. They include Eaton Vance Arizona Municipal Income Fund (Arizona Fund), Eaton Vance Connecticut Municipal Income Fund (Connecticut Fund), Eaton Vance Minnesota Municipal Income Fund (Minnesota Fund), Eaton Vance New Jersey Municipal Income Fund (New Jersey Fund) and Eaton Vance Pennsylvania Municipal Income Fund (Pennsylvania Fund), (each individually referred to as the Fund, and collectively, the Funds). The Funds seek to provide current income exempt from regular federal income tax and from particular state or local income or other taxes. The New Jersey Fund offers three classes of shares and the Arizona Fund, Connecticut Fund, Minnesota Fund and Pennsylvania Fund offer four classes of shares. Class A shares are generally sold subject to a sales charge imposed at time of purchase. Class B and Class C shares are sold at net asset value and are generally subject to a contingent deferred sales charge (see Note 5). Class I shares are sold at net asset value and are not subject to a sales charge. Class B shares of each Fund automatically convert to Class A shares eight years after their purchase as described in each Fund’s prospectus. Beginning January 1, 2012, Class B shares are only available for purchase upon exchange from another Eaton Vance fund or through reinvestment of distributions. Each class represents a pro-rata interest in the Fund, but votes separately on class-specific matters and (as noted below) is subject to different expenses. Realized and unrealized gains and losses are allocated daily to each class of shares based on the relative net assets of each class to the total net assets of the Fund. Net investment income, other than class-specific expenses, is allocated daily to each class of shares based upon the ratio of the value of each class’s paid shares to the total value of all paid shares. Each class of shares differs in its distribution plan and certain other class-specific expenses.
The following is a summary of significant accounting policies of the Funds. The policies are in conformity with accounting principles generally accepted in the United States of America.
A Investment Valuation — Debt obligations (including short-term obligations with a remaining maturity of more than sixty days) are generally valued on the basis of valuations provided by third party pricing services, as derived from such services’ pricing models. Inputs to the models may include, but are not limited to, reported trades, executable bid and asked prices, broker/dealer quotations, prices or yields of securities with similar characteristics, benchmark curves or information pertaining to the issuer, as well as industry and economic events. The pricing services may use a matrix approach, which considers information regarding securities with similar characteristics to determine the valuation for a security. Short-term obligations purchased with a remaining maturity of sixty days or less are generally valued at amortized cost, which approximates market value. Financial futures contracts are valued at the closing settlement price established by the board of trade or exchange on which they are traded. Interest rate swaps are normally valued using valuations provided by a third party pricing service. Such pricing service valuations are based on the present value of fixed and projected floating rate cash flows over the term of the swap contract. Future cash flows are discounted to their present value using swap rates provided by electronic data services or by broker/dealers. Investments for which valuations or market quotations are not readily available or are deemed unreliable are valued at fair value using methods determined in good faith by or at the direction of the Trustees of a Fund in a manner that fairly reflects the security’s value, or the amount that the Fund might reasonably expect to receive for the security upon its current sale in the ordinary course. Each such determination is based on a consideration of relevant factors, which are likely to vary from one pricing context to another. These factors may include, but are not limited to, the type of security, the existence of any contractual restrictions on the security’s disposition, the price and extent of public trading in similar securities of the issuer or of comparable entities, quotations or relevant information obtained from broker/dealers or other market participants, information obtained from the issuer, analysts, and/or the appropriate stock exchange (for exchange-traded securities), an analysis of the entity’s financial condition, and an evaluation of the forces that influence the issuer and the market(s) in which the security is purchased and sold.
B Investment Transactions and Related Income — Investment transactions for financial statement purposes are accounted for on a trade date basis. Realized gains and losses on investments sold are determined on the basis of identified cost. Interest income is recorded on the basis of interest accrued, adjusted for amortization of premium or accretion of discount.
C Federal Taxes — Each Fund’s policy is to comply with the provisions of the Internal Revenue Code applicable to regulated investment companies and to distribute to shareholders each year substantially all of its taxable, if any, and tax-exempt net investment income, and all or substantially all of its net realized capital gains. Accordingly, no provision for federal income or excise tax is necessary. Each Fund intends to satisfy conditions which will enable it to designate distributions from the interest income generated by its investments in municipal obligations, which are exempt from regular federal income tax when received by each Fund, as exempt-interest dividends. The portion of such interest, if any, earned on private activity bonds issued after August 7, 1986, may be considered a tax preference item to shareholders.
At July 31, 2012, the following Funds, for federal income tax purposes, had capital loss carryforwards and deferred capital losses which will reduce the respective Fund’s taxable income arising from future net realized gains on investment transactions, if any, to the extent permitted by the Internal Revenue Code, and thus will reduce the amount of distributions to shareholders, which would otherwise be necessary to relieve the Funds of any liability for federal income or excise tax. The deferred capital losses are treated as arising on the first day of the Funds’ next taxable year and are treated as realized prior to
Eaton Vance
Municipal Income Funds
January 31, 2013
Notes to Financial Statements (Unaudited) — continued
the utilization of the capital loss carryforward. The amounts and expiration dates of the capital loss carryforwards and the amounts of the deferred capital losses are as follows:
| | | | | | | | | | | | | | | | | | | | |
| Expiration Date | | Arizona
Fund | | | Connecticut
Fund | | | Minnesota
Fund | | | New Jersey
Fund | | | Pennsylvania
Fund | |
| | | | | |
July 31, 2013 | | $ | 691,155 | | | $ | 374,997 | | | $ | 504,289 | | | $ | — | | | $ | 3,349,896 | |
July 31, 2014 | | | 736,704 | | | | — | | | | — | | | | — | | | | — | |
July 31, 2016 | | | 160,306 | | | | 329,657 | | | | 410,833 | | | | 3,716,712 | | | | 1,414,955 | |
July 31, 2017 | | | 997,387 | | | | 662,277 | | | | 566,758 | | | | 6,120,511 | | | | 5,414,612 | |
July 31, 2018 | | | 3,471,707 | | | | 2,387,746 | | | | 1,523,293 | | | | 20,873,952 | | | | 10,375,222 | |
July 31, 2019 | | | — | | | | 685,091 | | | | 723,202 | | | | 3,741,998 | | | | 10,492,996 | |
| | | | | |
Total capital loss carryforward | | $ | 6,057,259 | | | $ | 4,439,768 | | | $ | 3,728,375 | | | $ | 34,453,173 | | | $ | 31,047,681 | |
| | | | | |
Deferred capital losses | | $ | 383,051 | | | $ | 1,716,154 | | | $ | 956,506 | | | $ | 11,432,596 | | | $ | 16,004,278 | |
As of January 31, 2013, the Funds had no uncertain tax positions that would require financial statement recognition, de-recognition, or disclosure. Each Fund files a U.S. federal income tax return annually after its fiscal year-end, which is subject to examination by the Internal Revenue Service for a period of three years from the date of filing.
D Expenses — The majority of expenses of the Trust are directly identifiable to an individual fund. Expenses which are not readily identifiable to a specific fund are allocated taking into consideration, among other things, the nature and type of expense and the relative size of the funds.
E Expense Reduction — State Street Bank and Trust Company (SSBT) serves as custodian of the Funds. Pursuant to the custodian agreement, SSBT receives a fee reduced by credits, which are determined based on the average daily cash balance each Fund maintains with SSBT. All credit balances, if any, used to reduce each Fund’s custodian fees are reported as a reduction of expenses in the Statements of Operations.
F Legal Fees — Legal fees and other related expenses incurred as part of negotiations of the terms and requirement of capital infusions, or that are expected to result in the restructuring of, or a plan of reorganization for, an investment are recorded as realized losses. Ongoing expenditures to protect or enhance an investment are treated as operating expenses.
G Use of Estimates — The preparation of the financial statements in conformity with accounting principles generally accepted in the United States of America requires management to make estimates and assumptions that affect the reported amounts of assets and liabilities at the date of the financial statements and the reported amounts of income and expense during the reporting period. Actual results could differ from those estimates.
H Indemnifications — Under the Trust’s organizational documents, its officers and Trustees may be indemnified against certain liabilities and expenses arising out of the performance of their duties to the Funds. Under Massachusetts law, if certain conditions prevail, shareholders of a Massachusetts business trust (such as the Trust) could be deemed to have personal liability for the obligations of the Trust. However, the Trust’s Declaration of Trust contains an express disclaimer of liability on the part of Fund shareholders and the By-laws provide that the Trust shall assume the defense on behalf of any Fund shareholders. Moreover, the By-laws also provide for indemnification out of Fund property of any shareholder held personally liable solely by reason of being or having been a shareholder for all loss or expense arising from such liability. Additionally, in the normal course of business, each Fund enters into agreements with service providers that may contain indemnification clauses. Each Fund’s maximum exposure under these arrangements is unknown as this would involve future claims that may be made against each Fund that have not yet occurred.
I Floating Rate Notes Issued in Conjunction with Securities Held — The Funds may invest in residual interest bonds, also referred to as inverse floating rate securities, whereby a Fund may sell a variable or fixed rate bond to a broker for cash. At the same time, the Fund buys a residual interest in the assets and cash flows of a Special-Purpose Vehicle (the SPV), (which is generally organized as a trust), set up by the broker. The broker deposits a bond into the SPV with the same CUSIP number as the bond sold to the broker by the Fund, and which may have been, but is not required to be, the bond purchased from the Fund (the Bond). The SPV also issues floating rate notes (Floating Rate Notes) which are sold to third-parties. The residual interest bond held by a Fund gives the Fund the right (1) to cause the holders of the Floating Rate Notes to generally tender their notes at par, and (2) to have the broker transfer the Bond held by the SPV to the Fund, thereby terminating the SPV. Should the Fund exercise such right, it would generally pay the broker the par amount due on the Floating Rate Notes and exchange the residual interest bond for the underlying Bond. Pursuant to generally accepted accounting principles for transfers and servicing of financial assets and extinguishment of liabilities, the Funds account for the transaction described above as a secured borrowing by including the Bond in their Portfolio of Investments and the Floating Rate Notes as a liability under the caption “Payable for floating rate notes issued” in their Statement of Assets and Liabilities. The Floating Rate Notes have interest rates that generally reset weekly and their holders have the option to tender their notes to the broker for redemption at par at each reset date. Accordingly, the fair value of the payable for floating rate notes issued approximates its carrying value. If measured at fair value, the payable for floating rate notes would have been considered as Level 2 in the fair value
Eaton Vance
Municipal Income Funds
January 31, 2013
Notes to Financial Statements (Unaudited) — continued
hierarchy (see Note 11) at January 31, 2013. Interest expense related to the Funds’ liability with respect to Floating Rate Notes is recorded as incurred. The SPV may be terminated by the Fund, as noted above, or by the broker upon the occurrence of certain termination events as defined in the trust agreement, such as a downgrade in the credit quality of the underlying Bond, bankruptcy of or payment failure by the issuer of the underlying Bond, the inability to remarket Floating Rate Notes that have been tendered due to insufficient buyers in the market, or the failure by the SPV to obtain renewal of the liquidity agreement under which liquidity support is provided for the Floating Rate Notes up to one year. At January 31, 2013, the amounts of the Funds’ Floating Rate Notes and related interest rates and collateral were as follows:
| | | | | | | | | | | | | | | | |
| | | Arizona
Fund | | | Connecticut
Fund | | | New Jersey
Fund | | | Pennsylvania
Fund | |
| | | | |
Floating Rate Notes Outstanding | | $ | 1,700,000 | | | $ | 7,225,000 | | | $ | 21,020,000 | | | $ | 17,350,000 | |
Interest Rate or Range of Interest Rates (%) | | | 0.10 - 0.11 | | | | 0.10 - 0.11 | | | | 0.10 - 0.25 | | | | 0.11 - 0.25 | |
Collateral for Floating Rate Notes Outstanding | | $ | 3,016,581 | | | $ | 11,477,954 | | | $ | 29,968,887 | | | $ | 29,647,475 | |
For the six months ended January 31, 2013, the Funds’ average Floating Rate Notes outstanding and the average interest rate (annualized) including fees were as follows:
| | | | | | | | | | | | | | | | |
| | | Arizona
Fund | | | Connecticut
Fund | | | New Jersey
Fund | | | Pennsylvania
Fund | |
| | | | |
Average Floating Rate Notes Outstanding | | $ | 1,700,000 | | | $ | 7,225,000 | | | $ | 21,020,000 | | | $ | 17,350,000 | |
Average Interest Rate | | | 0.91 | % | | | 0.83 | % | | | 0.70 | % | | | 0.78 | % |
The Funds may enter into shortfall and forbearance agreements with the broker by which a Fund agrees to reimburse the broker, in certain circumstances, for the difference between the liquidation value of the Bond held by the SPV and the liquidation value of the Floating Rate Notes, as well as any shortfalls in interest cash flows. The Funds had no shortfalls as of January 31, 2013.
The Funds may also purchase residual interest bonds from brokers in a secondary market transaction without first owning the underlying bond. Such transactions are not required to be treated as secured borrowings. Shortfall agreements, if any, related to residual interest bonds purchased in a secondary market transaction are disclosed in the Portfolio of Investments.
The Funds’ investment policies and restrictions expressly permit investments in residual interest bonds. Such bonds typically offer the potential for yields exceeding the yields available on fixed rate bonds with comparable credit quality and maturity. These securities tend to underperform the market for fixed rate bonds in a rising long-term interest rate environment, but tend to outperform the market for fixed rate bonds when long-term interest rates decline. The value and income of residual interest bonds are generally more volatile than that of a fixed rate bond. The Funds’ investment policies do not allow the Funds to borrow money except as permitted by the 1940 Act. Management believes that the Funds’ restrictions on borrowing money and issuing senior securities (other than as specifically permitted) do not apply to Floating Rate Notes issued by the SPV and included as a liability in the Funds’ Statement of Assets and Liabilities. As secured indebtedness issued by an SPV, Floating Rate Notes are distinct from the borrowings and senior securities to which the Funds’ restrictions apply. Residual interest bonds held by the Funds are securities exempt from registration under Rule 144A of the Securities Act of 1933.
J Financial Futures Contracts — Upon entering into a financial futures contract, a Fund is required to deposit with the broker, either in cash or securities, an amount equal to a certain percentage of the purchase price (initial margin). Subsequent payments, known as variation margin, are made or received by the Fund each business day, depending on the daily fluctuations in the value of the underlying security, and are recorded as unrealized gains or losses by the Fund. Gains (losses) are realized upon the expiration or closing of the financial futures contracts. Should market conditions change unexpectedly, the Fund may not achieve the anticipated benefits of the financial futures contracts and may realize a loss. Futures contracts have minimal counterparty risk as they are exchange traded and the clearinghouse for the exchange is substituted as the counterparty, guaranteeing counterparty performance.
K Interest Rate Swaps — Pursuant to interest rate swap agreements, a Fund makes periodic payments at a fixed interest rate and, in exchange, receives payments based on the interest rate of a benchmark industry index. Payments received or made are recorded as realized gains or losses. During the term of the outstanding swap agreement, changes in the underlying value of the swap are recorded as unrealized gains or losses. The value of the swap is determined by changes in the relationship between two rates of interest. A Fund is exposed to credit loss in the event of non-performance by the swap counterparty. Risk may also arise from movements in interest rates.
L When-Issued Securities and Delayed Delivery Transactions — The Funds may purchase or sell securities on a delayed delivery or when-issued basis. Payment and delivery may take place after the customary settlement period for that security. At the time the transaction is negotiated, the price of the security that will be delivered is fixed. The Funds maintain security positions for these commitments such that sufficient liquid assets will be available to make payments upon settlement. Securities purchased on a delayed delivery or when-issued basis are marked-to-market daily and begin earning interest
Eaton Vance
Municipal Income Funds
January 31, 2013
Notes to Financial Statements (Unaudited) — continued
on settlement date. Losses may arise due to changes in the market value of the underlying securities or if the counterparty does not perform under the contract.
M Interim Financial Statements — The interim financial statements relating to January 31, 2013 and for the six months then ended have not been audited by an independent registered public accounting firm, but in the opinion of the Funds’ management, reflect all adjustments, consisting only of normal recurring adjustments, necessary for the fair presentation of the financial statements.
2 Distributions to Shareholders
The net investment income of each Fund is determined daily and substantially all of the net investment income so determined is declared as a dividend to shareholders of record at the time of declaration. Distributions are declared separately for each class of shares. Distributions are paid monthly. Distributions of realized capital gains (reduced by available capital loss carryforwards, if any) are made at least annually. Shareholders may reinvest income and capital gain distributions in additional shares of the same class of a Fund at the net asset value as of the reinvestment date or, at the election of the shareholder, receive distributions in cash. The Funds distinguish between distributions on a tax basis and a financial reporting basis. Accounting principles generally accepted in the United States of America require that only distributions in excess of tax basis earnings and profits be reported in the financial statements as a return of capital. Permanent differences between book and tax accounting relating to distributions are reclassified to paid-in capital. For tax purposes, distributions from short-term capital gains are considered to be from ordinary income.
3 Investment Adviser Fee and Other Transactions with Affiliates
The investment adviser fee is earned by Boston Management and Research (BMR), a subsidiary of Eaton Vance Management (EVM), as compensation for management and investment advisory services rendered to each Fund. The fee is based upon a percentage of average daily net assets plus a percentage of gross income (i.e., income other than gains from the sale of securities) as presented in the following table and is payable monthly.
| | | | | | | | |
| Daily Net Assets | | Annual Asset
Rate | | | Daily Income
Rate | |
| | |
Up to $20 million | | | 0.10 | % | | | 1.00 | % |
$20 million up to $40 million | | | 0.20 | | | | 2.00 | |
$40 million up to $500 million | | | 0.30 | | | | 3.00 | |
On average daily net assets of $500 million or more, the rates are reduced.
For the six months ended January 31, 2013, investment adviser fees incurred by the Funds and the effective annual rates, as a percentage of average daily net assets, were as follows:
| | | | | | | | | | | | | | | | | | | | |
| | | Arizona
Fund | | | Connecticut
Fund | | | Minnesota
Fund | | | New Jersey
Fund | | | Pennsylvania
Fund | |
| | | | | |
Investment Adviser Fee | | $ | 131,958 | | | $ | 218,591 | | | $ | 213,251 | | | $ | 430,761 | | | $ | 518,195 | |
Effective Annual Rate | | | 0.32 | % | | | 0.36 | % | | | 0.35 | % | | | 0.40 | % | | | 0.41 | % |
EVM serves as administrator of each Fund, but receives no compensation. EVM serves as the sub-transfer agent of each Fund and receives from the transfer agent an aggregate fee based upon the actual expenses incurred by EVM in the performance of these services. Eaton Vance Distributors, Inc. (EVD), an affiliate of EVM and the Funds’ principal underwriter, received a portion of the sales charge on sales of Class A shares of the Funds. EVD also received distribution and service fees from Class A, Class B and Class C shares (see Note 4) and contingent deferred sales charges (see Note 5). Sub-transfer agent fees earned by EVM and Class A sales charges that the Funds were informed were received by EVD for the six months ended January 31, 2013 were as follows:
| | | | | | | | | | | | | | | | | | | | |
| | | Arizona
Fund | | | Connecticut
Fund | | | Minnesota
Fund | | | New Jersey
Fund | | | Pennsylvania
Fund | |
| | | | | |
EVM’s Sub-Transfer Agent Fees | | $ | 857 | | | $ | 1,928 | | | $ | 1,701 | | | $ | 3,005 | | | $ | 4,123 | |
EVD’s Class A Sales Charges | | $ | 8,906 | | | $ | 7,475 | | | $ | 5,713 | | | $ | 14,040 | | | $ | 21,350 | |
Eaton Vance
Municipal Income Funds
January 31, 2013
Notes to Financial Statements (Unaudited) — continued
Trustees and officers of the Funds who are members of EVM’s or BMR’s organizations receive remuneration for their services to the Funds out of the investment adviser fee. Trustees of the Funds who are not affiliated with the investment adviser may elect to defer receipt of all or a percentage of their annual fees in accordance with the terms of the Trustees Deferred Compensation Plan. For the six months ended January 31, 2013, no significant amounts have been deferred. Certain officers and Trustees of the Funds are officers of the above organizations.
4 Distribution Plans
Each Fund has in effect a distribution plan for Class A shares (Class A Plan) pursuant to Rule 12b-1 under the 1940 Act. The Class A Plan provides that each Fund will pay EVD a distribution and service fee not exceeding 0.25% per annum of its average daily net assets attributable to Class A shares for distribution services and facilities provided to each Fund by EVD, as well as for personal services and/or the maintenance of shareholder accounts. The Trustees approved distribution and service fee payments equal to 0.20% per annum of each Fund’s average daily net assets attributable to Class A shares. Distribution and service fees paid or accrued to EVD for the six months ended January 31, 2013 for Class A shares amounted to the following:
| | | | | | | | | | | | | | | | | | | | |
| | | Arizona
Fund | | | Connecticut
Fund | | | Minnesota
Fund | | | New Jersey
Fund | | | Pennsylvania
Fund | |
| | | | | |
Class A Distribution and Service Fees | | $ | 63,317 | | | $ | 102,332 | | | $ | 86,676 | | | $ | 174,477 | | | $ | 178,819 | |
Each Fund also has in effect distribution plans for Class B shares (Class B Plan) and Class C shares (Class C Plan) pursuant to Rule 12b-1 under the 1940 Act. Pursuant to the Class B and Class C Plans, each Fund pays EVD amounts equal to 0.75% per annum of its average daily net assets attributable to Class B and Class C shares for providing ongoing distribution services and facilities to the respective Funds. Each Fund will automatically discontinue payments to EVD during any period in which there are no outstanding Uncovered Distribution Charges, which are equivalent to the sum of (i) 5% and 6.25% of the aggregate amount received by each Fund for Class B and Class C shares sold, respectively, plus (ii) interest calculated by applying the rate of 1% over the prevailing prime rate to the outstanding balance of Uncovered Distribution Charges of EVD of each respective class, reduced by the aggregate amount of contingent deferred sales charges (see Note 5) and amounts theretofore paid or payable to EVD by each respective class. For the six months ended January 31, 2013, the Funds paid or accrued to EVD the following distribution fees, representing 0.75% (annualized) of the average daily net assets of each Fund’s Class B and Class C shares:
| | | | | | | | | | | | | | | | | | | | |
| | | Arizona
Fund | | | Connecticut
Fund | | | Minnesota
Fund | | | New Jersey
Fund | | | Pennsylvania
Fund | |
| | | | | |
Class B Distribution Fees | | $ | 4,893 | | | $ | 9,536 | | | $ | 4,810 | | | $ | — | | | $ | 24,946 | |
Class C Distribution Fees | | $ | 36,447 | | | $ | 30,049 | | | $ | 50,789 | | | $ | 110,029 | | | $ | 143,873 | |
At January 31, 2013, the amounts of Uncovered Distribution Charges of EVD calculated under the Class B and Class C Plans were approximately as follows:
| | | | | | | | | | | | | | | | | | | | |
| | | Arizona
Fund | | | Connecticut
Fund | | | Minnesota
Fund | | | New Jersey
Fund | | | Pennsylvania
Fund | |
| | | | | |
Class B | | $ | 989,000 | | | $ | 1,126,000 | | | $ | 727,000 | | | $ | — | | | $ | 1,112,000 | |
Class C | | $ | 1,000,000 | | | $ | 656,000 | | | $ | 832,000 | | | $ | 3,192,000 | | | $ | 3,413,000 | |
The Class B and Class C Plans also authorize the Funds to make payments of service fees to EVD, financial intermediaries and other persons in amounts not exceeding 0.25% per annum of the average daily net assets attributable to that class. The Trustees approved service fee payments equal to 0.20% per annum of each Fund’s average daily net assets attributable to Class B and Class C shares. Service fees paid or accrued are for personal services and/or the maintenance of shareholder accounts. They are separate and distinct from the Class B and Class C sales commissions and distribution fees and, as such, are not subject to automatic discontinuance when there are no outstanding Uncovered Distribution Charges of EVD. Service fees paid or accrued for the six months ended January 31, 2013 amounted to the following:
| | | | | | | | | | | | | | | | | | | | |
| | | Arizona
Fund | | | Connecticut
Fund | | | Minnesota
Fund | | | New Jersey
Fund | | | Pennsylvania
Fund | |
| | | | | |
Class B Service Fees | | $ | 1,305 | | | $ | 2,543 | | | $ | 1,283 | | | $ | — | | | $ | 6,652 | |
Class C Service Fees | | $ | 9,719 | | | $ | 8,013 | | | $ | 13,544 | | | $ | 29,341 | | | $ | 38,366 | |
Eaton Vance
Municipal Income Funds
January 31, 2013
Notes to Financial Statements (Unaudited) — continued
5 Contingent Deferred Sales Charges
A contingent deferred sales charge (CDSC) generally is imposed on redemptions of Class B shares made within six years of purchase and on redemptions of Class C shares made within one year of purchase. Class A shares may be subject to a 1% CDSC if redeemed within eighteen months of purchase (depending on the circumstances of purchase). Generally, the CDSC is based upon the lower of the net asset value at date of redemption or date of purchase. No charge is levied on shares acquired by reinvestment of dividends or capital gain distributions. The CDSC for Class B shares is imposed at declining rates that begin at 5% in the case of redemptions in the first and second year after purchase, declining one percentage point each subsequent year. Class C shares are subject to a 1% CDSC if redeemed within one year of purchase. No CDSC is levied on shares which have been sold to EVM or its affiliates or to their respective employees or clients and may be waived under certain other limited conditions. CDSCs received on Class B and Class C redemptions are paid to EVD to reduce the amount of Uncovered Distribution Charges calculated under each Fund’s Class B and Class C Plans. CDSCs received on Class B and Class C redemptions when no Uncovered Distribution Charges exist are credited to each Fund. For the six months ended January 31, 2013, the Funds were informed that EVD received approximately the following amounts of CDSCs paid by Class A, Class B and Class C shareholders:
| | | | | | | | | | | | | | | | | | | | |
| | | Arizona
Fund | | | Connecticut
Fund | | | Minnesota
Fund | | | New Jersey
Fund | | | Pennsylvania
Fund | |
| | | | | |
Class A | | $ | 100 | | | $ | — | | | $ | — | | | $ | 200 | | | $ | 50 | |
Class B | | $ | 3,000 | | | $ | 600 | | | $ | — | | | $ | — | | | $ | 5,800 | |
Class C | | $ | 2,000 | | | $ | 500 | | | $ | 200 | | | $ | 600 | | | $ | 100 | |
6 Purchases and Sales of Investments
Purchases and sales of investments, other than short-term obligations, for the six months ended January 31, 2013 were as follows:
| | | | | | | | | | | | | | | | | | | | |
| | | Arizona
Fund | | | Connecticut
Fund | | | Minnesota
Fund | | | New Jersey
Fund | | | Pennsylvania
Fund | |
| | | | | |
Purchases | | $ | 6,812,998 | | | $ | 7,269,029 | | | $ | 2,169,959 | | | $ | 3,933,876 | | | $ | 14,914,489 | |
Sales | | $ | 1,432,358 | | | $ | 10,156,749 | | | $ | 3,543,531 | | | $ | 9,262,229 | | | $ | 20,884,012 | |
7 Shares of Beneficial Interest
Each Fund’s Declaration of Trust permits the Trustees to issue an unlimited number of full and fractional shares of beneficial interest (without par value). Such shares may be issued in a number of different series (such as the Funds) and classes. Transactions in Fund shares were as follows:
| | | | | | | | | | | | | | | | |
Arizona Fund | | | | | | | | | | | | |
| | | Six Months Ended January 31, 2013 (Unaudited) | |
| | | Class A | | | Class B | | | Class C | | | Class I | |
| | | | |
Sales | | | 353,435 | | | | 70 | | | | 87,320 | | | | 698,923 | |
Issued to shareholders electing to receive payments of distributions in Fund shares | | | 92,490 | | | | 1,365 | | | | 11,535 | | | | 2,623 | |
Redemptions | | | (371,701 | ) | | | (18,378 | ) | | | (79,564 | ) | | | (46,659 | ) |
Exchange from Class B shares | | | 20,467 | | | | — | | | | — | | | | — | |
Exchange to Class A shares | | | — | | | | (18,410 | ) | | | — | | | | — | |
| | | | |
Net increase (decrease) | | | 94,691 | | | | (35,353 | ) | | | 19,291 | | | | 654,887 | |
Eaton Vance
Municipal Income Funds
January 31, 2013
Notes to Financial Statements (Unaudited) — continued
| | | | | | | | | | | | | | | | |
| | | Year Ended July 31, 2012 | |
| | | Class A | | | Class B | | | Class C | | | Class I | |
| | | | |
Sales | | | 488,702 | | | | 3,500 | | | | 263,330 | | | | 294,161 | |
Issued to shareholders electing to receive payments of distributions in Fund shares | | | 194,859 | | | | 3,483 | | | | 21,591 | | | | 6,610 | |
Redemptions | | | (1,693,861 | ) | | | (12,712 | ) | | | (107,712 | ) | | | (186,134 | ) |
Exchange from Class B shares | | | 31,361 | | | | — | | | | — | | | | — | |
Exchange to Class A shares | | | — | | | | (28,217 | ) | | | — | | | | — | |
| | | | |
Net increase (decrease) | | | (978,939 | ) | | | (33,946 | ) | | | 177,209 | | | | 114,637 | |
| | | | |
| | | | | | | | | | | | | | | | |
Connecticut Fund | | | | | | | | | | | | |
| | | Six Months Ended January 31, 2013 (Unaudited) | |
| | | Class A | | | Class B | | | Class C | | | Class I | |
| | | | |
Sales | | | 446,289 | | | | 882 | | | | 110,480 | | | | 200,131 | |
Issued to shareholders electing to receive payments of distributions in Fund shares | | | 134,748 | | | | 2,036 | | | | 6,668 | | | | 9,497 | |
Redemptions | | | (570,185 | ) | | | (9,297 | ) | | | (79,466 | ) | | | (322,163 | ) |
Exchange from Class B shares | | | 17,018 | | | | — | | | | — | | | | — | |
Exchange to Class A shares | | | — | | | | (17,099 | ) | | | — | | | | — | |
| | | | |
Net increase (decrease) | | | 27,870 | | | | (23,478 | ) | | | 37,682 | | | | (112,535 | ) |
| | | | |
| | | | | | | | | | | | | | | | |
| | | Year Ended July 31, 2012 | |
| | | Class A | | | Class B | | | Class C | | | Class I | |
| | | | |
Sales | | | 536,260 | | | | 40,133 | | | | 146,502 | | | | 700,991 | |
Issued to shareholders electing to receive payments of distributions in Fund shares | | | 285,898 | | | | 5,585 | | | | 14,966 | | | | 16,208 | |
Redemptions | | | (1,301,521 | ) | | | (12,557 | ) | | | (87,360 | ) | | | (247,894 | ) |
Exchange from Class B shares | | | 84,695 | | | | — | | | | — | | | | — | |
Exchange to Class A shares | | | — | | | | (85,096 | ) | | | — | | | | — | |
| | | | |
Net increase (decrease) | | | (394,668 | ) | | | (51,935 | ) | | | 74,108 | | | | 469,305 | |
| | | | |
| | | | | | | | | | | | | | | | |
Minnesota Fund | | | | | | | | | | | | |
| | | Six Months Ended January 31, 2013 (Unaudited) | |
| | | Class A | | | Class B | | | Class C | | | Class I | |
| | | | |
Sales | | | 803,389 | | | | — | | | | 176,180 | | | | 754,531 | |
Issued to shareholders electing to receive payments of distributions in Fund shares | | | 127,754 | | | | 1,232 | | | | 12,952 | | | | 5,759 | |
Redemptions | | | (1,034,991 | ) | | | (6,842 | ) | | | (109,677 | ) | | | (861,823 | ) |
Exchange from Class B shares | | | 3,868 | | | | — | | | | — | | | | — | |
Exchange to Class A shares | | | — | | | | (3,594 | ) | | | — | | | | — | |
| | | | |
Net increase (decrease) | | | (99,980 | ) | | | (9,204 | ) | | | 79,455 | | | | (101,533 | ) |
Eaton Vance
Municipal Income Funds
January 31, 2013
Notes to Financial Statements (Unaudited) — continued
| | | | | | | | | | | | | | | | |
| | | Year Ended July 31, 2012 | |
| | | Class A | | | Class B | | | Class C | | | Class I | |
| | | | |
Sales | | | 1,343,926 | | | | 4,104 | | | | 292,066 | | | | 2,087,670 | |
Issued to shareholders electing to receive payments of distributions in Fund shares | | | 273,612 | | | | 4,022 | | | | 26,799 | | | | 8,939 | |
Redemptions | | | (1,405,269 | ) | | | (15,647 | ) | | | (212,646 | ) | | | (182,175 | ) |
Exchange from Class B shares | | | 61,757 | | | | — | | | | — | | | | — | |
Exchange to Class A shares | | | — | | | | (57,392 | ) | | | — | | | | — | |
| | | | |
Net increase (decrease) | | | 274,026 | | | | (64,913 | ) | | | 106,219 | | | | 1,914,434 | |
| | | | |
| | | | | | | | | | | | | | | | |
New Jersey Fund | | | | | | | | | | | | |
| | | Six Months Ended January 31, 2013 (Unaudited) | |
| | | Class A | | | Class B | | | Class C | | | Class I | |
| | | | |
Sales | | | 482,795 | | | | — | | | | 328,009 | | | | 437,130 | |
Issued to shareholders electing to receive payments of distributions in Fund shares | | | 285,826 | | | | — | | | | 32,431 | | | | 13,093 | |
Redemptions | | | (1,222,464 | ) | | | — | | | | (193,492 | ) | | | (93,637 | ) |
| | | | |
Net increase (decrease) | | | (453,843 | ) | | | — | | | | 166,948 | | | | 356,586 | |
| | | | |
| | | | | | | | | | | | | | | | |
| | | Year Ended July 31, 2012 | |
| | | Class A | | | Class B | | | Class C | | | Class I | |
| | | | |
Sales | | | 1,167,863 | | | | — | | | | 489,053 | | | | 644,451 | |
Issued to shareholders electing to receive payments of distributions in Fund shares | | | 617,925 | | | | — | | | | 63,909 | | | | 18,249 | |
Redemptions | | | (3,082,371 | ) | | | — | | | | (432,689 | ) | | | (362,596 | ) |
| | | | |
Net increase (decrease) | | | (1,296,583 | ) | | | — | | | | 120,273 | | | | 300,104 | |
| | | | |
| | | | | | | | | | | | | | | | |
Pennsylvania Fund | | | | | | | | | | | | |
| | | Six Months Ended January 31, 2013 (Unaudited) | |
| | | Class A | | | Class B | | | Class C | | | Class I | |
| | | | |
Sales | | | 550,680 | | | | 783 | | | | 269,419 | | | | 1,191,605 | |
Issued to shareholders electing to receive payments of distributions in Fund shares | | | 325,825 | | | | 9,958 | | | | 55,328 | | | | 18,247 | |
Redemptions | | | (2,006,259 | ) | | | (90,805 | ) | | | (344,556 | ) | | | (195,094 | ) |
Exchange from Class B shares | | | 73,908 | | | | — | | | | — | | | | — | |
Exchange to Class A shares | | | — | | | | (71,380 | ) | | | — | | | | — | |
| | | | |
Net increase (decrease) | | | (1,055,846 | ) | | | (151,444 | ) | | | (19,809 | ) | | | 1,014,758 | |
| | | | |
| | | | | | | | | | | | | | | | |
| | | Year Ended July 31, 2012 | |
| | | Class A | | | Class B | | | Class C | | | Class I | |
| | | | |
Sales | | | 1,194,338 | | | | 13,441 | | | | 546,499 | | | | 497,328 | |
Issued to shareholders electing to receive payments of distributions in Fund shares | | | 665,025 | | | | 26,310 | | | | 113,593 | | | | 31,478 | |
Redemptions | | | (2,408,234 | ) | | | (138,165 | ) | | | (624,868 | ) | | | (730,557 | ) |
Exchange from Class B shares | | | 264,913 | | | | — | | | | — | | | | — | |
Exchange to Class A shares | | | — | | | | (255,890 | ) | | | — | | | | — | |
| | | | |
Net increase (decrease) | | | (283,958 | ) | | | (354,304 | ) | | | 35,224 | | | | (201,751 | ) |
Eaton Vance
Municipal Income Funds
January 31, 2013
Notes to Financial Statements (Unaudited) — continued
8 Federal Income Tax Basis of Investments
The cost and unrealized appreciation (depreciation) of investments of each Fund at January 31, 2013, as determined on a federal income tax basis, were as follows:
| | | | | | | | | | | | | | | | | | | | |
| | | Arizona Fund | | | Connecticut
Fund | | | Minnesota
Fund | | | New Jersey
Fund | | | Pennsylvania
Fund | |
| | | | | |
Aggregate cost | | $ | 72,083,891 | | | $ | 106,666,945 | | | $ | 104,216,525 | | | $ | 182,121,234 | | | $ | 217,051,504 | |
Gross unrealized appreciation | | $ | 8,616,981 | | | $ | 11,756,613 | | | $ | 11,479,665 | | | $ | 27,360,057 | | | $ | 31,181,640 | |
Gross unrealized depreciation | | | (318,773 | ) | | | (179,594 | ) | | | (4,553 | ) | | | (2,398,091 | ) | | | (2,227,806 | ) |
| | | | | |
Net unrealized appreciation | | $ | 8,298,208 | | | $ | 11,577,019 | | | $ | 11,475,112 | | | $ | 24,961,966 | | | $ | 28,953,834 | |
9 Line of Credit
The Funds participate with other portfolios and funds managed by EVM and its affiliates in a $600 million unsecured line of credit agreement with a group of banks. Borrowings are made by the Funds solely to facilitate the handling of unusual and/or unanticipated short-term cash requirements. Interest is charged to each Fund based on its borrowings at an amount above either the Eurodollar rate or Federal Funds rate. In addition, a fee computed at an annual rate of 0.08% on the daily unused portion of the line of credit is allocated among the participating portfolios and funds at the end of each quarter. Because the line of credit is not available exclusively to the Funds, a Fund may be unable to borrow some or all of its requested amounts at any particular time. The Funds did not have any significant borrowings or allocated fees during the six months ended January 31, 2013.
10 Financial Instruments
The Funds may trade in financial instruments with off-balance sheet risk in the normal course of their investing activities. These financial instruments may include financial futures contracts and may involve, to a varying degree, elements of risk in excess of the amounts recognized for financial statement purposes. The notional or contractual amounts of these instruments represent the investment a Fund has in particular classes of financial instruments and do not necessarily represent the amounts potentially subject to risk. The measurement of the risks associated with these instruments is meaningful only when all related and offsetting transactions are considered.
A summary of obligations under these financial instruments at January 31, 2013 is as follows:
| | | | | | | | | | | | | | | | | | | | |
| Futures Contracts | | | | |
| Fund | | Expiration
Month/Year | | | Contracts | | Position | | Aggregate
Cost | | | Value | | | Net
Unrealized
Appreciation | |
| | | | | | |
| Arizona | | | 3/13 | | | 38
U.S. 30-Year Treasury Bond | | Short | | $ | (5,699,634 | ) | | $ | (5,451,813 | ) | | $ | 247,821 | |
| Connecticut | | | 3/13 | | | 46
U.S. 30-Year Treasury Bond | | Short | | $ | (6,832,627 | ) | | $ | (6,599,563 | ) | | $ | 233,064 | |
| Minnesota | | | 3/13 | | | 47
U.S. 30-Year Treasury Bond | | Short | | $ | (7,049,547 | ) | | $ | (6,743,031 | ) | | $ | 306,516 | |
| New Jersey | | | 3/13 | | | 100
U.S. 10-Year Treasury Note | | Short | | $ | (13,305,313 | ) | | $ | (13,128,125 | ) | | $ | 177,188 | |
| | | | 3/13 | | | 255
U.S. 30-Year Treasury Bond | | Short | | | (38,135,978 | ) | | | (36,584,531 | ) | | | 1,551,447 | |
| Pennsylvania | | | 3/13 | | | 550
U.S. 30-Year Treasury Bond | | Short | | $ | (82,254,072 | ) | | $ | (78,907,813 | ) | | $ | 3,346,259 | |
At January 31, 2013, the Funds had sufficient cash and/or securities to cover commitments under these contracts.
Eaton Vance
Municipal Income Funds
January 31, 2013
Notes to Financial Statements (Unaudited) — continued
Each Fund is subject to interest rate risk in the normal course of pursuing its investment objective. Because the Funds hold fixed-rate bonds, the value of these bonds may decrease if interest rates rise. The Funds purchase and sell U.S. Treasury futures contracts to hedge against changes in interest rates.
The fair values of open derivative instruments (not considered to be hedging instruments for accounting disclosure purposes) and whose primary underlying risk exposure is interest rate risk at January 31, 2013 were as follows:
| | | | | | | | | | | | | | | | | | | | |
| | | Arizona
Fund | | | Connecticut
Fund | | | Minnesota
Fund | | | New Jersey
Fund | | | Pennsylvania
Fund | |
| | | | | |
Asset Derivative: | | | | | | | | | | | | | | | | | | | | |
Futures Contracts | | $ | 247,821 | (1) | | $ | 233,064 | (1) | | $ | 306,516 | (1) | | $ | 1,728,635 | (1) | | $ | 3,346,259 | (1) |
| | | | | |
Total | | $ | 247,821 | | | $ | 233,064 | | | $ | 306,516 | | | $ | 1,728,635 | | | $ | 3,346,259 | |
| (1) | Amount represents cumulative unrealized appreciation on futures contracts in the Futures Contracts table above. Only the current day’s variation margin on open futures contracts is reported within the Statement of Assets and Liabilities as Receivable or Payable for variation margin, as applicable. |
The effect of derivative instruments (not considered to be hedging instruments for accounting disclosure purposes) on the Statement of Operations and whose primary underlying risk exposure is interest rate risk for the six months ended January 31, 2013 was as follows:
| | | | | | | | | | | | | | | | | | | | |
| | | Arizona
Fund | | | Connecticut
Fund | | | Minnesota
Fund | | | New Jersey
Fund | | | Pennsylvania
Fund | |
| | | | | |
Realized Gain (Loss) on Derivatives Recognized in Income | | $ | (121,700 | )(1) | | $ | (152,651 | )(1) | | $ | (150,524 | )(1) | | $ | (889,434 | )(1) | | $ | (1,520,823 | )(1) |
Change in Unrealized Appreciation (Depreciation) on Derivatives Recognized in Income | | $ | 391,578 | (2) | | $ | 376,953 | (2) | | $ | 484,321 | (2) | | $ | 2,879,441 | (2) | | $ | 5,426,953 | (2) |
| (1) | Statement of Operations location: Net realized gain (loss) – Financial futures contracts. |
| (2) | Statement of Operations location: Change in unrealized appreciation (depreciation) – Financial futures contracts. |
The average notional amounts of futures contracts outstanding during the six months ended January 31, 2013, which are indicative of the volume of these derivative types, were approximately as follows:
| | | | | | | | | | | | | | | | | | | | |
| | | Arizona
Fund | | | Connecticut
Fund | | | Minnesota
Fund | | | New Jersey
Fund | | | Pennsylvania
Fund | |
| | | | | |
Average Notional Amount: | | | | | | | | | | | | | | | | | | | | |
Futures Contracts | | $ | 3,800,000 | | | $ | 3,771,000 | | | $ | 4,700,000 | | | $ | 35,500,000 | | | $ | 55,000,000 | |
11 Fair Value Measurements
Under generally accepted accounting principles for fair value measurements, a three-tier hierarchy to prioritize the assumptions, referred to as inputs, is used in valuation techniques to measure fair value. The three-tier hierarchy of inputs is summarized in the three broad levels listed below.
| Ÿ | | Level 1 – quoted prices in active markets for identical investments |
| Ÿ | | Level 2 – other significant observable inputs (including quoted prices for similar investments, interest rates, prepayment speeds, credit risk, etc.) |
| Ÿ | | Level 3 – significant unobservable inputs (including a fund’s own assumptions in determining the fair value of investments) |
In cases where the inputs used to measure fair value fall in different levels of the fair value hierarchy, the level disclosed is determined based on the lowest level input that is significant to the fair value measurement in its entirety. The inputs or methodology used for valuing securities are not necessarily an indication of the risk associated with investing in those securities.
Eaton Vance
Municipal Income Funds
January 31, 2013
Notes to Financial Statements (Unaudited) — continued
At January 31, 2013, the hierarchy of inputs used in valuing the Funds’ investments and open derivative instruments, which are carried at value, were as follows:
| | | | | | | | | | | | | | | | |
Arizona Fund | | | | | | | | | | | | |
| Asset Description | | Level 1 | | | Level 2 | | | Level 3 | | | Total | |
| | | | |
Tax-Exempt Investments | | $ | — | | | $ | 82,082,099 | | | $ | — | | | $ | 82,082,099 | |
| | | | |
Total Investments | | $ | — | | | $ | 82,082,099 | | | $ | — | | | $ | 82,082,099 | |
| | | | |
Futures Contracts | | $ | 247,821 | | | $ | — | | | $ | — | | | $ | 247,821 | |
| | | | |
Total | | $ | 247,821 | | | $ | 82,082,099 | | | $ | — | | | $ | 82,329,920 | |
| | | | |
| | | | | | | | | | | | | | | | |
Connecticut Fund | | | | | | | | | | | | |
| Asset Description | | Level 1 | | | Level 2 | | | Level 3 | | | Total | |
| | | | |
Tax-Exempt Investments | | $ | — | | | $ | 125,468,964 | | | $ | — | | | $ | 125,468,964 | |
| | | | |
Total Investments | | $ | — | | | $ | 125,468,964 | | | $ | — | | | $ | 125,468,964 | |
| | | | |
Futures Contracts | | $ | 233,064 | | | $ | — | | | $ | — | | | $ | 233,064 | |
| | | | |
Total | | $ | 233,064 | | | $ | 125,468,964 | | | $ | — | | | $ | 125,702,028 | |
| | | | |
| | | | | | | | | | | | | | | | |
Minnesota Fund | | | | | | | | | | | | |
| Asset Description | | Level 1 | | | Level 2 | | | Level 3 | | | Total | |
| | | | |
Tax-Exempt Investments | | $ | — | | | $ | 115,691,637 | | | $ | — | | | $ | 115,691,637 | |
| | | | |
Total Investments | | $ | — | | | $ | 115,691,637 | | | $ | — | | | $ | 115,691,637 | |
| | | | |
Futures Contracts | | $ | 306,516 | | | $ | — | | | $ | — | | | $ | 306,516 | |
| | | | |
Total | | $ | 306,516 | | | $ | 115,691,637 | | | $ | — | | | $ | 115,998,153 | |
| | | | |
| | | | | | | | | | | | | | | | |
New Jersey Fund | | | | | | | | | | | | |
| Asset Description | | Level 1 | | | Level 2 | | | Level 3 | | | Total | |
| | | | |
Tax-Exempt Investments | | $ | — | | | $ | 228,103,200 | | | $ | — | | | $ | 228,103,200 | |
| | | | |
Total Investments | | $ | — | | | $ | 228,103,200 | | | $ | — | | | $ | 228,103,200 | |
| | | | |
Futures Contracts | | $ | 1,728,635 | | | $ | — | | | $ | — | | | $ | 1,728,635 | |
| | | | |
Total | | $ | 1,728,635 | | | $ | 228,103,200 | | | $ | — | | | $ | 229,831,835 | |
| | | | |
| | | | | | | | | | | | | | | | |
Pennsylvania Fund | | | | | | | | | | | | |
| Asset Description | | Level 1 | | | Level 2 | | | Level 3 | | | Total | |
| | | | |
Tax-Exempt Investments | | $ | — | | | $ | 263,355,338 | | | $ | — | | | $ | 263,355,338 | |
| | | | |
Total Investments | | $ | — | | | $ | 263,355,338 | | | $ | — | | | $ | 263,355,338 | |
| | | | |
Futures Contracts | | $ | 3,346,259 | | | $ | — | | | $ | — | | | $ | 3,346,259 | |
| | | | |
Total | | $ | 3,346,259 | | | $ | 263,355,338 | | | $ | — | | | $ | 266,701,597 | |
The Funds held no investments or other financial instruments as of July 31, 2012 whose fair value was determined using Level 3 inputs. At January 31, 2013, there were no investments transferred between Level 1 and Level 2 during the six months then ended.
Eaton Vance
Municipal Income Funds
January 31, 2013
Officers and Trustees
Officers of Eaton Vance Municipals Trust
Thomas M. Metzold
President
Payson F. Swaffield
Vice President
Maureen A. Gemma
Vice President, Secretary and
Chief Legal Officer
James F. Kirchner
Treasurer
Paul M. O’Neil
Chief Compliance Officer
Trustees of Eaton Vance Municipals Trust
Ralph F. Verni
Chairman
Scott E. Eston
Benjamin C. Esty
Thomas E. Faust Jr.*
Allen R. Freedman
William H. Park
Ronald A. Pearlman
Helen Frame Peters
Lynn A. Stout
Harriett Tee Taggart
Eaton Vance Funds
IMPORTANT NOTICES
Privacy. The Eaton Vance organization is committed to ensuring your financial privacy. Each of the financial institutions identified below has in effect the following policy (“Privacy Policy”) with respect to nonpublic personal information about its customers:
| Ÿ | | Only such information received from you, through application forms or otherwise, and information about your Eaton Vance fund transactions will be collected. This may include information such as name, address, social security number, tax status, account balances and transactions. |
| Ÿ | | None of such information about you (or former customers) will be disclosed to anyone, except as permitted by law (which includes disclosure to employees necessary to service your account). In the normal course of servicing a customer’s account, Eaton Vance may share information with unaffiliated third parties that perform various required services such as transfer agents, custodians and broker-dealers. |
| Ÿ | | Policies and procedures (including physical, electronic and procedural safeguards) are in place that are designed to protect the confidentiality of such information. |
| Ÿ | | We reserve the right to change our Privacy Policy at any time upon proper notification to you. Customers may want to review our Privacy Policy periodically for changes by accessing the link on our homepage: www.eatonvance.com. |
Our pledge of privacy applies to the following entities within the Eaton Vance organization: the Eaton Vance Family of Funds, Eaton Vance Management, Eaton Vance Investment Counsel, Eaton Vance Distributors, Inc., Eaton Vance Trust Company, Eaton Vance Management’s Real Estate Investment Group and Boston Management and Research. In addition, our Privacy Policy applies only to those Eaton Vance customers who are individuals and who have a direct relationship with us. If a customer’s account (i.e., fund shares) is held in the name of a third-party financial adviser/broker-dealer, it is likely that only such advisor’s privacy policies apply to the customer. This notice supersedes all previously issued privacy disclosures. For more information about Eaton Vance’s Privacy Policy, please call 1-800-262-1122.
Delivery of Shareholder Documents. The Securities and Exchange Commission (SEC) permits funds to deliver only one copy of shareholder documents, including prospectuses, proxy statements and shareholder reports, to fund investors with multiple accounts at the same residential or post office box address. This practice is often called “householding” and it helps eliminate duplicate mailings to shareholders. Eaton Vance, or your financial advisor, may household the mailing of your documents indefinitely unless you instruct Eaton Vance, or your financial advisor, otherwise. If you would prefer that your Eaton Vance documents not be householded, please contact Eaton Vance at 1-800-262-1122, or contact your financial advisor. Your instructions that householding not apply to delivery of your Eaton Vance documents will be effective within 30 days of receipt by Eaton Vance or your financial advisor.
Portfolio Holdings. Each Eaton Vance Fund and its underlying Portfolio(s) (if applicable) will file a schedule of portfolio holdings on Form N-Q with the SEC for the first and third quarters of each fiscal year. The Form N-Q will be available on the Eaton Vance website at www.eatonvance.com, by calling Eaton Vance at 1-800-262-1122 or in the EDGAR database on the SEC’s website at www.sec.gov. Form N-Q may also be reviewed and copied at the SEC’s public reference room in Washington, D.C. (call 1-800-732-0330 for information on the operation of the public reference room).
Proxy Voting. From time to time, funds are required to vote proxies related to the securities held by the funds. The Eaton Vance Funds or their underlying Portfolios (if applicable) vote proxies according to a set of policies and procedures approved by the Funds’ and Portfolios’ Boards. You may obtain a description of these policies and procedures and information on how the Funds or Portfolios voted proxies relating to portfolio securities during the most recent 12-month period ended June 30, without charge, upon request, by calling 1-800-262-1122 and by accessing the SEC’s website at www.sec.gov.
This Page Intentionally Left Blank
This Page Intentionally Left Blank
Investment Adviser
Boston Management and Research
Two International Place
Boston, MA 02110
Administrator
Eaton Vance Management
Two International Place
Boston, MA 02110
Principal Underwriter*
Eaton Vance Distributors, Inc.
Two International Place
Boston, MA 02110
(617) 482-8260
Custodian
State Street Bank and Trust Company
200 Clarendon Street
Boston, MA 02116
Transfer Agent
BNY Mellon Asset Servicing (US) Inc.
Attn: Eaton Vance Funds
P.O. Box 9653
Providence, RI 02940-9653
(800) 262-1122
Fund Offices
Two International Place
Boston, MA 02110
| * | FINRA BrokerCheck. Investors may check the background of their Investment Professional by contacting the Financial Industry Regulatory Authority (FINRA). FINRA BrokerCheck is a free tool to help investors check the professional background of current and former FINRA-registered securities firms and brokers. FINRA BrokerCheck is available by calling 1-800-289-9999 and at www.FINRA.org. The FINRA BrokerCheck brochure describing the program is available to investors at www.FINRA.org. |

| | |
Eaton Vance Municipal Opportunities Fund Semiannual Report January 31, 2013 | | |

Fund shares are not insured by the FDIC and are not deposits or other obligations of, or guaranteed by, any depository institution. Shares are subject to investment risks, including possible loss of principal invested.
This report must be preceded or accompanied by a current summary prospectus or prospectus. Before investing, investors should consider carefully the investment objective, risks, and charges and expenses of a mutual fund. This and other important information is contained in the summary prospectus and prospectus, which can be obtained from a financial advisor. Prospective investors should read the prospectus carefully before investing. For further information, please call 1-800-262-1122.
Semiannual Report January 31, 2013
Eaton Vance
Municipal Opportunities Fund
Table of Contents
| | | | |
Performance | | | 2 | |
| |
Fund Profile | | | 2 | |
| |
Endnotes and Additional Disclosures | | | 3 | |
| |
Fund Expenses | | | 4 | |
| |
Financial Statements | | | 5 | |
| |
Officers and Trustees | | | 18 | |
| |
Important Notices | | | 19 | |
Eaton Vance
Municipal Opportunities Fund
January 31, 2013
Performance1,2
Portfolio Managers Cynthia J. Clemson, Thomas M. Metzold, CFA, William H. Ahern, Jr., CFA, Craig R. Brandon, CFA and Adam Weigold, CFA
| | | | | | | | | | | | | | | | |
| % Average Annual Total Returns | | Inception Date | | | Six Months | | | One Year | | | Since Inception | |
Class A at NAV | | | 05/31/2011 | | | | 2.56 | % | | | 6.03 | % | | | 10.88 | % |
Class A with 4.75% Maximum Sales Charge | | | — | | | | –2.30 | | | | 0.99 | | | | 7.69 | |
Class I at NAV | | | 05/31/2011 | | | | 2.79 | | | | 6.40 | | | | 11.28 | |
Barclays Capital Municipal Bond Index | | | 05/31/2011 | | | | 1.82 | % | | | 4.80 | % | | | 8.18 | % |
| | | | |
| | | | | | | | | | | | | | | | |
| % Total Annual Operating Expense Ratios3 | | | | | | | | Class A | | | Class I | |
Gross | | | | | | | | | | | 1.64 | % | | | 1.39 | % |
Net | | | | | | | | | | | 1.10 | | | | 0.85 | |
| | | | |
| | | | | | | | | | | | | | | | |
| % Distribution Rates/Yields4 | | | | | | | | Class A | | | Class I | |
Distribution Rate | | | | | | | | | | | 1.84 | % | | | 2.15 | % |
Taxable-Equivalent Distribution Rate | | | | | | | | | | | 2.83 | | | | 3.31 | |
SEC 30-day Yield | | | | | | | | | | | 1.27 | | | | 1.67 | |
Taxable-Equivalent SEC 30-day Yield | | | | | | | | | | | 1.95 | | | | 2.57 | |
Fund Profile
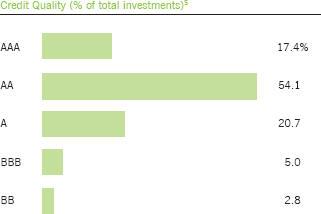
See Endnotes and Additional Disclosures in this report.
Past performance is no guarantee of future results. Returns are historical and are calculated by determining the percentage change in net asset value (NAV) or offering price (as applicable) with all distributions reinvested. Investment return and principal value will fluctuate so that shares, when redeemed, may be worth more or less than their original cost. Performance less than one year is cumulative. Performance is for the stated time period only; due to market volatility, the Fund’s current performance may be lower or higher than quoted. Returns are before taxes unless otherwise noted. For performance as of the most recent month end, please refer to www.eatonvance.com.
Eaton Vance
Municipal Opportunities Fund
January 31, 2013
Endnotes and Additional Disclosures
| 1 | Barclays Capital Municipal Bond Index is an unmanaged index of municipal bonds traded in the U.S. Unless otherwise stated, index returns do not reflect the effect of any applicable sales charges, commissions, expenses, taxes or leverage, as applicable. It is not possible to invest directly in an index. |
| 2 | Total Returns at NAV do not include applicable sales charges. If sales charges were deducted, the returns would be lower. Total |
Returns shown with maximum sales charge reflect the stated maximum sales charge. Unless otherwise stated, performance does not reflect the deduction of taxes on Fund distributions or redemptions of Fund shares.
| 3 | Source: Fund prospectus. Net expense ratio reflects a contractual expense reimbursement that continues through 11/30/13. Without the reimbursement, performance would have been lower. |
| 4 | The Distribution Rate is based on the Fund’s last regular distribution per share in the period (annualized) divided by the Fund’s NAV at the end of the period. The Fund’s distributions may be composed of ordinary income, tax-exempt income, net realized capital gains and return of capital. Taxable-equivalent performance is based on the highest combined federal and state income tax rates, where applicable. Lower tax rates would result in lower tax-equivalent performance. Actual tax rates will vary depending on your income, exemptions and deductions. Rates do not include local taxes. SEC Yield is a standardized measure based on the estimated yield to maturity of a fund’s investments over a 30-day period and is based on the maximum offer price at the date specified. The SEC Yield is not based on the distributions made by the Fund, which may differ. Yield reflects the effect of fee waivers and expense reimbursements. |
| 5 | Ratings are based on Moody’s, S&P or Fitch, as applicable. Credit ratings are based largely on the rating agency’s investment analysis at the time of rating and the rating assigned to any particular security is not necessarily a reflection of the issuer’s current financial condition. The rating assigned to a security by a rating agency does not necessarily reflect its assessment of the volatility of a security’s market value or of the liquidity of an investment in the security. If securities are rated differently by the rating agencies, the higher rating is applied. Ratings of BBB or higher by Standard and Poor’s or Fitch (Baa or higher by Moody’s) are considered to be investment grade quality. |
| | Fund profile subject to change due to active management. |
Eaton Vance
Municipal Opportunities Fund
January 31, 2013
Fund Expenses
Example: As a Fund shareholder, you incur two types of costs: (1) transaction costs, including sales charges (loads) on purchases and redemption fees (if applicable); and (2) ongoing costs, including management fees; distribution and/or service fees; and other Fund expenses. This Example is intended to help you understand your ongoing costs (in dollars) of Fund investing and to compare these costs with the ongoing costs of investing in other mutual funds. The Example is based on an investment of $1,000 invested at the beginning of the period and held for the entire period (August 1, 2012 – January 31, 2013).
Actual Expenses: The first section of the table below provides information about actual account values and actual expenses. You may use the information in this section, together with the amount you invested, to estimate the expenses that you paid over the period. Simply divide your account value by $1,000 (for example, an $8,600 account value divided by $1,000 = 8.6), then multiply the result by the number in the first section under the heading entitled “Expenses Paid During Period” to estimate the expenses you paid on your account during this period.
Hypothetical Example for Comparison Purposes: The second section of the table below provides information about hypothetical account values and hypothetical expenses based on the actual Fund expense ratio and an assumed rate of return of 5% per year (before expenses), which is not the actual Fund return. The hypothetical account values and expenses may not be used to estimate the actual ending account balance or expenses you paid for the period. You may use this information to compare the ongoing costs of investing in your Fund and other funds. To do so, compare this 5% hypothetical example with the 5% hypothetical examples that appear in the shareholder reports of the other funds.
Please note that the expenses shown in the table are meant to highlight your ongoing costs only and do not reflect any transactional costs, such as sales charges (loads) or redemption fees (if applicable). Therefore, the second section of the table is useful in comparing ongoing costs only, and will not help you determine the relative total costs of owning different funds. In addition, if these transactional costs were included, your costs would be higher.
| | | | | | | | | | | | | | | | |
| | | Beginning
Account Value
(8/1/12) | | | Ending
Account Value
(1/31/13) | | | Expenses Paid
During Period*
(8/1/12 – 1/31/13) | | | Annualized
Expense
Ratio | |
| | | | |
| | | | | | | | | | | | | | | | |
Actual | | | | | | | | | | | | | |
Class A | | $ | 1,000.00 | | | $ | 1,025.60 | | | $ | 5.62 | ** | | | 1.10 | % |
Class I | | $ | 1,000.00 | | | $ | 1,027.90 | | | $ | 4.34 | ** | | | 0.85 | % |
| | | | | | | | | | | | | | | | | |
| | | | |
| | | | | | | | | | | | | | | | |
Hypothetical | | | | | | | | | | | | | | | | |
(5% return per year before expenses) | | | | | | | | | | | | | |
Class A | | $ | 1,000.00 | | | $ | 1,019.70 | | | $ | 5.60 | ** | | | 1.10 | % |
Class I | | $ | 1,000.00 | | | $ | 1,020.90 | | | $ | 4.33 | ** | | | 0.85 | % |
| * | Expenses are equal to the Fund’s annualized expense ratio for the indicated Class, multiplied by the average account value over the period, multiplied by 184/365 (to reflect the one-half year period). The Example assumes that the $1,000 was invested at the net asset value per share determined at the close of business on July 31, 2012. |
| ** | Absent an allocation of certain expenses to an affiliate, expenses would be higher. |
Eaton Vance
Municipal Opportunities Fund
January 31, 2013
Portfolio of Investments (Unaudited)
| | | | | | | | |
| Tax-Exempt Municipal Securities — 84.6% | |
| | |
| | | | | | | | |
| Security | | Principal
Amount
(000’s omitted) | | | Value | |
|
Bond Bank — 2.7% | |
Arkansas Development Finance Authority, 5.00%, 6/1/24 | | $ | 200 | | | $ | 248,686 | |
New York Environmental Facilities Corp., (New York City Municipal Water Finance Authority), 5.00%, 6/15/31 | | | 500 | | | | 595,340 | |
| | | | | | | | | |
| | | | | | $ | 844,026 | |
| | | | | | | | | |
| | |
Education — 5.0% | | | | | | | | |
Harris County, TX, Cultural Education Facilities Finance Corp., (Baylor College of Medicine), 5.00%, 11/15/37 | | $ | 60 | | | $ | 67,322 | |
Hempstead, NY, Local Development Corp., (Adelphi University), 5.00%, 6/1/20 | | | 110 | | | | 130,325 | |
Hempstead, NY, Local Development Corp., (Adelphi University), 5.00%, 6/1/21 | | | 140 | | | | 166,932 | |
Massachusetts Health and Educational Facilities Authority, (Harvard University), 5.50%, 11/15/36 | | | 325 | | | | 391,115 | |
New York Dormitory Authority, (Rochester Institute of Technology), 4.00%, 7/1/26 | | | 15 | | | | 16,651 | |
New York Dormitory Authority, (Rochester Institute of Technology), 4.00%, 7/1/27 | | | 20 | | | | 22,158 | |
New York Dormitory Authority, (Rochester Institute of Technology), 4.00%, 7/1/29 | | | 15 | | | | 16,435 | |
New York Dormitory Authority, (Rochester Institute of Technology), 4.00%, 7/1/30 | | | 15 | | | | 16,332 | |
New York Dormitory Authority, (Rochester Institute of Technology), 4.00%, 7/1/31 | | | 15 | | | | 16,267 | |
New York Dormitory Authority, (Rochester Institute of Technology), 4.00%, 7/1/32 | | | 15 | | | | 16,203 | |
New York Dormitory Authority, (Rochester Institute of Technology), 4.00%, 7/1/33 | | | 10 | | | | 10,743 | |
New York Dormitory Authority, (State University Educational Facilities), 4.00%, 5/15/28 | | | 80 | | | | 86,542 | |
Union County, PA, Higher Educational Facilities Financing Authority, (Bucknell University), 4.00%, 4/1/23 | | | 195 | | | | 224,952 | |
University of Cincinnati, OH, 4.00%, 6/1/25 | | | 95 | | | | 105,233 | |
University of Cincinnati, OH, 4.00%, 6/1/26 | | | 40 | | | | 44,024 | |
University of Minnesota, 5.00%, 12/1/26 | | | 200 | | | | 246,100 | |
| | | | | | | | | |
| | | | | | $ | 1,577,334 | |
| | | | | | | | | |
| | |
Electric Utilities — 3.2% | | | | | | | | |
American Municipal Power, Inc., OH, (AMP Fremont Energy Center), 5.25%, 2/15/28 | | $ | 250 | | | $ | 295,218 | |
Seattle, WA, Municipal Light and Power, 5.00%, 2/1/22 | | | 350 | | | | 423,223 | |
Vernon, CA, Electric System Revenue, 5.125%, 8/1/21 | | | 250 | | | | 284,483 | |
| | | | | | | | | |
| | | | | | $ | 1,002,924 | |
| | | | | | | | | |
| | | | | | | | |
| Security | | Principal
Amount
(000’s omitted) | | | Value | |
| | |
General Obligations — 24.0% | | | | | | | | |
Banks School District No. 13, Washington County, OR, 3.00%, 6/15/22 | | $ | 135 | | | $ | 148,680 | |
Beaverton School District 48J, Washington and Multnomah Counties, OR, 4.00%, 6/15/23 | | | 230 | | | | 266,765 | |
California, 4.00%, 9/1/28 | | | 500 | | | | 553,440 | |
Comal Independent School District, TX, (PSF Guaranteed), 4.00%, 2/1/24 | | | 135 | | | | 153,703 | |
Denver City and County, CO, School District No. 1, 4.00%, 12/1/26 | | | 175 | | | | 196,364 | |
Ferndale, MI, Public Schools, 4.00%, 5/1/23 | | | 340 | | | | 383,799 | |
Georgia, 4.50%, 7/1/28 | | | 250 | | | | 294,270 | |
Hawaii, 5.00%, 11/1/27 | | | 30 | | | | 36,911 | |
Howell, MI, Public Schools, 4.50%, 5/1/29 | | | 495 | | | | 562,924 | |
Massachusetts, 0.76%, 11/1/25(1) | | | 500 | | | | 490,970 | |
Mendon, MI, Community Schools, 3.00%, 5/1/22(2) | | | 495 | | | | 526,645 | |
Middletown Township, NJ, Board of Education, 3.00%, 8/1/27(3) | | | 500 | | | | 525,560 | |
Minnesota, 5.00%, 8/1/20 | | | 220 | | | | 277,666 | |
New York, NY, 5.30%, 4/1/27 | | | 100 | | | | 121,106 | |
Pascack Valley Regional High School District, NJ, 3.00%, 8/15/17 | | | 10 | | | | 10,892 | |
Pascack Valley Regional High School District, NJ, 3.00%, 8/15/18 | | | 10 | | | | 10,979 | |
Pascack Valley Regional High School District, NJ, 3.00%, 8/15/19 | | | 15 | | | | 16,455 | |
Pascack Valley Regional High School District, NJ, 3.00%, 8/15/20 | | | 15 | | | | 16,422 | |
Pascack Valley Regional High School District, NJ, 3.00%, 8/15/21 | | | 10 | | | | 10,924 | |
Pascack Valley Regional High School District, NJ, 3.00%, 8/15/22 | | | 15 | | | | 16,402 | |
Phoenix, AZ, 4.00%, 7/1/27 | | | 250 | | | | 281,732 | |
Texas, (Texas Transportation Commission), 5.00%, 4/1/27 | | | 250 | | | | 308,120 | |
Texas, (Texas Transportation Commission), 5.00%, 4/1/42 | | | 250 | | | | 291,720 | |
Toppenish School District No. 202, Yakima County, WA, 3.00%, 12/1/21 | | | 370 | | | | 413,575 | |
Tualatin Valley, OR, Fire and Rescue, A Rural Fire Protection District, 5.00%, 6/1/25 | | | 350 | | | | 427,154 | |
Utah, 5.00%, 7/1/25 | | | 350 | | | | 432,638 | |
Virginia Beach, VA, 4.00%, 4/1/27 | | | 240 | | | | 271,486 | |
Washington, 4.00%, 7/1/27(3) | | | 500 | | | | 565,950 | |
| | | | | | | | | |
| | | | | | $ | 7,613,252 | |
| | | | | | | | | |
| | | | |
| | 5 | | See Notes to Financial Statements. |
Eaton Vance
Municipal Opportunities Fund
January 31, 2013
Portfolio of Investments (Unaudited) — continued
| | | | | | | | |
| Security | | Principal
Amount
(000’s omitted) | | | Value | |
| | |
Hospital — 10.7% | | | | | | | | |
California Health Facilities Financing Authority, (Memorial Health Services), 5.00%, 10/1/22 | | $ | 200 | | | $ | 246,950 | |
California Health Facilities Financing Authority, (Providence Health System), 6.50%, 10/1/38 | | | 345 | | | | 417,578 | |
California Health Facilities Financing Authority, (St. Joseph Health System), 5.50%, 7/1/29 | | | 200 | | | | 233,106 | |
Highlands County, FL, Health Facilities Authority, (Adventist Health System), 5.00%, 11/15/25 | | | 315 | | | | 346,213 | |
Lexington County, SC, Health Services District, Inc., (Lexington Medical Center), 5.00%, 11/1/32 | | | 525 | | | | 580,072 | |
Massachusetts Health and Educational Facilities Authority, (Lowell General Hospital), 4.75%, 7/1/25 | | | 285 | | | | 300,182 | |
New Jersey Health Care Facilities Financing Authority, (Meridian Health System), 5.00%, 7/1/21 | | | 250 | | | | 302,123 | |
New York Dormitory Authority, (Memorial Sloan-Kettering Cancer Center), 4.375%, 7/1/34 | | | 250 | | | | 273,438 | |
Norfolk, VA, Economic Development Authority, (Bon Secours Health System, Inc.), 5.00%, 11/1/28 | | | 275 | | | | 313,813 | |
Onondaga Civic Development Corp., NY, (St. Joseph’s Hospital Health Center), 4.50%, 7/1/32 | | | 210 | | | | 208,114 | |
Orange County, FL, Health Facilities Authority, (Orlando Health, Inc.), 5.00%, 10/1/42 | | | 150 | | | | 165,342 | |
| | | | | | | | | |
| | | | | | $ | 3,386,931 | |
| | | | | | | | | |
| | |
Industrial Development Revenue — 2.9% | | | | | | | | |
Brazos River Harbor Navigation District of Brazoria County, TX, (Dow Chemical Co.), (AMT), 5.95%, 5/15/33 | | $ | 250 | | | $ | 285,537 | |
California Pollution Control Financing Authority, (Waste Management, Inc.), (AMT), 5.125%, 11/1/23 | | | 250 | | | | 268,275 | |
Niagara Area Development Corp., NY, (Covanta Energy), 4.00%, 11/1/24 | | | 370 | | | | 380,301 | |
| | | | | | | | | |
| | | | | | $ | 934,113 | |
| | | | | | | | | |
| | |
Insured – Electric Utilities — 0.6% | | | | | | | | |
Long Island Power Authority, NY, Electric System Revenue, (BHAC), 5.75%, 4/1/33 | | $ | 170 | | | $ | 204,760 | |
| | | | | | | | | |
| | | | | | $ | 204,760 | |
| | | | | | | | | |
| | |
Insured – General Obligations — 1.1% | | | | | | | | |
Baldwin County, AL, (AGC), 5.00%, 5/1/23 | | $ | 45 | | | $ | 52,568 | |
Will County, IL, Community Unit School District No. 365-U, (Valley View), (NPFG), 0.00%, 11/1/25 | | | 450 | | | | 287,680 | |
| | | | | | | | | |
| | | | | | $ | 340,248 | |
| | | | | | | | | |
| | | | | | | | |
| Security | | Principal
Amount
(000’s omitted) | | | Value | |
| | |
Insured – Other Revenue — 0.6% | | | | | | | | |
New York, NY, Industrial Development Agency, (Yankee Stadium), (AGC), 7.00%, 3/1/49 | | $ | 150 | | | $ | 185,360 | |
| | | | | | | | | |
| | | | | | $ | 185,360 | |
| | | | | | | | | |
| | |
Insured – Special Tax Revenue — 1.2% | | | | | | | | |
Illinois Sports Facilities Authority, (AMBAC), 0.00%, 6/15/22 | | $ | 500 | | | $ | 364,570 | |
| | | | | | | | | |
| | | | | | $ | 364,570 | |
| | | | | | | | | |
| | |
Insured – Transportation — 0.0%(4) | | | | | | | | |
Metropolitan Transportation Authority, NY, (AGM), 4.00%, 11/15/30 | | $ | 10 | | | $ | 10,891 | |
| | | | | | | | | |
| | | | | | $ | 10,891 | |
| | | | | | | | | |
| | |
Insured – Water and Sewer — 0.6% | | | | | | | | |
Detroit, MI, Sewage Disposal System, (AGM), 5.00%, 7/1/39 | | $ | 175 | | | $ | 189,901 | |
| | | | | | | | | |
| | | | | | $ | 189,901 | |
| | | | | | | | | |
| | |
Other Revenue — 0.3% | | | | | | | | |
Texas Municipal Gas Acquisition and Supply Corp. III, Gas Supply Revenue, 5.00%, 12/15/32 | | $ | 100 | | | $ | 108,380 | |
| | | | | | | | | |
| | | | | | $ | 108,380 | |
| | | | | | | | | |
| | |
Senior Living / Life Care — 0.5% | | | | | | | | |
Lee County, FL, Industrial Development Authority, (Shell Point), 5.50%, 11/15/21 | | $ | 150 | | | $ | 169,133 | |
| | | | | | | | | |
| | | | | | $ | 169,133 | |
| | | | | | | | | |
| | |
Special Tax Revenue — 7.7% | | | | | | | | |
Baldwin County, AL, Board of Education, 5.00%, 6/1/22(2) | | $ | 500 | | | $ | 603,695 | |
Ernest N. Morial-New Orleans Exhibition Hall Authority, LA, 5.00%, 7/15/26 | | | 15 | | | | 17,400 | |
Ernest N. Morial-New Orleans Exhibition Hall Authority, LA, 5.00%, 7/15/27 | | | 10 | | | | 11,480 | |
Illinois, Sales Tax Revenue, 5.00%, 6/15/31 | | | 300 | | | | 350,775 | |
Massachusetts School Building Authority, Dedicated Sales Tax Revenue, 5.00%, 8/15/30 | | | 295 | | | | 358,499 | |
Metropolitan Transportation Authority, NY, Dedicated Tax Revenue, 0.00%, 11/15/30 | | | 160 | | | | 89,086 | |
Metropolitan Transportation Authority, NY, Dedicated Tax Revenue, 0.00%, 11/15/32 | | | 85 | | | | 43,188 | |
Metropolitan Transportation Authority, NY, Dedicated Tax Revenue, 5.00%, 11/15/29 | | | 55 | | | | 66,262 | |
Michigan Trunk Line Fund, 5.00%, 11/15/20 | | | 250 | | | | 311,035 | |
| | | | |
| | 6 | | See Notes to Financial Statements. |
Eaton Vance
Municipal Opportunities Fund
January 31, 2013
Portfolio of Investments (Unaudited) — continued
| | | | | | | | |
| Security | | Principal
Amount
(000’s omitted) | | | Value | |
|
Special Tax Revenue (continued) | |
New York, NY, Transitional Finance Authority, Future Tax Revenue, 4.00%, 11/1/25 | | $ | 500 | | | $ | 577,720 | |
| | | | | | | | | |
| | | | | | $ | 2,429,140 | |
| | | | | | | | | |
| | |
Student Loan — 2.1% | | | | | | | | |
Massachusetts Educational Financing Authority, (AMT), 5.50%, 7/1/26 | | $ | 200 | | | $ | 216,938 | |
New Jersey Higher Education Student Assistance Authority, (AMT), 5.00%, 12/1/27 | | | 405 | | | | 437,655 | |
| | | | | | | | | |
| | | | | | $ | 654,593 | |
| | | | | | | | | |
| | |
Transportation — 16.2% | | | | | | | | |
Dallas and Fort Worth, TX, (Dallas/Fort Worth International Airport), (AMT), 5.00%, 11/1/38 | | $ | 150 | | | $ | 163,577 | |
Dallas and Fort Worth, TX, (Dallas/Fort Worth International Airport), (AMT), 5.00%, 11/1/42 | | | 95 | | | | 102,715 | |
Greater Orlando, FL, Aviation Authority, (AMT), 5.00%, 10/1/21 | | | 250 | | | | 298,680 | |
Hawaii, Airports System Revenue, 5.25%, 7/1/29 | | | 250 | | | | 293,407 | |
Los Angeles, CA, Department of Airports, (Los Angeles International Airport), 5.25%, 5/15/28 | | | 250 | | | | 298,760 | |
Massachusetts Port Authority, (AMT), 5.00%, 7/1/42 | | | 500 | | | | 557,800 | |
Memphis-Shelby County, TN, Airport Authority, (AMT), 5.00%, 7/1/25 | | | 250 | | | | 283,065 | |
New Jersey Transportation Trust Fund Authority, (Transportation Program), 4.00%, 6/15/30 | | | 90 | | | | 96,429 | |
New Jersey Transportation Trust Fund Authority, (Transportation Program), 4.00%, 6/15/31 | | | 75 | | | | 79,980 | |
New Jersey Turnpike Authority, 5.00%, 1/1/35 | | | 125 | | | | 143,638 | |
Pennsylvania Economic Development Financing Authority, (Amtrak), (AMT), 5.00%, 11/1/41 | | | 250 | | | | 269,942 | |
Pennsylvania Turnpike Commission, 5.00%, 12/1/24 | | | 250 | | | | 290,185 | |
Philadelphia, PA, Airport Revenue, (AMT), 5.00%, 6/15/26 | | | 200 | | | | 224,844 | |
Port Authority of New York and New Jersey, 4.00%, 12/1/23 | | | 250 | | | | 286,685 | |
Port Authority of New York and New Jersey, (AMT), 4.50%, 4/1/37 | | | 230 | | | | 251,194 | |
Route 460 Funding Corp., VA, 0.00%, 7/1/29 | | | 1,000 | | | | 478,940 | |
San Francisco City and County, CA, Airport Commission, (San Francisco International Airport), (AMT), 5.00%, 5/1/24 | | | 400 | | | | 463,608 | |
Texas Transportation Commission, (Central Texas Turnpike System), 5.00%, 8/15/41 | | | 500 | | | | 552,895 | |
| | | | | | | | | |
| | | | | | $ | 5,136,344 | |
| | | | | | | | | |
| | |
Water and Sewer — 5.2% | | | | | | | | |
Baltimore, MD, (Wastewater Projects), 5.00%, 7/1/26 | | $ | 400 | | | $ | 484,252 | |
Kansas City, MO, Sanitary Sewer System Revenue, 4.00%, 1/1/32 | | | 250 | | | | 271,568 | |
| | | | | | | | |
| Security | | Principal
Amount
(000’s omitted) | | | Value | |
| | |
Water and Sewer (continued) | | | | | | | | |
New York, NY, Municipal Water Finance Authority, (Water and Sewer System), 5.00%, 6/15/34 | | $ | 250 | | | $ | 294,490 | |
Omaha, NE, Sanitary Sewerage System Revenue, 4.00%, 11/15/29 | | | 35 | | | | 38,620 | |
Omaha, NE, Sanitary Sewerage System Revenue, 4.00%, 11/15/30 | | | 45 | | | | 49,291 | |
Omaha, NE, Sanitary Sewerage System Revenue, 4.00%, 11/15/32 | | | 20 | | | | 21,641 | |
Post Falls, ID, Water Revenue, 3.50%, 3/1/22 | | | 195 | | | | 221,036 | |
Virginia Resources Authority, (Tuckahoe Creek Service District), 0.00%, 11/1/30 | | | 500 | | | | 270,805 | |
| | | | | | | | | |
| | | | | | $ | 1,651,703 | |
| | | | | | | | | |
| |
Total Tax-Exempt Municipal Securities — 84.6%
(identified cost $25,471,444) | | | $ | 26,803,603 | |
| | | | | | | | | |
|
| Taxable Municipal Securities — 0.2%(5) | |
| | |
| | | | | | | | |
| Security | | Principal
Amount
(000’s omitted) | | | Value | |
| | |
General Obligations — 0.2% | | | | | | | | |
Howard County, MD, 5.55%, 2/15/30 | | $ | 50 | | | $ | 60,339 | |
| | | | | | | | | |
| |
Total Taxable Municipal Securities — 0.2%
(identified cost $58,823) | | | $ | 60,339 | |
| | | | | | | | | |
| | |
Total Investments — 84.8%
(identified cost $25,530,267) | | | | | | $ | 26,863,942 | |
| | | | | | | | | |
| | |
Other Assets, Less Liabilities — 15.2% | | | | | | $ | 4,803,430 | |
| | | | | | | | | |
| | |
Net Assets — 100.0% | | | | | | $ | 31,667,372 | |
| | | | | | | | | |
The percentage shown for each investment category in the Portfolio of Investments is based on net assets.
| | | | |
| AGC | | – | | Assured Guaranty Corp. |
| AGM | | – | | Assured Guaranty Municipal Corp. |
| AMBAC | | – | | AMBAC Financial Group, Inc. |
| AMT | | – | | Interest earned from these securities may be considered a tax preference item for purposes of the Federal Alternative Minimum Tax. |
| BHAC | | – | | Berkshire Hathaway Assurance Corp. |
| NPFG | | – | | National Public Finance Guaranty Corp. |
| PSF | | – | | Permanent School Fund |
| | | | |
| | 7 | | See Notes to Financial Statements. |
Eaton Vance
Municipal Opportunities Fund
January 31, 2013
Portfolio of Investments (Unaudited) — continued
At January 31, 2013, the concentration of the Fund’s investments in the various states, determined as a percentage of net assets, is as follows:
| | | | |
| New York | | | 12.9% | |
| Others, representing less than 10% individually | | | 71.9% | |
The Fund invests primarily in debt securities issued by municipalities. The ability of the issuers of the debt securities to meet their obligations may be affected by economic developments in a specific industry or municipality. In order to reduce the risk associated with such economic developments, at January 31, 2013, 4.8% of total investments are backed by bond insurance of various financial institutions and financial guaranty assurance agencies. The aggregate percentage insured by an individual financial institution ranged from 0.7% to 1.4% of total investments.
| (1) | Variable rate security. The stated interest rate represents the rate in effect at January 31, 2013. |
| (2) | Security (or a portion thereof) has been segregated to cover payable for when-issued securities. |
| (3) | When-issued security. |
| (4) | Amount is less than 0.05%. |
| (5) | Build America Bonds. Represent taxable municipal obligations issued pursuant to the America Recovery and Reinvestment Act of 2009 or other legislation providing for the issuance of taxable municipal debt on which the issuer receives federal support. |
| | | | |
| | 8 | | See Notes to Financial Statements. |
Eaton Vance
Municipal Opportunities Fund
January 31, 2013
Statement of Assets and Liabilities (Unaudited)
| | | | |
| Assets | | January 31, 2013 | |
Investments, at value (identified cost, $25,530,267) | | $ | 26,863,942 | |
Cash | | | 6,008,634 | |
Interest receivable | | | 203,384 | |
Receivable for investments sold | | | 5,591 | |
Receivable for Fund shares sold | | | 126,175 | |
Receivable from affiliate | | | 8,720 | |
Total assets | | $ | 33,216,446 | |
|
| Liabilities | |
Payable for investments purchased | | $ | 356,589 | |
Payable for when-issued securities | | | 1,087,260 | |
Payable for Fund shares redeemed | | | 42,261 | |
Distributions payable | | | 20,856 | |
Payable to affiliates: | | | | |
Investment adviser and administration fee | | | 14,013 | |
Distribution and service fees | | | 2,619 | |
Accrued expenses | | | 25,476 | |
Total liabilities | | $ | 1,549,074 | |
Net Assets | | $ | 31,667,372 | |
|
| Sources of Net Assets | |
Paid-in capital | | $ | 30,247,607 | |
Accumulated net realized gain | | | 82,528 | |
Accumulated undistributed net investment income | | | 3,562 | |
Net unrealized appreciation | | | 1,333,675 | |
Net Assets | | $ | 31,667,372 | |
| |
| Class A Shares | | | | |
Net Assets | | $ | 15,635,441 | |
Shares Outstanding | | | 1,401,889 | |
Net Asset Value and Redemption Price Per Share | | | | |
(net assets ÷ shares of beneficial interest outstanding) | | $ | 11.15 | |
Maximum Offering Price Per Share | | | | |
(100 ÷ 95.25 of net asset value per share) | | $ | 11.71 | |
|
| Class I Shares | |
Net Assets | | $ | 16,031,931 | |
Shares Outstanding | | | 1,435,795 | |
Net Asset Value, Offering Price and Redemption Price Per Share | | | | |
(net assets ÷ shares of beneficial interest outstanding) | | $ | 11.17 | |
On sales of $50,000 or more, the offering price of Class A shares is reduced.
| | | | |
| | 9 | | See Notes to Financial Statements. |
Eaton Vance
Municipal Opportunities Fund
January 31, 2013
Statement of Operations (Unaudited)
| | | | |
| Investment Income | | Six Months Ended
January 31, 2013 | |
Interest | | $ | 361,209 | |
Total investment income | | $ | 361,209 | |
|
| Expenses | |
Investment adviser and administration fee | | $ | 68,340 | |
Distribution and service fees | | | | |
Class A | | | 11,208 | |
Trustees’ fees and expenses | | | 750 | |
Custodian fee | | | 14,351 | |
Transfer and dividend disbursing agent fees | | | 2,262 | |
Legal and accounting services | | | 14,978 | |
Printing and postage | | | 7,278 | |
Registration fees | | | 16,321 | |
Miscellaneous | | | 10,689 | |
Total expenses | | $ | 146,177 | |
Deduct — | | | | |
Reduction of custodian fee | | $ | 304 | |
Allocation of expenses to affiliate | | | 37,360 | |
Total expense reductions | | $ | 37,664 | |
| |
Net expenses | | $ | 108,513 | |
| |
Net investment income | | $ | 252,696 | |
|
| Realized and Unrealized Gain (Loss) | |
Net realized gain (loss) — | | | | |
Investment transactions | | $ | 142,910 | |
Net realized gain | | $ | 142,910 | |
Change in unrealized appreciation (depreciation) — | | | | |
Investments | | $ | 144,377 | |
Net change in unrealized appreciation (depreciation) | | $ | 144,377 | |
| |
Net realized and unrealized gain | | $ | 287,287 | |
| |
Net increase in net assets from operations | | $ | 539,983 | |
| | | | |
| | 10 | | See Notes to Financial Statements. |
Eaton Vance
Municipal Opportunities Fund
January 31, 2013
Statements of Changes in Net Assets
| | | | | | | | |
| Increase (Decrease) in Net Assets | | Six Months Ended
January 31, 2013 (Unaudited) | | | Year Ended
July 31, 2012 | |
From operations — | | | | | | | | |
Net investment income | | $ | 252,696 | | | $ | 395,947 | |
Net realized gain from investment transactions | | | 142,910 | | | | 562,492 | |
Net change in unrealized appreciation (depreciation) from investments | | | 144,377 | | | | 1,100,095 | |
Net increase in net assets from operations | | $ | 539,983 | | | $ | 2,058,534 | |
Distributions to shareholders — | | | | | | | | |
From net investment income | | | | | | | | |
Class A | | $ | (89,883 | ) | | $ | (91,899 | ) |
Class I | | | (159,251 | ) | | | (301,447 | ) |
From net realized gain | | | | | | | | |
Class A | | | (211,992 | ) | | | (19,329 | ) |
Class I | | | (343,486 | ) | | | (57,618 | ) |
Total distributions to shareholders | | $ | (804,612 | ) | | $ | (470,293 | ) |
Transactions in shares of beneficial interest — | | | | | | | | |
Proceeds from sale of shares | | | | | | | | |
Class A | | $ | 9,532,467 | | | $ | 7,302,770 | |
Class I | | | 3,601,059 | | | | 993,355 | |
Net asset value of shares issued to shareholders in payment of distributions declared | | | | | | | | |
Class A | | | 301,496 | | | | 109,621 | |
Class I | | | 100,901 | | | | 9,240 | |
Cost of shares redeemed | | | | | | | | |
Class A | | | (983,506 | ) | | | (1,116,673 | ) |
Class I | | | (52,531 | ) | | | (7,680 | ) |
Net increase in net assets from Fund share transactions | | $ | 12,499,886 | | | $ | 7,290,633 | |
| | |
Net increase in net assets | | $ | 12,235,257 | | | $ | 8,878,874 | |
|
| Net Assets | |
At beginning of period | | $ | 19,432,115 | | | $ | 10,553,241 | |
At end of period | | $ | 31,667,372 | | | $ | 19,432,115 | |
|
Accumulated undistributed net investment income included in net assets | |
At end of period | | $ | 3,562 | | | $ | — | |
| | | | |
| | 11 | | See Notes to Financial Statements. |
Eaton Vance
Municipal Opportunities Fund
January 31, 2013
Financial Highlights
| | | | | | | | | | | | |
| | | Class A | |
| | | Six Months Ended
January 31, 2013
(Unaudited) | | | Year Ended
July 31, 2012 | | | Period Ended
July 31, 2011(1) | |
Net asset value — Beginning of period | | $ | 11.240 | | | $ | 10.090 | | | $ | 10.000 | |
| |
| Income (Loss) From Operations | | | | | |
Net investment income | | $ | 0.118 | | | $ | 0.257 | | | $ | 0.015 | |
Net realized and unrealized gain | | | 0.170 | | | | 1.205 | | | | 0.090 | |
| | | |
Total income from operations | | $ | 0.288 | | | $ | 1.462 | | | $ | 0.105 | |
| |
| Less Distributions | | | | | |
From net investment income | | $ | (0.117 | ) | | $ | (0.257 | ) | | $ | (0.015 | ) |
From net realized gain | | | (0.261 | ) | | | (0.055 | ) | | | — | |
| | | |
Total distributions | | $ | (0.378 | ) | | $ | (0.312 | ) | | $ | (0.015 | ) |
| | | |
Net asset value — End of period | | $ | 11.150 | | | $ | 11.240 | | | $ | 10.090 | |
| | | |
Total Return(2) | | | 2.56 | %(3) | | | 14.69 | % | | | 1.05 | %(3) |
| |
| Ratios/Supplemental Data | | | | | |
Net assets, end of period (000’s omitted) | | $ | 15,635 | | | $ | 6,886 | | | $ | 217 | |
Ratios (as a percentage of average daily net assets): | | | | | | | | | | | | |
Expenses(4)(5) | | | 1.10 | %(6) | | | 1.10 | % | | | 1.10 | %(6) |
Net investment income | | | 2.02 | %(6) | | | 2.36 | % | | | 0.96 | %(6) |
Portfolio Turnover | | | 33 | %(3) | | | 85 | % | | | 21 | %(3) |
| (1) | For the period from the start of business, May 31, 2011, to July 31, 2011. |
| (2) | Returns are historical and are calculated by determining the percentage change in net asset value with all distributions reinvested and do not reflect the effect of sales charges. |
| (4) | The investment adviser and administrator reimbursed operating expenses (equal to 0.33%, 0.54% and 4.13% of average daily net assets for the six months ended January 31, 2013, the year ended July 31, 2012 and the period ended July 31, 2011, respectively). Absent this reimbursement, total return would have been lower. |
| (5) | Excludes the effect of custody fee credits, if any, of less than 0.005%. |
| | | | |
| | 12 | | See Notes to Financial Statements. |
Eaton Vance
Municipal Opportunities Fund
January 31, 2013
Financial Highlights — continued
| | | | | | | | | | | | |
| | | Class I | |
| | | Six Months Ended
January 31, 2013
(Unaudited) | | | Year Ended
July 31, 2012 | | | Period Ended
July 31, 2011(1) | |
Net asset value — Beginning of period | | $ | 11.250 | | | $ | 10.090 | | | $ | 10.000 | |
| |
| Income (Loss) From Operations | | | | | |
Net investment income | | $ | 0.134 | | | $ | 0.286 | | | $ | 0.018 | |
Net realized and unrealized gain | | | 0.179 | | | | 1.215 | | | | 0.090 | |
| | | |
Total income from operations | | $ | 0.313 | | | $ | 1.501 | | | $ | 0.108 | |
| |
| Less Distributions | | | | | |
From net investment income | | $ | (0.132 | ) | | $ | (0.286 | ) | | $ | (0.018 | ) |
From net realized gain | | | (0.261 | ) | | | (0.055 | ) | | | — | |
| | | |
Total distributions | | $ | (0.393 | ) | | $ | (0.341 | ) | | $ | (0.018 | ) |
| | | |
Net asset value — End of period | | $ | 11.170 | | | $ | 11.250 | | | $ | 10.090 | |
| | | |
Total Return(2) | | | 2.79 | %(3) | | | 15.10 | % | | | 1.08 | %(3) |
| |
| Ratios/Supplemental Data | | | | | |
Net assets, end of period (000’s omitted) | | $ | 16,032 | | | $ | 12,546 | | | $ | 10,336 | |
Ratios (as a percentage of average daily net assets): | | | | | | | | | | | | |
Expenses(4)(5) | | | 0.85 | %(6) | | | 0.85 | % | | | 0.85 | %(6) |
Net investment income | | | 2.33 | %(6) | | | 2.68 | % | | | 1.07 | %(6) |
Portfolio Turnover | | | 33 | %(3) | | | 85 | % | | | 21 | %(3) |
| (1) | For the period from the start of business, May 31, 2011, to July 31, 2011. |
| (2) | Returns are historical and are calculated by determining the percentage change in net asset value with all distributions reinvested. |
| (4) | The investment adviser and administrator reimbursed operating expenses (equal to 0.33%, 0.54% and 4.13% of average daily net assets for the six months ended January 31, 2013, the year ended July 31, 2012 and the period ended July 31, 2011, respectively). Absent this reimbursement, total return would have been lower. |
| (5) | Excludes the effect of custody fee credits, if any, of less than 0.005%. |
| | | | |
| | 13 | | See Notes to Financial Statements. |
Eaton Vance
Municipal Opportunities Fund
January 31, 2013
Notes to Financial Statements (Unaudited)
1 Significant Accounting Policies
Eaton Vance Municipal Opportunities Fund (the Fund) is a diversified series of Eaton Vance Municipals Trust (the Trust). The Trust is a Massachusetts business trust registered under the Investment Company Act of 1940, as amended (the 1940 Act), as an open-end management investment company. The Fund seeks to maximize after-tax total return. The Fund offers two classes of shares. Class A shares are generally sold subject to a sales charge imposed at time of purchase. Class I shares are sold at net asset value and are not subject to a sales charge. Each class represents a pro-rata interest in the Fund, but votes separately on class-specific matters and (as noted below) is subject to different expenses. Realized and unrealized gains and losses are allocated daily to each class of shares based on the relative net assets of each class to the total net assets of the Fund. Net investment income, other than class-specific expenses, is allocated daily to each class of shares based upon the ratio of the value of each class’s paid shares to the total value of all paid shares. Each class of shares differs in its distribution plan and certain other class-specific expenses.
The following is a summary of significant accounting policies of the Fund. The policies are in conformity with accounting principles generally accepted in the United States of America.
A Investment Valuation — Debt obligations (including short-term obligations with a remaining maturity of more than sixty days) are generally valued on the basis of valuations provided by third party pricing services, as derived from such services’ pricing models. Inputs to the models may include, but are not limited to, reported trades, executable bid and asked prices, broker/dealer quotations, prices or yields of securities with similar characteristics, benchmark curves or information pertaining to the issuer, as well as industry and economic events. The pricing services may use a matrix approach, which considers information regarding securities with similar characteristics to determine the valuation for a security. Short-term obligations purchased with a remaining maturity of sixty days or less are generally valued at amortized cost, which approximates market value. Investments for which valuations or market quotations are not readily available or are deemed unreliable are valued at fair value using methods determined in good faith by or at the direction of the Trustees of the Fund in a manner that fairly reflects the security’s value, or the amount that the Fund might reasonably expect to receive for the security upon its current sale in the ordinary course. Each such determination is based on a consideration of relevant factors, which are likely to vary from one pricing context to another. These factors may include, but are not limited to, the type of security, the existence of any contractual restrictions on the security’s disposition, the price and extent of public trading in similar securities of the issuer or of comparable entities, quotations or relevant information obtained from broker/dealers or other market participants, information obtained from the issuer, analysts, and/or the appropriate stock exchange (for exchange-traded securities), an analysis of the entity’s financial condition, and an evaluation of the forces that influence the issuer and the market(s) in which the security is purchased and sold.
B Investment Transactions and Related Income — Investment transactions for financial statement purposes are accounted for on a trade date basis. Realized gains and losses on investments sold are determined on the basis of identified cost. Interest income is recorded on the basis of interest accrued, adjusted for amortization of premium or accretion of discount.
C Federal Taxes — The Fund’s policy is to comply with the provisions of the Internal Revenue Code applicable to regulated investment companies and to distribute to shareholders each year substantially all of its taxable, if any, and tax-exempt net investment income, and all or substantially all of its net realized capital gains. Accordingly, no provision for federal income or excise tax is necessary. The Fund intends to satisfy conditions which will enable it to designate distributions from the interest income generated by its investments in non-taxable municipal securities, which are exempt from regular federal income tax when received by the Fund, as exempt-interest dividends. The portion of such interest, if any, earned on private activity bonds issued after August 7, 1986, may be considered a tax preference item to shareholders.
As of January 31, 2013, the Fund had no uncertain tax positions that would require financial statement recognition, de-recognition, or disclosure. The Fund files a U.S. federal income tax return annually after its fiscal year-end, which is subject to examination by the Internal Revenue Service for a period of three years from the date of filing.
D Expenses — The majority of expenses of the Trust are directly identifiable to an individual fund. Expenses which are not readily identifiable to a specific fund are allocated taking into consideration, among other things, the nature and type of expense and the relative size of the funds.
E Expense Reduction — State Street Bank and Trust Company (SSBT) serves as custodian of the Fund. Pursuant to the custodian agreement, SSBT receives a fee reduced by credits, which are determined based on the average daily cash balance the Fund maintains with SSBT. All credit balances, if any, used to reduce the Fund’s custodian fees are reported as a reduction of expenses in the Statement of Operations.
F Legal Fees — Legal fees and other related expenses incurred as part of negotiations of the terms and requirement of capital infusions, or that are expected to result in the restructuring of, or a plan of reorganization for, an investment are recorded as realized losses. Ongoing expenditures to protect or enhance an investment are treated as operating expenses.
G Use of Estimates — The preparation of the financial statements in conformity with accounting principles generally accepted in the United States of America requires management to make estimates and assumptions that affect the reported amounts of assets and liabilities at the date of the financial statements and the reported amounts of income and expense during the reporting period. Actual results could differ from those estimates.
H Indemnifications — Under the Trust’s organizational documents, its officers and Trustees may be indemnified against certain liabilities and expenses arising out of the performance of their duties to the Fund. Under Massachusetts law, if certain conditions prevail, shareholders of a Massachusetts business
Eaton Vance
Municipal Opportunities Fund
January 31, 2013
Notes to Financial Statements (Unaudited) — continued
trust (such as the Trust) could be deemed to have personal liability for the obligations of the Trust. However, the Trust’s Declaration of Trust contains an express disclaimer of liability on the part of Fund shareholders and the By-laws provide that the Trust shall assume the defense on behalf of any Fund shareholders. Moreover, the By-laws also provide for indemnification out of Fund property of any shareholder held personally liable solely by reason of being or having been a shareholder for all loss or expense arising from such liability. Additionally, in the normal course of business, the Fund enters into agreements with service providers that may contain indemnification clauses. The Fund’s maximum exposure under these arrangements is unknown as this would involve future claims that may be made against the Fund that have not yet occurred.
I When-Issued Securities and Delayed Delivery Transactions — The Fund may purchase or sell securities on a delayed delivery or when-issued basis. Payment and delivery may take place after the customary settlement period for that security. At the time the transaction is negotiated, the price of the security that will be delivered is fixed. The Fund maintains security positions for these commitments such that sufficient liquid assets will be available to make payments upon settlement. Securities purchased on a delayed delivery or when-issued basis are marked-to-market daily and begin earning interest on settlement date. Losses may arise due to changes in the market value of the underlying securities or if the counterparty does not perform under the contract.
J Interim Financial Statements — The interim financial statements relating to January 31, 2013 and for the six months then ended have not been audited by an independent registered public accounting firm, but in the opinion of the Fund’s management, reflect all adjustments, consisting only of normal recurring adjustments, necessary for the fair presentation of the financial statements.
2 Distributions to Shareholders
The net investment income of the Fund is determined daily and substantially all of the net investment income so determined is declared as a dividend to shareholders of record at the time of declaration. Distributions are declared separately for each class of shares. Distributions are paid monthly. Distributions of realized capital gains are made at least annually. Shareholders may reinvest income and capital gain distributions in additional shares of the same class of the Fund at the net asset value as of the reinvestment date or, at the election of the shareholder, receive distributions in cash. The Fund distinguishes between distributions on a tax basis and a financial reporting basis. Accounting principles generally accepted in the United States of America require that only distributions in excess of tax basis earnings and profits be reported in the financial statements as a return of capital. Permanent differences between book and tax accounting relating to distributions are reclassified to paid-in capital. For tax purposes, distributions from short-term capital gains are considered to be from ordinary income.
3 Investment Adviser and Administration Fee and Other Transactions with Affiliates
The investment adviser and administration fee is earned by Eaton Vance Management (EVM) as compensation for investment advisory and administrative services rendered to the Fund. The fee is computed at an annual rate of 0.60% of the Fund’s average daily net assets up to $500 million and is payable monthly. On net assets of $500 million and over, the annual fee is reduced. For the six months ended January 31, 2013, the investment adviser and administration fee amounted to $68,340 or 0.60% (annualized) of the Fund’s average daily net assets. EVM has agreed to reimburse the Fund’s expenses to the extent that total annual operating expenses (relating to ordinary operating expenses only) exceed 1.10% and 0.85% of the Fund’s average daily net assets for Class A and Class I, respectively. This agreement may be changed or terminated after November 30, 2013. Pursuant to this agreement, EVM was allocated $37,360 of the Fund’s operating expenses for the six months ended January 31, 2013. EVM serves as the sub-transfer agent of the Fund and receives from the transfer agent an aggregate fee based upon the actual expenses incurred by EVM in the performance of these services. For the six months ended January 31, 2013, EVM earned $107 in sub-transfer agent fees. The Fund was informed that Eaton Vance Distributors, Inc. (EVD), an affiliate of EVM and the Fund’s principal underwriter, received $6,229 as its portion of the sales charge on sales of Class A shares for the six months ended January 31, 2013. EVD also received distribution and service fees from Class A shares (see Note 4).
Trustees and officers of the Fund who are members of EVM’s organization receive remuneration for their services to the Fund out of the investment adviser and administration fee. Trustees of the Fund who are not affiliated with EVM may elect to defer receipt of all or a percentage of their annual fees in accordance with the terms of the Trustees Deferred Compensation Plan. For the six months ended January 31, 2013, no significant amounts have been deferred. Certain officers and Trustees of the Fund are officers of EVM.
4 Distribution Plan
The Fund has in effect a distribution plan for Class A shares (Class A Plan) pursuant to Rule 12b-1 under the 1940 Act. Pursuant to the Class A Plan, the Fund pays EVD a distribution and service fee of 0.25% per annum of its average daily net assets attributable to Class A shares for distribution services and facilities provided to the Fund by EVD, as well as for personal services and/or the maintenance of shareholder accounts. Distribution and service fees paid or accrued to EVD for the six months ended January 31, 2013 amounted to $11,208 for Class A shares.
5 Contingent Deferred Sales Charges
Class A shares may be subject to a 1% contingent deferred sales charge (CDSC) if redeemed within 18 months of purchase (depending on the circumstances of purchase). Generally, the CDSC is based upon the lower of the net asset value at date of redemption or date of purchase. No charge is
Eaton Vance
Municipal Opportunities Fund
January 31, 2013
Notes to Financial Statements (Unaudited) — continued
levied on shares acquired by reinvestment of dividends or capital gain distributions. No CDSC is levied on shares which have been sold to EVM or its affiliates or to their respective employees or clients and may be waived under certain other limited conditions. For the six months ended January 31, 2013, the Fund was informed that EVD received no CDSCs paid by Class A shareholders.
6 Purchases and Sales of Investments
Purchases and sales of investments, other than short-term obligations, aggregated $15,226,392 and $7,147,037, respectively, for the six months ended January 31, 2013.
7 Shares of Beneficial Interest
The Fund’s Declaration of Trust permits the Trustees to issue an unlimited number of full and fractional shares of beneficial interest (without par value). Such shares may be issued in a number of different series (such as the Fund) and classes. Transactions in Fund shares were as follows:
| | | | | | | | |
| Class A | | Six Months Ended
January 31, 2013
(Unaudited) | | | Year Ended
July 31, 2012 | |
| | |
Sales | | | 848,841 | | | | 684,329 | |
Issued to shareholders electing to receive payments of distributions in Fund shares | | | 26,851 | | | | 10,131 | |
Redemptions | | | (86,630 | ) | | | (103,184 | ) |
| | |
Net increase | | | 789,062 | | | | 591,276 | |
| | | | | | | | |
| Class I | | Six Months Ended
January 31, 2013
(Unaudited) | | | Year Ended
July 31, 2012 | |
| | |
Sales | | | 316,136 | | | | 91,219 | |
Issued to shareholders electing to receive payments of distributions in Fund shares | | | 8,986 | | | | 848 | |
Redemptions | | | (4,684 | ) | | | (710 | ) |
| | |
Net increase | | | 320,438 | | | | 91,357 | |
At January 31, 2013, EVM owned 35% of the value of the outstanding shares of the Fund.
8 Federal Income Tax Basis of Investments
The cost and unrealized appreciation (depreciation) of investments of the Fund at January 31, 2013, as determined on a federal income tax basis, were as follows:
| | | | |
| |
Aggregate cost | | $ | 25,524,219 | |
| |
Gross unrealized appreciation | | $ | 1,375,899 | |
Gross unrealized depreciation | | | (36,176 | ) |
| |
Net unrealized appreciation | | $ | 1,339,723 | |
9 Line of Credit
The Fund participates with other portfolios and funds managed by EVM and its affiliates in a $600 million unsecured line of credit agreement with a group of banks. Borrowings are made by the Fund solely to facilitate the handling of unusual and/or unanticipated short-term cash requirements. Interest is charged to the Fund based on its borrowings at an amount above either the Eurodollar rate or Federal Funds rate. In addition, a fee computed at an annual rate of 0.08% on the daily unused portion of the line of credit is allocated among the participating portfolios and funds at the end of each quarter. Because
Eaton Vance
Municipal Opportunities Fund
January 31, 2013
Notes to Financial Statements (Unaudited) — continued
the line of credit is not available exclusively to the Fund, it may be unable to borrow some or all of its requested amounts at any particular time. The Fund did not have any significant borrowings or allocated fees during the six months ended January 31, 2013.
10 Fair Value Measurements
Under generally accepted accounting principles for fair value measurements, a three-tier hierarchy to prioritize the assumptions, referred to as inputs, is used in valuation techniques to measure fair value. The three-tier hierarchy of inputs is summarized in the three broad levels listed below.
| Ÿ | | Level 1 – quoted prices in active markets for identical investments |
| Ÿ | | Level 2 – other significant observable inputs (including quoted prices for similar investments, interest rates, prepayment speeds, credit risk, etc.) |
| Ÿ | | Level 3 – significant unobservable inputs (including a fund’s own assumptions in determining the fair value of investments) |
In cases where the inputs used to measure fair value fall in different levels of the fair value hierarchy, the level disclosed is determined based on the lowest level input that is significant to the fair value measurement in its entirety. The inputs or methodology used for valuing securities are not necessarily an indication of the risk associated with investing in those securities.
At January 31, 2013, the hierarchy of inputs used in valuing the Fund’s investments, which are carried at value, were as follows:
| | | | | | | | | | | | | | | | |
| Asset Description | | Level 1 | | | Level 2 | | | Level 3 | | | Total | |
| | | | |
Tax-Exempt Municipal Securities | | | $ — | | | $ | 26,803,603 | | | $ | — | | | $ | 26,803,603 | |
Taxable Municipal Securities | | | — | | | | 60,339 | | | | — | | | | 60,339 | |
| | | | |
Total Investments | | $ | — | | | $ | 26,863,942 | | | $ | — | | | $ | 26,863,942 | |
The Fund held no investments or other financial instruments as of July 31, 2012 whose fair value was determined using Level 3 inputs. At January 31, 2013, there were no investments transferred between Level 1 and Level 2 during the six months then ended.
Eaton Vance
Municipal Opportunities Fund
January 31, 2013
Officers and Trustees
Officers of Eaton Vance Municipal Opportunities Fund
Thomas M. Metzold
President
Payson F. Swaffield
Vice President
Maureen A. Gemma
Vice President, Secretary and Chief Legal Officer
James F. Kirchner
Treasurer
Paul M. O’Neil
Chief Compliance Officer
Trustees of Eaton Vance Municipal Opportunities Fund
Ralph F. Verni
Chairman
Scott E. Eston
Benjamin C. Esty
Thomas E. Faust Jr.*
Allen R. Freedman
William H. Park
Ronald A. Pearlman
Helen Frame Peters
Lynn A. Stout
Harriett Tee Taggart
Eaton Vance Funds
IMPORTANT NOTICES
Privacy. The Eaton Vance organization is committed to ensuring your financial privacy. Each of the financial institutions identified below has in effect the following policy (“Privacy Policy”) with respect to nonpublic personal information about its customers:
| Ÿ | | Only such information received from you, through application forms or otherwise, and information about your Eaton Vance fund transactions will be collected. This may include information such as name, address, social security number, tax status, account balances and transactions. |
| Ÿ | | None of such information about you (or former customers) will be disclosed to anyone, except as permitted by law (which includes disclosure to employees necessary to service your account). In the normal course of servicing a customer’s account, Eaton Vance may share information with unaffiliated third parties that perform various required services such as transfer agents, custodians and broker-dealers. |
| Ÿ | | Policies and procedures (including physical, electronic and procedural safeguards) are in place that are designed to protect the confidentiality of such information. |
| Ÿ | | We reserve the right to change our Privacy Policy at any time upon proper notification to you. Customers may want to review our Privacy Policy periodically for changes by accessing the link on our homepage: www.eatonvance.com. |
Our pledge of privacy applies to the following entities within the Eaton Vance organization: the Eaton Vance Family of Funds, Eaton Vance Management, Eaton Vance Investment Counsel, Eaton Vance Distributors, Inc., Eaton Vance Trust Company, Eaton Vance Management’s Real Estate Investment Group and Boston Management and Research. In addition, our Privacy Policy applies only to those Eaton Vance customers who are individuals and who have a direct relationship with us. If a customer’s account (i.e., fund shares) is held in the name of a third-party financial advisor/broker-dealer, it is likely that only such advisor’s privacy policies apply to the customer. This notice supersedes all previously issued privacy disclosures. For more information about Eaton Vance’s Privacy Policy, please call 1-800-262-1122.
Delivery of Shareholder Documents. The Securities and Exchange Commission (SEC) permits funds to deliver only one copy of shareholder documents, including prospectuses, proxy statements and shareholder reports, to fund investors with multiple accounts at the same residential or post office box address. This practice is often called “householding” and it helps eliminate duplicate mailings to shareholders. Eaton Vance, or your financial advisor, may household the mailing of your documents indefinitely unless you instruct Eaton Vance, or your financial advisor, otherwise. If you would prefer that your Eaton Vance documents not be householded, please contact Eaton Vance at 1-800-262-1122, or contact your financial advisor. Your instructions that householding not apply to delivery of your Eaton Vance documents will be effective within 30 days of receipt by Eaton Vance or your financial advisor.
Portfolio Holdings. Each Eaton Vance Fund and its underlying Portfolio(s) (if applicable) will file a schedule of portfolio holdings on Form N-Q with the SEC for the first and third quarters of each fiscal year. The Form N-Q will be available on the Eaton Vance website at www.eatonvance.com, by calling Eaton Vance at 1-800-262-1122 or in the EDGAR database on the SEC’s website at www.sec.gov. Form N-Q may also be reviewed and copied at the SEC’s public reference room in Washington, D.C. (call 1-800-732-0330 for information on the operation of the public reference room).
Proxy Voting. From time to time, funds are required to vote proxies related to the securities held by the funds. The Eaton Vance Funds or their underlying Portfolios (if applicable) vote proxies according to a set of policies and procedures approved by the Funds’ and Portfolios’ Boards. You may obtain a description of these policies and procedures and information on how the Funds or Portfolios voted proxies relating to portfolio securities during the most recent 12-month period ended June 30, without charge, upon request, by calling 1-800-262-1122 and by accessing the SEC’s website at www.sec.gov.
This Page Intentionally Left Blank
Investment Advisor and Administrator
Eaton Vance Management
Two International Place
Boston, MA 02110
Principal Underwriter*
Eaton Vance Distributors, Inc.
Two International Place
Boston, MA 02110
(617) 482-8260
Custodian
State Street Bank and Trust Company
200 Clarendon Street
Boston, MA 02116
Transfer Agent
BNY Mellon Asset Servicing (US) Inc.
Attn: Eaton Vance Funds
P.O. Box 9653
Providence, RI 02940-9653
(800) 262-1122
Fund Offices
Two International Place
Boston, MA 02110
| * | FINRA BrokerCheck. Investors may check the background of their Investment Professional by contacting the Financial Industry Regulatory Authority (FINRA). FINRA BrokerCheck is a free tool to help investors check the professional background of current and former FINRA-registered securities firms and brokers. FINRA BrokerCheck is available by calling 1-800-289-9999 and at www.FINRA.org. The FINRA BrokerCheck brochure describing the program is available to investors at www.FINRA.org. |
Item 2. Code of Ethics
Not required in this filing.
Item 3. Audit Committee Financial Expert
The registrant’s Board has designated William H. Park, an independent trustee, as its audit committee financial expert. Mr. Park is a certified public accountant who is a consultant and private investor. Previously, he served as the Chief Financial Officer of Aveon Group, L.P. (an investment management firm), as the Vice Chairman of Commercial Industrial Finance Corp. (specialty finance company), as President and Chief Executive Officer of Prizm Capital Management, LLC (investment management firm), as Executive Vice President and Chief Financial Officer of United Asset Management Corporation (an institutional investment management firm) and as a Senior Manager at Price Waterhouse (now PricewaterhouseCoopers) (an independent registered public accounting firm).
Item 4. Principal Accountant Fees and Services
Not required in this filing.
Item 5. Audit Committee of Listed Registrants
Not required in this filing.
Item 6. Schedule of Investments
Please see schedule of investments contained in the Report to Stockholders included under Item 1 of this Form N-CSR.
Item 7. Disclosure of Proxy Voting Policies and Procedures for Closed-End Management Investment Companies
Not required in this filing.
Item 8. Portfolio Managers of Closed-End Management Investment Companies
Not required in this filing.
Item 9. Purchases of Equity Securities by Closed-End Management Investment Company and Affiliated Purchasers
Not required in this filing.
Item 10. Submission of Matters to a Vote of Security Holders
No Material Changes.
Item 11. Controls and Procedures
(a) It is the conclusion of the registrant’s principal executive officer and principal financial officer that the effectiveness of the registrant’s current disclosure controls and procedures (such disclosure controls and procedures having been evaluated within 90 days of the date of this filing) provide reasonable assurance that the information required to be disclosed by the registrant has been recorded, processed, summarized and reported within the time period specified in the Commission’s rules and forms and
that the information required to be disclosed by the registrant has been accumulated and communicated to the registrant’s principal executive officer and principal financial officer in order to allow timely decisions regarding required disclosure.
(b) There have been no changes in the registrant’s internal controls over financial reporting during the second fiscal quarter of the period covered by this report that has materially affected, or is reasonably likely to materially affect, the registrant’s internal control over financial reporting.
Item 12. Exhibits
| | |
| (a)(1) | | Registrant’s Code of Ethics – Not applicable (please see Item 2). |
| (a)(2)(i) | | Treasurer’s Section 302 certification. |
| (a)(2)(ii) | | President’s Section 302 certification. |
| (b) | | Combined Section 906 certification. |
Signatures
Pursuant to the requirements of the Securities Exchange Act of 1934 and the Investment Company Act of 1940, the registrant has duly caused this report to be signed on its behalf by the undersigned, thereunto duly authorized.
Eaton Vance Municipals Trust
| | |
| By: | | /s/ Thomas M. Metzold |
| | Thomas M. Metzold |
| | President |
Date: March 14, 2013
Pursuant to the requirements of the Securities Exchange Act of 1934 and the Investment Company Act of 1940, this report has been signed below by the following persons on behalf of the registrant and in the capacities and on the dates indicated.
| | |
| By: | | /s/ James F. Kirchner |
| | James F. Kirchner |
| | Treasurer |
Date: March 14, 2013
| | |
| By: | | /s/ Thomas M. Metzold |
| | Thomas M. Metzold |
| | President |
Date: March 14, 2013