UNITED STATES
SECURITIES AND EXCHANGE COMMISSION
Washington, D.C. 20549
Form N-CSR
CERTIFIED SHAREHOLDER REPORT OF REGISTERED
MANAGEMENT INVESTMENT COMPANIES
Investment Company Act File Number: 811-04409
Eaton Vance Municipals Trust
(Exact Name of Registrant as Specified in Charter)
Two International Place, Boston, Massachusetts 02110
(Address of Principal Executive Offices)
Maureen A. Gemma
Two International Place, Boston, Massachusetts 02110
(Name and Address of Agent for Services)
(617) 482-8260
(Registrant’s Telephone Number)
August 31
Date of Fiscal Year End
February 28, 2014
Date of Reporting Period
Item 1. Reports to Stockholders

Eaton Vance
Municipals Trust
Semiannual Report
February 28, 2014
Alabama • Arkansas • Georgia • Kentucky • Maryland • Missouri
North Carolina • Oregon • South Carolina • Tennessee • Virginia

Commodity Futures Trading Commission Registration. Effective December 31, 2012, the Commodity Futures Trading Commission (“CFTC”) adopted certain regulatory changes that subject registered investment companies and advisers to regulation by the CFTC if a fund invests more than a prescribed level of its assets in certain CFTC-regulated instruments (including futures, certain options and swap agreements) or markets itself as providing investment exposure to such instruments. Each Fund has claimed an exclusion from the definition of the term “commodity pool operator” under the Commodity Exchange Act. Accordingly, neither the Funds nor the adviser with respect to the operation of the Funds is subject to the CFTC regulation. Because of its management of other strategies, each Fund’s adviser is registered with the CFTC as a commodity pool operator and a commodity trading advisor.
Fund shares are not insured by the FDIC and are not deposits or other obligations of, or guaranteed by, any depository institution. Shares are subject to investment risks, including possible loss of principal invested.
This report must be preceded or accompanied by a current summary prospectus or prospectus. Before investing, investors should consider carefully the investment objective, risks, and charges and expenses of a mutual fund. This and other important information is contained in the summary prospectus and prospectus, which can be obtained from a financial advisor. Prospective investors should read the prospectus carefully before investing. For further information, please call 1-800-262-1122.
Semiannual Report February 28, 2014
Eaton Vance
Municipal Income Funds
Table of Contents
| | | | |
Performance and Fund Profile | | | | |
| |
| | | | |
Alabama | | | 2 | |
Arkansas | | | 3 | |
Georgia | | | 4 | |
Kentucky | | | 5 | |
Maryland | | | 6 | |
Missouri | | | 7 | |
North Carolina | | | 8 | |
Oregon | | | 9 | |
South Carolina | | | 10 | |
Tennessee | | | 11 | |
Virginia | | | 12 | |
| |
| | | | |
| |
Endnotes and Additional Disclosures | | | 13 | |
| |
Fund Expenses | | | 14 | |
| |
Financial Statements | | | 20 | |
| |
Officers and Trustees | | | 123 | |
| |
Important Notices | | | 124 | |
Eaton Vance
Alabama Municipal Income Fund
February 28, 2014
Performance1,2
Portfolio Manager Thomas M. Metzold, CFA
| | | | | | | | | | | | | | | | | | | | | | | | |
| % Average Annual Total Returns | | Class
Inception Date | | | Performance Inception Date | | | Six Months | | | One Year | | | Five Years | | | Ten Years | |
Class A at NAV | | | 12/07/1993 | | | | 05/01/1992 | | | | 6.83 | % | | | –2.20 | % | | | 5.61 | % | | | 3.62 | % |
Class A with 4.75% Maximum Sales Charge | | | — | | | | — | | | | 1.74 | | | | –6.85 | | | | 4.58 | | | | 3.12 | |
Class B at NAV | | | 05/01/1992 | | | | 05/01/1992 | | | | 6.51 | | | | –2.95 | | | | 4.84 | | | | 2.86 | |
Class B with 5% Maximum Sales Charge | | | — | | | | — | | | | 1.51 | | | | –7.66 | | | | 4.51 | | | | 2.86 | |
Class C at NAV | | | 03/21/2006 | | | | 05/01/1992 | | | | 6.50 | | | | –2.85 | | | | 4.86 | | | | 2.85 | |
Class C with 1% Maximum Sales Charge | | | — | | | | — | | | | 5.50 | | | | –3.80 | | | | 4.86 | | | | 2.85 | |
Class I at NAV | | | 03/03/2008 | | | | 05/01/1992 | | | | 7.05 | | | | –2.00 | | | | 5.84 | | | | 3.75 | |
Barclays Municipal Bond Index | | | — | | | | — | | | | 5.71 | % | | | –0.21 | % | | | 5.67 | % | | | 4.39 | % |
Barclays 20 Year Municipal Bond Index | | | — | | | | — | | | | 7.67 | | | | –1.34 | | | | 7.12 | | | | 5.05 | |
| | | | | | |
| | | | | | | | | | | | | | | | | | | | | | | | |
| % Total Annual Operating Expense Ratios3 | | | | | | | | Class A | | | Class B | | | Class C | | | Class I | |
Gross | | | | | | | | | | | 0.75 | % | | | 1.50 | % | | | 1.49 | % | | | 0.54 | % |
Net | | | | | | | | | | | 0.73 | | | | 1.48 | | | | 1.47 | | | | 0.52 | |
| | | | | | |
| | | | | | | | | | | | | | | | | | | | | | | | |
| % Distribution Rates/Yields4 | | | | | | | | Class A | | | Class B | | | Class C | | | Class I | |
Distribution Rate | | | | | | | | | | | 3.79 | % | | | 3.11 | % | | | 3.10 | % | | | 3.97 | % |
Taxable-Equivalent Distribution Rate | | | | | | | | | | | 7.05 | | | | 5.78 | | | | 5.77 | | | | 7.38 | |
SEC 30-day Yield | | | | | | | | | | | 2.71 | | | | 2.11 | | | | 2.10 | | | | 3.05 | |
Taxable-Equivalent SEC 30-day Yield | | | | | | | | | | | 5.04 | | | | 3.92 | | | | 3.91 | | | | 5.67 | |
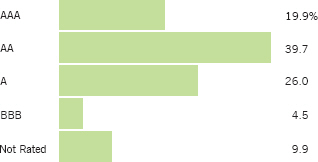
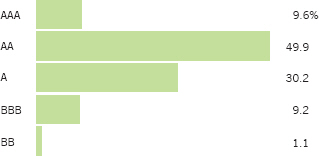
Fund Profile
Credit Quality (% of total investments)6
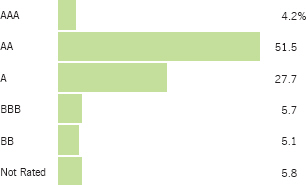
See Endnotes and Additional Disclosures in this report.
Past performance is no guarantee of future results. Returns are historical and are calculated by determining the percentage change in net asset value (NAV) or offering price (as applicable) with all distributions reinvested. Investment return and principal value will fluctuate so that shares, when redeemed, may be worth more or less than their original cost. Performance less than one year is cumulative. Performance is for the stated time period only; due to market volatility, the Fund’s current performance may be lower or higher than quoted. Returns are before taxes unless otherwise noted. For performance as of the most recent month end, please refer to eatonvance.com.
Eaton Vance
Arkansas Municipal Income Fund
February 28, 2014
Performance1,2
Portfolio Manager Adam A. Weigold, CFA
| | | | | | | | | | | | | | | | | | | | | | | | |
| % Average Annual Total Returns | | Class Inception Date | | | Performance Inception Date | | | Six Months | | | One Year | | | Five Years | | | Ten Years | |
Class A at NAV | | | 02/09/1994 | | | | 10/02/1992 | | | | 6.10 | % | | | –1.05 | % | | | 5.34 | % | | | 2.90 | % |
Class A with 4.75% Maximum Sales Charge | | | — | | | | — | | | | 1.09 | | | | –5.74 | | | | 4.33 | | | | 2.40 | |
Class B at NAV | | | 10/02/1992 | | | | 10/02/1992 | | | | 5.66 | | | | –1.86 | | | | 4.55 | | | | 2.14 | |
Class B with 5% Maximum Sales Charge | | | — | | | | — | | | | 0.66 | | | | –6.62 | | | | 4.21 | | | | 2.14 | |
Class C at NAV | | | 04/28/2006 | | | | 10/02/1992 | | | | 5.66 | | | | –1.86 | | | | 4.55 | | | | 2.10 | |
Class C with 1% Maximum Sales Charge | | | — | | | | — | | | | 4.66 | | | | –2.81 | | | | 4.55 | | | | 2.10 | |
Class I at NAV | | | 08/03/2010 | | | | 10/02/1992 | | | | 6.21 | | | | –0.87 | | | | 5.44 | | | | 2.95 | |
Barclays Municipal Bond Index | | | — | | | | — | | | | 5.71 | % | | | –0.21 | % | | | 5.67 | % | | | 4.39 | % |
Barclays 20 Year Municipal Bond Index | | | — | | | | — | | | | 7.67 | | | | –1.34 | | | | 7.12 | | | | 5.05 | |
| | | | | | |
| | | | | | | | | | | | | | | | | | | | | | | | |
| % Total Annual Operating Expense Ratios3 | | | | | | | | Class A | | | Class B | | | Class C | | | Class I | |
| | | | | | | | | | | 0.72 | % | | | 1.48 | % | | | 1.48 | % | | | 0.53 | % |
| | | | | | |
| | | | | | | | | | | | | | | | | | | | | | | | |
| % Distribution Rates/Yields4 | | | | | | | | Class A | | | Class B | | | Class C | | | Class I | |
Distribution Rate | | | | | | | | | | | 3.84 | % | | | 3.15 | % | | | 3.17 | % | | | 4.01 | % |
Taxable-Equivalent Distribution Rate | | | | | | | | | | | 7.29 | | | | 5.98 | | | | 6.02 | | | | 7.62 | |
SEC 30-day Yield | | | | | | | | | | | 2.66 | | | | 2.05 | | | | 2.06 | | | | 3.00 | |
Taxable-Equivalent SEC 30-day Yield | | | | | | | | | | | 5.05 | | | | 3.89 | | | | 3.91 | | | | 5.70 | |
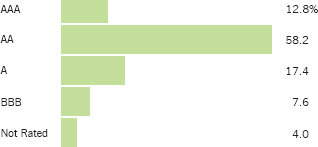
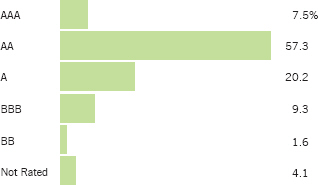
Fund Profile
Credit Quality (% of total investments)6
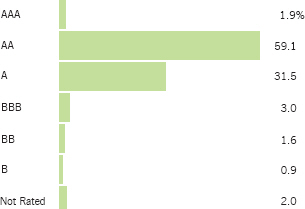
See Endnotes and Additional Disclosures in this report.
Past performance is no guarantee of future results. Returns are historical and are calculated by determining the percentage change in net asset value (NAV) or offering price (as applicable) with all distributions reinvested. Investment return and principal value will fluctuate so that shares, when redeemed, may be worth more or less than their original cost. Performance less than one year is cumulative. Performance is for the stated time period only; due to market volatility, the Fund’s current performance may be lower or higher than quoted. Returns are before taxes unless otherwise noted. For performance as of the most recent month end, please refer to eatonvance.com.
Eaton Vance
Georgia Municipal Income Fund
February 28, 2014
Performance1,2
Portfolio Manager Adam A. Weigold, CFA
| | | | | | | | | | | | | | | | | | | | | | | | |
| % Average Annual Total Returns | | Class Inception Date | | | Performance Inception Date | | | Six Months | | | One Year | | | Five Years | | | Ten Years | |
Class A at NAV | | | 12/07/1993 | | | | 12/23/1991 | | | | 7.11 | % | | | –1.43 | % | | | 5.50 | % | | | 3.02 | % |
Class A with 4.75% Maximum Sales Charge | | | — | | | | — | | | | 2.03 | | | | –6.08 | | | | 4.47 | | | | 2.52 | |
Class B at NAV | | | 12/23/1991 | | | | 12/23/1991 | | | | 6.63 | | | | –2.26 | | | | 4.69 | | | | 2.25 | |
Class B with 5% Maximum Sales Charge | | | — | | | | — | | | | 1.63 | | | | –7.00 | | | | 4.36 | | | | 2.25 | |
Class C at NAV | | | 04/25/2006 | | | | 12/23/1991 | | | | 6.75 | | | | –2.25 | | | | 4.70 | | | | 2.24 | |
Class C with 1% Maximum Sales Charge | | | — | | | | — | | | | 5.75 | | | | –3.20 | | | | 4.70 | | | | 2.24 | |
Class I at NAV | | | 03/03/2008 | | | | 12/23/1991 | | | | 7.21 | | | | –1.34 | | | | 5.70 | | | | 3.17 | |
Barclays Municipal Bond Index | | | — | | | | — | | | | 5.71 | % | | | –0.21 | % | | | 5.67 | % | | | 4.39 | % |
Barclays 20 Year Municipal Bond Index | | | — | | | | — | | | | 7.67 | | | | –1.34 | | | | 7.12 | | | | 5.05 | |
| | | | | | |
| | | | | | | | | | | | | | | | | | | | | | | | |
| % Total Annual Operating Expense Ratios3 | | | | | | | | Class A | | | Class B | | | Class C | | | Class I | |
Gross | | | | | | | | | | | 0.76 | % | | | 1.51 | % | | | 1.51 | % | | | 0.56 | % |
Net | | | | | | | | | | | 0.72 | | | | 1.47 | | | | 1.47 | �� | | | 0.52 | |
| | | | | | |
| | | | | | | | | | | | | | | | | | | | | | | | |
| % Distribution Rates/Yields4 | | | | | | | | Class A | | | Class B | | | Class C | | | Class I | |
Distribution Rate | | | | | | | | | | | 3.92 | % | | | 3.24 | % | | | 3.24 | % | | | 4.11 | % |
Taxable-Equivalent Distribution Rate | | | | | | | | | | | 7.37 | | | | 6.09 | | | | 6.09 | | | | 7.73 | |
SEC 30-day Yield | | | | | | | | | | | 3.00 | | | | 2.41 | | | | 2.41 | | | | 3.35 | |
Taxable-Equivalent SEC 30-day Yield | | | | | | | | | | | 5.64 | | | | 4.53 | | | | 4.53 | | | | 6.30 | |
| | | | | | |
| | | | | | | | | | | | | | | | | | | | | | | | |
| % Total Leverage5 | | | | | | | | | | | | | | | | | | |
Residual Interest Bond (RIB) | | | | | | | | | | | | | | | | | | | | | | | 5.52 | % |
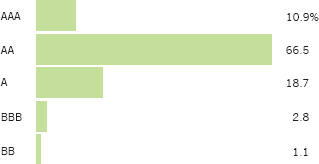
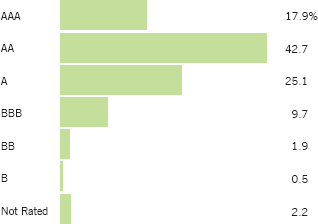
Fund Profile
Credit Quality (% of total investments)6
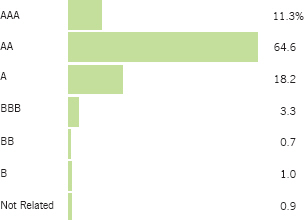
The above chart includes the ratings of securities held by special purpose vehicles established in connection with the RIB financing.5 Absent such securities, credit quality (% of total investments) is as follows:6
| | | | | | | | | | |
AAA | | | 6.0 | % | | BB | | | 0.8 | % |
AA | | | 68.5 | | | B | | | 1.1 | |
A | | | 19.3 | | | Not Rated | | | 0.9 | |
BBB | | | 3.4 | | | | | | | |
See Endnotes and Additional Disclosures in this report.
Past performance is no guarantee of future results. Returns are historical and are calculated by determining the percentage change in net asset value (NAV) or offering price (as applicable) with all distributions reinvested. Investment return and principal value will fluctuate so that shares, when redeemed, may be worth more or less than their original cost. Performance less than one year is cumulative. Performance is for the stated time period only; due to market volatility, the Fund’s current performance may be lower or higher than quoted. Returns are before taxes unless otherwise noted. For performance as of the most recent month end, please refer to eatonvance.com.
Eaton Vance
Kentucky Municipal Income Fund
February 28, 2014
Performance1,2
Portfolio Manager Adam A. Weigold, CFA
| | | | | | | | | | | | | | | | | | | | | | | | |
| % Average Annual Total Returns | | Class Inception Date | | | Performance Inception Date | | | Six Months | | | One Year | | | Five Years | | | Ten Years | |
Class A at NAV | | | 12/07/1993 | | | | 12/23/1991 | | | | 5.59 | % | | | –0.61 | % | | | 5.88 | % | | | 3.43 | % |
Class A with 4.75% Maximum Sales Charge | | | — | | | | — | | | | 0.56 | | | | –5.29 | | | | 4.85 | | | | 2.93 | |
Class B at NAV | | | 12/23/1991 | | | | 12/23/1991 | | | | 5.17 | | | | –1.43 | | | | 5.09 | | | | 2.66 | |
Class B with 5% Maximum Sales Charge | | | — | | | | — | | | | 0.17 | | | | –6.20 | | | | 4.76 | | | | 2.66 | |
Class C at NAV | | | 03/23/2006 | | | | 12/23/1991 | | | | 5.16 | | | | –1.32 | | | | 5.11 | | | | 2.65 | |
Class C with 1% Maximum Sales Charge | | | — | | | | — | | | | 4.16 | | | | –2.28 | | | | 5.11 | | | | 2.65 | |
Class I at NAV | | | 08/03/2010 | | | | 12/23/1991 | | | | 5.69 | | | | –0.41 | | | | 6.03 | | | | 3.50 | |
Barclays Municipal Bond Index | | | — | | | | — | | | | 5.71 | % | | | –0.21 | % | | | 5.67 | % | | | 4.39 | % |
Barclays 20 Year Municipal Bond Index | | | — | | | | — | | | | 7.67 | | | | –1.34 | | | | 7.12 | | | | 5.05 | |
| | | | | | |
| | | | | | | | | | | | | | | | | | | | | | | | |
| % Total Annual Operating Expense Ratios3 | | | | | | | | Class A | | | Class B | | | Class C | | | Class I | |
| | | | | | | | | | | 0.72 | % | | | 1.47 | % | | | 1.47 | % | | | 0.52 | % |
| | | | | | |
| | | | | | | | | | | | | | | | | | | | | | | | |
| % Distribution Rates/Yields4 | | | | | | | | Class A | | | Class B | | | Class C | | | Class I | |
Distribution Rate | | | | | | | | | | | 4.02 | % | | | 3.33 | % | | | 3.34 | % | | | 4.20 | % |
Taxable-Equivalent Distribution Rate | | | | | | | | | | | 7.56 | | | | 6.26 | | | | 6.28 | | | | 7.89 | |
SEC 30-day Yield | | | | | | | | | | | 2.77 | | | | 2.17 | | | | 2.17 | | | | 3.11 | |
Taxable-Equivalent SEC 30-day Yield | | | | | | | | | | | 5.21 | | | | 4.08 | | | | 4.08 | | | | 5.85 | |
Fund Profile
Credit Quality (% of total investments)6
See Endnotes and Additional Disclosures in this report.
Past performance is no guarantee of future results. Returns are historical and are calculated by determining the percentage change in net asset value (NAV) or offering price (as applicable) with all distributions reinvested. Investment return and principal value will fluctuate so that shares, when redeemed, may be worth more or less than their original cost. Performance less than one year is cumulative. Performance is for the stated time period only; due to market volatility, the Fund’s current performance may be lower or higher than quoted. Returns are before taxes unless otherwise noted. For performance as of the most recent month end, please refer to eatonvance.com.
Eaton Vance
Maryland Municipal Income Fund
February 28, 2014
Performance1,2
Portfolio Manager Craig R. Brandon, CFA
| | | | | | | | | | | | | | | | | | | | | | | | |
| % Average Annual Total Returns | | Class Inception Date | | | Performance Inception Date | | | Six Months | | | One Year | | | Five Years | | | Ten Years | |
Class A at NAV | | | 12/10/1993 | | | | 02/03/1992 | | | | 6.07 | % | | | –1.69 | % | | | 6.58 | % | | | 3.54 | % |
Class A with 4.75% Maximum Sales Charge | | | — | | | | — | | | | 1.03 | | | | –6.34 | | | | 5.55 | | | | 3.03 | |
Class B at NAV | | | 02/03/1992 | | | | 02/03/1992 | | | | 5.66 | | | | –2.47 | | | | 5.78 | | | | 2.77 | |
Class B with 5% Maximum Sales Charge | | | — | | | | — | | | | 0.66 | | | | –7.21 | | | | 5.46 | | | | 2.77 | |
Class C at NAV | | | 05/02/2006 | | | | 02/03/1992 | | | | 5.77 | | | | –2.37 | | | | 5.80 | | | | 2.78 | |
Class C with 1% Maximum Sales Charge | | | — | | | | — | | | | 4.77 | | | | –3.32 | | | | 5.80 | | | | 2.78 | |
Class I at NAV | | | 03/03/2008 | | | | 02/03/1992 | | | | 6.16 | | | | –1.48 | | | | 6.84 | | | | 3.68 | |
Barclays Municipal Bond Index | | | — | | | | — | | | | 5.71 | % | | | –0.21 | % | | | 5.67 | % | | | 4.39 | % |
Barclays 20 Year Municipal Bond Index | | | — | | | | — | | | | 7.67 | | | | –1.34 | | | | 7.12 | | | | 5.05 | |
| | | | | | |
| | | | | | | | | | | | | | | | | | | | | | | | |
| % Total Annual Operating Expense Ratios3 | | | | | | | | Class A | | | Class B | | | Class C | | | Class I | |
Gross | | | | | | | | | | | 0.78 | % | | | 1.53 | % | | | 1.53 | % | | | 0.58 | % |
Net | | | | | | | | | | | 0.75 | | | | 1.50 | | | | 1.50 | | | | 0.55 | |
| | | | | | |
| | | | | | | | | | | | | | | | | | | | | | | | |
| % Distribution Rates/Yields4 | | | | | | | | Class A | | | Class B | | | Class C | | | Class I | |
Distribution Rate | | | | | | | | | | | 3.68 | % | | | 2.99 | % | | | 2.99 | % | | | 3.86 | % |
Taxable-Equivalent Distribution Rate | | | | | | | | | | | 6.90 | | | | 5.60 | | | | 5.60 | | | | 7.24 | |
SEC 30-day Yield | | | | | | | | | | | 2.69 | | | | 2.08 | | | | 2.09 | | | | 3.03 | |
Taxable-Equivalent SEC 30-day Yield | | | | | | | | | | | 5.04 | | | | 3.90 | | | | 3.92 | | | | 5.68 | |
| | | | | | |
| | | | | | | | | | | | | | | | | | | | | | | | |
| % Total Leverage5 | | | | | | | | | | | | | | | | | | |
RIB | | | | | | | | | | | | | | | | | | | | | | | 3.06 | % |
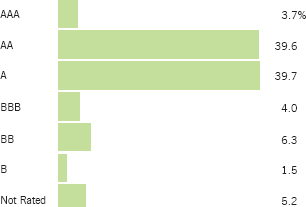
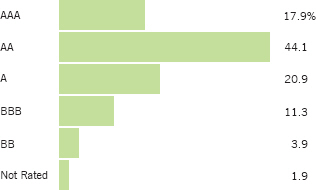
Fund Profile
Credit Quality (% of total investments)6
The above chart includes the ratings of securities held by special purpose vehicles established in connection with the RIB financing.5 Absent such securities, credit quality (% of total investments) is as follows:6
| | | | | | | | | | |
AAA | | | 20.5 | % | | BBB | | | 4.7 | % |
AA | | | 37.8 | | | Not Rated | | | 10.2 | |
A | | | 26.8 | | | | | | | |
See Endnotes and Additional Disclosures in this report.
Past performance is no guarantee of future results. Returns are historical and are calculated by determining the percentage change in net asset value (NAV) or offering price (as applicable) with all distributions reinvested. Investment return and principal value will fluctuate so that shares, when redeemed, may be worth more or less than their original cost. Performance less than one year is cumulative. Performance is for the stated time period only; due to market volatility, the Fund’s current performance may be lower or higher than quoted. Returns are before taxes unless otherwise noted. For performance as of the most recent month end, please refer to eatonvance.com.
Eaton Vance
Missouri Municipal Income Fund
February 28, 2014
Performance1,2
Portfolio Manager Cynthia J. Clemson
| | | | | | | | | | | | | | | | | | | | | | | | |
| % Average Annual Total Returns | | Class Inception Date | | | Performance Inception Date | | | Six Months | | | One Year | | | Five Years | | | Ten Years | |
Class A at NAV | | | 12/07/1993 | | | | 05/01/1992 | | | | 7.23 | % | | | –1.65 | % | | | 5.63 | % | | | 3.34 | % |
Class A with 4.75% Maximum Sales Charge | | | — | | | | — | | | | 2.17 | | | | –6.31 | | | | 4.61 | | | | 2.84 | |
Class B at NAV | | | 05/01/1992 | | | | 05/01/1992 | | | | 6.76 | | | | –2.43 | | | | 4.87 | | | | 2.58 | |
Class B with 5% Maximum Sales Charge | | | — | | | | — | | | | 1.76 | | | | –7.16 | | | | 4.53 | | | | 2.58 | |
Class C at NAV | | | 02/16/2006 | | | | 05/01/1992 | | | | 6.77 | | | | –2.43 | | | | 4.85 | | | | 2.55 | |
Class C with 1% Maximum Sales Charge | | | — | | | | — | | | | 5.77 | | | | –3.38 | | | | 4.85 | | | | 2.55 | |
Class I at NAV | | | 08/03/2010 | | | | 05/01/1992 | | | | 7.22 | | | | –1.45 | | | | 5.80 | | | | 3.42 | |
Barclays Municipal Bond Index | | | — | | | | — | | | | 5.71 | % | | | –0.21 | % | | | 5.67 | % | | | 4.39 | % |
Barclays 20 Year Municipal Bond Index | | | — | | | | — | | | | 7.67 | | | | –1.34 | | | | 7.12 | | | | 5.05 | |
| | | | | | |
| | | | | | | | | | | | | | | | | | | | | | | | |
| % Total Annual Operating Expense Ratios3 | | | | | | | | Class A | | | Class B | | | Class C | | | Class I | |
Gross | | | | | | | | | | | 0.74 | % | | | 1.49 | % | | | 1.49 | % | | | 0.54 | % |
Net | | | | | | | | | | | 0.72 | | | | 1.47 | | | | 1.47 | | | | 0.52 | |
| | | | | | |
| | | | | | | | | | | | | | | | | | | | | | | | |
| % Distribution Rates/Yields4 | | | | | | | | Class A | | | Class B | | | Class C | | | Class I | |
Distribution Rate | | | | | | | | | | | 3.73 | % | | | 3.04 | % | | | 3.04 | % | | | 3.96 | % |
Taxable-Equivalent Distribution Rate | | | | | | | | | | | 7.01 | | | | 5.71 | | | | 5.71 | | | | 7.44 | |
SEC 30-day Yield | | | | | | | | | | | 2.61 | | | | 2.00 | | | | 2.00 | | | | 2.94 | |
Taxable-Equivalent SEC 30-day Yield | | | | | | | | | | | 4.91 | | | | 3.76 | | | | 3.76 | | | | 5.53 | |
| | | | | | |
| | | | | | | | | | | | | | | | | | | | | | | | |
| % Total Leverage5 | | | | | | | | | | | | | | | | | | |
RIB | | | | | | | | | | | | | | | | | | | | | | | 1.18 | % |
Fund Profile
Credit Quality (% of total investments)6
The above chart includes the ratings of securities held by special purpose vehicles established in connection with the RIB financing.5 Absent such securities, credit quality (% of total investments) is as follows:6
| | | | | | | | | | |
AAA | | | 11.8 | % | | BBB | | | 7.7 | % |
AA | | | 58.9 | | | Not Rated | | | 4.0 | |
A | | | 17.6 | | | | | | | |
See Endnotes and Additional Disclosures in this report.
Past performance is no guarantee of future results. Returns are historical and are calculated by determining the percentage change in net asset value (NAV) or offering price (as applicable) with all distributions reinvested. Investment return and principal value will fluctuate so that shares, when redeemed, may be worth more or less than their original cost. Performance less than one year is cumulative. Performance is for the stated time period only; due to market volatility, the Fund’s current performance may be lower or higher than quoted. Returns are before taxes unless otherwise noted. For performance as of the most recent month end, please refer to eatonvance.com.
Eaton Vance
North Carolina Municipal Income Fund
February 28, 2014
Performance1,2
Portfolio Manager Adam A. Weigold, CFA
| | | | | | | | | | | | | | | | | | | | | | | | |
| % Average Annual Total Returns | | Class Inception Date | | | Performance Inception Date | | | Six Months | | | One Year | | | Five Years | | | Ten Years | |
Class A at NAV | | | 12/07/1993 | | | | 10/23/1991 | | | | 9.13 | % | | | –3.02 | % | | | 6.36 | % | | | 3.67 | % |
Class A with 4.75% Maximum Sales Charge | | | — | | | | — | | | | 3.89 | | | | –7.65 | | | | 5.33 | | | | 3.18 | |
Class B at NAV | | | 10/23/1991 | | | | 10/23/1991 | | | | 8.70 | | | | –3.74 | | | | 5.57 | | | | 2.91 | |
Class B with 5% Maximum Sales Charge | | | — | | | | — | | | | 3.70 | | | | –8.38 | | | | 5.25 | | | | 2.91 | |
Class C at NAV | | | 05/02/2006 | | | | 10/23/1991 | | | | 8.70 | | | | –3.74 | | | | 5.57 | | | | 2.91 | |
Class C with 1% Maximum Sales Charge | | | — | | | | — | | | | 7.70 | | | | –4.66 | | | | 5.57 | | | | 2.91 | |
Class I at NAV | | | 03/03/2008 | | | | 10/23/1991 | | | | 9.22 | | | | –2.82 | | | | 6.57 | | | | 3.82 | |
Barclays Municipal Bond Index | | | — | | | | — | | | | 5.71 | % | | | –0.21 | % | | | 5.67 | % | | | 4.39 | % |
Barclays 20 Year Municipal Bond Index | | | — | | | | — | | | | 7.67 | | | | –1.34 | | | | 7.12 | | | | 5.05 | |
| | | | | | |
| | | | | | | | | | | | | | | | | | | | | | | | |
| % Total Annual Operating Expense Ratios3 | | | | | | | | Class A | | | Class B | | | Class C | | | Class I | |
Gross | | | | | | | | | | | 0.80 | % | | | 1.55 | % | | | 1.55 | % | | | 0.60 | % |
Net | | | | | | | | | | | 0.74 | | | | 1.49 | | | | 1.49 | | | | 0.54 | |
| | | | | | |
| | | | | | | | | | | | | | | | | | | | | | | | |
| % Distribution Rates/Yields4 | | | | | | | | Class A | | | Class B | | | Class C | | | Class I | |
Distribution Rate | | | | | | | | | | | 4.13 | % | | | 3.45 | % | | | 3.45 | % | | | 4.32 | % |
Taxable-Equivalent Distribution Rate | | | | | | | | | | | 7.75 | | | | 6.47 | | | | 6.47 | | | | 8.10 | |
SEC 30-day Yield | | | | | | | | | | | 3.12 | | | | 2.54 | | | | 2.54 | | | | 3.48 | |
Taxable-Equivalent SEC 30-day Yield | | | | | | | | | | | 5.85 | | | | 4.76 | | | | 4.76 | | | | 6.53 | |
| | | | | | |
| | | | | | | | | | | | | | | | | | | | | | | | |
| % Total Leverage5 | | | | | | | | | | | | | | | | | | |
RIB | | | | | | | | | | | | | | | | | | | | | | | 7.92 | % |
Fund Profile
Credit Quality (% of total investments)6
The above chart includes the ratings of securities held by special purpose vehicles established in connection with the RIB financing.5 Absent such securities, credit quality (% of total investments) is as follows:6
| | | | | | | | | | |
AAA | | | 11.4 | % | | BBB | | | 2.9 | % |
AA | | | 65.0 | | | BB | | | 1.2 | |
A | | | 19.5 | | | | | | | |
See Endnotes and Additional Disclosures in this report.
Past performance is no guarantee of future results. Returns are historical and are calculated by determining the percentage change in net asset value (NAV) or offering price (as applicable) with all distributions reinvested. Investment return and principal value will fluctuate so that shares, when redeemed, may be worth more or less than their original cost. Performance less than one year is cumulative. Performance is for the stated time period only; due to market volatility, the Fund’s current performance may be lower or higher than quoted. Returns are before taxes unless otherwise noted. For performance as of the most recent month end, please refer to eatonvance.com.
Eaton Vance
Oregon Municipal Income Fund
February 28, 2014
Performance1,2
Portfolio Manager Adam A. Weigold, CFA
| | | | | | | | | | | | | | | | | | | | | | | | |
| % Average Annual Total Returns | | Class Inception Date | | | Performance Inception Date | | | Six Months | | | One Year | | | Five Years | | | Ten Years | |
Class A at NAV | | | 12/28/1993 | | | | 12/24/1991 | | | | 7.40 | % | | | –8.14 | % | | | 6.24 | % | | | 3.23 | % |
Class A with 4.75% Maximum Sales Charge | | | — | | | | — | | | | 2.32 | | | | –12.50 | | | | 5.22 | | | | 2.73 | |
Class B at NAV | | | 12/24/1991 | | | | 12/24/1991 | | | | 7.04 | | | | –8.73 | | | | 5.46 | | | | 2.48 | |
Class B with 5% Maximum Sales Charge | | | — | | | | — | | | | 2.04 | | | | –13.12 | | | | 5.14 | | | | 2.48 | |
Class C at NAV | | | 03/02/2006 | | | | 12/24/1991 | | | | 7.04 | | | | –8.71 | | | | 5.46 | | | | 2.48 | |
Class C with 1% Maximum Sales Charge | | | — | | | | — | | | | 6.04 | | | | –9.59 | | | | 5.46 | | | | 2.48 | |
Class I at NAV | | | 08/03/2010 | | | | 12/24/1991 | | | | 7.50 | | | | –7.86 | | | | 6.38 | | | | 3.30 | |
Barclays Municipal Bond Index | | | — | | | | — | | | | 5.71 | % | | | –0.21 | % | | | 5.67 | % | | | 4.39 | % |
Barclays 20 Year Municipal Bond Index | | | — | | | | — | | | | 7.67 | | | | –1.34 | | | | 7.12 | | | | 5.05 | |
| | | | | | |
| | | | | | | | | | | | | | | | | | | | | | | | |
| % Total Annual Operating Expense Ratios3 | | | | | | | | Class A | | | Class B | | | Class C | | | Class I | |
Gross | | | | | | | | | | | 0.81 | % | | | 1.56 | % | | | 1.56 | % | | | 0.61 | % |
Net | | | | | | | | | | | 0.73 | | | | 1.48 | | | | 1.48 | | | | 0.53 | |
| | | | | | |
| | | | | | | | | | | | | | | | | | | | | | | | |
| % Distribution Rates/Yields4 | | | | | | | | Class A | | | Class B | | | Class C | | | Class I | |
Distribution Rate | | | | | | | | | | | 4.22 | % | | | 3.53 | % | | | 3.55 | % | | | 4.43 | % |
Taxable-Equivalent Distribution Rate | | | | | | | | | | | 8.27 | | | | 6.92 | | | | 6.96 | | | | 8.69 | |
SEC 30-day Yield | | | | | | | | | | | 3.46 | | | | 2.89 | | | | 2.90 | | | | 3.83 | |
Taxable-Equivalent SEC 30-day Yield | | | | | | | | | | | 6.78 | | | | 5.67 | | | | 5.69 | | | | 7.51 | |
| | | | | | |
| | | | | | | | | | | | | | | | | | | | | | | | |
| % Total Leverage5 | | | | | | | | | | | | | | | | | | |
RIB | | | | | | | | | | | | | | | | | | | | | | | 6.23 | % |
Fund Profile
Credit Quality (% of total investments)6
The above chart includes the ratings of securities held by special purpose vehicles established in connection with the RIB financing.5 Absent such securities, credit quality (% of total investments) is as follows:6
| | | | | | | | | | |
AAA | | | 12.9 | % | | BBB | | | 12.1 | % |
AA | | | 46.4 | | | BB | | | 4.2 | |
A | | | 22.4 | | | Not Rated | | | 2.0 | |
See Endnotes and Additional Disclosures in this report.
Past performance is no guarantee of future results. Returns are historical and are calculated by determining the percentage change in net asset value (NAV) or offering price (as applicable) with all distributions reinvested. Investment return and principal value will fluctuate so that shares, when redeemed, may be worth more or less than their original cost. Performance less than one year is cumulative. Performance is for the stated time period only; due to market volatility, the Fund’s current performance may be lower or higher than quoted. Returns are before taxes unless otherwise noted. For performance as of the most recent month end, please refer to eatonvance.com.
Eaton Vance
South Carolina Municipal Income Fund
February 28, 2014
Performance1,2
Portfolio Manager Adam A. Weigold, CFA
| | | | | | | | | | | | | | | | | | | | | | | | |
| % Average Annual Total Returns | | Class Inception Date | | | Performance Inception Date | | | Six Months | | | One Year | | | Five Years | | | Ten Years | |
Class A at NAV | | | 02/14/1994 | | | | 10/02/1992 | | | | 8.71 | % | | | –4.02 | % | | | 6.43 | % | | | 3.57 | % |
Class A with 4.75% Maximum Sales Charge | | | — | | | | — | | | | 3.59 | | | | –8.57 | | | | 5.40 | | | | 3.06 | |
Class B at NAV | | | 10/02/1992 | | | | 10/02/1992 | | | | 8.16 | | | | –4.84 | | | | 5.63 | | | | 2.81 | |
Class B with 5% Maximum Sales Charge | | | — | | | | — | | | | 3.16 | | | | –9.43 | | | | 5.30 | | | | 2.81 | |
Class C at NAV | | | 01/12/2006 | | | | 10/02/1992 | | | | 8.28 | | | | –4.75 | | | | 5.65 | | | | 2.81 | |
Class C with 1% Maximum Sales Charge | | | — | | | | — | | | | 7.28 | | | | –5.66 | | | | 5.65 | | | | 2.81 | |
Class I at NAV | | | 03/03/2008 | | | | 10/02/1992 | | | | 8.80 | | | | –3.82 | | | | 6.63 | | | | 3.70 | |
Barclays Municipal Bond Index | | | — | | | | — | | | | 5.71 | % | | | –0.21 | % | | | 5.67 | % | | | 4.39 | % |
Barclays 20 Year Municipal Bond Index | | | — | | | | — | | | | 7.67 | | | | –1.34 | | | | 7.12 | | | | 5.05 | |
| | | | | | |
| | | | | | | | | | | | | | | | | | | | | | | | |
| % Total Annual Operating Expense Ratios3 | | | | | | | | Class A | | | Class B | | | Class C | | | Class I | |
Gross | | | | | | | | | | | 0.79 | % | | | 1.54 | % | | | 1.54 | % | | | 0.59 | % |
Net | | | | | | | | | | | 0.72 | | | | 1.47 | | | | 1.47 | | | | 0.52 | |
| | | | | | |
| | | | | | | | | | | | | | | | | | | | | | | | |
| % Distribution Rates/Yields4 | | | | | | | | Class A | | | Class B | | | Class C | | | Class I | |
Distribution Rate | | | | | | | | | | | 4.15 | % | | | 3.43 | % | | | 3.43 | % | | | 4.29 | % |
Taxable-Equivalent Distribution Rate | | | | | | | | | | | 7.88 | | | | 6.52 | | | | 6.52 | | | | 8.15 | |
SEC 30-day Yield | | | | | | | | | | | 3.36 | | | | 2.79 | | | | 2.79 | | | | 3.73 | |
Taxable-Equivalent SEC 30-day Yield | | | | | | | | | | | 6.38 | | | | 5.30 | | | | 5.30 | | | | 7.09 | |
| | | | | | |
| | | | | | | | | | | | | | | | | | | | | | | | |
| % Total Leverage5 | | | | | | | | | | | | | | | | | | |
RIB | | | | | | | | | | | | | | | | | | | | | | | 8.87 | % |
Fund Profile
Credit Quality (% of total investments)6
The above chart includes the ratings of securities held by special purpose vehicles established in connection with the RIB financing.5 Absent such securities, credit quality (% of total investments) is as follows:6
| | | | | | | | | | |
AAA | | | 10.1 | % | | BBB | | | 9.6 | % |
AA | | | 47.2 | | | BB | | | 1.2 | |
A | | | 31.9 | | | | | | | |
See Endnotes and Additional Disclosures in this report.
Past performance is no guarantee of future results. Returns are historical and are calculated by determining the percentage change in net asset value (NAV) or offering price (as applicable) with all distributions reinvested. Investment return and principal value will fluctuate so that shares, when redeemed, may be worth more or less than their original cost. Performance less than one year is cumulative. Performance is for the stated time period only; due to market volatility, the Fund’s current performance may be lower or higher than quoted. Returns are before taxes unless otherwise noted. For performance as of the most recent month end, please refer to eatonvance.com.
Eaton Vance
Tennessee Municipal Income Fund
February 28, 2014
Performance1,2
Portfolio Manager Adam A. Weigold, CFA
| | | | | | | | | | | | | | | | | | | | | | | | |
| % Average Annual Total Returns | | Class Inception Date | | | Performance Inception Date | | | Six Months | | | One Year | | | Five Years | | | Ten Years | |
Class A at NAV | | | 12/09/1993 | | | | 08/25/1992 | | | | 4.71 | % | | | –2.49 | % | | | 4.98 | % | | | 2.48 | % |
Class A with 4.75% Maximum Sales Charge | | | — | | | | — | | | | –0.25 | | | | –7.13 | | | | 3.96 | | | | 1.97 | |
Class B at NAV | | | 08/25/1992 | | | | 08/25/1992 | | | | 4.21 | | | | –3.23 | | | | 4.18 | | | | 1.71 | |
Class B with 5% Maximum Sales Charge | | | — | | | | — | | | | –0.79 | | | | –7.92 | | | | 3.84 | | | | 1.71 | |
Class C at NAV | | | 05/02/2006 | | | | 08/25/1992 | | | | 4.33 | | | | –3.23 | | | | 4.21 | | | | 1.71 | |
Class C with 1% Maximum Sales Charge | | | — | | | | — | | | | 3.33 | | | | –4.17 | | | | 4.21 | | | | 1.71 | |
Class I at NAV | | | 08/03/2010 | | | | 08/25/1992 | | | | 4.69 | | | | –2.30 | | | | 5.10 | | | | 2.53 | |
Barclays Municipal Bond Index | | | — | | | | — | | | | 5.71 | % | | | –0.21 | % | | | 5.67 | % | | | 4.39 | % |
Barclays 20 Year Municipal Bond Index | | | — | | | | — | | | | 7.67 | | | | –1.34 | | | | 7.12 | | | | 5.05 | |
| | | | | | |
| | | | | | | | | | | | | | | | | | | | | | | | |
| % Total Annual Operating Expense Ratios3 | | | | | | | | Class A | | | Class B | | | Class C | | | Class I | |
| | | | | | | | | | | 0.72 | % | | | 1.47 | % | | | 1.47 | % | | | 0.52 | % |
| | | | | | |
| | | | | | | | | | | | | | | | | | | | | | | | |
| % Distribution Rates/Yields4 | | | | | | | | Class A | | | Class B | | | Class C | | | Class I | |
Distribution Rate | | | | | | | | | | | 3.83 | % | | | 3.14 | % | | | 3.15 | % | | | 4.01 | % |
Taxable-Equivalent Distribution Rate | | | | | | | | | | | 7.20 | | | | 5.90 | | | | 5.92 | | | | 7.54 | |
SEC 30-day Yield | | | | | | | | | | | 2.49 | | | | 1.87 | | | | 1.88 | | | | 2.82 | |
Taxable-Equivalent SEC 30-day Yield | | | | | | | | | | | 4.68 | | | | 3.52 | | | | 3.53 | | | | 5.30 | |
Fund Profile
Credit Quality (% of total investments)6
See Endnotes and Additional Disclosures in this report.
Past performance is no guarantee of future results. Returns are historical and are calculated by determining the percentage change in net asset value (NAV) or offering price (as applicable) with all distributions reinvested. Investment return and principal value will fluctuate so that shares, when redeemed, may be worth more or less than their original cost. Performance less than one year is cumulative. Performance is for the stated time period only; due to market volatility, the Fund’s current performance may be lower or higher than quoted. Returns are before taxes unless otherwise noted. For performance as of the most recent month end, please refer to eatonvance.com.
Eaton Vance
Virginia Municipal Income Fund
February 28, 2014
Performance1,2
Portfolio Manager Adam A. Weigold, CFA
| | | | | | | | | | | | | | | | | | | | | | | | |
| % Average Annual Total Returns | | Class Inception Date | | | Performance Inception Date | | | Six Months | | | One Year | | | Five Years | | | Ten Years | |
Class A at NAV | | | 12/17/1993 | | | | 07/26/1991 | | | | 5.77 | % | | | –1.59 | % | | | 5.61 | % | | | 2.45 | % |
Class A with 4.75% Maximum Sales Charge | | | — | | | | — | | | | 0.73 | | | | –6.30 | | | | 4.59 | | | | 1.96 | |
Class B at NAV | | | 07/26/1991 | | | | 07/26/1991 | | | | 5.38 | | | | –2.43 | | | | 4.82 | | | | 1.70 | |
Class B with 5% Maximum Sales Charge | | | — | | | | — | | | | 0.38 | | | | –7.15 | | | | 4.48 | | | | 1.70 | |
Class C at NAV | | | 02/08/2006 | | | | 07/26/1991 | | | | 5.50 | | | | –2.32 | | | | 4.82 | | | | 1.70 | |
Class C with 1% Maximum Sales Charge | | | — | | | | — | | | | 4.50 | | | | –3.26 | | | | 4.82 | | | | 1.70 | |
Class I at NAV | | | 03/03/2008 | | | | 07/26/1991 | | | | 5.86 | | | | –1.38 | | | | 5.82 | | | | 2.60 | |
Barclays Municipal Bond Index | | | — | | | | — | | | | 5.71 | % | | | –0.21 | % | | | 5.67 | % | | | 4.39 | % |
Barclays 20 Year Municipal Bond Index | | | — | | | | — | | | | 7.67 | | | | –1.34 | | | | 7.12 | | | | 5.05 | |
| | | | | | |
| | | | | | | | | | | | | | | | | | | | | | | | |
| % Total Annual Operating Expense Ratios3 | | | | | | | | Class A | | | Class B | | | Class C | | | Class I | |
Gross | | | | | | | | | | | 0.77 | % | | | 1.52 | % | | | 1.52 | % | | | 0.57 | % |
Net | | | | | | | | | | | 0.73 | | | | 1.48 | | | | 1.48 | | | | 0.53 | |
| | | | | | |
| | | | | | | | | | | | | | | | | | | | | | | | |
| % Distribution Rates/Yields4 | | | | | | | | Class A | | | Class B | | | Class C | | | Class I | |
Distribution Rate | | | | | | | | | | | 4.32 | % | | | 3.64 | % | | | 3.64 | % | | | 4.51 | % |
Taxable-Equivalent Distribution Rate | | | | | | | | | | | 8.10 | | | | 6.82 | | | | 6.82 | | | | 8.45 | |
SEC 30-day Yield | | | | | | | | | | | 2.86 | | | | 2.26 | | | | 2.26 | | | | 3.20 | |
Taxable-Equivalent SEC 30-day Yield | | | | | | | | | | | 5.36 | | | | 4.24 | | | | 4.24 | | | | 6.00 | |
| | | | | | |
| | | | | | | | | | | | | | | | | | | | | | | | |
| % Total Leverage5 | | | | | | | | | | | | | | | | | | |
RIB | | | | | | | | | | | | | | | | | | | | | | | 3.73 | % |
Fund Profile
Credit Quality (% of total investments)6
The above chart includes the ratings of securities held by special purpose vehicles established in connection with the RIB financing.5 Absent such securities, credit quality (% of total investments) is as follows:6
| | | | | | | | | | |
AAA | | | 18.6 | % | | BB | | | 2.0 | % |
AA | | | 40.4 | | | B | | | 0.5 | |
A | | | 26.1 | | | Not Rated | | | 2.3 | |
BBB | | | 10.1 | | | | | | | |
See Endnotes and Additional Disclosures in this report.
Past performance is no guarantee of future results. Returns are historical and are calculated by determining the percentage change in net asset value (NAV) or offering price (as applicable) with all distributions reinvested. Investment return and principal value will fluctuate so that shares, when redeemed, may be worth more or less than their original cost. Performance less than one year is cumulative. Performance is for the stated time period only; due to market volatility, the Fund’s current performance may be lower or higher than quoted. Returns are before taxes unless otherwise noted. For performance as of the most recent month end, please refer to eatonvance.com.
Eaton Vance
Municipal Income Funds
February 28, 2014
Endnotes and Additional Disclosures
| 1 | Barclays Municipal Bond Index is an unmanaged index of municipal bonds traded in the U.S. Barclays 20 Year Municipal Bond Index is an unmanaged index of municipal bonds traded in the U.S. with maturities ranging from 17-22 years. Unless otherwise stated, index returns do not reflect the effect of any applicable sales charges, commissions, expenses, taxes or leverage, as applicable. It is not possible to invest directly in an index. |
| 2 | Total Returns at NAV do not include applicable sales charges. If sales charges were deducted, the returns would be lower. Total Returns shown with maximum sales charge reflect the stated maximum sales charge. Unless otherwise stated, performance does not reflect the deduction of taxes on Fund distributions or redemptions of Fund shares. |
| | Performance prior to the inception date of a class may be linked to the performance of an older class of the Fund. This linked performance is adjusted for any applicable sales charge, but is not adjusted for class expense differences. If adjusted for such differences, the performance would be different. Performance presented in the financial highlights included in the financial statements is not linked. In the performance table, the performance of Class C is linked to Class B and the performance of Class I is linked to Class A. Performance since inception for an index, if presented, is the performance since the Fund’s or oldest share class’ inception, as applicable. |
| 3 | Total annual operating expense ratios are as stated in the Fund’s most recent prospectus. Net expense ratio excludes interest expense relating to the Fund’s liability with respect to floating rate notes held by third parties in conjunction with residual interest bond transactions by the Fund. The Fund also records offsetting interest income in an amount equal to this expense relating to the municipal obligations underlying such transactions and, as a result, net asset value and performance have not been affected by this expense. |
| 4 | The Distribution Rate is based on the Fund’s last regular distribution per share in the period (annualized) divided by the Fund’s NAV at the end of the period. The Fund’s distributions may be composed of ordinary income, tax-exempt income, net realized capital gains and return of capital. The Fund’s distributions are determined by the investment adviser based on its current assessment of the Fund’s long-term return potential. As portfolio and market conditions change, the rate of distributions paid by the Fund could change. Taxable-equivalent performance is based on the highest combined federal and state income tax rates, where applicable. Lower tax rates would result in lower tax-equivalent performance. Actual tax rates will vary depending on your income, exemptions and deductions. Rates do not include local taxes. SEC Yield is a standardized measure based on the estimated yield to maturity of a fund’s investments over a 30-day period and is based on the maximum offer price at the date specified. The SEC Yield is not based on the distributions made by the Fund, which may differ. |
| 5 | Fund employs RIB financing. The leverage created by RIB investments provides an opportunity for increased income but, at the same time, creates special risks (including the likelihood of greater volatility of NAV). The cost of leverage rises and falls with changes in short-term interest rates. See “Floating Rate Notes Issued in Conjunction with Securities Held” in the notes to the financial statements for more information about RIB financing. RIB leverage represents the amount of Floating Rate Notes outstanding at period end as a percentage of Fund net assets plus Floating Rate Notes. Floating Rate Notes reflect the effect of RIBs purchased in secondary market transactions, if applicable. |
| 6 | Ratings are based on Moody’s, S&P or Fitch, as applicable. If securities are rated differently by the rating agencies, the higher rating is applied. Ratings, which are subject to change, apply to the creditworthiness of the issuers of the underlying securities and not to the Fund or its shares. Credit ratings measure the quality of a bond based on the issuer’s creditworthiness, with ratings ranging from AAA, being the highest, to D, being the lowest based on S&P’s measures. Ratings of BBB or higher by Standard and Poor’s or Fitch (Baa or higher by Moody’s) are considered to be investment grade quality. Credit ratings are based largely on the rating agency’s analysis at the time of rating. The rating assigned to any particular security is not necessarily a reflection of the issuer’s current financial condition and does not necessarily reflect its assessment of the volatility of a security’s market value or of the liquidity of an investment in the security. Holdings designated as “Not Rated” are not rated by the national rating agencies stated above. |
| | Fund profile subject to change due to active management. |
Eaton Vance
Municipal Income Funds
February 28, 2014
Fund Expenses
Example: As a Fund shareholder, you incur two types of costs: (1) transaction costs, including sales charges (loads) on purchases and redemption fees (if applicable); and (2) ongoing costs, including management fees; distribution and/or service fees; and other Fund expenses. This Example is intended to help you understand your ongoing costs (in dollars) of Fund investing and to compare these costs with the ongoing costs of investing in other mutual funds. The Example is based on an investment of $1,000 invested at the beginning of the period and held for the entire period (September 1, 2013 – February 28, 2014).
Actual Expenses: The first section of each table below provides information about actual account values and actual expenses. You may use the information in this section, together with the amount you invested, to estimate the expenses that you paid over the period. Simply divide your account value by $1,000 (for example, an $8,600 account value divided by $1,000 = 8.6), then multiply the result by the number in the first section under the heading entitled “Expenses Paid During Period” to estimate the expenses you paid on your account during this period.
Hypothetical Example for Comparison Purposes: The second section of each table below provides information about hypothetical account values and hypothetical expenses based on the actual Fund expense ratio and an assumed rate of return of 5% per year (before expenses), which is not the actual Fund return. The hypothetical account values and expenses may not be used to estimate the actual ending account balance or expenses you paid for the period. You may use this information to compare the ongoing costs of investing in your Fund and other funds. To do so, compare this 5% hypothetical example with the 5% hypothetical examples that appear in the shareholder reports of the other funds.
Please note that the expenses shown in each table are meant to highlight your ongoing costs only and do not reflect any transactional costs, such as sales charges (loads) or redemption fees (if applicable). Therefore, the second section of each table is useful in comparing ongoing costs only, and will not help you determine the relative total costs of owning different funds. In addition, if these transactional costs were included, your costs would be higher.
Eaton Vance Alabama Municipal Income Fund
| | | | | | | | | | | | | | | | |
| | | Beginning
Account Value
(9/1/13) | | | Ending
Account Value
(2/28/14) | | | Expenses Paid
During Period*
(9/1/13 – 2/28/14) | | | Annualized
Expense
Ratio | |
| | | | |
| | | | | | | | | | | | | | | | |
Actual | | | | | | | | | | | | | |
Class A | | $ | 1,000.00 | | | $ | 1,068.30 | | | $ | 3.69 | | | | 0.72 | % |
Class B | | $ | 1,000.00 | | | $ | 1,065.10 | | | $ | 7.58 | | | | 1.48 | % |
Class C | | $ | 1,000.00 | | | $ | 1,065.00 | | | $ | 7.53 | | | | 1.47 | % |
Class I | | $ | 1,000.00 | | | $ | 1,070.50 | | | $ | 2.67 | | | | 0.52 | % |
| | | | | | | | | | | | | | | | | |
| | | | |
| | | | | | | | | | | | | | | | |
Hypothetical | | | | | | | | | | | | | |
(5% return per year before expenses) | | | | | | | | | | | | | |
Class A | | $ | 1,000.00 | | | $ | 1,021.20 | | | $ | 3.61 | | | | 0.72 | % |
Class B | | $ | 1,000.00 | | | $ | 1,017.50 | | | $ | 7.40 | | | | 1.48 | % |
Class C | | $ | 1,000.00 | | | $ | 1,017.50 | | | $ | 7.35 | | | | 1.47 | % |
Class I | | $ | 1,000.00 | | | $ | 1,022.20 | | | $ | 2.61 | | | | 0.52 | % |
| * | Expenses are equal to the Fund’s annualized expense ratio for the indicated Class, multiplied by the average account value over the period, multiplied by 181/365 (to reflect the one-half year period). The Example assumes that the $1,000 was invested at the net asset value per share determined at the close of business on August 31, 2013. |
Eaton Vance
Municipal Income Funds
February 28, 2014
Fund Expenses — continued
Eaton Vance Arkansas Municipal Income Fund
| | | | | | | | | | | | | | | | |
| | | Beginning
Account Value
(9/1/13) | | | Ending
Account Value
(2/28/14) | | | Expenses Paid
During Period*
(9/1/13 – 2/28/14) | | | Annualized
Expense
Ratio | |
| | | | |
| | | | | | | | | | | | | | | | |
Actual | | | | | | | | | | | | | |
Class A | | $ | 1,000.00 | | | $ | 1,061.00 | | | $ | 3.78 | | | | 0.74 | % |
Class B | | $ | 1,000.00 | | | $ | 1,056.60 | | | $ | 7.60 | | | | 1.49 | % |
Class C | | $ | 1,000.00 | | | $ | 1,056.60 | | | $ | 7.60 | | | | 1.49 | % |
Class I | | $ | 1,000.00 | | | $ | 1,062.10 | | | $ | 2.76 | | | | 0.54 | % |
| | | | | | | | | | | | | | | | | |
| | | | |
| | | | | | | | | | | | | | | | |
Hypothetical | | | | | | | | | | | | | |
(5% return per year before expenses) | | | | | | | | | | | | | |
Class A | | $ | 1,000.00 | | | $ | 1,021.10 | | | $ | 3.71 | | | | 0.74 | % |
Class B | | $ | 1,000.00 | | | $ | 1,017.40 | | | $ | 7.45 | | | | 1.49 | % |
Class C | | $ | 1,000.00 | | | $ | 1,017.40 | | | $ | 7.45 | | | | 1.49 | % |
Class I | | $ | 1,000.00 | | | $ | 1,022.10 | | | $ | 2.71 | | | | 0.54 | % |
| * | Expenses are equal to the Fund’s annualized expense ratio for the indicated Class, multiplied by the average account value over the period, multiplied by 181/365 (to reflect the one-half year period). The Example assumes that the $1,000 was invested at the net asset value per share determined at the close of business on August 31, 2013. |
Eaton Vance Georgia Municipal Income Fund
| | | | | | | | | | | | | | | | |
| | | Beginning
Account Value
(9/1/13) | | | Ending
Account Value
(2/28/14) | | | Expenses Paid
During Period*
(9/1/13 – 2/28/14) | | | Annualized
Expense
Ratio | |
| | | | |
| | | | | | | | | | | | | | | | |
Actual | | | | | | | | | | | | | |
Class A | | $ | 1,000.00 | | | $ | 1,071.10 | | | $ | 3.90 | | | | 0.76 | % |
Class B | | $ | 1,000.00 | | | $ | 1,066.30 | | | $ | 7.74 | | | | 1.51 | % |
Class C | | $ | 1,000.00 | | | $ | 1,067.50 | | | $ | 7.74 | | | | 1.51 | % |
Class I | | $ | 1,000.00 | | | $ | 1,072.10 | | | $ | 2.88 | | | | 0.56 | % |
| | | | | | | | | | | | | | | | | |
| | | | |
| | | | | | | | | | | | | | | | |
Hypothetical | | | | | | | | | | | | | |
(5% return per year before expenses) | | | | | | | | | | | | | |
Class A | | $ | 1,000.00 | | | $ | 1,021.00 | | | $ | 3.81 | | | | 0.76 | % |
Class B | | $ | 1,000.00 | | | $ | 1,017.30 | | | $ | 7.55 | | | | 1.51 | % |
Class C | | $ | 1,000.00 | | | $ | 1,017.30 | | | $ | 7.55 | | | | 1.51 | % |
Class I | | $ | 1,000.00 | | | $ | 1,022.00 | | | $ | 2.81 | | | | 0.56 | % |
| * | Expenses are equal to the Fund’s annualized expense ratio for the indicated Class, multiplied by the average account value over the period, multiplied by 181/365 (to reflect the one-half year period). The Example assumes that the $1,000 was invested at the net asset value per share determined at the close of business on August 31, 2013. |
Eaton Vance
Municipal Income Funds
February 28, 2014
Fund Expenses — continued
Eaton Vance Kentucky Municipal Income Fund
| | | | | | | | | | | | | | | | |
| | | Beginning
Account Value
(9/1/13) | | | Ending
Account Value
(2/28/14) | | | Expenses Paid
During Period*
(9/1/13 – 2/28/14) | | | Annualized
Expense
Ratio | |
| | | | |
| | | | | | | | | | | | | | | | |
Actual | | | | | | | | | | | | | |
Class A | | $ | 1,000.00 | | | $ | 1,055.90 | | | $ | 3.72 | | | | 0.73 | % |
Class B | | $ | 1,000.00 | | | $ | 1,051.70 | | | $ | 7.53 | | | | 1.48 | % |
Class C | | $ | 1,000.00 | | | $ | 1,051.60 | | | $ | 7.53 | | | | 1.48 | % |
Class I | | $ | 1,000.00 | | | $ | 1,056.90 | | | $ | 2.70 | | | | 0.53 | % |
| | | | | | | | | | | | | | | | | |
| | | | |
| | | | | | | | | | | | | | | | |
Hypothetical | | | | | | | | | | | | | |
(5% return per year before expenses) | | | | | | | | | | | | | |
Class A | | $ | 1,000.00 | | | $ | 1,021.20 | | | $ | 3.66 | | | | 0.73 | % |
Class B | | $ | 1,000.00 | | | $ | 1,017.50 | | | $ | 7.40 | | | | 1.48 | % |
Class C | | $ | 1,000.00 | | | $ | 1,017.50 | | | $ | 7.40 | | | | 1.48 | % |
Class I | | $ | 1,000.00 | | | $ | 1,022.20 | | | $ | 2.66 | | | | 0.53 | % |
| * | Expenses are equal to the Fund’s annualized expense ratio for the indicated Class, multiplied by the average account value over the period, multiplied by 181/365 (to reflect the one-half year period). The Example assumes that the $1,000 was invested at the net asset value per share determined at the close of business on August 31, 2013. |
Eaton Vance Maryland Municipal Income Fund
| | | | | | | | | | | | | | | | |
| | | Beginning
Account Value
(9/1/13) | | | Ending
Account Value
(2/28/14) | | | Expenses Paid
During Period*
(9/1/13 – 2/28/14) | | | Annualized
Expense
Ratio | |
| | | | |
| | | | | | | | | | | | | | | | |
Actual | | | | | | | | | | | | | |
Class A | | $ | 1,000.00 | | | $ | 1,060.70 | | | $ | 4.09 | | | | 0.80 | % |
Class B | | $ | 1,000.00 | | | $ | 1,056.60 | | | $ | 7.90 | | | | 1.55 | % |
Class C | | $ | 1,000.00 | | | $ | 1,057.70 | | | $ | 7.91 | | | | 1.55 | % |
Class I | | $ | 1,000.00 | | | $ | 1,061.60 | | | $ | 3.07 | | | | 0.60 | % |
| | | | | | | | | | | | | | | | | |
| | | | |
| | | | | | | | | | | | | | | | |
Hypothetical | | | | | | | | | | | | | |
(5% return per year before expenses) | | | | | | | | | | | | | |
Class A | | $ | 1,000.00 | | | $ | 1,020.80 | | | $ | 4.01 | | | | 0.80 | % |
Class B | | $ | 1,000.00 | | | $ | 1,017.10 | | | $ | 7.75 | | | | 1.55 | % |
Class C | | $ | 1,000.00 | | | $ | 1,017.10 | | | $ | 7.75 | | | | 1.55 | % |
Class I | | $ | 1,000.00 | | | $ | 1,021.80 | | | $ | 3.01 | | | | 0.60 | % |
| * | Expenses are equal to the Fund’s annualized expense ratio for the indicated Class, multiplied by the average account value over the period, multiplied by 181/365 (to reflect the one-half year period). The Example assumes that the $1,000 was invested at the net asset value per share determined at the close of business on August 31, 2013. |
Eaton Vance
Municipal Income Funds
February 28, 2014
Fund Expenses — continued
Eaton Vance Missouri Municipal Income Fund
| | | | | | | | | | | | | | | | |
| | | Beginning
Account Value
(9/1/13) | | | Ending
Account Value
(2/28/14) | | | Expenses Paid
During Period*
(9/1/13 – 2/28/14) | | | Annualized
Expense
Ratio | |
| | | | |
| | | | | | | | | | | | | | | | |
Actual | | | | | | | | | | | | | |
Class A | | $ | 1,000.00 | | | $ | 1,072.30 | | | $ | 3.75 | | | | 0.73 | % |
Class B | | $ | 1,000.00 | | | $ | 1,067.60 | | | $ | 7.59 | | | | 1.48 | % |
Class C | | $ | 1,000.00 | | | $ | 1,067.70 | | | $ | 7.59 | | | | 1.48 | % |
Class I | | $ | 1,000.00 | | | $ | 1,072.20 | | | $ | 2.72 | | | | 0.53 | % |
| | | | | | | | | | | | | | | | | |
| | | | |
| | | | | | | | | | | | | | | | |
Hypothetical | | | | | | | | | | | | | |
(5% return per year before expenses) | | | | | | | | | | | | | |
Class A | | $ | 1,000.00 | | | $ | 1,021.20 | | | $ | 3.66 | | | | 0.73 | % |
Class B | | $ | 1,000.00 | | | $ | 1,017.50 | | | $ | 7.40 | | | | 1.48 | % |
Class C | | $ | 1,000.00 | | | $ | 1,017.50 | | | $ | 7.40 | | | | 1.48 | % |
Class I | | $ | 1,000.00 | | | $ | 1,022.20 | | | $ | 2.66 | | | | 0.53 | % |
| * | Expenses are equal to the Fund’s annualized expense ratio for the indicated Class, multiplied by the average account value over the period, multiplied by 181/365 (to reflect the one-half year period). The Example assumes that the $1,000 was invested at the net asset value per share determined at the close of business on August 31, 2013. |
Eaton Vance North Carolina Municipal Income Fund
| | | | | | | | | | | | | | | | |
| | | Beginning
Account Value
(9/1/13) | | | Ending
Account Value
(2/28/14) | | | Expenses Paid
During Period*
(9/1/13 – 2/28/14) | | | Annualized
Expense
Ratio | |
| | | | |
| | | | | | | | | | | | | | | | |
Actual | | | | | | | | | | | | | |
Class A | | $ | 1,000.00 | | | $ | 1,091.30 | | | $ | 4.25 | | | | 0.82 | % |
Class B | | $ | 1,000.00 | | | $ | 1,087.00 | | | $ | 8.12 | | | | 1.57 | % |
Class C | | $ | 1,000.00 | | | $ | 1,087.00 | | | $ | 8.12 | | | | 1.57 | % |
Class I | | $ | 1,000.00 | | | $ | 1,092.20 | | | $ | 3.22 | | | | 0.62 | % |
| | | | | | | | | | | | | | | | | |
| | | | |
| | | | | | | | | | | | | | | | |
Hypothetical | | | | | | | | | | | | | |
(5% return per year before expenses) | | | | | | | | | | | | | |
Class A | | $ | 1,000.00 | | | $ | 1,020.70 | | | $ | 4.11 | | | | 0.82 | % |
Class B | | $ | 1,000.00 | | | $ | 1,017.00 | | | $ | 7.85 | | | | 1.57 | % |
Class C | | $ | 1,000.00 | | | $ | 1,017.00 | | | $ | 7.85 | | | | 1.57 | % |
Class I | | $ | 1,000.00 | | | $ | 1,021.70 | | | $ | 3.11 | | | | 0.62 | % |
| * | Expenses are equal to the Fund’s annualized expense ratio for the indicated Class, multiplied by the average account value over the period, multiplied by 181/365 (to reflect the one-half year period). The Example assumes that the $1,000 was invested at the net asset value per share determined at the close of business on August 31, 2013. |
Eaton Vance
Municipal Income Funds
February 28, 2014
Fund Expenses — continued
Eaton Vance Oregon Municipal Income Fund
| | | | | | | | | | | | | | | | |
| | | Beginning
Account Value
(9/1/13) | | | Ending
Account Value
(2/28/14) | | | Expenses Paid
During Period*
(9/1/13 – 2/28/14) | | | Annualized
Expense
Ratio | |
| | | | |
| | | | | | | | | | | | | | | | |
Actual | | | | | | | | | | | | | |
Class A | | $ | 1,000.00 | | | $ | 1,074.00 | | | $ | 4.42 | | | | 0.86 | % |
Class B | | $ | 1,000.00 | | | $ | 1,070.40 | | | $ | 8.26 | | | | 1.61 | % |
Class C | | $ | 1,000.00 | | | $ | 1,070.40 | | | $ | 8.26 | | | | 1.61 | % |
Class I | | $ | 1,000.00 | | | $ | 1,075.00 | | | $ | 3.40 | | | | 0.66 | % |
| | | | | | | | | | | | | | | | | |
| | | | |
| | | | | | | | | | | | | | | | |
Hypothetical | | | | | | | | | | | | | |
(5% return per year before expenses) | | | | | | | | | | | | | |
Class A | | $ | 1,000.00 | | | $ | 1,020.50 | | | $ | 4.31 | | | | 0.86 | % |
Class B | | $ | 1,000.00 | | | $ | 1,016.80 | | | $ | 8.05 | | | | 1.61 | % |
Class C | | $ | 1,000.00 | | | $ | 1,016.80 | | | $ | 8.05 | | | | 1.61 | % |
Class I | | $ | 1,000.00 | | | $ | 1,021.50 | | | $ | 3.31 | | | | 0.66 | % |
| * | Expenses are equal to the Fund’s annualized expense ratio for the indicated Class, multiplied by the average account value over the period, multiplied by 181/365 (to reflect the one-half year period). The Example assumes that the $1,000 was invested at the net asset value per share determined at the close of business on August 31, 2013. |
Eaton Vance South Carolina Municipal Income Fund
| | | | | | | | | | | | | | | | |
| | | Beginning
Account Value
(9/1/13) | | | Ending
Account Value
(2/28/14) | | | Expenses Paid
During Period*
(9/1/13 – 2/28/14) | | | Annualized
Expense
Ratio | |
| | | | |
| | | | | | | | | | | | | | | | |
Actual | | | | | | | | | | | | | |
Class A | | $ | 1,000.00 | | | $ | 1,087.10 | | | $ | 4.35 | | | | 0.84 | % |
Class B | | $ | 1,000.00 | | | $ | 1,081.60 | | | $ | 8.26 | | | | 1.60 | % |
Class C | | $ | 1,000.00 | | | $ | 1,082.80 | | | $ | 8.21 | | | | 1.59 | % |
Class I | | $ | 1,000.00 | | | $ | 1,088.00 | | | $ | 3.37 | | | | 0.65 | % |
| | | | | | | | | | | | | | | | | |
| | | | |
| | | | | | | | | | | | | | | | |
Hypothetical | | | | | | | | | | | | | |
(5% return per year before expenses) | | | | | | | | | | | | | |
Class A | | $ | 1,000.00 | | | $ | 1,020.60 | | | $ | 4.21 | | | | 0.84 | % |
Class B | | $ | 1,000.00 | | | $ | 1,016.90 | | | $ | 8.00 | | | | 1.60 | % |
Class C | | $ | 1,000.00 | | | $ | 1,016.90 | | | $ | 7.95 | | | | 1.59 | % |
Class I | | $ | 1,000.00 | | | $ | 1,021.60 | | | $ | 3.26 | | | | 0.65 | % |
| * | Expenses are equal to the Fund’s annualized expense ratio for the indicated Class, multiplied by the average account value over the period, multiplied by 181/365 (to reflect the one-half year period). The Example assumes that the $1,000 was invested at the net asset value per share determined at the close of business on August 31, 2013. |
Eaton Vance
Municipal Income Funds
February 28, 2014
Fund Expenses — continued
Eaton Vance Tennessee Municipal Income Fund
| | | | | | | | | | | | | | | | |
| | | Beginning
Account Value
(9/1/13) | | | Ending
Account Value
(2/28/14) | | | Expenses Paid
During Period*
(9/1/13 – 2/28/14) | | | Annualized
Expense
Ratio | |
| | | | |
| | | | | | | | | | | | | | | | |
Actual | | | | | | | | | | | | | |
Class A | | $ | 1,000.00 | | | $ | 1,047.10 | | | $ | 3.71 | | | | 0.73 | % |
Class B | | $ | 1,000.00 | | | $ | 1,042.10 | | | $ | 7.49 | | | | 1.48 | % |
Class C | | $ | 1,000.00 | | | $ | 1,043.30 | | | $ | 7.50 | | | | 1.48 | % |
Class I | | $ | 1,000.00 | | | $ | 1,046.90 | | | $ | 2.69 | | | | 0.53 | % |
| | | | | | | | | | | | | | | | | |
| | | | |
| | | | | | | | | | | | | | | | |
Hypothetical | | | | | | | | | | | | | |
(5% return per year before expenses) | | | | | | | | | | | | | |
Class A | | $ | 1,000.00 | | | $ | 1,021.20 | | | $ | 3.66 | | | | 0.73 | % |
Class B | | $ | 1,000.00 | | | $ | 1,017.50 | | | $ | 7.40 | | | | 1.48 | % |
Class C | | $ | 1,000.00 | | | $ | 1,017.50 | | | $ | 7.40 | | | | 1.48 | % |
Class I | | $ | 1,000.00 | | | $ | 1,022.20 | | | $ | 2.66 | | | | 0.53 | % |
| * | Expenses are equal to the Fund’s annualized expense ratio for the indicated Class, multiplied by the average account value over the period, multiplied by 181/365 (to reflect the one-half year period). The Example assumes that the $1,000 was invested at the net asset value per share determined at the close of business on August 31, 2013. |
Eaton Vance Virginia Municipal Income Fund
| | | | | | | | | | | | | | | | |
| | | Beginning
Account Value
(9/1/13) | | | Ending
Account Value
(2/28/14) | | | Expenses Paid
During Period*
(9/1/13 – 2/28/14) | | | Annualized
Expense
Ratio | |
| | | | |
| | | | | | | | | | | | | | | | |
Actual | | | | | | | | | | | | | |
Class A | | $ | 1,000.00 | | | $ | 1,057.70 | | | $ | 3.88 | | | | 0.76 | % |
Class B | | $ | 1,000.00 | | | $ | 1,053.80 | | | $ | 7.69 | | | | 1.51 | % |
Class C | | $ | 1,000.00 | | | $ | 1,055.00 | | | $ | 7.69 | | | | 1.51 | % |
Class I | | $ | 1,000.00 | | | $ | 1,058.60 | | | $ | 2.86 | | | | 0.56 | % |
| | | | | | | | | | | | | | | | | |
| | | | |
| | | | | | | | | | | | | | | | |
Hypothetical | | | | | | | | | | | | | |
(5% return per year before expenses) | | | | | | | | | | | | | |
Class A | | $ | 1,000.00 | | | $ | 1,021.00 | | | $ | 3.81 | | | | 0.76 | % |
Class B | | $ | 1,000.00 | | | $ | 1,017.30 | | | $ | 7.55 | | | | 1.51 | % |
Class C | | $ | 1,000.00 | | | $ | 1,017.30 | | | $ | 7.55 | | | | 1.51 | % |
Class I | | $ | 1,000.00 | | | $ | 1,022.00 | | | $ | 2.81 | | | | 0.56 | % |
| * | Expenses are equal to the Fund’s annualized expense ratio for the indicated Class, multiplied by the average account value over the period, multiplied by 181/365 (to reflect the one-half year period). The Example assumes that the $1,000 was invested at the net asset value per share determined at the close of business on August 31, 2013. |
Eaton Vance
Alabama Municipal Income Fund
February 28, 2014
Portfolio of Investments (Unaudited)
| | | | | | | | |
| Tax-Exempt Investments — 98.1% | |
| | |
| | | | | | | | |
| Security | | Principal
Amount
(000’s omitted) | | | Value | |
| | | | | | | | |
|
Education — 6.4% | |
University of Alabama, 5.00%, 7/1/34 | | $ | 1,500 | | | $ | 1,619,565 | |
University of Alabama, 5.00%, 10/1/37 | | | 1,000 | | | | 1,091,050 | |
| | |
| | | | | | $ | 2,710,615 | |
| | |
|
General Obligations — 16.7% | |
Auburn, 5.25%, 12/1/27 | | $ | 1,000 | | | $ | 1,135,470 | |
Huntsville, 5.00%, 5/1/33 | | | 1,025 | | | | 1,130,995 | |
Madison, 5.15%, 2/1/39 | | | 1,250 | | | | 1,332,738 | |
Mobile, 5.00%, 2/15/27 | | | 1,000 | | | | 1,098,410 | |
Oxford, 5.00%, 2/1/32 | | | 1,205 | | | | 1,299,267 | |
Trussville, 5.00%, 10/1/39 | | | 1,000 | | | | 1,078,560 | |
| | |
| | | | | | $ | 7,075,440 | |
| | |
|
Hospital — 15.3% | |
Birmingham Special Care Facilities Financing Authority, (Children’s Hospital), 6.125%, 6/1/34 | | $ | 1,500 | | | $ | 1,614,345 | |
East Alabama, Health Care Authority, 5.00%, 9/1/27 | | | 1,000 | | | | 1,060,670 | |
Health Care Authority, (Baptist Health), 5.00%, 11/15/16 | | | 400 | | | | 418,896 | |
Health Care Authority, (Baptist Health), 5.00%, 11/15/18 | | | 750 | | | | 777,172 | |
Health Care Authority, (Baptist Health), 5.00%, 11/15/21 | | | 400 | | | | 407,560 | |
Huntsville, Health Care Authority, 5.50%, 6/1/25 | | | 1,000 | | | | 1,097,440 | |
University of Alabama, Hospital Revenue, 5.75%, to 9/1/18 (Put Date), 9/1/22 | | | 1,000 | | | | 1,121,720 | |
| | |
| | | | | | $ | 6,497,803 | |
| | |
|
Industrial Development Revenue — 5.5% | |
Butler Industrial Development Board, (Georgia-Pacific Corp.), (AMT), 5.75%, 9/1/28 | | $ | 600 | | | $ | 610,554 | |
Phenix City Industrial Development Board, (MeadWestvaco Coated Board), (AMT), 4.125%, 5/15/35 | | | 1,145 | | | | 914,947 | |
Selma Industrial Development Board, (International Paper Co.), 5.80%, 5/1/34 | | | 750 | | | | 794,542 | |
| | |
| | | | | | $ | 2,320,043 | |
| | |
|
Insured – Education — 10.1% | |
Alabama State Board of Education, (Chattahoochee Valley Community College), (AGC), 5.00%, 6/1/34 | | $ | 1,000 | | | $ | 1,048,630 | |
Alabama State University, (AGC), 4.75%, 5/1/33 | | | 475 | | | | 491,378 | |
Auburn University, (AGM), 5.00%, 6/1/38 | | | 250 | | | | 265,462 | |
Jacksonville State University, (AGC), 5.125%, 12/1/33 | | | 1,230 | | | | 1,286,998 | |
Montgomery, Public Educational Building Authority, (Alabama State University), (XLCA), 5.25%, 10/1/25 | | | 1,110 | | | | 1,182,794 | |
| | |
| | | | | | $ | 4,275,262 | |
| | |
| | | | | | | | |
| Security | | Principal
Amount
(000’s omitted) | | | Value | |
| | | | | | | | |
|
Insured – Electric Utilities — 1.0% | |
Puerto Rico Electric Power Authority, (BHAC), (FGIC), (NPFG), 5.25%, 7/1/24 | | $ | 400 | | | $ | 437,736 | |
| | |
| | | | | | $ | 437,736 | |
| | |
|
Insured – Escrowed / Prerefunded — 2.6% | |
Montgomery, BMC Special Care Facilities Financing Authority, (Baptist Health Montgomery), (NPFG), Prerefunded to 11/15/14, 5.15%, 11/15/27 | | $ | 1,065 | | | $ | 1,102,531 | |
| | |
| | | | | | $ | 1,102,531 | |
| | |
|
Insured – Lease Revenue / Certificates of Participation — 5.7% | |
Montgomery County, Public Building Authority, (NPFG), 5.00%, 3/1/31 | | $ | 500 | | | $ | 526,570 | |
Puerto Rico Public Finance Corp., (AMBAC), Escrowed to Maturity, 5.50%, 8/1/27 | | | 1,100 | | | | 1,311,310 | |
Puerto Rico Public Finance Corp., (Commonwealth Appropriation), (AMBAC), 5.125%, 6/1/24 | | | 520 | | | | 604,547 | |
| | |
| | | | | | $ | 2,442,427 | |
| | |
|
Insured – Special Tax Revenue — 4.6% | |
Alabama Public School and College Authority, (AGM), 2.50%, 12/1/27 | | $ | 1,705 | | | $ | 1,519,752 | |
Birmingham-Jefferson Civic Center Authority, (NPFG), 0.00%, 9/1/18 | | | 505 | | | | 436,396 | |
| | |
| | | | | | $ | 1,956,148 | |
| | |
|
Insured – Transportation — 1.9% | |
Puerto Rico Highway and Transportation Authority, (AMBAC), 0.00%, 7/1/16 | | $ | 1,000 | | | $ | 823,260 | |
| | |
| | | | | | $ | 823,260 | |
| | |
|
Insured – Water and Sewer — 11.9% | |
Alabama Drinking Water Finance Authority, (AMBAC), 4.00%, 8/15/28 | | $ | 2,410 | | | $ | 2,410,482 | |
Cullman Utilities Board, (AGM), 5.00%, 9/1/30 | | | 1,000 | | | | 1,069,510 | |
West Morgan-East Lawrence, Water and Sewer Authority, (AGM), 0.00%, 8/15/41 | | | 2,600 | | | | 515,164 | |
West Morgan-East Lawrence, Water and Sewer Authority, (AGM), 4.85%, 8/15/35 | | | 1,000 | | | | 1,041,910 | |
| | |
| | | | | | $ | 5,037,066 | |
| | |
|
Other Revenue — 3.9% | |
Alabama Incentives Financing Authority, 5.00%, 9/1/29 | | $ | 1,500 | | | $ | 1,641,300 | |
| | |
| | | | | | $ | 1,641,300 | |
| | |
| | | | |
| | 20 | | See Notes to Financial Statements. |
Eaton Vance
Alabama Municipal Income Fund
February 28, 2014
Portfolio of Investments (Unaudited) — continued
| | | | | | | | |
| Security | | Principal
Amount
(000’s omitted) | | | Value | |
| | | | | | | | |
|
Special Tax Revenue — 3.9% | |
Guam, Limited Obligation Bonds, 5.625%, 12/1/29 | | $ | 145 | | | $ | 153,900 | |
Guam, Limited Obligation Bonds, 5.75%, 12/1/34 | | | 155 | | | | 164,277 | |
Homewood City Board of Education, 5.00%, 4/1/32 | | | 500 | | | | 537,355 | |
Puerto Rico Sales Tax Financing Corp., 5.25%, 8/1/57 | | | 540 | | | | 443,896 | |
Virgin Islands Public Finance Authority, 6.75%, 10/1/37 | | | 325 | | | | 357,945 | |
| | |
| | | | | | $ | 1,657,373 | |
| | |
|
Water and Sewer — 8.6% | |
Auburn, Waterworks Board, 5.00%, 9/1/29 | | $ | 1,315 | | | $ | 1,510,396 | |
Opelika Utilities Board, 5.25%, 6/1/36 | | | 500 | | | | 532,985 | |
Opelika Utilities Board, 5.25%, 6/1/41 | | | 500 | | | | 528,175 | |
Scottsboro Waterworks, Sewer and Gas Board, 5.00%, 8/1/32 | | | 1,000 | | | | 1,065,370 | |
| | |
| | | | | | $ | 3,636,926 | |
| | |
| |
Total Tax-Exempt Investments — 98.1%
(identified cost $39,377,756) | | | $ | 41,613,930 | |
| | |
| |
Other Assets, Less Liabilities — 1.9% | | | $ | 803,737 | |
| | |
| |
Net Assets — 100.0% | | | $ | 42,417,667 | |
| | |
The percentage shown for each investment category in the Portfolio of Investments is based on net assets.
| | | | |
| AGC | | – | | Assured Guaranty Corp. |
| AGM | | – | | Assured Guaranty Municipal Corp. |
| AMBAC | | – | | AMBAC Financial Group, Inc. |
| AMT | | – | | Interest earned from these securities may be considered a tax preference item for purposes of the Federal Alternative Minimum Tax. |
| BHAC | | – | | Berkshire Hathaway Assurance Corp. |
| FGIC | | – | | Financial Guaranty Insurance Company |
| NPFG | | – | | National Public Finance Guaranty Corp. |
| XLCA | | – | | XL Capital Assurance, Inc. |
The Fund invests primarily in debt securities issued by Alabama municipalities. The ability of the issuers of the debt securities to meet their obligations may be affected by economic developments in a specific industry or municipality. In order to reduce the risk associated with such economic developments, at February 28, 2014, 38.6% of total investments are backed by bond insurance of various financial institutions and financial guaranty assurance agencies. The aggregate percentage insured by an individual financial institution or financial guaranty assurance agency ranged from 1.1% to 12.4% of total investments.
| | | | |
| | 21 | | See Notes to Financial Statements. |
Eaton Vance
Arkansas Municipal Income Fund
February 28, 2014
Portfolio of Investments (Unaudited)
| | | | | | | | |
| Tax-Exempt Investments — 99.2% | |
| | |
| | | | | | | | |
| Security | | Principal
Amount
(000’s omitted) | | | Value | |
| | | | | | | | |
|
Bond Bank — 1.4% | |
Arkansas Development Finance Authority, (Capital Improvement), 5.00%, 6/1/24 | | $ | 430 | | | $ | 504,966 | |
Arkansas Development Finance Authority, (Capital Improvement), 5.00%, 6/1/25 | | | 250 | | | | 291,668 | |
| | |
| | | | | | $ | 796,634 | |
| | |
|
Education — 4.3% | |
Texas A&M University, 5.00%, 7/1/26 | | $ | 200 | | | $ | 242,502 | |
University of Arkansas, (Auxiliary Facilities-Monticello Campus), 4.00%, 10/1/32 | | | 500 | | | | 506,340 | |
University of Arkansas, (Fort Smith Campus), 4.75%, 12/1/35 | | | 500 | | | | 522,440 | |
University of Arkansas, (Phillips Community College), 5.00%, 12/1/29 | | | 250 | | | | 268,895 | |
University of Arkansas, (UAMS Campus), 5.00%, 12/1/30 | | | 750 | | | | 840,180 | |
| | |
| | | | | | $ | 2,380,357 | |
| | |
|
Electric Utilities — 1.6% | |
Independence County, Pollution Control Revenue, (Entergy Arkansas, Inc.), 2.375%, 1/1/21 | | $ | 500 | | | $ | 492,405 | |
Puerto Rico Electric Power Authority, 6.75%, 7/1/36 | | | 500 | | | | 366,885 | |
| | |
| | | | | | $ | 859,290 | |
| | |
|
Escrowed / Prerefunded — 2.0% | |
Arkansas Development Finance Authority, (Waste Water System), Escrowed to Maturity, 5.50%, 12/1/19 | | $ | 250 | | | $ | 299,158 | |
Conway, School District No. 1, Prerefunded to 2/1/15, 4.75%, 2/1/34 | | | 750 | | | | 781,935 | |
| | |
| | | | | | $ | 1,081,093 | |
| | |
|
General Obligations — 20.4% | |
Arkansas, 4.75%, 6/1/29 | | $ | 750 | | | $ | 810,780 | |
Arkansas State College Savings, 0.00%, 6/1/14 | | | 2,750 | | | | 2,748,542 | |
Arkansas Water, Waste Disposal and Pollution Facilities, 4.875%, 7/1/43 | | | 1,000 | | | | 1,042,880 | |
Bentonville, School District No. 6, 4.50%, 6/1/40 | | | 1,000 | | | | 1,028,820 | |
Bradford, Special School District, 4.75%, 2/1/39 | | | 315 | | | | 319,681 | |
Bryant, School District No. 25, 4.75%, 2/1/39 | | | 1,490 | | | | 1,512,141 | |
Pottsville, School District No. 61, 4.50%, 2/1/38 | | | 1,250 | | | | 1,267,463 | |
Pulaski County, Special School District, 5.00%, 2/1/35 | | | 500 | | | | 508,080 | |
Springdale, School District No. 50, 4.625%, 6/1/35 | | | 1,000 | | | | 1,020,450 | |
Springdale, School District No. 50, 4.75%, 6/1/39 | | | 1,000 | | | | 1,022,980 | |
| | |
| | | | | | $ | 11,281,817 | |
| | |
| | | | | | | | |
| Security | | Principal
Amount
(000’s omitted) | | | Value | |
| | | | | | | | |
|
Hospital — 1.4% | |
Pulaski County, Public Facilities Board, (Central Arkansas Radiation Therapy Institute Inc.), 5.25%, 7/1/28 | | $ | 750 | | | $ | 792,473 | |
| | |
| | | | | | $ | 792,473 | |
| | |
|
Housing — 1.5% | |
Arkansas Development Finance Authority, SFMR, (GNMA/FNMA), (AMT), 4.75%, 7/1/32 | | $ | 380 | | | $ | 383,192 | |
Arkansas Development Finance Authority, SFMR, (GNMA/FNMA), (AMT), 4.80%, 7/1/26 | | | 275 | | | | 275,578 | |
Arkansas Development Finance Authority, SFMR, (GNMA/FNMA), (AMT), 5.05%, 7/1/31 | | | 145 | | | | 146,654 | |
| | |
| | | | | | $ | 805,424 | |
| | |
|
Industrial Development Revenue — 0.9% | |
Cleveland, OH, (Continental Airlines), (AMT), 5.70%, 12/1/19 | | $ | 510 | | | $ | 510,077 | |
| | |
| | | | | | $ | 510,077 | |
| | |
|
Insured – Education — 10.6% | |
Arkansas State University, (BEEBE Campus), (AMBAC), 5.00%, 9/1/35 | | $ | 1,000 | | | $ | 1,047,320 | |
Arkansas State University, (Consolidated Building System), (AMBAC), 5.00%, 4/1/24 | | | 1,000 | | | | 1,174,680 | |
Arkansas State University, (Consolidated Building System), (AMBAC), 5.00%, 3/1/32 | | | 1,250 | | | | 1,337,225 | |
Pulaski Technical College, (Capital Improvement), (AGM), 5.00%, 4/1/41 | | | 1,150 | | | | 1,225,003 | |
University of Arkansas, (Fayetteville Campus), (AMBAC), 5.00%, 11/1/36 | | | 1,000 | | | | 1,065,310 | |
| | |
| | | | | | $ | 5,849,538 | |
| | |
|
Insured – Electric Utilities — 2.4% | |
Puerto Rico Electric Power Authority, (NPFG), 5.25%, 7/1/29 | | $ | 940 | | | $ | 844,599 | |
Puerto Rico Electric Power Authority, (NPFG), 5.25%, 7/1/34 | | | 550 | | | | 479,122 | |
| | |
| | | | | | $ | 1,323,721 | |
| | |
|
Insured – Escrowed / Prerefunded — 4.5% | |
Arkansas Development Finance Authority, SFMR, (Donaghey Plaza), (AGM), Prerefunded to 6/1/14, 5.00%, 6/1/29 | | $ | 1,000 | | | $ | 1,012,630 | |
North Little Rock, Electric System, (NPFG), Escrowed to Maturity, 6.50%, 7/1/15 | | | 440 | | | | 461,155 | |
University of Arkansas, (UAMS Campus), (NPFG), Prerefunded to 11/1/14, 5.00%, 11/1/34 | | | 1,000 | | | | 1,032,860 | |
| | |
| | | | | | $ | 2,506,645 | |
| | |
| | | | |
| | 22 | | See Notes to Financial Statements. |
Eaton Vance
Arkansas Municipal Income Fund
February 28, 2014
Portfolio of Investments (Unaudited) — continued
| | | | | | | | |
| Security | | Principal
Amount
(000’s omitted) | | | Value | |
| | | | | | | | |
|
Insured – General Obligations — 0.9% | |
Arkansas State College Savings, (NPFG), 0.00%, 6/1/17 | | $ | 500 | | | $ | 485,425 | |
| | |
| | | | | | $ | 485,425 | |
| | |
|
Insured – Health – Miscellaneous — 0.9% | |
Arkansas Development Finance Authority, (Public Health Laboratory), (AMBAC), 3.90%, 12/1/24 | | $ | 5 | | | $ | 4,948 | |
Arkansas Development Finance Authority, (Public Health Laboratory), (AMBAC), 5.00%, 12/1/18 | | | 500 | | | | 502,065 | |
| | |
| | | | | | $ | 507,013 | |
| | |
|
Insured – Hospital — 7.7% | |
Heber Springs, Hospital and Health Care Facilities Board, (Baptist Healthcare System), (AGC), 5.00%, 5/1/26 | | $ | 1,140 | | | $ | 1,176,229 | |
Pulaski County, (Children’s Hospital), (AMBAC), 5.00%, 3/1/30 | | | 1,500 | | | | 1,514,520 | |
Pulaski County, (Children’s Hospital), (AMBAC), 5.00%, 3/1/35 | | | 1,565 | | | | 1,576,299 | |
| | |
| | | | | | $ | 4,267,048 | |
| | |
|
Insured – Other Revenue — 6.7% | |
Arkansas Development Finance Authority, Tobacco Settlement Revenue, (AMBAC), 0.00%, 7/1/24 | | $ | 1,000 | | | $ | 702,780 | |
Arkansas Development Finance Authority, Tobacco Settlement Revenue, (AMBAC), 0.00%, 7/1/30 | | | 820 | | | | 403,940 | |
Arkansas Development Finance Authority, Tobacco Settlement Revenue, (AMBAC), 0.00%, 7/1/36 | | | 3,500 | | | | 1,173,865 | |
Arkansas Development Finance Authority, Tobacco Settlement Revenue, (AMBAC), 0.00%, 7/1/46 | | | 7,445 | | | | 1,421,474 | |
| | |
| | | | | | $ | 3,702,059 | |
| | |
|
Insured – Special Tax Revenue — 2.2% | |
Puerto Rico Infrastructure Financing Authority, (AMBAC), 5.50%, 7/1/28 | | $ | 1,000 | | | $ | 819,890 | |
Puerto Rico Infrastructure Financing Authority, (FGIC), 0.00%, 7/1/42 | | | 1,000 | | | | 63,490 | |
Puerto Rico Sales Tax Financing Corp., (NPFG), 0.00%, 8/1/45 | | | 2,760 | | | | 350,051 | |
| | |
| | | | | | $ | 1,233,431 | |
| | |
|
Insured – Utilities — 4.2% | |
Benton, Public Utility Revenue, (AGM), 5.00%, 9/1/36 | | $ | 750 | | | $ | 798,345 | |
Benton, Public Utility Revenue, (AMBAC), 5.00%, 9/1/36 | | | 1,435 | | | | 1,530,643 | |
| | |
| | | | | | $ | 2,328,988 | |
| | |
|
Insured – Water and Sewer — 8.1% | |
Fort Smith, Water and Sewer, (AGM), 5.00%, 10/1/32 | | $ | 500 | | | $ | 544,350 | |
Little Rock, Sewer Revenue, (AGM), 4.75%, 6/1/37 | | | 1,000 | | | | 1,017,680 | |
| | | | | | | | |
| Security | | Principal
Amount
(000’s omitted) | | | Value | |
| | | | | | | | |
|
Insured – Water and Sewer (continued) | |
Little Rock, Sewer Revenue, (AGM), 5.00%, 6/1/31 | | $ | 450 | | | $ | 485,698 | |
Little Rock, Sewer Revenue, (AGM), 5.00%, 10/1/32 | | | 750 | | | | 805,380 | |
Rogers, Sewer Revenue, (AMBAC), 5.00%, 2/1/32 | | | 500 | | | | 536,290 | |
Rogers, Sewer Revenue, (AMBAC), 5.00%, 2/1/37 | | | 1,000 | | | | 1,056,990 | |
| | |
| | | | | | $ | 4,446,388 | |
| | |
|
Lease Revenue / Certificates of Participation — 5.2% | |
Arkansas Development Finance Authority, (Donaghey Plaza), 5.00%, 6/1/34 | | $ | 1,190 | | | $ | 1,285,521 | |
Arkansas Development Finance Authority, Correctional Facilities, 5.125%, 5/15/39 | | | 1,500 | | | | 1,565,340 | |
| | |
| | | | | | $ | 2,850,861 | |
| | |
|
Special Tax Revenue — 8.2% | |
Batesville Sales and Use Tax, 4.00%, 9/1/37 | | $ | 725 | | | $ | 697,486 | |
Cabot Sales & Use Tax, (Refunding & Improvement), 3.25%, 6/1/38 | | | 500 | | | | 466,900 | |
Cabot Sales & Use Tax, (Refunding & Improvement), 3.50%, 6/1/33 | | | 500 | | | | 450,690 | |
Fort Smith Sales and Use Tax, 5.00%, 5/1/23 | | | 400 | | | | 462,900 | |
Fort Smith Sales and Use Tax, 5.00%, 5/1/24 | | | 450 | | | | 515,101 | |
Little Rock, Hotel and Restaurant Gross Receipts Tax, 7.375%, 8/1/15 | | | 760 | | | | 789,845 | |
Puerto Rico Sales Tax Financing Corp., 5.00%, 8/1/40 | | | 140 | | | | 114,705 | |
Puerto Rico Sales Tax Financing Corp., 5.25%, 8/1/40 | | | 70 | | | | 58,787 | |
Rogers Sales and Use Tax, 4.125%, 11/1/31 | | | 500 | | | | 515,245 | |
Virgin Islands Public Finance Authority, 6.75%, 10/1/37 | | | 435 | | | | 479,096 | |
| | |
| | | | | | $ | 4,550,755 | |
| | |
|
Water and Sewer — 4.1% | |
Arkansas Community Water System Public Water Authority, 5.00%, 10/1/32 | | $ | 1,000 | | | $ | 1,071,690 | |
El Dorado, Water and Sewer System Revenue, 4.375%, 12/1/28 | | | 595 | | | | 636,287 | |
El Dorado, Water and Sewer System Revenue, 4.50%, 12/1/30 | | | 500 | | | | 534,340 | |
| | |
| | | | | | $ | 2,242,317 | |
| | |
| |
Total Tax-Exempt Investments — 99.2%
(identified cost $53,790,426) | | | $ | 54,801,354 | |
| | |
| |
Other Assets, Less Liabilities — 0.8% | | | $ | 427,039 | |
| | |
| |
Net Assets — 100.0% | | | $ | 55,228,393 | |
| | |
The percentage shown for each investment category in the Portfolio of Investments is based on net assets.
| | | | |
| | 23 | | See Notes to Financial Statements. |
Eaton Vance
Arkansas Municipal Income Fund
February 28, 2014
Portfolio of Investments (Unaudited) — continued
| | | | |
| AGC | | – | | Assured Guaranty Corp. |
| AGM | | – | | Assured Guaranty Municipal Corp. |
| AMBAC | | – | | AMBAC Financial Group, Inc. |
| AMT | | – | | Interest earned from these securities may be considered a tax preference item for purposes of the Federal Alternative Minimum Tax. |
| FGIC | | – | | Financial Guaranty Insurance Company |
| FNMA | | – | | Federal National Mortgage Association |
| GNMA | | – | | Government National Mortgage Association |
| NPFG | | – | | National Public Finance Guaranty Corp. |
| SFMR | | – | | Single Family Mortgage Revenue |
The Fund invests primarily in debt securities issued by Arkansas municipalities. The ability of the issuers of the debt securities to meet their obligations may be affected by economic developments in a specific industry or municipality. In order to reduce the risk associated with such economic developments, at February 28, 2014, 48.6% of total investments are backed by bond insurance of various financial institutions and financial guaranty assurance agencies. The aggregate percentage insured by an individual financial institution or financial guaranty assurance agency ranged from 0.1% to 29.0% of total investments.
| | | | |
| | 24 | | See Notes to Financial Statements. |
Eaton Vance
Georgia Municipal Income Fund
February 28, 2014
Portfolio of Investments (Unaudited)
| | | | | | | | |
| Tax-Exempt Investments — 103.0% | |
| | |
| | | | | | | | |
| Security | | Principal
Amount
(000’s omitted) | | | Value | |
| | | | | | | | |
|
Education — 4.0% | |
Atlanta Development Authority, Educational Facilities, 4.75%, 7/1/27 | | $ | 600 | | | $ | 628,896 | |
Fulton County Development Authority, (Georgia Tech Foundation Campus Recreation Center Project), 5.00%, 11/1/30 | | | 750 | | | | 833,378 | |
Fulton County Development Authority, (Georgia Tech Foundation Technology Square Project), 5.00%, 11/1/30 | | | 750 | | | | 839,812 | |
| | |
| | | | | | $ | 2,302,086 | |
| | |
|
Electric Utilities — 1.8% | |
Burke County Development Authority, (Oglethorpe Power Corp.), 5.50%, 1/1/33 | | $ | 1,000 | | | $ | 1,060,360 | |
| | |
| | | | | | $ | 1,060,360 | |
| | |
|
Escrowed /��Prerefunded — 1.8% | |
Forsyth County Hospital Authority, (Georgia Baptist Health Care System), Escrowed to Maturity, 6.375%, 10/1/28 | | $ | 800 | | | $ | 1,015,608 | |
| | |
| | | | | | $ | 1,015,608 | |
| | |
|
General Obligations — 15.1% | |
Georgia, 2.00%, 8/1/27 | | $ | 315 | | | $ | 279,159 | |
Georgia, 5.00%, 7/1/26 | | | 200 | | | | 234,638 | |
Gwinnett County School District, 5.00%, 2/1/36(1) | | | 4,500 | | | | 4,935,060 | |
Jefferson City, School District, 5.25%, 2/1/33 | | | 1,500 | | | | 1,633,680 | |
Lagrange-Troup County Hospital Authority, (West Georgia Health Foundation, Inc.), 5.50%, 7/1/38 | | | 500 | | | | 545,125 | |
Lincoln County School District, 5.50%, 4/1/37 | | | 1,000 | | | | 1,107,490 | |
| | |
| | | | | | $ | 8,735,152 | |
| | |
|
Hospital — 7.7% | |
DeKalb County Hospital Authority, (DeKalb Medical Center), 6.125%, 9/1/40 | | $ | 1,000 | | | $ | 1,012,950 | |
Fulton County Development Authority, (Children’s Healthcare of Atlanta), 5.25%, 11/15/39 | | | 1,000 | | | | 1,055,120 | |
Glynn-Brunswick Memorial Hospital Authority, (Georgia Medical Center), 5.625%, 8/1/34 | | | 750 | | | | 792,720 | |
Macon-Bibb County Hospital Authority, (The Medical Center of Central Georgia), 5.00%, 8/1/35 | | | 1,000 | | | | 1,043,600 | |
Savannah Hospital Authority, (St Joseph’s/Candler Health System, Inc.), 5.50%, 7/1/30 | | | 500 | | | | 541,725 | |
| | |
| | | | | | $ | 4,446,115 | |
| | |
| | | | | | | | |
| Security | | Principal
Amount
(000’s omitted) | | | Value | |
| | | | | | | | |
|
Industrial Development Revenue — 6.9% | |
Albany Dougherty Payroll Development Authority, Solid Waste Disposal, (Procter and Gamble), (AMT), 5.20%, 5/15/28 | | $ | 2,000 | | | $ | 2,289,780 | |
Cleveland, OH, (Continental Airlines), (AMT), 5.70%, 12/1/19 | | | 600 | | | | 600,090 | |
Cobb County Development Authority, Solid Waste Disposal, (Georgia Waste Management Project), (AMT), 5.00%, 4/1/33 | | | 925 | | | | 954,498 | |
Vienna Water and Sewer, (Cargill), (AMT), 6.00%, 9/1/14 | | | 160 | | | | 160,747 | |
| | |
| | | | | | $ | 4,005,115 | |
| | |
|
Insured – Education — 2.1% | |
Savannah Economic Development Authority, (SSU Community Development I, LLC), (AGC), 5.25%, 6/15/27 | | $ | 1,125 | | | $ | 1,217,295 | |
| | |
| | | | | | $ | 1,217,295 | |
| | |
|
Insured – Electric Utilities — 10.9% | |
Georgia Municipal Electric Power Authority, (NPFG), 5.50%, 1/1/20 | | $ | 1,600 | | | $ | 1,750,592 | |
Griffin Combined Public Utility Revenue, (AGM), 5.00%, 1/1/28 | | | 1,000 | | | | 1,100,000 | |
Newnan, Water, Sewerage and Light Commission, (AMBAC), 5.25%, 1/1/24 | | | 1,040 | | | | 1,231,766 | |
Newnan, Water, Sewerage and Light Commission, (AMBAC), 5.25%, 1/1/25 | | | 485 | | | | 576,679 | |
Puerto Rico Electric Power Authority, (NPFG), 5.25%, 7/1/29 | | | 980 | | | | 880,540 | |
Puerto Rico Electric Power Authority, (NPFG), 5.25%, 7/1/34 | | | 550 | | | | 479,121 | |
Puerto Rico Electric Power Authority, (NPFG), 5.25%, 7/1/35 | | | 300 | | | | 260,433 | |
| | |
| | | | | | $ | 6,279,131 | |
| | |
|
Insured – General Obligations — 2.4% | |
Coweta County, Water and Sewerage Authority, (AGM), 5.00%, 6/1/26 | | $ | 1,135 | | | $ | 1,378,514 | |
| | |
| | | | | | $ | 1,378,514 | |
| | |
|
Insured – Hospital — 3.2% | |
Cobb County Kennestone Hospital Authority, (Wellstar Health System), (AMBAC), 5.50%, 4/1/37 | | $ | 1,750 | | | $ | 1,870,610 | |
| | |
| | | | | | $ | 1,870,610 | |
| | |
|
Insured – Lease Revenue / Certificates of Participation — 6.1% | |
Georgia Local Government 1998A Grantor Trust Certificates of Participation, (NPFG), 4.75%, 6/1/28 | | $ | 1,330 | | | $ | 1,352,690 | |
Georgia Municipal Association, Inc. Certificates of Participation, (Riverdale), (AGC), 5.375%, 5/1/32 | | | 1,000 | | | | 1,061,960 | |
Georgia State University Higher Education Facilities Authority, (USG Real Estate Foundation), (AGC), 5.625%, 6/15/38 | | | 1,000 | | | | 1,108,010 | |
| | |
| | | | | | $ | 3,522,660 | |
| | |
| | | | |
| | 25 | | See Notes to Financial Statements. |
Eaton Vance
Georgia Municipal Income Fund
February 28, 2014
Portfolio of Investments (Unaudited) — continued
| | | | | | | | |
| Security | | Principal
Amount
(000’s omitted) | | | Value | |
| | | | | | | | |
|
Insured – Special Tax Revenue — 2.9% | |
Clarke County Hospital Authority, (Athens Regional Medical Center), (NPFG), 5.00%, 1/1/32 | | $ | 1,190 | | | $ | 1,216,942 | |
Puerto Rico Infrastructure Financing Authority, (AMBAC), 5.50%, 7/1/28 | | | 545 | | | | 446,840 | |
| | |
| | | | | | $ | 1,663,782 | |
| | |
|
Insured – Transportation — 3.3% | |
Atlanta, Airport Passenger Facility Charge, (AGM), 4.75%, 1/1/28 | | $ | 785 | | | $ | 808,958 | |
Metropolitan Atlanta Rapid Transit Authority, (AMBAC), 6.25%, 7/1/20 | | | 1,000 | | | | 1,116,980 | |
| | |
| | | | | | $ | 1,925,938 | |
| | |
|
Insured – Water and Sewer — 9.4% | |
Brunswick-Glynn County Joint Water and Sewer Commission, (AGM), 5.00%, 6/1/33 | | $ | 500 | | | $ | 531,250 | |
DeKalb County Water and Sewerage Revenue, (AGM), 5.25%, 10/1/32 | | | 1,590 | | | | 1,819,819 | |
Douglasville-Douglas County, Water and Sewer Authority, (NPFG), 5.00%, 6/1/37 | | | 750 | | | | 799,800 | |
Henry County, Water and Sewer Authority, (NPFG), 5.25%, 2/1/25 | | | 1,000 | | | | 1,213,170 | |
Walton County, Water and Sewer Authority, (AGM), 5.00%, 2/1/33 | | | 1,000 | | | | 1,066,790 | |
| | |
| | | | | | $ | 5,430,829 | |
| | |
|
Other Revenue — 1.4% | |
Georgia Municipal Gas Authority, (Gas Portfolio III), 5.00%, 10/1/27 | | $ | 750 | | | $ | 822,045 | |
| | |
| | | | | | $ | 822,045 | |
| | |
|
Senior Living / Life Care — 0.9% | |
Savannah Economic Development Authority, (Marshes of Skidaway Island), 6.00%, 1/1/24 | | $ | 500 | | | $ | 517,610 | |
| | |
| | | | | | $ | 517,610 | |
| | |
|
Special Tax Revenue — 9.3% | |
Athens-Clarke County Unified Government Development Authority, (Economic Development Projects), 5.00%, 6/1/32 | | $ | 1,080 | | | $ | 1,169,867 | |
Floyd County Hospital Authority, (Floyd Health Medical Center), 5.25%, 7/1/29 | | | 750 | | | | 806,025 | |
Gainesville and Hall County Hospital Authority, (Northeast Georgia Medical Center), 5.00%, 2/15/33 | | | 1,750 | | | | 1,816,150 | |
Guam, Limited Obligation Bonds, 5.625%, 12/1/29 | | | 205 | | | | 217,583 | |
Guam, Limited Obligation Bonds, 5.75%, 12/1/34 | | | 220 | | | | 233,167 | |
| | | | | | | | |
| Security | | Principal
Amount
(000’s omitted) | | | Value | |
|
Special Tax Revenue (continued) | |
Puerto Rico Sales Tax Financing Corp., 5.00%, 8/1/40 | | $ | 570 | | | $ | 467,012 | |
Puerto Rico Sales Tax Financing Corp., 5.25%, 8/1/40 | | | 260 | | | | 218,351 | |
Virgin Islands Public Finance Authority, 6.75%, 10/1/37 | | | 435 | | | | 479,096 | |
| | |
| | | | | | $ | 5,407,251 | |
| | |
|
Transportation — 1.4% | |
Atlanta, Airport Revenue, 5.00%, 1/1/35 | | $ | 750 | | | $ | 785,700 | |
| | |
| | | | | | $ | 785,700 | |
| | |
|
Water and Sewer — 12.4% | |
Athens-Clarke County, Unified Government Water and Sewer Revenue, 5.50%, 1/1/38 | | $ | 1,000 | | | $ | 1,114,940 | |
Atlanta, Water and Wastewater Revenue, 5.25%, 11/1/30 | | | 1,000 | | | | 1,133,310 | |
Cherokee County, Water and Sewer Authority, 5.00%, 8/1/32 | | | 1,000 | | | | 1,118,240 | |
Columbus, Water and Sewer Revenue, 5.00%, 5/1/30 | | | 750 | | | | 841,043 | |
Forsyth County, Water and Sewerage Authority, 5.00%, 4/1/27 | | | 1,100 | | | | 1,293,985 | |
Fulton County, Water and Sewer Revenue, 5.00%, 1/1/33 | | | 1,500 | | | | 1,652,370 | |
| | |
| | | | | | $ | 7,153,888 | |
| | |
| |
Total Tax-Exempt Investments — 103.0%
(identified cost $56,500,183) | | | $ | 59,539,689 | |
| | |
| |
Other Assets, Less Liabilities — (3.0)% | | | $ | (1,719,002 | ) |
| | |
| |
Net Assets — 100.0% | | | $ | 57,820,687 | |
| | |
The percentage shown for each investment category in the Portfolio of Investments is based on net assets.
| | | | |
| AGC | | – | | Assured Guaranty Corp. |
| AGM | | – | | Assured Guaranty Municipal Corp. |
| AMBAC | | – | | AMBAC Financial Group, Inc. |
| AMT | | – | | Interest earned from these securities may be considered a tax preference item for purposes of the Federal Alternative Minimum Tax. |
| NPFG | | – | | National Public Finance Guaranty Corp. |
The Fund invests primarily in debt securities issued by Georgia municipalities. The ability of the issuers of the debt securities to meet their obligations may be affected by economic developments in a specific industry or municipality. In order to reduce the risk associated with such economic developments, at February 28, 2014, 39.1% of total investments are backed by bond insurance of various financial institutions and financial guaranty assurance agencies. The aggregate percentage insured by an individual financial institution or financial guaranty assurance agency ranged from 5.7% to 13.4% of total investments.
| (1) | Security represents the municipal bond held by a trust that issues residual interest bonds (see Note 1I). |
| | | | |
| | 26 | | See Notes to Financial Statements. |
Eaton Vance
Kentucky Municipal Income Fund
February 28, 2014
Portfolio of Investments (Unaudited)
| | | | | | | | |
| Tax-Exempt Investments — 99.1% | |
| | |
| | | | | | | | |
| Security | | Principal
Amount
(000’s omitted) | | | Value | |
| | | | | | | | |
|
Bond Bank — 3.7% | |
Kentucky Infrastructure Authority, (Wastewater and Drinking Water), 5.00%, 2/1/27 | | $ | 1,000 | | | $ | 1,157,080 | |
Kentucky Infrastructure Authority, (Wastewater and Drinking Water), 5.00%, 2/1/30 | | | 500 | | | | 564,600 | |
| | |
| | | | | | $ | 1,721,680 | |
| | |
|
Education — 2.7% | |
Campbellsville, (Campbellsville University), 5.70%, 3/1/34 | | $ | 1,280 | | | $ | 1,289,638 | |
| | |
| | | | | | $ | 1,289,638 | |
| | |
|
Escrowed / Prerefunded — 4.4% | |
Puerto Rico Electric Power Authority, Escrowed to various sinking fund dates through 7/1/17, Series O, 0.00%, 7/1/17 | | $ | 2,250 | | | $ | 2,048,940 | |
| | |
| | | | | | $ | 2,048,940 | |
| | |
|
General Obligations — 4.6% | |
Lexington-Fayette Urban County Airport Board, 5.00%, 7/1/27 | | $ | 1,000 | | | $ | 1,113,710 | |
Lexington-Fayette Urban County Airport Board, (AMT), 5.00%, 7/1/30 | | | 500 | | | | 530,585 | |
Owensboro, 4.00%, 6/1/32 | | | 500 | | | | 507,895 | |
| | |
| | | | | | $ | 2,152,190 | |
| | |
|
Hospital — 9.8% | |
City of Russell, (Bon Secours Health System), 5.00%, 11/1/26 | | $ | 1,000 | | | $ | 1,079,100 | |
Kentucky Economic Development Finance Authority, (Ashland Hospital Corp.), 5.00%, 2/1/30 | | | 1,000 | | | | 1,017,910 | |
Kentucky Economic Development Finance Authority, (Baptist Healthcare System), 5.625%, 8/15/27 | | | 500 | | | | 543,715 | |
Kentucky Economic Development Finance Authority, (Catholic Health Initiatives), 5.00%, 5/1/29 | | | 500 | | | | 525,285 | |
Louisville/Jefferson County Metro Government, (Catholic Health Initiatives), 5.00%, 12/1/35 | | | 790 | | | | 812,002 | |
Murray Hospital Facilities, (Murray Calloway County Hospital), 5.125%, 8/1/37 | | | 75 | | | | 73,149 | |
Pikeville Hospital, (Pikeville Medical Center, Inc.), 6.25%, 3/1/31 | | | 500 | | | | 553,360 | |
| | |
| | | | | | $ | 4,604,521 | |
| | |
|
Housing — 0.0%(1) | |
Kentucky Housing Corp., (AMT), 5.00%, 7/1/37 | | $ | 5 | | | $ | 5,067 | |
| | |
| | | | | | $ | 5,067 | |
| | |
| | | | | | | | |
| Security | | Principal
Amount
(000’s omitted) | | | Value | |
| | | | | | | | |
|
Industrial Development Revenue — 4.5% | |
Cleveland, OH, (Continental Airlines), (AMT), 5.70%, 12/1/19 | | $ | 510 | | | $ | 510,076 | |
Owen County, (American Water Project), 6.25%, 6/1/39 | | | 500 | | | | 538,950 | |
Wickliffe, Solid Waste Disposal, (Westvaco Corp.), (AMT), 6.375%, 4/1/26 | | | 1,070 | | | | 1,069,968 | |
| | |
| | | | | | $ | 2,118,994 | |
| | |
|
Insured – Bond Bank — 2.3% | |
Kentucky Rural Water Finance Corp., (NPFG), 4.70%, 8/1/35 | | $ | 1,060 | | | $ | 1,077,320 | |
| | |
| | | | | | $ | 1,077,320 | |
| | |
|
Insured – Electric Utilities — 16.6% | |
Carroll County, Environmental Facilities, (AMBAC), (AMT), 5.75%, 2/1/26 | | $ | 1,000 | | | $ | 1,055,600 | |
Kentucky Municipal Power Agency, (Prairie State Project), (NPFG), 5.00%, 9/1/37 | | | 2,000 | | | | 2,074,860 | |
Kentucky Municipal Power Agency, (Prairie State Project), (NPFG), 5.25%, 9/1/27 | | | 1,000 | | | | 1,099,980 | |
Owensboro, (AMBAC), 0.00%, 1/1/20 | | | 2,000 | | | | 1,716,880 | |
Paducah Electric Plant Board, (AGC), 5.25%, 10/1/35 | | | 1,200 | | | | 1,298,868 | |
Trimble County, Environmental Facilities, (AMBAC), (AMT), 6.00%, 3/1/37 | | | 500 | | | | 554,105 | |
| | |
| | | | | | $ | 7,800,293 | |
| | |
|
Insured – Escrowed / Prerefunded — 4.5% | |
Jefferson County, School District Finance Corp., (AGM), Prerefunded to 7/1/16, 4.50%, 7/1/23 | | $ | 1,000 | | | $ | 1,095,830 | |
Louisville & Jefferson County Metropolitan Sewer District, (NPFG), Prerefunded to 5/15/14, 5.00%, 5/15/38 | | | 750 | | | | 765,375 | |
Wayne County, School District Finance Corp., (NPFG), Prerefunded to 7/1/15, 4.00%, 7/1/25 | | | 255 | | | | 267,712 | |
| | |
| | | | | | $ | 2,128,917 | |
| | |
|
Insured – Hospital — 6.6% | |
Hardin County, Hospital Revenue, (Hardin Memorial Hospital), (AGM), 5.75%, 8/1/33 | | $ | 750 | | | $ | 801,720 | |
Kentucky Economic Development Authority, (Norton Healthcare, Inc.), (NPFG), 0.00%, 10/1/27 | | | 4,445 | | | | 2,325,891 | |
| | |
| | | | | | $ | 3,127,611 | |
| | |
|
Insured – Lease Revenue / Certificates of Participation — 8.4% | |
Kentucky Area Development Districts Financing Trust, (XLCA), 4.70%, 6/1/35 | | $ | 1,150 | | | $ | 1,152,300 | |
Kentucky Property and Buildings Commission, (AGC), 5.25%, 2/1/29 | | | 500 | | | | 559,545 | |
| | | | |
| | 27 | | See Notes to Financial Statements. |
Eaton Vance
Kentucky Municipal Income Fund
February 28, 2014
Portfolio of Investments (Unaudited) — continued
| | | | | | | | |
| Security | | Principal
Amount
(000’s omitted) | | | Value | |
| | | | | | | | |
|
Insured – Lease Revenue / Certificates of Participation (continued) | |
Kentucky Property and Buildings Commission, (AGM), 5.00%, 11/1/26 | | $ | 500 | | | $ | 560,915 | |
Puerto Rico Public Buildings Authority, (AMBAC), 5.50%, 7/1/21 | | | 1,605 | | | | 1,470,164 | |
Puerto Rico Public Buildings Authority, (XLCA), 5.50%, 7/1/21 | | | 250 | | | | 206,272 | |
| | |
| | | | | | $ | 3,949,196 | |
| | |
|
Insured – Transportation — 4.9% | |
Louisville Regional Airport Authority, (AGM), (AMT), 5.50%, 7/1/38 | | $ | 1,000 | | | $ | 1,070,910 | |
Puerto Rico Highway and Transportation Authority, (AMBAC), 0.00%, 7/1/18 | | | 1,795 | | | | 1,251,600 | |
| | |
| | | | | | $ | 2,322,510 | |
| | |
|
Insured – Water and Sewer — 3.5% | |
Campbell, Kenton and Boone Counties, Sanitation District No. 1, (NPFG), 5.00%, 8/1/37 | | $ | 500 | | | $ | 521,550 | |
Owensboro, (AGC), 5.00%, 9/15/26 | | | 500 | | | | 552,345 | |
Owensboro, (AGC), 5.00%, 9/15/27 | | | 290 | | | | 321,068 | |
Owensboro, (AGC), 5.00%, 9/15/31 | | | 225 | | | | 243,067 | |
| | |
| | | | | | $ | 1,638,030 | |
| | |
|
Lease Revenue / Certificates of Participation — 12.4% | |
Fayette County, School District Finance Corp., 5.00%, 10/1/27 | | $ | 1,000 | | | $ | 1,128,680 | |
Jefferson County, (Capital Projects Corp.), 0.00%, 8/15/15 | | | 2,700 | | | | 2,675,862 | |
Kentucky Asset/Liability Commission, Federal Highway Trust Fund, 5.25%, 9/1/25 | | | 1,000 | | | | 1,178,130 | |
Kentucky Property and Buildings Commission, 5.50%, 11/1/28 | | | 750 | | | | 860,797 | |
| | |
| | | | | | $ | 5,843,469 | |
| | |
|
Other Revenue — 0.4% | |
Children’s Trust Fund, PR, Tobacco Settlement, 0.00%, 5/15/55 | | $ | 7,595 | | | $ | 193,217 | |
| | |
| | | | | | $ | 193,217 | |
| | |
|
Special Tax Revenue — 1.1% | |
Guam, Limited Obligation Bonds, 5.625%, 12/1/29 | | $ | 70 | | | $ | 74,297 | |
Guam, Limited Obligation Bonds, 5.75%, 12/1/34 | | | 75 | | | | 79,489 | |
Virgin Islands Public Finance Authority, 6.75%, 10/1/37 | | | 325 | | | | 357,945 | |
| | |
| | | | | | $ | 511,731 | |
| | |
| | | | | | | | |
| Security | | Principal
Amount
(000’s omitted) | | | Value | |
| | | | | | | | |
|
Transportation — 5.2% | |
Kentucky Public Transportation Infrastructure Authority, Toll Revenue, (Downtown Crossing Project), 0.00%, 7/1/23 | | $ | 300 | | | $ | 195,897 | |
Kentucky Turnpike Authority, (Revitalization Project), 5.00%, 7/1/28 | | | 500 | | | | 557,435 | |
Kentucky Turnpike Authority, (Revitalization Project), 5.00%, 7/1/29 | | | 1,000 | | | | 1,120,000 | |
Kentucky Turnpike Authority, (Revitalization Project), 5.00%, 7/1/32 | | | 500 | | | | 550,220 | |
| | |
| | | | | | $ | 2,423,552 | |
| | |
|
Water and Sewer — 3.5% | |
Louisville & Jefferson County Metropolitan Sewer District, 5.00%, 5/15/27 | | $ | 500 | | | $ | 565,820 | |
Louisville & Jefferson County Metropolitan Sewer District, 5.00%, 5/15/34 | | | 1,000 | | | | 1,084,050 | |
| | |
| | | | | | $ | 1,649,870 | |
| | |
| |
Total Tax-Exempt Investments — 99.1%
(identified cost $44,525,322) | | | $ | 46,606,746 | |
| | |
| |
Other Assets, Less Liabilities — 0.9% | | | $ | 444,579 | |
| | |
| |
Net Assets — 100.0% | | | $ | 47,051,325 | |
| | |
The percentage shown for each investment category in the Portfolio of Investments is based on net assets.
| | | | |
| AGC | | – | | Assured Guaranty Corp. |
| AGM | | – | | Assured Guaranty Municipal Corp. |
| AMBAC | | – | | AMBAC Financial Group, Inc. |
| AMT | | – | | Interest earned from these securities may be considered a tax preference item for purposes of the Federal Alternative Minimum Tax. |
| NPFG | | – | | National Public Finance Guaranty Corp. |
| XLCA | | – | | XL Capital Assurance, Inc. |
The Fund invests primarily in debt securities issued by Kentucky municipalities. In addition, 11.0% of the Fund’s net assets at February 28, 2014 were invested in municipal obligations issued by Puerto Rico. The ability of the issuers of the debt securities to meet their obligations may be affected by economic developments in a specific industry or municipality. In order to reduce the risk associated with such economic developments, at February 28, 2014, 47.3% of total investments are backed by bond insurance of various financial institutions and financial guaranty assurance agencies. The aggregate percentage insured by an individual financial institution or financial guaranty assurance agency ranged from 2.9% to 17.4% of total investments.
| (1) | Amount is less than 0.05%. |
| | | | |
| | 28 | | See Notes to Financial Statements. |
Eaton Vance
Maryland Municipal Income Fund
February 28, 2014
Portfolio of Investments (Unaudited)
| | | | | | | | |
| Tax-Exempt Investments — 103.2% | |
| | |
| | | | | | | | |
| Security | | Principal
Amount
(000’s omitted) | | | Value | |
| | | | | | | | |
|
Education — 14.2% | |
Maryland Health and Higher Educational Facilities Authority, (Goucher College), 5.00%, 7/1/34 | | $ | 1,000 | | | $ | 1,059,730 | |
Maryland Health and Higher Educational Facilities Authority, (Johns Hopkins University), 5.00%, 7/1/37 | | | 2,000 | | | | 2,188,800 | |
Maryland Health and Higher Educational Facilities Authority, (Loyola College), 4.75%, 10/1/33 | | | 1,660 | | | | 1,677,546 | |
Maryland Health and Higher Educational Facilities Authority, (Loyola College), 5.125%, 10/1/45 | | | 1,000 | | | | 1,012,290 | |
Maryland Health and Higher Educational Facilities Authority, (Maryland Institute College of Art), 5.00%, 6/1/36 | | | 1,500 | | | | 1,514,475 | |
Maryland Industrial Development Financing Authority, (Our Lady of Good Counsel High School), 6.00%, 5/1/35 | | | 1,000 | | | | 1,025,910 | |
University of Maryland, Auxiliary Facility and Tuition Revenue, 5.00%, 4/1/28 | | | 1,425 | | | | 1,606,046 | |
| | |
| | | | | | $ | 10,084,797 | |
| | |
|
Escrowed / Prerefunded — 3.6% | |
Prince George’s County Housing Authority, Prerefunded to 7/15/17, 5.00%, 7/15/23 | | $ | 2,235 | | | $ | 2,574,631 | |
| | |
| | | | | | $ | 2,574,631 | |
| | |
|
General Obligations — 17.2% | |
Anne Arundel County, Water and Sewer Construction, 4.50%, 4/1/29 | | $ | 1,140 | | | $ | 1,201,081 | |
Baltimore County, 4.00%, 8/1/26 | | | 1,000 | | | | 1,081,110 | |
Baltimore County, (Metropolitan District), 5.00%, 2/1/31 | | | 2,000 | | | | 2,183,940 | |
Baltimore, 4.00%, 10/15/25 | | | 1,520 | | | | 1,639,122 | |
Baltimore, 5.00%, 10/15/27 | | | 750 | | | | 862,883 | |
Maryland, 5.00%, 11/1/19 | | | 2,000 | | | | 2,421,100 | |
Montgomery County, 5.00%, 5/1/23 | | | 1,000 | | | | 1,128,600 | |
Montgomery County, 5.00%, 5/1/25 | | | 1,500 | | | | 1,683,900 | |
| | |
| | | | | | $ | 12,201,736 | |
| | |
|
Hospital — 16.4% | |
Baltimore County, (Catholic Health Initiatives), Prerefunded to 9/1/16, 4.50%, 9/1/33 | | $ | 780 | | | $ | 859,966 | |
Maryland Health and Higher Educational Facilities Authority, (Anne Arundel Health Care Services, Inc.), 5.00%, 7/1/32 | | | 1,000 | | | | 1,044,680 | |
Maryland Health and Higher Educational Facilities Authority, (Johns Hopkins Health Care), 5.00%, 7/1/33 | | | 1,000 | | | | 1,077,270 | |
Maryland Health and Higher Educational Facilities Authority, (Johns Hopkins Health Care), 5.00%, 5/15/40 | | | 2,000 | | | | 2,070,540 | |
Maryland Health and Higher Educational Facilities Authority, (Medstar Health, Inc.), 5.00%, 8/15/38 | | | 1,000 | | | | 1,021,920 | |
| | | | | | | | |
| Security | | Principal
Amount
(000’s omitted) | | | Value | |
| | | | | | | | |
|
Hospital (continued) | |
Maryland Health and Higher Educational Facilities Authority, (Medstar Health, Inc.), 5.25%, 5/15/46 | | $ | 1,475 | | | $ | 1,488,953 | |
Maryland Health and Higher Educational Facilities Authority, (Mercy Medical Center), 5.00%, 7/1/31 | | | 1,000 | | | | 1,021,830 | |
Maryland Health and Higher Educational Facilities Authority, (Peninsula Regional Medical Center), 5.00%, 7/1/36 | | | 1,280 | | | | 1,295,130 | |
Maryland Health and Higher Educational Facilities Authority, (University of Maryland Medical System), 5.00%, 7/1/41 | | | 1,000 | | | | 1,008,940 | |
Maryland Health and Higher Educational Facilities Authority, (Washington County Hospital), 5.75%, 1/1/38 | | | 750 | | | | 762,832 | |
| | |
| | | | | | $ | 11,652,061 | |
| | |
|
Housing — 5.9% | |
Maryland Community Development Administration, (AMT), 5.10%, 9/1/37 | | $ | 1,000 | | | $ | 1,013,330 | |
Maryland Community Development Administration, Department of Housing and Community Development, (AMT), 5.15%, 9/1/42(1) | | | 1,110 | | | | 1,122,621 | |
Maryland Community Development Administration, MFMR, (AMT), 4.85%, 9/1/37 | | | 1,000 | | | | 1,005,830 | |
Maryland Community Development Administration, MFMR, (AMT), 4.85%, 9/1/47 | | | 1,000 | | | | 1,006,300 | |
| | |
| | | | | | $ | 4,148,081 | |
| | |
|
Industrial Development Revenue — 2.8% | |
Maryland Economic Development Corp., (AFCO Cargo), (AMT), 6.50%, 7/1/24 | | $ | 825 | | | $ | 744,728 | |
Maryland Economic Development Corp., (AFCO Cargo), (AMT), 7.34%, 7/1/24 | | | 165 | | | | 158,459 | |
Maryland Economic Development Corp., (Waste Management, Inc.), (AMT), 4.60%, 4/1/16 | | | 1,000 | | | | 1,047,520 | |
| | |
| | | | | | $ | 1,950,707 | |
| | |
|
Insured – Education — 2.0% | |
Morgan State University, Academic and Auxiliary Facilities, (NPFG), 6.10%, 7/1/20 | | $ | 1,200 | | | $ | 1,416,732 | |
| | |
| | | | | | $ | 1,416,732 | |
| | |
|
Insured – Escrowed / Prerefunded — 6.6% | |
Maryland Health and Higher Educational Facilities Authority, (Helix Health Issue), (AMBAC), Escrowed to Maturity, 5.00%, 7/1/27 | | $ | 3,145 | | | $ | 3,696,884 | |
Maryland Transportation Authority, (AGM), Escrowed to Maturity, Prerefunded to 7/1/14, 5.00%, 7/1/28 | | | 1,000 | | | | 1,016,750 | |
| | |
| | | | | | $ | 4,713,634 | |
| | |
| | | | |
| | 29 | | See Notes to Financial Statements. |
Eaton Vance
Maryland Municipal Income Fund
February 28, 2014
Portfolio of Investments (Unaudited) — continued
| | | | | | | | |
| Security | | Principal
Amount
(000’s omitted) | | | Value | |
| | | | | | | | |
|
Insured – Hospital — 5.3% | |
Maryland Health and Higher Educational Facilities Authority, (LifeBridge Health), (AGC), 4.75%, 7/1/42 | | $ | 450 | | | $ | 451,076 | |
Maryland Health and Higher Educational Facilities Authority, (Medlantic/Helix Issue), (AMBAC), 5.25%, 8/15/38 | | | 3,035 | | | | 3,276,100 | |
| | |
| | | | | | $ | 3,727,176 | |
| | |
|
Insured – Transportation — 5.3% | |
Maryland Transportation Authority, (AGM), 5.00%, 7/1/36 | | $ | 1,500 | | | $ | 1,624,200 | |
Maryland Transportation Authority, (AGM), 5.00%, 7/1/41(1) | | | 2,000 | | | | 2,145,260 | |
| | |
| | | | | | $ | 3,769,460 | |
| | |
|
Insured – Water and Sewer — 4.9% | |
Baltimore, (Wastewater Projects), (NPFG), 5.00%, 7/1/22 | | $ | 1,000 | | | $ | 1,162,940 | |
Baltimore, (Wastewater Projects), (NPFG), 5.65%, 7/1/20 | | | 2,000 | | | | 2,279,260 | |
| | |
| | | | | | $ | 3,442,200 | |
| | |
|
Senior Living / Life Care — 1.2% | |
Maryland Health and Higher Educational Facilities Authority, (Charlestown Community, Inc.), 6.125%, 1/1/30 | | $ | 470 | | | $ | 509,048 | |
Maryland Health and Higher Educational Facilities Authority, (Edenwald), 5.40%, 1/1/37 | | | 370 | | | | 362,833 | |
| | |
| | | | | | $ | 871,881 | |
| | |
|
Special Tax Revenue — 7.7% | |
Baltimore, (Clipper Mill), 6.25%, 9/1/33 | | $ | 743 | | | $ | 755,936 | |
Baltimore, (Strathdale Manor), 7.00%, 7/1/33 | | | 495 | | | | 501,074 | |
Maryland State Department of Transportation, 5.00%, 2/15/28 | | | 1,000 | | | | 1,133,830 | |
Montgomery County, Department of Liquor Control, 5.00%, 4/1/21 | | | 1,000 | | | | 1,138,710 | |
Montgomery County, Department of Liquor Control, 5.00%, 4/1/29 | | | 250 | | | | 268,852 | |
Puerto Rico Sales Tax Financing Corp., 5.25%, 8/1/57 | | | 2,040 | | | | 1,676,941 | |
| | |
| | | | | | $ | 5,475,343 | |
| | |
|
Transportation — 10.1% | |
Maryland State Department of Transportation, County Transportation, 5.00%, 2/15/23 | | $ | 1,000 | | | $ | 1,136,160 | |
Maryland Transportation Authority, 4.00%, 7/1/27 | | | 1,000 | | | | 1,059,270 | |
Maryland Transportation Authority, Baltimore-Washington International Airport, Parking Revenues, (AMT), 5.00%, 3/1/23 | | | 2,000 | | | | 2,285,260 | |
| | | | | | | | |
| Security | | Principal
Amount
(000’s omitted) | | | Value | |
| | | | | | | | |
|
Transportation (continued) | |
Washington Metropolitan Area Transit Authority, 5.00%, 7/1/32 | | $ | 2,500 | | | $ | 2,672,975 | |
| | |
| | | | | | $ | 7,153,665 | |
| | |
| |
Total Tax-Exempt Investments — 103.2%
(identified cost $70,280,461) | | | $ | 73,182,104 | |
| | |
| |
Other Assets, Less Liabilities — (3.2)% | | | $ | (2,293,666 | ) |
| | |
| |
Net Assets — 100.0% | | | $ | 70,888,438 | |
| | |
The percentage shown for each investment category in the Portfolio of Investments is based on net assets.
| | | | |
| AGC | | – | | Assured Guaranty Corp. |
| AGM | | – | | Assured Guaranty Municipal Corp. |
| AMBAC | | – | | AMBAC Financial Group, Inc. |
| AMT | | – | | Interest earned from these securities may be considered a tax preference item for purposes of the Federal Alternative Minimum Tax. |
| MFMR | | – | | Multi-Family Mortgage Revenue |
| NPFG | | – | | National Public Finance Guaranty Corp. |
The Fund invests primarily in debt securities issued by Maryland municipalities. The ability of the issuers of the debt securities to meet their obligations may be affected by economic developments in a specific industry or municipality. In order to reduce the risk associated with such economic developments, at February 28, 2014, 23.3% of total investments are backed by bond insurance of various financial institutions and financial guaranty assurance agencies. The aggregate percentage insured by an individual financial institution or financial guaranty assurance agency ranged from 0.6% to 9.5% of total investments.
| (1) | Security represents the municipal bond held by a trust that issues residual interest bonds (see Note 1I). |
| | | | |
| | 30 | | See Notes to Financial Statements. |
Eaton Vance
Missouri Municipal Income Fund
February 28, 2014
Portfolio of Investments (Unaudited)
| | | | | | | | |
| Tax-Exempt Investments — 99.8% | |
| | |
| | | | | | | | |
| Security | | Principal
Amount
(000’s omitted) | | | Value | |
| | | | | | | | |
|
Bond Bank — 1.7% | |
Missouri Environmental Improvement and Energy Resources Authority, (Revolving Fund Program), Water Pollution Control, 7.20%, 7/1/16 | | $ | 40 | | | $ | 40,640 | |
Missouri Environmental Improvement and Energy Resources Authority, (Revolving Fund Program), Water Pollution Control and Drinking Water, 5.00%, 7/1/30 | | | 1,000 | | | | 1,162,700 | |
| | |
| | | | | | $ | 1,203,340 | |
| | |
|
Education — 8.9% | |
Curators of the University of Missouri System Facilities Revenue, 5.00%, 11/1/33 | | $ | 2,000 | | | $ | 2,190,160 | |
Missouri State Health and Educational Facilities Authority, (University of Central Missouri), 5.00%, 10/1/34 | | | 1,000 | | | | 1,068,700 | |
Missouri State Health and Educational Facilities Authority, (Washington University), 5.375%, 3/15/39 | | | 1,500 | | | | 1,655,565 | |
Missouri State Health and Educational Facilities Authority, (Washington University), 5.375%, 3/15/39(1) | | | 1,275 | | | | 1,407,230 | |
| | |
| | | | | | $ | 6,321,655 | |
| | |
|
General Obligations — 18.5% | |
Clay County, Public School District, 5.00%, 3/1/28 | | $ | 1,000 | | | $ | 1,117,460 | |
Columbia School District, 5.00%, 3/1/31 | | | 1,000 | | | | 1,101,320 | |
Hazelwood School District (Direct Deposit Program), 5.00%, 3/1/33 | | | 1,000 | | | | 1,110,550 | |
Independence School District, (Direct Deposit Program), 5.00%, 3/1/29 | | | 1,000 | | | | 1,095,670 | |
Independence School District, (Direct Deposit Program), 5.00%, 3/1/30 | | | 1,000 | | | | 1,089,970 | |
Jackson County, Reorganized School District No. 7, 5.00%, 3/1/28 | | | 1,000 | | | | 1,106,460 | |
Joplin Schools, (Direct Deposit Program), 3.25%, 3/1/33 | | | 1,000 | | | | 869,420 | |
Kansas City, 4.75%, 2/1/25 | | | 1,000 | | | | 1,115,440 | |
Lake Ozark, Osage School, (School Building), 5.00%, 3/1/34(2) | | | 1,000 | | | | 1,099,560 | |
Springfield School District No. R-12, (Direct Deposit Program), 5.00%, 3/1/33 | | | 1,000 | | | | 1,114,630 | |
University City School District, (Direct Deposit Program), 0.00%, 2/15/32 | | | 1,000 | | | | 451,810 | |
University City School District, (Direct Deposit Program), 0.00%, 2/15/33 | | | 1,000 | | | | 425,580 | |
Wentzville School District No. R-4, 0.00%, 3/1/28 | | | 3,000 | | | | 1,495,200 | |
| | |
| | | | | | $ | 13,193,070 | |
| | |
| | | | | | | | |
| Security | | Principal
Amount
(000’s omitted) | | | Value | |
| | | | | | | | |
|
Hospital — 8.0% | |
Cape Girardeau County Industrial Development Authority, (Southeast Missouri Hospital Association), 5.00%, 6/1/36 | | $ | 1,000 | | | $ | 1,005,890 | |
Cape Girardeau County Industrial Development Authority, (St. Francis Medical Center), 5.00%, 6/1/37 | | | 1,000 | | | | 1,036,900 | |
Missouri State Health and Educational Facilities Authority, (Children’s Mercy Hospital), 5.625%, 5/15/39 | | | 1,000 | | | | 1,049,320 | |
Missouri State Health and Educational Facilities Authority, (Heartland Regional Medical Center), 5.00%, 2/15/37 | | | 1,000 | | | | 1,033,140 | |
Missouri State Health and Educational Facilities Authority, (SSM Healthcare), 5.00%, 6/1/36 | | | 1,000 | | | | 1,024,760 | |
Saline County Industrial Development Authority, (John Fitzgibbon Memorial Hospital), 5.60%, 12/1/28 | | | 500 | | | | 540,350 | |
| | |
| | | | | | $ | 5,690,360 | |
| | |
|
Housing — 2.0% | |
Jefferson County Industrial Development Authority, MFMR, (Riverview Bend Apartments), (AMT), 6.75%, 11/1/29 | | $ | 770 | | | $ | 769,931 | |
Missouri Housing Development Commission, SFMR, (GNMA), (AMT), 4.50%, 9/1/29 | | | 135 | | | | 140,166 | |
Missouri Housing Development Commission, SFMR, (GNMA), (AMT), 4.70%, 3/1/35 | | | 410 | | | | 428,536 | |
Missouri Housing Development Commission, SFMR, (GNMA), (AMT), 5.00%, 9/1/37 | | | 80 | | | | 80,525 | |
| | |
| | | | | | $ | 1,419,158 | |
| | |
|
Industrial Development Revenue — 2.4% | |
Missouri Development Finance Authority, Solid Waste Disposal, (Procter & Gamble Paper Products), (AMT), 5.20%, 3/15/29 | | $ | 1,480 | | | $ | 1,683,811 | |
| | |
| | | | | | $ | 1,683,811 | |
| | |
|
Insured – Education — 1.6% | |
Missouri State University Auxiliary Enterprise System, (XLCA), 5.00%, 4/1/25 | | $ | 1,000 | | | $ | 1,110,940 | |
| | |
| | | | | | $ | 1,110,940 | |
| | |
|
Insured – Electric Utilities — 7.1% | |
Missouri Joint Municipal Electric Utility Commission, (Prairie State Project), (AMBAC), (BHAC), 5.00%, 1/1/32 | | $ | 1,500 | | | $ | 1,614,390 | |
Puerto Rico Electric Power Authority, (NPFG), 5.25%, 7/1/29 | | | 950 | | | | 853,585 | |
Puerto Rico Electric Power Authority, (NPFG), 5.25%, 7/1/34 | | | 280 | | | | 243,916 | |
Springfield Public Utility, (BHAC), (FGIC), 4.50%, 8/1/36(3) | | | 2,275 | | | | 2,318,270 | |
| | |
| | | | | | $ | 5,030,161 | |
| | |
| | | | |
| | 31 | | See Notes to Financial Statements. |
Eaton Vance
Missouri Municipal Income Fund
February 28, 2014
Portfolio of Investments (Unaudited) — continued
| | | | | | | | |
| Security | | Principal
Amount
(000’s omitted) | | | Value | |
| | | | | | | | |
|
Insured – Escrowed / Prerefunded — 4.4% | |
Missouri State Health and Educational Facilities Authority, (Lester Cox Medical Center), (NPFG), Escrowed to Maturity, 0.00%, 9/1/20 | | $ | 3,590 | | | $ | 3,153,133 | |
| | |
| | | | | | $ | 3,153,133 | |
| | |
|
Insured – General Obligations — 6.2% | |
Platte County Reorganized School District No. R-3, (AGM), 5.00%, 3/1/25 | | $ | 1,000 | | | $ | 1,117,200 | |
Saint Charles County, Francis Howell School District, (NPFG), 0.00%, 3/1/16 | | | 1,000 | | | | 987,550 | |
Saint Charles County, Francis Howell School District, (NPFG), 5.25%, 3/1/21 | | | 1,000 | | | | 1,219,410 | |
Springfield, School District No. R-12, (AGM), 5.25%, 3/1/25 | | | 1,000 | | | | 1,087,200 | |
| | |
| | | | | | $ | 4,411,360 | |
| | |
|
Insured – Hospital — 6.7% | |
Missouri State Health and Educational Facilities Authority, (Lester Cox Medical Center), (NPFG), 0.00%, 9/1/20 | | $ | 3,250 | | | $ | 2,694,608 | |
Missouri State Health and Educational Facilities Authority, (St. Luke’s Health System), (AGM), 5.50%, 11/15/28 | | | 1,850 | | | | 2,077,143 | |
| | |
| | | | | | $ | 4,771,751 | |
| | |
|
Insured – Industrial Development Revenue — 1.0% | |
Missouri Environmental Improvement and Energy Resources Authority, (Missouri-American Water Co.), (AMBAC), (AMT), 4.60%, 12/1/36 | | $ | 755 | | | $ | 710,749 | |
| | |
| | | | | | $ | 710,749 | |
| | |
|
Insured – Lease Revenue / Certificates of Participation — 4.5% | |
Jackson County, Leasehold Revenue, (Truman Sports), (AMBAC), 0.00%, 12/1/20 | | $ | 1,000 | | | $ | 820,700 | |
Kansas City, Leasehold Revenue, (Municipal Assistance), (AMBAC), 0.00%, 4/15/26 | | | 2,270 | | | | 1,375,938 | |
Kansas City, Leasehold Revenue, (Municipal Assistance), (AMBAC), 0.00%, 4/15/30 | | | 2,105 | | | | 1,002,843 | |
| | |
| | | | | | $ | 3,199,481 | |
| | |
|
Insured – Special Tax Revenue — 4.4% | |
Bi-State Development Agency, Missouri and Illinois Metropolitan District, (Saint Clair County Metrolink), (AGM), 5.25%, 7/1/28 | | $ | 2,350 | | | $ | 2,708,446 | |
Puerto Rico Sales Tax Financing Corp., (NPFG), 0.00%, 8/1/45 | | | 3,280 | | | | 416,002 | |
| | |
| | | | | | $ | 3,124,448 | |
| | |
| | | | | | | | |
| Security | | Principal
Amount
(000’s omitted) | | | Value | |
| | | | | | | | |
|
Insured – Transportation — 4.0% | |
Puerto Rico Highway and Transportation Authority, (AGC), (CIFG), 5.25%, 7/1/41 | | $ | 2,060 | | | $ | 1,758,128 | |
Saint Louis Airport, (Lambert International Airport), (NPFG), 5.50%, 7/1/30 | | | 1,000 | | | | 1,129,050 | |
| | |
| | | | | | $ | 2,887,178 | |
| | |
|
Insured – Water and Sewer — 1.5% | |
Metropolitan Saint Louis Sewer District, (NPFG), 5.00%, 5/1/36 | | $ | 1,000 | | | $ | 1,081,820 | |
| | |
| | | | | | $ | 1,081,820 | |
| | |
|
Other Revenue — 3.7% | |
Missouri Development Finance Board, Cultural Facilities, (Kauffman Center), 4.75%, 6/1/37 | | $ | 2,500 | | | $ | 2,654,800 | |
| | |
| | | | | | $ | 2,654,800 | |
| | |
|
Senior Living / Life Care — 4.6% | |
Lee’s Summit Industrial Development Authority, Senior Living Facilities, (John Knox Village), 5.125%, 8/15/32 | | $ | 925 | | | $ | 919,524 | |
Missouri State Health and Educational Facilities Authority, (Lutheran Senior Services), 5.125%, 2/1/27 | | | 1,300 | | | | 1,315,925 | |
Saint Louis County Industrial Development Authority, Series A, (Friendship Village West County), 5.50%, 9/1/28 | | | 1,000 | | | | 1,015,580 | |
| | |
| | | | | | $ | 3,251,029 | |
| | |
|
Special Tax Revenue — 2.9% | |
Guam, Limited Obligation Bonds, 5.625%, 12/1/29 | | $ | 270 | | | $ | 286,572 | |
Guam, Limited Obligation Bonds, 5.75%, 12/1/34 | | | 295 | | | | 312,656 | |
Kansas City, Tax Increment Revenue, (Maincor Project), Series A, 5.25%, 3/1/18 | | | 485 | | | | 533,835 | |
Puerto Rico Sales Tax Financing Corp., 5.00%, 8/1/40 | | | 530 | | | | 434,239 | |
Puerto Rico Sales Tax Financing Corp., 5.25%, 8/1/40 | | | 575 | | | | 482,891 | |
| | |
| | | | | | $ | 2,050,193 | |
| | |
|
Water and Sewer — 5.7% | |
Kansas City, Sanitation Sewer System Revenue, 5.25%, 1/1/34 | | $ | 1,200 | | | $ | 1,309,752 | |
Kansas City, Water Revenue, 5.25%, 12/1/32 | | | 1,465 | | | | 1,628,846 | |
Metropolitan Saint Louis Sewer District, 5.00%, 5/1/30 | | | 1,000 | | | | 1,134,300 | |
| | |
| | | | | | $ | 4,072,898 | |
| | |
| |
Total Tax-Exempt Investments — 99.8%
(identified cost $66,945,645) | | | $ | 71,021,335 | |
| | |
| |
Other Assets, Less Liabilities — 0.2% | | | $ | 145,666 | |
| | |
| |
Net Assets — 100.0% | | | $ | 71,167,001 | |
| | |
| | | | |
| | 32 | | See Notes to Financial Statements. |
Eaton Vance
Missouri Municipal Income Fund
February 28, 2014
Portfolio of Investments (Unaudited) — continued
The percentage shown for each investment category in the Portfolio of Investments is based on net assets.
| | | | |
| AGC | | – | | Assured Guaranty Corp. |
| AGM | | – | | Assured Guaranty Municipal Corp. |
| AMBAC | | – | | AMBAC Financial Group, Inc. |
| AMT | | – | | Interest earned from these securities may be considered a tax preference item for purposes of the Federal Alternative Minimum Tax. |
| BHAC | | – | | Berkshire Hathaway Assurance Corp. |
| CIFG | | – | | CIFG Assurance North America, Inc. |
| FGIC | | – | | Financial Guaranty Insurance Company |
| GNMA | | – | | Government National Mortgage Association |
| MFMR | | – | | Multi-Family Mortgage Revenue |
| NPFG | | – | | National Public Finance Guaranty Corp. |
| SFMR | | – | | Single Family Mortgage Revenue |
| XLCA | | – | | XL Capital Assurance, Inc. |
The Fund invests primarily in debt securities issued by Missouri municipalities. The ability of the issuers of the debt securities to meet their obligations may be affected by economic developments in a specific industry or municipality. In order to reduce the risk associated with such economic developments, at February 28, 2014, 41.5% of total investments are backed by bond insurance of various financial institutions and financial guaranty assurance agencies. The aggregate percentage insured by an individual financial institution or financial guaranty assurance agency ranged from 1.6% to 16.6% of total investments.
| (1) | Security represents the municipal bond held by a trust that issues residual interest bonds (see Note 1I). |
| (2) | When-issued security. |
| (3) | Security (or a portion thereof) has been segregated to cover payable for when-issued securities. |
| | | | |
| | 33 | | See Notes to Financial Statements. |
Eaton Vance
North Carolina Municipal Income Fund
February 28, 2014
Portfolio of Investments (Unaudited)
| | | | | | | | |
| Tax-Exempt Investments — 103.0% | |
| | |
| | | | | | | | |
| Security | | Principal
Amount
(000’s omitted) | | | Value | |
| | | | | | | | |
|
Education — 11.2% | |
North Carolina Capital Facilities Finance Agency, (Duke University), 5.00%, 10/1/38(1) | | $ | 5,000 | | | $ | 5,446,100 | |
North Carolina Capital Facilities Finance Agency, (Wake Forest University), 5.00%, 1/1/38 | | | 2,400 | | | | 2,557,296 | |
North Carolina State University at Raleigh, 5.00%, 10/1/42 | | | 1,140 | | | | 1,247,627 | |
University of North Carolina at Charlotte, 5.00%, 4/1/32 | | | 1,250 | | | | 1,366,587 | |
University of North Carolina at Greensboro, 3.75%, 4/1/32 | | | 785 | | | | 754,809 | |
University of North Carolina at Greensboro, 5.00%, 4/1/31 | | | 1,020 | | | | 1,124,326 | |
| | |
| | | | | | $ | 12,496,745 | |
| | |
|
Electric Utilities — 6.5% | |
North Carolina Eastern Municipal Power Agency, 6.75%, 1/1/24 | | $ | 2,000 | | | $ | 2,354,040 | |
North Carolina Municipal Power Agency, (Catawba), 3.00%, 1/1/32 | | | 1,000 | | | | 845,070 | |
North Carolina Municipal Power Agency, (Catawba), 5.00%, 1/1/30 | | | 1,230 | | | | 1,339,925 | |
North Carolina Municipal Power Agency, (Catawba), 5.00%, 1/1/31 | | | 885 | | | | 966,110 | |
Puerto Rico Electric Power Authority, 5.50%, 7/1/38 | | | 625 | | | | 424,888 | |
Puerto Rico Electric Power Authority, 6.75%, 7/1/36 | | | 1,845 | | | | 1,353,806 | |
| | |
| | | | | | $ | 7,283,839 | |
| | |
|
Escrowed / Prerefunded — 3.2% | |
Puerto Rico Electric Power Authority, Escrowed to various sinking fund dates through 7/1/17, Series N, 0.00%, 7/1/17 | | $ | 1,950 | | | $ | 1,731,561 | |
Puerto Rico Electric Power Authority, Escrowed to various sinking fund dates through 7/1/17, Series O, 0.00%, 7/1/17 | | | 2,000 | | | | 1,821,280 | |
| | |
| | | | | | $ | 3,552,841 | |
| | |
|
General Obligations — 3.5% | |
Buncombe County, 5.00%, 6/1/29 | | $ | 750 | | | $ | 861,210 | |
Greensboro, 5.00%, 2/1/27 | | | 650 | | | | 768,924 | |
North Carolina, 4.00%, 6/1/23 | | | 2,000 | | | | 2,277,580 | |
| | |
| | | | | | $ | 3,907,714 | |
| | |
|
Hospital — 19.6% | |
North Carolina Medical Care Commission, (Cape Fear Valley Health System), 5.00%, 10/1/32 | | $ | 2,000 | | | $ | 2,080,640 | |
North Carolina Medical Care Commission, (Duke University Health System), Series 2009A, 5.00%, 6/1/42 | | | 2,295 | | | | 2,445,850 | |
| | | | | | | | |
| Security | | Principal
Amount
(000’s omitted) | | | Value | |
| | | | | | | | |
|
Hospital (continued) | |
North Carolina Medical Care Commission, (Duke University Health System), Series 2012A, 5.00%, 6/1/42 | | $ | 1,250 | | | $ | 1,314,200 | |
North Carolina Medical Care Commission, (Mission Health System), 5.00%, 10/1/25 | | | 2,000 | | | | 2,208,820 | |
North Carolina Medical Care Commission, (Mission Health System), 5.00%, 10/1/36 | | | 825 | | | | 843,035 | |
North Carolina Medical Care Commission, (North Carolina Baptist Hospital), 5.25%, 6/1/29 | | | 3,100 | | | | 3,324,874 | |
North Carolina Medical Care Commission, (Novant Health, Inc.), Series A, 4.75%, 11/1/43 | | | 2,000 | | | | 2,013,520 | |
North Carolina Medical Care Commission, (Rex Hospital, Inc.), Series A, 5.00%, 7/1/30 | | | 900 | | | | 944,271 | |
North Carolina Medical Care Commission, (Southeastern Regional Medical Center), 5.00%, 6/1/32 | | | 1,645 | | | | 1,709,155 | |
North Carolina Medical Care Commission, (University Health Systems of Eastern Carolina), 6.25%, 12/1/33 | | | 2,500 | | | | 2,842,600 | |
North Carolina Medical Care Commission, (WakeMed), 5.00%, 10/1/31 | | | 2,000 | | | | 2,124,700 | |
| | |
| | | | | | $ | 21,851,665 | |
| | |
|
Housing — 2.7% | |
Charlotte Housing Authority, (South Oaks Crossing Apartments), (AMT), 4.60%, 8/20/26 | | $ | 1,430 | | | $ | 1,453,166 | |
North Carolina Housing Finance Agency, (AMT), 4.80%, 1/1/39 | | | 1,530 | | | | 1,536,763 | |
| | |
| | | | | | $ | 2,989,929 | |
| | |
|
Industrial Development Revenue — 0.7% | |
Columbus County Industrial Facilities & Pollution Control Financing Authority, 5.70%, 5/1/34 | | $ | 750 | | | $ | 790,560 | |
| | |
| | | | | | $ | 790,560 | |
| | |
|
Insured – Education — 1.0% | |
University of North Carolina at Wilmington, (AGC), 5.00%, 10/1/33 | | $ | 1,050 | | | $ | 1,118,996 | |
| | |
| | | | | | $ | 1,118,996 | |
| | |
|
Insured – Electric Utilities — 3.7% | |
Monroe, Combined Enterprise System Revenue, (AGC), 5.00%, 3/1/33 | | $ | 1,950 | | | $ | 2,075,541 | |
Puerto Rico Electric Power Authority, (NPFG), 5.25%, 7/1/34 | | | 1,740 | | | | 1,515,766 | |
Puerto Rico Electric Power Authority, (NPFG), 5.25%, 7/1/35 | | | 600 | | | | 520,866 | |
| | |
| | | | | | $ | 4,112,173 | |
| | |
| | | | |
| | 34 | | See Notes to Financial Statements. |
Eaton Vance
North Carolina Municipal Income Fund
February 28, 2014
Portfolio of Investments (Unaudited) — continued
| | | | | | | | |
| Security | | Principal
Amount
(000’s omitted) | | | Value | |
| | | | | | | | |
|
Insured – General Obligations — 0.8% | |
Puerto Rico, (NPFG), 5.50%, 7/1/20 | | $ | 840 | | | $ | 827,148 | |
| | |
| | | | | | $ | 827,148 | |
| | |
|
Insured – Hospital — 4.3% | |
Johnston Memorial Hospital, (AGM), 31.481%, 10/1/36(2)(3)(4) | | $ | 1,640 | | | $ | 2,116,584 | |
North Carolina Medical Care Commission, (Novant Health Obligated Group), (BHAC), (NPFG), 5.00%, 11/1/39 | | | 2,500 | | | | 2,643,475 | |
| | |
| | | | | | $ | 4,760,059 | |
| | |
|
Insured – Lease Revenue / Certificates of Participation — 2.4% | |
Franklin County, Certificates of Participation, (NPFG), 5.00%, 9/1/27 | | $ | 1,500 | | | $ | 1,642,380 | |
Monroe, Certificates of Participation, (AGC), 5.50%, 3/1/39 | | | 1,000 | | | | 1,053,780 | |
| | |
| | | | | | $ | 2,696,160 | |
| | |
|
Insured – Special Tax Revenue — 0.7% | |
Puerto Rico Infrastructure Financing Authority, (AMBAC), 5.50%, 7/1/27 | | $ | 550 | | | $ | 459,008 | |
Puerto Rico Sales Tax Financing Corp., (AMBAC), 0.00%, 8/1/54 | | | 4,390 | | | | 332,016 | |
| | |
| | | | | | $ | 791,024 | |
| | |
|
Insured – Transportation — 5.7% | |
North Carolina Turnpike Authority, (Triangle Expressway System), (AGC), 0.00%, 1/1/35 | | $ | 10,000 | | | $ | 3,729,000 | |
North Carolina Turnpike Authority, (Triangle Expressway System), (AGC), 5.375%, 1/1/26 | | | 1,000 | | | | 1,102,690 | |
Puerto Rico Highway and Transportation Authority, (AGC), (CIFG), 5.25%, 7/1/41(1)(5) | | | 1,800 | | | | 1,536,228 | |
| | |
| | | | | | $ | 6,367,918 | |
| | |
|
Lease Revenue / Certificates of Participation — 15.2% | |
Cabarrus County, Certificates of Participation, 5.00%, 6/1/29 | | $ | 1,550 | | | $ | 1,719,849 | |
Cabarrus County, Certificates of Participation, 5.25%, 6/1/28 | | | 1,400 | | | | 1,572,774 | |
Durham Capital Financing Corp., 5.00%, 6/1/32 | | | 1,700 | | | | 1,883,362 | |
Durham Capital Financing Corp., 5.00%, 6/1/38 | | | 1,000 | | | | 1,081,100 | |
Durham County, Certificates of Participation, 5.00%, 6/1/31 | | | 1,000 | | | | 1,096,320 | |
North Carolina Turnpike Authority, (Monroe Connector System), 5.00%, 7/1/31 | | | 1,000 | | | | 1,099,390 | |
North Carolina Turnpike Authority, (Monroe Connector System), 5.00%, 7/1/36 | | | 1,750 | | | | 1,883,927 | |
North Carolina, Capital Improvement Limited Obligation Bonds, 5.00%, 5/1/30 | | | 1,000 | | | | 1,112,170 | |
| | | | | | | | |
| Security | | Principal
Amount
(000’s omitted) | | | Value | |
| | | | | | | | |
|
Lease Revenue / Certificates of Participation (continued) | |
North Carolina, Capital Improvement Limited Obligation Bonds, 5.25%, 5/1/31 | | $ | 1,000 | | | $ | 1,125,030 | |
Raleigh, (Downtown Improvement Projects), 5.00%, 2/1/27 | | | 2,000 | | | | 2,163,380 | |
Wake County, 5.00%, 6/1/36 | | | 1,000 | | | | 1,094,790 | |
Watauga Public Facilities Corp., 5.00%, 6/1/27 | | | 1,000 | | | | 1,117,240 | |
| | |
| | | | | | $ | 16,949,332 | |
| | |
|
Other Revenue — 3.0% | |
Children’s Trust Fund, PR, Tobacco Settlement, 0.00%, 5/15/50 | | $ | 13,560 | | | $ | 863,772 | |
Durham County Industrial Facilities & Pollution Control Financing Authority, (Research Triangle Institute), 5.00%, 2/1/24 | | | 1,000 | | | | 1,191,210 | |
Durham County Industrial Facilities & Pollution Control Financing Authority, (Research Triangle Institute), 5.00%, 2/1/25 | | | 1,035 | | | | 1,240,085 | |
| | |
| | | | | | $ | 3,295,067 | |
| | |
|
Solid Waste — 1.0% | |
Mecklenburg County, Special Obligation, 5.00%, 1/1/26 | | $ | 1,000 | | | $ | 1,120,540 | |
| | |
| | | | | | $ | 1,120,540 | |
| | |
|
Special Tax Revenue — 3.0% | |
Puerto Rico Sales Tax Financing Corp., 0.00%, 8/1/56 | | $ | 8,625 | | | $ | 530,955 | |
Puerto Rico Sales Tax Financing Corp., 5.25%, 8/1/57 | | | 2,620 | | | | 2,153,718 | |
Virgin Islands Public Finance Authority, 6.75%, 10/1/37 | | | 545 | | | | 600,247 | |
| | |
| | | | | | $ | 3,284,920 | |
| | |
|
Transportation — 3.9% | |
Charlotte Airport, 5.50%, 7/1/34 | | $ | 535 | | | $ | 589,757 | |
Charlotte Airport, (AMT), 5.00%, 7/1/36 | | | 1,500 | | | | 1,547,775 | |
Charlotte Airport, (AMT), 5.375%, 7/1/28 | | | 1,000 | | | | 1,082,400 | |
North Carolina Ports Authority, 5.25%, 2/1/40 | | | 1,000 | | | | 1,059,110 | |
| | |
| | | | | | $ | 4,279,042 | |
| | |
|
Water and Sewer — 10.9% | |
Cape Fear Public Utility Authority, Water and Sewer System, 5.00%, 8/1/35 | | $ | 2,495 | | | $ | 2,689,435 | |
Cary, Combined Enterprise System Revenue, 5.00%, 12/1/33 | | | 2,000 | | | | 2,186,880 | |
Charlotte, Water and Sewer, 5.00%, 7/1/34 | | | 1,000 | | | | 1,114,200 | |
Charlotte, Water and Sewer, 5.00%, 7/1/38 | | | 1,800 | | | | 1,950,678 | |
Raleigh, Combined Enterprise System Revenue, 3.375%, 3/1/38 | | | 1,000 | | | | 872,680 | |
| | | | |
| | 35 | | See Notes to Financial Statements. |
Eaton Vance
North Carolina Municipal Income Fund
February 28, 2014
Portfolio of Investments (Unaudited) — continued
| | | | | | | | |
| Security | | Principal
Amount
(000’s omitted) | | | Value | |
| | | | | | | | |
|
Water and Sewer (continued) | |
Winston-Salem, Water and Sewer System, 5.00%, 6/1/34 | | $ | 1,000 | | | $ | 1,115,090 | |
Winston-Salem, Water and Sewer System, 5.00%, 6/1/39 | | | 2,000 | | | | 2,216,860 | |
| | |
| | | | | | $ | 12,145,823 | |
| | |
| |
Total Tax-Exempt Investments — 103.0%
(identified cost $110,940,951) | | | $ | 114,621,495 | |
| | |
| |
Other Assets, Less Liabilities — (3.0)% | | | $ | (3,296,474 | ) |
| | |
| |
Net Assets — 100.0% | | | $ | 111,325,021 | |
| | |
The percentage shown for each investment category in the Portfolio of Investments is based on net assets.
| | | | |
| AGC | | – | | Assured Guaranty Corp. |
| AGM | | – | | Assured Guaranty Municipal Corp. |
| AMBAC | | – | | AMBAC Financial Group, Inc. |
| AMT | | – | | Interest earned from these securities may be considered a tax preference item for purposes of the Federal Alternative Minimum Tax. |
| BHAC | | – | | Berkshire Hathaway Assurance Corp. |
| CIFG | | – | | CIFG Assurance North America, Inc. |
| NPFG | | – | | National Public Finance Guaranty Corp. |
The Fund invests primarily in debt securities issued by North Carolina municipalities. In addition, 12.6% of the Fund’s net assets at February 28, 2014 were invested in municipal obligations issued by Puerto Rico. The ability of the issuers of the debt securities to meet their obligations may be affected by economic developments in a specific industry or municipality. In order to reduce the risk associated with such economic developments, at February 28, 2014, 18.0% of total investments are backed by bond insurance of various financial institutions and financial guaranty assurance agencies. The aggregate percentage insured by an individual financial institution or financial guaranty assurance agency ranged from 0.7% to 9.3% of total investments.
| (1) | Security represents the municipal bond held by a trust that issues residual interest bonds (see Note 1I). |
| (2) | Security has been issued as a leveraged residual interest bond with a variable interest rate. The stated interest rate represents the rate in effect at February 28, 2014. |
| (3) | Security is subject to a shortfall agreement which may require the Fund to pay amounts to a counterparty in the event of a significant decline in the market value of the security held by the trust that issued the residual interest bond. In case of a shortfall, the maximum potential amount of payments the Fund could ultimately be required to make under the agreement is $4,920,000. However, such shortfall payment would be reduced by the proceeds from the sale of the security held by the trust that issued the residual interest bond. |
| (4) | Security exempt from registration pursuant to Rule 144A under the Securities Act of 1933. These securities may be sold in certain transactions (normally to qualified institutional buyers) and remain exempt |
| | from registration. At February 28, 2014, the aggregate value of these securities is $2,116,584 or 1.9% of the Fund’s net assets. |
| (5) | Security (or a portion thereof) has been pledged as collateral for residual interest bond transactions. The aggregate value of such collateral is $636,228. |
| | | | |
| | 36 | | See Notes to Financial Statements. |
Eaton Vance
Oregon Municipal Income Fund
February 28, 2014
Portfolio of Investments (Unaudited)
| | | | | | | | |
| Tax-Exempt Investments — 99.7% | |
| | |
| | | | | | | | |
| Security | | Principal
Amount
(000’s omitted) | | | Value | |
| | | | | | | | |
|
Education — 8.8% | |
Forest Grove, (Pacific University), 5.25%, 5/1/34(1) | | $ | 1,000 | | | $ | 1,037,600 | |
Oregon Facilities Authority, (Lewis & Clark College), 5.625%, 10/1/36 | | | 2,000 | | | | 2,217,120 | |
Oregon Facilities Authority, (Linfield College), 5.00%, 10/1/25 | | | 1,000 | | | | 1,017,050 | |
Oregon Facilities Authority, (Linfield College), 5.00%, 10/1/34 | | | 1,000 | | | | 1,022,770 | |
Oregon Facilities Authority, (Reed College), 4.75%, 7/1/32 | | | 250 | | | | 267,110 | |
Oregon Facilities Authority, (Reed College), 5.00%, 7/1/29 | | | 250 | | | | 275,255 | |
Oregon Facilities Authority, (Reed College), 5.125%, 7/1/41 | | | 1,630 | | | | 1,751,419 | |
Oregon Health and Science University, 5.75%, 7/1/39 | | | 2,000 | | | | 2,244,360 | |
| | |
| | | | | | $ | 9,832,684 | |
| | |
|
Electric Utilities — 2.4% | |
Port of Morrow, (Portland General Electric), 5.00%, 5/1/33 | | $ | 1,250 | | | $ | 1,335,612 | |
Puerto Rico Electric Power Authority, 6.75%, 7/1/36 | | | 1,845 | | | | 1,353,806 | |
| | |
| | | | | | $ | 2,689,418 | |
| | |
|
General Obligations — 24.2% | |
Benton and Polk Counties, Philomath School District No. 17J, 0.00%, 6/15/28 | | $ | 1,500 | | | $ | 863,550 | |
Benton and Polk Counties, Philomath School District No. 17J, 0.00%, 6/15/30 | | | 700 | | | | 362,145 | |
Benton and Polk Counties, Philomath School District No. 17J, 0.00%, 6/15/31 | | | 425 | | | | 209,023 | |
Deschutes and Jefferson Counties, Redmond School District No. 2J, 0.00%, 6/15/25 | | | 460 | | | | 315,095 | |
Deschutes and Jefferson Counties, Redmond School District No. 2J, 0.00%, 6/15/27 | | | 3,175 | | | | 1,931,321 | |
Jackson County, School District No. 549C, 5.00%, 6/15/33 | | | 2,000 | | | | 2,189,880 | |
Klamath County, School District, 5.00%, 6/15/29 | | | 1,155 | | | | 1,301,685 | |
Lake Oswego, 5.00%, 6/1/33 | | | 2,450 | | | | 2,749,684 | |
Medford, 5.00%, 7/15/32 | | | 545 | | | | 604,122 | |
Multnomah and Clackamas Counties, Riverdale School District No. 51JT, 0.00%, 6/15/29 | | | 1,000 | | | | 546,840 | |
Multnomah and Clackamas Counties, Riverdale School District No. 51JT, 0.00%, 6/15/30 | | | 1,215 | | | | 628,580 | |
Multnomah County, David Douglas School District No. 40, 0.00%, 6/15/24 | | | 1,640 | | | | 1,166,811 | |
Oregon Elderly and Disabled Housing, (AMT), 5.65%, 8/1/26 | | | 3,555 | | | | 3,560,652 | |
Polk, Marion and Benton Counties, School District No. 13J, 0.00%, 6/15/38 | | | 3,300 | | | | 1,064,811 | |
Polk, Marion and Benton Counties, School District No. 13J, 0.00%, 12/15/38 | | | 2,120 | | | | 668,309 | |
Portland Housing Authority, (Pearl Court LP), (AMT), 4.625%, 1/1/27 | | | 1,280 | | | | 1,302,259 | |
| | | | | | | | |
| Security | | Principal
Amount
(000’s omitted) | | | Value | |
| | | | | | | | |
|
General Obligations (continued) | |
Portland Housing Authority, (Yards Union Station Project), (AMT), 4.75%, 5/1/22 | | $ | 465 | | | $ | 482,075 | |
Portland Housing Authority, (Yards Union Station Project), (AMT), 4.85%, 5/1/29 | | | 2,740 | | | | 2,784,114 | |
Salem-Keizer, School District No. 24J, 0.00%, 6/15/29 | | | 1,000 | | | | 539,100 | |
Umatilla County, Pendleton School District No. 16R, 5.00%, 6/15/24 | | | 1,220 | | | | 1,477,457 | |
Umatilla County, Pendleton School District No. 16R, 5.00%, 6/15/28 | | | 1,000 | | | | 1,168,320 | |
Washington County, Forest Grove School District No. 15, 0.00%, 6/15/26 | | | 1,975 | | | | 1,257,028 | |
| | |
| | | | | | $ | 27,172,861 | |
| | |
|
Hospital — 10.3% | |
Deschutes County Hospital Facilities Authority, (Cascade Healthcare Community), 8.25%, 1/1/38 | | $ | 2,500 | | | $ | 2,974,175 | |
Hood River County Health Facilities Authority, Elderly Housing, (Down Manor), 6.50%, 1/1/17 | | | 1,350 | | | | 1,356,237 | |
Klamath Falls Intercommunity Hospital Authority Revenue, (Sky Lakes Medical Center), 5.00%, 9/1/20 | | | 1,320 | | | | 1,490,267 | |
Klamath Falls Intercommunity Hospital Authority Revenue, (Sky Lakes Medical Center), 5.00%, 9/1/22 | | | 250 | | | | 276,352 | |
Oregon State Facilities Authority, (Legacy Health System), 5.00%, 3/15/30 | | | 3,685 | | | | 3,848,909 | |
Oregon State Facilities Authority, (PeaceHealth), 5.00%, 11/15/29(1) | | | 1,500 | | | | 1,633,875 | |
| | |
| | | | | | $ | 11,579,815 | |
| | |
|
Housing — 7.7% | |
Oregon Health Authority, (Trillium Affordable Housing), Series A, (AMT), 6.75%, 2/15/29 | | $ | 735 | | | $ | 734,978 | |
Oregon Housing and Community Services Department, (AMT), 4.85%, 7/1/37 | | | 1,800 | | | | 1,809,846 | |
Oregon Housing and Community Services Department, (AMT), 5.15%, 7/1/42 | | | 5,000 | | | | 5,103,200 | |
Oregon Housing and Community Services Department, (AMT), 5.40%, 7/1/27 | | | 735 | | | | 758,520 | |
Oregon Housing and Community Services Department, SFMR, (AMT), 5.00%, 1/1/25 | | | 260 | | | | 267,384 | |
| | |
| | | | | | $ | 8,673,928 | |
| | |
|
Insured – Education — 3.8% | |
Oregon Health and Science University, (NPFG), 0.00%, 7/1/21 | | $ | 5,300 | | | $ | 4,288,760 | |
| | |
| | | | | | $ | 4,288,760 | |
| | |
| | | | |
| | 37 | | See Notes to Financial Statements. |
Eaton Vance
Oregon Municipal Income Fund
February 28, 2014
Portfolio of Investments (Unaudited) — continued
| | | | | | | | |
| Security | | Principal
Amount
(000’s omitted) | | | Value | |
| | | | | | | | |
|
Insured – Electric Utilities — 3.0% | |
Puerto Rico Electric Power Authority, (NPFG), 5.25%, 7/1/29 | | $ | 1,045 | | | $ | 938,943 | |
Puerto Rico Electric Power Authority, (NPFG), 5.25%, 7/1/34 | | | 2,760 | | | | 2,404,319 | |
| | |
| | | | | | $ | 3,343,262 | |
| | |
|
Insured – General Obligations — 6.8% | |
Beaverton School District, (AGC), 5.125%, 6/1/36 | | $ | 715 | | | $ | 797,554 | |
Clackamas and Washington Counties, School District No. 3, (NPFG), 0.00%, 6/15/23 | | | 800 | | | | 610,192 | |
Linn County, Lebanon Community School District No. 9, (NPFG), 5.50%, 6/15/30(2) | | | 4,000 | | | | 5,041,280 | |
Newport, (AGC), 0.00%, 6/1/28 | | | 1,000 | | | | 572,580 | |
Newport, (AGC), 0.00%, 6/1/29 | | | 1,225 | | | | 665,910 | |
| | |
| | | | | | $ | 7,687,516 | |
| | |
|
Insured – Hospital — 4.3% | |
Deschutes County Hospital Facilities Authority, (Cascade Healthcare Community), (AMBAC), 5.375%, 1/1/35 | | $ | 1,415 | | | $ | 1,465,204 | |
Medford Hospital Facilities Authority, (Asante Health System), (AGM), 5.50%, 8/15/28 | | | 3,000 | | | | 3,322,410 | |
| | |
| | | | | | $ | 4,787,614 | |
| | |
|
Insured – Special Tax Revenue — 3.1% | |
Puerto Rico Infrastructure Financing Authority, (AMBAC), 0.00%, 7/1/44 | | $ | 12,100 | | | $ | 987,965 | |
Puerto Rico Infrastructure Financing Authority, (AMBAC), 5.50%, 7/1/27 | | | 1,015 | | | | 847,078 | |
Puerto Rico Infrastructure Financing Authority, (FGIC), 0.00%, 7/1/42 | | | 20,000 | | | | 1,269,800 | |
Puerto Rico Sales Tax Financing Corp., (AMBAC), 0.00%, 8/1/54 | | | 4,400 | | | | 332,772 | |
| | |
| | | | | | $ | 3,437,615 | |
| | |
|
Insured – Transportation — 4.9% | |
Jackson County, Airport, (XLCA), 5.25%, 12/1/32 | | $ | 315 | | | $ | 322,570 | |
Jackson County, Airport, (XLCA), 5.25%, 12/1/37 | | | 1,685 | | | | 1,723,165 | |
Jackson County, Airport, (XLCA), (AMT), 5.25%, 12/1/23 | | | 1,675 | | | | 1,875,933 | |
Puerto Rico Highway and Transportation Authority, (AGC), (CIFG),
5.25%, 7/1/41(3)(4) | | | 1,800 | | | | 1,536,228 | |
| | |
| | | | | | $ | 5,457,896 | |
| | |
| | | | | | | | |
| Security | | Principal
Amount
(000’s omitted) | | | Value | |
| | | | | | | | |
|
Other Revenue — 10.0% | |
Children’s Trust Fund, PR, Tobacco Settlement, 0.00%, 5/15/50 | | $ | 20,255 | | | $ | 1,290,244 | |
Oregon Department of Administrative Services, 5.00%, 4/1/28(3)(4) | | | 8,740 | | | | 9,944,285 | |
| | |
| | | | | | $ | 11,234,529 | |
| | |
|
Special Tax Revenue — 5.1% | |
Puerto Rico Sales Tax Financing Corp., 0.00%, 8/1/56 | | $ | 13,180 | | | $ | 811,361 | |
Puerto Rico Sales Tax Financing Corp., 5.25%, 8/1/40 | | | 1,525 | | | | 1,280,710 | |
Puerto Rico Sales Tax Financing Corp., 5.25%, 8/1/57 | | | 720 | | | | 591,862 | |
Tri-County Metropolitan Transportation District, 5.00%, 9/1/30 | | | 2,000 | | | | 2,265,499 | |
Virgin Islands Public Finance Authority, 6.75%, 10/1/37 | | | 755 | | | | 831,534 | |
| | |
| | | | | | $ | 5,780,966 | |
| | |
|
Transportation — 5.3% | |
Port of Portland, Portland International Airport, 5.00%, 7/1/29 | | $ | 4,000 | | | $ | 4,297,440 | |
Redmond Airport Revenue, 5.50%, 6/1/24 | | | 215 | | | | 230,407 | |
Redmond Airport Revenue, 5.75%, 6/1/27 | | | 200 | | | | 211,912 | |
Redmond Airport Revenue, 6.00%, 6/1/34 | | | 550 | | | | 580,305 | |
Redmond Airport Revenue, 6.25%, 6/1/39 | | | 600 | | | | 635,382 | |
| | |
| | | | | | $ | 5,955,446 | |
| | |
| |
Total Tax-Exempt Investments — 99.7%
(identified cost $112,383,813) | | | $ | 111,922,310 | |
| | |
| |
Other Assets, Less Liabilities — 0.3% | | | $ | 284,070 | |
| | |
| |
Net Assets — 100.0% | | | $ | 112,206,380 | |
| | |
The percentage shown for each investment category in the Portfolio of Investments is based on net assets.
| | | | |
| AGC | | – | | Assured Guaranty Corp. |
| AGM | | – | | Assured Guaranty Municipal Corp. |
| AMBAC | | – | | AMBAC Financial Group, Inc. |
| AMT | | – | | Interest earned from these securities may be considered a tax preference item for purposes of the Federal Alternative Minimum Tax. |
| CIFG | | – | | CIFG Assurance North America, Inc. |
| FGIC | | – | | Financial Guaranty Insurance Company |
| NPFG | | – | | National Public Finance Guaranty Corp. |
| SFMR | | – | | Single Family Mortgage Revenue |
| XLCA | | – | | XL Capital Assurance, Inc. |
| | | | |
| | 38 | | See Notes to Financial Statements. |
Eaton Vance
Oregon Municipal Income Fund
February 28, 2014
Portfolio of Investments (Unaudited) — continued
The Fund invests primarily in debt securities issued by Oregon municipalities. In addition, 12.2% of the Fund’s net assets at February 28, 2014 were invested in municipal obligations issued by Puerto Rico. The ability of the issuers of the debt securities to meet their obligations may be affected by economic developments in a specific industry or municipality. In order to reduce the risk associated with such economic developments, at February 28, 2014, 25.9% of total investments are backed by bond insurance of various financial institutions and financial guaranty assurance agencies. The aggregate percentage insured by an individual financial institution or financial guaranty assurance agency ranged from 1.1% to 11.9% of total investments.
| (1) | When-issued security. |
| (2) | Security (or a portion thereof) has been segregated to cover payable for when-issued securities. |
| (3) | Security (or a portion thereof) has been pledged as collateral for residual interest bond transactions. The aggregate value of such collateral is $4,025,513. |
| (4) | Security represents the municipal bond held by a trust that issues residual interest bonds (see Note 1I). |
| | | | |
| | 39 | | See Notes to Financial Statements. |
Eaton Vance
South Carolina Municipal Income Fund
February 28, 2014
Portfolio of Investments (Unaudited)
| | | | | | | | |
| Tax-Exempt Investments — 99.7% | |
| | |
| | | | | | | | |
| Security | | Principal Amount (000’s omitted) | | | Value | |
| | | | | | | | |
| | |
Education — 2.4% | | | | | | | | |
College of Charleston, Academic and Administrative Facilities, 5.00%, 4/1/37 | | $ | 2,695 | | | $ | 2,843,710 | |
| | |
| | | | | | $ | 2,843,710 | |
| | |
|
Electric Utilities — 7.9% | |
Puerto Rico Electric Power Authority, 6.75%, 7/1/36 | | $ | 2,015 | | | $ | 1,478,546 | |
South Carolina Public Service Authority, (Santee Cooper), 5.375%, 1/1/28 | | | 4,510 | | | | 5,092,602 | |
South Carolina Public Service Authority, (Santee Cooper), 5.50%, 1/1/38 | | | 2,580 | | | | 2,859,337 | |
| | |
| | | | | | $ | 9,430,485 | |
| | |
|
General Obligations — 13.5% | |
Berkeley County, School District, 5.00%, 3/1/25 | | $ | 1,500 | | | $ | 1,804,995 | |
Charleston County, 4.00%, 11/1/29 | | | 2,650 | | | | 2,786,713 | |
Georgetown County, 5.00%, 3/1/31 | | | 2,510 | | | | 2,812,129 | |
Georgetown County, 5.00%, 3/1/33 | | | 2,750 | | | | 3,045,075 | |
Richland-Lexington Airport District, (AMT), 3.00%, 3/1/27 | | | 580 | | | | 537,092 | |
Richland-Lexington Airport District, (AMT), 4.00%, 3/1/22 | | | 195 | | | | 211,331 | |
Richland-Lexington Airport District, (AMT), 4.00%, 3/1/24 | | | 685 | | | | 726,963 | |
South Carolina, 3.25%, 8/1/30 | | | 815 | | | | 810,363 | |
South Carolina, (Air Carrier Hub Terminal A), 1.00%, 4/1/25 | | | 4,275 | | | | 3,462,750 | |
| | |
| | | | | | $ | 16,197,411 | |
| | |
|
Hospital — 22.3% | |
Florence County, (McLeod Regional Medical Center), 5.00%, 11/1/37 | | $ | 1,000 | | | $ | 1,036,950 | |
Greenwood County, 5.375%, 10/1/39 | | | 3,835 | | | | 4,028,092 | |
Greenwood County, (Self Regional Healthcare), 4.00%, 10/1/21 | | | 1,050 | | | | 1,124,287 | |
Lexington County, Health Services District, Inc., 5.00%, 11/1/27 | | | 3,615 | | | | 3,936,301 | |
Lexington County, Health Services District, Inc., 5.00%, 11/1/32 | | | 955 | | | | 980,279 | |
South Carolina Jobs Economic Development Authority, (Bon Secours Health System, Inc.), 5.00%, 11/1/28 | | | 2,500 | | | | 2,647,725 | |
South Carolina Jobs Economic Development Authority, (Bon Secours Health System, Inc.), 5.00%, 11/1/29 | | | 450 | | | | 472,914 | |
South Carolina Jobs Economic Development Authority, (Georgetown Hospital), 3.50%, 2/1/24 | | | 1,560 | | | | 1,532,326 | |
South Carolina Jobs Economic Development Authority, (Georgetown Hospital), 3.50%, 2/1/25 | | | 2,010 | | | | 1,938,685 | |
South Carolina Jobs Economic Development Authority, (Georgetown Hospital), 3.625%, 2/1/26 | | | 2,040 | | | | 1,964,500 | |
| | | | | | | | |
| Security | | Principal Amount (000’s omitted) | | | Value | |
| | | | | | | | |
|
Hospital (continued) | |
South Carolina Jobs Economic Development Authority, (Kershaw County Medical Center), 6.00%, 9/15/38 | | $ | 3,380 | | | $ | 3,546,634 | |
South Carolina Jobs Economic Development Authority, (Palmetto Health), 5.75%, 8/1/39 | | | 3,420 | | | | 3,611,828 | |
| | |
| | | | | | $ | 26,820,521 | |
| | |
|
Industrial Development Revenue — 1.2% | |
Richland County, (International Paper Co.), (AMT), 6.10%, 4/1/23 | | $ | 1,400 | | | $ | 1,416,884 | |
| | |
| | | | | | $ | 1,416,884 | |
| | |
|
Insured – Electric Utilities — 4.9% | |
Piedmont Municipal Power Agency, (NPFG), 0.00%, 1/1/23 | | $ | 1,090 | | | $ | 806,927 | |
Puerto Rico Electric Power Authority, (NPFG), 5.25%, 7/1/29 | | | 1,075 | | | | 965,898 | |
Puerto Rico Electric Power Authority, (NPFG), 5.25%, 7/1/32 | | | 1,350 | | | | 1,191,658 | |
Puerto Rico Electric Power Authority, (NPFG), 5.25%, 7/1/34 | | | 2,375 | | | | 2,068,934 | |
Puerto Rico Electric Power Authority, (NPFG), 5.25%, 7/1/35 | | | 950 | | | | 824,705 | |
| | |
| | | | | | $ | 5,858,122 | |
| | |
|
Insured – Lease Revenue / Certificates of Participation — 3.6% | |
Scago Educational Facilities Corp., Pickens School District, (AGM), 4.50%, 12/1/28 | | $ | 3,210 | | | $ | 3,324,276 | |
St. Peters Parish-Jasper County Public Facilities Corp., (County Office Buildings), (AGM), 5.00%, 4/1/31 | | | 1,000 | | | | 1,050,780 | |
| | |
| | | | | | $ | 4,375,056 | |
| | |
|
Insured – Special Tax Revenue — 0.7% | |
Puerto Rico Sales Tax Financing Corp., (AMBAC), 0.00%, 8/1/54 | | $ | 1,725 | | | $ | 130,462 | |
Puerto Rico Sales Tax Financing Corp., (NPFG), 0.00%, 8/1/41 | | | 4,075 | | | | 672,212 | |
| | |
| | | | | | $ | 802,674 | |
| | |
|
Insured – Transportation — 2.9% | |
Puerto Rico Highway and Transportation Authority, (AGC), (CIFG), 5.25%, 7/1/41(2)(3) | | $ | 2,700 | | | $ | 2,304,342 | |
Richland-Lexington Airport District, (Columbia Metropolitan Airport), (AGC), (AMT), 5.00%, 1/1/21 | | | 1,095 | | | | 1,164,029 | |
| | |
| | | | | | $ | 3,468,371 | |
| | |
|
Insured – Utilities — 3.0% | |
Greer, Combined Utility System, (AMBAC), 5.50%, 9/1/27(4) | | $ | 1,000 | | | $ | 1,207,600 | |
Greer, Combined Utility System, (AMBAC), 5.50%, 9/1/32 | | | 2,000 | | | | 2,396,960 | |
| | |
| | | | | | $ | 3,604,560 | |
| | |
| | | | |
| | 40 | | See Notes to Financial Statements. |
Eaton Vance
South Carolina Municipal Income Fund
February 28, 2014
Portfolio of Investments (Unaudited) — continued
| | | | | | | | |
| Security | | Principal Amount (000’s omitted) | | | Value | |
| | | | | | | | |
|
Insured – Water and Sewer — 4.0% | |
Greenwood, Metropolitan District Sewer System, (AGM),
29.935%, 10/1/30(5)(6)(7) | | $ | 1,875 | | | $ | 2,538,600 | |
Lexington, Waterworks and Sewer Revenue, (AGC), 5.00%, 1/15/35 | | | 2,025 | | | | 2,227,459 | |
| | |
| | | | | | $ | 4,766,059 | |
| | |
|
Lease Revenue / Certificates of Participation — 13.6% | |
Berkeley County, School District, 5.125%, 12/1/30 | | $ | 2,350 | | | $ | 2,519,929 | |
Charleston Educational Excellence Financing Corp., (Charleston County School District), 5.00%, 12/1/30(2)(3) | | | 5,875 | | | | 6,492,933 | |
Dorchester County, School District No. 2, (Growth Installment Purchase), 5.00%, 12/1/27 | | | 1,000 | | | | 1,127,300 | |
Laurens County, School District, 5.25%, 12/1/30 | | | 4,645 | | | | 4,793,036 | |
Newberry County, School District, 5.25%, 12/1/25 | | | 1,320 | | | | 1,402,038 | |
| | |
| | | | | | $ | 16,335,236 | |
| | |
|
Other Revenue — 1.1% | |
Children’s Trust Fund, PR, Tobacco Settlement, 0.00%, 5/15/50 | | $ | 21,465 | | | $ | 1,367,321 | |
| | |
| | | | | | $ | 1,367,321 | |
| | |
|
Special Tax Revenue — 4.8% | |
Myrtle Beach, (Hospitality Fee), 5.00%, 6/1/26(1) | | $ | 1,000 | | | $ | 1,135,470 | |
Puerto Rico Sales Tax Financing Corp., 0.00%, 8/1/56 | | | 24,080 | | | | 1,482,365 | |
Puerto Rico Sales Tax Financing Corp., 5.25%, 8/1/57 | | | 2,720 | | | | 2,235,921 | |
Virgin Islands Public Finance Authority, 6.75%, 10/1/37 | | | 810 | | | | 892,110 | |
| | |
| | | | | | $ | 5,745,866 | |
| | |
|
Student Loan — 1.8% | |
South Carolina Education Assistance Authority, 5.10%, 10/1/29 | | $ | 2,030 | | | $ | 2,146,542 | |
| | |
| | | | | | $ | 2,146,542 | |
| | |
|
Transportation — 3.3% | |
South Carolina Ports Authority, 5.25%, 7/1/40 | | $ | 3,725 | | | $ | 3,939,485 | |
| | |
| | | | | | $ | 3,939,485 | |
| | |
|
Water and Sewer — 8.7% | |
Charleston, Waterworks and Sewer Revenue, 5.00%, 1/1/30 | | $ | 1,000 | | | $ | 1,112,050 | |
Charleston, Waterworks and Sewer Revenue, 5.00%, 1/1/35 | | | 3,000 | | | | 3,253,500 | |
Columbia Waterworks and Sewer Revenue, 5.00%, 2/1/40 | | | 3,500 | | | | 3,833,340 | |
North Charleston Sewer District, 2.00%, 1/1/29 | | | 1,000 | | | | 829,040 | |
| | | | | | | | |
| Security | | Principal Amount (000’s omitted) | | | Value | |
| | | | | | | | |
|
Water and Sewer (continued) | |
North Charleston Sewer District, 2.00%, 1/1/30 | | $ | 800 | | | $ | 645,200 | |
North Charleston Sewer District, 2.00%, 1/1/31 | | | 900 | | | | 709,973 | |
| | |
| | | | | | $ | 10,383,103 | |
| | |
| |
Total Tax-Exempt Investments — 99.7%
(identified cost $116,575,837) | | | $ | 119,501,406 | |
| | |
| |
Other Assets, Less Liabilities — 0.3% | | | $ | 409,886 | |
| | |
| |
Net Assets — 100.0% | | | $ | 119,911,292 | |
| | |
The percentage shown for each investment category in the Portfolio of Investments is based on net assets.
| | | | |
| AGC | | – | | Assured Guaranty Corp. |
| AGM | | – | | Assured Guaranty Municipal Corp. |
| AMBAC | | – | | AMBAC Financial Group, Inc. |
| AMT | | – | | Interest earned from these securities may be considered a tax preference item for purposes of the Federal Alternative Minimum Tax. |
| CIFG | | – | | CIFG Assurance North America, Inc. |
| NPFG | | – | | National Public Finance Guaranty Corp. |
The Fund invests primarily in debt securities issued by South Carolina municipalities. In addition, 12.3% of the Fund’s net assets at February 28, 2014 were invested in municipal obligations issued by Puerto Rico. The ability of the issuers of the debt securities to meet their obligations may be affected by economic developments in a specific industry or municipality. In order to reduce the risk associated with such economic developments, at February 28, 2014, 19.1% of total investments are backed by bond insurance of various financial institutions and financial guaranty assurance agencies. The aggregate percentage insured by an individual financial institution or financial guaranty assurance agency ranged from 1.9% to 5.8% of total investments.
| (1) | When-issued security. |
| (2) | Security represents the municipal bond held by a trust that issues residual interest bonds (see Note 1I). |
| (3) | Security (or a portion thereof) has been pledged as collateral for residual interest bond transactions. The aggregate value of such collateral is $2,747,275. |
| (4) | Security (or a portion thereof) has been segregated to cover payable for when-issued securities. |
| (5) | Security is subject to a shortfall agreement which may require the Fund to pay amounts to a counterparty in the event of a significant decline in the market value of the security held by the trust that issued the residual interest bond. In case of a shortfall, the maximum potential amount of payments the Fund could ultimately be required to make under the agreement is $5,625,000. However, such shortfall payment would be reduced by the proceeds from the sale of the security held by the trust that issued the residual interest bond. |
| | | | |
| | 41 | | See Notes to Financial Statements. |
Eaton Vance
South Carolina Municipal Income Fund
February 28, 2014
Portfolio of Investments (Unaudited) — continued
| (6) | Security has been issued as a leveraged residual interest bond with a variable interest rate. The stated interest rate represents the rate in effect at February 28, 2014. |
| (7) | Security exempt from registration pursuant to Rule 144A under the Securities Act of 1933. These securities may be sold in certain transactions (normally to qualified institutional buyers) and remain exempt from registration. At February 28, 2014, the aggregate value of these securities is $2,538,600 or 2.1% of the Fund’s net assets. |
| | | | |
| | 42 | | See Notes to Financial Statements. |
Eaton Vance
Tennessee Municipal Income Fund
February 28, 2014
Portfolio of Investments (Unaudited)
| | | | | | | | |
| Tax-Exempt Investments — 98.9% | |
| | |
| | | | | | | | |
| Security | | Principal Amount (000’s omitted) | | | Value | |
| | | | | | | | |
|
Education — 10.7% | |
Metropolitan Government of Nashville and Davidson County, (Belmont University), 5.00%, 11/1/28 | | $ | 350 | | | $ | 372,320 | |
Metropolitan Government of Nashville and Davidson County, (Vanderbilt University), Series A, 5.00%, 10/1/39 | | | 1,000 | | | | 1,072,140 | |
Metropolitan Government of Nashville and Davidson County, (Vanderbilt University), Series B, 5.00%, 10/1/39 | | | 1,000 | | | | 1,072,140 | |
Tennessee School Bond Authority, 5.00%, 5/1/39 | | | 1,500 | | | | 1,600,830 | |
| | |
| | | | | | $ | 4,117,430 | |
| | |
|
Electric Utilities — 7.0% | |
Chattanooga, Electric Revenue, 5.00%, 9/1/33 | | $ | 1,500 | | | $ | 1,640,310 | |
Clarksville, Electric Revenue, 5.00%, 9/1/34 | | | 500 | | | | 536,840 | |
Metropolitan Government of Nashville and Davidson County, Electric System Revenue, Series A, 5.00%, 5/15/36 | | | 500 | | | | 541,950 | |
| | |
| | | | | | $ | 2,719,100 | |
| | |
|
General Obligations — 11.5% | |
Johnson City, 5.00%, 6/1/31 | | $ | 350 | | | $ | 383,712 | |
Metropolitan Government of Nashville and Davidson County, Series A, 5.00%, 1/1/33 | | | 750 | | | | 832,170 | |
Shelby County, 5.00%, 3/1/26 | | | 1,000 | | | | 1,155,330 | |
Tennessee, 5.00%, 5/1/29 | | | 1,000 | | | | 1,136,120 | |
Williamson County, 3.25%, 4/1/17 | | | 850 | | | | 921,630 | |
| | |
| | | | | | $ | 4,428,962 | |
| | |
|
Hospital — 13.9% | |
Chattanooga, Health, Educational and Housing Facilities Board, (Catholic Health Initiatives), 6.25%, 10/1/33 | | $ | 500 | | | $ | 566,220 | |
Johnson City, Health and Educational Facilities Board, 5.50%, 7/1/36 | | | 1,000 | | | | 1,029,090 | |
Knox County Health, Educational and Housing Facilities Board, (Covenant Health), 0.00%, 1/1/39 | | | 5,000 | | | | 1,112,450 | |
Knox County, Health, Educational and Housing Facilities Board, (Covenant Health), 0.00%, 1/1/42 | | | 615 | | | | 113,412 | |
Rutherford County, Health and Educational Facilities Board, (Ascension Health Care Group), 5.00%, 11/15/40 | | | 500 | | | | 515,360 | |
Shelby County, Health, Educational and Housing Facilities Board, (Methodist Le Bonheur Health), 5.00%, 5/1/42 | | | 1,000 | | | | 1,024,880 | |
Sullivan County Health, Educational and Facilities Board, (Wellmont Health System), 5.25%, 9/1/36 | | | 1,000 | | | | 1,004,650 | |
| | |
| | | | | | $ | 5,366,062 | |
| | |
| | | | | | | | |
| Security | | Principal Amount (000’s omitted) | | | Value | |
| | | | | | | | |
|
Housing — 4.3% | |
Tennessee Housing Development Agency, (AMT), 4.85%, 1/1/32 | | $ | 350 | | | $ | 352,828 | |
Tennessee Housing Development Agency, (AMT), 5.00%, 7/1/32 | | | 945 | | | | 959,430 | |
Tennessee Housing Development Agency, (AMT), 5.10%, 7/1/38 | | | 345 | | | | 349,709 | |
| | |
| | | | | | $ | 1,661,967 | |
| | |
|
Industrial Development Revenue — 1.8% | |
Hardeman County (Correctional Facilities Corp.), 7.75%, 8/1/17 | | $ | 215 | | | $ | 212,674 | |
Metropolitan Nashville Airport Authority, (Aero Nashville Project), 5.20%, 7/1/26 | | | 460 | | | | 469,977 | |
| | |
| | | | | | $ | 682,651 | |
| | |
|
Insured – Education — 3.5% | |
Metropolitan Government of Nashville and Davidson County, (Meharry Medical College), (AMBAC), 6.00%, 12/1/19 | | $ | 1,230 | | | $ | 1,369,359 | |
| | |
| | | | | | $ | 1,369,359 | |
| | |
|
Insured – Electric Utilities — 8.3% | |
Lawrenceburg, Electric Revenue, (NPFG), 6.625%, 7/1/18 | | $ | 760 | | | $ | 836,768 | |
Lawrenceburg, Public Building Authority, (Electric System-Public Works), (AMBAC), 5.00%, 7/1/26 | | | 600 | | | | 664,692 | |
Metropolitan Government of Nashville and Davidson County, Electric System Revenue, (NPFG), 0.00%, 5/15/17 | | | 1,000 | | | | 976,650 | |
Puerto Rico Electric Power Authority, (NPFG), 5.25%, 7/1/29 | | | 375 | | | | 336,941 | |
Puerto Rico Electric Power Authority, (NPFG), 5.25%, 7/1/34 | | | 280 | | | | 243,916 | |
Puerto Rico Electric Power Authority, (NPFG), 5.25%, 7/1/35 | | | 165 | | | | 143,238 | |
| | |
| | | | | | $ | 3,202,205 | |
| | |
|
Insured – Escrowed / Prerefunded — 4.4% | |
Johnson City, Health and Educational Facilities Board, (Johnson City Medical Center), (NPFG), Prerefunded to 7/1/23, 5.125%, 7/1/25 | | $ | 200 | | | $ | 200,838 | |
Knox County, First Utility District, (NPFG), Prerefunded to 12/1/16, 5.00%, 12/1/25 | | | 875 | | | | 985,469 | |
Metropolitan Government of Nashville and Davidson County, (AMBAC), Prerefunded to 5/15/14, 5.00%, 5/15/29 | | | 500 | | | | 505,230 | |
| | |
| | | | | | $ | 1,691,537 | |
| | |
|
Insured – General Obligations — 9.4% | |
Blount County, Public Building Authority, (AGC), 5.00%, 6/1/32 | | $ | 500 | | | $ | 536,570 | |
Franklin, Special School District, (AGM), 0.00%, 6/1/19 | | | 1,425 | | | | 1,315,247 | |
Franklin, Special School District, (AGM), 0.00%, 6/1/20 | | | 2,000 | | | | 1,768,260 | |
| | |
| | | | | | $ | 3,620,077 | |
| | |
| | | | |
| | 43 | | See Notes to Financial Statements. |
Eaton Vance
Tennessee Municipal Income Fund
February 28, 2014
Portfolio of Investments (Unaudited) — continued
| | | | | | | | |
| Security | | Principal Amount (000’s omitted) | | | Value | |
| | | | | | | | |
|
Insured – Special Tax Revenue — 1.5% | |
Puerto Rico Infrastructure Financing Authority, (AMBAC), 0.00%, 7/1/44 | | $ | 4,450 | | | $ | 363,342 | |
Puerto Rico Infrastructure Financing Authority, (FGIC), 0.00%, 7/1/33 | | | 1,750 | | | | 232,593 | |
| | |
| | | | | | $ | 595,935 | |
| | |
|
Insured – Transportation — 1.3% | |
Puerto Rico Highway and Transportation Authority, (NPFG), 5.25%, 7/1/32 | | $ | 590 | | | $ | 512,155 | |
| | |
| | | | | | $ | 512,155 | |
| | |
|
Insured – Water and Sewer — 9.9% | |
Clarksville, Water, Sewer and Gas, (AGM), 5.25%, 2/1/18 | | $ | 1,000 | | | $ | 1,167,710 | |
Harpeth Valley Utilities District, Davidson and Williamson Counties, (NPFG), 5.00%, 9/1/35 | | | 1,000 | | | | 1,069,290 | |
Memphis, Sanitary Sewer System, (AGM), 4.75%, 7/1/24 | | | 1,000 | | | | 1,056,340 | |
South Blount County, Utility District, Water Revenue, (AGM), 5.00%, 12/1/33 | | | 500 | | | | 533,805 | |
| | |
| | | | | | $ | 3,827,145 | |
| | |
|
Special Tax Revenue — 2.1% | |
Guam, Limited Obligation Bonds, 5.625%, 12/1/29 | | $ | 135 | | | $ | 143,286 | |
Guam, Limited Obligation Bonds, 5.75%, 12/1/34 | | | 145 | | | | 153,678 | |
Puerto Rico Sales Tax Financing Corp., 5.00%, 8/1/40 | | | 115 | | | | 94,222 | |
Puerto Rico Sales Tax Financing Corp., 5.25%, 8/1/40 | | | 55 | | | | 46,190 | |
Virgin Islands Public Finance Authority, 6.75%, 10/1/37 | | | 325 | | | | 357,945 | |
| | |
| | | | | | $ | 795,321 | |
| | |
|
Transportation — 5.1% | |
Memphis-Shelby County, Airport Authority, (AMT), 5.00%, 7/1/25 | | $ | 500 | | | $ | 537,775 | |
Memphis-Shelby County, Airport Authority, (AMT), 5.75%, 7/1/24 | | | 1,250 | | | | 1,413,975 | |
| | |
| | | | | | $ | 1,951,750 | |
| | | | | | | | | |
| | |
Water and Sewer — 4.2% | | | | | | | | |
Metropolitan Government of Nashville and Davidson County, Water & Sewer Revenue, 5.00%, 7/1/40 | | $ | 750 | | | $ | 814,950 | |
| | | | | | | | |
| Security | | Principal Amount (000’s omitted) | | | Value | |
| | | | | | | | |
|
Water and Sewer (continued) | |
Rutherford County, Consolidated Utility District, Waterworks Revenue, 4.00%, 2/1/27 | | $ | 750 | | | $ | 808,425 | |
| | |
| | | | | | $ | 1,623,375 | |
| | |
| |
Total Tax-Exempt Investments — 98.9%
(identified cost $37,354,721) | | | $ | 38,165,031 | |
| | |
| |
Other Assets, Less Liabilities — 1.1% | | | $ | 406,887 | |
| | |
| |
Net Assets — 100.0% | | | $ | 38,571,918 | |
| | |
The percentage shown for each investment category in the Portfolio of Investments is based on net assets.
| | | | |
| AGC | | – | | Assured Guaranty Corp. |
| AGM | | – | | Assured Guaranty Municipal Corp. |
| AMBAC | | – | | AMBAC Financial Group, Inc. |
| AMT | | – | | Interest earned from these securities may be considered a tax preference item for purposes of the Federal Alternative Minimum Tax. |
| FGIC | | – | | Financial Guaranty Insurance Company |
| NPFG | | – | | National Public Finance Guaranty Corp. |
The Fund invests primarily in debt securities issued by Tennessee municipalities. The ability of the issuers of the debt securities to meet their obligations may be affected by economic developments in a specific industry or municipality. In order to reduce the risk associated with such economic developments, at February 28, 2014, 38.8% of total investments are backed by bond insurance of various financial institutions and financial guaranty assurance agencies. The aggregate percentage insured by an individual financial institution or financial guaranty assurance agency ranged from 0.6% to 15.3% of total investments.
| | | | |
| | 44 | | See Notes to Financial Statements. |
Eaton Vance
Virginia Municipal Income Fund
February 28, 2014
Portfolio of Investments (Unaudited)
| | | | | | | | |
| Tax-Exempt Investments — 98.3% | |
| | |
| | | | | | | | |
| Security | | Principal Amount (000’s omitted) | | | Value | |
| | | | | | | | |
|
Bond Bank — 4.8% | |
Virginia Resources Authority, Clean Water Revenue, 5.00%, 10/1/31 | | $ | 1,000 | | | $ | 1,115,440 | |
Virginia Resources Authority, Infrastructure Revenue, 5.25%, 11/1/33 | | | 2,710 | | | | 3,009,157 | |
| | |
| | | | | | $ | 4,124,597 | |
| | |
|
Education — 11.5% | |
Alexandria Industrial Development Authority, (Episcopal High School), 5.00%, 1/1/40 | | $ | 1,700 | | | $ | 1,803,598 | |
University of Virginia, 5.00%, 6/1/40 | | | 3,100 | | | | 3,411,488 | |
Virginia College Building Authority, 5.00%, 9/1/33 | | | 4,000 | | | | 4,332,880 | |
Virginia College Building Authority, 5.00%, 9/1/38 | | | 275 | | | | 292,196 | |
| | |
| | | | | | $ | 9,840,162 | |
| | |
|
Electric Utilities — 2.7% | |
Chesterfield County Economic Development Authority, (Virginia Electric Power Co.), (AMT), 5.60%, 11/1/31 | | $ | 1,500 | | | $ | 1,584,060 | |
Puerto Rico Electric Power Authority, 5.25%, 7/1/27 | | | 1,015 | | | | 726,994 | |
| | |
| | | | | | $ | 2,311,054 | |
| | |
|
Escrowed/Prerefunded — 0.9% | |
Fauquier County Industrial Development Authority, (Fauquier Hospital), Prerefunded to 10/1/17, 5.25%, 10/1/37 | | $ | 700 | | | $ | 816,697 | |
| | | | | | | | | |
| | | $ | 816,697 | |
| | | | | | | | | |
|
General Obligations — 10.2% | |
Loudoun County, 5.00%, 7/1/27 | | $ | 2,820 | | | $ | 3,205,156 | |
Norfolk, 5.00%, 8/1/28 | | | 750 | | | | 866,947 | |
Portsmouth, 4.75%, 7/15/25 | | | 500 | | | | 559,770 | |
Portsmouth, 5.25%, 7/15/25 | | | 675 | | | | 782,656 | |
Virginia, 4.00%, 6/1/26 | | | 1,000 | | | | 1,100,470 | |
Virginia, 5.00%, 6/1/31 | | | 2,000 | | | | 2,250,040 | |
| | |
| | | | | | $ | 8,765,039 | |
| | |
|
Hospital — 18.9% | |
Fairfax County Industrial Development Authority, (Inova Health System Hospitals), 5.00%, 8/15/23(1)(2) | | $ | 5,000 | | | $ | 5,918,250 | |
Fairfax County Industrial Development Authority, (Inova Health System Hospitals), 5.50%, 5/15/35 | | | 3,000 | | | | 3,250,050 | |
Fredericksburg Economic Development Authority, (Mary Washington Healthcare), 1.94% to 2/1/17 (Put Date), 8/1/38(3) | | | 500 | | | | 500,995 | |
| | | | | | | | |
| Security | | Principal Amount (000’s omitted) | | | Value | |
| | | | | | | | |
|
Hospital (continued) | |
Henrico County Economic Development Authority, (Bon Secours Health System, Inc.), 5.00%, 11/1/30 | | $ | 645 | | | $ | 684,081 | |
Smyth County Industrial Development Authority, (Mountain States Health Alliance), 5.50%, 7/1/28 | | | 1,100 | | | | 1,168,134 | |
Virginia Small Business Financing Authority, (Wellmont Health), 5.25%, 9/1/27 | | | 1,500 | | | | 1,552,200 | |
Virginia Small Business Financing Authority, (Wellmont Health), 5.25%, 9/1/37 | | | 1,605 | | | | 1,616,732 | |
Winchester Industrial Development Authority, (Valley Health System), 5.25%, 1/1/37 | | | 1,500 | | | | 1,533,015 | |
| | |
| | | | | | $ | 16,223,457 | |
| | |
|
Insured – Education — 5.7% | |
Virginia College Building Authority, (Washington and Lee University), (NPFG), 5.25%, 1/1/31 | | $ | 4,155 | | | $ | 4,903,191 | |
| | |
| | | | | | $ | 4,903,191 | |
| | |
|
Insured – Electric Utilities — 2.0% | |
Puerto Rico Electric Power Authority, (NPFG), 5.25%, 7/1/29 | | $ | 1,000 | | | $ | 898,510 | |
Puerto Rico Electric Power Authority, (XLCA), 5.375%, 7/1/18 | | | 1,000 | | | | 854,230 | |
| | |
| | | | | | $ | 1,752,740 | |
| | |
|
Insured – Hospital — 5.9% | |
Henrico County Industrial Development Authority, (Bon Secours Health System, Inc.), (NPFG), 6.25%, 8/15/20 | | $ | 1,500 | | | $ | 1,727,865 | |
Virginia Beach, (Virginia Beach Memorial Hospital), (AMBAC), 5.125%, 2/15/18 | | | 2,995 | | | | 3,312,200 | |
| | |
| | | | | | $ | 5,040,065 | |
| | |
|
Insured – Other Revenue — 1.3% | |
Norfolk Airport Authority, (AGM), 5.00%, 7/1/26 | | $ | 1,000 | | | $ | 1,089,580 | |
| | |
| | | | | | $ | 1,089,580 | |
| | |
|
Insured – Special Tax Revenue — 0.4% | |
Puerto Rico Infrastructure Financing Authority, (AMBAC), 0.00%, 7/1/28 | | $ | 1,020 | | | $ | 309,968 | |
| | |
| | | | | | $ | 309,968 | |
| | |
|
Insured – Transportation — 16.6% | |
Chesapeake Bay Bridge and Tunnel Commission, (General Resolution), (NPFG), 5.50%, 7/1/25 | | $ | 5,000 | | | $ | 5,702,800 | |
Puerto Rico Highway and Transportation Authority, (AMBAC), 5.50%, 7/1/29 | | | 1,600 | | | | 1,300,992 | |
Richmond Metropolitan Authority, (NPFG), 5.25%, 7/15/22 | | | 3,800 | | | | 4,328,998 | |
| | | | |
| | 45 | | See Notes to Financial Statements. |
Eaton Vance
Virginia Municipal Income Fund
February 28, 2014
Portfolio of Investments (Unaudited) — continued
| | | | | | | | |
| Security | | Principal Amount (000’s omitted) | | | Value | |
| | | | | | | | |
| | |
Insured – Transportation (continued) | | | | | | | | |
Virginia Commonwealth Transportation Board, (NPFG), 0.00%, 4/1/26 | | $ | 200 | | | $ | 138,620 | |
Virginia Port Authority, (AGM), (FGIC), (AMT), 5.00%, 7/1/36 | | | 2,825 | | | | 2,826,751 | |
| | |
| | | | | | $ | 14,298,161 | |
| | | | | | | | | |
| | |
Lease Revenue / Certificates of Participation — 1.9% | | | | | | | | |
Washington County Industrial Development Authority, (Davenport & Co., LLC), 5.25%, 8/1/30 | | $ | 1,500 | | | $ | 1,628,700 | |
| | |
| | | | | | $ | 1,628,700 | |
| | |
|
Other Revenue — 1.7% | |
Children’s Trust Fund, PR, Tobacco Settlement, 0.00%, 5/15/55 | | $ | 14,980 | | | $ | 381,091 | |
Fairfax County Economic Development Authority, (Silver Line Phase I), 5.00%, 4/1/37 | | | 1,000 | | | | 1,061,600 | |
| | |
| | | | | | $ | 1,442,691 | |
| | |
|
Senior Living / Life Care — 3.4% | |
Albemarle County Economic Development Authority, (Westminster-Canterbury of the Blue Ridge), 5.00%, 1/1/42 | | $ | 100 | | | $ | 89,007 | |
Fairfax County Economic Development Authority, (Goodwin House, Inc.), 5.125%, 10/1/42 | | | 1,085 | | | | 1,098,595 | |
Harrisonburg Industrial Development Authority, (Sunnyside Presbyterian Home), 6.25%, 12/1/33 | | | 750 | | | | 765,555 | |
Virginia Beach Development Authority, (Westminster-Canterbury of Hampton Roads, Inc.), 5.375%, 11/1/32 | | | 1,000 | | | | 999,330 | |
| | |
| | | | | | $ | 2,952,487 | |
| | |
|
Special Tax Revenue — 0.6% | |
Puerto Rico Sales Tax Financing Corp., 0.00%, 8/1/38 | | $ | 3,750 | | | $ | 529,163 | |
| | |
| | | | | | $ | 529,163 | |
| | |
|
Transportation — 3.9% | |
Metropolitan Washington, DC, Airport Authority System, (AMT), 5.375%, 10/1/29 | | $ | 1,000 | | | $ | 1,072,920 | |
Route 460 Funding Corp. of Virginia, 0.00%, 7/1/32 | | | 1,000 | | | | 353,200 | |
Route 460 Funding Corp. of Virginia, 0.00%, 7/1/33 | | | 1,000 | | | | 330,930 | |
Washington Metropolitan Area Transit Authority, 5.00%, 7/1/32 | | | 1,500 | | | | 1,603,785 | |
| | |
| | | | | | $ | 3,360,835 | |
| | |
|
Water and Sewer — 5.9% | |
Hopewell Sewer System Revenue, 5.00%, 7/15/33 | | $ | 1,000 | | | $ | 1,083,590 | |
Fairfax County Water Authority, 5.25%, 4/1/27 | | | 2,795 | | | | 3,539,420 | |
Upper Occoquan Sewer Authority, 4.50%, 7/1/38 | | | 475 | | | | 486,894 | |
| | | | | | | | |
| | |
| | | | | | $ | 5,109,904 | |
| | |
| | | | | | |
| Security | | Principal Amount (000’s omitted) | | Value | |
| |
Total Tax-Exempt Investments — 98.3%
(identified cost $78,425,327) | | $ | 84,498,491 | |
| | |
| |
Other Assets, Less Liabilities — 1.7% | | $ | 1,475,401 | |
| | |
| |
Net Assets — 100.0% | | $ | 85,973,892 | |
| | |
The percentage shown for each investment category in the Portfolio of Investments is based on net assets.
| | | | |
| AGM | | – | | Assured Guaranty Municipal Corp. |
| AMBAC | | – | | AMBAC Financial Group, Inc. |
| AMT | | – | | Interest earned from these securities may be considered a tax preference item for purposes of the Federal Alternative Minimum Tax. |
| FGIC | | – | | Financial Guaranty Insurance Company |
| NPFG | | – | | National Public Finance Guaranty Corp. |
| XLCA | | – | | XL Capital Assurance, Inc. |
The Fund invests primarily in debt securities issued by Virginia municipalities. The ability of the issuers of the debt securities to meet their obligations may be affected by economic developments in a specific industry or municipality. In order to reduce the risk associated with such economic developments, at February 28, 2014, 32.4% of total investments are backed by bond insurance of various financial institutions and financial guaranty assurance agencies. The aggregate percentage insured by an individual financial institution or financial guaranty assurance agency ranged from 1.0% to 20.9% of total investments.
| (1) | Security represents the municipal bond held by a trust that issues residual interest bonds (see Note 1I). |
| (2) | Security (or a portion thereof) has been pledged as collateral for residual interest bond transactions. The aggregate value of such collateral is $2,588,250. |
| (3) | Variable rate security. The stated interest rate represents the rate in effect at February 28, 2014. |
| | | | |
| | 46 | | See Notes to Financial Statements. |
Eaton Vance
Municipal Income Funds
February 28, 2014
Statements of Assets and Liabilities (Unaudited)
| | | | | | | | | | | | | | | | |
| | | February 28, 2014 | |
| Assets | | Alabama Fund | | | Arkansas Fund | | | Georgia Fund | | | Kentucky Fund | |
Investments — | | | | | | | | | | | | | | | | |
Identified cost | | $ | 39,377,756 | | | $ | 53,790,426 | | | $ | 56,500,183 | | | $ | 44,525,322 | |
Unrealized appreciation | | | 2,236,174 | | | | 1,010,928 | | | | 3,039,506 | | | | 2,081,424 | |
Investments, at value | | $ | 41,613,930 | | | $ | 54,801,354 | | | $ | 59,539,689 | | | $ | 46,606,746 | |
Cash | | $ | 402,532 | | | $ | — | | | $ | 926,069 | | | $ | — | |
Restricted cash* | | | — | | | | 116,000 | | | | 316,000 | | | | 150,500 | |
Interest receivable | | | 506,418 | | | | 649,378 | | | | 654,728 | | | | 513,441 | |
Receivable for investments sold | | | — | | | | 5,000 | | | | — | | | | 24,493 | |
Receivable for Fund shares sold | | | 14,833 | | | | 4,671 | | | | 27,030 | | | | 5,345 | |
Receivable for variation margin on open financial futures contracts | | | — | | | | 2,500 | | | | 6,563 | | | | 3,125 | |
Total assets | | $ | 42,537,713 | | | $ | 55,578,903 | | | $ | 61,470,079 | | | $ | 47,303,650 | |
| Liabilities | |
Payable for floating rate notes issued | | $ | — | | | $ | — | | | $ | 3,375,000 | | | $ | — | |
Demand note payable | | | — | | | | 100,000 | | | | — | | | | 100,000 | |
Payable for Fund shares redeemed | | | 41,443 | | | | 87,751 | | | | 169,744 | | | | 51,448 | |
Distributions payable | | | 32,056 | | | | 18,903 | | | | 44,901 | | | | 16,985 | |
Due to custodian | | | — | | | | 84,426 | | | | — | | | | 34,612 | |
Payable to affiliates: | | | | | | | | | | | | | | | | |
Investment adviser fee | | | 7,572 | | | | 12,026 | | | | 12,992 | | | | 9,372 | |
Distribution and service fees | | | 7,411 | | | | 11,948 | | | | 11,235 | | | | 8,643 | |
Interest expense and fees payable | | | — | | | | — | | | | 2,251 | | | | — | |
Accrued expenses | | | 31,564 | | | | 35,456 | | | | 33,269 | | | | 31,265 | |
Total liabilities | | $ | 120,046 | | | $ | 350,510 | | | $ | 3,649,392 | | | $ | 252,325 | |
Net Assets | | $ | 42,417,667 | | | $ | 55,228,393 | | | $ | 57,820,687 | | | $ | 47,051,325 | |
| Sources of Net Assets | |
Paid-in capital | | $ | 43,624,251 | | | $ | 61,225,134 | | | $ | 65,230,103 | | | $ | 47,096,269 | |
Accumulated net realized loss | | | (3,408,598 | ) | | | (6,822,468 | ) | | | (10,209,343 | ) | | | (2,040,719 | ) |
Accumulated undistributed (distributions in excess of) net investment income | | | (34,160 | ) | | | (110,440 | ) | | | (43,332 | ) | | | 7,802 | |
Net unrealized appreciation | | | 2,236,174 | | | | 936,167 | | | | 2,843,259 | | | | 1,987,973 | |
Net Assets | | $ | 42,417,667 | | | $ | 55,228,393 | | | $ | 57,820,687 | | | $ | 47,051,325 | |
| Class A Shares | | | | | | | | | | | | | | | | |
Net Assets | | $ | 35,722,198 | | | $ | 46,343,205 | | | $ | 43,193,787 | | | $ | 37,474,448 | |
Shares Outstanding | | | 3,786,181 | | | | 5,259,856 | | | | 5,126,440 | | | | 4,307,745 | |
Net Asset Value and Redemption Price Per Share | | | | | | | | | | | | | | | | |
(net assets ÷ shares of beneficial interest outstanding) | | $ | 9.43 | | | $ | 8.81 | | | $ | 8.43 | | | $ | 8.70 | |
Maximum Offering Price Per Share | | | | | | | | | | | | | | | | |
(100 ÷ 95.25 of net asset value per share) | | $ | 9.90 | | | $ | 9.25 | | | $ | 8.85 | | | $ | 9.13 | |
| Class B Shares | | | | | | | | | | | | | | | | |
Net Assets | | $ | 388,545 | | | $ | 1,153,786 | | | $ | 1,044,584 | | | $ | 307,319 | |
Shares Outstanding | | | 37,440 | | | | 121,904 | | | | 116,025 | | | | 32,723 | |
Net Asset Value and Offering Price Per Share** | | | | | | | | | | | | | | | | |
(net assets ÷ shares of beneficial interest outstanding) | | $ | 10.38 | | | $ | 9.46 | | | $ | 9.00 | | | $ | 9.39 | |
| Class C Shares | | | | | | | | | | | | | | | | |
Net Assets | | $ | 2,257,499 | | | $ | 5,399,158 | | | $ | 5,349,065 | | | $ | 3,566,348 | |
Shares Outstanding | | | 217,366 | | | | 570,547 | | | | 593,696 | | | | 379,479 | |
Net Asset Value and Offering Price Per Share** | | | | | | | | | | | | | | | | |
(net assets ÷ shares of beneficial interest outstanding) | | $ | 10.39 | | | $ | 9.46 | | | $ | 9.01 | | | $ | 9.40 | |
| Class I Shares | | | | | | | | | | | | | | | | |
Net Assets | | $ | 4,049,425 | | | $ | 2,332,244 | | | $ | 8,233,251 | | | $ | 5,703,210 | |
Shares Outstanding | | | 429,145 | | | | 264,900 | | | | 974,524 | | | | 655,688 | |
Net Asset Value, Offering Price and Redemption Price Per Share | | | | | | | | | | | | | | | | |
(net assets ÷ shares of beneficial interest outstanding) | | $ | 9.44 | | | $ | 8.80 | | | $ | 8.45 | | | $ | 8.70 | |
On sales of $50,000 or more, the offering price of Class A shares is reduced.
| * | Represents restricted cash on deposit at the broker for open financial futures contracts. |
| ** | Redemption price per share is equal to the net asset value less any applicable contingent deferred sales charge. |
| | | | |
| | 47 | | See Notes to Financial Statements. |
Eaton Vance
Municipal Income Funds
February 28, 2014
Statements of Assets and Liabilities (Unaudited) — continued
| | | | | | | | | | | | | | | | |
| | | February 28, 2014 | |
| Assets | | Maryland Fund | | | Missouri Fund | | | North Carolina Fund | | | Oregon Fund | |
Investments — | | | | | | | | | | | | | | | | |
Identified cost | | $ | 70,280,461 | | | $ | 66,945,645 | | | $ | 110,940,951 | | | $ | 112,383,813 | |
Unrealized appreciation (depreciation) | | | 2,901,643 | | | | 4,075,690 | | | | 3,680,544 | | | | (461,503 | ) |
Investments, at value | | $ | 73,182,104 | | | $ | 71,021,335 | | | $ | 114,621,495 | | | $ | 111,922,310 | |
Cash | | $ | 17,561 | | | $ | 1,299,268 | | | $ | — | | | $ | 8,827,177 | |
Restricted cash* | | | 114,000 | | | | 78,000 | | | | — | | | | 195,000 | |
Interest receivable | | | 830,509 | | | | 815,920 | | | | 1,383,036 | | | | 1,074,925 | |
Receivable for investments sold | | | 544,484 | | | | 160,000 | | | | 75,568 | | | | 645,802 | |
Receivable for Fund shares sold | | | 83,587 | | | | 91,277 | | | | 298,209 | | | | 54,115 | |
Receivable for variation margin on open financial futures contracts | | | 2,375 | | | | 6,906 | | | | — | | | | 4,063 | |
Total assets | | $ | 74,774,620 | | | $ | 73,472,706 | | | $ | 116,378,308 | | | $ | 122,723,392 | |
| Liabilities | |
Payable for floating rate notes issued | | $ | 2,240,000 | | | $ | 850,000 | | | $ | 4,650,000 | | | $ | 7,455,000 | |
Demand note payable | | | 1,300,000 | | | | — | | | | — | | | | — | |
Payable for when-issued securities | | | — | | | | 1,087,730 | | | | — | | | | 2,654,015 | |
Payable for Fund shares redeemed | | | 213,314 | | | | 278,271 | | | | 212,729 | | | | 253,070 | |
Distributions payable | | | 57,334 | | | | 22,260 | | | | 74,599 | | | | 39,193 | |
Due to custodian | | | — | | | | — | | | | 919 | | | | — | |
Payable to affiliates: | | | | | | | | | | | | | | | | |
Investment adviser fee | | | 17,325 | | | | 17,067 | | | | 31,695 | | | | 32,151 | |
Distribution and service fees | | | 19,940 | | | | 14,550 | | | | 26,669 | | | | 25,772 | |
Interest expense and fees payable | | | 4,204 | | | | 2,852 | | | | 14,436 | | | | 19,687 | |
Accrued expenses | | | 34,065 | | | | 32,975 | | | | 42,240 | | | | 38,124 | |
Total liabilities | | $ | 3,886,182 | | | $ | 2,305,705 | | | $ | 5,053,287 | | | $ | 10,517,012 | |
Net Assets | | $ | 70,888,438 | | | $ | 71,167,001 | | | $ | 111,325,021 | | | $ | 112,206,380 | |
| Sources of Net Assets | |
Paid-in capital | | $ | 78,534,510 | | | $ | 76,131,491 | | | $ | 116,487,174 | | | $ | 131,352,984 | |
Accumulated net realized loss | | | (10,470,743 | ) | | | (9,036,321 | ) | | | (8,987,534 | ) | | | (18,808,385 | ) |
Accumulated undistributed (distributions in excess of) net investment income | | | (5,949 | ) | | | 30,687 | | | | 144,837 | | | | 244,770 | |
Net unrealized appreciation (depreciation) | | | 2,830,620 | | | | 4,041,144 | | | | 3,680,544 | | | | (582,989 | ) |
Net Assets | | $ | 70,888,438 | | | $ | 71,167,001 | | | $ | 111,325,021 | | | $ | 112,206,380 | |
| Class A Shares | | | | | | | | | | | | | | | | |
Net Assets | | $ | 49,405,520 | | | $ | 61,793,403 | | | $ | 75,166,472 | | | $ | 87,125,634 | |
Shares Outstanding | | | 5,507,300 | | | | 6,631,258 | | | | 8,449,683 | | | | 10,292,116 | |
Net Asset Value and Redemption Price Per Share | | | | | | | | | | | | | | | | |
(net assets ÷ shares of beneficial interest outstanding) | | $ | 8.97 | | | $ | 9.32 | | | $ | 8.90 | | | $ | 8.47 | |
Maximum Offering Price Per Share | | | | | | | | | | | | | | | | |
(100 ÷ 95.25 of net asset value per share) | | $ | 9.42 | | | $ | 9.78 | | | $ | 9.34 | | | $ | 8.89 | |
| Class B Shares | | | | | | | | | | | | | | | | |
Net Assets | | $ | 1,383,852 | | | $ | 1,290,656 | | | $ | 934,655 | | | $ | 2,778,016 | |
Shares Outstanding | | | 141,460 | | | | 125,323 | | | | 97,697 | | | | 300,023 | |
Net Asset Value and Offering Price Per Share** | | | | | | | | | | | | | | | | |
(net assets ÷ shares of beneficial interest outstanding) | | $ | 9.78 | | | $ | 10.30 | | | $ | 9.57 | | | $ | 9.26 | |
| Class C Shares | | | | | | | | | | | | | | | | |
Net Assets | | $ | 15,556,269 | | | $ | 5,862,287 | | | $ | 19,994,375 | | | $ | 14,252,110 | |
Shares Outstanding | | | 1,589,653 | | | | 569,759 | | | | 2,089,461 | | | | 1,537,520 | |
Net Asset Value and Offering Price Per Share** | | | | | | | | | | | | | | | | |
(net assets ÷ shares of beneficial interest outstanding) | | $ | 9.79 | | | $ | 10.29 | | | $ | 9.57 | | | $ | 9.27 | |
| Class I Shares | | | | | | | | | | | | | | | | |
Net Assets | | $ | 4,542,797 | | | $ | 2,220,655 | | | $ | 15,229,519 | | | $ | 8,050,620 | |
Shares Outstanding | | | 505,316 | | | | 237,975 | | | | 1,707,264 | | | | 951,784 | |
Net Asset Value, Offering Price and Redemption Price Per Share | | | | | | | | | | | | | | | | |
(net assets ÷ shares of beneficial interest outstanding) | | $ | 8.99 | | | $ | 9.33 | | | $ | 8.92 | | | $ | 8.46 | |
On sales of $50,000 or more, the offering price of Class A shares is reduced.
| * | Represents restricted cash on deposit at the broker for open financial futures contracts. |
| ** | Redemption price per share is equal to the net asset value less any applicable contingent deferred sales charge. |
| | | | |
| | 48 | | See Notes to Financial Statements. |
Eaton Vance
Municipal Income Funds
February 28, 2014
Statements of Assets and Liabilities (Unaudited) — continued
| | | | | | | | | | | | |
| | | February 28, 2014 | |
| Assets | | South Carolina Fund | | | Tennessee Fund | | | Virginia Fund | |
Investments — | | | | | | | | | | | | |
Identified cost | | $ | 116,575,837 | | | $ | 37,354,721 | | | $ | 78,425,327 | |
Unrealized appreciation | | | 2,925,569 | | | | 810,310 | | | | 6,073,164 | |
Investments, at value | | $ | 119,501,406 | | | $ | 38,165,031 | | | $ | 84,498,491 | |
Cash | | $ | 5,970,654 | | | $ | 98,329 | | | $ | 3,798,536 | |
Restricted cash* | | | — | | | | — | | | | 510,000 | |
Interest receivable | | | 1,506,526 | | | | 437,857 | | | | 895,223 | |
Receivable for investments sold | | | 455,460 | | | | — | | | | — | |
Receivable for Fund shares sold | | | 173,758 | | | | 2,557 | | | | 87,119 | |
Receivable for variation margin on open financial futures contracts | | | — | | | | — | | | | 10,625 | |
Total assets | | $ | 127,607,804 | | | $ | 38,703,774 | | | $ | 89,799,994 | |
| Liabilities | |
Payable for floating rate notes issued | | $ | 6,050,000 | | | $ | — | | | $ | 3,330,000 | |
Payable for when-issued securities | | | 1,100,070 | | | | — | | | | — | |
Payable for Fund shares redeemed | | | 346,450 | | | | 69,321 | | | | 337,872 | |
Distributions payable | | | 82,137 | | | | 14,295 | | | | 82,099 | |
Payable to affiliates: | | | | | | | | | | | | |
Investment adviser fee | | | 34,573 | | | | 6,729 | | | | 22,983 | |
Distribution and service fees | | | 31,058 | | | | 10,556 | | | | 16,303 | |
Interest expense and fees payable | | | 12,959 | | | | — | | | | 2,023 | |
Accrued expenses | | | 39,265 | | | | 30,955 | | | | 34,822 | |
Total liabilities | | $ | 7,696,512 | | | $ | 131,856 | | | $ | 3,826,102 | |
Net Assets | | $ | 119,911,292 | | | $ | 38,571,918 | | | $ | 85,973,892 | |
| Sources of Net Assets | |
Paid-in capital | | $ | 137,417,166 | | | $ | 44,732,131 | | | $ | 100,267,396 | |
Accumulated net realized loss | | | (20,573,564 | ) | | | (6,959,579 | ) | | | (20,149,850 | ) |
Accumulated undistributed (distributions in excess of) net investment income | | | 142,121 | | | | (10,944 | ) | | | 100,915 | |
Net unrealized appreciation | | | 2,925,569 | | | | 810,310 | | | | 5,755,431 | |
Net Assets | | $ | 119,911,292 | | | $ | 38,571,918 | | | $ | 85,973,892 | |
| Class A Shares | | | | | | | | | | | | |
Net Assets | | $ | 74,827,096 | | | $ | 29,948,828 | | | $ | 63,896,823 | |
Shares Outstanding | | | 8,287,894 | | | | 3,540,481 | | | | 7,919,703 | |
Net Asset Value and Redemption Price Per Share | | | | | | | | | | | | |
(net assets ÷ shares of beneficial interest outstanding) | | $ | 9.03 | | | $ | 8.46 | | | $ | 8.07 | |
Maximum Offering Price Per Share | | | | | | | | | | | | |
(100 ÷ 95.25 of net asset value per share) | | $ | 9.48 | | | $ | 8.88 | | | $ | 8.47 | |
| Class B Shares | | | | | | | | | | | | |
Net Assets | | $ | 2,062,183 | | | $ | 667,832 | | | $ | 1,293,787 | |
Shares Outstanding | | | 215,383 | | | | 72,474 | | | | 144,879 | |
Net Asset Value and Offering Price Per Share** | | | | | | | | | | | | |
(net assets ÷ shares of beneficial interest outstanding) | | $ | 9.57 | | | $ | 9.21 | | | $ | 8.93 | |
| Class C Shares | | | | | | | | | | | | |
Net Assets | | $ | 25,251,240 | | | $ | 7,365,329 | | | $ | 7,546,918 | |
Shares Outstanding | | | 2,636,414 | | | | 799,762 | | | | 844,600 | |
Net Asset Value and Offering Price Per Share** | | | | | | | | | | | | |
(net assets ÷ shares of beneficial interest outstanding) | | $ | 9.58 | | | $ | 9.21 | | | $ | 8.94 | |
| Class I Shares | | | | | | | | | | | | |
Net Assets | | $ | 17,770,773 | | | $ | 589,929 | | | $ | 13,236,364 | |
Shares Outstanding | | | 1,966,547 | | | | 69,785 | | | | 1,636,558 | |
Net Asset Value, Offering Price and Redemption Price Per Share | | | | | | | | | | | | |
(net assets ÷ shares of beneficial interest outstanding) | | $ | 9.04 | | | $ | 8.45 | | | $ | 8.09 | |
On sales of $50,000 or more, the offering price of Class A shares is reduced.
| * | Represents restricted cash on deposit at the broker for open financial futures contracts. |
| ** | Redemption price per share is equal to the net asset value less any applicable contingent deferred sales charge. |
| | | | |
| | 49 | | See Notes to Financial Statements. |
Eaton Vance
Municipal Income Funds
February 28, 2014
Statements of Operations (Unaudited)
| | | | | | | | | | | | | | | | |
| | | Six Months Ended February 28, 2014 | |
| Investment Income | | Alabama Fund | | | Arkansas Fund | | | Georgia Fund | | | Kentucky Fund | |
Interest | | $ | 985,458 | | | $ | 1,311,306 | | | $ | 1,406,859 | | | $ | 1,161,219 | |
Total investment income | | $ | 985,458 | | | $ | 1,311,306 | | | $ | 1,406,859 | | | $ | 1,161,219 | |
|
| Expenses | |
Investment adviser fee | | $ | 49,084 | | | $ | 81,799 | | | $ | 84,199 | | | $ | 61,910 | |
Distribution and service fees | | | | | | | | | | | | | | | | |
Class A | | | 35,354 | | | | 46,710 | | | | 43,340 | | | | 37,615 | |
Class B | | | 2,475 | | | | 6,257 | | | | 5,054 | | | | 1,463 | |
Class C | | | 10,794 | | | | 26,834 | | | | 26,014 | | | | 16,702 | |
Trustees’ fees and expenses | | | 1,126 | | | | 1,404 | | | | 1,438 | | | | 1,232 | |
Custodian fee | | | 13,326 | | | | 15,268 | | | | 15,178 | | | | 14,854 | |
Transfer and dividend disbursing agent fees | | | 7,851 | | | | 10,002 | | | | 10,570 | | | | 9,983 | |
Legal and accounting services | | | 23,233 | | | | 23,606 | | | | 22,434 | | | | 22,576 | |
Printing and postage | | | 5,185 | | | | 5,722 | | | | 5,204 | | | | 4,907 | |
Registration fees | | | 1,960 | | | | 3,810 | | | | 1,986 | | | | 2,574 | |
Interest expense and fees | | | 1,702 | | | | — | | | | 12,346 | | | | — | |
Miscellaneous | | | 6,929 | | | | 8,784 | | | | 7,635 | | | | 7,860 | |
Total expenses | | $ | 159,019 | | | $ | 230,196 | | | $ | 235,398 | | | $ | 181,676 | |
Deduct — | | | | | | | | | | | | | | | | |
Reduction of custodian fee | | $ | 73 | | | $ | 132 | | | $ | 48 | | | $ | 64 | |
Total expense reductions | | $ | 73 | | | $ | 132 | | | $ | 48 | | | $ | 64 | |
| | | | |
Net expenses | | $ | 158,946 | | | $ | 230,064 | | | $ | 235,350 | | | $ | 181,612 | |
| | | | |
Net investment income | | $ | 826,512 | | | $ | 1,081,242 | | | $ | 1,171,509 | | | $ | 979,607 | |
|
| Realized and Unrealized Gain (Loss) | |
Net realized gain (loss) — | | | | | | | | | | | | | | | | |
Investment transactions | | $ | (165,087 | ) | | $ | (539,976 | ) | | $ | (216,046 | ) | | $ | (71,969 | ) |
Financial futures contracts | | | (6,307 | ) | | | (196,163 | ) | | | (252,604 | ) | | | (88,116 | ) |
Net realized loss | | $ | (171,394 | ) | | $ | (736,139 | ) | | $ | (468,650 | ) | | $ | (160,085 | ) |
Change in unrealized appreciation (depreciation) — | | | | | | | | | | | | | | | | |
Investments | | $ | 2,185,412 | | | $ | 3,092,503 | | | $ | 3,474,983 | | | $ | 1,850,990 | |
Financial futures contracts | | | 673 | | | | (64,663 | ) | | | (182,110 | ) | | | (84,699 | ) |
Net change in unrealized appreciation (depreciation) | | $ | 2,186,085 | | | $ | 3,027,840 | | | $ | 3,292,873 | | | $ | 1,766,291 | |
| | | | |
Net realized and unrealized gain | | $ | 2,014,691 | | | $ | 2,291,701 | | | $ | 2,824,223 | | | $ | 1,606,206 | |
| | | | |
Net increase in net assets from operations | | $ | 2,841,203 | | | $ | 3,372,943 | | | $ | 3,995,732 | | | $ | 2,585,813 | |
| | | | |
| | 50 | | See Notes to Financial Statements. |
Eaton Vance
Municipal Income Funds
February 28, 2014
Statements of Operations (Unaudited) — continued
| | | | | | | | | | | | | | | | |
| | | Six Months Ended February 28, 2014 | |
| Investment Income | | Maryland Fund | | | Missouri Fund | | | North Carolina Fund | | | Oregon Fund | |
Interest | | $ | 1,687,439 | | | $ | 1,647,348 | | | $ | 2,946,955 | | | $ | 3,324,050 | |
Total investment income | | $ | 1,687,439 | | | $ | 1,647,348 | | | $ | 2,946,955 | | | $ | 3,324,050 | |
|
| Expenses | |
Investment adviser fee | | $ | 112,610 | | | $ | 112,021 | | | $ | 209,918 | | | $ | 219,818 | |
Distribution and service fees | | | | | | | | | | | | | | | | |
Class A | | | 49,314 | | | | 60,445 | | | | 75,952 | | | | 86,630 | |
Class B | | | 7,491 | | | | 5,953 | | | | 4,592 | | | | 13,938 | |
Class C | | | 75,358 | | | | 28,394 | | | | 93,909 | | | | 75,028 | |
Trustees’ fees and expenses | | | 1,742 | | | | 1,701 | | | | 2,490 | | | | 2,557 | |
Custodian fee | | | 16,577 | | | | 16,266 | | | | 20,917 | | | | 20,141 | |
Transfer and dividend disbursing agent fees | | | 14,855 | | | | 13,198 | | | | 21,936 | | | | 20,846 | |
Legal and accounting services | | | 31,973 | | | | 22,080 | | | | 25,266 | | | | 25,319 | |
Printing and postage | | | 6,267 | | | | 5,903 | | | | 8,135 | | | | 8,075 | |
Registration fees | | | 3,668 | | | | 1,815 | | | | 648 | | | | 838 | |
Interest expense and fees | | | 16,270 | | | | 3,177 | | | | 41,659 | | | | 65,065 | |
Miscellaneous | | | 8,219 | | | | 8,348 | | | | 11,474 | | | | 11,147 | |
Total expenses | | $ | 344,344 | | | $ | 279,301 | | | $ | 516,896 | | | $ | 549,402 | |
Deduct — | | | | | | | | | | | | | | | | |
Reduction of custodian fee | | $ | 100 | | | $ | 96 | | | $ | 83 | | | $ | 334 | |
Total expense reductions | | $ | 100 | | | $ | 96 | | | $ | 83 | | | $ | 334 | |
| | | | |
Net expenses | | $ | 344,244 | | | $ | 279,205 | | | $ | 516,813 | | | $ | 549,068 | |
| | | | |
Net investment income | | $ | 1,343,195 | | | $ | 1,368,143 | | | $ | 2,430,142 | | | $ | 2,774,982 | |
|
| Realized and Unrealized Gain (Loss) | |
Net realized gain (loss) — | | | | | | | | | | | | | | | | |
Investment transactions | | $ | (1,086,478 | ) | | $ | 166,360 | | | $ | 362,203 | | | $ | (1,719,208 | ) |
Financial futures contracts | | | (91,419 | ) | | | (140,276 | ) | | | — | | | | (103,832 | ) |
Net realized gain (loss) | | $ | (1,177,897 | ) | | $ | 26,084 | | | $ | 362,203 | | | $ | (1,823,040 | ) |
Change in unrealized appreciation (depreciation) — | | | | | | | | | | | | | | | | |
Investments | | $ | 4,098,979 | | | $ | 3,509,020 | | | $ | 6,872,994 | | | $ | 7,454,277 | |
Financial futures contracts | | | (65,907 | ) | | | (18,333 | ) | | | — | | | | (121,486 | ) |
Net change in unrealized appreciation (depreciation) | | $ | 4,033,072 | | | $ | 3,490,687 | | | $ | 6,872,994 | | | $ | 7,332,791 | |
| | | | |
Net realized and unrealized gain | | $ | 2,855,175 | | | $ | 3,516,771 | | | $ | 7,235,197 | | | $ | 5,509,751 | |
| | | | |
Net increase in net assets from operations | | $ | 4,198,370 | | | $ | 4,884,914 | | | $ | 9,665,339 | | | $ | 8,284,733 | |
| | | | |
| | 51 | | See Notes to Financial Statements. |
Eaton Vance
Municipal Income Funds
February 28, 2014
Statements of Operations (Unaudited) — continued
| | | | | | | | | | | | |
| | | Six Months Ended February 28, 2014 | |
| Investment Income | | South Carolina Fund | | | Tennessee Fund | | | Virginia Fund | |
Interest | | $ | 3,418,659 | | | $ | 977,614 | | | $ | 2,154,483 | |
Total investment income | | $ | 3,418,659 | | | $ | 977,614 | | | $ | 2,154,483 | |
|
| Expenses | |
Investment adviser fee | | $ | 237,583 | | | $ | 47,164 | | | $ | 152,011 | |
Distribution and service fees | | | | | | | | | | | | |
Class A | | | 75,324 | | | | 31,980 | | | | 64,050 | |
Class B | | | 11,085 | | | | 3,326 | | | | 6,878 | |
Class C | | | 119,148 | | | | 37,419 | | | | 36,792 | |
Trustees’ fees and expenses | | | 2,704 | | | | 1,103 | | | | 2,053 | |
Custodian fee | | | 22,459 | | | | 13,892 | | | | 18,588 | |
Transfer and dividend disbursing agent fees | | | 19,182 | | | | 7,910 | | | | 18,554 | |
Legal and accounting services | | | 28,444 | | | | 24,967 | | | | 22,123 | |
Printing and postage | | | 8,691 | | | | 4,754 | | | | 7,598 | |
Registration fees | | | 588 | | | | 2,172 | | | | 2,418 | |
Interest expense and fees | | | 63,929 | | | | — | | | | 15,294 | |
Miscellaneous | | | 10,888 | | | | 7,573 | | | | 8,000 | |
Total expenses | | $ | 600,025 | | | $ | 182,260 | | | $ | 354,359 | |
Deduct — | | | | | | | | | | | | |
Reduction of custodian fee | | $ | 199 | | | $ | 44 | | | $ | 466 | |
Total expense reductions | | $ | 199 | | | $ | 44 | | | $ | 466 | |
| | | |
Net expenses | | $ | 599,826 | | | $ | 182,216 | | | $ | 353,893 | |
| | | |
Net investment income | | $ | 2,818,833 | | | $ | 795,398 | | | $ | 1,800,590 | |
|
| Realized and Unrealized Gain (Loss) | |
Net realized gain (loss) — | | | | | | | | | | | | |
Investment transactions | | $ | (27,871 | ) | | $ | (154,380 | ) | | $ | (190,194 | ) |
Financial futures contracts | | | — | | | | (159,345 | ) | | | (421,042 | ) |
Net realized loss | | $ | (27,871 | ) | | $ | (313,725 | ) | | $ | (611,236 | ) |
Change in unrealized appreciation (depreciation) — | | | | | | | | | | | | |
Investments | | $ | 7,383,805 | | | $ | 1,368,516 | | | $ | 4,094,563 | |
Financial futures contracts | | | — | | | | 8,079 | | | | (290,805 | ) |
Net change in unrealized appreciation (depreciation) | | $ | 7,383,805 | | | $ | 1,376,595 | | | $ | 3,803,758 | |
| | | |
Net realized and unrealized gain | | $ | 7,355,934 | | | $ | 1,062,870 | | | $ | 3,192,522 | |
| | | |
Net increase in net assets from operations | | $ | 10,174,767 | | | $ | 1,858,268 | | | $ | 4,993,112 | |
| | | | |
| | 52 | | See Notes to Financial Statements. |
Eaton Vance
Municipal Income Funds
February 28, 2014
Statements of Changes in Net Assets
| | | | | | | | | | | | | | | | |
| | | Six Months Ended February 28, 2014 (Unaudited) | |
| Increase (Decrease) in Net Assets | | Alabama Fund | | | Arkansas Fund | | | Georgia Fund | | | Kentucky Fund | |
From operations — | | | | | | | | | | | | | | | | |
Net investment income | | $ | 826,512 | | | $ | 1,081,242 | | | $ | 1,171,509 | | | $ | 979,607 | |
Net realized loss from investment transactions and financial futures contracts | | | (171,394 | ) | | | (736,139 | ) | | | (468,650 | ) | | | (160,085 | ) |
Net change in unrealized appreciation (depreciation) from investments and financial futures contracts | | | 2,186,085 | | | | 3,027,840 | | | | 3,292,873 | | | | 1,766,291 | |
Net increase in net assets from operations | | $ | 2,841,203 | | | $ | 3,372,943 | | | $ | 3,995,732 | | | $ | 2,585,813 | |
Distributions to shareholders — | | | | | | | | | | | | | | | | |
From net investment income | | | | | | | | | | | | | | | | |
Class A | | $ | (696,699 | ) | | $ | (997,974 | ) | | $ | (886,223 | ) | | $ | (781,126 | ) |
Class B | | | (8,292 | ) | | | (23,152 | ) | | | (17,778 | ) | | | (5,239 | ) |
Class C | | | (36,294 | ) | | | (99,838 | ) | | | (91,443 | ) | | | (59,869 | ) |
Class I | | | (83,269 | ) | | | (55,912 | ) | | | (169,422 | ) | | | (133,349 | ) |
Total distributions to shareholders | | $ | (824,554 | ) | | $ | (1,176,876 | ) | | $ | (1,164,866 | ) | | $ | (979,583 | ) |
Transactions in shares of beneficial interest — | | | | | | | | | | | | | | | | |
Proceeds from sale of shares | | | | | | | | | | | | | | | | |
Class A | | $ | 419,267 | | | $ | 772,815 | | | $ | 915,030 | | | $ | 553,010 | |
Class B | | | 213 | | | | 581 | | | | 330 | | | | 186 | |
Class C | | | 120,441 | | | | 91,313 | | | | 124,176 | | | | 289,088 | |
Class I | | | 215,887 | | | | 748,822 | | | | 3,133,118 | | | | 690,086 | |
Net asset value of shares issued to shareholders in payment of distributions declared | | | | | | | | | | | | | | | | |
Class A | | | 568,322 | | | | 888,624 | | | | 744,130 | | | | 684,829 | |
Class B | | | 7,907 | | | | 21,262 | | | | 15,941 | | | | 4,623 | |
Class C | | | 17,264 | | | | 84,936 | | | | 74,176 | | | | 53,571 | |
Class I | | | 31,108 | | | | 53,944 | | | | 53,178 | | | | 131,815 | |
Cost of shares redeemed | | | | | | | | | | | | | | | | |
Class A | | | (3,219,635 | ) | | | (7,230,589 | ) | | | (5,828,577 | ) | | | (4,049,389 | ) |
Class B | | | (103,582 | ) | | | (202,422 | ) | | | (115,658 | ) | | | (18,420 | ) |
Class C | | | (400,433 | ) | | | (1,048,075 | ) | | | (798,294 | ) | | | (588,026 | ) |
Class I | | | (790,711 | ) | | | (513,874 | ) | | | (3,692,812 | ) | | | (3,343,171 | ) |
Net asset value of shares exchanged | | | | | | | | | | | | | | | | |
Class A | | | 147,693 | | | | 230,896 | | | | 70,043 | | | | 14,612 | |
Class B | | | (147,693 | ) | | | (230,896 | ) | | | (70,043 | ) | | | (14,612 | ) |
Net decrease in net assets from Fund share transactions | | $ | (3,133,952 | ) | | $ | (6,332,663 | ) | | $ | (5,375,262 | ) | | $ | (5,591,798 | ) |
| | | | |
Net decrease in net assets | | $ | (1,117,303 | ) | | $ | (4,136,596 | ) | | $ | (2,544,396 | ) | | $ | (3,985,568 | ) |
| | | | |
| Net Assets | | | | | | | | | | | | | | | | |
At beginning of period | | $ | 43,534,970 | | | $ | 59,364,989 | | | $ | 60,365,083 | | | $ | 51,036,893 | |
At end of period | | $ | 42,417,667 | | | $ | 55,228,393 | | | $ | 57,820,687 | | | $ | 47,051,325 | |
| | | |
Accumulated undistributed (distributions in excess of) net investment income
included in net assets | | | | | | | | | | | | | |
At end of period | | $ | (34,160 | ) | | $ | (110,440 | ) | | $ | (43,332 | ) | | $ | 7,802 | |
| | | | |
| | 53 | | See Notes to Financial Statements. |
Eaton Vance
Municipal Income Funds
February 28, 2014
Statements of Changes in Net Assets — continued
| | | | | | | | | | | | | | | | |
| | | Six Months Ended February 28, 2014 (Unaudited) | |
| Increase (Decrease) in Net Assets | | Maryland Fund | | | Missouri Fund | | | North Carolina Fund | | | Oregon Fund | |
From operations — | | | | | | | | | | | | | | | | |
Net investment income | | $ | 1,343,195 | | | $ | 1,368,143 | | | $ | 2,430,142 | | | $ | 2,774,982 | |
Net realized gain (loss) from investment transactions and financial futures contracts | | | (1,177,897 | ) | | | 26,084 | | | | 362,203 | | | | (1,823,040 | ) |
Net change in unrealized appreciation (depreciation) from investments and financial futures contracts | | | 4,033,072 | | | | 3,490,687 | | | | 6,872,994 | | | | 7,332,791 | |
Net increase in net assets from operations | | $ | 4,198,370 | | | $ | 4,884,914 | | | $ | 9,665,339 | | | $ | 8,284,733 | |
Distributions to shareholders — | | | | | | | | | | | | | | | | |
From net investment income | | | | | | | | | | | | | | | | |
Class A | | $ | (956,768 | ) | | $ | (1,252,977 | ) | | $ | (1,732,165 | ) | | $ | (2,132,457 | ) |
Class B | | | (24,609 | ) | | | (21,267 | ) | | | (18,433 | ) | | | (61,277 | ) |
Class C | | | (248,899 | ) | | | (101,457 | ) | | | (376,540 | ) | | | (330,892 | ) |
Class I | | | (90,844 | ) | | | (53,179 | ) | | | (348,977 | ) | | | (206,202 | ) |
Total distributions to shareholders | | $ | (1,321,120 | ) | | $ | (1,428,880 | ) | | $ | (2,476,115 | ) | | $ | (2,730,828 | ) |
Transactions in shares of beneficial interest — | | | | | | | | | | | | | | | | |
Proceeds from sale of shares | | | | | | | | | | | | | | | | |
Class A | | $ | 864,605 | | | $ | 3,040,016 | | | $ | 5,273,680 | | | $ | 6,715,538 | |
Class B | | | 3,007 | | | | 1,097 | | | | 5,106 | | | | 1,374 | |
Class C | | | 1,161,897 | | | | 172,611 | | | | 1,340,271 | | | | 466,549 | |
Class I | | | 1,251,990 | | | | 201,366 | | | | 4,249,767 | | | | 2,001,222 | |
Net asset value of shares issued to shareholders in payment of distributions declared | | | | | | | | | | | | | | | | |
Class A | | | 726,596 | | | | 1,138,968 | | | | 1,524,550 | | | | 2,000,980 | |
Class B | | | 19,267 | | | | 20,174 | | | | 16,854 | | | | 57,799 | |
Class C | | | 186,374 | | | | 74,692 | | | | 326,208 | | | | 308,301 | |
Class I | | | 36,026 | | | | 44,759 | | | | 95,723 | | | | 76,691 | |
Cost of shares redeemed | | | | | | | | | | | | | | | | |
Class A | | | (4,465,290 | ) | | | (6,767,152 | ) | | | (15,365,474 | ) | | | (15,036,535 | ) |
Class B | | | (237,589 | ) | | | (28,295 | ) | | | (231,952 | ) | | | (438,953 | ) |
Class C | | | (2,928,668 | ) | | | (741,707 | ) | | | (3,105,640 | ) | | | (4,556,169 | ) |
Class I | | | (1,518,056 | ) | | | (1,896,485 | ) | | | (6,068,264 | ) | | | (7,599,913 | ) |
Net asset value of shares exchanged | | | | | | | | | | | | | | | | |
Class A | | | 202,448 | | | | 9,301 | | | | 22,110 | | | | 174,071 | |
Class B | | | (202,448 | ) | | | (9,301 | ) | | | (22,110 | ) | | | (174,071 | ) |
Net decrease in net assets from Fund share transactions | | $ | (4,899,841 | ) | | $ | (4,739,956 | ) | | $ | (11,939,171 | ) | | $ | (16,003,116 | ) |
| | | | |
Net decrease in net assets | | $ | (2,022,591 | ) | | $ | (1,283,922 | ) | | $ | (4,749,947 | ) | | $ | (10,449,211 | ) |
| | | | |
| Net Assets | | | | | | | | | | | | | | | | |
At beginning of period | | $ | 72,911,029 | | | $ | 72,450,923 | | | $ | 116,074,968 | | | $ | 122,655,591 | |
At end of period | | $ | 70,888,438 | | | $ | 71,167,001 | | | $ | 111,325,021 | | | $ | 112,206,380 | |
| | | |
Accumulated undistributed (distributions in excess of) net investment income
included in net assets | | | | | | | | | | | | | |
At end of period | | $ | (5,949 | ) | | $ | 30,687 | | | $ | 144,837 | | | $ | 244,770 | |
| | | | |
| | 54 | | See Notes to Financial Statements. |
Eaton Vance
Municipal Income Funds
February 28, 2014
Statements of Changes in Net Assets — continued
| | | | | | | | | | | | |
| | | Six Months Ended February 28, 2014 (Unaudited) | |
| Increase (Decrease) in Net Assets | | South Carolina Fund | | | Tennessee Fund | | | Virginia Fund | |
From operations — | | | | | | | | | | | | |
Net investment income | | $ | 2,818,833 | | | $ | 795,398 | | | $ | 1,800,590 | |
Net realized loss from investment transactions and financial futures contracts | | | (27,871 | ) | | | (313,725 | ) | | | (611,236 | ) |
Net change in unrealized appreciation (depreciation) from investments and financial futures contracts | | | 7,383,805 | | | | 1,376,595 | | | | 3,803,758 | |
Net increase in net assets from operations | | $ | 10,174,767 | | | $ | 1,858,268 | | | $ | 4,993,112 | |
Distributions to shareholders — | | | | | | | | | | | | |
From net investment income | | | | | | | | | | | | |
Class A | | $ | (1,765,652 | ) | | $ | (638,471 | ) | | $ | (1,349,353 | ) |
Class B | | | (45,976 | ) | | | (11,318 | ) | | | (25,054 | ) |
Class C | | | (493,435 | ) | | | (127,821 | ) | | | (134,160 | ) |
Class I | | | (485,069 | ) | | | (12,446 | ) | | | (322,280 | ) |
Total distributions to shareholders | | $ | (2,790,132 | ) | | $ | (790,056 | ) | | $ | (1,830,847 | ) |
Transactions in shares of beneficial interest — | | | | | | | | | | | | |
Proceeds from sale of shares | | | | | | | | | | | | |
Class A | | $ | 3,042,759 | | | $ | 370,876 | | | $ | 973,755 | |
Class B | | | 40,091 | | | | 40 | | | | 457 | |
Class C | | | 1,330,940 | | | | 304,326 | | | | 652,153 | |
Class I | | | 2,289,462 | | | | 70,005 | | | | 2,157,061 | |
Net asset value of shares issued to shareholders in payment of distributions declared | | | | | | | | | | | | |
Class A | | | 1,595,830 | | | | 562,497 | | | | 1,117,039 | |
Class B | | | 44,236 | | | | 10,632 | | | | 23,289 | |
Class C | | | 425,091 | | | | 113,187 | | | | 108,170 | |
Class I | | | 117,565 | | | | 11,788 | | | | 97,937 | |
Cost of shares redeemed | | | | | | | | | | | | |
Class A | | | (11,447,322 | ) | | | (5,232,439 | ) | | | (6,346,499 | ) |
Class B | | | (442,278 | ) | | | (28,700 | ) | | | (307,200 | ) |
Class C | | | (3,995,174 | ) | | | (2,010,052 | ) | | | (1,548,419 | ) |
Class I | | | (8,542,608 | ) | | | (186,524 | ) | | | (6,101,086 | ) |
Net asset value of shares exchanged | | | | | | | | | | | | |
Class A | | | 521,398 | | | | 87,350 | | | | 100,125 | |
Class B | | | (521,398 | ) | | | (87,350 | ) | | | (100,125 | ) |
Net decrease in net assets from Fund share transactions | | $ | (15,541,408 | ) | | $ | (6,014,364 | ) | | $ | (9,173,343 | ) |
| | | |
Net decrease in net assets | | $ | (8,156,773 | ) | | $ | (4,946,152 | ) | | $ | (6,011,078 | ) |
| | | |
| Net Assets | | | | | | | | | | | | |
At beginning of period | | $ | 128,068,065 | | | $ | 43,518,070 | | | $ | 91,984,970 | |
At end of period | | $ | 119,911,292 | | | $ | 38,571,918 | | | $ | 85,973,892 | |
| | |
Accumulated undistributed (distributions in excess of) net investment income
included in net assets | | | | | | | | | |
At end of period | | $ | 142,121 | | | $ | (10,944 | ) | | $ | 100,915 | |
| | | | |
| | 55 | | See Notes to Financial Statements. |
Eaton Vance
Municipal Income Funds
February 28, 2014
Statements of Changes in Net Assets — continued
| | | | | | | | | | | | | | | | |
| | | Year Ended August 31, 2013 | |
| Increase (Decrease) in Net Assets | | Alabama Fund | | | Arkansas Fund | | | Georgia Fund | | | Kentucky Fund | |
From operations — | | | | | | | | | | | | | | | | |
Net investment income | | $ | 2,005,930 | | | $ | 2,391,317 | | | $ | 2,579,198 | | | $ | 2,083,914 | |
Net realized gain (loss) from investment transactions and financial futures contracts | | | (579,152 | ) | | | 768,409 | | | | 879,597 | | | | 629,539 | |
Net change in unrealized appreciation (depreciation) from investments and financial futures contracts | | | (5,170,257 | ) | | | (6,532,963 | ) | | | (7,578,109 | ) | | | (4,123,789 | ) |
Net decrease in net assets from operations | | $ | (3,743,479 | ) | | $ | (3,373,237 | ) | | $ | (4,119,314 | ) | | $ | (1,410,336 | ) |
Distributions to shareholders — | | | | | | | | | | | | | | | | |
From net investment income | | | | | | | | | | | | | | | | |
Class A | | $ | (1,477,349 | ) | | $ | (2,012,978 | ) | | $ | (1,825,748 | ) | | $ | (1,633,308 | ) |
Class B | | | (27,950 | ) | | | (53,631 | ) | | | (47,858 | ) | | | (15,731 | ) |
Class C | | | (85,763 | ) | | | (202,657 | ) | | | (203,903 | ) | | | (126,086 | ) |
Class I | | | (407,353 | ) | | | (86,474 | ) | | | (465,037 | ) | | | (314,300 | ) |
Tax return of capital | | | | | | | | | | | | | | | | |
Class A | | | (13,915 | ) | | | (14,759 | ) | | | (18,233 | ) | | | — | |
Class B | | | (237 | ) | | | (374 | ) | | | (417 | ) | | | — | |
Class C | | | (826 | ) | | | (1,490 | ) | | | (1,990 | ) | | | — | |
Class I | | | (4,812 | ) | | | (602 | ) | | | (4,513 | ) | | | — | |
Total distributions to shareholders | | $ | (2,018,205 | ) | | $ | (2,372,965 | ) | | $ | (2,567,699 | ) | | $ | (2,089,425 | ) |
Transactions in shares of beneficial interest — | | | | | | | | | | | | | | | | |
Proceeds from sale of shares | | | | | | | | | | | | | | | | |
Class A | | $ | 1,975,321 | | | $ | 5,480,592 | | | $ | 4,497,469 | | | $ | 1,689,171 | |
Class B | | | 29,112 | | | | 11,148 | | | | 808 | | | | 518 | |
Class C | | | 683,788 | | | | 1,815,050 | | | | 1,046,598 | | | | 1,623,875 | |
Class I | | | 13,457,509 | | | | 491,335 | | | | 2,577,043 | | | | 3,594,569 | |
Net asset value of shares issued to shareholders in payment of distributions declared | | | | | | | | | | | | | | | | |
Class A | | | 1,153,454 | | | | 1,759,004 | | | | 1,420,282 | | | | 1,393,554 | |
Class B | | | 24,858 | | | | 48,372 | | | | 41,243 | | | | 13,140 | |
Class C | | | 39,863 | | | | 173,485 | | | | 164,289 | | | | 115,229 | |
Class I | | | 237,208 | | | | 82,612 | | | | 180,103 | | | | 305,420 | |
Cost of shares redeemed | | | | | | | | | | | | | | | | |
Class A | | | (5,704,168 | ) | | | (8,851,824 | ) | | | (6,920,023 | ) | | | (5,868,757 | ) |
Class B | | | (268,875 | ) | | | (322,956 | ) | | | (144,875 | ) | | | (100,296 | ) |
Class C | | | (935,690 | ) | | | (2,246,195 | ) | | | (2,175,453 | ) | | | (1,472,490 | ) |
Class I | | | (14,376,678 | ) | | | (877,995 | ) | | | (5,766,395 | ) | | | (1,728,463 | ) |
Net asset value of shares exchanged | | | | | | | | | | | | | | | | |
Class A | | | 399,913 | | | | 190,907 | | | | 769,730 | | | | 238,855 | |
Class B | | | (399,913 | ) | | | (190,907 | ) | | | (769,730 | ) | | | (238,855 | ) |
Net decrease in net assets from Fund share transactions | | $ | (3,684,298 | ) | | $ | (2,437,372 | ) | | $ | (5,078,911 | ) | | $ | (434,530 | ) |
| | | | |
Net decrease in net assets | | $ | (9,445,982 | ) | | $ | (8,183,574 | ) | | $ | (11,765,924 | ) | | $ | (3,934,291 | ) |
| | | | |
| Net Assets | | | | | | | | | | | | | | | | |
At beginning of year | | $ | 52,980,952 | | | $ | 67,548,563 | | | $ | 72,131,007 | | | $ | 54,971,184 | |
At end of year | | $ | 43,534,970 | | | $ | 59,364,989 | | | $ | 60,365,083 | | | $ | 51,036,893 | |
| | | | |
| Accumulated undistributed (distributions in excess of) net investment income included in net assets | | | | | | | | | | | | | | | | |
At end of year | | $ | (36,118 | ) | | $ | (14,806 | ) | | $ | (49,975 | ) | | $ | 7,778 | |
| | | | |
| | 56 | | See Notes to Financial Statements. |
Eaton Vance
Municipal Income Funds
February 28, 2014
Statements of Changes in Net Assets — continued
| | | | | | | | | | | | | | | | |
| | | Year Ended August 31, 2013 | |
| Increase (Decrease) in Net Assets | | Maryland Fund | | | Missouri Fund | | | North Carolina Fund | | | Oregon Fund | |
From operations — | | | | | | | | | | | | | | | | |
Net investment income | | $ | 2,900,518 | | | $ | 3,130,015 | | | $ | 5,373,255 | | | $ | 6,728,448 | |
Net realized gain (loss) from investment transactions and financial futures contracts | | | (48,486 | ) | | | (345,856 | ) | | | 932,390 | | | | 1,218,408 | |
Net change in unrealized appreciation (depreciation) from investments and financial futures contracts | | | (7,112,814 | ) | | | (8,240,380 | ) | | | (18,216,131 | ) | | | (27,216,820 | ) |
Net decrease in net assets from operations | | $ | (4,260,782 | ) | | $ | (5,456,221 | ) | | $ | (11,910,486 | ) | | $ | (19,269,964 | ) |
Distributions to shareholders — | | | | | | | | | | | | | | | | |
From net investment income | | | | | | | | | | | | | | | | |
Class A | | $ | (2,127,530 | ) | | $ | (2,736,650 | ) | | $ | (3,655,514 | ) | | $ | (4,488,911 | ) |
Class B | | | (58,193 | ) | | | (46,872 | ) | | | (56,763 | ) | | | (153,799 | ) |
Class C | | | (502,508 | ) | | | (191,398 | ) | | | (775,217 | ) | | | (764,117 | ) |
Class I | | | (186,012 | ) | | | (130,395 | ) | | | (824,186 | ) | | | (1,249,442 | ) |
Total distributions to shareholders | | $ | (2,874,243 | ) | | $ | (3,105,315 | ) | | $ | (5,311,680 | ) | | $ | (6,656,269 | ) |
Transactions in shares of beneficial interest — | | | | | | | | | | | | | | | | |
Proceeds from sale of shares | | | | | | | | | | | | | | | | |
Class A | | $ | 2,247,211 | | | $ | 5,128,716 | | | $ | 17,155,477 | | | $ | 16,887,947 | |
Class B | | | 5,610 | | | | 1,916 | | | | 10,982 | | | | 28,095 | |
Class C | | | 5,822,604 | | | | 1,225,133 | | | | 6,400,955 | | | | 4,914,291 | |
Class I | | | 3,256,429 | | | | 2,359,845 | | | | 6,750,600 | | | | 15,473,331 | |
Net asset value of shares issued to shareholders in payment of distributions declared | | | | | | | | | | | | | | | | |
Class A | | | 1,611,238 | | | | 2,461,127 | | | | 3,144,965 | | | | 4,063,234 | |
Class B | | | 46,181 | | | | 43,668 | | | | 51,469 | | | | 130,087 | |
Class C | | | 371,816 | | | | 142,360 | | | | 668,414 | | | | 683,527 | |
Class I | | | 80,933 | | | | 115,750 | | | | 240,109 | | | | 236,074 | |
Cost of shares redeemed | | | | | | | | | | | | | | | | |
Class A | | | (11,438,323 | ) | | | (19,979,981 | ) | | | (17,892,856 | ) | | | (30,937,743 | ) |
Class B | | | (215,277 | ) | | | (279,519 | ) | | | (443,701 | ) | | | (1,095,622 | ) |
Class C | | | (4,161,766 | ) | | | (997,196 | ) | | | (5,259,889 | ) | | | (8,566,283 | ) |
Class I | | | (2,071,133 | ) | | | (603,149 | ) | | | (6,768,021 | ) | | | (25,154,279 | ) |
Net asset value of shares exchanged | | | | | | | | | | | | | | | | |
Class A | | | 219,900 | | | | 309,940 | | | | 424,857 | | | | 1,156,080 | |
Class B | | | (219,900 | ) | | | (309,940 | ) | | | (424,857 | ) | | | (1,156,080 | ) |
Net increase (decrease) in net assets from Fund share transactions | | $ | (4,444,477 | ) | | $ | (10,381,330 | ) | | $ | 4,058,504 | | | $ | (23,337,341 | ) |
| | | | |
Net decrease in net assets | | $ | (11,579,502 | ) | | $ | (18,942,866 | ) | | $ | (13,163,662 | ) | | $ | (49,263,574 | ) |
| | | | |
| Net Assets | | | | | | | | | | | | | | | | |
At beginning of year | | $ | 84,490,531 | | | $ | 91,393,789 | | | $ | 129,238,630 | | | $ | 171,919,165 | |
At end of year | | $ | 72,911,029 | | | $ | 72,450,923 | | | $ | 116,074,968 | | | $ | 122,655,591 | |
|
Accumulated undistributed (distributions in excess of) net investment income
included in net assets | |
At end of year | | $ | (28,024 | ) | | $ | 91,424 | | | $ | 190,810 | | | $ | 200,616 | |
| | | | |
| | 57 | | See Notes to Financial Statements. |
Eaton Vance
Municipal Income Funds
February 28, 2014
Statements of Changes in Net Assets — continued
| | | | | | | | | | | | |
| | | Year Ended August 31, 2013 | |
| Increase (Decrease) in Net Assets | | South Carolina Fund | | | Tennessee Fund | | | Virginia Fund | |
From operations — | | | | | | | | | | | | |
Net investment income | | $ | 6,115,158 | | | $ | 1,787,609 | | | $ | 4,182,625 | |
Net realized gain from investment transactions and financial futures contracts | | | 1,077,428 | | | | 231,978 | | | | 2,480,006 | |
Net change in unrealized appreciation (depreciation) from investments and financial futures contracts | | | (20,756,957 | ) | | | (4,396,944 | ) | | | (10,598,782 | ) |
Net decrease in net assets from operations | | $ | (13,564,371 | ) | | $ | (2,377,357 | ) | | $ | (3,936,151 | ) |
Distributions to shareholders — | | | | | | | | | | | | |
From net investment income | | | | | | | | | | | | |
Class A | | $ | (3,717,852 | ) | | $ | (1,431,820 | ) | | $ | (2,993,409 | ) |
Class B | | | (113,761 | ) | | | (27,656 | ) | | | (72,239 | ) |
Class C | | | (1,036,581 | ) | | | (292,975 | ) | | | (289,266 | ) |
Class I | | | (1,196,833 | ) | | | (33,899 | ) | | | (769,621 | ) |
Tax return of capital | | | | | | | | | | | | |
Class A | | | — | | | | (10,518 | ) | | | — | |
Class B | | | — | | | | (193 | ) | | | — | |
Class C | | | — | | | | (2,195 | ) | | | — | |
Class I | | | — | | | | (258 | ) | | | — | |
Total distributions to shareholders | | $ | (6,065,027 | ) | | $ | (1,799,514 | ) | | $ | (4,124,535 | ) |
Transactions in shares of beneficial interest — | | | | | | | | | | | | |
Proceeds from sale of shares | | | | | | | | | | | | |
Class A | | $ | 13,775,130 | | | $ | 3,056,834 | | | $ | 3,448,747 | |
Class B | | | 934 | | | | 842 | | | | 70,801 | |
Class C | | | 7,559,520 | | | | 2,462,270 | | | | 1,533,525 | |
Class I | | | 13,880,416 | | | | 513,227 | | | | 4,008,961 | |
Net asset value of shares issued to shareholders in payment of distributions declared | | | | | | | | | | | | |
Class A | | | 3,273,808 | | | | 1,213,143 | | | | 2,445,319 | |
Class B | | | 108,571 | | | | 25,144 | | | | 65,496 | |
Class C | | | 878,136 | | | | 240,517 | | | | 229,400 | |
Class I | | | 261,574 | | | | 31,498 | | | | 170,644 | |
Cost of shares redeemed | | | | | | | | | | | | |
Class A | | | (22,924,674 | ) | | | (8,363,989 | ) | | | (15,127,824 | ) |
Class B | | | (457,861 | ) | | | (78,587 | ) | | | (763,710 | ) |
Class C | | | (8,215,322 | ) | | | (2,968,585 | ) | | | (2,167,560 | ) |
Class I | | | (13,774,661 | ) | | | (585,220 | ) | | | (5,849,449 | ) |
Net asset value of shares exchanged | | | | | | | | | | | | |
Class A | | | 355,710 | | | | 297,632 | | | | 412,244 | |
Class B | | | (355,710 | ) | | | (297,632 | ) | | | (412,244 | ) |
Net decrease in net assets from Fund share transactions | | $ | (5,634,429 | ) | | $ | (4,452,906 | ) | | $ | (11,935,650 | ) |
| | | |
Net decrease in net assets | | $ | (25,263,827 | ) | | $ | (8,629,777 | ) | | $ | (19,996,336 | ) |
| | | |
| Net Assets | | | | | | | | | | | | |
At beginning of year | | $ | 153,331,892 | | | $ | 52,147,847 | | | $ | 111,981,306 | |
At end of year | | $ | 128,068,065 | | | $ | 43,518,070 | | | $ | 91,984,970 | |
| | | |
Accumulated undistributed (distributions in excess of) net investment income
included in net assets | | | | | | | | | | | | |
At end of year | | $ | 113,420 | | | $ | (16,286 | ) | | $ | 131,172 | |
| | | | |
| | 58 | | See Notes to Financial Statements. |
Eaton Vance
Municipal Income Funds
February 28, 2014
Statements of Cash Flows (Unaudited)*
| | | | | | | | |
| | | Six Months Ended February 28, 2014 | |
| Cash Flows From Operating Activities | | Oregon Fund | | | South Carolina Fund | |
Net increase in net assets from operations | | $ | 8,284,733 | | | $ | 10,174,767 | |
Adjustments to reconcile net increase in net assets from operations to net cash provided by operating activities: | | | | | | | | |
Investments purchased | | | (10,776,554 | ) | | | (8,508,585 | ) |
Investments sold | | | 45,052,631 | | | | 41,544,034 | |
Net amortization/accretion of premium (discount) | | | (861,893 | ) | | | (256,376 | ) |
Increase in restricted cash | | | (195,000 | ) | | | — | |
Decrease in interest receivable | | | 274,874 | | | | 173,125 | |
Increase in receivable for variation margin on open financial futures contracts | | | (4,063 | ) | | | — | |
Decrease in payable to affiliate for investment adviser fee | | | (12,249 | ) | | | (10,324 | ) |
Decrease in payable to affiliate for distribution and service fees | | | (7,340 | ) | | | (6,704 | ) |
Decrease in interest expense and fees payable | | | (10,268 | ) | | | (978 | ) |
Decrease in accrued expenses | | | (32,165 | ) | | | (30,078 | ) |
Net change in unrealized (appreciation) depreciation from investments | | | (7,454,277 | ) | | | (7,383,805 | ) |
Net realized loss from investments | | | 1,719,208 | | | | 27,871 | |
Net cash provided by operating activities | | $ | 35,977,637 | | | $ | 35,722,947 | |
| | |
| Cash Flows From Financing Activities | | | | | | | | |
Proceeds from Fund shares sold | | $ | 9,257,978 | | | $ | 6,554,860 | |
Fund shares redeemed | | | (28,114,073 | ) | | | (25,045,199 | ) |
Distributions paid, net of reinvestments | | | (325,788 | ) | | | (648,650 | ) |
Repayment of secured borrowings | | | (9,915,000 | ) | | | (11,540,000 | ) |
Net cash used in financing activities | | $ | (29,096,883 | ) | | $ | (30,678,989 | ) |
| | |
Net increase in cash | | $ | 6,880,754 | | | $ | 5,043,958 | |
| | |
Cash at beginning of period | | $ | 1,946,423 | | | $ | 926,696 | |
| | |
Cash at end of period | | $ | 8,827,177 | | | $ | 5,970,654 | |
| | |
| Supplemental disclosure of cash flow information: | | | | | | | | |
Noncash financing activities not included herein consist of: | | | | | | | | |
Reinvestment of dividends and distributions | | $ | 2,443,771 | | | $ | 2,182,722 | |
Cash paid for interest and fees | | | 75,333 | | | | 64,907 | |
| * | Statement of Cash Flows is not required for Alabama Fund, Arkansas Fund, Georgia Fund, Kentucky Fund, Maryland Fund, Missouri Fund, North Carolina Fund, Tennessee Fund and Virginia Fund. |
| | | | |
| | 59 | | See Notes to Financial Statements. |
Eaton Vance
Municipal Income Funds
February 28, 2014
Financial Highlights
| | | | | | | | | | | | | | | | | | | | | | | | |
| | | Alabama Fund — Class A | |
| | | Six Months Ended
February 28, 2014
(Unaudited) | | | Year Ended August 31, | |
| | | | 2013 | | | 2012 | | | 2011 | | | 2010 | | | 2009 | |
Net asset value — Beginning of period | | $ | 9.000 | | | $ | 10.020 | | | $ | 9.540 | | | $ | 9.930 | | | $ | 9.290 | | | $ | 9.330 | |
|
| Income (Loss) From Operations | |
Net investment income(1) | | $ | 0.180 | | | $ | 0.356 | | | $ | 0.388 | | | $ | 0.405 | | | $ | 0.402 | | | $ | 0.402 | |
Net realized and unrealized gain (loss) | | | 0.430 | | | | (1.018 | ) | | | 0.481 | | | | (0.392 | ) | | | 0.634 | | | | (0.036 | ) |
| | | | | | |
Total income (loss) from operations | | $ | 0.610 | | | $ | (0.662 | ) | | $ | 0.869 | | | $ | 0.013 | | | $ | 1.036 | | | $ | 0.366 | |
|
| Less Distributions | |
From net investment income | | $ | (0.180 | ) | | $ | (0.355 | ) | | $ | (0.388 | ) | | $ | (0.403 | ) | | $ | (0.396 | ) | | $ | (0.406 | ) |
Tax return of capital | | | — | | | | (0.003 | ) | | | (0.001 | ) | | | — | | | | — | | | | — | |
| | | | | | |
Total distributions | | $ | (0.180 | ) | | $ | (0.358 | ) | | $ | (0.389 | ) | | $ | (0.403 | ) | | $ | (0.396 | ) | | $ | (0.406 | ) |
| | | | | | |
Net asset value — End of period | | $ | 9.430 | | | $ | 9.000 | | | $ | 10.020 | | | $ | 9.540 | | | $ | 9.930 | | | $ | 9.290 | |
| | | | | | |
Total Return(2) | | | 6.83 | %(3) | | | (6.85 | )% | | | 9.27 | % | | | 0.26 | % | | | 11.37 | % | | | 4.19 | % |
|
| Ratios/Supplemental Data | |
Net assets, end of period (000’s omitted) | | $ | 35,722 | | | $ | 36,117 | | | $ | 42,461 | | | $ | 42,857 | | | $ | 49,083 | | | $ | 43,090 | |
Ratios (as a percentage of average daily net assets): | | | | | | | | | | | | | | | | | | | | | | | | |
Expenses excluding interest and fees | | | 0.71 | %(4) | | | 0.73 | % | | | 0.74 | % | | | 0.73 | % | | | 0.73 | % | | | 0.80 | % |
Interest and fee expense(5) | | | 0.01 | %(4) | | | 0.02 | % | | | 0.03 | % | | | 0.03 | % | | | 0.02 | % | | | 0.05 | % |
Total expenses before custodian fee reduction | | | 0.72 | %(4) | | | 0.75 | % | | | 0.77 | % | | | 0.76 | % | | | 0.75 | % | | | 0.85 | % |
Expenses after custodian fee reduction excluding interest and fees | | | 0.71 | %(4) | | | 0.73 | % | | | 0.74 | % | | | 0.73 | % | | | 0.73 | % | | | 0.79 | % |
Net investment income | | | 3.95 | %(4) | | | 3.62 | % | | | 3.96 | % | | | 4.27 | % | | | 4.18 | % | | | 4.59 | % |
Portfolio Turnover | | | 3 | %(3) | | | 36 | % | | | 11 | % | | | 10 | % | | | 16 | % | | | 22 | % |
| (1) | Computed using average shares outstanding. |
| (2) | Returns are historical and are calculated by determining the percentage change in net asset value with all distributions reinvested and do not reflect the effect of sales charges. |
| (5) | Interest and fee expense relates to the liability for floating rate notes issued in conjunction with residual interest bond transactions (see Note 1I). |
| | | | |
| | 60 | | See Notes to Financial Statements. |
Eaton Vance
Municipal Income Funds
February 28, 2014
Financial Highlights — continued
| | | | | | | | | | | | | | | | | | | | | | | | |
| | | Alabama Fund — Class B | |
| | | Six Months Ended
February 28, 2014
(Unaudited) | | | Year Ended August 31, | |
| | | | 2013 | | | 2012 | | | 2011 | | | 2010 | | | 2009 | |
Net asset value — Beginning of period | | $ | 9.900 | | | $ | 11.020 | | | $ | 10.490 | | | $ | 10.920 | | | $ | 10.230 | | | $ | 10.270 | |
|
| Income (Loss) From Operations | |
Net investment income(1) | | $ | 0.161 | | | $ | 0.312 | | | $ | 0.346 | | | $ | 0.368 | | | $ | 0.365 | | | $ | 0.370 | |
Net realized and unrealized gain (loss) | | | 0.479 | | | | (1.120 | ) | | | 0.531 | | | | (0.433 | ) | | | 0.684 | | | | (0.036 | ) |
| | | | | | |
Total income (loss) from operations | | $ | 0.640 | | | $ | (0.808 | ) | | $ | 0.877 | | | $ | (0.065 | ) | | $ | 1.049 | | | $ | 0.334 | |
|
| Less Distributions | |
From net investment income | | $ | (0.160 | ) | | $ | (0.309 | ) | | $ | (0.346 | ) | | $ | (0.365 | ) | | $ | (0.359 | ) | | $ | (0.374 | ) |
Tax return of capital | | | — | | | | (0.003 | ) | | | (0.001 | ) | | | — | | | | — | | | | — | |
| | | | | | |
Total distributions | | $ | (0.160 | ) | | $ | (0.312 | ) | | $ | (0.347 | ) | | $ | (0.365 | ) | | $ | (0.359 | ) | | $ | (0.374 | ) |
| | | | | | |
Net asset value — End of period | | $ | 10.380 | | | $ | 9.900 | | | $ | 11.020 | | | $ | 10.490 | | | $ | 10.920 | | | $ | 10.230 | |
| | | | | | |
Total Return(2) | | | 6.51 | %(3) | | | (7.53 | )% | | | 8.48 | % | | | (0.51 | )% | | | 10.42 | % | | | 3.56 | % |
|
| Ratios/Supplemental Data | |
Net assets, end of period (000’s omitted) | | $ | 389 | | | $ | 606 | | | $ | 1,304 | | | $ | 1,682 | | | $ | 3,949 | | | $ | 6,380 | |
Ratios (as a percentage of average daily net assets): | | | | | | | | | | | | | | | | | | | | | | | | |
Expenses excluding interest and fees | | | 1.47 | %(4) | | | 1.48 | % | | | 1.49 | % | | | 1.49 | % | | | 1.48 | % | | | 1.55 | % |
Interest and fee expense(5) | | | 0.01 | %(4) | | | 0.02 | % | | | 0.03 | % | | | 0.03 | % | | | 0.02 | % | | | 0.05 | % |
Total expenses before custodian fee reduction | | | 1.48 | %(4) | | | 1.50 | % | | | 1.52 | % | | | 1.52 | % | | | 1.50 | % | | | 1.60 | % |
Expenses after custodian fee reduction excluding interest and fees | | | 1.47 | %(4) | | | 1.48 | % | | | 1.49 | % | | | 1.49 | % | | | 1.48 | % | | | 1.54 | % |
Net investment income | | | 3.20 | %(4) | | | 2.87 | % | | | 3.22 | % | | | 3.52 | % | | | 3.46 | % | | | 3.85 | % |
Portfolio Turnover | | | 3 | %(3) | | | 36 | % | | | 11 | % | | | 10 | % | | | 16 | % | | | 22 | % |
| (1) | Computed using average shares outstanding. |
| (2) | Returns are historical and are calculated by determining the percentage change in net asset value with all distributions reinvested and do not reflect the effect of sales charges. |
| (5) | Interest and fee expense relates to the liability for floating rate notes issued in conjunction with residual interest bond transactions (see Note 1I). |
| | | | |
| | 61 | | See Notes to Financial Statements. |
Eaton Vance
Municipal Income Funds
February 28, 2014
Financial Highlights — continued
| | | | | | | | | | | | | | | | | | | | | | | | |
| | | Alabama Fund — Class C | |
| | | Six Months Ended
February 28, 2014
(Unaudited) | | | Year Ended August 31, | |
| | | | 2013 | | | 2012 | | | 2011 | | | 2010 | | | 2009 | |
Net asset value — Beginning of period | | $ | 9.910 | | | $ | 11.030 | | | $ | 10.500 | | | $ | 10.930 | | | $ | 10.230 | | | $ | 10.270 | |
|
| Income (Loss) From Operations | |
Net investment income(1) | | $ | 0.161 | | | $ | 0.310 | | | $ | 0.345 | | | $ | 0.368 | | | $ | 0.361 | | | $ | 0.369 | |
Net realized and unrealized gain (loss) | | | 0.479 | | | | (1.117 | ) | | | 0.532 | | | | (0.432 | ) | | | 0.698 | | | | (0.035 | ) |
| | | | | | |
Total income (loss) from operations | | $ | 0.640 | | | $ | (0.807 | ) | | $ | 0.877 | | | $ | (0.064 | ) | | $ | 1.059 | | | $ | 0.334 | |
|
| Less Distributions | |
From net investment income | | $ | (0.160 | ) | | $ | (0.310 | ) | | $ | (0.346 | ) | | $ | (0.366 | ) | | $ | (0.359 | ) | | $ | (0.374 | ) |
Tax return of capital | | | — | | | | (0.003 | ) | | | (0.001 | ) | | | — | | | | — | | | | — | |
| | | | | | |
Total distributions | | $ | (0.160 | ) | | $ | (0.313 | ) | | $ | (0.347 | ) | | $ | (0.366 | ) | | $ | (0.359 | ) | | $ | (0.374 | ) |
| | | | | | |
Net asset value — End of period | | $ | 10.390 | | | $ | 9.910 | | | $ | 11.030 | | | $ | 10.500 | | | $ | 10.930 | | | $ | 10.230 | |
| | | | | | |
Total Return(2) | | | 6.50 | %(3) | | | (7.52 | )% | | | 8.47 | % | | | (0.50 | )% | | | 10.52 | % | | | 3.55 | % |
|
| Ratios/Supplemental Data | |
Net assets, end of period (000’s omitted) | | $ | 2,257 | | | $ | 2,410 | | | $ | 2,944 | | | $ | 2,440 | | | $ | 2,935 | | | $ | 1,562 | |
Ratios (as a percentage of average daily net assets): | | | | | | | | | | | | | | | | | | | | | | | | |
Expenses excluding interest and fees | | | 1.46 | %(4) | | | 1.47 | % | | | 1.48 | % | | | 1.48 | % | | | 1.48 | % | | | 1.55 | % |
Interest and fee expense(5) | | | 0.01 | %(4) | | | 0.02 | % | | | 0.03 | % | | | 0.03 | % | | | 0.02 | % | | | 0.05 | % |
Total expenses before custodian fee reduction | | | 1.47 | %(4) | | | 1.49 | % | | | 1.51 | % | | | 1.51 | % | | | 1.50 | % | | | 1.60 | % |
Expenses after custodian fee reduction excluding interest and fees | | | 1.46 | %(4) | | | 1.47 | % | | | 1.48 | % | | | 1.48 | % | | | 1.48 | % | | | 1.54 | % |
Net investment income | | | 3.20 | %(4) | | | 2.86 | % | | | 3.20 | % | | | 3.52 | % | | | 3.40 | % | | | 3.82 | % |
Portfolio Turnover | | | 3 | %(3) | | | 36 | % | | | 11 | % | | | 10 | % | | | 16 | % | | | 22 | % |
| (1) | Computed using average shares outstanding. |
| (2) | Returns are historical and are calculated by determining the percentage change in net asset value with all distributions reinvested and do not reflect the effect of sales charges. |
| (5) | Interest and fee expense relates to the liability for floating rate notes issued in conjunction with residual interest bond transactions (see Note 1I). |
| | | | |
| | 62 | | See Notes to Financial Statements. |
Eaton Vance
Municipal Income Funds
February 28, 2014
Financial Highlights — continued
| | | | | | | | | | | | | | | | | | | | | | | | |
| | | Alabama Fund — Class I | |
| | | Six Months Ended
February 28, 2014
(Unaudited) | | | Year Ended August 31, | |
| | | | 2013 | | | 2012 | | | 2011 | | | 2010 | | | 2009 | |
Net asset value — Beginning of period | | $ | 9.000 | | | $ | 10.020 | | | $ | 9.550 | | | $ | 9.930 | | | $ | 9.300 | | | $ | 9.340 | |
|
| Income (Loss) From Operations | |
Net investment income(1) | | $ | 0.190 | | | $ | 0.366 | | | $ | 0.407 | | | $ | 0.423 | | | $ | 0.420 | | | $ | 0.419 | |
Net realized and unrealized gain (loss) | | | 0.439 | | | | (1.008 | ) | | | 0.471 | | | | (0.380 | ) | | | 0.625 | | | | (0.035 | ) |
| | | | | | |
Total income (loss) from operations | | $ | 0.629 | | | $ | (0.642 | ) | | $ | 0.878 | | | $ | 0.043 | | | $ | 1.045 | | | $ | 0.384 | |
|
| Less Distributions | |
From net investment income | | $ | (0.189 | ) | | $ | (0.374 | ) | | $ | (0.407 | ) | | $ | (0.423 | ) | | $ | (0.415 | ) | | $ | (0.424 | ) |
Tax return of capital | | | — | | | | (0.004 | ) | | | (0.001 | ) | | | — | | | | — | | | | — | |
| | | | | | |
Total distributions | | $ | (0.189 | ) | | $ | (0.378 | ) | | $ | (0.408 | ) | | $ | (0.423 | ) | | $ | (0.415 | ) | | $ | (0.424 | ) |
| | | | | | |
Net asset value — End of period | | $ | 9.440 | | | $ | 9.000 | | | $ | 10.020 | | | $ | 9.550 | | | $ | 9.930 | | | $ | 9.300 | |
| | | | | | |
Total Return(2) | | | 7.05 | %(3) | | | (6.67 | )% | | | 9.37 | % | | | 0.56 | % | | | 11.47 | % | | | 4.51 | % |
|
| Ratios/Supplemental Data | |
Net assets, end of period (000’s omitted) | | $ | 4,049 | | | $ | 4,402 | | | $ | 6,272 | | | $ | 5,163 | | | $ | 4,201 | | | $ | 3,343 | |
Ratios (as a percentage of average daily net assets): | | | | | | | | | | | | | | | | | | | | | | | | |
Expenses excluding interest and fees | | | 0.51 | %(4) | | | 0.52 | % | | | 0.54 | % | | | 0.53 | % | | | 0.53 | % | | | 0.60 | % |
Interest and fee expense(5) | | | 0.01 | %(4) | | | 0.02 | % | | | 0.03 | % | | | 0.03 | % | | | 0.02 | % | | | 0.05 | % |
Total expenses before custodian fee reduction | | | 0.52 | %(4) | | | 0.54 | % | | | 0.57 | % | | | 0.56 | % | | | 0.55 | % | | | 0.65 | % |
Expenses after custodian fee reduction excluding interest and fees | | | 0.51 | %(4) | | | 0.52 | % | | | 0.54 | % | | | 0.53 | % | | | 0.53 | % | | | 0.59 | % |
Net investment income | | | 4.15 | %(4) | | | 3.71 | % | | | 4.15 | % | | | 4.46 | % | | | 4.37 | % | | | 4.79 | % |
Portfolio Turnover | | | 3 | %(3) | | | 36 | % | | | 11 | % | | | 10 | % | | | 16 | % | | | 22 | % |
| (1) | Computed using average shares outstanding. |
| (2) | Returns are historical and are calculated by determining the percentage change in net asset value with all distributions reinvested. |
| (5) | Interest and fee expense relates to the liability for floating rate notes issued in conjunction with residual interest bond transactions (see Note 1I). |
| | | | |
| | 63 | | See Notes to Financial Statements. |
Eaton Vance
Municipal Income Funds
February 28, 2014
Financial Highlights — continued
| | | | | | | | | | | | | | | | | | | | | | | | |
| | | Arkansas Fund — Class A | |
| | | Six Months Ended
February 28, 2014
(Unaudited) | | | Year Ended August 31, | |
| | | | 2013 | | | 2012 | | | 2011 | | | 2010 | | | 2009 | |
Net asset value — Beginning of period | | $ | 8.480 | | | $ | 9.260 | | | $ | 8.950 | | | $ | 9.230 | | | $ | 8.870 | | | $ | 9.160 | |
|
| Income (Loss) From Operations | |
Net investment income(1) | | $ | 0.169 | | | $ | 0.333 | | | $ | 0.357 | | | $ | 0.381 | | | $ | 0.377 | | | $ | 0.392 | |
Net realized and unrealized gain (loss) | | | 0.344 | | | | (0.783 | ) | | | 0.308 | | | | (0.283 | ) | | | 0.356 | | | | (0.278 | ) |
| | | | | | |
Total income (loss) from operations | | $ | 0.513 | | | $ | (0.450 | ) | | $ | 0.665 | | | $ | 0.098 | | | $ | 0.733 | | | $ | 0.114 | |
|
| Less Distributions | |
From net investment income | | $ | (0.183 | ) | | $ | (0.328 | ) | | $ | (0.351 | ) | | $ | (0.378 | ) | | $ | (0.373 | ) | | $ | (0.404 | ) |
Tax return of capital | | | — | | | | (0.002 | ) | | | (0.004 | ) | | | — | | | | — | | | | — | |
| | | | | | |
Total distributions | | $ | (0.183 | ) | | $ | (0.330 | ) | | $ | (0.355 | ) | | $ | (0.378 | ) | | $ | (0.373 | ) | | $ | (0.404 | ) |
| | | | | | |
Net asset value — End of period | | $ | 8.810 | | | $ | 8.480 | | | $ | 9.260 | | | $ | 8.950 | | | $ | 9.230 | | | $ | 8.870 | |
| | | | | | |
Total Return(2) | | | 6.10 | %(3) | | | (5.05 | )% | | | 7.55 | % | | | 1.17 | % | | | 8.39 | % | | | 1.55 | % |
|
| Ratios/Supplemental Data | |
Net assets, end of period (000’s omitted) | | $ | 46,343 | | | $ | 49,852 | | | $ | 56,072 | | | $ | 57,912 | | | $ | 63,478 | | | $ | 59,111 | |
Ratios (as a percentage of average daily net assets): | | | | | | | | | | | | | | | | | | | | | | | | |
Expenses excluding interest and fees | | | 0.74 | %(4) | | | 0.72 | % | | | 0.73 | % | | | 0.73 | % | | | 0.75 | % | | | 0.78 | % |
Interest and fee expense | | | — | | | | 0.00 | %(5)(6) | | | 0.01 | %(5) | | | 0.01 | %(5) | | | 0.01 | %(5) | | | 0.05 | %(5) |
Total expenses(7) | | | 0.74 | %(4) | | | 0.72 | % | | | 0.74 | % | | | 0.74 | % | | | 0.76 | % | | | 0.83 | % |
Net investment income | | | 3.94 | %(4) | | | 3.65 | % | | | 3.90 | % | | | 4.27 | % | | | 4.13 | % | | | 4.71 | % |
Portfolio Turnover | | | 4 | %(3) | | | 13 | % | | | 10 | % | | | 7 | % | | | 8 | % | | | 18 | % |
| (1) | Computed using average shares outstanding. |
| (2) | Returns are historical and are calculated by determining the percentage change in net asset value with all distributions reinvested and do not reflect the effect of sales charges. |
| (5) | Interest and fee expense relates to the liability for floating rate notes issued in conjunction with residual interest bond transactions (see Note 1I). |
| (6) | Amount is less than 0.005%. |
| (7) | Excludes the effect of custody fee credits, if any, of less than 0.005%. |
| | | | |
| | 64 | | See Notes to Financial Statements. |
Eaton Vance
Municipal Income Funds
February 28, 2014
Financial Highlights — continued
| | | | | | | | | | | | | | | | | | | | | | | | |
| | | Arkansas Fund — Class B | |
| | | Six Months Ended
February 28, 2014
(Unaudited) | | | Year Ended August 31, | |
| | | | 2013 | | | 2012 | | | 2011 | | | 2010 | | | 2009 | |
Net asset value — Beginning of period | | $ | 9.110 | | | $ | 9.950 | | | $ | 9.610 | | | $ | 9.910 | | | $ | 9.530 | | | $ | 9.850 | |
|
| Income (Loss) From Operations | |
Net investment income(1) | | $ | 0.147 | | | $ | 0.285 | | | $ | 0.310 | | | $ | 0.336 | | | $ | 0.332 | | | $ | 0.356 | |
Net realized and unrealized gain (loss) | | | 0.365 | | | | (0.844 | ) | | | 0.338 | | | | (0.302 | ) | | | 0.377 | | | | (0.311 | ) |
| | | | | | |
Total income (loss) from operations | | $ | 0.512 | | | $ | (0.559 | ) | | $ | 0.648 | | | $ | 0.034 | | | $ | 0.709 | | | $ | 0.045 | |
|
| Less Distributions | |
From net investment income | | $ | (0.162 | ) | | $ | (0.279 | ) | | $ | (0.305 | ) | | $ | (0.334 | ) | | $ | (0.329 | ) | | $ | (0.365 | ) |
Tax return of capital | | | — | | | | (0.002 | ) | | | (0.003 | ) | | | — | | | | — | | | | — | |
| | | | | | |
Total distributions | | $ | (0.162 | ) | | $ | (0.281 | ) | | $ | (0.308 | ) | | $ | (0.334 | ) | | $ | (0.329 | ) | | $ | (0.365 | ) |
| | | | | | |
Net asset value — End of period | | $ | 9.460 | | | $ | 9.110 | | | $ | 9.950 | | | $ | 9.610 | | | $ | 9.910 | | | $ | 9.530 | |
| | | | | | |
Total Return(2) | | | 5.66 | %(3) | | | (5.78 | )% | | | 6.82 | % | | | 0.42 | % | | | 7.53 | % | | | 0.80 | % |
|
| Ratios/Supplemental Data | |
Net assets, end of period (000’s omitted) | | $ | 1,154 | | | $ | 1,512 | | | $ | 2,115 | | | $ | 2,717 | | | $ | 3,178 | | | $ | 3,525 | |
Ratios (as a percentage of average daily net assets): | | | | | | | | | | | | | | | | | | | | | | | | |
Expenses excluding interest and fees | | | 1.49 | %(4) | | | 1.48 | % | | | 1.48 | % | | | 1.48 | % | | | 1.50 | % | | | 1.53 | % |
Interest and fee expense | | | — | | | | 0.00 | %(5)(6) | | | 0.01 | %(5) | | | 0.01 | %(5) | | | 0.01 | %(5) | | | 0.05 | %(5) |
Total expenses(7) | | | 1.49 | %(4) | | | 1.48 | % | | | 1.49 | % | | | 1.49 | % | | | 1.51 | % | | | 1.58 | % |
Net investment income | | | 3.18 | %(4) | | | 2.90 | % | | | 3.16 | % | | | 3.52 | % | | | 3.38 | % | | | 3.98 | % |
Portfolio Turnover | | | 4 | %(3) | | | 13 | % | | | 10 | % | | | 7 | % | | | 8 | % | | | 18 | % |
| (1) | Computed using average shares outstanding. |
| (2) | Returns are historical and are calculated by determining the percentage change in net asset value with all distributions reinvested and do not reflect the effect of sales charges. |
| (5) | Interest and fee expense relates to the liability for floating rate notes issued in conjunction with residual interest bond transactions (see Note 1I). |
| (6) | Amount is less than 0.005%. |
| (7) | Excludes the effect of custody fee credits, if any, of less than 0.005%. |
| | | | |
| | 65 | | See Notes to Financial Statements. |
Eaton Vance
Municipal Income Funds
February 28, 2014
Financial Highlights — continued
| | | | | | | | | | | | | | | | | | | | | | | | |
| | | Arkansas Fund — Class C | |
| | | Six Months Ended
February 28, 2014
(Unaudited) | | | Year Ended August 31, | |
| | | | 2013 | | | 2012 | | | 2011 | | | 2010 | | | 2009 | |
Net asset value — Beginning of period | | $ | 9.110 | | | $ | 9.950 | | | $ | 9.610 | | | $ | 9.910 | | | $ | 9.530 | | | $ | 9.850 | |
|
| Income (Loss) From Operations | |
Net investment income(1) | | $ | 0.147 | | | $ | 0.284 | | | $ | 0.309 | | | $ | 0.336 | | | $ | 0.329 | | | $ | 0.354 | |
Net realized and unrealized gain (loss) | | | 0.365 | | | | (0.843 | ) | | | 0.339 | | | | (0.302 | ) | | | 0.380 | | | | (0.309 | ) |
| | | | | | |
Total income (loss) from operations | | $ | 0.512 | | | $ | (0.559 | ) | | $ | 0.648 | | | $ | 0.034 | | | $ | 0.709 | | | $ | 0.045 | |
|
| Less Distributions | |
From net investment income | | $ | (0.162 | ) | | $ | (0.279 | ) | | $ | (0.305 | ) | | $ | (0.334 | ) | | $ | (0.329 | ) | | $ | (0.365 | ) |
Tax return of capital | | | — | | | | (0.002 | ) | | | (0.003 | ) | | | — | | | | — | | | | — | |
| | | | | | |
Total distributions | | $ | (0.162 | ) | | $ | (0.281 | ) | | $ | (0.308 | ) | | $ | (0.334 | ) | | $ | (0.329 | ) | | $ | (0.365 | ) |
| | | | | | |
Net asset value — End of period | | $ | 9.460 | | | $ | 9.110 | | | $ | 9.950 | | | $ | 9.610 | | | $ | 9.910 | | | $ | 9.530 | |
| | | | | | |
Total Return(2) | | | 5.66 | %(3) | | | (5.78 | )% | | | 6.82 | % | | | 0.42 | % | | | 7.53 | % | | | 0.80 | % |
|
| Ratios/Supplemental Data | |
Net assets, end of period (000’s omitted) | | $ | 5,399 | | | $ | 6,052 | | | $ | 6,926 | | | $ | 6,409 | | | $ | 6,078 | | | $ | 3,386 | |
Ratios (as a percentage of average daily net assets): | | | | | | | | | | | | | | | | | | | | | | | | |
Expenses excluding interest and fees | | | 1.49 | %(4) | | | 1.48 | % | | | 1.48 | % | | | 1.48 | % | | | 1.50 | % | | | 1.53 | % |
Interest and fee expense | | | — | | | | 0.00 | %(5)(6) | | | 0.01 | %(5) | | | 0.01 | %(5) | | | 0.01 | %(5) | | | 0.05 | %(5) |
Total expenses before custodian fee reduction(7) | | | 1.49 | %(4) | | | 1.48 | % | | | 1.49 | % | | | 1.49 | % | | | 1.51 | % | | | 1.58 | % |
Net investment income | | | 3.20 | %(4) | | | 2.90 | % | | | 3.14 | % | | | 3.52 | % | | | 3.35 | % | | | 3.95 | % |
Portfolio Turnover | | | 4 | %(3) | | | 13 | % | | | 10 | % | | | 7 | % | | | 8 | % | | | 18 | % |
| (1) | Computed using average shares outstanding. |
| (2) | Returns are historical and are calculated by determining the percentage change in net asset value with all distributions reinvested and do not reflect the effect of sales charges. |
| (5) | Interest and fee expense relates to the liability for floating rate notes issued in conjunction with residual interest bond transactions (see Note 1I). |
| (6) | Amount is less than 0.005%. |
| (7) | Excludes the effect of custody fee credits, if any, of less than 0.005%. |
| | | | |
| | 66 | | See Notes to Financial Statements. |
Eaton Vance
Municipal Income Funds
February 28, 2014
Financial Highlights — continued
| | | | | | | | | | | | | | | | | | | | |
| | | Arkansas Fund — Class I | |
| | | Six Months Ended
February 28, 2014
(Unaudited) | | | Year Ended August 31, | | | Period Ended August 31, 2010(1) | |
| | | | 2013 | | | 2012 | | | 2011 | | |
Net asset value — Beginning of period | | $ | 8.470 | | | $ | 9.250 | | | $ | 8.940 | | | $ | 9.220 | | | $ | 9.130 | |
| | | | | |
| Income (Loss) From Operations | | | | | | | | | | | | | | | | | | | | |
Net investment income(2) | | $ | 0.177 | | | $ | 0.352 | | | $ | 0.373 | | | $ | 0.394 | | | $ | 0.031 | |
Net realized and unrealized gain (loss) | | | 0.344 | | | | (0.784 | ) | | | 0.310 | | | | (0.277 | ) | | | 0.090 | |
| | | | | |
Total income (loss) from operations | | $ | 0.521 | | | $ | (0.432 | ) | | $ | 0.683 | | | $ | 0.117 | | | $ | 0.121 | |
| | | | | |
| Less Distributions | | | | | | | | | | | | | | | | | | | | |
From net investment income | | $ | (0.191 | ) | | $ | (0.345 | ) | | $ | (0.369 | ) | | $ | (0.397 | ) | | $ | (0.031 | ) |
Tax return of capital | | | — | | | | (0.003 | ) | | | (0.004 | ) | | | — | | | | — | |
| | | | | |
Total distributions | | $ | (0.191 | ) | | $ | (0.348 | ) | | $ | (0.373 | ) | | $ | (0.397 | ) | | $ | (0.031 | ) |
| | | | | |
Net asset value — End of period | | $ | 8.800 | | | $ | 8.470 | | | $ | 9.250 | | | $ | 8.940 | | | $ | 9.220 | |
| | | | | |
Total Return(3) | | | 6.21 | %(4) | | | (4.87 | )% | | | 7.77 | % | | | 1.38 | % | | | 1.32 | %(4) |
|
| Ratios/Supplemental Data | |
Net assets, end of period (000’s omitted) | | $ | 2,332 | | | $ | 1,948 | | | $ | 2,435 | | | $ | 1,742 | | | $ | 1 | |
Ratios (as a percentage of average daily net assets): | | | | | | | | | | | | | | | | | | | | |
Expenses excluding interest and fees | | | 0.54 | %(5) | | | 0.53 | % | | | 0.53 | % | | | 0.53 | % | | | 0.55 | %(5) |
Interest and fee expense | | | — | | | | 0.00 | %(6)(7) | | | 0.01 | %(6) | | | 0.01 | %(6) | | | 0.01 | %(5)(6) |
Total expenses(8) | | | 0.54 | %(5) | | | 0.53 | % | | | 0.54 | % | | | 0.54 | % | | | 0.56 | %(5) |
Net investment income | | | 4.13 | %(5) | | | 3.85 | % | | | 4.07 | % | | | 4.40 | % | | | 4.25 | %(5) |
Portfolio Turnover | | | 4 | %(4) | | | 13 | % | | | 10 | % | | | 7 | % | | | 8 | %(9) |
| (1) | For the period from the commencement of operations on August 3, 2010 to August 31, 2010. |
| (2) | Computed using average shares outstanding. |
| (3) | Returns are historical and are calculated by determining the percentage change in net asset value with all distributions reinvested. |
| (6) | Interest and fee expense relates to the liability for floating rate notes issued in conjunction with residual interest bond transactions (see Note 1I). |
| (7) | Amount is less than 0.005%. |
| (8) | Excludes the effect of custody fee credits, if any, of less than 0.005%. |
| (9) | For the year ended August 31, 2010. |
| | | | |
| | 67 | | See Notes to Financial Statements. |
Eaton Vance
Municipal Income Funds
February 28, 2014
Financial Highlights — continued
| | | | | | | | | | | | | | | | | | | | | | | | |
| | | Georgia Fund — Class A | |
| | | Six Months Ended
February 28, 2014
(Unaudited) | | | Year Ended August 31, | |
| | | | 2013 | | | 2012 | | | 2011 | | | 2010 | | | 2009 | |
Net asset value — Beginning of period | | $ | 8.030 | | | $ | 8.860 | | | $ | 8.440 | | | $ | 8.820 | | | $ | 8.500 | | | $ | 8.730 | |
|
| Income (Loss) From Operations | |
Net investment income(1) | | $ | 0.168 | | | $ | 0.322 | | | $ | 0.352 | | | $ | 0.410 | | | $ | 0.400 | | | $ | 0.391 | |
Net realized and unrealized gain (loss) | | | 0.399 | | | | (0.831 | ) | | | 0.419 | | | | (0.391 | ) | | | 0.310 | | | | (0.229 | ) |
| | | | | | |
Total income (loss) from operations | | $ | 0.567 | | | $ | (0.509 | ) | | $ | 0.771 | | | $ | 0.019 | | | $ | 0.710 | | | $ | 0.162 | |
|
| Less Distributions | |
From net investment income | | $ | (0.167 | ) | | $ | (0.318 | ) | | $ | (0.349 | ) | | $ | (0.399 | ) | | $ | (0.390 | ) | | $ | (0.392 | ) |
Tax return of capital | | | — | | | | (0.003 | ) | | | (0.002 | ) | | | — | | | | — | | | | — | |
| | | | | | |
Total distributions | | $ | (0.167 | ) | | $ | (0.321 | ) | | $ | (0.351 | ) | | $ | (0.399 | ) | | $ | (0.390 | ) | | $ | (0.392 | ) |
| | | | | | |
Net asset value — End of period | | $ | 8.430 | | | $ | 8.030 | | | $ | 8.860 | | | $ | 8.440 | | | $ | 8.820 | | | $ | 8.500 | |
| | | | | | |
Total Return(2) | | | 7.11 | %(3) | | | (5.98 | )% | | | 9.31 | % | | | 0.32 | % | | | 8.49 | % | | | 2.30 | % |
|
| Ratios/Supplemental Data | |
Net assets, end of period (000’s omitted) | | $ | 43,194 | | | $ | 45,169 | | | $ | 50,236 | | | $ | 48,635 | | | $ | 58,448 | | | $ | 63,387 | |
Ratios (as a percentage of average daily net assets): | | | | | | | | | | | | | | | | | | | | | | | | |
Expenses excluding interest and fees | | | 0.72 | %(4) | | | 0.72 | % | | | 0.74 | % | | | 0.76 | % | | | 0.76 | % | | | 0.83 | % |
Interest and fee expense(5) | | | 0.04 | %(4) | | | 0.04 | % | | | 0.05 | % | | | 0.09 | % | | | 0.09 | % | | | 0.18 | % |
Total expenses before custodian fee reduction | | | 0.76 | %(4) | | | 0.76 | % | | | 0.79 | % | | | 0.85 | % | | | 0.85 | % | | | 1.01 | % |
Expenses after custodian fee reduction excluding interest and fees | | | 0.72 | %(4) | | | 0.72 | % | | | 0.74 | % | | | 0.76 | % | | | 0.76 | % | | | 0.81 | % |
Net investment income | | | 4.11 | %(4) | | | 3.69 | % | | | 4.06 | % | | | 4.84 | % | | | 4.57 | % | | | 4.92 | % |
Portfolio Turnover | | | 4 | %(3) | | | 19 | % | | | 12 | % | | | 6 | % | | | 12 | % | | | 18 | % |
| (1) | Computed using average shares outstanding. |
| (2) | Returns are historical and are calculated by determining the percentage change in net asset value with all distributions reinvested and do not reflect the effect of sales charges. |
| (5) | Interest and fee expense relates to the liability for floating rate notes issued in conjunction with residual interest bond transactions (see Note 1I). |
| | | | |
| | 68 | | See Notes to Financial Statements. |
Eaton Vance
Municipal Income Funds
February 28, 2014
Financial Highlights — continued
| | | | | | | | | | | | | | | | | | | | | | | | |
| | | Georgia Fund — Class B | |
| | | Six Months Ended
February 28, 2014
(Unaudited) | | | Year Ended August 31, | |
| | | | 2013 | | | 2012 | | | 2011 | | | 2010 | | | 2009 | |
Net asset value — Beginning of period | | $ | 8.580 | | | $ | 9.470 | | | $ | 9.020 | | | $ | 9.430 | | | $ | 9.080 | | | $ | 9.320 | |
|
| Income (Loss) From Operations | |
Net investment income(1) | | $ | 0.147 | | | $ | 0.275 | | | $ | 0.309 | | | $ | 0.371 | | | $ | 0.357 | | | $ | 0.354 | |
Net realized and unrealized gain (loss) | | | 0.419 | | | | (0.892 | ) | | | 0.446 | | | | (0.422 | ) | | | 0.342 | | | | (0.241 | ) |
| | | | | | |
Total income (loss) from operations | | $ | 0.566 | | | $ | (0.617 | ) | | $ | 0.755 | | | $ | (0.051 | ) | | $ | 0.699 | | | $ | 0.113 | |
|
| Less Distributions | |
From net investment income | | $ | (0.146 | ) | | $ | (0.270 | ) | | $ | (0.303 | ) | | $ | (0.359 | ) | | $ | (0.349 | ) | | $ | (0.353 | ) |
Tax return of capital | | | — | | | | (0.003 | ) | | | (0.002 | ) | | | — | | | | — | | | | — | |
| | | | | | |
Total distributions | | $ | (0.146 | ) | | $ | (0.273 | ) | | $ | (0.305 | ) | | $ | (0.359 | ) | | $ | (0.349 | ) | | $ | (0.353 | ) |
| | | | | | |
Net asset value — End of period | | $ | 9.000 | | | $ | 8.580 | | | $ | 9.470 | | | $ | 9.020 | | | $ | 9.430 | | | $ | 9.080 | |
| | | | | | |
Total Return(2) | | | 6.63 | %(3) | | | (6.71 | )% | | | 8.51 | % | | | (0.47 | )% | | | 7.80 | % | | | 1.45 | % |
|
| Ratios/Supplemental Data | |
Net assets, end of period (000’s omitted) | | $ | 1,045 | | | $ | 1,162 | | | $ | 2,157 | | | $ | 3,086 | | | $ | 5,143 | | | $ | 6,387 | |
Ratios (as a percentage of average daily net assets): | | | | | | | | | | | | | | | | | | | | | | | | |
Expenses excluding interest and fees | | | 1.47 | %(4) | | | 1.47 | % | | | 1.49 | % | | | 1.51 | % | | | 1.51 | % | | | 1.57 | % |
Interest and fee expense(5) | | | 0.04 | %(4) | | | 0.04 | % | | | 0.05 | % | | | 0.09 | % | | | 0.09 | % | | | 0.18 | % |
Total expenses before custodian fee reduction | | | 1.51 | %(4) | | | 1.51 | % | | | 1.54 | % | | | 1.60 | % | | | 1.60 | % | | | 1.75 | % |
Expenses after custodian fee reduction excluding interest and fees | | | 1.47 | %(4) | | | 1.47 | % | | | 1.49 | % | | | 1.51 | % | | | 1.51 | % | | | 1.56 | % |
Net investment income | | | 3.37 | %(4) | | | 2.94 | % | | | 3.35 | % | | | 4.09 | % | | | 3.81 | % | | | 4.18 | % |
Portfolio Turnover | | | 4 | %(3) | | | 19 | % | | | 12 | % | | | 6 | % | | | 12 | % | | | 18 | % |
| (1) | Computed using average shares outstanding. |
| (2) | Returns are historical and are calculated by determining the percentage change in net asset value with all distributions reinvested and do not reflect the effect of sales charges. |
| (5) | Interest and fee expense relates to the liability for floating rate notes issued in conjunction with residual interest bond transactions (see Note 1I). |
| | | | |
| | 69 | | See Notes to Financial Statements. |
Eaton Vance
Municipal Income Funds
February 28, 2014
Financial Highlights — continued
| | | | | | | | | | | | | | | | | | | | | | | | |
| | | Georgia Fund — Class C | |
| | | Six Months Ended
February 28, 2014
(Unaudited) | | | Year Ended August 31, | |
| | | | 2013 | | | 2012 | | | 2011 | | | 2010 | | | 2009 | |
Net asset value — Beginning of period | | $ | 8.580 | | | $ | 9.480 | | | $ | 9.030 | | | $ | 9.430 | | | $ | 9.090 | | | $ | 9.330 | |
|
| Income (Loss) From Operations | |
Net investment income(1) | | $ | 0.147 | | | $ | 0.275 | | | $ | 0.306 | | | $ | 0.372 | | | $ | 0.357 | | | $ | 0.354 | |
Net realized and unrealized gain (loss) | | | 0.429 | | | | (0.902 | ) | | | 0.450 | | | | (0.413 | ) | | | 0.333 | | | | (0.241 | ) |
| | | | | | |
Total income (loss) from operations | | $ | 0.576 | | | $ | (0.627 | ) | | $ | 0.756 | | | $ | (0.041 | ) | | $ | 0.690 | | | $ | 0.113 | |
|
| Less Distributions | |
From net investment income | | $ | (0.146 | ) | | $ | (0.270 | ) | | $ | (0.304 | ) | | $ | (0.359 | ) | | $ | (0.350 | ) | | $ | (0.353 | ) |
Tax return of capital | | | — | | | | (0.003 | ) | | | (0.002 | ) | | | — | | | | — | | | | — | |
| | | | | | |
Total distributions | | $ | (0.146 | ) | | $ | (0.273 | ) | | $ | (0.306 | ) | | $ | (0.359 | ) | | $ | (0.350 | ) | | $ | (0.353 | ) |
| | | | | | |
Net asset value — End of period | | $ | 9.010 | | | $ | 8.580 | | | $ | 9.480 | | | $ | 9.030 | | | $ | 9.430 | | | $ | 9.090 | |
| | | | | | |
Total Return(2) | | | 6.75 | %(3) | | | (6.81 | )% | | | 8.50 | % | | | (0.36 | )% | | | 7.69 | % | | | 1.56 | % |
|
| Ratios/Supplemental Data | |
Net assets, end of period (000’s omitted) | | $ | 5,349 | | | $ | 5,683 | | | $ | 7,277 | | | $ | 6,996 | | | $ | 9,621 | | | $ | 8,190 | |
Ratios (as a percentage of average daily net assets): | | | | | | | | | | | | | | | | | | | | | | | | |
Expenses excluding interest and fees | | | 1.47 | %(4) | | | 1.47 | % | | | 1.49 | % | | | 1.51 | % | | | 1.51 | % | | | 1.57 | % |
Interest and fee expense(5) | | | 0.04 | %(4) | | | 0.04 | % | | | 0.05 | % | | | 0.09 | % | | | 0.09 | % | | | 0.18 | % |
Total expenses before custodian fee reduction | | | 1.51 | %(4) | | | 1.51 | % | | | 1.54 | % | | | 1.60 | % | | | 1.60 | % | | | 1.75 | % |
Expenses after custodian fee reduction excluding interest and fees | | | 1.47 | %(4) | | | 1.47 | % | | | 1.49 | % | | | 1.51 | % | | | 1.51 | % | | | 1.56 | % |
Net investment income | | | 3.36 | %(4) | | | 2.93 | % | | | 3.31 | % | | | 4.10 | % | | | 3.81 | % | | | 4.16 | % |
Portfolio Turnover | | | 4 | %(3) | | | 19 | % | | | 12 | % | | | 6 | % | | | 12 | % | | | 18 | % |
| (1) | Computed using average shares outstanding. |
| (2) | Returns are historical and are calculated by determining the percentage change in net asset value with all distributions reinvested and do not reflect the effect of sales charges. |
| (5) | Interest and fee expense relates to the liability for floating rate notes issued in conjunction with residual interest bond transactions (see Note 1I). |
| | | | |
| | 70 | | See Notes to Financial Statements. |
Eaton Vance
Municipal Income Funds
February 28, 2014
Financial Highlights — continued
| | | | | | | | | | | | | | | | | | | | | | | | |
| | | Georgia Fund — Class I | |
| | | Six Months Ended
February 28, 2014
(Unaudited) | | | Year Ended August 31, | |
| | | | 2013 | | | 2012 | | | 2011 | | | 2010 | | | 2009 | |
Net asset value — Beginning of period | | $ | 8.050 | | | $ | 8.890 | | | $ | 8.470 | | | $ | 8.850 | | | $ | 8.520 | | | $ | 8.750 | |
|
| Income (Loss) From Operations | |
Net investment income(1) | | $ | 0.177 | | | $ | 0.341 | | | $ | 0.367 | | | $ | 0.427 | | | $ | 0.419 | | | $ | 0.407 | |
Net realized and unrealized gain (loss) | | | 0.399 | | | | (0.842 | ) | | | 0.422 | | | | (0.390 | ) | | | 0.319 | | | | (0.228 | ) |
| | | | | | |
Total income (loss) from operations | | $ | 0.576 | | | $ | (0.501 | ) | | $ | 0.789 | | | $ | 0.037 | | | $ | 0.738 | | | $ | 0.179 | |
|
| Less Distributions | |
From net investment income | | $ | (0.176 | ) | | $ | (0.336 | ) | | $ | (0.366 | ) | | $ | (0.417 | ) | | $ | (0.408 | ) | | $ | (0.409 | ) |
Tax return of capital | | | — | | | | (0.003 | ) | | | (0.003 | ) | | | — | | | | — | | | | — | |
| | | | | | |
Total distributions | | $ | (0.176 | ) | | $ | (0.339 | ) | | $ | (0.369 | ) | | $ | (0.417 | ) | | $ | (0.408 | ) | | $ | (0.409 | ) |
| | | | | | |
Net asset value — End of period | | $ | 8.450 | | | $ | 8.050 | | | $ | 8.890 | | | $ | 8.470 | | | $ | 8.850 | | | $ | 8.520 | |
| | | | | | |
Total Return(2) | | | 7.21 | %(3) | | | (5.87 | )% | | | 9.50 | % | | | 0.53 | % | | | 8.81 | % | | | 2.51 | % |
|
| Ratios/Supplemental Data | |
Net assets, end of period (000’s omitted) | | $ | 8,233 | | | $ | 8,352 | | | $ | 12,462 | | | $ | 9,207 | | | $ | 8,725 | | | $ | 6,555 | |
Ratios (as a percentage of average daily net assets): | | | | | | | | | | | | | | | | | | | | | | | | |
Expenses excluding interest and fees | | | 0.52 | %(4) | | | 0.52 | % | | | 0.54 | % | | | 0.56 | % | | | 0.56 | % | | | 0.62 | % |
Interest and fee expense(5) | | | 0.04 | %(4) | | | 0.04 | % | | | 0.05 | % | | | 0.09 | % | | | 0.09 | % | | | 0.18 | % |
Total expenses before custodian fee reduction | | | 0.56 | %(4) | | | 0.56 | % | | | 0.59 | % | | | 0.65 | % | | | 0.65 | % | | | 0.80 | % |
Expenses after custodian fee reduction excluding interest and fees | | | 0.52 | %(4) | | | 0.52 | % | | | 0.54 | % | | | 0.56 | % | | | 0.56 | % | | | 0.61 | % |
Net investment income | | | 4.31 | %(4) | | | 3.88 | % | | | 4.22 | % | | | 5.03 | % | | | 4.77 | % | | | 5.12 | % |
Portfolio Turnover | | | 4 | %(3) | | | 19 | % | | | 12 | % | | | 6 | % | | | 12 | % | | | 18 | % |
| (1) | Computed using average shares outstanding. |
| (2) | Returns are historical and are calculated by determining the percentage change in net asset value with all distributions reinvested. |
| (5) | Interest and fee expense relates to the liability for floating rate notes issued in conjunction with residual interest bond transactions (see Note 1I). |
| | | | |
| | 71 | | See Notes to Financial Statements. |
Eaton Vance
Municipal Income Funds
February 28, 2014
Financial Highlights — continued
| | | | | | | | | | | | | | | | | | | | | | | | |
| | | Kentucky Fund — Class A | |
| | | Six Months Ended
February 28, 2014
(Unaudited) | | | Year Ended August 31, | |
| | | | 2013 | | | 2012 | | | 2011 | | | 2010 | | | 2009 | |
Net asset value — Beginning of period | | $ | 8.410 | | | $ | 8.970 | | | $ | 8.610 | | | $ | 8.890 | | | $ | 8.410 | | | $ | 8.610 | |
|
| Income (Loss) From Operations | |
Net investment income(1) | | $ | 0.176 | | | $ | 0.339 | | | $ | 0.349 | | | $ | 0.371 | | | $ | 0.380 | | | $ | 0.382 | |
Net realized and unrealized gain (loss) | | | 0.290 | | | | (0.560 | ) | | | 0.359 | | | | (0.281 | ) | | | 0.473 | | | | (0.200 | ) |
| | | | | | |
Total income (loss) from operations | | $ | 0.466 | | | $ | (0.221 | ) | | $ | 0.708 | | | $ | 0.090 | | | $ | 0.853 | | | $ | 0.182 | |
|
| Less Distributions | |
From net investment income | | $ | (0.176 | ) | | $ | (0.339 | ) | | $ | (0.348 | ) | | $ | (0.370 | ) | | $ | (0.373 | ) | | $ | (0.382 | ) |
| | | | | | |
Total distributions | | $ | (0.176 | ) | | $ | (0.339 | ) | | $ | (0.348 | ) | | $ | (0.370 | ) | | $ | (0.373 | ) | | $ | (0.382 | ) |
| | | | | | |
Net asset value — End of period | | $ | 8.700 | | | $ | 8.410 | | | $ | 8.970 | | | $ | 8.610 | | | $ | 8.890 | | | $ | 8.410 | |
| | | | | | |
Total Return(2) | | | 5.59 | %(3) | | | (2.63 | )% | | | 8.36 | % | | | 1.13 | % | | | 10.32 | % | | | 2.44 | % |
|
| Ratios/Supplemental Data | |
Net assets, end of period (000’s omitted) | | $ | 37,474 | | | $ | 38,999 | | | $ | 44,184 | | | $ | 47,322 | | | $ | 48,929 | | | $ | 46,662 | |
Ratios (as a percentage of average daily net assets): | | | | | | | | | | | | | | | | | | | | | | | | |
Expenses before custodian fee reduction | | | 0.73 | %(4) | | | 0.72 | % | | | 0.73 | % | | | 0.74 | % | | | 0.74 | % | | | 0.78 | % |
Expenses after custodian fee reduction | | | 0.73 | %(4) | | | 0.72 | % | | | 0.73 | % | | | 0.73 | % | | | 0.74 | % | | | 0.77 | % |
Net investment income | | | 4.15 | %(4) | | | 3.78 | % | | | 3.96 | % | | | 4.33 | % | | | 4.36 | % | | | 4.75 | % |
Portfolio Turnover | | | 1 | %(3) | | | 14 | % | | | 12 | % | | | 7 | % | | | 7 | % | | | 15 | % |
| (1) | Computed using average shares outstanding. |
| (2) | Returns are historical and are calculated by determining the percentage change in net asset value with all distributions reinvested and do not reflect the effect of sales charges. |
| | | | |
| | 72 | | See Notes to Financial Statements. |
Eaton Vance
Municipal Income Funds
February 28, 2014
Financial Highlights — continued
| | | | | | | | | | | | | | | | | | | | | | | | |
| | | Kentucky Fund — Class B | |
| | | Six Months Ended
February 28, 2014
(Unaudited) | | | Year Ended August 31, | |
| | | | 2013 | | | 2012 | | | 2011 | | | 2010 | | | 2009 | |
Net asset value — Beginning of period | | $ | 9.080 | | | $ | 9.690 | | | $ | 9.300 | | | $ | 9.600 | | | $ | 9.080 | | | $ | 9.300 | |
|
| Income (Loss) From Operations | |
Net investment income(1) | | $ | 0.156 | | | $ | 0.292 | | | $ | 0.307 | | | $ | 0.332 | | | $ | 0.341 | | | $ | 0.347 | |
Net realized and unrealized gain (loss) | | | 0.310 | | | | (0.609 | ) | | | 0.387 | | | | (0.301 | ) | | | 0.513 | | | | (0.222 | ) |
| | | | | | |
Total income (loss) from operations | | $ | 0.466 | | | $ | (0.317 | ) | | $ | 0.694 | | | $ | 0.031 | | | $ | 0.854 | | | $ | 0.125 | |
|
| Less Distributions | |
From net investment income | | $ | (0.156 | ) | | $ | (0.293 | ) | | $ | (0.304 | ) | | $ | (0.331 | ) | | $ | (0.334 | ) | | $ | (0.345 | ) |
| | | | | | |
Total distributions | | $ | (0.156 | ) | | $ | (0.293 | ) | | $ | (0.304 | ) | | $ | (0.331 | ) | | $ | (0.334 | ) | | $ | (0.345 | ) |
| | | | | | |
Net asset value — End of period | | $ | 9.390 | | | $ | 9.080 | | | $ | 9.690 | | | $ | 9.300 | | | $ | 9.600 | | | $ | 9.080 | |
| | | | | | |
Total Return(2) | | | 5.17 | %(3) | | | (3.41 | )% | | | 7.57 | % | | | 0.41 | % | | | 9.54 | % | | | 1.60 | % |
|
| Ratios/Supplemental Data | |
Net assets, end of period (000’s omitted) | | $ | 307 | | | $ | 325 | | | $ | 671 | | | $ | 1,090 | | | $ | 2,607 | | | $ | 4,186 | |
Ratios (as a percentage of average daily net assets): | | | | | | | | | | | | | | | | | | | | | | | | |
Expenses before custodian fee reduction | | | 1.48 | %(4) | | | 1.47 | % | | | 1.48 | % | | | 1.49 | % | | | 1.49 | % | | | 1.53 | % |
Expenses after custodian fee reduction | | | 1.48 | %(4) | | | 1.47 | % | | | 1.48 | % | | | 1.48 | % | | | 1.49 | % | | | 1.52 | % |
Net investment income | | | 3.40 | %(4) | | | 3.01 | % | | | 3.23 | % | | | 3.59 | % | | | 3.62 | % | | | 4.01 | % |
Portfolio Turnover | | | 1 | %(3) | | | 14 | % | | | 12 | % | | | 7 | % | | | 7 | % | | | 15 | % |
| (1) | Computed using average shares outstanding. |
| (2) | Returns are historical and are calculated by determining the percentage change in net asset value with all distributions reinvested and do not reflect the effect of sales charges. |
| | | | |
| | 73 | | See Notes to Financial Statements. |
Eaton Vance
Municipal Income Funds
February 28, 2014
Financial Highlights — continued
| | | | | | | | | | | | | | | | | | | | | | | | |
| | | Kentucky Fund — Class C | |
| | | Six Months Ended
February 28, 2014
(Unaudited) | | | Year Ended August 31, | |
| | | | 2013 | | | 2012 | | | 2011 | | | 2010 | | | 2009 | |
Net asset value — Beginning of period | | $ | 9.090 | | | $ | 9.690 | | | $ | 9.300 | | | $ | 9.600 | | | $ | 9.090 | | | $ | 9.300 | |
|
| Income (Loss) From Operations | |
Net investment income(1) | | $ | 0.156 | | | $ | 0.293 | | | $ | 0.303 | | | $ | 0.331 | | | $ | 0.341 | | | $ | 0.348 | |
Net realized and unrealized gain (loss) | | | 0.310 | | | | (0.599 | ) | | | 0.391 | | | | (0.300 | ) | | | 0.504 | | | | (0.213 | ) |
| | | | | | |
Total income (loss) from operations | | $ | 0.466 | | | $ | (0.306 | ) | | $ | 0.694 | | | $ | 0.031 | | | $ | 0.845 | | | $ | 0.135 | |
|
| Less Distributions | |
From net investment income | | $ | (0.156 | ) | | $ | (0.294 | ) | | $ | (0.304 | ) | | $ | (0.331 | ) | | $ | (0.335 | ) | | $ | (0.345 | ) |
| | | | | | |
Total distributions | | $ | (0.156 | ) | | $ | (0.294 | ) | | $ | (0.304 | ) | | $ | (0.331 | ) | | $ | (0.335 | ) | | $ | (0.345 | ) |
| | | | | | |
Net asset value — End of period | | $ | 9.400 | | | $ | 9.090 | | | $ | 9.690 | | | $ | 9.300 | | | $ | 9.600 | | | $ | 9.090 | |
| | | | | | |
Total Return(2) | | | 5.16 | %(3) | | | (3.30 | )% | | | 7.57 | % | | | 0.40 | % | | | 9.42 | % | | | 1.71 | % |
|
| Ratios/Supplemental Data | |
Net assets, end of period (000’s omitted) | | $ | 3,566 | | | $ | 3,693 | | | $ | 3,696 | | | $ | 2,445 | | | $ | 2,243 | | | $ | 2,509 | |
Ratios (as a percentage of average daily net assets): | | | | | | | | | | | | | | | | | | | | | | | | |
Expenses before custodian fee reduction | | | 1.48 | %(4) | | | 1.47 | % | | | 1.48 | % | | | 1.49 | % | | | 1.49 | % | | | 1.53 | % |
Expenses after custodian fee reduction | | | 1.48 | %(4) | | | 1.47 | % | | | 1.48 | % | | | 1.48 | % | | | 1.49 | % | | | 1.52 | % |
Net investment income | | | 3.40 | %(4) | | | 3.02 | % | | | 3.18 | % | | | 3.57 | % | | | 3.61 | % | | | 4.00 | % |
Portfolio Turnover | | | 1 | %(3) | | | 14 | % | | | 12 | % | | | 7 | % | | | 7 | % | | | 15 | % |
| (1) | Computed using average shares outstanding. |
| (2) | Returns are historical and are calculated by determining the percentage change in net asset value with all distributions reinvested and do not reflect the effect of sales charges. |
| | | | |
| | 74 | | See Notes to Financial Statements. |
Eaton Vance
Municipal Income Funds
February 28, 2014
Financial Highlights — continued
| | | | | | | | | | | | | | | | | | | | |
| | | Kentucky Fund — Class I | |
| | | Six Months Ended
February 28, 2014
(Unaudited) | | | Year Ended August 31, | | | Period Ended August 31, 2010(1) | |
| | | | 2013 | | | 2012 | | | 2011 | | |
Net asset value — Beginning of period | | $ | 8.410 | | | $ | 8.970 | | | $ | 8.610 | | | $ | 8.890 | | | $ | 8.780 | |
| | | | | |
| Income (Loss) From Operations | | | | | | | | | | | | | | | | | | | | |
Net investment income(2) | | $ | 0.185 | | | $ | 0.357 | | | $ | 0.362 | | | $ | 0.385 | | | $ | 0.031 | |
Net realized and unrealized gain (loss) | | | 0.290 | | | | (0.560 | ) | | | 0.364 | | | | (0.275 | ) | | | 0.110 | |
| | | | | |
Total income (loss) from operations | | $ | 0.475 | | | $ | (0.203 | ) | | $ | 0.726 | | | $ | 0.110 | | | $ | 0.141 | |
| | | | | |
| Less Distributions | | | | | | | | | | | | | | | | | | | | |
From net investment income | | $ | (0.185 | ) | | $ | (0.357 | ) | | $ | (0.366 | ) | | $ | (0.390 | ) | | $ | (0.031 | ) |
| | | | | |
Total distributions | | $ | (0.185 | ) | | $ | (0.357 | ) | | $ | (0.366 | ) | | $ | (0.390 | ) | | $ | (0.031 | ) |
| | | | | |
Net asset value — End of period | | $ | 8.700 | | | $ | 8.410 | | | $ | 8.970 | | | $ | 8.610 | | | $ | 8.890 | |
| | | | | |
Total Return(3) | | | 5.69 | %(4) | | | (2.43 | )% | | | 8.58 | % | | | 1.35 | % | | | 1.60 | %(4) |
|
| Ratios/Supplemental Data | |
Net assets, end of period (000’s omitted) | | $ | 5,703 | | | $ | 8,020 | | | $ | 6,420 | | | $ | 512 | | | $ | 1 | |
Ratios (as a percentage of average daily net assets): | | | | | | | | | | | | | | | | | | | | |
Total expenses(5) | | | 0.53 | %(6) | | | 0.52 | % | | | 0.53 | % | | | 0.53 | % | | | 0.56 | %(6) |
Net investment income | | | 4.35 | %(6) | | | 3.99 | % | | | 4.06 | % | | | 4.48 | % | | | 4.40 | %(6) |
Portfolio Turnover | | | 1 | %(4) | | | 14 | % | | | 12 | % | | | 7 | % | | | 7 | %(7) |
| (1) | For the period from the commencement of operations on August 3, 2010 to August 31, 2010. |
| (2) | Computed using average shares outstanding. |
| (3) | Returns are historical and are calculated by determining the percentage change in net asset value with all distributions reinvested. |
| (5) | Excludes the effect of custody fee credits, if any, of less than 0.005%. |
| (7) | For the year ended August 31, 2010. |
| | | | |
| | 75 | | See Notes to Financial Statements. |
Eaton Vance
Municipal Income Funds
February 28, 2014
Financial Highlights — continued
| | | | | | | | | | | | | | | | | | | | | | | | |
| | | Maryland Fund — Class A | |
| | | Six Months Ended
February 28, 2014
(Unaudited) | | | Year Ended August 31, | |
| | | | 2013 | | | 2012 | | | 2011 | | | 2010 | | | 2009 | |
Net asset value — Beginning of period | | $ | 8.620 | | | $ | 9.420 | | | $ | 8.840 | | | $ | 9.150 | | | $ | 8.670 | | | $ | 8.900 | |
|
| Income (Loss) From Operations | |
Net investment income(1) | | $ | 0.172 | | | $ | 0.339 | | | $ | 0.365 | | | $ | 0.397 | | | $ | 0.391 | | | $ | 0.403 | |
Net realized and unrealized gain (loss) | | | 0.348 | | | | (0.804 | ) | | | 0.576 | | | | (0.316 | ) | | | 0.474 | | | | (0.226 | ) |
| | | | | | |
Total income (loss) from operations | | $ | 0.520 | | | $ | (0.465 | ) | | $ | 0.941 | | | $ | 0.081 | | | $ | 0.865 | | | $ | 0.177 | |
|
| Less Distributions | |
From net investment income | | $ | (0.170 | ) | | $ | (0.335 | ) | | $ | (0.361 | ) | | $ | (0.391 | ) | | $ | (0.385 | ) | | $ | (0.407 | ) |
| | | | | | |
Total distributions | | $ | (0.170 | ) | | $ | (0.335 | ) | | $ | (0.361 | ) | | $ | (0.391 | ) | | $ | (0.385 | ) | | $ | (0.407 | ) |
| | | | | | |
Net asset value — End of period | | $ | 8.970 | | | $ | 8.620 | | | $ | 9.420 | | | $ | 8.840 | | | $ | 9.150 | | | $ | 8.670 | |
| | | | | | |
Total Return(2) | | | 6.07 | %(3) | | | (5.14 | )% | | | 10.81 | % | | | 1.03 | % | | | 10.15 | % | | | 2.43 | % |
|
| Ratios/Supplemental Data | |
Net assets, end of period (000’s omitted) | | $ | 49,406 | | | $ | 50,085 | | | $ | 62,306 | | | $ | 57,801 | | | $ | 75,279 | | | $ | 75,555 | |
Ratios (as a percentage of average daily net assets): | | | | | | | | | | | | | | | | | | | | | | | | |
Expenses excluding interest and fees | | | 0.75 | %(4) | | | 0.75 | % | | | 0.75 | % | | | 0.78 | % | | | 0.78 | % | | | 0.82 | % |
Interest and fee expense(5) | | | 0.05 | %(4) | | | 0.03 | % | | | 0.04 | % | | | 0.04 | % | | | 0.03 | % | | | 0.10 | % |
Total expenses before custodian fee reduction | | | 0.80 | %(4) | | | 0.78 | % | | | 0.79 | % | | | 0.82 | % | | | 0.81 | % | | | 0.92 | % |
Expenses after custodian fee reduction excluding interest and fees | | | 0.75 | %(4) | | | 0.75 | % | | | 0.75 | % | | | 0.78 | % | | | 0.78 | % | | | 0.81 | % |
Net investment income | | | 3.94 | %(4) | | | 3.63 | % | | | 3.96 | % | | | 4.53 | % | | | 4.35 | % | | | 4.97 | % |
Portfolio Turnover | | | 0 | %(3) | | | 10 | % | | | 12 | % | | | 1 | % | | | 7 | % | | | 16 | % |
| (1) | Computed using average shares outstanding. |
| (2) | Returns are historical and are calculated by determining the percentage change in net asset value with all distributions reinvested and do not reflect the effect of sales charges. |
| (5) | Interest and fee expense relates to the liability for floating rate notes issued in conjunction with residual interest bond transactions (see Note 1I). |
| | | | |
| | 76 | | See Notes to Financial Statements. |
Eaton Vance
Municipal Income Funds
February 28, 2014
Financial Highlights — continued
| | | | | | | | | | | | | | | | | | | | | | | | |
| | | Maryland Fund — Class B | |
| | | Six Months Ended
February 28, 2014
(Unaudited) | | | Year Ended August 31, | |
| | | | 2013 | | | 2012 | | | 2011 | | | 2010 | | | 2009 | |
Net asset value — Beginning of period | | $ | 9.400 | | | $ | 10.270 | | | $ | 9.640 | | | $ | 9.980 | | | $ | 9.460 | | | $ | 9.700 | |
|
| Income (Loss) From Operations | |
Net investment income(1) | | $ | 0.152 | | | $ | 0.293 | | | $ | 0.325 | | | $ | 0.361 | | | $ | 0.353 | | | $ | 0.374 | |
Net realized and unrealized gain (loss) | | | 0.377 | | | | (0.874 | ) | | | 0.624 | | | | (0.346 | ) | | | 0.517 | | | | (0.239 | ) |
| | | | | | |
Total income (loss) from operations | | $ | 0.529 | | | $ | (0.581 | ) | | $ | 0.949 | | | $ | 0.015 | | | $ | 0.870 | | | $ | 0.135 | |
|
| Less Distributions | |
From net investment income | | $ | (0.149 | ) | | $ | (0.289 | ) | | $ | (0.319 | ) | | $ | (0.355 | ) | | $ | (0.350 | ) | | $ | (0.375 | ) |
| | | | | | |
Total distributions | | $ | (0.149 | ) | | $ | (0.289 | ) | | $ | (0.319 | ) | | $ | (0.355 | ) | | $ | (0.350 | ) | | $ | (0.375 | ) |
| | | | | | |
Net asset value — End of period | | $ | 9.780 | | | $ | 9.400 | | | $ | 10.270 | | | $ | 9.640 | | | $ | 9.980 | | | $ | 9.460 | |
| | | | | | |
Total Return(2) | | | 5.66 | %(3) | | | (5.83 | )% | | | 9.96 | % | | | 0.26 | % | | | 9.33 | % | | | 1.76 | % |
|
| Ratios/Supplemental Data | |
Net assets, end of period (000’s omitted) | | $ | 1,384 | | | $ | 1,738 | | | $ | 2,286 | | | $ | 3,494 | | | $ | 5,930 | | | $ | 7,742 | |
Ratios (as a percentage of average daily net assets): | | | | | | | | | | | | | | | | | | | | | | | | |
Expenses excluding interest and fees | | | 1.50 | %(4) | | | 1.50 | % | | | 1.50 | % | | | 1.53 | % | | | 1.53 | % | | | 1.58 | % |
Interest and fee expense(5) | | | 0.05 | %(4) | | | 0.03 | % | | | 0.04 | % | | | 0.04 | % | | | 0.03 | % | | | 0.10 | % |
Total expenses before custodian fee reduction | | | 1.55 | %(4) | | | 1.53 | % | | | 1.54 | % | | | 1.57 | % | | | 1.56 | % | | | 1.68 | % |
Expenses after custodian fee reduction excluding interest and fees | | | 1.50 | %(4) | | | 1.50 | % | | | 1.50 | % | | | 1.53 | % | | | 1.53 | % | | | 1.56 | % |
Net investment income | | | 3.19 | %(4) | | | 2.88 | % | | | 3.25 | % | | | 3.78 | % | | | 3.61 | % | | | 4.23 | % |
Portfolio Turnover | | | 0 | %(3) | | | 10 | % | | | 12 | % | | | 1 | % | | | 7 | % | | | 16 | % |
| (1) | Computed using average shares outstanding. |
| (2) | Returns are historical and are calculated by determining the percentage change in net asset value with all distributions reinvested and do not reflect the effect of sales charges. |
| (5) | Interest and fee expense relates to the liability for floating rate notes issued in conjunction with residual interest bond transactions (see Note 1I). |
| | | | |
| | 77 | | See Notes to Financial Statements. |
Eaton Vance
Municipal Income Funds
February 28, 2014
Financial Highlights — continued
| | | | | | | | | | | | | | | | | | | | | | | | |
| | | Maryland Fund — Class C | |
| | | Six Months Ended
February 28, 2014
(Unaudited) | | | Year Ended August 31, | |
| | | | 2013 | | | 2012 | | | 2011 | | | 2010 | | | 2009 | |
Net asset value — Beginning of period | | $ | 9.400 | | | $ | 10.280 | | | $ | 9.640 | | | $ | 9.980 | | | $ | 9.460 | | | $ | 9.710 | |
|
| Income (Loss) From Operations | |
Net investment income(1) | | $ | 0.153 | | | $ | 0.291 | | | $ | 0.321 | | | $ | 0.361 | | | $ | 0.352 | | | $ | 0.373 | |
Net realized and unrealized gain (loss) | | | 0.386 | | | | (0.882 | ) | | | 0.638 | | | | (0.346 | ) | | | 0.518 | | | | (0.248 | ) |
| | | | | | |
Total income (loss) from operations | | $ | 0.539 | | | $ | (0.591 | ) | | $ | 0.959 | | | $ | 0.015 | | | $ | 0.870 | | | $ | 0.125 | |
|
| Less Distributions | |
From net investment income | | $ | (0.149 | ) | | $ | (0.289 | ) | | $ | (0.319 | ) | | $ | (0.355 | ) | | $ | (0.350 | ) | | $ | (0.375 | ) |
| | | | | | |
Total distributions | | $ | (0.149 | ) | | $ | (0.289 | ) | | $ | (0.319 | ) | | $ | (0.355 | ) | | $ | (0.350 | ) | | $ | (0.375 | ) |
| | | | | | |
Net asset value — End of period | | $ | 9.790 | | | $ | 9.400 | | | $ | 10.280 | | | $ | 9.640 | | | $ | 9.980 | | | $ | 9.460 | |
| | | | | | |
Total Return(2) | | | 5.77 | %(3) | | | (5.92 | )% | | | 10.07 | % | | | 0.26 | % | | | 9.33 | % | | | 1.65 | % |
|
| Ratios/Supplemental Data | |
Net assets, end of period (000’s omitted) | | $ | 15,556 | | | $ | 16,493 | | | $ | 16,094 | | | $ | 11,488 | | | $ | 15,194 | | | $ | 12,388 | |
Ratios (as a percentage of average daily net assets): | | | | | | | | | | | | | | | | | | | | | | | | |
Expenses excluding interest and fees | | | 1.50 | %(4) | | | 1.50 | % | | | 1.50 | % | | | 1.53 | % | | | 1.52 | % | | | 1.57 | % |
Interest and fee expense(5) | | | 0.05 | %(4) | | | 0.03 | % | | | 0.04 | % | | | 0.04 | % | | | 0.03 | % | | | 0.10 | % |
Total expenses before custodian fee reduction | | | 1.55 | %(4) | | | 1.53 | % | | | 1.54 | % | | | 1.57 | % | | | 1.55 | % | | | 1.67 | % |
Expenses after custodian fee reduction excluding interest and fees | | | 1.50 | %(4) | | | 1.50 | % | | | 1.50 | % | | | 1.53 | % | | | 1.52 | % | | | 1.56 | % |
Net investment income | | | 3.20 | %(4) | | | 2.86 | % | | | 3.19 | % | | | 3.78 | % | | | 3.59 | % | | | 4.20 | % |
Portfolio Turnover | | | 0 | %(3) | | | 10 | % | | | 12 | % | | | 1 | % | | | 7 | % | | | 16 | % |
| (1) | Computed using average shares outstanding. |
| (2) | Returns are historical and are calculated by determining the percentage change in net asset value with all distributions reinvested and do not reflect the effect of sales charges. |
| (5) | Interest and fee expense relates to the liability for floating rate notes issued in conjunction with residual interest bond transactions (see Note 1I). |
| | | | |
| | 78 | | See Notes to Financial Statements. |
Eaton Vance
Municipal Income Funds
February 28, 2014
Financial Highlights — continued
| | | | | | | | | | | | | | | | | | | | | | | | |
| | | Maryland Fund — Class I | |
| | | Six Months Ended
February 28, 2014
(Unaudited) | | | Year Ended August 31, | |
| | | | 2013 | | | 2012 | | | 2011 | | | 2010 | | | 2009 | |
Net asset value — Beginning of period | | $ | 8.640 | | | $ | 9.440 | | | $ | 8.860 | | | $ | 9.170 | | | $ | 8.680 | | | $ | 8.900 | |
|
| Income (Loss) From Operations | |
Net investment income(1) | | $ | 0.182 | | | $ | 0.356 | | | $ | 0.382 | | | $ | 0.416 | | | $ | 0.406 | | | $ | 0.419 | |
Net realized and unrealized gain (loss) | | | 0.347 | | | | (0.802 | ) | | | 0.579 | | | | (0.316 | ) | | | 0.487 | | | | (0.216 | ) |
| | | | | | |
Total income (loss) from operations | | $ | 0.529 | | | $ | (0.446 | ) | | $ | 0.961 | | | $ | 0.100 | | | $ | 0.893 | | | $ | 0.203 | |
|
| Less Distributions | |
From net investment income | | $ | (0.179 | ) | | $ | (0.354 | ) | | $ | (0.381 | ) | | $ | (0.410 | ) | | $ | (0.403 | ) | | $ | (0.423 | ) |
| | | | | | |
Total distributions | | $ | (0.179 | ) | | $ | (0.354 | ) | | $ | (0.381 | ) | | $ | (0.410 | ) | | $ | (0.403 | ) | | $ | (0.423 | ) |
| | | | | | |
Net asset value — End of period | | $ | 8.990 | | | $ | 8.640 | | | $ | 9.440 | | | $ | 8.860 | | | $ | 9.170 | | | $ | 8.680 | |
| | | | | | |
Total Return(2) | | | 6.16 | %(3) | | | (4.93 | )% | | | 11.02 | % | | | 1.24 | % | | | 10.47 | % | | | 2.75 | % |
|
| Ratios/Supplemental Data | |
Net assets, end of period (000’s omitted) | | $ | 4,543 | | | $ | 4,595 | | | $ | 3,805 | | | $ | 2,452 | | | $ | 5,565 | | | $ | 448 | |
Ratios (as a percentage of average daily net assets): | | | | | | | | | | | | | | | | | | | | | | | | |
Expenses excluding interest and fees | | | 0.55 | %(4) | | | 0.55 | % | | | 0.55 | % | | | 0.58 | % | | | 0.58 | % | | | 0.61 | % |
Interest and fee expense(5) | | | 0.05 | %(4) | | | 0.03 | % | | | 0.04 | % | | | 0.04 | % | | | 0.03 | % | | | 0.10 | % |
Total expenses(6) | | | 0.60 | %(4) | | | 0.58 | % | | | 0.59 | % | | | 0.62 | % | | | 0.61 | % | | | 0.71 | % |
Net investment income | | | 4.15 | %(4) | | | 3.82 | % | | | 4.14 | % | | | 4.75 | % | | | 4.50 | % | | | 5.16 | % |
Portfolio Turnover | | | 0 | %(3) | | | 10 | % | | | 12 | % | | | 1 | % | | | 7 | % | | | 16 | % |
| (1) | Computed using average shares outstanding. |
| (2) | Returns are historical and are calculated by determining the percentage change in net asset value with all distributions reinvested. |
| (5) | Interest and fee expense relates to the liability for floating rate notes issued in conjunction with residual interest bond transactions (see Note 1I). |
| (6) | Excludes the effect of custody fee credits, if any, of less than 0.005%. |
| | | | |
| | 79 | | See Notes to Financial Statements. |
Eaton Vance
Municipal Income Funds
February 28, 2014
Financial Highlights — continued
| | | | | | | | | | | | | | | | | | | | | | | | |
| | | Missouri Fund — Class A | |
| | | Six Months Ended
February 28, 2014
(Unaudited) | | | Year Ended August 31, | |
| | | | 2013 | | | 2012 | | | 2011 | | | 2010 | | | 2009 | |
Net asset value — Beginning of period | | $ | 8.870 | | | $ | 9.830 | | | $ | 9.180 | | | $ | 9.570 | | | $ | 9.080 | | | $ | 9.370 | |
|
| Income (Loss) From Operations | |
Net investment income(1) | | $ | 0.179 | | | $ | 0.348 | | | $ | 0.365 | | | $ | 0.390 | | | $ | 0.386 | | | $ | 0.389 | |
Net realized and unrealized gain (loss) | | | 0.457 | | | | (0.963 | ) | | | 0.647 | | | | (0.393 | ) | | | 0.473 | | | | (0.288 | ) |
| | | | | | |
Total income (loss) from operations | | $ | 0.636 | | | $ | (0.615 | ) | | $ | 1.012 | | | $ | (0.003 | ) | | $ | 0.859 | | | $ | 0.101 | |
|
| Less Distributions | |
From net investment income | | $ | (0.186 | ) | | $ | (0.345 | ) | | $ | (0.362 | ) | | $ | (0.387 | ) | | $ | (0.369 | ) | | $ | (0.391 | ) |
| | | | | | |
Total distributions | | $ | (0.186 | ) | | $ | (0.345 | ) | | $ | (0.362 | ) | | $ | (0.387 | ) | | $ | (0.369 | ) | | $ | (0.391 | ) |
| | | | | | |
Net asset value — End of period | | $ | 9.320 | | | $ | 8.870 | | | $ | 9.830 | | | $ | 9.180 | | | $ | 9.570 | | | $ | 9.080 | |
| | | | | | |
Total Return(2) | | | 7.23 | %(3) | | | (6.49 | )% | | | 11.20 | % | | | 0.09 | % | | | 9.63 | % | | | 1.41 | % |
|
| Ratios/Supplemental Data | |
Net assets, end of period (000’s omitted) | | $ | 61,793 | | | $ | 61,391 | | | $ | 80,768 | | | $ | 76,391 | | | $ | 95,047 | | | $ | 89,556 | |
Ratios (as a percentage of average daily net assets): | | | | | | | | | | | | | | | | | | | | | | | | |
Expenses excluding interest and fees | | | 0.72 | %(4) | | | 0.72 | % | | | 0.73 | % | | | 0.74 | % | | | 0.75 | % | | | 0.80 | % |
Interest and fee expense(5) | | | 0.01 | %(4) | | | 0.02 | % | | | 0.02 | % | | | 0.03 | % | | | 0.02 | % | | | 0.04 | % |
Total expenses before custodian fee reduction | | | 0.73 | %(4) | | | 0.74 | % | | | 0.75 | % | | | 0.77 | % | | | 0.77 | % | | | 0.84 | % |
Expenses after custodian fee reduction excluding interest and fees | | | 0.72 | %(4) | | | 0.72 | % | | | 0.73 | % | | | 0.74 | % | | | 0.75 | % | | | 0.79 | % |
Net investment income | | | 3.97 | %(4) | | | 3.59 | % | | | 3.82 | % | | | 4.28 | % | | | 4.12 | % | | | 4.51 | % |
Portfolio Turnover | | | 9 | %(3) | | | 10 | % | | | 12 | % | | | 6 | % | | | 9 | % | | | 21 | % |
| (1) | Computed using average shares outstanding. |
| (2) | Returns are historical and are calculated by determining the percentage change in net asset value with all distributions reinvested and do not reflect the effect of sales charges. |
| (5) | Interest and fee expense relates to the liability for floating rate notes issued in conjunction with residual interest bond transactions (see Note 1I). |
| | | | |
| | 80 | | See Notes to Financial Statements. |
Eaton Vance
Municipal Income Funds
February 28, 2014
Financial Highlights — continued
| | | | | | | | | | | | | | | | | | | | | | | | |
| | | Missouri Fund — Class B | |
| | | Six Months Ended
February 28, 2014
(Unaudited) | | | Year Ended August 31, | |
| | | | 2013 | | | 2012 | | | 2011 | | | 2010 | | | 2009 | |
Net asset value — Beginning of period | | $ | 9.810 | | | $ | 10.870 | | | $ | 10.140 | | | $ | 10.580 | | | $ | 10.040 | | | $ | 10.360 | |
|
| Income (Loss) From Operations | |
Net investment income(1) | | $ | 0.160 | | | $ | 0.304 | | | $ | 0.327 | | | $ | 0.354 | | | $ | 0.349 | | | $ | 0.359 | |
Net realized and unrealized gain (loss) | | | 0.499 | | | | (1.063 | ) | | | 0.724 | | | | (0.442 | ) | | | 0.523 | | | | (0.320 | ) |
| | | | | | |
Total income (loss) from operations | | $ | 0.659 | | | $ | (0.759 | ) | | $ | 1.051 | | | $ | (0.088 | ) | | $ | 0.872 | | | $ | 0.039 | |
|
| Less Distributions | |
From net investment income | | $ | (0.169 | ) | | $ | (0.301 | ) | | $ | (0.321 | ) | | $ | (0.352 | ) | | $ | (0.332 | ) | | $ | (0.359 | ) |
| | | | | | |
Total distributions | | $ | (0.169 | ) | | $ | (0.301 | ) | | $ | (0.321 | ) | | $ | (0.352 | ) | | $ | (0.332 | ) | | $ | (0.359 | ) |
| | | | | | |
Net asset value — End of period | | $ | 10.300 | | | $ | 9.810 | | | $ | 10.870 | | | $ | 10.140 | | | $ | 10.580 | | | $ | 10.040 | |
| | | | | | |
Total Return(2) | | | 6.76 | %(3) | | | (7.17 | )% | | | 10.50 | % | | | (0.74 | )% | | | 8.82 | % | | | 0.64 | % |
|
| Ratios/Supplemental Data | |
Net assets, end of period (000’s omitted) | | $ | 1,291 | | | $ | 1,245 | | | $ | 1,936 | | | $ | 2,618 | | | $ | 4,467 | | | $ | 6,542 | |
Ratios (as a percentage of average daily net assets): | | | | | | | | | | | | | | | | | | | | | | | | |
Expenses excluding interest and fees | | | 1.47 | %(4) | | | 1.47 | % | | | 1.48 | % | | | 1.50 | % | | | 1.50 | % | | | 1.55 | % |
Interest and fee expense(5) | | | 0.01 | %(4) | | | 0.02 | % | | | 0.02 | % | | | 0.03 | % | | | 0.02 | % | | | 0.04 | % |
Total expenses before custodian fee reduction | | | 1.48 | %(4) | | | 1.49 | % | | | 1.50 | % | | | 1.53 | % | | | 1.52 | % | | | 1.59 | % |
Expenses after custodian fee reduction excluding interest and fees | | | 1.47 | %(4) | | | 1.47 | % | | | 1.48 | % | | | 1.50 | % | | | 1.50 | % | | | 1.54 | % |
Net investment income | | | 3.22 | %(4) | | | 2.84 | % | | | 3.11 | % | | | 3.52 | % | | | 3.38 | % | | | 3.77 | % |
Portfolio Turnover | | | 9 | %(3) | | | 10 | % | | | 12 | % | | | 6 | % | | | 9 | % | | | 21 | % |
| (1) | Computed using average shares outstanding. |
| (2) | Returns are historical and are calculated by determining the percentage change in net asset value with all distributions reinvested and do not reflect the effect of sales charges. |
| (5) | Interest and fee expense relates to the liability for floating rate notes issued in conjunction with residual interest bond transactions (see Note 1I). |
| | | | |
| | 81 | | See Notes to Financial Statements. |
Eaton Vance
Municipal Income Funds
February 28, 2014
Financial Highlights — continued
| | | | | | | | | | | | | | | | | | | | | | | | |
| | | Missouri Fund — Class C | |
| | | Six Months Ended
February 28, 2014
(Unaudited) | | | Year Ended August 31, | |
| | | | 2013 | | | 2012 | | | 2011 | | | 2010 | | | 2009 | |
Net asset value — Beginning of period | | $ | 9.800 | | | $ | 10.860 | | | $ | 10.140 | | | $ | 10.570 | | | $ | 10.030 | | | $ | 10.350 | |
| | | | | | |
| Income (Loss) From Operations | | | | | | | | | | | | | | | | | | | | | | | | |
Net investment income(1) | | $ | 0.160 | | | $ | 0.303 | | | $ | 0.321 | | | $ | 0.354 | | | $ | 0.348 | | | $ | 0.359 | |
Net realized and unrealized gain (loss) | | | 0.498 | | | | (1.062 | ) | | | 0.719 | | | | (0.432 | ) | | | 0.524 | | | | (0.320 | ) |
| | | | | | |
Total income (loss) from operations | | $ | 0.658 | | | $ | (0.759 | ) | | $ | 1.040 | | | $ | (0.078 | ) | | $ | 0.872 | | | $ | 0.039 | |
| | | | | | |
| Less Distributions | | | | | | | | | | | | | | | | | | | | | | | | |
From net investment income | | $ | (0.168 | ) | | $ | (0.301 | ) | | $ | (0.320 | ) | | $ | (0.352 | ) | | $ | (0.332 | ) | | $ | (0.359 | ) |
| | | | | | |
Total distributions | | $ | (0.168 | ) | | $ | (0.301 | ) | | $ | (0.320 | ) | | $ | (0.352 | ) | | $ | (0.332 | ) | | $ | (0.359 | ) |
| | | | | | |
Net asset value — End of period | | $ | 10.290 | | | $ | 9.800 | | | $ | 10.860 | | | $ | 10.140 | | | $ | 10.570 | | | $ | 10.030 | |
| | | | | | |
Total Return(2) | | | 6.77 | %(3) | | | (7.18 | )% | | | 10.40 | % | | | (0.65 | )% | | | 8.82 | % | | | 0.64 | % |
| | | | | | |
| Ratios/Supplemental Data | | | | | | | | | | | | | | | | | | | | | | | | |
Net assets, end of period (000’s omitted) | | $ | 5,862 | | | $ | 6,061 | | | $ | 6,380 | | | $ | 4,796 | | | $ | 5,856 | | | $ | 5,553 | |
Ratios (as a percentage of average daily net assets): | | | | | | | | | | | | | | | | | | | | | | | | |
Expenses excluding interest and fees | | | 1.47 | %(4) | | | 1.47 | % | | | 1.48 | % | | | 1.50 | % | | | 1.49 | % | | | 1.55 | % |
Interest and fee expense(5) | | | 0.01 | %(4) | | | 0.02 | % | | | 0.02 | % | | | 0.03 | % | | | 0.02 | % | | | 0.04 | % |
Total expenses before custodian fee reduction | | | 1.48 | %(4) | | | 1.49 | % | | | 1.50 | % | | | 1.53 | % | | | 1.51 | % | | | 1.59 | % |
Expenses after custodian fee reduction excluding interest and fees | | | 1.47 | %(4) | | | 1.47 | % | | | 1.48 | % | | | 1.50 | % | | | 1.49 | % | | | 1.54 | % |
Net investment income | | | 3.22 | %(4) | | | 2.84 | % | | | 3.04 | % | | | 3.52 | % | | | 3.37 | % | | | 3.76 | % |
Portfolio Turnover | | | 9 | %(3) | | | 10 | % | | | 12 | % | | | 6 | % | | | 9 | % | | | 21 | % |
| (1) | Computed using average shares outstanding. |
| (2) | Returns are historical and are calculated by determining the percentage change in net asset value with all distributions reinvested and do not reflect the effect of sales charges. |
| (5) | Interest and fee expense relates to the liability for floating rate notes issued in conjunction with residual interest bond transactions (see Note 1I). |
| | | | |
| | 82 | | See Notes to Financial Statements. |
Eaton Vance
Municipal Income Funds
February 28, 2014
Financial Highlights — continued
| | | | | | | | | | | | | | | | | | | | |
| | | Missouri Fund — Class I | |
| | | Six Months Ended
February 28, 2014
(Unaudited) | | | Year Ended August 31, | | | Period Ended
August 31, 2010(1) | |
| | | | 2013 | | | 2012 | | | 2011 | | |
Net asset value — Beginning of period | | $ | 8.890 | | | $ | 9.850 | | | $ | 9.190 | | | $ | 9.580 | | | $ | 9.370 | |
| | | | | |
| Income (Loss) From Operations | | | | | | | | | | | | | | | | | | | | |
Net investment income(2) | | $ | 0.191 | | | $ | 0.367 | | | $ | 0.376 | | | $ | 0.402 | | | $ | 0.032 | |
Net realized and unrealized gain (loss) | | | 0.445 | | | | (0.962 | ) | | | 0.665 | | | | (0.386 | ) | | | 0.210 | |
| | | | | |
Total income (loss) from operations | | $ | 0.636 | | | $ | (0.595 | ) | | $ | 1.041 | | | $ | 0.016 | | | $ | 0.242 | |
| | | | | |
| Less Distributions | | | | | | | | | | | | | | | | | | | | |
From net investment income | | $ | (0.196 | ) | | $ | (0.365 | ) | | $ | (0.381 | ) | | $ | (0.406 | ) | | $ | (0.032 | ) |
| | | | | |
Total distributions | | $ | (0.196 | ) | | $ | (0.365 | ) | | $ | (0.381 | ) | | $ | (0.406 | ) | | $ | (0.032 | ) |
| | | | | |
Net asset value — End of period | | $ | 9.330 | | | $ | 8.890 | | | $ | 9.850 | | | $ | 9.190 | | | $ | 9.580 | |
| | | | | |
Total Return(3) | | | 7.22 | %(4) | | | (6.28 | )% | | | 11.52 | % | | | 0.30 | % | | | 2.58 | %(4) |
| | | | | |
| Ratios/Supplemental Data | | | | | | | | | | | | | | | | | | | | |
Net assets, end of period (000’s omitted) | | $ | 2,221 | | | $ | 3,753 | | | $ | 2,310 | | | $ | 760 | | | $ | 1 | |
Ratios (as a percentage of average daily net assets): | | | | | | | | | | | | | | | | | | | | |
Expenses excluding interest and fees | | | 0.52 | %(5) | | | 0.52 | % | | | 0.53 | % | | | 0.54 | % | | | 0.56 | %(5) |
Interest and fee expense(6) | | | 0.01 | %(5) | | | 0.02 | % | | | 0.02 | % | | | 0.03 | % | | | 0.02 | %(5) |
Total expenses(7) | | | 0.53 | %(5) | | | 0.54 | % | | | 0.55 | % | | | 0.57 | % | | | 0.58 | %(5) |
Net investment income | | | 4.24 | %(5) | | | 3.80 | % | | | 3.91 | % | | | 4.41 | % | | | 4.19 | %(5) |
Portfolio Turnover | | | 9 | %(4) | | | 10 | % | | | 12 | % | | | 6 | % | | | 9 | %(8) |
| (1) | For the period from the commencement of operations on August 3, 2010 to August 31, 2010. |
| (2) | Computed using average shares outstanding. |
| (3) | Returns are historical and are calculated by determining the percentage change in net asset value with all distributions reinvested. |
| (6) | Interest and fee expense relates to the liability for floating rate notes issued in conjunction with residual interest bond transactions (see Note 1I). |
| (7) | Excludes the effect of custody fee credits, if any, of less than 0.005%. |
| (8) | For the year ended August 31, 2010. |
| | | | |
| | 83 | | See Notes to Financial Statements. |
Eaton Vance
Municipal Income Funds
February 28, 2014
Financial Highlights — continued
| | | | | | | | | | | | | | | | | | | | | | | | |
| | | North Carolina Fund — Class A | |
| | | Six Months Ended
February 28, 2014
(Unaudited) | | | Year Ended August 31, | |
| | | | 2013 | | | 2012 | | | 2011 | | | 2010 | | | 2009 | |
Net asset value — Beginning of period | | $ | 8.340 | | | $ | 9.480 | | | $ | 8.820 | | | $ | 9.340 | | | $ | 8.810 | | | $ | 8.810 | |
| | | | | | |
| Income (Loss) From Operations | | | | | | | | | | | | | | | | | | | | | | | | |
Net investment income(1) | | $ | 0.191 | | | $ | 0.374 | | | $ | 0.407 | | | $ | 0.437 | | | $ | 0.429 | | | $ | 0.418 | |
Net realized and unrealized gain (loss) | | | 0.563 | | | | (1.143 | ) | | | 0.656 | | | | (0.525 | ) | | | 0.513 | | | | (0.019 | ) |
| | | | | | |
Total income (loss) from operations | | $ | 0.754 | | | $ | (0.769 | ) | | $ | 1.063 | | | $ | (0.088 | ) | | $ | 0.942 | | | $ | 0.399 | |
| | | | | | |
| Less Distributions | | | | | | | | | | | | | | | | | | | | | | | | |
From net investment income | | $ | (0.194 | ) | | $ | (0.371 | ) | | $ | (0.403 | ) | | $ | (0.432 | ) | | $ | (0.412 | ) | | $ | (0.399 | ) |
| | | | | | |
Total distributions | | $ | (0.194 | ) | | $ | (0.371 | ) | | $ | (0.403 | ) | | $ | (0.432 | ) | | $ | (0.412 | ) | | $ | (0.399 | ) |
| | | | | | |
Net asset value — End of period | | $ | 8.900 | | | $ | 8.340 | | | $ | 9.480 | | | $ | 8.820 | | | $ | 9.340 | | | $ | 8.810 | |
| | | | | | |
Total Return(2) | | | 9.13 | %(3) | | | (8.46 | )% | | | 12.27 | % | | | (0.79 | )% | | | 10.92 | % | | | 4.99 | % |
| | | | | | |
| Ratios/Supplemental Data | | | | | | | | | | | | | | | | | | | | | | | | |
Net assets, end of period (000’s omitted) | | $ | 75,166 | | | $ | 78,864 | | | $ | 87,573 | | | $ | 74,111 | | | $ | 86,047 | | | $ | 78,245 | |
Ratios (as a percentage of average daily net assets): | | | | | | | | | | | | | | | | | | | | | | | | |
Expenses excluding interest and fees | | | 0.75 | %(4) | | | 0.74 | % | | | 0.75 | % | | | 0.78 | % | | | 0.77 | % | | | 0.82 | % |
Interest and fee expense(5) | | | 0.07 | %(4) | | | 0.06 | % | | | 0.07 | % | | | 0.09 | % | | | 0.08 | % | | | 0.11 | % |
Total expenses(6) | | | 0.82 | %(4) | | | 0.80 | % | | | 0.82 | % | | | 0.87 | % | | | 0.85 | % | | | 0.93 | % |
Net investment income | | | 4.48 | %(4) | | | 4.00 | % | | | 4.41 | % | | | 4.98 | % | | | 4.72 | % | | | 5.11 | % |
Portfolio Turnover | | | 4 | %(3) | | | 14 | % | | | 8 | % | | | 7 | % | | | 10 | % | | | 42 | % |
| (1) | Computed using average shares outstanding. |
| (2) | Returns are historical and are calculated by determining the percentage change in net asset value with all distributions reinvested and do not reflect the effect of sales charges. |
| (5) | Interest and fee expense primarily relates to the liability for floating rate notes issued in conjunction with residual interest bond transactions (see Note 1I). |
| (6) | Excludes the effect of custody fee credits, if any, of less than 0.005%. |
| | | | |
| | 84 | | See Notes to Financial Statements. |
Eaton Vance
Municipal Income Funds
February 28, 2014
Financial Highlights — continued
| | | | | | | | | | | | | | | | | | | | | | | | |
| | | North Carolina Fund — Class B | |
| | | Six Months Ended
February 28, 2014
(Unaudited) | | | Year Ended August 31, | |
| | | | 2013 | | | 2012 | | | 2011 | | | 2010 | | | 2009 | |
Net asset value — Beginning of period | | $ | 8.970 | | | $ | 10.190 | | | $ | 9.490 | | | $ | 10.050 | | | $ | 9.480 | | | $ | 9.470 | |
| | | | | | |
| Income (Loss) From Operations | | | | | | | | | | | | | | | | | | | | | | | | |
Net investment income(1) | | $ | 0.171 | | | $ | 0.328 | | | $ | 0.366 | | | $ | 0.398 | | | $ | 0.389 | | | $ | 0.383 | |
Net realized and unrealized gain (loss) | | | 0.604 | | | | (1.225 | ) | | | 0.693 | | | | (0.565 | ) | | | 0.555 | | | | (0.011 | ) |
| | | | | | |
Total income (loss) from operations | | $ | 0.775 | | | $ | (0.897 | ) | | $ | 1.059 | | | $ | (0.167 | ) | | $ | 0.944 | | | $ | 0.372 | |
| | | | | | |
| Less Distributions | | | | | | | | | | | | | | | | | | | | | | | | |
From net investment income | | $ | (0.175 | ) | | $ | (0.323 | ) | | $ | (0.359 | ) | | $ | (0.393 | ) | | $ | (0.374 | ) | | $ | (0.362 | ) |
| | | | | | |
Total distributions | | $ | (0.175 | ) | | $ | (0.323 | ) | | $ | (0.359 | ) | | $ | (0.393 | ) | | $ | (0.374 | ) | | $ | (0.362 | ) |
| | | | | | |
Net asset value — End of period | | $ | 9.570 | | | $ | 8.970 | | | $ | 10.190 | | | $ | 9.490 | | | $ | 10.050 | | | $ | 9.480 | |
| | | | | | |
Total Return(2) | | | 8.70 | %(3) | | | (9.09 | )% | | | 11.33 | % | | | (1.54 | )% | | | 10.14 | % | | | 4.30 | % |
| | | | | | |
| Ratios/Supplemental Data | | | | | | | | | | | | | | | | | | | | | | | | |
Net assets, end of period (000’s omitted) | | $ | 935 | | | $ | 1,103 | | | $ | 2,091 | | | $ | 2,544 | | | $ | 4,220 | | | $ | 5,209 | |
Ratios (as a percentage of average daily net assets): | | | | | | | | | | | | | | | | | | | | | | | | |
Expenses excluding interest and fees | | | 1.50 | %(4) | | | 1.49 | % | | | 1.50 | % | | | 1.53 | % | | | 1.52 | % | | | 1.57 | % |
Interest and fee expense(5) | | | 0.07 | %(4) | | | 0.06 | % | | | 0.07 | % | | | 0.09 | % | | | 0.08 | % | | | 0.11 | % |
Total expenses(6) | | | 1.57 | %(4) | | | 1.55 | % | | | 1.57 | % | | | 1.62 | % | | | 1.60 | % | | | 1.68 | % |
Net investment income | | | 3.74 | %(4) | | | 3.24 | % | | | 3.70 | % | | | 4.22 | % | | | 3.98 | % | | | 4.37 | % |
Portfolio Turnover | | | 4 | %(3) | | | 14 | % | | | 8 | % | | | 7 | % | | | 10 | % | | | 42 | % |
| (1) | Computed using average shares outstanding. |
| (2) | Returns are historical and are calculated by determining the percentage change in net asset value with all distributions reinvested and do not reflect the effect of sales charges. |
| (5) | Interest and fee expense primarily relates to the liability for floating rate notes issued in conjunction with residual interest bond transactions (see Note 1I). |
| (6) | Excludes the effect of custody fee credits, if any, of less than 0.005%. |
| | | | |
| | 85 | | See Notes to Financial Statements. |
Eaton Vance
Municipal Income Funds
February 28, 2014
Financial Highlights — continued
| | | | | | | | | | | | | | | | | | | | | | | | |
| | | North Carolina Fund — Class C | |
| | | Six Months Ended
February 28, 2014
(Unaudited) | | | Year Ended August 31, | |
| | | | 2013 | | | 2012 | | | 2011 | | | 2010 | | | 2009 | |
Net asset value — Beginning of period | | $ | 8.970 | | | $ | 10.190 | | | $ | 9.490 | | | $ | 10.050 | | | $ | 9.480 | | | $ | 9.470 | |
| | | | | | |
| Income (Loss) From Operations | | | | | | | | | | | | | | | | | | | | | | | | |
Net investment income(1) | | $ | 0.171 | | | $ | 0.327 | | | $ | 0.360 | | | $ | 0.398 | | | $ | 0.385 | | | $ | 0.384 | |
Net realized and unrealized gain (loss) | | | 0.604 | | | | (1.224 | ) | | | 0.699 | | | | (0.564 | ) | | | 0.558 | | | | (0.012 | ) |
| | | | | | |
Total income (loss) from operations | | $ | 0.775 | | | $ | (0.897 | ) | | $ | 1.059 | | | $ | (0.166 | ) | | $ | 0.943 | | | $ | 0.372 | |
| | | | | | |
| Less Distributions | | | | | | | | | | | | | | | | | | | | | | | | |
From net investment income | | $ | (0.175 | ) | | $ | (0.323 | ) | | $ | (0.359 | ) | | $ | (0.394 | ) | | $ | (0.373 | ) | | $ | (0.362 | ) |
| | | | | | |
Total distributions | | $ | (0.175 | ) | | $ | (0.323 | ) | | $ | (0.359 | ) | | $ | (0.394 | ) | | $ | (0.373 | ) | | $ | (0.362 | ) |
| | | | | | |
Net asset value — End of period | | $ | 9.570 | | | $ | 8.970 | | | $ | 10.190 | | | $ | 9.490 | | | $ | 10.050 | | | $ | 9.480 | |
| | | | | | |
Total Return(2) | | | 8.70 | %(3) | | | (9.09 | )% | | | 11.32 | % | | | (1.54 | )% | | | 10.13 | % | | | 4.30 | % |
| | | | | | |
| Ratios/Supplemental Data | | | | | | | | | | | | | | | | | | | | | | | | |
Net assets, end of period (000’s omitted) | | $ | 19,994 | | | $ | 20,150 | | | $ | 21,402 | | | $ | 13,509 | | | $ | 14,952 | | | $ | 8,734 | |
Ratios (as a percentage of average daily net assets): | | | | | | | | | | | | | | | | | | | | | | | | |
Expenses excluding interest and fees | | | 1.50 | %(4) | | | 1.49 | % | | | 1.49 | % | | | 1.53 | % | | | 1.52 | % | | | 1.57 | % |
Interest and fee expense(5) | | | 0.07 | %(4) | | | 0.06 | % | | | 0.07 | % | | | 0.09 | % | | | 0.08 | % | | | 0.11 | % |
Total expenses(6) | | | 1.57 | %(4) | | | 1.55 | % | | | 1.56 | % | | | 1.62 | % | | | 1.60 | % | | | 1.68 | % |
Net investment income | | | 3.73 | %(4) | | | 3.25 | % | | | 3.63 | % | | | 4.22 | % | | | 3.94 | % | | | 4.36 | % |
Portfolio Turnover | | | 4 | %(3) | | | 14 | % | | | 8 | % | | | 7 | % | | | 10 | % | | | 42 | % |
| (1) | Computed using average shares outstanding. |
| (2) | Returns are historical and are calculated by determining the percentage change in net asset value with all distributions reinvested and do not reflect the effect of sales charges. |
| (5) | Interest and fee expense primarily relates to the liability for floating rate notes issued in conjunction with residual interest bond transactions (see Note 1I). |
| (6) | Excludes the effect of custody fee credits, if any, of less than 0.005%. |
| | | | |
| | 86 | | See Notes to Financial Statements. |
Eaton Vance
Municipal Income Funds
February 28, 2014
Financial Highlights — continued
| | | | | | | | | | | | | | | | | | | | | | | | |
| | | North Carolina Fund — Class I | |
| | | Six Months Ended
February 28, 2014
(Unaudited) | | | Year Ended August 31, | |
| | | | 2013 | | | 2012 | | | 2011 | | | 2010 | | | 2009 | |
Net asset value — Beginning of period | | $ | 8.360 | | | $ | 9.500 | | | $ | 8.840 | | | $ | 9.370 | | | $ | 8.830 | | | $ | 8.820 | |
| | | | | | |
| Income (Loss) From Operations | | | | | | | | | | | | | | | | | | | | | | | | |
Net investment income(1) | | $ | 0.200 | | | $ | 0.394 | | | $ | 0.426 | | | $ | 0.455 | | | $ | 0.447 | | | $ | 0.437 | |
Net realized and unrealized gain (loss) | | | 0.563 | | | | (1.144 | ) | | | 0.656 | | | | (0.535 | ) | | | 0.523 | | | | (0.010 | ) |
| | | | | | |
Total income (loss) from operations | | $ | 0.763 | | | $ | (0.750 | ) | | $ | 1.082 | | | $ | (0.080 | ) | | $ | 0.970 | | | $ | 0.427 | |
| | | | | | |
| Less Distributions | | | | | | | | | | | | | | | | | | | | | | | | |
From net investment income | | $ | (0.203 | ) | | $ | (0.390 | ) | | $ | (0.422 | ) | | $ | (0.450 | ) | | $ | (0.430 | ) | | $ | (0.417 | ) |
| | | | | | |
Total distributions | | $ | (0.203 | ) | | $ | (0.390 | ) | | $ | (0.422 | ) | | $ | (0.450 | ) | | $ | (0.430 | ) | | $ | (0.417 | ) |
| | | | | | |
Net asset value — End of period | | $ | 8.920 | | | $ | 8.360 | | | $ | 9.500 | | | $ | 8.840 | | | $ | 9.370 | | | $ | 8.830 | |
| | | | | | |
Total Return(2) | | | 9.22 | %(3) | | | (8.25 | )% | | | 12.35 | % | | | (0.57 | )% | | | 11.23 | % | | | 5.32 | % |
| | | | | | |
| Ratios/Supplemental Data | | | | | | | | | | | | | | | | | | | | | | | | |
Net assets, end of period (000’s omitted) | | $ | 15,230 | | | $ | 15,958 | | | $ | 18,174 | | | $ | 14,491 | | | $ | 17,125 | | | $ | 8,303 | |
Ratios (as a percentage of average daily net assets): | | | | | | | | | | | | | | | | | | | | | | | | |
Expenses excluding interest and fees | | | 0.55 | %(4) | | | 0.54 | % | | | 0.55 | % | | | 0.58 | % | | | 0.58 | % | | | 0.63 | % |
Interest and fee expense(5) | | | 0.07 | %(4) | | | 0.06 | % | | | 0.07 | % | | | 0.09 | % | | | 0.08 | % | | | 0.11 | % |
Total expenses before custodian fee reduction | | | 0.62 | %(4) | | | 0.60 | % | | | 0.62 | % | | | 0.67 | % | | | 0.66 | % | | | 0.74 | % |
Expenses after custodian fee reduction excluding interest and fees | | | 0.55 | %(4) | | | 0.54 | % | | | 0.55 | % | | | 0.58 | % | | | 0.58 | % | | | 0.62 | % |
Net investment income | | | 4.67 | %(4) | | | 4.20 | % | | | 4.61 | % | | | 5.18 | % | | | 4.91 | % | | | 5.33 | % |
Portfolio Turnover | | | 4 | %(3) | | | 14 | % | | | 8 | % | | | 7 | % | | | 10 | % | | | 42 | % |
| (1) | Computed using average shares outstanding. |
| (2) | Returns are historical and are calculated by determining the percentage change in net asset value with all distributions reinvested. |
| (5) | Interest and fee expense relates to the liability for floating rate notes issued in conjunction with residual interest bond transactions (see Note 1I). |
| | | | |
| | 87 | | See Notes to Financial Statements. |
Eaton Vance
Municipal Income Funds
February 28, 2014
Financial Highlights — continued
| | | | | | | | | | | | | | | | | | | | | | | | |
| | | Oregon Fund — Class A | |
| | | Six Months Ended
February 28, 2014
(Unaudited) | | | Year Ended August 31, | |
| | | | 2013 | | | 2012 | | | 2011 | | | 2010 | | | 2009 | |
Net asset value — Beginning of period | | $ | 8.070 | | | $ | 9.570 | | | $ | 8.630 | | | $ | 9.180 | | | $ | 8.510 | | | $ | 8.720 | |
| | | | | | |
| Income (Loss) From Operations | | | | | | | | | | | | | | | | | | | | | | | | |
Net investment income(1) | | $ | 0.206 | | | $ | 0.380 | | | $ | 0.414 | | | $ | 0.443 | | | $ | 0.413 | | | $ | 0.399 | |
Net realized and unrealized gain (loss) | | | 0.396 | | | | (1.504 | ) | | | 0.939 | | | | (0.554 | ) | | | 0.648 | | | | (0.210 | ) |
| | | | | | |
Total income (loss) from operations | | $ | 0.602 | | | $ | (1.124 | ) | | $ | 1.353 | | | $ | (0.111 | ) | | $ | 1.061 | | | $ | 0.189 | |
| | | | | | |
| Less Distributions | | | | | | | | | | | | | | | | | | | | | | | | |
From net investment income | | $ | (0.202 | ) | | $ | (0.376 | ) | | $ | (0.413 | ) | | $ | (0.439 | ) | | $ | (0.391 | ) | | $ | (0.399 | ) |
| | | | | | |
Total distributions | | $ | (0.202 | ) | | $ | (0.376 | ) | | $ | (0.413 | ) | | $ | (0.439 | ) | | $ | (0.391 | ) | | $ | (0.399 | ) |
| | | | | | |
Net asset value — End of period | | $ | 8.470 | | | $ | 8.070 | | | $ | 9.570 | | | $ | 8.630 | | | $ | 9.180 | | | $ | 8.510 | |
| | | | | | |
Total Return(2) | | | 7.40 | %(3) | | | (12.19 | )% | | | 15.95 | % | | | (1.01 | )% | | | 12.77 | % | | | 2.65 | % |
| | | | | | |
| Ratios/Supplemental Data | | | | | | | | | | | | | | | | | | | | | | | | |
Net assets, end of period (000’s omitted) | | $ | 87,126 | | | $ | 89,102 | | | $ | 115,323 | | | $ | 99,049 | | | $ | 126,583 | | | $ | 118,827 | |
Ratios (as a percentage of average daily net assets): | | | | | | | | | | | | | | | | | | | | | | | | |
Expenses excluding interest and fees | | | 0.75 | %(4) | | | 0.73 | % | | | 0.74 | % | | | 0.77 | % | | | 0.78 | % | | | 0.82 | % |
Interest and fee expense(5) | | | 0.11 | %(4) | | | 0.08 | % | | | 0.10 | % | | | 0.10 | % | | | 0.04 | % | | | 0.12 | % |
Total expenses before custodian fee reduction | | | 0.86 | %(4) | | | 0.81 | % | | | 0.84 | % | | | 0.87 | % | | | 0.82 | % | | | 0.94 | % |
Expenses after custodian fee reduction excluding interest and fees | | | 0.74 | %(4) | | | 0.73 | % | | | 0.74 | % | | | 0.77 | % | | | 0.78 | % | | | 0.81 | % |
Net investment income | | | 5.00 | %(4) | | | 4.05 | % | | | 4.50 | % | | | 5.21 | % | | | 4.71 | % | | | 5.05 | % |
Portfolio Turnover | | | 11 | %(3) | | | 40 | % | | | 17 | % | | | 12 | % | | | 22 | % | | | 42 | % |
| (1) | Computed using average shares outstanding. |
| (2) | Returns are historical and are calculated by determining the percentage change in net asset value with all distributions reinvested and do not reflect the effect of sales charges. |
| (5) | Interest and fee expense relates to the liability for floating rate notes issued in conjunction with residual interest bond transactions (see Note 1I). |
| | | | |
| | 88 | | See Notes to Financial Statements. |
Eaton Vance
Municipal Income Funds
February 28, 2014
Financial Highlights — continued
| | | | | | | | | | | | | | | | | | | | | | | | |
| | | Oregon Fund — Class B | |
| | | Six Months Ended
February 28, 2014
(Unaudited) | | | Year Ended August 31, | |
| | | | 2013 | | | 2012 | | | 2011 | | | 2010 | | | 2009 | |
Net asset value — Beginning of period | | $ | 8.830 | | | $ | 10.460 | | | $ | 9.440 | | | $ | 10.040 | | | $ | 9.310 | | | $ | 9.540 | |
| | | | | | |
| Income (Loss) From Operations | | | | | | | | | | | | | | | | | | | | | | | | |
Net investment income(1) | | $ | 0.192 | | | $ | 0.338 | | | $ | 0.380 | | | $ | 0.414 | | | $ | 0.380 | | | $ | 0.372 | |
Net realized and unrealized gain (loss) | | | 0.425 | | | | (1.634 | ) | | | 1.016 | | | | (0.604 | ) | | | 0.708 | | | | (0.233 | ) |
| | | | | | |
Total income (loss) from operations | | $ | 0.617 | | | $ | (1.296 | ) | | $ | 1.396 | | | $ | (0.190 | ) | | $ | 1.088 | | | $ | 0.139 | |
| | | | | | |
| Less Distributions | | | | | | | | | | | | | | | | | | | | | | | | |
From net investment income | | $ | (0.187 | ) | | $ | (0.334 | ) | | $ | (0.376 | ) | | $ | (0.410 | ) | | $ | (0.358 | ) | | $ | (0.369 | ) |
| | | | | | |
Total distributions | | $ | (0.187 | ) | | $ | (0.334 | ) | | $ | (0.376 | ) | | $ | (0.410 | ) | | $ | (0.358 | ) | | $ | (0.369 | ) |
| | | | | | |
Net asset value — End of period | | $ | 9.260 | | | $ | 8.830 | | | $ | 10.460 | | | $ | 9.440 | | | $ | 10.040 | | | $ | 9.310 | |
| | | | | | |
Total Return(2) | | | 7.04 | %(3) | | | (12.75 | )% | | | 15.00 | % | | | (1.73 | )% | | | 11.92 | % | | | 1.85 | % |
| | | | | | |
| Ratios/Supplemental Data | | | | | | | | | | | | | | | | | | | | | | | | |
Net assets, end of period (000’s omitted) | | $ | 2,778 | | | $ | 3,186 | | | $ | 5,927 | | | $ | 6,873 | | | $ | 10,773 | | | $ | 12,114 | |
Ratios (as a percentage of average daily net assets): | | | | | | | | | | | | | | | | | | | | | | | | |
Expenses excluding interest and fees | | | 1.50 | %(4) | | | 1.48 | % | | | 1.49 | % | | | 1.52 | % | | | 1.53 | % | | | 1.56 | % |
Interest and fee expense(5) | | | 0.11 | %(4) | | | 0.08 | % | | | 0.10 | % | | | 0.10 | % | | | 0.04 | % | | | 0.12 | % |
Total expenses(6) | | | 1.61 | %(4) | | | 1.56 | % | | | 1.59 | % | | | 1.62 | % | | | 1.57 | % | | | 1.68 | % |
Net investment income | | | 4.26 | %(4) | | | 3.29 | % | | | 3.78 | % | | | 4.44 | % | | | 3.96 | % | | | 4.31 | % |
Portfolio Turnover | | | 11 | %(3) | | | 40 | % | | | 17 | % | | | 12 | % | | | 22 | % | | | 42 | % |
| (1) | Computed using average shares outstanding. |
| (2) | Returns are historical and are calculated by determining the percentage change in net asset value with all distributions reinvested and do not reflect the effect of sales charges. |
| (5) | Interest and fee expense relates to the liability for floating rate notes issued in conjunction with residual interest bond transactions (see Note 1I). |
| (6) | Excludes the effect of custody fee credits, if any, of less than 0.005%. |
| | | | |
| | 89 | | See Notes to Financial Statements. |
Eaton Vance
Municipal Income Funds
February 28, 2014
Financial Highlights — continued
| | | | | | | | | | | | | | | | | | | | | | | | |
| | | Oregon Fund — Class C | |
| | | Six Months Ended
February 28, 2014
(Unaudited) | | | Year Ended August 31, | |
| | | | 2013 | | | 2012 | | | 2011 | | | 2010 | | | 2009 | |
Net asset value — Beginning of period | | $ | 8.840 | | | $ | 10.470 | | | $ | 9.450 | | | $ | 10.050 | | | $ | 9.320 | | | $ | 9.550 | |
| | | | | | |
| Income (Loss) From Operations | | | | | | | | | | | | | | | | | | | | | | | | |
Net investment income(1) | | $ | 0.193 | | | $ | 0.339 | | | $ | 0.376 | | | $ | 0.415 | | | $ | 0.380 | | | $ | 0.371 | |
Net realized and unrealized gain (loss) | | | 0.425 | | | | (1.634 | ) | | | 1.020 | | | | (0.605 | ) | | | 0.708 | | | | (0.232 | ) |
| | | | | | |
Total income (loss) from operations | | $ | 0.618 | | | $ | (1.295 | ) | | $ | 1.396 | | | $ | (0.190 | ) | | $ | 1.088 | | | $ | 0.139 | |
| | | | | | |
| Less Distributions | | | | | | | | | | | | | | | | | | | | | | | | |
From net investment income | | $ | (0.188 | ) | | $ | (0.335 | ) | | $ | (0.376 | ) | | $ | (0.410 | ) | | $ | (0.358 | ) | | $ | (0.369 | ) |
| | | | | | |
Total distributions | | $ | (0.188 | ) | | $ | (0.335 | ) | | $ | (0.376 | ) | | $ | (0.410 | ) | | $ | (0.358 | ) | | $ | (0.369 | ) |
| | | | | | |
Net asset value — End of period | | $ | 9.270 | | | $ | 8.840 | | | $ | 10.470 | | | $ | 9.450 | | | $ | 10.050 | | | $ | 9.320 | |
| | | | | | |
Total Return(2) | | | 7.04 | %(3) | | | (12.74 | )% | | | 14.99 | % | | | (1.72 | )% | | | 11.91 | % | | | 1.85 | % |
| | | | | | |
| Ratios/Supplemental Data | | | | | | | | | | | | | | | | | | | | | | | | |
Net assets, end of period (000’s omitted) | | $ | 14,252 | | | $ | 17,275 | | | $ | 23,894 | | | $ | 16,815 | | | $ | 21,031 | | | $ | 19,429 | |
Ratios (as a percentage of average daily net assets): | | | | | | | | | | | | | | | | | | | | | | | | |
Expenses excluding interest and fees | | | 1.50 | %(4) | | | 1.48 | % | | | 1.48 | % | | | 1.52 | % | | | 1.53 | % | | | 1.57 | % |
Interest and fee expense(5) | | | 0.11 | %(4) | | | 0.08 | % | | | 0.10 | % | | | 0.10 | % | | | 0.04 | % | | | 0.12 | % |
Total expenses before custodian fee reduction | | | 1.61 | %(4) | | | 1.56 | % | | | 1.58 | % | | | 1.62 | % | | | 1.57 | % | | | 1.69 | % |
Expenses after custodian fee reduction excluding interest and fees | | | 1.50 | %(4) | | | 1.48 | % | | | 1.48 | % | | | 1.52 | % | | | 1.53 | % | | | 1.56 | % |
Net investment income | | | 4.27 | %(4) | | | 3.30 | % | | | 3.72 | % | | | 4.46 | % | | | 3.96 | % | | | 4.29 | % |
Portfolio Turnover | | | 11 | %(3) | | | 40 | % | | | 17 | % | | | 12 | % | | | 22 | % | | | 42 | % |
| (1) | Computed using average shares outstanding. |
| (2) | Returns are historical and are calculated by determining the percentage change in net asset value with all distributions reinvested and do not reflect the effect of sales charges. |
| (5) | Interest and fee expense relates to the liability for floating rate notes issued in conjunction with residual interest bond transactions (see Note 1I). |
| | | | |
| | 90 | | See Notes to Financial Statements. |
Eaton Vance
Municipal Income Funds
February 28, 2014
Financial Highlights — continued
| | | | | | | | | | | | | | | | | | | | |
| | | Oregon Fund — Class I | |
| | | Six Months Ended
February 28, 2014
(Unaudited) | | | Year Ended August 31, | | | Period Ended
August 31, 2010(1) | |
| | | | 2013 | | | 2012 | | | 2011 | | |
Net asset value — Beginning of period | | $ | 8.070 | | | $ | 9.560 | | | $ | 8.620 | | | $ | 9.180 | | | $ | 8.850 | |
| | | | | |
| Income (Loss) From Operations | | | | | | | | | | | | | | | | | | | | |
Net investment income(2) | | $ | 0.215 | | | $ | 0.397 | | | $ | 0.419 | | | $ | 0.461 | | | $ | 0.033 | |
Net realized and unrealized gain (loss) | | | 0.385 | | | | (1.493 | ) | | | 0.951 | | | | (0.566 | ) | | | 0.330 | |
| | | | | |
Total income (loss) from operations | | $ | 0.600 | | | $ | (1.096 | ) | | $ | 1.370 | | | $ | (0.105 | ) | | $ | 0.363 | |
| | | | | |
| Less Distributions | | | | | | | | | | | | | | | | | | | | |
From net investment income | | $ | (0.210 | ) | | $ | (0.394 | ) | | $ | (0.430 | ) | | $ | (0.455 | ) | | $ | (0.033 | ) |
| | | | | |
Total distributions | | $ | (0.210 | ) | | $ | (0.394 | ) | | $ | (0.430 | ) | | $ | (0.455 | ) | | $ | (0.033 | ) |
| | | | | |
Net asset value — End of period | | $ | 8.460 | | | $ | 8.070 | | | $ | 9.560 | | | $ | 8.620 | | | $ | 9.180 | |
| | | | | |
Total Return(3) | | | 7.50 | %(4) | | | (11.92 | )% | | | 16.19 | % | | | (0.92 | )% | | | 4.11 | %(4) |
| | | | | |
| Ratios/Supplemental Data | | | | | | | | | | | | | | | | | | | | |
Net assets, end of period (000’s omitted) | | $ | 8,051 | | | $ | 13,092 | | | $ | 26,776 | | | $ | 3,262 | | | $ | 1 | |
Ratios (as a percentage of average daily net assets): | | | | | | | | | | | | | | | | | | | | |
Expenses excluding interest and fees | | | 0.55 | %(5) | | | 0.53 | % | | | 0.53 | % | | | 0.57 | % | | | 0.60 | %(5) |
Interest and fee expense(6) | | | 0.11 | %(5) | | | 0.08 | % | | | 0.10 | % | | | 0.10 | % | | | 0.04 | %(5) |
Total expenses(7) | | | 0.66 | %(5) | | | 0.61 | % | | | 0.63 | % | | | 0.67 | % | | | 0.64 | %(5) |
Net investment income | | | 5.24 | %(5) | | | 4.21 | % | | | 4.48 | % | | | 5.44 | % | | | 4.66 | %(5) |
Portfolio Turnover | | | 11 | %(4) | | | 40 | % | | | 17 | % | | | 12 | % | | | 22 | %(8) |
| (1) | For the period from the commencement of operations on August 3, 2010 to August 31, 2010. |
| (2) | Computed using average shares outstanding. |
| (3) | Returns are historical and are calculated by determining the percentage change in net asset value with all distributions reinvested. |
| (6) | Interest and fee expense relates to the liability for floating rate notes issued in conjunction with residual interest bond transactions (see Note 1I). |
| (7) | Excludes the effect of custody fee credits, if any, of less than 0.005%. |
| (8) | For the year ended August 31, 2010. |
| | | | |
| | 91 | | See Notes to Financial Statements. |
Eaton Vance
Municipal Income Funds
February 28, 2014
Financial Highlights — continued
| | | | | | | | | | | | | | | | | | | | | | | | |
| | | South Carolina Fund — Class A | |
| | | Six Months Ended
February 28, 2014
(Unaudited) | | | Year Ended August 31, | |
| | | | 2013 | | | 2012 | | | 2011 | | | 2010 | | | 2009 | |
Net asset value — Beginning of period | | $ | 8.500 | | | $ | 9.690 | | | $ | 8.930 | | | $ | 9.530 | | | $ | 8.870 | | | $ | 9.100 | |
| | | | | | |
| Income (Loss) From Operations | | | | | | | | | | | | | | | | | | | | | | | | |
Net investment income(1) | | $ | 0.206 | | | $ | 0.382 | | | $ | 0.401 | | | $ | 0.442 | | | $ | 0.413 | | | $ | 0.405 | |
Net realized and unrealized gain (loss) | | | 0.528 | | | | (1.193 | ) | | | 0.758 | | | | (0.603 | ) | | | 0.639 | | | | (0.233 | ) |
| | | | | | |
Total income (loss) from operations | | $ | 0.734 | | | $ | (0.811 | ) | | $ | 1.159 | | | $ | (0.161 | ) | | $ | 1.052 | | | $ | 0.172 | |
| | | | | | |
| Less Distributions | | | | | | | | | | | | | | | | | | | | | | | | |
From net investment income | | $ | (0.204 | ) | | $ | (0.379 | ) | | $ | (0.399 | ) | | $ | (0.439 | ) | | $ | (0.392 | ) | | $ | (0.402 | ) |
| | | | | | |
Total distributions | | $ | (0.204 | ) | | $ | (0.379 | ) | | $ | (0.399 | ) | | $ | (0.439 | ) | | $ | (0.392 | ) | | $ | (0.402 | ) |
| | | | | | |
Net asset value — End of period | | $ | 9.030 | | | $ | 8.500 | | | $ | 9.690 | | | $ | 8.930 | | | $ | 9.530 | | | $ | 8.870 | |
| | | | | | |
Total Return(2) | | | 8.71 | %(3) | | | (8.73 | )% | | | 13.21 | % | | | (1.52 | )% | | | 12.12 | % | | | 2.23 | % |
| | | | | | |
| Ratios/Supplemental Data | | | | | | | | | | | | | | | | | | | | | | | | |
Net assets, end of period (000’s omitted) | | $ | 74,827 | | | $ | 76,573 | | | $ | 93,466 | | | $ | 78,406 | | | $ | 109,294 | | | $ | 103,451 | |
Ratios (as a percentage of average daily net assets): | | | | | | | | | | | | | | | | | | | | | | | | |
Expenses excluding interest and fees | | | 0.74 | %(4) | | | 0.72 | % | | | 0.74 | % | | | 0.76 | % | | | 0.75 | % | | | 0.80 | % |
Interest and fee expense(5) | | | 0.10 | %(4) | | | 0.07 | % | | | 0.07 | % | | | 0.10 | % | | | 0.04 | % | | | 0.10 | % |
Total expenses(6) | | | 0.84 | %(4) | | | 0.79 | % | | | 0.81 | % | | | 0.86 | % | | | 0.79 | % | | | 0.90 | % |
Net investment income | | | 4.74 | %(4) | | | 3.98 | % | | | 4.28 | % | | | 4.99 | % | | | 4.51 | % | | | 4.91 | % |
Portfolio Turnover | | | 4 | %(3) | | | 44 | % | | | 30 | % | | | 14 | % | | | 26 | % | | | 44 | % |
| (1) | Computed using average shares outstanding. |
| (2) | Returns are historical and are calculated by determining the percentage change in net asset value with all distributions reinvested and do not reflect the effect of sales charges. |
| (5) | Interest and fee expense primarily relates to the liability for floating rate notes issued in conjunction with residual interest bond transactions (see Note 1I). |
| (6) | Excludes the effect of custody fee credits, if any, of less than 0.005%. |
| | | | |
| | 92 | | See Notes to Financial Statements. |
Eaton Vance
Municipal Income Funds
February 28, 2014
Financial Highlights — continued
| | | | | | | | | | | | | | | | | | | | | | | | |
| | | South Carolina Fund — Class B | |
| | | Six Months Ended
February 28, 2014
(Unaudited) | | | Year Ended August 31, | |
| | | | 2013 | | | 2012 | | | 2011 | | | 2010 | | | 2009 | |
Net asset value — Beginning of period | | $ | 9.020 | | | $ | 10.270 | | | $ | 9.470 | | | $ | 10.110 | | | $ | 9.410 | | | $ | 9.650 | |
| | | | | | |
| Income (Loss) From Operations | | | | | | | | | | | | | | | | | | | | | | | | |
Net investment income(1) | | $ | 0.184 | | | $ | 0.329 | | | $ | 0.354 | | | $ | 0.398 | | | $ | 0.365 | | | $ | 0.364 | |
Net realized and unrealized gain (loss) | | | 0.547 | | | | (1.253 | ) | | | 0.795 | | | | (0.643 | ) | | | 0.680 | | | | (0.246 | ) |
| | | | | | |
Total income (loss) from operations | | $ | 0.731 | | | $ | (0.924 | ) | | $ | 1.149 | | | $ | (0.245 | ) | | $ | 1.045 | | | $ | 0.118 | |
| | | | | | |
| Less Distributions | | | | | | | | | | | | | | | | | | | | | | | | |
From net investment income | | $ | (0.181 | ) | | $ | (0.326 | ) | | $ | (0.349 | ) | | $ | (0.395 | ) | | $ | (0.345 | ) | | $ | (0.358 | ) |
| | | | | | |
Total distributions | | $ | (0.181 | ) | | $ | (0.326 | ) | | $ | (0.349 | ) | | $ | (0.395 | ) | | $ | (0.345 | ) | | $ | (0.358 | ) |
| | | | | | |
Net asset value — End of period | | $ | 9.570 | | | $ | 9.020 | | | $ | 10.270 | | | $ | 9.470 | | | $ | 10.110 | | | $ | 9.410 | |
| | | | | | |
Total Return(2) | | | 8.16 | %(3) | | | (9.30 | )% | | | 12.30 | % | | | (2.29 | )% | | | 11.31 | % | | | 1.59 | % |
| | | | | | |
| Ratios/Supplemental Data | | | | | | | | | | | | | | | | | | | | | | | | |
Net assets, end of period (000’s omitted) | | $ | 2,062 | | | $ | 2,797 | | | $ | 3,909 | | | $ | 4,585 | | | $ | 7,252 | | | $ | 9,442 | |
Ratios (as a percentage of average daily net assets): | | | | | | | | | | | | | | | | | | | | | | | | |
Expenses excluding interest and fees | | | 1.50 | %(4) | | | 1.47 | % | | | 1.49 | % | | | 1.52 | % | | | 1.51 | % | | | 1.56 | % |
Interest and fee expense(5) | | | 0.10 | %(4) | | | 0.07 | % | | | 0.07 | % | | | 0.10 | % | | | 0.04 | % | | | 0.10 | % |
Total expenses(6) | | | 1.60 | %(4) | | | 1.54 | % | | | 1.56 | % | | | 1.62 | % | | | 1.55 | % | | | 1.66 | % |
Net investment income | | | 4.00 | %(4) | | | 3.23 | % | | | 3.56 | % | | | 4.24 | % | | | 3.76 | % | | | 4.17 | % |
Portfolio Turnover | | | 4 | %(3) | | | 44 | % | | | 30 | % | | | 14 | % | | | 26 | % | | | 44 | % |
| (1) | Computed using average shares outstanding. |
| (2) | Returns are historical and are calculated by determining the percentage change in net asset value with all distributions reinvested and do not reflect the effect of sales charges. |
| (5) | Interest and fee expense primarily relates to the liability for floating rate notes issued in conjunction with residual interest bond transactions (see Note 1I). |
| (6) | Excludes the effect of custody fee credits, if any, of less than 0.005%. |
| | | | |
| | 93 | | See Notes to Financial Statements. |
Eaton Vance
Municipal Income Funds
February 28, 2014
Financial Highlights — continued
| | | | | | | | | | | | | | | | | | | | | | | | |
| | | South Carolina Fund — Class C | |
| | | Six Months Ended
February 28, 2014
(Unaudited) | | | Year Ended August 31, | |
| | | | 2013 | | | 2012 | | | 2011 | | | 2010 | | | 2009 | |
Net asset value — Beginning of period | | $ | 9.020 | | | $ | 10.280 | | | $ | 9.470 | | | $ | 10.110 | | | $ | 9.410 | | | $ | 9.660 | |
| | | | | | |
| Income (Loss) From Operations | | | | | | | | | | | | | | | | | | | | | | | | |
Net investment income(1) | | $ | 0.184 | | | $ | 0.329 | | | $ | 0.350 | | | $ | 0.399 | | | $ | 0.365 | | | $ | 0.364 | |
Net realized and unrealized gain (loss) | | | 0.557 | | | | (1.263 | ) | | | 0.809 | | | | (0.644 | ) | | | 0.680 | | | | (0.256 | ) |
| | | | | | |
Total income (loss) from operations | | $ | 0.741 | | | $ | (0.934 | ) | | $ | 1.159 | | | $ | (0.245 | ) | | $ | 1.045 | | | $ | 0.108 | |
| | | | | | |
| Less Distributions | | | | | | | | | | | | | | | | | | | | | | | | |
From net investment income | | $ | (0.181 | ) | | $ | (0.326 | ) | | $ | (0.349 | ) | | $ | (0.395 | ) | | $ | (0.345 | ) | | $ | (0.358 | ) |
| | | | | | |
Total distributions | | $ | (0.181 | ) | | $ | (0.326 | ) | | $ | (0.349 | ) | | $ | (0.395 | ) | | $ | (0.345 | ) | | $ | (0.358 | ) |
| | | | | | |
Net asset value — End of period | | $ | 9.580 | | | $ | 9.020 | | | $ | 10.280 | | | $ | 9.470 | | | $ | 10.110 | | | $ | 9.410 | |
| | | | | | |
Total Return(2) | | | 8.28 | %(3) | | | (9.39 | )% | | | 12.41 | % | | | (2.29 | )% | | | 11.31 | % | | | 1.48 | % |
| | | | | | |
| Ratios/Supplemental Data | | | | | | | | | | | | | | | | | | | | | | | | |
Net assets, end of period (000’s omitted) | | $ | 25,251 | | | $ | 25,971 | | | $ | 29,876 | | | $ | 22,267 | | | $ | 28,500 | | | $ | 23,022 | |
Ratios (as a percentage of average daily net assets): | | | | | | | | | | | | | | | | | | | | | | | | |
Expenses excluding interest and fees | | | 1.49 | %(4) | | | 1.47 | % | | | 1.48 | % | | | 1.51 | % | | | 1.50 | % | | | 1.55 | % |
Interest and fee expense(5) | | | 0.10 | %(4) | | | 0.07 | % | | | 0.07 | % | | | 0.10 | % | | | 0.04 | % | | | 0.10 | % |
Total expenses(6) | | | 1.59 | %(4) | | | 1.54 | % | | | 1.55 | % | | | 1.61 | % | | | 1.54 | % | | | 1.65 | % |
Net investment income | | | 3.98 | %(4) | | | 3.23 | % | | | 3.51 | % | | | 4.25 | % | | | 3.75 | % | | | 4.15 | % |
Portfolio Turnover | | | 4 | %(3) | | | 44 | % | | | 30 | % | | | 14 | % | | | 26 | % | | | 44 | % |
| (1) | Computed using average shares outstanding. |
| (2) | Returns are historical and are calculated by determining the percentage change in net asset value with all distributions reinvested and do not reflect the effect of sales charges. |
| (5) | Interest and fee expense primarily relates to the liability for floating rate notes issued in conjunction with residual interest bond transactions (see Note 1I). |
| (6) | Excludes the effect of custody fee credits, if any, of less than 0.005%. |
| | | | |
| | 94 | | See Notes to Financial Statements. |
Eaton Vance
Municipal Income Funds
February 28, 2014
Financial Highlights — continued
| | | | | | | | | | | | | | | | | | | | | | | | |
| | | South Carolina Fund — Class I | |
| | | Six Months Ended
February 28, 2014
(Unaudited) | | | Year Ended August 31, | |
| | | | 2013 | | | 2012 | | | 2011 | | | 2010 | | | 2009 | |
Net asset value — Beginning of period | | $ | 8.510 | | | $ | 9.700 | | | $ | 8.930 | | | $ | 9.540 | | | $ | 8.880 | | | $ | 9.110 | |
| | | | | | |
| Income (Loss) From Operations | | | | | | | | | | | | | | | | | | | | | | | | |
Net investment income(1) | | $ | 0.215 | | | $ | 0.402 | | | $ | 0.422 | | | $ | 0.459 | | | $ | 0.432 | | | $ | 0.422 | |
Net realized and unrealized gain (loss) | | | 0.527 | | | | (1.193 | ) | | | 0.766 | | | | (0.612 | ) | | | 0.637 | | | | (0.233 | ) |
| | | | | | |
Total income (loss) from operations | | $ | 0.742 | | | $ | (0.791 | ) | | $ | 1.188 | | | $ | (0.153 | ) | | $ | 1.069 | | | $ | 0.189 | |
| | | | | | |
| Less Distributions | | | | | | | | | | | | | | | | | | | | | | | | |
From net investment income | | $ | (0.212 | ) | | $ | (0.399 | ) | | $ | (0.418 | ) | | $ | (0.457 | ) | | $ | (0.409 | ) | | $ | (0.419 | ) |
| | | | | | |
Total distributions | | $ | (0.212 | ) | | $ | (0.399 | ) | | $ | (0.418 | ) | | $ | (0.457 | ) | | $ | (0.409 | ) | | $ | (0.419 | ) |
| | | | | | |
Net asset value — End of period | | $ | 9.040 | | | $ | 8.510 | | | $ | 9.700 | | | $ | 8.930 | | | $ | 9.540 | | | $ | 8.880 | |
| | | | | | |
Total Return(2) | | | 8.80 | %(3) | | | (8.53 | )% | | | 13.55 | % | | | (1.43 | )% | | | 12.32 | % | | | 2.56 | % |
| | | | | | |
| Ratios/Supplemental Data | | | | | | | | | | | | | | | | | | | | | | | | |
Net assets, end of period (000’s omitted) | | $ | 17,771 | | | $ | 22,726 | | | $ | 26,081 | | | $ | 24,270 | | | $ | 39,520 | | | $ | 23,727 | |
Ratios (as a percentage of average daily net assets): | | | | | | | | | | | | | | | | | | | | | | | | |
Expenses excluding interest and fees | | | 0.55 | %(4) | | | 0.52 | % | | | 0.54 | % | | | 0.56 | % | | | 0.56 | % | | | 0.60 | % |
Interest and fee expense(5) | | | 0.10 | %(4) | | | 0.07 | % | | | 0.07 | % | | | 0.10 | % | | | 0.04 | % | | | 0.10 | % |
Total expenses(6) | | | 0.65 | %(4) | | | 0.59 | % | | | 0.61 | % | | | 0.66 | % | | | 0.60 | % | | | 0.70 | % |
Net investment income | | | 4.95 | %(4) | | | 4.19 | % | | | 4.49 | % | | | 5.17 | % | | | 4.71 | % | | | 5.11 | % |
Portfolio Turnover | | | 4 | %(3) | | | 44 | % | | | 30 | % | | | 14 | % | | | 26 | % | | | 44 | % |
| (1) | Computed using average shares outstanding. |
| (2) | Returns are historical and are calculated by determining the percentage change in net asset value with all distributions reinvested. |
| (5) | Interest and fee expense relates to the liability for floating rate notes issued in conjunction with residual interest bond transactions (see Note 1I). |
| (6) | Excludes the effect of custody fee credits, if any, of less than 0.005%. |
| | | | |
| | 95 | | See Notes to Financial Statements. |
Eaton Vance
Municipal Income Funds
February 28, 2014
Financial Highlights — continued
| | | | | | | | | | | | | | | | | | | | | | | | |
| | | Tennessee Fund — Class A | |
| | | Six Months Ended
February 28, 2014
(Unaudited) | | | Year Ended August 31, | |
| | | | 2013 | | | 2012 | | | 2011 | | | 2010 | | | 2009 | |
Net asset value — Beginning of period | | $ | 8.240 | | | $ | 8.980 | | | $ | 8.560 | | | $ | 8.960 | | | $ | 8.670 | | | $ | 9.100 | |
| | | | | | |
| Income (Loss) From Operations | | | | | | | | | | | | | | | | | | | | | | | | |
Net investment income(1) | | $ | 0.167 | | | $ | 0.323 | | | $ | 0.351 | | | $ | 0.380 | | | $ | 0.380 | | | $ | 0.388 | |
Net realized and unrealized gain (loss) | | | 0.218 | | | | (0.739 | ) | | | 0.419 | | | | (0.403 | ) | | | 0.279 | | | | (0.424 | ) |
| | | | | | |
Total income (loss) from operations | | $ | 0.385 | | | $ | (0.416 | ) | | $ | 0.770 | | | $ | (0.023 | ) | | $ | 0.659 | | | $ | (0.036 | ) |
| | | | | | |
| Less Distributions | | | | | | | | | | | | | | | | | | | | | | | | |
From net investment income | | $ | (0.165 | ) | | $ | (0.322 | ) | | $ | (0.349 | ) | | $ | (0.377 | ) | | $ | (0.369 | ) | | $ | (0.394 | ) |
Tax return of capital | | | — | | | | (0.002 | ) | | | (0.001 | ) | | | — | | | | — | | | | — | |
| | | | | | |
Total distributions | | $ | (0.165 | ) | | $ | (0.324 | ) | | $ | (0.350 | ) | | $ | (0.377 | ) | | $ | (0.369 | ) | | $ | (0.394 | ) |
| | | | | | |
Net asset value — End of period | | $ | 8.460 | | | $ | 8.240 | | | $ | 8.980 | | | $ | 8.560 | | | $ | 8.960 | | | $ | 8.670 | |
| | | | | | |
Total Return(2) | | | 4.71 | %(3) | | | (4.82 | )% | | | 9.14 | % | | | (0.20 | )% | | | 7.71 | % | | | (0.03 | )% |
| | | | | | |
| Ratios/Supplemental Data | | | | | | | | | | | | | | | | | | | | | | | | |
Net assets, end of period (000’s omitted) | | $ | 29,949 | | | $ | 33,334 | | | $ | 40,318 | | | $ | 39,755 | | | $ | 47,371 | | | $ | 46,787 | |
Ratios (as a percentage of average daily net assets): | | | | | | | | | | | | | | | | | | | | | | | | |
Expenses excluding interest and fees | | | 0.73 | %(4) | | | 0.72 | % | | | 0.72 | % | | | 0.73 | % | | | 0.74 | % | | | 0.79 | % |
Interest and fee expense | | | — | | | | 0.00 | %(5)(6) | | | 0.01 | %(5) | | | 0.01 | %(5) | | | 0.01 | %(5) | | | 0.03 | %(5) |
Total expenses(7) | | | 0.73 | %(4) | | | 0.72 | % | | | 0.73 | % | | | 0.74 | % | | | 0.75 | % | | | 0.82 | % |
Net investment income | | | 4.02 | %(4) | | | 3.64 | % | | | 3.98 | % | | | 4.39 | % | | | 4.27 | % | | | 4.72 | % |
Portfolio Turnover | | | 0 | %(3)(8) | | | 14 | % | | | 9 | % | | | 5 | % | | | 12 | % | | | 20 | % |
| (1) | Computed using average shares outstanding. |
| (2) | Returns are historical and are calculated by determining the percentage change in net asset value with all distributions reinvested and do not reflect the effect of sales charges. |
| (5) | Interest and fee expense relates to the liability for floating rate notes issued in conjunction with residual interest bond transactions (see Note 1I). |
| (6) | Amount is less than 0.005%. |
| (7) | Excludes the effect of custody fee credits, if any, of less than 0.005%. |
| (8) | Amount is less than 0.5%. |
| | | | |
| | 96 | | See Notes to Financial Statements. |
Eaton Vance
Municipal Income Funds
February 28, 2014
Financial Highlights — continued
| | | | | | | | | | | | | | | | | | | | | | | | |
| | | Tennessee Fund — Class B | |
| | | Six Months Ended
February 28, 2014
(Unaudited) | | | Year Ended August 31, | |
| | | | 2013 | | | 2012 | | | 2011 | | | 2010 | | | 2009 | |
Net asset value — Beginning of period | | $ | 8.980 | | | $ | 9.780 | | | $ | 9.320 | | | $ | 9.760 | | | $ | 9.450 | | | $ | 9.910 | |
| | | | | | |
| Income (Loss) From Operations | | | | | | | | | | | | | | | | | | | | | | | | |
Net investment income(1) | | $ | 0.147 | | | $ | 0.279 | | | $ | 0.313 | | | $ | 0.343 | | | $ | 0.342 | | | $ | 0.356 | |
Net realized and unrealized gain (loss) | | | 0.229 | | | | (0.798 | ) | | | 0.456 | | | | (0.443 | ) | | | 0.298 | | | | (0.458 | ) |
| | | | | | |
Total income (loss) from operations | | $ | 0.376 | | | $ | (0.519 | ) | | $ | 0.769 | | | $ | (0.100 | ) | | $ | 0.640 | | | $ | (0.102 | ) |
| | | | | | |
| Less Distributions | | | | | | | | | | | | | | | | | | | | | | | | |
From net investment income | | $ | (0.146 | ) | | $ | (0.279 | ) | | $ | (0.308 | ) | | $ | (0.340 | ) | | $ | (0.330 | ) | | $ | (0.358 | ) |
Tax return of capital | | | — | | | | (0.002 | ) | | | (0.001 | ) | | | — | | | | — | | | | — | |
| | | | | | |
Total distributions | | $ | (0.146 | ) | | $ | (0.281 | ) | | $ | (0.309 | ) | | $ | (0.340 | ) | | $ | (0.330 | ) | | $ | (0.358 | ) |
| | | | | | |
Net asset value — End of period | | $ | 9.210 | | | $ | 8.980 | | | $ | 9.780 | | | $ | 9.320 | | | $ | 9.760 | | | $ | 9.450 | |
| | | | | | |
Total Return(2) | | | 4.21 | %(3) | | | (5.47 | )% | | | 8.35 | % | | | (0.99 | )% | | | 6.86 | % | | | (0.73 | )% |
| | | | | | |
| Ratios/Supplemental Data | | | | | | | | | | | | | | | | | | | | | | | | |
Net assets, end of period (000’s omitted) | | $ | 668 | | | $ | 755 | | | $ | 1,175 | | | $ | 1,634 | | | $ | 3,024 | | | $ | 4,069 | |
Ratios (as a percentage of average daily net assets): | | | | | | | | | | | | | | | | | | | | | | | | |
Expenses excluding interest and fees | | | 1.48 | %(4) | | | 1.47 | % | | | 1.47 | % | | | 1.49 | % | | | 1.49 | % | | | 1.54 | % |
Interest and fee expense | | | — | | | | 0.00 | %(5)(6) | | | 0.01 | %(5) | | | 0.01 | %(5) | | | 0.01 | %(5) | | | 0.03 | %(5) |
Total expenses(7) | | | 1.48 | %(4) | | | 1.47 | % | | | 1.48 | % | | | 1.50 | % | | | 1.50 | % | | | 1.57 | % |
Net investment income | | | 3.26 | %(4) | | | 2.89 | % | | | 3.26 | % | | | 3.64 | % | | | 3.52 | % | | | 3.99 | % |
Portfolio Turnover | | | 0 | %(3)(8) | | | 14 | % | | | 9 | % | | | 5 | % | | | 12 | % | | | 20 | % |
| (1) | Computed using average shares outstanding. |
| (2) | Returns are historical and are calculated by determining the percentage change in net asset value with all distributions reinvested and do not reflect the effect of sales charges. |
| (5) | Interest and fee expense relates to the liability for floating rate notes issued in conjunction with residual interest bond transactions (see Note 1I). |
| (6) | Amount is less than 0.005%. |
| (7) | Excludes the effect of custody fee credits, if any, of less than 0.005%. |
| (8) | Amount is less than 0.5%. |
| | | | |
| | 97 | | See Notes to Financial Statements. |
Eaton Vance
Municipal Income Funds
February 28, 2014
Financial Highlights — continued
| | | | | | | | | | | | | | | | | | | | | | | | |
| | | Tennessee Fund — Class C | |
| | | Six Months Ended
February 28, 2014
(Unaudited) | | | Year Ended August 31, | |
| | | | 2013 | | | 2012 | | | 2011 | | | 2010 | | | 2009 | |
Net asset value — Beginning of period | | $ | 8.970 | | | $ | 9.770 | | | $ | 9.320 | | | $ | 9.760 | | | $ | 9.440 | | | $ | 9.910 | |
| | | | | | |
| Income (Loss) From Operations | | | | | | | | | | | | | | | | | | | | | | | | |
Net investment income(1) | | $ | 0.148 | | | $ | 0.278 | | | $ | 0.308 | | | $ | 0.342 | | | $ | 0.339 | | | $ | 0.351 | |
Net realized and unrealized gain (loss) | | | 0.238 | | | | (0.797 | ) | | | 0.450 | | | | (0.442 | ) | | | 0.311 | | | | (0.463 | ) |
| | | | | | |
Total income (loss) from operations | | $ | 0.386 | | | $ | (0.519 | ) | | $ | 0.758 | | | $ | (0.100 | ) | | $ | 0.650 | | | $ | (0.112 | ) |
| | | | | | |
| Less Distributions | | | | | | | | | | | | | | | | | | | | | | | | |
From net investment income | | $ | (0.146 | ) | | $ | (0.279 | ) | | $ | (0.307 | ) | | $ | (0.340 | ) | | $ | (0.330 | ) | | $ | (0.358 | ) |
Tax return of capital | | | — | | | | (0.002 | ) | | | (0.001 | ) | | | — | | | | — | | | | — | |
| | | | | | |
Total distributions | | $ | (0.146 | ) | | $ | (0.281 | ) | | $ | (0.308 | ) | | $ | (0.340 | ) | | $ | (0.330 | ) | | $ | (0.358 | ) |
| | | | | | |
Net asset value — End of period | | $ | 9.210 | | | $ | 8.970 | | | $ | 9.770 | | | $ | 9.320 | | | $ | 9.760 | | | $ | 9.440 | |
| | | | | | |
Total Return(2) | | | 4.33 | %(3) | | | (5.48 | )% | | | 8.24 | % | | | (0.99 | )% | | | 6.97 | % | | | (0.83 | )% |
| | | | | | |
| Ratios/Supplemental Data | | | | | | | | | | | | | | | | | | | | | | | | |
Net assets, end of period (000’s omitted) | | $ | 7,365 | | | $ | 8,751 | | | $ | 9,864 | | | $ | 7,544 | | | $ | 9,013 | | | $ | 6,004 | |
Ratios (as a percentage of average daily net assets): | | | | | | | | | | | | | | | | | | | | | | | | |
Expenses excluding interest and fees | | | 1.48 | %(4) | | | 1.47 | % | | | 1.47 | % | | | 1.48 | % | | | 1.49 | % | | | 1.54 | % |
Interest and fee expense | | | — | | | | 0.00 | %(5)(6) | | | 0.01 | %(5) | | | 0.01 | %(5) | | | 0.01 | %(5) | | | 0.03 | %(5) |
Total expenses(7) | | | 1.48 | %(4) | | | 1.47 | % | | | 1.48 | % | | | 1.49 | % | | | 1.50 | % | | | 1.57 | % |
Net investment income | | | 3.27 | %(4) | | | 2.88 | % | | | 3.20 | % | | | 3.64 | % | | | 3.49 | % | | | 3.93 | % |
Portfolio Turnover | | | 0 | %(3)(8) | | | 14 | % | | | 9 | % | | | 5 | % | | | 12 | % | | | 20 | % |
| (1) | Computed using average shares outstanding. |
| (2) | Returns are historical and are calculated by determining the percentage change in net asset value with all distributions reinvested and do not reflect the effect of sales charges. |
| (5) | Interest and fee expense relates to the liability for floating rate notes issued in conjunction with residual interest bond transactions (see Note 1I). |
| (6) | Amount is less than 0.005%. |
| (7) | Excludes the effect of custody fee credits, if any, of less than 0.005%. |
| (8) | Amount is less than 0.5%. |
| | | | |
| | 98 | | See Notes to Financial Statements. |
Eaton Vance
Municipal Income Funds
February 28, 2014
Financial Highlights — continued
| | | | | | | | | | | | | | | | | | | | |
| | | Tennessee Fund — Class I | |
| | | Six Months Ended
February 28, 2014
(Unaudited) | | | Year Ended August 31, | | | Period Ended
August 31, 2010(1) | |
| | | | 2013 | | | 2012 | | | 2011 | | |
Net asset value — Beginning of period | | $ | 8.240 | | | $ | 8.970 | | | $ | 8.550 | | | $ | 8.960 | | | $ | 8.890 | |
| | | | | |
| Income (Loss) From Operations | | | | | | | | | | | | | | | | | | | | |
Net investment income(2) | | $ | 0.175 | | | $ | 0.340 | | | $ | 0.358 | | | $ | 0.395 | | | $ | 0.030 | |
Net realized and unrealized gain (loss) | | | 0.209 | | | | (0.728 | ) | | | 0.428 | | | | (0.413 | ) | | | 0.070 | |
| | | | | |
Total income (loss) from operations | | $ | 0.384 | | | $ | (0.388 | ) | | $ | 0.786 | | | $ | (0.018 | ) | | $ | 0.100 | |
| | | | | |
| Less Distributions | | | | | | | | | | | | | | | | | | | | |
From net investment income | | $ | (0.174 | ) | | $ | (0.339 | ) | | $ | (0.365 | ) | | $ | (0.392 | ) | | $ | (0.030 | ) |
Tax return of capital | | | — | | | | (0.003 | ) | | | (0.001 | ) | | | — | | | | — | |
| | | | | |
Total distributions | | $ | (0.174 | ) | | $ | (0.342 | ) | | $ | (0.366 | ) | | $ | (0.392 | ) | | $ | (0.030 | ) |
| | | | | |
Net asset value — End of period | | $ | 8.450 | | | $ | 8.240 | | | $ | 8.970 | | | $ | 8.550 | | | $ | 8.960 | |
| | | | | |
Total Return(3) | | | 4.69 | %(4) | | | (4.52 | )% | | | 9.35 | % | | | (0.15 | )% | | | 1.12 | %(4) |
| | | | | |
| Ratios/Supplemental Data | | | | | | | | | | | | | | | | | | | | |
Net assets, end of period (000’s omitted) | | $ | 590 | | | $ | 679 | | | $ | 790 | | | $ | 104 | | | $ | 1 | |
Ratios (as a percentage of average daily net assets): | | | | | | | | | | | | | | | | | | | | |
Expenses excluding interest and fees | | | 0.53 | %(5) | | | 0.52 | % | | | 0.52 | % | | | 0.53 | % | | | 0.57 | %(5) |
Interest and fee expense | | | — | | | | 0.00 | %(6)(7) | | | 0.01 | %(6) | | | 0.01 | %(6) | | | 0.01 | %(5)(6) |
Total expenses(8) | | | 0.53 | %(5) | | | 0.52 | % | | | 0.53 | % | | | 0.54 | % | | | 0.58 | %(5) |
Net investment income | | | 4.21 | %(5) | | | 3.84 | % | | | 4.02 | % | | | 4.59 | % | | | 4.24 | %(5) |
Portfolio Turnover | | | 0 | %(4)(10) | | | 14 | % | | | 9 | % | | | 5 | % | | | 12 | %(9) |
| (1) | For the period from the commencement of operations on August 3, 2010 to August 31, 2010. |
| (2) | Computed using average shares outstanding. |
| (3) | Returns are historical and are calculated by determining the percentage change in net asset value with all distributions reinvested. |
| (6) | Interest and fee expense relates to the liability for floating rate notes issued in conjunction with residual interest bond transactions (see Note 1I). |
| (7) | Amount is less than 0.005%. |
| (8) | Excludes the effect of custody fee credits, if any, of less than 0.005%. |
| (9) | For the year ended August 31, 2010. |
| (10) | Amount is less than 0.5%. |
| | | | |
| | 99 | | See Notes to Financial Statements. |
Eaton Vance
Municipal Income Funds
February 28, 2014
Financial Highlights — continued
| | | | | | | | | | | | | | | | | | | | | | | | |
| | | Virginia Fund — Class A | |
| | | Six Months Ended
February 28, 2014
(Unaudited) | | | Year Ended August 31, | |
| | | | 2013 | | | 2012 | | | 2011 | | | 2010 | | | 2009 | |
Net asset value — Beginning of period | | $ | 7.790 | | | $ | 8.460 | | | $ | 8.060 | | | $ | 8.480 | | | $ | 8.360 | | | $ | 8.690 | |
| | | | | | |
| Income (Loss) From Operations | | | | | | | | | | | | | | | | | | | | | | | | |
Net investment income(1) | | $ | 0.163 | | | $ | 0.334 | | | $ | 0.354 | | | $ | 0.394 | | | $ | 0.396 | | | $ | 0.391 | |
Net realized and unrealized gain (loss) | | | 0.283 | | | | (0.675 | ) | | | 0.397 | | | | (0.424 | ) | | | 0.100 | | | | (0.327 | ) |
| | | | | | |
Total income (loss) from operations | | $ | 0.446 | | | $ | (0.341 | ) | | $ | 0.751 | | | $ | (0.030 | ) | | $ | 0.496 | | | $ | 0.064 | |
| | | | | | |
| Less Distributions | | | | | | | | | | | | | | | | | | | | | | | | |
From net investment income | | $ | (0.166 | ) | | $ | (0.329 | ) | | $ | (0.351 | ) | | $ | (0.390 | ) | | $ | (0.376 | ) | | $ | (0.394 | ) |
| | | | | | |
Total distributions | | $ | (0.166 | ) | | $ | (0.329 | ) | | $ | (0.351 | ) | | $ | (0.390 | ) | | $ | (0.376 | ) | | $ | (0.394 | ) |
| | | | | | |
Net asset value — End of period | | $ | 8.070 | | | $ | 7.790 | | | $ | 8.460 | | | $ | 8.060 | | | $ | 8.480 | | | $ | 8.360 | |
| | | | | | |
Total Return(2) | | | 5.77 | %(3) | | | (4.25 | )% | | | 9.48 | % | | | (0.31 | )% | | | 5.97 | % | | | 1.27 | % |
| | | | | | |
| Ratios/Supplemental Data | | | | | | | | | | | | | | | | | | | | | | | | |
Net assets, end of period (000’s omitted) | | $ | 63,897 | | | $ | 65,762 | | | $ | 80,350 | | | $ | 80,065 | | | $ | 99,082 | | | $ | 105,788 | |
Ratios (as a percentage of average daily net assets): | | | | | | | | | | | | | | | | | | | | | | | | |
Expenses excluding interest and fees | | | 0.73 | %(4) | | | 0.73 | % | | | 0.76 | % | | | 0.77 | % | | | 0.78 | % | | | 0.83 | % |
Interest and fee expense(5) | | | 0.03 | %(4) | | | 0.04 | % | | | 0.04 | % | | | 0.05 | % | | | 0.04 | % | | | 0.12 | % |
Total expenses before custodian fee reduction | | | 0.76 | %(4) | | | 0.77 | % | | | 0.80 | % | | | 0.82 | % | | | 0.82 | % | | | 0.95 | % |
Expenses after custodian fee reduction excluding interest and fees | | | 0.73 | %(4) | | | 0.73 | % | | | 0.76 | % | | | 0.77 | % | | | 0.78 | % | | | 0.82 | % |
Net investment income | | | 4.15 | %(4) | | | 3.97 | % | | | 4.27 | % | | | 4.82 | % | | | 4.61 | % | | | 5.06 | % |
Portfolio Turnover | | | 3 | %(3) | | | 9 | % | | | 9 | % | | | 4 | % | | | 5 | % | | | 32 | % |
| (1) | Computed using average shares outstanding. |
| (2) | Returns are historical and are calculated by determining the percentage change in net asset value with all distributions reinvested and do not reflect the effect of sales charges. |
| (5) | Interest and fee expense relates to the liability for floating rate notes issued in conjunction with residual interest bond transactions (see Note 1I). |
| | | | |
| | 100 | | See Notes to Financial Statements. |
Eaton Vance
Municipal Income Funds
February 28, 2014
Financial Highlights — continued
| | | | | | | | | | | | | | | | | | | | | | | | |
| | | Virginia Fund — Class B | |
| | | Six Months Ended
February 28, 2014
(Unaudited) | | | Year Ended August 31, | |
| | | | 2013 | | | 2012 | | | 2011 | | | 2010 | | | 2009 | |
Net asset value — Beginning of period | | $ | 8.620 | | | $ | 9.360 | | | $ | 8.920 | | | $ | 9.380 | | | $ | 9.250 | | | $ | 9.620 | |
| | | | | | |
| Income (Loss) From Operations | | | | | | | | | | | | | | | | | | | | | | | | |
Net investment income(1) | | $ | 0.148 | | | $ | 0.300 | | | $ | 0.324 | | | $ | 0.368 | | | $ | 0.368 | | | $ | 0.370 | |
Net realized and unrealized gain (loss) | | | 0.313 | | | | (0.746 | ) | | | 0.435 | | | | (0.465 | ) | | | 0.110 | | | | (0.370 | ) |
| | | | | | |
Total income (loss) from operations | | $ | 0.461 | | | $ | (0.446 | ) | | $ | 0.759 | | | $ | (0.097 | ) | | $ | 0.478 | | | $ | — | |
| | | | | | |
| Less Distributions | | | | | | | | | | | | | | | | | | | | | | | | |
From net investment income | | $ | (0.151 | ) | | $ | (0.294 | ) | | $ | (0.319 | ) | | $ | (0.363 | ) | | $ | (0.348 | ) | | $ | (0.370 | ) |
| | | | | | |
Total distributions | | $ | (0.151 | ) | | $ | (0.294 | ) | | $ | (0.319 | ) | | $ | (0.363 | ) | | $ | (0.348 | ) | | $ | (0.370 | ) |
| | | | | | |
Net asset value — End of period | | $ | 8.930 | | | $ | 8.620 | | | $ | 9.360 | | | $ | 8.920 | | | $ | 9.380 | | | $ | 9.250 | |
| | | | | | |
Total Return(2) | | | 5.38 | %(3) | | | (4.95 | )% | | | 8.63 | % | | | (1.00 | )% | | | 5.19 | % | | | 0.43 | % |
| | | | | | |
| Ratios/Supplemental Data | | | | | | | | | | | | | | | | | | | | | | | | |
Net assets, end of period (000’s omitted) | | $ | 1,294 | | | $ | 1,626 | | | $ | 2,817 | | | $ | 3,757 | | | $ | 6,478 | | | $ | 9,863 | |
Ratios (as a percentage of average daily net assets): | | | | | | | | | | | | | | | | | | | | | | | | |
Expenses excluding interest and fees | | | 1.48 | %(4) | | | 1.48 | % | | | 1.51 | % | | | 1.52 | % | | | 1.53 | % | | | 1.58 | % |
Interest and fee expense(5) | | | 0.03 | %(4) | | | 0.04 | % | | | 0.04 | % | | | 0.05 | % | | | 0.04 | % | | | 0.12 | % |
Total expenses before custodian fee reduction | | | 1.51 | %(4) | | | 1.52 | % | | | 1.55 | % | | | 1.57 | % | | | 1.57 | % | | | 1.70 | % |
Expenses after custodian fee reduction excluding interest and fees | | | 1.48 | %(4) | | | 1.48 | % | | | 1.51 | % | | | 1.52 | % | | | 1.53 | % | | | 1.57 | % |
Net investment income | | | 3.40 | %(4) | | | 3.22 | % | | | 3.53 | % | | | 4.06 | % | | | 3.87 | % | | | 4.34 | % |
Portfolio Turnover | | | 3 | %(3) | | | 9 | % | | | 9 | % | | | 4 | % | | | 5 | % | | | 32 | % |
| (1) | Computed using average shares outstanding. |
| (2) | Returns are historical and are calculated by determining the percentage change in net asset value with all distributions reinvested and do not reflect the effect of sales charges. |
| (5) | Interest and fee expense relates to the liability for floating rate notes issued in conjunction with residual interest bond transactions (see Note 1I). |
| | | | |
| | 101 | | See Notes to Financial Statements. |
Eaton Vance
Municipal Income Funds
February 28, 2014
Financial Highlights — continued
| | | | | | | | | | | | | | | | | | | | | | | | |
| | | Virginia Fund — Class C | |
| | | Six Months Ended
February 28, 2014
(Unaudited) | | | Year Ended August 31, | |
| | | | 2013 | | | 2012 | | | 2011 | | | 2010 | | | 2009 | |
Net asset value — Beginning of period | | $ | 8.620 | | | $ | 9.370 | | | $ | 8.930 | | | $ | 9.390 | | | $ | 9.260 | | | $ | 9.630 | |
| | | | | | |
| Income (Loss) From Operations | | | | | | | | | | | | | | | | | | | | | | | | |
Net investment income(1) | | $ | 0.148 | | | $ | 0.299 | | | $ | 0.324 | | | $ | 0.369 | | | $ | 0.367 | | | $ | 0.368 | |
Net realized and unrealized gain (loss) | | | 0.323 | | | | (0.755 | ) | | | 0.435 | | | | (0.465 | ) | | | 0.111 | | | | (0.368 | ) |
| | | | | | |
Total income (loss) from operations | | $ | 0.471 | | | $ | (0.456 | ) | | $ | 0.759 | | | $ | (0.096 | ) | | $ | 0.478 | | | $ | — | |
| | | | | | |
| Less Distributions | | | | | | | | | | | | | | | | | | | | | | | | |
From net investment income | | $ | (0.151 | ) | | $ | (0.294 | ) | | $ | (0.319 | ) | | $ | (0.364 | ) | | $ | (0.348 | ) | | $ | (0.370 | ) |
| | | | | | |
Total distributions | | $ | (0.151 | ) | | $ | (0.294 | ) | | $ | (0.319 | ) | | $ | (0.364 | ) | | $ | (0.348 | ) | | $ | (0.370 | ) |
| | | | | | |
Net asset value — End of period | | $ | 8.940 | | | $ | 8.620 | | | $ | 9.370 | | | $ | 8.930 | | | $ | 9.390 | | | $ | 9.260 | |
| | | | | | |
Total Return(2) | | | 5.50 | %(3) | | | (5.05 | )% | | | 8.63 | % | | | (0.99 | )% | | | 5.19 | % | | | 0.43 | % |
| | | | | | |
| Ratios/Supplemental Data | | | | | | | | | | | | | | | | | | | | | | | | |
Net assets, end of period (000’s omitted) | | $ | 7,547 | | | $ | 8,059 | | | $ | 9,179 | | | $ | 9,699 | | | $ | 13,453 | | | $ | 12,287 | |
Ratios (as a percentage of average daily net assets): | | | | | | | | | | | | | | | | | | | | | | | | |
Expenses excluding interest and fees | | | 1.48 | %(4) | | | 1.48 | % | | | 1.51 | % | | | 1.52 | % | | | 1.53 | % | | | 1.59 | % |
Interest and fee expense(5) | | | 0.03 | %(4) | | | 0.04 | % | | | 0.04 | % | | | 0.05 | % | | | 0.04 | % | | | 0.12 | % |
Total expenses before custodian fee reduction | | | 1.51 | %(4) | | | 1.52 | % | | | 1.55 | % | | | 1.57 | % | | | 1.57 | % | | | 1.71 | % |
Expenses after custodian fee reduction excluding interest and fees | | | 1.48 | %(4) | | | 1.48 | % | | | 1.51 | % | | | 1.52 | % | | | 1.53 | % | | | 1.58 | % |
Net investment income | | | 3.40 | %(4) | | | 3.21 | % | | | 3.52 | % | | | 4.08 | % | | | 3.86 | % | | | 4.29 | % |
Portfolio Turnover | | | 3 | %(3) | | | 9 | % | | | 9 | % | | | 4 | % | | | 5 | % | | | 32 | % |
| (1) | Computed using average shares outstanding. |
| (2) | Returns are historical and are calculated by determining the percentage change in net asset value with all distributions reinvested and do not reflect the effect of sales charges. |
| (5) | Interest and fee expense relates to the liability for floating rate notes issued in conjunction with residual interest bond transactions (see Note 1I). |
| | | | |
| | 102 | | See Notes to Financial Statements. |
Eaton Vance
Municipal Income Funds
February 28, 2014
Financial Highlights — continued
| | | | | | | | | | | | | | | | | | | | | | | | |
| | | Virginia Fund — Class I | |
| | | Six Months Ended
February 28, 2014
(Unaudited) | | | Year Ended August 31, | |
| | | | 2013 | | | 2012 | | | 2011 | | | 2010 | | | 2009 | |
Net asset value — Beginning of period | | $ | 7.810 | | | $ | 8.480 | | | $ | 8.080 | | | $ | 8.500 | | | $ | 8.370 | | | $ | 8.710 | |
| | | | | | |
| Income (Loss) From Operations | | | | | | | | | | | | | | | | | | | | | | | | |
Net investment income(1) | | $ | 0.171 | | | $ | 0.351 | | | $ | 0.371 | | | $ | 0.411 | | | $ | 0.414 | | | $ | 0.403 | |
Net realized and unrealized gain (loss) | | | 0.283 | | | | (0.675 | ) | | | 0.397 | | | | (0.424 | ) | | | 0.109 | | | | (0.332 | ) |
| | | | | | |
Total income (loss) from operations | | $ | 0.454 | | | $ | (0.324 | ) | | $ | 0.768 | | | $ | (0.013 | ) | | $ | 0.523 | | | $ | 0.071 | |
| | | | | | |
| Less Distributions | | | | | | | | | | | | | | | | | | | | | | | | |
From net investment income | | $ | (0.174 | ) | | $ | (0.346 | ) | | $ | (0.368 | ) | | $ | (0.407 | ) | | $ | (0.393 | ) | | $ | (0.411 | ) |
| | | | | | |
Total distributions | | $ | (0.174 | ) | | $ | (0.346 | ) | | $ | (0.368 | ) | | $ | (0.407 | ) | | $ | (0.393 | ) | | $ | (0.411 | ) |
| | | | | | |
Net asset value — End of period | | $ | 8.090 | | | $ | 7.810 | | | $ | 8.480 | | | $ | 8.080 | | | $ | 8.500 | | | $ | 8.370 | |
| | | | | | |
Total Return(2) | | | 5.86 | %(3) | | | (4.03 | )% | | | 9.68 | % | | | (0.09 | )% | | | 6.30 | % | | | 1.36 | % |
| | | | | | |
| Ratios/Supplemental Data | | | | | | | | | | | | | | | | | | | | | | | | |
Net assets, end of period (000’s omitted) | | $ | 13,236 | | | $ | 16,539 | | | $ | 19,635 | | | $ | 18,510 | | | $ | 18,557 | | | $ | 9,945 | |
Ratios (as a percentage of average daily net assets): | | | | | | | | | | | | | | | | | | | | | | | | |
Expenses excluding interest and fees | | | 0.53 | %(4) | | | 0.53 | % | | | 0.55 | % | | | 0.57 | % | | | 0.57 | % | | | 0.64 | % |
Interest and fee expense(5) | | | 0.03 | %(4) | | | 0.04 | % | | | 0.04 | % | | | 0.05 | % | | | 0.04 | % | | | 0.12 | % |
Total expenses before custodian fee reduction | | | 0.56 | %(4) | | | 0.57 | % | | | 0.59 | % | | | 0.62 | % | | | 0.61 | % | | | 0.76 | % |
Expenses after custodian fee reduction excluding interest and fees | | | 0.53 | %(4) | | | 0.53 | % | | | 0.55 | % | | | 0.57 | % | | | 0.57 | % | | | 0.63 | % |
Net investment income | | | 4.33 | %(4) | | | 4.17 | % | | | 4.46 | % | | | 5.02 | % | | | 4.81 | % | | | 5.20 | % |
Portfolio Turnover | | | 3 | %(3) | | | 9 | % | | | 9 | % | | | 4 | % | | | 5 | % | | | 32 | % |
| (1) | Computed using average shares outstanding. |
| (2) | Returns are historical and are calculated by determining the percentage change in net asset value with all distributions reinvested. |
| (5) | Interest and fee expense relates to the liability for floating rate notes issued in conjunction with residual interest bond transactions (see Note 1I). |
| | | | |
| | 103 | | See Notes to Financial Statements. |
Eaton Vance
Municipal Income Funds
February 28, 2014
Notes to Financial Statements (Unaudited)
1 Significant Accounting Policies
Eaton Vance Municipals Trust (the Trust) is a Massachusetts business trust registered under the Investment Company Act of 1940, as amended (the 1940 Act), as an open-end management investment company. The Trust presently consists of twenty-two funds, eleven of which, each non-diversified, are included in these financial statements. They include Eaton Vance Alabama Municipal Income Fund (Alabama Fund), Eaton Vance Arkansas Municipal Income Fund (Arkansas Fund), Eaton Vance Georgia Municipal Income Fund (Georgia Fund), Eaton Vance Kentucky Municipal Income Fund (Kentucky Fund), Eaton Vance Maryland Municipal Income Fund (Maryland Fund), Eaton Vance Missouri Municipal Income Fund (Missouri Fund), Eaton Vance North Carolina Municipal Income Fund (North Carolina Fund), Eaton Vance Oregon Municipal Income Fund (Oregon Fund), Eaton Vance South Carolina Municipal Income Fund (South Carolina Fund), Eaton Vance Tennessee Municipal Income Fund (Tennessee Fund) and Eaton Vance Virginia Municipal Income Fund (Virginia Fund), (each individually referred to as the Fund, and collectively, the Funds). The Funds’ investment objective is to provide current income exempt from regular federal income tax and from particular state or local income or other taxes. The Funds offer four classes of shares. Class A shares are generally sold subject to a sales charge imposed at time of purchase. Class B and Class C shares are sold at net asset value and are generally subject to a contingent deferred sales charge (see Note 5). Class I shares are sold at net asset value and are not subject to a sales charge. Class B shares of each Fund automatically convert to Class A shares eight years after their purchase as described in each Fund’s prospectus. Beginning January 1, 2012, Class B shares are only available for purchase upon exchange from another Eaton Vance fund or through reinvestment of distributions. Each class represents a pro-rata interest in the Fund, but votes separately on class-specific matters and (as noted below) is subject to different expenses. Realized and unrealized gains and losses are allocated daily to each class of shares based on the relative net assets of each class to the total net assets of the Fund. Net investment income, other than class-specific expenses, is allocated daily to each class of shares based upon the ratio of the value of each class’s paid shares to the total value of all paid shares. Each class of shares differs in its distribution plan and certain other class-specific expenses.
The following is a summary of significant accounting policies of the Funds. The policies are in conformity with accounting principles generally accepted in the United States of America.
A Investment Valuation — The following methodologies are used to determine the market value or fair value of investments.
Debt Obligations. Debt obligations (including short-term obligations with a remaining maturity of more than sixty days) are generally valued on the basis of valuations provided by third party pricing services, as derived from such services’ pricing models. Inputs to the models may include, but are not limited to, reported trades, executable bid and asked prices, broker/dealer quotations, prices or yields of securities with similar characteristics, benchmark curves or information pertaining to the issuer, as well as industry and economic events. The pricing services may use a matrix approach, which considers information regarding securities with similar characteristics to determine the valuation for a security. Short-term obligations purchased with a remaining maturity of sixty days or less are generally valued at amortized cost, which approximates market value.
Derivatives. Financial futures contracts are valued at the closing settlement price established by the board of trade or exchange on which they are traded.
Fair Valuation. Investments for which valuations or market quotations are not readily available or are deemed unreliable are valued at fair value using methods determined in good faith by or at the direction of the Trustees of a Fund in a manner that fairly reflects the security’s value, or the amount that the Fund might reasonably expect to receive for the security upon its current sale in the ordinary course. Each such determination is based on a consideration of relevant factors, which are likely to vary from one pricing context to another. These factors may include, but are not limited to, the type of security, the existence of any contractual restrictions on the security’s disposition, the price and extent of public trading in similar securities of the issuer or of comparable entities, quotations or relevant information obtained from broker/dealers or other market participants, information obtained from the issuer, analysts, and/or the appropriate stock exchange (for exchange-traded securities), an analysis of the entity’s financial condition, and an evaluation of the forces that influence the issuer and the market(s) in which the security is purchased and sold.
B Investment Transactions and Related Income — Investment transactions for financial statement purposes are accounted for on a trade date basis. Realized gains and losses on investments sold are determined on the basis of identified cost. Interest income is recorded on the basis of interest accrued, adjusted for amortization of premium or accretion of discount.
C Federal Taxes — Each Fund’s policy is to comply with the provisions of the Internal Revenue Code applicable to regulated investment companies and to distribute to shareholders each year substantially all of its taxable, if any, and tax-exempt net investment income, and all or substantially all of its net realized capital gains. Accordingly, no provision for federal income or excise tax is necessary. Each Fund intends to satisfy conditions which will enable it to designate distributions from the interest income generated by its investments in non-taxable municipal securities, which are exempt from regular federal income tax when received by each Fund, as exempt-interest dividends. The portion of such interest, if any, earned on private activity bonds issued after August 7, 1986, may be considered a tax preference item to shareholders.
At August 31, 2013, the following Funds, for federal income tax purposes, had capital loss carryforwards and deferred capital losses which will reduce the respective Fund’s taxable income arising from future net realized gains on investment transactions, if any, to the extent permitted by the Internal Revenue Code, and thus will reduce the amount of distributions to shareholders, which would otherwise be necessary to relieve the Funds of any liability for federal income or excise tax. The deferred capital losses are treated as arising on the first day of the Funds’ next taxable year and are treated as realized prior to
Eaton Vance
Municipal Income Funds
February 28, 2014
Notes to Financial Statements (Unaudited) — continued
the utilization of the capital loss carryforward. The amounts and expiration dates of the capital loss carryforwards and the amounts of the deferred capital losses are as follows:
| | | | | | | | | | | | | | | | | | | | | | | | |
| Expiration Date | | Alabama Fund | | | Arkansas Fund | | | Georgia Fund | | | Kentucky Fund | | | Maryland Fund | | | Missouri Fund | |
| | | | | | |
August 31, 2015 | | $ | — | | | $ | — | | | $ | 536,265 | | | $ | — | | | $ | 204,999 | | | $ | — | |
August 31, 2016 | | | 143,185 | | | | 126,693 | | | | 306,338 | | | | 98,602 | | | | 4,159,062 | | | | 337,671 | |
August 31, 2017 | | | 149,650 | | | | 826,603 | | | | 980,989 | | | | 155,003 | | | | 34,823 | | | | 2,259,438 | |
August 31, 2018 | | | 1,195,230 | | | | 1,981,781 | | | | 2,812,349 | | | | 442,246 | | | | 2,032,881 | | | | 3,282,262 | |
August 31, 2019 | | | 434,821 | | | | 1,798,823 | | | | 3,087,553 | | | | 958,653 | | | | 1,823,894 | | | | 1,434,581 | |
| | | | | | |
Total capital loss carryforward | | $ | 1,922,886 | | | $ | 4,733,900 | | | $ | 7,723,494 | | | $ | 1,654,504 | | | $ | 8,255,659 | | | $ | 7,313,952 | |
| | | | | | |
Deferred capital losses | | $ | 1,341,092 | | | $ | 1,531,481 | | | $ | 2,080,080 | | | $ | 287,823 | | | $ | 1,236,399 | | | $ | 1,858,560 | |
| | | | | | | | | | | | | | | | | | | | |
| Expiration Date | | North Carolina Fund | | | Oregon Fund | | | South Carolina Fund | | | Tennessee Fund | | | Virginia Fund | |
| | | | | |
August 31, 2015 | | $ | 88,235 | | | $ | — | | | $ | — | | | $ | — | | | $ | — | |
August 31, 2016 | | | 274,170 | | | | 2,145,240 | | | | 1,027,752 | | | | 238,529 | | | | 502,088 | |
August 31, 2017 | | | — | | | | 1,066,237 | | | | 3,019,420 | | | | — | | | | 3,212,881 | |
August 31, 2018 | | | 3,573,563 | | | | 9,061,392 | | | | 10,869,967 | | | | 3,909,047 | | | | 464,954 | |
August 31, 2019 | | | 1,655,671 | | | | 809,441 | | | | 527,346 | | | | 1,662,071 | | | | 10,782,176 | |
| | | | | |
Total capital loss carryforward | | $ | 5,591,639 | | | $ | 13,082,310 | | | $ | 15,444,485 | | | $ | 5,809,647 | | | $ | 14,962,099 | |
| | | | | |
Deferred capital losses | | $ | 3,857,848 | | | $ | 4,364,457 | | | $ | 5,464,398 | | | $ | 898,036 | | | $ | 4,993,064 | |
As of February 28, 2014, the Funds had no uncertain tax positions that would require financial statement recognition, de-recognition, or disclosure. Each Fund files a U.S. federal income tax return annually after its fiscal year-end, which is subject to examination by the Internal Revenue Service for a period of three years from the date of filing.
D Expenses — The majority of expenses of the Trust are directly identifiable to an individual fund. Expenses which are not readily identifiable to a specific fund are allocated taking into consideration, among other things, the nature and type of expense and the relative size of the funds.
E Expense Reduction — State Street Bank and Trust Company (SSBT) serves as custodian of the Funds. Pursuant to the custodian agreement, SSBT receives a fee reduced by credits, which are determined based on the average daily cash balance each Fund maintains with SSBT. All credit balances, if any, used to reduce each Fund’s custodian fees are reported as a reduction of expenses in the Statements of Operations.
F Legal Fees — Legal fees and other related expenses incurred as part of negotiations of the terms and requirement of capital infusions, or that are expected to result in the restructuring of, or a plan of reorganization for, an investment are recorded as realized losses. Ongoing expenditures to protect or enhance an investment are treated as operating expenses.
G Use of Estimates — The preparation of the financial statements in conformity with accounting principles generally accepted in the United States of America requires management to make estimates and assumptions that affect the reported amounts of assets and liabilities at the date of the financial statements and the reported amounts of income and expense during the reporting period. Actual results could differ from those estimates.
H Indemnifications — Under the Trust’s organizational documents, its officers and Trustees may be indemnified against certain liabilities and expenses arising out of the performance of their duties to the Funds. Under Massachusetts law, if certain conditions prevail, shareholders of a Massachusetts business trust (such as the Trust) could be deemed to have personal liability for the obligations of the Trust. However, the Trust’s Declaration of Trust contains an express disclaimer of liability on the part of Fund shareholders and the By-laws provide that the Trust shall assume the defense on behalf of any Fund shareholders. Moreover, the By-laws also provide for indemnification out of Fund property of any shareholder held personally liable solely by reason of being or having been a shareholder for all loss or expense arising from such liability. Additionally, in the normal course of business, each Fund enters into agreements with service providers that may contain indemnification clauses. Each Fund’s maximum exposure under these arrangements is unknown as this would involve future claims that may be made against each Fund that have not yet occurred.
Eaton Vance
Municipal Income Funds
February 28, 2014
Notes to Financial Statements (Unaudited) — continued
I Floating Rate Notes Issued in Conjunction with Securities Held — The Funds may invest in residual interest bonds, also referred to as inverse floating rate securities, whereby a Fund may sell a variable or fixed rate bond to a broker for cash. At the same time, the Fund buys a residual interest in the assets and cash flows of a Special-Purpose Vehicle (the SPV), (which is generally organized as a trust), set up by the broker. The broker deposits a bond into the SPV with the same CUSIP number as the bond sold to the broker by the Fund, and which may have been, but is not required to be, the bond purchased from the Fund (the Bond). The SPV also issues floating rate notes (Floating Rate Notes) which are sold to third-parties. The residual interest bond held by a Fund gives the Fund the right (1) to cause the holders of the Floating Rate Notes to generally tender their notes at par, and (2) to have the broker transfer the Bond held by the SPV to the Fund, thereby terminating the SPV. Should the Fund exercise such right, it would generally pay the broker the par amount due on the Floating Rate Notes and exchange the residual interest bond for the underlying Bond. Pursuant to generally accepted accounting principles for transfers and servicing of financial assets and extinguishment of liabilities, the Funds account for the transaction described above as a secured borrowing by including the Bond in their Portfolio of Investments and the Floating Rate Notes as a liability under the caption “Payable for floating rate notes issued” in their Statement of Assets and Liabilities. The Floating Rate Notes have interest rates that generally reset weekly and their holders have the option to tender their notes to the broker for redemption at par at each reset date. Accordingly, the fair value of the payable for floating rate notes issued approximates its carrying value. If measured at fair value, the payable for floating rate notes would have been considered as Level 2 in the fair value hierarchy (see Note 12) at February 28, 2014. Interest expense related to the Funds’ liability with respect to Floating Rate Notes is recorded as incurred. The SPV may be terminated by the Fund, as noted above, or by the broker upon the occurrence of certain termination events as defined in the trust agreement, such as a downgrade in the credit quality of the underlying Bond, bankruptcy of or payment failure by the issuer of the underlying Bond, the inability to remarket Floating Rate Notes that have been tendered due to insufficient buyers in the market, or the failure by the SPV to obtain renewal of the liquidity agreement under which liquidity support is provided for the Floating Rate Notes up to one year. At February 28, 2014, the amounts of the Funds’ Floating Rate Notes and related interest rates and collateral were as follows:
| | | | | | | | | | | | | | | | |
| | | Georgia Fund | | | Maryland Fund | | | Missouri Fund | | | North Carolina Fund | |
| | | | |
Floating Rate Notes Outstanding | | $ | 3,375,000 | | | $ | 2,240,000 | | | $ | 850,000 | | | $ | 4,650,000 | |
Interest Rate or Range of Interest Rates (%) | | | 0.08 | | | | 0.08 | | | | 0.04 | | | | 0.04 - 1.18 | |
Collateral for Floating Rate Notes Outstanding | | $ | 4,935,060 | | | $ | 3,267,881 | | | $ | 1,407,230 | | | $ | 6,982,328 | |
| | | | | | | | | | | | |
| | | Oregon Fund | | | South Carolina
Fund | | | Virginia Fund | |
| | | |
Floating Rate Notes Outstanding | | $ | 7,455,000 | | | $ | 6,050,000 | | | $ | 3,330,000 | |
Interest Rate or Range of Interest Rates (%) | | | 0.05 - 1.18 | | | | 0.03 - 1.18 | | | | 0.03 | |
Collateral for Floating Rate Notes Outstanding | | $ | 11,480,513 | | | $ | 8,797,275 | | | $ | 5,918,250 | |
For the six months ended February 28, 2014, the Funds’ average Floating Rate Notes outstanding and the average interest rate (annualized) including fees were as follows:
| | | | | | | | | | | | | | | | |
| | | Alabama Fund | | | Georgia Fund | | | Maryland Fund | | | Missouri Fund | |
| | | | |
Average Floating Rate Notes Outstanding | | $ | 380,387 | | | $ | 3,375,000 | | | $ | 3,699,558 | | | $ | 850,000 | |
Average Interest Rate | | | 0.90 | % | | | 0.74 | % | | | 0.89 | % | | | 0.75 | % |
| | | | | | | | | | | | | | | | |
| | | North Carolina Fund | | | Oregon Fund | | | South Carolina Fund | | | Virginia Fund | |
| | | | |
Average Floating Rate Notes Outstanding | | $ | 9,136,906 | | | $ | 15,673,508 | | | $ | 14,633,149 | | | $ | 3,330,000 | |
Average Interest Rate | | | 0.92 | % | | | 0.84 | % | | | 0.88 | % | | | 0.93 | % |
The Funds may enter into shortfall and forbearance agreements with the broker by which a Fund agrees to reimburse the broker, in certain circumstances, for the difference between the liquidation value of the Bond held by the SPV and the liquidation value of the Floating Rate Notes, as well as any shortfalls in interest cash flows. The Funds had no shortfalls as of February 28, 2014.
Eaton Vance
Municipal Income Funds
February 28, 2014
Notes to Financial Statements (Unaudited) — continued
The Funds may also purchase residual interest bonds from brokers in a secondary market transaction without first owning the underlying bond. Such transactions are not required to be treated as secured borrowings. Shortfall agreements, if any, related to residual interest bonds purchased in a secondary market transaction are disclosed in the Portfolio of Investments.
The Funds’ investment policies and restrictions expressly permit investments in residual interest bonds. Such bonds typically offer the potential for yields exceeding the yields available on fixed rate bonds with comparable credit quality and maturity. These securities tend to underperform the market for fixed rate bonds in a rising long-term interest rate environment, but tend to outperform the market for fixed rate bonds when long-term interest rates decline. The value and income of residual interest bonds are generally more volatile than that of a fixed rate bond. The Funds’ investment policies do not allow the Funds to borrow money except as permitted by the 1940 Act. Management believes that the Funds’ restrictions on borrowing money and issuing senior securities (other than as specifically permitted) do not apply to Floating Rate Notes issued by the SPV and included as a liability in the Funds’ Statement of Assets and Liabilities. As secured indebtedness issued by an SPV, Floating Rate Notes are distinct from the borrowings and senior securities to which the Funds’ restrictions apply. Residual interest bonds held by the Funds are securities exempt from registration under Rule 144A of the Securities Act of 1933.
On December 10, 2013, five U.S. federal agencies published final rules implementing section 619 of the Dodd-Frank Wall Street Reform and Consumer Protection Act (the “Volcker Rule”). The Volcker Rule prohibits banking entities from engaging in proprietary trading of certain instruments and limits such entities’ investments in, and relationships with, covered funds, as defined in the rules. The compliance date for the Volcker Rule is July 21, 2015. The Volcker Rule may preclude banking entities and their affiliates from (i) sponsoring residual interest bond programs (as such programs are presently structured) and (ii) continuing relationships with or services for existing residual interest bond programs. As a result, residual interest bond trusts may need to be restructured or unwound. There can be no assurances that residual interest bond trusts can be restructured, that new sponsors of residual interest bond programs will develop, or that alternative forms of leverage will be available to the Funds. The effects of the Volcker Rule may make it more difficult for the Funds to maintain current or desired levels of leverage and may cause the Funds to incur additional expenses to maintain their leverage.
J Financial Futures Contracts — Upon entering into a financial futures contract, a Fund is required to deposit with the broker, either in cash or securities, an amount equal to a certain percentage of the contract amount (initial margin). Subsequent payments, known as variation margin, are made or received by the Fund each business day, depending on the daily fluctuations in the value of the underlying security, and are recorded as unrealized gains or losses by the Fund. Gains (losses) are realized upon the expiration or closing of the financial futures contracts. Should market conditions change unexpectedly, the Fund may not achieve the anticipated benefits of the financial futures contracts and may realize a loss. Futures contracts have minimal counterparty risk as they are exchange traded and the clearinghouse for the exchange is substituted as the counterparty, guaranteeing counterparty performance.
K When-Issued Securities and Delayed Delivery Transactions — The Funds may purchase or sell securities on a delayed delivery or when-issued basis. Payment and delivery may take place after the customary settlement period for that security. At the time the transaction is negotiated, the price of the security that will be delivered is fixed. The Funds maintain security positions for these commitments such that sufficient liquid assets will be available to make payments upon settlement. Securities purchased on a delayed delivery or when-issued basis are marked-to-market daily and begin earning interest on settlement date. Losses may arise due to changes in the market value of the underlying securities or if the counterparty does not perform under the contract.
L Statements of Cash Flows — The cash amount shown in the Statement of Cash Flows of a Fund is the amount included in the Fund’s Statement of Assets and Liabilities and represents the unrestricted cash on hand at its custodian and does not include any short-term investments.
M Interim Financial Statements — The interim financial statements relating to February 28, 2014 and for the six months then ended have not been audited by an independent registered public accounting firm, but in the opinion of the Funds’ management, reflect all adjustments, consisting only of normal recurring adjustments, necessary for the fair presentation of the financial statements.
2 Distributions to Shareholders
The net investment income of each Fund is determined daily and substantially all of the net investment income so determined is declared as a dividend to shareholders of record at the time of declaration. Distributions are declared separately for each class of shares. Distributions are paid monthly. Distributions of realized capital gains (reduced by available capital loss carryforwards) are made at least annually. Shareholders may reinvest income and capital gain distributions in additional shares of the same class of a Fund at the net asset value as of the reinvestment date or, at the election of the shareholder, receive distributions in cash. The Funds distinguish between distributions on a tax basis and a financial reporting basis. Accounting principles generally accepted in the United States of America require that only distributions in excess of tax basis earnings and profits be reported in the financial statements as a return of capital. Permanent differences between book and tax accounting relating to distributions are reclassified to paid-in capital. For tax purposes, distributions from short-term capital gains are considered to be from ordinary income.
Eaton Vance
Municipal Income Funds
February 28, 2014
Notes to Financial Statements (Unaudited) — continued
3 Investment Adviser Fee and Other Transactions with Affiliates
The investment adviser fee is earned by Boston Management and Research (BMR), a subsidiary of Eaton Vance Management (EVM), as compensation for management and investment advisory services rendered to each Fund. The fee is based upon a percentage of average daily net assets plus a percentage of gross income (i.e., income other than gains from the sale of securities) as presented in the following table and is payable monthly.
| | | | | | | | |
| Daily Net Assets | | Annual Asset Rate | | | Daily Income Rate | |
| | |
Up to $20 million | | | 0.10 | % | | | 1.00 | % |
$20 million up to $40 million | | | 0.20 | | | | 2.00 | |
$40 million up to $500 million | | | 0.30 | | | | 3.00 | |
On average daily net assets of $500 million or more, the rates are reduced.
For the six months ended February 28, 2014, investment adviser fees incurred by the Funds and the effective annual rates, as a percentage of average daily net assets, were as follows:
| | | | | | | | | | | | | | | | | | | | | | | | |
| | | Alabama
Fund | | | Arkansas
Fund | | | Georgia
Fund | | | Kentucky
Fund | | | Maryland
Fund | | | Missouri
Fund | |
| | | | | | |
Investment Adviser Fee | | $ | 49,084 | | | $ | 81,799 | | | $ | 84,199 | | | $ | 61,910 | | | $ | 112,610 | | | $ | 112,021 | |
Effective Annual Rate | | | 0.23 | % | | | 0.29 | % | | | 0.29 | % | | | 0.26 | % | | | 0.32 | % | | | 0.32 | % |
| | | | | | | | | | | | | | | | | | | | |
| | | North Carolina Fund | | | Oregon Fund | | | South Carolina Fund | | | Tennessee Fund | | | Virginia Fund | |
| | | | | |
Investment Adviser Fee | | $ | 209,918 | | | $ | 219,818 | | | $ | 237,583 | | | $ | 47,164 | | | $ | 152,011 | |
Effective Annual Rate | | | 0.38 | % | | | 0.39 | % | | | 0.39 | % | | | 0.23 | % | | | 0.35 | % |
EVM serves as administrator of each Fund, but receives no compensation. EVM provides sub-transfer agency and related services to the Funds pursuant to a Sub-Transfer Agency Support Services Agreement. Eaton Vance Distributors, Inc. (EVD), an affiliate of EVM and the Funds’ principal underwriter, received a portion of the sales charge on sales of Class A shares of the Funds. EVD also received distribution and service fees from Class A, Class B and Class C shares (see Note 4) and contingent deferred sales charges (see Note 5). Sub-transfer agent fees earned by EVM, which are included in transfer and dividend disbursing agent fees on the Statements of Operations, and Class A sales charges that the Funds were informed were received by EVD for the six months ended February 28, 2014 were as follows:
| | | | | | | | | | | | | | | | | | | | | | | | |
| | | Alabama
Fund | | | Arkansas
Fund | | | Georgia
Fund | | | Kentucky
Fund | | | Maryland
Fund | | | Missouri
Fund | |
| | | | | | |
EVM’s Sub-Transfer Agent Fees | | $ | 587 | | | $ | 668 | | | $ | 817 | | | $ | 820 | | | $ | 1,298 | | | $ | 1,026 | |
EVD’s Class A Sales Charges | | $ | 571 | | | $ | 2,355 | | | $ | 2,996 | | | $ | 2,712 | | | $ | 1,455 | | | $ | 11,121 | |
| | | | | | | | | | | | | | | | | | | | |
| | | North Carolina Fund | | | Oregon Fund | | | South Carolina Fund | | | Tennessee Fund | | | Virginia Fund | |
| | | | | |
EVM’s Sub-Transfer Agent Fees | | $ | 1,667 | | | $ | 1,376 | | | $ | 1,465 | | | $ | 523 | | | $ | 2,063 | |
EVD’s Class A Sales Charges | | $ | 8,743 | | | $ | 17,280 | | | $ | 8,167 | | | $ | 1,929 | | | $ | 1,769 | |
Trustees and officers of the Funds who are members of EVM’s or BMR’s organizations receive remuneration for their services to the Funds out of the investment adviser fee. Trustees of the Funds who are not affiliated with the investment adviser may elect to defer receipt of all or a percentage of their annual fees in accordance with the terms of the Trustees Deferred Compensation Plan. For the six months ended February 28, 2014, no significant amounts have been deferred. Certain officers and Trustees of the Funds are officers of the above organizations.
Eaton Vance
Municipal Income Funds
February 28, 2014
Notes to Financial Statements (Unaudited) — continued
4 Distribution Plans
Each Fund has in effect a distribution plan for Class A shares (Class A Plan) pursuant to Rule 12b-1 under the 1940 Act. The Class A Plan provides that each Fund will pay EVD a distribution and service fee not exceeding 0.25% per annum of its average daily net assets attributable to Class A shares for distribution services and facilities provided to each Fund by EVD, as well as for personal services and/or the maintenance of shareholder accounts. The Trustees approved distribution and service fee payments equal to 0.20% per annum of each Fund’s average daily net assets attributable to Class A shares. Distribution and service fees paid or accrued to EVD for the six months ended February 28, 2014 for Class A shares amounted to the following:
| | | | | | | | | | | | | | | | | | | | | | | | |
| | | Alabama Fund | | | Arkansas Fund | | | Georgia Fund | | | Kentucky Fund | | | Maryland Fund | | | Missouri Fund | |
| | | | | | |
Class A Distribution and Service Fees | | $ | 35,354 | | | $ | 46,710 | | | $ | 43,340 | | | $ | 37,615 | | | $ | 49,314 | | | $ | 60,445 | |
| | | | | | | | | | | | | | | | | | | | |
| | | North Carolina Fund | | | Oregon Fund | | | South Carolina Fund | | | Tennessee Fund | | | Virginia Fund | |
| | | | | |
Class A Distribution and Service Fees | | $ | 75,952 | | | $ | 86,630 | | | $ | 75,324 | | | $ | 31,980 | | | $ | 64,050 | |
Each Fund also has in effect distribution plans for Class B shares (Class B Plan) and Class C shares (Class C Plan) pursuant to Rule 12b-1 under the 1940 Act. Pursuant to the Class B and Class C Plans, each Fund pays EVD amounts equal to 0.75% per annum of its average daily net assets attributable to Class B and Class C shares for providing ongoing distribution services and facilities to the respective Funds. For the six months ended February 28, 2014, the Funds paid or accrued to EVD the following distribution fees:
| | | | | | | | | | | | | | | | | | | | | | | | |
| | | Alabama Fund | | | Arkansas Fund | | | Georgia Fund | | | Kentucky Fund | | | Maryland Fund | | | Missouri Fund | |
| | | | | | |
Class B Distribution Fees | | $ | 1,954 | | | $ | 4,940 | | | $ | 3,990 | | | $ | 1,155 | | | $ | 5,914 | | | $ | 4,700 | |
Class C Distribution Fees | | $ | 8,522 | | | $ | 21,185 | | | $ | 20,537 | | | $ | 13,186 | | | $ | 59,493 | | | $ | 22,416 | |
| | | | | | | | | | | | | | | | | | | | |
| | | North Carolina Fund | | | Oregon Fund | | | South Carolina Fund | | | Tennessee Fund | | | Virginia Fund | |
| | | | | |
Class B Distribution Fees | | $ | 3,625 | | | $ | 11,004 | | | $ | 8,751 | | | $ | 2,626 | | | $ | 5,430 | |
Class C Distribution Fees | | $ | 74,139 | | | $ | 59,233 | | | $ | 94,064 | | | $ | 29,541 | | | $ | 29,046 | |
The Class B and Class C Plans also authorize the Funds to make payments of service fees to EVD, financial intermediaries and other persons in amounts not exceeding 0.25% per annum of the average daily net assets attributable to that class. The Trustees approved service fee payments equal to 0.20% per annum of each Fund’s average daily net assets attributable to Class B and Class C shares. Service fees paid or accrued are for personal services and/or the maintenance of shareholder accounts. They are separate and distinct from the Class B and Class C sales commissions and distribution fees payable to EVD. Service fees paid or accrued for the six months ended February 28, 2014 amounted to the following:
| | | | | | | | | | | | | | | | | | | | | | | | |
| | | Alabama Fund | | | Arkansas Fund | | | Georgia Fund | | | Kentucky Fund | | | Maryland Fund | | | Missouri Fund | |
| | | | | | |
Class B Service Fees | | $ | 521 | | | $ | 1,317 | | | $ | 1,064 | | | $ | 308 | | | $ | 1,577 | | | $ | 1,253 | |
Class C Service Fees | | $ | 2,272 | | | $ | 5,649 | | | $ | 5,477 | | | $ | 3,516 | | | $ | 15,865 | | | $ | 5,978 | |
| | | | | | | | | | | | | | | | | | | | |
| | | North Carolina
Fund | | | Oregon
Fund | | | South Carolina
Fund | | | Tennessee
Fund | | | Virginia
Fund | |
| | | | | |
Class B Service Fees | | $ | 967 | | | $ | 2,934 | | | $ | 2,334 | | | $ | 700 | | | $ | 1,448 | |
Class C Service Fees | | $ | 19,770 | | | $ | 15,795 | | | $ | 25,084 | | | $ | 7,878 | | | $ | 7,746 | |
Eaton Vance
Municipal Income Funds
February 28, 2014
Notes to Financial Statements (Unaudited) — continued
Distribution and service fees are subject to the limitations contained in the Financial Industry Regulatory Authority’s NASD Conduct Rule 2830(d) and for Class B, are further limited to a 5% maximum sales charge as determined in accordance with such rule.
5 Contingent Deferred Sales Charges
A contingent deferred sales charge (CDSC) generally is imposed on redemptions of Class B shares made within six years of purchase and on redemptions of Class C shares made within one year of purchase. Class A shares may be subject to a 1% CDSC if redeemed within eighteen months of purchase (depending on the circumstances of purchase). Generally, the CDSC is based upon the lower of the net asset value at date of redemption or date of purchase. No charge is levied on shares acquired by reinvestment of dividends or capital gain distributions. The CDSC for Class B shares is imposed at declining rates that begin at 5% in the case of redemptions in the first and second year after purchase, declining one percentage point each subsequent year. Class C shares are subject to a 1% CDSC if redeemed within one year of purchase. For the six months ended February 28, 2014, the Funds were informed that EVD received approximately the following amounts of CDSCs paid by Class A, Class B and Class C shareholders:
| | | | | | | | | | | | | | | | | | | | | | | | |
| | | Alabama
Fund | | | Arkansas
Fund | | | Georgia
Fund | | | Kentucky
Fund | | | Maryland
Fund | | | Missouri
Fund | |
| | | | | | |
Class A | | $ | — | | | $ | — | | | $ | — | | | $ | — | | | $ | 40 | | | $ | 2,000 | |
Class B | | $ | 300 | | | $ | 3,000 | | | $ | — | | | $ | — | | | $ | — | | | $ | 200 | |
Class C | | $ | 1,000 | | | $ | 200 | | | $ | 100 | | | $ | 200 | | | $ | 2,000 | | | $ | 100 | |
| | | | | | | | | | | | | | | | | | | | |
| | | North Carolina
Fund | | | Oregon
Fund | | | South Carolina
Fund | | | Tennessee
Fund | | | Virginia
Fund | |
| | | | | |
Class A | | $ | 15,000 | | | $ | 2,000 | | | $ | 1,000 | | | $ | — | | | $ | — | |
Class B | | $ | 2,000 | | | $ | 2,000 | | | $ | 1,000 | | | $ | 40 | | | $ | 3,000 | |
Class C | | $ | 2,000 | | | $ | 3,000 | | | $ | 4,000 | | | $ | 1,000 | | | $ | 1,000 | |
6 Purchases and Sales of Investments
Purchases and sales of investments, other than short-term obligations, for the six months ended February 28, 2014 were as follows:
| | | | | | | | | | | | | | | | | | | | | | | | |
| | | Alabama
Fund | | | Arkansas
Fund | | | Georgia
Fund | | | Kentucky
Fund | | | Maryland
Fund | | | Missouri
Fund | |
| | | | | | |
Purchases | | $ | 1,066,530 | | | $ | 2,109,916 | | | $ | 2,138,970 | | | $ | 428,026 | | | $ | — | | | $ | 6,174,200 | |
Sales | | $ | 4,630,952 | | | $ | 8,398,191 | | | $ | 8,237,986 | | | $ | 6,231,892 | | | $ | 4,871,183 | | | $ | 9,423,883 | |
| | | | | | | | | | | | | | | | | | | | |
| | | North Carolina
Fund | | | Oregon Fund | | | South Carolina
Fund | | | Tennessee
Fund | | | Virginia Fund | |
| | | | | |
Purchases | | $ | 5,070,610 | | | $ | 13,430,569 | | | $ | 5,683,335 | | | $ | 144,694 | | | $ | 2,435,393 | |
Sales | | $ | 25,275,858 | | | $ | 45,698,433 | | | $ | 37,255,859 | | | $ | 6,328,664 | | | $ | 16,286,994 | |
Eaton Vance
Municipal Income Funds
February 28, 2014
Notes to Financial Statements (Unaudited) — continued
7 Shares of Beneficial Interest
Each Fund’s Declaration of Trust permits the Trustees to issue an unlimited number of full and fractional shares of beneficial interest (without par value). Such shares may be issued in a number of different series (such as the Funds) and classes. Transactions in Fund shares were as follows:
| | | | | | | | | | | | | | | | |
Alabama Fund | | | | | | | | | | | | |
| | | Six Months Ended February 28, 2014 (Unaudited) | |
| | | Class A | | | Class B | | | Class C | | | Class I | |
| | | | |
Sales | | | 45,662 | | | | 21 | | | | 11,942 | | | | 23,354 | |
Issued to shareholders electing to receive payments of distributions in Fund shares | | | 61,348 | | | | 776 | | | | 1,694 | | | | 3,357 | |
Redemptions | | | (350,347 | ) | | | (10,053 | ) | | | (39,545 | ) | | | (86,625 | ) |
Exchange from Class B shares | | | 15,998 | | | | — | | | | — | | | | — | |
Exchange to Class A shares | | | — | | | | (14,543 | ) | | | — | | | | — | |
| | | | |
Net decrease | | | (227,339 | ) | | | (23,799 | ) | | | (25,909 | ) | | | (59,914 | ) |
| | | | |
| | | | | | | | | | | | | | | | |
| | | Year Ended August 31, 2013 | |
| | | Class A | | | Class B | | | Class C | | | Class I | |
| | | | |
Sales | | | 202,121 | | | | 2,620 | | | | 61,711 | | | | 1,342,021 | |
Issued to shareholders electing to receive payments of distributions in Fund shares | | | 117,846 | | | | 2,294 | | | | 3,709 | | | | 24,156 | |
Redemptions | | | (585,525 | ) | | | (24,657 | ) | | | (89,089 | ) | | | (1,502,780 | ) |
Exchange from Class B shares | | | 41,037 | | | | — | | | | — | | | | — | |
Exchange to Class A shares | | | — | | | | (37,304 | ) | | | — | | | | — | |
| | | | |
Net decrease | | | (224,521 | ) | | | (57,047 | ) | | | (23,669 | ) | | | (136,603 | ) |
| | | | |
| | | | | | | | | | | | | | | | |
Arkansas Fund | | | | | | | | | | | | |
| | | Six Months Ended February 28, 2014 (Unaudited) | |
| | | Class A | | | Class B | | | Class C | | | Class I | |
| | | | |
Sales | | | 90,100 | | | | 63 | | | | 9,825 | | | | 88,182 | |
Issued to shareholders electing to receive payments of distributions in Fund shares | | | 102,303 | | | | 2,279 | | | | 9,106 | | | | 6,217 | |
Redemptions | | | (838,458 | ) | | | (21,704 | ) | | | (112,999 | ) | | | (59,436 | ) |
Exchange from Class B shares | | | 26,198 | | | | — | | | | — | | | | — | |
Exchange to Class A shares | | | — | | | | (24,757 | ) | | | — | | | | — | |
| | | | |
Net increase (decrease) | | | (619,857 | ) | | | (44,119 | ) | | | (94,068 | ) | | | 34,963 | |
| | | | |
| | | | | | | | | | | | | | | | |
| | | Year Ended August 31, 2013 | |
| | | Class A | | | Class B | | | Class C | | | Class I | |
| | | | |
Sales | | | 593,566 | | | | 1,121 | | | | 183,068 | | | | 54,461 | |
Issued to shareholders electing to receive payments of distributions in Fund shares | | | 193,675 | | | | 4,950 | | | | 17,769 | | | | 9,078 | |
Redemptions | | | (983,517 | ) | | | (33,277 | ) | | | (232,562 | ) | | | (96,811 | ) |
Exchange from Class B shares | | | 20,838 | | | | — | | | | — | | | | — | |
Exchange to Class A shares | | | — | | | | (19,394 | ) | | | — | | | | — | |
| | | | |
Net decrease | | | (175,438 | ) | | | (46,600 | ) | | | (31,725 | ) | | | (33,272 | ) |
Eaton Vance
Municipal Income Funds
February 28, 2014
Notes to Financial Statements (Unaudited) — continued
| | | | | | | | | | | | | | | | |
Georgia Fund | | | | | | | | | | | | |
| | | Six Months Ended February 28, 2014 (Unaudited) | |
| | | Class A | | | Class B | | | Class C | | | Class I | |
| | | | |
Sales | | | 110,288 | | | | 38 | | | | 14,011 | | | | 378,116 | |
Issued to shareholders electing to receive payments of distributions in Fund shares | | | 89,734 | | | | 1,799 | | | | 8,368 | | | | 6,392 | |
Redemptions | | | (708,325 | ) | | | (13,239 | ) | | | (90,642 | ) | | | (447,397 | ) |
Exchange from Class B shares | | | 8,524 | | | | — | | | | — | | | | — | |
Exchange to Class A shares | | | — | | | | (7,978 | ) | | | — | | | | — | |
| | | | |
Net decrease | | | (499,779 | ) | | | (19,380 | ) | | | (68,263 | ) | | | (62,889 | ) |
| | | | |
| | | | | | | | | | | | | | | | |
| | | Year Ended August 31, 2013 | |
| | | Class A | | | Class B | | | Class C | | | Class I | |
| | | | |
Sales | | | 508,909 | | | | 87 | | | | 111,421 | | | | 293,024 | |
Issued to shareholders electing to receive payments of distributions in Fund shares | | | 163,621 | | | | 4,421 | | | | 17,646 | | | | 20,524 | |
Redemptions | | | (801,508 | ) | | | (15,333 | ) | | | (234,889 | ) | | | (678,175 | ) |
Exchange from Class B shares | | | 87,139 | | | | — | | | | — | | | | — | |
Exchange to Class A shares | | | — | | | | (81,543 | ) | | | — | | | | — | |
| | | | |
Net decrease | | | (41,839 | ) | | | (92,368 | ) | | | (105,822 | ) | | | (364,627 | ) |
| | | | |
| | | | | | | | | | | | | | | | |
Kentucky Fund | | | | | | | | | | | | |
| | | Six Months Ended February 28, 2014 (Unaudited) | |
| | | Class A | | | Class B | | | Class C | | | Class I | |
| | | | |
Sales | | | 64,639 | | | | 20 | | | | 31,137 | | | | 80,832 | |
Issued to shareholders electing to receive payments of distributions in Fund shares | | | 79,662 | | | | 498 | | | | 5,766 | | | | 15,339 | |
Redemptions | | | (474,046 | ) | | | (1,994 | ) | | | (63,762 | ) | | | (393,901 | ) |
Exchange from Class B shares | | | 1,705 | | | | — | | | | — | | | | — | |
Exchange to Class A shares | | | — | | | | (1,579 | ) | | | — | | | | — | |
| | | | |
Net decrease | | | (328,040 | ) | | | (3,055 | ) | | | (26,859 | ) | | | (297,730 | ) |
| | | | |
| | | | | | | | | | | | | | | | |
| | | Year Ended August 31, 2013 | |
| | | Class A | | | Class B | | | Class C | | | Class I | |
| | | | |
Sales | | | 187,211 | | | | 54 | | | | 167,330 | | | | 398,553 | |
Issued to shareholders electing to receive payments of distributions in Fund shares | | | 156,148 | | | | 1,359 | | | | 11,953 | | | | 34,278 | |
Redemptions | | | (658,154 | ) | | | (10,393 | ) | | | (154,183 | ) | | | (194,897 | ) |
Exchange from Class B shares | | | 26,500 | | | | — | | | | — | | | | — | |
Exchange to Class A shares | | | — | | | | (24,542 | ) | | | — | | | | — | |
| | | | |
Net increase (decrease) | | | (288,295 | ) | | | (33,522 | ) | | | 25,100 | | | | 237,934 | |
Eaton Vance
Municipal Income Funds
February 28, 2014
Notes to Financial Statements (Unaudited) — continued
| | | | | | | | | | | | | | | | |
Maryland Fund | | | | | | | | | | | | |
| | | Six Months Ended February 28, 2014 (Unaudited) | |
| | | Class A | | | Class B | | | Class C | | | Class I | |
| | | | |
Sales | | | 97,953 | | | | 311 | | | | 120,881 | | | | 141,876 | |
Issued to shareholders electing to receive payments of distributions in Fund shares | | | 82,003 | | | | 1,995 | | | | 19,282 | | | | 4,058 | |
Redemptions | | | (507,255 | ) | | | (24,788 | ) | | | (304,879 | ) | | | (172,656 | ) |
Exchange from Class B shares | | | 22,951 | | | | — | | | | — | | | | — | |
Exchange to Class A shares | | | — | | | | (21,043 | ) | | | — | | | | — | |
| | | | |
Net decrease | | | (304,348 | ) | | | (43,525 | ) | | | (164,716 | ) | | | (26,722 | ) |
| | | | |
| | | | | | | | | | | | | | | | |
| | | Year Ended August 31, 2013 | |
| | | Class A | | | Class B | | | Class C | | | Class I | |
| | | | |
Sales | | | 240,292 | | | | 555 | | | | 569,651 | | | | 345,219 | |
Issued to shareholders electing to receive payments of distributions in Fund shares | | | 173,529 | | | | 4,557 | | | | 36,816 | | | | 8,748 | |
Redemptions | | | (1,238,715 | ) | | | (21,040 | ) | | | (418,022 | ) | | | (224,847 | ) |
Exchange from Class B shares | | | 23,548 | | | | — | | | | — | | | | — | |
Exchange to Class A shares | | | — | | | | (21,592 | ) | | | — | | | | — | |
| | | | |
Net increase (decrease) | | | (801,346 | ) | | | (37,520 | ) | | | 188,445 | | | | 129,120 | |
| | | | |
| | | | | | | | | | | | | | | | |
Missouri Fund | | | | | | | | | | | | |
| | | Six Months Ended February 28, 2014 (Unaudited) | |
| | | Class A | | | Class B | | | Class C | | | Class I | |
| | | | |
Sales | | | 333,923 | | | | 109 | | | | 17,262 | | | | 21,992 | |
Issued to shareholders electing to receive payments of distributions in Fund shares | | | 124,736 | | | | 1,999 | | | | 7,408 | | | | 4,897 | |
Redemptions | | | (747,479 | ) | | | (2,824 | ) | | | (73,615 | ) | | | (211,295 | ) |
Exchange from Class B shares | | | 1,027 | | | | — | | | | — | | | | — | |
Exchange to Class A shares | | | — | | | | (929 | ) | | | — | | | | — | |
| | | | |
Net decrease | | | (287,793 | ) | | | (1,645 | ) | | | (48,945 | ) | | | (184,406 | ) |
| | | | |
| | | | | | | | | | | | | | | | |
| | | Year Ended August 31, 2013 | |
| | | Class A | | | Class B | | | Class C | | | Class I | |
| | | | |
Sales | | | 520,705 | | | | 180 | | | | 113,223 | | | | 239,171 | |
Issued to shareholders electing to receive payments of distributions in Fund shares | | | 255,330 | | | | 4,094 | | | | 13,396 | | | | 12,049 | |
Redemptions | | | (2,104,209 | ) | | | (26,488 | ) | | | (95,635 | ) | | | (63,420 | ) |
Exchange from Class B shares | | | 32,043 | | | | — | | | | — | | | | — | |
Exchange to Class A shares | | | — | | | | (28,989 | ) | | | — | | | | — | |
| | | | |
Net increase (decrease) | | | (1,296,131 | ) | | | (51,203 | ) | | | 30,984 | | | | 187,800 | |
Eaton Vance
Municipal Income Funds
February 28, 2014
Notes to Financial Statements (Unaudited) — continued
| | | | | | | | | | | | | | | | |
North Carolina Fund | | | | | | | | | | | | |
| | | Six Months Ended February 28, 2014 (Unaudited) | |
| | | Class A | | | Class B | | | Class C | | | Class I | |
| | | | |
Sales | | | 612,309 | | | | 540 | | | | 144,972 | | | | 487,813 | |
Issued to shareholders electing to receive payments of distributions in Fund shares | | | 175,714 | | | | 1,806 | | | | 34,945 | | | | 10,983 | |
Redemptions | | | (1,798,530 | ) | | | (25,277 | ) | | | (336,828 | ) | | | (700,023 | ) |
Exchange from Class B shares | | | 2,568 | | | | — | | | | — | | | | — | |
Exchange to Class A shares | | | — | | | | (2,389 | ) | | | — | | | | — | |
| | | | |
Net decrease | | | (1,007,939 | ) | | | (25,320 | ) | | | (156,911 | ) | | | (201,227 | ) |
| | | | |
| | | | | | | | | | | | | | | | |
| | | Year Ended August 31, 2013 | |
| | | Class A | | | Class B | | | Class C | | | Class I | |
| | | | |
Sales | | | 1,813,686 | | | | 1,178 | | | | 627,463 | | | | 714,001 | |
Issued to shareholders electing to receive payments of distributions in Fund shares | | | 338,950 | | | | 5,129 | | | | 66,965 | | | | 25,723 | |
Redemptions | | | (1,982,005 | ) | | | (46,117 | ) | | | (547,577 | ) | | | (743,813 | ) |
Exchange from Class B shares | | | 45,510 | | | | — | | | | — | | | | — | |
Exchange to Class A shares | | | — | | | | (42,317 | ) | | | — | | | | — | |
| | | | |
Net increase (decrease) | | | 216,141 | | | | (82,127 | ) | | | 146,851 | | | | (4,089 | ) |
| | | | |
| | | | | | | | | | | | | | | | |
Oregon Fund | | | | | | | | | | | | |
| | | Six Months Ended February 28, 2014 (Unaudited) | |
| | | Class A | | | Class B | | | Class C | | | Class I | |
| | | | |
Sales | | | 808,967 | | | | 151 | | | | 51,368 | | | | 241,013 | |
Issued to shareholders electing to receive payments of distributions in Fund shares | | | 239,511 | | | | 6,326 | | | | 33,712 | | | | 9,180 | |
Redemptions | | | (1,814,091 | ) | | | (48,252 | ) | | | (501,712 | ) | | | (921,521 | ) |
Exchange from Class B shares | | | 20,816 | | | | — | | | | — | | | | — | |
Exchange to Class A shares | | | — | | | | (19,031 | ) | | | — | | | | — | |
| | | | |
Net decrease | | | (744,797 | ) | | | (60,806 | ) | | | (416,632 | ) | | | (671,328 | ) |
| | | | |
| | | | | | | | | | | | | | | | |
| | | Year Ended August 31, 2013 | |
| | | Class A | | | Class B | | | Class C | | | Class I | |
| | | | |
Sales | | | 1,778,229 | | | | 2,689 | | | | 468,771 | | | | 1,618,902 | |
Issued to shareholders electing to receive payments of distributions in Fund shares | | | 439,750 | | | | 12,855 | | | | 67,574 | | | | 25,429 | |
Redemptions | | | (3,359,359 | ) | | | (109,179 | ) | | | (863,448 | ) | | | (2,822,968 | ) |
Exchange from Class B shares | | | 122,503 | | | | — | | | | — | | | | — | |
Exchange to Class A shares | | | — | | | | (111,979 | ) | | | — | | | | — | |
| | | | |
Net decrease | | | (1,018,877 | ) | | | (205,614 | ) | | | (327,103 | ) | | | (1,178,637 | ) |
Eaton Vance
Municipal Income Funds
February 28, 2014
Notes to Financial Statements (Unaudited) — continued
| | | | | | | | | | | | | | | | |
South Carolina Fund | | | | | | | | | | | | |
| | | Six Months Ended February 28, 2014 (Unaudited) | |
| | | Class A | | | Class B | | | Class C | | | Class I | |
| | | | |
Sales | | | 347,379 | | | | 4,256 | | | | 143,051 | | | | 260,415 | |
Issued to shareholders electing to receive payments of distributions in Fund shares | | | 180,670 | | | | 4,724 | | | | 45,355 | | | | 13,295 | |
Redemptions | | | (1,305,456 | ) | | | (47,736 | ) | | | (431,223 | ) | | | (977,635 | ) |
Exchange from Class B shares | | | 59,476 | | | | — | | | | — | | | | — | |
Exchange to Class A shares | | | — | | | | (56,077 | ) | | | — | | | | — | |
| | | | |
Net decrease | | | (717,931 | ) | | | (94,833 | ) | | | (242,817 | ) | | | (703,925 | ) |
| | | | |
| | | | | | | | | | | | | | | | |
| | | Year Ended August 31, 2013 | |
| | | Class A | | | Class B | | | Class C | | | Class I | |
| | | | |
Sales | | | 1,417,018 | | | | 93 | | | | 731,519 | | | | 1,429,179 | |
Issued to shareholders electing to receive payments of distributions in Fund shares | | | 344,300 | | | | 10,755 | | | | 87,149 | | | | 27,524 | |
Redemptions | | | (2,440,606 | ) | | | (45,666 | ) | | | (846,224 | ) | | | (1,475,802 | ) |
Exchange from Class B shares | | | 37,597 | | | | — | | | | — | | | | — | |
Exchange to Class A shares | | | — | | | | (35,442 | ) | | | — | | | | — | |
| | | | |
Net decrease | | | (641,691 | ) | | | (70,260 | ) | | | (27,556 | ) | | | (19,099 | ) |
| | | | |
| | | | | | | | | | | | | | | | |
Tennessee Fund | | | | | | | | | | | | |
| | | Six Months Ended February 28, 2014 (Unaudited) | |
| | | Class A | | | Class B | | | Class C | | | Class I | |
| | | | |
Sales | | | 44,438 | | | | 4 | | | | 33,552 | | | | 8,408 | |
Issued to shareholders electing to receive payments of distributions in Fund shares | | | 67,026 | | | | 1,163 | | | | 12,388 | | | | 1,405 | |
Redemptions | | | (624,910 | ) | | | (3,156 | ) | | | (221,255 | ) | | | (22,407 | ) |
Exchange from Class B shares | | | 10,444 | | | | — | | | | — | | | | — | |
Exchange to Class A shares | | | — | | | | (9,583 | ) | | | — | | | | — | |
| | | | |
Net decrease | | | (503,002 | ) | | | (11,572 | ) | | | (175,315 | ) | | | (12,594 | ) |
| | | | |
| | | | | | | | | | | | | | | | |
| | | Year Ended August 31, 2013 | |
| | | Class A | | | Class B | | | Class C | | | Class I | |
| | | | |
Sales | | | 340,244 | | | | 87 | | | | 252,784 | | | | 59,450 | |
Issued to shareholders electing to receive payments of distributions in Fund shares | | | 137,282 | | | | 2,608 | | | | 25,049 | | | | 3,561 | |
Redemptions | | | (957,901 | ) | | | (8,112 | ) | | | (311,946 | ) | | | (68,712 | ) |
Exchange from Class B shares | | | 33,457 | | | | — | | | | — | | | | — | |
Exchange to Class A shares | | | — | | | | (30,714 | ) | | | — | | | | — | |
| | | | |
Net decrease | | | (446,918 | ) | | | (36,131 | ) | | | (34,113 | ) | | | (5,701 | ) |
Eaton Vance
Municipal Income Funds
February 28, 2014
Notes to Financial Statements (Unaudited) — continued
| | | | | | | | | | | | | | | | |
Virginia Fund | | | | | | | | | | | | |
| | | Six Months Ended February 28, 2014 (Unaudited) | |
| | | Class A | | | Class B | | | Class C | | | Class I | |
| | | | |
Sales | | | 122,265 | | | | 52 | | | | 73,856 | | | | 271,617 | |
Issued to shareholders electing to receive payments of distributions in Fund shares | | | 140,130 | | | | 2,639 | | | | 12,245 | | | | 12,270 | |
Redemptions | | | (801,062 | ) | | | (35,004 | ) | | | (175,959 | ) | | | (766,060 | ) |
Exchange from Class B shares | | | 12,638 | | | | — | | | | — | | | | — | |
Exchange to Class A shares | | | — | | | | (11,413 | ) | | | — | | | | — | |
| | | | |
Net decrease | | | (526,029 | ) | | | (43,726 | ) | | | (89,858 | ) | | | (482,173 | ) |
| | | | |
| | | | | | | | | | | | | | | | |
| | | Year Ended August 31, 2013 | |
| | | Class A | | | Class B | | | Class C | | | Class I | |
| | | | |
Sales | | | 410,208 | | | | 7,622 | | | | 165,131 | | | | 479,456 | |
Issued to shareholders electing to receive payments of distributions in Fund shares | | | 292,150 | | | | 7,053 | | | | 24,754 | | | | 20,580 | |
Redemptions | | | (1,806,321 | ) | | | (82,915 | ) | | | (235,382 | ) | | | (697,267 | ) |
Exchange from Class B shares | | | 48,802 | | | | — | | | | — | | | | — | |
Exchange to Class A shares | | | — | | | | (44,085 | ) | | | — | | | | — | |
| | | | |
Net decrease | | | (1,055,161 | ) | | | (112,325 | ) | | | (45,497 | ) | | | (197,231 | ) |
8 Federal Income Tax Basis of Investments
The cost and unrealized appreciation (depreciation) of investments of each Fund at February 28, 2014, as determined on a federal income tax basis, were as follows:
| | | | | | | | | | | | | | | | | | | | | | | | |
| | | Alabama Fund | | | Arkansas Fund | | | Georgia Fund | | | Kentucky Fund | | | Maryland Fund | | | Missouri Fund | |
| | | | | | |
Aggregate cost | | $ | 39,219,958 | | | $ | 53,776,141 | | | $ | 53,102,205 | | | $ | 44,472,567 | | | $ | 67,357,654 | | | $ | 66,078,626 | |
| | | | | | |
Gross unrealized appreciation | | $ | 2,587,157 | | | $ | 1,890,663 | | | $ | 3,673,334 | | | $ | 2,889,980 | | | $ | 4,129,149 | | | $ | 4,908,673 | |
Gross unrealized depreciation | | | (193,185 | ) | | | (865,450 | ) | | | (610,850 | ) | | | (755,801 | ) | | | (544,699 | ) | | | (815,964 | ) |
| | | | | | |
Net unrealized appreciation | | $ | 2,393,972 | | | $ | 1,025,213 | | | $ | 3,062,484 | | | $ | 2,134,179 | | | $ | 3,584,450 | | | $ | 4,092,709 | |
| | | | | | | | | | | | | | | | | | | | |
| | | North Carolina Fund | | | Oregon Fund | | | South Carolina Fund | | | Tennessee Fund | | | Virginia Fund | |
| | | | | |
Aggregate cost | | $ | 105,741,088 | | | $ | 104,506,664 | | | $ | 109,711,979 | | | $ | 37,295,889 | | | $ | 74,736,332 | |
| | | | | |
Gross unrealized appreciation | | $ | 7,064,638 | | | $ | 7,001,901 | | | $ | 6,521,852 | | | $ | 2,557,299 | | | $ | 8,252,937 | |
Gross unrealized depreciation | | | (2,834,231 | ) | | | (7,041,255 | ) | | | (2,782,425 | ) | | | (1,688,157 | ) | | | (1,820,778 | ) |
| | | | | |
Net unrealized appreciation (depreciation) | | $ | 4,230,407 | | | $ | (39,354 | ) | | $ | 3,739,427 | | | $ | 869,142 | | | $ | 6,432,159 | |
Eaton Vance
Municipal Income Funds
February 28, 2014
Notes to Financial Statements (Unaudited) — continued
9 Line of Credit
The Funds participate with other portfolios and funds managed by EVM and its affiliates in a $750 million unsecured line of credit agreement with a group of banks. Borrowings are made by the Funds solely to facilitate the handling of unusual and/or unanticipated short-term cash requirements. Interest is charged to each Fund based on its borrowings at an amount above either the Eurodollar rate or Federal Funds rate. In addition, a fee computed at an annual rate of 0.08% on the daily unused portion of the line of credit is allocated among the participating portfolios and funds at the end of each quarter. Because the line of credit is not available exclusively to the Funds, a Fund may be unable to borrow some or all of its requested amounts at any particular time. At February 28, 2014, the Arkansas Fund, Kentucky Fund and Maryland Fund had balances outstanding pursuant to this line of credit of $100,000, $100,000 and $1,300,000, respectively, at an interest rate of 1.07%. Based on the short-term nature of the borrowings under the line of credit and variable interest rate, the carrying value of the borrowings approximated its fair value at February 28, 2014. If measured at fair value, borrowings under the line of credit would have been considered as Level 2 in the fair value hierarchy (see Note 12) at February 28, 2014. The Funds’ average borrowings or allocated fees during the six months ended February 28, 2014 were not significant.
10 Overdraft Advances
Pursuant to the custodian agreement, SSBT may, in its discretion, advance funds to the Funds to make properly authorized payments. When such payments result in an overdraft, the Funds are obligated to repay SSBT at the current rate of interest charged by SSBT for secured loans (currently, the Federal Funds rate plus 2%). This obligation is payable on demand to SSBT. SSBT has a lien on a Fund’s assets to the extent of any overdraft. At February 28, 2014, the Arkansas Fund, Kentucky Fund and North Carolina Fund had overdraft balances due to SSBT pursuant to the foregoing arrangement of $84,426, $34,612 and $919, respectively. Based on the short-term nature of these payments and the variable interest rate, the carrying value of the overdraft advances approximated its fair value at February 28, 2014. If measured at fair value, overdraft advances would have been considered as Level 2 in the fair value hierarchy (see Note 12) at February 28, 2014. The Funds’ average overdraft advances during the six months ended February 28, 2014 were not significant.
11 Financial Instruments
The Funds may trade in financial instruments with off-balance sheet risk in the normal course of their investing activities. These financial instruments may include financial futures contracts and may involve, to a varying degree, elements of risk in excess of the amounts recognized for financial statement purposes. The notional or contractual amounts of these instruments represent the investment a Fund has in particular classes of financial instruments and do not necessarily represent the amounts potentially subject to risk. The measurement of the risks associated with these instruments is meaningful only when all related and offsetting transactions are considered.
A summary of obligations under these financial instruments at February 28, 2014 is as follows:
| | | | | | | | | | | | | | | | | | | | |
| Futures Contracts | |
| Fund | | Expiration
Month/Year | | | Contracts | | Position | | Aggregate
Cost | | | Value | | | Net
Unrealized
Depreciation | |
| | | | | | |
| Arkansas | | | 6/14 | | | 40
U.S. Long Treasury Bond | | Short | | $ | (5,247,739 | ) | | $ | (5,322,500 | ) | | $ | (74,761 | ) |
| Georgia | | | 6/14 | | | 105
U.S. Long Treasury Bond | | Short | | $ | (13,775,316 | ) | | $ | (13,971,563 | ) | | $ | (196,247 | ) |
| Kentucky | | | 6/14 | | | 50
U.S. Long Treasury Bond | | Short | | $ | (6,559,674 | ) | | $ | (6,653,125 | ) | | $ | (93,451 | ) |
| Maryland | | | 6/14 | | | 38
U.S. Long Treasury Bond | | Short | | $ | (4,985,352 | ) | | $ | (5,056,375 | ) | | $ | (71,023 | ) |
| Missouri | | | 6/14 | | | 29
U.S. 10-Year Treasury Note | | Short | | $ | (3,593,681 | ) | | $ | (3,611,406 | ) | | $ | (17,725 | ) |
| | | | 6/14 | | | 9
U.S. Long Treasury Bond | | Short | | | (1,180,741 | ) | | | (1,197,562 | ) | | | (16,821 | ) |
Eaton Vance
Municipal Income Funds
February 28, 2014
Notes to Financial Statements (Unaudited) — continued
| | | | | | | | | | | | | | | | | | | | |
| Futures Contracts (continued) | |
| Fund | | Expiration
Month/Year | | | Contracts | | Position | | Aggregate
Cost | | | Value | | | Net
Unrealized
Depreciation | |
| | | | | | |
| Oregon | | | 6/14 | | | 65
U.S. Long Treasury Bond | �� | Short | | $ | (8,527,576 | ) | | $ | (8,649,062 | ) | | $ | (121,486 | ) |
| Virginia | | | 6/14 | | | 170
U.S. Long Treasury Bond | | Short | | $ | (22,302,892 | ) | | $ | (22,620,625 | ) | | $ | (317,733 | ) |
At February 28, 2014, the Funds had sufficient cash and/or securities to cover commitments under these contracts.
Each Fund is subject to interest rate risk in the normal course of pursuing its investment objective. Because the Funds hold fixed-rate bonds, the value of these bonds may decrease if interest rates rise. The Funds purchase and sell U.S. Treasury futures contracts to hedge against changes in interest rates.
The fair values of open derivative instruments (not considered to be hedging instruments for accounting disclosure purposes) and whose primary underlying risk exposure is interest rate risk at February 28, 2014 were as follows:
| | | | | | | | | | | | | | | | |
| | | Arkansas Fund | | | Georgia Fund | | | Kentucky Fund | | | Maryland Fund | |
| | | |
Liability Derivative: | | | | | | | | | | | | |
Futures Contracts | | $ | (74,761 | )(1) | | $ | (196,247 | )(1) | | $ | (93,451 | )(1) | | $ | (71,023 | )(1) |
| | | | |
Total | | $ | (74,761 | ) | | $ | (196,247 | ) | | $ | (93,451 | ) | | $ | (71,023 | ) |
| | | | | | | | | | | | |
| | | Missouri Fund | | | Oregon Fund | | | Virginia Fund | |
| | |
Liability Derivative: | | | | | | | | |
Futures Contracts | | $ | (34,546 | )(1) | | $ | (121,486 | )(1) | | $ | (317,733 | )(1) |
| | | |
Total | | $ | (34,546 | ) | | $ | (121,486 | ) | | $ | (317,733 | ) |
| (1) | Amount represents cumulative unrealized depreciation on futures contracts in the Futures Contracts table above. Only the current day’s variation margin on open futures contracts is reported within the Statement of Assets and Liabilities as Receivable or Payable for variation margin, as applicable. |
The effect of derivative instruments (not considered to be hedging instruments for accounting disclosure purposes) on the Statement of Operations and whose primary underlying risk exposure is interest rate risk for the six months ended February 28, 2014 was as follows:
| | | | | | | | | | | | | | | | | | | | | | | | |
| | | Alabama Fund | | | Arkansas
Fund | | | Georgia Fund | | | Kentucky Fund | | | Maryland Fund | | | Missouri Fund | |
| | | | | | |
Realized Gain (Loss) on Derivatives Recognized in Income | | $ | (6,307 | )(1) | | $ | (196,163 | )(1) | | $ | (252,604 | )(1) | | $ | (88,116 | )(1) | | $ | (91,419 | )(1) | | $ | (140,276 | )(1) |
Change in Unrealized Appreciation (Depreciation) on Derivatives Recognized in Income | | $ | 673 | (2) | | $ | (64,663 | )(2) | | $ | (182,110 | )(2) | | $ | (84,699 | )(2) | | $ | (65,907 | )(2) | | $ | (18,333 | )(2) |
| (1) | Statement of Operations location: Net realized gain (loss) – Financial futures contracts. |
| (2) | Statement of Operations location: Change in unrealized appreciation (depreciation) – Financial futures contracts. |
Eaton Vance
Municipal Income Funds
February 28, 2014
Notes to Financial Statements (Unaudited) — continued
| | | | | | | | | | | | |
| | | Oregon Fund | | | Tennessee Fund | | | Virginia Fund | |
| | | |
Realized Gain (Loss) on Derivatives Recognized in Income | | $ | (103,832 | )(1) | | $ | (159,345 | )(1) | | $ | (421,042 | )(1) |
Change in Unrealized Appreciation (Depreciation) on Derivatives Recognized in Income | | $ | (121,486 | )(2) | | $ | 8,079 | (2) | | $ | (290,805 | )(2) |
| (1) | Statement of Operations location: Net realized gain (loss) – Financial futures contracts. |
| (2) | Statement of Operations location: Change in unrealized appreciation (depreciation) – Financial futures contracts. |
The average notional amounts of futures contracts outstanding during the six months ended February 28, 2014, which are indicative of the volume of this derivative type, were approximately as follows:
| | | | | | | | | | | | | | | | | | | | | | | | |
| | | Alabama Fund | | | Arkansas Fund | | | Georgia Fund | | | Kentucky Fund | | | Maryland Fund | | | Missouri Fund | |
| | | | |
Average Notional Amount: | | | | | | | | | | | | | | | | |
Futures Contracts | | $ | 214,000 | | | $ | 5,000,000 | | | $ | 10,500,000 | | | $ | 5,214,000 | | | $ | 3,800,000 | | | $ | 4,229,000 | |
| | | | | | | | | | | | |
| | | Oregon Fund | | | Tennessee Fund | | | Virginia Fund | |
| | | |
Average Notional Amount: | | | | | | | | | | | | |
Futures Contracts | | $ | 1,857,000 | | | $ | 5,143,000 | | | $ | 17,643,000 | |
12 Fair Value Measurements
Under generally accepted accounting principles for fair value measurements, a three-tier hierarchy to prioritize the assumptions, referred to as inputs, is used in valuation techniques to measure fair value. The three-tier hierarchy of inputs is summarized in the three broad levels listed below.
| Ÿ | | Level 1 – quoted prices in active markets for identical investments |
| Ÿ | | Level 2 – other significant observable inputs (including quoted prices for similar investments, interest rates, prepayment speeds, credit risk, etc.) |
| Ÿ | | Level 3 – significant unobservable inputs (including a fund’s own assumptions in determining the fair value of investments) |
In cases where the inputs used to measure fair value fall in different levels of the fair value hierarchy, the level disclosed is determined based on the lowest level input that is significant to the fair value measurement in its entirety. The inputs or methodology used for valuing securities are not necessarily an indication of the risk associated with investing in those securities.
At February 28, 2014, the hierarchy of inputs used in valuing the Funds’ investments and open derivative instruments, which are carried at value, were as follows:
| | | | | | | | | | | | | | | | |
Alabama Fund | | | | | | | | | | | | |
| Asset Description | | Level 1 | | | Level 2 | | | Level 3 | | | Total | |
| | | | |
Tax-Exempt Investments | | $ | — | | | $ | 41,613,930 | | | $ | — | | | $ | 41,613,930 | |
| | | | |
Total Investments | | $ | — | | | $ | 41,613,930 | | | $ | — | | | $ | 41,613,930 | |
| | | | |
| | | | | | | | | | | | | | | | |
Eaton Vance
Municipal Income Funds
February 28, 2014
Notes to Financial Statements (Unaudited) — continued
| | | | | | | | | | | | | | | | |
Arkansas Fund | | | | | | | | | | | | |
| Asset Description | | Level 1 | | | Level 2 | | | Level 3 | | | Total | |
| | | | |
Tax-Exempt Investments | | $ | — | | | $ | 54,801,354 | | | $ | — | | | $ | 54,801,354 | |
| | | | |
Total Investments | | $ | — | | | $ | 54,801,354 | | | $ | — | | | $ | 54,801,354 | |
| | | | |
Liability Description | | | | | | | | | | | | | | | | |
| | | | |
Futures Contracts | | $ | (74,761 | ) | | $ | — | | | $ | — | | | $ | (74,761 | ) |
| | | | |
Total | | $ | (74,761 | ) | | $ | — | | | $ | — | | | $ | (74,761 | ) |
| | | | |
| | | | | | | | | | | | | | | | |
Georgia Fund | | | | | | | | | | | | |
| Asset Description | | Level 1 | | | Level 2 | | | Level 3 | | | Total | |
| | | | |
Tax-Exempt Investments | | $ | — | | | $ | 59,539,689 | | | $ | — | | | $ | 59,539,689 | |
| | | | |
Total Investments | | $ | — | | | $ | 59,539,689 | | | $ | — | | | $ | 59,539,689 | |
| | | | |
Liability Description | | | | | | | | | | | | | | | | |
| | | | |
Futures Contracts | | $ | (196,247 | ) | | $ | — | | | $ | — | | | $ | (196,247 | ) |
| | | | |
Total | | $ | (196,247 | ) | | $ | — | | | $ | — | | | $ | (196,247 | ) |
| | | | |
| | | | | | | | | | | | | | | | |
Kentucky Fund | | | | | | | | | | | | |
| Asset Description | | Level 1 | | | Level 2 | | | Level 3 | | | Total | |
| | | | |
Tax-Exempt Investments | | $ | — | | | $ | 46,606,746 | | | $ | — | | | $ | 46,606,746 | |
| | | | |
Total Investments | | $ | — | | | $ | 46,606,746 | | | $ | — | | | $ | 46,606,746 | |
| | | | |
Liability Description | | | | | | | | | | | | | | | | |
| | | | |
Futures Contracts | | $ | (93,451 | ) | | $ | — | | | $ | — | | | $ | (93,451 | ) |
| | | | |
Total | | $ | (93,451 | ) | | $ | — | | | $ | — | | | $ | (96,451 | ) |
| | | | |
| | | | | | | | | | | | | | | | |
Maryland Fund | | | | | | | | | | | | |
| Asset Description | | Level 1 | | | Level 2 | | | Level 3 | | | Total | |
| | | | |
Tax-Exempt Investments | | $ | — | | | $ | 73,182,104 | | | $ | — | | | $ | 73,182,104 | |
| | | | |
Total Investments | | $ | — | | | $ | 73,182,104 | | | $ | — | | | $ | 73,182,104 | |
| | | | |
Liability Description | | | | | | | | | | | | | | | | |
| | | | |
Futures Contracts | | $ | (71,023 | ) | | $ | — | | | $ | — | | | $ | (71,023 | ) |
| | | | |
Total | | $ | (71,023 | ) | | $ | — | | | $ | — | | | $ | (71,023 | ) |
| | | | |
| | | | | | | | | | | | | | | | |
Eaton Vance
Municipal Income Funds
February 28, 2014
Notes to Financial Statements (Unaudited) — continued
| | | | | | | | | | | | | | | | |
Missouri Fund | | | | | | | | | | | | |
| Asset Description | | Level 1 | | | Level 2 | | | Level 3 | | | Total | |
| | | | |
Tax-Exempt Investments | | $ | — | | | $ | 71,021,335 | | | $ | — | | | $ | 71,021,335 | |
| | | | |
Total Investments | | $ | — | | | $ | 71,021,335 | | | $ | — | | | $ | 71,021,335 | |
| | | | |
Liability Description | | | | | | | | | | | | | | | | |
| | | | |
Futures Contracts | | $ | (34,546 | ) | | $ | — | | | $ | — | | | $ | (34,546 | ) |
| | | | |
Total | | $ | (34,546 | ) | | $ | — | | | $ | — | | | $ | (34,546 | ) |
| | | | |
| | | | | | | | | | | | | | | | |
North Carolina Fund | | | | | | | | | | | | |
| Asset Description | | Level 1 | | | Level 2 | | | Level 3 | | | Total | |
| | | | |
Tax-Exempt Investments | | $ | — | | | $ | 114,621,495 | | | $ | — | | | $ | 114,621,495 | |
| | | | |
Total Investments | | $ | — | | | $ | 114,621,495 | | | $ | — | | | $ | 114,621,495 | |
| | | | |
| | | | | | | | | | | | | | | | |
Oregon Fund | | | | | | | | | | | | |
| Asset Description | | Level 1 | | | Level 2 | | | Level 3 | | | Total | |
| | | | |
Tax-Exempt Investments | | $ | — | | | $ | 111,922,310 | | | $ | — | | | $ | 111,922,310 | |
| | | | |
Total Investments | | $ | — | | | $ | 111,922,310 | | | $ | — | | | $ | 111,922,310 | |
| | | | |
Liability Description | | | | | | | | | | | | | | | | |
| | | | |
Futures Contracts | | $ | (121,486 | ) | | $ | — | | | $ | — | | | $ | (121,486 | ) |
| | | | |
Total | | $ | (121,486 | ) | | $ | — | | | $ | — | | | $ | (121,486 | ) |
| | | | |
| | | | | | | | | | | | | | | | |
South Carolina Fund | | | | | | | | | | | | |
| Asset Description | | Level 1 | | | Level 2 | | | Level 3 | | | Total | |
| | | | |
Tax-Exempt Investments | | $ | — | | | $ | 119,501,406 | | | $ | — | | | $ | 119,501,406 | |
| | | | |
Total Investments | | $ | — | | | $ | 119,501,406 | | | $ | — | | | $ | 119,501,406 | |
| | | | |
| | | | | | | | | | | | | | | | |
Tennessee Fund | | | | | | | | | | | | |
| Asset Description | | Level 1 | | | Level 2 | | | Level 3 | | | Total | |
| | | | |
Tax-Exempt Investments | | $ | — | | | $ | 38,165,031 | | | $ | — | | | $ | 38,165,031 | |
| | | | |
Total Investments | | $ | — | | | $ | 38,165,031 | | | $ | — | | | $ | 38,165,031 | |
| | | | |
| | | | | | | | | | | | | | | | |
Eaton Vance
Municipal Income Funds
February 28, 2014
Notes to Financial Statements (Unaudited) — continued
| | | | | | | | | | | | | | | | |
Virginia Fund | | | | | | | | | | | | |
| Asset Description | | Level 1 | | | Level 2 | | | Level 3 | | | Total | |
| | | | |
Tax-Exempt Investments | | $ | — | | | $ | 84,498,491 | | | $ | — | | | $ | 84,498,491 | |
| | | | |
Total Investments | | $ | — | | | $ | 84,498,491 | | | $ | — | | | $ | 84,498,491 | |
| | | | |
Liability Description | | | | | | | | | | | | | | | | |
| | | | |
Futures Contracts | | $ | (317,733 | ) | | $ | — | | | $ | — | | | $ | (317,733 | ) |
| | | | |
Total | | $ | (317,733 | ) | | $ | — | | | $ | — | | | $ | (317,733 | ) |
The Funds held no investments or other financial instruments as of August 31, 2013 whose fair value was determined using Level 3 inputs. At February 28, 2014, there were no investments transferred between Level 1 and Level 2 during the six months then ended.
13 Proposed Plan of Reorganization
In December 2013, the Trustees of Alabama Fund, Arkansas Fund, Kentucky Fund and Tennessee Fund approved an Agreement and Plan of Reorganization (the Agreement) whereby Eaton Vance National Municipal Income Fund (National Fund) would acquire substantially all the assets and assume substantially all the liabilities of Alabama Fund, Arkansas Fund, Kentucky Fund and Tennessee Fund in exchange for shares of National Fund. The proposed reorganization of each of Alabama Fund, Arkansas Fund, Kentucky Fund and Tennessee Fund is a separate and independent transaction and is subject to approval by the shareholders of Alabama Fund, Arkansas Fund, Kentucky Fund and Tennessee Fund, respectively.
Eaton Vance
Municipal Income Funds
February 28, 2014
Officers and Trustees
Officers of Eaton Vance Municipals Trust
Payson F. Swaffield
President
Maureen A. Gemma
Vice President, Secretary and
Chief Legal Officer
James F. Kirchner
Treasurer
Paul M. O’Neil
Chief Compliance Officer
Trustees of Eaton Vance Municipals Trust
Ralph F. Verni
Chairman
Scott E. Eston
Thomas E. Faust Jr.*
Allen R. Freedman
Valerie A. Mosley
William H. Park
Ronald A. Pearlman
Helen Frame Peters
Harriett Tee Taggart
Eaton Vance Funds
IMPORTANT NOTICES
Privacy. The Eaton Vance organization is committed to ensuring your financial privacy. Each of the financial institutions identified below has in effect the following policy (“Privacy Policy”) with respect to nonpublic personal information about its customers:
| Ÿ | | Only such information received from you, through application forms or otherwise, and information about your Eaton Vance fund transactions will be collected. This may include information such as name, address, social security number, tax status, account balances and transactions. |
| Ÿ | | None of such information about you (or former customers) will be disclosed to anyone, except as permitted by law (which includes disclosure to employees necessary to service your account). In the normal course of servicing a customer’s account, Eaton Vance may share information with unaffiliated third parties that perform various required services such as transfer agents, custodians and broker-dealers. |
| Ÿ | | Policies and procedures (including physical, electronic and procedural safeguards) are in place that are designed to protect the confidentiality of such information. |
| Ÿ | | We reserve the right to change our Privacy Policy at any time upon proper notification to you. Customers may want to review our Privacy Policy periodically for changes by accessing the link on our homepage: www.eatonvance.com. |
Our pledge of privacy applies to the following entities within the Eaton Vance organization: the Eaton Vance Family of Funds, Eaton Vance Management, Eaton Vance Investment Counsel, Eaton Vance Distributors, Inc., Eaton Vance Trust Company, Eaton Vance Management’s Real Estate Investment Group and Boston Management and Research. In addition, our Privacy Policy applies only to those Eaton Vance customers who are individuals and who have a direct relationship with us. If a customer’s account (i.e., fund shares) is held in the name of a third-party financial advisor/broker-dealer, it is likely that only such advisor’s privacy policies apply to the customer. This notice supersedes all previously issued privacy disclosures. For more information about Eaton Vance’s Privacy Policy, please call 1-800-262-1122.
Delivery of Shareholder Documents. The Securities and Exchange Commission (SEC) permits funds to deliver only one copy of shareholder documents, including prospectuses, proxy statements and shareholder reports, to fund investors with multiple accounts at the same residential or post office box address. This practice is often called “householding” and it helps eliminate duplicate mailings to shareholders. Eaton Vance, or your financial advisor, may household the mailing of your documents indefinitely unless you instruct Eaton Vance, or your financial advisor, otherwise. If you would prefer that your Eaton Vance documents not be householded, please contact Eaton Vance at 1-800-262-1122, or contact your financial advisor. Your instructions that householding not apply to delivery of your Eaton Vance documents will be effective within 30 days of receipt by Eaton Vance or your financial advisor.
Portfolio Holdings. Each Eaton Vance Fund and its underlying Portfolio(s) (if applicable) will file a schedule of portfolio holdings on Form N-Q with the SEC for the first and third quarters of each fiscal year. The Form N-Q will be available on the Eaton Vance website at www.eatonvance.com, by calling Eaton Vance at 1-800-262-1122 or in the EDGAR database on the SEC’s website at www.sec.gov. Form N-Q may also be reviewed and copied at the SEC’s public reference room in Washington, D.C. (call 1-800-732-0330 for information on the operation of the public reference room).
Proxy Voting. From time to time, funds are required to vote proxies related to the securities held by the funds. The Eaton Vance Funds or their underlying Portfolios (if applicable) vote proxies according to a set of policies and procedures approved by the Funds’ and Portfolios’ Boards. You may obtain a description of these policies and procedures and information on how the Funds or Portfolios voted proxies relating to portfolio securities during the most recent 12-month period ended June 30, without charge, upon request, by calling 1-800-262-1122 and by accessing the SEC’s website at www.sec.gov.
Investment Adviser
Boston Management and Research
Two International Place
Boston, MA 02110
Administrator
Eaton Vance Management
Two International Place
Boston, MA 02110
Principal Underwriter*
Eaton Vance Distributors, Inc.
Two International Place
Boston, MA 02110
(617) 482-8260
Custodian
State Street Bank and Trust Company
200 Clarendon Street
Boston, MA 02116
Transfer Agent
BNY Mellon Investment Servicing (US) Inc.
Attn: Eaton Vance Funds
P.O. Box 9653
Providence, RI 02940-9653
(800) 262-1122
Fund Offices
Two International Place
Boston, MA 02110
| * | FINRA BrokerCheck. Investors may check the background of their Investment Professional by contacting the Financial Industry Regulatory Authority (FINRA). FINRA BrokerCheck is a free tool to help investors check the professional background of current and former FINRA-registered securities firms and brokers. FINRA BrokerCheck is available by calling 1-800-289-9999 and at www.FINRA.org. The FINRA BrokerCheck brochure describing this program is available to investors at www.FINRA.org. |
Item 2. Code of Ethics
Not required in this filing.
Item 3. Audit Committee Financial Expert
Not required in this filing.
Item 4. Principal Accountant Fees and Services
Not required in this filing.
Item 5. Audit Committee of Listed Registrants
Not applicable.
Item 6. Schedule of Investments
Please see schedule of investments contained in the Report to Stockholders included under Item 1 of this Form N-CSR.
Item 7. Disclosure of Proxy Voting Policies and Procedures for Closed-End Management Investment Companies
Not applicable.
Item 8. Portfolio Managers of Closed-End Management Investment Companies
Not applicable.
Item 9. Purchases of Equity Securities by Closed-End Management Investment Company and Affiliated Purchasers
Not applicable.
Item 10. Submission of Matters to a Vote of Security Holders
No material changes.
Item 11. Controls and Procedures
(a) It is the conclusion of the registrant’s principal executive officer and principal financial officer that the effectiveness of the registrant’s current disclosure controls and procedures (such disclosure controls and procedures having been evaluated within 90 days of the date of this filing) provide reasonable assurance that the information required to be disclosed by the registrant has been recorded, processed, summarized and reported within the time period specified in the Commission’s rules and forms and that the information required to be disclosed by the registrant has been accumulated and communicated to the registrant’s principal executive officer and principal financial officer in order to allow timely decisions regarding required disclosure.
(b) There have been no changes in the registrant’s internal controls over financial reporting during the second fiscal quarter of the period covered by this report that has materially affected, or is reasonably likely to materially affect, the registrant’s internal control over financial reporting.
Item 12. Exhibits
| | |
| |
| (a)(1) | | Registrant’s Code of Ethics – Not applicable (please see Item 2). |
| |
| (a)(2)(i) | | Treasurer’s Section 302 certification. |
| |
| (a)(2)(ii) | | President’s Section 302 certification. |
| |
| (b) | | Combined Section 906 certification. |
Signatures
Pursuant to the requirements of the Securities Exchange Act of 1934 and the Investment Company Act of 1940, the registrant has duly caused this report to be signed on its behalf by the undersigned, thereunto duly authorized.
| | |
| Eaton Vance Municipals Trust |
| |
| By: | | /s/ Payson F. Swaffield |
| | Payson F. Swaffield |
| | President |
| |
| Date: | | April 10, 2014 |
Pursuant to the requirements of the Securities Exchange Act of 1934 and the Investment Company Act of 1940, this report has been signed below by the following persons on behalf of the registrant and in the capacities and on the dates indicated.
| | |
| By: | | /s/ James F. Kirchner |
| | James F. Kirchner |
| | Treasurer |
| |
| Date: | | April 10, 2014 |
| |
| By: | | /s/ Payson F. Swaffield |
| | Payson F. Swaffield |
| | President |
| |
| Date: | | April 10, 2014 |