UNITED STATES
SECURITIES AND EXCHANGE COMMISSION
Washington, D.C. 20549
Form N-CSR
CERTIFIED SHAREHOLDER REPORT OF REGISTERED
MANAGEMENT INVESTMENT COMPANIES
Investment Company Act File Number: 811-04409
Eaton Vance Municipals Trust
(Exact Name of Registrant as Specified in Charter)
Two International Place, Boston, Massachusetts 02110
(Address of Principal Executive Offices)
Maureen A. Gemma
Two International Place, Boston, Massachusetts 02110
(Name and Address of Agent for Services)
(617) 482-8260
(Registrant’s Telephone Number)
August 31
Date of Fiscal Year End
August 31, 2016
Date of Reporting Period
Item 1. Reports to Stockholders

Eaton Vance
Municipal Income Funds
Annual Report
August 31, 2016
Georgia • Maryland • Missouri • North Carolina • Oregon
South Carolina • Virginia

Commodity Futures Trading Commission Registration. Effective December 31, 2012, the Commodity Futures Trading Commission (“CFTC”) adopted certain regulatory changes that subject registered investment companies and advisers to regulation by the CFTC if a fund invests more than a prescribed level of its assets in certain CFTC-regulated instruments (including futures, certain options and swap agreements) or markets itself as providing investment exposure to such instruments. Each Fund has claimed an exclusion from the definition of the term “commodity pool operator” under the Commodity Exchange Act. Accordingly, neither the Funds nor the adviser with respect to the operation of the Funds is subject to CFTC regulation. Because of its management of other strategies, each Fund’s adviser is registered with the CFTC as a commodity pool operator and a commodity trading advisor.
Fund shares are not insured by the FDIC and are not deposits or other obligations of, or guaranteed by, any depository institution. Shares are subject to investment risks, including possible loss of principal invested.
This report must be preceded or accompanied by a current summary prospectus or prospectus. Before investing, investors should consider carefully the investment objective, risks, and charges and expenses of a mutual fund. This and other important information is contained in the summary prospectus and prospectus, which can be obtained from a financial advisor. Prospective investors should read the prospectus carefully before investing. For further information, please call 1-800-262-1122.
Annual Report August 31, 2016
Eaton Vance
Municipal Income Funds
Table of Contents
| | | | |
Management’s Discussion of Fund Performance | | | 2 | |
| |
Performance and Fund Profile | | | | |
| |
| | | | |
Georgia Municipal Income Fund | | | 4 | |
Maryland Municipal Income Fund | | | 6 | |
Missouri Municipal Income Fund | | | 8 | |
North Carolina Municipal Income Fund | | | 10 | |
Oregon Municipal Income Fund | | | 12 | |
South Carolina Municipal Income Fund | | | 14 | |
Virginia Municipal Income Fund | | | 16 | |
| |
| | | | |
| |
Endnotes and Additional Disclosures | | | 18 | |
| |
Fund Expenses | | | 19 | |
| |
Financial Statements | | | 23 | |
| |
Report of Independent Registered Public Accounting Firm | | | 95 | |
| |
Federal Tax Information | | | 96 | |
| |
Board of Trustees’ Contract Approval | | | 97 | |
| |
Management and Organization | | | 100 | |
| |
Important Notices | | | 103 | |
Eaton Vance
Municipal Income Funds
August 31, 2016
Management’s Discussion of Fund Performance1
Economic and Market Conditions
As the period opened on September 1, 2015, U.S. Treasurys, along with municipal bonds, were about one month into a rally that would continue throughout the 12-month period ending August 31, 2016.
Just before the period began, China had surprised the markets by devaluing its currency. As a result, commodity prices continued a decline that had started in the spring of 2015. At its September 2015 meeting, the Federal Reserve Board (the Fed) decided not to raise rates, extending speculation about when anticipated rate hikes would finally begin.
Against this backdrop, many asset classes experienced dramatic volatility. But the municipal market, an asset class with a generally improving credit landscape, continued its steady rally despite a Fed rate hike in December 2015. A combination of lower than expected new issue supply and strong inflows into municipal mutual funds in the final quarter of 2015 was an additional tailwind for the asset class.
In January 2016, the municipal rally accelerated as U.S. equities experienced what was widely reported as their worst-ever start to a new year. The combination of plummeting oil prices and slowing economic growth in China helped drive a global “flight to quality,” with investors fleeing asset classes regarded as risky for the perceived safety of U.S. Treasurys and municipal bonds. Falling government interest rates around the world, driven by actions such as quantitative easing in Japan and the European Union, put many sovereign rates into negative territory and made Treasurys look attractive by comparison. In the closing months of the period, Great Britain’s vote to leave the European Union, ongoing Fed caution, and mixed U.S. economic reports continued to keep interest rates in a low range and fuel the municipal rally.
Even the Commonwealth of Puerto Rico’s July 1, 2016 default on over $1 billion in municipal bond and debt service payments — its second default in 2016 and its largest to date — failed to put a dent in the municipal market rally, as the market had anticipated the default for some time.
For the one-year period as a whole, the yield curve flattened for municipal AAA-rated7 issues. Rates rose in the one-year area of the curve — driven in part by new money market regulations set to take effect in mid-October 2016 — but fell for maturities of three through 30 years. In general,
longer maturities saw greater rate declines and thus better price performance. Across the yield curve, municipal bonds outperformed U.S. Treasurys for the period.
Fund Performance
For the fiscal year ended August 31, 2016, Georgia, Missouri, Oregon, South Carolina and Virginia Funds’ Class A shares at net asset value (NAV) outperformed the 6.88% return of the Funds’ primary benchmark, the Bloomberg Barclays Municipal Bond Index2 (the Index), while Maryland and North Carolina Funds’ Class A shares at NAV underperformed the Index.
Generally speaking, the Funds’ overall strategy is to normally invest primarily in municipal bonds with maturities of 10 years or more, in order to capture their typically higher yields and greater income stream relative to shorter-maturity municipal issues.
Management has the ability to hedge the portfolios to various degrees against the potential risk of interest-rate volatility at the long end of the yield curve by using Treasury futures. As a risk management strategy, the hedge is intended to moderate performance on both the upside and the downside. So in a period when municipal and Treasury bonds delivered positive returns, the hedging strategy mitigated a portion of the Funds’ positive performance — and was thus a detractor from relative results versus the Index — for Georgia, Maryland, Missouri and Oregon Funds. Virginia Fund’s hedging strategy did not have a significant impact on performance, and North Carolina and South Carolina Funds did not employ a hedging strategy during the period.
During the period, all Funds except Georgia Fund sought to enhance tax-exempt income by entering, to a small degree, into residual interest bond transactions6 and investing the proceeds of such transactions in additional municipal securities, which creates leverage in a fund. Leverage has the effect of magnifying a fund’s exposure to its underlying investments in both up and down markets. During this period of positive performance by municipal bonds, the use of leverage slightly helped performance versus the Index.
See Endnotes and Additional Disclosures in this report.
Past performance is no guarantee of future results. Returns are historical and are calculated by determining the percentage change in net asset value (NAV) or offering price (as applicable) with all distributions reinvested. Investment return and principal value will fluctuate so that shares, when redeemed, may be worth more or less than their original cost. Performance less than or equal to one year is cumulative. Performance is for the stated time period only; due to market volatility, the Fund’s current performance may be lower or higher than quoted. Returns are before taxes unless otherwise noted. For performance as of the most recent month-end, please refer to eatonvance.com.
Eaton Vance
Municipal Income Funds
August 31, 2016
Management’s Discussion of Fund Performance — continued
State-specific Results
Eaton Vance Georgia Municipal Income Fund’s Class A shares at NAV returned 6.94%, outperforming the 6.88% return of the Index. Significant contributors to results versus the Index included an overweight and security selection in the water and sewer sector, security selection in AA-rated bonds and security selection in insured Puerto Rico bonds. The majority of the Fund’s Puerto Rico holdings were insured by various municipal bond insurers. It should be noted that most uninsured bonds issued by the Commonwealth of Puerto Rico and its various conduit issuers were no longer included in the Index. As Puerto Rico continued to deal with an ongoing fiscal crisis, bonds issued by its various legal entities were impacted by a number of factors throughout the period. As the period ended, the situation in Puerto Rico was continuing to evolve. The major detractors from performance relative to the Index were an overweight in prerefunded, or escrowed, bonds; an underweight in zero-coupon bonds, which were the best-performing coupon structure in the Index during the period; and the Fund’s hedging strategy, as mentioned earlier.
Eaton Vance Maryland Municipal Income Fund’s Class A shares at NAV returned 5.20%, underperforming the 6.88% return of the Index. The Fund’s hedging strategy, an overweight in prerefunded bonds and an underweight in zero coupon bonds all detracted from relative performance versus the Index during the period. In contrast, an overweight and security selection in the hospital sector and an overweight and security selection in A-rated bonds contributed to relative performance versus the Index.
Eaton Vance Missouri Municipal Income Fund’s Class A shares at NAV returned 7.32%, outperforming the 6.88% return of the Index. Contributors to performance relative to the Index included security selection in insured Puerto Rico bonds, an overweight in zero-coupon bonds and an overweight and security selection in the hospital sector. Detractors from performance versus the Index included an overweight in prerefunded bonds, an underweight in bonds with 25 years or more remaining to maturity and the Fund’s hedging strategy.
Eaton Vance North Carolina Municipal Income Fund’s Class A shares at NAV returned 6.61%, underperforming the 6.88% return of the Index. Detractors from results versus the index included an overweight in prerefunded bonds, an underweight in bonds with 25 years or more remaining to maturity and
an underweight and security selection in A-rated and BBB-rated bonds. In contrast, performance versus the Index was helped by security selection in insured Puerto Rico bonds, an overweight and security selection in the hospital sector and an overweight in zero-coupon bonds.
Eaton Vance Oregon Municipal Income Fund’s Class A shares at NAV returned 7.98%, outperforming the 6.88% return of the Index. Performance versus the Index benefited from security selection in insured Puerto Rico bonds, an overweight in zero coupon bonds and an overweight and security selection in local government general obligation bonds. Detractors from performance relative to the Index included an overweight in prerefunded bonds, security selection in BBB-rated bonds and the Fund’s hedging strategy.
Eaton Vance South Carolina Municipal Income Fund’s Class A shares at NAV returned 8.14%, outperforming the 6.88% return of the Index. Contributors to performance versus the Index included security selection in insured Puerto Rico bonds, security selection in the education sector and an overweight and security selection in the government lease sector, which was the best-performing sector in the Index during the period. In contrast, an overweight in prerefunded bonds, an underweight in zero-coupon bonds, and an underweight in bonds with 25 years or more remaining to maturity all detracted from results relative to the Index.
Eaton Vance Virginia Municipal Income Fund’s Class A shares at NAV returned 7.26%, outperforming the 6.88% return of the Index. Contributors to performance relative to the Index included security selection in insured Puerto Rico bonds, an overweight and security selection in the transportation sector and an overweight in the hospital sector. Detractors from relative results versus the Index included an overweight in prerefunded bonds, an underweight in zero-coupon bonds and an underweight and security selection in bonds with 25 years or more remaining to maturity.
See Endnotes and Additional Disclosures in this report.
Past performance is no guarantee of future results. Returns are historical and are calculated by determining the percentage change in net asset value (NAV) or offering price (as applicable) with all distributions reinvested. Investment return and principal value will fluctuate so that shares, when redeemed, may be worth more or less than their original cost. Performance less than or equal to one year is cumulative. Performance is for the stated time period only; due to market volatility, the Fund’s current performance may be lower or higher than quoted. Returns are before taxes unless otherwise noted. For performance as of the most recent month-end, please refer to eatonvance.com.
Eaton Vance
Georgia Municipal Income Fund
August 31, 2016
Performance2,3
Portfolio Manager Adam A. Weigold, CFA
| | | | | | | | | | | | | | | | | | | | |
| % Average Annual Total Returns | | Class Inception Date | | | Performance
Inception Date | | | One Year | | | Five Years | | | Ten Years | |
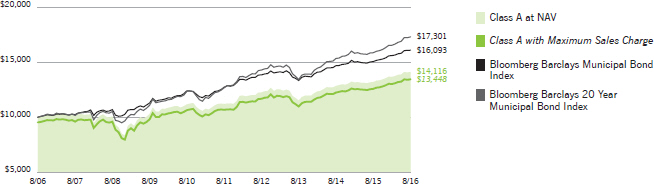
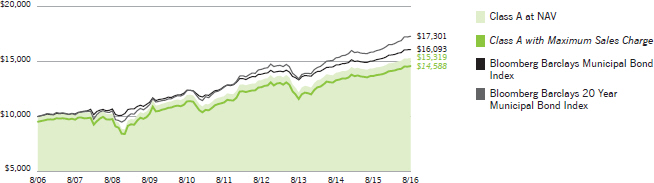
Class A at NAV | | | 12/07/1993 | | | | 12/23/1991 | | | | 6.94 | % | | | 4.72 | % | | | 3.50 | % |
Class A with 4.75% Maximum Sales Charge | | | — | | | | — | | | | 1.82 | | | | 3.71 | | | | 3.00 | |
Class B at NAV | | | 12/23/1991 | | | | 12/23/1991 | | | | 6.24 | | | | 3.95 | | | | 2.74 | |
Class B with 5% Maximum Sales Charge | | | — | | | | — | | | | 1.24 | | | | 3.60 | | | | 2.74 | |
Class C at NAV | | | 04/25/2006 | | | | 12/23/1991 | | | | 6.24 | | | | 3.95 | | | | 2.75 | |
Class C with 1% Maximum Sales Charge | | | — | | | | — | | | | 5.24 | | | | 3.95 | | | | 2.75 | |
Class I at NAV | | | 03/03/2008 | | | | 12/23/1991 | | | | 7.27 | | | | 4.93 | | | | 3.71 | |
Bloomberg Barclays Municipal Bond Index | | | — | | | | — | | | | 6.88 | % | | | 4.80 | % | | | 4.87 | % |
Bloomberg Barclays 20 Year Municipal Bond Index | | | — | | | | — | | | | 9.07 | | | | 6.41 | | | | 5.63 | |
| | | | | |
| | | | | | | | | | | | | | | | | | | | |
| % Total Annual Operating Expense Ratios4 | | | | | Class A | | | Class B | | | Class C | | | Class I | |
Gross | | | | | | | 0.73 | % | | | 1.49 | % | | | 1.48 | % | | | 0.53 | % |
Net | | | | | | | 0.70 | | | | 1.46 | | | | 1.45 | | | | 0.50 | |
| | | | | |
| | | | | | | | | | | | | | | | | | | | |
| % Distribution Rates/Yields5 | | | | | Class A | | | Class B | | | Class C | | | Class I | |
Distribution Rate | | | | | | | 2.97 | % | | | 2.21 | % | | | 2.21 | % | | | 3.17 | % |
Taxable-Equivalent Distribution Rate | | | | | | | 5.58 | | | | 4.15 | | | | 4.15 | | | | 5.96 | |
SEC 30-day Yield | | | | | | | 1.08 | | | | 0.39 | | | | 0.39 | | | | 1.33 | |
Taxable-Equivalent SEC 30-day Yield | | | | | | | 2.03 | | | | 0.74 | | | | 0.74 | | | | 2.50 | |
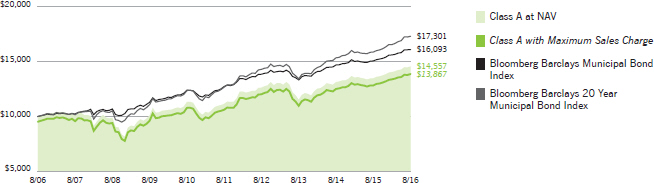
Growth of $10,000
This graph shows the change in value of a hypothetical investment of $10,000 in Class A of the Fund for the period indicated. For comparison, the same investment is shown in the indicated index.
| | | | | | | | | | | | | | | | |
| Growth of Investment3 | | Amount Invested | | | Period Beginning | | | At NAV | | | With Maximum Sales Charge | |
Class B | | $ | 10,000 | | | | 08/31/2006 | | | $ | 13,108 | | | | N.A. | |
Class C | | $ | 10,000 | | | | 08/31/2006 | | | $ | 13,122 | | | | N.A. | |
Class I | | $ | 250,000 | | | | 08/31/2006 | | | $ | 359,994 | | | | N.A. | |
See Endnotes and Additional Disclosures in this report.
Past performance is no guarantee of future results. Returns are historical and are calculated by determining the percentage change in net asset value (NAV) or offering price (as applicable) with all distributions reinvested. Investment return and principal value will fluctuate so that shares, when redeemed, may be worth more or less than their original cost. Performance less than or equal to one year is cumulative. Performance is for the stated time period only; due to market volatility, the Fund’s current performance may be lower or higher than quoted. Returns are before taxes unless otherwise noted. For performance as of the most recent month-end, please refer to eatonvance.com.
Eaton Vance
Georgia Municipal Income Fund
August 31, 2016
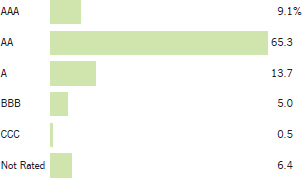
Fund Profile
Credit Quality (% of total investments)7
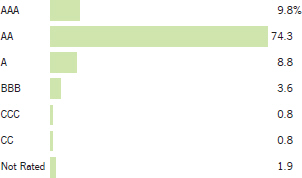
See Endnotes and Additional Disclosures in this report.
Eaton Vance
Maryland Municipal Income Fund
August 31, 2016
Performance2,3
Portfolio Manager Craig R. Brandon, CFA
| | | | | | | | | | | | | | | | | | | | |
| % Average Annual Total Returns | | Class
Inception Date | | | Performance
Inception Date | | | One Year | | | Five Years | | | Ten Years | |
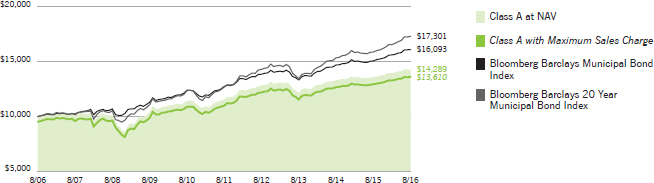
Class A at NAV | | | 12/10/1993 | | | | 02/03/1992 | | | | 5.20 | % | | | 4.37 | % | | | 3.63 | % |
Class A with 4.75% Maximum Sales Charge | | | — | | | | — | | | | 0.19 | | | | 3.36 | | | | 3.13 | |
Class B at NAV | | | 02/03/1992 | | | | 02/03/1992 | | | | 4.41 | | | | 3.58 | | | | 2.85 | |
Class B with 5% Maximum Sales Charge | | | — | | | | — | | | | –0.59 | | | | 3.23 | | | | 2.85 | |
Class C at NAV | | | 05/02/2006 | | | | 02/03/1992 | | | | 4.39 | | | | 3.60 | | | | 2.88 | |
Class C with 1% Maximum Sales Charge | | | — | | | | — | | | | 3.39 | | | | 3.60 | | | | 2.88 | |
Class I at NAV | | | 03/03/2008 | | | | 02/03/1992 | | | | 5.41 | | | | 4.57 | | | | 3.82 | |
Bloomberg Barclays Municipal Bond Index | | | — | | | | — | | | | 6.88 | % | | | 4.80 | % | | | 4.87 | % |
Bloomberg Barclays 20 Year Municipal Bond Index | | | — | | | | — | | | | 9.07 | | | | 6.41 | | | | 5.63 | |
| | | | | |
| | | | | | | | | | | | | | | | | | | | |
| % Total Annual Operating Expense Ratios4 | | | | | Class A | | | Class B | | | Class C | | | Class I | |
Gross | | | | | | | 0.75 | % | | | 1.50 | % | | | 1.50 | % | | | 0.55 | % |
Net | | | | | | | 0.73 | | | | 1.48 | | | | 1.48 | | | | 0.53 | |
| | | | | |
| | | | | | | | | | | | | | | | | | | | |
| % Distribution Rates/Yields5 | | | | | Class A | | | Class B | | | Class C | | | Class I | |
Distribution Rate | | | | | | | 2.98 | % | | | 2.22 | % | | | 2.22 | % | | | 3.18 | % |
Taxable-Equivalent Distribution Rate | | | | | | | 5.59 | | | | 4.16 | | | | 4.16 | | | | 5.96 | |
SEC 30-day Yield | | | | | | | 1.09 | | | | 0.40 | | | | 0.41 | | | | 1.34 | |
Taxable-Equivalent SEC 30-day Yield | | | | | | | 2.05 | | | | 0.75 | | | | 0.76 | | | | 2.52 | |
| | | | | |
| | | | | | | | | | | | | | | | | | | | |
| % Total Leverage6 | | | | | | | | | | | | | | | |
Residual Interest Bond (RIB) Financing | | | | | | | | | | | | | | | | | | | 2.19 | % |
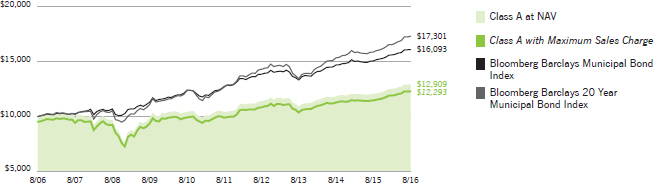
Growth of $10,000
This graph shows the change in value of a hypothetical investment of $10,000 in Class A of the Fund for the period indicated. For comparison, the same investment is shown in the indicated index.
| | | | | | | | | | | | | | | | |
| Growth of Investment3 | | Amount Invested | | | Period Beginning | | | At NAV | | | With Maximum Sales Charge | |
Class B | | $ | 10,000 | | | | 08/31/2006 | | | $ | 13,252 | | | | N.A. | |
Class C | | $ | 10,000 | | | | 08/31/2006 | | | $ | 13,288 | | | | N.A. | |
Class I | | $ | 250,000 | | | | 08/31/2006 | | | $ | 363,918 | | | | N.A. | |
See Endnotes and Additional Disclosures in this report.
Past performance is no guarantee of future results. Returns are historical and are calculated by determining the percentage change in net asset value (NAV) or offering price (as applicable) with all distributions reinvested. Investment return and principal value will fluctuate so that shares, when redeemed, may be worth more or less than their original cost. Performance less than or equal to one year is cumulative. Performance is for the stated time period only; due to market volatility, the Fund’s current performance may be lower or higher than quoted. Returns are before taxes unless otherwise noted. For performance as of the most recent month-end, please refer to eatonvance.com.
Eaton Vance
Maryland Municipal Income Fund
August 31, 2016
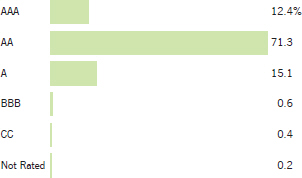
Fund Profile
Credit Quality (% of total investments)7,8
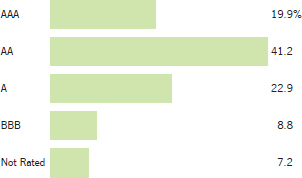
See Endnotes and Additional Disclosures in this report.
Eaton Vance
Missouri Municipal Income Fund
August 31, 2016
Performance2,3
Portfolio Manager Cynthia J. Clemson
| | | | | | | | | | | | | | | | | | | | |
| % Average Annual Total Returns | | Class Inception Date | | | Performance
Inception Date | | | One Year | | | Five Years | | | Ten Years | |
Class A at NAV | | | 12/07/1993 | | | | 05/01/1992 | | | | 7.32 | % | | | 5.13 | % | | | 3.71 | % |
Class A with 4.75% Maximum Sales Charge | | | — | | | | — | | | | 2.25 | | | | 4.11 | | | | 3.21 | |
Class B at NAV | | | 05/01/1992 | | | | 05/01/1992 | | | | 6.66 | | | | 4.37 | | | | 2.94 | |
Class B with 5% Maximum Sales Charge | | | — | | | | — | | | | 1.66 | | | | 4.04 | | | | 2.94 | |
Class C at NAV | | | 02/16/2006 | | | | 05/01/1992 | | | | 6.66 | | | | 4.35 | | | | 2.94 | |
Class C with 1% Maximum Sales Charge | | | — | | | | — | | | | 5.66 | | | | 4.35 | | | | 2.94 | |
Class I at NAV | | | 08/03/2010 | | | | 05/01/1992 | | | | 7.64 | | | | 5.36 | | | | 3.85 | |
Bloomberg Barclays Municipal Bond Index | | | — | | | | — | | | | 6.88 | % | | | 4.80 | % | | | 4.87 | % |
Bloomberg Barclays 20 Year Municipal Bond Index | | | — | | | | — | | | | 9.07 | | | | 6.41 | | | | 5.63 | |
| | | | | |
| | | | | | | | | | | | | | | | | | | | |
| % Total Annual Operating Expense Ratios4 | | | | | Class A | | | Class B | | | Class C | | | Class I | |
Gross | | | | | | | 0.71 | % | | | 1.47 | % | | | 1.46 | % | | | 0.51 | % |
Net | | | | | | | 0.70 | | | | 1.46 | | | | 1.45 | | | | 0.50 | |
| | | | | |
| | | | | | | | | | | | | | | | | | | | |
| % Distribution Rates/Yields5 | | | | | Class A | | | Class B | | | Class C | | | Class I | |
Distribution Rate | | | | | | | 3.36 | % | | | 2.59 | % | | | 2.60 | % | | | 3.56 | % |
Taxable-Equivalent Distribution Rate | | | | | | | 6.32 | | | | 4.87 | | | | 4.89 | | | | 6.69 | |
SEC 30-day Yield | | | | | | | 1.16 | | | | 0.46 | | | | 0.47 | | | | 1.41 | |
Taxable-Equivalent SEC 30-day Yield | | | | | | | 2.17 | | | | 0.87 | | | | 0.89 | | | | 2.65 | |
| | | | | |
| | | | | | | | | | | | | | | | | | | | |
| % Total Leverage6 | | | | | | | | | | | | | | | |
RIB Financing | | | | | | | | | | | | | | | | | | | 1.11 | % |
Growth of $10,000
This graph shows the change in value of a hypothetical investment of $10,000 in Class A of the Fund for the period indicated. For comparison, the same investment is shown in the indicated index.

| | | | | | | | | | | | | | | | |
| Growth of Investment3 | | Amount Invested | | | Period Beginning | | | At NAV | | | With Maximum Sales Charge | |
Class B | | $ | 10,000 | | | | 08/31/2006 | | | $ | 13,369 | | | | N.A. | |
Class C | | $ | 10,000 | | | | 08/31/2006 | | | $ | 13,369 | | | | N.A. | |
Class I | | $ | 250,000 | | | | 08/31/2006 | | | $ | 364,961 | | | | N.A. | |
See Endnotes and Additional Disclosures in this report.
Past performance is no guarantee of future results. Returns are historical and are calculated by determining the percentage change in net asset value (NAV) or offering price (as applicable) with all distributions reinvested. Investment return and principal value will fluctuate so that shares, when redeemed, may be worth more or less than their original cost. Performance less than or equal to one year is cumulative. Performance is for the stated time period only; due to market volatility, the Fund’s current performance may be lower or higher than quoted. Returns are before taxes unless otherwise noted. For performance as of the most recent month-end, please refer to eatonvance.com.
Eaton Vance
Missouri Municipal Income Fund
August 31, 2016
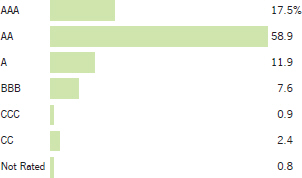
Fund Profile
Credit Quality (% of total investments)7,8
See Endnotes and Additional Disclosures in this report.
Eaton Vance
North Carolina Municipal Income Fund
August 31, 2016
Performance2,3
Portfolio Manager Adam A. Weigold, CFA
| | | | | | | | | | | | | | | | | | | | |
| % Average Annual Total Returns | | Class Inception Date | | | Performance
Inception Date | | | One Year | | | Five Years | | | Ten Years | |
Class A at NAV | | | 12/07/1993 | | | | 10/23/1991 | | | | 6.61 | % | | | 5.27 | % | | | 4.35 | % |
Class A with 4.75% Maximum Sales Charge | | | — | | | | — | | | | 1.60 | | | | 4.25 | | | | 3.84 | |
Class B at NAV | | | 10/23/1991 | | | | 10/23/1991 | | | | 5.81 | | | | 4.48 | | | | 3.57 | |
Class B with 5% Maximum Sales Charge | | | — | | | | — | | | | 0.81 | | | | 4.14 | | | | 3.57 | |
Class C at NAV | | | 05/02/2006 | | | | 10/23/1991 | | | | 5.80 | | | | 4.48 | | | | 3.58 | |
Class C with 1% Maximum Sales Charge | | | — | | | | — | | | | 4.80 | | | | 4.48 | | | | 3.58 | |
Class I at NAV | | | 03/03/2008 | | | | 10/23/1991 | | | | 6.82 | | | | 5.45 | | | | 4.55 | |
Bloomberg Barclays Municipal Bond Index | | | — | | | | — | | | | 6.88 | % | | | 4.80 | % | | | 4.87 | % |
Bloomberg Barclays 20 Year Municipal Bond Index | | | — | | | | — | | | | 9.07 | | | | 6.41 | | | | 5.63 | |
| | | | | |
| | | | | | | | | | | | | | | | | | | | |
| % Total Annual Operating Expense Ratios4 | | | | | Class A | | | Class B | | | Class C | | | Class I | |
Gross | | | | | | | 0.73 | % | | | 1.48 | % | | | 1.48 | % | | | 0.53 | % |
Net | | | | | | | 0.71 | | | | 1.46 | | | | 1.46 | | | | 0.51 | |
| | | | | |
| | | | | | | | | | | | | | | | | | | | |
| % Distribution Rates/Yields5 | | | | | Class A | | | Class B | | | Class C | | | Class I | |
Distribution Rate | | | | | | | 3.06 | % | | | 2.36 | % | | | 2.28 | % | | | 3.21 | % |
Taxable-Equivalent Distribution Rate | | | | | | | 5.74 | | | | 4.42 | | | | 4.27 | | | | 6.02 | |
SEC 30-day Yield | | | | | | | 0.91 | | | | 0.20 | | | | 0.20 | | | | 1.14 | |
Taxable-Equivalent SEC 30-day Yield | | | | | | | 1.70 | | | | 0.38 | | | | 0.37 | | | | 2.13 | |
| | | | | |
| | | | | | | | | | | | | | | | | | | | |
| % Total Leverage6 | | | | | | | | | | | | | | | |
RIB Financing | | | | | | | | | | | | | | | | | | | 5.92 | % |
Growth of $10,000
This graph shows the change in value of a hypothetical investment of $10,000 in Class A of the Fund for the period indicated. For comparison, the same investment is shown in the indicated index.
| | | | | | | | | | | | | | | | |
| Growth of Investment3 | | Amount Invested | | | Period Beginning | | | At NAV | | | With Maximum Sales Charge | |
Class B | | $ | 10,000 | | | | 08/31/2006 | | | $ | 14,211 | | | | N.A. | |
Class C | | $ | 10,000 | | | | 08/31/2006 | | | $ | 14,223 | | | | N.A. | |
Class I | | $ | 250,000 | | | | 08/31/2006 | | | $ | 390,162 | | | | N.A. | |
See Endnotes and Additional Disclosures in this report.
Past performance is no guarantee of future results. Returns are historical and are calculated by determining the percentage change in net asset value (NAV) or offering price (as applicable) with all distributions reinvested. Investment return and principal value will fluctuate so that shares, when redeemed, may be worth more or less than their original cost. Performance less than or equal to one year is cumulative. Performance is for the stated time period only; due to market volatility, the Fund’s current performance may be lower or higher than quoted. Returns are before taxes unless otherwise noted. For performance as of the most recent month-end, please refer to eatonvance.com.
Eaton Vance
North Carolina Municipal Income Fund
August 31, 2016
Fund Profile
Credit Quality (% of total investments)7,8
See Endnotes and Additional Disclosures in this report.
Eaton Vance
Oregon Municipal Income Fund
August 31, 2016
Performance2,3
Portfolio Manager Adam A. Weigold, CFA
| | | | | | | | | | | | | | | | | | | | |
| % Average Annual Total Returns | | Class Inception Date | | | Performance
Inception Date | | | One Year | | | Five Years | | | Ten Years | |
Class A at NAV | | | 12/28/1993 | | | | 12/24/1991 | | | | 7.98 | % | | | 4.99 | % | | | 3.87 | % |
Class A with 4.75% Maximum Sales Charge | | | — | | | | — | | | | 2.86 | | | | 3.98 | | | | 3.36 | |
Class B at NAV | | | 12/24/1991 | | | | 12/24/1991 | | | | 7.14 | | | | 4.21 | | | | 3.09 | |
Class B with 5% Maximum Sales Charge | | | — | | | | — | | | | 2.14 | | | | 3.86 | | | | 3.09 | |
Class C at NAV | | | 03/02/2006 | | | | 12/24/1991 | | | | 7.13 | | | | 4.20 | | | | 3.10 | |
Class C with 1% Maximum Sales Charge | | | — | | | | — | | | | 6.13 | | | | 4.20 | | | | 3.10 | |
Class I at NAV | | | 08/03/2010 | | | | 12/24/1991 | | | | 8.20 | | | | 5.20 | | | | 3.98 | |
Bloomberg Barclays Municipal Bond Index | | | — | | | | — | | | | 6.88 | % | | | 4.80 | % | | | 4.87 | % |
Bloomberg Barclays 20 Year Municipal Bond Index | | | — | | | | — | | | | 9.07 | | | | 6.41 | | | | 5.63 | |
| | | | | |
| | | | | | | | | | | | | | | | | | | | |
| % Total Annual Operating Expense Ratios4 | | | | | Class A | | | Class B | | | Class C | | | Class I | |
Gross | | | | | | | 0.74 | % | | | 1.50 | % | | | 1.49 | % | | | 0.54 | % |
Net | | | | | | | 0.70 | | | | 1.46 | | | | 1.45 | | | | 0.50 | |
| | | | | |
| | | | | | | | | | | | | | | | | | | | |
| % Distribution Rates/Yields5 | | | | | Class A | | | Class B | | | Class C | | | Class I | |
Distribution Rate | | | | | | | 3.40 | % | | | 2.65 | % | | | 2.64 | % | | | 3.59 | % |
Taxable-Equivalent Distribution Rate | | | | | | | 6.67 | | | | 5.20 | | | | 5.18 | | | | 7.04 | |
SEC 30-day Yield | | | | | | | 1.37 | | | | 0.71 | | | | 0.69 | | | | 1.62 | |
Taxable-Equivalent SEC 30-day Yield | | | | | | | 2.68 | | | | 1.39 | | | | 1.36 | | | | 3.17 | |
| | | | | |
| | | | | | | | | | | | | | | | | | | | |
| % Total Leverage6 | | | | | | | | | | | | | | | |
RIB Financing | | | | | | | | | | | | | | | | | | | 5.10 | % |
Growth of $10,000
This graph shows the change in value of a hypothetical investment of $10,000 in Class A of the Fund for the period indicated. For comparison, the same investment is shown in the indicated index.

| | | | | | | | | | | | | | | | |
| Growth of Investment3 | | Amount Invested | | | Period Beginning | | | At NAV | | | With Maximum Sales Charge | |
Class B | | $ | 10,000 | | | | 08/31/2006 | | | $ | 13,562 | | | | N.A. | |
Class C | | $ | 10,000 | | | | 08/31/2006 | | | $ | 13,575 | | | | N.A. | |
Class I | | $ | 250,000 | | | | 08/31/2006 | | | $ | 369,410 | | | | N.A. | |
See Endnotes and Additional Disclosures in this report.
Past performance is no guarantee of future results. Returns are historical and are calculated by determining the percentage change in net asset value (NAV) or offering price (as applicable) with all distributions reinvested. Investment return and principal value will fluctuate so that shares, when redeemed, may be worth more or less than their original cost. Performance less than or equal to one year is cumulative. Performance is for the stated time period only; due to market volatility, the Fund’s current performance may be lower or higher than quoted. Returns are before taxes unless otherwise noted. For performance as of the most recent month-end, please refer to eatonvance.com.
Eaton Vance
Oregon Municipal Income Fund
August 31, 2016
Fund Profile
Credit Quality (% of total investments)7,8
See Endnotes and Additional Disclosures in this report.
Eaton Vance
South Carolina Municipal Income Fund
August 31, 2016
Performance2,3
Portfolio Manager Adam A. Weigold, CFA
| | | | | | | | | | | | | | | | | | | | |
| % Average Annual Total Returns | | Class Inception Date | | | Performance Inception Date | | | One Year | | | Five Years | | | Ten Years | |
Class A at NAV | | | 02/14/1994 | | | | 10/02/1992 | | | | 8.14 | % | | | 5.47 | % | | | 3.82 | % |
Class A with 4.75% Maximum Sales Charge | | | — | | | | — | | | | 2.98 | | | | 4.44 | | | | 3.32 | |
Class B at NAV | | | 10/02/1992 | | | | 10/02/1992 | | | | 7.27 | | | | 4.69 | | | | 3.04 | |
Class B with 5% Maximum Sales Charge | | | — | | | | — | | | | 2.27 | | | | 4.35 | | | | 3.04 | |
Class C at NAV | | | 01/12/2006 | | | | 10/02/1992 | | | | 7.27 | | | | 4.69 | | | | 3.04 | |
Class C with 1% Maximum Sales Charge | | | — | | | | — | | | | 6.27 | | | | 4.69 | | | | 3.04 | |
Class I at NAV | | | 03/03/2008 | | | | 10/02/1992 | | | | 8.35 | | | | 5.70 | | | | 4.01 | |
Bloomberg Barclays Municipal Bond Index | | | — | | | | — | | | | 6.88 | % | | | 4.80 | % | | | 4.87 | % |
Bloomberg Barclays 20 Year Municipal Bond Index | | | — | | | | — | | | | 9.07 | | | | 6.41 | | | | 5.63 | |
| | | | | |
| | | | | | | | | | | | | | | | | | | | |
| % Total Annual Operating Expense Ratios4 | | | | | Class A | | | Class B | | | Class C | | | Class I | |
Gross | | | | | | | 0.71 | % | | | 1.47 | % | | | 1.46 | % | | | 0.51 | % |
Net | | | | | | | 0.70 | | | | 1.46 | | | | 1.45 | | | | 0.50 | |
| | | | | |
| | | | | | | | | | | | | | | | | | | | |
| % Distribution Rates/Yields5 | | | | | Class A | | | Class B | | | Class C | | | Class I | |
Distribution Rate | | | | | | | 2.96 | % | | | 2.19 | % | | | 2.20 | % | | | 3.16 | % |
Taxable-Equivalent Distribution Rate | | | | | | | 5.62 | | | | 4.16 | | | | 4.18 | | | | 6.00 | |
SEC 30-day Yield | | | | | | | 0.99 | | | | 0.30 | | | | 0.30 | | | | 1.24 | |
Taxable-Equivalent SEC 30-day Yield | | | | | | | 1.88 | | | | 0.57 | | | | 0.57 | | | | 2.35 | |
| | | | | |
| | | | | | | | | | | | | | | | | | | | |
| % Total Leverage6 | | | | | | | | | | | | | | | |
RIB Financing | | | | | | | | | | | | | | | | | | | 5.93 | % |
Growth of $10,000
This graph shows the change in value of a hypothetical investment of $10,000 in Class A of the Fund for the period indicated. For comparison, the same investment is shown in the indicated index.
| | | | | | | | | | | | | | | | |
| Growth of Investment3 | | Amount Invested | | | Period Beginning | | | At NAV | | | With Maximum Sales Charge | |
Class B | | $ | 10,000 | | | | 08/31/2006 | | | $ | 13,501 | | | | N.A. | |
Class C | | $ | 10,000 | | | | 08/31/2006 | | | $ | 13,499 | | | | N.A. | |
Class I | | $ | 250,000 | | | | 08/31/2006 | | | $ | 370,399 | | | | N.A. | |
See Endnotes and Additional Disclosures in this report.
Past performance is no guarantee of future results. Returns are historical and are calculated by determining the percentage change in net asset value (NAV) or offering price (as applicable) with all distributions reinvested. Investment return and principal value will fluctuate so that shares, when redeemed, may be worth more or less than their original cost. Performance less than or equal to one year is cumulative. Performance is for the stated time period only; due to market volatility, the Fund’s current performance may be lower or higher than quoted. Returns are before taxes unless otherwise noted. For performance as of the most recent month-end, please refer to eatonvance.com.
Eaton Vance
South Carolina Municipal Income Fund
August 31, 2016
Fund Profile
Credit Quality (% of total investments)7,8

See Endnotes and Additional Disclosures in this report.
Eaton Vance
Virginia Municipal Income Fund
August 31, 2016
Performance2,3
Portfolio Manager Adam A. Weigold, CFA
| | | | | | | | | | | | | | | | | | | | |
| % Average Annual Total Returns | | Class Inception Date | | | Performance Inception Date | | | One Year | | | Five Years | | | Ten Years | |
Class A at NAV | | | 12/17/1993 | | | | 07/26/1991 | | | | 7.26 | % | | | 4.45 | % | | | 2.58 | % |
Class A with 4.75% Maximum Sales Charge | | | — | | | | — | | | | 2.13 | | | | 3.44 | | | | 2.08 | |
Class B at NAV | | | 07/26/1991 | | | | 07/26/1991 | | | | 6.36 | | | | 3.67 | | | | 1.81 | |
Class B with 5% Maximum Sales Charge | | | — | | | | — | | | | 1.36 | | | | 3.32 | | | | 1.81 | |
Class C at NAV | | | 02/08/2006 | | | | 07/26/1991 | | | | 6.47 | | | | 3.67 | | | | 1.83 | |
Class C with 1% Maximum Sales Charge | | | — | | | | — | | | | 5.47 | | | | 3.67 | | | | 1.83 | |
Class I at NAV | | | 03/03/2008 | | | | 07/26/1991 | | | | 7.47 | | | | 4.65 | | | | 2.78 | |
Bloomberg Barclays Municipal Bond Index | | | — | | | | — | | | | 6.88 | % | | | 4.80 | % | | | 4.87 | % |
Bloomberg Barclays 20 Year Municipal Bond Index | | | — | | | | — | | | | 9.07 | | | | 6.41 | | | | 5.63 | |
| | | | | |
| | | | | | | | | | | | | | | | | | | | |
| % Total Annual Operating Expense Ratios4 | | | | | Class A | | | Class B | | | Class C | | | Class I | |
Gross | | | | | | | 0.76 | % | | | 1.51 | % | | | 1.51 | % | | | 0.56 | % |
Net | | | | | | | 0.73 | | | | 1.48 | | | | 1.48 | | | | 0.53 | |
| | | | | |
| | | | | | | | | | | | | | | | | | | | |
| % Distribution Rates/Yields5 | | | | | Class A | | | Class B | | | Class C | | | Class I | |
Distribution Rate | | | | | | | 3.37 | % | | | 2.61 | % | | | 2.61 | % | | | 3.57 | % |
Taxable-Equivalent Distribution Rate | | | | | | | 6.32 | | | | 4.89 | | | | 4.89 | | | | 6.69 | |
SEC 30-day Yield | | | | | | | 1.05 | | | | 0.37 | | | | 0.37 | | | | 1.31 | |
Taxable-Equivalent SEC 30-day Yield | | | | | | | 1.98 | | | | 0.69 | | | | 0.69 | | | | 2.45 | |
| | | | | |
| | | | | | | | | | | | | | | | | | | | |
| % Total Leverage6 | | | | | | | | | | | | | | | |
RIB Financing | | | | | | | | | | | | | | | | | | | 3.91 | % |
Growth of $10,000
This graph shows the change in value of a hypothetical investment of $10,000 in Class A of the Fund for the period indicated. For comparison, the same investment is shown in the indicated index.
| | | | | | | | | | | | | | | | |
| Growth of Investment3 | | Amount Invested | | | Period Beginning | | | At NAV | | | With Maximum Sales Charge | |
Class B | | $ | 10,000 | | | | 08/31/2006 | | | $ | 11,968 | | | | N.A. | |
Class C | | $ | 10,000 | | | | 08/31/2006 | | | $ | 11,993 | | | | N.A. | |
Class I | | $ | 250,000 | | | | 08/31/2006 | | | $ | 328,963 | | | | N.A. | |
See Endnotes and Additional Disclosures in this report.
Past performance is no guarantee of future results. Returns are historical and are calculated by determining the percentage change in net asset value (NAV) or offering price (as applicable) with all distributions reinvested. Investment return and principal value will fluctuate so that shares, when redeemed, may be worth more or less than their original cost. Performance less than or equal to one year is cumulative. Performance is for the stated time period only; due to market volatility, the Fund’s current performance may be lower or higher than quoted. Returns are before taxes unless otherwise noted. For performance as of the most recent month-end, please refer to eatonvance.com.
Eaton Vance
Virginia Municipal Income Fund
August 31, 2016
Fund Profile
Credit Quality (% of total investments)7,8

See Endnotes and Additional Disclosures in this report.
Eaton Vance
Municipal Income Funds
August 31, 2016
Endnotes and Additional Disclosures
| 1 | The views expressed in this report are those of the portfolio manager(s) and are current only through the date stated at the top of this page. These views are subject to change at any time based upon market or other conditions, and Eaton Vance and the Fund(s) disclaim any responsibility to update such views. These views may not be relied upon as investment advice and, because investment decisions are based on many factors, may not be relied upon as an indication of trading intent on behalf of any Eaton Vance fund. This commentary may contain statements that are not historical facts, referred to as “forward looking statements”. The Fund’s actual future results may differ significantly from those stated in any forward looking statement, depending on factors such as changes in securities or financial markets or general economic conditions, the volume of sales and purchases of Fund shares, the continuation of investment advisory, administrative and service contracts, and other risks discussed from time to time in the Fund’s filings with the Securities and Exchange Commission. |
| 2 | Bloomberg Barclays Municipal Bond Index is an unmanaged index of municipal bonds traded in the U.S. Bloomberg Barclays 20 Year Municipal Bond Index is an unmanaged index of municipal bonds traded in the U.S. with maturities ranging from 17-22 years. Prior to 8/24/16, Bloomberg Barclays Municipal Bond Index and Bloomberg Barclays 20 Year Municipal Bond Index were named Barclays Municipal Bond Index and Barclays 20 Year Municipal Bond Index, respectively. Unless otherwise stated, index returns do not reflect the effect of any applicable sales charges, commissions, expenses, taxes or leverage, as applicable. It is not possible to invest directly in an index. |
| 3 | Total Returns at NAV do not include applicable sales charges. If sales charges were deducted, the returns would be lower. Total Returns shown with maximum sales charge reflect the stated maximum sales charge. Unless otherwise stated, performance does not reflect the deduction of taxes on Fund distributions or redemptions of Fund shares. Performance prior to the inception date of a class may be linked to the performance of an older class of the Fund. This linked performance is adjusted for any applicable sales charge, but is not adjusted for class expense differences. If adjusted for such differences, the performance would be different. The performance of Class I is linked to Class A. Performance since inception for an index, if presented, is the performance since the Fund’s or oldest share class’ inception, as applicable. Performance presented in the Financial Highlights included in the financial statements is not linked. |
| 4 | Total annual operating expense ratios are as stated in the Fund’s most recent prospectus. Net expense ratio is not a result of a fee waiver or expense reimbursement. Net expense ratio excludes interest expense relating to the Fund’s liability with respect to floating rate notes held by third parties in conjunction with residual interest bond transactions by the Fund. The Fund also records offsetting interest income in an amount equal to this expense relating to the municipal obligations underlying such transactions and, as a result, net asset value and performance have not been affected by this expense. The expense ratios for the current reporting period can be found in the Financial Highlights section of this report. |
| 5 | The Distribution Rate is based on the Fund’s last regular distribution per share in the period (annualized) divided by the Fund’s NAV at the end of the period. The Fund’s distributions may be comprised of amounts characterized for federal income tax purposes as tax-exempt income, qualified and non-qualified ordinary dividends, capital gains and nondividend distributions, also known as return of capital. The Fund will determine the federal income tax character of distributions paid to a shareholder after the end of the calendar year. This is reported on the IRS form 1099-DIV and provided to the shareholder shortly after each year-end. The Fund’s distributions are determined by the investment adviser based on its current assessment of the Fund’s long-term return potential. As portfolio and market conditions change, the rate of distributions paid by the Fund could change. Taxable-equivalent performance is based on the highest combined federal and state income tax rates, where applicable. Lower tax rates would result in lower tax-equivalent performance. Actual tax rates will vary depending on your income, exemptions and deductions. Rates do not include local taxes. SEC Yield is a standardized measure based on the estimated yield to maturity of a fund’s investments over a 30-day period and is based on the maximum offer price at the date specified. The SEC Yield is not based on the distributions made by the Fund, which may differ. |
| 6 | Fund employs RIB financing. The leverage created by RIB investments provides an opportunity for increased income but, at the same time, creates special risks (including the likelihood of greater volatility of NAV). The cost of leverage rises and falls with changes in short-term interest rates. See “Floating Rate Notes Issued in Conjunction with Securities Held” in the notes to the financial statements for more information about RIB financing. RIB leverage represents the amount of Floating Rate Notes outstanding at period end as a percentage of Fund net assets plus Floating Rate Notes. |
| 7 | Ratings are based on Moody’s, S&P or Fitch, as applicable. If securities are rated differently by the ratings agencies, the higher rating is applied. Ratings, which are subject to change, apply to the creditworthiness of the issuers of the underlying securities and not to the Fund or its shares. Credit ratings measure the quality of a bond based on the issuer’s creditworthiness, with ratings ranging from AAA, being the highest, to D, being the lowest based on S&P’s measures. Ratings of BBB or higher by S&P or Fitch (Baa or higher by Moody’s) are considered to be investment-grade quality. Credit ratings are based largely on the ratings agency’s analysis at the time of rating. The rating assigned to any particular security is not necessarily a reflection of the issuer’s current financial condition and does not necessarily reflect its assessment of the volatility of a security’s market value or of the liquidity of an investment in the security. Holdings designated as “Not Rated” are not rated by the national ratings agencies stated above. |
| 8 | The chart includes the municipal bonds held by a trust that issues residual interest bonds, consistent with the Portfolio of Investments. |
| | Fund profile subject to change due to active management. |
Eaton Vance
Municipal Income Funds
August 31, 2016
Fund Expenses
Example: As a Fund shareholder, you incur two types of costs: (1) transaction costs, including sales charges (loads) on purchases and redemption fees (if applicable); and (2) ongoing costs, including management fees; distribution and/or service fees; and other Fund expenses. This Example is intended to help you understand your ongoing costs (in dollars) of Fund investing and to compare these costs with the ongoing costs of investing in other mutual funds. The Example is based on an investment of $1,000 invested at the beginning of the period and held for the entire period (March 1, 2016 – August 31, 2016).
Actual Expenses: The first section of each table below provides information about actual account values and actual expenses. You may use the information in this section, together with the amount you invested, to estimate the expenses that you paid over the period. Simply divide your account value by $1,000 (for example, an $8,600 account value divided by $1,000 = 8.6), then multiply the result by the number in the first section under the heading entitled “Expenses Paid During Period” to estimate the expenses you paid on your account during this period.
Hypothetical Example for Comparison Purposes: The second section of each table below provides information about hypothetical account values and hypothetical expenses based on the actual Fund expense ratio and an assumed rate of return of 5% per year (before expenses), which is not the actual Fund return. The hypothetical account values and expenses may not be used to estimate the actual ending account balance or expenses you paid for the period. You may use this information to compare the ongoing costs of investing in your Fund and other funds. To do so, compare this 5% hypothetical example with the 5% hypothetical examples that appear in the shareholder reports of the other funds.
Please note that the expenses shown in each table are meant to highlight your ongoing costs only and do not reflect any transactional costs, such as sales charges (loads) or redemption fees (if applicable). Therefore, the second section of each table is useful in comparing ongoing costs only, and will not help you determine the relative total costs of owning different funds. In addition, if these transactional costs were included, your costs would be higher.
Eaton Vance Georgia Municipal Income Fund
| | | | | | | | | | | | | | | | |
| | | Beginning
Account Value
(3/1/16) | | | Ending
Account Value
(8/31/16) | | | Expenses Paid
During Period*
(3/1/16 – 8/31/16) | | | Annualized
Expense
Ratio | |
| | | | |
| | | | | | | | | | | | | | | | |
Actual | | | | | | | | | | | | | |
Class A | | $ | 1,000.00 | | | $ | 1,033.60 | | | $ | 3.42 | | | | 0.67 | % |
Class B | | $ | 1,000.00 | | | $ | 1,029.60 | | | $ | 7.30 | | | | 1.43 | % |
Class C | | $ | 1,000.00 | | | $ | 1,029.60 | | | $ | 7.24 | | | | 1.42 | % |
Class I | | $ | 1,000.00 | | | $ | 1,034.60 | | | $ | 2.40 | | | | 0.47 | % |
| | | | | | | | | | | | | | | | | |
| | | | |
| | | | | | | | | | | | | | | | |
Hypothetical | | | | | | | | | | | | | |
(5% return per year before expenses) | | | | | | | | | | | | | |
Class A | | $ | 1,000.00 | | | $ | 1,021.80 | | | $ | 3.41 | | | | 0.67 | % |
Class B | | $ | 1,000.00 | | | $ | 1,017.90 | | | $ | 7.25 | | | | 1.43 | % |
Class C | | $ | 1,000.00 | | | $ | 1,018.00 | | | $ | 7.20 | | | | 1.42 | % |
Class I | | $ | 1,000.00 | | | $ | 1,022.80 | | | $ | 2.39 | | | | 0.47 | % |
| * | Expenses are equal to the Fund’s annualized expense ratio for the indicated Class, multiplied by the average account value over the period, multiplied by 184/366 (to reflect the one-half year period). The Example assumes that the $1,000 was invested at the net asset value per share determined at the close of business on February 29, 2016. |
Eaton Vance
Municipal Income Funds
August 31, 2016
Fund Expenses — continued
Eaton Vance Maryland Municipal Income Fund
| | | | | | | | | | | | | | | | |
| | | Beginning
Account Value
(3/1/16) | | | Ending
Account Value
(8/31/16) | | | Expenses Paid
During Period*
(3/1/16 – 8/31/16) | | | Annualized
Expense
Ratio | |
| | | | |
| | | | | | | | | | | | | | | | |
Actual | | | | | | | | | | | | | |
Class A | | $ | 1,000.00 | | | $ | 1,024.80 | | | $ | 3.77 | | | | 0.74 | % |
Class B | | $ | 1,000.00 | | | $ | 1,020.70 | | | $ | 7.62 | | | | 1.50 | % |
Class C | | $ | 1,000.00 | | | $ | 1,021.60 | | | $ | 7.57 | | | | 1.49 | % |
Class I | | $ | 1,000.00 | | | $ | 1,025.80 | | | $ | 2.75 | | | | 0.54 | % |
| | | | | | | | | | | | | | | | | |
| | | | |
| | | | | | | | | | | | | | | | |
Hypothetical | | | | | | | | | | | | | |
(5% return per year before expenses) | | | | | | | | | | | | | |
Class A | | $ | 1,000.00 | | | $ | 1,021.40 | | | $ | 3.76 | | | | 0.74 | % |
Class B | | $ | 1,000.00 | | | $ | 1,017.60 | | | $ | 7.61 | | | | 1.50 | % |
Class C | | $ | 1,000.00 | | | $ | 1,017.60 | | | $ | 7.56 | | | | 1.49 | % |
Class I | | $ | 1,000.00 | | | $ | 1,022.40 | | | $ | 2.75 | | | | 0.54 | % |
| * | Expenses are equal to the Fund’s annualized expense ratio for the indicated Class, multiplied by the average account value over the period, multiplied by 184/366 (to reflect the one-half year period). The Example assumes that the $1,000 was invested at the net asset value per share determined at the close of business on February 29, 2016. |
Eaton Vance Missouri Municipal Income Fund
| | | | | | | | | | | | | | | | |
| | | Beginning
Account Value
(3/1/16) | | | Ending
Account Value
(8/31/16) | | | Expenses Paid
During Period*
(3/1/16 – 8/31/16) | | | Annualized
Expense
Ratio | |
| | | | |
| | | | | | | | | | | | | | | | |
Actual | | | | | | | | | | | | | |
Class A | | $ | 1,000.00 | | | $ | 1,036.40 | | | $ | 3.63 | | | | 0.71 | % |
Class B | | $ | 1,000.00 | | | $ | 1,033.60 | | | $ | 7.46 | | | | 1.46 | % |
Class C | | $ | 1,000.00 | | | $ | 1,033.60 | | | $ | 7.41 | | | | 1.45 | % |
Class I | | $ | 1,000.00 | | | $ | 1,038.50 | | | $ | 2.56 | | | | 0.50 | % |
| | | | | | | | | | | | | | | | | |
| | | | |
| | | | | | | | | | | | | | | | |
Hypothetical | | | | | | | | | | | | | |
(5% return per year before expenses) | | | | | | | | | | | | | |
Class A | | $ | 1,000.00 | | | $ | 1,021.60 | | | $ | 3.61 | | | | 0.71 | % |
Class B | | $ | 1,000.00 | | | $ | 1,017.80 | | | $ | 7.41 | | | | 1.46 | % |
Class C | | $ | 1,000.00 | | | $ | 1,017.80 | | | $ | 7.35 | | | | 1.45 | % |
Class I | | $ | 1,000.00 | | | $ | 1,022.60 | | | $ | 2.54 | | | | 0.50 | % |
| * | Expenses are equal to the Fund’s annualized expense ratio for the indicated Class, multiplied by the average account value over the period, multiplied by 184/366 (to reflect the one-half year period). The Example assumes that the $1,000 was invested at the net asset value per share determined at the close of business on February 29, 2016. |
Eaton Vance
Municipal Income Funds
August 31, 2016
Fund Expenses — continued
Eaton Vance North Carolina Municipal Income Fund
| | | | | | | | | | | | | | | | |
| | | Beginning
Account Value
(3/1/16) | | | Ending
Account Value
(8/31/16) | | | Expenses Paid
During Period*
(3/1/16 – 8/31/16) | | | Annualized
Expense
Ratio | |
| | | | |
| | | | | | | | | | | | | | | | |
Actual | | | | | | | | | | | | | |
Class A | | $ | 1,000.00 | | | $ | 1,031.40 | | | $ | 3.88 | | | | 0.76 | % |
Class B | | $ | 1,000.00 | | | $ | 1,027.50 | | | $ | 7.70 | | | | 1.51 | % |
Class C | | $ | 1,000.00 | | | $ | 1,027.40 | | | $ | 7.70 | | | | 1.51 | % |
Class I | | $ | 1,000.00 | | | $ | 1,032.30 | | | $ | 2.91 | | | | 0.57 | % |
| | | | | | | | | | | | | | | | | |
| | | | |
| | | | | | | | | | | | | | | | |
Hypothetical | | | | | | | | | | | | | |
(5% return per year before expenses) | | | | | | | | | | | | | |
Class A | | $ | 1,000.00 | | | $ | 1,021.30 | | | $ | 3.86 | | | | 0.76 | % |
Class B | | $ | 1,000.00 | | | $ | 1,017.50 | | | $ | 7.66 | | | | 1.51 | % |
Class C | | $ | 1,000.00 | | | $ | 1,017.50 | | | $ | 7.66 | | | | 1.51 | % |
Class I | | $ | 1,000.00 | | | $ | 1,022.30 | | | $ | 2.90 | | | | 0.57 | % |
| * | Expenses are equal to the Fund’s annualized expense ratio for the indicated Class, multiplied by the average account value over the period, multiplied by 184/366 (to reflect the one-half year period). The Example assumes that the $1,000 was invested at the net asset value per share determined at the close of business on February 29, 2016. |
Eaton Vance Oregon Municipal Income Fund
| | | | | | | | | | | | | | | | |
| | | Beginning
Account Value
(3/1/16) | | | Ending
Account Value
(8/31/16) | | | Expenses Paid
During Period*
(3/1/16 – 8/31/16) | | | Annualized
Expense
Ratio | |
| | | | |
| | | | | | | | | | | | | | | | |
Actual | | | | | | | | | | | | | |
Class A | | $ | 1,000.00 | | | $ | 1,040.40 | | | $ | 3.90 | | | | 0.76 | % |
Class B | | $ | 1,000.00 | | | $ | 1,035.60 | | | $ | 7.73 | | | | 1.51 | % |
Class C | | $ | 1,000.00 | | | $ | 1,035.60 | | | $ | 7.73 | | | | 1.51 | % |
Class I | | $ | 1,000.00 | | | $ | 1,040.30 | | | $ | 2.87 | | | | 0.56 | % |
| | | | | | | | | | | | | | | | | |
| | | | |
| | | | | | | | | | | | | | | | |
Hypothetical | | | | | | | | | | | | | |
(5% return per year before expenses) | | | | | | | | | | | | | |
Class A | | $ | 1,000.00 | | | $ | 1,021.30 | | | $ | 3.86 | | | | 0.76 | % |
Class B | | $ | 1,000.00 | | | $ | 1,017.50 | | | $ | 7.66 | | | | 1.51 | % |
Class C | | $ | 1,000.00 | | | $ | 1,017.50 | | | $ | 7.66 | | | | 1.51 | % |
Class I | | $ | 1,000.00 | | | $ | 1,022.30 | | | $ | 2.85 | | | | 0.56 | % |
| * | Expenses are equal to the Fund’s annualized expense ratio for the indicated Class, multiplied by the average account value over the period, multiplied by 184/366 (to reflect the one-half year period). The Example assumes that the $1,000 was invested at the net asset value per share determined at the close of business on February 29, 2016. |
Eaton Vance
Municipal Income Funds
August 31, 2016
Fund Expenses — continued
Eaton Vance South Carolina Municipal Income Fund
| | | | | | | | | | | | | | | | |
| | | Beginning
Account Value
(3/1/16) | | | Ending
Account Value
(8/31/16) | | | Expenses Paid
During Period*
(3/1/16 – 8/31/16) | | | Annualized
Expense
Ratio | |
| | | | |
| | | | | | | | | | | | | | | | |
Actual | | | | | | | | | | | | | |
Class A | | $ | 1,000.00 | | | $ | 1,036.30 | | | $ | 3.79 | | | | 0.74 | % |
Class B | | $ | 1,000.00 | | | $ | 1,032.20 | | | $ | 7.61 | | | | 1.49 | % |
Class C | | $ | 1,000.00 | | | $ | 1,032.20 | | | $ | 7.61 | | | | 1.49 | % |
Class I | | $ | 1,000.00 | | | $ | 1,037.30 | | | $ | 2.77 | | | | 0.54 | % |
| | | | | | | | | | | | | | | | | |
| | | | |
| | | | | | | | | | | | | | | | |
Hypothetical | | | | | | | | | | | | | |
(5% return per year before expenses) | | | | | | | | | | | | | |
Class A | | $ | 1,000.00 | | | $ | 1,021.40 | | | $ | 3.76 | | | | 0.74 | % |
Class B | | $ | 1,000.00 | | | $ | 1,017.60 | | | $ | 7.56 | | | | 1.49 | % |
Class C | | $ | 1,000.00 | | | $ | 1,017.60 | | | $ | 7.56 | | | | 1.49 | % |
Class I | | $ | 1,000.00 | | | $ | 1,022.40 | | | $ | 2.75 | | | | 0.54 | % |
| * | Expenses are equal to the Fund’s annualized expense ratio for the indicated Class, multiplied by the average account value over the period, multiplied by 184/366 (to reflect the one-half year period). The Example assumes that the $1,000 was invested at the net asset value per share determined at the close of business on February 29, 2016. |
Eaton Vance Virginia Municipal Income Fund
| | | | | | | | | | | | | | | | |
| | | Beginning
Account Value
(3/1/16) | | | Ending
Account Value
(8/31/16) | | | Expenses Paid
During Period*
(3/1/16 – 8/31/16) | | | Annualized
Expense
Ratio | |
| | | | |
| | | | | | | | | | | | | | | | |
Actual | | | | | | | | | | | | | |
Class A | | $ | 1,000.00 | | | $ | 1,031.60 | | | $ | 3.88 | | | | 0.76 | % |
Class B | | $ | 1,000.00 | | | $ | 1,027.50 | | | $ | 7.70 | | | | 1.51 | % |
Class C | | $ | 1,000.00 | | | $ | 1,028.60 | | | $ | 7.70 | | | | 1.51 | % |
Class I | | $ | 1,000.00 | | | $ | 1,032.60 | | | $ | 2.86 | | | | 0.56 | % |
| | | | | | | | | | | | | | | | | |
| | | | |
| | | | | | | | | | | | | | | | |
Hypothetical | | | | | | | | | | | | | |
(5% return per year before expenses) | | | | | | | | | | | | | |
Class A | | $ | 1,000.00 | | | $ | 1,021.30 | | | $ | 3.86 | | | | 0.76 | % |
Class B | | $ | 1,000.00 | | | $ | 1,017.50 | | | $ | 7.66 | | | | 1.51 | % |
Class C | | $ | 1,000.00 | | | $ | 1,017.50 | | | $ | 7.66 | | | | 1.51 | % |
Class I | | $ | 1,000.00 | | | $ | 1,022.30 | | | $ | 2.85 | | | | 0.56 | % |
| * | Expenses are equal to the Fund’s annualized expense ratio for the indicated Class, multiplied by the average account value over the period, multiplied by 184/366 (to reflect the one-half year period). The Example assumes that the $1,000 was invested at the net asset value per share determined at the close of business on February 29, 2016. |
Eaton Vance
Georgia Municipal Income Fund
August 31, 2016
Portfolio of Investments
| | | | | | | | |
| Tax-Exempt Investments — 96.6% | |
| | |
| | | | | | | | |
| Security | | Principal
Amount
(000’s omitted) | | | Value | |
| | | | | | | | |
|
Education — 5.7% | |
Atlanta Development Authority, Educational Facilities, Prerefunded to 7/1/17, 4.75%, 7/1/27 | | $ | 600 | | | $ | 621,096 | |
Fulton County Development Authority, (Georgia Tech Foundation Campus Recreation Center Project), 5.00%, 11/1/30 | | | 750 | | | | 881,107 | |
Fulton County Development Authority, (Georgia Tech Foundation Technology Square Project), 5.00%, 11/1/30 | | | 750 | | | | 896,895 | |
Unified Government of Athens-Clarke County Development Authority, (UGAREF Central Precinct, LLC), 5.00%, 6/15/31 | | | 1,500 | | | | 1,886,070 | |
| | | | | | | | | |
| | | $ | 4,285,168 | |
| | | | | | | | | |
|
Electric Utilities — 2.7% | |
Burke County Development Authority, (Oglethorpe Power Corp.), 5.50%, 1/1/33 | | $ | 1,000 | | | $ | 1,056,690 | |
Monroe County Development Authority, (Oglethorpe Power Corp.), (LOC: JPMorgan Chase Bank, N.A.), 0.65%, 1/1/36(1) | | | 1,000 | | | | 1,000,000 | |
| | | | | | | | | |
| | | $ | 2,056,690 | |
| | | | | | | | | |
|
Escrowed / Prerefunded — 7.1% | |
Floyd County Hospital Authority, (Floyd Health Medical Center), Prerefunded to 7/1/19, 5.25%, 7/1/29 | | $ | 750 | | | $ | 846,128 | |
Forsyth County Hospital Authority, (Georgia Baptist Health Care System), Escrowed to Maturity, 6.375%, 10/1/28 | | | 800 | | | | 1,069,656 | |
Glynn-Brunswick Memorial Hospital Authority, (Southeast Georgia Health System), Prerefunded to 8/1/18, 5.625%, 8/1/34 | | | 675 | | | | 738,902 | |
Guam, Limited Obligation Bonds, Prerefunded to 12/1/19, 5.625%, 12/1/29 | | | 205 | | | | 236,547 | |
Guam, Limited Obligation Bonds, Prerefunded to 12/1/19, 5.75%, 12/1/34 | | | 220 | | | | 254,736 | |
Lincoln County School District, Prerefunded to 4/1/19, 5.50%, 4/1/37 | | | 1,000 | | | | 1,124,590 | |
Unified Government of Athens-Clarke County, Water and Sewerage Revenue, Prerefunded to 1/1/19, 5.50%, 1/1/38 | | | 1,000 | | | | 1,112,250 | |
| | | | | | | | | |
| | | $ | 5,382,809 | |
| | | | | | | | | |
| | |
General Obligations — 19.0% | | | | | | | | |
Cherokee County School System, 5.00%, 2/1/29 | | $ | 1,000 | | | $ | 1,250,490 | |
Columbia County, 5.00%, 4/1/23 | | | 450 | | | | 556,412 | |
DeKalb County, (Special Transportation, Parks and Greenspace and Libraries Tax District), 5.00%, 12/1/27 | | | 1,000 | | | | 1,303,170 | |
Downtown Savannah Authority, 4.00%, 8/1/25 | | | 2,495 | | | | 2,995,522 | |
Forsyth County, 5.00%, 3/1/28 | | | 1,000 | | | | 1,275,600 | |
Forsyth County Public Facilities Authority, (Forsyth County School District), 4.00%, 2/1/30 | | | 750 | | | | 873,952 | |
| | | | | | | | |
| Security | | Principal
Amount
(000’s omitted) | | | Value | |
| | | | | | | | |
| | |
General Obligations (continued) | | | | | | | | |
Forsyth County Public Facilities Authority, (Forsyth County School District), 4.00%, 2/1/31 | | $ | 290 | | | $ | 336,313 | |
Georgia, 2.00%, 8/1/27 | | | 315 | | | | 315,967 | |
Georgia, 5.00%, 2/1/28 | | | 1,500 | | | | 1,910,235 | |
Jefferson City School District, 5.25%, 2/1/33 | | | 1,500 | | | | 1,751,850 | |
Lagrange-Troup County Hospital Authority, (West Georgia Health Foundation, Inc.), 5.50%, 7/1/38 | | | 500 | | | | 537,775 | |
Valdosta School System, 5.00%, 2/1/28 | | | 1,000 | | | | 1,275,860 | |
| | | | | | | | | |
| | | $ | 14,383,146 | |
| | | | | | | | | |
|
Hospital — 8.6% | |
Carroll City-County Hospital Authority, (Tanner Medical Center, Inc.), 5.00%, 7/1/29 | | $ | 500 | | | $ | 633,040 | |
Cedartown Polk County Hospital Authority, (Polk Medical Center), 5.00%, 7/1/39 | | | 850 | | | | 1,007,726 | |
DeKalb County Hospital Authority, (DeKalb Medical Center), 6.125%, 9/1/40 | | | 1,000 | | | | 1,149,710 | |
Fulton County Development Authority, (Children’s Healthcare of Atlanta), 5.25%, 11/15/39 | | | 1,000 | | | | 1,129,330 | |
Glynn-Brunswick Memorial Hospital Authority, (Southeast Georgia Health System), 5.00%, 8/1/28 | | | 650 | | | | 806,123 | |
Glynn-Brunswick Memorial Hospital Authority, (Southeast Georgia Health System), 5.625%, 8/1/34 | | | 75 | | | | 81,068 | |
Macon-Bibb County Hospital Authority, (The Medical Center of Central Georgia), 5.00%, 8/1/35 | | | 1,000 | | | | 1,099,200 | |
Savannah Hospital Authority, (St Joseph’s/Candler Health System, Inc.), 5.50%, 7/1/30 | | | 500 | | | | 611,415 | |
| | | | | | | | | |
| | | $ | 6,517,612 | |
| | | | | | | | | |
|
Industrial Development Revenue — 3.4% | |
Albany Dougherty Payroll Development Authority, Solid Waste Disposal, (Procter and Gamble), (AMT), 5.20%, 5/15/28 | | $ | 2,000 | | | $ | 2,582,280 | |
| | | | | | | | | |
| | | $ | 2,582,280 | |
| | | | | | | | | |
|
Insured – Education — 1.7% | |
Savannah Economic Development Authority, (SSU Community Development I, LLC), (AGM), 5.25%, 6/15/27 | | $ | 1,125 | | | $ | 1,266,671 | |
| | | | | | | | | |
| | | $ | 1,266,671 | |
| | | | | | | | | |
|
Insured – Electric Utilities — 6.5% | |
Georgia Municipal Electric Power Authority, (NPFG), 5.50%, 1/1/20 | | $ | 435 | | | $ | 453,131 | |
Griffin, Combined Public Utility Revenue, (AGM), 5.00%, 1/1/28 | | | 1,000 | | | | 1,186,760 | |
Newnan, Water, Sewerage and Light Commission, (AMBAC), 5.25%, 1/1/24 | | | 1,040 | | | | 1,286,241 | |
| | | | |
| | 23 | | See Notes to Financial Statements. |
Eaton Vance
Georgia Municipal Income Fund
August 31, 2016
Portfolio of Investments — continued
| | | | | | | | |
| Security | | Principal
Amount
(000’s omitted) | | | Value | |
| | | | | | | | |
|
Insured – Electric Utilities (continued) | |
Puerto Rico Electric Power Authority, (NPFG), 5.25%, 7/1/29 | | $ | 980 | | | $ | 1,066,485 | |
Puerto Rico Electric Power Authority, (NPFG), 5.25%, 7/1/34 | | | 550 | | | | 601,953 | |
Puerto Rico Electric Power Authority, (NPFG), 5.25%, 7/1/35 | | | 300 | | | | 327,351 | |
| | | | | | | | | |
| | | $ | 4,921,921 | |
| | | | | | | | | |
|
Insured-Escrowed / Prerefunded — 3.9% | |
Douglasville-Douglas County, Water and Sewer Authority, (NPFG), Prerefunded to 6/1/17, 5.00%, 6/1/37 | | $ | 750 | | | $ | 774,795 | |
Georgia Higher Education Facilities Authority, (USG Real Estate Foundation I, LLC), (AGC), Prerefunded to 6/15/18, 5.625%, 6/15/38 | | | 170 | | | | 184,979 | |
Georgia Higher Education Facilities Authority, (USG Real Estate Foundation I, LLC), (AGC), Prerefunded to 6/15/18, 5.625%, 6/15/38 | | | 830 | | | | 903,131 | |
Walton County, Water and Sewer Authority, (AGM), Prerefunded to 2/1/18, 5.00%, 2/1/33 | | | 1,000 | | | | 1,062,380 | |
| | | | | | | | | |
| | | $ | 2,925,285 | |
| | | | | | | | | |
|
Insured – General Obligations — 2.0% | |
Coweta County, Water and Sewerage Authority, (AGM), 5.00%, 6/1/26 | | $ | 1,135 | | | $ | 1,487,667 | |
| | | | | | | | | |
| | | $ | 1,487,667 | |
| | | | | | | | | |
|
Insured – Hospital — 2.6% | |
Cobb County Kennestone Hospital Authority, (Wellstar Health System), (AMBAC), 5.50%, 4/1/37 | | $ | 1,750 | | | $ | 1,999,550 | |
| | | | | | | | | |
| | | $ | 1,999,550 | |
| | | | | | | | | |
|
Insured – Lease Revenue / Certificates of Participation — 3.5% | |
Georgia Local Government 1998A Grantor Trust, Certificates of Participation, (NPFG), 4.75%, 6/1/28 | | $ | 1,326 | | | $ | 1,556,697 | |
Georgia Municipal Association, Inc., Certificates of Participation, (Riverdale), (AGC), 5.375%, 5/1/32 | | | 1,000 | | | | 1,107,850 | |
| | | | | | | | | |
| | | $ | 2,664,547 | |
| | | | | | | | | |
|
Insured – Special Tax Revenue — 2.8% | |
Clarke County Hospital Authority, (Athens Regional Medical Center), (NPFG), 5.00%, 1/1/32 | | $ | 1,190 | | | $ | 1,205,577 | |
Metropolitan Atlanta Rapid Transit Authority, (AMBAC), 6.25%, 7/1/20 | | | 310 | | | | 346,180 | |
Puerto Rico Infrastructure Financing Authority, (AMBAC), 5.50%, 7/1/28 | | | 545 | | | | 588,562 | |
| | | | | | | | | |
| | | $ | 2,140,319 | |
| | | | | | | | | |
| | | | | | | | |
| Security | | Principal
Amount
(000’s omitted) | | | Value | |
| | | | | | | | |
|
Insured – Water and Sewer — 4.3% | |
Brunswick-Glynn County Joint Water and Sewer Commission, (AGM), 5.00%, 6/1/33 | | $ | 500 | | | $ | 563,845 | |
DeKalb County, Water and Sewerage Revenue, (AGM), 5.25%, 10/1/32 | | | 1,590 | | | | 2,064,790 | |
Henry County, Water and Sewer Authority, (NPFG), 5.25%, 2/1/25 | | | 500 | | | | 640,140 | |
| | | | | | | | | |
| | | $ | 3,268,775 | |
| | | | | | | | | |
|
Other Revenue — 2.9% | |
Georgia Municipal Gas Authority, (Gas Portfolio III), 5.00%, 10/1/27 | | $ | 750 | | | $ | 894,608 | |
Sandy Springs Public Facilities Authority, (City Center Project), 5.00%, 5/1/35 | | | 1,000 | | | | 1,259,470 | |
| | | | | | | | | |
| | | $ | 2,154,078 | |
| | | | | | | | | |
|
Senior Living / Life Care — 1.7% | |
Gainesville and Hall County Development Authority, (ACTS Retirement-Life Communities, Inc. Obligated Group), 5.00%, 11/15/33 | | $ | 500 | | | $ | 609,195 | |
Savannah Economic Development Authority, (Marshes of Skidaway Island), 6.00%, 1/1/24 | | | 550 | | | | 640,547 | |
| | | | | | | | | |
| | | $ | 1,249,742 | |
| | | | | | | | | |
|
Special Tax Revenue — 6.2% | |
Atlanta Development Authority, (New Downtown Atlanta Stadium), 5.00%, 7/1/29 | | $ | 750 | | | $ | 928,950 | |
Gainesville and Hall County Hospital Authority, (Northeast Georgia Medical Center), 5.00%, 2/15/33 | | | 1,750 | | | | 1,939,420 | |
Puerto Rico Sales Tax Financing Corp., 5.00%, 8/1/40 | | | 570 | | | | 408,884 | |
Puerto Rico Sales Tax Financing Corp., 5.25%, 8/1/40 | | | 260 | | | | 186,828 | |
Unified Government Development of Athens-Clarke County Development Authority, (Economic Development Projects), 5.00%, 6/1/32 | | | 1,080 | | | | 1,263,449 | |
| | | | | | | | | |
| | | $ | 4,727,531 | |
| | | | | | | | | |
|
Transportation — 2.7% | |
Atlanta, Airport Revenue, 5.00%, 1/1/31 | | $ | 1,000 | | | $ | 1,226,600 | |
Atlanta, Airport Revenue, 5.00%, 1/1/35 | | | 750 | | | | 840,225 | |
| | | | | | | | | |
| | | $ | 2,066,825 | |
| | | | | | | | | |
|
Water and Sewer — 9.3% | |
Atlanta, Water and Wastewater Revenue, 5.25%, 11/1/30 | | $ | 1,000 | | | $ | 1,244,660 | |
Cobb County-Marietta Water Authority, 5.00%, 11/1/28 | | | 375 | | | | 484,031 | |
Columbus, Water and Sewerage Revenue, 5.00%, 5/1/33 | | | 500 | | | | 608,890 | |
Columbus, Water and Sewerage Revenue, 5.00%, 5/1/36 | | | 250 | | | | 312,625 | |
| | | | |
| | 24 | | See Notes to Financial Statements. |
Eaton Vance
Georgia Municipal Income Fund
August 31, 2016
Portfolio of Investments — continued
| | | | | | | | |
| Security | | Principal
Amount
(000’s omitted) | | | Value | |
| | | | | | | | |
|
Water and Sewer (continued) | |
Forsyth County, Water and Sewerage Authority, 5.00%, 4/1/27 | | $ | 1,100 | | | $ | 1,363,868 | |
Fulton County, Water and Sewer Revenue, 5.00%, 1/1/33 | | | 1,500 | | | | 1,801,980 | |
Unified Government of Athens-Clarke County, Water and Sewerage Revenue, 5.00%, 1/1/29 | | | 1,000 | | | | 1,246,580 | |
| | |
| | | | | | $ | 7,062,634 | |
| | |
| |
Total Tax-Exempt Investments — 96.6%
(identified cost $65,920,227) | | | $ | 73,143,250 | |
| | |
| |
Other Assets, Less Liabilities — 3.4% | | | $ | 2,608,950 | |
| | |
| |
Net Assets — 100.0% | | | $ | 75,752,200 | |
| | |
The percentage shown for each investment category in the Portfolio of Investments is based on net assets.
The Fund invests primarily in debt securities issued by Georgia municipalities. The ability of the issuers of the debt securities to meet their obligations may be affected by economic developments in a specific industry or municipality. In order to reduce the risk associated with such economic developments, at August 31, 2016, 28.3% of total investments are backed by bond insurance of various financial institutions and financial guaranty assurance agencies. The aggregate percentage insured by an individual financial institution or financial guaranty assurance agency ranged from 3.0% to 10.4% of total investments.
| (1) | Variable rate demand obligation that may be tendered at par on any day for payment the lesser of 5 business days or 7 calendar days. The stated interest rate, which generally resets weekly, represents the rate in effect at August 31, 2016. |
| | | | | | | | | | | | | | | | | | | | | | | | |
| Futures Contracts | |
| Description | | Contracts | | | Position | | | Expiration
Month/Year | | | Aggregate Cost | | | Value | | | Net Unrealized
Appreciation | |
| | | | | | |
Interest Rate Futures | | | | | | | | | | | | | | | | | | | | | | | | |
| U.S. Long Treasury Bond | | | 15 | | | | Short | | | | Dec-16 | | | $ | (2,564,807 | ) | | $ | (2,555,625 | ) | | $ | 9,182 | |
| | | | | | |
| | | | | | | | | | | | | | | | | | | | | | | $ | 9,182 | |
Abbreviations:
| | | | |
| AGC | | – | | Assured Guaranty Corp. |
| AGM | | – | | Assured Guaranty Municipal Corp. |
| AMBAC | | – | | AMBAC Financial Group, Inc. |
| AMT | | – | | Interest earned from these securities may be considered a tax preference item for purposes of the Federal Alternative Minimum Tax. |
| LOC | | – | | Letter of Credit |
| NPFG | | – | | National Public Finance Guaranty Corp. |
| | | | |
| | 25 | | See Notes to Financial Statements. |
Eaton Vance
Maryland Municipal Income Fund
August 31, 2016
Portfolio of Investments
| | | | | | | | |
| Tax-Exempt Investments — 98.1% | |
| | |
| | | | | | | | |
| Security | | Principal
Amount
(000’s omitted) | | | Value | |
| | | | | | | | |
|
Education — 7.6% | |
Maryland Health and Higher Educational Facilities Authority, (Goucher College), 5.00%, 7/1/34 | | $ | 1,000 | | | $ | 1,169,780 | |
Maryland Health and Higher Educational Facilities Authority, (Johns Hopkins University), 5.00%, 7/1/37 | | | 2,000 | | | | 2,392,660 | |
Maryland Health and Higher Educational Facilities Authority, (Maryland Institute College of Art), 5.00%, 6/1/36 | | | 1,500 | | | | 1,528,650 | |
| | | | | | | | | |
| | | $ | 5,091,090 | |
| | | | | | | | | |
|
Electric Utilities — 0.8% | |
Maryland Economic Development Corp., (Constellation Energy Group, Inc.), 2.55% to 6/1/20 (Put Date), 12/1/25 | | $ | 500 | | | $ | 512,435 | |
| | | | | | | | | |
| | | $ | 512,435 | |
| | | | | | | | | |
|
Escrowed / Prerefunded — 12.2% | |
Anne Arundel County, Water and Sewer Construction, Prerefunded to 4/1/18, 4.50%, 4/1/29 | | $ | 1,140 | | | $ | 1,210,612 | |
Baltimore County, (Metropolitan District), Prerefunded to 2/1/18, 5.00%, 2/1/31 | | | 2,000 | | | | 2,125,360 | |
Maryland Health and Higher Educational Facilities Authority, (Washington County Hospital), Prerefunded to 1/1/18, 5.75%, 1/1/38 | | | 750 | | | | 801,578 | |
Prince George’s County Housing Authority, Prerefunded to 7/15/17, 5.00%, 7/15/23 | | | 2,235 | | | | 2,322,500 | |
University of Maryland, Auxiliary Facility and Tuition Revenue, Prerefunded to 4/1/21, 5.00%, 4/1/28 | | | 1,425 | | | | 1,690,990 | |
| | | | | | | | | |
| | | $ | 8,151,040 | |
| | | | | | | | | |
|
General Obligations — 11.7% | |
Baltimore, 4.00%, 10/15/25 | | $ | 1,350 | | | $ | 1,548,450 | |
Baltimore, 5.00%, 10/15/27 | | | 750 | | | | 916,170 | |
Maryland, 5.00%, 11/1/19 | | | 2,000 | | | | 2,269,740 | |
Maryland, 5.00%, 8/1/24 | | | 1,000 | | | | 1,219,710 | |
Montgomery County, 5.00%, 11/1/29 | | | 1,450 | | | | 1,838,455 | |
| | | | | | | | | |
| | | $ | 7,792,525 | |
| | | | | | | | | |
|
Hospital — 21.7% | |
Maryland Health and Higher Educational Facilities Authority, (Anne Arundel Health Care Services, Inc.), 5.00%, 7/1/32 | | $ | 1,000 | | | $ | 1,088,710 | |
Maryland Health and Higher Educational Facilities Authority, (Johns Hopkins Health Care), 5.00%, 7/1/33 | | | 1,000 | | | | 1,174,000 | |
Maryland Health and Higher Educational Facilities Authority, (Johns Hopkins Health Care), 5.00%, 5/15/40 | | | 2,000 | | | | 2,247,500 | |
Maryland Health and Higher Educational Facilities Authority, (Medstar Health, Inc.), 5.00%, 8/15/31 | | | 2,000 | | | | 2,423,900 | |
| | | | | | | | |
| Security | | Principal
Amount
(000’s omitted) | | | Value | |
| | | | | | | | |
|
Hospital (continued) | |
Maryland Health and Higher Educational Facilities Authority, (Medstar Health, Inc.), Series B, 5.00%, 8/15/38 | | $ | 1,000 | | | $ | 1,165,280 | |
Maryland Health and Higher Educational Facilities Authority, (Mercy Medical Center), 5.00%, 7/1/31 | | | 1,000 | | | | 1,144,520 | |
Maryland Health and Higher Educational Facilities Authority, (Peninsula Regional Medical Center), 5.00%, 7/1/39 | | | 1,000 | | | | 1,184,240 | |
Maryland Health and Higher Educational Facilities Authority, (University of Maryland Medical System), 5.00%, 7/1/29 | | | 1,000 | | | | 1,229,970 | |
Maryland Health and Higher Educational Facilities Authority, (University of Maryland Medical System), (LOC: Wells Fargo Bank, N.A.), 0.59%, 7/1/34(1) | | | 1,000 | | | | 1,000,000 | |
Montgomery County, (Trinity Health Corp.), 5.00%, 12/1/45 | | | 1,500 | | | | 1,841,580 | |
| | | | | | | | | |
| | | $ | 14,499,700 | |
| | | | | | | | | |
|
Housing — 2.8% | |
Maryland Community Development Administration, (AMT), 5.10%, 9/1/37 | | $ | 870 | | | $ | 877,769 | |
Maryland Community Development Administration, MFMR, (AMT), 4.85%, 9/1/37 | | | 1,000 | | | | 1,014,290 | |
| | | | | | | | | |
| | | $ | 1,892,059 | |
| | | | | | | | | |
|
Industrial Development Revenue — 1.2% | |
Maryland Economic Development Corp., (AFCO Cargo), (AMT), 6.50%, 7/1/24 | | $ | 675 | | | $ | 676,795 | |
Maryland Economic Development Corp., (AFCO Cargo), (AMT), 7.34%, 7/1/24 | | | 145 | | | | 145,470 | |
| | | | | | | | | |
| | | $ | 822,265 | |
| | | | | | | | | |
|
Insured – Education — 1.6% | |
Morgan State University, Academic and Auxiliary Facilities, (NPFG), 6.10%, 7/1/20 | | $ | 985 | | | $ | 1,089,784 | |
| | | | | | | | | |
| | | $ | 1,089,784 | |
| | | | | | | | | |
|
Insured – Escrowed / Prerefunded — 5.8% | |
Maryland Health and Higher Educational Facilities Authority, (Helix Health Issue), (AMBAC), Escrowed to Maturity, 5.00%, 7/1/27 | | $ | 3,145 | | | $ | 3,867,973 | |
| | | | | | | | | |
| | | $ | 3,867,973 | |
| | | | | | | | | |
|
Insured – Hospital — 5.8% | |
Maryland Health and Higher Educational Facilities Authority, (Medlantic/Helix Issue), (AMBAC), 5.25%, 8/15/38 | | $ | 3,035 | | | $ | 3,882,706 | |
| | | | | | | | | |
| | | $ | 3,882,706 | |
| | | | | | | | | |
| | | | |
| | 26 | | See Notes to Financial Statements. |
Eaton Vance
Maryland Municipal Income Fund
August 31, 2016
Portfolio of Investments — continued
| | | | | | | | |
| Security | | Principal
Amount
(000’s omitted) | | | Value | |
| | | | | | | | |
|
Insured – Housing — 0.5% | |
Maryland Economic Development Corp., (University of Maryland, College Park), (AGM), 5.00%, 6/1/35 | | $ | 250 | | | $ | 308,645 | |
| | | | | | | | | |
| | | $ | 308,645 | |
| | | | | | | | | |
|
Insured – Special Tax Revenue — 0.4% | |
Puerto Rico Sales Tax Financing Corp., (NPFG), 0.00%, 8/1/46 | | $ | 1,305 | | | $ | 236,949 | |
| | | | | | | | | |
| | | $ | 236,949 | |
| | | | | | | | | |
|
Insured – Transportation — 5.5% | |
Maryland Transportation Authority, (AGM), 5.00%, 7/1/36 | | $ | 1,400 | | | $ | 1,503,194 | |
Maryland Transportation Authority, (AGM), 5.00%, 7/1/41(2)(3) | | | 2,000 | | | | 2,147,420 | |
| | | | | | | | | |
| | | $ | 3,650,614 | |
| | | | | | | | | |
|
Insured – Water and Sewer — 2.6% | |
Baltimore, (Wastewater Projects), (NPFG), 5.00%, 7/1/22 | | $ | 875 | | | $ | 983,946 | |
Baltimore, (Wastewater Projects), (NPFG), 5.65%, 7/1/20 | | | 700 | | | | 766,395 | |
| | | | | | | | | |
| | | $ | 1,750,341 | |
| | | | | | | | | |
|
Other Revenue — 3.5% | |
Maryland Transportation Authority, Baltimore-Washington International Airport, Parking Revenues, (AMT), 5.00%, 3/1/23 | | $ | 2,000 | | | $ | 2,350,180 | |
| | | | | | | | | |
| | | $ | 2,350,180 | |
| | | | | | | | | |
|
Senior Living / Life Care — 1.7% | |
Maryland Health and Higher Educational Facilities Authority, (Charlestown Community, Inc.), 6.125%, 1/1/30 | | $ | 470 | | | $ | 554,468 | |
Maryland Health and Higher Educational Facilities Authority, (Edenwald), 5.25%, 1/1/37 | | | 500 | | | | 603,735 | |
| | | | | | | | | |
| | | $ | 1,158,203 | |
| | | | | | | | | |
|
Special Tax Revenue — 3.6% | |
Maryland Department of Transportation, Prerefunded to 2/15/18, 5.00%, 2/15/23 | | $ | 1,000 | | | $ | 1,063,440 | |
Montgomery County, Department of Liquor Control, 5.00%, 4/1/21 | | | 1,000 | | | | 1,103,850 | |
Montgomery County, Department of Liquor Control, 5.00%, 4/1/29 | | | 250 | | | | 272,073 | |
| | | | | | | | | |
| | | $ | 2,439,363 | |
| | | | | | | | | |
|
Transportation — 7.6% | |
Maryland Economic Development Corp., (Purple Line Light Rail), (AMT), 5.00%, 3/31/51 | | $ | 1,000 | | | $ | 1,191,100 | |
| | | | | | | | |
| Security | | Principal
Amount
(000’s omitted) | | | Value | |
| | | | | | | | |
|
Transportation (continued) | |
Maryland Transportation Authority, 4.00%, 7/1/27 | | $ | 1,000 | | | $ | 1,128,390 | |
Washington Metropolitan Area Transit Authority, 5.00%, 7/1/32 | | | 2,500 | | | | 2,773,100 | |
| | | | | | | | | |
| | | $ | 5,092,590 | |
| | | | | | | | | |
|
Water and Sewer — 1.5% | |
Washington Suburban Sanitary District, (SPA: TD Bank, N.A.), 0.62%, 6/1/23(1) | | $ | 1,000 | | | $ | 1,000,000 | |
| | |
| | | | | | $ | 1,000,000 | |
| | |
| |
Total Tax-Exempt Investments — 98.1%
(identified cost $60,275,301) | | | $ | 65,588,462 | |
| | |
| |
Other Assets, Less Liabilities — 1.9% | | | $ | 1,274,545 | |
| | |
| |
Net Assets — 100.0% | | | $ | 66,863,007 | |
| | |
The percentage shown for each investment category in the Portfolio of Investments is based on net assets.
The Fund invests primarily in debt securities issued by Maryland municipalities. The ability of the issuers of the debt securities to meet their obligations may be affected by economic developments in a specific industry or municipality. In order to reduce the risk associated with such economic developments, at August 31, 2016, 22.5% of total investments are backed by bond insurance of various financial institutions and financial guaranty assurance agencies. The aggregate percentage insured by an individual financial institution or financial guaranty assurance agency ranged from 4.7% to 11.8% of total investments.
| (1) | Variable rate demand obligation that may be tendered at par on any day for payment the lesser of 5 business days or 7 calendar days. The stated interest rate, which generally resets weekly, represents the rate in effect at August 31, 2016. |
| (2) | Security represents the municipal bond held by a trust that issues residual interest bonds (see Note 1H). |
| (3) | Security (or a portion thereof) has been pledged as collateral for residual interest bond transactions. The aggregate value of such collateral is $647,420. |
| | | | |
| | 27 | | See Notes to Financial Statements. |
Eaton Vance
Maryland Municipal Income Fund
August 31, 2016
Portfolio of Investments — continued
| | | | | | | | | | | | | | | | | | | | | | | | |
| Futures Contracts | |
| Description | | Contracts | | | Position | | | Expiration
Month/Year | | | Aggregate Cost | | | Value | | | Net Unrealized
Appreciation | |
| | | | | | |
Interest Rate Futures | | | | | | | | | | | | | | | | | | | | | | | | |
| U.S. Long Treasury Bond | | | 25 | | | | Short | | | | Dec-16 | | | $ | (4,274,679 | ) | | $ | (4,259,375 | ) | | $ | 15,304 | |
| | | | | | |
| | | | | | | | | | | | | | | | | | | | | | | $ | 15,304 | |
Abbreviations:
| | | | |
| AGM | | – | | Assured Guaranty Municipal Corp. |
| AMBAC | | – | | AMBAC Financial Group, Inc. |
| AMT | | – | | Interest earned from these securities may be considered a tax preference item for purposes of the Federal Alternative Minimum Tax. |
| LOC | | – | | Letter of Credit |
| MFMR | | – | | Multi-Family Mortgage Revenue |
| NPFG | | – | | National Public Finance Guaranty Corp. |
| SPA | | – | | Standby Bond Purchase Agreement |
| | | | |
| | 28 | | See Notes to Financial Statements. |
Eaton Vance
Missouri Municipal Income Fund
August 31, 2016
Portfolio of Investments
| | | | | | | | |
| Tax-Exempt Investments — 99.1% | |
| | |
| | | | | | | | |
| Security | | Principal
Amount
(000’s omitted) | | | Value | |
| | | | | | | | |
|
Bond Bank — 0.0%(1) | |
Missouri Environmental Improvement and Energy Resources Authority, Water Pollution Control and Drinking Water Revenue, (Revolving Funds Program), 5.00%, 7/1/30 | | $ | 30 | | | $ | 34,854 | |
| | | | | | | | | |
| | | $ | 34,854 | |
| | | | | | | | | |
|
Education — 3.7% | |
Missouri Health and Educational Facilities Authority, (St. Louis University), 5.00%, 10/1/38 | | $ | 500 | | | $ | 608,710 | |
Missouri Health and Educational Facilities Authority, (University of Central Missouri), 5.00%, 10/1/34 | | | 1,000 | | | | 1,182,710 | |
Missouri Health and Educational Facilities Authority, (Washington University), (LOC: Wells Fargo Bank, N.A.), 0.60%, 9/1/30(2) | | | 1,000 | | | | 1,000,000 | |
| | | | | | | | | |
| | | $ | 2,791,420 | |
| | | | | | | | | |
|
Electric Utilities — 3.2% | |
Missouri Joint Municipal Electric Utility Commission, (Iatan 2 Project), 5.00%, 1/1/34 | | $ | 1,000 | | | $ | 1,184,920 | |
Missouri Joint Municipal Electric Utility Commission, (Prairie State Energy Campus), 5.00%, 12/1/31 | | | 1,000 | | | | 1,216,390 | |
| | | | | | | | | |
| | | $ | 2,401,310 | |
| | | | | | | | | |
|
Escrowed / Prerefunded — 13.1% | |
Curators of the University of Missouri System Facilities Revenue, Prerefunded to 11/1/17, 5.00%, 11/1/33 | | $ | 2,000 | | | $ | 2,104,500 | |
Guam, Limited Obligation Bonds, Prerefunded to 12/1/19, 5.625%, 12/1/29 | | | 270 | | | | 311,550 | |
Guam, Limited Obligation Bonds, Prerefunded to 12/1/19, 5.75%, 12/1/34 | | | 295 | | | | 341,578 | |
Kansas City, Tax Increment Revenue, (Maincor Project), Escrowed to Maturity, 5.25%, 3/1/18 | | | 305 | | | | 319,186 | |
Missouri Development Finance Board, Cultural Facilities, (Kauffman Center), Prerefunded to 6/1/17, 4.75%, 6/1/37 | | | 1,500 | | | | 1,547,715 | |
Missouri Environmental Improvement and Energy Resources Authority, Water Pollution Control and Drinking Water Revenue, (Revolving Funds Program), Prerefunded to 1/1/21, 5.00%, 7/1/30 | | | 970 | | | | 1,142,941 | |
Missouri Health and Educational Facilities Authority, (Washington University), Prerefunded to 3/15/18,
5.375%, 3/15/39(3) | | | 1,275 | | | | 1,368,712 | |
Missouri Health and Educational Facilities Authority, (Washington University), Prerefunded to 3/15/18, 5.375%, 3/15/39 | | | 1,500 | | | | 1,610,250 | |
| | | | | | | | |
| Security | | Principal
Amount
(000’s omitted) | | | Value | |
| | | | | | | | |
|
Escrowed / Prerefunded (continued) | |
Wentzville R-IV School District, Prerefunded to 3/1/19, 0.00%, 3/1/28 | | $ | 1,975 | | | $ | 1,117,119 | |
| | | | | | | | | |
| | | $ | 9,863,551 | |
| | | | | | | | | |
|
General Obligations — 17.4% | |
Columbia School District, 5.00%, 3/1/31 | | $ | 1,000 | | | $ | 1,154,280 | |
Hazelwood School District, (Direct Deposit Program), 5.00%, 3/1/33 | | | 1,000 | | | | 1,209,100 | |
Independence School District, (Direct Deposit Program), 5.00%, 3/1/29 | | | 1,000 | | | | 1,131,590 | |
Independence School District, (Direct Deposit Program), 5.00%, 3/1/30 | | | 1,000 | | | | 1,137,560 | |
Kansas City, 4.75%, 2/1/25 | | | 1,000 | | | | 1,054,610 | |
Lake Ozark Osage School, (School Building), 5.00%, 3/1/34 | | | 1,000 | | | | 1,196,440 | |
Liberty Public School District No. 53, Clay County, 5.00%, 3/1/28 | | | 1,000 | | | | 1,063,310 | |
Reorganized School District No. 7 of Jackson County, 5.00%, 3/1/28 | | | 1,000 | | | | 1,063,620 | |
Springfield School District No. R-12, (Direct Deposit Program), 5.00%, 3/1/33 | | | 1,000 | | | | 1,209,100 | |
University City School District, 0.00%, 2/15/32 | | | 1,000 | | | | 689,190 | |
University City School District, 0.00%, 2/15/33 | | | 1,000 | | | | 670,170 | |
Wentzville R-IV School District, 0.00%, 3/1/27 | | | 1,250 | | | | 989,600 | |
Wentzville R-IV School District, 0.00%, 3/1/28 | | | 1,025 | | | | 572,565 | |
| | | | | | | | | |
| | | $ | 13,141,135 | |
| | | | | | | | | |
|
Hospital — 15.5% | |
Boone County, (Boone Hospital Center), 4.00%, 8/1/38 | | $ | 1,000 | | | $ | 1,074,980 | |
Cape Girardeau County Industrial Development Authority, (St. Francis Medical Center), 5.00%, 6/1/37 | | | 1,000 | | | | 1,128,800 | |
Missouri Health and Educational Facilities Authority, (BJC Health System), 4.15%, 1/1/32 | | | 1,000 | | | | 1,126,460 | |
Missouri Health and Educational Facilities Authority, (BJC Health System), 5.00%, 1/1/30 | | | 1,000 | | | | 1,210,480 | |
Missouri Health and Educational Facilities Authority, (Children’s Mercy Hospital), 5.625%, 5/15/39 | | | 1,000 | | | | 1,120,710 | |
Missouri Health and Educational Facilities Authority, (Heartland Regional Medical Center), 5.00%, 2/15/37 | | | 1,000 | | | | 1,147,900 | |
Missouri Health and Educational Facilities Authority, (Saint Luke’s Health System), 4.00%, 11/15/33 | | | 2,000 | | | | 2,228,760 | |
Missouri Health and Educational Facilities Authority, (SSM Healthcare), 5.00%, 6/1/36 | | | 1,000 | | | | 1,059,040 | |
Missouri Health and Educational Facilities Authority, (St. Anthony’s Medical Center), 4.00%, 2/1/40 | | | 1,000 | | | | 1,071,640 | |
Saline County Industrial Development Authority, (John Fitzgibbon Memorial Hospital), 5.60%, 12/1/28 | | | 500 | | | | 564,800 | |
| | | | | | | | | |
| | | $ | 11,733,570 | |
| | | | | | | | | |
| | | | |
| | 29 | | See Notes to Financial Statements. |
Eaton Vance
Missouri Municipal Income Fund
August 31, 2016
Portfolio of Investments — continued
| | | | | | | | |
| Security | | Principal
Amount
(000’s omitted) | | | Value | |
| | | | | | | | |
|
Housing — 0.5% | |
Missouri Housing Development Commission, SFMR, (GNMA), (AMT), 4.50%, 9/1/29 | | $ | 80 | | | $ | 84,684 | |
Missouri Housing Development Commission, SFMR, (GNMA), (AMT), 4.70%, 3/1/35 | | | 260 | | | | 276,955 | |
| | | | | | | | | |
| | | $ | 361,639 | |
| | | | | | | | | |
|
Industrial Development Revenue — 2.6% | |
Missouri Development Finance Authority, Solid Waste Disposal, (Procter & Gamble Paper Products), (AMT), 5.20%, 3/15/29 | | $ | 1,540 | | | $ | 2,004,110 | |
| | | | | | | | | |
| | | $ | 2,004,110 | |
| | | | | | | | | |
|
Insured – Electric Utilities — 1.8% | |
Puerto Rico Electric Power Authority, (NPFG), 5.25%, 7/1/29 | | $ | 950 | | | $ | 1,033,837 | |
Puerto Rico Electric Power Authority, (NPFG), 5.25%, 7/1/34 | | | 280 | | | | 306,449 | |
| | | | | | | | | |
| | | $ | 1,340,286 | |
| | | | | | | | | |
|
Insured – Escrowed / Prerefunded — 8.6% | |
Metropolitan Saint Louis Sewer District, (NPFG), Prerefunded to 5/1/17, 5.00%, 5/1/36 | | $ | 1,000 | | | $ | 1,029,390 | |
Missouri Health and Educational Facilities Authority, (Lester Cox Medical Center), (NPFG), Escrowed to Maturity, 0.00%, 9/1/20 | | | 3,590 | | | | 3,419,260 | |
Missouri Health and Educational Facilities Authority, (Saint Luke’s Health System), (AGM), Prerefunded to 11/15/18, 5.50%, 11/15/28 | | | 1,850 | | | | 2,046,895 | |
| | | | | | | | | |
| | | $ | 6,495,545 | |
| | | | | | | | | |
|
Insured – General Obligations — 4.3% | |
Platte County Reorganized School District No. R-3, (AGM), 5.00%, 3/1/25 | | $ | 1,000 | | | $ | 1,021,860 | |
Puerto Rico, (AGM), 5.00%, 7/1/35 | | | 1,000 | | | | 1,077,440 | |
Saint Charles County, Francis Howell School District, (NPFG), 5.25%, 3/1/21 | | | 1,000 | | | | 1,191,120 | |
| | | | | | | | | |
| | | $ | 3,290,420 | |
| | | | | | | | | |
|
Insured – Hospital — 2.8% | |
Missouri Health and Educational Facilities Authority, (Lester Cox Medical Center), (NPFG), 0.00%, 9/1/20 | | $ | 2,250 | | | $ | 2,093,648 | |
| | | | | | | | | |
| | | $ | 2,093,648 | |
| | | | | | | | | |
|
Insured – Industrial Development Revenue — 1.0% | |
Missouri Environmental Improvement and Energy Resources Authority, (Missouri-American Water Co.), (AMBAC), (AMT), 4.60%, 12/1/36 | | $ | 755 | | | $ | 756,782 | |
| | | | | | | | | |
| | | $ | 756,782 | |
| | | | | | | | | |
| | | | | | | | |
| Security | | Principal
Amount
(000’s omitted) | | | Value | |
| | | | | | | | |
|
Insured – Lease Revenue / Certificates of Participation — 5.4% | |
Jackson County, Leasehold Revenue, (Truman Sports Complex), (AMBAC), 0.00%, 12/1/20 | | $ | 1,000 | | | $ | 921,770 | |
Kansas City, Leasehold Revenue, (Municipal Assistance), (AMBAC), 0.00%, 4/15/26 | | | 2,170 | | | | 1,708,007 | |
Kansas City, Leasehold Revenue, (Municipal Assistance), (AMBAC), 0.00%, 4/15/30 | | | 2,105 | | | | 1,457,292 | |
| | | | | | | | | |
| | | $ | 4,087,069 | |
| | | | | | | | | |
| | |
Insured – Special Tax Revenue — 5.9% | | | | | | | | |
Bi-State Development Agency, Missouri and Illinois Metropolitan District, (Saint Clair County Metrolink), (AGM), 5.25%, 7/1/28 | | $ | 2,355 | | | $ | 3,152,026 | |
Puerto Rico Sales Tax Financing Corp., (NPFG), 0.00%, 8/1/45 | | | 3,280 | | | | 632,286 | |
Puerto Rico Sales Tax Financing Corp., (NPFG), 0.00%, 8/1/46 | | | 3,725 | | | | 676,348 | |
| | | | | | | | | |
| | | $ | 4,460,660 | |
| | | | | | | | | |
| | |
Insured – Transportation — 3.4% | | | | | | | | |
Puerto Rico Highway and Transportation Authority, (AGC), 5.25%, 7/1/41 | | $ | 1,060 | | | $ | 1,235,048 | |
Saint Louis Airport, (Lambert International Airport), (NPFG), 5.50%, 7/1/30 | | | 1,000 | | | | 1,336,480 | |
| | | | | | | | | |
| | | $ | 2,571,528 | |
| | | | | | | | | |
| | |
Senior Living / Life Care — 4.1% | | | | | | | | |
Lee’s Summit Industrial Development Authority, Senior Living Facilities, (John Knox Village), 5.125%, 8/15/32 | | $ | 925 | | | $ | 945,702 | |
Missouri Health and Educational Facilities Authority, (Bethesda Health Group, Inc.), 5.00%, 8/1/40 | | | 500 | | | | 561,345 | |
Saint Louis County Industrial Development Authority, (Friendship Village of West County), Series A, 5.50%, 9/1/28 | | | 1,000 | | | | 1,020,520 | |
Saint Louis County Industrial Development Authority, (St. Andrew’s Resources for Seniors Obligated Group), 5.00%, 12/1/35 | | | 500 | | | | 539,915 | |
| | | | | | | | | |
| | | $ | 3,067,482 | |
| | | | | | | | | |
| | |
Special Tax Revenue — 0.5% | | | | | | | | |
Puerto Rico Sales Tax Financing Corp., 5.00%, 8/1/40 | | $ | 530 | | | $ | 380,190 | |
| | | | | | | | | |
| | | $ | 380,190 | |
| | | | | | | | | |
| | |
Water and Sewer — 5.3% | | | | | | | | |
Kansas City, Sanitation Sewer System Revenue, 5.25%, 1/1/34 | | $ | 1,100 | | | $ | 1,206,733 | |
Kansas City, Water Revenue, 5.25%, 12/1/32 | | | 1,465 | | | | 1,605,830 | |
| | | | |
| | 30 | | See Notes to Financial Statements. |
Eaton Vance
Missouri Municipal Income Fund
August 31, 2016
Portfolio of Investments — continued
| | | | | | | | |
| Security | | Principal
Amount
(000’s omitted) | | | Value | |
| | | | | | | | |
| | |
Water and Sewer (continued) | | | | | | | | |
Metropolitan Saint Louis Sewer District, 5.00%, 5/1/30 | | $ | 1,000 | | | $ | 1,208,170 | |
| | |
| | | | | | $ | 4,020,733 | |
| | |
| |
Total Tax-Exempt Investments — 99.1%
(identified cost $66,837,345) | | | $ | 74,895,932 | |
| | |
| |
Other Assets, Less Liabilities — 0.9% | | | $ | 649,551 | |
| | |
| |
Net Assets — 100.0% | | | $ | 75,545,483 | |
| | |
The percentage shown for each investment category in the Portfolio of Investments is based on net assets.
The Fund invests primarily in debt securities issued by Missouri municipalities. The ability of the issuers of the debt securities to meet their obligations may be affected by economic developments in a specific industry or municipality. In order to reduce the risk associated with such economic developments, at August 31, 2016, 33.5% of total investments are backed by bond insurance of various financial institutions and financial guaranty assurance agencies. The aggregate percentage insured by an individual financial institution or financial guaranty assurance agency ranged from 1.6% to 15.6% of total investments.
| (1) | Amount is less than 0.05%. |
| (2) | Variable rate demand obligation that may be tendered at par on any day for payment the lesser of 5 business days or 7 calendar days. The stated interest rate, which resets daily, represents the rate in effect at August 31, 2016. |
| (3) | Security represents the municipal bond held by a trust that issues residual interest bonds (see Note 1H). |
| | | | | | | | | | | | | | | | | | | | | | | | |
| Futures Contracts | |
| Description | | Contracts | | | Position | | | Expiration
Month/Year | | | Aggregate Cost | | | Value | | | Net Unrealized
Appreciation | |
| | | | | | |
Interest Rate Futures | | | | | | | | | | | | | | | | | | | | | | | | |
| U.S. 10-Year Treasury Note | | | 29 | | | | Short | | | | Dec-16 | | | $ | (3,806,195 | ) | | $ | (3,796,734 | ) | | $ | 9,461 | |
| U.S. Long Treasury Bond | | | 6 | | | | Short | | | | Dec-16 | | | | (1,025,923 | ) | | | (1,022,250 | ) | | | 3,673 | |
| | | | | | |
| | | | | | | | | | | | | | | | | | | | | | | $ | 13,134 | |
Abbreviations:
| | | | |
| AGC | | – | | Assured Guaranty Corp. |
| AGM | | – | | Assured Guaranty Municipal Corp. |
| AMBAC | | – | | AMBAC Financial Group, Inc. |
| AMT | | – | | Interest earned from these securities may be considered a tax preference item for purposes of the Federal Alternative Minimum Tax. |
| GNMA | | – | | Government National Mortgage Association |
| LOC | | – | | Letter of Credit |
| NPFG | | – | | National Public Finance Guaranty Corp. |
| SFMR | | – | | Single Family Mortgage Revenue |
| | | | |
| | 31 | | See Notes to Financial Statements. |
Eaton Vance
North Carolina Municipal Income Fund
August 31, 2016
Portfolio of Investments
| | | | | | | | |
| Tax-Exempt Investments — 104.8% | |
| | |
| | | | | | | | |
| Security | | Principal Amount (000’s omitted) | | | Value | |
| | |
Education — 10.4% | | | | | | | | |
Appalachian State University, 5.00%, 10/1/25 | | $ | 400 | | | $ | 514,644 | |
Appalachian State University, 5.00%, 10/1/26 | | | 325 | | | | 420,803 | |
North Carolina Capital Facilities Finance Agency, (Davidson College), 5.00%, 3/1/25 | | | 365 | | | | 436,894 | |
North Carolina Capital Facilities Finance Agency, (Duke University), 5.00%, 10/1/38(1) | | | 5,000 | | | | 5,528,750 | |
North Carolina Capital Facilities Finance Agency, (Duke University), 5.00%, 10/1/41 | | | 2,000 | | | | 2,469,880 | |
North Carolina State University at Raleigh, 5.00%, 10/1/42 | | | 1,140 | | | | 1,388,338 | |
University of North Carolina at Charlotte, 5.00%, 4/1/32 | | | 1,250 | | | | 1,482,725 | |
University of North Carolina at Greensboro, 5.00%, 4/1/26 | | | 660 | | | | 823,924 | |
University of North Carolina at Greensboro, 5.00%, 4/1/31 | | | 1,020 | | | | 1,211,709 | |
| | | | | | | | | |
| | | | | | $ | 14,277,667 | |
| | | | | | | | | |
| | |
Electric Utilities — 4.0% | | | | | | | | |
Greenville Combined Enterprise System Revenue, 4.00%, 4/1/46 | | $ | 690 | | | $ | 772,089 | |
North Carolina Eastern Municipal Power Agency, Prerefunded to 1/1/19, 6.75%, 1/1/24 | | | 2,000 | | | | 2,281,280 | |
North Carolina Municipal Power Agency No. 1, (Catawba), 5.00%, 1/1/30 | | | 355 | | | | 387,749 | |
North Carolina Municipal Power Agency No. 1, (Catawba), 5.00%, 1/1/31 | | | 885 | | | | 1,039,211 | |
North Carolina Municipal Power Agency No. 1, (Catawba), Prerefunded to 1/1/19, 5.00%, 1/1/30 | | | 875 | | | | 961,599 | |
| | | | | | | | | |
| | | | | | $ | 5,441,928 | |
| | | | | | | | | |
| | |
Escrowed / Prerefunded — 17.8% | | | | | | | | |
Cabarrus County Certificates of Participation, Prerefunded to 6/1/18, 5.00%, 6/1/29 | | $ | 1,550 | | | $ | 1,669,149 | |
Cabarrus County Certificates of Participation, Prerefunded to 6/1/18, 5.25%, 6/1/28 | | | 1,400 | | | | 1,513,694 | |
Cape Fear Public Utility Authority, Water and Sewer System, Prerefunded to 8/1/18, 5.00%, 8/1/35 | | | 2,505 | | | | 2,714,393 | |
Cary, Combined Enterprise System Revenue, Prerefunded to 12/1/17, 5.00%, 12/1/33 | | | 2,000 | | | | 2,111,640 | |
Durham County Certificates of Participation, Prerefunded to 6/1/19, 5.00%, 6/1/31 | | | 1,000 | | | | 1,117,200 | |
North Carolina Capital Facilities Finance Agency, (Wake Forest University), Prerefunded to 1/1/19, 5.00%, 1/1/38 | | | 2,450 | | | | 2,695,465 | |
North Carolina Medical Care Commission, (Duke University Health System), Series 2009A, Prerefunded to 6/1/19, 5.00%, 6/1/42 | | | 2,295 | | | | 2,560,623 | |
North Carolina Medical Care Commission, (Mission Health System, Inc.), Prerefunded to 10/1/17, 5.00%, 10/1/25 | | | 2,000 | | | | 2,096,660 | |
| | | | | | | | |
| Security | | Principal Amount (000’s omitted) | | | Value | |
| | |
Escrowed / Prerefunded (continued) | | | | | | | | |
North Carolina Medical Care Commission, (Mission Health System, Inc.), Prerefunded to 10/1/17, 5.00%, 10/1/36 | | $ | 305 | | | $ | 319,741 | |
North Carolina Medical Care Commission, (University Health Systems of Eastern Carolina), Prerefunded to 12/1/18, 6.25%, 12/1/33 | | | 2,500 | | | | 2,811,975 | |
Puerto Rico Electric Power Authority, Escrowed to various sinking fund dates through 7/1/17, Series N, 0.00%, 7/1/17 | | | 405 | | | | 402,898 | |
Wake County, Prerefunded to 6/1/19, 5.00%, 6/1/36 | | | 1,000 | | | | 1,116,610 | |
Winston-Salem, Water and Sewer System, Prerefunded to 6/1/19, 5.00%, 6/1/34 | | | 1,000 | | | | 1,117,200 | |
Winston-Salem, Water and Sewer System, Prerefunded to 6/1/19, 5.00%, 6/1/39 | | | 2,000 | | | | 2,234,400 | |
| | | | | | | | | |
| | | | | | $ | 24,481,648 | |
| | | | | | | | | |
| | |
General Obligations — 5.4% | | | | | | | | |
Dare County Limited Obligation Bonds, 4.00%, 6/1/31 | | $ | 125 | | | $ | 142,408 | |
Dare County Limited Obligation Bonds, 5.00%, 6/1/20 | | | 340 | | | | 390,490 | |
Dare County Limited Obligation Bonds, 5.00%, 6/1/21 | | | 245 | | | | 289,347 | |
Dare County Limited Obligation Bonds, 5.00%, 6/1/22 | | | 450 | | | | 542,673 | |
Dare County Limited Obligation Bonds, 5.00%, 6/1/23 | | | 450 | | | | 552,960 | |
Davidson County, 5.00%, 6/1/24 | | | 600 | | | | 762,348 | |
Greensboro, 5.00%, 2/1/27 | | | 650 | | | | 817,108 | |
North Carolina, 4.00%, 6/1/23 | | | 2,000 | | | | 2,363,820 | |
North Carolina, 5.00%, 6/1/22 | | | 500 | | | | 611,670 | |
Wake County, (SPA: Wells Fargo Bank, N.A.), 0.56%, 4/1/20(2) | | | 1,000 | | | | 1,000,000 | |
| | | | | | | | | |
| | | | | | $ | 7,472,824 | |
| | | | | | | | | |
| | |
Hospital — 14.8% | | | | | | | | |
North Carolina Medical Care Commission, (Cape Fear Valley Health System), 5.00%, 10/1/32 | | $ | 2,000 | | | $ | 2,271,440 | |
North Carolina Medical Care Commission, (Duke University Health System), 4.00%, 6/1/42 | | | 1,000 | | | | 1,122,610 | |
North Carolina Medical Care Commission, (Duke University Health System), 5.00%, 6/1/26 | | | 1,150 | | | | 1,494,034 | |
North Carolina Medical Care Commission, (Duke University Health System), Series 2012A, 5.00%, 6/1/42 | | | 1,250 | | | | 1,460,837 | |
North Carolina Medical Care Commission, (Mission Health System, Inc.), 5.00%, 10/1/36 | | | 520 | | | | 541,258 | |
North Carolina Medical Care Commission, (North Carolina Baptist Hospital), 5.25%, 6/1/29 | | | 3,100 | | | | 3,534,372 | |
North Carolina Medical Care Commission, (Novant Health, Inc.), Series A, 4.75%, 11/1/43 | | | 1,000 | | | | 1,077,580 | |
North Carolina Medical Care Commission, (Rex Hospital, Inc.), 5.00%, 7/1/32 | | | 1,000 | | | | 1,220,500 | |
North Carolina Medical Care Commission, (Rex Hospital, Inc.), Series A, 5.00%, 7/1/30 | | | 910 | | | | 1,020,611 | |
| | | | |
| | 32 | | See Notes to Financial Statements. |
Eaton Vance
North Carolina Municipal Income Fund
August 31, 2016
Portfolio of Investments — continued
| | | | | | | | |
| Security | | Principal Amount (000’s omitted) | | | Value | |
| | |
Hospital (continued) | | | | | | | | |
North Carolina Medical Care Commission, (Southeastern Regional Medical Center), 5.00%, 6/1/32 | | $ | 1,645 | | | $ | 1,856,876 | |
North Carolina Medical Care Commission, (Vidant Health), 5.00%, 6/1/31 | | | 2,000 | | | | 2,455,060 | |
North Carolina Medical Care Commission, (WakeMed), 5.00%, 10/1/31 | | | 2,000 | | | | 2,346,100 | |
| | | | | | | | | |
| | | | | | $ | 20,401,278 | |
| | | | | | | | | |
| | |
Housing — 1.7% | | | | | | | | |
Charlotte Housing Authority, (South Oaks Crossing Apartments), MFMR, (GNMA), (AMT), 4.60%, 8/20/26 | | $ | 1,430 | | | $ | 1,432,445 | |
North Carolina Housing Finance Agency, (AMT), 4.80%, 1/1/39 | | | 840 | | | | 844,125 | |
| | | | | | | | | |
| | | | | | $ | 2,276,570 | |
| | | | | | | | | |
| | |
Industrial Development Revenue — 0.6% | | | | | | | | |
Columbus County Industrial Facilities & Pollution Control Financing Authority, 5.70%, 5/1/34 | | $ | 750 | | | $ | 867,045 | |
| | | | | | | | | |
| | | | | | $ | 867,045 | |
| | | | | | | | | |
| | |
Insured – Education — 0.1% | | | | | | | | |
University of North Carolina, (AGC), 5.00%, 10/1/33 | | $ | 155 | | | $ | 167,625 | |
| | | | | | | | | |
| | | | | | $ | 167,625 | |
| | | | | | | | | |
| | |
Insured – Electric Utilities — 1.9% | | | | | | | | |
Puerto Rico Electric Power Authority, (NPFG), 5.25%, 7/1/34 | | $ | 1,740 | | | $ | 1,904,360 | |
Puerto Rico Electric Power Authority, (NPFG), 5.25%, 7/1/35 | | | 600 | | | | 654,702 | |
| | | | | | | | | |
| | | | | | $ | 2,559,062 | |
| | | | | | | | | |
| | |
Insured – Escrowed / Prerefunded — 8.1% | | | | | | | | |
Johnston Memorial Hospital Authority, (AGM), Prerefunded to 4/1/18, 5.25%, 10/1/36(1)(3) | | $ | 6,560 | | | $ | 7,039,405 | |
Monroe, Certificates of Participation, (AGC), Prerefunded to 3/1/19, 5.50%, 3/1/39 | | | 1,000 | | | | 1,119,420 | |
Monroe, Combined Enterprise System Revenue, (AGC), Prerefunded to 3/1/18, 5.00%, 3/1/33 | | | 1,950 | | | | 2,077,998 | |
University of North Carolina, (AGC), Prerefunded to 10/1/18, 5.00%, 10/1/33 | | | 895 | | | | 975,818 | |
| | | | | | | | | |
| | | | | | $ | 11,212,641 | |
| | | | | | | | | |
| | |
Insured – General Obligations — 0.2% | | | | | | | | |
Puerto Rico, (NPFG), 5.50%, 7/1/20 | | $ | 285 | | | $ | 309,262 | |
| | | | | | | | | |
| | | | | | $ | 309,262 | |
| | | | | | | | | |
| | | | | | | | |
| Security | | Principal Amount (000’s omitted) | | | Value | |
| | |
Insured – Hospital — 1.8% | | | | | | | | |
North Carolina Medical Care Commission, (Novant Health Obligated Group), (BHAC), (NPFG), 5.00%, 11/1/39 | | $ | 2,500 | | | $ | 2,518,650 | |
| | | | | | | | | |
| | | | | | $ | 2,518,650 | |
| | | | | | | | | |
|
Insured – Lease Revenue / Certificates of Participation — 1.1% | |
Franklin County, Certificates of Participation, (NPFG), 5.00%, 9/1/27 | | $ | 1,500 | | | $ | 1,559,505 | |
| | | | | | | | | |
| | | | | | $ | 1,559,505 | |
| | | | | | | | | |
| | |
Insured – Special Tax Revenue — 0.4% | | | | | | | | |
Puerto Rico Infrastructure Financing Authority, (AMBAC), 5.50%, 7/1/27 | | $ | 550 | | | $ | 592,070 | |
| | | | | | | | | |
| | | | | | $ | 592,070 | |
| | | | | | | | | |
| | |
Insured – Transportation — 5.0% | | | | | | | | |
North Carolina Turnpike Authority, (Triangle Expressway System), (AGC), 0.00%, 1/1/35 | | $ | 6,500 | | | $ | 3,721,900 | |
North Carolina Turnpike Authority, (Triangle Expressway System), (AGC), 5.375%, 1/1/26 | | | 1,000 | | | | 1,093,580 | |
Puerto Rico Highway and Transportation Authority, (AGC), 5.25%, 7/1/41 | | | 1,800 | | | | 2,097,252 | |
| | | | | | | | | |
| | | | | | $ | 6,912,732 | |
| | | | | | | | | |
| | |
Lease Revenue / Certificates of Participation — 15.6% | | | | | | | | |
Buncombe County, 5.00%, 6/1/29 | | $ | 750 | | | $ | 923,580 | |
Buncombe County, 5.00%, 6/1/31 | | | 1,000 | | | | 1,228,050 | |
Cabarrus County Limited Obligation Bonds, 5.00%, 4/1/29 | | | 1,000 | | | | 1,264,920 | |
Cabarrus County Limited Obligation Bonds, 5.00%, 4/1/30 | | | 1,000 | | | | 1,258,440 | |
Davidson County Limited Obligation Bonds, 5.00%, 6/1/28 | | | 1,000 | | | | 1,292,290 | |
Davidson County Limited Obligation Bonds, 5.00%, 6/1/30 | | | 1,010 | | | | 1,283,316 | |
Durham Capital Financing Corp., 5.00%, 6/1/32 | | | 1,700 | | | | 2,031,857 | |
Durham Capital Financing Corp., 5.00%, 6/1/38 | | | 1,000 | | | | 1,209,580 | |
North Carolina Turnpike Authority, (Monroe Connector System), 5.00%, 7/1/31 | | | 1,000 | | | | 1,160,040 | |
North Carolina Turnpike Authority, (Monroe Connector System), 5.00%, 7/1/36 | | | 1,750 | | | | 2,030,070 | |
North Carolina, Capital Improvement Limited Obligation Bonds, 5.00%, 5/1/30 | | | 1,000 | | | | 1,167,510 | |
North Carolina, Capital Improvement Limited Obligation Bonds, 5.25%, 5/1/31 | | | 1,000 | | | | 1,154,980 | |
Raleigh Limited Obligation Bonds, 5.00%, 2/1/27 | | | 1,000 | | | | 1,290,530 | |
Raleigh, (Downtown Improvement Projects), Prerefunded to 2/1/17, 5.00%, 2/1/27 | | | 2,000 | | | | 2,037,280 | |
Watauga Public Facilities Corp., 5.00%, 6/1/27 | | | 1,000 | | | | 1,183,940 | |
Winston-Salem, 5.00%, 6/1/27 | | | 750 | | | | 932,378 | |
| | | | | | | | | |
| | | | | | $ | 21,448,761 | |
| | | | | | | | | |
| | | | |
| | 33 | | See Notes to Financial Statements. |
Eaton Vance
North Carolina Municipal Income Fund
August 31, 2016
Portfolio of Investments — continued
| | | | | | | | |
| Security | | Principal Amount (000’s omitted) | | | Value | |
| | |
Other Revenue — 1.9% | | | | | | | | |
Durham County Industrial Facilities & Pollution Control Financing Authority, (Research Triangle Institute), 5.00%, 2/1/24 | | $ | 1,000 | | | $ | 1,245,830 | |
Durham County Industrial Facilities & Pollution Control Financing Authority, (Research Triangle Institute), 5.00%, 2/1/25 | | | 1,035 | | | | 1,314,160 | |
| | | | | | | | | |
| | | | | | $ | 2,559,990 | |
| | | | | | | | | |
| | |
Senior Living / Life Care — 2.1% | | | | | | | | |
North Carolina Medical Care Commission, (Deerfield Episcopal Retirement Community, Inc.), 5.00%, 11/1/37 | | $ | 2,315 | | | $ | 2,821,198 | |
| | | | | | | | | |
| | | | | | $ | 2,821,198 | |
| | | | | | | | | |
| | |
Solid Waste — 0.8% | | | | | | | | |
Mecklenburg County, Special Obligation, 5.00%, 1/1/26 | | $ | 1,000 | | | $ | 1,161,810 | |
| | | | | | | | | |
| | | | | | $ | 1,161,810 | |
| | | | | | | | | |
| | |
Transportation — 3.3% | | | | | | | | |
Charlotte Airport, 5.50%, 7/1/34 | | $ | 535 | | | $ | 614,961 | |
Charlotte Airport, (AMT), 5.00%, 7/1/36 | | | 1,500 | | | | 1,679,115 | |
Charlotte Airport, (AMT), 5.375%, 7/1/28 | | | 1,000 | | | | 1,127,470 | |
North Carolina Ports Authority, 5.25%, 2/1/40 | | | 1,000 | | | | 1,123,390 | |
| | | | | | | | | |
| | | | | | $ | 4,544,936 | |
| | | | | | | | | |
| | |
Water and Sewer — 7.8% | | | | | | | | |
Brunswick County, (Water and Wastewater Systems), 5.00%, 4/1/30 | | $ | 750 | | | $ | 931,987 | |
Buncombe County Metropolitan Sewerage District, 5.00%, 7/1/26 | | | 355 | | | | 445,312 | |
Buncombe County Metropolitan Sewerage District, 5.00%, 7/1/28 | | | 540 | | | | 669,271 | |
Carolina Beach, Enterprise Systems Revenue, 4.00%, 6/1/32 | | | 385 | | | | 443,678 | |
Carolina Beach, Enterprise Systems Revenue, 5.00%, 6/1/31 | | | 200 | | | | 251,492 | |
Charlotte, Water and Sewer, 5.00%, 7/1/34 | | | 1,000 | | | | 1,118,170 | |
Charlotte, Water and Sewer, 5.00%, 7/1/38 | | | 1,750 | | | | 2,005,132 | |
Concord Utilities Systems Revenue, 5.00%, 12/1/29 | | | 845 | | | | 1,082,665 | |
Concord Utilities Systems Revenue, 5.00%, 12/1/31 | | | 775 | | | | 985,513 | |
Jacksonville, Enterprise Systems Revenue, 5.00%, 5/1/25 | | | 250 | | | | 320,163 | |
Jacksonville, Enterprise Systems Revenue, 5.00%, 5/1/26 | | | 625 | | | | 812,456 | |
Raleigh, Combined Enterprise System Revenue, 5.00%, 3/1/25 | | | 1,000 | | | | 1,243,430 | |
| | | | | | | | |
| Security | | Principal Amount (000’s omitted) | | | Value | |
| | |
Water and Sewer (continued) | | | | | | | | |
Wilmington, Storm Water Fee Revenue, 5.00%, 6/1/30 | | $ | 400 | | | $ | 499,880 | |
| | | | | | | | | |
| | | | | | $ | 10,809,149 | |
| | | | | | | | | |
| |
Total Tax-Exempt Investments — 104.8%
(identified cost $132,296,302) | | | $ | 144,396,351 | |
| | | | | | | | | |
| |
Other Assets, Less Liabilities — (4.8)% | | | $ | (6,611,758 | ) |
| | | | | | | | | |
| |
Net Assets — 100.0% | | | $ | 137,784,593 | |
| | | | | | | | | |
The percentage shown for each investment category in the Portfolio of Investments is based on net assets.
The Fund invests primarily in debt securities issued by North Carolina municipalities. The ability of the issuers of the debt securities to meet their obligations may be affected by economic developments in a specific industry or municipality. In order to reduce the risk associated with such economic developments, at August 31, 2016, 17.9% of total investments are backed by bond insurance of various financial institutions and financial guaranty assurance agencies. The aggregate percentage insured by an individual financial institution or financial guaranty assurance agency ranged from 0.4% to 7.8% of total investments.
| (1) | Security represents the municipal bond held by a trust that issues residual interest bonds (see Note 1H). |
| (2) | Variable rate demand obligation that may be tendered at par on any day for payment the lesser of 5 business days or 7 calendar days. The stated interest rate, which generally resets weekly, represents the rate in effect at August 31, 2016. |
| (3) | Security (or a portion thereof) has been pledged as collateral for residual interest bond transactions. The aggregate value of such collateral is $2,119,405. |
Abbreviations:
| | | | |
| AGC | | – | | Assured Guaranty Corp. |
| AGM | | – | | Assured Guaranty Municipal Corp. |
| AMBAC | | – | | AMBAC Financial Group, Inc. |
| AMT | | – | | Interest earned from these securities may be considered a tax preference item for purposes of the Federal Alternative Minimum Tax. |
| BHAC | | – | | Berkshire Hathaway Assurance Corp. |
| GNMA | | – | | Government National Mortgage Association |
| MFMR | | – | | Multi-Family Mortgage Revenue |
| NPFG | | – | | National Public Finance Guaranty Corp. |
| SPA | | – | | Standby Bond Purchase Agreement |
| | | | |
| | 34 | | See Notes to Financial Statements. |
Eaton Vance
Oregon Municipal Income Fund
August 31, 2016
Portfolio of Investments
| | | | | | | | |
| Tax-Exempt Investments — 103.7% | | | | | | | | |
| | |
| | | | | | | | |
| Security | | Principal Amount (000’s omitted) | | | Value | |
| | |
Education — 8.3% | | | | | | | | |
Forest Grove, (Pacific University), 5.00%, 5/1/30 | | $ | 500 | | | $ | 602,895 | |
Forest Grove, (Pacific University), 5.25%, 5/1/34 | | | 1,000 | | | | 1,156,440 | |
Oregon Facilities Authority, (Lewis & Clark College), 5.625%, 10/1/36 | | | 2,000 | | | | 2,401,220 | |
Oregon Facilities Authority, (Linfield College), 5.00%, 10/1/34 | | | 1,000 | | | | 1,104,230 | |
Oregon Facilities Authority, (Reed College), 4.75%, 7/1/32 | | | 250 | | | | 280,900 | |
Oregon Facilities Authority, (Reed College), 5.00%, 7/1/29 | | | 250 | | | | 284,375 | |
Oregon Facilities Authority, (Reed College), 5.125%, 7/1/41 | | | 1,630 | | | | 1,856,146 | |
Oregon Facilities Authority, (University of Portland), 5.00%, 4/1/27 | | | 500 | | | | 619,545 | |
Oregon Facilities Authority, (University of Portland), 5.00%, 4/1/29 | | | 500 | | | | 611,035 | |
Oregon Facilities Authority, (Willamette University), 5.00%, 10/1/40 | | | 1,000 | | | | 1,221,580 | |
| | | | | | | | | |
| | | | | | $ | 10,138,366 | |
| | | | | | | | | |
| | |
Electric Utilities — 1.2% | | | | | | | | |
Port of Morrow, (Portland General Electric), 5.00%, 5/1/33 | | $ | 1,250 | | | $ | 1,431,863 | |
| | | | | | | | | |
| | | | | | $ | 1,431,863 | |
| | | | | | | | | |
| | |
Escrowed / Prerefunded — 9.8% | | | | | | | | |
Deschutes County Hospital Facilities Authority, (Cascade Healthcare Community), Prerefunded to 1/1/19, 8.25%, 1/1/38 | | $ | 2,500 | | | $ | 2,938,275 | |
Oregon Health and Science University, Prerefunded to 7/1/19, 5.75%, 7/1/39 | | | 2,000 | | | | 2,280,720 | |
Port of Portland, Portland International Airport, Prerefunded to 7/1/18, 5.00%, 7/1/29 | | | 4,000 | | | | 4,321,520 | |
Tri-County Metropolitan Transportation District, Prerefunded to 9/1/22, 5.00%, 9/1/30 | | | 2,000 | | | | 2,459,720 | |
| | | | | | | | | |
| | | | | | $ | 12,000,235 | |
| | | | | | | | | |
| | |
General Obligations — 32.1% | | | | | | | | |
Beaverton School District 48J, Washington and Multnomah Counties, 5.00%, 6/15/32 | | $ | 1,235 | | | $ | 1,512,937 | |
Central School District No. 13J, Polk, Marion and Benton Counties, 0.00%, 6/15/38 | | | 750 | | | | 409,643 | |
Chemeketa Community College District, 5.00%, 6/15/25 | | | 1,000 | | | | 1,255,300 | |
David Douglas School District No. 40, Multnomah County, 0.00%, 6/15/24 | | | 1,640 | | | | 1,425,308 | |
Fern Ridge School District 28J, Lane and Douglas Counties, 4.00%, 6/15/24 | | | 1,055 | | | | 1,261,020 | |
Fern Ridge School District 28J, Lane and Douglas Counties, 5.00%, 6/15/25 | | | 575 | | | | 741,618 | |
| | | | | | | | |
| Security | | Principal Amount (000’s omitted) | | | Value | |
| | |
General Obligations (continued) | | | | | | | | |
Forest Grove School District No. 15, Washington County, 0.00%, 6/15/26 | | $ | 1,975 | | | $ | 1,617,367 | |
Klamath County School District, 5.00%, 6/15/29 | | | 1,155 | | | | 1,412,553 | |
Lake Oswego, 5.00%, 6/1/33 | | | 2,450 | | | | 3,001,985 | |
Medford, 5.00%, 7/15/32 | | | 545 | | | | 664,333 | |
Medford School District No. 549C, Jackson County, Prerefunded to 6/15/18, 5.00%, 6/15/33 | | | 2,000 | | | | 2,156,280 | |
North Clackamas School District No. 12, Clackamas County, 5.00%,��6/15/28 | | | 2,500 | | | | 3,103,725 | |
Oregon Elderly and Disabled Housing, (AMT), 5.65%, 8/1/26 | | | 1,570 | | | | 1,574,820 | |
Pendleton School District No. 16R, Umatilla County, 5.00%, 6/15/24 | | | 1,220 | | | | 1,548,156 | |
Pendleton School District No. 16R, Umatilla County, 5.00%, 6/15/28 | | | 1,000 | | | | 1,239,840 | |
Philomath School District No. 17J, Benton and Polk Counties, 0.00%, 6/15/28 | | | 1,500 | | | | 1,170,195 | |
Philomath School District No. 17J, Benton and Polk Counties, 0.00%, 6/15/30 | | | 700 | | | | 503,769 | |
Philomath School District No. 17J, Benton and Polk Counties, 0.00%, 6/15/31 | | | 425 | | | | 294,317 | |
Portland Housing Authority, (Pearl Court LP), (AMT), 4.625%, 1/1/27 | | | 1,280 | | | | 1,288,550 | |
Portland Housing Authority, (Yards Union Station Project), (AMT), 4.75%, 5/1/22 | | | 465 | | | | 473,370 | |
Portland Housing Authority, (Yards Union Station Project), (AMT), 4.85%, 5/1/29 | | | 2,740 | | | | 2,774,716 | |
Portland, Limited Tax, (Sellwood Bridge Project), 5.00%, 6/1/23 | | | 1,240 | | | | 1,543,192 | |
Redmond, 5.00%, 6/1/28 | | | 605 | | | | 740,078 | |
Redmond School District No. 2J, Deschutes and Jefferson Counties, 0.00%, 6/15/25 | | | 460 | | | | 397,463 | |
Redmond School District No. 2J, Deschutes and Jefferson Counties, 0.00%, 6/15/27 | | | 3,175 | | | | 2,560,669 | |
Riverdale School District No. 51JT, Multnomah and Clackamas Counties, 0.00%, 6/15/29 | | | 1,000 | | | | 749,010 | |
Riverdale School District No. 51JT, Multnomah and Clackamas Counties, 0.00%, 6/15/30 | | | 1,215 | | | | 874,399 | |
Rogue Community College District, 4.00%, 6/15/31 | | | 700 | | | | 815,094 | |
Salem-Keizer School District No. 24J, 0.00%, 6/15/29 | | | 1,050 | | | | 783,972 | |
Springfield School District No. 19, Lane County, 5.00%, 6/15/29 | | | 1,000 | | | | 1,256,340 | |
| | | | | | | | | |
| | | | | | $ | 39,150,019 | |
| | | | | | | | | |
| | |
Hospital — 7.2% | | | | | | | | |
Astoria Hospital Facilities Authority, (Columbia Memorial Hospital), 5.00%, 8/1/41 | | $ | 500 | | | $ | 589,680 | |
| | | | |
| | 35 | | See Notes to Financial Statements. |
Eaton Vance
Oregon Municipal Income Fund
August 31, 2016
Portfolio of Investments — continued
| | | | | | | | |
| Security | | Principal Amount (000’s omitted) | | | Value | |
| | |
Hospital (continued) | | | | | | | | |
Hood River County Health Facilities Authority, Elderly Housing, (Down Manor), 6.50%, 1/1/17 | | $ | 480 | | | $ | 482,179 | |
Klamath Falls Intercommunity Hospital Authority, (Sky Lakes Medical Center), 5.00%, 9/1/20 | | | 1,320 | | | | 1,521,920 | |
Klamath Falls Intercommunity Hospital Authority, (Sky Lakes Medical Center), 5.00%, 9/1/22 | | | 250 | | | | 299,948 | |
Oregon Facilities Authority, (Legacy Health System), 5.00%, 3/15/30 | | | 3,685 | | | | 4,102,253 | |
Oregon Facilities Authority, (PeaceHealth), 5.00%, 11/15/29 | | | 1,500 | | | | 1,830,765 | |
| | | | | | | | | |
| | | | | | $ | 8,826,745 | |
| | | | | | | | | |
| | |
Housing — 5.1% | | | | | | | | |
Oregon Housing and Community Services Department, (AMT), 4.85%, 7/1/37 | | $ | 1,150 | | | $ | 1,155,761 | |
Oregon Housing and Community Services Department, (AMT), 5.15%, 7/1/42 | | | 4,730 | | | | 5,016,922 | |
| | | | | | | | | |
| | | | | | $ | 6,172,683 | |
| | | | | | | | | |
| | |
Insured – Electric Utilities — 3.4% | | | | | | | | |
Puerto Rico Electric Power Authority, (NPFG), 5.25%, 7/1/29 | | $ | 1,045 | | | $ | 1,137,221 | |
Puerto Rico Electric Power Authority, (NPFG), 5.25%, 7/1/34 | | | 2,760 | | | | 3,020,710 | |
| | | | | | | | | |
| | | | | | $ | 4,157,931 | |
| | | | | | | | | |
| | |
Insured – Escrowed / Prerefunded — 0.7% | | | | | | | | |
Beaverton School District, (AGC), Prerefunded to 6/1/19, 5.125%, 6/1/36 | | $ | 715 | | | $ | 801,644 | |
| | | | | | | | | |
| | | | | | $ | 801,644 | |
| | | | | | | | | |
| | |
Insured – General Obligations — 6.5% | | | | | | | | |
Lebanon Community School District No. 9, Linn County, (NPFG), 5.50%, 6/15/30 | | $ | 4,000 | | | $ | 5,574,080 | |
Newport, (AGC), 0.00%, 6/1/28 | | | 1,000 | | | | 776,450 | |
Newport, (AGC), 0.00%, 6/1/29 | | | 1,225 | | | | 912,784 | |
West Linn-Wilsonville School District No. 3Jt, Clackamas and Washington Counties, (NPFG), 0.00%, 6/15/23 | | | 800 | | | | 724,568 | |
| | | | | | | | | |
| | | | | | $ | 7,987,882 | |
| | | | | | | | | |
| | |
Insured – Hospital — 7.9% | | | | | | | | |
Deschutes County Hospital Facilities Authority, (Cascade Healthcare Community), (AMBAC), Prerefunded to 1/1/18, 5.375%, 1/1/35 | | $ | 1,415 | | | $ | 1,504,881 | |
Medford Hospital Facilities Authority, (Asante Health System), (AGM), 5.50%, 8/15/28 | | | 3,000 | | | | 3,449,520 | |
Oregon Health and Science University, (NPFG), 0.00%, 7/1/21 | | | 5,265 | | | | 4,663,632 | |
| | | | | | | | | |
| | | | | | $ | 9,618,033 | |
| | | | | | | | | |
| | | | | | | | |
| Security | | Principal Amount (000’s omitted) | | | Value | |
| | |
Insured – Special Tax Revenue — 2.5% | | | | | | | | |
Puerto Rico Infrastructure Financing Authority, (AMBAC), 0.00%, 7/1/44 | | $ | 12,100 | | | $ | 1,961,531 | |
Puerto Rico Infrastructure Financing Authority, (AMBAC), 5.50%, 7/1/27 | | | 1,015 | | | | 1,092,637 | |
| | | | | | | | | |
| | | | | | $ | 3,054,168 | |
| | | | | | | | | |
| | |
Insured – Transportation — 4.7% | | | | | | | | |
Jackson County, Airport, (XLCA), Prerefunded to 12/1/17, 5.25%, 12/1/32 | | $ | 315 | | | $ | 333,361 | |
Jackson County, Airport, (XLCA), Prerefunded to 12/1/17, 5.25%, 12/1/37 | | | 1,685 | | | | 1,783,219 | |
Jackson County, Airport, (XLCA), (AMT), 5.25%, 12/1/23 | | | 1,390 | | | | 1,459,500 | |
Puerto Rico Highway and Transportation Authority, (AGC), 5.25%, 7/1/41 | | | 1,800 | | | | 2,097,252 | |
| | | | | | | | | |
| | | | | | $ | 5,673,332 | |
| | | | | | | | | |
| | |
Other Revenue — 7.9% | | | | | | | | |
Oregon Department of Administrative Services, Prerefunded to 4/1/19, 5.00%, 4/1/28(1)(2) | | $ | 8,740 | | | $ | 9,695,719 | |
| | | | | | | | | |
| | | | | | $ | 9,695,719 | |
| | | | | | | | | |
| | |
Senior Living / Life Care — 1.1% | | | | | | | | |
Multnomah County Hospital Facilities Authority, (Mirabella at South Waterfront), 5.00%, 10/1/24 | | $ | 415 | | | $ | 481,898 | |
Multnomah County Hospital Facilities Authority, (Terwilliger Plaza, Inc.), 5.00%, 12/1/36 | | | 750 | | | | 908,385 | |
| | | | | | | | | |
| | | | | | $ | 1,390,283 | |
| | | | | | | | | |
| | |
Special Tax Revenue — 2.5% | | | | | | | | |
Oregon Department of Transportation, Highway User Tax Revenue, 5.00%, 11/15/24 | | $ | 1,500 | | | $ | 1,929,270 | |
Puerto Rico Sales Tax Financing Corp., 5.25%, 8/1/40 | | | 1,525 | | | | 1,095,819 | |
| | | | | | | | | |
| | | | | | $ | 3,025,089 | |
| | | | | | | | | |
| | |
Transportation — 1.4% | | | | | | | | |
Redmond, Airport Revenue, 5.50%, 6/1/24 | | $ | 215 | | | $ | 236,788 | |
Redmond, Airport Revenue, 5.75%, 6/1/27 | | | 200 | | | | 221,036 | |
Redmond, Airport Revenue, 6.00%, 6/1/34 | | | 550 | | | | 613,778 | |
Redmond, Airport Revenue, 6.25%, 6/1/39 | | | 600 | | | | 672,210 | |
| | | | | | | | | |
| | | | | | $ | 1,743,812 | |
| | | | | | | | | |
| | |
Water and Sewer — 1.4% | | | | | | | | |
Clackamas River Water, 5.00%, 11/1/29 | | $ | 100 | | | $ | 125,053 | |
Clackamas River Water, 5.00%, 11/1/31 | | | 250 | | | | 310,525 | |
| | | | |
| | 36 | | See Notes to Financial Statements. |
Eaton Vance
Oregon Municipal Income Fund
August 31, 2016
Portfolio of Investments — continued
| | | | | | | | |
| Security | | Principal Amount (000’s omitted) | | | Value | |
| | |
Water and Sewer (continued) | | | | | | | | |
Eugene Water Utility System Revenue, 4.00%, 8/1/30 | | $ | 500 | | | $ | 587,085 | |
Eugene Water Utility System Revenue, 5.00%, 8/1/28 | | | 500 | | | | 646,725 | |
| | | | | | | | | |
| | | | | | $ | 1,669,388 | |
| | | | | | | | | |
| |
Total Tax-Exempt Investments — 103.7%
(identified cost $113,805,328) | | | $ | 126,537,192 | |
| | | | | | | | | |
| |
Other Assets, Less Liabilities — (3.7)% | | | $ | (4,463,137 | ) |
| | | | | | | | | |
| |
Net Assets — 100.0% | | | $ | 122,074,055 | |
| | | | | | | | | |
The percentage shown for each investment category in the Portfolio of Investments is based on net assets.
The Fund invests primarily in debt securities issued by Oregon municipalities. The ability of the issuers of the debt securities to meet their obligations may be affected by economic developments in a specific industry or municipality. In order to reduce the risk associated with such economic developments, at August 31, 2016, 24.7% of total investments are backed by bond insurance of various financial institutions and financial guaranty assurance agencies. The aggregate percentage insured by an individual financial institution or financial guaranty assurance agency ranged from 2.7% to 11.9% of total investments.
| (1) | Security represents the municipal bond held by a trust that issues residual interest bonds (see Note 1H). |
| (2) | Security (or a portion thereof) has been pledged as collateral for residual interest bond transactions. The aggregate value of such collateral is $3,140,719. |
| | | | | | | | | | | | | | | | | | | | | | | | |
| Futures Contracts | |
| Description | | Contracts | | | Position | | | Expiration
Month/Year | | | Aggregate Cost | | | Value | | | Net Unrealized
Appreciation | |
| | | | | | |
Interest Rate Futures | | | | | | | | | | | | | | | | | | | | | | | | |
| U.S. Long Treasury Bond | | | 20 | | | | Short | | | | Dec-16 | | | $ | (3,419,743 | ) | | $ | (3,407,500 | ) | | $ | 12,243 | |
| |
| | | | $ | 12,243 | |
Abbreviations:
| | | | |
| AGC | | – | | Assured Guaranty Corp. |
| AGM | | – | | Assured Guaranty Municipal Corp. |
| AMBAC | | – | | AMBAC Financial Group, Inc. |
| AMT | | – | | Interest earned from these securities may be considered a tax preference item for purposes of the Federal Alternative Minimum Tax. |
| NPFG | | – | | National Public Finance Guaranty Corp. |
| XLCA | | – | | XL Capital Assurance, Inc. |
| | | | |
| | 37 | | See Notes to Financial Statements. |
Eaton Vance
South Carolina Municipal Income Fund
August 31, 2016
Portfolio of Investments
| | | | | | | | |
| Tax-Exempt Investments — 102.8% | |
| | |
| | | | | | | | |
| Security | | Principal
Amount
(000’s omitted) | | | Value | |
| | | | | | | | |
| | |
Education — 8.7% | | | | | | | | |
Clemson University, 5.00%, 5/1/26 | | $ | 2,000 | | | $ | 2,613,760 | |
College of Charleston, Academic and Administrative Facilities, 5.00%, 4/1/37 | | | 2,695 | | | | 3,098,361 | |
Florence-Darlington Commission for Technical Education, 5.00%, 3/1/28 | | | 600 | | | | 722,616 | |
South Carolina Jobs-Economic Development Authority, (Furman University), 5.00%, 10/1/32 | | | 2,000 | | | | 2,433,020 | |
South Carolina Jobs-Economic Development Authority, (Furman University), 5.00%, 10/1/45 | | | 2,000 | | | | 2,402,200 | |
University of South Carolina, Higher Education, 5.00%, 5/1/30 | | | 600 | | | | 730,194 | |
| | | | | | | | | |
| | | $ | 12,000,151 | |
| | | | | | | | | |
|
Escrowed / Prerefunded — 13.5% | |
Berkeley County School District, Prerefunded to 12/1/16, 5.125%, 12/1/30 | | $ | 2,350 | | | $ | 2,377,284 | |
Charleston Waterworks and Sewer Revenue, Prerefunded to 1/1/21, 5.00%, 1/1/30 | | | 1,000 | | | | 1,177,820 | |
Charleston Waterworks and Sewer Revenue, Prerefunded to 1/1/21, 5.00%, 1/1/35 | | | 3,000 | | | | 3,533,460 | |
South Carolina Jobs-Economic Development Authority, (Kershaw County Medical Center), Prerefunded to 9/15/18, 6.00%, 9/15/38 | | | 3,380 | | | | 3,748,657 | |
South Carolina Public Service Authority, Prerefunded to 1/1/19, 5.375%, 1/1/28 | | | 155 | | | | 172,217 | |
South Carolina Public Service Authority, Prerefunded to 1/1/19, 5.375%, 1/1/28 | | | 4,355 | | | | 4,838,753 | |
South Carolina Public Service Authority, Prerefunded to 1/1/19, 5.50%, 1/1/38 | | | 205 | | | | 228,366 | |
South Carolina Public Service Authority, Prerefunded to 1/1/19, 5.50%, 1/1/38 | | | 2,375 | | | | 2,645,702 | |
| | | | | | | | | |
| | | $ | 18,722,259 | |
| | | | | | | | | |
|
General Obligations — 16.3% | |
Aiken County Consolidated School District, 5.00%, 3/1/25 | | $ | 2,020 | | | $ | 2,597,457 | |
Anderson County School District No. 5, 5.00%, 3/1/30 | | | 2,000 | | | | 2,538,560 | |
Georgetown County, 5.00%, 3/1/31 | | | 2,510 | | | | 3,038,305 | |
Georgetown County, 5.00%, 3/1/33 | | | 2,750 | | | | 3,317,490 | |
Horry County School District, 5.00%, 3/1/25 | | | 1,500 | | | | 1,912,275 | |
Lexington County School District No. 1, 5.00%, 2/1/26 | | | 1,060 | | | | 1,385,007 | |
Richland County, (Richland Library), 5.00%, 3/1/25(1) | | | 1,540 | | | | 1,999,012 | |
Richland-Lexington Airport District, (AMT), Prerefunded to 3/1/23, 3.00%, 3/1/27 | | | 580 | | | | 644,403 | |
Richland-Lexington Airport District, (AMT), 4.00%, 3/1/22 | | | 195 | | | | 221,608 | |
Richland-Lexington Airport District, (AMT), 4.00%, 3/1/24 | | | 685 | | | | 784,147 | |
South Carolina, (Air Carrier Hub Terminal A), 1.00%, 4/1/25 | | | 4,275 | | | | 4,103,530 | |
| | | | | | | | | |
| | | $ | 22,541,794 | |
| | | | | | | | | |
| | | | | | | | |
| Security | | Principal
Amount
(000’s omitted) | | | Value | |
| | | | | | | | |
|
Hospital — 20.1% | |
Florence County, (McLeod Regional Medical Center), 5.00%, 11/1/30 | | $ | 1,500 | | | $ | 1,819,830 | |
Florence County, (McLeod Regional Medical Center), 5.00%, 11/1/37 | | | 1,000 | | | | 1,124,880 | |
Greenville Health System, 5.00%, 5/1/31 | | | 1,500 | | | | 1,787,775 | |
Greenwood County, (Self Regional Healthcare), 4.00%, 10/1/21 | | | 1,050 | | | | 1,169,815 | |
Greenwood County, (Self Regional Healthcare), 5.375%, 10/1/39 | | | 3,835 | | | | 4,275,565 | |
Lexington County Health Services District, Inc., 5.00%, 11/1/27 | | | 3,615 | | | | 3,790,834 | |
Lexington County Health Services District, Inc., 5.00%, 11/1/32 | | | 955 | | | | 1,001,146 | |
South Carolina Jobs-Economic Development Authority, (Bon Secours Health System, Inc.), 5.00%, 11/1/28 | | | 2,500 | | | | 2,981,775 | |
South Carolina Jobs-Economic Development Authority, (Bon Secours Health System, Inc.), 5.00%, 11/1/29 | | | 450 | | | | 534,645 | |
South Carolina Jobs-Economic Development Authority, (Georgetown Hospital), 3.50%, 2/1/24 | | | 1,560 | | | | 1,569,422 | |
South Carolina Jobs-Economic Development Authority, (Georgetown Hospital), 3.50%, 2/1/25 | | | 2,010 | | | | 2,021,055 | |
South Carolina Jobs-Economic Development Authority, (Georgetown Hospital), 3.625%, 2/1/26 | | | 2,040 | | | | 2,050,996 | |
South Carolina Jobs-Economic Development Authority, (Palmetto Health), 5.75%, 8/1/39 | | | 3,420 | | | | 3,737,273 | |
| | | | | | | | | |
| | | $ | 27,865,011 | |
| | | | | | | | | |
|
Industrial Development Revenue — 1.2% | |
Richland County, (International Paper Co.), (AMT), 3.875%, 4/1/23 | | $ | 1,500 | | | $ | 1,650,765 | |
| | | | | | | | | |
| | | $ | 1,650,765 | |
| | | | | | | | | |
|
Insured – Electric Utilities — 5.2% | |
Piedmont Municipal Power Agency, (NPFG), 0.00%, 1/1/23 | | $ | 1,090 | | | $ | 967,876 | |
Puerto Rico Electric Power Authority, (NPFG), 5.25%, 7/1/29 | | | 1,075 | | | | 1,169,869 | |
Puerto Rico Electric Power Authority, (NPFG), 5.25%, 7/1/32 | | | 1,350 | | | | 1,478,979 | |
Puerto Rico Electric Power Authority, (NPFG), 5.25%, 7/1/34 | | | 2,375 | | | | 2,599,342 | |
Puerto Rico Electric Power Authority, (NPFG), 5.25%, 7/1/35 | | | 950 | | | | 1,036,612 | |
| | | | | | | | | |
| | | $ | 7,252,678 | |
| | | | | | | | | |
|
Insured – Escrowed / Prerefunded — 8.2% | |
Greenwood Metropolitan District, Sewer System, (AGM), Prerefunded to 10/1/18, 5.00%, 10/1/30(2)(3) | | $ | 7,500 | | | $ | 8,180,550 | |
Scago Educational Facilities Corp., Pickens School District, (AGM), Prerefunded to 12/1/16, 4.50%, 12/1/28 | | | 3,210 | | | | 3,242,421 | |
| | | | | | | | | |
| | | $ | 11,422,971 | |
| | | | | | | | | |
| | | | |
| | 38 | | See Notes to Financial Statements. |
Eaton Vance
South Carolina Municipal Income Fund
August 31, 2016
Portfolio of Investments — continued
| | | | | | | | |
| Security | | Principal
Amount
(000’s omitted) | | | Value | |
| | | | | | | | |
|
Insured – Lease Revenue / Certificates of Participation — 3.5% | |
St. Peters Parish/Jasper County Public Facilities Corp., (County Office Buildings), (AGM), 5.00%, 4/1/31 | | $ | 1,000 | | | $ | 1,139,210 | |
Sumter Two School Facilities, Inc., (Sumter School District), (BAM), 4.00%, 12/1/17 | | | 845 | | | | 877,279 | |
Sumter Two School Facilities, Inc., (Sumter School District), (BAM), 5.00%, 12/1/23 | | | 1,000 | | | | 1,214,150 | |
Sumter Two School Facilities, Inc., (Sumter School District), (BAM), 5.00%, 12/1/24 | | | 1,280 | | | | 1,576,678 | |
| | | | | | | | | |
| | | $ | 4,807,317 | |
| | | | | | | | | |
|
Insured – Special Tax Revenue — 0.7% | |
Puerto Rico Sales Tax Financing Corp., (NPFG), 0.00%, 8/1/41 | | $ | 4,075 | | | $ | 986,395 | |
| | | | | | | | | |
| | | $ | 986,395 | |
| | | | | | | | | |
|
Insured – Transportation — 2.3% | |
Puerto Rico Highway and Transportation Authority, (AGC), 5.25%, 7/1/41 | | $ | 2,700 | | | $ | 3,145,878 | |
| | | | | | | | | |
| | | $ | 3,145,878 | |
| | | | | | | | | |
|
Insured – Utilities — 3.3% | |
Greer, Combined Utility System, (AMBAC), 5.50%, 9/1/27 | | $ | 1,000 | | | $ | 1,282,310 | |
Greer, Combined Utility System, (AMBAC), 5.50%, 9/1/32 | | | 2,000 | | | | 2,676,160 | |
Newberry, (Combined Public Utility System), (AGM), 5.00%, 4/1/30 | | | 500 | | | | 606,770 | |
| | | | | | | | | |
| | | $ | 4,565,240 | |
| | | | | | | | | |
|
Insured – Water and Sewer — 1.6% | |
Lexington, Waterworks and Sewer Revenue, (AGC), 5.00%, 1/15/35 | | $ | 2,025 | | | $ | 2,267,109 | |
| | | | | | | | | |
| | | $ | 2,267,109 | |
| | | | | | | | | |
|
Lease Revenue / Certificates of Participation — 8.4% | |
Allendale County School District, (Refunding & Improvement), 5.00%, 12/1/22 | | $ | 1,155 | | | $ | 1,357,460 | |
Allendale County School District, (Refunding & Improvement), 5.00%, 12/1/24 | | | 500 | | | | 604,940 | |
Charleston Educational Excellence Financing Corp., (Charleston County School District), 5.00%, 12/1/30 | | | 2,000 | | | | 2,454,460 | |
Charleston Educational Excellence Financing Corp., (Charleston County School District), 5.00%, 12/1/30(2)(3) | | | 3,875 | | | | 4,755,516 | |
Dorchester County School District No. 2, (Growth Installment Purchase), 5.00%, 12/1/27 | | | 1,000 | | | | 1,213,150 | |
Securing Assets for Education, (Berkeley County School District), 5.00%, 12/1/27 | | | 1,000 | | | | 1,249,230 | |
| | | | | | | | | |
| | | $ | 11,634,756 | |
| | | | | | | | | |
| | | | | | | | |
| Security | | Principal
Amount
(000’s omitted) | | | Value | |
| | | | | | | | |
|
Special Tax Revenue — 0.9% | |
Myrtle Beach, (Hospitality Fee), 5.00%, 6/1/26 | | $ | 1,000 | | | $ | 1,219,580 | |
| | | | | | | | | |
| | | $ | 1,219,580 | |
| | | | | | | | | |
|
Student Loan — 1.2% | |
South Carolina Education Assistance Authority, 5.10%, 10/1/29 | | $ | 1,550 | | | $ | 1,667,521 | |
| | | | | | | | | |
| | | $ | 1,667,521 | |
| | | | | | | | | |
|
Transportation — 3.0% | |
South Carolina Ports Authority, 5.25%, 7/1/40 | | $ | 3,725 | | | $ | 4,218,861 | |
| | | | | | | | | |
| | | $ | 4,218,861 | |
| | | | | | | | | |
|
Water and Sewer — 4.7% | |
Charleston Waterworks and Sewer System Revenue, 5.00%, 1/1/29(1) | | $ | 1,550 | | | $ | 2,036,312 | |
Columbia Waterworks and Sewer Revenue, 5.00%, 2/1/40 | | | 3,500 | | | | 3,954,020 | |
North Charleston Sewer District, 2.00%, 1/1/29 | | | 500 | | | | 494,050 | |
| | | | | | | | | |
| | | $ | 6,484,382 | |
| | | | | | | | | |
| |
Total Tax-Exempt Investments — 102.8%
(identified cost $129,654,375) | | | $ | 142,452,668 | |
| | | | | | | | | |
| |
Other Assets, Less Liabilities — (2.8)% | | | $ | (3,936,308 | ) |
| | | | | | | | | |
| |
Net Assets — 100.0% | | | $ | 138,516,360 | |
| | | | | | | | | |
The percentage shown for each investment category in the Portfolio of Investments is based on net assets.
The Fund invests primarily in debt securities issued by South Carolina municipalities. The ability of the issuers of the debt securities to meet their obligations may be affected by economic developments in a specific industry or municipality. In order to reduce the risk associated with such economic developments, at August 31, 2016, 24.2% of total investments are backed by bond insurance of various financial institutions and financial guaranty assurance agencies. The aggregate percentage insured by an individual financial institution or financial guaranty assurance agency ranged from 2.6% to 9.2% of total investments.
| (1) | When-issued security. |
| (2) | Security represents the municipal bond held by a trust that issues residual interest bonds (see Note 1H). |
| (3) | Security (or a portion thereof) has been pledged as collateral for residual interest bond transactions. The aggregate value of such collateral is $4,211,066. |
| | | | |
| | 39 | | See Notes to Financial Statements. |
Eaton Vance
South Carolina Municipal Income Fund
August 31, 2016
Portfolio of Investments — continued
Abbreviations:
| | | | |
| AGC | | – | | Assured Guaranty Corp. |
| AGM | | – | | Assured Guaranty Municipal Corp. |
| AMBAC | | – | | AMBAC Financial Group, Inc. |
| AMT | | – | | Interest earned from these securities may be considered a tax preference item for purposes of the Federal Alternative Minimum Tax. |
| BAM | | – | | Build America Mutual Assurance Co. |
| NPFG | | – | | National Public Finance Guaranty Corp. |
| | | | |
| | 40 | | See Notes to Financial Statements. |
Eaton Vance
Virginia Municipal Income Fund
August 31, 2016
Portfolio of Investments
| | | | | | | | |
| Tax-Exempt Investments — 102.6% | |
| | |
| | | | | | | | |
| Security | | Principal
Amount
(000’s omitted) | | | Value | |
| | | | | | | | |
| | |
Bond Bank — 2.6% | | | | | | | | |
Virginia Resources Authority, Infrastructure Revenue, (Pooled Financing Program), 4.00%, 11/1/32 | | $ | 1,000 | | | $ | 1,164,150 | |
Virginia Resources Authority, Infrastructure Revenue, (Pooled Financing Program), 5.25%, 11/1/33 | | | 895 | | | | 982,298 | |
| | | | | | | | | |
| | | $ | 2,146,448 | |
| | | | | | | | | |
|
Education — 5.0% | |
Alexandria Industrial Development Authority, (Episcopal High School), 5.00%, 1/1/40 | | $ | 1,700 | | | $ | 1,853,850 | |
University of Virginia, 5.00%, 6/1/40 | | | 2,100 | | | | 2,258,781 | |
| | | | | | | | | |
| | | $ | 4,112,631 | |
| | | | | | | | | |
|
Electric Utilities — 1.9% | |
Chesterfield County Economic Development Authority, (Virginia Electric Power Co.), (AMT), 5.60%, 11/1/31 | | $ | 1,500 | | | $ | 1,555,920 | |
| | | | | | | | | |
| | | $ | 1,555,920 | |
| | | | | | | | | |
|
Escrowed / Prerefunded — 20.0% | |
Fairfax County Industrial Development Authority, (Inova Health System Hospitals), Prerefunded to 5/15/19, 5.50%, 5/15/35 | | $ | 1,060 | | | $ | 1,197,344 | |
Loudoun County, Prerefunded to 7/1/19, 5.00%, 7/1/27 | | | 2,820 | | | | 3,163,391 | |
Portsmouth, Prerefunded to 7/15/19, 5.25%, 7/15/25 | | | 390 | | | | 440,860 | |
Upper Occoquan Sewer Authority, Prerefunded to 7/1/17, 4.50%, 7/1/38 | | | 475 | | | | 490,756 | |
Virginia College Building Authority, Prerefunded to 9/1/18, 5.00%, 9/1/33 | | | 4,000 | | | | 4,351,200 | |
Virginia College Building Authority, Prerefunded to 9/1/18, 5.00%, 9/1/38 | | | 275 | | | | 299,145 | |
Virginia Resources Authority, Clean Water Revenue, Prerefunded to 10/1/19, 5.00%, 10/1/31 | | | 1,000 | | | | 1,130,600 | |
Virginia Resources Authority, Infrastructure Revenue, (Pooled Funding Program), Prerefunded to 11/1/18, 5.25%, 11/1/33 | | | 1,655 | | | | 1,821,096 | |
Virginia Resources Authority, Infrastructure Revenue, (Pooled Funding Program), Prerefunded to 11/1/18, 5.25%, 11/1/33 | | | 160 | | | | 176,058 | |
Washington County Industrial Development Authority, (Davenport & Co., LLC), Prerefunded to 8/1/20, 5.25%, 8/1/30 | | | 1,500 | | | | 1,757,385 | |
Winchester Industrial Development Authority, (Valley Health System), Prerefunded to 1/1/17, 5.25%, 1/1/37 | | | 1,500 | | | | 1,523,505 | |
| | | | | | | | | |
| | | $ | 16,351,340 | |
| | | | | | | | | |
|
General Obligations — 11.9% | |
Arlington County, 5.00%, 8/15/32 | | $ | 1,000 | | | $ | 1,292,570 | |
Culpeper, 5.00%, 8/1/25 | | | 1,350 | | | | 1,744,375 | |
| | | | | | | | |
| Security | | Principal
Amount
(000’s omitted) | | | Value | |
| | | | | | | | |
|
General Obligations (continued) | |
Lynchburg, 5.00%, 2/1/23 | | $ | 1,000 | | | $ | 1,236,830 | |
Newport News, 5.00%, 8/1/28 | | | 1,000 | | | | 1,299,790 | |
Norfolk, 5.00%, 8/1/28 | | | 750 | | | | 928,418 | |
Portsmouth, 4.75%, 7/15/25 | | | 500 | | | | 552,630 | |
Portsmouth, 5.25%, 7/15/25 | | | 285 | | | | 319,539 | |
Virginia, 5.00%, 6/1/31 | | | 2,000 | | | | 2,343,120 | |
| | | | | | | | | |
| | | $ | 9,717,272 | |
| | | | | | | | | |
|
Hospital — 19.1% | |
Fairfax County Industrial Development Authority, (Inova Health System Hospitals), 5.00%, 8/15/23(1)(2) | | $ | 5,000 | | | $ | 5,941,596 | |
Fairfax County Industrial Development Authority, (Inova Health System Hospitals), 5.50%, 5/15/35 | | | 1,940 | | | | 2,181,860 | |
Fredericksburg Economic Development Authority, (Mary Washington Healthcare), 2.46%, 2/1/17 (Put Date), 8/1/38(3) | | | 500 | | | | 501,545 | |
Fredericksburg Economic Development Authority, (Mary Washington Healthcare), 5.00%, 6/15/24 | | | 1,000 | | | | 1,235,540 | |
Henrico County Economic Development Authority, (Bon Secours Health System, Inc.), 5.00%, 11/1/30 | | | 645 | | | | 757,333 | |
Smyth County Industrial Development Authority, (Mountain States Health Alliance), 5.50%, 7/1/28 | | | 1,100 | | | | 1,234,651 | |
Virginia Small Business Financing Authority, (Wellmont Health), 5.25%, 9/1/27 | | | 1,500 | | | | 1,555,755 | |
Virginia Small Business Financing Authority, (Wellmont Health), 5.25%, 9/1/37 | | | 1,605 | | | | 1,659,233 | |
Winchester Economic Development Authority, (Valley Health System), 5.00%, 1/1/28 | | | 450 | | | | 539,100 | |
| | | | | | | | | |
| | | $ | 15,606,613 | |
| | | | | | | | | |
|
Insured – Education — 3.5% | |
Virginia College Building Authority, (Washington and Lee University), (NPFG), 5.25%, 1/1/31 | | $ | 2,155 | | | $ | 2,871,387 | |
| | | | | | | | | |
| | | $ | 2,871,387 | |
| | | | | | | | | |
|
Insured – Electric Utilities — 1.3% | |
Puerto Rico Electric Power Authority, (NPFG), 5.25%, 7/1/29 | | $ | 1,000 | | | $ | 1,088,250 | |
| | | | | | | | | |
| | | $ | 1,088,250 | |
| | | | | | | | | |
|
Insured – Hospital — 4.0% | |
Henrico County Industrial Development Authority, (Bon Secours Health System, Inc.), (NPFG), 6.25%, 8/15/20 | | $ | 1,500 | | | $ | 1,664,955 | |
Virginia Beach, (Virginia Beach Memorial Hospital), (AMBAC), 5.125%, 2/15/18 | | | 1,575 | | | | 1,625,117 | |
| | | | | | | | | |
| | | $ | 3,290,072 | |
| | | | | | | | | |
| | | | |
| | 41 | | See Notes to Financial Statements. |
Eaton Vance
Virginia Municipal Income Fund
August 31, 2016
Portfolio of Investments — continued
| | | | | | | | |
| Security | | Principal
Amount
(000’s omitted) | | | Value | |
| | | | | | | | |
|
Insured – Special Tax Revenue — 0.6% | |
Puerto Rico Infrastructure Financing Authority, (AMBAC), 0.00%, 7/1/28 | | $ | 1,020 | | | $ | 466,313 | |
| | | | | | | | | |
| | | $ | 466,313 | |
| | | | | | | | | |
|
Insured – Transportation — 11.7% | |
Chesapeake Bay Bridge and Tunnel Commission, (General Resolution), (NPFG), 5.50%, 7/1/25 | | $ | 2,500 | | | $ | 3,188,950 | |
Norfolk Airport Authority, (AGM), 5.00%, 7/1/26 | | | 1,000 | | | | 1,158,280 | |
Puerto Rico Highway and Transportation Authority, (AMBAC), 5.50%, 7/1/29 | | | 1,600 | | | | 1,732,640 | |
Richmond Metropolitan Authority, (NPFG), 5.25%, 7/15/22 | | | 2,870 | | | | 3,300,098 | |
Virginia Commonwealth Transportation Board, (NPFG), 0.00%, 4/1/26 | | | 200 | | | | 171,104 | |
| | | | | | | | | |
| | | $ | 9,551,072 | |
| | | | | | | | | |
|
Senior Living / Life Care — 3.8% | |
Albemarle County Economic Development Authority, (Westminster-Canterbury of the Blue Ridge), 5.00%, 1/1/42 | | $ | 150 | | | $ | 160,214 | |
Alexandria Industrial Development Authority, (Goodwin House, Inc.), 5.00%, 10/1/30 | | | 750 | | | | 905,227 | |
Fairfax County Economic Development Authority, (Goodwin House, Inc.), Prerefunded to 10/1/17, 5.125%, 10/1/42 | | | 1,085 | | | | 1,138,534 | |
Harrisonburg Industrial Development Authority, (Sunnyside Presbyterian Home), 6.25%, 12/1/33 | | | 750 | | | | 891,577 | |
| | | | | | | | | |
| | | $ | 3,095,552 | |
| | | | | | | | | |
|
Special Tax Revenue — 0.5% | |
Puerto Rico Sales Tax Financing Corp., 0.00%, 8/1/38 | | $ | 3,750 | | | $ | 369,713 | |
| | | | | | | | | |
| | | $ | 369,713 | |
| | | | | | | | | |
|
Transportation — 7.8% | |
Metropolitan Washington, DC, Airport Authority System, (AMT), 5.375%, 10/1/29 | | $ | 1,000 | | | $ | 1,081,910 | |
Virginia Port Authority, (AMT), 5.00%, 7/1/33 | | | 3,000 | | | | 3,593,670 | |
Washington Metropolitan Area Transit Authority, 5.00%, 7/1/32 | | | 1,500 | | | | 1,663,860 | |
| | | | | | | | | |
| | | $ | 6,339,440 | |
| | | | | | | | | |
|
Water and Sewer — 8.9% | |
Fairfax County Water Authority, 5.25%, 4/1/27 | | $ | 1,795 | | | $ | 2,447,267 | |
Fairfax County Sewer Revenue, 4.00%, 7/15/37 | | | 1,000 | | | | 1,147,450 | |
Henrico County Water and Sewer System Revenue, 5.00%, 5/1/28 | | | 1,000 | | | | 1,306,510 | |
| | | | | | | | |
| Security | | Principal
Amount
(000’s omitted) | | | Value | |
|
Water and Sewer (continued) | |
Hopewell, Sewer System Revenue, 5.00%, 7/15/33 | | $ | 1,000 | | | $ | 1,144,030 | |
Newport News Water Revenue, 5.00%, 7/15/33 | | | 1,000 | | | | 1,270,610 | |
| | | | | | | | | |
| | | $ | 7,315,867 | |
| | | | | | | | | |
| |
Total Tax-Exempt Investments — 102.6%
(identified cost $75,625,666) | | | $ | 83,877,890 | |
| | | | | | | | | |
| |
Other Assets, Less Liabilities — (2.6)% | | | $ | (2,097,006 | ) |
| | | | | | | | | |
| |
Net Assets — 100.0% | | | $ | 81,780,884 | |
| | | | | | | | | |
The percentage shown for each investment category in the Portfolio of Investments is based on net assets.
The Fund invests primarily in debt securities issued by Virginia municipalities. The ability of the issuers of the debt securities to meet their obligations may be affected by economic developments in a specific industry or municipality. In order to reduce the risk associated with such economic developments, at August 31, 2016, 20.6% of total investments are backed by bond insurance of various financial institutions and financial guaranty assurance agencies. The aggregate percentage insured by an individual financial institution or financial guaranty assurance agency ranged from 1.4% to 14.6% of total investments.
| (1) | Security represents the municipal bond held by a trust that issues residual interest bonds (see Note 1H). |
| (2) | Security (or a portion thereof) has been pledged as collateral for residual interest bond transactions. The aggregate value of such collateral is $2,611,596. |
| (3) | Variable rate security. The stated interest rate represents the rate in effect at August 31, 2016. |
Abbreviations:
| | | | |
| AGM | | – | | Assured Guaranty Municipal Corp. |
| AMBAC | | – | | AMBAC Financial Group, Inc. |
| AMT | | – | | Interest earned from these securities may be considered a tax preference item for purposes of the Federal Alternative Minimum Tax. |
| NPFG | | – | | National Public Finance Guaranty Corp. |
| | | | |
| | 42 | | See Notes to Financial Statements. |
Eaton Vance
Municipal Income Funds
August 31, 2016
Statements of Assets and Liabilities
| | | | | | | | | | | | | | | | |
| | | August 31, 2016 | |
| Assets | | Georgia Fund | | | Maryland Fund | | | Missouri Fund | | | North Carolina Fund | |
Investments — | | | | | | | | | | | | | | | | |
Identified cost | | $ | 65,920,227 | | | $ | 60,275,301 | | | $ | 66,837,345 | | | $ | 132,296,302 | |
Unrealized appreciation | | | 7,223,023 | | | | 5,313,161 | | | | 8,058,587 | | | | 12,100,049 | |
Investments, at value | | $ | 73,143,250 | | | $ | 65,588,462 | | | $ | 74,895,932 | | | $ | 144,396,351 | |
Cash | | $ | 2,052,080 | | | $ | 1,036,002 | | | $ | 807,580 | | | $ | 683,970 | |
Restricted cash* | | | 61,000 | | | | 102,000 | | | | 65,000 | | | | — | |
Interest receivable | | | 694,715 | | | | 614,995 | | | | 790,507 | | | | 1,655,093 | |
Receivable for investments sold | | | — | | | | 1,000,000 | | | | 5,000 | | | | 70,560 | |
Receivable for Fund shares sold | | | 253,941 | | | | 225,839 | | | | 122,979 | | | | 107,713 | |
Total assets | | $ | 76,204,986 | | | $ | 68,567,298 | | | $ | 76,686,998 | | | $ | 146,913,687 | |
| Liabilities | |
Payable for floating rate notes issued | | $ | — | | | $ | 1,500,000 | | | $ | 850,000 | | | $ | 8,670,000 | |
Payable for variation margin on open financial futures contracts | | | 938 | | | | 1,563 | | | | 375 | | | | — | |
Payable for Fund shares redeemed | | | 295,562 | | | | 46,709 | | | | 166,365 | | | | 201,139 | |
Distributions payable | | | 61,913 | | | | 46,046 | | | | 18,029 | | | | 64,961 | |
Payable to affiliates: | | | | | | | | | | | | | | | | |
Investment adviser fee | | | 18,693 | | | | 15,970 | | | | 19,641 | | | | 40,683 | |
Distribution and service fees | | | 12,837 | | | | 20,584 | | | | 18,158 | | | | 31,085 | |
Interest expense and fees payable | | | — | | | | 2,835 | | | | 4,376 | | | | 40,046 | |
Accrued expenses | | | 62,843 | | | | 70,584 | | | | 64,571 | | | | 81,180 | |
Total liabilities | | $ | 452,786 | | | $ | 1,704,291 | | | $ | 1,141,515 | | | $ | 9,129,094 | |
Net Assets | | $ | 75,752,200 | | | $ | 66,863,007 | | | $ | 75,545,483 | | | $ | 137,784,593 | |
| Sources of Net Assets | |
Paid-in capital | | $ | 78,991,762 | | | $ | 68,999,156 | | | $ | 76,352,183 | | | $ | 136,041,473 | |
Accumulated net realized loss | | | (10,426,771 | ) | | | (7,438,485 | ) | | | (8,969,845 | ) | | | (10,547,736 | ) |
Accumulated undistributed (distributions in excess of) net investment income | | | (44,996 | ) | | | (26,129 | ) | | | 91,424 | | | | 190,807 | |
Net unrealized appreciation | | | 7,232,205 | | | | 5,328,465 | | | | 8,071,721 | | | | 12,100,049 | |
Net Assets | | $ | 75,752,200 | | | $ | 66,863,007 | | | $ | 75,545,483 | | | $ | 137,784,593 | |
| Class A Shares | | | | | | | | | | | | |
Net Assets | | $ | 41,560,166 | | | $ | 42,479,099 | | | $ | 61,038,434 | | | $ | 83,512,047 | |
Shares Outstanding | | | 4,689,041 | | | | 4,653,245 | | | | 6,213,372 | | | | 8,874,762 | |
Net Asset Value and Redemption Price Per Share | | | | | | | | | | | | | | | | |
(net assets ÷ shares of beneficial interest outstanding) | | $ | 8.86 | | | $ | 9.13 | | | $ | 9.82 | | | $ | 9.41 | |
Maximum Offering Price Per Share | | | | | | | | | | | | | | | | |
(100 ÷ 95.25 of net asset value per share) | | $ | 9.30 | | | $ | 9.59 | | | $ | 10.31 | | | $ | 9.88 | |
| Class B Shares | | | | | | | | | | | | | |
Net Assets | | $ | 387,630 | | | $ | 455,804 | | | $ | 355,760 | | | $ | 369,658 | |
Shares Outstanding | | | 40,932 | | | | 45,795 | | | | 32,764 | | | | 36,526 | |
Net Asset Value and Offering Price Per Share** | | | | | | | | | | | | | | | | |
(net assets ÷ shares of beneficial interest outstanding) | | $ | 9.47 | | | $ | 9.95 | | | $ | 10.86 | | | $ | 10.12 | |
| Class C Shares | | | | | | | | | | | | | |
Net Assets | | $ | 7,057,993 | | | $ | 16,356,103 | | | $ | 9,419,787 | | | $ | 20,926,884 | |
Shares Outstanding | | | 744,679 | | | | 1,642,534 | | | | 868,465 | | | | 2,067,464 | |
Net Asset Value and Offering Price Per Share** | | | | | | | | | | | | | | | | |
(net assets ÷ shares of beneficial interest outstanding) | | $ | 9.48 | | | $ | 9.96 | | | $ | 10.85 | | | $ | 10.12 | |
| Class I Shares | | | | | | | | | | | | | |
Net Assets | | $ | 26,746,411 | | | $ | 7,572,001 | | | $ | 4,731,502 | | | $ | 32,976,004 | |
Shares Outstanding | | | 3,009,148 | | | | 827,602 | | | | 480,930 | | | | 3,495,109 | |
Net Asset Value, Offering Price and Redemption Price Per Share | | | | | | | | | | | | | | | | |
(net assets ÷ shares of beneficial interest outstanding) | | $ | 8.89 | | | $ | 9.15 | | | $ | 9.84 | | | $ | 9.43 | |
On sales of $50,000 or more, the offering price of Class A shares is reduced.
| * | Represents restricted cash on deposit at the broker for open financial futures contracts. |
| ** | Redemption price per share is equal to the net asset value less any applicable contingent deferred sales charge. |
| | | | |
| | 43 | | See Notes to Financial Statements. |
Eaton Vance
Municipal Income Funds
August 31, 2016
Statements of Assets and Liabilities — continued
| | | | | | | | | | | | |
| | | August 31, 2016 | |
| Assets | | Oregon Fund | | | South Carolina Fund | | | Virginia Fund | |
Investments — | | | | | | | | | | | | |
Identified cost | | $ | 113,805,328 | | | $ | 129,654,375 | | | $ | 75,625,666 | |
Unrealized appreciation | | | 12,731,864 | | | | 12,798,293 | | | | 8,252,224 | |
Investments, at value | | $ | 126,537,192 | | | $ | 142,452,668 | | | $ | 83,877,890 | |
Cash | | $ | 1,046,923 | | | $ | 10,139,747 | | | $ | 611,306 | |
Restricted cash* | | | 82,000 | | | | — | | | | — | |
Interest receivable | | | 1,212,186 | | | | 1,667,196 | | | | 827,777 | |
Receivable for Fund shares sold | | | 84,601 | | | | 156,067 | | | | 119,007 | |
Total assets | | $ | 128,962,902 | | | $ | 154,415,678 | | | $ | 85,435,980 | |
| Liabilities | |
Payable for floating rate notes issued | | $ | 6,555,000 | | | $ | 8,725,000 | | | $ | 3,330,000 | |
Payable for investments purchased | | | — | | | | 2,599,071 | | | | — | |
Payable for when-issued securities | | | — | | | | 4,027,092 | | | | — | |
Payable for variation margin on open financial futures contracts | | | 1,250 | | | | — | | | | — | |
Payable for Fund shares redeemed | | | 130,357 | | | | 278,074 | | | | 154,789 | |
Distributions payable | | | 33,968 | | | | 83,414 | | | | 61,245 | |
Payable to affiliates: | | | | | | | | | | | | |
Investment adviser fee | | | 36,274 | | | | 40,572 | | | | 22,084 | |
Distribution and service fees | | | 27,795 | | | | 35,242 | | | | 15,255 | |
Interest expense and fees payable | | | 26,575 | | | | 33,472 | | | | 1,796 | |
Accrued expenses | | | 77,628 | | | | 77,381 | | | | 69,927 | |
Total liabilities | | $ | 6,888,847 | | | $ | 15,899,318 | | | $ | 3,655,096 | |
Net Assets | | $ | 122,074,055 | | | $ | 138,516,360 | | | $ | 81,780,884 | |
| Sources of Net Assets | |
Paid-in capital | | $ | 132,261,020 | | | $ | 147,344,061 | | | $ | 93,900,237 | |
Accumulated net realized loss | | | (23,131,688 | ) | | | (21,739,415 | ) | | | (20,502,748 | ) |
Accumulated undistributed net investment income | | | 200,616 | | | | 113,421 | | | | 131,171 | |
Net unrealized appreciation | | | 12,744,107 | | | | 12,798,293 | | | | 8,252,224 | |
Net Assets | | $ | 122,074,055 | | | $ | 138,516,360 | | | $ | 81,780,884 | |
| Class A Shares | |
Net Assets | | $ | 89,845,431 | | | $ | 72,052,470 | | | $ | 59,460,020 | |
Shares Outstanding | | | 9,999,075 | | | | 7,498,492 | | | | 7,214,755 | |
Net Asset Value and Redemption Price Per Share | | | | | | | | | | | | |
(net assets ÷ shares of beneficial interest outstanding) | | $ | 8.99 | | | $ | 9.61 | | | $ | 8.24 | |
Maximum Offering Price Per Share | | | | | | | | | | | | |
(100 ÷ 95.25 of net asset value per share) | | $ | 9.44 | | | $ | 10.09 | | | $ | 8.65 | |
| Class B Shares | |
Net Assets | | $ | 984,945 | | | $ | 459,669 | | | $ | 349,262 | |
Shares Outstanding | | | 100,221 | | | | 45,113 | | | | 38,284 | |
Net Asset Value and Offering Price Per Share** | | | | | | | | | | | | |
(net assets ÷ shares of beneficial interest outstanding) | | $ | 9.83 | | | $ | 10.19 | | | $ | 9.12 | |
| Class C Shares | |
Net Assets | | $ | 14,817,486 | | | $ | 28,738,751 | | | $ | 6,043,624 | |
Shares Outstanding | | | 1,506,064 | | | | 2,819,250 | | | | 662,121 | |
Net Asset Value and Offering Price Per Share** | | | | | | | | | | | | |
(net assets ÷ shares of beneficial interest outstanding) | | $ | 9.84 | | | $ | 10.19 | | | $ | 9.13 | |
| Class I Shares | |
Net Assets | | $ | 16,426,193 | | | $ | 37,265,470 | | | $ | 15,927,978 | |
Shares Outstanding | | | 1,829,720 | | | | 3,874,443 | | | | 1,927,909 | |
Net Asset Value, Offering Price and Redemption Price Per Share | | | | | | | | | | | | |
(net assets ÷ shares of beneficial interest outstanding) | | $ | 8.98 | | | $ | 9.62 | | | $ | 8.26 | |
On sales of $50,000 or more, the offering price of Class A shares is reduced.
| * | Represents restricted cash on deposit at the broker for open financial futures contracts. |
| ** | Redemption price per share is equal to the net asset value less any applicable contingent deferred sales charge. |
| | | | |
| | 44 | | See Notes to Financial Statements. |
Eaton Vance
Municipal Income Funds
August 31, 2016
Statements of Operations
| | | | | | | | | | | | | | | | |
| | | Year Ended August 31, 2016 | |
| Investment Income | | Georgia Fund | | | Maryland Fund | | | Missouri Fund | | | North Carolina Fund | |
Interest | | $ | 2,666,831 | | | $ | 2,584,586 | | | $ | 3,102,890 | | | $ | 5,039,716 | |
Total investment income | | $ | 2,666,831 | | | $ | 2,584,586 | | | $ | 3,102,890 | | | $ | 5,039,716 | |
|
| Expenses | |
Investment adviser fee | | $ | 210,084 | | | $ | 191,251 | | | $ | 223,400 | | | $ | 438,402 | |
Distribution and service fees | | | | | | | | | | | | | | | | |
Class A | | | 82,035 | | | | 84,323 | | | | 121,523 | | | | 162,368 | |
Class B | | | 4,478 | | | | 5,640 | | | | 5,458 | | | | 4,401 | |
Class C | | | 61,086 | | | | 143,192 | | | | 70,172 | | | | 175,300 | |
Trustees’ fees and expenses | | | 4,281 | | | | 3,924 | | | | 4,332 | | | | 7,182 | |
Custodian fee | | | 29,743 | | | | 28,612 | | | | 30,287 | | | | 39,966 | |
Transfer and dividend disbursing agent fees | | | 22,983 | | | | 28,541 | | | | 27,124 | | | | 45,045 | |
Legal and accounting services | | | 56,932 | | | | 61,925 | | | | 44,528 | | | | 53,840 | |
Printing and postage | | | 7,163 | | | | 7,241 | | | | 7,583 | | | | 11,497 | |
Registration fees | | | 4,006 | | | | 8,005 | | | | 4,995 | | | | 1,305 | |
Interest expense and fees | | | — | | | | 14,272 | | | | 7,468 | | | | 88,421 | |
Miscellaneous | | | 19,151 | | | | 17,810 | | | | 18,626 | | | | 23,655 | |
Total expenses | | $ | 501,942 | | | $ | 594,736 | | | $ | 565,496 | | | $ | 1,051,382 | |
| | | | |
Net investment income | | $ | 2,164,889 | | | $ | 1,989,850 | | | $ | 2,537,394 | | | $ | 3,988,334 | |
|
| Realized and Unrealized Gain (Loss) | |
Net realized gain (loss) — | | | | | | | | | | | | | | | | |
Investment transactions | | $ | 80,105 | | | $ | 129,236 | | | $ | 292,727 | | | $ | 87,052 | |
Financial futures contracts | | | (330,188 | ) | | | (550,313 | ) | | | (302,656 | ) | | | — | |
Net realized gain (loss) | | $ | (250,083 | ) | | $ | (421,077 | ) | | $ | (9,929 | ) | | $ | 87,052 | |
Change in unrealized appreciation (depreciation) — | | | | | | | | | | | | | | | | |
Investments | | $ | 2,865,134 | | | $ | 1,574,079 | | | $ | 2,576,874 | | | $ | 3,779,914 | |
Financial futures contracts | | | 10,499 | | | | 17,499 | | | | 5,106 | | | | — | |
Net change in unrealized appreciation (depreciation) | | $ | 2,875,633 | | | $ | 1,591,578 | | | $ | 2,581,980 | | | $ | 3,779,914 | |
| | | | |
Net realized and unrealized gain | | $ | 2,625,550 | | | $ | 1,170,501 | | | $ | 2,572,051 | | | $ | 3,866,966 | |
| | | | |
Net increase in net assets from operations | | $ | 4,790,439 | | | $ | 3,160,351 | | | $ | 5,109,445 | | | $ | 7,855,300 | |
| | | | |
| | 45 | | See Notes to Financial Statements. |
Eaton Vance
Municipal Income Funds
August 31, 2016
Statements of Operations — continued
| | | | | | | | | | | | |
| | | Year Ended August 31, 2016 | |
| Investment Income | | Oregon Fund | | | South Carolina Fund | | | Virginia Fund | |
Interest | | $ | 5,207,865 | | | $ | 5,187,374 | | | $ | 3,567,744 | |
Total investment income | | $ | 5,207,865 | | | $ | 5,187,374 | | | $ | 3,567,744 | |
|
| Expenses | |
Investment adviser fee | | $ | 424,142 | | | $ | 449,065 | | | $ | 258,660 | |
Distribution and service fees | | | | | | | | | | | | |
Class A | | | 177,423 | | | | 140,313 | | | | 117,348 | |
Class B | | | 12,433 | | | | 7,286 | | | | 4,024 | |
Class C | | | 138,906 | | | | 253,209 | | | | 56,124 | |
Trustees’ fees and expenses | | | 6,797 | | | | 7,243 | | | | 4,729 | |
Custodian fee | | | 39,718 | | | | 40,756 | | | | 32,383 | |
Transfer and dividend disbursing agent fees | | | 43,828 | | | | 39,265 | | | | 34,900 | |
Legal and accounting services | | | 49,465 | | | | 54,207 | | | | 47,145 | |
Printing and postage | | | 12,135 | | | | 11,106 | | | | 8,914 | |
Registration fees | | | 1,763 | | | | 2,336 | | | | 4,466 | |
Interest expense and fees | | | 56,497 | | | | 49,746 | | | | 35,915 | |
Miscellaneous | | | 23,405 | | | | 19,914 | | | | 17,485 | |
Total expenses | | $ | 986,512 | | | $ | 1,074,446 | | | $ | 622,093 | |
| | | |
Net investment income | | $ | 4,221,353 | | | $ | 4,112,928 | | | $ | 2,945,651 | |
|
| Realized and Unrealized Gain (Loss) | |
Net realized gain (loss) — | | | | | | | | | | | | |
Investment transactions | | $ | (3,717,980 | ) | | $ | 243,205 | | | $ | 1,505,760 | |
Financial futures contracts | | | (440,309 | ) | | | — | | | | 38,296 | |
Net realized gain (loss) | | $ | (4,158,289 | ) | | $ | 243,205 | | | $ | 1,544,056 | |
Change in unrealized appreciation (depreciation) — | | | | | | | | | | | | |
Investments | | $ | 8,871,911 | | | $ | 5,310,524 | | | $ | 1,048,496 | |
Financial futures contracts | | | 13,999 | | | | — | | | | 4,391 | |
Net change in unrealized appreciation (depreciation) | | $ | 8,885,910 | | | $ | 5,310,524 | | | $ | 1,052,887 | |
| | | |
Net realized and unrealized gain | | $ | 4,727,621 | | | $ | 5,553,729 | | | $ | 2,596,943 | |
| | | |
Net increase in net assets from operations | | $ | 8,948,974 | | | $ | 9,666,657 | | | $ | 5,542,594 | |
| | | | |
| | 46 | | See Notes to Financial Statements. |
Eaton Vance
Municipal Income Funds
August 31, 2016
Statements of Changes in Net Assets
| | | | | | | | | | | | | | | | |
| | | Year Ended August 31, 2016 | |
| Increase (Decrease) in Net Assets | | Georgia Fund | | | Maryland Fund | | | Missouri Fund | | | North Carolina Fund | |
From operations — | | | | | | | | | | | | | | | | |
Net investment income | | $ | 2,164,889 | | | $ | 1,989,850 | | | $ | 2,537,394 | | | $ | 3,988,334 | |
Net realized gain (loss) from investment transactions and financial futures contracts | | | (250,083 | ) | | | (421,077 | ) | | | (9,929 | ) | | | 87,052 | |
Net change in unrealized appreciation (depreciation) from investments and financial futures contracts | | | 2,875,633 | | | | 1,591,578 | | | | 2,581,980 | | | | 3,779,914 | |
Net increase in net assets from operations | | $ | 4,790,439 | | | $ | 3,160,351 | | | $ | 5,109,445 | | | $ | 7,855,300 | |
Distributions to shareholders — | | | | | | | | | | | | | | | | |
From net investment income | | | | | | | | | | | | | | | | |
Class A | | $ | (1,247,548 | ) | | $ | (1,491,156 | ) | | $ | (2,156,519 | ) | | $ | (2,662,946 | ) |
Class B | | | (10,884 | ) | | | (16,635 | ) | | | (16,145 | ) | | | (11,818 | ) |
Class C | | | (147,051 | ) | | | (420,462 | ) | | | (204,899 | ) | | | (465,030 | ) |
Class I | | | (746,565 | ) | | | (252,232 | ) | | | (132,682 | ) | | | (842,177 | ) |
Total distributions to shareholders | | $ | (2,152,048 | ) | | $ | (2,180,485 | ) | | $ | (2,510,245 | ) | | $ | (3,981,971 | ) |
Transactions in shares of beneficial interest — | | | | | | | | | | | | | | | | |
Proceeds from sale of shares | | | | | | | | | | | | | | | | |
Class A | | $ | 2,798,858 | | | $ | 2,383,171 | | | $ | 3,071,341 | | | $ | 8,442,880 | |
Class B | | | — | | | | 582 | | | | 1,100 | | | | 22,050 | |
Class C | | | 2,109,230 | | | | 3,077,213 | | | | 3,156,205 | | | | 5,312,090 | |
Class I | | | 7,952,472 | | | | 2,329,561 | | | | 1,730,261 | | | | 16,937,430 | |
Net asset value of shares issued to shareholders in payment of distributions declared | | | | | | | | | | | | | | | | |
Class A | | | 1,053,973 | | | | 1,115,747 | | | | 2,010,057 | | | | 2,402,140 | |
Class B | | | 9,205 | | | | 15,318 | | | | 15,045 | | | | 10,924 | |
Class C | | | 124,643 | | | | 295,819 | | | | 169,287 | | | | 390,674 | |
Class I | | | 235,567 | | | | 73,770 | | | | 93,489 | | | | 460,385 | |
Cost of shares redeemed | | | | | | | | | | | | | | | | |
Class A | | | (4,359,700 | ) | | | (4,508,306 | ) | | | (8,481,272 | ) | | | (8,425,054 | ) |
Class B | | | (107,796 | ) | | | (108,813 | ) | | | (88,482 | ) | | | (102,627 | ) |
Class C | | | (1,405,907 | ) | | | (1,912,780 | ) | | | (545,953 | ) | | | (2,528,453 | ) |
Class I | | | (2,698,622 | ) | | | (2,098,373 | ) | | | (179,137 | ) | | | (5,858,288 | ) |
Net asset value of shares exchanged | | | | | | | | | | | | | | | | |
Class A | | | 92,593 | | | | 137,807 | | | | 385,988 | | | | 150,477 | |
Class B | | | (92,593 | ) | | | (137,807 | ) | | | (385,988 | ) | | | (150,477 | ) |
Net increase in net assets from Fund share transactions | | $ | 5,711,923 | | | $ | 662,909 | | | $ | 951,941 | | | $ | 17,064,151 | |
| | | | |
Net increase in net assets | | $ | 8,350,314 | | | $ | 1,642,775 | | | $ | 3,551,141 | | | $ | 20,937,480 | |
| | | | |
| Net Assets | | | | | | | | | | | | | | | | |
At beginning of year | | $ | 67,401,886 | | | $ | 65,220,232 | | | $ | 71,994,342 | | | $ | 116,847,113 | |
At end of year | | $ | 75,752,200 | | | $ | 66,863,007 | | | $ | 75,545,483 | | | $ | 137,784,593 | |
| |
Accumulated undistributed (distributions in excess of) net investment income
included in net assets | | | | | |
At end of year | | $ | (44,996 | ) | | $ | (26,129 | ) | | $ | 91,424 | | | $ | 190,807 | |
| | | | |
| | 47 | | See Notes to Financial Statements. |
Eaton Vance
Municipal Income Funds
August 31, 2016
Statements of Changes in Net Assets — continued
| | | | | | | | | | | | |
| | | Year Ended August 31, 2016 | |
| Increase (Decrease) in Net Assets | | Oregon Fund | | | South Carolina Fund | | | Virginia Fund | |
From operations — | | | | | | | | | | | | |
Net investment income | | $ | 4,221,353 | | | $ | 4,112,928 | | | $ | 2,945,651 | |
Net realized gain (loss) from investment transactions and financial futures contracts | | | (4,158,289 | ) | | | 243,205 | | | | 1,544,056 | |
Net change in unrealized appreciation (depreciation) from investments and financial futures contracts | | | 8,885,910 | | | | 5,310,524 | | | | 1,052,887 | |
Net increase in net assets from operations | | $ | 8,948,974 | | | $ | 9,666,657 | | | $ | 5,542,594 | |
Distributions to shareholders — | | | | | | | | | | | | |
From net investment income | | | | | | | | | | | | |
Class A | | $ | (3,194,894 | ) | | $ | (2,363,852 | ) | | $ | (2,163,303 | ) |
Class B | | | (37,491 | ) | | | (20,379 | ) | | | (12,555 | ) |
Class C | | | (416,562 | ) | | | (693,758 | ) | | | (174,040 | ) |
Class I | | | (534,711 | ) | | | (1,015,659 | ) | | | (576,698 | ) |
Total distributions to shareholders | | $ | (4,183,658 | ) | | $ | (4,093,648 | ) | | $ | (2,926,596 | ) |
Transactions in shares of beneficial interest — | | | | | | | | | | | | |
Proceeds from sale of shares | | | | | | | | | | | | |
Class A | | $ | 10,760,854 | | | $ | 7,970,287 | | | $ | 3,424,270 | |
Class B | | | 507 | | | | 12 | | | | 21,699 | |
Class C | | | 2,470,771 | | | | 4,751,449 | | | | 1,106,121 | |
Class I | | | 9,335,660 | | | | 22,783,156 | | | | 2,994,965 | |
Net asset value of shares issued to shareholders in payment of distributions declared | | | | | | | | | | | | |
Class A | | | 3,035,150 | | | | 2,158,246 | | | | 1,772,443 | |
Class B | | | 35,706 | | | | 19,952 | | | | 11,679 | |
Class C | | | 382,957 | | | | 605,385 | | | | 139,652 | |
Class I | | | 261,958 | | | | 349,414 | | | | 204,959 | |
Cost of shares redeemed | | | | | | | | | | | | |
Class A | | | (15,692,164 | ) | | | (13,810,266 | ) | | | (6,469,793 | ) |
Class B | | | (485,882 | ) | | | (57,166 | ) | | | (54,364 | ) |
Class C | | | (2,441,255 | ) | | | (2,969,301 | ) | | | (1,819,140 | ) |
Class I | | | (7,593,158 | ) | | | (5,825,444 | ) | | | (2,424,987 | ) |
Net asset value of shares exchanged | | | | | | | | | | | | |
Class A | | | 225,926 | | | | 475,586 | | | | 168,318 | |
Class B | | | (225,926 | ) | | | (475,586 | ) | | | (168,318 | ) |
Net increase (decrease) in net assets from Fund share transactions | | $ | 71,104 | | | $ | 15,975,724 | | | $ | (1,092,496 | ) |
| | | |
Net increase in net assets | | $ | 4,836,420 | | | $ | 21,548,733 | | | $ | 1,523,502 | |
| | | |
| Net Assets | | | | | | | | | | | | |
At beginning of year | | $ | 117,237,635 | | | $ | 116,967,627 | | | $ | 80,257,382 | |
At end of year | | $ | 122,074,055 | | | $ | 138,516,360 | | | $ | 81,780,884 | |
| | | |
Accumulated undistributed net investment income
included in net assets | | | | | | | | | | | | |
At end of year | | $ | 200,616 | | | $ | 113,421 | | | $ | 131,171 | |
| | | | |
| | 48 | | See Notes to Financial Statements. |
Eaton Vance
Municipal Income Funds
August 31, 2016
Statements of Changes in Net Assets — continued
| | | | | | | | | | | | | | | | |
| | | Year Ended August 31, 2015 | |
| Increase (Decrease) in Net Assets | | Georgia Fund | | | Maryland Fund | | | Missouri Fund | | | North Carolina Fund | |
From operations — | | | | | | | | | | | | | | | | |
Net investment income | | $ | 2,154,572 | | | $ | 2,272,763 | | | $ | 2,620,353 | | | $ | 3,940,257 | |
Net realized gain (loss) from investment transactions and financial futures contracts | | | 111,663 | | | | 78,052 | | | | (112,486 | ) | | | (42,504 | ) |
Net change in unrealized appreciation (depreciation) from investments and financial futures contracts | | | (662,709 | ) | | | (1,060,558 | ) | | | (917,392 | ) | | | (778,331 | ) |
Net increase in net assets from operations | | $ | 1,603,526 | | | $ | 1,290,257 | | | $ | 1,590,475 | | | $ | 3,119,422 | |
Distributions to shareholders — | | | | | | | | | | | | | | | | |
From net investment income | | | | | | | | | | | | | | | | |
Class A | | $ | (1,470,967 | ) | | $ | (1,556,010 | ) | | $ | (2,285,304 | ) | | $ | (2,766,073 | ) |
Class B | | | (20,365 | ) | | | (24,032 | ) | | | (27,370 | ) | | | (20,622 | ) |
Class C | | | (162,838 | ) | | | (419,521 | ) | | | (182,602 | ) | | | (481,958 | ) |
Class I | | | (487,063 | ) | | | (226,510 | ) | | | (97,752 | ) | | | (667,973 | ) |
Total distributions to shareholders | | $ | (2,141,233 | ) | | $ | (2,226,073 | ) | | $ | (2,593,028 | ) | | $ | (3,936,626 | ) |
Transactions in shares of beneficial interest — | | | | | | | | | | | | | | | | |
Proceeds from sale of shares | | | | | | | | | | | | | | | | |
Class A | | $ | 3,697,595 | | | $ | 2,115,853 | | | $ | 4,542,935 | | | $ | 10,286,223 | |
Class B | | | 55 | | | | 3,950 | | | | 1,444 | | | | 1,082 | |
Class C | | | 1,543,256 | | | | 2,109,367 | | | | 956,998 | | | | 3,326,861 | |
Class I | | | 14,406,709 | | | | 3,918,188 | | | | 1,144,351 | | | | 7,543,651 | |
Net asset value of shares issued to shareholders in payment of distributions declared | | | | | | | | | | | | | | | | |
Class A | | | 1,234,346 | | | | 1,177,324 | | | | 2,105,803 | | | | 2,459,618 | |
Class B | | | 18,286 | | | | 19,168 | | | | 25,817 | | | | 18,684 | |
Class C | | | 138,875 | | | | 292,606 | | | | 146,522 | | | | 405,399 | |
Class I | | | 174,537 | | | | 63,293 | | | | 79,121 | | | | 284,604 | |
Cost of shares redeemed | | | | | | | | | | | | | | | | |
Class A | | | (6,208,081 | ) | | | (8,769,600 | ) | | | (9,631,594 | ) | | | (13,213,657 | ) |
Class B | | | (132,966 | ) | | | (142,518 | ) | | | (68,492 | ) | | | (160,770 | ) |
Class C | | | (1,181,706 | ) | | | (3,390,182 | ) | | | (808,543 | ) | | | (4,061,198 | ) |
Class I | | | (3,476,013 | ) | | | (1,233,083 | ) | | | (457,737 | ) | | | (2,590,079 | ) |
Net asset value of shares exchanged | | | | | | | | | | | | | | | | |
Class A | | | 176,403 | | | | 342,216 | | | | 312,451 | | | | 152,598 | |
Class B | | | (176,403 | ) | | | (342,216 | ) | | | (312,451 | ) | | | (152,598 | ) |
Net increase (decrease) in net assets from Fund share transactions | | $ | 10,214,893 | | | $ | (3,835,634 | ) | | $ | (1,963,375 | ) | | $ | 4,300,418 | |
| | | | |
Net increase (decrease) in net assets | | $ | 9,677,186 | | | $ | (4,771,450 | ) | | $ | (2,965,928 | ) | | $ | 3,483,214 | |
| | | | |
| Net Assets | | | | | | | | | | | | | | | | |
At beginning of year | | $ | 57,724,700 | | | $ | 69,991,682 | | | $ | 74,960,270 | | | $ | 113,363,899 | |
At end of year | | $ | 67,401,886 | | | $ | 65,220,232 | | | $ | 71,994,342 | | | $ | 116,847,113 | |
| |
Accumulated undistributed (distributions in excess of) net investment income
included in net assets | | | | | |
At end of year | | $ | (44,996 | ) | | $ | (26,129 | ) | | $ | 91,424 | | | $ | 190,809 | |
| | | | |
| | 49 | | See Notes to Financial Statements. |
Eaton Vance
Municipal Income Funds
August 31, 2016
Statements of Changes in Net Assets — continued
| | | | | | | | | | | | |
| | | Year Ended August 31, 2015 | |
| Increase (Decrease) in Net Assets | | Oregon Fund | | | South Carolina Fund | | | Virginia Fund | |
From operations — | | | | | | | | | | | | |
Net investment income | | $ | 4,406,455 | | | $ | 4,308,837 | | | $ | 3,230,562 | |
Net realized gain (loss) from investment transactions and financial futures contracts | | | 56,874 | | | | 217,431 | | | | (12,450 | ) |
Net change in unrealized appreciation (depreciation) from investments and financial futures contracts | | | (1,880,883 | ) | | | (1,589,795 | ) | | | (1,753,763 | ) |
Net increase in net assets from operations | | $ | 2,582,446 | | | $ | 2,936,473 | | | $ | 1,464,349 | |
Distributions to shareholders — | | | | | | | | | | | | |
From net investment income | | | | | | | | | | | | |
Class A | | $ | (3,404,373 | ) | | $ | (2,720,124 | ) | | $ | (2,325,363 | ) |
Class B | | | (61,292 | ) | | | (35,926 | ) | | | (24,813 | ) |
Class C | | | (418,567 | ) | | | (730,882 | ) | | | (211,113 | ) |
Class I | | | (481,883 | ) | | | (783,252 | ) | | | (603,139 | ) |
Total distributions to shareholders | | $ | (4,366,115 | ) | | $ | (4,270,184 | ) | | $ | (3,164,428 | ) |
Transactions in shares of beneficial interest �� | | | | | | | | | | | | |
Proceeds from sale of shares | | | | | | | | | | | | |
Class A | | $ | 6,997,054 | | | $ | 5,282,013 | | | $ | 2,936,512 | |
Class B | | | 566 | | | | 172 | | | | — | |
Class C | | | 2,886,116 | | | | 3,278,874 | | | | 560,121 | |
Class I | | | 9,899,037 | | | | 8,334,509 | | | | 2,788,972 | |
Net asset value of shares issued to shareholders in payment of distributions declared | | | | | | | | | | | | |
Class A | | | 3,232,071 | | | | 2,481,328 | | | | 1,872,961 | |
Class B | | | 59,407 | | | | 34,943 | | | | 23,187 | |
Class C | | | 388,108 | | | | 637,455 | | | | 174,193 | |
Class I | | | 225,590 | | | | 244,613 | | | | 185,130 | |
Cost of shares redeemed | | | | | | | | | | | | |
Class A | | | (12,510,638 | ) | | | (12,062,655 | ) | | | (9,342,269 | ) |
Class B | | | (647,993 | ) | | | (250,808 | ) | | | (293,766 | ) |
Class C | | | (2,812,512 | ) | | | (4,417,683 | ) | | | (1,646,451 | ) |
Class I | | | (5,118,662 | ) | | | (8,039,347 | ) | | | (2,633,899 | ) |
Net asset value of shares exchanged | | | | | | | | | | | | |
Class A | | | 224,455 | | | | 314,220 | | | | 283,422 | |
Class B | | | (224,455 | ) | | | (314,220 | ) | | | (283,422 | ) |
Net increase (decrease) in net assets from Fund share transactions | | $ | 2,598,144 | | | $ | (4,476,586 | ) | | $ | (5,375,309 | ) |
| | | |
Net increase (decrease) in net assets | | $ | 814,475 | | | $ | (5,810,297 | ) | | $ | (7,075,388 | ) |
| | | |
| Net Assets | | | | | | | | | | | | |
At beginning of year | | $ | 116,423,160 | | | $ | 122,777,924 | | | $ | 87,332,770 | |
At end of year | | $ | 117,237,635 | | | $ | 116,967,627 | | | $ | 80,257,382 | |
| | | |
Accumulated undistributed net investment income
included in net assets | | | | | | | | | | | | |
At end of year | | $ | 200,615 | | | $ | 113,421 | | | $ | 131,173 | |
| | | | |
| | 50 | | See Notes to Financial Statements. |
Eaton Vance
Municipal Income Funds
August 31, 2016
Financial Highlights
| | | | | | | | | | | | | | | | | | | | |
| | | Georgia Fund — Class A | |
| | | Year Ended August 31, | |
| | | 2016 | | | 2015 | | | 2014 | | | 2013 | | | 2012 | |
Net asset value — Beginning of year | | $ | 8.540 | | | $ | 8.610 | | | $ | 8.030 | | | $ | 8.860 | | | $ | 8.440 | |
| | | | | |
| Income (Loss) From Operations | | | | | | | | | | | | | | | | | | | | |
Net investment income(1) | | $ | 0.267 | | | $ | 0.307 | | | $ | 0.335 | | | $ | 0.322 | | | $ | 0.352 | |
Net realized and unrealized gain (loss) | | | 0.318 | | | | (0.072 | ) | | | 0.578 | | | | (0.831 | ) | | | 0.419 | |
| | | | | |
Total income (loss) from operations | | $ | 0.585 | | | $ | 0.235 | | | $ | 0.913 | | | $ | (0.509 | ) | | $ | 0.771 | |
| | | | | |
| Less Distributions | | | | | | | | | | | | | | | | | | | | |
From net investment income | | $ | (0.265 | ) | | $ | (0.305 | ) | | $ | (0.333 | ) | | $ | (0.318 | ) | | $ | (0.349 | ) |
Tax return of capital | | | — | | | | — | | | | — | | | | (0.003 | ) | | | (0.002 | ) |
| | | | | |
Total distributions | | $ | (0.265 | ) | | $ | (0.305 | ) | | $ | (0.333 | ) | | $ | (0.321 | ) | | $ | (0.351 | ) |
| | | | | |
Net asset value — End of year | | $ | 8.860 | | | $ | 8.540 | | | $ | 8.610 | | | $ | 8.030 | | | $ | 8.860 | |
| | | | | |
Total Return(2) | | | 6.94 | % | | | 2.76 | % | | | 11.54 | % | | | (5.98 | )% | | | 9.31 | % |
| | | | | |
| Ratios/Supplemental Data | | | | | | | | | | | | | | | | | | | | |
Net assets, end of year (000’s omitted) | | $ | 41,560 | | | $ | 40,437 | | | $ | 41,884 | | | $ | 45,169 | | | $ | 50,236 | |
Ratios (as a percentage of average daily net assets): | | | | | | | | | | | | | | | | | | | | |
Expenses excluding interest and fees(3) | | | 0.70 | % | | | 0.70 | % | | | 0.71 | % | | | 0.72 | % | | | 0.74 | % |
Interest and fee expense(4) | | | — | | | | 0.03 | % | | | 0.04 | % | | | 0.04 | % | | | 0.05 | % |
Total expenses(3) | | | 0.70 | % | | | 0.73 | % | | | 0.75 | % | | | 0.76 | % | | | 0.79 | % |
Net investment income | | | 3.06 | % | | | 3.57 | % | | | 4.00 | % | | | 3.69 | % | | | 4.06 | % |
Portfolio Turnover | | | 7 | % | | | 14 | % | | | 7 | % | | | 19 | % | | | 12 | % |
| (1) | Computed using average shares outstanding. |
| (2) | Returns are historical and are calculated by determining the percentage change in net asset value with all distributions reinvested and do not reflect the effect of sales charges. |
| (3) | Excludes the effect of custody fee credits, if any, of less than 0.005%. Effective September 1, 2015, custody fee credits, which were earned on cash deposit balances, were discontinued by the custodian. |
| (4) | Interest and fee expense relates to the liability for floating rate notes issued in conjunction with residual interest bond transactions (see Note 1H). |
| | | | |
| | 51 | | See Notes to Financial Statements. |
Eaton Vance
Municipal Income Funds
August 31, 2016
Financial Highlights — continued
| | | | | | | | | | | | | | | | | | | | |
| | | Georgia Fund — Class B | |
| | | Year Ended August 31, | |
| | | 2016 | | | 2015 | | | 2014 | | | 2013 | | | 2012 | |
Net asset value — Beginning of year | | $ | 9.120 | | | $ | 9.200 | | | $ | 8.580 | | | $ | 9.470 | | | $ | 9.020 | |
| | | | | |
| Income (Loss) From Operations | | | | | | | | | | | | | | | | | | | | |
Net investment income(1) | | $ | 0.217 | | | $ | 0.262 | | | $ | 0.291 | | | $ | 0.275 | | | $ | 0.309 | |
Net realized and unrealized gain (loss) | | | 0.347 | | | | (0.085 | ) | | | 0.617 | | | | (0.892 | ) | | | 0.446 | |
| | | | | |
Total income (loss) from operations | | $ | 0.564 | | | $ | 0.177 | | | $ | 0.908 | | | $ | (0.617 | ) | | $ | 0.755 | |
| | | | | |
| Less Distributions | | | | | | | | | | | | | | | | | | | | |
From net investment income | | $ | (0.214 | ) | | $ | (0.257 | ) | | $ | (0.288 | ) | | $ | (0.270 | ) | | $ | (0.303 | ) |
Tax return of capital | | | — | | | | — | | | | — | | | | (0.003 | ) | | | (0.002 | ) |
| | | | | |
Total distributions | | $ | (0.214 | ) | | $ | (0.257 | ) | | $ | (0.288 | ) | | $ | (0.273 | ) | | $ | (0.305 | ) |
| | | | | |
Net asset value — End of year | | $ | 9.470 | | | $ | 9.120 | | | $ | 9.200 | | | $ | 8.580 | | | $ | 9.470 | |
| | | | | |
Total Return(2) | | | 6.24 | % | | | 1.94 | % | | | 10.71 | % | | | (6.71 | )% | | | 8.51 | % |
| | | | | |
| Ratios/Supplemental Data | | | | | | | | | | | | | | | | | | | | |
Net assets, end of year (000’s omitted) | | $ | 388 | | | $ | 561 | | | $ | 857 | | | $ | 1,162 | | | $ | 2,157 | |
Ratios (as a percentage of average daily net assets): | | | | | | | | | | | | | | | | | | | | |
Expenses excluding interest and fees(3) | | | 1.46 | % | | | 1.46 | % | | | 1.46 | % | | | 1.47 | % | | | 1.49 | % |
Interest and fee expense(4) | | | — | | | | 0.03 | % | | | 0.04 | % | | | 0.04 | % | | | 0.05 | % |
Total expenses(3) | | | 1.46 | % | | | 1.49 | % | | | 1.50 | % | | | 1.51 | % | | | 1.54 | % |
Net investment income | | | 2.33 | % | | | 2.84 | % | | | 3.25 | % | | | 2.94 | % | | | 3.35 | % |
Portfolio Turnover | | | 7 | % | | | 14 | % | | | 7 | % | | | 19 | % | | | 12 | % |
| (1) | Computed using average shares outstanding. |
| (2) | Returns are historical and are calculated by determining the percentage change in net asset value with all distributions reinvested and do not reflect the effect of sales charges. |
| (3) | Excludes the effect of custody fee credits, if any, of less than 0.005%. Effective September 1, 2015, custody fee credits, which were earned on cash deposit balances, were discontinued by the custodian. |
| (4) | Interest and fee expense relates to the liability for floating rate notes issued in conjunction with residual interest bond transactions (see Note 1H). |
| | | | |
| | 52 | | See Notes to Financial Statements. |
Eaton Vance
Municipal Income Funds
August 31, 2016
Financial Highlights — continued
| | | | | | | | | | | | | | | | | | | | |
| | | Georgia Fund — Class C | |
| | | Year Ended August 31, | |
| | | 2016 | | | 2015 | | | 2014 | | | 2013 | | | 2012 | |
Net asset value — Beginning of year | | $ | 9.130 | | | $ | 9.200 | | | $ | 8.580 | | | $ | 9.480 | | | $ | 9.030 | |
| | | | | |
| Income (Loss) From Operations | | | | | | | | | | | | | | | | | | | | |
Net investment income(1) | | $ | 0.215 | | | $ | 0.258 | | | $ | 0.291 | | | $ | 0.275 | | | $ | 0.306 | |
Net realized and unrealized gain (loss) | | | 0.349 | | | | (0.071 | ) | | | 0.618 | | | | (0.902 | ) | | | 0.450 | |
| | | | | |
Total income (loss) from operations | | $ | 0.564 | | | $ | 0.187 | | | $ | 0.909 | | | $ | (0.627 | ) | | $ | 0.756 | |
| | | | | |
| Less Distributions | | | | | | | | | | | | | | | | | | | | |
From net investment income | | $ | (0.214 | ) | | $ | (0.257 | ) | | $ | (0.289 | ) | | $ | (0.270 | ) | | $ | (0.304 | ) |
Tax return of capital | | | — | | | | — | | | | — | | | | (0.003 | ) | | | (0.002 | ) |
| | | | | |
Total distributions | | $ | (0.214 | ) | | $ | (0.257 | ) | | $ | (0.289 | ) | | $ | (0.273 | ) | | $ | (0.306 | ) |
| | | | | |
Net asset value — End of year | | $ | 9.480 | | | $ | 9.130 | | | $ | 9.200 | | | $ | 8.580 | | | $ | 9.480 | |
| | | | | |
Total Return(2) | | | 6.24 | % | | | 2.05 | % | | | 10.71 | % | | | (6.81 | )% | | | 8.50 | % |
| | | | | |
| Ratios/Supplemental Data | | | | | | | | | | | | | | | | | | | | |
Net assets, end of year (000’s omitted) | | $ | 7,058 | | | $ | 5,991 | | | $ | 5,543 | | | $ | 5,683 | | | $ | 7,277 | |
Ratios (as a percentage of average daily net assets): | | | | | | | | | | | | | | | | | | | | |
Expenses excluding interest and fees(3) | | | 1.45 | % | | | 1.45 | % | | | 1.46 | % | | | 1.47 | % | | | 1.49 | % |
Interest and fee expense(4) | | | — | | | | 0.03 | % | | | 0.04 | % | | | 0.04 | % | | | 0.05 | % |
Total expenses(3) | | | 1.45 | % | | | 1.48 | % | | | 1.50 | % | | | 1.51 | % | | | 1.54 | % |
Net investment income | | | 2.30 | % | | | 2.80 | % | | | 3.24 | % | | | 2.93 | % | | | 3.31 | % |
Portfolio Turnover | | | 7 | % | | | 14 | % | | | 7 | % | | | 19 | % | | | 12 | % |
| (1) | Computed using average shares outstanding. |
| (2) | Returns are historical and are calculated by determining the percentage change in net asset value with all distributions reinvested and do not reflect the effect of sales charges. |
| (3) | Excludes the effect of custody fee credits, if any, of less than 0.005%. Effective September 1, 2015, custody fee credits, which were earned on cash deposit balances, were discontinued by the custodian. |
| (4) | Interest and fee expense relates to the liability for floating rate notes issued in conjunction with residual interest bond transactions (see Note 1H). |
| | | | |
| | 53 | | See Notes to Financial Statements. |
Eaton Vance
Municipal Income Funds
August 31, 2016
Financial Highlights — continued
| | | | | | | | | | | | | | | | | | | | |
| | | Georgia Fund — Class I | |
| | | Year Ended August 31, | |
| | | 2016 | | | 2015 | | | 2014 | | | 2013 | | | 2012 | |
Net asset value — Beginning of year | | $ | 8.560 | | | $ | 8.630 | | | $ | 8.050 | | | $ | 8.890 | | | $ | 8.470 | |
| | | | | |
| Income (Loss) From Operations | | | | | | | | | | | | | | | | | | | | |
Net investment income(1) | | $ | 0.285 | | | $ | 0.318 | | | $ | 0.352 | | | $ | 0.341 | | | $ | 0.367 | |
Net realized and unrealized gain (loss) | | | 0.329 | | | | (0.065 | ) | | | 0.578 | | | | (0.842 | ) | | | 0.422 | |
| | | | | |
Total income (loss) from operations | | $ | 0.614 | | | $ | 0.253 | | | $ | 0.930 | | | $ | (0.501 | ) | | $ | 0.789 | |
| | | | | |
| Less Distributions | | | | | | | | | | | | | | | | | | | | |
From net investment income | | $ | (0.284 | ) | | $ | (0.323 | ) | | $ | (0.350 | ) | | $ | (0.336 | ) | | $ | (0.366 | ) |
Tax return of capital | | | — | | | | — | | | | — | | | | (0.003 | ) | | | (0.003 | ) |
| | | | | |
Total distributions | | $ | (0.284 | ) | | $ | (0.323 | ) | | $ | (0.350 | ) | | $ | (0.339 | ) | | $ | (0.369 | ) |
| | | | | |
Net asset value — End of year | | $ | 8.890 | | | $ | 8.560 | | | $ | 8.630 | | | $ | 8.050 | | | $ | 8.890 | |
| | | | | |
Total Return(2) | | | 7.27 | % | | | 2.97 | % | | | 11.74 | % | | | (5.87 | )% | | | 9.50 | % |
| | | | | |
| Ratios/Supplemental Data | | | | | | | | | | | | | | | | | | | | |
Net assets, end of year (000’s omitted) | | $ | 26,746 | | | $ | 20,413 | | | $ | 9,440 | | | $ | 8,352 | | | $ | 12,462 | |
Ratios (as a percentage of average daily net assets): | | | | | | | | | | | | | | | | | | | | |
Expenses excluding interest and fees(3) | | | 0.50 | % | | | 0.50 | % | | | 0.51 | % | | | 0.52 | % | | | 0.54 | % |
Interest and fee expense(4) | | | — | | | | 0.03 | % | | | 0.04 | % | | | 0.04 | % | | | 0.05 | % |
Total expenses(3) | | | 0.50 | % | | | 0.53 | % | | | 0.55 | % | | | 0.56 | % | | | 0.59 | % |
Net investment income | | | 3.25 | % | | | 3.69 | % | | | 4.19 | % | | | 3.88 | % | | | 4.22 | % |
Portfolio Turnover | | | 7 | % | | | 14 | % | | | 7 | % | | | 19 | % | | | 12 | % |
| (1) | Computed using average shares outstanding. |
| (2) | Returns are historical and are calculated by determining the percentage change in net asset value with all distributions reinvested. |
| (3) | Excludes the effect of custody fee credits, if any, of less than 0.005%. Effective September 1, 2015, custody fee credits, which were earned on cash deposit balances, were discontinued by the custodian. |
| (4) | Interest and fee expense relates to the liability for floating rate notes issued in conjunction with residual interest bond transactions (see Note 1H). |
| | | | |
| | 54 | | See Notes to Financial Statements. |
Eaton Vance
Municipal Income Funds
August 31, 2016
Financial Highlights — continued
| | | | | | | | | | | | | | | | | | | | |
| | | Maryland Fund — Class A | |
| | | Year Ended August 31, | |
| | | 2016 | | | 2015 | | | 2014 | | | 2013 | | | 2012 | |
Net asset value — Beginning of year | | $ | 8.990 | | | $ | 9.110 | | | $ | 8.620 | | | $ | 9.420 | | | $ | 8.840 | |
| | | | | |
| Income (Loss) From Operations | | | | | | | | | | | | | | | | | | | | |
Net investment income(1) | | $ | 0.294 | | | $ | 0.318 | | | $ | 0.338 | | | $ | 0.339 | | | $ | 0.365 | |
Net realized and unrealized gain (loss) | | | 0.167 | | | | (0.127 | ) | | | 0.484 | | | | (0.804 | ) | | | 0.576 | |
| | | | | |
Total income (loss) from operations | | $ | 0.461 | | | $ | 0.191 | | | $ | 0.822 | | | $ | (0.465 | ) | | $ | 0.941 | |
| | | | | |
| Less Distributions | | | | | | | | | | | | | | | | | | | | |
From net investment income | | $ | (0.321 | ) | | $ | (0.311 | ) | | $ | (0.332 | ) | | $ | (0.335 | ) | | $ | (0.361 | ) |
| | | | | |
Total distributions | | $ | (0.321 | ) | | $ | (0.311 | ) | | $ | (0.332 | ) | | $ | (0.335 | ) | | $ | (0.361 | ) |
| | | | | |
Net asset value — End of year | | $ | 9.130 | | | $ | 8.990 | | | $ | 9.110 | | | $ | 8.620 | | | $ | 9.420 | |
| | | | | |
Total Return(2) | | | 5.20 | % | | | 2.12 | % | | | 9.67 | % | | | (5.14 | )% | | | 10.81 | % |
| | | | | |
| Ratios/Supplemental Data | | | | | | | | | | | | | | | | | | | | |
Net assets, end of year (000’s omitted) | | $ | 42,479 | | | $ | 42,706 | | | $ | 48,449 | | | $ | 50,085 | | | $ | 62,306 | |
Ratios (as a percentage of average daily net assets): | | | | | | | | | | | | | | | | | | | | |
Expenses excluding interest and fees(3) | | | 0.74 | % | | | 0.73 | % | | | 0.74 | % | | | 0.75 | % | | | 0.75 | % |
Interest and fee expense(4) | | | 0.02 | % | | | 0.02 | % | | | 0.03 | % | | | 0.03 | % | | | 0.04 | % |
Total expenses(3) | | | 0.76 | % | | | 0.75 | % | | | 0.77 | % | | | 0.78 | % | | | 0.79 | % |
Net investment income | | | 3.24 | % | | | 3.50 | % | | | 3.79 | % | | | 3.63 | % | | | 3.96 | % |
Portfolio Turnover | | | 11 | % | | | 13 | % | | | 0 | %(5) | | | 10 | % | | | 12 | % |
| (1) | Computed using average shares outstanding. |
| (2) | Returns are historical and are calculated by determining the percentage change in net asset value with all distributions reinvested and do not reflect the effect of sales charges. |
| (3) | Excludes the effect of custody fee credits, if any, of less than 0.005%. Effective September 1, 2015, custody fee credits, which were earned on cash deposit balances, were discontinued by the custodian. |
| (4) | Interest and fee expense relates to the liability for floating rate notes issued in conjunction with residual interest bond transactions (see Note 1H). |
| (5) | Amount is less than 0.5%. |
| | | | |
| | 55 | | See Notes to Financial Statements. |
Eaton Vance
Municipal Income Funds
August 31, 2016
Financial Highlights — continued
| | | | | | | | | | | | | | | | | | | | |
| | | Maryland Fund — Class B | |
| | | Year Ended August 31, | |
| | | 2016 | | | 2015 | | | 2014 | | | 2013 | | | 2012 | |
Net asset value — Beginning of year | | $ | 9.800 | | | $ | 9.940 | | | $ | 9.400 | | | $ | 10.270 | | | $ | 9.640 | |
| | | | | |
| Income (Loss) From Operations | | | | | | | | | | | | | | | | | | | | |
Net investment income(1) | | $ | 0.248 | | | $ | 0.273 | | | $ | 0.297 | | | $ | 0.293 | | | $ | 0.325 | |
Net realized and unrealized gain (loss) | | | 0.180 | | | | (0.148 | ) | | | 0.532 | | | | (0.874 | ) | | | 0.624 | |
| | | | | |
Total income (loss) from operations | | $ | 0.428 | | | $ | 0.125 | | | $ | 0.829 | | | $ | (0.581 | ) | | $ | 0.949 | |
| | | | | |
| Less Distributions | | | | | | | | | | | | | | | | | | | | |
From net investment income | | $ | (0.278 | ) | | $ | (0.265 | ) | | $ | (0.289 | ) | | $ | (0.289 | ) | | $ | (0.319 | ) |
| | | | | |
Total distributions | | $ | (0.278 | ) | | $ | (0.265 | ) | | $ | (0.289 | ) | | $ | (0.289 | ) | | $ | (0.319 | ) |
| | | | | |
Net asset value — End of year | | $ | 9.950 | | | $ | 9.800 | | | $ | 9.940 | | | $ | 9.400 | | | $ | 10.270 | |
| | | | | |
Total Return(2) | | | 4.41 | % | | | 1.26 | % | | | 8.92 | % | | | (5.83 | )% | | | 9.96 | % |
| | | | | |
| Ratios/Supplemental Data | | | | | | | | | | | | | | | | | | | | |
Net assets, end of year (000’s omitted) | | $ | 456 | | | $ | 677 | | | $ | 1,150 | | | $ | 1,738 | | | $ | 2,286 | |
Ratios (as a percentage of average daily net assets): | | | | | | | | | | | | | | | | | | | | |
Expenses excluding interest and fees(3) | | | 1.49 | % | | | 1.48 | % | | | 1.49 | % | | | 1.50 | % | | | 1.50 | % |
Interest and fee expense(4) | | | 0.02 | % | | | 0.02 | % | | | 0.03 | % | | | 0.03 | % | | | 0.04 | % |
Total expenses(3) | | | 1.51 | % | | | 1.50 | % | | | 1.52 | % | | | 1.53 | % | | | 1.54 | % |
Net investment income | | | 2.51 | % | | | 2.76 | % | | | 3.05 | % | | | 2.88 | % | | | 3.25 | % |
Portfolio Turnover | | | 11 | % | | | 13 | % | | | 0 | %(5) | | | 10 | % | | | 12 | % |
| (1) | Computed using average shares outstanding. |
| (2) | Returns are historical and are calculated by determining the percentage change in net asset value with all distributions reinvested and do not reflect the effect of sales charges. |
| (3) | Excludes the effect of custody fee credits, if any, of less than 0.005%. Effective September 1, 2015, custody fee credits, which were earned on cash deposit balances, were discontinued by the custodian. |
| (4) | Interest and fee expense relates to the liability for floating rate notes issued in conjunction with residual interest bond transactions (see Note 1H). |
| (5) | Amount is less than 0.5%. |
| | | | |
| | 56 | | See Notes to Financial Statements. |
Eaton Vance
Municipal Income Funds
August 31, 2016
Financial Highlights — continued
| | | | | | | | | | | | | | | | | | | | |
| | | Maryland Fund — Class C | |
| | | Year Ended August 31, | |
| | | 2016 | | | 2015 | | | 2014 | | | 2013 | | | 2012 | |
Net asset value — Beginning of year | | $ | 9.810 | | | $ | 9.940 | | | $ | 9.400 | | | $ | 10.280 | | | $ | 9.640 | |
| | | | | |
| Income (Loss) From Operations | | | | | | | | | | | | | | | | | | | | |
Net investment income(1) | | $ | 0.247 | | | $ | 0.272 | | | $ | 0.296 | | | $ | 0.291 | | | $ | 0.321 | |
Net realized and unrealized gain (loss) | | | 0.179 | | | | (0.137 | ) | | | 0.533 | | | | (0.882 | ) | | | 0.638 | |
| | | | | |
Total income (loss) from operations | | $ | 0.426 | | | $ | 0.135 | | | $ | 0.829 | | | $ | (0.591 | ) | | $ | 0.959 | |
| | | | | |
| Less Distributions | | | | | | | | | | | | | | | | | | | | |
From net investment income | | $ | (0.276 | ) | | $ | (0.265 | ) | | $ | (0.289 | ) | | $ | (0.289 | ) | | $ | (0.319 | ) |
| | | | | |
Total distributions | | $ | (0.276 | ) | | $ | (0.265 | ) | | $ | (0.289 | ) | | $ | (0.289 | ) | | $ | (0.319 | ) |
| | | | | |
Net asset value — End of year | | $ | 9.960 | | | $ | 9.810 | | | $ | 9.940 | | | $ | 9.400 | | | $ | 10.280 | |
| | | | | |
Total Return(2) | | | 4.39 | % | | | 1.37 | % | | | 8.92 | % | | | (5.92 | )% | | | 10.07 | % |
| | | | | |
| Ratios/Supplemental Data | | | | | | | | | | | | | | | | | | | | |
Net assets, end of year (000’s omitted) | | $ | 16,356 | | | $ | 14,671 | | | $ | 15,875 | | | $ | 16,493 | | | $ | 16,094 | |
Ratios (as a percentage of average daily net assets): | | | | | | | | | | | | | | | | | | | | |
Expenses excluding interest and fees(3) | | | 1.49 | % | | | 1.48 | % | | | 1.49 | % | | | 1.50 | % | | | 1.50 | % |
Interest and fee expense(4) | | | 0.02 | % | | | 0.02 | % | | | 0.03 | % | | | 0.03 | % | | | 0.04 | % |
Total expenses(3) | | | 1.51 | % | | | 1.50 | % | | | 1.52 | % | | | 1.53 | % | | | 1.54 | % |
Net investment income | | | 2.49 | % | | | 2.75 | % | | | 3.04 | % | | | 2.86 | % | | | 3.19 | % |
Portfolio Turnover | | | 11 | % | | | 13 | % | | | 0 | %(5) | | | 10 | % | | | 12 | % |
| (1) | Computed using average shares outstanding. |
| (2) | Returns are historical and are calculated by determining the percentage change in net asset value with all distributions reinvested and do not reflect the effect of sales charges. |
| (3) | Excludes the effect of custody fee credits, if any, of less than 0.005%. Effective September 1, 2015, custody fee credits, which were earned on cash deposit balances, were discontinued by the custodian. |
| (4) | Interest and fee expense relates to the liability for floating rate notes issued in conjunction with residual interest bond transactions (see Note 1H). |
| (5) | Amount is less than 0.5%. |
| | | | |
| | 57 | | See Notes to Financial Statements. |
Eaton Vance
Municipal Income Funds
August 31, 2016
Financial Highlights — continued
| | | | | | | | | | | | | | | | | | | | |
| | | Maryland Fund — Class I | |
| | | Year Ended August 31, | |
| | | 2016 | | | 2015 | | | 2014 | | | 2013 | | | 2012 | |
Net asset value — Beginning of year | | $ | 9.010 | | | $ | 9.130 | | | $ | 8.640 | | | $ | 9.440 | | | $ | 8.860 | |
| | | | | |
| Income (Loss) From Operations | | | | | | | | | | | | | | | | | | | | |
Net investment income(1) | | $ | 0.310 | | | $ | 0.335 | | | $ | 0.357 | | | $ | 0.356 | | | $ | 0.382 | |
Net realized and unrealized gain (loss) | | | 0.170 | | | | (0.125 | ) | | | 0.484 | | | | (0.802 | ) | | | 0.579 | |
| | | | | |
Total income (loss) from operations | | $ | 0.480 | | | $ | 0.210 | | | $ | 0.841 | | | $ | (0.446 | ) | | $ | 0.961 | |
| | | | | |
| Less Distributions | | | | | | | | | | | | | | | | | | | | |
From net investment income | | $ | (0.340 | ) | | $ | (0.330 | ) | | $ | (0.351 | ) | | $ | (0.354 | ) | | $ | (0.381 | ) |
| | | | | |
Total distributions | | $ | (0.340 | ) | | $ | (0.330 | ) | | $ | (0.351 | ) | | $ | (0.354 | ) | | $ | (0.381 | ) |
| | | | | |
Net asset value — End of year | | $ | 9.150 | | | $ | 9.010 | | | $ | 9.130 | | | $ | 8.640 | | | $ | 9.440 | |
| | | | | |
Total Return(2) | | | 5.41 | % | | | 2.32 | % | | | 9.88 | % | | | (4.93 | )% | | | 11.02 | % |
| | | | | |
| Ratios/Supplemental Data | | | | | | | | | | | | | | | | | | | | |
Net assets, end of year (000’s omitted) | | $ | 7,572 | | | $ | 7,167 | | | $ | 4,518 | | | $ | 4,595 | | | $ | 3,805 | |
Ratios (as a percentage of average daily net assets): | | | | | | | | | | | | | | | | | | | | |
Expenses excluding interest and fees(3) | | | 0.54 | % | | | 0.53 | % | | | 0.54 | % | | | 0.55 | % | | | 0.55 | % |
Interest and fee expense(4) | | | 0.02 | % | | | 0.02 | % | | | 0.03 | % | | | 0.03 | % | | | 0.04 | % |
Total expenses(3) | | | 0.56 | % | | | 0.55 | % | | | 0.57 | % | | | 0.58 | % | | | 0.59 | % |
Net investment income | | | 3.41 | % | | | 3.68 | % | | | 3.99 | % | | | 3.82 | % | | | 4.14 | % |
Portfolio Turnover | | | 11 | % | | | 13 | % | | | 0 | %(5) | | | 10 | % | | | 12 | % |
| (1) | Computed using average shares outstanding. |
| (2) | Returns are historical and are calculated by determining the percentage change in net asset value with all distributions reinvested. |
| (3) | Excludes the effect of custody fee credits, if any, of less than 0.005%. Effective September 1, 2015, custody fee credits, which were earned on cash deposit balances, were discontinued by the custodian. |
| (4) | Interest and fee expense relates to the liability for floating rate notes issued in conjunction with residual interest bond transactions (see Note 1H). |
| (5) | Amount is less than 0.5%. |
| | | | |
| | 58 | | See Notes to Financial Statements. |
Eaton Vance
Municipal Income Funds
August 31, 2016
Financial Highlights — continued
| | | | | | | | | | | | | | | | | | | | |
| | | Missouri Fund — Class A | |
| | | Year Ended August 31, | |
| | | 2016 | | | 2015 | | | 2014 | | | 2013 | | | 2012 | |
Net asset value — Beginning of year | | $ | 9.480 | | | $ | 9.610 | | | $ | 8.870 | | | $ | 9.830 | | | $ | 9.180 | |
| | | | | |
| Income (Loss) From Operations | | | | | | | | | | | | | | | | | | | | |
Net investment income(1) | | $ | 0.346 | | | $ | 0.347 | | | $ | 0.352 | | | $ | 0.348 | | | $ | 0.365 | |
Net realized and unrealized gain (loss) | | | 0.336 | | | | (0.134 | ) | | | 0.746 | | | | (0.963 | ) | | | 0.647 | |
| | | | | |
Total income (loss) from operations | | $ | 0.682 | | | $ | 0.213 | | | $ | 1.098 | | | $ | (0.615 | ) | | $ | 1.012 | |
| | | | | |
| Less Distributions | | | | | | | | | | | | | | | | | | | | |
From net investment income | | $ | (0.342 | ) | | $ | (0.343 | ) | | $ | (0.358 | ) | | $ | (0.345 | ) | | $ | (0.362 | ) |
| | | | | |
Total distributions | | $ | (0.342 | ) | | $ | (0.343 | ) | | $ | (0.358 | ) | | $ | (0.345 | ) | | $ | (0.362 | ) |
| | | | | |
Net asset value — End of year | | $ | 9.820 | | | $ | 9.480 | | | $ | 9.610 | | | $ | 8.870 | | | $ | 9.830 | |
| | | | | |
Total Return(2) | | | 7.32 | % | | | 2.24 | % | | | 12.58 | % | | | (6.49 | )% | | | 11.20 | % |
| | | | | |
| Ratios/Supplemental Data | | | | | | | | | | | | | | | | | | | | |
Net assets, end of year (000’s omitted) | | $ | 61,038 | | | $ | 61,873 | | | $ | 65,399 | | | $ | 61,391 | | | $ | 80,768 | |
Ratios (as a percentage of average daily net assets): | | | | | | | | | | | | | | | | | | | | |
Expenses excluding interest and fees(3) | | | 0.70 | % | | | 0.70 | % | | | 0.71 | % | | | 0.72 | % | | | 0.73 | % |
Interest and fee expense(4) | | | 0.01 | % | | | 0.01 | % | | | 0.01 | % | | | 0.02 | % | | | 0.02 | % |
Total expenses(3) | | | 0.71 | % | | | 0.71 | % | | | 0.72 | % | | | 0.74 | % | | | 0.75 | % |
Net investment income | | | 3.59 | % | | | 3.62 | % | | | 3.79 | % | | | 3.59 | % | | | 3.82 | % |
Portfolio Turnover | | | 10 | % | | | 7 | % | | | 15 | % | | | 10 | % | | | 12 | % |
| (1) | Computed using average shares outstanding. |
| (2) | Returns are historical and are calculated by determining the percentage change in net asset value with all distributions reinvested and do not reflect the effect of sales charges. |
| (3) | Excludes the effect of custody fee credits, if any, of less than 0.005%. Effective September 1, 2015, custody fee credits, which were earned on cash deposit balances, were discontinued by the custodian. |
| (4) | Interest and fee expense relates to the liability for floating rate notes issued in conjunction with residual interest bond transactions (see Note 1H). |
| | | | |
| | 59 | | See Notes to Financial Statements. |
Eaton Vance
Municipal Income Funds
August 31, 2016
Financial Highlights — continued
| | | | | | | | | | | | | | | | | | | | |
| | | Missouri Fund — Class B | |
| | | Year Ended August 31, | |
| | | 2016 | | | 2015 | | | 2014 | | | 2013 | | | 2012 | |
Net asset value — Beginning of year | | $ | 10.470 | | | $ | 10.620 | | | $ | 9.810 | | | $ | 10.870 | | | $ | 10.140 | |
| | | | | |
| Income (Loss) From Operations | | | | | | | | | | | | | | | | | | | | |
Net investment income(1) | | $ | 0.304 | | | $ | 0.304 | | | $ | 0.312 | | | $ | 0.304 | | | $ | 0.327 | |
Net realized and unrealized gain (loss) | | | 0.384 | | | | (0.154 | ) | | | 0.817 | | | | (1.063 | ) | | | 0.724 | |
| | | | | |
Total income (loss) from operations | | $ | 0.688 | | | $ | 0.150 | | | $ | 1.129 | | | $ | (0.759 | ) | | $ | 1.051 | |
| | | | | |
| Less Distributions | | | | | | | | | | | | | | | | | | | | |
From net investment income | | $ | (0.298 | ) | | $ | (0.300 | ) | | $ | (0.319 | ) | | $ | (0.301 | ) | | $ | (0.321 | ) |
| | | | | |
Total distributions | | $ | (0.298 | ) | | $ | (0.300 | ) | | $ | (0.319 | ) | | $ | (0.301 | ) | | $ | (0.321 | ) |
| | | | | |
Net asset value — End of year | | $ | 10.860 | | | $ | 10.470 | | | $ | 10.620 | | | $ | 9.810 | | | $ | 10.870 | |
| | | | | |
Total Return(2) | | | 6.66 | % | | | 1.41 | % | | | 11.67 | % | | | (7.17 | )% | | | 10.50 | % |
| | | | | |
| Ratios/Supplemental Data | | | | | | | | | | | | | | | | | | | | |
Net assets, end of year (000’s omitted) | | $ | 356 | | | $ | 794 | | | $ | 1,159 | | | $ | 1,245 | | | $ | 1,936 | |
Ratios (as a percentage of average daily net assets): | | | | | | | | | | | | | | | | | | | | |
Expenses excluding interest and fees(3) | | | 1.45 | % | | | 1.46 | % | | | 1.46 | % | | | 1.47 | % | | | 1.48 | % |
Interest and fee expense(4) | | | 0.01 | % | | | 0.01 | % | | | 0.01 | % | | | 0.02 | % | | | 0.02 | % |
Total expenses(3) | | | 1.46 | % | | | 1.47 | % | | | 1.47 | % | | | 1.49 | % | | | 1.50 | % |
Net investment income | | | 2.85 | % | | | 2.87 | % | | | 3.04 | % | | | 2.84 | % | | | 3.11 | % |
Portfolio Turnover | | | 10 | % | | | 7 | % | | | 15 | % | | | 10 | % | | | 12 | % |
| (1) | Computed using average shares outstanding. |
| (2) | Returns are historical and are calculated by determining the percentage change in net asset value with all distributions reinvested and do not reflect the effect of sales charges. |
| (3) | Excludes the effect of custody fee credits, if any, of less than 0.005%. Effective September 1, 2015, custody fee credits, which were earned on cash deposit balances, were discontinued by the custodian. |
| (4) | Interest and fee expense relates to the liability for floating rate notes issued in conjunction with residual interest bond transactions (see Note 1H). |
| | | | |
| | 60 | | See Notes to Financial Statements. |
Eaton Vance
Municipal Income Funds
August 31, 2016
Financial Highlights — continued
| | | | | | | | | | | | | | | | | | | | |
| | | Missouri Fund — Class C | |
| | | Year Ended August 31, | |
| | | 2016 | | | 2015 | | | 2014 | | | 2013 | | | 2012 | |
Net asset value — Beginning of year | | $ | 10.460 | | | $ | 10.610 | | | $ | 9.800 | | | $ | 10.860 | | | $ | 10.140 | |
| | | | | |
| Income (Loss) From Operations | | | | | | | | | | | | | | | | | | | | |
Net investment income(1) | | $ | 0.299 | | | $ | 0.304 | | | $ | 0.312 | | | $ | 0.303 | | | $ | 0.321 | |
Net realized and unrealized gain (loss) | | | 0.389 | | | | (0.154 | ) | | | 0.817 | | | | (1.062 | ) | | | 0.719 | |
| | | | | |
Total income (loss) from operations | | $ | 0.688 | | | $ | 0.150 | | | $ | 1.129 | | | $ | (0.759 | ) | | $ | 1.040 | |
| | | | | |
| Less Distributions | | | | | | | | | | | | | | | | | | | | |
From net investment income | | $ | (0.298 | ) | | $ | (0.300 | ) | | $ | (0.319 | ) | | $ | (0.301 | ) | | $ | (0.320 | ) |
| | | | | |
Total distributions | | $ | (0.298 | ) | | $ | (0.300 | ) | | $ | (0.319 | ) | | $ | (0.301 | ) | | $ | (0.320 | ) |
| | | | | |
Net asset value — End of year | | $ | 10.850 | | | $ | 10.460 | | | $ | 10.610 | | | $ | 9.800 | | | $ | 10.860 | |
| | | | | |
Total Return(2) | | | 6.66 | % | | | 1.41 | % | | | 11.67 | % | | | (7.18 | )% | | | 10.40 | % |
| | | | | |
| Ratios/Supplemental Data | | | | | | | | | | | | | | | | | | | | |
Net assets, end of year (000’s omitted) | | $ | 9,420 | | | $ | 6,370 | | | $ | 6,170 | | | $ | 6,061 | | | $ | 6,380 | |
Ratios (as a percentage of average daily net assets): | | | | | | | | | | | | | | | | | | | | |
Expenses excluding interest and fees(3) | | | 1.45 | % | | | 1.45 | % | | | 1.46 | % | | | 1.47 | % | | | 1.48 | % |
Interest and fee expense(4) | | | 0.01 | % | | | 0.01 | % | | | 0.01 | % | | | 0.02 | % | | | 0.02 | % |
Total expenses(3) | | | 1.46 | % | | | 1.46 | % | | | 1.47 | % | | | 1.49 | % | | | 1.50 | % |
Net investment income | | | 2.81 | % | | | 2.87 | % | | | 3.05 | % | | | 2.84 | % | | | 3.04 | % |
Portfolio Turnover | | | 10 | % | | | 7 | % | | | 15 | % | | | 10 | % | | | 12 | % |
| (1) | Computed using average shares outstanding. |
| (2) | Returns are historical and are calculated by determining the percentage change in net asset value with all distributions reinvested and do not reflect the effect of sales charges. |
| (3) | Excludes the effect of custody fee credits, if any, of less than 0.005%. Effective September 1, 2015, custody fee credits, which were earned on cash deposit balances, were discontinued by the custodian. |
| (4) | Interest and fee expense relates to the liability for floating rate notes issued in conjunction with residual interest bond transactions (see Note 1H). |
| | | | |
| | 61 | | See Notes to Financial Statements. |
Eaton Vance
Municipal Income Funds
August 31, 2016
Financial Highlights — continued
| | | | | | | | | | | | | | | | | | | | |
| | | Missouri Fund — Class I | |
| | | Year Ended August 31, | |
| | | 2016 | | | 2015 | | | 2014 | | | 2013 | | | 2012 | |
Net asset value — Beginning of year | | $ | 9.490 | | | $ | 9.620 | | | $ | 8.890 | | | $ | 9.850 | | | $ | 9.190 | |
| | | | | |
| Income (Loss) From Operations | | | | | | | | | | | | | | | | | | | | |
Net investment income(1) | | $ | 0.364 | | | $ | 0.367 | | | $ | 0.375 | | | $ | 0.367 | | | $ | 0.376 | |
Net realized and unrealized gain (loss) | | | 0.348 | | | | (0.134 | ) | | | 0.733 | | | | (0.962 | ) | | | 0.665 | |
| | | | | |
Total income (loss) from operations | | $ | 0.712 | | | $ | 0.233 | | | $ | 1.108 | | | $ | (0.595 | ) | | $ | 1.041 | |
| | | | | |
| Less Distributions | | | | | | | | | | | | | | | | | | | | |
From net investment income | | $ | (0.362 | ) | | $ | (0.363 | ) | | $ | (0.378 | ) | | $ | (0.365 | ) | | $ | (0.381 | ) |
| | | | | |
Total distributions | | $ | (0.362 | ) | | $ | (0.363 | ) | | $ | (0.378 | ) | | $ | (0.365 | ) | | $ | (0.381 | ) |
| | | | | |
Net asset value — End of year | | $ | 9.840 | | | $ | 9.490 | | | $ | 9.620 | | | $ | 8.890 | | | $ | 9.850 | |
| | | | | |
Total Return(2) | | | 7.64 | % | | | 2.44 | % | | | 12.68 | % | | | (6.28 | )% | | | 11.52 | % |
| | | | | |
| Ratios/Supplemental Data | | | | | | | | | | | | | | | | | | | | |
Net assets, end of year (000’s omitted) | | $ | 4,732 | | | $ | 2,957 | | | $ | 2,232 | | | $ | 3,753 | | | $ | 2,310 | |
Ratios (as a percentage of average daily net assets): | | | | | | | | | | | | | | | | | | | | |
Expenses excluding interest and fees(3) | | | 0.50 | % | | | 0.50 | % | | | 0.51 | % | | | 0.52 | % | | | 0.53 | % |
Interest and fee expense(4) | | | 0.01 | % | | | 0.01 | % | | | 0.01 | % | | | 0.02 | % | | | 0.02 | % |
Total expenses(3) | | | 0.51 | % | | | 0.51 | % | | | 0.52 | % | | | 0.54 | % | | | 0.55 | % |
Net investment income | | | 3.76 | % | | | 3.82 | % | | | 4.05 | % | | | 3.80 | % | | | 3.91 | % |
Portfolio Turnover | | | 10 | % | | | 7 | % | | | 15 | % | | | 10 | % | | | 12 | % |
| (1) | Computed using average shares outstanding. |
| (2) | Returns are historical and are calculated by determining the percentage change in net asset value with all distributions reinvested. |
| (3) | Excludes the effect of custody fee credits, if any, of less than 0.005%. Effective September 1, 2015, custody fee credits, which were earned on cash deposit balances, were discontinued by the custodian. |
| (4) | Interest and fee expense relates to the liability for floating rate notes issued in conjunction with residual interest bond transactions (see Note 1H). |
| | | | |
| | 62 | | See Notes to Financial Statements. |
Eaton Vance
Municipal Income Funds
August 31, 2016
Financial Highlights — continued
| | | | | | | | | | | | | | | | | | | | |
| | | North Carolina Fund — Class A | |
| | | Year Ended August 31, | |
| | | 2016 | | | 2015 | | | 2014 | | | 2013 | | | 2012 | |
Net asset value — Beginning of year | | $ | 9.120 | | | $ | 9.180 | | | $ | 8.340 | | | $ | 9.480 | | | $ | 8.820 | |
| | | | | |
| Income (Loss) From Operations | | | | | | | | | | | | | | | | | | | | |
Net investment income(1) | | $ | 0.305 | | | $ | 0.323 | | | $ | 0.363 | | | $ | 0.374 | | | $ | 0.407 | |
Net realized and unrealized gain (loss) | | | 0.289 | | | | (0.061 | ) | | | 0.843 | | | | (1.143 | ) | | | 0.656 | |
| | | | | |
Total income (loss) from operations | | $ | 0.594 | | | $ | 0.262 | | | $ | 1.206 | | | $ | (0.769 | ) | | $ | 1.063 | |
| | | | | |
| Less Distributions | | | | | | | | | | | | | | | | | | | | |
From net investment income | | $ | (0.304 | ) | | $ | (0.322 | ) | | $ | (0.366 | ) | | $ | (0.371 | ) | | $ | (0.403 | ) |
| | | | | |
Total distributions | | $ | (0.304 | ) | | $ | (0.322 | ) | | $ | (0.366 | ) | | $ | (0.371 | ) | | $ | (0.403 | ) |
| | | | | |
Net asset value — End of year | | $ | 9.410 | | | $ | 9.120 | | | $ | 9.180 | | | $ | 8.340 | | | $ | 9.480 | |
| | | | | |
Total Return(2) | | | 6.61 | % | | | 2.88 | % | | | 14.70 | % | | | (8.46 | )% | | | 12.27 | % |
| | | | | |
| Ratios/Supplemental Data | | | | | | | | | | | | | | | | | | | | |
Net assets, end of year (000’s omitted) | | $ | 83,512 | | | $ | 78,397 | | | $ | 79,250 | | | $ | 78,864 | | | $ | 87,573 | |
Ratios (as a percentage of average daily net assets): | | | | | | | | | | | | | | | | | | | | |
Expenses excluding interest and fees(3) | | | 0.70 | % | | | 0.71 | % | | | 0.73 | % | | | 0.74 | % | | | 0.75 | % |
Interest and fee expense(4) | | | 0.07 | % | | | 0.02 | % | | | 0.05 | % | | | 0.06 | % | | | 0.07 | % |
Total expenses(3) | | | 0.77 | % | | | 0.73 | % | | | 0.78 | % | | | 0.80 | % | | | 0.82 | % |
Net investment income | | | 3.28 | % | | | 3.50 | % | | | 4.12 | % | | | 4.00 | % | | | 4.41 | % |
Portfolio Turnover | | | 8 | % | | | 2 | % | | | 8 | % | | | 14 | % | | | 8 | % |
| (1) | Computed using average shares outstanding. |
| (2) | Returns are historical and are calculated by determining the percentage change in net asset value with all distributions reinvested and do not reflect the effect of sales charges. |
| (3) | Excludes the effect of custody fee credits, if any, of less than 0.005%. Effective September 1, 2015, custody fee credits, which were earned on cash deposit balances, were discontinued by the custodian. |
| (4) | Interest and fee expense relates to the liability for floating rate notes issued in conjunction with residual interest bond transactions (see Note 1H). |
| | | | |
| | 63 | | See Notes to Financial Statements. |
Eaton Vance
Municipal Income Funds
August 31, 2016
Financial Highlights — continued
| | | | | | | | | | | | | | | | | | | | |
| | | North Carolina Fund — Class B | |
| | | Year Ended August 31, | |
| | | 2016 | | | 2015 | | | 2014 | | | 2013 | | | 2012 | |
Net asset value — Beginning of year | | $ | 9.810 | | | $ | 9.870 | | | $ | 8.970 | | | $ | 10.190 | | | $ | 9.490 | |
| | | | | |
| Income (Loss) From Operations | | | | | | | | | | | | | | | | | | | | |
Net investment income(1) | | $ | 0.255 | | | $ | 0.274 | | | $ | 0.322 | | | $ | 0.328 | | | $ | 0.366 | |
Net realized and unrealized gain (loss) | | | 0.308 | | | | (0.062 | ) | | | 0.900 | | | | (1.225 | ) | | | 0.693 | |
| | | | | |
Total income (loss) from operations | | $ | 0.563 | | | $ | 0.212 | | | $ | 1.222 | | | $ | (0.897 | ) | | $ | 1.059 | |
| | | | | |
| Less Distributions | | | | | | | | | | | | | | | | | | | | |
From net investment income | | $ | (0.253 | ) | | $ | (0.272 | ) | | $ | (0.322 | ) | | $ | (0.323 | ) | | $ | (0.359 | ) |
| | | | | |
Total distributions | | $ | (0.253 | ) | | $ | (0.272 | ) | | $ | (0.322 | ) | | $ | (0.323 | ) | | $ | (0.359 | ) |
| | | | | |
Net asset value — End of year | | $ | 10.120 | | | $ | 9.810 | | | $ | 9.870 | | | $ | 8.970 | | | $ | 10.190 | |
| | | | | |
Total Return(2) | | | 5.81 | % | | | 2.16 | % | | | 13.82 | % | | | (9.09 | )% | | | 11.33 | % |
| | | | | |
| Ratios/Supplemental Data | | | | | | | | | | | | | | | | | | | | |
Net assets, end of year (000’s omitted) | | $ | 370 | | | $ | 575 | | | $ | 871 | | | $ | 1,103 | | | $ | 2,091 | |
Ratios (as a percentage of average daily net assets): | | | | | | | | | | | | | | | | | | | | |
Expenses excluding interest and fees(3) | | | 1.45 | % | | | 1.46 | % | | | 1.48 | % | | | 1.49 | % | | | 1.50 | % |
Interest and fee expense(4) | | | 0.07 | % | | | 0.02 | % | | | 0.05 | % | | | 0.06 | % | | | 0.07 | % |
Total expenses(3) | | | 1.52 | % | | | 1.48 | % | | | 1.53 | % | | | 1.55 | % | | | 1.57 | % |
Net investment income | | | 2.56 | % | | | 2.77 | % | | | 3.40 | % | | | 3.24 | % | | | 3.70 | % |
Portfolio Turnover | | | 8 | % | | | 2 | % | | | 8 | % | | | 14 | % | | | 8 | % |
| (1) | Computed using average shares outstanding. |
| (2) | Returns are historical and are calculated by determining the percentage change in net asset value with all distributions reinvested and do not reflect the effect of sales charges. |
| (3) | Excludes the effect of custody fee credits, if any, of less than 0.005%. Effective September 1, 2015, custody fee credits, which were earned on cash deposit balances, were discontinued by the custodian. |
| (4) | Interest and fee expense relates to the liability for floating rate notes issued in conjunction with residual interest bond transactions (see Note 1H). |
| | | | |
| | 64 | | See Notes to Financial Statements. |
Eaton Vance
Municipal Income Funds
August 31, 2016
Financial Highlights — continued
| | | | | | | | | | | | | | | | | | | | |
| | | North Carolina Fund — Class C | |
| | | Year Ended August 31, | |
| | | 2016 | | | 2015 | | | 2014 | | | 2013 | | | 2012 | |
Net asset value — Beginning of year | | $ | 9.810 | | | $ | 9.870 | | | $ | 8.970 | | | $ | 10.190 | | | $ | 9.490 | |
| | | | | |
| Income (Loss) From Operations | | | | | | | | | | | | | | | | | | | | |
Net investment income(1) | | $ | 0.252 | | | $ | 0.273 | | | $ | 0.322 | | | $ | 0.327 | | | $ | 0.360 | |
Net realized and unrealized gain (loss) | | | 0.310 | | | | (0.061 | ) | | | 0.901 | | | | (1.224 | ) | | | 0.699 | |
| | | | | |
Total income (loss) from operations | | $ | 0.562 | | | $ | 0.212 | | | $ | 1.223 | | | $ | (0.897 | ) | | $ | 1.059 | |
| | | | | |
| Less Distributions | | | | | | | | | | | | | | | | | | | | |
From net investment income | | $ | (0.252 | ) | | $ | (0.272 | ) | | $ | (0.323 | ) | | $ | (0.323 | ) | | $ | (0.359 | ) |
| | | | | |
Total distributions | | $ | (0.252 | ) | | $ | (0.272 | ) | | $ | (0.323 | ) | | $ | (0.323 | ) | | $ | (0.359 | ) |
| | | | | |
Net asset value — End of year | | $ | 10.120 | | | $ | 9.810 | | | $ | 9.870 | | | $ | 8.970 | | | $ | 10.190 | |
| | | | | |
Total Return(2) | | | 5.80 | % | | | 2.16 | % | | | 13.82 | % | | | (9.09 | )% | | | 11.32 | % |
| | | | | |
| Ratios/Supplemental Data | | | | | | | | | | | | | | | | | | | | |
Net assets, end of year (000’s omitted) | | $ | 20,927 | | | $ | 17,180 | | | $ | 17,630 | | | $ | 20,150 | | | $ | 21,402 | |
Ratios (as a percentage of average daily net assets): | | | | | | | | | | | | | | | | | | | | |
Expenses excluding interest and fees(3) | | | 1.45 | % | | | 1.46 | % | | | 1.48 | % | | | 1.49 | % | | | 1.49 | % |
Interest and fee expense(4) | | | 0.07 | % | | | 0.02 | % | | | 0.05 | % | | | 0.06 | % | | | 0.07 | % |
Total expenses(3) | | | 1.52 | % | | | 1.48 | % | | | 1.53 | % | | | 1.55 | % | | | 1.56 | % |
Net investment income | | | 2.52 | % | | | 2.75 | % | | | 3.39 | % | | | 3.25 | % | | | 3.63 | % |
Portfolio Turnover | | | 8 | % | | | 2 | % | | | 8 | % | | | 14 | % | | | 8 | % |
| (1) | Computed using average shares outstanding. |
| (2) | Returns are historical and are calculated by determining the percentage change in net asset value with all distributions reinvested and do not reflect the effect of sales charges. |
| (3) | Excludes the effect of custody fee credits, if any, of less than 0.005%. Effective September 1, 2015, custody fee credits, which were earned on cash deposit balances, were discontinued by the custodian. |
| (4) | Interest and fee expense relates to the liability for floating rate notes issued in conjunction with residual interest bond transactions (see Note 1H). |
| | | | |
| | 65 | | See Notes to Financial Statements. |
Eaton Vance
Municipal Income Funds
August 31, 2016
Financial Highlights — continued
| | | | | | | | | | | | | | | | | | | | |
| | | North Carolina Fund — Class I | |
| | | Year Ended August 31, | |
| | | 2016 | | | 2015 | | | 2014 | | | 2013 | | | 2012 | |
Net asset value — Beginning of year | | $ | 9.140 | | | $ | 9.200 | | | $ | 8.360 | | | $ | 9.500 | | | $ | 8.840 | |
| | | | | |
| Income (Loss) From Operations | | | | | | | | | | | | | | | | | | | | |
Net investment income(1) | | $ | 0.321 | | | $ | 0.341 | | | $ | 0.382 | | | $ | 0.394 | | | $ | 0.426 | |
Net realized and unrealized gain (loss) | | | 0.292 | | | | (0.059 | ) | | | 0.843 | | | | (1.144 | ) | | | 0.656 | |
| | | | | |
Total income (loss) from operations | | $ | 0.613 | | | $ | 0.282 | | | $ | 1.225 | | | $ | (0.750 | ) | | $ | 1.082 | |
| | | | | |
| Less Distributions | | | | | | | | | | | | | | | | | | | | |
From net investment income | | $ | (0.323 | ) | | $ | (0.342 | ) | | $ | (0.385 | ) | | $ | (0.390 | ) | | $ | (0.422 | ) |
| | | | | |
Total distributions | | $ | (0.323 | ) | | $ | (0.342 | ) | | $ | (0.385 | ) | | $ | (0.390 | ) | | $ | (0.422 | ) |
| | | | | |
Net asset value — End of year | | $ | 9.430 | | | $ | 9.140 | | | $ | 9.200 | | | $ | 8.360 | | | $ | 9.500 | |
| | | | | |
Total Return(2) | | | 6.82 | % | | | 3.09 | % | | | 14.91 | % | | | (8.25 | )% | | | 12.35 | % |
| | | | | |
| Ratios/Supplemental Data | | | | | | | | | | | | | | | | | | | | |
Net assets, end of year (000’s omitted) | | $ | 32,976 | | | $ | 20,694 | | | $ | 15,613 | | | $ | 15,958 | | | $ | 18,174 | |
Ratios (as a percentage of average daily net assets): | | | | | | | | | | | | | | | | | | | | |
Expenses excluding interest and fees(3) | | | 0.50 | % | | | 0.51 | % | | | 0.53 | % | | | 0.54 | % | | | 0.55 | % |
Interest and fee expense(4) | | | 0.07 | % | | | 0.02 | % | | | 0.05 | % | | | 0.06 | % | | | 0.07 | % |
Total expenses(3) | | | 0.57 | % | | | 0.53 | % | | | 0.58 | % | | | 0.60 | % | | | 0.62 | % |
Net investment income | | | 3.45 | % | | | 3.70 | % | | | 4.32 | % | | | 4.20 | % | | | 4.61 | % |
Portfolio Turnover | | | 8 | % | | | 2 | % | | | 8 | % | | | 14 | % | | | 8 | % |
| (1) | Computed using average shares outstanding. |
| (2) | Returns are historical and are calculated by determining the percentage change in net asset value with all distributions reinvested. |
| (3) | Excludes the effect of custody fee credits, if any, of less than 0.005%. Effective September 1, 2015, custody fee credits, which were earned on cash deposit balances, were discontinued by the custodian. |
| (4) | Interest and fee expense relates to the liability for floating rate notes issued in conjunction with residual interest bond transactions (see Note 1H). |
| | | | |
| | 66 | | See Notes to Financial Statements. |
Eaton Vance
Municipal Income Funds
August 31, 2016
Financial Highlights — continued
| | | | | | | | | | | | | | | | | | | | |
| | | Oregon Fund — Class A | |
| | | Year Ended August 31, | |
| | | 2016 | | | 2015 | | | 2014 | | | 2013 | | | 2012 | |
Net asset value — Beginning of year | | $ | 8.630 | | | $ | 8.760 | | | $ | 8.070 | | | $ | 9.570 | | | $ | 8.630 | |
| | | | | |
| Income (Loss) From Operations | | | | | | | | | | | | | | | | | | | | |
Net investment income(1) | | $ | 0.320 | | | $ | 0.331 | | | $ | 0.383 | | | $ | 0.380 | | | $ | 0.414 | |
Net realized and unrealized gain (loss) | | | 0.357 | | | | (0.133 | ) | | | 0.684 | | | | (1.504 | ) | | | 0.939 | |
| | | | | |
Total income (loss) from operations | | $ | 0.677 | | | $ | 0.198 | | | $ | 1.067 | | | $ | (1.124 | ) | | $ | 1.353 | |
| | | | | |
| Less Distributions | | | | | | | | | | | | | | | | | | | | |
From net investment income | | $ | (0.317 | ) | | $ | (0.328 | ) | | $ | (0.377 | ) | | $ | (0.376 | ) | | $ | (0.413 | ) |
| | | | | |
Total distributions | | $ | (0.317 | ) | | $ | (0.328 | ) | | $ | (0.377 | ) | | $ | (0.376 | ) | | $ | (0.413 | ) |
| | | | | |
Net asset value — End of year | | $ | 8.990 | | | $ | 8.630 | | | $ | 8.760 | | | $ | 8.070 | | | $ | 9.570 | |
| | | | | |
Total Return(2) | | | 7.98 | % | | | 2.28 | % | | | 13.48 | % | | | (12.19 | )% | | | 15.95 | % |
| | | | | |
| Ratios/Supplemental Data | | | | | | | | | | | | | | | | | | | | |
Net assets, end of year (000’s omitted) | | $ | 89,845 | | | $ | 87,948 | | | $ | 91,306 | | | $ | 89,102 | | | $ | 115,323 | |
Ratios (as a percentage of average daily net assets): | | | | | | | | | | | | | | | | | | | | |
Expenses excluding interest and fees(3) | | | 0.70 | % | | | 0.70 | % | | | 0.73 | % | | | 0.73 | % | | | 0.74 | % |
Interest and fee expense(4) | | | 0.05 | % | | | 0.04 | % | | | 0.08 | % | | | 0.08 | % | | | 0.10 | % |
Total expenses(3) | | | 0.75 | % | | | 0.74 | % | | | 0.81 | % | | | 0.81 | % | | | 0.84 | % |
Net investment income | | | 3.63 | % | | | 3.79 | % | | | 4.54 | % | | | 4.05 | % | | | 4.50 | % |
Portfolio Turnover | | | 8 | % | | | 4 | % | | | 16 | % | | | 40 | % | | | 17 | % |
| (1) | Computed using average shares outstanding. |
| (2) | Returns are historical and are calculated by determining the percentage change in net asset value with all distributions reinvested and do not reflect the effect of sales charges. |
| (3) | Excludes the effect of custody fee credits, if any, of less than 0.005%. Effective September 1, 2015, custody fee credits, which were earned on cash deposit balances, were discontinued by the custodian. |
| (4) | Interest and fee expense relates to the liability for floating rate notes issued in conjunction with residual interest bond transactions (see Note 1H). |
| | | | |
| | 67 | | See Notes to Financial Statements. |
Eaton Vance
Municipal Income Funds
August 31, 2016
Financial Highlights — continued
| | | | | | | | | | | | | | | | | | | | |
| | | Oregon Fund — Class B | |
| | | Year Ended August 31, | |
| | | 2016 | | | 2015 | | | 2014 | | | 2013 | | | 2012 | |
Net asset value — Beginning of year | | $ | 9.440 | | | $ | 9.580 | | | $ | 8.830 | | | $ | 10.460 | | | $ | 9.440 | |
| | | | | |
| Income (Loss) From Operations | | | | | | | | | | | | | | | | | | | | |
Net investment income(1) | | $ | 0.279 | | | $ | 0.291 | | | $ | 0.353 | | | $ | 0.338 | | | $ | 0.380 | |
Net realized and unrealized gain (loss) | | | 0.386 | | | | (0.144 | ) | | | 0.741 | | | | (1.634 | ) | | | 1.016 | |
| | | | | |
Total income (loss) from operations | | $ | 0.665 | | | $ | 0.147 | | | $ | 1.094 | | | $ | (1.296 | ) | | $ | 1.396 | |
| | | | | |
| Less Distributions | | | | | | | | | | | | | | | | | | | | |
From net investment income | | $ | (0.275 | ) | | $ | (0.287 | ) | | $ | (0.344 | ) | | $ | (0.334 | ) | | $ | (0.376 | ) |
| | | | | |
Total distributions | | $ | (0.275 | ) | | $ | (0.287 | ) | | $ | (0.344 | ) | | $ | (0.334 | ) | | $ | (0.376 | ) |
| | | | | |
Net asset value — End of year | | $ | 9.830 | | | $ | 9.440 | | | $ | 9.580 | | | $ | 8.830 | | | $ | 10.460 | |
| | | | | |
Total Return(2) | | | 7.14 | % | | | 1.54 | % | | | 12.59 | % | | | (12.75 | )% | | | 15.00 | % |
| | | | | |
| Ratios/Supplemental Data | | | | | | | | | | | | | | | | | | | | |
Net assets, end of year (000’s omitted) | | $ | 985 | | | $ | 1,607 | | | $ | 2,445 | | | $ | 3,186 | | | $ | 5,927 | |
Ratios (as a percentage of average daily net assets): | | | | | | | | | | | | | | | | | | | | |
Expenses excluding interest and fees(3) | | | 1.45 | % | | | 1.46 | % | | | 1.48 | % | | | 1.48 | % | | | 1.49 | % |
Interest and fee expense(4) | | | 0.05 | % | | | 0.04 | % | | | 0.08 | % | | | 0.08 | % | | | 0.10 | % |
Total expenses(3) | | | 1.50 | % | | | 1.50 | % | | | 1.56 | % | | | 1.56 | % | | | 1.59 | % |
Net investment income | | | 2.90 | % | | | 3.04 | % | | | 3.84 | % | | | 3.29 | % | | | 3.78 | % |
Portfolio Turnover | | | 8 | % | | | 4 | % | | | 16 | % | | | 40 | % | | | 17 | % |
| (1) | Computed using average shares outstanding. |
| (2) | Returns are historical and are calculated by determining the percentage change in net asset value with all distributions reinvested and do not reflect the effect of sales charges. |
| (3) | Excludes the effect of custody fee credits, if any, of less than 0.005%. Effective September 1, 2015, custody fee credits, which were earned on cash deposit balances, were discontinued by the custodian. |
| (4) | Interest and fee expense relates to the liability for floating rate notes issued in conjunction with residual interest bond transactions (see Note 1H). |
| | | | |
| | 68 | | See Notes to Financial Statements. |
Eaton Vance
Municipal Income Funds
August 31, 2016
Financial Highlights — continued
| | | | | | | | | | | | | | | | | | | | |
| | | Oregon Fund — Class C | |
| | | Year Ended August 31, | |
| | | 2016 | | | 2015 | | | 2014 | | | 2013 | | | 2012 | |
Net asset value — Beginning of year | | $ | 9.450 | | | $ | 9.590 | | | $ | 8.840 | | | $ | 10.470 | | | $ | 9.450 | |
| | | | | |
| Income (Loss) From Operations | | | | | | | | | | | | | | | | | | | | |
Net investment income(1) | | $ | 0.278 | | | $ | 0.291 | | | $ | 0.354 | | | $ | 0.339 | | | $ | 0.376 | |
Net realized and unrealized gain (loss) | | | 0.387 | | | | (0.143 | ) | | | 0.740 | | | | (1.634 | ) | | | 1.020 | |
| | | | | |
Total income (loss) from operations | | $ | 0.665 | | | $ | 0.148 | | | $ | 1.094 | | | $ | (1.295 | ) | | $ | 1.396 | |
| | | | | |
| Less Distributions | | | | | | | | | | | | | | | | | | | | |
From net investment income | | $ | (0.275 | ) | | $ | (0.288 | ) | | $ | (0.344 | ) | | $ | (0.335 | ) | | $ | (0.376 | ) |
| | | | | |
Total distributions | | $ | (0.275 | ) | | $ | (0.288 | ) | | $ | (0.344 | ) | | $ | (0.335 | ) | | $ | (0.376 | ) |
| | | | | |
Net asset value — End of year | | $ | 9.840 | | | $ | 9.450 | | | $ | 9.590 | | | $ | 8.840 | | | $ | 10.470 | |
| | | | | |
Total Return(2) | | | 7.13 | % | | | 1.54 | % | | | 12.58 | % | | | (12.74 | )% | | | 14.99 | % |
| | | | | |
| Ratios/Supplemental Data | | | | | | | | | | | | | | | | | | | | |
Net assets, end of year (000’s omitted) | | $ | 14,817 | | | $ | 13,815 | | | $ | 13,558 | | | $ | 17,275 | | | $ | 23,894 | |
Ratios (as a percentage of average daily net assets): | | | | | | | | | | | | | | | | | | | | |
Expenses excluding interest and fees(3) | | | 1.45 | % | | | 1.45 | % | | | 1.48 | % | | | 1.48 | % | | | 1.48 | % |
Interest and fee expense(4) | | | 0.05 | % | | | 0.04 | % | | | 0.08 | % | | | 0.08 | % | | | 0.10 | % |
Total expenses(3) | | | 1.50 | % | | | 1.49 | % | | | 1.56 | % | | | 1.56 | % | | | 1.58 | % |
Net investment income | | | 2.88 | % | | | 3.04 | % | | | 3.84 | % | | | 3.30 | % | | | 3.72 | % |
Portfolio Turnover | | | 8 | % | | | 4 | % | | | 16 | % | | | 40 | % | | | 17 | % |
| (1) | Computed using average shares outstanding. |
| (2) | Returns are historical and are calculated by determining the percentage change in net asset value with all distributions reinvested and do not reflect the effect of sales charges. |
| (3) | Excludes the effect of custody fee credits, if any, of less than 0.005%. Effective September 1, 2015, custody fee credits, which were earned on cash deposit balances, were discontinued by the custodian. |
| (4) | Interest and fee expense relates to the liability for floating rate notes issued in conjunction with residual interest bond transactions (see Note 1H). |
| | | | |
| | 69 | | See Notes to Financial Statements. |
Eaton Vance
Municipal Income Funds
August 31, 2016
Financial Highlights — continued
| | | | | | | | | | | | | | | | | | | | |
| | | Oregon Fund — Class I | |
| | | Year Ended August 31, | |
| | | 2016 | | | 2015 | | | 2014 | | | 2013 | | | 2012 | |
Net asset value — Beginning of year | | $ | 8.620 | | | $ | 8.750 | | | $ | 8.070 | | | $ | 9.560 | | | $ | 8.620 | |
| | | | | |
| Income (Loss) From Operations | | | | | | | | | | | | | | | | | | | | |
Net investment income(1) | | $ | 0.336 | | | $ | 0.347 | | | $ | 0.401 | | | $ | 0.397 | | | $ | 0.419 | |
Net realized and unrealized gain (loss) | | | 0.358 | | | | (0.131 | ) | | | 0.673 | | | | (1.493 | ) | | | 0.951 | |
| | | | | |
Total income (loss) from operations | | $ | 0.694 | | | $ | 0.216 | | | $ | 1.074 | | | $ | (1.096 | ) | | $ | 1.370 | |
| | | | | |
| Less Distributions | | | | | | | | | | | | | | | | | | | | |
From net investment income | | $ | (0.334 | ) | | $ | (0.346 | ) | | $ | (0.394 | ) | | $ | (0.394 | ) | | $ | (0.430 | ) |
| | | | | |
Total distributions | | $ | (0.334 | ) | | $ | (0.346 | ) | | $ | (0.394 | ) | | $ | (0.394 | ) | | $ | (0.430 | ) |
| | | | | |
Net asset value — End of year | | $ | 8.980 | | | $ | 8.620 | | | $ | 8.750 | | | $ | 8.070 | | | $ | 9.560 | |
| | | | | |
Total Return(2) | | | 8.20 | % | | | 2.48 | % | | | 13.58 | % | | | (11.92 | )% | | | 16.19 | % |
| | | | | |
| Ratios/Supplemental Data | | | | | | | | | | | | | | | | | | | | |
Net assets, end of year (000’s omitted) | | $ | 16,426 | | | $ | 13,867 | | | $ | 9,114 | | | $ | 13,092 | | | $ | 26,776 | |
Ratios (as a percentage of average daily net assets): | | | | | | | | | | | | | | | | | | | | |
Expenses excluding interest and fees(3) | | | 0.50 | % | | | 0.50 | % | | | 0.53 | % | | | 0.53 | % | | | 0.53 | % |
Interest and fee expense(4) | | | 0.05 | % | | | 0.04 | % | | | 0.08 | % | | | 0.08 | % | | | 0.10 | % |
Total expenses(3) | | | 0.55 | % | | | 0.54 | % | | | 0.61 | % | | | 0.61 | % | | | 0.63 | % |
Net investment income | | | 3.81 | % | | | 3.97 | % | | | 4.76 | % | | | 4.21 | % | | | 4.48 | % |
Portfolio Turnover | | | 8 | % | | | 4 | % | | | 16 | % | | | 40 | % | | | 17 | % |
| (1) | Computed using average shares outstanding. |
| (2) | Returns are historical and are calculated by determining the percentage change in net asset value with all distributions reinvested. |
| (3) | Excludes the effect of custody fee credits, if any, of less than 0.005%. Effective September 1, 2015, custody fee credits, which were earned on cash deposit balances, were discontinued by the custodian. |
| (4) | Interest and fee expense relates to the liability for floating rate notes issued in conjunction with residual interest bond transactions (see Note 1H). |
| | | | |
| | 70 | | See Notes to Financial Statements. |
Eaton Vance
Municipal Income Funds
August 31, 2016
Financial Highlights — continued
| | | | | | | | | | | | | | | | | | | | |
| | | South Carolina Fund — Class A | |
| | | Year Ended August 31, | |
| | | 2016 | | | 2015 | | | 2014 | | | 2013 | | | 2012 | |
Net asset value — Beginning of year | | $ | 9.190 | | | $ | 9.290 | | | $ | 8.500 | | | $ | 9.690 | | | $ | 8.930 | |
| | | | | |
| Income (Loss) From Operations | | | | | | | | | | | | | | | | | | | | |
Net investment income(1) | | $ | 0.319 | | | $ | 0.337 | | | $ | 0.382 | | | $ | 0.382 | | | $ | 0.401 | |
Net realized and unrealized gain (loss) | | | 0.418 | | | | (0.103 | ) | | | 0.785 | | | | (1.193 | ) | | | 0.758 | |
| | | | | |
Total income (loss) from operations | | $ | 0.737 | | | $ | 0.234 | | | $ | 1.167 | | | $ | (0.811 | ) | | $ | 1.159 | |
| | | | | |
| Less Distributions | | | | | | | | | | | | | | | | | | | | |
From net investment income | | $ | (0.317 | ) | | $ | (0.334 | ) | | $ | (0.377 | ) | | $ | (0.379 | ) | | $ | (0.399 | ) |
| | | | | |
Total distributions | | $ | (0.317 | ) | | $ | (0.334 | ) | | $ | (0.377 | ) | | $ | (0.379 | ) | | $ | (0.399 | ) |
| | | | | |
Net asset value — End of year | | $ | 9.610 | | | $ | 9.190 | | | $ | 9.290 | | | $ | 8.500 | | | $ | 9.690 | |
| | | | | |
Total Return(2) | | | 8.14 | % | | | 2.52 | % | | | 13.96 | % | | | (8.73 | )% | | | 13.21 | % |
| | | | | |
| Ratios/Supplemental Data | | | | | | | | | | | | | | | | | | | | |
Net assets, end of year (000’s omitted) | | $ | 72,052 | | | $ | 72,162 | | | $ | 76,958 | | | $ | 76,573 | | | $ | 93,466 | |
Ratios (as a percentage of average daily net assets): | | | | | | | | | | | | | | | | | | | | |
Expenses excluding interest and fees(3) | | | 0.69 | % | | | 0.70 | % | | | 0.72 | % | | | 0.72 | % | | | 0.74 | % |
Interest and fee expense(4) | | | 0.04 | % | | | 0.01 | % | | | 0.06 | % | | | 0.07 | % | | | 0.07 | % |
Total expenses(3) | | | 0.73 | % | | | 0.71 | % | | | 0.78 | % | | | 0.79 | % | | | 0.81 | % |
Net investment income | | | 3.38 | % | | | 3.61 | % | | | 4.26 | % | | | 3.98 | % | | | 4.28 | % |
Portfolio Turnover | | | 6 | % | | | 5 | % | | | 10 | % | | | 44 | % | | | 30 | % |
| (1) | Computed using average shares outstanding. |
| (2) | Returns are historical and are calculated by determining the percentage change in net asset value with all distributions reinvested and do not reflect the effect of sales charges. |
| (3) | Excludes the effect of custody fee credits, if any, of less than 0.005%. Effective September 1, 2015, custody fee credits, which were earned on cash deposit balances, were discontinued by the custodian. |
| (4) | Interest and fee expense relates to the liability for floating rate notes issued in conjunction with residual interest bond transactions (see Note 1H). |
| | | | |
| | 71 | | See Notes to Financial Statements. |
Eaton Vance
Municipal Income Funds
August 31, 2016
Financial Highlights — continued
| | | | | | | | | | | | | | | | | | | | |
| | | South Carolina Fund — Class B | |
| | | Year Ended August 31, | |
| | | 2016 | | | 2015 | | | 2014 | | | 2013 | | | 2012 | |
Net asset value — Beginning of year | | $ | 9.750 | | | $ | 9.850 | | | $ | 9.020 | | | $ | 10.270 | | | $ | 9.470 | |
| | | | | |
| Income (Loss) From Operations | | | | | | | | | | | | | | | | | | | | |
Net investment income(1) | | $ | 0.267 | | | $ | 0.283 | | | $ | 0.340 | | | $ | 0.329 | | | $ | 0.354 | |
Net realized and unrealized gain (loss) | | | 0.434 | | | | (0.103 | ) | | | 0.818 | | | | (1.253 | ) | | | 0.795 | |
| | | | | |
Total income (loss) from operations | | $ | 0.701 | | | $ | 0.180 | | | $ | 1.158 | | | $ | (0.924 | ) | | $ | 1.149 | |
| | | | | |
| Less Distributions | | | | | | | | | | | | | | | | | | | | |
From net investment income | | $ | (0.261 | ) | | $ | (0.280 | ) | | $ | (0.328 | ) | | $ | (0.326 | ) | | $ | (0.349 | ) |
| | | | | |
Total distributions | | $ | (0.261 | ) | | $ | (0.280 | ) | | $ | (0.328 | ) | | $ | (0.326 | ) | | $ | (0.349 | ) |
| | | | | |
Net asset value — End of year | | $ | 10.190 | | | $ | 9.750 | | | $ | 9.850 | | | $ | 9.020 | | | $ | 10.270 | |
| | | | | |
Total Return(2) | | | 7.27 | % | | | 1.82 | % | | | 13.02 | % | | | (9.30 | )% | | | 12.30 | % |
| | | | | |
| Ratios/Supplemental Data | | | | | | | | | | | | | | | | | | | | |
Net assets, end of year (000’s omitted) | | $ | 460 | | | $ | 937 | | | $ | 1,477 | | | $ | 2,797 | | | $ | 3,909 | |
Ratios (as a percentage of average daily net assets): | | | | | | | | | | | | | | | | | | | | |
Expenses excluding interest and fees(3) | | | 1.44 | % | | | 1.46 | % | | | 1.48 | % | | | 1.47 | % | | | 1.49 | % |
Interest and fee expense(4) | | | 0.04 | % | | | 0.01 | % | | | 0.06 | % | | | 0.07 | % | | | 0.07 | % |
Total expenses(3) | | | 1.48 | % | | | 1.47 | % | | | 1.54 | % | | | 1.54 | % | | | 1.56 | % |
Net investment income | | | 2.68 | % | | | 2.86 | % | | | 3.60 | % | | | 3.23 | % | | | 3.56 | % |
Portfolio Turnover | | | 6 | % | | | 5 | % | | | 10 | % | | | 44 | % | | | 30 | % |
| (1) | Computed using average shares outstanding. |
| (2) | Returns are historical and are calculated by determining the percentage change in net asset value with all distributions reinvested and do not reflect the effect of sales charges. |
| (3) | Excludes the effect of custody fee credits, if any, of less than 0.005%. Effective September 1, 2015, custody fee credits, which were earned on cash deposit balances, were discontinued by the custodian. |
| (4) | Interest and fee expense relates to the liability for floating rate notes issued in conjunction with residual interest bond transactions (see Note 1H). |
| | | | |
| | 72 | | See Notes to Financial Statements. |
Eaton Vance
Municipal Income Funds
August 31, 2016
Financial Highlights — continued
| | | | | | | | | | | | | | | | | | | | |
| | | South Carolina Fund — Class C | |
| | | Year Ended August 31, | |
| | | 2016 | | | 2015 | | | 2014 | | | 2013 | | | 2012 | |
Net asset value — Beginning of year | | $ | 9.750 | | | $ | 9.860 | | | $ | 9.020 | | | $ | 10.280 | | | $ | 9.470 | |
| | | | | |
| Income (Loss) From Operations | | | | | | | | | | | | | | | | | | | | |
Net investment income(1) | | $ | 0.262 | | | $ | 0.283 | | | $ | 0.333 | | | $ | 0.329 | | | $ | 0.350 | |
Net realized and unrealized gain (loss) | | | 0.439 | | | | (0.113 | ) | | | 0.835 | | | | (1.263 | ) | | | 0.809 | |
| | | | | |
Total income (loss) from operations | | $ | 0.701 | | | $ | 0.170 | | | $ | 1.168 | | | $ | (0.934 | ) | | $ | 1.159 | |
| | | | | |
| Less Distributions | | | | | | | | | | | | | | | | | | | | |
From net investment income | | $ | (0.261 | ) | | $ | (0.280 | ) | | $ | (0.328 | ) | | $ | (0.326 | ) | | $ | (0.349 | ) |
| | | | | |
Total distributions | | $ | (0.261 | ) | | $ | (0.280 | ) | | $ | (0.328 | ) | | $ | (0.326 | ) | | $ | (0.349 | ) |
| | | | | |
Net asset value — End of year | | $ | 10.190 | | | $ | 9.750 | | | $ | 9.860 | | | $ | 9.020 | | | $ | 10.280 | |
| | | | | |
Total Return(2) | | | 7.27 | % | | | 1.72 | % | | | 13.13 | % | | | (9.39 | )% | | | 12.41 | % |
| | | | | |
| Ratios/Supplemental Data | | | | | | | | | | | | | | | | | | | | |
Net assets, end of year (000’s omitted) | | $ | 28,739 | | | $ | 25,178 | | | $ | 25,939 | | | $ | 25,971 | | | $ | 29,876 | |
Ratios (as a percentage of average daily net assets): | | | | | | | | | | | | | | | | | | | | |
Expenses excluding interest and fees(3) | | | 1.44 | % | | | 1.45 | % | | | 1.47 | % | | | 1.47 | % | | | 1.48 | % |
Interest and fee expense(4) | | | 0.04 | % | | | 0.01 | % | | | 0.06 | % | | | 0.07 | % | | | 0.07 | % |
Total expenses(3) | | | 1.48 | % | | | 1.46 | % | | | 1.53 | % | | | 1.54 | % | | | 1.55 | % |
Net investment income | | | 2.62 | % | | | 2.86 | % | | | 3.51 | % | | | 3.23 | % | | | 3.51 | % |
Portfolio Turnover | | | 6 | % | | | 5 | % | | | 10 | % | | | 44 | % | | | 30 | % |
| (1) | Computed using average shares outstanding. |
| (2) | Returns are historical and are calculated by determining the percentage change in net asset value with all distributions reinvested and do not reflect the effect of sales charges. |
| (3) | Excludes the effect of custody fee credits, if any, of less than 0.005%. Effective September 1, 2015, custody fee credits, which were earned on cash deposit balances, were discontinued by the custodian. |
| (4) | Interest and fee expense relates to the liability for floating rate notes issued in conjunction with residual interest bond transactions (see Note 1H). |
| | | | |
| | 73 | | See Notes to Financial Statements. |
Eaton Vance
Municipal Income Funds
August 31, 2016
Financial Highlights — continued
| | | | | | | | | | | | | | | | | | | | |
| | | South Carolina Fund — Class I | |
| | | Year Ended August 31, | |
| | | 2016 | | | 2015 | | | 2014 | | | 2013 | | | 2012 | |
Net asset value — Beginning of year | | $ | 9.200 | | | $ | 9.300 | | | $ | 8.510 | | | $ | 9.700 | | | $ | 8.930 | |
| | | | | |
| Income (Loss) From Operations | | | | | | | | | | | | | | | | | | | | |
Net investment income(1) | | $ | 0.332 | | | $ | 0.355 | | | $ | 0.402 | | | $ | 0.402 | | | $ | 0.422 | |
Net realized and unrealized gain (loss) | | | 0.424 | | | | (0.102 | ) | | | 0.783 | | | | (1.193 | ) | | | 0.766 | |
| | | | | |
Total income (loss) from operations | | $ | 0.756 | | | $ | 0.253 | | | $ | 1.185 | | | $ | (0.791 | ) | | $ | 1.188 | |
| | | | | |
| Less Distributions | | | | | | | | | | | | | | | | | | | | |
From net investment income | | $ | (0.336 | ) | | $ | (0.353 | ) | | $ | (0.395 | ) | | $ | (0.399 | ) | | $ | (0.418 | ) |
| | | | | |
Total distributions | | $ | (0.336 | ) | | $ | (0.353 | ) | | $ | (0.395 | ) | | $ | (0.399 | ) | | $ | (0.418 | ) |
| | | | | |
Net asset value — End of year | | $ | 9.620 | | | $ | 9.200 | | | $ | 9.300 | | | $ | 8.510 | | | $ | 9.700 | |
| | | | | |
Total Return(2) | | | 8.35 | % | | | 2.73 | % | | | 14.17 | % | | | (8.53 | )% | | | 13.55 | % |
| | | | | |
| Ratios/Supplemental Data | | | | | | | | | | | | | | | | | | | | |
Net assets, end of year (000’s omitted) | | $ | 37,265 | | | $ | 18,690 | | | $ | 18,404 | | | $ | 22,726 | | | $ | 26,081 | |
Ratios (as a percentage of average daily net assets): | | | | | | | | | | | | | | | | | | | | |
Expenses excluding interest and fees(3) | | | 0.49 | % | | | 0.50 | % | | | 0.52 | % | | | 0.52 | % | | | 0.54 | % |
Interest and fee expense(4) | | | 0.04 | % | | | 0.01 | % | | | 0.06 | % | | | 0.07 | % | | | 0.07 | % |
Total expenses(3) | | | 0.53 | % | | | 0.51 | % | | | 0.58 | % | | | 0.59 | % | | | 0.61 | % |
Net investment income | | | 3.51 | % | | | 3.81 | % | | | 4.49 | % | | | 4.19 | % | | | 4.49 | % |
Portfolio Turnover | | | 6 | % | | | 5 | % | | | 10 | % | | | 44 | % | | | 30 | % |
| (1) | Computed using average shares outstanding. |
| (2) | Returns are historical and are calculated by determining the percentage change in net asset value with all distributions reinvested. |
| (3) | Excludes the effect of custody fee credits, if any, of less than 0.005%. Effective September 1, 2015, custody fee credits, which were earned on cash deposit balances, were discontinued by the custodian. |
| (4) | Interest and fee expense relates to the liability for floating rate notes issued in conjunction with residual interest bond transactions (see Note 1H). |
| | | | |
| | 74 | | See Notes to Financial Statements. |
Eaton Vance
Municipal Income Funds
August 31, 2016
Financial Highlights — continued
| | | | | | | | | | | | | | | | | | | | |
| | | Virginia Fund — Class A | |
| | | Year Ended August 31, | |
| | | 2016 | | | 2015 | | | 2014 | | | 2013 | | | 2012 | |
Net asset value — Beginning of year | | $ | 7.970 | | | $ | 8.140 | | | $ | 7.790 | | | $ | 8.460 | | | $ | 8.060 | |
| | | | | |
| Income (Loss) From Operations | | | | | | | | | | | | | | | | | | | | |
Net investment income(1) | | $ | 0.301 | | | $ | 0.313 | | | $ | 0.320 | | | $ | 0.334 | | | $ | 0.354 | |
Net realized and unrealized gain (loss) | | | 0.268 | | | | (0.177 | ) | | | 0.350 | | | | (0.675 | ) | | | 0.397 | |
| | | | | |
Total income (loss) from operations | | $ | 0.569 | | | $ | 0.136 | | | $ | 0.670 | | | $ | (0.341 | ) | | $ | 0.751 | |
| | | | | |
| Less Distributions | | | | | | | | | | | | | | | | | | | | |
From net investment income | | $ | (0.299 | ) | | $ | (0.306 | ) | | $ | (0.320 | ) | | $ | (0.329 | ) | | $ | (0.351 | ) |
| | | | | |
Total distributions | | $ | (0.299 | ) | | $ | (0.306 | ) | | $ | (0.320 | ) | | $ | (0.329 | ) | | $ | (0.351 | ) |
| | | | | |
Net asset value — End of year | | $ | 8.240 | | | $ | 7.970 | | | $ | 8.140 | | | $ | 7.790 | | | $ | 8.460 | |
| | | | | |
Total Return(2) | | | 7.26 | % | | | 1.68 | % | | | 8.73 | % | | | (4.25 | )% | | | 9.48 | % |
| | | | | |
| Ratios/Supplemental Data | | | | | | | | | | | | | | | | | | | | |
Net assets, end of year (000’s omitted) | | $ | 59,460 | | | $ | 58,637 | | | $ | 64,124 | | | $ | 65,762 | | | $ | 80,350 | |
Ratios (as a percentage of average daily net assets): | | | | | | | | | | | | | | | | | | | | |
Expenses excluding interest and fees(3) | | | 0.71 | % | | | 0.73 | % | | | 0.72 | % | | | 0.73 | % | | | 0.76 | % |
Interest and fee expense(4) | | | 0.05 | % | | | 0.03 | % | | | 0.03 | % | | | 0.04 | % | | | 0.04 | % |
Total expenses(3) | | | 0.76 | % | | | 0.76 | % | | | 0.75 | % | | | 0.77 | % | | | 0.80 | % |
Net investment income | | | 3.71 | % | | | 3.87 | % | | | 3.98 | % | | | 3.97 | % | | | 4.27 | % |
Portfolio Turnover | | | 13 | % | | | 6 | % | | | 5 | % | | | 9 | % | | | 9 | % |
| (1) | Computed using average shares outstanding. |
| (2) | Returns are historical and are calculated by determining the percentage change in net asset value with all distributions reinvested and do not reflect the effect of sales charges. |
| (3) | Excludes the effect of custody fee credits, if any, of less than 0.005%. Effective September 1, 2015, custody fee credits, which were earned on cash deposit balances, were discontinued by the custodian. |
| (4) | Interest and fee expense relates to the liability for floating rate notes issued in conjunction with residual interest bond transactions (see Note 1H). |
| | | | |
| | 75 | | See Notes to Financial Statements. |
Eaton Vance
Municipal Income Funds
August 31, 2016
Financial Highlights — continued
| | | | | | | | | | | | | | | | | | | | |
| | | Virginia Fund — Class B | |
| | | Year Ended August 31, | |
| | | 2016 | | | 2015 | | | 2014 | | | 2013 | | | 2012 | |
Net asset value — Beginning of year | | $ | 8.830 | | | $ | 9.010 | | | $ | 8.620 | | | $ | 9.360 | | | $ | 8.920 | |
| | | | | |
| Income (Loss) From Operations | | | | | | | | | | | | | | | | | | | | |
Net investment income(1) | | $ | 0.268 | | | $ | 0.280 | | | $ | 0.290 | | | $ | 0.300 | | | $ | 0.324 | |
Net realized and unrealized gain (loss) | | | 0.286 | | | | (0.190 | ) | | | 0.388 | | | | (0.746 | ) | | | 0.435 | |
| | | | | |
Total income (loss) from operations | | $ | 0.554 | | | $ | 0.090 | | | $ | 0.678 | | | $ | (0.446 | ) | | $ | 0.759 | |
| | | | | |
| Less Distributions | | | | | | | | | | | | | | | | | | | | |
From net investment income | | $ | (0.264 | ) | | $ | (0.270 | ) | | $ | (0.288 | ) | | $ | (0.294 | ) | | $ | (0.319 | ) |
| | | | | |
Total distributions | | $ | (0.264 | ) | | $ | (0.270 | ) | | $ | (0.288 | ) | | $ | (0.294 | ) | | $ | (0.319 | ) |
| | | | | |
Net asset value — End of year | | $ | 9.120 | | | $ | 8.830 | | | $ | 9.010 | | | $ | 8.620 | | | $ | 9.360 | |
| | | | | |
Total Return(2) | | | 6.36 | % | | | 1.01 | % | | | 7.96 | % | | | (4.95 | )% | | | 8.63 | % |
| | | | | |
| Ratios/Supplemental Data | | | | | | | | | | | | | | | | | | | | |
Net assets, end of year (000’s omitted) | | $ | 349 | | | $ | 524 | | | $ | 1,093 | | | $ | 1,626 | | | $ | 2,817 | |
Ratios (as a percentage of average daily net assets): | | | | | | | | | | | | | | | | | | | | |
Expenses excluding interest and fees(3) | | | 1.46 | % | | | 1.48 | % | | | 1.48 | % | | | 1.48 | % | | | 1.51 | % |
Interest and fee expense(4) | | | 0.05 | % | | | 0.03 | % | | | 0.03 | % | | | 0.04 | % | | | 0.04 | % |
Total expenses(3) | | | 1.51 | % | | | 1.51 | % | | | 1.51 | % | | | 1.52 | % | | | 1.55 | % |
Net investment income | | | 2.99 | % | | | 3.13 | % | | | 3.26 | % | | | 3.22 | % | | | 3.53 | % |
Portfolio Turnover | | | 13 | % | | | 6 | % | | | 5 | % | | | 9 | % | | | 9 | % |
| (1) | Computed using average shares outstanding. |
| (2) | Returns are historical and are calculated by determining the percentage change in net asset value with all distributions reinvested and do not reflect the effect of sales charges. |
| (3) | Excludes the effect of custody fee credits, if any, of less than 0.005%. Effective September 1, 2015, custody fee credits, which were earned on cash deposit balances, were discontinued by the custodian. |
| (4) | Interest and fee expense relates to the liability for floating rate notes issued in conjunction with residual interest bond transactions (see Note 1H). |
| | | | |
| | 76 | | See Notes to Financial Statements. |
Eaton Vance
Municipal Income Funds
August 31, 2016
Financial Highlights — continued
| | | | | | | | | | | | | | | | | | | | |
| | | Virginia Fund — Class C | |
| | | Year Ended August 31, | |
| | | 2016 | | | 2015 | | | 2014 | | | 2013 | | | 2012 | |
Net asset value — Beginning of year | | $ | 8.830 | | | $ | 9.010 | | | $ | 8.620 | | | $ | 9.370 | | | $ | 8.930 | |
| | | | | |
| Income (Loss) From Operations | | | | | | | | | | | | | | | | | | | | |
Net investment income(1) | | $ | 0.267 | | | $ | 0.280 | | | $ | 0.288 | | | $ | 0.299 | | | $ | 0.324 | |
Net realized and unrealized gain (loss) | | | 0.297 | | | | (0.189 | ) | | | 0.390 | | | | (0.755 | ) | | | 0.435 | |
| | | | | |
Total income (loss) from operations | | $ | 0.564 | | | $ | 0.091 | | | $ | 0.678 | | | $ | (0.456 | ) | | $ | 0.759 | |
| | | | | |
| Less Distributions | | | | | | | | | | | | | | | | | | | | |
From net investment income | | $ | (0.264 | ) | | $ | (0.271 | ) | | $ | (0.288 | ) | | $ | (0.294 | ) | | $ | (0.319 | ) |
| | | | | |
Total distributions | | $ | (0.264 | ) | | $ | (0.271 | ) | | $ | (0.288 | ) | | $ | (0.294 | ) | | $ | (0.319 | ) |
| | | | | |
Net asset value — End of year | | $ | 9.130 | | | $ | 8.830 | | | $ | 9.010 | | | $ | 8.620 | | | $ | 9.370 | |
| | | | | |
Total Return(2) | | | 6.47 | % | | | 1.01 | % | | | 7.96 | % | | | (5.05 | )% | | | 8.63 | % |
| | | | | |
| Ratios/Supplemental Data | | | | | | | | | | | | | | | | | | | | |
Net assets, end of year (000’s omitted) | | $ | 6,044 | | | $ | 6,424 | | | $ | 7,475 | | | $ | 8,059 | | | $ | 9,179 | |
Ratios (as a percentage of average daily net assets): | | | | | | | | | | | | | | | | | | | | |
Expenses excluding interest and fees(3) | | | 1.46 | % | | | 1.48 | % | | | 1.47 | % | | | 1.48 | % | | | 1.51 | % |
Interest and fee expense(4) | | | 0.05 | % | | | 0.03 | % | | | 0.03 | % | | | 0.04 | % | | | 0.04 | % |
Total expenses(3) | | | 1.51 | % | | | 1.51 | % | | | 1.50 | % | | | 1.52 | % | | | 1.55 | % |
Net investment income | | | 2.97 | % | | | 3.12 | % | | | 3.24 | % | | | 3.21 | % | | | 3.52 | % |
Portfolio Turnover | | | 13 | % | | | 6 | % | | | 5 | % | | | 9 | % | | | 9 | % |
| (1) | Computed using average shares outstanding. |
| (2) | Returns are historical and are calculated by determining the percentage change in net asset value with all distributions reinvested and do not reflect the effect of sales charges. |
| (3) | Excludes the effect of custody fee credits, if any, of less than 0.005%. Effective September 1, 2015, custody fee credits, which were earned on cash deposit balances, were discontinued by the custodian. |
| (4) | Interest and fee expense relates to the liability for floating rate notes issued in conjunction with residual interest bond transactions (see Note 1H). |
| | | | |
| | 77 | | See Notes to Financial Statements. |
Eaton Vance
Municipal Income Funds
August 31, 2016
Financial Highlights — continued
| | | | | | | | | | | | | | | | | | | | |
| | | Virginia Fund — Class I | |
| | | Year Ended August 31, | |
| | | 2016 | | �� | 2015 | | | 2014 | | | 2013 | | | 2012 | |
Net asset value — Beginning of year | | $ | 7.990 | | | $ | 8.160 | | | $ | 7.810 | | | $ | 8.480 | | | $ | 8.080 | |
| | | | | |
| Income (Loss) From Operations | | | | | | | | | | | | | | | | | | | | |
Net investment income(1) | | $ | 0.318 | | | $ | 0.330 | | | $ | 0.337 | | | $ | 0.351 | | | $ | 0.371 | |
Net realized and unrealized gain (loss) | | | 0.268 | | | | (0.177 | ) | | | 0.350 | | | | (0.675 | ) | | | 0.397 | |
| | | | | |
Total income (loss) from operations | | $ | 0.586 | | | $ | 0.153 | | | $ | 0.687 | | | $ | (0.324 | ) | | $ | 0.768 | |
| | | | | |
| Less Distributions | | | | | | | | | | | | | | | | | | | | |
From net investment income | | $ | (0.316 | ) | | $ | (0.323 | ) | | $ | (0.337 | ) | | $ | (0.346 | ) | | $ | (0.368 | ) |
| | | | | |
Total distributions | | $ | (0.316 | ) | | $ | (0.323 | ) | | $ | (0.337 | ) | | $ | (0.346 | ) | | $ | (0.368 | ) |
| | | | | |
Net asset value — End of year | | $ | 8.260 | | | $ | 7.990 | | | $ | 8.160 | | | $ | 7.810 | | | $ | 8.480 | |
| | | | | |
Total Return(2) | | | 7.47 | % | | | 1.89 | % | | | 8.93 | % | | | (4.03 | )% | | | 9.68 | % |
| | | | | |
| Ratios/Supplemental Data | | | | | | | | | | | | | | | | | | | | |
Net assets, end of year (000’s omitted) | | $ | 15,928 | | | $ | 14,672 | | | $ | 14,640 | | | $ | 16,539 | | | $ | 19,635 | |
Ratios (as a percentage of average daily net assets): | | | | | | | | | | | | | | | | | | | | |
Expenses excluding interest and fees(3) | | | 0.51 | % | | | 0.53 | % | | | 0.52 | % | | | 0.53 | % | | | 0.55 | % |
Interest and fee expense(4) | | | 0.05 | % | | | 0.03 | % | | | 0.03 | % | | | 0.04 | % | | | 0.04 | % |
Total expenses(3) | | | 0.56 | % | | | 0.56 | % | | | 0.55 | % | | | 0.57 | % | | | 0.59 | % |
Net investment income | | | 3.90 | % | | | 4.07 | % | | | 4.18 | % | | | 4.17 | % | | | 4.46 | % |
Portfolio Turnover | | | 13 | % | | | 6 | % | | | 5 | % | | | 9 | % | | | 9 | % |
| (1) | Computed using average shares outstanding. |
| (2) | Returns are historical and are calculated by determining the percentage change in net asset value with all distributions reinvested. |
| (3) | Excludes the effect of custody fee credits, if any, of less than 0.005%. Effective September 1, 2015, custody fee credits, which were earned on cash deposit balances, were discontinued by the custodian. |
| (4) | Interest and fee expense relates to the liability for floating rate notes issued in conjunction with residual interest bond transactions (see Note 1H). |
| | | | |
| | 78 | | See Notes to Financial Statements. |
Eaton Vance
Municipal Income Funds
August 31, 2016
��
Notes to Financial Statements
1 Significant Accounting Policies
Eaton Vance Municipals Trust (the Trust) is a Massachusetts business trust registered under the Investment Company Act of 1940, as amended (the 1940 Act), as an open-end management investment company. The Trust presently consists of eighteen funds, seven of which, each non-diversified, are included in these financial statements. They include Eaton Vance Georgia Municipal Income Fund (Georgia Fund), Eaton Vance Maryland Municipal Income Fund (Maryland Fund), Eaton Vance Missouri Municipal Income Fund (Missouri Fund), Eaton Vance North Carolina Municipal Income Fund (North Carolina Fund), Eaton Vance Oregon Municipal Income Fund (Oregon Fund), Eaton Vance South Carolina Municipal Income Fund (South Carolina Fund) and Eaton Vance Virginia Municipal Income Fund (Virginia Fund), (each individually referred to as the Fund, and collectively, the Funds). The Funds’ investment objective is to provide current income exempt from regular federal income tax and from particular state or local income or other taxes. The Funds offer four classes of shares. Class A shares are generally sold subject to a sales charge imposed at time of purchase. Class B and Class C shares are sold at net asset value and are generally subject to a contingent deferred sales charge (see Note 5). Class I shares are sold at net asset value and are not subject to a sales charge. Class B shares of each Fund automatically convert to Class A shares eight years after their purchase as described in the Funds’ prospectus. Beginning January 1, 2012, Class B shares are only available for purchase upon exchange from another Eaton Vance fund or through reinvestment of distributions. Each class represents a pro-rata interest in the Fund, but votes separately on class-specific matters and (as noted below) is subject to different expenses. Realized and unrealized gains and losses are allocated daily to each class of shares based on the relative net assets of each class to the total net assets of the Fund. Net investment income, other than class-specific expenses, is allocated daily to each class of shares based upon the ratio of the value of each class’s paid shares to the total value of all paid shares. Each class of shares differs in its distribution plan and certain other class-specific expenses.
The following is a summary of significant accounting policies of the Funds. The policies are in conformity with accounting principles generally accepted in the United States of America (U.S. GAAP). Each Fund is an investment company and follows accounting and reporting guidance in the Financial Accounting Standards Board (“FASB”) Accounting Standards Codification Topic 946.
A Investment Valuation — The following methodologies are used to determine the market value or fair value of investments.
Debt Obligations. Debt obligations (including short-term obligations with a remaining maturity of more than sixty days) are generally valued on the basis of valuations provided by third party pricing services, as derived from such services’ pricing models. Inputs to the models may include, but are not limited to, reported trades, executable bid and asked prices, broker/dealer quotations, prices or yields of securities with similar characteristics, interest rates, anticipated prepayments, benchmark curves or information pertaining to the issuer, as well as industry and economic events. The pricing services may use a matrix approach, which considers information regarding securities with similar characteristics to determine the valuation for a security. Short-term obligations purchased with a remaining maturity of sixty days or less are generally valued at amortized cost, which approximates market value.
Derivatives. Financial futures contracts are valued at the closing settlement price established by the board of trade or exchange on which they are traded.
Fair Valuation. Investments for which valuations or market quotations are not readily available or are deemed unreliable are valued at fair value using methods determined in good faith by or at the direction of the Trustees of a Fund in a manner that fairly reflects the security’s value, or the amount that a Fund might reasonably expect to receive for the security upon its current sale in the ordinary course. Each such determination is based on a consideration of relevant factors, which are likely to vary from one pricing context to another. These factors may include, but are not limited to, the type of security, the existence of any contractual restrictions on the security’s disposition, the price and extent of public trading in similar securities of the issuer or of comparable entities, quotations or relevant information obtained from broker/dealers or other market participants, information obtained from the issuer, analysts, and/or the appropriate stock exchange (for exchange-traded securities), an analysis of the entity’s financial condition, and an evaluation of the forces that influence the issuer and the market(s) in which the security is purchased and sold.
B Investment Transactions and Related Income — Investment transactions for financial statement purposes are accounted for on a trade date basis. Realized gains and losses on investments sold are determined on the basis of identified cost. Interest income is recorded on the basis of interest accrued, adjusted for amortization of premium or accretion of discount.
C Federal Taxes — Each Fund’s policy is to comply with the provisions of the Internal Revenue Code applicable to regulated investment companies and to distribute to shareholders each year substantially all of its taxable, if any, and tax-exempt net investment income, and all or substantially all of its net realized capital gains. Accordingly, no provision for federal income or excise tax is necessary. Each Fund intends to satisfy conditions which will enable it to designate distributions from the interest income generated by its investments in municipal obligations, which are exempt from regular federal income tax when received by each Fund, as exempt-interest dividends. The portion of such interest, if any, earned on private activity bonds issued after August 7, 1986, may be considered a tax preference item to shareholders.
As of August 31, 2016, the Funds had no uncertain tax positions that would require financial statement recognition, de-recognition, or disclosure. Each Fund files a U.S. federal income tax return annually after its fiscal year-end, which is subject to examination by the Internal Revenue Service for a period of three years from the date of filing.
D Expenses — The majority of expenses of the Trust are directly identifiable to an individual fund. Expenses which are not readily identifiable to a specific fund are allocated taking into consideration, among other things, the nature and type of expense and the relative size of the funds.
Eaton Vance
Municipal Income Funds
August 31, 2016
Notes to Financial Statements — continued
E Legal Fees — Legal fees and other related expenses incurred as part of negotiations of the terms and requirement of capital infusions, or that are expected to result in the restructuring of, or a plan of reorganization for, an investment are recorded as realized losses. Ongoing expenditures to protect or enhance an investment are treated as operating expenses.
F Use of Estimates — The preparation of the financial statements in conformity with U.S. GAAP requires management to make estimates and assumptions that affect the reported amounts of assets and liabilities at the date of the financial statements and the reported amounts of income and expense during the reporting period. Actual results could differ from those estimates.
G Indemnifications — Under the Trust’s organizational documents, its officers and Trustees may be indemnified against certain liabilities and expenses arising out of the performance of their duties to the Funds. Under Massachusetts law, if certain conditions prevail, shareholders of a Massachusetts business trust (such as the Trust) could be deemed to have personal liability for the obligations of the Trust. However, the Trust’s Declaration of Trust contains an express disclaimer of liability on the part of Fund shareholders and the By-laws provide that the Trust shall assume the defense on behalf of any Fund shareholders. Moreover, the By-laws also provide for indemnification out of Fund property of any shareholder held personally liable solely by reason of being or having been a shareholder for all loss or expense arising from such liability. Additionally, in the normal course of business, each Fund enters into agreements with service providers that may contain indemnification clauses. Each Fund’s maximum exposure under these arrangements is unknown as this would involve future claims that may be made against each Fund that have not yet occurred.
H Floating Rate Notes Issued in Conjunction with Securities Held — The Funds may invest in residual interest bonds, also referred to as inverse floating rate securities, whereby a Fund may sell a variable or fixed rate bond for cash to a Special-Purpose Vehicle (the SPV), (which is generally organized as a trust), while at the same time, buying a residual interest in the assets and cash flows of the SPV. The bond is deposited into the SPV with the same CUSIP number as the bond sold to the SPV by the Fund, and which may have been, but is not required to be, the bond purchased from the Fund (the Bond). The SPV also issues floating rate notes (Floating Rate Notes) which are sold to third-parties. The residual interest bond held by a Fund gives the Fund the right (1) to cause the holders of the Floating Rate Notes to generally tender their notes at par, and (2) to have the Bond held by the SPV transferred to the Fund, thereby terminating the SPV. Should the Fund exercise such right, it would generally pay the SPV the par amount due on the Floating Rate Notes and exchange the residual interest bond for the underlying Bond. Pursuant to generally accepted accounting principles for transfers and servicing of financial assets and extinguishment of liabilities, the Funds account for the transaction described above as a secured borrowing by including the Bond in their Portfolio of Investments and the Floating Rate Notes as a liability under the caption “Payable for floating rate notes issued” in their Statement of Assets and Liabilities. The Floating Rate Notes have interest rates that generally reset weekly and their holders have the option to tender their notes to the SPV for redemption at par at each reset date. Accordingly, the fair value of the payable for floating rate notes issued approximates its carrying value. If measured at fair value, the payable for floating rate notes would have been considered as Level 2 in the fair value hierarchy (see Note 10) at August 31, 2016. Interest expense related to the Funds’ liability with respect to Floating Rate Notes is recorded as incurred. The SPV may be terminated by the Fund, as noted above, or by the occurrence of certain termination events as defined in the trust agreement, such as a downgrade in the credit quality of the underlying Bond, bankruptcy of or payment failure by the issuer of the underlying Bond, the inability to remarket Floating Rate Notes that have been tendered due to insufficient buyers in the market, or the failure by the SPV to obtain renewal of the liquidity agreement under which liquidity support is provided for the Floating Rate Notes up to one year. At August 31, 2016, the amounts of the Funds’ Floating Rate Notes and related interest rates and collateral were as follows:
| | | | | | | | | | | | |
| | | Maryland Fund | | | Missouri Fund | | | North Carolina
Fund | |
| | | |
Floating Rate Notes Outstanding | | $ | 1,500,000 | | | $ | 850,000 | | | $ | 8,670,000 | |
Interest Rate or Range of Interest Rates (%) | | | 0.61 | | | | 0.59 | | | | 0.59 - 0.60 | |
Collateral for Floating Rate Notes Outstanding | | $ | 2,147,420 | | | $ | 1,368,712 | | | $ | 12,568,155 | |
| | | | | | | | | | | | |
| | | Oregon
Fund | | | South Carolina
Fund | | | Virginia
Fund | |
| | | |
Floating Rate Notes Outstanding | | $ | 6,555,000 | | | $ | 8,725,000 | | | $ | 3,330,000 | |
Interest Rate or Range of Interest Rates (%) | | | 0.59 | | | | 0.59 - 0.61 | | | | 0.59 | |
Collateral for Floating Rate Notes Outstanding | | $ | 9,695,719 | | | $ | 12,936,066 | | | $ | 5,941,596 | |
Eaton Vance
Municipal Income Funds
August 31, 2016
Notes to Financial Statements — continued
For the year ended August 31, 2016, the Funds’ average Floating Rate Notes outstanding and the average interest rate including fees were as follows:
| | | | | | | | | | | | |
| | | Maryland Fund | | | Missouri Fund | | | North Carolina Fund | |
| | | |
Average Floating Rate Notes Outstanding | | $ | 1,500,000 | | | $ | 850,000 | | | $ | 7,997,869 | |
Average Interest Rate | | | 0.95 | % | | | 0.88 | % | | | 1.11 | % |
| | | | | | | | | | | | |
| | | Oregon Fund | | | South Carolina Fund | | | Virginia Fund | |
| | | |
Average Floating Rate Notes Outstanding | | $ | 6,555,000 | | | $ | 4,744,467 | | | $ | 3,330,000 | |
Average Interest Rate | | | 0.86 | % | | | 1.05 | % | | | 1.08 | % |
In certain circumstances, the Funds may enter into shortfall and forbearance agreements with brokers by which a Fund agrees to reimburse the broker for the difference between the liquidation value of the Bond held by the SPV and the liquidation value of the Floating Rate Notes, as well as any shortfalls in interest cash flows. The Funds had no shortfalls as of August 31, 2016.
The Funds may also purchase residual interest bonds in a secondary market transaction without first owning the underlying bond. Such transactions are not required to be treated as secured borrowings. Shortfall agreements, if any, related to residual interest bonds purchased in a secondary market transaction are disclosed in the Portfolio of Investments.
The Funds’ investment policies and restrictions expressly permit investments in residual interest bonds. Such bonds typically offer the potential for yields exceeding the yields available on fixed rate bonds with comparable credit quality and maturity. These securities tend to underperform the market for fixed rate bonds in a rising long-term interest rate environment, but tend to outperform the market for fixed rate bonds when long-term interest rates decline. The value and income of residual interest bonds are generally more volatile than that of a fixed rate bond. The Funds’ investment policies do not allow the Funds to borrow money except as permitted by the 1940 Act. Management believes that the Funds’ restrictions on borrowing money and issuing senior securities (other than as specifically permitted) do not apply to Floating Rate Notes issued by the SPV and included as a liability in the Funds’ Statement of Assets and Liabilities. As secured indebtedness issued by an SPV, Floating Rate Notes are distinct from the borrowings and senior securities to which the Funds’ restrictions apply. Residual interest bonds held by the Funds are securities exempt from registration under Rule 144A of the Securities Act of 1933.
Final rules implementing section 619 of the Dodd-Frank Wall Street Reform and Consumer Protection Act (the “Volcker Rule”) prohibit banking entities from engaging in proprietary trading of certain instruments and limit such entities’ investments in, and relationships with, covered funds (such as SPVs), as defined in the rules. The compliance date for the Volcker Rule for certain covered funds was July 21, 2015 while for other covered funds the compliance date is July 21, 2017, as announced on July 7, 2016. The Volcker Rule precludes banking entities and their affiliates from (i) sponsoring residual interest bond programs and (ii) continuing relationships with or services for existing residual interest bond programs. As a result, residual interest bond trusts were or will be restructured to comply with the Volcker Rule as of the applicable compliance dates. The effects of the Volcker Rule may make it more difficult for the Funds to maintain current or desired levels of income.
Legal and restructuring fees incurred in connection with the restructuring of residual interest bond trusts are recorded as interest expense.
I Financial Futures Contracts — Upon entering into a financial futures contract, a Fund is required to deposit with the broker, either in cash or securities, an amount equal to a certain percentage of the contract amount (initial margin). Subsequent payments, known as variation margin, are made or received by the Fund each business day, depending on the daily fluctuations in the value of the underlying security, and are recorded as unrealized gains or losses by the Fund. Gains (losses) are realized upon the expiration or closing of the financial futures contracts. Should market conditions change unexpectedly, the Fund may not achieve the anticipated benefits of the financial futures contracts and may realize a loss. Futures contracts have minimal counterparty risk as they are exchange traded and the clearinghouse for the exchange is substituted as the counterparty, guaranteeing counterparty performance.
J When-Issued Securities and Delayed Delivery Transactions — The Funds may purchase or sell securities on a delayed delivery or when-issued basis. Payment and delivery may take place after the customary settlement period for that security. At the time the transaction is negotiated, the price of the security that will be delivered is fixed. The Funds maintain cash and/or security positions for these commitments such that sufficient liquid assets will be available to make payments upon settlement. Securities purchased on a delayed delivery or when-issued basis are marked-to-market daily and begin earning interest on settlement date. Losses may arise due to changes in the market value of the underlying securities or if the counterparty does not perform under the contract.
Eaton Vance
Municipal Income Funds
August 31, 2016
Notes to Financial Statements — continued
2 Distributions to Shareholders and Income Tax Information
The net investment income of each Fund is determined daily and substantially all of the net investment income so determined is declared as a dividend to shareholders of record at the time of declaration. Distributions are declared separately for each class of shares. Distributions are paid monthly. Distributions of realized capital gains (reduced by available capital loss carryforwards) are made at least annually. Shareholders may reinvest income and capital gain distributions in additional shares of the same class of a Fund at the net asset value as of the reinvestment date or, at the election of the shareholder, receive distributions in cash. Distributions to shareholders are determined in accordance with income tax regulations, which may differ from U.S. GAAP. As required by U.S. GAAP, only distributions in excess of tax basis earnings and profits are reported in the financial statements as a return of capital. Permanent differences between book and tax accounting relating to distributions are reclassified to paid-in capital. For tax purposes, distributions from short-term capital gains are considered to be from ordinary income.
The tax character of distributions declared for the years ended August 31, 2016 and August 31, 2015 was as follows:
| | | | | | | | | | | | | | | | |
| | | Year Ended August 31, 2016 | |
| | | Georgia Fund | | | Maryland Fund | | | Missouri Fund | | | North Carolina
Fund | |
| | | | |
Distributions declared from: | | | | | | | | | | | | | | | | |
Tax-exempt income | | $ | 2,152,048 | | | $ | 1,998,512 | | | $ | 2,510,245 | | | $ | 3,981,971 | |
Ordinary income | | $ | — | | | $ | 181,973 | | | $ | — | | | $ | — | |
| | | | | | | | | | | | |
| | | Year Ended August 31, 2016 | |
| | | Oregon Fund | | | South Carolina
Fund | | | Virginia Fund | |
| | | |
Distributions declared from: | | | | | | | | | | | | |
Tax-exempt income | | $ | 4,183,658 | | | $ | 4,083,236 | | | $ | 2,892,106 | |
Ordinary income | | $ | — | | | $ | 10,412 | | | $ | 34,490 | |
| | | | | | | | | | | | | | | | |
| | | Year Ended August 31, 2015 | |
| | | Georgia Fund | | | Maryland Fund | | | Missouri Fund | | | North Carolina Fund | |
| | | | |
Distributions declared from: | | | | | | | | | | | | | | | | |
Tax-exempt income | | $ | 2,141,233 | | | $ | 2,226,073 | | | $ | 2,593,028 | | | $ | 3,936,626 | |
| | | | | | | | | | | | |
| | | Year Ended August 31, 2015 | |
| | | Oregon Fund | | | South Carolina
Fund | | | Virginia Fund | |
| | | |
Distributions declared from: | | | | | | | | | | | | |
Tax-exempt income | | $ | 4,364,302 | | | $ | 4,270,184 | | | $ | 3,164,428 | |
Ordinary income | | $ | 1,813 | | | $ | — | | | $ | — | |
Eaton Vance
Municipal Income Funds
August 31, 2016
Notes to Financial Statements — continued
During the year ended August 31, 2016, the following amounts were reclassified due to expired capital loss carryforwards and differences between book and tax accounting, primarily for premium amortization and accretion of market discount.
| | | | | | | | | | | | | | | | |
| | | Georgia Fund | | | Maryland Fund | | | Missouri
Fund | | | North Carolina
Fund | |
| | | | |
Change in: | | | | | | | | | | | | | | | | |
Paid-in capital | | $ | (306,338 | ) | | $ | (4,159,062 | ) | | $ | (337,671 | ) | | $ | (274,170 | ) |
Accumulated net realized loss | | $ | 319,179 | | | $ | 3,968,427 | | | $ | 364,820 | | | $ | 280,535 | |
Accumulated undistributed (distributions in excess of) net investment income | | $ | (12,841 | ) | | $ | 190,635 | | | $ | (27,149 | ) | | $ | (6,365 | ) |
| | | | | | | | | | | | |
| | | Oregon Fund | | | South Carolina
Fund | | | Virginia Fund | |
| | | |
Change in: | | | | | | | | | | | | |
Paid-in capital | | $ | (2,145,240 | ) | | $ | (1,027,752 | ) | | $ | (502,088 | ) |
Accumulated net realized loss | | $ | 2,182,934 | | | $ | 1,047,032 | | | $ | 521,145 | |
Accumulated undistributed net investment income | | $ | (37,694 | ) | | $ | (19,280 | ) | | $ | (19,057 | ) |
These reclassifications had no effect on the net assets or net asset value per share of the Funds.
As of August 31, 2016, the components of distributable earnings (accumulated losses) on a tax basis were as follows:
| | | | | | | | | | | | | | | | |
| | | Georgia Fund | | | Maryland Fund | | | Missouri Fund | | | North Carolina
Fund | |
| | | | |
Undistributed tax-exempt income | | $ | 16,917 | | | $ | 19,917 | | | $ | 109,453 | | | $ | 255,768 | |
Capital loss carryforwards and deferred capital losses | | $ | (10,469,176 | ) | | $ | (7,470,199 | ) | | $ | (8,998,866 | ) | | $ | (10,599,935 | ) |
Net unrealized appreciation | | $ | 7,274,610 | | | $ | 5,360,179 | | | $ | 8,100,742 | | | $ | 12,152,248 | |
Other temporary differences | | $ | (61,913 | ) | | $ | (46,046 | ) | | $ | (18,029 | ) | | $ | (64,961 | ) |
| | | | | | | | | | | | |
| | | Oregon Fund | | | South Carolina
Fund | | | Virginia Fund | |
| | | |
Undistributed tax-exempt income | | $ | 234,584 | | | $ | 196,835 | | | $ | 192,416 | |
Capital loss carryforwards and deferred capital losses | | $ | (23,427,139 | ) | | $ | (21,936,668 | ) | | $ | (20,895,644 | ) |
Net unrealized appreciation | | $ | 13,039,558 | | | $ | 12,995,546 | | | $ | 8,645,120 | |
Other temporary differences | | $ | (33,968 | ) | | $ | (83,414 | ) | | $ | (61,245 | ) |
The differences between components of distributable earnings (accumulated losses) on a tax basis and the amounts reflected in the Statements of Assets and Liabilities are primarily due to wash sales, futures contracts, residual interest bonds, premium amortization, accretion of market discount and the timing of recognizing distributions to shareholders.
At August 31, 2016, the following Funds, for federal income tax purposes, had capital loss carryforwards and deferred capital losses which would reduce the respective Fund’s taxable income arising from future net realized gains on investment transactions, if any, to the extent permitted by the Internal Revenue Code, and thus would reduce the amount of distributions to shareholders, which would otherwise be necessary to relieve the Funds of any liability for federal income or excise tax. Under tax regulations, capital losses incurred in taxable years beginning after December 2010 are considered deferred capital losses and are treated as arising on the first day of a Fund’s next taxable year, retaining the same short-term or long-term character as when originally deferred. Deferred capital losses are required to be used prior to capital loss carryforwards, which carry an expiration date. As a result of this
Eaton Vance
Municipal Income Funds
August 31, 2016
Notes to Financial Statements — continued
ordering rule, capital loss carryforwards may be more likely to expire unused. The amounts and expiration dates of the capital loss carryforwards, whose character is short-term, and the amounts of the deferred capital losses are as follows:
| | | | | | | | | | | | | | | | |
| Expiration Date | | Georgia Fund | | | Maryland Fund | | | Missouri Fund | | | North Carolina
Fund | |
| | | | |
August 31, 2017 | | $ | 980,989 | | | $ | 34,823 | | | $ | 2,259,438 | | | $ | — | |
August 31, 2018 | | | 2,812,349 | | | | 2,032,881 | | | | 3,282,262 | | | | 3,573,563 | |
August 31, 2019 | | | 3,087,553 | | | | 1,823,894 | | | | 1,434,581 | | | | 1,655,671 | |
| | | | |
Total capital loss carryforwards | | $ | 6,880,891 | | | $ | 3,891,598 | | | $ | 6,976,281 | | | $ | 5,229,234 | |
| | | | |
Deferred capital losses: | | | | | | | | | | | | | | | | |
Short-term | | $ | 1,990,050 | | | $ | 928,906 | | | $ | 1,312,451 | | | $ | 2,906,059 | |
Long-term | | $ | 1,598,235 | | | $ | 2,649,695 | | | $ | 710,134 | | | $ | 2,464,642 | |
| | | | | | | | | | | | |
| Expiration Date | | Oregon Fund | | | South Carolina
Fund | | | Virginia Fund | |
| | | |
August 31, 2017 | | $ | 1,066,237 | | | $ | 3,019,420 | | | $ | 3,212,881 | |
August 31, 2018 | | | 9,061,392 | | | | 10,869,967 | | | | 464,954 | |
August 31, 2019 | | | 809,441 | | | | 527,346 | | | | 10,782,176 | |
| | | |
Total capital loss carryforwards | | $ | 10,937,070 | | | $ | 14,416,733 | | | $ | 14,460,011 | |
| | | |
Deferred capital losses: | | | | | | | | | | | | |
Short-term | | $ | 5,123,144 | | | $ | 6,546,494 | | | $ | 2,874,676 | |
Long-term | | $ | 7,366,925 | | | $ | 973,441 | | | $ | 3,560,957 | |
The cost and unrealized appreciation (depreciation) of investments of each Fund at August 31, 2016, as determined on a federal income tax basis, were as follows:
| | | | | | | | | | | | | | | | |
| | | Georgia Fund | | | Maryland Fund | | | Missouri Fund | | | North Carolina
Fund | |
| | | | |
Aggregate cost | | $ | 65,868,640 | | | $ | 58,728,283 | | | $ | 65,945,190 | | | $ | 123,574,103 | |
| | | | |
Gross unrealized appreciation | | $ | 7,385,420 | | | $ | 5,363,134 | | | $ | 8,188,437 | | | $ | 12,152,637 | |
Gross unrealized depreciation | | | (110,810 | ) | | | (2,955 | ) | | | (87,695 | ) | | | (389 | ) |
| | | | |
Net unrealized appreciation | | $ | 7,274,610 | | | $ | 5,360,179 | | | $ | 8,100,742 | | | $ | 12,152,248 | |
| | | | | | | | | | | | |
| | | Oregon Fund | | | South Carolina
Fund | | | Virginia Fund | |
| | | |
Aggregate cost | | $ | 106,942,634 | | | $ | 120,732,122 | | | $ | 71,902,770 | |
| | | |
Gross unrealized appreciation | | $ | 13,811,640 | | | $ | 12,997,102 | | | $ | 9,308,564 | |
Gross unrealized depreciation | | | (772,082 | ) | | | (1,556 | ) | | | (663,444 | ) |
| | | |
Net unrealized appreciation | | $ | 13,039,558 | | | $ | 12,995,546 | | | $ | 8,645,120 | |
Eaton Vance
Municipal Income Funds
August 31, 2016
Notes to Financial Statements — continued
3 Investment Adviser Fee and Other Transactions with Affiliates
The investment adviser fee is earned by Boston Management and Research (BMR), a subsidiary of Eaton Vance Management (EVM), as compensation for management and investment advisory services rendered to each Fund. The fee is based upon a percentage of average daily net assets plus a percentage of gross income (i.e., income other than gains from the sale of securities) as presented in the following table and is payable monthly.
| | | | | | | | |
| Daily Net Assets | | Annual Asset
Rate | | | Daily Income
Rate | |
| | |
Up to $20 million | | | 0.10 | % | | | 1.00 | % |
$20 million up to $40 million | | | 0.20 | | | | 2.00 | |
$40 million up to $500 million | | | 0.30 | | | | 3.00 | |
On average daily net assets of $500 million or more, the rates are reduced.
For the year ended August 31, 2016, investment adviser fees incurred by the Funds and the effective annual rates, as a percentage of average daily net assets, were as follows:
| | | | | | | | | | | | | | | | |
| | | Georgia
Fund | | | Maryland
Fund | | | Missouri
Fund | | | North Carolina
Fund | |
| | | | |
Investment Adviser Fee | | $ | 210,084 | | | $ | 191,251 | | | $ | 223,400 | | | $ | 438,402 | |
Effective Annual Rate | | | 0.30 | % | | | 0.30 | % | | | 0.31 | % | | | 0.35 | % |
| | | | | | | | | | | | |
| | | Oregon Fund | | | South Carolina
Fund | | | Virginia
Fund | |
| | | |
Investment Adviser Fee | | $ | 424,142 | | | $ | 449,065 | | | $ | 258,660 | |
Effective Annual Rate | | | 0.36 | % | | | 0.35 | % | | | 0.32 | % |
EVM serves as the administrator of each Fund, but receives no compensation. EVM provides sub-transfer agency and related services to the Funds pursuant to a Sub-Transfer Agency Support Services Agreement. Eaton Vance Distributors, Inc. (EVD), an affiliate of EVM and the Funds’ principal underwriter, received a portion of the sales charge on sales of Class A shares of the Funds. EVD also received distribution and service fees from Class A, Class B and Class C shares (see Note 4) and contingent deferred sales charges (see Note 5). Sub-transfer agent fees earned by EVM, which are included in transfer and dividend disbursing agent fees on the Statements of Operations, and Class A sales charges that the Funds were informed were received by EVD for the year ended August 31, 2016 were as follows:
| | | | | | | | | | | | | | | | |
| | | Georgia
Fund | | | Maryland
Fund | | | Missouri
Fund | | | North Carolina
Fund | |
| | | | |
EVM’s Sub-Transfer Agent Fees | | $ | 2,310 | | | $ | 3,485 | | | $ | 2,718 | | | $ | 4,166 | |
EVD’s Class A Sales Charges | | $ | 7,764 | | | $ | 12,963 | | | $ | 12,163 | | | $ | 25,687 | |
| | | | | | | | | | | | |
| | | Oregon
Fund | | | South Carolina
Fund | | | Virginia
Fund | |
| | | |
EVM’s Sub-Transfer Agent Fees | | $ | 3,900 | | | $ | 3,330 | | | $ | 4,824 | |
EVD’s Class A Sales Charges | | $ | 43,086 | | | $ | 24,685 | | | $ | 7,861 | |
Trustees and officers of the Funds who are members of EVM’s or BMR’s organizations receive remuneration for their services to the Funds out of the investment adviser fee. Trustees of the Funds who are not affiliated with the investment adviser may elect to defer receipt of all or a percentage of their annual fees in accordance with the terms of the Trustees Deferred Compensation Plan. For the year ended August 31, 2016, no significant amounts have been deferred. Certain officers and Trustees of the Funds are officers of the above organizations.
Eaton Vance
Municipal Income Funds
August 31, 2016
Notes to Financial Statements — continued
4 Distribution Plans
Each Fund has in effect a distribution plan for Class A shares (Class A Plan) pursuant to Rule 12b-1 under the 1940 Act. The Class A Plan provides that each Fund will pay EVD a distribution and service fee not exceeding 0.25% per annum of its average daily net assets attributable to Class A shares for distribution services and facilities provided to each Fund by EVD, as well as for personal services and/or the maintenance of shareholder accounts. The Trustees approved distribution and service fee payments equal to 0.20% per annum of each Fund’s average daily net assets attributable to Class A shares. Distribution and service fees paid or accrued to EVD for the year ended August 31, 2016 for Class A shares amounted to the following:
| | | | | | | | | | | | | | | | |
| | | Georgia
Fund | | | Maryland
Fund | | | Missouri
Fund | | | North Carolina
Fund | |
| | | | |
Class A Distribution and Service Fees | | $ | 82,035 | | | $ | 84,323 | | | $ | 121,523 | | | $ | 162,368 | |
| | | | | | | | | | | | |
| | | Oregon Fund | | | South Carolina
Fund | | | Virginia
Fund | |
| | | |
Class A Distribution and Service Fees | | $ | 177,423 | | | $ | 140,313 | | | $ | 117,348 | |
Each Fund also has in effect distribution plans for Class B shares (Class B Plan) and Class C shares (Class C Plan) pursuant to Rule 12b-1 under the 1940 Act. Pursuant to the Class B and Class C Plans, each Fund pays EVD amounts equal to 0.75% per annum of its average daily net assets attributable to Class B and Class C shares for providing ongoing distribution services and facilities to the respective Funds. For the year ended August 31, 2016, the Funds paid or accrued to EVD the following distribution fees:
| | | | | | | | | | | | | | | | |
| | | Georgia
Fund | | | Maryland
Fund | | | Missouri
Fund | | | North Carolina
Fund | |
| | | | |
Class B Distribution Fees | | $ | 3,535 | | | $ | 4,453 | | | $ | 4,309 | | | $ | 3,474 | |
Class C Distribution Fees | | $ | 48,226 | | | $ | 113,046 | | | $ | 55,399 | | | $ | 138,395 | |
| | | | | | | | | | | | |
| | | Oregon Fund | | | South Carolina
Fund | | | Virginia
Fund | |
| | | |
Class B Distribution Fees | | $ | 9,815 | | | $ | 5,752 | | | $ | 3,177 | |
Class C Distribution Fees | | $ | 109,663 | | | $ | 199,902 | | | $ | 44,309 | |
The Class B and Class C Plans also authorize the Funds to make payments of service fees to EVD, financial intermediaries and other persons in amounts not exceeding 0.25% per annum of the average daily net assets attributable to that class. The Trustees approved service fee payments equal to 0.20% per annum of each Fund’s average daily net assets attributable to Class B and Class C shares. Service fees paid or accrued are for personal services and/or the maintenance of shareholder accounts. They are separate and distinct from the Class B and Class C sales commissions and distribution fees payable to EVD. Service fees paid or accrued for the year ended August 31, 2016 amounted to the following:
| | | | | | | | | | | | | | | | |
| | | Georgia
Fund | | | Maryland
Fund | | | Missouri
Fund | | | North Carolina
Fund | |
| | | | |
Class B Service Fees | | $ | 943 | | | $ | 1,187 | | | $ | 1,149 | | | $ | 927 | |
Class C Service Fees | | $ | 12,860 | | | $ | 30,146 | | | $ | 14,773 | | | $ | 36,905 | |
| | | | | | | | | | | | |
| | | Oregon
Fund | | | South Carolina
Fund | | | Virginia
Fund | |
| | | |
Class B Service Fees | | $ | 2,618 | | | $ | 1,534 | | | $ | 847 | |
Class C Service Fees | | $ | 29,243 | | | $ | 53,307 | | | $ | 11,815 | |
Eaton Vance
Municipal Income Funds
August 31, 2016
Notes to Financial Statements — continued
Distribution and service fees are subject to the limitations contained in the Financial Industry Regulatory Authority Rule 2341(d) and for Class B, are further limited to a 5% maximum sales charge as determined in accordance with such rule.
5 Contingent Deferred Sales Charges
A contingent deferred sales charge (CDSC) generally is imposed on redemptions of Class B shares made within six years of purchase and on redemptions of Class C shares made within one year of purchase. Class A shares may be subject to a 1% CDSC if redeemed within eighteen months of purchase (depending on the circumstances of purchase). Generally, the CDSC is based upon the lower of the net asset value at date of redemption or date of purchase. No charge is levied on shares acquired by reinvestment of dividends or capital gain distributions. The CDSC for Class B shares is imposed at declining rates that begin at 5% in the case of redemptions in the first and second year after purchase, declining one percentage point each subsequent year. Class C shares are subject to a 1% CDSC if redeemed within one year of purchase. For the year ended August 31, 2016, the Funds were informed that EVD received approximately the following amounts of CDSCs paid by Class A, Class B and Class C shareholders:
| | | | | | | | | | | | | | | | |
| | | Georgia
Fund | | | Maryland
Fund | | | Missouri
Fund | | | North Carolina
Fund | |
| | | | |
Class A | | $ | 300 | | | $ | — | | | $ | — | | | $ | 100 | |
Class B | | $ | — | | | $ | — | | | $ | 300 | | | $ | 1,000 | |
Class C | | $ | — | | | $ | 200 | | | $ | 100 | | | $ | 3,000 | |
| | | | | | | | | | | | |
| | | Oregon
Fund | | | South Carolina
Fund | | | Virginia
Fund | |
| | | |
Class A | | $ | 2,000 | | | $ | — | | | $ | — | |
Class B | | $ | — | | | $ | — | | | $ | 400 | |
Class C | | $ | 1,000 | | | $ | 2,000 | | | $ | 200 | |
6 Purchases and Sales of Investments
Purchases and sales of investments, other than short-term obligations, for the year ended August 31, 2016 were as follows:
| | | | | | | | | | | | | | | | |
| | | Georgia Fund | | | Maryland Fund | | | Missouri Fund | | | North Carolina
Fund | |
| | | | |
Purchases | | $ | 9,198,488 | | | $ | 7,032,612 | | | $ | 8,426,110 | | | $ | 33,193,775 | |
Sales | | $ | 5,115,020 | | | $ | 9,324,410 | | | $ | 7,557,421 | | | $ | 9,840,782 | |
| | | | | | | | | | | | |
| | | Oregon Fund | | | South Carolina
Fund | | | Virginia Fund | |
| | | |
Purchases | | $ | 10,253,941 | | | $ | 26,490,999 | | | $ | 10,379,780 | |
Sales | | $ | 11,974,529 | | | $ | 8,081,200 | | | $ | 11,494,987 | |
Eaton Vance
Municipal Income Funds
August 31, 2016
Notes to Financial Statements — continued
7 Shares of Beneficial Interest
Each Fund’s Declaration of Trust permits the Trustees to issue an unlimited number of full and fractional shares of beneficial interest (without par value). Such shares may be issued in a number of different series (such as the Funds) and classes. Transactions in Fund shares were as follows:
| | | | | | | | | | | | | | | | |
Georgia Fund | | | | | | | | | | | | |
| | | Year Ended August 31, 2016 | |
| | | Class A | | | Class B | | | Class C | | | Class I | |
| | | | |
Sales | | | 320,530 | | | | — | | | | 225,590 | | | | 906,722 | |
Issued to shareholders electing to receive payments of distributions in Fund shares | | | 120,707 | | | | 988 | | | | 13,348 | | | | 26,873 | |
Redemptions | | | (499,520 | ) | | | (11,615 | ) | | | (150,555 | ) | | | (308,786 | ) |
Exchange from Class B shares | | | 10,614 | | | | — | | | | — | | | | — | |
Exchange to Class A shares | | | — | | | | (9,936 | ) | | | — | | | | — | |
| | | | |
Net increase (decrease) | | | (47,669 | ) | | | (20,563 | ) | | | 88,383 | | | | 624,809 | |
| | | | |
| | | | | | | | | | | | | | | | |
| | | Year Ended August 31, 2015 | |
| | | Class A | | | Class B | | | Class C | | | Class I | |
| | | | |
Sales | | | 429,007 | | | | 6 | | | | 167,241 | | | | 1,675,030 | |
Issued to shareholders electing to receive payments of distributions in Fund shares | | | 143,358 | | | | 1,986 | | | | 15,085 | | | | 20,230 | |
Redemptions | | | (722,627 | ) | | | (14,568 | ) | | | (128,380 | ) | | | (404,752 | ) |
Exchange from Class B shares | | | 20,426 | | | | — | | | | — | | | | — | |
Exchange to Class A shares | | | — | | | | (19,114 | ) | | | — | | | | — | |
| | | | |
Net increase (decrease) | | | (129,836 | ) | | | (31,690 | ) | | | 53,946 | | | | 1,290,508 | |
| | | | |
| | | | | | | | | | | | | | | | |
Maryland Fund | | | | | | | | | | | | |
| | | Year Ended August 31, 2016 | |
| | | Class A | | | Class B | | | Class C | | | Class I | |
| | | | |
Sales | | | 261,717 | | | | 59 | | | | 310,336 | | | | 255,209 | |
Issued to shareholders electing to receive payments of distributions in Fund shares | | | 122,816 | | | | 1,547 | | | | 29,848 | | | | 8,098 | |
Redemptions | | | (496,771 | ) | | | (10,988 | ) | | | (193,599 | ) | | | (231,096 | ) |
Exchange from Class B shares | | | 15,160 | | | | — | | | | — | | | | — | |
Exchange to Class A shares | | | — | | | | (13,903 | ) | | | — | | | | — | |
| | | | |
Net increase (decrease) | | | (97,078 | ) | | | (23,285 | ) | | | 146,585 | | | | 32,211 | |
| | | | |
| | | | | | | | | | | | | | | | |
| | | Year Ended August 31, 2015 | |
| | | Class A | | | Class B | | | Class C | | | Class I | |
| | | | |
Sales | | | 233,151 | | | | 399 | | | | 212,882 | | | | 429,179 | |
Issued to shareholders electing to receive payments of distributions in Fund shares | | | 129,736 | | | | 1,936 | | | | 29,560 | | | | 6,961 | |
Redemptions | | | (966,249 | ) | | | (14,478 | ) | | | (343,313 | ) | | | (135,439 | ) |
Exchange from Class B shares | | | 37,587 | | | | — | | | | — | | | | — | |
Exchange to Class A shares | | | — | | | | (34,449 | ) | | | — | | | | — | |
| | | | |
Net increase (decrease) | | | (565,775 | ) | | | (46,592 | ) | | | (100,871 | ) | | | 300,701 | |
Eaton Vance
Municipal Income Funds
August 31, 2016
Notes to Financial Statements — continued
| | | | | | | | | | | | | | | | |
Missouri Fund | | | | | | | | | | | | |
| | | Year Ended August 31, 2016 | |
| | | Class A | | | Class B | | | Class C | | | Class I | |
| | | | |
Sales | | | 318,236 | | | | 103 | | | | 295,071 | | | | 178,380 | |
Issued to shareholders electing to receive payments of distributions in Fund shares | | | 208,148 | | | | 1,413 | | | | 15,855 | | | | 9,655 | |
Redemptions | | | (881,460 | ) | | | (8,332 | ) | | | (51,207 | ) | | | (18,668 | ) |
Exchange from Class B shares | | | 40,029 | | | | — | | | | — | | | | — | |
Exchange to Class A shares | | | — | | | | (36,224 | ) | | | — | | | | — | |
| | | | |
Net increase (decrease) | | | (315,047 | ) | | | (43,040 | ) | | | 259,719 | | | | 169,367 | |
| | | | |
| | | | | | | | | | | | | | | | |
| | | Year Ended August 31, 2015 | |
| | | Class A | | | Class B | | | Class C | | | Class I | |
| | | | |
Sales | | | 472,218 | | | | 135 | | | | 89,805 | | | | 119,006 | |
Issued to shareholders electing to receive payments of distributions in Fund shares | | | 219,564 | | | | 2,434 | | | | 13,840 | | | | 8,241 | |
Redemptions | | | (1,002,251 | ) | | | (6,485 | ) | | | (76,465 | ) | | | (47,660 | ) |
Exchange from Class B shares | | | 32,467 | | | | — | | | | — | | | | — | |
Exchange to Class A shares | | | — | | | | (29,407 | ) | | | — | | | | — | |
| | | | |
Net increase (decrease) | | | (278,002 | ) | | | (33,323 | ) | | | 27,180 | | | | 79,587 | |
| | | | |
| | | | | | | | | | | | | | | | |
North Carolina Fund | | | | | | | | | | | | |
| | | Year Ended August 31, 2016 | |
| | | Class A | | | Class B | | | Class C | | | Class I | |
| | | | |
Sales | | | 910,925 | | | | 2,171 | | | | 531,464 | | | | 1,815,348 | |
Issued to shareholders electing to receive payments of distributions in Fund shares | | | 258,873 | | | | 1,096 | | | | 39,134 | | | | 49,377 | |
Redemptions | | | (907,710 | ) | | | (10,349 | ) | | | (254,489 | ) | | | (632,590 | ) |
Exchange from Class B shares | | | 16,169 | | | | — | | | | — | | | | — | |
Exchange to Class A shares | | | — | | | | (15,035 | ) | | | — | | | | — | |
| | | | |
Net increase (decrease) | | | 278,257 | | | | (22,117 | ) | | | 316,109 | | | | 1,232,135 | |
| | | | |
| | | | | | | | | | | | | | | | |
| | | Year Ended August 31, 2015 | |
| | | Class A | | | Class B | | | Class C | | | Class I | |
| | | | |
Sales | | | 1,116,743 | | | | 109 | | | | 335,329 | | | | 816,470 | |
Issued to shareholders electing to receive payments of distributions in Fund shares | | | 267,104 | | | | 1,885 | | | | 40,933 | | | | 30,861 | |
Redemptions | | | (1,438,187 | ) | | | (16,295 | ) | | | (410,525 | ) | | | (280,700 | ) |
Exchange from Class B shares | | | 16,488 | | | | — | | | | — | | | | — | |
Exchange to Class A shares | | | — | | | | (15,337 | ) | | | — | | | | — | |
| | | | |
Net increase (decrease) | | | (37,852 | ) | | | (29,638 | ) | | | (34,263 | ) | | | 566,631 | |
Eaton Vance
Municipal Income Funds
August 31, 2016
Notes to Financial Statements — continued
| | | | | | | | | | | | | | | | |
Oregon Fund | | | | | | | | | | | | |
| | | Year Ended August 31, 2016 | |
| | | Class A | | | Class B | | | Class C | | | Class I | |
| | | | |
Sales | | | 1,218,234 | | | | 52 | | | | 256,817 | | | | 1,055,672 | |
Issued to shareholders electing to receive payments of distributions in Fund shares | | | 344,287 | | | | 3,707 | | | | 39,661 | | | | 29,666 | |
Redemptions | | | (1,778,611 | ) | | | (50,468 | ) | | | (252,242 | ) | | | (863,565 | ) |
Exchange from Class B shares | | | 25,472 | | | | — | | | | — | | | | — | |
Exchange to Class A shares | | | — | | | | (23,291 | ) | | | — | | | | — | |
| | | | |
Net increase (decrease) | | | (190,618 | ) | | | (70,000 | ) | | | 44,236 | | | | 221,773 | |
| | | | |
| | | | | | | | | | | | | | | | |
| | | Year Ended August 31, 2015 | |
| | | Class A | | | Class B | | | Class C | | | Class I | |
| | | | |
Sales | | | 798,689 | | | | 59 | | | | 300,590 | | | | 1,127,438 | |
Issued to shareholders electing to receive payments of distributions in Fund shares | | | 369,396 | | | | 6,202 | | | | 40,503 | | | | 25,811 | |
Redemptions | | | (1,432,268 | ) | | | (67,825 | ) | | | (293,439 | ) | | | (587,157 | ) |
Exchange from Class B shares | | | 25,706 | | | | — | | | | — | | | | — | |
Exchange to Class A shares | | | — | | | | (23,509 | ) | | | — | | | | — | |
| | | | |
Net increase (decrease) | | | (238,477 | ) | | | (85,073 | ) | | | 47,654 | | | | 566,092 | |
| | | | |
| | | | | | | | | | | | | | | | |
South Carolina Fund | | | | | | | | | | | | |
| | | Year Ended August 31, 2016 | |
| | | Class A | | | Class B | | | Class C | | | Class I | |
| | | | |
Sales | | | 842,613 | | | | 1 | | | | 473,220 | | | | 2,422,150 | |
Issued to shareholders electing to receive payments of distributions in Fund shares | | | 229,096 | | | | 2,002 | | | | 60,567 | | | | 36,917 | |
Redemptions | | | (1,473,354 | ) | | | (5,770 | ) | | | (296,373 | ) | | | (615,971 | ) |
Exchange from Class B shares | | | 50,163 | | | | — | | | | — | | | | — | |
Exchange to Class A shares | | | — | | | | (47,295 | ) | | | — | | | | — | |
| | | | |
Net increase (decrease) | | | (351,482 | ) | | | (51,062 | ) | | | 237,414 | | | | 1,843,096 | |
| | | | |
| | | | | | | | | | | | | | | | |
| | | Year Ended August 31, 2015 | |
| | | Class A | | | Class B | | | Class C | | | Class I | |
| | | | |
Sales | | | 565,385 | | | | 17 | | | | 331,851 | | | | 891,751 | |
Issued to shareholders electing to receive payments of distributions in Fund shares | | | 266,178 | | | | 3,533 | | | | 64,454 | | | | 26,220 | |
Redemptions | | | (1,299,244 | ) | | | (25,630 | ) | | | (446,510 | ) | | | (865,866 | ) |
Exchange from Class B shares | | | 33,590 | | | | — | | | | — | | | | — | |
Exchange to Class A shares | | | — | | | | (31,715 | ) | | | — | | | | — | |
| | | | |
Net increase (decrease) | | | (434,091 | ) | | | (53,795 | ) | | | (50,205 | ) | | | 52,105 | |
Eaton Vance
Municipal Income Funds
August 31, 2016
Notes to Financial Statements — continued
| | | | | | | | | | | | | | | | |
Virginia Fund | | | | | | | | | | | | |
| | | Year Ended August 31, 2016 | |
| | | Class A | | | Class B | | | Class C | | | Class I | |
| | | | |
Sales | | | 421,250 | | | | 2,457 | | | | 122,836 | | | | 365,347 | |
Issued to shareholders electing to receive payments of distributions in Fund shares | | | 218,082 | | | | 1,301 | | | | 15,524 | | | | 25,146 | |
Redemptions | | | (799,064 | ) | | | (6,162 | ) | | | (203,699 | ) | | | (298,152 | ) |
Exchange from Class B shares | | | 20,746 | | | | — | | | | — | | | | — | |
Exchange to Class A shares | | | — | | | | (18,734 | ) | | | — | | | | — | |
| | | | |
Net increase (decrease) | | | (138,986 | ) | | | (21,138 | ) | | | (65,339 | ) | | | 92,341 | |
| | | | |
| | | | | | | | | | | | | | | | |
| | | Year Ended August 31, 2015 | |
| | | Class A | | | Class B | | | Class C | | | Class I | |
| | | | |
Sales | | | 364,196 | | | | — | | | | 62,813 | | | | 342,433 | |
Issued to shareholders electing to receive payments of distributions in Fund shares | | | 231,810 | | | | 2,589 | | | | 19,470 | | | | 22,874 | |
Redemptions | | | (1,156,614 | ) | | | (32,882 | ) | | | (184,208 | ) | | | (324,260 | ) |
Exchange from Class B shares | | | 34,998 | | | | — | | | | — | | | | — | |
Exchange to Class A shares | | | — | | | | (31,610 | ) | | | — | | | | — | |
| | | | |
Net increase (decrease) | | | (525,610 | ) | | | (61,903 | ) | | | (101,925 | ) | | | 41,047 | |
At August 31, 2016, one shareholder owned 14.2% of the value of outstanding shares of Missouri Fund.
8 Line of Credit
The Funds participate with other portfolios and funds managed by EVM and its affiliates in a $625 million unsecured line of credit agreement with a group of banks, which is in effect through September 2, 2016. Borrowings are made by the Funds solely to facilitate the handling of unusual and/or unanticipated short-term cash requirements. Interest is charged to each Fund based on its borrowings at an amount above either the Eurodollar rate or Federal Funds rate. In addition, a fee computed at an annual rate of 0.10% on the daily unused portion of the line of credit is allocated among the participating portfolios and funds at the end of each quarter. Because the line of credit is not available exclusively to the Funds, a Fund may be unable to borrow some or all of its requested amounts at any particular time. The Funds did not have any significant borrowings or allocated fees during the year ended August 31, 2016.
On September 2, 2016, the Funds renewed their line of credit agreement, which expires September 1, 2017. Under the terms of the renewed credit agreement, the commitment amount was changed to $545 million and the commitment fee on the unused portion of the line of credit was changed to an annual rate of 0.15%.
9 Financial Instruments
The Funds may trade in financial instruments with off-balance sheet risk in the normal course of their investing activities. These financial instruments may include financial futures contracts and may involve, to a varying degree, elements of risk in excess of the amounts recognized for financial statement purposes. The notional or contractual amounts of these instruments represent the investment a Fund has in particular classes of financial instruments and do not necessarily represent the amounts potentially subject to risk. The measurement of the risks associated with these instruments is meaningful only when all related and offsetting transactions are considered. A summary of obligations under these financial instruments at August 31, 2016 is included in the Portfolios of Investments. At August 31, 2016, the Funds had sufficient cash and/or securities to cover commitments under these contracts.
Each Fund is subject to interest rate risk in the normal course of pursuing its investment objective. Because the Funds hold fixed-rate bonds, the value of these bonds may decrease if interest rates rise. The Funds enter into U.S. Treasury futures contracts to hedge against changes in interest rates.
Eaton Vance
Municipal Income Funds
August 31, 2016
Notes to Financial Statements — continued
The fair values of open derivative instruments (not considered to be hedging instruments for accounting disclosure purposes) and whose primary underlying risk exposure is interest rate risk at August 31, 2016 were as follows:
| | | | | | | | | | | | | | | | |
| | | Georgia
Fund | | | Maryland
Fund | | | Missouri
Fund | | | Oregon
Fund | |
| | |
Asset Derivative: | | | | | | | | |
Futures Contracts | | $ | 9,182 | (1) | | $ | 15,304 | (1) | | $ | 13,134 | (1) | | $ | 12,243 | (1) |
| | | | |
Total | | $ | 9,182 | | | $ | 15,304 | | | $ | 13,134 | | | $ | 12,243 | |
| (1) | Amount represents cumulative unrealized appreciation on futures contracts. Only the current day’s variation margin on open futures contracts is reported within the Statements of Assets and Liabilities as Payable for variation margin. |
The effect of derivative instruments (not considered to be hedging instruments for accounting disclosure purposes) on the Statements of Operations and whose primary underlying risk exposure is interest rate risk for the year ended August 31, 2016 was as follows:
| | | | | | | | | | | | | | | | | | | | |
| | | Georgia
Fund | | | Maryland
Fund | | | Missouri
Fund | | | Oregon
Fund | | | Virginia
Fund | |
| | | | | |
Realized Gain (Loss) on Derivatives Recognized in Income | | $ | (330,188 | )(1) | | $ | (550,313 | )(1) | | $ | (302,656 | )(1) | | $ | (440,309 | )(1) | | $ | 38,296 | (1) |
Change in Unrealized Appreciation (Depreciation) on Derivatives Recognized in Income | | $ | 10,499 | (2) | | $ | 17,499 | (2) | | $ | 5,106 | (2) | | $ | 13,999 | (2) | | $ | 4,391 | (2) |
| (1) | Statements of Operations location: Net realized gain (loss) – Financial futures contracts. |
| (2) | Statements of Operations location: Change in unrealized appreciation (depreciation) – Financial futures contracts. |
The average notional amounts of futures contracts (short) outstanding during the year ended August 31, 2016, which are indicative of the volume of this derivative type, were approximately as follows:
| | | | | | | | | | | | | | | | | | | | |
| | | Georgia
Fund | | | Maryland
Fund | | | Missouri
Fund | | | Oregon
Fund | | | Virginia
Fund | |
| | | |
Average Notional Amount: | | | | | | | | | | | | |
Futures Contracts — Short | | $ | 2,399,000 | | | $ | 3,999,000 | | | $ | 4,694,000 | | | $ | 3,199,000 | | | $ | 2,374,000 | |
10 Fair Value Measurements
Under generally accepted accounting principles for fair value measurements, a three-tier hierarchy to prioritize the assumptions, referred to as inputs, is used in valuation techniques to measure fair value. The three-tier hierarchy of inputs is summarized in the three broad levels listed below.
| • | | Level 1 – quoted prices in active markets for identical investments |
| • | | Level 2 – other significant observable inputs (including quoted prices for similar investments, interest rates, prepayment speeds, credit risk, etc.) |
| • | | Level 3 – significant unobservable inputs (including a fund’s own assumptions in determining the fair value of investments) |
In cases where the inputs used to measure fair value fall in different levels of the fair value hierarchy, the level disclosed is determined based on the lowest level input that is significant to the fair value measurement in its entirety. The inputs or methodology used for valuing securities are not necessarily an indication of the risk associated with investing in those securities.
Eaton Vance
Municipal Income Funds
August 31, 2016
Notes to Financial Statements — continued
At August 31, 2016, the hierarchy of inputs used in valuing the Funds’ investments and open derivative instruments, which are carried at value, were as follows:
| | | | | | | | | | | | | | | | |
Georgia Fund | | | | | | | | | | | | |
| Asset Description | | Level 1 | | | Level 2 | | | Level 3 | | | Total | |
| | | | |
Tax-Exempt Investments | | $ | — | | | $ | 73,143,250 | | | $ | — | | | $ | 73,143,250 | |
| | | | |
Total Investments | | $ | — | | | $ | 73,143,250 | | | $ | — | | | $ | 73,143,250 | |
| | | | |
Futures Contracts | | $ | 9,182 | | | $ | — | | | $ | — | | | $ | 9,182 | |
| | | | |
Total | | $ | 9,182 | | | $ | 73,143,250 | | | $ | — | | | $ | 73,152,432 | |
| | | | |
| | | | | | | | | | | | | | | | |
Maryland Fund | |
| Asset Description | | Level 1 | | | Level 2 | | | Level 3 | | | Total | |
| | | | |
Tax-Exempt Investments | | $ | — | | | $ | 65,588,462 | | | $ | — | | | $ | 65,588,462 | |
| | | | |
Total Investments | | $ | — | | | $ | 65,588,462 | | | $ | — | | | $ | 65,588,462 | |
| | | | |
Futures Contracts | | $ | 15,304 | | | $ | — | | | $ | — | | | $ | 15,304 | |
| | | | |
Total | | $ | 15,304 | | | $ | 65,588,462 | | | $ | — | | | $ | 65,603,766 | |
| | | | |
| | | | | | | | | | | | | | | | |
Missouri Fund | |
| Asset Description | | Level 1 | | | Level 2 | | | Level 3 | | | Total | |
| | | | |
Tax-Exempt Investments | | $ | — | | | $ | 74,895,932 | | | $ | — | | | $ | 74,895,932 | |
| | | | |
Total Investments | | $ | — | | | $ | 74,895,932 | | | $ | — | | | $ | 74,895,932 | |
| | | | |
Futures Contracts | | $ | 13,134 | | | $ | — | | | $ | — | | | $ | 13,134 | |
| | | | |
Total | | $ | 13,134 | | | $ | 74,895,932 | | | $ | — | | | $ | 74,909,066 | |
| | | | |
| | | | | | | | | | | | | | | | |
North Carolina Fund | |
| Asset Description | | Level 1 | | | Level 2 | | | Level 3 | | | Total | |
| | | | |
Tax-Exempt Investments | | $ | — | | | $ | 144,396,351 | | | $ | — | | | $ | 144,396,351 | |
| | | | |
Total Investments | | $ | — | | | $ | 144,396,351 | | | $ | — | | | $ | 144,396,351 | |
| | | | |
| | | | | | | | | | | | | | | | |
Oregon Fund | |
| Asset Description | | Level 1 | | | Level 2 | | | Level 3 | | | Total | |
| | | | |
Tax-Exempt Investments | | $ | — | | | $ | 126,537,192 | | | $ | — | | | $ | 126,537,192 | |
| | | | |
Total Investments | | $ | — | | | $ | 126,537,192 | | | $ | — | | | $ | 126,537,192 | |
| | | | |
Futures Contracts | | $ | 12,243 | | | $ | — | | | $ | — | | | $ | 12,243 | |
| | | | |
Total | | $ | 12,243 | | | $ | 126,537,192 | | | $ | — | | | $ | 126,549,435 | |
Eaton Vance
Municipal Income Funds
August 31, 2016
Notes to Financial Statements — continued
| | | | | | | | | | | | | | | | |
South Carolina Fund | |
| Asset Description | | Level 1 | | | Level 2 | | | Level 3 | | | Total | |
| | | | |
Tax-Exempt Investments | | $ | — | | | $ | 142,452,668 | | | $ | — | | | $ | 142,452,668 | |
| | | | |
Total Investments | | $ | — | | | $ | 142,452,668 | | | $ | — | | | $ | 142,452,668 | |
| | | | |
| | | | | | | | | | | | | | | | |
Virginia Fund | |
| Asset Description | | Level 1 | | | Level 2 | | | Level 3 | | | Total | |
| | | | |
Tax-Exempt Investments | | $ | — | | | $ | 83,877,890 | | | $ | — | | | $ | 83,877,890 | |
| | | | |
Total Investments | | $ | — | | | $ | 83,877,890 | | | $ | — | | | $ | 83,877,890 | |
The Funds held no investments or other financial instruments as of August 31, 2015 whose fair value was determined using Level 3 inputs. At August 31, 2016, there were no investments transferred between Level 1 and Level 2 during the year then ended.
Eaton Vance
Municipal Income Funds
August 31, 2016
Report of Independent Registered Public Accounting Firm
To the Trustees of Eaton Vance Municipals Trust and Shareholders of Eaton Vance Georgia Municipal Income Fund, Eaton Vance Maryland Municipal Income Fund, Eaton Vance Missouri Municipal Income Fund, Eaton Vance North Carolina Municipal Income Fund, Eaton Vance Oregon Municipal Income Fund, Eaton Vance South Carolina Municipal Income Fund, and Eaton Vance Virginia Municipal Income Fund:
We have audited the accompanying statements of assets and liabilities of Eaton Vance Georgia Municipal Income Fund, Eaton Vance Maryland Municipal Income Fund, Eaton Vance Missouri Municipal Income Fund, Eaton Vance North Carolina Municipal Income Fund, Eaton Vance Oregon Municipal Income Fund, Eaton Vance South Carolina Municipal Income Fund, and Eaton Vance Virginia Municipal Income Fund (collectively, the “Funds”) (certain of the funds constituting Eaton Vance Municipals Trust), including the portfolios of investments, as of August 31, 2016, and the related statements of operations for the year then ended, the statements of changes in net assets for each of the two years in the period then ended, and the financial highlights for each of the five years in the period then ended. These financial statements and financial highlights are the responsibility of the Funds’ management. Our responsibility is to express an opinion on these financial statements and financial highlights based on our audits.
We conducted our audits in accordance with the standards of the Public Company Accounting Oversight Board (United States). Those standards require that we plan and perform the audit to obtain reasonable assurance about whether the financial statements and financial highlights are free of material misstatement. The Funds are not required to have, nor were we engaged to perform, an audit of their internal control over financial reporting. Our audits included consideration of internal control over financial reporting as a basis for designing audit procedures that are appropriate in the circumstances, but not for the purpose of expressing an opinion on the effectiveness of the Funds’ internal control over financial reporting. Accordingly, we express no such opinion. An audit also includes examining, on a test basis, evidence supporting the amounts and disclosures in the financial statements, assessing the accounting principles used and significant estimates made by management, as well as evaluating the overall financial statement presentation. Our procedures included confirmation of securities owned as of August 31, 2016, by correspondence with the custodian and brokers; where replies were not received from brokers, we performed other auditing procedures. We believe that our audits provide a reasonable basis for our opinion.
In our opinion, the financial statements and financial highlights referred to above present fairly, in all material respects, the financial positions of Eaton Vance Georgia Municipal Income Fund, Eaton Vance Maryland Municipal Income Fund, Eaton Vance Missouri Municipal Income Fund, Eaton Vance North Carolina Municipal Income Fund, Eaton Vance Oregon Municipal Income Fund, Eaton Vance South Carolina Municipal Income Fund, and Eaton Vance Virginia Municipal Income Fund as of August 31, 2016, the results of their operations for the year then ended, the changes in their net assets for each of the two years in the period then ended, and the financial highlights for each of the five years in the period then ended, in conformity with accounting principles generally accepted in the United States of America.
DELOITTE & TOUCHE LLP
Boston, Massachusetts
October 20, 2016
Eaton Vance
Municipal Income Funds
August 31, 2016
Federal Tax Information (Unaudited)
The Form 1099-DIV you receive in February 2017 will show the tax status of all distributions paid to your account in calendar year 2016. Shareholders are advised to consult their own tax adviser with respect to the tax consequences of their investment in the Funds. As required by the Internal Revenue Code and/or regulations, shareholders must be notified regarding exempt-interest dividends.
Exempt-Interest Dividends. For the fiscal year ended August 31, 2016, the Funds designate the following percentages of distributions from net investment income as exempt-interest dividends:
| | | | |
Georgia Municipal Income Fund | | | 100.00 | % |
Maryland Municipal Income Fund | | | 91.65 | % |
Missouri Municipal Income Fund | | | 100.00 | % |
North Carolina Municipal Income Fund | | | 100.00 | % |
Oregon Municipal Income Fund | | | 100.00 | % |
South Carolina Municipal Income Fund | | | 99.75 | % |
Virginia Municipal Income Fund | | | 98.82 | % |
Eaton Vance
Municipal Income Funds
August 31, 2016
Board of Trustees’ Contract Approval
Overview of the Contract Review Process
The Investment Company Act of 1940, as amended (the “1940 Act”), provides, in substance, that each investment advisory agreement between a fund and its investment adviser will continue in effect from year to year only if its continuation is approved at least annually by the fund’s board of trustees, including by a vote of a majority of the trustees who are not “interested persons” of the fund (“Independent Trustees”), cast in person at a meeting called for the purpose of considering such approval.
At a meeting of the Boards of Trustees (each a “Board”) of the registered investment companies advised, administered and/or distributed by Eaton Vance Management or its affiliates (the “Eaton Vance Funds”) held on April 26, 2016, the Board, including a majority of the Independent Trustees, voted to approve continuation of existing investment advisory and sub-advisory agreements for the Eaton Vance Funds for an additional one-year period. In voting its approval, the Board relied upon the affirmative recommendation of its Contract Review Committee, which is a committee comprised exclusively of Independent Trustees. Prior to making its recommendation, the Contract Review Committee reviewed information furnished by each adviser to the Eaton Vance Funds (including information specifically requested by the Board) for a series of meetings of the Contract Review Committee held between February and April 2016. The Contract Review Committee also considered information received at prior meetings of the Board and its committees, as relevant to its annual evaluation of the investment advisory and sub-advisory agreements.
The information that the Board considered included, among other things, the following (for funds that invest through one or more underlying portfolio(s), references to “each fund” in this section may include information that was considered at the portfolio-level):
Information about Fees, Performance and Expenses
| • | | A report from an independent data provider comparing the advisory and related fees paid by each fund with fees paid by comparable funds as identified by the independent data provider (“comparable funds”); |
| • | | A report from an independent data provider comparing each fund’s total expense ratio and its components to comparable funds; |
| • | | A report from an independent data provider comparing the investment performance of each fund (including, where relevant, yield data, Sharpe ratios and information ratios) to the investment performance of comparable funds over various time periods; |
| • | | Data regarding investment performance in comparison to benchmark indices and customized groups of peer funds identified by the adviser in consultation with the Board; |
| • | | For each fund, comparative information concerning the fees charged and the services provided by each adviser in managing other accounts (including mutual funds, other collective investment funds and institutional accounts) using investment strategies and techniques similar to those used in managing such fund; |
| • | | Profitability analyses for each adviser with respect to each fund; |
Information about Portfolio Management and Trading
| • | | Descriptions of the investment management services provided to each fund, including the investment strategies and processes it employs; |
| • | | The procedures and processes used to determine the fair value of fund assets and actions taken to monitor and test the effectiveness of such procedures and processes; |
| • | | Information about each adviser’s policies and practices with respect to trading, including each adviser’s processes for monitoring best execution of portfolio transactions; |
| • | | Information about the allocation of brokerage transactions and the benefits received by each adviser as a result of brokerage allocation, including information concerning the acquisition of research through client commission arrangements and policies with respect to “soft dollars”; |
| • | | Data relating to portfolio turnover rates of each fund; |
Information about each Adviser
| • | | Reports detailing the financial results and condition of each adviser; |
| • | | Descriptions of the qualifications, education and experience of the individual investment professionals whose responsibilities include portfolio management and investment research for the funds, and information relating to their compensation and responsibilities with respect to managing other mutual funds and investment accounts; |
| • | | The Code of Ethics of each adviser and its affiliates, together with information relating to compliance with and the administration of such codes; |
| • | | Policies and procedures relating to proxy voting and the handling of corporate actions and class actions; |
| • | | Information concerning the resources devoted to compliance efforts undertaken by each adviser and its affiliates (including descriptions of various compliance programs) and their record of compliance; |
| • | | Information concerning the business continuity and disaster recovery plans of each adviser and its affiliates; |
| • | | A description of Eaton Vance Management’s procedures for overseeing third party advisers and sub-advisers, including with respect to regulatory and compliance issues, investment management and other matters; |
Eaton Vance
Municipal Income Funds
August 31, 2016
Board of Trustees’ Contract Approval — continued
Other Relevant Information
| • | | Information concerning the nature, cost and character of the administrative and other non-investment advisory services provided by Eaton Vance Management and its affiliates; |
| • | | Information concerning management of the relationship with the custodian, subcustodians and fund accountants by each adviser or the funds’ administrator; and |
| • | | The terms of each investment advisory agreement. |
Over the course of the twelve-month period ended April 30, 2016, with respect to one or more funds, the Board met ten times and the Contract Review Committee, the Audit Committee, the Governance Committee, the Portfolio Management Committee and the Compliance Reports and Regulatory Matters Committee, each of which is a Committee comprised solely of Independent Trustees, met seven, sixteen, four, nine and eleven times, respectively. At such meetings, the Trustees participated in investment and performance reviews with the portfolio managers and other investment professionals of each investment adviser relating to each fund, and considered various investment and trading strategies used in pursuing each fund’s investment objective, such as the use of derivative instruments, as well as risk management techniques. The Board and its Committees also evaluated issues pertaining to industry and regulatory developments, compliance procedures, fund governance and other issues with respect to the funds, and received and participated in reports and presentations provided by Eaton Vance Management and other fund advisers with respect to such matters. In addition to the formal meetings of the Board and its Committees, the Independent Trustees hold regular teleconferences in between meetings to discuss, among other topics, matters relating to the continuation of investment advisory and sub-advisory agreements.
For funds that invest through one or more underlying portfolios, the Board considered similar information about the portfolio(s) when considering the approval of investment advisory agreements. In addition, in cases where the fund’s investment adviser has engaged a sub-adviser, the Board considered similar information about the sub-adviser when considering the approval of any sub-advisory agreement.
The Contract Review Committee was assisted throughout the contract review process by Goodwin Procter LLP, independent legal counsel for the Independent Trustees. The members of the Contract Review Committee relied upon the advice of such counsel and their own business judgment in determining the material factors to be considered in evaluating each investment advisory and sub-advisory agreement and the weight to be given to each such factor. The conclusions reached with respect to each investment advisory and sub-advisory agreement were based on a comprehensive evaluation of all the information provided and not any single factor. Moreover, each member of the Contract Review Committee may have placed varying emphasis on particular factors in reaching conclusions with respect to each investment advisory and sub-advisory agreement. In evaluating each investment advisory and sub-advisory agreement, including the specific fee structures and other terms of the agreements, the Contract Review Committee was informed by multiple years of analysis and discussion among the Independent Trustees and the Eaton Vance Funds’ advisers and sub-advisers.
Results of the Process
Based on its consideration of the foregoing, and such other information as it deemed relevant, including the factors and conclusions described below, the Contract Review Committee concluded that the continuation of the investment advisory agreements of the following funds:
| • | | Eaton Vance Georgia Municipal Income Fund |
| • | | Eaton Vance Maryland Municipal Income Fund |
| • | | Eaton Vance Missouri Municipal Income Fund |
| • | | Eaton Vance North Carolina Municipal Income Fund |
| • | | Eaton Vance Oregon Municipal Income Fund |
| • | | Eaton Vance South Carolina Municipal Income Fund |
| • | | Eaton Vance Virginia Municipal Income Fund |
(the “Funds”), each with Boston Management and Research (the “Adviser”), an affiliate of Eaton Vance Management, including their fee structures, is in the interests of shareholders and, therefore, the Contract Review Committee recommended to the Board approval of each agreement. The Board accepted the recommendation of the Contract Review Committee based on the material factors considered and conclusions reached by the Contract Review Committee with respect to each agreement. Accordingly, the Board, including a majority of the Independent Trustees, voted to approve continuation of the investment advisory agreement for each Fund.
Nature, Extent and Quality of Services
In considering whether to approve the investment advisory agreements of the Funds, the Board evaluated the nature, extent and quality of services provided to the Funds by the Adviser.
The Board considered the Adviser’s management capabilities and investment process with respect to the types of investments held by each Fund, including the education, experience and number of its investment professionals and other personnel who provide portfolio management, investment research, and similar services to the Funds. In particular, the Board considered, where relevant, the abilities and experience of such investment professionals in analyzing factors such as credit risk, tax efficiency, and special considerations relevant to investing in municipal bonds. The Board considered the Adviser’s municipal
Eaton Vance
Municipal Income Funds
August 31, 2016
Board of Trustees’ Contract Approval — continued
bond team, which includes portfolio managers and credit specialists who provide services to the Funds. The Board also took into account the resources dedicated to portfolio management and other services, as well as the compensation methods of the Adviser and other factors, such as the reputation and resources of the Adviser to recruit and retain highly qualified research, advisory and supervisory investment professionals. In addition, the Board considered the time and attention devoted to the Eaton Vance Funds, including each Fund, by senior management, as well as the infrastructure, operational capabilities and support staff in place to assist in the portfolio management and operations of the Funds, including the provision of administrative services.
The Board considered the compliance programs of the Adviser and relevant affiliates thereof. Among other matters, the Board considered compliance and reporting matters relating to personal trading by investment professionals, selective disclosure of portfolio holdings, late trading, frequent trading, portfolio valuation, business continuity and the allocation of investment opportunities. The Board also considered the responses of the Adviser and its affiliates to requests in recent years from regulatory authorities such as the Securities and Exchange Commission and the Financial Industry Regulatory Authority.
The Board considered shareholder and other administrative services provided or managed by Eaton Vance Management and its affiliates, including transfer agency and accounting services. The Board evaluated the benefits to shareholders of investing in a fund that is a part of a large fund complex offering exposure to a variety of asset classes and investment disciplines, as well as the ability, in many cases, to exchange an investment among different funds without incurring additional sales charges.
After consideration of the foregoing factors, among others, the Board concluded that the nature, extent and quality of services provided by the Adviser, taken as a whole, are appropriate and consistent with the terms of the investment advisory agreements.
Fund Performance
The Board compared each Fund’s investment performance to that of comparable funds and appropriate benchmark indices, and, where relevant, a customized peer group of similarly managed funds, and assessed each Fund’s performance on the basis of total return and current income return. The Board’s review included comparative performance data for the one-, three-, five- and ten-year periods ended September 30, 2015 for each Fund. The Board considered, among other things, the Adviser’s efforts to generate competitive levels of tax exempt current income over time through investments that, relative to its comparable funds, focus on higher quality municipal bonds with longer maturities. In considering Eaton Vance Oregon Municipal Income Fund, on the basis of the foregoing and other relevant information provided by the Adviser in response to inquiries from the Contract Review Committee, the Board concluded that the performance of the Fund was satisfactory. With respect to each other Fund, the Board concluded that the performance of each Fund was satisfactory.
Management Fees and Expenses
The Board considered contractual fee rates payable by each Fund for advisory and administrative services (referred to collectively as “management fees”). As part of its review, the Board considered each Fund’s management fees and total expense ratio for the one year period ended September 30, 2015, as compared to those of comparable funds, before and after giving effect to any undertaking to waive fees or reimburse expenses. The Board also considered factors that had an impact on Fund expense ratios relative to comparable funds.
After considering the foregoing information, and in light of the nature, extent and quality of the services provided by the Adviser, the Board concluded that the management fees charged for advisory and related services are reasonable.
Profitability and Other “Fall-Out” Benefits
The Board considered the level of profits realized by the Adviser and relevant affiliates thereof in providing investment advisory and administrative services to each Fund and to all Eaton Vance Funds as a group. The Board considered the level of profits realized without regard to marketing support or other payments by the Adviser and its affiliates to third parties in respect of distribution services. The Board also considered other direct or indirect fall-out benefits received by the Adviser and its affiliates in connection with their relationships with the Funds, including the benefits of research services that may be available to the Adviser as a result of securities transactions effected for the Funds and other investment advisory clients.
The Board concluded that, in light of the foregoing factors and the nature, extent and quality of the services rendered, the profits realized by the Adviser and its affiliates are deemed not to be excessive.
Economies of Scale
In reviewing management fees and profitability, the Board also considered the extent to which the Adviser and its affiliates, on the one hand, and each Fund, on the other hand, can expect to realize benefits from economies of scale as the assets of each Fund increase. The Board acknowledged the difficulty in accurately measuring the benefits resulting from economies of scale, if any, with respect to the management of any specific fund or group of funds. The Board reviewed data summarizing the increases and decreases in the assets of each Fund and of all Eaton Vance Funds as a group over various time periods, and evaluated the extent to which the total expense ratio of each Fund and the profitability of the Adviser and its affiliates may have been affected by such increases or decreases. Based upon the foregoing, the Board concluded that each Fund currently shares in any benefits from economies of scale. The Board also concluded that, assuming reasonably foreseeable increases in the assets of each Fund, the structure of each advisory fee, which includes breakpoints at several asset levels, will allow each Fund to continue to benefit from any economies of scale in the future.
Eaton Vance
Municipal Income Funds
August 31, 2016
Management and Organization
Fund Management. The Trustees of Eaton Vance Municipals Trust (the Trust) are responsible for the overall management and supervision of the Trust’s affairs. The Trustees and officers of the Trust are listed below. Except as indicated, each individual has held the office shown or other offices in the same company for the last five years. Trustees and officers of the Trust hold indefinite terms of office. The “Noninterested Trustees” consist of those Trustees who are not “interested persons” of the Trust, as that term is defined under the 1940 Act. The business address of each Trustee and officer is Two International Place, Boston, Massachusetts 02110. As used below, “EVC” refers to Eaton Vance Corp., “EV” refers to Eaton Vance, Inc., “EVM” refers to Eaton Vance Management, “BMR” refers to Boston Management and Research, “EVMI” refers to Eaton Vance Management (International) Limited and “EVD” refers to Eaton Vance Distributors, Inc. EVC and EV are the corporate parent and trustee, respectively, of EVM and BMR. EVMI is an indirect, wholly-owned subsidiary of EVC. EVD is the Funds’ principal underwriter and a wholly-owned subsidiary of EVC. Each officer affiliated with Eaton Vance may hold a position with other Eaton Vance affiliates that is comparable to his or her position with EVM listed below. Each Trustee oversees 176 portfolios in the Eaton Vance Complex (including all master and feeder funds in a master feeder structure). Each officer serves as an officer of certain other Eaton Vance funds. Each Trustee and officer serves until his or her successor is elected.
| | | | | | |
| Name and Year of Birth | | Position(s) with the Trust | | Trustee Since(1) | | Principal Occupation(s) and Directorships
During Past Five Years and Other Relevant Experience |
Interested Trustee |
| | | |
Thomas E. Faust Jr. 1958 | | Trustee | | 2007 | | Chairman, Chief Executive Officer and President of EVC, Director and President of EV, Chief Executive Officer and President of EVM and BMR, and Director of EVD and EVMI. Trustee and/or officer of 176 registered investment companies. Mr. Faust is an interested person because of his positions with EVM, BMR, EVD, EVMI, EVC and EV, which are affiliates of the Trust. Directorships in the Last Five Years.(2) Director of EVC and Hexavest Inc. (investment management firm). |
| | | |
| | | | | | |
Noninterested Trustees |
| | | |
Scott E. Eston 1956 | | Trustee | | 2011 | | Private investor. Formerly held various positions at Grantham, Mayo, Van Otterloo and Co., L.L.C. (investment management firm) (1997-2009), including Chief Operating Officer (2002-2009), Chief Financial Officer (1997-2009) and Chairman of the Executive Committee (2002-2008); President and Principal Executive Officer, GMO Trust (open-end registered investment company) (2006-2009). Former Partner, Coopers and Lybrand L.L.P. (now PricewaterhouseCoopers) (a registered public accounting firm) (1987-1997). Mr. Eston has apprised the Board of Trustees that he intends to retire as a Trustee of all Eaton Vance funds at a mutually convenient time in 2017. Directorships in the Last Five Years.(2) None. |
| | | |
Mark R. Fetting(3) 1954 | | Trustee | | 2016 | | Private investor. Formerly, held various positions at Legg Mason, Inc. (investment management firm) (2000-2012), including President, Chief Executive Officer, Director and Chairman (2008-2012), Senior Executive Vice President (2004-2008) and Executive Vice President (2001-2004). Formerly, President of Legg Mason family of funds (2001-2008). Formerly, Division President and Senior Officer of Prudential Financial Group, Inc. and related companies (investment management firm) (1991-2000). Directorships in the Last Five Years. Director and Chairman of Legg Mason, Inc. (2008-2012); Director/Trustee and Chairman of Legg Mason family of funds (14 funds) (2008-2012); and Director/Trustee of the Royce family of funds (35 funds) (2001-2012). |
| | | |
Cynthia E. Frost 1961 | | Trustee | | 2014 | | Private investor. Formerly, Chief Investment Officer of Brown University (university endowment) (2000-2012); Portfolio Strategist for Duke Management Company (university endowment manager) (1995-2000); Managing Director, Cambridge Associates (investment consulting company) (1989-1995); Consultant, Bain and Company (management consulting firm) (1987-1989); Senior Equity Analyst, BA Investment Management Company (1983-1985). Directorships in the Last Five Years. None. |
| | | |
George J. Gorman 1952 | | Trustee | | 2014 | | Principal at George J. Gorman LLC (consulting firm). Formerly, Senior Partner at Ernst & Young LLP (a registered public accounting firm) (1974-2009). Directorships in the Last Five Years. Formerly, Trustee of the BofA Funds Series Trust (11 funds) (2011-2014) and of the Ashmore Funds (9 funds) (2010-2014). |
Eaton Vance
Municipal Income Funds
August 31, 2016
Management and Organization — continued
| | | | | | |
| Name and Year of Birth | | Position(s) with the Trust | | Trustee Since(1) | | Principal Occupation(s) and Directorships
During Past Five Years and Other Relevant Experience |
Noninterested Trustees (continued) |
| | | |
Valerie A. Mosley 1960 | | Trustee | | 2014 | | Chairwoman and Chief Executive Officer of Valmo Ventures (a consulting and investment firm). Former Partner and Senior Vice President, Portfolio Manager and Investment Strategist at Wellington Management Company, LLP (investment management firm) (1992-2012). Former Chief Investment Officer, PG Corbin Asset Management (1990-1992). Formerly worked in institutional corporate bond sales at Kidder Peabody (1986-1990). Directorships in the Last Five Years.(2) Director of Dynex Capital, Inc. (mortgage REIT) (since 2013). |
| | | |
William H. Park 1947 | | Chairperson of the Board and Trustee | | 2016 (Chairperson); 2003 (Trustee) | | Private investor. Formerly, Consultant (management and transactional) (2012-2014). Formerly, Chief Financial Officer, Aveon Group L.P. (investment management firm) (2010-2011). Formerly, Vice Chairman, Commercial Industrial Finance Corp. (specialty finance company) (2006-2010). Formerly, President and Chief Executive Officer, Prizm Capital Management, LLC (investment management firm) (2002-2005). Formerly, Executive Vice President and Chief Financial Officer, United Asset Management Corporation (investment management firm) (1982-2001). Formerly, Senior Manager, Price Waterhouse (now PricewaterhouseCoopers) (a registered public accounting firm) (1972-1981). Directorships in the Last Five Years.(2) None. |
| | | |
Helen Frame Peters 1948 | | Trustee | | 2008 | | Professor of Finance, Carroll School of Management, Boston College. Formerly, Dean, Carroll School of Management, Boston College (2000-2002). Formerly, Chief Investment Officer, Fixed Income, Scudder Kemper Investments (investment management firm) (1998-1999). Formerly, Chief Investment Officer, Equity and Fixed Income, Colonial Management Associates (investment management firm) (1991-1998). Directorships in the Last Five Years.(2) Formerly, Director of BJ’s Wholesale Club, Inc. (wholesale club retailer) (2004-2011). Formerly, Trustee of SPDR Index Shares Funds and SPDR Series Trust (exchange traded funds) (2000-2009). Formerly, Director of Federal Home Loan Bank of Boston (a bank for banks) (2007-2009). |
| | | |
Susan J. Sutherland 1957 | | Trustee | | 2015 | | Private investor. Formerly, Associate, Counsel and Partner at Skadden, Arps, Slate, Meagher & Flom LLP (law firm) (1982-2013). Directorships in the Last Five Years. Formerly, Director of Montpelier Re Holdings Ltd. (global provider of customized insurance and reinsurance products) (2013-2015). |
| | | |
Harriett Tee Taggart 1948 | | Trustee | | 2011 | | Managing Director, Taggart Associates (a professional practice firm). Formerly, Partner and Senior Vice President, Wellington Management Company, LLP (investment management firm) (1983-2006). Directorships in the Last Five Years.(2) Director of Albemarle Corporation (chemicals manufacturer) (since 2007) and The Hanover Group (specialty property and casualty insurance company) (since 2009). Formerly, Director of Lubrizol Corporation (specialty chemicals) (2007-2011). |
| | | |
Ralph F. Verni 1943 | | Trustee | | 2005 | | Consultant and private investor. Formerly, Chief Investment Officer (1982-1992), Chief Financial Officer (1988-1990) and Director (1982-1992), New England Life. Formerly, Chairperson, New England Mutual Funds (1982-1992). Formerly, President and Chief Executive Officer, State Street Management & Research (1992-2000). Formerly, Chairperson, State Street Research Mutual Funds (1992-2000). Formerly, Director, W.P. Carey, LLC (1998-2004) and First Pioneer Farm Credit Corp. (financial services cooperative) (2002-2006). Consistent with the Trustee retirement policy, Mr. Verni is currently expected to retire as a Trustee of all Eaton Vance funds effective July 1, 2017. Directorships in the Last Five Years.(2) None. |
Eaton Vance
Municipal Income Funds
August 31, 2016
Management and Organization — continued
| | | | | | |
| Name and Year of Birth | | Position(s) with the Trust | | Trustee Since(1) | | Principal Occupation(s) and Directorships
During Past Five Years and Other Relevant Experience |
Noninterested Trustees (continued) |
| | | |
Scott E. Wennerholm(3) 1959 | | Trustee | | 2016 | | Consultant at GF Parish Group (executive recruiting firm). Trustee at Wheelock College (postsecondary institution) (since 2012). Formerly, Chief Operating Officer and Executive Vice President at BNY Mellon Asset Management (investment management firm) (2005-2011). Formerly, Chief Operating Officer and Chief Financial Officer at Natixis Global Asset Management (investment management firm) (1997-2004). Formerly, Vice President at Fidelity Investments Institutional Services (investment management firm) (1994-1997). Directorships in the Last Five Years. None. |
| | | |
| | | | | | |
Principal Officers who are not Trustees |
| Name and Year of Birth | | Position(s) with the Trust | | Officer
Since(4) | | Principal Occupation(s) During Past Five Years |
Payson F. Swaffield 1956 | | President | | 2003 | | Vice President and Chief Income Investment Officer of EVM and BMR. |
| | | |
Maureen A. Gemma 1960 | | Vice President, Secretary and Chief Legal Officer | | 2005 | | Vice President of EVM and BMR. |
| | | |
James F. Kirchner 1967 | | Treasurer | | 2007 | | Vice President of EVM and BMR. |
| | | |
Paul M. O’Neil 1953 | | Chief Compliance Officer | | 2004 | | Vice President of EVM and BMR. |
| (1) | Year first appointed to serve as Trustee for a fund in the Eaton Vance family of funds. Each Trustee has served continuously since appointment unless indicated otherwise. |
| (2) | During their respective tenures, the Trustees (except for Mmes. Frost and Sutherland and Messrs. Fetting, Gorman and Wennerholm) also served as Board members of one or more of the following funds (which operated in the years noted): eUnitsTM 2 Year U.S. Market Participation Trust: Upside to Cap / Buffered Downside (launched in 2012 and terminated in 2014); eUnitsTM 2 Year U.S. Market Participation Trust II: Upside to Cap / Buffered Downside (launched in 2012 and terminated in 2014); and Eaton Vance National Municipal Income Trust (launched in 1998 and terminated in 2009). However, Ms. Mosley did not serve as a Board member of eUnitsTM 2 Year U.S. Market Participation Trust: Upside to Cap / Buffered Downside (launched in 2012 and terminated in 2014). |
| (3) | Messrs. Fetting and Wennerholm began serving as Trustees effective September 1, 2016. |
| (4) | Year first elected to serve as officer of a fund in the Eaton Vance family of funds when the officer has served continuously. Otherwise, year of most recent election as an officer of a fund in the Eaton Vance family of funds. Titles may have changed since initial election. |
The SAI for the Funds includes additional information about the Trustees and officers of the Funds and can be obtained without charge on Eaton Vance’s website at www.eatonvance.com or by calling 1-800-262-1122.
Eaton Vance Funds
IMPORTANT NOTICES
Privacy. The Eaton Vance organization is committed to ensuring your financial privacy. Each of the financial institutions identified below has in effect the following policy (“Privacy Policy”) with respect to nonpublic personal information about its customers:
| • | | Only such information received from you, through application forms or otherwise, and information about your Eaton Vance fund transactions will be collected. This may include information such as name, address, social security number, tax status, account balances and transactions. |
| • | | None of such information about you (or former customers) will be disclosed to anyone, except as permitted by law (which includes disclosure to employees necessary to service your account). In the normal course of servicing a customer’s account, Eaton Vance may share information with unaffiliated third parties that perform various required services such as transfer agents, custodians and broker-dealers. |
| • | | Policies and procedures (including physical, electronic and procedural safeguards) are in place that are designed to protect the confidentiality of such information. |
| • | | We reserve the right to change our Privacy Policy at any time upon proper notification to you. Customers may want to review our Privacy Policy periodically for changes by accessing the link on our homepage: www.eatonvance.com. |
Our pledge of privacy applies to the following entities within the Eaton Vance organization: the Eaton Vance Family of Funds, Eaton Vance Management, Eaton Vance Investment Counsel, Eaton Vance Distributors, Inc., Eaton Vance Trust Company, Eaton Vance Management (International) Limited, Eaton Vance Management’s Real Estate Investment Group and Boston Management and Research. In addition, our Privacy Policy applies only to those Eaton Vance customers who are individuals and who have a direct relationship with us. If a customer’s account (i.e., fund shares) is held in the name of a third-party financial advisor/broker-dealer, it is likely that only such advisor’s privacy policies apply to the customer. This notice supersedes all previously issued privacy disclosures. For more information about Eaton Vance’s Privacy Policy, please call 1-800-262-1122.
Delivery of Shareholder Documents. The Securities and Exchange Commission (SEC) permits funds to deliver only one copy of shareholder documents, including prospectuses, proxy statements and shareholder reports, to fund investors with multiple accounts at the same residential or post office box address. This practice is often called “householding” and it helps eliminate duplicate mailings to shareholders. Eaton Vance, or your financial advisor, may household the mailing of your documents indefinitely unless you instruct Eaton Vance, or your financial advisor, otherwise. If you would prefer that your Eaton Vance documents not be householded, please contact Eaton Vance at 1-800-262-1122, or contact your financial advisor. Your instructions that householding not apply to delivery of your Eaton Vance documents will typically be effective within 30 days of receipt by Eaton Vance or your financial advisor.
Portfolio Holdings. Each Eaton Vance Fund and its underlying Portfolio(s) (if applicable) will file a schedule of portfolio holdings on Form N-Q with the SEC for the first and third quarters of each fiscal year. The Form N-Q will be available on the Eaton Vance website at www.eatonvance.com, by calling Eaton Vance at 1-800-262-1122 or in the EDGAR database on the SEC’s website at www.sec.gov. Form N-Q may also be reviewed and copied at the SEC’s public reference room in Washington, D.C. (call 1-800-732-0330 for information on the operation of the public reference room).
Proxy Voting. From time to time, funds are required to vote proxies related to the securities held by the funds. The Eaton Vance Funds or their underlying Portfolios (if applicable) vote proxies according to a set of policies and procedures approved by the Funds’ and Portfolios’ Boards. You may obtain a description of these policies and procedures and information on how the Funds or Portfolios voted proxies relating to portfolio securities during the most recent 12-month period ended June 30, without charge, upon request, by calling 1-800-262-1122 and by accessing the SEC’s website at www.sec.gov.
This Page Intentionally Left Blank
Investment Adviser
Boston Management and Research
Two International Place
Boston, MA 02110
Administrator
Eaton Vance Management
Two International Place
Boston, MA 02110
Principal Underwriter*
Eaton Vance Distributors, Inc.
Two International Place
Boston, MA 02110
(617) 482-8260
Custodian
State Street Bank and Trust Company
State Street Financial Center, One Lincoln Street
Boston, MA 02111
Transfer Agent
BNY Mellon Investment Servicing (US) Inc.
Attn: Eaton Vance Funds
P.O. Box 9653
Providence, RI 02940-9653
(800) 262-1122
Independent Registered Public Accounting Firm
Deloitte & Touche LLP
200 Berkeley Street
Boston, MA 02116-5022
Fund Offices
Two International Place
Boston, MA 02110
| * | FINRA BrokerCheck. Investors may check the background of their Investment Professional by contacting the Financial Industry Regulatory Authority (FINRA). FINRA BrokerCheck is a free tool to help investors check the professional background of current and former FINRA-registered securities firms and brokers. FINRA BrokerCheck is available by calling 1-800-289-9999 and at www.FINRA.org. The FINRA BrokerCheck brochure describing this program is available to investors at www.FINRA.org. |
445 8.31.16
Item 2. Code of Ethics
The registrant has adopted a code of ethics applicable to its Principal Executive Officer, Principal Financial Officer and Principal Accounting Officer. The registrant undertakes to provide a copy of such code of ethics to any person upon request, without charge, by calling 1-800-262-1122. The registrant has not amended the code of ethics as described in Form N-CSR during the period covered by this report. The registrant has not granted any waiver, including an implicit waiver, from a provision of the code of ethics as described in Form N-CSR during the period covered by this report.
Item 3. Audit Committee Financial Expert
The registrant’s Board has designated William H. Park, an independent trustee, as its audit committee financial expert. Mr. Park is a certified public accountant who is a private investor. Previously, he served as a consultant, as the Chief Financial Officer of Aveon Group, L.P. (an investment management firm), as the Vice Chairman of Commercial Industrial Finance Corp. (specialty finance company), as President and Chief Executive Officer of Prizm Capital Management, LLC (investment management firm), as Executive Vice President and Chief Financial Officer of United Asset Management Corporation (an institutional investment management firm) and as a Senior Manager at Price Waterhouse (now PricewaterhouseCoopers) (an independent registered public accounting firm).
Item 4. Principal Accountant Fees and Services
Eaton Vance Georgia Municipal Income Fund, Eaton Vance Maryland Municipal Income Fund, Eaton Vance Missouri Municipal Income Fund, Eaton Vance North Carolina Municipal Income Fund, Eaton Vance Oregon Municipal Income Fund, Eaton Vance South Carolina Municipal Income Fund and Eaton Vance Virginia Municipal Income Fund (the “Fund(s)”) are series of Eaton Vance Municipals Trust (the “Trust”), a Massachusetts business trust, which, including the Funds, contains a total of 18 series (the “Series”). The Trust is registered under the Investment Company Act of 1940 as an open-end management investment company. This Form N-CSR relates to the Funds’ annual reports.
Rule 2-01(c)(1)(ii)(A) of Regulation S-X (the “Loan Rule”) prohibits an accounting firm, such as the Trust’s principal accountant, Deloitte & Touche LLP (“D&T”), from having certain financial relationships with their audit clients and affiliated entities. Specifically, the Loan Rule provides, in relevant part, that an accounting firm generally would not be independent if it receives a loan from a lender that is a “record or beneficial owner of more than ten percent of the audit client’s equity securities.” Based on information provided to the Audit Committee of the Board of Trustees (the “Audit Committee”) of the Eaton Vance Family of Funds by D&T, certain relationships between D&T and its affiliates (“Deloitte Entities”) and its lenders who are record owners of shares of one or more funds (the “Funds”) within the Eaton Vance Funds’ investment company complex implicate the Loan Rule, calling into question D&T’s independence with respect to the Funds. The Funds are providing this disclosure to explain the facts and circumstances as well as D&T’s conclusions concerning D&T’s objectivity and impartiality with respect to the audits of the Funds.
D&T advised the Audit Committee that it believes that, in light of the facts surrounding its lending relationships, its ability to exercise objective and impartial judgment on all issues encompassed within D&T’s audit engagement has not been impaired. D&T has advised the Audit Committee that this conclusion is based in part on the following considerations: (1) Deloitte Entity personnel responsible for managing the lending relationships have had no interactions with the audit engagement team; (2) the lending relationships are in good standing and the principal and interest payments are up-to-date; (3) the lending relationships are not significant to the Deloitte Entities or to D&T.
On June 20, 2016, the U.S. Securities and Exchange Commission (the “SEC”) issued no-action relief to another mutual fund complex (see Fidelity Management & Research Company et al., No-Action Letter (June 20, 2016))
related to the auditor independence issue described above. In that letter, the SEC indicated that it would not recommend enforcement action against the fund group if the auditor is not in compliance with the Loan Rule provided that: (1) the auditor has complied with PCAOB Rule 3526(b)(1) and 3526(b)(2); (2) the auditor’s non-compliance under the Loan Rule is with respect to certain lending relationships; and (3) notwithstanding such non-compliance, the auditor has concluded that it is objective and impartial with respect to the issues encompassed within its engagement as auditor of the funds. Based on information provided by D&T, the requirements of the no-action letter appear to be met with respect to D&T’s lending relationships described above. The SEC has indicated that the no-action relief will expire 18 months from its issuance.
(a) –(d)
The following tables present the aggregate fees billed to each Fund for the Funds’ fiscal years ended August 31, 2015 and August 31, 2016 by D&T for professional services rendered for the audit of the Funds’ annual financial statements and fees billed for other services rendered by D&T during those periods.
Eaton Vance Georgia Municipal Income Fund
| | | | | | | | |
Fiscal Years Ended | | 8/31/15 | | | 8/31/16 | |
Audit Fees | | $ | 31,610 | | | $ | 31,910 | |
Audit-Related Fees(1) | | $ | 0 | | | $ | 0 | |
Tax Fees(2) | | $ | 10,506 | | | $ | 10,611 | |
All Other Fees(3) | �� | $ | 0 | | | $ | 0 | |
| | | | | | | | |
Total | | $ | 42,116 | | | $ | 42,521 | |
| | | | | | | | |
Eaton Vance Maryland Municipal Income Fund
| | | | | | | | |
Fiscal Years Ended | | 8/31/15 | | | 8/31/16 | |
Audit Fees | | $ | 38,560 | | | $ | 39,560 | |
Audit-Related Fees(1) | | $ | 0 | | | $ | 0 | |
Tax Fees(2) | | $ | 10,403 | | | $ | 10,507 | |
All Other Fees(3) | | $ | 0 | | | $ | 0 | |
| | | | | | | | |
Total | | $ | 48,963 | | | $ | 50,067 | |
| | | | | | | | |
Eaton Vance Missouri Municipal Income Fund
| | | | | | | | |
Fiscal Years Ended | | 8/31/15 | | | 8/31/16 | |
Audit Fees | | $ | 34,760 | | | $ | 34,460 | |
Audit-Related Fees(1) | | $ | 0 | | | $ | 0 | |
Tax Fees(2) | | $ | 9,651 | | | $ | 9,748 | |
All Other Fees(3) | | $ | 0 | | | $ | 0 | |
| | | | | | | | |
Total | | $ | 44,411 | | | $ | 44,208 | |
| | | | | | | | |
Eaton Vance North Carolina Municipal Income Fund
| | | | | | | | |
Fiscal Years Ended | | 8/31/15 | | | 8/31/16 | |
Audit Fees | | $ | 38,290 | | | $ | 38,690 | |
Audit-Related Fees(1) | | $ | 0 | | | $ | 0 | |
Tax Fees(2) | | $ | 10,393 | | | $ | 10,497 | |
All Other Fees(3) | | $ | 0 | | | $ | 0 | |
| | | | | | | | |
Total | | $ | 48,683 | | | $ | 49,187 | |
| | | | | | | | |
Eaton Vance Oregon Municipal Income Fund
| | | | | | | | |
Fiscal Years Ended | | 8/31/15 | | | 8/31/16 | |
Audit Fees | | $ | 36,800 | | | $ | 36,500 | |
Audit-Related Fees(1) | | $ | 0 | | | $ | 0 | |
Tax Fees(2) | | $ | 9,806 | | | $ | 9,904 | |
All Other Fees(3) | | $ | 0 | | | $ | 0 | |
| | | | | | | | |
Total | | $ | 46,606 | | | $ | 46,404 | |
| | | | | | | | |
Eaton Vance South Carolina Municipal Income Fund
| | | | | | | | |
Fiscal Years Ended | | 8/31/15 | | | 8/31/16 | |
Audit Fees | | $ | 36,250 | | | $ | 37,150 | |
Audit-Related Fees(1) | | $ | 0 | | | $ | 0 | |
Tax Fees(2) | | $ | 10,393 | | | $ | 10,497 | |
All Other Fees(3) | | $ | 0 | | | $ | 0 | |
| | | | | | | | |
Total | | $ | 46,643 | | | $ | 47,647 | |
| | | | | | | | |
Eaton Vance Virginia Municipal Income Fund
| | | | | | | | |
Fiscal Years Ended | | 8/31/15 | | | 8/31/16 | |
Audit Fees | | $ | 35,790 | | | $ | 34,890 | |
Audit-Related Fees(1) | | $ | 0 | | | $ | 0 | |
Tax Fees(2) | | $ | 9,651 | | | $ | 9,748 | |
All Other Fees(3) | | $ | 0 | | | $ | 0 | |
| | | | | | | | |
Total | | $ | 45,441 | | | $ | 44,638 | |
| | | | | | | | |
| (1) | Audit-related fees consist of the aggregate fees billed for assurance and related services that are reasonably related to the performance of the audit of the registrant’s financial statements and are not reported under the category of audit fees. |
| (2) | Tax fees consist of the aggregate fees billed for professional services rendered by the principal accountant relating to tax compliance, tax advice, and tax planning and specifically include fees for tax return preparation and other related tax compliance/planning matters. |
| (3) | All other fees consist of the aggregate fees billed for products and services provided by the principal accountant other than audit, audit-related, and tax services. |
The Series comprising the Trust have varying fiscal year ends (July 31, August 31, and September 30). The following table presents the aggregate audit, audit-related, tax, and other fees billed to all of the Series in the Trust by D&T for the last two fiscal years of each Series.
| | | | | | | | | | | | | | | | | | | | | | | | |
Fiscal Years Ended | | 9/30/14 | | | 7/31/15 | | | 8/31/15 | | | 9/30/15 | | | 7/31/16 | | | 8/31/16 | |
Audit Fees | | $ | 327,322 | | | $ | 244,260 | | | $ | 252,060 | | | $ | 301,310 | | | $ | 245,710 | | | $ | 253,160 | |
Audit-Related Fees(1) | | $ | 3,075 | | | $ | 0 | | | $ | 0 | | | $ | 0 | | | $ | 0 | | | $ | 0 | |
Tax Fees(2) | | $ | 73,280 | | | $ | 59,957 | | | $ | 70,803 | | | $ | 64,903 | | | $ | 60,038 | | | $ | 71,512 | |
All Other Fees(3) | | $ | 0 | | | $ | 0 | | | $ | 0 | | | $ | 0 | | | $ | 0 | | | $ | 0 | |
| | | | | | | | | | | | | | | | | | | | | | | | |
Total | | $ | 403,677 | | | $ | 304,217 | | | $ | 322,863 | | | $ | 366,213 | | | $ | 305,748 | | | $ | 324,672 | |
| | | | | | | | | | | | | | | | | | | | | | | | |
| (1) | Audit-related fees consist of the aggregate fees billed for assurance and related services that are reasonably related to the performance of the audit of the registrant’s financial statements and are not reported under the category of audit fees. Includes consent fee for N-14 registration statements related to fund mergers. |
| (2) | Tax fees consist of the aggregate fees billed for professional services rendered by the principal accountant relating to tax compliance, tax advice, and tax planning and specifically include fees for tax return preparation and other related tax compliance/planning matters. |
| (3) | All other fees consist of the aggregate fees billed for products and services provided by the principal accountant other than audit, audit-related, and tax services. |
(e)(1) The registrant’s audit committee has adopted policies and procedures relating to the pre-approval of services provided by the registrant’s principal accountant (the “Pre-Approval Policies”). The Pre-Approval Policies establish a framework intended to assist the audit committee in the proper discharge of its pre-approval responsibilities. As a general matter, the Pre-Approval Policies (i) specify certain types of audit, audit-related, tax, and other services determined to be pre-approved by the audit committee; and (ii) delineate specific procedures governing the mechanics of the pre-approval process, including the approval and monitoring of audit and non-audit service fees. Unless a service is specifically pre-approved under the Pre-Approval Policies, it must be separately pre-approved by the audit committee.
The Pre-Approval Policies and the types of audit and non-audit services pre-approved therein must be reviewed and ratified by the registrant’s audit committee at least annually. The registrant’s audit committee maintains full responsibility for the appointment, compensation, and oversight of the work of the registrant’s principal accountant.
(e)(2) No services described in paragraphs (b)-(d) above were approved by the registrant’s audit committee pursuant to the “de minimis exception” set forth in Rule 2-01(c)(7)(i)(C) of Regulation S-X.
(f) Not applicable.
(g) The following table presents (i) the aggregate non-audit fees (i.e., fees for audit-related, tax, and other services) billed for services rendered to all of the Series in the Trust by D&T for the last two fiscal years of each Series; and (ii) the aggregate non-audit fees (i.e., fees for audit-related, tax, and other services) billed for services rendered to the Eaton Vance organization by D&T for the last two fiscal years of each Series.
| | | | | | | | | | | | | | | | | | | | | | | | |
Fiscal Years Ended | | 9/30/14 | | | 7/31/15 | | | 8/31/15 | | | 9/30/15 | | | 7/31/16 | | | 8/31/16 | |
Registrant(1) | | $ | 76,355 | | | $ | 59,957 | | | $ | 70,803 | | | $ | 64,903 | | | $ | 60,038 | | | $ | 71,512 | |
Eaton Vance(2) | | $ | 256,315 | | | $ | 46,000 | | | $ | 46,000 | | | $ | 46,000 | | | $ | 56,434 | | | $ | 56,434 | |
| (1) | Includes all of the Series of the Trust. |
| (2) | The investment adviser to the Series, as well as any of its affiliates that provide ongoing services to the Series, are subsidiaries of Eaton Vance Corp. |
(h) The registrant’s audit committee has considered whether the provision by the registrant’s principal accountant of non-audit services to the registrant’s investment adviser and any entity controlling, controlled by, or under common control with the adviser that provides ongoing services to the registrant that were not pre-approved pursuant to Rule 2-01(c)(7)(ii) of Regulation S-X is compatible with maintaining the principal accountant’s independence.
Item 5. Audit Committee of Listed Registrants
Not applicable.
Item 6. Schedule of Investments
Please see schedule of investments contained in the Report to Stockholders included under Item 1 of this Form N-CSR.
Item 7. Disclosure of Proxy Voting Policies and Procedures for Closed-End Management Investment Companies
Not applicable.
Item 8. Portfolio Managers of Closed-End Management Investment Companies
Not applicable.
Item 9. Purchase of Equity Securities by Closed-End Management Investment Company and Affiliated Purchases
Not applicable.
Item 10. Submission of Matters to a Vote of Security Holders
No material changes.
Item 11. Controls and Procedures
(a) It is the conclusion of the registrant’s principal executive officer and principal financial officer that the effectiveness of the registrant’s current disclosure controls and procedures (such disclosure controls and procedures having been evaluated within 90 days of the date of this filing) provide reasonable assurance that the information required to be disclosed by the registrant has been recorded, processed, summarized and reported within the time period specified in the Commission’s rules and forms and that the information required to be disclosed by the registrant has been accumulated and communicated to the registrant’s principal executive officer and principal financial officer in order to allow timely decisions regarding required disclosure.
(b) There have been no changes in the registrant’s internal controls over financial reporting during the second fiscal quarter of the period covered by this report that has materially affected, or is reasonably likely to materially affect, the registrant’s internal control over financial reporting.
Item 12. Exhibits
| | |
| (a)(1) | | Registrant’s Code of Ethics – Not applicable (please see Item 2). |
| |
| (a)(2)(i) | | Treasurer’s Section 302 certification. |
| |
| (a)(2)(ii) | | President’s Section 302 certification. |
| |
| (b) | | Combined Section 906 certification. |
Signatures
Pursuant to the requirements of the Securities Exchange Act of 1934 and the Investment Company Act of 1940, the registrant has duly caused this report to be signed on its behalf by the undersigned, thereunto duly authorized.
Eaton Vance Municipals Trust
| | |
| By: | | /s/ Payson F. Swaffield |
| | Payson F. Swaffield |
| | President |
| |
| Date: | | October 20, 2016 |
Pursuant to the requirements of the Securities Exchange Act of 1934 and the Investment Company Act of 1940, this report has been signed below by the following persons on behalf of the registrant and in the capacities and on the dates indicated.
| | |
| By: | | /s/ James F. Kirchner |
| | James F. Kirchner |
| | Treasurer |
| |
| Date: | | October 20, 2016 |
| | |
| By: | | /s/ Payson F. Swaffield |
| | Payson F. Swaffield |
| | President |
| |
| Date: | | October 20, 2016 |