UNITED STATES
SECURITIES AND EXCHANGE COMMISSION
Washington, D.C. 20549
Form N-CSR
CERTIFIED SHAREHOLDER REPORT OF REGISTERED
MANAGEMENT INVESTMENT COMPANIES
Investment Company Act File Number: 811-04409
Eaton Vance Municipals Trust
(Exact Name of Registrant as Specified in Charter)
Two International Place, Boston, Massachusetts 02110
(Address of Principal Executive Offices)
Deidre E. Walsh
Two International Place, Boston, Massachusetts 02110
(Name and Address of Agent for Services)
(617) 482-8260
(Registrant’s Telephone Number)
September 30
Date of Fiscal Year End
September 30, 2022
Date of Reporting Period
| Item 1. | Reports to Stockholders |
Eaton Vance
Municipal Income Funds
Annual Report
September 30, 2022
California Opportunities • Massachusetts • New York • Ohio
Commodity Futures Trading Commission Registration. The Commodity Futures Trading Commission (“CFTC”) has adopted regulations that subject registered investment companies and advisers to regulation by the CFTC if a fund invests more than a prescribed level of its assets in certain CFTC-regulated instruments (including futures, certain options and swap agreements) or markets itself as providing investment exposure to such instruments. The investment adviser has claimed an exclusion from the definition of “commodity pool operator” under the Commodity Exchange Act with respect to its management of each Fund. Accordingly, neither the Funds nor the adviser with respect to the operation of the Funds is subject to CFTC regulation. Because of its management of other strategies, the Funds' adviser is registered with the CFTC as a commodity pool operator. The adviser is also registered as a commodity trading advisor.
Fund shares are not insured by the FDIC and are not deposits or other obligations of, or guaranteed by, any depository institution. Shares are subject to investment risks, including possible loss of principal invested.
This report must be preceded or accompanied by a current summary prospectus or prospectus. Before investing, investors should consider carefully the investment objective, risks, and charges and expenses of a mutual fund. This and other important information is contained in the summary prospectus and prospectus, which can be obtained from a financial intermediary. Prospective investors should read the prospectus carefully before investing. For further information, please call 1-800-262-1122.
Annual Report September 30, 2022
Eaton Vance
Municipal Income Funds
Eaton Vance
Municipal Income Funds
September 30, 2022
Management’s Discussion of Fund Performance†
Economic and Market Conditions
The 12-month period starting October 1, 2021, encompassed the worst six-month start to a calendar year for municipal bond returns in four decades and the worst single month for municipals since 2008 — as well as the best one-month performance for municipal bonds in over two years with a July 2022 rally.
In the opening months of the period, interest rates rose and bond prices declined due in part to anticipation that the U.S. Federal Reserve (the Fed) would begin tapering its monthly bond purchases, which had helped hold interest rates down through much of the pandemic.
In late 2021, the Fed confirmed that tapering would begin in November and accelerate during the months to come. In December, U.S. Treasury rates rose against the backdrop of inflationary concerns and anticipation that the Fed would hike interest rates in 2022. Municipal bond rates, however, were nearly unchanged during the month.
But as the new year began, municipal bond rates resumed their upward trajectory as investors reevaluated the twin threats of persistent inflation and projected interest rate hikes. In February, Russia’s invasion of Ukraine sent shock waves through markets worldwide, exacerbating inflationary pressures on energy and food prices.
As markets recognized the potential for the Fed to raise interest rates at every policy meeting in 2022 to combat inflation, the Bloomberg Municipal Bond Index (the Index), a broad measure of the municipal bond market, declined 8.98% during the first six months of 2022 — its worst first-half performance since the 1980s. Municipal bond mutual funds — which had reported net inflows for all but one week in 2021 — recorded their worst outflow cycle on record.
In July 2022, however, municipal bond performance briefly turned positive. Helped by a tight supply of new issues and increased demand from the reinvestment of maturing debt and coupon payments, municipal mutual funds experienced their first net inflows since January 2022.
Heightened fears of recession also benefited the asset class by spurring a “flight to quality” that drove investors toward U.S. Treasurys and municipal securities. Expectations that a recession might lead the Fed to temper future rate hikes helped municipal returns as well. As a result, the Index returned 2.64% in July 2022, its best month since May 2020.
But in the final months of the period, municipal performance turned negative again and fund outflows resumed as investors reacted to statements from Fed officials that they were not done with rate hikes and that fighting inflation remained the central bank’s top priority. At its September meeting, the Fed followed through with its third straight 0.75% rate hike and announced a new year-end federal funds target of 4.40%, up from its previous projection of 3.40%. September 2022 entered the record books with the Index falling 3.84%, its worst one-month performance in 14 years.
For the period as a whole, the Index returned -11.50% as interest rates rose and bond prices declined across the municipal bond yield curve. Municipal bonds outperformed U.S. Treasurys in the short and medium areas of the yield curve — maturities of 10 years and below — but underperformed Treasurys at the 30-year end of the curve.
Fund Performance
For the 12-month period ended September 30, 2022, Eaton Vance California Municipal Opportunities Fund (the California Fund) and Eaton Vance Ohio Municipal Income Fund (the Ohio Fund) — Class A shares at net asset value (NAV) — outperformed their benchmark, the Index, which returned -11.50%. Eaton Vance Massachusetts Municipal Income Fund (the Massachusetts Fund) and Eaton Vance New York Municipal Income Fund (the New York Fund) underperformed the Index for Class A shares at NAV during the period.
Generally, in pursuing their investment objectives, the Massachusetts, New York, and Ohio Funds normally acquire municipal bonds with maturities of 10 years or more. The California Fund has a flexible investment strategy and may invest in obligations of any duration and credit quality.
Management has the ability to be opportunistic in pursuing the California Fund’s after-tax total return objective, with the ability to invest up to 20% of net assets in debt obligations other than tax-exempt municipal bonds, including but not limited to taxable municipal obligations, U.S. Treasury securities, and obligations of the U.S. government, its agencies and instrumentalities. Up to 50% of the California Fund’s net assets may be invested in obligations rated below investment-grade credit quality.
Management may attempt to hedge the portfolios to various degrees against the potential risk of interest rate volatility at the long end of the yield curve by using Treasury futures or interest rate swaps. In a period when Treasury bonds generally declined in price as yields moved higher, the California, New York, and Ohio Funds’ Treasury-futures hedging strategies contributed to relative returns versus the unhedged Index. The California Fund’s hedging strategy, however, was no longer employed at period-end. The Massachusetts Fund did not employ an interest rate hedge during the period.
See Endnotes and Additional Disclosures in this report.
Past performance is no guarantee of future results. Returns are historical and are calculated by determining the percentage change in net asset value (NAV) or offering price (as applicable) with all distributions reinvested. Furthermore, returns do not reflect the deduction of taxes that shareholders may have to pay on Fund distributions or upon the redemption of Fund shares. Investment return and principal value will fluctuate so that shares, when redeemed, may be worth more or less than their original cost. Performance for periods less than or equal to one year is cumulative. Performance is for the stated time period only; due to market volatility, current Fund performance may be lower or higher than the quoted return. For performance as of the most recent month-end, please refer to eatonvance.com.
Eaton Vance
Municipal Income Funds
September 30, 2022
Management’s Discussion of Fund Performance† — continued
Each Fund may seek to enhance tax-exempt income through the use of leveraged investments by purchasing residual interest bonds. Leveraged investments have the effect of magnifying a fund’s exposure to its underlying investments in both up and down markets. Although the use of leverage generated additional tax-exempt bond income for the Ohio Fund, it also magnified a significant decline in municipal bond prices during the period due to rising interest rates. As a result, the net effect of leverage detracted from the Ohio Fund’s performance relative to the Index, which does not employ leverage. While the Massachusetts and New York Funds also employed a small amount of leverage during the period, leverage had a minimal effect on their performances versus the Index. The California Fund did not employ leverage during the period.
Fund-Specific Results
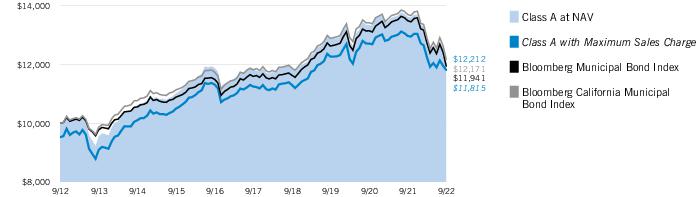
Eaton Vance California Municipal Opportunities Fund returned -10.35% for Class A shares at NAV, outperforming the Index, which returned -11.50% during the period.
Contributors to performance relative to the Index included security selections in the health care sector, security selections in BBB-rated bonds, and the California Fund’s Treasury-futures hedging strategy. The California Fund’s relatively defensive allocation to floating-rate notes and variable-rate demand notes — which have very short durations and are not represented within the Index — also contributed to relative performance as interest rates rose during the period.
In contrast, the main detractors from the California Fund’s performance relative to the Index included an overweight position relative to the Index in local general obligation bonds; an overweight position in 4% coupon bonds; and an allocation to taxable municipal bonds, which were not represented within the Index, during a period when taxable municipal bonds generally underperformed tax-exempt municipal bonds.
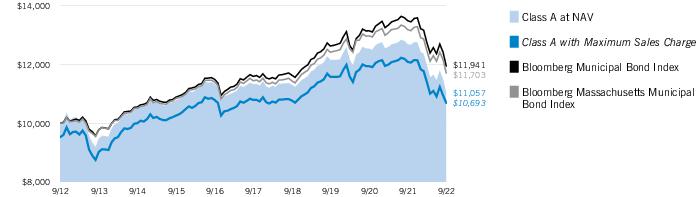
Eaton Vance Massachusetts Municipal Income Fund returned -12.89% for Class A shares at NAV, underperforming the Index, which returned -11.50% during the period.
Security selections and an overweight position in the education sector; security selections and an overweight position in 4% coupon bonds; and an allocation to taxable municipal bonds all detracted from the Massachusetts Fund’s performance relative to the Index during the period. In contrast, contributors to returns versus the Index included an underweight position in bonds with 22 years or more remaining to maturity, during a period when longer maturity bonds generally underperformed shorter maturity bonds; security selections in the housing sector; and an overweight position in AAA-rated bonds - the best-performing credit-rating category within the Index during the period.
Eaton Vance New York Municipal Income Fund returned -13.09% for Class A shares at NAV, underperforming the Index, which returned -11.50% during the period.
Detractors from the New York Fund’s performance versus the Index included security selections and overweight positions in the special tax and education sectors, as well as security selections and an overweight position in 4% coupon bonds. Contributors to performance relative to the Index included security selections in the health care sector; security selections in bonds with coupons less than 4%; and the New York Fund’s Treasury-futures hedging strategy.
Eaton Vance Ohio Municipal Income Fund returned -11.06% for Class A shares at NAV, outperforming the Index, which returned -11.50% during the period.
Security selections in the transportation sector, an underweight position in BBB-rated bonds — the worst-performing credit-rating category within the Index during the period — and the Ohio Fund’s Treasury-futures hedging strategy all contributed to performance versus the Index. Detractors from performance relative to the Index included an overweight position in the health care sector, security selections in 4% coupon bonds, and the use of leveraged investments during the period.
See Endnotes and Additional Disclosures in this report.
Past performance is no guarantee of future results. Returns are historical and are calculated by determining the percentage change in net asset value (NAV) or offering price (as applicable) with all distributions reinvested. Furthermore, returns do not reflect the deduction of taxes that shareholders may have to pay on Fund distributions or upon the redemption of Fund shares. Investment return and principal value will fluctuate so that shares, when redeemed, may be worth more or less than their original cost. Performance for periods less than or equal to one year is cumulative. Performance is for the stated time period only; due to market volatility, current Fund performance may be lower or higher than the quoted return. For performance as of the most recent month-end, please refer to eatonvance.com.
Eaton Vance
California Municipal Opportunities Fund
September 30, 2022
Performance
Portfolio Manager(s) Craig R. Brandon, CFA and Trevor G. Smith
| % Average Annual Total Returns1,2 | Class
Inception Date | Performance
Inception Date | One Year | Five Years | Ten Years |
| Class A at NAV | 05/27/1994 | 12/19/1985 | (10.35)% | 0.67% | 2.02% |
| Class A with 3.25% Maximum Sales Charge | — | — | (13.27) | 0.00* | 1.68 |
| Class C at NAV | 08/31/2004 | 12/19/1985 | (10.92) | (0.06) | 1.41 |
| Class C with 1% Maximum Deferred Sales Charge | — | — | (11.79) | (0.06) | 1.41 |
| Class I at NAV | 03/03/2008 | 12/19/1985 | (10.03) | 0.92 | 2.27 |
|
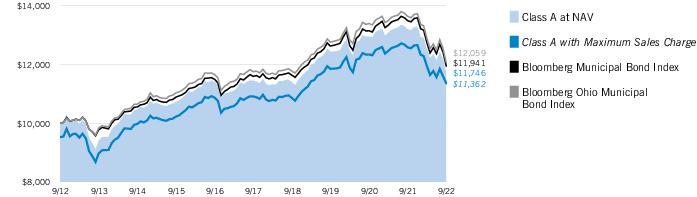
| Bloomberg Municipal Bond Index | — | — | (11.50)% | 0.59% | 1.79% |
| Bloomberg California Municipal Bond Index | — | — | (11.20) | 0.59 | 1.98 |
* Amount is less than 0.005%.
| % Total Annual Operating Expense Ratios3 | Class A | Class C | Class I |
| | 0.69% | 1.44% | 0.44% |
| % Distribution Rates/Yields4 | Class A | Class C | Class I |
| Distribution Rate | 2.31% | 1.55% | 2.57% |
| Taxable-Equivalent Distribution Rate | 5.04 | 3.37 | 5.59 |
| SEC 30-day Yield | 2.45 | 1.77 | 2.79 |
| Taxable-Equivalent SEC 30-day Yield | 5.34 | 3.86 | 6.08 |
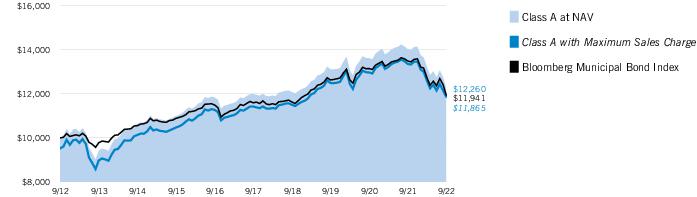
Growth of $10,000
This graph shows the change in value of a hypothetical investment of $10,000 in Class A of the Fund for the period indicated. For comparison, the same investment is shown in the indicated index.
| Growth of Investment | Amount Invested | Period Beginning | At NAV | With Maximum Sales Charge |
| Class C | $10,000 | 09/30/2012 | $11,505 | N.A. |
| Class I, at minimum investment | $1,000,000 | 09/30/2012 | $1,251,931 | N.A. |
See Endnotes and Additional Disclosures in this report.
Past performance is no guarantee of future results. Returns are historical and are calculated by determining the percentage change in net asset value (NAV) or offering price (as applicable) with all distributions reinvested. Furthermore, returns do not reflect the deduction of taxes that shareholders may have to pay on Fund distributions or upon the redemption of Fund shares. Investment return and principal value will fluctuate so that shares, when redeemed, may be worth more or less than their original cost. Performance for periods less than or equal to one year is cumulative. Performance is for the stated time period only; due to market volatility, current Fund performance may be lower or higher than the quoted return. For performance as of the most recent month-end, please refer to eatonvance.com.
Eaton Vance
California Municipal Opportunities Fund
September 30, 2022
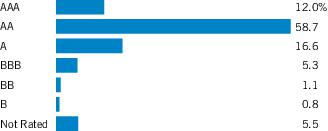
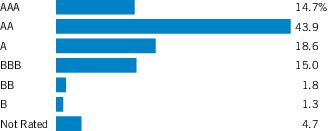
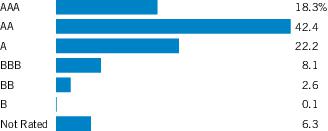
| Credit Quality (% of total investments)1 |
Footnotes:
| 1 | For purposes of the Fund’s rating restrictions, ratings are based on Moody’s Investors Service, Inc. (“Moody’s”), S&P Global Ratings (“S&P”) or Fitch Ratings (“Fitch”), as applicable. If securities are rated differently by the ratings agencies, the highest rating is applied. Ratings, which are subject to change, apply to the creditworthiness of the issuers of the underlying securities and not to the Fund or its shares. Credit ratings measure the quality of a bond based on the issuer’s creditworthiness, with ratings ranging from AAA, being the highest, to D, being the lowest based on S&P’s measures. Ratings of BBB or higher by S&P or Fitch (Baa or higher by Moody’s) are considered to be investment-grade quality. Credit ratings are based largely on the ratings agency’s analysis at the time of rating. The rating assigned to any particular security is not necessarily a reflection of the issuer’s current financial condition and does not necessarily reflect its assessment of the volatility of a security’s market value or of the liquidity of an investment in the security. Holdings designated as “Not Rated” (if any) are not rated by the national ratings agencies stated above. |
Eaton Vance
Massachusetts Municipal Income Fund
September 30, 2022
Performance
Portfolio Manager(s) Craig R. Brandon, CFA and Julie P. Callahan, CFA
| % Average Annual Total Returns1,2 | Class
Inception Date | Performance
Inception Date | One Year | Five Years | Ten Years |
| Class A at NAV | 12/07/1993 | 04/18/1991 | (12.89)% | (0.49)% | 1.01% |
| Class A with 3.25% Maximum Sales Charge | — | — | (15.71) | (1.15) | 0.67 |
| Class C at NAV | 05/02/2006 | 04/18/1991 | (13.45) | (1.22) | 0.40 |
| Class C with 1% Maximum Deferred Sales Charge | — | — | (14.30) | (1.22) | 0.40 |
| Class I at NAV | 06/17/1993 | 04/18/1991 | (12.60) | (0.25) | 1.22 |
|
| Bloomberg Municipal Bond Index | — | — | (11.50)% | 0.59% | 1.79% |
| Bloomberg Massachusetts Municipal Bond Index | — | — | (11.26) | 0.44 | 1.58 |
| % Total Annual Operating Expense Ratios3 | Class A | Class C | Class I |
| | 0.66% | 1.41% | 0.46% |
| % Distribution Rates/Yields4 | Class A | Class C | Class I |
| Distribution Rate | 2.66% | 1.89% | 2.86% |
| Taxable-Equivalent Distribution Rate | 4.91 | 3.48 | 5.28 |
| SEC 30-day Yield | 2.72 | 2.03 | 3.01 |
| Taxable-Equivalent SEC 30-day Yield | 5.01 | 3.75 | 5.55 |
| % Total Leverage5 | |
| Residual Interest Bond (RIB) Financing | 2.55% |
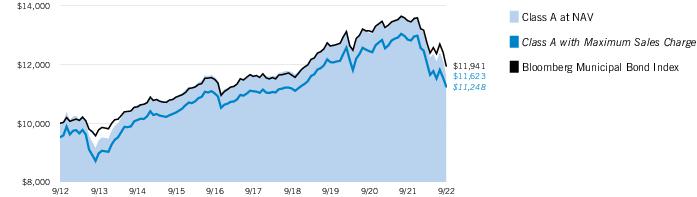
Growth of $10,000
This graph shows the change in value of a hypothetical investment of $10,000 in Class A of the Fund for the period indicated. For comparison, the same investment is shown in the indicated index.
| Growth of Investment | Amount Invested | Period Beginning | At NAV | With Maximum Sales Charge |
| Class C | $10,000 | 09/30/2012 | $10,408 | N.A. |
| Class I, at minimum investment | $1,000,000 | 09/30/2012 | $1,129,065 | N.A. |
See Endnotes and Additional Disclosures in this report.
Past performance is no guarantee of future results. Returns are historical and are calculated by determining the percentage change in net asset value (NAV) or offering price (as applicable) with all distributions reinvested. Furthermore, returns do not reflect the deduction of taxes that shareholders may have to pay on Fund distributions or upon the redemption of Fund shares. Investment return and principal value will fluctuate so that shares, when redeemed, may be worth more or less than their original cost. Performance for periods less than or equal to one year is cumulative. Performance is for the stated time period only; due to market volatility, current Fund performance may be lower or higher than the quoted return. For performance as of the most recent month-end, please refer to eatonvance.com.
Eaton Vance
Massachusetts Municipal Income Fund
September 30, 2022
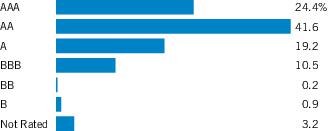
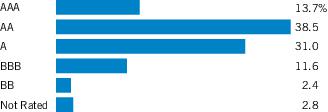
| Credit Quality (% of total investments)1,2 |
Footnotes:
| 1 | For purposes of the Fund’s rating restrictions, ratings are based on Moody’s Investors Service, Inc. (“Moody’s”), S&P Global Ratings (“S&P”) or Fitch Ratings (“Fitch”), as applicable. If securities are rated differently by the ratings agencies, the highest rating is applied. Ratings, which are subject to change, apply to the creditworthiness of the issuers of the underlying securities and not to the Fund or its shares. Credit ratings measure the quality of a bond based on the issuer’s creditworthiness, with ratings ranging from AAA, being the highest, to D, being the lowest based on S&P’s measures. Ratings of BBB or higher by S&P or Fitch (Baa or higher by Moody’s) are considered to be investment-grade quality. Credit ratings are based largely on the ratings agency’s analysis at the time of rating. The rating assigned to any particular security is not necessarily a reflection of the issuer’s current financial condition and does not necessarily reflect its assessment of the volatility of a security’s market value or of the liquidity of an investment in the security. Holdings designated as “Not Rated” (if any) are not rated by the national ratings agencies stated above. |
| 2 | The chart includes the municipal bonds held by a trust that issues residual interest bonds, consistent with the Portfolio of Investments. |
Eaton Vance
New York Municipal Income Fund
September 30, 2022
Performance
Portfolio Manager(s) Craig R. Brandon, CFA and Christopher J. Eustance, CFA
| % Average Annual Total Returns1,2 | Class
Inception Date | Performance
Inception Date | One Year | Five Years | Ten Years |
| Class A at NAV | 04/15/1994 | 08/30/1990 | (13.09)% | 0.08% | 1.63% |
| Class A with 3.25% Maximum Sales Charge | — | — | (15.92) | (0.58) | 1.29 |
| Class C at NAV | 09/30/2003 | 08/30/1990 | (13.65) | (0.66) | 1.02 |
| Class C with 1% Maximum Deferred Sales Charge | — | — | (14.49) | (0.66) | 1.02 |
| Class I at NAV | 03/03/2008 | 08/30/1990 | (12.83) | 0.28 | 1.83 |
|
| Bloomberg Municipal Bond Index | — | — | (11.50)% | 0.59% | 1.79% |
| Bloomberg New York Municipal Bond Index | — | — | (11.96) | 0.25 | 1.61 |
| % Total Annual Operating Expense Ratios3 | Class A | Class C | Class I |
| | 0.65% | 1.40% | 0.45% |
| % Distribution Rates/Yields4 | Class A | Class C | Class I |
| Distribution Rate | 2.65% | 1.87% | 2.85% |
| Taxable-Equivalent Distribution Rate | 5.48 | 3.88 | 5.90 |
| SEC 30-day Yield | 3.04 | 2.38 | 3.36 |
| Taxable-Equivalent SEC 30-day Yield | 6.30 | 4.92 | 6.95 |
| % Total Leverage5 | |
| RIB Financing | 0.69% |
Growth of $10,000
This graph shows the change in value of a hypothetical investment of $10,000 in Class A of the Fund for the period indicated. For comparison, the same investment is shown in the indicated index.
| Growth of Investment | Amount Invested | Period Beginning | At NAV | With Maximum Sales Charge |
| Class C | $10,000 | 09/30/2012 | $11,074 | N.A. |
| Class I, at minimum investment | $1,000,000 | 09/30/2012 | $1,199,154 | N.A. |
See Endnotes and Additional Disclosures in this report.
Past performance is no guarantee of future results. Returns are historical and are calculated by determining the percentage change in net asset value (NAV) or offering price (as applicable) with all distributions reinvested. Furthermore, returns do not reflect the deduction of taxes that shareholders may have to pay on Fund distributions or upon the redemption of Fund shares. Investment return and principal value will fluctuate so that shares, when redeemed, may be worth more or less than their original cost. Performance for periods less than or equal to one year is cumulative. Performance is for the stated time period only; due to market volatility, current Fund performance may be lower or higher than the quoted return. For performance as of the most recent month-end, please refer to eatonvance.com.
Eaton Vance
New York Municipal Income Fund
September 30, 2022
| Credit Quality (% of total investments)1,2 |
Footnotes:
| 1 | For purposes of the Fund’s rating restrictions, ratings are based on Moody’s Investors Service, Inc. (“Moody’s”), S&P Global Ratings (“S&P”) or Fitch Ratings (“Fitch”), as applicable. If securities are rated differently by the ratings agencies, the highest rating is applied. Ratings, which are subject to change, apply to the creditworthiness of the issuers of the underlying securities and not to the Fund or its shares. Credit ratings measure the quality of a bond based on the issuer’s creditworthiness, with ratings ranging from AAA, being the highest, to D, being the lowest based on S&P’s measures. Ratings of BBB or higher by S&P or Fitch (Baa or higher by Moody’s) are considered to be investment-grade quality. Credit ratings are based largely on the ratings agency’s analysis at the time of rating. The rating assigned to any particular security is not necessarily a reflection of the issuer’s current financial condition and does not necessarily reflect its assessment of the volatility of a security’s market value or of the liquidity of an investment in the security. Holdings designated as “Not Rated” (if any) are not rated by the national ratings agencies stated above. |
| 2 | The chart includes the municipal bonds held by a trust that issues residual interest bonds, consistent with the Portfolio of Investments. |
Eaton Vance
Ohio Municipal Income Fund
September 30, 2022
Performance
Portfolio Manager(s) Cynthia J. Clemson and Julie P. Callahan, CFA
| % Average Annual Total Returns1,2 | Class
Inception Date | Performance
Inception Date | One Year | Five Years | Ten Years |
| Class A at NAV | 12/07/1993 | 04/18/1991 | (11.06)% | 0.50% | 1.62% |
| Class A with 3.25% Maximum Sales Charge | — | — | (13.94) | (0.15) | 1.28 |
| Class C at NAV | 02/03/2006 | 04/18/1991 | (11.84) | (0.25) | 1.03 |
| Class C with 1% Maximum Deferred Sales Charge | — | — | (12.70) | (0.25) | 1.03 |
| Class I at NAV | 08/03/2010 | 04/18/1991 | (10.98) | 0.71 | 1.82 |
|
| Bloomberg Municipal Bond Index | — | — | (11.50)% | 0.59% | 1.79% |
| Bloomberg Ohio Municipal Bond Index | — | — | (11.60) | 0.51 | 1.89 |
| % Total Annual Operating Expense Ratios3 | Class A | Class C | Class I |
| | 0.71% | 1.46% | 0.51% |
| % Distribution Rates/Yields4 | Class A | Class C | Class I |
| Distribution Rate | 2.81% | 2.08% | 3.01% |
| Taxable-Equivalent Distribution Rate | 5.09 | 3.76 | 5.45 |
| SEC 30-day Yield | 2.75 | 2.08 | 3.05 |
| Taxable-Equivalent SEC 30-day Yield | 4.98 | 3.77 | 5.52 |
| % Total Leverage5 | |
| RIB Financing | 4.26% |
Growth of $10,000
This graph shows the change in value of a hypothetical investment of $10,000 in Class A of the Fund for the period indicated. For comparison, the same investment is shown in the indicated index.
| Growth of Investment | Amount Invested | Period Beginning | At NAV | With Maximum Sales Charge |
| Class C | $10,000 | 09/30/2012 | $11,075 | N.A. |
| Class I, at minimum investment | $1,000,000 | 09/30/2012 | $1,198,176 | N.A. |
See Endnotes and Additional Disclosures in this report.
Past performance is no guarantee of future results. Returns are historical and are calculated by determining the percentage change in net asset value (NAV) or offering price (as applicable) with all distributions reinvested. Furthermore, returns do not reflect the deduction of taxes that shareholders may have to pay on Fund distributions or upon the redemption of Fund shares. Investment return and principal value will fluctuate so that shares, when redeemed, may be worth more or less than their original cost. Performance for periods less than or equal to one year is cumulative. Performance is for the stated time period only; due to market volatility, current Fund performance may be lower or higher than the quoted return. For performance as of the most recent month-end, please refer to eatonvance.com.
Eaton Vance
Ohio Municipal Income Fund
September 30, 2022
| Credit Quality (% of total investments)1,2 |
Footnotes:
| 1 | For purposes of the Fund’s rating restrictions, ratings are based on Moody’s Investors Service, Inc. (“Moody’s”), S&P Global Ratings (“S&P”) or Fitch Ratings (“Fitch”), as applicable. If securities are rated differently by the ratings agencies, the highest rating is applied. Ratings, which are subject to change, apply to the creditworthiness of the issuers of the underlying securities and not to the Fund or its shares. Credit ratings measure the quality of a bond based on the issuer’s creditworthiness, with ratings ranging from AAA, being the highest, to D, being the lowest based on S&P’s measures. Ratings of BBB or higher by S&P or Fitch (Baa or higher by Moody’s) are considered to be investment-grade quality. Credit ratings are based largely on the ratings agency’s analysis at the time of rating. The rating assigned to any particular security is not necessarily a reflection of the issuer’s current financial condition and does not necessarily reflect its assessment of the volatility of a security’s market value or of the liquidity of an investment in the security. Holdings designated as “Not Rated” (if any) are not rated by the national ratings agencies stated above. |
| 2 | The chart includes the municipal bonds held by a trust that issues residual interest bonds, consistent with the Portfolio of Investments. |
Eaton Vance
Municipal Income Funds
September 30, 2022
Endnotes and Additional Disclosures
| † | The views expressed in this report are those of the portfolio manager(s) and are current only through the date stated at the top of this page. These views are subject to change at any time based upon market or other conditions, and Eaton Vance and the Fund(s) disclaim any responsibility to update such views. These views may not be relied upon as investment advice and, because investment decisions are based on many factors, may not be relied upon as an indication of trading intent on behalf of any Eaton Vance fund. This commentary may contain statements that are not historical facts, referred to as “forward-looking statements.” The Fund’s actual future results may differ significantly from those stated in any forward-looking statement, depending on factors such as changes in securities or financial markets or general economic conditions, the volume of sales and purchases of Fund shares, the continuation of investment advisory, administrative and service contracts, and other risks discussed from time to time in the Fund’s filings with the Securities and Exchange Commission. |
| | |
| 1 | Bloomberg Municipal Bond Index is an unmanaged index of municipal bonds traded in the U.S. Bloomberg California Municipal Bond Index is an unmanaged index of California municipal bonds. Bloomberg Massachusetts Municipal Bond Index is an unmanaged index of Massachusetts municipal bonds. Bloomberg New York Municipal Bond Index is an unmanaged index of New York municipal bonds. Bloomberg Ohio Municipal Bond Index is an unmanaged index of Ohio municipal bonds. Unless otherwise stated, index returns do not reflect the effect of any applicable sales charges, commissions, expenses, taxes or leverage, as applicable. It is not possible to invest directly in an index. |
| 2 | Total Returns at NAV do not include applicable sales charges. If sales charges were deducted, the returns would be lower. Total Returns shown with maximum sales charge reflect the stated maximum sales charge. Unless otherwise stated, performance does not reflect the deduction of taxes on Fund distributions or redemptions of Fund shares.Effective November 5, 2020, Class C shares automatically convert to Class A shares eight years after purchase. The average annual total returns listed for Class C reflect conversion to Class A shares after eight years. Prior to November 5, 2020, Class C shares automatically converted to Class A shares ten years after purchase.For California Municipal Opportunities Fund, performance prior to April 13, 2015 reflects the Fund’s performance under its former investment objective and strategy. |
| 3 | Source: Fund prospectus. The expense ratios for the current reporting period can be found in the Financial Highlights section of this report. |
| 4 | The Distribution Rate is based on the Fund’s last regular distribution per share in the period (annualized) divided by the Fund’s NAV at the end of the period. The Fund’s distributions may be comprised of amounts characterized for federal income tax purposes as tax-exempt income, qualified and non-qualified ordinary dividends, capital gains and nondividend distributions, also known as return of capital. The Fund will determine the federal income tax character of distributions paid to a shareholder after the end of the calendar year. This is reported on the IRS form 1099-DIV and provided to the shareholder shortly after each year-end. The Fund’s distributions are determined by the investment adviser based on its current assessment of the Fund’s long-term return potential. As portfolio and market conditions change, the rate of distributions paid by the Fund could change. Taxable-equivalent performance is based on the highest combined federal and state income tax rates, where applicable. Lower tax rates would result in lower tax-equivalent performance. Actual tax rates will vary depending on your income, exemptions and deductions. Rates do not include local taxes. The SEC Yield is a standardized measure based on the estimated yield to maturity of a fund’s investments over a 30-day period and is based on the maximum offer price at the date specified. The SEC Yield is not based on the distributions made by the Fund, which may differ. |
| 5 | Fund employs RIB financing. The leverage created by RIB investments provides an opportunity for increased income but, at the same time, creates special risks (including the likelihood of greater volatility of NAV). The cost of leverage rises and falls with changes in short-term interest rates. See “Floating Rate Notes Issued in Conjunction with Securities Held” in the notes to the financial statements for more information about RIB financing. RIB leverage represents the amount of Floating Rate Notes outstanding at period end as a percentage of Fund net assets plus Floating Rate Notes. |
| | Fund profiles subject to change due to active management. |
| | Additional Information |
| | Duration is a measure of the expected change in price of a bond — in percentage terms — given a one percent change in interest rates, all else being constant. Securities with lower durations tend to be less sensitive to interest rate changes. |
| | Yield curve is a graphical representation of the yields offered by bonds of various maturities. The yield curve flattens when long-term interest rates fall and/or short-term interest rates increase, and the yield curve steepens when long-term interest rates increase and/or short-term interest rates fall. |
Eaton Vance
Municipal Income Funds
September 30, 2022
Example
As a Fund shareholder, you incur two types of costs: (1) transaction costs, including sales charges (loads) on purchases and redemption fees (if applicable); and (2) ongoing costs, including management fees; distribution and/or service fees; and other Fund expenses. This Example is intended to help you understand your ongoing costs (in dollars) of Fund investing and to compare these costs with the ongoing costs of investing in other mutual funds. The Example is based on an investment of $1,000 invested at the beginning of the period and held for the entire period (April 1, 2022 to September 30, 2022).
Actual Expenses
The first section of each table below provides information about actual account values and actual expenses. You may use the information in this section, together with the amount you invested, to estimate the expenses that you paid over the period. Simply divide your account value by $1,000 (for example, an $8,600 account value divided by $1,000 = 8.6), then multiply the result by the number in the first section under the heading entitled “Expenses Paid During Period” to estimate the expenses you paid on your account during this period.
Hypothetical Example for Comparison Purposes
The second section of each table below provides information about hypothetical account values and hypothetical expenses based on the actual Fund expense ratio and an assumed rate of return of 5% per year (before expenses), which is not the actual Fund return. The hypothetical account values and expenses may not be used to estimate the actual ending account balance or expenses you paid for the period. You may use this information to compare the ongoing costs of investing in your Fund and other funds. To do so, compare this 5% hypothetical example with the 5% hypothetical examples that appear in the shareholder reports of the other funds.
Please note that the expenses shown in each table are meant to highlight your ongoing costs only and do not reflect any transactional costs, such as sales charges (loads) or redemption fees (if applicable). Therefore, the second section of each table is useful in comparing ongoing costs only, and will not help you determine the relative total costs of owning different funds. In addition, if these transactional costs were included, your costs would be higher.
Eaton Vance California Municipal Opportunities Fund
| | Beginning
Account Value
(4/1/22) | Ending
Account Value
(9/30/22) | Expenses Paid
During Period*
(4/1/22 – 9/30/22) | Annualized
Expense
Ratio |
| Actual | | | | |
| Class A | $1,000.00 | $ 949.20 | $3.62 | 0.74% |
| Class C | $1,000.00 | $ 946.00 | $7.27 | 1.49% |
| Class I | $1,000.00 | $ 951.40 | $2.40 | 0.49% |
| |
| Hypothetical | | | | |
| (5% return per year before expenses) | | | | |
| Class A | $1,000.00 | $1,021.36 | $3.75 | 0.74% |
| Class C | $1,000.00 | $1,017.60 | $7.54 | 1.49% |
| Class I | $1,000.00 | $1,022.61 | $2.48 | 0.49% |
| * | Expenses are equal to the Fund's annualized expense ratio for the indicated Class, multiplied by the average account value over the period, multiplied by 183/365 (to reflect the one-half year period). The Example assumes that the $1,000 was invested at the net asset value per share determined at the close of business on March 31, 2022. |
Eaton Vance
Municipal Income Funds
September 30, 2022
Fund Expenses — continued
Eaton Vance Massachusetts Municipal Income Fund
| | Beginning
Account Value
(4/1/22) | Ending
Account Value
(9/30/22) | Expenses Paid
During Period*
(4/1/22 – 9/30/22) | Annualized
Expense
Ratio |
| Actual | | | | |
| Class A | $1,000.00 | $ 923.90 | $3.57 | 0.74% |
| Class C | $1,000.00 | $ 921.50 | $7.23 | 1.50% |
| Class I | $1,000.00 | $ 926.00 | $2.66 | 0.55% |
| |
| Hypothetical | | | | |
| (5% return per year before expenses) | | | | |
| Class A | $1,000.00 | $1,021.36 | $3.75 | 0.74% |
| Class C | $1,000.00 | $1,017.55 | $7.59 | 1.50% |
| Class I | $1,000.00 | $1,022.31 | $2.79 | 0.55% |
| * | Expenses are equal to the Fund's annualized expense ratio for the indicated Class, multiplied by the average account value over the period, multiplied by 183/365 (to reflect the one-half year period). The Example assumes that the $1,000 was invested at the net asset value per share determined at the close of business on March 31, 2022. |
Eaton Vance New York Municipal Income Fund
| | Beginning
Account Value
(4/1/22) | Ending
Account Value
(9/30/22) | Expenses Paid
During Period*
(4/1/22 – 9/30/22) | Annualized
Expense
Ratio |
| Actual | | | | |
| Class A | $1,000.00 | $ 929.00 | $3.38 | 0.70% |
| Class C | $1,000.00 | $ 926.50 | $7.00 | 1.45% |
| Class I | $1,000.00 | $ 930.90 | $2.42 | 0.50% |
| |
| Hypothetical | | | | |
| (5% return per year before expenses) | | | | |
| Class A | $1,000.00 | $1,021.56 | $3.55 | 0.70% |
| Class C | $1,000.00 | $1,017.80 | $7.33 | 1.45% |
| Class I | $1,000.00 | $1,022.56 | $2.54 | 0.50% |
| * | Expenses are equal to the Fund's annualized expense ratio for the indicated Class, multiplied by the average account value over the period, multiplied by 183/365 (to reflect the one-half year period). The Example assumes that the $1,000 was invested at the net asset value per share determined at the close of business on March 31, 2022. |
Eaton Vance
Municipal Income Funds
September 30, 2022
Fund Expenses — continued
Eaton Vance Ohio Municipal Income Fund
| | Beginning
Account Value
(4/1/22) | Ending
Account Value
(9/30/22) | Expenses Paid
During Period*
(4/1/22 – 9/30/22) | Annualized
Expense
Ratio |
| Actual | | | | |
| Class A | $1,000.00 | $ 936.80 | $3.84 | 0.79% |
| Class C | $1,000.00 | $ 932.10 | $7.51 | 1.55% |
| Class I | $1,000.00 | $ 936.70 | $2.86 | 0.59% |
| |
| Hypothetical | | | | |
| (5% return per year before expenses) | | | | |
| Class A | $1,000.00 | $1,021.11 | $4.00 | 0.79% |
| Class C | $1,000.00 | $1,017.30 | $7.84 | 1.55% |
| Class I | $1,000.00 | $1,022.11 | $2.99 | 0.59% |
| * | Expenses are equal to the Fund's annualized expense ratio for the indicated Class, multiplied by the average account value over the period, multiplied by 183/365 (to reflect the one-half year period). The Example assumes that the $1,000 was invested at the net asset value per share determined at the close of business on March 31, 2022. |
Eaton Vance
California Municipal Opportunities Fund
September 30, 2022
| Security | Principal
Amount
(000's omitted) | Value |
| Other — 0.4% |
| Morongo Band of Mission Indians, 7.00%, 10/1/39(1) | $ | 2,080 | $ 2,197,520 |
Total Corporate Bonds
(identified cost $2,080,000) | | | $ 2,197,520 |
| Tax-Exempt Mortgage-Backed Securities — 0.4% |
| Security | Principal
Amount
(000's omitted) | Value |
| Housing — 0.4% |
| California Housing Finance Agency, Municipal Certificates, Series 2021-1, Class A, 3.50%, 11/20/35 | $ | 2,568 | $ 2,219,950 |
Total Tax-Exempt Mortgage-Backed Securities
(identified cost $2,868,447) | | | $ 2,219,950 |
| Tax-Exempt Municipal Obligations — 92.8% |
| Security | Principal
Amount
(000's omitted) | Value |
| Education — 3.3% |
| California Educational Facilities Authority, (Chapman University), 5.00%, 4/1/28 | $ | 395 | $ 422,125 |
| California Enterprise Development Authority, (The Thacher School), 4.00%, 9/1/32 | | 425 | 435,939 |
| California Infrastructure and Economic Development Bank, (The Colburn School), Social Bonds, 3.36%, (SIFMA + 0.90%), 6/1/27 (Put Date), 8/1/72(2) | | 5,000 | 4,921,150 |
| California School Finance Authority, (Granada Hills Charter Obligated Group), 4.00%, 7/1/38(1) | | 465 | 398,445 |
| California School Finance Authority, (Green Dot Public Schools): | | | |
| 5.00%, 8/1/28(1) | | 380 | 388,178 |
| 5.00%, 8/1/38(1) | | 2,500 | 2,476,475 |
| California School Finance Authority, (KIPP SoCal Public Schools): | | | |
| 4.00%, 7/1/40(1) | | 800 | 674,984 |
| 5.00%, 7/1/28(1) | | 100 | 103,199 |
| 5.00%, 7/1/29(1) | | 100 | 103,323 |
| California State University, 4.00%, 11/1/37 | | 2,555 | 2,503,951 |
| University of California, 5.00%, 5/15/35 | | 4,215 | 4,415,507 |
| University of California Medical Center, 5.00%, 5/15/47 | | 2,500 | 2,599,100 |
| | | | $ 19,442,376 |
| Security | Principal
Amount
(000's omitted) | Value |
| Electric Utilities — 4.1% |
| Anaheim Housing and Public Improvements Authority, CA, (Electric Utility Distribution System), 5.00%, 10/1/52 | $ | 8,040 | $ 8,270,829 |
| Glendale, CA, Electric System Revenue, 5.00%, 2/1/38 | | 1,005 | 1,040,798 |
| Los Angeles Department of Airports, CA, (Los Angeles International Airport), 5.00%, 7/1/49 | | 2,425 | 2,523,528 |
| Los Angeles Department of Water and Power, CA, Power System Revenue: | | | |
| 5.00%, 7/1/26 | | 2,090 | 2,227,898 |
| 5.00%, 7/1/51 | | 5,000 | 5,232,200 |
| Sacramento Municipal Utility District, CA, 5.00% to 10/15/25 (Put Date), 8/15/49 | | 1,500 | 1,543,305 |
| Southern California Public Power Authority, Green Bonds, 5.00%, 4/1/24 | | 1,435 | 1,467,890 |
| Vernon, CA, Electric System Revenue, 5.00%, 8/1/35 | | 1,420 | 1,439,766 |
| | | | $ 23,746,214 |
| Escrowed/Prerefunded — 3.5% |
| California Health Facilities Financing Authority, (Sutter Health): | | | |
| Prerefunded to 11/15/25, 5.00%, 11/15/32 | $ | 1,040 | $ 1,097,710 |
| Prerefunded to 11/15/25, 5.00%, 11/15/41 | | 4,985 | 5,261,618 |
| California Statewide Communities Development Authority, (The Redwoods, a Community of Seniors), Prerefunded to 11/15/23, 5.125%, 11/15/35 | | 715 | 730,501 |
| Foothill/Eastern Transportation Corridor Agency, CA, Escrowed to Maturity, 0.00%, 1/1/24 | | 10,000 | 9,596,800 |
| San Luis Coastal Unified School District, CA, (Election of 2014), Prerefunded to 8/1/26, 5.00%, 8/1/36 | | 3,550 | 3,786,323 |
| | | | $ 20,472,952 |
| General Obligations — 27.3% |
| Albany Unified School District, CA, (Election of 2016), 4.00%, 8/1/36 | $ | 110 | $ 107,861 |
| Alisal Union School District, CA, (Election of 2016), 5.00%, 8/1/48 | | 2,780 | 2,896,037 |
| Baldwin Park Unified School District, CA, (Election of 2018), 3.00%, 8/1/38 | | 325 | 262,974 |
| Berryessa Union School District, CA, (Election of 2020), 4.00%, 8/1/39 | | 1,150 | 1,074,307 |
| Brisbane School District, CA, (Election of 2020), 5.00%, 8/1/45 | | 535 | 558,192 |
| California: | | | |
| 4.00%, 9/1/27 | | 3,750 | 3,875,737 |
| 4.00%, 9/1/42 | | 10,330 | 9,650,079 |
| 5.00%, 10/1/24 | | 2,065 | 2,140,765 |
| 5.00%, 8/1/25 | | 1,845 | 1,938,486 |
| 5.00%, 10/1/26 | | 1,230 | 1,315,620 |
16
See Notes to Financial Statements.
Eaton Vance
California Municipal Opportunities Fund
September 30, 2022
Portfolio of Investments — continued
| Security | Principal
Amount
(000's omitted) | Value |
| General Obligations (continued) |
| California: (continued) | | | |
| 5.00%, 9/1/35 | $ | 1,500 | $ 1,641,975 |
| 5.00%, 9/1/42 | | 3,300 | 3,457,410 |
| 5.00%, 9/1/52 | | 1,000 | 1,061,440 |
| Prerefunded to 12/1/22, 2.89%, (SIFMA + 0.43%), 12/1/29(2) | | 3,000 | 2,996,790 |
| Cerritos Community College District, CA,, 5.00%, 8/1/25 | | 3,360 | 3,471,619 |
| Huntington Beach Union High School District, CA, 1.884%, 8/1/29 | | 1,775 | 1,464,943 |
| Liberty Union High School District, CA, (Election of 2016), 3.00%, 8/1/38 | | 890 | 720,144 |
| Los Angeles Community College District, CA, 5.00%, 8/1/25 | | 5,890 | 6,186,856 |
| Los Angeles Community College District, CA, (Election of 2008), 4.00%, 8/1/37 | | 2,215 | 2,144,873 |
| Los Angeles Unified School District, CA: | | | |
| 4.00%, 7/1/39 | | 1,825 | 1,725,355 |
| 5.00%, 7/1/26 | | 1,075 | 1,146,316 |
| Lucia Mar Unified School District, CA, (Election of 2016), 5.25%, 8/1/47 | | 9,000 | 9,719,820 |
| Mariposa County Unified School District, CA, (Election of 2016): | | | |
| 5.00%, 8/1/40 | | 1,315 | 1,367,902 |
| 5.00%, 8/1/43 | | 1,265 | 1,311,552 |
| Morgan Hill Unified School District, CA, (Election of 2012): | | | |
| 5.25%, 8/1/40(3) | | 3,860 | 4,241,522 |
| 5.25%, 8/1/41(3) | | 2,440 | 2,673,386 |
| 5.25%, 8/1/42(3) | | 2,000 | 2,185,440 |
| Murrieta Valley Unified School District, CA, (Election of 2014), 5.25%, 9/1/51 | | 5,700 | 6,168,996 |
| Oceanside Unified School District, CA, 5.00%, 8/1/39 | | 1,005 | 1,068,677 |
| Oceanside Unified School District, CA, (Election of 2008): | | | |
| 5.00%, 8/1/40 | | 1,020 | 1,081,363 |
| 5.00%, 8/1/43 | | 1,000 | 1,055,990 |
| Old Adobe Union School District, CA, (Election of 2018), 5.00%, 8/1/44 | | 1,860 | 1,926,607 |
| Orange Unified School District, CA, (Election of 2016): | | | |
| 5.00%, 8/1/41 | | 3,380 | 3,656,552 |
| 5.00%, 8/1/42 | | 1,315 | 1,418,740 |
| Oxnard Union High School District, CA, (Election of 2018): | | | |
| 4.00%, 8/1/38 | | 1,000 | 967,610 |
| Prerefunded to 8/1/26, 5.00%, 8/1/35 | | 1,805 | 1,925,159 |
| Pittsburg Unified School District, CA, (Election of 2014): | | | |
| 5.00%, 8/1/40 | | 1,235 | 1,282,449 |
| 5.00%, 8/1/42 | | 1,545 | 1,600,898 |
| Security | Principal
Amount
(000's omitted) | Value |
| General Obligations (continued) |
| Placer Union High School District, CA, (Election of 2018), 5.00%, 8/1/45 | $ | 2,675 | $ 2,805,299 |
| Puerto Rico: | | | |
| 0.00%, 7/1/24 | | 59 | 54,655 |
| 0.00%, 7/1/33 | | 229 | 126,483 |
| 4.00%, 7/1/33 | | 178 | 156,714 |
| 4.00%, 7/1/35 | | 160 | 136,976 |
| 4.00%, 7/1/37 | | 137 | 112,884 |
| 5.25%, 7/1/23 | | 5,099 | 5,123,176 |
| 5.625%, 7/1/29 | | 2,238 | 2,292,825 |
| 5.75%, 7/1/31 | | 187 | 191,501 |
| San Bruno Park School District, CA, (Election of 2018): | | | |
| 4.375%, 8/1/49 | | 1,250 | 1,202,050 |
| 5.00%, 8/1/53 | | 8,000 | 8,442,400 |
| San Francisco Bay Area Rapid Transit District, CA, (Election of 2016), Green Bonds, 4.00%, 8/1/34 | | 2,250 | 2,283,930 |
| San Francisco City and County, CA: | | | |
| 5.00%, 6/15/25 | | 3,750 | 3,940,912 |
| 5.00%, 6/15/26 | | 5,000 | 5,340,750 |
| San Francisco Unified School District, CA, (Election of 2016): | | | |
| 5.00%, 6/15/24 | | 2,250 | 2,322,045 |
| 5.00%, 6/15/25 | | 1,125 | 1,177,808 |
| San Rafael City Elementary School District: | | | |
| 4.00%, 8/1/42 | | 1,540 | 1,439,623 |
| 4.25%, 8/1/47 | | 3,000 | 2,837,010 |
| 5.25%, 8/1/52 | | 4,000 | 4,240,760 |
| San Rafael City Elementary School District, CA, (Election of 2015), 5.00%, 8/1/38 | | 500 | 529,810 |
| San Rafael City High School District: | | | |
| 4.00%, 8/1/41 | | 1,245 | 1,167,300 |
| 5.25%, 8/1/52 | | 4,000 | 4,265,360 |
| Sunnyvale School District, CA, 3.00%, 9/1/44 | | 9,500 | 7,130,605 |
| Tahoe-Truckee Unified School District, CA, (Election of 2014), 5.00%, 8/1/36 | | 1,000 | 1,050,520 |
| West Sonoma County Union High School District, CA, (Election of 2018): | | | |
| 5.00%, 8/1/37 | | 500 | 530,785 |
| 5.00%, 8/1/40 | | 1,125 | 1,181,857 |
| 5.00%, 8/1/43 | | 1,000 | 1,044,460 |
| Westminster School District, CA, (Election of 2016): | | | |
| 5.00%, 8/1/38 | | 1,325 | 1,416,266 |
| 5.00%, 8/1/41 | | 1,150 | 1,223,784 |
| 5.00%, 8/1/42 | | 1,000 | 1,039,780 |
| | | | $158,298,770 |
17
See Notes to Financial Statements.
Eaton Vance
California Municipal Opportunities Fund
September 30, 2022
Portfolio of Investments — continued
| Security | Principal
Amount
(000's omitted) | Value |
| Hospital — 7.8% |
| California Health Facilities Financing Authority, (Adventist Health System/West), 4.00%, 3/1/39 | $ | 2,665 | $ 2,386,907 |
| California Health Facilities Financing Authority, (Cedars-Sinai Health System): | | | |
| 4.00%, 8/15/48 | | 9,400 | 8,306,028 |
| 5.00%, 8/15/51 | | 8,250 | 8,533,305 |
| California Health Facilities Financing Authority, (Cedars-Sinai Medical Center), 5.00%, 11/15/29 | | 3,000 | 3,151,230 |
| California Health Facilities Financing Authority, (City of Hope): | | | |
| 5.00%, 11/15/32 | | 735 | 735,265 |
| 5.00%, 11/15/35 | | 1,050 | 1,050,136 |
| California Health Facilities Financing Authority, (Lucile Packard Children's Hospital at Stanford): | | | |
| 5.00%, 5/15/26 | | 1,000 | 1,050,310 |
| 5.00%, 8/15/32 | | 1,210 | 1,248,587 |
| California Health Facilities Financing Authority, (Providence Health & Services), 5.00%, 10/1/44 | | 4,100 | 4,105,371 |
| California Health Facilities Financing Authority, (Providence St. Joseph Health), 5.00% to 10/1/27 (Put Date), 10/1/39 | | 2,275 | 2,386,998 |
| California Health Facilities Financing Authority, (St. Joseph Health System), Prerefunded to 7/1/23, 5.00%, 7/1/33 | | 1,500 | 1,520,235 |
| California Health Facilities Financing Authority, (Sutter Health), 5.00%, 11/15/26 | | 1,270 | 1,337,729 |
| California Municipal Finance Authority, (NorthBay Healthcare Group): | | | |
| 5.00%, 11/1/24 | | 800 | 814,032 |
| 5.00%, 11/1/25 | | 200 | 202,724 |
| 5.00%, 11/1/26 | | 500 | 515,915 |
| 5.00%, 11/1/27 | | 165 | 166,950 |
| 5.00%, 11/1/30 | | 150 | 151,277 |
| Series 2017A, 5.00%, 11/1/25 | | 800 | 819,992 |
| California Public Finance Authority, (Henry Mayo Newhall Hospital), 5.00%, 10/15/33 | | 425 | 431,303 |
| California Statewide Communities Development Authority, (Methodist Hospital of Southern California), 5.00%, 1/1/38 | | 2,000 | 1,998,440 |
| Oroville, CA, (Oroville Hospital), 5.25%, 4/1/49 | | 5,000 | 4,533,250 |
| | | | $ 45,445,984 |
| Housing — 0.8% |
| Independent Cities Finance Authority, CA, (Castle Mobile Estates), 3.00%, 5/15/36 | $ | 1,205 | $ 1,006,199 |
| Security | Principal
Amount
(000's omitted) | Value |
| Housing (continued) |
| Independent Cities Finance Authority, CA, (Union City Tropics), 5.00%, 5/15/48 | $ | 2,000 | $ 2,003,280 |
| Independent Cities Finance Authority, CA, (Vista de Santa Barbara Mobilehome Park), 3.00%, 9/15/36 | | 1,725 | 1,400,165 |
| | | | $ 4,409,644 |
| Industrial Development Revenue — 1.7% |
| California Municipal Finance Authority, (Waste Management, Inc.), (AMT), 2.95% to 12/1/22 (Put Date), 10/1/45(4) | $ | 6,500 | $ 6,490,640 |
| California Pollution Control Financing Authority, (Waste Management, Inc.): | | | |
| (AMT), 2.50% to 5/1/24 (Put Date), 11/1/38 | | 2,500 | 2,450,350 |
| (AMT), 3.375%, 7/1/25 | | 1,000 | 981,840 |
| | | | $ 9,922,830 |
| Insured - Electric Utilities — 0.5% |
| Puerto Rico Electric Power Authority: | | | |
| (NPFG), 5.00%, 7/1/23 | $ | 125 | $ 124,990 |
| (NPFG), 5.25%, 7/1/32 | | 2,100 | 2,067,765 |
| Series RR, (NPFG), 5.00%, 7/1/24 | | 300 | 299,976 |
| Series SS, (NPFG), 5.00%, 7/1/24 | | 130 | 129,990 |
| | | | $ 2,622,721 |
| Insured - Escrowed/Prerefunded — 0.3% |
| Compton Community College District, CA, (Election of 2014), (BAM), Prerefunded to 8/1/26, 5.00%, 8/1/36 | $ | 1,690 | $ 1,802,503 |
| | | | $ 1,802,503 |
| Insured - General Obligations — 4.3% |
| ABC Unified School District, CA, (Election of 1997), (NPFG), 0.00%, 8/1/25 | $ | 2,035 | $ 1,840,352 |
| Alameda Unified School District, CA, (Election of 2004), (AGM), 0.00%, 8/1/26 | | 1,000 | 868,230 |
| Cotati-Rohnert Park Unified School District, CA, (Election of 2016): | | | |
| (AGM), 5.00%, 8/1/33 | | 710 | 745,983 |
| (AGM), 5.00%, 8/1/34 | | 825 | 865,978 |
| (AGM), 5.00%, 8/1/35 | | 955 | 1,001,996 |
| (AGM), 5.00%, 8/1/36 | | 1,015 | 1,062,583 |
| (AGM), 5.00%, 8/1/37 | | 1,135 | 1,185,859 |
| (AGM), 5.00%, 8/1/38 | | 1,175 | 1,226,112 |
| Galt Joint Union High School District, CA, (Election of 2016): | | | |
| (BAM), 5.00%, 8/1/37 | | 500 | 521,865 |
| (BAM), 5.00%, 8/1/38 | | 500 | 520,300 |
18
See Notes to Financial Statements.
Eaton Vance
California Municipal Opportunities Fund
September 30, 2022
Portfolio of Investments — continued
| Security | Principal
Amount
(000's omitted) | Value |
| Insured - General Obligations (continued) |
| Galt Joint Union High School District, CA, (Election of 2016): (continued) | | | |
| (BAM), 5.00%, 8/1/43 | $ | 1,000 | $ 1,031,420 |
| Holtville Unified School District, CA, (AGM), 6.00%, 8/1/52(3) | | 1,000 | 1,139,800 |
| McFarland Unified School District, CA, (Election of 2020), (BAM), 5.25%, 11/1/49(3) | | 2,500 | 2,620,525 |
| Modesto High School District Stanislaus County, CA, (Election of 2001), (NPFG), 0.00%, 8/1/24 | | 1,375 | 1,290,616 |
| Palo Verde Unified School District, CA, (Election of 2018), (AGM), 5.50%, 8/1/50 | | 1,200 | 1,288,788 |
| Rio Elementary School District, CA, (Election of 2018), (BAM), 5.00%, 8/1/47 | | 1,750 | 1,813,595 |
| San Leandro Unified School District, CA, (Election of 2016), (BAM), 5.00%, 8/1/38 | | 1,000 | 1,053,750 |
| Ukiah Unified School District, CA, (Election of 2020): | | | |
| (AGM), 5.00%, 8/1/40 | | 1,000 | 1,040,520 |
| (AGM), 5.00%, 8/1/42 | | 1,085 | 1,120,914 |
| (AGM), 5.50%, 8/1/49(3) | | 2,350 | 2,527,036 |
| | | | $ 24,766,222 |
| Insured - Special Tax Revenue — 1.5% |
| Lake Elsinore School Financing Authority, CA: | | | |
| (BAM), 5.00%, 10/1/36 | $ | 1,570 | $ 1,683,966 |
| (BAM), 5.00%, 10/1/37 | | 470 | 501,950 |
| Murrieta Financing Authority, CA: | | | |
| (BAM), 5.00%, 9/1/25 | | 1,000 | 1,044,420 |
| (BAM), 5.00%, 9/1/27 | | 1,275 | 1,362,682 |
| (BAM), 5.00%, 9/1/28 | | 1,000 | 1,076,940 |
| RNR School Financing Authority Community Facilities District No. 92-1, CA: | | | |
| (BAM), 4.00%, 9/1/40 | | 1,000 | 913,740 |
| (BAM), 4.00%, 9/1/42 | | 1,000 | 901,680 |
| Successor Agency to San Francisco City and County Redevelopment Agency, CA, (NPFG), 5.00%, 8/1/41 | | 1,320 | 1,364,669 |
| | | | $ 8,850,047 |
| Insured - Transportation — 1.9% |
| Alameda Corridor Transportation Authority, CA, (AGM), (AMBAC), 0.00%, 10/1/26 | $ | 10,000 | $ 8,175,900 |
| Puerto Rico Highway and Transportation Authority, (AGC), 5.25%, 7/1/41 | | 1,125 | 1,096,616 |
| San Joaquin Hills Transportation Corridor Agency, CA, (NPFG), 0.00%, 1/15/24 | | 1,800 | 1,724,958 |
| | | | $ 10,997,474 |
| Security | Principal
Amount
(000's omitted) | Value |
| Lease Revenue/Certificates of Participation — 0.7% |
| Riverside County, CA, Tax and Revenue Anticipation Notes, 5.00%, 6/30/23 | $ | 4,000 | $ 4,056,680 |
| | | | $ 4,056,680 |
| Other Revenue — 2.7% |
| California Infrastructure and Economic Development Bank, (Academy of Motion Picture Arts and Sciences Obligated Group): | | | |
| 5.00%, 11/1/33 | $ | 1,740 | $ 1,763,090 |
| 5.00%, 11/1/34 | | 1,290 | 1,306,706 |
| California Infrastructure and Economic Development Bank, (California Academy of Sciences), Sustainability Bonds, 2.81%, (SIFMA + 0.35%), 8/1/24 (Put Date), 8/1/47(2) | | 7,380 | 7,301,624 |
| Los Angeles County, CA, Tax and Revenue Anticipation, 4.00%, 6/30/23 | | 5,030 | 5,064,305 |
| Morongo Band of Mission Indians, CA, 5.00%, 10/1/42(1) | | 440 | 454,238 |
| | | | $ 15,889,963 |
| Senior Living/Life Care — 1.2% |
| California Municipal Finance Authority, (HumanGood - California Obligated Group), 4.00%, 10/1/38 | $ | 3,790 | $ 3,467,395 |
| California Municipal Finance Authority, (Mt. San Antonio Gardens), 5.00%, 11/15/39 | | 1,000 | 986,370 |
| California Public Finance Authority, (Enso Village), Green Bonds, 2.125%, 11/15/27(1) | | 575 | 510,784 |
| California Statewide Communities Development Authority, (American Baptist Homes of the West): | | | |
| 5.00%, 10/1/23 | | 500 | 505,475 |
| 5.00%, 10/1/26 | | 500 | 513,665 |
| 5.00%, 10/1/27 | | 780 | 800,350 |
| | | | $ 6,784,039 |
| Special Tax Revenue — 4.8% |
| Chula Vista Municipal Financing Authority, CA, 5.50%, 9/1/30 | $ | 1,525 | $ 1,554,265 |
| Folsom Ranch Financing Authority, CA, (White Rock Springs Ranch): | | | |
| 3.00%, 9/1/24 | | 130 | 125,228 |
| 4.00%, 9/1/34 | | 115 | 105,630 |
| 4.00%, 9/1/35 | | 185 | 168,674 |
| 4.00%, 9/1/36 | | 195 | 176,424 |
| 4.00%, 9/1/37 | | 215 | 192,786 |
| 4.00%, 9/1/38 | | 230 | 204,109 |
| 4.00%, 9/1/39 | | 165 | 145,192 |
| Fontana Community Facilities District No. 90, CA, (Summit at Rosena Phase One): | | | |
| 4.00%, 9/1/26 | | 125 | 123,264 |
19
See Notes to Financial Statements.
Eaton Vance
California Municipal Opportunities Fund
September 30, 2022
Portfolio of Investments — continued
| Security | Principal
Amount
(000's omitted) | Value |
| Special Tax Revenue (continued) |
| Fontana Community Facilities District No. 90, CA, (Summit at Rosena Phase One): (continued) | | | |
| 4.00%, 9/1/27 | $ | 125 | $ 122,681 |
| 4.00%, 9/1/28 | | 130 | 126,890 |
| 4.00%, 9/1/29 | | 135 | 130,830 |
| 4.00%, 9/1/30 | | 135 | 129,300 |
| 4.00%, 9/1/32 | | 150 | 140,619 |
| 4.00%, 9/1/33 | | 205 | 190,125 |
| 4.00%, 9/1/41 | | 600 | 517,566 |
| 4.00%, 9/1/46 | | 975 | 804,960 |
| Irvine Community Facilities District No. 2013-3, CA, (Great Park): | | | |
| 5.00%, 9/1/30 | | 580 | 589,431 |
| 5.00%, 9/1/31 | | 465 | 471,966 |
| 5.00%, 9/1/33 | | 545 | 551,851 |
| 5.00%, 9/1/35 | | 1,150 | 1,179,371 |
| 5.00%, 9/1/38 | | 1,000 | 1,019,580 |
| Series 2014, 5.00%, 9/1/32 | | 450 | 456,269 |
| Series 2014, 5.00%, 9/1/34 | | 360 | 364,082 |
| Series 2018, 5.00%, 9/1/32 | | 625 | 646,600 |
| Series 2018, 5.00%, 9/1/34 | | 765 | 786,160 |
| Los Angeles County Community Facilities District No. 3, CA, (Valencia/Newhall Area), 5.00%, 9/1/23 | | 520 | 520,759 |
| Los Angeles County Metropolitan Transportation Authority, CA, Sales Tax Revenue: | | | |
| 5.00%, 6/1/35 | | 1,500 | 1,576,830 |
| Green Bonds, 5.00%, 7/1/44 | | 7,000 | 7,315,420 |
| Puerto Rico Sales Tax Financing Corp., 5.00%, 7/1/58 | | 3,615 | 3,200,359 |
| San Luis Obispo Community Facilities District No. 2019-1, CA, (San Luis Ranch): | | | |
| 3.00%, 9/1/24 | | 150 | 145,079 |
| 4.00%, 9/1/27 | | 130 | 128,662 |
| 4.00%, 9/1/29 | | 185 | 180,895 |
| 4.00%, 9/1/33 | | 125 | 116,938 |
| 4.00%, 9/1/36 | | 175 | 159,318 |
| 4.00%, 9/1/39 | | 200 | 177,032 |
| 4.00%, 9/1/41 | | 175 | 151,531 |
| South Orange County Public Financing Authority, CA, Special Tax Revenue, (Ladera Ranch): | | | |
| 5.00%, 8/15/27 | | 515 | 520,624 |
| 5.00%, 8/15/28 | | 775 | 783,354 |
| Successor Agency to San Francisco City and County Redevelopment Agency, CA, 5.00%, 8/1/37 | | 1,630 | 1,677,840 |
| | | | $ 27,678,494 |
| Security | Principal
Amount
(000's omitted) | Value |
| Transportation — 19.0% |
| Bay Area Toll Authority, CA, (San Francisco Bay Area): | | | |
| 2.74%, (SIFMA + 0.28%), 4/1/24 (Put Date), 4/1/56(2) | $ | 2,500 | $ 2,488,125 |
| 2.76%, (SIFMA + 0.30%), 4/1/27 (Put Date), 4/1/56(2) | | 5,000 | 4,851,150 |
| 2.91%, (SIFMA + 0.45%), 4/1/26 (Put Date), 4/1/56(2) | | 800 | 787,144 |
| California Municipal Finance Authority, (LINXS Automated People Mover): | | | |
| (AMT), 5.00%, 12/31/37 | | 2,570 | 2,566,993 |
| (AMT), 5.00%, 12/31/43 | | 4,220 | 4,110,702 |
| (AMT), 5.00%, 12/31/47 | | 2,200 | 2,112,330 |
| Long Beach, CA, Harbor Revenue, (AMT), 5.00%, 5/15/30 | | 500 | 527,140 |
| Los Angeles Department of Airports, CA, (Los Angeles International Airport): | | | |
| (AMT), 5.00%, 5/15/23 | | 1,000 | 1,008,480 |
| (AMT), 5.00%, 5/15/24 | | 3,750 | 3,824,700 |
| (AMT), 5.00%, 5/15/24 | | 1,000 | 1,019,920 |
| (AMT), 5.00%, 5/15/25 | | 1,500 | 1,545,945 |
| (AMT), 5.00%, 5/15/25 | | 1,185 | 1,221,297 |
| (AMT), 5.00%, 5/15/26 | | 4,000 | 4,148,920 |
| (AMT), 5.00%, 5/15/26 | | 4,725 | 4,900,912 |
| (AMT), 5.00%, 5/15/27 | | 1,230 | 1,283,948 |
| (AMT), 5.00%, 5/15/28 | | 1,310 | 1,371,112 |
| (AMT), 5.00%, 5/15/28 | | 2,190 | 2,292,163 |
| (AMT), 5.00%, 5/15/29 | | 1,000 | 1,050,330 |
| (AMT), 5.00%, 5/15/36 | | 5,900 | 6,034,638 |
| (AMT), 5.00%, 5/15/44 | | 2,000 | 2,003,800 |
| (AMT), 5.00%, 5/15/46 | | 8,165 | 8,171,450 |
| (AMT), 5.00%, 5/15/47 | | 2,005 | 2,005,922 |
| (AMT), 5.50%, 5/15/47 | | 10,000 | 10,520,900 |
| Los Angeles Harbor Department, CA: | | | |
| 4.00%, 8/1/36 | | 1,005 | 975,172 |
| (AMT), 5.00%, 8/1/28 | | 2,145 | 2,198,089 |
| Port of Oakland, CA, (AMT), 5.00%, 5/1/27 | | 1,250 | 1,312,450 |
| San Diego County Regional Airport Authority, CA: | | | |
| 5.00%, 7/1/51 | | 4,000 | 4,043,560 |
| (AMT), 4.00%, 7/1/44 | | 1,000 | 863,550 |
| San Francisco City and County Airport Commission, CA, (San Francisco International Airport): | | | |
| (AMT), 5.00%, 5/1/41 | | 9,355 | 9,384,936 |
| (AMT), 5.00%, 5/1/43 | | 5,015 | 5,019,062 |
| (AMT), 5.00%, 5/1/46 | | 2,680 | 2,680,402 |
| (AMT), 5.00%, 5/1/48 | | 5,000 | 4,999,900 |
| San Francisco Municipal Transportation Agency, CA, Green Bonds, 5.00%, 3/1/51 | | 2,285 | 2,397,673 |
20
See Notes to Financial Statements.
Eaton Vance
California Municipal Opportunities Fund
September 30, 2022
Portfolio of Investments — continued
| Security | Principal
Amount
(000's omitted) | Value |
| Transportation (continued) |
| San Jose, CA, Airport Revenue: | | | |
| (AMT), 5.00%, 3/1/25 | $ | 1,575 | $ 1,615,730 |
| (AMT), 5.00%, 3/1/37 | | 1,735 | 1,751,968 |
| (AMT), 5.00%, 3/1/47 | | 3,000 | 3,000,180 |
| | | | $110,090,693 |
| Water and Sewer — 7.4% |
| Anaheim Housing and Public Improvements Authority, CA, (Water System), 5.00%, 10/1/52 | $ | 8,345 | $ 8,622,388 |
| California Department of Water Resources, 5.00%, 12/1/24 | | 1,260 | 1,312,265 |
| East Bay Municipal Utility District, CA, Water System Revenue, 5.00%, 6/1/32 | | 1,500 | 1,569,150 |
| Los Angeles Department of Airports, CA, (Los Angeles International Airport), 5.00%, 7/1/47 | | 3,475 | 3,648,159 |
| Los Angeles, CA, Wastewater System Revenue, 5.00%, 6/1/25 | | 2,000 | 2,098,360 |
| Metropolitan Water District of Southern California: | | | |
| 2.60%, (SIFMA + 0.14%), 5/21/24 (Put Date), 7/1/37(2) | | 14,330 | 14,258,350 |
| 5.00%, 10/1/26 | | 6,250 | 6,704,500 |
| Ross Valley Public Financing Authority, CA, (Sanitary District No. 1 of Marin County), 5.00%, 1/1/39 | | 500 | 513,015 |
| San Francisco City and County Public Utilities Commission, CA, Wastewater Revenue, Green Bonds, 4.00%, 10/1/51 | | 5,000 | 4,436,500 |
| | | | $ 43,162,687 |
Total Tax-Exempt Municipal Obligations
(identified cost $556,224,450) | | | $538,440,293 |
| Taxable Municipal Obligations — 6.3% |
| Security | Principal
Amount
(000's omitted) | Value |
| Education — 0.4% |
| California Municipal Finance Authority, (Albert Einstein Academies), 3.75%, 8/1/31(1) | $ | 2,675 | $ 2,342,203 |
| California School Finance Authority, (Granada Hills Charter Obligated Group), 2.00%, 7/1/24(1) | | 205 | 193,975 |
| | | | $ 2,536,178 |
| General Obligations — 1.0% |
| Alameda County, CA, 3.28%, 8/1/23 | $ | 2,250 | $ 2,233,103 |
| Ohlone Community College District, CA, 2.243%, 8/1/33 | | 220 | 171,217 |
| Security | Principal
Amount
(000's omitted) | Value |
| General Obligations (continued) |
| Ojai Unified School District, CA, 2.019%, 8/1/31 | $ | 480 | $ 380,726 |
| Palmdale School District, CA, 1.67%, 8/1/29 | | 500 | 414,735 |
| Puerto Rico, GO Contingent Value Instrument, 0.00%, 11/1/43 | | 888 | 444,885 |
| San Mateo Union High School District, CA, 2.111%, 9/1/34 | | 1,220 | 912,877 |
| Tustin Unified School District, CA: | | | |
| 1.954%, 8/1/33 | | 590 | 445,822 |
| 2.649%, 8/1/42 | | 1,125 | 781,965 |
| | | | $ 5,785,330 |
| Hospital — 0.7% |
| California Statewide Communities Development Authority, (Loma Linda University Medical Center), 6.00%, 12/1/24 | $ | 4,000 | $ 4,102,440 |
| | | | $ 4,102,440 |
| Housing — 0.5% |
| Independent Cities Finance Authority, CA, (Sahara Mobile Home Park): | | | |
| 3.20%, 6/15/41 | $ | 775 | $ 559,697 |
| 3.20%, 6/15/56 | | 3,685 | 2,342,960 |
| | | | $ 2,902,657 |
| Insured - General Obligations — 0.4% |
| Byron Union School District, CA: | | | |
| (BAM), 2.10%, 8/1/30 | $ | 345 | $ 279,698 |
| (BAM), 2.20%, 8/1/31 | | 380 | 302,028 |
| Mojave Unified School District, CA, (BAM), 2.731%, 8/1/37 | | 500 | 370,650 |
| Oak Grove School District, CA: | | | |
| (BAM), 2.397%, 8/1/34 | | 275 | 210,405 |
| (BAM), 2.497%, 8/1/35 | | 285 | 216,355 |
| (BAM), 2.597%, 8/1/36 | | 290 | 218,486 |
| Sanger Unified School District, CA, (BAM), 2.371%, 8/1/35 | | 445 | 328,165 |
| Santa Rosa High School District, CA: | | | |
| (BAM), 1.676%, 8/1/28 | | 255 | 216,314 |
| (BAM), 1.932%, 8/1/29 | | 220 | 184,325 |
| | | | $ 2,326,426 |
| Insured - Lease Revenue/Certificates of Participation — 1.2% |
| Anaheim, CA, Public Financing Authority, (Public Improvements), (AGM), 1.643%, 7/1/25 | $ | 7,850 | $ 7,183,457 |
| | | | $ 7,183,457 |
21
See Notes to Financial Statements.
Eaton Vance
California Municipal Opportunities Fund
September 30, 2022
Portfolio of Investments — continued
| Security | Principal
Amount
(000's omitted) | Value |
| Insured - Special Tax Revenue — 0.5% |
| Rio Elementary School District Community Facilities District No. 1, CA: | | | |
| (BAM), 1.826%, 9/1/28 | $ | 1,000 | $ 832,100 |
| (BAM), 2.307%, 9/1/31 | | 1,500 | 1,188,780 |
| Successor Agency to West Hollywood Community Development Commission, CA: | | | |
| (AGM), 1.668%, 9/1/28 | | 400 | 334,624 |
| (AGM), 1.847%, 9/1/29 | | 385 | 315,904 |
| | | | $ 2,671,408 |
| Insured - Transportation — 0.1% |
| Alameda Corridor Transportation Authority, CA, (AMBAC), 0.00%, 10/1/27 | $ | 740 | $ 566,233 |
| | | | $ 566,233 |
| Lease Revenue/Certificates of Participation — 0.3% |
| Downey, CA, Pension Obligation Bonds: | | | |
| 1.95%, 6/1/31 | $ | 185 | $ 145,064 |
| 2.05%, 6/1/32 | | 850 | 653,718 |
| Monterey Park, CA, Pension Obligation Bonds: | | | |
| 2.193%, 6/1/33 | | 560 | 424,514 |
| 2.293%, 6/1/34 | | 750 | 557,865 |
| | | | $ 1,781,161 |
| Other Revenue — 0.2% |
| Manhattan Beach, CA, Pension Obligation Bonds: | | | |
| 2.141%, 1/1/30 | $ | 400 | $ 332,108 |
| 2.241%, 1/1/31 | | 400 | 326,248 |
| 2.491%, 1/1/33 | | 675 | 539,426 |
| | | | $ 1,197,782 |
| Special Tax Revenue — 1.0% |
| Riverside Unified School District Financing Authority, CA, 1.463%, 9/1/25 | $ | 800 | $ 729,328 |
| San Francisco Bay Area Rapid Transit District, CA, Sales Tax Revenue, Green Bond, 2.621%, 7/1/23 | | 4,050 | 4,000,347 |
| Successor Agency to San Diego Redevelopment Agency, CA: | | | |
| 3.375%, 9/1/23 | | 250 | 247,688 |
| 3.50%, 9/1/24 | | 250 | 244,605 |
| 3.625%, 9/1/25 | | 250 | 242,365 |
| Security | Principal
Amount
(000's omitted) | Value |
| Special Tax Revenue (continued) |
| Successor Agency to San Diego Redevelopment Agency, CA: (continued) | | | |
| 3.75%, 9/1/26 | $ | 250 | $ 240,500 |
| | | | $ 5,704,833 |
Total Taxable Municipal Obligations
(identified cost $41,982,766) | | | $ 36,757,905 |
Total Investments — 99.9%
(identified cost $603,155,663) | | | $579,615,668 |
| Other Assets, Less Liabilities — 0.1% | | | $ 490,211 |
| Net Assets — 100.0% | | | $580,105,879 |
| The percentage shown for each investment category in the Portfolio of Investments is based on net assets. |
| (1) | Security exempt from registration under Rule 144A of the Securities Act of 1933, as amended. These securities may be sold in certain transactions in reliance on an exemption from registration (normally to qualified institutional buyers). At September 30, 2022, the aggregate value of these securities is $9,843,324 or 1.7% of the Fund's net assets. |
| (2) | Floating rate security. The stated interest rate represents the rate in effect at September 30, 2022. |
| (3) | When-issued security. |
| (4) | Variable rate security that may be tendered at par quarterly. The stated interest rate, which resets quarterly, is determined by the remarketing agent and represents the rate in effect at September 30, 2022. |
| The Fund invests primarily in debt securities issued by California municipalities. The ability of the issuers of the debt securities to meet their obligations may be affected by economic developments in a specific industry or municipality. At September 30, 2022, 10.7% of total investments are backed by bond insurance of various financial institutions and financial guaranty assurance agencies. The aggregate percentage insured by an individual financial institution or financial guaranty assurance agency ranged from 0.2% to 5.2% of total investments. |
| Abbreviations: |
| AGC | – Assured Guaranty Corp. |
| AGM | – Assured Guaranty Municipal Corp. |
| AMBAC | – AMBAC Financial Group, Inc. |
| AMT | – Interest earned from these securities may be considered a tax preference item for purposes of the Federal Alternative Minimum Tax. |
| BAM | – Build America Mutual Assurance Co. |
| NPFG | – National Public Finance Guarantee Corp. |
| SIFMA | – Securities Industry and Financial Markets Association Municipal Swap Index |
22
See Notes to Financial Statements.
Eaton Vance
Massachusetts Municipal Income Fund
September 30, 2022
| Tax-Exempt Municipal Obligations — 94.8% |
| Security | Principal
Amount
(000's omitted) | Value |
| Bond Bank — 2.6% |
| Massachusetts Water Pollution Abatement Trust, 5.25%, 8/1/34 | $ | 3,105 | $ 3,589,225 |
| | | | $ 3,589,225 |
| Education — 27.8% |
| Massachusetts Development Finance Agency, (Babson College), 5.00%, 10/1/42 | $ | 1,500 | $ 1,521,180 |
| Massachusetts Development Finance Agency, (Bentley University), 4.00%, 7/1/39 | | 1,400 | 1,252,370 |
| Massachusetts Development Finance Agency, (Berklee College of Music), 5.00%, 10/1/39 | | 2,000 | 2,043,840 |
| Massachusetts Development Finance Agency, (Boston University): | | | |
| 4.00%, 10/1/46 | | 2,750 | 2,446,098 |
| 5.00%, 10/1/46 | | 3,000 | 3,078,360 |
| 5.45%, 5/15/59 | | 400 | 444,188 |
| Massachusetts Development Finance Agency, (Dexter Southfield): | | | |
| 5.00%, 5/1/33 | | 1,550 | 1,585,883 |
| 5.00%, 5/1/35 | | 1,660 | 1,696,404 |
| Massachusetts Development Finance Agency, (Northeastern University), 5.00%, 3/1/33 | | 1,950 | 1,959,984 |
| Massachusetts Development Finance Agency, (Olin College), 5.00%, 11/1/38 | | 1,750 | 1,759,625 |
| Massachusetts Development Finance Agency, (Springfield College), Green Bonds, 4.00%, 6/1/56 | | 2,700 | 2,097,765 |
| Massachusetts Development Finance Agency, (Suffolk University): | | | |
| 5.00%, 7/1/31 | | 620 | 641,055 |
| 5.00%, 7/1/32 | | 770 | 791,190 |
| 5.00%, 7/1/38 | | 340 | 340,809 |
| Massachusetts Development Finance Agency, (Wentworth Institute of Technology), 5.00%, 10/1/36 | | 1,575 | 1,584,749 |
| Massachusetts Development Finance Agency, (Williams College), 5.00%, 7/1/46 | | 2,000 | 2,043,140 |
| Massachusetts Development Finance Agency, (Worcester Polytechnic Institute), 5.00%, 9/1/45 | | 5,000 | 5,068,850 |
| Massachusetts Health and Educational Facilities Authority, (Massachusetts Institute of Technology), 5.50%, 7/1/32 | | 5,000 | 5,850,350 |
| University of Massachusetts Building Authority, 5.00%, 11/1/41 | | 2,365 | 2,508,082 |
| | | | $ 38,713,922 |
| Security | Principal
Amount
(000's omitted) | Value |
| Escrowed/Prerefunded — 2.2% |
| Massachusetts Development Finance Agency, (Children's Hospital), Prerefunded to 10/1/24, 5.00%, 10/1/31 | $ | 1,840 | $ 1,905,357 |
| Massachusetts Development Finance Agency, (Partners HealthCare System), Prerefunded to 7/1/23, 5.00%, 7/1/44 | | 1,100 | 1,114,916 |
| | | | $ 3,020,273 |
| General Obligations — 20.5% |
| Andover, MA, 4.00%, 7/15/52 | $ | 2,000 | $ 1,782,660 |
| Belmont, MA: | | | |
| 4.00%, 2/15/30 | | 1,245 | 1,282,188 |
| 4.00%, 2/15/31 | | 1,045 | 1,070,592 |
| 4.00%, 3/15/31 | | 2,910 | 2,981,528 |
| Framingham, MA: | | | |
| 5.00%, 8/1/38 | | 1,010 | 1,088,578 |
| 5.00%, 8/1/39 | | 1,025 | 1,102,500 |
| Franklin, MA: | | | |
| 4.00%, 5/15/32 | | 455 | 464,541 |
| 4.00%, 5/15/33 | | 455 | 460,797 |
| Lexington, MA, 4.00%, 2/1/29 | | 1,855 | 1,920,722 |
| Lincoln, MA: | | | |
| 4.00%, 3/1/30 | | 2,120 | 2,183,621 |
| 4.00%, 3/1/31 | | 2,205 | 2,259,133 |
| Manchester Essex Regional School District, MA: | | | |
| 4.00%, 2/1/41 | | 1,075 | 982,195 |
| 4.00%, 2/1/42 | | 975 | 889,366 |
| Massachusetts, 5.00%, 3/1/31 | | 3,000 | 3,069,630 |
| Norwood, MA, Chapter 70B, 4.00%, 9/15/47 | | 2,500 | 2,213,625 |
| Quincy, MA, 4.00%, 7/7/23 | | 2,000 | 2,012,360 |
| Shrewsbury, MA, 4.00%, 7/15/33 | | 2,370 | 2,399,649 |
| Swampscott, MA, 5.00%, 1/15/26 | | 355 | 376,680 |
| | | | $ 28,540,365 |
| Hospital — 10.7% |
| Massachusetts Development Finance Agency, (Beth Israel Lahey Health): | | | |
| 5.00%, 7/1/33 | $ | 625 | $ 650,188 |
| 5.00%, 7/1/38 | | 600 | 601,770 |
| Massachusetts Development Finance Agency, (Boston Medical Center), Green Bonds, 5.00%, 7/1/44 | | 2,500 | 2,432,075 |
| Massachusetts Development Finance Agency, (CareGroup), 5.00%, 7/1/27 | | 1,000 | 1,037,840 |
| Massachusetts Development Finance Agency, (Dana-Farber Cancer Institute), 5.00%, 12/1/36 | | 1,690 | 1,722,701 |
| Massachusetts Development Finance Agency, (Lahey Health System Obligated Group), 5.00%, 8/15/40 | | 2,000 | 1,998,200 |
23
See Notes to Financial Statements.
Eaton Vance
Massachusetts Municipal Income Fund
September 30, 2022
Portfolio of Investments — continued
| Security | Principal
Amount
(000's omitted) | Value |
| Hospital (continued) |
| Massachusetts Development Finance Agency, (Partners HealthCare System): | | | |
| 5.00%, 7/1/37 | $ | 1,600 | $ 1,663,344 |
| 5.00%, 7/1/47 | | 2,000 | 2,000,020 |
| Massachusetts Development Finance Agency, (South Shore Hospital), 5.00%, 7/1/41 | | 2,795 | 2,756,429 |
| | | | $ 14,862,567 |
| Housing — 3.5% |
| Massachusetts Housing Finance Agency, (Mill Road Apartments), 3.01%, (SIFMA + 0.55%), 11/1/23 (Put Date), 11/1/48(1) | $ | 2,935 | $ 2,935,000 |
| Massachusetts Housing Finance Agency, Sustainability Bonds: | | | |
| 2.15%, 6/1/24 | | 1,000 | 978,480 |
| 2.65%, 6/1/26 | | 1,000 | 963,840 |
| | | | $ 4,877,320 |
| Industrial Development Revenue — 0.9% |
| National Finance Authority, NH, (Covanta): | | | |
| 4.625%, 11/1/42(2) | $ | 670 | $ 575,885 |
| (AMT), 4.875%, 11/1/42(2) | | 740 | 657,794 |
| | | | $ 1,233,679 |
| Insured - Education — 4.4% |
| Massachusetts Development Finance Agency, (College of the Holy Cross), (AMBAC), 5.25%, 9/1/32(3) | $ | 5,460 | $ 6,156,477 |
| | | | $ 6,156,477 |
| Insured - Special Tax Revenue — 5.3% |
| Martha's Vineyard Land Bank, MA, (BAM), 5.00%, 5/1/26 | $ | 1,760 | $ 1,821,143 |
| Massachusetts, Dedicated Tax Revenue, (NPFG), 5.50%, 1/1/30 | | 4,955 | 5,553,861 |
| | | | $ 7,375,004 |
| Senior Living/Life Care — 2.2% |
| Massachusetts Development Finance Agency, (Carleton-Willard Village): | | | |
| 4.00%, 12/1/42 | $ | 490 | $ 420,949 |
| 5.00%, 12/1/42 | | 525 | 519,745 |
| Massachusetts Development Finance Agency, (Linden Ponds, Inc.): | | | |
| 5.00%, 11/15/33(2) | | 205 | 209,897 |
| 5.00%, 11/15/38(2) | | 135 | 135,439 |
| Massachusetts Development Finance Agency, (Loomis Communities), 4.00%, 1/1/51 | | 690 | 550,786 |
| Security | Principal
Amount
(000's omitted) | Value |
| Senior Living/Life Care (continued) |
| Massachusetts Development Finance Agency, (Salem Community Corp.): | | | |
| 5.00%, 1/1/23 | $ | 445 | $ 445,049 |
| 5.00%, 1/1/24 | | 345 | 344,520 |
| 5.00%, 1/1/25 | | 365 | 363,595 |
| | | | $ 2,989,980 |
| Special Tax Revenue — 3.7% |
| American Samoa Economic Development Authority, 5.00%, 9/1/38(2) | $ | 300 | $ 303,282 |
| Massachusetts Bay Transportation Authority, Sales Tax Revenue: | | | |
| 4.00%, 7/1/39 | | 2,170 | 2,042,621 |
| 5.25%, 7/1/31 | | 1,240 | 1,422,156 |
| Puerto Rico Sales Tax Financing Corp., 5.00%, 7/1/58 | | 1,470 | 1,301,391 |
| | | | $ 5,069,450 |
| Student Loan — 2.0% |
| Massachusetts Educational Financing Authority: | | | |
| (AMT), 3.625%, 7/1/38 | $ | 2,000 | $ 1,732,980 |
| (AMT), 5.00%, 7/1/23 | | 1,000 | 1,010,910 |
| | | | $ 2,743,890 |
| Transportation — 8.8% |
| Massachusetts Port Authority: | | | |
| (AMT), 4.00%, 7/1/46 | $ | 3,000 | $ 2,537,580 |
| (AMT), 5.00%, 7/1/31 | | 1,555 | 1,629,049 |
| (AMT), 5.00%, 7/1/34 | | 2,110 | 2,156,061 |
| Green Bonds, (AMT), 5.00%, 7/1/41 | | 2,030 | 2,071,493 |
| Massachusetts, (Accelerated Bridge Program), 5.00%, 6/15/27 | | 2,000 | 2,063,240 |
| Massachusetts, (Rail Enhancement Program), Sustainability Bonds, 5.00%, 6/1/50 | | 1,750 | 1,836,853 |
| | | | $ 12,294,276 |
| Water and Sewer — 0.2% |
| Springfield Water and Sewer Commission, MA, 4.00%, 4/15/33 | $ | 335 | $ 336,142 |
| | | | $ 336,142 |
Total Tax-Exempt Municipal Obligations
(identified cost $136,413,785) | | | $131,802,570 |
24
See Notes to Financial Statements.
Eaton Vance
Massachusetts Municipal Income Fund
September 30, 2022
Portfolio of Investments — continued
| Taxable Municipal Obligations — 4.5% |
| Security | Principal
Amount
(000's omitted) | Value |
| Education — 1.7% |
| University of Massachusetts Building Authority, 2.917%, 11/1/33 | $ | 2,850 | $ 2,336,145 |
| | | | $ 2,336,145 |
| General Obligations — 2.1% |
| Massachusetts, Special Obligation Revenue Bonds, Social Bonds, 3.564%, 7/15/23 | $ | 3,000 | $ 2,982,450 |
| | | | $ 2,982,450 |
| Insured - Hospital — 0.7% |
| Massachusetts Development Finance Agency, (Wellforce), (AGM), 3.89%, 7/1/25 | $ | 1,000 | $ 967,580 |
| | | | $ 967,580 |
Total Taxable Municipal Obligations
(identified cost $6,850,000) | | | $ 6,286,175 |
Total Investments — 99.3%
(identified cost $143,263,785) | | | $138,088,745 |
| Other Assets, Less Liabilities — 0.7% | | | $ 956,041 |
| Net Assets — 100.0% | | | $139,044,786 |
| The percentage shown for each investment category in the Portfolio of Investments is based on net assets. |
| (1) | Floating rate security. The stated interest rate represents the rate in effect at September 30, 2022. |
| (2) | Security exempt from registration under Rule 144A of the Securities Act of 1933, as amended. These securities may be sold in certain transactions in reliance on an exemption from registration (normally to qualified institutional buyers). At September 30, 2022, the aggregate value of these securities is $1,882,296 or 1.4% of the Fund's net assets. |
| (3) | Security represents the municipal bond held by a trust that issues residual interest bonds (see Note 1H). |
| The Fund invests primarily in debt securities issued by Massachusetts municipalities. The ability of the issuers of the debt securities to meet their obligations may be affected by economic developments in a specific industry or municipality. At September 30, 2022, 10.5% of total investments are backed by bond insurance of various financial institutions and financial guaranty assurance agencies. The aggregate percentage insured by an individual financial institution or financial guaranty assurance agency ranged from 0.7% to 4.5% of total investments. |
| Abbreviations: |
| AGM | – Assured Guaranty Municipal Corp. |
| AMBAC | – AMBAC Financial Group, Inc. |
| AMT | – Interest earned from these securities may be considered a tax preference item for purposes of the Federal Alternative Minimum Tax. |
| BAM | – Build America Mutual Assurance Co. |
| NPFG | – National Public Finance Guarantee Corp. |
| SIFMA | – Securities Industry and Financial Markets Association Municipal Swap Index |
25
See Notes to Financial Statements.
Eaton Vance
New York Municipal Income Fund
September 30, 2022
| Security | Principal
Amount
(000's omitted) | Value |
| Hospital — 0.4% |
| Montefiore Obligated Group, 4.287%, 9/1/50 | $ | 2,080 | $ 1,311,164 |
Total Corporate Bonds
(identified cost $2,080,000) | | | $ 1,311,164 |
| Tax-Exempt Municipal Obligations — 94.8% |
| Security | Principal
Amount
(000's omitted) | Value |
| Bond Bank — 0.7% |
| New York State Environmental Facilities Corp., (New York City Municipal Water Finance Authority), 5.00%, 6/15/36 | $ | 1,140 | $ 1,225,682 |
| New York State Environmental Facilities Corp., (State Revolving Fund): | | | |
| Green Bonds, 4.00%, 10/15/34 | | 400 | 398,964 |
| Green Bonds, 4.00%, 10/15/38 | | 750 | 709,845 |
| | | | $ 2,334,491 |
| Cogeneration — 0.2% |
| Suffolk County Industrial Development Agency, NY, (Nissequogue Cogeneration Partners Facility), (AMT), 5.50%, 1/1/23 | $ | 845 | $ 845,330 |
| | | | $ 845,330 |
| Education — 10.7% |
| Albany Capital Resource Corp., NY, (Albany College of Pharmacy and Health Sciences), 5.00%, 12/1/30 | $ | 250 | $ 253,558 |
| Albany Capital Resource Corp., NY, (Empire Commons Student Housing, Inc.): | | | |
| 5.00%, 5/1/28 | | 300 | 307,578 |
| 5.00%, 5/1/29 | | 540 | 552,204 |
| 5.00%, 5/1/30 | | 635 | 647,662 |
| 5.00%, 5/1/31 | | 450 | 458,528 |
| 5.00%, 5/1/32 | | 1,095 | 1,110,319 |
| Build NYC Resource Corp., NY, (Academic Leadership Charter School), 4.00%, 6/15/36 | | 200 | 174,172 |
| Build NYC Resource Corp., NY, (New World Preparatory Charter School): | | | |
| 4.00%, 6/15/31 | | 240 | 220,039 |
| 4.00%, 6/15/41 | | 315 | 254,189 |
| Dutchess County Local Development Corp., NY, (Culinary Institute of America), 4.00%, 7/1/37 | | 250 | 219,350 |
| Security | Principal
Amount
(000's omitted) | Value |
| Education (continued) |
| Monroe County Industrial Development Corp., NY, (Nazareth College of Rochester): | | | |
| 5.00%, 10/1/31 | $ | 235 | $ 240,215 |
| 5.00%, 10/1/32 | | 260 | 265,114 |
| Monroe County Industrial Development Corp., NY, (True North Rochester Preparatory Charter School): | | | |
| 5.00%, 6/1/40(1) | | 430 | 412,099 |
| 5.00%, 6/1/50(1) | | 1,640 | 1,507,390 |
| New York Dormitory Authority, (Barnard College), 4.00%, 7/1/49 | | 2,000 | 1,639,540 |
| New York Dormitory Authority, (Brooklyn Law School), 5.00%, 7/1/33 | | 1,650 | 1,680,706 |
| New York Dormitory Authority, (Columbia University), 5.00%, 10/1/38 | | 8,910 | 9,518,909 |
| New York Dormitory Authority, (Iona College): | | | |
| 5.00%, 7/1/29 | | 150 | 156,050 |
| 5.00%, 7/1/32 | | 275 | 283,088 |
| 5.00%, 7/1/46 | | 375 | 366,101 |
| New York Dormitory Authority, (New York University): | | | |
| 4.00%, 7/1/39 | | 1,260 | 1,169,267 |
| 5.00%, 7/1/51 | | 2,750 | 2,865,527 |
| New York Dormitory Authority, (Rochester Institute of Technology), 5.00%, 7/1/40 | | 1,265 | 1,307,504 |
| New York Dormitory Authority, (State University of New York): | | | |
| 5.00%, 7/1/30 | | 750 | 818,512 |
| 5.00%, 7/1/32 | | 400 | 439,416 |
| Saratoga County Capital Resource Corp., NY, (Skidmore College), 5.00%, 7/1/45 | | 1,320 | 1,362,504 |
| St. Lawrence County Industrial Development Agency, NY, (Clarkson University): | | | |
| Series 2021A, 5.00%, 9/1/36 | | 100 | 101,536 |
| Series 2021A, 5.00%, 9/1/37 | | 130 | 131,669 |
| Series 2021A, 5.00%, 9/1/38 | | 125 | 126,188 |
| Series 2021A, 5.00%, 9/1/39 | | 125 | 125,933 |
| Series 2021A, 5.00%, 9/1/40 | | 100 | 100,516 |
| Series 2021A, 5.00%, 9/1/41 | | 125 | 125,398 |
| Series 2021B, 5.00%, 9/1/34 | | 235 | 239,533 |
| Series 2021B, 5.00%, 9/1/35 | | 230 | 233,926 |
| Series 2021B, 5.00%, 9/1/36 | | 250 | 253,840 |
| Series 2021B, 5.00%, 9/1/37 | | 260 | 263,338 |
| Series 2021B, 5.00%, 9/1/38 | | 210 | 211,995 |
| Series 2021B, 5.00%, 9/1/39 | | 200 | 201,492 |
| Series 2021B, 5.00%, 9/1/40 | | 250 | 251,290 |
| Series 2021B, 5.00%, 9/1/41 | | 250 | 250,795 |
26
See Notes to Financial Statements.
Eaton Vance
New York Municipal Income Fund
September 30, 2022
Portfolio of Investments — continued
| Security | Principal
Amount
(000's omitted) | Value |
| Education (continued) |
| Troy Capital Resource Corp., NY, (Rensselaer Polytechnic Institute): | | | |
| 5.00%, 9/1/37 | $ | 1,250 | $ 1,290,275 |
| 5.00%, 9/1/38 | | 3,925 | 4,041,926 |
| Yonkers Economic Development Corp., NY, (Lamartine/Warburton, LLC - Charter School of Educational Excellence), 5.00%, 10/15/40 | | 775 | 708,644 |
| | | | $ 36,887,835 |
| Electric Utilities — 7.6% |
| Long Island Power Authority, NY, Electric System Revenue: | | | |
| 4.00%, 9/1/38 | $ | 2,900 | $ 2,658,111 |
| 5.00%, 9/1/35 | | 2,400 | 2,522,256 |
| 5.00%, 9/1/39 | | 2,500 | 2,600,275 |
| New York Power Authority, Green Bonds, 4.00%, 11/15/50 | | 7,925 | 6,977,645 |
| Utility Debt Securitization Authority, NY: | | | |
| 5.00%, 6/15/26 | | 2,485 | 2,556,270 |
| 5.00%, 12/15/26 | | 2,600 | 2,695,056 |
| 5.00%, 12/15/33 | | 2,895 | 2,950,092 |
| 5.00%, 9/15/52 | | 3,050 | 3,226,168 |
| | | | $ 26,185,873 |
| Escrowed/Prerefunded — 3.0% |
| Sales Tax Asset Receivable Corp., NY: | | | |
| Prerefunded to 10/15/24, 5.00%, 10/15/27 | $ | 5,000 | $ 5,175,900 |
| Prerefunded to 10/15/24, 5.00%, 10/15/28 | | 5,000 | 5,175,900 |
| | | | $ 10,351,800 |
| General Obligations — 8.7% |
| Bedford Village Fire District, NY: | | | |
| 2.00%, 11/15/33 | $ | 420 | $ 335,097 |
| 2.00%, 11/15/34 | | 430 | 334,609 |
| 2.00%, 11/15/35 | | 490 | 359,846 |
| East Meadow Union Free School District, NY: | | | |
| 2.00%, 6/15/33 | | 950 | 737,988 |
| 2.00%, 6/15/34 | | 970 | 729,974 |
| 3.00%, 6/15/32 | | 920 | 834,937 |
| New York City, NY: | | | |
| 5.00%, 8/1/27 | | 2,000 | 2,150,180 |
| 5.50%, 5/1/44 | | 2,500 | 2,729,325 |
| 5.50%, 5/1/46 | | 2,600 | 2,829,008 |
| New York Thruway Authority, 4.00%, 1/1/41 | | 3,000 | 2,712,390 |
| New York, NY: | | | |
| 4.00%, 9/1/46 | | 2,000 | 1,792,760 |
| Security | Principal
Amount
(000's omitted) | Value |
| General Obligations (continued) |
| New York, NY: (continued) | | | |
| 5.25%, 9/1/43 | $ | 2,500 | $ 2,683,125 |
| North Hempstead, NY, 2.00%, 9/15/35 | | 170 | 122,368 |
| Pelham Union Free School District, NY: | | | |
| 2.00%, 11/1/31 | | 2,180 | 1,822,524 |
| 2.00%, 11/1/32 | | 1,445 | 1,174,539 |
| 2.00%, 11/1/33 | | 530 | 417,985 |
| 2.00%, 11/1/34 | | 2,015 | 1,548,527 |
| 2.00%, 11/1/35 | | 2,225 | 1,625,919 |
| Puerto Rico, 5.625%, 7/1/29 | | 2,250 | 2,305,125 |
| Suffolk County, NY, 5.00%, 6/15/31 | | 1,775 | 1,920,745 |
| Valley Stream, NY: | | | |
| 2.25%, 5/15/27 | | 250 | 227,773 |
| 2.375%, 5/15/28 | | 255 | 229,418 |
| Westchester County, NY, 2.00%, 10/15/33 | | 510 | 387,508 |
| | | | $ 30,011,670 |
| Hospital — 7.4% |
| Brookhaven Local Development Corp., NY, (Long Island Community Hospital): | | | |
| 5.00%, 10/1/32 | $ | 700 | $ 720,209 |
| 5.00%, 10/1/33 | | 730 | 747,863 |
| 5.00%, 10/1/34 | | 750 | 765,540 |
| 5.00%, 10/1/35 | | 800 | 815,072 |
| Jefferson County Civic Facility Development Corp., NY, (Samaritan Medical Center): | | | |
| 4.00%, 11/1/47 | | 505 | 374,710 |
| 5.00%, 11/1/37 | | 1,615 | 1,624,964 |
| Monroe County Industrial Development Corp., NY, (Rochester Regional Health), 5.00%, 12/1/34 | | 500 | 505,950 |
| New York Dormitory Authority, (Catholic Health System Obligated Group): | | | |
| 4.00%, 7/1/38 | | 975 | 753,441 |
| 4.00%, 7/1/39 | | 1,130 | 862,823 |
| New York Dormitory Authority, (Montefiore Obligated Group), 5.00%, 8/1/30 | | 750 | 739,500 |
| New York Dormitory Authority, (Northwell Health Obligated Group), 5.00%, 5/1/52 | | 5,000 | 4,951,150 |
| New York Dormitory Authority, (NYU Hospitals Center), 5.00%, 7/1/30 | | 3,480 | 3,522,282 |
| New York Dormitory Authority, (NYU Langone Hospitals Obligated Group), 4.00%, 7/1/50 | | 3,000 | 2,541,750 |
| New York Dormitory Authority, (Orange Regional Medical Center): | | | |
| 5.00%, 12/1/30(1) | | 4,500 | 4,496,850 |
| 5.00%, 12/1/32(1) | | 2,200 | 2,159,410 |
| | | | $ 25,581,514 |
27
See Notes to Financial Statements.
Eaton Vance
New York Municipal Income Fund
September 30, 2022
Portfolio of Investments — continued
| Security | Principal
Amount
(000's omitted) | Value |
| Housing — 1.2% |
| New York City Housing Development Corp., NY: | | | |
| 2.60%, 11/1/46 | $ | 2,000 | $ 1,295,820 |
| Green Bonds, 0.60% to 7/1/25 (Put Date), 5/1/61 | | 800 | 726,736 |
| New York Mortgage Agency, 3.65%, 4/1/32 | | 115 | 114,310 |
| Westchester County Local Development Corp., NY, (Purchase Housing Corp. II): | | | |
| 5.00%, 6/1/27 | | 185 | 191,827 |
| 5.00%, 6/1/28 | | 550 | 567,000 |
| 5.00%, 6/1/29 | | 160 | 164,266 |
| 5.00%, 6/1/42 | | 1,250 | 1,228,412 |
| | | | $ 4,288,371 |
| Industrial Development Revenue — 3.6% |
| Build NYC Resource Corp., NY, (Pratt Paper (NY), Inc.), (AMT), 4.50%, 1/1/25(1) | $ | 395 | $ 398,061 |
| New York Energy Research and Development Authority, (Rochester Gas and Electric Corp.), 2.875% to 7/1/25 (Put Date), 5/15/32 | | 3,845 | 3,780,673 |
| New York State Environmental Facilities Corp., (Casella Waste Systems, Inc.), (AMT), 2.875% to 12/3/29 (Put Date), 12/1/44(1) | | 930 | 781,098 |
| New York Transportation Development Corp., (Delta Air Lines, Inc. - LaGuardia Airport Terminals C&D Redevelopment), (AMT), 5.00%, 10/1/40 | | 4,165 | 3,912,934 |
| Niagara Area Development Corp., NY, (Covanta), (AMT), 4.75%, 11/1/42(1) | | 4,000 | 3,496,880 |
| | | | $ 12,369,646 |
| Insured - Education — 2.7% |
| New York Dormitory Authority, (CUNY Student Housing), (AMBAC), (BAM), 5.50%, 7/1/35 | $ | 6,600 | $ 7,367,382 |
| New York Dormitory Authority, (School Districts Revenue Bond Financing Program), (AGM), 5.00%, 10/1/31 | | 1,800 | 1,973,340 |
| | | | $ 9,340,722 |
| Insured - Electric Utilities — 0.7% |
| New York Power Authority, Green Transmission Revenue, (AGM), 5.00%, 11/15/26 | $ | 2,250 | $ 2,403,720 |
| | | | $ 2,403,720 |
| Insured - Escrowed/Prerefunded — 2.6% |
| New York Dormitory Authority, (Memorial Sloan Kettering Cancer Center), (NPFG), Escrowed to Maturity, 0.00%, 7/1/30 | $ | 11,530 | $ 8,824,140 |
| | | | $ 8,824,140 |
| Security | Principal
Amount
(000's omitted) | Value |
| Insured - General Obligations — 2.9% |
| East Ramapo Central School District, NY, (AGM), 4.00%, 12/15/28 | $ | 520 | $ 533,239 |
| Monroe County, NY: | | | |
| (AGM), 5.00%, 6/1/29 | | 300 | 331,713 |
| (AGM), 5.00%, 6/1/30 | | 1,420 | 1,584,110 |
| Nassau County, NY: | | | |
| (AGM), 4.00%, 4/1/47 | | 3,140 | 2,812,341 |
| (AGM), 5.00%, 4/1/37 | | 3,325 | 3,525,065 |
| Oyster Bay, NY, (AGM), 5.00%, 8/1/25 | | 1,000 | 1,047,080 |
| | | | $ 9,833,548 |
| Insured - Lease Revenue/Certificates of Participation — 0.1% |
| New York Dormitory Authority, (St. Lawrence-Lewis), (BAM), 4.00%, 8/15/29 | $ | 225 | $ 232,585 |
| | | | $ 232,585 |
| Insured - Other Revenue — 0.3% |
| New York City Industrial Development Agency, NY, (Yankee Stadium), (AGC), 0.00%, 3/1/31 | $ | 1,690 | $ 1,170,409 |
| | | | $ 1,170,409 |
| Insured - Solid Waste — 0.6% |
| Onondaga County Resource Recovery Agency, NY: | | | |
| (AGM), (AMT), 5.00%, 5/1/30 | $ | 275 | $ 288,775 |
| (AGM), (AMT), 5.00%, 5/1/31 | | 350 | 366,440 |
| (AGM), (AMT), 5.00%, 5/1/32 | | 450 | 469,750 |
| (AGM), (AMT), 5.00%, 5/1/33 | | 375 | 390,637 |
| (AGM), (AMT), 5.00%, 5/1/34 | | 500 | 519,370 |
| | | | $ 2,034,972 |
| Insured - Transportation — 0.8% |
| Metropolitan Transportation Authority, NY, Green Bonds, (AGM), 5.00%, 11/15/44 | $ | 2,720 | $ 2,792,216 |
| | | | $ 2,792,216 |
| Lease Revenue/Certificates of Participation — 3.2% |
| Erie Industrial Development Authority, NY, (School District Buffalo Project): | | | |
| 5.00%, 5/1/25 | $ | 2,000 | $ 2,089,440 |
| 5.00%, 5/1/26 | | 1,000 | 1,059,840 |
| Hudson Yards Infrastructure Corp., NY: | | | |
| 5.00%, 2/15/42 | | 3,855 | 3,950,411 |
| Green Bonds, 4.00%, 2/15/37 | | 2,300 | 2,162,644 |
| Green Bonds, 4.00%, 2/15/44 | | 2,000 | 1,790,160 |
| | | | $ 11,052,495 |
28
See Notes to Financial Statements.
Eaton Vance
New York Municipal Income Fund
September 30, 2022
Portfolio of Investments — continued
| Security | Principal
Amount
(000's omitted) | Value |
| Other Revenue — 2.7% |
| Battery Park City Authority, NY, Sustainability Bonds, 5.00%, 11/1/49 | $ | 3,065 | $ 3,242,801 |
| Build NYC Resource Corp., NY, (Children's Aid Society): | | | |
| 4.00%, 7/1/36 | | 125 | 115,903 |
| 4.00%, 7/1/37 | | 165 | 152,731 |
| 4.00%, 7/1/38 | | 150 | 137,512 |
| New York City Cultural Resources Trust, NY, (Lincoln Center for the Performing Arts, Inc.), 5.00%, 12/1/31 | | 1,800 | 1,968,966 |
| New York City Transitional Finance Authority, NY, (Building Aid), 5.00%, 7/15/43 | | 3,560 | 3,628,850 |
| | | | $ 9,246,763 |
| Senior Living/Life Care — 3.9% |
| Brookhaven Local Development Corp., NY, (Jefferson's Ferry): | | | |
| 4.00%, 11/1/45 | $ | 1,650 | $ 1,366,266 |
| 5.25%, 11/1/30 | | 830 | 850,733 |
| 5.25%, 11/1/31 | | 675 | 690,350 |
| Buffalo and Erie County Industrial Land Development Corp., NY, (Orchard Park CCRC, Inc.), 5.00%, 11/15/37 | | 4,500 | 4,528,080 |
| Suffolk County Economic Development Corp., NY, (Peconic Landing at Southold, Inc.): | | | |
| Series 2019A, 5.00%, 12/1/40 | | 150 | 149,811 |
| Series 2020B, 5.00%, 12/1/40 | | 2,000 | 1,997,480 |
| Tompkins County Development Corp., NY, (Kendal at Ithaca), 5.00%, 7/1/34 | | 100 | 100,671 |
| Westchester County Local Development Corp., NY, (Kendal on Hudson): | | | |
| Prerefunded to 1/1/23, 5.00%, 1/1/28 | | 1,090 | 1,090,447 |
| Prerefunded to 1/1/23, 5.00%, 1/1/34 | | 1,485 | 1,485,609 |
| Westchester County Local Development Corp., NY, (Miriam Osborn Memorial Home Association): | | | |
| 5.00%, 7/1/27 | | 270 | 280,814 |
| 5.00%, 7/1/28 | | 640 | 670,406 |
| 5.00%, 7/1/29 | | 250 | 261,870 |
| | | | $ 13,472,537 |
| Special Tax Revenue — 11.2% |
| New York City Transitional Finance Authority, NY, Future Tax Revenue: | | | |
| 4.00%, 8/1/38 | $ | 1,500 | $ 1,419,480 |
| 4.00%, 5/1/41 | | 3,000 | 2,789,250 |
| 4.00%, 2/1/43 | | 4,000 | 3,669,080 |
| 4.00%, 8/1/48 | | 2,000 | 1,786,380 |
| 5.00%, 11/1/39 | | 2,195 | 2,270,442 |
| 5.00%, 5/1/42 | | 2,200 | 2,247,740 |
| 5.00%, 2/1/51 | | 1,500 | 1,539,885 |
| Security | Principal
Amount
(000's omitted) | Value |
| Special Tax Revenue (continued) |
| New York Dormitory Authority, Personal Income Tax Revenue: | | | |
| 4.00%, 3/15/41 | $ | 1,500 | $ 1,384,515 |
| 4.00%, 3/15/47 | | 2,595 | 2,305,865 |
| New York Dormitory Authority, Sales Tax Revenue: | | | |
| 5.00%, 3/15/36 | | 1,960 | 2,027,228 |
| 5.00%, 3/15/40 | | 4,000 | 4,143,000 |
| (AMT), 5.00%, 3/15/33 | | 890 | 938,380 |
| New York State Urban Development Corp., Personal Income Tax Revenue, 4.00%, 3/15/45 | | 4,250 | 3,811,868 |
| New York State Urban Development Corp., Sales Tax Revenue, 4.00%, 3/15/42 | | 2,500 | 2,266,775 |
| Puerto Rico Sales Tax Financing Corp., 5.00%, 7/1/58 | | 3,000 | 2,655,900 |
| Triborough Bridge and Tunnel Authority, NY, Green Bonds, 5.25%, 5/15/47(2) | | 3,000 | 3,176,730 |
| | | | $ 38,432,518 |
| Transportation — 17.0% |
| Albany County Airport Authority, NY: | | | |
| (AMT), 5.00%, 12/15/24 | $ | 1,000 | $ 1,023,320 |
| (AMT), 5.00%, 12/15/26 | | 1,000 | 1,032,610 |
| Buffalo and Fort Erie Public Bridge Authority, NY, 5.00%, 1/1/37 | | 200 | 210,346 |
| Nassau County Bridge Authority, NY, 5.00%, 10/1/40 | | 1,915 | 1,917,911 |
| New York Thruway Authority: | | | |
| 4.00%, 1/1/45 | | 2,425 | 2,139,044 |
| 5.00%, 1/1/37 | | 775 | 812,750 |
| Series 2016A, 5.00%, 1/1/33 | | 3,125 | 3,212,406 |
| Series 2019B, 5.00%, 1/1/33 | | 1,910 | 2,031,285 |
| New York Transportation Development Corp., (LaGuardia Airport Terminal B Redevelopment), (AMT), 5.00%, 7/1/46 | | 8,100 | 7,695,486 |
| New York Transportation Development Corp., (Terminal 4 John F. Kennedy International Airport): | | | |
| 4.00%, 12/1/41 | | 400 | 334,704 |
| 4.00%, 12/1/42 | | 2,100 | 1,728,048 |
| 5.00%, 12/1/33 | | 500 | 508,025 |
| (AMT), 4.00%, 12/1/40 | | 100 | 82,430 |
| (AMT), 5.00%, 12/1/28 | | 2,000 | 2,044,820 |
| (AMT), 5.00%, 12/1/35 | | 550 | 541,211 |
| (AMT), 5.00%, 12/1/38 | | 1,500 | 1,448,820 |
| Niagara Frontier Transportation Authority, NY, (Buffalo Niagara International Airport): | | | |
| (AMT), 5.00%, 4/1/26 | | 1,210 | 1,225,028 |
| (AMT), 5.00%, 4/1/28 | | 525 | 545,144 |
| (AMT), 5.00%, 4/1/29 | | 275 | 286,264 |
| (AMT), 5.00%, 4/1/30 | | 460 | 476,703 |
29
See Notes to Financial Statements.
Eaton Vance
New York Municipal Income Fund
September 30, 2022
Portfolio of Investments — continued
| Security | Principal
Amount
(000's omitted) | Value |
| Transportation (continued) |
| Niagara Frontier Transportation Authority, NY, (Buffalo Niagara International Airport): (continued) | | | |
| (AMT), 5.00%, 4/1/31 | $ | 180 | $ 185,393 |
| Port Authority of New York and New Jersey: | | | |
| 4.00%, 11/1/39 | | 1,100 | 1,036,882 |
| 4.00%, 11/1/49 | | 5,000 | 4,453,350 |
| 6.125%, 6/1/94 | | 2,500 | 2,580,375 |
| (AMT), 4.00%, 3/15/30 | | 2,500 | 2,498,700 |
| (AMT), 4.00%, 9/1/38 | | 1,000 | 896,520 |
| (AMT), 5.00%, 10/15/24 | | 1,750 | 1,796,603 |
| (AMT), 5.00%, 10/15/35 | | 1,520 | 1,559,246 |
| (AMT), 5.00%, 11/15/37 | | 1,250 | 1,266,788 |
| (AMT), 5.50%, 8/1/52 | | 2,000 | 2,096,700 |
| Triborough Bridge and Tunnel Authority, NY: | | | |
| 3.00%, 11/15/46 | | 4,000 | 2,863,400 |
| 5.00%, 11/15/49 | | 7,545 | 7,799,568 |
| | | | $ 58,329,880 |
| Water and Sewer — 3.0% |
| New York City Municipal Water Finance Authority, NY, (Water and Sewer System): | | | |
| 4.00%, 6/15/37 | $ | 1,000 | $ 960,090 |
| 4.00%, 6/15/41 | | 1,000 | 930,620 |
| 5.00%, 6/15/35 | | 1,130 | 1,170,838 |
| 5.00%, 6/15/40 | | 1,100 | 1,148,741 |
| 5.00%, 6/15/50 | | 3,025 | 3,130,361 |
| Series 2020 GG-1, 5.00%, 6/15/48 | | 1,920 | 1,985,587 |
| Western Nassau County Water Authority, NY: | | | |
| Green Bonds, 4.00%, 4/1/34 | | 275 | 263,203 |
| Green Bonds, 4.00%, 4/1/35 | | 325 | 306,936 |
| Green Bonds, 5.00%, 4/1/32 | | 225 | 250,016 |
| | | | $ 10,146,392 |
Total Tax-Exempt Municipal Obligations
(identified cost $353,376,251) | | | $326,169,427 |
| Taxable Municipal Obligations — 1.5% |
| Security | Principal
Amount
(000's omitted) | Value |
| General Obligations — 1.2% |
| New York City, NY, 1.50%, 8/1/28 | $ | 5,000 | $ 4,122,400 |
| | | | $ 4,122,400 |
| Security | Principal
Amount
(000's omitted) | Value |
| Hospital — 0.3% |
| Jefferson County Civic Facility Development Corp., NY, (Samaritan Medical Center), 4.25%, 11/1/28 | $ | 1,375 | $ 1,274,130 |
| | | | $ 1,274,130 |
Total Taxable Municipal Obligations
(identified cost $6,388,374) | | | $ 5,396,530 |
Total Investments — 96.7%
(identified cost $361,844,625) | | | $332,877,121 |
| Other Assets, Less Liabilities — 3.3% | | | $ 11,238,275 |
| Net Assets — 100.0% | | | $344,115,396 |
| The percentage shown for each investment category in the Portfolio of Investments is based on net assets. |
| (1) | Security exempt from registration under Rule 144A of the Securities Act of 1933, as amended. These securities may be sold in certain transactions in reliance on an exemption from registration (normally to qualified institutional buyers). At September 30, 2022, the aggregate value of these securities is $13,251,788 or 3.9% of the Fund's net assets. |
| (2) | Security represents the municipal bond held by a trust that issues residual interest bonds (see Note 1H). |
| The Fund invests primarily in debt securities issued by New York municipalities. The ability of the issuers of the debt securities to meet their obligations may be affected by economic developments in a specific industry or municipality. At September 30, 2022, 11.0% of total investments are backed by bond insurance of various financial institutions and financial guaranty assurance agencies. The aggregate percentage insured by an individual financial institution or financial guaranty assurance agency ranged from 0.4% to 5.7% of total investments. |
30
See Notes to Financial Statements.
Eaton Vance
New York Municipal Income Fund
September 30, 2022
Portfolio of Investments — continued
| Futures Contracts |
| Description | Number of
Contracts | Position | Expiration
Date | Notional
Amount | Value/Unrealized
Appreciation
(Depreciation) |
| Interest Rate Futures | | | | | |
| U.S. Long Treasury Bond | (113) | Short | 12/20/22 | $(14,283,906) | $ 1,232,319 |
| | | | | | $1,232,319 |
| Abbreviations: |
| AGC | – Assured Guaranty Corp. |
| AGM | – Assured Guaranty Municipal Corp. |
| AMBAC | – AMBAC Financial Group, Inc. |
| AMT | – Interest earned from these securities may be considered a tax preference item for purposes of the Federal Alternative Minimum Tax. |
| BAM | – Build America Mutual Assurance Co. |
| NPFG | – National Public Finance Guarantee Corp. |
31
See Notes to Financial Statements.
Eaton Vance
Ohio Municipal Income Fund
September 30, 2022
| Tax-Exempt Municipal Obligations — 96.2% |
| Security | Principal
Amount
(000's omitted) | Value |
| Bond Bank — 3.4% |
| Ohio Water Development Authority: | | | |
| 4.00%, 6/1/36 | $ | 1,500 | $ 1,496,850 |
| 5.00%, 12/1/35 | | 2,000 | 2,087,040 |
| Ohio Water Development Authority, Water Pollution Control Loan Fund, 5.00%, 12/1/40 | | 1,000 | 1,064,870 |
| Rickenbacker Port Authority, OH, (OASBO Expanded Asset Pooled Financing Program), 5.375%, 1/1/32 | | 1,640 | 1,778,039 |
| | | | $ 6,426,799 |
| Education — 11.7% |
| Bowling Green State University, OH: | | | |
| 4.00%, 6/1/39 | $ | 750 | $ 707,640 |
| 4.00%, 6/1/45 | | 1,300 | 1,170,949 |
| Kent State University, OH: | | | |
| 5.00%, 5/1/37 | | 215 | 225,907 |
| 5.00%, 5/1/38 | | 250 | 262,083 |
| 5.00%, 5/1/39 | | 265 | 277,312 |
| 5.00%, 5/1/40 | | 405 | 422,958 |
| Miami University, OH, 4.00%, 9/1/45 | | 2,000 | 1,801,220 |
| Ohio Higher Educational Facility Commission, (Case Western Reserve University): | | | |
| 5.00%, 12/1/26 | | 350 | 370,506 |
| 5.00%, 12/1/27 | | 300 | 316,626 |
| 5.00%, 12/1/40 | | 1,000 | 1,030,810 |
| Ohio Higher Educational Facility Commission, (Denison University): | | | |
| 4.00%, 11/1/39 | | 115 | 103,643 |
| 5.25%, 11/1/46 | | 1,355 | 1,408,224 |
| Ohio Higher Educational Facility Commission, (Kenyon College), 4.00%, 7/1/40 | | 1,000 | 857,560 |
| Ohio Higher Educational Facility Commission, (Oberlin College): | | | |
| 5.00%, 10/1/33 | | 2,000 | 2,016,080 |
| 5.00%, 10/1/38 | | 910 | 915,378 |
| Ohio Higher Educational Facility Commission, (The College of Wooster), 5.00%, 9/1/36 | | 1,000 | 1,051,820 |
| Ohio Higher Educational Facility Commission, (University of Dayton): | | | |
| 5.00%, 12/1/32 | | 550 | 565,587 |
| 5.00%, 2/1/38 | | 1,200 | 1,257,636 |
| Ohio State University, 5.00%, 12/1/29 | | 1,060 | 1,177,957 |
| Ohio University, 5.00%, 12/1/35 | | 500 | 521,240 |
| Port of Greater Cincinnati Development Authority, OH, (St. Xavier High School, Inc.): | | | |
| 4.00%, 4/1/33 | | 335 | 326,618 |
| Security | Principal
Amount
(000's omitted) | Value |
| Education (continued) |
| Port of Greater Cincinnati Development Authority, OH, (St. Xavier High School, Inc.): (continued) | | | |
| 4.00%, 4/1/34 | $ | 510 | $ 490,992 |
| 4.00%, 4/1/35 | | 350 | 333,175 |
| 4.00%, 4/1/36 | | 350 | 329,651 |
| 4.00%, 4/1/37 | | 560 | 520,044 |
| 4.00%, 4/1/38 | | 400 | 366,940 |
| 4.00%, 4/1/39 | | 415 | 375,849 |
| 4.00%, 4/1/40 | | 415 | 370,815 |
| University of Cincinnati, OH: | | | |
| 5.00%, 6/1/34 | | 585 | 600,579 |
| 5.00%, 6/1/45 | | 2,000 | 2,065,940 |
| | | | $ 22,241,739 |
| Electric Utilities — 1.9% |
| American Municipal Power, Inc., OH, (Greenup Hydroelectric Facility), 5.00%, 2/15/46 | $ | 1,000 | $ 1,009,480 |
| American Municipal Power, Inc., OH, (Meldahl Hydroelectric): | | | |
| 4.00%, 2/15/34 | | 2,005 | 1,905,411 |
| 5.00%, 2/15/33 | | 595 | 615,034 |
| | | | $ 3,529,925 |
| Escrowed/Prerefunded — 2.7% |
| Cuyahoga County, OH, Sales Tax Revenue, Prerefunded to 12/1/24, 5.00%, 12/1/35 | $ | 1,000 | $ 1,038,290 |
| Highland Local School District, OH: | | | |
| Prerefunded to 6/1/23, 5.00%, 12/1/37 | | 540 | 546,739 |
| Prerefunded to 6/1/23, 5.00%, 12/1/39 | | 1,100 | 1,113,728 |
| Lakewood City School District, OH, Prerefunded to 11/1/22, 5.00%, 11/1/36 | | 1,030 | 1,031,535 |
| Northeast Ohio Regional Sewer District, Prerefunded to 11/15/24, 5.00%, 11/15/44 | | 1,255 | 1,302,138 |
| Ohio State University, Escrowed to Maturity, 5.00%, 12/1/29 | | 45 | 49,705 |
| Ohio, (Cleveland Clinic Health System), Prerefunded to 1/1/28, 4.00%, 1/1/43 | | 20 | 20,573 |
| | | | $ 5,102,708 |
| General Obligations — 10.3% |
| Butler County, OH, Special Tax Assessment, 5.50%, 12/1/28 | $ | 1,000 | $ 1,001,700 |
| Cleveland, OH: | | | |
| 5.00%, 12/1/44 | | 1,000 | 1,050,370 |
| 5.00%, 12/1/47 | | 1,000 | 1,046,390 |
| 5.00%, 12/1/51 | | 1,000 | 1,042,450 |
32
See Notes to Financial Statements.
Eaton Vance
Ohio Municipal Income Fund
September 30, 2022
Portfolio of Investments — continued
| Security | Principal
Amount
(000's omitted) | Value |
| General Obligations (continued) |
| Columbus City School District, OH, 5.00%, 12/1/30 | $ | 1,500 | $ 1,579,965 |
| Columbus, OH: | | | |
| 5.00%, 4/1/37 | | 1,000 | 1,089,850 |
| 5.00%, 4/1/39 | | 2,700 | 2,905,956 |
| Cuyahoga Community College District, OH: | | | |
| 3.50%, 12/1/39 | | 1,400 | 1,189,874 |
| 4.00%, 12/1/42 | | 1,500 | 1,369,875 |
| Northwest Local School District, OH, Prerefunded to 12/1/23, 5.00%, 12/1/40 | | 500 | 510,310 |
| Ohio: | | | |
| 5.00%, 5/1/24 | | 575 | 591,629 |
| 5.00%, 5/1/25 | | 500 | 522,865 |
| 5.00%, 5/1/33 | | 1,500 | 1,580,745 |
| 5.00%, 5/1/37 | | 1,025 | 1,113,458 |
| 5.00%, 3/1/40 | | 1,500 | 1,615,725 |
| Streetsboro City School District, OH, 4.00%, 12/1/36 | | 210 | 211,976 |
| Summit County, OH, 5.00%, 12/1/43 | | 1,000 | 1,054,610 |
| | | | $ 19,477,748 |
| Hospital — 15.0% |
| Akron, Bath and Copley Joint Township Hospital District, OH, (Children's Hospital Medical Center of Akron): | | | |
| 4.00%, 11/15/42 | $ | 1,250 | $ 1,101,812 |
| Prerefunded to 5/15/23, 5.00%, 11/15/38 | | 1,155 | 1,166,827 |
| Akron, Bath and Copley Joint Township Hospital District, OH, (Summa Health Obligated Group): | | | |
| 4.00%, 11/15/35 | | 500 | 432,330 |
| 4.00%, 11/15/37 | | 150 | 127,224 |
| Allen County, OH, (Bon Secours Mercy Health, Inc.), 4.00%, 12/1/40 | | 1,000 | 899,090 |
| Allen County, OH, (Mercy Health): | | | |
| 4.00%, 8/1/47(1) | | 5,150 | 4,419,678 |
| 5.00%, 8/1/29 | | 2,340 | 2,485,197 |
| Bluffton, OH, (Blanchard Valley Health System), 5.00%, 12/1/31 | | 750 | 771,983 |
| Butler County, OH, (UC Health): | | | |
| 4.00%, 11/15/37 | | 920 | 835,176 |
| 5.00%, 11/15/28 | | 590 | 613,783 |
| Franklin County, OH, (Nationwide Children's Hospital), 5.00%, 11/1/34 | | 750 | 778,552 |
| Franklin County, OH, (OhioHealth Corp.): | | | |
| 4.00%, 5/15/47 | | 2,000 | 1,747,220 |
| 5.00%, 5/15/40 | | 1,200 | 1,210,248 |
| Franklin County, OH, (Trinity Health Credit Group), 5.00%, 12/1/46 | | 2,000 | 2,001,160 |
| Hamilton County, OH, (UC Health), 5.00%, 9/15/45 | | 1,125 | 1,103,636 |
| Security | Principal
Amount
(000's omitted) | Value |
| Hospital (continued) |
| Miami County, OH, (Kettering Health Network Obligated Group), 5.00%, 8/1/38 | $ | 1,000 | $ 1,000,600 |
| Middleburg Heights, OH, (Southwest General Health Center), 4.00%, 8/1/47 | | 2,000 | 1,702,300 |
| Montgomery County, OH, (Kettering Health Network Obligated Group), 4.00%, 8/1/41 | | 500 | 443,525 |
| Muskingum County, OH, (Genesis HealthCare System Obligated Group), 5.00%, 2/15/33 | | 460 | 439,254 |
| Ohio Higher Educational Facility Commission, (University Hospitals Health System, Inc.): | | | |
| 5.00%, 1/15/27 | | 1,500 | 1,504,005 |
| 5.00%, 1/15/29 | | 450 | 450,824 |
| Ohio, (Cleveland Clinic Health System), 4.00%, 1/1/43 | | 2,165 | 1,948,522 |
| Ohio, (University Hospitals Health System, Inc.), 4.00%, 1/15/39 | | 1,100 | 1,017,137 |
| Southeastern Ohio Port Authority, (Memorial Health System Obligated Group), 5.00%, 12/1/24 | | 215 | 214,295 |
| | | | $ 28,414,378 |
| Housing — 0.2% |
| Ohio Housing Finance Agency, 3.00%, 9/1/39 | $ | 385 | $ 346,184 |
| | | | $ 346,184 |
| Industrial Development Revenue — 3.2% |
| Cleveland, OH, (Continental Airlines), (AMT), 5.375%, 9/15/27 | $ | 1,630 | $ 1,610,815 |
| Ohio Air Quality Development Authority, (Pratt Paper, LLC), (AMT), 4.25%, 1/15/38(2) | | 1,700 | 1,546,337 |
| Ohio, (Republic Services, Inc.), 2.75% to 12/1/22 (Put Date), 11/1/35(3) | | 3,000 | 2,997,930 |
| | | | $ 6,155,082 |
| Insured - Electric Utilities — 7.2% |
| Cleveland, OH, Public Power System Revenue: | | | |
| (AGM), 4.00%, 11/15/36 | $ | 1,000 | $ 932,900 |
| (AGM), 5.00%, 11/15/24 | | 1,265 | 1,309,604 |
| (NPFG), 0.00%, 11/15/27 | | 2,540 | 2,080,946 |
| Ohio Municipal Electric Generation Agency: | | | |
| (NPFG), 0.00%, 2/15/26 | | 3,000 | 2,634,450 |
| (NPFG), 0.00%, 2/15/27 | | 2,500 | 2,106,225 |
| (NPFG), 0.00%, 2/15/28 | | 4,750 | 3,835,055 |
| Puerto Rico Electric Power Authority, (NPFG), 5.25%, 7/1/34 | | 770 | 751,489 |
| | | | $ 13,650,669 |
33
See Notes to Financial Statements.
Eaton Vance
Ohio Municipal Income Fund
September 30, 2022
Portfolio of Investments — continued
| Security | Principal
Amount
(000's omitted) | Value |
| Insured - Escrowed/Prerefunded — 0.2% |
| Cleveland, OH, Public Power System Revenue, (AGM), Escrowed to Maturity, 5.00%, 11/15/24 | $ | 235 | $ 243,582 |
| Warrensville Heights City School District, OH, (BAM), Prerefunded to 12/1/24, 5.00%, 12/1/44 | | 215 | 223,005 |
| | | | $ 466,587 |
| Insured - General Obligations — 16.5% |
| Cincinnati City School District, OH, (AGM), 5.25%, 12/1/29(1) | $ | 7,500 | $ 8,407,725 |
| Cleveland, OH, (AMBAC), 5.50%, 10/1/23 | | 2,105 | 2,152,215 |
| Gahanna-Jefferson City School District, OH, (AGM), 4.00%, 12/1/44 | | 1,500 | 1,356,525 |
| Kettering City School District, OH, (AGM), 5.25%, 12/1/31 | | 4,505 | 4,909,188 |
| Mason City School District, OH, (AGM), 5.25%, 12/1/31 | | 3,525 | 3,911,869 |
| Springboro Community City School District, OH, (AGM), 5.25%, 12/1/30 | | 5,000 | 5,513,750 |
| Warrensville Heights City School District, OH, (BAM), 5.00%, 12/1/44 | | 85 | 86,791 |
| Westerville City School District, OH, (XLCA), 5.00%, 12/1/27 | | 4,590 | 4,903,222 |
| | | | $ 31,241,285 |
| Insured - Hospital — 0.8% |
| Lucas County, OH, (ProMedica Healthcare Obligated Group), (AGM), 4.00%, 11/15/45 | $ | 1,725 | $ 1,483,638 |
| | | | $ 1,483,638 |
| Insured - Transportation — 3.6% |
| Cleveland, OH, Airport System Revenue, (AGM), (AMT), 5.00%, 1/1/43 | $ | 1,000 | $ 999,640 |
| Ohio Turnpike Commission, (NPFG), 5.50%, 2/15/24 | | 3,420 | 3,487,818 |
| Ohio, (Portsmouth Gateway Group, LLC), (AGM), (AMT), 5.00%, 12/31/35 | | 1,500 | 1,508,295 |
| Puerto Rico Highway and Transportation Authority, (AGC), 5.25%, 7/1/41 | | 940 | 916,284 |
| | | | $ 6,912,037 |
| Insured - Water and Sewer — 2.0% |
| Newark, OH, Water System Revenue, (AGM), 5.00%, 12/1/39 | $ | 3,680 | $ 3,821,864 |
| | | | $ 3,821,864 |
| Other Revenue — 4.7% |
| Buckeye Tobacco Settlement Financing Authority, OH: | | | |
| 4.00%, 6/1/38 | $ | 1,875 | $ 1,703,212 |
| 5.00%, 6/1/31 | | 2,000 | 2,089,040 |
| Security | Principal
Amount
(000's omitted) | Value |
| Other Revenue (continued) |
| Cuyahoga County, OH, (Cleveland Orchestra): | | | |
| 5.00%, 1/1/33 | $ | 400 | $ 421,688 |
| 5.00%, 1/1/34 | | 300 | 315,129 |
| 5.00%, 1/1/35 | | 500 | 523,745 |
| 5.00%, 1/1/41 | | 725 | 751,173 |
| Riversouth Authority, OH, (Lazarus Building Redevelopment), 5.75%, 12/1/27 | | 1,775 | 1,767,030 |
| Summit County Port Authority, OH, Prerefunded to 12/1/22, 5.00%, 12/1/31 | | 1,410 | 1,414,315 |
| | | | $ 8,985,332 |
| Senior Living/Life Care — 1.6% |
| Butler County Port Authority, OH, (Community First Solutions), 4.00%, 5/15/46 | $ | 650 | $ 578,461 |
| Franklin County, OH, (Ohio Living Communities), 4.00%, 7/1/40 | | 1,000 | 846,370 |
| Lorain County Port Authority, OH, (Kendal at Oberlin), Prerefunded to 11/15/23, 5.00%, 11/15/30 | | 580 | 590,568 |
| Warren County, OH, (Otterbein Homes Obligated Group), 5.75%, 7/1/33 | | 905 | 921,534 |
| | | | $ 2,936,933 |
| Special Tax Revenue — 6.9% |
| Akron, OH, Income Tax Revenue: | | | |
| 4.00%, 12/1/24 | $ | 1,085 | $ 1,100,743 |
| 4.00%, 12/1/36 | | 655 | 656,061 |
| 4.00%, 12/1/37 | | 520 | 514,077 |
| American Samoa Economic Development Authority, 5.00%, 9/1/38(2) | | 300 | 303,282 |
| Cleveland, OH, Income Tax Revenue, 4.00%, 10/1/31 | | 470 | 483,719 |
| Cuyahoga County, OH, Sales Tax Revenue, 4.00%, 1/1/37 | | 575 | 562,114 |
| Delaware County, OH, Sales Tax Revenue, 5.00%, 12/1/28 | | 2,000 | 2,085,360 |
| Franklin County Convention Facilities Authority, OH, 5.00%, 12/1/26 | | 1,000 | 1,031,950 |
| Franklin County Convention Facilities Authority, OH, (Greater Columbus Convention Center Hotel Expansion), 5.00%, 12/1/39 | | 525 | 509,371 |
| Franklin County, OH, Sales Tax Revenue, 5.00%, 6/1/43 | | 1,000 | 1,057,800 |
| Greater Cleveland Regional Transit Authority, OH, Sales Tax Revenue, Prerefunded to 12/1/26, 5.00%, 12/1/31 | | 435 | 465,359 |
| Green, OH, Income Tax Revenue, (Community Learning Centers): | | | |
| Prerefunded to 12/1/22, 5.00%, 12/1/26 | | 570 | 571,790 |
| Prerefunded to 12/1/22, 5.00%, 12/1/28 | | 940 | 942,952 |
34
See Notes to Financial Statements.
Eaton Vance
Ohio Municipal Income Fund
September 30, 2022
Portfolio of Investments — continued
| Security | Principal
Amount
(000's omitted) | Value |
| Special Tax Revenue (continued) |
| Hamilton County, OH, Sales Tax Revenue, 5.00%, 12/1/32 | $ | 1,000 | $ 1,117,680 |
| Puerto Rico Sales Tax Financing Corp., 5.00%, 7/1/58 | | 1,955 | 1,730,761 |
| | | | $ 13,133,019 |
| Transportation — 1.2% |
| Cleveland, OH, Airport System Revenue, (AMT), 5.00%, 1/1/27 | $ | 625 | $ 645,563 |
| Ohio Turnpike and Infrastructure Commission, 5.00%, 2/15/46 | | 1,500 | 1,579,050 |
| | | | $ 2,224,613 |
| Water and Sewer — 3.1% |
| Cleveland, OH, Water Pollution Control Revenue, 5.00%, 11/15/41 | $ | 945 | $ 964,429 |
| Columbus, OH, Sewerage System Revenue, 5.00%, 6/1/30 | | 1,500 | 1,579,440 |
| Lancaster, OH, Wastewater System Revenue, 4.00%, 12/1/33 | | 1,265 | 1,282,584 |
| Toledo, OH, Water System Revenue, 5.00%, 11/15/41 | | 2,000 | 2,064,900 |
| | | | $ 5,891,353 |
Total Tax-Exempt Municipal Obligations
(identified cost $190,680,797) | | | $182,441,893 |
Total Investments — 96.2%
(identified cost $190,680,797) | | | $182,441,893 |
| Other Assets, Less Liabilities — 3.8% | | | $ 7,145,450 |
| Net Assets — 100.0% | | | $189,587,343 |
| The percentage shown for each investment category in the Portfolio of Investments is based on net assets. |
| (1) | Security represents the municipal bond held by a trust that issues residual interest bonds (see Note 1H). |
| (2) | Security exempt from registration under Rule 144A of the Securities Act of 1933, as amended. These securities may be sold in certain transactions in reliance on an exemption from registration (normally to qualified institutional buyers). At September 30, 2022, the aggregate value of these securities is $1,849,619 or 1.0% of the Fund's net assets. |
| (3) | Variable rate security that may be tendered at par quarterly. The stated interest rate, which resets quarterly, is determined by the remarketing agent and represents the rate in effect at September 30, 2022. |
| The Fund invests primarily in debt securities issued by Ohio municipalities. The ability of the issuers of the debt securities to meet their obligations may be affected by economic developments in a specific industry or municipality. At September 30, 2022, 31.6% of total investments are backed by bond insurance of various financial institutions and financial guaranty assurance agencies. The aggregate percentage insured by an individual financial institution or financial guaranty assurance agency ranged from 0.2% to 18.9% of total investments. |
| Futures Contracts |
| Description | Number of
Contracts | Position | Expiration
Date | Notional
Amount | Value/Unrealized
Appreciation
(Depreciation) |
| Interest Rate Futures | | | | | |
| U.S. Long Treasury Bond | (30) | Short | 12/20/22 | $(3,792,188) | $ 327,164 |
| | | | | | $327,164 |
35
See Notes to Financial Statements.
Eaton Vance
Ohio Municipal Income Fund
September 30, 2022
Portfolio of Investments — continued
| Abbreviations: |
| AGC | – Assured Guaranty Corp. |
| AGM | – Assured Guaranty Municipal Corp. |
| AMBAC | – AMBAC Financial Group, Inc. |
| AMT | – Interest earned from these securities may be considered a tax preference item for purposes of the Federal Alternative Minimum Tax. |
| BAM | – Build America Mutual Assurance Co. |
| NPFG | – National Public Finance Guarantee Corp. |
| XLCA | – XL Capital Assurance, Inc. |
36
See Notes to Financial Statements.
Eaton Vance
Municipal Income Funds
September 30, 2022
Statements of Assets and Liabilities
| | September 30, 2022 |
| | California
Opportunities Fund | Massachusetts Fund | New York Fund | Ohio Fund |
| Assets | | | | |
| Investments: | | | | |
| Identified cost | $ 603,155,663 | $ 143,263,785 | $ 361,844,625 | $ 190,680,797 |
| Unrealized depreciation | (23,539,995) | (5,175,040) | (28,967,504) | (8,238,904) |
| Investments, at value | $579,615,668 | $138,088,745 | $332,877,121 | $182,441,893 |
| Cash | $ 1,638 | $ 940,838 | $ 5,117,618 | $ 12,112,364 |
| Deposits for derivatives collateral: | | | | |
| Futures contracts | — | — | 432,025 | 125,472 |
| Interest receivable | 5,904,821 | 1,550,332 | 4,408,298 | 2,452,560 |
| Receivable for investments sold | 22,720,890 | 3,328,110 | 4,531,481 | 1,500,000 |
| Receivable for Fund shares sold | 2,138,860 | 344,136 | 1,568,040 | 1,024,083 |
| Receivable for variation margin on open futures contracts | — | — | 74,156 | 19,730 |
| Total assets | $610,381,877 | $144,252,161 | $349,008,739 | $199,676,102 |
| Liabilities | | | | |
| Payable for floating rate notes issued | $ — | $ 3,652,594 | $ 2,399,976 | $ 8,456,266 |
| Demand note payable | 6,360,000 | — | — | — |
| Payable for investments purchased | 5,023,481 | — | — | — |
| Payable for when-issued securities | 15,381,774 | — | — | — |
| Payable for Fund shares redeemed | 2,915,109 | 1,316,504 | 2,064,596 | 1,354,838 |
| Distributions payable | 144,941 | 62,282 | 99,120 | 42,908 |
| Payable to affiliates: | | | | |
| Investment adviser fee | 189,996 | 42,006 | 109,576 | 57,625 |
| Distribution and service fees | 41,607 | 16,378 | 42,064 | 20,626 |
| Interest expense and fees payable | — | 6,460 | 2,020 | 45,204 |
| Accrued expenses | 219,090 | 111,151 | 175,991 | 111,292 |
| Total liabilities | $ 30,275,998 | $ 5,207,375 | $ 4,893,343 | $ 10,088,759 |
| Net Assets | $580,105,879 | $139,044,786 | $344,115,396 | $189,587,343 |
| Sources of Net Assets | | | | |
| Paid-in capital | $ 638,422,164 | $ 152,531,288 | $ 389,633,833 | $ 208,480,167 |
| Accumulated loss | (58,316,285) | (13,486,502) | (45,518,437) | (18,892,824) |
| Net Assets | $580,105,879 | $139,044,786 | $344,115,396 | $189,587,343 |
| Class A Shares | | | | |
| Net Assets | $ 117,491,469 | $ 73,926,494 | $ 184,700,439 | $ 89,734,369 |
| Shares Outstanding | 12,160,894 | 9,658,006 | 21,007,457 | 11,193,187 |
Net Asset Value and Redemption Price Per Share
(net assets ÷ shares of beneficial interest outstanding) | $ 9.66 | $ 7.65 | $ 8.79 | $ 8.02 |
Maximum Offering Price Per Share
(100 ÷ 96.75 of net asset value per share) | $ 9.98 | $ 7.91 | $ 9.09 | $ 8.29 |
| Class C Shares | | | | |
| Net Assets | $ 19,575,236 | $ 4,451,712 | $ 12,832,517 | $ 6,697,424 |
| Shares Outstanding | 2,192,753 | 581,732 | 1,458,907 | 835,862 |
Net Asset Value and Offering Price Per Share*
(net assets ÷ shares of beneficial interest outstanding) | $ 8.93 | $ 7.65 | $ 8.80 | $ 8.01 |
37
See Notes to Financial Statements.
Eaton Vance
Municipal Income Funds
September 30, 2022
Statements of Assets and Liabilities — continued
| | September 30, 2022 |
| | California
Opportunities Fund | Massachusetts Fund | New York Fund | Ohio Fund |
| Class I Shares | | | | |
| Net Assets | $443,039,174 | $60,666,580 | $146,582,440 | $93,155,550 |
| Shares Outstanding | 45,827,640 | 7,924,357 | 16,674,898 | 11,613,732 |
Net Asset Value, Offering Price and Redemption Price Per Share
(net assets ÷ shares of beneficial interest outstanding) | $ 9.67 | $ 7.66 | $ 8.79 | $ 8.02 |
| On sales of $100,000 or more, the offering price of Class A shares is reduced. |
| * | Redemption price per share is equal to the net asset value less any applicable contingent deferred sales charge. |
38
See Notes to Financial Statements.
Eaton Vance
Municipal Income Funds
September 30, 2022
| | Year Ended September 30, 2022 |
| | California
Opportunities Fund | Massachusetts Fund | New York Fund | Ohio Fund |
| Investment Income | | | | |
| Interest income | $ 14,972,126 | $ 4,890,918 | $ 10,710,320 | $ 6,485,063 |
| Total investment income | $ 14,972,126 | $ 4,890,918 | $ 10,710,320 | $ 6,485,063 |
| Expenses | | | | |
| Investment adviser fee | $ 2,367,635 | $ 597,221 | $ 1,464,492 | $ 679,337 |
| Distribution and service fees: | | | | |
| Class A | 338,409 | 173,690 | 441,566 | 202,529 |
| Class C | 255,220 | 63,527 | 171,279 | 88,639 |
| Trustees’ fees and expenses | 40,694 | 10,998 | 25,212 | 12,231 |
| Custodian fee | 161,642 | 47,544 | 99,135 | 49,977 |
| Transfer and dividend disbursing agent fees | 191,294 | 65,057 | 165,563 | 80,862 |
| Legal and accounting services | 87,385 | 71,306 | 90,306 | 65,348 |
| Printing and postage | 27,032 | 7,974 | 18,355 | 8,507 |
| Registration fees | 2,520 | 12,000 | 6,996 | 8,180 |
| Interest expense and fees | — | 40,140 | 2,020 | 104,868 |
| Miscellaneous | 115,929 | 32,196 | 67,026 | 40,846 |
| Total expenses | $ 3,587,760 | $ 1,121,653 | $ 2,551,950 | $ 1,341,324 |
| Net investment income | $ 11,384,366 | $ 3,769,265 | $ 8,158,370 | $ 5,143,739 |
| Realized and Unrealized Gain (Loss) | | | | |
| Net realized gain (loss): | | | | |
| Investment transactions | $ (37,070,522) | $ (7,982,128) | $ (19,995,063) | $ (2,373,817) |
| Futures contracts | 2,626,533 | — | 2,796,691 | 742,484 |
| Net realized loss | $(34,443,989) | $ (7,982,128) | $(17,198,372) | $ (1,631,333) |
| Change in unrealized appreciation (depreciation): | | | | |
| Investments | $ (46,182,704) | $ (19,191,238) | $ (46,945,040) | $ (25,934,528) |
| Futures contracts | — | — | 740,805 | 196,674 |
| Net change in unrealized appreciation (depreciation) | $(46,182,704) | $(19,191,238) | $(46,204,235) | $(25,737,854) |
| Net realized and unrealized loss | $(80,626,693) | $(27,173,366) | $(63,402,607) | $(27,369,187) |
| Net decrease in net assets from operations | $(69,242,327) | $(23,404,101) | $(55,244,237) | $(22,225,448) |
39
See Notes to Financial Statements.
Eaton Vance
Municipal Income Funds
September 30, 2022
Statements of Changes in Net Assets
| | Year Ended September 30, 2022 |
| | California
Opportunities Fund | Massachusetts Fund | New York Fund | Ohio Fund |
| Increase (Decrease) in Net Assets | | | | |
| From operations: | | | | |
| Net investment income | $ 11,384,366 | $ 3,769,265 | $ 8,158,370 | $ 5,143,739 |
| Net realized loss | (34,443,989) | (7,982,128) | (17,198,372) | (1,631,333) |
| Net change in unrealized appreciation (depreciation) | (46,182,704) | (19,191,238) | (46,204,235) | (25,737,854) |
| Net decrease in net assets from operations | $ (69,242,327) | $ (23,404,101) | $ (55,244,237) | $ (22,225,448) |
| Distributions to shareholders: | | | | |
| Class A | $ (2,656,213) | $ (1,807,484) | $ (6,287,464) | $ (2,669,845) |
| Class C | (318,949) | (86,829) | (383,702) | (175,380) |
| Class I | (10,978,729) | (1,868,332) | (5,095,988) | (2,254,596) |
| Total distributions to shareholders | $ (13,953,891) | $ (3,762,645) | $ (11,767,154) | $ (5,099,821) |
| Transactions in shares of beneficial interest: | | | | |
| Class A | $ (10,725,103) | $ (9,174,665) | $ (29,731,129) | $ (7,535,722) |
| Class C | (8,027,012) | (3,004,910) | (6,615,735) | (3,094,393) |
| Class I | (66,858,446) | (26,255,727) | (16,581,861) | 31,024,198 |
| Net increase (decrease) in net assets from Fund share transactions | $ (85,610,561) | $ (38,435,302) | $ (52,928,725) | $ 20,394,083 |
| Net decrease in net assets | $(168,806,779) | $ (65,602,048) | $(119,940,116) | $ (6,931,186) |
| Net Assets | | | | |
| At beginning of year | $ 748,912,658 | $ 204,646,834 | $ 464,055,512 | $ 196,518,529 |
| At end of year | $ 580,105,879 | $139,044,786 | $ 344,115,396 | $189,587,343 |
40
See Notes to Financial Statements.
Eaton Vance
Municipal Income Funds
September 30, 2022
Statements of Changes in Net Assets — continued
| | Year Ended September 30, 2021 |
| | California
Opportunities Fund | Massachusetts Fund | New York Fund | Ohio Fund |
| Increase (Decrease) in Net Assets | | | | |
| From operations: | | | | |
| Net investment income | $ 9,452,343 | $ 4,036,725 | $ 7,293,905 | $ 4,971,854 |
| Net realized gain | 2,752,572 | 78,999 | 3,715,320 | 473,373 |
| Net change in unrealized appreciation (depreciation) | 884,910 | (1,609,682) | 3,858,579 | (1,864,369) |
| Net increase in net assets from operations | $ 13,089,825 | $ 2,506,042 | $ 14,867,804 | $ 3,580,858 |
| Distributions to shareholders: | | | | |
| Class A | $ (2,231,599) | $ (1,894,087) | $ (9,739,841) | $ (2,850,002) |
| Class C | (228,505) | (102,588) | (885,587) | (191,452) |
| Class I | (8,633,538) | (2,144,549) | (7,211,868) | (1,879,740) |
| Total distributions to shareholders | $ (11,093,642) | $ (4,141,224) | $ (17,837,296) | $ (4,921,194) |
| Transactions in shares of beneficial interest: | | | | |
| Class A | $ (2,685,390) | $ (2,847,643) | $ 11,074,685 | $ 6,479,775 |
| Class C | 1,716,077 | (1,278,564) | (8,865,535) | 344,168 |
| Class I | 161,157,108 | 3,717,250 | 26,936,878 | 11,046,442 |
| Net increase (decrease) in net assets from Fund share transactions | $160,187,795 | $ (408,957) | $ 29,146,028 | $ 17,870,385 |
| Net increase (decrease) in net assets | $162,183,978 | $ (2,044,139) | $ 26,176,536 | $ 16,530,049 |
| Net Assets | | | | |
| At beginning of year | $ 586,728,680 | $ 206,690,973 | $ 437,878,976 | $ 179,988,480 |
| At end of year | $748,912,658 | $204,646,834 | $464,055,512 | $196,518,529 |
41
See Notes to Financial Statements.
Eaton Vance
Municipal Income Funds
September 30, 2022
| | California Opportunities Fund — Class A |
| | Year Ended September 30, |
| | 2022 | 2021 | 2020 | 2019 | 2018 |
| Net asset value — Beginning of year | $ 10.990 | $ 10.930 | $ 10.800 | $ 10.210 | $ 10.410 |
| Income (Loss) From Operations | | | | | |
| Net investment income(1) | $ 0.166 | $ 0.136 | $ 0.203 | $ 0.258 | $ 0.263 |
| Net realized and unrealized gain (loss) | (1.291) | 0.089 | 0.177 | 0.590 | (0.200) |
| Total income (loss) from operations | $ (1.125) | $ 0.225 | $ 0.380 | $ 0.848 | $ 0.063 |
| Less Distributions | | | | | |
| From net investment income | $ (0.168) | $ (0.136) | $ (0.214) | $ (0.258) | $ (0.263) |
| From net realized gain | (0.037) | (0.029) | (0.036) | — | — |
| Total distributions | $ (0.205) | $ (0.165) | $ (0.250) | $ (0.258) | $ (0.263) |
| Net asset value — End of year | $ 9.660 | $ 10.990 | $ 10.930 | $ 10.800 | $ 10.210 |
| Total Return(2) | (10.35)% | 2.06% | 3.58% | 8.52% | 0.52% |
| Ratios/Supplemental Data | | | | | |
| Net assets, end of year (000’s omitted) | $117,491 | $145,636 | $147,662 | $126,381 | $107,204 |
| Ratios (as a percentage of average daily net assets): | | | | | |
| Expenses excluding interest and fees | 0.71% | 0.69% | 0.71% | 0.76% | 0.77% |
| Interest and fee expense(3) | — | — | 0.01% | 0.04% | 0.07% |
| Total expenses | 0.71% | 0.69% | 0.72% | 0.80% | 0.84% |
| Net investment income | 1.59% | 1.23% | 1.88% | 2.47% | 2.56% |
| Portfolio Turnover | 170% | 104% | 184% | 235% | 293% |
| (1) | Computed using average shares outstanding. |
| (2) | Returns are historical and are calculated by determining the percentage change in net asset value with all distributions reinvested and do not reflect the effect of sales charges. |
| (3) | Interest and fee expense relates to the liability for floating rate notes issued in conjunction with residual interest bond transactions (see Note 1H). |
42
See Notes to Financial Statements.
Eaton Vance
Municipal Income Funds
September 30, 2022
Financial Highlights — continued
| | California Opportunities Fund — Class C |
| | Year Ended September 30, |
| | 2022 | 2021 | 2020 | 2019 | 2018 |
| Net asset value — Beginning of year | $10.150 | $ 10.110 | $ 9.990 | $ 9.440 | $ 9.620 |
| Income (Loss) From Operations | | | | | |
| Net investment income(1) | $ 0.078 | $ 0.049 | $ 0.113 | $ 0.166 | $ 0.172 |
| Net realized and unrealized gain (loss) | (1.178) | 0.069 | 0.166 | 0.550 | (0.180) |
| Total income (loss) from operations | $ (1.100) | $ 0.118 | $ 0.279 | $ 0.716 | $ (0.008) |
| Less Distributions | | | | | |
| From net investment income | $ (0.083) | $ (0.049) | $ (0.123) | $ (0.166) | $ (0.172) |
| From net realized gain | (0.037) | (0.029) | (0.036) | — | — |
| Total distributions | $ (0.120) | $ (0.078) | $ (0.159) | $ (0.166) | $ (0.172) |
| Net asset value — End of year | $ 8.930 | $10.150 | $10.110 | $ 9.990 | $ 9.440 |
| Total Return(2) | (10.92)% | 1.16% | 2.83% | 7.66% | (0.08)% |
| Ratios/Supplemental Data | | | | | |
| Net assets, end of year (000’s omitted) | $19,575 | $ 30,823 | $ 28,977 | $27,616 | $24,437 |
| Ratios (as a percentage of average daily net assets): | | | | | |
| Expenses excluding interest and fees | 1.46% | 1.44% | 1.46% | 1.51% | 1.52% |
| Interest and fee expense(3) | — | — | 0.01% | 0.04% | 0.07% |
| Total expenses | 1.46% | 1.44% | 1.47% | 1.55% | 1.59% |
| Net investment income | 0.81% | 0.48% | 1.13% | 1.72% | 1.80% |
| Portfolio Turnover | 170% | 104% | 184% | 235% | 293% |
| (1) | Computed using average shares outstanding. |
| (2) | Returns are historical and are calculated by determining the percentage change in net asset value with all distributions reinvested and do not reflect the effect of sales charges. |
| (3) | Interest and fee expense relates to the liability for floating rate notes issued in conjunction with residual interest bond transactions (see Note 1H). |
43
See Notes to Financial Statements.
Eaton Vance
Municipal Income Funds
September 30, 2022
Financial Highlights — continued
| | California Opportunities Fund — Class I |
| | Year Ended September 30, |
| | 2022 | 2021 | 2020 | 2019 | 2018 |
| Net asset value — Beginning of year | $ 10.990 | $ 10.940 | $ 10.810 | $ 10.210 | $ 10.420 |
| Income (Loss) From Operations | | | | | |
| Net investment income(1) | $ 0.191 | $ 0.162 | $ 0.225 | $ 0.282 | $ 0.289 |
| Net realized and unrealized gain (loss) | (1.280) | 0.080 | 0.181 | 0.602 | (0.210) |
| Total income (loss) from operations | $ (1.089) | $ 0.242 | $ 0.406 | $ 0.884 | $ 0.079 |
| Less Distributions | | | | | |
| From net investment income | $ (0.194) | $ (0.163) | $ (0.240) | $ (0.284) | $ (0.289) |
| From net realized gain | (0.037) | (0.029) | (0.036) | — | — |
| Total distributions | $ (0.231) | $ (0.192) | $ (0.276) | $ (0.284) | $ (0.289) |
| Net asset value — End of year | $ 9.670 | $ 10.990 | $ 10.940 | $ 10.810 | $ 10.210 |
| Total Return(2) | (10.03)% | 2.22% | 3.82% | 8.79% | 0.77% |
| Ratios/Supplemental Data | | | | | |
| Net assets, end of year (000’s omitted) | $443,039 | $572,453 | $410,090 | $195,115 | $116,940 |
| Ratios (as a percentage of average daily net assets): | | | | | |
| Expenses excluding interest and fees | 0.46% | 0.44% | 0.46% | 0.51% | 0.51% |
| Interest and fee expense(3) | — | — | 0.01% | 0.04% | 0.07% |
| Total expenses | 0.46% | 0.44% | 0.47% | 0.55% | 0.58% |
| Net investment income | 1.83% | 1.47% | 2.08% | 2.68% | 2.80% |
| Portfolio Turnover | 170% | 104% | 184% | 235% | 293% |
| (1) | Computed using average shares outstanding. |
| (2) | Returns are historical and are calculated by determining the percentage change in net asset value with all distributions reinvested. |
| (3) | Interest and fee expense relates to the liability for floating rate notes issued in conjunction with residual interest bond transactions (see Note 1H). |
44
See Notes to Financial Statements.
Eaton Vance
Municipal Income Funds
September 30, 2022
Financial Highlights — continued
| | Massachusetts Fund — Class A |
| | Year Ended September 30, |
| | 2022 | 2021 | 2020 | 2019 | 2018 |
| Net asset value — Beginning of year | $ 8.970 | $ 9.030 | $ 8.980 | $ 8.600 | $ 8.890 |
| Income (Loss) From Operations | | | | | |
| Net investment income(1) | $ 0.176 | $ 0.166 | $ 0.206 | $ 0.252 | $ 0.265 |
| Net realized and unrealized gain (loss) | (1.320) | (0.055) | 0.071 | 0.382 | (0.280) |
| Total income (loss) from operations | $ (1.144) | $ 0.111 | $ 0.277 | $ 0.634 | $ (0.015) |
| Less Distributions | | | | | |
| From net investment income | $ (0.176) | $ (0.171) | $ (0.227) | $ (0.254) | $ (0.275) |
| Total distributions | $ (0.176) | $ (0.171) | $ (0.227) | $ (0.254) | $ (0.275) |
| Net asset value — End of year | $ 7.650 | $ 8.970 | $ 9.030 | $ 8.980 | $ 8.600 |
| Total Return(2) | (12.89)% | 1.23% | 3.13% | 7.48% | (0.17)% |
| Ratios/Supplemental Data | | | | | |
| Net assets, end of year (000’s omitted) | $73,926 | $96,499 | $100,099 | $93,288 | $88,205 |
| Ratios (as a percentage of average daily net assets): | | | | | |
| Expenses excluding interest and fees | 0.68% | 0.65% | 0.68% | 0.71% | 0.72% |
| Interest and fee expense(3) | 0.02% | 0.01% | 0.03% | 0.05% | 0.05% |
| Total expenses | 0.70% | 0.66% | 0.71% | 0.76% | 0.77% |
| Net investment income | 2.09% | 1.83% | 2.30% | 2.87% | 3.03% |
| Portfolio Turnover | 46% | 26% | 15% | 49% | 41% |
| (1) | Computed using average shares outstanding. |
| (2) | Returns are historical and are calculated by determining the percentage change in net asset value with all distributions reinvested and do not reflect the effect of sales charges. |
| (3) | Interest and fee expense relates to the liability for floating rate notes issued in conjunction with residual interest bond transactions (see Note 1H). |
45
See Notes to Financial Statements.
Eaton Vance
Municipal Income Funds
September 30, 2022
Financial Highlights — continued
| | Massachusetts Fund — Class C |
| | Year Ended September 30, |
| | 2022 | 2021 | 2020 | 2019 | 2018 |
| Net asset value — Beginning of year | $ 8.960 | $ 9.040 | $ 8.990 | $ 8.610 | $ 8.890 |
| Income (Loss) From Operations | | | | | |
| Net investment income(1) | $ 0.111 | $ 0.098 | $ 0.140 | $ 0.186 | $ 0.200 |
| Net realized and unrealized gain (loss) | (1.308) | (0.072) | 0.073 | 0.382 | (0.270) |
| Total income (loss) from operations | $(1.197) | $ 0.026 | $ 0.213 | $ 0.568 | $ (0.070) |
| Less Distributions | | | | | |
| From net investment income | $ (0.113) | $ (0.106) | $ (0.163) | $ (0.188) | $ (0.210) |
| Total distributions | $(0.113) | $(0.106) | $(0.163) | $ (0.188) | $ (0.210) |
| Net asset value — End of year | $ 7.650 | $ 8.960 | $ 9.040 | $ 8.990 | $ 8.610 |
| Total Return(2) | (13.45)% | 0.39% | 2.40% | 6.55% | (0.80)% |
| Ratios/Supplemental Data | | | | | |
| Net assets, end of year (000’s omitted) | $ 4,452 | $ 8,464 | $ 9,811 | $12,518 | $14,848 |
| Ratios (as a percentage of average daily net assets): | | | | | |
| Expenses excluding interest and fees | 1.43% | 1.40% | 1.43% | 1.46% | 1.47% |
| Interest and fee expense(3) | 0.02% | 0.01% | 0.03% | 0.05% | 0.05% |
| Total expenses | 1.45% | 1.41% | 1.46% | 1.51% | 1.52% |
| Net investment income | 1.31% | 1.08% | 1.56% | 2.12% | 2.29% |
| Portfolio Turnover | 46% | 26% | 15% | 49% | 41% |
| (1) | Computed using average shares outstanding. |
| (2) | Returns are historical and are calculated by determining the percentage change in net asset value with all distributions reinvested and do not reflect the effect of sales charges. |
| (3) | Interest and fee expense relates to the liability for floating rate notes issued in conjunction with residual interest bond transactions (see Note 1H). |
46
See Notes to Financial Statements.
Eaton Vance
Municipal Income Funds
September 30, 2022
Financial Highlights — continued
| | Massachusetts Fund — Class I |
| | Year Ended September 30, |
| | 2022 | 2021 | 2020 | 2019 | 2018 |
| Net asset value — Beginning of year | $ 8.970 | $ 9.030 | $ 8.980 | $ 8.600 | $ 8.880 |
| Income (Loss) From Operations | | | | | |
| Net investment income(1) | $ 0.192 | $ 0.184 | $ 0.222 | $ 0.268 | $ 0.283 |
| Net realized and unrealized gain (loss) | (1.309) | (0.056) | 0.071 | 0.384 | (0.270) |
| Total income (loss) from operations | $ (1.117) | $ 0.128 | $ 0.293 | $ 0.652 | $ 0.013 |
| Less Distributions | | | | | |
| From net investment income | $ (0.193) | $ (0.188) | $ (0.243) | $ (0.272) | $ (0.293) |
| Total distributions | $ (0.193) | $ (0.188) | $ (0.243) | $ (0.272) | $ (0.293) |
| Net asset value — End of year | $ 7.660 | $ 8.970 | $ 9.030 | $ 8.980 | $ 8.600 |
| Total Return(2) | (12.60)% | 1.42% | 3.31% | 7.69% | 0.15% |
| Ratios/Supplemental Data | | | | | |
| Net assets, end of year (000’s omitted) | $60,667 | $99,684 | $96,780 | $63,829 | $40,691 |
| Ratios (as a percentage of average daily net assets): | | | | | |
| Expenses excluding interest and fees | 0.48% | 0.45% | 0.48% | 0.51% | 0.52% |
| Interest and fee expense(3) | 0.02% | 0.01% | 0.03% | 0.05% | 0.05% |
| Total expenses | 0.50% | 0.46% | 0.51% | 0.56% | 0.57% |
| Net investment income | 2.27% | 2.03% | 2.48% | 3.05% | 3.23% |
| Portfolio Turnover | 46% | 26% | 15% | 49% | 41% |
| (1) | Computed using average shares outstanding. |
| (2) | Returns are historical and are calculated by determining the percentage change in net asset value with all distributions reinvested. |
| (3) | Interest and fee expense relates to the liability for floating rate notes issued in conjunction with residual interest bond transactions (see Note 1H). |
47
See Notes to Financial Statements.
Eaton Vance
Municipal Income Funds
September 30, 2022
Financial Highlights — continued
| | New York Fund — Class A |
| | Year Ended September 30, |
| | 2022 | 2021 | 2020 | 2019 | 2018 |
| Net asset value — Beginning of year | $ 10.400 | $ 10.470 | $ 10.380 | $ 9.800 | $ 10.110 |
| Income (Loss) From Operations | | | | | |
| Net investment income(1) | $ 0.191 | $ 0.162 | $ 0.216 | $ 0.265 | $ 0.285 |
| Net realized and unrealized gain (loss) | (1.527) | 0.179 | 0.103 | 0.580 | (0.311) |
| Total income (loss) from operations | $ (1.336) | $ 0.341 | $ 0.319 | $ 0.845 | $ (0.026) |
| Less Distributions | | | | | |
| From net investment income | $ (0.191) | $ (0.162) | $ (0.229) | $ (0.265) | $ (0.284) |
| From net realized gain | (0.083) | (0.249) | — | — | — |
| Total distributions | $ (0.274) | $ (0.411) | $ (0.229) | $ (0.265) | $ (0.284) |
| Net asset value — End of year | $ 8.790 | $ 10.400 | $ 10.470 | $ 10.380 | $ 9.800 |
| Total Return(2) | (13.09)% | 3.30% | 3.11% | 8.74% | (0.26)% |
| Ratios/Supplemental Data | | | | | |
| Net assets, end of year (000’s omitted) | $184,700 | $250,441 | $240,960 | $235,528 | $218,892 |
| Ratios (as a percentage of average daily net assets): | | | | | |
| Expenses excluding interest and fees | 0.68% | 0.65% | 0.67% | 0.69% | 0.70% |
| Interest and fee expense(3) | 0.00% (4) | — | — | 0.04% | 0.09% |
| Total expenses | 0.68% | 0.65% | 0.67% | 0.73% | 0.79% |
| Net investment income | 1.96% | 1.55% | 2.07% | 2.63% | 2.86% |
| Portfolio Turnover | 59% | 63% | 125% | 114% | 75% |
| (1) | Computed using average shares outstanding. |
| (2) | Returns are historical and are calculated by determining the percentage change in net asset value with all distributions reinvested and do not reflect the effect of sales charges. |
| (3) | Interest and fee expense relates to the liability for floating rate notes issued in conjunction with residual interest bond transactions (see Note 1H). |
| (4) | Amount is less than 0.005%. |
48
See Notes to Financial Statements.
Eaton Vance
Municipal Income Funds
September 30, 2022
Financial Highlights — continued
| | New York Fund — Class C |
| | Year Ended September 30, |
| | 2022 | 2021 | 2020 | 2019 | 2018 |
| Net asset value — Beginning of year | $10.400 | $ 10.470 | $ 10.390 | $ 9.800 | $10.120 |
| Income (Loss) From Operations | | | | | |
| Net investment income(1) | $ 0.116 | $ 0.085 | $ 0.139 | $ 0.192 | $ 0.211 |
| Net realized and unrealized gain (loss) | (1.515) | 0.177 | 0.093 | 0.588 | (0.321) |
| Total income (loss) from operations | $ (1.399) | $ 0.262 | $ 0.232 | $ 0.780 | $ (0.110) |
| Less Distributions | | | | | |
| From net investment income | $ (0.118) | $ (0.083) | $ (0.152) | $ (0.190) | $ (0.210) |
| From net realized gain | (0.083) | (0.249) | — | — | — |
| Total distributions | $ (0.201) | $ (0.332) | $ (0.152) | $ (0.190) | $ (0.210) |
| Net asset value — End of year | $ 8.800 | $10.400 | $10.470 | $10.390 | $ 9.800 |
| Total Return(2) | (13.65)% | 2.53% | 2.25% | 8.03% | (1.10)% |
| Ratios/Supplemental Data | | | | | |
| Net assets, end of year (000’s omitted) | $12,833 | $ 22,375 | $ 31,347 | $ 40,711 | $55,817 |
| Ratios (as a percentage of average daily net assets): | | | | | |
| Expenses excluding interest and fees | 1.43% | 1.40% | 1.42% | 1.44% | 1.45% |
| Interest and fee expense(3) | 0.00% (4) | — | — | 0.04% | 0.09% |
| Total expenses | 1.43% | 1.40% | 1.42% | 1.48% | 1.54% |
| Net investment income | 1.19% | 0.81% | 1.33% | 1.91% | 2.11% |
| Portfolio Turnover | 59% | 63% | 125% | 114% | 75% |
| (1) | Computed using average shares outstanding. |
| (2) | Returns are historical and are calculated by determining the percentage change in net asset value with all distributions reinvested and do not reflect the effect of sales charges. |
| (3) | Interest and fee expense relates to the liability for floating rate notes issued in conjunction with residual interest bond transactions (see Note 1H). |
| (4) | Amount is less than 0.005%. |
49
See Notes to Financial Statements.
Eaton Vance
Municipal Income Funds
September 30, 2022
Financial Highlights — continued
| | New York Fund — Class I |
| | Year Ended September 30, |
| | 2022 | 2021 | 2020 | 2019 | 2018 |
| Net asset value — Beginning of year | $ 10.390 | $ 10.470 | $ 10.380 | $ 9.800 | $ 10.110 |
| Income (Loss) From Operations | | | | | |
| Net investment income(1) | $ 0.210 | $ 0.183 | $ 0.236 | $ 0.285 | $ 0.305 |
| Net realized and unrealized gain (loss) | (1.517) | 0.169 | 0.103 | 0.580 | (0.311) |
| Total income (loss) from operations | $ (1.307) | $ 0.352 | $ 0.339 | $ 0.865 | $ (0.006) |
| Less Distributions | | | | | |
| From net investment income | $ (0.210) | $ (0.183) | $ (0.249) | $ (0.285) | $ (0.304) |
| From net realized gain | (0.083) | (0.249) | — | — | — |
| Total distributions | $ (0.293) | $ (0.432) | $ (0.249) | $ (0.285) | $ (0.304) |
| Net asset value — End of year | $ 8.790 | $ 10.390 | $ 10.470 | $ 10.380 | $ 9.800 |
| Total Return(2) | (12.83)% | 3.41% | 3.30% | 8.96% | (0.06)% |
| Ratios/Supplemental Data | | | | | |
| Net assets, end of year (000’s omitted) | $146,582 | $191,239 | $165,573 | $136,913 | $123,119 |
| Ratios (as a percentage of average daily net assets): | | | | | |
| Expenses excluding interest and fees | 0.48% | 0.45% | 0.47% | 0.49% | 0.50% |
| Interest and fee expense(3) | 0.00% (4) | — | — | 0.04% | 0.09% |
| Total expenses | 0.48% | 0.45% | 0.47% | 0.53% | 0.59% |
| Net investment income | 2.16% | 1.74% | 2.27% | 2.83% | 3.06% |
| Portfolio Turnover | 59% | 63% | 125% | 114% | 75% |
| (1) | Computed using average shares outstanding. |
| (2) | Returns are historical and are calculated by determining the percentage change in net asset value with all distributions reinvested. |
| (3) | Interest and fee expense relates to the liability for floating rate notes issued in conjunction with residual interest bond transactions (see Note 1H). |
| (4) | Amount is less than 0.005%. |
50
See Notes to Financial Statements.
Eaton Vance
Municipal Income Funds
September 30, 2022
Financial Highlights — continued
| | Ohio Fund — Class A |
| | Year Ended September 30, |
| | 2022 | 2021 | 2020 | 2019 | 2018 |
| Net asset value — Beginning of year | $ 9.260 | $ 9.320 | $ 9.210 | $ 8.700 | $ 9.020 |
| Income (Loss) From Operations | | | | | |
| Net investment income(1) | $ 0.233 | $ 0.244 | $ 0.262 | $ 0.276 | $ 0.283 |
| Net realized and unrealized gain (loss) | (1.242) | (0.063) | 0.111 | 0.506 | (0.324) |
| Total income (loss) from operations | $ (1.009) | $ 0.181 | $ 0.373 | $ 0.782 | $ (0.041) |
| Less Distributions | | | | | |
| From net investment income | $ (0.231) | $ (0.241) | $ (0.263) | $ (0.272) | $ (0.279) |
| Total distributions | $ (0.231) | $ (0.241) | $ (0.263) | $ (0.272) | $ (0.279) |
| Net asset value — End of year | $ 8.020 | $ 9.260 | $ 9.320 | $ 9.210 | $ 8.700 |
| Total Return(2) | (11.06)% | 1.95% | 4.11% | 9.12% | (0.45)% |
| Ratios/Supplemental Data | | | | | |
| Net assets, end of year (000’s omitted) | $89,734 | $111,629 | $105,917 | $102,651 | $97,736 |
| Ratios (as a percentage of average daily net assets): | | | | | |
| Expenses excluding interest and fees | 0.70% | 0.68% | 0.69% | 0.71% | 0.71% |
| Interest and fee expense(3) | 0.05% | 0.03% | 0.07% | 0.13% | 0.14% |
| Total expenses | 0.75% | 0.71% | 0.76% | 0.84% | 0.85% |
| Net investment income | 2.66% | 2.60% | 2.84% | 3.08% | 3.20% |
| Portfolio Turnover | 17% | 3% | 11% | 11% | 13% |
| (1) | Computed using average shares outstanding. |
| (2) | Returns are historical and are calculated by determining the percentage change in net asset value with all distributions reinvested and do not reflect the effect of sales charges. |
| (3) | Interest and fee expense relates to the liability for floating rate notes issued in conjunction with residual interest bond transactions (see Note 1H). |
51
See Notes to Financial Statements.
Eaton Vance
Municipal Income Funds
September 30, 2022
Financial Highlights — continued
| | Ohio Fund — Class C |
| | Year Ended September 30, |
| | 2022 | 2021 | 2020 | 2019 | 2018 |
| Net asset value — Beginning of year | $ 9.260 | $ 9.320 | $ 9.200 | $ 8.700 | $ 9.010 |
| Income (Loss) From Operations | | | | | |
| Net investment income(1) | $ 0.168 | $ 0.173 | $ 0.193 | $ 0.209 | $ 0.217 |
| Net realized and unrealized gain (loss) | (1.252) | (0.062) | 0.121 | 0.496 | (0.314) |
| Total income (loss) from operations | $(1.084) | $ 0.111 | $ 0.314 | $ 0.705 | $ (0.097) |
| Less Distributions | | | | | |
| From net investment income | $ (0.166) | $ (0.171) | $ (0.194) | $ (0.205) | $ (0.213) |
| Total distributions | $(0.166) | $ (0.171) | $ (0.194) | $ (0.205) | $ (0.213) |
| Net asset value — End of year | $ 8.010 | $ 9.260 | $ 9.320 | $ 9.200 | $ 8.700 |
| Total Return(2) | (11.84)% | 1.19% | 3.45% | 8.19% | (1.09)% |
| Ratios/Supplemental Data | | | | | |
| Net assets, end of year (000’s omitted) | $ 6,697 | $11,078 | $10,805 | $13,233 | $19,191 |
| Ratios (as a percentage of average daily net assets): | | | | | |
| Expenses excluding interest and fees | 1.45% | 1.43% | 1.44% | 1.47% | 1.46% |
| Interest and fee expense(3) | 0.05% | 0.03% | 0.07% | 0.13% | 0.14% |
| Total expenses | 1.50% | 1.46% | 1.51% | 1.60% | 1.60% |
| Net investment income | 1.90% | 1.85% | 2.09% | 2.35% | 2.45% |
| Portfolio Turnover | 17% | 3% | 11% | 11% | 13% |
| (1) | Computed using average shares outstanding. |
| (2) | Returns are historical and are calculated by determining the percentage change in net asset value with all distributions reinvested and do not reflect the effect of sales charges. |
| (3) | Interest and fee expense relates to the liability for floating rate notes issued in conjunction with residual interest bond transactions (see Note 1H). |
52
See Notes to Financial Statements.
Eaton Vance
Municipal Income Funds
September 30, 2022
Financial Highlights — continued
| | Ohio Fund — Class I |
| | Year Ended September 30, |
| | 2022 | 2021 | 2020 | 2019 | 2018 |
| Net asset value — Beginning of year | $ 9.270 | $ 9.330 | $ 9.210 | $ 8.710 | $ 9.020 |
| Income (Loss) From Operations | | | | | |
| Net investment income(1) | $ 0.250 | $ 0.262 | $ 0.281 | $ 0.293 | $ 0.300 |
| Net realized and unrealized gain (loss) | (1.251) | (0.062) | 0.121 | 0.498 | (0.313) |
| Total income (loss) from operations | $ (1.001) | $ 0.200 | $ 0.402 | $ 0.791 | $ (0.013) |
| Less Distributions | | | | | |
| From net investment income | $ (0.249) | $ (0.260) | $ (0.282) | $ (0.291) | $ (0.297) |
| Total distributions | $ (0.249) | $ (0.260) | $ (0.282) | $ (0.291) | $ (0.297) |
| Net asset value — End of year | $ 8.020 | $ 9.270 | $ 9.330 | $ 9.210 | $ 8.710 |
| Total Return(2) | (10.98)% | 2.16% | 4.43% | 9.21% | (0.14)% |
| Ratios/Supplemental Data | | | | | |
| Net assets, end of year (000’s omitted) | $93,156 | $73,812 | $63,267 | $49,932 | $35,722 |
| Ratios (as a percentage of average daily net assets): | | | | | |
| Expenses excluding interest and fees | 0.50% | 0.48% | 0.49% | 0.51% | 0.51% |
| Interest and fee expense(3) | 0.05% | 0.03% | 0.07% | 0.13% | 0.14% |
| Total expenses | 0.55% | 0.51% | 0.56% | 0.64% | 0.65% |
| Net investment income | 2.87% | 2.80% | 3.04% | 3.26% | 3.39% |
| Portfolio Turnover | 17% | 3% | 11% | 11% | 13% |
| (1) | Computed using average shares outstanding. |
| (2) | Returns are historical and are calculated by determining the percentage change in net asset value with all distributions reinvested. |
| (3) | Interest and fee expense relates to the liability for floating rate notes issued in conjunction with residual interest bond transactions (see Note 1H). |
53
See Notes to Financial Statements.
Eaton Vance
Municipal Income Funds
September 30, 2022
Notes to Financial Statements
1 Significant Accounting Policies
Eaton Vance Municipals Trust (the Trust) is a Massachusetts business trust registered under the Investment Company Act of 1940, as amended (the 1940 Act), as an open-end management investment company. The Trust presently consists of eighteen funds, four of which, each non-diversified, are included in these financial statements. They include Eaton Vance California Municipal Opportunities Fund (California Opportunities Fund), Eaton Vance Massachusetts Municipal Income Fund (Massachusetts Fund), Eaton Vance New York Municipal Income Fund (New York Fund) and Eaton Vance Ohio Municipal Income Fund (Ohio Fund), (each individually referred to as the Fund, and collectively, the Funds). The investment objective of the Massachusetts Fund, New York Fund and Ohio Fund is to provide current income exempt from regular federal income tax and from particular state or local income or other taxes. The investment objective of the California Opportunities Fund is to seek to maximize after-tax total return. The Funds offer three classes of shares. Class A shares are generally sold subject to a sales charge imposed at time of purchase. Class C shares are sold at net asset value and are generally subject to a contingent deferred sales charge (see Note 5). Effective November 5, 2020, Class C shares automatically convert to Class A shares eight years after their purchase as described in the Funds' prospectus. Class I shares are sold at net asset value and are not subject to a sales charge. Each class represents a pro-rata interest in the Fund, but votes separately on class-specific matters and (as noted below) is subject to different expenses. Realized and unrealized gains and losses are allocated daily to each class of shares based on the relative net assets of each class to the total net assets of the Fund. Net investment income, other than class-specific expenses, is allocated daily to each class of shares based upon the ratio of the value of each class’s paid shares to the total value of all paid shares. Each class of shares differs in its distribution plan and certain other class-specific expenses.
The following is a summary of significant accounting policies of the Funds. The policies are in conformity with accounting principles generally accepted in the United States of America (U.S. GAAP). Each Fund is an investment company and follows accounting and reporting guidance in the Financial Accounting Standards Board (FASB) Accounting Standards Codification Topic 946.
A Investment Valuation—The following methodologies are used to determine the market value or fair value of investments.
Debt Obligations. Debt obligations are generally valued on the basis of valuations provided by third party pricing services, as derived from such services’ pricing models. Inputs to the models may include, but are not limited to, reported trades, executable bid and ask prices, broker/dealer quotations, prices or yields of securities with similar characteristics, interest rates, anticipated prepayments, benchmark curves or information pertaining to the issuer, as well as industry and economic events. The pricing services may use a matrix approach, which considers information regarding securities with similar characteristics to determine the valuation for a security. Short-term debt obligations purchased with a remaining maturity of sixty days or less for which a valuation from a third party pricing service is not readily available may be valued at amortized cost, which approximates fair value.
Derivatives. Futures contracts are valued at the closing settlement price established by the board of trade or exchange on which they are traded.
Fair Valuation. In connection with Rule 2a-5 of the 1940 Act, which became effective September 8, 2022, the Trustees have designated a Fund’s investment adviser as its valuation designee. Investments for which valuations or market quotations are not readily available or are deemed unreliable are valued by the investment adviser, as valuation designee, at fair value using methods that most fairly reflect the security’s “fair value”, which is the amount that a Fund might reasonably expect to receive for the security upon its current sale in the ordinary course. Each such determination is based on a consideration of relevant factors, which are likely to vary from one pricing context to another. These factors may include, but are not limited to, the type of security, the existence of any contractual restrictions on the security’s disposition, the price and extent of public trading in similar securities of the issuer or of comparable companies or entities, quotations or relevant information obtained from broker/dealers or other market participants, information obtained from the issuer, analysts, and/or the appropriate stock exchange (for exchange-traded securities), an analysis of the company’s or entity’s financial statements, and an evaluation of the forces that influence the issuer and the market(s) in which the security is purchased and sold.
B Investment Transactions and Related Income—Investment transactions for financial statement purposes are accounted for on a trade date basis. Realized gains and losses on investments sold are determined on the basis of identified cost. Interest income is recorded on the basis of interest accrued, adjusted for amortization of premium or accretion of discount.
C Federal Taxes—Each Fund’s policy is to comply with the provisions of the Internal Revenue Code applicable to regulated investment companies and to distribute to shareholders each year substantially all of its taxable, if any, and tax-exempt net investment income, and all or substantially all of its net realized capital gains. Accordingly, no provision for federal income or excise tax is necessary. Each Fund intends to satisfy conditions which will enable it to designate distributions from the interest income generated by its investments in non-taxable municipal securities, which are exempt from regular federal income tax when received by each Fund, as exempt-interest dividends. The portion of such interest, if any, earned on private activity bonds issued after August 7, 1986, may be considered a tax preference item to shareholders.
As of September 30, 2022, the Funds had no uncertain tax positions that would require financial statement recognition, de-recognition, or disclosure. Each Fund files a U.S. federal income tax return annually after its fiscal year-end, which is subject to examination by the Internal Revenue Service for a period of three years from the date of filing.
D Expenses—The majority of expenses of the Trust are directly identifiable to an individual fund. Expenses which are not readily identifiable to a specific fund are allocated taking into consideration, among other things, the nature and type of expense and the relative size of the funds.
Eaton Vance
Municipal Income Funds
September 30, 2022
Notes to Financial Statements — continued
E Legal Fees— Legal fees and other related expenses incurred as part of negotiations of the terms and requirement of capital infusions, or that are expected to result in the restructuring of, or a plan of reorganization for, an investment are recorded as realized losses. Ongoing expenditures to protect or enhance an investment are treated as operating expenses.
F Use of Estimates—The preparation of the financial statements in conformity with U.S. GAAP requires management to make estimates and assumptions that affect the reported amounts of assets and liabilities at the date of the financial statements and the reported amounts of income and expense during the reporting period. Actual results could differ from those estimates.
G Indemnifications—Under the Trust’s organizational documents, its officers and Trustees may be indemnified against certain liabilities and expenses arising out of the performance of their duties to the Funds. Under Massachusetts law, if certain conditions prevail, shareholders of a Massachusetts business trust (such as the Trust) could be deemed to have personal liability for the obligations of the Trust. However, the Trust’s Declaration of Trust contains an express disclaimer of liability on the part of Fund shareholders and the By-laws provide that the Trust shall assume, upon request by the shareholder, the defense on behalf of any Fund shareholders. Moreover, the By-laws also provide for indemnification out of Fund property of any shareholder held personally liable solely by reason of being or having been a shareholder for all loss or expense arising from such liability. Additionally, in the normal course of business, each Fund enters into agreements with service providers that may contain indemnification clauses. Each Fund’s maximum exposure under these arrangements is unknown as this would involve future claims that may be made against each Fund that have not yet occurred.
H Floating Rate Notes Issued in Conjunction with Securities Held— The Funds may invest in residual interest bonds, also referred to as inverse floating rate securities, whereby a Fund may sell a variable or fixed rate bond for cash to a Special-Purpose Vehicle (the SPV), (which is generally organized as a trust), while at the same time, buying a residual interest in the assets and cash flows of the SPV. The bond is deposited into the SPV with the same CUSIP number as the bond sold to the SPV by the Fund, and which may have been, but is not required to be, the bond purchased from the Fund (the Bond). The SPV also issues floating rate notes (Floating Rate Notes) which are sold to third-parties. The residual interest bond held by a Fund gives the Fund the right (1) to cause the holders of the Floating Rate Notes to generally tender their notes at par, and (2) to have the Bond held by the SPV transferred to the Fund, thereby terminating the SPV. Should the Fund exercise such right, it would generally pay the SPV the par amount due on the Floating Rate Notes and exchange the residual interest bond for the underlying Bond. Pursuant to generally accepted accounting principles for transfers and servicing of financial assets and extinguishment of liabilities, the Funds account for the transaction described above as a secured borrowing by including the Bond in their Portfolio of Investments and the Floating Rate Notes as a liability under the caption “Payable for floating rate notes issued” in their Statement of Assets and Liabilities. The Floating Rate Notes have interest rates that generally reset weekly and their holders have the option to tender their notes to the SPV for redemption at par at each reset date. Accordingly, the fair value of the payable for floating rate notes issued approximates its carrying value. If measured at fair value, the payable for floating rate notes would have been considered as Level 2 in the fair value hierarchy (see Note 10) at September 30, 2022. Interest expense related to a Fund’s liability with respect to Floating Rate Notes is recorded as incurred. The SPV may be terminated by the Fund, as noted above, or by the occurrence of certain termination events as defined in the trust agreement, such as a downgrade in the credit quality of the underlying Bond, bankruptcy of or payment failure by the issuer of the underlying Bond, the inability to remarket Floating Rate Notes that have been tendered due to insufficient buyers in the market, or the failure by the SPV to obtain renewal of the liquidity agreement under which liquidity support is provided for the Floating Rate Notes up to one year. At September 30, 2022, the amounts of the Funds’ Floating Rate Notes and related interest rates and collateral were as follows:
| | Massachusetts
Fund | New York
Fund | Ohio
Fund |
| Floating Rate Notes Outstanding | $3,652,594 | $ 2,399,976 | $ 8,456,266 |
| Interest Rate or Range of Interest Rates (%) | 2.49 | 2.49 | 2.49 - 2.55 |
| Collateral for Floating Rate Notes Outstanding | $6,156,477 | $ 3,176,730 | $12,827,403 |
For the year ended September 30, 2022, the Funds’ average settled Floating Rate Notes outstanding and the average interest rate including fees were as follows:
| | Massachusetts
Fund | New York
Fund | Ohio
Fund |
| Average Floating Rate Notes Outstanding | $3,640,000 | $ 78,904 | $ 8,934,205 |
| Average Interest Rate | 1.10% | 2.56% | 1.17% |
In certain circumstances, the Funds may enter into shortfall and forbearance agreements with brokers by which a Fund agrees to reimburse the broker for the difference between the liquidation value of the Bond held by the SPV and the liquidation value of the Floating Rate Notes, as well as any shortfalls in interest cash flows. The Funds had no shortfalls as of September 30, 2022.
Eaton Vance
Municipal Income Funds
September 30, 2022
Notes to Financial Statements — continued
The Funds may also purchase residual interest bonds in a secondary market transaction without first owning the underlying bond. Such transactions are not required to be treated as secured borrowings. Shortfall agreements, if any, related to residual interest bonds purchased in a secondary market transaction are disclosed in the Portfolio of Investments.
The Funds' investment policies and restrictions expressly permit investments in residual interest bonds. Such bonds typically offer the potential for yields exceeding the yields available on fixed rate bonds with comparable credit quality and maturity. These securities tend to underperform the market for fixed rate bonds in a rising long-term interest rate environment, but tend to outperform the market for fixed rate bonds when long-term interest rates decline. The value and income of residual interest bonds are generally more volatile than that of a fixed rate bond. The Funds' investment policies do not allow the Funds to borrow money except as permitted by the 1940 Act. Management believes that the Funds' restrictions on borrowing money and issuing senior securities (other than as specifically permitted) do not apply to Floating Rate Notes issued by the SPV and included as a liability in the Funds' Statement of Assets and Liabilities. As secured indebtedness issued by an SPV, Floating Rate Notes are distinct from the borrowings and senior securities to which the Funds' restrictions apply. Residual interest bonds held by the Funds are securities exempt from registration under Rule 144A of the Securities Act of 1933.
I Futures Contracts—Upon entering into a futures contract, a Fund is required to deposit with the broker, either in cash or securities, an amount equal to a certain percentage of the contract amount (initial margin). Subsequent payments, known as variation margin, are made or received by the Fund each business day, depending on the daily fluctuations in the value of the underlying security, and are recorded as unrealized gains or losses by the Fund. Gains (losses) are realized upon the expiration or closing of the futures contracts. Should market conditions change unexpectedly, the Fund may not achieve the anticipated benefits of the futures contracts and may realize a loss. Futures contracts have minimal counterparty risk as they are exchange traded and the clearinghouse for the exchange is substituted as the counterparty, guaranteeing counterparty performance.
J When-Issued Securities and Delayed Delivery Transactions—The Funds may purchase securities on a delayed delivery or when-issued basis. Payment and delivery may take place after the customary settlement period for that security. At the time the transaction is negotiated, the price of the security that will be delivered is fixed. The Funds maintain cash and/or security positions for these commitments such that sufficient liquid assets will be available to make payments upon settlement. Securities purchased on a delayed delivery or when-issued basis are marked-to-market daily and begin earning interest on settlement date. Such security purchases are subject to the risk that when delivered they will be worth less than the agreed upon payment price. Losses may also arise if the counterparty does not perform under the contract.
2 Distributions to Shareholders and Income Tax Information
The net investment income of each Fund is determined daily and substantially all of the net investment income so determined is declared as a dividend to shareholders of record at the time of declaration. Distributions are declared separately for each class of shares. Distributions are paid monthly. Distributions of realized capital gains are made at least annually. Shareholders may reinvest income and capital gain distributions in additional shares of the same class of a Fund at the net asset value as of the reinvestment date or, at the election of the shareholder, receive distributions in cash. Distributions to shareholders are determined in accordance with income tax regulations, which may differ from U.S. GAAP. As required by U.S. GAAP, only distributions in excess of tax basis earnings and profits are reported in the financial statements as a return of capital. Permanent differences between book and tax accounting relating to distributions are reclassified to paid-in capital. For tax purposes, distributions from short-term capital gains are considered to be from ordinary income.
The tax character of distributions declared for the years ended September 30, 2022 and September 30, 2021 was as follows:
| | Year Ended September 30, 2022 |
| | California
Opportunities
Fund | Massachusetts
Fund | New York
Fund | Ohio
Fund |
| Tax-exempt income | $10,181,029 | $3,439,415 | $7,914,759 | $5,099,821 |
| Ordinary income | $ 3,613,946 | $ 323,230 | $2,559,007 | $ — |
| Long-term capital gains | $ 158,916 | $ — | $1,293,388 | $ — |
Eaton Vance
Municipal Income Funds
September 30, 2022
Notes to Financial Statements — continued
| | Year Ended September 30, 2021 |
| | California
Opportunities
Fund | Massachusetts
Fund | New York
Fund | Ohio
Fund |
| Tax-exempt income | $8,476,460 | $3,792,735 | $7,121,562 | $4,921,194 |
| Ordinary income | $2,503,596 | $ 348,489 | $7,669,584 | $ — |
| Long-term capital gains | $ 113,586 | $ — | $3,046,150 | $ — |
During the year ended September 30, 2022, the following amounts were reclassified due to the tax treatment of distributions in excess of net tax-exempt income.
| | California
Opportunities
Fund | Massachusetts
Fund | New York
Fund | Ohio
Fund |
| Change in: | | | | |
| Paid-in capital | $ — | $ — | $ — | $(4,181) |
| Accumulated loss | $ — | $ — | $ — | $ 4,181 |
These reclassifications had no effect on the net assets or net asset value per share of the Funds.
As of September 30, 2022, the components of distributable earnings (accumulated loss) on a tax basis were as follows:
| | California
Opportunities
Fund | Massachusetts
Fund | New York
Fund | Ohio
Fund |
| Undistributed tax-exempt income | $ 136,564 | $ 62,285 | $ 27,054 | $ — |
| Deferred capital losses | (34,306,633) | (8,317,408) | (16,508,076) | (11,123,902) |
| Net unrealized depreciation | (24,001,275) | (5,169,097) | (28,938,295) | (7,726,014) |
| Distributions payable | (144,941) | (62,282) | (99,120) | (42,908) |
| Accumulated loss | $(58,316,285) | $(13,486,502) | $(45,518,437) | $(18,892,824) |
At September 30, 2022, the following Funds, for federal income tax purposes, had deferred capital losses which would reduce the respective Fund’s taxable income arising from future net realized gains on investment transactions, if any, to the extent permitted by the Internal Revenue Code, and thus would reduce the amount of distributions to shareholders, which would otherwise be necessary to relieve the Funds of any liability for federal income or excise tax. The deferred capital losses are treated as arising on the first day of a Fund’s next taxable year and retain the same short-term or long-term character as when originally deferred. The amounts of the deferred capital losses are as follows:
| | California
Opportunities
Fund | Massachusetts
Fund | New York
Fund | Ohio
Fund |
| Deferred capital losses: | | | | |
| Short-term | $20,797,860 | $4,238,447 | $9,029,571 | $6,655,005 |
| Long-term | $13,508,773 | $4,078,961 | $7,478,505 | $4,468,897 |
Eaton Vance
Municipal Income Funds
September 30, 2022
Notes to Financial Statements — continued
The cost and unrealized appreciation (depreciation) of investments, including open derivative contracts, of each Fund at September 30, 2022, as determined on a federal income tax basis, were as follows:
| | California
Opportunities
Fund | Massachusetts
Fund | New York
Fund | Ohio
Fund |
| Aggregate cost | $ 603,616,943 | $139,605,248 | $ 359,415,440 | $ 181,711,641 |
| Gross unrealized appreciation | $ 454,869 | $ 2,300,073 | $ 1,545,942 | $ 3,602,518 |
| Gross unrealized depreciation | (24,456,144) | (7,469,170) | (30,484,237) | (11,328,532) |
| Net unrealized depreciation | $ (24,001,275) | $ (5,169,097) | $ (28,938,295) | $ (7,726,014) |
3 Investment Adviser Fee and Other Transactions with Affiliates
The investment adviser fee is earned by Boston Management and Research (BMR), an indirect, wholly-owned subsidiary of Morgan Stanley, as compensation for investment advisory services rendered to each Fund. The investment adviser fee is based upon a percentage of total daily net assets plus a percentage of total daily gross income (i.e., income other than gains from the sale of securities) as follows and is payable monthly:
California Opportunities Fund
| Total Daily Net Assets | Annual Asset
Rate | Daily Income
Rate |
| Up to $500 million | 0.300% | 3.000% |
| $500 million but less than $1 billion | 0.275% | 2.750% |
| $1 billion but less than $1.5 billion | 0.250% | 2.500% |
| $1.5 billion but less than $2 billion | 0.225% | 2.250% |
| $2 billion but less than $3 billion | 0.200% | 2.000% |
| $3 billion and over | 0.175% | 1.750% |
Massachusetts Fund, New York Fund and Ohio Fund
| Total Daily Net Assets | Annual Asset
Rate | Daily Income
Rate |
| Up to $20 million | 0.100% | 1.000% |
| $20 million but less than $40 million | 0.200% | 2.000% |
| $40 million but less than $500 million | 0.300% | 3.000% |
| $500 million but less than $1 billion | 0.275% | 2.750% |
| $1 billion but less than $1.5 billion | 0.250% | 2.500% |
| $1.5 billion but less than $2 billion | 0.225% | 2.250% |
| $2 billion but less than $3 billion | 0.200% | 2.000% |
| $3 billion and over | 0.175% | 1.750% |
Eaton Vance
Municipal Income Funds
September 30, 2022
Notes to Financial Statements — continued
For the year ended September 30, 2022, investment adviser fees incurred by the Funds and the effective annual rates, as a percentage of average daily net assets, were as follows:
| | California
Opportunities
Fund | Massachusetts
Fund | New York
Fund | Ohio
Fund |
| Investment Adviser Fee | $2,367,635 | $597,221 | $1,464,492 | $679,337 |
| Effective Annual Rate | 0.36% | 0.34% | 0.36% | 0.36% |
Eaton Vance Management (EVM), an affiliate of BMR and an indirect, wholly-owned subsidiary of Morgan Stanley, serves as the administrator of each Fund, but receives no compensation.
EVM provides sub-transfer agency and related services to the Funds pursuant to a Sub-Transfer Agency Support Services Agreement. Eaton Vance Distributors, Inc. (EVD), an affiliate of EVM and the Funds’ principal underwriter, received a portion of the sales charge on sales of Class A shares of the Funds. Morgan Stanley affiliated broker-dealers, which may be deemed to be affiliates of BMR, EVM and EVD, also received a portion of the sales charge on sales of Class A shares. EVD also received distribution and service fees from Class A and Class C shares (see Note 4) and contingent deferred sales charges (see Note 5). Sub-transfer agent fees earned by EVM, which are included in transfer and dividend disbursing agent fees on the Statements of Operations, and Class A sales charges that the Funds were informed were received by EVD and Morgan Stanley affiliated broker-dealers for the year ended September 30, 2022 were as follows:
| | California
Opportunities
Fund | Massachusetts
Fund | New York
Fund | Ohio
Fund |
| EVM's Sub-Transfer Agent Fees | $13,577 | $13,667 | $36,500 | $13,164 |
| EVD's Class A Sales Charges | $ 4,095 | $ 2,254 | $ 9,087 | $ 8,207 |
| Morgan Stanley affiliated broker-dealers’ Class A Sales Charges | $ 5,812 | $ 510 | $ 2,275 | $ 1,275 |
Trustees and officers of the Funds who are members of EVM’s or BMR’s organizations receive remuneration for their services to the Funds out of the investment adviser fee. Trustees of the Funds who are not affiliated with the investment advisers may elect to defer receipt of all or a percentage of their annual fees in accordance with the terms of the Trustees Deferred Compensation Plan. For the year ended September 30, 2022, no significant amounts have been deferred. Certain officers and Trustees of the Funds are officers of the above organizations.
4 Distribution Plans
Each Fund has in effect a distribution plan for Class A shares (Class A Plan) pursuant to Rule 12b-1 under the 1940 Act. The Class A Plan provides that each Fund will pay EVD a distribution and service fee not exceeding 0.25% per annum of its average daily net assets attributable to Class A shares for distribution services and facilities provided to each Fund by EVD, as well as for personal services and/or the maintenance of shareholder accounts. The Trustees approved distribution and service fee payments equal to 0.20% (0.25% for California Opportunities Fund) per annum of each Fund’s average daily net assets attributable to Class A shares. Distribution and service fees paid or accrued to EVD for the year ended September 30, 2022 for Class A shares amounted to the following:
| | California
Opportunities
Fund | Massachusetts
Fund | New York
Fund | Ohio
Fund |
| Class A Distribution and Service Fees | $338,409 | $173,690 | $441,566 | $202,529 |
Eaton Vance
Municipal Income Funds
September 30, 2022
Notes to Financial Statements — continued
Each Fund also has in effect a distribution plan for Class C shares (Class C Plan) pursuant to Rule 12b-1 under the 1940 Act. Pursuant to the Class C Plan, each Fund pays EVD amounts equal to 0.75% per annum of its average daily net assets attributable to Class C shares for providing ongoing distribution services and facilities to the respective Funds. For the year ended September 30, 2022, the Funds paid or accrued to EVD the following distribution fees:
| | California
Opportunities
Fund | Massachusetts
Fund | New York
Fund | Ohio
Fund |
| Class C Distribution Fees | $191,415 | $50,153 | $135,220 | $69,978 |
The Class C Plan also authorizes each Fund to make payments of service fees to EVD, financial intermediaries and other persons in amounts not exceeding 0.25% per annum of the average daily net assets attributable to Class C shares. The Trustees approved service fee payments equal to 0.20% (0.25% for California Opportunities Fund) per annum of each Fund’s average daily net assets attributable to Class C shares. Service fees paid or accrued are for personal services and/or the maintenance of shareholder accounts. They are separate and distinct from the Class C sales commissions and distribution fees payable to EVD. Service fees paid or accrued for the year ended September 30, 2022 amounted to the following:
| | California
Opportunities
Fund | Massachusetts
Fund | New York
Fund | Ohio
Fund |
| Class C Service Fees | $63,805 | $13,374 | $36,059 | $18,661 |
Distribution and service fees are subject to the limitations contained in the Financial Industry Regulatory Authority Rule 2341(d).
5 Contingent Deferred Sales Charges
A contingent deferred sales charge (CDSC) of 1% generally is imposed on redemptions of Class C shares made within 12 months of purchase. Class A shares may be subject to a 0.75% (1% prior to April 29, 2022) CDSC if redeemed within 12 months (18 months prior to April 29, 2022) of purchase (depending on the circumstances of purchase). Generally, the CDSC is based upon the lower of the net asset value at date of redemption or date of purchase. No charge is levied on shares acquired by reinvestment of dividends or capital gain distributions. For the year ended September 30, 2022, the Funds were informed that EVD received approximately the following amounts of CDSCs paid by Class A and Class C shareholders:
| | California
Opportunities
Fund | Massachusetts
Fund | New York
Fund | Ohio
Fund |
| Class A | $7,000 | $2,000 | $ — | $2,000 |
| Class C | $8,000 | $ 300 | $2,000 | $5,000 |
6 Purchases and Sales of Investments
Purchases and sales of investments, other than short-term obligations, for the year ended September 30, 2022 were as follows:
| | California
Opportunities
Fund | Massachusetts
Fund | New York
Fund | Ohio
Fund |
| Purchases | $1,079,597,929 | $ 78,943,812 | $232,840,641 | $48,961,242 |
| Sales | $1,124,142,649 | $120,268,448 | $287,324,966 | $33,062,039 |
Eaton Vance
Municipal Income Funds
September 30, 2022
Notes to Financial Statements — continued
7 Shares of Beneficial Interest
Each Fund’s Declaration of Trust permits the Trustees to issue an unlimited number of full and fractional shares of beneficial interest (without par value). Such shares may be issued in a number of different series (such as the Funds) and classes. Transactions in Fund shares were as follows:
| California Opportunities Fund | | | |
| | | Year Ended
September 30, 2022 | | Year Ended
September 30, 2021 |
| | | Shares | Amount | Shares | Amount |
| Class A | | | | | |
| Sales | | 2,844,677 | $ 29,575,427 | 2,251,866 | $ 24,877,116 |
| Issued to shareholders electing to receive payments of distributions in Fund shares | | 221,379 | 2,301,810 | 174,575 | 1,926,260 |
| Redemptions | | (4,181,992) | (42,811,027) | (2,783,870) | (30,694,996) |
| Converted from Class C shares | | 20,642 | 208,687 | 109,066 | 1,206,230 |
| Net decrease | | (1,095,294) | $ (10,725,103) | (248,363) | $ (2,685,390) |
| Class C | | | | | |
| Sales | | 248,803 | $ 2,384,374 | 779,123 | $ 7,934,916 |
| Issued to shareholders electing to receive payments of distributions in Fund shares | | 31,844 | 307,813 | 21,249 | 216,816 |
| Redemptions | | (1,101,027) | (10,510,512) | (513,465) | (5,229,425) |
| Converted to Class A shares | | (22,333) | (208,687) | (118,001) | (1,206,230) |
| Net increase (decrease) | | (842,713) | $ (8,027,012) | 168,906 | $ 1,716,077 |
| Class I | | | | | |
| Sales | | 34,620,410 | $ 352,099,265 | 24,419,903 | $ 269,692,428 |
| Issued to shareholders electing to receive payments of distributions in Fund shares | | 940,490 | 9,799,673 | 693,870 | 7,661,751 |
| Redemptions | | (41,806,675) | (428,757,384) | (10,522,198) | (116,197,071) |
| Net increase (decrease) | | (6,245,775) | $ (66,858,446) | 14,591,575 | $ 161,157,108 |
| Massachusetts Fund | | | |
| | | Year Ended
September 30, 2022 | | Year Ended
September 30, 2021 |
| | | Shares | Amount | Shares | Amount |
| Class A | | | | | |
| Sales | | 533,925 | $ 4,545,437 | 960,047 | $ 8,700,440 |
| Issued to shareholders electing to receive payments of distributions in Fund shares | | 184,453 | 1,540,227 | 178,660 | 1,615,374 |
| Redemptions | | (1,893,233) | (15,822,294) | (1,663,609) | (15,054,878) |
| Converted from Class C shares | | 69,386 | 561,965 | 208,888 | 1,891,421 |
| Net decrease | | (1,105,469) | $ (9,174,665) | (316,014) | $ (2,847,643) |
Eaton Vance
Municipal Income Funds
September 30, 2022
Notes to Financial Statements — continued
| Massachusetts Fund (continued) | | | |
| | | Year Ended
September 30, 2022 | | Year Ended
September 30, 2021 |
| | | Shares | Amount | Shares | Amount |
| Class C | | | | | |
| Sales | | 48,135 | $ 410,310 | 172,487 | $ 1,564,201 |
| Issued to shareholders electing to receive payments of distributions in Fund shares | | 9,091 | 76,060 | 9,995 | 90,334 |
| Redemptions | | (350,396) | (2,929,315) | (115,219) | (1,041,678) |
| Converted to Class A shares | | (69,384) | (561,965) | (208,883) | (1,891,421) |
| Net decrease | | (362,554) | $ (3,004,910) | (141,620) | $ (1,278,564) |
| Class I | | | | | |
| Sales | | 4,284,683 | $ 35,540,066 | 3,809,029 | $ 34,517,897 |
| Issued to shareholders electing to receive payments of distributions in Fund shares | | 177,318 | 1,489,753 | 190,117 | 1,719,339 |
| Redemptions | | (7,654,198) | (63,285,546) | (3,594,871) | (32,519,986) |
| Net increase (decrease) | | (3,192,197) | $(26,255,727) | 404,275 | $ 3,717,250 |
| New York Fund | | | |
| | | Year Ended
September 30, 2022 | | Year Ended
September 30, 2021 |
| | | Shares | Amount | Shares | Amount |
| Class A | | | | | |
| Sales | | 1,277,250 | $ 11,998,678 | 2,399,151 | $ 25,052,034 |
| Issued to shareholders electing to receive payments of distributions in Fund shares | | 567,175 | 5,573,542 | 830,571 | 8,657,427 |
| Redemptions | | (5,113,659) | (49,116,567) | (2,501,732) | (26,222,369) |
| Converted from Class C shares | | 189,462 | 1,813,218 | 339,568 | 3,587,593 |
| Net increase (decrease) | | (3,079,772) | $ (29,731,129) | 1,067,558 | $ 11,074,685 |
| Class C | | | | | |
| Sales | | 100,995 | $ 981,241 | 258,056 | $ 2,703,731 |
| Issued to shareholders electing to receive payments of distributions in Fund shares | | 34,602 | 343,265 | 74,931 | 780,076 |
| Redemptions | | (638,447) | (6,127,023) | (835,882) | (8,761,749) |
| Converted to Class A shares | | (189,334) | (1,813,218) | (339,492) | (3,587,593) |
| Net decrease | | (692,184) | $ (6,615,735) | (842,387) | $ (8,865,535) |
| Class I | | | | | |
| Sales | | 11,209,649 | $ 106,409,144 | 5,275,505 | $ 55,225,016 |
| Issued to shareholders electing to receive payments of distributions in Fund shares | | 435,523 | 4,268,922 | 564,609 | 5,886,137 |
| Redemptions | | (13,367,672) | (127,259,927) | (3,264,193) | (34,174,275) |
| Net increase (decrease) | | (1,722,500) | $ (16,581,861) | 2,575,921 | $ 26,936,878 |
Eaton Vance
Municipal Income Funds
September 30, 2022
Notes to Financial Statements — continued
| Ohio Fund | | | |
| | | Year Ended
September 30, 2022 | | Year Ended
September 30, 2021 |
| | | Shares | Amount | Shares | Amount |
| Class A | | | | | |
| Sales | | 1,001,398 | $ 8,617,302 | 1,730,747 | $ 16,208,027 |
| Issued to shareholders electing to receive payments of distributions in Fund shares | | 270,689 | 2,357,788 | 267,232 | 2,496,131 |
| Redemptions | | (2,215,283) | (19,254,525) | (1,460,454) | (13,643,627) |
| Converted from Class C shares | | 85,165 | 743,713 | 151,282 | 1,419,244 |
| Net increase (decrease) | | (858,031) | $ (7,535,722) | 688,807 | $ 6,479,775 |
| Class C | | | | | |
| Sales | | 106,915 | $ 950,983 | 378,636 | $ 3,542,463 |
| Issued to shareholders electing to receive payments of distributions in Fund shares | | 18,880 | 164,959 | 19,338 | 180,511 |
| Redemptions | | (401,286) | (3,466,622) | (209,734) | (1,959,562) |
| Converted to Class A shares | | (85,221) | (743,713) | (151,431) | (1,419,244) |
| Net increase (decrease) | | (360,712) | $ (3,094,393) | 36,809 | $ 344,168 |
| Class I | | | | | |
| Sales | | 7,902,129 | $ 67,364,457 | 2,982,434 | $ 27,919,924 |
| Issued to shareholders electing to receive payments of distributions in Fund shares | | 235,800 | 2,042,397 | 179,378 | 1,676,394 |
| Redemptions | | (4,488,435) | (38,382,656) | (1,980,575) | (18,549,876) |
| Net increase | | 3,649,494 | $ 31,024,198 | 1,181,237 | $ 11,046,442 |
8 Line of Credit
The Funds participate with other portfolios and funds managed by EVM and its affiliates in an $800 million unsecured line of credit agreement with a group of banks, which is in effect through October 25, 2022. Borrowings are made by the Funds solely for temporary purposes related to redemptions and other short-term cash needs. Interest is charged to each Fund based on its borrowings at an amount above either the Secured Overnight Financing Rate (SOFR) or Federal Funds rate. In addition, a fee computed at an annual rate of 0.15% on the daily unused portion of the line of credit is allocated among the participating portfolios and funds at the end of each quarter. In connection with the renewal of the agreement in October 2021, an arrangement fee totaling $150,000 was incurred that was allocated to the participating portfolios and funds. Because the line of credit is not available exclusively to the Funds, a Fund may be unable to borrow some or all of its requested amounts at any particular time. At September 30, 2022, the California Opportunities Fund had a balance outstanding pursuant to this line of credit of $6,360,000 at an interest rate of 4.08%. Based on the short-term nature of the borrowings under the line of credit and variable interest rate, the carrying value of the borrowings approximated its fair value at September 30, 2022. If measured at fair value, borrowings under the line of credit would have been considered as Level 2 in the fair value hierarchy (see Note 10) at September 30, 2022. The Funds did not have any significant borrowings or allocated fees during the year ended September 30, 2022.
Effective October 25, 2022, the Funds renewed their line of credit agreement, which expires October 24, 2023. In connection with the renewal, the borrowing limit was decreased to $725 million.
Eaton Vance
Municipal Income Funds
September 30, 2022
Notes to Financial Statements — continued
9 Financial Instruments
The Funds may trade in financial instruments with off-balance sheet risk in the normal course of their investing activities. These financial instruments may include futures contracts and may involve, to a varying degree, elements of risk in excess of the amounts recognized for financial statement purposes. The notional or contractual amounts of these instruments represent the investment a Fund has in particular classes of financial instruments and do not necessarily represent the amounts potentially subject to risk. The measurement of the risks associated with these instruments is meaningful only when all related and offsetting transactions are considered. A summary of obligations under these financial instruments at September 30, 2022 is included in the Portfolio of Investments. At September 30, 2022, the Ohio and New York Funds had sufficient cash and/or securities to cover commitments under these contracts.
Each Fund is subject to interest rate risk in the normal course of pursuing its investment objective. Because the Funds hold fixed-rate bonds, the value of these bonds may decrease if interest rates rise. During the year ended September 30, 2022, the California Opportunities, New York and Ohio Funds entered into U.S. Treasury futures contracts to hedge against changes in interest rates.
The fair values of open derivative instruments (not considered to be hedging instruments for accounting disclosure purposes) and whose primary underlying risk exposure is interest rate risk at September 30, 2022 was as follows:
| | New York
Fund | Ohio
Fund |
| Asset Derivatives | | |
| Futures contracts | $ 1,232,319(1) | $ 327,164(1) |
| Total | $1,232,319 | $327,164 |
| (1) | Only the current day's variation margin on open futures contracts is reported within the Statements of Assets and Liabilities as Receivable or Payable for variation margin on open futures contracts, as applicable. |
The effect of derivative instruments (not considered to be hedging instruments for accounting disclosure purposes) on the Statements of Operations and whose primary underlying risk exposure is interest rate risk for the year ended September 30, 2022 was as follows:
| | California
Opportunities
Fund | New York
Fund | Ohio
Fund |
| Realized Gain (Loss) on Derivatives Recognized in Income | $2,626,533 (1) | $2,796,691 (1) | $742,484 (1) |
| Change in Unrealized Appreciation (Depreciation) on Derivatives Recognized in Income | $ — | $ 740,805(2) | $196,674 (2) |
| (1) | Statements of Operations location: Net realized gain (loss) - Futures contracts. |
| (2) | Statements of Operations location: Change in unrealized appreciation (depreciation) - Futures contracts. |
The average notional cost of futures contracts outstanding during the year ended September 30, 2022, which is indicative of the volume of this derivative type, was approximately as follows:
| | California
Opportunities
Fund | New York
Fund | Ohio
Fund |
| Average Notional Cost: | | | |
| Futures Contracts — Short | $3,169,000 | $17,012,000 | $4,516,000 |
Eaton Vance
Municipal Income Funds
September 30, 2022
Notes to Financial Statements — continued
10 Fair Value Measurements
Under generally accepted accounting principles for fair value measurements, a three-tier hierarchy to prioritize the assumptions, referred to as inputs, is used in valuation techniques to measure fair value. The three-tier hierarchy of inputs is summarized in the three broad levels listed below.
| • | Level 1 – quoted prices in active markets for identical investments |
| • | Level 2 – other significant observable inputs (including quoted prices for similar investments, interest rates, prepayment speeds, credit risk, etc.) |
| • | Level 3 – significant unobservable inputs (including a fund's own assumptions in determining the fair value of investments) |
In cases where the inputs used to measure fair value fall in different levels of the fair value hierarchy, the level disclosed is determined based on the lowest level input that is significant to the fair value measurement in its entirety. The inputs or methodology used for valuing securities are not necessarily an indication of the risk associated with investing in those securities.
At September 30, 2022, the hierarchy of inputs used in valuing the Funds' investments and open derivative instruments, which are carried at value, were as follows:
| California Opportunities Fund | | | | |
| Asset Description | Level 1 | Level 2 | Level 3 | Total |
| Corporate Bonds | $ — | $ 2,197,520 | $ — | $ 2,197,520 |
| Tax-Exempt Mortgage-Backed Securities | — | 2,219,950 | — | 2,219,950 |
| Tax-Exempt Municipal Obligations | — | 538,440,293 | — | 538,440,293 |
| Taxable Municipal Obligations | — | 36,757,905 | — | 36,757,905 |
| Total Investments | $ — | $579,615,668 | $ — | $579,615,668 |
| Massachusetts Fund | | | | |
| Asset Description | Level 1 | Level 2 | Level 3 | Total |
| Tax-Exempt Municipal Obligations | $ — | $ 131,802,570 | $ — | $ 131,802,570 |
| Taxable Municipal Obligations | — | 6,286,175 | — | 6,286,175 |
| Total Investments | $ — | $138,088,745 | $ — | $138,088,745 |
| New York Fund | | | | |
| Asset Description | Level 1 | Level 2 | Level 3 | Total |
| Corporate Bonds | $ — | $ 1,311,164 | $ — | $ 1,311,164 |
| Tax-Exempt Municipal Obligations | — | 326,169,427 | — | 326,169,427 |
| Taxable Municipal Obligations | — | 5,396,530 | — | 5,396,530 |
| Total Investments | $ — | $332,877,121 | $ — | $332,877,121 |
| Futures Contracts | $ 1,232,319 | $ — | $ — | $ 1,232,319 |
| Total | $1,232,319 | $332,877,121 | $ — | $334,109,440 |
Eaton Vance
Municipal Income Funds
September 30, 2022
Notes to Financial Statements — continued
| Ohio Fund | | | | |
| Asset Description | Level 1 | Level 2 | Level 3 | Total |
| Tax-Exempt Municipal Obligations | $ — | $ 182,441,893 | $ — | $ 182,441,893 |
| Total Investments | $ — | $182,441,893 | $ — | $182,441,893 |
| Futures Contracts | $ 327,164 | $ — | $ — | $ 327,164 |
| Total | $ 327,164 | $182,441,893 | $ — | $182,769,057 |
Level 3 investments held by the New York Fund at the beginning and/or end of the period in relation to net assets were not significant and accordingly, a reconciliation of Level 3 assets for the year ended September 30, 2022 is not presented.
11 Risks and Uncertainties
Pandemic Risk
An outbreak of respiratory disease caused by a novel coronavirus was first detected in China in late 2019 and subsequently spread internationally. This coronavirus has resulted in closing borders, enhanced health screenings, changes to healthcare service preparation and delivery, quarantines, cancellations, disruptions to supply chains and customer activity, as well as general concern and uncertainty. Health crises caused by outbreaks of disease, such as the coronavirus outbreak, may exacerbate other pre-existing political, social and economic risks and disrupt normal market conditions and operations. The impact of this outbreak has negatively affected the worldwide economy, as well as the economies of individual countries and industries, and could continue to affect the market in significant and unforeseen ways. Other epidemics and pandemics that may arise in the future may have similar effects. Any such impact could adversely affect the Funds' performance, or the performance of the securities in which the Funds invest.
Eaton Vance
Municipal Income Funds
September 30, 2022
Report of Independent Registered Public Accounting Firm
To the Trustees of Eaton Vance Municipals Trust and Shareholders of Eaton Vance California Municipal Opportunities Fund, Eaton Vance Massachusetts Municipal Income Fund, Eaton Vance New York Municipal Income Fund and Eaton Vance Ohio Municipal Income Fund:
Opinion on the Financial Statements and Financial Highlights
We have audited the accompanying statements of assets and liabilities of Eaton Vance California Municipal Opportunities Fund, Eaton Vance Massachusetts Municipal Income Fund, Eaton Vance New York Municipal Income Fund, and Eaton Vance Ohio Municipal Income Fund (collectively, the “Funds”) (certain of the funds constituting Eaton Vance Municipals Trust), including the portfolios of investments, as of September 30, 2022, the related statements of operations for the year then ended, the statements of changes in net assets for each of the two years in the period then ended, the financial highlights for each of the five years in the period then ended, and the related notes. In our opinion, the financial statements and financial highlights present fairly, in all material respects, the financial position of each of the Funds as of September 30, 2022, and the results of their operations for the year then ended, the changes in their net assets for each of the two years in the period then ended, and the financial highlights for each of the five years in the period then ended, in conformity with accounting principles generally accepted in the United States of America.
Basis for Opinion
These financial statements and financial highlights are the responsibility of the Funds’ management. Our responsibility is to express an opinion on the Funds’ financial statements and financial highlights based on our audits. We are a public accounting firm registered with the Public Company Accounting Oversight Board (United States) (PCAOB) and are required to be independent with respect to the Funds in accordance with the U.S. federal securities laws and the applicable rules and regulations of the Securities and Exchange Commission and the PCAOB.
We conducted our audits in accordance with the standards of the PCAOB. Those standards require that we plan and perform the audit to obtain reasonable assurance about whether the financial statements and financial highlights are free of material misstatement, whether due to error or fraud. The Funds are not required to have, nor were we engaged to perform, an audit of their internal control over financial reporting. As part of our audits, we are required to obtain an understanding of internal control over financial reporting but not for the purpose of expressing an opinion on the effectiveness of the Funds’ internal control over financial reporting. Accordingly, we express no such opinion.
Our audits included performing procedures to assess the risks of material misstatement of the financial statements and financial highlights, whether due to error or fraud, and performing procedures that respond to those risks. Such procedures included examining, on a test basis, evidence regarding the amounts and disclosures in the financial statements and financial highlights. Our audits also included evaluating the accounting principles used and significant estimates made by management, as well as evaluating the overall presentation of the financial statements and financial highlights. Our procedures included confirmation of securities owned as of September 30, 2022, by correspondence with the custodian and brokers; when replies were not received from brokers, we performed other auditing procedures. We believe that our audits provide a reasonable basis for our opinion.
/s/ Deloitte & Touche LLP
Boston, Massachusetts
November 23, 2022
We have served as the auditor of one or more Eaton Vance investment companies since 1959.
Eaton Vance
Municipal Income Funds
September 30, 2022
Federal Tax Information (Unaudited)
The Form 1099-DIV you receive in February 2023 will show the tax status of all distributions paid to your account in calendar year 2022. Shareholders are advised to consult their own tax adviser with respect to the tax consequences of their investment in the Funds. As required by the Internal Revenue Code and/or regulations, shareholders must be notified regarding exempt-interest dividends.
Exempt-Interest Dividends. For the fiscal year ended September 30, 2022, the Funds designate the following percentages of distributions from net investment income as exempt-interest dividends:
| California Municipal Opportunities Fund | 89.08% |
| Massachusetts Municipal Income Fund | 91.41% |
| New York Municipal Income Fund | 97.19% |
| Ohio Municipal Income Fund | 100.00% |
Eaton Vance
Municipal Income Funds
September 30, 2022
Board of Trustees’ Contract Approval
Overview of the Contract Review Process
The Investment Company Act of 1940, as amended (the “1940 Act”), provides, in substance, that the investment advisory agreement between a fund and its investment adviser will continue in effect from year-to-year only if its continuation is approved on an annual basis by a vote of the fund’s board of trustees, including a majority of the trustees who are not “interested persons” of the fund (“independent trustees”), cast in person at a meeting called for the purpose of considering such approval.
At a meeting held on June 8, 2022, the Boards of Trustees/Directors (collectively, the “Board”) that oversee the registered investment companies advised by Eaton Vance Management or its affiliate, Boston Management and Research (the “Eaton Vance Funds”), including a majority of the independent trustees (the “Independent Trustees”), voted to approve the continuation of existing investment advisory agreements and sub-advisory agreements1 for each of the Eaton Vance Funds for an additional one-year period. The Board relied upon the affirmative recommendation of its Contract Review Committee, which is a committee exclusively comprised of Independent Trustees. Prior to making its recommendation, the Contract Review Committee reviewed information furnished by the adviser and sub-adviser to each of the Eaton Vance Funds (including information specifically requested by the Board) for a series of formal meetings held between April and June 2022. Members of the Contract Review Committee also considered information received at prior meetings of the Board and its committees, to the extent such information was relevant to the Contract Review Committee’s annual evaluation of the investment advisory agreements and sub-advisory agreements.
In connection with its evaluation of the investment advisory agreements and sub-advisory agreements, the Board considered various information relating to the Eaton Vance Funds. This included information applicable to all or groups of Eaton Vance Funds, which is referenced immediately below, and information applicable to the particular Eaton Vance Fund covered by this report (additional fund-specific information is referenced below under “Results of the Contract Review Process”). (For funds that invest through one or more underlying portfolios, references to “each fund” in this section may include information that was considered at the portfolio-level.)
Information about Fees, Performance and Expenses
• A report from an independent data provider comparing advisory and other fees paid by each fund to such fees paid by comparable funds, as identified by the independent data provider (“comparable funds”);
• A report from an independent data provider comparing each fund’s total expense ratio (and its components) to those of comparable funds;
• A report from an independent data provider comparing the investment performance of each fund (including, as relevant, total return data, income data, Sharpe ratios and information ratios) to the investment performance of comparable funds and, as applicable, benchmark indices, over various time periods;
• In certain instances, data regarding investment performance relative to customized groups of peer funds and blended indices identified by the adviser in consultation with the Portfolio Management Committee of the Board (a committee exclusively comprised of Independent Trustees);
• Comparative information concerning the fees charged and services provided by the adviser and sub-adviser to each fund in managing other accounts (which may include other mutual funds, collective investment funds and institutional accounts) using investment strategies and techniques similar to those used in managing such fund(s), if any;
• Profitability analyses with respect to the adviser and sub-adviser to each of the funds;
Information about Portfolio Management and Trading
• Descriptions of the investment management services provided to each fund, as well as each of the funds’ investment strategies and policies;
• The procedures and processes used to determine the value of fund assets, including, when necessary, the determination of “fair value” and actions taken to monitor and test the effectiveness of such procedures and processes;
• Information about the policies and practices of each fund’s adviser and sub-adviser with respect to trading, including their processes for seeking best execution of portfolio transactions;
• Information about the allocation of brokerage transactions and the benefits, if any, received by the adviser and sub-adviser to each fund as a result of brokerage allocation, including, as applicable, information concerning the acquisition of research through client commission arrangements and policies with respect to “soft dollars”;
• Data relating to the portfolio turnover rate of each fund and related information regarding active management in the context of particular strategies;
Information about each Adviser and Sub-adviser
• Reports detailing the financial results and condition of the adviser and sub-adviser to each fund;
1 Not all Eaton Vance Funds have entered into a sub-advisory agreement with a sub-adviser. Accordingly, references to “sub-adviser” or “sub-advisory agreement” in this “Overview” section may not be applicable to the particular Eaton Vance Fund covered by this report. Following the “Overview” section, further information regarding the Board’s evaluation of a fund’s contractual arrangements is included under the “Results of the Contract Review Process” section.
Eaton Vance
Municipal Income Funds
September 30, 2022
Board of Trustees’ Contract Approval — continued
• Information regarding the individual investment professionals whose responsibilities include portfolio management and investment research for the funds, and, for portfolio managers and certain other investment professionals, information relating to their responsibilities with respect to managing other mutual funds and investment accounts, as applicable;
• Information regarding the adviser’s and its parent company’s (Morgan Stanley’s) efforts to retain and attract talented investment professionals, including in the context of a particularly competitive marketplace for talent, as well as the ongoing unique environment presented by hybrid, remote and other alternative work arrangements;
• The Code of Ethics of the adviser and its affiliates and the sub-adviser of each fund, together with information relating to compliance with, and the administration of, such codes;
• Policies and procedures relating to proxy voting, including regular reporting with respect to fund proxy voting activities;
• Information regarding the handling of corporate actions and class actions, as well as information regarding litigation and other regulatory matters;
• Information concerning the resources devoted to compliance efforts undertaken by the adviser and its affiliates and the sub-adviser of each fund, if any, including descriptions of their various compliance programs and their record of compliance;
• Information concerning the business continuity and disaster recovery plans of the adviser and its affiliates and the sub-adviser of each fund, if any;
• A description of Eaton Vance Management’s and Boston Management and Research’s oversight of sub-advisers, including with respect to regulatory and compliance issues, investment management and other matters;
Other Relevant Information
• Information regarding ongoing initiatives to further integrate and harmonize, where applicable, the investment management and other departments of the adviser and its affiliates with the overall investment management infrastructure of Morgan Stanley, in light of Morgan Stanley’s acquisition of Eaton Vance on March 1, 2021;
• Information concerning the nature, cost and character of the administrative and other non-investment advisory services provided by Eaton Vance Management and its affiliates;
• Information concerning oversight of the relationship with the custodian, subcustodians, fund accountants, and other third-party service providers by the adviser and/or administrator to each of the funds;
• Information concerning efforts to implement policies and procedures with respect to various new regulations applicable to the funds, including Rule 12d1-4 (the Fund-of-Funds Rule), Rule 18f-4 (the Derivatives Rule) and Rule 2a-5 (the Fair Valuation Rule);
• For an Eaton Vance Fund structured as an exchange-listed closed-end fund, information concerning the benefits of the closed-end fund structure, as well as, where relevant, the closed-end fund’s market prices (including as compared to the closed-end fund’s net asset value (NAV)), trading volume data, continued use of auction preferred shares (where applicable), distribution rates and other relevant matters;
• The risks which the adviser and/or its affiliates incur in connection with the management and operation of the funds, including, among others, litigation, regulatory, entrepreneurial, and other business risks (and the associated costs of such risks); and
• The terms of each investment advisory agreement and sub-advisory agreement.
During the various meetings of the Board and its committees over the course of the year leading up to the June 8, 2022 meeting, the Trustees received information from portfolio managers and other investment professionals of the advisers and sub-advisers of the funds regarding investment and performance matters, and considered various investment and trading strategies used in pursuing the funds’ investment objectives. The Trustees also received information regarding risk management techniques employed in connection with the management of the funds. The Board and its committees evaluated issues pertaining to industry and regulatory developments, compliance procedures, fund governance and other issues with respect to the funds, and received and participated in reports and presentations provided by Eaton Vance Management, Boston Management and Research and fund sub-advisers, with respect to such matters. In addition to the formal meetings of the Board and its committees, the Independent Trustees held regular teleconferences to discuss, among other topics, matters relating to the continuation of investment advisory agreements and sub-advisory agreements.
The Contract Review Committee was advised throughout the contract review process by Goodwin Procter LLP, independent legal counsel for the Independent Trustees. The members of the Contract Review Committee, with the advice of such counsel, exercised their own business judgment in determining the material factors to be considered in evaluating each investment advisory agreement and sub-advisory agreement and the weight to be given to each such factor. The conclusions reached with respect to each investment advisory agreement and sub-advisory agreement were based on a comprehensive evaluation of all the information provided and not any single factor. Moreover, each member of the Contract Review Committee may have placed varying emphasis on particular factors in reaching conclusions with respect to each investment advisory agreement and sub-advisory agreement. In evaluating each investment advisory agreement and sub-advisory agreement, including the fee structures and other terms contained in such agreements, the members of the Contract Review Committee were also informed by multiple years of analysis and discussion with the adviser and sub-adviser to each of the Eaton Vance Funds.
Results of the Contract Review Process
Based on its consideration of the foregoing, and such other information it deemed relevant, including the factors and conclusions described below, the Contract Review Committee concluded that the continuation of the investment advisory agreements between each of the following funds:
• Eaton Vance California Municipal Opportunities Fund
• Eaton Vance Massachusetts Municipal Income Fund
Eaton Vance
Municipal Income Funds
September 30, 2022
Board of Trustees’ Contract Approval — continued
• Eaton Vance New York Municipal Income Fund
• Eaton Vance Ohio Municipal Income Fund
(the “Funds”) and Boston Management and Research (the “Adviser”), including their respective fee structures, are in the interests of shareholders and, therefore, recommended to the Board approval of each agreement. Based on the recommendation of the Contract Review Committee, the Board, including a majority of the Independent Trustees, voted to approve continuation of the investment advisory agreement for each Fund.
Nature, Extent and Quality of Services
In considering whether to approve the investment advisory agreement for each Fund, the Board evaluated the nature, extent and quality of services provided to the Funds by the Adviser.
The Board considered the Adviser’s management capabilities and investment processes in light of the types of investments held by each Fund, including the education, experience and number of investment professionals and other personnel who provide portfolio management, investment research, and similar services to the Funds, including recent changes to such personnel. In particular, the Board considered, where relevant, the abilities and experience of the Adviser’s investment professionals in analyzing factors such as credit risk, tax efficiency, and special considerations relevant to investing in municipal obligations. The Board considered the Adviser’s municipal bond team, which includes investment professionals and credit specialists who provide services to the Funds. The Board also took into account the resources dedicated to portfolio management and other services, the compensation methods of the Adviser and other factors, including the reputation and resources of the Adviser to recruit and retain highly qualified research, advisory and supervisory investment professionals. In addition, the Board considered the time and attention devoted to the Eaton Vance Funds, including each Fund, by senior management, as well as the infrastructure, operational capabilities and support staff in place to assist in the portfolio management and operations of the Funds, including the provision of administrative services. The Board also considered the business-related and other risks to which the Adviser or its affiliates may be subject in managing the Funds.
The Board considered the compliance programs of the Adviser and relevant affiliates thereof. The Board considered compliance and reporting matters regarding, among other things, personal trading by investment professionals, disclosure of portfolio holdings, late trading, frequent trading, portfolio valuation, business continuity and the allocation of investment opportunities. The Board also considered the responses of the Adviser and its affiliates to requests in recent years from regulatory authorities, such as the Securities and Exchange Commission and the Financial Industry Regulatory Authority.
The Board considered other administrative services provided or overseen by Eaton Vance Management and its affiliates, including transfer agency and accounting services. The Board evaluated the benefits to shareholders of investing in a fund that is a part of a large fund complex offering exposure to a variety of asset classes and investment disciplines, as well as the ability, in many cases, to exchange an investment among different funds without incurring additional sales charges.
After consideration of the foregoing factors, among others, the Board concluded that the nature, extent and quality of services provided by the Adviser, taken as a whole, are appropriate and consistent with the terms of the investment advisory agreements.
Fund Performance
The Board compared each Fund’s investment performance to that of comparable funds identified by an independent data provider (the peer group), as well as appropriate benchmark indices, and, for each Fund other than Eaton Vance California Municipal Opportunities Fund, assessed such Fund’s performance on the basis of total return and current income return. The Board’s review included comparative performance data with respect to each Fund for the one-, three-, five- and ten-year periods ended December 31, 2021.
In this regard, the Board noted each Fund’s performance relative to its peer group, primary benchmark index and secondary benchmark index for the three-year period, as follows:
| | Performance Relative to: |
| Fund | Median of
Peer Group | Primary
Index | Secondary
Index |
| Eaton Vance California Municipal Opportunities Fund | Higher | Lower | Lower |
| Eaton Vance Massachusetts Municipal Income Fund | Lower | Lower | Lower |
| Eaton Vance New York Municipal Income Fund | Higher | Higher | Higher |
| Eaton Vance Ohio Municipal Income Fund | Higher | Lower | Lower |
With respect to Eaton Vance Massachusetts Municipal Income Fund, Eaton Vance New York Municipal Income Fund and Eaton Vance Ohio Municipal Income Fund, the Board considered, among other things, the Adviser’s efforts to generate competitive levels of tax-exempt current income over time through investments that, relative to comparable funds, focus on higher quality municipal bonds with longer maturities. With respect to Eaton Vance
Eaton Vance
Municipal Income Funds
September 30, 2022
Board of Trustees’ Contract Approval — continued
Massachusetts Municipal Income Fund, the Board noted that the Fund’s security selection, including with respect to an overweight allocation to higher rated general obligation bonds and an underweight position to AA and BBB rated bonds, detracted from the Fund’s relative performance. With respect to all other Funds, the Board concluded that the performance of each Fund was satisfactory.
Management Fees and Expenses
The Board considered contractual fee rates payable by each Fund for advisory and administrative services (referred to collectively as “management fees”). As part of its review, the Board considered each Fund’s management fees and total expense ratio for the one-year period ended December 31, 2021, as compared to those of comparable funds, before and after giving effect to any undertaking to waive fees or reimburse expenses. The Board also considered factors that had an impact on each Fund’s total expense ratio relative to comparable funds.
After considering the foregoing information, and in light of the nature, extent and quality of the services provided by the Adviser, the Board concluded that the management fees charged for advisory and related services are reasonable.
Profitability and “Fall-Out” Benefits
The Board considered the level of profits realized by the Adviser and relevant affiliates thereof in providing investment advisory and administrative services to each Fund and to all Eaton Vance Funds as a group. The Board considered the level of profits realized without regard to marketing support or other payments by the Adviser and its affiliates to third parties in respect of distribution or other services.
The Board concluded that, in light of the foregoing factors and the nature, extent and quality of the services rendered, the profits realized by the Adviser and its affiliates are deemed not to be excessive.
The Board also considered direct or indirect fall-out benefits received by the Adviser and its affiliates in connection with their respective relationships with the Funds, including the benefits of research services that may be available to the Adviser as a result of securities transactions effected for the Funds and other investment advisory clients.
Economies of Scale
In reviewing management fees and profitability, the Board also considered the extent to which the Adviser and its affiliates, on the one hand, and each Fund, on the other hand, can expect to realize benefits from economies of scale as the assets of each Fund increase. The Board acknowledged the difficulty in accurately measuring the benefits resulting from economies of scale, if any, with respect to the management of any specific fund or group of funds. The Board reviewed data summarizing the increases and decreases in the assets of each Fund and of all Eaton Vance Funds as a group over various time periods, and evaluated the extent to which the total expense ratio of each Fund and the profitability of the Adviser and its affiliates may have been affected by such increases or decreases. Based upon the foregoing, the Board concluded that each Fund currently shares in the benefits from economies of scale, if any, when they are realized by the Adviser. The Board also concluded that the structure of each advisory fee, which includes breakpoints at several asset levels, will allow each Fund to continue to benefit from any economies of scale in the future.
Eaton Vance
Municipal Income Funds
September 30, 2022
Liquidity Risk Management Program
Each Fund has implemented a written liquidity risk management program (Program) and related procedures to manage its liquidity in accordance with Rule 22e-4 under the Investment Company Act of 1940, as amended (Liquidity Rule). The Liquidity Rule defines “liquidity risk” as the risk that a fund could not meet requests to redeem shares issued by the fund without significant dilution of the remaining investors’ interests in the fund. Each Fund’s Board of Trustees/Directors has designated the investment adviser to serve as the administrator of the Program and the related procedures. The administrator has established a Liquidity Risk Management Oversight Committee (Committee) to perform the functions necessary to administer the Program. As part of the Program, the administrator is responsible for identifying illiquid investments and categorizing the relative liquidity of each Fund’s investments in accordance with the Liquidity Rule. Under the Program, the administrator assesses, manages, and periodically reviews each Fund’s liquidity risk, and is responsible for making certain reports to the Fund’s Board of Trustees/Directors and the Securities and Exchange Commission (SEC) regarding the liquidity of the Fund’s investments, and to notify the Board of Trustees/Directors and the SEC of certain liquidity events specified in the Liquidity Rule. The liquidity of each Fund’s portfolio investments is determined based on a number of factors including, but not limited to, relevant market, trading and investment-specific considerations under the Program.
At a meeting of each Fund’s Board of Trustees/Directors on June 7, 2022, the Committee provided a written report to the Fund’s Board of Trustees/Directors pertaining to the operation, adequacy, and effectiveness of implementation of the Program, as well as the operation of the highly liquid investment minimum (if applicable) for the period January 1, 2021 through December 31, 2021 (Review Period). The Program operated effectively during the Review Period, supporting the administrator’s ability to assess, manage and monitor Fund liquidity risk, including during periods of market volatility and net redemptions. During the Review Period, each Fund met redemption requests on a timely basis.
There can be no assurance that the Program will achieve its objectives in the future. Please refer to each Fund’s prospectus for more information regarding the Fund’s exposure to liquidity risk and other principal risks to which an investment in the Fund may be subject.
Eaton Vance
Municipal Income Funds
September 30, 2022
Management and Organization
Fund Management. The Trustees of Eaton Vance Municipals Trust (the Trust) are responsible for the overall management and supervision of the Trust's affairs. The Board members and officers of Trust are listed below. Except as indicated, each individual has held the office shown or other offices in the same company for the last five years. Board members hold indefinite terms of office. Each Trustee holds office until his or her successor is elected and qualified, subject to a prior death, resignation, retirement, disqualification or removal. Under the terms of each Fund's current Trustee retirement policy, an Independent Trustee must retire and resign as a Trustee on the earlier of: (i) the first day of July following his or her 74th birthday; or (ii), with limited exception, December 31st of the 20th year in which he or she has served as a Trustee. However, if such retirement and resignation would cause the Funds to be out of compliance with Section 16 of the 1940 Act or any other regulations or guidance of the SEC, then such retirement and resignation will not become effective until such time as action has been taken for each Fund to be in compliance therewith. The “noninterested Trustees” consist of those Trustees who are not “interested persons” of Trust, as that term is defined under the 1940 Act. The business address of each Board member and officer is Two International Place, Boston, Massachusetts 02110. As used below, “BMR” refers to Boston Management and Research, “EVC” refers to Eaton Vance Corp., “EV” refers to EV LLC, “EVM” refers to Eaton Vance Management and “EVD” refers to Eaton Vance Distributors, Inc. EV is the trustee of each of EVM and BMR. Effective March 1, 2021, each of EVM, BMR, EVD and EV are indirect, wholly owned subsidiaries of Morgan Stanley. Each officer affiliated with EVM may hold a position with other EVM affiliates that is comparable to his or her position with EVM listed below. Each Trustee oversees 136 funds (with the exception of Mr. Bowser who oversees 110 funds and Ms. Wiser who oversee 135 funds) in the Eaton Vance Complex (including both funds and portfolios in a hub and spoke structure).
| Name and Year of Birth | Trust
Position(s) | Length of Service | Principal Occupation(s) and Other Directorships
During Past Five Years and Other Relevant Experience |
| Interested Trustee |
Thomas E. Faust Jr.
1958 | Trustee | Since 2007 | Chairman of Morgan Stanley Investment Management, Inc. (MSIM), member of the Board of Managers and President of EV (since 2021), Chief Executive Officer of EVM and BMR. Formerly, Chairman, Chief Executive Officer (2007-2021) and President (2006-2021) of EVC and Director of EVD (2007-2022). Mr. Faust is an interested person because of his positions with MSIM, BMR, EVM and EV, which are affiliates of the Trust.
Other Directorships. Formerly, Director of EVC (2007-2021) and Hexavest Inc. (investment management firm) (2012-2021). |
| Noninterested Trustees |
Alan C. Bowser(1)
1962 | Trustee | Since 2022 | Chief Diversity Officer, Partner and a member of the Operating Committee, and formerly served as Senior Advisor on Diversity and Inclusion for the firm’s chief executive officer, Co-Head of the Americas Region, and Senior Client Advisor of Bridgewater Associates, an asset management firm (2011- present).
Other Directorships. None. |
Mark R. Fetting
1954 | Trustee | Since 2016 | Private investor. Formerly held various positions at Legg Mason, Inc. (investment management firm) (2000-2012), including President, Chief Executive Officer, Director and Chairman (2008-2012), Senior Executive Vice President (2004-2008) and Executive Vice President (2001-2004). Formerly, President of Legg Mason family of funds (2001-2008). Formerly, Division President and Senior Officer of Prudential Financial Group, Inc. and related companies (investment management firm) (1991-2000).
Other Directorships. None. |
Cynthia E. Frost
1961 | Trustee | Since 2014 | Private investor. Formerly, Chief Investment Officer of Brown University (university endowment) (2000-2012). Formerly, Portfolio Strategist for Duke Management Company (university endowment manager) (1995-2000). Formerly, Managing Director, Cambridge Associates (investment consulting company) (1989-1995). Formerly, Consultant, Bain and Company (management consulting firm) (1987-1989). Formerly, Senior Equity Analyst, BA Investment Management Company (1983-1985).
Other Directorships. None. |
George J. Gorman
1952 | Chairperson
of the Board
and Trustee | Since 2021
(Chairperson) and
2014 (Trustee) | Principal at George J. Gorman LLC (consulting firm). Formerly, Senior Partner at Ernst & Young LLP (a registered public accounting firm) (1974-2009).
Other Directorships. None. |
Eaton Vance
Municipal Income Funds
September 30, 2022
Management and Organization — continued
| Name and Year of Birth | Trust
Position(s) | Length of Service | Principal Occupation(s) and Other Directorships
During Past Five Years and Other Relevant Experience |
| Noninterested Trustees (continued) |
Valerie A. Mosley
1960 | Trustee | Since 2014 | Chairwoman and Chief Executive Officer of Valmo Ventures (a consulting and investment firm). Founder of Upward Wealth, Inc., dba BrightUP, a fintech platform. Formerly, Partner and Senior Vice President, Portfolio Manager and Investment Strategist at Wellington Management Company, LLP (investment management firm) (1992-2012). Formerly, Chief Investment Officer, PG Corbin Asset Management (1990-1992). Formerly worked in institutional corporate bond sales at Kidder Peabody (1986-1990).
Other Directorships. Director of DraftKings, Inc. (digital sports entertainment and gaming company) (since September 2020). Director of Envestnet, Inc. (provider of intelligent systems for wealth management and financial wellness) (since 2018). Formerly, Director of Dynex Capital, Inc. (mortgage REIT) (2013-2020) and Director of Groupon, Inc. (ecommerce provider) (2020-2022). |
Keith Quinton
1958 | Trustee | Since 2018 | Private investor, researcher and lecturer. Formerly, Independent Investment Committee Member at New Hampshire Retirement System (2017-2021). Formerly, Portfolio Manager and Senior Quantitative Analyst at Fidelity Investments (investment management firm) (2001-2014).
Other Directorships. Formerly, Director (2016-2021) and Chairman (2019-2021) of New Hampshire Municipal Bond Bank. |
Marcus L. Smith
1966 | Trustee | Since 2018 | Private investor and independent corporate director. Formerly, Chief Investment Officer, Canada (2012-2017), Chief Investment Officer, Asia (2010-2012), Director of Asian Research (2004-2010) and portfolio manager (2001-2017) at MFS Investment Management (investment management firm).
Other Directorships. Director of First Industrial Realty Trust, Inc. (an industrial REIT) (since 2021). Director of MSCI Inc. (global provider of investment decision support tools) (since 2017). Formerly, Director of DCT Industrial Trust Inc. (logistics real estate company) (2017-2018). |
Susan J. Sutherland
1957 | Trustee | Since 2015 | Private investor. Director of Ascot Group Limited and certain of its subsidiaries (insurance and reinsurance) (since 2017). Formerly, Director of Hagerty Holding Corp. (insurance) (2015-2018) and Montpelier Re Holdings Ltd. (insurance and reinsurance) (2013-2015). Formerly, Associate, Counsel and Partner at Skadden, Arps, Slate, Meagher & Flom LLP (law firm) (1982-2013).
Other Directorships. Director of Kairos Acquisition Corp. (insurance/InsurTech acquisition company) (since 2021). |
Scott E. Wennerholm
1959 | Trustee | Since 2016 | Private investor. Formerly, Trustee at Wheelock College (postsecondary institution) (2012-2018). Formerly, Consultant at GF Parish Group (executive recruiting firm) (2016-2017). Formerly, Chief Operating Officer and Executive Vice President at BNY Mellon Asset Management (investment management firm) (2005-2011). Formerly, Chief Operating Officer and Chief Financial Officer at Natixis Global Asset Management (investment management firm) (1997-2004). Formerly, Vice President at Fidelity Investments Institutional Services (investment management firm) (1994-1997).
Other Directorships. None. |
Nancy A. Wiser(1)
1967 | Trustee | Since 2022 | Formerly, Executive Vice President and the Global Head of Operations at Wells Fargo Asset Management (2011-2021).
Other Directorships. None. |
| Name and Year of Birth | Trust
Position(s) | Length of Service | Principal Occupation(s)
During Past Five Years |
| Principal Officers who are not Trustees |
Eric A. Stein
1980 | President | Since 2020 | Vice President and Chief Investment Officer, Fixed Income of EVM and BMR. Prior to November 1, 2020, Mr. Stein was a co-Director of Eaton Vance’s Global Income Investments. Also Vice President of Calvert Research and Management (“CRM”). |
Deidre E. Walsh
1971 | Vice President and
Chief Legal Officer | Since 2009 | Vice President of EVM and BMR. Also Vice President of CRM. |
James F. Kirchner
1967 | Treasurer | Since 2007 | Vice President of EVM and BMR. Also Vice President of CRM. |
Eaton Vance
Municipal Income Funds
September 30, 2022
Management and Organization — continued
| Name and Year of Birth | Trust
Position(s) | Length of Service | Principal Occupation(s)
During Past Five Years |
| Principal Officers who are not Trustees (continued) |
Jill R. Damon
1984 | Secretary | Since 2022 | Vice President of EVM and BMR since 2017. Formerly, associate at Dechert LLP (2009-2017). |
Richard F. Froio
1968 | Chief Compliance
Officer | Since 2017 | Vice President of EVM and BMR since 2017. Formerly, Deputy Chief Compliance Officer (Adviser/Funds) and Chief Compliance Officer (Distribution) at PIMCO (2012-2017) and Managing Director at BlackRock/Barclays Global Investors (2009-2012). |
(1) Mr. Bowser and Ms. Wiser began serving as Trustees effective April 4, 2022.
The SAI for each Fund includes additional information about the Trustees and officers of the Funds and can be obtained without charge on Eaton Vance’s website at www.eatonvance.com or by calling 1-800-262-1122.
| FACTS | WHAT DOES EATON VANCE DO WITH YOUR
PERSONAL INFORMATION? |
| Why? | Financial companies choose how they share your personal information. Federal law gives consumers the right to limit some but not all sharing. Federal law also requires us to tell you how we collect, share, and protect your personal information. Please read this notice carefully to understand what we do. |
| |
| What? | The types of personal information we collect and share depend on the product or service you have with us. This information can include:■ Social Security number and income
■ investment experience and risk tolerance
■ checking account number and wire transfer instructions |
| |
| How? | All financial companies need to share customers’ personal information to run their everyday business. In the section below, we list the reasons financial companies can share their customers’ personal information; the reasons Eaton Vance chooses to share; and whether you can limit this sharing. |
Reasons we can share your
personal information | Does Eaton Vance
share? | Can you limit
this sharing? |
| For our everyday business purposes — such as to process your transactions, maintain your account(s), respond to court orders and legal investigations, or report to credit bureaus | Yes | No |
| For our marketing purposes — to offer our products and services to you | Yes | No |
| For joint marketing with other financial companies | No | We don’t share |
| For our investment management affiliates’ everyday business purposes — information about your transactions, experiences, and creditworthiness | Yes | Yes |
| For our affiliates’ everyday business purposes — information about your transactions and experiences | Yes | No |
| For our affiliates’ everyday business purposes — information about your creditworthiness | No | We don’t share |
| For our investment management affiliates to market to you | Yes | Yes |
| For our affiliates to market to you | No | We don’t share |
| For nonaffiliates to market to you | No | We don’t share |
To limit our
sharing | Call toll-free 1-800-262-1122 or email: EVPrivacy@eatonvance.comPlease note:If you are a new customer, we can begin sharing your information 30 days from the date we sent this notice. When you are no longer our customer, we continue to share your information as described in this notice. However, you can contact us at any time to limit our sharing. |
| Questions? | Call toll-free 1-800-262-1122 or email: EVPrivacy@eatonvance.com |
| Privacy Notice — continued | April 2021 |
| Who we are |
| Who is providing this notice? | Eaton Vance Management, Eaton Vance Distributors, Inc., Eaton Vance Trust Company, Eaton Vance Management (International) Limited, Eaton Vance Advisers International Ltd., Eaton Vance Global Advisors Limited, Eaton Vance Management’s Real Estate Investment Group, Boston Management and Research, Calvert Research and Management, Eaton Vance and Calvert Fund Families and our investment advisory affiliates (“Eaton Vance”) (see Investment Management Affiliates definition below) |
| What we do |
How does Eaton Vance
protect my personal
information? | To protect your personal information from unauthorized access and use, we use security measures that comply with federal law. These measures include computer safeguards and secured files and buildings. We have policies governing the proper handling of customer information by personnel and requiring third parties that provide support to adhere to appropriate security standards with respect to such information. |
How does Eaton Vance
collect my personal
information? | We collect your personal information, for example, when you■ open an account or make deposits or withdrawals from your account
■ buy securities from us or make a wire transfer
■ give us your contact informationWe also collect your personal information from others, such as credit bureaus, affiliates, or other companies. |
| Why can’t I limit all sharing? | Federal law gives you the right to limit only■ sharing for affiliates’ everyday business purposes — information about your creditworthiness
■ affiliates from using your information to market to you
■ sharing for nonaffiliates to market to youState laws and individual companies may give you additional rights to limit sharing. See below for more on your rights under state law. |
| Definitions |
Investment Management
Affiliates | Eaton Vance Investment Management Affiliates include registered investment advisers, registered broker- dealers, and registered and unregistered funds. Investment Management Affiliates does not include entities associated with Morgan Stanley Wealth Management, such as Morgan Stanley Smith Barney LLC and Morgan Stanley & Co. |
| Affiliates | Companies related by common ownership or control. They can be financial and nonfinancial companies.■ Our affiliates include companies with a Morgan Stanley name and financial companies such as Morgan Stanley Smith Barney LLC and Morgan Stanley & Co. |
| Nonaffiliates | Companies not related by common ownership or control. They can be financial and nonfinancial companies.■ Eaton Vance does not share with nonaffiliates so they can market to you. |
| Joint marketing | A formal agreement between nonaffiliated financial companies that together market financial products or services to you.■ Eaton Vance doesn’t jointly market. |
| Other important information |
| Vermont: Except as permitted by law, we will not share personal information we collect about Vermont residents with Nonaffiliates unless you provide us with your written consent to share such information.California: Except as permitted by law, we will not share personal information we collect about California residents with Nonaffiliates and we will limit sharing such personal information with our Affiliates to comply with California privacy laws that apply to us. |
Delivery of Shareholder Documents. The Securities and Exchange Commission (SEC) permits funds to deliver only one copy of shareholder documents, including prospectuses, proxy statements and shareholder reports, to fund investors with multiple accounts at the same residential or post office box address. This practice is often called “householding” and it helps eliminate duplicate mailings to shareholders. Eaton Vance, or your financial intermediary, may household the mailing of your documents indefinitely unless you instruct Eaton Vance, or your financial intermediary, otherwise. If you would prefer that your Eaton Vance documents not be householded, please contact Eaton Vance at 1-800-262-1122, or contact your financial intermediary. Your instructions that householding not apply to delivery of your Eaton Vance documents will typically be effective within 30 days of receipt by Eaton Vance or your financial intermediary.
Portfolio Holdings. Each Eaton Vance Fund and its underlying Portfolio(s) (if applicable) files a schedule of portfolio holdings on Part F to Form N-PORT with the SEC. Certain information filed on Form N-PORT may be viewed on the Eaton Vance website at www.eatonvance.com, by calling Eaton Vance at 1-800-262-1122 or in the EDGAR database on the SEC’s website at www.sec.gov.
Proxy Voting. From time to time, funds are required to vote proxies related to the securities held by the funds. The Eaton Vance Funds or their underlying Portfolios (if applicable) vote proxies according to a set of policies and procedures approved by the Funds’ and Portfolios’ Boards. You may obtain a description of these policies and procedures and information on how the Funds or Portfolios voted proxies relating to portfolio securities during the most recent 12-month period ended June 30, without charge, upon request, by calling 1-800-262-1122 and by accessing the SEC’s website at www.sec.gov.
This Page Intentionally Left Blank
Investment Adviser
Boston Management and Research
Two International Place
Boston, MA 02110
Administrator
Eaton Vance Management
Two International Place
Boston, MA 02110
Principal Underwriter*
Eaton Vance Distributors, Inc.
Two International Place
Boston, MA 02110
(617) 482-8260
Custodian
State Street Bank and Trust Company
State Street Financial Center, One Lincoln Street
Boston, MA 02111
Transfer Agent
BNY Mellon Investment Servicing (US) Inc.
Attn: Eaton Vance Funds
P.O. Box 9653
Providence, RI 02940-9653
(800) 262-1122
Independent Registered Public Accounting Firm
Deloitte & Touche LLP
200 Berkeley Street
Boston, MA 02116-5022
Fund Offices
Two International Place
Boston, MA 02110
* FINRA BrokerCheck. Investors may check the background of their Investment Professional by contacting the Financial Industry Regulatory Authority (FINRA). FINRA BrokerCheck is a free tool to help investors check the professional background of current and former FINRA-registered securities firms and brokers. FINRA BrokerCheck is available by calling 1-800-289-9999 and at www.FINRA.org. The FINRA BrokerCheck brochure describing this program is available to investors at www.FINRA.org.
Eaton Vance
Municipal Income Funds
Annual Report
September 30, 2022
Commodity Futures Trading Commission Registration. The Commodity Futures Trading Commission (“CFTC”) has adopted regulations that subject registered investment companies and advisers to regulation by the CFTC if a fund invests more than a prescribed level of its assets in certain CFTC-regulated instruments (including futures, certain options and swap agreements) or markets itself as providing investment exposure to such instruments. Each investment adviser has claimed an exclusion from the definition of “commodity pool operator” under the Commodity Exchange Act with respect to its management of each Fund. Accordingly, neither the Funds nor the adviser with respect to the operation of the Funds is subject to CFTC regulation. Because of its management of other strategies, each Fund's adviser is registered with the CFTC as a commodity pool operator. Each adviser is also registered as a commodity trading advisor.
Fund shares are not insured by the FDIC and are not deposits or other obligations of, or guaranteed by, any depository institution. Shares are subject to investment risks, including possible loss of principal invested.
This report must be preceded or accompanied by a current summary prospectus or prospectus. Before investing, investors should consider carefully the investment objective, risks, and charges and expenses of a mutual fund. This and other important information is contained in the summary prospectus and prospectus, which can be obtained from a financial intermediary. Prospective investors should read the prospectus carefully before investing. For further information, please call 1-800-262-1122.
Annual Report September 30, 2022
Eaton Vance
Municipal Income Funds
Eaton Vance
Municipal Income Funds
September 30, 2022
Management’s Discussion of Fund Performance†
Economic and Market Conditions
The 12-month period starting October 1, 2021, encompassed the worst six-month start to a calendar year for municipal bond returns in four decades and the worst single month for municipals since 2008 — as well as the best one-month performance for municipal bonds in over two years with a July 2022 rally.
In the opening months of the period, interest rates rose and bond prices declined due in part to anticipation that the U.S. Federal Reserve (the Fed) would begin tapering its monthly bond purchases, which had helped hold interest rates down through much of the pandemic.
In late 2021, the Fed confirmed that tapering would begin in November and accelerate during the months to come. In December, U.S. Treasury rates rose against the backdrop of inflationary concerns and anticipation that the Fed would hike interest rates in 2022. Municipal bond rates, however, were nearly unchanged during the month.
But as the new year began, municipal bond rates resumed their upward trajectory as investors reevaluated the twin threats of persistent inflation and projected interest rate hikes. In February, Russia’s invasion of Ukraine sent shock waves through markets worldwide, exacerbating inflationary pressures on energy and food prices.
As markets recognized the potential for the Fed to raise interest rates at every policy meeting in 2022 to combat inflation, the Bloomberg Municipal Bond Index (the Index), a broad measure of the municipal bond market, declined 8.98% during the first six months of 2022 — its worst first-half performance since the 1980s. Municipal bond mutual funds — which had reported net inflows for all but one week in 2021 — recorded their worst outflow cycle on record.
In July 2022, however, municipal bond performance briefly turned positive. Helped by a tight supply of new issues and increased demand from the reinvestment of maturing debt and coupon payments, municipal mutual funds experienced their first net inflows since January 2022.
Heightened fears of recession also benefited the asset class by spurring a “flight to quality” that drove investors toward U.S. Treasurys and municipal securities. Expectations that a recession might lead the Fed to temper future rate hikes helped municipal returns as well. As a result, the Index returned 2.64% in July 2022, its best month since May 2020.
But in the final months of the period, municipal performance turned negative again and fund outflows resumed as investors reacted to statements from Fed officials that they were not done with rate hikes and that fighting inflation remained the central bank’s top priority. At its September meeting, the Fed followed through with its third straight 0.75% rate hike and announced a new year-end federal funds target of 4.40%, up from its previous projection of 3.40%. September 2022 entered the record books with the Index falling 3.84%, its worst one-month performance in 14 years.
For the period as a whole, the Index returned -11.50% as interest rates rose and bond prices declined across the municipal bond yield curve. Municipal bonds outperformed U.S. Treasurys in the short and medium areas of the yield curve — maturities of 10 years and below — but underperformed Treasurys at the 30-year end of the curve.
Fund Performance
For the 12-month period ended September 30, 2022, Eaton Vance AMT-Free Municipal Income Fund (the AMT-Free Fund) and Eaton Vance National Municipal Income Fund (the National Fund) — Class A shares at net asset value (NAV) — underperformed their benchmark, the Index, which returned -11.50%.
In pursuing their objectives, the Funds normally acquire municipal obligations with maturities of 10 years or more.
The Funds may seek to enhance tax-exempt income through the use of leveraged investments by purchasing residual interest bonds. Leveraged investments have the effect of magnifying each Fund’s exposure to its underlying investments in both up and down markets. Although the use of leverage generated additional tax-exempt bond income for both Funds, it also magnified a significant decline in municipal bond prices during the period due to rising interest rates. As a result, the net effect of leverage detracted from the performance of both Funds relative to the Index, which does not employ leverage.
Management may attempt to hedge each portfolio to various degrees against the potential risk of interest rate volatility at the long end of the yield curve by using Treasury futures or interest rate swaps. In a period when Treasury bonds generally declined in price as yields moved higher, the National Fund’s Treasury-futures hedging strategy contributed to relative returns versus the unhedged Index. The AMT-Free Fund did not employ an interest rate hedge during the period.
See Endnotes and Additional Disclosures in this report.
Past performance is no guarantee of future results. Returns are historical and are calculated by determining the percentage change in net asset value (NAV) or offering price (as applicable) with all distributions reinvested. Furthermore, returns do not reflect the deduction of taxes that shareholders may have to pay on Fund distributions or upon the redemption of Fund shares. Investment return and principal value will fluctuate so that shares, when redeemed, may be worth more or less than their original cost. Performance for periods less than or equal to one year is cumulative. Performance is for the stated time period only; due to market volatility, current Fund performance may be lower or higher than the quoted return. For performance as of the most recent month-end, please refer to eatonvance.com.
Eaton Vance
Municipal Income Funds
September 30, 2022
Management’s Discussion of Fund Performance† — continued
Fund-Specific Results
Eaton Vance AMT-Free Municipal Income Fund returned -13.85% for Class A shares at NAV, underperforming the Index, which returned -11.50% during the period.
In addition to leverage, detractors from Fund performance versus the Index included security selections and an overweight position relative to the Index in 4% coupon bonds, and security selections and an overweight position in BBB-rated bonds — the worst-performing credit-rating category within the Index during the period.
In contrast, contributors to returns relative to the Index included an overweight position in prerefunded, or escrowed, bonds — the best-performing sector within the Index during the period; an underweight position in bonds with 22 years or more remaining to maturity, during a period when longer maturity bonds generally underperformed shorter maturity bonds; and security selections in California bonds.
Eaton Vance National Municipal Income Fund returned -12.62% for Class A shares at NAV, underperforming the Index, which returned -11.50% during the period.
In addition to leverage, detractors from performance relative to the Index included security selections and overweight positions in the health care sector and BBB-rated bonds, as well as an overweight position in bonds with 17 years or more remaining to maturity.
In addition to the National Fund’s Treasury-futures hedging strategy, contributors to performance versus the Index included security selections in state general obligation bonds and security selections in AAA-rated bonds during the period.
See Endnotes and Additional Disclosures in this report.
Past performance is no guarantee of future results. Returns are historical and are calculated by determining the percentage change in net asset value (NAV) or offering price (as applicable) with all distributions reinvested. Furthermore, returns do not reflect the deduction of taxes that shareholders may have to pay on Fund distributions or upon the redemption of Fund shares. Investment return and principal value will fluctuate so that shares, when redeemed, may be worth more or less than their original cost. Performance for periods less than or equal to one year is cumulative. Performance is for the stated time period only; due to market volatility, current Fund performance may be lower or higher than the quoted return. For performance as of the most recent month-end, please refer to eatonvance.com.
Eaton Vance
AMT-Free Municipal Income Fund
September 30, 2022
Performance
Portfolio Manager(s) Cynthia J. Clemson and Julie P. Callahan, CFA
| % Average Annual Total Returns1,2 | Class
Inception Date | Performance
Inception Date | One Year | Five Years | Ten Years |
| Class A at NAV | 01/06/1998 | 03/16/1978 | (13.85)% | (0.04)% | 1.51% |
| Class A with 3.25% Maximum Sales Charge | — | — | (16.63) | (0.70) | 1.18 |
| Class C at NAV | 05/02/2006 | 03/16/1978 | (14.59) | (0.80) | 0.91 |
| Class C with 1% Maximum Deferred Sales Charge | — | — | (15.42) | (0.80) | 0.91 |
| Class I at NAV | 03/16/1978 | 03/16/1978 | (13.64) | 0.22 | 1.77 |
|
| Bloomberg Municipal Bond Index | — | — | (11.50)% | 0.59% | 1.79% |
| % Total Annual Operating Expense Ratios3 | Class A | Class C | Class I |
| | 0.80% | 1.55% | 0.55% |
| % Distribution Rates/Yields4 | Class A | Class C | Class I |
| Distribution Rate | 3.36% | 2.59% | 3.62% |
| Taxable-Equivalent Distribution Rate | 5.68 | 4.38 | 6.11 |
| SEC 30-day Yield | 3.07 | 2.40 | 3.43 |
| Taxable-Equivalent SEC 30-day Yield | 5.19 | 4.06 | 5.80 |
| % Total Leverage5 | |
| Residual Interest Bond (RIB) Financing | 5.20% |
Growth of $10,000
This graph shows the change in value of a hypothetical investment of $10,000 in Class A of the Fund for the period indicated. For comparison, the same investment is shown in the indicated index.
| Growth of Investment | Amount Invested | Period Beginning | At NAV | With Maximum Sales Charge |
| Class C | $10,000 | 09/30/2012 | $10,947 | N.A. |
| Class I, at minimum investment | $1,000,000 | 09/30/2012 | $1,192,435 | N.A. |
See Endnotes and Additional Disclosures in this report.
Past performance is no guarantee of future results. Returns are historical and are calculated by determining the percentage change in net asset value (NAV) or offering price (as applicable) with all distributions reinvested. Furthermore, returns do not reflect the deduction of taxes that shareholders may have to pay on Fund distributions or upon the redemption of Fund shares. Investment return and principal value will fluctuate so that shares, when redeemed, may be worth more or less than their original cost. Performance for periods less than or equal to one year is cumulative. Performance is for the stated time period only; due to market volatility, current Fund performance may be lower or higher than the quoted return. For performance as of the most recent month-end, please refer to eatonvance.com.
Eaton Vance
AMT-Free Municipal Income Fund
September 30, 2022
| Credit Quality (% of total investments)1,2 |
Footnotes:
| 1 | For purposes of the Fund’s rating restrictions, ratings are based on Moody’s Investors Service, Inc. (“Moody’s”), S&P Global Ratings (“S&P”) or Fitch Ratings (“Fitch”), as applicable. If securities are rated differently by the ratings agencies, the highest rating is applied. Ratings, which are subject to change, apply to the creditworthiness of the issuers of the underlying securities and not to the Fund or its shares. Credit ratings measure the quality of a bond based on the issuer’s creditworthiness, with ratings ranging from AAA, being the highest, to D, being the lowest based on S&P’s measures. Ratings of BBB or higher by S&P or Fitch (Baa or higher by Moody’s) are considered to be investment-grade quality. Credit ratings are based largely on the ratings agency’s analysis at the time of rating. The rating assigned to any particular security is not necessarily a reflection of the issuer’s current financial condition and does not necessarily reflect its assessment of the volatility of a security’s market value or of the liquidity of an investment in the security. Holdings designated as “Not Rated” (if any) are not rated by the national ratings agencies stated above. |
| 2 | The chart includes the municipal bonds held by a trust that issues residual interest bonds, consistent with the Portfolio of Investments. |
Eaton Vance
National Municipal Income Fund
September 30, 2022
Performance
Portfolio Manager(s) Craig R. Brandon, CFA and Christopher J. Eustance, CFA
| % Average Annual Total Returns1,2 | Class
Inception Date | Performance
Inception Date | One Year | Five Years | Ten Years |
| Class A at NAV | 04/05/1994 | 12/19/1985 | (12.62)% | 0.44% | 2.06% |
| Class A with 3.25% Maximum Sales Charge | — | — | (15.49) | (0.21) | 1.72 |
| Class C at NAV | 12/03/1993 | 12/19/1985 | (13.28) | (0.31) | 1.45 |
| Class C with 1% Maximum Deferred Sales Charge | — | — | (14.13) | (0.31) | 1.45 |
| Class I at NAV | 07/01/1999 | 12/19/1985 | (12.40) | 0.69 | 2.31 |
|
| Bloomberg Municipal Bond Index | — | — | (11.50)% | 0.59% | 1.79% |
| % Total Annual Operating Expense Ratios3 | Class A | Class C | Class I |
| | 0.63% | 1.38% | 0.38% |
| % Distribution Rates/Yields4 | Class A | Class C | Class I |
| Distribution Rate | 3.43% | 2.66% | 3.69% |
| Taxable-Equivalent Distribution Rate | 5.80 | 4.50 | 6.23 |
| SEC 30-day Yield | 3.26 | 2.60 | 3.62 |
| Taxable-Equivalent SEC 30-day Yield | 5.51 | 4.39 | 6.12 |
| % Total Leverage5 | |
| RIB Financing | 2.95% |
Growth of $10,000
This graph shows the change in value of a hypothetical investment of $10,000 in Class A of the Fund for the period indicated. For comparison, the same investment is shown in the indicated index.
| Growth of Investment | Amount Invested | Period Beginning | At NAV | With Maximum Sales Charge |
| Class C | $10,000 | 09/30/2012 | $11,551 | N.A. |
| Class I, at minimum investment | $1,000,000 | 09/30/2012 | $1,256,831 | N.A. |
See Endnotes and Additional Disclosures in this report.
Past performance is no guarantee of future results. Returns are historical and are calculated by determining the percentage change in net asset value (NAV) or offering price (as applicable) with all distributions reinvested. Furthermore, returns do not reflect the deduction of taxes that shareholders may have to pay on Fund distributions or upon the redemption of Fund shares. Investment return and principal value will fluctuate so that shares, when redeemed, may be worth more or less than their original cost. Performance for periods less than or equal to one year is cumulative. Performance is for the stated time period only; due to market volatility, current Fund performance may be lower or higher than the quoted return. For performance as of the most recent month-end, please refer to eatonvance.com.
Eaton Vance
National Municipal Income Fund
September 30, 2022
| Credit Quality (% of total investments)1,2 |
Footnotes:
| 1 | For purposes of the Fund’s rating restrictions, ratings are based on Moody’s Investors Service, Inc. (“Moody’s”), S&P Global Ratings (“S&P”) or Fitch Ratings (“Fitch”), as applicable. If securities are rated differently by the ratings agencies, the highest rating is applied. Ratings, which are subject to change, apply to the creditworthiness of the issuers of the underlying securities and not to the Fund or its shares. Credit ratings measure the quality of a bond based on the issuer’s creditworthiness, with ratings ranging from AAA, being the highest, to D, being the lowest based on S&P’s measures. Ratings of BBB or higher by S&P or Fitch (Baa or higher by Moody’s) are considered to be investment-grade quality. Credit ratings are based largely on the ratings agency’s analysis at the time of rating. The rating assigned to any particular security is not necessarily a reflection of the issuer’s current financial condition and does not necessarily reflect its assessment of the volatility of a security’s market value or of the liquidity of an investment in the security. Holdings designated as “Not Rated” (if any) are not rated by the national ratings agencies stated above. |
| 2 | The chart includes the municipal bonds held by a trust that issues residual interest bonds, consistent with the Portfolio of Investments. |
Eaton Vance
Municipal Income Funds
September 30, 2022
Endnotes and Additional Disclosures
| † | The views expressed in this report are those of the portfolio manager(s) and are current only through the date stated at the top of this page. These views are subject to change at any time based upon market or other conditions, and Eaton Vance and the Fund(s) disclaim any responsibility to update such views. These views may not be relied upon as investment advice and, because investment decisions are based on many factors, may not be relied upon as an indication of trading intent on behalf of any Eaton Vance fund. This commentary may contain statements that are not historical facts, referred to as “forward-looking statements.” The Fund’s actual future results may differ significantly from those stated in any forward-looking statement, depending on factors such as changes in securities or financial markets or general economic conditions, the volume of sales and purchases of Fund shares, the continuation of investment advisory, administrative and service contracts, and other risks discussed from time to time in the Fund’s filings with the Securities and Exchange Commission. |
| | |
| 1 | Bloomberg Municipal Bond Index is an unmanaged index of municipal bonds traded in the U.S. Unless otherwise stated, index returns do not reflect the effect of any applicable sales charges, commissions, expenses, taxes or leverage, as applicable. It is not possible to invest directly in an index. |
| 2 | Total Returns at NAV do not include applicable sales charges. If sales charges were deducted, the returns would be lower. Total Returns shown with maximum sales charge reflect the stated maximum sales charge. Unless otherwise stated, performance does not reflect the deduction of taxes on Fund distributions or redemptions of Fund shares.Effective November 5, 2020, Class C shares automatically convert to Class A shares eight years after purchase. The average annual total returns listed for Class C reflect conversion to Class A shares after eight years. Prior to November 5, 2020, Class C shares automatically converted to Class A shares ten years after purchase. |
| 3 | Source: Fund prospectus. The expense ratios for the current reporting period can be found in the Financial Highlights section of this report. |
| 4 | The Distribution Rate is based on the Fund’s last regular distribution per share in the period (annualized) divided by the Fund’s NAV at the end of the period. The Fund’s distributions may be comprised of amounts characterized for federal income tax purposes as tax-exempt income, qualified and non-qualified ordinary dividends, capital gains and nondividend distributions, also known as return of capital. The Fund will determine the federal income tax character of distributions paid to a shareholder after the end of the calendar year. This is reported on the IRS form 1099-DIV and provided to the shareholder shortly after each year-end. The Fund’s distributions are determined by the investment adviser based on its current assessment of the Fund’s long-term return potential. As portfolio and market conditions change, the rate of distributions paid by the Fund could change. Taxable-equivalent performance is based on the highest combined federal and state income tax rates, where applicable. Lower tax rates would result in lower tax-equivalent performance. Actual tax rates will vary depending on your income, exemptions and deductions. Rates do not include local taxes. The SEC Yield is a standardized measure based on the estimated yield to maturity of a fund’s investments over a 30-day period and is based on the maximum offer price at the date specified. The SEC Yield is not based on the distributions made by the Fund, which may differ. |
| 5 | Fund employs RIB financing. The leverage created by RIB investments provides an opportunity for increased income but, at the same time, creates special risks (including the likelihood of greater volatility of NAV). The cost of leverage rises and falls with changes in short-term interest rates. See “Floating Rate Notes Issued in Conjunction with Securities Held” in the notes to the financial statements for more information about RIB financing. RIB leverage represents the amount of Floating Rate Notes outstanding at period end as a percentage of Fund net assets plus Floating Rate Notes. |
| | Fund profiles subject to change due to active management. |
| | Additional Information |
| | Yield curve is a graphical representation of the yields offered by bonds of various maturities. The yield curve flattens when long-term interest rates fall and/or short-term interest rates increase, and the yield curve steepens when long-term interest rates increase and/or short-term interest rates fall. |
Eaton Vance
Municipal Income Funds
September 30, 2022
Example
As a Fund shareholder, you incur two types of costs: (1) transaction costs, including sales charges (loads) on purchases and redemption fees (if applicable); and (2) ongoing costs, including management fees; distribution and/or service fees; and other Fund expenses. This Example is intended to help you understand your ongoing costs (in dollars) of Fund investing and to compare these costs with the ongoing costs of investing in other mutual funds. The Example is based on an investment of $1,000 invested at the beginning of the period and held for the entire period (April 1, 2022 to September 30, 2022).
Actual Expenses
The first section of each table below provides information about actual account values and actual expenses. You may use the information in this section, together with the amount you invested, to estimate the expenses that you paid over the period. Simply divide your account value by $1,000 (for example, an $8,600 account value divided by $1,000 = 8.6), then multiply the result by the number in the first section under the heading entitled “Expenses Paid During Period” to estimate the expenses you paid on your account during this period.
Hypothetical Example for Comparison Purposes
The second section of each table below provides information about hypothetical account values and hypothetical expenses based on the actual Fund expense ratio and an assumed rate of return of 5% per year (before expenses), which is not the actual Fund return. The hypothetical account values and expenses may not be used to estimate the actual ending account balance or expenses you paid for the period. You may use this information to compare the ongoing costs of investing in your Fund and other funds. To do so, compare this 5% hypothetical example with the 5% hypothetical examples that appear in the shareholder reports of the other funds.
Please note that the expenses shown in each table are meant to highlight your ongoing costs only and do not reflect any transactional costs, such as sales charges (loads) or redemption fees (if applicable). Therefore, the second section of each table is useful in comparing ongoing costs only, and will not help you determine the relative total costs of owning different funds. In addition, if these transactional costs were included, your costs would be higher.
Eaton Vance AMT-Free Municipal Income Fund
| | Beginning
Account Value
(4/1/22) | Ending
Account Value
(9/30/22) | Expenses Paid
During Period*
(4/1/22 – 9/30/22) | Annualized
Expense
Ratio |
| Actual | | | | |
| Class A | $1,000.00 | $ 918.30 | $4.42 | 0.92% |
| Class C | $1,000.00 | $ 914.30 | $8.06 | 1.68% |
| Class I | $1,000.00 | $ 920.00 | $3.22 | 0.67% |
| |
| Hypothetical | | | | |
| (5% return per year before expenses) | | | | |
| Class A | $1,000.00 | $1,020.46 | $4.66 | 0.92% |
| Class C | $1,000.00 | $1,016.65 | $8.49 | 1.68% |
| Class I | $1,000.00 | $1,021.71 | $3.40 | 0.67% |
| * | Expenses are equal to the Fund's annualized expense ratio for the indicated Class, multiplied by the average account value over the period, multiplied by 183/365 (to reflect the one-half year period). The Example assumes that the $1,000 was invested at the net asset value per share determined at the close of business on March 31, 2022. |
Eaton Vance
Municipal Income Funds
September 30, 2022
Fund Expenses — continued
Eaton Vance National Municipal Income Fund
| | Beginning
Account Value
(4/1/22) | Ending
Account Value
(9/30/22) | Expenses Paid
During Period*
(4/1/22 – 9/30/22) | Annualized
Expense
Ratio |
| Actual | | | | |
| Class A | $1,000.00 | $ 926.40 | $3.43 | 0.71% |
| Class C | $1,000.00 | $ 922.90 | $7.04 | 1.46% |
| Class I | $1,000.00 | $ 927.60 | $2.22 | 0.46% |
| |
| Hypothetical | | | | |
| (5% return per year before expenses) | | | | |
| Class A | $1,000.00 | $1,021.51 | $3.60 | 0.71% |
| Class C | $1,000.00 | $1,017.75 | $7.39 | 1.46% |
| Class I | $1,000.00 | $1,022.76 | $2.33 | 0.46% |
| * | Expenses are equal to the Fund's annualized expense ratio for the indicated Class, multiplied by the average account value over the period, multiplied by 183/365 (to reflect the one-half year period). The Example assumes that the $1,000 was invested at the net asset value per share determined at the close of business on March 31, 2022. |
Eaton Vance
AMT-Free Municipal Income Fund
September 30, 2022
| Tax-Exempt Mortgage-Backed Securities — 0.4% |
| Security | Principal
Amount
(000's omitted) | Value |
| Housing — 0.4% |
| Washington Housing Finance Commission, Municipal Certificates, Series 2021-1, Class A, 3.50%, 12/20/35 | $ | 1,069 | $ 908,059 |
Total Tax-Exempt Mortgage-Backed Securities
(identified cost $1,201,478) | | | $ 908,059 |
| Tax-Exempt Municipal Obligations — 101.3% |
| Security | Principal
Amount
(000's omitted) | Value |
| Education — 6.4% |
| Build NYC Resource Corp., NY, (New World Preparatory Charter School), 4.00%, 6/15/41 | $ | 245 | $ 197,703 |
| Connecticut Health and Educational Facilities Authority, (Fairfield University), 5.00%, 7/1/46 | | 5,000 | 5,089,300 |
| Connecticut Health and Educational Facilities Authority, (Sacred Heart University), 4.00%, 7/1/45 | | 875 | 759,378 |
| District of Columbia, (KIPP DC): | | | |
| 4.00%, 7/1/44 | | 105 | 88,220 |
| 4.00%, 7/1/49 | | 135 | 109,750 |
| Erie Higher Education Building Authority, PA, (Gannon University), 5.00%, 5/1/30 | | 390 | 405,272 |
| Florida Development Finance Corp., (River City Science Academy), 4.00%, 7/1/45 | | 185 | 143,769 |
| Georgia Private Colleges and Universities Authority, (Savannah College of Art and Design), 4.00%, 4/1/40 | | 1,400 | 1,252,384 |
| Maryland Stadium Authority, Built to Learn Revenue, 4.00%, 6/1/52 | | 2,000 | 1,669,940 |
| Pennsylvania Higher Educational Facilities Authority, (Drexel University), 5.00%, 5/1/37 | | 1,750 | 1,784,440 |
| University of California, 5.25%, 5/15/35 | | 3,555 | 3,654,824 |
| | | | $ 15,154,980 |
| Electric Utilities — 3.0% |
| Douglas County Public Utility District No. 1, WA, 3.00%, 9/1/52 | $ | 1,355 | $ 918,080 |
| Lower Colorado River Authority, TX, (LCRA Transmission Services Corp.), 5.00%, 5/15/40 | | 1,000 | 1,038,880 |
| Northern Municipal Power Agency, MN: | | | |
| 5.00%, 1/1/31 | | 200 | 211,432 |
| 5.00%, 1/1/35 | | 170 | 178,230 |
| 5.00%, 1/1/36 | | 160 | 167,638 |
| Security | Principal
Amount
(000's omitted) | Value |
| Electric Utilities (continued) |
| Utility Debt Securitization Authority, NY: | | | |
| 5.00%, 12/15/33 | $ | 2,895 | $ 2,950,092 |
| Green Bonds, 5.00%, 12/15/49 | | 1,500 | 1,589,895 |
| | | | $ 7,054,247 |
| Escrowed/Prerefunded — 5.8% |
| Foothill-De Anza Community College District, CA: | | | |
| Prerefunded to 8/1/24, 5.00%, 8/1/34 | $ | 1,150 | $ 1,188,617 |
| Prerefunded to 8/1/24, 5.00%, 8/1/36 | | 1,150 | 1,188,617 |
| Henrico County Economic Development Authority, VA, (Bon Secours Health System, Inc.), Prerefunded to 11/1/22, 5.00%, 11/1/30 | | 1,185 | 1,186,576 |
| Massachusetts Development Finance Agency, (Children's Hospital), Prerefunded to 10/1/24, 5.00%, 10/1/31 | | 2,110 | 2,184,947 |
| North Carolina Capital Facilities Finance Agency, (Duke University), Prerefunded to 10/1/25, 5.00%, 10/1/41 | | 1,480 | 1,554,829 |
| San Joaquin Hills Transportation Corridor Agency, CA, Prerefunded to 1/15/25, 5.00%, 1/15/34 | | 5,235 | 5,440,317 |
| Springfield School District No. 19, OR, Prerefunded to 6/15/25, 5.00%, 6/15/30 | | 1,085 | 1,134,812 |
| | | | $ 13,878,715 |
| General Obligations — 14.8% |
| Andover, MA, 4.00%, 7/15/52 | $ | 1,500 | $ 1,336,995 |
| Chicago Board of Education, IL: | | | |
| 5.00%, 12/1/42 | | 260 | 242,460 |
| 5.00%, 12/1/44 | | 1,405 | 1,366,377 |
| Chicago, IL: | | | |
| 5.00%, 1/1/39 | | 1,400 | 1,367,478 |
| 5.00%, 1/1/44 | | 1,490 | 1,420,253 |
| Del Valle Independent School District, TX, (PSF Guaranteed), 4.00%, 6/15/47 | | 4,000 | 3,758,760 |
| District of Columbia, 5.00%, 6/1/37(1) | | 7,000 | 7,327,670 |
| Fennville Public Schools, MI, 4.00%, 5/1/34 | | 1,000 | 1,018,710 |
| Fort Worth Independent School District, TX, (PSF Guaranteed), 4.00%, 2/15/42 | | 3,970 | 3,716,595 |
| Illinois: | | | |
| 4.00%, 11/1/40 | | 1,000 | 838,760 |
| 5.00%, 5/1/35 | | 2,000 | 1,982,600 |
| 5.50%, 5/1/39 | | 205 | 208,801 |
| 5.50%, 3/1/42 | | 2,300 | 2,329,325 |
| 5.75%, 5/1/45 | | 210 | 214,706 |
| Kane, Cook and DuPage Counties School District No. 46, IL, 5.00%, 1/1/31 | | 4,470 | 4,554,259 |
| New York, NY, 4.00%, 9/1/46 | | 2,000 | 1,792,760 |
11
See Notes to Financial Statements.
Eaton Vance
AMT-Free Municipal Income Fund
September 30, 2022
Portfolio of Investments — continued
| Security | Principal
Amount
(000's omitted) | Value |
| General Obligations (continued) |
| Salem-Keizer School District No. 24J, OR, 0.00%, 6/15/24 | $ | 1,220 | $ 1,150,484 |
| University of Connecticut, 5.00%, 2/15/32 | | 650 | 662,188 |
| | | | $ 35,289,181 |
| Hospital — 14.5% |
| Brevard County Health Facilities Authority, FL, (Health First Obligated Group), 5.00%, 4/1/52 | $ | 5,000 | $ 4,928,800 |
| California Health Facilities Financing Authority, (St. Joseph Health System): | | | |
| Prerefunded to 7/1/23, 5.00%, 7/1/33 | | 1,720 | 1,743,203 |
| Prerefunded to 7/1/23, 5.00%, 7/1/37 | | 2,300 | 2,331,027 |
| California Statewide Communities Development Authority, (Loma Linda University Medical Center), 5.25%, 12/1/34 | | 3,000 | 3,030,180 |
| Chattanooga Health, Educational and Housing Facility Board, TN, (CommonSpirit Health), 4.00%, 8/1/37 | | 1,250 | 1,126,188 |
| Colorado Health Facilities Authority, (Craig Hospital), 5.00%, 12/1/47 | | 1,835 | 1,825,201 |
| Colorado Health Facilities Authority, (Vail Valley Medical Center), 5.00%, 1/15/35 | | 2,000 | 2,027,960 |
| Delaware Health Facilities Authority, (Beebe Medical Center): | | | |
| 5.00%, 6/1/36 | | 3,730 | 3,829,143 |
| 5.00%, 6/1/37 | | 1,000 | 1,024,390 |
| Escambia County Health Facilities Authority, FL, (Baptist Health Care Corp. Obligated Group), 4.00%, 8/15/45 | | 500 | 399,250 |
| Missouri Health and Educational Facilities Authority, (Mercy Health), 5.00%, 11/15/47 | | 3,000 | 2,954,610 |
| New York Dormitory Authority, (Northwell Health Obligated Group), 5.00%, 5/1/52 | | 2,500 | 2,475,575 |
| Ohio, (University Hospitals Health System, Inc.), 4.00%, 1/15/39 | | 2,100 | 1,941,807 |
| Tarrant County Cultural Education Facilities Finance Corp., TX, (Cook Children's Medical Center), 5.25%, 12/1/39(1) | | 5,000 | 5,054,000 |
| | | | $ 34,691,334 |
| Housing — 1.2% |
| Cuyahoga Metropolitan Housing Authority, OH, 2.00%, 12/1/31 | $ | 1,250 | $ 1,033,538 |
| Phoenix Industrial Development Authority, AZ, (Downtown Phoenix Student Housing, LLC - Arizona State University): | | | |
| 5.00%, 7/1/37 | | 500 | 478,335 |
| 5.00%, 7/1/42 | | 1,250 | 1,159,562 |
| Security | Principal
Amount
(000's omitted) | Value |
| Housing (continued) |
| Texas Student Housing Corp., (University of North Texas), 9.375%, 7/1/06(2) | $ | 285 | $ 285,000 |
| | | | $ 2,956,435 |
| Insured - Education — 1.2% |
| Northern Illinois University, IL, (BAM), 5.00%, 4/1/31 | $ | 950 | $ 1,010,135 |
| Virginia College Building Authority, (Washington and Lee University), (NPFG), 5.25%, 1/1/31 | | 1,750 | 1,917,020 |
| | | | $ 2,927,155 |
| Insured - Electric Utilities — 0.9% |
| Ohio Municipal Electric Generation Agency, (NPFG), 0.00%, 2/15/29 | $ | 2,865 | $ 2,214,330 |
| | | | $ 2,214,330 |
| Insured - General Obligations — 3.2% |
| Atlantic City, NJ, (AGM), 4.00%, 3/1/42 | $ | 145 | $ 130,503 |
| Chicago Board of Education, IL, (AGM), 5.00%, 12/1/24 | | 505 | 516,797 |
| McCook, IL: | | | |
| (AGM), 4.00%, 12/1/29 | | 240 | 246,189 |
| (AGM), 4.00%, 12/1/30 | | 200 | 204,198 |
| (AGM), 4.00%, 12/1/33 | | 500 | 502,385 |
| (AGM), 4.00%, 12/1/34 | | 190 | 188,961 |
| Proviso Township High School District No. 209, IL, (AGM), 4.00%, 12/1/38 | | 1,500 | 1,425,435 |
| Wyandotte County Unified School District No. 203, KS: | | | |
| (AGM), 5.00%, 9/1/38 | | 1,000 | 1,081,390 |
| (AGM), 5.00%, 9/1/40 | | 1,000 | 1,076,260 |
| (AGM), 5.00%, 9/1/42 | | 1,080 | 1,156,691 |
| (AGM), 5.00%, 9/1/44 | | 1,065 | 1,135,247 |
| | | | $ 7,664,056 |
| Insured - Lease Revenue/Certificates of Participation — 3.0% |
| Anaheim Public Financing Authority, CA, (Anaheim Public Improvements), (AGM), 0.00%, 9/1/31 | $ | 8,680 | $ 6,060,810 |
| Hudson Yards Infrastructure Corp., NY, (AGM), 4.00%, 2/15/47 | | 1,155 | 1,024,612 |
| | | | $ 7,085,422 |
| Insured - Other Revenue — 2.3% |
| Harris County-Houston Sports Authority, TX, (AGM), (NPFG), 0.00%, 11/15/34 | $ | 10,600 | $ 5,610,686 |
| | | | $ 5,610,686 |
12
See Notes to Financial Statements.
Eaton Vance
AMT-Free Municipal Income Fund
September 30, 2022
Portfolio of Investments — continued
| Security | Principal
Amount
(000's omitted) | Value |
| Insured - Special Tax Revenue — 4.4% |
| Massachusetts, Dedicated Tax Revenue: | | | |
| (NPFG), 5.50%, 1/1/27 | $ | 6,000 | $ 6,457,920 |
| (NPFG), 5.50%, 1/1/30 | | 2,565 | 2,875,006 |
| Successor Agency to San Francisco City and County Redevelopment Agency, CA, (NPFG), 5.00%, 8/1/43 | | 1,100 | 1,134,562 |
| | | | $ 10,467,488 |
| Insured - Transportation — 8.4% |
| Chicago, IL, (O'Hare International Airport): | | | |
| (AGM), 5.00%, 1/1/28 | $ | 1,000 | $ 1,003,590 |
| (AGM), 5.125%, 1/1/31 | | 1,000 | 1,003,060 |
| (AGM), 5.25%, 1/1/32 | | 785 | 787,371 |
| E-470 Public Highway Authority, CO, (NPFG), 0.00%, 9/1/39 | | 7,120 | 2,981,500 |
| Metropolitan Transportation Authority, NY: | | | |
| Green Bonds, (AGM), 4.00%, 11/15/46 | | 125 | 111,644 |
| Green Bonds, (AGM), 5.00%, 11/15/44 | | 1,675 | 1,719,471 |
| Pennsylvania Turnpike Commission, (AGM), 6.375%, 12/1/38 | | 11,000 | 12,376,980 |
| | | | $ 19,983,616 |
| Insured - Water and Sewer — 0.9% |
| Michigan Finance Authority, (Detroit Water and Sewerage Department): | | | |
| (AGM), 5.00%, 7/1/32 | $ | 655 | $ 668,107 |
| (AGM), 5.00%, 7/1/33 | | 565 | 575,735 |
| (AGM), 5.00%, 7/1/35 | | 280 | 284,847 |
| (AGM), 5.00%, 7/1/37 | | 565 | 574,209 |
| | | | $ 2,102,898 |
| Lease Revenue/Certificates of Participation — 1.3% |
| New Jersey Economic Development Authority, (School Facilities Construction), 5.00%, 6/15/37 | $ | 3,000 | $ 3,017,190 |
| | | | $ 3,017,190 |
| Other Revenue — 1.6% |
| Buckeye Tobacco Settlement Financing Authority, OH, 5.00%, 6/1/55 | $ | 1,125 | $ 946,384 |
| Central Falls Detention Facility Corp., RI, 7.25%, 7/15/35(2) | | 1,200 | 216,000 |
| Loudoun County Economic Development Authority, VA, (Howard Hughes Medical Institute), 4.00%, 10/1/52 | | 2,000 | 1,816,760 |
| Mercer County Improvement Authority, NJ, 4.00%, 3/15/40 | | 935 | 854,730 |
| | | | $ 3,833,874 |
| Security | Principal
Amount
(000's omitted) | Value |
| Senior Living/Life Care — 4.5% |
| California Public Finance Authority, (Enso Village), Green Bonds, 2.375%, 11/15/28(3) | $ | 140 | $ 121,852 |
| Manhattan, KS, (Meadowlark Hills), 4.00%, 6/1/46 | | 1,150 | 849,563 |
| National Finance Authority, NH, (The Vista): | | | |
| 5.25%, 7/1/39(3) | | 265 | 226,408 |
| 5.625%, 7/1/46(3) | | 360 | 308,959 |
| 5.75%, 7/1/54(3) | | 775 | 658,122 |
| New Hope Cultural Education Facilities Finance Corp., TX, (The Outlook at Windhaven), 6.75%, 10/1/52 | | 1,000 | 934,560 |
| North Carolina Medical Care Commission, (EveryAge), 4.00%, 9/1/41 | | 840 | 696,461 |
| Pompano Beach, FL, (John Knox Village), 4.00%, 9/1/41 | | 1,270 | 1,041,235 |
| Saint Louis County Industrial Development Authority, MO, (St. Andrew's Resources for Seniors Obligated Group), 5.00%, 12/1/35 | | 1,700 | 1,641,061 |
| Washington Housing Finance Commission, (Horizon House): | | | |
| 5.00%, 1/1/32(3) | | 1,575 | 1,597,333 |
| 5.00%, 1/1/38(3) | | 2,325 | 2,337,578 |
| Washington Housing Finance Commission, (Transforming Age), 5.00%, 1/1/34(3) | | 245 | 220,691 |
| | | | $ 10,633,823 |
| Special Tax Revenue — 8.6% |
| District of Columbia, Income Tax Revenue, 5.50%, 7/1/47 | $ | 1,500 | $ 1,649,790 |
| Jurupa Public Financing Authority, CA, 5.00%, 9/1/31 | | 1,200 | 1,231,932 |
| Maryland Economic Development Corp., (Port Covington), 4.00%, 9/1/40 | | 115 | 96,991 |
| Metropolitan Pier and Exposition Authority, IL, (McCormick Place Expansion), 4.00%, 6/15/50 | | 5,000 | 3,844,400 |
| Miami-Dade County, FL, Transit Sales Surtax Revenue, 5.00%, 7/1/49 | | 5,000 | 5,195,750 |
| New York City Transitional Finance Authority, NY, Future Tax Revenue: | | | |
| 4.00%, 5/1/39 | | 1,000 | 941,440 |
| 4.00%, 5/1/45 | | 1,415 | 1,281,410 |
| 5.00%, 5/1/42 | | 4,400 | 4,495,480 |
| New York Dormitory Authority, Personal Income Tax Revenue, 4.00%, 3/15/45 | | 1,000 | 898,190 |
| Washington Convention and Sports Authority, D.C., Dedicated Tax Revenue, 4.00%, 10/1/38 | | 1,000 | 913,030 |
| | | | $ 20,548,413 |
| Transportation — 10.4% |
| Central Texas Regional Mobility Authority, 5.00%, 1/1/45 | $ | 1,550 | $ 1,558,138 |
13
See Notes to Financial Statements.
Eaton Vance
AMT-Free Municipal Income Fund
September 30, 2022
Portfolio of Investments — continued
| Security | Principal
Amount
(000's omitted) | Value |
| Transportation (continued) |
| Dallas and Fort Worth, TX, (Dallas/Fort Worth International Airport): | | | |
| 5.25%, 11/1/30 | $ | 1,100 | $ 1,118,777 |
| 5.25%, 11/1/31 | | 1,455 | 1,478,760 |
| Denver City and County, CO, Airport System Revenue, 5.00%, 11/15/47 | | 2,500 | 2,582,625 |
| Georgia Ports Authority, 4.00%, 7/1/47 | | 2,625 | 2,341,185 |
| Grand Parkway Transportation Corp., TX, 5.125%, 10/1/43 | | 1,100 | 1,096,172 |
| Miami-Dade County, FL, Aviation Revenue, 5.00%, 10/1/33 | | 2,650 | 2,698,204 |
| New Jersey Transportation Trust Fund Authority, (Transportation Program), 5.00%, 6/15/50 | | 2,500 | 2,475,225 |
| New Jersey Transportation Trust Fund Authority, (Transportation System): | | | |
| 0.00%, 12/15/25 | | 1,000 | 875,360 |
| 4.00%, 6/15/36 | | 1,665 | 1,500,631 |
| New Orleans Aviation Board, LA, 5.00%, 1/1/43 | | 1,555 | 1,567,735 |
| New York Transportation Development Corp., (Terminal 4 John F. Kennedy International Airport): | | | |
| 4.00%, 12/1/41 | | 500 | 418,380 |
| 4.00%, 12/1/42 | | 2,400 | 1,974,912 |
| South Jersey Transportation Authority, NJ, 4.625%, 11/1/47 | | 1,500 | 1,426,800 |
| Texas Private Activity Bond Surface Transportation Corp., (North Tarrant Express Managed Lanes Project): | | | |
| 4.00%, 12/31/37 | | 275 | 239,742 |
| 4.00%, 12/31/38 | | 510 | 440,033 |
| 4.00%, 12/31/39 | | 265 | 226,493 |
| 5.00%, 12/31/35 | | 355 | 354,627 |
| Texas Transportation Commission, 0.00%, 8/1/40 | | 1,000 | 366,120 |
| | | | $ 24,739,919 |
| Water and Sewer — 4.9% |
| Atlanta, GA, Water and Wastewater Revenue, 5.00%, 11/1/35(1) | $ | 6,990 | $ 7,388,080 |
| Security | Principal
Amount
(000's omitted) | Value |
| Water and Sewer (continued) |
| New York City Municipal Water Finance Authority, NY, (Water and Sewer System), 4.00%, 6/15/41 | $ | 4,500 | $ 4,187,790 |
| | | | $ 11,575,870 |
Total Tax-Exempt Municipal Obligations
(identified cost $249,415,163) | | | $ 241,429,632 |
Total Investments — 101.7%
(identified cost $250,616,641) | | | $ 242,337,691 |
| Other Assets, Less Liabilities — (1.7)% | | | $ (4,031,459) |
| Net Assets — 100.0% | | | $ 238,306,232 |
| The percentage shown for each investment category in the Portfolio of Investments is based on net assets. |
| (1) | Security represents the municipal bond held by a trust that issues residual interest bonds (see Note 1H). |
| (2) | Defaulted security. Issuer has defaulted on the payment of interest and/or principal or has filed for bankruptcy. |
| (3) | Security exempt from registration under Rule 144A of the Securities Act of 1933, as amended. These securities may be sold in certain transactions in reliance on an exemption from registration (normally to qualified institutional buyers). At September 30, 2022, the aggregate value of these securities is $5,470,943 or 2.3% of the Fund's net assets. |
| At September 30, 2022, the concentration of the Fund’s investments in the various states, determined as a percentage of net assets, is as follows: |
| Texas | 11.6% |
| California | 11.3% |
| New York | 10.8% |
| Illinois | 10.5% |
| Others, representing less than 10% individually | 57.5% |
| The Fund invests primarily in debt securities issued by municipalities. The ability of the issuers of the debt securities to meet their obligations may be affected by economic developments in a specific industry or municipality. At September 30, 2022, 24.0% of total investments are backed by bond insurance of various financial institutions and financial guaranty assurance agencies. The aggregate percentage insured by an individual financial institution or financial guaranty assurance agency ranged from 0.4% to 16.3% of total investments. |
| Abbreviations: |
| AGM | – Assured Guaranty Municipal Corp. |
| BAM | – Build America Mutual Assurance Co. |
| NPFG | – National Public Finance Guarantee Corp. |
| PSF | – Permanent School Fund |
14
See Notes to Financial Statements.
Eaton Vance
National Municipal Income Fund
September 30, 2022
| Security | Principal
Amount
(000's omitted) | Value |
| Education — 0.8% |
| Chapman University: | | | |
| 1.56%, 4/1/27 | $ | 4,995 | $ 4,241,959 |
| 1.867%, 4/1/29 | | 5,160 | 4,219,544 |
| Grand Canyon University, 4.125%, 10/1/24 | | 20,000 | 18,466,600 |
| | | | $ 26,928,103 |
| Other — 0.1% |
| YMCA of Greater New York, 2.303%, 8/1/26 | $ | 2,590 | $ 2,283,965 |
| | | | $ 2,283,965 |
Total Corporate Bonds
(identified cost $32,745,001) | | | $ 29,212,068 |
| Tax-Exempt Municipal Obligations — 95.6% |
| Security | Principal
Amount
(000's omitted) | Value |
| Bond Bank — 0.4% |
| Rickenbacker Port Authority, OH, (OASBO Expanded Asset Pooled Financing Program), 5.375%, 1/1/32 | $ | 10,435 | $ 11,313,314 |
| | | | $ 11,313,314 |
| Cogeneration — 0.1% |
| Northampton County Industrial Development Authority, PA, (Northampton Generating), (AMT), 5.00%, 12/31/23(1) | $ | 14,652 | $ 2,637,417 |
| | | | $ 2,637,417 |
| Education — 8.4% |
| Arizona Industrial Development Authority, (Somerset Academy of Las Vegas), 4.00%, 12/15/41(2) | $ | 600 | $ 478,848 |
| Connecticut Health and Educational Facilities Authority, (Yale University), 2.60%, 7/1/36(3) | | 8,000 | 8,000,000 |
| Florida Development Finance Corp., (River City Science Academy), 4.00%, 7/1/45 | | 365 | 283,652 |
| Florida Higher Educational Facilities Financing Authority, (Jacksonville University), 4.75%, 6/1/38(2) | | 2,245 | 2,045,397 |
| Maryland Health and Higher Educational Facilities Authority, (Stevenson University): | | | |
| 4.00%, 6/1/36 | | 350 | 314,041 |
| 4.00%, 6/1/40 | | 400 | 345,492 |
| Maryland Stadium Authority, Built to Learn Revenue, 4.00%, 6/1/52 | | 6,830 | 5,702,845 |
| Security | Principal
Amount
(000's omitted) | Value |
| Education (continued) |
| Massachusetts Development Finance Agency, (Harvard University), 5.00%, 7/15/34 | $ | 18,855 | $ 19,958,772 |
| Massachusetts Development Finance Agency, (Northeastern University), 5.00%, 10/1/44 | | 2,500 | 2,581,475 |
| Miami University, OH, 4.00%, 9/1/45 | | 4,030 | 3,629,458 |
| Michigan State University, 4.00%, 2/15/44 | | 5,000 | 4,569,050 |
| New York Dormitory Authority, (Columbia University), 5.00%, 10/1/38 | | 18,310 | 19,561,305 |
| New York Dormitory Authority, (Rockefeller University), 5.00%, 7/1/53 | | 13,750 | 14,227,125 |
| Oregon Health and Science University, Green Bonds, 4.00%, 7/1/51 | | 5,000 | 4,341,100 |
| Pennsylvania State University, 5.00%, 9/1/47 | | 4,240 | 4,426,009 |
| San Antonio Education Facilities Corp., TX, (University of the Incarnate Word), 4.00%, 4/1/46 | | 3,500 | 2,775,465 |
| Swarthmore Borough Authority, PA, (Swarthmore College), 4.00%, 9/15/43 | | 3,000 | 2,712,510 |
| Troy Capital Resource Corp., NY, (Rensselaer Polytechnic Institute), 5.00%, 9/1/38 | | 5,000 | 5,148,950 |
| University of California: | | | |
| 5.00%, 5/15/52 | | 23,110 | 24,253,252 |
| 5.25%, 5/15/36 | | 5,720 | 5,876,957 |
| 5.25%, 5/15/37 | | 13,000 | 13,344,370 |
| 5.25%, 5/15/38 | | 7,700 | 7,897,890 |
| University of California Medical Center, 5.00%, 5/15/47 | | 16,500 | 17,154,060 |
| University of Texas: | | | |
| 4.00%, 7/1/42(4) | | 4,900 | 4,580,765 |
| 5.00%, 8/15/25 | | 3,750 | 3,929,888 |
| 5.00%, 7/1/41 | | 20,000 | 20,149,400 |
| University of Virginia: | | | |
| 5.00%, 4/1/38 | | 13,205 | 13,967,193 |
| 5.00%, 4/1/39 | | 40,970 | 43,285,624 |
| Utah Board of Higher Education, (Dixie State University), 4.00%, 6/1/44 | | 7,645 | 6,890,974 |
| | | | $ 262,431,867 |
| Electric Utilities — 6.9% |
| Douglas County Public Utility District No. 1, WA, 3.00%, 9/1/52 | $ | 16,020 | $ 10,854,351 |
| Intermountain Power Agency, UT, Power Supply Revenue, 5.00%, 7/1/42 | | 15,000 | 15,847,650 |
| Los Angeles Department of Water and Power, CA, Power System Revenue: | | | |
| 5.00%, 7/1/51 | | 29,000 | 30,346,760 |
| 5.00%, 7/1/51 | | 12,500 | 13,080,500 |
| New York Power Authority, 4.00%, 11/15/45 | | 5,825 | 5,240,228 |
15
See Notes to Financial Statements.
Eaton Vance
National Municipal Income Fund
September 30, 2022
Portfolio of Investments — continued
| Security | Principal
Amount
(000's omitted) | Value |
| Electric Utilities (continued) |
| Omaha Public Power District, NE: | | | |
| 5.00%, 2/1/39 | $ | 10,805 | $ 11,126,341 |
| 5.00%, 2/1/47(4)(5) | | 20,000 | 21,163,800 |
| 5.25%, 2/1/52(4) | | 22,500 | 24,155,325 |
| Philadelphia, PA, Gas Works Revenue, (LOC: TD Bank, N.A.), 2.50%, 8/1/31(6) | | 3,600 | 3,600,000 |
| Public Power Generation Agency, NE, (Whelan Energy Center Unit 2), 5.00%, 1/1/28 | | 6,025 | 6,213,884 |
| Utility Debt Securitization Authority, NY: | | | |
| 5.00%, 12/15/30(5) | | 22,500 | 22,930,875 |
| 5.00%, 12/15/31(5) | | 27,500 | 28,026,625 |
| 5.00%, 12/15/33 | | 10,000 | 10,413,400 |
| 5.00%, 12/15/40 | | 13,260 | 14,037,168 |
| | | | $ 217,036,907 |
| Escrowed/Prerefunded — 2.4% |
| Charleston County Airport District, SC, (AMT), Prerefunded to 7/1/23, 5.50%, 7/1/38 | $ | 10,000 | $ 10,153,500 |
| New Jersey Turnpike Authority, Prerefunded to 7/1/24, 5.00%, 1/1/31 | | 10,000 | 10,312,700 |
| New York Dormitory Authority, Sales Tax Revenue, (AMT), Escrowed to Maturity, 5.00%, 3/15/27 | | 1,620 | 1,730,468 |
| Oxnard Union High School District, CA, (Election of 2018), Prerefunded to 8/1/26, 5.00%, 8/1/43 | | 3,750 | 3,999,637 |
| Rutgers State University, NJ, Prerefunded to 5/1/23, 5.00%, 5/1/43(5) | | 37,000 | 37,408,480 |
| Southwestern Illinois Development Authority, (Memorial Group, Inc.), Prerefunded to 11/1/23, 7.25%, 11/1/33 | | 9,170 | 9,542,577 |
| University of California, Prerefunded to 5/15/24, 5.25%, 5/15/36 | | 1,360 | 1,406,009 |
| | | | $ 74,553,371 |
| General Obligations — 20.9% |
| Andover, MA, 4.00%, 7/15/52 | $ | 12,250 | $ 10,918,792 |
| Bergen County Improvement Authority, NJ, (Bergen New Bridge Medical Center), 5.00%, 8/1/47 | | 5,000 | 5,316,000 |
| California: | | | |
| 5.00%, 9/1/52 | | 14,750 | 15,656,240 |
| 5.25%, 9/1/47 | | 11,500 | 12,521,430 |
| Prerefunded to 12/1/22, 2.89%, (SIFMA + 0.43%), 12/1/29(7) | | 15,000 | 14,983,950 |
| Centennial School District No. 28Jt, OR, 5.00%, 6/15/50 | | 10,000 | 10,476,400 |
| Chicago Board of Education, IL: | | | |
| 5.00%, 12/1/42 | | 7,770 | 7,245,836 |
| 5.00%, 12/1/44 | | 15,110 | 14,694,626 |
| Security | Principal
Amount
(000's omitted) | Value |
| General Obligations (continued) |
| Chicago, IL: | | | |
| 5.00%, 1/1/39 | $ | 2,100 | $ 2,051,217 |
| 5.00%, 1/1/40 | | 1,500 | 1,458,360 |
| Clackamas Community College District, OR: | | | |
| 5.00%, 6/15/38 | | 760 | 792,513 |
| 5.00%, 6/15/39 | | 1,000 | 1,041,470 |
| 5.00%, 6/15/40 | | 1,250 | 1,300,213 |
| Clark County, NV, 5.00%, 5/1/48 | | 19,650 | 20,283,712 |
| Community Independent School District, TX, (PSF Guaranteed), 5.00%, 2/15/54 | | 10,000 | 10,363,200 |
| Connecticut: | | | |
| 4.00%, 1/15/37 | | 10,000 | 9,349,600 |
| Social Bonds, 4.00%, 1/15/36 | | 10,000 | 9,397,800 |
| Conroe Independent School District, TX, (PSF Guaranteed), 4.00%, 2/15/47 | | 5,265 | 4,857,647 |
| Cypress-Fairbanks Independent School District, TX, (PSF Guaranteed), 4.50%, 2/15/47(4) | | 5,000 | 4,950,650 |
| Dallas Independent School District, TX, (PSF Guaranteed), 5.00%, 2/15/26 | | 2,750 | 2,903,835 |
| Denver City and County School District No. 1, CO, 5.00%, 12/1/45 | | 43,985 | 46,890,649 |
| Fort Bend Independent School District, TX, (PSF Guaranteed), 3.00% to 8/1/23 (Put Date), 8/1/52 | | 15,000 | 14,928,750 |
| Fort Worth Independent School District, TX, (PSF Guaranteed), 5.00%, 2/15/47 | | 7,000 | 7,267,050 |
| Galveston Independent School District, TX, (PSF Guaranteed), 4.00%, 2/1/47 | | 10,000 | 9,022,500 |
| Hawaii, 5.00%, 1/1/34 | | 13,700 | 14,517,890 |
| Hermiston School District No. 8R, OR: | | | |
| 0.00%, 6/15/42 | | 6,475 | 2,410,772 |
| 0.00%, 6/15/45 | | 4,595 | 1,442,049 |
| Houston Independent School District, TX, (PSF Guaranteed), 3.50% to 6/1/25 (Put Date), 6/1/39 | | 14,300 | 14,224,925 |
| Illinois: | | | |
| 5.00%, 2/1/24 | | 10,705 | 10,851,658 |
| 5.00%, 11/1/24 | | 11,295 | 11,483,852 |
| 5.00%, 2/1/27 | | 18,500 | 18,728,105 |
| 5.00%, 2/1/29 | | 15,000 | 15,248,400 |
| 5.00%, 5/1/39 | | 10,000 | 9,779,200 |
| 5.25%, 7/1/30 | | 6,150 | 6,183,764 |
| 5.50%, 5/1/39 | | 870 | 886,130 |
| 5.50%, 3/1/42 | | 11,700 | 11,849,175 |
| 5.75%, 5/1/45 | | 890 | 909,945 |
| Jackson County Consolidated School District No. 4, MO: | | | |
| 5.00%, 3/1/37 | | 3,575 | 3,709,206 |
| 5.00%, 3/1/38 | | 3,675 | 3,807,521 |
16
See Notes to Financial Statements.
Eaton Vance
National Municipal Income Fund
September 30, 2022
Portfolio of Investments — continued
| Security | Principal
Amount
(000's omitted) | Value |
| General Obligations (continued) |
Jackson County Consolidated School District No. 4, MO:
(continued) | | | |
| 5.00%, 3/1/39 | $ | 2,000 | $ 2,069,800 |
| Kane, Cook and DuPage Counties School District No. 46, IL: | | | |
| 5.00%, 1/1/29 | | 1,920 | 1,957,133 |
| 5.00%, 1/1/30 | | 4,105 | 4,182,379 |
| Massachusetts: | | | |
| 3.00%, 2/1/48 | | 15,000 | 10,774,500 |
| 3.00%, 4/1/49 | | 10,000 | 7,098,700 |
| 4.00%, 12/1/44 | | 7,850 | 7,182,593 |
| 5.00%, 7/1/35 | | 10,000 | 10,309,800 |
| New York, NY: | | | |
| 4.00%, 8/1/38 | | 11,520 | 10,826,726 |
| 4.00%, 9/1/46 | | 10,000 | 8,963,800 |
| 5.00%, 8/1/47 | | 22,350 | 23,192,595 |
| 5.25%, 9/1/42 | | 5,000 | 5,380,000 |
| 5.25%, 9/1/43 | | 5,000 | 5,366,250 |
| Norwalk, CT, 4.00%, 8/15/47 | | 10,000 | 9,073,400 |
| Norwood, MA, 4.00%, 9/15/47 | | 11,065 | 9,797,504 |
| Pasadena Independent School District, TX, (PSF Guaranteed), 4.00%, 2/15/52 | | 10,000 | 8,894,100 |
| Prosper Independent School District, TX, (PSF Guaranteed), 4.00%, 2/15/47 | | 8,250 | 7,417,327 |
| Puerto Rico: | | | |
| 0.00%, 7/1/24 | | 503 | 462,967 |
| 0.00%, 7/1/33 | | 1,938 | 1,071,396 |
| 4.00%, 7/1/33 | | 1,506 | 1,327,480 |
| 4.00%, 7/1/35 | | 1,353 | 1,160,285 |
| 4.00%, 7/1/37 | | 1,162 | 956,208 |
| 5.25%, 7/1/23 | | 841 | 844,746 |
| 5.625%, 7/1/29 | | 12,397 | 12,700,264 |
| 5.75%, 7/1/31 | | 1,588 | 1,622,145 |
| Rice County, MN, 4.00%, 2/1/52 | | 7,170 | 6,330,034 |
| San Antonio Independent School District, TX, (PSF Guaranteed), 5.00%, 8/15/52 | | 3,500 | 3,714,235 |
| San Juan Unified School District, CA, (Election of 2016): | | | |
| 5.00%, 8/1/40 | | 3,315 | 3,550,133 |
| 5.00%, 8/1/42 | | 6,600 | 7,039,626 |
| Seattle, WA: | | | |
| 4.00%, 9/1/26 | | 9,640 | 9,942,600 |
| 4.00%, 9/1/27 | | 10,020 | 10,402,564 |
| Temple Independent School District, TX, (PSF Guaranteed), 4.25%, 2/1/47 | | 13,000 | 12,211,420 |
| Security | Principal
Amount
(000's omitted) | Value |
| General Obligations (continued) |
| Texas: | | | |
| 5.00%, 8/1/39 | $ | 3,000 | $ 3,096,150 |
| 5.00%, 8/1/40 | | 4,000 | 4,113,080 |
| 5.00%, 8/1/41 | | 5,000 | 5,129,250 |
| Texas, (Texas Transportation Commission), Prerefunded to 10/1/24, 5.00%, 10/1/44 | | 10,000 | 10,355,200 |
| Waco Independent School District, TX, (PSF Guaranteed), 4.125%, 8/15/47 | | 6,000 | 5,518,860 |
| Washington: | | | |
| 5.00%, 2/1/33 | | 13,140 | 13,388,215 |
| 5.00%, 8/1/35 | | 14,355 | 15,176,824 |
| 5.00%, 8/1/40 | | 5,000 | 5,293,600 |
| Westwood, MA, 4.00%, 8/15/52 | | 10,000 | 8,912,400 |
| Ysleta Independent School District, TX, (PSF Guaranteed): | | | |
| 4.25%, 8/15/56 | | 6,000 | 5,568,660 |
| 5.00%, 8/15/56(5) | | 5,000 | 5,206,950 |
| | | | $ 652,286,931 |
| Hospital — 10.1% |
| Arlington County Industrial Development Authority, VA, (Virginia Hospital Center), 4.00%, 7/1/38 | $ | 1,000 | $ 907,440 |
| Brevard County Health Facilities Authority, FL, (Health First Obligated Group), 5.00%, 4/1/52 | | 20,000 | 19,715,200 |
| Bucks County Industrial Development Authority, PA, (Grand View Hospital), 4.00%, 7/1/51 | | 4,000 | 2,755,080 |
| California Health Facilities Financing Authority, (Cedars-Sinai Health System): | | | |
| 4.00%, 8/15/48 | | 24,255 | 21,432,203 |
| 5.00%, 8/15/51 | | 22,615 | 23,391,599 |
| California Health Facilities Financing Authority, (St. Joseph Health System): | | | |
| Prerefunded to 7/1/23, 5.00%, 7/1/33 | | 17,530 | 17,766,480 |
| Prerefunded to 7/1/23, 5.00%, 7/1/37 | | 25,465 | 25,808,523 |
| Colorado Health Facilities Authority, (AdventHealth Obligated Group), 4.00%, 11/15/43 | | 7,525 | 6,705,377 |
| Colorado Health Facilities Authority, (Intermountain Healthcare), 4.00%, 5/15/52 | | 4,000 | 3,471,560 |
| Connecticut Health and Educational Facilities Authority, (Nuvance Health), 4.00%, 7/1/41 | | 2,885 | 2,337,542 |
| Decatur Hospital Authority, TX, (Wise Health System), 4.00%, 9/1/35 | | 845 | 710,096 |
| Escambia County Health Facilities Authority, FL, (Baptist Health Care Corp. Obligated Group), 4.00%, 8/15/45 | | 4,305 | 3,437,543 |
| Geisinger Authority, PA, (Geisinger Health System), 4.00%, 2/15/47 | | 8,000 | 6,873,600 |
| Hamilton County, OH, (UC Health), 5.00%, 9/15/50 | | 8,000 | 7,792,480 |
17
See Notes to Financial Statements.
Eaton Vance
National Municipal Income Fund
September 30, 2022
Portfolio of Investments — continued
| Security | Principal
Amount
(000's omitted) | Value |
| Hospital (continued) |
| Illinois Finance Authority, (Presence Health Network): | | | |
| 5.00%, 2/15/26 | $ | 7,500 | $ 7,858,575 |
| 5.00%, 2/15/33 | | 1,500 | 1,545,540 |
| Lancaster County Hospital Authority, PA, (Penn State Health), 5.00%, 11/1/46 | | 10,500 | 10,449,810 |
| Massachusetts Development Finance Agency, (Partners HealthCare System), 5.00%, 7/1/47 | | 13,000 | 13,000,130 |
| Michigan Finance Authority, (Henry Ford Health System), 4.00%, 11/15/50 | | 7,500 | 6,400,200 |
| Michigan Finance Authority, (Trinity Health Credit Group), 4.00%, 12/1/45 | | 10,000 | 8,810,400 |
| Minneapolis, MN, (Allina Health System), 4.00%, 11/15/39 | | 6,405 | 5,862,176 |
| Missouri Health and Educational Facilities Authority, (BJC Health System), 4.00% to 1/1/46 (Put Date), 1/1/50 | | 4,000 | 3,469,720 |
| Missouri Health and Educational Facilities Authority, (SSM Health Care), Prerefunded to 6/1/24, 5.00%, 6/1/30 | | 7,505 | 7,716,866 |
| New York Dormitory Authority, (Northwell Health Obligated Group), 5.00%, 5/1/52 | | 20,000 | 19,804,600 |
| New York Dormitory Authority, (NYU Langone Hospitals Obligated Group), 4.00%, 7/1/50 | | 7,000 | 5,930,750 |
| Oregon Facilities Authority, (Samaritan Health Services), 5.00%, 10/1/35 | | 2,260 | 2,275,865 |
| Public Finance Authority, WI, (Cone Health), 5.00%, 10/1/52 | | 5,000 | 5,006,300 |
| Salem Hospital Facility Authority, OR, (Salem Health Projects), 5.00%, 5/15/46 | | 5,000 | 4,922,000 |
| South Broward Hospital District, FL, 3.00%, 5/1/51 | | 1,420 | 956,810 |
| Southcentral Pennsylvania General Authority, (WellSpan Health Obligated Group), 4.00%, 6/1/49 | | 5,000 | 4,293,300 |
| University of Kansas Hospital Authority, 5.00%, 9/1/45 | | 25,500 | 25,572,675 |
| Washington Health Care Facilities Authority, (Seattle Cancer Care Alliance), 5.00%, 9/1/55 | | 3,340 | 3,274,402 |
| West Virginia Hospital Finance Authority, (West Virginia United Health System Obligated Group), Prerefunded to 6/1/23, 5.375%, 6/1/38 | | 21,895 | 22,214,229 |
| Wisconsin Health and Educational Facilities Authority, (Ascension Health Alliance Senior Credit Group), 4.00%, 11/15/43 | | 4,625 | 4,108,388 |
| Wisconsin Health and Educational Facilities Authority, (Ascension Senior Credit Group): | | | |
| 4.00%, 11/15/39 | | 5,000 | 4,615,750 |
| 4.00%, 11/15/46 | | 5,000 | 4,357,700 |
| | | | $ 315,550,909 |
| Security | Principal
Amount
(000's omitted) | Value |
| Housing — 1.2% |
| California Community Housing Agency, (Summit at Sausalito Apartments), 3.00%, 2/1/57(2) | $ | 2,335 | $ 1,456,036 |
| CMFA Special Finance Agency, CA, (Solana at Grand), 4.00%, 8/1/56(2) | | 5,525 | 4,321,379 |
| CSCDA Community Improvement Authority, CA, (City of Orange Portfolio), Essential Housing Revenue, Social Bonds, 3.00%, 3/1/57(2) | | 14,005 | 8,775,113 |
| CSCDA Community Improvement Authority, CA, (Pasadena Portfolio), Essential Housing Revenue, Social Bonds, 3.00%, 12/1/56(2) | | 6,810 | 4,273,343 |
| Maryland Economic Development Corp., (Morgan State University), Student Housing Revenue, 5.00%, 7/1/56 | | 1,750 | 1,576,820 |
| Massachusetts Housing Finance Agency, (Mill Road Apartments), 3.01%, (SIFMA + 0.55%), 11/1/23 (Put Date), 11/1/48(7) | | 3,920 | 3,920,000 |
| New York City Housing Development Corp., NY, 2.60%, 11/1/46 | | 3,000 | 1,943,730 |
| Texas Student Housing Corp., (University of Northern Texas), 6.85%, 7/1/31 | | 10,640 | 10,427,200 |
| | | | $ 36,693,621 |
| Industrial Development Revenue — 1.4% |
| Arkansas Development Finance Authority, (Big River Steel), (AMT), 4.75%, 9/1/49(2) | $ | 1,000 | $ 845,800 |
| Metropolitan Nashville Airport Authority, TN, (Aero Nashville), 5.20%, 7/1/26 | | 190 | 179,028 |
| New York Transportation Development Corp., (Delta Air Lines, Inc. - LaGuardia Airport Terminals C&D Redevelopment), (AMT), 5.00%, 10/1/40 | | 41,585 | 39,068,276 |
| Vermont Economic Development Authority, (Casella Waste Systems, Inc.), (AMT), 4.625% to 4/3/28 (Put Date), 4/1/36(2) | | 475 | 452,480 |
| Warren County, MS, (International Paper Co.), 1.375% to 6/16/25 (Put Date), 5/1/34 | | 4,000 | 3,724,960 |
| | | | $ 44,270,544 |
| Insured - Bond Bank — 0.7% |
| Indianapolis Local Public Improvement Bond Bank, IN, (AGM), 4.00%, 6/1/39 | $ | 24,130 | $ 21,811,348 |
| | | | $ 21,811,348 |
| Insured - Electric Utilities — 0.1% |
| Brownsville, TX, Utility System Revenue, (BAM), 5.00%, 9/1/51 | $ | 1,220 | $ 1,238,825 |
| West Memphis, AR, Public Utility System Revenue, (BAM), 3.00%, 12/1/41 | | 1,250 | 944,675 |
| | | | $ 2,183,500 |
18
See Notes to Financial Statements.
Eaton Vance
National Municipal Income Fund
September 30, 2022
Portfolio of Investments — continued
| Security | Principal
Amount
(000's omitted) | Value |
| Insured - Escrowed/Prerefunded — 1.2% |
| North Texas Tollway Authority, (AGC), Prerefunded to 1/1/25, 6.20%, 1/1/42 | $ | 37,070 | $ 39,346,839 |
| | | | $ 39,346,839 |
| Insured - General Obligations — 1.7% |
| Cabrillo Unified School District, CA, (Election of 2018), (AGM), 5.00%, 8/1/50 | $ | 10,355 | $ 10,758,742 |
| Clark County School District, NV, (AGM), 4.25%, 6/15/41 | | 5,000 | 4,627,500 |
| Ellis County Unified School District No. 489, KS, (AGM), 5.00%, 9/1/47 | | 11,840 | 12,405,360 |
| Lumberton Municipal Utility District, TX, (AGM), 3.00%, 8/15/52 | | 5,045 | 3,337,368 |
| Nassau County, NY, (AGM), 5.00%, 4/1/44 | | 10,205 | 10,671,879 |
| Wyandotte County Unified School District No. 203, KS, (AGM), 5.25%, 9/1/52 | | 10,165 | 10,950,856 |
| | | | $ 52,751,705 |
| Insured - Lease Revenue/Certificates of Participation — 0.0%(8) |
| Hudson Yards Infrastructure Corp., NY, (AGM), 4.00%, 2/15/47 | $ | 1,530 | $ 1,357,278 |
| | | | $ 1,357,278 |
| Insured - Other Revenue — 1.0% |
| Harris County-Houston Sports Authority, TX, (AGM), (NPFG), 0.00%, 11/15/34 | $ | 58,155 | $ 30,782,023 |
| | | | $ 30,782,023 |
| Insured - Special Tax Revenue — 1.0% |
| Massachusetts, Dedicated Tax Revenue: | | | |
| (NPFG), 5.50%, 1/1/29 | $ | 11,000 | $ 12,179,090 |
| (NPFG), 5.50%, 1/1/30 | | 3,080 | 3,452,249 |
| Metropolitan Pier and Exposition Authority, IL, (McCormick Place), (BAM), 4.00%, 12/15/42 | | 10,440 | 8,685,140 |
| Pittsburgh and Allegheny County Sports & Exhibition Authority, PA, Hotel Room Excise Tax Revenue, (AGM), 5.00%, 2/1/30 | | 7,615 | 8,112,260 |
| | | | $ 32,428,739 |
| Insured - Transportation — 1.3% |
| E-470 Public Highway Authority, CO, (NPFG), 0.00%, 9/1/37 | $ | 13,335 | $ 6,323,990 |
| Kansas City Industrial Development Authority, MO, (Kansas City International Airport Terminal Modernization): | | | |
| (AGM), (AMT), 5.00%, 3/1/49 | | 3,025 | 2,999,348 |
| (AGM), (AMT), 5.00%, 3/1/55 | | 7,785 | 7,645,104 |
| Security | Principal
Amount
(000's omitted) | Value |
| Insured - Transportation (continued) |
| Kansas City Industrial Development Authority, MO, (Kansas City International Airport Terminal Modernization): (continued) | | | |
| (AGM), (AMT), 5.00%, 3/1/57 | $ | 12,775 | $ 12,540,195 |
| Love Field Airport Modernization Corp., TX, (AGM), (AMT), 4.00%, 11/1/37 | | 4,000 | 3,623,160 |
| Metropolitan Transportation Authority, NY: | | | |
| Green Bonds, (AGM), 4.00%, 11/15/46 | | 640 | 571,616 |
| Green Bonds, (AGM), 4.00%, 11/15/48 | | 8,900 | 7,878,636 |
| | | | $ 41,582,049 |
| Insured - Water and Sewer — 0.4% |
| Pittsburg Public Financing Authority, CA, Water Revenue, (AGM), 5.00%, 8/1/52 | $ | 10,000 | $ 10,422,100 |
| West Harris County Regional Water Authority, TX, (BAM), 4.00%, 12/15/39 | | 860 | 790,976 |
| | | | $ 11,213,076 |
| Lease Revenue/Certificates of Participation — 2.0% |
| Colorado, Certificates of Participation, 6.00%, 12/15/38 | $ | 5,355 | $ 6,221,493 |
| Hampton Roads Transportation Accountability Commission, VA, 4.00%, 7/1/57 | | 5,000 | 4,478,150 |
| Minnesota, 5.00%, 3/1/27(4) | | 12,000 | 12,858,720 |
| New Jersey Economic Development Authority, (School Facilities Construction): | | | |
| 5.00%, 6/15/23 | | 4,810 | 4,861,275 |
| 5.00%, 6/15/34 | | 8,460 | 8,562,789 |
| 5.00%, 6/15/35 | | 13,300 | 13,442,975 |
| 5.00%, 6/15/39 | | 2,165 | 2,156,340 |
| Regional Transportation District, CO, Certificates of Participation, 5.00%, 6/1/27 | | 8,815 | 9,339,404 |
| | | | $ 61,921,146 |
| Nursing Home — 0.1% |
| Mississippi Business Finance Corp., (Magnolia Healthcare), 7.99%, 7/1/25 | $ | 3,190 | $ 3,198,709 |
| | | | $ 3,198,709 |
| Other Revenue — 3.1% |
| Battery Park City Authority, NY, (SPA: TD Bank, N.A.), 2.55%, 11/1/38(6) | $ | 10,800 | $ 10,800,000 |
| Buckeye Tobacco Settlement Financing Authority, OH, 5.00%, 6/1/55 | | 35,865 | 30,170,714 |
| Central Falls Detention Facility Corp., RI, 7.25%, 7/15/35(9) | | 250 | 45,000 |
19
See Notes to Financial Statements.
Eaton Vance
National Municipal Income Fund
September 30, 2022
Portfolio of Investments — continued
| Security | Principal
Amount
(000's omitted) | Value |
| Other Revenue (continued) |
| Cleveland-Cuyahoga County Port Authority, OH, (Playhouse Square Foundation), 5.25%, 12/1/38 | $ | 750 | $ 749,130 |
| DuPage County, IL, (The Morton Arboretum), Green Bonds, 3.00%, 5/15/47 | | 5,085 | 3,539,363 |
| Houston, TX, Hotel Occupancy Tax and Special Revenue: | | | |
| 3.00%, 9/1/32 | | 450 | 391,581 |
| 3.00%, 9/1/33 | | 140 | 119,476 |
| 4.00%, 9/1/31 | | 425 | 426,186 |
| Kalispel Tribe of Indians, WA: | | | |
| Series A, 5.25%, 1/1/38(2) | | 1,865 | 1,951,368 |
| Series B, 5.25%, 1/1/38(2) | | 1,000 | 1,046,310 |
| Minnesota Municipal Gas Agency, (Liq: Royal Bank of Canada), 2.983%, (67% of SOFR + 1.00%), 12/1/27 (Put Date), 12/1/52(7) | | 10,000 | 9,339,000 |
| New York City Transitional Finance Authority, NY, (Building Aid), 5.00%, 7/15/43 | | 22,350 | 22,782,249 |
| Texas Municipal Gas Acquisition and Supply Corp. I, Gas Supply Revenue, 6.25%, 12/15/26 | | 13,960 | 14,507,372 |
| | | | $ 95,867,749 |
| Senior Living/Life Care — 1.7% |
| California Public Finance Authority, (Enso Village): | | | |
| Green Bonds, 2.125%, 11/15/27(2) | $ | 1,155 | $ 1,026,010 |
| Green Bonds, 2.375%, 11/15/28(2) | | 970 | 844,259 |
| Green Bonds, 5.00%, 11/15/46(2) | | 540 | 451,748 |
| Clackamas County Hospital Facility Authority, OR, (Rose Villa): | | | |
| 5.25%, 11/15/50 | | 250 | 218,558 |
| 5.375%, 11/15/55 | | 300 | 263,448 |
| Iowa Finance Authority, (Lifespace Communities, Inc.), 5.00%, 5/15/48 | | 9,000 | 7,793,100 |
| Manhattan, KS, (Meadowlark Hills), 4.00%, 6/1/46 | | 1,000 | 738,750 |
| Multnomah County Hospital Facilities Authority, OR, (Terwilliger Plaza), 4.00%, 12/1/36 | | 2,035 | 1,748,126 |
| New Hope Cultural Education Facilities Finance Corp., TX, (Longhorn Village), 5.00%, 1/1/47 | | 8,000 | 7,181,280 |
| Palm Beach County Health Facilities Authority, FL, (Green Cay Life Plan Village), 11.50%, 7/1/27(2) | | 5,550 | 5,370,013 |
| Palm Beach County Health Facilities Authority, FL, (Toby & Leon Cooperman Sinai Residences of Boca Raton), 4.25%, 6/1/56 | | 4,440 | 3,276,276 |
| Public Finance Authority, WI, (Searstone CCRC), 3.00%, 6/1/28(2) | | 17,410 | 15,185,698 |
| Rockville, MD, (Ingleside at King Farm): | | | |
| 5.00%, 11/1/31 | | 1,010 | 967,984 |
| 5.00%, 11/1/32 | | 525 | 499,417 |
| Security | Principal
Amount
(000's omitted) | Value |
| Senior Living/Life Care (continued) |
| St. Johns County Industrial Development Authority, FL, (Vicar's Landing), 4.00%, 12/15/41 | $ | 750 | $ 578,167 |
| Tarrant County Cultural Education Facilities Finance Corp., TX, (MRC Stevenson Oaks): | | | |
| 6.625%, 11/15/41 | | 730 | 683,835 |
| 6.75%, 11/15/51 | | 3,250 | 2,945,052 |
| 6.875%, 11/15/55 | | 200 | 182,734 |
| Wisconsin Health and Educational Facilities Authority, (Saint John's Communities, Inc.): | | | |
| 4.00%, 9/15/41 | | 765 | 632,548 |
| 4.00%, 9/15/45 | | 650 | 513,013 |
| Prerefunded to 9/15/23, 5.00%, 9/15/40 | | 750 | 761,737 |
| | | | $ 51,861,753 |
| Special Tax Revenue — 7.8% |
| District of Columbia, Income Tax Revenue, 5.00%, 7/1/47 | $ | 10,000 | $ 10,521,400 |
| Illinois Sports Facilities Authority, 5.00%, 6/15/30 | | 2,400 | 2,410,080 |
| Kissimmee City, FL, Sales Tax Revenue, 4.00%, 10/1/51 | | 10,180 | 8,812,623 |
| Los Angeles County Metropolitan Transportation Authority, CA, Sales Tax Revenue, 5.00%, 7/1/44 | | 15,060 | 16,035,436 |
| Maryland Economic Development Corp., (Port Covington), 4.00%, 9/1/40 | | 1,285 | 1,083,769 |
| Metropolitan Pier and Exposition Authority, IL, (McCormick Place Expansion), 4.00%, 6/15/50 | | 10,250 | 7,881,020 |
| Miami-Dade County, FL, Transit System Sales Surtax Revenue: | | | |
| 5.00%, 7/1/50 | | 25,000 | 25,962,500 |
| 5.00%, 7/1/51 | | 10,000 | 10,378,500 |
| Michigan Trunk Line Fund, 4.00%, 11/15/46 | | 8,390 | 7,579,274 |
| New River Community Development District, FL, (Capital Improvements): | | | |
| 5.00%, 5/1/13(9) | | 230 | 0 |
| 5.35%, 5/1/38(9) | | 80 | 0 |
| 5.75%, 5/1/38 | | 340 | 342,546 |
| New York City Transitional Finance Authority, NY, Future Tax Revenue: | | | |
| 4.00%, 11/1/38 | | 5,000 | 4,728,800 |
| 4.00%, 5/1/47 | | 5,000 | 4,488,100 |
| 4.00%, 8/1/48 | | 7,000 | 6,252,330 |
| 5.00%, 5/1/42 | | 12,960 | 13,241,232 |
| 2015 Series B, 5.00%, 8/1/39 | | 4,585 | 4,685,687 |
| 2018 Series A, 5.00%, 8/1/39 | | 11,845 | 12,189,097 |
| New York Dormitory Authority, Personal Income Tax Revenue: | | | |
| 4.00%, 3/15/39 | | 10,000 | 9,307,300 |
| 4.00%, 3/15/45 | | 6,000 | 5,389,140 |
20
See Notes to Financial Statements.
Eaton Vance
National Municipal Income Fund
September 30, 2022
Portfolio of Investments — continued
| Security | Principal
Amount
(000's omitted) | Value |
| Special Tax Revenue (continued) |
| New York Dormitory Authority, Personal Income Tax Revenue: (continued) | | | |
| 4.00%, 3/15/46 | $ | 5,000 | $ 4,463,800 |
| New York Dormitory Authority, Sales Tax Revenue: | | | |
| 5.00%, 3/15/36 | | 7,840 | 8,108,912 |
| (AMT), 5.00%, 3/15/28 | | 1,705 | 1,840,479 |
| (AMT), 5.00%, 3/15/29 | | 1,790 | 1,927,991 |
| (AMT), 5.00%, 3/15/31 | | 970 | 1,039,947 |
| (AMT), 5.00%, 3/15/32 | | 2,070 | 2,197,181 |
| New York State Urban Development Corp., 5.00%, 3/15/49(4) | | 25,000 | 25,631,825 |
| New York State Urban Development Corp., Personal Income Tax Revenue, 5.00%, 3/15/35 | | 10,000 | 10,271,600 |
| Puerto Rico Sales Tax Financing Corp.: | | | |
| 4.329%, 7/1/40 | | 7,536 | �� 6,528,211 |
| 5.00%, 7/1/58 | | 18,790 | 16,634,787 |
| Southern Hills Plantation I Community Development District, FL: | | | |
| Series A1, 5.80%, 5/1/35 | | 420 | 377,589 |
| Series A2, 5.80%, 5/1/35 | | 310 | 207,616 |
| Sterling Hill Community Development District, FL, 6.20%, 5/1/35 | | 1,532 | 827,089 |
| Texas Transportation Commission, Prerefunded to 4/1/24, 5.00%, 4/1/33(5) | | 10,000 | 10,263,100 |
| Washington Convention and Sports Authority, D.C., Dedicated Tax Revenue: | | | |
| 4.00%, 10/1/37 | | 1,000 | 926,840 |
| 4.00%, 10/1/39 | | 1,000 | 912,230 |
| | | | $ 243,448,031 |
| Student Loan — 0.1% |
| New Jersey Higher Education Student Assistance Authority, Series 2015-1A, (AMT), 4.00%, 12/1/28 | $ | 2,380 | $ 2,370,337 |
| | | | $ 2,370,337 |
| Transportation — 19.2% |
| Allegheny County Airport Authority, PA, (Pittsburgh International Airport), (AMT), 4.00%, 1/1/39 | $ | 7,000 | $ 6,230,910 |
| Austin, TX, Airport System Revenue: | | | |
| (AMT), 5.00%, 11/15/34 | | 2,000 | 2,044,360 |
| (AMT), 5.00%, 11/15/38 | | 6,175 | 6,227,364 |
| Chicago, IL, (Midway International Airport): | | | |
| 5.00%, 1/1/33 | | 3,830 | 3,876,113 |
| (AMT), 5.00%, 1/1/34 | | 5,250 | 5,262,495 |
| Chicago, IL, (O'Hare International Airport): | | | |
| 5.00%, 1/1/35 | | 15,000 | 15,805,650 |
| Security | Principal
Amount
(000's omitted) | Value |
| Transportation (continued) |
| Chicago, IL, (O'Hare International Airport): (continued) | | | |
| 5.00%, 1/1/36 | $ | 6,000 | $ 6,123,600 |
| (AMT), 4.50%, 1/1/48(4) | | 12,000 | 11,016,000 |
| (AMT), 5.00%, 1/1/23 | | 1,125 | 1,129,230 |
| (AMT), 5.00%, 1/1/33 | | 7,300 | 7,357,743 |
| (AMT), 5.00%, 1/1/39 | | 4,000 | 4,030,600 |
| (AMT), 5.00%, 1/1/48 | | 2,630 | 2,607,619 |
| (AMT), 5.00%, 1/1/53 | | 14,370 | 14,162,066 |
| (AMT), 5.25%, 1/1/53(4) | | 10,500 | 10,580,220 |
| Prerefunded to 1/1/23, (AMT), 5.00%, 1/1/25 | | 16,100 | 16,168,747 |
| Dallas and Fort Worth, TX, (Dallas/Fort Worth International Airport): | | | |
| 5.25%, 11/1/31 | | 10,395 | 10,564,750 |
| (AMT), 5.25%, 11/1/30 | | 11,015 | 11,119,422 |
| Denver City and County, CO, Airport System Revenue: | | | |
| (AMT), 5.00%, 12/1/35 | | 5,000 | 5,063,550 |
| (AMT), 5.00%, 12/1/38 | | 10,000 | 10,080,100 |
| Florida Development Finance Corp., (Brightline Florida Passenger Rail), Green Bonds, (AMT), 7.375%, 1/1/49(2) | | 9,095 | 7,860,718 |
| Georgia Ports Authority: | | | |
| 4.00%, 7/1/40 | | 6,750 | 6,283,845 |
| 4.00%, 7/1/52 | | 8,000 | 7,003,920 |
| Harris County, TX, Toll Road Revenue, 4.00%, 8/15/48 | | 2,500 | 2,215,700 |
| Hawaii, Airports System Revenue: | | | |
| (AMT), 5.00%, 7/1/43 | | 10,000 | 9,996,300 |
| (AMT), 5.00%, 7/1/47 | | 12,500 | 12,501,625 |
| Houston, TX, Airport System Revenue, (AMT), 4.00%, 7/1/35 | | 1,500 | 1,378,800 |
| Kansas City Industrial Development Authority, MO, (Kansas City International Airport Terminal Modernization): | | | |
| (AMT), 4.00%, 3/1/39 | | 3,000 | 2,668,260 |
| (AMT), 5.00%, 3/1/38 | | 13,500 | 13,509,180 |
| (AMT), 5.00%, 3/1/54 | | 4,835 | 4,727,034 |
| Lee County, FL, Airport Revenue, (AMT), 5.00%, 10/1/46 | | 6,775 | 6,777,778 |
| Los Angeles Department of Airports, CA, (Los Angeles International Airport): | | | |
| (AMT), 5.00%, 5/15/46 | | 20,000 | 20,036,400 |
| Green Bonds, (AMT), 5.00%, 5/15/47 | | 17,855 | 17,870,534 |
| Maryland Economic Development Corp., (Transportation Facilities), 5.00%, 6/1/35 | | 1,050 | 1,086,782 |
| Massachusetts Port Authority, (AMT), 4.00%, 7/1/46 | | 7,000 | 5,921,020 |
| Metropolitan Nashville Airport Authority, TN, (AMT), 5.00%, 7/1/49 | | 20,500 | 20,413,695 |
21
See Notes to Financial Statements.
Eaton Vance
National Municipal Income Fund
September 30, 2022
Portfolio of Investments — continued
| Security | Principal
Amount
(000's omitted) | Value |
| Transportation (continued) |
| Metropolitan Transportation Authority, NY, (LOC: TD Bank, N.A.), 2.55%, 11/1/32(6) | $ | 7,000 | $ 7,000,000 |
| Miami-Dade County, FL, Aviation Revenue, (AMT), 5.00%, 10/1/36 | | 9,125 | 9,163,051 |
| New Jersey Economic Development Authority, (Transit Transportation Project), 5.00%, 11/1/44 | | 10,500 | 10,403,085 |
| New Jersey Transportation Trust Fund Authority, (Transportation Program): | | | |
| 5.00%, 6/15/50 | | 20,500 | 20,296,845 |
| 2019 Series BB, 4.00%, 6/15/50 | | 17,575 | 14,533,470 |
| 2020 Series AA, 4.00%, 6/15/50 | | 10,000 | 8,269,400 |
| New Jersey Transportation Trust Fund Authority, (Transportation System), 4.00%, 6/15/36 | | 4,085 | 3,681,729 |
| New Jersey Turnpike Authority, 5.00%, 1/1/31 | | 2,680 | 2,760,212 |
| New York Thruway Authority, 4.00%, 1/1/44 | | 10,000 | 9,040,000 |
| New York Transportation Development Corp., (LaGuardia Airport Terminal B Redevelopment): | | | |
| (AMT), 5.00%, 7/1/46 | | 17,865 | 16,972,822 |
| (AMT), 5.25%, 1/1/50 | | 1,180 | 1,145,556 |
| New York Transportation Development Corp., (Terminal 4 John F. Kennedy International Airport), (AMT), 5.00%, 12/1/29 | | 10,000 | 10,244,200 |
| North Texas Tollway Authority, 5.00%, 1/1/29 | | 5,000 | 5,224,850 |
| Oregon Department of Transportation, 4.00%, 11/15/42 | | 15,030 | 13,813,321 |
| Pennsylvania Turnpike Commission: | | | |
| 4.00%, 12/1/42 | | 4,000 | 3,670,120 |
| 4.00%, 12/1/51 | | 9,000 | 7,857,810 |
| 4.00%, 12/1/53 | | 16,645 | 14,436,541 |
| (LOC: TD Bank, N.A.), 2.55%, 12/1/39(6) | | 17,000 | 17,000,000 |
| Philadelphia, PA, Airport Revenue, (AMT), 5.00%, 7/1/47 | | 4,595 | 4,532,232 |
| Phoenix Civic Improvement Corp., AZ, Airport Revenue, (AMT), 5.00%, 7/1/49 | | 10,000 | 10,000,200 |
| Port Authority of New York and New Jersey: | | | |
| 4.00%, 11/1/39 | | 2,150 | 2,026,633 |
| 5.00%, 9/1/37 | | 6,000 | 6,317,940 |
| Port Freeport, TX, (AMT), 4.00%, 6/1/46 | | 1,000 | 847,230 |
| Port of Portland, OR, (Portland International Airport): | | | |
| (AMT), 5.00%, 7/1/44 | | 8,000 | 7,989,280 |
| (AMT), 5.00%, 7/1/45 | | 12,260 | 12,239,771 |
| Port of Seattle, WA, (AMT), 5.00%, 4/1/44 | | 9,870 | 9,880,956 |
| Salt Lake City, UT, (Salt Lake City International Airport): | | | |
| (AMT), 5.00%, 7/1/42 | | 17,330 | 17,329,133 |
| (AMT), 5.00%, 7/1/43 | | 11,750 | 11,759,400 |
| (AMT), 5.00%, 7/1/46 | | 15,975 | 15,980,272 |
| (AMT), 5.25%, 7/1/48 | | 6,260 | 6,318,218 |
| Security | Principal
Amount
(000's omitted) | Value |
| Transportation (continued) |
| San Diego County Regional Airport Authority, CA, 4.00%, 7/1/51 | $ | 10,750 | $ 9,156,313 |
| San Francisco City and County Airport Commission, CA, (San Francisco International Airport), (AMT), 5.00%, 5/1/49 | | 5,000 | 5,000,250 |
| Texas Private Activity Bond Surface Transportation Corp., (North Tarrant Express Managed Lanes Project): | | | |
| 4.00%, 12/31/37 | | 2,230 | 1,944,092 |
| 4.00%, 12/31/38 | | 5,390 | 4,650,546 |
| 4.00%, 12/31/39 | | 2,140 | 1,829,037 |
| 5.00%, 12/31/35 | | 2,885 | 2,881,971 |
| Virginia Small Business Financing Authority, (95 Express Lanes, LLC), (AMT), 4.00%, 1/1/39 | | 7,000 | 6,145,510 |
| | | | $ 602,044,126 |
| Water and Sewer — 2.4% |
| East Bay Municipal Utility District, CA, Water System Revenue, 5.00%, 6/1/37 | $ | 7,280 | $ 7,552,563 |
| Gilbert Water Resources Municipal Property Corp., AZ, Green Bonds, 4.00%, 7/15/47 | | 3,000 | 2,687,340 |
| Metropolitan Water District of Southern California, 2.60%, (SIFMA + 0.14%), 5/21/24 (Put Date), 7/1/37(7) | | 3,335 | 3,318,325 |
| Michigan Finance Authority, (Detroit Water and Sewerage Department), 5.00%, 7/1/33 | | 13,095 | 13,332,674 |
| New York City Municipal Water Finance Authority, NY, (Water and Sewer System), 5.00%, 6/15/35 | | 3,955 | 4,097,934 |
| Philadelphia, PA, Water and Wastewater Revenue, 5.00%, 10/1/43 | | 5,000 | 5,153,200 |
| San Francisco City and County Public Utilities Commission, CA, Wastewater Revenue, Green Bonds, 4.00%, 10/1/51 | | 10,000 | 8,873,000 |
| San Mateo-Foster City Public Financing Authority, CA, (Clean Water Program), 5.00%, 8/1/49 | | 14,445 | 15,055,590 |
| Sarasota County, FL, Utility System Revenue, 5.25%, 10/1/52 | | 15,000 | 16,193,250 |
| | | | $ 76,263,876 |
Total Tax-Exempt Municipal Obligations
(identified cost $3,102,050,209) | | | $2,987,207,165 |
22
See Notes to Financial Statements.
Eaton Vance
National Municipal Income Fund
September 30, 2022
Portfolio of Investments — continued
| Taxable Municipal Obligations — 5.4% |
| Security | Principal
Amount
(000's omitted) | Value |
| Cogeneration — 0.0%(8) |
| Northampton County Industrial Development Authority, PA, (Northampton Generating), 5.00%, 12/31/23(1) | $ | 5,934 | $ 1,068,113 |
| | | | $ 1,068,113 |
| Education — 0.1% |
| San Antonio Education Facilities Corp., TX, (University of the Incarnate Word): | | | |
| 2.65%, 4/1/30 | $ | 1,100 | $ 881,661 |
| 3.15%, 4/1/37 | | 1,750 | 1,280,913 |
| | | | $ 2,162,574 |
| General Obligations — 1.6% |
| Chicago, IL, 7.75%, 1/1/42 | $ | 4,050 | $ 4,230,103 |
| Detroit, MI, 2.96%, 4/1/27 | | 1,000 | 882,510 |
| Douglas County School District No. 17, NE, 2.192%, 6/15/35 | | 775 | 576,972 |
| Lakeside School District No. 9, AR: | | | |
| 1.65%, 4/1/36 | | 1,115 | 736,803 |
| 1.90%, 4/1/39 | | 750 | 469,672 |
| Larkspur-Corte Madera School District, CA, (Election of 2011 and 2014), 2.302%, 8/1/36 | | 1,405 | 1,029,458 |
| Marin Community College District, CA, 2.01%, 8/1/33 | | 1,140 | 855,467 |
| Maryland, 0.41%, 8/1/23 | | 5,240 | 5,087,097 |
| Massachusetts, Special Obligation Revenue Bonds, Social Bonds, 3.564%, 7/15/23 | | 28,900 | 28,730,935 |
| Mattawan Consolidated School, MI, 2.096%, 5/1/33 | | 1,120 | 911,725 |
| Naugatuck, CT, 2.94%, 9/15/41 | | 1,700 | 1,183,523 |
| Puerto Rico, GO Contingent Value Instrument, 0.00%, 11/1/43 | | 7,511 | 3,764,640 |
| Tustin Unified School District, CA, 2.254%, 8/1/36 | | 1,155 | 837,814 |
| | | | $ 49,296,719 |
| Hospital — 1.1% |
| California Statewide Communities Development Authority, (Loma Linda University Medical Center), 6.00%, 12/1/24 | $ | 34,250 | $ 35,127,142 |
| | | | $ 35,127,142 |
| Insured - General Obligations — 0.0%(8) |
| Westland Tax Increment Finance Authority, MI: | | | |
| (AGM), 2.31%, 4/1/33 | $ | 1,165 | $ 911,519 |
| Security | Principal
Amount
(000's omitted) | Value |
| Insured - General Obligations (continued) |
Westland Tax Increment Finance Authority, MI:
(continued) | | | |
| (AGM), 2.41%, 4/1/34 | $ | 195 | $ 150,874 |
| | | | $ 1,062,393 |
| Insured - Special Tax Revenue — 0.1% |
| Bexar County, TX, Venue Project Revenue, (AGM), 2.534%, 8/15/34 | $ | 2,805 | $ 2,159,345 |
| Rio Elementary School District Community Facilities District No. 1, CA, (BAM), 2.557%, 9/1/33 | | 1,055 | 815,610 |
| | | | $ 2,974,955 |
| Insured - Transportation — 1.4% |
| Alameda Corridor Transportation Authority, CA: | | | |
| (AMBAC), 0.00%, 10/1/26 | $ | 22,500 | $ 18,288,900 |
| (AMBAC), 0.00%, 10/1/27 | | 34,390 | 26,314,540 |
| | | | $ 44,603,440 |
| Lease Revenue/Certificates of Participation — 0.1% |
| Golden State Tobacco Securitization Corp., CA, 1.60%, 6/1/26 | $ | 4,250 | $ 3,753,345 |
| | | | $ 3,753,345 |
| Other Revenue — 0.8% |
| Golden State Tobacco Securitization Corp., CA, 3.714%, 6/1/41 | $ | 28,000 | $ 21,316,960 |
| Santa Cruz County, CA, Pension Obligation Bonds, 2.291%, 6/1/33 | | 3,000 | 2,345,100 |
| | | | $ 23,662,060 |
| Senior Living/Life Care — 0.1% |
| Montgomery County Industrial Development Authority, PA, (ACTS Retirement-Life Communities, Inc. Obligated Group), 2.45%, 11/15/23 | $ | 1,250 | $ 1,216,350 |
| | | | $ 1,216,350 |
| Special Tax Revenue — 0.1% |
| Illinois, Sales Tax Revenue, 1.999%, 6/15/28 | $ | 3,000 | $ 2,468,070 |
| | | | $ 2,468,070 |
23
See Notes to Financial Statements.
Eaton Vance
National Municipal Income Fund
September 30, 2022
Portfolio of Investments — continued
| Security | Principal
Amount
(000's omitted) | Value |
| Transportation — 0.0%(8) |
| Central Texas Regional Mobility Authority, 2.174%, 1/1/29 | $ | 1,260 | $ 1,057,820 |
| | | | $ 1,057,820 |
Total Taxable Municipal Obligations
(identified cost $184,228,906) | | | $ 168,452,981 |
Total Investments — 101.9%
(identified cost $3,319,024,116) | | | $3,184,872,214 |
| Other Assets, Less Liabilities — (1.9)% | | | $ (58,180,977) |
| Net Assets — 100.0% | | | $3,126,691,237 |
| The percentage shown for each investment category in the Portfolio of Investments is based on net assets. |
| (1) | Represents a payment-in-kind security which may pay interest in additional principal at the issuer’s discretion. |
| (2) | Security exempt from registration under Rule 144A of the Securities Act of 1933, as amended. These securities may be sold in certain transactions in reliance on an exemption from registration (normally to qualified institutional buyers). At September 30, 2022, the aggregate value of these securities is $56,384,520 or 1.8% of the Fund's net assets. |
| (3) | Variable rate demand obligation that may be tendered at par on any day for payment the same or next business day. The stated interest rate, which generally resets daily, is determined by the remarketing agent and represents the rate in effect at September 30, 2022. |
| (4) | When-issued/delayed delivery security. |
| (5) | Security represents the municipal bond held by a trust that issues residual interest bonds (see Note 1H). |
| (6) | Variable rate demand obligation that may be tendered at par on any day for payment the lesser of 5 business days or 7 calendar days. The stated interest rate, which generally resets weekly, is determined by the remarketing agent and represents the rate in effect at September 30, 2022. |
| (7) | Floating rate security. The stated interest rate represents the rate in effect at September 30, 2022. |
| (8) | Amount is less than 0.05%. |
| (9) | Defaulted security. Issuer has defaulted on the payment of interest and/or principal or has filed for bankruptcy. |
| At September 30, 2022, the concentration of the Fund's investments in the various states and territories, determined as a percentage of net assets, is as follows: |
| California | 16.7% |
| New York | 15.3% |
| Texas | 11.3% |
| Others, representing less than 10% individually | 57.7% |
| The Fund invests primarily in debt securities issued by municipalities. The ability of the issuers of the debt securities to meet their obligations may be affected by economic developments in a specific industry or municipality. At September 30, 2022, 8.9% of total investments are backed by bond insurance of various financial institutions and financial guaranty assurance agencies. The aggregate percentage insured by an individual financial institution or financial guaranty assurance agency ranged from 0.4% to 5.1% of total investments. |
| Futures Contracts |
| Description | Number of
Contracts | Position | Expiration
Date | Notional
Amount | Value/Unrealized
Appreciation
(Depreciation) |
| Interest Rate Futures | | | | | |
| U.S. Long Treasury Bond | (925) | Short | 12/20/22 | $(116,925,781) | $ 10,087,569 |
| | | | | | $10,087,569 |
| Abbreviations: |
| AGC | – Assured Guaranty Corp. |
| AGM | – Assured Guaranty Municipal Corp. |
| AMBAC | – AMBAC Financial Group, Inc. |
| AMT | – Interest earned from these securities may be considered a tax preference item for purposes of the Federal Alternative Minimum Tax. |
| BAM | – Build America Mutual Assurance Co. |
| Liq | – Liquidity Provider |
| |
| LOC | – Letter of Credit |
| NPFG | – National Public Finance Guarantee Corp. |
| PSF | – Permanent School Fund |
| SIFMA | – Securities Industry and Financial Markets Association Municipal Swap Index |
| SOFR | – Secured Overnight Financing Rate |
| SPA | – Standby Bond Purchase Agreement |
24
See Notes to Financial Statements.
Eaton Vance
Municipal Income Funds
September 30, 2022
Statements of Assets and Liabilities
| | September 30, 2022 |
| | AMT-Free Fund | National Fund |
| Assets | | |
| Investments: | | |
| Identified cost | $ 250,616,641 | $ 3,319,024,116 |
| Unrealized depreciation | (8,278,950) | (134,151,902) |
| Investments, at value | $242,337,691 | $3,184,872,214 |
| Cash | $ 1,944 | $ 706,031 |
| Restricted cash | — | 580,000 |
| Deposits for derivatives collateral — futures contracts | — | 3,529,595 |
| Interest receivable | 3,138,946 | 38,057,854 |
| Receivable for investments sold | 13,222,660 | 155,330,894 |
| Receivable for Fund shares sold | 905,513 | 23,231,849 |
| Receivable for variation margin on open futures contracts | — | 607,062 |
| Due from broker for floating rate notes issued | — | 2,380,000 |
| Total assets | $259,606,754 | $3,409,295,499 |
| Liabilities | | |
| Payable for floating rate notes issued | $ 13,074,953 | $ 95,099,601 |
| Demand note payable | 290,000 | — |
| Due to broker for floating rate notes redeemed | 3,420,000 | — |
| Payable for investments purchased | 2,937,522 | 32,790,373 |
| Payable for when-issued/delayed delivery securities | — | 124,542,291 |
| Payable for Fund shares redeemed | 1,139,463 | 25,809,862 |
| Distributions payable | 95,885 | 1,900,645 |
| Payable to affiliates: | | |
| Investment adviser fee | 86,583 | 887,595 |
| Distribution and service fees | 28,489 | 298,914 |
| Interest expense and fees payable | 89,774 | 518,620 |
| Accrued expenses | 137,853 | 756,361 |
| Total liabilities | $ 21,300,522 | $ 282,604,262 |
| Net Assets | $238,306,232 | $3,126,691,237 |
| Sources of Net Assets | | |
| Paid-in capital | $ 290,554,813 | $ 3,632,398,717 |
| Accumulated loss | (52,248,581) | (505,707,480) |
| Net Assets | $238,306,232 | $3,126,691,237 |
| Class A Shares | | |
| Net Assets | $ 113,933,119 | $ 1,179,909,137 |
| Shares Outstanding | 14,629,390 | 134,311,426 |
Net Asset Value and Redemption Price Per Share
(net assets ÷ shares of beneficial interest outstanding) | $ 7.79 | $ 8.78 |
Maximum Offering Price Per Share
(100 ÷ 96.75 of net asset value per share) | $ 8.05 | $ 9.07 |
| Class C Shares | | |
| Net Assets | $ 4,906,102 | $ 55,557,660 |
| Shares Outstanding | 633,605 | 6,324,743 |
Net Asset Value and Offering Price Per Share*
(net assets ÷ shares of beneficial interest outstanding) | $ 7.74 | $ 8.78 |
25
See Notes to Financial Statements.
Eaton Vance
Municipal Income Funds
September 30, 2022
Statements of Assets and Liabilities — continued
| | September 30, 2022 |
| | AMT-Free Fund | National Fund |
| Class I Shares | | |
| Net Assets | $119,467,011 | $1,891,224,440 |
| Shares Outstanding | 14,046,693 | 215,308,460 |
Net Asset Value, Offering Price and Redemption Price Per Share
(net assets ÷ shares of beneficial interest outstanding) | $ 8.50 | $ 8.78 |
| On sales of $100,000 or more, the offering price of Class A shares is reduced. |
| * | Redemption price per share is equal to the net asset value less any applicable contingent deferred sales charge. |
26
See Notes to Financial Statements.
Eaton Vance
Municipal Income Funds
September 30, 2022
| | Year Ended September 30, 2022 |
| | AMT-Free Fund | National Fund |
| Investment Income | | |
| Interest income | $ 10,401,656 | $ 106,507,240 |
| Total investment income | $ 10,401,656 | $ 106,507,240 |
| Expenses | | |
| Investment adviser fee | $ 1,216,262 | $ 10,910,311 |
| Distribution and service fees: | | |
| Class A | 350,236 | 3,466,932 |
| Class C | 72,955 | 762,712 |
| Trustees’ fees and expenses | 18,722 | 108,500 |
| Custodian fee | 74,229 | 638,923 |
| Transfer and dividend disbursing agent fees | 97,999 | 1,401,419 |
| Legal and accounting services | 74,730 | 168,127 |
| Printing and postage | 7,232 | 120,061 |
| Registration fees | 73,450 | 238,411 |
| Interest expense and fees | 211,683 | 1,144,267 |
| Miscellaneous | 55,678 | 229,790 |
| Total expenses | $ 2,253,176 | $ 19,189,453 |
| Net investment income | $ 8,148,480 | $ 87,317,787 |
| Realized and Unrealized Gain (Loss) | | |
| Net realized gain (loss): | | |
| Investment transactions | $ (18,029,404) | $ (255,666,551) |
| Futures contracts | — | 22,893,263 |
| Net realized loss | $(18,029,404) | $(232,773,288) |
| Change in unrealized appreciation (depreciation): | | |
| Investments | $ (33,643,392) | $ (329,878,941) |
| Futures contracts | — | 6,064,113 |
| Net change in unrealized appreciation (depreciation) | $(33,643,392) | $(323,814,828) |
| Net realized and unrealized loss | $(51,672,796) | $(556,588,116) |
| Net decrease in net assets from operations | $(43,524,316) | $(469,270,329) |
27
See Notes to Financial Statements.
Eaton Vance
Municipal Income Funds
September 30, 2022
Statements of Changes in Net Assets
| | Year Ended September 30, 2022 |
| | AMT-Free Fund | National Fund |
| Increase (Decrease) in Net Assets | | |
| From operations: | | |
| Net investment income | $ 8,148,480 | $ 87,317,787 |
| Net realized loss | (18,029,404) | (232,773,288) |
| Net change in unrealized appreciation (depreciation) | (33,643,392) | (323,814,828) |
| Net decrease in net assets from operations | $ (43,524,316) | $ (469,270,329) |
| Distributions to shareholders: | | |
| Class A | $ (3,726,887) | $ (34,992,231) |
| Class C | (137,551) | (1,325,303) |
| Class I | (4,457,845) | (58,955,993) |
| Total distributions to shareholders | $ (8,322,283) | $ (95,273,527) |
| Transactions in shares of beneficial interest: | | |
| Class A | $ (20,210,316) | $ (162,612,967) |
| Class C | (2,892,659) | (27,668,849) |
| Class I | (37,743,092) | (118,929,047) |
| Net decrease in net assets from Fund share transactions | $ (60,846,067) | $ (309,210,863) |
| Net decrease in net assets | $(112,692,666) | $ (873,754,719) |
| Net Assets | | |
| At beginning of year | $ 350,998,898 | $ 4,000,445,956 |
| At end of year | $ 238,306,232 | $3,126,691,237 |
28
See Notes to Financial Statements.
Eaton Vance
Municipal Income Funds
September 30, 2022
Statements of Changes in Net Assets — continued
| | Year Ended September 30, 2021 |
| | AMT-Free Fund | National Fund |
| Increase (Decrease) in Net Assets | | |
| From operations: | | |
| Net investment income | $ 9,214,288 | $ 85,910,593 |
| Net realized gain | 1,787,813 | 23,602,415 |
| Net change in unrealized appreciation (depreciation) | (339,343) | 2,780,570 |
| Net increase in net assets from operations | $ 10,662,758 | $ 112,293,578 |
| Distributions to shareholders: | | |
| Class A | $ (4,300,571) | $ (36,519,653) |
| Class C | (208,934) | (1,594,901) |
| Class I | (5,185,414) | (51,964,079) |
| Total distributions to shareholders | $ (9,694,919) | $ (90,078,633) |
| Transactions in shares of beneficial interest: | | |
| Class A | $ (1,156,043) | $ (74,309,751) |
| Class C | (6,154,882) | (37,545,612) |
| Class I | 15,406,188 | 541,213,178 |
| Net increase in net assets from Fund share transactions | $ 8,095,263 | $ 429,357,815 |
| Net increase in net assets | $ 9,063,102 | $ 451,572,760 |
| Net Assets | | |
| At beginning of year | $ 341,935,796 | $ 3,548,873,196 |
| At end of year | $350,998,898 | $4,000,445,956 |
29
See Notes to Financial Statements.
Eaton Vance
Municipal Income Funds
September 30, 2022
| | AMT-Free Fund — Class A |
| | Year Ended September 30, |
| | 2022 | 2021 | 2020 | 2019 | 2018 |
| Net asset value — Beginning of year | $ 9.290 | $ 9.250 | $ 9.250 | $ 8.870 | $ 9.130 |
| Income (Loss) From Operations | | | | | |
| Net investment income(1) | $ 0.227 | $ 0.236 | $ 0.274 | $ 0.317 | $ 0.336 |
| Net realized and unrealized gain (loss) | (1.495) | 0.053 | 0.011 (2) | 0.381 | (0.262) |
| Total income (loss) from operations | $ (1.268) | $ 0.289 | $ 0.285 | $ 0.698 | $ 0.074 |
| Less Distributions | | | | | |
| From net investment income | $ (0.232) | $ (0.249) | $ (0.285) | $ (0.318) | $ (0.334) |
| Total distributions | $ (0.232) | $ (0.249) | $ (0.285) | $ (0.318) | $ (0.334) |
| Net asset value — End of year | $ 7.790 | $ 9.290 | $ 9.250 | $ 9.250 | $ 8.870 |
| Total Return(3) | (13.85)% | 3.14% | 3.12% | 8.02% | 0.83% |
| Ratios/Supplemental Data | | | | | |
| Net assets, end of year (000’s omitted) | $113,933 | $157,981 | $158,729 | $150,853 | $139,623 |
| Ratios (as a percentage of average daily net assets): | | | | | |
| Expenses excluding interest and fees | 0.79% | 0.76% | 0.78% | 0.81% | 0.81% |
| Interest and fee expense(4) | 0.07% | 0.04% | 0.14% | 0.23% | 0.24% |
| Total expenses | 0.86% | 0.80% | 0.92% | 1.04% | 1.05% |
| Net investment income | 2.61% | 2.53% | 2.97% | 3.51% | 3.74% |
| Portfolio Turnover | 60% | 32% | 58% | 33% | 18% |
| (1) | Computed using average shares outstanding. |
| (2) | The per share amount is not in accord with the net realized and unrealized gain (loss) for the period because of the timing of Fund share transactions and the amount of the per share realized and unrealized gains and losses at such time. |
| (3) | Returns are historical and are calculated by determining the percentage change in net asset value with all distributions reinvested and do not reflect the effect of sales charges. |
| (4) | Interest and fee expense relates to the liability for floating rate notes issued in conjunction with residual interest bond transactions (see Note 1H). |
30
See Notes to Financial Statements.
Eaton Vance
Municipal Income Funds
September 30, 2022
Financial Highlights — continued
| | AMT-Free Fund — Class C |
| | Year Ended September 30, |
| | 2022 | 2021 | 2020 | 2019 | 2018 |
| Net asset value — Beginning of year | $ 9.240 | $ 9.200 | $ 9.200 | $ 8.820 | $ 9.080 |
| Income (Loss) From Operations | | | | | |
| Net investment income(1) | $ 0.159 | $ 0.167 | $ 0.204 | $ 0.249 | $ 0.267 |
| Net realized and unrealized gain (loss) | (1.493) | 0.051 | 0.011 (2) | 0.380 | (0.262) |
| Total income (loss) from operations | $(1.334) | $ 0.218 | $ 0.215 | $ 0.629 | $ 0.005 |
| Less Distributions | | | | | |
| From net investment income | $ (0.166) | $ (0.178) | $ (0.215) | $ (0.249) | $ (0.265) |
| Total distributions | $(0.166) | $(0.178) | $ (0.215) | $ (0.249) | $ (0.265) |
| Net asset value — End of year | $ 7.740 | $ 9.240 | $ 9.200 | $ 9.200 | $ 8.820 |
| Total Return(3) | (14.59)% | 2.38% | 2.36% | 7.24% | 0.06% |
| Ratios/Supplemental Data | | | | | |
| Net assets, end of year (000’s omitted) | $ 4,906 | $ 9,017 | $15,094 | $19,715 | $32,545 |
| Ratios (as a percentage of average daily net assets): | | | | | |
| Expenses excluding interest and fees | 1.54% | 1.51% | 1.53% | 1.56% | 1.56% |
| Interest and fee expense(4) | 0.07% | 0.04% | 0.14% | 0.23% | 0.24% |
| Total expenses | 1.61% | 1.55% | 1.67% | 1.79% | 1.80% |
| Net investment income | 1.83% | 1.80% | 2.23% | 2.78% | 2.99% |
| Portfolio Turnover | 60% | 32% | 58% | 33% | 18% |
| (1) | Computed using average shares outstanding. |
| (2) | The per share amount is not in accord with the net realized and unrealized gain (loss) for the period because of the timing of Fund share transactions and the amount of the per share realized and unrealized gains and losses at such time. |
| (3) | Returns are historical and are calculated by determining the percentage change in net asset value with all distributions reinvested and do not reflect the effect of sales charges. |
| (4) | Interest and fee expense relates to the liability for floating rate notes issued in conjunction with residual interest bond transactions (see Note 1H). |
31
See Notes to Financial Statements.
Eaton Vance
Municipal Income Funds
September 30, 2022
Financial Highlights — continued
| | AMT-Free Fund — Class I |
| | Year Ended September 30, |
| | 2022 | 2021 | 2020 | 2019 | 2018 |
| Net asset value — Beginning of year | $ 10.150 | $ 10.110 | $ 10.100 | $ 9.680 | $ 9.970 |
| Income (Loss) From Operations | | | | | |
| Net investment income(1) | $ 0.271 | $ 0.283 | $ 0.323 | $ 0.370 | $ 0.391 |
| Net realized and unrealized gain (loss) | (1.644) | 0.055 | 0.023 (2) | 0.422 | (0.292) |
| Total income (loss) from operations | $ (1.373) | $ 0.338 | $ 0.346 | $ 0.792 | $ 0.099 |
| Less Distributions | | | | | |
| From net investment income | $ (0.277) | $ (0.298) | $ (0.336) | $ (0.372) | $ (0.389) |
| Total distributions | $ (0.277) | $ (0.298) | $ (0.336) | $ (0.372) | $ (0.389) |
| Net asset value — End of year | $ 8.500 | $ 10.150 | $ 10.110 | $ 10.100 | $ 9.680 |
| Total Return(3) | (13.64)% | 3.36% | 3.48% | 8.34% | 1.02% |
| Ratios/Supplemental Data | | | | | |
| Net assets, end of year (000’s omitted) | $119,467 | $184,002 | $168,113 | $145,788 | $132,313 |
| Ratios (as a percentage of average daily net assets): | | | | | |
| Expenses excluding interest and fees | 0.54% | 0.51% | 0.53% | 0.56% | 0.56% |
| Interest and fee expense(4) | 0.07% | 0.04% | 0.14% | 0.23% | 0.24% |
| Total expenses | 0.61% | 0.55% | 0.67% | 0.79% | 0.80% |
| Net investment income | 2.84% | 2.77% | 3.21% | 3.76% | 3.98% |
| Portfolio Turnover | 60% | 32% | 58% | 33% | 18% |
| (1) | Computed using average shares outstanding. |
| (2) | The per share amount is not in accord with the net realized and unrealized gain (loss) for the period because of the timing of Fund share transactions and the amount of the per share realized and unrealized gains and losses at such time. |
| (3) | Returns are historical and are calculated by determining the percentage change in net asset value with all distributions reinvested. |
| (4) | Interest and fee expense relates to the liability for floating rate notes issued in conjunction with residual interest bond transactions (see Note 1H). |
32
See Notes to Financial Statements.
Eaton Vance
Municipal Income Funds
September 30, 2022
Financial Highlights — continued
| | National Fund — Class A |
| | Year Ended September 30, |
| | 2022 | 2021 | 2020 | 2019 | 2018 |
| Net asset value — Beginning of year | $ 10.310 | $ 10.240 | $ 10.140 | $ 9.650 | $ 9.930 |
| Income (Loss) From Operations | | | | | |
| Net investment income(1) | $ 0.224 | $ 0.223 | $ 0.265 | $ 0.322 | $ 0.350 |
| Net realized and unrealized gain (loss) | (1.507) | 0.082 | 0.119 | 0.491 | (0.277) |
| Total income (loss) from operations | $ (1.283) | $ 0.305 | $ 0.384 | $ 0.813 | $ 0.073 |
| Less Distributions | | | | | |
| From net investment income | $ (0.247) | $ (0.235) | $ (0.284) | $ (0.323) | $ (0.353) |
| Total distributions | $ (0.247) | $ (0.235) | $ (0.284) | $ (0.323) | $ (0.353) |
| Net asset value — End of year | $ 8.780 | $ 10.310 | $ 10.240 | $ 10.140 | $ 9.650 |
| Total Return(2) | (12.62)% | 2.99% | 3.84% | 8.57% | 0.76% |
| Ratios/Supplemental Data | | | | | |
| Net assets, end of year (000’s omitted) | $1,179,909 | $1,558,418 | $1,620,505 | $1,605,407 | $1,419,239 |
| Ratios (as a percentage of average daily net assets): | | | | | |
| Expenses excluding interest and fees | 0.64% | 0.61% | 0.64% | 0.68% | 0.69% |
| Interest and fee expense(3) | 0.03% | 0.02% | 0.05% | 0.12% | 0.19% |
| Total expenses | 0.67% | 0.63% | 0.69% | 0.80% | 0.88% |
| Net investment income | 2.30% | 2.15% | 2.61% | 3.26% | 3.58% |
| Portfolio Turnover | 151% | 56% | 105% | 89% | 67% |
| (1) | Computed using average shares outstanding. |
| (2) | Returns are historical and are calculated by determining the percentage change in net asset value with all distributions reinvested and do not reflect the effect of sales charges. |
| (3) | Interest and fee expense relates to the liability for floating rate notes issued in conjunction with residual interest bond transactions (see Note 1H). |
33
See Notes to Financial Statements.
Eaton Vance
Municipal Income Funds
September 30, 2022
Financial Highlights — continued
| | National Fund — Class C |
| | Year Ended September 30, |
| | 2022 | 2021 | 2020 | 2019 | 2018 |
| Net asset value — Beginning of year | $10.310 | $ 10.240 | $ 10.140 | $ 9.650 | $ 9.930 |
| Income (Loss) From Operations | | | | | |
| Net investment income(1) | $ 0.148 | $ 0.146 | $ 0.190 | $ 0.252 | $ 0.276 |
| Net realized and unrealized gain (loss) | (1.504) | 0.081 | 0.119 | 0.488 | (0.276) |
| Total income (loss) from operations | $ (1.356) | $ 0.227 | $ 0.309 | $ 0.740 | $ — |
| Less Distributions | | | | | |
| From net investment income | $ (0.174) | $ (0.157) | $ (0.209) | $ (0.250) | $ (0.280) |
| Total distributions | $ (0.174) | $ (0.157) | $ (0.209) | $ (0.250) | $ (0.280) |
| Net asset value — End of year | $ 8.780 | $10.310 | $ 10.240 | $ 10.140 | $ 9.650 |
| Total Return(2) | (13.28)% | 2.22% | 3.08% | 7.77% | 0.01% |
| Ratios/Supplemental Data | | | | | |
| Net assets, end of year (000’s omitted) | $55,558 | $ 94,851 | $131,330 | $172,417 | $363,026 |
| Ratios (as a percentage of average daily net assets): | | | | | |
| Expenses excluding interest and fees | 1.39% | 1.36% | 1.39% | 1.43% | 1.44% |
| Interest and fee expense(3) | 0.03% | 0.02% | 0.05% | 0.12% | 0.19% |
| Total expenses | 1.42% | 1.38% | 1.44% | 1.55% | 1.63% |
| Net investment income | 1.52% | 1.41% | 1.87% | 2.57% | 2.83% |
| Portfolio Turnover | 151% | 56% | 105% | 89% | 67% |
| (1) | Computed using average shares outstanding. |
| (2) | Returns are historical and are calculated by determining the percentage change in net asset value with all distributions reinvested and do not reflect the effect of sales charges. |
| (3) | Interest and fee expense relates to the liability for floating rate notes issued in conjunction with residual interest bond transactions (see Note 1H). |
34
See Notes to Financial Statements.
Eaton Vance
Municipal Income Funds
September 30, 2022
Financial Highlights — continued
| | National Fund — Class I |
| | Year Ended September 30, |
| | 2022 | 2021 | 2020 | 2019 | 2018 |
| Net asset value — Beginning of year | $ 10.310 | $ 10.240 | $ 10.140 | $ 9.650 | $ 9.930 |
| Income (Loss) From Operations | | | | | |
| Net investment income(1) | $ 0.248 | $ 0.248 | $ 0.289 | $ 0.341 | $ 0.374 |
| Net realized and unrealized gain (loss) | (1.507) | 0.082 | 0.120 | 0.495 | (0.277) |
| Total income (loss) from operations | $ (1.259) | $ 0.330 | $ 0.409 | $ 0.836 | $ 0.097 |
| Less Distributions | | | | | |
| From net investment income | $ (0.271) | $ (0.260) | $ (0.309) | $ (0.346) | $ (0.377) |
| Total distributions | $ (0.271) | $ (0.260) | $ (0.309) | $ (0.346) | $ (0.377) |
| Net asset value — End of year | $ 8.780 | $ 10.310 | $ 10.240 | $ 10.140 | $ 9.650 |
| Total Return(2) | (12.40)% | 3.24% | 4.10% | 8.83% | 1.01% |
| Ratios/Supplemental Data | | | | | |
| Net assets, end of year (000’s omitted) | $1,891,224 | $2,347,177 | $1,797,038 | $1,348,563 | $756,446 |
| Ratios (as a percentage of average daily net assets): | | | | | |
| Expenses excluding interest and fees | 0.39% | 0.36% | 0.39% | 0.43% | 0.44% |
| Interest and fee expense(3) | 0.03% | 0.02% | 0.05% | 0.12% | 0.19% |
| Total expenses | 0.42% | 0.38% | 0.44% | 0.55% | 0.63% |
| Net investment income | 2.55% | 2.39% | 2.85% | 3.45% | 3.83% |
| Portfolio Turnover | 151% | 56% | 105% | 89% | 67% |
| (1) | Computed using average shares outstanding. |
| (2) | Returns are historical and are calculated by determining the percentage change in net asset value with all distributions reinvested. |
| (3) | Interest and fee expense relates to the liability for floating rate notes issued in conjunction with residual interest bond transactions (see Note 1H). |
35
See Notes to Financial Statements.
Eaton Vance
Municipal Income Funds
September 30, 2022
Notes to Financial Statements
1 Significant Accounting Policies
Eaton Vance AMT-Free Municipal Income Fund (AMT-Free Fund) and Eaton Vance National Municipal Income Fund (National Fund) (each individually referred to as the Fund, and collectively, the Funds) are a diversified series of Eaton Vance Mutual Funds Trust and Eaton Vance Municipals Trust, respectively (collectively, the Trusts). The Trusts are Massachusetts business trusts registered under the Investment Company Act of 1940, as amended (the 1940 Act), as open-end management investment companies. Each Fund’s investment objective is to provide current income exempt from regular federal income tax. The Funds offer three classes of shares. Class A shares are generally sold subject to a sales charge imposed at time of purchase. Class C shares are sold at net asset value and are generally subject to a contingent deferred sales charge (see Note 5). Effective November 5, 2020, Class C shares automatically convert to Class A shares eight years after their purchase as described in the Funds’ prospectus. Class I shares are sold at net asset value and are not subject to a sales charge. Each class represents a pro-rata interest in the Fund, but votes separately on class-specific matters and (as noted below) is subject to different expenses. Realized and unrealized gains and losses are allocated daily to each class of shares based on the relative net assets of each class to the total net assets of the Fund. Net investment income, other than class-specific expenses, is allocated daily to each class of shares based upon the ratio of the value of each class’s paid shares to the total value of all paid shares. Each class of shares differs in its distribution plan and certain other class-specific expenses.
The following is a summary of significant accounting policies of the Funds. The policies are in conformity with accounting principles generally accepted in the United States of America (U.S. GAAP). Each Fund is an investment company and follows accounting and reporting guidance in the Financial Accounting Standards Board (FASB) Accounting Standards Codification Topic 946.
A Investment Valuation—The following methodologies are used to determine the market value or fair value of investments.
Debt Obligations. Debt obligations are generally valued on the basis of valuations provided by third party pricing services, as derived from such services’ pricing models. Inputs to the models may include, but are not limited to, reported trades, executable bid and ask prices, broker/dealer quotations, prices or yields of securities with similar characteristics, interest rates, anticipated prepayments, benchmark curves or information pertaining to the issuer, as well as industry and economic events. The pricing services may use a matrix approach, which considers information regarding securities with similar characteristics to determine the valuation for a security. Short-term debt obligations purchased with a remaining maturity of sixty days or less for which a valuation from a third party pricing service is not readily available may be valued at amortized cost, which approximates fair value.
Derivatives. Futures contracts are valued at the closing settlement price established by the board of trade or exchange on which they are traded.
Fair Valuation. In connection with Rule 2a-5 of the 1940 Act, which became effective September 8, 2022, the Trustees have designated a Fund’s investment adviser as its valuation designee. Investments for which valuations or market quotations are not readily available or are deemed unreliable are valued by the investment adviser, as valuation designee, at fair value using methods that most fairly reflect the security’s “fair value”, which is the amount that a Fund might reasonably expect to receive for the security upon its current sale in the ordinary course. Each such determination is based on a consideration of relevant factors, which are likely to vary from one pricing context to another. These factors may include, but are not limited to, the type of security, the existence of any contractual restrictions on the security’s disposition, the price and extent of public trading in similar securities of the issuer or of comparable companies or entities, quotations or relevant information obtained from broker/dealers or other market participants, information obtained from the issuer, analysts, and/or the appropriate stock exchange (for exchange-traded securities), an analysis of the company’s or entity’s financial statements, and an evaluation of the forces that influence the issuer and the market(s) in which the security is purchased and sold.
B Investment Transactions and Related Income—Investment transactions for financial statement purposes are accounted for on a trade date basis. Realized gains and losses on investments sold are determined on the basis of identified cost. Interest income is recorded on the basis of interest accrued, adjusted for amortization of premium or accretion of discount.
C Federal Taxes—Each Fund’s policy is to comply with the provisions of the Internal Revenue Code applicable to regulated investment companies and to distribute to shareholders each year substantially all of its taxable, if any, and tax-exempt net investment income, and all or substantially all of its net realized capital gains. Accordingly, no provision for federal income or excise tax is necessary. Each Fund intends to satisfy conditions which will enable it to designate distributions from the interest income generated by its investments in non-taxable municipal securities, which are exempt from regular federal income tax when received by each Fund, as exempt-interest dividends. For National Fund, the portion of such interest, if any, earned on private activity bonds issued after August 7, 1986, may be considered a tax preference item to shareholders.
As of September 30, 2022, the Funds had no uncertain tax positions that would require financial statement recognition, de-recognition, or disclosure. Each Fund files a U.S. federal income tax return annually after its fiscal year-end, which is subject to examination by the Internal Revenue Service for a period of three years from the date of filing.
D Expenses—The majority of expenses of the Trusts are directly identifiable to an individual fund. Expenses which are not readily identifiable to a specific fund are allocated taking into consideration, among other things, the nature and type of expense and the relative size of the funds.
E Legal Fees— Legal fees and other related expenses incurred as part of negotiations of the terms and requirement of capital infusions, or that are expected to result in the restructuring of, or a plan of reorganization for, an investment are recorded as realized losses. Ongoing expenditures to protect or enhance an investment are treated as operating expenses.
Eaton Vance
Municipal Income Funds
September 30, 2022
Notes to Financial Statements — continued
F Use of Estimates—The preparation of the financial statements in conformity with U.S. GAAP requires management to make estimates and assumptions that affect the reported amounts of assets and liabilities at the date of the financial statements and the reported amounts of income and expense during the reporting period. Actual results could differ from those estimates.
G Indemnifications—Under each Trust’s organizational documents, its officers and Trustees may be indemnified against certain liabilities and expenses arising out of the performance of their duties to the Funds. Under Massachusetts law, if certain conditions prevail, shareholders of a Massachusetts business trust (such as a Trust) could be deemed to have personal liability for the obligations of the Trust. However, each Trust’s Declaration of Trust contains an express disclaimer of liability on the part of Fund shareholders and the By-laws provide that the Trust shall assume, upon request by the shareholder, the defense on behalf of any Fund shareholders. Moreover, the By-laws also provide for indemnification out of Fund property of any shareholder held personally liable solely by reason of being or having been a shareholder for all loss or expense arising from such liability. Additionally, in the normal course of business, each Fund enters into agreements with service providers that may contain indemnification clauses. Each Fund’s maximum exposure under these arrangements is unknown as this would involve future claims that may be made against each Fund that have not yet occurred.
H Floating Rate Notes Issued in Conjunction with Securities Held— The Funds may invest in residual interest bonds, also referred to as inverse floating rate securities, whereby a Fund may sell a variable or fixed rate bond for cash to a Special-Purpose Vehicle (the SPV), (which is generally organized as a trust), while at the same time, buying a residual interest in the assets and cash flows of the SPV. The bond is deposited into the SPV with the same CUSIP number as the bond sold to the SPV by the Fund, and which may have been, but is not required to be, the bond purchased from the Fund (the Bond). The SPV also issues floating rate notes (Floating Rate Notes) which are sold to third-parties. The residual interest bond held by a Fund gives the Fund the right (1) to cause the holders of the Floating Rate Notes to generally tender their notes at par, and (2) to have the Bond held by the SPV transferred to the Fund, thereby terminating the SPV. Should the Fund exercise such right, it would generally pay the SPV the par amount due on the Floating Rate Notes and exchange the residual interest bond for the underlying Bond. Pursuant to generally accepted accounting principles for transfers and servicing of financial assets and extinguishment of liabilities, the Funds account for the transaction described above as a secured borrowing by including the Bond in their Portfolio of Investments and the Floating Rate Notes as a liability under the caption “Payable for floating rate notes issued” in their Statement of Assets and Liabilities. The Floating Rate Notes have interest rates that generally reset weekly and their holders have the option to tender their notes to the SPV for redemption at par at each reset date. Accordingly, the fair value of the payable for floating rate notes issued approximates its carrying value. If measured at fair value, the payable for floating rate notes would have been considered as Level 2 in the fair value hierarchy (see Note 10) at September 30, 2022. Interest expense related to a Fund’s liability with respect to Floating Rate Notes is recorded as incurred. The SPV may be terminated by the Fund, as noted above, or by the occurrence of certain termination events as defined in the trust agreement, such as a downgrade in the credit quality of the underlying Bond, bankruptcy of or payment failure by the issuer of the underlying Bond, the inability to remarket Floating Rate Notes that have been tendered due to insufficient buyers in the market, or the failure by the SPV to obtain renewal of the liquidity agreement under which liquidity support is provided for the Floating Rate Notes up to one year. At September 30, 2022, the amounts of the Funds’ Floating Rate Notes and related interest rates and collateral were as follows:
| | AMT-Free
Fund | National
Fund |
| Floating Rate Notes Outstanding | $13,074,953 | $ 95,099,601 |
| Interest Rate or Range of Interest Rates (%) | 2.49 | 2.48 - 2.51 |
| Collateral for Floating Rate Notes Outstanding | $19,769,750 | $ 124,999,830 |
In addition, at September 30, 2022, National Fund pledged cash collateral of $580,000 for the benefit of a liquidity provider for certain Floating Rate Notes. Such collateral is reflected as restricted cash on the Statement of Assets and Liabilities.
For the year ended September 30, 2022, the Funds’ average settled Floating Rate Notes outstanding and the average interest rate including fees were as follows:
| | AMT-Free
Fund | National
Fund |
| Average Floating Rate Notes Outstanding | $17,820,205 | $ 99,510,658 |
| Average Interest Rate | 1.19% | 1.15% |
In certain circumstances, the Funds may enter into shortfall and forbearance agreements with brokers by which a Fund agrees to reimburse the broker for the difference between the liquidation value of the Bond held by the SPV and the liquidation value of the Floating Rate Notes, as well as any shortfalls in interest cash flows. The Funds had no shortfalls as of September 30, 2022.
Eaton Vance
Municipal Income Funds
September 30, 2022
Notes to Financial Statements — continued
The Funds may also purchase residual interest bonds in a secondary market transaction without first owning the underlying bond. Such transactions are not required to be treated as secured borrowings. Shortfall agreements, if any, related to residual interest bonds purchased in a secondary market transaction are disclosed in the Portfolio of Investments.
The Funds' investment policies and restrictions expressly permit investments in residual interest bonds. Such bonds typically offer the potential for yields exceeding the yields available on fixed rate bonds with comparable credit quality and maturity. These securities tend to underperform the market for fixed rate bonds in a rising long-term interest rate environment, but tend to outperform the market for fixed rate bonds when long-term interest rates decline. The value and income of residual interest bonds are generally more volatile than that of a fixed rate bond. The Funds' investment policies do not allow the Funds to borrow money except as permitted by the 1940 Act. Management believes that the Funds' restrictions on borrowing money and issuing senior securities (other than as specifically permitted) do not apply to Floating Rate Notes issued by the SPV and included as a liability in the Funds' Statement of Assets and Liabilities. As secured indebtedness issued by an SPV, Floating Rate Notes are distinct from the borrowings and senior securities to which the Funds' restrictions apply. Residual interest bonds held by the Funds are securities exempt from registration under Rule 144A of the Securities Act of 1933.
I Futures Contracts—Upon entering into a futures contract, a Fund is required to deposit with the broker, either in cash or securities, an amount equal to a certain percentage of the contract amount (initial margin). Subsequent payments, known as variation margin, are made or received by the Fund each business day, depending on the daily fluctuations in the value of the underlying security, and are recorded as unrealized gains or losses by the Fund. Gains (losses) are realized upon the expiration or closing of the futures contracts. Should market conditions change unexpectedly, the Fund may not achieve the anticipated benefits of the futures contracts and may realize a loss. Futures contracts have minimal counterparty risk as they are exchange traded and the clearinghouse for the exchange is substituted as the counterparty, guaranteeing counterparty performance.
J When-Issued Securities and Delayed Delivery Transactions—The Funds may purchase securities on a delayed delivery or when-issued basis. Payment and delivery may take place after the customary settlement period for that security. At the time the transaction is negotiated, the price of the security that will be delivered is fixed. The Funds maintain cash and/or security positions for these commitments such that sufficient liquid assets will be available to make payments upon settlement. Securities purchased on a delayed delivery or when-issued basis are marked-to-market daily and begin earning interest on settlement date. Such security purchases are subject to the risk that when delivered they will be worth less than the agreed upon payment price. Losses may also arise if the counterparty does not perform under the contract.
2 Distributions to Shareholders and Income Tax Information
The net investment income of each Fund is determined daily and substantially all of the net investment income so determined is declared as a dividend to shareholders of record at the time of declaration. Distributions are declared separately for each class of shares. Distributions are paid monthly. Distributions of realized capital gains are made at least annually. Shareholders may reinvest income and capital gain distributions in additional shares of the same class of a Fund at the net asset value as of the reinvestment date or, at the election of the shareholder, receive distributions in cash. Distributions to shareholders are determined in accordance with income tax regulations, which may differ from U.S. GAAP. As required by U.S. GAAP, only distributions in excess of tax basis earnings and profits are reported in the financial statements as a return of capital. Permanent differences between book and tax accounting relating to distributions are reclassified to paid-in capital. For tax purposes, distributions from short-term capital gains are considered to be from ordinary income.
The tax character of distributions declared for the years ended September 30, 2022 and September 30, 2021 was as follows:
| | AMT-Free
Fund | | National
Fund |
| | Year Ended September 30, | | Year Ended September 30, |
| | 2022 | 2021 | | 2022 | 2021 |
| Tax-exempt income | $8,322,283 | $9,682,218 | | $87,321,107 | $83,800,571 |
| Ordinary income | $ — | $ 12,701 | | $ 7,952,420 | $ 6,278,062 |
Eaton Vance
Municipal Income Funds
September 30, 2022
Notes to Financial Statements — continued
As of September 30, 2022, the components of distributable earnings (accumulated loss) on a tax basis were as follows:
| | AMT-Free
Fund | National
Fund |
| Undistributed tax-exempt income | $ 723,027 | $ 2,118,518 |
| Deferred capital losses | (44,601,049) | (364,165,260) |
| Net unrealized depreciation | (8,274,674) | (141,760,093) |
| Distributions payable | (95,885) | (1,900,645) |
| Accumulated loss | $(52,248,581) | $(505,707,480) |
At September 30, 2022, the following Funds, for federal income tax purposes, had deferred capital losses which would reduce the respective Fund’s taxable income arising from future net realized gains on investment transactions, if any, to the extent permitted by the Internal Revenue Code, and thus would reduce the amount of distributions to shareholders, which would otherwise be necessary to relieve the Funds of any liability for federal income or excise tax. The deferred capital losses are treated as arising on the first day of a Fund’s next taxable year and retain the same short-term or long-term character as when originally deferred. The amounts of the deferred capital losses are as follows:
| | AMT-Free
Fund | National
Fund |
| Deferred capital losses: | | |
| Short-term | $24,969,327 | $260,355,105 |
| Long-term | $19,631,722 | $103,810,155 |
The cost and unrealized appreciation (depreciation) of investments, including open derivative contracts, of each Fund at September 30, 2022, as determined on a federal income tax basis, were as follows:
| | AMT-Free
Fund | National
Fund |
| Aggregate cost | $ 237,537,412 | $3,231,532,706 |
| Gross unrealized appreciation | $ 4,286,038 | $ 19,599,499 |
| Gross unrealized depreciation | (12,560,712) | (161,359,592) |
| Net unrealized depreciation | $ (8,274,674) | $ (141,760,093) |
Eaton Vance
Municipal Income Funds
September 30, 2022
Notes to Financial Statements — continued
3 Investment Adviser Fee and Other Transactions with Affiliates
The investment adviser fee is earned by Eaton Vance Management (EVM), an indirect, wholly-owned subsidiary of Morgan Stanley, for AMT-Free Fund and Boston Management and Research (BMR), an affiliate of EVM, for National Fund as compensation for management and investment advisory services rendered to each Fund. The investment adviser fee is based upon a percentage of total daily net assets plus a percentage of total daily gross income (i.e., income other than gains from the sale of securities) as follows and is payable monthly:
| Total Daily Net Assets | Annual Asset
Rate | Daily Income
Rate |
| Up to $500 million | 0.300% | 3.000% |
| $500 million but less than $1 billion | 0.275% | 2.750% |
| $1 billion but less than $1.5 billion | 0.250% | 2.500% |
| $1.5 billion but less than $2 billion | 0.225% | 2.250% |
| $2 billion but less than $3 billion | 0.200% | 2.000% |
| $3 billion and over | 0.175% | 1.750% |
For the year ended September 30, 2022, investment adviser fees incurred by the Funds and the effective annual rates, as a percentage of average daily net assets, were as follows:
| | AMT-Free
Fund | National
Fund |
| Investment Adviser Fee | $1,216,262 | $10,910,311 |
| Effective Annual Rate | 0.40% | 0.30% |
EVM serves as the administrator of each Fund, but receives no compensation.
EVM provides sub-transfer agency and related services to the Funds pursuant to a Sub-Transfer Agency Support Services Agreement. Eaton Vance Distributors, Inc. (EVD), an affiliate of EVM and the Funds’ principal underwriter, received a portion of the sales charge on sales of Class A shares of the Funds. Morgan Stanley affiliated broker-dealers, which may be deemed to be affiliates of BMR, EVM and EVD, also received a portion of the sales charge on sales of Class A shares. EVD also received distribution and service fees from Class A and Class C shares (see Note 4) and contingent deferred sales charges (see Note 5). Sub-transfer agent fees earned by EVM, which are included in transfer and dividend disbursing agent fees on the Statements of Operations, and Class A sales charges that the Funds were informed were received by EVD and Morgan Stanley affiliated broker-dealers for the year ended September 30, 2022 were as follows:
| | AMT-Free
Fund | National
Fund |
| EVM's Sub-Transfer Agent Fees | $12,734 | $193,808 |
| EVD's Class A Sales Charges | $ 4,454 | $ 44,433 |
| Morgan Stanley affiliated broker-dealers’ Class A Sales Charges | $ — | $ 19,488 |
Trustees and officers of the Funds who are members of EVM’s or BMR’s organizations receive remuneration for their services to the Funds out of the investment adviser fee. Trustees of the Funds who are not affiliated with the investment advisers may elect to defer receipt of all or a percentage of their annual fees in accordance with the terms of the Trustees Deferred Compensation Plan. For the year ended September 30, 2022, no significant amounts have been deferred. Certain officers and Trustees of the Funds are officers of the above organizations.
Eaton Vance
Municipal Income Funds
September 30, 2022
Notes to Financial Statements — continued
4 Distribution Plans
Each Fund has in effect a distribution plan for Class A shares (Class A Plan) pursuant to Rule 12b-1 under the 1940 Act. Pursuant to the Class A Plan, each Fund pays EVD a distribution and service fee of 0.25% per annum of its average daily net assets attributable to Class A shares for distribution services and facilities provided to each Fund by EVD, as well as for personal services and/or the maintenance of shareholder accounts. Distribution and service fees paid or accrued to EVD for the year ended September 30, 2022 for Class A shares amounted to the following:
| | AMT-Free
Fund | National
Fund |
| Class A Distribution and Service Fees | $350,236 | $3,466,932 |
Each Fund also has in effect a distribution plan for Class C shares (Class C Plan) pursuant to Rule 12b-1 under the 1940 Act. Pursuant to the Class C Plan, each Fund pays EVD amounts equal to 0.75% per annum of its average daily net assets attributable to Class C shares for providing ongoing distribution services and facilities to the respective Funds. For the year ended September 30, 2022, the Funds paid or accrued to EVD the following distribution fees:
| | AMT-Free
Fund | National
Fund |
| Class C Distribution Fees | $54,716 | $572,034 |
The Class C Plan also authorizes each Fund to make payments of service fees to EVD, financial intermediaries and other persons in amounts equal to 0.25% per annum of the average daily net assets attributable to Class C shares. Service fees paid or accrued are for personal services and/or the maintenance of shareholder accounts. They are separate and distinct from the Class C sales commissions and distribution fees payable to EVD. Service fees paid or accrued for the year ended September 30, 2022 amounted to the following:
| | AMT-Free
Fund | National
Fund |
| Class C Service Fees | $18,239 | $190,678 |
Distribution and service fees are subject to the limitations contained in the Financial Industry Regulatory Authority Rule 2341(d).
5 Contingent Deferred Sales Charges
A contingent deferred sales charge (CDSC) of 1% generally is imposed on redemptions of Class C shares made within 12 months of purchase. Class A shares may be subject to a 0.75% (1% prior to April 29, 2022) CDSC if redeemed within 12 months (18 months prior to April 29, 2022) of purchase (depending on the circumstances of purchase). Generally, the CDSC is based upon the lower of the net asset value at date of redemption or date of purchase. No charge is levied on shares acquired by reinvestment of dividends or capital gain distributions. For the year ended September 30, 2022, the Funds were informed that EVD received approximately the following amounts of CDSCs paid by Class A and Class C shareholders:
| | AMT-Free
Fund | National
Fund |
| Class A | $500 | $66,000 |
| Class C | $700 | $ 7,000 |
Eaton Vance
Municipal Income Funds
September 30, 2022
Notes to Financial Statements — continued
6 Purchases and Sales of Investments
Purchases and sales of investments, other than short-term obligations and including maturities, for the year ended September 30, 2022 were as follows:
| | AMT-Free
Fund | National
Fund |
| Purchases | $189,578,376 | $5,467,044,049 |
| Sales | $263,863,327 | $5,737,737,477 |
7 Shares of Beneficial Interest
Each Fund’s Declaration of Trust permits the Trustees to issue an unlimited number of full and fractional shares of beneficial interest (without par value). Such shares may be issued in a number of different series (such as the Funds) and classes. Transactions in Fund shares were as follows:
| AMT-Free Fund | | | |
| | | Year Ended
September 30, 2022 | | Year Ended
September 30, 2021 |
| | | Shares | Amount | Shares | Amount |
| Class A | | | | | |
| Sales | | 1,293,685 | $ 11,070,243 | 2,641,027 | $ 24,766,387 |
| Issued to shareholders electing to receive payments of distributions in Fund shares | | 360,010 | 3,096,193 | 391,532 | 3,658,118 |
| Redemptions | | (4,119,650) | (35,134,920) | (3,720,359) | (34,629,729) |
| Converted from Class C shares | | 89,508 | 758,168 | 541,353 | 5,049,181 |
| Net decrease | | (2,376,447) | $(20,210,316) | (146,447) | $ (1,156,043) |
| Class C | | | | | |
| Sales | | 35,647 | $ 317,123 | 132,529 | $ 1,235,057 |
| Issued to shareholders electing to receive payments of distributions in Fund shares | | 15,751 | 134,955 | 21,623 | 200,701 |
| Redemptions | | (303,879) | (2,586,569) | (274,046) | (2,541,459) |
| Converted to Class A shares | | (90,033) | (758,168) | (544,356) | (5,049,181) |
| Net decrease | | (342,514) | $ (2,892,659) | (664,250) | $ (6,154,882) |
| Class I | | | | | |
| Sales | | 5,504,437 | $ 51,653,218 | 5,087,241 | $ 52,068,921 |
| Issued to shareholders electing to receive payments of distributions in Fund shares | | 410,806 | 3,874,689 | 434,152 | 4,431,087 |
| Redemptions | | (10,004,257) | (93,270,999) | (4,019,286) | (41,093,820) |
| Net increase (decrease) | | (4,089,014) | $(37,743,092) | 1,502,107 | $ 15,406,188 |
Eaton Vance
Municipal Income Funds
September 30, 2022
Notes to Financial Statements — continued
| National Fund | | | |
| | | Year Ended
September 30, 2022 | | Year Ended
September 30, 2021 |
| | | Shares | Amount | Shares | Amount |
| Class A | | | | | |
| Sales | | 9,382,479 | $ 89,723,271 | 11,047,967 | $ 114,627,273 |
| Issued to shareholders electing to receive payments of distributions in Fund shares | | 3,099,907 | 29,725,930 | 2,984,855 | 30,945,109 |
| Redemptions | | (29,993,424) | (288,815,393) | (24,540,436) | (254,580,665) |
| Converted from Class C shares | | 702,331 | 6,753,225 | 3,351,755 | 34,698,532 |
| Net decrease | | (16,808,707) | $ (162,612,967) | (7,155,859) | $ (74,309,751) |
| Class C | | | | | |
| Sales | | 590,143 | $ 5,726,338 | 1,859,069 | $ 19,296,295 |
| Issued to shareholders electing to receive payments of distributions in Fund shares | | 124,890 | 1,197,694 | 137,455 | 1,423,778 |
| Redemptions | | (2,886,392) | (27,839,656) | (2,272,863) | (23,567,153) |
| Converted to Class A shares | | (702,521) | (6,753,225) | (3,351,767) | (34,698,532) |
| Net decrease | | (2,873,880) | $ (27,668,849) | (3,628,106) | $ (37,545,612) |
| Class I | | | | | |
| Sales | | 138,884,926 | $ 1,320,089,504 | 90,354,141 | $ 938,155,202 |
| Issued to shareholders electing to receive payments of distributions in Fund shares | | 4,908,694 | 47,139,306 | 4,167,096 | 43,217,465 |
| Redemptions | | (156,108,342) | (1,486,157,857) | (42,427,981) | (440,159,489) |
| Net increase (decrease) | | (12,314,722) | $ (118,929,047) | 52,093,256 | $ 541,213,178 |
8 Financial Instruments
The Funds may trade in financial instruments with off-balance sheet risk in the normal course of their investing activities. These financial instruments may include futures contracts and may involve, to a varying degree, elements of risk in excess of the amounts recognized for financial statement purposes. The notional or contractual amounts of these instruments represent the investment a Fund has in particular classes of financial instruments and do not necessarily represent the amounts potentially subject to risk. The measurement of the risks associated with these instruments is meaningful only when all related and offsetting transactions are considered. A summary of obligations under these financial instruments at September 30, 2022 is included in the Portfolio of Investments. At September 30, 2022, National Fund had sufficient cash and/or securities to cover commitments under these contracts.
Each Fund is subject to interest rate risk in the normal course of pursuing its investment objective. Because the Funds hold fixed-rate bonds, the value of these bonds may decrease if interest rates rise. During the year ended September 30, 2022, National Fund entered into U.S. Treasury futures contracts to hedge against changes in interest rates.
Eaton Vance
Municipal Income Funds
September 30, 2022
Notes to Financial Statements — continued
The fair value of open derivative instruments (not considered to be hedging instruments for accounting disclosure purposes) and whose primary underlying risk exposure is interest rate risk at September 30, 2022 was as follows:
| | National
Fund |
| Asset Derivatives | |
| Futures contracts | $ 10,087,569(1) |
| Total | $10,087,569 |
| (1) | Only the current day’s variation margin on open futures contracts is reported within the Statement of Assets and Liabilities as Receivable or Payable for variation margin on open futures contracts, as applicable. |
The effect of derivative instruments (not considered to be hedging instruments for accounting disclosure purposes) on the Statement of Operations and whose primary underlying risk exposure is interest rate risk for the year ended September 30, 2022 was as follows:
| | National
Fund |
| Realized Gain (Loss) on Derivatives Recognized in Income | $22,893,263 (1) |
| Change in Unrealized Appreciation (Depreciation) on Derivatives Recognized in Income | $ 6,064,113(2) |
| (1) | Statement of Operations location: Net realized gain (loss) - Futures contracts. |
| (2) | Statement of Operations location: Change in unrealized appreciation (depreciation) - Futures contracts. |
The average notional cost of futures contracts outstanding during the year ended September 30, 2022, which is indicative of the volume of this derivative type, was approximately as follows:
| | National
Fund |
| Average Notional Cost: | |
| Futures Contracts — Short | $139,256,000 |
9 Line of Credit
The Funds participate with other portfolios and funds managed by EVM and its affiliates in an $800 million unsecured line of credit agreement with a group of banks, which is in effect through October 25, 2022. Borrowings are made by the Funds solely for temporary purposes related to redemptions and other short-term cash needs. Interest is charged to each Fund based on its borrowings at an amount above either the Secured Overnight Financing Rate (SOFR) or Federal Funds rate. In addition, a fee computed at an annual rate of 0.15% on the daily unused portion of the line of credit is allocated among the participating portfolios and funds at the end of each quarter. In connection with the renewal of the agreement in October 2021, an arrangement fee totaling $150,000 was incurred that was allocated to the participating portfolios and funds. Because the line of credit is not available exclusively to the Funds, a Fund may be unable to borrow some or all of its requested amounts at any particular time. At September 30, 2022, the AMT-Free Fund had a balance outstanding pursuant to this line of credit of $290,000 at an interest rate of 4.08%. Based on the short-term nature of the borrowings under the line of credit and variable interest rate, the carrying value of the borrowings approximated its fair value at September 30, 2022. If measured at fair value, borrowings under the line of credit would have been considered as Level 2 in the fair value hierarchy (see Note 10) at September 30, 2022. The Funds did not have any significant borrowings or allocated fees during the year ended September 30, 2022. Effective October 25, 2022, the Funds renewed their line of credit agreement, which expires October 24, 2023. In connection with the renewal, the borrowing limit was decreased to $725 million.
Eaton Vance
Municipal Income Funds
September 30, 2022
Notes to Financial Statements — continued
10 Fair Value Measurements
Under generally accepted accounting principles for fair value measurements, a three-tier hierarchy to prioritize the assumptions, referred to as inputs, is used in valuation techniques to measure fair value. The three-tier hierarchy of inputs is summarized in the three broad levels listed below.
| • | Level 1 – quoted prices in active markets for identical investments |
| • | Level 2 – other significant observable inputs (including quoted prices for similar investments, interest rates, prepayment speeds, credit risk, etc.) |
| • | Level 3 – significant unobservable inputs (including a fund's own assumptions in determining the fair value of investments) |
In cases where the inputs used to measure fair value fall in different levels of the fair value hierarchy, the level disclosed is determined based on the lowest level input that is significant to the fair value measurement in its entirety. The inputs or methodology used for valuing securities are not necessarily an indication of the risk associated with investing in those securities.
At September 30, 2022, the hierarchy of inputs used in valuing the Funds' investments and open derivative instruments, which are carried at value, were as follows:
| AMT-Free Fund | | | | |
| Asset Description | Level 1 | Level 2 | Level 3 | Total |
| Tax-Exempt Mortgage-Backed Securities | $ — | $ 908,059 | $ — | $ 908,059 |
| Tax-Exempt Municipal Obligations | — | 241,429,632 | — | 241,429,632 |
| Total Investments | $ — | $ 242,337,691 | $ — | $ 242,337,691 |
| National Fund | | | | |
| Asset Description | Level 1 | Level 2 | Level 3 | Total |
| Corporate Bonds | $ — | $ 29,212,068 | $ — | $ 29,212,068 |
| Tax-Exempt Municipal Obligations | — | 2,987,207,165 | — | 2,987,207,165 |
| Taxable Municipal Obligations | — | 168,452,981 | — | 168,452,981 |
| Total Investments | $ — | $3,184,872,214 | $ — | $3,184,872,214 |
| Futures Contracts | $ 10,087,569 | $ — | $ — | $ 10,087,569 |
| Total | $10,087,569 | $3,184,872,214 | $ — | $3,194,959,783 |
11 Risks and Uncertainties
Pandemic Risk
An outbreak of respiratory disease caused by a novel coronavirus was first detected in China in late 2019 and subsequently spread internationally. This coronavirus has resulted in closing borders, enhanced health screenings, changes to healthcare service preparation and delivery, quarantines, cancellations, disruptions to supply chains and customer activity, as well as general concern and uncertainty. Health crises caused by outbreaks of disease, such as the coronavirus outbreak, may exacerbate other pre-existing political, social and economic risks and disrupt normal market conditions and operations. The impact of this outbreak has negatively affected the worldwide economy, as well as the economies of individual countries and industries, and could continue to affect the market in significant and unforeseen ways. Other epidemics and pandemics that may arise in the future may have similar effects. Any such impact could adversely affect the Funds' performance, or the performance of the securities in which the Funds invest.
Eaton Vance
AMT-Free Municipal Income Fund
September 30, 2022
Report of Independent Registered Public Accounting Firm
To the Trustees of Eaton Vance Mutual Funds Trust and Shareholders of Eaton Vance AMT-Free Municipal Income Fund:
Opinion on the Financial Statements and Financial Highlights
We have audited the accompanying statement of assets and liabilities of Eaton Vance AMT-Free Municipal Income Fund (the “Fund”) (one of the funds constituting Eaton Vance Mutual Funds Trust), including the portfolio of investments, as of September 30, 2022, the related statement of operations for the year then ended, the statements of changes in net assets for each of the two years in the period then ended, the financial highlights for each of the five years in the period then ended, and the related notes. In our opinion, the financial statements and financial highlights present fairly, in all material respects, the financial position of the Fund as of September 30, 2022, and the results of its operations for the year then ended, the changes in its net assets for each of the two years in the period then ended, and the financial highlights for each of the five years in the period then ended, in conformity with accounting principles generally accepted in the United States of America.
Basis for Opinion
These financial statements and financial highlights are the responsibility of the Fund's management. Our responsibility is to express an opinion on the Fund's financial statements and financial highlights based on our audits. We are a public accounting firm registered with the Public Company Accounting Oversight Board (United States) (PCAOB) and are required to be independent with respect to the Fund in accordance with the U.S. federal securities laws and the applicable rules and regulations of the Securities and Exchange Commission and the PCAOB.
We conducted our audits in accordance with the standards of the PCAOB. Those standards require that we plan and perform the audit to obtain reasonable assurance about whether the financial statements and financial highlights are free of material misstatement, whether due to error or fraud. The Fund is not required to have, nor were we engaged to perform, an audit of its internal control over financial reporting. As part of our audits, we are required to obtain an understanding of internal control over financial reporting but not for the purpose of expressing an opinion on the effectiveness of the Fund’s internal control over financial reporting. Accordingly, we express no such opinion.
Our audits included performing procedures to assess the risks of material misstatement of the financial statements and financial highlights, whether due to error or fraud, and performing procedures that respond to those risks. Such procedures included examining, on a test basis, evidence regarding the amounts and disclosures in the financial statements and financial highlights. Our audits also included evaluating the accounting principles used and significant estimates made by management, as well as evaluating the overall presentation of the financial statements and financial highlights. Our procedures included confirmation of securities owned as of September 30, 2022, by correspondence with the custodian and brokers; when replies were not received from brokers, we performed other auditing procedures. We believe that our audits provide a reasonable basis for our opinion.
/s/ Deloitte & Touche LLP
Boston, Massachusetts
November 23, 2022
We have served as the auditor of one or more Eaton Vance investment companies since 1959.
Eaton Vance
National Municipal Income Fund
September 30, 2022
Report of Independent Registered Public Accounting Firm
To the Trustees of Eaton Vance Municipals Trust and Shareholders of Eaton Vance National Municipal Income Fund:
Opinion on the Financial Statements and Financial Highlights
We have audited the accompanying statement of assets and liabilities of Eaton Vance National Municipal Income Fund (the “Fund”) (one of the funds constituting Eaton Vance Municipals Trust), including the portfolio of investments, as of September 30, 2022, the related statement of operations for the year then ended, the statements of changes in net assets for each of the two years in the period then ended, the financial highlights for each of the five years in the period then ended, and the related notes. In our opinion, the financial statements and financial highlights present fairly, in all material respects, the financial position of the Fund as of September 30, 2022, and the results of its operations for the year then ended, the changes in its net assets for each of the two years in the period then ended, and the financial highlights for each of the five years in the period then ended, in conformity with accounting principles generally accepted in the United States of America.
Basis for Opinion
These financial statements and financial highlights are the responsibility of the Fund's management. Our responsibility is to express an opinion on the Fund's financial statements and financial highlights based on our audits. We are a public accounting firm registered with the Public Company Accounting Oversight Board (United States) (PCAOB) and are required to be independent with respect to the Fund in accordance with the U.S. federal securities laws and the applicable rules and regulations of the Securities and Exchange Commission and the PCAOB.
We conducted our audits in accordance with the standards of the PCAOB. Those standards require that we plan and perform the audit to obtain reasonable assurance about whether the financial statements and financial highlights are free of material misstatement, whether due to error or fraud. The Fund is not required to have, nor were we engaged to perform, an audit of its internal control over financial reporting. As part of our audits, we are required to obtain an understanding of internal control over financial reporting but not for the purpose of expressing an opinion on the effectiveness of the Fund’s internal control over financial reporting. Accordingly, we express no such opinion.
Our audits included performing procedures to assess the risks of material misstatement of the financial statements and financial highlights, whether due to error or fraud, and performing procedures that respond to those risks. Such procedures included examining, on a test basis, evidence regarding the amounts and disclosures in the financial statements and financial highlights. Our audits also included evaluating the accounting principles used and significant estimates made by management, as well as evaluating the overall presentation of the financial statements and financial highlights. Our procedures included confirmation of securities owned as of September 30, 2022, by correspondence with the custodian and brokers; when replies were not received from brokers, we performed other auditing procedures. We believe that our audits provide a reasonable basis for our opinion.
/s/ Deloitte & Touche LLP
Boston, Massachusetts
November 23, 2022
We have served as the auditor of one or more Eaton Vance investment companies since 1959.
Eaton Vance
Municipal Income Funds
September 30, 2022
Federal Tax Information (Unaudited)
The Form 1099-DIV you receive in February 2023 will show the tax status of all distributions paid to your account in calendar year 2022. Shareholders are advised to consult their own tax adviser with respect to the tax consequences of their investment in the Funds. As required by the Internal Revenue Code and/or regulations, shareholders must be notified regarding exempt-interest dividends.
Exempt-Interest Dividends. For the fiscal year ended September 30, 2022, the Funds designate the following percentages of distributions from net investment income as exempt-interest dividends:
| AMT-Free Municipal Income Fund | 100.00% |
| National Municipal Income Fund | 91.65% |
Eaton Vance
Municipal Income Funds
September 30, 2022
Board of Trustees’ Contract Approval
Overview of the Contract Review Process
The Investment Company Act of 1940, as amended (the “1940 Act”), provides, in substance, that the investment advisory agreement between a fund and its investment adviser will continue in effect from year-to-year only if its continuation is approved on an annual basis by a vote of the fund’s board of trustees, including a majority of the trustees who are not “interested persons” of the fund (“independent trustees”), cast in person at a meeting called for the purpose of considering such approval.
At a meeting held on June 8, 2022, the Boards of Trustees/Directors (collectively, the “Board”) that oversee the registered investment companies advised by Eaton Vance Management or its affiliate, Boston Management and Research (the “Eaton Vance Funds”), including a majority of the independent trustees (the “Independent Trustees”), voted to approve the continuation of existing investment advisory agreements and sub-advisory agreements1 for each of the Eaton Vance Funds for an additional one-year period. The Board relied upon the affirmative recommendation of its Contract Review Committee, which is a committee exclusively comprised of Independent Trustees. Prior to making its recommendation, the Contract Review Committee reviewed information furnished by the adviser and sub-adviser to each of the Eaton Vance Funds (including information specifically requested by the Board) for a series of formal meetings held between April and June 2022. Members of the Contract Review Committee also considered information received at prior meetings of the Board and its committees, to the extent such information was relevant to the Contract Review Committee’s annual evaluation of the investment advisory agreements and sub-advisory agreements.
In connection with its evaluation of the investment advisory agreements and sub-advisory agreements, the Board considered various information relating to the Eaton Vance Funds. This included information applicable to all or groups of Eaton Vance Funds, which is referenced immediately below, and information applicable to the particular Eaton Vance Fund covered by this report (additional fund-specific information is referenced below under “Results of the Contract Review Process”). (For funds that invest through one or more underlying portfolios, references to “each fund” in this section may include information that was considered at the portfolio-level.)
Information about Fees, Performance and Expenses
• A report from an independent data provider comparing advisory and other fees paid by each fund to such fees paid by comparable funds, as identified by the independent data provider (“comparable funds”);
• A report from an independent data provider comparing each fund’s total expense ratio (and its components) to those of comparable funds;
• A report from an independent data provider comparing the investment performance of each fund (including, as relevant, total return data, income data, Sharpe ratios and information ratios) to the investment performance of comparable funds and, as applicable, benchmark indices, over various time periods;
• In certain instances, data regarding investment performance relative to customized groups of peer funds and blended indices identified by the adviser in consultation with the Portfolio Management Committee of the Board (a committee exclusively comprised of Independent Trustees);
• Comparative information concerning the fees charged and services provided by the adviser and sub-adviser to each fund in managing other accounts (which may include other mutual funds, collective investment funds and institutional accounts) using investment strategies and techniques similar to those used in managing such fund(s), if any;
• Profitability analyses with respect to the adviser and sub-adviser to each of the funds;
Information about Portfolio Management and Trading
• Descriptions of the investment management services provided to each fund, as well as each of the funds’ investment strategies and policies;
• The procedures and processes used to determine the value of fund assets, including, when necessary, the determination of “fair value” and actions taken to monitor and test the effectiveness of such procedures and processes;
• Information about the policies and practices of each fund’s adviser and sub-adviser with respect to trading, including their processes for seeking best execution of portfolio transactions;
• Information about the allocation of brokerage transactions and the benefits, if any, received by the adviser and sub-adviser to each fund as a result of brokerage allocation, including, as applicable, information concerning the acquisition of research through client commission arrangements and policies with respect to “soft dollars”;
• Data relating to the portfolio turnover rate of each fund and related information regarding active management in the context of particular strategies;
Information about each Adviser and Sub-adviser
• Reports detailing the financial results and condition of the adviser and sub-adviser to each fund;
• Information regarding the individual investment professionals whose responsibilities include portfolio management and investment research for the funds, and, for portfolio managers and certain other investment professionals, information relating to their responsibilities with respect to managing other mutual funds and investment accounts, as applicable;
1 Not all Eaton Vance Funds have entered into a sub-advisory agreement with a sub-adviser. Accordingly, references to “sub-adviser” or “sub-advisory agreement” in this “Overview” section may not be applicable to the particular Eaton Vance Fund covered by this report. Following the “Overview” section, further information regarding the Board’s evaluation of a fund’s contractual arrangements is included under the “Results of the Contract Review Process” section.
Eaton Vance
Municipal Income Funds
September 30, 2022
Board of Trustees’ Contract Approval — continued
• Information regarding the adviser’s and its parent company’s (Morgan Stanley’s) efforts to retain and attract talented investment professionals, including in the context of a particularly competitive marketplace for talent, as well as the ongoing unique environment presented by hybrid, remote and other alternative work arrangements;
• The Code of Ethics of the adviser and its affiliates and the sub-adviser of each fund, together with information relating to compliance with, and the administration of, such codes;
• Policies and procedures relating to proxy voting, including regular reporting with respect to fund proxy voting activities;
• Information regarding the handling of corporate actions and class actions, as well as information regarding litigation and other regulatory matters;
• Information concerning the resources devoted to compliance efforts undertaken by the adviser and its affiliates and the sub-adviser of each fund, if any, including descriptions of their various compliance programs and their record of compliance;
• Information concerning the business continuity and disaster recovery plans of the adviser and its affiliates and the sub-adviser of each fund, if any;
• A description of Eaton Vance Management’s and Boston Management and Research’s oversight of sub-advisers, including with respect to regulatory and compliance issues, investment management and other matters;
Other Relevant Information
• Information regarding ongoing initiatives to further integrate and harmonize, where applicable, the investment management and other departments of the adviser and its affiliates with the overall investment management infrastructure of Morgan Stanley, in light of Morgan Stanley’s acquisition of Eaton Vance on March 1, 2021;
• Information concerning the nature, cost and character of the administrative and other non-investment advisory services provided by Eaton Vance Management and its affiliates;
• Information concerning oversight of the relationship with the custodian, subcustodians, fund accountants, and other third-party service providers by the adviser and/or administrator to each of the funds;
• Information concerning efforts to implement policies and procedures with respect to various new regulations applicable to the funds, including Rule 12d1-4 (the Fund-of-Funds Rule), Rule 18f-4 (the Derivatives Rule) and Rule 2a-5 (the Fair Valuation Rule);
• For an Eaton Vance Fund structured as an exchange-listed closed-end fund, information concerning the benefits of the closed-end fund structure, as well as, where relevant, the closed-end fund’s market prices (including as compared to the closed-end fund’s net asset value (NAV)), trading volume data, continued use of auction preferred shares (where applicable), distribution rates and other relevant matters;
• The risks which the adviser and/or its affiliates incur in connection with the management and operation of the funds, including, among others, litigation, regulatory, entrepreneurial, and other business risks (and the associated costs of such risks); and
• The terms of each investment advisory agreement and sub-advisory agreement.
During the various meetings of the Board and its committees over the course of the year leading up to the June 8, 2022 meeting, the Trustees received information from portfolio managers and other investment professionals of the advisers and sub-advisers of the funds regarding investment and performance matters, and considered various investment and trading strategies used in pursuing the funds’ investment objectives. The Trustees also received information regarding risk management techniques employed in connection with the management of the funds. The Board and its committees evaluated issues pertaining to industry and regulatory developments, compliance procedures, fund governance and other issues with respect to the funds, and received and participated in reports and presentations provided by Eaton Vance Management, Boston Management and Research and fund sub-advisers, with respect to such matters. In addition to the formal meetings of the Board and its committees, the Independent Trustees held regular teleconferences to discuss, among other topics, matters relating to the continuation of investment advisory agreements and sub-advisory agreements.
The Contract Review Committee was advised throughout the contract review process by Goodwin Procter LLP, independent legal counsel for the Independent Trustees. The members of the Contract Review Committee, with the advice of such counsel, exercised their own business judgment in determining the material factors to be considered in evaluating each investment advisory agreement and sub-advisory agreement and the weight to be given to each such factor. The conclusions reached with respect to each investment advisory agreement and sub-advisory agreement were based on a comprehensive evaluation of all the information provided and not any single factor. Moreover, each member of the Contract Review Committee may have placed varying emphasis on particular factors in reaching conclusions with respect to each investment advisory agreement and sub-advisory agreement. In evaluating each investment advisory agreement and sub-advisory agreement, including the fee structures and other terms contained in such agreements, the members of the Contract Review Committee were also informed by multiple years of analysis and discussion with the adviser and sub-adviser to each of the Eaton Vance Funds.
Results of the Contract Review Process
Based on its consideration of the foregoing, and such other information it deemed relevant, including the factors and conclusions described below, the Contract Review Committee concluded that (i) the continuation of the investment advisory agreement between Eaton Vance AMT-Free Municipal Income Fund (the “AMT-Free Muni Income Fund”) and Eaton Vance Management (“EVM”) and (ii) the continuation of the investment advisory agreement between Eaton Vance National Municipal Income Fund (the “National Muni Income Fund”, together with the AMT-Free Muni Income Fund, the “Funds” and each, a “Fund”) and Boston Management and Research (“BMR”) (EVM, with respect to the AMT-Free Muni Income Fund, and BMR, with respect to the National
Eaton Vance
Municipal Income Funds
September 30, 2022
Board of Trustees’ Contract Approval — continued
Muni Income Fund, are each referred to herein as the “Adviser”), including their respective fee structures, are in the interests of shareholders and, therefore, recommended to the Board approval of each agreement. Based on the recommendation of the Contract Review Committee, the Board, including a majority of the Independent Trustees, voted to approve continuation of the investment advisory agreement for each Fund.
Nature, Extent and Quality of Services
In considering whether to approve the investment advisory agreement for each Fund, the Board evaluated the nature, extent and quality of services provided to the Funds by the applicable Adviser.
The Board considered each Adviser’s management capabilities and investment processes in light of the types of investments held by each Fund, respectively, including the education, experience and number of investment professionals and other personnel who provide portfolio management, investment research, and similar services to the Funds, including recent changes to such personnel. In particular, the Board considered, where relevant, the abilities and experience of each Adviser’s investment professionals in analyzing factors such as credit risk, tax efficiency, and special considerations relevant to investing in municipal obligations. The Board considered each Adviser’s municipal bond team, which includes investment professionals and credit specialists who provide services to the applicable Fund. The Board also took into account the resources dedicated to portfolio management and other services, the compensation methods of each Adviser and other factors, including the reputation and resources of the Adviser to recruit and retain highly qualified research, advisory and supervisory investment professionals. In addition, the Board considered the time and attention devoted to the Eaton Vance Funds, including each Fund, by senior management, as well as the infrastructure, operational capabilities and support staff in place to assist in the portfolio management and operations of the Funds, including the provision of administrative services. The Board also considered the business-related and other risks to which the Advisers or its affiliates may be subject in managing the Funds.
The Board considered the compliance programs of each Adviser and relevant affiliates thereof. The Board considered compliance and reporting matters regarding, among other things, personal trading by investment professionals, disclosure of portfolio holdings, late trading, frequent trading, portfolio valuation, business continuity and the allocation of investment opportunities. The Board also considered the responses of each Adviser and its affiliates to requests in recent years from regulatory authorities, such as the Securities and Exchange Commission and the Financial Industry Regulatory Authority.
The Board considered other administrative services provided or overseen by Eaton Vance Management and its affiliates, including transfer agency and accounting services. The Board evaluated the benefits to shareholders of investing in a fund that is a part of a large fund complex offering exposure to a variety of asset classes and investment disciplines, as well as the ability, in many cases, to exchange an investment among different funds without incurring additional sales charges.
After consideration of the foregoing factors, among others, the Board concluded that the nature, extent and quality of services provided by each Adviser, taken as a whole, are appropriate and consistent with the terms of the applicable investment advisory agreement.
Fund Performance
The Board compared each Fund’s investment performance to that of comparable funds identified by an independent data provider (the peer group), as well as an appropriate benchmark index, and assessed each Fund’s performance on the basis of total return and current income return. The Board’s review included comparative performance data with respect to each Fund for the one-, three-, five- and ten-year periods ended December 31, 2021.
In this regard, the Board noted each Fund’s performance relative to its peer group and benchmark index for the three-year period, as follows:
| | Performance Relative to: |
| Fund | Median of
Peer Group | Benchmark
Index |
| Eaton Vance AMT-Free Municipal Income Fund | Lower | Higher |
| Eaton Vance National Municipal Income Fund | Consistent with | Higher |
The Board considered, among other things, each Adviser’s efforts to generate competitive levels of tax-exempt current income over time through investments that, relative to comparable funds, focus on higher quality municipal bonds with longer maturities. With respect to the Eaton Vance AMT-Free Municipal Income Fund, the Board also considered that, in response to inquiries from the Contract Review Committee, the Fund’s performance record had improved relative to its peers in more recent periods. The Board also noted that the income return of the Fund was higher than the median income return of the Fund’s peer group for the three-year period. On the basis of the foregoing and other relevant information provided by the Adviser in response to inquiries from the Contract Review Committee, the Board concluded that the performance of the Fund was satisfactory. With respect to the Eaton Vance National Municipal Income Fund, the Board concluded that the performance of the Fund was satisfactory.
Eaton Vance
Municipal Income Funds
September 30, 2022
Board of Trustees’ Contract Approval — continued
Management Fees and Expenses
The Board considered contractual fee rates payable by each Fund for advisory and administrative services (referred to collectively as “management fees”). As part of its review, the Board considered each Fund’s management fees and total expense ratio for the one-year period ended December 31, 2021, as compared to those of comparable funds, before and after giving effect to any undertaking to waive fees or reimburse expenses. The Board also considered factors that had an impact on each Fund’s total expense ratio relative to comparable funds.
After considering the foregoing information, and in light of the nature, extent and quality of the services provided by each Adviser, the Board concluded that the management fees charged for advisory and related services are reasonable.
Profitability and “Fall-Out” Benefits
The Board considered the level of profits realized by each Adviser and relevant affiliates thereof in providing investment advisory and administrative services to each Fund and to all Eaton Vance Funds as a group. The Board considered the level of profits realized without regard to marketing support or other payments by each Adviser and its affiliates to third parties in respect of distribution or other services.
The Board concluded that, in light of the foregoing factors and the nature, extent and quality of the services rendered, the profits realized by each Adviser and its affiliates are deemed not to be excessive.
The Board also considered direct or indirect fall-out benefits received by each Adviser and its affiliates in connection with their respective relationships with the Funds, including the benefits of research services that may be available to each Adviser as a result of securities transactions effected for the Funds and other investment advisory clients.
Economies of Scale
In reviewing management fees and profitability, the Board also considered the extent to which the applicable Adviser and its affiliates, on the one hand, and each Fund, on the other hand, can expect to realize benefits from economies of scale as the assets of each Fund increase. The Board acknowledged the difficulty in accurately measuring the benefits resulting from economies of scale, if any, with respect to the management of any specific fund or group of funds. The Board reviewed data summarizing the increases and decreases in the assets of each Fund and of all Eaton Vance Funds as a group over various time periods, and evaluated the extent to which the total expense ratio of each Fund and the profitability of each Adviser and its affiliates may have been affected by such increases or decreases. Based upon the foregoing, the Board concluded that each Fund currently shares in the benefits from economies of scale, if any, when they are realized by the Adviser. The Board also concluded that the structure of each advisory fee, which includes breakpoints at several asset levels, will allow each Fund to continue to benefit from any economies of scale in the future.
Eaton Vance
Municipal Income Funds
September 30, 2022
Liquidity Risk Management Program
Each Fund has implemented a written liquidity risk management program (Program) and related procedures to manage its liquidity in accordance with Rule 22e-4 under the Investment Company Act of 1940, as amended (Liquidity Rule). The Liquidity Rule defines “liquidity risk” as the risk that a fund could not meet requests to redeem shares issued by the fund without significant dilution of the remaining investors’ interests in the fund. Each Fund’s Board of Trustees/Directors has designated the investment adviser to serve as the administrator of the Program and the related procedures. The administrator has established a Liquidity Risk Management Oversight Committee (Committee) to perform the functions necessary to administer the Program. As part of the Program, the administrator is responsible for identifying illiquid investments and categorizing the relative liquidity of each Fund’s investments in accordance with the Liquidity Rule. Under the Program, the administrator assesses, manages, and periodically reviews each Fund’s liquidity risk, and is responsible for making certain reports to the Fund’s Board of Trustees/Directors and the Securities and Exchange Commission (SEC) regarding the liquidity of the Fund’s investments, and to notify the Board of Trustees/Directors and the SEC of certain liquidity events specified in the Liquidity Rule. The liquidity of each Fund’s portfolio investments is determined based on a number of factors including, but not limited to, relevant market, trading and investment-specific considerations under the Program.
At a meeting of each Fund’s Board of Trustees/Directors on June 7, 2022, the Committee provided a written report to the Fund’s Board of Trustees/Directors pertaining to the operation, adequacy, and effectiveness of implementation of the Program, as well as the operation of the highly liquid investment minimum (if applicable) for the period January 1, 2021 through December 31, 2021 (Review Period). The Program operated effectively during the Review Period, supporting the administrator’s ability to assess, manage and monitor Fund liquidity risk, including during periods of market volatility and net redemptions. During the Review Period, each Fund met redemption requests on a timely basis.
There can be no assurance that the Program will achieve its objectives in the future. Please refer to each Fund’s prospectus for more information regarding the Fund’s exposure to liquidity risk and other principal risks to which an investment in the Fund may be subject.
Eaton Vance
Municipal Income Funds
September 30, 2022
Management and Organization
Fund Management.The Trustees of Eaton Vance Municipals Trust and Eaton Vance Mutual Funds Trust (collectively, the Trusts) are responsible for the overall management and supervision of the Trusts' affairs. The Board members and officers of the Trusts are listed below. Except as indicated, each individual has held the office shown or other offices in the same company for the last five years. Board members hold indefinite terms of office. Each Trustee holds office until his or her successor is elected and qualified, subject to a prior death, resignation, retirement, disqualification or removal. Under the terms of each Fund's current Trustee retirement policy, an Independent Trustee must retire and resign as a Trustee on the earlier of: (i) the first day of July following his or her 74th birthday; or (ii), with limited exception, December 31st of the 20th year in which he or she has served as a Trustee. However, if such retirement and resignation would cause the Funds to be out of compliance with Section 16 of the 1940 Act or any other regulations or guidance of the SEC, then such retirement and resignation will not become effective until such time as action has been taken for each Fund to be in compliance therewith. The “noninterested Trustees” consist of those Trustees who are not “interested persons” of the Trusts, as that term is defined under the 1940 Act. The business address of each Board member and officer is Two International Place, Boston, Massachusetts 02110. As used below, “BMR” refers to Boston Management and Research, “EVC” refers to Eaton Vance Corp., “EV” refers to EV LLC, “EVM” refers to Eaton Vance Management and “EVD” refers to Eaton Vance Distributors, Inc. EV is the trustee of each of EVM and BMR. Effective March 1, 2021, each of EVM, BMR, EVD and EV are indirect, wholly owned subsidiaries of Morgan Stanley. Each officer affiliated with EVM may hold a position with other EVM affiliates that is comparable to his or her position with EVM listed below. Each Trustee oversees 135 funds (with the exception of Mr. Bowser who oversees 110 funds) in the Eaton Vance fund complex (including both funds and portfolios in a hub and spoke structure).
| Name and Year of Birth | Trust
Position(s) | Length of Service | Principal Occupation(s) and Other Directorships
During Past Five Years and Other Relevant Experience |
| Interested Trustee |
Thomas E. Faust Jr.
1958 | Trustee | Since 2007 | Chairman of Morgan Stanley Investment Management, Inc. (MSIM), member of the Board of Managers and President of EV (since 2021), Chief Executive Officer of EVM and BMR. Formerly, Chairman, Chief Executive Officer (2007-2021) and President (2006-2021) of EVC and Director of EVD (2007-2022). Mr. Faust is an interested person because of his positions with MSIM, BMR, EVM, and EV, which are affiliates of the Trusts.
Other Directorships. Formerly, Director of EVC (2007-2021) and Hexavest Inc.
(investment management firm) (2012-2021). |
| Noninterested Trustees |
Alan C. Bowser(1)
1962 | Trustee | Since 2022 | Chief Diversity Officer, Partner and a member of the Operating Committee, and formerly served as Senior Advisor on Diversity and Inclusion for the firm’s chief executive officer, Co-Head of the Americas Region, and Senior Client Advisor of Bridgewater Associates, an asset management firm (2011- present).
Other Directorships. None. |
Mark R. Fetting
1954 | Trustee | Since 2016 | Private investor. Formerly held various positions at Legg Mason, Inc. (investment management firm) (2000-2012), including President, Chief Executive Officer, Director and Chairman (2008-2012), Senior Executive Vice President (2004-2008) and Executive Vice President (2001-2004). Formerly, President of Legg Mason family of funds (2001-2008). Formerly, Division President and Senior Officer of Prudential Financial Group, Inc. and related companies (investment management firm) (1991-2000).
Other Directorships. None. |
Cynthia E. Frost
1961 | Trustee | Since 2014 | Private investor. Formerly, Chief Investment Officer of Brown University (university endowment) (2000-2012). Formerly, Portfolio Strategist for Duke Management Company (university endowment manager) (1995-2000). Formerly, Managing Director, Cambridge Associates (investment consulting company) (1989-1995). Formerly, Consultant, Bain and Company (management consulting firm) (1987-1989). Formerly, Senior Equity Analyst, BA Investment Management Company (1983-1985).
Other Directorships. None. |
George J. Gorman
1952 | Chairperson
of the Board
and Trustee | Since 2021
(Chairperson) and
2014 (Trustee) | Principal at George J. Gorman LLC (consulting firm). Formerly, Senior Partner at Ernst & Young LLP (a registered public accounting firm) (1974-2009).
Other Directorships. None. |
Eaton Vance
Municipal Income Funds
September 30, 2022
Management and Organization — continued
| Name and Year of Birth | Trust
Position(s) | Length of Service | Principal Occupation(s) and Other Directorships
During Past Five Years and Other Relevant Experience |
| Noninterested Trustees (continued) |
Valerie A. Mosley
1960 | Trustee | Since 2014 | Chairwoman and Chief Executive Officer of Valmo Ventures (a consulting and investment firm). Founder of Upward Wealth, Inc., dba BrightUP, a fintech platform. Formerly, Partner and Senior Vice President, Portfolio Manager and Investment Strategist at Wellington Management Company, LLP (investment management firm) (1992-2012). Formerly, Chief Investment Officer, PG Corbin Asset Management (1990-1992). Formerly worked in institutional corporate bond sales at Kidder Peabody (1986-1990).
Other Directorships. Director of DraftKings, Inc. (digital sports entertainment and gaming company) (since September 2020). Director of Envestnet, Inc. (provider of intelligent systems for wealth management and financial wellness) (since 2018). Formerly, Director of Dynex Capital, Inc. (mortgage REIT) (2013-2020) and Director of Groupon, Inc. (ecommerce provider) (2020-2022). |
Keith Quinton
1958 | Trustee | Since 2018 | Private investor, researcher and lecturer. Formerly, Independent Investment Committee Member at New Hampshire Retirement System (2017-2021). Formerly, Portfolio Manager and Senior Quantitative Analyst at Fidelity Investments (investment management firm) (2001-2014).
Other Directorships. Formerly, Director (2016-2021) and Chairman (2019-2021) of New Hampshire Municipal Bond Bank. |
Marcus L. Smith
1966 | Trustee | Since 2018 | Private investor and independent corporate director. Formerly, Chief Investment Officer, Canada (2012-2017), Chief Investment Officer, Asia (2010-2012), Director of Asian Research (2004-2010) and portfolio manager (2001-2017) at MFS Investment Management (investment management firm).
Other Directorships. Director of First Industrial Realty Trust, Inc. (an industrial REIT) (since 2021). Director of MSCI Inc. (global provider of investment decision support tools) (since 2017). Formerly, Director of DCT Industrial Trust Inc. (logistics real estate company) (2017-2018). |
Susan J. Sutherland
1957 | Trustee | Since 2015 | Private investor. Director of Ascot Group Limited and certain of its subsidiaries (insurance and reinsurance) (since 2017). Formerly, Director of Hagerty Holding Corp. (insurance) (2015-2018) and Montpelier Re Holdings Ltd. (insurance and reinsurance) (2013-2015). Formerly, Associate, Counsel and Partner at Skadden, Arps, Slate, Meagher & Flom LLP (law firm) (1982-2013).
Other Directorships. Director of Kairos Acquisition Corp. (insurance/InsurTech acquisition company) (since 2021). |
Scott E. Wennerholm
1959 | Trustee | Since 2016 | Private investor. Formerly, Trustee at Wheelock College (postsecondary institution) (2012-2018). Formerly, Consultant at GF Parish Group (executive recruiting firm) (2016-2017). Formerly, Chief Operating Officer and Executive Vice President at BNY Mellon Asset Management (investment management firm) (2005-2011). Formerly, Chief Operating Officer and Chief Financial Officer at Natixis Global Asset Management (investment management firm) (1997-2004). Formerly, Vice President at Fidelity Investments Institutional Services (investment management firm) (1994-1997).
Other Directorships. None. |
Nancy A. Wiser(1)
1967 | Trustee | Since 2022 | Formerly, Executive Vice President and the Global Head of Operations at Wells Fargo Asset Management (2011-2021).
Other Directorships. None. |
| Name and Year of Birth | Trust
Position(s) | Length of Service | Principal Occupation(s)
During Past Five Years |
| Principal Officers who are not Trustees |
Eric A. Stein
1980 | President | Since 2020 | Vice President and Chief Investment Officer, Fixed Income of EVM and BMR. Prior to November 1, 2020, Mr. Stein was a co-Director of Eaton Vance’s Global Income Investments. Also Vice President of Calvert Research and Management (“CRM”). |
Deidre E. Walsh
1971 | Vice President and
Chief Legal Officer | Since 2009 | Vice President of EVM and BMR. Also Vice President of CRM. |
James F. Kirchner
1967 | Treasurer | Since 2007 | Vice President of EVM and BMR. Also Vice President of CRM. |
Eaton Vance
Municipal Income Funds
September 30, 2022
Management and Organization — continued
| Name and Year of Birth | Trust
Position(s) | Length of Service | Principal Occupation(s)
During Past Five Years |
| Principal Officers who are not Trustees (continued) |
Jill R. Damon
1984 | Secretary | Since 2022 | Vice President of EVM and BMR since 2017. Formerly, associate at Dechert LLP (2009-2017). |
Richard F. Froio
1968 | Chief Compliance
Officer | Since 2017 | Vice President of EVM and BMR since 2017. Formerly, Deputy Chief Compliance Officer (Adviser/Funds) and Chief Compliance Officer (Distribution) at PIMCO (2012-2017) and Managing Director at BlackRock/Barclays Global Investors (2009-2012). |
(1) Mr. Bowser and Ms. Wiser began serving as Trustees effective April 4, 2022.
The SAI for each Fund includes additional information about the Trustees and officers of the Funds and can be obtained without charge on Eaton Vance’s website at www.eatonvance.com or by calling 1-800-262-1122.
| FACTS | WHAT DOES EATON VANCE DO WITH YOUR
PERSONAL INFORMATION? |
| Why? | Financial companies choose how they share your personal information. Federal law gives consumers the right to limit some but not all sharing. Federal law also requires us to tell you how we collect, share, and protect your personal information. Please read this notice carefully to understand what we do. |
| |
| What? | The types of personal information we collect and share depend on the product or service you have with us. This information can include:■ Social Security number and income
■ investment experience and risk tolerance
■ checking account number and wire transfer instructions |
| |
| How? | All financial companies need to share customers’ personal information to run their everyday business. In the section below, we list the reasons financial companies can share their customers’ personal information; the reasons Eaton Vance chooses to share; and whether you can limit this sharing. |
Reasons we can share your
personal information | Does Eaton Vance
share? | Can you limit
this sharing? |
| For our everyday business purposes — such as to process your transactions, maintain your account(s), respond to court orders and legal investigations, or report to credit bureaus | Yes | No |
| For our marketing purposes — to offer our products and services to you | Yes | No |
| For joint marketing with other financial companies | No | We don’t share |
| For our investment management affiliates’ everyday business purposes — information about your transactions, experiences, and creditworthiness | Yes | Yes |
| For our affiliates’ everyday business purposes — information about your transactions and experiences | Yes | No |
| For our affiliates’ everyday business purposes — information about your creditworthiness | No | We don’t share |
| For our investment management affiliates to market to you | Yes | Yes |
| For our affiliates to market to you | No | We don’t share |
| For nonaffiliates to market to you | No | We don’t share |
To limit our
sharing | Call toll-free 1-800-262-1122 or email: EVPrivacy@eatonvance.comPlease note:If you are a new customer, we can begin sharing your information 30 days from the date we sent this notice. When you are no longer our customer, we continue to share your information as described in this notice. However, you can contact us at any time to limit our sharing. |
| Questions? | Call toll-free 1-800-262-1122 or email: EVPrivacy@eatonvance.com |
| Privacy Notice — continued | April 2021 |
| Who we are |
| Who is providing this notice? | Eaton Vance Management, Eaton Vance Distributors, Inc., Eaton Vance Trust Company, Eaton Vance Management (International) Limited, Eaton Vance Advisers International Ltd., Eaton Vance Global Advisors Limited, Eaton Vance Management’s Real Estate Investment Group, Boston Management and Research, Calvert Research and Management, Eaton Vance and Calvert Fund Families and our investment advisory affiliates (“Eaton Vance”) (see Investment Management Affiliates definition below) |
| What we do |
How does Eaton Vance
protect my personal
information? | To protect your personal information from unauthorized access and use, we use security measures that comply with federal law. These measures include computer safeguards and secured files and buildings. We have policies governing the proper handling of customer information by personnel and requiring third parties that provide support to adhere to appropriate security standards with respect to such information. |
How does Eaton Vance
collect my personal
information? | We collect your personal information, for example, when you■ open an account or make deposits or withdrawals from your account
■ buy securities from us or make a wire transfer
■ give us your contact informationWe also collect your personal information from others, such as credit bureaus, affiliates, or other companies. |
| Why can’t I limit all sharing? | Federal law gives you the right to limit only■ sharing for affiliates’ everyday business purposes — information about your creditworthiness
■ affiliates from using your information to market to you
■ sharing for nonaffiliates to market to youState laws and individual companies may give you additional rights to limit sharing. See below for more on your rights under state law. |
| Definitions |
Investment Management
Affiliates | Eaton Vance Investment Management Affiliates include registered investment advisers, registered broker- dealers, and registered and unregistered funds. Investment Management Affiliates does not include entities associated with Morgan Stanley Wealth Management, such as Morgan Stanley Smith Barney LLC and Morgan Stanley & Co. |
| Affiliates | Companies related by common ownership or control. They can be financial and nonfinancial companies.■ Our affiliates include companies with a Morgan Stanley name and financial companies such as Morgan Stanley Smith Barney LLC and Morgan Stanley & Co. |
| Nonaffiliates | Companies not related by common ownership or control. They can be financial and nonfinancial companies.■ Eaton Vance does not share with nonaffiliates so they can market to you. |
| Joint marketing | A formal agreement between nonaffiliated financial companies that together market financial products or services to you.■ Eaton Vance doesn’t jointly market. |
| Other important information |
| Vermont: Except as permitted by law, we will not share personal information we collect about Vermont residents with Nonaffiliates unless you provide us with your written consent to share such information.California: Except as permitted by law, we will not share personal information we collect about California residents with Nonaffiliates and we will limit sharing such personal information with our Affiliates to comply with California privacy laws that apply to us. |
Delivery of Shareholder Documents. The Securities and Exchange Commission (SEC) permits funds to deliver only one copy of shareholder documents, including prospectuses, proxy statements and shareholder reports, to fund investors with multiple accounts at the same residential or post office box address. This practice is often called “householding” and it helps eliminate duplicate mailings to shareholders. Eaton Vance, or your financial intermediary, may household the mailing of your documents indefinitely unless you instruct Eaton Vance, or your financial intermediary, otherwise. If you would prefer that your Eaton Vance documents not be householded, please contact Eaton Vance at 1-800-262-1122, or contact your financial intermediary. Your instructions that householding not apply to delivery of your Eaton Vance documents will typically be effective within 30 days of receipt by Eaton Vance or your financial intermediary.
Portfolio Holdings. Each Eaton Vance Fund and its underlying Portfolio(s) (if applicable) files a schedule of portfolio holdings on Part F to Form N-PORT with the SEC. Certain information filed on Form N-PORT may be viewed on the Eaton Vance website at www.eatonvance.com, by calling Eaton Vance at 1-800-262-1122 or in the EDGAR database on the SEC’s website at www.sec.gov.
Proxy Voting. From time to time, funds are required to vote proxies related to the securities held by the funds. The Eaton Vance Funds or their underlying Portfolios (if applicable) vote proxies according to a set of policies and procedures approved by the Funds’ and Portfolios’ Boards. You may obtain a description of these policies and procedures and information on how the Funds or Portfolios voted proxies relating to portfolio securities during the most recent 12-month period ended June 30, without charge, upon request, by calling 1-800-262-1122 and by accessing the SEC’s website at www.sec.gov.
This Page Intentionally Left Blank
Investment Advisers
AMT-Free Municipal Income Fund
Eaton Vance Management
Two International Place
Boston, MA 02110
National Municipal Income Fund
Boston Management and Research
Two International Place
Boston, MA 02110
Administrator
Eaton Vance Management
Two International Place
Boston, MA 02110
Principal Underwriter*
Eaton Vance Distributors, Inc.
Two International Place
Boston, MA 02110
(617) 482-8260
Custodian
State Street Bank and Trust Company
State Street Financial Center, One Lincoln Street
Boston, MA 02111
Transfer Agent
BNY Mellon Investment Servicing (US) Inc.
Attn: Eaton Vance Funds
P.O. Box 9653
Providence, RI 02940-9653
(800) 262-1122
Independent Registered Public Accounting Firm
Deloitte & Touche LLP
200 Berkeley Street
Boston, MA 02116-5022
Fund Offices
Two International Place
Boston, MA 02110
*FINRA BrokerCheck. Investors may check the background of their Investment Professional by contacting the Financial Industry Regulatory Authority (FINRA). FINRA BrokerCheck is a free tool to help investors check the professional background of current and former FINRA-registered securities firms and brokers. FINRA BrokerCheck is available by calling 1-800-289-9999 and at www.FINRA.org. The FINRA BrokerCheck brochure describing this program is available to investors at www.FINRA.org.
The registrant (sometimes referred to as the “Fund”) has adopted a code of ethics applicable to its Principal Executive Officer, Principal Financial Officer and Principal Accounting Officer. The registrant undertakes to provide a copy of such code of ethics to any person upon request, without charge, by calling 1-800-262-1122. The registrant has not amended the code of ethics as described in Form N-CSR during the period covered by this report. The registrant has not granted any waiver, including an implicit waiver, from a provision of the code of ethics as described in Form N-CSR during the period covered by this report.
| Item 3. | Audit Committee Financial Expert |
The registrant’s Board of Trustees (the “Board”) has designated George J. Gorman and Scott E. Wennerholm, each an independent trustee, as audit committee financial experts. Mr. Gorman is a certified public accountant who is the Principal at George J. Gorman LLC (a consulting firm). Previously, Mr. Gorman served in various capacities at Ernst & Young LLP (a registered public accounting firm), including as Senior Partner. Mr. Gorman also has experience serving as an independent trustee and audit committee financial expert of other
mutual fund complexes. Mr. Wennerholm is a private investor. Previously, Mr. Wennerholm served as a Trustee at Wheelock College (postsecondary institution), as a Consultant at GF Parish Group (executive recruiting firm), Chief Operating Officer and Executive Vice President at BNY Mellon Asset Management (investment management firm), Chief Operating Officer and Chief Financial Officer at Natixis Global Asset Management (investment management firm), and Vice President at Fidelity Investments Institutional Services (investment management firm).
| Item 4. | Principal Accountant Fees and Services |
Eaton Vance California Municipal Opportunities Fund, Eaton Vance Massachusetts Municipal Income Fund, Eaton Vance National Municipal Income Fund, Eaton Vance New York Municipal Income Fund and Eaton Vance Ohio Municipal Income Fund (the “Fund(s)”) are series of Eaton Vance Municipals Trust (the “Trust”), a Massachusetts business trust, which, including the Funds, contains a total of 18 series (the “Series”). The Trust is registered under the Investment Company Act of 1940 as an open-end management investment company. This Form N-CSR relates to the Funds’ annual reports.
(a)-(d)
The following tables present the aggregate fees billed to each Fund for the Fund’s respective fiscal years ended September 30, 2021 and September 30, 2022 by the registrant’s principal accountant, Deloitte & Touche LLP (“D&T”), for professional services rendered for the audit of the Funds’ annual financial statements and fees billed for other services rendered by D&T for the same time periods.
Eaton Vance California Municipal Opportunities Fund
| | | | | | | | |
Fiscal Years Ended | | 9/30/21 | | | 9/30/22 | |
Audit Fees | | $ | 54,050 | | | $ | 59,250 | |
Audit-Related Fees(1) | | $ | 0 | | | $ | 0 | |
Tax Fees(2) | | $ | 10,896 | | | $ | 1,650 | |
All Other Fees(3) | | $ | 0 | | | $ | 0 | |
| | | | | | | | |
Total | | $ | 64,946 | | | $ | 60,900 | |
| | | | | | | | |
Eaton Vance Massachusetts Municipal Income Fund
| | | | | | | | |
Fiscal Years Ended | | 9/30/21 | | | 9/30/22 | |
Audit Fees | | $ | 48,850 | | | $ | 53,750 | |
Audit-Related Fees(1) | | $ | 0 | | | $ | 0 | |
Tax Fees(2) | | $ | 8,712 | | | $ | 350 | |
All Other Fees(3) | | $ | 0 | | | $ | 0 | |
| | | | | | | | |
Total | | $ | 57,562 | | | $ | 54,100 | |
| | | | | | | | |
Eaton Vance National Municipal Income Fund
| | | | | | | | |
Fiscal Years Ended | | 9/30/21 | | | 9/30/22 | |
Audit Fees | | $ | 92,250 | | | $ | 100,150 | |
Audit-Related Fees(1) | | $ | 0 | | | $ | 0 | |
Tax Fees(2) | | $ | 18,817 | | | $ | 350 | |
All Other Fees(3) | | $ | 0 | | | $ | 0 | |
| | | | | | | | |
Total | | $ | 111,067 | | | $ | 100,500 | |
| | | | | | | | |
Eaton Vance New York Municipal Income Fund
| | | | | | | | |
Fiscal Years Ended | | 9/30/21 | | | 9/30/22 | |
Audit Fees | | $ | 56,350 | | | $ | 61,750 | |
Audit-Related Fees(1) | | $ | 0 | | | $ | 0 | |
Tax Fees(2) | | $ | 12,101 | | | $ | 1,300 | |
All Other Fees(3) | | $ | 0 | | | $ | 0 | |
| | | | | | | | |
Total | | $ | 68,451 | | | $ | 63,050 | |
| | | | | | | | |
Eaton Vance Ohio Municipal Income Fund
| | | | | | | | |
Fiscal Years Ended | | 9/30/21 | | | 9/30/22 | |
Audit Fees | | $ | 41,850 | | | $ | 46,250 | |
Audit-Related Fees(1) | | $ | 0 | | | $ | 0 | |
Tax Fees(2) | | $ | 7,507 | | | $ | 0 | |
All Other Fees(3) | | $ | 0 | | | $ | 0 | |
| | | | | | | | |
Total | | $ | 49,357 | | | $ | 46,250 | |
| | | | | | | | |
| (1) | Audit-related fees consist of the aggregate fees billed for assurance and related services that are reasonably related to the performance of the audit of the registrant’s financial statements and are not reported under the category of audit fees. |
| (2) | Tax fees consist of the aggregate fees billed for professional services rendered by the principal accountant relating to tax compliance, tax advice, and tax planning and specifically include fees for tax return preparation and other related tax compliance/planning matters. |
| (3) | All other fees consist of the aggregate fees billed for products and services provided by the principal accountant other than audit, audit-related, and tax services. |
The Series comprising the Trust have varying fiscal year ends (July 31, August 31, and September 30). The following table presents the aggregate audit, audit-related, tax, and other fees billed to all of the Series in the Trust by D&T for the last two fiscal years of each Series.
| | | | | | | | | | | | | | | | | | | | | | | | |
Fiscal Years Ended | | 7/31/21 | | | 8/31/21 | | | 9/30/21 | | | 7/31/22 | | | 8/31/22 | | | 9/30/22 | |
Audit Fees | | $ | 253,000 | | | $ | 259,550 | | | $ | 293,350 | | | $ | 276,300 | | | $ | 286,950 | | | $ | 321,150 | |
Audit-Related Fees(1) | | $ | 0 | | | $ | 0 | | | $ | 0 | | | $ | 0 | | | $ | 0 | | | $ | 0 | |
Tax Fees(2) | | $ | 43,653 | | | $ | 53,663 | | | $ | 58,033 | | | $ | 3,400 | | | $ | 350 | | | $ | 3,650 | |
All Other Fees(3) | | $ | 0 | | | $ | 0 | | | $ | 0 | | | $ | 0 | | | $ | 0 | | | $ | 0 | |
| | | | | | | | | | | | | | | | | | | | | | | | |
Total | | $ | 296,653 | | | $ | 313,203 | | | $ | 351,383 | | | $ | 279,700 | | | $ | 287,300 | | | $ | 324,800 | |
| | | | | | | | | | | | | | | | | | | | | | | | |
| (1) | Audit-related fees consist of the aggregate fees billed for assurance and related services that are reasonably related to the performance of the audit of the registrant’s financial statements and are not reported under the category of audit fees. |
| (2) | Tax fees consist of the aggregate fees billed for professional services rendered by the principal accountant relating to tax compliance, tax advice, and tax planning and specifically include fees for tax return preparation and other related tax compliance/planning matters. |
| (3) | All other fees consist of the aggregate fees billed for products and services provided by the principal accountant other than audit, audit-related, and tax services. |
(e)(1) The registrant’s audit committee has adopted policies and procedures relating to the pre-approval of services provided by the registrant’s principal accountant (the “Pre-Approval Policies”). The Pre-Approval Policies establish a framework intended to assist the audit committee in the proper discharge of its pre-approval responsibilities. As a general matter, the Pre-Approval Policies (i) specify certain types of audit, audit-related, tax, and other services determined to be pre-approved by the audit committee; and (ii) delineate specific procedures governing the mechanics of the pre-approval process, including the approval and monitoring of audit and non-audit service fees. Unless a service is specifically pre-approved under the Pre-Approval Policies, it must be separately pre-approved by the audit committee.
The Pre-Approval Policies and the types of audit and non-audit services pre-approved therein must be reviewed and ratified by the registrant’s audit committee at least annually. The registrant’s audit committee maintains full responsibility for the appointment, compensation, and oversight of the work of the registrant’s principal accountant.
(e)(2) No services described in paragraphs (b)-(d) above were approved by the registrant’s audit committee pursuant to the “de minimis exception” set forth in Rule 2-01(c)(7)(i)(C) of Regulation S-X.
(f) Not applicable.
(g) The following table presents (i) the aggregate non-audit fees (i.e., fees for audit-related, tax, and other services) billed for services rendered to all of the Series in the Trust by the Series’ principal accountant for the last two fiscal years of each Series; and (ii) the aggregate non-audit fees (i.e., fees for audit-related, tax, and other services) billed for services rendered to the Eaton Vance organization by D&T for the last two fiscal years of each Series.
| | | | | | | | | | | | | | | | | | | | | | | | |
Fiscal Years Ended | | 7/31/21 | | | 8/31/21 | | | 9/30/21 | | | 7/31/22 | | | 8/31/22 | | | 9/30/22 | |
Registrant(1) | | $ | 43,653 | | | $ | 53,653 | | | $ | 58,033 | | | $ | 3,400 | | | $ | 350 | | | $ | 3,650 | |
Eaton Vance(2) | | $ | 150,300 | | | $ | 150,300 | | | $ | 51,800 | | | $ | 0 | | | $ | 0 | | | $ | 52,836 | |
| (1) | Includes all of the Series of the Trust. |
| (2) | The investment adviser to the Series, as well as any of its affiliates that provide ongoing services to the Series, are subsidiaries of Morgan Stanley.. |
(h) The registrant’s audit committee has considered whether the provision by the registrant’s principal accountant of non-audit services to the registrant’s investment adviser and any entity controlling, controlled by, or under common control with the adviser that provides ongoing services to the registrant that were not pre-approved pursuant to Rule 2-01(c)(7)(ii) of Regulation S-X is compatible with maintaining the principal accountant’s independence.
| Item 5. | Audit Committee of Listed Registrants |
Not applicable.
| Item 6. | Schedule of Investments |
Please see schedule of investments contained in the Report to Stockholders included under Item 1 of this Form N-CSR.
| Item 7. | Disclosure of Proxy Voting Policies and Procedures for Closed-End Management Investment Companies |
Not applicable.
| Item 8. | Portfolio Managers of Closed-End Management Investment Companies |
Not applicable.
| Item 9. | Purchases of Equity Securities by Closed-End Management Investment Company and Affiliated Purchasers |
Not applicable.
| Item 10. | Submission of Matters to a Vote of Security Holders |
No material changes.
| Item 11. | Controls and Procedures |
(a) It is the conclusion of the registrant’s principal executive officer and principal financial officer that the effectiveness of the registrant’s current disclosure controls and procedures (such disclosure controls and procedures having been evaluated within 90 days of the date of this filing) provide reasonable assurance that the information required to be disclosed by the registrant has been recorded, processed, summarized and reported within the time period specified in the Commission’s rules and forms and that the information required to be disclosed by the registrant has been accumulated and communicated to the registrant’s principal executive officer and principal financial officer in order to allow timely decisions regarding required disclosure.
(b) There have been no changes in the registrant’s internal controls over financial reporting during the period covered by this report that has materially affected, or is reasonably likely to materially affect, the registrant’s internal control over financial reporting.
| Item 12. | Disclosure of Securities Lending Activities for Closed-End Management Investment Companies |
Not applicable.
Signatures
Pursuant to the requirements of the Securities Exchange Act of 1934 and the Investment Company Act of 1940, the registrant has duly caused this report to be signed on its behalf by the undersigned, thereunto duly authorized.
| | |
| Eaton Vance Municipals Trust |
| |
| By: | | /s/ Eric A. Stein |
| | Eric A. Stein |
| | President |
| |
| Date: | | November 23, 2022 |
Pursuant to the requirements of the Securities Exchange Act of 1934 and the Investment Company Act of 1940, this report has been signed below by the following persons on behalf of the registrant and in the capacities and on the dates indicated.
| | |
| By: | | /s/ James F. Kirchner |
| | James F. Kirchner |
| | Treasurer |
| |
| Date: | | November 23, 2022 |
| | |
| By: | | /s/ Eric A. Stein |
| | Eric A. Stein |
| | President |
| |
| Date: | | November 23, 2022 |