UNITED STATES
SECURITIES AND EXCHANGE COMMISSION
Washington, D.C. 20549
Form N-CSR
CERTIFIED SHAREHOLDER REPORT OF REGISTERED
MANAGEMENT INVESTMENT COMPANIES
Investment Company Act File Number: 811-04409
Eaton Vance Municipals Trust
(Exact Name of Registrant as Specified in Charter)
Two International Place, Boston, Massachusetts 02110
(Address of Principal Executive Offices)
Deidre E. Walsh
Two International Place, Boston, Massachusetts 02110
(Name and Address of Agent for Services)
(617) 482-8260
(Registrant’s Telephone Number)
July 31
Date of Fiscal Year End
January 31, 2023
Date of Reporting Period
Item 1. Reports to Stockholders
Eaton Vance
Municipals Trust
Semiannual Report
January 31, 2023
Arizona • Connecticut • Minnesota • New Jersey • Pennsylvania
Commodity Futures Trading Commission Registration. The Commodity Futures Trading Commission (“CFTC”) has adopted regulations that subject registered investment companies and advisers to regulation by the CFTC if a fund invests more than a prescribed level of its assets in certain CFTC-regulated instruments (including futures, certain options and swap agreements) or markets itself as providing investment exposure to such instruments. The investment adviser has claimed an exclusion from the definition of “commodity pool operator” under the Commodity Exchange Act with respect to its management of each Fund. Accordingly, neither the Funds nor the adviser with respect to the operation of the Funds is subject to CFTC regulation. Because of its management of other strategies, the Funds' adviser is registered with the CFTC as a commodity pool operator. The adviser is also registered as a commodity trading advisor.
Fund shares are not insured by the FDIC and are not deposits or other obligations of, or guaranteed by, any depository institution. Shares are subject to investment risks, including possible loss of principal invested.
This report must be preceded or accompanied by a current summary prospectus or prospectus. Before investing, investors should consider carefully the investment objective, risks, and charges and expenses of a mutual fund. This and other important information is contained in the summary prospectus and prospectus, which can be obtained from a financial intermediary. Prospective investors should read the prospectus carefully before investing. For further information, please call 1-800-262-1122.
Semiannual Report January 31, 2023
Eaton Vance
Municipal Income Funds
Eaton Vance
Arizona Municipal Income Fund
January 31, 2023
Performance
Portfolio Manager(s) Trevor G. Smith
| % Average Annual Total Returns1,2 | Class
Inception Date | Performance
Inception Date | Six Months | One Year | Five Years | Ten Years |
| Class A at NAV | 12/13/1993 | 07/25/1991 | 0.49% | (3.36)% | 1.54% | 1.92% |
| Class A with 3.25% Maximum Sales Charge | — | — | (2.83) | (6.49) | 0.87 | 1.58 |
| Class C at NAV | 12/16/2005 | 07/25/1991 | (0.01) | (4.18) | 0.77 | 1.32 |
| Class C with 1% Maximum Deferred Sales Charge | — | — | (1.00) | (5.12) | 0.77 | 1.32 |
| Class I at NAV | 08/03/2010 | 07/25/1991 | 0.59 | (3.17) | 1.74 | 2.13 |
|
| Bloomberg Municipal Bond Index | — | — | 0.73% | (3.25)% | 2.07% | 2.38% |
| Bloomberg Arizona Municipal Bond Index | — | — | 0.42 | (3.62) | 1.80 | 2.25 |
| % Total Annual Operating Expense Ratios3 | Class A | Class C | Class I |
| | 0.69% | 1.44% | 0.49% |
| % Distribution Rates/Yields4 | Class A | Class C | Class I |
| Distribution Rate | 2.46% | 1.71% | 2.66% |
| Taxable-Equivalent Distribution Rate | 4.37 | 3.04 | 4.72 |
| SEC 30-day Yield | 2.36 | 1.70 | 2.64 |
| Taxable-Equivalent SEC 30-day Yield | 4.20 | 3.03 | 4.69 |
See Endnotes and Additional Disclosures in this report.
Past performance is no guarantee of future results. Returns are historical and are calculated by determining the percentage change in net asset value (NAV) or offering price (as applicable) with all distributions reinvested. Furthermore, returns do not reflect the deduction of taxes that shareholders may have to pay on Fund distributions or upon the redemption of Fund shares. Investment return and principal value will fluctuate so that shares, when redeemed, may be worth more or less than their original cost. Performance for periods less than or equal to one year is cumulative. Performance is for the stated time period only; due to market volatility, current Fund performance may be lower or higher than the quoted return. For performance as of the most recent month-end, please refer to eatonvance.com.
Eaton Vance
Arizona Municipal Income Fund
January 31, 2023
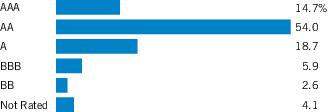
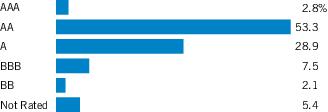
| Credit Quality (% of total investments)1 |
Footnotes:
| 1 | For purposes of the Fund’s rating restrictions, ratings are based on Moody’s Investors Service, Inc. (“Moody’s”), S&P Global Ratings (“S&P”) or Fitch Ratings (“Fitch”), as applicable. If securities are rated differently by the ratings agencies, the highest rating is applied. Ratings, which are subject to change, apply to the creditworthiness of the issuers of the underlying securities and not to the Fund or its shares. Credit ratings measure the quality of a bond based on the issuer’s creditworthiness, with ratings ranging from AAA, being the highest, to D, being the lowest based on S&P’s measures. Ratings of BBB or higher by S&P or Fitch (Baa or higher by Moody’s) are considered to be investment-grade quality. Credit ratings are based largely on the ratings agency’s analysis at the time of rating. The rating assigned to any particular security is not necessarily a reflection of the issuer’s current financial condition and does not necessarily reflect its assessment of the volatility of a security’s market value or of the liquidity of an investment in the security. Holdings designated as “Not Rated” (if any) are not rated by the national ratings agencies stated above. |
Eaton Vance
Connecticut Municipal Income Fund
January 31, 2023
Performance
Portfolio Manager(s) Trevor G. Smith
| % Average Annual Total Returns1,2 | Class
Inception Date | Performance
Inception Date | Six Months | One Year | Five Years | Ten Years |
| Class A at NAV | 04/19/1994 | 05/01/1992 | 0.77% | (2.88)% | 1.54% | 1.86% |
| Class A with 3.25% Maximum Sales Charge | — | — | (2.50) | (6.07) | 0.87 | 1.53 |
| Class C at NAV | 02/09/2006 | 05/01/1992 | 0.28 | (3.63) | 0.78 | 1.25 |
| Class C with 1% Maximum Deferred Sales Charge | — | — | (0.72) | (4.58) | 0.78 | 1.25 |
| Class I at NAV | 03/03/2008 | 05/01/1992 | 0.87 | (2.69) | 1.75 | 2.07 |
|
| Bloomberg Municipal Bond Index | — | — | 0.73% | (3.25)% | 2.07% | 2.38% |
| Bloomberg Connecticut Municipal Bond Index | — | — | 0.90 | (1.74) | 2.47 | 2.23 |
| % Total Annual Operating Expense Ratios3 | Class A | Class C | Class I |
| | 0.69% | 1.44% | 0.49% |
| % Distribution Rates/Yields4 | Class A | Class C | Class I |
| Distribution Rate | 2.38% | 1.63% | 2.58% |
| Taxable-Equivalent Distribution Rate | 4.56 | 3.13 | 4.94 |
| SEC 30-day Yield | 2.29 | 1.63 | 2.57 |
| Taxable-Equivalent SEC 30-day Yield | 4.39 | 3.12 | 4.92 |
See Endnotes and Additional Disclosures in this report.
Past performance is no guarantee of future results. Returns are historical and are calculated by determining the percentage change in net asset value (NAV) or offering price (as applicable) with all distributions reinvested. Furthermore, returns do not reflect the deduction of taxes that shareholders may have to pay on Fund distributions or upon the redemption of Fund shares. Investment return and principal value will fluctuate so that shares, when redeemed, may be worth more or less than their original cost. Performance for periods less than or equal to one year is cumulative. Performance is for the stated time period only; due to market volatility, current Fund performance may be lower or higher than the quoted return. For performance as of the most recent month-end, please refer to eatonvance.com.
Eaton Vance
Connecticut Municipal Income Fund
January 31, 2023
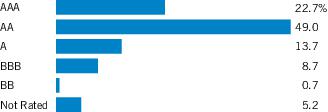
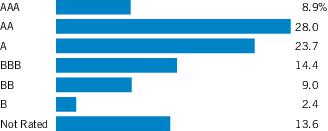
| Credit Quality (% of total investments)1 |
Footnotes:
| 1 | For purposes of the Fund’s rating restrictions, ratings are based on Moody’s Investors Service, Inc. (“Moody’s”), S&P Global Ratings (“S&P”) or Fitch Ratings (“Fitch”), as applicable. If securities are rated differently by the ratings agencies, the highest rating is applied. Ratings, which are subject to change, apply to the creditworthiness of the issuers of the underlying securities and not to the Fund or its shares. Credit ratings measure the quality of a bond based on the issuer’s creditworthiness, with ratings ranging from AAA, being the highest, to D, being the lowest based on S&P’s measures. Ratings of BBB or higher by S&P or Fitch (Baa or higher by Moody’s) are considered to be investment-grade quality. Credit ratings are based largely on the ratings agency’s analysis at the time of rating. The rating assigned to any particular security is not necessarily a reflection of the issuer’s current financial condition and does not necessarily reflect its assessment of the volatility of a security’s market value or of the liquidity of an investment in the security. Holdings designated as “Not Rated” (if any) are not rated by the national ratings agencies stated above. |
Eaton Vance
Minnesota Municipal Income Fund
January 31, 2023
Performance
Portfolio Manager(s) Christopher J. Eustance, CFA and Julie P. Callahan, CFA
| % Average Annual Total Returns1,2 | Class
Inception Date | Performance
Inception Date | Six Months | One Year | Five Years | Ten Years |
| Class A at NAV | 12/09/1993 | 07/29/1991 | 0.57% | (2.15)% | 1.69% | 1.84% |
| Class A with 3.25% Maximum Sales Charge | — | — | (2.71) | (5.33) | 1.02 | 1.51 |
| Class C at NAV | 12/21/2005 | 07/29/1991 | 0.23 | (2.88) | 0.93 | 1.24 |
| Class C with 1% Maximum Deferred Sales Charge | — | — | (0.77) | (3.84) | 0.93 | 1.24 |
| Class I at NAV | 08/03/2010 | 07/29/1991 | 0.67 | (1.95) | 1.89 | 2.04 |
|
| Bloomberg Municipal Bond Index | — | — | 0.73% | (3.25)% | 2.07% | 2.38% |
| Bloomberg Minnesota Municipal Bond Index | — | — | 0.96 | (2.54) | 1.93 | 2.08 |
| % Total Annual Operating Expense Ratios3 | Class A | Class C | Class I |
| | 0.66% | 1.41% | 0.46% |
| % Distribution Rates/Yields4 | Class A | Class C | Class I |
| Distribution Rate | 2.20% | 1.45% | 2.40% |
| Taxable-Equivalent Distribution Rate | 4.45 | 2.95 | 4.85 |
| SEC 30-day Yield | 2.22 | 1.56 | 2.49 |
| Taxable-Equivalent SEC 30-day Yield | 4.50 | 3.16 | 5.05 |
See Endnotes and Additional Disclosures in this report.
Past performance is no guarantee of future results. Returns are historical and are calculated by determining the percentage change in net asset value (NAV) or offering price (as applicable) with all distributions reinvested. Furthermore, returns do not reflect the deduction of taxes that shareholders may have to pay on Fund distributions or upon the redemption of Fund shares. Investment return and principal value will fluctuate so that shares, when redeemed, may be worth more or less than their original cost. Performance for periods less than or equal to one year is cumulative. Performance is for the stated time period only; due to market volatility, current Fund performance may be lower or higher than the quoted return. For performance as of the most recent month-end, please refer to eatonvance.com.
Eaton Vance
Minnesota Municipal Income Fund
January 31, 2023
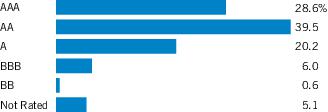
| Credit Quality (% of total investments)1 |
Footnotes:
| 1 | For purposes of the Fund’s rating restrictions, ratings are based on Moody’s Investors Service, Inc. (“Moody’s”), S&P Global Ratings (“S&P”) or Fitch Ratings (“Fitch”), as applicable. If securities are rated differently by the ratings agencies, the highest rating is applied. Ratings, which are subject to change, apply to the creditworthiness of the issuers of the underlying securities and not to the Fund or its shares. Credit ratings measure the quality of a bond based on the issuer’s creditworthiness, with ratings ranging from AAA, being the highest, to D, being the lowest based on S&P’s measures. Ratings of BBB or higher by S&P or Fitch (Baa or higher by Moody’s) are considered to be investment-grade quality. Credit ratings are based largely on the ratings agency’s analysis at the time of rating. The rating assigned to any particular security is not necessarily a reflection of the issuer’s current financial condition and does not necessarily reflect its assessment of the volatility of a security’s market value or of the liquidity of an investment in the security. Holdings designated as “Not Rated” (if any) are not rated by the national ratings agencies stated above. |
Eaton Vance
New Jersey Municipal Income Fund
January 31, 2023
Performance
Portfolio Manager(s) Cynthia J. Clemson, Christopher J. Eustance, CFA and Julie P. Callahan, CFA
| % Average Annual Total Returns1,2 | Class
Inception Date | Performance
Inception Date | Six Months | One Year | Five Years | Ten Years |
| Class A at NAV | 04/13/1994 | 01/08/1991 | 0.02% | (4.97)% | 1.91% | 2.10% |
| Class A with 3.25% Maximum Sales Charge | — | — | (3.27) | (8.10) | 1.23 | 1.76 |
| Class C at NAV | 12/14/2005 | 01/08/1991 | (0.41) | (5.79) | 1.13 | 1.48 |
| Class C with 1% Maximum Deferred Sales Charge | — | — | (1.40) | (6.71) | 1.13 | 1.48 |
| Class I at NAV | 03/03/2008 | 01/08/1991 | 0.12 | (4.87) | 2.09 | 2.29 |
|
| Bloomberg Municipal Bond Index | — | — | 0.73% | (3.25)% | 2.07% | 2.38% |
| Bloomberg New Jersey Municipal Bond Index | — | — | 1.08 | (3.00) | 2.94 | 2.98 |
| % Total Annual Operating Expense Ratios3 | Class A | Class C | Class I |
| | 0.69% | 1.44% | 0.49% |
| % Distribution Rates/Yields4 | Class A | Class C | Class I |
| Distribution Rate | 2.72% | 1.98% | 2.92% |
| Taxable-Equivalent Distribution Rate | 5.62 | 4.08 | 6.03 |
| SEC 30-day Yield | 2.56 | 1.90 | 2.84 |
| Taxable-Equivalent SEC 30-day Yield | 5.28 | 3.93 | 5.86 |
See Endnotes and Additional Disclosures in this report.
Past performance is no guarantee of future results. Returns are historical and are calculated by determining the percentage change in net asset value (NAV) or offering price (as applicable) with all distributions reinvested. Furthermore, returns do not reflect the deduction of taxes that shareholders may have to pay on Fund distributions or upon the redemption of Fund shares. Investment return and principal value will fluctuate so that shares, when redeemed, may be worth more or less than their original cost. Performance for periods less than or equal to one year is cumulative. Performance is for the stated time period only; due to market volatility, current Fund performance may be lower or higher than the quoted return. For performance as of the most recent month-end, please refer to eatonvance.com.
Eaton Vance
New Jersey Municipal Income Fund
January 31, 2023
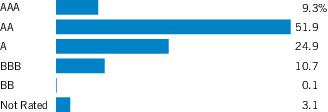
| Credit Quality (% of total investments)1 |
Footnotes:
| 1 | For purposes of the Fund’s rating restrictions, ratings are based on Moody’s Investors Service, Inc. (“Moody’s”), S&P Global Ratings (“S&P”) or Fitch Ratings (“Fitch”), as applicable. If securities are rated differently by the ratings agencies, the highest rating is applied. Ratings, which are subject to change, apply to the creditworthiness of the issuers of the underlying securities and not to the Fund or its shares. Credit ratings measure the quality of a bond based on the issuer’s creditworthiness, with ratings ranging from AAA, being the highest, to D, being the lowest based on S&P’s measures. Ratings of BBB or higher by S&P or Fitch (Baa or higher by Moody’s) are considered to be investment-grade quality. Credit ratings are based largely on the ratings agency’s analysis at the time of rating. The rating assigned to any particular security is not necessarily a reflection of the issuer’s current financial condition and does not necessarily reflect its assessment of the volatility of a security’s market value or of the liquidity of an investment in the security. Holdings designated as “Not Rated” (if any) are not rated by the national ratings agencies stated above. |
Eaton Vance
Pennsylvania Municipal Income Fund
January 31, 2023
Performance
Portfolio Manager(s) Christopher J. Eustance, CFA
| % Average Annual Total Returns1,2 | Class
Inception Date | Performance
Inception Date | Six Months | One Year | Five Years | Ten Years |
| Class A at NAV | 06/01/1994 | 01/08/1991 | 0.60% | (4.32)% | 1.43% | 1.79% |
| Class A with 3.25% Maximum Sales Charge | — | — | (2.71) | (7.38) | 0.76 | 1.46 |
| Class C at NAV | 01/13/2006 | 01/08/1991 | 0.13 | (5.02) | 0.66 | 1.18 |
| Class C with 1% Maximum Deferred Sales Charge | — | — | (0.86) | (5.95) | 0.66 | 1.18 |
| Class I at NAV | 03/03/2008 | 01/08/1991 | 0.70 | (4.10) | 1.62 | 1.99 |
|
| Bloomberg Municipal Bond Index | — | — | 0.73% | (3.25)% | 2.07% | 2.38% |
| Bloomberg Pennsylvania Municipal Bond Index | — | — | 0.63 | (3.74) | 2.28 | 2.64 |
| % Total Annual Operating Expense Ratios3 | Class A | Class C | Class I |
| | 0.74% | 1.49% | 0.54% |
| % Distribution Rates/Yields4 | Class A | Class C | Class I |
| Distribution Rate | 2.87% | 2.13% | 3.07% |
| Taxable-Equivalent Distribution Rate | 5.12 | 3.79 | 5.47 |
| SEC 30-day Yield | 2.52 | 1.86 | 2.80 |
| Taxable-Equivalent SEC 30-day Yield | 4.48 | 3.31 | 4.98 |
| % Total Leverage5 | |
| Residual Interest Bond (RIB) Financing | 3.07% |
See Endnotes and Additional Disclosures in this report.
Past performance is no guarantee of future results. Returns are historical and are calculated by determining the percentage change in net asset value (NAV) or offering price (as applicable) with all distributions reinvested. Furthermore, returns do not reflect the deduction of taxes that shareholders may have to pay on Fund distributions or upon the redemption of Fund shares. Investment return and principal value will fluctuate so that shares, when redeemed, may be worth more or less than their original cost. Performance for periods less than or equal to one year is cumulative. Performance is for the stated time period only; due to market volatility, current Fund performance may be lower or higher than the quoted return. For performance as of the most recent month-end, please refer to eatonvance.com.
Eaton Vance
Pennsylvania Municipal Income Fund
January 31, 2023
| Credit Quality (% of total investments)1,2 |
Footnotes:
| 1 | For purposes of the Fund’s rating restrictions, ratings are based on Moody’s Investors Service, Inc. (“Moody’s”), S&P Global Ratings (“S&P”) or Fitch Ratings (“Fitch”), as applicable. If securities are rated differently by the ratings agencies, the highest rating is applied. Ratings, which are subject to change, apply to the creditworthiness of the issuers of the underlying securities and not to the Fund or its shares. Credit ratings measure the quality of a bond based on the issuer’s creditworthiness, with ratings ranging from AAA, being the highest, to D, being the lowest based on S&P’s measures. Ratings of BBB or higher by S&P or Fitch (Baa or higher by Moody’s) are considered to be investment-grade quality. Credit ratings are based largely on the ratings agency’s analysis at the time of rating. The rating assigned to any particular security is not necessarily a reflection of the issuer’s current financial condition and does not necessarily reflect its assessment of the volatility of a security’s market value or of the liquidity of an investment in the security. Holdings designated as “Not Rated” (if any) are not rated by the national ratings agencies stated above. |
| 2 | The chart includes the municipal bonds held by a trust that issues residual interest bonds, consistent with the Portfolio of Investments. |
Eaton Vance
Municipal Income Funds
January 31, 2023
Endnotes and Additional Disclosures
| 1 | Bloomberg Municipal Bond Index is an unmanaged index of municipal bonds traded in the U.S. Bloomberg Arizona Municipal Bond Index is an unmanaged index of Arizona municipal bonds. Bloomberg Connecticut Municipal Bond Index is an unmanaged index of Connecticut municipal bonds. Bloomberg Minnesota Municipal Bond Index is an unmanaged index of Minnesota municipal bonds. Bloomberg New Jersey Municipal Bond Index is an unmanaged index of New Jersey municipal bonds. Bloomberg Pennsylvania Municipal Bond Index is an unmanaged index of Pennsylvania municipal bonds. Unless otherwise stated, index returns do not reflect the effect of any applicable sales charges, commissions, expenses, taxes or leverage, as applicable. It is not possible to invest directly in an index. |
| 2 | Total Returns at NAV do not include applicable sales charges. If sales charges were deducted, the returns would be lower. Total Returns shown with maximum sales charge reflect the stated maximum sales charge. Unless otherwise stated, performance does not reflect the deduction of taxes on Fund distributions or redemptions of Fund shares.Effective November 5, 2020, Class C shares automatically convert to Class A shares eight years after purchase. The average annual total returns listed for Class C reflect conversion to Class A shares after eight years. Prior to November 5, 2020, Class C shares automatically converted to Class A shares ten years after purchase. |
| 3 | Source: Fund prospectus. The expense ratios for the current reporting period can be found in the Financial Highlights section of this report. |
| 4 | The Distribution Rate is based on the Fund’s last regular distribution per share in the period (annualized) divided by the Fund’s NAV at the end of the period. The Fund’s distributions may be comprised of amounts characterized for federal income tax purposes as tax-exempt income, qualified and non-qualified ordinary dividends, capital gains and nondividend distributions, also known as return of capital. The Fund will determine the federal income tax character of distributions paid to a shareholder after the end of the calendar year. This is reported on the IRS form 1099-DIV and provided to the shareholder shortly after each year-end.The Fund’s distributions are determined by the investment adviser based on its current assessment of the Fund’s long-term return potential. As portfolio and market conditions change, the rate of distributions paid by the Fund could change. Taxable-equivalent performance is based on the highest combined federal and state income tax rates, where applicable. Lower tax rates would result in lower tax-equivalent performance. Actual tax rates will vary depending on your income, exemptions and deductions. Rates do not include local taxes. The SEC Yield is a standardized measure based on the estimated yield to maturity of a fund’s investments over a 30-day period and is based on the maximum offer price at the date specified. The SEC Yield is not based on the distributions made by the Fund, which may differ. |
| 5 | Fund employs RIB financing. The leverage created by RIB investments provides an opportunity for increased income but, at the same time, creates special risks (including the likelihood of greater volatility of NAV). The cost of leverage rises and falls with changes in short-term interest rates. See “Floating Rate Notes Issued in Conjunction with Securities Held” in the notes to the financial statements for more information about RIB financing. RIB leverage represents the amount of Floating Rate Notes outstanding at period end as a percentage of |
| | Fund net assets plus Floating Rate Notes. |
| | Fund profiles subject to change due to active management. |
Eaton Vance
Municipal Income Funds
January 31, 2023
Example
As a Fund shareholder, you incur two types of costs: (1) transaction costs, including sales charges (loads) on purchases; and (2) ongoing costs, including management fees; distribution and/or service fees; and other Fund expenses. This Example is intended to help you understand your ongoing costs (in dollars) of Fund investing and to compare these costs with the ongoing costs of investing in other mutual funds. The Example is based on an investment of $1,000 invested at the beginning of the period and held for the entire period (August 1, 2022 to January 31, 2023).
Actual Expenses
The first section of each table below provides information about actual account values and actual expenses. You may use the information in this section, together with the amount you invested, to estimate the expenses that you paid over the period. Simply divide your account value by $1,000 (for example, an $8,600 account value divided by $1,000 = 8.6), then multiply the result by the number in the first section under the heading entitled “Expenses Paid During Period” to estimate the expenses you paid on your account during this period.
Hypothetical Example for Comparison Purposes
The second section of each table below provides information about hypothetical account values and hypothetical expenses based on the actual Fund expense ratio and an assumed rate of return of 5% per year (before expenses), which is not the actual Fund return. The hypothetical account values and expenses may not be used to estimate the actual ending account balance or expenses you paid for the period. You may use this information to compare the ongoing costs of investing in your Fund and other funds. To do so, compare this 5% hypothetical example with the 5% hypothetical examples that appear in the shareholder reports of the other funds.
Please note that the expenses shown in each table are meant to highlight your ongoing costs only and do not reflect any transactional costs, such as sales charges (loads). Therefore, the second section of each table is useful in comparing ongoing costs only, and will not help you determine the relative total costs of owning different funds. In addition, if these transactional costs were included, your costs would be higher.
Eaton Vance Arizona Municipal Income Fund
| | Beginning
Account Value
(8/1/22) | Ending
Account Value
(1/31/23) | Expenses Paid
During Period*
(8/1/22 – 1/31/23) | Annualized
Expense
Ratio |
| Actual | | | | |
| Class A | $1,000.00 | $1,004.90 | $3.69 | 0.73% |
| Class C | $1,000.00 | $ 999.90 | $7.46 | 1.48% |
| Class I | $1,000.00 | $1,005.90 | $2.68 | 0.53% |
| |
| Hypothetical | | | | |
| (5% return per year before expenses) | | | | |
| Class A | $1,000.00 | $1,021.53 | $3.72 | 0.73% |
| Class C | $1,000.00 | $1,017.75 | $7.53 | 1.48% |
| Class I | $1,000.00 | $1,022.53 | $2.70 | 0.53% |
| * | Expenses are equal to the Fund's annualized expense ratio for the indicated Class, multiplied by the average account value over the period, multiplied by 184/365 (to reflect the one-half year period). The Example assumes that the $1,000 was invested at the net asset value per share determined at the close of business on July 31, 2022. |
Eaton Vance
Municipal Income Funds
January 31, 2023
Fund Expenses — continued
Eaton Vance Connecticut Municipal Income Fund
| | Beginning
Account Value
(8/1/22) | Ending
Account Value
(1/31/23) | Expenses Paid
During Period*
(8/1/22 – 1/31/23) | Annualized
Expense
Ratio |
| Actual | | | | |
| Class A | $1,000.00 | $1,007.70 | $3.64 | 0.72% |
| Class C | $1,000.00 | $1,002.80 | $7.42 | 1.47% |
| Class I | $1,000.00 | $1,008.70 | $2.63 | 0.52% |
| |
| Hypothetical | | | | |
| (5% return per year before expenses) | | | | |
| Class A | $1,000.00 | $1,021.58 | $3.67 | 0.72% |
| Class C | $1,000.00 | $1,017.80 | $7.48 | 1.47% |
| Class I | $1,000.00 | $1,022.58 | $2.65 | 0.52% |
| * | Expenses are equal to the Fund's annualized expense ratio for the indicated Class, multiplied by the average account value over the period, multiplied by 184/365 (to reflect the one-half year period). The Example assumes that the $1,000 was invested at the net asset value per share determined at the close of business on July 31, 2022. |
Eaton Vance Minnesota Municipal Income Fund
| | Beginning
Account Value
(8/1/22) | Ending
Account Value
(1/31/23) | Expenses Paid
During Period*
(8/1/22 – 1/31/23) | Annualized
Expense
Ratio |
| Actual | | | | |
| Class A | $1,000.00 | $1,005.70 | $3.49 | 0.69% |
| Class C | $1,000.00 | $1,002.30 | $7.27 | 1.44% |
| Class I | $1,000.00 | $1,006.70 | $2.48 | 0.49% |
| |
| Hypothetical | | | | |
| (5% return per year before expenses) | | | | |
| Class A | $1,000.00 | $1,021.73 | $3.52 | 0.69% |
| Class C | $1,000.00 | $1,017.95 | $7.32 | 1.44% |
| Class I | $1,000.00 | $1,022.74 | $2.50 | 0.49% |
| * | Expenses are equal to the Fund's annualized expense ratio for the indicated Class, multiplied by the average account value over the period, multiplied by 184/365 (to reflect the one-half year period). The Example assumes that the $1,000 was invested at the net asset value per share determined at the close of business on July 31, 2022. |
Eaton Vance
Municipal Income Funds
January 31, 2023
Fund Expenses — continued
Eaton Vance New Jersey Municipal Income Fund
| | Beginning
Account Value
(8/1/22) | Ending
Account Value
(1/31/23) | Expenses Paid
During Period*
(8/1/22 – 1/31/23) | Annualized
Expense
Ratio |
| Actual | | | | |
| Class A | $1,000.00 | $1,000.20 | $3.73 | 0.74% |
| Class C | $1,000.00 | $ 995.90 | $7.50 | 1.49% |
| Class I | $1,000.00 | $1,001.20 | $2.72 | 0.54% |
| |
| Hypothetical | | | | |
| (5% return per year before expenses) | | | | |
| Class A | $1,000.00 | $1,021.48 | $3.77 | 0.74% |
| Class C | $1,000.00 | $1,017.69 | $7.58 | 1.49% |
| Class I | $1,000.00 | $1,022.48 | $2.75 | 0.54% |
| * | Expenses are equal to the Fund's annualized expense ratio for the indicated Class, multiplied by the average account value over the period, multiplied by 184/365 (to reflect the one-half year period). The Example assumes that the $1,000 was invested at the net asset value per share determined at the close of business on July 31, 2022. |
Eaton Vance Pennsylvania Municipal Income Fund
| | Beginning
Account Value
(8/1/22) | Ending
Account Value
(1/31/23) | Expenses Paid
During Period*
(8/1/22 – 1/31/23) | Annualized
Expense
Ratio |
| Actual | | | | |
| Class A | $1,000.00 | $1,006.00 | $4.30 | 0.85% |
| Class C | $1,000.00 | $1,001.30 | $8.07 | 1.60% |
| Class I | $1,000.00 | $1,007.00 | $3.29 | 0.65% |
| |
| Hypothetical | | | | |
| (5% return per year before expenses) | | | | |
| Class A | $1,000.00 | $1,020.92 | $4.33 | 0.85% |
| Class C | $1,000.00 | $1,017.14 | $8.13 | 1.60% |
| Class I | $1,000.00 | $1,021.93 | $3.31 | 0.65% |
| * | Expenses are equal to the Fund's annualized expense ratio for the indicated Class, multiplied by the average account value over the period, multiplied by 184/365 (to reflect the one-half year period). The Example assumes that the $1,000 was invested at the net asset value per share determined at the close of business on July 31, 2022. |
Eaton Vance
Arizona Municipal Income Fund
January 31, 2023
Portfolio of Investments (Unaudited)
| Tax-Exempt Municipal Obligations — 93.9% |
| Security | Principal
Amount
(000's omitted) | Value |
| Education — 12.6% |
| Arizona Industrial Development Authority, (Academies of Math & Science), 5.00%, 7/1/39(1) | $ | 250 | $ 250,667 |
| Arizona Industrial Development Authority, (Doral Academy of Nevada): | | | |
| 5.00%, 7/15/39(1) | | 55 | 53,891 |
| 5.00%, 7/15/40(1) | | 350 | 340,847 |
| Arizona Industrial Development Authority, (Pinecrest Academy of Nevada), 4.00%, 7/15/50(1) | | 60 | 47,683 |
| Arizona Industrial Development Authority, (Somerset Academy of Las Vegas), 3.00%, 12/15/31(1) | | 525 | 471,487 |
| Arizona State University, 5.00%, 7/1/36 | | 1,150 | 1,203,015 |
| Glendale Industrial Development Authority, AZ, (Midwestern University Foundation), (AMT), 2.125%, 7/1/33 | | 250 | 219,415 |
| La Paz County Industrial Development Authority, AZ, (Harmony Public Schools), 4.00%, 2/15/41 | | 430 | 384,115 |
| Maricopa County Industrial Development Authority, AZ, (Legacy Traditional Schools), 4.00%, 7/1/41(1) | | 500 | 428,895 |
| Northern Arizona University, 5.00%, 6/1/38 | | 1,000 | 1,064,330 |
| Pima County Community College District, AZ: | | | |
| 5.00%, 7/1/33 | | 300 | 337,419 |
| 5.00%, 7/1/35 | | 720 | 799,711 |
| University of Arizona: | | | |
| 5.00%, 6/1/38 | | 1,500 | 1,598,445 |
| 5.00%, 8/1/38 | | 600 | 675,894 |
| 5.00%, 6/1/42 | | 1,500 | 1,647,765 |
| | | | $ 9,523,579 |
| Electric Utilities — 7.6% |
| Mesa, AZ, Utility Systems Revenue: | | | |
| 4.00%, 7/1/31 | $ | 1,160 | $ 1,218,638 |
| 5.00%, 7/1/36 | | 1,000 | 1,210,760 |
| Pinal County Electrical District No. 3, AZ, 5.00%, 7/1/33 | | 1,000 | 1,072,990 |
| Salt River Project Agricultural Improvement and Power District, AZ: | | | |
| 5.00%, 1/1/35 | | 1,000 | 1,114,970 |
| 5.00%, 1/1/45 | | 1,000 | 1,118,350 |
| | | | $ 5,735,708 |
| Escrowed/Prerefunded — 0.3% |
| Kyrene Elementary School District No. 28, AZ, Prerefunded to 7/1/23, 5.50%, 7/1/30 | $ | 200 | $ 202,566 |
| | | | $ 202,566 |
| Security | Principal
Amount
(000's omitted) | Value |
| General Obligations — 10.6% |
| Chandler Unified School District No. 80, AZ, 4.00%, 7/1/33 | $ | 225 | $ 236,048 |
| Paradise Valley Unified School District No. 69, AZ, 4.00%, 7/1/42 | | 1,550 | 1,586,115 |
| Phoenix Union High School District No. 210, AZ, 4.00%, 7/1/39 | | 300 | 308,226 |
| Phoenix, AZ, 5.00%, 7/1/25 | | 1,320 | 1,404,968 |
| Puerto Rico, 5.625%, 7/1/29 | | 500 | 532,445 |
| Scottsdale Unified School District No. 48, AZ, 5.00%, 7/1/31 | | 750 | 835,867 |
| Scottsdale, AZ, 4.00%, 7/1/39(2) | | 1,500 | 1,578,345 |
| Tempe, AZ, 5.00%, 7/1/30 | | 1,000 | 1,143,180 |
| Western Maricopa Education Center District No. 402, AZ, 4.50%, 7/1/34 | | 350 | 355,905 |
| | | | $ 7,981,099 |
| Hospital — 10.1% |
| Arizona Health Facilities Authority, (Scottsdale Lincoln Hospitals), 5.00%, 12/1/39 | $ | 1,665 | $ 1,699,965 |
| Arizona Industrial Development Authority, (Phoenix Children's Hospitals), (LOC: JPMorgan Chase Bank, N.A.), 1.20%, 2/1/48(3) | | 2,000 | 2,000,000 |
| Maricopa County Industrial Development Authority, AZ, (Banner Health): | | | |
| 4.00%, 1/1/44 | | 1,000 | 979,100 |
| 4.00%, 1/1/45 | | 1,000 | 975,870 |
| Maricopa County Industrial Development Authority, AZ, (HonorHealth), 5.00%, 9/1/32 | | 400 | 447,592 |
| Yavapai County Industrial Development Authority, AZ, (Yavapai Regional Medical Center), 5.25%, 8/1/33 | | 500 | 504,735 |
| Yuma Industrial Development Authority, AZ, (Yuma Regional Medical Center), 5.00%, 8/1/32 | | 1,005 | 1,027,301 |
| | | | $ 7,634,563 |
| Housing — 2.3% |
| Phoenix Industrial Development Authority, AZ, (Downtown Phoenix Student Housing II, LLC - Arizona State University): | | | |
| 5.00%, 7/1/39 | $ | 500 | $ 512,375 |
| 5.00%, 7/1/44 | | 250 | 253,132 |
| Phoenix Industrial Development Authority, AZ, (Downtown Phoenix Student Housing, LLC - Arizona State University): | | | |
| 5.00%, 7/1/27 | | 415 | 433,331 |
| 5.00%, 7/1/37 | | 500 | 510,425 |
| | | | $ 1,709,263 |
16
See Notes to Financial Statements.
Eaton Vance
Arizona Municipal Income Fund
January 31, 2023
Portfolio of Investments (Unaudited) — continued
| Security | Principal
Amount
(000's omitted) | Value |
| Industrial Development Revenue — 4.2% |
| Chandler Industrial Development Authority, AZ, (Intel Corp.), (AMT), 5.00% to 9/1/27 (Put Date), 9/1/52 | $ | 2,000 | $ 2,119,380 |
| Maricopa County Pollution Control Corp., AZ, (El Paso Electric Co.): | | | |
| 3.60%, 2/1/40 | | 250 | 229,138 |
| 4.50%, 8/1/42 | | 850 | 850,221 |
| | | | $ 3,198,739 |
| Insured - Electric Utilities — 2.3% |
| Mesa, AZ, Utility Systems Revenue: | | | |
| (NPFG), 5.00%, 7/1/23 | $ | 430 | $ 434,515 |
| (NPFG), Escrowed to Maturity, 5.00%, 7/1/23 | | 450 | 454,666 |
| (NPFG), Escrowed to Maturity, 5.00%, 7/1/23 | | 120 | 121,295 |
| Puerto Rico Electric Power Authority: | | | |
| (NPFG), 5.25%, 7/1/29 | | 485 | 491,557 |
| Series SS, (NPFG), 5.00%, 7/1/25 | | 245 | 245,299 |
| | | | $ 1,747,332 |
| Insured - General Obligations — 11.8% |
| Apache Junction Unified School District No. 43, AZ, (AGM), 5.00%, 7/1/24 | $ | 1,200 | $ 1,240,968 |
| Marana Unified School District No. 6, AZ, (AGM), 4.00%, 7/1/37 | | 500 | 522,025 |
| Maricopa County Elementary School District No. 2, AZ, (AGM), 5.00%, 7/1/34 | | 1,000 | 1,187,210 |
| Maricopa County Elementary School District No. 3, AZ, (AGM), 5.00%, 7/1/25 | | 2,670 | 2,839,919 |
| Maricopa County Elementary School District No. 25, AZ, (AGM), 4.375%, 7/1/42 | | 2,120 | 2,302,320 |
| Maricopa County Elementary School District No. 66, AZ: | | | |
| (BAM), 4.00%, 7/1/37 | | 375 | 393,236 |
| (BAM), 4.00%, 7/1/39 | | 400 | 414,212 |
| | | | $ 8,899,890 |
| Insured - Lease Revenue/Certificates of Participation — 2.0% |
| Higley Unified School District No. 60, AZ, Certificates of Participation: | | | |
| (AGM), 4.125%, 6/1/42(2) | $ | 500 | $ 506,585 |
| (AGM), 4.25%, 6/1/47(2) | | 1,000 | 1,010,250 |
| | | | $ 1,516,835 |
| Insured - Special Tax Revenue — 4.5% |
| Glendale, AZ, Transportation Excise Tax Revenue, (AGM), 5.00%, 7/1/30 | $ | 1,250 | $ 1,323,500 |
| Security | Principal
Amount
(000's omitted) | Value |
| Insured - Special Tax Revenue (continued) |
| Phoenix Civic Improvement Corp., AZ, (Civic Plaza), (NPFG), 5.50%, 7/1/41 | $ | 1,635 | $ 2,061,310 |
| | | | $ 3,384,810 |
| Other Revenue — 1.9% |
| Salt Verde Financial Corp., AZ, Senior Gas Revenue, 5.00%, 12/1/37 | $ | 1,355 | $ 1,437,316 |
| | | | $ 1,437,316 |
| Senior Living/Life Care — 2.0% |
| Glendale Industrial Development Authority, AZ, (Royal Oaks - Inspirata Pointe), 5.00%, 5/15/41 | $ | 500 | $ 475,225 |
| Glendale Industrial Development Authority, AZ, (Terraces of Phoenix), 4.00%, 7/1/28 | | 225 | 209,273 |
| Tempe Industrial Development Authority, AZ, (Friendship Village of Tempe): | | | |
| 4.00%, 12/1/29 | | 380 | 359,480 |
| 4.00%, 12/1/30 | | 500 | 468,205 |
| | | | $ 1,512,183 |
| Special Tax Revenue — 7.9% |
| American Samoa Economic Development Authority, 5.00%, 9/1/38(1) | $ | 200 | $ 201,568 |
| Bullhead City, AZ, Excise Taxes Revenue: | | | |
| 0.75%, 7/1/25 | | 40 | 37,738 |
| 1.30%, 7/1/28 | | 500 | 459,050 |
| 2.10%, 7/1/36 | | 580 | 474,765 |
| 2.55%, 7/1/46 | | 125 | 92,019 |
| 4.00%, 7/1/32 | | 275 | 293,711 |
| Phoenix Civic Improvement Corp., AZ, Excise Tax Revenue, 4.00%, 7/1/45 | | 1,000 | 1,005,790 |
| Pinal County, AZ, Pledged Revenue: | | | |
| 4.00%, 8/1/33 | | 600 | 640,872 |
| 4.00%, 8/1/36 | | 500 | 520,440 |
| Puerto Rico Sales Tax Financing Corp., 5.00%, 7/1/58 | | 1,000 | 987,740 |
| Queen Creek, AZ, Excise Tax and State Shared Revenue, 5.00%, 8/1/30 | | 1,165 | 1,269,978 |
| | | | $ 5,983,671 |
| Transportation — 6.6% |
| Arizona Transportation Board, Highway Revenue, 5.00%, 7/1/33 | $ | 1,000 | $ 1,032,450 |
| Phoenix Civic Improvement Corp., AZ, Airport Revenue: | | | |
| (AMT), 4.00%, 7/1/37 | | 1,500 | 1,491,900 |
| (AMT), 4.00%, 7/1/38 | | 1,000 | 993,550 |
17
See Notes to Financial Statements.
Eaton Vance
Arizona Municipal Income Fund
January 31, 2023
Portfolio of Investments (Unaudited) — continued
| Security | Principal
Amount
(000's omitted) | Value |
| Transportation (continued) |
Phoenix Civic Improvement Corp., AZ, Airport Revenue:
(continued) | | | |
| (AMT), 5.00%, 7/1/49 | $ | 1,455 | $ 1,513,724 |
| | | | $ 5,031,624 |
| Water and Sewer — 7.2% |
| Central Arizona Water Conservation District, 5.00%, 1/1/35 | $ | 1,500 | $ 1,594,605 |
| Gilbert Water Resources Municipal Property Corp., AZ: | | | |
| 4.00%, 7/1/36 | | 750 | 772,402 |
| Green Bonds, 4.00%, 7/15/47 | | 1,000 | 1,002,640 |
| Phoenix Civic Improvement Corp., AZ, Wastewater System Revenue, 5.00%, 7/1/28 | | 860 | 893,385 |
| Tucson, AZ, Water System Revenue: | | | |
| 5.00%, 7/1/32 | | 545 | 601,844 |
| 5.00%, 7/1/35 | | 530 | 581,092 |
| | | | $ 5,445,968 |
Total Tax-Exempt Municipal Obligations
(identified cost $70,175,010) | | | $ 70,945,146 |
| Taxable Municipal Obligations — 4.8% |
| Security | Principal
Amount
(000's omitted) | Value |
| Education — 0.3% |
| Arizona Industrial Development Authority, (Doral Academy of Northern Nevada), 3.375%, 7/15/25(1) | $ | 175 | $ 167,379 |
| La Paz County Industrial Development Authority, AZ, (Harmony Public Schools), 3.00%, 2/15/24 | | 45 | 44,005 |
| | | | $ 211,384 |
| General Obligations — 0.8% |
| Maricopa County Elementary School District No. 2, AZ, 4.50%, 7/1/24 | $ | 655 | $ 650,952 |
| | | | $ 650,952 |
| Special Tax Revenue — 3.7% |
| Coconino County, AZ, Pledged Revenue, 4.073%, 7/1/23 | $ | 500 | $ 498,680 |
| Cottonwood, AZ, Pledged Revenue, 2.625%, 7/1/35 | | 850 | 692,206 |
| Tempe, AZ, Transit Excise Tax Revenue: | | | |
| 1.145%, 7/1/27 | | 540 | 473,115 |
| Security | Principal
Amount
(000's omitted) | Value |
| Special Tax Revenue (continued) |
| Tempe, AZ, Transit Excise Tax Revenue: (continued) | | | |
| 1.345%, 7/1/28 | $ | 1,330 | $ 1,145,476 |
| | | | $ 2,809,477 |
Total Taxable Municipal Obligations
(identified cost $4,141,962) | | | $ 3,671,813 |
| Security | Notional
Amount
(000's omitted) | Value |
| Transportation — 0.7% |
| HTA TRRB 2005L-745190UR7 Assured Custodial Trust, 5.25%, 7/1/41 | $ | 500 | $ 504,925 |
Total Trust Units
(identified cost $497,285) | | | $ 504,925 |
Total Investments — 99.4%
(identified cost $74,814,257) | | | $ 75,121,884 |
| Other Assets, Less Liabilities — 0.6% | | | $ 430,783 |
| Net Assets — 100.0% | | | $ 75,552,667 |
| The percentage shown for each investment category in the Portfolio of Investments is based on net assets. |
| (1) | Security exempt from registration under Rule 144A of the Securities Act of 1933, as amended. These securities may be sold in certain transactions in reliance on an exemption from registration (normally to qualified institutional buyers). At January 31, 2023, the aggregate value of these securities is $1,962,418 or 2.6% of the Fund's net assets. |
| (2) | When-issued security. |
| (3) | Variable rate demand obligation that may be tendered at par on any day for payment the same or next business day. The stated interest rate, which generally resets daily, is determined by the remarketing agent and represents the rate in effect at January 31, 2023. |
| The Fund invests primarily in debt securities issued by Arizona municipalities. The ability of the issuers of the debt securities to meet their obligations may be affected by economic developments in a specific industry or municipality. At January 31, 2023, 20.7% of total investments are backed by bond insurance of various financial institutions and financial guaranty assurance agencies. The aggregate percentage insured by an individual financial institution or financial guaranty assurance agency ranged from 1.1% to 14.6% of total investments. |
18
See Notes to Financial Statements.
Eaton Vance
Arizona Municipal Income Fund
January 31, 2023
Portfolio of Investments (Unaudited) — continued
| Abbreviations: |
| AGM | – Assured Guaranty Municipal Corp. |
| AMT | – Interest earned from these securities may be considered a tax preference item for purposes of the Federal Alternative Minimum Tax. |
| BAM | – Build America Mutual Assurance Co. |
| LOC | – Letter of Credit |
| NPFG | – National Public Finance Guarantee Corp. |
19
See Notes to Financial Statements.
Eaton Vance
Connecticut Municipal Income Fund
January 31, 2023
Portfolio of Investments (Unaudited)
| Security | Principal
Amount
(000's omitted) | Value |
| Education — 0.9% |
| Yale University, 0.873%, 4/15/25 | $ | 1,000 | $ 927,244 |
Total Corporate Bonds
(identified cost $928,000) | | | $ 927,244 |
| Tax-Exempt Municipal Obligations — 95.6% |
| Security | Principal
Amount
(000's omitted) | Value |
| Bond Bank — 1.1% |
| Connecticut, (Revolving Fund), Green Bonds, 5.00%, 5/1/34 | $ | 1,000 | $ 1,107,830 |
| | | | $ 1,107,830 |
| Education — 23.3% |
| Connecticut Health and Educational Facilities Authority, (Avon Old Farms School): | | | |
| 4.00%, 7/1/41 | $ | 600 | $ 606,360 |
| 5.00%, 7/1/30 | | 175 | 203,007 |
| Connecticut Health and Educational Facilities Authority, (Choate Rosemary Hall): | | | |
| 4.00%, 7/1/33 | | 340 | 371,205 |
| 4.00%, 7/1/34 | | 375 | 405,127 |
| 4.00%, 7/1/35 | | 310 | 331,502 |
| Connecticut Health and Educational Facilities Authority, (Connecticut College): | | | |
| 4.00%, 7/1/36 | | 255 | 261,622 |
| 4.00%, 7/1/37 | | 270 | 274,671 |
| 5.00%, 7/1/26 | | 270 | 289,524 |
| Connecticut Health and Educational Facilities Authority, (Fairfield University), 4.00%, 7/1/42 | | 2,500 | 2,471,900 |
| Connecticut Health and Educational Facilities Authority, (Hopkins School), 5.25%, 7/1/47 | | 1,725 | 1,927,722 |
| Connecticut Health and Educational Facilities Authority, (Quinnipiac University): | | | |
| 4.125%, 7/1/41 | | 500 | 499,185 |
| 5.00%, 7/1/34 | | 1,475 | 1,567,984 |
| Connecticut Health and Educational Facilities Authority, (Sacred Heart University), 5.00%, 7/1/37 | | 450 | 476,811 |
| Connecticut Health and Educational Facilities Authority, (The Taft School): | | | |
| 4.00%, 7/1/28 | | 135 | 146,355 |
| 4.00%, 7/1/29 | | 100 | 108,572 |
| 4.00%, 7/1/30 | | 125 | 135,533 |
| Security | Principal
Amount
(000's omitted) | Value |
| Education (continued) |
| Connecticut Health and Educational Facilities Authority, (The Taft School): (continued) | | | |
| 4.00%, 7/1/33 | $ | 430 | $ 458,922 |
| 4.00%, 7/1/34 | | 1,095 | 1,157,360 |
| 4.00%, 7/1/36 | | 560 | 580,070 |
| Connecticut Health and Educational Facilities Authority, (University of New Haven): | | | |
| 5.00%, 7/1/34 | | 810 | 834,689 |
| 5.00%, 7/1/35 | | 850 | 869,677 |
| Connecticut Health and Educational Facilities Authority, (Yale University): | | | |
| 0.375% to 7/12/24 (Put Date), 7/1/35 | | 1,000 | 957,810 |
| 0.40%, 7/1/36(1) | | 1,000 | 1,000,000 |
| 0.50%, 7/1/36(1) | | 1,700 | 1,700,000 |
| 2.00% to 7/1/26 (Put Date), 7/1/42 | | 1,785 | 1,718,759 |
| 2.80% to 2/10/26 (Put Date), 7/1/48 | | 2,000 | 1,997,820 |
| University of Connecticut, 5.00%, 5/1/25 | | 1,000 | 1,058,650 |
| | | | $ 22,410,837 |
| Escrowed/Prerefunded — 1.7% |
| Connecticut Higher Education Supplemental Loan Authority: | | | |
| (AMT), Prerefunded to 5/15/24, 4.00%, 11/15/30 | $ | 415 | $ 422,665 |
| (AMT), Prerefunded to 11/15/25, 4.125%, 11/15/33 | | 150 | 155,805 |
| Greater New Haven Water Pollution Control Authority, CT, Prerefunded to 8/15/24, 5.00%, 8/15/32 | | 1,000 | 1,040,390 |
| | | | $ 1,618,860 |
| General Obligations — 29.0% |
| Bridgeport, CT, 5.00%, 8/1/32 | $ | 175 | $ 205,730 |
| Colchester, CT, 4.00%, 10/15/28 | | 440 | 452,945 |
| Connecticut: | | | |
| 4.00%, 1/15/38 | | 1,000 | 1,029,570 |
| 4.00%, 6/15/39 | | 300 | 307,647 |
| 4.00%, 6/15/41 | | 300 | 303,849 |
| 5.00%, 4/15/30 | | 1,150 | 1,323,443 |
| Social Bonds, 5.00%, 11/15/42 | | 1,500 | 1,685,775 |
| Darien, CT, 4.00%, 8/1/37 | | 1,310 | 1,360,776 |
| East Haddam, CT: | | | |
| 3.00%, 12/1/35 | | 400 | 395,908 |
| 3.00%, 12/1/37 | | 335 | 318,826 |
| Ellington, CT: | | | |
| 3.00%, 9/15/33 | | 280 | 282,083 |
| 3.00%, 9/15/35 | | 210 | 204,945 |
| Enfield, CT, 4.00%, 8/1/29 | | 500 | 538,375 |
20
See Notes to Financial Statements.
Eaton Vance
Connecticut Municipal Income Fund
January 31, 2023
Portfolio of Investments (Unaudited) — continued
| Security | Principal
Amount
(000's omitted) | Value |
| General Obligations (continued) |
| Greenwich, CT: | | | |
| 4.00%, 7/15/29 | $ | 450 | $ 461,588 |
| 4.00%, 7/15/30 | | 250 | 256,030 |
| 4.00%, 7/15/32 | | 400 | 408,536 |
| Groton, CT: | | | |
| Green Bonds, 4.00%, 4/1/40 | | 1,410 | 1,428,894 |
| Green Bonds, 4.125%, 4/1/41 | | 1,410 | 1,440,738 |
| Guilford, CT, 3.00%, 8/1/34 | | 500 | 501,930 |
| North Haven, CT: | | | |
| 5.00%, 7/15/23 | | 1,475 | 1,492,641 |
| 5.00%, 7/15/25 | | 1,490 | 1,590,188 |
| Norwalk, CT, 4.00%, 8/15/47 | | 1,425 | 1,457,020 |
| Puerto Rico: | | | |
| 5.625%, 7/1/27 | | 328 | 343,944 |
| 5.625%, 7/1/29 | | 750 | 798,667 |
| Rocky Hill, CT, 4.00%, 1/15/33 | | 1,000 | 1,063,970 |
| South Windsor, CT, 4.00%, 2/1/43(2) | | 1,425 | 1,470,217 |
| Thomaston, CT, 3.00%, 8/8/23 | | 2,000 | 2,000,040 |
| Waterbury, CT, 5.00%, 8/1/37 | | 1,150 | 1,315,853 |
| West Haven, CT, 4.00%, 9/15/36 | | 1,500 | 1,514,100 |
| Windsor Locks, CT: | | | |
| 4.125%, 7/15/41 | | 640 | 660,096 |
| 4.25%, 7/15/48 | | 1,280 | 1,329,690 |
| | | | $ 27,944,014 |
| Hospital — 8.5% |
| Connecticut Health and Educational Facilities Authority, (Nuvance Health), 4.00%, 7/1/41 | $ | 1,500 | $ 1,375,785 |
| Connecticut Health and Educational Facilities Authority, (Stamford Hospital): | | | |
| 4.00%, 7/1/46 | | 1,620 | 1,484,033 |
| 5.00%, 7/1/31 | | 1,000 | 1,134,750 |
| Connecticut Health and Educational Facilities Authority, (Trinity Health Corp.), 5.00%, 12/1/33 | | 2,000 | 2,157,780 |
| Connecticut Health and Educational Facilities Authority, (Yale-New Haven Health): | | | |
| 5.00%, 7/1/31 | | 500 | 516,095 |
| 5.00%, 7/1/34 | | 1,520 | 1,564,263 |
| | | | $ 8,232,706 |
| Housing — 6.8% |
| Connecticut Housing Finance Authority: | | | |
| 4.00%, 11/15/38 | $ | 750 | $ 758,228 |
| (FHLMC), (FNMA), (GNMA), 3.20%, 11/15/33 | | 745 | 740,783 |
| (SPA: TD Bank, N.A.), 1.60%, 11/15/50(3) | | 3,000 | 3,000,000 |
| Security | Principal
Amount
(000's omitted) | Value |
| Housing (continued) |
| Connecticut Housing Finance Authority: (continued) | | | |
| Social Bonds, (FHLMC), (FNMA), (GNMA), 4.55%, 11/15/37 | $ | 1,000 | $ 1,060,640 |
| Sustainability Bonds, 4.05%, 11/15/42 | | 1,000 | 1,005,010 |
| | | | $ 6,564,661 |
| Insured - Education — 4.9% |
| Connecticut Health and Educational Facilities Authority, (Loomis Chaffee School): | | | |
| (AMBAC), 5.25%, 7/1/30 | $ | 1,950 | $ 2,288,988 |
| (AMBAC), 5.25%, 7/1/31 | | 2,050 | 2,447,351 |
| | | | $ 4,736,339 |
| Insured - General Obligations — 7.9% |
| Bridgeport, CT, (AGM), 5.00%, 8/15/32 | $ | 1,120 | $ 1,218,246 |
| Hamden, CT, (BAM), 5.00%, 8/15/32 | | 1,375 | 1,594,477 |
| Hartford, CT: | | | |
| (AGC), 5.00%, 8/15/28 | | 500 | 501,135 |
| (AGM), 5.00%, 4/1/31 | | 240 | 240,538 |
| New Britain, CT: | | | |
| (BAM), 4.00%, 3/1/47 | | 2,000 | 1,980,240 |
| (BAM), 5.00%, 3/1/47 | | 1,000 | 1,082,930 |
| New Haven, CT, (AGM), 5.00%, 8/1/25 | | 1,000 | 1,036,600 |
| | | | $ 7,654,166 |
| Insured - Hospital — 1.1% |
| Connecticut Health and Educational Facilities Authority, (Hartford HealthCare Obligated Group), (AGM), 4.00%, 7/1/37 | $ | 1,000 | $ 1,020,600 |
| | | | $ 1,020,600 |
| Insured - Water and Sewer — 3.7% |
| South Central Connecticut Regional Water Authority, (NPFG), 5.25%, 8/1/24 | $ | 3,420 | $ 3,566,205 |
| | | | $ 3,566,205 |
| Senior Living/Life Care — 2.0% |
| Connecticut Health and Educational Facilities Authority, (Covenant Home, Inc.), 5.00%, 12/1/34 | $ | 1,000 | $ 1,043,700 |
| Connecticut Health and Educational Facilities Authority, (Jerome Home): | | | |
| 4.00%, 7/1/23 | | 130 | 130,120 |
| 4.00%, 7/1/31 | | 235 | 224,427 |
| Connecticut Health and Educational Facilities Authority, (McLean Affiliates, Inc.), 5.00%, 1/1/45(4) | | 500 | 483,180 |
| | | | $ 1,881,427 |
21
See Notes to Financial Statements.
Eaton Vance
Connecticut Municipal Income Fund
January 31, 2023
Portfolio of Investments (Unaudited) — continued
| Security | Principal
Amount
(000's omitted) | Value |
| Special Tax Revenue — 1.5% |
| American Samoa Economic Development Authority, 5.00%, 9/1/38(4) | $ | 200 | $ 201,568 |
| Puerto Rico Sales Tax Financing Corp., 5.00%, 7/1/58 | | 1,250 | 1,234,675 |
| | | | $ 1,436,243 |
| Student Loan — 0.6% |
| Connecticut Higher Education Supplemental Loan Authority: | | | |
| (AMT), 5.00%, 11/15/28 | $ | 250 | $ 275,275 |
| (AMT), 5.00%, 11/15/29 | | 240 | 266,998 |
| | | | $ 542,273 |
| Transportation — 0.9% |
| Connecticut Airport Authority, (Ground Transportation Center), (AMT), 4.00%, 7/1/49 | $ | 1,000 | $ 864,330 |
| | | | $ 864,330 |
| Water and Sewer — 2.6% |
| South Central Connecticut Regional Water Authority: | | | |
| 4.00%, 8/1/34 | $ | 450 | $ 479,578 |
| 5.00%, 8/1/32 | | 355 | 408,474 |
| Stamford, CT, (Water Pollution Control System): | | | |
| 4.00%, 4/1/44 | | 1,000 | 1,017,450 |
| 5.00%, 9/15/29 | | 200 | 213,864 |
| 5.00%, 9/15/30 | | 125 | 133,500 |
| 5.00%, 4/1/33 | | 100 | 114,961 |
| 5.00%, 4/1/34 | | 100 | 114,829 |
| | | | $ 2,482,656 |
Total Tax-Exempt Municipal Obligations
(identified cost $91,884,810) | | | $ 92,063,147 |
| Taxable Municipal Obligations — 2.9% |
| Security | Principal
Amount
(000's omitted) | Value |
| Education — 0.6% |
| Connecticut Health and Educational Facilities Authority, (Avon Old Farms School): | | | |
| 1.30%, 7/1/23 | $ | 250 | $ 246,205 |
| 1.65%, 7/1/24 | | 300 | 286,851 |
| | | | $ 533,056 |
| Security | Principal
Amount
(000's omitted) | Value |
| General Obligations — 2.3% |
| Connecticut, 3.136%, 4/15/25 | $ | 770 | $ 750,427 |
| Naugatuck, CT: | | | |
| 1.14%, 9/15/26 | | 200 | 177,528 |
| 1.40%, 9/15/27 | | 250 | 217,387 |
| 1.60%, 9/15/28 | | 255 | 217,487 |
| 1.79%, 9/15/29 | | 750 | 629,535 |
| Watertown, CT, 2.25%, 10/15/33 | | 290 | 235,677 |
| | | | $ 2,228,041 |
Total Taxable Municipal Obligations
(identified cost $3,046,646) | | | $ 2,761,097 |
| Security | Notional
Amount
(000's omitted) | Value |
| Transportation — 0.7% |
| HTA TRRB 2005L-745190R75 Assured Custodial Trust, 5.25%, 7/1/41 | $ | 670 | $ 676,599 |
Total Trust Units
(identified cost $675,026) | | | $ 676,599 |
Total Investments — 100.1%
(identified cost $96,534,482) | | | $ 96,428,087 |
| Other Assets, Less Liabilities — (0.1)% | | | $ (128,829) |
| Net Assets — 100.0% | | | $ 96,299,258 |
| The percentage shown for each investment category in the Portfolio of Investments is based on net assets. |
| (1) | Variable rate demand obligation that may be tendered at par on any day for payment the same or next business day. The stated interest rate, which generally resets daily, is determined by the remarketing agent and represents the rate in effect at January 31, 2023. |
| (2) | When-issued security. |
| (3) | Variable rate demand obligation that may be tendered at par on any day for payment the lesser of 5 business days or 7 calendar days. The stated interest rate, which generally resets weekly, is determined by the remarketing agent and represents the rate in effect at January 31, 2023. |
| (4) | Security exempt from registration under Rule 144A of the Securities Act of 1933, as amended. These securities may be sold in certain transactions in reliance on an exemption from registration (normally to qualified institutional buyers). At January 31, 2023, the aggregate value of these securities is $684,748 or 0.7% of the Fund's net assets. |
22
See Notes to Financial Statements.
Eaton Vance
Connecticut Municipal Income Fund
January 31, 2023
Portfolio of Investments (Unaudited) — continued
| The Fund invests primarily in debt securities issued by Connecticut municipalities. The ability of the issuers of the debt securities to meet their obligations may be affected by economic developments in a specific industry or municipality. At January 31, 2023, 17.6% of total investments are backed by bond insurance of various financial institutions and financial guaranty assurance agencies. The aggregate percentage insured by an individual financial institution or financial guaranty assurance agency ranged from 0.5% to 4.9% of total investments. |
| Abbreviations: |
| AGC | – Assured Guaranty Corp. |
| AGM | – Assured Guaranty Municipal Corp. |
| AMBAC | – AMBAC Financial Group, Inc. |
| AMT | – Interest earned from these securities may be considered a tax preference item for purposes of the Federal Alternative Minimum Tax. |
| BAM | – Build America Mutual Assurance Co. |
| FHLMC | – Federal Home Loan Mortgage Corp. |
| FNMA | – Federal National Mortgage Association |
| GNMA | – Government National Mortgage Association |
| NPFG | – National Public Finance Guarantee Corp. |
| SPA | – Standby Bond Purchase Agreement |
23
See Notes to Financial Statements.
Eaton Vance
Minnesota Municipal Income Fund
January 31, 2023
Portfolio of Investments (Unaudited)
| Tax-Exempt Municipal Obligations — 96.9% |
| Security | Principal
Amount
(000's omitted) | Value |
| Bond Bank — 1.0% |
| Minnesota Public Facilities Authority, (Revolving Fund): | | | |
| 5.00%, 3/1/29 | $ | 1,000 | $ 1,083,840 |
| 5.00%, 3/1/30 | | 1,000 | 1,083,530 |
| | | | $ 2,167,370 |
| Education — 12.5% |
| Minnesota Higher Education Facilities Authority, (Carleton College): | | | |
| 5.00%, 3/1/29 | $ | 2,250 | $ 2,480,535 |
| 5.00%, 3/1/31 | | 1,000 | 1,102,280 |
| 5.00%, 3/1/34 | | 500 | 549,500 |
| Minnesota Higher Education Facilities Authority, (College of Saint Benedict): | | | |
| 4.00%, 3/1/36 | | 400 | 399,140 |
| 5.00%, 3/1/37 | | 1,500 | 1,544,835 |
| 5.00%, 10/1/52 | | 2,000 | 2,125,180 |
| Minnesota Higher Education Facilities Authority, (College of St. Scholastica), 4.00%, 12/1/40 | | 1,850 | 1,693,286 |
| Minnesota Higher Education Facilities Authority, (Gustavus Adolphus College), 5.00%, 10/1/35 | | 565 | 605,776 |
| Minnesota Higher Education Facilities Authority, (Macalester College): | | | |
| 4.00%, 3/1/26 | | 115 | 120,643 |
| 4.00%, 3/1/27 | | 125 | 132,974 |
| 4.00%, 3/1/28 | | 100 | 107,948 |
| 4.00%, 3/1/29 | | 100 | 109,363 |
| 5.00%, 3/1/27 | | 500 | 524,700 |
| 5.00%, 3/1/28 | | 1,010 | 1,059,258 |
| Minnesota Higher Education Facilities Authority, (St. Catherine University), 5.00%, 10/1/32 | | 500 | 545,110 |
| Minnesota Higher Education Facilities Authority, (St. Olaf College): | | | |
| 4.00%, 10/1/35 | | 500 | 510,370 |
| 4.00%, 10/1/46 | | 1,500 | 1,495,350 |
| 5.00%, 12/1/29 | | 1,815 | 1,933,429 |
| Minnesota Higher Education Facilities Authority, (University of St. Thomas): | | | |
| 4.00%, 10/1/32 | | 910 | 961,606 |
| 4.00%, 10/1/36 | | 500 | 509,070 |
| 4.00%, 10/1/37 | | 500 | 506,235 |
| 5.00%, 10/1/30 | | 650 | 714,110 |
| 5.00%, 10/1/34 | | 250 | 279,750 |
| 5.00%, 4/1/35 | | 750 | 796,582 |
| Security | Principal
Amount
(000's omitted) | Value |
| Education (continued) |
| Minnesota State Colleges and Universities, 5.00%, 10/1/26 | $ | 1,535 | $ 1,682,590 |
| St. Paul Housing and Redevelopment Authority, MN, (Hmong College Prep Academy), 5.00%, 9/1/43 | | 1,000 | 960,220 |
| University of Minnesota: | | | |
| 5.00%, 4/1/27 | | 500 | 541,920 |
| 5.00%, 8/1/27 | | 625 | 663,781 |
| 5.00%, 4/1/41 | | 2,000 | 2,116,740 |
| | | | $ 26,772,281 |
| Electric Utilities — 6.3% |
| Chaska, MN, Electric System Revenue, 5.00%, 10/1/30 | $ | 550 | $ 586,768 |
| Hutchinson, MN, Public Utility Revenue, 5.00%, 12/1/26 | | 350 | 350,770 |
| Minnesota Municipal Power Agency: | | | |
| 5.00%, 10/1/33 | | 250 | 259,475 |
| 5.00%, 10/1/34 | | 250 | 259,475 |
| 5.00%, 10/1/35 | | 200 | 207,480 |
| Northern Municipal Power Agency, MN: | | | |
| 5.00%, 1/1/30 | | 460 | 499,965 |
| 5.00%, 1/1/31 | | 670 | 718,682 |
| 5.00%, 1/1/41 | | 240 | 251,196 |
| Rochester, MN, Electric Utility Revenue: | | | |
| 5.00%, 12/1/29 | | 700 | 772,212 |
| 5.00%, 12/1/30 | | 700 | 770,049 |
| 5.00%, 12/1/42 | | 820 | 873,767 |
| St. Paul Port Authority, MN, District Energy Revenue: | | | |
| 4.00%, 10/1/42 | | 1,250 | 1,244,325 |
| (AMT), 4.00%, 10/1/40 | | 1,000 | 990,230 |
| Western Minnesota Municipal Power Agency: | | | |
| 5.00%, 1/1/25 | | 750 | 786,338 |
| 5.00%, 1/1/27 | | 750 | 825,480 |
| 5.00%, 1/1/29 | | 1,000 | 1,146,150 |
| 5.00%, 1/1/30 | | 750 | 875,722 |
| 5.00%, 1/1/34 | | 1,000 | 1,070,040 |
| 5.00%, 1/1/36 | | 900 | 957,285 |
| | | | $ 13,445,409 |
| Escrowed/Prerefunded — 0.5% |
| Western Minnesota Municipal Power Agency, Prerefunded to 1/1/24, 5.00%, 1/1/34 | $ | 1,000 | $ 1,023,310 |
| | | | $ 1,023,310 |
| General Obligations — 38.3% |
| Andover, MN, 4.00%, 2/1/30 | $ | 795 | $ 858,473 |
24
See Notes to Financial Statements.
Eaton Vance
Minnesota Municipal Income Fund
January 31, 2023
Portfolio of Investments (Unaudited) — continued
| Security | Principal
Amount
(000's omitted) | Value |
| General Obligations (continued) |
| Anoka-Hennepin Independent School District No. 11, MN: | | | |
| 5.00%, 2/1/27 | $ | 1,000 | $ 1,110,040 |
| 5.00%, 2/1/28 | | 1,040 | 1,154,098 |
| Brooklyn Center Independent School District No. 286, MN, 4.00%, 2/1/40 | | 2,000 | 2,033,600 |
| Brooklyn Center, MN, 4.00%, 2/1/30 | | 1,060 | 1,146,199 |
| Burnsville, MN: | | | |
| 3.00%, 12/20/32 | | 620 | 632,611 |
| 4.00%, 12/20/31 | | 640 | 719,827 |
| Centennial Independent School District No. 12, MN: | | | |
| 0.00%, 2/1/28 | | 1,000 | 858,920 |
| 0.00%, 2/1/35 | | 350 | 223,094 |
| Cloquet Independent School District No. 94, MN, 5.00%, 2/1/30 | | 2,000 | 2,091,380 |
| Coon Rapids, MN, 5.00%, 2/1/33 | | 1,525 | 1,854,339 |
| Dilworth-Glyndon-Felton Independent School District No. 2164, MN, 4.00%, 2/1/27 | | 730 | 770,858 |
| Duluth, MN: | | | |
| 5.00%, 2/1/34 | | 1,000 | 1,064,540 |
| Series 2016A, 5.00%, 2/1/31 | | 1,000 | 1,070,490 |
| Series 2019C, 5.00%, 2/1/31 | | 500 | 573,595 |
| Eden Prairie Independent School District No. 272, MN, 5.00%, 2/1/30 | | 1,000 | 1,128,810 |
| Edina Independent School District No. 273, MN, 5.00%, 2/1/28 | | 1,625 | 1,796,714 |
| Elk River Area Independent School District No. 728, MN, 4.00%, 2/1/32 | | 2,000 | 2,034,200 |
| Hawley Independent School District No. 150, MN, 4.25%, 2/1/46(1) | | 2,250 | 2,291,040 |
| Hennepin County Independent School District No. 281, MN, 5.00%, 2/1/29 | | 1,010 | 1,138,563 |
| Hennepin County Regional Railroad Authority, MN, 5.00%, 12/1/32 | | 675 | 778,302 |
| Hennepin County, MN: | | | |
| 5.00%, 12/1/32 | | 1,000 | 1,224,550 |
| 5.00%, 12/15/33 | | 2,280 | 2,630,048 |
| 5.00%, 12/1/35 | | 2,000 | 2,181,680 |
| 5.00%, 12/1/39 | | 2,000 | 2,344,200 |
| Hopkins Independent School District No. 270, MN, 4.00%, 2/1/25 | | 1,250 | 1,251,825 |
| Mahtomedi Independent School District No. 832, MN, 5.00%, 2/1/31 | | 1,000 | 1,044,690 |
| Maple River Independent School District No. 2135, MN, 4.00%, 2/1/45 | | 1,200 | 1,227,300 |
| Minneapolis Special School District No. 1, MN: | | | |
| 4.00%, 2/1/33 | | 1,500 | 1,602,465 |
| 5.00%, 2/1/32 | | 1,500 | 1,688,970 |
| Security | Principal
Amount
(000's omitted) | Value |
| General Obligations (continued) |
| Minneapolis, MN, 4.00%, 12/1/39 | $ | 2,500 | $ 2,607,975 |
| Minneapolis-St. Paul Metropolitan Council, MN: | | | |
| 4.00%, 3/1/30 | | 1,000 | 1,073,120 |
| 5.00%, 3/1/29 | | 2,000 | 2,331,740 |
| Series 2018C, 5.00%, 3/1/28 | | 2,500 | 2,782,775 |
| Series 2022B, 5.00%, 3/1/28 | | 2,000 | 2,280,860 |
| Minnesota: | | | |
| 5.00%, 8/1/32 | | 2,000 | 2,135,140 |
| 5.00%, 8/1/34 | | 500 | 568,170 |
| 5.00%, 10/1/34 | | 1,000 | 1,115,690 |
| 5.00%, 8/1/38 | | 1,135 | 1,339,232 |
| Pipestone, Rock and Murray Counties Independent School District No. 2689, MN, 5.00%, 2/1/29 | | 1,205 | 1,395,089 |
| Plymouth, MN, 4.00%, 2/1/30 | | 390 | 427,643 |
| Puerto Rico: | | | |
| 5.625%, 7/1/29 | | 1,500 | 1,597,335 |
| 5.75%, 7/1/31 | | 500 | 543,350 |
| Rice County, MN, 4.00%, 2/1/52 | | 3,000 | 3,070,350 |
| Rosemount-Apple Valley-Eagan Independent School District No. 196, MN: | | | |
| 4.00%, 2/1/28 | | 2,000 | 2,105,680 |
| 5.00%, 2/1/27 | | 1,000 | 1,082,830 |
| Russell-Tyler-Ruthton Independent School District No. 2902, MN, 5.00%, 2/1/27 | | 1,400 | 1,547,252 |
| Sartell-St. Stephen Independent School District No. 748, MN: | | | |
| 0.00%, 2/1/32 | | 1,350 | 1,017,657 |
| 0.00%, 2/1/37 | | 1,500 | 871,995 |
| Scott County, MN, 4.00%, 12/1/34 | | 2,000 | 2,146,340 |
| Spring Lake Park Independent School District No. 16, MN, 4.00%, 2/1/29 | | 1,075 | 1,132,846 |
| St. Louis Park Independent School District No. 283, MN, 4.00%, 2/1/31 | | 2,000 | 2,128,020 |
| St. Louis Park, MN, 4.00%, 2/1/28 | | 1,000 | 1,069,210 |
| St. Paul, MN: | | | |
| 5.00%, 12/1/27 | | 750 | 827,077 |
| 5.00%, 5/1/28 | | 1,200 | 1,370,448 |
| Waseca Independent School District No. 829, MN, 4.00%, 2/1/28 | | 1,575 | 1,658,223 |
| Watertown-Mayer Independent School District No. 111, MN, 0.00%, 2/1/36 | | 1,000 | 618,300 |
| Worthington Independent School District No. 518, MN, 4.00%, 2/1/31 | | 730 | 771,741 |
| | | | $ 82,141,509 |
25
See Notes to Financial Statements.
Eaton Vance
Minnesota Municipal Income Fund
January 31, 2023
Portfolio of Investments (Unaudited) — continued
| Security | Principal
Amount
(000's omitted) | Value |
| Hospital — 15.6% |
| Duluth Economic Development Authority, MN, (Essentia Health Obligated Group): | | | |
| 5.00%, 2/15/37 | $ | 1,000 | $ 1,053,300 |
| 5.00%, 2/15/48 | | 3,000 | 3,098,520 |
| Duluth Economic Development Authority, MN, (St. Luke's Hospital of Duluth Obligated Group): | | | |
| 4.00%, 6/15/34 | | 520 | 519,256 |
| 4.00%, 6/15/38 | | 375 | 351,709 |
| 4.00%, 6/15/39 | | 225 | 208,890 |
| 5.25%, 6/15/52 | | 2,000 | 2,068,500 |
| Maple Grove, MN, (Maple Grove Hospital Corp.): | | | |
| 5.00%, 5/1/30 | | 850 | 907,460 |
| 5.00%, 5/1/31 | | 500 | 532,600 |
| 5.00%, 5/1/32 | | 500 | 530,025 |
| Minneapolis and St. Paul Housing and Redevelopment Authority, MN, (Allina Health System): | | | |
| 5.00%, 11/15/28 | | 2,975 | 3,278,182 |
| 5.00%, 11/15/29 | | 915 | 1,006,006 |
| Minneapolis, MN, (Allina Health System), 4.00%, 11/15/39 | | 3,250 | 3,293,582 |
| Minneapolis, MN, (Fairview Health Services), 5.00%, 11/15/28 | | 225 | 237,191 |
| Rochester, MN, (Mayo Clinic): | | | |
| 4.00%, 11/15/48 | | 1,000 | 1,004,310 |
| 5.00%, 11/15/57 | | 750 | 828,143 |
| (SPA: Northern Trust Co.), 1.65%, 11/15/38(2) | | 6,000 | 6,000,000 |
| St. Cloud, MN, (CentraCare Health System), 5.00%, 5/1/46 | | 2,650 | 2,729,102 |
| St. Paul Housing and Redevelopment Authority, MN, (Fairview Health Services): | | | |
| 5.00%, 11/15/31 | | 1,000 | 1,081,490 |
| 5.00%, 11/15/34 | | 500 | 535,910 |
| 5.00%, 11/15/47 | | 500 | 516,360 |
| St. Paul Housing and Redevelopment Authority, MN, (HealthPartners Obligated Group): | | | |
| 5.00%, 7/1/29 | | 500 | 523,725 |
| 5.00%, 7/1/30 | | 1,000 | 1,047,370 |
| 5.00%, 7/1/32 | | 1,995 | 2,083,758 |
| | | | $ 33,435,389 |
| Housing — 1.7% |
| Minnesota Housing Finance Agency: | | | |
| 2.15%, 7/1/45 | $ | 900 | $ 650,340 |
| 4.00%, 8/1/39 | | 2,055 | 2,103,395 |
| (FHLMC), (FNMA), (GNMA), 2.40%, 1/1/35 | | 605 | 524,747 |
| (FHLMC), (FNMA), (GNMA), 3.15%, 1/1/37 | | 285 | 281,349 |
| | | | $ 3,559,831 |
| Security | Principal
Amount
(000's omitted) | Value |
| Insured - Electric Utilities — 4.8% |
| Central Minnesota Municipal Power Agency: | | | |
| (AGM), 4.00%, 1/1/42 | $ | 340 | $ 345,328 |
| (AGM), 5.00%, 1/1/30 | | 200 | 231,728 |
| Puerto Rico Electric Power Authority, (NPFG), 5.25%, 7/1/32 | | 1,150 | 1,158,130 |
| Southern Minnesota Municipal Power Agency, (NPFG), 0.00%, 1/1/25 | | 9,000 | 8,520,120 |
| | | | $ 10,255,306 |
| Insured - Hospital — 1.0% |
| Minneapolis, MN, (Fairview Health Services), (AGM), 5.00%, 11/15/44 | $ | 2,000 | $ 2,050,500 |
| | | | $ 2,050,500 |
| Lease Revenue/Certificates of Participation — 3.8% |
| Anoka-Hennepin Independent School District No. 11, MN, 5.00%, 2/1/34 | $ | 1,000 | $ 1,022,280 |
| Minnesota: | | | |
| 5.00%, 3/1/27 | | 3,000 | 3,335,550 |
| 5.00%, 6/1/29 | | 1,335 | 1,344,826 |
| 5.00%, 6/1/38 | | 2,500 | 2,512,925 |
| | | | $ 8,215,581 |
| Other Revenue — 2.8% |
| Center City, MN, (Hazelden Betty Ford Foundation): | | | |
| 4.00%, 11/1/28 | $ | 825 | $ 828,275 |
| 4.00%, 11/1/34 | | 500 | 487,150 |
| 5.00%, 11/1/27 | | 400 | 409,856 |
| 5.00%, 11/1/29 | | 300 | 305,808 |
| Minnesota Municipal Gas Agency: | | | |
| (Liq: Royal Bank of Canada), 3.881%, (67% of SOFR + 1.00%), 12/1/27 (Put Date), 12/1/52(3) | | 2,000 | 1,957,960 |
| (Liq: Royal Bank of Canada), 4.00% to 12/1/27 (Put Date), 12/1/52 | | 2,045 | 2,085,328 |
| | | | $ 6,074,377 |
| Senior Living/Life Care — 2.6% |
| Apple Valley, MN, (PHS Apple Valley Senior Housing, Inc.): | | | |
| 4.50%, 9/1/53 | $ | 940 | $ 858,493 |
| 5.00%, 9/1/43 | | 1,000 | 1,002,350 |
| North Oaks, MN, (Waverly Gardens): | | | |
| 4.00%, 10/1/25 | | 1,600 | 1,605,952 |
| 4.00%, 10/1/26 | | 1,680 | 1,685,611 |
26
See Notes to Financial Statements.
Eaton Vance
Minnesota Municipal Income Fund
January 31, 2023
Portfolio of Investments (Unaudited) — continued
| Security | Principal
Amount
(000's omitted) | Value |
| Senior Living/Life Care (continued) |
| Wayzata, MN, (Folkestone Senior Living Community), 4.00%, 8/1/44 | $ | 435 | $ 364,430 |
| | | | $ 5,516,836 |
| Special Tax Revenue — 2.1% |
| American Samoa Economic Development Authority, 5.00%, 9/1/38(4) | $ | 200 | $ 201,568 |
| Hennepin County, MN, Sales Tax Revenue, 5.00%, 12/15/24 | | 1,325 | 1,386,652 |
| Puerto Rico Sales Tax Financing Corp., 5.00%, 7/1/58 | | 3,000 | 2,963,220 |
| | | | $ 4,551,440 |
| Transportation — 3.9% |
| Minneapolis-St. Paul Metropolitan Airports Commission, MN: | | | |
| 5.00%, 1/1/27 | $ | 1,000 | $ 1,099,850 |
| 5.00%, 1/1/35 | | 1,000 | 1,019,240 |
| 5.00%, 1/1/52 | | 1,500 | 1,623,030 |
| (AMT), 5.00%, 1/1/28 | | 1,250 | 1,359,025 |
| (AMT), 5.00%, 1/1/33 | | 1,200 | 1,327,056 |
| (AMT), 5.25%, 1/1/47 | | 1,750 | 1,896,755 |
| | | | $ 8,324,956 |
Total Tax-Exempt Municipal Obligations
(identified cost $208,456,616) | | | $207,534,095 |
Total Investments — 96.9%
(identified cost $208,456,616) | | | $207,534,095 |
| Other Assets, Less Liabilities — 3.1% | | | $ 6,684,874 |
| Net Assets — 100.0% | | | $214,218,969 |
| The percentage shown for each investment category in the Portfolio of Investments is based on net assets. |
| (1) | When-issued security. |
| (2) | Variable rate demand obligation that may be tendered at par on any day for payment the lesser of 5 business days or 7 calendar days. The stated interest rate, which generally resets weekly, represents the rate in effect at January 31, 2023. |
| (3) | Floating rate security. The stated interest rate represents the rate in effect at January 31, 2023. |
| (4) | Security exempt from registration under Rule 144A of the Securities Act of 1933, as amended. These securities may be sold in certain transactions in reliance on an exemption from registration (normally to qualified institutional buyers). At January 31, 2023, the aggregate value of these securities is $201,568 or 0.1% of the Fund's net assets. |
| The Fund invests primarily in debt securities issued by Minnesota municipalities. The ability of the issuers of the debt securities to meet their obligations may be affected by economic developments in a specific industry or municipality. At January 31, 2023, 5.9% of total investments are backed by bond insurance of various financial institutions and financial guaranty assurance agencies. The aggregate percentage insured by an individual financial institution or financial guaranty assurance agency ranged from 1.3% to 4.7% of total investments. |
| Abbreviations: |
| AGM | – Assured Guaranty Municipal Corp. |
| AMT | – Interest earned from these securities may be considered a tax preference item for purposes of the Federal Alternative Minimum Tax. |
| FHLMC | – Federal Home Loan Mortgage Corp. |
| FNMA | – Federal National Mortgage Association |
| GNMA | – Government National Mortgage Association |
| NPFG | – National Public Finance Guarantee Corp. |
| SOFR | – Secured Overnight Financing Rate |
27
See Notes to Financial Statements.
Eaton Vance
New Jersey Municipal Income Fund
January 31, 2023
Portfolio of Investments (Unaudited)
| Tax-Exempt Municipal Obligations — 91.5% |
| Security | Principal
Amount
(000's omitted) | Value |
| Bond Bank — 1.2% |
| New Jersey Infrastructure Bank: | | | |
| Green Bonds, 5.00%, 9/1/36 | $ | 1,000 | $ 1,197,120 |
| Green Bonds , 5.00%, 9/1/38 | | 500 | 586,520 |
| | | | $ 1,783,640 |
| Education — 2.8% |
| Essex County Improvement Authority, NJ, (Friends of TEAM Charter Schools, Inc.), 4.00%, 6/15/56 | $ | 1,550 | $ 1,344,811 |
| New Jersey Educational Facilities Authority, (Montclair State University), 5.00%, 7/1/30 | | 1,765 | 1,818,374 |
| New Jersey Educational Facilities Authority, (Princeton University), 5.00%, 7/1/42 | | 1,000 | 1,084,910 |
| | | | $ 4,248,095 |
| Escrowed/Prerefunded — 1.4% |
| Delaware River Port Authority of Pennsylvania and New Jersey, Prerefunded to 1/1/24, 5.00%, 1/1/28 | $ | 2,000 | $ 2,045,700 |
| | | | $ 2,045,700 |
| General Obligations — 17.0% |
| Bergen County Improvement Authority, NJ, (Bergen New Bridge Medical Center), 5.00%, 8/1/42 | $ | 2,575 | $ 2,964,726 |
| Burlington County Bridge Commission, NJ: | | | |
| 5.00%, 8/1/30 | | 500 | 570,680 |
| 5.00%, 8/1/31 | | 410 | 468,339 |
| 5.00%, 8/1/32 | | 250 | 285,283 |
| 5.00%, 10/1/36 | | 1,000 | 1,095,830 |
| Chester Township, NJ: | | | |
| 2.00%, 10/1/29 | | 1,000 | 940,600 |
| 2.00%, 10/1/30 | | 495 | 459,291 |
| East Brunswick Board of Education, NJ, 4.00%, 8/1/34 | | 1,200 | 1,292,964 |
| East Brunswick, NJ, 2.00%, 7/15/30 | | 2,375 | 2,209,890 |
| Essex County, NJ: | | | |
| 2.00%, 9/1/31 | | 995 | 890,853 |
| 2.00%, 9/1/32 | | 2,935 | 2,590,724 |
| 4.00%, 8/15/33 | | 1,170 | 1,302,818 |
| Gloucester County Improvement Authority, NJ, 4.00%, 4/1/35 | | 2,000 | 2,051,420 |
| Jersey City, NJ, 5.00%, 11/1/33 | | 800 | 889,736 |
| Monmouth County Improvement Authority, NJ: | | | |
| 3.00%, 12/1/36 | | 100 | 97,140 |
| 5.00%, 12/1/37 | | 925 | 1,094,775 |
| 5.00%, 12/1/38 | | 645 | 757,314 |
| Security | Principal
Amount
(000's omitted) | Value |
| General Obligations (continued) |
| Morris County Improvement Authority, NJ: | | | |
| 3.00%, 3/1/35 | $ | 145 | $ 144,060 |
| 3.00%, 3/1/36 | | 150 | 145,388 |
| 3.00%, 3/1/37 | | 260 | 243,511 |
| 3.00%, 3/1/39 | | 275 | 248,982 |
| 3.00%, 3/1/41 | | 290 | 255,130 |
| 3.00%, 3/1/44 | | 930 | 801,102 |
| Passaic County Improvement Authority, NJ: | | | |
| 3.00%, 8/15/36 | | 110 | 104,907 |
| 3.00%, 8/15/38 | | 150 | 135,317 |
| Piscataway Township, NJ, 2.00%, 10/15/37 | | 1,600 | 1,240,032 |
| Puerto Rico, 5.625%, 7/1/29 | | 1,000 | 1,064,890 |
| Summit, NJ, 3.00%, 7/15/45 | | 1,360 | 1,189,361 |
| | | | $ 25,535,063 |
| Hospital — 10.6% |
| Camden County Improvement Authority, NJ, (Cooper Health System): | | | |
| 5.00%, 2/15/35 | $ | 750 | $ 757,238 |
| 5.75%, 2/15/42 | | 1,100 | 1,101,925 |
| New Jersey Health Care Facilities Financing Authority, (AHS Hospital Corp.), 5.00%, 7/1/27 | | 175 | 175,243 |
| New Jersey Health Care Facilities Financing Authority, (AtlantiCare Health System Obligated Group), 4.00%, 7/1/37 | | 710 | 733,593 |
| New Jersey Health Care Facilities Financing Authority, (Princeton HealthCare System): | | | |
| 5.00%, 7/1/32 | | 590 | 637,914 |
| 5.00%, 7/1/39 | | 2,750 | 2,893,495 |
| New Jersey Health Care Facilities Financing Authority, (Robert Wood Johnson University Hospital): | | | |
| 5.00%, 7/1/32 | | 50 | 51,730 |
| 5.00%, 7/1/33 | | 1,155 | 1,193,854 |
| New Jersey Health Care Facilities Financing Authority, (RWJ Barnabas Health Obligated Group), 5.00%, 7/1/31 | | 2,355 | 2,547,827 |
| New Jersey Health Care Facilities Financing Authority, (St. Joseph's Healthcare System Obligated Group): | | | |
| 3.00%, 7/1/32 | | 1,100 | 1,016,070 |
| 3.125%, 7/1/33 | | 835 | 772,375 |
| 4.00%, 7/1/48 | | 3,000 | 2,515,920 |
| New Jersey Health Care Facilities Financing Authority, (Trinitas Regional Medical Center Obligated Group): | | | |
| Prerefunded to 7/1/26, 5.00%, 7/1/28 | | 1,000 | 1,086,940 |
| Prerefunded to 7/1/26, 5.00%, 7/1/29 | | 500 | 543,470 |
| | | | $ 16,027,594 |
28
See Notes to Financial Statements.
Eaton Vance
New Jersey Municipal Income Fund
January 31, 2023
Portfolio of Investments (Unaudited) — continued
| Security | Principal
Amount
(000's omitted) | Value |
| Housing — 2.9% |
| New Jersey Housing and Mortgage Finance Agency, SFMR: | | | |
| (AMT), 3.80%, 10/1/32 | $ | 2,350 | $ 2,281,991 |
| Social Bonds, 4.50%, 10/1/42 | | 2,000 | 2,029,360 |
| | | | $ 4,311,351 |
| Industrial Development Revenue — 4.0% |
| New Jersey Economic Development Authority, (Middlesex Water Co.), (AMT), 5.00%, 8/1/59 | $ | 3,000 | $ 3,088,890 |
| New Jersey Economic Development Authority, (New Jersey Natural Gas Co.), 3.375%, 4/1/38 | | 3,000 | 2,887,410 |
| | | | $ 5,976,300 |
| Insured - Education — 0.1% |
| New Jersey Educational Facilities Authority, (William Paterson University), (AGM), 4.00%, 7/1/36 | $ | 135 | $ 139,174 |
| | | | $ 139,174 |
| Insured - Electric Utilities — 2.0% |
| Puerto Rico Electric Power Authority, (NPFG), 5.25%, 7/1/34 | $ | 3,020 | $ 3,044,613 |
| | | | $ 3,044,613 |
| Insured - Escrowed/Prerefunded — 0.9% |
| Bayonne, NJ, (AGM), Prerefunded to 8/1/25, 5.00%, 8/1/26 | $ | 865 | $ 922,358 |
| New Jersey Economic Development Authority, (Motor Vehicle Surcharges), (NPFG), Escrowed to Maturity, 5.25%, 7/1/26 | | 380 | 416,792 |
| | | | $ 1,339,150 |
| Insured - General Obligations — 8.9% |
| Atlantic City, NJ: | | | |
| (AGM), 4.00%, 3/1/42 | $ | 250 | $ 251,273 |
| (AGM), 5.00%, 3/1/37 | | 1,500 | 1,600,785 |
| Bayonne, NJ, (AGM), 5.00%, 8/1/25 | | 615 | 654,083 |
| East Orange, NJ: | | | |
| (AGM), 5.00%, 10/15/30 | | 175 | 203,569 |
| (AGM), 5.00%, 10/15/31 | | 400 | 465,116 |
| Irvington Township, NJ, (AGM), 0.00%, 7/15/23 | | 3,775 | 3,723,471 |
| Montclair Board of Education, NJ, (BAM), 4.00%, 1/15/43(1) | | 4,200 | 4,275,810 |
| Newark Board of Education, NJ, Sustainability Bonds, (BAM), 4.00%, 7/15/37 | | 430 | 437,314 |
| Security | Principal
Amount
(000's omitted) | Value |
| Insured - General Obligations (continued) |
| Paterson, NJ, (BAM), 5.00%, 1/15/26 | $ | 1,305 | $ 1,307,832 |
| Trenton, NJ, (BAM), 5.00%, 12/1/26 | | 500 | 535,670 |
| | | | $ 13,454,923 |
| Insured - Special Tax Revenue — 10.7% |
| Garden State Preservation Trust, NJ, (AGM), 0.00%, 11/1/24 | $ | 6,000 | $ 5,727,540 |
| New Jersey Economic Development Authority, (Motor Vehicle Surcharges): | | | |
| (AGC), 0.00%, 7/1/26 | | 6,500 | 5,864,820 |
| (AGC), 0.00%, 7/1/27 | | 1,900 | 1,658,795 |
| (NPFG), 5.25%, 7/1/26 | | 1,620 | 1,748,061 |
| Newark, NJ, (Mulberry Pedestrian Bridge Redevelopment), (AGM), 5.00%, 11/15/42 | | 1,000 | 1,107,230 |
| | | | $ 16,106,446 |
| Insured - Transportation — 1.7% |
| New Jersey Economic Development Authority, (The Goethals Bridge Replacement), (AGM), (AMT), 5.00%, 1/1/31 | $ | 2,015 | $ 2,043,150 |
| South Jersey Transportation Authority, NJ, (AGM), 5.00%, 11/1/33 | | 500 | 558,710 |
| | | | $ 2,601,860 |
| Other Revenue — 0.7% |
| New Jersey Economic Development Authority, (The Seeing Eye, Inc.), 5.00%, 6/1/32 | $ | 1,000 | $ 1,080,430 |
| | | | $ 1,080,430 |
| Special Tax Revenue — 1.3% |
| American Samoa Economic Development Authority, 5.00%, 9/1/38(2) | $ | 200 | $ 201,568 |
| Puerto Rico Sales Tax Financing Corp., 5.00%, 7/1/58 | | 1,825 | 1,802,625 |
| | | | $ 2,004,193 |
| Student Loan — 3.0% |
| New Jersey Higher Education Student Assistance Authority: | | | |
| (AMT), 3.25%, 12/1/29 | $ | 620 | $ 609,255 |
| (AMT), 4.00%, 12/1/34 | | 455 | 457,507 |
| (AMT), 5.00%, 12/1/29 | | 1,565 | 1,742,002 |
| (AMT), 5.711%, (3 mo. USD LIBOR + 0.95%), 6/1/36(3) | | 1,640 | 1,638,163 |
| | | | $ 4,446,927 |
29
See Notes to Financial Statements.
Eaton Vance
New Jersey Municipal Income Fund
January 31, 2023
Portfolio of Investments (Unaudited) — continued
| Security | Principal
Amount
(000's omitted) | Value |
| Transportation — 22.3% |
| Delaware River and Bay Authority of Delaware and New Jersey, 4.00%, 1/1/39 | $ | 1,000 | $ 1,022,680 |
| Delaware River Port Authority of Pennsylvania and New Jersey: | | | |
| 5.00%, 1/1/33 | | 1,000 | 1,132,940 |
| 5.00%, 1/1/35 | | 2,270 | 2,547,144 |
| 5.00%, 1/1/36 | | 1,250 | 1,388,150 |
| New Jersey Economic Development Authority, (Port Newark Container Terminal, LLC), (AMT), 5.00%, 10/1/37 | | 1,500 | 1,527,345 |
| New Jersey Economic Development Authority, (Portal North Bridge), 5.25%, 11/1/47 | | 1,700 | 1,844,857 |
| New Jersey Economic Development Authority, (The Goethals Bridge Replacement), (AMT), 5.375%, 1/1/43 | | 275 | 278,223 |
| New Jersey Transportation Trust Fund Authority, (Transportation Program): | | | |
| 4.00%, 6/15/39 | | 1,000 | 1,003,060 |
| 5.00%, 6/15/35 | | 1,000 | 1,134,710 |
| 5.00%, 6/15/38 | | 3,220 | 3,422,055 |
| New Jersey Transportation Trust Fund Authority, (Transportation System), 4.00%, 6/15/36 | | 1,500 | 1,532,385 |
| New Jersey Turnpike Authority: | | | |
| 4.00%, 1/1/48 | | 580 | 575,969 |
| 4.50%, 1/1/48 | | 2,000 | 2,085,380 |
| 5.00%, 1/1/45 | | 2,780 | 2,860,147 |
| Newark Housing Authority, NJ, (Newark Marine Terminal), 4.00%, 1/1/37 | | 1,500 | 1,535,835 |
| Port Authority of New York and New Jersey: | | | |
| (AMT), 5.00%, 10/15/35 | | 2,530 | 2,686,860 |
| (AMT), 5.00%, 11/15/36 | | 3,160 | 3,293,700 |
| (AMT), 5.00%, 1/15/47 | | 1,000 | 1,075,810 |
| South Jersey Transportation Authority, NJ: | | | |
| 4.625%, 11/1/47 | | 1,500 | 1,528,095 |
| 5.00%, 11/1/31 | | 1,000 | 1,026,170 |
| | | | $ 33,501,515 |
Total Tax-Exempt Municipal Obligations
(identified cost $137,702,578) | | | $137,646,974 |
| Taxable Municipal Obligations — 5.1% |
| Security | Principal
Amount
(000's omitted) | Value |
| General Obligations — 2.2% |
| Atlantic City, NJ, 7.50%, 3/1/40 | $ | 455 | $ 538,961 |
| Security | Principal
Amount
(000's omitted) | Value |
| General Obligations (continued) |
| Monroe Township Board of Education, NJ: | | | |
| 1.126%, 3/1/26 | $ | 585 | $ 531,139 |
| 1.357%, 3/1/27 | | 500 | 444,520 |
| 1.547%, 3/1/28 | | 500 | 435,880 |
| 2.729%, 8/1/33 | | 700 | 586,600 |
| 2.849%, 8/1/35 | | 1,000 | 818,140 |
| | | | $ 3,355,240 |
| Transportation — 2.9% |
| New Jersey Transportation Trust Fund Authority, 5.754%, 12/15/28(4) | $ | 4,250 | $ 4,364,198 |
| | | | $ 4,364,198 |
Total Taxable Municipal Obligations
(identified cost $8,559,692) | | | $ 7,719,438 |
Total Investments — 96.6%
(identified cost $146,262,270) | | | $145,366,412 |
| Other Assets, Less Liabilities — 3.4% | | | $ 5,059,806 |
| Net Assets — 100.0% | | | $150,426,218 |
| The percentage shown for each investment category in the Portfolio of Investments is based on net assets. |
| (1) | When-issued security. |
| (2) | Security exempt from registration under Rule 144A of the Securities Act of 1933, as amended. These securities may be sold in certain transactions in reliance on an exemption from registration (normally to qualified institutional buyers). At January 31, 2023, the aggregate value of these securities is $201,568 or 0.1% of the Fund's net assets. |
| (3) | Floating rate security. The stated interest rate represents the rate in effect at January 31, 2023. |
| (4) | Build America Bond. Represents taxable municipal obligation issued pursuant to the American Recovery and Reinvestment Act of 2009 or other legislation providing for the issuance of taxable municipal debt on which the issuer receives federal support. |
| The Fund invests primarily in debt securities issued by New Jersey municipalities. The ability of the issuers of the debt securities to meet their obligations may be affected by economic developments in a specific industry or municipality. At January 31, 2023, 25.2% of total investments are backed by bond insurance of various financial institutions and financial guaranty assurance agencies. The aggregate percentage insured by an individual financial institution or financial guaranty assurance agency ranged from 3.6% to 12.0% of total investments. |
30
See Notes to Financial Statements.
Eaton Vance
New Jersey Municipal Income Fund
January 31, 2023
Portfolio of Investments (Unaudited) — continued
| Abbreviations: |
| AGC | – Assured Guaranty Corp. |
| AGM | – Assured Guaranty Municipal Corp. |
| AMT | – Interest earned from these securities may be considered a tax preference item for purposes of the Federal Alternative Minimum Tax. |
| BAM | – Build America Mutual Assurance Co. |
| LIBOR | – London Interbank Offered Rate |
| NPFG | – National Public Finance Guarantee Corp. |
| SFMR | – Single Family Mortgage Revenue |
| Currency Abbreviations: |
| USD | – United States Dollar |
31
See Notes to Financial Statements.
Eaton Vance
Pennsylvania Municipal Income Fund
January 31, 2023
Portfolio of Investments (Unaudited)
| Tax-Exempt Municipal Obligations — 99.3% |
| Security | Principal
Amount
(000's omitted) | Value |
| Bond Bank — 3.6% |
| Delaware Valley Regional Finance Authority, PA, 5.75%, 7/1/32 | $ | 4,500 | $ 5,645,790 |
| | | | $ 5,645,790 |
| Cogeneration — 0.2% |
| Northampton County Industrial Development Authority, PA, (Northampton Generating), (AMT), 5.00%, 12/31/23(1) | $ | 1,323 | $ 238,218 |
| | | | $ 238,218 |
| Education — 15.6% |
| Adams County General Authority, PA, (Gettysburg College), 4.00%, 8/15/45 | $ | 1,250 | $ 1,226,512 |
| Allegheny County Higher Education Building Authority, PA, (Carnegie Mellon University), 3.30%, (70% of SOFR + 0.29%), 8/1/27 (Put Date), 2/1/33(2) | | 1,600 | 1,554,544 |
| Bethlehem Redevelopment Authority, PA, (Moravian University): | | | |
| 4.00%, 10/1/38 | | 300 | 282,081 |
| 5.00%, 10/1/28 | | 700 | 753,592 |
| Cumberland County Municipal Authority, PA, (Dickinson College): | | | |
| 5.00%, 5/1/30 | | 775 | 829,831 |
| 5.00%, 5/1/31 | | 1,145 | 1,224,532 |
| Delaware County Authority, PA, (Haverford College), 5.00%, 10/1/42 | | 1,470 | 1,561,463 |
| Delaware County Authority, PA, (Villanova University), 5.00%, 8/1/40 | | 1,120 | 1,171,184 |
| Erie Higher Education Building Authority, PA, (Gannon University), 4.00%, 5/1/36 | | 300 | 282,105 |
| Lancaster Higher Education Authority, PA, (Elizabethtown College), 5.00%, 10/1/31 | | 1,500 | 1,623,150 |
| Lehigh County General Purpose Authority, PA, (Lehigh Valley Academy Regional Charter School), 4.00%, 6/1/52 | | 2,000 | 1,749,140 |
| Montgomery County Industrial Development Authority, PA, (Germantown Academy): | | | |
| 4.00%, 10/1/41 | | 450 | 402,971 |
| 4.00%, 10/1/46 | | 625 | 537,387 |
| Pennsylvania Higher Educational Facilities Authority, (Bryn Mawr College), 4.00%, 12/1/48 | | 2,500 | 2,516,875 |
| Pennsylvania Higher Educational Facilities Authority, (University of Pennsylvania), 4.00%, 2/15/43 | | 2,000 | 2,013,260 |
| Pennsylvania State University: | | | |
| 5.00%, 9/1/34 | | 1,585 | 1,724,306 |
| Security | Principal
Amount
(000's omitted) | Value |
| Education (continued) |
| Pennsylvania State University: (continued) | | | |
| 5.00%, 9/1/47 | $ | 2,000 | $ 2,225,820 |
| Philadelphia Authority for Industrial Development, (Temple University), 5.00%, 4/1/45 | | 1,035 | 1,061,900 |
| Swarthmore Borough Authority, PA, (Swarthmore College), 4.00%, 9/15/43 | | 1,875 | 1,904,550 |
| | | | $ 24,645,203 |
| Escrowed/Prerefunded — 0.9% |
| Chartiers Valley School District, PA, Prerefunded to 4/15/25, 5.00%, 10/15/35 | $ | 1,000 | $ 1,058,840 |
| Lancaster Industrial Development Authority, PA, (Garden Spot Village), Prerefunded to 5/1/23, 5.375%, 5/1/28 | | 300 | 302,160 |
| | | | $ 1,361,000 |
| General Obligations — 6.8% |
| Allegheny County, PA, 5.00%, 11/1/43 | $ | 1,000 | $ 1,089,180 |
| Boyertown Area School District, PA: | | | |
| 5.00%, 10/1/38 | | 1,000 | 1,026,770 |
| 5.00%, 10/1/42 | | 500 | 550,070 |
| Lower Merion School District, PA, 1.50%, 11/15/25 | | 2,660 | 2,554,611 |
| North Allegheny School District, PA, 4.00%, 5/1/37 | | 1,000 | 1,027,370 |
| Penn-Delco School District, PA, 4.00%, 6/1/45 | | 1,500 | 1,507,500 |
| Pequea Valley School District, PA, 4.00%, 5/15/46 | | 825 | 829,901 |
| Puerto Rico: | | | |
| 5.625%, 7/1/29 | | 500 | 532,445 |
| 5.75%, 7/1/31 | | 750 | 815,025 |
| Seneca Valley School District, PA, 5.00%, 4/1/31 | | 750 | 854,017 |
| | | | $ 10,786,889 |
| Hospital — 13.6% |
| Allegheny County Hospital Development Authority, PA, (UPMC Health System), 5.00%, 7/15/33 | $ | 1,000 | $ 1,130,760 |
| Bucks County Industrial Development Authority, PA, (Grand View Hospital): | | | |
| 5.00%, 7/1/27 | | 450 | 473,053 |
| 5.00%, 7/1/35 | | 500 | 508,485 |
| Centre County Hospital Authority, PA, (Mount Nittany Medical Center), 5.00%, 11/15/30 | | 505 | 529,255 |
| Geisinger Authority, PA, (Geisinger Health System): | | | |
| 4.00%, 4/1/39 | | 2,000 | 2,006,320 |
| 5.00%, 2/15/45 | | 3,150 | 3,236,845 |
| Indiana County Hospital Authority, PA, (Indiana Regional Medical Center), Prerefunded to 6/1/23, 6.00%, 6/1/39 | | 1,345 | 1,359,069 |
32
See Notes to Financial Statements.
Eaton Vance
Pennsylvania Municipal Income Fund
January 31, 2023
Portfolio of Investments (Unaudited) — continued
| Security | Principal
Amount
(000's omitted) | Value |
| Hospital (continued) |
| Lancaster County Hospital Authority, PA, (Penn State Health), 5.00%, 11/1/46 | $ | 1,500 | $ 1,584,360 |
| Lancaster County Hospital Authority, PA, (University of Pennsylvania Health System), 5.00%, 8/15/36 | | 650 | 692,575 |
| Lehigh County General Purpose Authority, PA, (Lehigh Valley Health Network), 4.00%, 7/1/35 | | 1,000 | 1,004,650 |
| Montgomery County Higher Education and Health Authority, PA, (Thomas Jefferson University Obligated Group), 5.00%, 5/1/57 | | 2,000 | 2,061,180 |
| Pennsylvania Economic Development Financing Authority, (UPMC), 2.08%, (SIFMA + 0.42%), 11/15/24(2) | | 1,000 | 987,870 |
| Pennsylvania Higher Educational Facilities Authority, (University of Pennsylvania Health System): | | | |
| 4.00%, 8/15/42 | | 150 | 148,709 |
| 5.00%, 8/15/37 | | 2,600 | 2,798,666 |
| Southcentral Pennsylvania General Authority, (WellSpan Health Obligated Group), 4.00%, 6/1/49 | | 3,000 | 2,861,910 |
| | | | $ 21,383,707 |
| Housing — 1.3% |
| Pennsylvania Housing Finance Agency, SFMR: | | | |
| 2.35%, 10/1/40 | $ | 1,405 | $ 1,067,322 |
| Social Bonds, 4.40%, 10/1/38(3) | | 1,000 | 1,023,100 |
| | | | $ 2,090,422 |
| Insured - Education — 3.4% |
| State Public School Building Authority, PA, (Delaware County Community College): | | | |
| (BAM), 4.00%, 10/1/40 | $ | 1,000 | $ 994,080 |
| (BAM), 4.00%, 10/1/41 | | 1,000 | 988,600 |
| (BAM), 4.00%, 10/1/42 | | 1,000 | 987,320 |
| (BAM), 4.125%, 10/1/48 | | 1,250 | 1,237,638 |
| (BAM), 5.25%, 10/1/44 | | 1,100 | 1,210,748 |
| | | | $ 5,418,386 |
| Insured - Electric Utilities — 0.7% |
| Puerto Rico Electric Power Authority, (NPFG), 5.25%, 7/1/34 | $ | 1,130 | $ 1,139,210 |
| | | | $ 1,139,210 |
| Insured - Escrowed/Prerefunded — 2.9% |
| Cambria County, PA, (BAM), Prerefunded to 8/1/24, 5.00%, 8/1/30 | $ | 2,270 | $ 2,357,713 |
| McKeesport Area School District, PA: | | | |
| (AGM), Prerefunded to 9/1/23, 5.00%, 3/1/38 | | 60 | 60,892 |
| Security | Principal
Amount
(000's omitted) | Value |
| Insured - Escrowed/Prerefunded (continued) |
| McKeesport Area School District, PA: (continued) | | | |
| (AMBAC), Escrowed to Maturity, 0.00%, 10/1/25 | $ | 2,320 | $ 2,175,232 |
| | | | $ 4,593,837 |
| Insured - General Obligations — 9.9% |
| Allentown City School District, PA: | | | |
| (BAM), 5.00%, 6/1/32 | $ | 1,000 | $ 1,073,860 |
| (BAM), 5.00%, 6/1/33 | | 1,000 | 1,072,540 |
| Bethlehem Area School District, PA, (BAM), 5.00%, 8/1/32 | | 1,500 | 1,589,700 |
| Cambria County, PA, (BAM), 5.00%, 8/1/30 | | 1,050 | 1,087,422 |
| Elizabeth Forward School District, PA, (NPFG), 0.00%, 9/1/23 | | 2,170 | 2,126,578 |
| Hopewell School District, PA, (AGM), 0.00%, 9/1/26 | | 1,000 | 909,340 |
| Lake-Lehman School District, PA, (NPFG), 0.00%, 4/1/26 | | 1,315 | 1,194,178 |
| Lancaster School District, PA, (AGM), 4.00%, 6/1/36 | | 60 | 62,759 |
| Luzerne County, PA, (AGM), 5.00%, 11/15/29 | | 1,000 | 1,063,280 |
| McKeesport Area School District, PA, (AMBAC), 0.00%, 10/1/25 | | 1,100 | 1,008,590 |
| Montour School District, PA: | | | |
| (AGM), 5.00%, 4/1/32 | | 1,000 | 1,058,080 |
| (AGM), 5.00%, 4/1/33 | | 1,960 | 2,068,663 |
| Oakmont Borough, PA, (AGM), 4.00%, 11/15/46 | | 1,300 | 1,308,905 |
| | | | $ 15,623,895 |
| Insured - Hospital — 1.3% |
| Allegheny County Hospital Development Authority, PA, (UPMC Health System), (NPFG), 6.00%, 7/1/24 | $ | 2,000 | $ 2,093,020 |
| | | | $ 2,093,020 |
| Insured - Lease Revenue/Certificates of Participation — 6.9% |
| State Public School Building Authority, PA, (Philadelphia School District): | | | |
| (AGM), 5.50%, 6/1/28 | $ | 3,250 | $ 3,748,550 |
| (AGM), 5.50%, 6/1/28(4) | | 6,250 | 7,208,750 |
| | | | $ 10,957,300 |
| Insured - Transportation — 2.5% |
| Pennsylvania Economic Development Financing Authority, (PennDOT Major Bridges Package One), (AGM), (AMT), 5.50%, 6/30/42 | $ | 1,500 | $ 1,673,490 |
| Pennsylvania Turnpike Commission, (AGM), 6.375%, 12/1/38 | | 2,000 | 2,306,540 |
| | | | $ 3,980,030 |
33
See Notes to Financial Statements.
Eaton Vance
Pennsylvania Municipal Income Fund
January 31, 2023
Portfolio of Investments (Unaudited) — continued
| Security | Principal
Amount
(000's omitted) | Value |
| Insured - Water and Sewer — 5.4% |
| Allegheny County Sanitary Authority, PA, (BAM), 5.00%, 12/1/28 | $ | 1,000 | $ 1,020,920 |
| Bucks County Water and Sewer Authority, PA: | | | |
| (AGM), 4.25%, 12/1/47 | | 1,200 | 1,221,936 |
| (AGM), 5.25%, 12/1/47 | | 1,250 | 1,423,200 |
| Pittsburgh Water and Sewer Authority, PA, (AGM), 5.50%, 9/1/47 | | 4,250 | 4,830,635 |
| | | | $ 8,496,691 |
| Lease Revenue/Certificates of Participation — 2.1% |
| Commonwealth Financing Authority, PA, 5.00%, 6/1/35 | $ | 2,950 | $ 3,226,681 |
| | | | $ 3,226,681 |
| Other Revenue — 0.6% |
| Allentown Neighborhood Improvement Zone Development Authority, PA, (City Center Project), Series 2018, 5.00%, 5/1/42(5) | $ | 1,000 | $ 944,400 |
| | | | $ 944,400 |
| Senior Living/Life Care — 4.9% |
| Cumberland County Municipal Authority, PA, (Diakon Lutheran Social Ministries): | | | |
| 5.00%, 1/1/31 | $ | 500 | $ 518,880 |
| 5.00%, 1/1/39 | | 285 | 290,241 |
| Prerefunded to 1/1/29, 5.00%, 1/1/39 | | 190 | 217,883 |
| Prerefunded to 1/1/29, 5.00%, 1/1/39 | | 1,525 | 1,748,794 |
| Franklin County Industrial Development Authority, PA, (Menno-Haven, Inc.): | | | |
| 5.00%, 12/1/29 | | 815 | 771,112 |
| 5.00%, 12/1/33 | | 455 | 416,725 |
| Lancaster County Hospital Authority, PA, (Brethren Village), 5.125%, 7/1/37 | | 1,265 | 1,216,917 |
| Montgomery County Industrial Development Authority, PA, (ACTS Retirement-Life Communities, Inc. Obligated Group): | | | |
| 4.00%, 11/15/43 | | 200 | 173,150 |
| 5.00%, 11/15/45 | | 1,000 | 999,920 |
| Montgomery County Industrial Development Authority, PA, (Whitemarsh Continuing Care Retirement Community), 5.00%, 1/1/33 | | 1,000 | 989,180 |
| West Cornwall Township Municipal Authority, PA, (Lebanon Valley Brethren Home), 4.00%, 11/15/46 | | 525 | 445,909 |
| | | | $ 7,788,711 |
| Special Tax Revenue — 2.0% |
| American Samoa Economic Development Authority, 5.00%, 9/1/38(5) | $ | 200 | $ 201,568 |
| Security | Principal
Amount
(000's omitted) | Value |
| Special Tax Revenue (continued) |
| Puerto Rico Sales Tax Financing Corp.: | | | |
| 0.00%, 7/1/24 | $ | 36 | $ 33,931 |
| 0.00%, 7/1/27 | | 34 | 28,077 |
| 0.00%, 7/1/29 | | 34 | 25,482 |
| 0.00%, 7/1/31 | | 43 | 29,015 |
| 0.00%, 7/1/33 | | 49 | 29,723 |
| 0.00%, 7/1/46 | | 463 | 127,719 |
| 0.00%, 7/1/51 | | 377 | 78,797 |
| 4.50%, 7/1/34 | | 74 | 74,355 |
| 4.536%, 7/1/53 | | 5 | 4,602 |
| 5.00%, 7/1/58 | | 2,533 | 2,501,945 |
| | | | $ 3,135,214 |
| Transportation — 11.5% |
| Allegheny County Airport Authority, PA, (Pittsburgh International Airport): | | | |
| (AMT), 4.00%, 1/1/37 | $ | 5,000 | $ 4,959,950 |
| (AMT), 5.00%, 1/1/56 | | 1,000 | 1,045,180 |
| Delaware River Port Authority of Pennsylvania and New Jersey, 5.00%, 1/1/38 | | 2,470 | 2,709,640 |
| Pennsylvania Turnpike Commission: | | | |
| 4.00%, 12/1/43 | | 1,750 | 1,761,830 |
| 4.00%, 12/1/45 | | 500 | 491,970 |
| 4.00%, 12/1/51 | | 1,000 | 962,920 |
| 4.25%, 12/1/41 | | 1,125 | 1,165,455 |
| 5.00%, 12/1/39 | | 1,500 | 1,624,365 |
| Philadelphia, PA, Airport Revenue, (AMT), 5.00%, 7/1/33 | | 1,000 | 1,131,010 |
| Southeastern Pennsylvania Transportation Authority, 5.25%, 6/1/47 | | 2,000 | 2,282,280 |
| | | | $ 18,134,600 |
| Water and Sewer — 3.2% |
| Allegheny County Sanitary Authority, PA, 5.00%, 6/1/43 | $ | 1,425 | $ 1,526,360 |
| Luzerne County Industrial Development Authority, PA, (Pennsylvania-American Water Co.), (AMT), 2.45% to 12/3/29 (Put Date), 12/1/39 | | 750 | 698,730 |
| Pennsylvania Economic Development Financing Authority, (Pennsylvania-American Water Co.), 3.00%, 4/1/39 | | 2,000 | 1,773,200 |
| Philadelphia, PA, Water and Wastewater Revenue, 5.00%, 10/1/43 | | 1,000 | 1,069,330 |
| | | | $ 5,067,620 |
Total Tax-Exempt Municipal Obligations
(identified cost $154,727,264) | | | $156,750,824 |
34
See Notes to Financial Statements.
Eaton Vance
Pennsylvania Municipal Income Fund
January 31, 2023
Portfolio of Investments (Unaudited) — continued
| Taxable Municipal Obligations — 1.5% |
| Security | Principal
Amount
(000's omitted) | Value |
| Cogeneration — 0.1% |
| Northampton County Industrial Development Authority, PA, (Northampton Generating), 5.00%, 12/31/23(1) | $ | 536 | $ 96,471 |
| | | | $ 96,471 |
| Insured - General Obligations — 0.1% |
| Valley View School District, PA, (BAM), 2.875%, 5/15/31 | $ | 250 | $ 223,013 |
| | | | $ 223,013 |
| Other Revenue — 1.3% |
| Philadelphia Industrial Development Authority, PA, City Service Agreement Revenue, 3.964%, 4/15/26 | $ | 2,120 | $ 2,074,017 |
| | | | $ 2,074,017 |
Total Taxable Municipal Obligations
(identified cost $2,992,070) | | | $ 2,393,501 |
Total Investments — 100.8%
(identified cost $157,719,334) | | | $159,144,325 |
| Other Assets, Less Liabilities — (0.8)% | | | $ (1,231,471) |
| Net Assets — 100.0% | | | $157,912,854 |
| The percentage shown for each investment category in the Portfolio of Investments is based on net assets. |
| (1) | Represents a payment-in-kind security which may pay interest in additional principal at the issuer’s discretion. |
| (2) | Floating rate security. The stated interest rate represents the rate in effect at January 31, 2023. |
| (3) | When-issued security. |
| (4) | Security represents the municipal bond held by a trust that issues residual interest bonds (see Note 1H). |
| (5) | Security exempt from registration under Rule 144A of the Securities Act of 1933, as amended. These securities may be sold in certain transactions in reliance on an exemption from registration (normally to qualified institutional buyers). At January 31, 2023, the aggregate value of these securities is $1,145,968 or 0.7% of the Fund's net assets. |
| The Fund invests primarily in debt securities issued by Pennsylvania municipalities. The ability of the issuers of the debt securities to meet their obligations may be affected by economic developments in a specific industry or municipality. At January 31, 2023, 33.0% of total investments are backed by bond insurance of various financial institutions and financial guaranty assurance agencies. The aggregate percentage insured by an individual financial institution or financial guaranty assurance agency ranged from 2.0% to 18.2% of total investments. |
| Abbreviations: |
| AGM | – Assured Guaranty Municipal Corp. |
| AMBAC | – AMBAC Financial Group, Inc. |
| AMT | – Interest earned from these securities may be considered a tax preference item for purposes of the Federal Alternative Minimum Tax. |
| BAM | – Build America Mutual Assurance Co. |
| NPFG | – National Public Finance Guarantee Corp. |
| SFMR | – Single Family Mortgage Revenue |
| SIFMA | – Securities Industry and Financial Markets Association Municipal Swap Index |
| SOFR | – Secured Overnight Financing Rate |
35
See Notes to Financial Statements.
Eaton Vance
Municipal Income Funds
January 31, 2023
Statements of Assets and Liabilities (Unaudited)
| | January 31, 2023 |
| | Arizona Fund | Connecticut Fund | Minnesota Fund |
| Assets | | | |
| Investments: | | | |
| Identified cost | $ 74,814,257 | $ 96,534,482 | $ 208,456,616 |
| Unrealized appreciation (depreciation) | 307,627 | (106,395) | (922,521) |
| Investments, at value | $75,121,884 | $ 96,428,087 | $207,534,095 |
| Cash | $ 3,214,641 | $ 2,742,775 | $ 6,962,498 |
| Interest receivable | 448,414 | 823,092 | 2,595,367 |
| Receivable for investments sold | 50,000 | — | — |
| Receivable for Fund shares sold | 23,511 | 12,089 | 593,445 |
| Total assets | $78,858,450 | $100,006,043 | $217,685,405 |
| Liabilities | | | |
| Payable for when-issued securities | $ 3,042,195 | $ 3,468,733 | $ 2,227,163 |
| Payable for Fund shares redeemed | 166,331 | 83,333 | 945,249 |
| Distributions payable | 10,716 | 44,431 | 129,681 |
| Payable to affiliates: | | | |
| Investment adviser fee | 18,185 | 25,123 | 63,487 |
| Distribution and service fees | 6,837 | 10,280 | 10,057 |
| Accrued expenses | 61,519 | 74,885 | 90,799 |
| Total liabilities | $ 3,305,783 | $ 3,706,785 | $ 3,466,436 |
| Net Assets | $75,552,667 | $ 96,299,258 | $214,218,969 |
| Sources of Net Assets | | | |
| Paid-in capital | $ 76,623,995 | $ 98,218,386 | $ 218,351,987 |
| Accumulated loss | (1,071,328) | (1,919,128) | (4,133,018) |
| Net Assets | $75,552,667 | $ 96,299,258 | $214,218,969 |
| Class A Shares | | | |
| Net Assets | $ 31,379,694 | $ 47,295,684 | $ 49,879,315 |
| Shares Outstanding | 3,482,988 | 4,983,318 | 5,463,662 |
Net Asset Value and Redemption Price Per Share
(net assets ÷ shares of beneficial interest outstanding) | $ 9.01 | $ 9.49 | $ 9.13 |
Maximum Offering Price Per Share
(100 ÷ 96.75 of net asset value per share) | $ 9.31 | $ 9.81 | $ 9.44 |
| Class C Shares | | | |
| Net Assets | $ 1,977,076 | $ 2,865,352 | $ 2,154,225 |
| Shares Outstanding | 197,420 | 303,062 | 219,374 |
Net Asset Value and Offering Price Per Share*
(net assets ÷ shares of beneficial interest outstanding) | $ 10.01 | $ 9.45 | $ 9.82 |
| Class I Shares | | | |
| Net Assets | $ 42,195,897 | $ 46,138,222 | $ 162,185,429 |
| Shares Outstanding | 4,683,663 | 4,860,387 | 17,765,059 |
Net Asset Value, Offering Price and Redemption Price Per Share
(net assets ÷ shares of beneficial interest outstanding) | $ 9.01 | $ 9.49 | $ 9.13 |
| On sales of $100,000 or more, the offering price of Class A shares is reduced. |
| * | Redemption price per share is equal to the net asset value less any applicable contingent deferred sales charge. |
36
See Notes to Financial Statements.
Eaton Vance
Municipal Income Funds
January 31, 2023
Statements of Assets and Liabilities (Unaudited) — continued
| | January 31, 2023 |
| | New Jersey Fund | Pennsylvania Fund |
| Assets | | |
| Investments: | | |
| Identified cost | $ 146,262,270 | $ 157,719,334 |
| Unrealized appreciation (depreciation) | (895,858) | 1,424,991 |
| Investments, at value | $145,366,412 | $159,144,325 |
| Cash | $ 8,300,858 | $ 3,118,625 |
| Interest receivable | 1,129,966 | 1,594,060 |
| Receivable for Fund shares sold | 488,357 | 784,134 |
| Total assets | $155,285,593 | $164,641,144 |
| Liabilities | | |
| Payable for floating rate notes issued | $ — | $ 4,999,950 |
| Payable for when-issued securities | 4,275,978 | 1,000,000 |
| Payable for Fund shares redeemed | 363,984 | 446,644 |
| Distributions payable | 55,220 | 80,290 |
| Payable to affiliates: | | |
| Investment adviser fee | 43,663 | 47,234 |
| Distribution and service fees | 19,274 | 18,378 |
| Interest expense and fees payable | — | 29,018 |
| Accrued expenses | 101,256 | 106,776 |
| Total liabilities | $ 4,859,375 | $ 6,728,290 |
| Net Assets | $150,426,218 | $157,912,854 |
| Sources of Net Assets | | |
| Paid-in capital | $ 158,186,860 | $ 173,897,555 |
| Accumulated loss | (7,760,642) | (15,984,701) |
| Net Assets | $150,426,218 | $157,912,854 |
| Class A Shares | | |
| Net Assets | $ 83,104,802 | $ 87,956,958 |
| Shares Outstanding | 9,556,792 | 11,171,265 |
Net Asset Value and Redemption Price Per Share
(net assets ÷ shares of beneficial interest outstanding) | $ 8.70 | $ 7.87 |
Maximum Offering Price Per Share
(100 ÷ 96.75 of net asset value per share) | $ 8.99 | $ 8.13 |
| Class C Shares | | |
| Net Assets | $ 6,578,660 | $ 4,466,765 |
| Shares Outstanding | 725,873 | 547,834 |
Net Asset Value and Offering Price Per Share*
(net assets ÷ shares of beneficial interest outstanding) | $ 9.06 | $ 8.15 |
| Class I Shares | | |
| Net Assets | $ 60,742,756 | $ 65,489,131 |
| Shares Outstanding | 6,971,806 | 8,286,231 |
Net Asset Value, Offering Price and Redemption Price Per Share
(net assets ÷ shares of beneficial interest outstanding) | $ 8.71 | $ 7.90 |
| On sales of $100,000 or more, the offering price of Class A shares is reduced. |
| * | Redemption price per share is equal to the net asset value less any applicable contingent deferred sales charge. |
37
See Notes to Financial Statements.
Eaton Vance
Municipal Income Funds
January 31, 2023
Statements of Operations (Unaudited)
| | Six Months Ended January 31, 2023 |
| | Arizona Fund | Connecticut Fund | Minnesota Fund |
| Investment Income | | | |
| Interest income | $ 1,131,486 | $ 1,471,116 | $ 3,066,235 |
| Total investment income | $1,131,486 | $1,471,116 | $ 3,066,235 |
| Expenses | | | |
| Investment adviser fee | $ 98,459 | $ 138,928 | $ 370,276 |
| Distribution and service fees: | | | |
| Class A | 30,298 | 46,477 | 51,381 |
| Class C | 9,993 | 13,214 | 10,816 |
| Trustees’ fees and expenses | 2,614 | 3,326 | 7,150 |
| Custodian fee | 13,588 | 15,600 | 26,613 |
| Transfer and dividend disbursing agent fees | 12,001 | 22,392 | 41,478 |
| Legal and accounting services | 31,713 | 32,564 | 32,424 |
| Printing and postage | 3,084 | 1,900 | 4,307 |
| Registration fees | 10,301 | 2,626 | 10,543 |
| Miscellaneous | 12,960 | 16,119 | 24,446 |
| Total expenses | $ 225,011 | $ 293,146 | $ 579,434 |
| Net investment income | $ 906,475 | $1,177,970 | $ 2,486,801 |
| Realized and Unrealized Gain (Loss) | | | |
| Net realized gain (loss): | | | |
| Investment transactions | $ (493,088) | $ (208,413) | $ (1,186,343) |
| Net realized loss | $ (493,088) | $ (208,413) | $(1,186,343) |
| Change in unrealized appreciation (depreciation): | | | |
| Investments | $ 122,940 | $ (187,320) | $ (250,446) |
| Net change in unrealized appreciation (depreciation) | $ 122,940 | $ (187,320) | $ (250,446) |
| Net realized and unrealized loss | $ (370,148) | $ (395,733) | $(1,436,789) |
| Net increase in net assets from operations | $ 536,327 | $ 782,237 | $ 1,050,012 |
38
See Notes to Financial Statements.
Eaton Vance
Municipal Income Funds
January 31, 2023
Statements of Operations (Unaudited) — continued
| | Six Months Ended January 31, 2023 |
| | New Jersey Fund | Pennsylvania Fund |
| Investment Income | | |
| Interest income | $ 2,591,840 | $ 2,951,473 |
| Total investment income | $ 2,591,840 | $ 2,951,473 |
| Expenses | | |
| Investment adviser fee | $ 256,887 | $ 272,674 |
| Distribution and service fees: | | |
| Class A | 83,958 | 87,111 |
| Class C | 30,057 | 22,774 |
| Trustees’ fees and expenses | 4,962 | 5,315 |
| Custodian fee | 20,518 | 21,499 |
| Transfer and dividend disbursing agent fees | 39,973 | 45,685 |
| Legal and accounting services | 48,004 | 50,173 |
| Printing and postage | 7,549 | 7,553 |
| Registration fees | 3,396 | 3,109 |
| Interest expense and fees | — | 73,925 |
| Miscellaneous | 16,641 | 17,166 |
| Total expenses | $ 511,945 | $ 606,984 |
| Net investment income | $ 2,079,895 | $ 2,344,489 |
| Realized and Unrealized Gain (Loss) | | |
| Net realized gain (loss): | | |
| Investment transactions | $ (2,577,553) | $ (3,376,840) |
| Net realized loss | $(2,577,553) | $(3,376,840) |
| Change in unrealized appreciation (depreciation): | | |
| Investments | $ 274,376 | $ 2,029,795 |
| Net change in unrealized appreciation (depreciation) | $ 274,376 | $ 2,029,795 |
| Net realized and unrealized loss | $(2,303,177) | $(1,347,045) |
| Net increase (decrease) in net assets from operations | $ (223,282) | $ 997,444 |
39
See Notes to Financial Statements.
Eaton Vance
Municipal Income Funds
January 31, 2023
Statements of Changes in Net Assets
| | Six Months Ended January 31, 2023 (Unaudited) |
| | Arizona Fund | Connecticut Fund | Minnesota Fund |
| Increase (Decrease) in Net Assets | | | |
| From operations: | | | |
| Net investment income | $ 906,475 | $ 1,177,970 | $ 2,486,801 |
| Net realized loss | (493,088) | (208,413) | (1,186,343) |
| Net change in unrealized appreciation (depreciation) | 122,940 | (187,320) | (250,446) |
| Net increase in net assets from operations | $ 536,327 | $ 782,237 | $ 1,050,012 |
| Distributions to shareholders: | | | |
| Class A | $ (378,151) | $ (591,154) | $ (565,786) |
| Class C | (18,284) | (24,928) | (16,518) |
| Class I | (505,311) | (559,318) | (1,901,978) |
| Total distributions to shareholders | $ (901,746) | $ (1,175,400) | $ (2,484,282) |
| Transactions in shares of beneficial interest: | | | |
| Class A | $ 482,737 | $ (78,437) | $ (4,095,718) |
| Class C | (372,218) | (40,273) | (332,299) |
| Class I | 9,303,614 | 8,345,385 | 15,416,612 |
| Net increase in net assets from Fund share transactions | $ 9,414,133 | $ 8,226,675 | $ 10,988,595 |
| Net increase in net assets | $ 9,048,714 | $ 7,833,512 | $ 9,554,325 |
| Net Assets | | | |
| At beginning of period | $ 66,503,953 | $ 88,465,746 | $ 204,664,644 |
| At end of period | $75,552,667 | $96,299,258 | $214,218,969 |
40
See Notes to Financial Statements.
Eaton Vance
Municipal Income Funds
January 31, 2023
Statements of Changes in Net Assets — continued
| | Six Months Ended January 31, 2023 (Unaudited) |
| | New Jersey Fund | Pennsylvania Fund |
| Increase (Decrease) in Net Assets | | |
| From operations: | | |
| Net investment income | $ 2,079,895 | $ 2,344,489 |
| Net realized loss | (2,577,553) | (3,376,840) |
| Net change in unrealized appreciation (depreciation) | 274,376 | 2,029,795 |
| Net increase (decrease) in net assets from operations | $ (223,282) | $ 997,444 |
| Distributions to shareholders: | | |
| Class A | $ (1,152,437) | $ (1,275,567) |
| Class C | (63,021) | (52,157) |
| Class I | (836,334) | (957,516) |
| Total distributions to shareholders | $ (2,051,792) | $ (2,285,240) |
| Transactions in shares of beneficial interest: | | |
| Class A | $ (3,015,259) | $ (1,803,090) |
| Class C | (174,675) | (786,140) |
| Class I | 1,834,770 | 5,889,414 |
| Net increase (decrease) in net assets from Fund share transactions | $ (1,355,164) | $ 3,300,184 |
| Net increase (decrease) in net assets | $ (3,630,238) | $ 2,012,388 |
| Net Assets | | |
| At beginning of period | $ 154,056,456 | $ 155,900,466 |
| At end of period | $150,426,218 | $157,912,854 |
41
See Notes to Financial Statements.
Eaton Vance
Municipal Income Funds
January 31, 2023
Statements of Changes in Net Assets — continued
| | Year Ended July 31, 2022 |
| | Arizona Fund | Connecticut Fund | Minnesota Fund |
| Increase (Decrease) in Net Assets | | | |
| From operations: | | | |
| Net investment income | $ 1,583,232 | $ 1,797,269 | $ 3,452,597 |
| Net realized loss | (593,587) | (739,747) | (1,256,260) |
| Net change in unrealized appreciation (depreciation) | (6,059,063) | (6,156,169) | (12,786,850) |
| Net decrease in net assets from operations | $ (5,069,418) | $ (5,098,647) | $ (10,590,513) |
| Distributions to shareholders: | | | |
| Class A | $ (781,462) | $ (1,068,991) | $ (994,207) |
| Class C | (39,608) | (47,633) | (31,390) |
| Class I | (766,802) | (679,633) | (2,494,800) |
| Total distributions to shareholders | $ (1,587,872) | $ (1,796,257) | $ (3,520,397) |
| Transactions in shares of beneficial interest: | | | |
| Class A | $ (7,129,178) | $ (944,936) | $ (3,983,341) |
| Class C | (1,049,820) | (586,261) | (1,713,386) |
| Class I | (198,605) | 13,733,099 | 27,845,206 |
| Net increase (decrease) in net assets from Fund share transactions | $ (8,377,603) | $12,201,902 | $ 22,148,479 |
| Net increase (decrease) in net assets | $(15,034,893) | $ 5,306,998 | $ 8,037,569 |
| Net Assets | | | |
| At beginning of year | $ 81,538,846 | $ 83,158,748 | $ 196,627,075 |
| At end of year | $ 66,503,953 | $88,465,746 | $204,664,644 |
42
See Notes to Financial Statements.
Eaton Vance
Municipal Income Funds
January 31, 2023
Statements of Changes in Net Assets — continued
| | Year Ended July 31, 2022 |
| | New Jersey Fund | Pennsylvania Fund |
| Increase (Decrease) in Net Assets | | |
| From operations: | | |
| Net investment income | $ 4,007,699 | $ 4,346,352 |
| Net realized loss | (4,579,358) | (2,213,310) |
| Net change in unrealized appreciation (depreciation) | (16,045,083) | (16,113,808) |
| Net decrease in net assets from operations | $ (16,616,742) | $ (13,980,766) |
| Distributions to shareholders: | | |
| Class A | $ (2,272,763) | $ (2,564,121) |
| Class C | (136,975) | (115,392) |
| Class I | (1,859,863) | (1,754,196) |
| Total distributions to shareholders | $ (4,269,601) | $ (4,433,709) |
| Transactions in shares of beneficial interest: | | |
| Class A | $ (8,775,622) | $ (11,345,524) |
| Class C | (2,016,247) | (1,761,462) |
| Class I | (11,920,973) | 156,603 |
| Net decrease in net assets from Fund share transactions | $ (22,712,842) | $ (12,950,383) |
| Net decrease in net assets | $ (43,599,185) | $ (31,364,858) |
| Net Assets | | |
| At beginning of year | $ 197,655,641 | $ 187,265,324 |
| At end of year | $154,056,456 | $155,900,466 |
43
See Notes to Financial Statements.
Eaton Vance
Municipal Income Funds
January 31, 2023
| | Arizona Fund — Class A |
| | Six Months Ended
January 31, 2023
(Unaudited) | Year Ended July 31, |
| | | 2022 | 2021 | 2020 | 2019 | 2018 |
| Net asset value — Beginning of period | $ 9.080 | $ 9.930 | $ 9.910 | $ 9.750 | $ 9.440 | $ 9.580 |
| Income (Loss) From Operations | | | | | | |
| Net investment income(1) | $ 0.112 | $ 0.200 | $ 0.206 | $ 0.238 | $ 0.258 | $ 0.276 |
| Net realized and unrealized gain (loss) | (0.071) | (0.849) | 0.032 | 0.182 | 0.310 | (0.132) |
| Total income (loss) from operations | $ 0.041 | $ (0.649) | $ 0.238 | $ 0.420 | $ 0.568 | $ 0.144 |
| Less Distributions | | | | | | |
| From net investment income | $ (0.111) | $ (0.201) | $ (0.218) | $ (0.260) | $ (0.258) | $ (0.284) |
| Total distributions | $ (0.111) | $ (0.201) | $ (0.218) | $ (0.260) | $ (0.258) | $ (0.284) |
| Net asset value — End of period | $ 9.010 | $ 9.080 | $ 9.930 | $ 9.910 | $ 9.750 | $ 9.440 |
| Total Return(2) | 0.49% (3) | (6.59)% | 2.44% | 4.38% | 6.12% | 1.53% |
| Ratios/Supplemental Data | | | | | | |
| Net assets, end of period (000’s omitted) | $31,380 | $31,125 | $41,643 | $38,854 | $34,704 | $33,704 |
| Ratios (as a percentage of average daily net assets): | | | | | | |
| Expenses | 0.73% (4) | 0.69% | 0.67% | 0.68% | 0.70% | 0.71% |
| Net investment income | 2.51% (4) | 2.11% | 2.08% | 2.44% | 2.73% | 2.90% |
| Portfolio Turnover | 20% (3) | 19% | 26% | 16% | 6% | 8% |
| (1) | Computed using average shares outstanding. |
| (2) | Returns are historical and are calculated by determining the percentage change in net asset value with all distributions reinvested and do not reflect the effect of sales charges. |
| (3) | Not annualized. |
| (4) | Annualized. |
44
See Notes to Financial Statements.
Eaton Vance
Municipal Income Funds
January 31, 2023
Financial Highlights — continued
| | Arizona Fund — Class C |
| | Six Months Ended
January 31, 2023
(Unaudited) | Year Ended July 31, |
| | | 2022 | 2021 | 2020 | 2019 | 2018 |
| Net asset value — Beginning of period | $ 10.100 | $ 11.040 | $ 11.020 | $ 10.840 | $ 10.500 | $ 10.650 |
| Income (Loss) From Operations | | | | | | |
| Net investment income(1) | $ 0.087 | $ 0.142 | $ 0.148 | $ 0.183 | $ 0.208 | $ 0.227 |
| Net realized and unrealized gain (loss) | (0.091) | (0.938) | 0.034 | 0.208 | 0.339 | (0.140) |
| Total income (loss) from operations | $ (0.004) | $ (0.796) | $ 0.182 | $ 0.391 | $ 0.547 | $ 0.087 |
| Less Distributions | | | | | | |
| From net investment income | $ (0.086) | $ (0.144) | $ (0.162) | $ (0.211) | $ (0.207) | $ (0.237) |
| Total distributions | $ (0.086) | $ (0.144) | $ (0.162) | $ (0.211) | $ (0.207) | $ (0.237) |
| Net asset value — End of period | $10.010 | $10.100 | $11.040 | $11.020 | $10.840 | $10.500 |
| Total Return(2) | (0.01)% (3) | (7.24)% | 1.67% | 3.65% | 5.28% | 0.83% |
| Ratios/Supplemental Data | | | | | | |
| Net assets, end of period (000’s omitted) | $ 1,977 | $ 2,384 | $ 3,684 | $ 4,490 | $ 4,279 | $ 5,025 |
| Ratios (as a percentage of average daily net assets): | | | | | | |
| Expenses | 1.48% (4) | 1.44% | 1.42% | 1.43% | 1.45% | 1.46% |
| Net investment income | 1.75% (4) | 1.35% | 1.35% | 1.69% | 1.98% | 2.15% |
| Portfolio Turnover | 20% (3) | 19% | 26% | 16% | 6% | 8% |
| (1) | Computed using average shares outstanding. |
| (2) | Returns are historical and are calculated by determining the percentage change in net asset value with all distributions reinvested and do not reflect the effect of sales charges. |
| (3) | Not annualized. |
| (4) | Annualized. |
45
See Notes to Financial Statements.
Eaton Vance
Municipal Income Funds
January 31, 2023
Financial Highlights — continued
| | Arizona Fund — Class I |
| | Six Months Ended
January 31, 2023
(Unaudited) | Year Ended July 31, |
| | | 2022 | 2021 | 2020 | 2019 | 2018 |
| Net asset value — Beginning of period | $ 9.080 | $ 9.930 | $ 9.910 | $ 9.750 | $ 9.440 | $ 9.580 |
| Income (Loss) From Operations | | | | | | |
| Net investment income(1) | $ 0.120 | $ 0.219 | $ 0.223 | $ 0.257 | $ 0.276 | $ 0.295 |
| Net realized and unrealized gain (loss) | (0.070) | (0.849) | 0.034 | 0.184 | 0.310 | (0.132) |
| Total income (loss) from operations | $ 0.050 | $ (0.630) | $ 0.257 | $ 0.441 | $ 0.586 | $ 0.163 |
| Less Distributions | | | | | | |
| From net investment income | $ (0.120) | $ (0.220) | $ (0.237) | $ (0.281) | $ (0.276) | $ (0.303) |
| Total distributions | $ (0.120) | $ (0.220) | $ (0.237) | $ (0.281) | $ (0.276) | $ (0.303) |
| Net asset value — End of period | $ 9.010 | $ 9.080 | $ 9.930 | $ 9.910 | $ 9.750 | $ 9.440 |
| Total Return(2) | 0.59% (3) | (6.40)% | 2.64% | 4.60% | 6.33% | 1.74% |
| Ratios/Supplemental Data | | | | | | |
| Net assets, end of period (000’s omitted) | $42,196 | $32,995 | $36,212 | $22,611 | $19,612 | $13,292 |
| Ratios (as a percentage of average daily net assets): | | | | | | |
| Expenses | 0.53% (4) | 0.49% | 0.47% | 0.48% | 0.49% | 0.51% |
| Net investment income | 2.71% (4) | 2.31% | 2.26% | 2.64% | 2.91% | 3.10% |
| Portfolio Turnover | 20% (3) | 19% | 26% | 16% | 6% | 8% |
| (1) | Computed using average shares outstanding. |
| (2) | Returns are historical and are calculated by determining the percentage change in net asset value with all distributions reinvested. |
| (3) | Not annualized. |
| (4) | Annualized. |
46
See Notes to Financial Statements.
Eaton Vance
Municipal Income Funds
January 31, 2023
Financial Highlights — continued
| | Connecticut Fund — Class A |
| | Six Months Ended
January 31, 2023
(Unaudited) | Year Ended July 31, |
| | | 2022 | 2021 | 2020 | 2019 | 2018 |
| Net asset value — Beginning of period | $ 9.540 | $10.410 | $ 10.350 | $ 10.230 | $ 9.960 | $10.200 |
| Income (Loss) From Operations | | | | | | |
| Net investment income(1) | $ 0.119 | $ 0.214 | $ 0.242 | $ 0.265 | $ 0.296 | $ 0.324 |
| Net realized and unrealized gain (loss) | (0.051) | (0.870) | 0.059 | 0.136 | 0.269 | (0.243) |
| Total income (loss) from operations | $ 0.068 | $ (0.656) | $ 0.301 | $ 0.401 | $ 0.565 | $ 0.081 |
| Less Distributions | | | | | | |
| From net investment income | $ (0.118) | $ (0.214) | $ (0.241) | $ (0.281) | $ (0.295) | $ (0.321) |
| Total distributions | $ (0.118) | $ (0.214) | $ (0.241) | $ (0.281) | $ (0.295) | $ (0.321) |
| Net asset value — End of period | $ 9.490 | $ 9.540 | $10.410 | $10.350 | $10.230 | $ 9.960 |
| Total Return(2) | 0.77% (3) | (6.36)% | 2.95% | 3.99% | 5.78% | 0.82% |
| Ratios/Supplemental Data | | | | | | |
| Net assets, end of period (000’s omitted) | $47,296 | $47,639 | $ 52,924 | $ 52,501 | $ 52,275 | $54,900 |
| Ratios (as a percentage of average daily net assets): | | | | | | |
| Expenses | 0.72% (4) | 0.69% | 0.69% | 0.72% | 0.73% | 0.73% |
| Net investment income | 2.55% (4) | 2.15% | 2.34% | 2.59% | 2.97% | 3.22% |
| Portfolio Turnover | 17% (3) | 31% | 19% | 26% | 16% | 10% |
| (1) | Computed using average shares outstanding. |
| (2) | Returns are historical and are calculated by determining the percentage change in net asset value with all distributions reinvested and do not reflect the effect of sales charges. |
| (3) | Not annualized. |
| (4) | Annualized. |
47
See Notes to Financial Statements.
Eaton Vance
Municipal Income Funds
January 31, 2023
Financial Highlights — continued
| | Connecticut Fund — Class C |
| | Six Months Ended
January 31, 2023
(Unaudited) | Year Ended July 31, |
| | | 2022 | 2021 | 2020 | 2019 | 2018 |
| Net asset value — Beginning of period | $ 9.510 | $10.370 | $ 10.310 | $ 10.190 | $ 9.920 | $10.160 |
| Income (Loss) From Operations | | | | | | |
| Net investment income(1) | $ 0.083 | $ 0.139 | $ 0.164 | $ 0.187 | $ 0.220 | $ 0.247 |
| Net realized and unrealized gain (loss) | (0.060) | (0.860) | 0.059 | 0.136 | 0.269 | (0.242) |
| Total income (loss) from operations | $ 0.023 | $ (0.721) | $ 0.223 | $ 0.323 | $ 0.489 | $ 0.005 |
| Less Distributions | | | | | | |
| From net investment income | $ (0.083) | $ (0.139) | $ (0.163) | $ (0.203) | $ (0.219) | $ (0.245) |
| Total distributions | $(0.083) | $ (0.139) | $ (0.163) | $ (0.203) | $ (0.219) | $ (0.245) |
| Net asset value — End of period | $ 9.450 | $ 9.510 | $10.370 | $10.310 | $10.190 | $ 9.920 |
| Total Return(2) | 0.28% (3) | (6.99)% | 2.19% | 3.21% | 5.01% | 0.06% |
| Ratios/Supplemental Data | | | | | | |
| Net assets, end of period (000’s omitted) | $ 2,865 | $ 2,926 | $ 3,815 | $ 5,194 | $ 4,782 | $ 4,588 |
| Ratios (as a percentage of average daily net assets): | | | | | | |
| Expenses | 1.47% (4) | 1.44% | 1.44% | 1.47% | 1.47% | 1.48% |
| Net investment income | 1.80% (4) | 1.40% | 1.59% | 1.84% | 2.21% | 2.47% |
| Portfolio Turnover | 17% (3) | 31% | 19% | 26% | 16% | 10% |
| (1) | Computed using average shares outstanding. |
| (2) | Returns are historical and are calculated by determining the percentage change in net asset value with all distributions reinvested and do not reflect the effect of sales charges. |
| (3) | Not annualized. |
| (4) | Annualized. |
48
See Notes to Financial Statements.
Eaton Vance
Municipal Income Funds
January 31, 2023
Financial Highlights — continued
| | Connecticut Fund — Class I |
| | Six Months Ended
January 31, 2023
(Unaudited) | Year Ended July 31, |
| | | 2022 | 2021 | 2020 | 2019 | 2018 |
| Net asset value — Beginning of period | $ 9.540 | $10.410 | $ 10.350 | $ 10.230 | $ 9.960 | $10.200 |
| Income (Loss) From Operations | | | | | | |
| Net investment income(1) | $ 0.128 | $ 0.233 | $ 0.262 | $ 0.286 | $ 0.316 | $ 0.344 |
| Net realized and unrealized gain (loss) | (0.050) | (0.869) | 0.060 | 0.136 | 0.269 | (0.242) |
| Total income (loss) from operations | $ 0.078 | $ (0.636) | $ 0.322 | $ 0.422 | $ 0.585 | $ 0.102 |
| Less Distributions | | | | | | |
| From net investment income | $ (0.128) | $ (0.234) | $ (0.262) | $ (0.302) | $ (0.315) | $ (0.342) |
| Total distributions | $ (0.128) | $ (0.234) | $ (0.262) | $ (0.302) | $ (0.315) | $ (0.342) |
| Net asset value — End of period | $ 9.490 | $ 9.540 | $10.410 | $10.350 | $10.230 | $ 9.960 |
| Total Return(2) | 0.87% (3) | (6.17)% | 3.16% | 4.20% | 6.00% | 1.03% |
| Ratios/Supplemental Data | | | | | | |
| Net assets, end of period (000’s omitted) | $46,138 | $37,901 | $ 26,420 | $ 21,544 | $ 21,081 | $13,842 |
| Ratios (as a percentage of average daily net assets): | | | | | | |
| Expenses | 0.52% (4) | 0.49% | 0.49% | 0.52% | 0.53% | 0.53% |
| Net investment income | 2.75% (4) | 2.37% | 2.53% | 2.80% | 3.16% | 3.42% |
| Portfolio Turnover | 17% (3) | 31% | 19% | 26% | 16% | 10% |
| (1) | Computed using average shares outstanding. |
| (2) | Returns are historical and are calculated by determining the percentage change in net asset value with all distributions reinvested. |
| (3) | Not annualized. |
| (4) | Annualized. |
49
See Notes to Financial Statements.
Eaton Vance
Municipal Income Funds
January 31, 2023
Financial Highlights — continued
| | Minnesota Fund — Class A |
| | Six Months Ended
January 31, 2023
(Unaudited) | Year Ended July 31, |
| | | 2022 | 2021 | 2020 | 2019 | 2018 |
| Net asset value — Beginning of period | $ 9.180 | $ 9.860 | $ 9.840 | $ 9.610 | $ 9.250 | $ 9.480 |
| Income (Loss) From Operations | | | | | | |
| Net investment income(1) | $ 0.099 | $ 0.156 | $ 0.170 | $ 0.187 | $ 0.224 | $ 0.241 |
| Net realized and unrealized gain (loss) | (0.050) | (0.677) | 0.021 | 0.233 | 0.361 | (0.227) |
| Total income (loss) from operations | $ 0.049 | $ (0.521) | $ 0.191 | $ 0.420 | $ 0.585 | $ 0.014 |
| Less Distributions | | | | | | |
| From net investment income | $ (0.099) | $ (0.159) | $ (0.171) | $ (0.190) | $ (0.225) | $ (0.244) |
| Total distributions | $ (0.099) | $ (0.159) | $ (0.171) | $ (0.190) | $ (0.225) | $ (0.244) |
| Net asset value — End of period | $ 9.130 | $ 9.180 | $ 9.860 | $ 9.840 | $ 9.610 | $ 9.250 |
| Total Return(2) | 0.57% (3) | (5.31)% | 1.96% | 4.42% | 6.42% | 0.15% |
| Ratios/Supplemental Data | | | | | | |
| Net assets, end of period (000’s omitted) | $49,879 | $54,415 | $62,712 | $60,367 | $57,812 | $56,760 |
| Ratios (as a percentage of average daily net assets): | | | | | | |
| Expenses | 0.69% (4) | 0.66% | 0.65% | 0.66% | 0.70% | 0.69% |
| Net investment income | 2.21% (4) | 1.64% | 1.73% | 1.93% | 2.41% | 2.57% |
| Portfolio Turnover | 11% (3) | 23% | 9% | 14% | 21% | 20% |
| (1) | Computed using average shares outstanding. |
| (2) | Returns are historical and are calculated by determining the percentage change in net asset value with all distributions reinvested and do not reflect the effect of sales charges. |
| (3) | Not annualized. |
| (4) | Annualized. |
50
See Notes to Financial Statements.
Eaton Vance
Municipal Income Funds
January 31, 2023
Financial Highlights — continued
| | Minnesota Fund — Class C |
| | Six Months Ended
January 31, 2023
(Unaudited) | Year Ended July 31, |
| | | 2022 | 2021 | 2020 | 2019 | 2018 |
| Net asset value — Beginning of period | $ 9.870 | $10.600 | $ 10.580 | $ 10.330 | $ 9.950 | $10.200 |
| Income (Loss) From Operations | | | | | | |
| Net investment income(1) | $ 0.070 | $ 0.090 | $ 0.104 | $ 0.123 | $ 0.168 | $ 0.184 |
| Net realized and unrealized gain (loss) | (0.049) | (0.725) | 0.020 | 0.253 | 0.379 | (0.247) |
| Total income (loss) from operations | $ 0.021 | $ (0.635) | $ 0.124 | $ 0.376 | $ 0.547 | $ (0.063) |
| Less Distributions | | | | | | |
| From net investment income | $ (0.071) | $ (0.095) | $ (0.104) | $ (0.126) | $ (0.167) | $ (0.187) |
| Total distributions | $(0.071) | $ (0.095) | $ (0.104) | $ (0.126) | $ (0.167) | $ (0.187) |
| Net asset value — End of period | $ 9.820 | $ 9.870 | $10.600 | $10.580 | $10.330 | $ 9.950 |
| Total Return(2) | 0.23% (3) | (6.01)% | 1.19% | 3.67% | 5.56% | (0.62)% |
| Ratios/Supplemental Data | | | | | | |
| Net assets, end of period (000’s omitted) | $ 2,154 | $ 2,505 | $ 4,478 | $ 6,616 | $ 6,595 | $ 9,484 |
| Ratios (as a percentage of average daily net assets): | | | | | | |
| Expenses | 1.44% (4) | 1.41% | 1.40% | 1.41% | 1.46% | 1.44% |
| Net investment income | 1.45% (4) | 0.88% | 0.99% | 1.18% | 1.68% | 1.82% |
| Portfolio Turnover | 11% (3) | 23% | 9% | 14% | 21% | 20% |
| (1) | Computed using average shares outstanding. |
| (2) | Returns are historical and are calculated by determining the percentage change in net asset value with all distributions reinvested and do not reflect the effect of sales charges. |
| (3) | Not annualized. |
| (4) | Annualized. |
51
See Notes to Financial Statements.
Eaton Vance
Municipal Income Funds
January 31, 2023
Financial Highlights — continued
| | Minnesota Fund — Class I |
| | Six Months Ended
January 31, 2023
(Unaudited) | Year Ended July 31, |
| | | 2022 | 2021 | 2020 | 2019 | 2018 |
| Net asset value — Beginning of period | $ 9.180 | $ 9.860 | $ 9.840 | $ 9.610 | $ 9.250 | $ 9.480 |
| Income (Loss) From Operations | | | | | | |
| Net investment income(1) | $ 0.108 | $ 0.174 | $ 0.190 | $ 0.205 | $ 0.242 | $ 0.260 |
| Net realized and unrealized gain (loss) | (0.050) | (0.676) | 0.020 | 0.234 | 0.361 | (0.227) |
| Total income (loss) from operations | $ 0.058 | $ (0.502) | $ 0.210 | $ 0.439 | $ 0.603 | $ 0.033 |
| Less Distributions | | | | | | |
| From net investment income | $ (0.108) | $ (0.178) | $ (0.190) | $ (0.209) | $ (0.243) | $ (0.263) |
| Total distributions | $ (0.108) | $ (0.178) | $ (0.190) | $ (0.209) | $ (0.243) | $ (0.263) |
| Net asset value — End of period | $ 9.130 | $ 9.180 | $ 9.860 | $ 9.840 | $ 9.610 | $ 9.250 |
| Total Return(2) | 0.67% (3) | (5.12)% | 2.17% | 4.63% | 6.64% | 0.36% |
| Ratios/Supplemental Data | | | | | | |
| Net assets, end of period (000’s omitted) | $162,185 | $147,745 | $129,437 | $122,078 | $88,841 | $73,789 |
| Ratios (as a percentage of average daily net assets): | | | | | | |
| Expenses | 0.49% (4) | 0.46% | 0.45% | 0.46% | 0.50% | 0.49% |
| Net investment income | 2.41% (4) | 1.84% | 1.93% | 2.13% | 2.59% | 2.77% |
| Portfolio Turnover | 11% (3) | 23% | 9% | 14% | 21% | 20% |
| (1) | Computed using average shares outstanding. |
| (2) | Returns are historical and are calculated by determining the percentage change in net asset value with all distributions reinvested. |
| (3) | Not annualized. |
| (4) | Annualized. |
52
See Notes to Financial Statements.
Eaton Vance
Municipal Income Funds
January 31, 2023
Financial Highlights — continued
| | New Jersey Fund — Class A |
| | Six Months Ended
January 31, 2023
(Unaudited) | Year Ended July 31, |
| | | 2022 | 2021 | 2020 | 2019 | 2018 |
| Net asset value — Beginning of period | $ 8.820 | $ 9.820 | $ 9.650 | $ 9.480 | $ 9.080 | $ 9.230 |
| Income (Loss) From Operations | | | | | | |
| Net investment income(1) | $ 0.119 | $ 0.198 | $ 0.203 | $ 0.244 | $ 0.287 | $ 0.317 |
| Net realized and unrealized gain (loss) | (0.121) | (0.986) | 0.206 | 0.193 | 0.398 | (0.146) |
| Total income (loss) from operations | $ (0.002) | $ (0.788) | $ 0.409 | $ 0.437 | $ 0.685 | $ 0.171 |
| Less Distributions | | | | | | |
| From net investment income | $ (0.118) | $ (0.204) | $ (0.239) | $ (0.267) | $ (0.285) | $ (0.321) |
| From net realized gain | — | (0.008) | — | — | — | — |
| Total distributions | $ (0.118) | $ (0.212) | $ (0.239) | $ (0.267) | $ (0.285) | $ (0.321) |
| Net asset value — End of period | $ 8.700 | $ 8.820 | $ 9.820 | $ 9.650 | $ 9.480 | $ 9.080 |
| Total Return(2) | 0.02% (3) | (8.10)% | 4.29% | 4.68% | 7.69% | 1.89% |
| Ratios/Supplemental Data | | | | | | |
| Net assets, end of period (000’s omitted) | $83,105 | $87,385 | $107,117 | $100,417 | $101,283 | $98,224 |
| Ratios (as a percentage of average daily net assets): | | | | | | |
| Expenses | 0.74% (4) | 0.69% | 0.67% | 0.69% | 0.72% | 0.73% |
| Net investment income | 2.78% (4) | 2.13% | 2.09% | 2.57% | 3.14% | 3.47% |
| Portfolio Turnover | 17% (3) | 24% | 39% | 37% | 39% | 13% |
| (1) | Computed using average shares outstanding. |
| (2) | Returns are historical and are calculated by determining the percentage change in net asset value with all distributions reinvested and do not reflect the effect of sales charges. |
| (3) | Not annualized. |
| (4) | Annualized. |
53
See Notes to Financial Statements.
Eaton Vance
Municipal Income Funds
January 31, 2023
Financial Highlights — continued
| | New Jersey Fund — Class C |
| | Six Months Ended
January 31, 2023
(Unaudited) | Year Ended July 31, |
| | | 2022 | 2021 | 2020 | 2019 | 2018 |
| Net asset value — Beginning of period | $ 9.190 | $10.230 | $ 10.070 | $ 9.890 | $ 9.470 | $ 9.630 |
| Income (Loss) From Operations | | | | | | |
| Net investment income(1) | $ 0.091 | $ 0.133 | $ 0.136 | $ 0.180 | $ 0.229 | $ 0.259 |
| Net realized and unrealized gain (loss) | (0.132) | (1.021) | 0.205 | 0.205 | 0.416 | (0.155) |
| Total income (loss) from operations | $(0.041) | $ (0.888) | $ 0.341 | $ 0.385 | $ 0.645 | $ 0.104 |
| Less Distributions | | | | | | |
| From net investment income | $ (0.089) | $ (0.144) | $ (0.181) | $ (0.205) | $ (0.225) | $ (0.264) |
| From net realized gain | — | (0.008) | — | — | — | — |
| Total distributions | $(0.089) | $ (0.152) | $ (0.181) | $ (0.205) | $ (0.225) | $ (0.264) |
| Net asset value — End of period | $ 9.060 | $ 9.190 | $10.230 | $10.070 | $ 9.890 | $ 9.470 |
| Total Return(2) | (0.41)% (3) | (8.75)% | 3.43% | 3.94% | 6.92% | 1.10% |
| Ratios/Supplemental Data | | | | | | |
| Net assets, end of period (000’s omitted) | $ 6,579 | $ 6,865 | $ 9,904 | $ 10,804 | $12,202 | $17,481 |
| Ratios (as a percentage of average daily net assets): | | | | | | |
| Expenses | 1.49% (4) | 1.44% | 1.42% | 1.44% | 1.47% | 1.48% |
| Net investment income | 2.03% (4) | 1.37% | 1.35% | 1.81% | 2.41% | 2.72% |
| Portfolio Turnover | 17% (3) | 24% | 39% | 37% | 39% | 13% |
| (1) | Computed using average shares outstanding. |
| (2) | Returns are historical and are calculated by determining the percentage change in net asset value with all distributions reinvested and do not reflect the effect of sales charges. |
| (3) | Not annualized. |
| (4) | Annualized. |
54
See Notes to Financial Statements.
Eaton Vance
Municipal Income Funds
January 31, 2023
Financial Highlights — continued
| | New Jersey Fund — Class I |
| | Six Months Ended
January 31, 2023
(Unaudited) | Year Ended July 31, |
| | | 2022 | 2021 | 2020 | 2019 | 2018 |
| Net asset value — Beginning of period | $ 8.830 | $ 9.830 | $ 9.660 | $ 9.480 | $ 9.080 | $ 9.230 |
| Income (Loss) From Operations | | | | | | |
| Net investment income(1) | $ 0.128 | $ 0.217 | $ 0.222 | $ 0.262 | $ 0.303 | $ 0.335 |
| Net realized and unrealized gain (loss) | (0.122) | (0.988) | 0.198 | 0.202 | 0.400 | (0.146) |
| Total income (loss) from operations | $ 0.006 | $ (0.771) | $ 0.420 | $ 0.464 | $ 0.703 | $ 0.189 |
| Less Distributions | | | | | | |
| From net investment income | $ (0.126) | $ (0.221) | $ (0.250) | $ (0.284) | $ (0.303) | $ (0.339) |
| From net realized gain | — | (0.008) | — | — | — | — |
| Total distributions | $ (0.126) | $ (0.229) | $ (0.250) | $ (0.284) | $ (0.303) | $ (0.339) |
| Net asset value — End of period | $ 8.710 | $ 8.830 | $ 9.830 | $ 9.660 | $ 9.480 | $ 9.080 |
| Total Return(2) | 0.12% (3) | (7.93)% | 4.41% | 4.97% | 7.91% | 2.09% |
| Ratios/Supplemental Data | | | | | | |
| Net assets, end of period (000’s omitted) | $60,743 | $59,806 | $80,634 | $66,447 | $51,021 | $32,285 |
| Ratios (as a percentage of average daily net assets): | | | | | | |
| Expenses | 0.54% (4) | 0.49% | 0.47% | 0.49% | 0.52% | 0.53% |
| Net investment income | 2.98% (4) | 2.32% | 2.29% | 2.76% | 3.30% | 3.66% |
| Portfolio Turnover | 17% (3) | 24% | 39% | 37% | 39% | 13% |
| (1) | Computed using average shares outstanding. |
| (2) | Returns are historical and are calculated by determining the percentage change in net asset value with all distributions reinvested. |
| (3) | Not annualized. |
| (4) | Annualized. |
55
See Notes to Financial Statements.
Eaton Vance
Municipal Income Funds
January 31, 2023
Financial Highlights — continued
| | Pennsylvania Fund — Class A |
| | Six Months Ended
January 31, 2023
(Unaudited) | Year Ended July 31, |
| | | 2022 | 2021 | 2020 | 2019 | 2018 |
| Net asset value — Beginning of period | $ 7.940 | $ 8.830 | $ 8.740 | $ 8.650 | $ 8.500 | $ 8.730 |
| Income (Loss) From Operations | | | | | | |
| Net investment income(1) | $ 0.116 | $ 0.207 | $ 0.219 | $ 0.269 | $ 0.310 | $ 0.334 |
| Net realized and unrealized gain (loss) | (0.073) | (0.886) | 0.090 | 0.093 | 0.153 | (0.236) |
| Total income (loss) from operations | $ 0.043 | $ (0.679) | $ 0.309 | $ 0.362 | $ 0.463 | $ 0.098 |
| Less Distributions | | | | | | |
| From net investment income | $ (0.113) | $ (0.211) | $ (0.219) | $ (0.272) | $ (0.313) | $ (0.328) |
| Total distributions | $ (0.113) | $ (0.211) | $ (0.219) | $ (0.272) | $ (0.313) | $ (0.328) |
| Net asset value — End of period | $ 7.870 | $ 7.940 | $ 8.830 | $ 8.740 | $ 8.650 | $ 8.500 |
| Total Return(2) | 0.60% (3) | (7.77)% | 3.59% | 4.26% | 5.58% | 1.16% |
| Ratios/Supplemental Data | | | | | | |
| Net assets, end of period (000’s omitted) | $87,957 | $90,612 | $112,748 | $115,340 | $119,324 | $112,508 |
| Ratios (as a percentage of average daily net assets): | | | | | | |
| Expenses excluding interest and fees | 0.75% (4) | 0.71% | 0.69% | 0.71% | 0.75% | 0.75% |
| Interest and fee expense(5) | 0.10% (4) | 0.03% | 0.02% | 0.05% | 0.07% | 0.05% |
| Total expenses | 0.85% (4) | 0.74% | 0.71% | 0.76% | 0.82% | 0.80% |
| Net investment income | 3.01% (4) | 2.47% | 2.51% | 3.11% | 3.65% | 3.89% |
| Portfolio Turnover | 43% (3) | 36% | 34% | 20% | 18% | 9% |
| (1) | Computed using average shares outstanding. |
| (2) | Returns are historical and are calculated by determining the percentage change in net asset value with all distributions reinvested and do not reflect the effect of sales charges. |
| (3) | Not annualized. |
| (4) | Annualized. |
| (5) | Interest and fee expense relates to the liability for floating rate notes issued in conjunction with residual interest bond transactions (see Note 1H). |
56
See Notes to Financial Statements.
Eaton Vance
Municipal Income Funds
January 31, 2023
Financial Highlights — continued
| | Pennsylvania Fund — Class C |
| | Six Months Ended
January 31, 2023
(Unaudited) | Year Ended July 31, |
| | | 2022 | 2021 | 2020 | 2019 | 2018 |
| Net asset value — Beginning of period | $ 8.220 | $ 9.140 | $ 9.050 | $ 8.960 | $ 8.800 | $ 9.040 |
| Income (Loss) From Operations | | | | | | |
| Net investment income(1) | $ 0.090 | $ 0.149 | $ 0.160 | $ 0.211 | $ 0.257 | $ 0.279 |
| Net realized and unrealized gain (loss) | (0.073) | (0.915) | 0.089 | 0.093 | 0.161 | (0.246) |
| Total income (loss) from operations | $ 0.017 | $(0.766) | $ 0.249 | $ 0.304 | $ 0.418 | $ 0.033 |
| Less Distributions | | | | | | |
| From net investment income | $ (0.087) | $ (0.154) | $ (0.159) | $ (0.214) | $ (0.258) | $ (0.273) |
| Total distributions | $(0.087) | $(0.154) | $(0.159) | $ (0.214) | $ (0.258) | $ (0.273) |
| Net asset value — End of period | $ 8.150 | $ 8.220 | $ 9.140 | $ 9.050 | $ 8.960 | $ 8.800 |
| Total Return(2) | 0.13% (3) | (8.34)% | 2.78% | 3.45% | 4.84% | 0.39% |
| Ratios/Supplemental Data | | | | | | |
| Net assets, end of period (000’s omitted) | $ 4,467 | $ 5,317 | $ 7,781 | $11,815 | $13,088 | $22,991 |
| Ratios (as a percentage of average daily net assets): | | | | | | |
| Expenses excluding interest and fees | 1.50% (4) | 1.46% | 1.44% | 1.46% | 1.50% | 1.50% |
| Interest and fee expense(5) | 0.10% (4) | 0.03% | 0.02% | 0.05% | 0.07% | 0.05% |
| Total expenses | 1.60% (4) | 1.49% | 1.46% | 1.51% | 1.57% | 1.55% |
| Net investment income | 2.26% (4) | 1.71% | 1.77% | 2.36% | 2.93% | 3.13% |
| Portfolio Turnover | 43% (3) | 36% | 34% | 20% | 18% | 9% |
| (1) | Computed using average shares outstanding. |
| (2) | Returns are historical and are calculated by determining the percentage change in net asset value with all distributions reinvested and do not reflect the effect of sales charges. |
| (3) | Not annualized. |
| (4) | Annualized. |
| (5) | Interest and fee expense relates to the liability for floating rate notes issued in conjunction with residual interest bond transactions (see Note 1H). |
57
See Notes to Financial Statements.
Eaton Vance
Municipal Income Funds
January 31, 2023
Financial Highlights — continued
| | Pennsylvania Fund — Class I |
| | Six Months Ended
January 31, 2023
(Unaudited) | Year Ended July 31, |
| | | 2022 | 2021 | 2020 | 2019 | 2018 |
| Net asset value — Beginning of period | $ 7.970 | $ 8.860 | $ 8.770 | $ 8.690 | $ 8.530 | $ 8.760 |
| Income (Loss) From Operations | | | | | | |
| Net investment income(1) | $ 0.124 | $ 0.224 | $ 0.237 | $ 0.287 | $ 0.328 | $ 0.352 |
| Net realized and unrealized gain (loss) | (0.073) | (0.885) | 0.090 | 0.083 | 0.163 | (0.235) |
| Total income (loss) from operations | $ 0.051 | $ (0.661) | $ 0.327 | $ 0.370 | $ 0.491 | $ 0.117 |
| Less Distributions | | | | | | |
| From net investment income | $ (0.121) | $ (0.229) | $ (0.237) | $ (0.290) | $ (0.331) | $ (0.347) |
| Total distributions | $ (0.121) | $ (0.229) | $ (0.237) | $ (0.290) | $ (0.331) | $ (0.347) |
| Net asset value — End of period | $ 7.900 | $ 7.970 | $ 8.860 | $ 8.770 | $ 8.690 | $ 8.530 |
| Total Return(2) | 0.70% (3) | (7.55)% | 3.80% | 4.34% | 5.90% | 1.37% |
| Ratios/Supplemental Data | | | | | | |
| Net assets, end of period (000’s omitted) | $65,489 | $59,972 | $66,737 | $64,685 | $53,541 | $46,396 |
| Ratios (as a percentage of average daily net assets): | | | | | | |
| Expenses excluding interest and fees | 0.55% (4) | 0.51% | 0.49% | 0.51% | 0.54% | 0.55% |
| Interest and fee expense(5) | 0.10% (4) | 0.03% | 0.02% | 0.05% | 0.07% | 0.05% |
| Total expenses | 0.65% (4) | 0.54% | 0.51% | 0.56% | 0.61% | 0.60% |
| Net investment income | 3.20% (4) | 2.67% | 2.71% | 3.31% | 3.84% | 4.09% |
| Portfolio Turnover | 43% (3) | 36% | 34% | 20% | 18% | 9% |
| (1) | Computed using average shares outstanding. |
| (2) | Returns are historical and are calculated by determining the percentage change in net asset value with all distributions reinvested. |
| (3) | Not annualized. |
| (4) | Annualized. |
| (5) | Interest and fee expense relates to the liability for floating rate notes issued in conjunction with residual interest bond transactions (see Note 1H). |
58
See Notes to Financial Statements.
Eaton Vance
Municipal Income Funds
January 31, 2023
Notes to Financial Statements (Unaudited)
1 Significant Accounting Policies
Eaton Vance Municipals Trust (the Trust) is a Massachusetts business trust registered under the Investment Company Act of 1940, as amended (the 1940 Act), as an open-end management investment company. The Trust presently consists of eighteen funds, five of which, each non-diversified, are included in these financial statements. They include Eaton Vance Arizona Municipal Income Fund (Arizona Fund), Eaton Vance Connecticut Municipal Income Fund (Connecticut Fund), Eaton Vance Minnesota Municipal Income Fund (Minnesota Fund), Eaton Vance New Jersey Municipal Income Fund (New Jersey Fund) and Eaton Vance Pennsylvania Municipal Income Fund (Pennsylvania Fund), (each individually referred to as the Fund, and collectively, the Funds). The Funds’ investment objective is to provide current income exempt from regular federal income tax and from particular state or local income or other taxes. The Funds offer three classes of shares. Class A shares are generally sold subject to a sales charge imposed at time of purchase. Class C shares are sold at net asset value and are generally subject to a contingent deferred sales charge (see Note 5). Effective November 5, 2020, Class C shares automatically convert to Class A shares eight years after their purchase as described in the Funds’ prospectus. Class I shares are sold at net asset value and are not subject to a sales charge. Each class represents a pro-rata interest in the Fund, but votes separately on class-specific matters and (as noted below) is subject to different expenses. Realized and unrealized gains and losses are allocated daily to each class of shares based on the relative net assets of each class to the total net assets of the Fund. Net investment income, other than class-specific expenses, is allocated daily to each class of shares based upon the ratio of the value of each class’s paid shares to the total value of all paid shares. Each class of shares differs in its distribution plan and certain other class-specific expenses.
The following is a summary of significant accounting policies of the Funds. The policies are in conformity with accounting principles generally accepted in the United States of America (U.S. GAAP). Each Fund is an investment company and follows accounting and reporting guidance in the Financial Accounting Standards Board (FASB) Accounting Standards Codification Topic 946.
A Investment Valuation—The following methodologies are used to determine the market value or fair value of investments.
Debt Obligations. Debt obligations are generally valued on the basis of valuations provided by third party pricing services, as derived from such services’ pricing models. Inputs to the models may include, but are not limited to, reported trades, executable bid and ask prices, broker/dealer quotations, prices or yields of securities with similar characteristics, interest rates, anticipated prepayments, benchmark curves or information pertaining to the issuer, as well as industry and economic events. The pricing services may use a matrix approach, which considers information regarding securities with similar characteristics to determine the valuation for a security. Short-term debt obligations purchased with a remaining maturity of sixty days or less for which a valuation from a third party pricing service is not readily available may be valued at amortized cost, which approximates fair value.
Fair Valuation. In connection with Rule 2a-5 of the 1940 Act, the Trustees have designated a Fund’s investment adviser as its valuation designee. Investments for which valuations or market quotations are not readily available or are deemed unreliable are valued by the investment adviser, as valuation designee, at fair value using methods that most fairly reflect the security’s “fair value”, which is the amount that a Fund might reasonably expect to receive for the security upon its current sale in the ordinary course. Each such determination is based on a consideration of relevant factors, which are likely to vary from one pricing context to another. These factors may include, but are not limited to, the type of security, the existence of any contractual restrictions on the security’s disposition, the price and extent of public trading in similar securities of the issuer or of comparable entities, quotations or relevant information obtained from broker/dealers or other market participants, information obtained from the issuer, analysts, and/or the appropriate stock exchange (for exchange-traded securities), an analysis of the entity’s financial statements, and an evaluation of the forces that influence the issuer and the market(s) in which the security is purchased and sold.
B Investment Transactions and Related Income—Investment transactions for financial statement purposes are accounted for on a trade date basis. Realized gains and losses on investments sold are determined on the basis of identified cost. Interest income is recorded on the basis of interest accrued, adjusted for amortization of premium or accretion of discount.
C Federal Taxes—Each Fund's policy is to comply with the provisions of the Internal Revenue Code applicable to regulated investment companies and to distribute to shareholders each year substantially all of its taxable, if any, and tax-exempt net investment income, and all or substantially all of its net realized capital gains. Accordingly, no provision for federal income or excise tax is necessary. Each Fund intends to satisfy conditions which will enable it to designate distributions from the interest income generated by its investments in non-taxable municipal securities, which are exempt from regular federal income tax when received by each Fund, as exempt-interest dividends. The portion of such interest, if any, earned on private activity bonds issued after August 7, 1986, may be considered a tax preference item to shareholders.
As of January 31, 2023, the Funds had no uncertain tax positions that would require financial statement recognition, de-recognition, or disclosure. Each Fund files a U.S. federal income tax return annually after its fiscal year-end, which is subject to examination by the Internal Revenue Service for a period of three years from the date of filing.
D Expenses—The majority of expenses of the Trust are directly identifiable to an individual fund. Expenses which are not readily identifiable to a specific fund are allocated taking into consideration, among other things, the nature and type of expense and the relative size of the funds.
E Legal Fees—Legal fees and other related expenses incurred as part of negotiations of the terms and requirement of capital infusions, or that are expected to result in the restructuring of, or a plan of reorganization for, an investment are recorded as realized losses. Ongoing expenditures to protect or enhance an investment are treated as operating expenses.
Eaton Vance
Municipal Income Funds
January 31, 2023
Notes to Financial Statements (Unaudited) — continued
F Use of Estimates—The preparation of the financial statements in conformity with U.S. GAAP requires management to make estimates and assumptions that affect the reported amounts of assets and liabilities at the date of the financial statements and the reported amounts of income and expense during the reporting period. Actual results could differ from those estimates.
G Indemnifications—Under the Trust’s organizational documents, its officers and Trustees may be indemnified against certain liabilities and expenses arising out of the performance of their duties to the Funds. Under Massachusetts law, if certain conditions prevail, shareholders of a Massachusetts business trust (such as the Trust) could be deemed to have personal liability for the obligations of the Trust. However, the Trust’s Declaration of Trust contains an express disclaimer of liability on the part of Fund shareholders and the By-laws provide that the Trust shall assume, upon request by the shareholder, the defense on behalf of any Fund shareholders. Moreover, the By-laws also provide for indemnification out of Fund property of any shareholder held personally liable solely by reason of being or having been a shareholder for all loss or expense arising from such liability. Additionally, in the normal course of business, each Fund enters into agreements with service providers that may contain indemnification clauses. Each Fund’s maximum exposure under these arrangements is unknown as this would involve future claims that may be made against each Fund that have not yet occurred.
H Floating Rate Notes Issued in Conjunction with Securities Held— The Funds may invest in residual interest bonds, also referred to as inverse floating rate securities, whereby a Fund may sell a variable or fixed rate bond for cash to a Special-Purpose Vehicle (the SPV), (which is generally organized as a trust), while at the same time, buying a residual interest in the assets and cash flows of the SPV. The bond is deposited into the SPV with the same CUSIP number as the bond sold to the SPV by the Fund, and which may have been, but is not required to be, the bond purchased from the Fund (the Bond). The SPV also issues floating rate notes (Floating Rate Notes) which are sold to third-parties. The residual interest bond held by a Fund gives the Fund the right (1) to cause the holders of the Floating Rate Notes to generally tender their notes at par, and (2) to have the Bond held by the SPV transferred to the Fund, thereby terminating the SPV. Should the Fund exercise such right, it would generally pay the SPV the par amount due on the Floating Rate Notes and exchange the residual interest bond for the underlying Bond. Pursuant to generally accepted accounting principles for transfers and servicing of financial assets and extinguishment of liabilities, the Funds account for the transaction described above as a secured borrowing by including the Bond in their Portfolio of Investments and the Floating Rate Notes as a liability under the caption “Payable for floating rate notes issued” in their Statement of Assets and Liabilities. The Floating Rate Notes have interest rates that generally reset weekly and their holders have the option to tender their notes to the SPV for redemption at par at each reset date. Accordingly, the fair value of the payable for floating rate notes issued approximates its carrying value. If measured at fair value, the payable for floating rate notes would have been considered as Level 2 in the fair value hierarchy (see Note 9) at January 31, 2023. Interest expense related to a Fund’s liability with respect to Floating Rate Notes is recorded as incurred. The SPV may be terminated by the Fund, as noted above, or by the occurrence of certain termination events as defined in the trust agreement, such as a downgrade in the credit quality of the underlying Bond, bankruptcy of or payment failure by the issuer of the underlying Bond, the inability to remarket Floating Rate Notes that have been tendered due to insufficient buyers in the market, or the failure by the SPV to obtain renewal of the liquidity agreement under which liquidity support is provided for the Floating Rate Notes up to one year. At January 31, 2023, the amounts of the Funds’ Floating Rate Notes and related interest rates and collateral were as follows:
| | Pennsylvania
Fund |
| Floating Rate Notes Outstanding | $4,999,950 |
| Interest Rate or Range of Interest Rates (%) | 1.74 |
| Collateral for Floating Rate Notes Outstanding | $7,208,750 |
For the six months ended January 31, 2023, the Funds’ average settled Floating Rate Notes outstanding and the average interest rate (annualized) including fees were as follows:
| | Pennsylvania
Fund |
| Average Floating Rate Notes Outstanding | $5,000,000 |
| Average Interest Rate | 2.93% |
In certain circumstances, the Funds may enter into shortfall and forbearance agreements with brokers by which a Fund agrees to reimburse the broker for the difference between the liquidation value of the Bond held by the SPV and the liquidation value of the Floating Rate Notes, as well as any shortfalls in interest cash flows. The Funds had no shortfalls as of January 31, 2023.
The Funds may also purchase residual interest bonds in a secondary market transaction without first owning the underlying bond. Such transactions are not required to be treated as secured borrowings. Shortfall agreements, if any, related to residual interest bonds purchased in a secondary market transaction are disclosed in the Portfolio of Investments.
Eaton Vance
Municipal Income Funds
January 31, 2023
Notes to Financial Statements (Unaudited) — continued
The Funds' investment policies and restrictions expressly permit investments in residual interest bonds. Such bonds typically offer the potential for yields exceeding the yields available on fixed rate bonds with comparable credit quality and maturity. These securities tend to underperform the market for fixed rate bonds in a rising long-term interest rate environment, but tend to outperform the market for fixed rate bonds when long-term interest rates decline. The value and income of residual interest bonds are generally more volatile than that of a fixed rate bond. The Funds' investment policies do not allow the Funds to borrow money except as permitted by the 1940 Act. Effective August 19, 2022, the Funds began operating under Rule 18f-4 under the 1940 Act, which, among other things, governs the use of derivative investments and certain financing transactions by registered investment companies. As of the date of this report, consistent with Rule 18f-4, the Funds have elected to comply with the asset coverage requirements of Section 18 with respect to its investments in residual interest bonds (as opposed to treating such interests as derivatives transactions). The Funds may change this election (and elect to treat these investments and other similar financing transactions as derivatives transactions) at any time. Residual interest bonds held by the Funds are securities exempt from registration under Rule 144A of the Securities Act of 1933.
I When-Issued Securities and Delayed Delivery Transactions—The Funds may purchase securities on a delayed delivery or when-issued basis. Payment and delivery may take place after the customary settlement period for that security. At the time the transaction is negotiated, the price of the security that will be delivered is fixed. The Funds maintain cash and/or security positions for these commitments such that sufficient liquid assets will be available to make payments upon settlement. Securities purchased on a delayed delivery or when-issued basis are marked-to-market daily and begin earning interest on settlement date. Such security purchases are subject to the risk that when delivered they will be worth less than the agreed upon payment price. Losses may also arise if the counterparty does not perform under the contract.
J Interim Financial Statements—The interim financial statements relating to January 31, 2023 and for the six months then ended have not been audited by an independent registered public accounting firm, but in the opinion of the Funds' management, reflect all adjustments, consisting only of normal recurring adjustments, necessary for the fair presentation of the financial statements.
2 Distributions to Shareholders and Income Tax Information
The net investment income of each Fund is determined daily and substantially all of the net investment income so determined is declared as a dividend to shareholders of record at the time of declaration. Distributions are declared separately for each class of shares. Distributions are paid monthly. Distributions of realized capital gains are made at least annually. Shareholders may reinvest income and capital gain distributions in additional shares of the same class of a Fund at the net asset value as of the reinvestment date or, at the election of the shareholder, receive distributions in cash. Distributions to shareholders are determined in accordance with income tax regulations, which may differ from U.S. GAAP. As required by U.S. GAAP, only distributions in excess of tax basis earnings and profits are reported in the financial statements as a return of capital. Permanent differences between book and tax accounting relating to distributions are reclassified to paid-in capital. For tax purposes, distributions from short-term capital gains are considered to be from ordinary income.
At July 31, 2022, the following Funds, for federal income tax purposes, had deferred capital losses which would reduce the respective Fund’s taxable income arising from future net realized gains on investment transactions, if any, to the extent permitted by the Internal Revenue Code, and thus would reduce the amount of distributions to shareholders, which would otherwise be necessary to relieve the Funds of any liability for federal income or excise tax. The deferred capital losses are treated as arising on the first day of a Fund’s next taxable year and retain the same short-term or long-term character as when originally deferred. The amounts of the deferred capital losses are as follows:
| | Arizona
Fund | Connecticut
Fund | Minnesota
Fund | New Jersey
Fund | Pennsylvania
Fund |
| Deferred capital losses: | | | | | |
| Short-term | $459,098 | $1,302,596 | $ 714,819 | $1,632,136 | $6,132,351 |
| Long-term | $473,203 | $ 281,402 | $1,312,750 | $2,941,883 | $8,026,453 |
Eaton Vance
Municipal Income Funds
January 31, 2023
Notes to Financial Statements (Unaudited) — continued
The cost and unrealized appreciation (depreciation) of investments of each Fund at January 31, 2023, as determined on a federal income tax basis, were as follows:
| | Arizona
Fund | Connecticut
Fund | Minnesota
Fund | New Jersey
Fund | Pennsylvania
Fund |
| Aggregate cost | $ 74,767,859 | $ 96,531,740 | $208,453,204 | $145,973,470 | $152,595,644 |
| Gross unrealized appreciation | $ 1,946,983 | $ 1,746,173 | $ 2,489,368 | $ 3,483,392 | $ 5,928,592 |
| Gross unrealized depreciation | (1,592,958) | (1,849,826) | (3,408,477) | (4,090,450) | (4,379,861) |
| Net unrealized appreciation (depreciation) | $ 354,025 | $ (103,653) | $ (919,109) | $ (607,058) | $ 1,548,731 |
3 Investment Adviser Fee and Other Transactions with Affiliates
The investment adviser fee is earned by Boston Management and Research (BMR), an indirect, wholly-owned subsidiary of Morgan Stanley, as compensation for investment advisory services rendered to each Fund. The investment adviser fee is based upon a percentage of total daily net assets plus a percentage of total daily gross income (i.e., income other than gains from the sale of securities) as follows and is payable monthly:
| Total Daily Net Assets | Annual Asset
Rate | Daily Income
Rate |
| Up to $20 million | 0.100% | 1.000% |
| $20 million but less than $40 million | 0.200% | 2.000% |
| $40 million but less than $500 million | 0.300% | 3.000% |
| $500 million but less than $1 billion | 0.275% | 2.750% |
| $1 billion but less than $1.5 billion | 0.250% | 2.500% |
| $1.5 billion but less than $2 billion | 0.225% | 2.250% |
| $2 billion but less than $3 billion | 0.200% | 2.000% |
| $3 billion and over | 0.175% | 1.750% |
For the six months ended January 31, 2023, investment adviser fees incurred by the Funds and the effective annual rates, as a percentage of average daily net assets, were as follows:
| | Arizona
Fund | Connecticut
Fund | Minnesota
Fund | New Jersey
Fund | Pennsylvania
Fund |
| Investment Adviser Fee | $98,459 | $138,928 | $370,276 | $256,887 | $272,674 |
| Effective Annual Rate | 0.28% | 0.31% | 0.35% | 0.35% | 0.36% |
Eaton Vance Management (EVM), an affiliate of BMR, serves as the administrator of each Fund, but receives no compensation.
EVM provides sub-transfer agency and related services to the Funds pursuant to a Sub-Transfer Agency Support Services Agreement. Eaton Vance Distributors, Inc. (EVD), an affiliate of EVM and the Funds’ principal underwriter, received a portion of the sales charge on sales of Class A shares of the Funds. Morgan Stanley affiliated broker-dealers, which may be deemed to be affiliates of BMR, EVM and EVD, also received a portion of the sales charge on sales of Class A shares. EVD also received distribution and service fees from Class A and Class C shares (see Note 4) and contingent deferred sales
Eaton Vance
Municipal Income Funds
January 31, 2023
Notes to Financial Statements (Unaudited) — continued
charges (see Note 5). Sub-transfer agent fees earned by EVM, which are included in transfer and dividend disbursing agent fees on the Statements of Operations, and Class A sales charges that the Funds were informed were received by EVD and Morgan Stanley affiliated broker-dealers for the six months ended January 31, 2023 were as follows:
| | Arizona
Fund | Connecticut
Fund | Minnesota
Fund | New Jersey
Fund | Pennsylvania
Fund |
| EVM's Sub-Transfer Agent Fees | $2,855 | $7,795 | $13,605 | $11,441 | $15,240 |
| EVD's Class A Sales Charges | $ 572 | $ 504 | $ 47 | $ 3,295 | $ 3,548 |
| Morgan Stanley affiliated broker-dealers’ Class A Sales Charges | $ — | $ — | $ — | $ — | $ 719 |
Trustees and officers of the Funds who are members of EVM’s or BMR’s organizations receive remuneration for their services to the Funds out of the investment adviser fee. Trustees of the Funds who are not affiliated with the investment adviser may elect to defer receipt of all or a percentage of their annual fees in accordance with the terms of the Trustees Deferred Compensation Plan. For the six months ended January 31, 2023, no significant amounts have been deferred. Certain officers and Trustees of the Funds are officers of the above organizations.
4 Distribution Plans
Each Fund has in effect a distribution plan for Class A shares (Class A Plan) pursuant to Rule 12b-1 under the 1940 Act. The Class A Plan provides that each Fund will pay EVD a distribution and service fee not exceeding 0.25% per annum of its average daily net assets attributable to Class A shares for distribution services and facilities provided to each Fund by EVD, as well as for personal services and/or the maintenance of shareholder accounts. The Trustees approved distribution and service fee payments equal to 0.20% per annum of each Fund’s average daily net assets attributable to Class A shares. Distribution and service fees paid or accrued to EVD for the six months ended January 31, 2023 for Class A shares amounted to the following:
| | Arizona
Fund | Connecticut
Fund | Minnesota
Fund | New Jersey
Fund | Pennsylvania
Fund |
| Class A Distribution and Service Fees | $30,298 | $46,477 | $51,381 | $83,958 | $87,111 |
Each Fund also has in effect a distribution plan for Class C shares (Class C Plan) pursuant to Rule 12b-1 under the 1940 Act. Pursuant to the Class C Plan, each Fund pays EVD amounts equal to 0.75% per annum of its average daily net assets attributable to Class C shares for providing ongoing distribution services and facilities to the respective Funds. For the six months ended January 31, 2023, the Funds paid or accrued to EVD the following distribution fees:
| | Arizona
Fund | Connecticut
Fund | Minnesota
Fund | New Jersey
Fund | Pennsylvania
Fund |
| Class C Distribution Fees | $7,889 | $10,432 | $8,539 | $23,729 | $17,980 |
The Class C Plan also authorizes each Fund to make payments of service fees to EVD, financial intermediaries and other persons in amounts not exceeding 0.25% per annum of the average daily net assets attributable to Class C shares. The Trustees approved service fee payments equal to 0.20% per annum of each Fund’s average daily net assets attributable to Class C shares. Service fees paid or accrued are for personal services and/or the maintenance of shareholder accounts. They are separate and distinct from the Class C sales commissions and distribution fees payable to EVD. Service fees paid or accrued for the six months ended January 31, 2023 amounted to the following:
| | Arizona
Fund | Connecticut
Fund | Minnesota
Fund | New Jersey
Fund | Pennsylvania
Fund |
| Class C Service Fees | $2,104 | $2,782 | $2,277 | $6,328 | $4,794 |
Distribution and service fees are subject to the limitations contained in the Financial Industry Regulatory Authority Rule 2341(d).
Eaton Vance
Municipal Income Funds
January 31, 2023
Notes to Financial Statements (Unaudited) — continued
5 Contingent Deferred Sales Charges
A contingent deferred sales charge (CDSC) of 1% generally is imposed on redemptions of Class C shares made within 12 months of purchase. Class A shares may be subject to a 0.75% CDSC if redeemed within 12 months of purchase (depending on the circumstances of purchase). Generally, the CDSC is based upon the lower of the net asset value at date of redemption or date of purchase. No charge is levied on shares acquired by reinvestment of dividends or capital gain distributions. For the six months ended January 31, 2023, the Funds were informed that EVD received approximately the following amounts of CDSCs paid by Class A and Class C shareholders:
| | Arizona
Fund | Connecticut
Fund | Minnesota
Fund | New Jersey
Fund | Pennsylvania
Fund |
| Class A | $ — | $ — | $ — | $ — | $200 |
| Class C | $1,000 | $ 100 | $ — | $ — | $200 |
6 Purchases and Sales of Investments
Purchases and sales of investments, other than short-term obligations and including maturities, for the six months ended January 31, 2023 were as follows:
| | Arizona
Fund | Connecticut
Fund | Minnesota
Fund | New Jersey
Fund | Pennsylvania
Fund |
| Purchases | $25,031,764 | $27,205,179 | $44,952,557 | $23,759,198 | $66,999,538 |
| Sales | $13,685,915 | $15,165,602 | $22,625,162 | $28,337,177 | $65,580,650 |
7 Shares of Beneficial Interest
Each Fund’s Declaration of Trust permits the Trustees to issue an unlimited number of full and fractional shares of beneficial interest (without par value). Such shares may be issued in a number of different series (such as the Funds) and classes. Transactions in Fund shares, including direct exchanges pursuant to share class conversions for all periods presented, were as follows:
| Arizona Fund | | | |
| | | Six Months Ended
January 31, 2023
(Unaudited) | | Year Ended
July 31, 2022 |
| | | Shares | Amount | Shares | Amount |
| Class A | | | | | |
| Sales | | 406,948 | $ 3,554,156 | 633,014 | $ 6,001,840 |
| Issued to shareholders electing to receive payments of distributions in Fund shares | | 39,902 | 349,986 | 76,842 | 725,739 |
| Redemptions | | (390,290) | (3,421,405) | (1,476,147) | (13,856,757) |
| Net increase (decrease) | | 56,560 | $ 482,737 | (766,291) | $ (7,129,178) |
| Class C | | | | | |
| Sales | | 5,150 | $ 50,578 | 33,071 | $ 351,200 |
| Issued to shareholders electing to receive payments of distributions in Fund shares | | 1,772 | 17,259 | 3,500 | 36,731 |
| Redemptions | | (45,599) | (440,055) | (134,168) | (1,437,751) |
| Net decrease | | (38,677) | $ (372,218) | (97,597) | $ (1,049,820) |
Eaton Vance
Municipal Income Funds
January 31, 2023
Notes to Financial Statements (Unaudited) — continued
| Arizona Fund (continued) | | | |
| | | Six Months Ended
January 31, 2023
(Unaudited) | | Year Ended
July 31, 2022 |
| | | Shares | Amount | Shares | Amount |
| Class I | | | | | |
| Sales | | 1,926,338 | $ 16,990,600 | 2,023,597 | $ 18,740,444 |
| Issued to shareholders electing to receive payments of distributions in Fund shares | | 53,299 | 467,658 | 69,127 | 650,231 |
| Redemptions | | (928,324) | (8,154,644) | (2,106,598) | (19,589,280) |
| Net increase (decrease) | | 1,051,313 | $ 9,303,614 | (13,874) | $ (198,605) |
| Connecticut Fund | | | |
| | | Six Months Ended
January 31, 2023
(Unaudited) | | Year Ended
July 31, 2022 |
| | | Shares | Amount | Shares | Amount |
| Class A | | | | | |
| Sales | | 145,428 | $ 1,343,302 | 685,096 | $ 6,622,624 |
| Issued to shareholders electing to receive payments of distributions in Fund shares | | 55,083 | 505,986 | 89,641 | 886,160 |
| Redemptions | | (209,218) | (1,927,725) | (868,133) | (8,453,720) |
| Net decrease | | (8,707) | $ (78,437) | (93,396) | $ (944,936) |
| Class C | | | | | |
| Sales | | 27,930 | $ 258,234 | 42,439 | $ 425,307 |
| Issued to shareholders electing to receive payments of distributions in Fund shares | | 2,099 | 19,204 | 3,791 | 37,409 |
| Redemptions | | (34,739) | (317,711) | (106,407) | (1,048,977) |
| Net decrease | | (4,710) | $ (40,273) | (60,177) | $ (586,261) |
| Class I | | | | | |
| Sales | | 2,085,696 | $ 19,306,836 | 2,443,741 | $ 23,334,302 |
| Issued to shareholders electing to receive payments of distributions in Fund shares | | 44,487 | 408,846 | 54,316 | 534,438 |
| Redemptions | | (1,240,730) | (11,370,297) | (1,065,269) | (10,135,641) |
| Net increase | | 889,453 | $ 8,345,385 | 1,432,788 | $ 13,733,099 |
Eaton Vance
Municipal Income Funds
January 31, 2023
Notes to Financial Statements (Unaudited) — continued
| Minnesota Fund | | | |
| | | Six Months Ended
January 31, 2023
(Unaudited) | | Year Ended
July 31, 2022 |
| | | Shares | Amount | Shares | Amount |
| Class A | | | | | |
| Sales | | 656,969 | $ 5,891,525 | 994,921 | $ 9,385,041 |
| Issued to shareholders electing to receive payments of distributions in Fund shares | | 61,917 | 550,459 | 99,694 | 940,030 |
| Redemptions | | (1,185,431) | (10,537,702) | (1,526,797) | (14,308,412) |
| Net decrease | | (466,545) | $ (4,095,718) | (432,182) | $ (3,983,341) |
| Class C | | | | | |
| Sales | | 29,593 | $ 281,348 | 4,178 | $ 42,397 |
| Issued to shareholders electing to receive payments of distributions in Fund shares | | 1,610 | 15,399 | 2,896 | 29,418 |
| Redemptions | | (65,627) | (629,046) | (175,633) | (1,785,201) |
| Net decrease | | (34,424) | $ (332,299) | (168,559) | $ (1,713,386) |
| Class I | | | | | |
| Sales | | 7,578,095 | $ 67,843,777 | 12,046,549 | $ 110,864,800 |
| Issued to shareholders electing to receive payments of distributions in Fund shares | | 127,808 | 1,136,783 | 173,377 | 1,632,895 |
| Redemptions | | (6,042,215) | (53,563,948) | (9,250,462) | (84,652,489) |
| Net increase | | 1,663,688 | $ 15,416,612 | 2,969,464 | $ 27,845,206 |
| New Jersey Fund | | | |
| | | Six Months Ended
January 31, 2023
(Unaudited) | | Year Ended
July 31, 2022 |
| | | Shares | Amount | Shares | Amount |
| Class A | | | | | |
| Sales | | 548,045 | $ 4,626,878 | 895,573 | $ 8,458,626 |
| Issued to shareholders electing to receive payments of distributions in Fund shares | | 112,014 | 946,410 | 202,993 | 1,880,191 |
| Redemptions | | (1,016,346) | (8,588,547) | (2,098,239) | (19,114,439) |
| Net decrease | | (356,287) | $ (3,015,259) | (999,673) | $ (8,775,622) |
| Class C | | | | | |
| Sales | | 64,670 | $ 577,316 | 127,020 | $ 1,262,223 |
| Issued to shareholders electing to receive payments of distributions in Fund shares | | 6,291 | 55,389 | 12,597 | 121,838 |
| Redemptions | | (92,282) | (807,380) | (360,213) | (3,400,308) |
| Net decrease | | (21,321) | $ (174,675) | (220,596) | $ (2,016,247) |
Eaton Vance
Municipal Income Funds
January 31, 2023
Notes to Financial Statements (Unaudited) — continued
| New Jersey Fund (continued) | | | |
| | | Six Months Ended
January 31, 2023
(Unaudited) | | Year Ended
July 31, 2022 |
| | | Shares | Amount | Shares | Amount |
| Class I | | | | | |
| Sales | | 3,106,677 | $ 26,484,015 | 5,035,621 | $ 46,167,000 |
| Issued to shareholders electing to receive payments of distributions in Fund shares | | 85,193 | 721,271 | 175,803 | 1,635,727 |
| Redemptions | | (2,992,131) | (25,370,516) | (6,641,631) | (59,723,700) |
| Net increase (decrease) | | 199,739 | $ 1,834,770 | (1,430,207) | $(11,920,973) |
| Pennsylvania Fund | | | |
| | | Six Months Ended
January 31, 2023
(Unaudited) | | Year Ended
July 31, 2022 |
| | | Shares | Amount | Shares | Amount |
| Class A | | | | | |
| Sales | | 869,774 | $ 6,683,969 | 642,945 | $ 5,478,317 |
| Issued to shareholders electing to receive payments of distributions in Fund shares | | 147,664 | 1,126,085 | 269,534 | 2,245,235 |
| Redemptions | | (1,255,420) | (9,613,144) | (2,271,950) | (19,069,076) |
| Net decrease | | (237,982) | $ (1,803,090) | (1,359,471) | $(11,345,524) |
| Class C | | | | | |
| Sales | | 59,528 | $ 462,062 | 79,355 | $ 697,795 |
| Issued to shareholders electing to receive payments of distributions in Fund shares | | 6,297 | 49,685 | 12,791 | 110,445 |
| Redemptions | | (164,473) | (1,297,887) | (296,618) | (2,569,702) |
| Net decrease | | (98,648) | $ (786,140) | (204,472) | $ (1,761,462) |
| Class I | | | | | |
| Sales | | 3,231,488 | $ 24,772,989 | 2,561,764 | $ 21,203,153 |
| Issued to shareholders electing to receive payments of distributions in Fund shares | | 85,239 | 652,996 | 136,510 | 1,139,406 |
| Redemptions | | (2,553,366) | (19,536,571) | (2,704,966) | (22,185,956) |
| Net increase (decrease) | | 763,361 | $ 5,889,414 | (6,692) | $ 156,603 |
Eaton Vance
Municipal Income Funds
January 31, 2023
Notes to Financial Statements (Unaudited) — continued
8 Line of Credit
The Funds participate with other portfolios and funds managed by EVM and its affiliates in a $725 million unsecured line of credit agreement with a group of banks, which is in effect through October 24, 2023. In connection with the renewal of the agreement on October 25, 2022, the borrowing limit was decreased from $800 million. Borrowings are made by the Funds solely for temporary purposes related to redemptions and other short-term cash needs. Interest is charged to each Fund based on its borrowings at an amount above either the Secured Overnight Financing Rate (SOFR) or Federal Funds rate. In addition, a fee computed at an annual rate of 0.15% on the daily unused portion of the line of credit is allocated among the participating portfolios and funds at the end of each quarter. Also in connection with the renewal of the agreement, an arrangement fee totaling $150,000 was incurred that was allocated to the participating portfolios and funds. Because the line of credit is not available exclusively to the Funds, a Fund may be unable to borrow some or all of its requested amounts at any particular time. The Funds did not have any significant borrowings or allocated fees during the six months ended January 31, 2023.
9 Fair Value Measurements
Under generally accepted accounting principles for fair value measurements, a three-tier hierarchy to prioritize the assumptions, referred to as inputs, is used in valuation techniques to measure fair value. The three-tier hierarchy of inputs is summarized in the three broad levels listed below.
| • | Level 1 – quoted prices in active markets for identical investments |
| • | Level 2 – other significant observable inputs (including quoted prices for similar investments, interest rates, prepayment speeds, credit risk, etc.) |
| • | Level 3 – significant unobservable inputs (including a fund's own assumptions in determining the fair value of investments) |
In cases where the inputs used to measure fair value fall in different levels of the fair value hierarchy, the level disclosed is determined based on the lowest level input that is significant to the fair value measurement in its entirety. The inputs or methodology used for valuing securities are not necessarily an indication of the risk associated with investing in those securities.
At January 31, 2023, the hierarchy of inputs used in valuing the Funds' investments, which are carried at value, were as follows:
| Arizona Fund | | | | |
| Asset Description | Level 1 | Level 2 | Level 3 | Total |
| Tax-Exempt Municipal Obligations | $ — | $ 70,945,146 | $ — | $ 70,945,146 |
| Taxable Municipal Obligations | — | 3,671,813 | — | 3,671,813 |
| Trust Units | — | 504,925 | — | 504,925 |
| Total Investments | $ — | $ 75,121,884 | $ — | $ 75,121,884 |
| Connecticut Fund | | | | |
| Asset Description | Level 1 | Level 2 | Level 3 | Total |
| Corporate Bonds | $ — | $ 927,244 | $ — | $ 927,244 |
| Tax-Exempt Municipal Obligations | — | 92,063,147 | — | 92,063,147 |
| Taxable Municipal Obligations | — | 2,761,097 | — | 2,761,097 |
| Trust Units | — | 676,599 | — | 676,599 |
| Total Investments | $ — | $ 96,428,087 | $ — | $ 96,428,087 |
| Minnesota Fund | | | | |
| Asset Description | Level 1 | Level 2 | Level 3 | Total |
| Tax-Exempt Municipal Obligations | $ — | $ 207,534,095 | $ — | $ 207,534,095 |
| Total Investments | $ — | $207,534,095 | $ — | $207,534,095 |
Eaton Vance
Municipal Income Funds
January 31, 2023
Notes to Financial Statements (Unaudited) — continued
| New Jersey Fund | | | | |
| Asset Description | Level 1 | Level 2 | Level 3 | Total |
| Tax-Exempt Municipal Obligations | $ — | $ 137,646,974 | $ — | $ 137,646,974 |
| Taxable Municipal Obligations | — | 7,719,438 | — | 7,719,438 |
| Total Investments | $ — | $145,366,412 | $ — | $145,366,412 |
| Pennsylvania Fund | | | | |
| Asset Description | Level 1 | Level 2 | Level 3 | Total |
| Tax-Exempt Municipal Obligations | $ — | $ 156,750,824 | $ — | $ 156,750,824 |
| Taxable Municipal Obligations | — | 2,393,501 | — | 2,393,501 |
| Total Investments | $ — | $159,144,325 | $ — | $159,144,325 |
10 Risks and Uncertainties
Pandemic Risk
An outbreak of respiratory disease caused by a novel coronavirus was first detected in China in late 2019 and subsequently spread internationally. This coronavirus has resulted in closing borders, enhanced health screenings, changes to healthcare service preparation and delivery, quarantines, cancellations, disruptions to supply chains and customer activity, as well as general concern and uncertainty. Health crises caused by outbreaks of disease, such as the coronavirus outbreak, may exacerbate other pre-existing political, social and economic risks and disrupt normal market conditions and operations. The impact of this outbreak has negatively affected the worldwide economy, as well as the economies of individual countries and industries, and could continue to affect the market in significant and unforeseen ways. Other epidemics and pandemics that may arise in the future may have similar effects. Any such impact could adversely affect the Funds' performance, or the performance of the securities in which the Funds invest.
Eaton Vance
Municipal Income Funds
January 31, 2023
| Officers |
Eric A. Stein
President | Nicholas S. Di Lorenzo
Secretary |
Deidre E. Walsh
Vice President and Chief Legal Officer | Richard F. Froio
Chief Compliance Officer |
James F. Kirchner
Treasurer | |
George J. Gorman
Chairperson | |
| Alan C. Bowser** | |
| Thomas E. Faust Jr.* | |
| Mark R. Fetting | |
| Cynthia E. Frost | |
| Valerie A. Mosley | |
| Keith Quinton | |
| Marcus L. Smith | |
| Susan J. Sutherland | |
| Scott E. Wennerholm | |
| Nancy A. Wiser** | |
| * | Interested Trustee |
| ** | Mr. Bowser and Ms. Wiser began serving as Trustees effective April 4, 2022. |
| FACTS | WHAT DOES EATON VANCE DO WITH YOUR
PERSONAL INFORMATION? |
| Why? | Financial companies choose how they share your personal information. Federal law gives consumers the right to limit some but not all sharing. Federal law also requires us to tell you how we collect, share, and protect your personal information. Please read this notice carefully to understand what we do. |
| |
| What? | The types of personal information we collect and share depend on the product or service you have with us. This information can include:■ Social Security number and income
■ investment experience and risk tolerance
■ checking account number and wire transfer instructions |
| |
| How? | All financial companies need to share customers’ personal information to run their everyday business. In the section below, we list the reasons financial companies can share their customers’ personal information; the reasons Eaton Vance chooses to share; and whether you can limit this sharing. |
Reasons we can share your
personal information | Does Eaton Vance
share? | Can you limit
this sharing? |
| For our everyday business purposes — such as to process your transactions, maintain your account(s), respond to court orders and legal investigations, or report to credit bureaus | Yes | No |
| For our marketing purposes — to offer our products and services to you | Yes | No |
| For joint marketing with other financial companies | No | We don’t share |
| For our investment management affiliates’ everyday business purposes — information about your transactions, experiences, and creditworthiness | Yes | Yes |
| For our affiliates’ everyday business purposes — information about your transactions and experiences | Yes | No |
| For our affiliates’ everyday business purposes — information about your creditworthiness | No | We don’t share |
| For our investment management affiliates to market to you | Yes | Yes |
| For our affiliates to market to you | No | We don’t share |
| For nonaffiliates to market to you | No | We don’t share |
To limit our
sharing | Call toll-free 1-800-262-1122 or email: EVPrivacy@eatonvance.comPlease note:If you are a new customer, we can begin sharing your information 30 days from the date we sent this notice. When you are no longer our customer, we continue to share your information as described in this notice. However, you can contact us at any time to limit our sharing. |
| Questions? | Call toll-free 1-800-262-1122 or email: EVPrivacy@eatonvance.com |
| Privacy Notice — continued | April 2021 |
| Who we are |
| Who is providing this notice? | Eaton Vance Management, Eaton Vance Distributors, Inc., Eaton Vance Trust Company, Eaton Vance Management (International) Limited, Eaton Vance Advisers International Ltd., Eaton Vance Global Advisors Limited, Eaton Vance Management’s Real Estate Investment Group, Boston Management and Research, Calvert Research and Management, Eaton Vance and Calvert Fund Families and our investment advisory affiliates (“Eaton Vance”) (see Investment Management Affiliates definition below) |
| What we do |
How does Eaton Vance
protect my personal
information? | To protect your personal information from unauthorized access and use, we use security measures that comply with federal law. These measures include computer safeguards and secured files and buildings. We have policies governing the proper handling of customer information by personnel and requiring third parties that provide support to adhere to appropriate security standards with respect to such information. |
How does Eaton Vance
collect my personal
information? | We collect your personal information, for example, when you■ open an account or make deposits or withdrawals from your account
■ buy securities from us or make a wire transfer
■ give us your contact informationWe also collect your personal information from others, such as credit bureaus, affiliates, or other companies. |
| Why can’t I limit all sharing? | Federal law gives you the right to limit only■ sharing for affiliates’ everyday business purposes — information about your creditworthiness
■ affiliates from using your information to market to you
■ sharing for nonaffiliates to market to youState laws and individual companies may give you additional rights to limit sharing. See below for more on your rights under state law. |
| Definitions |
Investment Management
Affiliates | Eaton Vance Investment Management Affiliates include registered investment advisers, registered broker- dealers, and registered and unregistered funds. Investment Management Affiliates does not include entities associated with Morgan Stanley Wealth Management, such as Morgan Stanley Smith Barney LLC and Morgan Stanley & Co. |
| Affiliates | Companies related by common ownership or control. They can be financial and nonfinancial companies.■ Our affiliates include companies with a Morgan Stanley name and financial companies such as Morgan Stanley Smith Barney LLC and Morgan Stanley & Co. |
| Nonaffiliates | Companies not related by common ownership or control. They can be financial and nonfinancial companies.■ Eaton Vance does not share with nonaffiliates so they can market to you. |
| Joint marketing | A formal agreement between nonaffiliated financial companies that together market financial products or services to you.■ Eaton Vance doesn’t jointly market. |
| Other important information |
| Vermont: Except as permitted by law, we will not share personal information we collect about Vermont residents with Nonaffiliates unless you provide us with your written consent to share such information.California: Except as permitted by law, we will not share personal information we collect about California residents with Nonaffiliates and we will limit sharing such personal information with our Affiliates to comply with California privacy laws that apply to us. |
Delivery of Shareholder Documents. The Securities and Exchange Commission (SEC) permits funds to deliver only one copy of shareholder documents, including prospectuses, proxy statements and shareholder reports, to fund investors with multiple accounts at the same residential or post office box address. This practice is often called “householding” and it helps eliminate duplicate mailings to shareholders. Eaton Vance, or your financial intermediary, may household the mailing of your documents indefinitely unless you instruct Eaton Vance, or your financial intermediary, otherwise. If you would prefer that your Eaton Vance documents not be householded, please contact Eaton Vance at 1-800-262-1122, or contact your financial intermediary. Your instructions that householding not apply to delivery of your Eaton Vance documents will typically be effective within 30 days of receipt by Eaton Vance or your financial intermediary.
Portfolio Holdings. Each Eaton Vance Fund and its underlying Portfolio(s) (if applicable) files a schedule of portfolio holdings on Part F to Form N-PORT with the SEC. Certain information filed on Form N-PORT may be viewed on the Eaton Vance website at www.eatonvance.com, by calling Eaton Vance at 1-800-262-1122 or in the EDGAR database on the SEC’s website at www.sec.gov.
Proxy Voting. From time to time, funds are required to vote proxies related to the securities held by the funds. The Eaton Vance Funds or their underlying Portfolios (if applicable) vote proxies according to a set of policies and procedures approved by the Funds’ and Portfolios’ Boards. You may obtain a description of these policies and procedures and information on how the Funds or Portfolios voted proxies relating to portfolio securities during the most recent 12-month period ended June 30, without charge, upon request, by calling 1-800-262-1122 and by accessing the SEC’s website at www.sec.gov.
This Page Intentionally Left Blank
This Page Intentionally Left Blank
This Page Intentionally Left Blank
Investment Adviser
Boston Management and Research
Two International Place
Boston, MA 02110
Administrator
Eaton Vance Management
Two International Place
Boston, MA 02110
Principal Underwriter*
Eaton Vance Distributors, Inc.
Two International Place
Boston, MA 02110
(617) 482-8260
Custodian
State Street Bank and Trust Company
State Street Financial Center, One Lincoln Street
Boston, MA 02111
Transfer Agent
BNY Mellon Investment Servicing (US) Inc.
Attn: Eaton Vance Funds
P.O. Box 534439
Pittsburgh, PA 15253-4439
(800) 262-1122
Fund Offices
Two International Place
Boston, MA 02110
* FINRA BrokerCheck. Investors may check the background of their Investment Professional by contacting the Financial Industry Regulatory Authority (FINRA). FINRA BrokerCheck is a free tool to help investors check the professional background of current and former FINRA-registered securities firms and brokers. FINRA BrokerCheck is available by calling 1-800-289-9999 and at www.FINRA.org. The FINRA BrokerCheck brochure describing this program is available to investors at www.FINRA.org.
Eaton Vance
Municipal Opportunities Fund
Semiannual Report
January 31, 2023
Commodity Futures Trading Commission Registration. The Commodity Futures Trading Commission (“CFTC”) has adopted regulations that subject registered investment companies and advisers to regulation by the CFTC if a fund invests more than a prescribed level of its assets in certain CFTC-regulated instruments (including futures, certain options and swap agreements) or markets itself as providing investment exposure to such instruments. The investment adviser has claimed an exclusion from the definition of “commodity pool operator” under the Commodity Exchange Act with respect to its management of the Fund. Accordingly, neither the Fund nor the adviser with respect to the operation of the Fund is subject to CFTC regulation. Because of its management of other strategies, the Fund's adviser is registered with the CFTC as a commodity pool operator. The adviser is also registered as a commodity trading advisor.
Fund shares are not insured by the FDIC and are not deposits or other obligations of, or guaranteed by, any depository institution. Shares are subject to investment risks, including possible loss of principal invested.
This report must be preceded or accompanied by a current summary prospectus or prospectus. Before investing, investors should consider carefully the investment objective, risks, and charges and expenses of a mutual fund. This and other important information is contained in the summary prospectus and prospectus, which can be obtained from a financial intermediary. Prospective investors should read the prospectus carefully before investing. For further information, please call 1-800-262-1122.
Semiannual Report January 31, 2023
Eaton Vance
Municipal Opportunities Fund
Eaton Vance
Municipal Opportunities Fund
January 31, 2023
Performance
Portfolio Manager(s) Craig R. Brandon, CFA and Trevor G. Smith
| % Average Annual Total Returns1,2 | Class
Inception Date | Performance
Inception Date | Six Months | One Year | Five Years | Ten Years | Since
Inception |
| Class A at NAV | 05/31/2011 | 05/31/2011 | 0.55% | (4.89)% | 1.50% | 2.40% | 3.58% |
| Class A with 3.25% Maximum Sales Charge | — | — | (2.69) | (7.99) | 0.83 | 2.07 | 3.28 |
| Class C at NAV | 08/18/2014 | 08/18/2014 | 0.08 | (5.69) | 0.73 | — | 1.58 |
| Class C with 1% Maximum Deferred Sales Charge | — | — | (0.91) | (6.61) | 0.73 | — | 1.58 |
| Class I at NAV | 05/31/2011 | 05/31/2011 | 0.59 | (4.72) | 1.74 | 2.65 | 3.85 |
|
| Bloomberg Municipal Bond Index | — | — | 0.73% | (3.25)% | 2.07% | 2.38% | 3.19% |
| % Total Annual Operating Expense Ratios3 | Class A | Class C | Class I |
| | 0.93% | 1.68% | 0.67% |
| % Distribution Rates/Yields4 | Class A | Class C | Class I |
| Distribution Rate | 3.25% | 2.51% | 3.50% |
| Taxable-Equivalent Distribution Rate | 5.48 | 4.24 | 5.91 |
| SEC 30-day Yield | 2.88 | 2.24 | 3.23 |
| Taxable-Equivalent SEC 30-day Yield | 4.87 | 3.78 | 5.46 |
| % Total Leverage5 | |
| Residual Interest Bond (RIB) Financing | 0.44% |
See Endnotes and Additional Disclosures in this report.
Past performance is no guarantee of future results. Returns are historical and are calculated by determining the percentage change in net asset value (NAV) or offering price (as applicable) with all distributions reinvested. Furthermore, returns do not reflect the deduction of taxes that shareholders may have to pay on Fund distributions or upon the redemption of Fund shares. Investment return and principal value will fluctuate so that shares, when redeemed, may be worth more or less than their original cost. Performance for periods less than or equal to one year is cumulative. Performance is for the stated time period only; due to market volatility, current Fund performance may be lower or higher than the quoted return. For performance as of the most recent month-end, please refer to eatonvance.com.
Eaton Vance
Municipal Opportunities Fund
January 31, 2023
| Credit Quality (% of total investments)1,2 |
Footnotes:
| 1 | For purposes of the Fund’s rating restrictions, ratings are based on Moody’s Investors Service, Inc. (“Moody’s”), S&P Global Ratings (“S&P”) or Fitch Ratings (“Fitch”), as applicable. If securities are rated differently by the ratings agencies, the highest rating is applied. Ratings, which are subject to change, apply to the creditworthiness of the issuers of the underlying securities and not to the Fund or its shares. Credit ratings measure the quality of a bond based on the issuer’s creditworthiness, with ratings ranging from AAA, being the highest, to D, being the lowest based on S&P’s measures. Ratings of BBB or higher by S&P or Fitch (Baa or higher by Moody’s) are considered to be investment-grade quality. Credit ratings are based largely on the ratings agency’s analysis at the time of rating. The rating assigned to any particular security is not necessarily a reflection of the issuer’s current financial condition and does not necessarily reflect its assessment of the volatility of a security’s market value or of the liquidity of an investment in the security. Holdings designated as “Not Rated” (if any) are not rated by the national ratings agencies stated above. |
| 2 | The chart includes the municipal bonds held by a trust that issues residual interest bonds, consistent with the Portfolio of Investments. |
Eaton Vance
Municipal Opportunities Fund
January 31, 2023
Endnotes and Additional Disclosures
| 1 | Bloomberg Municipal Bond Index is an unmanaged index of municipal bonds traded in the U.S. Unless otherwise stated, index returns do not reflect the effect of any applicable sales charges, commissions, expenses, taxes or leverage, as applicable. It is not possible to invest directly in an index. |
| 2 | Total Returns at NAV do not include applicable sales charges. If sales charges were deducted, the returns would be lower. Total Returns shown with maximum sales charge reflect the stated maximum sales charge. Unless otherwise stated, performance does not reflect the deduction of taxes on Fund distributions or redemptions of Fund shares. Performance since inception for an index, if presented, is the performance since the Fund’s or oldest share class’s inception, as applicable. |
| 3 | Source: Fund prospectus. The expense ratios for the current reporting period can be found in the Financial Highlights section of this report. |
| 4 | The Distribution Rate is based on the Fund’s last regular distribution per share in the period (annualized) divided by the Fund’s NAV at the end of the period. The Fund’s distributions may be comprised of amounts characterized for federal income tax purposes as tax-exempt income, qualified and non-qualified ordinary dividends, capital gains and nondividend distributions, also known as return of capital. The Fund will determine the federal income tax character of distributions paid to a shareholder after the end of the calendar year. This is reported on the IRS form 1099-DIV and provided to the shareholder shortly after each year-end.The Fund’s distributions are determined by the investment adviser based on its current assessment of the Fund’s long-term return potential. As portfolio and market conditions change, the rate of distributions paid by the Fund could change. Taxable-
equivalent performance is based on the highest combined federal and state income tax rates, where applicable. Lower tax rates would result in lower tax-equivalent performance. Actual tax rates will vary depending on your income, exemptions and deductions. Rates do not include local taxes. The SEC Yield is a standardized measure based on the estimated yield to maturity of a fund’s investments over a 30-day period and is based on the maximum offer price at the date specified. The SEC Yield is not based on the distributions made by the Fund, which may differ. |
| 5 | Fund employs RIB financing. The leverage created by RIB investments provides an opportunity for increased income but, at the same time, creates special risks (including the likelihood of greater volatility of NAV). The cost of leverage rises and falls with changes in short-term interest rates. See “Floating Rate Notes Issued in Conjunction with Securities Held” in the notes to the financial statements for more information about RIB financing. RIB leverage represents the amount of Floating Rate Notes outstanding at period end as a percentage of Fund net assets plus Floating Rate Notes. |
| | Fund profile subject to change due to active management. |
Eaton Vance
Municipal Opportunities Fund
January 31, 2023
Example
As a Fund shareholder, you incur two types of costs: (1) transaction costs, including sales charges (loads) on purchases; and (2) ongoing costs, including management fees; distribution and/or service fees; and other Fund expenses. This Example is intended to help you understand your ongoing costs (in dollars) of Fund investing and to compare these costs with the ongoing costs of investing in other mutual funds. The Example is based on an investment of $1,000 invested at the beginning of the period and held for the entire period (August 1, 2022 to January 31, 2023).
Actual Expenses
The first section of the table below provides information about actual account values and actual expenses. You may use the information in this section, together with the amount you invested, to estimate the expenses that you paid over the period. Simply divide your account value by $1,000 (for example, an $8,600 account value divided by $1,000 = 8.6), then multiply the result by the number in the first section under the heading entitled “Expenses Paid During Period” to estimate the expenses you paid on your account during this period.
Hypothetical Example for Comparison Purposes
The second section of the table below provides information about hypothetical account values and hypothetical expenses based on the actual Fund expense ratio and an assumed rate of return of 5% per year (before expenses), which is not the actual Fund return. The hypothetical account values and expenses may not be used to estimate the actual ending account balance or expenses you paid for the period. You may use this information to compare the ongoing costs of investing in your Fund and other funds. To do so, compare this 5% hypothetical example with the 5% hypothetical examples that appear in the shareholder reports of the other funds.
Please note that the expenses shown in the table are meant to highlight your ongoing costs only and do not reflect any transactional costs, such as sales charges (loads). Therefore, the second section of the table is useful in comparing ongoing costs only, and will not help you determine the relative total costs of owning different funds. In addition, if these transactional costs were included, your costs would be higher.
| | Beginning
Account Value
(8/1/22) | Ending
Account Value
(1/31/23) | Expenses Paid
During Period*
(8/1/22 – 1/31/23) | Annualized
Expense
Ratio |
| Actual | | | | |
| Class A | $1,000.00 | $1,005.50 | $4.95 | 0.98% |
| Class C | $1,000.00 | $1,000.80 | $8.72 | 1.73% |
| Class I | $1,000.00 | $1,005.90 | $3.69 | 0.73% |
| |
| Hypothetical | | | | |
| (5% return per year before expenses) | | | | |
| Class A | $1,000.00 | $1,020.27 | $4.99 | 0.98% |
| Class C | $1,000.00 | $1,016.48 | $8.79 | 1.73% |
| Class I | $1,000.00 | $1,021.53 | $3.72 | 0.73% |
| * | Expenses are equal to the Fund's annualized expense ratio for the indicated Class, multiplied by the average account value over the period, multiplied by 184/365 (to reflect the one-half year period). The Example assumes that the $1,000 was invested at the net asset value per share determined at the close of business on July 31, 2022. |
Eaton Vance
Municipal Opportunities Fund
January 31, 2023
Portfolio of Investments (Unaudited)
| Security | Principal
Amount
(000's omitted) | Value |
| Education — 0.3% |
| Grand Canyon University, 4.125%, 10/1/24 | $ | 2,000 | $ 1,906,120 |
| | | | $ 1,906,120 |
| Hospital — 2.6% |
| Care New England Health System, 5.50%, 9/1/26 | $ | 11,000 | $ 10,702,230 |
| Harnett Health System, Inc., 4.25% to 4/1/25 (Put Date), 4/1/32 | | 3,275 | 3,225,875 |
| | | | $ 13,928,105 |
Total Corporate Bonds
(identified cost $15,898,759) | | | $ 15,834,225 |
| Tax-Exempt Mortgage-Backed Securities — 0.1% |
| Security | Principal
Amount
(000's omitted) | Value |
| Housing — 0.1% |
| FRETE 2017-ML01 Trust, Class A, (Freddie Mac guaranteed), 5.016%, (1 mo. USD LIBOR + 0.50%), 1/25/33(1)(2) | $ | 458 | $ 454,667 |
Total Tax-Exempt Mortgage-Backed Securities
(identified cost $457,789) | | | $ 454,667 |
| Tax-Exempt Municipal Obligations — 90.6% |
| Security | Principal
Amount
(000's omitted) | Value |
| Bond Bank — 1.9% |
| Delaware Valley Regional Finance Authority, PA, 3.687%, (67% of 1 mo. USD LIBOR + 0.76%), 9/1/24 (Put Date), 9/1/48(2) | $ | 8,000 | $ 8,013,520 |
| Virginia Resources Authority, (Pooled Financing Program), 5.25%, 11/1/47 | | 1,850 | 2,145,833 |
| | | | $ 10,159,353 |
| Education — 4.0% |
| Arizona Industrial Development Authority, (Academies of Math & Science), 5.00%, 7/1/39(1) | $ | 525 | $ 526,402 |
| California Municipal Finance Authority, (California Lutheran University): | | | |
| 5.00%, 10/1/31 | | 600 | 640,494 |
| Security | Principal
Amount
(000's omitted) | Value |
| Education (continued) |
| California Municipal Finance Authority, (California Lutheran University): (continued) | | | |
| 5.00%, 10/1/35 | $ | 1,125 | $ 1,179,945 |
| 5.00%, 10/1/37 | | 1,400 | 1,453,326 |
| Capital Trust Agency, FL, (Florida Charter Educational Foundation, Inc.), 4.50%, 6/15/28(1) | | 500 | 493,645 |
| Colorado State University, 4.00%, 3/1/45 | | 3,370 | 3,367,776 |
| Connecticut Health and Educational Facilities Authority, (Avon Old Farms School): | | | |
| 4.00%, 7/1/35 | | 250 | 264,095 |
| 4.00%, 7/1/41 | | 600 | 606,360 |
| District of Columbia, (Rocketship DC Obligated Group), 5.00%, 6/1/39(1) | | 1,425 | 1,428,748 |
| Massachusetts Development Finance Agency, (Harvard University), 4.00%, 7/15/36 | | 5,000 | 5,178,650 |
| Michigan Finance Authority, (Cesar Chavez Academy), 5.00%, 2/1/33 | | 830 | 840,715 |
| Pinellas County Educational Facilities Authority, FL, (Pinellas Academy of Math and Science): | | | |
| 4.125%, 12/15/28(1) | | 445 | 452,623 |
| 5.00%, 12/15/38(1) | | 2,690 | 2,766,046 |
| Public Finance Authority, WI, (North Carolina Leadership Academy): | | | |
| 5.00%, 6/15/39(1) | | 205 | 198,965 |
| 5.00%, 6/15/49(1) | | 260 | 240,300 |
| Public Finance Authority, WI, (Roseman University of Health Sciences): | | | |
| 5.00%, 4/1/40(1) | | 840 | 832,297 |
| 5.00%, 4/1/50(1) | | 1,010 | 954,197 |
| Yonkers Economic Development Corp., NY, (Lamartine/Warburton, LLC - Charter School of Educational Excellence), 5.00%, 10/15/54 | | 430 | 397,268 |
| | | | $ 21,821,852 |
| Electric Utilities — 4.8% |
| Hawaii Department of Budget and Finance, (Hawaiian Electric Co.), 3.20%, 7/1/39 | $ | 6,005 | $ 5,176,310 |
| Long Island Power Authority, NY, Electric System Revenue, 3.808%, (70% of 1 mo. USD LIBOR + 0.75%), 10/1/23 (Put Date), 5/1/33(2) | | 6,000 | 5,997,600 |
| Lower Colorado River Authority, TX, (LCRA Transmission Services Corp.): | | | |
| 5.25%, 5/15/35 | �� | 500 | 592,775 |
| 5.25%, 5/15/36 | | 1,000 | 1,168,800 |
| 5.25%, 5/15/37 | | 1,000 | 1,154,690 |
| Missouri Joint Municipal Electric Utility Commission, (MoPEP Facilities): | | | |
| Green Bonds, 5.00%, 12/1/35 | | 540 | 615,789 |
6
See Notes to Financial Statements.
Eaton Vance
Municipal Opportunities Fund
January 31, 2023
Portfolio of Investments (Unaudited) — continued
| Security | Principal
Amount
(000's omitted) | Value |
| Electric Utilities (continued) |
| Missouri Joint Municipal Electric Utility Commission, (MoPEP Facilities): (continued) | | | |
| Green Bonds, 5.25%, 12/1/39 | $ | 1,000 | $ 1,125,990 |
| Public Power Generation Agency, NE, (Whelan Energy Center Unit 2), 5.00%, 1/1/25 | | 2,525 | 2,630,949 |
| Seattle, WA, Municipal Light and Power Improvement Revenue, 4.00%, 7/1/43 | | 3,000 | 3,024,900 |
| South Carolina Public Service Authority: | | | |
| 5.25%, 12/1/33 | | 2,000 | 2,342,520 |
| 5.25%, 12/1/34 | | 2,000 | 2,307,380 |
| | | | $ 26,137,703 |
| Escrowed/Prerefunded — 0.9% |
| Central Texas Regional Mobility Authority, Prerefunded to 7/1/25, 5.00%, 1/1/29 | $ | 600 | $ 639,060 |
| Connecticut Higher Education Supplemental Loan Authority, (AMT), Escrowed to Maturity, 5.00%, 11/15/24 | | 600 | 622,950 |
| District of Columbia, (Association of American Medical Colleges), Prerefunded to 10/1/23, 5.00%, 10/1/30 | | 570 | 579,867 |
| East Hempfield Township Industrial Development Authority, PA, (Student Services, Inc.), Prerefunded to 7/1/24, 5.00%, 7/1/29 | | 500 | 517,140 |
| Illinois Finance Authority, (Plymouth Place, Inc.), Escrowed to Maturity, 5.00%, 5/15/25 | | 1,010 | 1,043,431 |
| Massachusetts Development Finance Agency, (Atrius Health), Prerefunded to 6/1/29, 4.00%, 6/1/49 | | 850 | 940,661 |
| University of North Carolina at Charlotte, Prerefunded to 4/1/25, 4.00%, 4/1/37 | | 625 | 648,012 |
| | | | $ 4,991,121 |
| General Obligations — 8.9% |
| ABC Unified School District, CA, (Election of 2018), 4.00%, 8/1/47 | $ | 5,000 | $ 5,069,350 |
| Atlanta, GA, Social Bonds, 5.00%, 12/1/37 | | 3,500 | 4,132,520 |
| California, 5.00%, 11/1/42 | | 5,000 | 5,814,600 |
| Charles County, MD, 4.25%, 10/1/47 | | 3,345 | 3,461,272 |
| Chicago Park District, IL, 5.00%, 1/1/24 | | 500 | 510,010 |
| Connecticut, 5.00%, 9/15/32 | | 325 | 393,435 |
| District of Columbia, 4.00%, 2/1/46 | | 3,000 | 3,026,940 |
| Hermiston School District No. 8R, OR, 0.00%, 6/15/43 | | 2,665 | 1,106,188 |
| Illinois: | | | |
| 5.50%, 5/1/39 | | 1,980 | 2,150,993 |
| 5.75%, 5/1/45 | | 1,780 | 1,912,307 |
| Kenosha County, WI: | | | |
| 1.50%, 9/1/29 | | 540 | 509,620 |
| 1.50%, 9/1/30 | | 480 | 441,384 |
| Security | Principal
Amount
(000's omitted) | Value |
| General Obligations (continued) |
| Kern Community College District, CA, (Election of 2016), 5.25%, 8/1/39 | $ | 1,400 | $ 1,648,738 |
| Lamar Consolidated Independent School District, TX, (PSF Guaranteed), 4.00%, 2/15/47 | | 6,000 | 6,047,040 |
| New York, NY, 5.00%, 8/1/29 | | 450 | 455,202 |
| Puerto Rico: | | | |
| 0.00%, 7/1/24 | | 98 | 91,732 |
| 0.00%, 7/1/33 | | 377 | 218,771 |
| 5.25%, 7/1/23 | | 164 | 164,310 |
| 5.625%, 7/1/29 | | 848 | 903,203 |
| 5.75%, 7/1/31 | | 627 | 681,049 |
| Sarpy County School District 0037, NE, 5.00%, 12/15/27 | | 1,500 | 1,608,870 |
| Spring Branch Independent School District, TX, (PSF Guaranteed), 5.00%, 2/1/42 | | 4,620 | 5,256,313 |
| Westwood, MA, 4.00%, 8/15/52 | | 2,750 | 2,767,545 |
| | | | $ 48,371,392 |
| Hospital — 11.5% |
| Calhoun County Hospital Finance Authority, MI, (Oaklawn Hospital), 5.00%, 2/15/32 | $ | 2,110 | $ 2,216,175 |
| California Municipal Finance Authority, (NorthBay Healthcare Group): | | | |
| 5.00%, 11/1/28 | | 300 | 308,172 |
| 5.00%, 11/1/30 | | 150 | 153,689 |
| California Statewide Communities Development Authority, (Cottage Health System Obligated Group), Prerefunded to 11/1/24, 5.00%, 11/1/26 | | 425 | 444,023 |
| Colorado Health Facilities Authority, (CommonSpirit Health), 5.00%, 11/1/42 | | 500 | 531,520 |
| Crawford County Hospital Authority, PA, (Meadville Medical Center): | | | |
| 6.00%, 6/1/36 | | 2,660 | 2,782,493 |
| 6.00%, 6/1/51 | | 4,715 | 4,819,437 |
| Darke County, OH, (Wayne HealthCare): | | | |
| 4.00%, 9/1/40 | | 1,000 | 903,830 |
| 4.00%, 9/1/45 | | 2,580 | 2,258,842 |
| Fredericksburg Economic Development Authority, VA, (Mary Washington Healthcare), 5.00%, 6/15/24 | | 1,000 | 1,028,930 |
| Halifax Hospital Medical Center, FL: | | | |
| 5.00%, 6/1/27 | | 2,890 | 3,095,421 |
| 5.00%, 6/1/29 | | 1,830 | 1,953,708 |
| Illinois Finance Authority, (Presence Health Network), 3.75%, 2/15/34 | | 3,145 | 3,215,857 |
| Illinois Finance Authority, (Silver Cross Hospital and Medical Centers): | | | |
| 5.00%, 8/15/23 | | 1,000 | 1,011,490 |
| 5.00%, 8/15/28 | | 1,670 | 1,752,782 |
7
See Notes to Financial Statements.
Eaton Vance
Municipal Opportunities Fund
January 31, 2023
Portfolio of Investments (Unaudited) — continued
| Security | Principal
Amount
(000's omitted) | Value |
| Hospital (continued) |
| Indiana County Hospital Authority, PA, (Indiana Regional Medical Center): | | | |
| Prerefunded to 6/1/23, 5.125%, 6/1/26 | $ | 475 | $ 478,643 |
| Prerefunded to 6/1/23, 5.25%, 6/1/27 | | 415 | 418,353 |
| Prerefunded to 6/1/23, 5.375%, 6/1/28 | | 455 | 458,863 |
| Jefferson County Civic Facility Development Corp., NY, (Samaritan Medical Center): | | | |
| 4.00%, 11/1/29 | �� | 505 | 500,713 |
| 4.00%, 11/1/30 | | 1,605 | 1,583,589 |
| 5.00%, 11/1/26 | | 1,375 | 1,418,024 |
| 5.00%, 11/1/27 | | 1,440 | 1,496,837 |
| Lancaster County Hospital Authority, PA, (Penn State Health), 5.00%, 11/1/41 | | 1,950 | 2,091,901 |
| Lexington County Health Services District, Inc., SC, 5.00%, 11/1/27 | | 200 | 219,932 |
| Massachusetts Development Finance Agency, (Milford Regional Medical Center), 5.00%, 7/15/35(1) | | 275 | 276,361 |
| Nassau County Local Economic Assistance Corp., NY, (Catholic Health Services of Long Island), 5.00%, 7/1/29 | | 1,000 | 1,029,170 |
| New Hampshire Health and Education Facilities Authority, (Concord Hospital): | | | |
| 5.00%, 10/1/32 | | 500 | 540,655 |
| 5.00%, 10/1/33 | | 1,000 | 1,078,940 |
| 5.00%, 10/1/34 | | 1,070 | 1,149,191 |
| 5.00%, 10/1/35 | | 1,550 | 1,653,586 |
| New Jersey Health Care Facilities Financing Authority, (Hunterdon Medical Center Obligated Group), Prerefunded to 7/1/24, 5.00%, 7/1/30 | | 500 | 517,495 |
| New Jersey Health Care Facilities Financing Authority, (Inspira Health Obligated Group): | | | |
| 5.00%, 7/1/27 | | 470 | 480,711 |
| Prerefunded to 1/1/24, 5.00%, 7/1/27 | | 30 | 30,672 |
| New Jersey Health Care Facilities Financing Authority, (St. Joseph's Healthcare System Obligated Group), 5.00%, 7/1/30 | | 30 | 31,385 |
| New Jersey Health Care Facilities Financing Authority, (Valley Health System Obligated Group): | | | |
| 4.00%, 7/1/36 | | 1,000 | 1,010,070 |
| 4.00%, 7/1/37 | | 1,000 | 1,008,450 |
| Northampton County General Purpose Authority, PA, (St. Luke's University Health Network), 4.098%, (70% of 1 mo. USD LIBOR + 1.04%), 8/15/24 (Put Date), 8/15/48(2) | | 1,000 | 1,000,060 |
| Oregon Facilities Authority, (Samaritan Health Services), 5.00%, 10/1/29 | | 300 | 331,728 |
| Oroville, CA, (Oroville Hospital): | | | |
| 5.00%, 4/1/31 | | 1,705 | 1,780,412 |
| 5.25%, 4/1/34 | | 2,000 | 2,109,860 |
| Security | Principal
Amount
(000's omitted) | Value |
| Hospital (continued) |
| Savannah Hospital Authority, GA, (St. Joseph's/Candler Health System, Inc.), 4.00%, 7/1/43 | $ | 2,500 | $ 2,460,975 |
| Southcentral Pennsylvania General Authority, (Hanover Hospital, Inc.): | | | |
| 5.00%, 12/1/25 | | 1,530 | 1,624,248 |
| 5.00%, 12/1/26 | | 1,410 | 1,494,290 |
| 5.00%, 12/1/28 | | 1,550 | 1,637,420 |
| Ward County, ND, (Trinity Obligated Group): | | | |
| 5.00%, 6/1/29 | | 1,300 | 1,306,773 |
| 5.00%, 6/1/30 | | 1,815 | 1,821,534 |
| 5.00%, 6/1/31 | | 1,885 | 1,889,128 |
| Washington Health Care Facilities Authority, (PeaceHealth), Prerefunded to 5/15/24, 5.00%, 11/15/26 | | 1,000 | 1,031,040 |
| Yavapai County Industrial Development Authority, AZ, (Yavapai Regional Medical Center), 5.25%, 8/1/33 | | 250 | 252,368 |
| | | | $ 62,689,746 |
| Housing — 3.5% |
| California Municipal Finance Authority, (CHF-Riverside II, LLC), 5.00%, 5/15/37 | $ | 3,320 | $ 3,459,274 |
| Independent Cities Finance Authority, CA, (Union City Tropics): | | | |
| 4.00%, 5/15/32 | | 1,060 | 1,092,807 |
| 4.00%, 5/15/33 | | 1,100 | 1,131,812 |
| Maryland Economic Development Corp., (Bowie State University), Student Housing Revenue: | | | |
| 4.00%, 7/1/34 | | 340 | 343,264 |
| 4.00%, 7/1/35 | | 350 | 350,410 |
| 4.00%, 7/1/40 | | 450 | 432,486 |
| New York City Housing Development Corp., NY, Green Bonds, 0.60% to 7/1/25 (Put Date), 5/1/61 | | 3,200 | 2,991,552 |
| Phoenix Industrial Development Authority, AZ, (Downtown Phoenix Student Housing II, LLC - Arizona State University): | | | |
| 5.00%, 7/1/35 | | 770 | 797,720 |
| 5.00%, 7/1/37 | | 1,235 | 1,273,878 |
| 5.00%, 7/1/39 | | 860 | 881,285 |
| 5.00%, 7/1/59 | | 1,500 | 1,502,370 |
| Phoenix Industrial Development Authority, AZ, (Downtown Phoenix Student Housing, LLC - Arizona State University), 5.00%, 7/1/31 | | 355 | 371,763 |
| Public Finance Authority, WI, (NC A&T Real Estate Foundation, LLC): | | | |
| 5.00%, 6/1/28 | | 10 | 10,344 |
| 5.00%, 6/1/29 | | 365 | 379,209 |
| 5.00%, 6/1/34 | | 2,560 | 2,631,091 |
8
See Notes to Financial Statements.
Eaton Vance
Municipal Opportunities Fund
January 31, 2023
Portfolio of Investments (Unaudited) — continued
| Security | Principal
Amount
(000's omitted) | Value |
| Housing (continued) |
| Public Finance Authority, WI, (NC A&T Real Estate Foundation, LLC): (continued) | | | |
| 5.00%, 6/1/39 | $ | 1,595 | $ 1,605,208 |
| | | | $ 19,254,473 |
| Industrial Development Revenue — 6.7% |
| Arkansas Development Finance Authority, (Big River Steel), (AMT), 4.50%, 9/1/49(1) | $ | 4,000 | $ 3,625,640 |
| California Infrastructure and Economic Development Bank, (Infrastructure State Revolving Fund), 5.00%, 10/1/47 | | 5,000 | 5,731,200 |
| Chandler Industrial Development Authority, AZ, (Intel Corp.), (AMT), 5.00% to 9/1/27 (Put Date), 9/1/52 | | 2,500 | 2,649,225 |
| Maine Finance Authority, (Casella Waste Systems, Inc.): | | | |
| (AMT), 4.375% to 8/1/25 (Put Date), 8/1/35(1) | | 875 | 866,950 |
| (AMT), 5.125% to 8/1/25 (Put Date), 8/1/35(1) | | 940 | 947,764 |
| Miami-Dade County Industrial Development Authority, FL, (Waste Management, Inc.), (AMT), 4.40% to 11/1/23 (Put Date), 11/1/41 | | 5,000 | 5,039,700 |
| National Finance Authority, NH, (Covanta), Green Bonds, (AMT), 3.75% to 7/2/40 (Put Date), 7/1/45(1) | | 5,500 | 4,445,980 |
| New Hampshire Business Finance Authority, (United Illuminating Co.), 2.80% to 10/2/23 (Put Date), 10/1/33 | | 1,500 | 1,498,665 |
| New Jersey Economic Development Authority, (Continental Airlines), (AMT), 5.625%, 11/15/30 | | 215 | 220,164 |
| New Jersey Economic Development Authority, (New Jersey Natural Gas Co.), (AMT), 2.45% to 4/1/26 (Put Date), 4/1/59 | | 2,500 | 2,458,050 |
| New York State Environmental Facilities Corp., (Casella Waste Systems, Inc.), (AMT), 2.875% to 12/3/29 (Put Date), 12/1/44(1) | | 1,175 | 1,035,622 |
| New York Transportation Development Corp., (Delta Air Lines, Inc. - LaGuardia Airport Terminals C&D Redevelopment), (AMT), 5.00%, 1/1/34 | | 5,000 | 5,204,950 |
| Niagara Area Development Corp., NY, (Covanta), 3.50%, 11/1/24(1) | | 1,920 | 1,877,914 |
| Public Finance Authority, WI, (Celanese Corp.), (AMT), 5.00%, 12/1/25 | | 1,000 | 1,020,540 |
| | | | $ 36,622,364 |
| Insured - Education — 0.1% |
| Missouri Southern State University: | | | |
| (AGM), 4.00%, 10/1/33 | $ | 220 | $ 231,900 |
| (AGM), 4.00%, 10/1/35 | | 125 | 130,071 |
| (AGM), 4.00%, 10/1/36 | | 150 | 155,019 |
| (AGM), 4.00%, 10/1/37 | | 85 | 87,323 |
| (AGM), 4.00%, 10/1/38 | | 70 | 71,491 |
| Security | Principal
Amount
(000's omitted) | Value |
| Insured - Education (continued) |
| Missouri Southern State University: (continued) | | | |
| (AGM), 4.00%, 10/1/39 | $ | 55 | $ 55,872 |
| | | | $ 731,676 |
| Insured - Electric Utilities — 1.2% |
| Brownsville, TX, Utility System Revenue: | | | |
| (AGM), 4.00%, 9/1/45 | $ | 1,505 | $ 1,516,709 |
| (BAM), 5.00%, 9/1/42 | | 1,000 | 1,101,430 |
| Paducah Electric Plant Board, KY, (AGM), 5.00%, 10/1/29 | | 1,500 | 1,624,410 |
| Puerto Rico Electric Power Authority: | | | |
| (AGC), 5.00%, 7/1/26 | | 280 | 282,019 |
| (NPFG), 5.25%, 7/1/23 | | 335 | 335,757 |
| (NPFG), 5.25%, 7/1/25 | | 170 | 171,054 |
| (NPFG), 5.25%, 7/1/29 | | 1,110 | 1,125,007 |
| (NPFG), 5.25%, 7/1/30 | | 530 | 536,461 |
| (NPFG), 5.25%, 7/1/34 | | 100 | 100,815 |
| | | | $ 6,793,662 |
| Insured - General Obligations — 3.3% |
| Atlantic City, NJ, (BAM), 5.00%, 3/1/24 | $ | 300 | $ 307,380 |
| Bayonne, NJ: | | | |
| (AGM), 5.00%, 8/1/23 | | 300 | 303,720 |
| (AGM), 5.00%, 8/1/24 | | 300 | 311,097 |
| (AGM), 5.00%, 8/1/25 | | 885 | 941,242 |
| (AGM), 5.00%, 8/1/26 | | 915 | 974,768 |
| Cambria County, PA, (BAM), 5.00%, 8/1/23 | | 985 | 996,978 |
| Chicago Board of Education, IL: | | | |
| (NPFG), 0.00%, 12/1/26 | | 1,580 | 1,384,522 |
| (NPFG), 0.00%, 12/1/28 | | 1,560 | 1,257,719 |
| Detroit, MI, (AMBAC), 5.00%, 4/1/24 | | 329 | 338,163 |
| Luzerne County, PA, (AGM), 5.00%, 11/15/24 | | 2,480 | 2,583,391 |
| McCook, IL: | | | |
| (AGM), 4.00%, 12/1/26 | | 260 | 275,610 |
| (AGM), 4.00%, 12/1/27 | | 300 | 322,386 |
| (AGM), 4.00%, 12/1/28 | | 300 | 326,265 |
| McHenry County Community Unit School District No. 12, IL: | | | |
| (AGM), 5.00%, 1/1/25 | | 890 | 909,277 |
| (AGM), 5.00%, 1/1/26 | | 925 | 945,544 |
| Monroe County Industrial Development Corp., NY, (Monroe Community College Association, Inc.), (AGM), 5.00%, 1/15/25 | | 750 | 767,460 |
| Proviso Township High School District No. 209, IL, (AGM), 5.00%, 12/1/28 | | 1,000 | 1,141,910 |
| Rockland County, NY, (AGM), 5.00%, 3/1/24 | | 350 | 359,821 |
9
See Notes to Financial Statements.
Eaton Vance
Municipal Opportunities Fund
January 31, 2023
Portfolio of Investments (Unaudited) — continued
| Security | Principal
Amount
(000's omitted) | Value |
| Insured - General Obligations (continued) |
| Vauxmont Metropolitan District, CO: | | | |
| (AGM), 5.00%, 12/1/34 | $ | 1,140 | $ 1,280,779 |
| (AGM), 5.00%, 12/1/50 | | 1,500 | 1,567,980 |
| Will and Cook Counties Community High School District No. 210, IL: | | | |
| (AGM), 0.00%, 1/1/28 | | 500 | 426,675 |
| (BAM), 0.00%, 1/1/33 | | 200 | 141,202 |
| | | | $ 17,863,889 |
| Insured - Housing — 0.1% |
| New Hope Cultural Education Facilities Finance Corp., TX, (CHF-Collegiate Housing College Station I, LLC), (AGM), 4.00%, 4/1/24 | $ | 400 | $ 406,248 |
| | | | $ 406,248 |
| Insured - Lease Revenue/Certificates of Participation — 0.2% |
| Georgia Local Government 1998A Grantor Trust, Certificates of Participation, (NPFG), 4.75%, 6/1/28 | $ | 800 | $ 862,944 |
| | | | $ 862,944 |
| Insured - Special Tax Revenue — 0.8% |
| Sales Tax Securitization Corp., IL, (BAM), 5.00%, 1/1/37 | $ | 4,000 | $ 4,374,320 |
| | | | $ 4,374,320 |
| Insured - Transportation — 2.7% |
| Allegheny County Airport Authority, PA, (Pittsburgh International Airport), (AGM), (AMT), 4.00%, 1/1/46 | $ | 5,000 | $ 4,804,900 |
| Love Field Airport Modernization Corp., TX, (AGM), (AMT), 4.00%, 11/1/37 | | 2,840 | 2,833,354 |
| New Jersey Economic Development Authority, (The Goethals Bridge Replacement), (AGM), (AMT), 5.00%, 1/1/31 | | 185 | 187,585 |
| New Jersey Transportation Trust Fund Authority, (Transportation System), (AMBAC), 0.00%, 12/15/28 | | 1,185 | 987,034 |
| New York Transportation Development Corp., (LaGuardia Airport Terminal B Redevelopment), (AGM), (AMT), 4.00%, 7/1/32 | | 2,000 | 2,013,280 |
| Ohio, (Portsmouth Gateway Group, LLC), (AGM), (AMT), 5.00%, 12/31/26 | | 1,000 | 1,043,910 |
| Pennsylvania Economic Development Financing Authority, (PennDOT Major Bridges Package One), (AGM), (AMT), 5.50%, 6/30/42 | | 2,500 | 2,789,150 |
| | | | $ 14,659,213 |
| Insured - Water and Sewer — 1.8% |
| Eagle River Water and Sanitation District, CO, (AGM), 4.00%, 12/1/52 | $ | 5,500 | $ 5,404,465 |
| Security | Principal
Amount
(000's omitted) | Value |
| Insured - Water and Sewer (continued) |
| Michigan Finance Authority, (Detroit Water and Sewerage Department), (AGM), 5.00%, 7/1/26 | $ | 4,000 | $ 4,142,240 |
| | | | $ 9,546,705 |
| Lease Revenue/Certificates of Participation — 1.2% |
| Commonwealth Financing Authority, PA, Tobacco Master Settlement Payment Revenue: | | | |
| 5.00%, 6/1/29 | $ | 2,000 | $ 2,227,260 |
| 5.00%, 6/1/30 | | 3,000 | 3,338,580 |
| Michigan Strategic Fund, (Facility for Rare Isotope Beams), 5.00%, 3/1/27 | | 1,000 | 1,024,390 |
| | | | $ 6,590,230 |
| Other Revenue — 6.1% |
| Black Belt Energy Gas District, AL, 2.03%, (SIFMA + 0.37%), 10/1/26 (Put Date), 10/1/49(2) | $ | 5,000 | $ 4,805,900 |
| Buckeye Tobacco Settlement Financing Authority, OH: | | | |
| 4.00%, 6/1/37 | | 4,000 | 4,014,960 |
| 5.00%, 6/1/36 | | 2,000 | 2,143,880 |
| 5.00%, 6/1/55 | | 3,055 | 2,917,525 |
| California Infrastructure and Economic Development Bank, (Los Angeles County Museum of Art), 2.36%, (SIFMA + 0.70%), 6/1/26 (Put Date), 12/1/50(2) | | 2,300 | 2,220,880 |
| Cleveland-Cuyahoga County Port Authority, OH, (Playhouse Square Foundation): | | | |
| 5.00%, 12/1/28 | | 1,050 | 1,085,480 |
| 5.50%, 12/1/53 | | 740 | 758,078 |
| Kalispel Tribe of Indians, WA: | | | |
| Series A, 5.00%, 1/1/32(1) | | 1,455 | 1,520,795 |
| Series B, 5.00%, 1/1/32(1) | | 1,000 | 1,045,220 |
| Main Street Natural Gas, Inc., GA, Gas Supply Revenue, 5.00% to 6/1/30 (Put Date), 6/1/53(3) | | 2,000 | 2,123,980 |
| Morongo Band of Mission Indians, CA, 5.00%, 10/1/42(1) | | 1,775 | 1,793,265 |
| Southeast Alabama Gas Supply District, (Project No. 2), 3.777%, (67% of 1 mo. USD LIBOR + 0.85%), 6/1/24 (Put Date), 6/1/49(2) | | 3,000 | 2,996,970 |
| Texas Municipal Gas Acquisition and Supply Corp. I, Gas Supply Revenue, 3.895%, (67% of 3 mo. USD LIBOR + 0.70%), 12/15/26(2) | | 3,150 | 3,133,273 |
| Will and Kankakee Counties Community Unit School District No. 255-U, IL: | | | |
| 5.00%, 6/1/26 | | 635 | 672,554 |
| 5.00%, 6/1/28 | | 1,370 | 1,447,501 |
| 5.00%, 6/1/29 | | 700 | 738,787 |
| | | | $ 33,419,048 |
10
See Notes to Financial Statements.
Eaton Vance
Municipal Opportunities Fund
January 31, 2023
Portfolio of Investments (Unaudited) — continued
| Security | Principal
Amount
(000's omitted) | Value |
| Senior Living/Life Care — 12.6% |
| Buffalo and Erie County Industrial Land Development Corp., NY, (Orchard Park CCRC, Inc.): | | | |
| 5.00%, 11/15/26 | $ | 1,730 | $ 1,784,754 |
| 5.00%, 11/15/27 | | 1,320 | 1,357,198 |
| Centerville, OH, (Graceworks Lutheran Services): | | | |
| 5.00%, 11/1/23 | | 450 | 451,534 |
| 5.00%, 11/1/24 | | 705 | 708,807 |
| 5.00%, 11/1/26 | | 770 | 773,588 |
| 5.00%, 11/1/27 | | 425 | 424,788 |
| Clackamas County Hospital Facility Authority, OR, (Rose Villa): | | | |
| 5.00%, 11/15/27 | | 285 | 288,240 |
| 5.00%, 11/15/28 | | 300 | 302,772 |
| 5.00%, 11/15/29 | | 315 | 317,240 |
| 5.00%, 11/15/30 | | 330 | 331,647 |
| 5.125%, 11/15/40 | | 260 | 249,857 |
| 5.375%, 11/15/55 | | 300 | 279,288 |
| Colorado Health Facilities Authority, (Christian Living Neighborhoods), 4.00%, 1/1/29 | | 600 | 555,630 |
| Colorado Health Facilities Authority, (Frasier Meadows Retirement Community): | | | |
| 5.00%, 5/15/24 | | 525 | 528,727 |
| 5.00%, 5/15/25 | | 300 | 302,100 |
| 5.00%, 5/15/26 | | 350 | 352,926 |
| 5.00%, 5/15/27 | | 400 | 402,728 |
| District of Columbia, (Ingleside at Rock Creek), 4.125%, 7/1/27 | | 850 | 816,926 |
| Franklin County Industrial Development Authority, PA, (Menno-Haven, Inc.): | | | |
| 5.00%, 12/1/30 | | 500 | 469,375 |
| 5.00%, 12/1/39 | | 370 | 324,331 |
| Glendale Industrial Development Authority, AZ, (Terraces of Phoenix), 4.00%, 7/1/28 | | 225 | 209,273 |
| Hanover County Economic Development Authority, VA, (Covenant Woods): | | | |
| 5.00%, 7/1/38 | | 125 | 125,043 |
| 5.00%, 7/1/48 | | 465 | 441,889 |
| 5.00%, 7/1/51 | | 1,000 | 943,560 |
| Howard County, MD, (Vantage House): | | | |
| 5.00%, 4/1/26 | | 1,290 | 1,275,075 |
| 5.00%, 4/1/36 | | 2,035 | 1,893,466 |
| Illinois Finance Authority, (Lifespace Communities, Inc.), 5.00%, 5/15/27 | | 370 | 367,858 |
| Illinois Finance Authority, (Presbyterian Homes Obligated Group), 2.36%, (SIFMA + 0.70%), 5/1/26 (Put Date), 5/1/42(2) | | 1,090 | 1,059,545 |
| Security | Principal
Amount
(000's omitted) | Value |
| Senior Living/Life Care (continued) |
| Lancaster County Hospital Authority, PA, (Brethren Village): | | | |
| 5.00%, 7/1/23 | $ | 700 | $ 700,791 |
| 5.00%, 7/1/24 | | 915 | 916,812 |
| 5.00%, 7/1/25 | | 650 | 651,430 |
| Massachusetts Development Finance Agency, (Linden Ponds, Inc.), 5.00%, 11/15/28(1) | | 1,200 | 1,279,728 |
| Missouri Health and Educational Facilities Authority, (Lutheran Senior Services): | | | |
| 4.00%, 2/1/35 | | 310 | 281,496 |
| 5.00%, 2/1/46 | | 1,480 | 1,423,272 |
| Montgomery County Industrial Development Authority, PA, (Waverly Heights, Ltd.): | | | |
| 4.00%, 12/1/30 | | 200 | 207,436 |
| 4.00%, 12/1/31 | | 150 | 155,426 |
| 4.00%, 12/1/32 | | 200 | 206,942 |
| 4.00%, 12/1/33 | | 100 | 102,960 |
| 4.00%, 12/1/34 | | 200 | 204,722 |
| 4.00%, 12/1/35 | | 350 | 355,541 |
| 4.00%, 12/1/36 | | 350 | 353,647 |
| 4.00%, 12/1/37 | | 300 | 302,067 |
| 4.00%, 12/1/38 | | 300 | 300,660 |
| Montgomery County Industrial Development Authority, PA, (Whitemarsh Continuing Care Retirement Community), 5.00%, 1/1/33 | | 1,890 | 1,869,550 |
| National Finance Authority, NH, (The Vista): | | | |
| 5.25%, 7/1/39(1) | | 920 | 871,498 |
| 5.75%, 7/1/54(1) | | 1,725 | 1,645,529 |
| New Hope Cultural Education Facilities Finance Corp., TX, (Longhorn Village): | | | |
| 5.00%, 1/1/25 | | 1,000 | 1,005,020 |
| 5.00%, 1/1/26 | | 1,040 | 1,047,509 |
| 5.00%, 1/1/27 | | 1,095 | 1,102,676 |
| 5.00%, 1/1/29 | | 1,205 | 1,210,892 |
| 5.00%, 1/1/30 | | 630 | 631,298 |
| New Mexico Hospital Equipment Loan Council, (Haverland Carter Lifestyle Group): | | | |
| 5.00%, 7/1/30 | | 430 | 413,991 |
| 5.00%, 7/1/31 | | 220 | 210,232 |
| 5.00%, 7/1/32 | | 160 | 150,917 |
| 5.00%, 7/1/33 | | 305 | 285,202 |
| 5.00%, 7/1/34 | | 195 | 180,714 |
| 5.00%, 7/1/39 | | 2,450 | 2,182,166 |
| Norfolk Redevelopment and Housing Authority, VA, (Fort Norfolk Retirement Community, Inc. - Harbor's Edge): | | | |
| 4.00%, 1/1/29 | | 1,335 | 1,243,953 |
| 5.25%, 1/1/54 | | 250 | 210,300 |
11
See Notes to Financial Statements.
Eaton Vance
Municipal Opportunities Fund
January 31, 2023
Portfolio of Investments (Unaudited) — continued
| Security | Principal
Amount
(000's omitted) | Value |
| Senior Living/Life Care (continued) |
| Palm Beach County Health Facilities Authority, FL, (Lifespace Communities, Inc.): | | | |
| 5.00%, 5/15/28 | $ | 255 | $ 252,649 |
| 5.00%, 5/15/30 | | 300 | 294,594 |
| 5.00%, 5/15/31 | | 775 | 756,966 |
| 5.00%, 5/15/32 | | 650 | 631,150 |
| Polk County Industrial Development Authority, FL, (Carpenter's Home Estates, Inc.), 5.00%, 1/1/39 | | 400 | 382,628 |
| Public Finance Authority, WI, (Penick Village), 5.00%, 9/1/39(1) | | 1,540 | 1,342,926 |
| Salem Hospital Facility Authority, OR, (Capital Manor): | | | |
| 5.00%, 5/15/27 | | 250 | 252,863 |
| 5.00%, 5/15/28 | | 270 | 273,102 |
| Santa Fe, NM, (El Castillo Retirement Residences): | | | |
| 5.00%, 5/15/34 | | 650 | 624,994 |
| 5.00%, 5/15/39 | | 480 | 439,368 |
| South Carolina Jobs-Economic Development Authority, (Bishop Gadsden Episcopal Retirement Community): | | | |
| 4.00%, 4/1/34 | | 600 | 540,510 |
| 5.00%, 4/1/49 | | 1,510 | 1,390,106 |
| South Carolina Jobs-Economic Development Authority, (South Carolina Episcopal Home at Still Hopes): | | | |
| 5.00%, 4/1/28 | | 1,675 | 1,650,947 |
| 5.00%, 4/1/29 | | 1,000 | 980,720 |
| South Carolina Jobs-Economic Development Authority, (Woodlands at Furman), 5.00%, 11/15/42 | | 300 | 280,650 |
| St. Louis County Industrial Development Authority, MO, (Friendship Village of St. Louis Obligated Group), 5.00%, 9/1/27 | | 1,930 | 1,964,663 |
| St. Louis County Industrial Development Authority, MO, (St. Andrew's Resources for Seniors Obligated Group), 5.00%, 12/1/25 | | 625 | 629,831 |
| Suffolk County Economic Development Corp., NY, (Peconic Landing at Southold, Inc.), 5.00%, 12/1/29 | | 500 | 519,095 |
| Tarrant County Cultural Education Facilities Finance Corp., TX, (MRC Stevenson Oaks), 6.875%, 11/15/55 | | 4,650 | 4,488,319 |
| Tempe Industrial Development Authority, AZ, (Mirabella at ASU), 5.35%, 10/1/25(1) | | 3,000 | 2,934,390 |
| Tulsa County Industrial Authority, OK, (Montereau, Inc.): | | | |
| 5.00%, 11/15/28 | | 540 | 559,705 |
| 5.00%, 11/15/29 | | 400 | 414,596 |
| Vermont Economic Development Authority, (Wake Robin Corp.): | | | |
| 5.00%, 5/1/23 | | 1,690 | 1,691,825 |
| 5.00%, 5/1/25 | | 745 | 750,446 |
| 5.00%, 5/1/26 | | 585 | 589,481 |
| 5.00%, 5/1/27 | | 500 | 502,045 |
| Security | Principal
Amount
(000's omitted) | Value |
| Senior Living/Life Care (continued) |
| Washington Housing Finance Commission, (Bayview Manor Homes): | | | |
| 4.00%, 7/1/26(1) | $ | 765 | $ 733,589 |
| 5.00%, 7/1/31(1) | | 750 | 713,812 |
| Washington Housing Finance Commission, (Judson Park), 4.00%, 7/1/28(1) | | 250 | 233,635 |
| Washington Housing Finance Commission, (Transforming Age): | | | |
| 5.00%, 1/1/27(1) | | 840 | 816,438 |
| 5.00%, 1/1/28(1) | | 445 | 428,838 |
| 5.00%, 1/1/29(1) | | 460 | 439,337 |
| 5.00%, 1/1/34(1) | | 500 | 454,375 |
| 5.00%, 1/1/39(1) | | 750 | 650,827 |
| | | | $ 68,651,962 |
| Special Tax Revenue — 3.4% |
| Baltimore, MD, (Harbor Point): | | | |
| 3.45%, 6/1/35(1) | $ | 310 | $ 264,551 |
| 3.50%, 6/1/39(1) | | 650 | 540,247 |
| Bullhead City, AZ, Excise Taxes Revenue, 2.10%, 7/1/36 | | 585 | 478,858 |
| Franklin County Convention Facilities Authority, OH, (Greater Columbus Convention Center Hotel Expansion): | | | |
| 5.00%, 12/1/36 | | 1,360 | 1,376,510 |
| 5.00%, 12/1/37 | | 350 | 352,471 |
| Irving, TX, Hotel Occupancy Tax Revenue: | | | |
| 5.00%, 8/15/31 | | 225 | 244,760 |
| 5.00%, 8/15/33 | | 190 | 205,510 |
| Lafayette Parish School Board, LA, Sales Tax Revenue, 4.00%, 4/1/53(3) | | 2,500 | 2,444,150 |
| Michigan Finance Authority, Detroit Financial Recovery Income Tax Revenue, 4.50%, 10/1/29 | | 2,145 | 2,167,051 |
| New York City Transitional Finance Authority, NY, Future Tax Revenue, 4.00%, 5/1/47 | | 5,000 | 4,903,800 |
| Puerto Rico Sales Tax Financing Corp., 5.00%, 7/1/58 | | 4,265 | 4,212,711 |
| South Village Community Development District, FL: | | | |
| 2.375%, 5/1/23 | | 100 | 99,809 |
| 2.50%, 5/1/24 | | 100 | 99,270 |
| 2.75%, 5/1/25 | | 95 | 94,168 |
| 3.25%, 5/1/27 | | 95 | 94,841 |
| 4.35%, 5/1/26 | | 300 | 300,714 |
| St. Louis Land Clearance for Redevelopment Authority, MO, (Kiel Opera House Renovation), 3.875%, 10/1/35 | | 875 | 736,706 |
| | | | $ 18,616,127 |
12
See Notes to Financial Statements.
Eaton Vance
Municipal Opportunities Fund
January 31, 2023
Portfolio of Investments (Unaudited) — continued
| Security | Principal
Amount
(000's omitted) | Value |
| Transportation — 8.5% |
| Bay Area Toll Authority, CA, Toll Bridge Revenue, (San Francisco Bay Area), 2.11%, (SIFMA + 0.45%), 4/1/26 (Put Date), 4/1/56(2) | $ | 3,200 | $ 3,154,048 |
| Central Texas Regional Mobility Authority: | | | |
| 5.00%, 1/1/26 | | 500 | 527,740 |
| 5.00%, 1/1/27 | | 550 | 580,861 |
| 5.00%, 1/1/28 | | 750 | 790,867 |
| Chicago, IL, (Midway International Airport), (AMT), 5.00%, 1/1/27 | | 1,000 | 1,016,180 |
| Colorado Bridge Enterprise, (Central 70 Project): | | | |
| (AMT), 4.00%, 12/31/27 | | 2,425 | 2,523,697 |
| (AMT), 4.00%, 12/31/28 | | 2,760 | 2,863,942 |
| Denver City and County, CO, Airport System Revenue: | | | |
| 4.00%, 11/15/43 | | 1,600 | 1,600,032 |
| (AMT), 5.00%, 11/15/28 | | 2,680 | 2,987,048 |
| Illinois Toll Highway Authority, 5.00%, 1/1/27 | | 1,250 | 1,280,587 |
| Los Angeles Department of Airports, CA, (Los Angeles International Airport): | | | |
| (AMT), 5.00%, 5/15/25 | | 3,220 | 3,377,844 |
| (AMT), 5.00%, 5/15/36 | | 3,080 | 3,333,145 |
| Green Bonds, (AMT), 4.00%, 5/15/42 | | 2,085 | 2,090,379 |
| Maryland Economic Development Corp., (Seagirt Marine Terminal), (AMT), 5.00%, 6/1/44 | | 500 | 521,150 |
| Memphis-Shelby County Airport Authority, TN: | | | |
| (AMT), 5.00%, 7/1/27 | | 1,330 | 1,426,678 |
| (AMT), 5.00%, 7/1/29 | | 1,470 | 1,598,404 |
| (AMT), 5.00%, 7/1/35 | | 1,995 | 2,134,012 |
| New Jersey Transportation Trust Fund Authority, (Transportation Program): | | | |
| 5.00%, 6/15/40 | | 2,000 | 2,165,600 |
| 5.25%, 6/15/39 | | 1,500 | 1,663,440 |
| Port of Seattle, WA, (AMT), 5.00%, 8/1/28 | | 2,270 | 2,509,894 |
| San Francisco City and County Airport Commission, CA, (San Francisco International Airport), (AMT), 5.00%, 5/1/44 | | 5,000 | 5,253,850 |
| Texas Private Activity Bond Surface Transportation Corp., (North Tarrant Express Managed Lanes Project), 5.00%, 12/31/34 | | 3,000 | 3,217,260 |
| | | | $ 46,616,658 |
| Water and Sewer — 6.4% |
| Austin, TX, Water and Wastewater System Revenue, 5.00%, 11/15/42 | $ | 5,000 | $ 5,726,300 |
| Coldwater Local Development Finance Authority, MI: | | | |
| Series A, (AMT), 5.00%, 12/1/27 | | 390 | 410,163 |
| Series B, (AMT), 5.00%, 12/1/27 | | 505 | 531,109 |
| Fairfax County, VA, Sewer Revenue, 4.00%, 7/15/40 | | 3,195 | 3,378,840 |
| Security | Principal
Amount
(000's omitted) | Value |
| Water and Sewer (continued) |
| Los Angeles Department of Water and Power, CA, Water System Revenue, 5.00%, 7/1/52 | $ | 3,250 | $ 3,665,480 |
| Luzerne County Industrial Development Authority, PA, (Pennsylvania-American Water Co.), (AMT), 2.45% to 12/3/29 (Put Date), 12/1/39 | | 2,750 | 2,562,010 |
| Marin Municipal Water District, CA, 4.00%, 6/15/45 | | 5,000 | 5,076,650 |
| New York City Municipal Water Finance Authority, NY, (Water and Sewer System), 5.25%, 6/15/52(4) | | 3,000 | 3,426,420 |
| San Diego Public Facilities Financing Authority, CA, Wastewater System Revenue, 5.00%, 5/15/47 | | 5,000 | 5,676,550 |
| Tacoma, WA, Sewer Revenue, 4.00%, 12/1/48 | | 2,500 | 2,487,650 |
| Walton County Water and Sewerage Authority, GA, 5.00%, 2/1/53 | | 2,000 | 2,223,640 |
| | | | $ 35,164,812 |
Total Tax-Exempt Municipal Obligations
(identified cost $492,841,297) | | | $494,345,498 |
| Taxable Municipal Obligations — 6.2% |
| Security | Principal
Amount
(000's omitted) | Value |
| Education — 0.1% |
| Harris County Cultural Education Facilities Finance Corp., TX, (Baylor College of Medicine), 1.593%, 11/15/23 | $ | 795 | $ 775,968 |
| | | | $ 775,968 |
| Electric Utilities — 0.3% |
| Vernon, CA, Electric System Revenue, 4.05%, 8/1/23 | $ | 2,000 | $ 1,981,220 |
| | | | $ 1,981,220 |
| General Obligations — 3.3% |
| Atlantic City, NJ, 7.00%, 3/1/28 | $ | 2,105 | $ 2,209,997 |
| Chicago, IL: | | | |
| 7.375%, 1/1/33 | | 3,250 | 3,543,962 |
| 7.75%, 1/1/42 | | 3,811 | 3,908,409 |
| 7.781%, 1/1/35 | | 2,600 | 2,898,558 |
| Collin County, TX, 1.683%, 2/15/30 | | 100 | 82,819 |
| Larkspur-Corte Madera School District, CA, (Election of 2011 and 2014), 2.002%, 8/1/33 | | 650 | 516,939 |
| Marin Community College District, CA, 2.14%, 8/1/34 | | 1,500 | 1,190,595 |
| Maryland, 0.41%, 8/1/23 | | 2,000 | 1,962,520 |
13
See Notes to Financial Statements.
Eaton Vance
Municipal Opportunities Fund
January 31, 2023
Portfolio of Investments (Unaudited) — continued
| Security | Principal
Amount
(000's omitted) | Value |
| General Obligations (continued) |
| Mattawan Consolidated School, MI, 1.966%, 5/1/32 | $ | 1,100 | $ 900,988 |
| Puerto Rico, GO Contingent Value Instrument, 0.00%, 11/1/43 | | 1,384 | 612,438 |
| | | | $ 17,827,225 |
| Insured - General Obligations — 1.0% |
| Altoona Area School District, PA, (BAM), 2.288%, 12/1/34 | $ | 750 | $ 584,115 |
| Detroit, MI, (AMBAC), 5.15%, 4/1/25 | | 4,930 | 4,877,893 |
| | | | $ 5,462,008 |
| Insured - Special Tax Revenue — 0.9% |
| Bexar County, TX, Venue Project Revenue, (AGM), 2.434%, 8/15/33 | $ | 1,505 | $ 1,206,273 |
| Rio Elementary School District Community Facilities District No. 1, CA, (BAM), 2.457%, 9/1/32 | | 1,500 | 1,227,750 |
| Successor Agency to Pittsburg Redevelopment Agency, CA, (AGM), 3.684%, 8/1/24 | | 1,030 | 1,015,384 |
| Successor Agency to San Bernardino County Redevelopment Agency, CA: | | | |
| (AGM), 3.50%, 9/1/23 | | 510 | 505,818 |
| (AGM), 3.75%, 9/1/25 | | 500 | 486,820 |
| (AGM), 4.00%, 9/1/26 | | 500 | 486,760 |
| | | | $ 4,928,805 |
| Senior Living/Life Care — 0.2% |
| Berks County Industrial Development Authority, PA, (Highlands at Wyomissing), 3.95%, 5/15/24 | $ | 985 | $ 970,018 |
| | | | $ 970,018 |
| Special Tax Revenue — 0.4% |
| Massachusetts School Building Authority, Social Bonds, 1.753%, 8/15/30 | $ | 2,000 | $ 1,699,540 |
| Ohio County Commission, WV, (Fort Henry Economic Opportunity Development District - The Highlands), 5.25%, 3/1/31 | | 335 | 319,275 |
| | | | $ 2,018,815 |
Total Taxable Municipal Obligations
(identified cost $35,049,431) | | | $ 33,964,059 |
Total Investments — 99.8%
(identified cost $544,247,276) | | | $544,598,449 |
| Other Assets, Less Liabilities — 0.2% | | | $ 1,038,283 |
| Net Assets — 100.0% | | | $545,636,732 |
| The percentage shown for each investment category in the Portfolio of Investments is based on net assets. |
| (1) | Security exempt from registration under Rule 144A of the Securities Act of 1933, as amended. These securities may be sold in certain transactions in reliance on an exemption from registration (normally to qualified institutional buyers). At January 31, 2023, the aggregate value of these securities is $39,133,121 or 7.2% of the Fund's net assets. |
| (2) | Floating rate security. The stated interest rate represents the rate in effect at January 31, 2023. |
| (3) | When-issued security. |
| (4) | Security represents the municipal bond held by a trust that issues residual interest bonds (see Note 1H). |
| At January 31, 2023, the concentration of the Fund’s investments in the various states and territories, determined as a percentage of net assets, is as follows: |
| California | 13.5% |
| Others, representing less than 10% individually | 83.4% |
| The Fund invests primarily in debt securities issued by municipalities. The ability of the issuers of the debt securities to meet their obligations may be affected by economic developments in a specific industry or municipality. At January 31, 2023, 12.1% of total investments are backed by bond insurance of various financial institutions and financial guaranty assurance agencies. The aggregate percentage insured by an individual financial institution or financial guaranty assurance agency ranged from 0.1% to 8.2% of total investments. |
| Abbreviations: |
| AGC | – Assured Guaranty Corp. |
| AGM | – Assured Guaranty Municipal Corp. |
| AMBAC | – AMBAC Financial Group, Inc. |
| AMT | – Interest earned from these securities may be considered a tax preference item for purposes of the Federal Alternative Minimum Tax. |
| BAM | – Build America Mutual Assurance Co. |
| LIBOR | – London Interbank Offered Rate |
| NPFG | – National Public Finance Guarantee Corp. |
| PSF | – Permanent School Fund |
| SIFMA | – Securities Industry and Financial Markets Association Municipal Swap Index |
| Currency Abbreviations: |
| USD | – United States Dollar |
14
See Notes to Financial Statements.
Eaton Vance
Municipal Opportunities Fund
January 31, 2023
Statement of Assets and Liabilities (Unaudited)
| | January 31, 2023 |
| Assets | |
| Investments, at value (identified cost $544,247,276) | $ 544,598,449 |
| Cash | 3,883,455 |
| Interest receivable | 5,029,026 |
| Receivable for investments sold | 4,213,214 |
| Receivable for Fund shares sold | 1,666,855 |
| Total assets | $559,390,999 |
| Liabilities | |
| Payable for floating rate notes issued | $ 2,408,064 |
| Demand note payable | 2,790,000 |
| Payable for when-issued securities | 4,554,655 |
| Payable for Fund shares redeemed | 3,240,434 |
| Distributions payable | 206,427 |
| Payable to affiliates: | |
| Investment adviser and administration fee | 275,641 |
| Distribution and service fees | 28,990 |
| Interest expense and fees payable | 13,369 |
| Accrued expenses | 236,687 |
| Total liabilities | $ 13,754,267 |
| Net Assets | $545,636,732 |
| Sources of Net Assets | |
| Paid-in capital | $ 605,317,937 |
| Accumulated loss | (59,681,205) |
| Net Assets | $545,636,732 |
| Class A Shares | |
| Net Assets | $ 61,501,571 |
| Shares Outstanding | 5,448,528 |
Net Asset Value and Redemption Price Per Share
(net assets ÷ shares of beneficial interest outstanding) | $ 11.29 |
Maximum Offering Price Per Share
(100 ÷ 96.75 of net asset value per share) | $ 11.67 |
| Class C Shares | |
| Net Assets | $ 18,566,074 |
| Shares Outstanding | 1,645,327 |
Net Asset Value and Offering Price Per Share*
(net assets ÷ shares of beneficial interest outstanding) | $ 11.28 |
| Class I Shares | |
| Net Assets | $ 465,569,087 |
| Shares Outstanding | 41,187,223 |
Net Asset Value, Offering Price and Redemption Price Per Share
(net assets ÷ shares of beneficial interest outstanding) | $ 11.30 |
| On sales of $100,000 or more, the offering price of Class A shares is reduced. |
| * | Redemption price per share is equal to the net asset value less any applicable contingent deferred sales charge. |
15
See Notes to Financial Statements.
Eaton Vance
Municipal Opportunities Fund
January 31, 2023
Statement of Operations (Unaudited)
| | Six Months Ended |
| | January 31, 2023 |
| Investment Income | |
| Interest income | $ 11,872,039 |
| Total investment income | $ 11,872,039 |
| Expenses | |
| Investment adviser and administration fee | $ 1,875,992 |
| Distribution and service fees: | |
| Class A | 85,601 |
| Class C | 105,681 |
| Trustees’ fees and expenses | 17,783 |
| Custodian fee | 78,331 |
| Transfer and dividend disbursing agent fees | 122,546 |
| Legal and accounting services | 45,831 |
| Printing and postage | 15,331 |
| Registration fees | 49,336 |
| Interest expense and fees | 13,369 |
| Miscellaneous | 66,756 |
| Total expenses | $ 2,476,557 |
| Net investment income | $ 9,395,482 |
| Realized and Unrealized Gain (Loss) | |
| Net realized gain (loss): | |
| Investment transactions | $ (25,041,811) |
| Futures contracts | 3,696,690 |
| Net realized loss | $(21,345,121) |
| Change in unrealized appreciation (depreciation): | |
| Investments | $ 9,277,388 |
| Net change in unrealized appreciation (depreciation) | $ 9,277,388 |
| Net realized and unrealized loss | $(12,067,733) |
| Net decrease in net assets from operations | $ (2,672,251) |
16
See Notes to Financial Statements.
Eaton Vance
Municipal Opportunities Fund
January 31, 2023
Statements of Changes in Net Assets
| | Six Months Ended
January 31, 2023
(Unaudited) | Year Ended
July 31, 2022 |
| Increase (Decrease) in Net Assets | | |
| From operations: | | |
| Net investment income | $ 9,395,482 | $ 22,523,550 |
| Net realized loss | (21,345,121) | (39,117,869) |
| Net change in unrealized appreciation (depreciation) | 9,277,388 | (89,909,346) |
| Net decrease in net assets from operations | $ (2,672,251) | $ (106,503,665) |
| Distributions to shareholders: | | |
| Class A | $ (963,830) | $ (3,808,390) |
| Class C | (218,403) | (861,036) |
| Class I | (8,268,318) | (37,920,723) |
| Total distributions to shareholders | $ (9,450,551) | $ (42,590,149) |
| Transactions in shares of beneficial interest: | | |
| Class A | $ (16,773,400) | $ (34,054,610) |
| Class C | (5,372,675) | (8,140,191) |
| Class I | (169,392,729) | (426,023,493) |
| Net decrease in net assets from Fund share transactions | $(191,538,804) | $ (468,218,294) |
| Net decrease in net assets | $(203,661,606) | $ (617,312,108) |
| Net Assets | | |
| At beginning of period | $ 749,298,338 | $1,366,610,446 |
| At end of period | $ 545,636,732 | $ 749,298,338 |
17
See Notes to Financial Statements.
Eaton Vance
Municipal Opportunities Fund
January 31, 2023
| | Class A |
| | Six Months Ended
January 31, 2023
(Unaudited) | Year Ended July 31, |
| | | 2022 | 2021 | 2020 | 2019 | 2018 |
| Net asset value — Beginning of period | $ 11.390 | $ 12.870 | $ 12.330 | $ 12.310 | $ 11.880 | $ 11.960 |
| Income (Loss) From Operations | | | | | | |
| Net investment income(1) | $ 0.156 | $ 0.215 | $ 0.232 | $ 0.262 | $ 0.277 | $ 0.251 |
| Net realized and unrealized gain (loss) | (0.098) | (1.282) | 0.541 | 0.018 (2) | 0.427 | (0.084) |
| Total income (loss) from operations | $ 0.058 | $ (1.067) | $ 0.773 | $ 0.280 | $ 0.704 | $ 0.167 |
| Less Distributions | | | | | | |
| From net investment income | $ (0.158) | $ (0.219) | $ (0.233) | $ (0.260) | $ (0.274) | $ (0.247) |
| From net realized gain | — | (0.194) | — | — | — | — |
| Total distributions | $ (0.158) | $ (0.413) | $ (0.233) | $ (0.260) | $ (0.274) | $ (0.247) |
| Net asset value — End of period | $11.290 | $11.390 | $ 12.870 | $ 12.330 | $ 12.310 | $ 11.880 |
| Total Return(3) | 0.55% (4) | (8.47)% | 6.34% | 2.32% | 6.02% | 1.41% |
| Ratios/Supplemental Data | | | | | | |
| Net assets, end of period (000’s omitted) | $ 61,502 | $ 79,594 | $127,729 | $129,416 | $127,094 | $116,961 |
| Ratios (as a percentage of average daily net assets): | | | | | | |
| Expenses excluding interest and fees | 0.98% (5) | 0.93% | 0.92% | 0.92% | 0.94% | 0.93% |
| Interest and fee expense(6) | 0.00% (5)(7) | — | 0.00% (7) | 0.00% (7) | — | — |
| Total expenses | 0.98% (5) | 0.93% | 0.92% | 0.92% | 0.94% | 0.93% |
| Net investment income | 2.80% (5) | 1.77% | 1.84% | 2.15% | 2.32% | 2.11% |
| Portfolio Turnover | 30% (4) | 35% | 62% | 56% | 34% | 30% |
| (1) | Computed using average shares outstanding. |
| (2) | The per share amount is not in accord with the net realized and unrealized gain (loss) for the period because of the timing of Fund share transactions and the amount of the per share realized and unrealized gains and losses at such time. |
| (3) | Returns are historical and are calculated by determining the percentage change in net asset value with all distributions reinvested and do not reflect the effect of sales charges. |
| (4) | Not annualized. |
| (5) | Annualized. |
| (6) | Interest and fee expense relates to the liability for floating rate notes issued in conjunction with residual interest bond transactions (see Note 1H). |
| (7) | Amount is less than 0.005%. |
18
See Notes to Financial Statements.
Eaton Vance
Municipal Opportunities Fund
January 31, 2023
Financial Highlights — continued
| | Class C |
| | Six Months Ended
January 31, 2023
(Unaudited) | Year Ended July 31, |
| | | 2022 | 2021 | 2020 | 2019 | 2018 |
| Net asset value — Beginning of period | $ 11.390 | $ 12.870 | $ 12.330 | $ 12.300 | $ 11.870 | $ 11.960 |
| Income (Loss) From Operations | | | | | | |
| Net investment income(1) | $ 0.114 | $ 0.124 | $ 0.139 | $ 0.171 | $ 0.188 | $ 0.161 |
| Net realized and unrealized gain (loss) | (0.108) | (1.282) | 0.540 | 0.027 (2) | 0.426 | (0.093) |
| Total income (loss) from operations | $ 0.006 | $ (1.158) | $ 0.679 | $ 0.198 | $ 0.614 | $ 0.068 |
| Less Distributions | | | | | | |
| From net investment income | $ (0.116) | $ (0.128) | $ (0.139) | $ (0.168) | $ (0.184) | $ (0.158) |
| From net realized gain | — | (0.194) | — | — | — | — |
| Total distributions | $ (0.116) | $ (0.322) | $ (0.139) | $ (0.168) | $ (0.184) | $ (0.158) |
| Net asset value — End of period | $11.280 | $11.390 | $12.870 | $12.330 | $12.300 | $11.870 |
| Total Return(3) | 0.08% (4) | (9.15)% | 5.55% | 1.64% | 5.23% | 0.57% |
| Ratios/Supplemental Data | | | | | | |
| Net assets, end of period (000’s omitted) | $ 18,566 | $ 24,274 | $ 36,398 | $ 41,939 | $ 47,617 | $ 51,587 |
| Ratios (as a percentage of average daily net assets): | | | | | | |
| Expenses excluding interest and fees | 1.73% (5) | 1.68% | 1.67% | 1.67% | 1.69% | 1.69% |
| Interest and fee expense(6) | 0.00% (5)(7) | — | 0.00% (7) | 0.00% (7) | — | — |
| Total expenses | 1.73% (5) | 1.68% | 1.67% | 1.67% | 1.69% | 1.69% |
| Net investment income | 2.05% (5) | 1.03% | 1.11% | 1.40% | 1.57% | 1.35% |
| Portfolio Turnover | 30% (4) | 35% | 62% | 56% | 34% | 30% |
| (1) | Computed using average shares outstanding. |
| (2) | The per share amount is not in accord with the net realized and unrealized gain (loss) for the period because of the timing of Fund share transactions and the amount of the per share realized and unrealized gains and losses at such time. |
| (3) | Returns are historical and are calculated by determining the percentage change in net asset value with all distributions reinvested and do not reflect the effect of sales charges. |
| (4) | Not annualized. |
| (5) | Annualized. |
| (6) | Interest and fee expense relates to the liability for floating rate notes issued in conjunction with residual interest bond transactions (see Note 1H). |
| (7) | Amount is less than 0.005%. |
19
See Notes to Financial Statements.
Eaton Vance
Municipal Opportunities Fund
January 31, 2023
Financial Highlights — continued
| | Class I |
| | Six Months Ended
January 31, 2023
(Unaudited) | Year Ended July 31, |
| | | 2022 | 2021 | 2020 | 2019 | 2018 |
| Net asset value — Beginning of period | $ 11.410 | $ 12.890 | $ 12.350 | $ 12.320 | $ 11.900 | $ 11.980 |
| Income (Loss) From Operations | | | | | | |
| Net investment income(1) | $ 0.170 | $ 0.245 | $ 0.263 | $ 0.293 | $ 0.306 | $ 0.282 |
| Net realized and unrealized gain (loss) | (0.108) | (1.282) | 0.542 | 0.028 (2) | 0.418 | (0.085) |
| Total income (loss) from operations | $ 0.062 | $ (1.037) | $ 0.805 | $ 0.321 | $ 0.724 | $ 0.197 |
| Less Distributions | | | | | | |
| From net investment income | $ (0.172) | $ (0.249) | $ (0.265) | $ (0.291) | $ (0.304) | $ (0.277) |
| From net realized gain | — | (0.194) | — | — | — | — |
| Total distributions | $ (0.172) | $ (0.443) | $ (0.265) | $ (0.291) | $ (0.304) | $ (0.277) |
| Net asset value — End of period | $ 11.300 | $ 11.410 | $ 12.890 | $ 12.350 | $ 12.320 | $ 11.900 |
| Total Return(3) | 0.59% (4) | (8.22)% | 6.60% | 2.66% | 6.19% | 1.67% |
| Ratios/Supplemental Data | | | | | | |
| Net assets, end of period (000’s omitted) | $465,569 | $645,430 | $1,202,483 | $1,245,273 | $1,129,022 | $840,654 |
| Ratios (as a percentage of average daily net assets): | | | | | | |
| Expenses excluding interest and fees | 0.73% (5) | 0.67% | 0.67% | 0.67% | 0.69% | 0.68% |
| Interest and fee expense(6) | 0.00% (5)(7) | — | 0.00% (7) | 0.00% (7) | — | — |
| Total expenses | 0.73% (5) | 0.67% | 0.67% | 0.67% | 0.69% | 0.68% |
| Net investment income | 3.05% (5) | 2.01% | 2.10% | 2.40% | 2.56% | 2.37% |
| Portfolio Turnover | 30% (4) | 35% | 62% | 56% | 34% | 30% |
| (1) | Computed using average shares outstanding. |
| (2) | The per share amount is not in accord with the net realized and unrealized gain (loss) for the period because of the timing of Fund share transactions and the amount of the per share realized and unrealized gains and losses at such time. |
| (3) | Returns are historical and are calculated by determining the percentage change in net asset value with all distributions reinvested. |
| (4) | Not annualized. |
| (5) | Annualized. |
| (6) | Interest and fee expense relates to the liability for floating rate notes issued in conjunction with residual interest bond transactions (see Note 1H). |
| (7) | Amount is less than 0.005%. |
20
See Notes to Financial Statements.
Eaton Vance
Municipal Opportunities Fund
January 31, 2023
Notes to Financial Statements (Unaudited)
1 Significant Accounting Policies
Eaton Vance Municipal Opportunities Fund (the Fund) is a diversified series of Eaton Vance Municipals Trust (the Trust). The Trust is a Massachusetts business trust registered under the Investment Company Act of 1940, as amended (the 1940 Act), as an open-end management investment company. The Fund seeks to maximize after-tax total return. The Fund offers three classes of shares. Class A shares are generally sold subject to a sales charge imposed at time of purchase. Class C shares are sold at net asset value and are generally subject to a contingent deferred sales charge (see Note 5). Effective November 5, 2020, Class C shares automatically convert to Class A shares eight years after their purchase as described in the Fund’s prospectus. Class I shares are sold at net asset value and are not subject to a sales charge. Each class represents a pro-rata interest in the Fund, but votes separately on class-specific matters and (as noted below) is subject to different expenses. Realized and unrealized gains and losses are allocated daily to each class of shares based on the relative net assets of each class to the total net assets of the Fund. Net investment income, other than class-specific expenses, is allocated daily to each class of shares based upon the ratio of the value of each class’s paid shares to the total value of all paid shares. Each class of shares differs in its distribution plan and certain other class-specific expenses.
The following is a summary of significant accounting policies of the Fund. The policies are in conformity with accounting principles generally accepted in the United States of America (U.S. GAAP). The Fund is an investment company and follows accounting and reporting guidance in the Financial Accounting Standards Board (FASB) Accounting Standards Codification Topic 946.
A Investment Valuation—The following methodologies are used to determine the market value or fair value of investments.
Debt Obligations. Debt obligations are generally valued on the basis of valuations provided by third party pricing services, as derived from such services’ pricing models. Inputs to the models may include, but are not limited to, reported trades, executable bid and ask prices, broker/dealer quotations, prices or yields of securities with similar characteristics, interest rates, anticipated prepayments, benchmark curves or information pertaining to the issuer, as well as industry and economic events. The pricing services may use a matrix approach, which considers information regarding securities with similar characteristics to determine the valuation for a security. Short-term debt obligations purchased with a remaining maturity of sixty days or less for which a valuation from a third party pricing service is not readily available may be valued at amortized cost, which approximates fair value.
Derivatives. Futures contracts are valued at the closing settlement price established by the board of trade or exchange on which they are traded.
Fair Valuation. In connection with Rule 2a-5 of the 1940 Act, the Trustees have designated the Fund’s investment adviser as its valuation designee. Investments for which valuations or market quotations are not readily available or are deemed unreliable are valued by the investment adviser, as valuation designee, at fair value using methods that most fairly reflect the security’s “fair value”, which is the amount that the Fund might reasonably expect to receive for the security upon its current sale in the ordinary course. Each such determination is based on a consideration of relevant factors, which are likely to vary from one pricing context to another. These factors may include, but are not limited to, the type of security, the existence of any contractual restrictions on the security’s disposition, the price and extent of public trading in similar securities of the issuer or of comparable companies or entities, quotations or relevant information obtained from broker/dealers or other market participants, information obtained from the issuer, analysts, and/or the appropriate stock exchange (for exchange-traded securities), an analysis of the company’s or entity’s financial statements, and an evaluation of the forces that influence the issuer and the market(s) in which the security is purchased and sold.
B Investment Transactions and Related Income—Investment transactions for financial statement purposes are accounted for on a trade date basis. Realized gains and losses on investments sold are determined on the basis of identified cost. Interest income is recorded on the basis of interest accrued, adjusted for amortization of premium or accretion of discount.
C Federal Taxes—The Fund's policy is to comply with the provisions of the Internal Revenue Code applicable to regulated investment companies and to distribute to shareholders each year substantially all of its taxable, if any, and tax-exempt net investment income, and all or substantially all of its net realized capital gains. Accordingly, no provision for federal income or excise tax is necessary. The Fund intends to satisfy conditions which will enable it to designate distributions from the interest income generated by its investments in non-taxable municipal securities, which are exempt from regular federal income tax when received by the Fund, as exempt-interest dividends. The portion of such interest, if any, earned on private activity bonds issued after August 7, 1986, may be considered a tax preference item to shareholders.
As of January 31, 2023, the Fund had no uncertain tax positions that would require financial statement recognition, de-recognition, or disclosure. The Fund files a U.S. federal income tax return annually after its fiscal year-end, which is subject to examination by the Internal Revenue Service for a period of three years from the date of filing.
D Expenses—The majority of expenses of the Trust are directly identifiable to an individual fund. Expenses which are not readily identifiable to a specific fund are allocated taking into consideration, among other things, the nature and type of expense and the relative size of the funds.
E Legal Fees—Legal fees and other related expenses incurred as part of negotiations of the terms and requirement of capital infusions, or that are expected to result in the restructuring of, or a plan of reorganization for, an investment are recorded as realized losses. Ongoing expenditures to protect or enhance an investment are treated as operating expenses.
Eaton Vance
Municipal Opportunities Fund
January 31, 2023
Notes to Financial Statements (Unaudited) — continued
F Use of Estimates—The preparation of the financial statements in conformity with U.S. GAAP requires management to make estimates and assumptions that affect the reported amounts of assets and liabilities at the date of the financial statements and the reported amounts of income and expense during the reporting period. Actual results could differ from those estimates.
G Indemnifications—Under the Trust’s organizational documents, its officers and Trustees may be indemnified against certain liabilities and expenses arising out of the performance of their duties to the Fund. Under Massachusetts law, if certain conditions prevail, shareholders of a Massachusetts business trust (such as the Trust) could be deemed to have personal liability for the obligations of the Trust. However, the Trust’s Declaration of Trust contains an express disclaimer of liability on the part of Fund shareholders and the By-laws provide that the Trust shall assume, upon request by the shareholder, the defense on behalf of any Fund shareholders. Moreover, the By-laws also provide for indemnification out of Fund property of any shareholder held personally liable solely by reason of being or having been a shareholder for all loss or expense arising from such liability. Additionally, in the normal course of business, the Fund enters into agreements with service providers that may contain indemnification clauses. The Fund’s maximum exposure under these arrangements is unknown as this would involve future claims that may be made against the Fund that have not yet occurred.
H Floating Rate Notes Issued in Conjunction with Securities Held—The Fund may invest in residual interest bonds, also referred to as inverse floating rate securities, whereby the Fund may sell a variable or fixed rate bond for cash to a Special-Purpose Vehicle (the SPV), (which is generally organized as a trust), while at the same time, buying a residual interest in the assets and cash flows of the SPV. The bond is deposited into the SPV with the same CUSIP number as the bond sold to the SPV by the Fund, and which may have been, but is not required to be, the bond purchased from the Fund (the Bond).The SPV also issues floating rate notes (Floating Rate Notes) which are sold to third-parties. The residual interest bond held by the Fund gives the Fund the right (1) to cause the holders of the Floating Rate Notes to generally tender their notes at par, and (2) to have the Bond held by the SPV transferred to the Fund, thereby terminating the SPV. Should the Fund exercise such right, it would generally pay the SPV the par amount due on the Floating Rate Notes and exchange the residual interest bond for the underlying Bond. Pursuant to generally accepted accounting principles for transfers and servicing of financial assets and extinguishment of liabilities, the Fund accounts for the transaction described above as a secured borrowing by including the Bond in its Portfolio of Investments and the Floating Rate Notes as a liability under the caption “Payable for floating rate notes issued” in its Statement of Assets and Liabilities. The Floating Rate Notes have interest rates that generally reset weekly and their holders have the option to tender their notes to the SPV for redemption at par at each reset date. Accordingly, the fair value of the payable for floating rate notes issued approximates its carrying value. If measured at fair value, the payable for floating rate notes would have been considered as Level 2 in the fair value hierarchy (see Note 10) at January 31, 2023. Interest expense related to the Fund’s liability with respect to Floating Rate Notes is recorded as incurred. The SPV may be terminated by the Fund, as noted above, or by the occurrence of certain termination events as defined in the trust agreement, such as a downgrade in the credit quality of the underlying Bond, bankruptcy of or payment failure by the issuer of the underlying Bond, the inability to remarket Floating Rate Notes that have been tendered due to insufficient buyers in the market, or the failure by the SPV to obtain renewal of the liquidity agreement under which liquidity support is provided for the Floating Rate Notes up to one year. At January 31, 2023, the amount of the Fund’s Floating Rate Notes outstanding and the related collateral were $2,408,064 and $3,426,420, respectively. The interest rate on the Floating Rate Notes outstanding at January 31, 2023 was 1.69%. For the six months ended January 31, 2023, the Fund’s average settled Floating Rate Notes outstanding and the average interest rate (annualized) including fees were $834,783 and 3.18%, respectively.
In certain circumstances, the Fund may enter into shortfall and forbearance agreements with brokers by which the Fund agrees to reimburse the broker for the difference between the liquidation value of the Bond held by the SPV and the liquidation value of the Floating Rate Notes, as well as any shortfalls in interest cash flows. The Fund had no shortfalls as of January 31, 2023.
The Fund may also purchase residual interest bonds in a secondary market transaction without first owning the underlying bond. Such transactions are not required to be treated as secured borrowings. Shortfall agreements, if any, related to residual interest bonds purchased in a secondary market transaction are disclosed in the Portfolio of Investments.
The Fund’s investment policies and restrictions expressly permit investments in residual interest bonds. Such bonds typically offer the potential for yields exceeding the yields available on fixed rate bonds with comparable credit quality and maturity. These securities tend to underperform the market for fixed rate bonds in a rising long-term interest rate environment, but tend to outperform the market for fixed rate bonds when long-term interest rates decline. The value and income of residual interest bonds are generally more volatile than that of a fixed rate bond. The Fund’s investment policies do not allow the Fund to borrow money except as permitted by the 1940 Act. Effective August 19, 2022, the Fund began operating under Rule 18f-4 under the 1940 Act, which, among other things, governs the use of derivative investments and certain financing transactions by registered investment companies. As of the date of this report, consistent with Rule 18f-4, the Fund has elected to comply with the asset coverage requirements of Section 18 with respect to its investments in residual interest bonds (as opposed to treating such interests as derivatives transactions). The Fund may change this election (and elect to treat these investments and other similar financing transactions as derivatives transactions) at any time. Residual interest bonds held by the Fund are securities exempt from registration under Rule 144A of the Securities Act of 1933.
I Futures Contracts —Upon entering into a futures contract, the Fund is required to deposit with the broker, either in cash or securities, an amount equal to a certain percentage of the contract amount (initial margin). Subsequent payments, known as variation margin, are made or received by the Fund each business day, depending on the daily fluctuations in the value of the underlying security, and are recorded as unrealized gains or losses by the Fund. Gains (losses) are realized upon the expiration or closing of the futures contracts. Should market conditions change unexpectedly, the Fund may not achieve the
Eaton Vance
Municipal Opportunities Fund
January 31, 2023
Notes to Financial Statements (Unaudited) — continued
anticipated benefits of the futures contracts and may realize a loss. Futures contracts have minimal counterparty risk as they are exchange traded and the clearinghouse for the exchange is substituted as the counterparty, guaranteeing counterparty performance.
J When-Issued Securities and Delayed Delivery Transactions—The Fund may purchase securities on a delayed delivery or when-issued basis. Payment and delivery may take place after the customary settlement period for that security. At the time the transaction is negotiated, the price of the security that will be delivered is fixed. The Fund maintains cash and/or security positions for these commitments such that sufficient liquid assets will be available to make payments upon settlement. Securities purchased on a delayed delivery or when-issued basis are marked-to-market daily and begin earning interest on settlement date. Such security purchases are subject to the risk that when delivered they will be worth less than the agreed upon payment price. Losses may also arise if the counterparty does not perform under the contract.
K Interim Financial Statements—The interim financial statements relating to January 31, 2023 and for the six months then ended have not been audited by an independent registered public accounting firm, but in the opinion of the Fund's management, reflect all adjustments, consisting only of normal recurring adjustments, necessary for the fair presentation of the financial statements.
2 Distributions to Shareholders and Income Tax Information
The net investment income of the Fund is determined daily and substantially all of the net investment income so determined is declared as a dividend to shareholders of record at the time of declaration. Distributions are declared separately for each class of shares. Distributions are paid monthly. Distributions of realized capital gains are made at least annually. Shareholders may reinvest income and capital gain distributions in additional shares of the same class of the Fund at the net asset value as of the reinvestment date or, at the election of the shareholder, receive distributions in cash. Distributions to shareholders are determined in accordance with income tax regulations, which may differ from U.S. GAAP. As required by U.S. GAAP, only distributions in excess of tax basis earnings and profits are reported in the financial statements as a return of capital. Permanent differences between book and tax accounting relating to distributions are reclassified to paid-in capital. For tax purposes, distributions from short-term capital gains are considered to be from ordinary income.
The cost and unrealized appreciation (depreciation) of investments of the Fund at January 31, 2023, as determined on a federal income tax basis, were as follows:
| Aggregate cost | $ 541,732,615 |
| Gross unrealized appreciation | $ 13,117,006 |
| Gross unrealized depreciation | (12,659,236) |
| Net unrealized appreciation | $ 457,770 |
3 Investment Adviser and Administration Fee and Other Transactions with Affiliates
The investment adviser and administration fee is earned by Eaton Vance Management (EVM), an indirect, wholly-owned subsidiary of Morgan Stanley, as compensation for investment advisory and administrative services rendered to the Fund. The investment adviser and administration fee is computed at an annual rate as a percentage of the Fund’s average daily net assets as follows and is payable monthly:
| Average Daily Net Assets | Annual Fee Rate |
| Up to $500 million | 0.600% |
| $500 million but less than $1 billion | 0.575% |
| $1 billion but less than $2.5 billion | 0.550% |
| $2.5 billion but less than $5 billion | 0.530% |
| $5 billion and over | 0.515% |
For the six months ended January 31, 2023, the Fund's investment adviser and administration fee amounted to $1,875,992 or 0.60% (annualized) of the Fund’s average daily net assets.
EVM provides sub-transfer agency and related services to the Fund pursuant to a Sub-Transfer Agency Support Services Agreement. For the six months ended January 31, 2023, EVM earned $7,156 from the Fund pursuant to such agreement, which is included in transfer and dividend disbursing agent fees on the Statement of Operations. The Fund was informed that Eaton Vance Distributors, Inc. (EVD), an affiliate of EVM and the Fund's principal underwriter, received $814 as its portion of the sales charge on sales of Class A shares for the six months ended January 31, 2023. EVD also received
Eaton Vance
Municipal Opportunities Fund
January 31, 2023
Notes to Financial Statements (Unaudited) — continued
distribution and service fees from Class A and Class C shares (see Note 4) and contingent deferred sales charges (see Note 5).
Trustees and officers of the Fund who are members of EVM’s organization receive remuneration for their services to the Fund out of the investment adviser and administration fee. Trustees of the Fund who are not affiliated with EVM may elect to defer receipt of all or a percentage of their annual fees in accordance with the terms of the Trustees Deferred Compensation Plan. For the six months ended January 31, 2023, no significant amounts have been deferred. Certain officers and Trustees of the Fund are officers of EVM.
4 Distribution Plans
The Fund has in effect a distribution plan for Class A shares (Class A Plan) pursuant to Rule 12b-1 under the 1940 Act. Pursuant to the Class A Plan, the Fund pays EVD a distribution and service fee of 0.25% per annum of its average daily net assets attributable to Class A shares for distribution services and facilities provided to the Fund by EVD, as well as for personal services and/or the maintenance of shareholder accounts. Distribution and service fees paid or accrued to EVD for the six months ended January 31, 2023 amounted to $85,601 for Class A shares.
The Fund also has in effect a distribution plan for Class C shares (Class C Plan) pursuant to Rule 12b-1 under the 1940 Act. Pursuant to the Class C Plan, the Fund pays EVD amounts equal to 0.75% per annum of its average daily net assets attributable to Class C shares for providing ongoing distribution services and facilities to the Fund. For the six months ended January 31, 2023, the Fund paid or accrued to EVD $79,261 for Class C shares.
Pursuant to the Class C Plan, the Fund also makes payments of service fees to EVD, financial intermediaries and other persons in amounts equal to 0.25% per annum of its average daily net assets attributable to Class C shares. Service fees paid or accrued are for personal services and/or the maintenance of shareholder accounts. They are separate and distinct from the sales commissions and distribution fees payable to EVD. Service fees paid or accrued for the six months ended January 31, 2023 amounted to $26,420 for Class C shares.
Distribution and service fees are subject to the limitations contained in the Financial Industry Regulatory Authority Rule 2341(d).
5 Contingent Deferred Sales Charges
A contingent deferred sales charge (CDSC) of 1% generally is imposed on redemptions of Class C shares made within 12 months of purchase. Class A shares may be subject to a 0.75% CDSC if redeemed within 12 months of purchase (depending on the circumstances of purchase). Generally, the CDSC is based upon the lower of the net asset value at date of redemption or date of purchase. No charge is levied on shares acquired by reinvestment of dividends or capital gain distributions. For the six months ended January 31, 2023, the Fund was informed that EVD received approximately $3,000 of CDSCs paid by Class C shareholders and no CDSCs paid by Class A shareholders.
6 Purchases and Sales of Investments
Purchases and sales of investments, other than short-term obligations and including maturities, aggregated $190,676,366 and $367,406,661, respectively, for the six months ended January 31, 2023.
7 Shares of Beneficial Interest
The Fund’s Declaration of Trust permits the Trustees to issue an unlimited number of full and fractional shares of beneficial interest (without par value). Such shares may be issued in a number of different series (such as the Fund) and classes. Transactions in Fund shares, including direct exchanges pursuant to share class conversions for all periods presented, were as follows:
| | Six Months Ended
January 31, 2023
(Unaudited) | | Year Ended
July 31, 2022 |
| | Shares | Amount | | Shares | Amount |
| Class A | | | | | |
| Sales | 1,471,422 | $ 16,110,164 | | 1,300,438 | $ 15,469,675 |
| Issued to shareholders electing to receive payments of distributions in Fund shares | 77,724 | 854,527 | | 281,993 | 3,456,210 |
| Redemptions | (3,086,019) | (33,738,091) | | (4,518,204) | (52,980,495) |
| Net decrease | (1,536,873) | $ (16,773,400) | | (2,935,773) | $ (34,054,610) |
Eaton Vance
Municipal Opportunities Fund
January 31, 2023
Notes to Financial Statements (Unaudited) — continued
| | Six Months Ended
January 31, 2023
(Unaudited) | | Year Ended
July 31, 2022 |
| | Shares | Amount | | Shares | Amount |
| Class C | | | | | |
| Sales | 131,012 | $ 1,448,392 | | 146,884 | $ 1,816,121 |
| Issued to shareholders electing to receive payments of distributions in Fund shares | 17,823 | 195,977 | | 63,861 | 784,274 |
| Redemptions | (634,650) | (7,017,044) | | (907,742) | (10,740,586) |
| Net decrease | (485,815) | $ (5,372,675) | | (696,997) | $ (8,140,191) |
| Class I | | | | | |
| Sales | 10,879,892 | $ 120,233,260 | | 17,324,361 | $ 207,605,346 |
| Issued to shareholders electing to receive payments of distributions in Fund shares | 649,810 | 7,152,187 | | 2,628,830 | 32,266,907 |
| Redemptions | (26,908,779) | (296,778,176) | | (56,658,603) | (665,895,746) |
| Net decrease | (15,379,077) | $(169,392,729) | | (36,705,412) | $(426,023,493) |
8 Line of Credit
The Fund participates with other portfolios and funds managed by EVM and its affiliates in a $725 million unsecured line of credit agreement with a group of banks, which is in effect through October 24, 2023. In connection with the renewal of the agreement on October 25, 2022, the borrowing limit was decreased from $800 million. Borrowings are made by the Fund solely for temporary purposes related to redemptions and other short-term cash needs. Interest is charged to the Fund based on its borrowings at an amount above either the Secured Overnight Financing Rate (SOFR) or Federal Funds rate. In addition, a fee computed at an annual rate of 0.15% on the daily unused portion of the line of credit is allocated among the participating portfolios and funds at the end of each quarter. Also in connection with the renewal of the agreement, an arrangement fee totaling $150,000 was incurred that was allocated to the participating portfolios and funds. Because the line of credit is not available exclusively to the Fund, it may be unable to borrow some or all of its requested amounts at any particular time. At January 31, 2023, the Fund had a balance outstanding pursuant to this line of credit of $2,790,000 at an interest rate of 5.53%. Based on the short-term nature of the borrowings under the line of credit and variable interest rate, the carrying value of the borrowings approximated its fair value at January 31, 2023. If measured at fair value, borrowings under the line of credit would have been considered as Level 2 in the fair value hierarchy (see Note 10) at January 31, 2023. The Fund’s average borrowings or allocated fees during the six months ended January 31, 2023 were not significant.
9 Financial Instruments
The Fund may trade in financial instruments with off-balance sheet risk in the normal course of its investing activities. These financial instruments may include futures contracts and may involve, to a varying degree, elements of risk in excess of the amounts recognized for financial statement purposes. The notional or contractual amounts of these instruments represent the investment the Fund has in particular classes of financial instruments and do not necessarily represent the amounts potentially subject to risk. The measurement of the risks associated with these instruments is meaningful only when all related and offsetting transactions are considered. At January 31, 2023, there were no obligations outstanding under these financial instruments.
The Fund is subject to interest rate risk in the normal course of pursuing its investment objective. Because the Fund holds fixed-rate bonds, the value of these bonds may decrease if interest rates rise. During the six months ended January 31, 2023, the Fund entered into U.S. Treasury futures contracts to hedge against changes in interest rates.
Eaton Vance
Municipal Opportunities Fund
January 31, 2023
Notes to Financial Statements (Unaudited) — continued
The effect of derivative instruments (not considered to be hedging instruments for accounting disclosure purposes) on the Statement of Operations and whose primary underlying risk exposure is interest rate risk for the six months ended January 31, 2023 was as follows:
| Derivative | Realized Gain (Loss)
on Derivatives Recognized
in Income(1) | Change in Unrealized
Appreciation (Depreciation) on
Derivatives Recognized in Income |
| Futures contracts | $3,696,690 | $ — |
| |
| (1) | Statement of Operations location: Net realized gain (loss) - Futures contracts. |
The average notional cost of futures contracts (short) outstanding during the six months ended January 31, 2023, which is indicative of the volume of this derivative type, was approximately $6,120,000.
10 Fair Value Measurements
Under generally accepted accounting principles for fair value measurements, a three-tier hierarchy to prioritize the assumptions, referred to as inputs, is used in valuation techniques to measure fair value. The three-tier hierarchy of inputs is summarized in the three broad levels listed below.
| • | Level 1 – quoted prices in active markets for identical investments |
| • | Level 2 – other significant observable inputs (including quoted prices for similar investments, interest rates, prepayment speeds, credit risk, etc.) |
| • | Level 3 – significant unobservable inputs (including a fund's own assumptions in determining the fair value of investments) |
In cases where the inputs used to measure fair value fall in different levels of the fair value hierarchy, the level disclosed is determined based on the lowest level input that is significant to the fair value measurement in its entirety. The inputs or methodology used for valuing securities are not necessarily an indication of the risk associated with investing in those securities.
At January 31, 2023, the hierarchy of inputs used in valuing the Fund's investments, which are carried at value, were as follows:
| Asset Description | Level 1 | Level 2 | Level 3 | Total |
| Corporate Bonds | $ — | $ 15,834,225 | $ — | $ 15,834,225 |
| Tax-Exempt Mortgage-Backed Securities | — | 454,667 | — | 454,667 |
| Tax-Exempt Municipal Obligations | — | 494,345,498 | — | 494,345,498 |
| Taxable Municipal Obligations | — | 33,964,059 | — | 33,964,059 |
| Total Investments | $ — | $544,598,449 | $ — | $544,598,449 |
11 Risks and Uncertainties
Pandemic Risk
An outbreak of respiratory disease caused by a novel coronavirus was first detected in China in late 2019 and subsequently spread internationally. This coronavirus has resulted in closing borders, enhanced health screenings, changes to healthcare service preparation and delivery, quarantines, cancellations, disruptions to supply chains and customer activity, as well as general concern and uncertainty. Health crises caused by outbreaks of disease, such as the coronavirus outbreak, may exacerbate other pre-existing political, social and economic risks and disrupt normal market conditions and operations. The impact of this outbreak has negatively affected the worldwide economy, as well as the economies of individual countries and industries, and could continue to affect the market in significant and unforeseen ways. Other epidemics and pandemics that may arise in the future may have similar effects. Any such impact could adversely affect the Fund's performance, or the performance of the securities in which the Fund invests.
Eaton Vance
Municipal Opportunities Fund
January 31, 2023
| Officers |
Eric A. Stein
President | Nicholas S. Di Lorenzo
Secretary |
Deidre E. Walsh
Vice President and Chief Legal Officer | Richard F. Froio
Chief Compliance Officer |
James F. Kirchner
Treasurer | |
George J. Gorman
Chairperson | |
| Alan C. Bowser** | |
| Thomas E. Faust Jr.* | |
| Mark R. Fetting | |
| Cynthia E. Frost | |
| Valerie A. Mosley | |
| Keith Quinton | |
| Marcus L. Smith | |
| Susan J. Sutherland | |
| Scott E. Wennerholm | |
| Nancy A. Wiser** | |
| * | Interested Trustee |
| ** | Mr. Bowser and Ms. Wiser began serving as Trustees effective April 4, 2022. |
| FACTS | WHAT DOES EATON VANCE DO WITH YOUR
PERSONAL INFORMATION? |
| Why? | Financial companies choose how they share your personal information. Federal law gives consumers the right to limit some but not all sharing. Federal law also requires us to tell you how we collect, share, and protect your personal information. Please read this notice carefully to understand what we do. |
| |
| What? | The types of personal information we collect and share depend on the product or service you have with us. This information can include:■ Social Security number and income
■ investment experience and risk tolerance
■ checking account number and wire transfer instructions |
| |
| How? | All financial companies need to share customers’ personal information to run their everyday business. In the section below, we list the reasons financial companies can share their customers’ personal information; the reasons Eaton Vance chooses to share; and whether you can limit this sharing. |
Reasons we can share your
personal information | Does Eaton Vance
share? | Can you limit
this sharing? |
| For our everyday business purposes — such as to process your transactions, maintain your account(s), respond to court orders and legal investigations, or report to credit bureaus | Yes | No |
| For our marketing purposes — to offer our products and services to you | Yes | No |
| For joint marketing with other financial companies | No | We don’t share |
| For our investment management affiliates’ everyday business purposes — information about your transactions, experiences, and creditworthiness | Yes | Yes |
| For our affiliates’ everyday business purposes — information about your transactions and experiences | Yes | No |
| For our affiliates’ everyday business purposes — information about your creditworthiness | No | We don’t share |
| For our investment management affiliates to market to you | Yes | Yes |
| For our affiliates to market to you | No | We don’t share |
| For nonaffiliates to market to you | No | We don’t share |
To limit our
sharing | Call toll-free 1-800-262-1122 or email: EVPrivacy@eatonvance.comPlease note:If you are a new customer, we can begin sharing your information 30 days from the date we sent this notice. When you are no longer our customer, we continue to share your information as described in this notice. However, you can contact us at any time to limit our sharing. |
| Questions? | Call toll-free 1-800-262-1122 or email: EVPrivacy@eatonvance.com |
| Privacy Notice — continued | April 2021 |
| Who we are |
| Who is providing this notice? | Eaton Vance Management, Eaton Vance Distributors, Inc., Eaton Vance Trust Company, Eaton Vance Management (International) Limited, Eaton Vance Advisers International Ltd., Eaton Vance Global Advisors Limited, Eaton Vance Management’s Real Estate Investment Group, Boston Management and Research, Calvert Research and Management, Eaton Vance and Calvert Fund Families and our investment advisory affiliates (“Eaton Vance”) (see Investment Management Affiliates definition below) |
| What we do |
How does Eaton Vance
protect my personal
information? | To protect your personal information from unauthorized access and use, we use security measures that comply with federal law. These measures include computer safeguards and secured files and buildings. We have policies governing the proper handling of customer information by personnel and requiring third parties that provide support to adhere to appropriate security standards with respect to such information. |
How does Eaton Vance
collect my personal
information? | We collect your personal information, for example, when you■ open an account or make deposits or withdrawals from your account
■ buy securities from us or make a wire transfer
■ give us your contact informationWe also collect your personal information from others, such as credit bureaus, affiliates, or other companies. |
| Why can’t I limit all sharing? | Federal law gives you the right to limit only■ sharing for affiliates’ everyday business purposes — information about your creditworthiness
■ affiliates from using your information to market to you
■ sharing for nonaffiliates to market to youState laws and individual companies may give you additional rights to limit sharing. See below for more on your rights under state law. |
| Definitions |
Investment Management
Affiliates | Eaton Vance Investment Management Affiliates include registered investment advisers, registered broker- dealers, and registered and unregistered funds. Investment Management Affiliates does not include entities associated with Morgan Stanley Wealth Management, such as Morgan Stanley Smith Barney LLC and Morgan Stanley & Co. |
| Affiliates | Companies related by common ownership or control. They can be financial and nonfinancial companies.■ Our affiliates include companies with a Morgan Stanley name and financial companies such as Morgan Stanley Smith Barney LLC and Morgan Stanley & Co. |
| Nonaffiliates | Companies not related by common ownership or control. They can be financial and nonfinancial companies.■ Eaton Vance does not share with nonaffiliates so they can market to you. |
| Joint marketing | A formal agreement between nonaffiliated financial companies that together market financial products or services to you.■ Eaton Vance doesn’t jointly market. |
| Other important information |
| Vermont: Except as permitted by law, we will not share personal information we collect about Vermont residents with Nonaffiliates unless you provide us with your written consent to share such information.California: Except as permitted by law, we will not share personal information we collect about California residents with Nonaffiliates and we will limit sharing such personal information with our Affiliates to comply with California privacy laws that apply to us. |
Delivery of Shareholder Documents. The Securities and Exchange Commission (SEC) permits funds to deliver only one copy of shareholder documents, including prospectuses, proxy statements and shareholder reports, to fund investors with multiple accounts at the same residential or post office box address. This practice is often called “householding” and it helps eliminate duplicate mailings to shareholders. Eaton Vance, or your financial intermediary, may household the mailing of your documents indefinitely unless you instruct Eaton Vance, or your financial intermediary, otherwise. If you would prefer that your Eaton Vance documents not be householded, please contact Eaton Vance at 1-800-262-1122, or contact your financial intermediary. Your instructions that householding not apply to delivery of your Eaton Vance documents will typically be effective within 30 days of receipt by Eaton Vance or your financial intermediary.
Portfolio Holdings. Each Eaton Vance Fund and its underlying Portfolio(s) (if applicable) files a schedule of portfolio holdings on Part F to Form N-PORT with the SEC. Certain information filed on Form N-PORT may be viewed on the Eaton Vance website at www.eatonvance.com, by calling Eaton Vance at 1-800-262-1122 or in the EDGAR database on the SEC’s website at www.sec.gov.
Proxy Voting. From time to time, funds are required to vote proxies related to the securities held by the funds. The Eaton Vance Funds or their underlying Portfolios (if applicable) vote proxies according to a set of policies and procedures approved by the Funds’ and Portfolios’ Boards. You may obtain a description of these policies and procedures and information on how the Funds or Portfolios voted proxies relating to portfolio securities during the most recent 12-month period ended June 30, without charge, upon request, by calling 1-800-262-1122 and by accessing the SEC’s website at www.sec.gov.
This Page Intentionally Left Blank
This Page Intentionally Left Blank
Investment Adviser and Administrator
Eaton Vance Management
Two International Place
Boston, MA 02110
Principal Underwriter*
Eaton Vance Distributors, Inc.
Two International Place
Boston, MA 02110
(617) 482-8260
Custodian
State Street Bank and Trust Company
State Street Financial Center, One Lincoln Street
Boston, MA 02111
Transfer Agent
BNY Mellon Investment Servicing (US) Inc.
Attn: Eaton Vance Funds
P.O. Box 534439
Pittsburgh, PA 15253-4439
(800) 262-1122
Fund Offices
Two International Place
Boston, MA 02110
* FINRA BrokerCheck. Investors may check the background of their Investment Professional by contacting the Financial Industry Regulatory Authority (FINRA). FINRA BrokerCheck is a free tool to help investors check the professional background of current and former FINRA-registered securities firms and brokers. FINRA BrokerCheck is available by calling 1-800-289-9999 and at www.FINRA.org. The FINRA BrokerCheck brochure describing this program is available to investors at www.FINRA.org.
Item 2. Code of Ethics
Not required in this filing.
Item 3. Audit Committee Financial Expert
Not required in this filing.
Item 4. Principal Accountant Fees and Services
Not required in this filing.
Item 5. Audit Committee of Listed Registrants
Not applicable.
Item 6. Schedule of Investments
Please see schedule of investments contained in the Report to Stockholders included under Item 1 of this Form N-CSR.
Item 7. Disclosure of Proxy Voting Policies and Procedures for Closed-End Management Investment Companies
Not applicable.
Item 8. Portfolio Managers of Closed-End Management Investment Companies
Not applicable.
Item 9. Purchases of Equity Securities by Closed-End Management Investment Company and Affiliated Purchasers
Not applicable.
Item 10. Submission of Matters to a Vote of Security Holders
No material changes.
Item 11. Controls and Procedures
(a) It is the conclusion of the registrant’s principal executive officer and principal financial officer that the effectiveness of the registrant’s current disclosure controls and procedures (such disclosure controls and procedures having been evaluated within 90 days of the date of this filing) provide reasonable assurance that the information required to be disclosed by the registrant has been recorded, processed, summarized and reported within the time period specified in the Commission’s rules and forms and that the information required to be disclosed by the registrant has been accumulated and communicated to the registrant’s principal executive officer and principal financial officer in order to allow timely decisions regarding required disclosure.
(b) There have been no changes in the registrant’s internal controls over financial reporting during the period covered by this report that has materially affected, or is reasonably likely to materially affect, the registrant’s internal control over financial reporting.
Item 12. Disclosure of Securities Lending Activities for Closed-End Management Investment Companies
Not applicable.
Item 13. Exhibits
Signatures
Pursuant to the requirements of the Securities Exchange Act of 1934 and the Investment Company Act of 1940, the registrant has duly caused this report to be signed on its behalf by the undersigned, thereunto duly authorized.
| | |
| Eaton Vance Municipals Trust |
| |
| By: | | /s/ Eric A. Stein |
| | Eric A. Stein |
| | President |
Date: March 24, 2023
Pursuant to the requirements of the Securities Exchange Act of 1934 and the Investment Company Act of 1940, this report has been signed below by the following persons on behalf of the registrant and in the capacities and on the dates indicated.
| | |
| By: | | /s/ James F. Kirchner |
| | James F. Kirchner |
| | Treasurer |
Date: March 24, 2023
| | |
| By: | | /s/ Eric A. Stein |
| | Eric A. Stein |
| | President |
Date: March 24, 2023