ASSOCIATED BANC-CORP 2Q 2015 EARNINGS PRESENTATION JULY 16, 2015 Exhibit 99.2
FORWARD-LOOKING STATEMENTS Important note regarding forward-looking statements: Statements made in this presentation which are not purely historical are forward-looking statements, as defined in the Private Securities Litigation Reform Act of 1995. This includes any statements regarding management’s plans, objectives, or goals for future operations, products or services, and forecasts of its revenues, earnings, or other measures of performance. Such forward-looking statements may be identified by the use of words such as “believe”, “expect”, “anticipate”, “plan”, “estimate”, “should”, “will”, “intend”, “outlook”, or similar expressions. Forward- looking statements are based on current management expectations and, by their nature, are subject to risks and uncertainties. Actual results may differ materially from those contained in the forward-looking statements. Factors which may cause actual results to differ materially from those contained in such forward-looking statements include those identified in the Company’s most recent Form 10-K and subsequent SEC filings. Such factors are incorporated herein by reference. 1

2015 SECOND QUARTER HIGHLIGHTS 2 Solid Loan and Fee-Revenue Growth Offset Continued Margin Compression • Average loans of $18.2 billion were up $373 million, or 2% from the first quarter ‒ Average commercial loans grew $220 million, 59% of the quarter’s growth ‒ Average consumer loans grew $153 million, 41% of the quarter’s growth • Average deposits of $19.6 billion were up $571 million, or 3% from the first quarter • Net interest income of $166 million was down $1 million from the first quarter – Net interest margin of 2.83% compared to 2.89% in the first quarter • Quarterly dividend of $0.10 / common share • Repurchased 3.2 million shares of common stock during the second quarter • Issued $65 million in preferred stock with a dividend rate of 6.125% • Capital ratios remain strong with a Tier 1 common equity ratio of 9.30% • Noninterest income of $87 million was up $6 million compared to the first quarter ‒ Core fee-based revenue increased $2 million from the first quarter ‒ Mortgage banking revenue was up $3 million from the first quarter • Noninterest expense of $177 million was up $3 million from the first quarter ‒ Personnel expense increased $3 million which included $2 million in severance • Net income available to common shareholders of $48 million, or $0.31 per share • Pretax income of $71 million was up $2 million, or 3% from the first quarter • Return on average Tier 1 common equity of 10.55% Net Interest Income & Net Interest Margin Noninterest Income & Expenses Capital Balance Sheet Net Income & ROT1CE
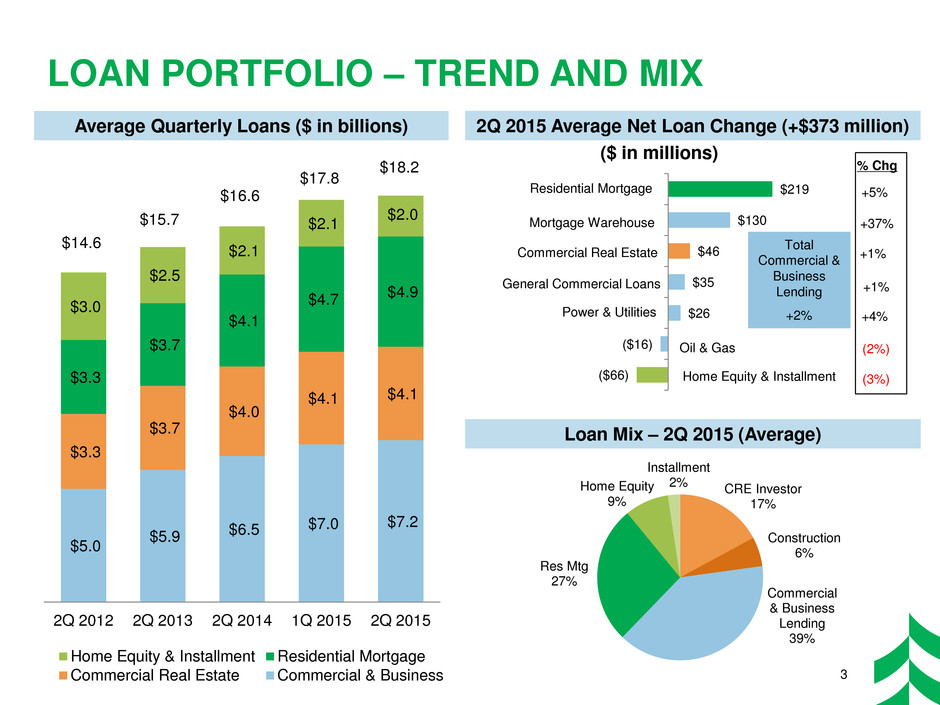
($66) ($16) $26 $35 $46 $130 $219 LOAN PORTFOLIO – TREND AND MIX 3 2Q 2015 Average Net Loan Change (+$373 million) Loan Mix – 2Q 2015 (Average) CRE Investor 17% Construction 6% Commercial & Business Lending 39% Res Mtg 27% Home Equity 9% Installment 2% ($ in millions) Home Equity & Installment Commercial Real Estate Residential Mortgage Power & Utilities Oil & Gas Mortgage Warehouse General Commercial Loans Average Quarterly Loans ($ in billions) $5.0 $5.9 $6.5 $7.0 $7.2 $3.3 $3.7 $4.0 $4.1 $4.1 $3.3 $3.7 $4.1 $4.7 $4.9 $3.0 $2.5 $2.1 $2.1 $2.0 2Q 2012 2Q 2013 2Q 2014 1Q 2015 2Q 2015 Home Equity & Installment Residential Mortgage Commercial Real Estate Commercial & Business $18.2 +5% % Chg +37% +1% +1% $16.6 +4% $17.8 $15.7 $14.6 (3%) (2%) Total Commercial & Business Lending +2%
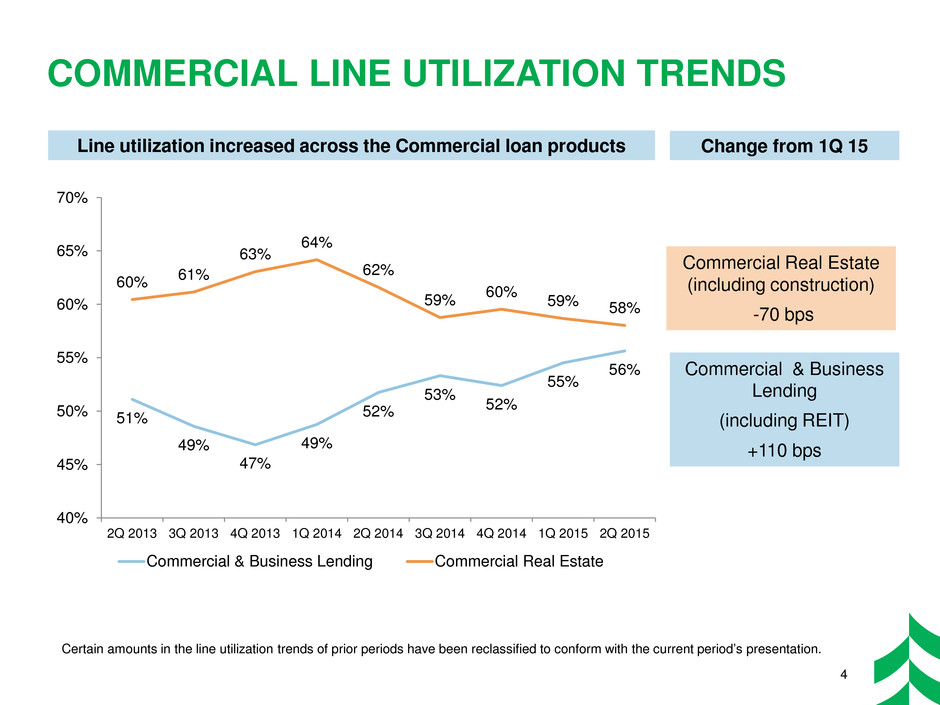
COMMERCIAL LINE UTILIZATION TRENDS 4 51% 49% 47% 49% 52% 53% 52% 55% 56% 60% 61% 63% 64% 62% 59% 60% 59% 58% 40% 45% 50% 55% 60% 65% 70% 2Q 2013 3Q 2013 4Q 2013 1Q 2014 2Q 2014 3Q 2014 4Q 2014 1Q 2015 2Q 2015 Commercial & Business Lending Commercial Real Estate Line utilization increased across the Commercial loan products Change from 1Q 15 Commercial Real Estate (including construction) -70 bps Commercial & Business Lending (including REIT) +110 bps Certain amounts in the line utilization trends of prior periods have been reclassified to conform with the current period’s presentation.
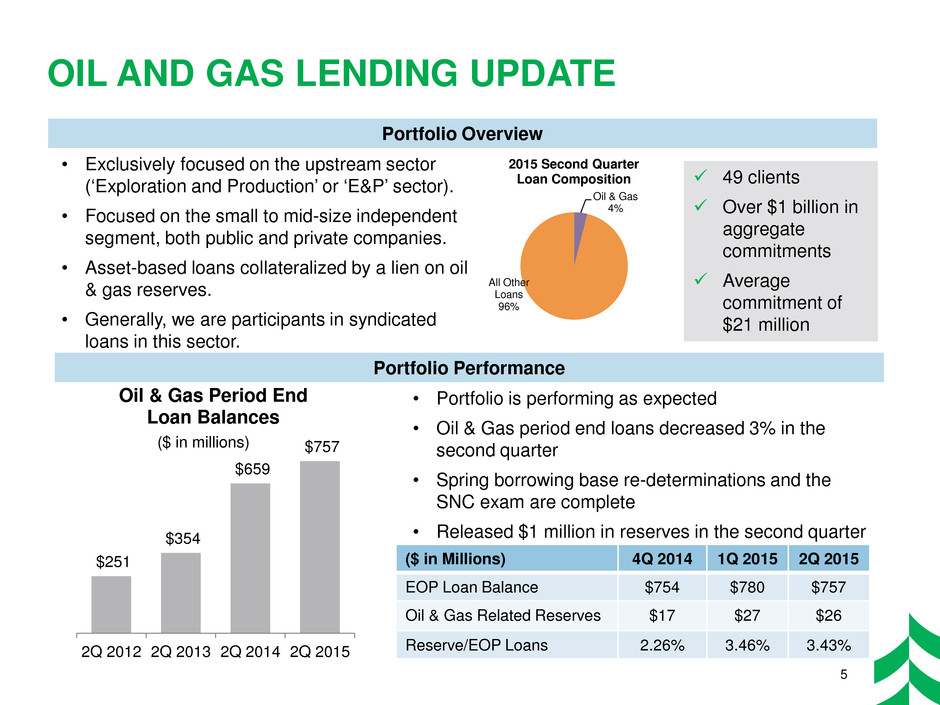
OIL AND GAS LENDING UPDATE 5 • Portfolio is performing as expected • Oil & Gas period end loans decreased 3% in the second quarter • Spring borrowing base re-determinations and the SNC exam are complete • Released $1 million in reserves in the second quarter ($ in Millions) 4Q 2014 1Q 2015 2Q 2015 EOP Loan Balance $754 $780 $757 Oil & Gas Related Reserves $17 $27 $26 Reserve/EOP Loans 2.26% 3.46% 3.43% Portfolio Overview Oil & Gas 4% All Other Loans 96% 2015 Second Quarter Loan Composition 49 clients Over $1 billion in aggregate commitments Average commitment of $21 million • Exclusively focused on the upstream sector (‘Exploration and Production’ or ‘E&P’ sector). • Focused on the small to mid-size independent segment, both public and private companies. • Asset-based loans collateralized by a lien on oil & gas reserves. • Generally, we are participants in syndicated loans in this sector. Portfolio Performance $251 $354 $659 $757 2Q 2012 2Q 2013 2Q 2014 2Q 2015 Oil & Gas Period End Loan Balances ($ in millions)
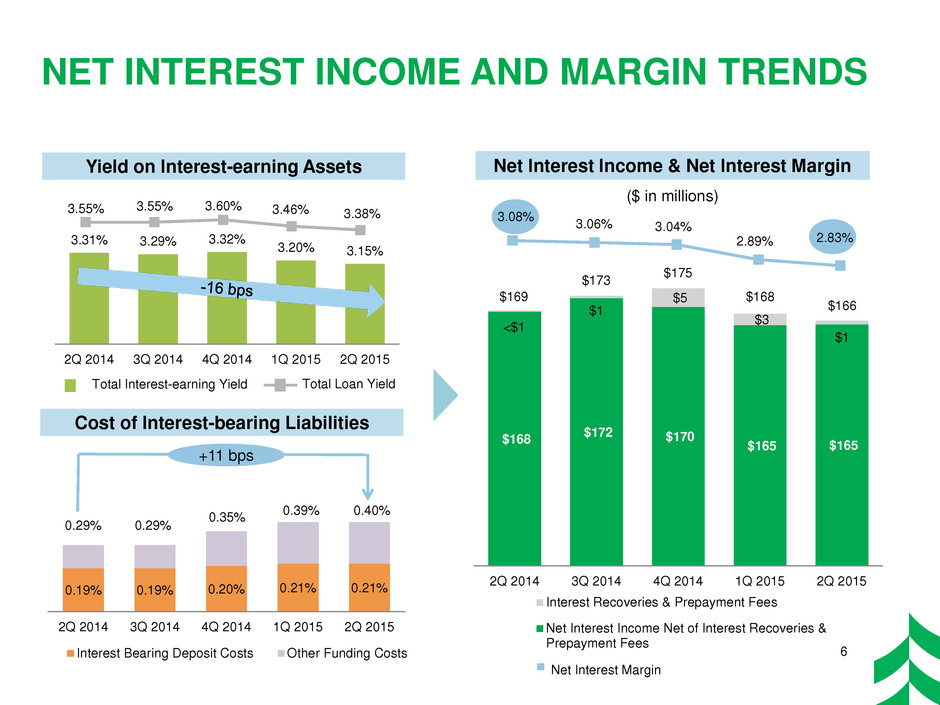
3.08% 3.06% 3.04% 2.89% 2.83% 0.00% 0.50% 1.00% 1.50% 2.00% 2.50% 3.00% 3.50% 4.00% $- $4 $8 $12 $16 $20 $24 $28 $32 $36 $40 $44 $48 $52 $56 $60 $64 $68 $72 $76 $80 $84 $88 $92 $96 $100 $104 $108 $112 $116 $120 $124 $128 $132 $136 $140 $144 $148 $152 $156 $160 $164 $168 $172 $176 $180 3.31% 3.29% 3.32% 3.20% 3.15% 2Q 2014 3Q 2014 4Q 2014 1Q 2015 2Q 2015 NET INTEREST INCOME AND MARGIN TRENDS 6 Yield on Interest-earning Assets Cost of Interest-bearing Liabilities Net Interest Income & Net Interest Margin ($ in millions) $168 $172 $170 $165 $165 $5 $3 2Q 2014 3Q 2014 4Q 2014 1Q 2015 2Q 2015 Interest Recoveries & Prepayment Fees Net Interest Income Net of Interest Recoveries & Prepayment Fees Net Interest Margin $169 0.19% 0.19% 0.20% 0.21% 0.21% 2Q 2014 3Q 2014 4Q 2014 1Q 2015 2Q 2015 Interest Bearing Deposit Costs Other Funding Costs 0.29% 0.29% 0.35% 0.40% $175 3.55% 3.55% 3.60% 3.46% 3.38% 0.00% 0.50% 1.00% 1.50% 2.00% 2.50% 3.00% 3.50% 4.00% 4.50% $140 $144 $148 $153 $157 $161 $165 $169 $174 $178 Total Loan Yield Total Interest-earning Yield <$1 $166 0.39% $168 $173 $1 +11 bps $1
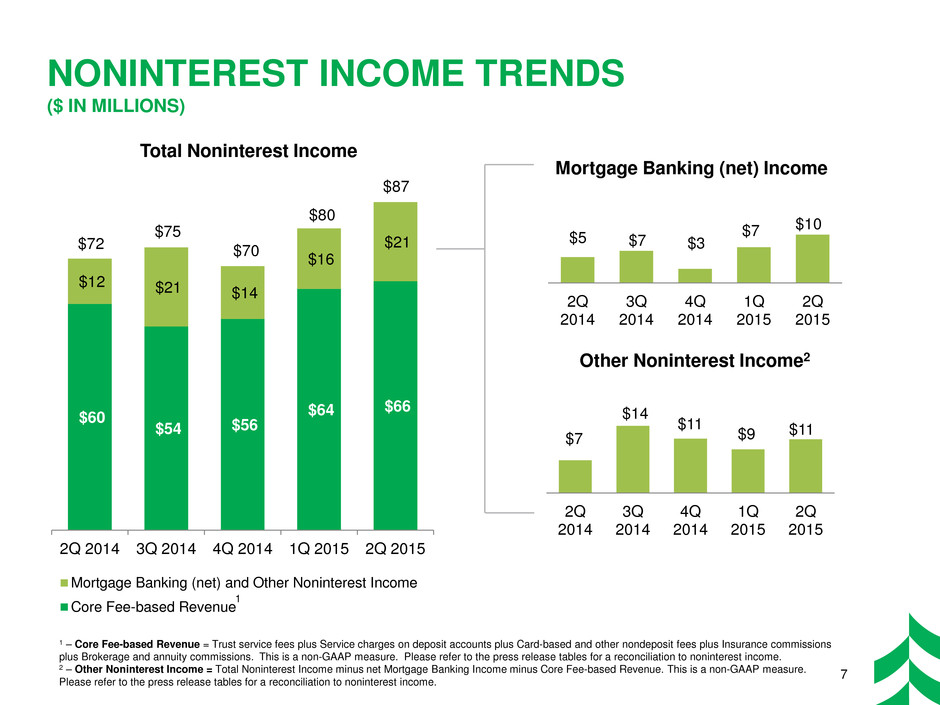
NONINTEREST INCOME TRENDS ($ IN MILLIONS) $7 $14 $11 $9 $11 2Q 2014 3Q 2014 4Q 2014 1Q 2015 2Q 2015 Mortgage Banking (net) Income $60 $54 $56 $64 $66 $12 $21 $14 $16 $21 2Q 2014 3Q 2014 4Q 2014 1Q 2015 2Q 2015 Mortgage Banking (net) and Other Noninterest Income Core Fee-based Revenue Total Noninterest Income $5 $7 $3 $7 $10 2Q 2014 3Q 2014 4Q 2014 1Q 2015 2Q 2015 Other Noninterest Income2 7 1 – Core Fee-based Revenue = Trust service fees plus Service charges on deposit accounts plus Card-based and other nondeposit fees plus Insurance commissions plus Brokerage and annuity commissions. This is a non-GAAP measure. Please refer to the press release tables for a reconciliation to noninterest income. 2 – Other Noninterest Income = Total Noninterest Income minus net Mortgage Banking Income minus Core Fee-based Revenue. This is a non-GAAP measure. Please refer to the press release tables for a reconciliation to noninterest income. $72 $75 $70 $80 $87 1
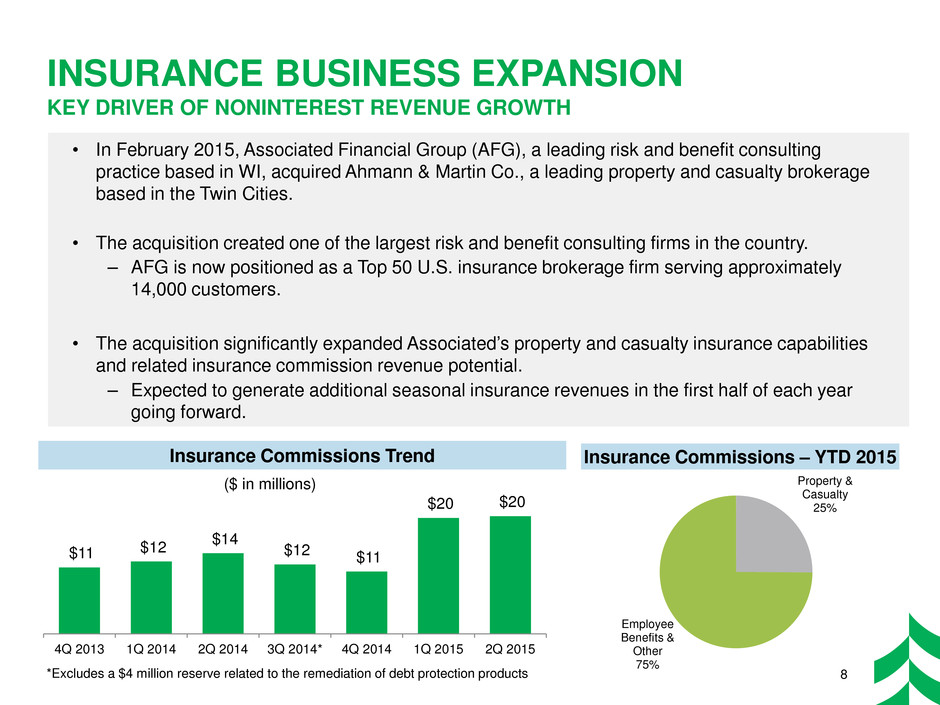
INSURANCE BUSINESS EXPANSION KEY DRIVER OF NONINTEREST REVENUE GROWTH 8 Insurance Commissions Trend Insurance Commissions – YTD 2015 • In February 2015, Associated Financial Group (AFG), a leading risk and benefit consulting practice based in WI, acquired Ahmann & Martin Co., a leading property and casualty brokerage based in the Twin Cities. • The acquisition created one of the largest risk and benefit consulting firms in the country. – AFG is now positioned as a Top 50 U.S. insurance brokerage firm serving approximately 14,000 customers. • The acquisition significantly expanded Associated’s property and casualty insurance capabilities and related insurance commission revenue potential. – Expected to generate additional seasonal insurance revenues in the first half of each year going forward. Property & Casualty 25% Employee Benefits & Other 75% *Excludes a $4 million reserve related to the remediation of debt protection products $11 $12 $14 $12 $11 $20 $20 4Q 2013 1Q 2014 2Q 2014 3Q 2014* 4Q 2014 1Q 2015 2Q 2015 ($ in millions)
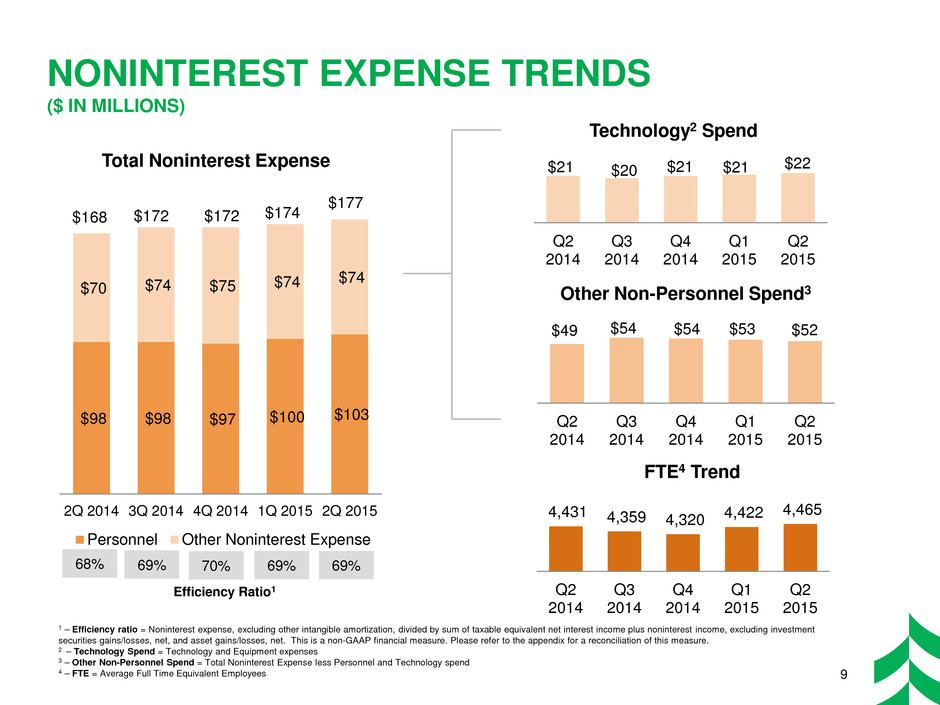
NONINTEREST EXPENSE TRENDS ($ IN MILLIONS) $49 $54 $54 $53 $52 Q2 2014 Q3 2014 Q4 2014 Q1 2015 Q2 2015 Technology2 Spend Total Noninterest Expense $21 $20 $21 $21 $22 Q2 2014 Q3 2014 Q4 2014 Q1 2015 Q2 2015 Other Non-Personnel Spend3 4,431 4,359 4,320 4,422 4,465 3,800 4,000 4,200 4,400 4,600 4,800 5,000 Q2 2014 Q3 2014 Q4 2014 Q1 2015 Q2 2015 1 – Efficiency ratio = Noninterest expense, excluding other intangible amortization, divided by sum of taxable equivalent net interest income plus noninterest income, excluding investment securities gains/losses, net, and asset gains/losses, net. This is a non-GAAP financial measure. Please refer to the appendix for a reconciliation of this measure. 2 – Technology Spend = Technology and Equipment expenses 3 – Other Non-Personnel Spend = Total Noninterest Expense less Personnel and Technology spend 4 – FTE = Average Full Time Equivalent Employees Efficiency Ratio1 68% 69% 70% 69% 69% 9 $98 $98 $97 $100 $103 $70 $74 $75 $74 $74 2Q 2014 3Q 2014 4Q 2014 1Q 2015 2Q 2015 Personnel Other Noninterest Expense FTE4 Trend $168 $172 $172 $174 $177
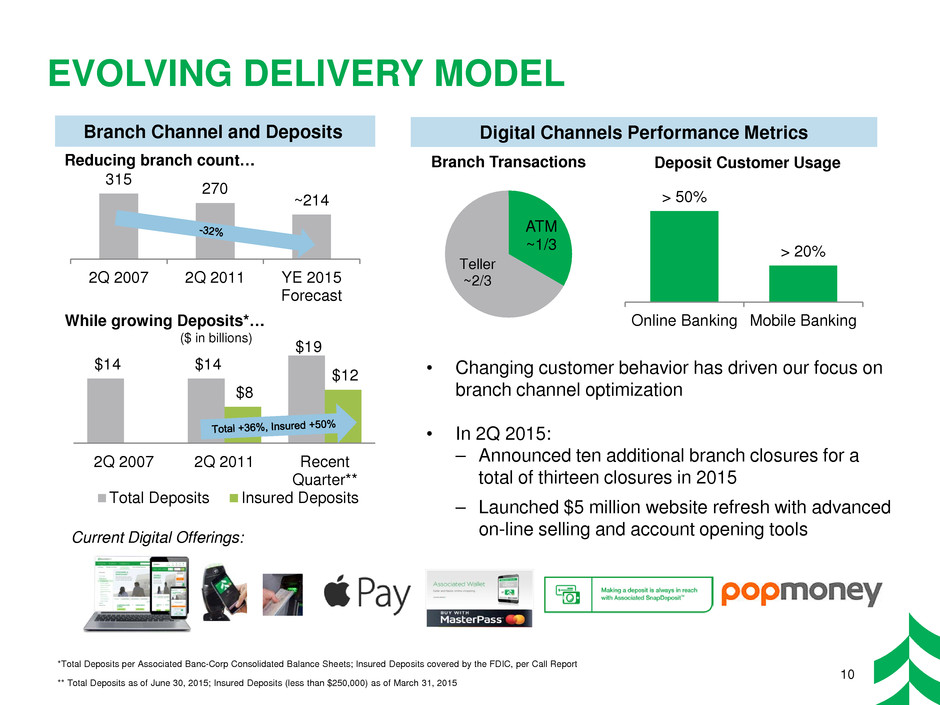
EVOLVING DELIVERY MODEL 10 • Changing customer behavior has driven our focus on branch channel optimization • In 2Q 2015: – Announced ten additional branch closures for a total of thirteen closures in 2015 – Launched $5 million website refresh with advanced on-line selling and account opening tools Digital Channels Performance Metrics Branch Channel and Deposits Current Digital Offerings: 315 270 ~214 2Q 2007 2Q 2011 YE 2015 Forecast $14 $14 $19 $8 $12 2Q 2007 2Q 2011 Recent Quarter** Total Deposits Insured Deposits Reducing branch count… While growing Deposits*… ATM ~1/3 Teller ~2/3 Branch Transactions Deposit Customer Usage ($ in billions) > 50% > 20% Online Banking Mobile Banking *Total Deposits per Associated Banc-Corp Consolidated Balance Sheets; Insured Deposits covered by the FDIC, per Call Report ** Total Deposits as of June 30, 2015; Insured Deposits (less than $250,000) as of March 31, 2015
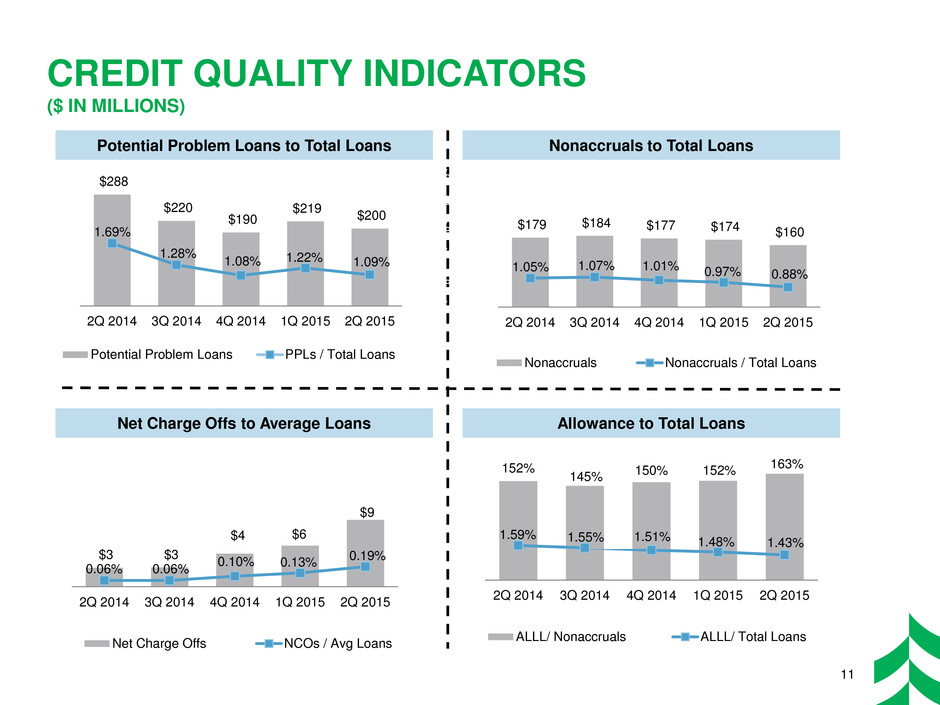
CREDIT QUALITY INDICATORS ($ IN MILLIONS) 11 $179 $184 $177 $174 $160 1.05% 1.07% 1.01% 0.97% 0.88% 0.50% 1.00% 1.50% 2.00% 2.50% 3.00% $- $4 8 $12 6 $20 4 $28 32 $ 6 40 $ 4 48 $52 6 $60 4 $68 72 $ 6 80 $ 4 88 $92 6 $100 4 $108 12 $1 6 20 $1 4 28 $132 6 $140 4 $148 52 $1 6 60 $1 4 68 $172 6 $180 4 $188 92 $1 6 200 $ 4 208 $ 12 2 6 $ 20 2 4 $ 28 232 $ 6 240 $ 4 248 $ 52 2 6 $ 60 2 4 $ 68 272 $ 6 280 $ 4 288 $ 92 2 6 $300 4 $308 12 $3 6 20 $3 4 28 $332 6 $340 2Q 2014 3Q 2014 4Q 2014 1Q 2015 2Q 2015 Nonaccruals Nonaccruals / Total Loans $3 $3 $4 $6 $9 0.06% 0.06% 0.10% 0.13% 0.19% 0.00% 0.20% 0.40% 0.60% 0.80% 1.00% 1.20% 1.40% $- $4 $8 $12 $16 $20 2Q 2014 3Q 2014 4Q 2014 1Q 2015 2Q 2015 Net Charge Offs NCOs / Avg Loans 152% 145% 150% 152% 163% 1.59% 1.55% 1.51% 1.48% 1.43% 1.00% 1.50% 2.00% 2.50% 3.00% 0% 80% 160% 2Q 2014 3Q 2014 4Q 2014 1Q 2015 2Q 2015 ALLL/ Nonaccruals ALLL/ Total Loans $288 $220 $190 $219 $200 1.69% 1.28% 1.08% 1.22% 1.09% 0.50% 1.00% 1.50% 2.00% 2.50% 3.00% $- $4 8 $12 6 $20 4 $28 32 $ 6 40 $ 4 48 $52 6 $60 4 $68 72 $ 6 80 $ 4 88 $92 6 $100 4 $108 12 $1 6 20 $1 4 28 $132 6 $140 4 $148 52 $1 6 60 $1 4 68 $172 6 $180 4 $188 92 $1 6 200 $ 4 208 $ 12 2 6 $ 20 2 4 $ 28 232 $ 6 240 $ 4 248 $ 52 2 6 $ 60 2 4 $ 68 272 $ 6 280 $ 4 288 $ 92 2 6 $300 4 $308 12 $3 6 20 $3 4 28 $332 6 $340 2Q 2014 3Q 2014 4Q 2014 1Q 2015 2Q 2015 Potential Problem Loans PPLs / Total Loans Potential Problem Loans to Total Loans Nonaccruals to Total Loans Allowance to Total Loans Net Charge Offs to Average Loans
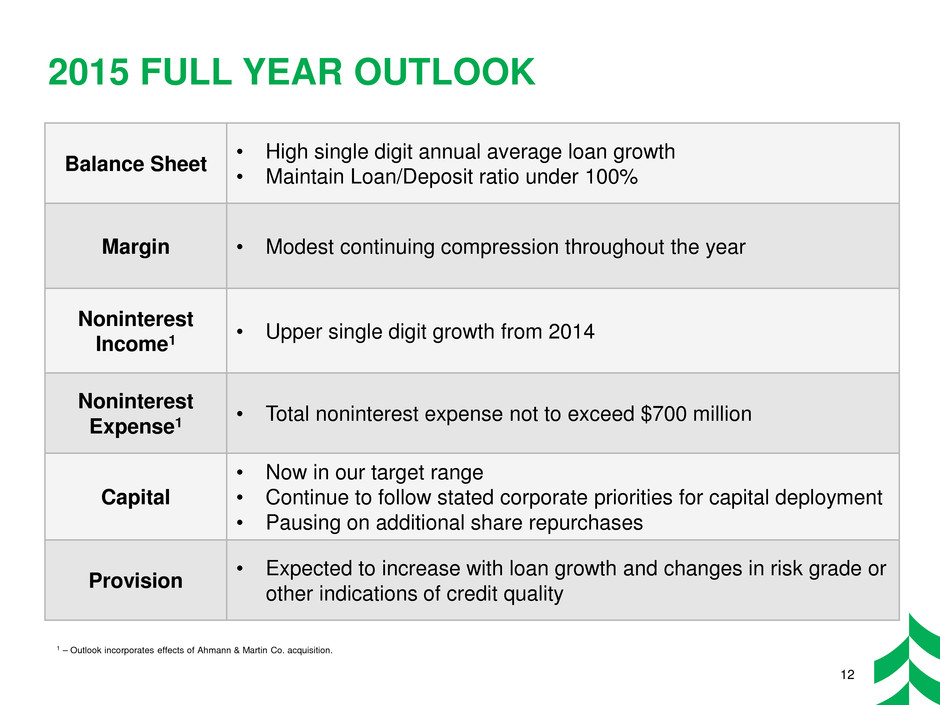
2015 FULL YEAR OUTLOOK 12 Balance Sheet • High single digit annual average loan growth • Maintain Loan/Deposit ratio under 100% Margin • Modest continuing compression throughout the year Noninterest Income1 • Upper single digit growth from 2014 Noninterest Expense1 • Total noninterest expense not to exceed $700 million Capital • Now in our target range • Continue to follow stated corporate priorities for capital deployment • Pausing on additional share repurchases Provision • Expected to increase with loan growth and changes in risk grade or other indications of credit quality 1 – Outlook incorporates effects of Ahmann & Martin Co. acquisition.

APPENDIX 13

RECONCILIATION AND DEFINITIONS OF NON-GAAP ITEMS 2Q 2014 3Q 2014 4Q 2014 1Q 2015 2Q 2015 Efficiency Ratio Reconciliation: Efficiency ratio (1) 69.70% 69.44% 70.33% 70.30% 70.23% Taxable equivalent adjustment (1.32) (1.36) (1.40) (1.42) (1.34) Asset gains, net 0.26 1.36 1.05 0.30 0.51 Other intangible amortization (0.41) (0.40) (0.32) (0.32) (0.35) Efficiency ratio, fully taxable equivalent (1) 68.23% 69.04% 69.66% 68.86% 69.05% (1) Efficiency ratio is defined by the Federal Reserve guidance as noninterest expense divided by the sum of net interest income plus noninterest income, excluding investment securities gains / losses, net. Efficiency ratio, fully taxable equivalent, is noninterest expense, excluding other intangible amortization, divided by the sum of taxable equivalent net interest income plus noninterest income, excluding investment securities gains / losses, net and asset gains / losses, net. This efficiency ratio is presented on a taxable equivalent basis, which adjusts net interest income for the tax-favored status of certain loans and investment securities. Management believes this measure to be the preferred industry measurement of net interest income as it enhances the comparability of net interest income arising from taxable and tax-exempt sources and it excludes certain specific revenue items (such as investment securities gains / losses, net and asset gains / losses, net). Tier 1 common equity, a non-GAAP financial measure, is used by banking regulators, investors and analysts to assess and compare the quality and composition of our capital with the capital of other financial services companies. Management uses Tier 1 common equity, along with other capital measures, to assess and monitor our capital position. Tier 1 common equity (period end and average) is Tier 1 capital excluding qualifying perpetual preferred stock and qualifying trust preferred securities. The Corporation adopted the Basel III regulatory standards during the first quarter of 2015; all prior periods presented are disclosed under Basel I regulatory standards. 14


