Associated Banc-Corp Investor Presentation FOURTH QUARTER 2016 Exhibit 99.1
FORWARD-LOOKING STATEMENTS Important note regarding forward-looking statements: Statements made in this presentation which are not purely historical are forward-looking statements, as defined in the Private Securities Litigation Reform Act of 1995. This includes any statements regarding management’s plans, objectives, or goals for future operations, products or services, and forecasts of its revenues, earnings, or other measures of performance. Such forward-looking statements may be identified by the use of words such as “believe,” “expect,” “anticipate,” “plan,” “estimate,” “should,” “will,” “intend,” “outlook” or similar expressions. Forward-looking statements are based on current management expectations and, by their nature, are subject to risks and uncertainties. Actual results may differ materially from those contained in the forward-looking statements. Factors which may cause actual results to differ materially from those contained in such forward-looking statements include those identified in the Company’s most recent Form 10-K and subsequent SEC filings. Such factors are incorporated herein by reference. Trademarks: All trademarks, service marks, and trade names referenced in this material are official trademarks and the property of their respective owners. 1
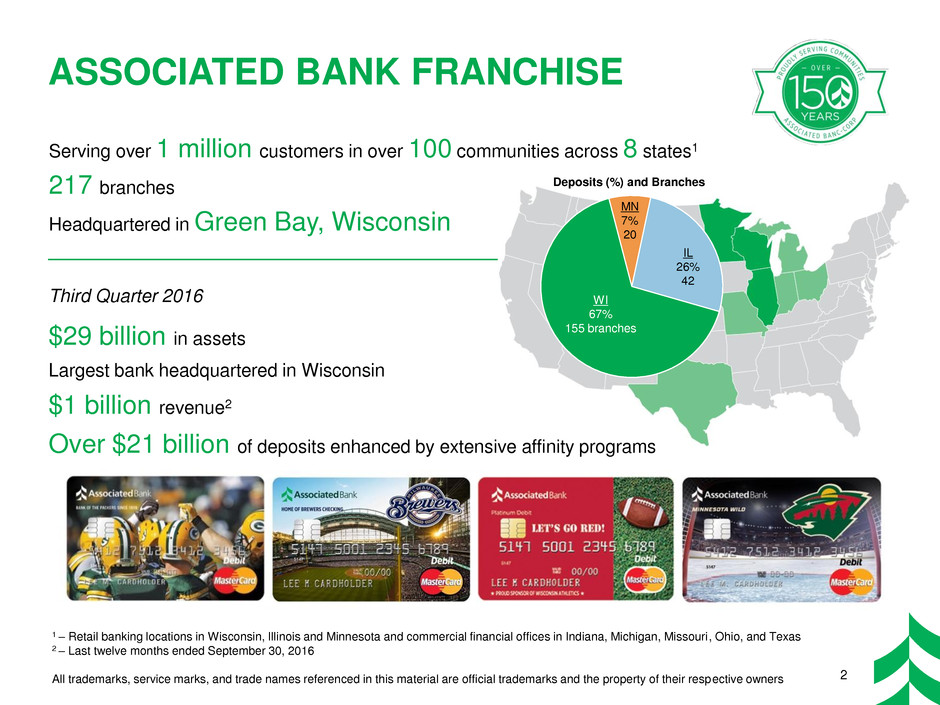
Serving over 1 million customers in over 100 communities across 8 states1 217 branches Headquartered in Green Bay, Wisconsin ASSOCIATED BANK FRANCHISE 2 1 – Retail banking locations in Wisconsin, Illinois and Minnesota and commercial financial offices in Indiana, Michigan, Missouri, Ohio, and Texas 2 – Last twelve months ended September 30, 2016 All trademarks, service marks, and trade names referenced in this material are official trademarks and the property of their respective owners Deposits (%) and Branches WI 67% 155 branches IL 26% 42 MN 7% 20 Third Quarter 2016 $29 billion in assets Largest bank headquartered in Wisconsin $1 billion revenue2 Over $21 billion of deposits enhanced by extensive affinity programs
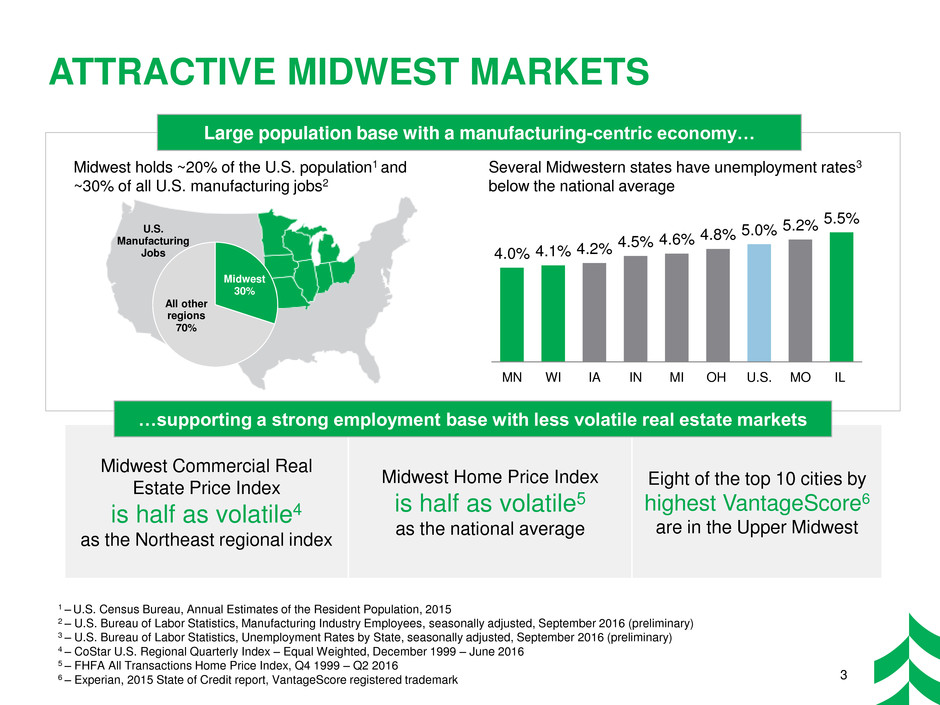
Midwest Commercial Real Estate Price Index is half as volatile4 as the Northeast regional index Midwest Home Price Index is half as volatile5 as the national average Eight of the top 10 cities by highest VantageScore6 are in the Upper Midwest ATTRACTIVE MIDWEST MARKETS 4.0% 4.1% 4.2% 4.5% 4.6% 4.8% 5.0% 5.2% 5.5% MN WI IA IN MI OH U.S. MO IL Midwest 30% All other regions 70% U.S. Manufacturing Jobs 1 – U.S. Census Bureau, Annual Estimates of the Resident Population, 2015 2 – U.S. Bureau of Labor Statistics, Manufacturing Industry Employees, seasonally adjusted, September 2016 (preliminary) 3 – U.S. Bureau of Labor Statistics, Unemployment Rates by State, seasonally adjusted, September 2016 (preliminary) 4 – CoStar U.S. Regional Quarterly Index – Equal Weighted, December 1999 – June 2016 5 – FHFA All Transactions Home Price Index, Q4 1999 – Q2 2016 6 – Experian, 2015 State of Credit report, VantageScore registered trademark Midwest holds ~20% of the U.S. population1 and ~30% of all U.S. manufacturing jobs2 3 Large population base with a manufacturing-centric economy… …supporting a strong employment base with less volatile real estate markets Several Midwestern states have unemployment rates3 below the national average
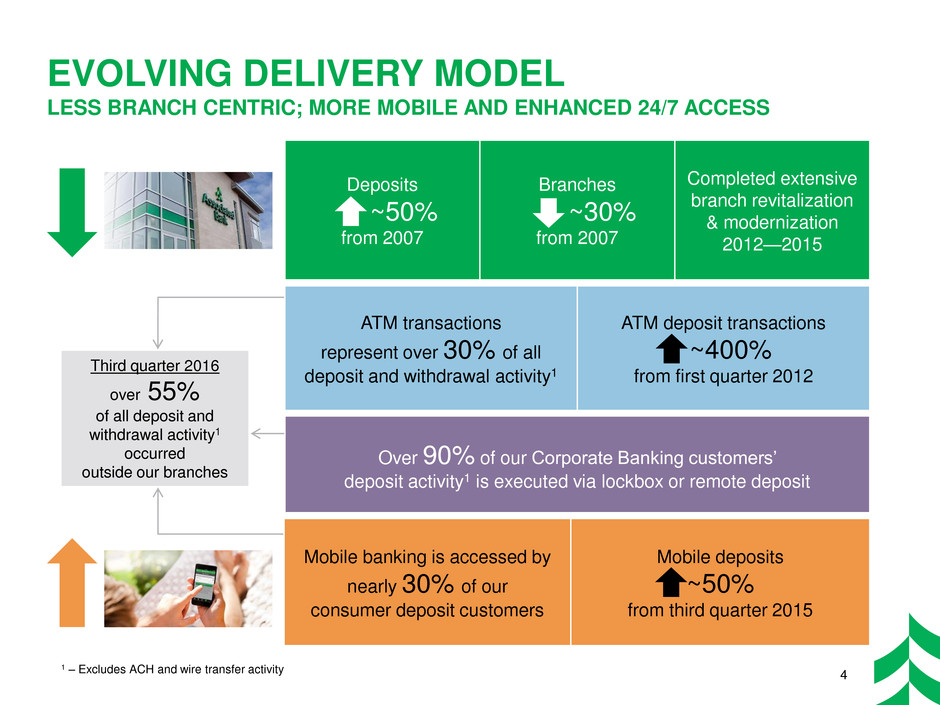
4 EVOLVING DELIVERY MODEL LESS BRANCH CENTRIC; MORE MOBILE AND ENHANCED 24/7 ACCESS Mobile banking is accessed by nearly 30% of our consumer deposit customers Mobile deposits ~50% from third quarter 2015 Deposits ~50% from 2007 Branches ~30% from 2007 Completed extensive branch revitalization & modernization 2012—2015 ATM transactions represent over 30% of all deposit and withdrawal activity1 ATM deposit transactions ~400% from first quarter 2012 Over 90% of our Corporate Banking customers’ deposit activity1 is executed via lockbox or remote deposit Third quarter 2016 over 55% of all deposit and withdrawal activity1 occurred outside our branches 1 – Excludes ACH and wire transfer activity
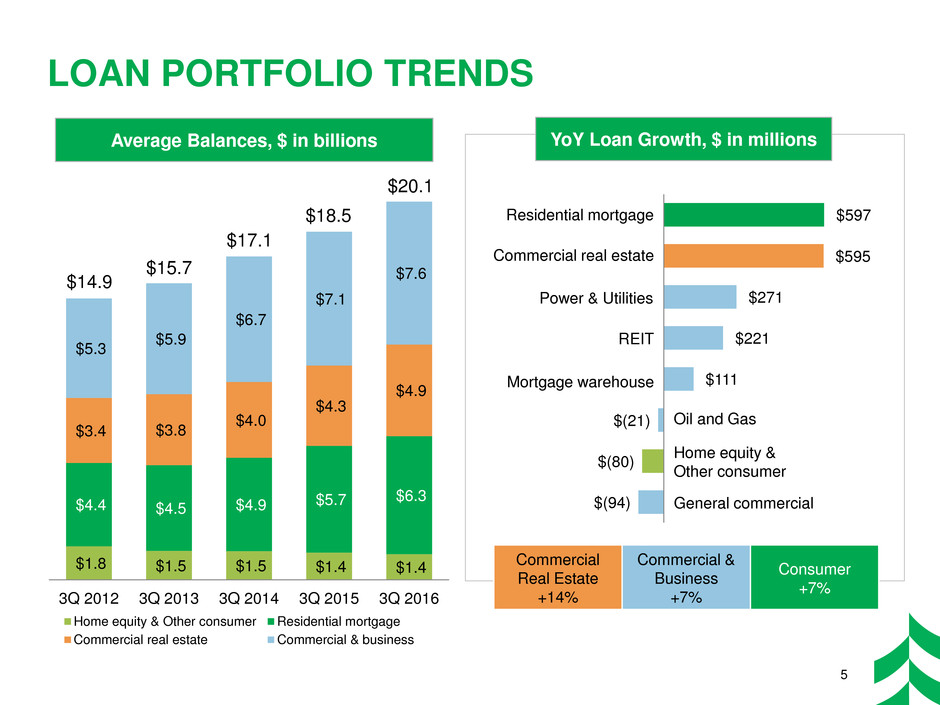
$1.8 $1.5 $1.5 $1.4 $1.4 $4.4 $4.5 $4.9 $5.7 $6.3 $3.4 $3.8 $4.0 $4.3 $4.9 $5.3 $5.9 $6.7 $7.1 $7.6 3Q 2012 3Q 2013 3Q 2014 3Q 2015 3Q 2016 Home equity & Other consumer Residential mortgage Commercial real estate Commercial & business $15.7 $14.9 $17.1 $18.5 $20.1 5 LOAN PORTFOLIO TRENDS $(94) $(80) $(21) $111 $221 $271 $595 $597 Home equity & Other consumer Commercial real estate Residential mortgage Power & Utilities Mortgage warehouse REIT Oil and Gas General commercial YoY Loan Growth, $ in millions Average Balances, $ in billions Commercial Real Estate +14% Commercial & Business +7% Consumer +7%
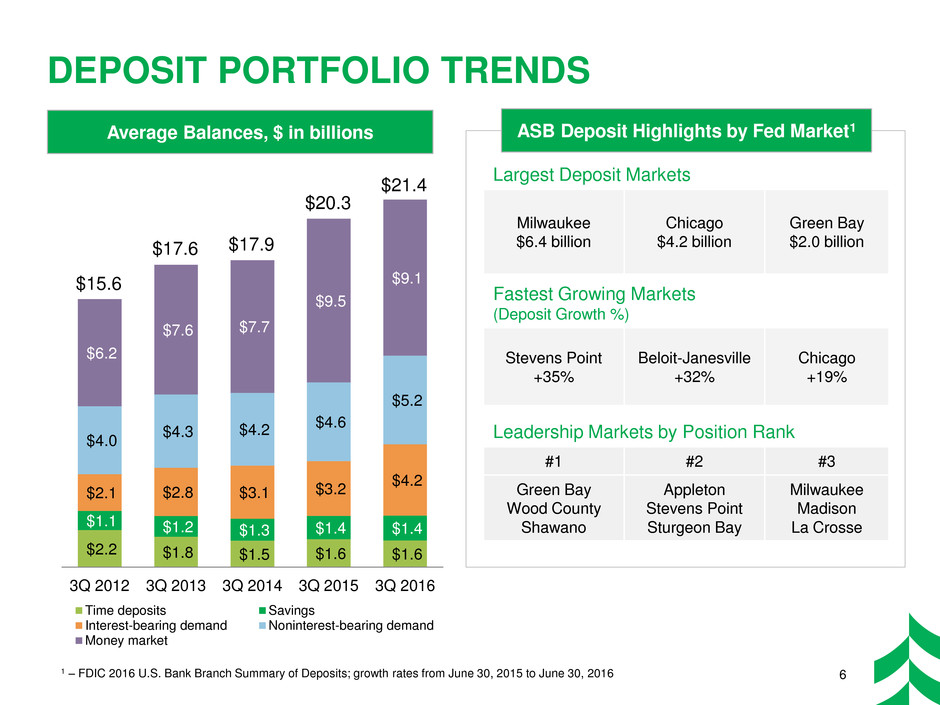
Largest Deposit Markets Milwaukee $6.4 billion Chicago $4.2 billion Green Bay $2.0 billion Fastest Growing Markets (Deposit Growth %) Stevens Point +35% Beloit-Janesville +32% Chicago +19% Leadership Markets by Position Rank #1 #2 #3 Green Bay Wood County Shawano Appleton Stevens Point Sturgeon Bay Milwaukee Madison La Crosse $2.2 $1.8 $1.5 $1.6 $1.6 $1.1 $1.2 $1.3 $1.4 $1.4 $2.1 $2.8 $3.1 $3.2 $4.2 $4.0 $4.3 $4.2 $4.6 $5.2 $6.2 $7.6 $7.7 $9.5 $9.1 3Q 2012 3Q 2013 3Q 2014 3Q 2015 3Q 2016 Time deposits Savings Interest-bearing demand Noninterest-bearing demand Money market 6 DEPOSIT PORTFOLIO TRENDS $17.6 $15.6 $17.9 $20.3 $21.4 1 – FDIC 2016 U.S. Bank Branch Summary of Deposits; growth rates from June 30, 2015 to June 30, 2016 Average Balances, $ in billions ASB Deposit Highlights by Fed Market1
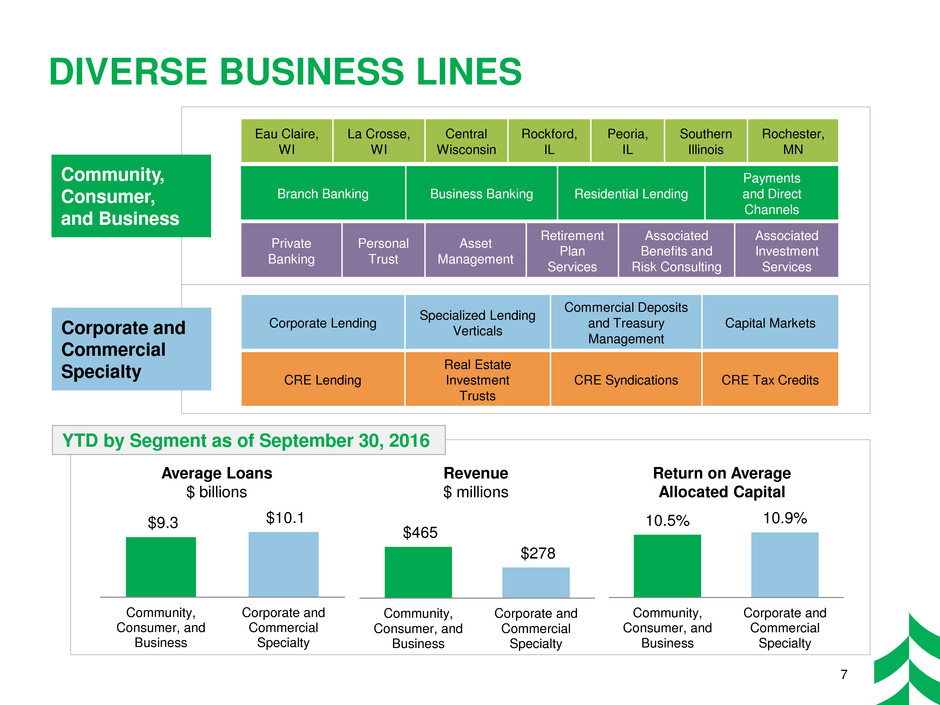
$9.3 $10.1 Community, Consumer, and Business Corporate and Commercial Specialty Average Loans $ billions Revenue $ millions Return on Average Allocated Capital 10.5% 10.9% Community, Consumer, and Business Corporate and Commercial Specialty $465 $278 Community, Consumer, and Business Corporate and Commercial Specialty DIVERSE BUSINESS LINES 7 Community, Consumer, and Business Corporate and Commercial Specialty Branch Banking Business Banking Residential Lending Payments and Direct Channels Eau Claire, WI La Crosse, WI Central Wisconsin Rockford, IL Peoria, IL Southern Illinois Rochester, MN Private Banking Personal Trust Asset Management Retirement Plan Services Associated Benefits and Risk Consulting Associated Investment Services Corporate Lending Specialized Lending Verticals Commercial Deposits and Treasury Management Capital Markets CRE Lending Real Estate Investment Trusts CRE Syndications CRE Tax Credits YTD by Segment as of September 30, 2016
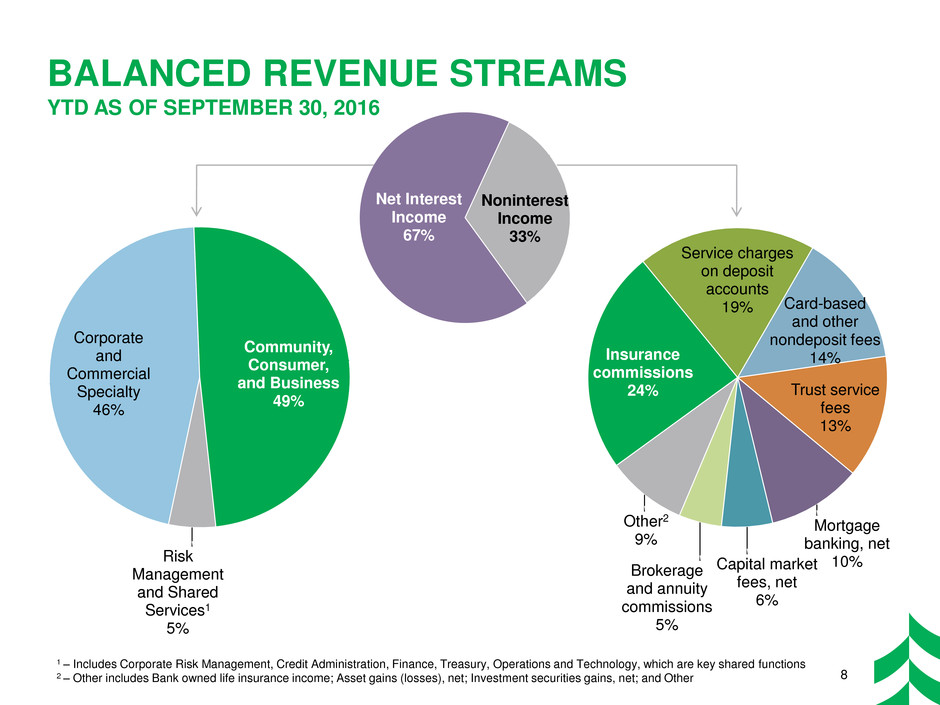
Insurance commissions 24% Service charges on deposit accounts 19% Card-based and other nondeposit fees 14% Trust service fees 13% Mortgage banking, net 10% Capital market fees, net 6% Brokerage and annuity commissions 5% Other2 9% Corporate and Commercial Specialty 46% Community, Consumer, and Business 49% Risk Management and Shared Services1 5% BALANCED REVENUE STREAMS YTD AS OF SEPTEMBER 30, 2016 1 – Includes Corporate Risk Management, Credit Administration, Finance, Treasury, Operations and Technology, which are key shared functions 2 – Other includes Bank owned life insurance income; Asset gains (losses), net; Investment securities gains, net; and Other 8 Net Interest Income 67% Noninterest Income 33%
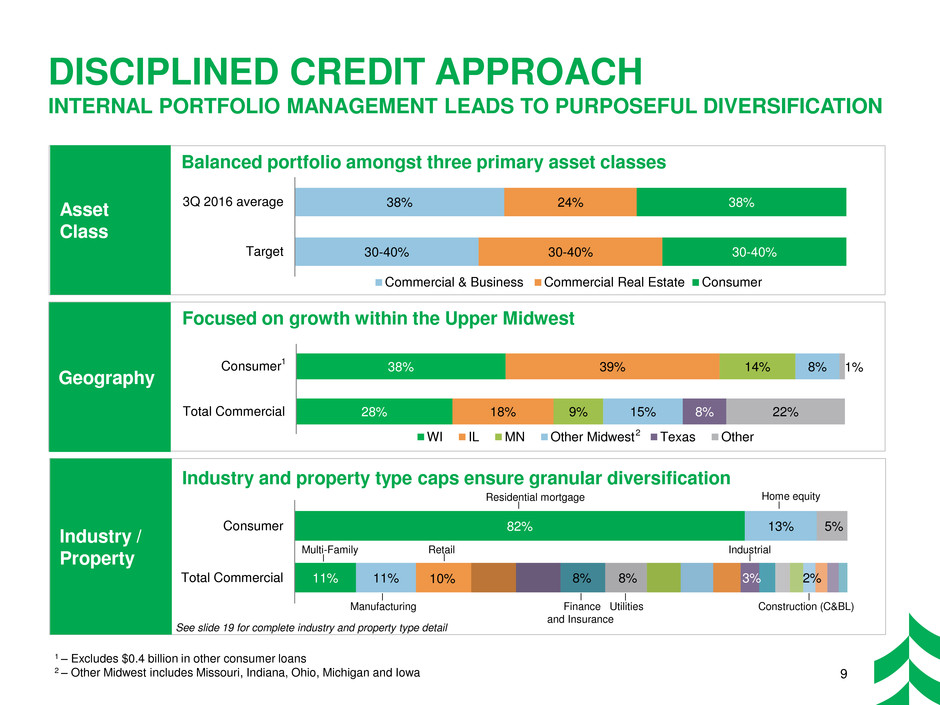
28% 38% 18% 39% 9% 14% 15% 8% 8% 22% 1% Total Commercial Consumer WI IL MN Other Midwest Texas Other DISCIPLINED CREDIT APPROACH INTERNAL PORTFOLIO MANAGEMENT LEADS TO PURPOSEFUL DIVERSIFICATION 9 Asset Class Geography Industry / Property 30-40% 38% 30-40% 24% 30-40% 38% Target 3Q 2016 average Commercial & Business Commercial Real Estate Consumer Focused on growth within the Upper Midwest Industry and property type caps ensure granular diversification Balanced portfolio amongst three primary asset classes 11% 82% 11% 13% 5% 8% 8% 3% 2% Total Commercial Consumer Residential mortgage Manufacturing Finance Utilities Construction (C&BL) and Insurance Home equity Multi-Family Retail Industrial 1 – Excludes $0.4 billion in other consumer loans 2 – Other Midwest includes Missouri, Indiana, Ohio, Michigan and Iowa 1 2 10% See slide 19 for complete industry and property type detail
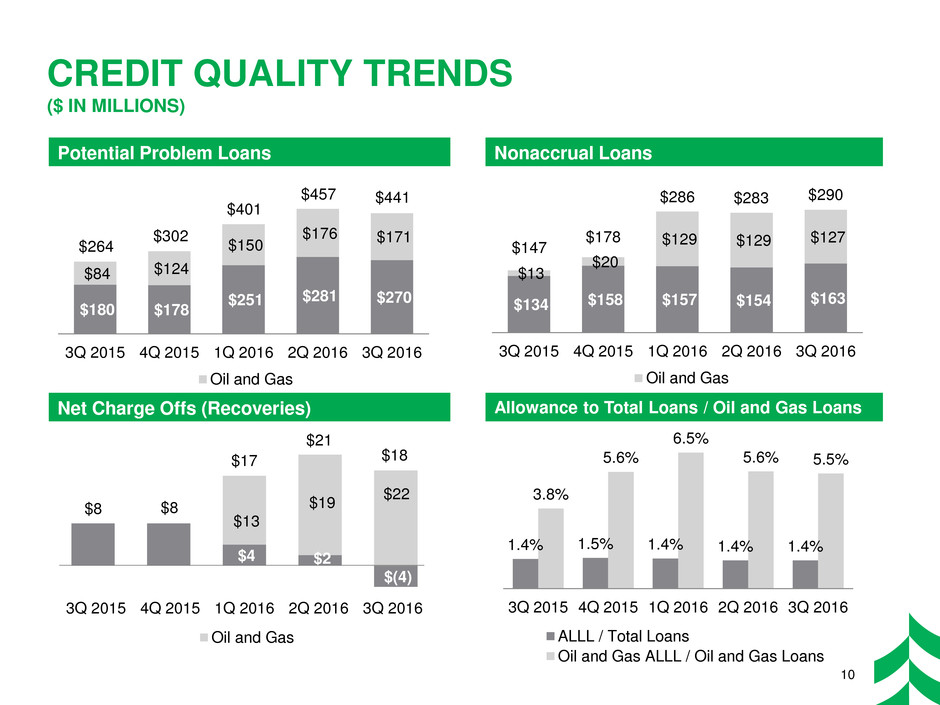
CREDIT QUALITY TRENDS ($ IN MILLIONS) $180 $178 $251 $281 $270 $84 $124 $150 $176 $171 3Q 2015 4Q 2015 1Q 2016 2Q 2016 3Q 2016 Oil and Gas $134 $158 $157 $154 $163 $13 $20 $129 $129 $127 3Q 2015 4Q 2015 1Q 2016 2Q 2016 3Q 2016 Oil and Gas Potential Problem Loans Nonaccrual Loans Net Charge Offs (Recoveries) Allowance to Total Loans / Oil and Gas Loans 1.4% 1.5% 1.4% 1.4% 1.4% 3.8% 5.6% 6.5% 5.6% 5.5% 3Q 2015 4Q 2015 1Q 2016 2Q 2016 3Q 2016 ALLL / Total Loans Oil and Gas ALLL / Oil and Gas Loans 10 $264 $302 $401 $457 $441 $147 $178 $286 $283 $290 3Q 2015 4Q 2015 1Q 2016 2Q 2016 3Q 2016 Oil and Gas $4 $2 $(4) $13 $19 $22 $17 $21 $18 $8 $8
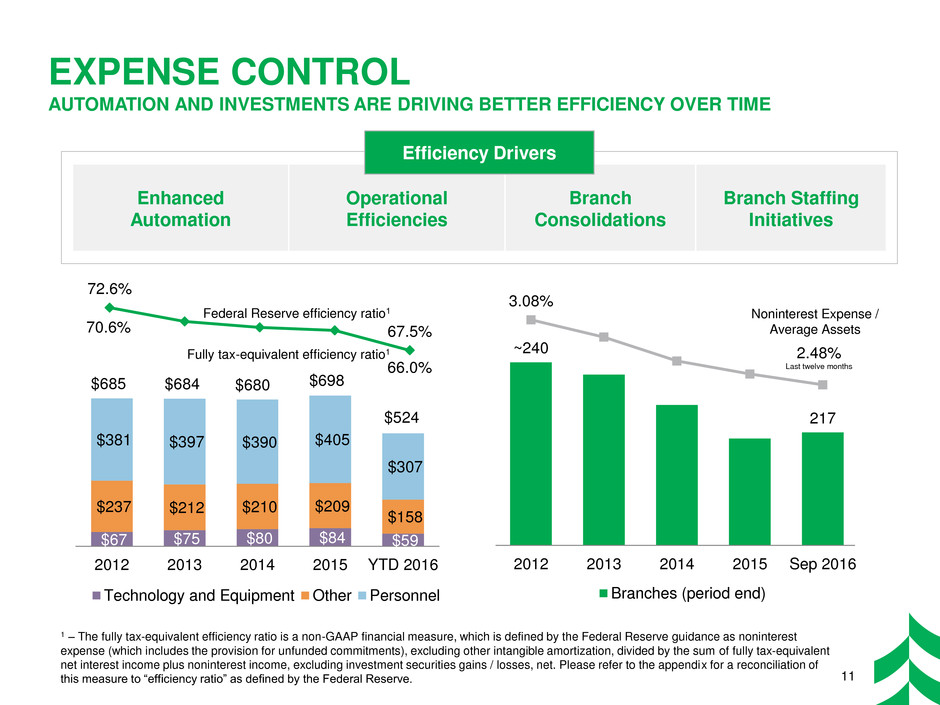
Enhanced Automation Operational Efficiencies Branch Consolidations Branch Staffing Initiatives EXPENSE CONTROL AUTOMATION AND INVESTMENTS ARE DRIVING BETTER EFFICIENCY OVER TIME Efficiency Drivers 1 – The fully tax-equivalent efficiency ratio is a non-GAAP financial measure, which is defined by the Federal Reserve guidance as noninterest expense (which includes the provision for unfunded commitments), excluding other intangible amortization, divided by the sum of fully tax-equivalent net interest income plus noninterest income, excluding investment securities gains / losses, net. Please refer to the appendix for a reconciliation of this measure to “efficiency ratio” as defined by the Federal Reserve. 11 72.6% 67.5% $67 $75 $80 $84 $59 $237 $212 $210 $209 $158 $381 $397 $390 $405 $307 2012 2013 2014 2015 YTD 2016 Technology and Equipment Other Personnel $685 $684 $680 $698 $524 70.6% 66.0% Federal Reserve efficiency ratio1 Fully tax-equivalent efficiency ratio1 ~240 217 3.08% 2.48% Last twelve months 1.00% 1.50% 2.00% 2.50% 3.00% 180 190 200 210 220 230 240 250 260 2012 2013 2014 2015 Sep 2016 Branches (period end) Noninterest Expense / Average Assets
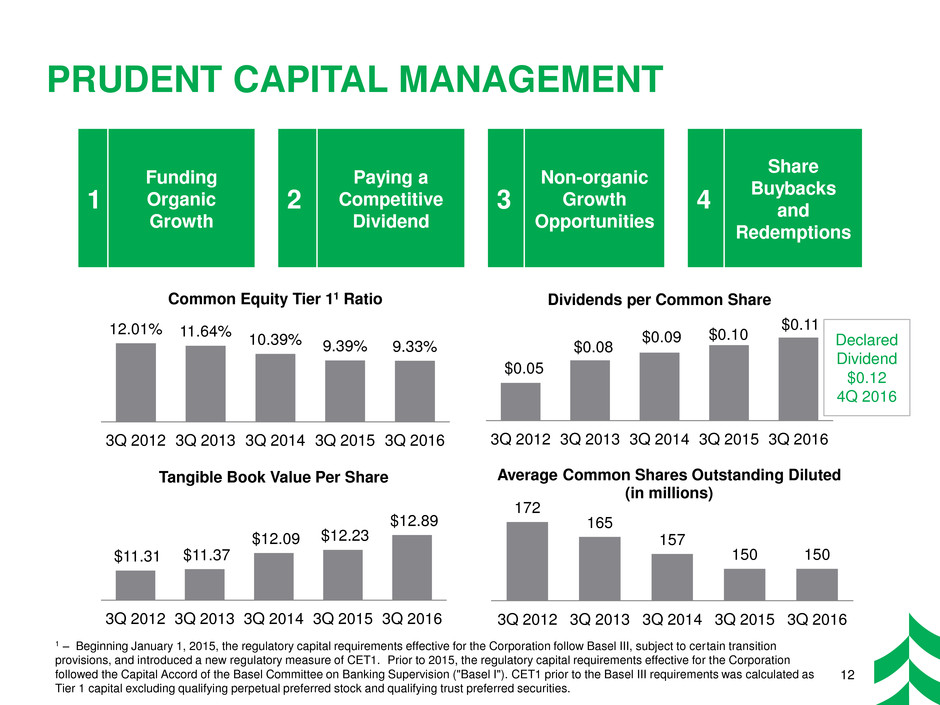
$0.05 $0.08 $0.09 $0.10 $0.11 3Q 2012 3Q 2013 3Q 2014 3Q 2015 3Q 2016 Dividends per Common Share PRUDENT CAPITAL MANAGEMENT 12 172 165 157 150 150 3Q 2012 3Q 2013 3Q 2014 3Q 2015 3Q 2016 Average Common Shares Outstanding Diluted (in millions) 12.01% 11.64% 10.39% 9.39% 9.33% 3Q 2012 3Q 2013 3Q 2014 3Q 2015 3Q 2016 Common Equity Tier 11 Ratio $11.31 $11.37 $12.09 $12.23 $12.89 3Q 2012 3Q 2013 3Q 2014 3Q 2015 3Q 2016 Tangible Book Value Per Share 1 – Beginning January 1, 2015, the regulatory capital requirements effective for the Corporation follow Basel III, subject to certain transition provisions, and introduced a new regulatory measure of CET1. Prior to 2015, the regulatory capital requirements effective for the Corporation followed the Capital Accord of the Basel Committee on Banking Supervision ("Basel I"). CET1 prior to the Basel III requirements was calculated as Tier 1 capital excluding qualifying perpetual preferred stock and qualifying trust preferred securities. 4 1 Funding Organic Growth 2 Paying a Competitive Dividend 3 Non-organic Growth Opportunities 4 Share Buybacks and Redemptions Declared Dividend $0.12 4Q 2016
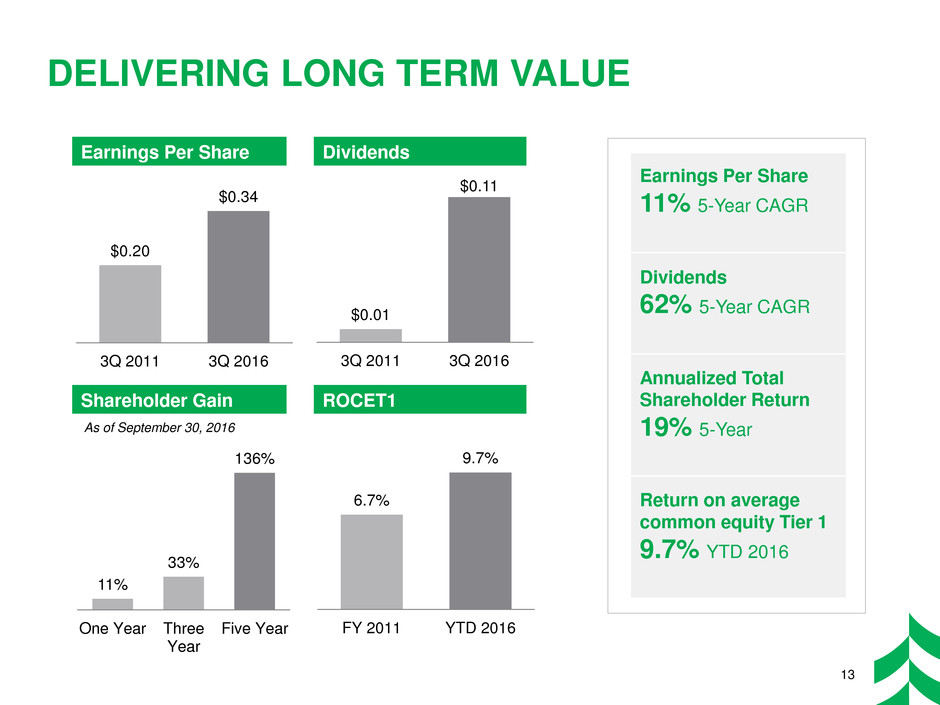
Earnings Per Share 11% 5-Year CAGR Dividends 62% 5-Year CAGR Annualized Total Shareholder Return 19% 5-Year Return on average common equity Tier 1 9.7% YTD 2016 DELIVERING LONG TERM VALUE 13 6.7% 9.7% FY 2011 YTD 2016 $0.01 $0.11 3Q 2011 3Q 2016 $0.20 $0.34 3Q 2011 3Q 2016 11% 33% 136% One Year Three Year Five Year As of September 30, 2016 Shareholder Gain ROCET1 Earnings Per Share Dividends

APPENDIX
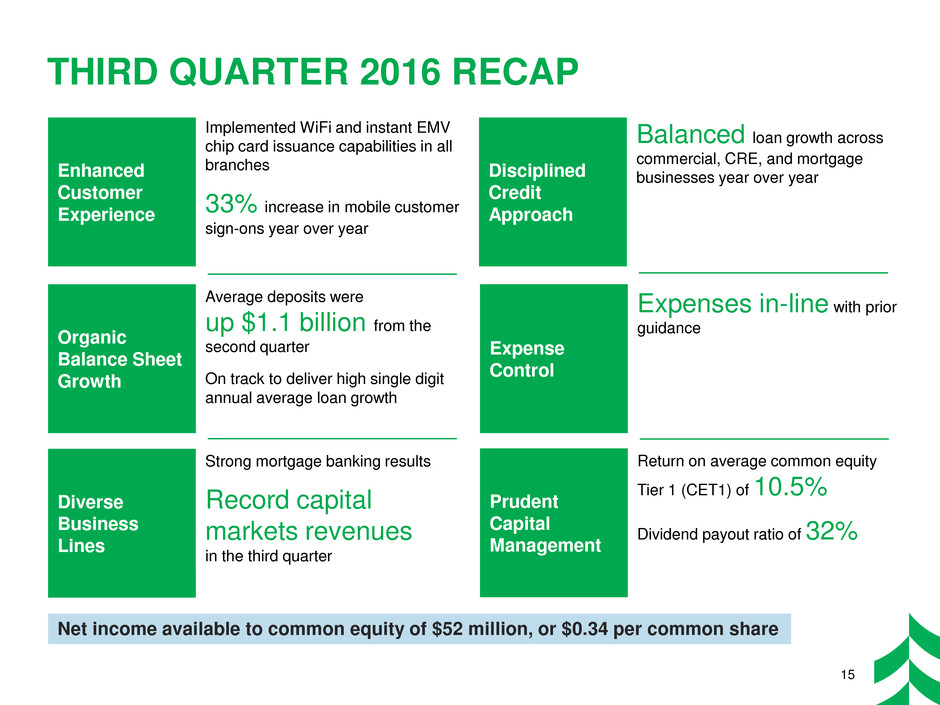
THIRD QUARTER 2016 RECAP Net income available to common equity of $52 million, or $0.34 per common share 15 Enhanced Customer Experience Implemented WiFi and instant EMV chip card issuance capabilities in all branches 33% increase in mobile customer sign-ons year over year Organic Balance Sheet Growth Average deposits were up $1.1 billion from the second quarter On track to deliver high single digit annual average loan growth Diverse Business Lines Strong mortgage banking results Record capital markets revenues in the third quarter Disciplined Credit Approach Balanced loan growth across commercial, CRE, and mortgage businesses year over year Expense Control Expenses in-line with prior guidance Prudent Capital Management Return on average common equity Tier 1 (CET1) of 10.5% Dividend payout ratio of 32%
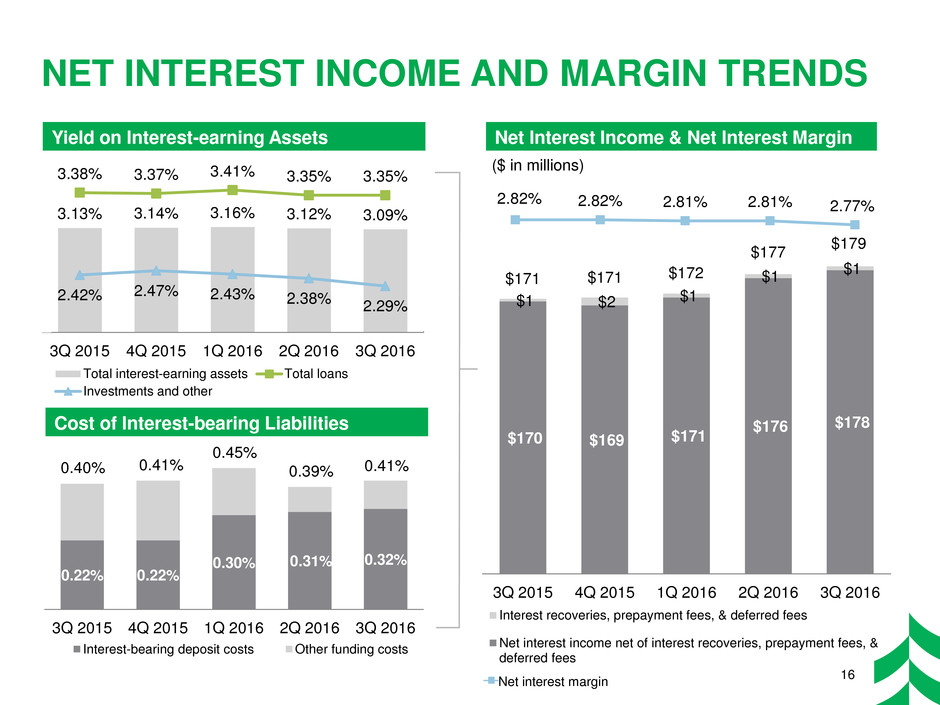
0.22% 0.22% 0.30% 0.31% 0.32% 3Q 2015 4Q 2015 1Q 2016 2Q 2016 3Q 2016 Interest-bearing deposit costs Other funding costs $170 $169 $171 $176 $178 $1 $2 $1 $1 $1 3Q 2015 4Q 2015 1Q 2016 2Q 2016 3Q 2016 Interest recoveries, prepayment fees, & deferred fees Net interest income net of interest recoveries, prepayment fees, & deferred fees Net interest margin 2.82% 2.82% 2.81% 2.81% 2.77% 0.00% 0.50% 1.00% 1.50% 2.00% 2.50% 3.00% 3.50% 4.00% $- $4 $8 $12 $16 $20 $24 $28 $32 $36 $40 $44 $48 $52 $56 $60 $64 $68 $72 $76 $80 $84 $88 $92 $96 $100 $104 $108 $112 $116 $120 $124 $128 $132 $136 $140 $144 $148 $152 $156 $160 $164 $168 $172 $176 $180 Yield on Interest-earning Assets Net Interest Income & Net Interest Margin NET INTEREST INCOME AND MARGIN TRENDS ($ in millions) 0.40% 0.41% 0.39% $171 $177 0.45% $172 $171 $179 Cost of Interest-bearing Liabilities 16 0.41% 3.13% 3.14% 3.16% 3.12% 3.09% 3.38% 3.37% 3.41% 3.35% 3.35% 2.42% 2.47% 2.43% 2.38% 2.29% 3Q 2015 4Q 2015 1Q 2016 2Q 2016 3Q 2016 Total interest-earning assets Total loans Investments and other
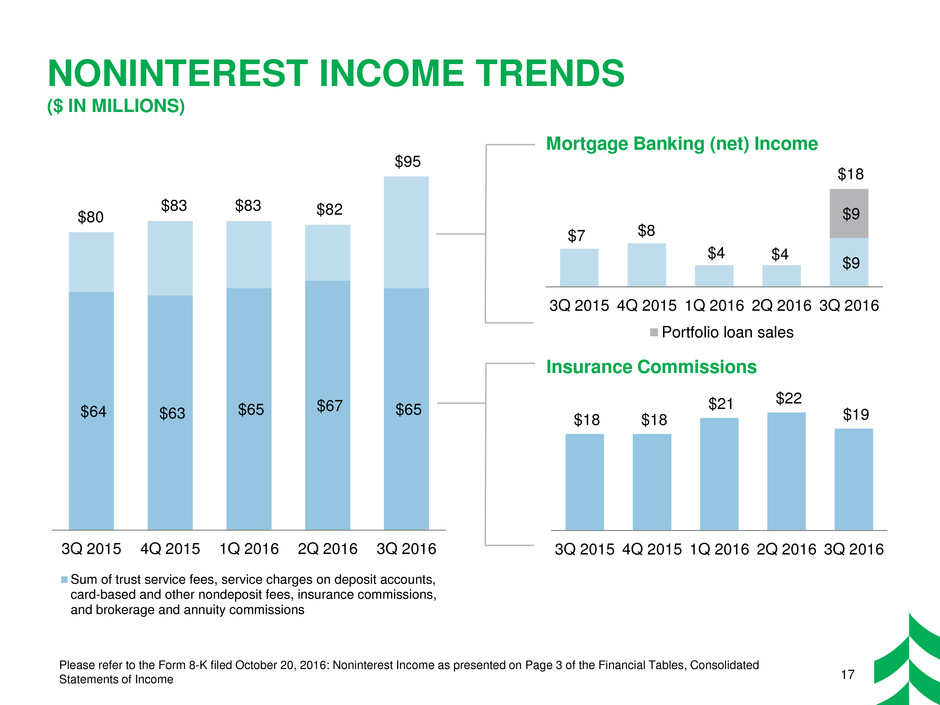
$7 $8 $4 $4 $9 $9 3Q 2015 4Q 2015 1Q 2016 2Q 2016 3Q 2016 Portfolio loan sales NONINTEREST INCOME TRENDS ($ IN MILLIONS) Mortgage Banking (net) Income $64 $63 $65 $67 $65 3Q 2015 4Q 2015 1Q 2016 2Q 2016 3Q 2016 Sum of trust service fees, service charges on deposit accounts, card-based and other nondeposit fees, insurance commissions, and brokerage and annuity commissions Please refer to the Form 8-K filed October 20, 2016: Noninterest Income as presented on Page 3 of the Financial Tables, Consolidated Statements of Income $95 $80 $83 $83 Insurance Commissions $18 $18 $21 $22 $19 3Q 2015 4Q 2015 1Q 2016 2Q 2016 3Q 2016 $82 17 $18
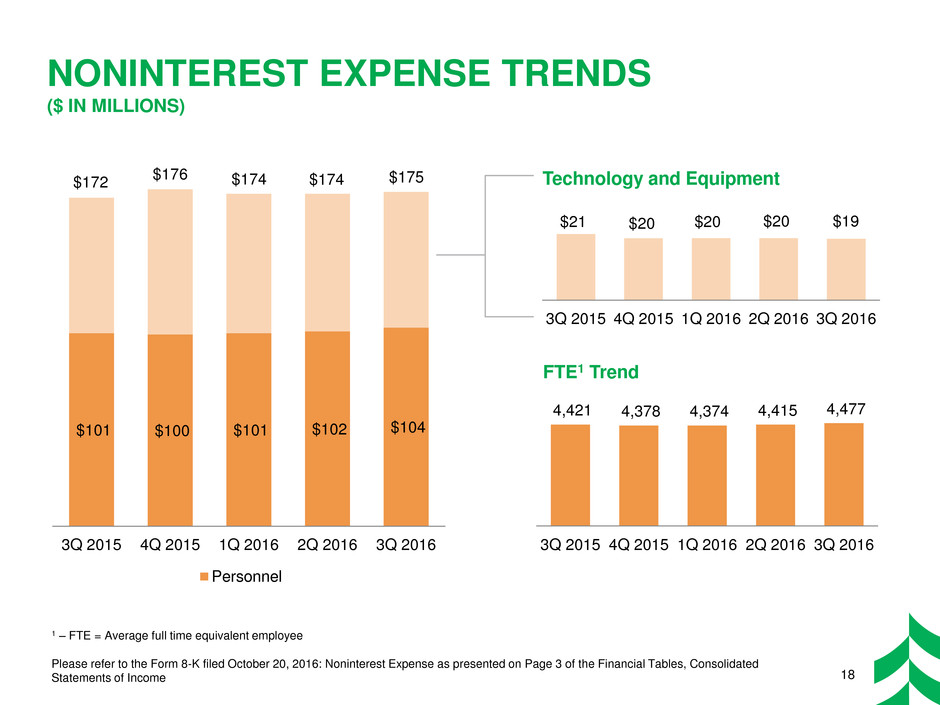
$101 $100 $101 $102 $104 3Q 2015 4Q 2015 1Q 2016 2Q 2016 3Q 2016 Personnel $21 $20 $20 $20 $19 3Q 2015 4Q 2015 1Q 2016 2Q 2016 3Q 2016 NONINTEREST EXPENSE TRENDS ($ IN MILLIONS) Technology and Equipment 1 – FTE = Average full time equivalent employee Please refer to the Form 8-K filed October 20, 2016: Noninterest Expense as presented on Page 3 of the Financial Tables, Consolidated Statements of Income FTE1 Trend $172 $176 $174 $174 4,421 4,378 4,374 4,415 4,477 3Q 2015 4Q 2015 1Q 2016 2Q 2016 3Q 2016 18 $175
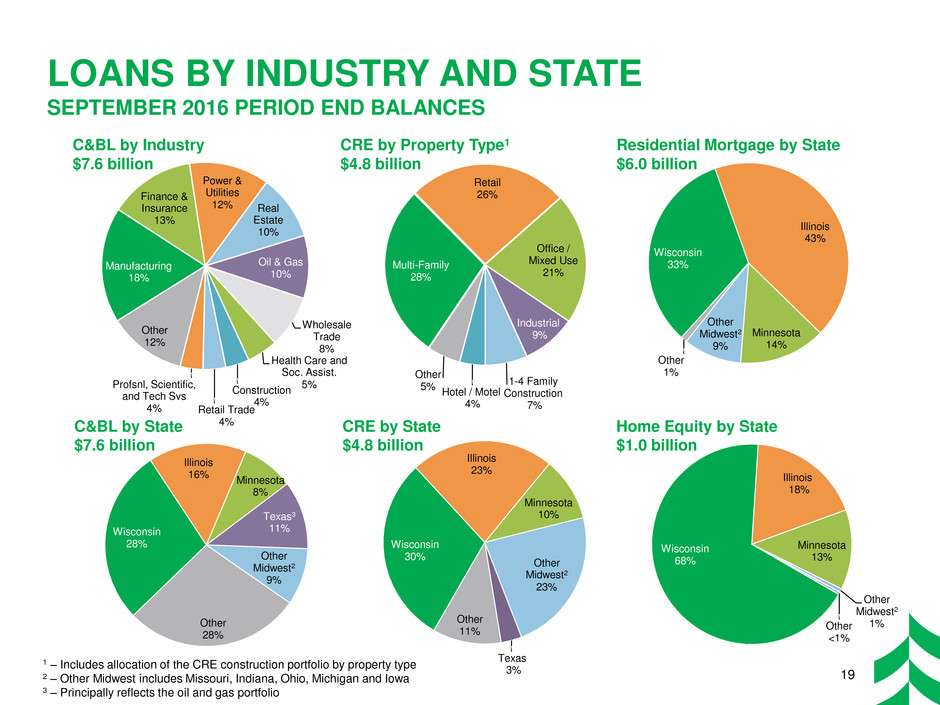
C&BL by State $7.6 billion CRE by State $4.8 billion Home Equity by State $1.0 billion C&BL by Industry $7.6 billion CRE by Property Type1 $4.8 billion Residential Mortgage by State $6.0 billion Wisconsin 33% Illinois 43% Minnesota 14% Other Midwest2 9% Other 1% Manufacturing 18% Finance & Insurance 13% Power & Utilities 12% Real Estate 10% Oil & Gas 10% Wholesale Trade 8% Health Care and Soc. Assist. 5% Construction 4% Retail Trade 4% Profsnl, Scientific, and Tech Svs 4% Other 12% Wisconsin 28% Illinois 16% Minnesota 8% Texas3 11% Other Midwest2 9% Other 28% Wisconsin 30% Illinois 23% Minnesota 10% Other Midwest2 23% Texas 3% Other 11% Wisconsin 68% Illinois 18% Minnesota 13% Other Midwest2 1% Other <1% 1 – Includes allocation of the CRE construction portfolio by property type 2 – Other Midwest includes Missouri, Indiana, Ohio, Michigan and Iowa 3 – Principally reflects the oil and gas portfolio LOANS BY INDUSTRY AND STATE SEPTEMBER 2016 PERIOD END BALANCES 19 Multi-Family 28% Retail 26% Office / Mixed Use 21% Industrial 9% 1-4 Family Construction 7% Hotel / Motel 4% Other 5%
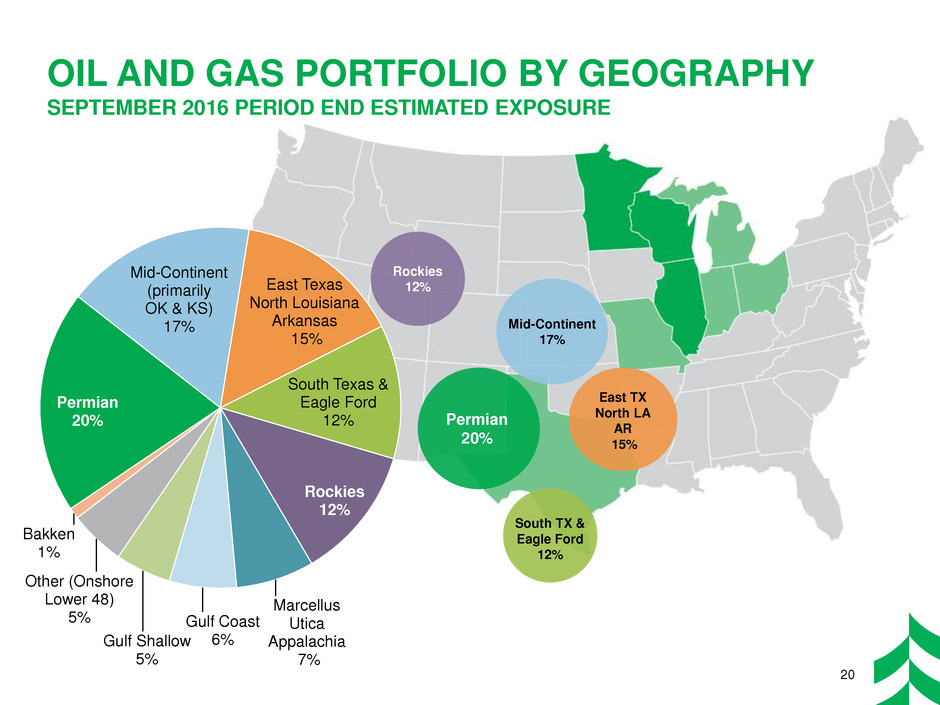
OIL AND GAS PORTFOLIO BY GEOGRAPHY SEPTEMBER 2016 PERIOD END ESTIMATED EXPOSURE 20 Permian 20% South TX & Eagle Ford 12% East TX North LA AR 15% Mid-Continent 17% Rockies 12% Permian 20% Mid-Continent (primarily OK & KS) 17% East Texas North Louisiana Arkansas 15% South Texas & Eagle Ford 12% Rockies 12% Marcellus Utica Appalachia 7% Gulf Coast 6% Gulf Shallow 5% Other (Onshore Lower 48) 5% Bakken 1%
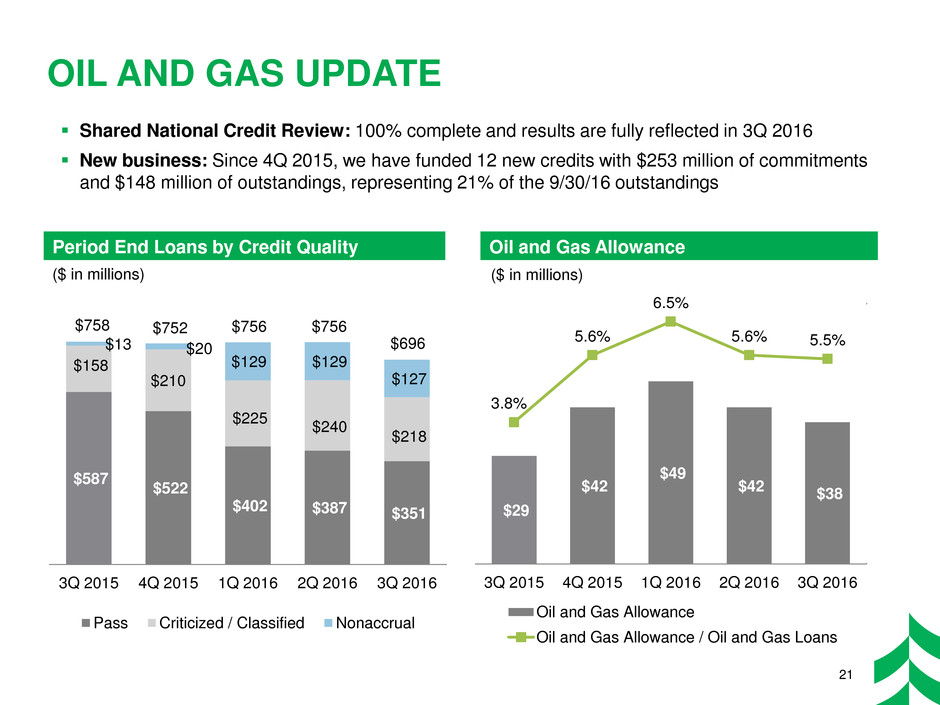
OIL AND GAS UPDATE Shared National Credit Review: 100% complete and results are fully reflected in 3Q 2016 New business: Since 4Q 2015, we have funded 12 new credits with $253 million of commitments and $148 million of outstandings, representing 21% of the 9/30/16 outstandings 21 $587 $522 $402 $387 $351 $158 $210 $225 $240 $218 $13 $20 $129 $129 $127 3Q 2015 4Q 2015 1Q 2016 2Q 2016 3Q 2016 Pass Criticized / Classified Nonaccrual $758 $752 $756 $756 $696 Period End Loans by Credit Quality Oil and Gas Allowance $29 $42 $49 $42 $38 3.8% 5.6% 6.5% 5.6% 5.5% 3Q 2015 4Q 2015 1Q 2016 2Q 2016 3Q 2016 Oil and Gas Allowance Oil and Gas Allowance / Oil and Gas Loans ($ in millions) ($ in millions)
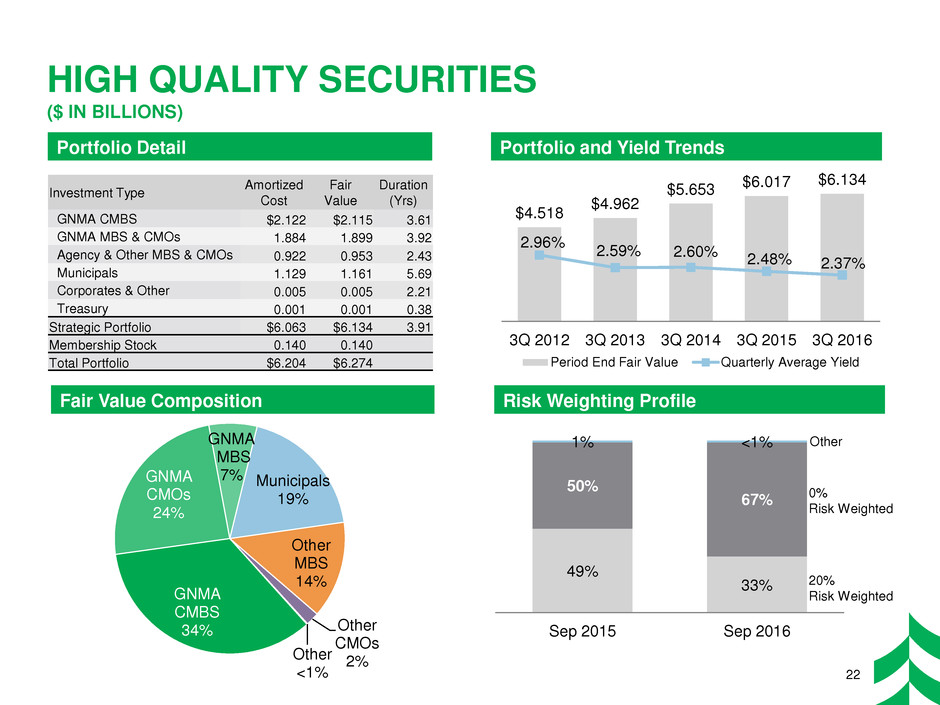
49% 33% 50% 67% 1% <1% Sep 2015 Sep 2016 HIGH QUALITY SECURITIES ($ IN BILLIONS) 22 $4.518 $4.962 $5.653 $6.017 $6.134 2.96% 2.59% 2.60% 2.48% 2.37% 1.00% 2.00% 3.00% 4.00% 5.00% $- $0.01 .$0 2 . .3$0 .4 .$0 5 . .6$0 .7 .$0 8 .9 $0. .1 0$ .1 1.$ 2 .1 .3$ .41 .$ 5 .1 6 .$ .71 $ .8 .1 9$ . 2 0 .$ .12 .$ 2 .2 3 .$ .42 .$ 5 .2 6 $ .7 2. $ .82 .9$ .3 0 .$ .13 .$ 2 .3 3 .$ 4 .3 $ .5 3.6$ .73 .$ .83 .9$ .4 0 .$ 1 .4 .$ 2 .4 3 $ .4 4.$ .54 .6$ .74 .$ 8 .4 .9$ .5 0 .$ 1 .5 $ .2 5.3$ .45 .$ 5 .5 .6$ .75 .$ 8 .5 9 .$ .6 0 $ .1 6.$ 2 . 6 .3$ .46 .$ 5 . 3Q 2012 3Q 2013 3Q 2014 3Q 2015 3Q 2016 Period End Fair Value Quarterly Average Yield Investment Type Amortized Cost Fair Value Duration (Yrs) GNMA CMBS $2.122 $2.115 3.61 GNMA MBS & CMOs 1.884 1.899 3.92 Agency & Other MBS & CMOs 0.922 0.953 2.43 Municipals 1.129 1.161 5.69 Corporates & Other 0.005 0.005 2.21 Treasury 0.001 0.001 0.38 Strategic Portfolio $6.063 $6.134 3.91 Membership Stock 0.140 0.140 Total Portfolio $6.204 $6.274 GNMA CMBS 34% GNMA CMOs 24% GNMA MBS 7% Municipals 19% Other MBS 14% Other CMOs 2% Other <1% Fair Value Composition Risk Weighting Profile Portfolio Detail Portfolio and Yield Trends 0% Risk Weighted 20% Risk Weighted Other
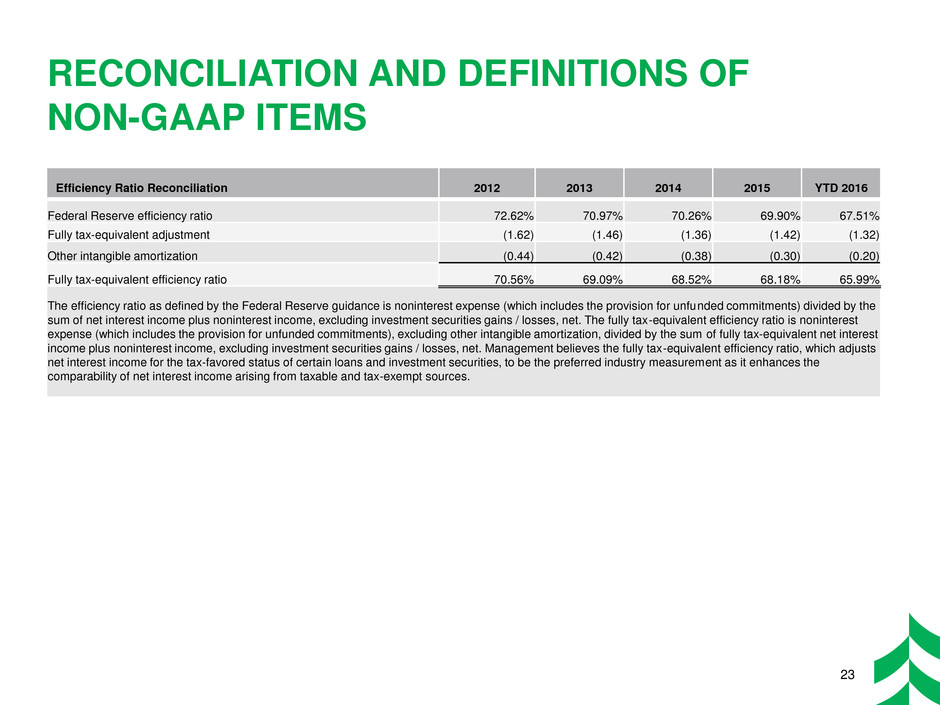
RECONCILIATION AND DEFINITIONS OF NON-GAAP ITEMS 23 Efficiency Ratio Reconciliation 2012 2013 2014 2015 YTD 2016 Federal Reserve efficiency ratio 72.62% 70.97% 70.26% 69.90% 67.51% Fully tax-equivalent adjustment (1.62) (1.46) (1.36) (1.42) (1.32) Other intangible amortization (0.44) (0.42) (0.38) (0.30) (0.20) Fully tax-equivalent efficiency ratio 70.56% 69.09% 68.52% 68.18% 65.99% The efficiency ratio as defined by the Federal Reserve guidance is noninterest expense (which includes the provision for unfunded commitments) divided by the sum of net interest income plus noninterest income, excluding investment securities gains / losses, net. The fully tax-equivalent efficiency ratio is noninterest expense (which includes the provision for unfunded commitments), excluding other intangible amortization, divided by the sum of fully tax-equivalent net interest income plus noninterest income, excluding investment securities gains / losses, net. Management believes the fully tax-equivalent efficiency ratio, which adjusts net interest income for the tax-favored status of certain loans and investment securities, to be the preferred industry measurement as it enhances the comparability of net interest income arising from taxable and tax-exempt sources.


