
FOURTH QUARTER 2017 EARNINGS PRESENTATION January 25, 2018 Exhibit 99.2
DISCLAIMER Important note regarding forward-looking statements: Statements made in this presentation which are not purely historical are forward-looking statements, as defined in the Private Securities Litigation Reform Act of 1995. This includes any statements regarding management’s plans, objectives, or goals for future operations, products or services, and forecasts of its revenues, earnings, or other measures of performance. Such forward-looking statements may be identified by the use of words such as “believe,” “expect,” “anticipate,” “plan,” “estimate,” “should,” “will,” “intend,” “outlook” or similar expressions. Forward-looking statements are based on current management expectations and, by their nature, are subject to risks and uncertainties. Actual results may differ materially from those contained in the forward-looking statements. Factors which may cause actual results to differ materially from those contained in such forward-looking statements include those identified in the Company’s most recent Form 10-K and subsequent SEC filings. Such factors are incorporated herein by reference. Non-GAAP Measures This presentation includes certain non-GAAP financial measures. These non-GAAP measures are provided in addition to, and not as substitutes for, measures of our financial performance determined in accordance with GAAP. Our calculation of these non-GAAP measures may not be comparable to similarly titled measures of other companies due to potential differences between companies in the method of calculation. As a result, the use of these non-GAAP measures has limitations and should not be considered superior to, in isolation from, or as a substitute for, related GAAP measures. Reconciliations of these non- GAAP financial measures to the most directly comparable GAAP financial measures can be found at the end of this presentation. 2
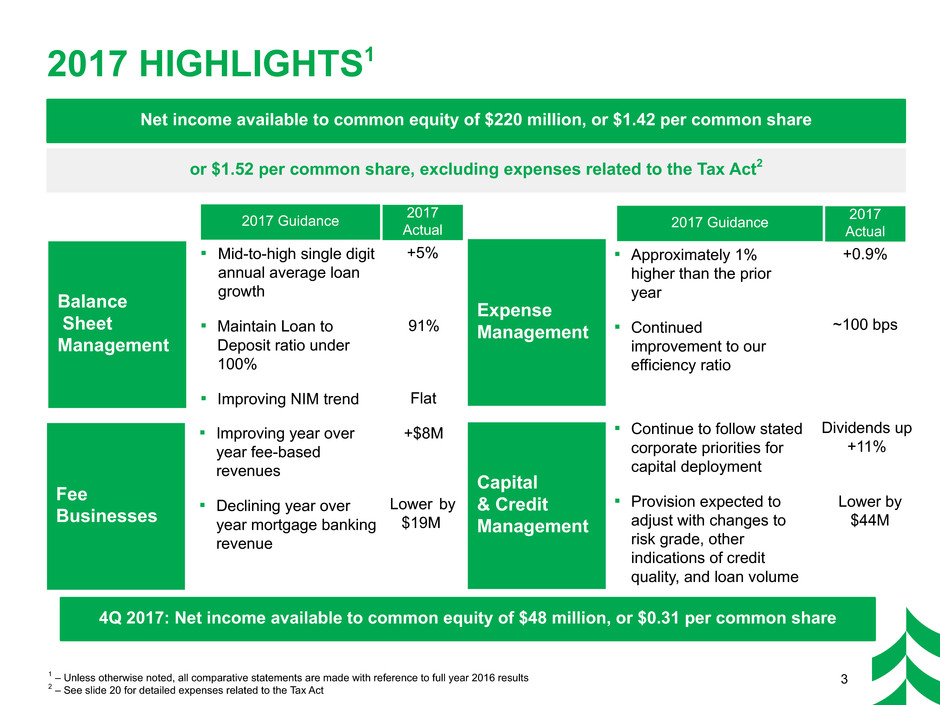
▪ Improving year over year fee-based revenues ▪ Declining year over year mortgage banking revenue 1 – Unless otherwise noted, all comparative statements are made with reference to full year 2016 results 2 – See slide 20 for detailed expenses related to the Tax Act 2017 HIGHLIGHTS1 3 Balance Sheet Management ▪ Mid-to-high single digit annual average loan growth ▪ Maintain Loan to Deposit ratio under 100% ▪ Improving NIM trend Fee Businesses Expense Management ▪ Approximately 1% higher than the prior year ▪ Continued improvement to our efficiency ratio Capital & Credit Management ▪ Continue to follow stated corporate priorities for capital deployment ▪ Provision expected to adjust with changes to risk grade, other indications of credit quality, and loan volume Net income available to common equity of $220 million, or $1.42 per common share 4Q 2017: Net income available to common equity of $48 million, or $0.31 per common share 2017 Actual Dividends up +11% 91% Flat +5% Lower by $19M +$8M +0.9% ~100 bps 2017 Guidance 2017 Actual2017 Guidance Lower by $44M or $1.52 per common share, excluding expenses related to the Tax Act2
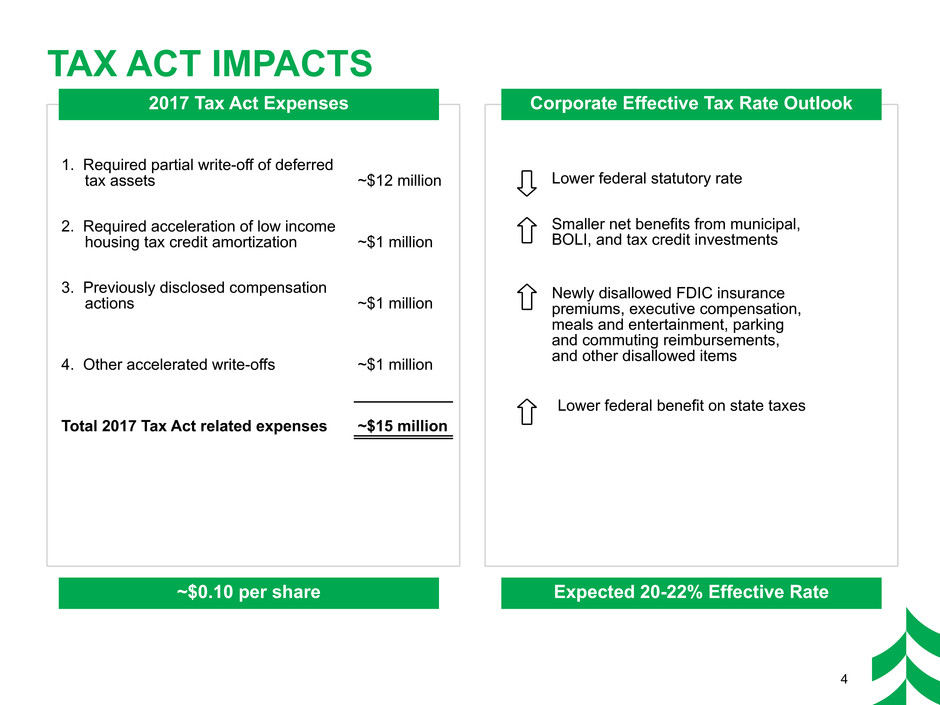
TAX ACT IMPACTS 2017 Tax Act Expenses 4 ~$0.10 per share Corporate Effective Tax Rate Outlook Expected 20-22% Effective Rate 1. Required partial write-off of deferred tax assets ~$12 million 2. Required acceleration of low income housing tax credit amortization ~$1 million 3. Previously disclosed compensation actions ~$1 million 4. Other accelerated write-offs ~$1 million Total 2017 Tax Act related expenses ~$15 million Lower federal statutory rate Smaller net benefits from municipal, BOLI, and tax credit investments Newly disallowed FDIC insurance premiums, executive compensation, meals and entertainment, parking and commuting reimbursements, and other disallowed items Lower federal benefit on state taxes
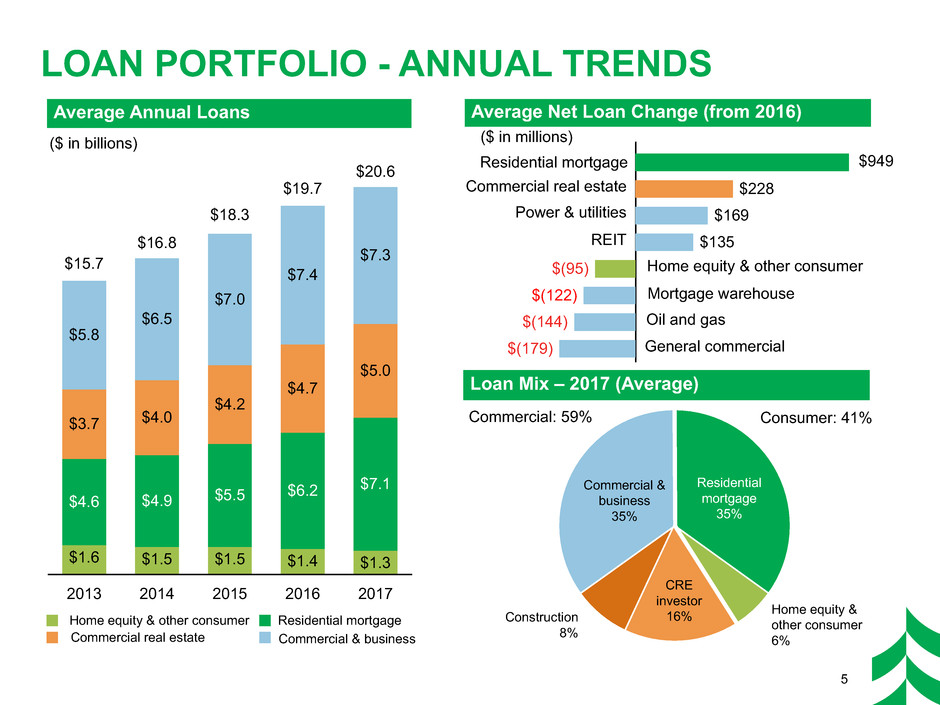
Commercial & business 35% Residential mortgage 35% CRE investor 16%Construction 8% 2013 2014 2015 2016 2017 $1.6 $1.5 $1.5 $1.4 $1.3 $4.6 $4.9 $5.5 $6.2 $7.1 $3.7 $4.0 $4.2 $4.7 $5.0 $5.8 $6.5 $7.0 $7.4 $7.3$15.7 $16.8 $18.3 $19.7 $20.6 Home equity & other consumer 6% 5 Average Net Loan Change (from 2016)Average Annual Loans ($ in billions) Home equity & other consumer Commercial real estate Residential mortgage Commercial & business Commercial: 59% Consumer: 41% Loan Mix – 2017 (Average) ($ in millions) Home equity & other consumer Commercial real estate Residential mortgage Power & utilities Mortgage warehouse REIT General commercial Oil and gas $949 LOAN PORTFOLIO - ANNUAL TRENDS $228 $169 $135 $(95) $(122) $(144) $(179)
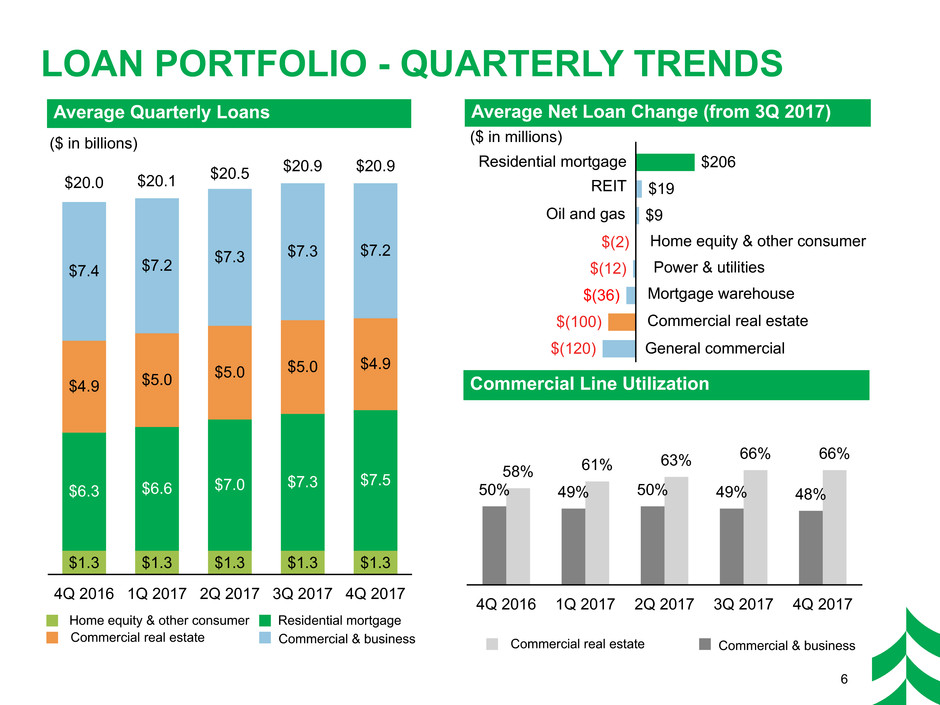
($ in billions) LOAN PORTFOLIO - QUARTERLY TRENDS $206 $19 $9 $(2) $(12) $(36) $(100) $(120) 6 4Q 2016 1Q 2017 2Q 2017 3Q 2017 4Q 2017 $1.3 $1.3 $1.3 $1.3 $1.3 $6.3 $6.6 $7.0 $7.3 $7.5 $4.9 $5.0 $5.0 $5.0 $4.9 $7.4 $7.2 $7.3 $7.3 $7.2 $20.0 $20.1 $20.5 $20.9 $20.9 Average Net Loan Change (from 3Q 2017)Average Quarterly Loans Home equity & other consumer Commercial real estate Residential mortgage Commercial & business Commercial Line Utilization ($ in millions) Home equity & other consumer Commercial real estate Residential mortgage Power & utilities REIT General commercial Oil and gas Mortgage warehouse 4Q 2016 1Q 2017 2Q 2017 3Q 2017 4Q 2017 50% 49% 50% 49% 48% 58% 61% 63% 66% 66% Commercial real estate Commercial & business
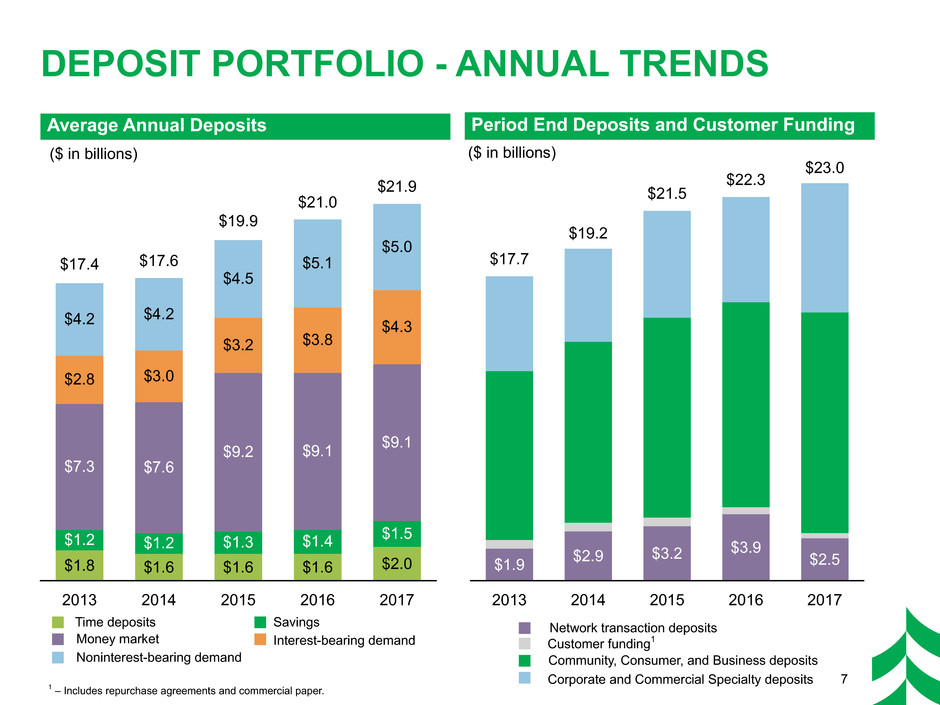
2013 2014 2015 2016 2017 $1.9 $2.9 $3.2 $3.9 $2.5 $17.7 $19.2 $21.5 $22.3 $23.0 7 ($ in billions) DEPOSIT PORTFOLIO - ANNUAL TRENDS 2013 2014 2015 2016 2017 $1.8 $1.6 $1.6 $1.6 $2.0 $1.2 $1.2 $1.3 $1.4 $1.5 $7.3 $7.6 $9.2 $9.1 $9.1 $2.8 $3.0 $3.2 $3.8 $4.3$4.2 $4.2 $4.5 $5.1 $5.0 $17.4 $17.6 $19.9 $21.0 $21.9 Period End Deposits and Customer Funding Average Annual Deposits Time deposits Money market Noninterest-bearing demand Savings Interest-bearing demand Network transaction deposits ($ in billions) Customer funding1 Community, Consumer, and Business deposits Corporate and Commercial Specialty deposits 1 – Includes repurchase agreements and commercial paper.
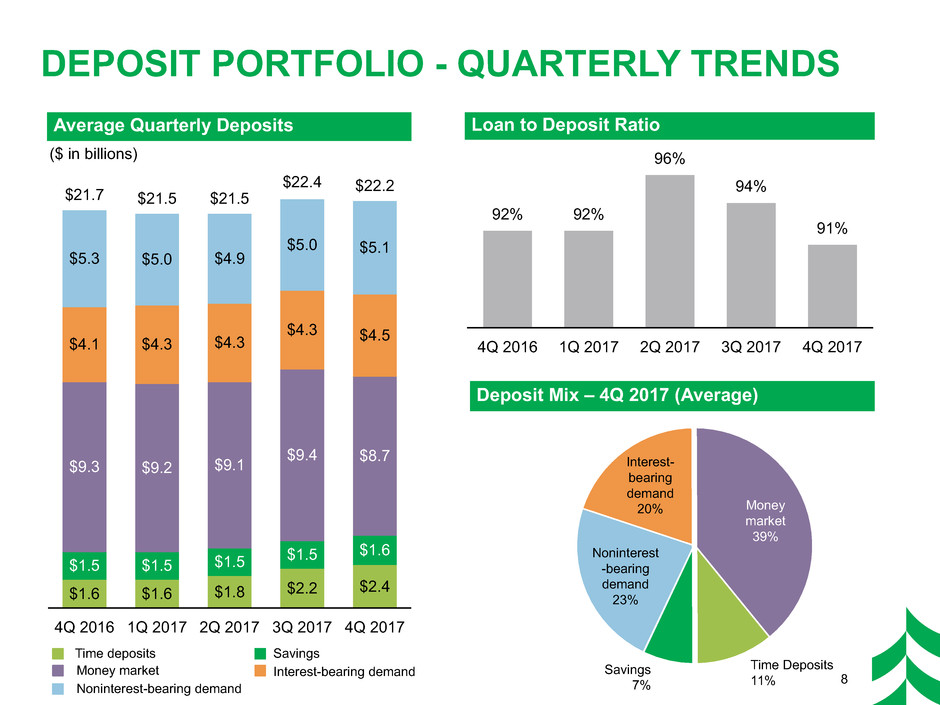
DEPOSIT PORTFOLIO - QUARTERLY TRENDS 4Q 2016 1Q 2017 2Q 2017 3Q 2017 4Q 2017 92% 92% 96% 94% 91% 8 ($ in billions) Money market 39% Time Deposits 11% Savings 7% Noninterest -bearing demand 23% Interest- bearing demand 20% 4Q 2016 1Q 2017 2Q 2017 3Q 2017 4Q 2017 $1.6 $1.6 $1.8 $2.2 $2.4 $1.5 $1.5 $1.5 $1.5 $1.6 $9.3 $9.2 $9.1 $9.4 $8.7 $4.1 $4.3 $4.3 $4.3 $4.5 $5.3 $5.0 $4.9 $5.0 $5.1 $21.7 $21.5 $21.5 $22.4 $22.2 Loan to Deposit Ratio Deposit Mix – 4Q 2017 (Average) Average Quarterly Deposits Time deposits Money market Noninterest-bearing demand Savings Interest-bearing demand
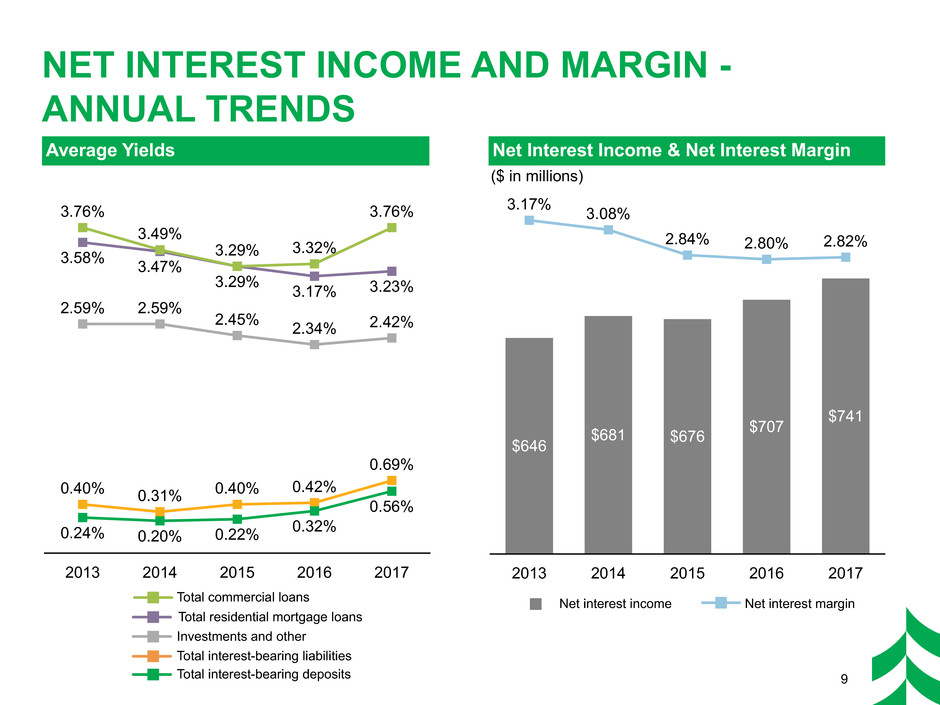
9 NET INTEREST INCOME AND MARGIN - ANNUAL TRENDS 2013 2014 2015 2016 2017 $646 $681 $676 $707 $741 3.17% 3.08% 2.84% 2.80% 2.82% Average Yields Net Interest Income & Net Interest Margin ($ in millions) Net interest income Net interest marginTotal commercial loans Investments and other Total residential mortgage loans Total interest-bearing liabilities 2013 2014 2015 2016 2017 3.76% 3.49% 3.29% 3.32% 3.76% 3.58% 3.47% 3.29% 3.17% 3.23% 2.59% 2.59% 2.45% 2.34% 2.42% 0.24% 0.20% 0.22% 0.32% 0.56% 0.40% 0.31% 0.40% 0.42% 0.69% Total interest-bearing deposits
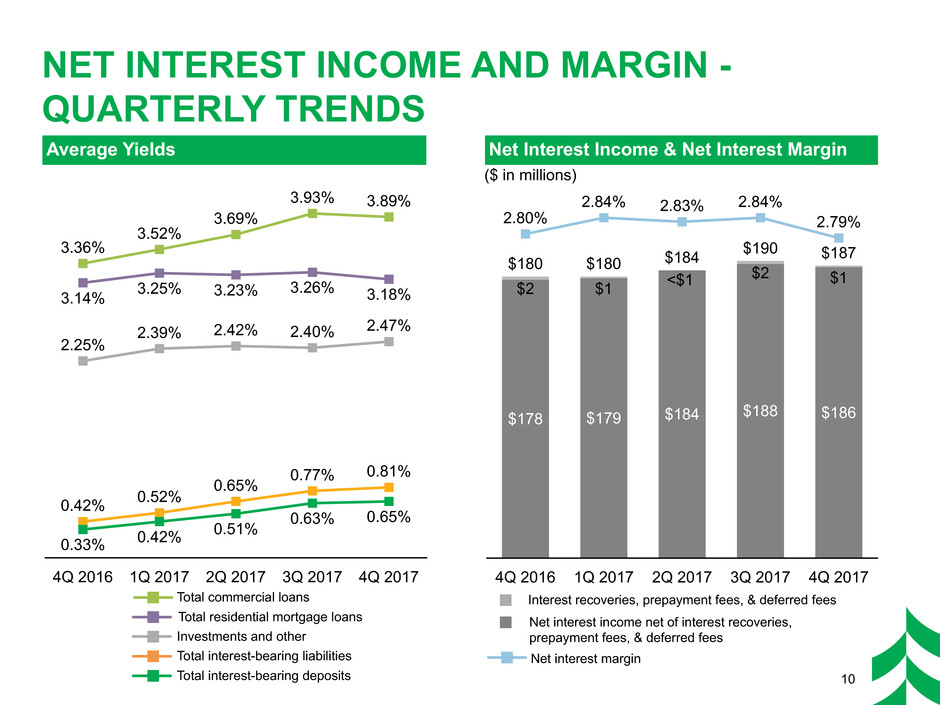
10 NET INTEREST INCOME AND MARGIN - QUARTERLY TRENDS 4Q 2016 1Q 2017 2Q 2017 3Q 2017 4Q 2017 $178 $179 $184 $184 $188 $186 $2 $180 $1 $180 $2 $190 $1 $187 2.80% 2.84% 2.83% 2.84% 2.79% Average Yields Net Interest Income & Net Interest Margin ($ in millions) Interest recoveries, prepayment fees, & deferred fees Net interest income net of interest recoveries, prepayment fees, & deferred fees Net interest margin Total commercial loans Investments and other Total residential mortgage loans Total interest-bearing liabilities <$1 4Q 2016 1Q 2017 2Q 2017 3Q 2017 4Q 2017 3.36% 3.52% 3.69% 3.93% 3.89% 3.14% 3.25% 3.23% 3.26% 3.18% 2.25% 2.39% 2.42% 2.40% 2.47% 0.33% 0.42% 0.51% 0.63% 0.65%0.42% 0.52% 0.65% 0.77% 0.81% Total interest-bearing deposits
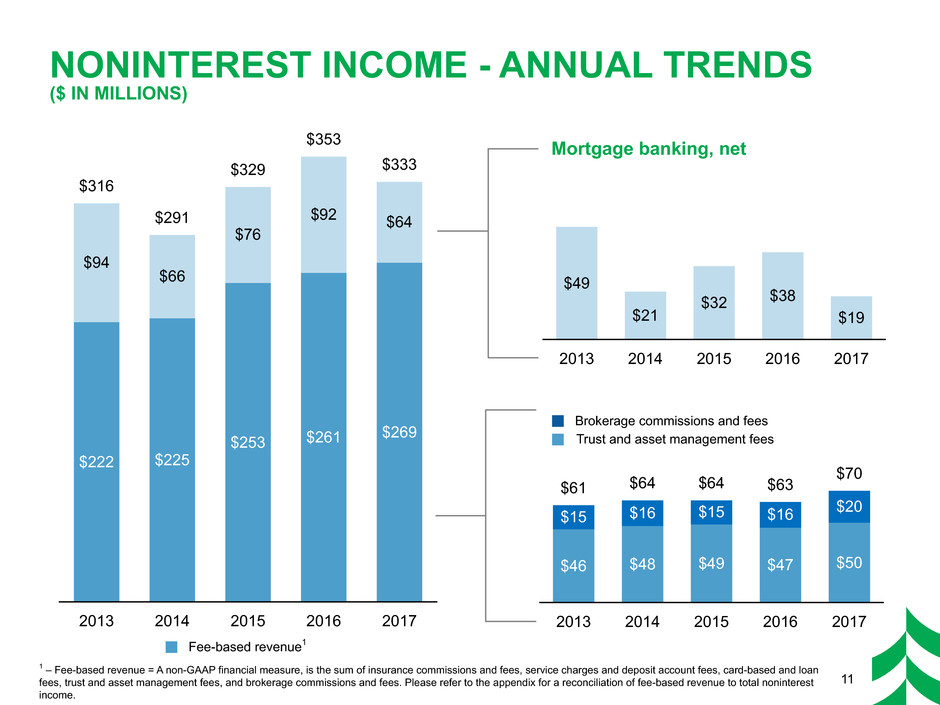
2013 2014 2015 2016 2017 $49 $21 $32 $38 $19 2013 2014 2015 2016 2017 $222 $225 $253 $261 $269 $94 $66 $76 $92 $64 $316 $291 $329 $353 $333 NONINTEREST INCOME - ANNUAL TRENDS ($ IN MILLIONS) 1 – Fee-based revenue = A non-GAAP financial measure, is the sum of insurance commissions and fees, service charges and deposit account fees, card-based and loan fees, trust and asset management fees, and brokerage commissions and fees. Please refer to the appendix for a reconciliation of fee-based revenue to total noninterest income. Fee-based revenue1 11 2013 2014 2015 2016 2017 $46 $48 $49 $47 $50 $15 $16 $15 $16 $20 $61 $64 $64 $63 $70 Trust and asset management fees Brokerage commissions and fees Mortgage banking, net
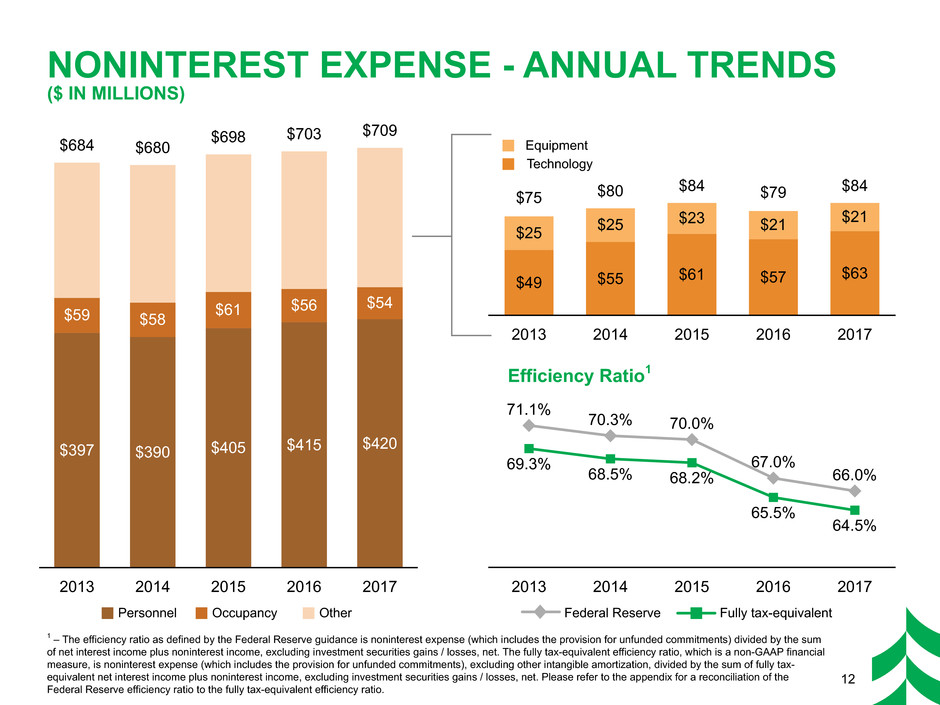
NONINTEREST EXPENSE - ANNUAL TRENDS ($ IN MILLIONS) 2013 2014 2015 2016 2017 71.1% 70.3% 70.0% 67.0% 66.0%69.3% 68.5% 68.2% 65.5% 64.5% 2013 2014 2015 2016 2017 $397 $390 $405 $415 $420 $59 $58 $61 $56 $54 $684 $680 $698 $703 $709 1 – The efficiency ratio as defined by the Federal Reserve guidance is noninterest expense (which includes the provision for unfunded commitments) divided by the sum of net interest income plus noninterest income, excluding investment securities gains / losses, net. The fully tax-equivalent efficiency ratio, which is a non-GAAP financial measure, is noninterest expense (which includes the provision for unfunded commitments), excluding other intangible amortization, divided by the sum of fully tax- equivalent net interest income plus noninterest income, excluding investment securities gains / losses, net. Please refer to the appendix for a reconciliation of the Federal Reserve efficiency ratio to the fully tax-equivalent efficiency ratio. Efficiency Ratio1 Personnel Fully tax-equivalentFederal Reserve 12 Occupancy Other Technology Equipment 2013 2014 2015 2016 2017 $49 $55 $61 $57 $63 $25 $25 $23 $21 $21 $75 $80 $84 $79 $84
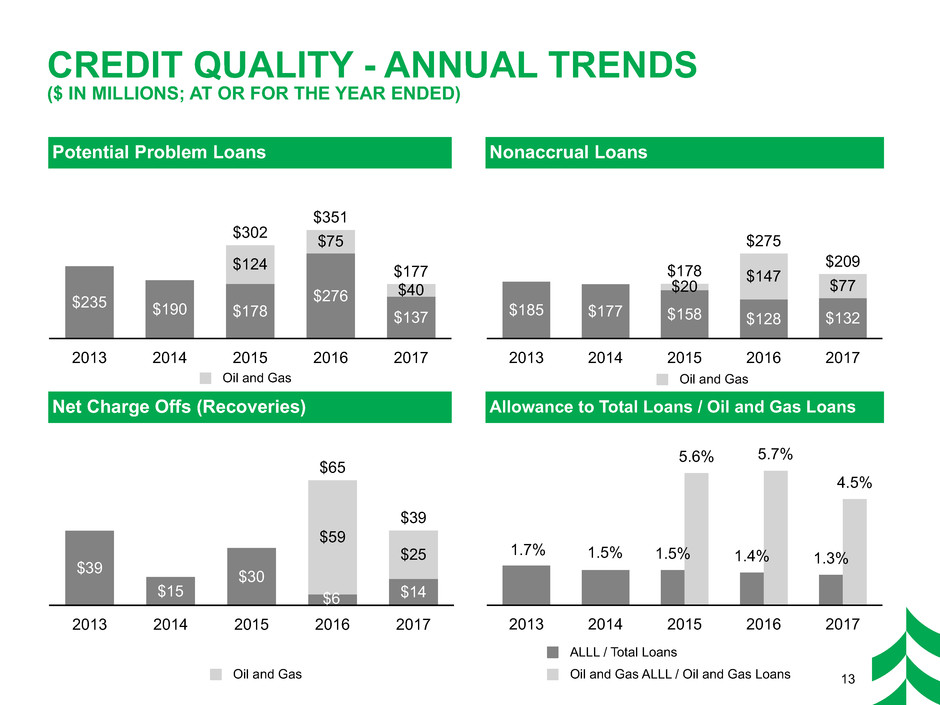
13 CREDIT QUALITY - ANNUAL TRENDS ($ IN MILLIONS; AT OR FOR THE YEAR ENDED) Potential Problem Loans Nonaccrual Loans Net Charge Offs (Recoveries) Allowance to Total Loans / Oil and Gas Loans 2013 2014 2015 2016 2017 $235 $190 $178 $276 $137 $124 $302 $75 $351 $40 $177 2013 2014 2015 2016 2017 $185 $177 $158 $128 $132 $20 $178 $147 $275 $77 $209 2013 2014 2015 2016 2017 1.5% 1.4% 1.3% 5.6% 5.7% 4.5% Oil and Gas Oil and Gas Oil and Gas ALLL / Total Loans Oil and Gas ALLL / Oil and Gas Loans 2013 2014 2015 2016 2017 $39 $15 $30 $14 $59 $65 $25 $39 $6 1.7% 1.5%
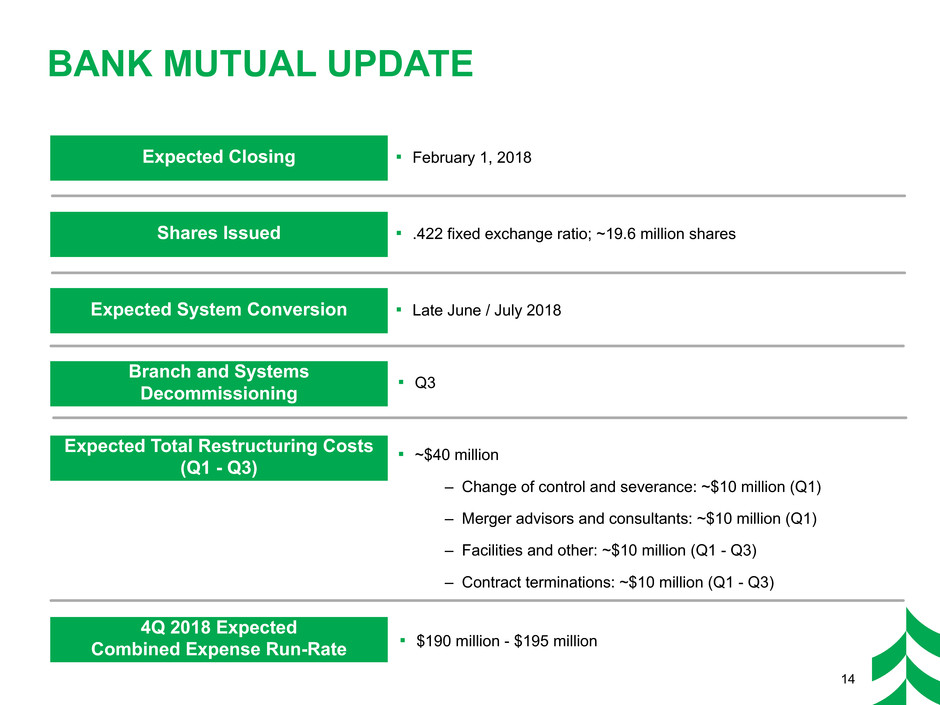
BANK MUTUAL UPDATE Expected Closing 14 Expected System Conversion Branch and Systems Decommissioning Expected Total Restructuring Costs (Q1 - Q3) ▪ February 1, 2018 ▪ Late June / July 2018 ▪ Q3 ▪ ~$40 million – Change of control and severance: ~$10 million (Q1) – Merger advisors and consultants: ~$10 million (Q1) – Facilities and other: ~$10 million (Q1 - Q3) – Contract terminations: ~$10 million (Q1 - Q3) Shares Issued ▪ .422 fixed exchange ratio; ~19.6 million shares 4Q 2018 Expected Combined Expense Run-Rate ▪ $190 million - $195 million
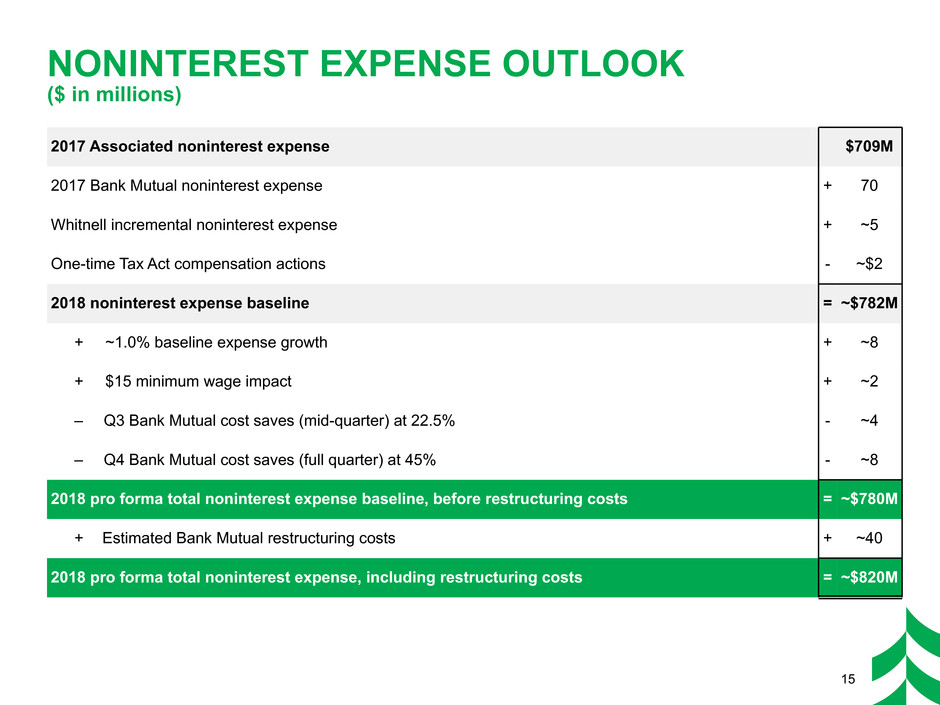
NONINTEREST EXPENSE OUTLOOK ($ in millions) 15 2017 Associated noninterest expense $709M 2017 Bank Mutual noninterest expense + 70 Whitnell incremental noninterest expense + ~5 One-time Tax Act compensation actions - ~$2 2018 noninterest expense baseline = ~$782M + ~1.0% baseline expense growth + ~8 + $15 minimum wage impact + ~2 – Q3 Bank Mutual cost saves (mid-quarter) at 22.5% - ~4 – Q4 Bank Mutual cost saves (full quarter) at 45% - ~8 2018 pro forma total noninterest expense baseline, before restructuring costs = ~$780M + Estimated Bank Mutual restructuring costs + ~40 2018 pro forma total noninterest expense, including restructuring costs = ~$820M
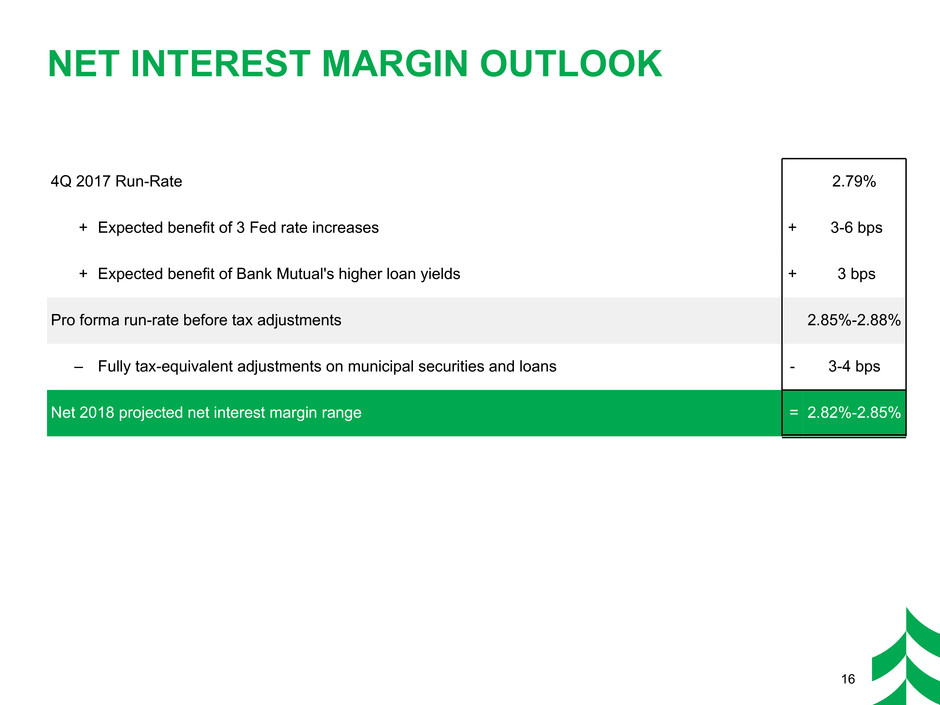
NET INTEREST MARGIN OUTLOOK 16 4Q 2017 Run-Rate 2.79% + Expected benefit of 3 Fed rate increases + 3-6 bps + Expected benefit of Bank Mutual's higher loan yields + 3 bps Pro forma run-rate before tax adjustments 2.85%-2.88% – Fully tax-equivalent adjustments on municipal securities and loans - 3-4 bps Net 2018 projected net interest margin range '= 2.82%-2.85%
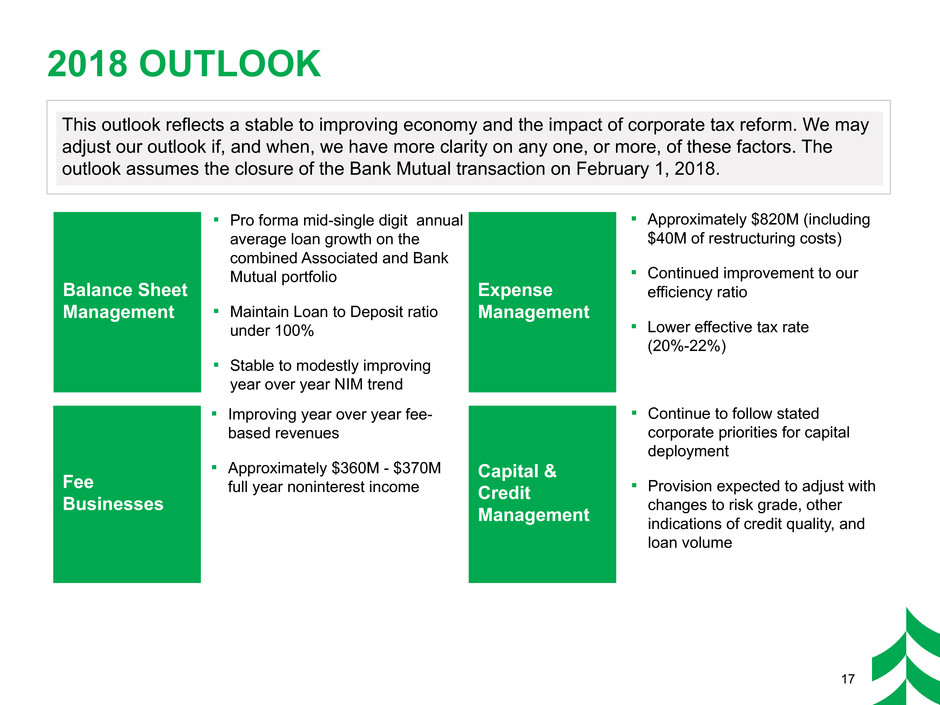
2018 OUTLOOK Balance Sheet Management ▪ Pro forma mid-single digit annual average loan growth on the combined Associated and Bank Mutual portfolio ▪ Maintain Loan to Deposit ratio under 100% ▪ Stable to modestly improving year over year NIM trend Fee Businesses ▪ Improving year over year fee- based revenues ▪ Approximately $360M - $370M full year noninterest income Expense Management ▪ Approximately $820M (including $40M of restructuring costs) ▪ Continued improvement to our efficiency ratio ▪ Lower effective tax rate (20%-22%) Capital & Credit Management ▪ Continue to follow stated corporate priorities for capital deployment ▪ Provision expected to adjust with changes to risk grade, other indications of credit quality, and loan volume This outlook reflects a stable to improving economy and the impact of corporate tax reform. We may adjust our outlook if, and when, we have more clarity on any one, or more, of these factors. The outlook assumes the closure of the Bank Mutual transaction on February 1, 2018. 17

APPENDIX
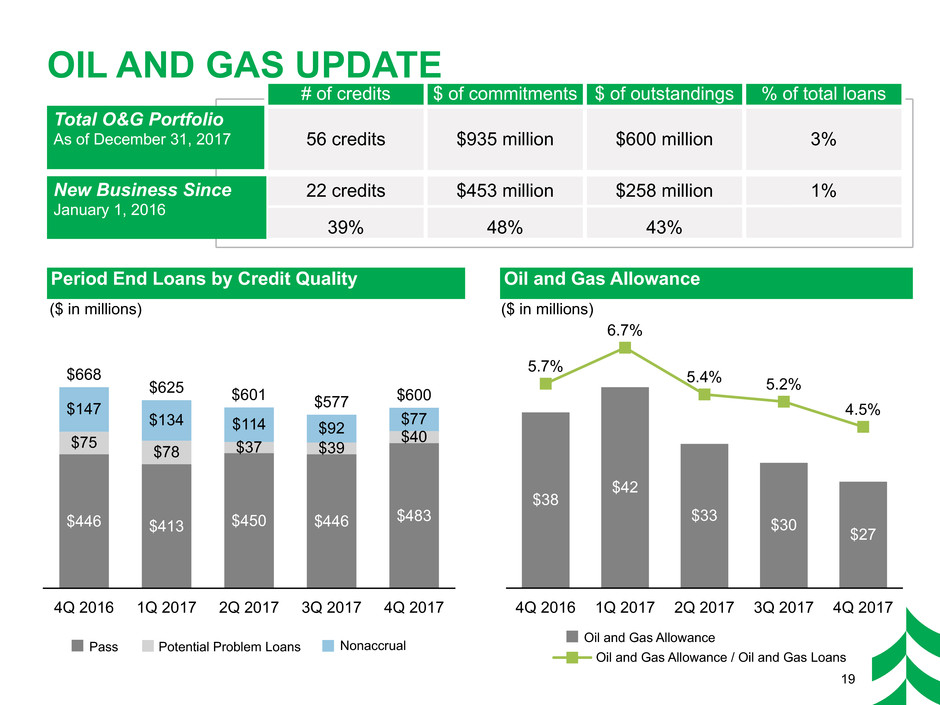
19 OIL AND GAS UPDATE Period End Loans by Credit Quality Oil and Gas Allowance ($ in millions) ($ in millions) 4Q 2016 1Q 2017 2Q 2017 3Q 2017 4Q 2017 5.7% 6.7% 5.4% 5.2% 4.5% $38 $42 $33 $30 $27 Total O&G Portfolio As of December 31, 2017 # of credits $ of commitments $ of outstandings % of total loans 56 credits $935 million $600 million 3% 22 credits 39% $453 million 48% $258 million 43% 1% Pass Potential Problem Loans Nonaccrual Oil and Gas Allowance Oil and Gas Allowance / Oil and Gas Loans 4Q 2016 1Q 2017 2Q 2017 3Q 2017 4Q 2017 $446 $413 $450 $446 $483 $75 $78 $37 $39 $40 $147 $668 $134 $625 $114 $601 $92 $577 $77 $600 New Business Since January 1, 2016
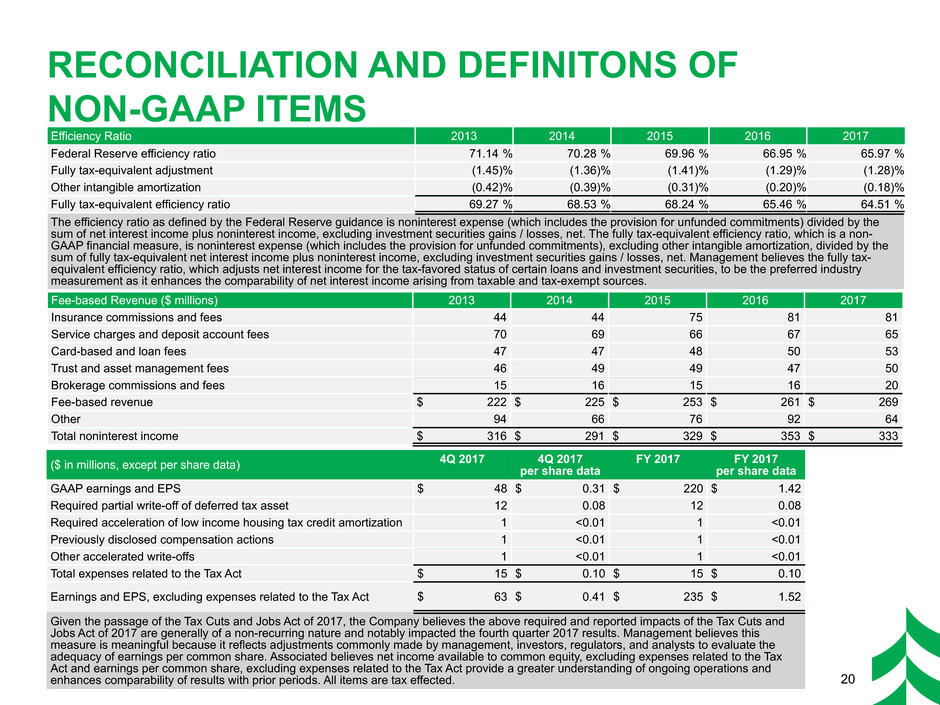
20 RECONCILIATION AND DEFINITONS OF NON-GAAP ITEMS Efficiency Ratio 2013 2014 2015 2016 2017 Federal Reserve efficiency ratio 71.14 % 70.28 % 69.96 % 66.95 % 65.97 % Fully tax-equivalent adjustment (1.45)% (1.36)% (1.41)% (1.29)% (1.28)% Other intangible amortization (0.42)% (0.39)% (0.31)% (0.20)% (0.18)% Fully tax-equivalent efficiency ratio 69.27 % 68.53 % 68.24 % 65.46 % 64.51 % The efficiency ratio as defined by the Federal Reserve guidance is noninterest expense (which includes the provision for unfunded commitments) divided by the sum of net interest income plus noninterest income, excluding investment securities gains / losses, net. The fully tax-equivalent efficiency ratio, which is a non- GAAP financial measure, is noninterest expense (which includes the provision for unfunded commitments), excluding other intangible amortization, divided by the sum of fully tax-equivalent net interest income plus noninterest income, excluding investment securities gains / losses, net. Management believes the fully tax- equivalent efficiency ratio, which adjusts net interest income for the tax-favored status of certain loans and investment securities, to be the preferred industry measurement as it enhances the comparability of net interest income arising from taxable and tax-exempt sources. Fee-based Revenue ($ millions) 2013 2014 2015 2016 2017 Insurance commissions and fees 44 44 75 81 81 Service charges and deposit account fees 70 69 66 67 65 Card-based and loan fees 47 47 48 50 53 Trust and asset management fees 46 49 49 47 50 Brokerage commissions and fees 15 16 15 16 20 Fee-based revenue $ 222 $ 225 $ 253 $ 261 $ 269 Other 94 66 76 92 64 Total noninterest income $ 316 $ 291 $ 329 $ 353 $ 333 ($ in millions, except per share data) 4Q 2017 4Q 2017per share data FY 2017 FY 2017 per share data GAAP earnings and EPS $ 48 $ 0.31 $ 220 $ 1.42 Required partial write-off of deferred tax asset 12 0.08 12 0.08 Required acceleration of low income housing tax credit amortization 1 <0.01 1 <0.01 Previously disclosed compensation actions 1 <0.01 1 <0.01 Other accelerated write-offs 1 <0.01 1 <0.01 Total expenses related to the Tax Act $ 15 $ 0.10 $ 15 $ 0.10 Earnings and EPS, excluding expenses related to the Tax Act $ 63 $ 0.41 $ 235 $ 1.52 Given the passage of the Tax Cuts and Jobs Act of 2017, the Company believes the above required and reported impacts of the Tax Cuts and Jobs Act of 2017 are generally of a non-recurring nature and notably impacted the fourth quarter 2017 results. Management believes this measure is meaningful because it reflects adjustments commonly made by management, investors, regulators, and analysts to evaluate the adequacy of earnings per common share. Associated believes net income available to common equity, excluding expenses related to the Tax Act and earnings per common share, excluding expenses related to the Tax Act provide a greater understanding of ongoing operations and enhances comparability of results with prior periods. All items are tax effected.


