November 8, 2021 Associated Banc-Corp Fourth Quarter Investor Presentation Exhibit 99.1
1 Forward-Looking Statements Important note regarding forward-looking statements: Statements made in this presentation which are not purely historical are forward-looking statements, as defined in the Private Securities Litigation Reform Act of 1995. This includes any statements regarding management’s plans, objectives, or goals for future operations, products or services, and forecasts of its revenues, earnings, or other measures of performance. Such forward-looking statements may be identified by the use of words such as “believe,” “expect,” “anticipate,” “plan,” “estimate,” “should,” “will,” “intend,” "target,“ “outlook,” “project,” “guidance,” or similar expressions. Forward-looking statements are based on current management expectations and, by their nature, are subject to risks and uncertainties. Actual results may differ materially from those contained in the forward-looking statements. Factors which may cause actual results to differ materially from those contained in such forward-looking statements include those identified in the Company’s most recent Form 10-K and subsequent Form 10-Qs and other SEC filings, and such factors are incorporated herein by reference. Trademarks: All trademarks, service marks, and trade names referenced in this material are official trademarks and the property of their respective owners. Presentation: Within the charts and tables presented, certain segments, columns and rows may not sum to totals shown due to rounding. Non-GAAP Measures: This presentation includes certain non-GAAP financial measures. These non-GAAP measures are provided in addition to, and not as substitutes for, measures of our financial performance determined in accordance with GAAP. Our calculation of these non-GAAP measures may not be comparable to similarly titled measures of other companies due to potential differences between companies in the method of calculation. As a result, the use of these non-GAAP measures has limitations and should not be considered superior to, in isolation from, or as a substitute for, related GAAP measures. Reconciliations of these non-GAAP financial measures to the most directly comparable GAAP financial measures can be found at the end of this presentation.

2 Strategic Vision We’ve set our direction for driving Associated’s shareholder returns higher over the next several years Digital ForwardGrowth Focused ▪ Serving our customers where and when they need us via online, mobile, and other channels ▪ Proactively listening to our customers to deliver differentiated and responsive solutions in real time that add value and deepen engagement ▪ Capitalizing on the opportunities we see in our markets with investments geared to drive the bottom line ▪ Expanding and diversifying revenue with new commercial and consumer lending verticals Transforming our systems to accelerate growth Driving positive core operating leverage and improving ROATCE
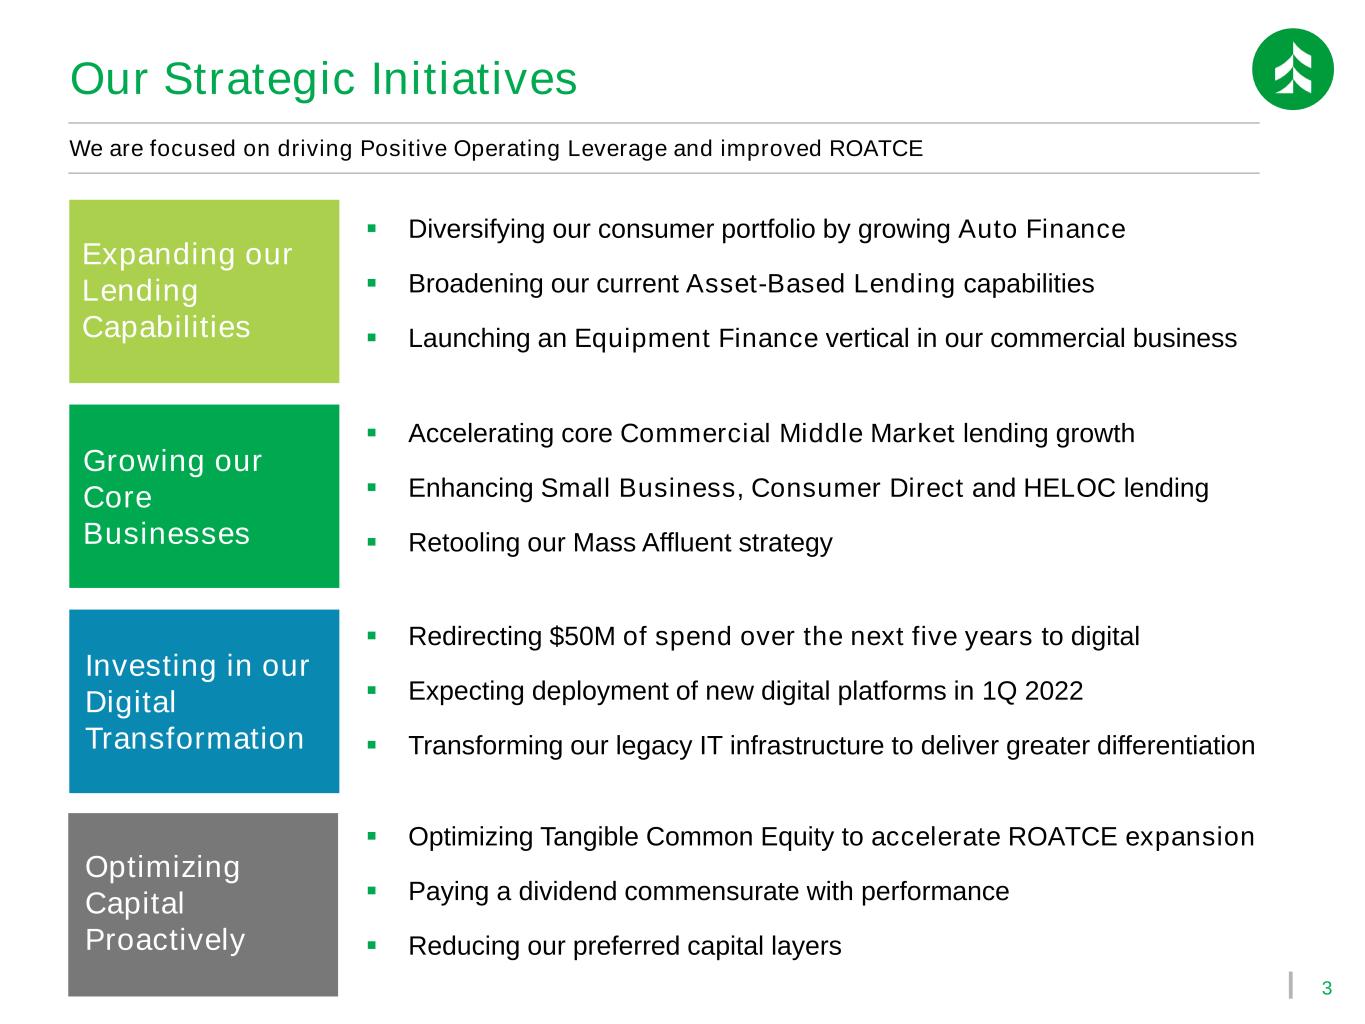
3 Our Strategic Initiatives We are focused on driving Positive Operating Leverage and improved ROATCE Expanding our Lending Capabilities Growing our Core Businesses Investing in our Digital Transformation ▪ Diversifying our consumer portfolio by growing Auto Finance ▪ Broadening our current Asset-Based Lending capabilities ▪ Launching an Equipment Finance vertical in our commercial business ▪ Accelerating core Commercial Middle Market lending growth ▪ Enhancing Small Business, Consumer Direct and HELOC lending ▪ Retooling our Mass Affluent strategy Optimizing Capital Proactively ▪ Redirecting $50M of spend over the next five years to digital ▪ Expecting deployment of new digital platforms in 1Q 2022 ▪ Transforming our legacy IT infrastructure to deliver greater differentiation ▪ Optimizing Tangible Common Equity to accelerate ROATCE expansion ▪ Paying a dividend commensurate with performance ▪ Reducing our preferred capital layers
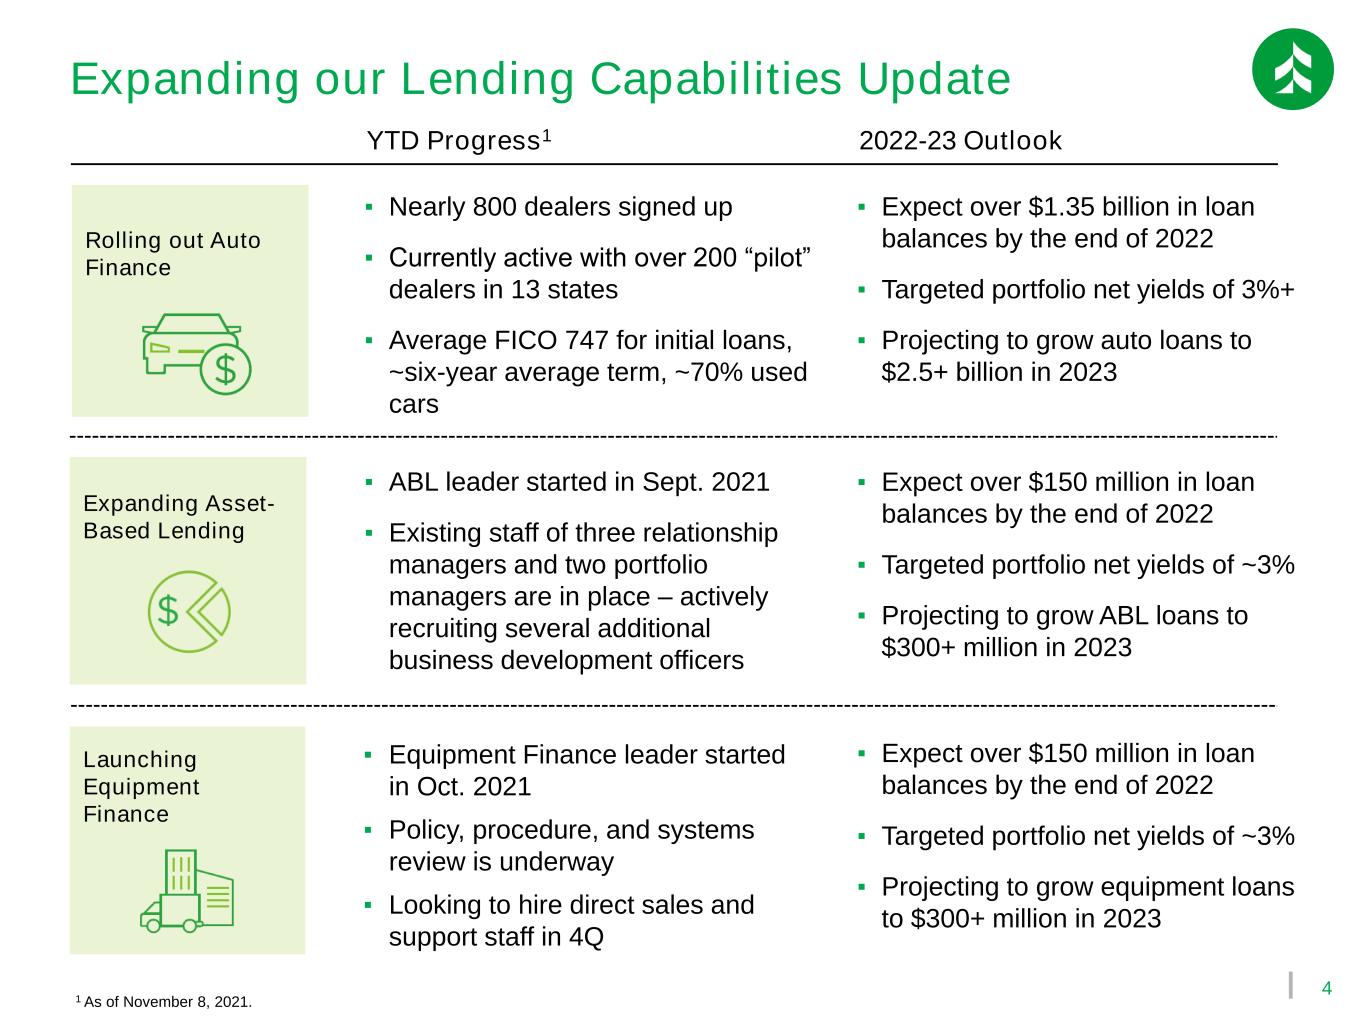
4 Expanding Asset- Based Lending Expanding our Lending Capabilities Update ▪ Equipment Finance leader started in Oct. 2021 ▪ Policy, procedure, and systems review is underway ▪ Looking to hire direct sales and support staff in 4Q ▪ ABL leader started in Sept. 2021 ▪ Existing staff of three relationship managers and two portfolio managers are in place – actively recruiting several additional business development officers ▪ Expect over $150 million in loan balances by the end of 2022 ▪ Targeted portfolio net yields of ~3% ▪ Projecting to grow equipment loans to $300+ million in 2023 ▪ Expect over $150 million in loan balances by the end of 2022 ▪ Targeted portfolio net yields of ~3% ▪ Projecting to grow ABL loans to $300+ million in 2023 Rolling out Auto Finance ▪ Nearly 800 dealers signed up ▪ Currently active with over 200 “pilot” dealers in 13 states ▪ Average FICO 747 for initial loans, ~six-year average term, ~70% used cars ▪ Expect over $1.35 billion in loan balances by the end of 2022 ▪ Targeted portfolio net yields of 3%+ ▪ Projecting to grow auto loans to $2.5+ billion in 2023 YTD Progress1 2022-23 Outlook Launching Equipment Finance 1 As of November 8, 2021.
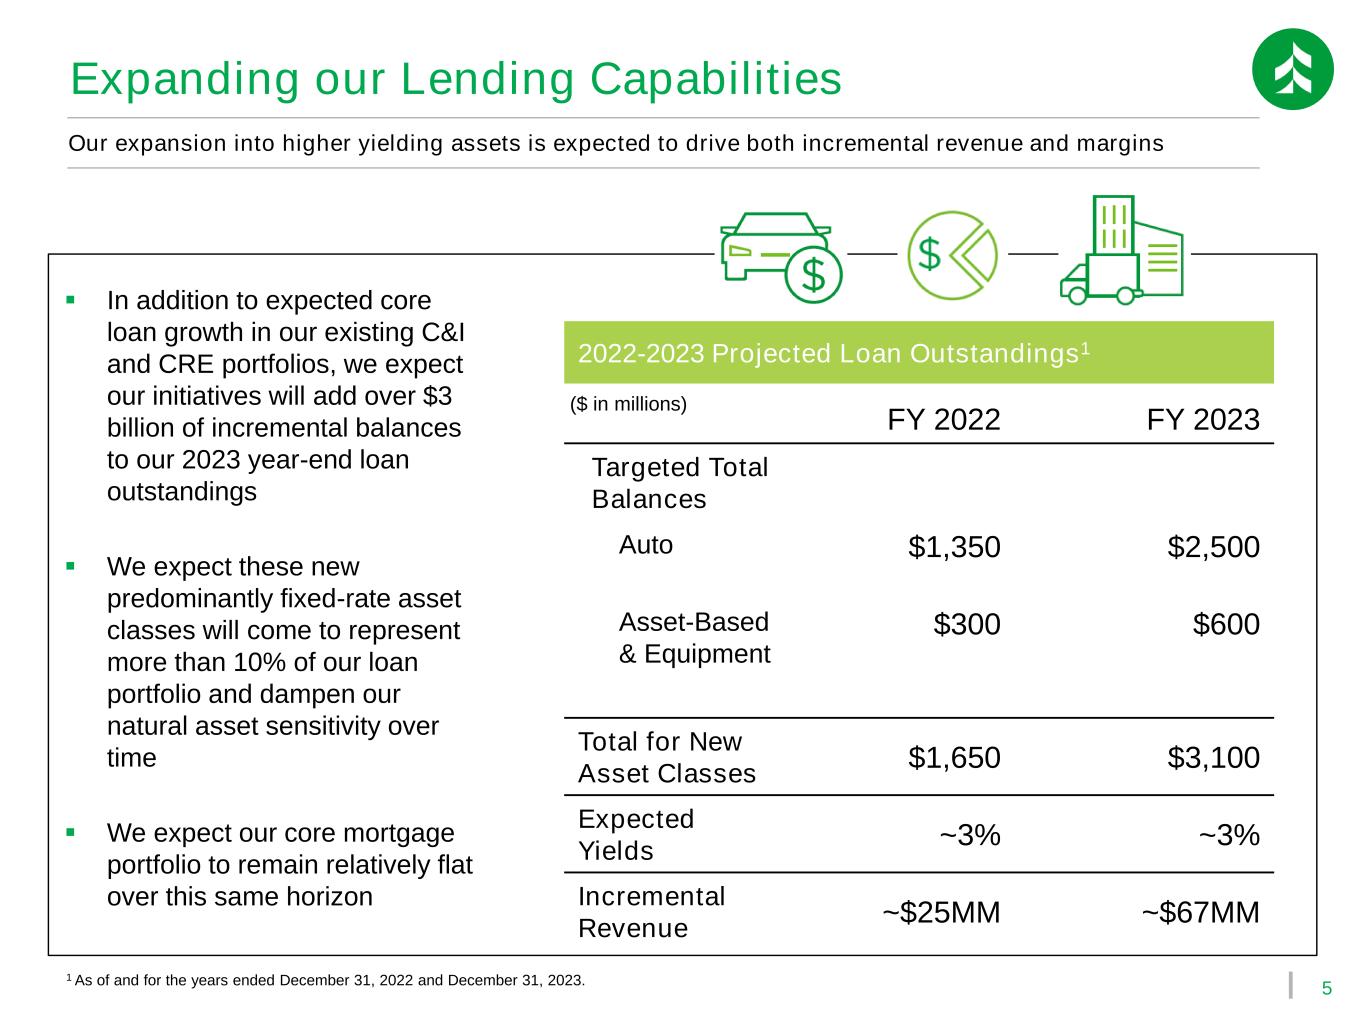
5 Expanding our Lending Capabilities FY 2022 FY 2023 Targeted Total Balances Auto $1,350 $2,500 Asset-Based & Equipment $300 $600 Total for New Asset Classes $1,650 $3,100 Expected Yields ~3% ~3% Incremental Revenue ~$25MM ~$67MM 2022-2023 Projected Loan Outstandings1 ▪ In addition to expected core loan growth in our existing C&I and CRE portfolios, we expect our initiatives will add over $3 billion of incremental balances to our 2023 year-end loan outstandings ▪ We expect these new predominantly fixed-rate asset classes will come to represent more than 10% of our loan portfolio and dampen our natural asset sensitivity over time ▪ We expect our core mortgage portfolio to remain relatively flat over this same horizon ($ in millions) Our expansion into higher yielding assets is expected to drive both incremental revenue and margins 1 As of and for the years ended December 31, 2022 and December 31, 2023.
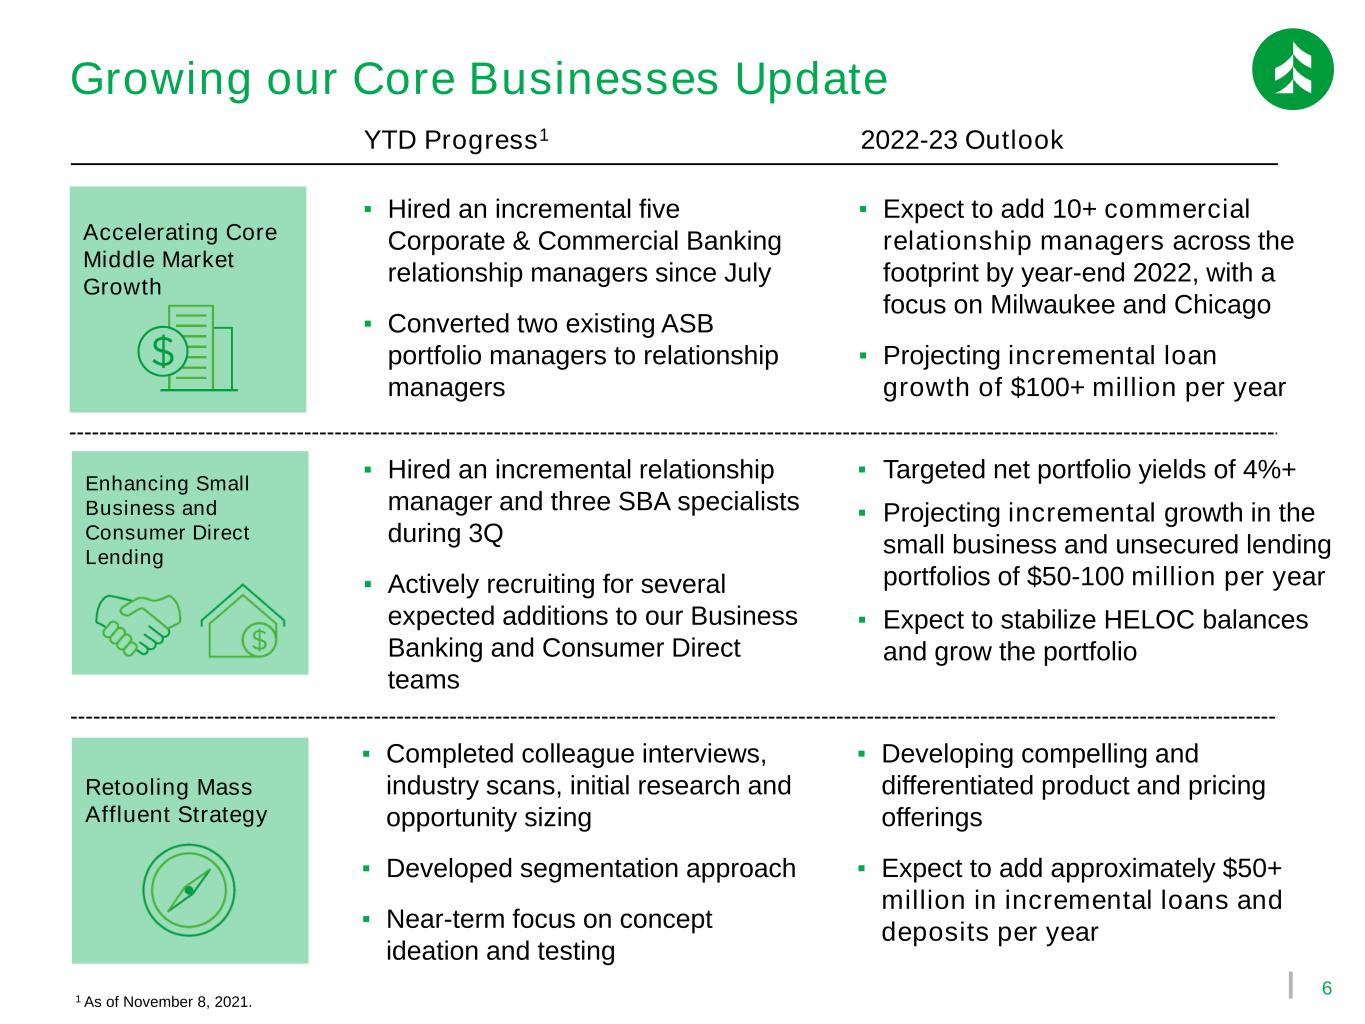
6 Enhancing Small Business and Consumer Direct Lending Retooling Mass Affluent Strategy Accelerating Core Middle Market Growth Growing our Core Businesses Update ▪ Hired an incremental relationship manager and three SBA specialists during 3Q ▪ Actively recruiting for several expected additions to our Business Banking and Consumer Direct teams ▪ Completed colleague interviews, industry scans, initial research and opportunity sizing ▪ Developed segmentation approach ▪ Near-term focus on concept ideation and testing ▪ Targeted net portfolio yields of 4%+ ▪ Projecting incremental growth in the small business and unsecured lending portfolios of $50-100 million per year ▪ Expect to stabilize HELOC balances and grow the portfolio ▪ Developing compelling and differentiated product and pricing offerings ▪ Expect to add approximately $50+ million in incremental loans and deposits per year ▪ Hired an incremental five Corporate & Commercial Banking relationship managers since July ▪ Converted two existing ASB portfolio managers to relationship managers ▪ Expect to add 10+ commercial relationship managers across the footprint by year-end 2022, with a focus on Milwaukee and Chicago ▪ Projecting incremental loan growth of $100+ million per year YTD Progress1 2022-23 Outlook 1 As of November 8, 2021.
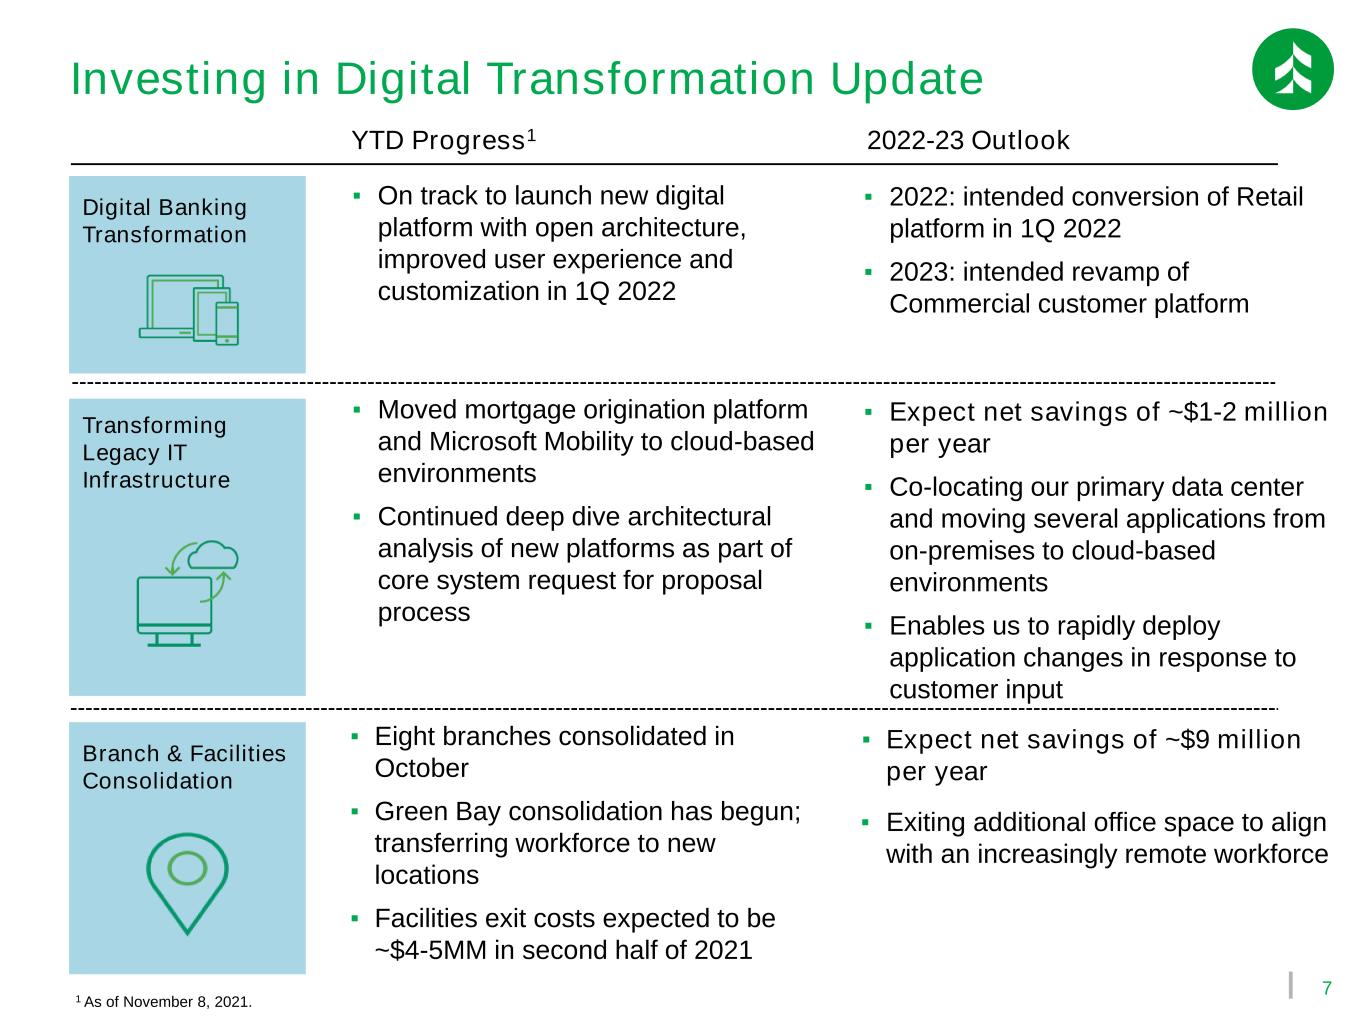
7 Digital Banking Transformation Branch & Facilities Consolidation Transforming Legacy IT Infrastructure Investing in Digital Transformation Update YTD Progress1 2022-23 Outlook ▪ Expect net savings of ~$9 million per year ▪ Exiting additional office space to align with an increasingly remote workforce ▪ 2022: intended conversion of Retail platform in 1Q 2022 ▪ 2023: intended revamp of Commercial customer platform ▪ Eight branches consolidated in October ▪ Green Bay consolidation has begun; transferring workforce to new locations ▪ Facilities exit costs expected to be ~$4-5MM in second half of 2021 ▪ On track to launch new digital platform with open architecture, improved user experience and customization in 1Q 2022 ▪ Expect net savings of ~$1-2 million per year ▪ Co-locating our primary data center and moving several applications from on-premises to cloud-based environments ▪ Enables us to rapidly deploy application changes in response to customer input ▪ Moved mortgage origination platform and Microsoft Mobility to cloud-based environments ▪ Continued deep dive architectural analysis of new platforms as part of core system request for proposal process 1 As of November 8, 2021.
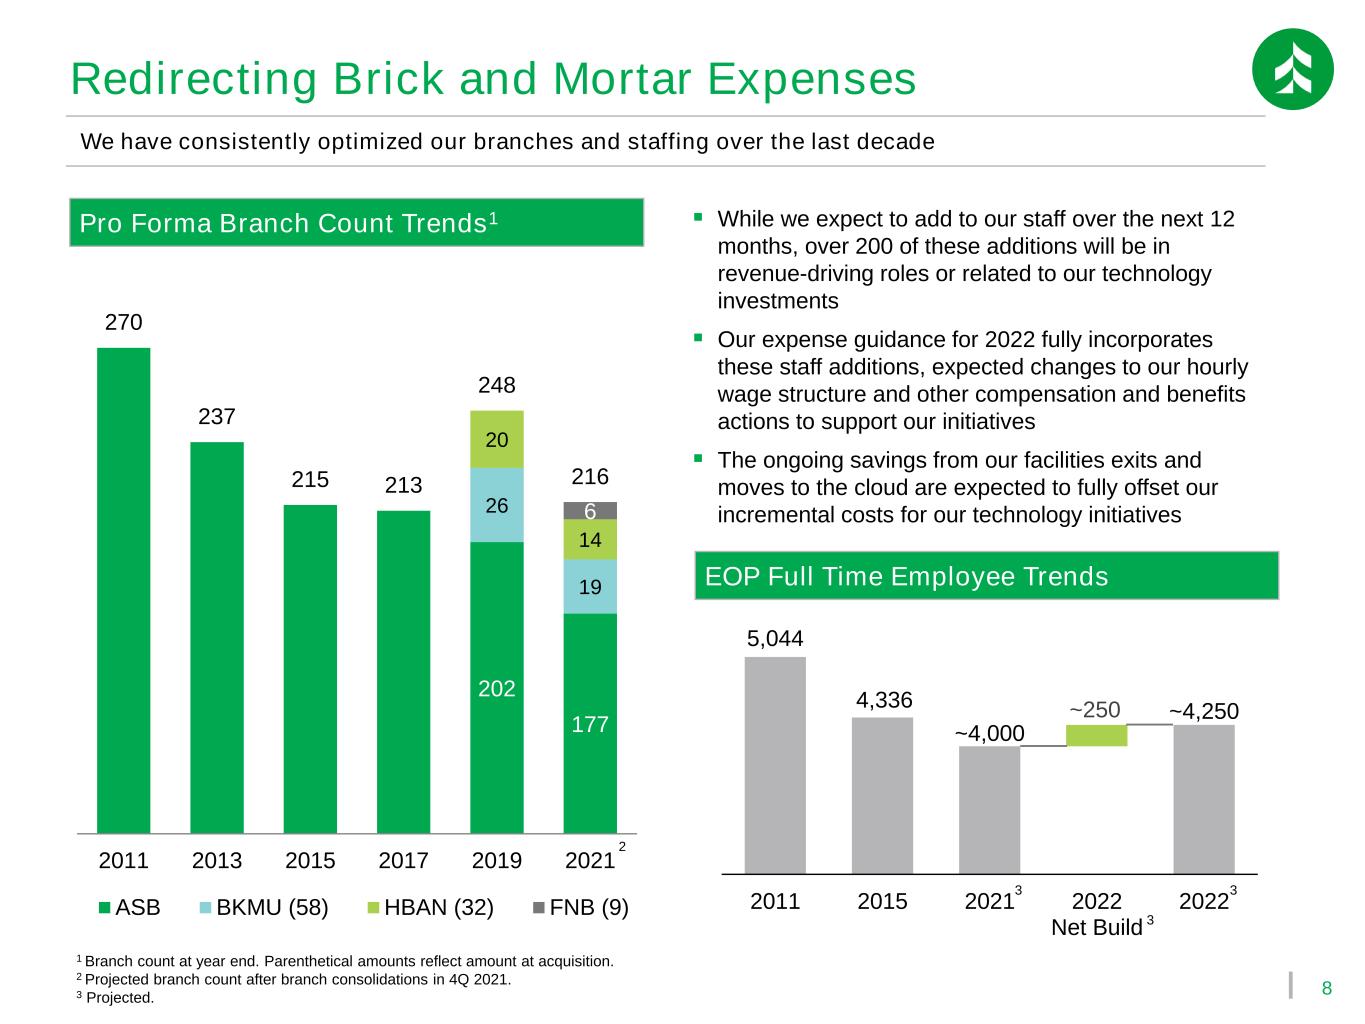
8 Redirecting Brick and Mortar Expenses We have consistently optimized our branches and staffing over the last decade Pro Forma Branch Count Trends1 202 177 26 19 20 14 6 270 237 215 213 248 216 2011 2013 2015 2017 2019 2021 ASB BKMU (58) HBAN (32) FNB (9) 2 1 Branch count at year end. Parenthetical amounts reflect amount at acquisition. 2 Projected branch count after branch consolidations in 4Q 2021. 3 Projected. ▪ While we expect to add to our staff over the next 12 months, over 200 of these additions will be in revenue-driving roles or related to our technology investments ▪ Our expense guidance for 2022 fully incorporates these staff additions, expected changes to our hourly wage structure and other compensation and benefits actions to support our initiatives ▪ The ongoing savings from our facilities exits and moves to the cloud are expected to fully offset our incremental costs for our technology initiatives EOP Full Time Employee Trends 5,044 4,336 ~4,000 ~4,250~250 2011 2015 2021 2022 Net Build 2022 3 3 3
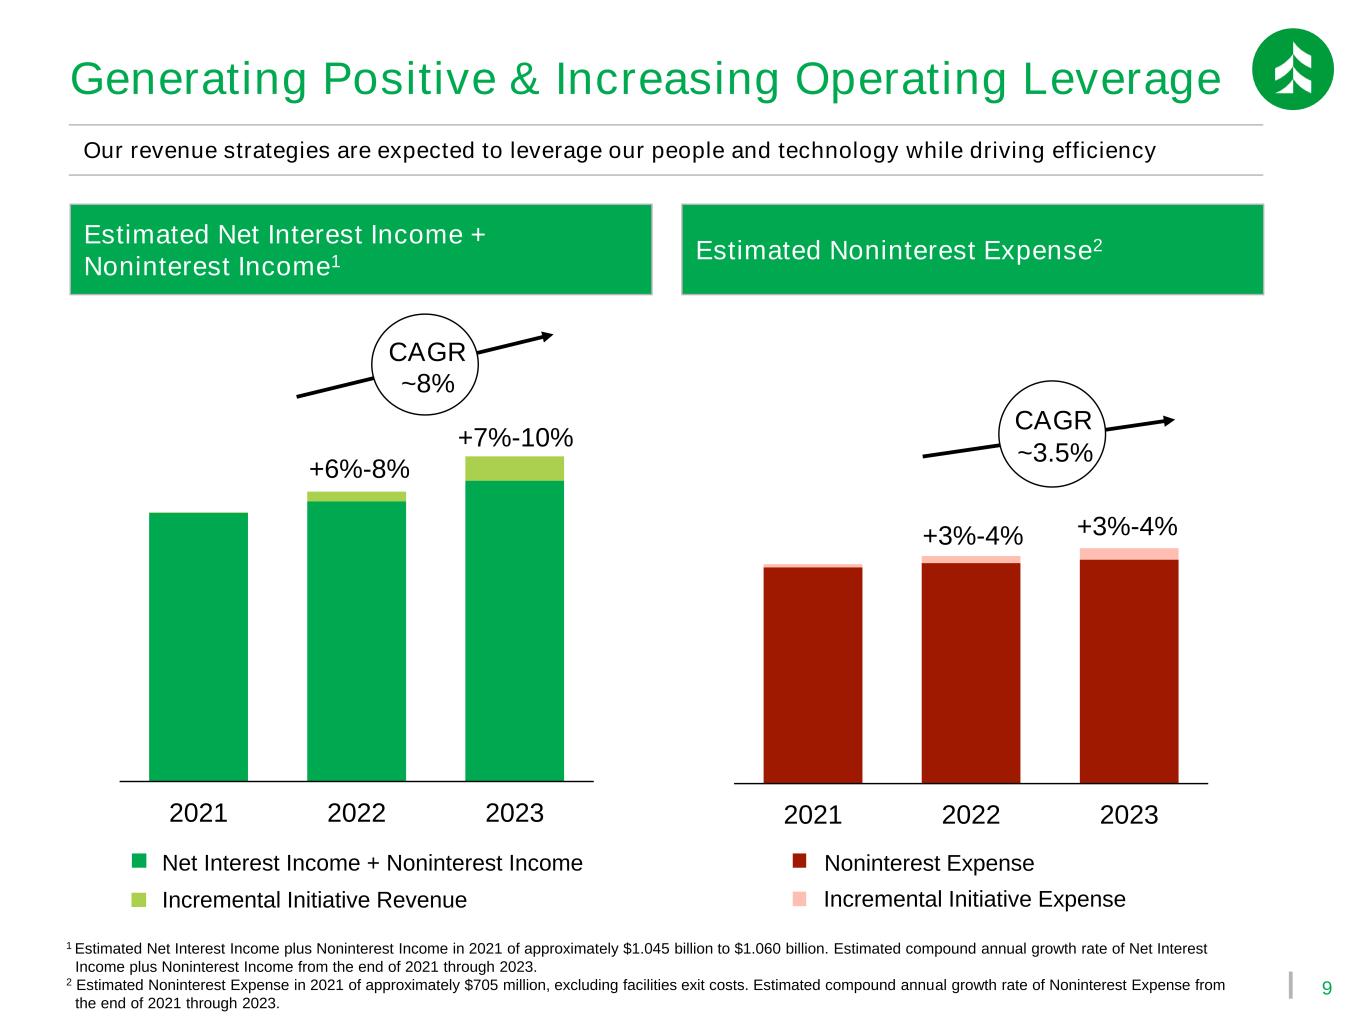
9 +6%-8% +7%-10% 2021 2022 2023 +3%-4% +3%-4% 2021 2022 2023 Generating Positive & Increasing Operating Leverage Our revenue strategies are expected to leverage our people and technology while driving efficiency ~8% ~3.5% CAGR CAGR Estimated Net Interest Income + Noninterest Income1 Estimated Noninterest Expense2 Net Interest Income + Noninterest Income Incremental Initiative Revenue Incremental Initiative Expense Noninterest Expense 1 Estimated Net Interest Income plus Noninterest Income in 2021 of approximately $1.045 billion to $1.060 billion. Estimated compound annual growth rate of Net Interest Income plus Noninterest Income from the end of 2021 through 2023. 2 Estimated Noninterest Expense in 2021 of approximately $705 million, excluding facilities exit costs. Estimated compound annual growth rate of Noninterest Expense from the end of 2021 through 2023.
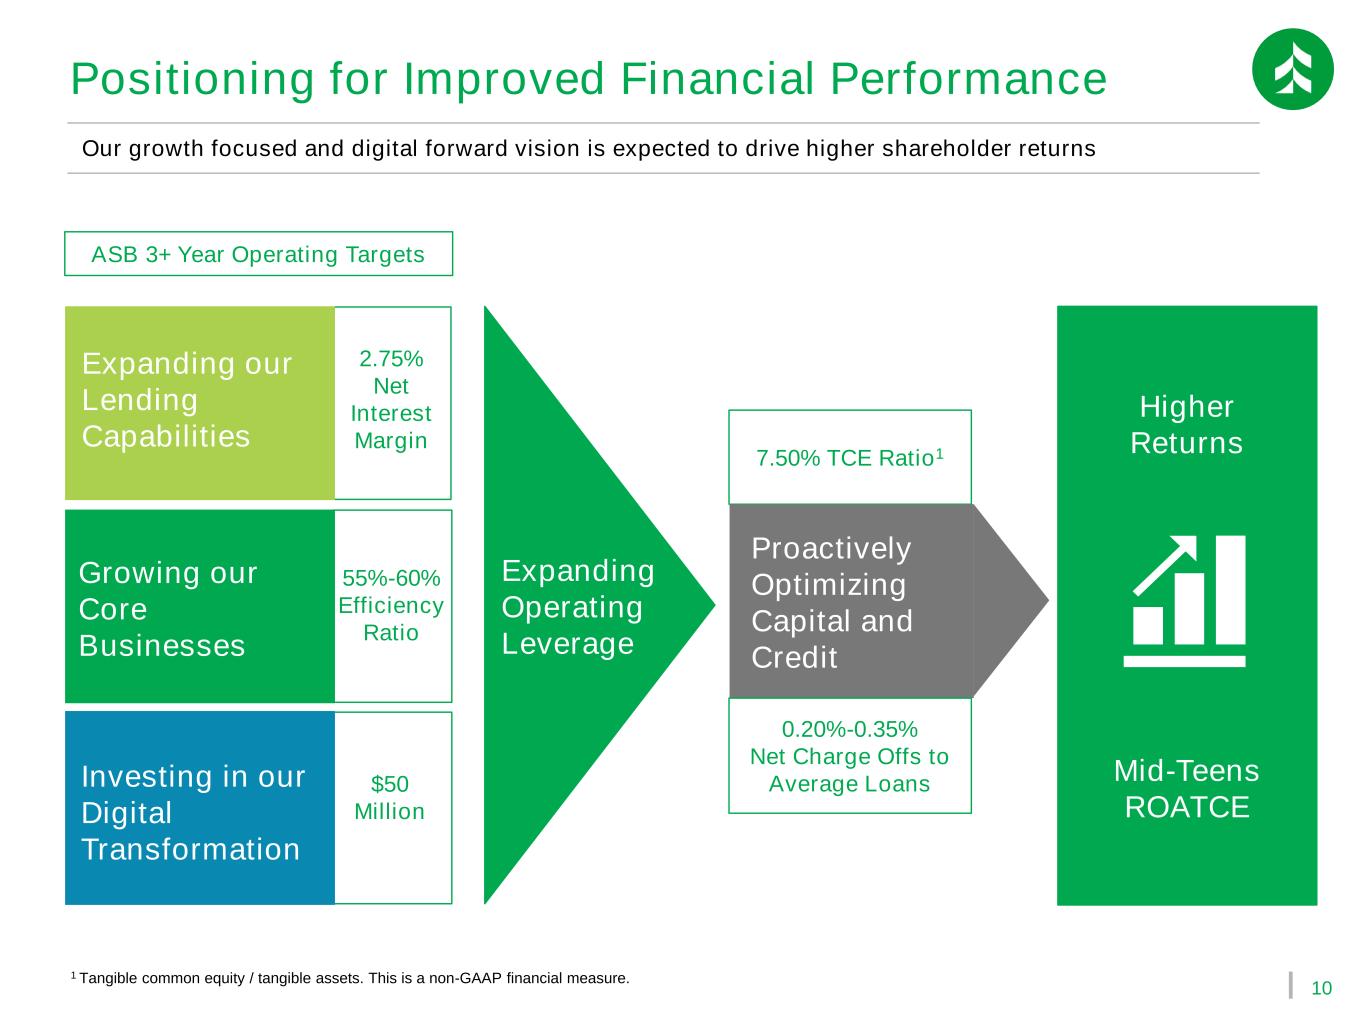
10 7.50% TCE Ratio1 Positioning for Improved Financial Performance Our growth focused and digital forward vision is expected to drive higher shareholder returns Expanding our Lending Capabilities Growing our Core Businesses Investing in our Digital Transformation 2.75% Net Interest Margin 55%-60% Efficiency Ratio Higher Returns Mid-Teens ROATCE Proactively Optimizing Capital and Credit Expanding Operating Leverage ASB 3+ Year Operating Targets $50 Million 0.20%-0.35% Net Charge Offs to Average Loans 1 Tangible common equity / tangible assets. This is a non-GAAP financial measure.
3Q 2021 Financial Trends
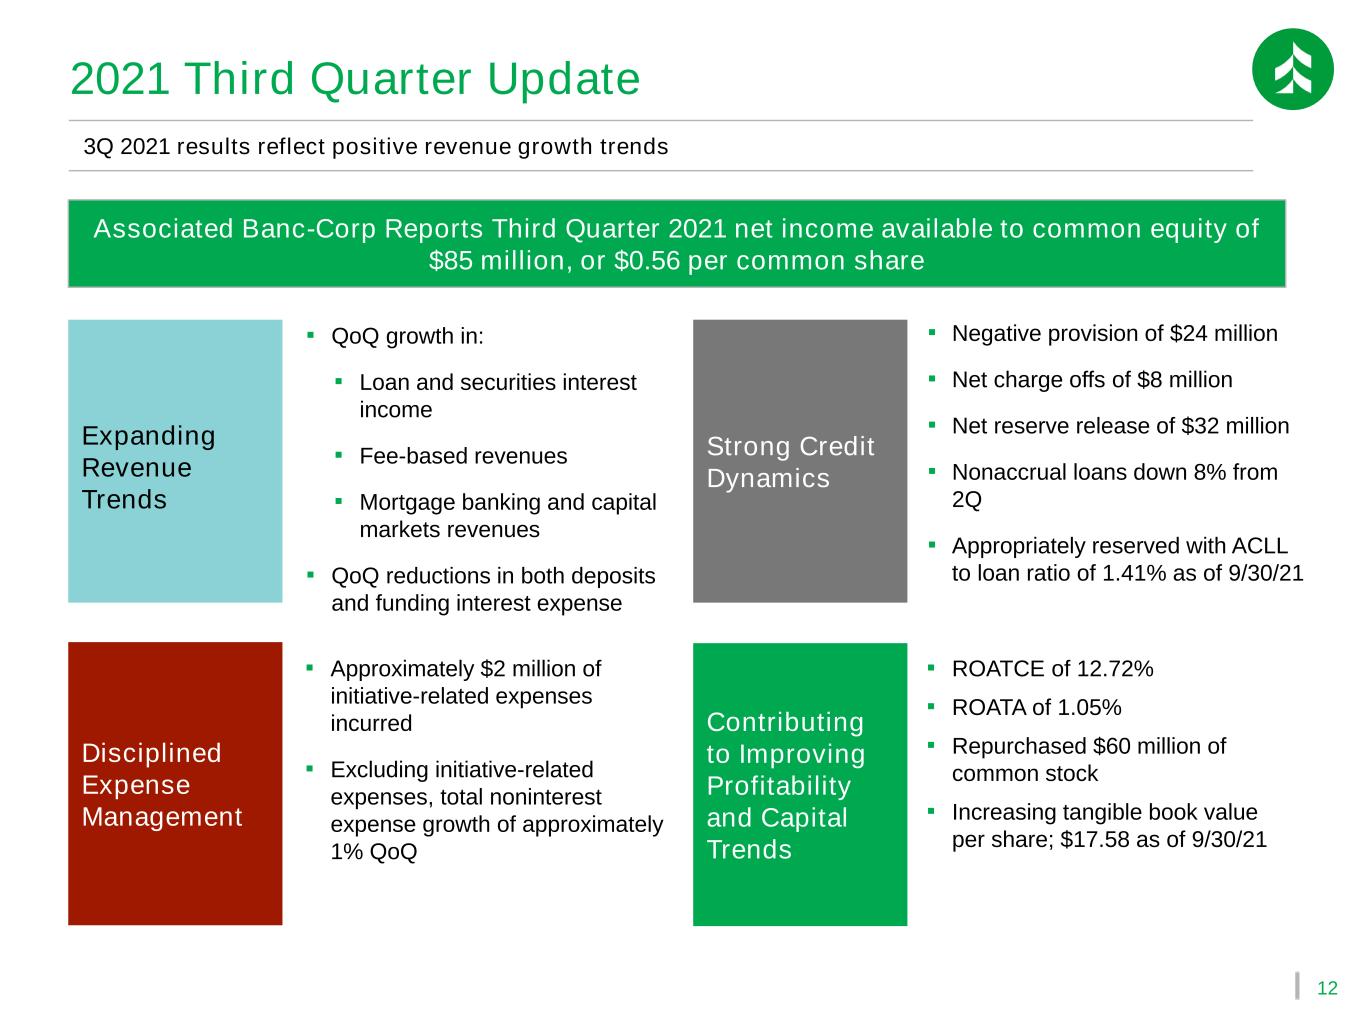
12 Expanding Revenue Trends ▪ QoQ growth in: ▪ Loan and securities interest income ▪ Fee-based revenues ▪ Mortgage banking and capital markets revenues ▪ QoQ reductions in both deposits and funding interest expense Contributing to Improving Profitability and Capital Trends ▪ ROATCE of 12.72% ▪ ROATA of 1.05% ▪ Repurchased $60 million of common stock ▪ Increasing tangible book value per share; $17.58 as of 9/30/21 Strong Credit Dynamics ▪ Negative provision of $24 million ▪ Net charge offs of $8 million ▪ Net reserve release of $32 million ▪ Nonaccrual loans down 8% from 2Q ▪ Appropriately reserved with ACLL to loan ratio of 1.41% as of 9/30/21 ▪ Approximately $2 million of initiative-related expenses incurred ▪ Excluding initiative-related expenses, total noninterest expense growth of approximately 1% QoQ 3Q 2021 results reflect positive revenue growth trends Associated Banc-Corp Reports Third Quarter 2021 net income available to common equity of $85 million, or $0.56 per common share 2021 Third Quarter Update Disciplined Expense Management
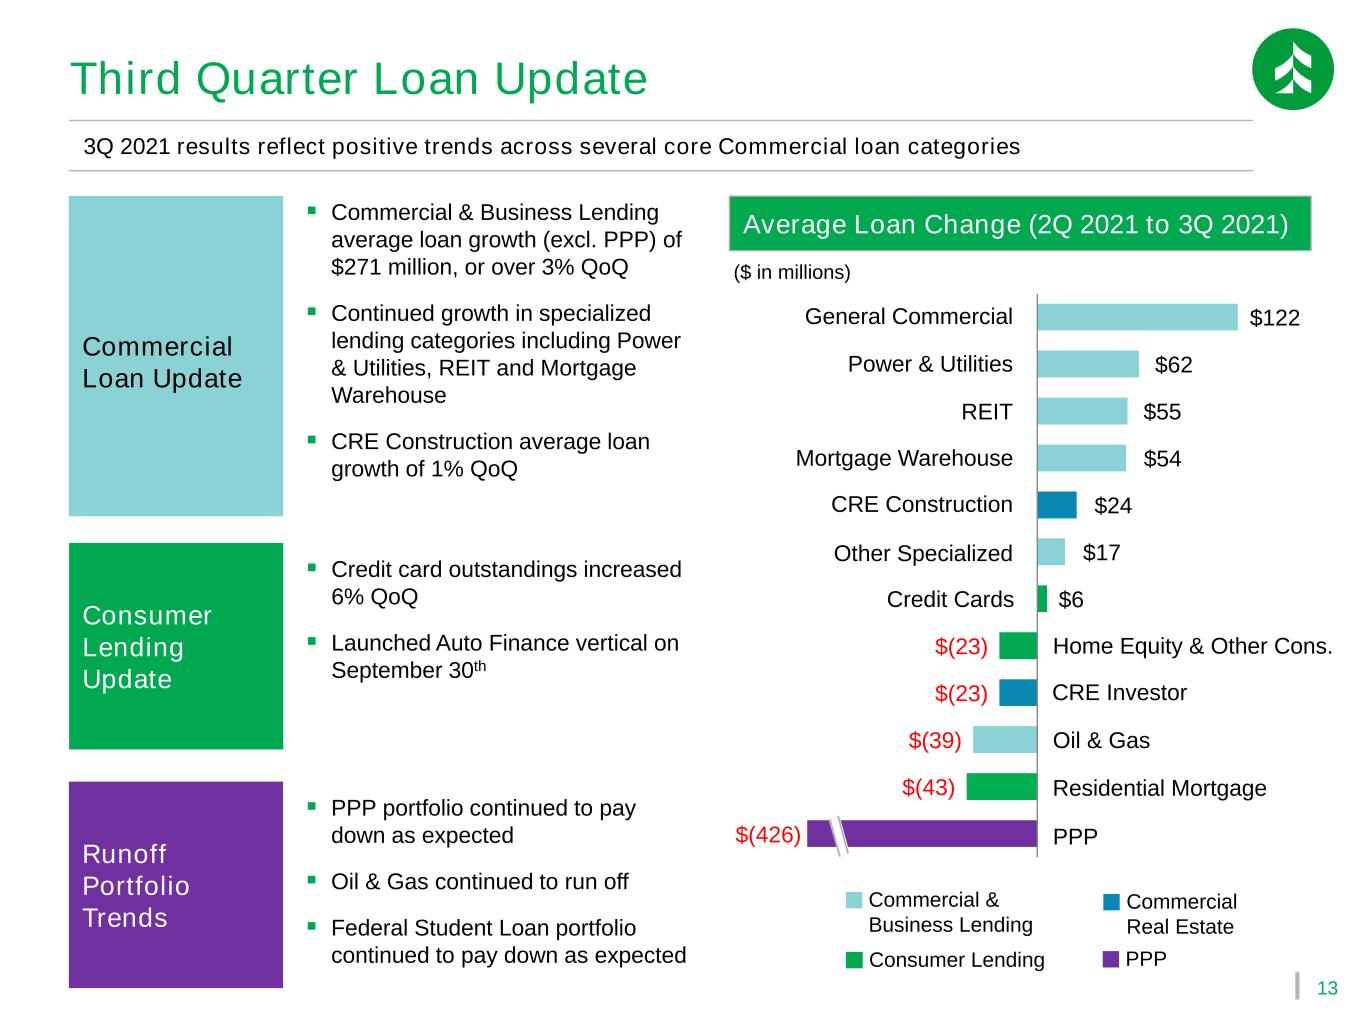
13 Commercial Loan Update ▪ Commercial & Business Lending average loan growth (excl. PPP) of $271 million, or over 3% QoQ ▪ Continued growth in specialized lending categories including Power & Utilities, REIT and Mortgage Warehouse ▪ CRE Construction average loan growth of 1% QoQ ▪ PPP portfolio continued to pay down as expected ▪ Oil & Gas continued to run off ▪ Federal Student Loan portfolio continued to pay down as expected 3Q 2021 results reflect positive trends across several core Commercial loan categories Third Quarter Loan Update Runoff Portfolio Trends $(43) $(39) $(23) $(23) $6 $17 $24 $54 $55 $62 $122 Mortgage Warehouse Residential Mortgage CRE Investor Power & Utilities General Commercial REIT ($ in millions) PPP Credit Cards Average Loan Change (2Q 2021 to 3Q 2021) CRE Construction $(426) Other Specialized ▪ Credit card outstandings increased 6% QoQ ▪ Launched Auto Finance vertical on September 30th Consumer Lending Update Home Equity & Other Cons. Oil & Gas Commercial & Business Lending Commercial Real Estate Consumer Lending PPP
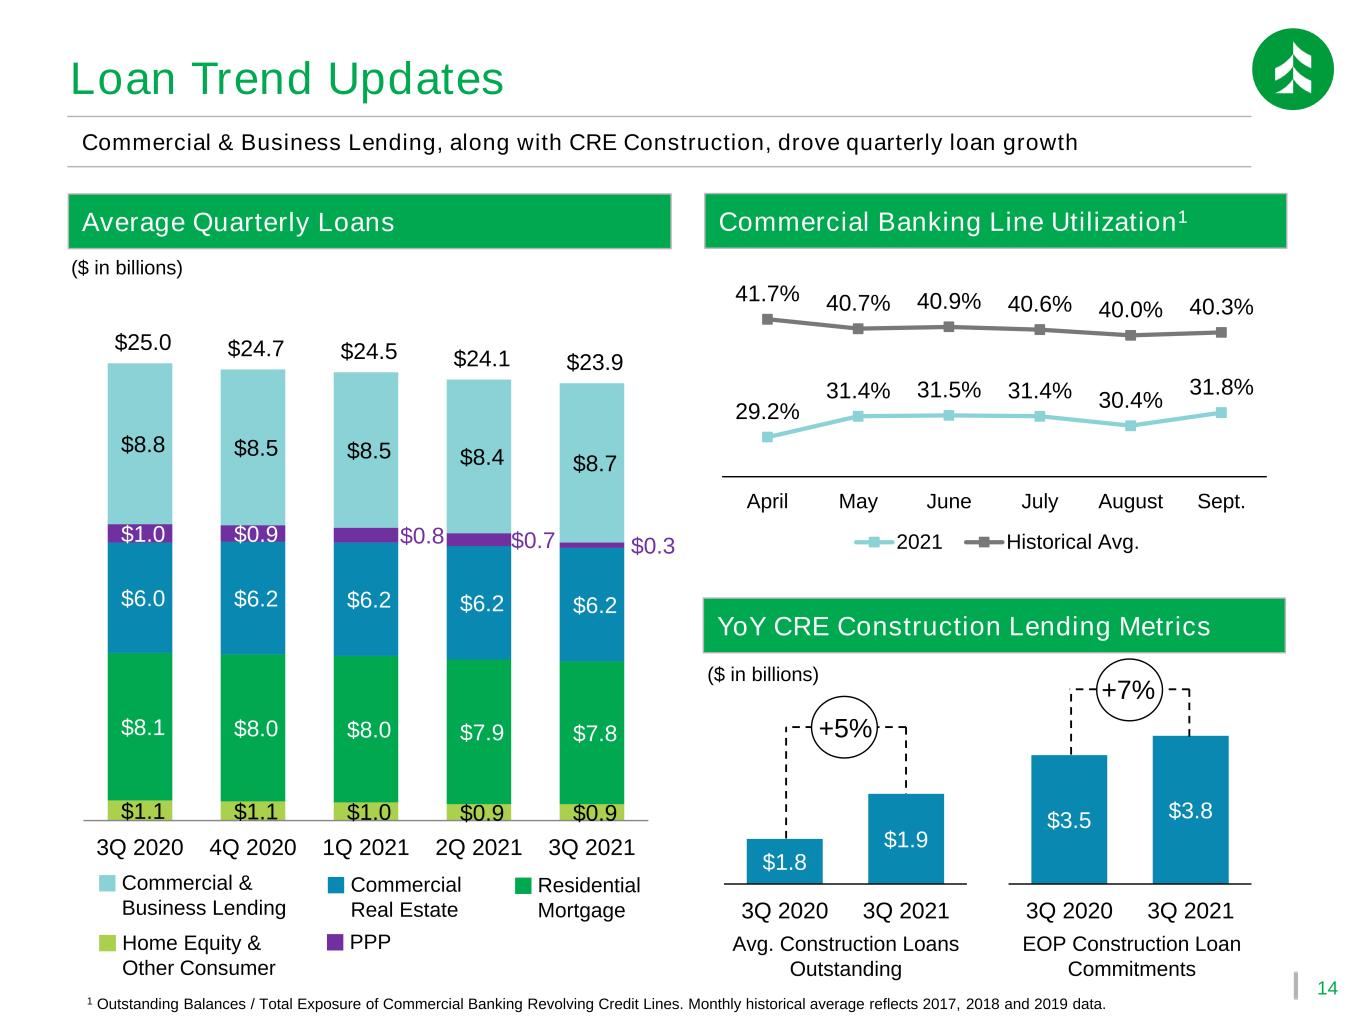
14 $1.8 $1.9 3Q 2020 3Q 2021 29.2% 31.4% 31.5% 31.4% 30.4% 31.8% 41.7% 40.7% 40.9% 40.6% 40.0% 40.3% April May June July August Sept. 2021 Historical Avg. $1.1 $1.1 $1.0 $0.9 $0.9 $8.1 $8.0 $8.0 $7.9 $7.8 $6.0 $6.2 $6.2 $6.2 $6.2 $1.0 $0.9 $0.8 $0.7 $0.3 $8.8 $8.5 $8.5 $8.4 $8.7 $25.0 $24.7 $24.5 $24.1 $23.9 3Q 2020 4Q 2020 1Q 2021 2Q 2021 3Q 2021 Loan Trend Updates Commercial & Business Lending, along with CRE Construction, drove quarterly loan growth Average Quarterly Loans ($ in billions) Commercial & Business Lending Commercial Real Estate Residential Mortgage Home Equity & Other Consumer PPP Commercial Banking Line Utilization1 1 Outstanding Balances / Total Exposure of Commercial Banking Revolving Credit Lines. Monthly historical average reflects 2017, 2018 and 2019 data. YoY CRE Construction Lending Metrics ($ in billions) $3.5 $3.8 3Q 2020 3Q 2021 Avg. Construction Loans Outstanding EOP Construction Loan Commitments +5% +7%

15 Noninterest Income (excl. Asset Gains) 3Q 2021 Pre-Tax Pre-Provision Income1 Walk-Forward 3Q PTPP expansion driven by higher net interest income, fees, asset gains and controlled expenses 2Q PTPP Income Net Interest Income Personnel Expense Initiative-related Facilities Exit Costs 3Q Pre-Tax Income ($ in millions) $88 1 A non-GAAP measure. Please refer to the appendix for a reconciliation of pre-tax pre-provision income to income before income taxes. Given the adoption of CECL last year and the volatility of provision during the pandemic, we believe pre-tax pre-provision income provides meaningful disclosure to investors regarding the Company’s operations. Net Asset Gains $(1) $(24) $112 3Q PTPP Income 3Q Provision2Q Pre-Tax Income 2Q Provision
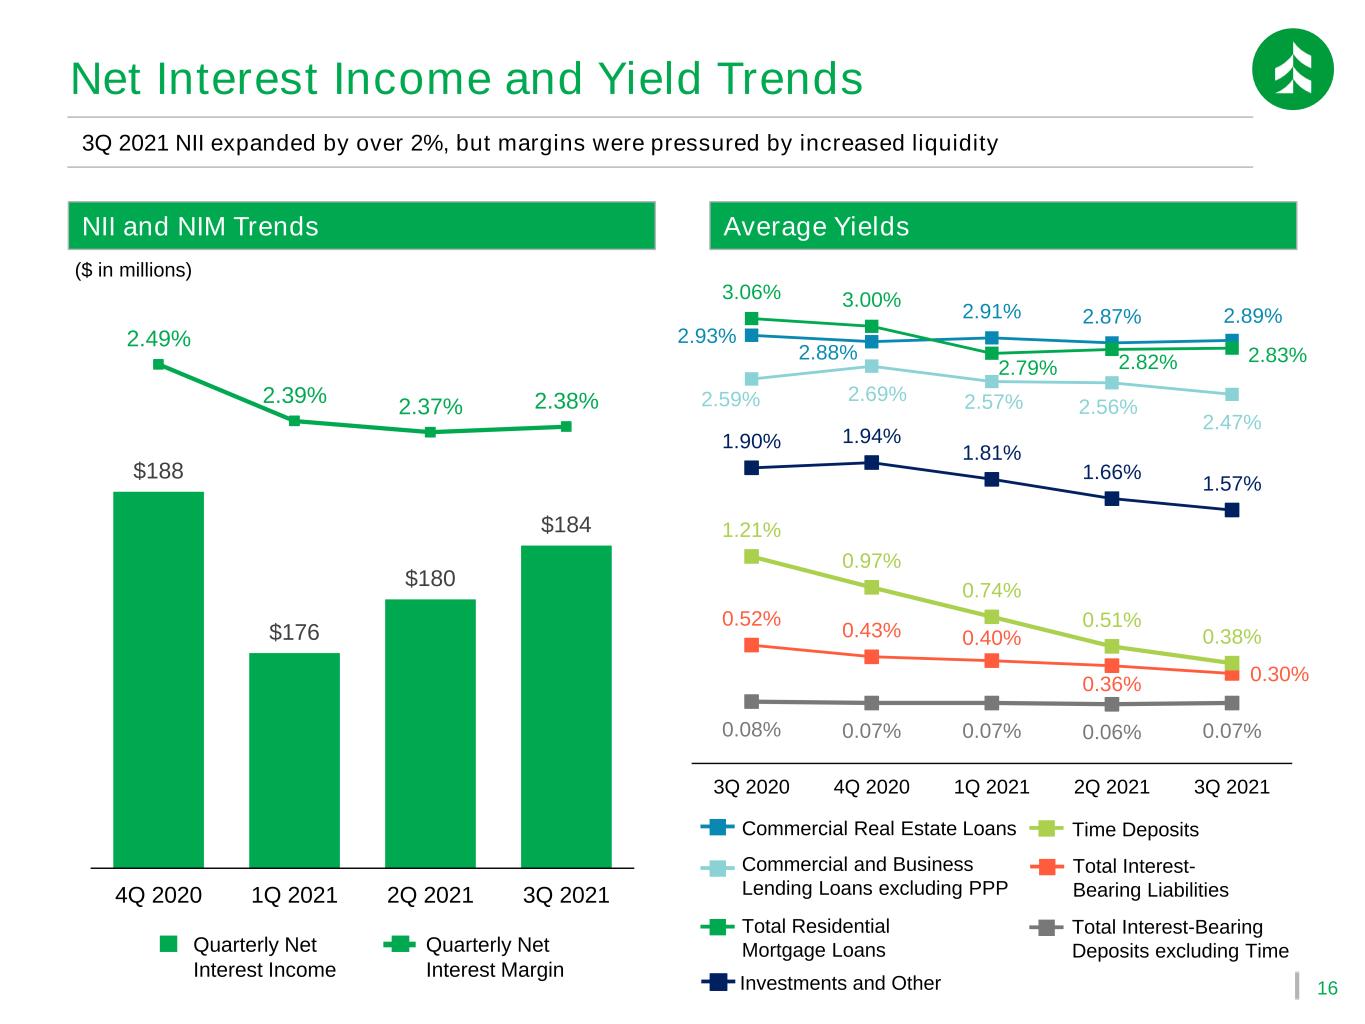
16 Net Interest Income and Yield Trends NII and NIM Trends 2.93% 2.88% 2.91% 2.87% 2.89% 2.59% 2.69% 2.57% 2.56% 2.47% 3.06% 3.00% 2.79% 2.82% 2.83% 1.90% 1.94% 1.81% 1.66% 1.57% 0.52% 0.43% 0.40% 0.36% 0.30% 0.08% 0.07% 0.07% 0.06% 0.07% 1.21% 0.97% 0.74% 0.51% 0.38% 3Q 2020 4Q 2020 1Q 2021 2Q 2021 3Q 2021 Average Yields ($ in millions) 3Q 2021 NII expanded by over 2%, but margins were pressured by increased liquidity Total Residential Mortgage Loans Commercial and Business Lending Loans excluding PPP Commercial Real Estate Loans Total Interest- Bearing Liabilities Time Deposits Quarterly Net Interest Income Total Interest-Bearing Deposits excluding Time 4Q 2020 1Q 2021 2Q 2021 3Q 2021 Investments and Other Quarterly Net Interest Margin $188 $176 $180 $184 2.49% 2.39% 2.37% 2.38% 4Q 2020 1Q 2021 2Q 2021 3Q 2021
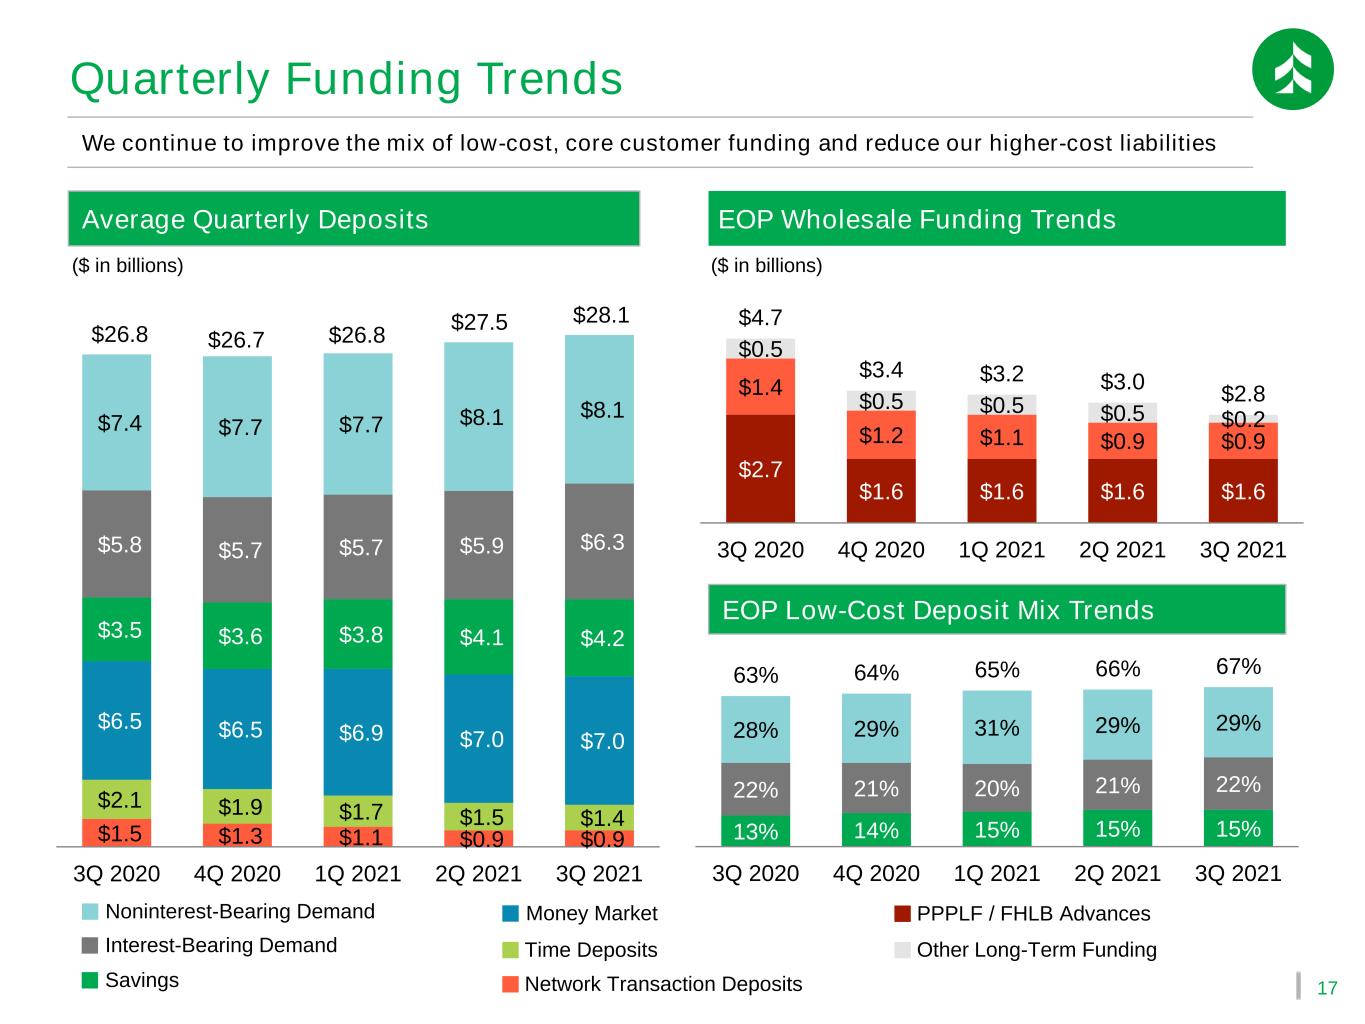
17 $1.5 $1.3 $1.1 $0.9 $0.9 $2.1 $1.9 $1.7 $1.5 $1.4 $6.5 $6.5 $6.9 $7.0 $7.0 $3.5 $3.6 $3.8 $4.1 $4.2 $5.8 $5.7 $5.7 $5.9 $6.3 $7.4 $7.7 $7.7 $8.1 $8.1 $26.8 $26.7 $26.8 $27.5 $28.1 3Q 2020 4Q 2020 1Q 2021 2Q 2021 3Q 2021 Quarterly Funding Trends ($ in billions) Average Quarterly Deposits Time Deposits Savings Money Market EOP Wholesale Funding Trends Network Transaction Deposits We continue to improve the mix of low-cost, core customer funding and reduce our higher-cost liabilities Noninterest-Bearing Demand Interest-Bearing Demand ($ in billions) EOP Low-Cost Deposit Mix Trends 13% 14% 15% 15% 15% 22% 21% 20% 21% 22% 28% 29% 31% 29% 29% 63% 64% 65% 66% 67% 3Q 2020 4Q 2020 1Q 2021 2Q 2021 3Q 2021 PPPLF / FHLB Advances Other Long-Term Funding $2.7 $1.6 $1.6 $1.6 $1.6 $1.4 $1.2 $1.1 $0.9 $0.9 $0.5 $0.5 $0.5 $0.5 $0.2 $4.7 $3.4 $3.2 $3.0 $2.8 3Q 2020 4Q 2020 1Q 2021 2Q 2021 3Q 2021

18 $3.4 $3.2 $3.0 $3.2 $3.3 $1.9 $1.9 $1.9 $2.0 $2.0 $1.8 $1.0 $1.0 $1.8 $2.2 $7.1 $6.1 $5.9 $6.9 $7.5 1.90% 1.94% 1.81% 1.66% 1.57% 3Q 2020 4Q 2020 1Q 2021 2Q 2021 3Q 2021 16% 15% 16% 16% 17% 3% 2% 6% 5% 5% 19% 18% 21% 21% 22% 3Q 2020 4Q 2020 1Q 2021 2Q 2021 3Q 2021 Securities Cash Cash and Investment Securities Portfolio Average Investments and Yield Trends EOP Securities + Cash / Total Assets We are targeting rebuilding the investment portfolio to 20%+ of assets by year-end 2022 ($ in billions) • We anticipate deploying our current $1+ billion of excess liquidity into investment assets over the next nine months • We expect the overall reinvestment portfolio yields to be approximately 2% or better; as compared to our 3Q blended investment yield of 1.57% Tax-Exempt Securities Taxable Securities Other Short-Term Investments Blended Investments Yield
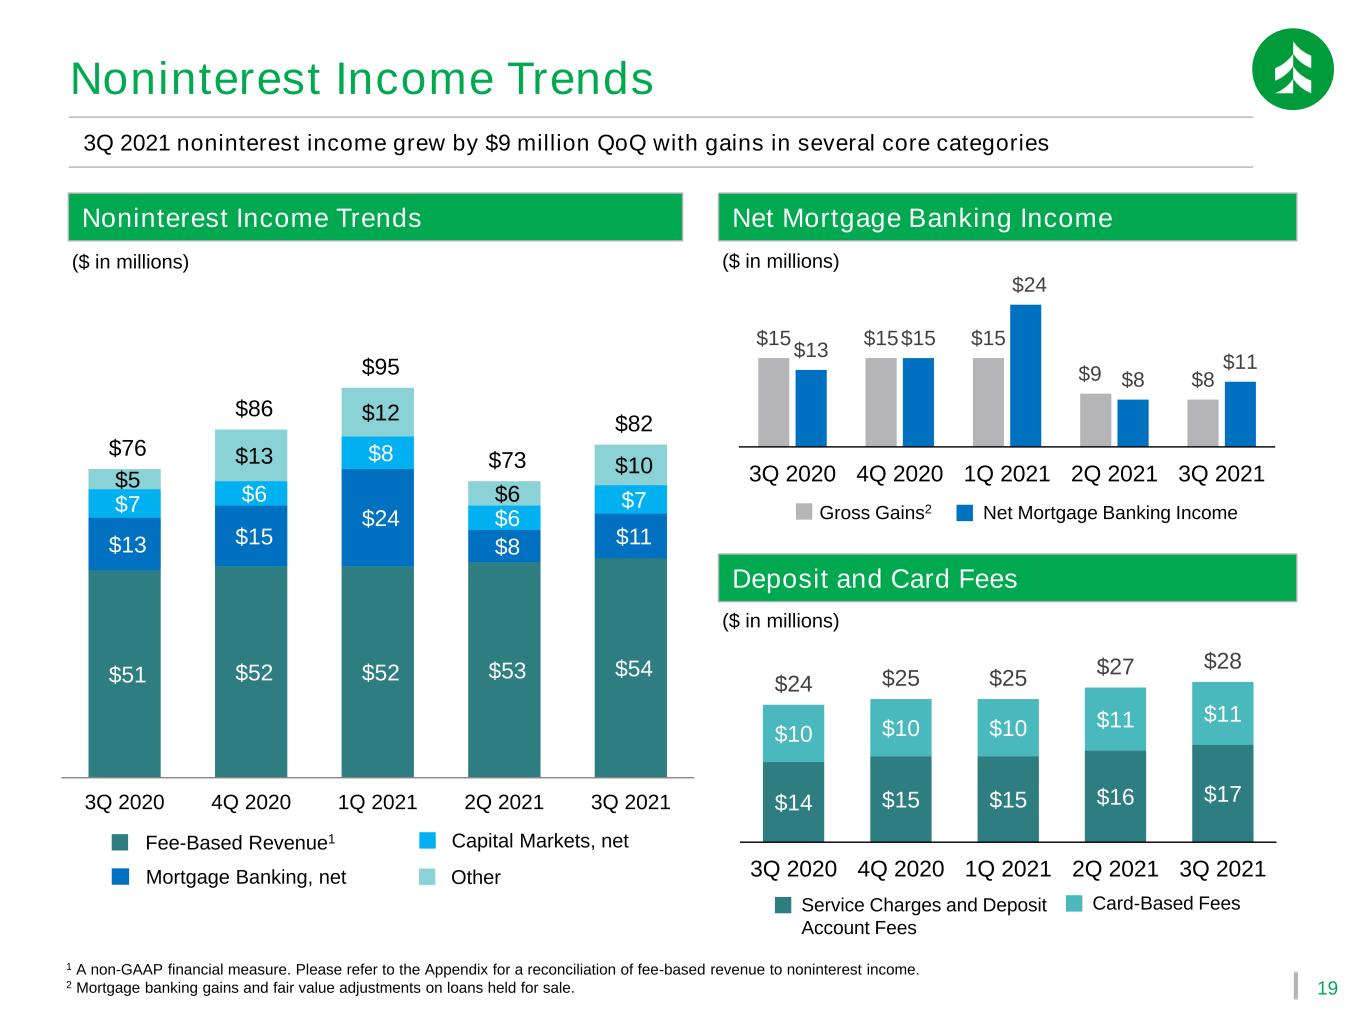
19 $15 $15 $15 $9 $8 $13 $15 $24 $8 $11 3Q 2020 4Q 2020 1Q 2021 2Q 2021 3Q 2021 $51 $52 $52 $53 $54 $13 $15 $24 $8 $11 $7 $6 $8 $6 $7 $5 $13 $12 $6 $10 $76 $86 $95 $73 $82 3Q 2020 4Q 2020 1Q 2021 2Q 2021 3Q 2021 Noninterest Income Trends Net Mortgage Banking IncomeNoninterest Income Trends ($ in millions) ($ in millions) ($ in millions) Deposit and Card Fees 3Q 2021 noninterest income grew by $9 million QoQ with gains in several core categories Fee-Based Revenue1 Capital Markets, net Mortgage Banking, net Other Net Mortgage Banking IncomeGross Gains2 $14 $15 $15 $16 $17 $10 $10 $10 $11 $11 $24 $25 $25 $27 $28 3Q 2020 4Q 2020 1Q 2021 2Q 2021 3Q 2021 1 A non-GAAP financial measure. Please refer to the Appendix for a reconciliation of fee-based revenue to noninterest income. 2 Mortgage banking gains and fair value adjustments on loans held for sale. Card-Based FeesService Charges and Deposit Account Fees
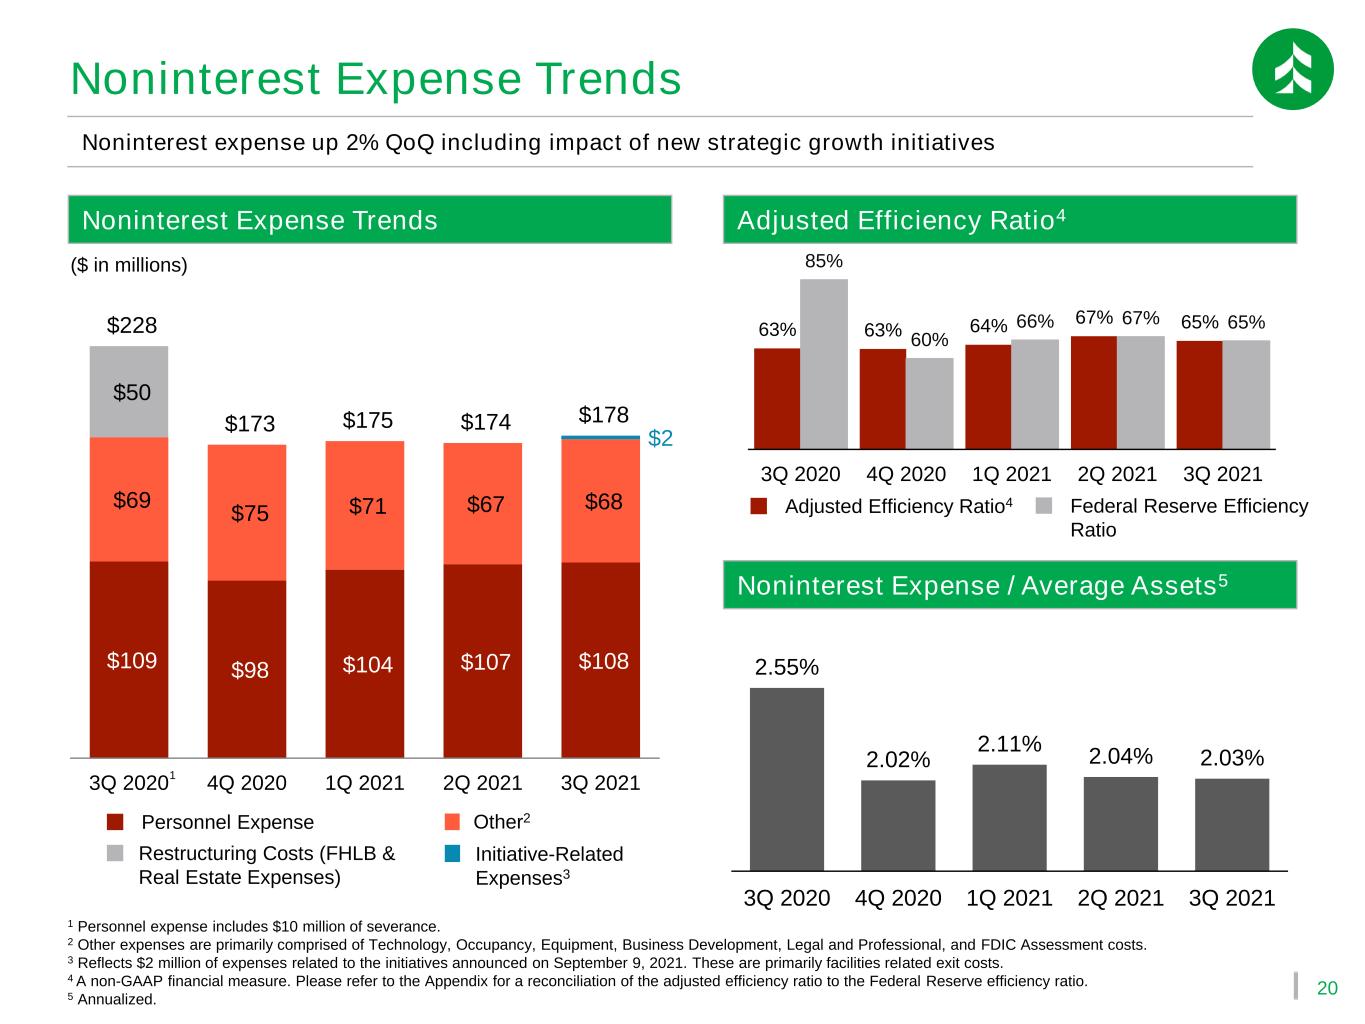
20 $109 $98 $104 $107 $108 $69 $75 $71 $67 $68 $2 $50 $228 $173 $175 $174 $178 3Q 2020 4Q 2020 1Q 2021 2Q 2021 3Q 2021 Noninterest Expense Trends Adjusted Efficiency Ratio4Noninterest Expense Trends 1 Personnel expense includes $10 million of severance. 2 Other expenses are primarily comprised of Technology, Occupancy, Equipment, Business Development, Legal and Professional, and FDIC Assessment costs. 3 Reflects $2 million of expenses related to the initiatives announced on September 9, 2021. These are primarily facilities related exit costs. 4 A non-GAAP financial measure. Please refer to the Appendix for a reconciliation of the adjusted efficiency ratio to the Federal Reserve efficiency ratio. 5 Annualized. ($ in millions) Noninterest expense up 2% QoQ including impact of new strategic growth initiatives Personnel Expense Other2 Restructuring Costs (FHLB & Real Estate Expenses) 1 Federal Reserve Efficiency Ratio 63% 63% 64% 67% 65% 85% 60% 66% 67% 65% 3Q 2020 4Q 2020 1Q 2021 2Q 2021 3Q 2021 Adjusted Efficiency Ratio4 Noninterest Expense / Average Assets5 2.55% 2.02% 2.11% 2.04% 2.03% 3Q 2020 4Q 2020 1Q 2021 2Q 2021 3Q 2021 Initiative-Related Expenses3
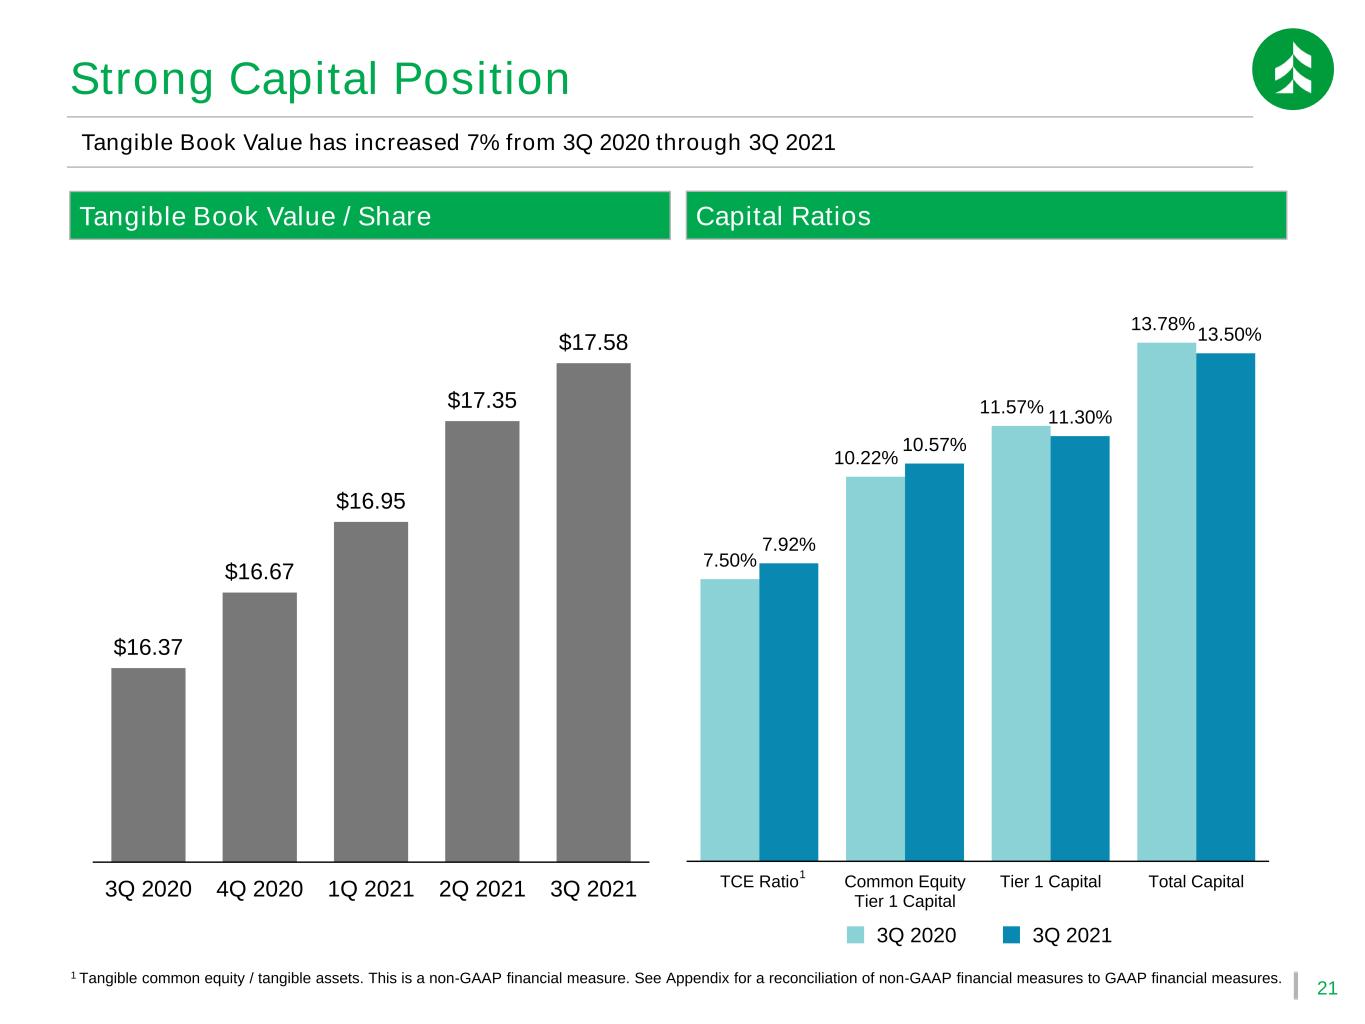
21 7.50% 10.22% 11.57% 13.78% 7.92% 10.57% 11.30% 13.50% TCE Ratio Common Equity Tier 1 Capital Tier 1 Capital Total Capital 1 Tangible common equity / tangible assets. This is a non-GAAP financial measure. See Appendix for a reconciliation of non-GAAP financial measures to GAAP financial measures. Capital Ratios 3Q 2020 Tangible Book Value has increased 7% from 3Q 2020 through 3Q 2021 3Q 2021 Strong Capital Position Tangible Book Value / Share $16.37 $16.67 $16.95 $17.35 $17.58 3Q 2020 4Q 2020 1Q 2021 2Q 2021 3Q 2021 1
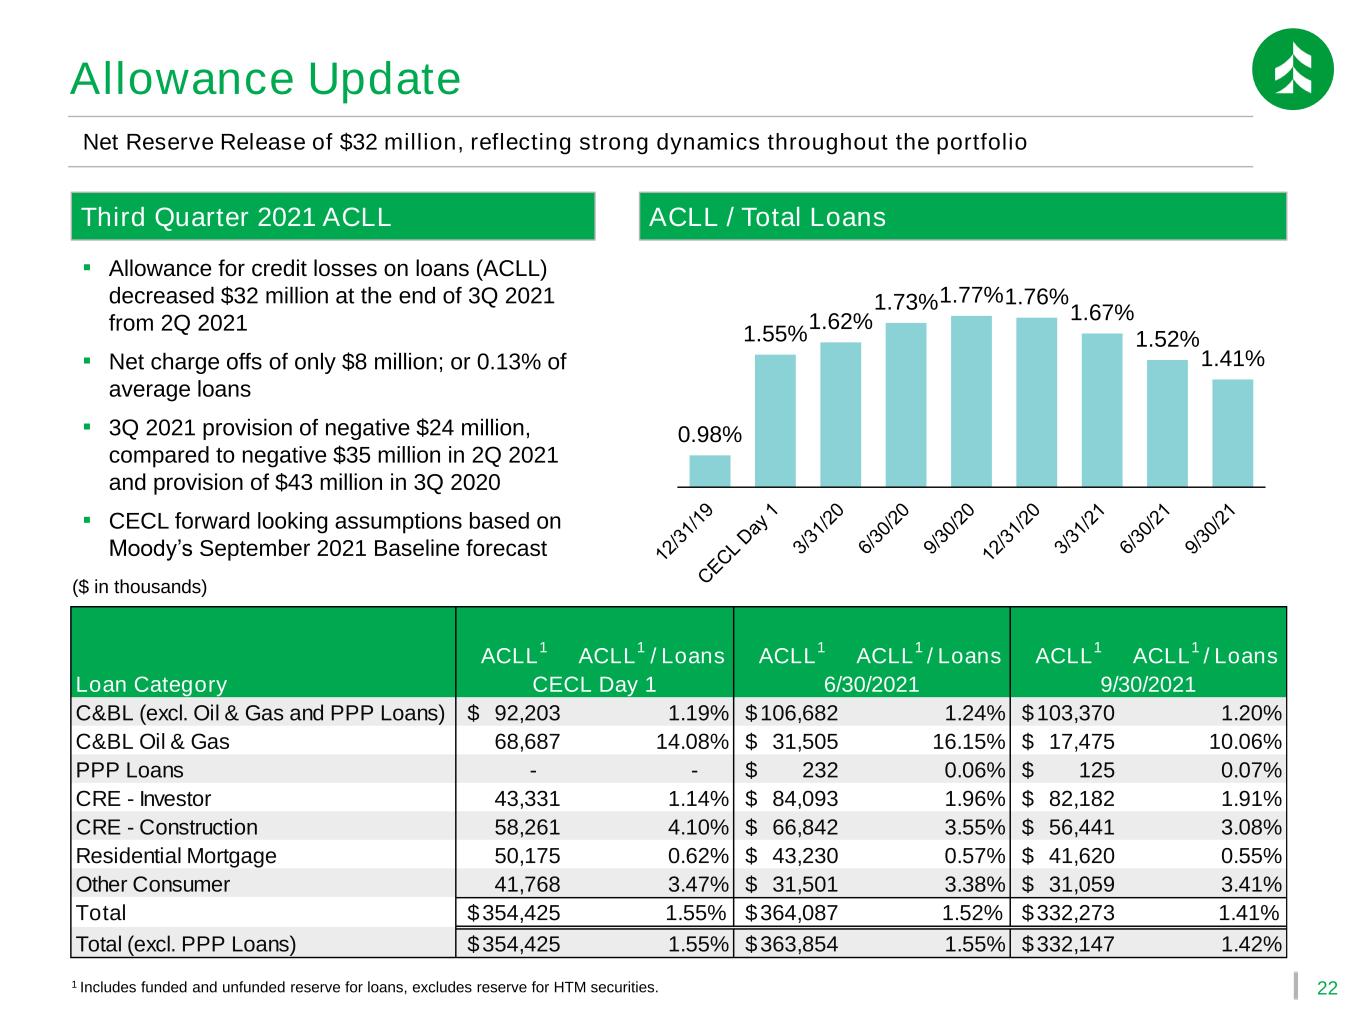
22 Third Quarter 2021 ACLL ▪ Allowance for credit losses on loans (ACLL) decreased $32 million at the end of 3Q 2021 from 2Q 2021 ▪ Net charge offs of only $8 million; or 0.13% of average loans ▪ 3Q 2021 provision of negative $24 million, compared to negative $35 million in 2Q 2021 and provision of $43 million in 3Q 2020 ▪ CECL forward looking assumptions based on Moody’s September 2021 Baseline forecast 1 Includes funded and unfunded reserve for loans, excludes reserve for HTM securities. ($ in thousands) ACLL / Total Loans Net Reserve Release of $32 million, reflecting strong dynamics throughout the portfolio Allowance Update 0.98% 1.55% 1.62% 1.73%1.77%1.76% 1.67% 1.52% 1.41% ACLL 1 ACLL 1 / Loans ACLL 1 ACLL 1 / Loans ACLL 1 ACLL 1 / Loans Loan Category C&BL (excl. Oil & Gas and PPP Loans) 92,203$ 1.19% 106,682$ 1.24% 103,370$ 1.20% C&BL Oil & Gas 68,687 14.08% 31,505$ 16.15% 17,475$ 10.06% PPP Loans - - 232$ 0.06% 125$ 0.07% CRE - Investor 43,331 1.14% 84,093$ 1.96% 82,182$ 1.91% CRE - Construction 58,261 4.10% 66,842$ 3.55% 56,441$ 3.08% Residential Mortgage 50,175 0.62% 43,230$ 0.57% 41,620$ 0.55% Other Consumer 41,768 3.47% 31,501$ 3.38% 31,059$ 3.41% Total 354,425$ 1.55% 364,087$ 1.52% 332,273$ 1.41% Total (excl. PPP Loans) 354,425$ 1.55% 363,854$ 1.55% 332,147$ 1.42% CECL Day 1 6/30/2021 9/30/2021
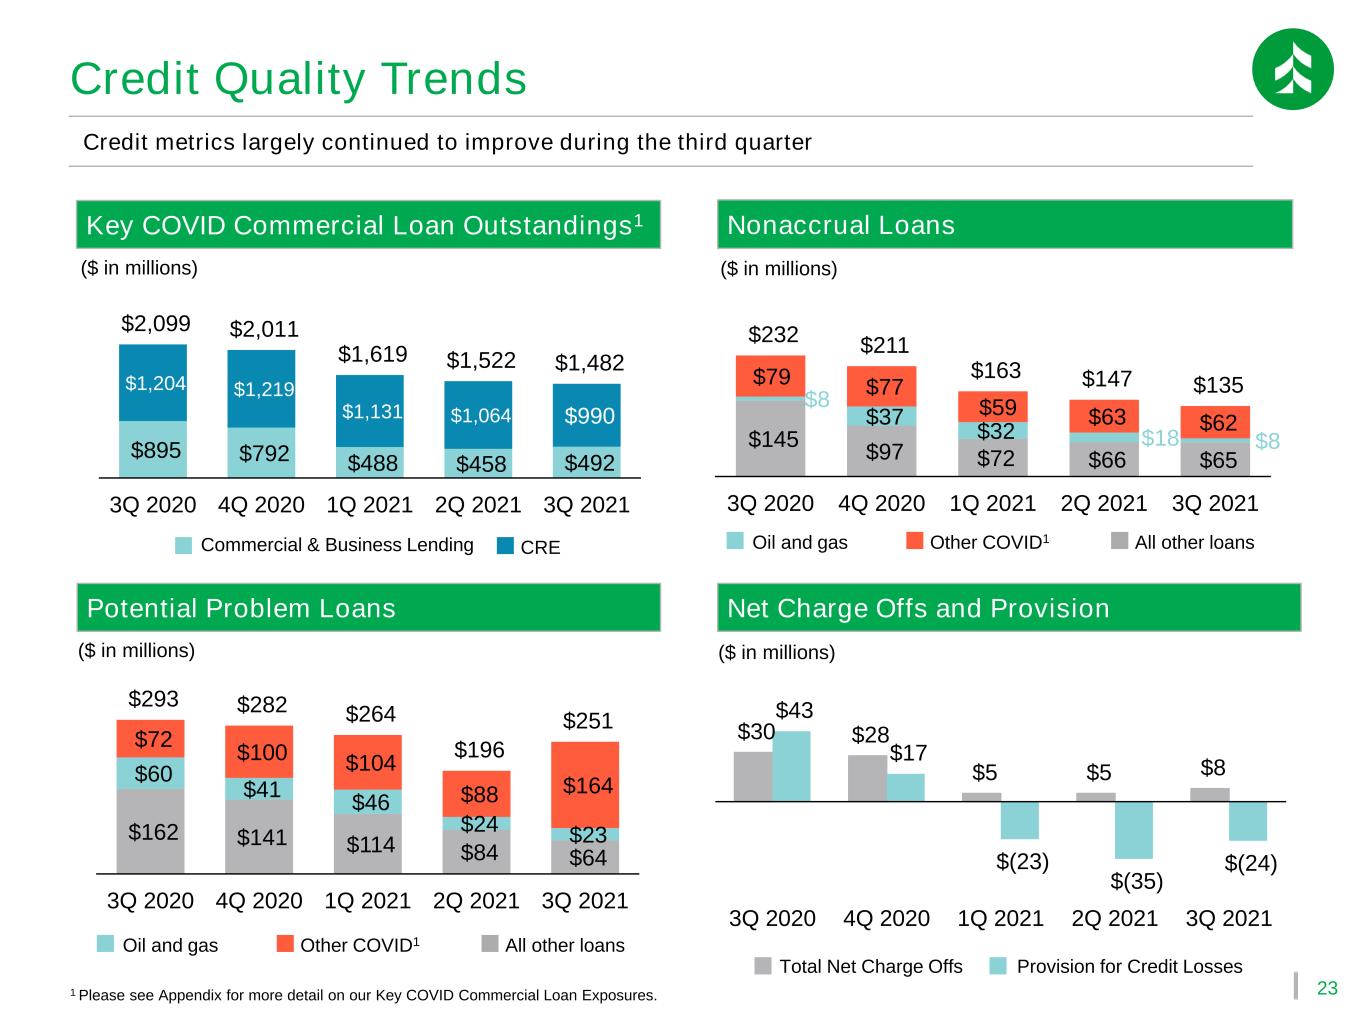
23 Credit Quality Trends $145 $97 $72 $66 $65 $8 $37 $32 $18 $8 $79 $77 $59 $63 $62 $232 $211 $163 $147 $135 3Q 2020 4Q 2020 1Q 2021 2Q 2021 3Q 2021 $162 $141 $114 $84 $64 $60 $41 $46 $24 $23 $72 $100 $104 $88 $164 $293 $282 $264 $196 $251 3Q 2020 4Q 2020 1Q 2021 2Q 2021 3Q 2021 Credit metrics largely continued to improve during the third quarter ($ in millions) ($ in millions) ($ in millions) 1 Please see Appendix for more detail on our Key COVID Commercial Loan Exposures. Potential Problem Loans Nonaccrual LoansKey COVID Commercial Loan Outstandings1 Net Charge Offs and Provision Oil and gas All other loansOther COVID1 Oil and gas All other loansOther COVID1 $895 $792 $488 $458 $492 $1,204 $1,219 $1,131 $1,064 $990 $2,099 $2,011 $1,619 $1,522 $1,482 3Q 2020 4Q 2020 1Q 2021 2Q 2021 3Q 2021 ($ in millions) $30 $28 $5 $5 $8 $43 $17 $(23) $(35) $(24) 3Q 2020 4Q 2020 1Q 2021 2Q 2021 3Q 2021 Commercial & Business Lending CRE Total Net Charge Offs Provision for Credit Losses
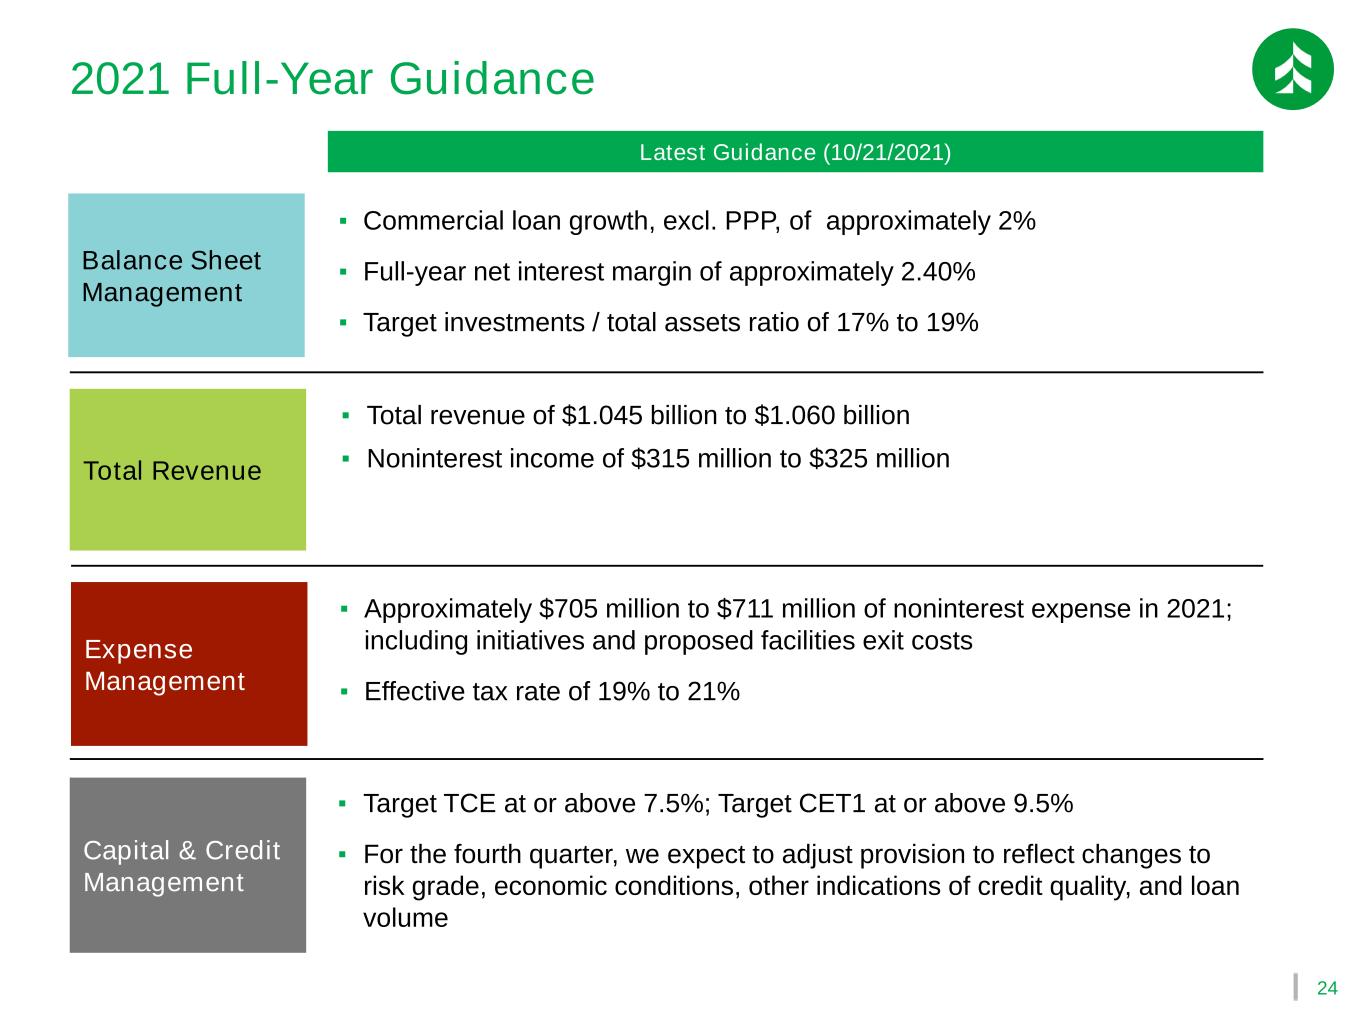
24 Balance Sheet Management ▪ Commercial loan growth, excl. PPP, of approximately 2% ▪ Full-year net interest margin of approximately 2.40% ▪ Target investments / total assets ratio of 17% to 19% Total Revenue ▪ Total revenue of $1.045 billion to $1.060 billion ▪ Noninterest income of $315 million to $325 million Expense Management ▪ Approximately $705 million to $711 million of noninterest expense in 2021; including initiatives and proposed facilities exit costs ▪ Effective tax rate of 19% to 21% Capital & Credit Management ▪ Target TCE at or above 7.5%; Target CET1 at or above 9.5% ▪ For the fourth quarter, we expect to adjust provision to reflect changes to risk grade, economic conditions, other indications of credit quality, and loan volume 2021 Full-Year Guidance Latest Guidance (10/21/2021)

Appendix
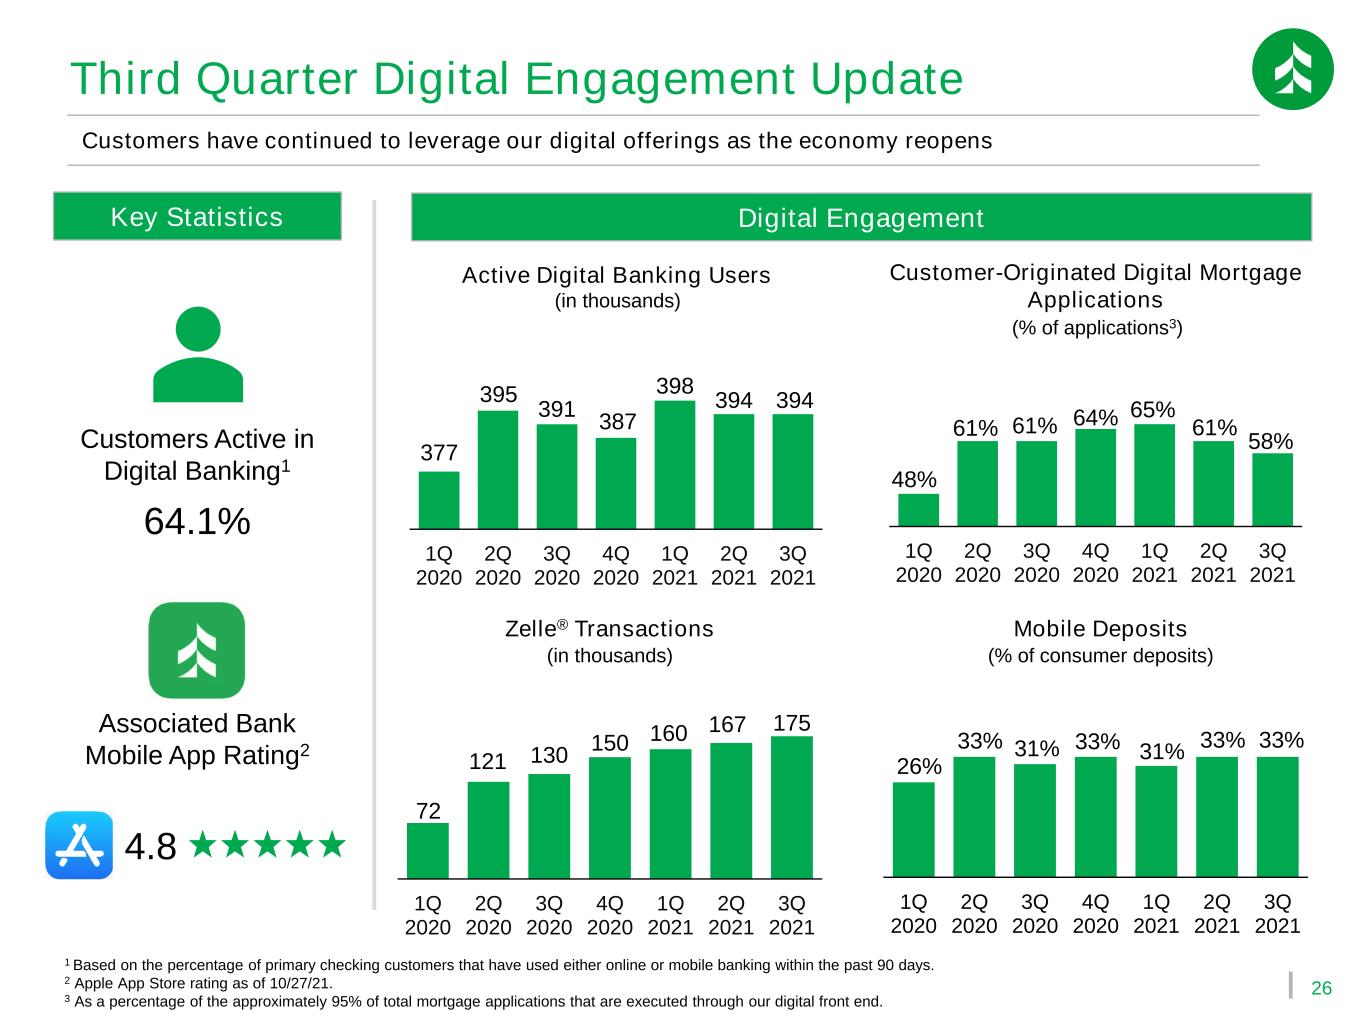
26 377 395 391 387 398 394 394 1Q 2020 2Q 2020 3Q 2020 4Q 2020 1Q 2021 2Q 2021 3Q 2021 Customer-Originated Digital Mortgage Applications 26% 33% 31% 33% 31% 33% 33% 1Q 2020 2Q 2020 3Q 2020 4Q 2020 1Q 2021 2Q 2021 3Q 2021 Third Quarter Digital Engagement Update Digital Engagement Customers have continued to leverage our digital offerings as the economy reopens Active Digital Banking Users (in thousands) Mobile Deposits 72 121 130 150 160 167 175 1Q 2020 2Q 2020 3Q 2020 4Q 2020 1Q 2021 2Q 2021 3Q 2021 Zelle® Transactions (in thousands) Key Statistics Customers Active in Digital Banking1 64.1% Associated Bank Mobile App Rating2 4.8 1 Based on the percentage of primary checking customers that have used either online or mobile banking within the past 90 days. 2 Apple App Store rating as of 10/27/21. 3 As a percentage of the approximately 95% of total mortgage applications that are executed through our digital front end. (% of consumer deposits) 48% 61% 61% 64% 65% 61% 58% 1Q 2020 2Q 2020 3Q 2020 4Q 2020 1Q 2021 2Q 2021 3Q 2021 (% of applications3)
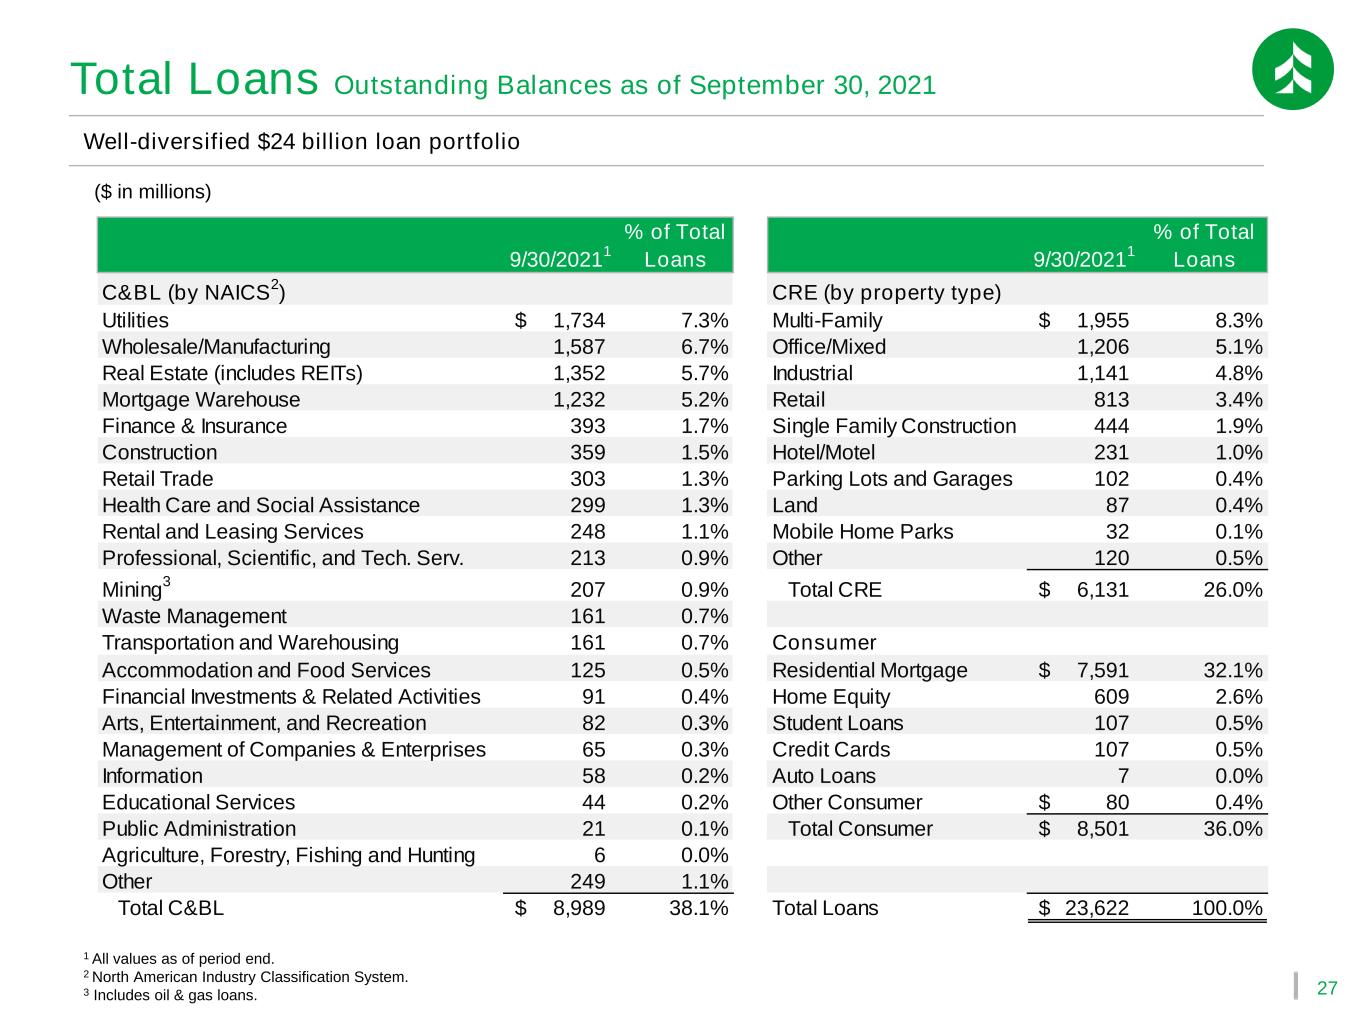
27 Total Loans Outstanding Balances as of September 30, 2021 Well-diversified $24 billion loan portfolio ($ in millions) 1 All values as of period end. 2 North American Industry Classification System. 3 Includes oil & gas loans. 9/30/2021 1 % of Total Loans 9/30/2021 1 % of Total Loans C&BL (by NAICS 2 ) CRE (by property type) Utilities 1,734$ 7.3% Multi-Family 1,955$ 8.3% Wholesale/Manufacturing 1,587 6.7% Office/Mixed 1,206 5.1% Real Estate (includes REITs) 1,352 5.7% Industrial 1,141 4.8% Mortgage Warehouse 1,232 5.2% Retail 813 3.4% Finance & Insurance 393 1.7% Single Family Construction 444 1.9% Construction 359 1.5% Hotel/Motel 231 1.0% Retail Trade 303 1.3% Parking Lots and Garages 102 0.4% Health Care and Social Assistance 299 1.3% Land 87 0.4% Rental and Leasing Services 248 1.1% Mobile Home Parks 32 0.1% Professional, Scientific, and Tech. Serv. 213 0.9% Other 120 0.5% Mining 3 207 0.9% Total CRE 6,131$ 26.0% Waste Management 161 0.7% Transportation and Warehousing 161 0.7% Consumer Accommodation and Food Services 125 0.5% Residential Mortgage 7,591$ 32.1% Financial Investments & Related Activities 91 0.4% Home Equity 609 2.6% Arts, Entertainment, and Recreation 82 0.3% Student Loans 107 0.5% Management of Companies & Enterprises 65 0.3% Credit Cards 107 0.5% Information 58 0.2% Auto Loans 7 0.0% Educational Services 44 0.2% Other Consumer 80$ 0.4% Public Administration 21 0.1% Total Consumer 8,501$ 36.0% Agriculture, Forestry, Fishing and Hunting 6 0.0% Other 249 1.1% Total C&BL 8,989$ 38.1% Total Loans 23,622$ 100.0%
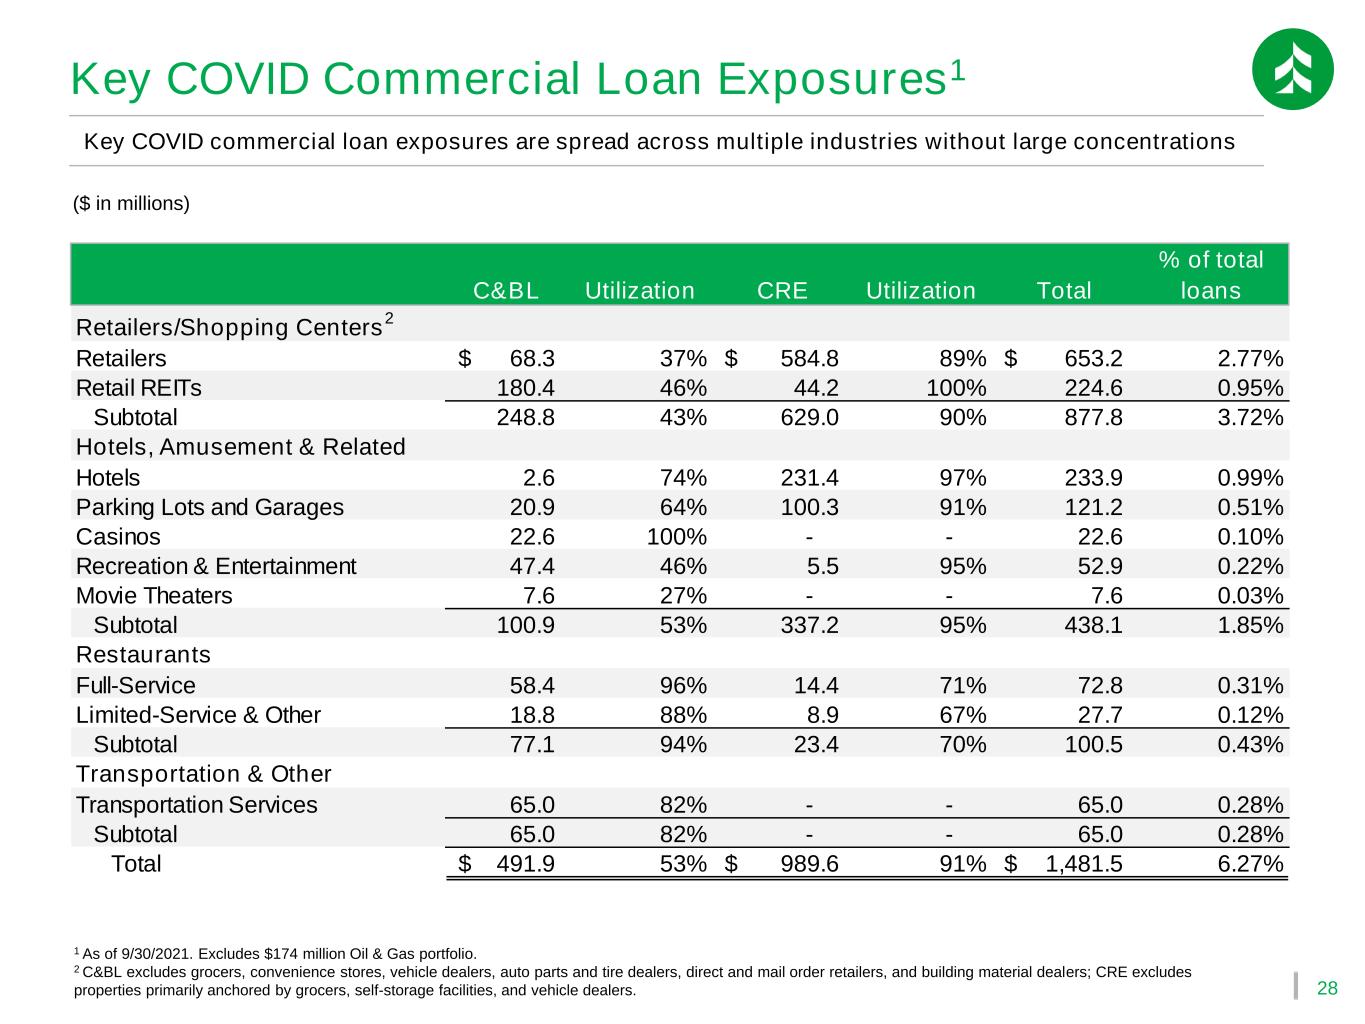
28 1 As of 9/30/2021. Excludes $174 million Oil & Gas portfolio. 2 C&BL excludes grocers, convenience stores, vehicle dealers, auto parts and tire dealers, direct and mail order retailers, and building material dealers; CRE excludes properties primarily anchored by grocers, self-storage facilities, and vehicle dealers. Key COVID commercial loan exposures are spread across multiple industries without large concentrations ($ in millions) Key COVID Commercial Loan Exposures1 C&BL Utilization CRE Utilization Total % of total loans Retailers/Shopping Centers 2 Retailers 68.3$ 37% 584.8$ 89% 653.2$ 2.77% Retail REITs 180.4 46% 44.2 100% 224.6 0.95% Subtotal 248.8 43% 629.0 90% 877.8 3.72% Hotels, Amusement & Related Hotels 2.6 74% 231.4 97% 233.9 0.99% Parking Lots and Garages 20.9 64% 100.3 91% 121.2 0.51% Casinos 22.6 100% - - 22.6 0.10% Recreation & Entertainment 47.4 46% 5.5 95% 52.9 0.22% Movie Theaters 7.6 27% - - 7.6 0.03% Subtotal 100.9 53% 337.2 95% 438.1 1.85% Restaurants Full-Service 58.4 96% 14.4 71% 72.8 0.31% Limited-Service & Other 18.8 88% 8.9 67% 27.7 0.12% Subtotal 77.1 94% 23.4 70% 100.5 0.43% Transportation & Other Transportation Services 65.0 82% - - 65.0 0.28% Subtotal 65.0 82% - - 65.0 0.28% Total 491.9$ 53% 989.6$ 91% 1,481.5$ 6.27%
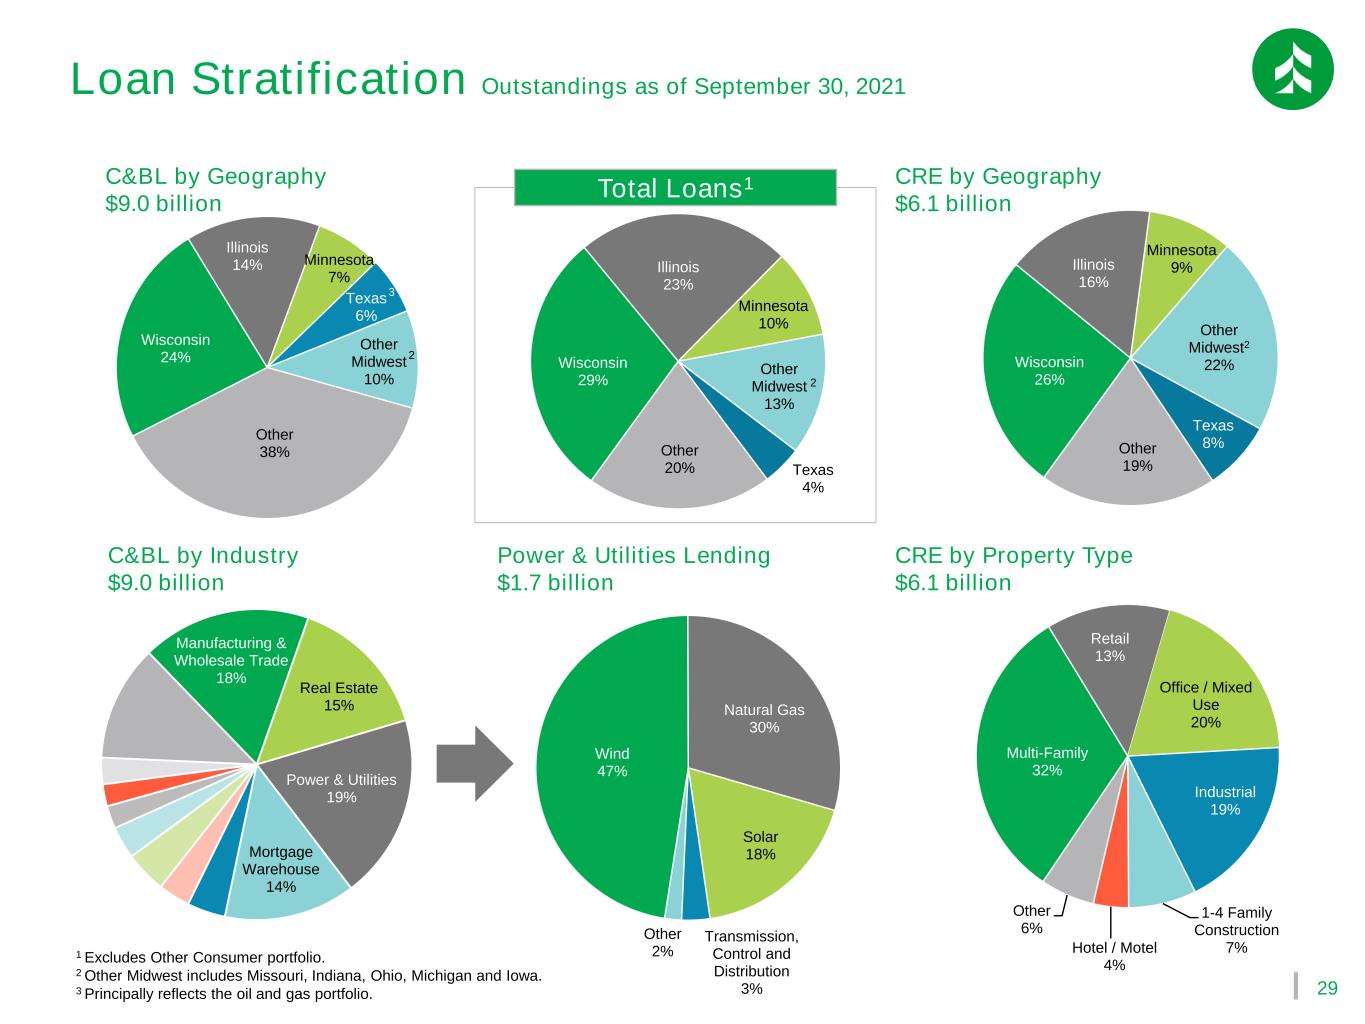
29 Manufacturing & Wholesale Trade 18% Real Estate 15% Power & Utilities 19% Mortgage Warehouse 14% 1 Excludes Other Consumer portfolio. 2 Other Midwest includes Missouri, Indiana, Ohio, Michigan and Iowa. 3 Principally reflects the oil and gas portfolio. C&BL by Geography $9.0 billion CRE by Geography $6.1 billion Multi-Family 32% Retail 13% Office / Mixed Use 20% Industrial 19% 1-4 Family Construction 7%Hotel / Motel 4% Other 6% Wind 47% Natural Gas 30% Solar 18% Transmission, Control and Distribution 3% Other 2% Wisconsin 24% Illinois 14% Minnesota 7% Texas 6% Other Midwest 10% Other 38% Wisconsin 26% Illinois 16% Minnesota 9% Other Midwest2 22% Texas 8%Other 19% Total Loans1 Wisconsin 29% Illinois 23% Minnesota 10% Other Midwest 13% Texas 4% Other 20% C&BL by Industry $9.0 billion Power & Utilities Lending $1.7 billion CRE by Property Type $6.1 billion 3 2 2 Loan Stratification Outstandings as of September 30, 2021
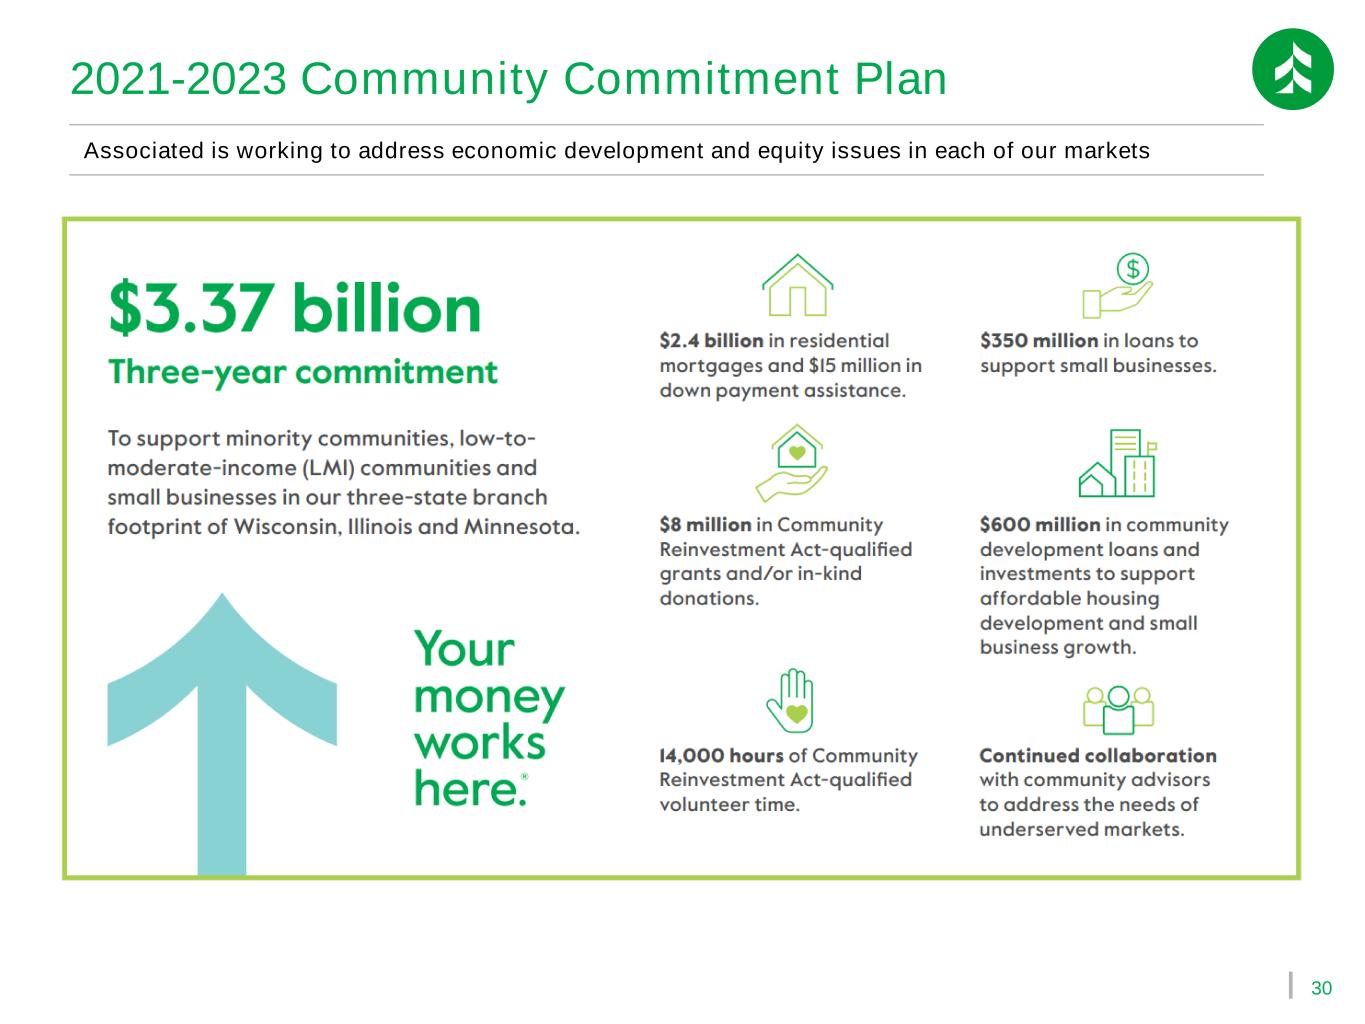
30 2021-2023 Community Commitment Plan Associated is working to address economic development and equity issues in each of our markets
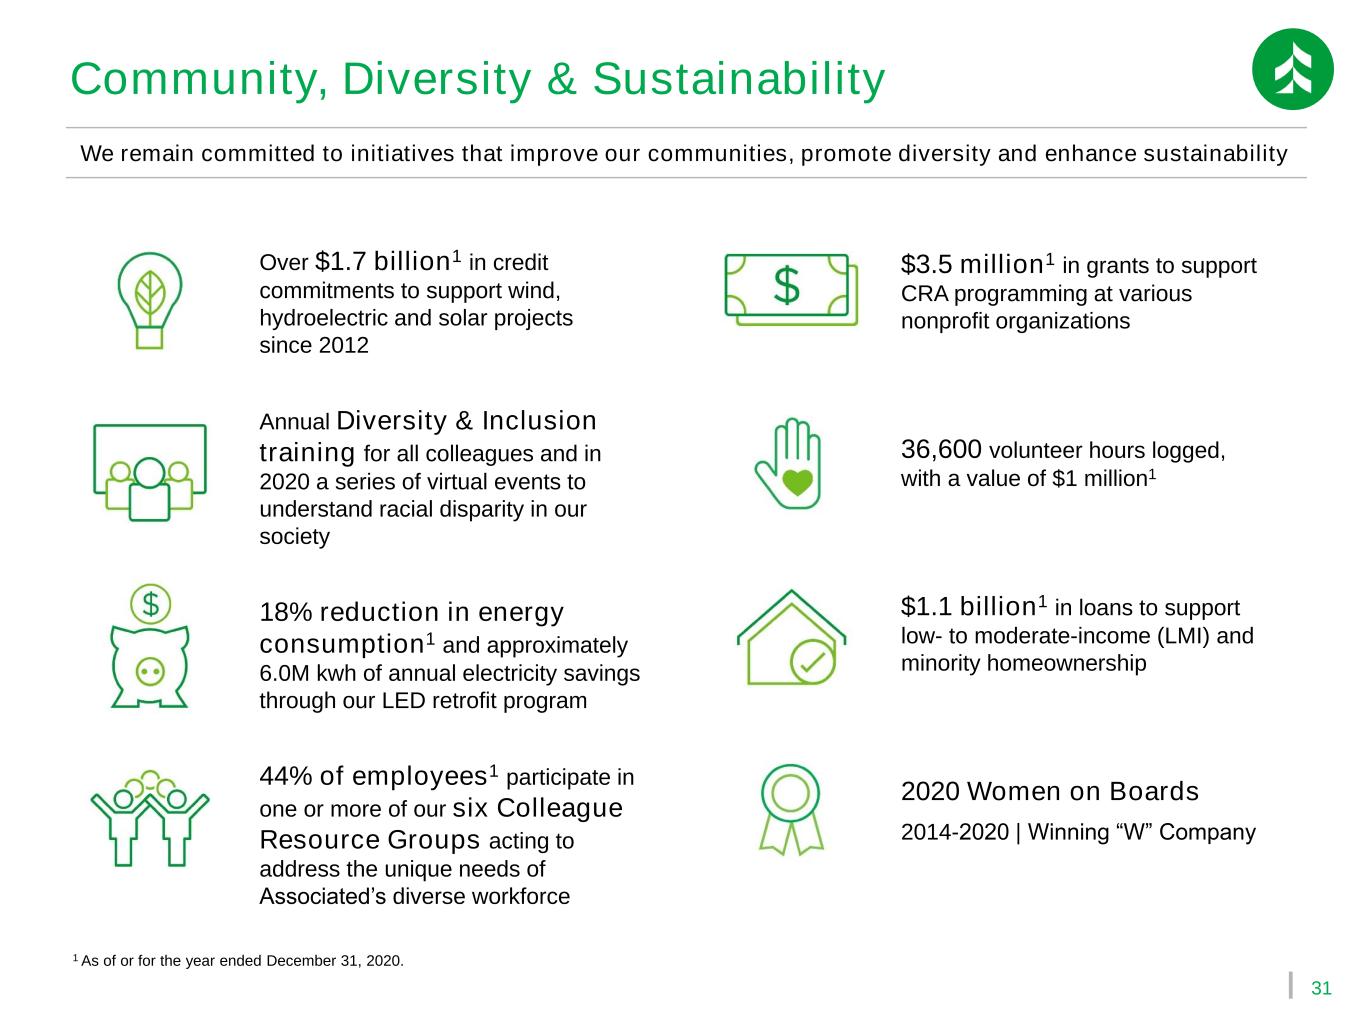
31 Community, Diversity & Sustainability We remain committed to initiatives that improve our communities, promote diversity and enhance sustainability Over $1.7 billion1 in credit commitments to support wind, hydroelectric and solar projects since 2012 Annual Diversity & Inclusion training for all colleagues and in 2020 a series of virtual events to understand racial disparity in our society 18% reduction in energy consumption1 and approximately 6.0M kwh of annual electricity savings through our LED retrofit program 44% of employees1 participate in one or more of our six Colleague Resource Groups acting to address the unique needs of Associated’s diverse workforce $3.5 million1 in grants to support CRA programming at various nonprofit organizations 1 As of or for the year ended December 31, 2020. 36,600 volunteer hours logged, with a value of $1 million1 $1.1 billion1 in loans to support low- to moderate-income (LMI) and minority homeownership 2020 Women on Boards 2014-2020 | Winning “W” Company
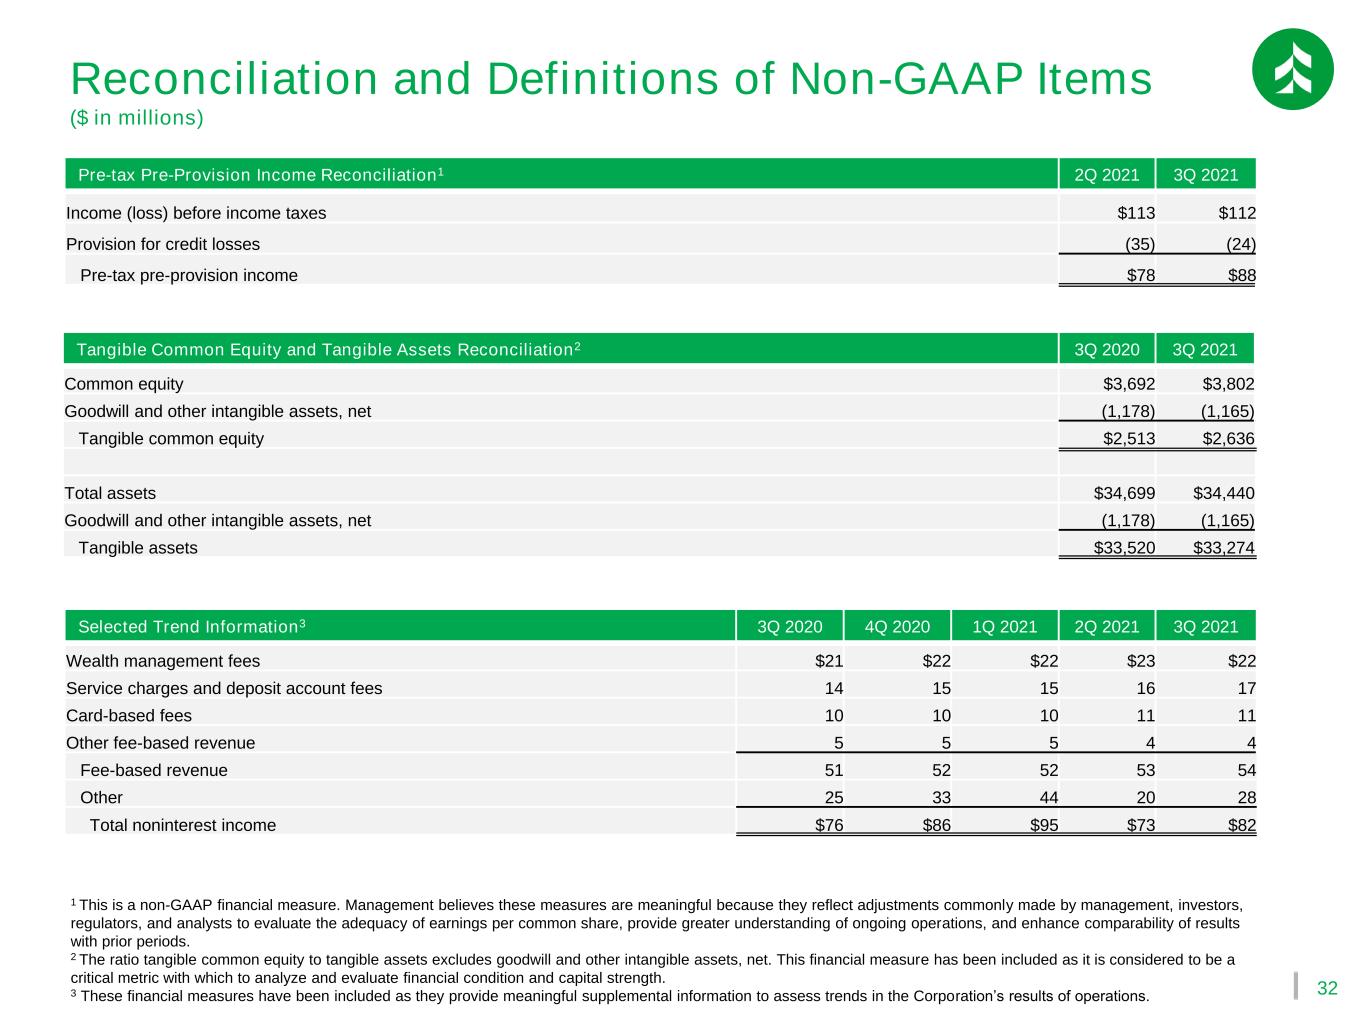
32 Reconciliation and Definitions of Non-GAAP Items ($ in millions) 1 This is a non-GAAP financial measure. Management believes these measures are meaningful because they reflect adjustments commonly made by management, investors, regulators, and analysts to evaluate the adequacy of earnings per common share, provide greater understanding of ongoing operations, and enhance comparability of results with prior periods. 2 The ratio tangible common equity to tangible assets excludes goodwill and other intangible assets, net. This financial measure has been included as it is considered to be a critical metric with which to analyze and evaluate financial condition and capital strength. 3 These financial measures have been included as they provide meaningful supplemental information to assess trends in the Corporation’s results of operations. Pre-tax Pre-Provision Income Reconciliation1 2Q 2021 3Q 2021 Income (loss) before income taxes $113 $112 Provision for credit losses (35) (24) Pre-tax pre-provision income $78 $88 Tangible Common Equity and Tangible Assets Reconciliation2 3Q 2020 3Q 2021 Common equity $3,692 $3,802 Goodwill and other intangible assets, net (1,178) (1,165) Tangible common equity $2,513 $2,636 Total assets $34,699 $34,440 Goodwill and other intangible assets, net (1,178) (1,165) Tangible assets $33,520 $33,274 Selected Trend Information3 3Q 2020 4Q 2020 1Q 2021 2Q 2021 3Q 2021 Wealth management fees $21 $22 $22 $23 $22 Service charges and deposit account fees 14 15 15 16 17 Card-based fees 10 10 10 11 11 Other fee-based revenue 5 5 5 4 4 Fee-based revenue 51 52 52 53 54 Other 25 33 44 20 28 Total noninterest income $76 $86 $95 $73 $82
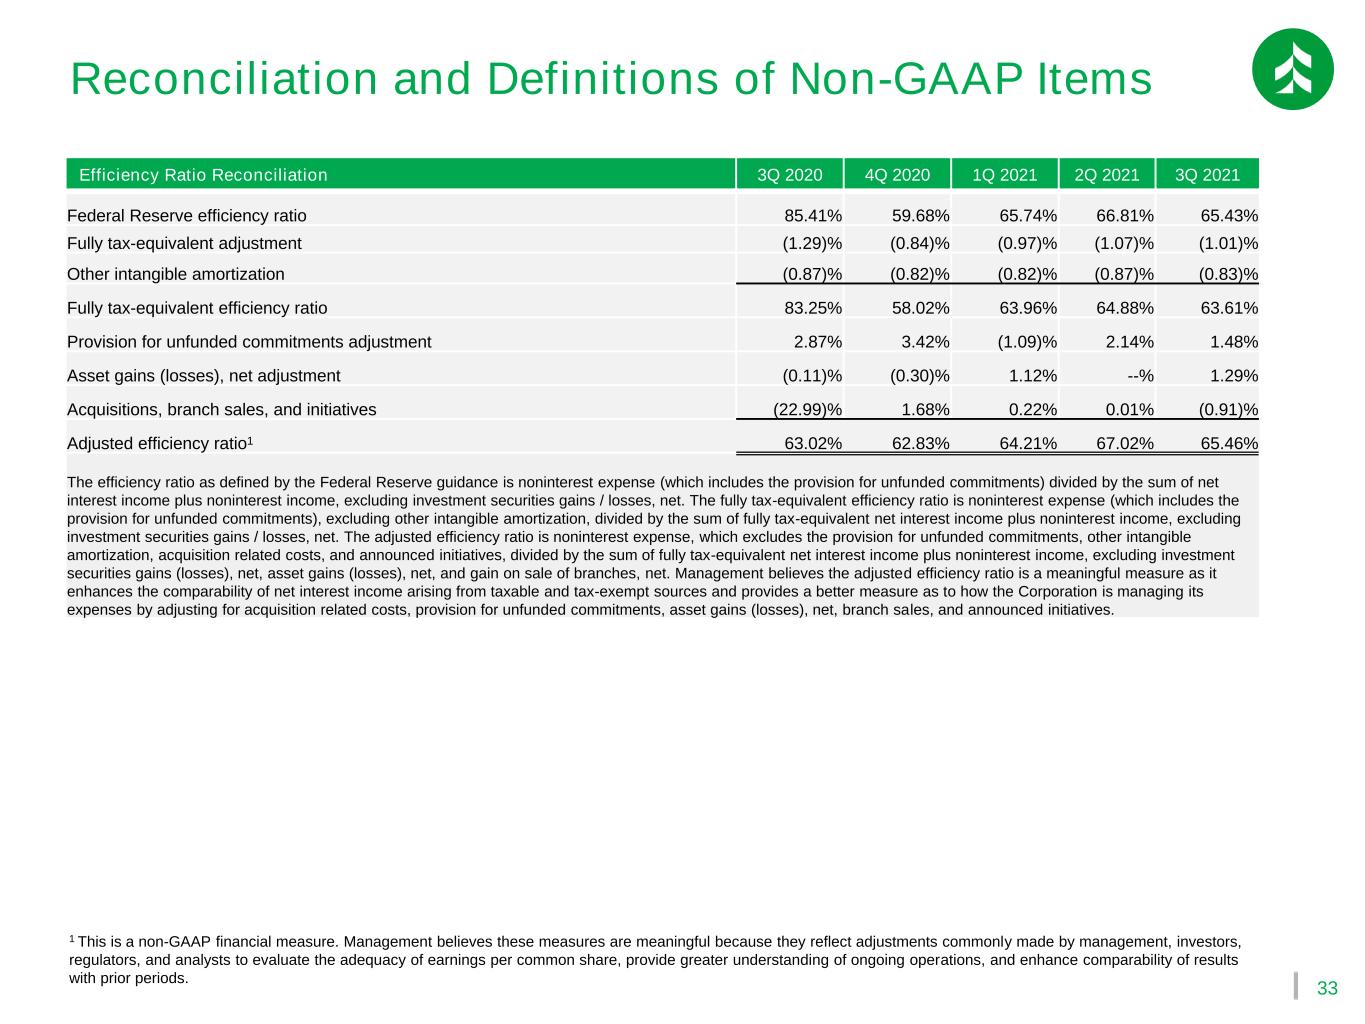
33 Reconciliation and Definitions of Non-GAAP Items 1 This is a non-GAAP financial measure. Management believes these measures are meaningful because they reflect adjustments commonly made by management, investors, regulators, and analysts to evaluate the adequacy of earnings per common share, provide greater understanding of ongoing operations, and enhance comparability of results with prior periods. Efficiency Ratio Reconciliation 3Q 2020 4Q 2020 1Q 2021 2Q 2021 3Q 2021 Federal Reserve efficiency ratio 85.41% 59.68% 65.74% 66.81% 65.43% Fully tax-equivalent adjustment (1.29)% (0.84)% (0.97)% (1.07)% (1.01)% Other intangible amortization (0.87)% (0.82)% (0.82)% (0.87)% (0.83)% Fully tax-equivalent efficiency ratio 83.25% 58.02% 63.96% 64.88% 63.61% Provision for unfunded commitments adjustment 2.87% 3.42% (1.09)% 2.14% 1.48% Asset gains (losses), net adjustment (0.11)% (0.30)% 1.12% --% 1.29% Acquisitions, branch sales, and initiatives (22.99)% 1.68% 0.22% 0.01% (0.91)% Adjusted efficiency ratio1 63.02% 62.83% 64.21% 67.02% 65.46% The efficiency ratio as defined by the Federal Reserve guidance is noninterest expense (which includes the provision for unfunded commitments) divided by the sum of net interest income plus noninterest income, excluding investment securities gains / losses, net. The fully tax-equivalent efficiency ratio is noninterest expense (which includes the provision for unfunded commitments), excluding other intangible amortization, divided by the sum of fully tax-equivalent net interest income plus noninterest income, excluding investment securities gains / losses, net. The adjusted efficiency ratio is noninterest expense, which excludes the provision for unfunded commitments, other intangible amortization, acquisition related costs, and announced initiatives, divided by the sum of fully tax-equivalent net interest income plus noninterest income, excluding investment securities gains (losses), net, asset gains (losses), net, and gain on sale of branches, net. Management believes the adjusted efficiency ratio is a meaningful measure as it enhances the comparability of net interest income arising from taxable and tax-exempt sources and provides a better measure as to how the Corporation is managing its expenses by adjusting for acquisition related costs, provision for unfunded commitments, asset gains (losses), net, branch sales, and announced initiatives.


