
February 13, 2023 First Quarter 2023 Investor Presentation Associated Banc-Corp
1 Forward-Looking Statements Important note regarding forward-looking statements: Statements made in this presentation which are not purely historical are forward-looking statements, as defined in the Private Securities Litigation Reform Act of 1995. This includes any statements regarding management’s plans, objectives, or goals for future operations, products or services, and forecasts of its revenues, earnings, or other measures of performance. Such forward-looking statements may be identified by the use of words such as “believe,” “expect,” “anticipate,” “plan,” “estimate,” “should,” “will,” “intend,” "target,“ “outlook,” “project,” “guidance,” or similar expressions. Forward-looking statements are based on current management expectations and, by their nature, are subject to risks and uncertainties. Actual results may differ materially from those contained in the forward-looking statements. Factors which may cause actual results to differ materially from those contained in such forward-looking statements include those identified in the Company’s most recent Form 10-K and subsequent Form 10-Qs and other SEC filings, and such factors are incorporated herein by reference. Trademarks: All trademarks, service marks, and trade names referenced in this material are official trademarks and the property of their respective owners. Presentation: Within the charts and tables presented, certain segments, columns and rows may not sum to totals shown due to rounding. Non-GAAP Measures: This presentation includes certain non-GAAP financial measures. These non-GAAP measures are provided in addition to, and not as substitutes for, measures of our financial performance determined in accordance with GAAP. Our calculation of these non-GAAP measures may not be comparable to similarly titled measures of other companies due to potential differences between companies in the method of calculation. As a result, the use of these non-GAAP measures has limitations and should not be considered superior to, in isolation from, or as a substitute for, related GAAP measures.
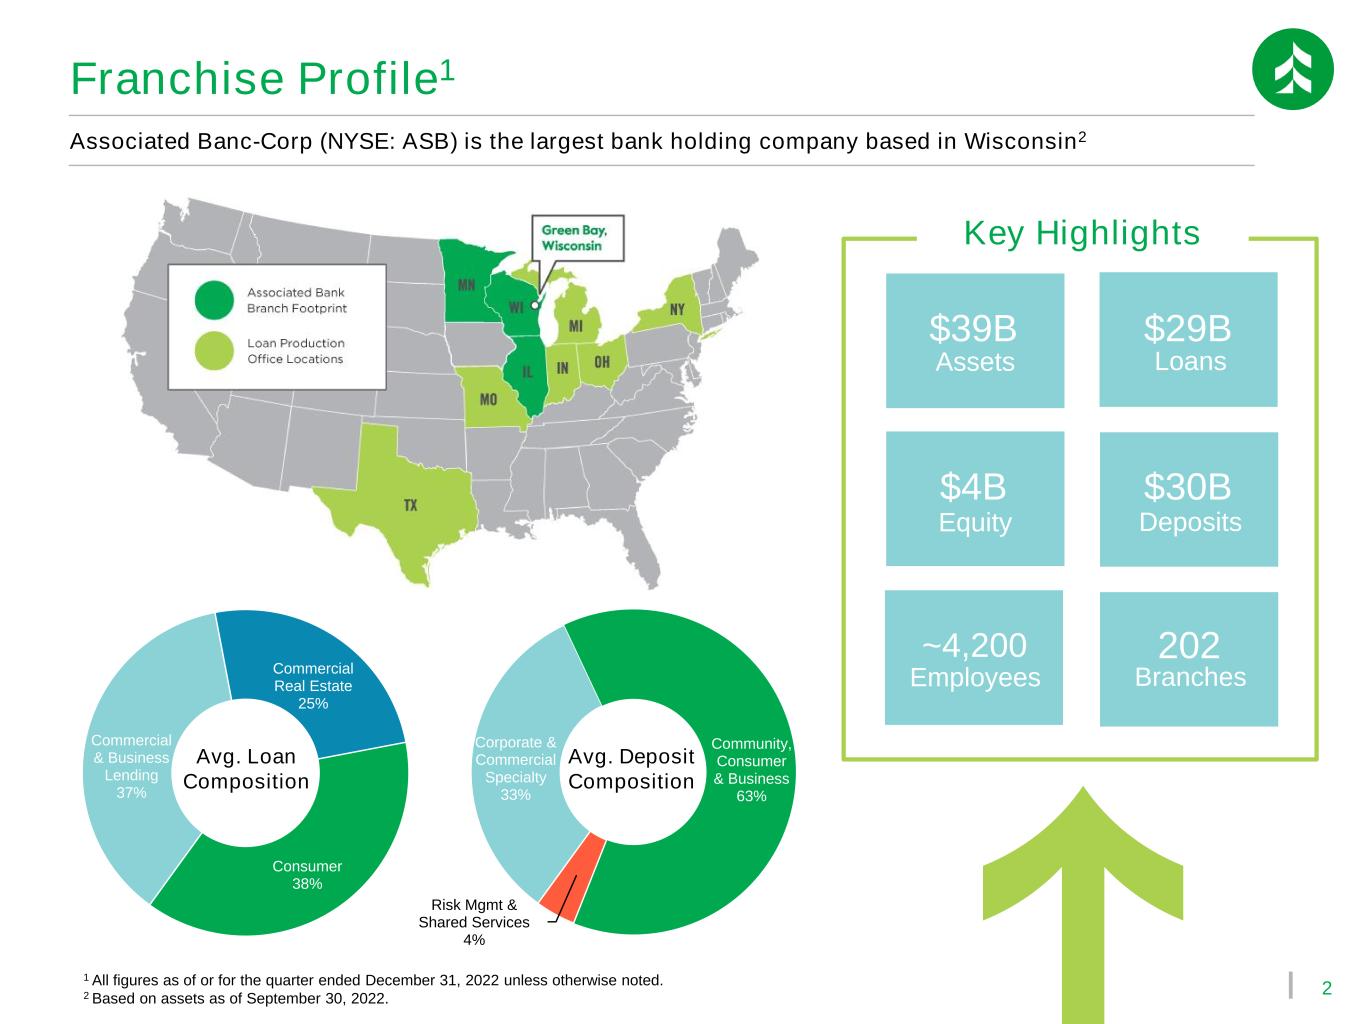
2 Associated Banc-Corp (NYSE: ASB) is the largest bank holding company based in Wisconsin2 Franchise Profile1 Key Highlights $39B $29B $4B $30B ~4,200 202 Assets Loans Equity Deposits Employees Branches Commercial & Business Lending 37% Commercial Real Estate 25% Consumer 38% Corporate & Commercial Specialty 33% Community, Consumer & Business 63% Risk Mgmt & Shared Services 4% Avg. Loan Composition Avg. Deposit Composition 1 All figures as of or for the quarter ended December 31, 2022 unless otherwise noted. 2 Based on assets as of September 30, 2022.
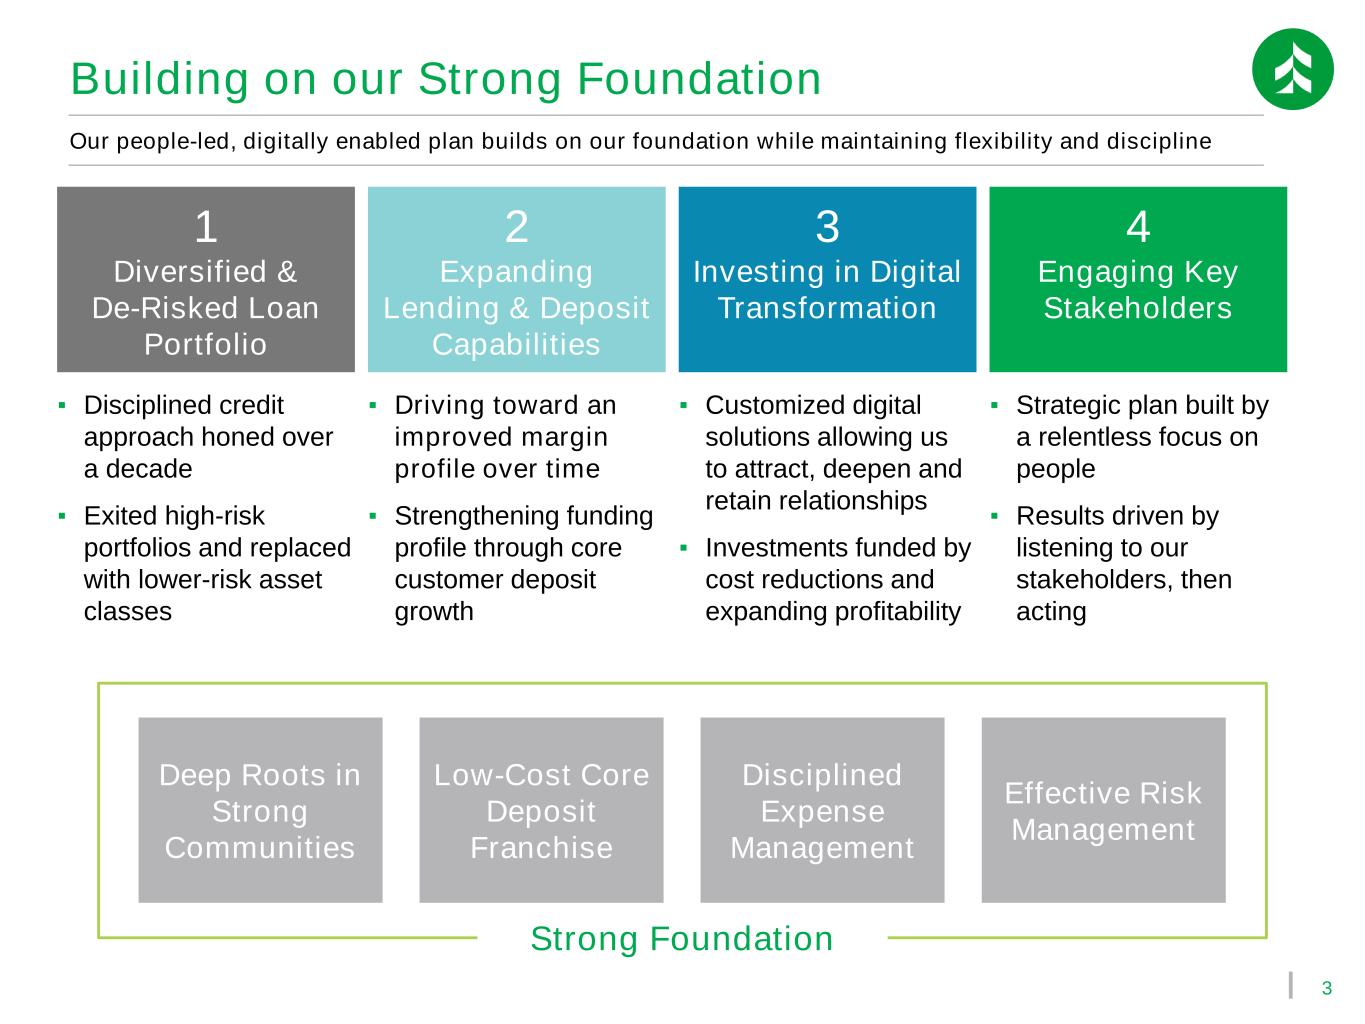
3 Building on our Strong Foundation Our people-led, digitally enabled plan builds on our foundation while maintaining flexibility and discipline 1 Diversified & De-Risked Loan Portfolio 2 Expanding Lending & Deposit Capabilities 4 Engaging Key Stakeholders 3 Investing in Digital Transformation ▪ Disciplined credit approach honed over a decade ▪ Exited high-risk portfolios and replaced with lower-risk asset classes ▪ Driving toward an improved margin profile over time ▪ Strengthening funding profile through core customer deposit growth ▪ Customized digital solutions allowing us to attract, deepen and retain relationships ▪ Investments funded by cost reductions and expanding profitability ▪ Strategic plan built by a relentless focus on people ▪ Results driven by listening to our stakeholders, then acting Deep Roots in Strong Communities Disciplined Expense Management Low-Cost Core Deposit Franchise Strong Foundation Effective Risk Management
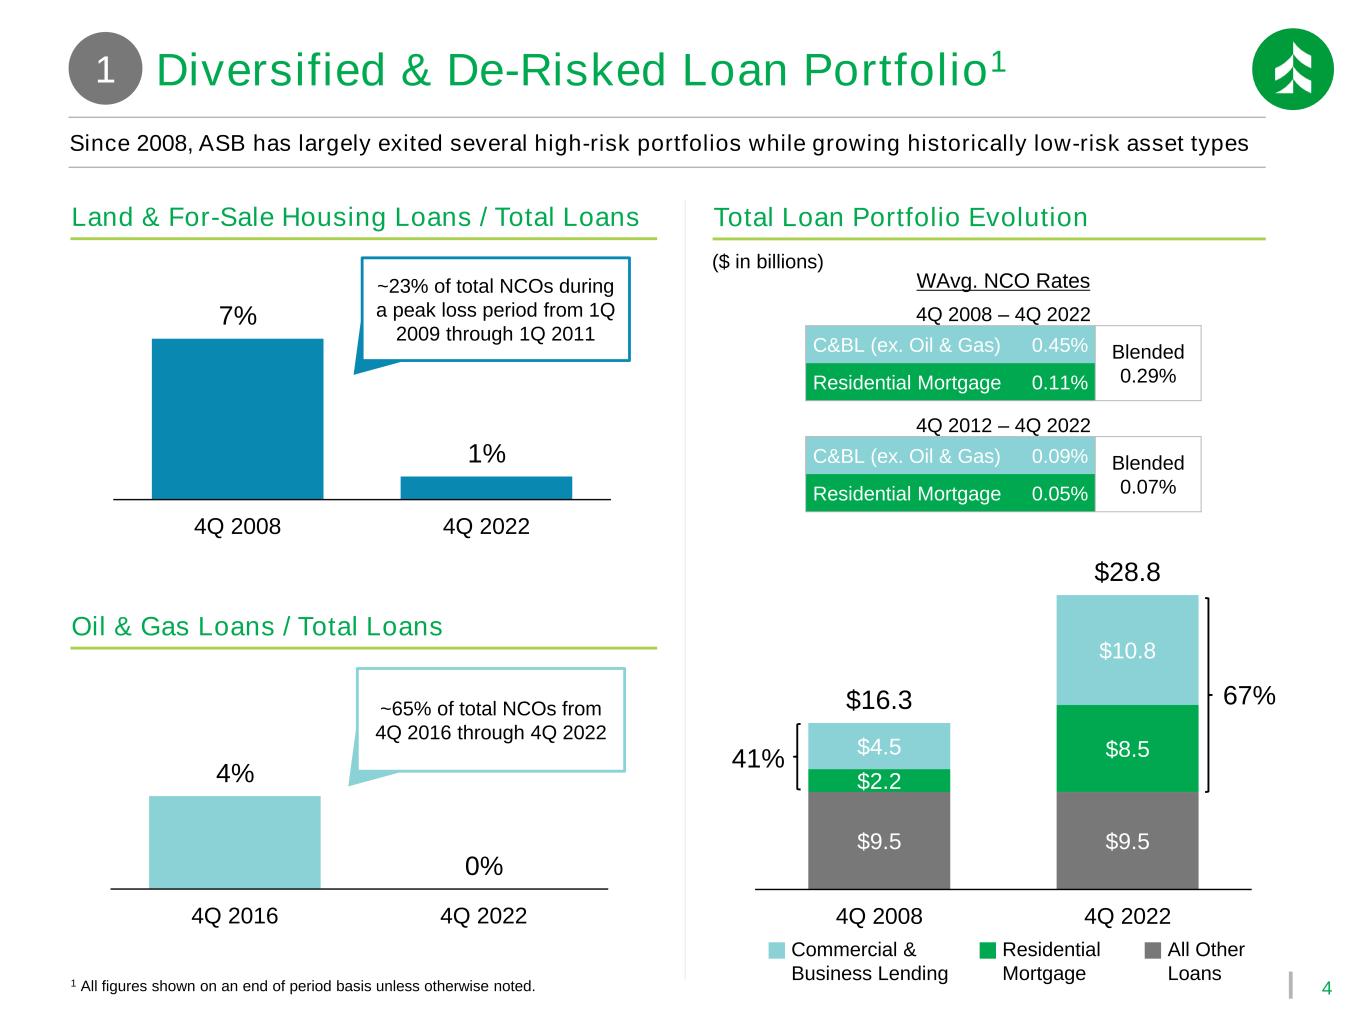
4 4% 0% 4Q 2016 4Q 2022 7% 1% 4Q 2008 4Q 2022 Diversified & De-Risked Loan Portfolio1 Since 2008, ASB has largely exited several high-risk portfolios while growing historically low-risk asset types 1 $9.5 $9.5 $2.2 $8.5$4.5 $10.8 $16.3 $28.8 4Q 2008 4Q 2022 Land & For-Sale Housing Loans / Total Loans Oil & Gas Loans / Total Loans Total Loan Portfolio Evolution ($ in billions) Commercial & Business Lending Residential Mortgage All Other Loans 1 All figures shown on an end of period basis unless otherwise noted. 41% 67% 4Q 2012 – 4Q 2022 C&BL (ex. Oil & Gas) 0.09% Blended 0.07%Residential Mortgage 0.05% ~23% of total NCOs during a peak loss period from 1Q 2009 through 1Q 2011 ~65% of total NCOs from 4Q 2016 through 4Q 2022 4Q 2008 – 4Q 2022 C&BL (ex. Oil & Gas) 0.45% Blended 0.29%Residential Mortgage 0.11% WAvg. NCO Rates
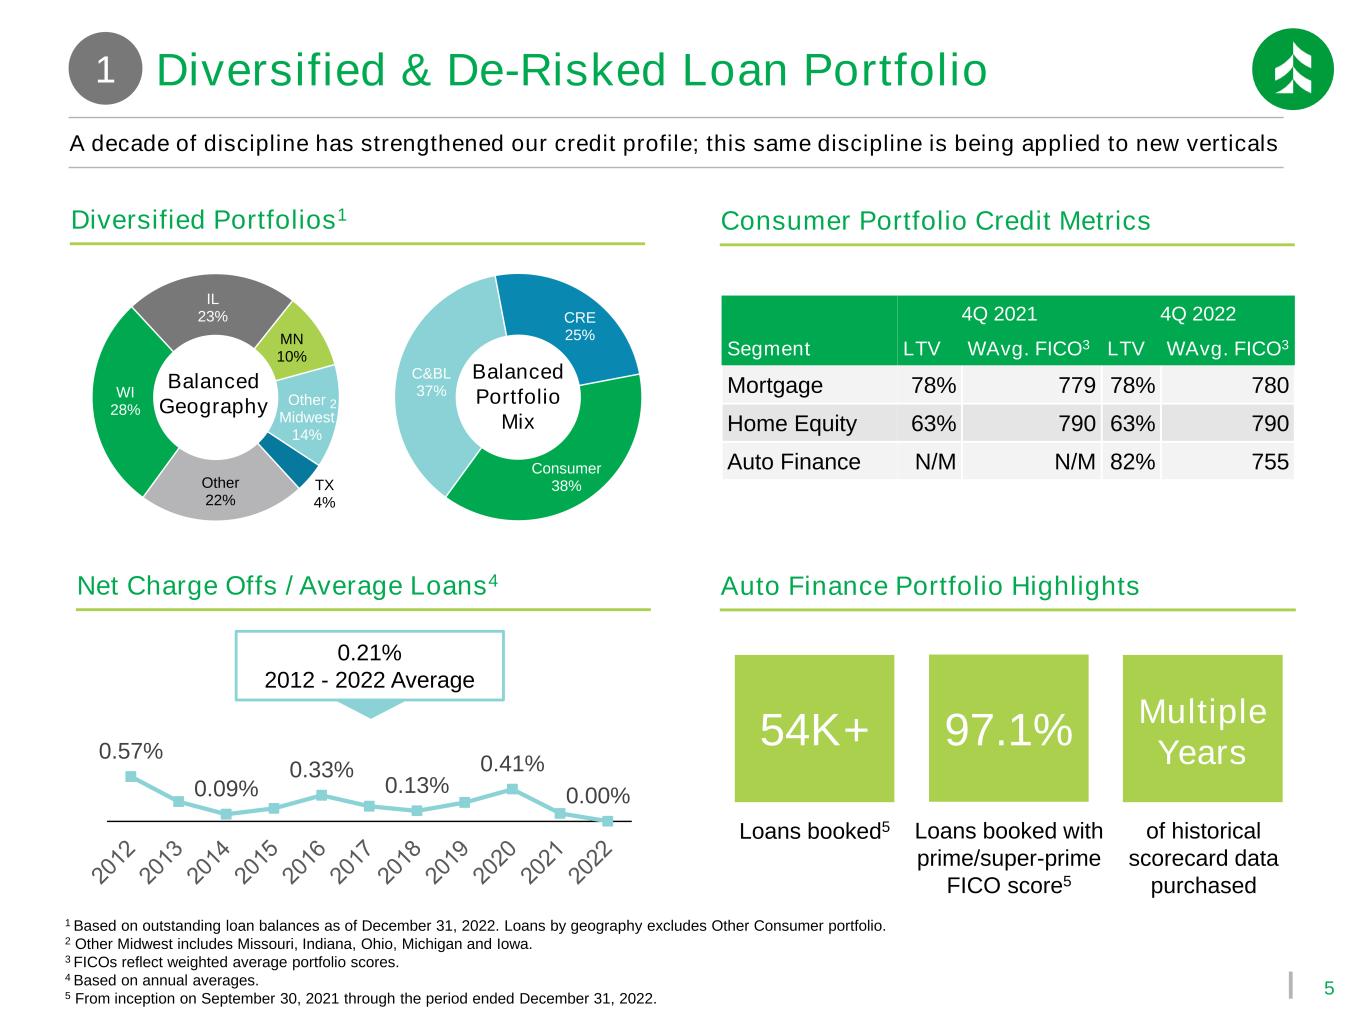
5 1 Based on outstanding loan balances as of December 31, 2022. Loans by geography excludes Other Consumer portfolio. 2 Other Midwest includes Missouri, Indiana, Ohio, Michigan and Iowa. 3 FICOs reflect weighted average portfolio scores. 4 Based on annual averages. 5 From inception on September 30, 2021 through the period ended December 31, 2022. WI 28% IL 23% MN 10% Other Midwest 14% TX 4% Other 22% Balanced Geography C&BL 37% CRE 25% Consumer 38% Balanced Portfolio Mix 2 A decade of discipline has strengthened our credit profile; this same discipline is being applied to new verticals 0.57% 0.09% 0.33% 0.13% 0.41% 0.00% 4Q 2021 4Q 2022 Segment LTV WAvg. FICO3 LTV WAvg. FICO3 Mortgage 78% 779 78% 780 Home Equity 63% 790 63% 790 Auto Finance N/M N/M 82% 755 Consumer Portfolio Credit MetricsDiversified Portfolios1 Net Charge Offs / Average Loans4 Diversified & De-Risked Loan Portfolio1 0.21% 2012 - 2022 Average Auto Finance Portfolio Highlights 97.1% Multiple Years Loans booked with prime/super-prime FICO score5 of historical scorecard data purchased 54K+ Loans booked5
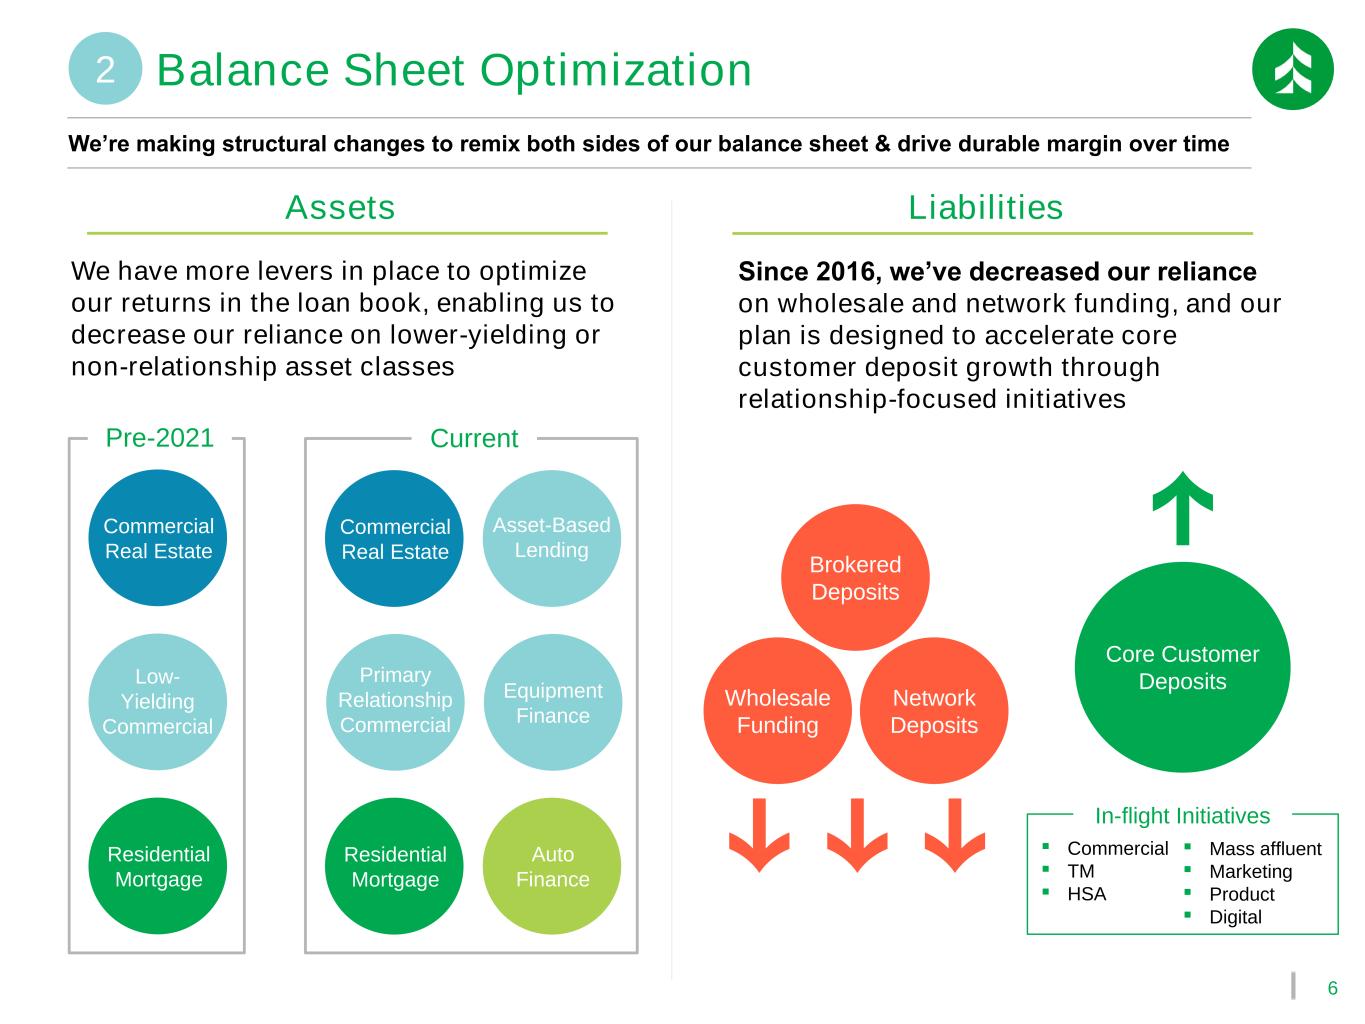
6 We’re making structural changes to remix both sides of our balance sheet & drive durable margin over time Liabilities Balance Sheet Optimization2 Assets We have more levers in place to optimize our returns in the loan book, enabling us to decrease our reliance on lower-yielding or non-relationship asset classes Equipment Finance Asset-Based Lending Auto Finance Primary Relationship Commercial Low- Yielding Commercial Residential Mortgage Since 2016, we’ve decreased our reliance on wholesale and network funding, and our plan is designed to accelerate core customer deposit growth through relationship-focused initiatives Wholesale Funding Network Deposits Core Customer Deposits Brokered Deposits ▪ Commercial ▪ TM ▪ HSA ▪ Mass affluent ▪ Marketing ▪ Product ▪ Digital Commercial Real Estate Residential Mortgage Commercial Real Estate Pre-2021 Current In-flight Initiatives
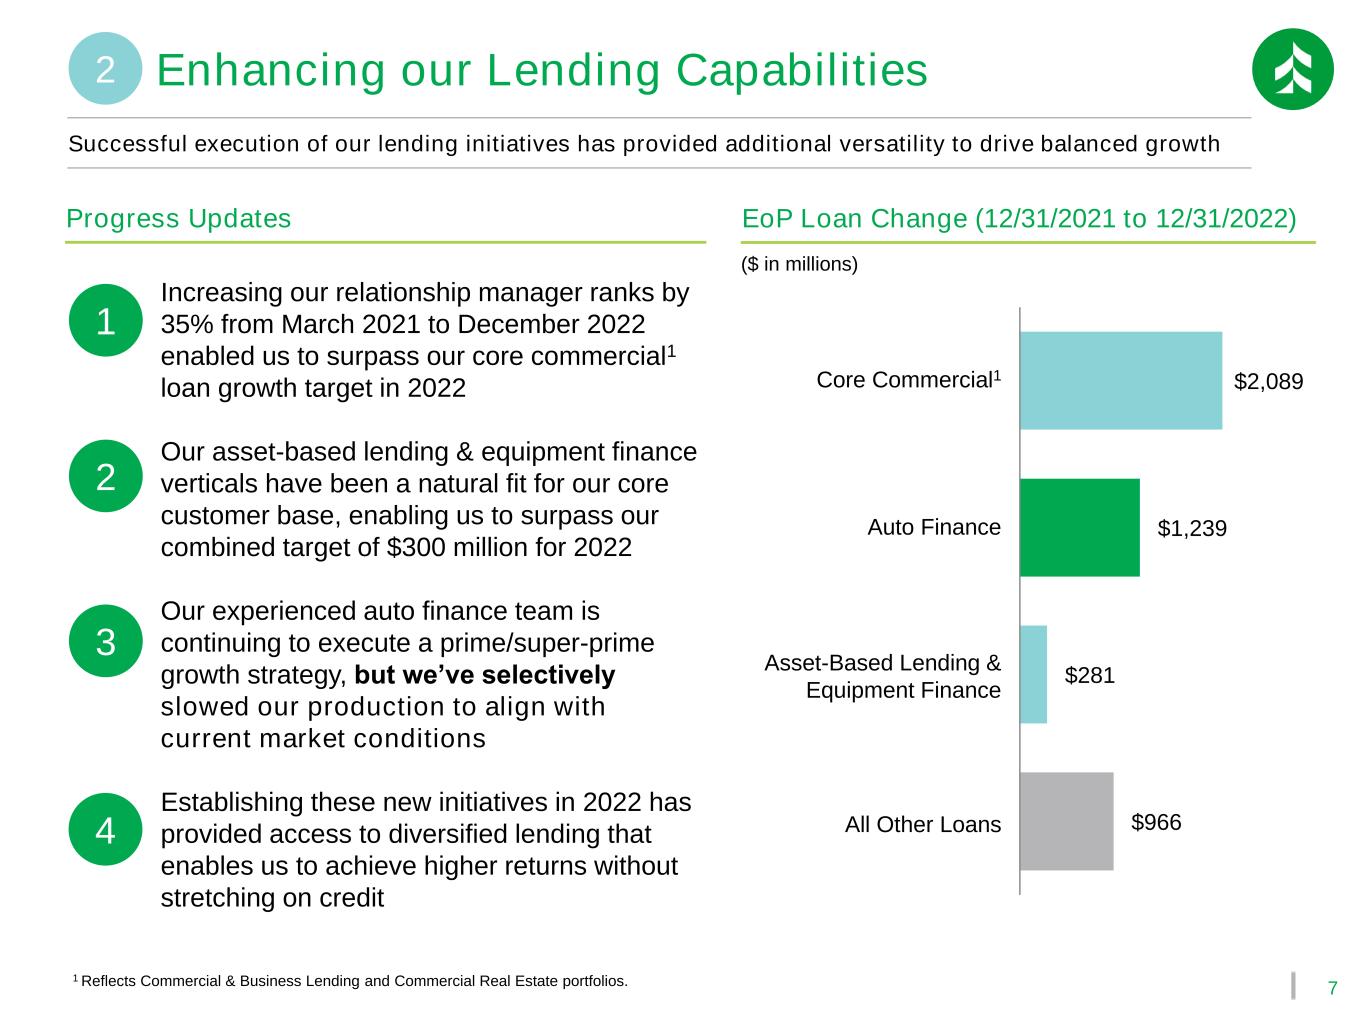
7 Successful execution of our lending initiatives has provided additional versatility to drive balanced growth ($ in millions) $966 $281 $1,239 $2,089 Core Commercial1 All Other Loans EoP Loan Change (12/31/2021 to 12/31/2022) Asset-Based Lending & Equipment Finance Auto Finance Enhancing our Lending Capabilities2 Progress Updates 1 Increasing our relationship manager ranks by 35% from March 2021 to December 2022 enabled us to surpass our core commercial1 loan growth target in 2022 Our asset-based lending & equipment finance verticals have been a natural fit for our core customer base, enabling us to surpass our combined target of $300 million for 2022 Our experienced auto finance team is continuing to execute a prime/super-prime growth strategy, but we’ve selectively slowed our production to align with current market conditions Establishing these new initiatives in 2022 has provided access to diversified lending that enables us to achieve higher returns without stretching on credit 2 3 4 1 Reflects Commercial & Business Lending and Commercial Real Estate portfolios.

8 2022 Cumulative Int-Bearing Deposit Beta1 We’ve grown deposits for 11 straight years and have taken steps to reduce our reliance on higher-beta funding ($ in billions) Customer Deposits Network Deposits, Brokered Deposits & Other Wholesale Funding Funding Trends (2016 vs. 2022) 1 Beta calculated as change in quarterly average yield from 4Q 2021 to 4Q 2022 vs. change in average Fed Effective Rate. Fed data derived from St. Louis FRED database. Our Funding Profile Shift has Already Begun 2 +357 bps +106 bps Avg. Fed Funds Effective Rate ASB Avg. Interest-Bearing Deposit Costs ~30% beta $7.8 $6.7 $17.9 $28.1 12/31/2016 12/31/2022 $25.7 $34.8 30.3% 19.2% $14.4 $15.6 $17.4 $17.6 $19.9 $21.0 $21.9 $24.1 $24.7 $26.0 $27.7 $28.8 2011 2012 2013 2014 2015 2016 2017 2018 2019 2020 2021 2022 Average Annual Deposits ($ in billions)
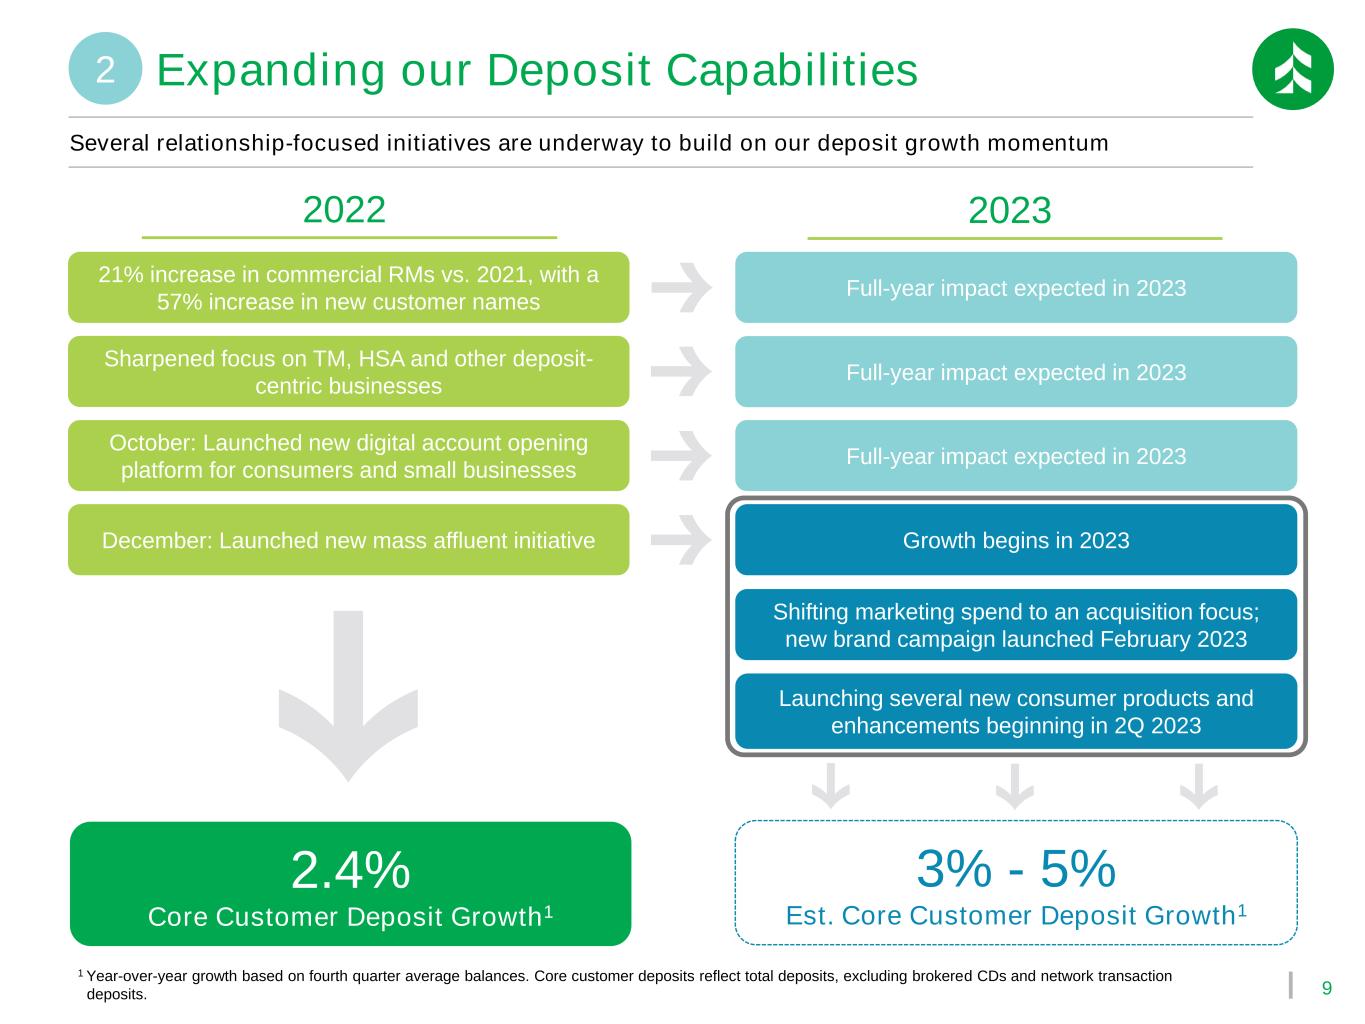
9 Full-year impact expected in 2023 Several relationship-focused initiatives are underway to build on our deposit growth momentum 21% increase in commercial RMs vs. 2021, with a 57% increase in new customer names Sharpened focus on TM, HSA and other deposit- centric businesses October: Launched new digital account opening platform for consumers and small businesses December: Launched new mass affluent initiative Full-year impact expected in 2023 Full-year impact expected in 2023 Growth begins in 2023 Launching several new consumer products and enhancements beginning in 2Q 2023 Shifting marketing spend to an acquisition focus; new brand campaign launched February 2023 20232022 1 Year-over-year growth based on fourth quarter average balances. Core customer deposits reflect total deposits, excluding brokered CDs and network transaction deposits. 2.4% Core Customer Deposit Growth1 3% - 5% Est. Core Customer Deposit Growth1 Expanding our Deposit Capabilities2
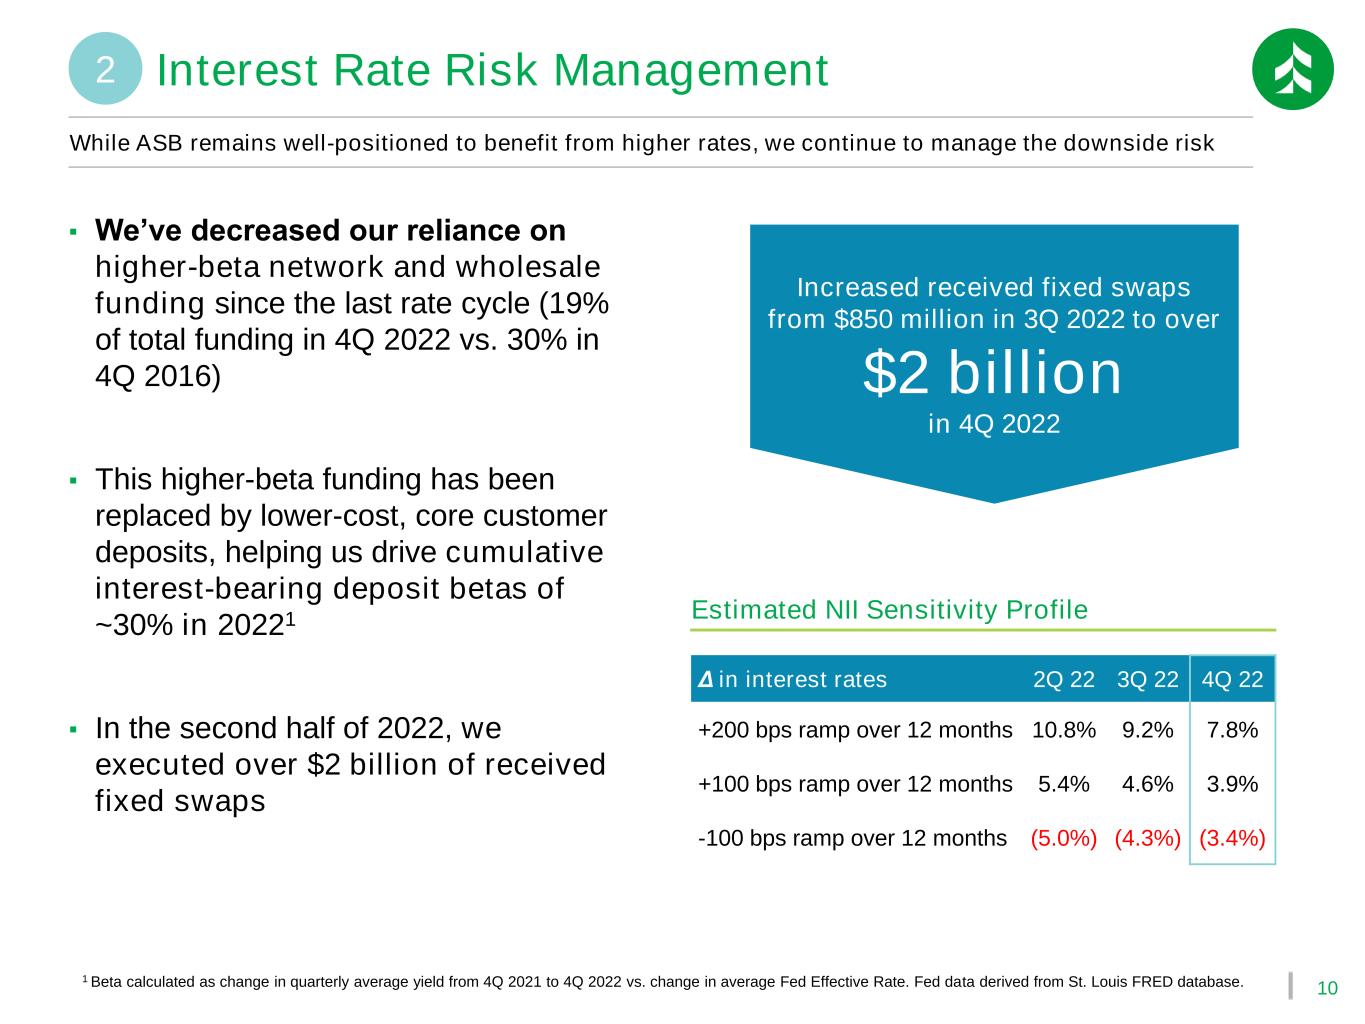
10 While ASB remains well-positioned to benefit from higher rates, we continue to manage the downside risk Estimated NII Sensitivity Profile Δ in interest rates 2Q 22 3Q 22 4Q 22 +200 bps ramp over 12 months 10.8% 9.2% 7.8% +100 bps ramp over 12 months 5.4% 4.6% 3.9% -100 bps ramp over 12 months (5.0%) (4.3%) (3.4%) 1 Beta calculated as change in quarterly average yield from 4Q 2021 to 4Q 2022 vs. change in average Fed Effective Rate. Fed data derived from St. Louis FRED database. ▪ We’ve decreased our reliance on higher-beta network and wholesale funding since the last rate cycle (19% of total funding in 4Q 2022 vs. 30% in 4Q 2016) ▪ This higher-beta funding has been replaced by lower-cost, core customer deposits, helping us drive cumulative interest-bearing deposit betas of ~30% in 20221 ▪ In the second half of 2022, we executed over $2 billion of received fixed swaps Increased received fixed swaps from $850 million in 3Q 2022 to over $2 billion in 4Q 2022 2 Interest Rate Risk Management

11 We are leveraging agile frameworks and customer feedback to more quickly deliver custom digital solutions Investing in Digital Transformation3 Launch of Associated Bank Digital AI-led Financial Wellness and Personal Insights Debit Card Controls Digital Account Opening Upgrades ▪ Cloud-based platform with 99.9% uptime ▪ Open architecture ▪ Improved security and self-service controls This investment is largely being funded with physical distribution cost savings ▪ Pruned our branch network by 11% vs. year-end 20201 ▪ Reduced staffing levels in mortgage banking and branch management ▪ Closed and consolidated several back-office facilities 1 11% reduction based on branch count at December 31, 2022. ▪ Fast, simplified & intuitive experience ▪ Flexible platform structure ▪ More robust risk controls
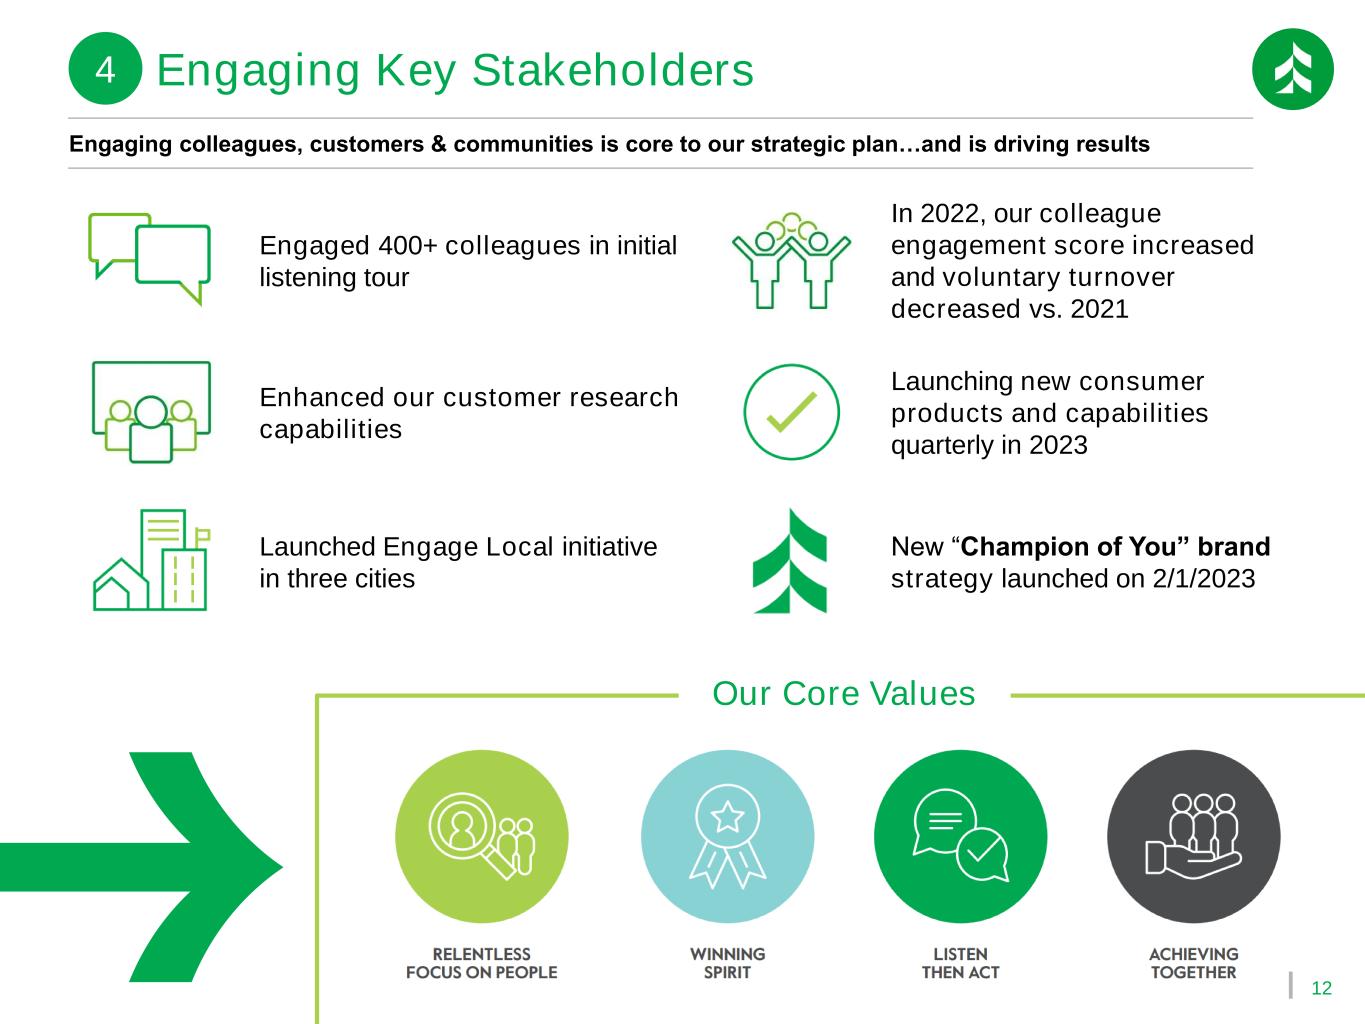
12 Engaging colleagues, customers & communities is core to our strategic plan…and is driving results Engaged 400+ colleagues in initial listening tour Enhanced our customer research capabilities Launched Engage Local initiative in three cities In 2022, our colleague engagement score increased and voluntary turnover decreased vs. 2021 Launching new consumer products and capabilities quarterly in 2023 New “Champion of You” brand strategy launched on 2/1/2023 Engaging Key Stakeholders4 Our Core Values
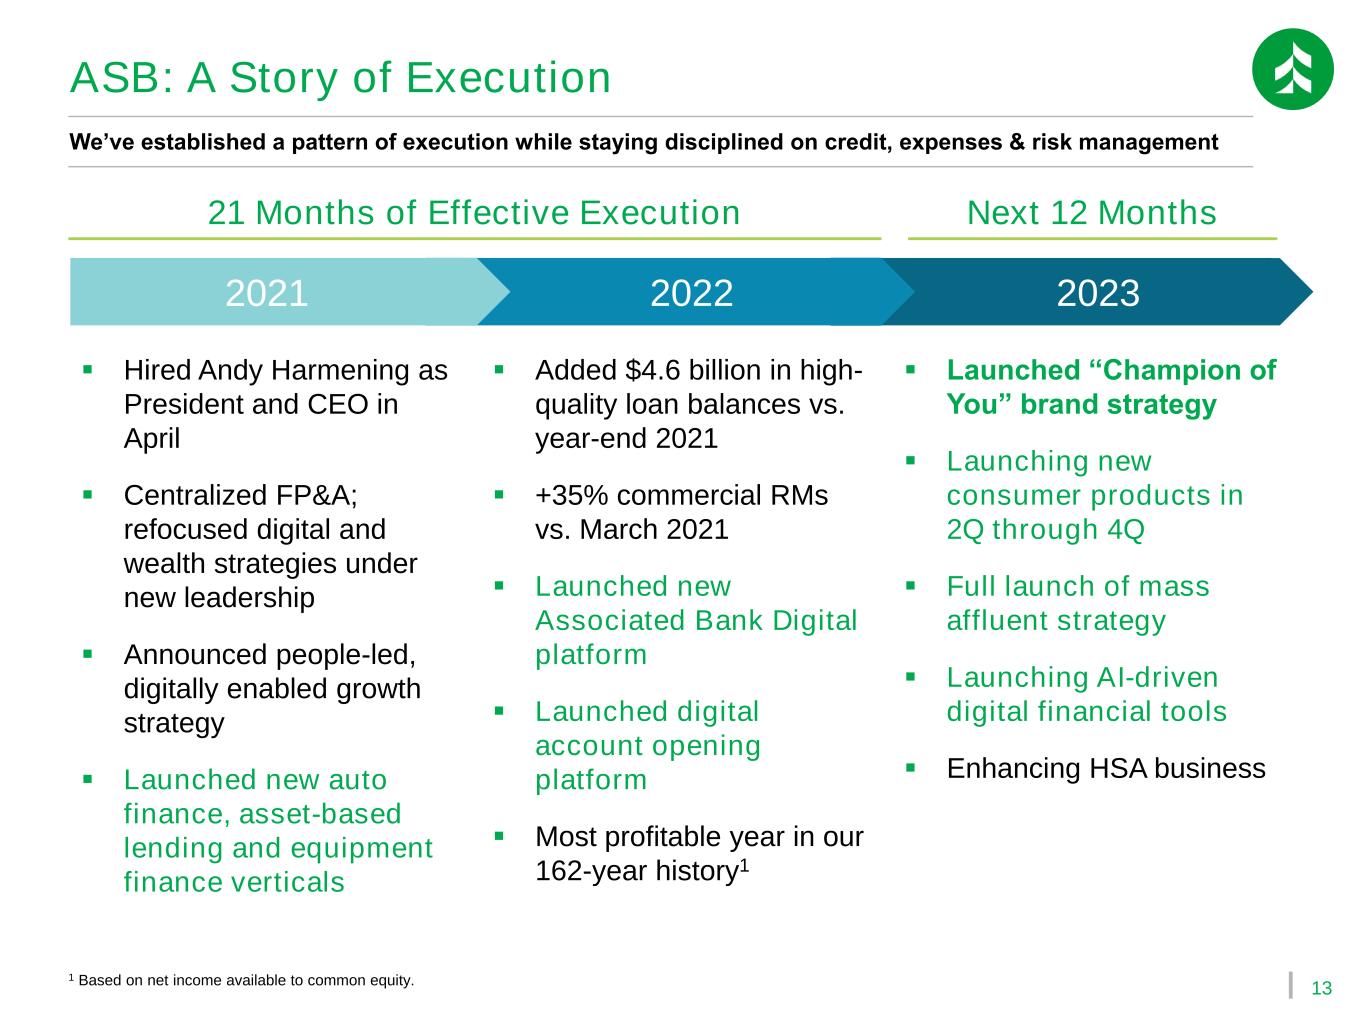
13 21 Months of Effective Execution ASB: A Story of Execution We’ve established a pattern of execution while staying disciplined on credit, expenses & risk management 2021 2022 2023 ▪ Hired Andy Harmening as President and CEO in April ▪ Centralized FP&A; refocused digital and wealth strategies under new leadership ▪ Announced people-led, digitally enabled growth strategy ▪ Launched new auto finance, asset-based lending and equipment finance verticals ▪ Added $4.6 billion in high- quality loan balances vs. year-end 2021 ▪ +35% commercial RMs vs. March 2021 ▪ Launched new Associated Bank Digital platform ▪ Launched digital account opening platform ▪ Most profitable year in our 162-year history1 ▪ Launched “Champion of You” brand strategy ▪ Launching new consumer products in 2Q through 4Q ▪ Full launch of mass affluent strategy ▪ Launching AI-driven digital financial tools ▪ Enhancing HSA business Next 12 Months 1 Based on net income available to common equity.
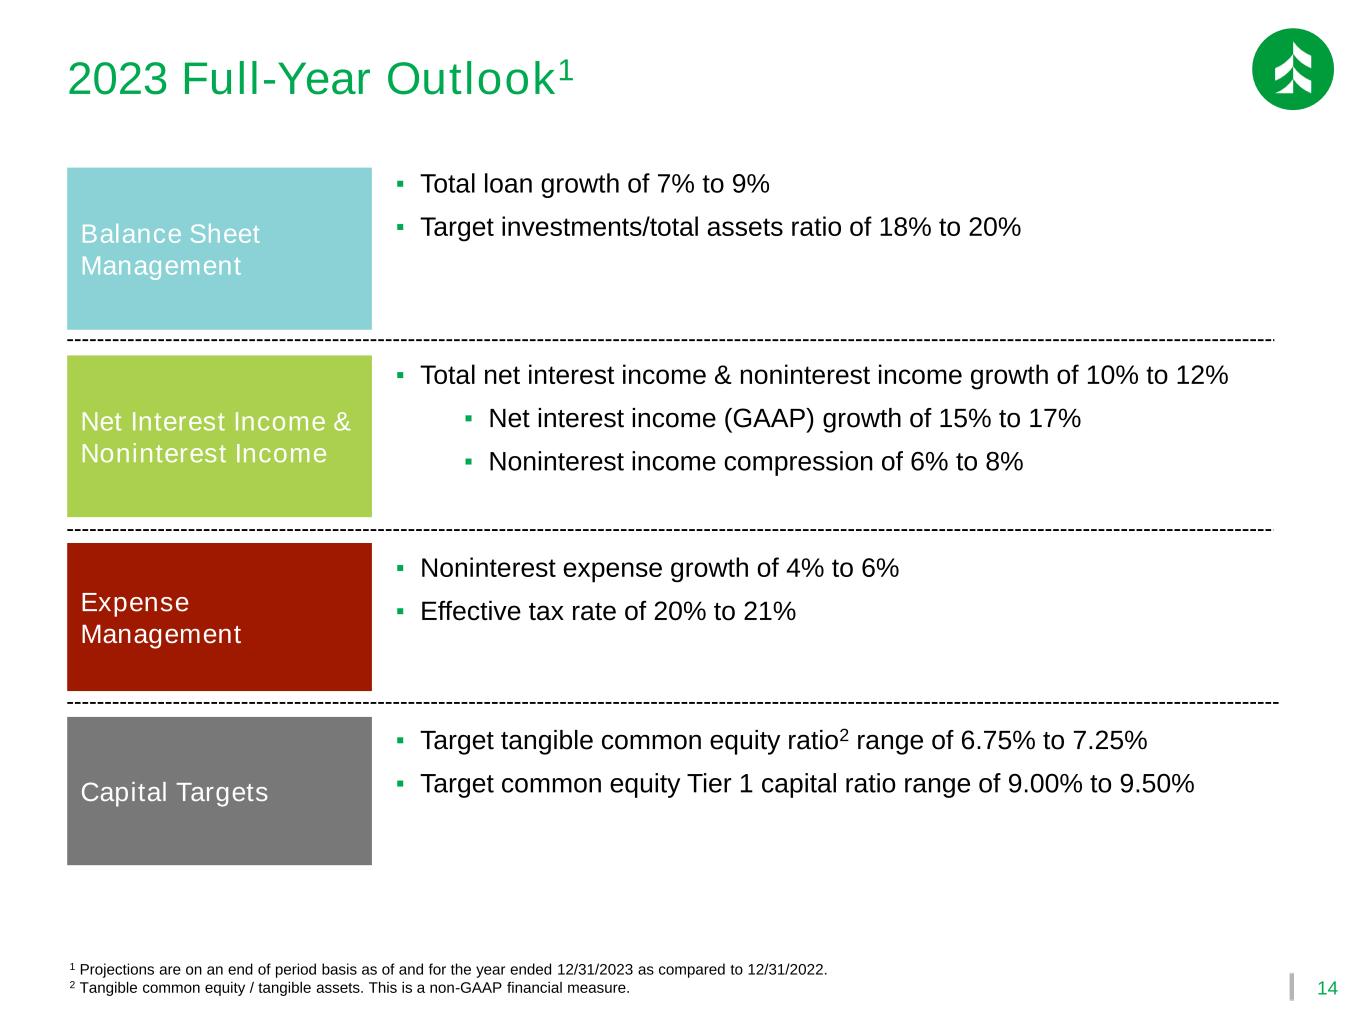
14 Balance Sheet Management Net Interest Income & Noninterest Income ▪ Total net interest income & noninterest income growth of 10% to 12% ▪ Net interest income (GAAP) growth of 15% to 17% ▪ Noninterest income compression of 6% to 8% Expense Management ▪ Noninterest expense growth of 4% to 6% ▪ Effective tax rate of 20% to 21% Capital Targets ▪ Target tangible common equity ratio2 range of 6.75% to 7.25% ▪ Target common equity Tier 1 capital ratio range of 9.00% to 9.50% 1 Projections are on an end of period basis as of and for the year ended 12/31/2023 as compared to 12/31/2022. 2 Tangible common equity / tangible assets. This is a non-GAAP financial measure. ▪ Total loan growth of 7% to 9% ▪ Target investments/total assets ratio of 18% to 20% 2023 Full-Year Outlook1

Appendix

16 Total Loans Outstanding Balances as of December 31, 2022 Well-diversified $29 billion loan portfolio ($ in millions) 1 All values as of period end. 2 North American Industry Classification System. 12/31/2022 1 % of Total Loans 12/31/2022 1 % of Total Loans C&BL (by NAICS 2 ) CRE (by property type) Manufacturing & Wholesale Trade 2,182$ 7.6% Multi-Family 2,487$ 8.6% Utilities 2,160 7.5% Industrial 1,640 5.7% Real Estate (includes REITs) 1,982 6.9% Office/Mixed 1,296 4.5% Mortgage Warehouse 600 2.1% Retail 683 2.4% Finance & Insurance 577 2.0% Single Family Construction 491 1.7% Retail Trade 468 1.6% Hotel/Motel 212 0.7% Construction 440 1.5% Land 83 0.3% Health Care and Social Assistance 412 1.4% Mobile Home Parks 65 0.2% Professional, Scientific, and Tech. Serv. 331 1.2% Parking Lots and Garages 9 0.0% Rental and Leasing Services 323 1.1% Other 271 0.9% Transportation and Warehousing 306 1.1% Total CRE 7,236$ 25.1% Waste Management 229 0.8% Accommodation and Food Services 88 0.3% Consumer Arts, Entertainment, and Recreation 84 0.3% Residential Mortgage 8,512$ 29.6% Management of Companies & Enterprises 81 0.3% Auto Finance 1,382 4.8% Information 77 0.3% Home Equity 624 2.2% Financial Investments & Related Activities 74 0.3% Credit Cards 132 0.5% Mining 33 0.1% Student Loans 76 0.3% Public Administration 27 0.1% Other Consumer 87 0.3% Educational Services 27 0.1% Total Consumer 10,813$ 37.5% Agriculture, Forestry, Fishing and Hunting 0 0.0% Other 248 0.9% Total C&BL 10,751$ 37.3% Total Loans 28,800$ 100.0%
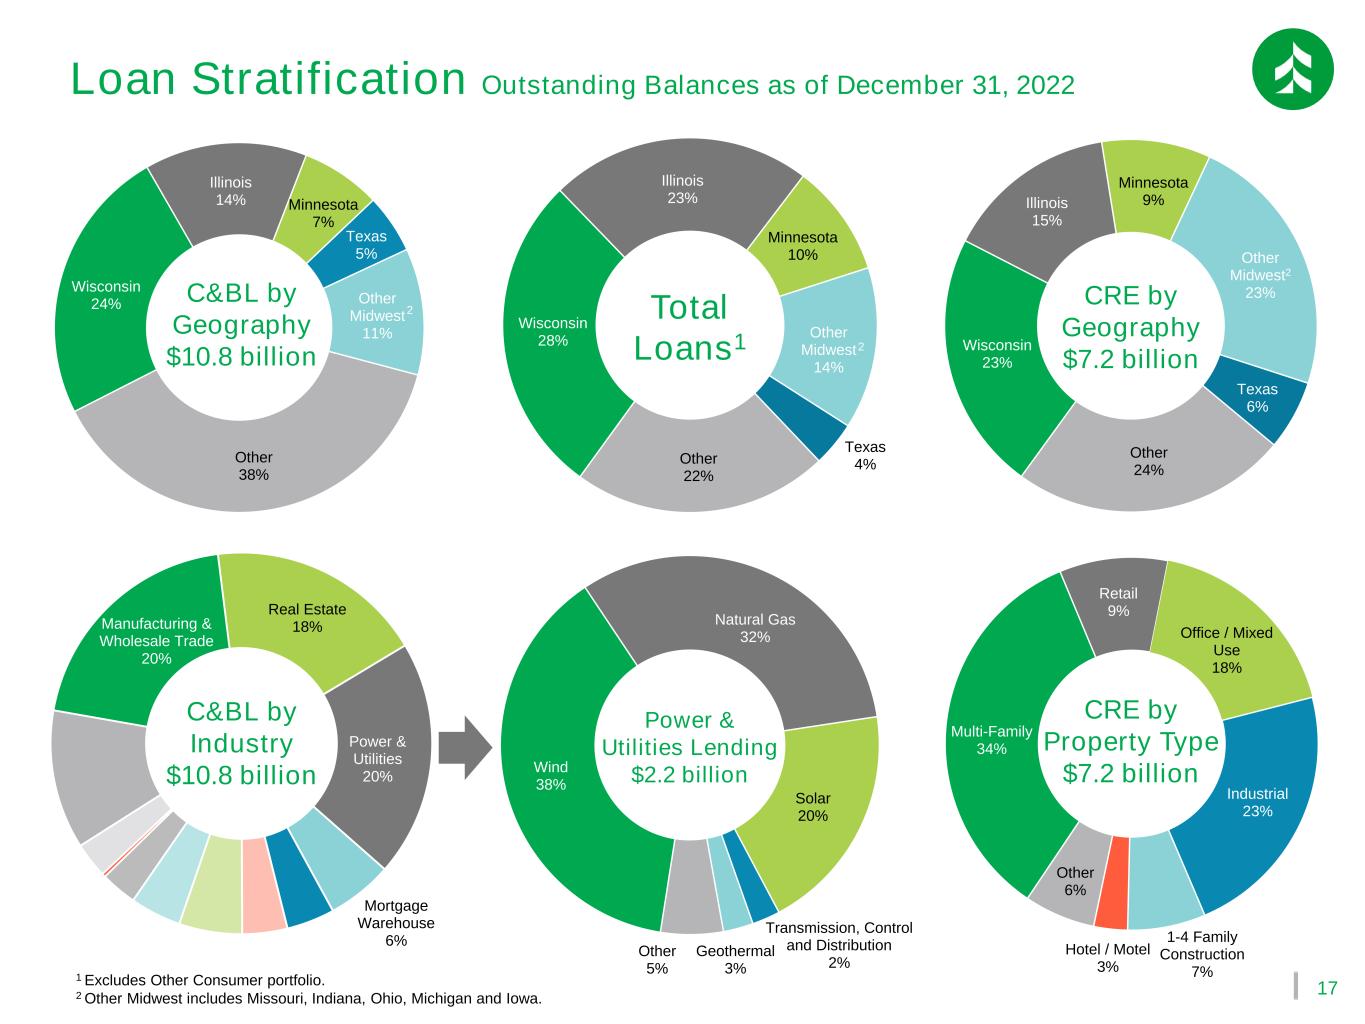
17 Wisconsin 28% Illinois 23% Minnesota 10% Other Midwest 14% Texas 4%Other 22% Manufacturing & Wholesale Trade 20% Real Estate 18% Power & Utilities 20% Mortgage Warehouse 6% 1 Excludes Other Consumer portfolio. 2 Other Midwest includes Missouri, Indiana, Ohio, Michigan and Iowa. Wind 38% Natural Gas 32% Solar 20% Transmission, Control and Distribution 2% Geothermal 3% Other 5% Wisconsin 24% Illinois 14% Minnesota 7% Texas 5% Other Midwest 11% Other 38% Wisconsin 23% Illinois 15% Minnesota 9% Other Midwest2 23% Texas 6% Other 24% 2 2 Loan Stratification Outstanding Balances as of December 31, 2022 C&BL by Geography $10.8 billion Power & Utilities Lending $2.2 billion C&BL by Industry $10.8 billion Total Loans1 CRE by Geography $7.2 billion CRE by Property Type $7.2 billion Multi-Family 34% Retail 9% Office / Mixed Use 18% Industrial 23% 1-4 Family Construction 7% Hotel / Motel 3% Other 6%


