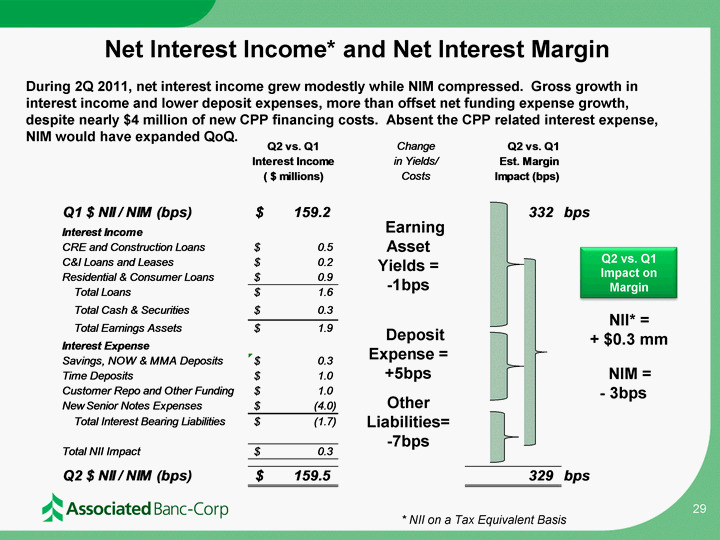
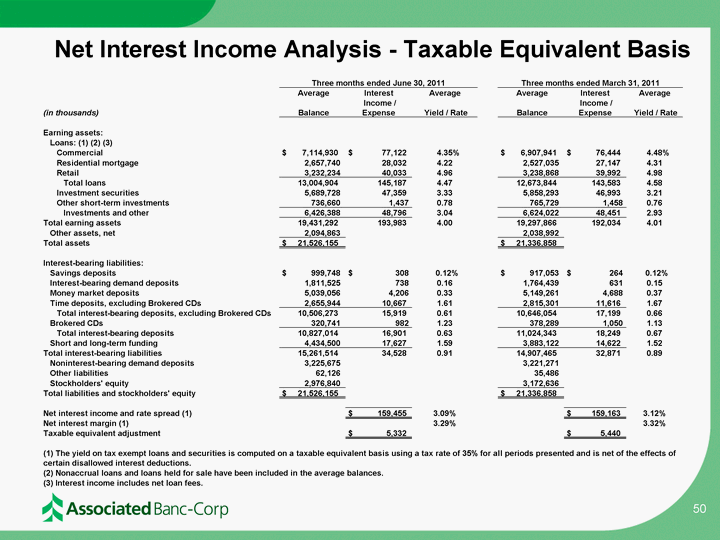
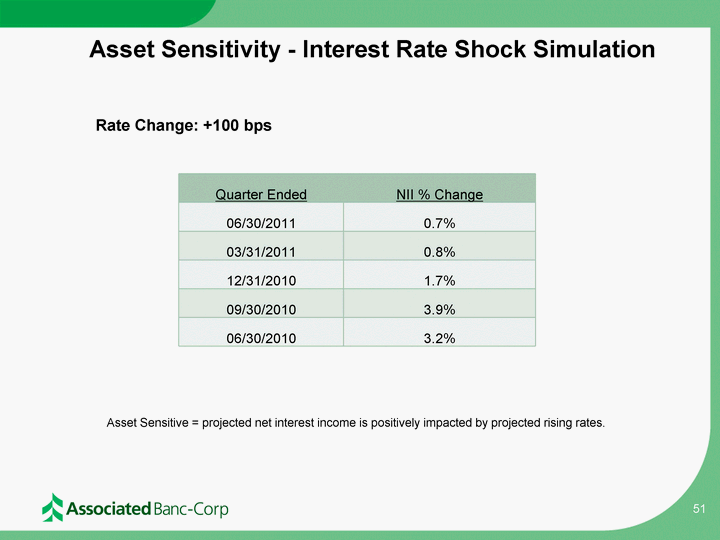
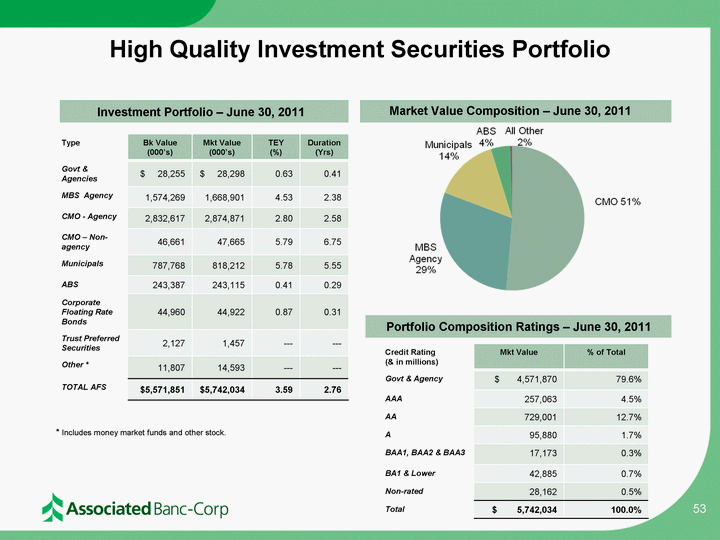
| Net Interest Income Analysis - Taxable Equivalent Basis 50 Three months ended June 30, 2011 Three months ended June 30, 2011 Three months ended June 30, 2011 Three months ended March 31, 2011 Three months ended March 31, 2011 Three months ended March 31, 2011 Average Interest Average Average Interest Average (in thousands) Balance Income / Expense Yield / Rate Balance Income / Expense Yield / Rate Earning assets: Loans: (1) (2) (3) Commercial $ 7,114,930 $ 77,122 4.35% $ 6,907,941 $ 76,444 4.48% Residential mortgage 2,657,740 28,032 4.22 2,527,035 27,147 4.31 Retail 3,232,234 40,033 4.96 3,238,868 39,992 4.98 Total loans 13,004,904 145,187 4.47 12,673,844 143,583 4.58 Investment securities 5,689,728 47,359 3.33 5,858,293 46,993 3.21 Other short-term investments 736,660 1,437 0.78 765,729 1,458 0.76 Investments and other 6,426,388 48,796 3.04 6,624,022 48,451 2.93 Total earning assets 19,431,292 193,983 4.00 19,297,866 192,034 4.01 Other assets, net 2,094,863 2,038,992 Total assets $ 21,526,155 $ 21,336,858 Interest-bearing liabilities: Savings deposits $ 999,748 $ 308 0.12% $ 917,053 $ 264 0.12% Interest-bearing demand deposits 1,811,525 738 0.16 1,764,439 631 0.15 Money market deposits 5,039,056 4,206 0.33 5,149,261 4,688 0.37 Time deposits, excluding Brokered CDs 2,655,944 10,667 1.61 2,815,301 11,616 1.67 Total interest-bearing deposits, excluding Brokered CDs Total interest-bearing deposits, excluding Brokered CDs 10,506,273 15,919 0.61 10,646,054 17,199 0.66 Brokered CDs 320,741 982 1.23 378,289 1,050 1.13 Total interest-bearing deposits 10,827,014 16,901 0.63 11,024,343 18,249 0.67 Short and long-term funding 4,434,500 17,627 1.59 3,883,122 14,622 1.52 Total interest-bearing liabilities 15,261,514 34,528 0.91 14,907,465 32,871 0.89 Noninterest-bearing demand deposits 3,225,675 3,221,271 Other liabilities 62,126 35,486 Stockholders' equity 2,976,840 3,172,636 Total liabilities and stockholders' equity $ 21,526,155 $ 21,336,858 Net interest income and rate spread (1) $ 159,455 3.09% $ 159,163 3.12% Net interest margin (1) 3.29% 3.32% Taxable equivalent adjustment $ 5,332 $ 5,440 (1) The yield on tax exempt loans and securities is computed on a taxable equivalent basis using a tax rate of 35% for all periods presented and is net of the effects of certain disallowed interest deductions. (1) The yield on tax exempt loans and securities is computed on a taxable equivalent basis using a tax rate of 35% for all periods presented and is net of the effects of certain disallowed interest deductions. (1) The yield on tax exempt loans and securities is computed on a taxable equivalent basis using a tax rate of 35% for all periods presented and is net of the effects of certain disallowed interest deductions. (1) The yield on tax exempt loans and securities is computed on a taxable equivalent basis using a tax rate of 35% for all periods presented and is net of the effects of certain disallowed interest deductions. (1) The yield on tax exempt loans and securities is computed on a taxable equivalent basis using a tax rate of 35% for all periods presented and is net of the effects of certain disallowed interest deductions. (1) The yield on tax exempt loans and securities is computed on a taxable equivalent basis using a tax rate of 35% for all periods presented and is net of the effects of certain disallowed interest deductions. (1) The yield on tax exempt loans and securities is computed on a taxable equivalent basis using a tax rate of 35% for all periods presented and is net of the effects of certain disallowed interest deductions. (1) The yield on tax exempt loans and securities is computed on a taxable equivalent basis using a tax rate of 35% for all periods presented and is net of the effects of certain disallowed interest deductions. (1) The yield on tax exempt loans and securities is computed on a taxable equivalent basis using a tax rate of 35% for all periods presented and is net of the effects of certain disallowed interest deductions. (2) Nonaccrual loans and loans held for sale have been included in the average balances. (2) Nonaccrual loans and loans held for sale have been included in the average balances. (2) Nonaccrual loans and loans held for sale have been included in the average balances. (2) Nonaccrual loans and loans held for sale have been included in the average balances. (3) Interest income includes net loan fees. |

