Exhibit 99.2

December 4, 2024 Strategic Update Presentation Associated Banc - Corp
1 Important Disclosures Important note regarding forward - looking statements: Statements made in this presentation which are not purely historical are forward - looking statements, as defined in the Private Securities Litigation Reform Act of 1995. This includes any statements regarding management’s plans, objectives, or goals for future operations, products or services, and forecasts of its revenues, earnings, or other measures of performance. Such forward - looking statements may be identified by the use of words such as “believe,” “expect,” “anticipate,” “plan,” “estimate,” “should,” “intend,” "target,” “outlook,” “project,” “guidance,” “forecast,” or si mil ar expressions. Forward - looking statements are based on current management expectations and, by their nature, are subject to risks and uncertainties. Actual results may differ materially from those contained in the forward - looking statements. Factors which may cause actual results to differ materially from those contained in such forward - looking statements include those identified in the Company’s most recent Form 10 - K and subsequent Form 10 - Qs and other SEC filings, and such factors are incorporated herein by reference. Trademarks: All trademarks, service marks, and trade names referenced in this material are official trademarks and the property of their respective owners. Presentation: Within the charts and tables presented, certain segments, columns and rows may not sum to totals shown due to rounding. Non - GAAP Measures: This presentation includes certain non - GAAP financial measures. These non - GAAP measures are provided in addition to, and not as substitutes for, measures of our financial performance determined in accordance with GAAP. Our calculation of these non - GAAP measures may not be comparable to similarly titled measures of other companies due to potential differences between companies in the method of calculation. As a result, the use of these non - GAAP measures has limitations and should not be considered superior to, in isolation from, or as a substitute for, related GAAP measures. Reconciliations of these non - GAAP financial measures to the most directly comparable GAAP financial measures can be found at the end of this presentation.
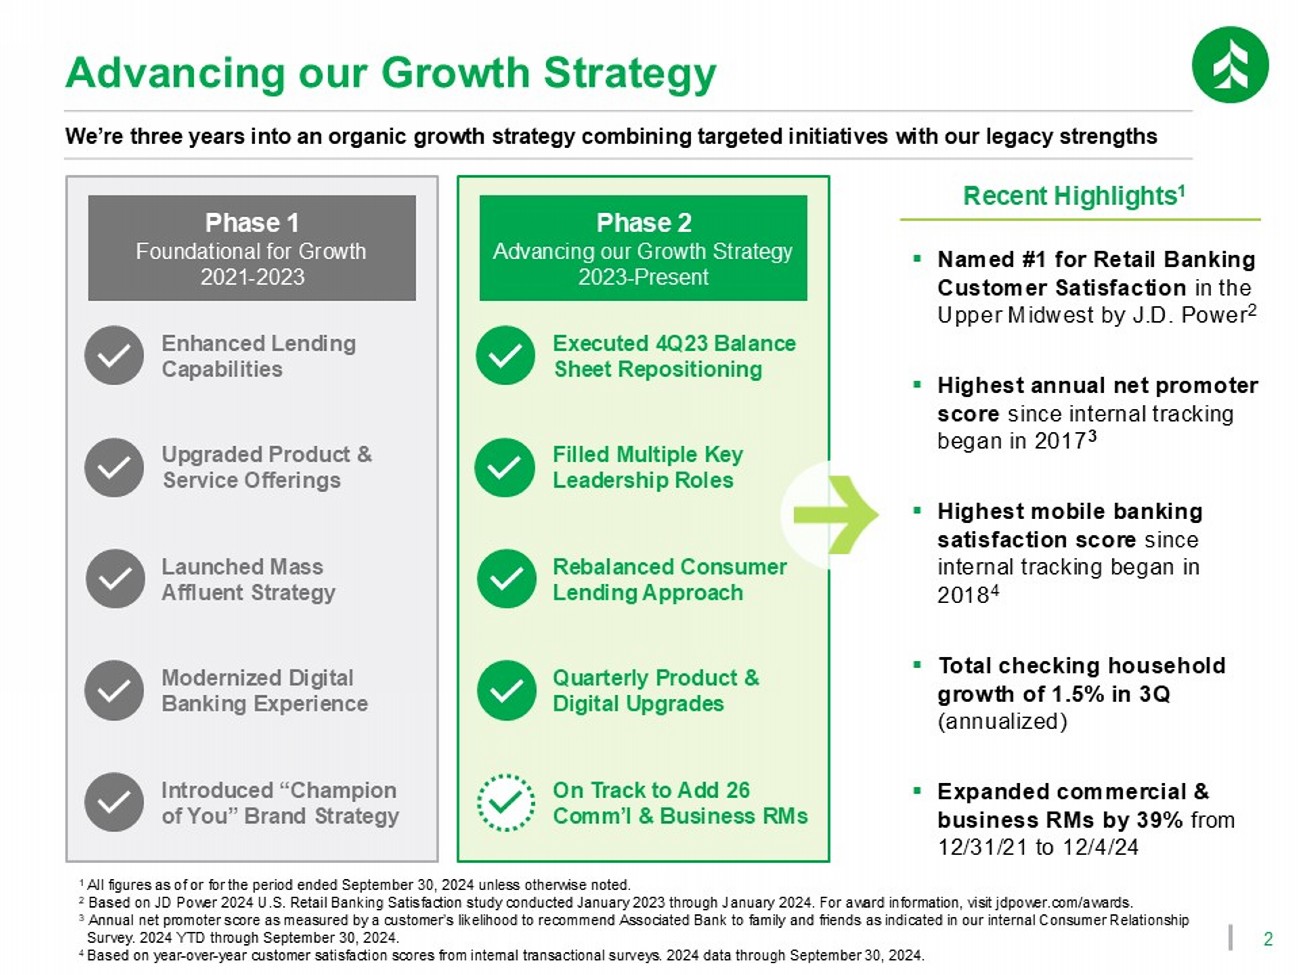
2 Advancing our Growth Strategy Phase 1 Foundational for Growth 2021 - 2023 Phase 2 Advancing our Growth Strategy 2023 - Present Upgraded Product & Service Offerings Launched Mass Affluent Strategy Modernized Digital Banking Experience Introduced “Champion of You” Brand Strategy Enhanced Lending Capabilities Executed 4Q23 Balance Sheet Repositioning Filled Multiple Key Leadership Roles Rebalanced Consumer Lending Approach Quarterly Product & Digital Upgrades On Track to Add 26 Comm’l & Business RMs We’re three years into an organic growth strategy combining targeted initiatives with our legacy strengths ▪ Highest mobile banking satisfaction score since internal tracking began in 2018 4 ▪ Total checking household growth of 1.5% in 3Q (annualized) ▪ Highest annual net promoter score since internal tracking began in 2017 3 ▪ Named #1 for Retail Banking Customer Satisfaction in the Upper Midwest by J.D. Power 2 ▪ Expanded commercial & business RMs by 39% from 12/31/21 to 12/4/24 Recent Highlights 1 1 All figures as of or for the period ended September 30, 2024 unless otherwise noted. 2 Based on JD Power 2024 U.S. Retail Banking Satisfaction study conducted January 2023 through January 2024. For award informat io n, visit jdpower.com/awards. 3 Annual net promoter score as measured by a customer’s likelihood to recommend Associated Bank to family and friends as indica te d in our internal Consumer Relationship Survey. 2024 YTD through September 30, 2024. 4 Based on year - over - year customer satisfaction scores from internal transactional surveys. 2024 data through September 30, 2024.
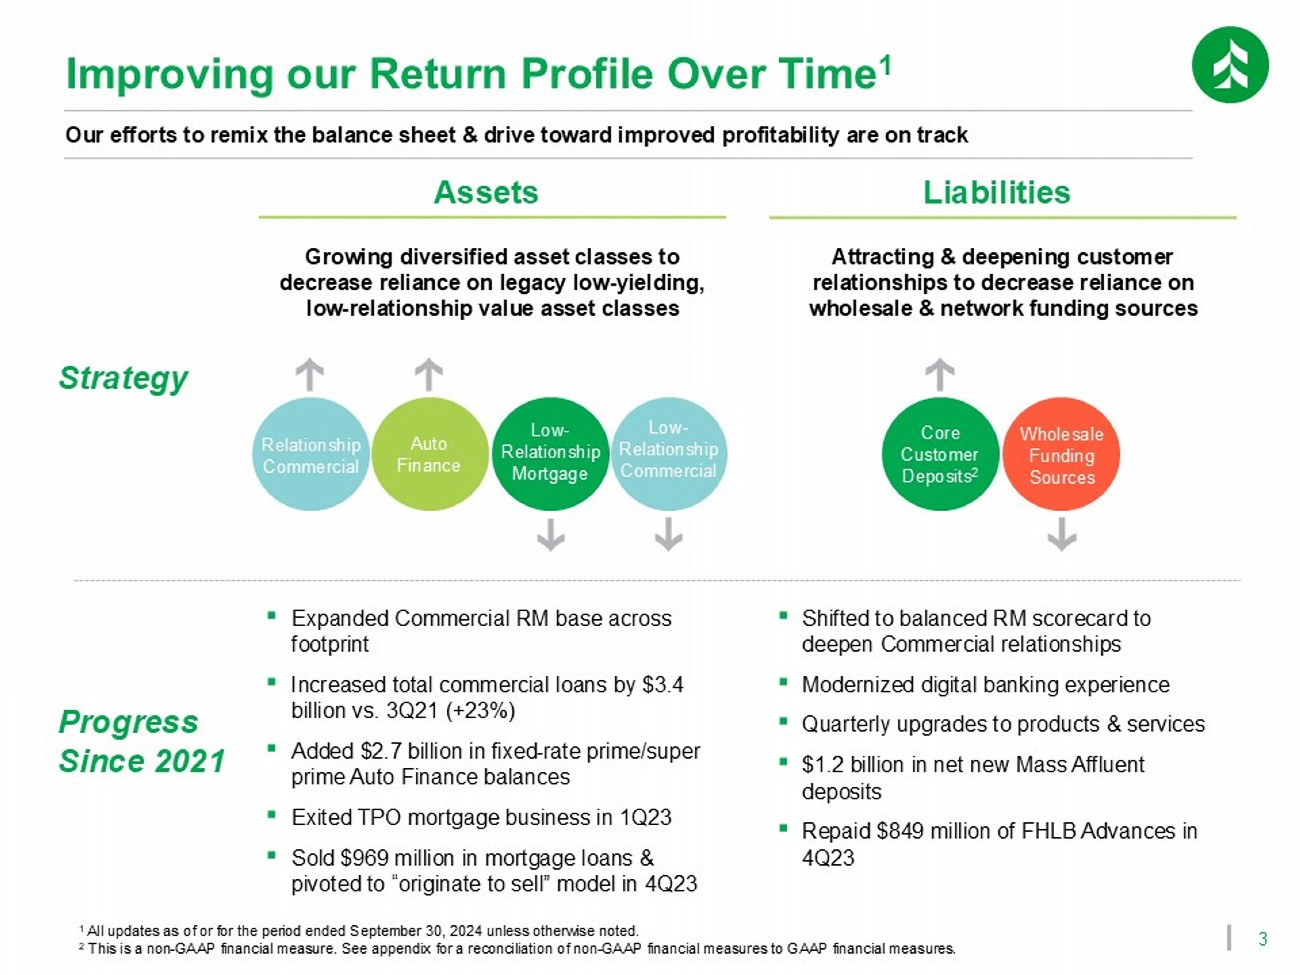
3 Improving our Return Profile Over Time 1 Our efforts to remix the balance sheet & drive toward improved profitability are on track Strategy Progress Since 2021 Growing diversified asset classes to decrease reliance on legacy low - yielding, low - relationship value asset classes ▪ Expanded Commercial RM base across footprint ▪ Increased total commercial loans by $3.4 billion vs. 3Q21 (+23%) ▪ Added $2.7 billion in fixed - rate prime/super prime Auto Finance balances ▪ Exited TPO mortgage business in 1Q23 ▪ Sold $969 million in mortgage loans & pivoted to “originate to sell” model in 4Q23 ▪ Shifted to balanced RM scorecard to deepen Commercial relationships ▪ Modernized digital banking experience ▪ Quarterly upgrades to products & services ▪ $1.2 billion in net new Mass Affluent deposits ▪ Repaid $849 million of FHLB Advances in 4Q23 Liabilities Assets Auto Finance Relationship Commercial Low - Relationship Mortgage Low - Relationship Commercial Wholesale Funding Sources Core Customer Deposits 2 Attracting & deepening customer relationships to decrease reliance on wholesale & network funding sources 1 All updates as of or for the period ended September 30, 2024 unless otherwise noted. 2 This is a non - GAAP financial measure. See appendix for a reconciliation of non - GAAP financial measures to GAAP financial measure s.

4 Accelerating our Growth Strategy Summary of actions taken in November & December 2024 Common Stock Offering Securities Sale & Reinvestment Residential Mortgage Loan Sale 1 3 Sold ~$1.3 billion of AFS securities and reinvested into ~$1.5 billion of securities at higher rates ▪ Weighted avg. yield of 1.87% on securities sold ▪ Weighted avg. yield of 5.08% on securities reinvested ▪ Duration of ~4 years on securities reinvested Announced a common stock offering on 11/14/2024 to bolster capital & support our organic growth strategy ▪ Issued 13.8 million new shares of ASB common stock at $25.00 / share ▪ 6.3% discount to last sale (11/14/2024) ▪ Raised ~$330.7 million in capital Agreed to sell ~$0.7 billion in low - yielding residential mortgage loans, primarily in single - product relationships ▪ ~$0.2 billion in ARMs ▪ ~$0.5 billion in fixed - rate mortgages ▪ Weighted avg. yield of ~2.99% 2 Balance Sheet Repositioning
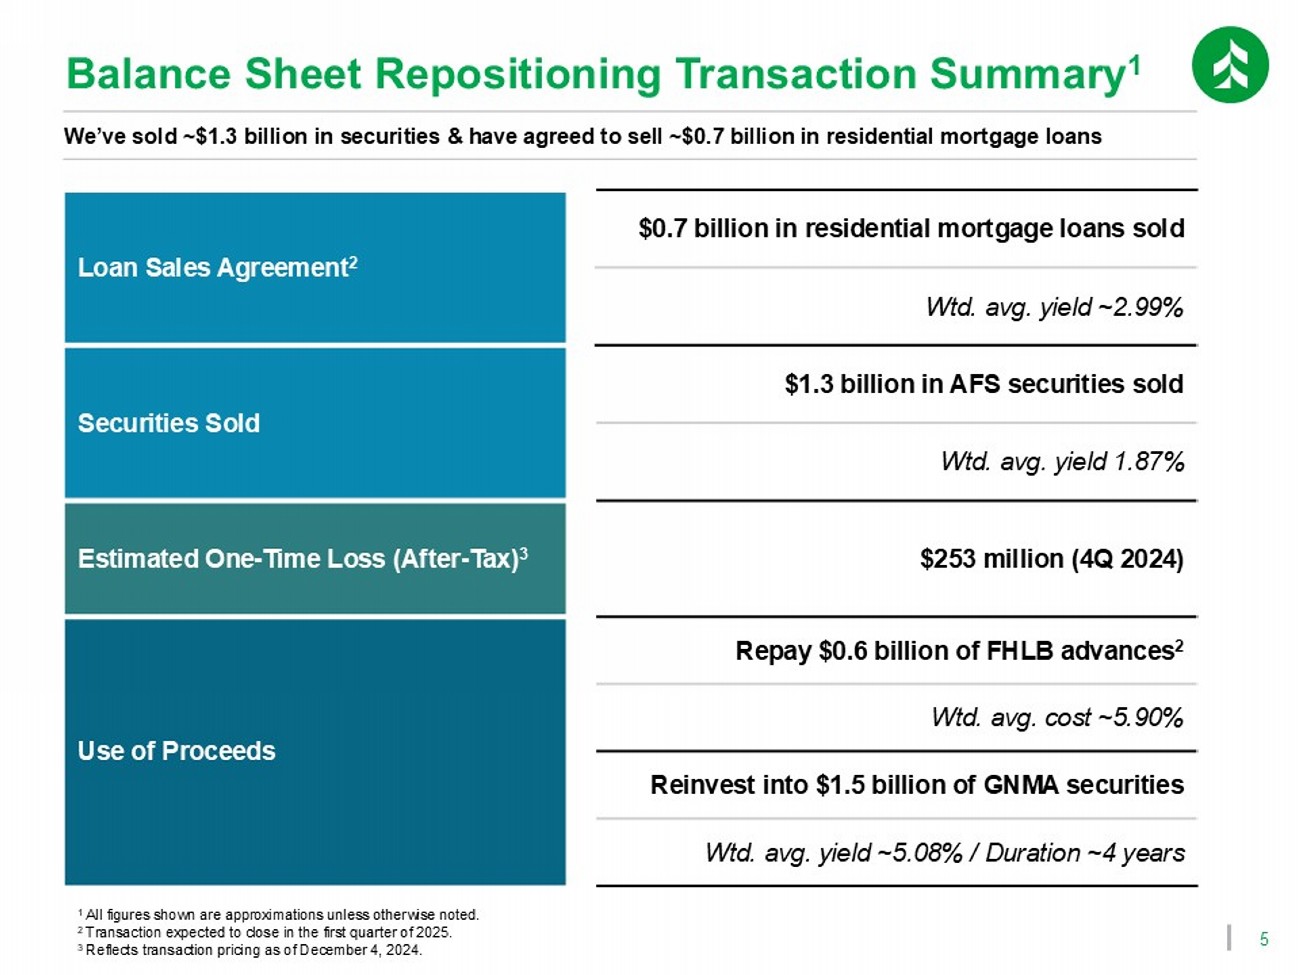
5 1 All figures shown are approximations unless otherwise noted. 2 Transaction expected to close in the first quarter of 2025. 3 Reflects transaction pricing as of December 4, 2024. We’ve sold ~$1.3 billion in securities & have agreed to sell ~$0.7 billion in residential mortgage loans Balance Sheet Repositioning Transaction Summary 1 $0.7 billion in residential mortgage loans sold Loan Sales Agreement 2 Wtd. avg. yield ~2.99% $1.3 billion in AFS securities sold Securities Sold Wtd. avg. yield 1.87% $253 million (4Q 2024) Estimated One - Time Loss (After - Tax) 3 Repay $0.6 billion of FHLB advances 2 Use of Proceeds Wtd. avg. cost ~5.90% Reinvest into $1.5 billion of GNMA securities Wtd. avg. yield ~5.08% / Duration ~4 years

6 $0.56 $0.56 $0.03 $0.59 3Q 2024 Actual 3Q 2024 Pro Forma 9.72% 9.72% 0.39% 10.11% 3Q 2024 Actual 3Q 2024 Pro Forma 1 Return on average tangible common equity. This is a non - GAAP financial measure. See appendix for a reconciliation of non - GAAP financial measures to GAAP financial measure s. Earnings Per Share Impact (Diluted) Net Interest Margin Impact 11.52% 11.52% 0.83% 12.35% 3Q 2024 Actual 3Q 2024 Pro Forma ROATCE 1 Impact CET1 Ratio Impact + + Our common stock offering & balance sheet repositioning combine to enhance our earnings profile & capital levels Key Benefits of Offering + Repositioning 2.78% 2.78% 0.19% 2.97% 3Q 2024 Actual 3Q 2024 Pro Forma + +
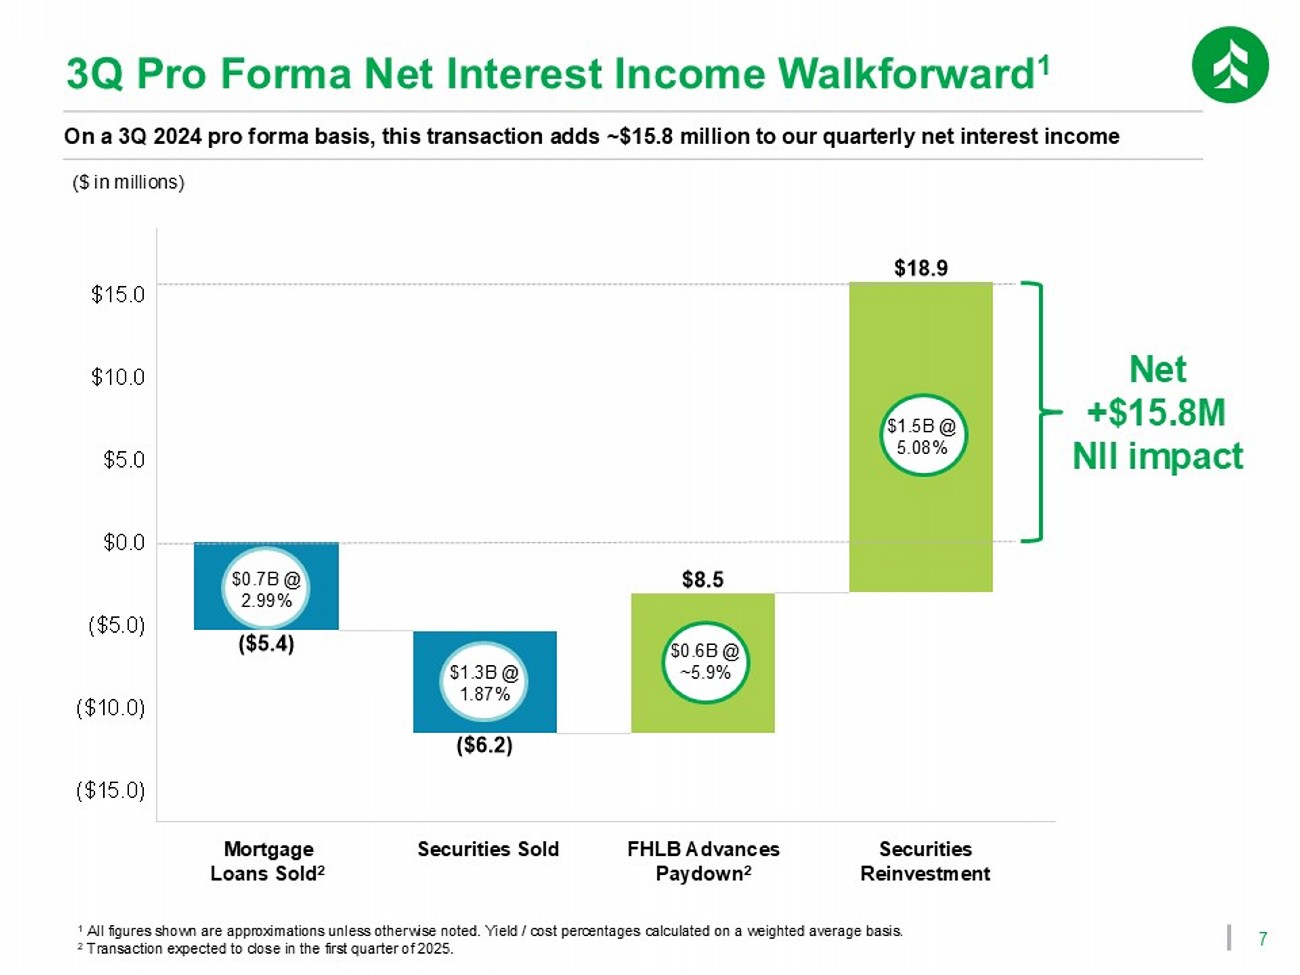
7 ($ in millions) Mortgage Loans Sold 2 FHLB Advances Paydown 2 Securities Reinvestment On a 3Q 2024 pro forma basis, this transaction adds ~$15.8 million to our quarterly net interest income Net +$15.8M NII impact $1.3B @ 1.87% $0.7B @ 2.99% $0.6B @ ~5.9% $1.5B @ 5.08% 3Q Pro Forma Net Interest Income Walkforward 1 Securities Sold 1 All figures shown are approximations unless otherwise noted. Yield / cost percentages calculated on a weighted average basis. 2 Transaction expected to close in the first quarter of 2025.

8 $0.9 $2.0 $2.9 $3.6 $3.6 $7.6 $8.3 $8.8 $7.8 $7.1 $6.1 $6.9 $7.3 $7.2 $7.2 $9.0 $10.6 $11.2 $11.4 $11.4 $7.7 $7.2 $8.4 $9.1 $9.4 $3.1 $3.0 $3.1 $3.1 $3.1 $34.4 $38.0 $41.6 $42.2 $41.8 3Q 2021 3Q 2022 3Q 2023 3Q 2024 3Q 2024 Pro Forma Repositioning enables us to accelerate our organic strategy by disposing of low - yielding, long - duration assets Period End Total Assets ($ in billions) Commercial & Business Lending Loans Commercial Real Estate Loans Residential Mortgage Loans Auto Finance, Home Equity & Other Consumer Loans Other Assets Securities + Cash Residential Mortgage Loans / Total Loans Other Pro Forma Impacts 32.1% 29.9% 29.1% 26.0% 24.2% ( 1.8% ) 3Q 2021 3Q 2022 3Q 2023 3Q 2024 3Q 2024 Pro Forma
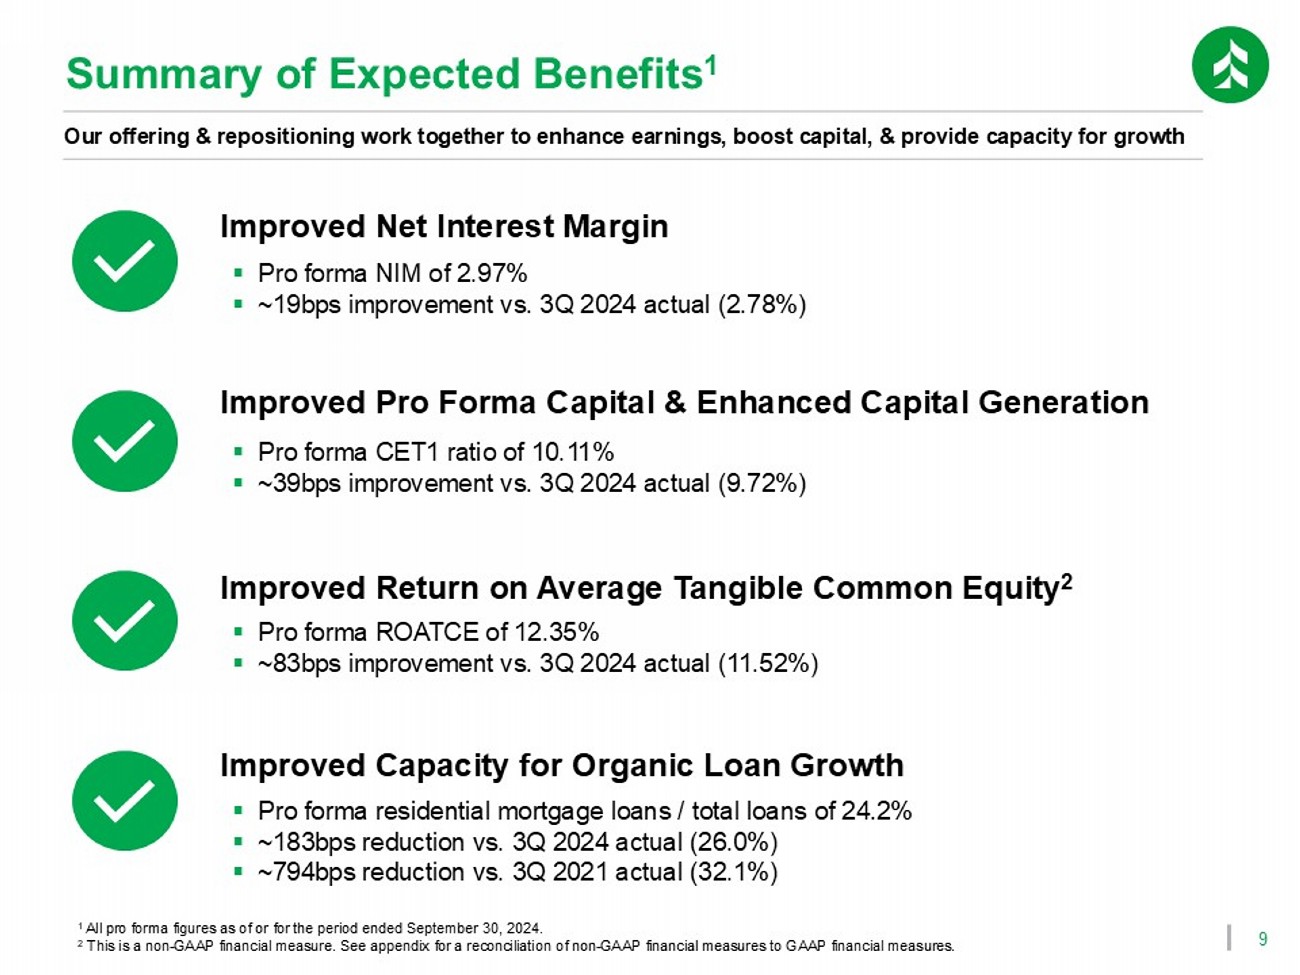
9 Summary of Expected Benefits 1 Improved Net Interest Margin Improved Pro Forma Capital & Enhanced Capital Generation Improved Return on Average Tangible Common Equity 2 Our offering & repositioning work together to enhance earnings, boost capital, & provide capacity for growth 1 All pro forma figures as of or for the period ended September 30, 2024. 2 This is a non - GAAP financial measure. See appendix for a reconciliation of non - GAAP financial measures to GAAP financial measure s. ▪ Pro forma NIM of 2.97% ▪ ~19bps improvement vs. 3Q 2024 actual (2.78%) ▪ Pro forma CET1 ratio of 10.11% ▪ ~39bps improvement vs. 3Q 2024 actual (9.72%) ▪ Pro forma ROATCE of 12.35% ▪ ~83bps improvement vs. 3Q 2024 actual (11.52%) Improved Capacity for Organic Loan Growth ▪ Pro forma residential mortgage loans / total loans of 24.2% ▪ ~183bps reduction vs. 3Q 2024 actual (26.0%) ▪ ~794bps reduction vs. 3Q 2021 actual (32.1%)

Appendix

11 Common Stock Offering Transaction Summary Associated Banc - Corp Issuer ASB / NYSE Ticker / Listing 13.8 million shares @ $25.00 per share Offering Size ~$330.7 million Net Proceeds (6.3%) Discount to Last Sale (11/14/2024) November 14, 2024 Offering Announced General corporate purposes to support continued organic growth, which may include investments in Associated Bank, NA and potential balance sheet optimization strategies Use of Proceeds 90 days for directors and executive officers Lock - Up BofA Securities, J.P. Morgan Bookrunners We completed a common stock offering in November to bolster capital & support our organic growth strategy

12 Reconciliation & Definitions of Non - GAAP Items 3Q 2024 2Q 2024 1Q 2024 4Q 2023 3Q 2023 Period End Core Customer Deposits Reconciliation ($ in millions) $33,554 $32,691 $33,713 $33,446 $32,123 Total deposits (4,243) (4,062) (3,931) (4,447) (3,351) Brokered CDs (1,567) (1,503) (1,793) (1,566) (1,649) Network transaction deposits $27,745 $27,127 $27,989 $27,432 $27,123 Core customer deposits 3Q 2024 2Q 2024 1Q 2024 4Q 2023 3Q 2023 Quarterly Average Core Customer Deposits Reconciliation ($ in millions) $33,321 $32,629 $33,267 $32,192 $32,002 Total deposits (4,248) (3,928) (4,269) (3,471) (3,429) Brokered CDs (1,644) (1,595) (1,652) (1,617) (1,640) Network transaction deposits $27,429 $27,106 $27,346 $27,105 $26,933 Core customer deposits 3Q 2024 Pro Forma 3Q 2024 Adjusted Net Income Available to Common Equity Reconciliation ($ in millions) $97 $85 Net income available to common equity 2 2 Other intangible amortization, net of tax $99 $87 Adjusted net income available to common equity 1 This financial measure has been included as it is considered to be a critical metric with which to analyze and evaluate finan cia l condition and capital strength. 3Q 2024 Pro Forma 3Q 2024 Average Tangible Common Equity Reconciliation 1 ($ in millions) $4,343 $4,137 Common equity (1,140) (1,140) Goodwill and other intangible assets, net $3,203 $2,997 Tangible common equity