 Associated Banc-Corp 4Q 2011 Earnings Presentation January 19, 2012 Exhibit 99.2 |
 Forward-Looking Statements 1 Important note regarding forward-looking statements: Statements made in this presentation which are not purely historical are forward-looking statements, as defined in the Private Securities Litigation Reform Act of 1995. This includes any statements regarding management’s plans, objectives, or goals for future operations, products or services, and forecasts of its revenues, earnings, or other measures of performance. Forward-looking statements are based on current management expectations and, by their nature, are subject to risks and uncertainties. These statements may be identified by the use of words such as “believe”, “expect”, “anticipate”, “plan”, “estimate”, “should”, “will”, “intend”, “outlook”, or similar expressions. Outcomes related to such statements are subject to numerous risk factors and uncertainties including those listed in the company’s most recent Form 10-K and any subsequent Form10-Q. |
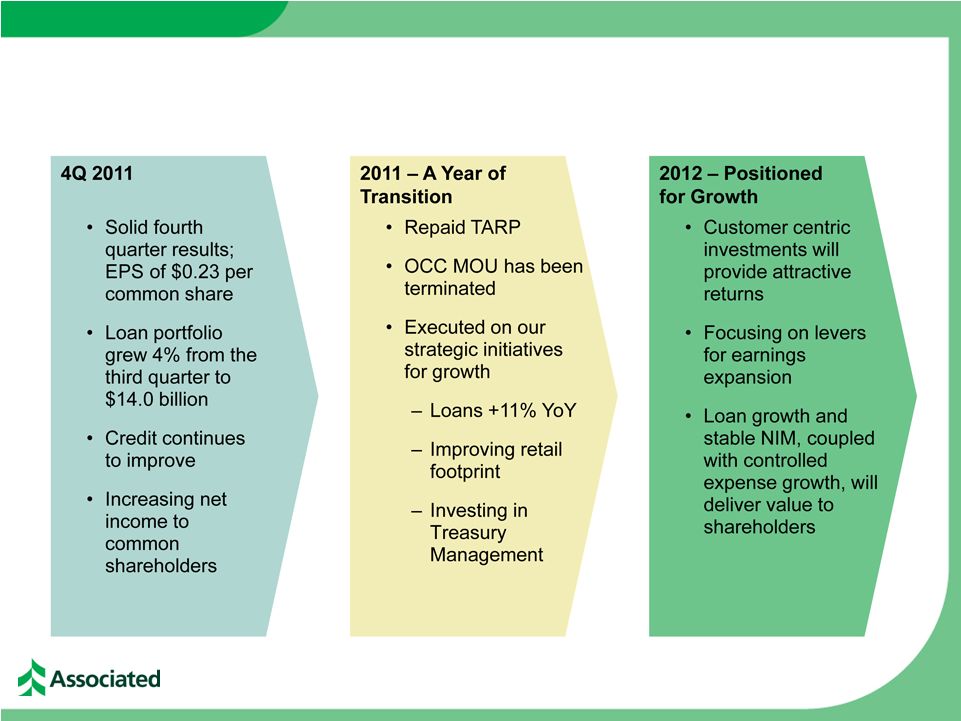
 Fourth Quarter 2011 Highlights • Net income available to common shareholders of $40 million or $0.23 per share – Improved 17%, or $6 million from the prior quarter • Total loans of $14.0 billion were up 4% from the end of the third quarter – Commercial and business lending grew by a net $386 million – Commercial real estate lending increased by a net $112 million – Residential mortgages grew by a net $111 million • Continued improvement in key credit metrics – Nonaccrual loans declined 12% from the prior quarter and 38% on a year-over-year basis to $357 million, the lowest level in eight quarters – Provision for loan losses of $1 million was down significantly from the prior quarter – Net charge offs of $23 million were down 25% from $30 million for the third quarter • Capital ratios remain very strong with a Tier 1 common ratio of 12.24% and total capital ratio of 15.53% 2 |
 2011 Recap 3 TARP / MOU • Completed the repurchase of TARP funds in September – No incremental common equity raised • OCC Memorandum of Understanding (MOU) terminated in September Loan Growth Earnings Credit • Grew loans and gained market share – Total loans grew 11% YoY; commercial and business loans grew 17% YoY • FY 2011 earnings of $115 million compared to a net loss in 2010 • Increased earnings per share in each of the four quarters – EPS improved $0.84 per share from FY 2010; EPS improved $0.19 per share from 4Q10 to 4Q11 • Credit quality continues to improve at a steady pace – Nonaccruals down 38% YoY; net charge offs down 69% YoY Net Interest Margin • Defended the margin despite interest rate headwinds – NIM increased 6 bps from FY 2010 to FY 2011; up 8bps 4Q11 vs. 4Q10 A Year of Transition; Executing on Strategic Plan |
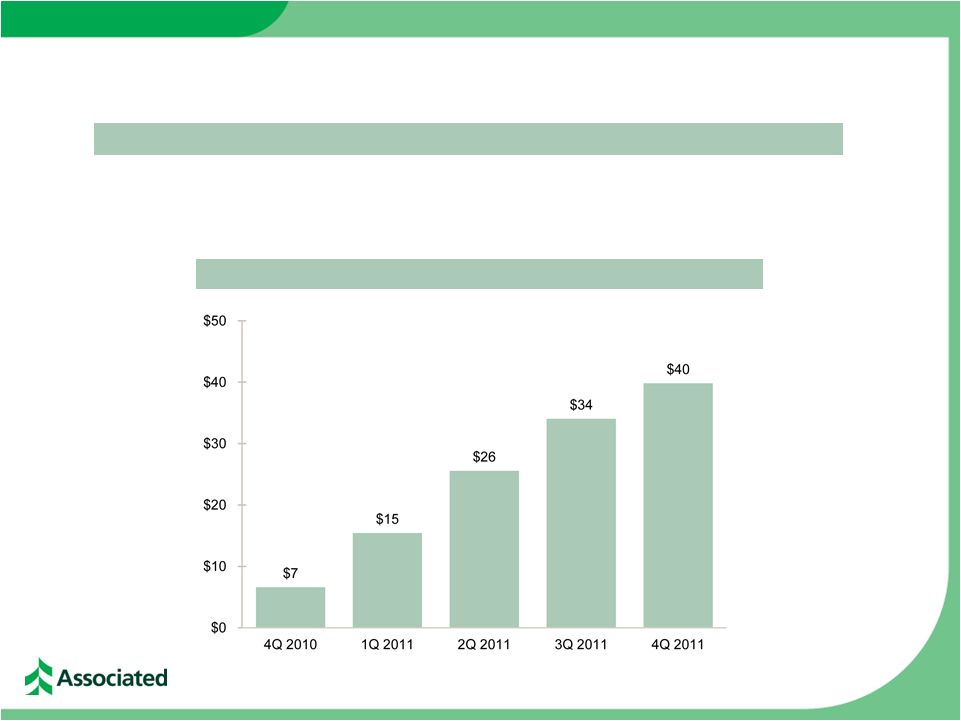 Improving Earnings Profile 4 Net Income Available to Common Quarterly Results Reflect Positive Trends • Net income available to common shareholders improved 17%, or $6 million, from the prior quarter, and improved $33 million from a year ago • Full-year 2011 EPS of $0.66 per share ($ in millions) |
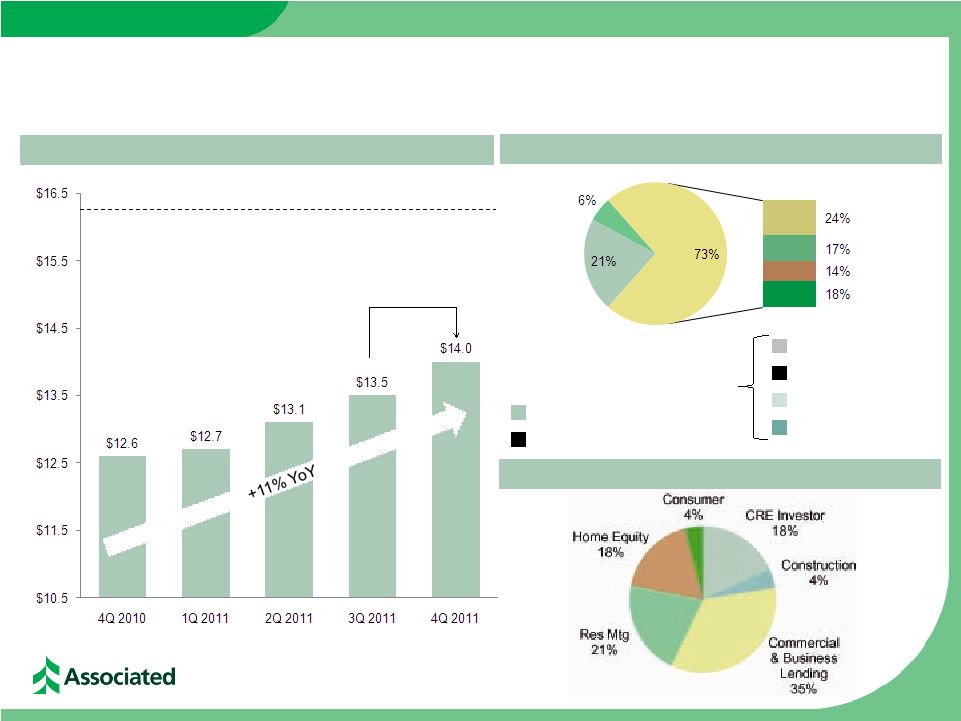 Loan Portfolio Growth and Composition Total Loans of $14.0 billion at December 31, 2011 4Q 2011 Net Loan Growth of $528 million Total Loans ($ in billions) +4% QoQ Peak Loans (4Q 2008) $16.3 billion Commercial real estate lending Retail and residential mortgage Mortgage warehouse Power & Utilities Oil & Gas Loan Mix – 4Q 2011 Commercial and business lending General commercial loans 5 |
 Loan Growth Trends 6 ($ in thousands) Sep 30, 2011 Dec 31, 2011 $ Change % Change Commercial and industrial 3,360,502 $ 3,724,736 $ 364,234 $ 10.8% Lease financing 54,849 58,194 3,345 6.1% Commercial real estate - owner occupied 1,068,616 1,086,829 18,213 1.7% Commerical and business lending 4,483,967 4,869,759 385,792 8.6% Commercial real estate - investor 2,481,411 2,563,767 82,356 3.3% Real estate - construction 554,024 584,046 30,022 5.4% Commercial real estate lending 3,035,435 3,147,813 112,378 3.7% Total commercial 7,519,402 8,017,572 498,170 6.6% Home equity 2,571,404 2,504,704 (66,700) -2.6% Installment 572,243 557,782 (14,461) -2.5% Total retail 3,143,647 3,062,486 (81,161) -2.6% Residential mortgage 2,840,458 2,951,013 110,555 3.9% Total Loans 13,503,507 $ 14,031,071 $ 527,564 $ 3.9% Mortgage Origination Activities Mortgage loans originated for sale 470,530 $ 843,614 $ 373,084 $ 79.3% Net mortgage banking income 4,521 9,677 5,156 114.0% Mortgage loans sold from portfolio N/A 93,953 $ 93,953 $ N/A Sep 11 vs Dec 11 Period End Loan Composition |
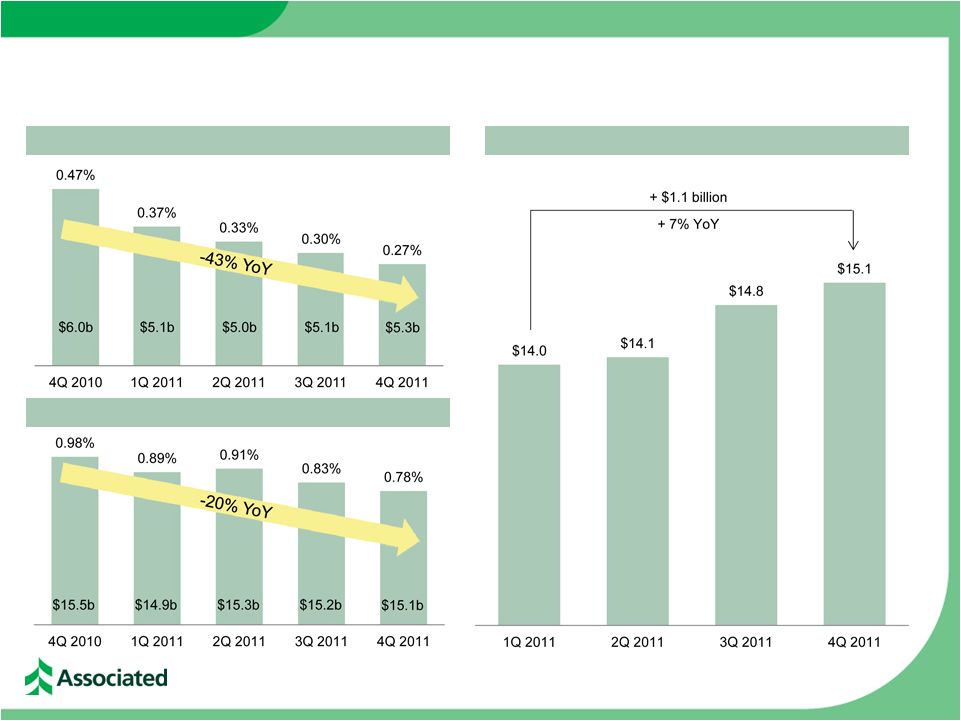 Managing the Cost of Funds and Deposit Levels 7 Cost of Money Market Deposits Cost of Interest-Bearing Liabilities Total Deposits ($ in billions) Total Deposits of $15.1 billion at December 31, 2011 |
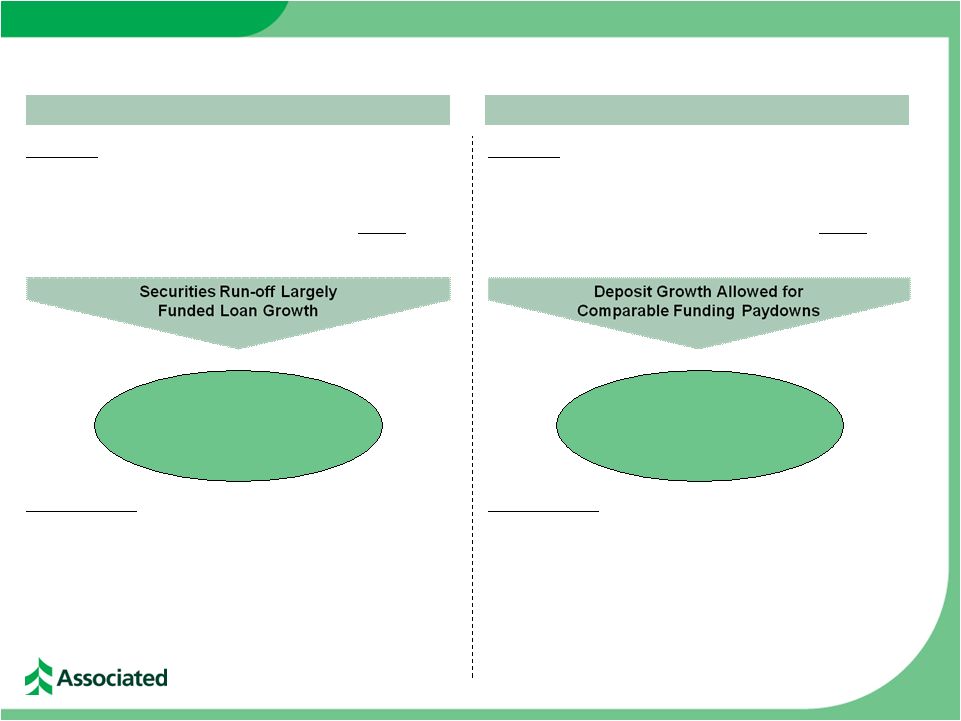 Funding the Balance Sheet 8 Assets ($ in millions) Liabilities ($ in millions) Q4 2011 Q4 2011 Net short and long-term funding - 318 Net loan growth + 528 Net deposit growth + 308 2012 Outlook 2012 Outlook • Continued securities run-off over first half of year • Continued loan growth throughout the year • Continued run-off of high cost and brokered CDs • Growing commercial and business deposit balances throughout the year More Attractive Asset Mix Lower Average Cost Liability Mix Net securities run-off - 516 |
 Significant Improvements in Credit Quality Indicators 9 ($ in millions) 4Q 2010 1Q 2011 2Q 2011 3Q 2011 4Q 2011 Provision for loan losses $ 63.0 $ 31.0 $ 16.0 $ 4.0 $ 1.0 Net charge offs $ 108.2 $ 53.4 $ 44.5 $ 30.2 $ 22.6 Potential problem loans $ 963.7 $ 911.5 $ 699.4 $ 659.5 $ 566.4 Nonaccruals $ 574.4 $ 488.3 $ 467.6 $ 403.4 $ 356.8 ALLL/Total loans 3.78% 3.59% 3.25% 2.96% 2.70% ALLL/Nonaccruals 83.02% 93.07% 91.09% 99.09% 105.99% NPA/Assets 2.84% 2.50% 2.33% 2.03% 1.82% Nonaccruals/Loans 4.55% 3.86% 3.57% 2.99% 2.54% NCOs / Avg Loans 3.41% 1.71% 1.37% 0.90% 0.64% |
 Maintaining a Strong Capital Profile ASBC Capital Ratios 4Q 2010 1Q 2011 2Q 2011 3Q 2011 4Q 2011 Stockholders’ equity / assets 14.50% 14.88% 13.60% 13.01% 13.07% Tangible common equity / tangible assets 8.12% 8.42% 8.49% 8.77% 8.84% Tangible equity / tangible assets 10.59% 10.93% 9.71% 9.07% 9.14% Tier 1 common equity / risk-weighted assets 12.26% 12.65% 12.61% 12.44% 12.24% Tier 1 leverage ratio 11.19% 11.65% 10.46% 9.62% 9.81% Tier 1 risk-based capital ratio 17.58% 18.08% 16.03% 14.35% Total risk-based capital ratio 19.05% 19.56% 17.50% 15.81% 15.53% 10 |
 2012 Outlook 11 Loan Growth • ~3% quarterly growth Deposit Growth Fee Income Expenses NIM Positioned for Growth; Creating Long-Term Shareholder Value Footprint Credit Capital • Continued run-off of high cost CDs & disciplined deposit pricing • Sustained focus on treasury management solutions to drive growth in commercial deposits • Relatively stable • Modest improvement despite considerable headwinds • Low single-digit YoY growth • Net consolidation in branch network while remodeling and renovations continue • Continuing improvement in credit trends • Very modest provision outlook • Increased dividends in 2012; subject to Fed approval |
 12 Summary |