Exhibit 99.1
Associated Banc-Corp Investor Presentation
February 2012
Forward-Looking Statements
Important note regarding forward-looking statements:
Statements made in this presentation which are not purely historical are forward-looking statements, as defined in the Private Securities Litigation Reform Act of 1995. This includes any statements regarding management’s plans, objectives, or goals for future operations, products or services, and forecasts of its revenues, earnings, or other measures of performance. Forward-looking statements are based on current management expectations and, by their nature, are subject to risks and uncertainties. These statements may be identified by the use of words such as “believe”, “expect”, “anticipate”, “plan”, “estimate”, “should”, “will”, “intend”, “outlook”, or similar expressions. Outcomes related to such statements are subject to numerous risk factors and uncertainties including those listed in the company’s most recent Form 10-K and any subsequent Form 10-Q.
1
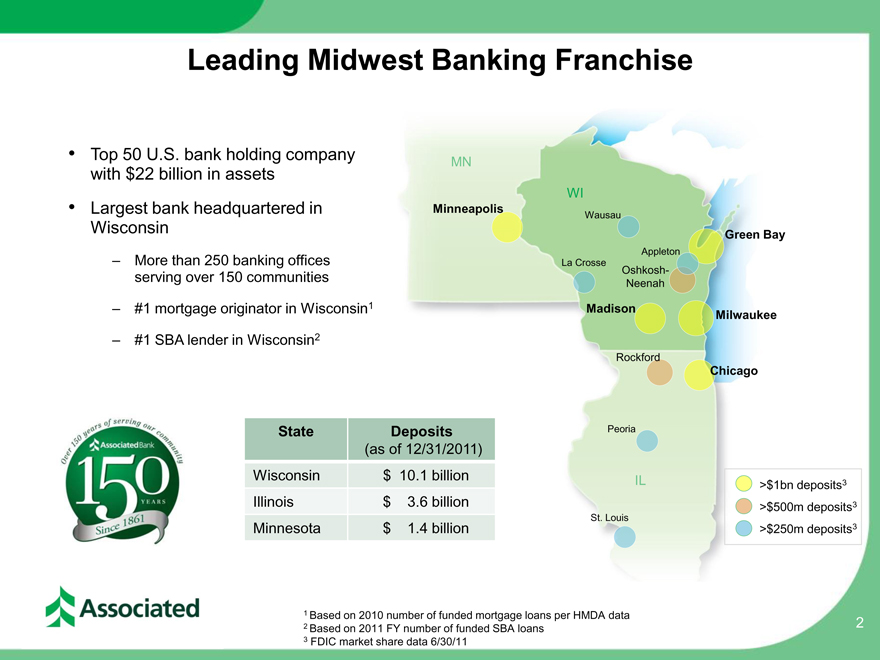
Leading Midwest Banking Franchise
Top 50 U.S. bank holding company with $22 billion in assets
Largest bank headquartered in Wisconsin
– More than 250 banking offices serving over 150 communities
– #1 mortgage originator in Wisconsin1
– #1 SBA lender in Wisconsin2
State Deposits
(as of 12/31/2011)
Wisconsin $ 10.1 billion
Illinois $ 3.6 billion
Minnesota $ 1.4 billion
MN
WI
Minneapolis
Wausau
Green Bay
Appleton La Crosse Oshkosh-Neenah
Madison
Milwaukee
Rockford
Chicago
Peoria
IL
St. Louis
>$1bn deposits3
>$500m deposits3
>$250m deposits3
1 Based on 2010 number of funded mortgage loans per HMDA data
2 Based on 2011 FY number of funded SBA loans
3 FDIC market share data 6/30/11
2
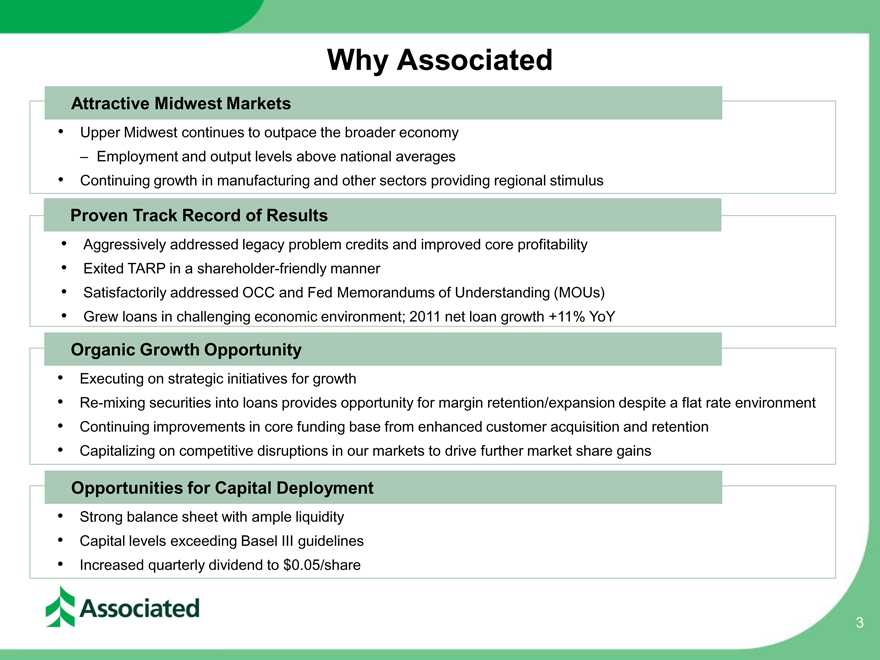
Why Associated
Attractive Midwest Markets
• Upper Midwest continues to outpace the broader economy
– Employment and output levels above national averages
• Continuing growth in manufacturing and other sectors providing regional stimulus
Proven Track Record of Results
• Aggressively addressed legacy problem credits and improved core profitability
• Exited TARP in a shareholder-friendly manner
• Satisfactorily addressed OCC and Fed Memorandums of Understanding (MOUs)
• Grew loans in challenging economic environment; 2011 net loan growth +11% YoY
Organic Growth Opportunity
• Executing on strategic initiatives for growth
• Re-mixing securities into loans provides opportunity for margin retention/expansion despite a flat rate environment
• Continuing improvements in core funding base from enhanced customer acquisition and retention
• Capitalizing on competitive disruptions in our markets to drive further market share gains
Opportunities for Capital Deployment
• Strong balance sheet with ample liquidity
• Capital levels exceeding Basel III guidelines
• Increased quarterly dividend to $0.05/share
3
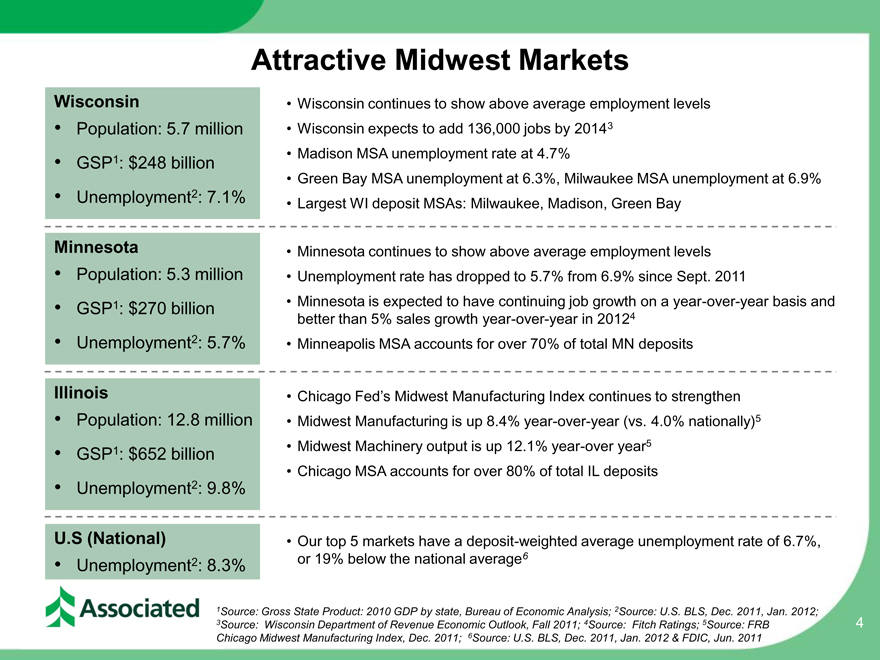
Attractive Midwest Markets
Wisconsin •Wisconsin continues to show above average employment levels
• Population: 5.7 million •Wisconsin expects to add 136,000 jobs by 20143
• GSP1: $248 billion •Madison MSA unemployment rate at 4.7%
•Green Bay MSA unemployment at 6.3%, Milwaukee MSA unemployment at 6.9%
• Unemployment2: 7.1% •Largest WI deposit MSAs: Milwaukee, Madison, Green Bay
Minnesota •Minnesota continues to show above average employment levels
• Population: 5.3 million •Unemployment rate has dropped to 5.7% from 6.9% since Sept. 2011
• GSP1: $270 billion •Minnesota is expected to have continuing job growth on a year-over-year basis and
better than 5% sales growth year-over-year in 20124
• Unemployment2: 5.7% •Minneapolis MSA accounts for over 70% of total MN deposits
Illinois •Chicago Fed’s Midwest Manufacturing Index continues to strengthen
• Population: 12.8 million •Midwest Manufacturing is up 8.4% year-over-year (vs. 4.0% nationally)5
• GSP1: $652 billion •Midwest Machinery output is up 12.1% year-over year5
•Chicago MSA accounts for over 80% of total IL deposits
• Unemployment2: 9.8%
U.S (National) •Our top 5 markets have a deposit-weighted average unemployment rate of 6.7%,
• Unemployment2: 8.3% or 19% below the national average6
1Source: Gross State Product: 2010 GDP by state, Bureau of Economic Analysis; 2Source: U.S. BLS, Dec. 2011, Jan. 2012; 3Source: Wisconsin Department of Revenue Economic Outlook, Fall 2011; 4Source: Fitch Ratings; 5Source: FRB
Chicago Midwest Manufacturing Index, Dec. 2011; 6Source: U.S. BLS, Dec. 2011, Jan. 2012 & FDIC, Jun. 2011
4
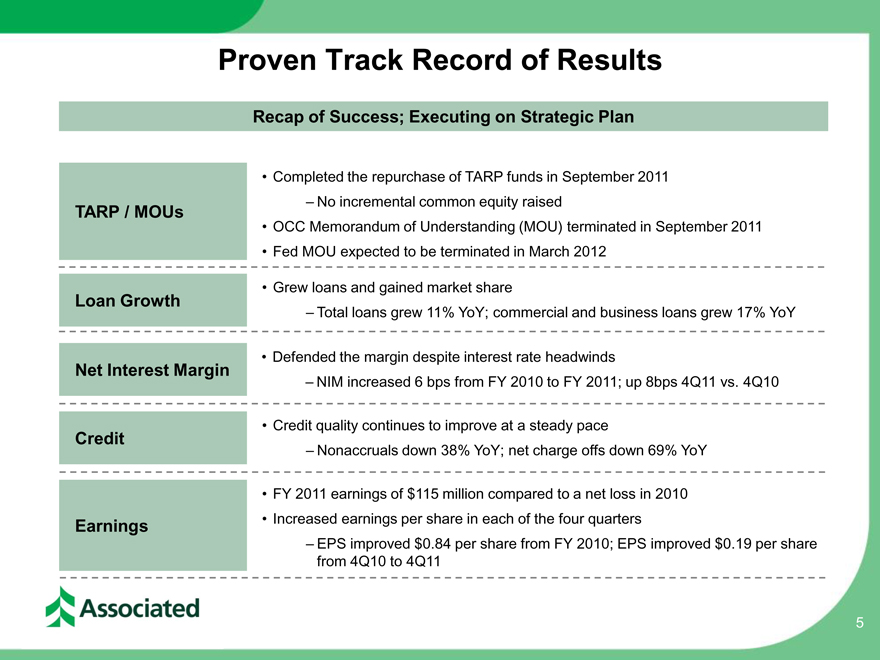
Proven Track Record of Results
Recap of Success; Executing on Strategic Plan
•Completed the repurchase of TARP funds in September 2011
TARP / MOUs –No incremental common equity raised
•OCC Memorandum of Understanding (MOU) terminated in September 2011
•Fed MOU expected to be terminated in March 2012
•Grew loans and gained market share
Loan Growth
–Total loans grew 11% YoY; commercial and business loans grew 17% YoY
•Defended the margin despite interest rate headwinds
Net Interest Margin
–NIM increased 6 bps from FY 2010 to FY 2011; up 8bps 4Q11 vs. 4Q10
•Credit quality continues to improve at a steady pace
Credit
–Nonaccruals down 38% YoY; net charge offs down 69% YoY
•FY 2011 earnings of $115 million compared to a net loss in 2010
Earnings •Increased earnings per share in each of the four quarters
–EPS improved $0.84 per share from FY 2010; EPS improved $0.19 per share
from 4Q10 to 4Q11
5
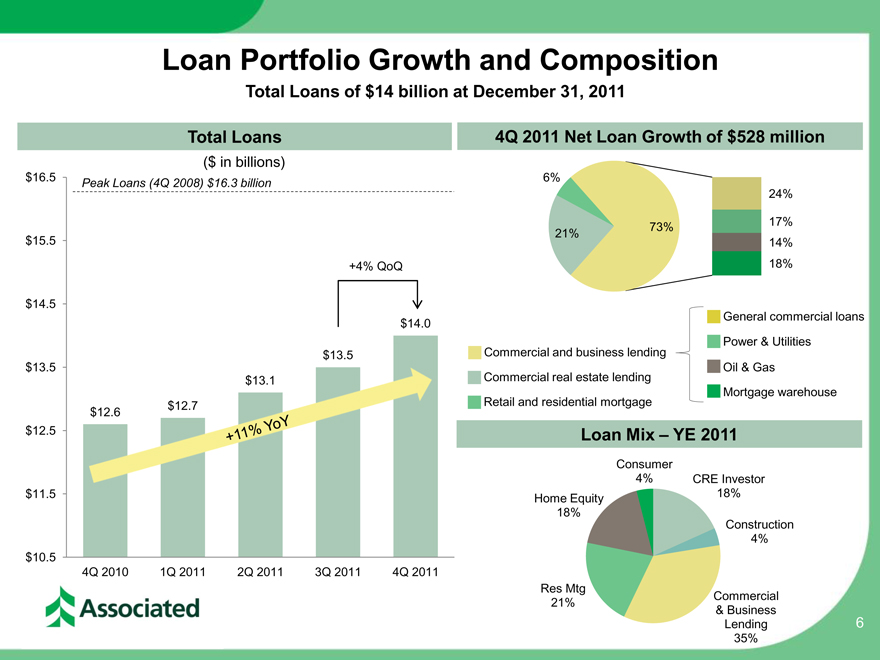
Loan Portfolio Growth and Composition
Total Loans of $14 billion at December 31, 2011
Total Loans
$16.5 Peak Loans (4Q 2008) $16.3 billion
$15.5
+4% QoQ
$14.5
$14.0
$13.5
$13.5
$13.1
$12.6 $12.7
$12.5
$11.5
$10.5
4Q 2010 1Q 2011 2Q 2011 3Q 2011 4Q 2011
+11% YOY
4Q 2011 Net Loan Growth of $528 million
6%
24%
73% 17%
21%
14%
18%
Commercial and business lending Commercial real estate lending Retail and residential mortgage
General commercial loans Power & Utilities Oil & Gas Mortgage warehouse
Loan Mix – YE 2011
Consumer
4% CRE Investor
Home Equity 18%
18%
Construction
4%
Res Mtg
21% Commercial
& Business
Lending
35%
6
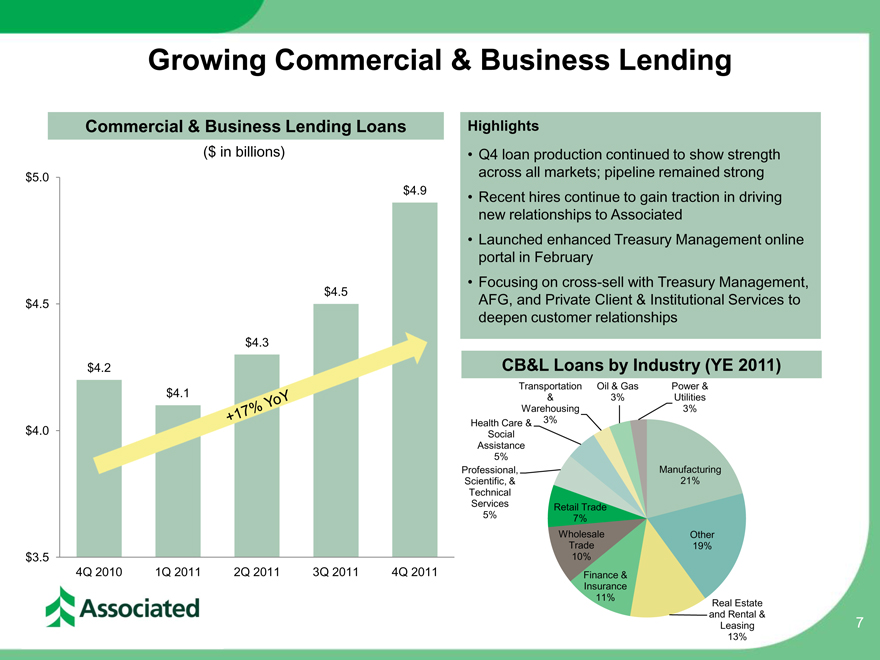
Growing Commercial & Business Lending
Commercial & Business Lending Loans
($ in billions)
$5.0
$4.9
$4.5
$4.5
$4.3
$4.2
$4.1
$4.0
$3.5
4Q 2010 1Q 2011 2Q 2011 3Q 2011 4Q 2011
+17% YOY
Highlights
•Q4 loan production continued to show strength across all markets; pipeline remained strong •Recent hires continue to gain traction in driving new relationships to Associated •Launched enhanced Treasury Management online portal in February •Focusing on cross-sell with Treasury Management, AFG, and Private Client & Institutional Services to deepen customer relationships
CB&L Loans by Industry (YE 2011)
Transportation Oil & Gas Power &
3% Utilities
Warehousing 3%
Health Care & 3%
Social
Assistance
5%
Professional, Manufacturing
Scientific, & 21%
Technical
Services Retail Trade
5% 7%
Wholesale Other
Trade 19%
10%
Finance &
Insurance
11% Real Estate
and Rental &
Leasing
13%
7
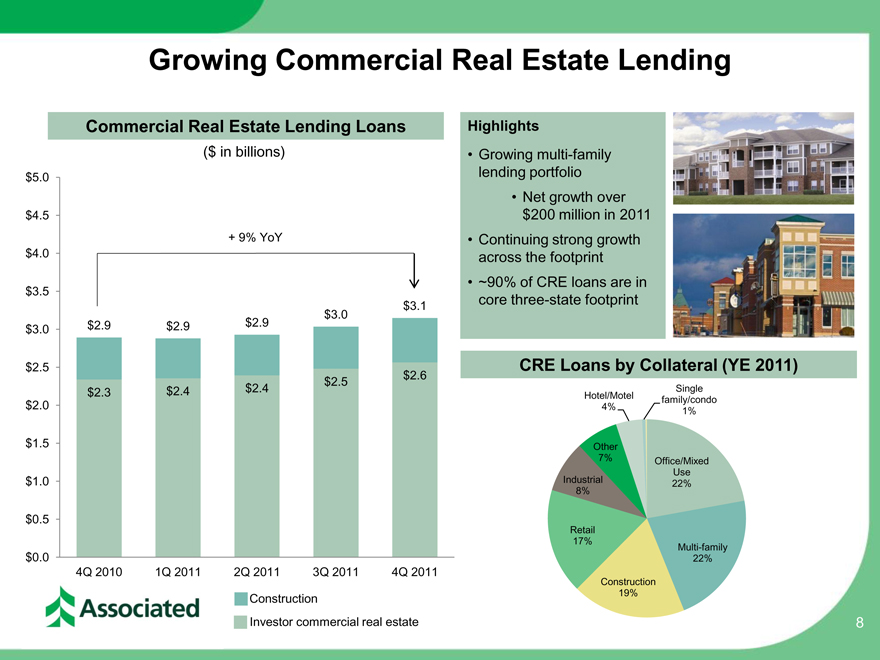
Growing Commercial Real Estate Lending
Commercial Real Estate Lending Loans
($ in billions)
$5.0
$4.5
+ 9% YoY
$4.0
$3.5
$3.1
$3.0
$3.0 $2.9 $2.9 $2.9
$2.5
$2.5 $2.6
$2.3 $2.4 $2.4
$2.0
$1.5
$1.0
$0.5
$0.0
4Q 2010 1Q 2011 2Q 2011 3Q 2011 4Q 2011
Construction
Investor commercial real estate
Highlights
•Growing multi-family lending portfolio •Net growth over $200 million in 2011 •Continuing strong growth across the footprint •~90% of CRE loans are in core three-state footprint
CRE Loans by Collateral (YE 2011)
Single
Hotel/Motel family/condo
4% 1%
Other
7% Office/Mixed
Use
Industrial 22%
8%
Retail
17% Multi-family
22%
Construction
19%
8
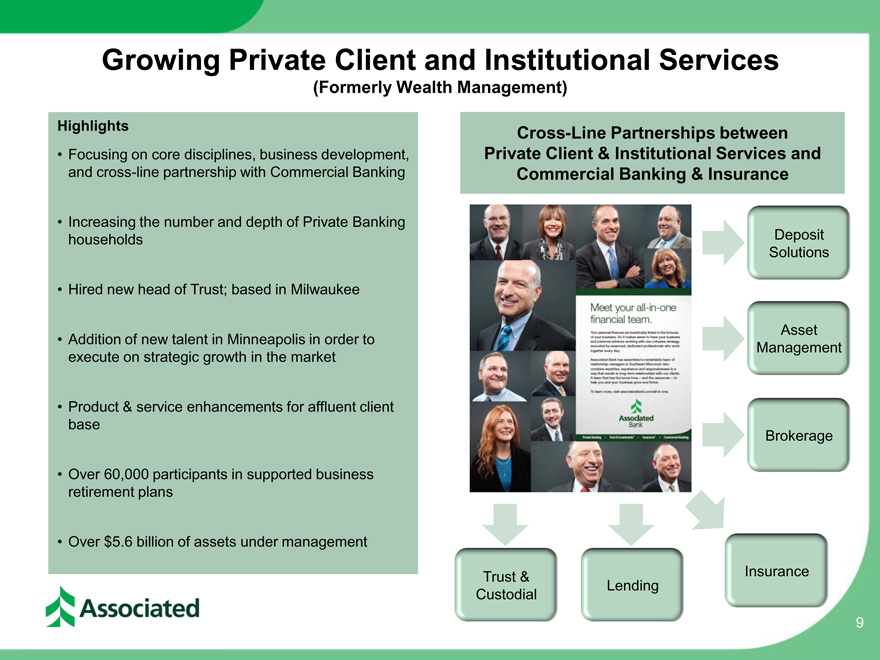
Growing Private Client and Institutional Services
(Formerly Wealth Management)
Highlights
•Focusing on core disciplines, business development, and cross-line partnership with Commercial Banking
•Increasing the number and depth of Private Banking households
•Hired new head of Trust; based in Milwaukee
•Addition of new talent in Minneapolis in order to execute on strategic growth in the market
•Product & service enhancements for affluent client base
•Over 60,000 participants in supported business retirement plans
•Over $5.6 billion of assets under management
Cross-Line Partnerships between Private Client & Institutional Services and Commercial Banking & Insurance
Deposit
Solutions
Asset
Management
Brokerage
Trust & Insurance
Custodial Lending
9
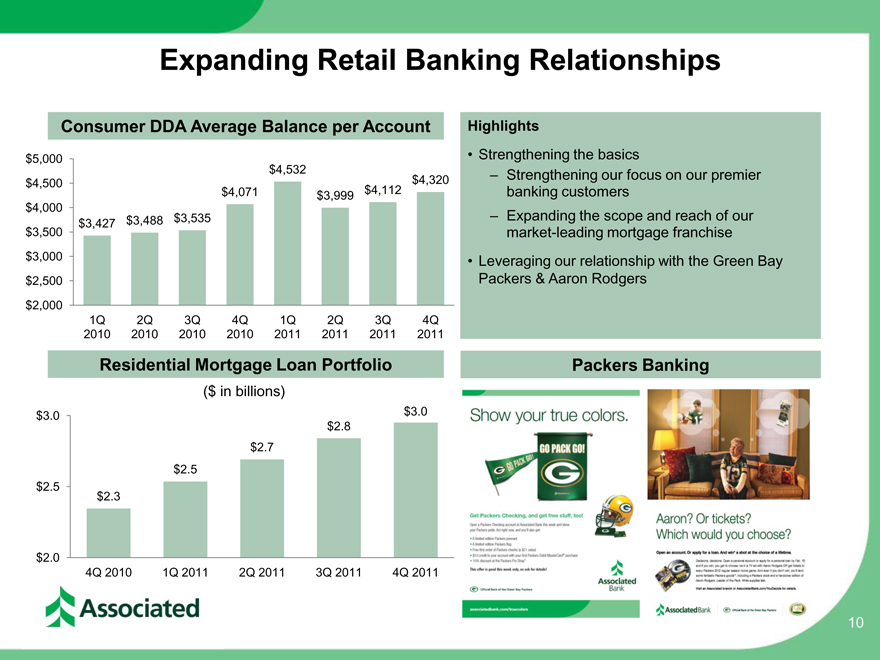
Expanding Retail Banking Relationships
Consumer DDA Average Balance per Account
$5,000
$4,532
$4,500 $4,320
$4,071 $3,999 $4,112
$4,000
$3,427 $3,488 $3,535
$3,500
$3,000
$2,500
$2,000
1Q 2Q 3Q 4Q 1Q 2Q 3Q 4Q
2010 2010 2010 2010 2011 2011 2011 2011
Residential Mortgage Loan Portfolio
($ in billions)
$3.0 $3.0
$2.8
$2.7
$2.5
$2.5
$2.3
$2.0
4Q 2010 1Q 2011 2Q 2011 3Q 2011 4Q 2011
Highlights
•Strengthening the basics
– Strengthening our focus on our premier banking customers
– Expanding the scope and reach of our market-leading mortgage franchise •Leveraging our relationship with the Green Bay Packers & Aaron Rodgers
Packers Banking
10
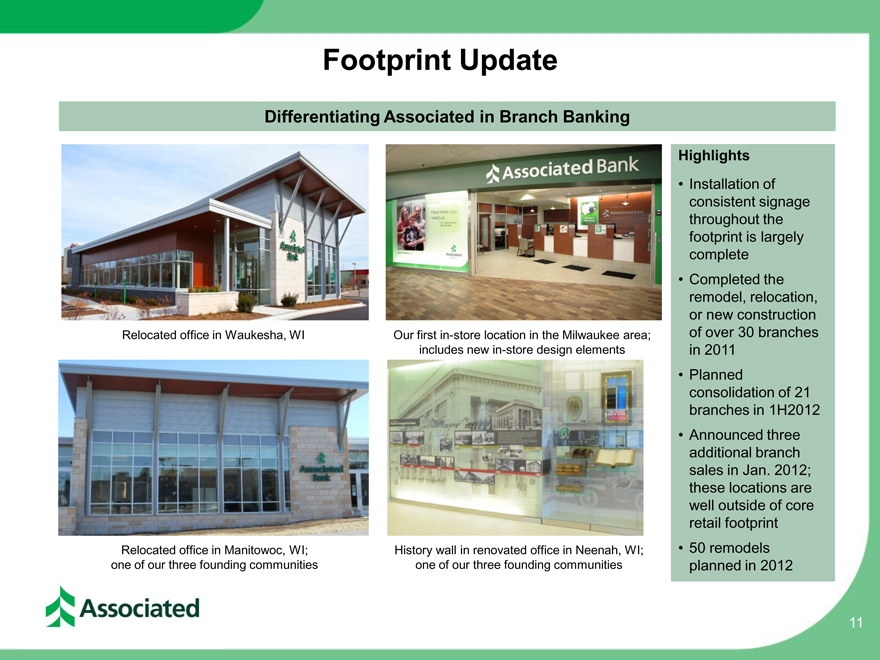
Footprint Update
Differentiating Associated in Branch Banking
Highlights
•Installation of
consistent signage
throughout the
footprint is largely
complete
•Completed the
remodel, relocation,
or new construction
Relocated office in Waukesha, WI Our first in-store location in the Milwaukee area; of over 30 branches
includes new in-store design elements in 2011
•Planned
consolidation of 21
branches in 1H2012
•Announced three
additional branch
sales in Jan. 2012;
these locations are
well outside of core
retail footprint
Relocated office in Manitowoc, WI; History wall in renovated office in Neenah, WI; •50 remodels
one of our three founding communities one of our three founding communities planned in 2012
11
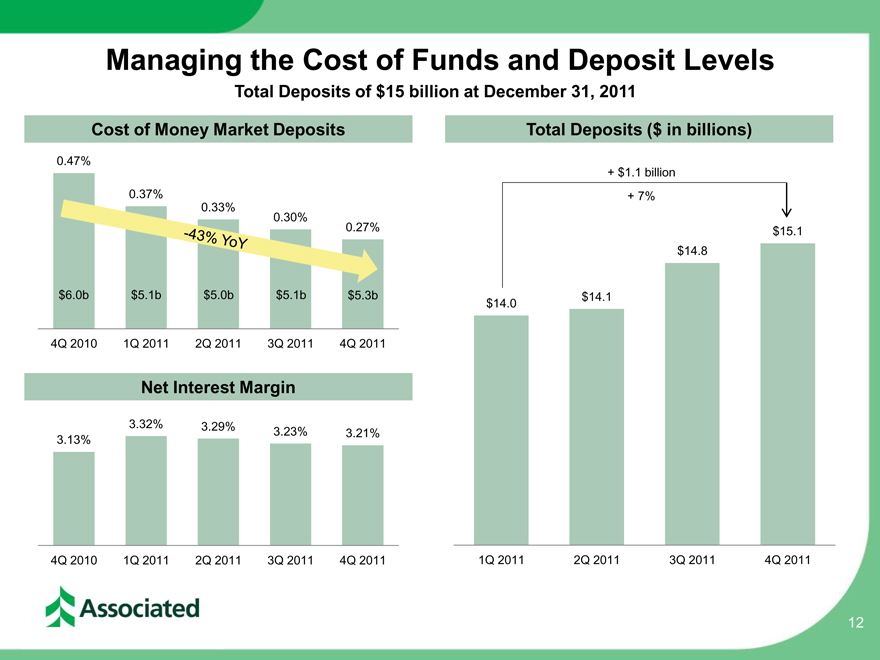
Managing the Cost of Funds and Deposit Levels
Total Deposits of $15 billion at December 31, 2011
Cost of Money Market Deposits
0.47%
0.37%
0.33%
0.30%
0.27%
$6.0b $5.1b $5.0b $5.1b $5.3b
4Q 2010 1Q 2011 2Q 2011 3Q 2011 4Q 2011 -43% YoY
Net Interest Margin
3.32% 3.29% 3.23% 3.21%
3.13%
4Q 2010 1Q 2011 2Q 2011 3Q 2011 4Q 2011
Total Deposits ($ in billions)
+ $1.1 billion
+ 7%
$15.1
$14.8
$14.0 $14.1
1Q 2011 2Q 2011 3Q 2011 4Q 2011
12
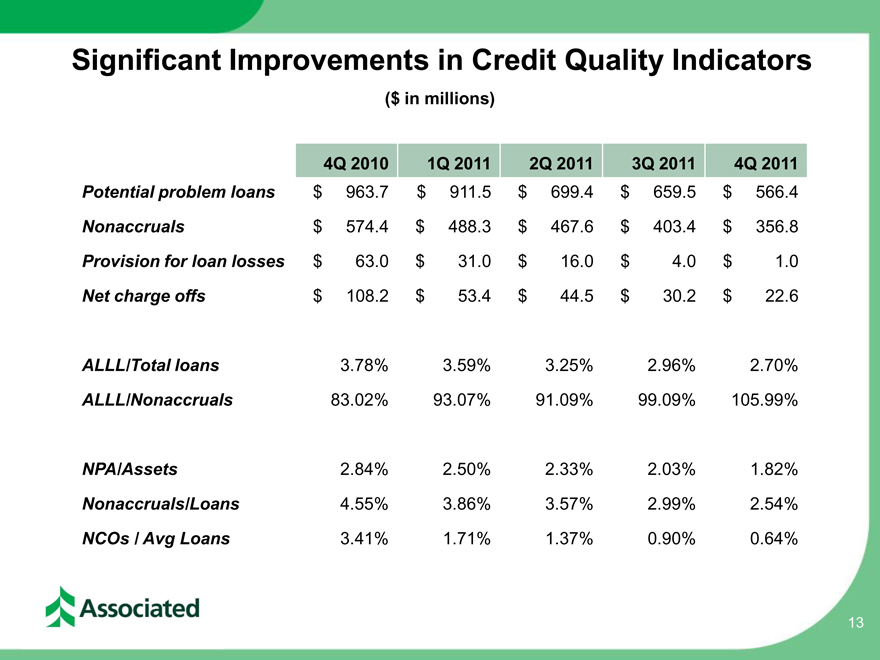
Significant Improvements in Credit Quality Indicators
($ in millions)
4Q 2010 1Q 2011 2Q 2011 3Q 2011 4Q 2011
Potential problem loans $ 963.7 $ 911.5 $ 699.4 $ 659.5 $ 566.4
Nonaccruals $ 574.4 $ 488.3 $ 467.6 $ 403.4 $ 356.8
Provision for loan losses $ 63.0 $ 31.0 $ 16.0 $ 4.0 $ 1.0
Net charge offs $ 108.2 $ 53.4 $ 44.5 $ 30.2 $ 22.6
ALLL/Total loans 3.78% 3.59% 3.25% 2.96% 2.70%
ALLL/Nonaccruals 83.02% 93.07% 91.09% 99.09% 105.99%
NPA/Assets 2.84% 2.50% 2.33% 2.03% 1.82%
Nonaccruals/Loans 4.55% 3.86% 3.57% 2.99% 2.54%
NCOs / Avg Loans 3.41% 1.71% 1.37% 0.90% 0.64%
13
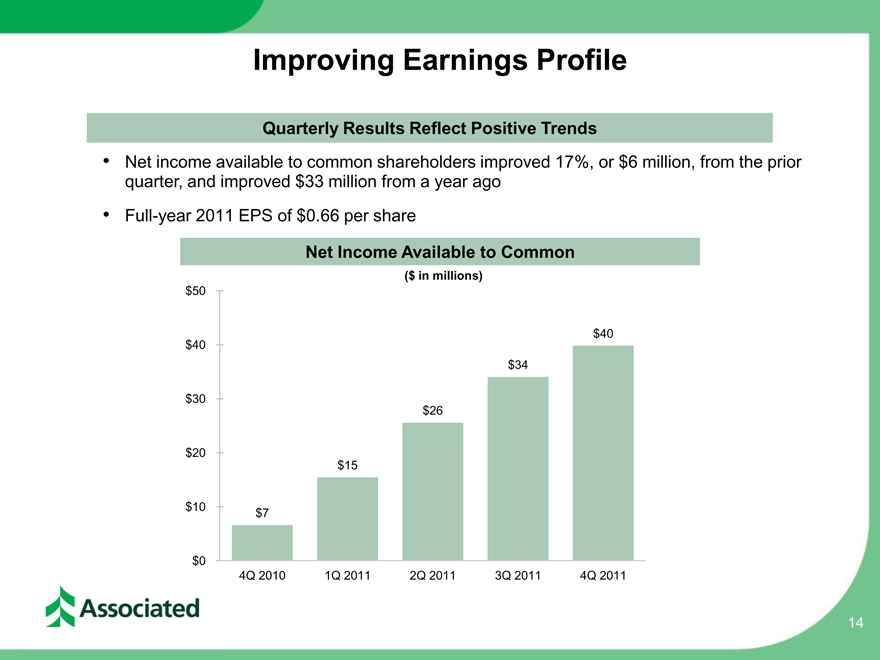
Improving Earnings Profile
Quarterly Results Reflect Positive Trends
•Net income available to common shareholders improved 17%, or $6 million, from the prior quarter, and improved $33 million from a year ago
•Full-year 2011 EPS of $0.66 per share
Net Income Available to Common
($ in millions)
$50
$40
$40
$34
$30
$26
$20
$15
$10 $7
$0
4Q 2010 1Q 2011 2Q 2011 3Q 2011 4Q 2011
14
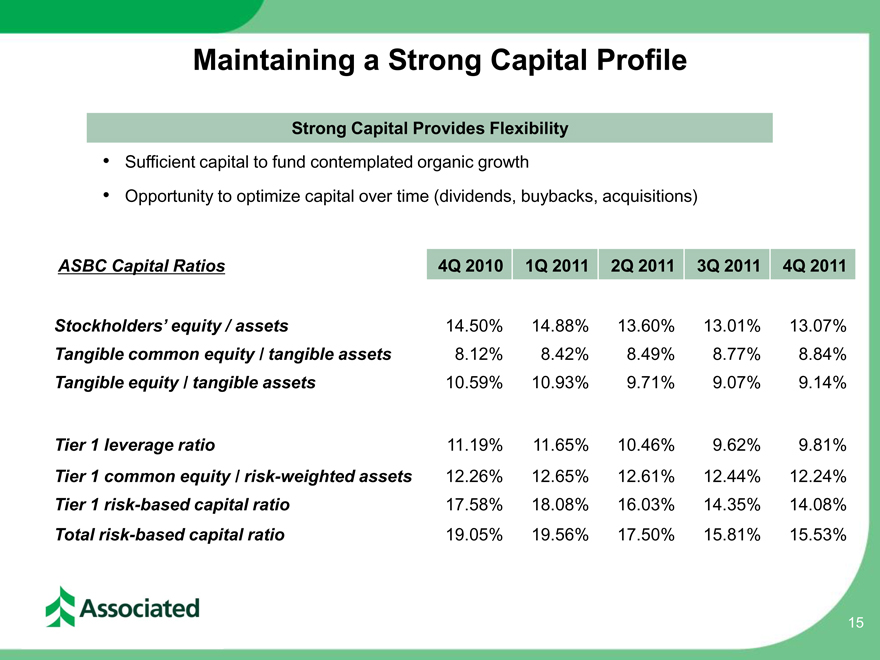
Maintaining a Strong Capital Profile
Strong Capital Provides Flexibility
•Sufficient capital to fund contemplated organic growth
•Opportunity to optimize capital over time (dividends, buybacks, acquisitions)
ASBC Capital Ratios 4Q 2010 1Q 2011 2Q 2011 3Q 2011 4Q 2011
Stockholders’ equity/ assets 14. 50% 14.88% 13.60% 13.01% 13.07%
Tangible common equity / tangible assets 8.12% 8.42% 8.49% 8.77% 8.84%
Tangible equity / tangible assets 10.59% 10.93% 9.71% 9.07% 9.14%
Tier 1 leverage ratio 11.19% 11.65% 10.46% 9.62% 9.81%
Tier 1 common equity / risk-weighted assets 12.26% 12.65% 12.61% 12.44% 12.24%
Tier 1 risk-based capital ratio 17.58% 18.08% 16.03% 14.35% 14.08%
Total risk-based capital ratio 19.05% 19.56% 17.50% 15.81% 15.53%
15

2012 Outlook
Positioned for Growth; Creating Long-Term Shareholder Value
Loan Growth •~3% quarterly growth Expenses •Low single-digit YoY growth
•Continued run-off of high cost
CDs & disciplined deposit pricing •Net consolidation in branch
Deposit Growth Footprint network while remodeling and
•Sustained focus on treasury renovations continue
management solutions to drive
growth in commercial deposits
•Continuing improvement in
credit trends
NIM •Relatively stable Credit
•Very modest provision outlook
•Continuing to fund organic
•Modest improvement despite growth
Fee Income Capital
considerable headwinds •Increased quarterly dividend
to $0.05; payable on March 15
16
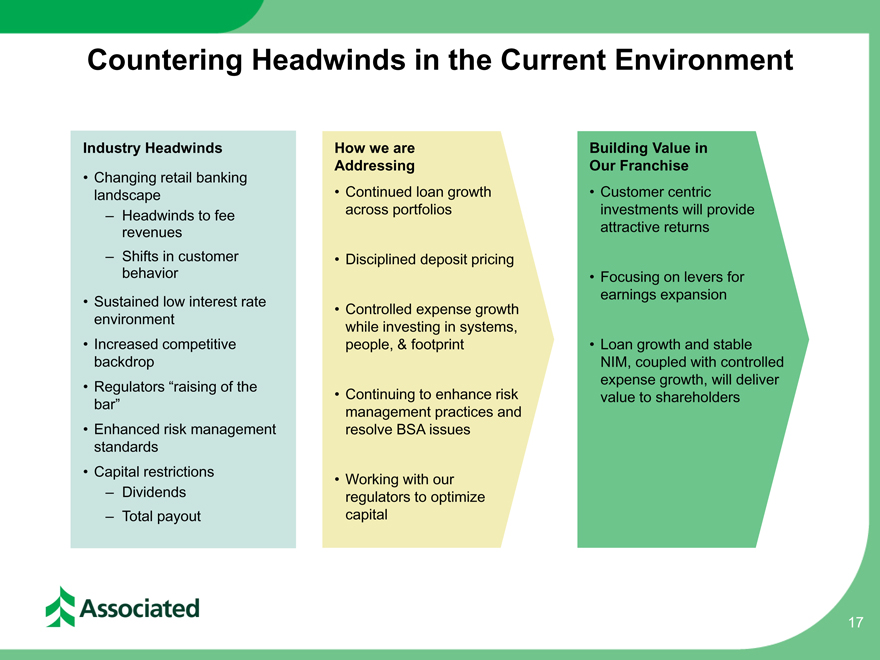
Countering Headwinds in the Current Environment
Industry Headwinds
Changing retail banking landscape
Headwinds to fee revenues
Shifts in customer behavior
Sustained low interest rate environment
Increased competitive backdrop
Regulators “raising of the bar”
Enhanced risk management standards
Capital restrictions
Dividends
Total payout
How we are
Addressing
Continued loan growth across portfolios
Disciplined deposit pricing
Controlled expense growth while investing in systems, people, & footprint
Continuing to enhance risk management practices and resolve BSA issues
Working with our regulators to optimize capital
Building Value in
Our Franchise
Customer centric investments will provide attractive returns
Focusing on levers for earnings expansion
Loan growth and stable NIM, coupled with controlled expense growth, will deliver value to shareholders
17

Associated Banc-Corp will be the most admired Midwestern financial services company, distinguished by sound, value-added financial solutions with personal service for our customers, built upon a strong commitment to our colleagues and the communities we serve, resulting in exceptional value for our shareholders.
Appendix
19
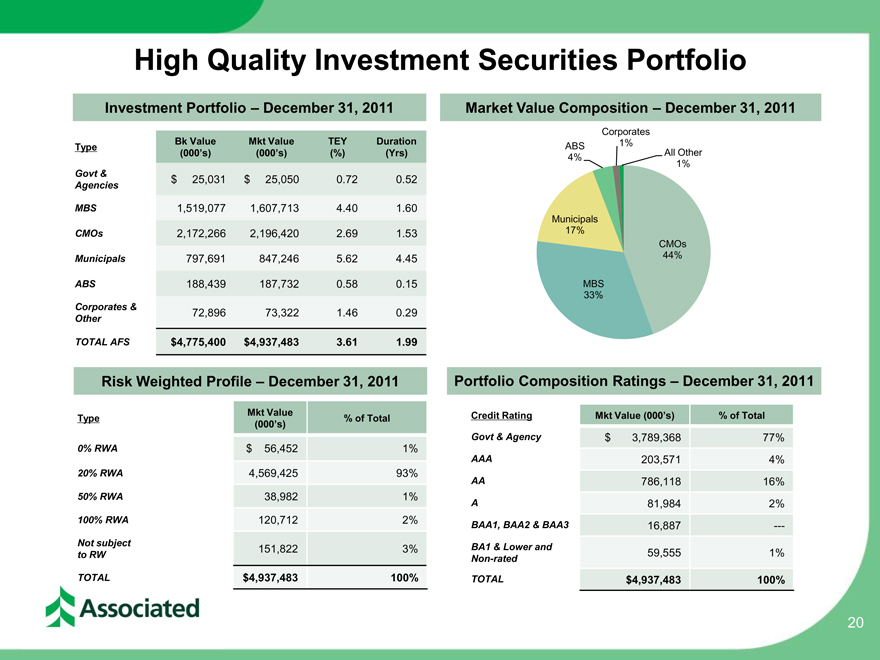
High Quality Investment Securities Portfolio
Investment Portfolio –December 31, 2011
Type Bk Value Mkt Value TEY Duration
(000’s) (000’s) (%)(Yrs)
Govt & $ 25,031 $ 25,050 0.72 0.52
Agencies
MBS 1,519,077 1,607,713 4.40 1.60
CMOs 2,172,266 2,196,420 2.69 1.53
Municipals 797,691 847,246 5.62 4.45
ABS 188,439 187,732 0.58 0.15
Corporates & 72,896 73,322 1.46 0.29
Other
TOTAL AFS $4,775,400 $4,937,483 3.61 1.99
Risk Weighted Profile –December 31, 2011
Mkt Value
Type% of Total
(000’s)
0% RWA $ 56,452 1%
20% RWA 4,569,425 93%
50% RWA 38,982 1%
100% RWA 120,712 2%
Not subject 151,822 3%
to RW
TOTAL $4,937,483 100%
Market Value Composition –December 31, 2011
Corporates
ABS 1%
4% All Other
1%
Municipals
17%
CMOs
44%
MBS
33%
Portfolio Composition Ratings –December 31, 2011
Credit Rating Mkt Value (000’s)% of Total
Govt & Agency $ 3,789,368 77%
AAA 203,571 4%
AA 786,118 16%
A 81,984 2%
BAA1, BAA2 & BAA3 16,887 -—
BA1 & Lower and 59,555 1%
Non-rated
TOTAL $4,937,483 100%
20
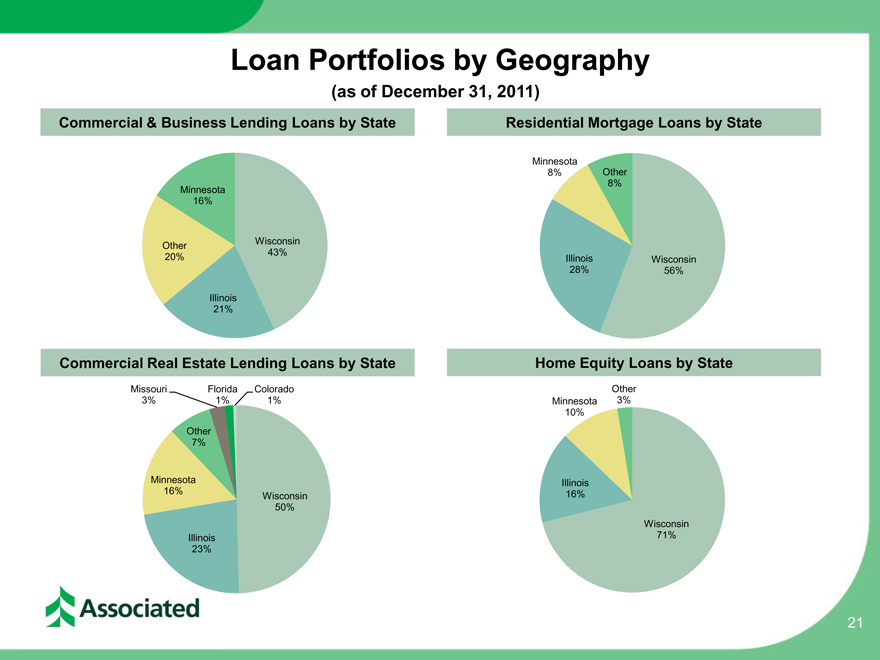
Loan Portfolios by Geography
(as of December 31, 2011)
Commercial & Business Lending Loans by State
Minnesota
16%
Other Wisconsin
20% 43%
Illinois
21%
Commercial Real Estate Lending Loans by State
Missouri Florida Colorado
3% 1% 1%
Other
7%
Minnesota
16% Wisconsin
50%
Illinois
23%
Residential Mortgage Loans by State
Minnesota
8% Other
8%
Illinois Wisconsin
28% 56%
Home Equity Loans by State
Other
Minnesota 3%
10%
Illinois
16%
Wisconsin
71%
21