EXHIBIT 99.2
Associated Banc-Corp 1Q 2012 Earnings Presentation April 19, 20129
Forward-Looking Statements
Important note regarding forward-looking statements:
Statements made in this presentation which are not purely historical are forward-looking statements, as defined in the Private Securities Litigation Reform Act of 1995. This includes any statements regarding management’s plans, objectives, or goals for future operations, products or services, and forecasts of its revenues, earnings, or other measures of performance. Forward-looking statements are based on current management expectations and, by their nature, are subject to risks and uncertainties. These statements may be identified by the use of words such as “believe”, “expect”, “anticipate”, “plan”, “estimate”, “should”, “will”, “intend”, “outlook”, or similar expressions. Outcomes related to such statements are subject to numerous risk factors and uncertainties including those listed in the company’s most recent Form 10-K and any subsequent Form10-Q.
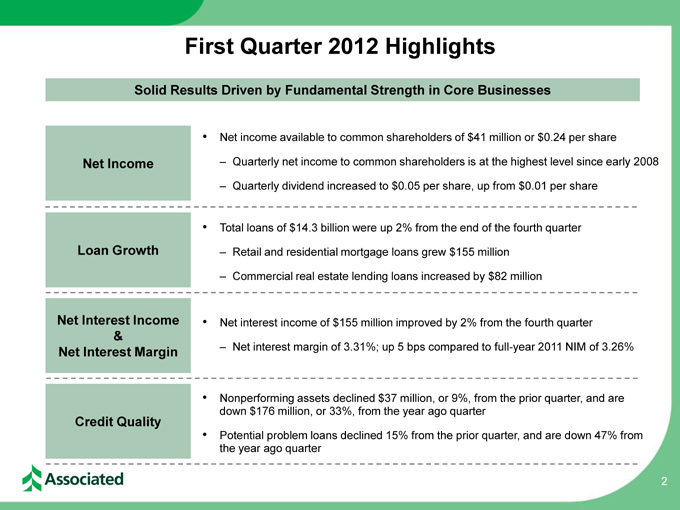
First Quarter 2012 Highlights
Net income available to common shareholders of $41 million or $0.24 per share
–Quarterly net income to common shareholders is at the highest level since early 2008
–Quarterly dividend increased to $0.05 per share, up from $0.01 per share
2 Solid Results Driven by Fundamental Strength in Core Businesses Net Income Loan Growth Net Interest Income & Net Interest Margin
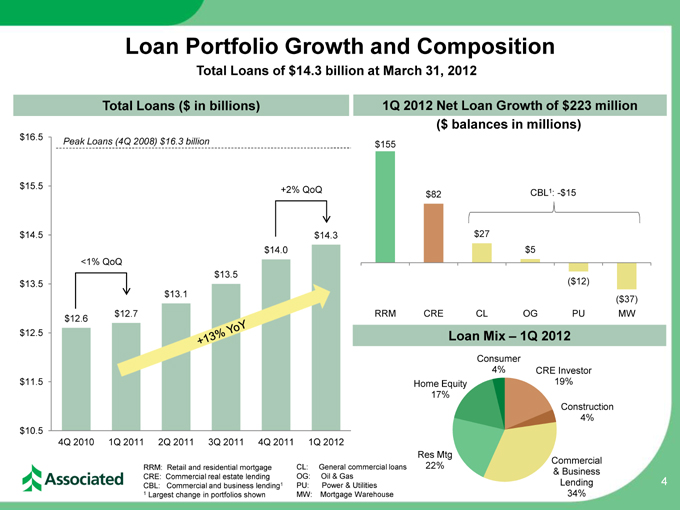
Total loans of $14.3 billion were up 2% from the end of the fourth quarter
–Retail and residential mortgage loans grew $155 million
–Commercial real estate lending loans increased by $82 million
Net interest income of $155 million improved by 2% from the fourth quarter
–Net interest margin of 3.31%; up 5 bps compared to full-year 2011 NIM of 3.26%
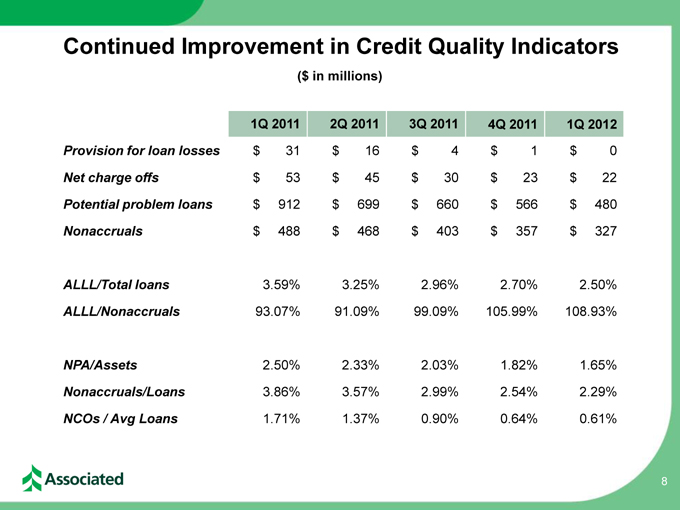
Credit Quality
Nonperforming assets declined $37 million, or 9%, from the prior quarter, and are down $176 million, or 33%, from the year ago quarter
Potential problem loans declined 15% from the prior quarter, and are down 47% from the year ago quarter
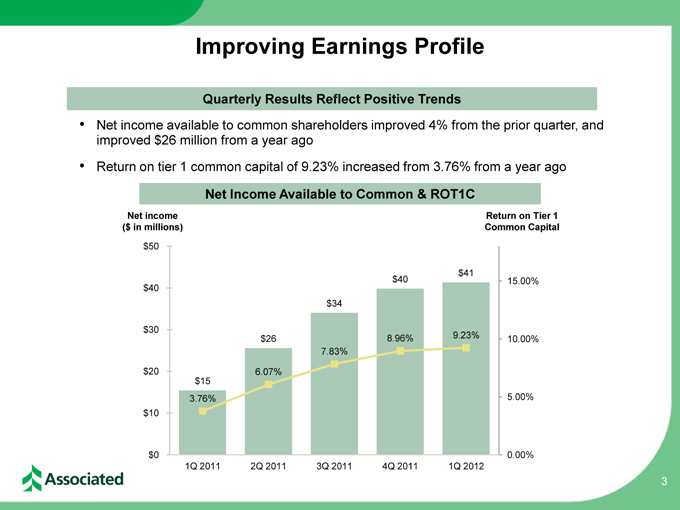
Improving Earnings Profile 3 Quarterly Results Reflect Positive Trends
Net income available to common shareholders improved 4% from the prior quarter, and improved $26 million from a year ago
Return on tier 1 common capital of 9.23% increased from 3.76% from a year ago
$15 $26 $34 $40 $41 3.76% 6.07% 7.83%
8.96% 9.23% 0.00% 5.00% 10.00% 15.00% $0
$10 $20 $30 $40 $50 1Q 2011 2Q 2011 3Q 2011 4Q 2011
1Q 2012 Net Income Available to Common & ROT1C Net income ($ in millions) Return on Tier 1 Common Capital
$155 $82 $27 $5 ($12) ($37) RRM CRE CL OG PU MW $12.6 $12.7 $13.1
$13.5 $14.0 $14.3 $10.5 $11.5 $12.5 $13.5
$14.5 $15.5 $16.5 4Q 2010 1Q 2011 2Q 2011 3Q 2011 4Q 2011 1Q 2012
Loan Portfolio Growth and Composition 4 Total Loans of $14.3 billion at March 31, 2012 1Q 2012 Net Loan Growth of $223 million Total Loans ($ in billions) + 2% QoQ
Peak Loans (4Q 2008) $16.3 billion Loan Mix – 1Q 2012 CRE Investor 19%
Construction 4% Commercial & Business Lending 34% Res Mtg 22% Home Equity 17% Consumer 4% <1% QoQ ($ balances in millions) RRM: Retail and residential mortgage CRE: Commercial real estate lending CBL: Commercial and business lending1 1 Largest change in portfolios shown CL: General commercial loans OG: Oil & Gas PU: Power & Utilities MW: Mortgage Warehouse CBL1: -$15
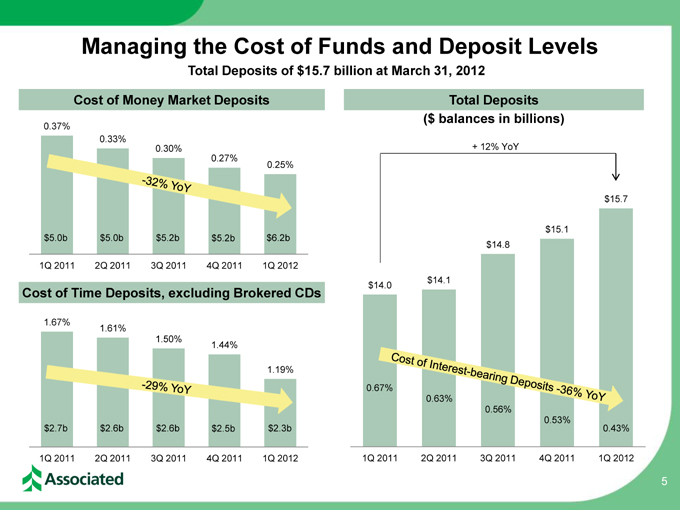
1.67% 1.61% 1.50% 1.44% 1.19% 1Q 2011 2Q 2011 3Q 2011 4Q 2011 1Q 2012 0.37% 0.33% 0.30% 0.27% 0.25%
1Q 2011 2Q 2011 3Q 2011 4Q 2011 1Q 2012
$14.0 $14.1 $14.8 $15.1 $15.7 1Q 2011
2Q 2011 3Q 2011 4Q 2011 1Q 2012 Managing the Cost of Funds and Deposit Levels 5 Cost of Money Market Deposits Cost of Time Deposits, excluding Brokered CDs
$6 .2 b $5.0b $5.0b $5.2b Total Deposits ($ balances in billions)
$5.2b $2.3b $2.7b $2.6b $2.6b $2.5b Total Deposits of $15.7 billion at March 31, 2012 + 12% YoY 0.43% 0.67%
0.63% 0.56% 0.53%
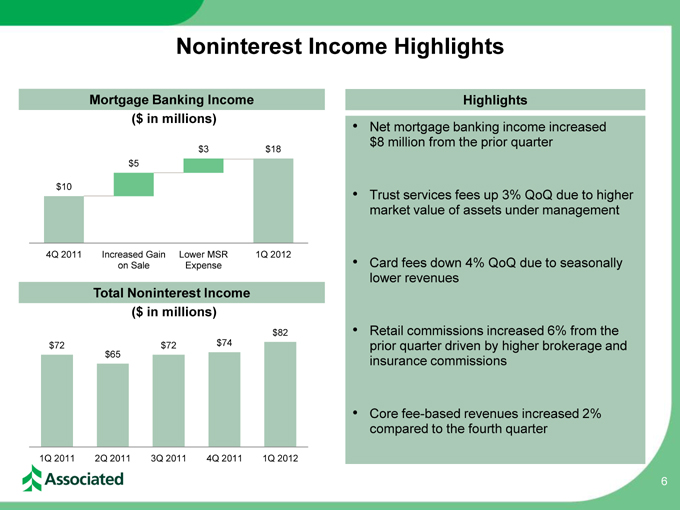
Noninterest Income Highlights 6
Net mortgage banking income increased $8 million from the prior quarter
Trust services fees up 3% QoQ due to higher market value of assets under management
Card fees down 4% QoQ due to seasonally lower revenues
Retail commissions increased 6% from the prior quarter driven by higher brokerage and insurance commissions
Core fee-based revenues increased 2% compared to the fourth quarter
Highlights ($ in millions) ($ in millions)
$72 $65 $72 $74 $82 1Q 2011
2Q 2011 3Q 2011 4Q 2011 1Q 2012 Total Noninterest Income Mortgage Banking Income
$10 $5 $3 $18 4Q 2011 Increased Gain on Sale
Lower MSR Expense 1Q 2012
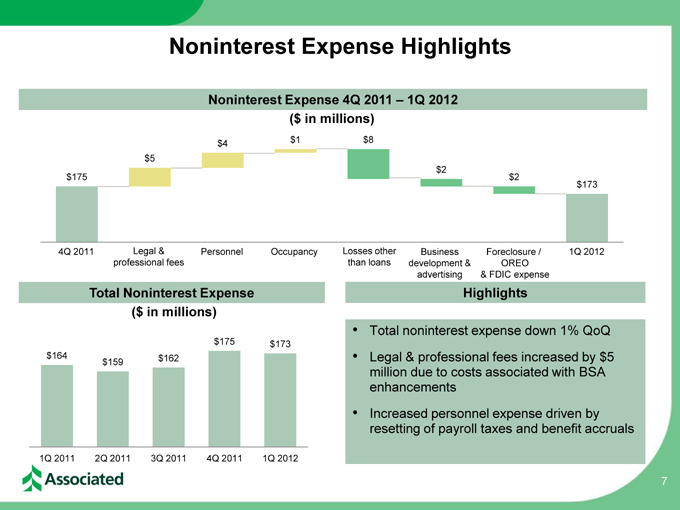
$175 $5 $4 $1 $8 $2 $2 $173 Noninterest Expense Highlights 7
Total noninterest expense down 1% QoQ
Legal & professional fees increased by $5 million due to costs associated with BSA enhancements
Increased personnel expense driven by resetting of payroll taxes and benefit accruals
Highlights ($ in millions) ($ in millions) $164 $159 $162 $175 $173 1Q 2011 2Q 2011 3Q 2011
4Q 2011 1Q 2012 Total Noninterest Expense Noninterest Expense 4Q 2011 – 1Q 2012 Personnel Occupancy
Losses other
than loans Business development & advertising Foreclosure / OREO & FDIC expense 1Q 2012 Legal & professional fees 4Q 2011
1Q 2011
2Q 2011
3Q 2011
4Q 2011
1Q 2012
Provision for loan losses
$ 31
$ 16
$ 4
$ 1
$ 0
Net charge offs
$ 53
$ 45
$ 30
$ 23
$ 22
Potential problem loans
$ 912
$ 699
$ 660
$ 566
$ 480
Nonaccruals
$ 488
$ 468
$ 403
$ 357
$ 327
ALLL/Total loans
3.59%
3.25%
2.96%
2.70%
2.50%
ALLL/Nonaccruals
93.07%
91.09%
99.09%
105.99%
108.93%
NPA/Assets
2.50%
2.33%
2.03%
1.82%
1.65%
Nonaccruals/Loans
3.86%
3.57%
2.99%
2.54%
2.29%
NCOs / Avg Loans
1.71%
1.37%
0.90%
0.64%
0.61%
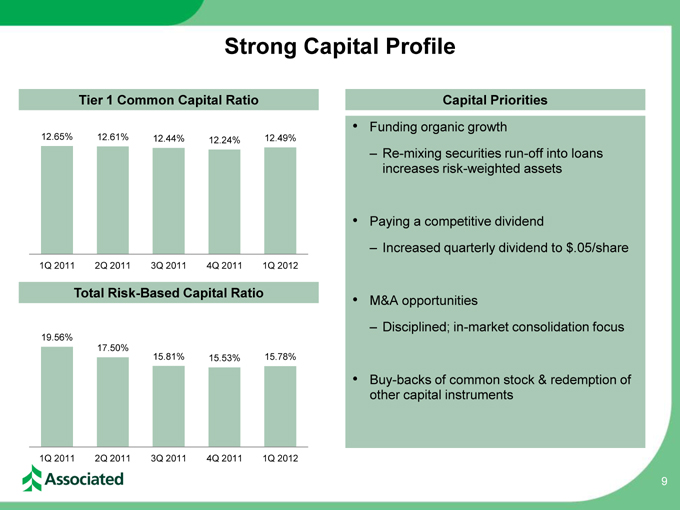
Strong Capital Profile
Funding organic growth
–Re-mixing securities run-off into loans increases risk-weighted assets
Paying a competitive dividend
–Increased quarterly dividend to $.05/share
M&A opportunities
–Disciplined; in-market consolidation focus
Buy-backs of common stock & redemption of other capital instruments
9 19.56% 17.50% 15.81% 15.53% 15.78% 1Q 2011 2Q 2011 3Q 2011 4Q 2011 1Q 2012 12.65% 12.61% 12.44%
12.24% 12.49% 1Q 2011 2Q 2011 3Q 2011 4Q 2011 1Q 2012 Tier 1 Common Capital Ratio Total Risk-Based Capital Ratio Capital Priorities
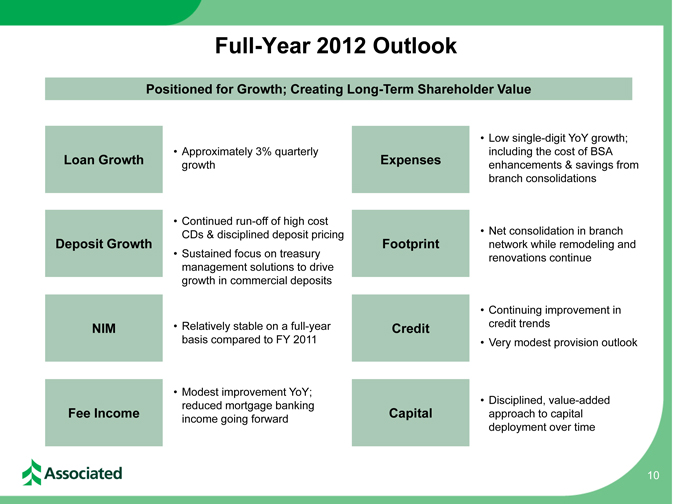
Full-Year 2012 Outlook 10
Positioned for Growth; Creating Long-Term Shareholder Value
Loan Growth
Approximately 3% quarterly growth
Deposit Growth
Continued run-off of high cost CDs & disciplined deposit pricing
Sustained focus on treasury management solutions to drive growth in commercial deposits
NIM
Relatively stable on a full-year basis compared to FY 2011
Fee Income
Modest improvement YoY; reduced mortgage banking income going forward
Expenses
Low single-digit YoY growth; including the cost of BSA enhancements & savings from branch consolidations
Footprint
Net consolidation in branch network while remodeling and renovations continue
Credit
Continuing improvement in credit trends
Very modest provision outlook
Capital
Disciplined, value-added approach to capital deployment over time