 Associated Banc-Corp Investor Presentation Third Quarter 2012 August 14, 2012 Exhibit 99.1 |
 Forward-Looking Statements Important note regarding forward-looking statements: 1 Statements made in this presentation which are not purely historical are forward-looking statements, as defined in the Private Securities Litigation Reform Act of 1995. This includes any statements regarding management’s plans, objectives, or goals for future operations, products or services, and forecasts of its revenues, earnings, or other measures of performance. Such forward-looking statements may be identified by the use of words such as “believe”, “expect”, “anticipate”, “plan”, “estimate”, “should”, “will”, “intend”, “outlook”, or similar expressions. Forward-looking statements are based on current management expectations and, by their nature, are subject to risks and uncertainties. Actual results may differ materially from those contained in the forward-looking statements. Factors which may cause actual results to differ materially from those contained in such forward-looking statements include those identified in the company’s most recent Form 10-K and subsequent SEC filings. Such factors are incorporated herein by reference. |
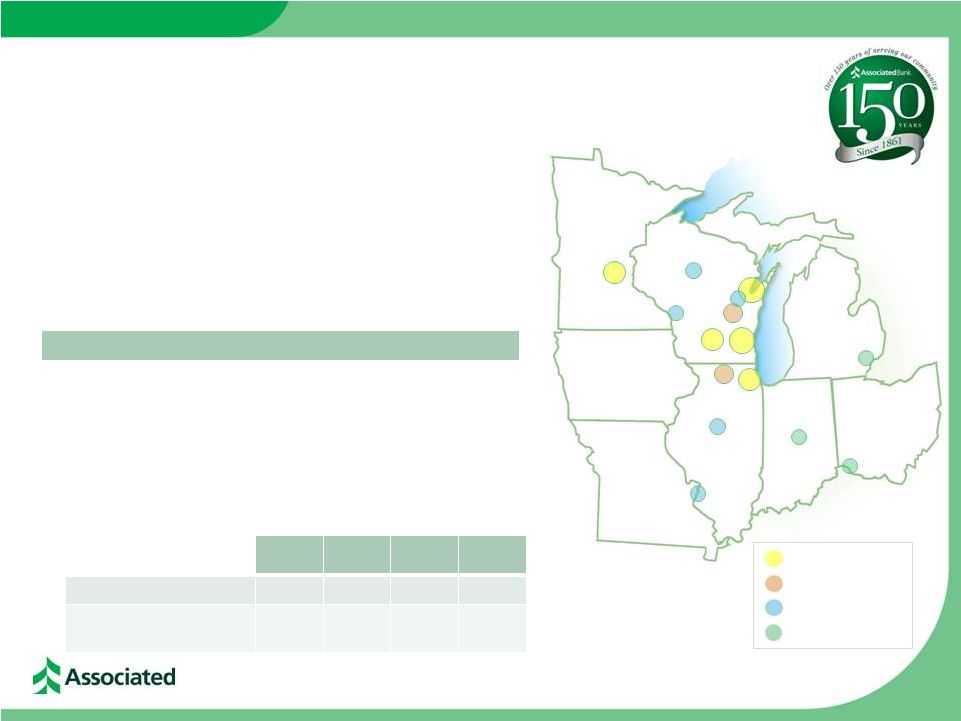 • Top 50, publicly traded, U.S. bank holding company • $22 billion in assets; largest bank headquartered in Wisconsin – Over 250 banking offices serving over 150 communities – #1 mortgage originator in Wisconsin 1 – #1 SBA lender in Wisconsin 2 Leading Midwest Banking Franchise 2 1 Based on 2010 number of funded mortgage loans per HMDA data; 2 Based on 2011 FY number of funded SBA loans; 3 FDIC market share data 6/30/11; 4 Source: U.S. BLS, Jun. 2012; 5 Source: FRB Chicago Midwest Manufacturing Index, June 2012; 6 Source: FRB Midwest Economy Index, June 2012 La Crosse Green Bay Peoria Chicago Madison Rockford Neenah St. Louis Milwaukee Wausau Appleton Operating in Attractive Midwest Markets • WI & MN continue to show above average employment levels 4 • Midwest Manufacturing output is up 11.0% YoY (vs. 5.6% nationally) 5 • Midwest Machinery output is up 12.2% YoY 5 • Midwest Economy Index above historical trend for 8 consecutive month 6 WI MN IL U.S. Unemployment Rate 4 7.0% 5.6% 8.7% 8.2% ASBC Deposits ($ in billions) $10.6 $1.5 $3.0 $15.1 Minneapolis Indianapolis Cincinnati Detroit >$1bn deposits 3 >$500m deposits 3 >$250m deposits 3 Commercial offices th |
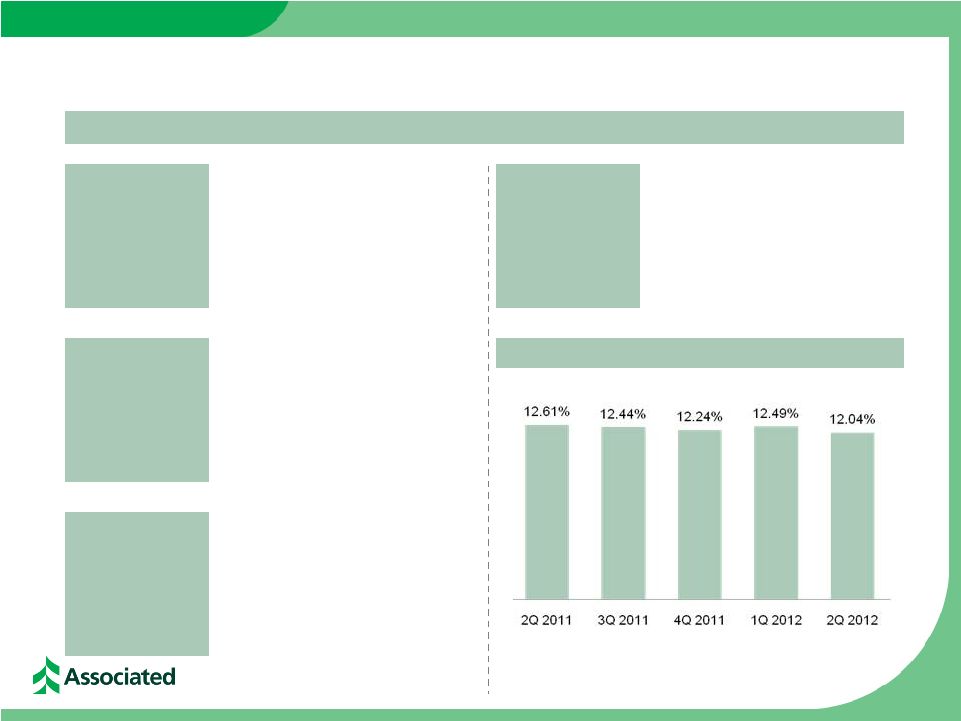 Core Regional Banking Business Model • Upper Midwest regional focus on servicing U.S. customers operating in domestic markets • No European loans & no direct exposure to foreign governments or foreign central banks 3 Differentiation from Large-Cap, Diversified Financial Institutions Nominal European Exposure Nominal Trading & Derivative Positions Basel III Compliant Capital • No overseas or off-shore trading or investment functions • No proprietary trading activities or portfolios • No market maker positions in derivatives • Current capital levels are well in excess of “well-capitalized” regulatory benchmarks • Existing capital levels are already above proposed Basel III capital levels Tier 1 Common Equity Ratio Nominal Mortgage Put-back Exposure • Nominal historical agency repurchase levels • No significant exposure to high risk mortgage asset classes or high risk underwriting programs |
 Core Organic Loan Growth 4 Total Loans of $14.7 billion at June 30, 2012 Quarterly Net Loan Growth Trend Total Loans ($ in billions) ($ in millions) +3% QoQ Peak Loans (4Q 2008) $16.3 billion Loan Mix – 2Q 2012 |
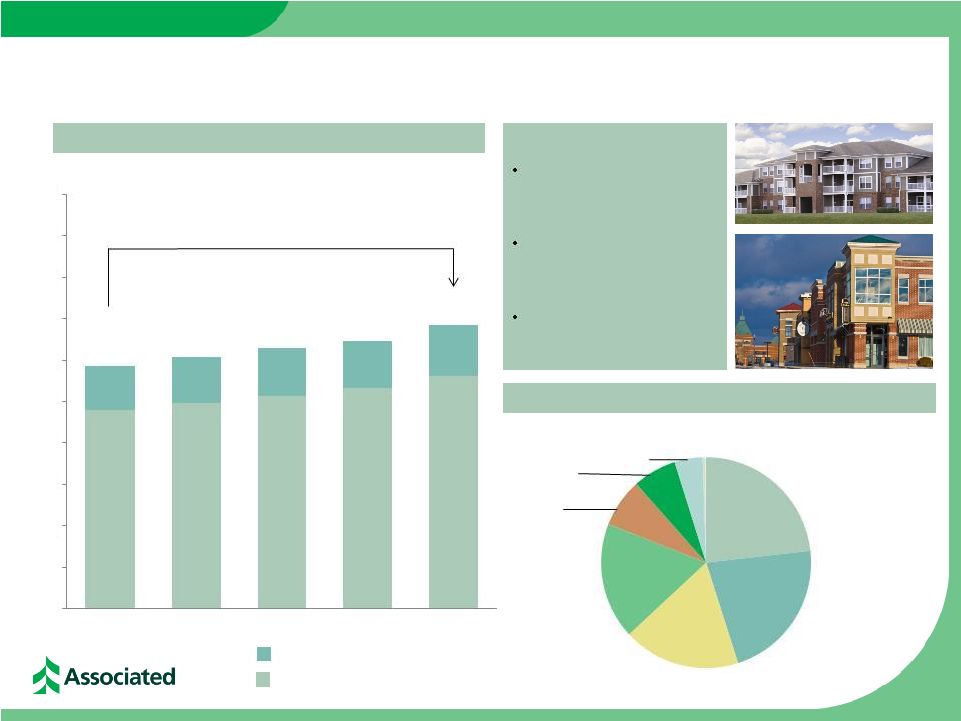
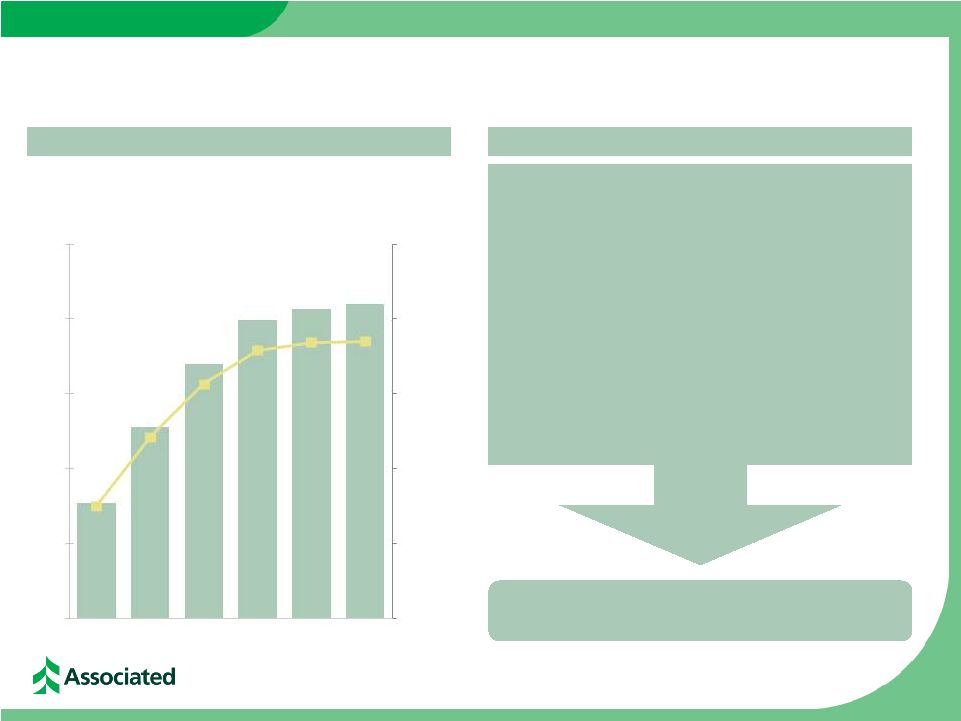
 Growing Commercial & Business Lending 5 ($ in billions) CB&L Loans by Industry (2Q 2012) Q2 loan production continued to show strength Recent hires continue to gain traction in driving new relationships to Associated Launched enhanced Treasury Management online portal in February Focusing on cross-sell with Treasury Management, AFG, and Private Client & Institutional Services to deepen customer relationships Commercial & Business Lending Loans $4.3 $4.5 $4.9 $4.9 $5.3 $3.5 $4.0 $4.5 $5.0 $5.5 $6.0 2Q 2011 3Q 2011 4Q 2011 1Q 2012 2Q 2012 Health Care and 5% Professional, Scientific, and Technical Services, 4% Oil & Gas, 5% Other, 23% Manufacturing, 17% Real Estate and Rental & Leasing, 12% Finance and Insurance, 12% Wholesale Trade, 10% Retail Trade, 6% Social Assistance, Transportation and Warehousing, 2% Power & Utilities 3% Highlights |
 Growing Commercial Real Estate Lending 6 ($ in billions) Highlights Commercial Real Estate Lending Loans CRE Loans by Collateral (2Q 2012) Construction Investor commercial real estate + 17% YoY Growing multi-family lending portfolio Continuing strong growth across the footprint ~90% of CRE loans are in core footprint $2.4 $2.5 $2.6 $2.7 $2.8 $2.9 $3.0 $3.1 $3.2 $3.4 $0.0 $0.5 $1.0 $1.5 $2.0 $2.5 $3.0 $3.5 $4.0 $4.5 $5.0 2Q 2011 3Q 2011 4Q 2011 1Q 2012 2Q 2012 MULTI - FAMILY 23% OFFICE / MIXED USE 22% RETAIL 18% 18% INDUSTRIAL 7% OTHER 7% HOTEL / MOTEL 4% CONSTRUCTION |
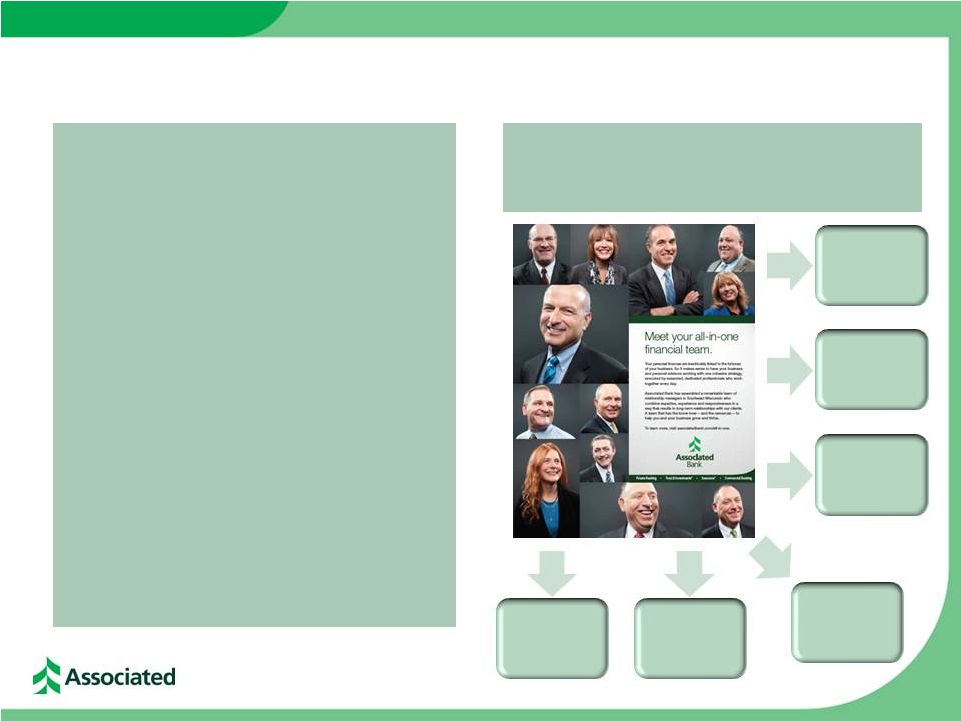 Growing Private Client and Institutional Services (Formerly Wealth Management) 7 Cross-Line Partnerships between Private Client & Institutional Services and Commercial Banking & Insurance • • • • • • • Highlights Focusing on core disciplines, business development, and cross-line partnership with Commercial Banking Increasing the number and depth of Private Banking households Hired new head of Trust; based in Milwaukee Addition of new talent in Minneapolis in order to execute on strategic growth in the market Product & service enhancements for affluent client base Over 60,000 participants in supported business retirement plans Over $5.9 billion of assets under management Deposit Solutions Asset Management Brokerage Insurance Lending Trust & Custodial |
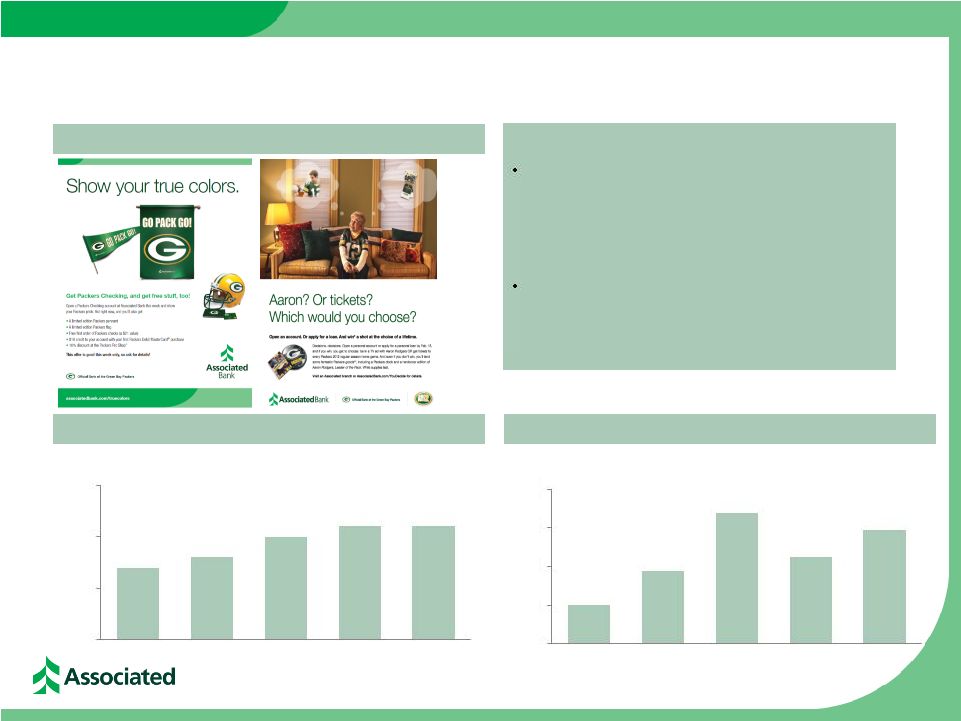 Expanding Retail Banking Relationships 8 Strengthening the basics – Strengthening our focus on our premier banking customers – Expanding the scope and reach of our market-leading mortgage franchise Leveraging our relationship with the Green Bay Packers Banking Residential Mortgage Loan Portfolio ($ in billions) Mortgage Loans Originated for Sale ($ in millions) Highlights $2.0 $2.5 $3.0 $3.5 2Q 2011 3Q 2011 4Q 2011 1Q 2012 2Q 2012 $251 $471 $844 $564 $738 $0 $250 $500 $750 $1,000 2Q 2011 3Q 2011 4Q 2011 1Q 2012 2Q 2012 $2.7 $2.8 $3.0 $3.1 $3.1 Packers & Aaron Rodgers |
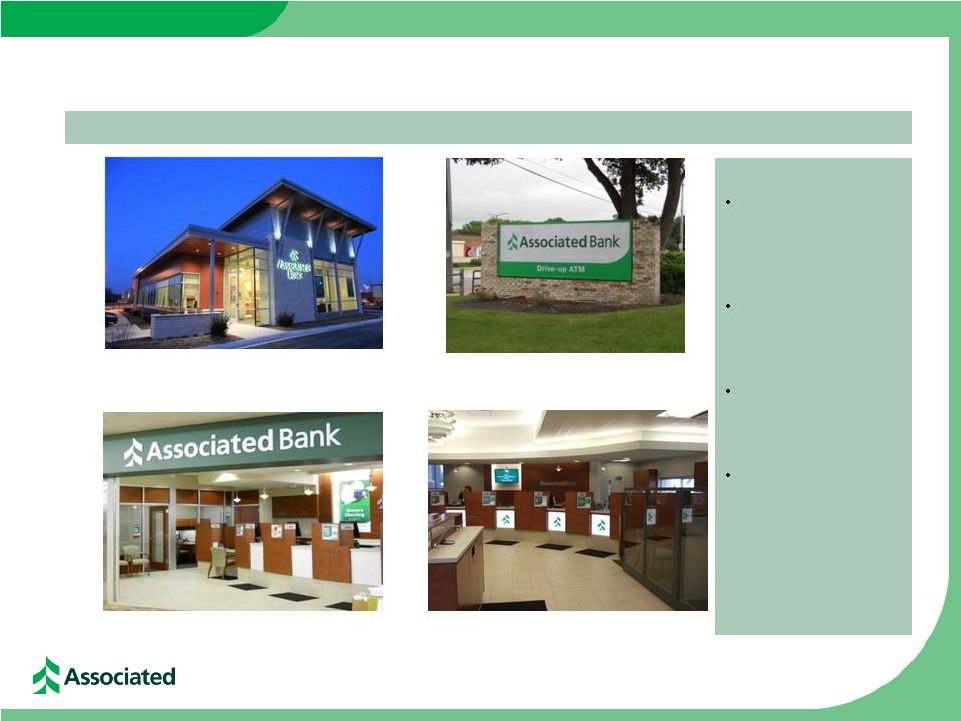 Footprint Update 9 Example relocated office Updated signage completed across the footprint Differentiating Associated in Branch Banking Completed the remodel, relocation, or new construction of over 30 branches in 2011 50 remodels planned in 2012; completed ~30 branches in 1 H2012 FY 2011 PPE expense of $77 million includes ongoing investments in franchise Consolidated 21 branches in 1H2012 and sold three additional outlying branches in Jan. 2012 Example in-store remodel Example traditional remodel Highlights |
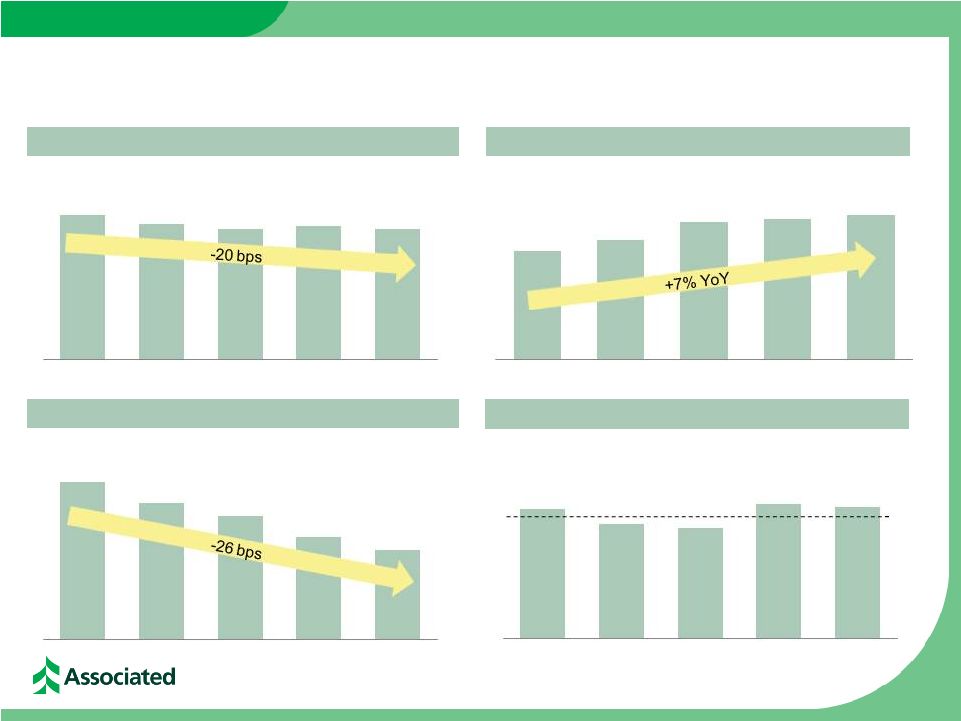 Disciplined Deposit Pricing and Stable Margins 10 Yield on Interest-earning Assets Cost of Interest-bearing Liabilities Average Deposits Net Interest Margin ($ balances in billions) Average Total Deposits of $15.1 billion at June 30, 2012 2Q 2011 3Q 2011 4Q 2011 1Q 2012 2Q 2012 2Q 2011 3Q 2011 4Q 2011 1Q 2012 2Q 2012 2Q 2011 3Q 2011 4Q 2011 1Q 2012 2Q 2012 2Q 2011 3Q 2011 4Q 2011 1Q 2012 2Q 2012 4.00% 3.88% 3.81% 3.85% 3.80% 3.29% 3.23% 3.21% 3.31% 3.30% FY2011: 3.26% 0.91% 0.83% 0.78% 0.70% 0.65% $14.1 $14.4 $14.9 $15.0 $15.1 |
 • Continue to examine options for acquisitions while maintaining discipline in pricing of any transaction • Branch consolidation transactions with cost take-out opportunities provide greater value in current environment • Focused on transactions with lower tangible book value dilution and shorter-term earn back period Value-added Approach to Capital Management • Focus remains on funding organic loan growth across the footprint • Supporting business growth initiatives 11 Funding Organic Growth Paying a Competitive Dividend • Increased quarterly dividend to $0.05/share in 1Q12 • Committed to revisiting the dividend policy at the end of 2012 Buybacks and Redemptions • Repurchased $30 million of common stock during 2Q12 • Redeemed $25 million of outstanding 7.625% Trust preferred securities in 2Q12 • Board of Directors has approved the redemption of all outstanding Trust preferred securities over the next 90 days Non-organic Growth Opportunities |
 Outlook 12 Loan Growth • Approximately 3% quarterly growth Deposit Growth Fee Income Expenses NIM Positioned for Growth; Creating Long-Term Shareholder Value Footprint Credit Capital • Continued disciplined pricing • Slowing run-off of high cost CDs • Sustained focus on treasury management solutions to drive growth in commercial deposits • Relatively stable on a full-year basis compared to full-year 2011 • Modest improvement quarterly in core fee-based revenues with mortgage banking income likely reduced going forward • Low single-digit quarterly growth; including the cost of continuing BSA enhancements & footprint updates • Continue to invest in our branches while optimizing our network • Consolidating in downtown Green Bay • Continuing improvement in credit trends • Very modest provision outlook • Disciplined, value-added approach to capital deployment over time |
 Why Associated 13 Net Income Available to Common ($ in millions) Return on Tier 1 Common Equity Reasons to Invest Net Income Available to Common & ROT1CE Management Team Focused on Creating Long-Term Shareholder Value • Leading Midwest Bank Operating in Attractive Markets • Core Organic Growth Opportunity • Disciplined Deposit Pricing & Stable Margin • Improving Credit Quality • Strong Capital Profile Above Basel III Expectations & Opportunities for Capital Deployment • Improving Earnings Profile $15 $26 $34 $40 $41 $42 3.76% 6.07% 7.83% 8.96% 9.23% 9.26% 0.00% 2.50% 5.00% 7.50% 10.00% 12.50% $0 $10 $20 $30 $40 $50 1Q 2011 2Q 2011 3Q 2011 4Q 2011 1Q 2012 2Q 2012 |
 Associated Banc-Corp will be the most admired Midwestern financial services company, distinguished by sound, value-added financial solutions with personal service for our customers, built upon a strong commitment to our colleagues and the communities we serve, resulting in exceptional value for our shareholders. |
 Appendix 15 |
 Continued Improvement in Credit Quality Indicators 16 ($ in millions) 2Q 2011 3Q 2011 4Q 2011 1Q 2012 2Q 2012 Potential problem loans $ 699 $ 660 $ 566 $ 480 $ 410 Nonaccruals $ 468 $ 403 $ 357 $ 327 $ 318 Provision for loan losses $ 16 $ 4 $ 1 $ 0 $ 0 Net charge offs $ 45 $ 30 $ 23 $ 22 $ 24 ALLL/Total loans 3.25% 2.96% 2.70% 2.50% 2.26% ALLL/Nonaccruals 91.09% 99.09% 105.99% 108.93% 104.65% NPA/Assets 2.33% 2.03% 1.82% 1.65% 1.62% Nonaccruals/Loans 3.57% 2.99% 2.54% 2.29% 2.16% NCOs / Avg Loans 1.37% 0.90% 0.64% 0.61% 0.65% |
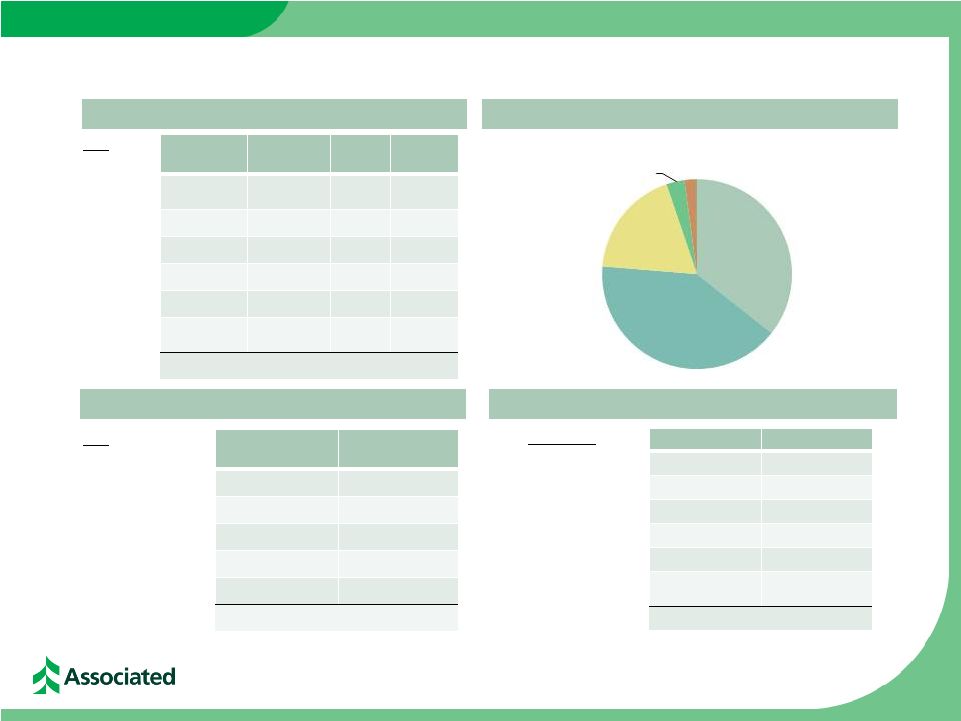 High Quality Investment Securities Portfolio Market Value Composition – June 30, 2012 Investment Portfolio – June 30, 2012 Portfolio Composition Ratings – June 30, 2012 Risk – Weighted Profile – June 30, 2012 Credit Rating Mkt Value (000’s) % of Total Govt & Agency $ 3,443,846 76% AAA 153,723 3% AA 763,854 17% A 125,579 3% BAA1, BAA2 & BAA3 15,132 --- BA1 & Lower and Non-rated 19,302 --- TOTAL $4,521,436 100% Type Mkt Value (000’s) % of Total 0% RWA $ 37,469 1% 20% RWA 4,190,343 93% 50% RWA 35,849 1% =>100% RWA 100,464 2% Not subject to RW 157,311 3% TOTAL $4,521,436 100% Type Bk Value (000’s) Mkt Value (000’s) TEY (%) Duration (Yrs) Govt & Agencies $ 1,011 $ 1,011 0.33 2.10 MBS 1,753,910 1,838,909 3.80 2.14 CMOs 1,586,621 1,611,471 2.76 0.63 Municipals 786,511 835,136 5.53 4.36 ABS 139,368 139,164 0.67 0.19 Corporates & Other 93,144 95,745 1.86 1.30 TOTAL AFS $4,360,565 $4,521,436 3.59 1.94 17 CMOs 36% MBS 41% Municipals 18% ABS 3% Corporates & Other 2% |
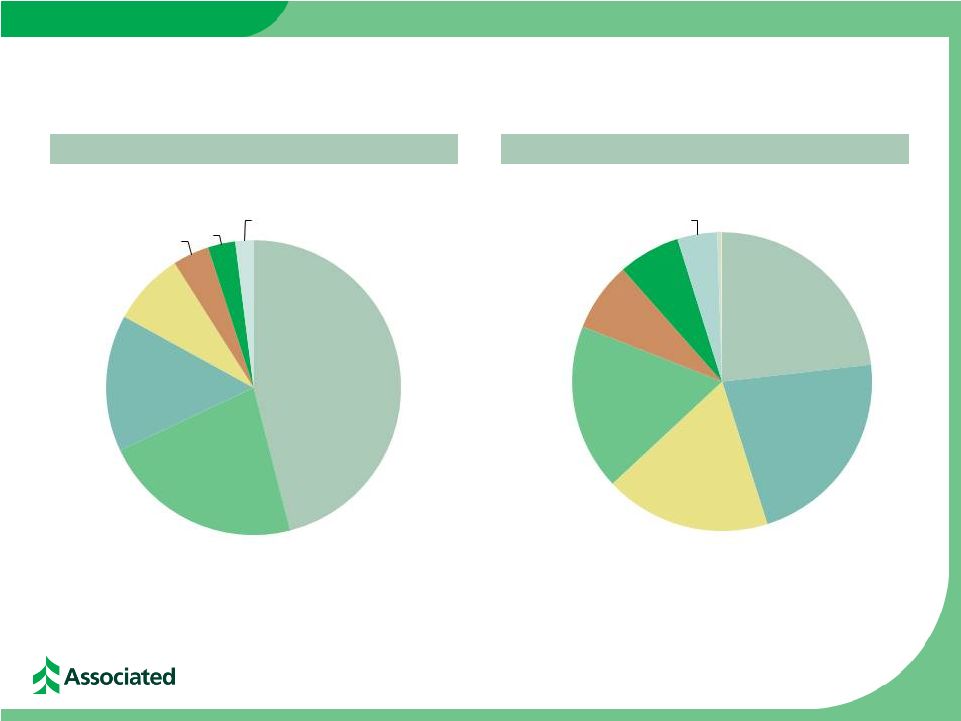
 Consumer Loan Portfolios by Geography 18 (as of June 30, 2012) Residential Mortgage Loans by State Home Equity Loans by State Approximately half of home equity portfolio is in first-lien position WISCONSIN 53% ILLINOIS 31% MINNESOTA 9% MISSOURI 4% OTHER 3% WISCONSIN 72% ILLINOIS 16% MINNESOTA 11% OTHER 2% |
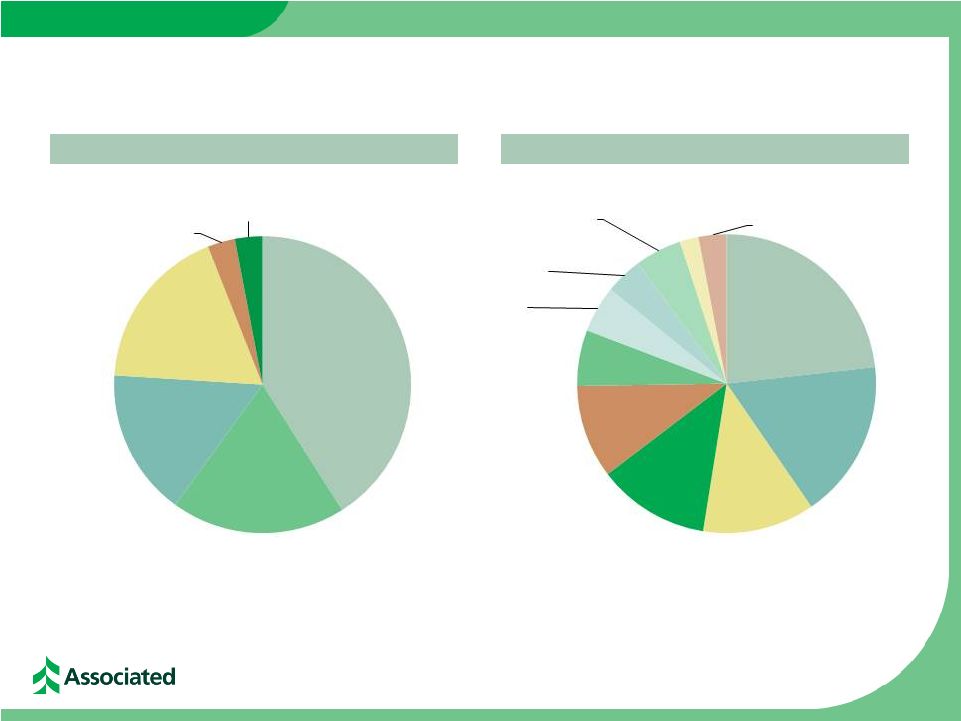 19 Commercial & Business Lending Loans Commercial & Business Lending portfolio of $5.3 billion, or 36% of Total Loans, at June 30, 2012 Commercial & Business Lending Loans by State Commercial & Business Lending Loans by Industry WISCONSIN 41% ILLINOIS 19% MINNESOTA 16% OTHER 18% CALIFORNIA 3% TEXAS 3% Other, 23% Manufacturing, 17% Real Estate and Rental & Leasing, 12% Finance and Insurance, 12% Wholesale Trade, 10% Retail Trade, 6% Health Care and Social Assistance, 5% Professional, Technical Services, 4% Oil & Gas, 5% Transportation and Warehousing, 2% Power & Utilities, 3% Scientific, and |
 20 Commercial Real Estate Lending Loans Commercial Real Estate Lending portfolio of $3.4 billion, or 23% of Total Loans, at June 30, 2012 Commercial Real Estate Lending Loans by State Commercial Real Estate Lending Loans by Collateral MULTI-FAMILY 23% OFFICE/MIXED USE 22% RETAIL 18% CONSTRUCTION 18% INDUSTRIAL 7% OTHER 7% HOTEL/MOTEL 4% WISCONSIN 46% ILLINOIS 22% MINNESOTA 15% OTHER 8% OHIO 4% MISSOURI 3% INDIANA 2% |