 | Project Black Olive Discussion Materials for the Special Committee of Independent Directors Bluegreen Corporation November 14, 2012 |
 | DISCLAIMER Project Black Olive This presentation, and any supplemental information (written or oral) or other documents provided in connection therewith (collectively, the “Materials”), are provided solely for the information of the Special Committee of Independent Directors of the Board of Directors (the “Committee”) of Bluegreen Corporation (“Bluegreen” or the “Company”) by Cassel Salpeter & Co, LLC. (“CS”) in connection with the Committee’s consideration of a potential transaction (the “Transaction”) involving the Company. This presentation is incomplete without reference to, and should be considered in conjunction with, any supplemental information provided by and discussions with CS in connection therewith. The Materials are for discussion purposes only and may not be relied upon by any person or entity for any purpose without CS’s express prior written consent. The Materials were prepared for specific persons familiar with the business and affairs of the Company for use in a specific context and were not prepared with a view to public disclosure or to conform with any disclosure standards under any state, federal or international securities laws or other laws, rules or regulations, and none of the Committee, the Company or CS takes any responsibility for the use of the Materials by persons other than the Committee. The Materials are provided on a confidential basis solely for the information of the Committee and may not be disclosed, summarized, reproduced, disseminated or quoted or otherwise referred to, in whole or in part, without CS’s express prior written consent. The Materials necessarily are based on financial, economic, market, tax and other conditions as in effect on, and the information available to CS as of, the date of the Materials. Although subsequent developments may affect the contents of the Materials, CS has not undertaken, and is under no obligation, to update, revise or reaffirm the Materials. The Materials are not intended to provide the sole basis for evaluation of the Transaction and do not purport to contain all information that may be required. The Materials do not address the underlying business decision of the Committee, the Board, the Company or any other party to proceed with or effect the Transaction. The Materials do not constitute any opinion, nor do the Materials constitute a recommendation to the Committee, the Company, any security holder of the Company or any other person as to how to vote or act with respect to any matter relating to the Transaction or whether to buy or sell any assets or securities of any company. CS’s only opinion will be the opinion, if any, that is actually delivered to the Committee in connection with the Transaction. The preparation of the Materials was a complex process involving quantitative and qualitative judgments and determinations with respect to the financial, comparative and other analytic methods employed and the adaptation and application of these methods to the unique facts and circumstances presented and, therefore, is not readily susceptible to partial analysis or summary description. Furthermore, CS did not attribute any particular weight to any analysis or factor considered by it, but rather made qualitative judgments as to the significance and relevance of each analysis and factor. Accordingly, the analyses contained in the Materials must be considered as a whole. Selecting portions of the analyses, analytic methods and factors without considering all analyses and factors could create a misleading or incomplete view. 1 |
 | DISCLAIMER (continued) Project Black Olive The Materials reflect judgments and assumptions with regard to general business, economic, regulatory, market, tax and financial conditions and other matters, many of which are beyond the control of the participants in the Transaction. Any estimates of value contained in the Materials are not necessarily indicative of actual value or predictive of future results or values, which may be significantly more or less favorable. In addition, any analyses relating to the value of assets, businesses or securities do not purport to be appraisals or to reflect the prices at which any assets, businesses or securities may actually be sold. All budgets, projections, estimates, financial analyses, reports, and other information with respect to the Company or any party to the Transaction, their assets and liabilities (contingent or not) as reflected in the Materials have been prepared by management of the relevant party or are derived from such budgets, projections, estimates, financial analyses, reports, and other information or from other sources, which involve numerous and significant subjective determinations made by management of the relevant party and/or which such management has reviewed and found reasonable. The budgets, projections, and estimates contained in the Materials may or may not be achieved and differences between projected results and those actually achieved may be material. CS has relied upon representations made by management of the Company that such budgets, projections, and estimates have been reasonably prepared in good faith on bases reflecting the best currently available estimates and judgments of such management (or, with respect to information obtained from public sources, represent reasonable estimates), and CS expresses no opinion with respect to such budgets, projections, or estimates or the assumptions on which they are based. The scope of the financial analysis contained herein is based on discussions with the Committee (including, without limitation, regarding the methodologies to be utilized), and CS does not make any representation, express or implied, as to the sufficiency or adequacy of such financial analysis or the scope thereof for any particular purpose. CS’s role in reviewing any information is limited solely to performing such a review as it shall deem necessary to support its own advice and analysis. CS has assumed and relied upon the accuracy and completeness of the financial, and other information provided to or reviewed by it without (and without assuming responsibility for) independent verification of such information, makes no representation or warranty (express or implied) in respect of the accuracy or completeness of such information and has further relied upon the assurances of the Company that it is not aware of any facts or circumstances that would make such information inaccurate or misleading. In addition, CS has relied upon representations made by management of the Company, without independent verification, that there has been no change in the business, assets, liabilities, financial condition, results of operations, cash flows, or prospects of the Company or any other participant in the Transaction since the date of the most recent financial statements provided to CS that would be material to our analyses, and that the final forms of any draft documents reviewed by CS will not differ in any material respect from such draft documents. 2 |
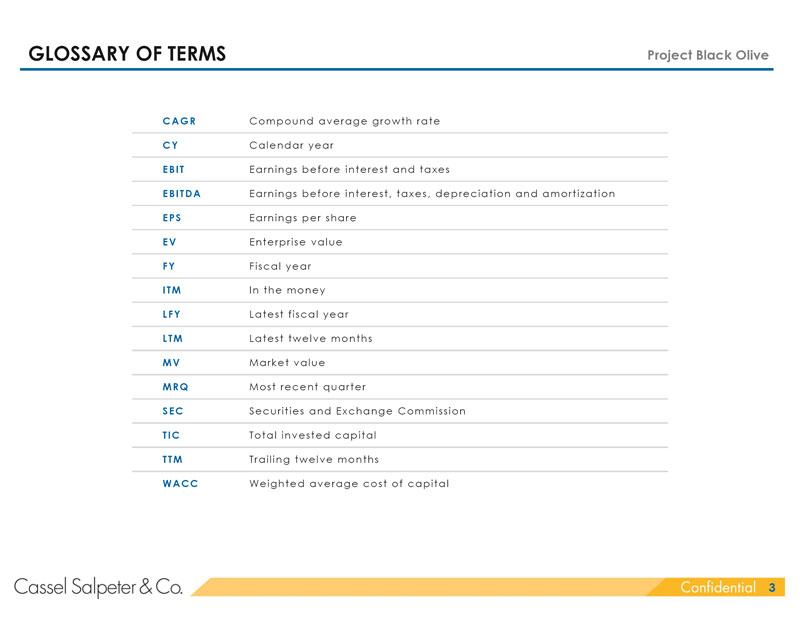 | GLOSSARY OF TERMS Project Black Olive CAGR Compound average growth rate CY Calendar year EBIT Earnings before interest and taxes EBITDA Earnings before interest, taxes, depreciation and amortization EPS Earnings per share EV Enterprise value FY Fiscal year ITM In the money LFY Latest fiscal year LTM Latest twelve months MV Market value MRQ Most recent quarter SEC Securities and Exchange Commission TIC Total invested capital TTM Trailing twelve months WACC Weighted average cost of capital 3 |
 | Project Black Olive I EXECUTIVE SUMMARY II ANALYSIS III APPENDIX 4 |
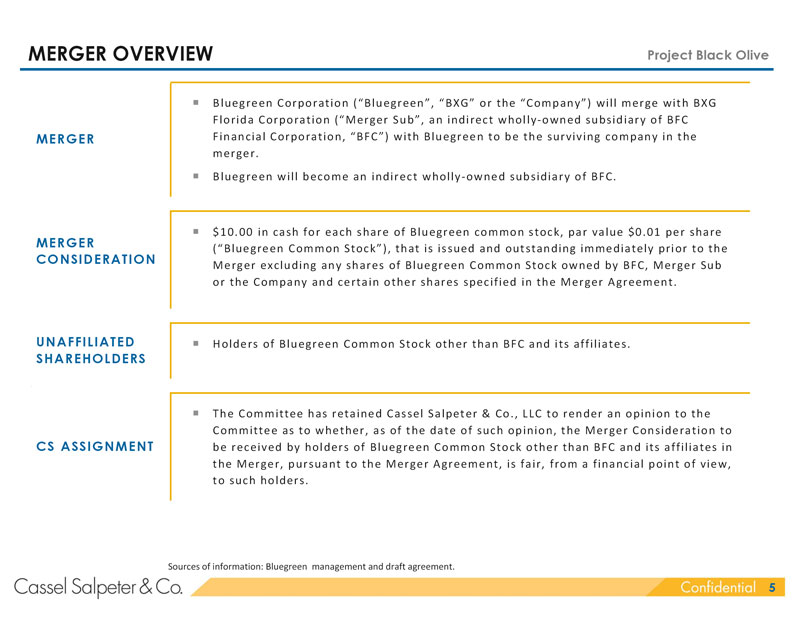 | MERGER OVERVIEW Project Black Olive Bluegreen Corporation (“Bluegreen”, “BXG” or the “Company”) will merge with BXG Florida Corporation (“Merger Sub”, an indirect wholly-owned subsidiary of BFC MERGER Financial Corporation, “BFC”) with Bluegreen to be the surviving company in the merger. Bluegreen will become an indirect wholly-owned subsidiary of BFC. $10.00 in cash for each share of Bluegreen common stock, par value $0.01 per share MERGER (“Bluegreen Common Stock”), that is issued and outstanding immediately prior to the CONSIDERATION Merger excluding any shares of Bluegreen Common Stock owned by BFC, Merger Sub or the Company and certain other shares specified in the Merger Agreement. UNAFFILIATED Holders of Bluegreen Common Stock other than BFC and its affiliates. SHAREHOLDERS The Committee has retained Cassel Salpeter & Co., LLC to render an opinion to the Committee as to whether, as of the date of such opinion, the Merger Consideration to CS ASSIGNMENT be received by holders of Bluegreen Common Stock other than BFC and its affiliates in the Merger, pursuant to the Merger Agreement, is fair, from a financial point of view, to such holders. Sources of information: Bluegreen management and draft agreement. 5 |
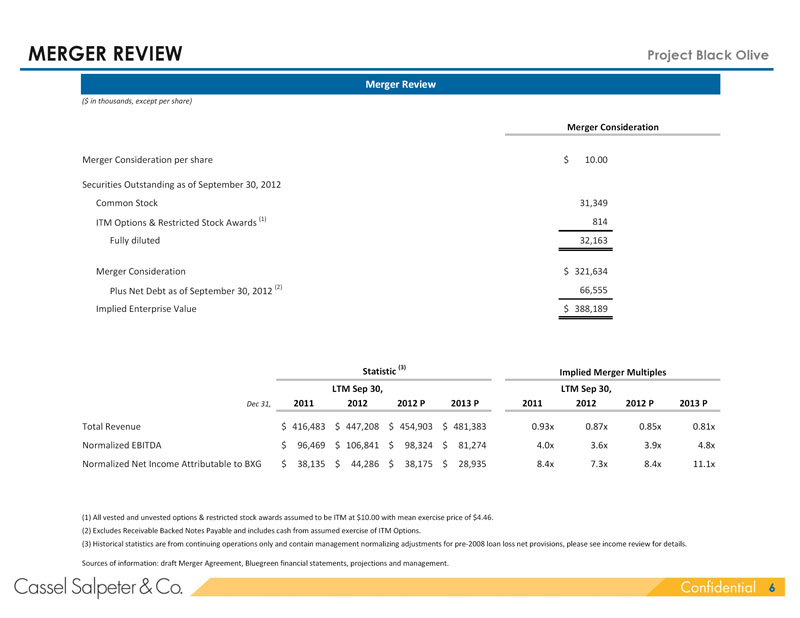 | MERGER REVIEW Project Black Olive Merger Review ($ in thousands, except per share) Merger Consideration Merger Consideration per share $ 10.00 Securities Outstanding as of September 30, 2012 Common Stock 31,349 ITM Options & Restricted Stock Awards (1) 814 Fully diluted 32,163 Merger Consideration $ 321,634 Plus Net Debt as of September 30, 2012 (2) 66,555 Implied Enterprise Value $ 388,189 Statistic (3) Implied Merger Multiples LTM Sep 30, LTM Sep 30, Dec 31, 2011 2012 2012 P 2013 P 2011 2012 2012 P 2013 P Total Revenue $ 416,483 $ 447,208 $ 454,903 $ 481,383 0.93x 0.87x 0.85x 0.81x Normalized EBITDA $ 96,469 $ 106,841 $ 98,324 $ 81,274 4.0x 3.6x 3.9x 4.8x Normalized Net Income Attributable to BXG $ 38,135 $ 44,286 $ 38,175 $ 28,935 8.4x 7.3x 8.4x 11.1x (1) All vested and unvested options & restricted stock awards assumed to be ITM at $10.00 with mean exercise price of $4.46. (2) Excludes Receivable Backed Notes Payable and includes cash from assumed exercise of ITM Options. (3) Historical statistics are from continuing operations only and contain management normalizing adjustments for pre-2008 loan loss net provisions, please see income review for details. Sources of information: draft Merger Agreement, Bluegreen financial statements, projections and management. 6 |
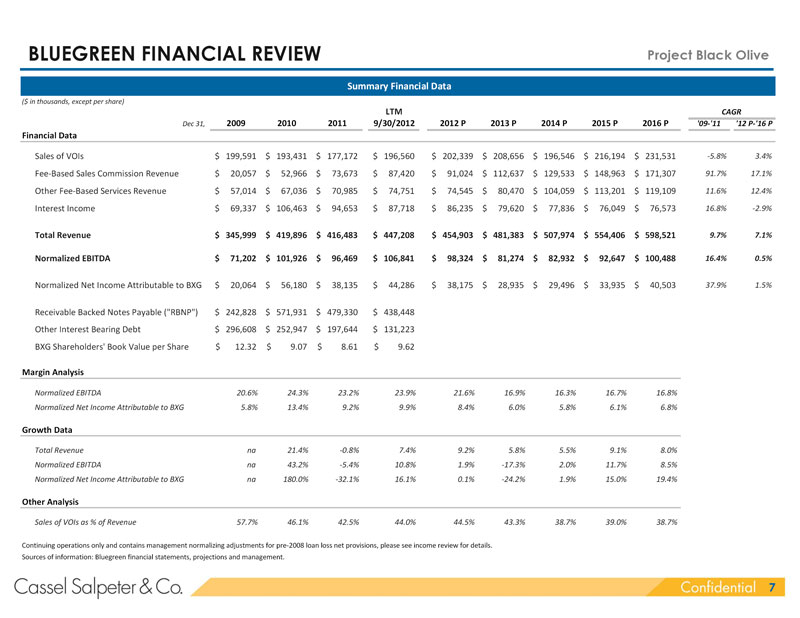 | BLUEGREEN FINANCIAL REVIEW Project Black Olive Summary Financial Data ($ in thousands, except per share) LTM CAGR Dec 31, 2009 2010 2011 9/30/2012 2012 P 2013 P 2014 P 2015 P 2016 P ’09-’11 ’12 P-’16 P Financial Data Sales of VOIs $ 199,591 $ 193,431 $ 177,172 $ 196,560 $ 202,339 $ 208,656 $ 196,546 $ 216,194 $ 231,531 -5.8% 3.4% Fee-Based Sales Commission Revenue $ 20,057 $ 52,966 $ 73,673 $ 87,420 $ 91,024 $ 112,637 $ 129,533 $ 148,963 $ 171,307 91.7% 17.1% Other Fee-Based Services Revenue $ 57,014 $ 67,036 $ 70,985 $ 74,751 $ 74,545 $ 80,470 $ 104,059 $ 113,201 $ 119,109 11.6% 12.4% Interest Income $ 69,337 $ 106,463 $ 94,653 $ 87,718 $ 86,235 $ 79,620 $ 77,836 $ 76,049 $ 76,573 16.8% -2.9% Total Revenue $ 345,999 $ 419,896 $ 416,483 $ 447,208 $ 454,903 $ 481,383 $ 507,974 $ 554,406 $ 598,521 9.7% 7.1% Normalized EBITDA $ 71,202 $ 101,926 $ 96,469 $ 106,841 $ 98,324 $ 81,274 $ 82,932 $ 92,647 $ 100,488 16.4% 0.5% Normalized Net Income Attributable to BXG $ 20,064 $ 56,180 $ 38,135 $ 44,286 $ 38,175 $ 28,935 $ 29,496 $ 33,935 $ 40,503 37.9% 1.5% Receivable Backed Notes Payable (“RBNP”) $ 242,828 $ 571,931 $ 479,330 $ 438,448 Other Interest Bearing Debt $ 296,608 $ 252,947 $ 197,644 $ 131,223 BXG Shareholders’ Book Value per Share $ 12.32 $ 9.07 $ 8.61 $ 9.62 Margin Analysis Normalized EBITDA 20.6% 24.3% 23.2% 23.9% 21.6% 16.9% 16.3% 16.7% 16.8% Normalized Net Income Attributable to BXG 5.8% 13.4% 9.2% 9.9% 8.4% 6.0% 5.8% 6.1% 6.8% Growth Data Total Revenue na 21.4% -0.8% 7.4% 9.2% 5.8% 5.5% 9.1% 8.0% Normalized EBITDA na 43.2% -5.4% 10.8% 1.9% -17.3% 2.0% 11.7% 8.5% Normalized Net Income Attributable to BXG na 180.0% -32.1% 16.1% 0.1% -24.2% 1.9% 15.0% 19.4% Other Analysis Sales of VOIs as % of Revenue 57.7% 46.1% 42.5% 44.0% 44.5% 43.3% 38.7% 39.0% 38.7% Continuing operations only and contains management normalizing adjustments for pre-2008 loan loss net provisions, please see income review for details. Sources of information: Bluegreen financial statements, projections and management. 7 |
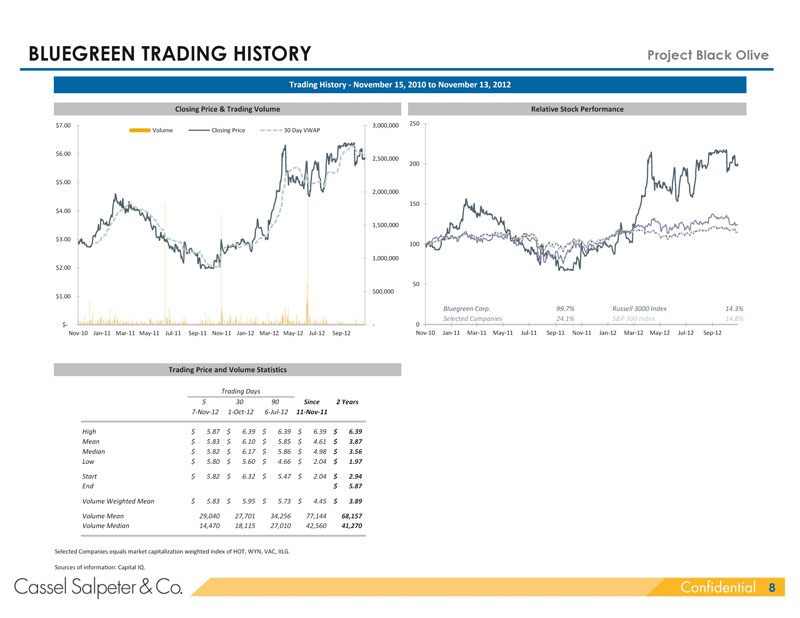 | BLUEGREEN TRADING HISTORY Project Black Olive Trading History - November 15, 2010 to November 13, 2012 Closing Price & Trading Volume Relative Stock Performance $7.00 3,000,000 250 Volume Closing Price 30 Day VWAP $6.00 2,500,000 200 $5.00 2,000,000 150 $4.00 1,500,000 $3.00 100 1,000,000 $2.00 50 500,000 $1.00 Bluegreen Corp. 99.7% Russell 3000 Index 14.3% Selected Companies 24.1% S&P 500 Index 14.8% $- - 0 Nov-10 Jan-11 Mar-11 May-11 Jul-11 Sep-11 Nov-11 Jan-12 Mar-12 May-12 Jul-12 Sep-12 Nov-10 Jan-11 Mar-11 May-11 Jul-11 Sep-11 Nov-11 Jan-12 Mar-12 May-12 Jul-12 Sep-12 Trading Price and Volume Statistics Trading Days 5 30 90 Since 2 Years 7-Nov-12 1-Oct-12 6-Jul-12 11-Nov-11 High $ 5.87 $ 6.39 $ 6.39 $ 6.39 $ 6.39 Mean $ 5.83 $ 6.10 $ 5.85 $ 4.61 $ 3.87 Median $ 5.82 $ 6.17 $ 5.86 $ 4.98 $ 3.56 Low $ 5.80 $ 5.60 $ 4.66 $ 2.04 $ 1.97 Start $ 5.82 $ 6.32 $ 5.47 $ 2.04 $ 2.94 End $ 5.87 Volume Weighted Mean $ 5.83 $ 5.95 $ 5.73 $ 4.45 $ 3.89 Volume Mean 29,040 27,701 34,256 77,144 68,157 Volume Median 14,470 18,115 27,010 42,560 41,270 Selected Companies equals market capitalization weighted index of HOT, WYN, VAC, IILG. Sources of information: Capital IQ. 8 |
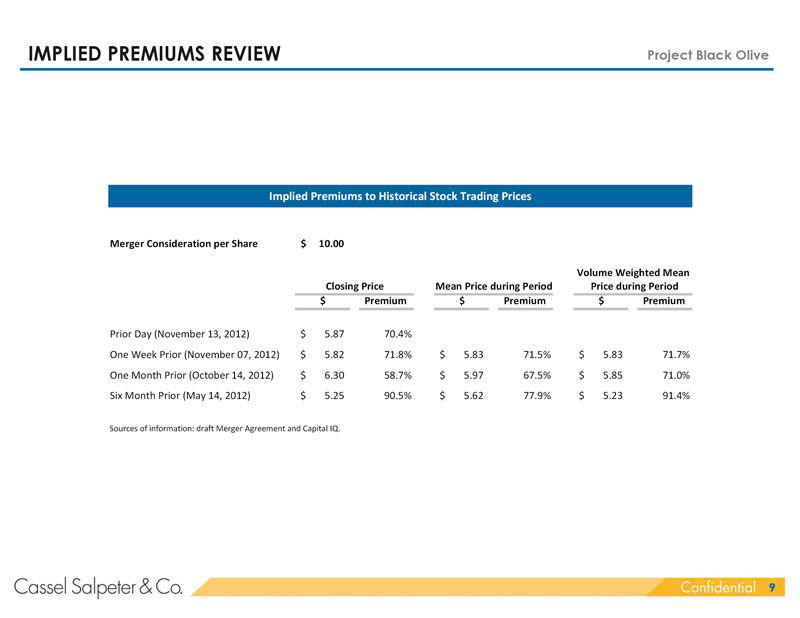 | IMPLIED PREMIUMS REVIEW Project Black Olive Implied Premiums to Historical Stock Trading Prices Merger Consideration per Share $ 10.00 Volume Weighted Mean Closing Price Mean Price during Period Price during Period $ Premium $ Premium $ Premium Prior Day (November 13, 2012) $ 5.87 70.4% One Week Prior (November 07, 2012) $ 5.82 71.8% $ 5.83 71.5% $ 5.83 71.7% One Month Prior (October 14, 2012) $ 6.30 58.7% $ 5.97 67.5% $ 5.85 71.0% Six Month Prior (May 14, 2012) $ 5.25 90.5% $ 5.62 77.9% $ 5.23 91.4% Sources of information: draft Merger Agreement and Capital IQ. 9 |
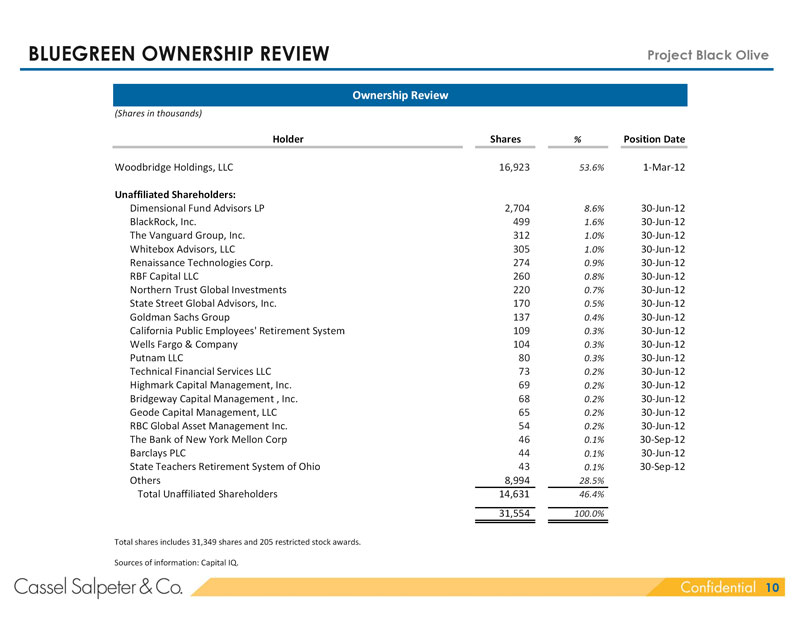 | BLUEGREEN OWNERSHIP REVIEW Project Black Olive Ownership Review (Shares in thousands) IQ_HOLDER_NAME IQ_HOLDER_SHARES IQ_HOLDER_P Holder Shares % Position Date Woodbridge Holdings, LLC 16,923 53.6% 1-Mar-12 Unaffiliated Shareholders: Dimensional Fund Advisors LP 2,704 8.6% 30-Jun-12 BlackRock, Inc. 499 1.6% 30-Jun-12 The Vanguard Group, Inc. 312 1.0% 30-Jun-12 Whitebox Advisors, LLC 305 1.0% 30-Jun-12 Renaissance Technologies Corp. 274 0.9% 30-Jun-12 RBF Capital LLC 260 0.8% 30-Jun-12 Northern Trust Global Investments 220 0.7% 30-Jun-12 State Street Global Advisors, Inc. 170 0.5% 30-Jun-12 Goldman Sachs Group 137 0.4% 30-Jun-12 California Public Employees’ Retirement System 109 0.3% 30-Jun-12 Wells Fargo & Company 104 0.3% 30-Jun-12 Putnam LLC 80 0.3% 30-Jun-12 Technical Financial Services LLC 73 0.2% 30-Jun-12 Highmark Capital Management, Inc. 69 0.2% 30-Jun-12 Bridgeway Capital Management , Inc. 68 0.2% 30-Jun-12 Geode Capital Management, LLC 65 0.2% 30-Jun-12 RBC Global Asset Management Inc. 54 0.2% 30-Jun-12 The Bank of New York Mellon Corp 46 0.1% 30-Sep-12 Barclays PLC 44 0.1% 30-Jun-12 State Teachers Retirement System of Ohio 43 0.1% 30-Sep-12 Others 8,994 28.5% Total Unaffiliated Shareholders 14,631 46.4% 31,554 100.0% Total shares includes 31,349 shares and 205 restricted stock awards. Sources of information: Capital IQ. 10 |
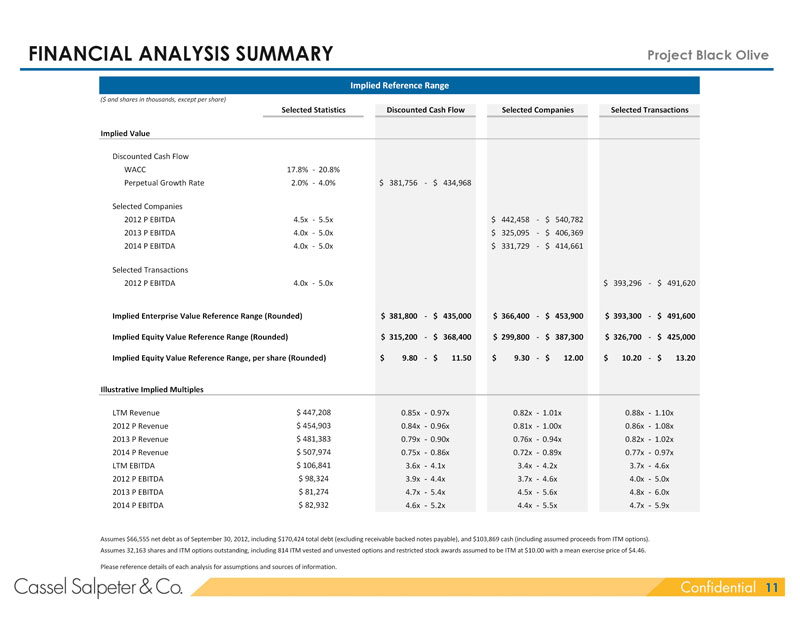 | FINANCIAL ANALYSIS SUMMARY Project Black Olive Implied Reference Range ($ and shares in thousands, except per share) Selected Statistics Discounted Cash Flow Selected Companies Selected Transactions Implied Value Discounted Cash Flow WACC 17.8% - 20.8% Perpetual Growth Rate 2.0% - 4.0% $ 381,756 - $ 434,968 Selected Companies 2012 P EBITDA 4.5x - 5.5x $ 442,458 - $ 540,782 2013 P EBITDA 4.0x - 5.0x $ 325,095 - $ 406,369 2014 P EBITDA 4.0x - 5.0x $ 331,729 - $ 414,661 Selected Transactions 2012 P EBITDA 4.0x - 5.0x $ 393,296 - $ 491,620 Implied Enterprise Value Reference Range (Rounded) $ 381,800 - $ 435,000 $ 366,400 - $ 453,900 $ 393,300 - $ 491,600 Implied Equity Value Reference Range (Rounded) $ 315,200 - $ 368,400 $ 299,800 - $ 387,300 $ 326,700 - $ 425,000 Implied Equity Value Reference Range, per share (Rounded) $ 9.80 - $ 11.50 $ 9.30 - $ 12.00 $ 10.20 - $ 13.20 Illustrative Implied Multiples LTM Revenue $ 447,208 0.85x - 0.97x 0.82x - 1.01x 0.88x - 1.10x 2012 P Revenue $ 454,903 0.84x - 0.96x 0.81x - 1.00x 0.86x - 1.08x 2013 P Revenue $ 481,383 0.79x - 0.90x 0.76x - 0.94x 0.82x - 1.02x 2014 P Revenue $ 507,974 0.75x - 0.86x 0.72x - 0.89x 0.77x - 0.97x LTM EBITDA $ 106,841 3.6x - 4.1x 3.4x - 4.2x 3.7x - 4.6x 2012 P EBITDA $ 98,324 3.9x - 4.4x 3.7x - 4.6x 4.0x - 5.0x 2013 P EBITDA $ 81,274 4.7x - 5.4x 4.5x - 5.6x 4.8x - 6.0x 2014 P EBITDA $ 82,932 4.6x - 5.2x 4.4x - 5.5x 4.7x - 5.9x Assumes $66,555 net debt as of September 30, 2012, including $170,424 total debt (excluding receivable backed notes payable), and $103,869 cash (including assumed proceeds from ITM options). Assumes 32,163 shares and ITM options outstanding, including 814 ITM vested and unvested options and restricted stock awards assumed to be ITM at $10.00 with a mean exercise price of $4.46. Please reference details of each analysis for assumptions and sources of information. 11 |
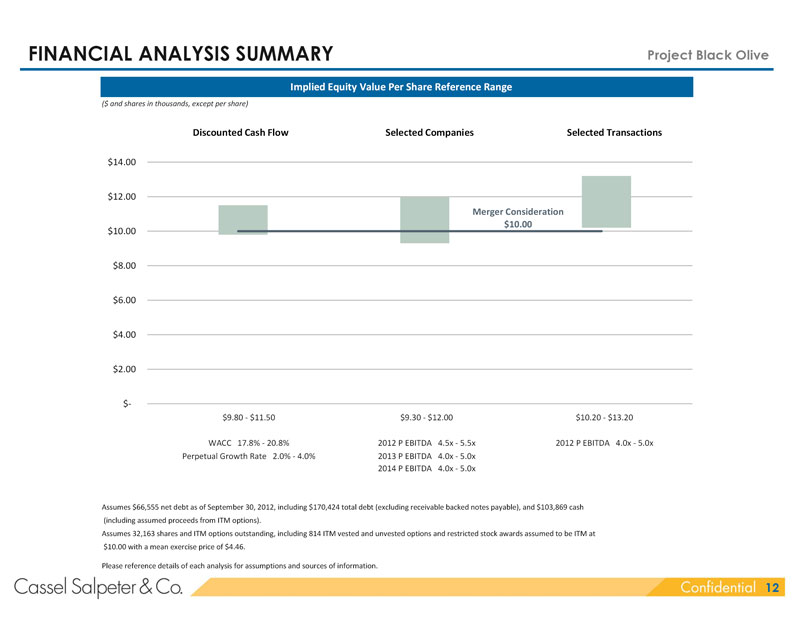 | FINANCIAL ANALYSIS SUMMARY Project Black Olive Implied Equity Value Per Share Reference Range ($ and shares in thousands, except per share) Discounted Cash Flow Selected Companies Selected Transactions $14.00 $12.00 Merger Consideration $10.00 $10.00 $8.00 $6.00 $4.00 $2.00 $-$9.80 - $11.50 $9.30 - $12.00 $10.20 - $13.20 WACC 17.8% - 20.8% 2012 P EBITDA 4.5x - 5.5x 2012 P EBITDA 4.0x - 5.0x Perpetual Growth Rate 2.0% - 4.0% 2013 P EBITDA 4.0x - 5.0x 2014 P EBITDA 4.0x - 5.0x Assumes $66,555 net debt as of September 30, 2012, including $170,424 total debt (excluding receivable backed notes payable), and $103,869 cash (including assumed proceeds from ITM options). Assumes 32,163 shares and ITM options outstanding, including 814 ITM vested and unvested options and restricted stock awards assumed to be ITM at $10.00 with a mean exercise price of $4.46. Please reference details of each analysis for assumptions and sources of information. 12 |
 | Project Black Olive I EXECUTIVE SUMMARY II ANALYSIS III APPENDIX 13 |
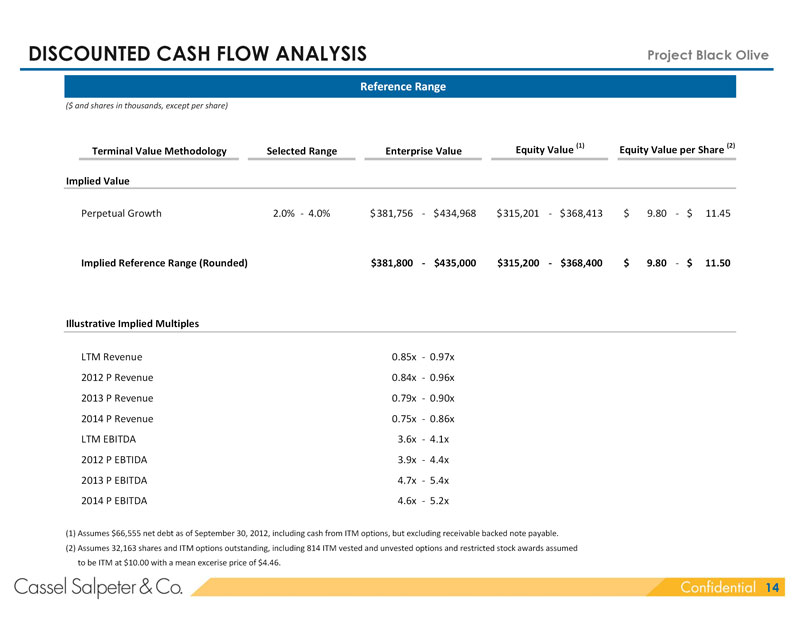 | DISCOUNTED CASH FLOW ANALYSIS Project Black Olive Reference Range ($ and shares in thousands, except per share) Equity Value (1) Equity Value per Share (2) Terminal Value Methodology Selected Range Enterprise Value Implied Value Perpetual Growth 2.0% - 4.0% $ 381,756 - $ 434,968 $ 315,201 - $ 368,413 $ 9.80 - $ 11.45 Implied Reference Range (Rounded) $381,800 - $435,000 $315,200 - $368,400 $ 9.80 - $ 11.50 Illustrative Implied Multiples LTM Revenue 0.85x - 0.97x 2012 P Revenue 0.84x - 0.96x 2013 P Revenue 0.79x - 0.90x 2014 P Revenue 0.75x - 0.86x LTM EBITDA 3.6x - 4.1x 2012 P EBTIDA 3.9x - 4.4x 2013 P EBITDA 4.7x - 5.4x 2014 P EBITDA 4.6x - 5.2x (1) Assumes $66,555 net debt as of September 30, 2012, including cash from ITM options, but excluding receivable backed note payable. (2) Assumes 32,163 shares and ITM options outstanding, including 814 ITM vested and unvested options and restricted stock awards assumed to be ITM at $10.00 with a mean excerise price of $4.46. 14 |
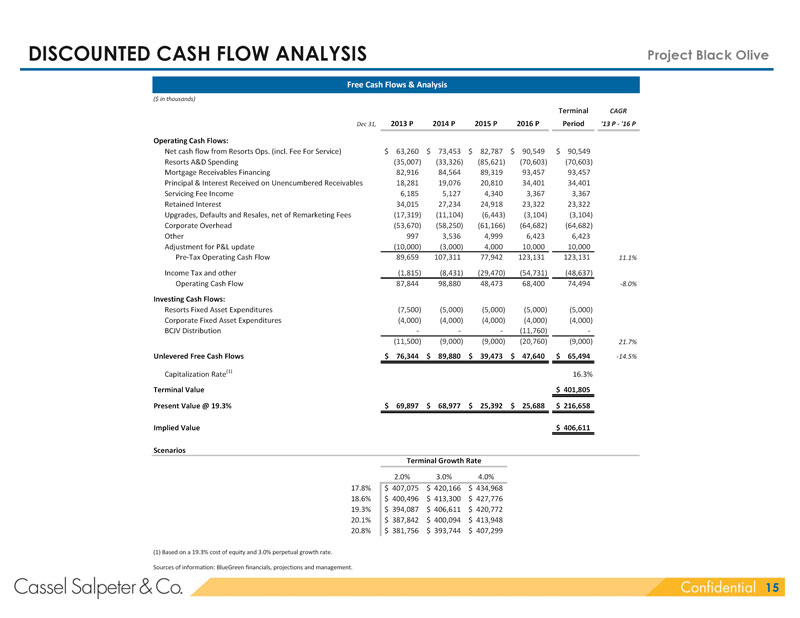 | DISCOUNTED CASH FLOW ANALYSIS Project Black Olive Free Cash Flows & Analysis ($ in thousands) Terminal CAGR Dec 31, 2013 P 2014 P 2015 P 2016 P Period ’13 P - ’16 P Operating Cash Flows: Net cash flow from Resorts Ops. (incl. Fee For Service) $ 63,260 $ 73,453 $ 82,787 $ 90,549 $ 90,549 Resorts A&D Spending (35,007) (33,326) (85,621) (70,603) (70,603) Mortgage Receivables Financing 82,916 84,564 89,319 93,457 93,457 Principal & Interest Received on Unencumbered Receivables 18,281 19,076 20,810 34,401 34,401 Servicing Fee Income 6,185 5,127 4,340 3,367 3,367 Retained Interest 34,015 27,234 24,918 23,322 23,322 Upgrades, Defaults and Resales, net of Remarketing Fees (17,319) (11,104) (6,443) (3,104) (3,104) Corporate Overhead (53,670) (58,250) (61,166) (64,682) (64,682) Other 997 3,536 4,999 6,423 6,423 Adjustment for P&L update (10,000) (3,000) 4,000 10,000 10,000 Pre-Tax Operating Cash Flow 89,659 107,311 77,942 123,131 123,131 11.1% Income Tax and other (1,815) (8,431) (29,470) (54,731) (48,637) Operating Cash Flow 87,844 98,880 48,473 68,400 74,494 -8.0% Investing Cash Flows: Resorts Fixed Asset Expenditures (7,500) (5,000) (5,000) (5,000) (5,000) Corporate Fixed Asset Expenditures (4,000) (4,000) (4,000) (4,000) (4,000) BCJV Distribution - - - (11,760) - (11,500) (9,000) (9,000) (20,760) (9,000) 21.7% Unlevered Free Cash Flows $ 76,344 $ 89,880 $ 39,473 $ 47,640 $ 65,494 -14.5% Capitalization Rate(1) 16.3% Terminal Value $ 401,805 Present Value @ 19.3% $ 69,897 $ 68,977 $ 25,392 $ 25,688 $ 216,658 Implied Value $ 406,611 Scenarios Terminal Growth Rate 2.0% 3.0% 4.0% 17.8% $ 407,075 $ 420,166 $ 434,968 18.6% $ 400,496 $ 413,300 $ 427,776 19.3% $ 394,087 $ 406,611 $ 420,772 20.1% $ 387,842 $ 400,094 $ 413,948 20.8% $ 381,756 $ 393,744 $ 407,299 (1) Based on a 19.3% cost of equity and 3.0% perpetual growth rate. Sources of information: BlueGreen financials, projections and management. 15 |
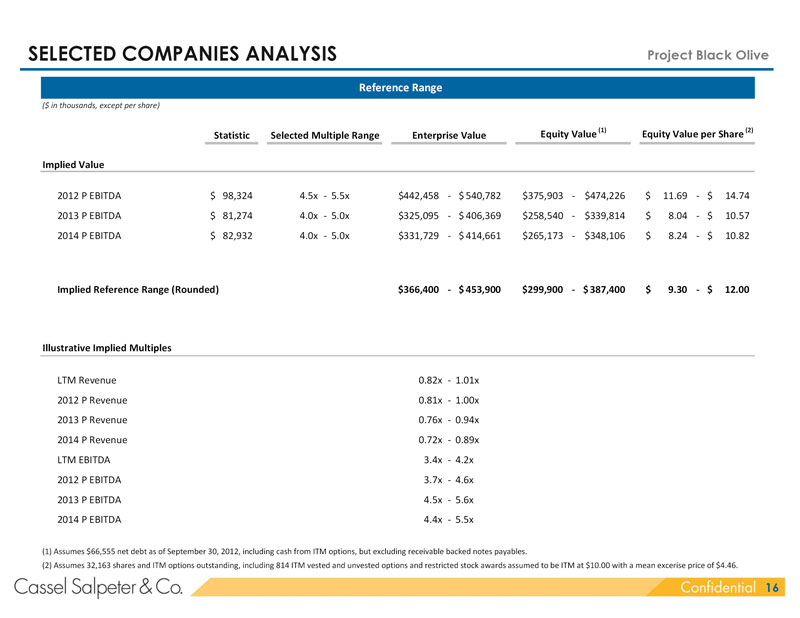 | SELECTED COMPANIES ANALYSIS Project Black Olive Reference Range ($ in thousands, except per share) Statistic Selected Multiple Range Enterprise Value Equity Value (1) Equity Value per Share (2) Implied Value 2012 P EBITDA $ 98,324 4.5x - 5.5x $ 442,458 - $ 540,782 $375,903 - $474,226 $ 11.69 - $ 14.74 2013 P EBITDA $ 81,274 4.0x - 5.0x $ 325,095 - $ 406,369 $258,540 - $339,814 $ 8.04 - $ 10.57 2014 P EBITDA $ 82,932 4.0x - 5.0x $ 331,729 - $ 414,661 $265,173 - $ 348,106 $ 8.24 - $ 10.82 Implied Reference Range (Rounded) $366,400 - $ 453,900 $299,900 - $ 387,400 $ 9.30 - $ 12.00 Illustrative Implied Multiples LTM Revenue 0.82x - 1.01x 2012 P Revenue 0.81x - 1.00x 2013 P Revenue 0.76x - 0.94x 2014 P Revenue 0.72x - 0.89x LTM EBITDA 3.4x - 4.2x 2012 P EBITDA 3.7x - 4.6x 2013 P EBITDA 4.5x - 5.6x 2014 P EBITDA 4.4x - 5.5x (1) Assumes $66,555 net debt as of September 30, 2012, including cash from ITM options, but excluding receivable backed notes payables. (2) Assumes 32,163 shares and ITM options outstanding, including 814 ITM vested and unvested options and restricted stock awards assumed to be ITM at $10.00 with a mean excerise price of $4.46. 16 |
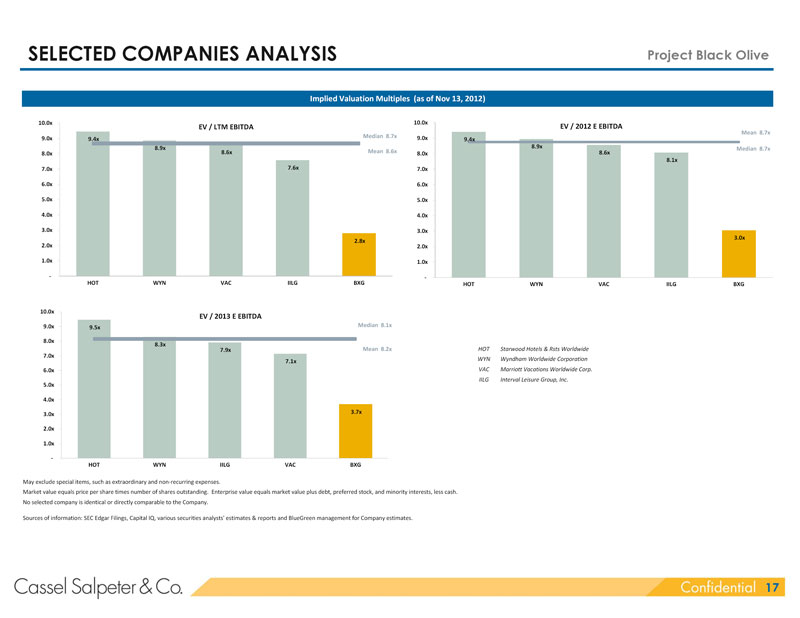 | SELECTED COMPANIES ANALYSIS Project Black Olive Implied Valuation Multiples (as of Nov 13, 2012) 10.0x 10.0x EV / LTM EBITDA EV / 2012 E EBITDA Mean 8.7x 9.0x Median 8.7x 9.0x 9.4x 9.4x 8.9x 8.9x Median 8.7x 8.6x Mean 8.6x 8.0x 8.6x 8.0x 8.1x 7.0x 7.6x 7.0x 6.0x 6.0x 5.0x 5.0x 4.0x 4.0x 3.0x 3.0x 3.0x 2.8x 2.0x 2.0x 1.0x 1.0x - - HOT WYN VAC IILG BXG HOT WYN VAC IILG BXG 10.0x EV / 2013 E EBITDA 9.0x 9.5x Median 8.1x 8.0x 8.3x 7.9x Mean 8.2x HOT Starwood Hotels & Rsts Worldwide 7.0x 7.1x WYN Wyndham Worldwide Corporation 6.0x VAC Marriott Vacations Worldwide Corp. IILG Interval Leisure Group, Inc. 5.0x 4.0x 3.7x 3.0x 2.0x 1.0x - HOT WYN IILG VAC BXG May exclude special items, such as extraordinary and non-recurring expenses. Market value equals price per share times number of shares outstanding. Enterprise value equals market value plus debt, preferred stock, and minority interests, less cash. No selected company is identical or directly comparable to the Company. Sources of information: SEC Edgar Filings, Capital IQ, various securities analysts’ estimates & reports and BlueGreen management for Company estimates. 17 |
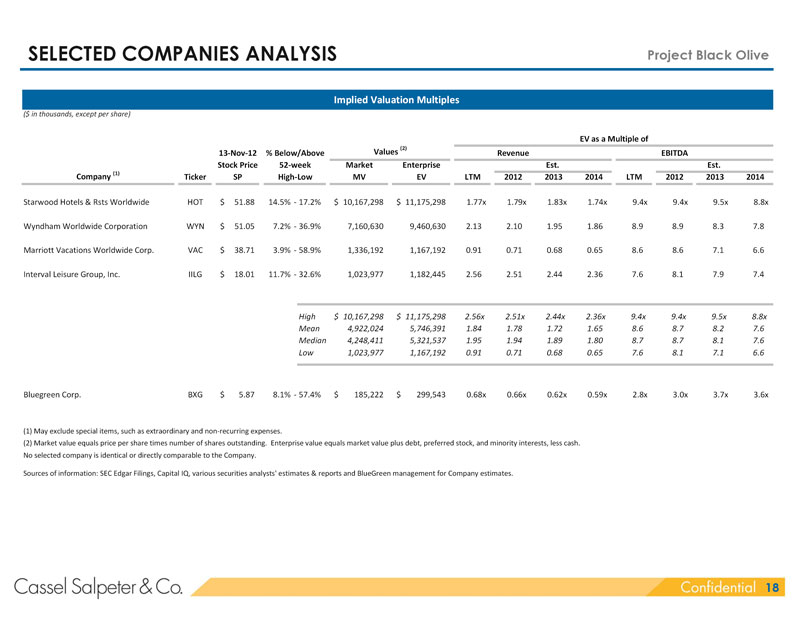 | SELECTED COMPANIES ANALYSIS Project Black Olive Implied Valuation Multiples ($ in thousands, except per share) EV as a Multiple of (2) 13 -Nov-12 % Below/Above Values Revenue EBITDA Stock Price 52-week Market Enterprise Est. Est. (1) Company Ticker SP High-Low MV EV LTM 2012 2013 2014 LTM 2012 2013 2014 Starwood Hotels & Rsts Worldwide HOT $ 51.88 14.5% - 17.2% $ 10,167,298 $ 11,175,298 1.77x 1.79x 1.83x 1.74x 9.4x 9.4x 9.5x 8.8x Wyndham Worldwide Corporation WYN $ 51.05 7.2% - 36.9% 7,160,630 9,460,630 2.13 2.10 1.95 1.86 8.9 8.9 8.3 7.8 Marriott Vacations Worldwide Corp. VAC $ 38.71 3.9% - 58.9% 1,336,192 1,167,192 0.91 0.71 0.68 0.65 8.6 8.6 7.1 6.6 Interval Leisure Group, Inc. IILG $ 18.01 11.7% - 32.6% 1,023,977 1,182,445 2.56 2.51 2.44 2.36 7.6 8.1 7.9 7.4 High $ 10,167,298 $ 11,175,298 2.56x 2.51x 2.44x 2.36x 9.4x 9.4x 9.5x 8.8x Mean 4,922,024 5,746,391 1.84 1.78 1.72 1.65 8.6 8.7 8.2 7.6 Median 4,248,411 5,321,537 1.95 1.94 1.89 1.80 8.7 8.7 8.1 7.6 Low 1,023,977 1,167,192 0.91 0.71 0.68 0.65 7.6 8.1 7.1 6.6 Bluegreen Corp. BXG $ 5.87 8.1% - 57.4% $ 185,222 $ 299,543 0.68x 0.66x 0.62x 0.59x 2.8x 3.0x 3.7x 3.6x (1) May exclude special items, such as extraordinary and non-recurring expenses. (2) Market value equals price per share times number of shares outstanding. Enterprise value equals market value plus debt, preferred stock, and minority interests, less cash. No selected company is identical or directly comparable to the Company. Sources of information: SEC Edgar Filings, Capital IQ, various securities analysts’ estimates & reports and BlueGreen management for Company estimates. 18 |
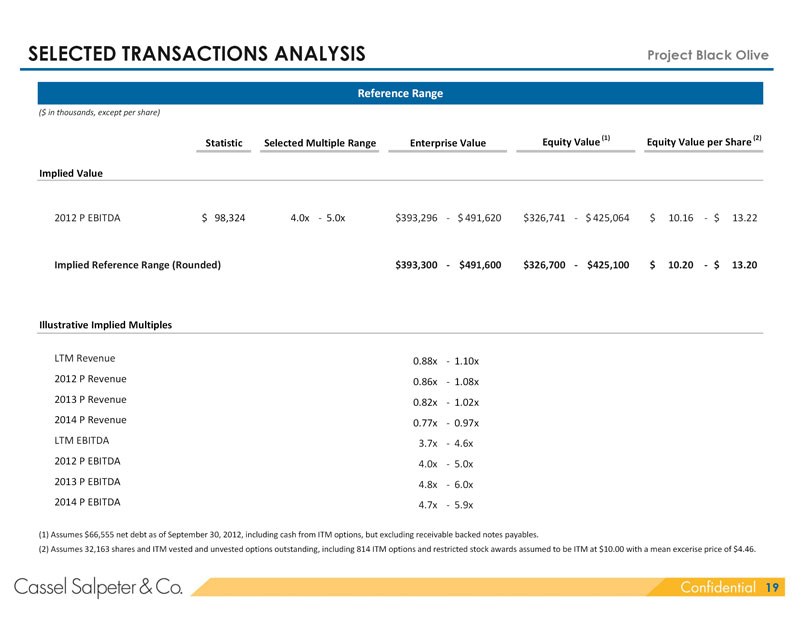 | SELECTED TRANSACTIONS ANALYSIS Project Black Olive Reference Range ($ in thousands, except per share) Equity Value (1) Equity Value per Share (2) Statistic Selected Multiple Range Enterprise Value Implied Value 2012 P EBITDA $ 98,324 4.0x - 5.0x $393,296 - $ 491,620 $326,741 - $ 425,064 $ 10.16 - $ 13.22 Implied Reference Range (Rounded) $393,300 - $491,600 $326,700 - $425,100 $ 10.20 - $ 13.20 Illustrative Implied Multiples LTM Revenue 0.88x - 1.10x 2012 P Revenue 0.86x - 1.08x 2013 P Revenue 0.82x - 1.02x 2014 P Revenue 0.77x - 0.97x LTM EBITDA 3.7x - 4.6x 2012 P EBITDA 4.0x - 5.0x 2013 P EBITDA 4.8x - 6.0x 2014 P EBITDA 4.7x - 5.9x (1) Assumes $66,555 net debt as of September 30, 2012, including cash from ITM options, but excluding receivable backed notes payables. (2) Assumes 32,163 shares and ITM vested and unvested options outstanding, including 814 ITM options and restricted stock awards assumed to be ITM at $10.00 with a mean excerise price of $4.46. 19 |
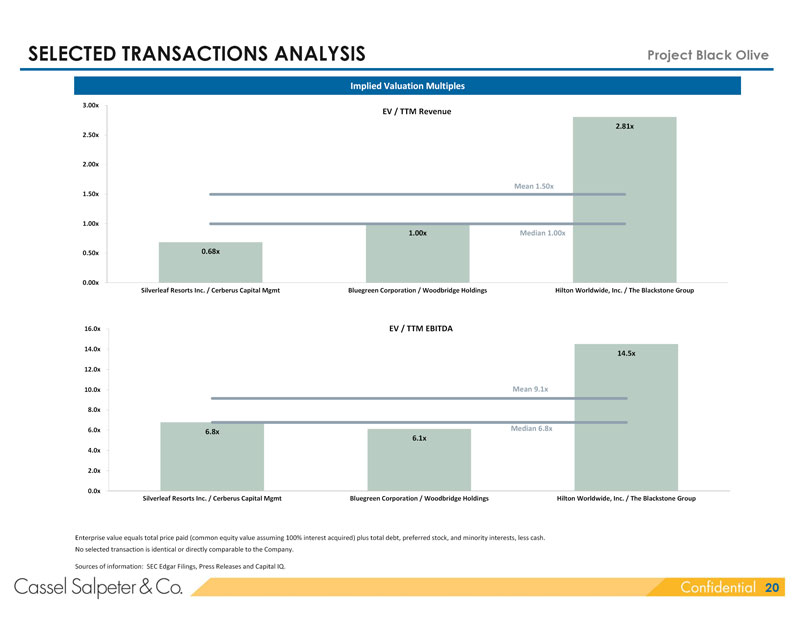 | SELECTED TRANSACTIONS ANALYSIS Project Black Olive Implied Valuation Multiples 3.00x EV / TTM Revenue 2.81x 2.50x 2.00x Mean 1.50x 1.50x 1.00x 1.00x Median 1.00x 0.50x 0.68x 0.00x Silverleaf Resorts Inc. / Cerberus Capital Mgmt Bluegreen Corporation / Woodbridge Holdings Hilton Worldwide, Inc. / The Blackstone Group 16.0x EV / TTM EBITDA 14.0x 14.5x 12.0x 10.0x Mean 9.1x 8.0x 6.0x Median 6.8x 6.8x 6.1x 4.0x 2.0x 0.0x Silverleaf Resorts Inc. / Cerberus Capital Mgmt Bluegreen Corporation / Woodbridge Holdings Hilton Worldwide, Inc. / The Blackstone Group Enterprise value equals total price paid (common equity value assuming 100% interest acquired) plus total debt, preferred stock, and minority interests, less cash. No selected transaction is identical or directly comparable to the Company. Sources of information: SEC Edgar Filings, Press Releases and Capital IQ. 20 |
 | SELECTED TRANSACTIONS ANALYSIS Project Black Olive Transactions Overview ($ in millions) TTM Total Enterprise EV Multiple of Date Target / EBITDA Price Paid Value Ancd/Closed Acquiror Target Description Notes Revenue EBITDA Margin TPP (1) EV (2) Revenue EBITDA 3-Feb-11 Silverleaf Resorts Inc. Silverleaf engages in selling Debt adjusted to exclude $ 226.01 $ 22.85 10.1% $ 95.34 $ 154.73 0.68x 6.8x vacation intervals in the US. receivable backed debt (RBD) of 16 -May-11 Cerberus Capital Mgmt The company develops and $340.9m. EBITDA is adjusted to acquires timeshare resorts. include interest exp on RBD. 16 -Nov-09 Bluegreen Corporation Bluegreen sells and manages Acquired 22.75% from Central 365.96 59.45 16.2% 101.41 364.51 1.00 6.1 (NYSE: BXG) vacation ownership interests Florida Investments for $23m. 16 -Nov-09 Woodbridge Holdings (VOIs) in resorts in the US and Numbers represent FY09 Aruba. numbers and include BG Communities. 3-Jul-07 Hilton Worldwide, Inc. Hilton Worldwide operates Timeshare segment of 2006 8,665.00 1,676.00 19.3% 18,970.00 24,317.00 2.81 14.5 3750 hotels and timeshare Revenue was $650 out of $8,162, 24 -Oct-07 The Blackstone Group properties or roughly 8%. Details on RBD was unavailable. High $ 8,665.00 $ 1,676.00 19.3% $ 18,970.00 $ 24,317.00 2.81x 14.5x Mean 3,085.66 586.10 15.2% 6,388.92 8,278.75 1.50 9.1 Median 365.96 59.45 16.2% 101.41 364.51 1.00 6.8 Low 226.01 22.85 10.1% 95.34 154.73 0.68 6.1 (1) Total price paid equals common equity value assuming 100% interest acquired. (2) Enterprise value equals total price paid plus total debt, preferred stock, and minority interests, less cash. (3) No selected transaction is identical or directly comparable to the Company. Sources of information: SEC Edgar Filings, Press Releases and Capital IQ. 21 |
 | Project Black Olive I EXECUTIVE SUMMARY II ANALYSIS III APPENDIX 22 |
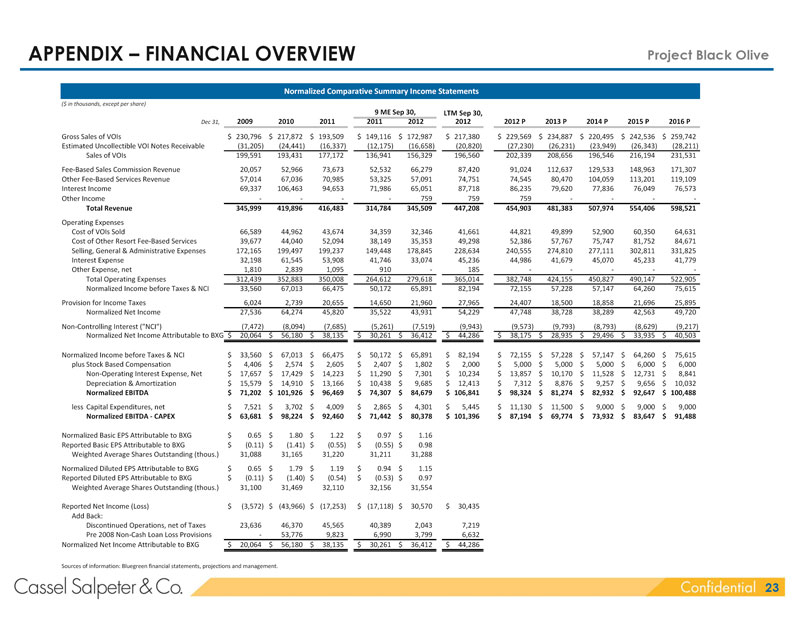 | APPENDIX – FINANCIAL OVERVIEW Project Black Olive Normalized Comparative Summary Income Statements ($ in thousands, except per share) 9 ME Sep 30, LTM Sep 30, Dec 31, 2009 2010 2011 2011 2012 2012 2012 P 2013 P 2014 P 2015 P 2016 P Gross Sales of VOIs $ 230,796 $ 217,872 $ 193,509 $ 149,116 $ 172,987 $ 217,380 $ 229,569 $ 234,887 $ 220,495 $ 242,536 $ 259,742 Estimated Uncollectible VOI Notes Receivable (31,205) (24,441) (16,337) (12,175) (16,658) (20,820) (27,230) (26,231) (23,949) (26,343) (28,211) Sales of VOIs 199,591 193,431 177,172 136,941 156,329 196,560 202,339 208,656 196,546 216,194 231,531 Fee-Based Sales Commission Revenue 20,057 52,966 73,673 52,532 66,279 87,420 91,024 112,637 129,533 148,963 171,307 Other Fee-Based Services Revenue 57,014 67,036 70,985 53,325 57,091 74,751 74,545 80,470 104,059 113,201 119,109 Interest Income 69,337 106,463 94,653 71,986 65,051 87,718 86,235 79,620 77,836 76,049 76,573 Other Income - - - - 759 759 759 - - - - Total Revenue 345,999 419,896 416,483 314,784 345,509 447,208 454,903 481,383 507,974 554,406 598,521 Operating Expenses Cost of VOIs Sold 66,589 44,962 43,674 34,359 32,346 41,661 44,821 49,899 52,900 60,350 64,631 Cost of Other Resort Fee-Based Services 39,677 44,040 52,094 38,149 35,353 49,298 52,386 57,767 75,747 81,752 84,671 Selling, General & Administrative Expenses 172,165 199,497 199,237 149,448 178,845 228,634 240,555 274,810 277,111 302,811 331,825 Interest Expense 32,198 61,545 53,908 41,746 33,074 45,236 44,986 41,679 45,070 45,233 41,779 Other Expense, net 1,810 2,839 1,095 910 - 185 - - - - - Total Operating Expenses 312,439 352,883 350,008 264,612 279,618 365,014 382,748 424,155 450,827 490,147 522,905 Normalized Income before Taxes & NCI 33,560 67,013 66,475 50,172 65,891 82,194 72,155 57,228 57,147 64,260 75,615 Provision for Income Taxes 6,024 2,739 20,655 14,650 21,960 27,965 24,407 18,500 18,858 21,696 25,895 Normalized Net Income 27,536 64,274 45,820 35,522 43,931 54,229 47,748 38,728 38,289 42,563 49,720 Non-Controlling Interest (“NCI”) (7,472) (8,094) (7,685) (5,261) (7,519) (9,943) (9,573) (9,793) (8,793) (8,629) (9,217) Normalized Net Income Attributable to BXG $ 20,064 $ 56,180 $ 38,135 $ 30,261 $ 36,412 $ 44,286 $ 38,175 $ 28,935 $ 29,496 $ 33,935 $ 40,503 Normalized Income before Taxes & NCI $ 33,560 $ 67,013 $ 66,475 $ 50,172 $ 65,891 $ 82,194 $ 72,155 $ 57,228 $ 57,147 $ 64,260 $ 75,615 plus Stock Based Compensation $ 4,406 $ 2,574 $ 2,605 $ 2,407 $ 1,802 $ 2,000 $ 5,000 $ 5,000 $ 5,000 $ 6,000 $ 6,000 Non-Operating Interest Expense, Net $ 17,657 $ 17,429 $ 14,223 $ 11,290 $ 7,301 $ 10,234 $ 13,857 $ 10,170 $ 11,528 $ 12,731 $ 8,841 Depreciation & Amortization $ 15,579 $ 14,910 $ 13,166 $ 10,438 $ 9,685 $ 12,413 $ 7,312 $ 8,876 $ 9,257 $ 9,656 $ 10,032 Normalized EBITDA $ 71,202 $ 101,926 $ 96,469 $ 74,307 $ 84,679 $ 106,841 $ 98,324 $ 81,274 $ 82,932 $ 92,647 $ 100,488 less Capital Expenditures, net $ 7,521 $ 3,702 $ 4,009 $ 2,865 $ 4,301 $ 5,445 $ 11,130 $ 11,500 $ 9,000 $ 9,000 $ 9,000 Normalized EBITDA - CAPEX $ 63,681 $ 98,224 $ 92,460 $ 71,442 $ 80,378 $ 101,396 $ 87,194 $ 69,774 $ 73,932 $ 83,647 $ 91,488 Normalized Basic EPS Attributable to BXG $ 0.65 $ 1.80 $ 1.22 $ 0.97 $ 1.16 Reported Basic EPS Attributable to BXG $ (0.11) $ (1.41) $ (0.55) $ (0.55) $ 0.98 Weighted Average Shares Outstanding (thous.) 31,088 31,165 31,220 31,211 31,288 Normalized Diluted EPS Attributable to BXG $ 0.65 $ 1.79 $ 1.19 $ 0.94 $ 1.15 Reported Diluted EPS Attributable to BXG $ (0.11) $ (1.40) $ (0.54) $ (0.53) $ 0.97 Weighted Average Shares Outstanding (thous.) 31,100 31,469 32,110 32,156 31,554 Reported Net Income (Loss) $ (3,572) $ (43,966) $ (17,253) $ (17,118) $ 30,570 $ 30,435 Add Back: Discontinued Operations, net of Taxes 23,636 46,370 45,565 40,389 2,043 7,219 Pre 2008 Non-Cash Loan Loss Provisions - 53,776 9,823 6,990 3,799 6,632 Normalized Net Income Attributable to BXG $ 20,064 $ 56,180 $ 38,135 $ 30,261 $ 36,412 $ 44,286 Sources of information: Bluegreen financial statements, projections and management. 23 |
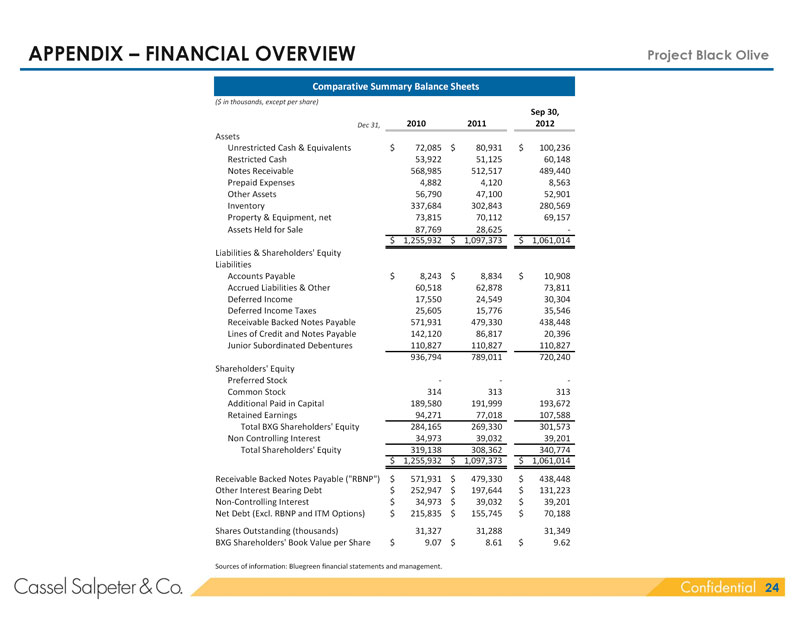 | APPENDIX – FINANCIAL OVERVIEW Project Black Olive Comparative Summary Balance Sheets ($ in thousands, except per share) Sep 30, Dec 31, 2010 2011 2012 Assets Unrestricted Cash & Equivalents $ 72,085 $ 80,931 $ 100,236 Restricted Cash 53,922 51,125 60,148 Notes Receivable 568,985 512,517 489,440 Prepaid Expenses 4,882 4,120 8,563 Other Assets 56,790 47,100 52,901 Inventory 337,684 302,843 280,569 Property & Equipment, net 73,815 70,112 69,157 Assets Held for Sale 87,769 28,625 - $ 1,255,932 $ 1,097,373 $ 1,061,014 Liabilities & Shareholders’ Equity Liabilities Accounts Payable $ 8,243 $ 8,834 $ 10,908 Accrued Liabilities & Other 60,518 62,878 73,811 Deferred Income 17,550 24,549 30,304 Deferred Income Taxes 25,605 15,776 35,546 Receivable Backed Notes Payable 571,931 479,330 438,448 Lines of Credit and Notes Payable 142,120 86,817 20,396 Junior Subordinated Debentures 110,827 110,827 110,827 936,794 789,011 720,240 Shareholders’ Equity Preferred Stock - - -Common Stock 314 313 313 Additional Paid in Capital 189,580 191,999 193,672 Retained Earnings 94,271 77,018 107,588 Total BXG Shareholders’ Equity 284,165 269,330 301,573 Non Controlling Interest 34,973 39,032 39,201 Total Shareholders’ Equity 319,138 308,362 340,774 $ 1,255,932 $ 1,097,373 $ 1,061,014 Receivable Backed Notes Payable (“RBNP”) $ 571,931 $ 479,330 $ 438,448 Other Interest Bearing Debt $ 252,947 $ 197,644 $ 131,223 Non-Controlling Interest $ 34,973 $ 39,032 $ 39,201 Net Debt (Excl. RBNP and ITM Options) $ 215,835 $ 155,745 $ 70,188 Shares Outstanding (thousands) 31,327 31,288 31,349 BXG Shareholders’ Book Value per Share $ 9.07 $ 8.61 $ 9.62 Sources of information: Bluegreen financial statements and management. 24 |
 | APPENDIX – FINANCIAL OVERVIEW Project Black Olive Net Debt and Shares Review as of September 30, 2012 ($ and securities in thousands) Net Debt (1) Lines of Credit and Notes Payable $ 20,396 Junior Subordinated Debentures 110,827 Total Corporate Debt $ 131,223 Plus: Non-Controlling Interests 39,201 170,424 Less: Cash & Equivalents 100,236 Cash from ITM Options (2) 3,633 103,869 Net Debt $ 66,555 Fully Diluted Shares Outstanding Shares Outstanding 31,349 ITM Options & Restricted Stock Awards (2) 814 Shares Outstanding including ITM Options & Restricted Stock Awards 32,163 (1) Excludes Receivable Backed Notes Payable. (2) Includes 814 vested & unvested options & restricted stock awards assumed to be ITM at $10.00 with mean exercise price of $4.46. Sources of information: Bluegreen financial statements and management. 25 |
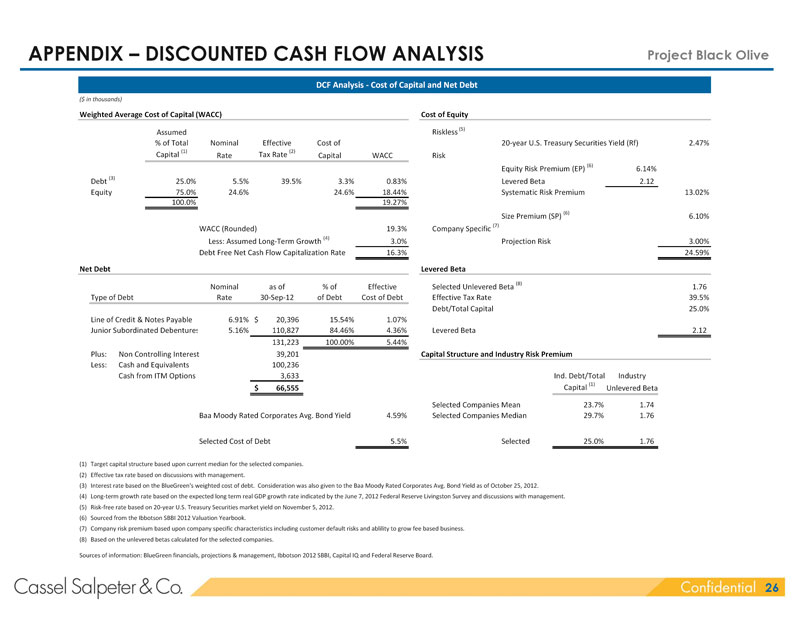 | APPENDIX – DISCOUNTED CASH FLOW ANALYSIS Project Black Olive DCF Analysis - Cost of Capital and Net Debt ($ in thousands) Weighted Average Cost of Capital (WACC) Cost of Equity Riskless (5) Assumed % of Total Nominal Effective Cost of 20-year U.S. Treasury Securities Yield (Rf) 2.47% Capital (1) Tax Rate (2) Rate Capital WACC Risk Equity Risk Premium (EP) (6) 6.14% Debt (3) 25.0% 5.5% 39.5% 3.3% 0.83% Levered Beta 2.12 Equity 75.0% 24.6% 24.6% 18.44% Systematic Risk Premium 13.02% 100.0% 19.27% Size Premium (SP) (6) 6.10% Company Specific (7) WACC (Rounded) 19.3% Less: Assumed Long-Term Growth (4) 3.0% Projection Risk 3.00% Debt Free Net Cash Flow Capitalization Rate 16.3% 24.59% Net Debt Levered Beta Selected Unlevered Beta (8) Nominal as of % of Effective 1.76 Type of Debt Rate 30-Sep-12 of Debt Cost of Debt Effective Tax Rate 39.5% Debt/Total Capital 25.0% Line of Credit & Notes Payable 6.91% $ 20,396 15.54% 1.07% Junior Subordinated Debenture 5.16% 110,827 84.46% 4.36% Levered Beta 2.12 131,223 100.00% 5.44% Plus: Non Controlling Interest 39,201 Capital Structure and Industry Risk Premium Less: Cash and Equivalents 100,236 Cash from ITM Options 3,633 Ind. Debt/Total Industry Capital (1) $ 66,555 Unlevered Beta Selected Companies Mean 23.7% 1.74 Baa Moody Rated Corporates Avg. Bond Yield 4.59% Selected Companies Median 29.7% 1.76 Selected Cost of Debt 5.5% Selected 25.0% 1.76 (1) Target capital structure based upon current median for the selected companies. (2) Effective tax rate based on discussions with management. (3) Interest rate based on the BlueGreen’s weighted cost of debt. Consideration was also given to the Baa Moody Rated Corporates Avg. Bond Yield as of October 25, 2012. (4) Long-term growth rate based on the expected long term real GDP growth rate indicated by the June 7, 2012 Federal Reserve Livingston Survey and discussions with management. (5) Risk-free rate based on 20-year U.S. Treasury Securities market yield on November 5, 2012. (6) Sourced from the Ibbotson SBBI 2012 Valuation Yearbook. (7) Company risk premium based upon company specific characteristics including customer default risks and ablility to grow fee based business. (8) Based on the unlevered betas calculated for the selected companies. Sources of information: BlueGreen financials, projections & management, Ibbotson 2012 SBBI, Capital IQ and Federal Reserve Board. 26 |
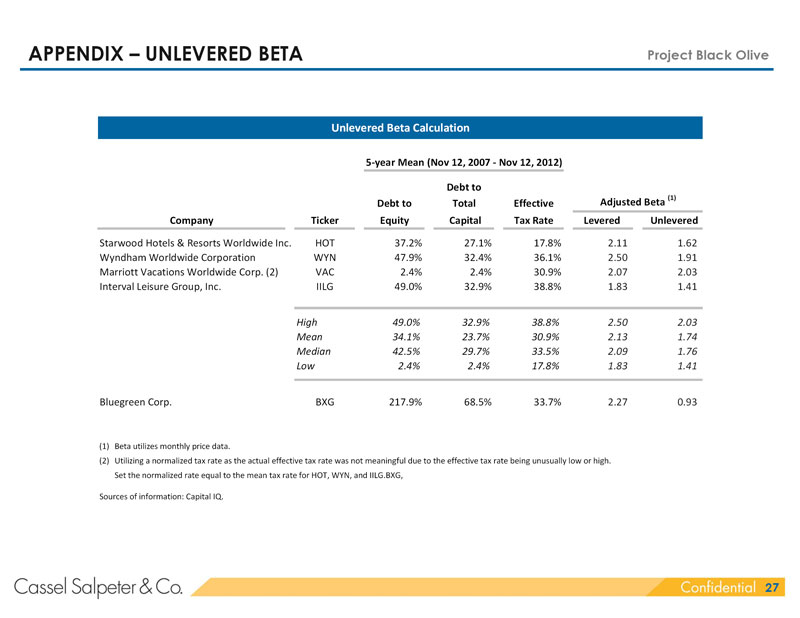 | APPENDIX – UNLEVERED BETA Project Black Olive Unlevered Beta Calculation 5-year Mean (Nov 12, 2007 - Nov 12, 2012) Debt to Adjusted Beta (1) Debt to Total Effective Company Ticker Equity Capital Tax Rate Levered Unlevered Starwood Hotels & Resorts Worldwide Inc. HOT 37.2% 27.1% 17.8% 2.11 1.62 Wyndham Worldwide Corporation WYN 47.9% 32.4% 36.1% 2.50 1.91 Marriott Vacations Worldwide Corp. (2) VAC 2.4% 2.4% 30.9% 2.07 2.03 Interval Leisure Group, Inc. IILG 49.0% 32.9% 38.8% 1.83 1.41 High 49.0% 32.9% 38.8% 2.50 2.03 Mean 34.1% 23.7% 30.9% 2.13 1.74 Median 42.5% 29.7% 33.5% 2.09 1.76 Low 2.4% 2.4% 17.8% 1.83 1.41 Bluegreen Corp. BXG 217.9% 68.5% 33.7% 2.27 0.93 (1) Beta utilizes monthly price data. (2) Utilizing a normalized tax rate as the actual effective tax rate was not meaningful due to the effective tax rate being unusually low or high. Set the normalized rate equal to the mean tax rate for HOT, WYN, and IILG.BXG, Sources of information: Capital IQ. 27 |
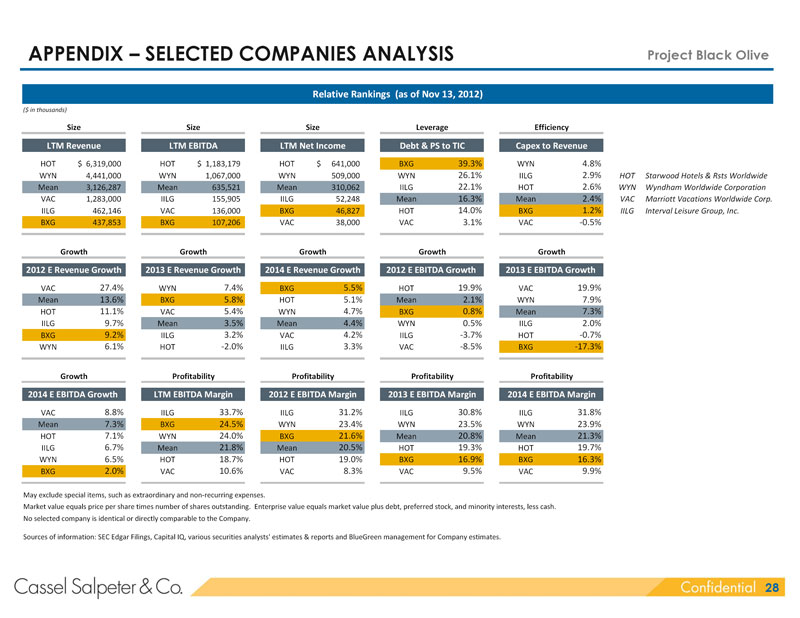 | APPENDIX – SELECTED COMPANIES ANALYSIS Project Black Olive Relative Rankings (as of Nov 13, 2012) ($ in thousands) Size Size Size Leverage Efficiency 1 2 4 56 53 LTM Revenue LTM EBITDA LTM Net Income Debt & PS to TIC Capex to Revenue HOT $ 6,319,000 HOT $ 1,183,179 HOT $ 641,000 BXG 39.3% WYN 4.8% BXG Bluegreen Corp. WYN 4,441,000 WYN 1,067,000 WYN 509,000 WYN 26.1% IILG 2.9% HOT Starwood Hotels & Rsts Worldwide Mean 3,126,287 Mean 635,521 Mean 310,062 IILG 22.1% HOT 2.6% WYN Wyndham Worldwide Corporation VAC 1,283,000 IILG 155,905 IILG 52,248 Mean 16.3% Mean 2.4% VAC Marriott Vacations Worldwide Corp. IILG 462,146 VAC 136,000 BXG 46,827 HOT 14.0% BXG 1.2% IILG Interval Leisure Group, Inc. BXG 437,853 BXG 107,206 VAC 38,000 VAC 3.1% VAC -0.5% Growth Growth Growth Growth Growth 35 36 37 40 41 2012 E Revenue Growth 2013 E Revenue Growth 2014 E Revenue Growth 2012 E EBITDA Growth 2013 E EBITDA Growth VAC 27.4% WYN 7.4% BXG 5.5% HOT 19.9% VAC 19.9% Mean 13.6% BXG 5.8% HOT 5.1% Mean 2.1% WYN 7.9% HOT 11.1% VAC 5.4% WYN 4.7% BXG 0.8% Mean 7.3% IILG 9.7% Mean 3.5% Mean 4.4% WYN 0.5% IILG 2.0% BXG 9.2% IILG 3.2% VAC 4.2% IILG -3.7% HOT -0.7% WYN 6.1% HOT -2.0% IILG 3.3% VAC -8.5% BXG -17.3% Growth Profitability Profitability Profitability Profitability 42 25 26 27 28 2014 E EBITDA Growth LTM EBITDA Margin 2012 E EBITDA Margin 2013 E EBITDA Margin 2014 E EBITDA Margin VAC 8.8% IILG 33.7% IILG 31.2% IILG 30.8% IILG 31.8% Mean 7.3% BXG 24.5% WYN 23.4% WYN 23.5% WYN 23.9% HOT 7.1% WYN 24.0% BXG 21.6% Mean 20.8% Mean 21.3% IILG 6.7% Mean 21.8% Mean 20.5% HOT 19.3% HOT 19.7% WYN 6.5% HOT 18.7% HOT 19.0% BXG 16.9% BXG 16.3% BXG 2.0% VAC 10.6% VAC 8.3% VAC 9.5% VAC 9.9% May exclude special items, such as extraordinary and non-recurring expenses. Market value equals price per share times number of shares outstanding. Enterprise value equals market value plus debt, preferred stock, and minority interests, less cash. No selected company is identical or directly comparable to the Company. Sources of information: SEC Edgar Filings, Capital IQ, various securities analysts’ estimates & reports and BlueGreen management for Company estimates. 28 |