U.S. SECURITIES AND EXCHANGE COMMISSION
Washington, D.C. 20549
Form 10-K
[X] | Annual Report Pursuant to Section 13 or 15(d) of the Securities Exchange Act of 1934 for the fiscal year ended December 31, 2013. |
[ ] | Transition Report Pursuant to Section 13 or 15(d) of the Securities Exchange Act of 1934 [No FeeRequired] for the transition period from to . |
Commission File Number: 000-14209
FIRSTBANK CORPORATION
(Exact name of registrant as specified in its charter)
Michigan | 38-2633910 |
(State of Incorporation) | (I.R.S. Employer Identification No.) |
| |
| 311 Woodworth Avenue | |
| Alma, Michigan | 48801 |
| (Address of principal executive offices) | (Zip Code) |
Registrant’s telephone number, including area code: (989) 463-3131
Securities registered pursuant to Section 12(b) of the Exchange Act:
Title of Class | Name of each exchange on which registered |
Common Stock | The Nasdaq Stock Market LLC |
Securities registered pursuant to Section 12(g) of the Exchange Act: none
Indicate by check mark if the registrant is a well-known seasoned issuer, as defined in Rule 405 of the Securities Act. Yes No _X_
Indicate by check mark if the registrant is not required to file reports pursuant to Section 13 or Section 15(d) of the Exchange Act.
Yes [ ] No [X]
Indicate by check mark whether the registrant (1) has filed all reports to be filed by Section 13 or 15(d) of the Exchange Act of 1934 during the preceding 12 months (or for such shorter period that the registrant was required to file such reports) and (2) has been subject to such filing requirements for the past 90 days. Yes X No
Indicate by check mark whether the registrant has submitted electronically and posted on its corporate Web site, if any, every Interactive Data File required to be submitted and posted pursuant to Rule 405 of Regulation S-T (§ 232.405 of this chapter) during the preceding 12 months (or for such shorter period that the registrant was required to submit and post such files). Yes [ X ] No [ ]
Indicate by check mark if disclosure of delinquent filers pursuant to Item 405 of Regulation S-K (§ 229.405 of this chapter)is not contained herein and will not be contained, to the best of registrant’s knowledge, in definitive proxy or information statements incorporated by reference in Part III of this Form 10-K or any amendment to this Form 10-K. [ ]
Indicate by check mark whether the registrant is a large accelerated filer, an accelerated filer, a non-accelerated filer, or a smaller reporting company. See definitions of “large accelerated filer”, “accelerated filer”, and “smaller company filer” in Rule 12b-2 of the Exchange Act. Large accelerated filer ___ Accelerated filerX Non-accelerated filer ___ Smaller reporting company
Indicate by check mark whether the registrant is a shell company (as defined in Rule 12b-2 of the Exchange Act). Yes NoX
Aggregate Market Value of common stock held by non-affiliates of the registrant as of June 30, 2013: $102,013,000
Common stock outstanding at February 28, 2014: 8,085,822 shares.
FORWARD LOOKING STATEMENTS
This annual report on Form 10-K including, without limitation, management’s discussion and analysis of financial condition and results of operations and other sections of the Corporation’s Annual Report to Shareholders which are incorporated by reference in this report, contains forward looking statements that are based on management’s beliefs, assumptions, current expectations, estimates and projections about the financial services industry, the economy, and about the Corporation itself. Words such as “anticipate”, “believe”, “determine”, “estimate”, “expect”, “forecast”, “intend”, “is likely”, “plan”, “project”, “opinion”, variations of such terms, and similar expressions are intended to identify such forward looking statements. The presentations and discussions of the provision and allowance for loan losses and determinations as to the need for other allowances presented or incorporated by reference in this report are inherently forward looking statements in that they involve judgments and statements of belief as to the outcome of future events. These statements are not guarantees of future performance and involve certain risks, uncertainties, and assumptions that are difficult to predict with regard to timing, extent, likelihood, and degree of occurrence. Therefore, actual results and outcomes may materially differ from what may be expressed or forecasted in such forward looking statements. Internal and external factors that may cause such a difference include changes in interest rates and interest rate relationships; demand for products and services; the degree of competition of traditional and non-traditional competitors; changes in banking regulations; changes in tax laws; changes in prices, levies, and assessments; the impact of technological advances; governmental and regulatory policy changes; the outcomes of pending and future litigation and contingencies; trends in customer behavior and customer ability to repay loans; software failure; errors or miscalculations; changes in accounting principles, policies and guidelines; and the vicissitudes of the national economy. The Corporation undertakes no obligation to update, amend or clarify forward looking statements, whether as a result of new information, future events, or otherwise.
The Corporation’s Annual Report on Form 10-K, Quarterly Reports on Form 10-Q, Current Reports on Form 8-K, and amendments to those reports filed or furnished pursuant to Section 13(a) or 15(d) of the Securities Exchange Act of 1934 are available free of charge through the Corporation’s website (www.firstbankmi.com) as soon as reasonably practicable after the Corporation electronically files the material with, or furnishes it to, the Securities and Exchange Commission. The reference to our website address does not constitute incorporation by reference of the information contained on the website, and the information contained on the website is not part of this document.
PART 1
ITEM 1. Business.
Firstbank Corporation (“We” or the “Corporation”) is a bank holding company. Prior to February 1, 2013, we owned all of the outstanding stock of Firstbank – Alma, Firstbank (Mt. Pleasant), Firstbank-West Branch, Keystone Community Bank, Firstbank-West Michigan, and FBMI Risk Management Services, Inc. (a captive insurance company). Effective February 1, 2013, we consolidated Firstbank-Alma, Firstbank-West Branch and Firstbank-West Michigan into Firstbank. From February 1, 2013 going forward we have two subsidiary banks, Firstbank and Keystone Community Bank. FBMI Risk Management Services, Inc. was dissolved effective December 27, 2013.
Our business is concentrated in a single industry segment – commercial banking. Each subsidiary bank is a full-service community bank. Our subsidiary banks offer all customary banking services, including the acceptance of checking, savings, and time deposits and the making of commercial, mortgage (principally single family), home improvement, automobile, and other consumer loans.
Additional Information
Our principal sources of revenues are interest and fees on loans and non-interest revenue resulting from banking and non-bank subsidiary activity. On a consolidated basis, interest and fees on loans accounted for approximately 76% of total revenue in 2013, 75% in 2012, and 79% in 2011. Non-interest revenue accounted for approximately 16% of total revenue in 2013, 17% in 2012, and 13% in 2011. Interest on securities accounted for approximately 8% of total revenue in 2013, 2012, and 2011. We have no foreign assets and no income from foreign sources. The business of our subsidiary banks is not seasonal to any material extent. Each of our subsidiary banks also offers securities brokerage services at their main offices through arrangements with third party brokerage firms.
Firstbank is a Michigan state chartered bank which was incorporated in 1894. Its main office is located in Mt Pleasant, Michigan and it has 39 branch offices. Keystone Community bank has its main office and three branches located in Kalamazoo, Michigan, two additional branches in Portage, Michigan, and one branch in Paw Paw, Michigan. The banks have no material foreign assets or income.
Prior to February 1, 2013, Firstbank – Alma was a Michigan state chartered bank. It and its predecessors have operated continuously in Alma, Michigan since 1880. Its main office and one branch are located in Alma. Firstbank – Alma also had two full service branches located in St Johns, and one full service branch located in each of the following communities near Alma: Ashley, Dewitt, Ithaca, Merrill, Pine River Township, St. Charles, St. Louis and Vestaburg. Firstbank – Alma Mortgage Company, a subsidiary of the bank, was established in 2001. Firstbank – Alma was consolidated into Firstbank on February 1, 2013.
Proposed Merger with Mercantile Bank Corporation
On August 14, 2013, Mercantile Bank Corporation ("Mercantile") and Firstbank Corporation entered into a definitive Agreement and Plan of Merger (the "Merger Agreement") pursuant to which Firstbank Corporation will merge with and into Mercantile (the "Merger"). Following the Merger, our subsidiary banks Firstbank and Keystone Community Bank will be consolidated with and into Mercantile Bank of Michigan, a wholly owned subsidiary of Mercantile Bank Corporation. Under the terms of the Merger Agreement, included as Exhibit 2.1 to this Annual Report on Form 10-K, as of the effective time of the Merger shareholders of Firstbank Corporation will receive 1.0 share of Mercantile common stock for each share of our common stock they own.
The Merger Agreement contains customary representations, warranties and covenants of Firstbank and Mercantile, including, among others, our covenant to conduct our business in the ordinary course during the interim period between the execution of the Merger Agreement and the completion of the Merger.
The Merger has been approved by our shareholders and by the shareholders of Mercantile. Consummation of the Merger is subject receipt of appropriate regulatory approvals and certain other closing conditions. Subject to the terms and conditions of the Merger Agreement, the transaction is expected to be completed in the second quarter of 2014.
The following table shows comparative information concerning our subsidiary banks at December 31, 2013:
| | | Firstbank | | | Keystone | | | Total | |
| | | | | | | | | | | | | |
| | | | | | | | | | | | | |
Assets | | $ | 1,220,552 | | | $ | 255,413 | | | $ | 1,479,725 | |
Deposits | | $ | 1,035,665 | | | $ | 210,370 | | | $ | 1,232,792 | |
Loans | | $ | 813,664 | | | $ | 173,626 | | | $ | 987,547 | |
As of December 31, 2013 we employed 426 persons on a full-time equivalent basis.
Banking in our market areas and in the State of Michigan is highly competitive. In addition to competition from other commercial banks, we face significant competition from non-bank financial institutions. Savings and loan associations are able to compete aggressively with commercial banks for deposits and loans. Credit unions and finance companies are also significant factors in the consumer loan market. Insurance companies, investment firms and retailers are significant competitors for investment products. Banks compete for deposits with a broad spectrum of other types of investments such as mutual funds, debt securities of corporations and debt securities of the federal government, state governments and their respective agencies. The principal methods of competition for financial services are price (interest rates paid on deposits, interest rates charged on loans and fees charged for services) and service (the convenience and quality of services rendered to customers).
Our subsidiary banks compete directly with other banks, thrift institutions, credit unions and other non-depository financial institutions in five geographic banking markets where their offices are located. Firstbank primarily competes in Gratiot, Clinton, Bay, Montcalm, Saginaw, Isabella, Clare, Mecosta, Montcalm, Wexford, Iosco, Oscoda, Ogemaw, Roscommon, Ionia, Kent, Montcalm, Barry, and Eaton counties; Keystone Community Bank primarily in Kalamazoo and Van Buren counties.
SUPERVISION AND REGULATION
Banks and bank holding companies are extensively regulated. We are a bank holding company that is regulated by the Federal Reserve System. Firstbank and Keystone Community Bank are chartered under state law and are supervised, examined, and regulated by the Federal Deposit Insurance Corporation and the Division of Financial Institutions of the Michigan Department of Insurance and Financial Services.
General
Financial institutions and their holding companies are extensively regulated under federal and state law. Consequently, our growth and earnings performance can be affected not only by management decisions and general economic conditions, but also by the statutes administered by, and the regulations and policies of, various governmental regulatory authorities. Those authorities include, but are not limited to, the Board of Governors of the Federal Reserve System (the "Federal Reserve Board"), the Federal Deposit Insurance Corporation (“FDIC”), the Commissioner of the Michigan Department of Insurance and Financial Services ("Commissioner"), the Internal Revenue Service, and state taxing authorities. The effect of such statutes, regulations and policies can be significant, and cannot be predicted with a high degree of certainty.
Federal and state laws and regulations generally applicable to financial institutions and their holding companies regulate, among other things, the scope of business, investments, reserves against deposits, capital levels relative to operations, lending activities and practices, the nature and amount of collateral for loans, the establishment of branches, mergers, consolidations and dividends. The system of supervision and regulation applicable to us and our banks establishes a comprehensive framework for our respective operations and is intended primarily for the protection of the FDIC's deposit insurance funds, our depositors, and the public, rather than our shareholders.
Federal law and regulations establish supervisory standards applicable to the lending activities of our bank, including internal controls, credit underwriting, loan documentation and loan-to-value ratios for loans secured by real property.
Regulatory Developments
Dodd-Frank Act:The Dodd-Frank Act was signed into law by President Obama on July 21, 2010. The Dodd-Frank Act represents a comprehensive overhaul of the financial services industry within the United States, established the new federal Consumer Financial Protection Bureau ("CFPB"), and requires the CFPB and other federal agencies to implement many new and significant rules and regulations. The CFPB has issued significant new regulations that impact consumer mortgage lending and servicing. Those regulations became effective in January 2014. In addition, the CFPB is drafting regulations that will change the disclosure requirements and forms used under the Truth in Lending Act and Real Estate Settlement and Procedures Act. Compliance with these new laws and regulations and other regulations under consideration by the CFPB may result in additional costs to us.
Deposit Insurance:The FDIC finalized changes to its deposit insurance assessment base effective April 1, 2011, which uses average consolidated total assets less average tangible equity as the assessment base instead of quarterly deposits. Additional information about these changes may be found in this Item 1 below under the heading "Our Subsidiary Banks – Deposit Insurance."
As a result of provisions of the Dodd-Frank Act, all funds in a "noninterest-bearing transaction account" were insured in full by the FDIC from December 31, 2010, through December 31, 2012. This temporary unlimited coverage was in addition to, and separate from, the general FDIC deposit insurance coverage of up to $250,000 available to depositors. The temporary coverage for noninterest-bearing transaction accounts expired as scheduled on December 31, 2012. Large depositors may look to reduce their exposure to individual institutions and spread their deposits among various institutions. While we don’t believe the impact of the expiring deposit insurance will have a significant impact on our banks or our customers, it is possible that large depositors could remove their uninsured balances from our banks. However, our banks could also benefit from movement of large uninsured balances from other financial institutions to our banks. The increase in maximum deposit insurance coverage to $250,000 was made permanent under the Dodd-Frank Act.
Debit Card Interchange Fees and Routing:The Federal Reserve Board in June 2011 issued a rule to implement a provision in the Dodd-Frank Act that requires it to set debit-card interchange fees so they are "reasonable and proportional" in relation to the cost of the transaction incurred by the card issuer. The rule could result in a significant reduction in banks' debit-card interchange revenue. Though the rule technically does not apply to institutions with less than $10 billion, there is concern that the price controls will harm community banks, such as our banks, which will be pressured by the marketplace to lower their own interchange rates.
Future Legislation. Various other legislative and regulatory initiatives, including proposals to overhaul the banking regulatory system, are from time to time introduced in Congress and state legislatures, as well as regulatory agencies. Such future legislation regarding financial institutions may change banking statutes and our operating environment in substantial and unpredictable ways, and could increase or decrease the cost of doing business, limit or expand permissible activities or affect the competitive balance depending on whether any such potential legislation is introduced and enacted. The nature and extent of future legislative and regulatory changes affecting financial institutions is very unpredictable. We cannot determine the ultimate effect that any such potential legislation, if enacted, would have upon our financial condition or results of operations.
Firstbank Corporation
General. Firstbank Corporation is registered with, and subject to regulation by, the Federal Reserve Board under the Bank Holding Company Act, as amended (the "BHCA"). Under the BHCA, we are subject to periodic examination by the Federal Reserve Board, and are required to file with the Federal Reserve Board periodic reports of our operations and such additional information as the Federal Reserve Board may require.
In accordance with Federal Reserve Board policy, we are expected to act as a source of financial strength to our subsidiary banks and to commit resources to support our subsidiary banks in circumstances where we might not do so absent such policy. The Dodd-Frank Act codified this policy as a statutory requirement.
In addition, if the Commissioner deems one or more of our subsidiary bank's capital to be impaired, the Commissioner may require our subsidiary bank to restore its capital by a special assessment upon us as the bank's sole shareholder. If we were to fail to pay any such assessment, the directors of the applicable bank would be required, under Michigan law, to sell the shares of the bank's stock owned by us to the highest bidder at either a public or private auction and use the proceeds of the sale to restore the bank's capital.
Investments and Activities. In general, any direct or indirect acquisition by us of any voting shares of any bank which would result in our direct or indirect ownership or control of more than 5% of any class of voting shares of such bank, and any merger or consolidation between us and another financial holding company or bank holding company, will require the prior written approval of the Federal Reserve Board under the BHCA.
The merger or consolidation of an existing bank subsidiary of ours with another bank, or the acquisition by such a subsidiary of assets of another bank, or the assumption of liability by such a subsidiary to pay any deposits in another bank, will require the prior written approval of the responsible Federal depository institution regulatory agency under the Bank Merger Act. In addition, in certain such cases, an application to, and the prior approval of, the Federal Reserve Board under the BHCA and/or the Commissioner under the Michigan Banking Code, may be required.
Capital Requirements. The Federal Reserve Board uses capital adequacy guidelines in its examination and regulation of bank holding companies. If capital falls below minimum guidelines, a bank holding company may, among other items, be denied approval to acquire or establish additional banks or non-bank businesses.
The Federal Reserve Board's capital guidelines establish the following minimum regulatory capital requirements for bank holding companies: (a) a leverage capital requirement expressed as a percentage of total average assets, and (b) a risk-based requirement expressed as a percentage of total risk-weighted assets. The leverage capital requirement consists of a minimum ratio of Tier 1 capital (which consists principally of shareholders' equity) to total average assets of 3% for the most highly rated companies, with minimum requirements of 4% to 5% for all others. The risk-based requirement consists of a minimum ratio of total capital to total risk-weighted assets of 8%, of which at least one-half must be Tier 1 capital.
Included in our Tier 1 capital as of December 31, 2013, is $36.1 million of trust preferred securities (classified on our balance sheet as "Subordinated Debentures"). The Federal Reserve has issued rules regarding trust preferred securities as a component of the Tier 1 capital of bank holding companies. The aggregate amount of trust preferred securities and certain other capital elements is limited to 25 percent of Tier 1 capital elements, net of goodwill (net of any associated deferred tax liability). The amount of trust preferred securities and certain other elements in excess of the limit could be included in the Tier 2 capital, subject to restrictions. The provisions of the Dodd-Frank Act imposed additional limitations on the ability to include trust preferred securities as Tier 1 capital; however, these additional limitations do not apply to our outstanding trust preferred securities.
Dividends. Firstbank Corporation is a corporation separate and distinct from our subsidiary banks. Most of our revenues are dividends paid by our banks. Thus, our ability to pay dividends to our shareholders is indirectly limited by statutory restrictions on our banks' ability to pay dividends described below. Further, in a policy statement, the Federal Reserve Board has expressed its view that a bank holding company experiencing earnings weaknesses should not pay cash dividends exceeding its net income or which can only be funded in ways that weaken the bank holding company's financial health, such as by borrowing. Additionally, the Federal Reserve Board possesses enforcement powers over bank holding companies and their non-bank subsidiaries to prevent or remedy actions that represent unsafe or unsound practices or violations of applicable statutes and regulations. Among these powers is the ability to proscribe the payment of dividends by banks and bank holding companies. Similar enforcement powers over our banks are possessed by the FDIC. The "prompt corrective action" provisions of federal law and regulation authorizes the Federal Reserve Board to restrict the payment of dividends by us for an insured bank which fails to meet specified capital levels.
In addition to the restrictions on dividends imposed by the Federal Reserve Board, the Michigan Business Corporation Act provides that dividends may be legally declared or paid only if after the distribution a corporation, like us, can pay its debts as they come due in the usual course of business and its total assets equal or exceed the sum of its liabilities plus the amount that would be needed to satisfy the preferential rights upon dissolution of any holders of preferred stock whose preferential rights are superior to those receiving the distribution.
Prior to January 30, 2012, under the rules of the Troubled Asset Relief Program ("TARP") the consent of the United States Treasury was required for us to declare or pay any dividend or make any distribution on or repurchase of common stock other than (a) regular quarterly cash dividends of not more than $0.225 per share, as adjusted for any stock split, stock dividend, reverse stock split, reclassification or similar transaction, or (b) dividends payable solely in shares of our common stock. Since our exit from the TARP program, those restrictions no longer apply.
Federal Securities Regulation. Our common stock is registered with the Securities and Exchange Commission ("SEC") under the Securities Act of 1933, as amended, and the Securities Exchange Act of 1934, as amended. We are therefore subject to the information, proxy solicitation, insider trading and other restrictions and requirements of the SEC under those statutes and related regulations.
Our Subsidiary Banks
General. Each of our banks is a Michigan banking corporation, and its deposit accounts are insured by the Deposit Insurance Fund (the "DIF") of the FDIC. As DIF insured Michigan chartered banks, our banks are subject to the examination, supervision, reporting and enforcement requirements of various agencies. These agencies and the federal and state laws applicable to our banks and their operations, extensively regulate various aspects of the banking business including, among other things, permissible types and amounts of loans, investments and other activities, capital adequacy, branching, interest rates on loans and on deposits, the maintenance of non-interest bearing reserves on deposit accounts, and the safety and soundness of banking practices.
Deposit Insurance. As an FDIC-insured institution, our banks are required to pay deposit insurance premium assessments to the FDIC. The FDIC has adopted a risk-based assessment system under which all insured depository institutions are placed into one of four categories and assessed insurance premiums, based upon their respective levels of capital and results of supervisory evaluation.
The FDIC is required to establish assessment rates for insured depository institutions at levels that will maintain the DIF at a Designated Reserve Ratio (DRR) selected by the FDIC within a range of 1.15% to 1.50% of estimated insured deposits. The FDIC is allowed to manage the pace at which the reserve ratio varies within this range. Due to recent disruptions in the financial markets and large numbers of bank failures in recent years, the DRR fell below 1.15%. The FDIC has adopted an Amended Restoration Plan which established the time within which the reserve ratio must be returned to 1.15% at seven years. The FDIC imposed a special assessment on all insured depository institutions that was collected on September 30, 2009. The FDIC may impose additional special assessments under certain circumstances. Additionally, in the fourth quarter of 2009, insured institutions were required to prepay their estimated risk-based assessments for all of 2010, 2011 and 2012 based on a 5% annual growth rate.
The FDIC implemented changes to its deposit insurance assessment base effective April 1, 2011, which uses average consolidated total assets less average tangible equity as the assessment base instead of quarterly deposits. Under this new calculation, most well capitalized banks will pay 5 to 9 basis points annually, increasing up to 35 basis points for banks that post significant supervisory concerns. This base rate may be adjusted for the level of unsecured debt and brokered deposits, resulting in adjusted rates ranging from 2.5 to 9 basis points annually for most well capitalized banks to 30 to 45 basis points for banks that pose significant supervisory concerns.
During the fourth quarter of 2009, we prepaid estimated quarterly deposit insurance premium assessments to the FDIC for periods through the fourth quarter of 2012. These estimated quarterly deposit insurance premium assessments were based on projected deposit balances over the assessment periods. Due to changes in how FDIC premiums are assessed, the unused prepaid deposit insurance premium assessments totaled $2.0 million at December 31, 2012 and will be expensed over future assessment periods. The actual expense over the assessment periods will be different from this prepaid amount due to various factors, including variances in actual deposit balances and the assessment base and rates used during each assessment period.
In addition, our banks elected to participate in the FDIC's Transaction Account Guarantee Program (TAGP), which required us to pay an additional assessment to the FDIC. Under the TAGP, funds in non-interest bearing transaction accounts, in interest-bearing transaction accounts with an interest rate of 0.25% or less (after June 30, 2010), and in Interest on Lawyers Trust Accounts (IOLTA) had a temporary unlimited guarantee from the FDIC. This temporary coverage expired on December 31, 2010. The Dodd-Frank Act extended protection similar to that provided under the TAGP through December 31, 2012 for only non-interest bearing transaction accounts. This coverage applied to all insured depository institutions, and there was no separate FDIC assessment for the insurance. Furthermore, this unlimited coverage was separate from, and in addition to, the coverage provided to depositors with respect to other accounts held at an insured depository institution.
FICO Assessments. Our subsidiary banks, as members of the DIF, are subject to assessments to cover the payments on outstanding obligations of the Financing Corporation ("FICO"). From now until the maturity of the outstanding FICO obligations in 2019, DIF members will share the cost of the interest on the FICO bonds on a pro rata basis. It is estimated that FICO assessments during this period will be less than 0.025% of deposits.
Commissioner Assessments. Michigan banks are required to pay supervisory fees to the Commissioner to fund the operations of the Commissioner. The amount of supervisory fees paid by a bank is based upon the bank's total assets, as reported to the Commissioner.
Capital Requirements. The FDIC has established the following minimum capital standards for state-chartered, FDIC insured non-member banks, such as our banks. A leverage requirement consisting of a minimum ratio of Tier 1 capital to total average assets of 3% for the most highly-rated banks with minimum requirements of 4% to 5% for all others, and a risk-based capital requirement consisting of a minimum ratio of total capital to total risk-weighted assets of 8%, at least one-half of which must be Tier 1 capital. Tier 1 capital consists principally of shareholders' equity. These capital requirements are minimum requirements. Higher capital levels will be required if warranted by the particular circumstances or risk profiles of individual institutions.
Federal law provides the federal banking regulators with broad power to take prompt corrective action to resolve the problems of undercapitalized institutions. The extent of the regulators' powers depends on whether the institution in question is "well capitalized," "adequately capitalized," "undercapitalized," "significantly undercapitalized," or "critically undercapitalized."
Regulations define these capital categories as follows:
| | | Total Risk-Based Capital Ratio | | | Tier 1 Risk-Based Capital Ratio | | Leverage Ratio |
| | | | | | | | |
Well capitalized | | 10% or above | | | 6% or above | | 5% or above |
Adequately capitalized | | 8% or above | | | 4% or above | | 4% or above |
Undercapitalized | | Less than 8% | | | Less than 4% | | Less than 4% |
Significantly undercapitalized | | Less than 6% | | | Less than 3% | | Less than 3% |
Critically undercapitalized | | -- | | | -- | | A ratio of tangible equity to total assets of 2% or less |
As of December 31, 2013, each of our subsidiary banks' ratios exceeded minimum requirements for the well capitalized category.
Depending upon the capital category to which an institution is assigned, the regulators' corrective powers include: requiring the submission of a capital restoration plan; placing limits on asset growth and restrictions on activities; requiring the institution to issue additional capital stock (including additional voting stock) or to be acquired; restricting transactions with affiliates; restricting the interest rate the institution may pay on deposits; ordering a new election of directors of the institution; requiring that senior executive officers or directors be dismissed; prohibiting the institution from accepting deposits from correspondent banks; requiring the institution to divest certain subsidiaries; prohibiting the payment of principal or interest on subordinated debt; and ultimately, appointing a receiver for the institution.
In general, a depository institution may be reclassified to a lower category than is indicated by its capital levels if the appropriate federal depository institution regulatory agency determines the institution to be otherwise in an unsafe or unsound condition or to be engaged in an unsafe or unsound practice. This could include a failure by the institution, following receipt of a less-than-satisfactory rating on its most recent examination report, to correct the deficiency.
| | | Tier 1LeverageRatio | | | Tier 1Risk-BasedCapital Ratio | | | TotalRisk-BasedCapital Ratio | |
| | | | | | | | | | | | | |
Minimum regulatory requirement | | | 4 | % | | | 4 | % | | | 8 | % |
Well capitalized regulatory level | | | 5 | % | | | 6 | % | | | 10 | % |
| | | | | | | | | | | | | |
Firstbank Corporation – Consolidated | | | 9.49 | % | | | 14.08 | % | | | 15.33 | % |
Firstbank | | | 8.19 | % | | | 12.51 | % | | | 13.77 | % |
Keystone Community Bank | | | 9.91 | % | | | 12.67 | % | | | 13.94 | % |
The following table shows the amounts by which our capital (on a consolidated basis) exceeds current regulatory requirements for a well capitalized bank on a dollar amount basis:
| | | Tier 1Leverage | | | Tier 1 Risk-Based Capital | | | TotalRisk-BasedCapital | |
| | | (In Thousands of Dollars) | |
| | | | | | | | | | | | | |
Capital Balances at December 31, 2013 | | $ | 137,355 | | | $ | 137,355 | | | $ | 149,581 | |
Well Capitalized Regulatory Capital Required | | | 72,387 | | | | 58,543 | | | | 97,572 | |
Capital in Excess of Regulatory Well Capitalized | | $ | 64,968 | | | $ | 78,812 | | | $ | 52,009 | |
Dividends.Under Michigan law, our banks are restricted as to the maximum amount of dividends it may pay on its common stock. Our banks may not pay dividends except out of net income after deducting its losses and bad debts. A Michigan state bank may not declare or pay a dividend unless the bank will have surplus amounting to at least 20% of its capital after the payment of the dividend.
Federal law generally prohibits a depository institution from making any capital distribution (including payment of a dividend) or paying any management fee to its holding company if the depository institution would thereafter be undercapitalized. The FDIC may prevent an insured bank from paying dividends if the bank is in default of payment of any assessment due to the FDIC. In addition, the FDIC may prohibit the payment of dividends by our bank, if such payment is determined, by reason of the financial condition of our bank, to be an unsafe and unsound banking practice.
Insider Transactions.Our banks are subject to certain restrictions imposed by the Federal Reserve Act on any extensions of credit to us or our subsidiaries, on investments in the stock or other securities of our subsidiaries and the acceptance of the stock or other securities of us or our subsidiaries as collateral for loans. Certain limitations and reporting requirements are also placed on extensions of credit by our banks to their respective directors and officers, to our directors and officers, to the directors and officers of our bank, to our principal shareholders and to "related interests" of such directors, officers and principal shareholders. In addition, federal law and regulations may affect the terms upon which any person becoming a director or officer of our company or one of its subsidiaries or a principal shareholder in our company may obtain credit from banks with which our banks maintain a correspondent relationship.
Safety and Soundness Standards.The federal banking agencies have adopted guidelines to promote the safety and soundness of federally insured depository institutions. These guidelines establish standards for internal controls, information systems, internal audit systems, loan documentation, credit underwriting, interest rate exposure, asset growth, compensation, fees and benefits, asset quality and earnings.
Investments and Other Activities.Under federal law and FDIC regulations, FDIC insured state banks are prohibited, subject to certain exceptions, from making or retaining equity investments of a type, or in an amount, that are not permissible for a national bank. Federal law, as implemented by FDIC regulations, also prohibits FDIC insured state banks and their subsidiaries, subject to certain exceptions, from engaging as principal in any activity that is not permitted for a national bank or its subsidiary, respectively, unless the bank meets, and continues to meet, its minimum regulatory capital requirements and the FDIC determines the activity would not pose a significant risk to the deposit insurance fund of which the bank is a member. Impermissible investments and activities must be divested or discontinued within certain time frames set by the FDIC in accordance with federal law. These restrictions are not currently expected to have a material impact on the operations of our bank.
Consumer Protection Laws.Our banks' business includes making a variety of types of loans to individuals. In making these loans, we are subject to State usury and regulatory laws and to various federal statutes, including the privacy of consumer financial information provisions of the Gramm-Leach-Bliley Act and regulations promulgated there under, the Equal Credit Opportunity Act, the Fair Credit Reporting Act, the Truth in Lending Act, the Real Estate Settlement Procedures Act, and the Home Mortgage Disclosure Act and the regulations promulgated there under, which prohibit discrimination, specify disclosures to be made to borrowers regarding credit and settlement costs, and regulate the mortgage loan servicing activities of our bank, including the maintenance and operation of escrow accounts and the transfer of mortgage loan servicing. In receiving deposits, our banks are subject to extensive regulation under State and federal law and regulations, including the Truth in Savings Act, the Expedited Funds Availability Act, the Bank Secrecy Act, the Electronic Funds Transfer Act, and the Federal Deposit Insurance Act. Violation of these laws could result in the imposition of significant damages and fines upon our banks and their respective directors and officers.
Branching Authority.Michigan banks have the authority under Michigan law to establish branches anywhere in the State of Michigan, subject to receipt of all required regulatory approvals. Banks may establish interstate branch networks through acquisitions of other banks. The establishment of de novo interstate branches or the acquisition of individual branches of a bank in another state (rather than the acquisition of an out-of-state bank in its entirety) is allowed only if specifically authorized by state law.
Michigan permits both U.S. and non-U.S. banks to establish branch offices in Michigan. The Michigan Banking Code permits, in appropriate circumstances and with the approval of the Michigan Office of Financial and Insurance Regulation, Division of Financial Institutions, (a) acquisition of Michigan banks by FDIC-insured banks, savings banks or savings and loan associations located in other states, (b) sale by a Michigan bank of branches to an FDIC-insured bank, savings bank or savings and loan association located in a state in which a Michigan bank could purchase branches of the purchasing entity, (c) consolidation of Michigan banks and FDIC-insured banks, savings banks or savings and loan associations located in other states having laws permitting such consolidation, (d) establishment of branches in Michigan by FDIC-insured banks located in other states, the District of Columbia or U.S. territories or protectorates having laws permitting a Michigan bank to establish a branch in such jurisdiction, and (e) establishment by foreign banks of branches located in Michigan.
The nature of the business of our subsidiaries is such that they hold title, on a temporary or permanent basis, to a number of parcels of real property. These include property owned for branch offices and other business purposes as well as properties taken in, or in lieu of, foreclosures to satisfy loans in default. Under current state and federal laws, present and past owners of real property may be exposed to liability for the cost of remediation of contamination on or originating from such properties, even though they are wholly innocent of the actions which caused the contamination. Such liabilities can be material and can exceed the value of the contaminated property.
Investment Securities Portfolio
The carrying values of investment securities as of the date indicated are summarized as follows:
(In Thousands of Dollars) | | December 31 | |
| | | 2013 | | | 2012 | | | 2011 | |
Taxable | | | | | | | | | | | | |
US Government Agencies | | $ | 101,604 | | | $ | 106,885 | | | $ | 133,834 | |
States and Political Subdivisions | | | 107,122 | | | | 38,015 | | | | 31,162 | |
Mortgage Backed Securities | | | 59,259 | | | | 66,277 | | | | 71,052 | |
Collateralized Mortgage Obligations | | | 34,486 | | | | 61,030 | | | | 57,845 | |
Equity and Other Securities | | | 1,589 | | | | 1,672 | | | | 1,664 | |
Total Taxable | | $ | 304,060 | | | $ | 273,879 | | | $ | 295,557 | |
| | | | | | | | | | | | | |
Tax-Exempt | | | | | | | | | | | | |
States and Political Subdivisions | | $ | 39,542 | | | $ | 79,799 | | | $ | 46,627 | |
Analysis of Investment Securities Portfolio
The following table shows, by class of maturities at December 31, 2013, the amounts and weighted average yields of such investment securities(1):
| | | CarryingValue | | | AverageYield(2) | |
| | | (In Thousands of Dollars) | |
US Government Agencies: | | | | | | | | |
One Year or Less | | $ | 24,935 | | | | 2.56 | % |
Over One Through Five Years | | | 71,341 | | | | 2.49 | % |
Over Five Through Ten Years | | | 5,328 | | | | 2.67 | % |
Total | | | 101,604 | | | | | |
| | | | | | | | | |
States and Political Subdivisions: | | | | | | | | |
One Year or Less | | | 27,936 | | | | 2.02 | % |
Over One Through Five Years | | | 69,631 | | | | 2.44 | % |
Over Five Through Ten Years | | | 45,399 | | | | 2.88 | % |
Over Ten Years | | | 3,698 | | | | 4.76 | % |
Total | | | 146,664 | | | | | |
| | | | | | | | | |
Mortgage Backed Securities: | | | | | | | | |
One Year or Less | | | 48 | | | | 4.09 | % |
Over One Through Five Years | | | 1,077 | | | | 4.89 | % |
Over Five Through Ten Years | | | 46,445 | | | | 2.91 | % |
Over Ten Years | | | 11,689 | | | | 2.83 | % |
Total | | | 59,259 | | | | | |
| | | | | | | | | |
Collateralized Mortgage Obligations: | | | | | | | | |
One Year or Less | | | 0 | | | | - | |
Over One Through Five Years | | | 1,877 | | | | 2.77 | % |
Over Five Through Ten Years | | | 2,146 | | | | 4.80 | % |
Over Ten Years | | | 30,463 | | | | 3.37 | % |
Total | | | 34,486 | | | | | |
| | | | | | | | | |
Equity and Other Securities | | | | | | | | |
One Year or Less | | | 1,589 | | | | - | |
Total | | | 1,589 | | | | | |
| | | | | | | | | |
TOTAL | | $ | 343,602 | | | | | |
(1) | Calculated on the basis of the carrying value and effective yields weighted for the scheduled maturity of each security. |
(2) | Weighted average yield has been computed on a fully taxable equivalent basis. The rates shown on securities issued by states and political subdivisions have been presented assuming a 35% tax rate. |
Loan Portfolio
The following table presents the loans outstanding at December 31st for the years ended:
| | | 2013 | | | 2012 | | | 2011 | | | 2010 | | | 2009 | |
| | | (In Thousands of Dollars) | |
Loan Categories: | | | | | | | | | | | | | | | | | | | | |
Commercial and Industrial | | $ | 167,047 | | | $ | 149,265 | | | $ | 156,551 | | | $ | 164,413 | | | $ | 192,096 | |
Commercial Real Estate | | | 359,920 | | | | 357,831 | | | | 365,029 | | | | 373,996 | | | | 398,416 | |
Real Estate Mortgages | | | 339,608 | | | | 331,896 | | | | 340,060 | | | | 354,007 | | | | 377,261 | |
Real Estate Construction | | | 52,155 | | | | 58,530 | | | | 60,280 | | | | 81,016 | | | | 85,229 | |
Consumer | | | 68,416 | | | | 66,240 | | | | 61,989 | | | | 59,543 | | | | 69,735 | |
| | | | | | | | | | | | | | | | | | | | | |
Total | | $ | 987,146 | | | $ | 963,762 | | | $ | 983,909 | | | $ | 1,032,975 | | | $ | 1,122,737 | |
The following table shows the maturity of commercial and industrial and real estate construction loans outstanding at December 31, 2013. Also provided are the amounts due after one year, classified according to their sensitivity to changes in interest rates.
| | | One Year or Less | | | One Year to Five Years | | | After Five Years | | | Total | |
| | | (In Thousands of Dollars) | |
| | | | | | | | | | | | | | | | | |
Commercial and Industrial | | $ | 73,027 | | | $ | 66,120 | | | $ | 27,900 | | | $ | 167,047 | |
Real Estate Construction | | | 20,931 | | | | 25,192 | | | | 6,032 | | | | 52,155 | |
Total | | $ | 93,958 | | | $ | 91,312 | | | $ | 33,932 | | | $ | 219,202 | |
| | | | | | | | | | | | | | | | | |
| | | | | | | | | | | | | | | | | |
Loans Due after One Year: | | | | | | | | | | | | | | | | |
With Pre-determined Rate | | | | | | $ | 78,493 | | | $ | 23,928 | | | $ | 102,421 | |
With Adjustable Rates | | | | | | | 12,819 | | | | 10,004 | | | | 22,823 | |
Total | | | | | | $ | 91,312 | | | $ | 33,932 | | | $ | 125,244 | |
Nonperforming Loans and Assets
The following table summarizes nonaccrual, troubled debt restructurings and past-due loans at December 31st for the years ended:
| | | 2013 | | | 2012 | | | 2011 | | | 2010 | | | 2009 | |
| | | (In Thousands of Dollars) | |
Nonperforming Loans: | | | | | | | | | | | | | | | | | | | | |
Nonaccrual Loans: | | | | | | | | | | | | | | | | | | | | |
Commercial and Industrial | | $ | 116 | | | $ | 448 | | | $ | 1,771 | | | $ | 3,565 | | | $ | 3,576 | |
Commercial Real Estate | | | 5,447 | | | | 8,452 | | | | 15,336 | | | | 16,868 | | | | 22,945 | |
Real Estate Mortgages | | | 4,504 | | | | 6,367 | | | | 5,652 | | | | 5,745 | | | | 3,821 | |
Consumer | | | 9 | | | | 401 | | | | 210 | | | | 184 | | | | 335 | |
Total | | | 10,076 | | | | 15,668 | | | | 22,969 | | | | 26,362 | | | | 30,677 | |
| | | | | | | | | | | | | | | | | | | | | |
Accruing Loans 90 Days or More Past Due: | | | | | | | | | | | | | | | | | | | | |
Commercial and Agricultural | | | 0 | | | | 0 | | | | 0 | | | | 0 | | | | 183 | |
Commercial Real Estate | | | 0 | | | | 0 | | | | 0 | | | | 18 | | | | 408 | |
Real Estate Mortgages | | | 0 | | | | 37 | | | | 401 | | | | 573 | | | | 2,504 | |
Consumer | | | 0 | | | | 0 | | | | 18 | | | | 15 | | | | 126 | |
Total | | | 0 | | | | 37 | | | | 419 | | | | 606 | | | | 3,221 | |
| | | | | | | | | | | | | | | | | | | | | |
Renegotiated Loans: | | | | | | | | | | | | | | | | | | | | |
Commercial and Industrial | | | 1,272 | | | | 3,234 | | | | 3,562 | | | | 36 | | | | 3,566 | |
Commercial Real Estate | | | 14,016 | | | | 12,106 | | | | 10,652 | | | | 5,768 | | | | 1,980 | |
Real Estate Mortgages | | | 5,276 | | | | 5,188 | | | | 4,703 | | | | 4,252 | | | | 1,560 | |
Consumer | | | 132 | | | | 191 | | | | 210 | | | | 0 | | | | 0 | |
Total | | | 20,696 | | | | 20,719 | | | | 19,127 | | | | 10,056 | | | | 7,106 | |
| | | | | | | | | | | | | | | | | | | | | |
Total Nonperforming Loans | | | 30,772 | | | | 36,427 | | | | 42,305 | | | | 37,024 | | | | 41,004 | |
| | | | | | | | | | | | | | | | | | | | | |
Property from Defaulted Loans | | | 1,838 | | | | 2,925 | | | | 5,251 | | | | 8,316 | | | | 7,425 | |
| | | | | | | | | | | | | | | | | | | | | |
Total Nonperforming Assets | | $ | 32,610 | | | $ | 39,352 | | | $ | 47,556 | | | $ | 45,340 | | | $ | 48,429 | |
Nonperforming assets are defined as nonaccrual loans, accruing loans 90 days or more past due, property from defaulted loans and renegotiated loans.
The amount of interest income on the above loans that was included in net income for the period ended December 31, 2013, was $1,959,000. If the nonaccrual and renegotiated loans had performed in accordance with their original terms and had been outstanding throughout the period, or since origination if held for part of the period, an additional $477,000 in gross interest income would have been recorded.
Loan performance is reviewed regularly by external loan review specialists, loan officers and senior management. When reasonable doubt exists concerning collectability of interest or principal, the loan is placed in nonaccrual status. Any interest previously accrued but not collected at that time is reversed and charged against current earnings.
At December 31, 2013 we had $97,310,000 in commercial and mortgage loans for which payments are presently current although the borrowers are experiencing financial difficulties. Those loans are subject to special attention and their status is reviewed on a monthly basis.
At December 31, 2013, there were no concentrations of loans exceeding 10 percent of total loans, which are not otherwise disclosed as a category of loans, in our consolidated balance sheets contained in our Annual Report to shareholders for the year ended December 31, 2013.
Analysis of the Allowance for Loan Losses
The following table summarizes changes in the allowance for loan losses arising from loans charged off and recoveries on loans previously charged off by loan category and additions to the allowance which were charged to expense at December 31st for the years ended:
(In Thousands of Dollars)
| | | 2013 | | | 2012 | | | 2011 | | | 2010 | | | 2009 | |
| | | | | | | | | | | | | | | | | | | | | |
Balance at Beginning of Period | | $ | 21,340 | | | $ | 21,019 | | | $ | 21,431 | | | $ | 19,114 | | | $ | 14,594 | |
Charge-Offs: | | | | | | | | | | | | | | | | | | | | |
Commercial and Commercial Real Estate | | | 2,924 | | | | 5,000 | | | | 10,519 | | | | 8,073 | | | | 7,422 | |
Residential Real Estate Mortgages | | | 2,630 | | | | 2,705 | | | | 3,490 | | | | 2,788 | | | | 2,231 | |
Consumer | | | 490 | | | | 727 | | | | 913 | | | | 1,102 | | | | 1,532 | |
Total Charge-Offs | | | 6,044 | | | | 8,432 | | | | 14,922 | | | | 11,963 | | | | 11,185 | |
Recoveries: | | | | | | | | | | | | | | | | | | | | |
Commercial and Commercial Real Estate | | | 455 | | | | 513 | | | | 692 | | | | 325 | | | | 557 | |
Residential Real Estate Mortgages | | | 166 | | | | 258 | | | | 180 | | | | 216 | | | | 128 | |
Consumer | | | 250 | | | | 292 | | | | 301 | | | | 395 | | | | 349 | |
Total Recoveries | | | 871 | | | | 1,063 | | | | 1,173 | | | | 936 | | | | 1,034 | |
Net Charge-Offs | | | 5,173 | | | | 7,369 | | | | 13,749 | | | | 11,027 | | | | 10,151 | |
Provision for Loan Losses | | | 1,830 | | | | 7,690 | | | | 13,337 | | | | 13,344 | | | | 14,671 | |
Balance at End of Period | | $ | 17,997 | | | $ | 21,340 | | | $ | 21,019 | | | $ | 21,431 | | | $ | 19,114 | |
| | | | | | | | | | | | | | | | | | | | | |
Net Charge-Offs as a Percent of Average Loans | | | 0.53 | % | | | 0.75 | % | | | 1.37 | % | | | 1.05 | % | | | .89 | % |
The allowance for loan losses is based on management’s evaluation of the portfolio, past loan loss experience, current economic conditions, volume, growth, composition of the loan portfolio and other relevant factors. The allowance is increased by provisions for loan losses that have been charged to expense and reduced by net charge-offs.
Allocation of the Allowance for Loan Losses
The allowance for loan losses was allocated to provide for inherent losses within the following loan categories as of December 31st for the years ended:
| | | 2013 | | | 2012 | | | 2011 | | | 2010 | | | 2009 | |
| (In Thousands of Dollars) | | | | | | | | | | | | | | | | | | | | | | | | | | | | |
| | | Allowance for loan losses | | | % of loans to total loans | | | Allowance for loan losses | | | % of loans to total loans | | | Allowance for loan losses | | | % of loans to total loans | | | Allowance for loan losses | | | % of loans to total loans | | | Allowance for loan losses | | | % of loans to total loans | |
Commercial and Industrial | | $ | 1,812 | | | | 17 | % | | $ | 1,896 | | | | 16 | % | | $ | 2,485 | | | | 16 | % | | $ | 3,024 | | | | 16 | % | | $ | 3,640 | | | | 17 | % |
Secured by Real Estate | | | 15,077 | | | | 76 | % | | | 17,776 | | | | 77 | % | | | 17,432 | | | | 77 | % | | | 17,109 | | | | 76 | % | | | 13,942 | | | | 77 | % |
Consumer | | | 540 | | | | 7 | % | | | 805 | | | | 7 | % | | | 931 | | | | 7 | % | | | 1,162 | | | | 8 | % | | | 1,525 | | | | 6 | % |
Unallocated | | | 568 | | | | 0 | % | | | 863 | | | | 0 | % | | | 171 | | | | 0 | % | | | 136 | | | | 0 | % | | | 7 | | | | 0 | % |
| | | | | | | | | | | | | | | | | | | | | | | | | | | | | | | | | | | | | | | | | |
Total | | $ | 17,997 | | | | 100 | % | | $ | 21,340 | | | | 100 | % | | $ | 21,019 | | | | 100 | % | | $ | 21,431 | | | | 100 | % | | $ | 19,114 | | | | 100 | % |
We have developed and implemented a comprehensive quantitative and qualitative methodology for analyzing factors which impact the allowance for loan losses. This methodology is applied consistently across our five banking subsidiaries and considers exposures to industries potentially most affected by current risks in the economic and political environment and the review of potential risks in certain credits.
Average Deposits
The daily average deposits and rates paid on such deposits for the years ending December 31st are as follows:
| | | 2013 | | | 2012 | | | 2011 | |
| | | Amount | | | Rate | | | Amount | | | Rate | | | Amount | | | Rate | |
Average Balance: | | (In Thousands of Dollars) | |
Non-interest-bearing demand deposits | | $ | 255,189 | | | | | | | $ | 226,061 | | | | | | | $ | 199,849 | | | | | |
Interest-bearing demand deposits | | | 354,877 | | | | 0.19 | % | | | 344,363 | | | | 0.23 | % | | | 319,053 | | | | 0.41 | % |
Other savings deposits | | | 275,539 | | | | 0.19 | % | | | 259,330 | | | | 0.22 | % | | | 235,422 | | | | 0.44 | % |
Other time deposits | | | 347,038 | | | | 1.07 | % | | | 400,397 | | | | 1.31 | % | | | 470,314 | | | | 1.82 | % |
Total average deposits | | $ | 1,232,643 | | | | 0.40 | % | | $ | 1,230,151 | | | | 0.54 | % | | $ | 1,224,638 | | | | 0.89 | % |
The time remaining until maturity of time certificates of deposit and other time deposits of $100,000 or more at December 31, 2013, was as follows (In Thousands of Dollars):
Three Months or Less | | $ | 39,222 | |
Over Three Through Six Months | | | 15,750 | |
Over Six Through Twelve Months | | | 40,658 | |
Over Twelve Months | | | 56,844 | |
Total | | $ | 152,474 | |
Return on Equity and Assets
The following table sets forth certain financial ratios for the years ended:
| | | 2013 | | | 2012 | | | 2011 | |
Financial Ratios: | | | | | | | | | | | | |
Return on Average Assets | | | 0.82 | % | | | 0.70 | % | | | 0.38 | % |
Return on Average Total Equity | | | 8.66 | % | | | 7.00 | % | | | 3.75 | % |
Average Equity to Average Total Assets | | | 9.49 | % | | | 10.04 | % | | | 10.07 | % |
Dividend Payout Ratio | | | 16.55 | % | | | 21.97 | % | | | 5.58 | % |
Short Term Borrowed Funds
Included in short term borrowed funds are repurchase agreements as described in Note 11 to the consolidated financial statements in our Annual Report to Shareholders for the year ended December 31, 2013, which consist of the following:
| (In Thousands of Dollars) | | | | | | | | | | | | |
| | | 2013 | | | 2012 | | | 2011 | |
Amounts Outstanding at the End of the Year | | $ | 47,635 | | | $ | 42,785 | | | $ | 46,784 | |
| | | | | | | | | | | | | |
Weighted Average Interest Rate at the End of the Year | | | 0.19 | % | | | 0.19 | % | | | 0.19 | % |
| | | | | | | | | | | | | |
Longest Maturity | | 1/1/14 | | | 1/1/13 | | | 1/1/12 | |
| | | | | | | | | | | | | |
Maximum Amount Outstanding at any Month End During Year | | $ | 50,830 | | | $ | 55,047 | | | $ | 47,603 | |
| | | | | | | | | | | | | |
Approximate Average Amounts Outstanding During the Year | | $ | 46,050 | | | $ | 47,605 | | | $ | 43,847 | |
| | | | | | | | | | | | | |
Approximate Weighted Average Interest Rate for the Year | | | 0.18 | % | | | 0.18 | % | | | 0.19 | % |
The weighted average interest rates are derived by dividing the interest expense for the period by the daily average balance during the period.
ITEM 1A. Risk Factors
You should carefully consider the following risk factors, together with the other information provided in this Annual Report on Form 10-K.
Changes in economic conditions or interest rates may negatively affect our earnings, capital and liquidity.
The results of operations for financial institutions, including our banks, may be materially and adversely affected by changes in prevailing local and national economic conditions, including declines in real estate market values, rapid increases or decreases in interest rates and changes in the monetary and fiscal policies of the federal government. Our profitability is heavily influenced by the spread between the interest rates we earn on investments and loans and the interest rates we pay on deposits and other interest-bearing liabilities. Substantially all our loans are to businesses and individuals in Michigan and any decline in the economy of this area could adversely affect us. Like most banking institutions, our net interest spread and margin will be affected by general economic conditions and other factors that influence market interest rates and our ability to respond to changes in such rates. At any given time, our assets and liabilities may be such that they are affected differently by a given change in interest rates.
The value of certain securities in our investment portfolio may be negatively affected by disruptions in the market for those securities and future declines or other-than-temporary impairments could materially adversely affect our future earnings and regulatory capital.
Continued volatility in the market value for certain of our investment securities, whether caused by changes in market perceptions of credit risk, as reflected in the expected market yield of the security, or actual defaults in the portfolio could result in significant fluctuations in the value of the securities. During the fourth quarter of 2008, the Corporation recorded an impairment charge on certain securities in its portfolio. Further impairment of these securities or other securities is possible. In addition, changes in accounting resulting from changes in and interpretations of applicable accounting standards may affect how we account for certain investment securities in our portfolio. The valuation and accounting for our investment securities could have a material adverse impact on our net income and shareholders’ equity depending on the direction of the fluctuations. Furthermore, future downgrades or defaults in these securities could result in future classifications as other than temporarily impaired. This could have a material impact on our future earnings and financial condition.
The state of financial markets and the economy may adversely affect our sources of liquidity and capital.
There has been significant recent turmoil and volatility in worldwide financial markets which is, at present, ongoing. These conditions have resulted in a disruption in the liquidity of financial markets, and could directly impact us to the extent we need to access capital markets to raise funds to support our business and overall liquidity position. This situation could affect the cost of such funds or our ability to raise such funds. If we were unable to access any of these funding sources when needed, it could adversely impact our financial condition, results of operations, cash flows, and level of regulatory-qualifying capital.
There can be no assurance that the Emergency Economic Stabilization Act of 2008 and the American Recovery and Reinvestment Act will stabilize the U.S. economy and financial system.
The U.S. Congress enacted the EESA in response to the impact of the volatility and disruption in the capital and credit markets on the financial sector. The U.S. Department of the Treasury and the federal banking regulators are implementing a number of programs under this legislation that are intended to address these conditions and the asset quality, capital and liquidity issues they have caused for certain financial institutions and to improve the general availability of credit for consumers and businesses. In addition, the U.S. Congress enacted the American Recovery and Reinvestment Act (“ARRA”) in an effort to save and create jobs, stimulate the U.S. economy and promote long-term growth and stability. There can be no assurance that EESA, ARRA or the programs that are implemented under them will achieve their intended purposes. The failure of EESA, ARRA or the programs that are implemented under them to achieve their intended purposes could result in a continuation or worsening of current economic and market conditions, and this could adversely affect our financial condition, results of operations, and/or the trading price of our common stock.
Our credit losses could increase and our allowance for loan losses may not be adequate to cover actual loan losses.
The risk of nonpayment of loans is inherent in all lending activities and nonpayment, if it occurs, may have a material adverse affect on our earnings and overall financial condition as well as the value of our common stock. We make various assumptions and judgments about the collectability of our loan portfolio and provide an allowance for potential losses based on a number of factors. If our assumptions are wrong, our allowance for loan and lease losses may not be sufficient to cover our losses, thereby having an adverse affect on our operating results, and may cause us to increase the allowance in the future. The actual amount of future provisions for loan losses cannot now be determined and may exceed the amounts of past provisions. Additionally, federal banking regulators, as an integral part of their supervisory function, periodically review our allowance for credit losses. These regulatory agencies may require us to increase our provision for credit losses or to recognize further loan or lease charge-offs based upon their judgments, which may be different from ours. Any increase in the allowance for credit losses could have a negative effect on our net income, financial condition and results of operations.
Our business is subject to various lending risks depending on the nature of the borrower's business, its cash flow and our collateral.
Repayment of our commercial loans is often dependent on cash flow of the borrower, which may be unpredictable, and collateral securing these loans may fluctuate in value. Our commercial loans are primarily made based on the cash flow of the borrower and secondarily on the underlying collateral provided by the borrower. Most often, this collateral is accounts receivable, inventory, equipment or real estate. In the case of loans secured by accounts receivable, the availability of funds for the repayment of these loans may be substantially dependent on the ability of the borrower to collect amounts due from its customers. Other collateral securing loans may depreciate over time, may be difficult to appraise and may fluctuate in value based on the success of the business.
Our commercial real estate loans involve higher principal amounts than other loans, and repayment of these loans may be dependent on factors outside our control or the control of our borrowers. Commercial real estate lending typically involves higher loan principal amounts, and the repayment of these loans generally is dependent, in large part, on sufficient income from the properties securing the loans to cover operating expenses and debt service. Because payments on loans secured by commercial real estate often depend upon the successful operating and management of the properties, repayment of such loans may be affected by factors outside the borrower's control, such as adverse conditions in the real estate market or the economy or changes in government regulation. If the cash flow from the project is reduced, the borrower's ability to repay the loan and the value of the security for the loan may be impaired.
Our construction loans are based upon estimates of costs to construct and value associated with the completed project. These estimates may be inaccurate. Because of the uncertainties inherent in estimating construction costs, as well as the market value of the completed project, it is relatively difficult to evaluate accurately the total funds required to complete a project and the related loan-to-value ratio. As a result, construction loans often involve the disbursement of substantial funds with repayment dependent, in part, on the success of the ultimate project and the ability of the borrower to sell or lease the property, rather than the ability of the borrower or guarantor to repay principal and interest. Delays in completing the project may arise from labor problems, material shortages and other unpredictable contingencies. If the estimate of the cost of construction is inaccurate, we may be required to advance additional funds to complete construction. If our appraisal of the value of the completed project proves to be overstated, we may have inadequate security for the repayment of the loan upon completion of the project.
Our consumer loans generally have a higher risk of default than our other loans. Consumer loans may involve greater risk than our other loans, particularly in the case of consumer loans that are unsecured or secured by rapidly depreciating assets. In such cases, any repossessed collateral for a defaulted consumer loan may not provide an adequate source of repayment of the outstanding loan balance as a result of damage, loss or depreciation. The remaining deficiency often does not warrant further substantial collection efforts against the borrower beyond obtaining a deficiency judgment. In addition, consumer loan collections are dependent on the borrower's continuing financial stability, and thus, are more likely to be adversely affected by job loss, divorce, illness or personal bankruptcy, all of which increase when the economy is weak. Furthermore, the application of various Federal and state laws, including Federal and state bankruptcy and insolvency laws, may limit the amount that can be recovered on such loans.
We may experience difficulties in managing our growth.
To sustain our continued growth, we require additional capital to fund our expanding lending activities and any bank or branch acquisitions. We may acquire banks and related businesses that we believe provide a strategic fit with our business. To the extent that we grow through acquisitions, we cannot assure you that we will be able to adequately or profitably manage such growth. Acquiring other banks and businesses involves risks commonly associated with acquisitions.
We rely heavily on our management and other key personnel, and the loss of any of them may adversely affect our operations.
We are and will continue to be dependent upon the services of our management team, including our Chief Executive Officer, Chief Financial Officer, the Presidents of each of our banks, and our other senior managers and commercial lenders. Losing one or more key members of the management team could adversely affect our operations. We do not maintain key man life insurance on any of our officers or directors.
Our future success is dependent on our ability to compete effectively in the highly competitive banking industry.
We face substantial competition in all phases of our operations from a variety of different competitors. Our future growth and success will depend on our ability to compete effectively in this highly competitive environment. We compete for deposits, loans and other financial services with numerous Michigan-based and out-of-state banks, thrifts, credit unions and other financial institutions as well as other entities which provide financial services. Some of the financial institutions and financial services organizations with which we compete are not subject to the same degree of regulation as we are. Many of our competitors have been in business for many years, are larger and have higher lending limits than we do. The financial services industry is also likely to become more competitive as further technological advances enable more companies to provide financial services. These technological advances may diminish the importance of depository institutions and other financial intermediaries in the transfer of funds between parties.
We are subject to significant government regulation, and any regulatory changes may adversely affect us.
The banking industry is heavily regulated under both federal and state law. These regulations are primarily intended to protect customers, not our creditors or shareholders. As a bank holding company, we are also subject to extensive regulation by the Federal Reserve, in addition to other regulatory and self-regulatory organizations. Our ability to establish new facilities or make acquisitions is conditioned upon the receipt of the required regulatory approvals from these organizations. Regulations affecting banks and financial services companies undergo continuous change, and we cannot predict the ultimate effect of such changes, which could have a material adverse effect on our profitability or financial condition.
We continually encounter technological change, and we may have fewer resources than our competitors to continue to invest in technological improvements.
The banking industry is undergoing rapid technological changes with frequent introductions of new technology-driven products and services. In addition to better serving customers, the effective use of technology increases efficiency and enables financial institutions to reduce costs. Our future success will depend, in part, on our ability to address the needs of our customers by using technology to provide products and services that will satisfy customer demands for convenience as well as to create additional efficiencies in our operations. Many of our competitors have substantially greater resources to invest in technological improvements. There can be no assurance that we will be able to effectively implement new technology-driven products and services or be successful in marketing such products and services to our customers.
Our articles of incorporation and by-laws and Michigan laws contain certain provisions that could make a takeover more difficult.
Our articles of incorporation and by-laws, and the laws of Michigan, include provisions which are designed to provide our board of directors with time to consider whether a hostile takeover offer is in our best interest and the best interests of our shareholders. These provisions, however, could discourage potential acquisition proposals and could delay or prevent a change in control. The provisions also could diminish the opportunities for a holder of our common stock to participate in tender offers, including tender offers at a price above the then-current price for our common stock. These provisions could also prevent transactions in which our shareholders might otherwise receive a premium for their shares over then current market prices, and may limit the ability of our shareholders to approve transactions that they may deem to be in their best interests.
The Michigan Business Corporation Act contains provisions intended to protect shareholders and prohibit or discourage certain types of hostile takeover activities. In addition to these provisions and the provisions of our articles of incorporation and by-laws, Federal law requires the Federal Reserve Board's approval prior to acquisition of "control" of a bank holding company. All of these provisions may have the effect of delaying or preventing a change in control at the company level without action by our shareholders, and therefore, could adversely affect the price of our common stock.
Our ability to pay dividends is limited by law and contract.
We are a holding company and substantially all of our assets are held by our banks. Our ability to continue to make dividend payments to our shareholders will depend primarily on available cash resources at the holding company and dividends from our banks. Dividend payments or extensions of credit from our banks are subject to regulatory limitations, generally based on capital levels and current and retained earnings, imposed by regulatory agencies with authority over our banks. The ability of our banks to pay dividends is also subject to their profitability, financial condition, capital expenditures and other cash flow requirements. We cannot assure you that our banks will be able to pay dividends to us in the future.
Acquisitions may affect our results.
Our financial results may be adversely affected if we are unable to successfully manage any financial institutions that we acquire.
The market price for our common stock fluctuates.
The market price for our common stock has fluctuated, and the overall market and the price of our common stock may continue to fluctuate. There may be a significant impact on the market price for our common stock due to, among other things:
• | Variations in our anticipated or actual operating results or the results of our competitors; |
• | Changes in investors' or analysts' perceptions of the risks and conditions of our business; |
• | The size of the public float of our common stock; |
• | Regulatory developments; |
• | Market conditions; and |
• | General economic conditions. |
Additionally, the average daily trading volume for our common stock as reported on the Nasdaq National Market is relatively low compared to larger companies whose shares trade on Nasdaq. There can be no assurance that a more active or consistent trading market in our common stock will develop. As a result, relatively small trades could have a significant impact on the price of our common stock.
ITEM 1B. Unresolved Staff Comments
There are no unresolved SEC comments with respect to reports filed by the Corporation under the Securities Exchange Act of 1934.
ITEM 2. Properties
Our headquarters is located in the main branch office in Alma, Michigan. Our subsidiary banks operate 46 banking offices throughout central and southwestern Michigan, most of which are full service facilities. Firstbank operates larger facilities in Alma, Mt. Pleasant, West Branch and Ionia. Keystone Community Bank’s main office is in Kalamazoo. The remaining branch facilities range in size from 1,200 to 3,200 square feet, based on the location and number of employees located at the facility. All but nine of the branch locations are owned by the company, with the remaining facilities rented under various operating lease agreements which have a range of remaining terms and renewal arrangements. In several instances, branch facilities contain more space than is required for current banking operations. This excess space, totaling approximately 17,000 square feet, is leased to unrelated businesses. We also maintain a separate facility for our central operations unit near our headquarters office in Alma, Michigan.
We consider our properties and equipment to be well maintained, in good operating condition and capable of accommodating current growth forecasts for their operations. However, we may choose to add additional branch locations to expand our presence in current or contiguous markets in the future to improve our opportunities for growth. We may also enter into sale/leaseback agreements in the future.
ITEM 3. Legal Proceedings.
We are parties, as plaintiff or as defendant, to routine litigation arising in the normal course of their business. In the opinion of management, the liabilities arising from these proceedings, if any, will not be material to our consolidated financial condition.
ITEM 4. Mine Safety Disclosures.
Not applicable.
Supplemental Item. Executive Officers of the Registrant.
Officers of the Corporation are appointed annually by the Board of Directors of the Corporation and serve at the pleasure of the Board of Directors. Information concerning the executive officers of the Corporation is given below. Thomas R. Sullivan and Samuel G. Stone are executive officers of the corporation. None of the other listed officers are executive officers. Except as otherwise indicated, all existing officers have had the same principal employment for over 5 years.
William L. Benear(age 67) became President & CEO of Firstbank – West Michigan in August 2008. Mr. Benear became executive vice president of Firstbank – West Michigan in February of 2008. Mr. Benear has been a Vice President of the Corporation since 2000. Prior to joining the West Michigan staff, Mr. Benear was President & CEO of Firstbank – Lakeview since January of 2000.
David L. Miller(age 48) was named a Vice President of the Corporation in December 2000. Prior to this appointment Mr. Miller served as Senior Vice President of Firstbank – Lakeview, having been employed there since 1992. Mr. Miller serves in the Human Resources Department for the Corporation and its subsidiaries.
Douglas J. Ouellette (age 47) became President & CEO of Firstbank (Mt. Pleasant) and Vice President of the Corporation in February 2007. Mr. Ouellette joined Firstbank (Mt. Pleasant) in 2000 and has served as Executive Vice President for Firstbank (Mt. Pleasant) since 2005. Subsequent to year end 2012, Mr. Ouellette was named President and Chief Operating Officer of Firstbank following the merger of the bank charters.
Daniel H. Grenier(age 60) became President & CEO of Firstbank – West Branch and Vice President of the Corporation in January 2010. Mr. Grenier joined Firstbank – West Branch in 1987. Prior to his appointment as President & CEO, Mr. Grenier served as Executive Vice President for Firstbank – West Branch.
Richard D. Rice (age 54) was named a Vice President of the Corporation in April 2004. Mr. Rice joined the Corporation in July 2003 and has served as the Corporation’s Controller since December 2003. From 1998 until his appointment to Firstbank Corporation, Mr. Rice served as Vice President – Accounting of National City Corporation (successor to First of America). Previous positions Mr. Rice held during his 13-year tenure with First of America include Vice President – Accounting and several staff accounting positions.
Thomas O. Schlueter(age 56) became President & CEO of Keystone Community Bank and Vice President of the Corporation in October 2005. From November 1998 until his appointment to President of Keystone Community Bank, Mr. Schlueter served as Executive Vice President, in addition to being named Chief Operating Officer and a Director of Keystone Community Bank in December 1999. Prior to joining Keystone Community Bank, Mr. Schlueter was employed by First of America Bank/National City Bank for approximately 23 years, with his last position being that of Senior Vice President/Middle Market Lending Group Manager for Southwest Michigan.
Samuel G. Stone(age 68) was appointed Executive Vice President, CFO, Secretary and Treasurer of the Corporation in December 2001. From November 2000 to the December 2001 appointment, Mr. Stone was Vice President, CFO, Secretary and Treasurer of the Corporation. From 1998 until his appointment to Firstbank Corporation, Mr. Stone served as Senior Vice President – Corporate Planning of National City Corporation (successor to First of America). Previous positions Mr. Stone held during his 28-year tenure with First of America included Senior Vice President and Treasurer, Vice President – Director of Corporate Planning and Vice President – Trust Investments. Subsequent to year end 2012, Mr. Stone was named Chief Financial Officer of Firstbank following the consolidation of the bank charters.
Thomas R. Sullivan (age 63) was appointed President & CEO of the Corporation in January 2000 and also served as President, CEO, and Director of Firstbank (Mt. Pleasant) from 1991 through 2007. Mr. Sullivan was Executive Vice President of the Corporation from 1996 to 2000 and served as Vice President of the Corporation from 1991 to 1996. Subsequent to year end 2012, Mr. Sullivan was named Chief Executive Officer of Firstbank, following the consolidation of the bank charters.
James E. Wheeler, II(age 54) was appointed President & CEO of Firstbank – Alma in January 2000. Mr. Wheeler has served as Vice President of the Corporation since March 1989. Mr. Wheeler served as Executive Vice President of Firstbank – Alma from 1999 to 2000 and from 1989 to 1999 as Senior Vice President and Chief Loan Officer of Firstbank – Alma. Subsequent to year end 2012, Mr. Wheeler was named Chief Lending Officer of Firstbank following the consolidation of bank charters.
PART II
ITEM 5. Market for Registrant’s Common Equity, Related Stockholder Matters, and Issuer Purchases of Equity Securities.
Firstbank Corporation Common Stock was held by1,715 shareholdersof record as of December 31, 2013. Total shareholders number approximately2,600,including those whose shares are held in nominee name through brokerage firms. Our shares are listed on the NASDAQ Global Select Market under the symbol FBMI and are traded by several brokers. The range of high and low sales prices for shares of common stock for each quarterly period during the past two years is as follows:
| Quarter | | High | | | Low | |
4th 2013 | | | $ | 20.79 | | | $ | 17.66 | |
3rd 2013 | | | $ | 19.73 | | | $ | 13.45 | |
2nd 2013 | | | $ | 13.83 | | | $ | 12.40 | |
1st 2013 | | | $ | 13.78 | | | $ | 9.88 | |
4th 2012 | | | $ | 11.45 | | | $ | 10.00 | |
3rd 2012 | | | $ | 11.49 | | | $ | 9.19 | |
2nd 2012 | | | $ | 10.42 | | | $ | 8.32 | |
1st 2012 | | | $ | 8.68 | | | $ | 4.97 | |
The prices quoted above were obtained from www.NASDAQ.com. Prices have been adjusted to reflect stock dividends.
The following table summarizes cash dividends paid per share of common stock during 2013 and 2012.
| | | 2013 | | | 2012 | |
First Quarter | | $ | 0.06 | | | $ | 0.06 | |
Second Quarter | | | 0.06 | | | | 0.01 | |
Third Quarter | | | 0.06 | | | | 0.01 | |
Fourth Quarter | | | 0.06 | | | | 0.21 | |
Total | | $ | 0.24 | | | $ | 0.29 | |
Our principal sources of funds to pay cash dividends are the earnings of, and dividends paid by, our subsidiary banks. Under current regulations the subsidiary banks are restricted in their ability to transfer funds in the form of cash dividends, loans, and advances to the holding company (See Note 20 of the Notes to Consolidated Financial Statements). As of January 1, 2014, approximately $22.1 million of the subsidiaries’ retained earnings were available for transfer in the form of dividends to the holding company without prior regulatory approval. In addition, the subsidiaries’ 2013 earnings are expected to be available for distributions as dividends to the holding company.
STOCK PERFORMANCE
The following graph compares the cumulative total shareholder return on the common stock of the Corporation to the Standard & Poor’s 500 Stock Index and the NASDAQ Bank Index, assuming a $100 investment at the end of 2008. The Standard & Poor’s 500 Stock Index is a broad equity market index. The NASDAQ Bank Index is composed of banks and savings institutions as well as companies performing functions closely related to banking, such as check cashing agencies, currency exchanges, safe deposit companies and corporations for banking abroad. Cumulative total return is measured by dividing (1) the sum of (A) the cumulative amount of dividends for the measurement period, assuming dividend reinvestment, and (B) the difference between the share price at the end and the beginning of the measurement period; by (2) the share price at the beginning of the measurement period.
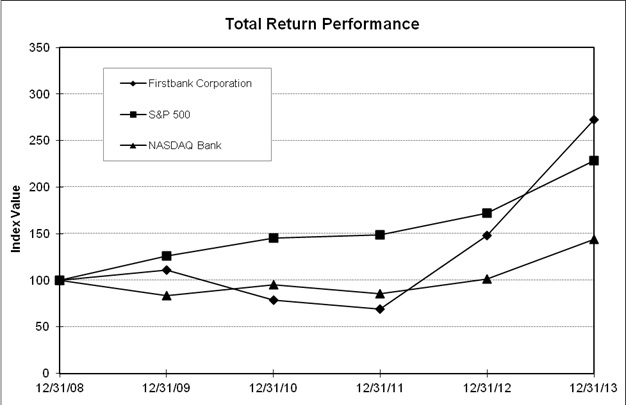
The table below shows dollar values for cumulative total shareholder return plotted in the graph above.
| | | 2008 | | | 2009 | | | 2010 | | | 2011 | | | 2012 | | | 2013 | |
Firstbank Corporation | | $ | 100.00 | | | $ | 111.13 | | | $ | 78.40 | | | $ | 69.12 | | | $ | 148.43 | | | $ | 272.71 | |
S & P 500 | | $ | 100.00 | | | $ | 126.46 | | | $ | 145.51 | | | $ | 148.59 | | | $ | 172.37 | | | $ | 228.19 | |
NASDAQ Bank | | $ | 100.00 | | | $ | 83.70 | | | $ | 95.55 | | | $ | 85.52 | | | $ | 101.50 | | | $ | 143.84 | |
ITEM 6. Selected Financial Data.
FINANCIAL HIGHLIGHTS
Firstbank Corporation
(In Thousands of Dollars, Except per Share Data) | | | | | | | | | | | | | | | | | |
For the year: | | 2013 | | | 2012 | | | 2011 | | | 2010 | | | 2009 | |
Interest income | | $ | 58,274 | | | $ | 62,866 | | | $ | 67,644 | | | $ | 72,382 | | | $ | 74,686 | |
Net interest income | | | 52,100 | | | | 54,492 | | | | 54,672 | | | | 51,492 | | | | 48,747 | |
Provision for loan losses | | | 1,830 | | | | 7,690 | | | | 13,337 | | | | 13,344 | | | | 14,671 | |
Non-interest income | | | 10,788 | | | | 12,670 | | | | 9,675 | | | | 11,829 | | | | 15,409 | |
Non-interest expense | | | 43,690 | | | | 44,682 | | | | 43,553 | | | | 44,702 | | | | 45,750 | |
Net income | | | 12,234 | | | | 10,534 | | | | 5,623 | | | | 3,763 | | | | 2,691 | |
Net income available to common shareholders | | | 11,753 | | | | 9,259 | | | | 3,944 | | | | 2,084 | | | | 1,151 | |
| | | | | | | | | | | | | | | | | | | | | |
At year end: | | | | | | | | | | | | | | | | | | | | |
Total assets | | | 1,479,725 | | | | 1,498,762 | | | | 1,485,299 | | | | 1,458,343 | | | | 1,482,356 | |
Total earning assets | | | 1,385,157 | | | | 1,375,946 | | | | 1,351,099 | | | | 1,332,662 | | | | 1,342,530 | |
Loans | | | 987,547 | | | | 966,683 | | | | 984,258 | | | | 1,032,975 | | | | 1,122,185 | |
Deposits | | | 1,232,792 | | | | 1,241,401 | | | | 1,220,542 | | | | 1,183,783 | | | | 1,149,063 | |
Other borrowings | | | 103,509 | | | | 101,362 | | | | 102,325 | | | | 118,070 | | | | 175,756 | |
Common shareholders’ equity | | | 137,626 | | | | 130,150 | | | | 122,585 | | | | 115,665 | | | | 114,173 | |
Total shareholders’ equity | | | 137,626 | | | | 147,058 | | | | 155,377 | | | | 148,428 | | | | 146,880 | |
| | | | | | | | | | | | | | | | | | | | | |
Average balances: | | | | | | | | | | | | | | | | | | | | |
Total assets | | | 1,487,270 | | | | 1,500,015 | | | | 1,489,737 | | | | 1,488,673 | | | | 1,433,555 | |
Total earning assets | | | 1,381,144 | | | | 1,382,519 | | | | 1,364,139 | | | | 1,351,872 | | | | 1,300,354 | |
Loans | | | 973,693 | | | | 982,124 | | | | 1,004,599 | | | | 1,077,718 | | | | 1,135,868 | |
Deposits | | | 1,232,644 | | | | 1,230,151 | | | | 1,224,638 | | | | 1,170,195 | | | | 1,064,567 | |
Other borrowings | | | 103,414 | | | | 106,569 | | | | 104,010 | | | | 160,547 | | | | 207,614 | |
Common shareholders’ equity | | | 133,650 | | | | 125,900 | | | | 117,287 | | | | 114,207 | | | | 114,424 | |
Total shareholders’ equity | | | 141,205 | | | | 150,535 | | | | 150,065 | | | | 146,948 | | | | 144,583 | |
| | | | | | | | | | | | | | | | | | | | | |
Per common share: | | | | | | | | | | | | | | | | | | | | |
Basic earnings | | $ | 1.46 | | | $ | 1.17 | | | $ | 0.50 | | | $ | 0.27 | | | $ | 0.15 | |
Diluted earnings | | $ | 1.45 | | | $ | 1.16 | | | $ | 0.50 | | | $ | 0.27 | | | $ | 0.15 | |
Cash dividends | | $ | 0.24 | | | $ | 0.29 | | | $ | 0.04 | | | $ | 0.08 | | | $ | 0.40 | |
Common shareholders’ equity | | $ | 17.03 | | | $ | 16.24 | | | $ | 15.53 | | | $ | 14.82 | | | $ | 14.77 | |
| | | | | | | | | | | | | | | | | | | | | |
Financial ratios: | | | | | | | | | | | | | | | | | | | | |
Return on average assets | | | 0.82 | % | | | 0.70 | % | | | 0.38 | % | | | 0.25 | % | | | 0.19 | % |
Return on average total equity | | | 8.66 | % | | | 7.00 | % | | | 3.75 | % | | | 2.56 | % | | | 1.86 | % |
Average equity to average assets | | | 9.49 | % | | | 10.04 | % | | | 10.07 | % | | | 9.87 | % | | | 10.09 | % |
Average common equityto average assets | | | 8.99 | % | | | 8.39 | % | | | 7.87 | % | | | 7.67 | % | | | 7.98 | % |
Dividend payout ratioon common stock | | | 16.55 | % | | | 21.97 | % | | | 5.58 | % | | | 16.47 | % | | | 113.80 | % |
The Company’s Form 10-K Annual Report filed with the Securities and Exchange Commission will be provided to any shareholder, without charge, upon written request. Requests should be addressed to: Samuel G. Stone, Chief Financial Officer, Firstbank Corporation, 311 Woodworth Avenue, P.O. Box 1029, Alma, Michigan 48801-6029 The Company’s Form 10-K may also be viewed through our web site atwww.firstbankmi.com.
ITEM 7. Management’s Discussion and Analysis of Financial Condition and Results of Operations.
The purpose of this section of the annual report is to provide a narrative discussion about Firstbank Corporation’s financial condition and results of operations. Please refer to the consolidated financial statements and the selected financial data presented in this report in addition to the following discussion and analysis. We also encourage you to read our Annual Report on Form 10-K filed with the U.S. Securities and Exchange Commission.
RESULTS OF OPERATIONS
Highlights
Firstbank Corporation (“We” or “the Company”) had net income of $12.2 million for 2013 compared with $10.5 million in 2012, an increase of $1.7 million, or 16%. After payment of dividends on preferred stock, net income available to common shareholders was $11.8 million for 2013 compared with $9.3 million in 2012, an increase of $2.5 million or 27%. Core banking activities continued to provide a solid basis for earnings as net interest income was relatively constant, down $2.4 million from 2012. Lower loan loss provisioning was a key to the improved earnings, declining $5.9 million from a year ago to $1.8 million in 2013.
In June we redeemed the remaining $17 million outstanding preferred stock, at par from private investors.
In August, we announced our intention to merge the Company with Mercantile Bank Corporation in Grand Rapids. Shareholders from both companies voted on the combination, and overwhelmingly approved the merger transaction in December. We are actively planning for the merger as we await final regulatory approval to complete the transaction. As a result of activities associated with the planned merger, we incurred $871,000 of expenses during 2013.
Gain on the sale of mortgage loans at $4.4 million in 2013 continued to support earnings, although at a reduced level from $6.5 million in the prior year.
We achieved a return on average assets of 0.82%, 0.70%, and 0.38% for 2013, 2012, and 2011, respectively. Total average assets decreased $13 million in 2013, after having increased $10 million in 2012, and $1 million in 2011. Basic and diluted earnings per share were $1.46 and $1.45 in 2013 compared with, $1.17 and $1.16 in 2012, and $0.50 for both measures in 2011. Return on equity was 8.66% in 2013, 7.00% in 2012, and 3.75% in 2011.
Net Interest Income
Our core business is earning interest on loans and securities while paying interest on deposits and borrowings. In response to an economic recession in the United States, the Federal Reserve maintained overnight interest rates at historically low levels of 0.00% to 0.25% for a fifth consecutive year. While these low short term rates allow us to lower the rates we pay on certain deposit products, it also reduces the rates we are able to earn on variable rate loan products and rates charged on renewing fixed rate loans. The net interest spread, the difference between the interest rates charged on earning assets and the rate paid on interest bearing liabilities, was relatively stable throughout the year, although lower than the previous year, averaging 3.72%. We ended 2012 with a 3.77% net interest spread in the fourth quarter of 2012. As a result, our net interest margin decreased, ending the year with a net interest margin of 3.84% compared with 3.99% in 2012, and 4.06% in 2011. During 2013, our average loan to average deposit ratio was 79%, lower than the 80% in 2012 and 82% in 2011. The decreasing ratio is a result of both our efforts in attracting core deposits and declining loan balances. We maintain capital and funding capacity as well as a desire to expand lending; however, demand for quality loans in our local economies remains very soft at this time.
Net interest income decreased in 2013 by $2.4 million as our lower net interest margin and a slightly lower level of average earning assets combined to lower net interest income. Average interest earning assets decreased $1.4 million from 2012 levels. The decrease in average interest earning assets was largely a result of higher average balances in the investment portfolio, which rose by $10 million, $27 million decrease in average interest bearing deposits, and a $1.5 million decrease in average loan balances. A critical task of management is to price assets and liabilities so that the spread between the interest earned on assets and the interest paid on liabilities is maximized while maintaining acceptable levels of risk. While interest rates on earning assets and interest bearing liabilities are subject to market forces, in general and in the short run, we can exert more control over deposit rates than earning asset rates. However, competitive forces and the need to retain and grow deposits as a funding source place limitations on the degree of control over deposit rates. Average interest bearing liabilities decreased $29 million during the year, and the average rate paid on these liabilities fell by 19 basis points resulting in a decrease to interest expense of $2.2 million.
The following table presents a summary of net interest income for 2013, 2012, and 2011.
Summary of Consolidated Net Interest Income
| | | Year EndedDecember 31, 2013 | | | Year EndedDecember 31, 2012 | | | Year EndedDecember 31, 2011 | |
(In Thousands of Dollars) | | Average Balance | | | Interest | | | Average Rate | | | Average Balance | | | Interest | | | Average Rate | | | Average Balance | | | Interest | | | Average Rate | |
| | | | | | | | | | | | | | | | | | | | | | | | | | | | | | | | | | | | | |
Average Assets | | | | | | | | | | | | | | | | | | | | | | | | | | | | | | | | | | | | |
Interest Earning Assets: | | | | | | | | | | | | | | | | | | | | | | | | | | | | | | | | | | | | |
Taxable securities | | $ | 258,074 | | | $ | 3,799 | | | | 1.47 | % | | $ | 293,554 | | | $ | 4,512 | | | | 1.54 | % | | $ | 264,657 | | | $ | 4,808 | | | | 1.82 | % |
Tax exempt securities(1) | | | 100,618 | | | | 2,595 | | | | 2.58 | % | | | 54,796 | | | | 1,774 | | | | 3.24 | % | | | 40,273 | | | | 1,719 | | | | 4.27 | % |
Total Securities | | | 358,692 | | | | 6,394 | | | | 1.78 | % | | | 348,350 | | | | 6,286 | | | | 1.80 | % | | | 304,930 | | | | 6,527 | | | | 2.14 | % |
| | | | | | | | | | | | | | | | | | | | | | | | | | | | | | | | | | | | | |
Loans(1) (2) | | | 961,536 | | | | 52,708 | | | | 5.48 | % | | | 963,027 | | | | 57,086 | | | | 5.93 | % | | | 981,976 | | | | 61,545 | | | | 6.27 | % |
Federal funds sold | | | 123 | | | | 1 | | | | 0.32 | % | | | 626 | | | | 1 | | | | 0.16 | % | | | 642 | | | | 1 | | | | 0.16 | % |
Interest bearing deposits | | | 60,793 | | | | 176 | | | | 0.29 | % | | | 70,516 | | | | 209 | | | | 0.30 | % | | | 76,591 | | | | 253 | | | | 0.33 | % |
Total Earning Assets | | | 1,381,144 | | | | 59,279 | | | | 4.29 | % | | | 1,382,519 | | | | 63,582 | | | | 4.60 | % | | | 1,364,139 | | | | 68,326 | | | | 5.01 | % |
| | | | | | | | | | | | | | | | | | | | | | | | | | | | | | | | | | | | | |
Nonaccrual loans | | | 11,940 | | | | | | | | | | | | 19,097 | | | | | | | | | | | | 22,623 | | | | | | | | | |
Less allowance for loan loss | | | (20,638 | ) | | | | | | | | | | | (21,814 | ) | | | | | | | | | | | (21,650 | ) | | | | | | | | |
Cash and due from banks | | | 26,266 | | | | | | | | | | | | 27,645 | | | | | | | | | | | | 26,867 | | | | | | | | | |
Other non-earning assets | | | 88,558 | | | | | | | | | | | | 92,568 | | | | | | | | | | | | 97,758 | | | | | | | | | |
Total Assets | | $ | 1,487,270 | | | | | | | | | | | $ | 1,500,015 | | | | | | | | | | | $ | 1,489,737 | | | | | | | | | |
| | | | | | | | | | | | | | | | | | | | | | | | | | | | | | | | | | | | | |
Average Liabilities | | | | | | | | | | | | | | | | | | | | | | | | | | | | | | | | | | | | |
Interest Bearing Liabilities: | | | | | | | | | | | | | | | | | | | | | | | | | | | | | | | | | | | | |
Demand | | $ | 354,877 | | | | 662 | | | | 0.19 | % | | $ | 344,363 | | | | 801 | | | | 0.23 | % | | $ | 319,053 | | | | 1,306 | | | | 0.41 | % |
Savings | | | 275,539 | | | | 518 | | | | 0.19 | % | | | 259,330 | | | | 579 | | | | 0.22 | % | | | 235,422 | | | | 1,032 | | | | 0.44 | % |
Time | | | 347,038 | | | | 3,711 | | | | 1.07 | % | | | 400,397 | | | | 5,246 | | | | 1.31 | % | | | 470,314 | | | | 8,554 | | | | 1.82 | % |
Total Deposits | | | 977,454 | | | | 4,891 | | | | 0.50 | % | | | 1,004,090 | | | | 6,626 | | | | 0.66 | % | | | 1,024,789 | | | | 10,892 | | | | 1.06 | % |
| | | | | | | | | | | | | | | | | | | | | | | | | | | | | | | | | | | | | |
Federal funds purchasedand repurchase agreements | | | 46,694 | | | | 85 | | | | 0.18 | % | | | 47,659 | | | | 87 | | | | 0.18 | % | | | 43,848 | | | | 83 | | | | 0.19 | % |
FHLB advances andnotes payable | | | 21,280 | | | | 547 | | | | 2.57 | % | | | 22,831 | | | | 625 | | | | 2.74 | % | | | 24,078 | | | | 802 | | | | 3.33 | % |
Subordinated debentures | | | 36,084 | | | | 658 | | | | 1.82 | % | | | 36,084 | | | | 1,068 | | | | 2.96 | % | | | 36,084 | | | | 1,197 | | | | 3.32 | % |
Total Interest Bearing | | | | | | | | | | | | | | | | | | | | | | | | | | | | | | | | | | | | |
Liabilities | | | 1,081,512 | | | | 6,181 | | | | 0.57 | % | | | 1,110,664 | | | | 8,406 | | | | 0.76 | % | | | 1,128,799 | | | | 12,974 | | | | 1.15 | % |
| | | | | | | | | | | | | | | | | | | | | | | | | | | | | | | | | | | | | |
Demand Deposits | | | 255,189 | | | | | | | | | | | | 226,061 | | | | | | | | | | | | 199,849 | | | | | | | | | |
Total Funds | | | 1,336,701 | | | | | | | | | | | | 1,336,725 | | | | | | | | | | | | 1,328,648 | | | | | | | | | |
| | | | | | | | | | | | | | | | | | | | | | | | | | | | | | | | | | | | | |
Other Non-Interest Bearing | | | | | | | | | | | | | | | | | | | | | | | | | | | | | | | | | | | | |
Liabilities | | | 9,364 | | | | | | | | | | | | 12,755 | | | | | | | | | | | | 11,024 | | | | | | | | | |
Total Liabilities | | | 1,346,065 | | | | | | | | | | | | 1,349,480 | | | | | | | | | | | | 1,339,672 | | | | | | | | | |
| | | | | | | | | | | | | | | | | | | | | | | | | | | | | | | | | | | | | |
Average Shareholders’ Equity | | | 141,205 | | | | | | | | | | | | 150,535 | | | | | | | | | | | | 150,065 | | | | | | | | | |
Total Liabilities andShareholders’ Equity | | $ | 1,487,270 | | | | | | | | | | | $ | 1,500,015 | | | | | | | | | | | $ | 1,489,737 | | | | | | | | | |
| | | | | | | | | | | | | | | | | | | | | | | | | | | | | | | | | | | | | |
Net Interest Income(1) | | | | | | $ | 53,098 | | | | | | | | | | | $ | 55,176 | | | | | | | | | | | $ | 55,352 | | | | | |
| | | | | | | | | | | | | | | | | | | | | | | | | | | | | | | | | | | | | |
Rate Spread(1) | | | | | | | | | | | 3.72 | % | | | | | | | | | | | 3.84 | % | | | | | | | | | | | 3.86 | % |
| | | | | | | | | | | | | | | | | | | | | | | | | | | | | | | | | | | | | |
Net Interest Margin (percent ofAverage earning assets)(1) | | | | | | | | | | | 3.84 | % | | | | | | | | | | | 3.99 | % | | | | | | | | | | | 4.06 | % |
(1) | Presented on a fully taxable equivalent basis using a federal income tax rate of 35% for all periods presented. |
| |
(2) | Interest income includes amortization of loan fees of $1.9 million, $2.0 million, and $1.8 million for 2013, 2012, and 2011, respectively. Uncollected interest on nonaccrual loans is not included |
The table below provides an analysis of the changes in interest income and interest expense due to volume and rate:
| | | 2012/2013 | | | 2011/2012 | |
| | | | | | | | | | | | | | | | | | | | | | | | | |
| | | Change in Interest Due to: (1) | | | Change in Interest Due to: (1) | |
| | | | | | | | | | | | | | | | | | | | | | | | | |
| | | AverageVolume | | | AverageRate | | | NetChange | | | AverageVolume | | | AverageRate | | | NetChange | |
| | | (In Thousands of Dollars) | |
| | | | | | | | | | | | | | | | | | | | | | | | | |
Interest Income: | | | | | | | | | | | | | | | | | | | | | | | | |
Securities | | | | | | | | | | | | | | | | | | | | | | | | |
Taxable Securities(2) | | $ | (537 | ) | | $ | (76 | ) | | $ | (613 | ) | | $ | 393 | | | $ | (770 | ) | | $ | (377 | ) |
Tax-exempt Securities | | | 1,212 | | | | (491 | ) | | �� | 721 | | | | 530 | | | | (475 | ) | | | 55 | |
Total Securities | | | 675 | | | | (567 | ) | | | 108 | | | | 923 | | | | (1,245 | ) | | | (322 | ) |
| | | | | | | | | | | | | | | | | | | | | | | | | |
Loans(2) | | | (88 | ) | | | (4,290 | ) | | | (4,378 | ) | | | (1,171 | ) | | | (3,288 | ) | | | (4,459 | ) |
Federal Funds Sold | | | (1 | ) | | | 1 | | | | 0 | | | | | | | | | | | | | |
Interest Bearing Deposits | | | (28 | ) | | | (5 | ) | | | (33 | ) | | | 0 | | | | 37 | | | | 37 | |
| | | | | | | | | | | | | | | | | | | | | | | | | |
Total Interest Income on Earning Assets | | | 558 | | | | (4,861 | ) | | | (4,303 | ) | | | (248 | ) | | | (4,496 | ) | | | (4,744 | ) |
| | | | | | | | | | | | | | | | | | | | | | | | | |
| | | | | | | | | | | | | | | | | | | | | | | | | |
Interest Expense: | | | | | | | | | | | | | | | | | | | | | | | | |
Deposits | | | | | | | | | | | | | | | | | | | | | | | | |
Interest Paying Demand | | | 24 | | | | (163 | ) | | | (139 | ) | | | 97 | | | | (602 | ) | | | (505 | ) |
Savings | | | 35 | | | | (96 | ) | | | (61 | ) | | | 96 | | | | (549 | ) | | | (453 | ) |
Time | | | (645 | ) | | | (890 | ) | | | (1,535 | ) | | | (1,148 | ) | | | (2,160 | ) | | | (3,308 | ) |
Total Deposits | | | (586 | ) | | | (1,149 | ) | | | (1,735 | ) | | | (955 | ) | | | (3,311 | ) | | | (4,266 | ) |
| | | | | | | | | | | | | | | | | | | | | | | | | |
| | | | | | | | | | | | | | | | | | | | | | | | | |
Federal Funds Purchased and Securities | | | | | | | | | | | | | | | | | | | | | | | | |
Sold under Agreements to Repurchase | | | (2 | ) | | | 0 | | | | (2 | ) | | | 7 | | | | (3 | ) | | | 4 | |
FHLB and Other Notes Payable | | | (41 | ) | | | (38 | ) | | | (79 | ) | | | (40 | ) | | | (137 | ) | | | (177 | ) |
Subordinated Debentures | | | 0 | | | | (410 | ) | | | (410 | ) | | | 0 | | | | (129 | ) | | | (129 | ) |
| | | | | | | | | | | | | | | | | | | | | | | | | |
Total Interest Expense on Liabilities | | | (629 | ) | | | (1,597 | ) | | | (2,226 | ) | | | (988 | ) | | | (3,580 | ) | | | (4,568 | ) |
| | | | | | | | | | | | | | | | | | | | | | | | | |
Net Interest Income | | $ | 1,187 | | | $ | (3,264 | ) | | $ | (2,077 | ) | | $ | 740 | | | $ | (916 | ) | | $ | (176 | ) |
(1) | Changes in volume/rate have been allocated between the volume and rate variances on the basis of the ratio that the volume and rate variances bear to each other. |
(2) | Interest is presented on a fully taxable equivalent basis using a federal income tax rate of 35%. |
In 2013, the average rate realized on earning assets was 4.29%, a decrease of 31 basis points from the 2012 results of 4.60%, and 72 basis points lower than the 5.01% realized in 2011. In 2008, in reaction to a weakening economy and a credit crisis in the financial markets, the Federal Reserve aggressively lowered rates by 2.25% between January and April bringing the prime rate down to 5.00%. After a six month pause in the rate reduction strategy, the Federal Reserve then lowered rates by another 1.75% in the fourth quarter with the prime rate settling at 3.25% at year end 2008, where it has remained through the end of 2013. Current language from the Federal Reserve indicates their intention to maintain this level of rates sometime into 2015. In addition, the Federal Reserve has also been purchasing longer term bonds in the open market in an effort to keep longer term rates low.
Average loans outstanding decreased $1.5 million in 2013 when compared with 2012. As of December 31, 2013, approximately 19% of the loan portfolio was comprised of variable rate instruments, compared with 22% as of the end of 2012. The remaining 81% of the loan portfolio is made up of fixed rate loans that do not re-price until maturity. Of the fixed rate loans approximately $90 million, or11%,mature within twelve months and are subject to rate adjustments at maturity. At year end 2013, 87%of our variable rate commercial loan portfolio was protected by a floor compared with 92% at the end of 2012.
During 2012 and 2013 maturing securities in the investment portfolio were replaced with securities of comparable quality bearing generally lower yields. As a result, maturing securities ran off from the investment portfolio at higher rates than comparable current offerings, decreasing the overall investment portfolio tax equivalent yield from 2.14% in 2011 to 1.80% in 2012 and 1.78% in 2013.
Average total interest bearing deposits for the year decreased $27 million. The average rate paid on interest bearing liabilities was 0.57% in 2013, compared to 0.76% in 2012, and 1.15% in 2011. Deposit rates decreased during 2012 and 2013 with the soft economy. Average rates paid on time deposits decreased 24 basis points in 2013 compared with 2012 and 75 basis points compared with 2011, as new and renewing deposits re-priced to lower rates. Rates on checking and savings deposits also decreased in 2013, falling four basis points and three basis points, respectively. These same rates were 22 basis points and 26 basis points lower in 2013 than they had been in 2011.
Brokered CDs are more sensitive to changes in the interest rate than CDs offered in local markets and have been issued with original maturities ranging from three months to two years. The average balance of brokered CDs in 2013 was $17 million, compared with $18 million in 2012 and $15 million in 2011. These CDs carried an average interest rate of 0.62% in 2013 compared with 0.69% in 2012, and 0.88% in 2011.
We fund a portion of our loan portfolio with borrowings from the Federal Home Loan Bank (FHLB). During 2013, the average outstanding balance of FHLB advances decreased $1.6 million and year-end balance decreased $2.7 million when compared with 2012 balances. While FHLB borrowings are one method of funding loans when core deposits are not available, the cost is typically higher than our core deposit costs. As core deposit funding has increased and loan demand decreased, we have been able to reduce our reliance on this source of funding. The 2013 average rate paid for Federal Home Loan Bank advances and notes payable was 2.57%, 17 basis points lower than 2012’s rate of 2.74%. Subsequent to year end we prepaid approximately $6.8 million in FHLB Advances, incurring a prepayment penalty of $1.3 million.
In July of 2007, we issued $15.5 million in subordinated debentures to fund a portion of the ICNB acquisition. That issuance was split evenly between debentures that carry a fixed rate of 6.566% for five years, and variable interest rate debentures that carry a rate of 90 day LIBOR plus 1.35%. During 2012 the fixed rate debentures converted to variable rate debentures that carry a rate of 90 day LIBOR plus 1.35%. In January of 2006, we issued $10.3 million in subordinated debentures that carried a fixed rate of 6.049% for five years. During 2011 this issuance converted to a variable interest rate of 90 day LIBOR plus 1.27%. In October of 2004, we issued $10.3 million in subordinated debentures, at a variable interest rate of 90 day LIBOR plus 1.99%. The average rate paid on all subordinated debentures during 2013 was 1.82% compared with 2.96% and 3.32% in 2012 and 2011, respectively. All of the variable rate debentures re-price quarterly.
We utilize short term borrowing, made up of Federal Funds Purchased and Repurchase Agreements as a source of liquidity and to balance our daily cash needs. Average short term borrowed funds decreased by $1 million when 2013 is compared with 2012.
The 2013 interest rate spread of 3.72% is 12 basis points lower than the 2012 spread of 3.84%, and 14 basis points lower than the 2011 spread of 3.86%. Tax equivalent net interest income decreased $2.1 million in 2013 as a decrease in total average earning assets of $1.4 million and a 15 basis point decline in the net interest margin decreased earnings. The net interest margin of 3.84% for 2013 was 15 basis points below 2012 and 22 basis points lower than 2011. The decrease in the rate spread in 2013 was the result of rates on average earning assets decreasing 31 basis points while the average cost of interest bearing liabilities decreased 19 basis points. The 15 basis point decrease in the net interest margin was attributable to these same metrics. Average earning assets represented 93% of total average assets in 2013 compared with 92% in 2012 and 91% in 2011.
Provision for Loan Losses
In accordance with accounting standards, we allocate a portion of the allowance to loans that we determine to be impaired. We analyze other loans and current market conditions on a pool basis in order to arrive at the appropriate allowance for loan losses. If a loan for which allocations had been established pays off, or the risk of loss is otherwise reduced, we reverse those specific allocations. The methodology described above resulted in a provision for loan losses in 2013 of $1.8 million, compared with $7.7 million in 2012, and $13.3 million in 2011. These provision charges, which exceed pre-recession levels, were incurred as struggling borrowers resulted in new problem loans for which either allocated reserves were established for probable losses, or loans were charged off during the year.
During 2013, we had recoveries of previously charged off loans totaling $871,000, and favorable outcomes on certain previously identified problem loans, reducing the amount of provision expense needed, while deterioration of certain loans to problem status and charge offs of $6.0 million increased the amount of provision expense needed. In 2012, we had recoveries of previously charged off loans totaling $1.1 million and favorable outcomes on certain previously identified problem loans, reducing the amount of provision expense needed, while deterioration of certain loans to problem status and charge offs of $8.4 million increased the amount of provision expense needed.
At December 31, 2013, the allowance for loan losses as a percent of total loans was 1.82% compared to 2.21% and 2.14% at December 31, 2012, and December 31, 2011, respectively. Total nonperforming loans (including performing restructured loans) were 3.12% of ending loans at December 31, 2013, compared to 3.78% and 4.27% at the two previous year ends. The decrease in the ratio in 2013 was due to a decrease in nonaccrual loans of $6 million. Loans 90 days past due and restructured loans were unchanged from the prior year end. All loans reported as restructured are current or less than 90 days past due and conforming to the agreed upon restructured terms of the loan. The decrease in the nonperforming ratio in 2012 was due to a decrease in nonaccrual loans of $7 million, a reduction in 90 day past due loans of $0.4 million, which were partially offset by an increase in restructured loans of $2 million.
Net charged off loans totaled $5.2 million in 2013 compared to $7.4 million in 2012, and $13.7 million in 2011. Net charged off loans as a percent of average loans were 0.53% in 2013, 0.75% in 2012, and 1.37% in 2011. Charge offs of $932,000 in 2013 had specific reserves established in a prior year, while in 2012 and 2011, $1.7 million and $3.9 million, respectively, of specific allowance allocations had been set aside at the end of the prior year. Provision expense did not need to be increased to cover those previously identified losses.
Non-interest Income
Non-interest income decreased by $1.9 million when 2013 is compared with 2012. Affecting the results in 2013 were gains on the sale of mortgages, which were down $2.1 million, service charges on deposit accounts which decreased $83,000, and a decrease in other income of $304,000. Partially offsetting these items were increases in gain on sale of securities of $290,000, and increases in mortgage servicing income of $294,000. Comparing 2012 to 2011 non-interest income increased by $3.0 million. Affecting the comparison in 2012 were gains on the sale of mortgages, which were up $2.8 million, and other income which increased $652,000. Partially offsetting these items was a decrease in service charges on deposit accounts of $273,000 and a decline in mortgage servicing income of $320,000.
Gains on the sale of mortgage loans decreased $2.1 million when comparing 2013 to 2012. Steady demand for re-financing of existing mortgage loans gave way in the latter half of 2013 as rates moved higher slowing the pace of gains. Gains on the sale of mortgage loans increased $2.8 million in 2012 compared with 2011. The low interest rate environment during 2012 pushed mortgage rates to record lows during the year, spurring a high level of refinance activity. In 2011, new regulatory requirements and onerous conditions placed on the sale of loans in the secondary market resulted in lower gains on the sale of loans. By midyear 2011, rates had fallen once again to the point where refinance activity picked up and the second half of the year generated higher gains
Mortgage servicing rights, net of amortization, increased from a negative $231,000 in 2012 to a positive $63,000 in 2013 as amortization and write downs of servicing rights due to the high level of refinancing receded during the year. When a mortgage is refinanced or pre-paid, capitalized mortgage servicing rights relating to that mortgage are written off, with the write off amounts included in the amortization cost of servicing rights. Comparing 2012 to 2011, mortgage servicing rights, net of amortization, declined from $89,000 in 2011 to a negative $231,000 in 2012 as amortization and write downs of servicing rights due to the high level of refinancing negatively affected this line item. The higher level of refinance activity in 2012 compared with 2011 resulted in $605,000 more of servicing rights reversals. Income from servicing loans increased by $285,000 during 2012, partially offsetting the higher servicing rights expense.
Deposit account service charges declined $83,000 in 2013 to $4.1 million, stabilizing somewhat compared to the prior year. Deposit account service charges declined $273,000 from $4.5 million in 2011 to $4.2 million in 2012. Changing customer behavior associated with new regulations regarding overdraft charges put in place mid-year 2011 resulted in lower fees collected.
During 2013 we booked $334,000 in gains on securities transactions compared with $44,000 during 2012. These gains are ancillary income from our available for sale securities portfolio. During 2013, we liquidated a position in FHLMC preferred stock that had previously been written down and had recovered some of its value. Comparing 2012 to 2011, we recorded $44,000 in securities gains in 2012 compared with a loss on securities of $37,000 the prior year. The gains in 2012 and losses in 2011 resulted from routine securities transactions during the year.
Other income decreased $304,000 in 2013 to $1.8 million. Within the category of other income, gains on the sale of other real estate owned decreased by $47,000, and in 2012 we recorded $178,000 non-recurring item relating to a director benefit plan. Comparing 2012 to 2011, other income increased $652,000 from $1.5 million in 2011 to $2.1 million in 2012, primarily due to higher gains on the sale of other real estate owned, which improved by $389,000, and other income increased $263,000 primarily due to a $178,000 non-recurring item relating to a director benefit plan. Gains on the sale of other real estate owned were $436,000 in 2013, $484,000 in 2012, and $95,000 in 2011.
Non-interest Expense
Total non-interest expense was $43.7 million in 2013 compared with $44.7 million in 2012 and $43.6 million in 2011. Within non-interest expense, salaries and benefits increased $601,000, merger related expenses were $871,000, while other real estate owned expenses decreased $1.1 million and other non-interest expense decreased $958,000. Comparing 2012 to 2011, salaries and benefits increased $1.4 million and other non-interest expense increased $1.7 million, while other real estate owned expense decreased $1.5 million.
Salary and employee benefits expenses increased $601,000 in 2013 from $22.7 million in 2012 to $23.3 million in 2013. Within this line item, benefits costs increased $194,000, variable compensation expense increased $128,000, and base salaries increased $279,000.
Salary and employee benefits expenses increased $1.4 million in 2012 from $21.3 million in 2011 to $22.7 million in 2012. Within this line item, benefits cost increased $131,000, variable compensation expense increased $711,000, and base salaries increased $575,000, or 3.6%. The company’s improved performance resulted in higher payments under the variable compensation plan.
Occupancy and equipment costs increased $154,000 in 2013 compared with 2012 primarily due to a project to replace many of our office computers, due to impending operating system obsolescence, more than offset a $68,000 decrease in depreciation expense. Occupancy and equipment costs decreased $159,000 in 2012 compared with 2011 primarily due to a $147,000 decrease in depreciation expense.
FDIC expense decreased $231,000 to $989,000 in 2013 as the merger of four of our bank charters resulted in a lower assessment costs. FDIC expense decreased $340,000 to $1.2 million in 2012, mainly due to the full year impact of a new method of assessing premiums to banks that was instituted mid way through 2011.
Amortization of intangibles was $369,000 in 2013, compared with $483,000 in 2012, a reduction of $114,000. Amortization expense in 2011 was $698,000. The year over year reduction in the costs are primarily due to the accelerated amortization method used to expense core deposit premiums from recent acquisitions and the completion of amortization on a prior acquisition.
Expenses for outside professional services was relatively unchanged at $1.3 million in both 2013 and 2012 and up only slightly from $1.2 million in 2011.
Advertising and special promotion expense was $1.3 million, down $176,000, or 11.8% in 2013 following an increase of $66,000 in 2012. The changes in this expense category are somewhat affected by special promotion expense which is related to mortgage refinance volumes. This expense decreased $159,000 in 2013 after having increased $89,000 during 2012 due to higher mortgage activity.
Other real estate expense and valuation write downs declined $1.1 million to $559,000 in 2013 from $1.7 million in 2012 and $3.2 million in 2011. The cost of carrying properties for longer time frames and write downs due to decreasing property values caused the level of these expenses to be elevated in 2011. Since that time, property values have stabilized and few loans have defaulted. Within this category of expenses, valuation write downs were $209,000 in 2013, $1.1 million in 2012, and $2.3 million in 2011.
Other non-interest expense decreased to $9.7 million from $10.7 million in 2012 and was $8.9 million in 2011. Affecting the costs on this line in 2012 were one time nonrecurring expenses of $754,000 related to branch closings and $170,000 related to the auction and repurchase of preferred shares. We also recorded reserves for losses associated with mortgage put backs from loans we have sold in the secondary market of $700,000 in 2013 and $750,000 in 2012. We also incurred $871,000 in costs associated with our planned merger with Mercantile Bank during 2013. These expenses relate primarily to investment banker fees, legal fees, and proxy solicitation expenses for the shareholder vote.
Federal Income Tax
In 2013 we had federal tax expense of $5.1 million on pre-tax earnings of $17.4 million, resulting in an effective tax rate of 30%. In 2012 we had federal tax expense of $4.3 million on pre-tax earnings of $14.8 million, resulting in an effective tax rate of 29% and in 2011 we had federal tax expense of $1.8 million on pre-tax earnings of $7.5 million, resulting in an effective tax rate of 25%.
Summary of Significant Costs Relating to Asset Quality, Deposit Insurance and Branch Closings
Management believes that understanding certain costs which it believes were elevated in the 2013 and previous years business environment may benefit the readers of this report in evaluating potential changes to our future results. While significant progress was made in 2013, the following table illustrates certain costs which management believes either have been at an elevated level and will return to historically lower levels as the economic environment continues to improve, or are non-recurring and are not expected to continue.
(In Thousands of Dollars) | | | | | | | | | | | | | | | | | | | | |
| | | 2013 | | | 2012 | | | 2011 | | | 2010 | | | 2009 | |
Provision for loan losses | | $ | 1,830 | | | $ | 7,690 | | | $ | 13,337 | | | $ | 13,344 | | | $ | 14,671 | |
Securities (gains)/losses | | | (346 | ) | | | (48 | ) | | | 48 | | | | (7 | ) | | | (1,321 | ) |
Loss/(gain) on sale of OREO properties | | | (437 | ) | | | (484 | ) | | | 95 | | | | 354 | | | | 336 | |
FDIC expense | | | 989 | | | | 1,220 | | | | 1,560 | | | | 2,098 | | | | 2,430 | |
Legal fees | | | 556 | | | | 745 | | | | 814 | | | | 822 | | | | 734 | |
Other real estate operating costs | | | 350 | | | | 528 | | | | 894 | | | | 1,206 | | | | 1,116 | |
Other real estate valuation write-downs | | | 209 | | | | 1,151 | | | | 2,258 | | | | 2,307 | | | | 1,275 | |
Branch closing expenses | | | 0 | | | | 754 | | | | 0 | | | | 0 | | | | 0 | |
Merger related expenses | | | 871 | | | | 0 | | | | 0 | | | | 0 | | | | 0 | |
Tax benefit on items listed at 34% | | | (1,367 | ) | | | (3,929 | ) | | | (6,462 | ) | | | (6,842 | ) | | | (6,542 | ) |
Total of items net of tax benefit | | | 2,655 | | | | 7,627 | | | | 12,544 | | | | 13,282 | | | | 12,699 | |
Deferred tax write off | | | 0 | | | | 0 | | | | 0 | | | | 484 | | | | 659 | |
Total | | $ | 2,655 | | | $ | 7,627 | | | $ | 12,544 | | | $ | 13,766 | | | $ | 13,358 | |
FINANCIAL CONDITION
Total assets at December 31, 2013 were $1.480 billion, compared with December 31, 2012 total assets of $1.499 billion, a decrease of $19 million, or 1.3%. Slow loan demand, while improved over 2012, resulted in a modest increase in the loan portfolio of 2.4%.
Commercial loans increased $17 million, or 11.2%, while commercial real estate loans increased $7 million, or 1.4%. First lien residential mortgage loans increased $3 million, or 1.2%, while junior lien residential mortgage loans were $4 million lower at December 31, 2013, decreasing 7.3%, from the previous year end. Consumer loans grew by $1 million or 2.0% during the year. Mortgages serviced for others were $1.0 million, or 0.2% higher.
(In Thousands of Dollars) | | | | | | | | | | | | | | | | |
| | | 2013 | | | 2012 | | | Change | | | % Change | |
Commercial and industrial | | $ | 166,994 | | | $ | 150,208 | | | $ | 16,786 | | | | 11.2 | % |
Commercial real estate | | | 479,396 | | | | 472,618 | | | | 6,778 | | | | 1.4 | % |
First lien residential real estate | | | 216,952 | | | | 214,379 | | | | 2,573 | | | | 1.2 | % |
Junior lien residential real estate | | | 54,488 | | | | 58,748 | | | | (4,260 | ) | | | (7.3 | %) |
Consumer | | | 69,164 | | | | 67,809 | | | | 1,355 | | | | 2.0 | % |
Total | | $ | 987,146 | | | $ | 963,762 | | | $ | 23,232 | | | | 2.4 | % |
| | | | | | | | | | | | | | | | | |
Mortgages serviced for others | | $ | 609,244 | | | $ | 608,234 | | | $ | 1,010 | | | | 0.2 | % |
Total securities available for sale decreased $10 million, or 2.8%. The increase was mainly due to allowing maturing investments to be used to fund the growth in our loan portfolio. Securities available for sale were 23% of total assets at year end 2013, compared with 24% at the end of 2012. As loan demand picks up in the future, it is expected that the securities portfolio will decline providing the funding for that growth.
Premises and equipment decreased $187,000 after recognized depreciation of $1.8 million. We made investments of $1.7 million in new software, equipment and facility updates during the year.
Total deposits decreased at the end of 2013 to $1.233 billion, a decrease of 0.6%, compared to $1.241 billion at year end 2012. Non-interest bearing demand deposit balances increased from the end of 2012, by $16 million to $267 million at year end 2013, an increase of 6.5%. Interest bearing demand deposits grew by $12 million, or 3.5%, and savings account balances increased $17 million, or 6.4%.
At the end of 2013, we had $18 million of wholesale CDs on the balance sheet, the same level as the end of 2012. Wholesale CDs, which contain both brokered CDs and internet CDs, typically carry a higher interest rate than locally generated CDs of similar duration but are available in large dollar pools which results in lower operational cost than smaller dollar local deposits. Large dollar CDs which are generated internally and placed in our CDARS program to provide FDIC insurance for our customers are included in the wholesale CD total, but typically carry lower rates than other wholesale CDs. At the end of 2013 and 2012, all $18 million of wholesale CDs were part of our CDARS program. Including wholesale CDs, total time deposits decreased $54 million, or 14.4% compared with the end of 2012. Time deposits were allowed to run off as we re-priced higher rate CD’s to the current low rate market because of reduced funding needs in the loan portfolio. Much of the declining balances in CDs moved to other deposit categories during the year as customers preferred the liquidity of these products over the marginal increase in rate that could be achieved from locking in their money for a longer term.
Securities sold under agreements to repurchase and federal funds purchased increased by $5 million due to normal balance fluctuations of our customers. Over the past three to four years, management has focused its branch network on increasing core deposit growth. As a result of the growth in these core deposits and a reduction in the size of our loan portfolio, we have been able to reduce our reliance on Federal Home Loan Bank advance funding to support the loan portfolio. Federal Home Loan Bank advances were just $20 million at year end 2013, a decrease of $3 million from December 31, 2012.
Asset Quality
The Michigan economy continued to progress during 2013 resulting in a lower unemployment rate and stronger business climate for our customers. The improving economy and the ongoing efforts of our lenders have resulted in improvement in our problem loan metrics. Our net charged off loans declined in 2013, as fewer customers succumbed to economic problems. Within the last year, the value of development projects and residential properties showed some improvement resulting in fewer charged off loans and nonaccrual loan balances. Our nonaccrual loan balances were much improved, down 36% from year end 2012. Total of nonaccrual, restructured, and 90 day past due loans decreased 15% from year end 2012 as nonaccrual loans were down $6 million, 90 day past due loans and restructured loans remained flat. While the restructured loan balance often is included in a nonperforming loans total, these loans might be better characterized as underperforming. All loans reported as restructured are in compliance with the renegotiated terms of the loan. Renegotiated terms on a loan may include such things as a reduced interest rate, extending the amortization period for the loan, or in some cases a partial forgiveness of the balance due on the loan. We continue to be vigilant at monitoring these loan relationships and working through these issues with our customers.
Loans are carried at an amount which management believes will be collected. A balance considered not collectible is charged against (reduction of) the allowance for loan losses. In 2013, net charged off loans were $5.2 million, compared with $7.4 million in 2012 and $13.7 million in 2011. Net charged off loans as a percentage of average loans were 0.53% in 2013 compared with 0.75% in 2012 and 1.37% in 2011.
The total of nonaccrual loans, loans 90 days past due and any troubled loans where borrowers are under financial stress and the terms have been renegotiated to below normal market terms was $30.8 million and $36.4 million at December 31, 2013 and 2012, respectively. Total nonaccrual loans were $10.1 million at December 31, 2013, compared to $15.7 million at the end of 2012. While improvement is clearly evident, the elevated level in nonaccrual loans for both years was largely due to economic stresses being felt in Michigan. Borrowers which had previously been able to meet their loan obligations during better times have become unable to do so. Loans past due 90 days or more decreased to zero at year end 2013 compared with $37,000 at the end of 2012, in part because of loans moving to nonaccrual status during the year. Impaired loans are commercial loans for which we believe it is probable that we will be unable to collect all amounts due according to the contractual terms of the loan agreement. The average investment in impaired loans was $27.7 million during 2013 compared to $35.5 million during 2012. At year end, impaired loans were $24.4 million compared with $32.9 million at December 31, 2012. Although the improvement in these asset quality metrics is significant, we continue to find it necessary to work with some customers to restructure loans to reduce the probability of loss to the bank. At the end of the year, we had $20.7 millionof restructured loans, the same level as year end 2012.
The allowance for loan losses was $3.3 million, or 16%, lower at year end 2013 compared with 2012. This decrease was a result of provision expense of $1.8 million versus charged off loans of $6.0 million during the year, and recoveries of prior charged off loans of $0.9 million. Through our analysis process, we determined that it was necessary to provide less for future probable losses than we realized in net charge offs this year due to several factors. We record provision for loan loss expense when loans for which losses are likely, are identified. For loans which carry an allocated allowance, no expense is recognized at the time of charge off to the extent that allowance has been previously provided. See the discussion of loan loss provision expense previously presented for additional information. The allowance for loan losses represents 1.82% of outstanding loans at the end of 2013, compared with 2.21% at December 31, 2012.
We maintain the allowance at a level which we believe adequately provides for losses inherent in the loan portfolio. Such losses are estimated by a variety of factors, including specific examination of certain borrowing relationships and consideration of historical losses incurred on certain types of credits. We focus on early identification of problem credits through ongoing reviews by management, loan personnel and an outside loan review specialist. Please refer to Note 6 of the Notes to Consolidated Financial Statements for more information on impaired loans.
CONTRACTUAL OBLIGATIONS, COMMITMENTS, CONTINGENT LIABLILITES, AND OFF-BALANCE SHEET ARRANGEMENTS
We have various financial obligations, including contractual obligations and commitments that may require future cash payments.
The following table presents, as of December 31, 2013, significant fixed and determinable contractual obligations to third parties by payment date.
(In Thousands of Dollars) | | | | | | | | | | | | | | | | | | | | | | | | |
Contractual Obligation | | One Yearor Less | | 1 – 3Years | | 3 – 5Years | | More than5 Years | | Total | |
| | | | | | | | | | | | | | | | | | | | | | | | | |
Time Deposits | | $ | 196,360 | | | | $ | 97,696 | | | | $ | 28,075 | | | | $ | 81 | | | | $ | 322,212 | |
Federal Funds Borrowed andRepurchase Agreements | | | 47,635 | | | | | 0 | | | | | 0 | | | | | 0 | | | | | 47,635 | |
Long Term Debt | | | 4,000 | | | | | 9,773 | | | | | 3,052 | | | | | 2,965 | | | | | 19,790 | |
Subordinated Debt | | | 0 | | | | | 0 | | | | | 0 | | | | | 36,084 | | | | | 36,084 | |
Operating Leases | | | 331 | | | | | 523 | | | | | 506 | | | | | 0 | | | | | 1,360 | |
Further discussion of the nature of each obligation is included in Notes 7, 10, 11, 12, and 13 to the consolidated financial statements.
Our operating lease obligations represent short and long-term lease and rental payments, primarily for facilities, and to a lesser degree for certain software and data processing equipment.
The following table details the amounts and expected maturities of significant commitments as of December 31, 2013.
(In Thousands of Dollars) | | | | | | | | | | | | | | | | | | | | |
| | | One Year or Less | | | 1 - 3 Years | | | 3 - 5 Years | | | More than 5 Years | | | Total | |
Credit: | | | | | | | | | | | | | | | | | | | | |
Commercial real estate | | $ | 97,058 | | | $ | 7,710 | | | $ | 8,307 | | | $ | 13,107 | | | $ | 126,182 | |
Residential real estate | | | 1,282 | | | | 0 | | | | 30 | | | | 16,271 | | | | 17,583 | |
Construction loans | | | 5,465 | | | | 6,104 | | | | 575 | | | | 52 | | | | 12,196 | |
Revolving home equity and credit card lines | | | 6,741 | | | | 10,985 | | | | 20,437 | | | | 1,685 | | | | 39,848 | |
Other | | | 1,039 | | | | 862 | | | | 701 | | | | 7,557 | | | | 10,159 | |
Commercial standby letters of credit | | | 5,715 | | | | 379 | | | | 50 | | | | 3,079 | | | | 9,223 | |
Total Commitments | | $ | 117,300 | | | $ | 26,040 | | | $ | 30,100 | | | $ | 41,751 | | | $ | 215,191 | |
Commitments to extend credit, including loan commitments, standby letters of credit and commercial letters of credit, do not necessarily represent future cash requirements in that these commitments often expire without being drawn upon. Further discussion of these commitments is included in Note 18 to the consolidated financial statements.
CRITICAL ACCOUNTING POLICIES
Certain of our accounting policies are important to the portrayal of our financial condition since they require management to make difficult, complex or subjective judgments, some of which may relate to matters that are inherently uncertain. Estimates associated with these policies are susceptible to material changes as a result of changes in facts and circumstances. Facts and circumstances which could affect these judgments include, without limitation, changes in interest rates, in local and national economic conditions or the financial condition of borrowers. Our significant accounting policies are discussed in detail in Note 1 of the Notes to the Consolidated Financial Statements.
We view critical accounting policies to be those which are highly dependent on subjective or complex judgments, estimates and assumptions, and where changes in those estimates and assumptions could have a significant impact on the financial statements. We believe that our critical accounting policies include determining the allowance for loan losses, determining the fair value of securities and other financial instruments, including possible impairment of goodwill and other assets, the valuation of mortgage servicing rights, determination of purchase accounting adjustments, determination of the fair value of other real estate owned, and estimating state and federal tax liabilities.
Allowance for Loan LossesThe allowance for loan losses is a valuation allowance for probable incurred credit losses. We use a quantitative and qualitative methodology for analyzing factors which impact the allowance for loan losses consistently across our five banking subsidiaries. The process applies risk factors for historical charge-offs and delinquency experience, portfolio segment weightings and industry and regional factors and trends as they affect the banks’ portfolios. The consideration of exposures to industries potentially most affected by current risks in the economic and political environment, and the review of potential risks in certain credits that either are, or are not, considered part of the non-performing loan category contributed to the establishment of the allowance levels at each bank. Loan losses are charged off against the allowance when management believes the uncollectibility of a loan balance is confirmed.
Loans are reviewed on an ongoing basis for impairment. A loan is impaired when it is probable that we will be unable to collect all amounts due substantially in accordance with the contractual terms of the loan agreement. Impaired loans are measured based on the present value of expected cash flows discounted at the loan’s effective interest rate or, as a practical expedient, the fair value of collateral if the loan is collateral dependent. Loans considered to be impaired are reduced to the present value of expected future cash flow or to the fair value of collateral by allocating a portion of the allowance for loan losses to such loans. If these allocations cause an increase in the calculated allowance for loan losses, such increase is reported as provision for loan loss expense. Increases or decreases in carrying value due to changes in estimates of future payments or the passage of time are reported as reductions or increases in the provision for loan losses.
Smaller balance homogeneous loans such as residential first mortgage loans secured by one to four family residences, residential construction, automobile, home equity and second mortgage loans, are collectively evaluated for impairment. Commercial loans and first mortgage loans secured by other properties are evaluated individually for impairment. When credit analysis of the borrower’s operating results and financial condition indicates the underlying ability of the borrower’s business activity is not sufficient to generate adequate cash flow to service the business’ cash needs, including our loans to the borrower, the loan is evaluated for impairment. Often this is associated with a delay or shortfall in payments of 90 days or less. Commercial loans are rated on a scale of 1 to 10, with grades 1 to 4 being satisfactory grades, 5 and 6 special attention or watch, 7 substandard, 8 impaired, 9 doubtful, and 10 loss. Loans graded 6 through 9 are considered for impairment. Loans are generally moved to nonaccrual status when 90 days or more past due. These loans are often considered impaired. Impaired loans, or portions thereof, are charged off when deemed uncollectible.
Fair Value of Securities and Other Financial InstrumentsSecurities available for sale consist of bonds and notes which might be sold prior to maturity due to changes in interest rate, prepayment risks, yield and availability of alternative investments, liquidity needs or other factors. Securities classified as available for sale are reported at their fair value. Declines in the fair value of securities below their cost that are other than temporary are reflected as realized losses. In estimating other-than-temporary losses, management considers: (1) the length of time and extent that fair value has been less than carrying value; (2) the financial condition and near term prospects of the issuer; and (3) our ability and intent to hold the security for a period of time sufficient to allow for any anticipated recovery in fair value.
Market values for securities available for sale are obtained from outside sources and applied to individual securities within the portfolio. The difference between the amortized cost and the current market value of securities is recorded as a valuation adjustment and reported in other comprehensive income.
Valuation of Mortgage Servicing RightsMortgage servicing rights are recognized as assets for the allocated value of retained servicing rights on loans sold. Servicing rights are expensed in proportion to, and over the period of, estimated net servicing revenues.
We utilize a discounted cash flow model to determine the value of our servicing rights. The valuation model utilizes mortgage prepayment speeds, the remaining life of the mortgage pool, delinquency rates, our cost to service loans, and other factors to determine the cash flow that we will receive from serving each grouping of loans. These cash flows are then discounted based on current interest rate assumptions to arrive at the fair value of the right to service those loans. Impairment is evaluated based on the fair value of the rights, using groupings of the underlying loans classified by interest rates. Any impairment of a grouping is reported as a valuation allowance.
Acquisition IntangiblesGenerally accepted accounting principles require us to determine the fair value of all of the assets and liabilities of an acquired entity, and record their fair value on the date of acquisition. We employ a variety of means in determination of the fair value, including the use of discounted cash flow analysis, market comparisons, and projected future revenue streams. For certain items that we believe we have the appropriate expertise to determine the fair value, we may choose to use our own calculation of the value. In other cases, where the value is not easily determined, we consult with outside parties to determine the fair value of the asset or liability. Once valuations have been adjusted, the net difference between the price paid for the acquired company and the value of its balance sheet is recorded as goodwill. Due to the unique market conditions this year and our lower level of earnings, we contracted to have a goodwill impairment analysis completed in the third quarter. The results of that analysis indicated that no impairment existed at that time. See Note 8 to the financial statements for further information on the valuation results.
Other Real Estate Ownedis carried at its fair value. Fair value is determined through the use of appraisals and/or broker price opinions, discounted for the expected costs to maintain and sell of the property.
Uncertain Tax LiabilitiesUncertain tax liabilities are estimated based on our exposures to interpretation of the applicable tax codes. We estimate our contingent tax liabilities by determining the amount of income that may be at risk of an adverse interpretation by taxing authorities on specific issues, multiplied by our effective tax rate, to determine our gross exposure. Once this exposure is determined, an estimate of the probability of an adverse adjustment being required is determined and applied to the gross liability to determine the contingent tax reserve.
Recent Accounting Pronouncements In July 2013, the FASB issued Accounting Standards Update 2013-12, Definition of a Public Business Entity. This Standard seeks to distinguish when a company is considered a public entity or a private company for purposes of the application of certain GAAP standards. This Standard has no published effective date, but is considered to be effective immediately and will have no impact on us.
CAPITAL RESOURCES
We obtain funds for our operating expenses and dividends to shareholders through dividends from our subsidiary banks. In general, the subsidiary banks pay only those amounts required to meet holding company cash requirements, while maintaining appropriate capital at the banks. Capital is maintained at the subsidiary banks to support their current operations and projected future growth.
Bank regulators have established risk based capital guidelines for banks and bank holding companies. Minimum capital levels are established under these guidelines and each asset category is assigned a perceived risk weighting. Off balance sheet items, such as loan commitments and standby letters of credit, also require capital allocations.
As of December 31, 2013, our total capital to risk weighted assets exceeded the minimum requirement for capital adequacy purposes of 8% by $72 million. Tier 1 capital to risk weighted assets exceeded the minimum of 4% by $98 million, and Tier 1 capital to average assets exceeded the minimum of 4% by $79 million. In the current economic environment, regulatory agencies are encouraging banks to maintain capital well above this minimum requirement. At year end 2013, our total capital to risk weighted assets exceeded the well capitalized minimum requirement for capital adequacy purposes of 10% by $52 million. Tier 1 capital to risk weighted assets exceeded the well capitalized minimum of 6% by $79 million, and Tier 1 capital to average assets exceeded the well capitalized minimum of 5% by $65 million.
For a more complete discussion of capital requirements please refer to Note 22 of the Notes to Consolidated Financial Statements. The Federal Deposit Insurance Corporation insures specified customer deposits and assesses premium rates based on defined criteria. Insurance assessment rates may vary from bank to bank based on the factors that measure the perceived risk of a financial institution. One condition for maintaining the lowest risk assessment, and therefore, the lowest insurance rate, is the maintenance of capital at the “well capitalized” level. Both of our affiliate banks have exceeded the regulatory criteria for a “well capitalized” financial institution.
A certain level of capital growth is desirable to maintain an appropriate ratio of equity to total assets. The compound annual growth rate for total average assets for the past five years was1.3%.The compound annual growth rate for average equity over the same period was 3.6%.
We have established an internal goal of maintaining our dividend payout ratio within a range that will create capital growth to support asset growth in the balance sheet. In the first quarter of 2012, the Board of Directors determined to pay an additional $0.05 per share cash dividend on common stock in addition to the regular quarterly amount of $0.01 per share, for a total of $0.06 per share, based on the results of earnings for the full year of 2011. As 2012 concluded, the Board of Directors determined to pay an additional $0.20 per share in addition to the regular quarterly amount of $0.01 per share, based on projected 2012 earnings, resulting in a total payout of $0.24 per share relating to 2012. To achieve the goal of acceptable internal capital growth, we intend to continue our efforts to return to higher earnings levels, and will adjust our dividend payout rate as appropriate. In 2013 we followed our past practices of paying a dividend commensurate with expected earnings, and paid dividends of $0.06 per share each quarter for a total dividend in 2013 of $0.24. In accordance with terms of our merger agreement with Mercantile Bank Corporation, we will not increase this amount without their consent during pendency of the merger.
As an additional enhancement to capital growth we offer a dividend reinvestment program. The Firstbank Corporation Dividend Reinvestment Plan was first offered in 1988. At December 31, 1988, 123 owners holding 209,856 shares participated in the Plan. At the end of 2013, 1,168 owners held over 1.2 million shares in the Plan. Dividend reinvestment is suspended during pendency of the merger with Mercantile Bank Corporation.
To further strengthen our capital position, we elected to participate in the United States Treasury’s Capital Purchase Plan (CPP), whereby we issued $33 million of preferred stock and warrants to purchase up to 578,947 shares of our common stock at a price of $8.55, to the United States Treasury on January 30, 2009. The preferred stock issued in this transaction required a 5% dividend for five years and then converted to a 9% dividend rate. As our capital position had improved, we exited the CPP and repurchased $16 million of the preferred stock and our outstanding common stock warrants during 2012. The remaining $17 million of the preferred stock was sold by the Treasury to private investors. In 2013 we repurchased the remaining $17 million of outstanding preferred stock from the private sector.
We are not aware of any recommendations by regulatory authorities at December 31, 2013, which are likely to have a material effect on our liquidity, capital resources or operations.
POLICY REGARDING THE CONFIDENTIALITY OF REGULATORY EXAMINATIONS
Firstbank Corporation and its affiliate banks are subject to regular examination by government regulators, as are all other banks and bank holding companies. By law we are prohibited from disclosing the ratings and other information contained in those examination reports. These confidentiality requirements are designed to promote the integrity of the examination process and to avoid the results being used as a rating or endorsement of a particular financial institution.
We sometimes receive inquiries about the contents and results of our regulatory examinations. Disclosing this information could violate the confidentiality requirements under federal law. In addition, even partial disclosure taken out of context could result in misunderstanding and misinterpretation. As a result, it is the policy of Firstbank Corporation and its affiliates not to comment on or disclose information regarding regulatory examination reports and related communications. Firstbank Corporation remains committed to disclosing detailed information through the United States Securities and Exchange Commission reporting process. In addition, the quarterly reports of condition reports for each of our banks are available at www.fdic.gov and information regarding our holding company is available atwww.federalreserve.gov.
FORWARD LOOKING STATEMENTS
This annual report including, without limitation, management’s discussion and analysis of financial condition and results of operations, and other sections of our Annual Report to Shareholders, contain forward-looking statements that are based on management’s beliefs, assumptions, current expectations, estimates and projections about the financial services industry, the economy, and about the Company itself. Words such as “anticipate”, “believe”, “determine”, “estimate”, “expect”, “forecast”, “intend”, “is likely”, “plan”, “project”, “opinion”, “should”, variations of such terms, and similar expressions are intended to identify such forward-looking statements. These statements are not guarantees of future performance and involve certain risks, uncertainties and assumptions that are difficult to predict with regard to timing, extent, likelihood, and degree of occurrence. Therefore, actual results and outcomes may materially differ from what may be expressed or forecasted in such forward looking statements. Internal and external factors that may cause such a difference include changes in interest rates and interest rate relationships; demand for products and services; the degree of competition by traditional and non-traditional competitors; changes in banking regulations; changes in tax laws; changes in prices, levies, and assessments; the impact of technological advances; governmental and regulatory policy changes; the outcomes of pending and future litigation and contingencies; trends in customer behavior and customer ability to repay loans; software failure, errors or miscalculations; the ability of the Company to locate and correct all data sensitive computer codes; and the vicissitudes of the national economy. The Company undertakes no obligation to update, amend or clarify forward-looking statements, whether as a result of new information, future events, or otherwise.
ITEM 7A. Quantitative and Qualitative Disclosures About Market Risk.
Liquidity and Interest Rate Sensitivity
Asset liability management aids us in achieving reasonable and predictable earnings and liquidity while maintaining a balance between interest earning assets and interest bearing liabilities. We maintain a complex interest rate risk modeling system which assists management in understanding the impact of changes in rates, both in the past, and forecasted. This information allows management to make adjustment as to its view toward certain products with regard to rate and term in order to minimize our interest rate risk in a changing rate environment.
Cash provided from operations during the year was $25.7 million while investing activities used $25.7 million in cash. Financing activities used an additional $24.9 million in cash resulting in a total decrease in our cash position of $24.9 million. Primary uses of cash for financing activities was $17 million to repurchase all of our outstanding preferred stock, repayment of FHLB advances, and payment of dividends. For additional details on these activities see the Consolidated Statement of Cash Flows contained within this report.
Liquidity management involves the ability to meet the cash flow requirements of our customers. These customers may be either borrowers needing to meet their credit requirements or depositors wanting to withdraw funds. Management of interest rate sensitivity attempts to manage the level of varying net interest margins and to achieve consistent net interest income through periods of changing interest rates. The net interest margin was 3.84% in 2013 compared to 3.99% in 2012. The yield on the securities portfolio fell two basis points, from 1.80% in 2012 to 1.78% in 2013. Loan yields decreased 45 basis points, to 5.48% in 2013, from 5.93% in 2012. Deposit costs decreased 16 basis points from 0.66% in 2012 to 0.50% in 2013. Loan demand, while improved, resulted in a decrease of just $1.5 million in average loan balances. Average total earning assets decreased a similar $1.4 million as average securities investment increased $10 million and average interest bearing deposits with banks decreased $10 million. The interest bearing deposit balances at banks is primarily due to excess balances held at the Federal Reserve.
Full year average balances in time deposits decreased $53 million compared with the prior year, while average demand and savings balances increased $27 million. The use of Federal Home Loan Bank advances and notes payable continued to become a less significant source of longer term funding, with average advances decreasing from the prior year by $1.6 million as we utilized increased core deposits to reduce these borrowings.
A decision to decrease deposit rates immediately affects most rates paid, other than time deposits, and has an immediate positive impact on net interest margin. With the exception of variable rate loans, an increase in loan rates does not affect the yield until a new loan is made or an existing loan is renewed. Likewise, an increase in deposit rates raises our cost of funds, and a decrease in loan rates only effects variable rate loans, until such time as a new fixed rate loan is generated, or re-finances. The prime rate is used to price virtually our entire variable rate loan portfolio. Therefore, reductions in the prime rate immediately have a negative effect on earnings, while an increase in prime rate has a positive effect on earnings.
The prime rate, was held constant at 3.25% throughout all of 2012 and 2013 as the Federal Reserve maintained its target fed funds rate at a range of 0 to 0.25% for both years in an effort to get the economy growing again. Prime rate began 2008 at 7.25%, was reduced seven times during the year, and once more in January of 2009 for a cumulative reduction of 4.00%. With the prime rate currently at 3.25%, the Federal Reserve has made no changes to the prime rate through the end of 2013 and has indicated that rates will likely remain at these levels through sometime in 2015.
The principal sources of liquidity for us are maturing securities, federal funds purchased or sold, loan payments by borrowers, investment securities, loans held for sale, deposit or deposit equivalent growth and Federal Home Loan Bank advances. Securities maturing or re-pricing within one year at December 31, 2013 were $53 million,compared to $103 million at December 31, 2012. Total investments available for sale were $344 million at year end 2013, a decrease of $10 million from the prior year end.
The table below shows the interest sensitivity gaps for five different intervals as of December 31, 2013. Deposits that do not have a fixed maturity date are shown as immediately re-pricing according to reporting conventions.
| | | Maturity or Re-Pricing Frequency | |
| | | | | | | (In Millions of Dollars) | | | | | |
| | | 1 Day | | | 2 Days through 3 Months | | | 4 Months through 12 Months | | | 13 Months through 5 Years | | | More than 5 Years | |
| | | | | | | | | | | | | | | | | | | | | |
| | | | | | | | | | | | | | | | | | | | | |
Interest Earning Assets: | | | | | | | | | | | | | | | | | | | | |
Loans | | $ | 192 | | | $ | 27 | | | $ | 79 | | | $ | 324 | | | $ | 355 | |
Securities | | | 7 | | | | 7 | | | | 48 | | | | 125 | | | | 149 | |
Other earning assets | | | 46 | | | | 0 | | | | 0 | | | | 0 | | | | 7 | |
Total | | | 245 | | | | 34 | | | | 127 | | | | 449 | | | | 511 | |
| | | | | | | | | | | | | | | | | | | | | |
Interest Bearing Liabilities: | | | | | | | | | | | | | | | | | | | | |
Deposits | | | 643 | | | | 32 | | | | 75 | | | | 186 | | | | 28 | |
Other interest bearing liabilities | | | 48 | | | | 43 | | | | 0 | | | | 13 | | | | 0 | |
Total | | | 691 | | | | 75 | | | | 75 | | | | 199 | | | | 28 | |
| | | | | | | | | | | | | | | | | | | | | |
Interest Sensitivity Gap | | $ | (446 | ) | | $ | (41 | ) | | $ | 52 | | | $ | 250 | | | $ | 483 | |
| | | | | | | | | | | | | | | | | | | | | |
Cumulative Gap | | $ | (446 | ) | | $ | (487 | ) | | $ | (435 | ) | | $ | (185 | ) | | $ | 298 | |
For the one day interval, maturities of interest bearing liabilities exceed those of interest earning assets by $446 million. Included in the one day maturity classification are$643 million in savings and checking accounts which are contractually available to our customers immediately, but in practice, function as core deposits with considerably longer maturities. In the two day through the five year time frame, interest sensitive assets exceed interest sensitive liabilities by$261 million, resulting in a cumulative position of interest sensitive liabilities exceeding interest sensitive assets by $185 millionthrough five years. For the time period greater than five years, the analysis shows an asset sensitive position, such that cumulatively, interest sensitive assets exceed interest sensitive liabilities by$298 million.
Showing a negative cumulative gap through the twelve month period does not necessarily result in a corresponding increase in net interest income during a falling rate environment. In practice, deposit rates do not change as rapidly as would be indicated by the contractual availability of deposit balances to customers. Also, changes in the steepness of the yield curve can cause differing effects on different products. Some of the benefit associated with lower deposit rates is mitigated by rate decreases on variable rate loans, renewals of fixed rate loans to lower rates, and customer prepayments. Conversely, showing a positive cumulative gap through the twelve month period does not necessarily result in a corresponding increase in net interest income during a rising rate environment for similar reasons.
Interest rate sensitivity varies with different types of interest earning assets and interest bearing liabilities. Overnight investments, on which rates change daily, and loans tied to the prime rate differ considerably from long term investment securities and fixed rate loans. Time deposits over $100,000 and money market accounts are more interest sensitive than regular savings accounts. Comparison of the re-pricing intervals of interest earning assets to interest bearing liabilities is a measure of the interest sensitivity gap, not interest rate risk. Balancing interest rate sensitivity is a continual challenge in a changing rate environment. We use a sophisticated computer program to perform analysis of interest rate risk, assist with our asset and liability management, and measure the expected impact of interest rate changes and our sensitivity to those changes.
Market risk
We face market risk to the extent that both earnings and the fair market values of our financial instruments are affected by changes in interest rates and liquidity of markets. We manage this risk with static GAP analysis and simulation modeling.Our models indicate that we have maintained an overall liability sensitive position, whereby we should benefit as rates decline. These models do not fully incorporate customer preferences and changes in their behavior. As such, we believe we are somewhat less liability sensitive in a downward rate environment than the analysis indicates. In the short run, we expect our net interest margin to be stable to slightly rising as rates on our assets re-price downward at a slower pace than our liabilities. In the longer run as time deposits re-price to lower rates, we believe or net interest margin will be fairly stable, and maintain our overall profitability. As of the date of this annual report we do not know of nor expect there to be any material change in the general nature of our primary market risk exposure in the near term.
Our market risk exposure is mainly comprised of our vulnerability to interest rate risk. We do not accept significant interest rate risk in our mortgage banking operations. To manage our interest rate risk in mortgage banking we generally lock in our sale price to the secondary market at the same time we make a rate commitment to the borrower. Prevailing interest rates and interest rate relationships in the future will be primarily determined by market factors which are outside of our control. All information provided in response to this item consists of forward looking statements. Reference is made to the section captioned “Forward Looking Statements” in this annual report for a discussion of the limitations on our responsibility for such statements.
The following tables provide information about our financial instruments that are sensitive to changes in interest rates as of December 31, 2013 and 2012. They show expected maturity date values for loans and securities which were calculated without adjusting the instruments’ contractual maturity dates for expected prepayments. Maturity date values for interest bearing core deposits were not based on estimates of the period over which the deposits would be outstanding, but rather, the opportunity for re-pricing. We believe that re-pricing dates, as opposed to expected maturity dates, may be more relevant in analyzing the value of such instruments and are reported as such in the following tables. Fair value is computed as the present value of expected cash flows at rates in effect at the date indicated.
Principal/Notional Amounts Maturing or Re-pricing in: | | | (In Thousands of Dollars) | | | | | |
| | | | | | | | | | | | | | | | | | | | | | | | | | | | | | | | |
As of December 31, 2013 | | 2014 | | | 2015 | | | 2016 | | | 2017 | | | 2018 | | | Thereafter | | | Total | | | Fair Value 12/31/13 | |
Rate Sensitive Assets: | | | | | | | | | | | | | | | | | | | | | | | | | | | | | | | | |
Fixed interest rate loans | | $ | 89,640 | | | $ | 63,113 | | | $ | 71,677 | | | $ | 118,010 | | | $ | 165,015 | | | $ | 282,732 | | | $ | 790,187 | | | $ | 795,773 | |
Average interest rate | | | 6.07 | % | | | 5.95 | % | | | 5.45 | % | | | 5.05 | % | | | 4.74 | % | | | 5.04 | % | | | | | | | | |
Variable interest rate loans | | | 98,300 | | | | 12,786 | | | | 20,076 | | | | 26,410 | | | | 19,010 | | | | 20,778 | | | | 197,360 | | | | 190,697 | |
Average interest rate | | | 4.18 | % | | | 4.31 | % | | | 4.15 | % | | | 4.24 | % | | | 4.23 | % | | | 4.86 | % | | | | | | | | |
Fixed interest rate securities | | | 52,919 | | | | 27,157 | | | | 40,821 | | | | 39,184 | | | | 36,762 | | | | 138,525 | | | | 335,368 | | | | 335,368 | |
Average interest rate | | | 1.45 | % | | | 1.69 | % | | | 0.87 | % | | | 1.41 | % | | | 1.67 | % | | | 2.48 | % | | | | | | | | |
Variable interest rate | | | | | | | | | | | | | | | | | | | | | | | | | | | | | | | | |
Securities | | | | | | | | | | | | | | | | | | | 2 | | | | 8,232 | | | | 8,234 | | | | 8,234 | |
Average interest rate | | | | | | | | | | | | | | | | | | | 2.25 | % | | | 1.94 | % | | | | | | | | |
Other interest bearing assets | | | 46,227 | | | | 497 | | | | | | | | | | | | | | | | 7,266 | | | | 53,990 | | | | 53,990 | |
Average interest rate | | | 0.26 | % | | | 1.30 | % | | | | | | | | | | | | | | | | | | | | | | | | |
Rate Sensitive Liabilities: | | | | | | | | | | | | | | | | | | | | | | | | | | | | | | | | |
Savings and interest bearing | | | | | | | | | | | | | | | | | | | | | | | | | | | | | | | | |
checking | | | 643,175 | | | | | | | | | | | | | | | | | | | | | | | | 643,175 | | | | 630,080 | |
Average interest rate | | | 0.17 | % | | | | | | | | | | | | | | | | | | | | | | | | | | | | |
Time deposits | | | 196,360 | | | | 69,655 | | | | 28,041 | | | | 16,056 | | | | 12,019 | | | | 81 | | | | 322,212 | | | | 324,522 | |
Average interest rate | | | 0.56 | % | | | 1.12 | % | | | 1.45 | % | | | 0.94 | % | | | 0.88 | % | | | 1.12 | % | | | | | | | | |
Fixed interest rate | | | | | | | | | | | | | | | | | | | | | | | | | | | | | | | | |
borrowings | | | 4,000 | | | | 6,700 | | | | 3,073 | | | | 3,052 | | | | | | | | 2,965 | | | | 19,790 | | | | 20,098 | |
Average interest rate | | | 0.47 | % | | | 1.09 | % | | | 1.39 | % | | | 5.42 | % | | | | | | | 6.09 | % | | | | | | | | |
Variable interest rate | | | | | | | | | | | | | | | | | | | | | | | | | | | | | | | | |
borrowings | | | | | | | | | | | | | | | | | | | | | | | 36,084 | | | | 36,084 | | | | 21,084 | |
Average interest rate | | | | | | | | | | | | | | | | | | | | | | | 1.75 | % | | | | | | | | |
Repurchase agreements | | | 47,635 | | | | | | | | | | | | | | | | | | | | | | | | 47,635 | | | | 47,635 | |
| | | | | | | | | | | | | | | | | | | | | | | | | | | | | | | Fair Value | |
As of December 31, 2012 | | 2013 | | | 2014 | | | 2015 | | | 2016 | | | 2017 | | | Thereafter | | | Total | | | 12/31/12 | |
Rate Sensitive Assets: | | | | | | | | | | | | | | | | | | | | | | | | | | | | | | | | |
Fixed interest rate loans | | $ | 118,044 | | | $ | 86,252 | | | $ | 76,460 | | | $ | 92,776 | | | $ | 135,106 | | | $ | 228,901 | | | $ | 737,539 | | | $ | 735,315 | |
Average interest rate | | | 6.21 | % | | | 6.46 | % | | | 6.18 | % | | | 5.62 | % | | | 5.16 | % | | | 5.63 | % | | | | | | | | |
Variable interest rate loans | | | 111,074 | | | | 23,696 | | | | 12,407 | | | | 22,503 | | | | 29,762 | | | | 29,702 | | | | 229,144 | | | | 216,217 | |
Average interest rate | | | 4.22 | % | | | 4.75 | % | | | 4.81 | % | | | 4.15 | % | | | 4.26 | % | | | 4.43 | % | | | | | | | | |
Fixed interest rate securities | | | 43,536 | | | | 49,742 | | | | 27,445 | | | | 43,143 | | | | 24,780 | | | | 154,249 | | | | 342,895 | | | | 342,895 | |
Average interest rate | | | 1.30 | % | | | 1.50 | % | | | 1.82 | % | | | 0.96 | % | | | 1.64 | % | | | 2.33 | % | | | | | | | | |
Variable interest rate securities | | | | | | | | | | | | | | | | | | | | | | | 10,783 | | | | 10,783 | | | | 10,783 | |
Average interest rate | | | | | | | | | | | | | | | | | | | | | | | 2.51 | % | | | | | | | | |
Other interest bearing assets | | | 63,040 | | | | 447 | | | | 497 | | | | | | | | | | | | 7,266 | | | | 71,250 | | | | 71,250 | |
Average interest rate | | | 0.28 | % | | | 1.29 | % | | | 1.30 | % | | | | | | | | | | | | | | | | | | | | |
Rate Sensitive Liabilities: | | | | | | | | | | | | | | | | | | | | | | | | | | | | | | | | |
Savings and interest bearingchecking | | | 613,921 | | | | | | | | | | | | | | | | | | | | | | | | 613,921 | | | | 613,847 | |
Average interest rate | | | 0.20 | % | | | | | | | | | | | | | | | | | | | | | | | | | | | | |
Time deposits | | | 239,810 | | | | 69,766 | | | | 31,135 | | | | 22,614 | | | | 13,041 | | | | 5 | | | | 376,371 | | | | 378,756 | |
Average interest rate | | | 0.85 | % | | | 1.24 | % | | | 2.27 | % | | | 1.83 | % | | | 1.01 | % | | | 1.49 | % | | | | | | | | |
Fixed interest rateborrowings | | | 2,500 | | | | 4,000 | | | | 6,777 | | | | 3,094 | | | | 3,087 | | | | 3,035 | | | | 22,493 | | | | 24,122 | |
Average interest rate | | | 1.81 | % | | | 0.47 | % | | | 1.13 | % | | | 1.42 | % | | | 5.44 | % | | | 6.09 | % | | | | | | | | |
Variable interest rateborrowings | | | | | | | | | | | | | | | | | | | | | | | 36,084 | | | | 36,084 | | | | 36,093 | |
Average interest rate | | | | | | | | | | | | | | | | | | | | | | | 1.83 | % | | | | | | | | |
Repurchase agreements | | | 42,785 | | | | | | | | | | | | | | | | | | | | | | | | 42,785 | | | | 42,785 | |
Average interest rate | | | 0.18 | % | | | | | | | | | | | | | | | | | | | | | | | | | | | | |
ITEM 8. Financial Statements and Supplementary Data.

REPORT OF INDEPENDENT REGISTERED PUBLIC ACCOUNTING FIRM
Board of Directors and Shareholders
Firstbank Corporation
We have audited the accompanying consolidated balance sheets of Firstbank Corporation as of December 31, 2013 and 2012, and the related consolidated statements of income, comprehensive income, changes in shareholders' equity, and cash flows for each of the years in the three-year period ended December 31, 2013. We also have audited Firstbank Corporation's internal control over financial reporting as of December 31, 2013, based on criteria established in Internal Control - Integrated Framework issued by the Committee of Sponsoring Organizations of the Treadway Commission (COSO) in 1992. Firstbank Corporation’s management is responsible for these financial statements, for maintaining effective internal control over financial reporting, and for its assessment of the effectiveness of internal control over financial reporting, included in the accompanying Report by Firstbank Corporation’s Management on Internal Control over Financial Reporting. Our responsibility is to express an opinion on these financial statements and an opinion on the company's internal control over financial reporting based on our audits.
We conducted our audits in accordance with the standards of the Public Company Accounting Oversight Board (United States). Those standards require that we plan and perform the audits to obtain reasonable assurance about whether the financial statements are free of material misstatement and whether effective internal control over financial reporting was maintained in all material respects. Our audits of the financial statements included examining, on a test basis, evidence supporting the amounts and disclosures in the financial statements, assessing the accounting principles used and significant estimates made by management, and evaluating the overall financial statement presentation. Our audit of internal control over financial reporting included obtaining an understanding of internal control over financial reporting, assessing the risk that a material weakness exists, and testing and evaluating the design and operating effectiveness of internal control based on the assessed risk. Our audits also included performing such other procedures as we considered necessary in the circumstances. We believe that our audits provide a reasonable basis for our opinions.
A company's internal control over financial reporting is a process designed to provide reasonable assurance regarding the reliability of financial reporting and the preparation of financial statements for external purposes in accordance with generally accepted accounting principles. A company's internal control over financial reporting includes those policies and procedures that (1) pertain to the maintenance of records that, in reasonable detail, accurately and fairly reflect the transactions and dispositions of the assets of the company; (2) provide reasonable assurance that transactions are recorded as necessary to permit preparation of financial statements in accordance with generally accepted accounting principles, and that receipts and expenditures of the company are being made only in accordance with authorizations of management and directors of the company; and (3) provide reasonable assurance regarding prevention or timely detection of unauthorized acquisition, use, or disposition of the company's assets that could have a material effect on the financial statements.
Because of its inherent limitations, internal control over financial reporting may not prevent or detect misstatements. Also, projections of any evaluation of effectiveness to future periods are subject to the risk that controls may become inadequate because of changes in conditions, or that the degree of compliance with the policies or procedures may deteriorate.
In our opinion, the financial statements referred to above present fairly, in all material respects, the financial position of Firstbank Corporation as of December 31, 2013 and 2012, and the results of its operations and its cash flows for each of the years in the three-year period ended December 31, 2013 in conformity with accounting principles generally accepted in the United States of America. Also in our opinion, Firstbank Corporation maintained, in all material respects, effective internal control over financial reporting as of December 31, 2013, based on criteria established in Internal Control - Integrated Framework issued by the Committee of Sponsoring Organizations of the Treadway Commission (COSO) in 1992.
| | |
| | /s/ Plante & Moran, PLLC |
| | Plante & Moran, PLLC |
| | | Grand Rapids, Michigan |
| | | |
| | | March 10, 2014 |
FIRSTBANK CORPORATION
CONSOLIDATED BALANCE SHEETS
(In Thousands of Dollars, Except for Share Data)
| | | December 31, | |
| | 2013 | | | 2012 | |
| ASSETS | | | | | | | | |
| | | | | | | | | |
Cash and due from banks | | $ | 28,874 | | | $ | 38,544 | |
Short term investments | | | 45,780 | | | | 61,057 | |
Total cash and cash equivalents | | | 74,654 | | | | 99,601 | |
FDIC insured bank time certificates of deposit | | | 944 | | | | 2,927 | |
Trading Account Securities | | | 18 | | | | 6 | |
Securities available for sale | | | 343,602 | | | | 353,678 | |
Federal Home Loan Bank stock | | | 7,266 | | | | 7,266 | |
Loans held for sale | | | 401 | | | | 2,921 | |
Loans | | | 987,146 | | | | 963,762 | |
Allowance for loan losses | | | (17,997 | ) | | | (21,340 | ) |
Premises and equipment, net | | | 24,169 | | | | 24,356 | |
Goodwill | | | 35,513 | | | | 35,513 | |
Core deposits and other intangibles | | | 596 | | | | 965 | |
Other real estate owned | | | 1,838 | | | | 2,925 | |
Accrued interest receivable and other assets | | | 21,575 | | | | 26,182 | |
| | | | | | | | | |
TOTAL ASSETS | | $ | 1,479,725 | | | $ | 1,498,762 | |
| | | | | | | | | |
LIABILITIES AND SHAREHOLDERS’ EQUITY | | | | | | | | |
| | | | | | | | | |
LIABILITIES | | | | | | | | |
Deposits: | | | | | | | | |
Non-interest bearing demand accounts | | $ | 267,405 | | | $ | 251,109 | |
Interest bearing accounts: | | | | | | | | |
Demand | | | 360,834 | | | | 348,598 | |
Savings | | | 282,341 | | | | 265,323 | |
Time | | | 322,212 | | | | 376,371 | |
Total Deposits | | | 1,232,792 | | | | 1,241,401 | |
| | | | | | | | | |
Securities sold under agreements to repurchase and overnight borrowings | | | 47,635 | | | | 42,785 | |
Federal Home Loan Bank advances | | | 19,790 | | | | 22,493 | |
Subordinated debentures | | | 36,084 | | | | 36,084 | |
Accrued interest payable and other liabilities | | | 5,798 | | | | 8,941 | |
Total Liabilities | | | 1,342,099 | | | | 1,351,704 | |
| | | | | | | | | |
SHAREHOLDERS’ EQUITY | | | | | | | | |
Preferred stock; no par value, 300,000 shares authorized;None issued and outstanding in 2013 and17,000 shares issued and outstanding in 2012 | | | 0 | | | | 16,908 | |
Common stock; no par value, 20,000,000 shares authorized;8,083,022 and 8,001,903 shares issued and outstanding in 2013 and 2012 | | | 116,640 | | | | 115,621 | |
Retained earnings | | | 20,739 | | | | 10,921 | |
Accumulated other comprehensive income | | | 247 | | | | 3,608 | |
Total Shareholders’ Equity | | | 137,626 | | | | 147,058 | |
| | | | | | | | | |
TOTAL LIABILITIES AND SHAREHOLDERS’ EQUITY | | $ | 1,479,725 | | | $ | 1,498,762 | |
See notes to consolidated financial statements.
FIRSTBANK CORPORATION
CONSOLIDATED STATEMENTS OF INCOME
(In Thousands of Dollars, Except for Per Share Data)
| | | Year Ended December 31, | |
| | | 2013 | | | 2012 | | | 2011 | |
Interest Income: | | | | | | | | | | | | |
Loans, including fees | | $ | 52,604 | | | $ | 56,975 | | | $ | 61,465 | |
Securities: | | | | | | | | | | | | |
Taxable | | | 3,799 | | | | 4,557 | | | | 4,888 | |
Exempt from federal income tax | | | 1,693 | | | | 1,169 | | | | 1,118 | |
Short term investments | | | 178 | | | | 165 | | | | 173 | |
Total Interest Income | | | 58,274 | | | | 62,866 | | | | 67,644 | |
| | | | | | | | | | | | | |
Interest Expense: | | | | | | | | | | | | |
Deposits | | | 4,891 | | | | 6,626 | | | | 10,891 | |
FHLB advances and notes payable | | | 538 | | | | 625 | | | | 801 | |
Subordinated debentures | | | 659 | | | | 1,036 | | | | 1,197 | |
Other | | | 86 | | | | 87 | | | | 83 | |
Total Interest Expense | | | 6,174 | | | | 8,374 | | | | 12,972 | |
Net Interest Income | | | 52,100 | | | | 54,492 | | | | 54,672 | |
| | | | | | | | | | | | | |
Provision for loan losses | | | 1,830 | | | | 7,690 | | | | 13,337 | |
Net Interest Income after Provision for Loan Losses | | | 50,270 | | | | 46,802 | | | | 41,335 | |
| | | | | | | | | | | | | |
Non-Interest Income: | | | | | | | | | | | | |
Service charges on deposit accounts | | | 4,136 | | | | 4,219 | | | | 4,492 | |
Gain on sale of mortgage loans | | | 4,436 | | | | 6,523 | | | | 3,683 | |
Mortgage servicing, net of amortization | | | 63 | | | | (231 | ) | | | 89 | |
Gain/(loss) on trading account securities | | | 12 | | | | 4 | | | | (11 | ) |
Gain/(loss) on securities transactions | | | 334 | | | | 44 | | | | (37 | ) |
Other | | | 1,807 | | | | 2,111 | | | | 1,459 | |
Total Non-Interest Income | | | 10,788 | | | | 12,670 | | | | 9,675 | |
| | | | | | | | | | | | | |
Non-Interest Expense: | | | | | | | | | | | | |
Salaries and employee benefits | | | 23,281 | | | | 22,680 | | | | 21,263 | |
Occupancy and equipment | | | 5,306 | | | | 5,152 | | | | 5,311 | |
FDIC insurance premium | | | 989 | | | | 1,220 | | | | 1,560 | |
Amortization of intangibles | | | 369 | | | | 483 | | | | 698 | |
Outside professional services | | | 1,268 | | | | 1,287 | | | | 1,202 | |
Advertising and promotions | | | 1,315 | | | | 1,491 | | | | 1,425 | |
Other real estate owned costs | | | 559 | | | | 1,679 | | | | 3,153 | |
Merger related expenses | | | 871 | | | | 0 | | | | 0 | |
Other | | | 9,732 | | | | 10,690 | | | | 8,941 | |
Total Non-Interest Expense | | | 43,690 | | | | 44,682 | | | | 43,553 | |
Income before federal income taxes | | | 17,368 | | | | 14,790 | | | | 7,457 | |
Federal income taxes | | | 5,134 | | | | 4,256 | | | | 1,834 | |
NET INCOME | | $ | 12,234 | | | $ | 10,534 | | | $ | 5,623 | |
| | | | | | | | | | | | | |
Preferred stock dividends and accretion of discount on preferred stock | | | 481 | | | | 1,275 | | | | 1,679 | |
NET INCOME AVAILABLE TO COMMON SHAREHOLDERS | | $ | 11,753 | | | $ | 9,259 | | | $ | 3,944 | |
| | | | | | | | | | | | | |
Basic earnings per common share | | $ | 1.46 | | | $ | 1.17 | | | $ | 0.50 | |
| | | | | | | | | | | | | |
Diluted earnings per common share | | $ | 1.45 | | | $ | 1.16 | | | $ | 0.50 | |
See notes to consolidated financial statements.
FIRSTBANK CORPORATION
CONSOLIDATED STATEMENTS OF COMPREHENSIVE INCOME
(In Thousands of Dollars)
| | | Year Ended December 31, | |
| | | 2013 | | | 2012 | | | 2011 | |
Net income | | $ | 12,234 | | | $ | 10,534 | | | $ | 5,623 | |
Other comprehensive income/(loss): | | | | | | | | | | | | |
Unrealized holding gains/(losses) arising during the period | | | (4,764 | ) | | | 1,123 | | | | 4,130 | |
Less: reclassification adjustment for (gains)/losses included in net income | | | (334 | ) | | | (44 | ) | | | 37 | |
Other comprehensive income/(loss) before taxes | | | (5,098 | ) | | | 1,079 | | | | 4,167 | |
Income tax expense/(benefit) related to items in other comprehensive income | | | 1,737 | | | | (367 | ) | | | (1,417 | ) |
Other comprehensive income net of income tax effect fromreclassification of $172, 23 and $(19) in 2013, 2012 and 2011, respectively | | | (3,361 | ) | | | 712 | | | | 2,750 | |
Comprehensive income | | $ | 8,873 | | | $ | 11,246 | | | $ | 8,373 | |
See notes to consolidated financial statements.
FIRSTBANK CORPORATION
CONSOLIDATED STATEMENTS OF CHANGES IN SHAREHOLDERS’ EQUITY
FOR THE YEARS ENDED DECEMBER 31, 2013, 2012, AND 2011
(In Thousands of Dollars, Except for Share and per Share Data)
| | Common Stock | | Preferred Stock | | RetainedEarnings/ (Accumulated Deficit) | | Accumulated Other Comprehensive Income (Loss) | | Total | |
Balances at January 1, 2011 | $ | 115,224 | | $ | 32,763 | | $ | 295 | | $ | 146 | | $ | 148,428 | |
Net income for 2011 | | | | | | | | 5,623 | | | | | | 5,623 | |
Cash dividends on common stock - $0.04per share | | | | | | | | (313 | ) | | | | | (313 | ) |
Accrued dividends on preferred stock andaccretion of discount on preferred stock | | | | | 29 | | | (1,679 | ) | | | | | (1,650 | ) |
Amortization of stock warrants | | (29 | ) | | | | | 29 | | | | | | 0 | |
Issuance of 11,610 shares of common stockthrough the dividend reinvestment plan | | 62 | | | | | | | | | | | | 62 | |
Issuance of 34,803 shares of common stockfrom supplemental shareholder investments | | 197 | | | | | | | | | | | | 197 | |
Issuance of 42,379 shares of common stock | | 162 | | | | | | | | | | | | 162 | |
Stock option and restricted stock expense | | 118 | | | | | | | | | | | | 118 | |
Net change in unrealized gain/(loss) onsecurities available for sale, net of tax of $1,417 | | | | | | | | | | | 2,750 | | | 2,750 | |
BALANCES AT DECEMBER 31, 2011 | | 115,734 | | | 32,792 | | | 3,955 | | | 2,896 | | | 155,377 | |
| | | | | | | | | | | | | | | | |
Net income for 2012 | | | | | | | | 10,534 | | | | | | 10,534 | |
Cash dividends on common stock - $0.29per share | | | | | | | | (2,314 | ) | | | | | (2,314 | ) |
Accrued dividends on preferred stock andaccretion of discount on preferred stock | | | | | 22 | | | (1,269 | ) | | | | | (1,247 | ) |
Redemption of 16,000 shares of preferred stock | | 850 | | | (15,906 | ) | | | | | | | | (15,056 | ) |
Amortization of stock warrants | | (15 | ) | | | | | 15 | | | | | | 0 | |
Repurchase of stock warrants | | (1,947 | ) | | | | | | | | | | | (1,947 | ) |
Issuance of 46,512 shares of common stockthrough the dividend reinvestment plan | | 440 | | | | | | | | | | | | 440 | |
Issuance of 21,925 shares of common stockfrom supplemental shareholder investments | | 201 | | | | | | | | | | | | 201 | |
Issuance of 40,980 shares of common stock | | 262 | | | | | | | | | | | | 262 | |
Stock option and restricted stock expense | | 96 | | | | | | | | | | | | 96 | |
Net change in unrealized gain/(loss) onsecurities available for sale, net of tax of $367 | | | | | | | | | | | 712 | | | 712 | |
BALANCES AT DECEMBER 31, 2012 | | 115,621 | | | 16,908 | | | 10,921 | | | 3,608 | | | 147,058 | |
| | | | | | | | | | | | | | | | |
Net income for 2013 | | | | | | | | 12,234 | | | | | | 12,234 | |
Cash dividends on common stock - $0.24per share | | | | | | | | (1,935 | ) | | | | | (1,935 | ) |
Accrued dividends on preferred stock andaccretion of discount on preferred stock | | | | | 92 | | | (481 | ) | | | | | (389 | ) |
Redemption of 17,000 shares of preferred stock | | | | | (17,000 | ) | | | | | | | | (17,000 | ) |
Issuance of 13,543 shares of common stockthrough the dividend reinvestment plan | | 177 | | | | | | | | | | | | 177 | |
Issuance of 8,386 shares of common stockfrom supplemental shareholder investments | | 111 | | | | | | | | | | | | 111 | |
Issuance of 37,900 shares of common stock | | 338 | | | | | | | | | | | | 338 | |
Exercise of 21,290 stock options | | 232 | | | | | | | | | | | | 232 | |
Stock option and restricted stock expense | | 161 | | | | | | | | | | | | 161 | |
Net change in unrealized gain/(loss) onsecurities available for sale, net of tax benefit of $1,731 | | | | | | | | | | | (3,361 | ) | | (3,361 | ) |
BALANCES AT DECEMBER 31, 2013 | $ | 116,640 | | $ | 0 | | $ | 20,739 | | $ | 247 | | $ | 137,626 | |
See notes to consolidated financial statements
FIRSTBANK CORPORATION
CONSOLIDATED STATEMENTS OF CASHFLOWS
(In Thousands of Dollars)
| | | Year Ended December 31, | |
| | | 2013 | | | 2012 | | | 2011 | |
OPERATING ACTIVITIES | | | | | | | | | | | | |
Net income | | $ | 12,234 | | | $ | 10,534 | | | $ | 5,623 | |
Adjustments to reconcile net income to net cash fromoperating activities: | | | | | | | | | | | | |
Provision for loan losses | | | 1,830 | | | | 7,690 | | | | 13,337 | |
Depreciation of premises and equipment | | | 1,847 | | | | 1,915 | | | | 2,062 | |
Net amortization and accretion of security premiums/discounts | | | 4,095 | | | | 4,096 | | | | 3,783 | |
(Gain)/Loss on trading account securities | | | (12 | ) | | | (4 | ) | | | 11 | |
(Gain)/Loss on securities transactions | | | (334 | ) | | | (44 | ) | | | 37 | |
Amortization of intangibles | | | 369 | | | | 483 | | | | 698 | |
Stock option and restricted stock grant compensation expense | | | 161 | | | | 96 | | | | 118 | |
Gain on sale of mortgage loans | | | (4,436 | ) | | | (6,523 | ) | | | (3,683 | ) |
Proceeds from sales of mortgage loans | | | 135,204 | | | | 200,957 | | | | 115,100 | |
Loans originated for sale | | | (128,248 | ) | | | (197,006 | ) | | | (110,411 | ) |
Deferred federal income tax benefit | | | (290 | ) | | | (27 | ) | | | (1,299 | ) |
Decrease/(increase) in accrued interest receivable and other assets | | | 6,404 | | | | (860 | ) | | | 4,513 | |
Increase/(decrease) in accrued interest payable and other liabilities | | | (3,143 | ) | | | 1,886 | | | | (1,007 | ) |
NET CASH FROM OPERATING ACTIVITIES | | | 25,681 | | | | 23,193 | | | | 28,882 | |
| | | | | | | | | | | | | |
INVESTING ACTIVITIES | | | | | | | | | | | | |
Proceeds from sales of securities available for sale | | | 8,936 | | | | 2,780 | | | | 2,190 | |
Proceeds from maturities of CDs | | | 1,983 | | | | 1,505 | | | | 0 | |
Proceeds from maturities and calls of securities available for sale | | | 98,550 | | | | 136,526 | | | | 128,048 | |
Purchase of securities available for sale | | | (106,263 | ) | | | (153,775 | ) | | | (210,398 | ) |
Redemption of Federal Home Loan Bank stock | | | 0 | | | | 0 | | | | 937 | |
Net (increase)/decrease in portfolio loans | | | (33,656 | ) | | | 8,632 | | | | 28,015 | |
Proceeds from sale of other real estate owned | | | 6,410 | | | | 5,873 | | | | 6,850 | |
Net purchases of premises and equipment | | | (1,660 | ) | | | (1,184 | ) | | | (1,718 | ) |
NET CASH FROM/(USED IN) INVESTING ACTIVITIES | | | (25,700 | ) | | | 357 | | | | (46,076 | ) |
| | | | | | | | | | | | | |
FINANCING ACTIVITIES | | | | | | | | | | | | |
Net increase (decrease) in deposits | | | (8,609 | ) | | | 20,859 | | | | 36,759 | |
Net increase/(decrease) in securities sold under agreements torepurchase and overnight borrowings | | | 4,850 | | | | (3,999 | ) | | | 5,456 | |
Repayment of Federal Home Loan Bank borrowings | | | (2,703 | ) | | | (7,964 | ) | | | (24,201 | ) |
Proceeds from Federal Home Loan Bank borrowings | | | 0 | | | | 11,000 | | | | 3,000 | |
Redemption of preferred stock | | | (17,000 | ) | | | (15,056 | ) | | | 0 | |
Repurchase of stock warrants | | | 0 | | | | (1,947 | ) | | | 0 | |
Cash proceeds from issuance of common stock | | | 858 | | | | 903 | | | | 421 | |
Cash dividends on preferred stock | | | (389 | ) | | | (1,247 | ) | | | (1,650 | ) |
Cash dividends on common stock | | | (1,935 | ) | | | (2,314 | ) | | | (313 | ) |
NET CASH FROM/(USED IN) FINANCING ACTIVITIES | | | (24,928 | ) | | | 235 | | | | 19,472 | |
| | | | | | | | | | | | | |
INCREASE (DECREASE) IN CASH AND CASH EQUIVALENTS | | | (24,947 | ) | | | 23,785 | | | | 2,278 | |
Cash and cash equivalents at beginning of year | | | 99,601 | | | | 75,816 | | | | 73,538 | |
| | | | | | | | | | | | | |
CASH AND CASH EQUIVALENTS AT END OF YEAR | | $ | 74,654 | | | $ | 99,601 | | | $ | 75,816 | |
| | | | | | | | | | | | | |
Supplemental disclosure of cash flow information: | | | | | | | | | | | | |
Cash paid during the year for: | | | | | | | | | | | | |
Interest | | $ | 6,450 | | | $ | 8,677 | | | $ | 13,539 | |
Income taxes | | $ | 4,425 | | | $ | 4,800 | | | $ | 1,975 | |
| | | | | | | | | | | | | |
Non cash transfer of loans to other real estate owned | | $ | 5,099 | | | $ | 4,214 | | | $ | 5,948 | |
See notes to consolidated financial statements.
NOTES TO CONSOLIDATED FINANCIAL STATEMENTS
NOTE 1 – SIGNIFICANT ACCOUNTING POLICIES
Nature of Operations:Firstbank Corporation (the “Company”) is a bank holding company. Each of our subsidiary banks is a full service community bank. The subsidiary banks offer all customary banking services, including the acceptance of checking, savings and time deposits, and the making of commercial, agricultural, real estate, personal, home improvement, automobile and other installment and consumer loans. Our consolidated assets were, $1.5 billion as of December 31, 2013, and primarily represent commercial and retail banking activity. Mortgage loans serviced for others of $609 million,as of December 31, 2013, are not included in the consolidated balance sheet.
Principles of Consolidation:The consolidated financial statements include the accounts of the Company and its subsidiaries, Firstbank; Keystone Community Bank; Austin Mortgage Company; 1st Investors Title, LLC, and FBMI Risk Management Services, Inc., (dissolved in December 2013), after elimination of inter-company accounts and transactions. These subsidiaries are wholly owned, except 1st Investors Title, LLC, in which we held a 44% share at December 31, 2013. We do not consolidate the results of 1st Investors Title, LLC into the results of the Company. During 2004 we formed a special purpose trust, Firstbank Capital Trust I, in 2006 we formed Firstbank Capital Trust II, and in 2007 we formed Firstbank Capital Trust III and Firstbank Capital Trust IV, for the sole purpose of issuing trust preferred securities. These trusts are not consolidated into our financial statements. In February 2013, we merged Firstbank-Alma, Firstbank (Mt Pleasant), Firstbank-West Branch, and Firstbank-West Michigan into a single Firstbank charter.
Use of Estimates:The preparation of financial statements in conformity with accounting principles generally accepted in the United States of America requires management to make estimates and assumptions that affect the reported amounts of assets and liabilities and disclosure of contingent assets and liabilities at the date of the financial statements and the reported amounts of revenues and expenses during the reported period. Actual results could differ from those estimates.
Investments:Investments are presented at fair value as required by accounting principles. Our investment portfolio is classified as available for sale, as such; adjustments to the fair value are reported as a change in equity. If a security is deemed to be other than temporarily impaired, the adjustment to fair value is recorded through the income statement.
Trading Account Securities:From time to time, we invest in the common stock of other companies. Trading account securities are adjusted to fair value through the income statement, with increases in value reflected as non-interest income and decreases in value reflected as a decrease to non-interest income.
Securities Available for Sale:Securities available for sale consist of bonds and notes which might be sold prior to maturity due to changes in interest rate, prepayment risks, yield and availability of alternative investments, liquidity needs or other factors. Securities classified as available for sale are reported at their fair value and the related unrealized holding gain or loss (the difference between the fair value and amortized cost of the securities so classified) is reported in other comprehensive income. Other securities such as Federal Home Loan Bank stock are carried at cost. Interest income includes amortization of purchase premium or discount. Premiums and discounts on securities are amortized on the level-yield method. Gains and losses on sales are recorded on the trade date and are determined using the specific identification method.
Declines in the fair value of securities below their cost that are other than temporary are reflected as realized losses. In estimating other-than-temporary losses, management considers: (1) the length of time and extent that fair value has been less than carrying value; (2) the financial condition and near term prospects of the issuer; and (3) the Company’s ability and intent to hold the security for a period of time sufficient to allow for any anticipated recovery in fair value.
Certain Significant Estimates:The primary estimates incorporated into our financial statements, which are susceptible to change in the near term, include the allowance for loan losses, the determination of the fair value of certain financial instruments, fair value of investments, determination of state and federal tax assets and liabilities, goodwill, purchase accounting and core deposit intangible valuations, valuation of other real estate owned, and the valuation of mortgage servicing rights.
Current Vulnerability Due to Certain Concentrations:Our business is concentrated in the mid-central and southwestern sections of the lower peninsula of Michigan. While the loan portfolio is diversified, the customers’ ability to honor their debts is partially dependent on the local economies. Our service area is primarily dependent on manufacturing (automotive and other), agricultural and recreational industries. Most commercial and agricultural loans are secured by business assets, including commercial and agricultural real estate and federal farm agency guarantees. Generally, consumer loans are secured by various items of personal property and mortgage loans are secured by residential real estate. Our funding sources include time deposits and other deposit products which bear interest. Periods of rising interest rates result in an increase in our cost of funds and an increase in the yields on certain assets. Conversely, periods of falling interest rates result in a decrease in yields on certain assets and costs of certain funds.
Cash and Cash Equivalents:Cash and cash equivalents include cash on hand, amounts due from banks and short term investments with an original maturity of 90 days or less, which include interest bearing deposits with banks and the Federal Reserve, federal funds sold, and overnight money market fund investments. Generally, federal funds and overnight money market funds are purchased for a one day period. We report customer loan transactions, deposit transactions and repurchase agreements and overnight borrowings on a net basis within our cash flow statement.
Mortgage Banking Activities:Servicing rights are recognized as assets based on the allocated value of retained servicing rights on loans sold. Servicing rights are expensed in proportion to, and over the period of, estimated net servicing revenues. Impairment is evaluated based on the fair value of the rights, using groupings of the underlying loans as to interest rates. Any impairment of a grouping is reported as a valuation allowance.
Servicing fee income is recorded for fees earned for servicing loans. The fees are based on a contractual percentage of the outstanding principal or a fixed amount per loan and are recorded as income when earned. Amortization of mortgage serving rights is netted against loan servicing fee income in the income statement.
Mortgage Derivatives:From time to time, we enter into mortgage banking derivatives such as forward contracts and rate lock commitments in the ordinary course of business. The derivatives are not designated as hedges and are carried at fair value. The net gain or loss on mortgage banking derivatives is included in gain on sale of loans.
Loans Held for Sale: Mortgage loans originated and intended for sale in the secondary market are carried at the lower of aggregate cost or market, as determined by outstanding commitments from investors. Net unrealized losses, if any, are recorded as a valuation allowance and charged to earnings.
Mortgage loans held for sale are generally sold with servicing rights retained. Gains and losses on sales of mortgage loans are based on the difference between the selling price and the carrying value of the related loan sold, which is reduced by the cost allocated to the servicing right. We generally lock in the sale price to the purchaser of the loan at the same time we make a rate commitment to the borrower.
Loans:Loans receivable, for which management has the intent and ability to hold for the foreseeable future or payoff are reported at their outstanding unpaid principal balances, net of any deferred fees or costs on originated loans, unamortized premiums or discounts. Loan origination fees and certain origination costs are capitalized and recognized as an adjustment to yield of the related loan. Interest income is reported on the interest method and includes amortization of net deferred loan fees and costs over the loan term without anticipating prepayments. Interest income on mortgage and commercial loans is discontinued at the time the loan becomes 90 days delinquent unless the credit is well secured and in process of collection. Consumer and unsecured consumer line of credit loans are typically charged off no later than 120 days past due. Loans are placed on nonaccrual or charged off at an earlier date if collection of principal or interest is considered doubtful.
All interest accrued, but not received, for loans placed on nonaccrual status, is reversed against interest income. Interest received on such loans is accounted for on the cash-basis or cost-recovery method until qualifying for return to accrual. Loans are returned to accrual status when all of the principal and interest amounts contractually due are brought current and future payments are reasonably assured.
Loans classified as troubled debt restructurings (TDR’s) are accounted for in generally the same manner as all other loans. Troubled debt restructuring of loans is undertaken to improve the likelihood that the loan will be repaid in full under the modified terms in accordance with a reasonable repayment schedule. All modified loans are evaluated to determine whether the loans should be reported as a TDR. A loan is a TDR when we, for economic or legal reasons related to the borrower’s financial difficulties, grant a concession to the borrower by modifying or renewing a loan that we would not otherwise consider. To make this determination, we must determine whether (1) the borrower is experiencing financial difficulties and (2) we have granted the borrower a concession. This determination requires consideration of all of the facts and circumstances surrounding the modification. An overall general decline in the economy or some deterioration in a borrower’s financial condition does not automatically mean the borrower is experiencing financial difficulties.
If the loan is in accrual status at the time of the restructuring, the borrower has the ability to make the payments under the restructured terms, and the restructuring does not forgive principal, the loan remains on an accrual basis under the new terms. If there is a forgiveness of debt or partial charge off, the loan will generally be placed on nonaccrual status with any accrued interest reversed against interest income. If a loan is in nonaccrual status at the time of a restructuring or subsequently becomes nonaccrual, it will remain in nonaccrual status until the borrower has demonstrated the ability to make the payments under the restructured terms by making a minimum of six monthly payments. If the borrower makes the six monthly payments without becoming past due 30 days or more, it may be returned to accrual status. The determination of the need for an allowance for loan loss adjustment is based on the sum of: (1) a factor relating to historical losses multiplied times the balance of the loan, and (2) a net present value adjustment relating to a change in interest rate, if applicable. The amount recorded in the allowance for loan losses for restructured loans during the years ended December 31, 2013 and 2012 was $4.2 million and $2.3 million, respectively. Restructured loans charged off were $914,000 in 2013 and $1.7 million in 2012.
Allowance for Loan Losses:The allowance for loan losses is a valuation allowance for probable incurred credit losses. Management uses a quantitative and qualitative methodology for analyzing factors which impact the allowance for loan losses consistently across its banking subsidiaries. The process applies risk factors for historical charge-offs and delinquency experience, portfolio segment weightings and industry and regional factors and trends as they affect the banks’ portfolios. Consideration of exposures to industries potentially most affected by risks in the current economic and political environment, and the review of potential risks in certain credits that are considered part of the non-performing loan category contributed to the establishment of the allowance levels at each bank. Loan losses are charged off against the allowance when management believes the loan balance is confirmed to be uncollectible.
Loans are reviewed on an ongoing basis for impairment. A loan is impaired when it is probable that we will be unable to collect all amounts due according to the contractual terms of the loan agreement. Impaired loans are measured based on the present value of expected cash flows discounted at the loan’s effective interest rate or, as a practical expedient, the fair value of collateral, if the loan is collateral dependent. Loans considered to be impaired are reduced to the present value of expected future cash flows or to the fair value of collateral by allocating a portion of the allowance for loan losses to such loans. If these allocations cause an increase in the allowance for loan losses such increase is reported as provision for loan loss through the income statement. Increases or decreases in carrying value due to changes in estimates of future payments or the passage of time are reported as reductions or increases in the provision for loan losses.
Smaller balance homogeneous loans such as residential first mortgage loans secured by one to four family residences, residential construction, automobile, home equity and second mortgage loans, are collectively evaluated for impairment. Commercial loans and first mortgage loans secured by other properties are evaluated individually for impairment. When credit analysis of the borrower’s operating results and financial condition indicates the underlying ability of the borrower’s business activity is not sufficient to generate adequate cash flow to service the business’ cash needs, including our loans to the borrower, the loan is evaluated for impairment. Often this is associated with a delay or shortfall in payments of 90 days or less. Commercial and commercial real estate loans are rated on a scale of 1 to 10, with grades 1 to 4 being pass grades, 5 watch, 6 special mention, 7 substandard, 8 impaired, 9 doubtful and 10 loss. Loans graded 6, 7, and 8 are reviewed for possible impairment at least quarterly. Loans are generally moved to nonaccrual status when 90 days or more past due and considered impaired. Impaired loans, or portions thereof, are charged off when deemed uncollectible. For a more complete explanation of our loan grading system, see Note 6.
Premises and Equipment:Premises and equipment are stated on the basis of cost less accumulated depreciation. Depreciation is computed over the estimated useful lives of the assets, primarily by accelerated methods for income tax purposes and by the straight line method for financial reporting purposes. Buildings and related components are assigned useful lives ranging from 5 to 33 years. Furniture, fixtures and equipment are assigned useful lives ranging from 3 to 10 years.
Other Real Estate Owned:Other real estate owned includes properties acquired through either a foreclosure proceeding or acceptance of a deed in lieu of foreclosure and is initially recorded at the fair value less estimated carrying and selling costs when acquired, establishing a new cost basis. These properties are evaluated periodically and, if fair value is deemed to have declined subsequent to foreclosure, a valuation allowance is recorded through noninterest expense. Costs incurred for the property after foreclosure are expensed as incurred. Other real estate owned totaled approximately $1.8 million and $2.9 million at December 31, 2013 and 2012. Gains and losses on the sale of other real estate owned are recorded on the income statement as other income.
The following table summarizes the activity associated with other real estate owned during the years ended December 31:
(In Thousands of Dollars) | | 2013 | | | 2012 | |
Balance at beginning of year | | $ | 2,925 | | | $ | 5,251 | |
Properties transferred into OREO | | | 5,099 | | | | 4,214 | |
Valuation impairments recorded | | | (212 | ) | | | (1,151 | ) |
Proceeds from sale of properties | | | (6,410 | ) | | | (5,873 | ) |
Gain on sale of properties | | | 436 | | | | 484 | |
Balance at end of year | | $ | 1,838 | | | $ | 2,925 | |
Goodwill and Other Intangible Assets:Goodwill results from business acquisitions and represents the excess of the purchase price over the fair value of acquired tangible assets and liabilities and identifiable intangible assets. Goodwill is assessed at least annually for impairment and any such impairment is recognized in the period identified. A more frequent assessment is performed if conditions in the market place or changes in the company’s organizational structure occur. We use a discounted income approach and a market valuation model, which compares the inherent value of our company to valuations of recent transactions in the market place to determine if our goodwill has been impaired. See Note 8 for additional information.
Other intangible assets consist of core deposit intangibles arising from whole bank and branch acquisitions. They are initially measured at fair value and then are amortized on an accelerated method over their estimated useful lives.
Long Term Assets:Premises and equipment, core deposit and other intangible assets, and other long-term assets are reviewed for impairment when events indicate their carrying amount may not be recoverable from future undiscounted cash flows. If impaired, a charge is taken to earnings, and the assets are written down to new estimate of fair value.
Loan Commitments and Related Financial Instruments:Financial instruments include off-balance sheet credit instruments, such as commitments to make loans and commercial letters of credit, issued to meet customer financing needs. The face amount for these items represents the exposure to loss, before considering customer collateral or ability to repay. Such financial instruments are recorded when they are funded.
Income Taxes:We record income tax expense based on the amount of taxes due on our tax return plus the change in deferred taxes, computed based on the future tax consequences of temporary differences between the carrying amounts and tax bases of assets and liabilities using enacted tax rates. A valuation allowance is recorded, if needed, and reduces deferred tax assets to the amount expected to be realized.
Earnings Per Share:Basic earnings per share is calculated by dividing net income available for common shareholders (net income less preferred stock dividends and accretion of the preferred stock discount when applicable) by the weighted average number of common shares outstanding. Diluted earnings per share is calculated by dividing net income available for common shareholders by the weighted average common shares outstanding including the dilutive effect of additional common shares that may be issued under outstanding stock options and warrants.
Comprehensive Income:Comprehensive income consists of net income and changes in unrealized gains and losses on securities available for sale, net of tax, which is recognized as a separate component of equity. Accumulated other comprehensive income consists of unrealized gains and losses on securities available for sale, net of tax.
Recent Accounting Pronouncements:In July 2013, the Financial Accounting Standards Board (FASB) issued Accounting Standards Update 2013-12, Definition of a Public Business Entity. This Standard seeks to distinguish when a company is considered a public entity or a private company for purposes of the application of certain U.S. generally accepted accounting principles (GAAP) standards. This Standard has no published effective date, but is considered to be effective immediately and will have no impact on us.
In February 2013, the FASB issued Accounting Standards Update No. 2013-02, Reporting of Amounts Reclassified Out of Accumulated Other Comprehensive Income, to improve the reporting of reclassifications out of accumulated other comprehensive income. This standard requires that an entity report the effect of significant reclassifications out of accumulated other comprehensive income on the respective line items in net income if the amount being reclassified is required under U.S. GAAP to be reclassified in its entirety to net income. For other amounts that are not required under U.S. GAAP to be reclassified in their entirety to net income in the same reporting period, an entity is required to cross-reference other disclosures required under U.S. GAAP that provide additional detail about these amounts. The standard is effective prospectively for reporting periods beginning after December 15, 2012. The Company adopted ASU 2013-02 as of January 1, 2013.
In July 2012, the FASB issued ASU No. 2012-02, Intangibles – Goodwill and Other: Testing Indefinite-Lived Intangible Assets for Impairment to reduce the cost and complexity of testing indefinite-lived intangible assets for impairment. This standard gives an entity the option of first assessing qualitative factors to determine whether the existence of events and circumstances indicates that it is more likely than not that the indefinite-lived intangible asset is impaired. If, after assessing the totality of events and circumstances, an entity concludes that it is not more likely than not that the indefinite-lived asset is impaired, then the entity is not required to take further action. However, if an entity concludes otherwise, then it is required to determine the fair value of the indefinite-lived asset and perform the quantitative impairment test by comparing the fair value with the carrying amount in accordance with Subtopic 350-30. An entity also has the option to bypass the qualitative assessment for any indefinite-lived asset in any period and proceed directly to performing the quantitative impairment test. An entity will be able to resume performing the qualitative assessment in any subsequent period. This standard is effective for fiscal years beginning after September 15, 2012 and early adoption is permitted. The adoption of ASU 2012-02 is not expected to have a material impact on the Company’s consolidated financial condition or results of operations.
Loss Contingencies:Loss contingencies, including claims and legal actions arising in the ordinary course of business, are recorded as liabilities when the likelihood of loss is probable and an amount or range of loss can be reasonably estimated. Management does not believe there are such matters that will have a material effect on the financial statements as of December 31, 2013.
Fair Value of Financial Instruments: Fair values of financial instruments are estimated using relevant market information and other assumptions, as more fully disclosed in a separate note. Fair value estimates involve uncertainties and matters of significant judgment regarding interest rates, credit risk, prepayments, and other factors, especially in the absence of broad markets for particular items. Changes in assumptions or in market conditions could significantly affect the estimates.
Reclassification:Certain 2012 and 2011 amounts may have been reclassified to conform to the 2013 presentation.
Operating Segments:While the chief decision-makers monitor the revenue streams of the various products and services, operations are managed and financial performance is evaluated on a company wide basis. Operating segments are aggregated into one as operating results for all segments are similar. Accordingly, all of the financial service operations are considered by management to be aggregated in one reportable operating segment.
Merger Expenses: All costs relating to mergers are expensed as incurred. Contingent fees are expensed when the circumstances relating to the contingency are satisfied.
NOTE 2 – ACQUISITIONS AND DIVESTITURES
We have entered into an agreement to merge with and into Mercantile Bank Corporation. Shareholders from both companies have approved the merger and we are awaiting regulatory approval to complete the transaction sometime during 2014.
In December 2013 we closed and dissolved our FBMI Risk Management Services, Inc. subsidiary.
NOTE 3 – RESTRICTIONS ON CASH AND DUE FROM BANKS
Our subsidiary banks are required to maintain average reserve balances in the form of cash and non-interest bearing balances due from the Federal Reserve Bank. The average reserve balances required to be maintained at year end 2013 and 2012 were $28.1 million and $20.6 million, respectively. These balances earned interest at a rate of 0.25% during both 2013 and 2012.
NOTE 4 – SECURITIES
The fair value of securities available for sale was as follows:
| (In Thousands of Dollars) | | Amortized Cost | | | Gross Unrealized Gains | | | Gross Unrealized Losses | | | Carrying Value | |
Securities Available for Sale: | | | | | | | | | | | | | | | | |
December 31, 2013: | | | | | | | | | | | | | | | | |
U.S. governmental agency | | $ | 101,444 | | | $ | 445 | | | $ | (285 | ) | | $ | 101,604 | |
States and political subdivisions | | | 147,421 | | | | 756 | | | | (1,513 | ) | | | 146,664 | |
Mortgage Backed Securities | | | 58,533 | | | | 961 | | | | (235 | ) | | | 59,259 | |
Collateralized Mortgage Obligations | | | 34,225 | | | | 361 | | | | (100 | ) | | | 34,486 | |
Equity and other Securities | | | 1,589 | | | | 0 | | | | 0 | | | | 1,589 | |
Total | | $ | 343,212 | | | $ | 2,523 | | | $ | (2,133 | ) | | $ | 343,602 | |
| | | | | | | | | | | | | | | | | |
December 31, 2012: | | | | | | | | | | | | | | | | |
U.S. governmental agency | | $ | 105,629 | | | $ | 1,271 | | | $ | (15 | ) | | $ | 106,885 | |
States and political subdivisions | | | 116,123 | | | | 1,786 | | | | (95 | ) | | | 117,814 | |
Mortgage Backed Securities | | | 64,550 | | | | 1,729 | | | | (2 | ) | | | 66,277 | |
Collateralized Mortgage Obligations | | | 60,278 | | | | 810 | | | | (58 | ) | | | 61,030 | |
Equity and other Securities | | | 1,610 | | | | 62 | | | | 0 | | | | 1,672 | |
Total | | $ | 348,190 | | | $ | 5,658 | | | $ | (170 | ) | | $ | 353,678 | |
Securities with unrealized losses at year end 2013 and 2012 not recognized in income are as follows:
(In Thousands of Dollars) | | Less than 12 Months | | | 12 Months or More | | | Total | |
Description of Securities | | FairValue | | | Unrealized Loss | | | FairValue | | | Unrealized Loss | | | FairValue | | | Unrealized Loss | |
December 31, 2013: | | | | | | | | | | | | | | | | | | | | | | | | |
U.S. governmental agency | | $ | 23,077 | | | $ | (237 | ) | | $ | 9,836 | | | $ | (48 | ) | | $ | 32,913 | | | $ | (285 | ) |
States and political subdivisions | | | 53,185 | | | | (1,176 | ) | | | 14,085 | | | | (337 | ) | | | 67,270 | | | | (1,513 | ) |
Mortgage Backed Securities | | | 16,719 | | | | (235 | ) | | | 0 | | | | 0 | | | | 16,719 | | | | (235 | ) |
Collateralized Mortgage Obligations | | | 4,132 | | | | (35 | ) | | | 8,246 | | | | (65 | ) | | | 12,378 | | | | (100 | ) |
Total Temporarily Impaired | | $ | 97,113 | | | $ | (1,683 | ) | | $ | 32,167 | | | $ | (450 | ) | | $ | 129,280 | | | $ | (2,133 | ) |
| | | | | | | | | | | | | | | | | | | | | | | | | |
December 31, 2012: | | | | | | | | | | | | | | | | | | | | | | | | |
U.S. governmental agency | | $ | 10,135 | | | $ | (15 | ) | | $ | 0 | | | $ | 0 | | | $ | 10,135 | | | $ | (15 | ) |
States and political subdivisions | | | 17,141 | | | | (93 | ) | | | 582 | | | | (2 | ) | | | 17,723 | | | | (95 | ) |
Mortgage Backed Securities | | | 0 | | | | 0 | | | | 513 | | | | (2 | ) | | | 513 | | | | (2 | ) |
Collateralized Mortgage Obligations | | | 19,995 | | | | (55 | ) | | | 721 | | | | (3 | ) | | | 20,716 | | | | (58 | ) |
Total Temporarily Impaired | | $ | 47,271 | | | $ | (163 | ) | | $ | 1,816 | | | $ | (7 | ) | | $ | 49,087 | | | $ | (170 | ) |
Unrealized losses on securities shown in the previous tables have not been recognized into income because management has the intent and ability to hold these securities for the foreseeable future. The decline in market value is due to changes in interest rates for debt securities and considered normal market fluctuations for debt securities. Management has also reviewed the issuers’ bond ratings, noting they are of high credit quality.
Trading account securities are marked to market with the change in value reported on the income statement. Gains and losses onavailable for sale securities are recognized if the security is either deemed to be other than temporarily impaired, or the security are sold.
The following table shows gross gains and losses on investment securities for the three year period:
(In Thousands of Dollars) | | 2013 | | | 2012 | | | 2011 | |
Trading Account Securities Gains/(Losses) | | $ | 12 | | | $ | 4 | | | $ | (11 | ) |
| | | | | | | | | | | | | |
Available for Sale Securities | | | | | | | | | | | | |
Gross realized gains | | $ | 363 | | | $ | 44 | | | $ | 28 | |
Gross realized losses | | | (29 | ) | | | 0 | | | | (65 | ) |
Net realized gains (losses) | | $ | 334 | | | $ | 44 | | | $ | (37 | ) |
The fair value of securities available for sale at December 31, 2013, by stated maturity, is shown below. Actual maturities may differ from stated maturities because issuers may have the right to call or prepay obligations with or without call or prepayment penalties.
(In Thousands of Dollars) | | Fair Value | |
Due in one year or less | | $ | 52,919 | |
Due after one year through five years | | | 143,926 | |
Due after five years through ten years | | | 99,318 | |
Due after ten years | | | 45,850 | |
Total | | | 342,013 | |
| | | | | |
Equity securities | | | 1,589 | |
Total available for sale securities | | $ | 343,602 | |
At December 31, 2013 and 2012, securities with carrying values approximating $47,635,000 and $45,645,000 were pledged to secure public trust deposits, securities sold under agreements to repurchase, and for such other purposes as required or permitted by law.
Federal Home Loan Bank stock is carried at cost, which approximates its fair value.
NOTE 5 – LOAN SERVICING
Loans held for sale at year end are as follows:
(In Thousands of Dollars) | | | | | | | | |
| | | 2013 | | | 2012 | |
Loans held for sale | | $ | 401 | | | $ | 2,921 | |
Less: Allowance to adjust to lower of cost or market | | | 0 | | | | 0 | |
Loans held for sale, net | | $ | 401 | | | $ | 2,921 | |
Mortgage loans serviced for others are not reported as assets. The principal balances of these loans at year end are as follows:
(In Thousands of Dollars) | | | | | | | | |
| | | 2013 | | | 2012 | |
Mortgage loan portfolios serviced for: | | | | | | | | |
Freddie Mac | | $ | 607,410 | | | $ | 605,000 | |
Fannie Mae | | $ | 0 | | | $ | 1,140 | |
Federal Home Loan Bank | | $ | 1,834 | | | $ | 2,094 | |
Custodial escrow balances maintained in connection with serviced loans were $1,476,000 and $1,433,000 at year end 2013 and 2012.
Activity for capitalized mortgage servicing rights, included in other assets on the Consolidated Balance Sheet, was as follows:
(In Thousands of Dollars) | | | | | | | | | | | | |
| | | 2013 | | | 2012 | | | 2011 | |
Servicing rights: | | | | | | | | | | | | |
Beginning of year | | $ | 4,993 | | | $ | 4,596 | | | $ | 4,603 | |
Additions | | | 1,715 | | | | 2,512 | | | | 1,505 | |
Amortized to expense | | | (1,779 | ) | | | (2,115 | ) | | | (1,512 | ) |
End of year | | $ | 4,929 | | | $ | 4,993 | | | $ | 4,596 | |
Management has determined that no valuation allowance was necessary at December 31, 2013, 2012, or 2011.
The fair value of mortgage servicing rights was $7,475,000 and $5,494,000 at year end 2013 and 2012. Fair value at the end of 2013 was determined using a discount rate of 7.691%, a weighted average constant prepayment rate of 14.07%, depending on the stratification of the specific right, and a weighted average delinquency rate of 0.90%. At the end of 2012, fair value was determined using a discount rate of 7.018%, a weighted average constant prepayment rate of 17.01%, depending on the stratification of the specific right, and a weighted average delinquency rate of 1.01%
The weighted average amortization period is 3.1 yearsas of December 31, 2013. Estimated amortization expense for each of the next five years is:
(In Thousands of Dollars) | |
2014 | | $ | 1,263 | |
2015 | | | 1,041 | |
2016 | | | 873 | |
2017 | | | 722 | |
2018 | | | 580 | |
Thereafter | | | 450 | |
NOTE 6 – LOANS
The following information provides a description of how loan grades are determined for our Commercial and Industrial and Commercial Real Estate segments. In general, for Commercial and Industrial, and Commercial Real Estate segments, the probability of loss increases with each rate change from the Grade 1 Excellent down through the Grade 9 Doubtful Nonaccrual classes. For Consumer and Residential Mortgage segments, the probability of loss increases as loans move down from current to greater than 60 days past due, nonaccrual.
Grade 1 Excellent – Characteristics of loans in this category include: the loan is generally secured by cash or readily marketable securities; the borrower provides annual audited financials with interim financials reviewed quarterly; the loan has no delinquencies over ten days in the past year; the company’s management is considered to have a high degree of integrity; management of the company has over 15 years of experience; lines of credit have not and are not expected to be utilized; financial statements demonstrate consistently strong profits; and the company has little competition and excellent growth prospects.
Grade 2 Quality – Characteristics of loans in this category include: high net worth borrowers with excellent cash flow and a high degree of liquidity; the borrower generally has annual audited financial statements; there has been one or fewer delinquencies over ten days in the past year; the company’s management is considered to have a high degree of integrity; the company’s management has over ten years of experience; lines of credit have had nominal use over the preceding 12 months; financial statements demonstrate consistent profitability; and the company is in an excellent competitive position.
Grade 3 Good – Loans in this category are very strong, but may lack some of the net worth and/or cash flow characteristics of the previous rating. Characteristics of loans in this category include: annual reviewed financial statements and compiled quarterly financial statements; there has only been one or fewer delinquencies over 15 days in the past year; the company’s management has solid integrity; the company’s management is capable and has over five years of experience; lines of credit have regular usage with no balance in the last 60 days; financial statements demonstrate consistent but nominal profits; and the company has good a solid market share.
Grade 4 Acceptable – Characteristics of loans in this category include: annual compiled financial statements with quarterly information available or CPA prepared tax returns; there are only two or fewer delinquencies over 15 days of which only one is over 30 days in the past year; the company’s management has average business experience of over three years; lines of credit have regular use but have no current balance or a significant reduction in balance in the last 30 days; the company has been profitable in two of the preceding three years; and the company is competitive in its market and is maintaining its market share.
Loans graded as one through four are considered as Pass loans and are shown as one class of loans in our credit quality table.
Grade 5 Watch - This rating is used for loans which have shown some sign of weakness, but have not degraded to the point of requiring an impairment review. Characteristics of loans in this rating include: annual management prepared financial statements; delinquencies not exceeding three times over 30 days or one time over 60 days in the past year; weakening financial statements but profitable in two of the last three years; and a declining market share in a competitive market. These loans merit monitoring by management to assure that if circumstances deteriorate further actions are taken to protect the bank’s position.
Grade 6 Special Mention - This rating is used for loans which are included on a watch list and have degraded to a point where additional supervision is required; however, the bank remains confident in the full collection of all principal and interest. These loans are reviewed for impairment on a quarterly basis. Characteristics of loans in this rating may include: repeat delinquency; longer term negative trends in financial results; continuing deterioration of cash flows; concerns regarding the liquidity of guarantors; and other negative business trends.
Grade 7 Substandard - This rating is for loans for which a lender is actively working with the borrower to resolve issues and the full repayment of the loan is questionable. The loan is inadequately protected by current sound worth of the borrower, paying capacity of the guarantor, or pledged collateral. Loans in this grade have well defined weaknesses that jeopardize the full collectability of the loan and a distinct possibility of loss exists. These loans are reviewed for impairment on a quarterly basis. Characteristics of loans in this rating may include: persistent delinquency; poor financial results of the business; negative cash flow; the ability of guarantor(s) to provide support for the loan is questionable.
Grade 8 Impaired Nonaccrual - This rating is for loans which are considered impaired and classified as nonaccrual. Loans in this grade have all the weaknesses of those classified as substandard grade 7 above, with the added characteristic that, based upon currently known facts, the weaknesses make collection of all principal and interest due according to contractual terms unlikely. These loans are reviewed for impairment on a quarterly basis. Loans in this grade may be assigned an allocated reserve in the loan loss allowance analysis if a determination is made that the future cash flows or the value of the collateral do not support the current carrying value of the loan.
Grade 9 Doubtful Nonaccrual - This rating is for loans which are considered impaired and are classified as nonaccrual. Loans in this grade have all the weaknesses of those classified as impaired nonaccrual grade 8 above, with the added characteristic that the weaknesses make full collection through payment or liquidation of the collateral, based on currently known facts, highly questionable or improbable. These loans are reviewed for impairment on a quarterly basis. Loans in this grade may be assigned an allocated reserve in the loan loss allowance analysis if a determination is made that the future cash flows or the value of the collateral do not support the current carrying value of the loan.
Restructured Loans
Impaired Restructured and Accruing - Loans where the borrower is experiencing financial difficulty and the bank has granted a concession to the borrower. A concession may be: a reduction in the contractual interest rate below current market rates for loans of similar quality, a lengthening of the accrual time frame beyond normal market terms, a forgiveness of a portion of the outstanding principal, or acceptance of collateral in lieu of payment for a portion of the loan balance. If the loan is in accrual status at the time of the restructuring, the borrower has the ability to make the payments under the restructured terms, and the restructuring does not forgive principal, the loan remains on an accrual status under the new terms. However, if there is a forgiveness of debt or partial charge off, the loan will generally be graded as impaired nonaccrual (Grade 8) with any accrued interest reversed against interest income. If a loan is in nonaccrual status at the time of a restructuring, it will remain in nonaccrual status (Grade 8) at the time of restructuring. All non-accruing restructured loans remain in nonaccrual status until the borrower has demonstrated the ability to make the payments under the restructured terms by making a minimum of six months of payments. If the borrower makes the six months of payments without becoming past due 30 days or more, the loan may be returned to accrual status. The determination of the need for an allowance for loan loss adjustment is based on a factor relating to historical losses multiplied by the balance of the loan for residential mortgages, or a collateral impairment review for commercial loans, and a net present value adjustment relating to a change in interest rate and other terms, if applicable.
Impaired Restructured and Accruing loans are graded seven or better based on the above definitions. If a restructured loan is graded as eight or nine, it is reported as Impaired Nonaccrual, or Doubtful Nonaccrual, respectively.
For commercial loans graded eight and nine and consumer and residential mortgage loans reported in nonaccrual, interest income is generally not recognized until the loan improves and is returned to accrual status. In some cases, if the loan is well secured and the borrower’s ability to support the loan payments has improved, such as in the case of a restructured nonaccrual loan, interest income may be recognized on a cash basis while the loan is in nonaccrual status.
For Consumer and Residential Mortgage Loan segments, loans are classified by risk based on current delinquency and nonaccrual status. These segments of loans will contain a separate class for restructured loans, if they exist.
The following credit quality indicators provide a system for distribution of our loan portfolio in a manner consistent with the previously described loan grading system and for use in the determination of our loan loss allowance. This presentation differs somewhat by loan category from classification of loans presented elsewhere in our regulatory reports and within this report. These variations primarily relate to how real estate loans are analyzed internally to determine the adequacy of the loan loss allowance, versus how we are required to report real estate loans for regulatory purposes.
Credit Quality Indicators:
Loans at period end were as follows: | | | | | | | | |
(In Thousands of Dollars) | | December 31, 2013 | | | December 31, 2012 | |
| | | | | | | | | |
Commercial and Industrial | | | | | | | | |
Pass loans | | $ | 152,031 | | | $ | 133,678 | |
Watch loans | | | 6,578 | | | | 5,367 | |
Special mention loans | | | 4,549 | | | | 5,436 | |
Substandard loans | | | 2,448 | | | | 1,881 | |
Impaired restructured and accruing loans | | | 1,272 | | | | 3,234 | |
Impaired nonaccrual loans | | | 116 | | | | 448 | |
Total Commercial and Industrial | | | 166,994 | | | | 150,044 | |
| | | | | | | | | |
Commercial Real Estate | | | | | | | | |
Pass loans | | $ | 391,485 | | | $ | 373,577 | |
Watch loans | | | 46,061 | | | | 50,790 | |
Special mention loans | | | 16,623 | | | | 18,117 | |
Substandard loans | | | 5,764 | | | | 9,655 | |
Impaired restructured and accruing loans | | | 14,016 | | | | 12,106 | |
Impaired nonaccrual loans | | | 5,447 | | | | 8,427 | |
Doubtful nonaccrual loans | | | 0 | | | | 25 | |
Total Commercial Real Estate | | | 479,396 | | | | 472,697 | |
| | | | | | | | | |
Residential Mortgages 1st Liens | | | | | | | | |
Performing loans | | $ | 207,019 | | | $ | 202,357 | |
Loans > 60 days past due | | | 686 | | | | 1,046 | |
Impaired restructured and accruing loans | | | 5,030 | | | | 4,953 | |
Nonaccrual loans | | | 4,217 | | | | 6,040 | |
Total First Lien Residential Mortgage loans | | | 216,952 | | | | 214,396 | |
| | | | | | | | | |
Residential Mortgages Junior Liens | | | | | | | | |
Performing loans | | $ | 53,874 | | | $ | 58,089 | |
Loans > 60 days past due | | | 81 | | | | 96 | |
Impaired restructured and accruing loans | | | 246 | | | | 235 | |
Nonaccrual loans | | | 287 | | | | 327 | |
Total Junior Lien Residential Mortgage loans | | | 54,488 | | | | 58,747 | |
| | | | | | | | | |
Consumer | | | | | | | | |
Performing loans | | $ | 68,987 | | | $ | 67,042 | |
Loans > 60 days past due | | | 36 | | | | 39 | |
Impaired restructured and accruing loans | | | 132 | | | | 191 | |
Nonaccrual loans | | | 9 | | | | 401 | |
Total Consumer | | | 69,164 | | | | 67,673 | |
| | | | | | | | | |
Loan Fees | | | 152 | | | | 205 | |
| | | | | | | | | |
Total Loans | | $ | 987,146 | | | $ | 963,762 | |
Allowance for Loan Losses
The allowance for loan losses is determined based on management’s estimate of probable losses incurred within the loan portfolio as of the balance sheet date. We determine the amount of the allowance for loan losses based on periodic evaluation of the loan portfolios and other relevant factors. This evaluation is inherently subjective and requires material estimates, which are subject to change. Factors that are considered in the evaluation of individual, and pools of loans, include: historical loss experience; likelihood of default; liquidation value of a loan’s underlying collateral; timing and amounts of expected future cash flows; and our exposure to loss in the event of default. We further estimate the impact of qualitative factors that may cause future losses to differ from historical experience. Such factors include: changes in credit quality, macro economic impacts on our customers, and changes in underwriting standards.
Our historical loss experience is determined based on actual losses incurred over the previous twelve quarters. We utilize a method of averaging these losses whereby we place a heavier emphasis on more recent experience. Our model provides a 50% weighting on the most recent four quarters, 30% weighting on the middle four quarters, and 20% weighting on the oldest four quarters.
The loan portfolio is segmented into five loan types: commercial and industrial loans; commercial real estate loans; consumer loans; residential mortgages – first liens; and residential mortgage – junior liens. These segments are further grouped by credit quality classifications.
The segments comprising commercial and industrial loans and commercial real estate loans are classified based on the loan grading system described above. We group loans rated as one through four together into one class of Pass loans. Commercial and industrial and commercial real estate loans graded as Pass and Watch are assigned a unique pooled loss rate based on historical losses incurred over the prior three years as described above. We adjust the calculated historical loss rate up or down based on current developments, that in management’s judgment are not reflected in the historical losses of the company. The current outstanding balance for each of these classes of loans is then multiplied by the adjusted historical loss rate to determine the amount of allowance for loan losses to reserve on that pool of loans.
Loans graded special mention use a shorter 12 month loss history to determine the loss rate. Losses over the preceding 12 month period are divided by the average balance outstanding of substandard and impaired loans to determine a historical loss rate. That calculated historical loss rate is multiplied by a probability factor to determine a loss rate to be applied to this class of loans. The probability factor is determined from an analysis of the migration of special mention loans to more severe risk classes over the preceding 12 month period.
Loans graded as substandard use the shorter 12 month loss history to determine the loss rate. Losses over the preceding 12 month period are divided by the average balance outstanding of substandard and impaired loans to determine a historical loss rate. The calculated historical loss rate, without adjustment for migration, is then multiplied times the outstanding balance of substandard loans to determine the amount of allowance for loan losses to provide for this class of loans.
Loans graded as impaired nonaccrual, impaired doubtful, and impaired restructured and accruing are individually analyzed for loan losses. An allocated reserve is established within the allowance for loan losses for the difference between the carrying value of the loan and its determined collectable value. To determine the collectable value of the loan, the present value of expected cash flows, the collateral value, or some combination of the two is used. The allocated reserve is established as the difference between the carrying value of the loan and the collectable value.
For consumer and residential loan segments, loans that are current, or less than 60 days past due are assigned a unique historical loss rate as described above for commercial Pass and Watch loans. For loans that are more than 60 days past due including nonaccrual loans, a loss rate is determined based on charge offs within the last 12 months, divided by the sum of the average balance of loans 60 days or more past due and nonaccrual loans. These loss rates are multiplied by the outstanding balances in each unique loan segment at the end of the reporting period to determine the amount of allowance for loan loss.
For restructured loans where the bank has granted a rate concession, an additional amount is added to the loan loss reserve that represents the difference in the present value of the cash flows between the original terms and the new terms of the modified loan, using the original interest rate of the loan as a discount rate. Any change in the present value of the loan due to passage of time is reflected as an adjustment to provision for loan loss expense.
After each of the steps outlined above is completed, the results are aggregated and compared with the existing balance of the allowance for loan losses. If the aggregation is greater than the balance, the allowance for loan losses is increased through a charge to earnings on the provision for loan losses line. If the resulting aggregation is below the current balance of the allowance for loan losses, management will determine, based upon the number, potential impact, and uncertainty of the estimates contained within the process whether the unallocated reserve is excessive. If in management’s judgment the unallocated reserve exceeds a level deemed prudent given the inherent uncertainty of these issues, a reversal of the provision for loan losses may be recorded.
The following table provides a breakdown of our loan portfolio by the primary credit quality indicators we use in the determination of our allowance for loan losses.
Allowance for credit losses and recorded investment in financing receivables:
(In Thousands of Dollars) | | | | | | | | | | | | | | | | | | | | | | | | | | | | |
Twelve months ending December 31, 2013 | | Commercial and Industrial | | | Commercial Real Estate | | | First Lien Residential Mortgages | | | Junior Lien Residential Mortgages | | | Consumer Loans | | | Unallocated | | | Total | |
Allowance for Credit Losses: | | | | | | | | | | | | | | | | | | | | | | | | | | | | |
Beginning balance | | $ | 1,896 | | | $ | 11,565 | | | $ | 5,656 | | | $ | 555 | | | $ | 805 | | | $ | 863 | | | $ | 21,340 | |
Provision for loan losses | | | 23 | | | | 105 | | | | 1,705 | | | | 317 | | | | (25 | ) | | | (295 | ) | | | 1,830 | |
Loans charged off | | | (223 | ) | | | (2,701 | ) | | | (2,366 | ) | | | (264 | ) | | | (490 | ) | | | 0 | | | | (6,044 | ) |
Recoveries | | | 116 | | | | 339 | | | | 166 | | | | 0 | | | | 250 | | | | 0 | | | | 871 | |
Ending balance | | $ | 1,812 | | | $ | 9,308 | | | $ | 5,161 | | | $ | 608 | | | $ | 540 | | | $ | 568 | | | $ | 17,997 | |
| | | | | | | | | | | | | | | | | | | | | | | | | | | | | |
Ending balance: individuallyevaluated for impairment | | $ | 549 | | | $ | 3,678 | | | $ | 2,082 | | | $ | 168 | | | $ | 19 | | | $ | 0 | | | $ | 6,496 | |
| | | | | | | | | | | | | | | | | | | | | | | | | | | | | |
Ending balance: collectivelyevaluated for impairment | | $ | 1,263 | | | $ | 5,630 | | | $ | 3,079 | | | $ | 440 | | | $ | 521 | | | $ | 568 | | | $ | 11,501 | |
| | | | | | | | | | | | | | | | | | | | | | | | | | | | | |
Financing Receivables:Ending balance | | $ | 166,994 | | | $ | 479,396 | | | $ | 216,952 | | | $ | 54,488 | | | $ | 69,164 | | | $ | 0 | | | $ | 986,994 | |
| | | | | | | | | | | | | | | | | | | | | | | | | | | | | |
Ending balance: individuallyevaluated for impairment | | $ | 1,388 | | | $ | 19,463 | | | $ | 9,247 | | | $ | 533 | | | $ | 141 | | | $ | 0 | | | $ | 30,772 | |
| | | | | | | | | | | | | | | | | | | | | | | | | | | | | |
Ending balance: collectivelyevaluated for impairment | | $ | 165,606 | | | $ | 459,933 | | | $ | 207,705 | | | $ | 53,955 | | | $ | 69,023 | | | $ | 0 | | | $ | 956,222 | |
| | | | | | | | | | | | | | | | | | | | | | | | | | | | | |
Twelve months ending December 31, 2012 | | | | | | | | | | | | | | | | | | | | | | | | | | | | |
Allowance for Credit Losses: | | | | | | | | | | | | | | | | | | | | | | | | | | | | |
Beginning balance | | $ | 2,485 | | | $ | 11,534 | | | $ | 5,393 | | | $ | 505 | | | $ | 931 | | | $ | 171 | | | $ | 21,019 | |
Provision for loan losses | | | (104 | ) | | | 4,033 | | | | 2,225 | | | | 535 | | | | 309 | | | | 692 | | | | 7,690 | |
Loans charged off | | | (560 | ) | | | (4,440 | ) | | | (2,220 | ) | | | (485 | ) | | | (727 | ) | | | 0 | | | | (8,432 | ) |
Recoveries | | | 75 | | | | 438 | | | | 258 | | | | 0 | | | | 292 | | | | 0 | | | | 1,063 | |
Ending balance | | $ | 1,896 | | | $ | 11,565 | | | $ | 5,656 | | | $ | 555 | | | $ | 805 | | | $ | 863 | | | $ | 21,340 | |
| | | | | | | | | | | | | | | | | | | | | | | | | | | | | |
Ending balance: individuallyevaluated for impairment | | $ | 515 | | | $ | 2,971 | | | $ | 2,481 | | | $ | 122 | | | $ | 234 | | | $ | 0 | | | $ | 6,323 | |
| | | | | | | | | | | | | | | | | | | | | | | | | | | | | |
Ending balance: collectivelyevaluated for impairment | | $ | 1,381 | | | $ | 8,594 | | | $ | 3,175 | | | $ | 433 | | | $ | 571 | | | $ | 863 | | | $ | 15,017 | |
| | | | | | | | | | | | | | | | | | | | | | | | | | | | | |
Financing Receivables:Ending balance | | $ | 150,044 | | | $ | 472,697 | | | $ | 214,396 | | | $ | 58,747 | | | $ | 67,673 | | | $ | 0 | | | $ | 963,557 | |
| | | | | | | | | | | | | | | | | | | | | | | | | | | | | |
Ending balance: individuallyevaluated for impairment | | $ | 3,682 | | | $ | 20,558 | | | $ | 10,993 | | | $ | 562 | | | $ | 592 | | | $ | 0 | | | $ | 36,387 | |
| | | | | | | | | | | | | | | | | | | | | | | | | | | | | |
Ending balance: collectivelyevaluated for impairment | | $ | 146,362 | | | $ | 452,139 | | | $ | 203,403 | | | $ | 58,185 | | | $ | 67,081 | | | $ | 0 | | | $ | 927,170 | |
(continued) | | | | | | | | | | | | | | | | | | | | | | | | | | | | |
Twelve months ending December 31, 2011 | | Commercial and Industrial | | | Commercial Real Estate | | | First Lien Residential Mortgages | | | Junior Lien Residential Mortgages | | | Consumer Loans | | | Unallocated | | | Total | |
Allowance for Credit Losses: | | | | | | | | | | | | | | | | | | | | | | | | | | | | |
Beginning balance | | $ | 3,024 | | | $ | 12,375 | | | $ | 3,960 | | | $ | 774 | | | $ | 1,162 | | | $ | 136 | | | $ | 21,431 | |
Provision for loan losses | | | 1,836 | | | | 6,611 | | | | 4,468 | | | | 6 | | | | 381 | | | | 35 | | | | 13,337 | |
Loans charged off | | | (2,546 | ) | | | (7,973 | ) | | | (3,215 | ) | | | (275 | ) | | | (913 | ) | | | 0 | | | | (14,922 | ) |
Recoveries | | | 171 | | | | 521 | | | | 180 | | | | 0 | | | | 301 | | | | 0 | | | | 1,173 | |
Ending balance | | $ | 2,485 | | | $ | 11,534 | | | $ | 5,393 | | | $ | 505 | | | $ | 931 | | | $ | 171 | | | $ | 21,019 | |
| | | | | | | | | | | | | | | | | | | | | | | | | | | | | |
Ending balance: individuallyevaluated for impairment | | $ | 253 | | | $ | 3,622 | | | $ | 1,875 | | | $ | 180 | | | $ | 104 | | | $ | 0 | | | $ | 6,034 | |
| | | | | | | | | | | | | | | | | | | | | | | | | | | | | |
Ending balance: collectivelyevaluated for impairment | | $ | 2,232 | | | $ | 7,912 | | | $ | 3,518 | | | $ | 325 | | | $ | 827 | | | $ | 171 | | | $ | 14,985 | |
| | | | | | | | | | | | | | | | | | | | | | | | | | | | | |
Financing Receivables: | | | | | | | | | | | | | | | | | | | | | | | | | | | | |
Ending balance | | $ | 158,493 | | | $ | 482,720 | | | $ | 211,397 | | | $ | 66,775 | | | $ | 64,524 | | | $ | 0 | | | $ | 983,909 | |
| | | | | | | | | | | | | | | | | | | | | | | | | | | | | |
Ending balance: individuallyevaluated for impairment | | $ | 5,331 | | | $ | 25,988 | | | $ | 10,080 | | | $ | 606 | | | $ | 210 | | | $ | 0 | | | $ | 42,215 | |
| | | | | | | | | | | | | | | | | | | | | | | | | | | | | |
Ending balance: collectivelyevaluated for impairment | | $ | 153,162 | | | $ | 456,732 | | | $ | 201,317 | | | $ | 66,169 | | | $ | 64,314 | | | $ | 0 | | | $ | 941,694 | |
Age Analysis of Past Due Loans:
(In thousands of dollars) | | | | | | | | | | | | | | | | | | | | | | | | | | | | | | | | |
At December 31, 2013 | | 30-59 Days Past Due | | | 60-89 Days Past Due | | | 90 Days or More Past Due | | | Total Past Due | | | Nonaccrual loans | | | Current | | | Total Financing Receivables | | | Recorded Investment > 90 days and accruing | |
Commercial and Industrial | | $ | 220 | | | $ | 0 | | | $ | 0 | | | $ | 220 | | | $ | 116 | | | $ | 166,658 | | | $ | 166,994 | | | $ | 0 | |
Commercial Real Estate | | | 999 | | | | 97 | | | | 0 | | | | 1,096 | | | | 5,447 | | | | 472,853 | | | | 479,396 | | | | 0 | |
Residential Mortgages 1st Liens | | | 907 | | | | 826 | | | | 0 | | | | 1,733 | | | | 4,217 | | | | 211,002 | | | | 216,952 | | | | 0 | |
Residential Mortgages Junior Liens | | | 0 | | | | 81 | | | | 0 | | | | 81 | | | | 287 | | | | 54,120 | | | | 54,488 | | | | 0 | |
Consumer | | | 459 | | | | 36 | | | | 0 | | | | 495 | | | | 9 | | | | 68,660 | | | | 69,164 | | | | 0 | |
Total | | $ | 2,585 | | | $ | 1,040 | | | $ | 0 | | | $ | 3,625 | | | $ | 10,076 | | | $ | 973,293 | | | $ | 986,994 | | | $ | 0 | |
At December 31, 2012 | | | | | | | | | | | | | | | | | | | | | | | | | | | | | | | | |
Commercial and Industrial | | $ | 206 | | | $ | 140 | | | $ | 0 | | | $ | 346 | | | $ | 447 | | | $ | 149,251 | | | $ | 150,044 | | | $ | 0 | |
Commercial Real Estate | | | 604 | | | | 1,881 | | | | 0 | | | | 2,485 | | | | 8,454 | | | | 461,758 | | | | 472,697 | | | | 0 | |
Residential Mortgages 1st Liens | | | 772 | | | | 969 | | | | 37 | | | | 1,778 | | | | 6,038 | | | | 206,580 | | | | 214,396 | | | | 37 | |
Residential Mortgages Junior Liens | | | 473 | | | | 96 | | | | 0 | | | | 569 | | | | 328 | | | | 57,850 | | | | 58,747 | | | | 0 | |
Consumer | | | 435 | | | | 39 | | | | 0 | | | | 474 | | | | 401 | | | | 66,798 | | | | 67,673 | | | | 0 | |
Total | | $ | 2,490 | | | $ | 3,125 | | | $ | 37 | | | $ | 5,652 | | | $ | 15,668 | | | $ | 942,237 | | | $ | 963,557 | | | $ | 37 | |
Impaired loans were as follows:
(In Thousands of Dollars) | | | | | | | | | | | | |
December 31, 2013 | | Recorded Investment | | | Unpaid Principal Balance | | | Related Allowance | |
Period end loans with no allocated allowance for loan losses | | | | | | | | | | | | |
Commercial and Industrial | | $ | 398 | | | $ | 396 | | | $ | 0 | |
Commercial Real Estate | | | 7,473 | | | | 7,449 | | | | 0 | |
Residential Mortgages 1st Liens | | | 0 | | | | 0 | | | | 0 | |
Residential Mortgages Junior Liens | | | 0 | | | | 0 | | | | 0 | |
Consumer | | | 0 | | | | 0 | | | | 0 | |
Total | | $ | 7,871 | | | $ | 7,845 | | | $ | 0 | |
| | | | | | | | | | | | | |
Period end loans with allocated allowance for loan losses | | | | | | | | | | | | |
Commercial and Industrial | | $ | 448 | | | $ | 992 | | | $ | 549 | |
Commercial Real Estate | | | 8,313 | | | | 12,014 | | | | 3,678 | |
Residential Mortgages 1st Liens | | | 7,013 | | | | 9,247 | | | | 2,082 | |
Residential Mortgages Junior Liens | | | 365 | | | | 533 | | | | 168 | |
Consumer | | | 399 | | | | 141 | | | | 19 | |
Total | | $ | 16,538 | | | $ | 22,927 | | | $ | 6,496 | |
| | | | | | | | | | | | | |
Total | | | | | | | | | | | | |
Commercial and Industrial | | $ | 846 | | | $ | 1,388 | | | $ | 549 | |
Commercial Real Estate | | | 15,786 | | | | 19,463 | | | | 3,678 | |
Residential Mortgages 1st Liens | | | 7,013 | | | | 9,247 | | | | 2,082 | |
Residential Mortgages Junior Liens | | | 365 | | | | 533 | | | | 168 | |
Consumer | | | 399 | | | | 141 | | | | 19 | |
Total | | $ | 24,409 | | | $ | 30,772 | | | $ | 6,496 | |
| | | | | | | | | | | | | |
December 31, 2012 | | | | | | | | | | | | |
Period end loans with no allocated allowance for loan losses | | | | | | | | | | | | |
Commercial and Industrial | | $ | 891 | | | $ | 891 | | | $ | 0 | |
Commercial Real Estate | | | 9,215 | | | | 9,212 | | | | 0 | |
Residential Mortgages 1st Liens | | | 0 | | | | 0 | | | | 0 | |
Residential Mortgages Junior Liens | | | 0 | | | | 0 | | | | 0 | |
Consumer | | | 0 | | | | 0 | | | | 0 | |
Total | | $ | 10,106 | | | $ | 10,103 | | | $ | 0 | |
| | | | | | | | | | | | | |
Period end loans with allocated allowance for loan losses | | | | | | | | | | | | |
Commercial and Industrial | | $ | 2,273 | | | $ | 2,791 | | | $ | 515 | |
Commercial Real Estate | | | 8,377 | | | | 11,346 | | | | 2,971 | |
Residential Mortgages 1st Liens | | | 10,993 | | | | 10,993 | | | | 2,481 | |
Residential Mortgages Junior Liens | | | 562 | | | | 562 | | | | 122 | |
Consumer | | | 592 | | | | 592 | | | | 234 | |
Total | | $ | 22,797 | | | $ | 26,284 | | | $ | 6,323 | |
| | | | | | | | | | | | | |
Total | | | | | | | | | | | | |
Commercial and Industrial | | $ | 3,164 | | | $ | 3,682 | | | $ | 515 | |
Commercial Real Estate | | | 17,592 | | | | 20,558 | | | | 2,971 | |
Residential Mortgages 1st Liens | | | 10,993 | | | | 10,993 | | | | 2,481 | |
Residential Mortgages Junior Liens | | | 562 | | | | 562 | | | | 122 | |
Consumer | | | 592 | | | | 592 | | | | 234 | |
Total | | $ | 32,903 | | | $ | 36,387 | | | $ | 6,323 | |
Note: Recorded investment includes principal outstanding plus deferred fee and accrued interest, net of related allowance for loan losses.
Average recorded investment and income recognized on impaired loans were as follows:
(In Thousands of Dollars) | | Twelve months endedDecember 31, 2013 | | | Twelve months endedDecember 31, 2012 | | | Twelve months endedDecember 31, 2011 | |
| | | Average Recorded Investment | | | Interest Income Recognized | | | Average Recorded Investment | | | Interest Income Recognized | | | Average Recorded Investment | | | Interest Income Recognized | |
Period end loans with no allocated allowance for loan losses | | | | | | | | | | | | | | | | | | | | | | | | |
Commercial and Industrial | | $ | 920 | | | $ | 27 | | | $ | 2,862 | | | $ | 160 | | | $ | 2,073 | | | $ | 116 | |
Commercial Real Estate | | | 8,025 | | | | 266 | | | | 10,213 | | | | 846 | | | | 12,444 | | | | 452 | |
Residential Mortgages 1st Liens | | | 0 | | | | 0 | | | | 0 | | | | 0 | | | | 0 | | | | 0 | |
Residential Mortgages Junior Liens | | | 0 | | | | 0 | | | | 0 | | | | 0 | | | | 0 | | | | 0 | |
Consumer | | | 0 | | | | 0 | | | | 0 | | | | 0 | | | | 0 | | | | 0 | |
Total | | $ | 8,945 | | | $ | 293 | | | $ | 13,075 | | | $ | 1,006 | | | $ | 14,517 | | | $ | 568 | |
| | | | | | | | | | | | | | | | | | | | | | | | | |
Period end loans with allocated allowance for loan losses | | | | | | | | | | | | | | | | | | | | | | | | |
Commercial and Industrial | | $ | 989 | | | $ | 57 | | | $ | 880 | | | $ | 24 | | | $ | 722 | | | $ | 0 | |
Commercial Real Estate | | | 8,476 | | | | 517 | | | | 10,561 | | | | 52 | | | | 9,003 | | | | 28 | |
Residential Mortgages 1st Liens | | | 8,584 | | | | 327 | | | | 9,998 | | | | 416 | | | | 9,223 | | | | 219 | |
Residential Mortgages Junior Liens | | | 470 | | | | 12 | | | | 502 | | | | 13 | | | | 459 | | | | 2 | |
Consumer | | | 265 | | | | 7 | | | | 450 | | | | 17 | | | | 192 | | | | 0 | |
Total | | $ | 18,784 | | | $ | 920 | | | $ | 22,391 | | | $ | 522 | | | $ | 19,599 | | | $ | 249 | |
| | | | | | | | | | | | | | | | | | | | | | | | | |
Total | | | | | | | | | | | | | | | | | | | | | | | | |
Commercial and Industrial | | $ | 1,909 | | | $ | 84 | | | $ | 3,742 | | | $ | 184 | | | $ | 2,795 | | | $ | 116 | |
Commercial Real Estate | | | 16,501 | | | | 783 | | | | 20,774 | | | | 898 | | | | 21,447 | | | | 480 | |
Residential Mortgages 1st Liens | | | 8,584 | | | | 327 | | | | 9,998 | | | | 416 | | | | 9,223 | | | | 219 | |
Residential Mortgages Junior Liens | | | 470 | | | | 12 | | | | 502 | | | | 13 | | | | 459 | | | | 2 | |
Consumer | | | 265 | | | | 7 | | | | 450 | | | | 17 | | | | 191 | | | | 0 | |
Total | | $ | 27,729 | | | $ | 1,213 | | | $ | 35,466 | | | $ | 1,528 | | | $ | 34,116 | | | $ | 817 | |
Loan Modifications as of the period ending:
(In thousands of dollars) | | Troubled Debt Restructurings | | | Troubled Debt Restructurings that Subsequently Defaulted | |
| | | Number of contracts | | | Pre-modification outstanding recorded investment | | | Post-modification outstanding recorded investment | | | Number of contracts | | | Recorded investment | |
December 31, 2013 | | | | | | | | | | | | | | | | | | | | |
Commercial and Industrial | | | 6 | | | $ | 236 | | | $ | 235 | | | | 1 | | | $ | 0 | |
Commercial Real Estate | | | 7 | | | | 581 | | | | 581 | | | | 2 | | | | 439 | |
Residential Mortgages 1st Liens | | | 14 | | | | 1,399 | | | | 1,342 | | | | 9 | | | | 420 | |
Residential Mortgages Junior Liens | | | 2 | | | | 48 | | | | 27 | | | | 0 | | | | 0 | |
Consumer | | | 0 | | | | 0 | | | | 0 | | | | 0 | | | | 0 | |
Total | | | 29 | | | $ | 2,264 | | | $ | 2,185 | | | | 12 | | | $ | 859 | |
| | | | | | | | | | | | | | | | | | | | | |
December 31, 2012 | | | | | | | | | | | | | | | | | | | | |
Commercial and Industrial | | | 11 | | | $ | 1,199 | | | $ | 1,188 | | | | 5 | | | $ | 1,143 | |
Commercial Real Estate | | | 17 | | | | 4,456 | | | | 4,221 | | | | 4 | | | | 401 | |
Residential Mortgages 1st Liens | | | 19 | | | | 1,948 | | | | 1,943 | | | | 2 | | | | 190 | |
Residential Mortgages Junior Liens | | | 4 | | | | 126 | | | | 126 | | | | 1 | | | | 9 | |
Consumer | | | 3 | | | | 128 | | | | 127 | | | | 0 | | | | 0 | |
Total | | | 54 | | | $ | 7,857 | | | $ | 7,605 | | | | 12 | | | $ | 1,743 | |
| | | | | | | | | | | | | | | | | | | | | |
December 31, 2011 | | | | | | | | | | | | | | | | | | | | |
Commercial and Industrial | | | 11 | | | $ | 3,615 | | | $ | 3,526 | | | | 2 | | | $ | 468 | |
Commercial Real Estate | | | 13 | | | | 4,017 | | | | 3,786 | | | | 10 | | | | 1,233 | |
Residential Mortgages 1st Liens | | | 13 | | | | 1,427 | | | | 1,291 | | | | 11 | | | | 828 | |
Residential Mortgages Junior Liens | | | 1 | | | | 83 | | | | 83 | | | | 0 | | | | 0 | |
Consumer | | | 0 | | | | 0 | | | | 0 | | | | 0 | | | | 0 | |
Total | | | 38 | | | $ | 9,142 | | | $ | 8,686 | | | | 23 | | | $ | 2,529 | |
NOTE 7 – PREMISES AND EQUIPMENT
Year end premises and equipment were as follows: | | | | | | | | |
| | | | | | | | | |
(In Thousands of Dollars) | | 2013 | | | 2012 | |
Land | | $ | 7,461 | | | $ | 6,186 | |
Buildings | | | 31,895 | | | | 32,891 | |
Furniture, fixtures and equipment | | | 17,312 | | | | 17,431 | |
Total | | | 56,668 | | | | 56,508 | |
Less: | | | | | | | | |
Accumulated depreciation | | | (32,499 | ) | | | (32,152 | ) |
Total | | $ | 24,169 | | | $ | 24,356 | |
Depreciation expense was $1,847,000, $1,915,000, and $2,062,000 for 2013, 2012, and 2011. Facility rent expense was $350,000 in 2013 compared with $359,000 for 2012, and $377,000 for 2011. Equipment rent expense was $233,000 in 2013 compared with $249,000 for 2012, and $250,000 for 2011. Rental commitments for the next five years under non-cancelable operating leases were as follows (before considering renewal options that generally are present):
(In Thousands of Dollars) | | | | | | | | | |
| | | Facilities | | | Equipment | | | Total | |
2014 | | $ | 322 | | | $ | 9 | | | $ | 331 | |
2015 | | | 262 | | | | 9 | | | | 271 | |
2016 | | | 246 | | | | 6 | | | | 252 | |
2017 | | | 251 | | | | 0 | | | | 251 | |
2018 | | | 255 | | | | 0 | | | | 255 | |
Total | | $ | 1,336 | | | $ | 24 | | | $ | 1,360 | |
NOTE 8 – GOODWILL AND INTANGIBLE ASSETS
Goodwill
During the third quarter, we performed a goodwill impairment analysis. Under new accounting standards for goodwill impairment testing, a company is allowed to forgo a full goodwill impairment study and assess relevant events and circumstances from the time of the prior testing. As such, we reviewed the following factors:
1) General economic conditions in our banking area have continued to improve from July 2012 through the time of the review.
2) Overall financial performance of the bank improved over the review period.
a. | Increase in market capitalization of the stock; |
b. | Increase in net income; |
c. | Increase in earnings per share; |
d. | Decrease in nonperforming loans; and |
e. | Decrease in charged off loans. |
In addition to the factors mentioned above, the agreed upon sales price with Mercantile Bank resulted in a fair value mark for the Bank that was in excess of the current tangible book value by more than the current book value of goodwill.
Based on the analysis, management concluded that the implied fair value of goodwill exceeded the carrying value; therefore, no goodwill impairment charge was required at this time. Whole bank sale transactions at a premium to tangible book value in the market place play an important role in the determination of fair value of the company. Changes in the pricing of future whole bank sales could negatively affect future valuation and result in goodwill impairment at a future date.
There was no change in the carrying amount of goodwill during the year.
(In Thousands of Dollars) | | | | | | | | |
| | | 2013 | | | 2012 | |
Balance at January 1 | | $ | 35,513 | | | $ | 35,513 | |
Goodwill from acquisitions/(divestitures) | | | 0 | | | | 0 | |
Balance at December 31 | | $ | 35,513 | | | $ | 35,513 | |
Acquired Intangible Assets
Acquired intangible assets at year end were as follows:
(In Thousands of Dollars) | | 2013 | | | 2012 | | | 2011 | |
Core deposit intangibles resulting from bank and branch acquisitions: | | | | | | | | | | | | |
Gross Amount | | $ | 7,930 | | | $ | 7,930 | | | $ | 7,930 | |
Accumulated Amortization | | | (7,334 | ) | | | (6,965 | ) | | | (6,482 | ) |
Net Carrying Value | | $ | 596 | | | $ | 965 | | | $ | 1,448 | |
Aggregate amortization expense was $369,000, $483,000, and $698,000 for 2013, 2012, and 2011, respectively. Our estimated amortization expense for each of the next five years is:
(In Thousands of Dollars)
Year | | Amount | |
2014 | | $ | 278 | |
2015 | | | 185 | |
2016 | | | 99 | |
2017 | | | 34 | |
2018 | | | 0 | |
NOTE 9 – FEDERAL INCOME TAXES
Federal income taxes consist of the following:
(In Thousands of Dollars) | | 2013 | | | 2012 | | | 2011 | |
Current expense | | $ | 5,424 | | | $ | 4,283 | | | $ | 3,133 | |
Deferred benefit | | | (290 | ) | | | (27 | ) | | | (1,299 | ) |
Total | | $ | 5,134 | | | $ | 4,256 | | | $ | 1,834 | |
A reconciliation of the difference between federal income tax expense and the amount computed by applying the federal statutory tax rate of 35% in 2013, 2012 and 2011 is as follows:
(In Thousands of Dollars) | | 2013 | | | 2012 | | | 2011 | |
Tax at statutory rate | | $ | 6,079 | | | $ | 5,177 | | | $ | 2,610 | |
Effect of tax-exempt interest | | | (669 | ) | | | (479 | ) | | | (443 | ) |
Other | | | (276 | ) | | | (442 | ) | | | (333 | ) |
Federal income taxes | | $ | 5,134 | | | $ | 4,256 | | | $ | 1,834 | |
| | | | | | | | | | | | | |
Effective tax rate | | | 30 | % | | | 29 | % | | | 25 | % |
The components of deferred tax assets and liabilities included in other assets on the Consolidated Balance Sheet consist of the following at December 31st year end:
(In Thousands of Dollars) | | | | | | | | |
| | | 2013 | | | 2012 | |
Deferred tax assets: | | | | | | | | |
Allowance for loan losses | | $ | 6,119 | | | $ | 7,256 | |
Deferred compensation | | | 591 | | | | 655 | |
Losses on capital investments | | | 1,131 | | | | 1,159 | |
Other | | | 468 | | | | 1,254 | |
Total deferred tax assets | | | 8,309 | | | | 10,324 | |
Deferred tax liabilities: | | | | | | | | |
Fixed assets | | | (1,586 | ) | | | (1,821 | ) |
Mortgage servicing rights | | | (1,676 | ) | | | (1,697 | ) |
Purchase accounting adjustments | | | (234 | ) | | | (234 | ) |
Unrealized gain on securities available for sale | | | (143 | ) | | | (1,880 | ) |
Other | | | (675 | ) | | | (407 | ) |
Total deferred tax liabilities | | | (4,314 | ) | | | (6,039 | ) |
Net deferred tax assets | | | 3,995 | | | | 4,285 | |
Deferred tax valuation allowance | | | (1,143 | ) | | | (1,143 | ) |
Net deferred tax assets | | $ | 2,852 | | | $ | 3,142 | |
A valuation allowance related to deferred tax assets is required when it is considered more likely than not that all or part of the benefits related to such assets will not be realized. In reviewing the company’s position relative to deferred tax assets associated with certain incurred capital losses, management determined that a valuation adjustment of $1,143,000 was needed at year end 2013, and $1,143,000 was necessary at year end 2012. These valuation adjustments were recorded through the income statement on the Federal income tax line item when they occurred. The establishment of a valuation allowance does not relinquish our rights to utilize the deferred asset, but rather recognizes that at the current time management does not believe the deferred asset will be able to be utilized prior to its expiration. The deferred assets for which the valuation allowance was established were related to capital losses for which we do not believe we will have capital gains to offset. These assets are: $646,000 to expire in 2015 and $485,000 for which an expiration date has yet to be established, as we have not sold the underlying stock.
Losses on capital investments have a three year carry back and five year carry forward time period for offset. The timeframe begins with the sale of the investment. Certain tax planning strategies have been established, including the possible sale and leaseback of certain of our facilities or other assets that management believes could be executed if necessary to retain the benefits listed above.
Net deferred tax assets at December 31, 2013 and 2012 are included in other assets in the accompanying consolidated balance sheets.
NOTE 10 – DEPOSITS
Time deposits of $100,000 or more were $152 million and $167 million at year end 2013 and 2012. There were $18.3 million and $17.6 million of brokered CDs included in time deposits of $100,000 or more in 2013 and 2012 respectively.
Scheduled maturities of time deposits at December 31, 2013 were as follows:
(In Thousands of Dollars) | |
Year | | Amount | |
2014 | | $ | 196,360 | |
2015 | | | 69,655 | |
2016 | | | 28,041 | |
2017 | | | 16,056 | |
2018 | | | 12,019 | |
2019 and thereafter | | | 81 | |
Total | | $ | 322,212 | |
NOTE 11 – BORROWINGS
On May 17, 2013 we established a two year $10 million revolving line of credit agreement at a variable rate of prime rate plus 0.125% on the outstanding balance of the line. We borrowed $8 million on the line in June to facilitate the redemption of our preferred stock. At December 31, 2013, the line of credit had $0 outstanding. The line of credit is subject to standard industry covenants and required pledging of the stock in our two banking subsidiaries as collateral for the loan and requires quarterly interest payments. The line of credit will expire on May 17, 2015.
Information relating to securities sold under agreements to repurchase is as follows:
(In Thousands of Dollars) | |
| | | 2013 | | | 2012 | |
At December 31: | | | | | | | | |
Outstanding Balance | | $ | 47,635 | | | $ | 42,785 | |
Average Interest Rate | | | 0.19 | % | | | 0.19 | % |
| | | | | | | | | |
Daily Average for the Year: | | | | | | | | |
Outstanding Balance | | $ | 46,050 | | | $ | 47,605 | |
Average Interest Rate | | | 0.18 | % | | | 0.18 | % |
| | | | | | | | | |
Maximum Outstanding at any Month End | | $ | 50,830 | | | $ | 55,047 | |
Securities sold under agreements to repurchase (repurchase agreements) generally have original maturities of less than one year. Repurchase agreements are treated as financings and the obligations to repurchase securities sold are reflected as liabilities. Securities involved with the agreements are recorded as assets of the Company and are primarily held in safekeeping by correspondent banks. Repurchase agreements are offered principally to certain large deposit customers as deposit equivalent investments.
We had no unsecured overnight borrowings, in the form of federal funds purchased at December 31, 2013. There were no overnight borrowings at December 31, 2013.
NOTE 12 – FEDERAL HOME LOAN BANK ADVANCES
Long term borrowings have been secured from the Federal Home Loan Bank. At year end, advances from the Federal Home Loan Bank were as follows:
(In Thousands of Dollars) | | | | | | | | |
| | | 2013 | | | 2012 | |
Borrowings with a fixed rates at year end | | $ | 19,790 | | | $ | 22,493 | |
Borrowings with a variable rate of interest at year end | | $ | 0 | | | $ | 0 | |
Fixed rate advances shown above ranged in the interest rate owed from 0.41% to 7.30% and averaged 2.43% at year end 2013 and maturity dates ranged from January 2014 to March 2026. Higher rate advances were borrowed to match fund specific loans in the past, and are matched in duration and prepayment terms to those loans. At the end of 2012, rates ranged from 0.41% to 7.30% and averaged 2.39%, with maturities ranging from January 2013 to March 2026. Each Federal Home Loan Bank advance is payable at its maturity date without penalty, however, substantial penalties do exist if an advance is paid before its contractual maturity. Such penalties vary from advance to advance and are based on the size, interest rate, and remaining term of each specific advance. Advances of $2.0 million may be converted from fixed to variable rate by the FHLB, but may be repaid, without penalty, if that option is exercised. The advances were collateralized by $201.4 million and $177.7 million of first mortgage loans under a blanket lien arrangement and pledges of specific mortgages at year end 2013 and 2012, respectively. As of December 31, 2013, we had $103.5 million of additional borrowing capacity with the Federal Home Loan Bank. Federal Home Loan Bank borrowings have decreased substantially as increased core deposits and low loan demand have combined to reduce the need for this funding in the near term.
Maturities of FHLB advances are as follows:
(In Thousands of Dollars) | |
2014 | | $ | 4,000 | |
2015 | | | 6,700 | |
2016 | | | 3,073 | |
2017 | | | 3,052 | |
2018 | | | 0 | |
2019 and thereafter | | | 2,965 | |
Total | | $ | 19,790 | |
Early in 2014, we prepaid advances totaling approximately $6.8 million, incurring a prepayment penalty of $1.3 million. These advances were higher rate advances with scheduled maturities ranging from May 2015 through March 2026 and interest rates ranging from 4.58% to 7.30%
NOTE 13 – SUBORDINATED DEBENTURES
On October 18, 2004, a trust formed by us issued $10,310,000 of 90 day LIBOR plus 1.99% variable rate trust preferred securities as part of a pooled offering of such securities. We issued subordinated debentures to the trust in exchange for the proceeds of the offering; the debentures represent the sole assets of the trust. We may redeem the subordinated debentures, in whole or in part, any time on or after October 18, 2009 at 100% of the principal amount of the securities. The debentures are required to be paid in full on October 18, 2034.
On January 20, 2006, a trust formed by us issued $10,310,000 of trust preferred securities as part of a pooled offering of such securities. The securities carried an interest rate of 6.049% for five years, and then converted to a variable rate of 90 day LIBOR plus 1.27% in 2011, for the remainder of their term. We issued subordinated debentures to the trust in exchange for the proceeds of the offering; the debentures represent the sole assets of the trust. We may redeem the subordinated debentures, in whole or in part, any time on or after April 7, 2011 at 100% of the principal amount of the securities. The debentures are required to be paid in full on April 7, 2036.
On July 30, 2007, two trusts, formed by us, issued $15,464,000 of trust preferred securities as part of a pooled offering of such securities. One of the trusts issued $7,732,000 of variable rate securities at 90 day LIBOR plus 1.35% (6.71% on the date of issuance). The other trust issued $7,732,000 of fixed rate securities that carried an interest rate of 6.566% for five years, and then converted to a variable rate of 90 day LIBOR plus 1.35% in 2012 for the remainder of their term. Firstbank then issued subordinated debentures to the trust in exchange for the proceeds of the offering; the debentures represent the sole assets of each of the trusts. We may redeem the subordinated debentures, in whole or in part, any time on or after July 30, 2012 at 100% of the principal amount of the securities. The debentures are required to be paid in full on July 30, 2037.
The trusts are not consolidated with the Company’s financial statements, but rather the subordinated debentures are shown as a liability. Our investment in the stock of the trust was $1,084,000 and is included in equity securities available for sale. These investments are restricted from sale and are carried at historical cost, which approximates fair value.
NOTE 14 – SHAREHOLDERS’ EQUITY
We are subject to various regulatory policies and requirements relating to the payment of dividends, including requirements to maintain adequate capital above regulatory minimums. At year end 2013 and 2012 we exceeded all requirements to be classified as well as capitalized.
On January 30, 2009 we issued 33,000 shares of Series A, no par value $1,000 liquidation preference, fixed rate cumulative perpetual preferred stock (Preferred Stock) and warrants to purchase 578,947 shares of our common stock at an exercise price of $8.55 per share (Warrants), to the U.S. Department of Treasury in return for $33 million under the Capital Purchase Program (CPP). Of the proceeds, $32.7 million was allocated to the Preferred Stock and $0.3 million was allocated to the Warrants based on the relative fair value of each. The $0.3 million discount on the Preferred Stock was accreted using an effective yield method. The Preferred Stock and Warrants qualified as Tier 1 capital.
On June 28, 2012 the U.S. Department of Treasury sold all of the shares of our Preferred Stock in a modified Dutch auction process. During the auction, we successfully bid on and retired 16,000 of the 33,000 outstanding shares of our Preferred Stock at a price of $941.01 per share, or $15.1 million in the aggregate. As a result of the retirement of these shares, 17,000 shares remained outstanding, held by private investors, and carried the same terms under which they were originally issued.
The warrants were immediately exercisable for 578,947 shares of our common stock at an exercise price of $8.55 per common share. The warrants were transferrable and could be have been exercised at any time on or before January 30, 2019. We negotiated a repurchase of all of the outstanding warrants with the U.S. Treasury at a price of $1,946,670. The repurchase of these warrants occurred in July 2012 and reduced equity by the amount of the purchase price.
The remaining 17,000 shares of Preferred Stock paid cumulative quarterly cash dividends at a rate of 5% per year on the $1,000 liquidation preference value. We redeemed the remaining Preferred Stock for the liquidation preference value plus accrued and unpaid dividends in June 2013.
NOTE 15 – BENEFIT PLANS
The Firstbank Corporation 401(k) plan, a defined contribution plan, is an IRS qualified 401(k) salary deferral plan, under which Firstbank Corporation stock is one of the investment options. The Board of Directors approved changing the plan to a Safe Harbor 401(k) plan for the 2008 plan year. A Safe Harbor plan relieves administrative testing in exchange for immediate vesting of the employee’s matching contributions. Both employee and employer contributions may be made to the plan. The Company’s 2013, 2012 and 2011 matching 401(k) contributions charged to expense were $588,000, $539,000 and $522,000 respectively. The percent of the Company’s matching contribution to the 401(k), and the determination to offer a Safe Harbor plan, is determined annually by the Board of Directors.
Firstbank – West Michigan had a deferred compensation plan for its directors and executive officers. The plan was frozen before the ICNB acquisition and has a balance at the end of 2013 of $1.6 million compared with $1.9 million at the end of 2012. Expense associated with the plan was $0 in 2013, $131,000 in 2012, and $110,000 in 2011. Payments under the deferred plan were $263,000 in 2013, $231,000 in 2012, and $171,000 in 2011.
NOTE 16 – STOCK BASED COMPENSATION
The Company has stock based compensation plans as described below. Total compensation cost that has been charged against income for those plans was $161,000, $96,000, and $118,000 for 2013, 2012 and 2011. The total income tax benefit resulting from these charges was $54,000, $33,000 and $40,000, respectively.
The Firstbank Corporation Stock Compensation Plans of 1997 and 2006 (“Plans”), as amended, which were shareholder approved, provide for the grant of 593,798 and 315,000 shares of stock, respectively, in either restricted form or under option. Options may be either incentive stock options or nonqualified stock options. As of December 31, 2013 only nonqualified stock options and restricted stock shares have been issued under the plans. The 1997 Plan terminated April 28, 2007. The 2006 Plan will terminate February 27, 2016. The Board, at its discretion, may terminate any or all of the Plans prior to the Plans’ scheduled termination dates. At year end 2013, there were 48,994 shares available for grant under the 2006 Plan.
Stock Option
Each option granted under the Plans may be exercised in whole or in part during such period as is specified in the option agreement governing that option. Options may only be issued with exercise prices equal to, or greater than, the stock’s market value on the date of issuance. The length of time available for a stock option to be exercised is governed by each option agreement, but has not been more than ten years from the issuance date.
All companies are required to record compensation cost for stock options provided to employees in return for employee service. The cost is measured at the fair value of the options when granted. This cost is expensed over the employee service period, which is normally the vesting period of the options.
The fair value of each option award is estimated on the date of grant using a closed form option valuation (Black-Scholes) model that uses the assumptions noted in the table below. Expected volatilities are based on historical volatilities of our common stock. We use historical data to estimate option exercise and post-vesting termination behavior. The expected term of options granted is based on historical data and represents the period of time that options granted are expected to be outstanding, which takes into account that the options are not transferable. The risk-free interest rate for the expected term of the option is based on the U.S. Treasury yield curve in effect at the time of the grant. There were no options granted in 2011, 2012 or 2013.
Activity under the plans:
| | | Twelve months ended December 31, 2013 | | | Twelve months ended December 31, 2012 | |
Total options outstanding | | Shares | | | Weighted Average Exercise Price | | | Weighted Average Remaining Contractual Life (years) | | | Aggregate Intrinsic Value (000) | | | Shares | | | Weighted Average Exercise Price | | | Weighted Average Remaining Contractual Life (years) | | | Aggregate Intrinsic Value (000) | |
Beginning of period | | | 356,030 | | | $ | 16.29 | | | | | | | | | | | | 396,898 | | | $ | 16.58 | | | | | | | | | |
Granted | | | 0 | | | | - | | | | | | | | | | | | 0 | | | | - | | | | | | | | | |
Exercised | | | (21,290 | ) | | $ | 8.33 | | | | | | | | | | | | 0 | | | | - | | | | | | | | | |
Forfeited | | | (3,266 | ) | | $ | 14.70 | | | | | | | | | | | | (6,279 | ) | | $ | 19.00 | | | | | | | | | |
Expired | | | (39,899 | ) | | $ | 26.18 | | | | | | | | | | | | (34,589 | ) | | $ | 19.20 | | | | | | | | | |
End of period | | | 291,575 | | | $ | 15.53 | | | | 3.8 | | | $ | 1,579 | | | | 356,030 | | | $ | 16.29 | | | | 4.5 | | | $ | 479 | |
| | | | | | | | | | | | | | | | | | | | | | | | | | | | | | | | | |
Options exercisable,end of period | | | 267,245 | | | $ | 16.38 | | | | 3.6 | | | $ | 1,260 | | | | 303,270 | | | $ | 17.95 | | | | 4.0 | | | $ | 269 | |
There were 21,290 options exercised in 2013. There were no options exercised in 2012. As of December 31, 2013, there was $12,000 of total unrecognized compensation cost related to non-vested stock options granted under the Plans and is expected to be recognized over a weighted-average period of 0.8 years.. The intrinsic value of non-vested stock options at December 31, 2013 was $319,000.
Options outstanding at December 31, 2013 were as follows:
| | | | | | Options outstanding | | | Exercisable | |
| Range of exercise prices | | | Shares | | | WeightedAverageExercisePrice | | | Weighted Average Contractual Life (years) | | | Shares | | | Weighted Average Exercise Price | |
| $5.19 | - | 8.00 | | | | 83,530 | | | $ | 6.59 | | | | 5.8 | | | | 66,490 | | | $ | 6.95 | |
| $8.01 | - | 16.00 | | | | 81,630 | | | $ | 13.04 | | | | 4.7 | | | | 74,340 | | | $ | 13.48 | |
| $16.01 | - | 23.00 | | | | 88,267 | | | $ | 22.42 | | | | 2.4 | | | | 88,267 | | | $ | 22.42 | |
| $23.01 | - | 26.18 | | | | 38,148 | | | $ | 24.49 | | | | 0.9 | | | | 38,148 | | | $ | 24.49 | |
Total | | | | 291,575 | | | $ | 15.53 | | | | 3.8 | | | | 267,245 | | | $ | 16.38 | |
Restricted Stock
Restricted shares may be issued under the Plans as described above. Compensation expense is recognized over the vesting period of the shares based on the market value of the shares on the issue date.
A summary of changes in the Company’s non-vested shares for 2013 and 2012 follows:
| | | 2013 | | | 2012 | |
Non-vested Shares | | Shares | | | Weighted-Average Grant-Date Fair Value | | | Shares | | | Weighted-Average Grant-Date Fair Value | |
Non-vested at January 1, 2013 | | | 34,054 | | | $ | 7.68 | | | | 22,627 | | | $ | 5.99 | |
Granted | | | 11,800 | | | $ | 11.13 | | | | 14,980 | | | $ | 10.30 | |
Vested | | | (4,687 | ) | | $ | 7.71 | | | | (3,553 | ) | | $ | 7.61 | |
Forfeited | | | (400 | ) | | $ | 5.00 | | | | 0 | | | | - | |
Non-vested at December 31, 2013 | | | 40,767 | | | $ | 8.71 | | | | 34,054 | | | $ | 7.68 | |
As of December 31, 2013, there was $199,000 of total unrecognized compensation cost related to non-vested shares granted under the Restricted Stock Plan. The cost is expected to be recognized over a weighted-average period of 1.0 years. The total fair value of shares vested during the years ended December 31, 2013, 2012 and 2011 was $36,000, $27,000, and $57,000. Expense associated with restricted stock and include in the total compensation cost presented earlier in this note were $143,000 in 2013 compared with $56,000 in 2012 and $37,000 in 2011. Under the merger agreement with Mercantile Bank Corporation, all restricted stock will become vested with the consummation of the merger.
NOTE 17 – RELATED PARTY TRANSACTIONS
Loans to principal officers, directors, and their affiliates were as follows:
(In Thousands of Dollars) | | 2013 | | | 2012 | |
Beginning balance | | $ | 34,770 | | | $ | 40,477 | |
New loans | | | 4,082 | | | | 39,074 | |
Repayments | | | (4,668 | ) | | | (43,885 | ) |
Deletion of Directors | | | (28,774 | ) | | | (896 | ) |
Ending balance | | $ | 5,410 | | | $ | 34,770 | |
Deposits from principal officers, directors, and their affiliates at year end 2013 and 2012 were $17.6 million and $27.1 million respectively.
NOTE 18 – FINANCIAL INSTRUMENTS WITH OFF-BALANCE SHEET RISK
Some financial instruments, such as loan commitments, credit lines, letters of credit and overdraft protection are issued to meet customer financing needs. These are agreements to provide credit or to support the credit of others, as long as conditions established in the contract are met and usually have expiration dates. Commitments may expire without being used. Off-balance sheet risk to credit loss exists up to the face amount of these instruments although material losses are not anticipated. The same credit policies are used to make such commitments as are used for loans, including obtaining collateral at exercise of the commitment.
Financial instruments with off-balance sheet risk were as follows at year end:
(In Thousands of Dollars) | | 2013 | | | 2012 | |
| | | Fixed Rate | | | Variable Rate | | | Fixed Rate | | | Variable Rate | |
Commitments to make loans(at market rates) | | $ | 34,740 | | | $ | 7,802 | | | $ | 82,395 | | | $ | 10,137 | |
Unused lines of credit and lettersof credit | | $ | 29,708 | | | $ | 133,718 | | | $ | 25,923 | | | $ | 126,490 | |
Standby letters of credit | | $ | 3,360 | | | $ | 5,863 | | | $ | 5,201 | | | $ | 15,225 | |
Commitments to make loans are generally made for periods of 60 days or less. Fixed rate loan commitments have interest rates ranging from 3.00% to 6.50% and maturities ranging from 1 year to 11 years.
NOTE 19 – CONTINGENCIES
From time to time certain claims are made against the Company and its banking subsidiaries in the normal course of business. There were no outstanding claims considered by management to be material at December 31, 2013.
NOTE 20 – DIVIDEND LIMITATION OF SUBSIDIARIES
Capital guidelines adopted by Federal and State regulatory agencies and restrictions imposed by law limit the amount of cash dividends the banks can pay to the Company. At December 31, 2013, using the most restrictive of these conditions for each bank, the aggregate cash dividends that the banks can pay the Company without prior approval was $22,089,000. It is not the intent of management to have dividends paid in amounts which would reduce the capital of the banks to levels below those which are considered prudent by management and in accordance with guidelines of regulatory authorities.
NOTE 21 – STOCK REPURCHASE PROGRAM
We currently have no authorized common or preferred stock repurchase program in place. No common stock was repurchased in 2012 or 2013. In June of 2012 we repurchased 16,000 shares of our 33,000 outstanding shares of preferred stock at a price of at a price of $941.01 per share (liquidation preference value $1,000). In July of 2012, we negotiated a repurchase of all 578,947 outstanding common stock warrants, which were issued to the U.S. Treasury at the time of their investment in our preferred shares, for a total price of $1,946,670. In June of 2013 we repurchased the remaining 17,000 outstanding shares of preferred stock at a price of $1,000 per share (liquidation preference value $1,000).
NOTE 22 – CAPITAL ADEQUACY
Banks and bank holding companies are subject to regulatory capital requirements administered by federal banking agencies. Capital adequacy guidelines and, additionally for banks, prompt corrective action regulations involve quantitative measures of assets, liabilities, and certain off-balance sheet items calculated under regulatory accounting practices. Capital amounts and classifications are also subject to qualitative judgments by regulators. Failure to meet capital requirements can initiate regulatory action.
Prompt corrective action regulations provide five classifications: well capitalized, adequately capitalized, undercapitalized, significantly undercapitalized and critically undercapitalized, although these terms are not used to represent overall financial condition. If adequately capitalized, regulatory approval is required to accept brokered deposits. If undercapitalized, capital distributions are limited; as are asset growth and expansion, and capital restoration plans are required.
At year end 2013 and 2012, the most recent regulatory notifications categorize us as well capitalized under the regulatory framework for prompt corrective action. There are no conditions or events since that notification that management believes have changed that classification.
Actual and required capital amounts at year end and ratios are presented below:
| | | Actual | | | Minimum Required For Capital Adequacy Purposes | | | To Be Well Capitalized Under Prompt Corrective Action Provisions | |
| | | | | | | | | | | | | | | | | | | | | | | | | |
(In thousands of dollars) | | | | | | | | | | | | | | | | | | | | | | | | |
| | | Amount | | | Ratio | | | Amount | | | Ratio | | | Amount | | | Ratio | |
2013 | | | | | | | | | | | | | | | | | | | | | | | | |
Total Capital to Risk Weighted Assets | | | | | | | | | | | | | | | | | | | | | | | | |
Consolidated | | $ | 149,581 | | | | 15.33 | % | | $ | 78,058 | | | | 8.00 | % | | $ | 97,572 | | | | 10.00 | % |
Firstbank | | | 109,076 | | | | 13.77 | % | | | 63,376 | | | | 8.00 | % | | | 79,220 | | | | 10.00 | % |
Keystone Community Bank | | | 25,070 | | | | 13.94 | % | | | 14,390 | | | | 8.00 | % | | | 17,987 | | | | 10.00 | % |
| | | | | | | | | | | | | | | | | | | | | | | | | |
Tier 1 (Core) Capital to Risk Weighted Assets | | | | | | | | | | | | | | | | | | | | | | | | |
Consolidated | | $ | 137,355 | | | | 14.08 | % | | $ | 39,029 | | | | 4.00 | % | | $ | 58,543 | | | | 6.00 | % |
Firstbank | | | 99,129 | | | | 12.51 | % | | | 31,688 | | | | 4.00 | % | | | 47,532 | | | | 6.00 | % |
Keystone Community Bank | | | 22,795 | | | | 12.67 | % | | | 7,195 | | | | 4.00 | % | | | 10,792 | | | | 6.00 | % |
| | | | | | | | | | | | | | | | | | | | | | | | | |
Tier 1 (Core) Capital to Average Assets | | | | | | | | | | | | | | | | | | | | | | | | |
Consolidated | | $ | 137,355 | | | | 9.49 | % | | $ | 57,910 | | | | 4.00 | % | | $ | 72,387 | | | | 5.00 | % |
Firstbank | | | 99,129 | | | | 8.19 | % | | | 48,393 | | | | 4.00 | % | | | 60,491 | | | | 5.00 | % |
Keystone Community Bank | | | 22,795 | | | | 9.91 | % | | | 9,204 | | | | 4.00 | % | | | 11,505 | | | | 5.00 | % |
| | | | | | | | | | | | | | | | | | | | | | | | | |
| | | Amount | | | Ratio | | | Amount | | | Ratio | | | Amount | | | Ratio | |
2012 | | | | | | | | | | | | | | | | | | | | | | | | |
Total Capital to Risk Weighted Assets | | | | | | | | | | | | | | | | | | | | | | | | |
Consolidated | | $ | 155,135 | | | | 15.99 | % | | $ | 77,618 | | | | 8.00 | % | | $ | 97,023 | | | | 10.00 | % |
Firstbank – Alma | | | 33,195 | | | | 15.81 | % | | | 16,797 | | | | 8.00 | % | | | 20,997 | | | | 10.00 | % |
Firstbank – Mt. Pleasant | | | 37,816 | | | | 12.74 | % | | | 23,748 | | | | 8.00 | % | | | 29,685 | | | | 10.00 | % |
Firstbank – West Branch | | | 23,021 | | | | 14.01 | % | | | 13,144 | | | | 8.00 | % | | | 16,430 | | | | 10.00 | % |
Keystone Community Bank | | | 28,641 | | | | 15.78 | % | | | 14,521 | | | | 8.00 | % | | | 18,151 | | | | 10.00 | % |
Firstbank – West Michigan | | | 15,226 | | | | 12.83 | % | | | 9,493 | | | | 8.00 | % | | | 11,866 | | | | 10.00 | % |
| | | | | | | | | | | | | | | | | | | | | | | | | |
Tier 1 (Core) Capital to Risk Weighted Assets | | | | | | | | | | | | | | | | | | | | | | | | |
Consolidated | | $ | 142,884 | | | | 14.73 | % | | $ | 38,809 | | | | 4.00 | % | | $ | 58,214 | | | | 6.00 | % |
Firstbank – Alma | | | 30,541 | | | | 14.55 | % | | | 8,399 | | | | 4.00 | % | | | 12,598 | | | | 6.00 | % |
Firstbank – Mt. Pleasant | | | 34,097 | | | | 11.49 | % | | | 11,874 | | | | 4.00 | % | | | 17,811 | | | | 6.00 | % |
Firstbank – West Branch | | | 20,945 | | | | 12.75 | % | | | 6,572 | | | | 4.00 | % | | | 9,858 | | | | 6.00 | % |
Keystone Community Bank | | | 26,333 | | | | 14.51 | % | | | 7,260 | | | | 4.00 | % | | | 10,891 | | | | 6.00 | % |
Firstbank – West Michigan | | | 13,729 | | | | 11.57 | % | | | 4,746 | | | | 4.00 | % | | | 7,119 | | | | 6.00 | % |
| | | | | | | | | | | | | | | | | | | | | | | | | |
Tier 1 (Core) Capital to Average Assets | | | | | | | | | | | | | | | | | | | | | | | | |
Consolidated | | $ | 142,884 | | | | 9.71 | % | | $ | 58,854 | | | | 4.00 | % | | $ | 73,568 | | | | 5.00 | % |
Firstbank – Alma | | | 30,541 | | | | 8.15 | % | | | 14,998 | | | | 4.00 | % | | | 18,748 | | | | 5.00 | % |
Firstbank – Mt. Pleasant | | | 34,097 | | | | 8.12 | % | | | 16,765 | | | | 4.00 | % | | | 20,994 | | | | 5.00 | % |
Firstbank – West Branch | | | 20,945 | | | | 8.55 | % | | | 9,803 | | | | 4.00 | % | | | 12,253 | | | | 5.00 | % |
Keystone Community Bank | | | 26,333 | | | | 11.61 | % | | | 9,072 | | | | 4.00 | % | | | 11,340 | | | | 5.00 | % |
Firstbank – West Michigan | | | 13,729 | | | | 7.29 | % | | | 7,538 | | | | 4.00 | % | | | 9,422 | | | | 5.00 | % |
NOTE 23 – FAIR VALUE
Carrying amount and estimated fair values of financial instruments were as follows at year end:
December 31, 2013 | | Carrying Amount | | | Estimated Fair Value | | | Quoted Prices in Active Markets (Level 1) | | | Significant Other Observable Inputs (Level 2) | | | Significant Unobservable Inputs (Level 3) | |
| (In thousands of dollars) | | | | | | | | | | | | | | | | | | | | |
Financial Assets: | | | | | | | | | | | | | | | | | | | | |
Cash and cash equivalents | | $ | 74,654 | | | $ | 74,654 | | | $ | 74,654 | | | $ | 0 | | | $ | 0 | |
FDIC insured bank certificates of deposit | | | 944 | | | | 944 | | | | 944 | | | | 0 | | | | 0 | |
Trading account securities | | | 18 | | | | 18 | | | | 18 | | | | 0 | | | | 0 | |
Securities available for sale | | | 343,602 | | | | 343,602 | | | | 570 | | | | 323,582 | | | | 19,450 | |
Federal Home Loan Bank stock | | | 7,266 | | | | 7,266 | | | | 0 | | | | 0 | | | | 7,266 | |
Loans held for sale | | | 401 | | | | 401 | | | | 0 | | | | 401 | | | | 0 | |
Loans, net of allowance | | | 969,149 | | | | 968,072 | | | | 0 | | | | 0 | | | | 968,072 | |
| | | | | | | | | | | | | | | | | | | | | |
Financial Liabilities: | | | | | | | | | | | | | | | | | | | | |
Deposits | | | (1,232,792 | ) | | | (1,213,535 | ) | | | 0 | | | | 0 | | | | (1,213,535 | ) |
Securities sold under agreementsto repurchase and overnight borrowings | | | (47,635 | ) | | | (47,635 | ) | | | 0 | | | | (47,635 | ) | | | 0 | |
Federal Home Loan Bank advances | | | (19,790 | ) | | | (20,098 | ) | | | 0 | | | | 0 | | | | (20,098 | ) |
Subordinated debentures | | | (36,084 | ) | | | (21,084 | ) | | | 0 | | | | 0 | | | | (21,084 | ) |
December 31, 2012 | | Carrying Amount | | | Estimated Fair Value | | | Quoted Prices in Active Markets (Level 1) | | | Significant Other Observable Inputs (Level 2) | | | Significant Unobservable Inputs (Level 3) | |
| (In thousands of dollars) | | | | | | | | | | | | | | | | | | | | |
Financial Assets: | | | | | | | | | | | | | | | | | | | | |
Cash and cash equivalents | | $ | 99,601 | | | $ | 99,601 | | | $ | 99,601 | | | $ | 0 | | | $ | 0 | |
FDIC insured bank certificates of deposit | | | 2,927 | | | | 2,927 | | | | 2,927 | | | | 0 | | | | 0 | |
Trading account securities | | | 6 | | | | 6 | | | | 6 | | | | 0 | | | | 0 | |
Securities available for sale | | | 353,678 | | | | 353,678 | | | | 91 | | | | 331,717 | | | | 21,870 | |
Federal Home Loan Bank stock | | | 7,266 | | | | 7,266 | | | | 0 | | | | 0 | | | | 7,266 | |
Loans held for sale | | | 2,921 | | | | 2,921 | | | | 0 | | | | 2,921 | | | | 0 | |
Loans, net of allowance | | | 942,422 | | | | 930,354 | | | | 0 | | | | 0 | | | | 930,354 | |
| | | | | | | | | | | | | | | | | | | | | |
Financial Liabilities: | | | | | | | | | | | | | | | | | | | | |
Deposits | | | (1,241,401 | ) | | | (1,243,712 | ) | | | 0 | | | | 0 | | | | (1,243,712 | ) |
Securities sold under agreementsto repurchase and overnight borrowings | | | (42,785 | ) | | | (42,785 | ) | | | 0 | | | | (42,785 | ) | | | 0 | |
Federal Home Loan Bank advances | | | (22,493 | ) | | | (24,122 | ) | | | 0 | | | | 0 | | | | (24,122 | ) |
Subordinated debentures | | | (36,084 | ) | | | (36,093 | ) | | | 0 | | | | 0 | | | | (36,093 | ) |
The methods and assumptions used to estimate fair value are described as follows: The carrying amount is the estimated fair value for cash and cash equivalents, short term borrowings, Federal Home Loan Bank stock, demand deposits, short term debt, and variable rate loans or deposits that re-price frequently and fully. Security fair values are based on market prices or dealer quotes, and if no such information is available, on the rate and term of the security and information about the issuer. For fixed rate loans and variable rate loans, fair value is based on discounted cash flows using current market rates applied to the estimated life and credit risk based on historical losses on similar loan pools. For deposits with infrequent re-pricing or re-pricing limits, fair value is based on discounted cash flows using current market rates applied to the estimated life of the product.
Fair values for impaired loans are estimated using discounted cash flow analysis or underlying collateral values for the specific loans in the portfolio and assumes the bank will resolve them through orderly liquidation. Fair value of loans held for sale is based on market quotes. Fair value of debt is based on current rates for similar financing. The fair value of off-balance sheet items is based on the current fees or cost that would be charged to enter into or terminate such arrangements. The fair value of off-balance sheet items was not material to the consolidated financial statements at December 31, 2013 and 2012.
The following tables present information about our assets measured at fair value on a recurring basis at December 31, 2013 and 2012, and valuation techniques used by us to determine those fair values.
Level 1 assets are those which are actively traded on an open market and pricing is publicly available.
Fair values determined by Level 2 inputs use other inputs that are observable, either directly or indirectly. These Level 2 inputs include quoted prices for similar assets in active markets, and other inputs such as interest rates and yield curves that are observable at commonly quoted intervals.
Level 3 inputs are unobservable inputs, including inputs that are available in situations where there is little, if any, market activity for the related asset or liability. Level 3 securities include local municipal securities where market pricing is not available, trust preferred securities issued by banks, and other miscellaneous investments.
Assets Measured at Fair Value on a Recurring Basis
(Dollars in Thousands) | | Quoted Prices in Active Markets for Identical Assets (Level 1) | | | Significant Other Observable Inputs (Level 2) | | | Significant Unobservable Inputs (Level 3) | | | Total | |
December 31, 2013 | | | | | | | | | | | | | | | | |
Securities available for sale | | | | | | | | | | | | | | | | |
U.S. Government Agency Bonds | | $ | 0 | | | $ | 101,604 | | | $ | 0 | | | $ | 101,604 | |
Mortgage Backed Securities | | | 0 | | | | 59,259 | | | | 0 | | | | 59,259 | |
U.S. Government Agency CMOs | | | 570 | | | | 33,916 | | | | 0 | | | | 34,486 | |
States and political subdivisions | | | 0 | | | | 128,803 | | | | 17,861 | | | | 146,664 | |
Equity and Other Securities | | | 0 | | | | 0 | | | | 1,589 | | | | 1,589 | |
Total Securities available for sale | | $ | 570 | | | $ | 323,582 | | | $ | 19,450 | | | $ | 343,602 | |
| | | | | | | | | | | | | | | | | |
Trading equity securities | | $ | 18 | | | $ | 0 | | | $ | 0 | | | $ | 18 | |
| | | | | | | | | | | | | | | | | |
December 31, 2012 | | | | | | | | | | | | | | | | |
Securities available for sale | | | | | | | | | | | | | | | | |
U.S. Government Agency Bonds | | $ | 0 | | | $ | 106,885 | | | $ | 0 | | | $ | 106,885 | |
Mortgage Backed Securities | | | 0 | | | | 66,277 | | | | 0 | | | | 66,277 | |
U.S. Government Agency CMOs | | | 0 | | | | 61,030 | | | | 0 | | | | 61,030 | |
States and political subdivisions | | | 0 | | | | 97,525 | | | | 20,289 | | | | 117,814 | |
Equity and Other Securities | | | 91 | | | | 0 | | | | 1,581 | | | | 1,672 | |
Total Securities available for sale | | $ | 91 | | | $ | 331,717 | | | $ | 21,870 | | | $ | 353,678 | |
| | | | | | | | | | | | | | | | | |
Trading equity securities | | $ | 6 | | | $ | 0 | | | $ | 0 | | | $ | 6 | |
Changes in Level 3 Assets Measured at Fair Value on a Recurring Basis
(Dollars in Thousands) | | 2013 | | | 2012 | |
Balance at beginning of year | | $ | 21,870 | | | $ | 16,914 | |
Total realized and unrealized gains/(losses) included in income | | | 0 | | | | 0 | |
Total unrealized gains/(losses) included in other comprehensive income | | | 0 | | | | 0 | |
Purchases of securities | | | 6,225 | | | | 17,262 | |
Sales of securities | | | 0 | | | | 0 | |
Calls and maturities | | | (8,066 | ) | | | (12,663 | ) |
Net transfers into (out of) Level 3 | | | (579 | ) | | | 357 | |
Balance at December 31 of each year | | $ | 19,450 | | | $ | 21,870 | |
Both observable and unobservable inputs may be used to determine the fair value of positions classified as Level 3 assets. As a result, the unrealized gains and losses for these assets presented in the tables above may include changes in fair value that were attributable to both observable and unobservable inputs.
Available for sale investments securities categorized as Level 3 assets primarily consist of bonds issued by local municipalities and other like assets. We carry local municipal securities at historical cost, which approximates fair value, unless economic conditions for the municipality changes to a degree requiring a valuation adjustment.
We also have assets that under certain conditions are subject to measurement at fair value on a non-recurring basis. These assets consist of impaired loans and other real estate owned. We have estimated the fair value of impaired loans using Level 3 inputs, specifically valuation of loans based on either a discounted cash flow projection, or a discount to the appraised value of the collateral underlying the loan. We use discounted appraised values or broker’s price opinions to determine the fair value other real estate owned.
Assets Measured at Fair Value on a Nonrecurring Basis
(Dollars in Thousands) | | Balance at December 31, | | | Quoted Prices in Active Markets for Identical Assets (Level 1) | | | Significant Other Observable Inputs (Level 2) | | | Significant Unobservable Inputs (Level 3) | |
2013 | | | | | | | | | | | | | | | | |
Impaired loans | | $ | 30,772 | | | $ | 0 | | | $ | 0 | | | $ | 30,772 | |
Other real estate owned | | $ | 537 | | | $ | 0 | | | $ | 0 | | | $ | 537 | |
| | | | | | | | | | | | | | | | | |
2012 | | | | | | | | | | | | | | | | |
Impaired loans | | $ | 36,387 | | | $ | 0 | | | $ | 0 | | | $ | 36,387 | |
Other real estate owned | | $ | 1,296 | | | $ | 0 | | | $ | 0 | | | $ | 1,296 | |
Other repossessed assets | | $ | 250 | | | $ | 0 | | | $ | 0 | | | $ | 250 | |
Impaired loans categorized as Level 3 assets consist of non-homogeneous loans that are considered impaired. We estimate the fair value of the loans based on the present value of expected future cash flows using management’s best estimate of key assumptions. These assumptions include future payment ability, timing of payment streams, and estimated realizable values of available collateral (typically based on outside appraisals). Other real estate owned is valued based on either a recent appraisal for the property or a brokers' price opinion of the value of the property, which are discounted for expected costs to dispose of the property. Losses on impaired loans were charged to the allowance for loan losses. Losses in other real estate owned and other repossessed assets were charged to earnings through other non-interest expense on the income statement.
NOTE 24 – BASIC AND DILUTED EARNINGS PER SHARE
| (In Thousands, Except per Share Data) | | Year Ended December 31 | |
| | | 2013 | | | 2012 | | | 2011 | |
Basic earnings per common share | | | | | | | | | | | | |
Net income available to common shareholders | | $ | 11,753 | | | $ | 9,259 | | | $ | 3,944 | |
Weighted average common shares outstanding | | | 8,054 | | | | 7,933 | | | | 7,843 | |
| | | | | | | | | | | | | |
Basic earnings per common share | | $ | 1.46 | | | $ | 1.17 | | | $ | 0.50 | |
| | | | | | | | | | | | | |
Diluted Earnings per Share | | | | | | | | | | | | |
Net income available to common shareholders | | $ | 11,753 | | | $ | 9,259 | | | $ | 3,944 | |
Weighted average common shares outstanding | | | 8,054 | | | | 7,933 | | | | 7,843 | |
Add dilutive effects of assumed exercises of options | | | 62 | | | | 24 | | | | 2 | |
Weighted average common and dilutive potential | | | | | | | | | | | | |
Common shares outstanding | | | 8,116 | | | | 7,957 | | | | 7,845 | |
| | | | | | | | | | | | | |
Diluted earnings per common share | | $ | 1.45 | | | $ | 1.16 | | | $ | 0.50 | |
Stock options for 175,415 shares of common stock were not considered in computing diluted earnings per share for 2013, because they were anti-dilutive. Stock options and warrants for 219,223 and 975,845 shares of common stock were not considered in computing diluted earnings per share for 2012 and 2011, respectively, because they were anti-dilutive.
NOTE 25 – FIRSTBANK CORPORATION (PARENT COMPANY ONLY)
CONDENSED FINANCIAL INFORMATION
CONDENSED BALANCE SHEETS
| | | Year Ended December 31, | |
(In Thousands of Dollars) | | 2013 | | | 2012 | |
ASSETS | | | | | | | | |
Cash and cash equivalents | | $ | 12,556 | | | $ | 11,167 | |
Investment in and advances to banking subsidiaries | | | 159,008 | | | | 168,883 | |
Securities | | | 1,102 | | | | 1,090 | |
Other assets | | | 2,372 | | | | 4,327 | |
Total Assets | | $ | 175,038 | | | $ | 185,467 | |
LIABILITIES AND EQUITY | | | | | | | | |
Accrued expenses and other liabilities | | $ | 1,328 | | | $ | 2,325 | |
Subordinated Debentures | | | 36,084 | | | | 36,084 | |
Shareholders’ equity | | | 137,626 | | | | 147,058 | |
Total Liabilities and Shareholders’ Equity | | $ | 175,038 | | | $ | 185,467 | |
CONDENSED STATEMENTS OF INCOME AND COMPREHENSIVE INCOME
| | | Year Ended December 31, | |
| | | 2013 | | | 2012 | | | 2011 | |
Dividends and returns of capital from subsidiaries (net of capital infusions) | | $ | 15,308 | | | $ | 8,150 | | | $ | 3,680 | |
Net Interest Expense | | | (678 | ) | | | (992 | ) | | | (1,110 | ) |
Other income | | | 211 | | | | 6,813 | | | | 7,031 | |
Other expense | | | (3,244 | ) | | | (10,043 | ) | | | (8,440 | ) |
Income before income tax and undistributed subsidiary income | | | 11,597 | | | | 3,928 | | | | 1,161 | |
Income tax benefit | | | 1,152 | | | | 1,416 | | | | 844 | |
Equity in undistributed subsidiary income/(loss) | | | (515 | ) | | | 5,190 | | | | 3,618 | |
Net income | | | 12,234 | | | | 10,534 | | | | 5,623 | |
Change in unrealized gain (loss) on securities, net of tax andclassification effects | | | (3,361 | ) | | | 712 | | | | 2,750 | |
Comprehensive income | | $ | 8,873 | | | $ | 11,246 | | | $ | 8,373 | |
CONDENSED STATEMENTS OF CASH FLOWS
| | | Year Ended December 31, | |
| | 2013 | | | 2012 | | | 2011 | |
| Cash flows from operating actsivities | | | | | | | | | | | | |
Net income | | $ | 12,234 | | | $ | 10,534 | | | $ | 5,623 | |
Adjustments: | | | | | | | | | | | | |
Unrealized (gain)/loss on trading account securities | | | (12 | ) | | | (4 | ) | | | 11 | |
Equity in undistributed subsidiary income | | | 515 | | | | (5,190 | ) | | | (3,618 | ) |
Stock option and restricted stock grant compensation expense | | | 161 | | | | 96 | | | | 118 | |
Change in other assets | | | 1,954 | | | | (223 | ) | | | 3,797 | |
Change in other liabilities | | | (997 | ) | | | 745 | | | | 138 | |
Net cash from operating activities | | | 13,855 | | | | 5,958 | | | | 6,069 | |
| | | | | | | | | | | | | |
Cash flows from investing activities | | | | | | | | | | | | |
Net decrease in commercial loans | | | 0 | | | | 0 | | | | 1,000 | |
Return from/(payments for) investments in subsidiaries | | | 6,000 | | | | 8,000 | | | | (4,220 | ) |
Net cash from/(used in) investing activities | | | 6,000 | | | | 8,000 | | | | (3,220 | ) |
| | | | | | | | | | | | | |
Cash flows from financing activities | | | | | | | | | | | | |
Borrowing on line of credit | | | 8,000 | | | | 0 | | | | 0 | |
Repayment of borrowing on line of credit | | | (8,000 | ) | | | 0 | | | | 0 | |
Redemption of preferred stock | | | (17,000 | ) | | | (15,056 | ) | | | 0 | |
Redemption of common stock warrants | | | 0 | | | | (1,947 | ) | | | 0 | |
Proceeds from issuance of common stock | | | 858 | | | | 903 | | | | 421 | |
Dividends on preferred stock, net of accretion | | | (389 | ) | | | (1,247 | ) | | | (1,650 | ) |
Dividends on common stock | | | (1,935 | ) | | | (2,314 | ) | | | (313 | ) |
Net cash used for financing activities | | | (18,466 | ) | | | (19,661 | ) | | | (1,542 | ) |
| | | | | | | | | | | | | |
Net change in cash and cash equivalents | | | 1,389 | | | | (5,703 | ) | | | 1,307 | |
Beginning cash and cash equivalents | | | 11,167 | | | | 16,870 | | | | 15,563 | |
Ending cash and cash equivalents | | $ | 12,556 | | | $ | 11,167 | | | $ | 16,870 | |
NOTE 26 – QUARTERLY FINANCIAL DATA (UNAUDITED)
| (In Thousands of Dollars, Except per Share Data) | | | |
| | | 2013 | |
| | | 1st Quarter | | | 2nd Quarter | | | 3rd Quarter | | | 4th Quarter | | | Year | |
Interest income | | $ | 14,672 | | | $ | 14,751 | | | $ | 14,383 | | | $ | 14,468 | | | $ | 58,274 | |
Net interest income | | | 13,012 | | | | 13,191 | | | | 12,855 | | | | 13,042 | | | | 52,100 | |
Income before federal income taxes | | | 4,028 | | | | 4,705 | | | | 4,094 | | | | 4,541 | | | | 17,368 | |
Net income | | | 2,863 | | | | 3,343 | | | | 2,869 | | | | 3,159 | | | | 12,234 | |
Preferred stock dividends | | | 213 | | | | 268 | | | | 0 | | | | 0 | | | | 481 | |
Net income available to common shareholders | | | 2,650 | | | | 3,075 | | | | 2,869 | | | | 3,159 | | | | 11,753 | |
Basic earnings per common share | | $ | 0.33 | | | $ | 0.38 | | | $ | 0.36 | | | $ | 0.39 | | | $ | 1.46 | |
Diluted earnings per common share | | $ | 0.33 | | | $ | 0.38 | | | $ | 0.35 | | | $ | 0.39 | | | $ | 1.45 | |
| | | | | | | | | | | | | | | | | | | | | |
| | | 2012 | |
| | | 1st Quarter | | | 2nd Quarter | | | 3rd Quarter | | | 4th Quarter | | | Year | |
Interest income | | $ | 16,126 | | | $ | 16,020 | | | $ | 15,574 | | | $ | 15,146 | | | $ | 62,866 | |
Net interest income | | | 13,766 | | | | 13,838 | | | | 13,542 | | | | 13,346 | | | | 54,492 | |
Income before federal income taxes | | | 3,440 | | | | 3,342 | | | | 3,765 | | | | 4,243 | | | | 14,790 | |
Net income | | | 2,417 | | | | 2,404 | | | | 2,715 | | | | 2,998 | | | | 10,534 | |
Preferred stock dividends | | | 420 | | | | 420 | | | | 220 | | | | 215 | | | | 1,275 | |
Net income available to common shareholders | | | 1,997 | | | | 1,984 | | | | 2,495 | | | | 2,783 | | | | 9,259 | |
Basic earnings per common share | | $ | 0.25 | | | $ | 0.25 | | | $ | 0.32 | | | $ | 0.35 | | | $ | 1.17 | |
Diluted earnings per common share | | $ | 0.25 | | | $ | 0.25 | | | $ | 0.31 | | | $ | 0.35 | | | $ | 1.16 | |
ITEM 9. Changes in and Disagreements with Accountants on Accounting and Financial Disclosure.
None.
ITEM 9A. Controls and Procedures
(a) Evaluation of Disclosure Controls and Procedures.
The Corporation’s management is responsible for the establishing and maintaining effective disclosure controls and procedures as defined in Exchange Act Rules 13a-15(e) and 15(d)-15(e)) as of the end of the period covered by this Form 10-K Annual Report. The Corporation’s Chief Executive Officer and the Chief Financial Officer, after evaluating the effectiveness of the Corporation’s disclosure controls and procedures, have concluded that the Corporation’s disclosure controls and procedures as of December 31, 2013 were adequate and effective to ensure that information required to be disclosed in this Annual Report on Form 10-K was recorded, processed, summarized, and reported on a timely basis. Management’s responsibility relating to establishing and maintaining effective disclosure controls over financial reporting are designed to produce reliable financial statements in accordance with accounting principles generally accepted in the United States.
(b) Management’s Report on Internal Controls over Financial Reporting.
The management of Firstbank Corporation is responsible for establishing and maintaining adequate internal control over financial reporting. The Company's internal control system is designed to provide reasonable assurance to the Company's management and Board of Directors regarding the reliability of financial reporting and the presentation of published financial statements. The system of internal control provides for division of responsibility and is documented by written policies and procedures that are communicated to employees with significant roles in the financial reporting process and updated as necessary. Management monitors the system of internal control for compliance.
The Company maintains an internal auditing program that independently assesses the effectiveness of the internal controls and recommends possible improvements thereto. However, all internal control systems, no matter how well designed, have inherent limitations.
The Company's management assessed the effectiveness of the Company's internal control over financial reporting as of December 31, 2013. In making this assessment, it used the criteria for effective internal control over financial reporting set forth by the Committee of Sponsoring Organizations of the Treadway Commission (COSO) in "Internal Control-Integrated Framework". Based on our assessment management concludes that, as of December 31, 2013, the Company's internal control over financial reporting is effective based on those criteria.
(c) Changes in Internal Controls.
During the year ended December 31, 2013, there were no significant changes in the Corporation's internal control over financial reporting that have materially affected or are reasonably likely to materially affect the Corporation’s internal control over financial reporting. There were no significant changes in the Corporation’s system of internal controls or other factors that could significantly affect internal controls subsequent to December 31, 2013.
FIRSTBANK CORPORATION
| | |
| | /s/ Thomas R. Sullivan | |
| | Thomas R. Sullivan | |
| | President & Chief Executive Officer | |
| | (Principal Executive Officer) | |
| | | |
| | |
| | /s/ Samuel G. Stone | |
| | Samuel G. Stone | |
| | Executive Vice President & Chief Financial Officer | |
| | (Principal Financial and Accounting Officer) | |
Dated: March 10, 2014
ITEM 9B. Other Information.
None.
PART III
ITEM 10. Directors, Executive Officers and Corporate Governance.
The Board of Directors of the Corporation has determined that Edward B. Grant, a director and member of the Audit Committee, qualifies as an "Audit Committee Financial Expert" as defined in rules adopted by the Securities and Exchange Committee pursuant to the Sarbanes-Oxley Act of 2002.
The Board of Directors of the Corporation has adopted a Code of Ethics which details principles and responsibilities governing ethical conduct for all Corporation directors and executive officers. The Code of Ethics is filed as an Exhibit to this Report on Form 10-K.
We provide stock options and restricted stock to our employees that qualify for those benefits under the Firstbank Corporation Stock Option Plans of 1997 and 2006, as amended. These plans provide for shares of stock, in either restricted form or under option. Grant of options may be either incentive stock options or nonqualified stock options.
We provide an incentive based bonus program as a part of our overall compensation plan. All full time employees are eligible to receive payment under the plan, provided that our net income for the year is satisfactory. Annual bonuses are paid based on a discretionary evaluation of the performance of the employee and the employee’s individual achievements.
Reference is made to Item 4 of this Annual Report for information concerning our executive officers.
BOARD OF DIRECTORS
Our Articles of Incorporation provide that the Board of Directors will be divided into three classes, as nearly equal in number as practicable, with the term of office of one class expiring each year. The present Board of Directors consists of seven persons who are elected to the Board of Directors for terms of three years each by our shareholders.
Biographical information concerning the current directors is presented below. Except as otherwise indicated, all directors have had the same principal employment for over five years. With the exception of Mr. Sullivan, our President and Chief Executive Officer, all directors have been determined by the Board of Directors to be independent under the NASDAQ Listing Standards.
A. Directors with 3-Year Terms Expiring in 2016
David W. Fultz(age 66) has been a director of Firstbank – West Branch since October, 1994 and of the Corporation since 2004. He is the owner of Fultz Insurance Agency located in St. Helen, Michigan and Kirtland Insurance Agency located in Rose City, Michigan.
William E. Goggin (age 68) has been a director of Firstbank - Alma since February, 1974 and of the Corporation since December, 1985. Mr. Goggin has served as Chairman of the Board of the Corporation since 1986 and Chairman of the Board of Firstbank - Alma since 1978. He is an attorney with the law firm Goggin Law Offices in Alma, Michigan
B. Directors for 3-Year Terms Expiring in 2015
Jeff A. Gardner(age 61) has been a director and vice-chairman of Keystone Community Bank since 1997 and a director of the Corporation since October 2005. Mr. Gardner is President of Gardner Group, which he formed in 1980. Gardner Group provides real estate services throughout southwestern Michigan, including development, construction, management, brokerage and maintenance. Mr. Gardner is a principal in numerous real estate developments, construction projects, and a consulting company. Mr. Gardner holds the designation of Certified Property Manager (CPM).
Thomas R. Sullivan (age 63) became President & Chief Executive Officer of Firstbank Corporation in January, 2000. He served as President, Chief Executive Officer of Firstbank (Mt. Pleasant) from December, 1991 until January, 2007. He has served as a director of Firstbank (Mt. Pleasant) since 1991. He has also served as a director of Firstbank – Alma and Firstbank – West Branch since January, 2000, Keystone Community Bank since October, 2005 and as a director of Firstbank – West Michigan since July, 2007. Mr. Sullivan has also served as an Officer of the Corporation since 1991.
C. Directors with 3-Year Terms Expiring in 2014
Edward B. Grant (age 64) has been a director of Firstbank (Mt. Pleasant) since 1988 and of the Corporation since 1990. He has served as Chairman of the Board of Firstbank (Mt. Pleasant) since 1989. Mr. Grant is the General Manager of Public Broadcasting at Central Michigan University. Mr. Grant is a Certified Public Accountant, and holds a Ph.D. in accounting from Michigan State University.
Samuel A. Smith(age 61) became a director of Firstbank – St. Johns in June, 2000 and a director of Firstbank – Alma upon the merger of those two banks in September, 2011. Mr. Smith has been a director of Firstbank Corporation since June, 2003. Mr. Smith is the owner of Smith Family Funeral Homes, Inc. headquartered in Elsie, Michigan.
Thomas D. Dickinson(age 55) has been a director of Firstbank – West Michigan (formerly known as Ionia County National Bank) since September, 2003 and of the Corporation since July, 2007. He is a principal in the CPA firm of Biggs, Hausserman Thompson & Dickinson P.C. in Saranac, Michigan. Mr. Dickinson also serves as a Managing Member of Biggs, Dickinson & Roberts Wealth Management Services, LLC and is a member of the Michigan Association of CPAs and the American Institute of CPAs.
CORPORATE GOVERNANCE
Director Qualifications and Nominations
Directors and nominees are considered, and must be approved by, the directors on the Board who are independent under SEC and NASDAQ Standards. The Board searches for potential candidates that it identifies by a variety of means as deemed appropriate by the Board.
The Board has not established specific minimum age, education, years of business experience, or specific types of skills for potential candidates, but, in general, expects qualified candidates will have ample experience and a proven record of business success and leadership. In general, the Board requires that each of its members will have the highest personal and professional ethics, integrity and values; will consistently exercise sound and objective business judgment; and will have a comfort with diversity in its broadest sense.
Although the Board does not have a specific diversity policy, it is anticipated that the Board as a whole will have individuals with significant appropriate senior management and leadership experience, a comfort with technology, a long-term and strategic perspective, and the ability to advance constructive debate. It will be important for the Board as a whole to operate in an atmosphere where the chemistry of the individuals is a key element.
When considering whether directors and nominees have the experience, qualifications, attributes and skills, taken as a whole, to enable the Board of Directors to satisfy its oversight responsibilities effectively in light of our business and structure, the Board of Directors and the independent directors considered the information discussed in each director’s biography. The Board of Directors also considered the many years of experience represented by Messrs. Fultz, Gardner, Goggin, Grant, and Sullivan, each of whom have been involved with Firstbank Corporation or its subsidiary banks for at least fifteen years. Each of our directors also has business and personal relationships with people in their respective communities which provide an important connection to our customers. In addition, the Board of Directors believes that each of the directors has a reputation for honesty, integrity and adherence to high ethical standards.
With regard to Mr. Goggin, an attorney, the Board also considered his legal knowledge and experience which is beneficial in the highly regulated financial services industry. With regard to Mr. Fultz the Board considered his experience in insurance and his experience owning and operating a business. Mr. Smith also has experience owning and operating a business. Messrs. Dickinson and Grant are each certified public accountants with a thorough knowledge of accounting and financial statements. Mr. Gardner has extensive experience with real estate development, construction, management, brokerage and maintenance, which is valuable for a community banking organization with a number of locations and for which real estate often serves as collateral for loans. Mr. Sullivan is an experienced community banker with knowledge of how to operate and manage community banks.
Shareholder nominations may be made directly by a shareholder or by written notice delivered or mailed to the secretary of the Corporation not less than ten (10) nor more than fifty (50) days prior to the annual meeting. However, if a shareholder wishes the Board of Directors to consider a nomination as a part of a slate of nominees approved by the Board of Directors, the nomination process described below must be followed.
The independent directors will consider shareholder nominations for directors submitted in accordance with the following procedure. A notice relating to the nomination must be given in writing to the Corporation not later than sixty (60) days nor more than ninety (90) days prior to the anniversary of the prior year's annual meeting. Such notice must be accompanied by the nominee's written consent, contain information relating to the business experience and background of the nominee and contain information with respect to the nominating shareholder and persons acting in concert with the nominating shareholder. There are no differences in the manner in which the independent directors evaluate a candidate that is recommended for nomination for membership on our Board by a shareholder. As of this time, the Board has not received any recommended nominations from any of our shareholders in connection with the annual Meeting.
Upon receipt of information concerning a shareholder proposed candidate, the Chair of the Board assesses the Board's needs, primarily whether or not there is a current or pending vacancy or a possible need to fulfill by adding or replacing a director, and then develops a director profile by comparing the current state of Board characteristics with the desired state and the candidate's qualifications. The profile and the candidate's submitted information are provided to the Board for discussion. Similarly, if at any time the Board determines there may be a need to add or replace a director, the Chair of the Board develops a Director profile by comparing the current state of Board characteristics with the desired state. If no candidates are apparent from any source, the Board will determine the appropriate method to conduct a search. The Board has, to date, not paid any third party fees to assist in identifying and evaluating nominees.
We have not established a nominating committee because we desire active participation of all Board members in the analysis and process of making nominations. In addition, nominations are approved by directors who are independent, ensuring the integrity of the nomination process in the same manner that establishing a nominating committee would. The Board has not adopted nomination charter provisions but it has adopted a formal written board resolution approving the procedure described above.
In making nominations for election to the Board of Directors, the Board will consider recommendations of shareholders. Shareholders who wish to recommend nominees should submit their recommendations in writing, delivered or mailed, to the Secretary of the Corporation.
Board of Directors Leadership Structure/Role in Risk Oversight
The Board of Directors has chosen to separate the CEO position from the Chairman position. This separation helps to ensure that control by one person is not achieved. Also the separation between the CEO and Chairman positions ensures that while we achieve the goal of employee retention (CEO), the Chairman position could be rotated throughout the board members. Finally, the separate position of Chairman, allows additional leadership to be present among management, in the absence of the CEO or CFO.
The Board of Directors oversees and monitors our risk management policies and processes both directly and through board committees. Types of risk include credit risk, liquidity risk, operational risk, reputational risk, and compensation/incentive risk. The Board and its committees monitor risk through various reports received from management, internal and external auditors, and regulatory examiners. Our Audit Committee exercises risk oversight by approving the independent auditor and receiving reports from both external and internal auditors. Our compensation committee monitors potential risks related to our compensation plans and practices through a risk review process and by utilizing outside expertise when necessary. Each member of our Board of Directors is also a director of one of our subsidiary banks, and as a result they are familiar with the types of risk relevant to financial institutions.
Shareholder Communication with the Corporation's Board of Directors
Shareholders may communicate with members of our Board by mail addressed to the full Board, a specific member of the Board, or to a particular committee of the Board at 311 Woodworth Avenue, Alma, Michigan 48801.
Code of Ethics
We have adopted a Code of Ethics that applies to our executive officers (including our Chief Executive Officer and principal Financial Officer) and all of the directors. Our Code of Ethics is available on our website www.firstbankmi.com under Investor Relations and can be obtained free of charge by sending a request to our corporate secretary at 311 Woodworth Avenue, Alma, Michigan 48801. Any changes or waivers to the Code of Ethics will be disclosed on the website.
Audit Committee
The Audit Committee oversees our accounting and financial reporting process. For this purpose, the Audit Committee performs several functions. For example, the Audit Committee evaluates the performance of and assesses the qualifications of the independent auditors; appoints and approves the compensation of the independent auditors; determines whether to retain or terminate the existing independent auditors or to appoint and engage new independent auditors; reviews and approves the retention of the auditors to perform the internal audit functions and services which the independent auditors are not permitted to perform; reviews the financial statements to be included in our Annual Report on Form 10-K; and discusses with management and the independent auditors the results of the annual audit and the results of our quarterly financial statements.
The Audit Committee is composed of Messrs. Dickinson, Fultz, Gardner, Grant, and Smith. The Audit Committee met 6 times during the fiscal year ended December 31, 2013.
All members of our Audit Committee are independent (as independence is defined in Rule 4200(a)(15) of the NASDAQ listing standards and as defined in Securities and Exchange Commission rules). Mr. Grant has been designated by the Board as the Audit Committee's financial expert. Mr. Grant is independent of management, as such term is used in item 7(d)(3)(iv) of Schedule 14A under the Securities Exchange Act of 1934, as amended. We have adopted a written Audit Committee Charter which is available at our website www.firstbankmi.com under Investor Relations.
On February 20, 2014 the Audit Committee submitted to the Board the following report.
Audit Committee Report
We have reviewed and discussed with management the Corporation’s audited consolidated balance sheet as of December 31, 2013 and 2012, and the related consolidated statements of income and comprehensive income, changes in shareholders’ equity and cash flows for each of the three years for the periods ending December 31, 2013, 2012, and 2011.
We have discussed with the independent auditors the matters required to be discussed based on Audit Standard No. 16 issued by the Public Company Oversight Board.
We have received and reviewed the written disclosures and the letter from the independent registered public accounting firm required by the applicable requirements of the Public Company Accounting Oversight Board regarding the independent accountant's communications with the Audit Committee concerning independence and has discussed with the independent accountant the independent accountant's independence.
Based on the reviews and discussions referred to above, we recommend to the Board of Directors that the financial statements referred to above be included in the Corporation’s Annual Report on Form 10-K for the year ended December 31, 2013.
| | Respectfully submitted, | |
| | | |
| | |
| | Edward B. Grant, CPA, Chairman | |
| | Thomas D. Dickinson, CPA, CFP | |
| | | David W. Fultz | |
| | Jeff A. Gardner | |
| | Samuel A. Smith | |
SECTION 16(a) BENEFICIAL OWNERSHIP REPORTING COMPLIANCE
The Exchange Act requires our directors, officers and persons who own more than 10% of our common stock to file reports of ownership and changes in ownership with the Securities and Exchange Commission (the “SEC”). SEC regulations require such reporting persons to furnish us with copies of all such reports they file. Based solely on our review of the forms we received, or written representations from certain reporting persons that no filings were required for those persons. We believe that from January 1, 2013 through December 31, 2013, our directors, officers and greater than 10% shareholders complied with all applicable filing requirements.
ITEM 11. Executive Compensation.
DIRECTOR COMPENSATION
All of the non-employee directors of Firstbank Corporation are also Directors of one of the subsidiary banks within the holding company. As a result, non-employee directors receive compensation for their duties at both the holding company and regional bank level. Mr. Sullivan does not receive any Director fees. Outside Directors of the Corporation and of the subsidiary banks have the option of receiving fees in cash, or using the fees to purchase Firstbank Corporation common stock, except when the fee is noted as being paid in shares of common stock.
Historically, we have purchased outside independent compensation data that compares our level of Director Compensation to other banking companies of our size and structure. Annually the Compensation Committee reviews Director Compensation to ensure that the fees earned/paid are competitive compared to market-based director compensation data.
The Compensation Committee determined at its January 28, 2013 meeting that the current fee schedule, which has been in place since January, 2011 still achieved the targeted competitive position compared to market and that no changes would be made for 2013. Firstbank Corporation, and its affiliate banks, paid outside directors during 2013 as follows:
Corporate Board of Directors | | Annual Retainer | | | Meeting Fee per Meeting Attended | |
| | FBMI Stock | | | Cash | | | Cash | |
Chairman of the Board | | 2,300 shares | | | $ | 5,000 | | | | | |
Chairman of the Audit Committee | | 2,200 shares | | | $ | 3,000 | | | | | |
Chairman of the Compensation Committee | | 2,200 shares | | | $ | 3,000 | | | | | |
All Other Independent Board Members | | 2,200 shares | | | $ | 0 | | | | | |
Regular Board Meeting Attended | | | | | | | | | | $ | 700 | |
Teleconference Meeting Attended | | | | | | | | | | $ | 250 | |
Full Day Special Meeting Attended | | | | | | | | | | $ | 1,250 | |
Half Day Special Meeting Attended | | | | | | | | | | $ | 1,000 | |
Committee Meeting Attended | | | | | | | | | | $ | 250 | |
Affiliate Bank Board of Directors (includes all affiliate banks unless otherwise noted) | | Annual Retainer | | | Meeting Fee per Meeting Attended | |
| | FBMI Stock | | | Cash | | | Cash | |
Chairman of the Board | | 400 shares | | | $ | 0 | | | | | |
All Other Independent Board Members | | 300 shares | | | $ | 0 | | | | | |
Regular Board Meeting Attended | | | | | | | | | | $ | 500 | |
Full Day Special Meeting Attended | | | | | | | | | | $ | 900 | |
Half Day Special Meeting Attended | | | | | | | | | | $ | 600 | |
Executive Committee Meeting Attended | | | | | | | | | | $ | 200 | |
Committee Meeting Attended | | | | | | | | | | $ | 100 | |
Director Compensation Philosophy
Because of the critical role the Board of Directors fulfill in leading the company through the current economic conditions and the importance of attracting and retaining directors in light of increased regulations, liability and demands on their time, the Compensation Committee has adopted the following philosophy for director compensation.
Create a “pay for service” approach with an appropriate amount of compensation paid for both corporate duties and affiliate bank duties, with a combination of cash and equity to help balance pay for current service and long-term shareholder value. The Company targets a market positioning that is competitive versus peer on an average director basis.
The Compensation Committee will continue to review director compensation trends and market data as well as benchmark our director compensation to director compensation at similar banking companies. The Compensation Committee did not conduct a formal market review of director compensation during 2013, since one was conducted in 2010 and because of the Compensation Committee’s understanding that director compensation has not seen significant increases or decreases in recent years. The Compensation Committee will continue to assess what the appropriate benchmark percentile to peer group is, and may adjust director compensation when appropriate in future years.
Director Compensation Table
Name | | Fees Earned or Paid in Cash ($) | | | Stock Awards ($) | | | Option Awards ($) | | | All Other Compen-sation ($) | | | Total ($) | |
| | | (1) | | | (2)(3) | | | (3) | | | | | | | | | |
William Goggin Chairman | | $ | 20,250 | | | $ | 39,540 | | | $ | 0 | | | $ | 0 | | | $ | 59,790 | |
Thomas Dickinson Director | | $ | 21,400 | | | $ | 31,947 | | | $ | 0 | | | $ | 0 | | | $ | 53,347 | |
David Fultz Director | | $ | 21,050 | | | $ | 31,947 | | | $ | 0 | | | $ | 0 | | | $ | 52,997 | |
Jeff Gardner Director and Compensation Chair | | $ | 21,550 | | | $ | 34,947 | | | $ | 0 | | | $ | 0 | | | $ | 56,497 | |
Edward Grant Director and Audit Chair | | $ | 23,300 | | | $ | 36,268 | | | $ | 0 | | | $ | 0 | | | $ | 59,568 | |
Samuel Smith Director | | $ | 20,250 | | | $ | 31,947 | | | $ | 0 | | | $ | 0 | | | $ | 52,197 | |
(1) | Cash fees includes earnings for both the corporate board and bank board, as well as any committees the director serves on. |
(2) | Represents shares provided as retainers for both corporate and bank board service. The grants are unrestricted shares of common stock valued at the market price on the grant date that vest immediately. |
(3) | There are no outstanding equity awards. |
COMPENSATION DISCUSSION AND ANALYSIS
The following narrative section discusses and analyzes Firstbank Corporation’s compensation policies, programs and practices for the named executive officers. This narrative section also includes an overview of our assessment of risks in the senior executive officer compensation plans and the employee compensation plans. The risk assessments are conducted to analyze, identify and mitigate any material risks associated with these compensation plans.
On June 28, 2012, Firstbank Corporation redeemed $33 million of preferred stock and warrants to the U.S. Treasury and exited the TARP/CPP program through the U.S. Treasury sponsored auction. Through detailed analysis and information provided to the Board of Directors, the company retired $16 million of Preferred Shares through a cash purchase. The remaining $17 million was purchased by private investors.
With our participation in the Capital Purchase Program (CPP) ending on June 28, 2012, the Compensation Committee has reviewed the required compensation standards, and will continue to assess any changes deemed necessary to our compensation practices.
Firstbank Corporation completed all required regulatory and Office of Financial Stability reporting through June 28, 2012 and filed its final CPP certification reports to both the Office of Financial Stability at the U.S. Treasury and the Federal Reserve, who is our primary regulator. These final CPP reports were approved by the Compensation Committee at their January 28, 2013 meeting.
Compensation Consultant Disclosure
The Corporation’s Compensation Committee has engaged an independent consulting firm to review Executive and Board of Director compensation, review the CD&A and annual Proxy statement, assess the overall compliance with CPP restrictions, assist with the Risk Reviews, and provide general consulting advice to the Committee over the course of the year.
At the Committee’s January 28, 2013 meeting, the Compensation Committee approved engaging Blanchard Consulting Group as the Committee’s consultant for 2013. The engagement for 2013 included a review of the Compensation Discussion and Analysis and annual Proxy statement and a Compensation Risk Review. Blanchard Consulting Group is an independent third-party consulting firm that is exclusively focused on the banking marketplace and has performed additional consulting projects for the Committee in past years.
Although we are no longer required to provide formal semi-annual Risk Assessments as a CPP participant, we determined it was a good business practice to continue to conduct compensation plan risk assessments.
Compensation Program Details
The foregoing discussion provides background and context for the information that follows regarding our existing compensation programs to those persons who served as our named executive officers during 2013 and to assist in understanding the information in the executive compensation tables included later in our proxy statement. Named executive officers are determined using current year compensation for the year being disclosed.
The 2013 named executive officers were:
| | 1. | Thomas R. Sullivan, President & Chief Executive Officer – Firstbank Corporation, and Chief Executive Officer – Firstbank |
| | 2. | Samuel G. Stone, Executive Vice President & Chief Financial Officer – Firstbank Corporation, and Executive Vice President & Chief Financial Officer – Firstbank |
| | 3. | William L. Benear, Vice President – Firstbank Corporation, and President-West Michigan |
| | 4. | Douglas J. Ouellette, Vice President – Firstbank Corporation, and President & Chief Operating Officer – Firstbank |
5. James E. Wheeler, II, Vice President – Firstbank Corporation, and President-Alma & Chief Lending Officer – Firstbank
Compensation Philosophy
We have adopted, and operate under, a written Compensation Committee Charter which is available at the Corporation's websitewww.firstbankmi.com under Investor Relations. The Compensation Committee is guided by the following key principles in determining the compensation of our senior executives:
Total compensation opportunities must be competitive.The Committee believes that compensation should reflect the competitive marketplace, which will enable us to attract, retain and motivate talented executives. The total compensation package will be based on the pay opportunities of comparable financial institutions and will be targeted at levels that enable us to compete with other employers. The comparable market will include comparable financial institutions with positions of similar scope.
A portion of compensation should be performance based.A portion of each executive’s compensation should be tied to financial and individual performance, in order to hold executives accountable for the business results of their areas of responsibility, and to encourage and reflect individual contributions to our performance in achieving Company goals.
Compensation should be aligned with stockholder interests.We believe that aligning the compensation of bank executives with the interests of stockholders encourages them to focus on shareholder returns. To this end the compensation package should include reward opportunities that reflect the returns to our shareholders, which will provide motivation for enhancing shareholder value.
We use a variety of compensation elements to achieve our compensation philosophy and goals, including:
| | ♦ | Base salarieswhich are designed to provide executives with a reasonable current income that is sufficiently competitive to attract and retain high quality leadership. |
| | ♦ | Annual cash incentiveswhich are used to motivate, recognize, and reward the achievement of operational, financial, and/or strategic goals. |
| | ♦ | Long-term incentiveswhich are provided for the dual purpose of: 1) aligning executives’ interests with stockholders’ long-term interests; and 2) promoting retention and enhancing the benefit to those executives that remain with us for extended periods. |
We have established salary ranges with a goal to have our named executive officers at or near the mid-point (50th percentile) of their range. However, for those who are still mastering their role, developing their skills or have relatively limited experience in their position, we typically set their base salary between the minimum of the range and the 25th percentile. Our “at or near” mid-point (40th – 60th percentile) goal is for those who are fully proficient in their role, and who consistently perform up to expectations. We reserve above the 75th percentile positioning for only the top performing and highly-experienced individuals.
Primary Components of Compensation Plans
Base Salary – The goal of establishing fair and competitive base salaries for the named executive officers is to attract and retain top talent. We believe that our people make a difference in how successful we are as an organization. The base salary ranges for the named executive officers have been determined using multiple methods. First, we purchase and review survey salary data to ensure our base salaries are competitive. Second, during 2010 the Compensation Committee engaged an independent third party consultant to conduct an executive compensation review. This review included the creation of, and an analysis of, a peer group of publicly traded banks as previously mentioned. It has been the practice of the Company to establish individual base salaries at or near the mid-point of the appropriate salary range taking into consideration overall individual performance, an individual’s time and experience in the position, and market forces within the various communities in which we operate.
During our 2012 engagement with Blanchard Consulting Group, the Compensation Committee has continued discussions with the consultant to ensure our base salaries continue to be competitive. At the Compensation Committee’s January 24, 2012 meeting where annual base salaries are determined, it was noted that all named executive officers are now at or near their mid-point, which had been the Committee’s goal. For 2012, the named executive officers received a nominal merit increase representing a cost of living adjustment, except for Mr. Sullivan, who based on his own recommendation, did not receive an increase for 2012.
Base salaries for 2013 were reviewed at the Compensation Committee’s January 28, 2013 meeting. The Compensation Committee recognized that some of the base salaries that were increased during the TARP period to account for the fact that no incentive compensation was available should now be returned to a lower level to reflect each individual’s mid-point of their 2013 salary range. The average base salary increase of the Named Executive Officers for 2013 was -2.9%. The full re-implementation of incentive compensation has allowed the Committee to return to its desired compensation philosophy. Adjustments as a result of CPP restrictions are no longer applicable going-forward.
For 2014, the salary ranges for our named executive officers will be increased by 3% instead of completing a full market study. This 3% adjustment was based on various industry trend data that was provided by surveys, compensation experts, and our consultant.
Annual Short Term Incentive Compensation – Annual short term incentive compensation is the second component of total cash compensation and is also used to attract and retain top talent. Annual short term cash incentive compensation is paid through the Board approved Firstbank Corporation Management Incentive Plan (“Management Incentive Plan”) for the Corporation’s officers.
With our exit from the TARP program, incentive compensation was eligible to be reinstated for the highly compensated officers who were previously prohibited from receiving cash incentives. However, according to the Interim Final Rules from the Office of Financial Stability, only the period that was not a TARP period could be considered. Therefore, our earnings and performance for the period of January 1, 2012 to June 28, 2012 could not be considered for the purpose of calculating any incentive compensation.
All incentive compensation for 2012 was solely based on our performance in the second half of 2012 (from July 1, 2012 to December 31, 2012). The earnings and performance from this six-month period was compared to the planned earnings of the same six-month period.
Incentive compensation for 2013 has returned to utilizing the Management Incentive Plan described below.
The Management Incentive Plan’s threshold, target and maximum award levels have historically been determined based on competitive market information supplied to the Compensation Committee. However, going forward, and after work performed by the Compensation Committee’s independent compensation consultant, the plan structure has been modified to ensure that it continues to meet our long-term needs, complies with regulations, and is sound. We have added non-financial and discretionary components to the plan, in addition to the financial performance measures. The goal is to create a plan that has an acceptable level of risk and is well balanced.
The amounts an individual can earn under the Plan are highlighted in the table below. The Management Incentive Plan’s performance measures include a minimum earnings hurdle that must be achieved to activate that portion of the plan. If the earnings hurdle is exceeded, the incentive potential can range from 10 – 50% of the individual’s base salary on an annual basis, calculated by measuring the level of performance achieved. The amounts that can be earned are based on different levels of performance: “threshold” – is the minimum level of performance; “target” – is the planned level of performance; and, “maximum” – is the highest level of performance.
The objective of the Management Incentive Plan is to reward high levels of performance by the Corporation and/or the individual business units for which the named executives have responsibility, and secondly, to assure that the executive’s total cash compensation is appropriate considering the Company’s performance relative to other community banks. The addition of the non-financial and discretionary components is intended to provide us with additional tools to manage and balance risk vs. reward.
The Management Incentive Plan’s target goal is 100% of plan earnings. The threshold goal is set at 85% of target, while the maximum goal is set at 125% of target. If the Management Incentive Plan is activated by achieving the earnings hurdle, then risk features have also been limited by including additional triggers for non-financial performance measures for incentive compensation to our named executive officers. These items include: acceptable audit and examination results, acceptable asset quality measures and acceptable implementation of strategic objectives helping to ensure that the named executive officers are reviewing and focused on more than earnings.
In 2010, the Board of Directors approved a Claw-back Policy as required by our participation in the CPP/TARP program and is continuing to maintain this policy going forward. The claw-back policy allows the Corporation to recover any compensation, including incentive compensation that is paid based on materially inaccurate financial statements, results or performance criteria. The policy also states that any manipulation of earnings to enhance the compensation of the employee is grounds for termination.
2013 Management Incentive Plan*
| | | Payout Levels (% of Salaries) | | | Goal Weighting | |
| | | Threshold | | | Target | | | Maximum | | | Corporate Net Income | | | Business Unit | | | Individual | |
Thomas R. Sullivan, President & Chief Executive Officer | | | 15% | | | | 30% | | | | 50% | | | | 70% | | | n/a | | | | 30% | |
Samuel G. Stone EVP & Chief Financial Officer | | | 10% | | | | 25% | | | | 50% | | | | 60% | | | n/a | | | | 40% | |
William L. Benear Vice President | | | 10% | | | | 25% | | | | 50% | | | | 50% | | | | 25% | | | | 25% | |
Douglas J. Ouellette Vice President | | | 10% | | | | 25% | | | | 50% | | | | 50% | | | | 25% | | | | 25% | |
James E. Wheeler, II Vice President | | | 10% | | | | 25% | | | | 50% | | | | 50% | | | | 25% | | | | 25% | |
*The above table represents the annual award opportunities under the plan.
The Management Incentive Plan fits within our compensation objectives by achieving an overall competitive compensation package that includes performance-based compensation. The “corporate net income” component of this short-term incentive compensation will only be paid when the financial performance of the company exceeds a pre-set, minimally acceptable level of net income, as determined by the board of directors.
When discretionary components were added, payments could be made under the “business unit” and/or the “individual” discretionary components, as the Compensation Committee and board deemed appropriate.
2013 Management Incentive Plan Goals and Performance
Thomas R. Sullivan(1) – 2013 MIP Goals | |
Goal | | Weight | | | $ Target | | Performance Relative to Plan | | $ Payout (2) | | | Total Payout as % of Base Salary | |
Corporate Net Income | | | 70 | % | | $ | 73,500 | | Above Target | | $ | 73,500 | | | | 30 | % |
Individual Discretionary Performance | | | 30 | % | | $ | 31,500 | | Target | | $ | 31,500 | | | | | |
| | | | | | | | | | | | | | | | | | | |
Samuel G. Stone(1) – 2013 MIP Goals | |
Goal | | Weight | | | $ Target | | Performance Relative to Plan | | $ Payout (2) | | | Total Payout as % of Base Salary | |
Corporate Net Income | | | 60 | % | | $ | 39,000 | | Above Target | | $ | 39,000 | | | | 25 | % |
Individual Discretionary Performance | | | 40 | % | | $ | 26,000 | | Above Target | | $ | 26,000 | | | | | |
| | | | | | | | | | | | | | | | | | | |
William L. Benear(1) – 2013 MIP Goals | | | | | | | | | | | | | | | | | |
Goal | | Weight | | | $ Target | | Performance Relative to Plan | | $ Payout (2) | | | Total Payout as % of Base Salary | |
Corporate Net Income | | | 50 | % | | $ | 22,500 | | Above Target | | $ | 22,500 | | | | 25 | % |
Business Unit Discretionary Performance | | | 25 | % | | $ | 11,250 | | Above Target | | $ | 11,250 | | | | | |
Individual Discretionary Performance | | | 25 | % | | $ | 11,250 | | Target | | $ | 11,250 | | | | | |
| | | | | | | | | | | | | | | | | | | |
Douglas J. Ouellette(1) – 2013 MIP Goals | |
Goal | | Weight | | | $ Target | | Performance Relative to Plan | | $ Payout (2) | | | Total Payout as % of Base Salary | |
Corporate Net Income | | | 50 | % | | $ | 22,813 | | Above Target | | $ | 22,813 | | | | 25 | % |
Business Unit Discretionary Performance | | | 25 | % | | $ | 11,406 | | Above Target | | $ | 11,406 | | | | | |
Individual Discretionary Performance | | | 25 | % | | $ | 11,406 | | Above Target | | $ | 11,406 | | | | | |
| | | | | | | | | | | | | | | | | | | |
James E. Wheeler, II(1) – 2013 MIP Goals | |
Goal | | Weight | | | $ Target | | Performance Relative to Plan | | $ Payout (2) | | | Total Payout as % of Base Salary | |
Corporate Net Income | | | 50 | % | | $ | 22,500 | | Above Target | | $ | 22,500 | | | | 25 | % |
Business Unit Discretionary Performance | | | 25 | % | | $ | 11,250 | | Above Target | | $ | 11,250 | | | | | |
Individual Discretionary Performance | | | 25 | % | | $ | 11,250 | | Above Target | | $ | 11,250 | | | | | |
(1) | The total dollar amount paid out to these named executive officers is reflected in the Summary Compensation Table under the Non-Equity Incentive Plan Compensation column. |
(2) | Even though “Above Target” performance was achieved in several categories, only the “Target” amount was paid to the participants per the Mercantile Bank Corporation/Firstbank Corporation Merger Agreement. |
Stock Option Grants – Our shareholders approved the establishment of a Stock Option Plan in 1993, a Stock Option and Restricted Stock Plan in 1997 and a Stock Compensation Plan in 2006.
Based upon a recommendation from the Compensation Committee, the Board of Directors approves the amount and terms of any stock option grants on a discretionary basis. Our practice is to award the options and set the option price at the closing price on the date of the board meeting in which the options are approved. We have never back-dated options, have never granted options at a price lower than the value on the date of the grant, and have not provided special treatment or favorable pricing to any employee including the named executive officers.
During 2013 no stock option grants were awarded to any of the named executive officers, or any other management employee due to the merger agreement.
Restricted Stock Grants – We have restricted stock available to grant under the same shareholder approved plan that allows stock option grants. Restricted stock has been primarily used as an executive recruitment tool, and secondarily to address individual compensation or performance. Normally, restricted stock awards vest over a five year period, vest upon achievement of certain predetermined goals, or vest upon some combination of time and goal achievement. Grants of restricted stock provide executives with an ownership stake in the company, focusing them on shareholder return. We do not have formal stock ownership requirements in place for executive officers at this time.
During 2011, the Corporate Compensation Committee recommended, and the Board of Directors approved changing our practice from granting Stock Options to granting Restricted Stock. Restricted Stock encourages the executives to own our shares and aligns their interests with the shareholders. We also believe it provides a better tool for delivering value to the plan’s participants in today’s compensation environment. Restricted Stock is considered a long-term compensation tool and has a strong link to the long-term performance of the Corporation. In changing from Stock Options to awards of Restricted Stock, the number of shares awarded was reduced to correlate with the industry standard and our Black Sholes model. All Restricted Stock grants are made on a discretionary basis, taking into consideration such areas as the person’s job duties, responsibilities and performance.
During 2012 no Restricted Stock grants were made to the named executive officers. However, the Compensation Committee continued its practice of granting restricted stock to various management employees. On January 28, 2013 the Committee determined it would make Restricted stock grants to corporate officers, as well as the named executive officers. These grants are in line with, and similar amounts to, the grants awarded to other management employees. Since the grants are discretionary, not tied to any performance period and were approved in 2013, they are considered 2013 compensation and will be reported in future disclosures as 2013 compensation.
No Restricted Stock awards have been made since the January 28, 2013 award due to the merger agreement.
401(k) Savings Plan – The Firstbank Corporation 401(k) Savings Plan is a defined contribution plan, which complies with the requirements of the Internal Revenue Service and allows a variety of investment options, including our stock. We contribute a company “match” that encourages all of our employees to save for their retirement, including the named executive officers.
The 401(k) Savings Plan is the only company sponsored retirement vehicle for our named executive officers. The Compensation Committee intends to continue to work with an independent compensation consultant to maintain the competitiveness of the Company’s retirement benefits as part of the overall compensation plan.
The Compensation Committee, at its December 3, 2013 meeting approved to increase the 401(k) match from the 4.2% to 4.25%. This increase was to coordinate 401(k) plans with Mercantile Bank Corporation due to the pending merger. This represents a 1% increase and continues to be at industry averages.
Effective January 1, 2014 the amount of the Safe Harbor Match is a 100% match of the first 4.25% contributed by the employee. The Safe Harbor match is immediately vested to the employee.
Perquisites – Each of the named executives has business development responsibilities and is required to travel from time to time in the normal performance of their duties.
To facilitate the conduct of the Company’s business in an appropriate environment, and for entertainment of existing and potential customers, we maintain memberships in a variety of clubs and organizations. Each of the named executive officers may be provided membership in one or more civic and social organizations or clubs. The executive is responsible for maintaining records of the personal use of such clubs, and personal use is reported as compensation.
Company owned automobiles have been made available for the use of each of the named executives, and each executive is responsible to record the level of business and personal use of the vehicle assigned. Personal use of the automobile is reported as compensation to the executive in accordance with IRS regulations. Effective January 1, 2014 personal use of a company owned automobile has been discontinued. Each executive will use their personal vehicles and be reimbursed for any business miles driven due to the merger agreement.
We maintain a modest level of perquisites for executives, and the amounts reported as perquisites consist primarily of personal use of automobiles and clubs. Also, the Board of Directors has adopted an Excessive and Luxury Expenditure Policy which can be found on the company’s web-site atwww.firstbankmi.com under Investor Relations
Deferred Compensation Plan – Firstbank Corporation does not provide a Deferred Compensation plan to its named executive officers, or to any management employees.
Executive Agreements – We have entered into change-in-control agreements, referred to as Management Continuity Agreements, with our named executive officers. These agreements provide certain protections in the event of a change of control of Firstbank Corporation. The protections provided by the Management Continuity Agreements include lump-sum severance payments and other benefits, as further described under “Executive Compensation - Potential Payments Upon Termination or Change in Control” below. Severance benefits for the named executive officers were subject to significant limitations due to our participation in CPP. These restrictions are now lifted because we exited the CPP/TARP programs by redeeming preferred shares from the U.S. Treasury. Other than the Management Continuity Agreements, we do not have employment agreements with our named executive officers except as described in the next paragraph.
In connection with the contemplated merger with Mercantile Bank Corporation, Firstbank and Mercantile Bank Corporation entered into new employment agreements with each of our named executive officers. At the effective time of the merger, these new employment agreements supersede the prior agreements providing for change of control benefits. The new employment agreements are discussed in more detail below under the heading "Potential Payments to Firstbank Named Executive Officers Upon a Change in Control Resulting from the Proposed Merger with Mercantile Bank Corporation."
Non-binding Advisory Shareholder Vote “Say on Pay”
For the past three years shareholders have been asked to cast an advisory, non-binding vote approving Firstbank Corporation’s executive compensation programs. At the most recent shareholder’s meeting, held on April 22, 2013 there were 3,814,699 votes cast in favor of the Company’s executive compensation programs, which represented a 95% approval rating of the votes cast on this proposal. The Compensation Committee considered this information as they continued to make compensation decisions during 2013.
EXECUTIVE COMPENSATION
Summary Compensation Table
Name and Principal Position | | Year | | | Salary ($) | | | Bonus ($) | | | Stock Awards ($) | | | Option Awards ($) | | | Non-Equity Incentive Plan Compen-sation ($) | | | All Other Compen-sation ($) | | | Total ($) | |
| | | | | | | | | | | | | | | | (1) | | | | (1) | | | | | | | | (2) | | | | | |
Thomas R. Sullivan President & Chief Executive Officer | | | 2013 2012 2011 | | | $ | 356,731 336,000 335,404 | | | $ | 0 0 0 | | | $ | 31,164 0 0 | | | $ | 0 0 0 | | | $ | 105,000 80,000 0 | | | $ | 17,972 17,199 16,989 | | | $ | 510,867 433,199 352,393 | |
Samuel G. Stone EVP & Chief Financial Officer | | | 2013 2012 2011 | | | $ | 265,000 251,865 244,231 | | | $ | 0 0 0 | | | $ | 20,034 0 0 | | | $ | 0 0 0 | | | $ | 65,000 63,000 0 | | | $ | 22,651 22,832 20,152 | | | $ | 372,685 337,697 264,383 | |
William L. Benear Vice President | | | 2013 2012 2011 | | | $ | 183,462 194,904 189,616 | | | $ | 0 0 0 | | | $ | 13,356 0 0 | | | $ | 0 0 0 | | | $ | 45,000 34,430 0 | | | $ | 22,969 20,493 21,380 | | | $ | 264,786 249,827 210,996 | |
Douglas J. Ouellette Vice President | | | 2013 2012 2011 | | | $ | 186,010 194,615 174,904 | | | $ | 0 0 0 | | | $ | 13,356 0 0 | | | $ | 0 0 0 | | | $ | 45,625 43,448 0 | | | $ | 14,676 13,461 14,905 | | | $ | 259,666 251,524 189,809 | |
James E. Wheeler, II Vice President | | | 2013 2012 2011 | | | $ | 183,462 194,904 189,616 | | | $ | 0 0 0 | | | $ | 13,356 0 0 | | | $ | 0 0 | | | $ | 45,000 41,620 0 | | | $ | 14,374 12,008 12,070 | | | $ | 256,191 248,532 201,686 | |
(1) | Amounts in this column reflect the aggregate grant date fair value computed in accordance with FASB ASC Topic 718 (formerly FAS123R). |
(2) | All other compensation includes: 401(k) match, group-term life insurance premiums, the value of perquisites, restricted stock dividends and “opt-out” payments to employees who decline our group health insurance. The individual amounts are as follows: |
| | | 401(k) Match | | | Life Insurance Premiums | | | Cars | | | Dues | | | Restricted Stock Dividends | | | “Opt-out” | |
Mr. Sullivan | | $ | 10,710 | | | $ | 3,564 | | | $ | 2,892 | | | $ | 0 | | | $ | 806 | | | $ | 0 | |
Mr. Stone | | $ | 10,710 | | | $ | 6,858 | | | $ | 4,643 | | | $ | 0 | | | $ | 440 | | | $ | 0 | |
Mr. Benear | | $ | 9,166 | | | $ | 4,760 | | | $ | 6,157 | | | $ | 2,536 | | | $ | 350 | | | $ | 0 | |
Mr. Ouellette | | $ | 9,651 | | | $ | 570 | | | $ | 2,984 | | | $ | 434 | | | $ | 336 | | | $ | 700 | |
Mr. Wheeler | | $ | 9,468 | | | $ | 862 | | | $ | 3,687 | | | $ | 0 | | | $ | 356 | | | $ | 0 | |
Grants of Plan-Based Award Table
Name | Grant Date | | Estimated Future Payouts Under Non-Equity Incentive Plan | | | Estimated Future Payouts Under Equity Incentive Plan | | | All Other Stock Award (#) | | | All Other Option Awards # of Secur-ities Under-lying Options (#) | | | Exer-cise or Base Price of Option Award ($/Sh) | | | Grant Date Fair Value of Stock and Option Awards ($) | |
| | Thres- hold ($) | | | Target(1) ($) | | | Maxi- mum ($) | | | Thres-hold ($) | | | Tar-get ($) | | | Maxi-mum ($) | | | | | | | | | |
| | | | | | | | | | | | | | | | | | | | | | | | | | | | | | | | | | | | | | | | | | |
Thomas R. Sullivan | 1/28/2013 | | $ | 52,500 | | | $ | 105,000 | | | $ | 175,000 | | | | -- | | | | -- | | | | -- | | | | -- | | | | -- | | | | -- | | | | -- | |
Samuel G. Stone | 1/28/2013 | | $ | 26,000 | | | $ | 65,000 | | | $ | 130,000 | | | | -- | | | | -- | | | | -- | | | | -- | | | | -- | | | | -- | | | | -- | |
William L. Benear | 1/28/2013 | | $ | 18,000 | | | $ | 45,000 | | | $ | 90,000 | | | | -- | | | | -- | | | | -- | | | | -- | | | | -- | | | | -- | | | | -- | |
Douglas J. Ouellette | 1/28/2013 | | $ | 18,250 | | | $ | 45,625 | | | $ | 91,250 | | | | -- | | | | -- | | | | -- | | | | -- | | | | -- | | | | -- | | | | -- | |
James E. Wheeler, II | 1/28/2013 | | $ | 18,000 | | | $ | 45,000 | | | $ | 90,000 | | | | -- | | | | -- | | | | -- | | | | -- | | | | -- | | | | -- | | | | -- | |
(1)Target levels were established at the January 28, 2013 Compensation Committee meeting, per the Management Incentive Plan detailed earlier in this proxy.
Outstanding Equity Awards at Fiscal Year-End
| | | Option Awards | | Stock Awards |
Name | | # Securities Unexer-cised Options (#) Exercis-able(1) | | | # Securities Un-exercised Options (#) Unexercis-able | | | Equity Award # of Securities Unexer-cised Unearned Options (#) | | | Option Exercise Price ($) | | Option Expiration Date | | # of Shares of Stock that Have not Vested (#) | | Market Value of Shares that have not vested ($) | Equity Awards: # of Unearned Shares that have not vested (#) | Equity Awards: Market Value |
| | | | | | | | | | | | | | | | | | | | | | | | | | | | |
Thomas R. Sullivan | | | 1,736.44 1,653.75 1,575.00 7,000.00 7,000.00 | | | | 0.00 0.00 0.00 0.00 0.00 | | | | 0 0 0 0 0 | | | | $24.46 $22.86 $22.00 $16.00 $7.80 | | 11/22/2014 11/28/2015 11/27/2016 12/03/2017 11/24/2018 | | | 2,800 300 | (3) (2) | | | $54,152 $5,802 | (4) (4) | n/a n/a | n/a n/a |
Samuel G. Stone | | | 1,447.03 1,378.13 1,312.50 4,500.00 4,500.00 | | | | 0.00 0.00 0.00 0.00 0.00 | | | | 0 0 0 0 0 | | | | $24.46 $22.86 $22.00 $16.00 $7.80 | | 11/22/2014 11/28/2015 11/27/2016 12/03/2017 11/24/2018 | | | 1,800 200 | (3) (2) | | | $34,812 $3,868 | (4) (4) | n/a n/a | n/a n/a |
William L. Benear | | | 1,447.03 1,378.13 1,312.50 3,075.00 3,075.00 | | | | 0.00 0.00 0.00 0.00 0.00 | | | | 0 0 0 0 0 | | | | $24.46 $22.86 $22.00 $16.00 $7.80 | | 11/22/2014 11/28/2015 11/27/2016 12/03/2017 11/24/2018 | | | 1,200 120 | (3) (2) | | | $23,208 $2,321 | (4) (4) | n/a n/a | n/a n/a |
Douglas J. Ouellette | | | 926.10 1,102.50 1,050.00 3,075.00 3,075.00 2,460.00 1,845.00 | | | | 0.00 0.00 0.00 0.00 0.00 615.00 1,230.00 | | | | 0 0 0 0 0 0 0 | | | | $24.46 $22.86 $22.00 $16.00 $7.80 $8.60 $5.19 | | 11/22/2014 11/28/2015 11/27/2016 12/03/2017 11/24/2018 11/23/2019 11/22/2020 | | | 1,200 200 | (3) (2) | | | $23,208 $3,868 | (4) (4) | n/a n/a | n/a n/a |
James E. Wheeler II | | | 1,447.03 1,378.13 1,312.50 3,075.00 3,075.00 | | | | 0.00 0.00 0.00 0.00 0.00 | | | | 0 0 0 0 0 | | | | $24.46 $22.86 $22.00 $16.00 $7.80 | | 11/22/2014 11/28/2015 11/27/2016 12/03/2017 11/24/2018 | | | 1,200 120 | (3) (2) | | | $23,208 $2,321 | (4) (4) | n/a n/a | n/a n/a |
(1) | The stock option awards have a 10 year life and a 5 year vesting schedule with 20% of the award vesting each anniversary date. |
(2) | These restricted stock awards were granted on January 26, 2009 and have a 5 year vesting schedule, with 20% of the award vesting each anniversary date. The first anniversary was January 26, 2010 and the remaining shares will vest in equal annual amounts. |
(3) | These restricted stock awards were granted on January 28, 2013 and have a 3 year vesting schedule, with 100% of the award vesting after 3 years. |
(4) | Market value based on stock price of $19.34 on 12/31/2013. |
Option Exercises and Stock Vested
| | | Option Awards | | | Stock Awards | |
Name | | Number of Shares Acquired on Exercise (#) (1) | | | Value Realized on Exercise ($) | | | Number of Shares Acquired on Vesting (#) (2) | | | Value Realized on Vesting ($) (2) | |
Thomas R. Sullivan | | | -- | | | $ | 0 | | | | 700 | | | $ | 9,483 | |
Samuel G. Stone | | | -- | | | $ | 0 | | | | 200 | | | $ | 2,202 | |
William L. Benear | | | -- | | | $ | 0 | | | | 320 | | | $ | 4,411 | |
Douglas J. Ouellette | | | -- | | | $ | 0 | | | | 200 | | | $ | 2,202 | |
James E. Wheeler, II | | | -- | | | $ | 0 | | | | 340 | | | $ | 4,720 | |
(1) | No stock options were exercised during 2013. |
(2) | The restricted shares acquired on vesting were from both the July 28, 2008 grant and the January 26, 2009 grant, which both have a 5 year vesting schedule, with 20% of the award vesting each anniversary date. The value realized on vesting was determined by using the closing prices of $11.01 per share on January 25, 2013 and $15.45 per share on July 26, 2013. |
Non-Qualified Deferred Compensation
Firstbank Corporation terminated the deferred compensation plan in 2009 and paid out the balances pursuant to the terms of the plan document. As a result, there were no contributions, earnings, or any balances to report for 2012 or 2013.
Potential Payments Upon Termination or Change of Control
We have entered into certain agreements and maintain certain plans that will require us to provide compensation to our named executive officers in the event of a termination of employment or a change in control of Firstbank Corporation. The estimated payouts under a variety of termination scenarios for the named executive officers are shown in tables later in this section. All scenarios assume the named executive officer's date of termination is December 31, 2013 (the last business day of the last completed fiscal year) and that the price per share of the Corporation's stock on the date of termination is $19.34 per share (the closing market price as of that day).
Firstbank Corporation exited the TARP program on June 28, 2012 and redeemed a portion of its outstanding preferred shares and warrants from the U.S. Treasury. The compensation restrictions were lifted for the second half of 2012 and therefore the named executive officers were reinstated as participants to any severance payments, outside of vested benefits, in the case of a termination as a result of a change of control as they were before the Company entered into the TARP program.
Voluntary Retirement – As of December 31, 2013, of the named executive officers, Messrs. Sullivan, Stone, and Benear met the eligibility for normal retirement (at least 62 years of age with at least five years of service). Upon normal retirement, the outstanding stock options held by a named executive officer become fully vested and are exercisable for a period of 15 months following termination of employment. Also upon normal retirement, unvested grants of restricted stock held by the named executive officer become fully vested.
As of December 31, 2013, of the other named executive officers, none are eligible for early retirement (at least 55 years of age with at least 10 years of service). If a named executive officer were to terminate employment at a time when they were eligible for early retirement, any outstanding stock options would become fully vested and exercisable for a period of 15 months following termination of employment. Unvested grants of restricted stock are forfeited upon early retirement, although the Compensation Committee may approve acceleration of the vesting of those awards. Such acceleration would typically only be considered in limited retirement situations.
Voluntary or Involuntary Termination – Other than the arrangements detailed below under "Change of Control Agreements", the Corporation does not have contracts with its named executive officers that would require cash severance payments upon voluntary or involuntary termination of employment.
Disability – We offer the same long-term disability insurance to all benefit eligible employees, including the named executive officers. The plan offers coverage of 50% of base salary up to a limit set by the Corporation's disability carrier. The amounts for disability payments in the case of termination due to disability in the tables shown later in this section reflect the monthly benefit the executive would receive until age 65 from this fully insured plan.
If an executive's employment terminated due to disability, the executive's stock options become fully vested and continue to be exercisable for one year after the termination of employment due to disability. Restricted stock awards also vest upon termination due to disability.
Death– In the event of the death of a named executive officer, stock options and restricted stock granted under our stock plans become fully vested. The stock options would continue to be exercisable for one year after death. We offer life insurance to all benefit eligible employees, including the named executive officers. The amounts for life insurance in the case of termination due to death in the table shown later in this section reflect the amount of life insurance the executive would receive from this fully insured plan.
Vesting Upon Change in Control– Our restricted stock awards vest upon a change of control. Options granted under our 2006 Stock Compensation Plan vest upon a change in control if the successor fails to assume the options or substitute equivalent options. Options granted under our Restricted Stock Plan of 1997 automatically vest upon a change in control. No other incentive compensation plan vests upon a change in control.
Change in Control Agreements – We have entered into agreements (the "Continuity Agreements") with each of the named executive officers. These agreements provide the individual a severance benefit only if a “change of control” event and a corresponding termination occur during the time the agreement remains in effect. The Continuity Agreements are for an initial three-year period and on each three year anniversary are extended automatically for an additional three year term unless we deliver written notice to the named executive officer, at least six months prior to the renewal date, that the Continuity Agreement will not be extended. These Continuity Agreements are currently in effect, but will be superseded on the effective date of the proposed merger of Firstbank Corporation into Mercantile Bank Corporation.
In connection with the contemplated merger with Mercantile Bank Corporation, Firstbank and Mercantile Bank Corporation entered into new employment agreements with each of our named executive officers (the "New Employment Agreements"). At the effective time of the merger, these new employment agreements supersede the prior agreements providing for change of control benefits.
This Annual Report includes disclosure of both the existing Continuity Agreements and the New Employment Agreements.
Potential Payments Upon a Change of Control under the existing Continuity Agreements (other than in connection with the merger of Firstbank Corporation into Mercantile Bank Corporation)
Under the existing Continuity Agreements, if a “change of control” occurs and the executive’s employment is either involuntary terminated other than for cause, or is voluntarily terminated due to a substantial change in duties, then the affected named executive is entitled to 150% of their highest rate of annual base salary during the 12 months prior to the date of termination, 150% of any incentive bonus that may have been earned through the date of termination, plus continued health insurance and life insuranc for two years. The severance benefit formula is the same for each of the named executive officers, regardless of position. The salary and benefit continuation payments are guaranteed to the individual if the termination of employment occurs within six months before or two years after the date of the change in control event. "Cause" for a termination without severance would include willful commission of a felony or other criminal act likely to harm the Corporation, an act of fraud, or a continued willful failure to perform duties. A substantial change in duties giving the executive the right to terminate employment and collect the benefit would include diminished responsibilities or authority, reduced compensation, reduced benefits, or a requirement to relocate.
If any payments or benefits to the executive under the existing Continuity Agreements or otherwise would constitute a "parachute payment" under Section 280G of the Internal Revenue Code, then the aggregate present value of such payments and benefits is limited to a maximum of 2.99 times the executive's "base amount" calculated as described in the Continuity Agreements and under the Internal Revenue Code.
In exchange for the right to the severance benefits under certain circumstances as provided for in the Continuity Agreements, the Continuity Agreements contain a non-competition covenant that limits the executive’s ability to compete if they are no longer employed by Firstbank Corporation. The non-competition covenant covers a geographical area within 25 miles of any of our bank’s main offices and is for a period of two years from the date of termination. The non-competition covenant is an important protection for us. The non-competition covenant is effective upon execution of the agreement, and is enforceable regardless of whether a “change of control” occurs.
We believe that the Continuity Agreements help in attracting and retaining executives by reducing the personal uncertainty that arises from the possibility of a future business combination. Moreover, the Continuity Agreements are designed to offset the uncertainty of executives as to their own futures if a change in control occurs, and make the executives neutral to change in control transactions that are in the best interests of the Corporation and its shareholders, thereby increasing shareholder value.
Termination Scenarios under the Existing Continuity Agreements – Because Firstbank Corporation is no longer a CPP participant, the severance benefits that would be paid to the named executive officers, assuming an event that triggered payments as of December 31, 2013, would be as follows:
Termination Scenarios as of December 31, 2013 under the Existing Continuity Agreements
Named Executive Officer | | Voluntary or Involuntary Termination Absent a Change in Control (1) | | | Change in Control Without a Qualifying Termination ($) (2) | | | Qualifying Termination in Connection with Change in Control ($) (3) | | | Termination in the Event of Retirement ($) (4) | | | Termination in the Event of Disability ($) (5) | | | Termination in the Event of Death ($) (6) | |
Thomas R. Sullivan | | $ | 0 | | | $ | 59,954 | | | $ | 761,230 | | | $ | 64,000 | | | $ | 269,954 | | | $ | 559,954 | |
Samuel G. Stone | | $ | 0 | | | $ | 38,680 | | | $ | 544,956 | | | $ | 41,281 | | | $ | 38,680 | | | $ | 376,680 | |
William L. Benear | | $ | 0 | | | $ | 25,529 | | | $ | 381,805 | | | $ | 27,306 | | | $ | 25,529 | | | $ | 259,529 | |
Douglas J. Ouellette | | $ | 0 | | | $ | 27,076 | | | $ | 385,304 | | | n/a | | | $ | 1,717,076 | | | $ | 392,076 | |
James E. Wheeler, II | | $ | 0 | | | $ | 25,529 | | | $ | 381,805 | | | n/a | | | $ | 1,033,029 | | | $ | 385,529 | |
(1) | This column represents voluntary or involuntary termination absent change in control, retirement, disability or death. The named executive officers do not have employment agreements entitling them to compensation upon termination of employment absent a change of control (except for any provisions under the New Employment Agreements that become effective upon the effective date of a merger of Firstbank Corporation into Mercantile Bank Corporation). |
(2) | The amounts shown in this column reflect the value of restricted stock with respect to which transferability restrictions would have lapsed if a change of control had occurred on December 31, 2013. |
(3) | The amounts shown in this column reflect the value of compensation and benefits payable under the Continuity Agreements, including a lump sum cash payment equal to 1.5 times the executive's base salary and target incentive compensation and two years of benefits continuation. The value of 2 years benefit continuation included in this column is $18,776 for each named executive officer that elects our medical plan ($16,040 if not on medical), which is an estimate based on current premium expenditures. This column also includes the value of restricted stock that would automatically vest upon a change of control (the dollar amount is shown separately in column 2). |
(4) | Represents the value of accelerated vesting of stock options upon normal retirement. As of December 31, 2013, only Mr. Sullivan, Mr. Stone and Mr. Benear were eligible for normal retirement and the amount shown represents the value with respect to the shares of unvested stock options that would vest upon retirement as of December 31, 2013. This column also includes the value of restricted stock that would automatically vest upon a change of control (the dollar amount shown separately in column 2) because Restricted Stock vests upon normal retirement. |
(5) | Disability termination amounts include the value of restricted shares with respect to which restrictions would have lapsed had the executive become disabled as of December 31, 2013 (the dollar amount is shown separately in column 2) because Restricted Stock vests upon disability as well. The amounts shown also include the amount of monthly disability benefits payable until age 65 from a fully insured disability benefit plan offered to all of the corporation’s benefit eligible employees. |
(6) | Death termination amounts include the value of restricted shares with respect to which restrictions would have lapsed upon death (the dollar amount is shown separately in column 2) because Restricted Stock vests upon death as well. The amounts shown also include the total death benefit from a fully insured life insurance benefit plan offered to all of the corporation’s benefit eligible employees. This benefit reduces 35% at age 65, which applies to Mr. Stone and Mr. Benear. |
Potential Payments to Firstbank Named Executive Officers Upon a Change in Control Resulting from the Proposed Merger with Mercantile Bank Corporation
New Employment Agreements with Firstbank Named Executive Officers
On August 14, 2013, Firstbank and each of Firstbank’s named executive officers entered into new employment agreements, as described below, that become effective as of the effective date of the merger, at which time they will supersede the prior employment agreements. The new agreements describe the position and duties of each officer after the effective date of the merger. Under the new agreements, the Firstbank named executive officers (other than Mr. Sullivan, Mr. Stone and Mr. Benear) no longer have the right to obtain a severance payment by terminating their employment for a “substantial change” based on a significant reduction or material change in their authority or responsibility after the merger compared to their authority or responsibility prior to the merger. In addition, the new employment agreements for all of Firstbank’s named executive officers include noncompetition and nonsolicitation covenants designed to protect the combined organization, as described in more detail below. At the effective time of the merger, these new employment agreements supersede the prior agreements providing for change of control benefits.
Employment Agreement with Mr. Sullivan
Mr. Sullivan’s employment agreement provides that he will be employed by Mercantile for a period of one year from the effective date of the merger as the Chairman of the Board of Directors of Mercantile and as a director and Vice-Chairman of the Board of Directors of the consolidated bank. The board of directors of Mercantile will nominate and vote for Mr. Sullivan’s re-election to the board of directors of Mercantile at any meeting of Mercantile’s shareholders within three years of the effective date of the agreement. Mr. Sullivan will be paid an annual salary of $364,750 and fringe and welfare benefits (other than life insurance, as described below) consistent with those provided to the Chief Executive Officer of Mercantile. Mr. Sullivan may also purchase the company vehicle he used while employed by Firstbank at its depreciated value as of December 31, 2013.
Mr. Sullivan’s employment agreement entitles him to certain change in control benefits if the merger becomes effective. Following the effective date of the merger, Mercantile will pay Mr. Sullivan a lump sum cash change in control payment equal to the sum of (i) $525,000 (150% of his salary, plus (ii) $157,500 (150% of his target incentive compensation), plus (iii) a pro-rated cash bonus, being $105,000 multiplied by a fraction, the numerator of which is the number of days from and including January 1, 2013 through the effective date of the merger and the denominator of which is 365, minus (iv) amount of any bonus or incentive compensation previously paid for 2013.
Under Mr. Sullivan’s new employment agreement, if Mercantile terminates his employment prior to the end of the one year term, then as severance Mercantile will continue to pay his salary through the end of the 12 month term.
When Mr. Sullivan’s employment with Mercantile terminates, Mercantile will also reimburse Mr. Sullivan for COBRA continuation coverage premiums to continue his and his dependents’ then current health, dental and prescription drug coverage beginning on the date of his termination and continuing for 18 months thereafter, subject to certain conditions. In addition, following the 18 month COBRA continuation period, Mr. Sullivan will be paid a lump sum cash payment of $9,000 which may be used to offset the cost of obtaining individual health insurance or for any other purpose. When Mr. Sullivan’s employment with Mercantile terminates, he will further be entitled to life insurance coverage or reimbursement for the cost of such coverage for a period of two years following the termination of his employment, with a death benefit equal to the largest death benefit provided to him under Firstbank’s group life insurance plan in the 12 month period prior to the merger.
If any part of the benefits to Mr. Sullivan under his new employment agreement constitute a “parachute payment” under Section 280G of the Internal Revenue Code of 1986, as amended, then, if the aggregate present value of such payments exceeds 2.99 times Mr. Sullivan’s “base amount” as defined in such Section 280G, the parachute payments will be reduced to an amount equal to 2.99 times Mr. Sullivan’s base amount.
Employment Agreement with Mr. Stone
Mr. Stone’s employment agreement provides that he will be employed by Mercantile for a period of 18 months from the effective date of the merger as the Executive Vice President — Corporate Finance and Strategic Planning. Mr. Stone will be paid an annual salary of $274,000 and fringe and welfare benefits (other than life insurance, as described below) consistent with those provided to similarly situated executives of Mercantile. Mr. Stone may also purchase the company vehicle he used while employed by Firstbank at its depreciated value as of December 31, 2013.
Mr. Stone’s employment agreement entitles him to certain change in control benefits if the merger becomes effective. Following the effective date of the merger, Mercantile will pay Mr. Stone a lump sum cash change in control payment equal to the sum of (i) $390,000 (150% of his salary), plus (ii) $97,500 (150% of his target incentive compensation), plus (iii) a pro-rated cash bonus, being $65,000 multiplied by a fraction, the numerator of which is the number of days from and including January 1, 2013 through the effective date of the merger and the denominator of which is 365, minus (iv) amount of any bonus or incentive compensation previously paid for 2013.
Under Mr. Stone’s new employment agreement, if Mercantile terminates his employment prior to the end of the 18 month term, then as severance Mercantile will continue to pay his salary through the end of the 18 month term. When Mr. Stone’s employment with Mercantile terminates, Mercantile will also reimburse Mr. Stone for COBRA continuation coverage premiums to continue his and his dependents’ then current health, dental and prescription drug coverage beginning on the date of his termination and continuing for 18 months thereafter, subject to certain conditions. In addition, following the 18 month COBRA continuation period, Mr. Stone will be paid a lump sum cash payment of $9,000 which may be used to offset the cost of obtaining individual health insurance or for any other purpose. When Mr. Stone’s employment with Mercantile terminates, he will further be entitled to life insurance coverage or reimbursement for the cost of such coverage for a period of two years following the termination of his employment, with a death benefit equal to the largest death benefit provided to him under Firstbank’s group life insurance plan in the 12 month period prior to the merger.
If any part of the benefits to Mr. Stone under his new employment agreement constitute a “parachute payment” under Section 280G of the Internal Revenue Code of 1986, as amended, then, if the aggregate present value of such payments exceeds 2.99 times Mr. Stone’s “base amount” as defined in such Section 280G, by 2% or less, then the parachute payments will be reduced to an amount equal to 2.99 times Mr. Stone’s base amount. If the federal excise tax intended to be avoided by the above adjustment cannot be avoided without reducing the amounts otherwise owing to Mr. Stone by more than 2%, then Mercantile will make a gross-up payment to Mr. Stone to make him whole for the excise tax and associated interest and penalties. However, Mr. Stone will be entitled to this gross-up payment only if Mercantile terminates his employment without “cause” or he terminates his employment for “good reason” as such terms are defined in his new employment agreement.
Employment Separation Agreement with Mr. Benear
Mr. Benear’s employment agreement provides that he will be employed by Mercantile for a period of up to 30 days from the effective date of the merger as an employee of Mercantile. Mr. Benear will be paid at an annual salary rate of $180,000. Mr. Benear may also purchase the company vehicle he used while employed by Firstbank at its depreciated value as of December 31, 2013.
Mr. Benear’s employment agreement entitles him to certain change in control benefits if the merger becomes effective payable after his employment terminates, which is expected to occur within 30 days following the effective date of the merger. Mercantile will pay Mr. Benear a lump sum cash change in control payment equal to the sum of (i) $292,500 (150% of his salary), plus (ii) $73,125 (150% of his target incentive compensation), plus (iii) a pro-rated cash bonus, being $45,000 multiplied by a fraction, the numerator of which is the number of days from and including January 1, 2013 through the effective date of the merger and the denominator of which is 365, minus (iv) amount of any bonus or incentive compensation previously paid for 2013.
When Mr. Benear’s employment with Mercantile terminates, Mercantile will also reimburse Mr. Benear for COBRA continuation coverage premiums to continue his and his dependents’ then current health, dental and prescription drug coverage beginning on the date of his termination and continuing for 18 months thereafter, subject to certain conditions. In addition, following the 18 month COBRA continuation period, Mr. Benear will be paid a lump sum cash payment of $9,000 which may be used to offset the cost of obtaining individual health insurance or for any other purpose. When Mr. Benear’s employment with Mercantile terminates, he will further be entitled to life insurance coverage or reimbursement for the cost of such coverage for a period of two years following the termination of his employment, with a death benefit equal to the largest death benefit provided to him under Firstbank’s group life insurance plan in the 12 month period prior to the merger.
If any part of the benefits to Mr. Benear under his new employment agreement constitute a “parachute payment” under Section 280G of the Internal Revenue Code of 1986, as amended, then, if the aggregate present value of such payments exceeds 2.99 times Mr. Benear’s “base amount” as defined in such Section 280G, the parachute payments will be reduced to an amount equal to 2.99 times Mr. Benear’s base amount.
Employment Agreement with Mr. Ouellette
Mr. Ouellette’s employment agreement provides that he will be employed by Mercantile for a period of 12 months from the effective date of the merger as the Senior Vice President & Director, Central Region President and President — Mt. Pleasant. Mr. Ouellette will be paid an annual salary of $215,000 and fringe and welfare benefits consistent with those provided to similarly situated executives of Mercantile. Mr. Ouellette may also purchase the company vehicle he used while employed by Firstbank at its depreciated value as of December 31, 2013.
Under the new employment agreement, Mercantile will make a severance payment to Mr. Ouellette if (i) during the first 12 months of his employment, Mr. Ouellette has his employment terminated or his salary reduced, is assigned a position or duties that are substantially diminished from his initial position or duties with Mercantile, or is relocated more than 25 miles from his initial primary work location with Mercantile and (ii) Mr. Ouellette terminates his employment with Mercantile. The severance payment will be a lump sum cash payment equal to the sum of (i) $292,500 (150% of his salary), plus (ii) $73,125 (150% of his target incentive compensation), minus (iii) amount of any bonus or incentive compensation previously paid for 2013.
Under the new employment agreement, Mercantile will pay Mr. Ouellette retention bonuses of $60,937.50 each (25% of his salary and target incentive compensation), payable on the first payroll following each of: (i) the effective date of the merger, (ii) six months of his employment with Mercantile, and (iii) 12 months of his employment with Mercantile.
If any part of the benefits to Mr. Ouellette under his new employment agreement constitute a “parachute payment” under Section 280G of the Internal Revenue Code of 1986, as amended, then, if the aggregate present value of such payments exceeds 2.99 times Mr. Ouellette’s “base amount” as defined in such Section 280G, the parachute payments will be reduced to an amount equal to 2.99 times Mr. Ouellette’s base amount.
Employment Agreement with Mr. J. Wheeler
Mr. J. Wheeler’s employment agreement provides that he will be employed by Mercantile for a period of 12 months from the effective date of the merger as Senior Vice President, Senior Loan Officer — Central Region and President — Alma. Mr. J. Wheeler will be paid an annual salary of $191,400 and fringe and welfare benefits consistent with those provided to similarly situated executives of Mercantile. Mr J. Wheeler may also purchase the company vehicle he used while employed by Firstbank at its depreciated value as of December 31, 2013.
Under the new employment agreement, Mercantile will make a severance payment to Mr. J. Wheeler if (i) during the first 12 months of his employment, Mr. J. Wheeler has his employment terminated or his salary reduced, is assigned a position or duties that are substantially diminished from his initial position or duties with Mercantile, or is relocated more than 25 miles from his initial primary work location with Mercantile and (ii) Mr. J. Wheeler terminates his employment with Mercantile. The severance payment will be a lump sum cash payment equal to the sum of (i) $292,500 (150% of his salary), plus (ii) $73,125, (150% of his target incentive compensation), minus (iii) amount of any bonus or incentive compensation previously paid for 2013.
Under the new employment agreement, Mercantile will pay Mr. J. Wheeler retention bonuses of $60,937.50 each (25% of his salary and target incentive compensation), payable on the first payroll following each of: (i) the effective date of the merger, (ii) six months of his employment with Mercantile, and (iii) 12 months of his employment with Mercantile.
If any part of the benefits to Mr. J. Wheeler under his new employment agreement constitute a “parachute payment” under Section 280G of the Internal Revenue Code of 1986, as amended, then, if the aggregate present value of such payments exceeds 2.99 times Mr. J. Wheeler’s “base amount” as defined in such Section 280G, the parachute payments will be reduced to an amount equal to 2.99 times Mr. J. Wheeler’s base amount.
The table below shows the amounts that would be realized with respect to each of Firstbank’s named executive officers’ severance payments and benefits, including certain benefits that have been previously earned and/or are currently fully vested, (i) upon a change in control pursuant to the merger with Mercantile and (ii) in the event each executive officer incurs a qualifying termination following the merger, in each case, assuming the merger and qualifying termination occurred on December 31, 2013.
Firstbank’s executive officers will be entitled to certain amounts disclosed below that are payable upon the change of control resulting from the merger and (except for Mr. Benear) will be further entitled to certain severance benefits under their employment agreements only if their employment is terminated by Mercantile without cause or if they terminate their employment for “good reason” as defined in their employment agreement. The executives will receive the full “Cash Severance” disclosed in the table below only if their employment is terminated after the effective date of the merger without cause or if they terminate under circumstances that qualify as “good reason” under the terms of their respective employment agreements. The amount of cash severance payable to any of the executives will decrease over time as their employment continues.
Name | | Cash ($)(1) | | | Restricted Stock ($)(2) | | | Subtotal Upon a Change in Control Without a Qualifying Termination ($) | | | Health & Welfare Benefits ($)(3) | | | Excise Tax & Gross-Up ($)(4) | | | Cash Severance ($)(5) | | | Total Upon a Change in Control With a Qualifying Termination ($) | |
| | | | | | | | | | | | | | | | | | | | | | | | | | | | | |
Thomas R. Sullivan | | | 752,405 | | | | 59,954 | | | | 812,359 | | | | 85,988 | | | | -- | | | | 364,750 | | | | 1,263,097 | |
Samuel G. Stone | | | 530,774 | | | | 38,680 | | | | 569,454 | | | | 79,432 | | | | 431,197 | | | | 411,000 | | | | 1,491,083 | |
William L. Benear | | | 395,584 | | | | 25,529 | | | | 421,113 | | | | 66,974 | | | | -- | | | | 0 | | | | 488,087 | |
Douglas J. Oullette | | | 60,938 | | | | 27,076 | | | | 88,014 | | | | -- | | | | -- | | | | 304,687 | | | | 392,701 | |
James E. Wheeler II | | | 60,938 | | | | 25,529 | | | | 86,467 | | | | -- | | | | -- | | | | 304,687 | | | | 391,154 | |
(1) | For each of Mr. Sullivan, Mr. Stone and Mr. Benear, the lump sum cash payment is set forth in their employment agreements described below, and is calculated based on each of their respective salaries, target incentive compensation and pro-rata bonuses. These calculations assume that no bonus or incentive compensation for 2013 has been previously paid to any of Mr. Sullivan, Mr. Stone or Mr. Benear. In the case of Mr. Benear, the cash payment becomes payable after his brief employment with Mercantile terminates, but such termination is intended to be on or soon after the effective date of the merger. For Mr. Ouellette and Mr. J. Wheeler, the cash payment represents the first retention bonus payable on the first payroll period following the effective time of the merger. |
(2) | Represents acceleration of outstanding Firstbank restricted stock awards which are unvested at the time of the merger, expressed as an aggregate dollar value which represents $19.34 (the closing market price of Firstbank common stock on December 31, 2013) for each unvested share of restricted common stock for which vesting will be accelerated as a result of the merger. |
(3) | Mr. Sullivan’s health and welfare benefits include: (a) $25,298 for continuation of his and his dependents’ elected health, dental and prescription drug benefit coverage, based on Mercantile’s 2013 COBRA rates, for 18 months following a qualifying termination, (b) $9,000 as a lump sum payable at the end of such 18 month period, and (c) $51,690 for coverage or reimbursement for life insurance for two years following a qualifying termination. Mr. Stone’s health and welfare benefits include: (a) $25,049 for continuation of his and his dependents’ elected health, dental and prescription drug benefit coverage, based on Mercantile’s 2013 COBRA rates, for 18 months following a qualifying termination, (b) $9,000 as a lump sum payable at the end of such 18 month period, and (c) $45,383 for coverage or reimbursement for life insurance for two years following a qualifying termination. Mr. Benear’s health and welfare benefits include: (a) $25,298 for continuation of his and his dependents’ elected health, dental and prescription drug benefit coverage, based on Mercantile’s 2013 COBRA rates, for 18 months following a qualifying termination, (b) $9,000 as a lump sum payable at the end of such 18 month period, and (c) $32,676 for coverage or reimbursement for life insurance for two years following a qualifying termination. |
(4) | Under certain circumstances, Mr. Stone may be subject to certain excise taxes pursuant to Section 280G of the Internal Revenue Code. Mr. Stone’s employment agreement provides that he will be reimbursed for all excise taxes that are imposed on the executive under Section 280G and any income and excise taxes that are payable by the executive as a result of any reimbursements for Section 280G excise taxes only if Mercantile terminates the executive’s employment without cause or the executive terminates his employment for good reason. The total 280G tax gross-up amount in the above table assumes that the executive is entitled to a full reimbursement by us of (i) any excise taxes that are imposed upon the executive as a result of the change in control, (ii) any income and excise taxes imposed upon the executive as a result of our reimbursement of the excise tax amount and (iii) any additional income and excise taxes that are imposed upon the executive as a result of our reimbursement of the executive for any excise or income taxes. The calculation of the 280G gross-up amount in the above table is based upon his average compensation for the years 2008 through 2012, a 280G excise tax rate of 20%, a 35% federal income tax rate, a 1.45% Medicare tax rate and a 4.25% state income tax rate. For the purposes of the 280G calculation it is assumed that no amounts will be discounted as attributable to reasonable compensation or noncompetition covenants. The payment of the 280G tax gross-up will be payable to the executive for an excise tax incurred only if Mercantile terminates the executive’s employment without cause or the executive terminates his employment for good reason. However, the amount of the 280G tax gross-up will change based upon whether the executive’s employment with us is terminated and when it is terminated because the amount of compensation subject to Section 280G will change. |
(5) | Each of Mr. Sullivan and Mr. Stone would be entitled to a continuation of each of their respective salaries through the end of the term of their respective employment agreements. Amounts disclosed assume a qualifying termination occurs immediately following the effective date of the merger. Mr. Benear’s cash severance would be paid as a change in control payment, as described above. These calculations assume that no bonus or incentive compensation for 2013 have been paid. Mr. Ouellette and Mr. J. Wheeler would be entitled to the lump sum cash payments set forth in their employment agreements described above, and is calculated based on each of their respective salaries, target incentive compensation and retention bonuses. These calculations assume that only the retention bonuses payable on the first payroll period following the effective time of the merger have been paid. |
Non-Competition and Non-Solicitation Agreements with Firstbank Executive Officers
In addition to entering into the new agreements described above, each named executive officer entered into a Non-Compete and Non-Solicitation Agreement with Mercantile and its subsidiaries and affiliates that will become effective as of the effective date of the merger. These non-competition agreements were entered into as a condition to entering into the new employment agreements described above.
Generally, the restrictions in the non-competition agreements prohibit the officers for a period of one year from the date their employment with Mercantile terminates (unless terminated without “cause,” as defined in the agreement) or, if earlier, until a change in control of Mercantile occurs, from directly or indirectly competing with Mercantile or its subsidiaries or affiliates within a 50 mile radius of any of Mercantile’s bank branches or offices and from soliciting customers and employees of Mercantile or its subsidiaries or affiliates. For purposes of these non-competition agreements, “cause” generally means an act of dishonesty intended for personal gain, intentional neglect that continues unremedied after notice, conviction of a felony, an intentional breach of certain duties, or regulatory or court order.
COMPENSATION COMMITTEE INTERLOCKS AND INSIDER PARTICIPATION
The Compensation Committee is comprised of outside members of the Board of Directors of the Corporation. Mr. Sullivan, the President and Chief Executive Officer of the Corporation, has served on the Board of Directors and participated in deliberations concerning compensation of other executive officers. Mr. Sullivan, however, has been excused from meetings at which decisions with respect to his own compensation have been discussed and made.
COMPENSATION COMMITTEE REPORT
Our Compensation Committee has reviewed and discussed the Compensation Discussion and Analysis required by Item 402(b) of Regulation S-K with management and, based on such review and discussions, the Compensation Committee recommended to the Board of Directors that the Compensation Discussion and Analysis be included in this Proxy Statement.
The Firstbank Corporation Compensation Committee, which met 5 times throughout 2013, has reached the conclusion that the compensation programs and practices at Firstbank Corporation do not encourage employees, including the named executive officers, to take unnecessary and/or excessive risk that would threaten the value of the Corporation.
Risk features have been limited in the compensation plans for our named executive officers by the additions of non-financial performance measures and discretionary components. Items such as acceptable audit and examination results, acceptable asset quality measures and acceptable implementation of strategic objectives help to ensure that the named executive officers have a long-term view and that manipulation of earnings would not enhance their compensation.
The Firstbank Corporation Compensation Committee hereby certifies:
| | ♦ | It has reviewed with the senior risk officer all SEO compensation plans and has made all reasonable efforts to ensure that these plans do not encourage SEOs to take unnecessary and excessive risks that threaten the value of Firstbank Corporation; |
| | ♦ | It has reviewed with the senior risk officer the employee compensation plans and has made all reasonable efforts to limit any unnecessary risks these plans pose to Firstbank Corporation; and |
| | ♦ | It has reviewed the employee compensation plans to eliminate the features of these plans that would encourage the manipulation of reported earnings of Firstbank Corporation to enhance the compensation of any employee. |
| | Respectfully submitted, | |
| | | |
| | |
| | Jeff A. Gardner, Chairman | |
| | Thomas D. Dickinson, CPA, CFP | |
| | David W. Fultz | |
| | Jeff A. Gardner | |
| | William E. Goggin | |
| | | Edward B. Grant | |
| | | Samuel A. Smith | |
ITEM 12. Security Ownership of Certain Beneficial Owners and Management and Related Shareholder Matters.
Voting Securities
At the close of business on February 28, 2014, we had issued and outstanding 8,085,822 share of its Common Stock, the only class of voting securities presently outstanding. Each share entitles its holder to one vote on each matter on which the shareholders are entitled to vote.
Security Ownership Of Management
The following table shows certain information concerning the common and preferred shares beneficially owned by each of our directors, by the executive officers named in the summary compensation table below, and by all directors and executive officers as a group as of December 31, 2013.
| | | Amount and Nature of Beneficial Ownership(1) | |
| | | | | | | | | | | | | | | | | |
Name of Beneficial Owner | | Sole Voting and Investment Power | | | Shared Voting or Investment Power(2) | | | Total Common StockBeneficial Ownership | | | Percent of Common Stock | |
| | | | | | | | | | | | | | | | | |
William L. Benear | | | 21,968 | (3)(4) | | | 0 | | | | 21,968 | (3)(4) | | | * | |
| | | | | | | | | | | | | | | | | |
Thomas D. Dickinson | | | 15,964 | | | | 1,719 | | | | 17,683 | | | | * | |
| | | | | | | | | | | | | | | | | |
David W. Fultz | | | 0 | | | | 12,109 | | | | 12,109 | | | | * | |
| | | | | | | | | | | | | | | | | |
Jeff A. Gardner | | | 69,877 | | | | 31,613 | | | | 101,490 | | | | 1.2% | |
| | | | | | | | | | | | | | | | | |
William E. Goggin | | | 45,119 | | | | 1,341 | | | | 46,460 | | | | * | |
| | | | | | | | | | | | | | | | | |
Edward B. Grant | | | 20,032 | | | | 0 | | | | 20,032 | | | | * | |
| | | | | | | | | | | | | | | | | |
Douglas J. Ouellette | | | 22,431 | (3)(4) | | | 0 | | | | 22,431 | (3)(4) | | | * | |
| | | | | | | | | | | | | | | | | |
Samuel A. Smith | | | 5,860 | | | | 34,450 | | | | 40,310 | | | | * | |
| | | | | | | | | | | | | | | | | |
Samuel G. Stone | | | 43,265 | (3)(4) | | | 3,745 | | | | 47,010 | (3)(4) | | | * | |
| | | | | | | | | | | | | | | | | |
Thomas R. Sullivan | | | 118,092 | (3)(4) | | | 0 | | | | 118,092 | (3)(4) | | | 1.4% | |
| | | | | | | | | | | | | | | | | |
James E. Wheeler, II | | | 18,360 | (3)(4) | | | 26,092 | | | | 44,452 | (3)(4) | | | * | |
| | | | | | | | | | | | | | | | | |
All Directors and Executive Officers as a Group (11 Persons) | | | 380,968 | | | | 111,069 | | | | 492,037 | | | | 5.8% | |
*Represents less than 1 percent of the outstanding shares of the class indicated.
(1) | The numbers of shares stated are based on information furnished by each person listed and includes shares personally owned of record by that person and shares which under applicable regulations are deemed to be otherwise beneficially owned by that person. Under these regulations a beneficial owner of a security includes any person who, directly or indirectly, through any contract, arrangement, understanding, relationship or otherwise, has or shares voting power or investment power with respect to the security. Voting power includes the power to vote or to direct the voting of the security. Investment power includes the power to dispose or to direct the disposition of the security. A person will also be considered the beneficial owner of a security if the person has a right to acquire beneficial ownership of the security within 60 days. |
(2) | Includes shares as to which the indicated person is legally entitled to share voting or investment power by reason of joint ownership, trust, or other contract or property right and shares held by spouses and children over whom the indicated person may have substantial influence by reason of the relationship. |
(3) | Includes shares allocated to individual accounts under the Firstbank Corporation employee 401(k) Plan. |
(4) | Shares that may be acquired pursuant to stock options that are exercisable within 60 days are included in the table. The number of shares subject to such options for Mr. Benear is 10,288 shares; Mr. Ouellette is 13,534; Mr. Wheeler is 10,288; Mr. Stone is 13,138 shares; and Mr. Sullivan is 18,965 shares. |
Common Stock Ownership of Certain Beneficial Owners
The following table contains information with respect to ownership of our common stock by persons or entities that are beneficial owners of more than five percent of our voting securities as of December 31, 2013.
Name and Address Of Beneficial Owner | Amount and Nature of Beneficial Ownership | Percent of Class |
| | |
Wellington Management Company, LLP 280 Congress Street Boston, MA 02210 | 427,037 shares(1) | 5.3% |
| | | |
| Banc Funds L.P. | 528,132 shares(1) | 6.5% |
(1) | This information is based solely upon information as of December 31, 2013 contained in a filing with the Securities and Exchange Commission on February 14, 2013 by Wellington Management Company, LLP and Banc Funds L.P., including notice that it has shared power to vote and shared dispositive power as to 427,037 and 528,132 shares, respectively. |
Securities Authorized for Issuance Under Equity Compensation Plans.
We had the following equity compensation plans at December 31, 2013:
EQUITY COMPENSATION PLAN INFORMATION
| | | Number of securities to be issued upon exercise of outstanding options | | | Weighted-average exercise price of outstanding options | | | Number of securities remaining available for future issuance under equity compensation plans (excluding securities reflected in column A) | |
Plan Category | | (A) | | | (B) | | | (C) | |
| | | | | | | | | | | | | |
Equity compensation plans approved by security holders | | | 291,575 | | | $ | 15.53 | | | | 48,994 | |
| | | | | | | | | | | | | |
Equity compensation plans not approved by security holders | | | 0 | | | | - | | | | 0 | |
| | | | | | | | | | | | | |
Total | | | 291,575 | | | $ | 15.53 | | | | 48,994 | |
These equity compensation plans are more fully described in Note 16 to the Consolidated Financial Statements.
ITEM 13. Certain Relationships and Related Transactions, and Director Independence.
Certain Relationships and Related Transactions
Our directors and officers and their associates were customers of, and had transactions with, our subsidiary banks in the ordinary course of business between January 1, 2013 and December 31, 2013. All loans and commitments included in such transactions were made on substantially the same terms, including interest rates and collateral, as those prevailing at the time for comparable transactions with other persons not related to the lender and did not involve more than the normal risk of collectability or present other unfavorable features. All loans to directors, officers and their associates were current as of December 31, 2013.
We and our subsidiary banks are subject to Federal Reserve Board Regulation O which governs extensions of credit by our banks to any executive officer, Director or principal shareholder of the Corporation or its banks. We have established processes for reviewing and approving related party transactions. Related party transactions are approved by the Board of Directors of the appropriate entity. The related parties do not participate in the deliberations or voting regarding the approval or ratification of the related party transaction. We disclose related party transactions in our proxy statement to the extent required by the Securities and Exchange Commission.
Independence of Directors and Attendance at Meetings
Our Board of Directors is composed of a majority of independent directors (as independence is defined in the NASDAQ Listing Standards). During the fiscal year ended December 31, 2013, our board held a total of 13 regular meetings. Various committees of the Board held meetings as needed. Each director attended at least seventy-five percent (75%) of the total meetings of the Board of Directors and meetings of the committees on which they served. We also encourage all members of the Board to attend our annual meeting of shareholders each year. All members of our Board of Directors of the Corporation attended the Corporation's 2013 annual meeting.
Currently, no outside Director of Firstbank Corporation serves as a director of another publicly traded company, nor have they during the past 5 years. Mr. Sullivan served as an elected director of the Federal Home Loan Bank of Indianapolis from January 1, 2004 thru December 31, 2009 at which time the size of the board was reduced and Mr. Sullivan’s board position was eliminated. During 2010 Mr. Sullivan was re-elected by the Michigan members of the Federal Home Loan Bank of Indianapolis to a four year term on the FHLBI board of directors commencing January 1, 2011. The Federal Home Loan Bank of Indianapolis has a class of securities registered under the Securities Exchange Act of 1934, as amended. Mr. Sullivan’s current term on this board ends December 31, 2014.
During the past 10 years, none of our Directors has reported being subject to any legal proceedings as defined within Item 401 of Regulation S-K.
ITEM 14. Principal Accountant Fees and Services.
Our financial statements for the year ended December 31, 2013, have been examined by Plante & Moran, PLLC, certified public accountants, as independent auditors of the Corporation for the 2013 fiscal year.
Audit Fees. The following table shows the fees for professional services paid to Plante & Moran, PLLC, for audit and other services they provided to us for 2013 and 2012:
| | | 2013 | | | 2012 | |
Audit Fees (1) | | $ | 210,000 | | | $ | 207,500 | |
Tax Fees (2) | | | 35,500 | | | | 35,500 | |
All Other Fees (3) | | | 19,600 | | | | 49,520 | |
(1) | Includes the aggregate fees billed for professional services rendered by Plante & Moran, PLLC for the audit of Firstbank’s annual financial statements, and review of financial statements included in Firstbank’s quarterly reports on Form 10-Q. |
(2) | Principally tax compliance services (including U.S. federal and state tax returns), review of quarterly tax computations and consultations regarding various tax strategies. |
(3) | All Other Fees are charges associated with review of SEC documents and consultations on various accounting and tax related projects. |
The Audit Committee’s policy is to pre-approve all audit services and non-audit services that are to be performed for Firstbank by its independent auditors. Under the Audit Committee’s policy, authority to pre-approve permitted services has been delegated to the Audit Committee chairman who can act alone for circumstances when pre-approval is not obtained from the full Audit Committee. Any pre-approval by the delegated authority is required to be reported to the Audit Committee at its next meeting. For 2013 and 2012, all of the services described in the table above were approved by the Audit Committee.
ITEM 15. Exhibits and Financial Statement Schedules.
(a)(1) Financial Statements.
The following are filed as part of Item 8 of this Annual Report:
Statement or Report | Page Number in Annual Report |
| |
Report of Independent Registered Public Accounting Firm | 38 |
Consolidated Balance Sheets as of December 31, 2013 and 2012 | 39 |
Consolidated Statements of Income for the years ended December 31, 2013, 2012, and 2011 | 40 |
Comprehensive Income for the years ended December 31, 2013, 2012, and 2011 | 41 |
Consolidated Statements of Changes in Shareholders’ Equity for the years ended December 31, 2013, 2012, and 2011 | 42 |
Consolidated Statements of Cash Flows for the years endedDecember 31, 2013, 2012, and 2011 | 43 |
Notes to Consolidated Financial Statements | 44-73 |
(2) Schedules to the consolidated financial statements required by Article 9 of Regulation S-X are not required under the related instructions or are inapplicable, and therefore have been omitted.
(3) Exhibits (Numbered in accordance with Item 601 of Regulation S-K)
The Exhibit Index is located on the pages immediately following the signature pages to this report on Form 10-K.
SIGNATURES
Pursuant to the requirements of Section 13 or 15(d) of the Securities and Exchange Act of 1934, the Registrant has duly caused this report to be signed on its behalf by the undersigned, thereunto duly authorized, dated March 10, 2014.
FIRSTBANK CORPORATION
By: /s/ Thomas R. Sullivan | | By: /s/ Samuel G. Stone | |
Thomas R. Sullivan | | Samuel G. Stone | |
President & Chief Executive Officer | | Executive Vice President & Chief Financial Officer | |
(Principal Executive Officer) | | (Principal Financial and Accounting Officer) | |
Pursuant to the requirements of the Securities Exchange Act of 1934, this report has been signed by the following persons on behalf of the Registrant and in the capacities and on the date indicated. Each director of the Registrant, whose signature appears below, hereby appoints Thomas R. Sullivan and Samuel G. Stone and each of them severally, as his attorney-in-fact, to sign in his name and on his behalf, as a director of the Registrant, and to file with the Commission any and all Amendments to this Report on Form 10-K.
Signature | | Date | |
| | | |
/s/ Thomas R. Sullivan | | March 10, 2014 | |
Thomas R. Sullivan, Principal Executive Officer and a Director | | | |
| | | |
/s/ Samuel G. Stone | | March 10, 2014 | |
Samuel G. Stone, Principal Financial and Accounting Officer | | | |
| | | |
/s/ Thomas D. Dickinson | | March 10, 2014 | |
Thomas D. Dickinson, Director | | | |
| | | |
/s/ David W. Fultz | | March 10, 2014 | |
David W. Fultz, Director | | | |
| | | |
/s/ Jeff A. Gardner | | March 10, 2014 | |
Jeff A. Gardner, Director | | | |
| | | | |
/s/ William E. Goggin | | March 10, 2014 | |
William E. Goggin, Director | | | |
| | | | |
| /s/ Edward B. Grant | | March 10, 2014 | |
Edward B. Grant, Director | | | |
| | | | |
| /s/ Samuel A. Smith | | March 10, 2014 | |
Samuel A. Smith, Director | | | |
| | |
2.1 | Agreement and Plan of Merger dated August 14, 2013. Exhibits and schedules to this agreement are listed and identified in the agreement. Omitted exhibits and schedules will be furnished supplementally to the Commission upon request. Filed as exhibit 10.1 to Firstbank Corporation's Current Report on Form 8-K dated August 14, 2013 and here incorporated by reference. As amended by the First Amendment to Agreement and Plan of Merger dated February 20, 2014, filed as exhibit 10.1 to Firstbank Corporation's Current Report on Form 8-K dated February 20, 2014, and here incorporated by reference. |
3(a) | Restated Articles of Incorporation of Firstbank Corporation, incorporated by reference to the Exhibit 3(a) to the registrant’s Annual Report on Form 10-K for the year ended December 31, 2009. |
3(b) | Bylaws. Previously filed as exhibit 3.2 to the Form 8-K dated January 30, 2009, and here incorporated by reference. As amended by the Amendment to Firstbank Corporation Bylaws dated February 20, 2014, filed as exhibit 3.1 to Firstbank Corporation's Current Report on Form 8-K dated February 20, 2014, and here incorporated by reference. |
3(c) | Certificate of Designation for Fixed Rate Cumulative Perpetual Preferred Stock, Series A, incorporated by reference to Exhibit 3.1 to the Firstbank Corporation Current Report on Form 8-K dated January 26, 2009. |
4(a) | Form of Certificate for the Fixed Rate Cumulative Perpetual Preferred Stock, Series A, incorporated by reference to Exhibit 4.1 to the Firstbank Corporation Current Report on Form 8-K dated January 26, 2009. |
4(b) | Instruments defining the Rights of Security Holders– reference is made to Exhibits 3(a), 3(b) and 3(c). In accordance with Regulation S-K Item 601(b)(4), Firstbank Corporation is not filing copies of instruments defining the rights of holders of long-term debt because none of those instruments authorizes debt in excess of 10% of the total assets of Firstbank Corporation and its subsidiaries on a consolidated basis. Firstbank Corporation hereby agrees to furnish a copy of any such instrument to the Securities and Exchange Commission upon request. |
10(a)* | Form of Indemnity Agreement with Directors and Officers. Previously filed as Exhibit 10.1 to the registrant's Current Report on Form 8-K dated June 27, 2005. Hereincorporated by reference. |
10(b)* | Stock Option and Restricted Stock Plan of 1997. Previously filed as an appendix to the registrant’s definitive proxy statement for its annual meeting of shareholders held April 28, 1997. Here incorporated by reference. |
10(c)* | 2006 Stock Compensation Plan. Previously filed as Appendix A to registrant’s proxy statement dated March 13, 2006. Here incorporated by reference. |
10(d)* | Employee Stock Purchase Plan of 1999. Previously filed as an exhibit to the registrant’s Registration Statement on Form S-8 (Registration No. 333-89771) filed on October 27, 1999. Here incorporated by reference. |
10(e)* | Form of Agreement between Firstbank Corporation and each of Thomas R. Sullivan, Samuel G. Stone, William L. Benear, Douglas J. Ouellette and James E. Wheeler, II providing for certain severance benefits in connection with a change of control of Firstbank Corporation. Filed as exhibit 10 to registrant’s report on Form 10-Q for the quarter ended September 30, 2000. Here incorporated by reference. |
10(f)* | Form of Stock Option Agreement. Previously filed as Exhibit 10(h) to the registrant’s annual report on Form 10-K for the year ended December 31, 2004. Here incorporated by reference. |
10(g)* | Form of Stock Option Agreement for 2006 Stock Compensation Plan. Filed as exhibit 10.1 to registrant’s report on Form 10-Q for the quarter ended June 30, 2006. Here incorporated by reference. |
10(h)* | Form of Restricted Stock Agreement for 2006 Stock Compensation Plan, filed as exhibit 10(k) to registrant’s Annual Report on form 10-K for the year ended December 31, 2009. Here incorporated by reference. |
10(i)* | Firstbank Corporation Management Incentive Plan filed as exhibit 10.1 to registrant's Annual Report on Form 10-K for the year ended December 31, 2012. Here incorporated by reference. |
10(j) | Form of Voting Agreement dated August 14, 2013. Filed as exhibit 10.1 to Firstbank Corporation's Current Report on Form 8-K dated August 14, 2013. Here incorporated by reference. |
10(k)* | Agreement dated August 14, 2013, by and between Firstbank Corporation and Thomas Sullivan amending that certain Agreement between Firstbank Corporation and Executive dated December 31, 1998, the form of which was previously filed as exhibit 10 to Firstbank Corporation's Quarterly Report on Form 10-Q for the quarter ended September 30, 2000. Filed as exhibit 10.2 to Firstbank Corporation's Current Report on Form 8-K dated August 14, 2013. Here incorporated by reference. |
10(l)* | Agreement dated August 14, 2013, by and between Firstbank Corporation and Samuel Stone amending that certain Agreement between Firstbank Corporation and Executive dated November 27, 2000, the form of which was previously filed as exhibit 10 to Firstbank Corporation's Quarterly Report on Form 10-Q for the quarter ended September 30, 2000. Filed as exhibit 10.3 to Firstbank Corporation's Current Report on Form 8-K dated August 14, 2013. Here incorporated by reference. |
10(m)* | Agreement dated August 14, 2013, by and between Firstbank Corporation and William Benear amending that certain Agreement between Firstbank Corporation and Executive dated December 17, 1998, the form of which was previously filed as exhibit 10 to Firstbank Corporation's Quarterly Report on Form 10-Q for the quarter ended September 30, 2000. Filed as exhibit 10.4 to Firstbank Corporation's Current Report on Form 8-K dated August 14, 2013. Here incorporated by reference. |
10(n)* | Agreement dated August 14, 2013, by and between Firstbank Corporation and Thomas O. Schlueter amending that certain Agreement between Firstbank Corporation and Executive dated May 11, 2005, the form of which was previously filed as exhibit 10 to Firstbank Corporation's Quarterly Report on Form 10-Q for the quarter ended September 30, 2000. Filed as exhibit 10.5 to Firstbank Corporation's Current Report on Form 8-K dated August 14, 2013. Here incorporated by reference. |
10(o)* | Agreement dated August 14, 2013, by and between Firstbank Corporation and David Miller amending that certain Agreement between Firstbank Corporation and Executive dated December 7, 2000, the form of which was previously filed as exhibit 10 to Firstbank Corporation's Quarterly Report on Form 10-Q for the quarter ended September 30, 2000. Filed as exhibit 10.6 to Firstbank Corporation's Current Report on Form 8-K dated August 14, 2013. Here incorporated by reference. |
10(p)* | Agreement dated August 14, 2013, by and between Firstbank Corporation and Richard Rice amending that certain Agreement between Firstbank Corporation and Executive dated April 28, 2005, the form of which was previously filed as exhibit 10 to Firstbank Corporation's Quarterly Report on Form 10-Q for the quarter ended September 30, 2000. Filed as exhibit 10.7 to Firstbank Corporation's Current Report on Form 8-K dated August 14, 2013. Here incorporated by reference. |
10(q)* | Agreement dated August 14, 2013, by and between Firstbank Corporation and James Wheeler II amending that certain Agreement between Firstbank Corporation and Executive dated December 30, 1999, the form of which was previously filed as exhibit 10 to Firstbank Corporation's Quarterly Report on Form 10-Q for the quarter ended September 30, 2000. Filed as exhibit 10.8 to Firstbank Corporation's Current Report on Form 8-K dated August 14, 2013. Here incorporated by reference. |
10(r)* | Agreement dated August 14, 2013, by and between Firstbank Corporation and Douglas Ouellette amending that certain Agreement between Firstbank Corporation and Executive dated February 22, 2005, the form of which was previously filed as exhibit 10 to Firstbank Corporation's Quarterly Report on Form 10-Q for the quarter ended September 30, 2000. Filed as exhibit 10.9 to Firstbank Corporation's Current Report on Form 8-K dated August 14, 2013. Here incorporated by reference. |
10(s)* | Agreement dated August 14, 2013, by and between Firstbank Corporation and Daniel Grenier amending that certain Agreement between Firstbank Corporation and Executive dated December 31, 1998, the form of which was previously filed as exhibit 10 to Firstbank Corporation's Quarterly Report on Form 10-Q for the quarter ended September 30, 2000. Filed as exhibit 10.10 to Firstbank Corporation's Current Report on Form 8-K dated August 14, 2013. Here incorporated by reference. |
10(t)* | Employment Agreement by and among Thomas Sullivan, Mercantile Bank Corporation, Mercantile Bank of Michigan and Firstbank, dated August 14, 2013. Filed as exhibit 10.11 to Firstbank Corporation's Current Report on Form 8-K dated August 14, 2013. Here incorporated by reference. |
10(u)* | Employment Agreement by and among Samuel Stone, Mercantile Bank Corporation, Mercantile Bank of Michigan and Firstbank, dated August 14, 2013. Filed as exhibit 10.12 to Firstbank Corporation's Current Report on Form 8-K dated August 14, 2013. Here incorporated by reference. |
10(v)* | Employment Separation Agreement by and among Mercantile Bank Corporation, Mercantile Bank of Michigan, Firstbank Corporation and William Benear, dated August 14, 2013. Filed as exhibit 10.13 to Firstbank Corporation's Current Report on Form 8-K dated August 14, 2013. Here incorporated by reference. |
10(w)* | Employment Agreement by and among James E. Wheeler II, Mercantile Bank Corporation, Mercantile Bank of Michigan and Firstbank, dated August 14, 2013. Filed as exhibit 10.14 to Firstbank Corporation's Current Report on Form 8-K dated August 14, 2013. Here incorporated by reference. |
10(x)* | Employment Agreement by and among Douglas J. Ouellette, Mercantile Bank Corporation, Mercantile Bank of Michigan and Firstbank, dated August 14, 2013. Filed as exhibit 10.15 to Firstbank Corporation's Current Report on Form 8-K dated August 14, 2013. Here incorporated by reference. |
10(y)* | Employment Agreement by and among Thomas O. Schlueter, Mercantile Bank Corporation, Mercantile Bank of Michigan and Firstbank, dated August 14, 2013. Filed as exhibit 10.16 to Firstbank Corporation's Current Report on Form 8-K dated August 14, 2013. Here incorporated by reference. |
10(z)* | Employment Agreement by and among Richard D. Rice, Mercantile Bank Corporation, Mercantile Bank of Michigan and Firstbank, dated August 14, 2013. Filed as exhibit 10.17 to Firstbank Corporation's Current Report on Form 8-K dated August 14, 2013. Here incorporated by reference. |
10(aa)* | Employment Agreement by and among Daniel H. Grenier, Mercantile Bank Corporation, Mercantile Bank of Michigan and Firstbank, dated August 14, 2013. Filed as exhibit 10.18 to Firstbank Corporation's Current Report on Form 8-K dated August 14, 2013. Here incorporated by reference. |
10(bb)* | Employment Agreement by and among David L. Miller, Mercantile Bank Corporation, Mercantile Bank of Michigan and Firstbank, dated August 14, 2013. Filed as exhibit 10.19 to Firstbank Corporation's Current Report on Form 8-K dated August 14, 2013. Here incorporated by reference. |
12 | Ratio of Earning to Fixed Charges |
21 | Subsidiaries of Registrant. |
23.1 | Consent of Plante & Moran PLLC - Independent Registered Public Accounting Firm. |
24 | Powers of Attorney. Contained on the signature page of this report. |
31.1 | Certificate of Chief Executive Officer of Firstbank Corporation pursuant to 15 U.S.C. Section 7241, as adopted pursuant to Section 302 of the Sarbanes-Oxley Act of 2002. |
31.2 | Certificate of Chief Financial Officer of Firstbank Corporation pursuant to 15 U.S.C. Section 7241, as adopted pursuant to Section 302 of the Sarbanes-Oxley Act of 2002. |
32.1 | Certificate of Chief Executive Officer and Chief Financial Officer of Firstbank Corporation pursuant to 18 U.S.C. Section 1350, as adopted pursuant to Section 906 of the Sarbanes-Oxley Act of 2002. |
99.1 | Certification of Chief Executive Officer and Chief Financial Officer pursuant to Section 111(b)(4) of the Emergency Economic Stabilization Act of 2008 and 31 CFR subsection 30.15. |
99.2 | Firstbank Corporation 401(k) Plan Performance Table. |
*Management contract or compensatory plan.
The registrant will furnish a copy of any exhibit listed above to any shareholder of the registrant without charge upon written request to Samuel G. Stone, Secretary, Firstbank Corporation, 311 Woodworth Avenue, P.O. Box 1029, Alma, Michigan 48801.
- 108 -