Exhibit (c)(10)
| [VRC Logo] | 1 |
Cox Radio | Business Description |
Business Description (1)
| • | Cox Radio is one of the nation’s largest radio broadcasting companies and engages in the ownership, acquisition and operation of radio stations in the United States. | |
| • | Cox Radio owns, operates, or provides sales and other services to 80 stations in 18 markets, including 67 FM and 13 AM stations. | |
| • | Seventy five percent of profits from Top 50 markets, including Atlanta, Orlando, Houston and Tampa. |
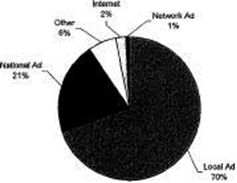
2007 Revenue Contribution (1)
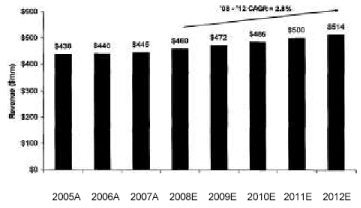
Revenue Forecast (1)
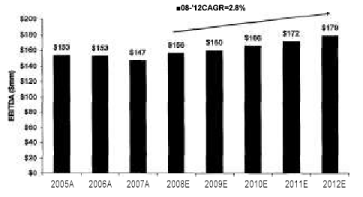
EBITDA Forecast(1)
Notes
| (I) | Management provided information, 2007. |
| [VRC Logo] | 2 |
Cox Radio | Industry Overview |
Radio Broadcasting Industry
Industry Description
The term “radio broadcasting” refers to the transmission of over-the-air sound waves from amplitude-modulated (AM) or frequency-modulated (FM) stations. Radio transmissions reach audiences in homes, cars, workplaces, and elsewhere. Radio reaches 96.0 percent of persons aged 12 years or older in an average week1.
A typical listener tunes in for at least two hours each weekday, with about 41.7 percent of this listening occurring in a car or truck, 37.3 percent at home, and 21.0 percent at work or other places. During the weekends, listening in the car or truck jumps to 47.3 percent, home listening rises to 40.5 percent and listening at work or elsewhere falls to 12.2 percent1.
Radio Station Revenues
Radio stations generate advertising revenues by providing programming, such as local news, talk, music, sports, weather, and traffic, serving the needs of their local communities. Programming may be produced in-house or acquired from syndicated networks, such as Westwood One Inc. and ABC Radio Network Inc. Local advertising sales typically account for about 80.0 percent of a station’s revenues, with the rest of revenues derived from national advertisers.
Broadcast Competition
Radio broadcasters generally compete for advertising dollars with a host of other in-home and out-of-home mass media outlets, including cable, newspapers, billboards, and the Internet. Increased competition has come in the form of advancements in newer digital outlets, such as the Internet, MP3 players, wireless applications, video games, and satellite radio.
Over the past few years satellite radio established itself as a viable platform. After winning FCC licenses in 1997, XM Satellite Radio Holdings Inc. launched (in November 2001) the nation’s first digital audio radio service (DARS), followed in July 2002 by Sirius Satellite Radio Inc. XM and Sirius have been adding customers rapidly, targeting a combined 17.6 million subscribers by the end of 2007. In February 2007, the two companies signed a definitive merger agreement. Subject to various approvals and conditions, the companies expect the merger to be consummated by the end of March 20082.
Industry Statistics&Expectations
| • | Radio continues to face challenges from the downturn in the economy to satellite radio. However, radio’s strongest growth potential may be the Internet. Revenue streams separate from traditional advertising, or “non-spot revenue” such as revenue from Internet advertising, grew 10 percent in the first three quarters of 20071. | ||
| • | Network radio, which mainly composes nationally syndicated programs, also shows strong top-line growth potential. Although local advertising, (e.g., car delaers) is the main source of revenue, network revenue grew 5 percent in the first three quarters of 2007. |
TOP 10 TERRESTRIAL RADIO GROUPS
(Ranked by 2005 revenues, in millions of dollars)
(Ranked by 2005 revenues, in millions of dollars)
| COMPANY | 2006 REVENUES | NO. OF STATIONS | NO. OF MARKETS | |||||||||
| 1 Clear Channel Communications | 3,535 | 1,171 | 191 | |||||||||
| 2 CBS Radio | 2,242 | 179 | 41 | |||||||||
| 3 Entercom Communications | 486 | 104 | 22 | |||||||||
| 4 Cox Radio | 483 | 78 | 19 | |||||||||
| 5 Citadel/ABC | 417 | 24 | 9 | |||||||||
| 6 Citadel Communications | 413 | 215 | 50 | |||||||||
| 7 Radio One | 389 | 70 | 22 | |||||||||
| 8 Univision Communications | 382 | 73 | 22 | |||||||||
| 9 Cumulus Broadcasting | 313 | 299 | 56 | |||||||||
| 10 Emmis Communications | 298 | 23 | 7 | |||||||||
Source: BIA Financial Network.
Notes:
(1) The State of the News Media, 2008. http://www.stateofthenewsmedia.org/2008
(2) Churchwell, Damon. Value Line Publishing, Inc. XM Satellite Radio, Feb 15, 2008.
| [VRC Logo] | 3 |
Cox Radio | Adjusted Operating Balance Sheet |
AS OF DECEMBER 31, 2007
(THOUSANDS)
(THOUSANDS)
| AS OF DECEMBER 31 | ||||||||||||||||||||||||||||||||||||||||
| 2007 | % | 2006 | % | 2005 | % | 2004 | % | 2003 | % | |||||||||||||||||||||||||||||||
CURRENT ASSETS: | ||||||||||||||||||||||||||||||||||||||||
| Cash & Investments (1) | $ | 0 | 0.0 | % | $ | 0 | 0.0 | % | $ | 0 | 0.0 | % | $ | 0 | �� | 0.0 | % | $ | 0 | 0.0 | % | |||||||||||||||||||
| Accounts Receivable | 85,555 | 4.3 | % | 87,640 | 4.1 | % | 83,388 | 3.7 | % | 84,066 | 3.7 | % | 84,516 | 3.7 | % | |||||||||||||||||||||||||
| Other | 5,650 | 0.3 | % | 5,254 | 0.2 | % | 6,026 | 0.3 | % | 14,271 | 0.6 | % | 13,478 | 0.6 | % | |||||||||||||||||||||||||
| Total | 91,205 | 4.6 | % | 92,894 | 4.4 | % | 89,414 | 4.0 | % | 98,337 | 4.3 | % | 97,994 | 4.3 | % | |||||||||||||||||||||||||
LONG TERM ASSETS: | ||||||||||||||||||||||||||||||||||||||||
| Net Property and Equipment | 72,528 | 3.6 | % | 74,334 | 3.5 | % | 74,025 | 3.3 | % | 74,322 | 3.3 | % | 78,333 | 3.4 | % | |||||||||||||||||||||||||
| Other | 1,831,624 | 91.8 | % | 1,946,308 | 92.1 | % | 2,099,170 | 92.8 | % | 2,105,986 | 92.4 | % | 2,098,263 | 92.2 | % | |||||||||||||||||||||||||
| Total | 1,904,152 | 95.4 | % | 2,020,642 | 95.6 | % | 2,173,195 | 96.0 | % | 2,180,308 | 95.7 | % | 2,176,596 | 95.7 | % | |||||||||||||||||||||||||
TOTAL ASSETS: | $ | 1,995,357 | 100.0 | % | $ | 2,113,536 | 100.0 | % | $ | 2,262,609 | 100.0 | % | $ | 2,278,645 | 100.0 | % | $ | 2,274,590 | 100.0 | % | ||||||||||||||||||||
CURRENT LIABILITIES | ||||||||||||||||||||||||||||||||||||||||
| Accounts Payable | $ | 33,091 | 1.7 | % | $ | 27,987 | 1.3 | % | 26,664 | 1.2 | % | $ | 26,849 | 1.2 | % | $ | 28,602 | 1.3 | % | |||||||||||||||||||||
| Other | 6,484 | 0.3 | % | 9,431 | 0.4 | % | 25,081 | 1.1 | % | 17,928 | 0.8 | % | 26,996 | 1.2 | % | |||||||||||||||||||||||||
| Total | 39,575 | 2.0 | % | 37,418 | 1.8 | % | 51,745 | 2.3 | % | 64,777 | 2.8 | % | 55,598 | 2.4 | % | |||||||||||||||||||||||||
LONG TERM LIABILITIES: | ||||||||||||||||||||||||||||||||||||||||
| Deferred Taxes | 442,859 | 22.2 | % | 468,082 | 22.1 | % | 520,040 | 23.0 | % | 500,304 | 22.0 | % | 502,015 | 22.1 | % | |||||||||||||||||||||||||
| Long-Term Debt | 320,000 | 16.0 | % | 380,000 | 18.0 | % | 404,988 | 17.9 | % | 454,877 | 20.0 | % | 534,744 | 23.5 | % | |||||||||||||||||||||||||
| Other | 23,957 | 1.2 | % | 14,378 | 0.7 | % | 8,631 | 0,4 | % | 4,244 | 0.2 | % | 4,767 | 0.2 | % | |||||||||||||||||||||||||
| Total | 786,816 | 39.4 | % | 862,460 | 40.8 | % | 933,659 | 41.3 | % | 959,425 | 42.1 | % | 1,041,526 | 45.8 | % | |||||||||||||||||||||||||
EQUITY: | ||||||||||||||||||||||||||||||||||||||||
| Common Stock | 33,635 | 1.7 | % | 33,545 | 1.6 | % | 33,305 | 1.5 | % | 33,277 | 1.5 | % | 33,149 | 1.5 | % | |||||||||||||||||||||||||
| Retained Earnings (2) | 492,705 | 24.7 | % | 626,508 | 29.6 | % | 649,716 | 28.7 | % | 587,627 | 25.8 | % | 519,664 | 22.8 | % | |||||||||||||||||||||||||
| Additional Paid-in Capital | 642,626 | 32.2 | % | 553,605 | 26.2 | % | 594,184 | 26.3 | % | 633,539 | 27.8 | % | 624,653 | 27.5 | % | |||||||||||||||||||||||||
| Total | 1,168,966 | 58.6 | % | 1,213,658 | 57.4 | % | 1,277,205 | 56.4 | % | 1,254,443 | 55.1 | % | 1,177,466 | 51.8 | % | |||||||||||||||||||||||||
TOTAL LIABILITIES & EQUITY | $ | 1,995,357 | 100.0 | % | $ | 2,113,536 | 100.0 | % | $ | 2,262,609 | 100.0 | % | $ | 2,278,645 | 100.0 | % | $ | 2,274,590 | 100.0 | % | ||||||||||||||||||||
Notes:
| (1) | Adjusted for Nonoperational Assets — Cash. | |
| (2) | Adjusted Retained Earnings for Nonoperational Asset Adjustments in Order to Balance Accounts. |
| [VRC Logo] | 4 |
Cox Radio | Adjusted Income Statement Summary | |
| (THOUSANDS) |
| AS OF DECEMBER 31 | ||||||||||||||||||||||||||||||||||||||||||||||||
| 2007 | % | 2006 | % | 2005 | % | 2004 | % | 2003 | % | 2002 | % | |||||||||||||||||||||||||||||||||||||
| Net Sales | $ | 444,858 | 100.0 | % | $ | 440,468 | 100.0 | % | $ | 437,930 | 100.0 | % | $ | 438,213 | 100.0 | % | $ | 425,873 | 100.0 | % | $ | 420,592 | 100.0 | % | ||||||||||||||||||||||||
Adjustment | 0 | 0.0 | % | 0 | 0.0 | % | 0 | 0.0 | % | 0 | 0.0 | % | 0 | 0.0 | % | 0 | 0.0 | % | ||||||||||||||||||||||||||||||
| Adjusted Net Sales | $ | 444,858 | 100.0 | % | $ | 440,468 | 100.0 | % | $ | 437,930 | 100.0 | % | $ | 438,213 | 100.0 | % | $ | 425,873 | 100.0 | % | $ | 420,592 | 100.0 | % | ||||||||||||||||||||||||
| Cost of Sales (1) | 93,564 | 21.0 | % | 86,440 | 19.6 | % | 86,252 | 19.7 | % | 98,219 | 22.4 | % | 95,617 | 22.5 | % | 93,152 | 22.1 | % | ||||||||||||||||||||||||||||||
Adjustment | 0 | 0.0 | % | 0 | 0.0 | % | 0 | 0.0 | % | 0 | 0.0 | % | 0 | 0.0 | % | 0 | 0.0 | % | ||||||||||||||||||||||||||||||
| Adjusted Cost Of Sales (1) | 93,564 | 21.0 | % | 86,440 | 19.6 | % | 86,252 | 19.7 | % | 98,219 | 22.4 | % | 95,617 | 22.5 | % | 93,152 | 22.1 | % | ||||||||||||||||||||||||||||||
| Gross Profit | 351,294 | 79.0 | % | 354,028 | 80.4 | % | 351,678 | 80.3 | % | 339,994 | 77.6 | % | 330,256 | 77.5 | % | 327,440 | 77.9 | % | ||||||||||||||||||||||||||||||
| Operating Expenses (1): | ||||||||||||||||||||||||||||||||||||||||||||||||
| Sales & Marketing Expenses | 191,139 | 43.0 | % | 172,160 | 39.1 | % | 169,804 | 38.8 | % | 166,774 | 38.1 | % | 163,061 | 38.3 | % | 161,406 | 38.4 | % | ||||||||||||||||||||||||||||||
Adjustment | 0 | 0.0 | % | 0 | 0.0 | % | 0 | 0.0 | % | 0 | 0.0 | % | 0 | 0.0 | % | 0 | 0.0 | % | ||||||||||||||||||||||||||||||
| Adjusted Sales & Marketing Expenses | 191,139 | 43.0 | %% | 172,160 | 39.1 | % | 169,804 | 38.8 | % | 166,774 | 38.1 | % | 163,061 | 38.3 | % | 161,406 | 38.4 | % | ||||||||||||||||||||||||||||||
| Administrative Expenses | 6,264 | 1.4 | % | 196,200 | 44.5 | % | 33,790 | 7.7 | % | 17,676 | 4.0 | % | 16,272 | 3.8 | % | 15,489 | 3.7 | % | ||||||||||||||||||||||||||||||
Adjustments: | ||||||||||||||||||||||||||||||||||||||||||||||||
| Corporate Overhead (2) | 7,033 | 1.6 | % | 9,143 | 2.1 | % | 9,090 | 2.1 | % | 9,096 | 2.1 | % | 8,840 | 2.1 | % | 8,730 | 2.1 | % | ||||||||||||||||||||||||||||||
| Other (3) | 0 | 0.0 | % | (176,331 | ) | -40.0 | % | (14,351 | ) | -3.3 | % | (3,064 | ) | -0.7 | % | (471 | ) | -0.1 | % | (789 | ) | -0.2 | % | |||||||||||||||||||||||||
| Adjusted Administrative Expenses | 13,297 | 3.0 | % | 29,012 | 6.6 | % | 28,529 | 6.5 | % | 23,708 | 5.4 | % | 24,641 | 5.8 | % | 23,430 | 5.6 | % | ||||||||||||||||||||||||||||||
| Adjusted Total Operating Expenses | 204,436 | 46.0 | % | 201,172 | 45.7 | % | 198,333 | 45.3 | % | 190,482 | 43.5 | % | 187,702 | 44.1 | % | 184,836 | 43.9 | % | ||||||||||||||||||||||||||||||
| EBITDA (4) | 146,858 | 33.0 | % | 152,856 | 34.7 | % | 153,345 | 35.0 | % | 149,512 | 34.1 | % | 142,554 | 33.5 | % | 142,604 | 33.9 | % | ||||||||||||||||||||||||||||||
| Depreciation & Amortization | 11,171 | 2.5 | % | 11,195 | 2.5 | % | 11,245 | 2.6 | % | 11,867 | 2.7 | % | 11,831 | 2.8 | % | 12,214 | 2.9 | % | ||||||||||||||||||||||||||||||
| EBIT (5) | 135,687 | 30.5 | % | 141,661 | 32.2 | % | 142,100 | 32.4 | % | 137,645 | 31.4 | % | 130,723 | 30.7 | % | 130,390 | 31.0 | % | ||||||||||||||||||||||||||||||
| Other Expense (Income) | 63,381 | 14.2 | % | 0 | 0.0 | % | 39 | 0.0 | % | 387 | 0.1 | % | 479 | 0.1 | % | 508 | 0.1 | % | ||||||||||||||||||||||||||||||
Adjustment | 0 | 0.0 | % | 0 | 0.0 | % | 0 | 0.0 | % | 0 | 0.0 | % | 0 | 0.0 | % | 0 | 0.0 | % | ||||||||||||||||||||||||||||||
| Adjusted Other Expense (Income) | 63,381 | 14.2 | % | 0 | 0.0 | % | 39 | 0.0 | % | 387 | 0.1 | % | 479 | 0.1 | % | 508 | 0.1 | % | ||||||||||||||||||||||||||||||
| Pretax Earnings | $ | 72,306 | 16.3 | % | $ | 141,661 | 32.2 | % | $ | 142,061 | 32.4 | % | $ | 137,258 | 31.3 | % | $ | 130,244 | 30.6 | % | $ | 129,882 | 30.9 | % | ||||||||||||||||||||||||
| Adjusted Five-Year Average EBITDA | $ | 149,025 | ||||||||||||||||||||||||||||||||||||||||||||||
| Adjusted Five-Year Average EBIT | $ | 137,563 | ||||||||||||||||||||||||||||||||||||||||||||||
Notes:
| (1) | Excludes Depreciation. | |
| (2) | Allocation of Corporate Overhead based on projections by management. | |
| (3) | Excludes Non-Recurring Items. | |
| (4) | Earnings Before Interest, Taxes, Depreciation and Amortization. | |
| (5) | Earnings Before Interest and Taxes. |
| [VRC Logo] | 5 |
Cox Radio | Management Operating Projections | |
| (THOUSANDS) |
| Actual | ||||||||||||||||||||||||||||||||||||||||||||||||||
| 2007 | % | 2008 | % | 2009 | % | 2010 | % | 2011 | % | 2012 | % | |||||||||||||||||||||||||||||||||||||||
Net Sales | $ | 444,858 | 100.0 | % | $ | 459,938 | 100.0 | % | $ | 472,389 | 100.0 | % | $ | 485,772 | 100.0 | % | $ | 499,558 | 100.0 | % | $ | 514,387 | 100.0 | % | ||||||||||||||||||||||||||
| Cost of Sales (1) | 93,564 | 21.0 | % | 94,064 | 20.5 | % | 96,115 | 20.3 | % | 97,955 | 20.2 | % | 100,047 | 20.0 | % | 101,959 | 19.8 | % | ||||||||||||||||||||||||||||||||
| Gross Profit | 351,294 | 79.0 | % | 365,873 | 79.5 | % | 376,274 | 79.7 | % | 387,817 | 79.8 | % | 399,511 | 80.0 | % | 412,428 | 80.2 | % | ||||||||||||||||||||||||||||||||
| Total Operating Expenses (1) | 204,436 | 46.0 | % | 209,849 | 45.6 | % | 216,263 | 45.8 | % | 222,256 | 45.8 | % | 227,857 | 45.6 | % | 233,336 | 45.4 | % | ||||||||||||||||||||||||||||||||
EBITDA(2) | 146,858 | 33.0 | % | 156,024 | 33.9 | % | 160,011 | 33.9 | % | 165,562 | 34.1 | % | 171,654 | 34.4 | % | 179,093 | 34.8 | % | ||||||||||||||||||||||||||||||||
| Depreciation & Amortization | 11,171 | 2.5 | % | 11,566 | 2.5 | % | 11,586 | 2.5 | % | 11,616 | 2.4 | % | 11,358 | 2.3 | % | 10,855 | 2.1 | % | ||||||||||||||||||||||||||||||||
EBIT(3) | 135,687 | 30.5 | % | 144,458 | 31.4 | % | 148,425 | 31.4 | % | 153,946 | 31.7 | % | 160,296 | 32.1 | % | 168,238 | 32.7 | % | ||||||||||||||||||||||||||||||||
| Interest Expense | 20,911 | 4.7 | % | 0 | 0.0 | % | 0 | 0.0 | % | 0 | 0.0 | % | 0 | 0.0 | % | 0 | 0.0 | % | ||||||||||||||||||||||||||||||||
| Other Expense (Income) | 63,381 | 14.2 | % | 0 | 0.0 | % | 0 | 0.0 | % | 0 | 0.0 | % | 0 | 0.0 | % | 0 | 0.0 | % | ||||||||||||||||||||||||||||||||
| Pretax Profit | 51,395 | 11.6 | % | 144,458 | 31.4 | % | 148,425 | 31.4 | % | 153,946 | 31.7 | % | 160,296 | 32.1 | % | 168,238 | 32.7 | % | ||||||||||||||||||||||||||||||||
| Taxes (4) | 23,494 | 5.3 | % | 57,783 | 12.6 | % | 59,370 | 12.6 | % | 61,578 | 12.7 | % | 64,118 | 12.8 | % | 67,295 | 13.1 | % | ||||||||||||||||||||||||||||||||
| Net Income | $ | 27,901 | 6.3 | % | $ | 86,675 | 18.8 | % | $ | 89,055 | 18.9 | % | $ | 92,368 | 19.0 | % | $ | 96,178 | 19.3 | % | $ | 100,943 | 19.6 | % | ||||||||||||||||||||||||||
| Capital Expenditures | $ | 9,420 | $ | 13,798 | $ | 14,172 | $ | 14,573 | $ | 14,987 | $ | 15,432 | ||||||||||||||||||||||||||||||||||||||
Annual Sales Growth | 3.4 | % | 2.7 | % | 2.8 | % | 2.8 | % | 3.0 | % | ||||||||||||||||||||||||||||||||||||||||
Annual EBITDA Growth | 6.2 | % | 2.6 | % | 3.5 | % | 3.7 | % | 4.3 | % | ||||||||||||||||||||||||||||||||||||||||
| Forecast | ||||
| Period (5) | ||||
Compound Growth: | ||||
| Sales | 2.8 | % | ||
| EBITDA | 3.5 | % | ||
Averages as a % of Sales: | ||||
| Cost of Sales | 20.2 | % | ||
| Operating Expenses | 45.6 | % | ||
| EBITDA | 34.2 | % | ||
Notes:
| (1) | Excludes Depreciation | |
| (2) | Earnings Before Interest, Taxes, Depreciation, and Amortization | |
| (3) | Earnings Before Interest and Taxes. | |
| (4) | Assume 40.0 percent Tax Rate. | |
| (5) | FYE 2008 — 2012. |
| [VRC Logo] | 6 |
Cox Radio | Discounted Cash Flow Analysis |
AS OF
DECEMBER 31, 2007
(THOUSANDS)
DECEMBER 31, 2007
(THOUSANDS)
| AS OF DECEMBER 31 | ||||||||||||||||||||||||||||||||||||||||
| Year | 2008 | 2009 | 2010 | 2011 | 2012 | 2013 | 2014 | 2015 | 2016 | 2017 | ||||||||||||||||||||||||||||||
| Sales | $ | 459,938 | $ | 472,389 | $ | 485,772 | $ | 499,558 | $ | 514,387 | $ | 529,819 | $ | 545,714 | $ | 562,085 | $ | 578,947 | $ | 596,316 | ||||||||||||||||||||
Growth Rate | 3.4 | % | 3.9 | % | 3.4 | % | 3.7 | % | 3.3 | % | 3.0 | % | 3.0 | % | 3.0 | % | 3.0 | % | 3.0 | % | ||||||||||||||||||||
| Cost of Sales (1) | 94,064 | 96,115 | 97,955 | 100,047 | 101,959 | 105,018 | 108,168 | 111,413 | 114,756 | 118,198 | ||||||||||||||||||||||||||||||
| Gross Profit | 365,873 | 376,274 | 387,817 | 399,511 | 412,428 | 424,801 | 437,545 | 450,672 | 464,192 | 478,118 | ||||||||||||||||||||||||||||||
% of Sales | 79.5 | % | 79.7 | % | 79.8 | % | 80.0 | % | 80.2 | % | 80.2 | % | 80.2 | % | 80.2 | % | 80.2 | % | 80.2 | % | ||||||||||||||||||||
| Corporate Overhead | 7,398 | 7,257 | 7,758 | 7,666 | 8,354 | 8,604 | 8,862 | 9,128 | 9,402 | 9,684 | ||||||||||||||||||||||||||||||
| Operating Expenses (1) | 209,849 | 216,263 | 222,256 | 227,857 | 233,336 | 240,336 | 247,546 | 254,972 | 262,622 | 270,500 | ||||||||||||||||||||||||||||||
| Total Operating Expenses (1) | 217,247 | 223,520 | 230,013 | 235,523 | 241,690 | 248,940 | 256,408 | 264,101 | 272,024 | 280,184 | ||||||||||||||||||||||||||||||
% of Sales | 47.2 | % | 47.3 | % | 47.4 | % | 47.1 | % | 47.0 | % | 47.0 | % | 47.0 | % | 47.0 | % | 47.0 | % | 47.0 | % | ||||||||||||||||||||
| EBITDA(2) | 148,626 | 152,754 | 157,804 | 163,987 | 170,739 | 175,861 | 181,137 | 186,571 | 192,168 | 197,933 | ||||||||||||||||||||||||||||||
% of Sales | 32.3 | % | 32.3 | % | 32.5 | % | 32.8 | % | 33.2 | % | 33.2 | % | 33.2 | % | 33.2 | % | 33.2 | % | 33.2 | % | ||||||||||||||||||||
| Depreciation | 11,566 | 11,586 | 11,616 | 11,358 | 10,855 | 13,245 | 15,826 | 15,738 | 16,789 | 17,889 | ||||||||||||||||||||||||||||||
| EBIT (3) | 137,060 | 141,168 | 146,188 | 152,630 | 159,884 | 162,616 | 165,311 | 170,833 | 175,379 | 180,044 | ||||||||||||||||||||||||||||||
EBIT Margin | 29.8 | % | 29.9 | % | 30.1 | % | 30.6 | % | 31.1 | % | 30.7 | % | 30.3 | % | 30.4 | % | 30.3 | % | 30.2 | % | ||||||||||||||||||||
| Tax Provision @ 40% | 54,824 | 56,467 | 58,475 | 61,052 | 63,954 | 65,046 | 66,124 | 68,333 | 70,151 | 72,017 | ||||||||||||||||||||||||||||||
| Net Income | 82,236 | 84,701 | 87,713 | 91,578 | 95,930 | 97,569 | 99,187 | 102,500 | 105,227 | 108,026 | ||||||||||||||||||||||||||||||
| Depreciation | 11,566 | 11,586 | 11,616 | 11,358 | 10,855 | 13,245 | 15,826 | 15,738 | 16,789 | 17,889 | ||||||||||||||||||||||||||||||
| Capital Expenditures | (13,798 | ) | (14,172 | ) | (14,573 | ) | (14,987 | ) | (15,432 | ) | (15,895 | ) | (16,371 | ) | (16,863 | ) | (17,368 | ) | (17,889 | ) | ||||||||||||||||||||
| Working Capital Changes | (25,754 | ) | (8,380 | ) | (8,822 | ) | (9,313 | ) | (9,852 | ) | (3,413 | ) | (3,515 | ) | (3,620 | ) | (3,729 | ) | (3,841 | ) | ||||||||||||||||||||
| Free Cash Flow | 54,250 | 73,735 | 75,933 | 78,636 | 81,502 | 91,508 | 95,126 | 97,755 | 100,919 | 104,185 | ||||||||||||||||||||||||||||||
| PV Factor | 0.958 | 0.879 | 0.806 | 0.740 | 0.679 | 0.623 | 0.571 | 0.524 | 0.481 | 0.441 | ||||||||||||||||||||||||||||||
Discount Rate 9.0% | ||||||||||||||||||||||||||||||||||||||||
| PV of Cash Flows | $ | 51,962 | $ | 64,794 | $ | 61,216 | $ | 58,160 | $ | 55,303 | $ | 56,966 | $ | 54,328 | $ | 51,220 | $ | 48,512 | $ | 45,947 | ||||||||||||||||||||
| Sum of PV Cash Flows | $ | 548,408 | $ | 104,185 | 4 | |||||||||||||||||||||||||||||||||||
| PV of Residual | 864.635 | * 18,818 | 5 | |||||||||||||||||||||||||||||||||||||
| Operating Business Enterprise Value | $ | 1,413,043 | 1960579.2 | |||||||||||||||||||||||||||||||||||||
| Nonoperational Value | 2,500 | * 0.441 | 6 | |||||||||||||||||||||||||||||||||||||
| Total Business Enterprise Value | $ | 1,415,543 | $ | 864,635 | ||||||||||||||||||||||||||||||||||||
| 2013 | ||||||||||||||||||||||||
| Assumptions: | 2008 | 2009 | 2010 | 2011 | 2012 | -2017 | ||||||||||||||||||
| Sales Growth Rate | 3.4 | % | 2.7 | % | 2.8 | % | 2.8 | % | 3.0 | % | 3.0 | % | ||||||||||||
| Cost of Sales/Sales | 20.5 | % | 20.3 | % | 20.2 | % | 20.0 | % | 19.8 | % | 19.8 | % | ||||||||||||
| Corporate Overhead/Sales | 1.6 | % | 1.5 | % | 1.6 | % | 1.5 | % | 1.6 | % | 1.6 | % | ||||||||||||
| Operating Expenses/Sales | 45.6 | % | 45.8 | % | 45.8 | % | 45.6 | % | 45.4 | % | 45.4 | % | ||||||||||||
| EBITDA/Sales | 32.3 | % | 32.3 | % | 32.5 | % | 32.8 | % | 33.2 | % | 33.2 | % | ||||||||||||
| Depreciation/Sales | 2.5 | % | 2.5 | % | 2.4 | % | 2.3 | % | 2.1 | % | 2.5% to 3.0 | % | ||||||||||||
| Capital Expenditures/Sales | 3.0 | % | 3.0 | % | 3.0 | % | 3.0 | % | 3.0 | % | 3.0 | % | ||||||||||||
| Working Capital/Sales | 16.8 | % | 18.2 | % | 19.5 | % | 20.8 | % | 22.1 | % | 22.1 | % | ||||||||||||
| Discount Rate | 9.0 | % | 9.0 | % | 9.0 | % | 9.0 | % | 9.0 | % | 9.0 | % | ||||||||||||
| Notes: | ||
| (1) | Excludes Depreciation. | |
| (2) | Earnings Before Interest, Taxes, Depreciation, and Amortization. | |
| (3) | Earnings Before Interest and Taxes. | |
| (4) | Available Debt-Free Cash Flow in Year 2017 | |
| (5) | Residual Value Multiple Based on Gordon Growth Model and Long-Term Growth Rate. | |
| (6) | Discount Rate Factor Based on 9.0 percent Discount Rate at Year 2017. |
| [VRC Logo] | 7 |
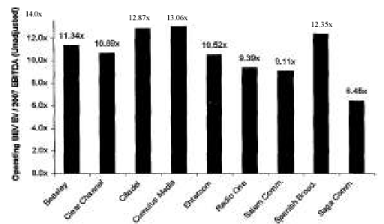
Cox Radio | Guideline Comparable Company Ratios | |
| AS OF DECEMBER 31, 2007 | ||
| (THOUSANDS) |
| Beasley | Cumulus | ||||||||||||||||||||||||||||||||||||||||||||||||||||||||
| Broadcast | Clear Channel | Citadel | Media | Entercom | Radio One, | Salem | Spanish | Saga | Sirius | Cox Radio | |||||||||||||||||||||||||||||||||||||||||||||||
| Group | Communications | Broadcasting | Inc. | Communications | Inc. | Communications | Broadcasting | Communications | Satellite | XM Satellite | COMPARABLES | Inc. | |||||||||||||||||||||||||||||||||||||||||||||
| BBGI | CCU | CDL | CMLS | ETM | ROIAK | SALM | SBSA | SGA | SIRI | Radio XMSR | Average/Median | CXR | |||||||||||||||||||||||||||||||||||||||||||||
ENTERPRISE VALUE RATIOS: | |||||||||||||||||||||||||||||||||||||||||||||||||||||||||
| EBIT:(1) | |||||||||||||||||||||||||||||||||||||||||||||||||||||||||
| Current | 12.8 | 14.4 | 14.9 | 16.0 | 11.9 | 10.9 | 12.5 | 14.0 | 8.3 | -10.3 | -11.4 | 12.6 | 12.7 | 10.4 | |||||||||||||||||||||||||||||||||||||||||||
| Five-Year Average | 11.5 | 14.8 | 27.3 | 16.1 | 10.7 | 8.1 | 13.5 | 11.5 | 8.2 | -7.6 | -11.2 | 11.8 | 11.5 | 10.3 | |||||||||||||||||||||||||||||||||||||||||||
| EBITDA: (1) | |||||||||||||||||||||||||||||||||||||||||||||||||||||||||
| Current | 11.3 | 10.7 | 12.9 | 13.1 | 10.5 | 9.4 | 9.1 | 12.4 | 6.5 | -13.0 | -19.3 | 10.4 | 10.6 | 9.7 | |||||||||||||||||||||||||||||||||||||||||||
| Five-Year Average | 10.3 | 10.6 | 17.1 | 12.6 | 9.6 | 7.2 | 10.0 | 10.6 | 6.5 | -8.8 | -17.1 | 9.7 | 10.2 | 9.5 | |||||||||||||||||||||||||||||||||||||||||||
| Sales: (1) | |||||||||||||||||||||||||||||||||||||||||||||||||||||||||
| Current | 2.3 | 3.5 | 4.0 | 3.2 | 3.2 | 3.1 | 2.2 | 2.7 | 1.7 | 5.7 | 4.6 | 2.7 | 2.9 | 3.2 | |||||||||||||||||||||||||||||||||||||||||||
FINANCIAL RATIOS: | |||||||||||||||||||||||||||||||||||||||||||||||||||||||||
| SALES (MILLIONS) | $134 | $6,817 | $720 | $332 | $468 | $330 | $232 | $178 | $145 | $922 | $1,137 | $1,080 | $281 | $445 | |||||||||||||||||||||||||||||||||||||||||||
| ASSETS (MILLIONS) | 337 | 18,806 | 3,843 | 1,248 | 1,919 | 1,668 | 681 | 938 | 331 | 1,694 | 1,609 | $ | 3241 | 1,609 | 1,997 | ||||||||||||||||||||||||||||||||||||||||||
| ASSET TURNOVER | |||||||||||||||||||||||||||||||||||||||||||||||||||||||||
| Current | 0.4 | 0.4 | 0.2 | 0.3 | 0.2 | 0.2 | 0.3 | 0.2 | 0.4 | 0.5 | 0.7 | 0.3 | 0.3 | 0.2 | |||||||||||||||||||||||||||||||||||||||||||
| Five-Year Average | 0.4 | 0.4 | 0.2 | 0.2 | 0.3 | 0.2 | 0.3 | 0.2 | 0.5 | 0.2 | 0.3 | 0.3 | 0.3 | 0.1 | |||||||||||||||||||||||||||||||||||||||||||
| D.F..EARNINGS/SALES | 11.0 | % | 14.7 | % | 16.3 | % | 12.3 | % | 16.3 | % | 17.4 | % | 10.7 | % | 11.9 | % | 12.2 | % | -33.9 | % | -24.5 | % | 13.3 | % | 12.2 | % | 18.3 | % | |||||||||||||||||||||||||||||
| EBIT/SALES: | |||||||||||||||||||||||||||||||||||||||||||||||||||||||||
| Current | 20.3 | % | 32.4 | % | 31.0 | % | 24.8 | % | 30.3 | % | 33.1 | % | 24.1 | % | 22.2 | % | 25.6 | % | -44.1 | % | -23.8 | % | 26.6 | % | 25.2 | % | 30.5 | % | |||||||||||||||||||||||||||||
| Five-Year Average | 24.2 | % | 29.2 | % | 36.3 | % | 28.0 | % | 35.9 | % | 42.5 | % | 25.3 | % | 29.0 | % | 27.8 | % | -781.0 | % | -114.7 | % | 30.2 | % | 28.5 | % | 31.4 | % | |||||||||||||||||||||||||||||
| EBITA/SALES: | |||||||||||||||||||||||||||||||||||||||||||||||||||||||||
| Current | 23.3 | % | 32.3 | % | 33.4 | % | 24.7 | % | 30.9 | % | 35.9 | % | 24.5 | % | 21.7 | % | 25.7 | % | -68.3 | % | -20.8 | % | 27.4 | % | 25.2 | % | 33.0 | % | |||||||||||||||||||||||||||||
| Five-Year Average | 24.6 | % | 28.5 | % | 35.2 | % | 27.8 | % | 35.4 | % | 43.1 | % | 25.3 | % | 28.7 | % | 26.5 | % | -5298.4 | % | -349.7 | % | 30.0 | % | 28.2 | % | 34.1 | % | |||||||||||||||||||||||||||||
| EBIT/ASSETS: | |||||||||||||||||||||||||||||||||||||||||||||||||||||||||
| Current | 7.3 | % | 8.8 | % | 5.3 | % | 5.4 | % | 6.6 | % | 5.7 | % | 6.0 | % | 4.0 | % | 9.0 | % | -42.1 | % | -31.5 | % | 6.6 | % | 6.3 | % | 6.8 | % | |||||||||||||||||||||||||||||
| Five-Year Average | 9.5 | % | 7.9 | % | 4.0 | % | 4.6 | % | 8.2 | % | 6.3 | % | 6.2 | % | 5.5 | % | 11.0 | % | -59.0 | % | -35.2 | % | 7.4 | % | 7.1 | % | 6.3 | % | |||||||||||||||||||||||||||||
| EBITDA/ASSETS: | |||||||||||||||||||||||||||||||||||||||||||||||||||||||||
| Current | 8.2 | % | 11.8 | % | 6.1 | % | 6.6 | % | 7.4 | % | 6.6 | % | 8.2 | % | 4.5 | % | 11.6 | % | -33.3 | % | -18.6 | % | 8.1 | % | 7.8 | % | 7.4 | % | |||||||||||||||||||||||||||||
| Five Year Average | 10.6 | % | 11.0 | % | 6.7 | % | 6.0 | % | 9.2 | % | 7.1 | % | 8.4 | % | 5.9 | % | 13.8 | % | -50.5 | % | -23.1 | % | 9.0 | % | 8.8 | % | 6.8 | % | |||||||||||||||||||||||||||||
AVERAGE COMPOUND ANNUAL GROWTH: | |||||||||||||||||||||||||||||||||||||||||||||||||||||||||
| Sales | 4.0 | % | -6.5 | % | 18.0 | % | 5.9 | % | 4.0 | % | 2.2 | % | 7.6 | % | 5.1 | % | 5.0 | % | 190.9 | % | 87.6 | % | 3.4 | % | 4.5 | % | 1.1 | % | |||||||||||||||||||||||||||||
| EBITDA | -2.4 | % | -0.6 | % | 13.1 | % | 1.2 | % | -1.8 | % | -37.2 | % | 8.3 | % | -2.9 | % | 1.0 | % | 5.6 | % | -2.3 | % | -4.3 | % | -1.2 | % | 0.5 | % | |||||||||||||||||||||||||||||
| Notes: | ||
| (1) | Excludes SIRI, XMSR and CDL |
| [VRC Logo] | 8 |
| Cox Radio AS OF DECEMBER 31, 2007 (THOUSANDS) | Market Comparable Analysis Summary |
| Operating | Total | |||||||||||||||||||
| Business | Business | |||||||||||||||||||
| Earnings / | Enterprise | NonOperating | Enterprise | |||||||||||||||||
| Revenue Base | Multiplier | Value | Asset Value | Value | ||||||||||||||||
| EBIT | ||||||||||||||||||||
| Current | $ | 135,687 | 12.9 | $ | 1,750,362 | $ | 2,500 | $ | 1,752,862 | |||||||||||
| Five-Year Average | 137,563 | 13.0 | 1,788,319 | 2,500 | 1,790,819 | |||||||||||||||
| EBITDA | ||||||||||||||||||||
| Current | 146,858 | 11.2 | 1,644,809 | 2,500 | 1,647,309 | |||||||||||||||
| Five-Year Average | 149,025 | 11.0 | 1,639,275 | 2,500 | 1,641,775 | |||||||||||||||
| Sales | 444,858 | 2.7 | 1,201,117 | 2,500 | 1,203,617 | |||||||||||||||
| Operating Business Enterprise Value | $ | 1,604,776 | ||||||||||||||||||
| Add: Non-Operating Asset Value | 2,500 | |||||||||||||||||||
| Total Business Enterprise Value | $ | 1,607,276 | ||||||||||||||||||
| [VRC Logo] | 9 |
| Cox Radio | Private Market Transactions |
| Target | EV- | |||||||||||||||||||||||||||||||||||||||||
| Announcement | Revenue | Assets | Enterprise | EV/ | EBITDA | EBIT | ||||||||||||||||||||||||||||||||||||
| Date | Seller | LTM($mm) | ($mm) | Value($mm) | EV / Sales | EBITDA | EV/EBIT | EBITDA | EBIT | Margin | Margin | |||||||||||||||||||||||||||||||
| 11/16/2006 | Clear Channel Communications, Inc. | $ | 6,906.5 | $ | 18,931.2 | $ | 27,313.3 | 4.0 | 12.4 | 17.5 | $ | 2,202.3 | $ | 1,559.2 | 31.9 | % | 22.6 | % | ||||||||||||||||||||||||
| 07/12/2006 | CHUM Ltd. | 615.8 | 954.5 | 1,450.7 | 2.4 | 12.2 | 15.4 | 118.9 | 93.9 | 19.3 | % | 15.3 | % | |||||||||||||||||||||||||||||
| 05/08/2006 | Emmis Communications Corp. | 650.4 | 2,110.0 | 2,146.2 | 3.3 | 9.4 | 14.1 | 229.1 | 152.5 | 35.2 | % | 23.4 | % | |||||||||||||||||||||||||||||
| 06/21/2005 | Scottish Radio Holdings PLC | 185.7 | 401.7 | 827.0 | 4.5 | 16.0 | 23.8 | 51.5 | 34.8 | 27.8 | % | 18.8 | % | |||||||||||||||||||||||||||||
| 06/03/2004 | RG Capital Radio Ltd. | 40.0 | 123.3 | 157.3 | 3.9 | 13.0 | 13.0 | 12.1 | 12.1 | 30.2 | % | 30.2 | % | |||||||||||||||||||||||||||||
| 01/16/2004 | Scottish Radio Holdings PLC | 138.8 | 337.5 | 644.6 | 4.6 | 22.9 | 26.9 | 28.1 | 23.9 | 20.2 | % | 17.2 | % | |||||||||||||||||||||||||||||
| Average: | 1,422.9 | 3,809.7 | 3.8 | 14.3 | 18.5 | 440.3 | 312.7 | 27.4 | % | 21.2 | % | |||||||||||||||||||||||||||||||
| Median: | 400.7 | 678.1 | 3.9 | 12.7 | 16.5 | 85.2 | 64.4 | 29.0 | % | 20.7 | % | |||||||||||||||||||||||||||||||
| Cox Radio | $ | 444.9 | $ | 1,995.4 | 3.2 | 10.4 | 9.7 | $146.9 | $135.7 | 33.0 | % | 30.5 | % | |||||||||||||||||||||||||||||
Notes:
Source: Mergerstat 2007.
| [VRC Logo] | 10 |
Cox Radio | Market Price Analysis Summary |
AS OF DECEMBER 31, 2007
(THOUSANDS)
(THOUSANDS)
Market Determined Invested Capital
Number of Fully Diluted Shares Outstanding1 | 94,513 | |||
Share Price2 | $ | 12.15 | ||
| Market Value Of Common Equity | $ | 1,148,333 | ||
| Long-Term Debt | $ | 336,600 | ||
| Operating Business Enterprise Value | $ | 1,484,933 | ||
| Non Operating Assets | 2,500 | |||
| Total Business Enterprise Value | $ | 1,487,433 | ||
Notes:
| (1) | Fully diluted shares outstanding from Cox Radio 2007Form 10-K, p. 52. | |
| (2) | Based on closing market price per share on December 31, 2007. |
| [VRC Logo] | 11 |
Cox Radio | Summary of Valuations — Control Value |
AS OF DECEMBER 31, 2007
(THOUSANDS)
(THOUSANDS)
| Weight | Value Indication | |||||||
Operating Business Enterprise Value Indications: | ||||||||
Discounted Cash Flow Analysis | 25 | % | $ | 1,413,043 | ||||
Market Comparable Analysis | 25 | % | $ | 1,604,776 | ||||
Market Price Analysis | 50 | % | $ | 1,484,933 | ||||
Operating Business Enterprises Value Conclusion: | $ | 1,496,921 | ||||||
Add: Non-Operating Asset Value | 2,500 | |||||||
| Total Business Enterprises Value Conclusion: | $ | 1,499,421 | ||||||
Multiples of Value
Conclusions
Conclusions
Operating Business Enterprises to: | ||||
LTM Sales | 3.4 | |||
EBITDA: | ||||
Current | 10.2 | |||
Average | 10.0 | |||
EBIT: | ||||
Current | 11.0 | |||
Average | 10.9 |
| [VRC Logo] | 12 |
Cox Radio | Summary Analysis |
| • | Concluded Operating Business Enterprise Value for Cox Radio, based on a market comparison and discounted cash flow analysis, supported by transactions, is $1.50 billion, or 10.2x FYE 2007 EBITDA. | |
| • | Discounted cash flow approach: |
| • | Management provided projections which were analyzed relative to past performance as well as management’s plan (key cash flow drivers). | ||
| • | Calculated weighted average cost of capital. |
| • | Market approach multiples were calculated and then adjusted as follows: |
| • | Identified comparable companies to Cox Radio. | ||
| • | Developed multiples as of the Valuation Date. | ||
| • | The multiples were adjusted to reflect differences between the comparable companies and the subject company as follows: |
| • | An adjustment was made based on the market capitalization of Cox Radio relative to its guideline companies1 , | ||
| • | An adjustment was made for growth based on Sales and EBITDA margins of Cox Radio relative to its guideline companies; and | ||
| • | An adjustment for asset utilization, based on operating income, and growth sustainability was made after comparing Cox Radio to its guideline companies2. |
| • | Market price analysis: |
| • | Market determined BEV (NYSE Ticker: CXR) | ||
| • | Calculated by adding the Market Capitalization plus Long-Term Debt and Non-operating assets. |
Selected Publicly Traded Company EBITDA Multiples
Notes:
| (1) | Based upon Ibbotson Associates Data. | |
| (2) | Adjustment for Expected Longer-Term Sustainable Growth. |
| [VRC Logo] | 13 |