Item 1: Report to Shareholders
 |
| GNMA Fund | May 31, 2007 |
The views and opinions in this report were current as of May 31, 2007. They are not guarantees of performance or investment results and should not be taken as investment advice. Investment decisions reflect a variety of factors, and the managers reserve the right to change their views about individual stocks, sectors, and the markets at any time. As a result, the views expressed should not be relied upon as a forecast of the fund’s future investment intent. The report is certified under the Sarbanes-Oxley Act, which requires mutual funds and other public companies to affirm that, to the best of their knowledge, the information in their financial reports is fairly and accurately stated in all material respects.
REPORTS ON THE WEB
Sign up for our E-mail Program, and you can begin to receive updated fund reports and prospectuses online rather than through the mail. Log in to your account at troweprice.com for more information.
Manager’s Letter
Fellow Shareholders
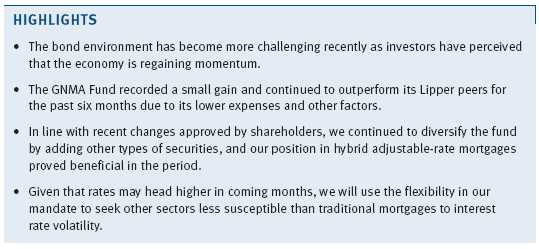
The environment for bonds became somewhat more difficult over the past six months. Although the economy slowed significantly in the first quarter of 2007, bond prices suffered as investors became nervous over signs that the expansion was regaining momentum as the year progressed. Thanks to favorable income returns, the GNMA Fund was able to record a small gain for the past six months, while recording much better results for the one-year period. The fund outpaced its Lipper peers over both time periods, thanks to its lower expenses and other factors.
ECONOMY AND INTEREST RATES
Although corporate profits remained strong and unemployment stayed low, U.S. economic growth was lackluster over the past six months. According to the most recent estimates, the economy grew at an annualized rate of only 0.6% in the first quarter of 2007, its slowest pace of expansion in recent years. An important factor in the slowdown was the weakening housing market, which weighed on consumer confidence as well as construction employment and spending.
Rising problems in the subprime mortgage sector grabbed headlines in the late winter and early spring. Defaults on loans to homebuyers with poor credit histories or challenging financial situations increased dramatically as 2007 began. The defaults led, in turn, to serious problems and even bankruptcies among subprime mortgage lenders, many of which were forced to repurchase loans at par in situations where a bad loan was made—for example, in cases where loans were written based on inflated home appraisals. While subprime problems led to tighter mortgage lending standards, fears that they would lead to a broader “credit contagion” in the fixed-income markets and derail the economic expansion appeared unfounded as the period ended.
Troubles in the housing sector and the softening expansion raised investors’ hopes that the Fed might cut interest rates to spur growth. Following each meeting of the Fed’s monetary policy committee over the past six months, however, central bank officials stated that the predominant risk was accelerating inflation rather than slower economic growth. Indeed, evidence emerged in May that manufacturing and business spending trends were strengthening, and that consumers remained upbeat thanks to the favorable labor market. Bond prices fell at the end of the period as investors concluded that the Fed would maintain short-term rates at current levels for the remainder of the year.
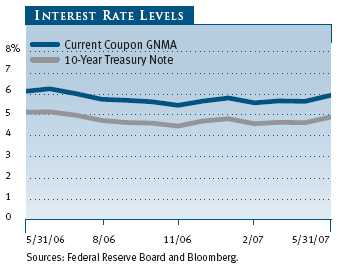
The Treasury yield curve—a graphic comparison of yields and maturities—steepened substantially over the past six months, returning to a more normal slope in which investors expect higher yields when investing for longer periods. Yields on the current coupon GNMA (see Glossary for explanation) and the 10-year Treasury note moved significantly higher over the six-month period, although they remained below their levels of a year ago. Yields on the 10-year Treasury hit a low of 4.43% in early December as fears of a housing slowdown began to preoccupy investors. Yields remained volatile over the subsequent months, but they ended the period near their highs in response to data indicating a resurgence in economic growth.
PERFORMANCE AND STRATEGY REVIEW
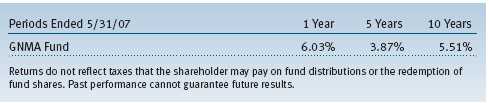
The GNMA Fund returned 1.00% and 6.03% for the 6- and 12-month periods ended May 31, 2007, respectively. As shown in the table, the portfolio outpaced its peer group of funds as represented by the Lipper GNMA Funds Average, while trailing the Lehman Brothers index. These results placed the fund in or near the top quartile of our Lipper peer group for the 3-, 5-, and 10-year performance periods ended May 31, 2007. (Based on cumulative total return, Lipper ranked the GNMA Fund 27 out of 59, 17 out of 58, 15 out of 54, and 6 out of 29 GNMA funds for the 1-, 3-, 5-, and 10-year periods ended May 31, 2007, respectively. Results will vary for other time periods. Past performance cannot guarantee future results.)

Mortgages fared decently during the last six months despite volatility in interest rates, which often leads to refinancing and poor returns for mortgage securities. GNMAs got off to a weak start in the early spring due to concerns that severe problems in the subprime mortgage market would result in increased supply of GNMAs, which would weigh on their performance compared to other types of mortgages. The predominant backer of GNMA mortgages is the Federal Housing Administration (FHA), which often insures loans to borrowers with lower-quality credit. It therefore appeared likely that some subprime borrowers—if they could qualify—would refinance out of their current adjustable rate mortgages into fixed-rate FHA loans. When this wave of supply failed to materialize at the end of the period, however, GNMAs managed to outperform their counterparts. Indeed, GNMAs fared better than the mortgage sector overall for the six-month period and managed to outpace Treasuries of equal duration.
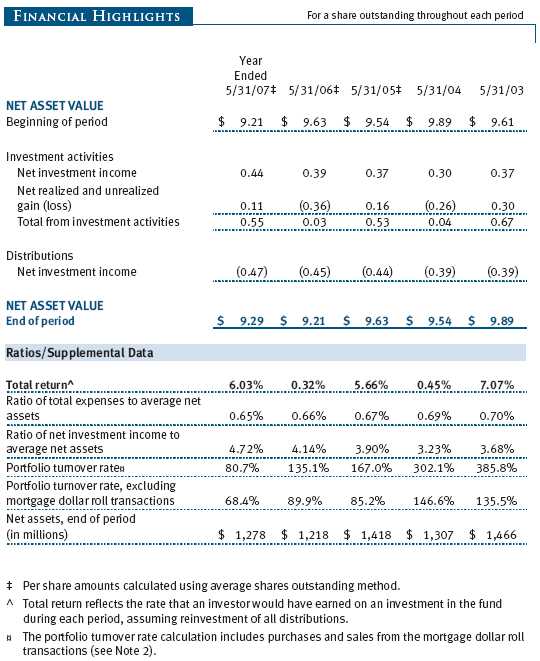
Although the fund’s net asset value fell by $0.14 over the past six months due to the rise in yields, this was more than offset by $0.23 in dividends paid over the period. The fund’s net asset value climbed by $0.08 over the past 12 months, and it paid $0.47 in dividends over the period.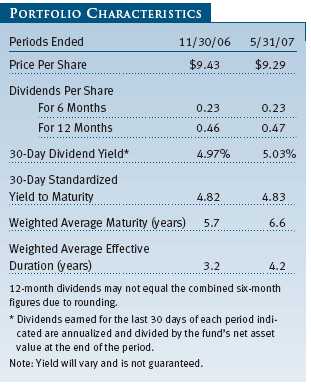
For the most part, our duration posture was in line with or slightly longer than the benchmark’s during the past six months; in other words we had slightly more sensitivity in the fund to changes in interest rates. We typically do not take large duration bets with the fund by adjusting the weighted average maturity of the portfolio in relation to the benchmark. This is because a mortgage security’s duration, unlike a corporate or Treasury bond, will fluctuate in response to changes in interest rates, making the fund’s overall duration difficult to manage precisely. We will shade the portfolio’s duration based on our view of the direction of the economy and interest rates, however. Our marginally long posture served us well throughout most of the period, but it detracted from performance when interest rates shot upward in May.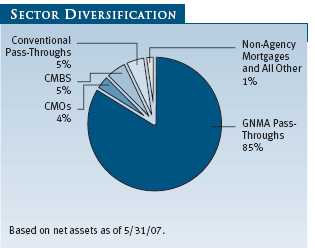
We continued our program of diversifying the portfolio over the period. We have added commercial mortgage-backed securities (CMBS), which, as the name implies, are backed by mortgages on commercial real estate. We have also added hybrid adjustable rate mortgages (ARMs), which feature a fixed rate for a period, followed by a floating rate. To accommodate these holdings, we opportunistically sold GNMAs.
Our performance over the period was hurt by an increase in relative yields in the CMBS sector. These securities suffered from some spillover from the subprime residential market due mainly to certain large investors adopting a strategy of shorting—or betting against—CMBS alongside subprime securities. We have recently lightened up on these holdings—not because we believe CMBS have any fundamental problems, but because we acknowledge that technical factors in the market have turned against the sector. Meanwhile, hybrid ARMs did slightly better than GNMAs, which helped our relative returns.
Our asset allocation weighed on results relative to the benchmark due to our overweight in 15-year mortgages, which underperformed their 30-year counterparts. We continue to see value in these holdings, however, due to their more stable cash flows and because they are no longer being issued and would be nearly impossible to replace in the portfolio.
OUTLOOK
It appears that we may be at a turning point in the economic and interest rate cycles, making the direction of rate movements especially hard to predict. Should the bond bears quiet down and interest rates settle back into a range—albeit a higher one—mortgages should perform well. They continue to offer a haven from credit concerns and appear more attractive than they have in the recent past given the increase in their yields relative to Treasuries.
If interest rates continue to increase, on the other hand, mortgages will suffer as origination activity declines, homeowners stick with their current loans, durations extend, and cash flows slow. In such an environment, security selection becomes particularly important. We will continue to look for pools of mortgages that react favorably to changes in interest rates and are better protected against extension risk, or the chance that prepayments will slow, preventing investors from benefiting from higher rates. We will also use the greater flexibility in our mandate recently granted us by shareholders to seek other sectors less vulnerable to the negative impact of extreme changes in rates.
I would like to take a moment to thank you for your confidence in our firm and for investing in the T. Rowe Price GNMA Fund. After more than nine years with the company, I have decided to retire at the beginning of 2008. We expect the transition toward a new portfolio manager to be seamless and do not anticipate any major changes in the fund’s investment style.
As always, thank you for investing with T. Rowe Price.
Respectfully submitted,

Connice A. Bavely
Chairman of the Investment Advisory Committee
GNMA Fund
June 21, 2007
The committee chairman has day-to-day responsibility for managing the portfolio and works with committee members in developing and executing the fund’s investment program.
PORTFOLIO MANAGEMENT CHANGE
After more than nine years with T. Rowe Price, Connice A. Bavely has decided to retire at the beginning of 2008. We appreciate Connie’s service over the years and her commitment to the firm and to the interests of our clients. Connie started in the Fixed Income Division in 1998, bringing more than 20 years of investment experience to her roles as portfolio manager for the T. Rowe Price GNMA and Summit GNMA Funds, as well as co-manager of several separately managed portfolios. Connie’s contributions have significantly improved T. Rowe Price’s expertise in this area of the fixed-income market. We have already begun the process of planning for Connie’s successor to assure a smooth transition of her responsibilities and will let you know of our plans as they unfold.
RISK OF GNMA FUND INVESTING
Even though principal and interest payments on GNMAs are guaranteed, an increase in interest rates can cause the share price to decline, resulting in a loss of principal. Investors in bond funds are also subject to several other types of risk—interest rate risk, credit risk, prepayment risk, extension risk, and derivatives risk. Since the fund invests primarily in GNMAs, which are backed by the full faith and credit of the U.S. government, its exposure to credit risk is low. A mortgage-backed bond, unlike most other bonds, can be hurt when interest rates fall because homeowners tend to refinance and prepay principal. Prepayments can cause the average maturity of the portfolio to shorten, require the fund to reinvest proceeds at lower interest rates, or even cause certain bonds’ prices to fall below what the fund paid for them, resulting in a capital loss. Increased interest rates can cause the fund’s average maturity to lengthen unexpectedly due to a drop in mortgage prepayments. Shareholders are also exposed to derivatives risk, the potential that our investments in these complex and volatile instruments could affect the fund’s share price.
GLOSSARY
Average maturity: For a bond fund, this is the weighted average of the stated maturity dates of the portfolio’s securities. In general, the longer the average maturity, the greater the fund’s sensitivity to interest rate changes, which can mean greater price fluctuation. A shorter average maturity usually means less interest rate sensitivity, and consequently, a less volatile portfolio.
Basis point: One one-hundredth of one percentage point, or 0.01%.
Call protection: Any of a number of provisions that prohibits a bond’s early redemption for a given period.
Collateralized mortgage obligation (CMO): Collateralized mortgage obligations are investment-grade bonds that are backed by mortgage pass-throughs whose cash flows are directed in different ways to different classes. Some classes may have less risk associated with prepayments, and, by default, the other classes will have more prepayment risk. Those classes with less risk generally yield less than other mortgage-backed securities.
Current coupon GNMA: An index that tracks a theoretical 30-year GNMA mortgage that is priced at par. It is computed by interpolating from the two 30-year GNMAs whose prices bracket par.
Duration: A measure of a bond or bond fund’s sensitivity to changes in interest rates. For example, a fund with a duration of five years would fall about 5% in response to a one-percentage-point rise in rates, and vice versa.
Extension risk: As interest rates rise, the likelihood of prepayment decreases, and the average life and duration of mortgage securities lengthens. Investors are unable to capitalize on higher interest rates because their investment is locked in at a lower rate for a longer period of time.
Lehman Brothers U.S. GNMA Index: Tracks the performance of mortgage-backed pass-through securities of the Government National Mortgage Association (GNMA).
Lipper averages: Consist of all mutual funds in a particular category as tracked by Lipper Inc.
Total return: The annual rate of return on a bond, taking into account interest income, plus appreciation or depreciation. If a bond is held to maturity, its total return equals its yield to maturity.
Yield curve: A graphic depiction of the relationship between yields and maturity dates for a set of similar securities, such as Treasuries or municipal securities. Securities with longer maturities usually have a higher yield. If short-term securities offer a higher yield, then the curve is said to be “inverted.” If short- and long-term bonds are offering equivalent yields, then the curve is said to be “flat.”
Performance and Expenses
| GROWTH OF $10,000 |
This chart shows the value of a hypothetical $10,000 investment in the fund over the past 10 fiscal year periods or since inception (for funds lacking 10-year records). The result is compared with benchmarks, which may include a broad-based market index and a peer group average or index. Market indexes do not include expenses, which are deducted from fund returns as well as mutual fund averages and indexes.
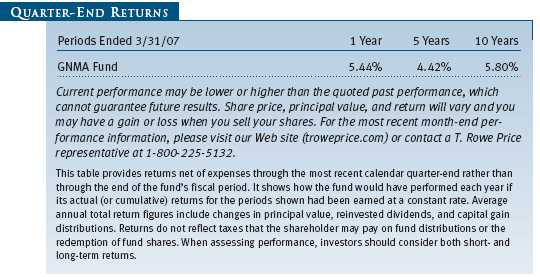
| AVERAGE ANNUAL COMPOUND TOTAL RETURN |
This table shows how the fund would have performed each year if its actual (or cumulative) returns for the periods shown had been earned at a constant rate.
| FUND EXPENSE EXAMPLE |
As a mutual fund shareholder, you may incur two types of costs: (1) transaction costs, such as redemption fees or sales loads, and (2) ongoing costs, including management fees, distribution and service (12b-1) fees, and other fund expenses. The following example is intended to help you understand your ongoing costs (in dollars) of investing in the fund and to compare these costs with the ongoing costs of investing in other mutual funds. The example is based on an investment of $1,000 invested at the beginning of the most recent six-month period and held for the entire period.
Actual Expenses
The first line of the following table (“Actual”) provides information about actual account values and expenses based on the fund’s actual returns. You may use the information in this line, together with your account balance, to estimate the expenses that you paid over the period. Simply divide your account value by $1,000 (for example, an $8,600 account value divided by $1,000 = 8.6), then multiply the result by the number in the first line under the heading “Expenses Paid During Period” to estimate the expenses you paid on your account during this period.
Hypothetical Example for Comparison Purposes
The information on the second line of the table (“Hypothetical”) is based on hypothetical account values and expenses derived from the fund’s actual expense ratio and an assumed 5% per year rate of return before expenses (not the fund’s actual return). You may compare the ongoing costs of investing in the fund with other funds by contrasting this 5% hypothetical example and the 5% hypothetical examples that appear in the shareholder reports of the other funds. The hypothetical account values and expenses may not be used to estimate the actual ending account balance or expenses you paid for the period.
Note: T. Rowe Price charges an annual small-account maintenance fee of $10, generally for accounts with less than $2,000 ($500 for UGMA/UTMA). The fee is waived for any investor whose T. Rowe Price mutual fund accounts total $25,000 or more, accounts employing automatic investing, and IRAs and other retirement plan accounts that utilize a prototype plan sponsored by T. Rowe Price (although a separate custodial or administrative fee may apply to such accounts). This fee is not included in the accompanying table. If you are subject to the fee, keep it in mind when you are estimating the ongoing expenses of investing in the fund and when comparing the expenses of this fund with other funds.
You should also be aware that the expenses shown in the table highlight only your ongoing costs and do not reflect any transaction costs, such as redemption fees or sales loads. Therefore, the second line of the table is useful in comparing ongoing costs only and will not help you determine the relative total costs of owning different funds. To the extent a fund charges transaction costs, however, the total cost of owning that fund is higher.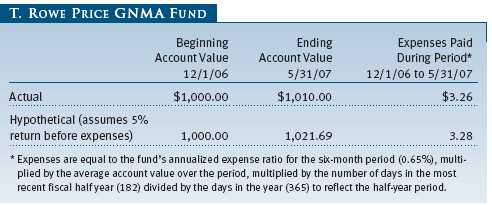
The accompanying notes are an integral part of these financial statements.

![]()
The accompanying notes are an integral part of these financial statements.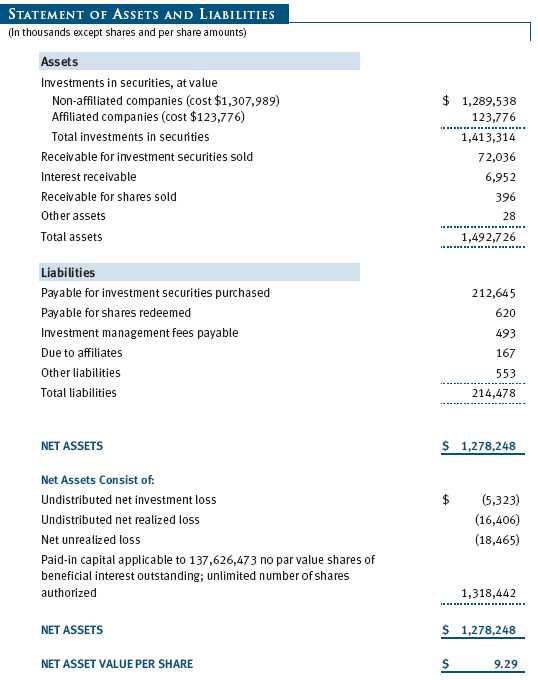
The accompanying notes are an integral part of these financial statements.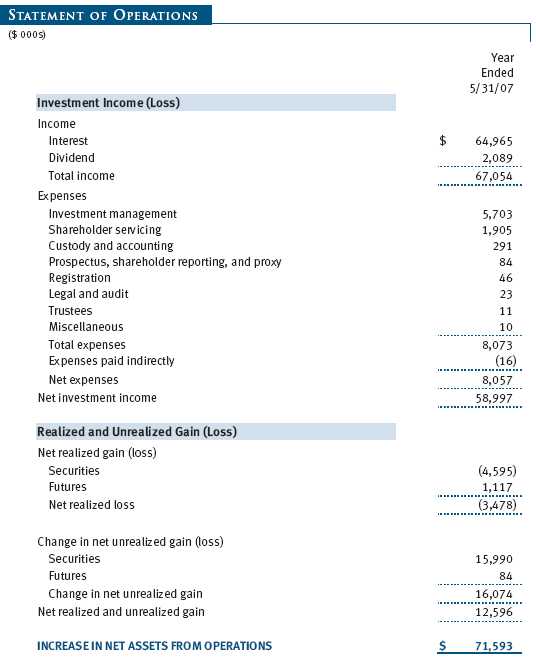
The accompanying notes are an integral part of these financial statements.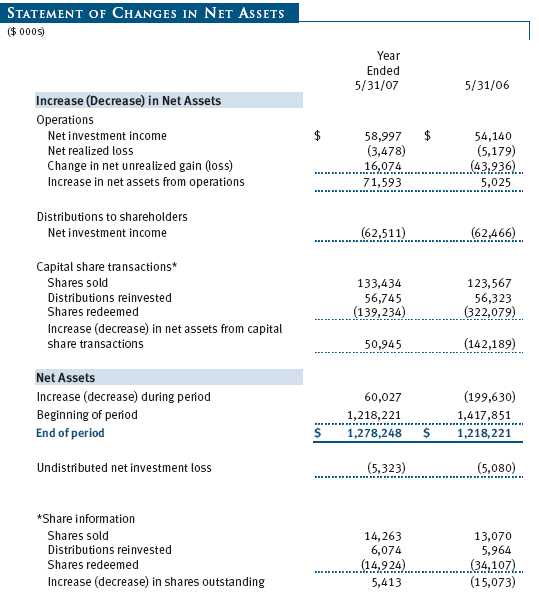
The accompanying notes are an integral part of these financial statements.
| NOTES TO FINANCIAL STATEMENTS |
NOTE 1 - SIGNIFICANT ACCOUNTING POLICIES
T. Rowe Price GNMA Fund (the fund), is registered under the Investment Company Act of 1940 (the 1940 Act) as a diversified, open-end management investment company. The fund commenced operations on November 26, 1985. The fund seeks high current income consistent with high overall credit quality and moderate price fluctuation by investing at least 80% of its total assets in GNMA securities backed by the full faith and credit of the U.S. government.
The accompanying financial statements were prepared in accordance with accounting principles generally accepted in the United States of America, which require the use of estimates made by fund management. Fund management believes that estimates and security valuations are appropriate; however, actual results may differ from those estimates, and the security valuations reflected in the financial statements may differ from the value the fund ultimately realizes upon sale of the securities.
Valuation The fund values its investments and computes its net asset value per share at the close of the New York Stock Exchange (NYSE), normally 4 p.m. ET, each day that the NYSE is open for business. Debt securities are generally traded in the over-the-counter market. Securities with original maturities of one year or more are valued at prices furnished by dealers who make markets in such securities or by an independent pricing service, which considers yield or price of bonds of comparable quality, coupon, maturity, and type, as well as prices quoted by dealers who make markets in such securities. Securities with original maturities of less than one year are valued at amortized cost in local currency, which approximates fair value when combined with accrued interest.
Investments in mutual funds are valued at the mutual fund’s closing net asset value per share on the day of valuation. Financial futures contracts are valued at closing settlement prices.
Other investments, including restricted securities, and those for which the above valuation procedures are inappropriate or are deemed not to reflect fair value are stated at fair value as determined in good faith by the T. Rowe Price Valuation Committee, established by the fund’s Board of Trustees.
Credits The fund earns credits on temporarily uninvested cash balances at the custodian that reduce the fund’s custody charges. Custody expense in the accompanying financial statements is presented before reduction for credits, which are reflected as expenses paid indirectly.
Investment Transactions, Investment Income, and Distributions Income and expenses are recorded on the accrual basis. Premiums and discounts on debt securities are amortized for financial reporting purposes. Dividends received from mutual fund investments are reflected as dividend income; capital gain distributions are reflected as realized gain/loss. Dividend income and capital gain distributions are recorded on the ex-dividend date. Investment transactions are accounted for on the trade date. Realized gains and losses are reported on the identified cost basis. Payments (“variation margin”) made or received to settle the daily fluctuations in the value of futures contracts are recorded as unrealized gains or losses until the contracts are closed. Unsettled variation margin on futures contracts is reflected as other assets or liabilities, and unrealized gains and losses on futures contracts are reflected as the change in net unrealized gain or loss in the accompanying financial statements. Paydown gains and losses are recorded as an adjustment to interest income. Distributions to shareholders are recorded on the ex-dividend date. Income distributions are declared on a daily basis and paid monthly. Capital gain distributions, if any, are declared and paid by the fund, typically on an annual basis.
New Accounting Pronouncements In June 2006, the Financial Accounting Standards Board (?FASB?) issued FASB Interpretation No. 48 (?FIN 48?), Accounting for Uncertainty in Income Taxes, a clarification of FASB Statement No. 109, Accounting for Income Taxes. FIN 48 establishes financial reporting rules regarding recognition and measurement of tax positions taken or expected to be taken on a tax return. Management is evaluating the anticipated impact, if any, that FIN 48 will have on the fund upon adoption, which, pursuant to a delay granted by the U.S. Securities and Exchange Commission, is expected to be on the last business day of the fund’s semiannual period, November 30, 2007.
In September 2006, the FASB released the Statement of Financial Accounting Standard No. 157 (“FAS 157”), Fair Value Measurements. FAS 157 clarifies the definition of fair value and establishes the framework for measuring fair value, as well as proper disclosure of this methodology in the financial statements. It will be effective for the fund’s fiscal year beginning June 1, 2008. Management is evaluating the effects of FAS 157; however, it is not expected to have a material impact on the fund’s net assets or results of operations.
NOTE 2 - INVESTMENT TRANSACTIONS
Consistent with its investment objective, the fund engages in the following practices to manage exposure to certain risks or to enhance performance. The investment objective, policies, program, and risk factors of the fund are described more fully in the fund’s prospectus and Statement of Additional Information.
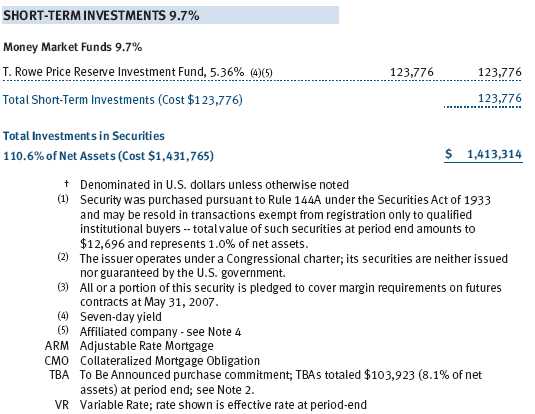
Restricted Securities The fund may invest in securities that are subject to legal or contractual restrictions on resale. Although certain of these securities may be readily sold, for example, under Rule 144A, others may be illiquid, their sale may involve substantial delays and additional costs, and prompt sale at an acceptable price may be difficult.
Futures Contracts During the year ended May 31, 2007, the fund was a party to futures contracts, which provide for the future sale by one party and purchase by another of a specified amount of a specific financial instrument at an agreed upon price, date, time, and place. Risks arise from possible illiquidity of the futures market and from movements in security values and/or interest rates.
TBA Purchase Commitments During the year ended May 31, 2007, the fund entered into to be announced (TBA) purchase commitments, pursuant to which it agrees to purchase mortgage-backed securities for a fixed unit price, with payment and delivery at a scheduled future date beyond the customary settlement period for that security. With TBA transactions, the particular securities to be delivered are not identified at the trade date; however, delivered securities must meet specified terms, including issuer, rate, and mortgage term, and be within industry-accepted “good delivery” standards. The fund generally enters into TBAs with the intention of taking possession of the underlying mortgage securities. Until settlement, the fund maintains cash reserves and liquid assets sufficient to settle its TBAs.
Dollar Rolls During the year ended May 31, 2007, the fund entered into dollar roll transactions, pursuant to which it sells a mortgage-backed TBA or security and simultaneously purchases a similar, but not identical, TBA with the same issuer, rate, and terms. The fund may execute a “roll” to obtain better underlying mortgage securities or to enhance returns. The fund generally enters into dollar roll transactions with the intention of taking possession of the underlying mortgage securities, but may close a contract prior to settlement or “roll” settlement to a later date if deemed in the best interest of shareholders. Actual mortgages received by the fund may be less favorable than those anticipated.
The fund accounts for dollar roll transactions as purchases and sales, which has the effect of increasing its portfolio turnover rate.
Other Purchases and sales of portfolio securities, other than short-term and U.S. government securities, aggregated $133,702,000 and $43,313,000, respectively, for the year ended May 31, 2007. Purchases and sales of U.S. government securities aggregated $946,286,000 and $950,504,000, respectively, for the year ended May 31, 2007.
NOTE 3 - FEDERAL INCOME TAXES
No provision for federal income taxes is required since the fund intends to continue to qualify as a regulated investment company under Subchapter M of the Internal Revenue Code and distribute to shareholders all of its taxable income and gains. Federal income tax regulations differ from generally accepted accounting principles; therefore, distributions determined in accordance with tax regulations may differ significantly in amount or character from net investment income and realized gains for financial reporting purposes. Financial reporting records are adjusted for permanent book/tax differences to reflect tax character. Financial records are not adjusted for temporary differences.
Distributions during the year ended May 31, 2007, totaled $62,511,000 and were characterized as ordinary income for tax purposes. At May 31, 2007, the tax-basis components of net assets were as follows:
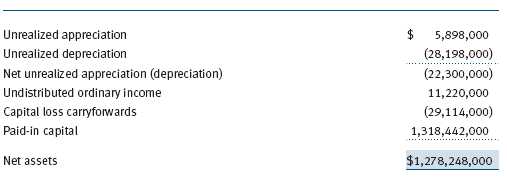
Pursuant to federal income tax regulations applicable to investment companies, the fund has elected to treat net capital losses realized between November 1 and May 31 of each year as occurring on the first day of the following tax year. Consequently, $3,849,000 of realized losses reflected in the accompanying financial statements will not be recognized for tax purposes until 2008.
The fund intends to retain realized gains to the extent of available capital loss carryforwards. During the fiscal year ended May 31, 2007, the fund utilized no capital loss carryforwards. As of May 31, 2007, the fund had $8,219,000 of capital loss carryforwards that expire in fiscal 2012, $4,682,000 that expire in fiscal 2013, $7,180,000 that expire in fiscal 2014 and $9,033,000 that expire in fiscal 2015.
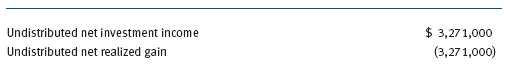
For the year ended May 31, 2007, the fund recorded the following permanent reclassifications to reflect tax character. Reclassifications between income and gain relate primarily to the character of paydown gains and losses on asset-backed securities. Results of operations and net assets were not affected by these reclassifications.
At May 31, 2007, the cost of investments for federal income tax purposes was $1,435,614,000.
NOTE 4 - RELATED PARTY TRANSACTIONS
The fund is managed by T. Rowe Price Associates, Inc. (the manager or Price Associates), a wholly owned subsidiary of T. Rowe Price Group, Inc. The investment management agreement between the fund and the manager provides for an annual investment management fee, which is computed daily and paid monthly. The fee consists of an individual fund fee, equal to 0.15% of the fund’s average daily net assets, and a group fee. The group fee rate is calculated based on the combined net assets of certain mutual funds sponsored by Price Associates (the group) applied to a graduated fee schedule, with rates ranging from 0.48% for the first $1 billion of assets to 0.285% for assets in excess of $220 billion. The fund’s group fee is determined by applying the group fee rate to the fund’s average daily net assets. At May 31, 2007, the effective annual group fee rate was 0.30%.
In addition, the fund has entered into service agreements with Price Associates and two wholly owned subsidiaries of Price Associates (collectively, Price). Price Associates computes the daily share price and provides certain other administrative services to the fund. T. Rowe Price Services, Inc., provides shareholder and administrative services in its capacity as the fund’s transfer and dividend disbursing agent. T. Rowe Price Retirement Plan Services, Inc., provides subaccounting and recordkeeping services for certain retirement accounts invested in the fund. For the year ended May 31, 2007, expenses incurred pursuant to these service agreements were $126,000 for Price Associates, $582,000 for T. Rowe Price Services, Inc., and $127,000 for T. Rowe Price Retirement Plan Services, Inc. The total amount payable at period-end pursuant to these service agreements is reflected as Due to Affiliates in the accompanying financial statements.
The fund is also one of several mutual funds sponsored by Price Associates (underlying Price funds) in which the T. Rowe Price Spectrum Funds (Spectrum Funds) may invest. The Spectrum Funds do not invest in the underlying Price funds for the purpose of exercising management or control. Pursuant to a special servicing agreement, expenses associated with the operation of the Spectrum Funds are borne by each underlying Price fund to the extent of estimated savings to it and in proportion to the average daily value of its shares owned by the Spectrum Funds. Expenses allocated under this agreement are reflected as shareholder servicing expense in the accompanying financial statements. For the year ended May 31, 2007, the fund was allocated $939,000 of Spectrum Funds’ expenses, of which $667,000 related to services provided by Price. The amount payable at period-end pursuant to this agreement is reflected as Due to Affiliates in the accompanying financial statements. At May 31, 2007, approximately 45% of the outstanding shares of the fund were held by the Spectrum Funds.
The fund may invest in the T. Rowe Price Reserve Investment Fund and the T. Rowe Price Government Reserve Investment Fund (collectively, the T. Rowe Price Reserve Investment Funds), open-end management investment companies managed by Price Associates and affiliates of the fund. The T. Rowe Price Reserve Investment Funds are offered as cash management options to mutual funds, trusts, and other accounts managed by Price Associates and/or its affiliates, and are not available for direct purchase by members of the public. The T. Rowe Price Reserve Investment Funds pay no investment management fees. During the year ended May 31, 2007, dividend income from the T. Rowe Price Reserve Investment Funds totaled $2,089,000, and the value of shares of the T. Rowe Price Reserve Investment Funds held at May 31, 2007, and May 31, 2006, was $123,776,000 and $46,458,000, respectively.
| REPORT OF INDEPENDENT REGISTERED PUBLIC ACCOUNTING FIRM |
To the Board of Directors and Shareholders of T. Rowe Price GNMA Fund
In our opinion, the accompanying statement of assets and liabilities, including the portfolio of investments, and the related statements of operations and of changes in net assets and the financial highlights present fairly, in all material respects, the financial position of T. Rowe Price GNMA Fund (the “Fund”) at May 31, 2007, the results of its operations for the year then ended, the changes in its net assets for each of the two years in the period then ended and the financial highlights for each of the five years in the period then ended, in conformity with accounting principles generally accepted in the United States of America. These financial statements and financial highlights (hereafter referred to as “financial statements”) are the responsibility of the Fund’s management; our responsibility is to express an opinion on these financial statements based on our audits. We conducted our audits of these financial statements in accordance with the auditing standards of the Public Company Accounting Oversight Board (United States). Those standards require that we plan and perform the audit to obtain reasonable assurance about whether the financial statements are free of material misstatement. An audit includes examining, on a test basis, evidence supporting the amounts and disclosures in the financial statements, assessing the accounting principles used and significant estimates made by management, and evaluating the overall financial statement presentation. We believe that our audits, which included confirmation of securities at May 31, 2007 by correspondence with the custodian and brokers, and by agreement to the underlying ownership records for T. Rowe Price Reserve Investment Fund, provide a reasonable basis for our opinion.
PricewaterhouseCoopers LLP
Baltimore, Maryland
July 12, 2007
| TAX INFORMATION (UNAUDITED) FOR THE TAX YEAR ENDED 5/31/07 |
We are providing this information as required by the Internal Revenue Code. The amounts shown may differ from those elsewhere in this report because of differences between tax and financial reporting requirements. The fund’s distributions to shareholders included $354,000 from short-term capital gains.
| INFORMATION ON PROXY VOTING POLICIES, PROCEDURES, AND RECORDS |
A description of the policies and procedures used by T. Rowe Price funds and portfolios to determine how to vote proxies relating to portfolio securities is available in each fund’s Statement of Additional Information, which you may request by calling 1-800-225-5132 or by accessing the SEC’s Web site, www.sec.gov. The description of our proxy voting policies and procedures is also available on our Web site, www.troweprice.com. To access it, click on the words “Company Info” at the top of our homepage for individual investors. Then, in the window that appears, click on the “Proxy Voting Policy” navigation button in the top left corner.
Each fund’s most recent annual proxy voting record is available on our Web site and through the SEC’s Web site. To access it through our Web site, follow the directions above, then click on the words “Proxy Voting Record” at the bottom of the Proxy Voting Policy page.
| HOW TO OBTAIN QUARTERLY PORTFOLIO HOLDINGS |
The fund files a complete schedule of portfolio holdings with the Securities and Exchange Commission for the first and third quarters of each fiscal year on Form N-Q. The fund’s Form N-Q is available electronically on the SEC’s Web site (www.sec.gov); hard copies may be reviewed and copied at the SEC’s Public Reference Room, 450 Fifth St. N.W., Washington, DC 20549. For more information on the Public Reference Room, call 1-800-SEC-0330.
| APPROVAL OF INVESTMENT MANAGEMENT AGREEMENT |
On March 7, 2007, the fund’s Board of Trustees (Board) unanimously approved the investment advisory contract (Contract) between the fund and its investment manager, T. Rowe Price Associates, Inc. (Manager). The Board considered a variety of factors in connection with its review of the Contract, also taking into account information provided by the Manager during the course of the year, as discussed below:
Services Provided by the Manager
The Board considered the nature, quality, and extent of the services provided to the fund by the Manager. These services included, but were not limited to, management of the fund’s portfolio and a variety of related activities, as well as financial and administrative services, reporting, and communications. The Board also reviewed the background and experience of the Manager’s senior management team and investment personnel involved in the management of the fund. The Board concluded that it was satisfied with the nature, quality, and extent of the services provided by the Manager.
Investment Performance of the Fund
The Board reviewed the fund’s average annual total return over the 1-, 3-, 5-, and 10-year periods as well as the fund’s year-by-year returns and compared these returns with a wide variety of previously agreed upon comparable performance measures and market data, including those supplied by Lipper and Morningstar, which are independent providers of mutual fund data. On the basis of this evaluation and the Board’s ongoing review of investment results, the Board concluded that the fund’s performance was satisfactory.
Costs, Benefits, Profits, and Economies of Scale
The Board reviewed detailed information regarding the revenues received by the Manager under the Contract and other benefits that the Manager (and its affiliates) may have realized from its relationship with the fund, including research received under “soft dollar” agreements. The Board noted that soft dollars were not used to pay for third-party, non-broker research. The Board also received information on the estimated costs incurred and profits realized by the Manager and its affiliates from advising T. Rowe Price mutual funds, as well as estimates of the gross profits realized from managing the fund in particular. The Board concluded that the Manager’s profits were reasonable in light of the services provided to the fund. The Board also considered whether the fund or other funds benefit under the fee levels set forth in the Contract from any economies of scale realized by the Manager. Under the Contract, the fund pays a fee to the Manager composed of two components—a group fee rate based on the aggregate assets of certain T. Rowe Price mutual funds (including the fund) that declines at certain asset levels and an individual fund fee rate that is assessed on the assets of the fund. The Board concluded that the advisory fee structure for the fund continued to provide for a reasonable sharing of benefits from economies of scale with the fund’s investors.
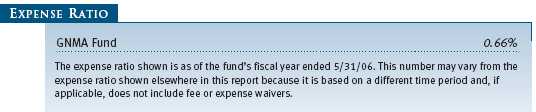
Fees
The Board reviewed the fund’s management fee rate, operating expenses, and total expense ratio and compared them with fees and expenses of other comparable funds based on information and data supplied by Lipper. The information provided to the Board showed that the fund’s management fee rate was above the median of certain groups of comparable funds but at or below the median of other groups of comparable funds. The information also indicated that the fund’s expense ratio was above the median of certain groups of comparable funds but at or below the median of other groups of comparable funds. The Board also reviewed the fee schedules for comparable privately managed accounts of the Manager and its affiliates. Management informed the Board that the Manager’s responsibilities for privately managed accounts are more limited than its responsibilities for the fund and other T. Rowe Price mutual funds that it or its affiliates advise. On the basis of the information provided, the Board concluded that the fees paid by the fund under the Contract were reasonable.
Approval of the Contract
As noted, the Board approved the continuation of the Contract. No single factor was considered in isolation or to be determinative to the decision. Rather, the Board concluded, in light of a weighting and balancing of all factors considered, that it was in the best interests of the fund to approve the continuation of the Contract, including the fees to be charged for services thereunder.
| ABOUT THE FUND’S TRUSTEES AND OFFICERS |
Your fund is governed by a Board of Trustees (Board) that meets regularly to review a wide variety of matters affecting the fund, including performance, investment programs, compliance matters, advisory fees and expenses, service providers, and other business affairs. The Board elects the fund’s officers, who are listed in the final table. At least 75% of Board members are independent of T. Rowe Price Associates, Inc. (T. Rowe Price), and T. Rowe Price International, Inc. (T. Rowe Price International); “inside” or “interested” trustees are employees or officers of T. Rowe Price. The business address of each trustee and officer is 100 East Pratt Street, Baltimore, Maryland 21202. The Statement of Additional Information includes additional information about the fund trustees and is available without charge by calling a T. Rowe Price representative at 1-800-225-5132.
| Independent Trustees | |
| Name | |
| (Year of Birth) | Principal Occupation(s) During Past 5 Years and |
| Year Elected* | Directorships of Other Public Companies |
| Jeremiah E. Casey | Director, National Life Insurance (2001 to 2005); Director, The Rouse |
| (1940) | Company, real estate developers (1990 to 2004); Director, Allfirst |
| 2006 | Financial Inc. (previously First Maryland Bancorp) (1983 to 2002) |
| Anthony W. Deering | Chairman, Exeter Capital, LLC, a private investment firm (2004 to |
| (1945) | present); Director, Vornado Real Estate Investment Trust (3/04 to |
| 1985 | present); Director, Mercantile Bankshares (4/03 to present); Member, |
| Advisory Board, Deutsche Bank North America (2004 to present); | |
| Director, Chairman of the Board, and Chief Executive Officer, The | |
| Rouse Company, real estate developers (1997 to 2004) | |
| Donald W. Dick, Jr. | Principal, EuroCapital Advisors, LLC, an acquisition and management |
| (1943) | advisory firm; Chairman, The Haven Group, a custom manufacturer of |
| 2001 | modular homes (1/04 to present) |
| David K. Fagin | Chairman and President, Nye Corporation (6/88 to present); Director, |
| (1938) | Canyon Resources Corp. (5/00 to present); Director, Golden Star |
| 2001 | Resources Ltd. (5/92 to present); Director, Pacific Rim Mining Corp. |
| (2/02 to present) | |
| Karen N. Horn | Director, Federal National Mortgage Association (9/06 to present); |
| (1943) | Managing Director and President, Global Private Client Services, |
| 2003 | Marsh Inc. (1999 to 2003); Managing Director and Head of |
| International Private Banking, Bankers Trust (1996 to 1999); Director, | |
| Georgia Pacific (5/04 to 12/05), Eli Lilly and Company, and Simon | |
| Property Group | |
| Theo C. Rodgers | President, A&R Development Corporation (1977 to present) |
| (1941) | |
| 2005 | |
| John G. Schreiber | Owner/President, Centaur Capital Partners, Inc., a real estate invest- |
| (1946) | ment company; Partner, Blackstone Real Estate Advisors, L.P. |
| 1992 | |
| * Each independent trustee oversees 119 T. Rowe Price portfolios and serves until retirement, resignation, |
| or election of a successor. |
| Inside Trustees | |
| Name | |
| (Year of Birth) | |
| Year Elected* | |
| [Number of T. Rowe Price | Principal Occupation(s) During Past 5 Years and |
| Portfolios Overseen] | Directorships of Other Public Companies |
| Edward C. Bernard | Director and Vice President, T. Rowe Price; Vice Chairman of the Board, |
| (1956) | Director, and Vice President, T. Rowe Price Group, Inc.; Chairman of |
| 2006 | the Board, Director, and President, T. Rowe Price Investment Services, |
| [119] | Inc., and T. Rowe Price Retirement Plan Services, Inc.; Chairman of the |
| Board and Director, T. Rowe Price Services, Inc., T. Rowe Price Savings | |
| Bank, T. Rowe Price Global Asset Management Limited, and T. Rowe | |
| Price Global Investment Services Limited; Director, T. Rowe Price | |
| International, Inc.; Chief Executive Officer, Chairman of the Board, | |
| Director, and President, T. Rowe Price Trust Company; Chairman of | |
| the Board, all funds | |
| Mary J. Miller, CFA | Director, T. Rowe Price Trust Company; Director and Vice President, |
| (1955) | T. Rowe Price; Vice President, T. Rowe Price Group, Inc.; Vice |
| 2004 | President, GNMA Fund |
| [37] | |
| *Each inside trustee serves until retirement, resignation, or election of a successor. |
| Officers | |
| Name (Year of Birth) | |
| Title and Fund(s) Served | Principal Occupation(s) |
| Connice A. Bavely, CFA (1951) | Vice President, T. Rowe Price and T. Rowe Price |
| President, GNMA Fund | Group, Inc. |
| Joseph A. Carrier, CPA (1960) | Vice President, T. Rowe Price, T. Rowe Price |
| Treasurer, GNMA Fund | Group, Inc., T. Rowe Price Investment Services, |
| Inc., and T. Rowe Price Trust Company | |
| Roger L. Fiery III, CPA (1959) | Vice President, T. Rowe Price, T. Rowe Price |
| Vice President, GNMA Fund | Group, Inc., T. Rowe Price International, Inc., |
| and T. Rowe Price Trust Company | |
| John R. Gilner (1961) | Chief Compliance Officer and Vice President, |
| Chief Compliance Officer, GNMA Fund | T. Rowe Price; Vice President, T. Rowe Price |
| Group, Inc., and T. Rowe Price Investment | |
| Services, Inc. | |
| Gregory S. Golczewski (1966) | Vice President, T. Rowe Price and T. Rowe Price |
| Vice President, GNMA Fund | Trust Company |
| Henry H. Hopkins (1942) | Director and Vice President, T. Rowe Price |
| Vice President, GNMA Fund | Investment Services, Inc., T. Rowe Price Services, |
| Inc., and T. Rowe Price Trust Company; Vice | |
| President, T. Rowe Price, T. Rowe Price Group, | |
| Inc., T. Rowe Price International, Inc., and | |
| T. Rowe Price Retirement Plan Services, Inc. | |
| Keir R. Joyce (1972) | Vice President, T. Rowe Price |
| Vice President, GNMA Fund | |
| Alan D. Levenson, Ph.D. (1958) | Vice President, T. Rowe Price and T. Rowe Price |
| Vice President, GNMA Fund | Group, Inc. |
| Patricia B. Lippert (1953) | Assistant Vice President, T. Rowe Price and |
| Secretary, GNMA Fund | T. Rowe Price Investment Services, Inc. |
| Julie L. Waples (1970) | Vice President, T. Rowe Price |
| Vice President, GNMA Fund | |
| John D. Wells (1960) | Vice President, T. Rowe Price, T. Rowe Price |
| Vice President, GNMA Fund | Group, Inc., and T. Rowe Price Savings Bank |
| Unless otherwise noted, officers have been employees of T. Rowe Price or T. Rowe Price International for at least |
| five years. |
Item 2. Code of Ethics.
The registrant has adopted a code of ethics, as defined in Item 2 of Form N-CSR, applicable to its principal executive officer, principal financial officer, principal accounting officer or controller, or persons performing similar functions. A copy of this code of ethics is filed as an exhibit to this Form N-CSR. No substantive amendments were approved or waivers were granted to this code of ethics during the period covered by this report.
Item 3. Audit Committee Financial Expert.
The registrant’s Board of Directors/Trustees has determined that Mr. Donald W. Dick Jr. qualifies as an audit committee financial expert, as defined in Item 3 of Form N-CSR. Mr. Dick is considered independent for purposes of Item 3 of Form N-CSR.
Item 4. Principal Accountant Fees and Services.
(a) – (d) Aggregate fees billed to the registrant for the last two fiscal years for professional services rendered by the registrant’s principal accountant were as follows:
Audit fees include amounts related to the audit of the registrant’s annual financial statements and services normally provided by the accountant in connection with statutory and regulatory filings. Audit-related fees include amounts reasonably related to the performance of the audit of the registrant’s financial statements and specifically include the issuance of a report on internal controls and, if applicable, agreed-upon procedures related to fund acquisitions. Tax fees include amounts related to services for tax compliance, tax planning, and tax advice. The nature of these services specifically includes the review of distribution calculations and the preparation of Federal, state, and excise tax returns. All other fees include the registrant’s pro-rata share of amounts for agreed-upon procedures in conjunction with service contract approvals by the registrant’s Board of Directors/Trustees.
(e)(1) The registrant’s audit committee has adopted a policy whereby audit and non-audit services performed by the registrant’s principal accountant for the registrant, its investment adviser, and any entity controlling, controlled by, or under common control with the investment adviser that provides ongoing services to the registrant require pre-approval in advance at regularly scheduled audit committee meetings. If such a service is required between regularly scheduled audit committee meetings, pre-approval may be authorized by one audit committee member with ratification at the next scheduled audit committee meeting. Waiver of pre-approval for audit or non-audit services requiring fees of a de minimis amount is not permitted.
(2) No services included in (b) – (d) above were approved pursuant to paragraph (c)(7)(i)(C) of Rule 2-01 of Regulation S-X.
(f) Less than 50 percent of the hours expended on the principal accountant’s engagement to audit the registrant’s financial statements for the most recent fiscal year were attributed to work performed by persons other than the principal accountant’s full-time, permanent employees.
(g) The aggregate fees billed for the most recent fiscal year and the preceding fiscal year by the registrant’s principal accountant for non-audit services rendered to the registrant, its investment adviser, and any entity controlling, controlled by, or under common control with the investment adviser that provides ongoing services to the registrant were $1,201,000 and $883,000, respectively, and were less than the aggregate fees billed for those same periods by the registrant’s principal accountant for audit services rendered to the T. Rowe Price Funds.
(h) All non-audit services rendered in (g) above were pre-approved by the registrant’s audit committee. Accordingly, these services were considered by the registrant’s audit committee in maintaining the principal accountant’s independence.
Item 5. Audit Committee of Listed Registrants.Not applicable.
Item 6. Schedule of Investments.
Not applicable. The complete schedule of investments is included in Item 1 of this Form N-CSR.
Item 7. Disclosure of Proxy Voting Policies and Procedures for Closed-End Management Investment Companies.
Not applicable.
Item 8. Portfolio Managers of Closed-End Management Investment Companies.
Not applicable.
Item 9. Purchases of Equity Securities by Closed-End Management Investment Company and Affiliated Purchasers.
Not applicable.
Item 10. Submission of Matters to a Vote of Security Holders.
Not applicable.
Item 11. Controls and Procedures.
(a) The registrant’s principal executive officer and principal financial officer have evaluated the registrant’s disclosure controls and procedures within 90 days of this filing and have concluded that the registrant’s disclosure controls and procedures were effective, as of that date, in ensuring that information required to be disclosed by the registrant in this Form N-CSR was recorded, processed, summarized, and reported timely.
(b) The registrant’s principal executive officer and principal financial officer are aware of no change in the registrant’s internal control over financial reporting that occurred during the registrant’s second fiscal quarter covered by this report that has materially affected, or is reasonably likely to materially affect, the registrant’s internal control over financial reporting.
Item 12. Exhibits.
(a)(1) The registrant’s code of ethics pursuant to Item 2 of Form N-CSR is attached.
(2) Separate certifications by the registrant's principal executive officer and principal financial officer, pursuant to Section 302 of the Sarbanes-Oxley Act of 2002 and required by Rule 30a-2(a) under the Investment Company Act of 1940, are attached.
(3) Written solicitation to repurchase securities issued by closed-end companies: not applicable.
(b) A certification by the registrant's principal executive officer and principal financial officer, pursuant to Section 906 of the Sarbanes-Oxley Act of 2002 and required by Rule 30a-2(b) under the Investment Company Act of 1940, is attached.
SIGNATURES | |
| Pursuant to the requirements of the Securities Exchange Act of 1934 and the Investment | |
| Company Act of 1940, the registrant has duly caused this report to be signed on its behalf by the | |
| undersigned, thereunto duly authorized. | |
| T. Rowe Price GNMA Fund | |
| By | /s/ Edward C. Bernard |
| Edward C. Bernard | |
| Principal Executive Officer | |
| Date | July 23, 2007 |
| Pursuant to the requirements of the Securities Exchange Act of 1934 and the Investment | |
| Company Act of 1940, this report has been signed below by the following persons on behalf of | |
| the registrant and in the capacities and on the dates indicated. | |
| By | /s/ Edward C. Bernard |
| Edward C. Bernard | |
| Principal Executive Officer | |
| Date | July 23, 2007 |
| By | /s/ Joseph A. Carrier |
| Joseph A. Carrier | |
| Principal Financial Officer | |
| Date | July 23, 2007 |