UNITED STATES
SECURITIES AND EXCHANGE COMMISSION
Washington, D.C. 20549
FORM N-CSR
CERTIFIED SHAREHOLDER REPORT OF REGISTERED
MANAGEMENT INVESTMENT COMPANIES
Investment Company Act File Number: 811-04441
| T. Rowe Price GNMA Fund, Inc. |
|
| (Exact name of registrant as specified in charter) |
| |
| 100 East Pratt Street, Baltimore, MD 21202 |
|
| (Address of principal executive offices) |
| |
| David Oestreicher |
| 100 East Pratt Street, Baltimore, MD 21202 |
|
| (Name and address of agent for service) |
Registrant’s telephone number, including area code: (410) 345-2000
Date of fiscal year end: May 31
Date of reporting period: May 31, 2021
Item 1. Reports to Shareholders
(a) Report pursuant to Rule 30e-1.
| PRGMX | Investor Class |
| PRXAX | I Class |
| TRZGX | Z Class |
HIGHLIGHTS
| ■ | The GNMA Fund outperformed its benchmark but underperformed its Lipper peer group average during the 12-month period ended May 31, 2021. |
| |
| ■ | GNMA securities faced headwinds from elevated prepayment speeds during the period as record-low mortgage rates led to increased refinancing activity. |
| |
| ■ | The fund benefited from an underweight to GNMAs and an overweight to conventional agency mortgage-backed securities. |
| |
| ■ | We expect potential changes to the Federal Reserve’s asset purchase program to be a focus of the mortgage market in the second half of 2021. |
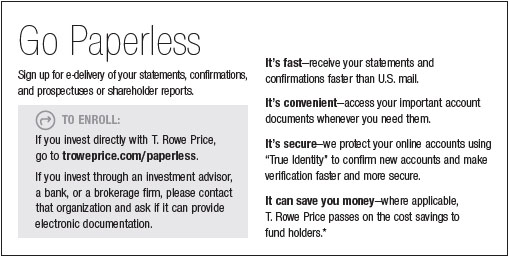
Log in to your account at troweprice.com for more information.
*Certain mutual fund accounts that are assessed an annual account service fee can also save money by switching to e-delivery.
CIO Market Commentary
Dear Shareholder
Global stock markets produced very strong returns during your fund’s fiscal year, the 12-month period ended May 31, 2021, while rising yields weighed on returns in some bond sectors. Investor sentiment was buoyed by the rollout of coronavirus vaccines, unprecedented fiscal and monetary stimulus, and expectations that the economy would benefit from a release of pent-up demand.
All major global and regional equity benchmarks recorded positive results during the period, and returns in the 20% to 50% range were common across developed and emerging markets. The large-cap S&P 500 Index gained 40% for the 12-month period and finished up nearly 25% above where it stood just before the pandemic roiled markets early last year.
Market leadership shifted during the period as successful vaccine trials in November spurred a rotation toward segments that had been beaten down in the initial phase of the pandemic. Value shares rebounded and outperformed their growth counterparts for the reporting period, and sector leaders also changed. Within the S&P 500, financial stocks produced strong gains as banks benefited from rising longer-term interest rates, and the materials and the industrials and business services sectors outperformed amid higher commodity prices and a rebound in economic growth. Energy stocks, which had negative results in the first half of our reporting period, staged a strong recovery as oil prices rallied to their highest level in more than two years. Meanwhile, information technology and consumer discretionary companies, which had been the big winners in the early days of the pandemic, produced more modest gains later in the period.
Outside the U.S., emerging markets generally outpaced stocks in developed markets. A weaker U.S. dollar aided returns for U.S. investors in most regions.
Fiscal and monetary support remained a key factor in providing a positive backdrop for markets. President Joe Biden signed the American Rescue Plan Act into law in March, a $1.9 trillion program that included direct payments of up to $1,400 to most Americans. The Federal Reserve kept its short-term lending rate near zero, and policymakers emphasized that the time had not yet arrived for scaling back asset purchases designed to keep downward pressure on long-term interest rates.
Economic news was also generally positive. According to the latest estimate, U.S. gross domestic product grew at an annualized rate of 6.4% in the first quarter of 2021 following 4.3% growth in the fourth quarter of 2020.
Meanwhile, overall profits for companies in the S&P 500 rose by roughly 52% versus the year before in the first quarter, according to FactSet—the best showing since late 2009.
Inflation data drew increasing attention later in the period as investors tried to assess the impact of higher prices on the broader economy as well as the chance that an overheating economy might lead the Fed to start rolling back its accommodative monetary policies earlier than expected. The central bank’s preferred inflation measure, the core personal consumption expenditures price index, increased 3.1% in the year ended in April, the biggest increase in nearly three decades and above the Fed’s 2% inflation target. However, Fed policymakers stressed that the increase in inflation was a temporary result of the economic recovery and that they remain committed to accommodative policy.
As expected—since higher prices erode the value of the fixed payments provided by bonds—rising inflation concerns were more evident in the fixed income market than in equities. Yields of longer-term Treasuries surged during the first quarter of 2021 as inflation expectations increased, weighing on returns for the sector. (Bond prices and yields move in opposite directions.) High yield bonds, which are less sensitive to interest rate changes, produced strong results, though, and investment-grade corporate bonds also performed well amid solid corporate fundamentals. Mortgage-backed securities, despite considerable Fed support during the period, had negative results amid uncertainty regarding when the central bank would begin tapering its asset purchases.
As we look ahead, the central question for investors—assuming the economy’s recovery from the pandemic continues apace—is whether the returns on financial assets will be as robust. Valuations are elevated in nearly all asset classes, and in some areas, there are clear signs of speculation. It is not an easy environment to invest in, but our investment teams remain rooted in company fundamentals and focused on the long term, and they will continue to apply strong fundamental analysis as they seek out the best investments for your portfolio.
Thank you for your continued confidence in T. Rowe Price.
Sincerely,

Robert Sharps
Group Chief Investment Officer
Management’s Discussion of Fund Performance
INVESTMENT OBJECTIVE
The fund seeks high current income consistent with high overall credit quality and moderate price fluctuation by investing at least 80% of its total assets in Government National Mortgage Association securities backed by the full faith and credit of the U.S. government.
FUND COMMENTARY
How did the fund perform in the past 12 months?
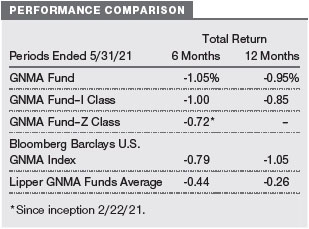
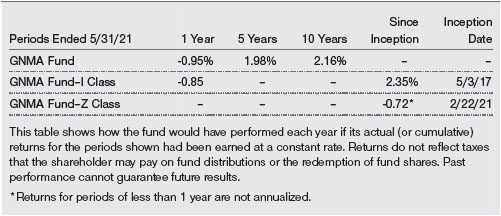
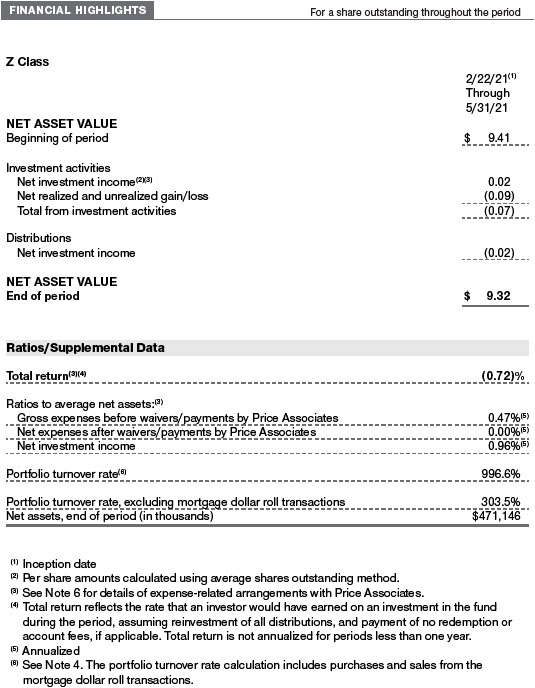
The GNMA Fund returned -0.95% for the 12 months through May 31, 2021, outperforming its benchmark, the Bloomberg Barclays U.S. GNMA Index, while underperforming its Lipper peer group average. (Returns for I and Z Class shares may vary, reflecting their different fee structures. Past performance cannot guarantee future results.)
What factors influenced the fund’s performance?
During the 12-month period, GNMAs produced negative results but outperformed Treasuries on a total return basis. High-quality government bonds faced headwinds, particularly during the second half of our reporting period, from a surge in intermediate- and long-term interest rates.
Sector allocation was the largest contributor to the fund’s performance versus the benchmark over the annual period. We maintained an underweight position in GNMAs in favor of conventional agency mortgage-backed securities (MBS), which are securities issued by Fannie Mae and Freddie Mac. This out-of-benchmark positioning was beneficial as prepayment speeds did not increase as quickly for conventional mortgages as they did for the GNMA segment, which was very reactive to lower rates.
Our positioning within the GNMA sector added value. Our underweight to GNMAs with midrange (2.5% and 3%) coupons was beneficial as they were less exposed to refinancing risk than securities with coupons of 4% and above. Security selection was also a positive factor as our fundamental research and quantitative analysis capabilities helped us identify specified GNMA pools that outperformed based on their lower refinance risk.
Interest rate management detracted from the portfolio’s relative performance. A longer-than-benchmark duration posture hampered results as yields rose sharply over the past six months except at the front end of the yield curve, which remained anchored by the Fed’s zero interest rate policy. The steepening yield curve also weighed on returns. However, the incremental yield we received as a result of our longer-duration position was beneficial.
Our out-of-benchmark position in collateralized mortgage obligations (CMOs) also detracted from the fund’s relative results. These interest-only securities performed poorly amid rapid refinancing activity, which reduced their income streams.
How is the fund positioned?
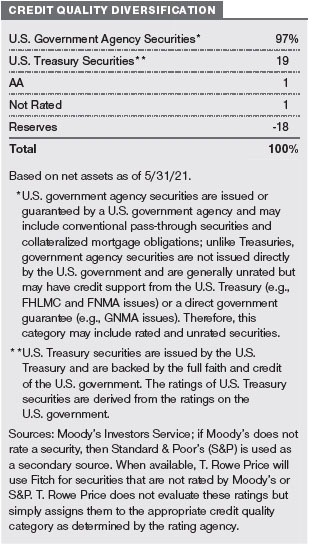
GNMAs represented about 86% of the fund’s net assets at the end of the period, which was down from 95% six months ago but higher than the 81% level at the start of the period. We have trimmed positions in both GNMAs and conventional MBS over the past six months as valuations became less attractive. Instead, we have rotated some assets into Treasuries. With a steeper yield curve, we believe Treasuries offer better total return opportunities, and the sector offers some protection if MBS credit spreads widen from their very low levels.
Within the GNMA sector, the fund favored higher-coupon securities at the end of the period and maintained an underweight position in lower coupons. We also had small positions in interest-only CMOs, which would benefit in a rising rate environment, and high-quality non-agency residential MBS, which are supported by strong housing fundamentals.
The duration of both the portfolio and the benchmark meaningfully extended over the past six months as rising Treasury yields caused mortgage rates to climb. The fund reduced its duration overweight but maintained a slightly longer duration than the index at the end of the period, which can help balance some of the risks in our MBS positioning.
What is portfolio management’s outlook?
As we look ahead to the second half of 2021, we expect potential changes—or discussions about potential changes—to the Federal Reserve’s asset purchase program to be a major focus in the mortgage market.
Since the pandemic-driven market sell-off in March 2020, the Fed has been buying about $40 billion of MBS per month, and while central bank officials have, so far, avoided discussing the timing for reducing purchases, the economic recovery and the strong housing market have increased investor speculation about when the Fed will begin to cut back its support for the sector.
Although discussions by policymakers about when to begin tapering could lead to some volatility, we don’t expect a sharp sell-off in the MBS market—barring unexpected developments. Many investors have a more hawkish view than Fed officials of where monetary policy should be, so a removal of some accommodation wouldn’t be jarring. We also expect tapering to be very gradual. However, we think some repricing is likely as valuations will probably need to cheapen to bring buyers back into the market to replace the demand that the Fed has been providing amid heavy supply.
Although GNMAs continue to be a high-quality segment of the fixed income market, we acknowledge that it is harder in this environment to find attractive valuations in the sector. We have adjusted asset allocations in the portfolio to try to reduce the risks from spread widening, and we are continuing to use our research capabilities to identify parts of the market with the potential to outperform. Security selection remains critical, and we will continue to rely heavily on our extensive team of analysts, who provide careful fundamental and quantitative research on individual bonds.
The views expressed reflect the opinions of T. Rowe Price as of the date of this report and are subject to change based on changes in market, economic, or other conditions. These views are not intended to be a forecast of future events and are no guarantee of future results.
RISK OF GNMA FUND INVESTING
Even though principal and interest payments on GNMAs are guaranteed, an increase in interest rates can cause the share price to decline, resulting in a loss of principal. Investors in bond funds are also subject to several other types of risk—interest rate risk, credit risk, prepayment risk, extension risk, and derivatives risk. Since the fund invests primarily in GNMAs, which are backed by the full faith and credit of the U.S. government, its exposure to credit risk is low. A mortgage-backed bond, unlike most other bonds, can be hurt when interest rates fall because homeowners tend to refinance and prepay principal. Prepayments can cause the average maturity of the portfolio to shorten, require the fund to reinvest proceeds at lower interest rates, or even cause certain bonds’ prices to fall below what the fund paid for them, resulting in a capital loss. Increased interest rates can cause the fund’s average maturity to lengthen unexpectedly due to a drop in mortgage prepayments. Shareholders are also exposed to derivatives risk, the potential that our investments in these complex and volatile instruments could affect the fund’s share price.
BENCHMARK INFORMATION
Note: Bloomberg Index Services Limited. BLOOMBERG® is a trademark and service mark of Bloomberg Finance L.P. and its affiliates (collectively “Bloomberg”). BARCLAYS® is a trademark and service mark of Barclays Bank Plc (collectively with its affiliates, “Barclays”), used under license. Bloomberg or Bloomberg’s licensors, including Barclays, own all proprietary rights in the Bloomberg Barclays Indices. Neither Bloomberg nor Barclays approves or endorses this material, or guarantees the accuracy or completeness of any information herein, or makes any warranty, express or implied, as to the results to be obtained therefrom and, to the maximum extent allowed by law, neither shall have any liability or responsibility for injury or damages arising in connection therewith.
Note: Lipper, a Thomson Reuters Company, is the source for all Lipper content reflected in these materials. Copyright 2021 © Refinitiv. All rights reserved. Any copying, republication or redistribution of Lipper content is expressly prohibited without the prior written consent of Lipper. Lipper shall not be liable for any errors or delays in the content, or for any actions taken in reliance thereon.
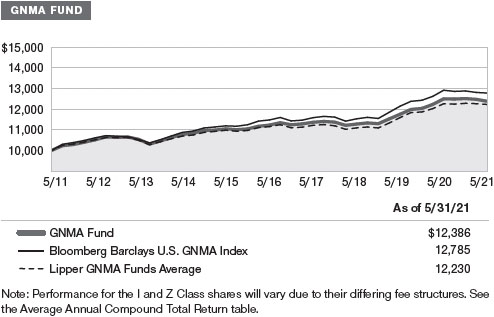
GROWTH OF $10,000
This chart shows the value of a hypothetical $10,000 investment in the fund over the past 10 fiscal year periods or since inception (for funds lacking 10-year records). The result is compared with benchmarks, which include a broad-based market index and may also include a peer group average or index. Market indexes do not include expenses, which are deducted from fund returns as well as mutual fund averages and indexes.
AVERAGE ANNUAL COMPOUND TOTAL RETURN
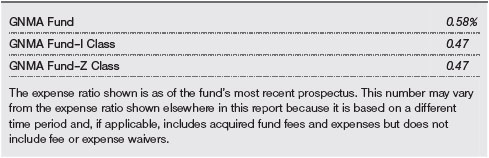
EXPENSE RATIO
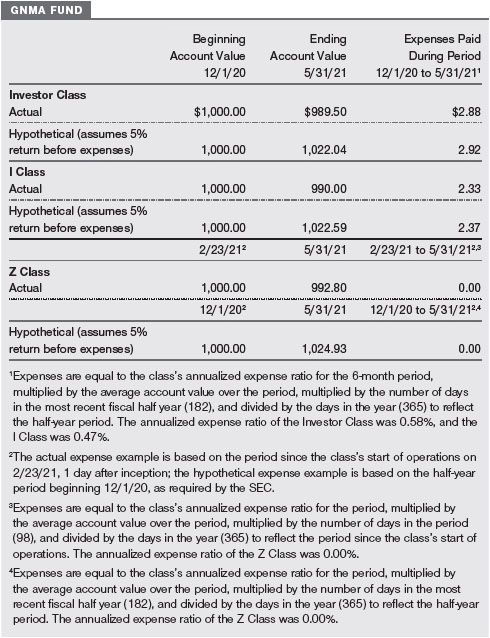
FUND EXPENSE EXAMPLE
As a mutual fund shareholder, you may incur two types of costs: (1) transaction costs, such as redemption fees or sales loads, and (2) ongoing costs, including management fees, distribution and service (12b-1) fees, and other fund expenses. The following example is intended to help you understand your ongoing costs (in dollars) of investing in the fund and to compare these costs with the ongoing costs of investing in other mutual funds. The example is based on an investment of $1,000 invested at the beginning of the most recent six-month period and held for the entire period.
Please note that the fund has three share classes: The original share class (Investor Class) charges no distribution and service (12b-1) fee, I Class shares are also available to institutionally oriented clients and impose no 12b-1 or administrative fee payment, and Z Class shares are offered only to funds advised by T. Rowe Price and other advisory clients of T. Rowe Price or its affiliates that are subject to a contractual fee for investment management services and impose no 12b-1 fee or administrative fee payment. Each share class is presented separately in the table.
Actual Expenses
The first line of the following table (Actual) provides information about actual account values and expenses based on the fund’s actual returns. You may use the information on this line, together with your account balance, to estimate the expenses that you paid over the period. Simply divide your account value by $1,000 (for example, an $8,600 account value divided by $1,000 = 8.6), then multiply the result by the number on the first line under the heading “Expenses Paid During Period” to estimate the expenses you paid on your account during this period.
Hypothetical Example for Comparison Purposes
The information on the second line of the table (Hypothetical) is based on hypothetical account values and expenses derived from the fund’s actual expense ratio and an assumed 5% per year rate of return before expenses (not the fund’s actual return). You may compare the ongoing costs of investing in the fund with other funds by contrasting this 5% hypothetical example and the 5% hypothetical examples that appear in the shareholder reports of the other funds. The hypothetical account values and expenses may not be used to estimate the actual ending account balance or expenses you paid for the period.
Note: T. Rowe Price charges an annual account service fee of $20, generally for accounts with less than $10,000. The fee is waived for any investor whose T. Rowe Price mutual fund accounts total $50,000 or more; accounts electing to receive electronic delivery of account statements, transaction confirmations, prospectuses, and shareholder reports; or accounts of an investor who is a T. Rowe Price Personal Services or Enhanced Personal Services client (enrollment in these programs generally requires T. Rowe Price assets of at least $250,000). This fee is not included in the accompanying table. If you are subject to the fee, keep it in mind when you are estimating the ongoing expenses of investing in the fund and when comparing the expenses of this fund with other funds.
You should also be aware that the expenses shown in the table highlight only your ongoing costs and do not reflect any transaction costs, such as redemption fees or sales loads. Therefore, the second line of the table is useful in comparing ongoing costs only and will not help you determine the relative total costs of owning different funds. To the extent a fund charges transaction costs, however, the total cost of owning that fund is higher.
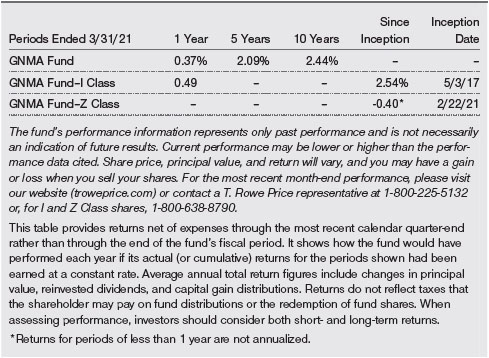
QUARTER-END RETURNS
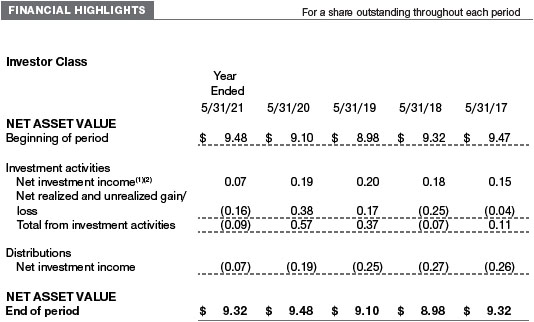
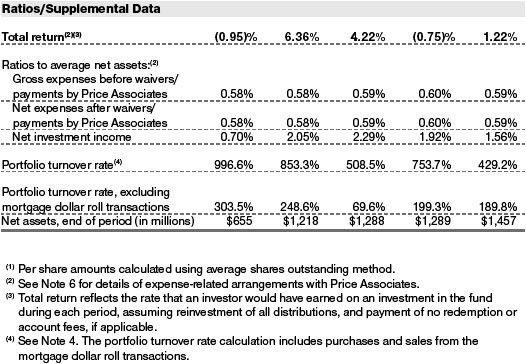
The accompanying notes are an integral part of these financial statements.
The accompanying notes are an integral part of these financial statements.
The accompanying notes are an integral part of these financial statements.
May 31, 2021
The accompanying notes are an integral part of these financial statements.
May 31, 2021
The accompanying notes are an integral part of these financial statements.
The accompanying notes are an integral part of these financial statements.
The accompanying notes are an integral part of these financial statements.
| NOTES TO FINANCIAL STATEMENTS |
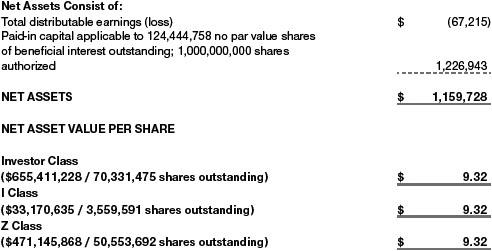
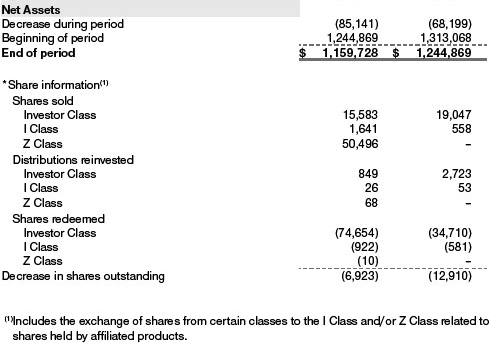
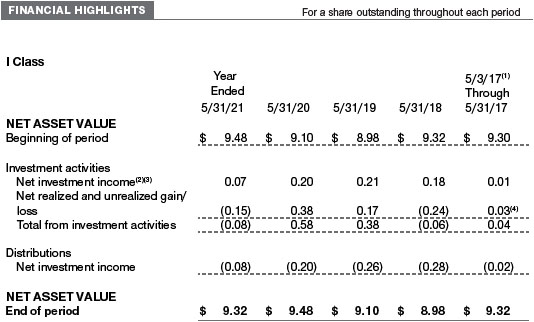
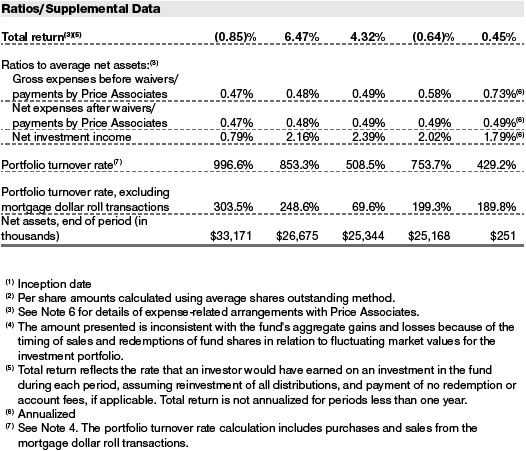
T. Rowe Price GNMA Fund, Inc. (the fund) is registered under the Investment Company Act of 1940 (the 1940 Act) as a diversified, open-end management investment company. The fund seeks high current income consistent with high overall credit quality and moderate price fluctuation by investing at least 80% of its total assets in Government National Mortgage Association securities backed by the full faith and credit of the U.S. government. The fund has three classes of shares: the GNMA Fund (Investor Class), the GNMA Fund–I Class (I Class), and the GNMA Fund–Z Class (Z Class). I Class shares require a $1 million initial investment minimum, although the minimum generally is waived for retirement plans, financial intermediaries, and certain other accounts. The Z Class is only available to funds advised by T. Rowe Price Associates, Inc. and its affiliates and other clients that are subject to a contractual fee for investment management services. Each class has exclusive voting rights on matters related solely to that class; separate voting rights on matters that relate to all classes; and, in all other respects, the same rights and obligations as the other classes.
NOTE 1 - SIGNIFICANT ACCOUNTING POLICIES
Basis of Preparation The fund is an investment company and follows accounting and reporting guidance in the Financial Accounting Standards Board (FASB) Accounting Standards Codification Topic 946 (ASC 946). The accompanying financial statements were prepared in accordance with accounting principles generally accepted in the United States of America (GAAP), including, but not limited to, ASC 946. GAAP requires the use of estimates made by management. Management believes that estimates and valuations are appropriate; however, actual results may differ from those estimates, and the valuations reflected in the accompanying financial statements may differ from the value ultimately realized upon sale or maturity.
Investment Transactions, Investment Income, and Distributions Investment transactions are accounted for on the trade date basis. Income and expenses are recorded on the accrual basis. Realized gains and losses are reported on the identified cost basis. Premiums and discounts on debt securities are amortized for financial reporting purposes. Paydown gains and losses are recorded as an adjustment to interest income. Inflation adjustments to the principal amount of inflation-indexed bonds are reflected as interest income. Income tax-related interest and penalties, if incurred, are recorded as income tax expense. Dividends received from mutual fund investments are reflected as dividend income; capital gain distributions are reflected as realized gain/loss. Dividend income and capital gain distributions are recorded on the ex-dividend date. Non-cash dividends, if any, are recorded at the fair market value of the asset received. Distributions to shareholders are recorded on the ex-dividend date. Income distributions are declared by each class daily and paid monthly. A capital gain distribution may also be declared and paid by the fund annually.
Class Accounting Shareholder servicing, prospectus, and shareholder report expenses incurred by each class are charged directly to the class to which they relate. Expenses common to all classes and investment income are allocated to the classes based upon the relative daily net assets of each class’s settled shares; realized and unrealized gains and losses are allocated based upon the relative daily net assets of each class’s outstanding shares.
Capital Transactions Each investor’s interest in the net assets of the fund is represented by fund shares. The fund’s net asset value (NAV) per share is computed at the close of the New York Stock Exchange (NYSE), normally 4 p.m. ET, each day the NYSE is open for business. However, the NAV per share may be calculated at a time other than the normal close of the NYSE if trading on the NYSE is restricted, if the NYSE closes earlier, or as may be permitted by the SEC. Purchases and redemptions of fund shares are transacted at the next-computed NAV per share, after receipt of the transaction order by T. Rowe Price Associates, Inc., or its agents.
New Accounting Guidance In March 2020, the FASB issued Accounting Standards Update (ASU), ASU 2020–04, Reference Rate Reform (Topic 848) – Facilitation of the Effects of Reference Rate Reform on Financial Reporting, which provides optional, temporary relief with respect to the financial reporting of contracts subject to certain types of modifications due to the planned discontinuation of the London Interbank Offered Rate (LIBOR) and other interbank-offered based reference rates as of the end of 2021. The guidance is effective for certain reference rate-related contract modifications that occur during the period March 12, 2020 through December 31, 2022. Management expects that the adoption of the guidance will not have a material impact on the fund's financial statements.
Indemnification In the normal course of business, the fund may provide indemnification in connection with its officers and directors, service providers, and/or private company investments. The fund’s maximum exposure under these arrangements is unknown; however, the risk of material loss is currently considered to be remote.
NOTE 2 - VALUATION
Fair Value The fund’s financial instruments are valued at the close of the NYSE and are reported at fair value, which GAAP defines as the price that would be received to sell an asset or paid to transfer a liability in an orderly transaction between market participants at the measurement date. The T. Rowe Price Valuation Committee (the Valuation Committee) is an internal committee that has been delegated certain responsibilities by the fund’s Board of Directors (the Board) to ensure that financial instruments are appropriately priced at fair value in accordance with GAAP and the 1940 Act. Subject to oversight by the Board, the Valuation Committee develops and oversees pricing-related policies and procedures and approves all fair value determinations. Specifically, the Valuation Committee establishes policies and procedures used in valuing financial instruments, including those which cannot be valued in accordance with normal procedures or using pricing vendors; determines pricing techniques, sources, and persons eligible to effect fair value pricing actions; evaluates the services and performance of the pricing vendors; oversees the pricing process to ensure policies and procedures are being followed; and provides guidance on internal controls and valuation-related matters. The Valuation Committee provides periodic reporting to the Board on valuation matters.
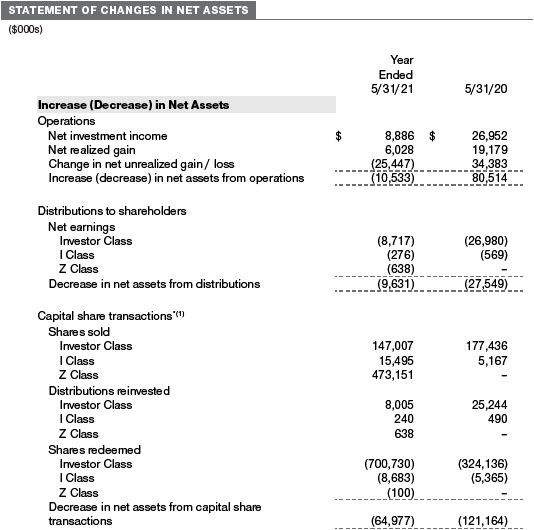
Various valuation techniques and inputs are used to determine the fair value of financial instruments. GAAP establishes the following fair value hierarchy that categorizes the inputs used to measure fair value:
Level 1 – quoted prices (unadjusted) in active markets for identical financial instruments that the fund can access at the reporting date
Level 2 – inputs other than Level 1 quoted prices that are observable, either directly or indirectly (including, but not limited to, quoted prices for similar financial instruments in active markets, quoted prices for identical or similar financial instruments in inactive markets, interest rates and yield curves, implied volatilities, and credit spreads)
Level 3 – unobservable inputs (including the fund's own assumptions in determining fair value)
Observable inputs are developed using market data, such as publicly available information about actual events or transactions, and reflect the assumptions that market participants would use to price the financial instrument. Unobservable inputs are those for which market data are not available and are developed using the best information available about the assumptions that market participants would use to price the financial instrument. GAAP requires valuation techniques to maximize the use of relevant observable inputs and minimize the use of unobservable inputs. When multiple inputs are used to derive fair value, the financial instrument is assigned to the level within the fair value hierarchy based on the lowest-level input that is significant to the fair value of the financial instrument. Input levels are not necessarily an indication of the risk or liquidity associated with financial instruments at that level but rather the degree of judgment used in determining those values.
Valuation Techniques Debt securities generally are traded in the over-the-counter (OTC) market and are valued at prices furnished by independent pricing services or by broker dealers who make markets in such securities. When valuing securities, the independent pricing services consider the yield or price of bonds of comparable quality, coupon, maturity, and type, as well as prices quoted by dealers who make markets in such securities.
Investments in mutual funds are valued at the mutual fund’s closing NAV per share on the day of valuation. Futures contracts are valued at closing settlement prices. Swaps are valued at prices furnished by an independent pricing service or independent swap dealers. Assets and liabilities other than financial instruments, including short-term receivables and payables, are carried at cost, or estimated realizable value, if less, which approximates fair value.
Investments for which market quotations or market-based valuations are not readily available or deemed unreliable are valued at fair value as determined in good faith by the Valuation Committee, in accordance with fair valuation policies and procedures. The objective of any fair value pricing determination is to arrive at a price that could reasonably be expected from a current sale. Financial instruments fair valued by the Valuation Committee are primarily private placements, restricted securities, warrants, rights, and other securities that are not publicly traded. Factors used in determining fair value vary by type of investment and may include market or investment specific considerations. The Valuation Committee typically will afford greatest weight to actual prices in arm’s length transactions, to the extent they represent orderly transactions between market participants, transaction information can be reliably obtained, and prices are deemed representative of fair value. However, the Valuation Committee may also consider other valuation methods such as market-based valuation multiples; a discount or premium from market value of a similar, freely traded security of the same issuer; discounted cash flows; yield to maturity; or some combination. Fair value determinations are reviewed on a regular basis and updated as information becomes available, including actual purchase and sale transactions of the investment. Because any fair value determination involves a significant amount of judgment, there is a degree of subjectivity inherent in such pricing decisions, and fair value prices determined by the Valuation Committee could differ from those of other market participants.
Valuation Inputs The following table summarizes the fund’s financial instruments, based on the inputs used to determine their fair values on May 31, 2021 (for further detail by category, please refer to the accompanying Portfolio of Investments):
NOTE 3 - DERIVATIVE INSTRUMENTS
During the year ended May 31, 2021, the fund invested in derivative instruments. As defined by GAAP, a derivative is a financial instrument whose value is derived from an underlying security price, foreign exchange rate, interest rate, index of prices or rates, or other variable; it requires little or no initial investment and permits or requires net settlement. The fund invests in derivatives only if the expected risks and rewards are consistent with its investment objectives, policies, and overall risk profile, as described in its prospectus and Statement of Additional Information. The fund may use derivatives for a variety of purposes, such as seeking to hedge against declines in principal value, increase yield, invest in an asset with greater efficiency and at a lower cost than is possible through direct investment, to enhance return, or to adjust portfolio duration and credit exposure. The risks associated with the use of derivatives are different from, and potentially much greater than, the risks associated with investing directly in the instruments on which the derivatives are based. The fund at all times maintains sufficient cash reserves, liquid assets, or other SEC-permitted asset types to cover its settlement obligations under open derivative contracts.
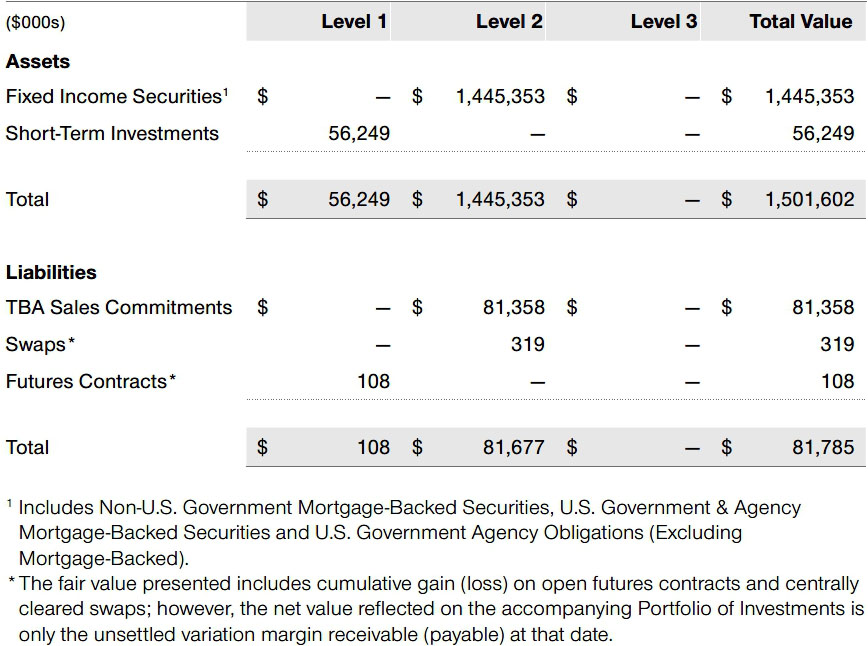
The fund values its derivatives at fair value and recognizes changes in fair value currently in its results of operations. Accordingly, the fund does not follow hedge accounting, even for derivatives employed as economic hedges. Generally, the fund accounts for its derivatives on a gross basis. It does not offset the fair value of derivative liabilities against the fair value of derivative assets on its financial statements, nor does it offset the fair value of derivative instruments against the right to reclaim or obligation to return collateral. The following table summarizes the fair value of the fund’s derivative instruments held as of May 31, 2021, and the related location on the accompanying Statement of Assets and Liabilities, presented by primary underlying risk exposure:
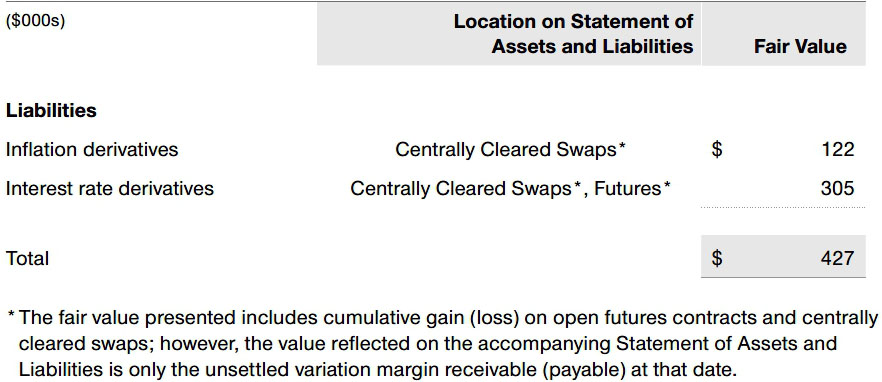
Additionally, the amount of gains and losses on derivative instruments recognized in fund earnings during the year ended May 31, 2021, and the related location on the accompanying Statement of Operations is summarized in the following table by primary underlying risk exposure:
Counterparty Risk and Collateral The fund invests in exchange-traded or centrally cleared derivative contracts, such as futures, exchange-traded options, and centrally cleared swaps. Counterparty risk on such derivatives is minimal because the clearinghouse provides protection against counterparty defaults. For futures and centrally cleared swaps, the fund is required to deposit collateral in an amount specified by the clearinghouse and the clearing firm (margin requirement), and the margin requirement must be maintained over the life of the contract. Each clearinghouse and clearing firm, in its sole discretion, may adjust the margin requirements applicable to the fund.
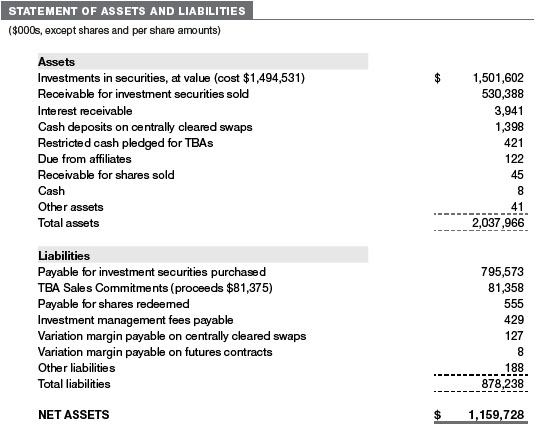
Collateral may be in the form of cash or debt securities issued by the U.S. government or related agencies. Cash posted by the fund is reflected as cash deposits in the accompanying financial statements and generally is restricted from withdrawal by the fund; securities posted by the fund are so noted in the accompanying Portfolio of Investments; both remain in the fund’s assets. While typically not sold in the same manner as equity or fixed income securities, exchange-traded or centrally cleared derivatives may be closed out only on the exchange or clearinghouse where the contracts were traded. This ability is subject to the liquidity of underlying positions. As of May 31, 2021, cash of $1,398,000 and securities valued at $475,000 had been posted by the fund for exchange-traded and/or centrally cleared derivatives.
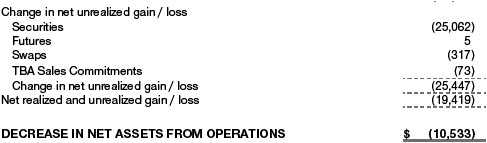
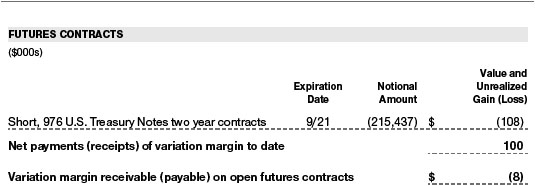
Futures Contracts The fund is subject to interest rate risk in the normal course of pursuing its investment objectives and uses futures contracts to help manage such risk. The fund may enter into futures contracts to manage exposure to interest rate and yield curve movements, security prices, foreign currencies, credit quality, and mortgage prepayments; as an efficient means of adjusting exposure to all or part of a target market; to enhance income; as a cash management tool; or to adjust portfolio duration and credit exposure. A futures contract provides for the future sale by one party and purchase by another of a specified amount of a specific underlying financial instrument at an agreed-upon price, date, time, and place. The fund currently invests only in exchange-traded futures, which generally are standardized as to maturity date, underlying financial instrument, and other contract terms. Payments are made or received by the fund each day to settle daily fluctuations in the value of the contract (variation margin), which reflect changes in the value of the underlying financial instrument. Variation margin is recorded as unrealized gain or loss until the contract is closed. The value of a futures contract included in net assets is the amount of unsettled variation margin; net variation margin receivable is reflected as an asset and net variation margin payable is reflected as a liability on the accompanying Statement of Assets and Liabilities. Risks related to the use of futures contracts include possible illiquidity of the futures markets, contract prices that can be highly volatile and imperfectly correlated to movements in hedged security values and/or interest rates, and potential losses in excess of the fund’s initial investment. During the year ended May 31, 2021, the volume of the fund’s activity in futures, based on underlying notional amounts, was generally between 0% and 18% of net assets.
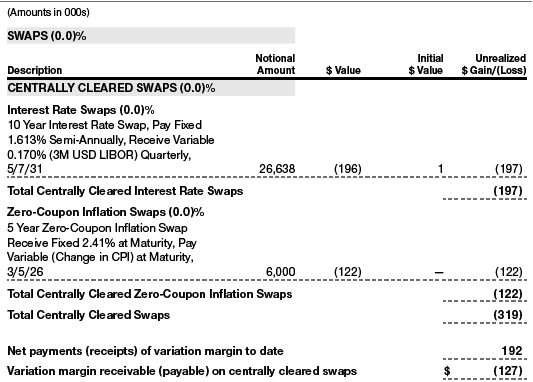
Swaps The fund is subject to interest rate risk, credit risk and inflation risk in the normal course of pursuing its investment objectives and uses swap contracts to help manage such risks. The fund may use swaps in an effort to manage both long and short exposure to changes in interest rates, inflation rates, and credit quality; to adjust overall exposure to certain markets; to enhance total return or protect the value of portfolio securities; to serve as a cash management tool; or to adjust portfolio duration and credit exposure. Swap agreements can be settled either directly with the counterparty (bilateral swap) or through a central clearinghouse (centrally cleared swap). Fluctuations in the fair value of a contract are reflected in unrealized gain or loss and are reclassified to realized gain or loss upon contract termination or cash settlement. Net periodic receipts or payments required by a contract increase or decrease, respectively, the value of the contract until the contractual payment date, at which time such amounts are reclassified from unrealized to realized gain or loss. For bilateral swaps, cash payments are made or received by the fund on a periodic basis in accordance with contract terms; unrealized gain on contracts and premiums paid are reflected as assets and unrealized loss on contracts and premiums received are reflected as liabilities on the accompanying Statement of Assets and Liabilities. For bilateral swaps, premiums paid or received are amortized over the life of the swap and are recognized as realized gain or loss in the Statement of Operations. For centrally cleared swaps, payments are made or received by the fund each day to settle the daily fluctuation in the value of the contract (variation margin). Accordingly, the value of a centrally cleared swap included in net assets is the unsettled variation margin; net variation margin receivable is reflected as an asset and net variation margin payable is reflected as a liability on the accompanying Statement of Assets and Liabilities.
Interest rate swaps are agreements to exchange cash flows based on the difference between specified interest rates applied to a notional principal amount for a specified period of time. Risks related to the use of interest rate swaps include the potential for unanticipated movements in interest or currency rates, the possible failure of a counterparty to perform in accordance with the terms of the swap agreements, potential government regulation that could adversely affect the fund’s swap investments, and potential losses in excess of the fund’s initial investment.
Credit default swaps are agreements where one party (the protection buyer) agrees to make periodic payments to another party (the protection seller) in exchange for protection against specified credit events, such as certain defaults and bankruptcies related to an underlying credit instrument, or issuer or index of such instruments. Upon occurrence of a specified credit event, the protection seller is required to pay the buyer the difference between the notional amount of the swap and the value of the underlying credit, either in the form of a net cash settlement or by paying the gross notional amount and accepting delivery of the relevant underlying credit. For credit default swaps where the underlying credit is an index, a specified credit event may affect all or individual underlying securities included in the index and will be settled based upon the relative weighting of the affected underlying security(ies) within the index. Risks related to the use of credit default swaps include the possible inability of the fund to accurately assess the current and future creditworthiness of underlying issuers, the possible failure of a counterparty to perform in accordance with the terms of the swap agreements, potential government regulation that could adversely affect the fund’s swap investments, and potential losses in excess of the fund’s initial investment.
Zero-coupon inflation swaps are agreements to exchange cash flows, on the contract’s maturity date, based on the difference between a predetermined fixed rate and the cumulative change in the consumer price index, both applied to a notional principal amount for a specified period of time. Risks related to the use of zero-coupon inflation swaps include the potential for unanticipated movements in inflation rates, the possible failure of a counterparty to perform in accordance with the terms of the swap agreements, potential government regulation that could adversely affect the fund’s swap investments, and potential losses in excess of the fund’s initial investment.
During the year ended May 31, 2021, the volume of the fund’s activity in swaps, based on underlying notional amounts, was generally between 0% and 3% of net assets.
NOTE 4 - OTHER INVESTMENT TRANSACTIONS
Consistent with its investment objective, the fund engages in the following practices to manage exposure to certain risks and/or to enhance performance. The investment objective, policies, program, and risk factors of the fund are described more fully in the fund’s prospectus and Statement of Additional Information.
Restricted Securities The fund invests in securities that are subject to legal or contractual restrictions on resale. Prompt sale of such securities at an acceptable price may be difficult and may involve substantial delays and additional costs.
Collateralized Loan Obligations The fund invests in collateralized loan obligations (CLOs) which are entities backed by a diversified pool of syndicated bank loans. The cash flows of the CLO can be split into multiple segments, called “tranches” or “classes”, which will vary in risk profile and yield. The riskiest segments, which are the subordinate or “equity” tranches, bear the greatest risk of loss from defaults in the underlying assets of the CLO and serve to protect the other, more senior, tranches. Senior tranches will typically have higher credit ratings and lower yields than the securities underlying the CLO. Despite the protection from the more junior tranches, senior tranches can experience substantial losses.
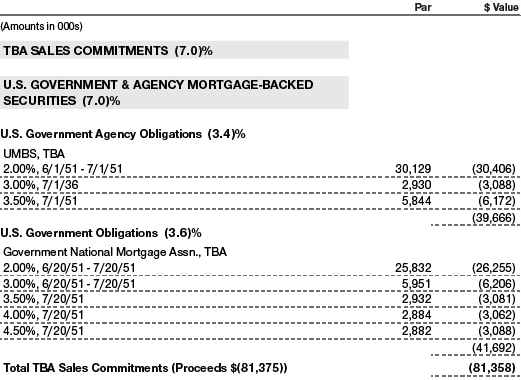
TBA Purchase, Sale Commitments and Forward Settling Mortgage Obligations The fund enters into to-be-announced (TBA) purchase or sale commitments (collectively, TBA transactions), pursuant to which it agrees to purchase or sell, respectively, mortgage-backed securities for a fixed unit price, with payment and delivery at a scheduled future date beyond the customary settlement period for such securities. With TBA transactions, the particular securities to be received or delivered by the fund are not identified at the trade date; however, the securities must meet specified terms, including rate and mortgage term, and be within industry-accepted “good delivery” standards. The fund may enter into TBA transactions with the intention of taking possession of or relinquishing the underlying securities, may elect to extend the settlement by “rolling” the transaction, and/or may use TBA transactions to gain or reduce interim exposure to underlying securities. Until settlement, the fund maintains liquid assets sufficient to settle its commitment to purchase a TBA or, in the case of a sale commitment, the fund maintains an entitlement to the security to be sold.
To mitigate counterparty risk, the fund has entered into Master Securities Forward Transaction Agreements (MSFTA) with counterparties that provide for collateral and the right to offset amounts due to or from those counterparties under specified conditions. Subject to minimum transfer amounts, collateral requirements are determined and transfers made based on the net aggregate unrealized gain or loss on all TBA commitments and other forward settling mortgage obligations with a particular counterparty (collectively, MSFTA Transactions). At any time, the fund’s risk of loss from a particular counterparty related to its MSFTA Transactions is the aggregate unrealized gain on appreciated MSFTA Transactions in excess of unrealized loss on depreciated MSFTA Transactions and collateral received, if any, from such counterparty. As of May 31, 2021, cash of $421,000 had been posted by the fund to counterparties for MSFTA Transactions. Collateral pledged by counterparties to the fund for MSFTA Transactions consisted of $171,000 cash as of May 31, 2021.
Dollar Rolls The fund enters into dollar roll transactions, pursuant to which it sells a mortgage-backed TBA or security and simultaneously agrees to purchase a similar, but not identical, TBA with the same issuer, rate, and terms on a later date at a set price from the same counterparty. The fund may execute a “roll” to obtain better underlying mortgage securities or to enhance returns. While the fund may enter into dollar roll transactions with the intention of taking possession of the underlying mortgage securities, it may also close a contract prior to settlement or “roll” settlement to a later date if deemed to be in the best interest of shareholders. Actual mortgages received by the fund may be less favorable than those anticipated. The fund accounts for dollar roll transactions as purchases and sales, which has the effect of increasing its portfolio turnover rate.
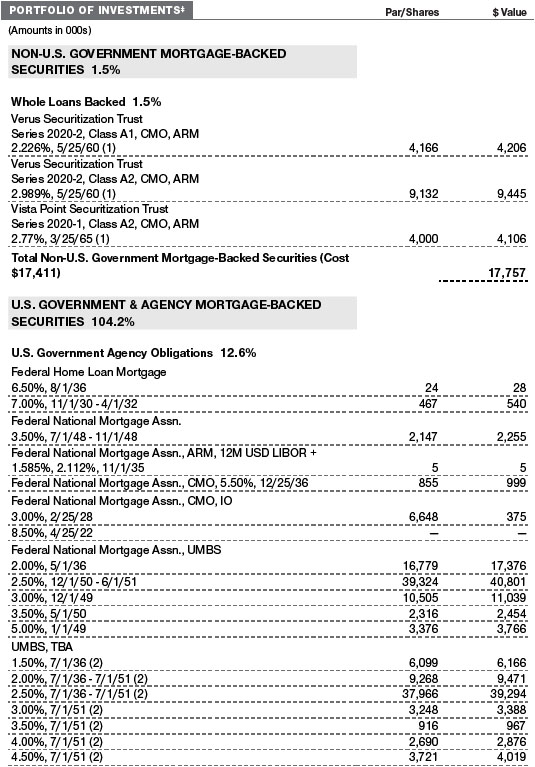
Mortgage-Backed Securities The fund invests in mortgage-backed securities (MBS or pass-through certificates) that represent an interest in a pool of specific underlying mortgage loans and entitle the fund to the periodic payments of principal and interest from those mortgages. MBS may be issued by government agencies or corporations, or private issuers. Most MBS issued by government agencies are guaranteed; however, the degree of protection differs based on the issuer. The fund also invests in stripped MBS, created when a traditional MBS is split into an interest-only (IO) and a principal-only (PO) strip. MBS, including IOs and POs, are sensitive to changes in economic conditions that affect the rate of prepayments and defaults on the underlying mortgages; accordingly, the value, income, and related cash flows from MBS may be more volatile than other debt instruments. IOs also risk loss of invested principal from faster-than-anticipated prepayments.
LIBOR The fund may invest in instruments that are tied to reference rates, including LIBOR. On March 5, 2021, the ICE Benchmark Administration Limited, the administrator of LIBOR, announced its intention to cease publishing a majority of the USD LIBOR settings immediately after publication on June 30, 2023, with the remaining USD LIBOR settings to end immediately after publication on December 31, 2021. There remains uncertainty regarding the future utilization of LIBOR and the nature of any replacement rate. Any potential effects of the transition away from LIBOR on the fund, or on certain instruments in which the fund invests, are not known. The transition process may result in, among other things, an increase in volatility or illiquidity of markets for instruments that currently rely on LIBOR, a reduction in the value of certain instruments held by the fund, or a reduction in the effectiveness of related fund transactions such as hedges. Any such effects could have an adverse impact on the fund's performance.
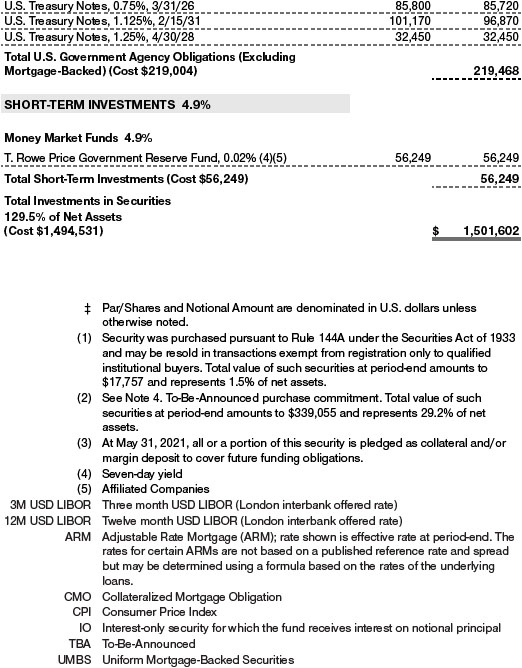
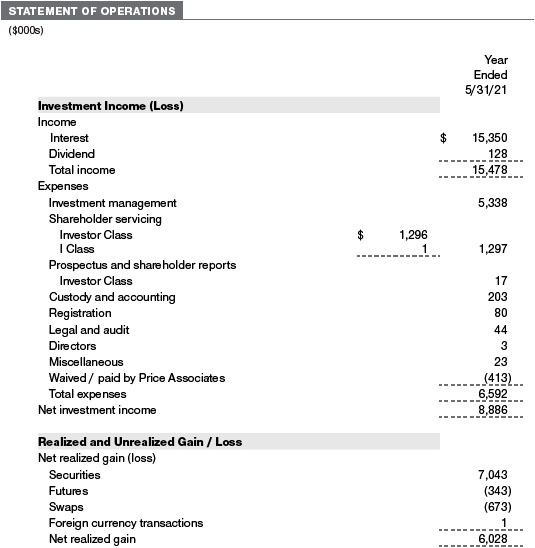
Other Purchases and sales of portfolio securities other than short-term and U.S. government securities aggregated $8,827,000 and $28,675,000, respectively, for the year ended May 31, 2021. Purchases and sales of U.S. government securities aggregated $14,126,230,000 and $13,952,170,000, respectively, for the year ended May 31, 2021.
NOTE 5 - FEDERAL INCOME TAXES
Generally, no provision for federal income taxes is required since the fund intends to continue to qualify as a regulated investment company under Subchapter M of the Internal Revenue Code and distribute to shareholders all of its taxable income and gains. Distributions determined in accordance with federal income tax regulations may differ in amount or character from net investment income and realized gains for financial reporting purposes.
The fund files U.S. federal, state, and local tax returns as required. The fund’s tax returns are subject to examination by the relevant tax authorities until expiration of the applicable statute of limitations, which is generally three years after the filing of the tax return but which can be extended to six years in certain circumstances. Tax returns for open years have incorporated no uncertain tax positions that require a provision for income taxes.
Financial reporting records are adjusted for permanent book/tax differences to reflect tax character but are not adjusted for temporary differences. The permanent book/tax adjustments have no impact on results of operations or net assets and relate primarily to an over-distribution of taxable income not deemed a return of capital for tax purposes and the character of income on swaps. For the year ended May 31, 2021, the following reclassification was recorded:
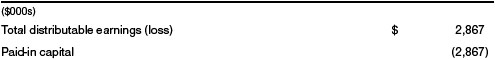
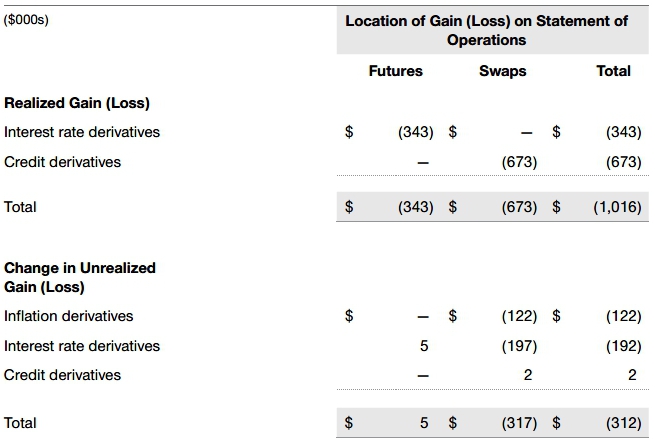
Distributions during the years ended May 31, 2021 and May 31, 2020, totaled $9,631,000 and $27,549,000, respectively, and were characterized as ordinary income for tax purposes. At May 31, 2021, the tax-basis cost of investments, including derivatives, and components of net assets were as follows:
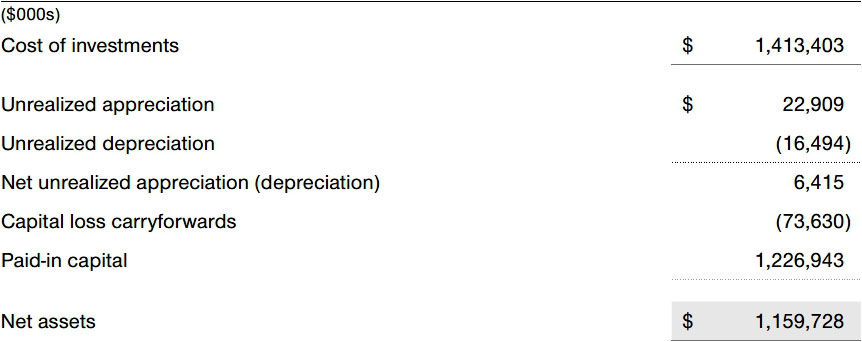
The fund intends to retain realized gains to the extent of available capital loss carryforwards. Net realized capital losses may be carried forward indefinitely to offset future realized capital gains. During the year ended May 31, 2021, the fund utilized $6,245,000 of capital loss carryforwards.
NOTE 6 - RELATED PARTY TRANSACTIONS
The fund is managed by T. Rowe Price Associates, Inc. (Price Associates), a wholly owned subsidiary of T. Rowe Price Group, Inc. (Price Group). The investment management agreement between the fund and Price Associates provides for an annual investment management fee, which is computed daily and paid monthly. The fee consists of an individual fund fee, equal to 0.15% of the fund’s average daily net assets, and a group fee. The group fee rate is calculated based on the combined net assets of certain mutual funds sponsored by Price Associates (the group) applied to a graduated fee schedule, with rates ranging from 0.48% for the first $1 billion of assets to 0.260% for assets in excess of $845 billion. The fund’s group fee is determined by applying the group fee rate to the fund’s average daily net assets. The fee is computed daily and paid monthly. At May 31, 2021, the effective annual group fee rate was 0.28%.
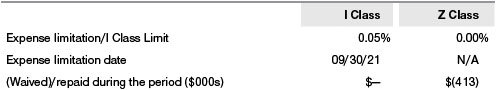
The I Class is subject to an operating expense limitation (I Class Limit) pursuant to which Price Associates is contractually required to pay all operating expenses of the I Class, excluding management fees; interest; expenses related to borrowings, taxes, and brokerage; and other non-recurring expenses permitted by the investment management agreement, to the extent such operating expenses, on an annualized basis, exceed the I Class Limit. This agreement will continue through the expense limitation date indicated in the table below, and may be renewed, revised, or revoked only with approval of the fund’s Board. The I Class is required to repay Price Associates for expenses previously paid to the extent the class’s net assets grow or expenses decline sufficiently to allow repayment without causing the class’s operating expenses (after the repayment is taken into account) to exceed the lesser of: (1) the I Class Limit in place at the time such amounts were paid; or (2) the current I Class Limit. However, no repayment will be made more than three years after the date of a payment or waiver.
The Z Class is also subject to a contractual expense limitation agreement whereby Price Associates has agreed to waive and/or bear all of the Z Class’ expenses (excluding interest; expenses related to borrowings, taxes, and brokerage; and nonrecurring expenses) in their entirety. This fee waiver and/or expense reimbursement arrangement is expected to remain in place indefinitely, and the agreement may only be amended or terminated with approval by the fund’s Board. Expenses of the fund waived/paid by the manager are not subject to later repayment by the fund.
In addition, the fund has entered into service agreements with Price Associates and two wholly owned subsidiaries of Price Associates, each an affiliate of the fund (collectively, Price). Price Associates provides certain accounting and administrative services to the fund. T. Rowe Price Services, Inc. provides shareholder and administrative services in its capacity as the fund’s transfer and dividend-disbursing agent. T. Rowe Price Retirement Plan Services, Inc. provides subaccounting and recordkeeping services for certain retirement accounts invested in the Investor Class. For the year ended May 31, 2021, expenses incurred pursuant to these service agreements were $69,000 for Price Associates; $516,000 for T. Rowe Price Services, Inc.; and $56,000 for T. Rowe Price Retirement Plan Services, Inc. All amounts due to and due from Price, exclusive of investment management fees payable, are presented net on the accompanying Statement of Assets and Liabilities.
The fund is also one of several mutual funds sponsored by Price Associates (underlying Price Funds) in which the T. Rowe Price Spectrum Funds (Spectrum Funds) have invested. The Spectrum Funds do not invest in the underlying Price Funds for the purpose of exercising management or control. Prior to March 24, 2021, pursuant to special servicing agreements, expenses associated with the operation of the Spectrum Funds were borne by each underlying Price Fund to the extent of estimated savings to it and in proportion to the average daily value of its shares owned by the Spectrum Funds. These special servicing arrangements between the fund and the Spectrum Funds terminated on March 24, 2021. Expenses allocated under these special servicing agreements are reflected as shareholder servicing expense in the accompanying financial statements. For the year ended May 31, 2021, the fund was allocated $397,000 of Spectrum Funds’ expenses. Of these amounts, $254,000 related to services provided by Price. All amounts due to and due from Price, exclusive of investment management fees payable, are presented net on the accompanying Statement of Assets and Liabilities. At May 31, 2021, approximately 100% of the outstanding shares of the Z Class were held by the Spectrum Funds.
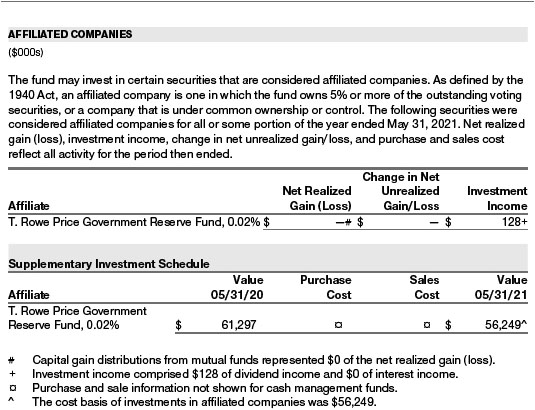
The fund may invest its cash reserves in certain open-end management investment companies managed by Price Associates and considered affiliates of the fund: the T. Rowe Price Government Reserve Fund or the T. Rowe Price Treasury Reserve Fund, organized as money market funds, or the T. Rowe Price Short-Term Fund, a short-term bond fund (collectively, the Price Reserve Funds). The Price Reserve Funds are offered as short-term investment options to mutual funds, trusts, and other accounts managed by Price Associates or its affiliates and are not available for direct purchase by members of the public. Cash collateral from securities lending is invested in the T. Rowe Price Short-Term Fund. The Price Reserve Funds pay no investment management fees.
The fund may participate in securities purchase and sale transactions with other funds or accounts advised by Price Associates (cross trades), in accordance with procedures adopted by the fund’s Board and Securities and Exchange Commission rules, which require, among other things, that such purchase and sale cross trades be effected at the independent current market price of the security. During the year ended May 31, 2021, the fund had no purchases or sales cross trades with other funds or accounts advised by Price Associates.
NOTE 7 - OTHER MATTERS
Unpredictable events such as environmental or natural disasters, war, terrorism, pandemics, outbreaks of infectious diseases, and similar public health threats may significantly affect the economy and the markets and issuers in which a fund invests. Certain events may cause instability across global markets, including reduced liquidity and disruptions in trading markets, while some events may affect certain geographic regions, countries, sectors, and industries more significantly than others, and exacerbate other pre-existing political, social, and economic risks. During 2020, a novel strain of coronavirus (COVID-19) resulted in disruptions to global business activity and caused significant volatility and declines in global financial markets.
These types of events, such as the global pandemic caused by COVID-19, may also cause widespread fear and uncertainty, and result in, among other things: enhanced health screenings, quarantines, cancellations, and travel restrictions, including border closings; disruptions to business operations and supply chains and customer activity; exchange trading suspensions and closures, and overall reduced liquidity of securities, derivatives, and commodities trading markets; reductions in consumer demand and economic output; and significant challenges in healthcare service preparation and delivery. The fund could be negatively impacted if the value of a portfolio holding were harmed by such political or economic conditions or events. In addition, the operations of the fund, its investment advisers, and the fund’s service providers may be significantly impacted, or even temporarily halted, as a result of any impairment to their information technology and other operation systems, extensive employee illnesses or unavailability, government quarantine measures, and restrictions on travel or meetings and other factors related to public emergencies.
Governmental and quasi-governmental authorities and regulators have in the past responded to major economic disruptions with a variety of significant fiscal and monetary policy changes, including but not limited to, direct capital infusions into companies, new monetary programs, and dramatically lower interest rates. An unexpected or quick reversal of these policies, or the ineffectiveness of these policies, could negatively impact overall investor sentiment and further increase volatility in securities markets.
REPORT OF INDEPENDENT REGISTERED PUBLIC ACCOUNTING FIRM
To the Board of Directors and Shareholders of T. Rowe Price GNMA Fund, Inc.
Opinion on the Financial Statements
We have audited the accompanying statement of assets and liabilities, including the portfolio of investments, of T. Rowe Price GNMA Fund, Inc. (the “Fund”) as of May 31, 2021, the related statement of operations for the year ended May 31, 2021, the statement of changes in net assets for each of the two years in the period ended May 31, 2021, including the related notes, and the financial highlights for each of the periods indicated therein (collectively referred to as the “financial statements”). In our opinion, the financial statements present fairly, in all material respects, the financial position of the Fund as of May 31, 2021, the results of its operations for the year then ended, the changes in its net assets for each of the two years in the period ended May 31, 2021 and the financial highlights for each of the periods indicated therein, in conformity with accounting principles generally accepted in the United States of America.
Basis for Opinion
These financial statements are the responsibility of the Fund’s management. Our responsibility is to express an opinion on the Fund’s financial statements based on our audits. We are a public accounting firm registered with the Public Company Accounting Oversight Board (United States) (PCAOB) and are required to be independent with respect to the Fund in accordance with the U.S. federal securities laws and the applicable rules and regulations of the Securities and Exchange Commission and the PCAOB.
We conducted our audits of these financial statements in accordance with the standards of the PCAOB. Those standards require that we plan and perform the audit to obtain reasonable assurance about whether the financial statements are free of material misstatement, whether due to error or fraud.
Our audits included performing procedures to assess the risks of material misstatement of the financial statements, whether due to error or fraud, and performing procedures that respond to those risks. Such procedures included examining, on a test basis, evidence regarding the amounts and disclosures in the financial statements. Our audits also included evaluating the accounting principles used and significant estimates made by management, as well as evaluating the overall presentation of the financial statements. Our procedures included confirmation of securities owned as of May 31, 2021 by correspondence with the custodian, transfer agent and brokers; when replies were not received from brokers, we performed other auditing procedures. We believe that our audits provide a reasonable basis for our opinion.
PricewaterhouseCoopers LLP
Baltimore, Maryland
July 20, 2021
We have served as the auditor of one or more investment companies in the T. Rowe Price group of investment companies since 1973.
TAX INFORMATION (UNAUDITED) FOR THE TAX YEAR ENDED 5/31/21
We are providing this information as required by the Internal Revenue Code. The amounts shown may differ from those elsewhere in this report because of differences between tax and financial reporting requirements.
For nonresident alien shareholders, $8,892,000 of income dividends are interest-related dividends.
For shareholders subject to interest expense deduction limitation under Section 163(j), $8,744,000 of the fund’s income qualifies as a Section 163(j) interest dividend and can be treated as interest income for purposes of Section 163(j), subject to holding period requirements and other limitations.
INFORMATION ON PROXY VOTING POLICIES, PROCEDURES, AND RECORDS
A description of the policies and procedures used by T. Rowe Price funds to determine how to vote proxies relating to portfolio securities is available in each fund’s Statement of Additional Information. You may request this document by calling 1-800-225-5132 or by accessing the SEC’s website, sec.gov.
The description of our proxy voting policies and procedures is also available on our corporate website. To access it, please visit the following Web page:
https://www.troweprice.com/corporate/en/utility/policies.html
Scroll down to the section near the bottom of the page that says, “Proxy Voting Policies.” Click on the Proxy Voting Policies link in the shaded box.
Each fund’s most recent annual proxy voting record is available on our website and through the SEC’s website. To access it through T. Rowe Price, visit the website location shown above, and scroll down to the section near the bottom of the page that says, “Proxy Voting Records.” Click on the Proxy Voting Records link in the shaded box.
HOW TO OBTAIN QUARTERLY PORTFOLIO HOLDINGS
The fund files a complete schedule of portfolio holdings with the Securities and Exchange Commission (SEC) for the first and third quarters of each fiscal year as an exhibit to its reports on Form N-PORT. The fund’s reports on Form N-PORT are available electronically on the SEC’s website (sec.gov). In addition, most T. Rowe Price funds disclose their first and third fiscal quarter-end holdings on troweprice.com.
APPROVAL OF INVESTMENT MANAGEMENT AGREEMENT
Each year, the fund’s Board of Directors (Board) considers the continuation of the investment management agreement (Advisory Contract) between the fund and its investment advisor, T. Rowe Price Associates, Inc. (Advisor). In that regard, at a meeting held on March 8–9, 2021 (Meeting), the Board, including all of the fund’s independent directors, approved the continuation of the fund’s Advisory Contract. At the Meeting, the Board considered the factors and reached the conclusions described below relating to the selection of the Advisor and the approval of the Advisory Contract. The independent directors were assisted in their evaluation of the Advisory Contract by independent legal counsel from whom they received separate legal advice and with whom they met separately.
In providing information to the Board, the Advisor was guided by a detailed set of requests for information submitted by independent legal counsel on behalf of the independent directors. In considering and approving the Advisory Contract, the Board considered the information it believed was relevant, including, but not limited to, the information discussed below. The Board considered not only the specific information presented in connection with the Meeting but also the knowledge gained over time through interaction with the Advisor about various topics. The Board meets regularly and, at each of its meetings, covers an extensive agenda of topics and materials and considers factors that are relevant to its annual consideration of the renewal of the T. Rowe Price funds’ advisory contracts, including performance and the services and support provided to the funds and their shareholders.
Services Provided by the Advisor
The Board considered the nature, quality, and extent of the services provided to the fund by the Advisor. These services included, but were not limited to, directing the fund’s investments in accordance with its investment program and the overall management of the fund’s portfolio, as well as a variety of related activities such as financial, investment operations, and administrative services; compliance; maintaining the fund’s records and registrations; and shareholder communications. The Board also reviewed the background and experience of the Advisor’s senior management team and investment personnel involved in the management of the fund, as well as the Advisor’s compliance record. The Board concluded that it was satisfied with the nature, quality, and extent of the services provided by the Advisor.
Investment Performance of the Fund
The Board took into account discussions with the Advisor and reports that it receives throughout the year relating to fund performance. In connection with the Meeting, the Board reviewed the fund’s net annualized total returns for the 1-, 2-, 3-, 4-, 5-, and 10-year periods as of September 30, 2020, and compared these returns with the performance of a peer group of funds with similar investment programs and a wide variety of other previously agreed-upon comparable performance measures and market data, including those supplied by Broadridge, which is an independent provider of mutual fund data.
On the basis of this evaluation and the Board’s ongoing review of investment results, and factoring in the relative market conditions during certain of the performance periods, the Board concluded that the fund’s performance was satisfactory.
Costs, Benefits, Profits, and Economies of Scale
The Board reviewed detailed information regarding the revenues received by the Advisor under the Advisory Contract and other direct and indirect benefits that the Advisor (and its affiliates) may have realized from its relationship with the fund. In considering soft-dollar arrangements pursuant to which research may be received from broker-dealers that execute the fund’s portfolio transactions, the Board noted that the Advisor bears the cost of research services for all client accounts that it advises, including the T. Rowe Price funds. The Board received information on the estimated costs incurred and profits realized by the Advisor from managing the T. Rowe Price funds. The Board also reviewed estimates of the profits realized from managing the fund in particular, and the Board concluded that the Advisor’s profits were reasonable in light of the services provided to the fund.
The Board also considered whether the fund benefits under the fee levels set forth in the Advisory Contract from any economies of scale realized by the Advisor. Under the Advisory Contract, the fund pays a fee to the Advisor for investment management services composed of two components—a group fee rate based on the combined average net assets of most of the T. Rowe Price funds (including the fund) that declines at certain asset levels and an individual fund fee rate based on the fund’s average daily net assets—and the fund pays its own expenses of operations. The Board concluded that the advisory fee structure for the fund continued to provide for a reasonable sharing of benefits from any economies of scale with the fund’s investors.
Fees and Expenses
The Board was provided with information regarding industry trends in management fees and expenses. Among other things, the Board reviewed data for peer groups that were compiled by Broadridge, which compared: (i) contractual management fees, total expenses, actual management fees, and nonmanagement expenses of the Investor Class of the fund with a group of competitor funds selected by Broadridge (Expense Group); and (ii) total expenses, actual management fees, and nonmanagement expenses of the Investor Class of the fund with a broader set of funds within the Lipper investment classification (Expense Universe). The Board considered the fund’s contractual management fee rate, actual management fee rate (which reflects the management fees actually received from the fund by the Advisor after any applicable waivers, reductions, or reimbursements), operating expenses, and total expenses (which reflect the net total expense ratio of the fund after any waivers, reductions, or reimbursements) in comparison with the information for the Broadridge peer groups. Broadridge generally constructed the peer groups by seeking the most comparable funds based on similar investment classifications and objectives, expense structure, asset size, and operating components and attributes and ranked funds into quintiles, with the first quintile representing the funds with the lowest relative expenses and the fifth quintile representing the funds with the highest relative expenses. The information provided to the Board indicated that the fund’s contractual management fee ranked in the fourth quintile (Expense Group), the fund’s actual management fee rate ranked in the fourth quintile (Expense Group and Expense Universe), and the fund’s total expenses ranked in the fourth and fifth quintiles (Expense Group and Expense Universe).
The Board received additional information from management with respect to the fund’s relative management fee and total expenses ranking in the fourth and fifth quintiles, and reviewed and considered the information provided relating to the fund, other funds in the peer groups, and other factors that the Board determined to be relevant.
The Board also reviewed the fee schedules for other investment portfolios with similar mandates that are advised or subadvised by the Advisor and its affiliates, including separately managed accounts for institutional and individual investors; subadvised funds; and other sponsored investment portfolios, including collective investment trusts and pooled vehicles organized and offered to investors outside the United States. Management provided the Board with information about the Advisor’s responsibilities and services provided to subadvisory and other institutional account clients, including information about how the requirements and economics of the institutional business are fundamentally different from those of the proprietary mutual fund business. The Board considered information showing that the Advisor’s mutual fund business is generally more complex from a business and compliance perspective than its institutional account business and considered various relevant factors, such as the broader scope of operations and oversight, more extensive shareholder communication infrastructure, greater asset flows, heightened business risks, and differences in applicable laws and regulations associated with the Advisor’s proprietary mutual fund business. In assessing the reasonableness of the fund’s management fee rate, the Board considered the differences in the nature of the services required for the Advisor to manage its mutual fund business versus managing a discrete pool of assets as a subadvisor to another institution’s mutual fund or for an institutional account and that the Advisor generally performs significant additional services and assumes greater risk in managing the fund and other T. Rowe Price funds than it does for institutional account clients, including subadvised funds.
On the basis of the information provided and the factors considered, the Board concluded that the fees paid by the fund under the Advisory Contract are reasonable.
Approval of the Advisory Contract
As noted, the Board approved the continuation of the Advisory Contract. No single factor was considered in isolation or to be determinative to the decision. Rather, the Board concluded, in light of a weighting and balancing of all factors considered, that it was in the best interests of the fund and its shareholders for the Board to approve the continuation of the Advisory Contract (including the fees to be charged for services thereunder).
ABOUT THE FUND’S DIRECTORS AND OFFICERS
Your fund is overseen by a Board of Directors (Board) that meets regularly to review a wide variety of matters affecting or potentially affecting the fund, including performance, investment programs, compliance matters, advisory fees and expenses, service providers, and business and regulatory affairs. The Board elects the fund’s officers, who are listed in the final table. At least 75% of the Board’s members are considered to be independent, i.e., not “interested persons” as defined in Section 2(a)(19) of the 1940 Act, of the Boards of T. Rowe Price Associates, Inc. (T. Rowe Price), and its affiliates; “interested” directors and officers are employees of T. Rowe Price. The business address of each director and officer is 100 East Pratt Street, Baltimore, Maryland 21202. The Statement of Additional Information includes additional information about the fund directors and is available without charge by calling a T. Rowe Price representative at 1-800-638-5660.
| INDEPENDENT DIRECTORS(a) |
| | | |
Name
(Year of Birth)
Year Elected
[Number of T. Rowe Price
Portfolios Overseen] | | Principal Occupation(s) and Directorships of Public Companies and
Other Investment Companies During the Past Five Years |
| | | |
Teresa Bryce Bazemore
(1959)
2018
[190] | | President and Chief Executive Officer, Federal Home Loan Bank of San Francisco (2021 to present); President, Radian Guaranty (2008 to 2017); Chief Executive Officer, Bazemore Consulting LLC (2018 to 2021); Director, Chimera Investment Corporation (2017 to 2021); Director, First Industrial Realty Trust (2020 to present); Director, Federal Home Loan Bank of Pittsburgh (2017 to 2019) |
| | | |
Ronald J. Daniels
(1959)
2018
[190] | | President, The Johns Hopkins University(b) and Professor, Political Science Department, The Johns Hopkins University (2009 to present); Director, Lyndhurst Holdings (2015 to present); Director, BridgeBio Pharma, Inc. (2020 to present) |
| | | |
Bruce W. Duncan
(1951)
2013
[190] | | President, Chief Executive Officer, and Director, CyrusOne, Inc. (2020 to present); Chief Executive Officer and Director (2009 to 2016), Chair of the Board (2016 to 2020), and President (2009 to 2016), First Industrial Realty Trust, owner and operator of industrial properties; Chair of the Board (2005 to 2016) and Director (1999 to 2016), Starwood Hotels & Resorts, a hotel and leisure company; Member, Investment Company Institute Board of Governors (2017 to 2019); Member, Independent Directors Council Governing Board (2017 to 2019); Senior Advisor, KKR (2018 to present); Director, Boston Properties (2016 to present); Director, Marriott International, Inc. (2016 to 2020) |
| | | |
Robert J. Gerrard, Jr.
(1952)
2013
[190] | | Advisory Board Member, Pipeline Crisis/Winning Strategies, a collaborative working to improve opportunities for young African Americans (1997 to 2016); Chair of the Board, all funds (since July 2018) |
| | | |
Paul F. McBride
(1956)
2013
[190] | | Advisory Board Member, Vizzia Technologies (2015 to present); Board Member, Dunbar Armored (2012 to 2018) |
| | | |
Cecilia E. Rouse, Ph.D.(c)
(1963)
2013
[0] | | Dean, Princeton School of Public and International Affairs (2012 to present); Professor and Researcher, Princeton University (1992 to present); Director of Education Studies Committee, MDRC, a nonprofit education and social policy research organization (2011 to 2020); Member, National Academy of Education (2010 to present); Board Member, National Bureau of Economic Research (2011 to present); Board Member of the Council on Foreign Relations (2018 to present); Board Member, The Pennington School (2017 to present); Board Member, the University of Rhode Island (2020 to present); Chair of Committee on the Status of Minority Groups in the Economic Profession of the American Economic Association (2012 to 2018); Vice President (2015 to 2016) and Board Member (2018 to present), American Economic Association |
| | | |
John G. Schreiber
(1946)
1992
[190] | | Owner/President, Centaur Capital Partners, Inc., a real estate investment company (1991 to present); Cofounder, Partner, and CoChair of the Investment Committee, Blackstone Real Estate Advisors, L.P. (1992 to 2015); Director, Blackstone Mortgage Trust, a real estate finance company (2012 to 2016); Director and Chair of the Board, Brixmor Property Group, Inc. (2013 to present); Director, Hilton Worldwide (2007 to present); Director, Hudson Pacific Properties (2014 to 2016); Director, Invitation Homes (2014 to 2017); Director, JMB Realty Corporation (1980 to present) |
| | | |
| (a)All information about the independent directors was current as of December 31, 2020, unless otherwise indicated, except for the number of portfolios overseen, which is current as of the date of this report. |
| (b)William J. Stromberg, Chair of the Board, Director, and Chief Executive Officer of T. Rowe Price Group, Inc., the parent company of the Price Funds’ investment advisor, has served on the Board of Trustees of Johns Hopkins University since 2014. |
| (c)Effective March 4, 2021, Dr. Rouse resigned from her role as independent director of the Price Funds. |
| INTERESTED DIRECTORS(a) |
| | | |
Name
(Year of Birth)
Year Elected
[Number of T. Rowe Price
Portfolios Overseen] | | Principal Occupation(s) and Directorships of Public Companies and
Other Investment Companies During the Past Five Years |
| | | |
David Oestreicher
(1967)
2018
[190] | | General Counsel, Vice President, and Secretary, T. Rowe Price Group, Inc.; Chair of the Board, Chief Executive Officer, President, and Secretary, T. Rowe Price Trust Company; Director, Vice President, and Secretary, T. Rowe Price, T. Rowe Price Investment Services, Inc., T. Rowe Price Retirement Plan Services, Inc., and T. Rowe Price Services, Inc.; Vice President and Secretary, T. Rowe Price International; Vice President, T. Rowe Price Hong Kong (Price Hong Kong), T. Rowe Price Japan (Price Japan), and T. Rowe Price Singapore (Price Singapore); Principal Executive Officer and Executive Vice President, all funds |
| | | |
Robert W. Sharps, CFA, CPA
(1971)
2019
[190] | | Director and Vice President, T. Rowe Price; President, T. Rowe Price Group, Inc.; and Vice President, T. Rowe Price Trust Company |
| | | |
| (a)All information about the interested directors was current as of December 31, 2020, unless otherwise indicated, except for the number of portfolios overseen, which is current as of the date of this report. |
| OFFICERS |
| |
Name (Year of Birth)
Position Held With GNMA Fund | | Principal Occupation(s) |
| | | |
Scott Edwin Ackerman (1987)
Vice President | | Assistant Vice President, T. Rowe Price |
| | | |
Joseph Anastasio (1986)
Vice President | | Vice President, T. Rowe Price and T. Rowe Price Group, Inc.; formerly, Vice President, RC Capital Markets (to 2018); Vice President, Nomura Securities International (to 2017) |
| | | |
Anil Kumar Andhavarapu (1980)
Vice President | | Vice President, T. Rowe Price and T. Rowe Price Group, Inc. |
| | | |
Brian J. Brennan, CFA (1964)
Vice President | | Vice President, T. Rowe Price, T. Rowe Price Group, Inc., T. Rowe Price International, and T. Rowe Price Trust Company |
| | | |
Christopher P. Brown, CFA (1977)
Vice President | | Vice President, T. Rowe Price and T. Rowe Price Group, Inc. |
| | | |
Ramon Roberto de Castro (1966)
Vice President | | Vice President, T. Rowe Price and T. Rowe Price Group, Inc. |
| | | |
Alan S. Dupski, CPA (1982)
Principal Financial Officer, Vice President, and Treasurer | | Vice President, T. Rowe Price, T. Rowe Price Group, Inc., and T. Rowe Price Trust Company |
| | | |
John R. Gilner (1961)
Chief Compliance Officer | | Chief Compliance Officer and Vice President, T. Rowe Price; Vice President, T. Rowe Price Group, Inc., and T. Rowe Price Investment Services, Inc. |
| | | |
Gary J. Greb (1961)
Vice President | | Vice President, T. Rowe Price, T. Rowe Price International, and T. Rowe Price Trust Company |
| | | |
Keir R. Joyce, CFA (1972)
President | | Vice President, T. Rowe Price and T. Rowe Price Group, Inc. |
| | | |
Paul J. Krug, CPA (1964)
Vice President | | Vice President, T. Rowe Price, T. Rowe Price Group, Inc., and T. Rowe Price Trust Company |
| | | |
Alan D. Levenson, Ph.D. (1958)
Vice President | | Vice President, T. Rowe Price and T. Rowe Price Group, Inc. |
| | | |
Fran M. Pollack-Matz (1961)
Vice President and Secretary | | Vice President, T. Rowe Price, T. Rowe Price Group, Inc., T. Rowe Price Investment Services, Inc., and T. Rowe Price Services, Inc. |
| | | |
Shannon H. Rauser (1987)
Assistant Secretary | | Assistant Vice President, T. Rowe Price |
| | | |
Megan Warren (1968)
Vice President | | Vice President, T. Rowe Price, T. Rowe Price Group, Inc., T. Rowe Price Retirement Plan Services, Inc., T. Rowe Price Services, Inc., and T. Rowe Price Trust Company; formerly, Executive Director, JPMorgan Chase (to 2017) |
| | | |
| Unless otherwise noted, officers have been employees of T. Rowe Price or T. Rowe Price International for at least 5 years. |
Item 1. (b) Notice pursuant to Rule 30e-3.
Not applicable.
Item 2. Code of Ethics.
The registrant has adopted a code of ethics, as defined in Item 2 of Form N-CSR, applicable to its principal executive officer, principal financial officer, principal accounting officer or controller, or persons performing similar functions. A copy of this code of ethics is filed as an exhibit to this Form N-CSR. No substantive amendments were approved or waivers were granted to this code of ethics during the period covered by this report.
Item 3. Audit Committee Financial Expert.
The registrant’s Board of Directors/Trustees has determined that Mr. Bruce W. Duncan qualifies as an audit committee financial expert, as defined in Item 3 of Form N-CSR. Mr. Duncan is considered independent for purposes of Item 3 of Form N-CSR.
Item 4. Principal Accountant Fees and Services.
(a) – (d) Aggregate fees billed for the last two fiscal years for professional services rendered to, or on behalf of, the registrant by the registrant’s principal accountant were as follows:
Audit fees include amounts related to the audit of the registrant’s annual financial statements and services normally provided by the accountant in connection with statutory and regulatory filings. Audit-related fees include amounts reasonably related to the performance of the audit of the registrant’s financial statements and specifically include the issuance of a report on internal controls and, if applicable, agreed-upon procedures related to fund acquisitions. Tax fees include amounts related to services for tax compliance, tax planning, and tax advice. The nature of these services specifically includes the review of distribution calculations and the preparation of Federal, state, and excise tax returns. All other fees include the registrant’s pro-rata share of amounts for agreed-upon procedures in conjunction with service contract approvals by the registrant’s Board of Directors/Trustees.
(e)(1) The registrant’s audit committee has adopted a policy whereby audit and non-audit services performed by the registrant’s principal accountant for the registrant, its investment adviser, and any entity controlling, controlled by, or under common control with the investment adviser that provides ongoing services to the registrant require pre-approval in advance at regularly scheduled audit committee meetings. If such a service is required between regularly scheduled audit committee meetings, pre-approval may be authorized by one audit committee member with ratification at the next scheduled audit committee meeting. Waiver of pre-approval for audit or non-audit services requiring fees of a de minimis amount is not permitted.
(2) No services included in (b) – (d) above were approved pursuant to paragraph (c)(7)(i)(C) of Rule 2-01 of Regulation S-X.
(f) Less than 50 percent of the hours expended on the principal accountant’s engagement to audit the registrant’s financial statements for the most recent fiscal year were attributed to work performed by persons other than the principal accountant’s full-time, permanent employees.
(g) The aggregate fees billed for the most recent fiscal year and the preceding fiscal year by the registrant’s principal accountant for non-audit services rendered to the registrant, its investment adviser, and any entity controlling, controlled by, or under common control with the investment adviser that provides ongoing services to the registrant were $3,481,000 and $3,671,000, respectively.
(h) All non-audit services rendered in (g) above were pre-approved by the registrant’s audit committee. Accordingly, these services were considered by the registrant’s audit committee in maintaining the principal accountant’s independence.
Item 5. Audit Committee of Listed Registrants.
Not applicable.
Item 6. Investments.
(a) Not applicable. The complete schedule of investments is included in Item 1 of this Form N-CSR.
(b) Not applicable.
Item 7. Disclosure of Proxy Voting Policies and Procedures for Closed-End Management Investment Companies.
Not applicable.
Item 8. Portfolio Managers of Closed-End Management Investment Companies.
Not applicable.
Item 9. Purchases of Equity Securities by Closed-End Management Investment Company and Affiliated Purchasers.
Not applicable.
Item 10. Submission of Matters to a Vote of Security Holders.
There has been no change to the procedures by which shareholders may recommend nominees to the registrant’s board of directors.
Item 11. Controls and Procedures.
(a) The registrant’s principal executive officer and principal financial officer have evaluated the registrant’s disclosure controls and procedures within 90 days of this filing and have concluded that the registrant’s disclosure controls and procedures were effective, as of that date, in ensuring that information required to be disclosed by the registrant in this Form N-CSR was recorded, processed, summarized, and reported timely.
(b) The registrant’s principal executive officer and principal financial officer are aware of no change in the registrant’s internal control over financial reporting that occurred during the period covered by this report that has materially affected, or is reasonably likely to materially affect, the registrant’s internal control over financial reporting.
Item 12. Disclosure of Securities Lending Activities for Closed-End Management Investment Companies.
Not applicable.
Item 13. Exhibits.
(a)(1) The registrant’s code of ethics pursuant to Item 2 of Form N-CSR is attached.
(2) Separate certifications by the registrant's principal executive officer and principal financial officer, pursuant to Section 302 of the Sarbanes-Oxley Act of 2002 and required by Rule 30a-2(a) under the Investment Company Act of 1940, are attached.
(3) Written solicitation to repurchase securities issued by closed-end companies: not applicable.
(b) A certification by the registrant's principal executive officer and principal financial officer, pursuant to Section 906 of the Sarbanes-Oxley Act of 2002 and required by Rule 30a-2(b) under the Investment Company Act of 1940, is attached.
SIGNATURES
Pursuant to the requirements of the Securities Exchange Act of 1934 and the Investment Company Act of 1940, the registrant has duly caused this report to be signed on its behalf by the undersigned, thereunto duly authorized.
T. Rowe Price GNMA Fund, Inc.
| By | | /s/ David Oestreicher |
| | | David Oestreicher |
| | | Principal Executive Officer |
| |
| Date | | July 20, 2021 | | | | |
Pursuant to the requirements of the Securities Exchange Act of 1934 and the Investment Company Act of 1940, this report has been signed below by the following persons on behalf of the registrant and in the capacities and on the dates indicated.
| By | | /s/ David Oestreicher |
| | | David Oestreicher |
| | | Principal Executive Officer |
| |
| Date | | July 20, 2021 | | | | |
| |
| |
| By | | /s/ Alan S. Dupski |
| | | Alan S. Dupski |
| | | Principal Financial Officer |
| |
| Date | | July 20, 2021 | | | | |